Full Papers - e-rheo-iba
274
Challenges in rheology and product development FCT/UC, Coimbra, Portugal September 7–9, 2015 Full Papers
-
Upload
khangminh22 -
Category
Documents
-
view
0 -
download
0
Transcript of Full Papers - e-rheo-iba

Challenges in rheology and product development
FCT/UC, Coimbra, Portugal
September 7–9, 2015
Full Papers

ISBN Digital: 978-989-26-1056-6

Table of Contents
Welcome Message I
Committees II
Oral Communications 1
Poster Presentations 94
Author Index 267
i
IBEREO’15 IBERIAN RHEOLOGY CONFERENCE, 2015
Coimbra, Portugal
September 7th – 9th 2015
IBEREO’15, the Iberian Rheology Conference 2015, was the 5th in the series of conferences
organized jointly by the Portuguese Society of Rheology (SPR) and the Spanish Group of
Rheology (GER), which started in 2004 in Beja, Portugal. IBEREO presently takes place every
two years, either in Portugal or in Spain, and this time took place in Coimbra, Portugal, hosted
by the University of Coimbra, well known by its history of over 700 years, in its engineering
campus. This year’s conference was subjected to the topic “Challenges in Rheology and
Product Development”, having addressed the most recent trends in rheology, including:
Experimental Methods; Modelling and Simulation in Rheology; Multiphase Systems and
Composites; Product Formulation; Interface Rheology; Microrheology and Micro Fluidics and
Applications, with special emphasis on food, polymers and biopolymers and cosmetics.
The Conference, which took place from the 7th to the 9th of September, joined together around
100 participants from eleven different countries, and was an opportunity to bring together
experts in the field of rheology to discuss and learn about different and important topics in this
field, exchanging experiences and creating the opportunity for networking and establishment
of future collaborations. A selection of papers is being published in the on-line journal e-
Rheo.Iba (Ibero_American Journal of Rheology).
On behalf of IBEREO’15 Organizing Committee Maria Graça Rasteiro (IBEREO’15 Chair) University of Coimbra, Coimbra, Portugal

ii
COMMITTEES
ORGANIZING COMMITTEE
Abel Ferreira (University of Coimbra and CIEPQPF-UC)
Fátima Barreiros (Polytechnic Institute of Leiria and CEMUC-UC)
Filipe Antunes (University of Coimbra, Portugal)
Hermínio Sousa (University of Coimbra and CIEPQPF-UC)
Maria Graça Rasteiro (Chair) (University of Coimbra and CIEPQPF-UC)
Maria Teresa Cidade (Vice-chair) (New University of Lisbon and
President of SPR)
SCIENTIFIC COMMITTEE
Antxon Santamaria (University of the Basque Country, Spain)
Bob Powell (Davis University, USA)
David Harbottle (Leeds University, UK)
Francisco Rubio Hernandez (University of Malaga, Spain)
Isabel Sousa (University of Lisbon, Portugal)
José Covas (University of Minho, Portugal)
José Maria Franco (University of Huelva, Spain)
José Muñoz Garcia (University of Seville, Spain)
Juha Salmela (VTT, Finland)
Maria Teresa Cidade (New University of Lisbon and President of SPR,
Portugal)
Miguel Nóbrega (University of Minho, Portugal)
Maria Graça Rasteiro (Chair) (University of Coimbra and CIEPQPF-UC)

Oral Communications
1

Mechanical characteristics of acorn starch gels
María Dolores Torres Pérez1
1Department of Chemical Engineering, University of Santiago de Compostela, Lope Gómez de Marzoa St.,
Santiago de Compostela E-15782, Spain
Correspondence to: M.D. Torres (E-mail: [email protected])
ABSTRACT
Some underexploited renewable sources of biopolymers are found in the northwest of the Iberia
Peninsula, in abundance and at low cost. One of them is the acorn from cork oak (Quercus suber
L.), a non-conventional source of starch. The purpose of this study was to investigate the thermo-
mechanical characteristics of acorn starch samples at different concentrations. Rheological
testing at small amplitude oscillatory shear was made using a stress-controlled rheometer to
follow the evolution of the structure of acorn systems. Texture characteristics of the final gels
were determined from the texture profile analysis. Preliminary physicochemical properties of the
starch were also studied. Mechanical properties of studied gels were notably dependent on acorn
starch concentration, given a set of gels with suite gelling properties for a wide range of
applications.
KEYWORDS acorn starch, gluten-free, gels, rheology, texture
INTRODUCTION
A non-conventional source of starch founded in the Iberian Peninsula is the acorn from cork oak
(Quercus suber L.). Acorn starch is an unexploited ingredient which could have attractive
characteristics to be used in gluten-free diets. This could be also a strategy to add value to the
acorn industry by-products. Naturally, acorns show a high content of tannins, which must be
removed in the process of producing starch for food applications1. Despite its promising
properties, this source of starch has had very little research into its structural and thermo-
rheological features.
Applications (Food)
O1
2

The development of alternative gluten-free products based on gelled systems from starches
involves the understanding of how these carbohydrates behave under food processing conditions.
The final structure and textural properties of these systems are strongly dependent on processing
temperature/time, cooling rates, polysaccharide content or pH conditions since they can affect
the dynamic process of competition between phase separation and gel formation. In this context,
the main objective of this work is to carry out a systematic investigation of the mechanical
properties of acorn starch samples at different experimental conditions. The evolution of the
structure of these systems was monitored by rheological testing at small amplitude oscillatory
shear (SAOS) using a stress-controlled rheometer. Texture characteristics of the final gels were
determined from the texture profile analysis. Preliminary physicochemical characteristics of the
starch were also studied.
MATERIAL AND METHODS
Raw materials
Acorns from cork oak (Quercus suber L.) were collected in the northwest of the Iberian
Peninsula. Acorns of uniform size were selected for the extraction of starch. Selected samples
were peeled and cut into small pieces. Representative samples of 500 g were ground in a blender
with 1 L of water. After filtration of the slurry, the residue was ground again with the same
proportion of water (1:2) and filtered. Both filtrates were let to settle over 24 h. Settled solids
were separated from the supernatant and, then washed with distilled water several times until the
acorn starch was free of colour; the acorn starch was then dried in a ventilated oven at 40ºC.
Acorn gels were prepared at several concentrations (from 15 to 85% w/w). The starch was
dispersed in demineralised water by stirring at 800 rpm for 10 min at room temperature. Acorn
starch suspensions were heated up to 90ºC and kept at this temperature for 30 min in order to
prepare the gels. After, samples were placed in a fridge to allow full maturation of gels, which
were kept at 5ºC for 24h before performing texture measurements.
Methods
Initial moisture, carbohydrates and starch content were determined according to standard
methods. The measurements were made in triplicate.
3
Gels firmness (N) was determined in triplicate from the texture profile analysis (TPA) using a
TA-XT2i (Stable Micro Systems, UK) texturometer (load cell of 5 kg). Before performing any
measurements, gels were allowed to equilibrate at 20 ºC for around 1 h in a temperature-
controlled room.
Thermo-rheological measurements were performed at least in duplicate on a controlled-stress
rheometer using serrated parallel plates (35 mm diameter and 0.5 mm gap). Suspensions of
starch were held at 20ºC between the plates for 10 min before testing. After, samples were heated
to 90ºC at 2ºC/min. Then, time sweeps were conducted at 90ºC for 60 min at 0.1 Hz. After,
samples were cooled down to 5ºC at 1 ºC/min. Temperature sweeps were performed at 0.1 Hz. A
constant stress (2 Pa) within the linear viscoelastic region (LVR) was used in above tests. After
cooling, time sweep tests were conducted at 5 ºC, during 60 min at 1 Hz. Without disturbing the
gel, frequency sweep measurements were made at 20ºC, with oscillation frequencies over the
range 0.01 to 100 rad/s. A constant stress (30 Pa) within the LVR of gels was used in the two
latter tests.
Experimental data were analysed by one-factor analysis of variance followed by Scheffe test to
differentiate means with 95% confidence (p < 0.05) using PASW Statistics (v.18, NY, USA).
RESULTS AND DISCUSSION
Acorn samples contained (% w/w, dry weight) 82% of carbohydrates, of which 64% was starch.
The extracted starch from cork oak’s acorn presented an average moisture content of 11.2%.
These values are consistent with those previously reported for different gluten-free starches with
similar starch content2.
Thermo-rheological outcomes gathered that the interval of gelatinization temperature range of
acorn starch extracted experimentally (from intitial gelatinization temperature, T0, around 61ºC
to final gelatinization temperature, T1, around 76ºC) is similar to starches from other commercial
sources2 (Figure 1).
Rheological and texture measurements were notably dependent on acorn starch concentration.
These results are in harmony with those reported for other gluten-free starches such as chestnut
4

starch2. Overall, this study delivered a set of acorn starch gels showing a suite of gelling
properties for a wide range of applications.
FIGURE 1 Representative temperature sweep profile of acorn starch gels prepared at concentration of
85%. Symbols: closed squares – storage (G') open squares– loss (G") moduli.
CONCLUSIONS
This study showed that extracted acorn starch samples at different concentrations induces
different degrees of gel structure that could be applied in the production of a large variety of food
products. This knowledge allows to create a new markets, add value and new applications to
underexploited renewable sources of the northwest of the Iberia Peninsula, acorn starch extracted
from cork oak.
ACKNOWLEDGEMENTS
The authors acknowledge the financial support (POS-A/2012/116) from Xunta de Galicia of Spain and
the European Union’s European Social Fund. The authors also wish to thank Professor D. Pérez and
Professor G. Torres for his help with the experiments and for useful discussions.
REFERENCES AND NOTES
1. Stevenson, D.G.; Jane, J.; Inglett, G.E., Starch, 2006, 58, 553-560.
2. Moreira, R.; Chenlo, F.; Torres, M.D., Glazer, J., Journal of Food Engineering, 2012, 112, 94-99.
5

Evaluation by DMTA of Gelatinization Temperatures of Starch in Maize and Chestnut Flour Doughs
Ramón Moreira, Francisco Chenlo, Santiago Arufe
Departamento de Enxeñaría Química, ETSE, Universidade de Santiago de Compostela, Rúa Lope Gómez de Marzoa, s/n, 15782 Santiago de Compostela (Spain)
Correspondence to: Ramón Moreira (E-mail: [email protected])
ABSTRACT
Gluten-free flour doughs (three from different maize varieties and one from chestnut fruit)
processed at the same consistency level (1.10 ± 0.07 Nm) with different water absorption were
used to determine the starch gelatinization by means of two different experimental techniques,
differential scanning calorimetry (DSC) and dynamic thermal mechanical analysis (DMTA). The
ranges of temperatures of gelatinization (G) and amylopectin melting (M1) for all tested flour
doughs were determined by both experimental techniques and results showed good agreement
between them. In DMTA, G and M1 were determined by means of the elastic modulus or
damping factor evolution with temperature. The temperatures of the transitions determined by
DSC depended on water content, the nature and characteristics of the starch and the presence of
other compounds (mainly lipid and sugars) in the flour doughs.
KEYWORDS amylopectin melting, DSC, gluten-free flour, water absorption
INTRODUCTION
Gelatinization of different starches is well studied in the bibliography by its importance in starch
processing for food and non-food purposes. At high water content, using DSC technique, one
broad endothermic peak, G, by the swelling of the amorphous region and subsequent melting of
crystallites is observed, but at intermediate water content, this transition is partially postponed to
higher temperatures resulting M1 transition1. Nevertheless, some endothermic peaks associated
to the thermal transitions are very weak and consequently their determination and evaluation is
troublesome and other techniques are necessary. The study of the starch transitions in cereal
flour doughs is more complex than the study of isolated starch from different sources. The
O3
6

presence of other biopolymers like proteins and lipids, together with the particle size of the flour,
affect significantly the water absorption of the samples to achieve a determined consistency.
Dynamic Mechanical Thermal Analysis (DMTA) consists on the application of a sinusoidal
force to the sample at fixed angular frequency measuring the stress and strain inside the LVR at
constant heating/cooling rate. DMTA was employed to evaluate the starch gelatinization due to
strong structural changes take place during the plasticizing process promoted by water2.
The aim of this work is to determine the G and M1 transitions of gluten-free flour doughs
processed at the same consistency level with different water absorption by DSC and DMTA.
Starch transitions are discussed regarding to physicochemical properties of flours and doughs.
EXPERIMENTAL
Maize (Zea mais) flours obtained from 3 different varieties of Spanish maize kernels, white
(WM, Rebordanes), yellow (YM, Sarreaus) and purple (PM, Meiro) and chestnut (CH, Castanea
sativa Mill.) flour were used. Flours were placed in a desiccator at 25ºC and RH 54%, until
flours equilibration with constant moisture content (8-10 %, d.b.). Flours were stored at 4ºC in
vacuum sealed bags until use. Doughs for DMTA experiments were prepared by using Mixolab®
apparatus (Chopin Technologies, France)3. At the consistency of 1.10 Nm, water absorption
(WA, % d.b.) was determined. In the case of DSC studies, samples, at the same WA of doughs
studied by DMTA, were prepared by other protocol. The flour (~1g) was put in a glass vial and
water was added to obtain the desired WA. The vial was sealed and sample was equilibrated for
24 h at room temperature. A portion of the sample (< 18 mg) was introduced in a steel pan and
sealed. Thermal properties were determined with a calorimeter (Q200, TA Instruments, USA).
An empty steel pan was used as reference. Sample was heated from 40ºC up to 110ºC at 4ºC/min.
Flour doughs at the target consistency were tested in a controlled stress rheometer (MCR 301,
Anton Paar, Austria) equipped with a chamber (CTD 450, Anton Paar, Austria) using parallel
plates (50 mm diameter, 2 mm gap) by DMTA. The assays were performed in the LVR of the
doughs (0.1 % of strain, 1 Hz). Temperature increased from 30 to 110ºC at 4ºC/min. G´ and tan δ
values were used to determine the temperatures associated with starch transitions. All assays
were performed at least in duplicate. Differences among means were identified by one-factor
analysis of variance with Scheffe test and significant P-values ≤ 0.05 (IBM SPSS Statistics 22).
7

RESULTS AND DISCUSSION
In DSC experiments, all samples showed gelatinization endotherm, G, which appeared at low
temperature (66.7-69.1ºC, see Table). This endotherm at high WA corresponds to the
gelatinization of amylopectin4. When water is restricted, gelatinization can be partly postponed
to higher temperatures due to the melting of the remaining amylopectin crystallites giving as
result M1 peak. At intermediate WA, M1 peak appears as a shoulder overlapped with the G peak
giving as result a broad temperature range of gelatinization. At lower WA, M1 is separated from
G and shifted to higher temperatures. In maize doughs, YM dough (low WA) showed separately
G and M1 peaks and WM and PM doughs only one peak (G + M1). CH dough also showed a
peak with shoulder (G + M1), in spite of it is the sample with the lowest WA. This result reveals
that the nature of starch and its interactions with other hydrophilic components (carbohydrates
and proteins) modify the available water for starch gelatinization. Samples with peaks overlap
showed a broad temperature range for the glass transition (from 66.7 to 93.3 ºC, Table).
TABLE. Onset (To), peak (Tp) and final (T1) temperatures of thermal starch transitions determined by DSC and DMTA for tested maize and chestnut flour doughs♣
♣Standard deviations of temperature data for DSC were ±0.2ºC. Data with different letters in rows are significantly different, P ≤ 0.05.
Figure shows the G´ peaks during DMTA of YM and WM dough samples, as example of two
behaviours observed. At low temperatures G´ values decreased slightly with increasing
temperature up to achieve a minimum. This point, labeled like To´, determines the beginning of
the physical phenomena of gelatinization, corresponding to the swelling of the starch granules.
G´ increased due to the growing turgor of starch granules. G´ values sharply increase from 50-
YM WM PM CH WA (%, d.b.) 63.0±1.0b 90.0±2.0d 81.1±1.4c 52.9±0.5a
T (ºC) DSC
G To 66.7a 66.7a 68.2b 69.1b Tp 74.0a 76.7b 78.8c 77.5b T1 82.6a 90.6b 93.3c 90.2b
M1 To 83.0 - - - Tp 91.7 - - - T1 100.7 - - -
DMTA
G
To´ G´ 53.6±0.1a 50.0±1.3a 56.1±0.2a 56.9±2.5a tan δ - - - -
To G´ - - - - tan δ 66.9±0.1a 68.6±1.9a 71.5±0.6a 71.0±0.7a
Tp G´ 74.4±0.1a 74.5±0.3a 77.3±0.5b 76.9±0.2b tan δ 77.0±0.2a 75.8±2.0a 79.0±0.6a 78.9±0.6a
T1 G´ - 86.8±0.2a 85.0±0.4a 86.5±0.3a tan δ - 83.0±0.2a 87.5±1.5a 84.5±0.1a
M1 T1 G´ 102.5±2.1 - - -
8

57ºC. This point was not detected by DSC, because thermal properties of dough were not
modified. Starch gelatinization continues at higher temperatures with the disintegration of the
granules and starchy polymers melting with a generation of a continuous matrix of leached
amylose molecules that increases the viscous character. In fact, tan δ increased above To,
measured by DSC, up to a maximum value, Tp. This peak temperature coincides with Tp given
by relative maximum of G´, Table. To and Tp measured by DSC and DMTA showed deviations
< 2ºC. Final temperature, T1, can be evaluated through the minimum value of tan δ and also by
the point in which the slope (straight line in Figure) of G´ changes after Tp. This peak is the sum
of G and M1 transitions for WM, PM and CH doughs while YM sample showed separated peaks.
In DMTA both peaks of YM dough were not observed, but a broader temperature interval with
constant slope was found. Consequently, structural changes and phase transitions promoted
during G and M1 endotherms measured by DSC are jointly observed by DMTA.
FIGURE. DMTA rheograms for yellow (YM) and white (WM) maize flour doughs.
ACKNOWLEDGEMENTS
The authors acknowledge the financial support to Ministerio de Economía y Competitividad of Spain and FEDER
(CTQ 2013-43616/P).
REFERENCES AND NOTES
1. Jang, J.K.; Pyun, Y.R. Starch/Stärke, 1996, 48, 48-51.
2. Chanvrier, H.; Appelqvist, I.; Li, Z. Food Research International, 2013, 53, 73-80.
3. ICC. Standard Methods. International Association for Cereal Chemistry, Vienna 337, 1996.
4. Liu, H.; Yu, L.; Xie, F.; Chen, L. Carbohydrate Polymers, 2006, 65, 357-363.
9

Rheology and texture of liquid whey protein concentrates (LWPC) based gels:
influence of the acidification process
Marta Helena Fernandes Henriques1,2, David Manuel Gama Simões Gomes1,2, Carlos José Dias Pereira1,2
1Polytechnic Institute of Coimbra - College of Agriculture, Department of Food Science and Technology,
Bencanta, 3040-316 Coimbra, Portugal
2CERNAS – Research Center for Natural Resources, Environment and Society, Bencanta, 3040-316 Coimbra, Portugal
Correspondence to: Marta Helena Fernandes Henriques (E-mail: [email protected])
ABSTRACT
The aim of this work was to study the gelation properties of liquid whey protein concentrate (LWPC) as
raw material for dairy food applications. The gelation was promoted by acidification. Acid-induced gels
were produced with non-defatted LWPC by bacterial fermentation (yogurt type) and glucono-δ-lactone
(GDL) acidification (dessert type) with or without fortification with skimmed milk powder (SMP). All the
produced gels showed viscoelastic behaviour. The fermented systems formed weaker gel structures
than the equivalent chemically acidified gels. The acidification process and the sequence in which
protein denaturation is performed may be responsible for these differences. It was also observed that
molecular rearrangement continues during cold storage, and that fortification with SMP favoured
gelation improving the rheological properties and the viscosity of the LWPC gels.
KEYWORDS Liquid whey proteins, acid gelation, rheology, viscosity, texture
INTRODUCTION
Whey proteins are pointed out as carriers for ligands and trace elements as well as for their biological
functions 1. In food products, dry whey protein concentrates (WPC) are widely used in bakery and
confectionary products 2, salads 3, beverages 4, meat and dairy products 5,6. The application of WPC in
food, in order to increase nutritional and functional properties (e.g. emulsifying and gelling) is not
random, and depends on the origin, production process and chemical composition of the whey protein
concentrates. Among the functional properties of whey proteins, gelation is cited as one of the most
interesting hydration-related properties.
Membrane technologies, namely ultrafiltration (UF) enable the extraction and concentration of whey
proteins from whey. Despite WPC are largely used as ingredients the direct use of liquid whey protein
concentrates (LWPC), being a less expensive alternative 7 avoiding drying processes, is rarely applied and
no attention has been paid to its functionality.
O20
10

MATERIAL AND METHODS
Bovine cheese whey used in the production of non-defatted (ND) LWPC was supplied by Queijaria
Serqueijos SA (Portugal). GDL was supplied by Enzilab and the mixed culture of Streptococcus
thermophilus and Lactobacillus bulgaricus was supplied by Ezal YO-MIX 601.
Manufacture of LWPC and gel preparation
No defatted LWPC was produced according to Henriques 7, whose chemical composition was 20.5% of
total solids, 7.1% of fat, 9.6% of protein and 0.85% of ash. Titratable acidity (TA) was 0.52% lactic acid.
Acid gels of ND LWPC, used as food model for yogurt and dessert, were produced by lactic fermentation
or acidification by GDL respectively, with or without SMP. For yogurt type acid gel production, the LWPC
was first pasteurized at 90 ºC/5 min and cooled down to 60 ºC. The product was divided into two parts
and SMP was added to one part to obtain 5% incorporation in the final formulation. After that, both
products were homogenized at 100 bar. The fermentation, performed by a commercial mixed culture of
bacteria, took place at 44 ºC until pH reached 4.6. In the case of the acid gel desserts, 5% sucrose was
added to the ND LWPC and two separate formulations were produced (0% and 5% SMP). Both mixtures
were heated to 60 ºC and homogenized at 100 bar. GDL was then added to a level of 1.5% (w/w, protein
basis) and the mixture was gently stirred and distributed into glass cups. Acidification by GDL hydrolysis
to gluconic acid was performed also at 44 ºC until pH 4.6. Finally, acid gel desserts were heat treated at
90 ºC/30 min. All the samples were then refrigerated and stored at 5 ºC.
Gel composition and physicochemical analyses
Acid gels were analysed in triplicate and characterised in terms of dry matter, fat, total proteins, ash,
carbohydrates, titratable acidity (TA) and pH. Gel water retention capacity (WRC) was determined
according to the method of Gauche 7. The texture profile analysis (TPA) was run in a Stable Micro
Systems Texture analyser (TA.XT Express Enhanced model) with a penetration distance of 5 mm at 1
mm/s test speed, using an acrylic cylindrical probe with a diameter of 0.6 mm and a height of 3.5 mm.
The rheological properties, elastic modulus (G’) and viscous modulus (G”) were evaluated at 15ºC in the
range of 0.05 - 1.5 Hz at 3 Pa, using a controlled stress rheometer (Rheostress 1, ThermoHaake) in
oscillatory mode. The measuring system consisted of a cone and plate geometry, C60/Ti - 0.052 mm (60
mm Ø and of 1º angle).
RESULTS AND DISCUSSION
As expected, the products with SMP had significantly higher total solids than the unfortified products.
The fat content did not vary in each product type (p > 0.05) with the addition of SMP. Although the
protein content increased in products with 5% SMP, due to the incorporation of caseins, no significant
differences (p > 0.05) were observed between formulations or product types. Lactic desserts had
significantly higher levels of other solids (mainly carbohydrates) due to the addition of sucrose in the
formulation (5%, wet basis). Solvent evaporation due to the longer heat treatment (30 min) and the
11

fermentation process in the case of yogurts, which converted lactose into lactic acid, may also have
contributed to this difference.
The titratable acidity (Table 1) achieved for LWPC yogurt type acid gels (1.30-1.88%) was higher than for
the dessert gels (1.05-1.58%). This may indicate that acidification by bacterial fermentation is more
effective than by GDL hydrolysis to gluconic acid. A significant decrease in pH was also observed during
storage for yogurts, which may point out that fermentation continues during storage. A distinctive type
of behaviour was found in desserts. This divergence in the pH between products may be due to the
period at which the heat treatment was performed during gel production. In the case of yogurts, whey
protein denaturation occurs during the pasteurisation (90 ºC, 5 min) of LWPC, prior to the addition of
SMP and fermentation whereas in the case of desserts, acid-induced gelation occurs when the whey
proteins are still in their native form. Specific WRC behaviour (Table 1) can be observed in the LWPC acid
gels according to their nature (yogurt or dessert), SMP incorporation and storage time. The desserts
showed a higher WRC (64.12-100%) than yogurts (53.11-65.74%), which can be attributed firstly to their
higher total solids content and also to the heat treatment after acidification. With regard to hardness, it
was observed that desserts presented higher values than yogurts, and the incorporation of SMP in the
formulation also contributes to this. These results concur with the higher WRC observed for desserts
with 5% SMP, indicating that harder gel structures have the ability to prevent syneresis more efficiently.
TABLE 1 TA, WRC and hardness of ND LWPC yogurts and desserts (0% and 5% of SMP) during storage
Gel type Yogurt Dessert
Parameter Time (days) 0% 5% 0% 5%
Titratable acidity TA (% lactic acid)
1 1.38±0.17 aA 1.46±0.18 aA 1.05±0.01 aA 1.58±0.02 bA
21 1.30±0.08 aA 1.88±0.11 bB 1.19±0.08 aB 1.21±0.14 aB
Water retention capacity WRC (%)
1 65.74±1.62 bA 53.11±1.16 aA 70.49±4.58 aB 99.52±0.58 bA
21 64.04±1.03 bA 56.59±2.94 aB 64.12±4.87 aA 100.00±0.00 bA
Hardness (N)
1 0.10±0.00 aA 0.09±0.01 aA 0.11±0.02 aA 0.59±0.12 bA
21 0.11±0.00 aA 0.15±0.01 bB 0.18±0.02 aA 0.44±0.16 bA
Means without the same letter differ statistically at p < 0.05. a,b Lowercase letters represent differences between products (0 and 5% of SMP).A,B Uppercase letters represent differences over time (1st and 21st days).
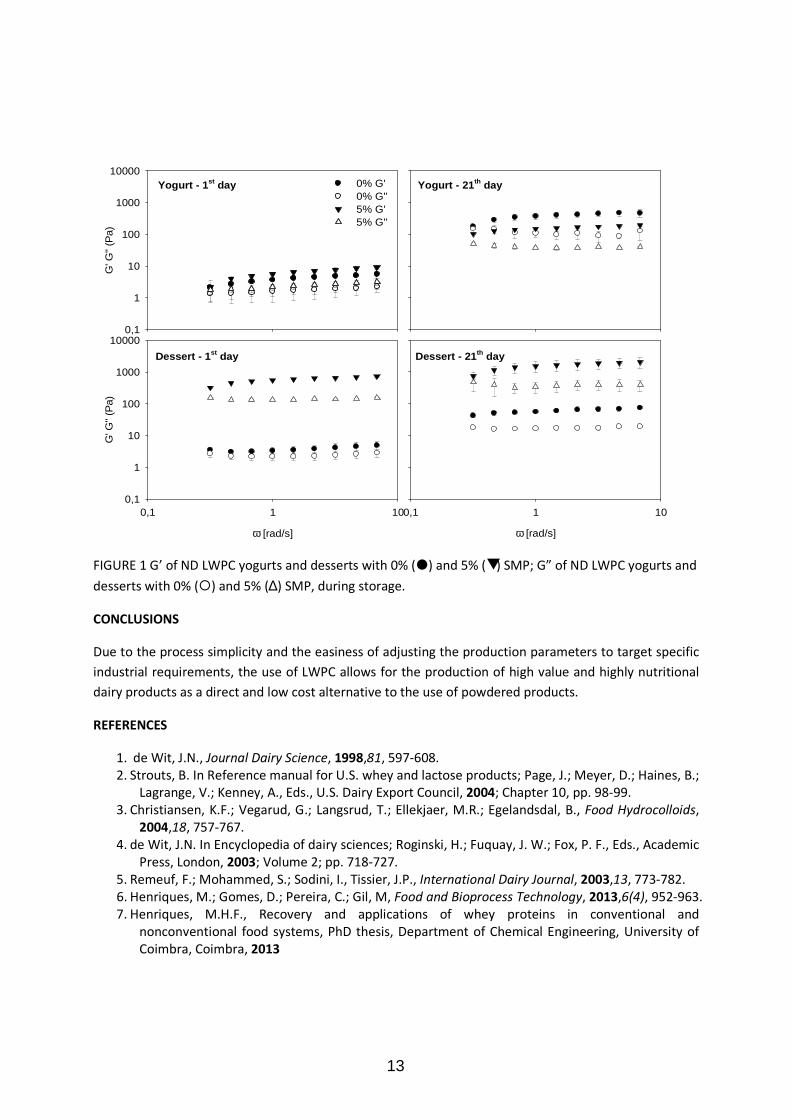
In Fig. 1 it can be observed that in all cases G’ is higher than G’’ demonstrating the gel structure and the
viscoelastic behaviour of both products. An increase in G’ and G’’ was observed over time, indicating
that protein polymerization and molecular structure rearrangements continue during refrigeration, thus
making the gels stronger. In yogurts no significant differences were observed between products one day
after production, with or without SMP fortification. However, at the end of the storage time the yogurts
with SMP presented lower G’ and G’’ values than the ones with no SMP addition. The presence of casein
micelles that were not denatured may increase protein heterogeneity and disturb the protein network
by producing weaker gels. In the case of desserts, a very stable product was obtained using SMP (Fig. 1).
These results corroborate the higher hardness values and WRC (Table 1) achieved for these acid gels.
12
Yogurt - 1st day
G' G
'' (P
a)
0,1
1
10
100
1000
100000% G'0% G''5% G'5% G''
Yogurt - 21th day
Dessert - 1st day
ω [rad/s]
0,1 1 10
G' G
'' (P
a)
0,1
1
10
100
1000
10000
Dessert - 21th day
ω [rad/s]
0,1 1 10
FIGURE 1 G’ of ND LWPC yogurts and desserts with 0% (�) and 5% (▼ ) SMP; G” of ND LWPC yogurts and
desserts with 0% (�) and 5% (∆) SMP, during storage.
CONCLUSIONS
Due to the process simplicity and the easiness of adjusting the production parameters to target specific
industrial requirements, the use of LWPC allows for the production of high value and highly nutritional
dairy products as a direct and low cost alternative to the use of powdered products.
REFERENCES
1. de Wit, J.N., Journal Dairy Science, 1998,81, 597-608.
2. Strouts, B. In Reference manual for U.S. whey and lactose products; Page, J.; Meyer, D.; Haines, B.;
Lagrange, V.; Kenney, A., Eds., U.S. Dairy Export Council, 2004; Chapter 10, pp. 98-99.
3. Christiansen, K.F.; Vegarud, G.; Langsrud, T.; Ellekjaer, M.R.; Egelandsdal, B., Food Hydrocolloids,
2004,18, 757-767.
4. de Wit, J.N. In Encyclopedia of dairy sciences; Roginski, H.; Fuquay, J. W.; Fox, P. F., Eds., Academic
Press, London, 2003; Volume 2; pp. 718-727.
5. Remeuf, F.; Mohammed, S.; Sodini, I., Tissier, J.P., International Dairy Journal, 2003,13, 773-782.
6. Henriques, M.; Gomes, D.; Pereira, C.; Gil, M, Food and Bioprocess Technology, 2013,6(4), 952-963.
7. Henriques, M.H.F., Recovery and applications of whey proteins in conventional and
nonconventional food systems, PhD thesis, Department of Chemical Engineering, University of
Coimbra, Coimbra, 2013
13

Soybean proteins as basis on the formation of superabsorbent materials
Lucia Fernández-Espada, Carlos Bengoechea, Felipe Cordobés, Antonio Guerrero
Departamento de ingeniería química, Universidad de Sevilla, España
Correspondence to: Carlos Bengoechea (E-mail: [email protected])
ABSTRACT
Superabsorbent materials (SAMs) can absorb large volumes of aqueous fluids, retaining absorbed water
even under heating or some pressure. The environmentally friendly characteristics of materials have
become an essential index to evaluate their applicability in practice. Currently, the biodegradable SAMs
are mainly focused on the natural polysaccharide family (e.g. starch) having been applied in many fields,
prominently in agriculture, horticulture, and hygiene products.
Due to its hygroscopic character, a soy protein isolate (SPI) was selected to produce materials through
injection molding with the goal of evaluate their water uptake capacity
In order to obtain a material with a higher water uptake capacity, sodium bicarbonate was introduced in
the formulation, along glycerol as plasticiser. Depending on the composition used and on the processing
conditions selected, water uptake values as higher as 900.02 ± 21% (2.5% bicarbonate) were reached.
Moreover, it was clear how a higher content of bicarbonate produced materials with a lower Young
modulus and higher maximum strain. These materials show a remarkable capacity to absorb water,
explained by the hygroscopic character of both the protein and plasticizer and presumably by the high
porosity produced due to the bicarbonate decomposition, which may be of special interest for future
applications.
KEYWORDS soy protein, bioplastic, injection moulding, superabsorbent, water uptake
INTRODUCTION
Petroleum-based plastics are well extended, though many drawbacks result from their use. A
great concern goes to the generation of important wastes that are difficult to degrade. Those
negative attributes have led to an increasing interest on environmentally friendly plastics from
alternative sources1.
Even if environmentally friendly bioplastics have been produced from proteins, lipids or
polysaccharides2,3,4
, there is still a lot of work ahead in order to improve mechanical and physical
O21
14

properties of protein-based bioplastics. Depending on their future applications, possible
inconveniences may be found, as good hygroscopic properties normally are paired with lower
elastic properties.
Soybean proteins may be transformed into biodegradable plastics when mixed with a
plasticizer5,6
. However, these soybean bioplastics have showed low mechanical strength and high
moisture absorption. Thus, they may have potential applications in the field of Superabsorbent
Materials (SAMs).
The objective of the present work is to study how composition and processing conditions may
produce soybean protein-based bioplastic materials with a higher water uptake capacity and
proper mechanical properties with potential application as SAMs.
RESULTS AND DISCUSSION
Soybean protein is known for its high higroscopicity, which may be an asset when the aim is a
material with a high water uptake capacity, which eventually would have a potential application
as SAM. Among the several methods available to produce protein-based bioplastic materials,
injection moulding was selected.
Processing condiitions
Water uptake (%)
E’ (Pa) ·10-8
E’’ (Pa) ·10-8
tanδ
80ºC 243 ± 21 1.33 ± 0.06 0.44 ± 0.03 0.33 ± 0.01
100ºC 213 ± 43 1.33 ± 0.06 0.44 ± 0.01 0.33 ± 0.03
Tcylinder
120ºC 125 ± 48 1.46 ± 0.03 0.45 ± 0.04 0.31 ± 0.02
80ºC 523 ± 19 1.23 ± 0.20 0.36 ± 0.34 0.29 ± 0.01
100ºC 429 ± 14 1.74 ± 0.13 0.50 ± 0.12 0.29 ± 0.00
120’ºC 243 ± 21 1.46 ± 0.03 0.45 ± 0.04 0.31 ± 0.02
Tmould
140ºC 218 ± 5 1.29 ± 0.36 0.41 ± 0.11 0.32 ± 0.01
250 bars 233 ± 6 1.38 ± 0.05 0.38 ± 0.00 0.28 ± 0.01
500 bars 224 ± 27 4.25 ± 0.26 1.20 ± 0.11 0.28 ± 0.01
Pinjection
1000 bars 260 ± 13 7.68 ± 0.78 2.19 ± 0.24 0.28 ± 0.00
TABLE 1 Flexural parameters (1Hz, 25ºC) for SPI/Gly (50/50) bioplastics processed through injection
moulding. When not indicated: Tcylinder: 80ºC; Tmould: 120ºC; Pinjection: 500 bars. No bicarbonate included.
15

The first stage of this research focused on the optimization of the processing parameters. Thus,
different 50/50 SPI/Gly bioplastic materials were obtained at different cylinder temperature
(Tcylinder), mould temperature (Tmould) and injection pressure (Pinjection) values.
The best capacity to absorb water when immersed is observed at lower cylinder and mould
temperature values (e.g. 80ºC), being the impact of pressure on water uptake seemingly less
important (Table 1). When observing the influence on flexural properties (elastic and viscous
moduli, E’ and E’’ respectively), Tmould and especially Pinjection show the greater effect: an
increase in Tmould over 100ºC produces a lowering in E’ and E’’, while an increase in Pinjection
results in a strengthening of the structure (higher E’, E’’).
Once those processing conditions have been studied, the effect of the addition of sodium
bicarbonate on the water uptake capacity is studied. The decomposition of sodium bicarbonate
on the injection-moulding device leads to the formation of a porous structure that may enhance
the water absorption. Milder processing conditions (Tcylinder: 40ºC; Tmould; 70ºC) were used in
order to avoid a major decomposition of bicarbonate in the injection-moulding device. Moreover,
it has been proved how lower temperature values promote a higher water uptake.
As observed in Figure 1, the addition of bicarbonate in the formulation in a concentration within
1 to 5% results in higher water uptake capacities, and also in a decrease in their Young moduli
and an increase in their maximum strength.
FIGURE 1. Water uptake capacity (left); and tensile parameters (maximum strength (σmax), strain at
fracture (εf), Young modulus (E)) (right) for SPI/Gly (50/50) bioplastics processed through injection
moulding (Tcylinder: 40ºC; Tmould: 70ºC; Pinjection: 500 bars) and different sodium bicarbonate concentrations
16

CONCLUSIONS
When a high water uptake capacity is pursued for 50/50 SPI/Gly bioplastic materials through
injection moulding, low mould temperatures and medium to high pressures are required.
At those processing conditions, a higher water uptake capacity is obtained when bicarbonate is
present in the formulation of 50/50 SPI/Gly bioplastic materials, especially at concentrations
ranging from 1 to 2.5%, obtaining water uptake values around 900%. These high values may be
used in the production of SAMs, though further research in this direction is needed.
ACKNOWLEDGEMENTS
The authors would like to kindly acknowledge the financial support from MCI (MAT2011-
29275-C02-02).
REFERENCES
1. Jones, A., Ashton Zeller, M., Sharma, S., Progress in Biomaterials. 2013, 2:12
2. Avérous, L., Macromolecular Science -Polymer Reviews., 2004, C4(3): 231-274.
3. Hernández-Izquierdo, V.M., Krochta, J.M., Journal of Food Science, 2008 (73): 30–39.
4. Siracusa, V., Rocculi, P., Romani, S., Dalla Rosa, M., Trends in Food Science & Technology, 2008,
(19): 634–643.
5. Liu, W., Mohanty, AK., Askeland, P., Drzal, LT., Mirsa, M., Polymer, 2004, 45: 7589-7596
6. Liu, W., Mohanty, AK., Askeland, P., Drzal, LT., Mirsa, M., Polymer, 2005, 46: 2710-2721
17

Rheology of healthy bonbons with functional characteristics
Vanessa Batista, Margarida Faísca, Patrícia Fradinho, Anabela Raymundo, Isabel de Sousa LEAF- Instituto Superior de Agronomia/Universidade de Lisboa, Edifício Ferreira Lapa-
Tapada da Ajuda 1349-017 Lisboa, Portugal
ABSTRACT
The present work is part of a joint project with a traditional confectionery company. The aim of
the project was to develop gourmet fillings for bonbons, based on gelled matrices of Portuguese
products of unquestioned quality and international recognition including port wine, olive oil,
olives and fruits. The gelling system was obtained by adding rice flour and Psyllium fiber. The
objective was to reduce the calories of the product and enrich the fillings in i) functional
ingredients: chicory fiber (inulin) and Psyllium fiber and ii) spices as natural antimicrobials
(cinnamon, ginger, clove and nutmeg).
Characterization of fillings included chemical composition and nutritional content, rheology
behaviour and water activity (aw of quick Rotronic, Hygrolab).
The rheology behaviour of the new fillings was compared with the traditional/commercial
fillings. The results show that the fillings under study have a similar viscoelastic behavior to the
commercial fillings, the latter showing higher values in the viscoelastic functions.
KEYWORDS
Healthy bonbons, functional ingredients, spices, chicory fiber, psyllium fiber, rheology behavior.
INTRODUCTION
Currently, there is an increased awareness of consumers towards the consumption of healthy
products with functional characteristics. Bonbons are products of high demand and due to high
calorie intakes their consumption is limited by dietary issues. Therefore, some studies on low
calorie bonbons can be seen on literature1.
Correspondence to: Isabel de Sousa (E-mail: [email protected])
O22
18

Fat has multiple effects on food products, e.g., thermal stability, mouthfeel lubrication and
smoothness. When fat is to be replaced for nutritional/dietary reasons, it is often necessary the
use of combinations of hydrocolloids to reach the expected sensory properties of the low fat food
product 2.
The incorporation of Psyllium and inulin fibers in bonbons fillings was an important innovation
in this project and the spices were used to improve the sensory characteristics of the fillings and
extend the shelf-life of the products.
The Psyllium husk has about 80% of soluble fiber and is an excellent source of soluble and
insoluble fiber3, 4
. This fiber has been reported as an important health promoter in the prevention
of several diseases5.
The Psyllium, besides being a functional ingredient, is also important for the gelling capacity and
for this reason is a good alternative to replace fat, keeping the texture and smooth mouthfeel.
The Inulin is a dietetic fiber extracted from chicory, whose extensive use in food industry is
based on the nutritional and technological properties of inulin. Other important properties of
inulin are the positive effect on bowel habit, but also the prebiotic effect6.
METHODS
Preparation of the filling
In the technological diagram below (FIGURE 1), the steps for the fillings production are
presented.
FIGURE 1. Technological diagram of the developed fillings
19

Characterization of filling
Rheology measurements
The internal structure of the filling matrices was evaluated by small amplitude oscillatory shear
(SAOS) with a controlled stress MARS III (Haake) rheometer coupled with a Peltier system, to
control temperature. The texture properties were analyzed in texturometer TA XTplus through
TPA-Texture Profile Analysis.
Analysis of the chemical filling composition
The chemical composition and nutritional content of the developed and the commercial fillings
was evaluated by determining protein (Kjeldahl), fat (Soxhlet), total sugars (NP 1420:1987) and
fibers (methods AOAC).
Determination of water activity
The water activity (aw) was evaluated using a Rotronic device (20ºC ± 1ºC).
RESULTS AND CONCLUSIONS
The results from the rheology behaviour of the new fillings and traditional/commercial fillings
are presented in FIGURE 2.
1,00E+00
1,00E+01
1,00E+02
1,00E+03
1,00E+04
1,00E+05
1,00E+06
0,001 0,01 0,1 1 10 100
G' G
'' (P
a)
f (Hz)
G' Comercial Filling (raspberry)
G'' Comercial Filling (raspberry)
G' Comercial Filling (passion fruit)
G'' Comercial Filling (passion fruit)
G' Filling with rice flour
G'' Filling with rice flour
G' Filling with rice four + cinnamon
G'' Filling with rice flour + cinnamon
G' Filling with psyllium fiber
G'' Filling with psyllium fiber
FIGURE 2. Mechanical spectra of the fillings
20

The new fillings have a viscoelastic behavior similar to the commercial fillings, with the later
showing higher values in the viscoelastic functions, therefore being more structured.
It was verified that the storage modulus G’ is always higher than the loss modulus G’’ and both
the moduli increase with the increase of frequency, which reflects a predominance of the elastic
component over the viscous component, in all the samples, typical for the weak gel model. It is
highlighted that the new filling with rice flour and cinnamon is the one that shows the lower
level of structure, with lower values for the viscoelastic functions.
The developed fillings presented a high potential to scale up into the market. These products
follow the present consumption trends, in markets with well-informed consumers that look for
products with high quality differentiating features.
ACKNOWLEDGEMENTS
This work was supported by COMPETE program: QREN- “ Healthybonbons” project 33880 in
collaboration with AJM pastelarias, Lda .
REFERENCES
1. Dias, J.; Sousa, I., Accepted for publication on the Journal of Food Science and Technology 2004,
JFST-D-14-00666.
2. McClements, J.; Demetriedes, K., Crit.Rev. Food Sci. Nutr., Philadelphia, 1998, 38, 6, 511-536.
3. Yu, L.; Perret, J., Journal of Agricultural and Food Chemistry, 2003, 51, 492-495.
4. Raymundo, A.; Fradinho, P.; Nunes., M., Bioactive Carbohyrates and Dietary Fibre, 2014, 3, 96-
105.
5. Bijkerk, C. J.; Muris, J. W. M.; Knottnerus, J. A.; Hoes, A. W.; Wit, N. J., Alimentary
Pharmacology & Therapeutics, 2004, 19, 245-251.
6. Tungland, B. C.; Meyer, D., Comprehensive Reviews in Food Science and Food Safety, 2002, 3,
73 and 92.
21

Rheological assessment of carolino rice flour gels for pasta making
Patrícia Fradinho, Ana Filipa Rocha, Isabel de Sousa, Anabela Raymundo
LEAF – Instituto Superior de Agronomia/Universidade de Lisboa, Tapada da Ajuda-Edifício Ferreira
Lapa, 1349-017 Lisboa, Portugal
Correspondence to: Anabela Raymundo ([email protected])
ABSTRACT
Rice is a largely consumed cereal, with high nutritional value. However, during dehusking and
polishing steps, high quantities of by-products are originated, of which about 15% is broken rice.
This by-product can be ground and the resulting flour used to develop added-value gluten free
food products.
This study aims the development of gluten-free gel based on carolino rice flour from broken rice
to future incorporation in a pasta formulation. Aqueous suspensions with 5% to 60% (w/w) flour
were prepared, and the viscoelastic behaviour was evaluated using SAOS measurements.
The critical gelation concentration of rice flour was 7% (w/w). The gel with 40% rice flour was
selected for pasta incorporation.
KEYWORDS rice flour, viscoelasticity, gel, gelatinization, gluten-free pasta
INTRODUCTION
Carolino rice is a traditional Portuguese variety, much used due to its gastronomic singularities.
Understanding how this flour behaves under processing conditions could be the key factor in
producing a viscoelastic dough for gluten-free pasta production.
Since rice protein lacks the functionality of gluten to produce a viscoelastic dough structure,
several authors suggested starch gelatinization as an essential step to improve the properties of
rice dough and produce pasta with good quality1.
In order to optimize the gelatinization process, carolino rice flour suspensions in water, with
concentrations between 5% and 60% (w/w) were prepared, and its thermorheological behaviour
was assessed.
O33
22

EXPERIMENTAL
Carolino broken rice was milled into flour by a rice company and used for gel preparations.
Carolino rice flour solutions were prepared, ranging from 5% to 60% (w/w). Flour was dispersed
in water, under mechanical stirring (Eurostar Digital, IKA-WERKE) at 350 rpm and heated at
90ºC during 30 min, in a water bath2. The mixtures between 5 and 20% were poured into a glass
container and left for 24h at 4ºC to ensure full gel maturation. Rice flour suspensions between 30
and 60% were transferred to the bottom plate of a 35 mm serrated parallel plate sensor (PP35) on
the rheometer (MARS III, Haake), to promote the gelation in situ.
Viscoelastic behaviour was investigated using SAOS measurements, performed in a controlled
stress rheometer coupled with an UTC-Peltier system, using the PP35. Stress sweep tests were
conducted on suspensions and gels in order to identify the linear viscoelastic region.
Temperature, time and frequency sweeps tests were performed inside this region at 1Hz.
The suspensions were heated from 20 to 90ºC at 1ºC/min, maintained at this temperature for 30
min, and cooled down to 5 ºC. The gel maturation was performed at this temperature, during 30
min, followed by the mechanical spectra. After maturation, flow curves were obtained, using the
same sensor system. Each formulation was tested at least in duplicate.
RESULTS AND DISCUSSION
In Figure 1 the evolution of viscoelastic parameters G’ and G’’ is depicted.
FIGURE 1. Thermorheological measurements from 20 to 90ºC at 1ºC/min of aqueous
suspensions with rice flour: ● 7%; ● 10%; ● 15%; ● 20% (closed symbols-G’; open symbols–G’’).
During the initial heating, systems with 10 to 20% rice flour show a practically constant
viscoelastic parameters, with G’ larger than G’’. Around 75ºC both modulli increase about half a
decade until 82ºC, corresponding to the starch gelatinization temperature. 7% rice flour gel
1.E+00
1.E+01
1.E+02
1.E+03
1.E+04
1.E+05
1.E+06
20 30 40 50 60 70 80 90
G' (
Pa)
; G
'' (P
a)
Temperatura (ºC)
G'7% G''7% G'10% G"10% G'15% G''15% G'20% G''20%
23

shows a different heating behaviour, since viscoelastic modulli are strongly temperature
dependent. The variations observed for G’’ value of 7% and 10% curves could result from the
low rice concentration close to critical gelling concentration.
During the cooling cycle (data not shown), the gel structure was slightly reinforced, especially in
7% rice gel. Both modulli increased, achieving larger values at the lowest temperatures.
The maturation kinetics at 5ºC of studied gels are presented in Figure 2.
FIGURE 2. Maturation kinetics of rice flour gels: a) ● 7%; ● 10%; ● 15%; ● 20%;
b) ● 30%; ● 40%; ● 50%; ● 60% (closed symbols-G’; open symbols–G’’).
All gels show rapid maturation, since both modulli remained stable after 30 min maturation. This
may be considered an important advantage from an industrial point of view.
The mechanical spectra of rice flour gels ranging from 7 to 60% (w/w) obtained after the
heating/cooling cycle previously described are resumed in Figure 3.
FIGURE 3. Mechanical spectra of rice flour gels ranging from: a) 7 to 20% (w/w); b) 30 to 60% (w/w).
(● 7%; ● 10%; ● 15%; ● 20%; ● 30%; ● 40%; ● 50%; ● 60%; closed symbols-G’; open symbols–G’’).
From the mechanical spectra, weak gel-like structures are observed, as G’ is always higher than
G’’, but both modulli show a frequency dependence. For all concentrations it is observed an
increase in the linear viscoelastic functions with rice flour content, which reflects an increase in
1.E+02
1.E+03
1.E+04
1.E+05
1.E+06
0.001 0.01 0.1 1 10 100 1000
G' (
Pa)
; G
'' (P
a)
f (Hz)
1.E+02
1.E+03
1.E+04
1.E+05
1.E+06
0.001 0.01 0.1 1 10 100 1000
G' (
Pa)
; G
'' (P
a)
f (Hz)a b
1.E+02
1.E+03
1.E+04
1.E+05
1.E+06
0 500 1000 1500 2000G
' (P
a)
; G
'' (P
a)
t (s)
1.E+02
1.E+03
1.E+04
1.E+05
1.E+06
0 500 1000 1500 2000
G' (
Pa) ;
G''
(P
a)
t (s)a b
24

1.E-02
1.E-01
1.E+00
1.E+01
1.E+02
1.E+03
1.E+04
1.E+05
1.E+06
1.E+07
1.E-07 1.E-05 1.E-03 1.E-01 1.E+01 1.E+03 1.E+05
vis
cosi
ty (
Pa
.s)
shear rate (1/s)
gel structure level. According to Cham, et al (2010)3 a soft gel is more suitable for making
making fresh pasta, whereas a stronger one is preferable for dry pasta production.
The critical concentration for rice flour gelation was 7%. The mechanical spectrum of 5%
mixture (data not presented) show an overlap of the viscoelastic functions, meaning that for this
concentration a gel structure is not formed.
The flow curves of the developed rice flour mixtures are presented in Figure 4.
FIGURE 4. Flow curves of carolino rice flour mixtures from 5 to 40% (w/w).
(● 5% (w/w); ● 7% (w/w); ● 10% (w/w); ● 15% (w/w); ● 20% (w/w); ● 30% (w/w); ● 40% (w/w))
Above 40% rice flour, the gel becomes very hard and brittle, making impossible to proceed with
the rheological assessment of viscosity of 50% and 60% rice flour gels.
All flow curves present the same pattern, with a newtonian plateau region at lower shear rates,
followed by a shear-thinning region. Viscosity increases with the rice flour concentration.
CONCLUSIONS
The optimum rice gel concentration for pasta making was established at 40% (w/w), due to its
high viscosity. The study of different proportions of gelled rice flour with raw rice flour and
other gluten free flours, will be the next step for the optimization of pasta specially designed for
celiac population.
ACKNOWLEDGEMENTS
This work was supported by COMPETE program: QREN - “Arroz +“ project n.38749.
REFERENCES AND NOTES
1. Marti, A.; Seetharaman, K.; Pagani, M.A., Journal of Cereal Science, 2010, 52, 404-409.
2. Torres, M.D.; Fradinho, P.; Raymundo, A; Sousa, I., Food & Bioprocess Tech, 2014, 7, 1171-1182.
3. Cham, S. & Suwannaporn, P., Journal of Cereal Science. 2010, 51(1), 284-291.
25
Formulation and processing of egg white protein-based nanobiocomposites
Isabel Diañez, Inmaculada Martínez, Pedro Partal
Dpto. Ingeniería Química, Centro de Investigación en Tecnología de Productos y Procesos Químicos
(Pro2TecS), Universidad de Huelva-Campus Excelencia CeiA3, Campus El Carmen, 21071, Huelva, Spain
Correspondence to: Isabel Diañez (E-mail: [email protected])
ABSTRACT
Egg white protein/montmorillonite clay nanobiocomposites have been obtained by thermomechanical
processing. The influence of plasticizer composition on thermal and mechanical behaviour were analysed.
Thus, it could be noticed that a change in the plasticizer used, as well as the reduction of mixing time and
temperature can lead to a significant improvement of tensile properties of resulting protein-based
nanobiocomposites.
KEYWORDS Nanobiocomposite, protein, clay, plasticizer, thermomechanical behaviour, water uptake.
INTRODUCTION
In the last few years, it has been spreading the use of different types of nanoparticles for reinforcing
of all sorts of materials, specially plastics and bioplastics, in order to enhance their properties
(mechanical performance 1, thermal stability 2, barrier effect against gases and vapours 3, etc.).
However, to observe these effects it is necessary to achieve a proper dispersion of nanoparticles in
the polymer matrix, which is critical for food packaging applications.
Both formulation and processing have been demonstrated to be essential factors when trying to
develop nanobiocomposites with suitable properties for use in packaging and other purposes.
EXPERIMENTAL
The spray-dried egg white albumen (EW) was purchased from PROANDA, S.L. (Spain). Glycerol
from Guinama (Spain), polyethylene glycol 300 (PEG) from Manuel Riesgo, S.A. (Spain) and
distilled water were used as protein plasticizers. A natural sodium montmorillonite nanoclay,
Cloisite® Na+ (MMT-Na), provided by Southern Clay Products, Inc. (USA) was selected for this
study.
O34
26
In every formulation prepared, a constant plasticizer/protein ratio of 0.4 was always maintained.
The influence of the addition of glycerol as plasticizer was studied over the neat matrix. With
regard to the mixing time effect, a formulation at 3 wt.% nanoclay was used, plasticized with a
blend of PEG, glycerol and distilled water. The overall compositions are included in Table 1.
TABLE 1 Final compositions of the samples studied
Sample
Composition
(wt. %)
PEG W G EW Clay
PEG/W a 30 30 0 40 0
PEG/W/G a 30 15 15 40 0
MMT-Na-10 a 29.1 14.6 14.6 38.8 3
MMT-Na-6 b 29.1 14.6 14.6 38.8 3
a 10 min. mixing time, b 6 min. mixing time
The thermomechanical processing includes two steps: thermoplastic processing and compression-
moulding. Mixing of the ingredients was carried out, for 10 or 6 min starting at room temperature,
in the kneading tool (Rheomix 3000p) of a torque-rheometer (Polylab, Thermo Haake GmbH,
Germany) equipped with two counter-rotating rollers turning at 50 rpm under adiabatic conditions.
Specific mechanical energy (SME) was calculated as follows 4:
𝑆𝑀𝐸 =𝜔
𝑚∫ 𝑀(𝑡)𝜕(𝑡)𝑡𝑚𝑖𝑥
0 (1)
where ω (rad/s) is the mixing speed, m (g) is the sample mass, M(t) (N·m) the torque and tmix (s)
the mixing time.
Compression-moulding of the resulting dough-like material (100 bar, 120 ⁰C, 10 min) into ASTM
D638 “Type IV” dogbone specimens, for tensile tests, and 50x10x3 mm3 rectangular specimens
were performanced.
Dynamic mechanical thermal analysis (DMTA) tests were conducted in a controlled-stress
rheometer Physica MCR-301 (Anton Paar, Austria), in torsion mode, at 400 Pa (within the linear
voscoeslastic region) and a constant frequency of 1 Hz, using a heating rate of 2 ⁰C/min, between
25 and 180 ⁰C.
Tensile tests were carried out with a Shimadzu AG-IS (Shimadzu, Japan) testing machine at a
single cycle of 50 mm/min, meeting the ASTM D638-10 Standard.
27

RESULTS AND DISCUSSION
Thermoplastic processing
Table 2 shows the SME transferred and the temperature increase undergone by the blend during
this process.
TABLE 2 SME values and temperature increment during thermoplastic processing of bioplastics
Sample SME
(kJ/kg)
ΔT
(⁰C)
PEG/W 15.5 28.4
PEG/W/G 1.2 5.0
MMT-Na-10 8.6 30.6
MMT-Na-6 1.0 6.5
It can be seen how the addition of only a 15 wt. % of glycerol radically decreases the value of SME
and, consequently, the temperature increment. Apart from energy saving, this effect is very
beneficial, since high temperatures adversely affect the protein performance. Thus, the PEG/W/G
blend seems to be the best option for plasticizing EW nanobiocomposites, inasmuch as the friction
due to presence of solid particles leads to a greater heat generation.
Thermomechanical behaviour
Figure 1 shows the evolution with temperature of storage and loss moduli, which continuously
decay as temperature increases, as well as corresponding tanδ curves.
FIGURE 1 DMTA tests performed on bioplastics and nanobiocomposites, in torsion mode
30 60 90 120 150 180
106
107
108
30 60 90 120 150 180
0,08
0,12
0,16
0,20
0,24
PEG/W
PEG/W/G
MMT-Na-10
MMT-Na-6
G', G
'' [P
a]
T [°C]
tan
T [°C]
28

PEG/W/G samples present higher values of tan at lowest temperatures if compared to the sample
without glycerol as a plasticizer. But, around 85 ⁰C, this trend is reversed and these samples present
a more elastic behaviour. Moreover, the addition of nanoparticles causes an increase in both
storage and loss moduli, if compared with their non-nanoreinforced counterparts. However, the
shortest mixing time leads to higher tanδ values within the whole range of temperatures studied.
Tensile properties
The use of glycerol as plasticizer provides a significant increase in elongation capacity (Table 3),
while tensile strength and elastic modulus values remain very similar to those obtained for PEG/W
samples.
TABLE 3 Tensile properties of bioplastics and nanobiocomposites
Sample Tensile strength
[MPa] Strain at break
[%] Elastic modulus
[MPa]
PEG/W 5.51±0.33 69.92±15.77 53.75±7.56
PEG/W/G 5.22±0.36 125.37±23.37 41.15±1.52
MMT-Na-10 3.29±0.45 17.93±7.45 38.41±1.93
MMT-Na-6 4.11±0.27 91.94±16.45 26.38±2.72
With regard to the nanobiocomposites, the enhancement of elongation capacity is even greater
when reducing mixing time. Tensile strength is also increased in this case and only the elastic
modulus is slightly reduced.
CONCLUSIONS
The most significant change that can be observed in thermomechanical behavior and processability
of nanobiocomposites is that caused by the addition of glycerol as a plasticizer. However, both
addition of glycerol and reduction in mixing time improved nanobiocomposites performance,
especially regarding tensile properties.
REFERENCES AND NOTES
1. Lee, J.; Kim, K.M., Journal of Applied Polymer Science, 2010, 118, 2257-2263.
2. Mohanty, S.; Nayak, S.K., Journal of Polymers and the Environment, 2012, 20, 195-207.
3. Sanchez-Garcia, M.D.; Lopez-Rubio, A.; Lagaron, J.M., Trends in Food Science & Technology, 2010,
21, 528-536.
4. Redl, A.; Morel, M.; Bonicel, J.; Guilbert, S.; Vergnes, B., Rheologica Acta, 1999, 38, 311-320.
29

Rheological changes induced by the functionalization of the carbon nanotubes
in a CNT/polymer nanocomposite
Maite Landa, Mercedes Fernández, María Eugenia Muñoz, Antxon Santamaría
Polymer Science and Technology Department and POLYMAT, Faculty of Quemistry, University of the
Basque CountryUPV/EHU.20080 San Sebastián,Spain
Correspondence to: Maite Landa (E‐mail: [email protected])
ABSTRACT
The rheological changes induced by the functionalization of the carbon nanotubes in a CNT/polymer
nanocomposite are investigated in this study. Non functionalized multiwalled carbon nanotubes
(MWCNT) and functionalized ones (MWCNTOH) are dispersed, respectively, by melt mixing method in a
polyurethane matrix. Composites based on MWCNTOH exhibit lower percolation threshold and a
fastening of the crystallization process below the percolation threshold. Elongational flow
measurements show that there is not strain hardening behaviour, indicating that the interfacial
interactions between carbon nanotubes and polyurethane chains are not strong enough to produce an
anchorage effect.
KEYWORDS (Carbon nanotubes, polyurethane, crystallization, elongational measurements )
INTRODUCTION
The performance of a carbon nanotube/polymer nanocomposite depends on the dispersion of the
carbon nanotubes in the matrix and on the interfacial interactions between these and the polymer.
Thus, a significant challenge in developing high performance polymer/CNTs composites is to
achieve better dispersion and strong interfacial interactions, to improve the load transfer across
the CNT-polymer matrix interface. In this study a polyurethane (PUR) matrix is loaded with
multiwalled carbon nanotubes (MWCNT). In an effort to improve the interactions between the
carbon nanotubes and the matrix, hydroxyl multiwalled carbon nanotubes (MWCNTOH) are also
considered, with the final aim of obtaining electrically conductive hot melt adhesives. Within
this context, we demonstrate that rheology is a powerful tool to evaluate the degree of success
reached in the dispersion of nanoparticles in a polymer matrix.
Multiphase Systems
O4
Multiphase Systems
O4
30

EXPERIMENTAL PART
The matrix of the studied nanocomposites is a semicrystalline thermoplastic polyurethane
produced by Merquinsa (Spain) and used as a Hot Melt adhesive. Multiwall carbon nanotubes
(MWCNT) and hydroxyl multiwalled carbon nanotubes (MWCNTOH) were supplied by Cheap
Tubes Inc. with the following characteristics: Diameter D=30-50 nm, length L=10-20 μm and
purity greater than 95%. MWCNTOH carbon nanotubes contain 1 % of OH groups.
The dynamic viscoelastic behaviour in the molten state was analysed at T=100 ºC in a TA
Instruments ARES viscoelastometer with parallel-plate shear geometry. The isothermal
crystallization process was investigated using the same equipment; the variation of the elastic
modulus with time was monitorised at a frequency of 1 Hz, at T = 50 ºC, at the lowest strain. The
extensional properties were measured with an Anton Paar Rheometer MCR equipped with a SER
device.
RESULTS AND DISCUSSION
It is well known that above percolation a significant alteration of the viscoelastic terminal zone
takes place, owed to the formation of a polymer/nanoparticles network. As frequency tends to
zero the storage modulus, G’, prevails over the loss modulus, G’’, and both moduli become
independent of the frequency in percolated systems. Figure 1a shows the frequency dependence
of the storage modulus (G’). On the other hand, it is expected that adding chemically
functionalized nanotubes to the PUR matrix enhances G’ at low frequencies (terminal flow zone),
because of the interactions between MWCNTOH and PUR. In fact, only for the
1 wt. % MWCNTOH based nanocomposite a higher modulus and a weaker frequency
dependence of G’ at low frequencies is observed, as compared with MWCNT based
nanocomposites.
On the other hand, the analysis of the thermal properties of hot melt adhesives is particularly
interesting, because a crystallization process takes place during cooling, to give rise to a
permanent weld1. Therefore, the study of the crystallization of the selected nanocomposites has a
basic and applied purpose. In Figure 1b an analysis of the variation of the storage modulus, G’
with time is presented. The modulus increases sharply after a certain induction time, revealing
rheology as a sound tool to analyze crystallization. It can be seen that below the percolation
31

threshold MWCNTOH based nanocomposites exhibit a sharper slope than the non functionalized
MWCNT based nanocomposites. Below percolation threshold, better dispersions are obtained
with hydroxyl functionalized nanotubes, as indicated by the fastening of the crystallization and
the higher storage modulus obtained from oscillatory results.
FIGURE 1. a) Storage modulus as a function of frequency at T = 100 ºC, for the PUR/MWCNTOH (empty symbols) and the PUR/MWCNT (full symbols) nanocomposites. b) Evolution of storage modulus with time at 50 º C for the
PUR/MWCNTOH (empty symbols) and the PUR/MWCNT (full symbols).
In attempt to study interactions between the functionalized nanotubes and the PUR chains,
elongational measurements were carried out. The elongational viscosity results are shown in
Figure 2. As can be seen, the increase of viscosity due to the presence of the MWCNTs
diminishes, when the Hencky rate is increased. These results lead to conclude that the
MWCNT/polymer network is not able to produce a strain hardening response, because the
structure does not stand the applied elongational flow2. Hydroxyl functionalized nanotubes were
expected to bring about enhanced interfacial MWCNTOH/polymer interactions, which would
produce strain hardening, but the observed behaviour is similar to that of non functionalized
MWCNTs. This suggests that interactions between carbon nanotubes and polyurethane chains
are not strong enough to produce an anchorage effect.
a) b)
32

FIGURE 2. Uniaxial elongational viscosity versus time at different Hencky rates εH at 70 ºC for the functionalized (black dots) and non-functionalized (red dots) nanotubes based nanocomposites.
CONCLUSIONS
The effect of the MWCNTs is clearly observed in the viscoelastic terminal zone, reflecting the
obstruction caused to the motion of the polymer chains as a whole. The use of MWCNTOH
functionalized nanotubes, leads to a decrease of the percolation threshold concentration, but
above this concentration there are no noticeable differences in the storage modulus, as compared
with non functionalized MWCNTs. The crystallization process, monitored by dynamic
measurements, is fastened with the addition of MWCNTs. For MWCNTOHs below the
percolation threshold, the slope of the storage modulus is sharpened, indicator of a fastening of
the crystallization, due to a better dispersion of the MWCNTOHs in the matrix. The results
obtained from elongational flow measurements show that there is not strain hardening behavior,
as the interfacial interactions are not strong enough to give rise to an anchorage effect.
ACKNOWLEDGEMENTS
M.L. acknowledges the financial support of the University of the Basque Country by “Contratación de Doctores Recientes hasta su Integración en Programas de Formación Postdoctoral del Vicerrectorado de Investigación de la UPV/EHU” program. Financial support trough UPV/EHU (UFI 11/56) and GICIT‐586‐13 (Basque Government) projects is acknowledged.
REFERENCES AND NOTES
1. Landa, M.; Canales, J.; Fernández, M.; Muñoz, M.E.; Santamaría, A., Polymer Testing, 2014,
35,101‐108.
2. Fernández, M.; Landa, M.; Muñoz, M.E.; Santamaría, A., Int J Adhes Adhes, 2010, 30, 609–614.
33

Electrorheological Behavior of Suspensions of Camphorsulfonic acid (CSA) doped
polyaniline nanofibers in silicone oil
Sumita Goswami, Paulo Gonçalves, Maria Teresa Cidade
Departamento de Ciência dos Materiais, CENIMAT/I3N, Faculdade de Ciências e Tecnologia,
Universidade Nova de Lisboa, 2829-516 Caparica, Portugal
Correspondence to: Maria Teresa Cidade (E-mail: [email protected])
ABSTRACT
The electrorheological (ER) effect is known as the enhancement of the apparent viscosity upon
application of an external electric field applied perpendicular to the flow direction. Suspensions of
polarizable particles in non-conducting solvents are the most studied electrorheological fluids. The
increase in viscosity observed in the suspensions is due to the formation of columns that align with the
electric field.
This work presents the electrorheological (ER) behavior of suspensions, in silicone oil, of
camphorsulfonic acid (CSA) doped polyaniline (PANI) nanofibers. The ER properties of the suspensions
were investigated with a rotational rheometer, to which an ER cell was coupled, in steady shear, and
electrical field strengths up to 2 kV/mm. The effects of the electric field strength, content of
nanostructures and viscosity of the continuum phase, in the shear viscosity and yield stress, were
investigated at room temperature.
As expected, the ER effect increases with the increase of the electric field as well as with the increase of
content of nanofibers and it decreases with the increase of the oil viscosity. The suspensions present
giant ER effects (higher than 2 decades increase in viscosity for low shear rates and high electric fields),
showing their potential application as ER smart materials.
KEYWORDS: Electrorheological effect, suspensions, camphorsulfonic acid doped polyaniline, nanofibers,
ER smart material
INTRODUCTION
The electrorheological (ER) effect can be considered as the change of the fluid apparent viscosity
in the presence of an external electric field1, sometimes having dramatic consequences, inducing
fluid solidification1,2
. The ER effect is an important phenomenon that brings new technological
applications which may be used in a wide spectrum of domains, spanning from the electro-
optical devices to automobile industries and robotics. The first observation of the ER effect was
reported by Winslow3, for a suspension of polarizable micro particles adsorbed in water. The
variation of the apparent viscosity was due to the micro particles alignment in chains or
O5
34

columnar structures oriented in the direction of the electric field, increasing the solution’s
viscosity in one order of magnitude.
In the past two decades, several experimental and theoretical studies of the ER effect in different
systems have been reported, some of them presenting giant ER effects, with 2 or 3 decades
increase in viscosity4. Liquid crystalline materials
5 and suspensions of polarizable particles in a
non-conducting continuum phase6
are two of the major kind of systems being studied in this
framework.
EXPERIMENTAL
Materials
The synthesis of camphorsulfonic acid doped polyaniline nanofibers (PANICSA) is shown in
figure 1, along with the FESEM image of the fibers. Analytical grade aniline (Merck) was
purified by distillation under reduced pressure prior to use. All other reagents like,
camphorsulphonic acid (CSA, Sigma Aldrich), ammonium persulphate or APS (NH4)2S2O8,
Sigma Aldrich), were received as analytical grade and were used without further purification.
Aniline monomer was polymerized in an ice bath (0˚C) to form polyaniline nanofibers using
APS as the oxidant and CSA as the dopant as well as structure directing agent. During the
reaction procedure, firstly the aqueous solution of CSA with aniline monomer was prepared
(molar ratio, CSA: monomer 0.25:1) to form a colorless mixture of the two having aniline-CSA
complex in micelle form. Then the APS aqueous solution (molar ratio, APS: monomer 1:1) was
prepared. Both the solutions were kept at 0˚C for 15 minutes and then mixed slowly to each other.
The reaction was maintained to stay undisturbed for 1 hour in the ice bath. Finally, the
precipitate was collected after filtration and washing several times with distilled water and
methanol. The sample was ready after the vacuum drying for 24 hours at 60˚C in oven.
The fibers were mixed with silicone oil to form a suspension. Silicone oil of two different
viscosities were used (approximately 19 and 48 mPa.s), both purchased from Clearco Products
Co., Inc (commercialized as silicone oils of 20 and 50 cSt). For each oil 1 and 2 wt% of
PANICSA nanofibers were introduced. The suspensions were stirred and sonicated during 10min
before subjected to rheological characterization.
Characterization
The ER properties of the suspensions were studied using a rotational rheometer, Bohlin Gemini
HRnano
(Malvern, Worcestershire, UK), to which a ER cell of high-voltage supply (5kV) was
coupled. The measurements were performed under a constant temperature of 25°C. The
measuring system used was parallel plates of 40 mm diameter with the upper plate isolated and a
gap of 500µm.
Before starting the measurements, the suspensions were subjected to a pre-shear stage of 1s-1
applied during 60s followed by an equilibrium time (the time elapsed after stopping the pre-shear
and starting the measurements) of 180s.
35

.
(a) (b)
Figure 1. Schematic representation of the synthesis (a) and FESEM image (b) of PANICSA nanofibers.
RESULTS AND DISCUSSION
Figures 2a and 2b present the apparent viscosity as a function of the shear rate for 2 wt%
PANICSA in oils of two different viscosities. Comparing these two figures we conclude that the
higher the viscosity of the oil the lower the ER effect, which may be explained in terms of an
easier formation of the columns in the oil of lower viscosity. Figures 2c compares the increase in
apparent viscosity for 2 different contents of nanofibers, showing, as expected, that the ER effect
increases with the increase of the content of semi-conducting particles. The ER effect also
increases, as expected with the electric field strength.
(a) (b) (c)
Figure 2. Apparent viscosity of 2 wt% PANICSA in a silicone oil of 19 mPa.s (a) and 48 mPa.s (b) and 1 and 2 wt%
PANICSA in a silicone oil of 48 mPa.s cSt.
Figure 3 presents the flow curve of 2 wt% PANICSA/19 mPa.s silicone oil, as an example.
During the absence of electric field the shear stress presents a small yield stress that increases
abruptly when a DC electric field is applied, increasing with the electrical field from then on.
36

Figure 3. Flow curve of 2 wt% PANICSA/19 mPa.s Figure 4. ER efficiency of PANICSA in oil of
silicone oil 19 mPa.s, at a shear rate of 0.0134 s-1
Figure 4 presents the ER efficiency of the PANICSA/19 mPa.s silicone oil suspensions (similar
results are presented for the oil of 48 mPa.s), measured from the increase of shear stress to the
situation where no current is applied, at the smallest shear rate, the one for which the effect is
more pronounced. The efficiency increases linearly with the electric filed strength and the
increase is more pronounced for the higher PANICSA content.
CONCLUSIONS
Camphorsulfonic acid doped polyaniline nanofibers/silicone oil suspensions present an important
ER effect, showing its potential as ER smart materials. The higher viscosities attained with the
oil of smaller viscosity may be interpreted in terms of an easier formation of the columns. The
increase of nanofibers content, as expected, increases the efficiency of the ER fluid, the same
happening with the electric field strength.
ACKNOWLEDGEMENTS
This work is funded by FEDER funds through the COMPETE 2020 Programme and National
Funds through FCT - Portuguese Foundation for Science and Technology under the project
UID/CTM/50025/2013.
References
1. Wen, W, Huang, ., X., Sheng, P., Soft Matter, 2008, 4, 200-210.
2. Larson. R.G., The Structure and Rheology of Complex Fluids; Keith E. Gubbins, Ed.; Oxford
University Press: New York, Oxford, 1999
3. Winslow, W.M., J. Appl. Phys., 1949, 20, 1137-1149.
4. Goswami, S. Brehm, T. Filonovitch, S., Cidade M.T., Smart Mater. Struct., 2014, 23, paper
no.105012.
5. Patrício, P., Leal, C.R., Pinto, L.F.V., Boto, A., Cidade, M.T., Liquid Crystals, 2012,39, 25-37.
6. Brehm, T., Pereira, G., Leal, C.R., Gonçalves, C, Borges, J.P., Cidade, M.T., Physica Scripta ,
2015, 90, paper 035802.
37

Rheological behaviour of new nanoclay/MDI/bitumen composites
F.J. Ortega, F.J. Navarro, M. García-Morales, P. Partal
Departamento de Ingeniería Química, Centro de Investigación en Tecnología de Productos y
Procesos Químicos (Pro2TecS), Campus de ‘El Carmen’, Universidad de Huelva, 21071, Huelva
(Spain)
Correspondence to: F.J. Ortega (E-mail: [email protected])
ABSTRACT
Bitumen, residue from crude oil distillation, is commonly utilized to provide waterproofing and
protective coating, as well as for paving applications. However, problems related to temperature
susceptibility and aging may change its properties leading to premature failure1. Lately, layered
silicates have increasingly been used to improve bitumen performance2. In this sense, bitumen
with penetration grade of 162 dmm was modified with polymeric MDI (4,4’-diphenylmethane
diisocyanate) and the nanoclay Cloisite 20A® (OMMT). Chemical modification of bitumen with
2 wt.% MDI provoked a notable increase in the viscoelastic moduli, especially after 24 h curing.
Physical modification with 10 wt.% OMMT dramatically improved the viscoelastic performance,
what is attributed to the structural reinforcing effect of the intercalated/exfoliated clay tactoids2.
However, further addition of 2 wt.% MDI to this previous formulation lowered its overall
viscoelastic response at temperatures at which the bituminous matrix softens, especially after 24
h curing. This result might stem from the disruption of the clay-based reinforcing network, as a
consequence of clay tactoid re-aggregation during blending3, promoted by chemical interactions
with MDI.
KEYWORDS
Bitumen, nanoclay, composite, isocyanate, intercalation, exfoliation
INTRODUCTION
Bitumen is a complex mixture of different organic molecules, predominantly hydrocarbons with
a small amount of structurally analogous heterocyclic species, along with functional groups
O6
38

containing sulphur, nitrogen and oxygen atoms1. Because of its good viscoelastic and
waterproofing properties, it is widely used in road and building construction.
However, the combination of loads, extreme temperatures and environmental factors (oxygen
diffusion, UV radiation, etc.) may affect its properties during in-life service, leading to problems
related to thermal susceptibility and ageing, like high temperature rutting or low temperature
cracking1,4
. In order to improve its performance, bitumen has traditionally been modified by
addition of polymers (EVA, SBS, etc.)1. Recently, a growing interest has arisen in the physical
modification of bitumen using layered silicates (nanoclays), due to their nanoscale
characteristics2; as well as in its chemical modification. Both have shown to improve its
performance and resistance against the previously mentioned factors, extending its in-life service.
With this aim, the viscoelastic behaviour of the binary blends bitumen/nanoclay and
bitumen/MDI, and the corresponding ternary composite bitumen/nanoclay/MDI has been
investigated in this work.
MATERIALS AND METHODS
Bitumen with penetration grade of 162 dmm (EN 1426) and softening point of 32ºC (EN 1427)
was used as the base bitumen for the modification. Polymeric MDI (4,4’-diphenylmethane
diisocyanate) was chosen as a modifier given it has shown to greatly enhance bitumen properties
1,5, its easy availability, and lower price and toxicity, if compared to other isocyanates sources.
Cloisite® 20A nanoclay (“C20A” hereafter), a natural montmorillonite modified with N,N-
dimethyl di-hydrogenated tallow (C14-C18) quaternary ammonium chloride, with a cation
exchange capacity of 92.6 meq/100 g clay, was also employed as a bitumen modifier.
Formulations were prepared by melt blending. In ternary blends, bitumen was first heated at
150ºC and 10 wt.% C20A was added and low-shear blended for 10 min. Afterwards, an
Ultraturrax™ high-shear mixer was used for 20 minutes to ensure the adequate dispersion of the
nanoclay (a sample of this bitumen/nanoclay blend was taken for testing at this point). Thereafter,
2 wt.% polymeric MDI was added and low-shear blended for 24h. In MDI/bitumen binary
blends, bitumen was first heated at 150ºC and 2 wt.% polymeric MDI was added and low-shear
blended for 24h. In both procedures, samples were also taken 1h after MDI addition.
Oscillatory shear temperature sweep tests within LVE, at 10 rad/s, were conducted at a heating
rate of 1 K/min, on a Physica MCR-301 rheometer (Anton Paar, Austria).
39

RESULTS AND DISCUSSION
As depicted in Fig. 1A, neat bitumen exhibits terminal-flow-shaped curves, typical of materials
with prevailing viscous behaviour. The addition of MDI to neat bitumen leads to the same
viscous behaviour, greatly influenced by the curing time. Hence, 1 h curing provokes a marked
increase in both dynamic moduli, mainly attributed to the reactive interaction between isocyanate
groups in MDI and pendant active hydrogen groups present in bitumen5. Extending curing time
up to 24 h seems to promote the mentioned reactive interaction to a greater extent.
30 45 60 75 90 105 120 135 15010
0
101
102
103
104
105
106
107
Bitumen/C20A/MDI composites
G' G'' 24 h curing
G' G'' 1 h curing
Bitumen/C20A composite
G' G'' HSB
G' G'' Neat Bitumen
G',
G''
(Pa
)
T (ºC)
B
30 45 60 75 90 105 12010
0
101
102
103
104
105
106
107
G',
G''
(Pa
)
MDI-modified bitumen
G' G'' 24 h curing
G' G'' 1 h curing
G' G'' Neat bitumen
T (ºC)
A
Fig. 1. (A) Temperature sweep tests in oscillatory shear, at 10 rad/s, for (A) neat and MDI-modified
bitumen; and (B) bitumen/C20A and bitumen/C20A/MDI composites.
On the other hand, the modification of neat bitumen with 10 wt.% C20A gives rise to quite a
different viscoelastic behaviour, as depicted in Fig. 1B, with nearly coincident values of G’ and
G’’ (which increase significantly if compared to neat bitumen) in the low-to-medium
temperature range, and a plateau zone (prevailing elastic response) at the highest temperatures
studied. The LVE behaviour observed hints at the formation of a clay-based network which
reinforces the system structure via inter-particle interaction, involving the assembly of individual
silicate platelets, as similarly reported for composites forming a percolated network2.
As portrayed in Fig. 1B, further addition of 2 wt.% MDI to the C20A-bitumen binary blend and
curing for 1 h barely affects the above viscoelastic response, with G’’ slightly higher than G’ in
the low-to-medium temperature range, and a plateau zone (with lower G’ and G’’ values than
40

before) at higher temperatures. A longer curing time of 24 h provokes, at low-to-medium
temperatures, a major increase in both moduli, which continuously decay with increasing
temperature, and fall well below the other two systems at temperatures higher than 100ºC
approximately. This seemingly results from the promotion of the interaction between neighbour
clay tactoids/platelets, leading to their agglomeration/re-aggregation3, which significantly affects
the composite overall viscoelastic response when the modified bitumen phase softens.
CONCLUSIONS
The single addition of 2 wt.% MDI to bitumen yields an improvement in the viscoelastic
response, favoured by long curing times, with prevalence of the viscous response. This is mainly
due to the development of a new and more complex microstructure, which stems from the
formation of new urethane and urea bonds. By contrast, the bitumen/C20A composite exhibits a
well-defined plateau zone, at high temperatures, which indicates the formation of a clay-based
network. If MDI is further added and let react for 24 h, the ternary composite stiffness is
improved at temperatures below that at which the modified bitumen phase softens. However, a
worsening in the viscoelastic behaviour (with a predominant viscous response) is clearly noticed
as temperature is raised, which is attributed to the agglomeration of neighbour clay tactoids,
promoted by chemical interactions, with MDI acting as linking points.
ACKNOWLEDGEMENTS
This work is part of a research project sponsored by “Junta de Andalucia” (TEP-6689). The
authors gratefully acknowledge their financial support.
REFERENCES AND NOTES
1. Read, J., Whiteoak, D., The shell bitumen handbook; Thomas Telford: London, 2003.
2. Ray, S. S.; Okamoto, M., Progress in Polymer Science, 2003, 28(11), 1539-1641.
3. Rajasekar, R.; Pal, K.; Heinrich, G.; Das, A.; Das, C.K., Materials & Design, 2009, 30,
3839-3845.
4. Navarro, F. J.; Partal, P.; Mart nez-Boza, F.; Valencia, C.; Gallegos, C., Chemical
Engineering Journal, 2002, 89(1–3), 53-61.
5. Navarro, F. J.; Partal, P.; Martinez-Boza, F.; Gallegos, C.; Bordado, J. C. M.; Diogo, A.
C., Mechanics of Time-Dependent Materials, 2006, 10(4), 347-359.
41

A study of the effect of pressure on the viscosity of PS filled with conductive
nanoparticles of different morphologies
Mercedes Fernández1 , Estibaliz Rodriguez1, Maria Eugenia Muñoz1 , Antxon Santamaria1
1 Institute of Polymer Materials (POLYMAT) and Polymer Science and Technology Department, Faculty of
Chemistry, University of the Basque Country (UPV/EHU), Paseo Manuel de Lardizabal 3, 20018 Donostia‐
San Sebastián, Spain
e‐mail of the presenter: [email protected]
ABSTRACT
Notwithstanding the number of papers dealing with polymer nanocomposites has increased
exponentially, the transfer of the generated knowledge towards industrial application is poor. There are
two crucial factors that bring about this shortcoming: a) Difficulties on getting good dispersions using
conventional mixing methods b) Lack of rheological studies related to the behaviour of the
nanocomposites during processing. In this work we focus on the second issue.
We have investigated the viscosity of nanocomposites based on a polystyrene matrix, PS, that contains
mutiwall carbon nanotubes (MWCNTs) and graphene platelets, respectively. Besides of studying the
viscosity as a function of shear rate and temperature, we have analysed the effect of pressure. To our
knowledge, values of the pressure‐viscosity coefficient at different shear rates have never been
reported for polymers filled with MWCNTs or graphene sheets, so far.
KEYWORDS Graphene, Multiwall Carbon Nanotubes, Pressure dependence of viscosity
INTRODUCTION
Previous studies on the pressure dependence of viscosity of polymer melts revealed that pressure
effects are more important for those polymers with bulkier backbones in their molecular
structure: the reduced amount of free volume available to molecules results in an increase in
intermolecular interactions and, thus, a viscosity enhancement is observed experimentally.1-2 The
relationship between viscosity and free volume has been considered by several authors in terms
of the free volume fraction determined by fitting Pressure-Volume-Temperature (PVT) data to
the Simha–Somcinsky equation of state following the procedure developed by Utracki3 and
Sedlacek4. An alternative procedure using PVT data and activation energy of flow has also
proved to be useful to evaluate the pressure sensitivity of several polymers. 5
O23
42

The addition of small amount of nanofillers to polymer matrix leads to the creation of
composites materials where reinforcing particles can be distributed at the nanometer level.
Although carbon nanotubes and graphene are both useful to elaborate electrically conductive
polymers, their morphology is unlike. In the wide range of shear rates contemplated in our work,
the arrangement and orientation of cylinder-like and platelet-like nanoparticles is different. The
effects of the developed differents morphologies on the pressure-viscosity coefficient are
investigated from both, direct experiment - using high pressure extrusion and indirect procedure-
correlation with free volume property, in terms of PVT data.
EXPERIMENTAL
The Polystyrene considered in this work (STYRON) was kindly supplied by Dow (Germany).
Commercial graphene, avanGRAPHENE-2 was purchased from Avanzare, (Spain) and
Multiwall Carbon Nanotubes ( MWCNT), which have specified diameters of D=30-50 nm,
length between 10 and 20 m and purity greater than 95% were supplied by Cheap Tubes Inc.
(Brattleboro, VT, USA). The dispersion of the filler was carried out by melt mixing method in a
co-rotating twin screw-mixer (Collin ZK-25) at T=200ºC. The screw speed was 300 rpm and the
obtained extrudates were cooled down in a water bath and then pelletized.
The dynamic viscoelastic behavior in the molten state was investigated in an ARG2 rheometer
(TA Instruments, USA), using parallel plates geometry. Small amplitude oscillatory experiments
were carried out in the linear viscoelastic regime at temperatures in the range from 180-210ºC.
Extrusion flow experiments were performed in a Göttfert Rheograph 25 rheometer. The standard
equipment was modified by an additional unit called the counter pressure chamber (CPC). The
CPC is mounted below the rheometer barrel and capillary die. The pressure level in the chamber
can be adjusted with a conical valve bolt mounted inside the CPC body. During the
measurements, the pressure was monitored at two locations by pressure transducers: in the barrel
just above the capillary and in the pressure chamber right below the capillary. The estimation of
the viscosity is explained in detail elsewhere.2
Pressure-Volume-Temperature measurements were carried out in a PVT apparatus of the piston-
die type (PVT 100 Haake, Germany) data were obtained using an isobaric cooling mode
procedure in the pressure range from 200 to 1600 bar with a cooling rate of 5ºC.
43

RESULTS AND DISCUSSION
Dynamic viscoelastic results
Figure 1a, shows the complex viscosity for the neat PS and blends. Considering the applied
scope of our work, compositions above percolation threshold were studied: 9 wt% Graphene/PS
and 5 wt%MWCNT/PS nanocomposites. The similar yield stress behaviour found in both
nanocomposites accounts for the percolated nanostructure.
Figure 1. Melt viscosity at T=200ºC. a) Complex viscosity in the linear viscoelastic regime. b) Effect of pressure obtained in high pressure extrusion experiments
High pressure extrusion results
The dependence of viscosity on pressure (p) is usually accounted for by appropriate shift factors ( ). For the pressure, an exponential function is commonly used, that is,
exp (1) where b is a material-dependent pressure coefficient
and is the reference pressure. Based on the present viscosity measurements, the pressure coefficients were determined at
different shear rates. The obtained PS pressure coefficients agreed well with the values reported
in literature2, clearly decreasing with shear, as expected. Figure 1b and Table 1, reveal different
trends for the two nanocomposites. Graphene/PS coefficients were lower than that of the pure PS.
In contrast, the pressure sensitivity of MWCNT/PS was found to be slightly higher.
Pressure‐Volume‐Temperature results
Glass Transition temperature, Tg, was found to increase with the nanoparticle addition. MWCNT
and Graphene restrict the segmental motion of the polymer chain, resulting in a higher Tg. On
102
103
104
105
106
10-2 10-1 100 101 102 103
Graphene/PSMWCNT/PSPS
*
[P
a s]
[rad/s]
(a)0
1 10-3
2 10-3
3 10-3
4 10-3
5 10-3
0 10 20 30 40 50 60 70 80
PSGraphene/PSMWCNT/PS
PM
[MPa]
[
MP
a·s]
=100 s-1.
=20 s-1.
(b)
44
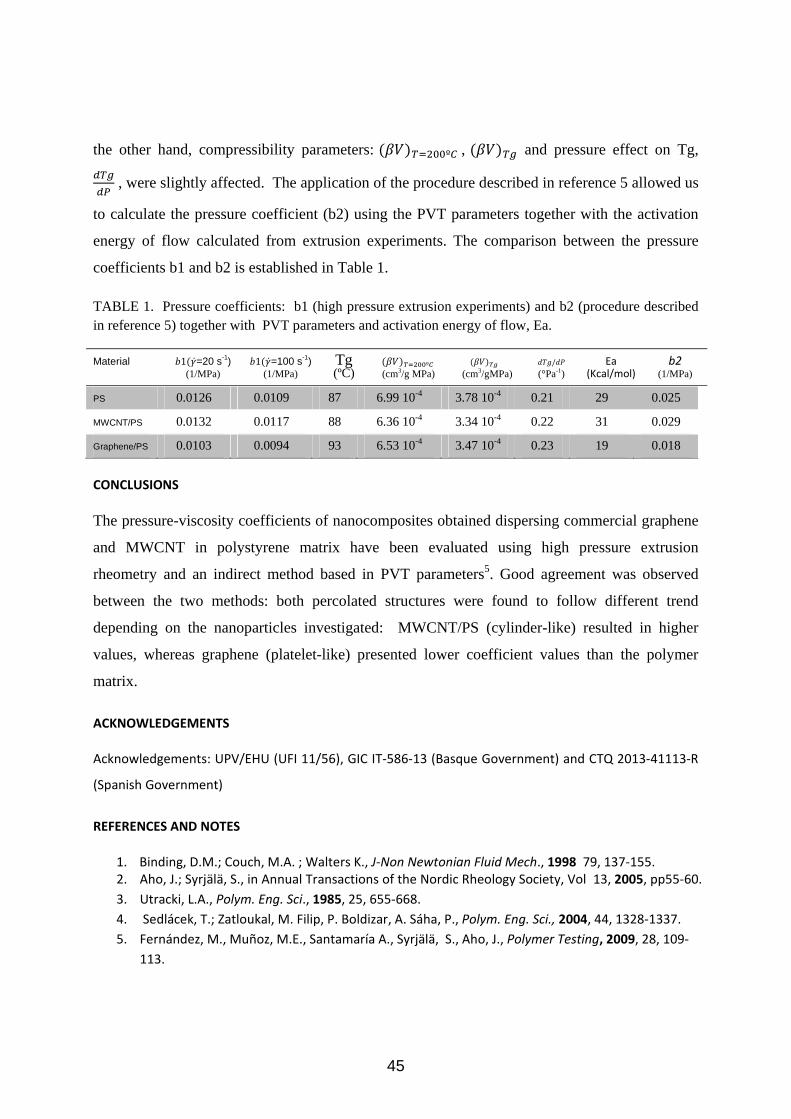
the other hand, compressibility parameters: º , and pressure effect on Tg,
, were slightly affected. The application of the procedure described in reference 5 allowed us
to calculate the pressure coefficient (b2) using the PVT parameters together with the activation
energy of flow calculated from extrusion experiments. The comparison between the pressure
coefficients b1 and b2 is established in Table 1.
TABLE 1. Pressure coefficients: b1 (high pressure extrusion experiments) and b2 (procedure described in reference 5) together with PVT parameters and activation energy of flow, Ea.
Material 1 =20 s-1) (1/MPa)
1 =100 s-1) (1/MPa)
Tg (ºC)
º (cm3/g MPa)
(cm3/gMPa) /
(°Pa-1) Ea
(Kcal/mol) b2
(1/MPa)
PS 0.0126 0.0109 87 6.99 10-4 3.78 10-4 0.21 29 0.025
MWCNT/PS 0.0132 0.0117 88 6.36 10-4 3.34 10-4 0.22 31 0.029
Graphene/PS 0.0103 0.0094 93 6.53 10-4 3.47 10-4 0.23 19 0.018
CONCLUSIONS
The pressure-viscosity coefficients of nanocomposites obtained dispersing commercial graphene
and MWCNT in polystyrene matrix have been evaluated using high pressure extrusion
rheometry and an indirect method based in PVT parameters5. Good agreement was observed
between the two methods: both percolated structures were found to follow different trend
depending on the nanoparticles investigated: MWCNT/PS (cylinder-like) resulted in higher
values, whereas graphene (platelet-like) presented lower coefficient values than the polymer
matrix.
ACKNOWLEDGEMENTS
Acknowledgements: UPV/EHU (UFI 11/56), GIC IT‐586‐13 (Basque Government) and CTQ 2013‐41113‐R
(Spanish Government)
REFERENCES AND NOTES
1. Binding, D.M.; Couch, M.A. ; Walters K., J‐Non Newtonian Fluid Mech., 1998 79, 137‐155. 2. Aho, J.; Syrjälä, S., in Annual Transactions of the Nordic Rheology Society, Vol 13, 2005, pp55‐60.
3. Utracki, L.A., Polym. Eng. Sci., 1985, 25, 655‐668.
4. Sedlácek, T.; Zatloukal, M. Filip, P. Boldizar, A. Sáha, P., Polym. Eng. Sci., 2004, 44, 1328‐1337.
5. Fernández, M., Muñoz, M.E., Santamaría A., Syrjälä, S., Aho, J., Polymer Testing, 2009, 28, 109‐
113.
45

Flowability of type II cement pastes in the presence of polymeric additives
Maria Graça G. Rasteiro1 Fernando Branco2
1Chemical Eng. Dep., University of Coimbra, Rua Sílvio Lima, 3030-790 Coimbra, Portugal 2Civil Eng. Dep., University of Coimbra, Rua Sílvio Lima, 3030-790 Coimbra, Portugal
Correspondence to: Maria Graça G. Rasteiro (E-mail: [email protected])
ABSTRACT
Concrete preparation in hot environment often raises workability issues. A solution for this problem is the
addition of admixtures. Most admixtures are surfactants, modified polycarboxylates being the most recent
superplasticizers. In this study, cement properties (specific surface, particle size distribution, rheology,
setting time, mechanical strengths and porosity) were analyzed for Type I and II cements and the
workability of cement pastes was quantified through rheological tests. Several temperatures, that
represent the in-situ application conditions of cement were tested. Tests were carried out to check if the
inclusion of superplasticizers in cement pastes would contribute to reduce de rate of flowability decay.
KEYWORDS: flowability; cement; admixtures; Bingham fluid
INTRODUCTION
Cement’s workability is closely related with the rate of cement hydration. A faster hydration
process leads to quicker loss of workability. Concrete casting in hot environment, often raises
workability issues1. This property significantly influences fundamental parameters related with
the effectiveness of concrete use. A solution for this problem is the manipulation of the mixing
process by the addition of admixtures. These substances are commonly used to improve the
workability of cement, to reduce the need of mixing water or to increase the initial or final
mechanical strength. During the mixing process, particles of cement tend to flocculate, water is
consumed and the ability of cement to flow is reduced. The addition of high efficiency
superplasticizers leads to a mechanism of steric impediment, resulting in deflocculation and
dispersion of cement. However, high amounts of superplasticizer incorporated in a concrete with
a low water/cement ratio, may lead to premature hardening and false workability, due to
segregation and flow blocking2. As mentioned, the evaporation rate is a problem inherent during
hot weather. The use of superplasticizers may reduce the amount of free water and increase the
flow ability, i.e., reduce viscosity, keeping the workability of cement paste2. After mixing, flow
O24
46

ability of cement pastes and mortars tends to decrease with time. This effect is especially
noticeable at higher temperatures. Superplasticizers can counteract this tendency.
Cement behaves like a non-Newtonian fluid, in other words, at fixed temperature the viscosity
varies depending on the flow conditions. Some authors classify cement as a Bingham plastic,
therefore, cement flow and resistance to flow may be expressed by two fundamental rheological
properties: yield stress (τy) and plastic viscosity ( ). The rheological behavior is influenced by
the cement particles concentration in the paste and by their fineness.
The aim of this study was to analyze the workability of type II Portland cement (CEM II/A-L
42.5R) at several temperatures, that represent the in-situ application conditions of cement
mortars. The evolution of flow ability loss with time was evaluated using rheological tests. The
performance of cement pastes when high-performance superplasticizers were used was analyzed.
EXPERIMENTAL
In this study, two types of Portland cement were used, CEM I/42.5R and CEM II/A-L 42.5R,
both produced according the European standard EN 197-1 (2000) and supplied by CIMPOR
(Portugal). Besides cement, two admixtures were also used: Sika® ViscoCrete® 3005 and the
Sika® ViscoCrete® 3002 HE. These two products, are high-performance superplasticizers,
constituted by anionic surfactants (modified polycarboxylates - polycarboxylate ethers). Using
these materials, different series of cement pastes were prepared (Table 1). Series 2A was
produced using ViscoCrete® 3005 and Series 2B used ViscoCrete® 3002. The tests were carried
out in two stages: initially (Series 2A and 2B) the water content was kept equal to the one in
paste 2; in a second stage, the water content was reduced about 16% (series 2A’ and 2B’).
TABLE 1 Summary of the cement pastes produced with and without superplasticizers
Paste Constitution Cement mass (g) Water mass (g) Superplasticizer
volume (ml)
1 CEM I - Water: normal amount 500 145 -
2 CEM II - Water: normal amount 500 143 -
2A CEM II - Water: normal amount
SIKA 3005: 0.5% of cement mass 500 143 2.4
2A’ CEM II - Water: 84% of normal amount
SIKA 3005: 0.5% of cement mass 500 120 2.4
2B CEM II - Water: normal amount
SIKA 3002 HE: 0.5% of cement mass 500 143 2.4
2B’ CEM II - Water: 84% of normal amount
SIKA 3002 HE: 0.5% of cement mass 500 120 2.4
47

2AA CEM II - Water: normal amount
SIKA 3005: 0.7% of cement mass 500 143 3.3
2AA’ CEM II - Water: 84% of normal amount
SIKA 3005: 0.7% of cement mass 500 120 3.3
Laboratory tests for physical and mechanical characterization of the cements and of the cement
pastes produced were carried out. Several properties of cement (specific surface and particle size
distribution) and of the cement pastes (rheology, setting time, mechanical strengths and porosity)
were quantified. The cement pastes were analyzed in a rheometer (Haake-Rheostress 1) with the
parallel plates (PP20Ti) configuration. Tests were carried out at temperatures of 10, 23 and 40°C.
Cement pastes were kept in a bath at constant temperature prior to testing. Tests were performed
from 1.5 till 66 minutes after paste preparation.
RESULTS AND DISCUSSION
The analysis of the rheological tests of the cement series pastes produced without
superplasticizers allows concluding that higher shear stresses result from the increase of
temperature, for both types of cement and for all ages of the cement paste. This fact is explained
because as temperature increases, evaporation rate also increases and the resistance of mortar to
flow increases, leading to a faster decrease of flow ability. Keeping the same type of cement, for
the same temperature, it is possible to conclude, as expected, that higher shear stresses result
when the age of the cement paste increases. At the same temperature and age, mortars produced
with CEM II exhibit higher shear stresses than those produced with CEM I. This is quite obvious
for the 40 ºC temperature, the behaviour of the two cements being similar for the other
temperatures. This may be explained because CEM II has finer particles, which offer more
resistance to shear and, simultaneously, lead to quicker flow ability drop, since the hydration
reaction for this cement is quicker. CEM II specific surface is higher than that of CEM I.
Figure 1 presents the results of the flow tests carried out on a cement paste that was kept in a
bath at 40°C. Results show that both superplasticizers increase the workability of the cement
paste when water content is kept at the regular level (series 2A and 2B). Superplasticizer 3005
did not provide satisfactory results of workability if the amount of water is reduced (series 2A’).
This cement paste loses flow ability at a higher rate than when superplasticizers are not present
(series 2). On the other hand, for the same reduced amount of water, the presence of
superplaticizer 3002 HE (series 2B’) leads to a significantly better performance, since the cement
paste keeps its workability for a longer period of time. The results obtained with a concentration
48

of superplasticizer 3005 of 0.5% of cement mass showed that a reduction of the water amount
around 16% (series 2A’) led to a significant loss of workability when compared with the
situation where the amount of water was kept at the regular level (series 2A).
(a) (b)
FIGURE 1 Shear stress/shear rate relationship at 40°C for several pastes: 1.5 minutes after
preparation – (a) and 26.5 minutes after preparation – (b).
The use of superplasticizer 3002 HE improves the performance of the cement paste by extending
both the initial and the final setting time as well as the mechanical strength. This effect was
achieved when keeping the water content and also when reducing the water amount.
CONCLUSIONS
The workability of cement pastes tends to decrease with time. In the present work, the
workability of cement pastes was quantified through rheological tests. When ambient
temperature increases, the rate of decay of the cement paste flow ability increases. Tests were
carried out to check if the inclusion of superplasticizers in cement pastes would contribute to
reduce de rate of flow ability decay. Results using two different superplasticizers showed that the
presence of this additive significantly increased the workability of the cement paste, for all
temperatures tested, when the water amount was kept at the regular value. Some tests were also
performed to check if the workability improvement was still visible if a 16% reduction on the
water amount was implemented. At 40°C, the addition of either superplasticizer 3002 HE or
3005 showed remarkable improvements on CEM II paste workability.
REFERENCES
1. Ortiz, J.; Aguado, A.; Agulló, L.; García, T.; Zermeño, M., Construction and Building
Materials, 2009, 23, 1808–1814.
2. Seabra, M.P.; Paiva, H.; Labrincha, J.A.; V.M. Ferreira, J. A., Construction and Building
Materials, 2009, 23, 1147-1153.
49

Study of rheological behaviour of stainless steel feedstock taking into account the thermal effects
Christian Kukla1, Ivica Duretek2, Stephan Schuschnigg2, Joamin Gonzalez-Gutierrez2, Ali Gooneie2, Clemens Holzer2
1 Montanuniversitaet Leoben, Industrial Liaison Department, Peter Tunner Str. 27, 8700 Leoben, Austria 2 Montanuniversitaet Leoben, Department of Polymer Engineering and Science, Chair of Polymer
Processing, Otto Gloeckel-Str. 2, 8700 Leoben, Austria
Correspondence to: Christian Kukla (E-mail: [email protected])
ABSTRACT
Powder injection moulding (PIM) process is well established for production of small precision components with both metal and ceramic powders. In comparison to unfilled polymers, the PIM-feedstocks are highly filled multiphase systems, whose flow behaviour is very sensitive to composition of binder and powder loading. Furthermore, the rheology of highly filled multiphase systems is characterized by strain and temperature dependence and influenced by flow instabilities and yield stress. In this study, the rheological behaviour of 316L feedstocks with a polypropylene/wax binder system and different powder loadings was investigated. The experimental work was performed with a rotational and a high pressure capillary rheometer. The aim of this work was to evaluate mixing rules predicting the viscosity of the feedstock out of its composition taking into account the melt temperature rise due to dissipative heating. Hence, measured data were corrected with respect to temperature. Thus the influence of the temperature onto the viscosity and the related model was evaluated.
KEYWORDS: rheology, powder injection moulding, highly filled polymer, heat dissipation, modelling
INTRODUCTION
PIM is a complex, multi-step process with a significant technological and economic potential.
The binder system plays one big role in the production of PIM parts; even though as it is
completely removed in the final part. One of the main functions of the binder system is to
provide mouldability to the metal or ceramic powder. Thus the main property is viscosity.
Knowledge of the dependence of viscosities of binder constituents and powder characteristics on
the final composition is required for the solution of many engineering problems1, 2.
O25
50

In a previous work we calculated the final feedstock viscosity starting with the viscosities of the
binder constituents2. We found that existing models mainly describe the viscosity increase by a
certain powder loading but do not take into account further effects like the shift of the transition
region from Newtonian to shear thinning behaviour. For the shift of the transition region we
employed the model by Geisbüsch3 and found good agreement with our measurements. In Fig. 1-
left one can see that the transition region is described properly. Additional effects like the
increase of viscosity in the region of low shear rates, due to Herschel-Bulkley behaviour, or the
change of the slope in the shear thinning region as a function of powder loading cannot be
described with this model.
FIGURE 1 Left: Measured and according to Geisbüsch calculated viscosities for the feedstocks with polypropylene/wax binder system2; Right: Increased shear in highly filled polymers, where k is the factor to describe the increase in shear3
Here we look at the difference of the slope in the shear thinning region, whether it is due to an
higher temperature increase caused by an increased shear rate in the binder system or not. As
shown in Fig. 1-right in a highly filled polymer all the shear has to be taken by the polymer.
When you look at this feedstock as a one phase system you get a certain value for the shear rate.
In reality it is a two phase system with a stiff second phase. Thus the shear in the fluid has to be
higher than the one calculated by the one phase approach. With this higher shear a higher
temperature increase in the polymer due to dissipation should occur especially at higher shear
rates.
Increased temperature in a polymer highly filled with stiff powders
To evaluate the amount of the increased temperature due to shear and its influence onto the
viscosity measurements we followed three approaches. First, we evaluated the contribution of
51

viscous dissipation over the heat conduction normal to the direction of flow, by calculating the
Griffith number ( ). The Griffith number for a power law fluid can be calculated using Eq. (1):
(1)
Where is the binder’s consistency index, is the shear rate, is the binder’s flow index, is
the temperature coefficient, is the distance between particles estimated, and is the thermal
conductivity of the binder. Calculation of was done to show that at high shear rates the heat
generated in the binder due to viscous dissipation is larger than the heat transmitted by
conduction to the metal particles (i.e. > 1), and thus the binder will have higher temperature
than the filler particles (see Fig.2 left).
Second, finite element simulations (Polyflow-ANSYS) were performed assuming that feedstock
material was a one-phase material with physical properties that are arising from the feedstock as
a whole. Thus we got the lower limit for the temperature rise due to feedstock flow (Fig.2-right).
Third, finite element simulations (Polyflow-ANSYS) were performed assuming that the binder in
the system was flowing through fixed spheres of steel. Thus we got the upper limit for the
temperature raise due to binder flow (Fig. 2-right).
FIGURE 2 Left: Griffith number as function of shear rate for 60 vol.-% feedstock; Right: Increase in temperature as a function of shear rate for 60 vol.-% feedstock by simulations; selected temperature is estimation between the extremes of the flow of a fluid through static spheres and a 1 phase fluid.
It can be seen in Fig. 2-right that at shear rates lower than 100 s-1 the rise in temperature is very
small. This is in agreement with the calculated Griffith number. In reality, the binder is not a
one-phase system flowing through the die and it is not a fluid flowing through static spheres, but
it is a two phase system with a fluid moving along with the filler particles, therefore the
temperature raise should be between the two extremes calculated in the simulations (Fig. 2-right).
0
1
10
100
1E+1 1E+2 1E+3 1E+4
Grif
fith
num
ber
(/)
Shear rate ( s-1)
52

To undertake a first improvement of our Geisbüsch fitting of the viscosity curve we estimated
deliberately a temperature between these two extremes by taking 97% of the maximum melt
temperature of a fluid through static spheres (Fig. 3).
Viscosity corrections due to increased temperature in polymer
Using the estimated temperature rise, one can correct the viscosity at high shear rates and use the
model proposed by Geisbüsch to predict the measured data. This is shown in Fig. 3 for the
particular example of 60%vol feedstock. The viscosity values were shifted by using the
Arrhenius equation, and it can be seen that the prediction from the model has improved at the
higher shear rates; however some further corrections are needed.
FIGURE 3: Viscosity corrections due to temperature increase at high shear rates and predictions by the Geisbüsch model for 60 vol.-% feedstock.
CONCLUSIONS
Increase in temperature due to viscous heating is certainly a factor that influences the viscosity
behaviour of feedstock at high shear rates ( >100 s-1), but it may not be the only one. Other
important factor may be the particle-particle interactions, which the current model doesn’t take
into account. In the future, two-phase flow simulations will be implemented to obtain a more
accurate estimate of the changes in temperature due to increased shear rates in the binder.
REFERENCES AND NOTES
1. C. Kukla, I. Duretek, C. Holzer: Rheological behaviour of binder systems for PIM and mixing rules for calculation of viscosity, EURO PM2013 Congress and Exhibition, Gothenburg, 2013.
2. C. Kukla, I. Duretek, C. Holzer: Modelling of rheological behaviour of 316L feedstocks with different powder loadings and binder compositions, EURO PM2014 Congress and Exhibition, Salzburg, 2014.
3. Geisbüsch, P.: Ansätze zur Schwindungsberechnung ungefüllter und mineralisch gefüllter Thermoplaste, Dissertation an der RWTH Aachen, 1980
53

Development of ecofriendly emulsions based on product engineering principles.
Nuria Calero1, Jenifer Santos1, José Muñoz1. 1Reología Aplicada. Tecnología de Coloides. Departamento de Ingeniería Química. Facultad de
Química. Universidad de Sevilla c/ P. García González, 1, E41012, Sevilla España.
Correspondence to: Nuria Calero (E-‐mail: [email protected])
ABSTRACT
The chemistry and technology of agrochemical products has undergone extensive
changes over the last 20 years. New formulations and ingredients must meet the needs
of the agrochemical industry for products exhibiting greater safety to users, much lower
environmental impact and better performance. N,N-Dimethyldecanamide (AMD-10TM)
and D-limonene are solvents that fulfil the requirements to be considered green
solvents. This contribution deals with the study of emulsions formulated with a mixture
of these solvents and an eco-friendly emulsifier. All studied emulsions showed shear
thinning behaviour which fitted fairly well the Cross model. The influence of aging time
on zero shear viscosity was demonstrated to be a powerful tool to assist in predicting the
destabilization process of emulsions.
KEYWORDS: eco-friendly emulsions, rheology, laser diffraction, product engineering, physical stability.
INTRODUCTION
Satisfying the needs of consumers is one of the basic principles of product engineering.
Consequently, traditional organic solvents are being replaced by new eco-friendly
solvents in agrochemical products in order to avoid contamination and reduce the risk
for farmers1. N,N-Dimethyldecanamide (AMD-10) and D-Limonene are solvents that
fulfill the requirements of a sustainable society. In addition, polyoxyethylene glycerol
esters are also eco-friendly and nontoxic, hence they are considered as green surfactants.
Rheology is a useful tool to provide early information on destabilization mechanisms in
emulsions. In order to detect the onset of creaming or coalescence, it is necessary to
determine the viscosity at very low stresses.2
Product Formulation
O7
54

The main target of this work was to study the influence of AMD-10/D-limonene ratio
on flow curves and droplet size distributions of stable O/W emulsions formulated with
these eco-friendly solvents and a polyoxyethylene glycerol ester as emulsifier.
MATERIALS AND METHODS
Materials
N,N-Dimethyldecanamide (Agnique AMD-10TM, BASF), D-Limonene (Sigma Aldrich)
and Glycereth-17 Cocoate (Levenol C-201TM, KAO) as emulsifier with HLB 13, were
used. Some RD antifoam agent (DOW CORNING®) and deionized water were for the
preparation of emulsions.
Methods
Preparation of emulsions
Emulsions containing 3 wt % Levenol C-201TM as emulsifier, 0.1 wt % RD antifoam
agent and 30 wt% solvent(s) were prepared. The ratio of solvents studied were 100/0,
85/15, 80/20, 75/25, 70/30, 65/35, 50/50, 25/75, and 0/100 of AMD-10/D-limonene.
These O/W emulsions were prepared using a Silverson L5M at 6000 rpm during 60 s.
Laser diffraction measurements
Size distribution of oil droplets were determined by laser diffraction using a Mastersizer
X (Malvern, Worcestershire, UK). The mean droplet diameter was expressed as Sauter´s
diameter (D3,2):
𝐷 𝑀,𝑁 =𝐷! 𝑛 𝐷 𝑑𝐷𝐷!𝑛 𝐷 𝑑𝐷
!!!!
(1)
Rheological measurements
Flow curve tests were conducted with a Haake MARS controlled-stress rheometer
(Thermo-Scientific, Germany), equipped with a sand-blasted coaxial cylinder Z-20 to
avoid slip effects. Flow curves were carried out from 0.05 to 1 Pa at 20ºC. RESULTS AND DISCUSSION
Figure 1 shows D3,2 as a function of the ratio of solvents for emulsions prepared at 6000
rpm. All emulsions formulated with the mixture of solvents yielded lower D3,2 values
than their counterparts with only one solvent. This is probably due to the combination of
different properties of the solvents used. The addition of AMD-10 provokes a certain
55

decrease in the interfacial tension, whereas D-Limonene confers more apolar character3.
The combination of both solvents led to emulsions with submicron mean diameters. In
fact, it was possible to obtain emulsions with D3,2 as low as 290 nm, using just a rotor
stator device. This demonstrates that the choice of an optimum formulation made
possible to use a relatively low-energy homogenizer to get fine emulsions, which fits
one of the basic principles of product engineering.
Figure 2A shows flow curves of 1-day-aged stable emulsions studied as a function of
the ratio of solvents. Only the most stable emulsions were measured. All emulsions
exhibited a trend to reach a Newtonian region at low-shear rates, which allowed the
zero-shear viscosity, (ηo) to be estimated. This range was followed by a slight decrease
in viscosity (shear-thinning behaviour) above a critical shear rate. Figure 2A also
illustrates the fitting quality to the Cross model (R2>0.999).
𝜂 = !!
!! !!!
!!! (2)
Two levels in zero shear viscosity values were observed. Emulsions with higher D-
Limonene content (65/35, 70/30 and 75/25) showed higher η0 than 80/20 and 85/15
emulsions, which is consistent with laser diffraction results and different flocculation
degree.
Figure 2B shows the relative increase in zero-shear viscosity from day 1 to day 40,
calculated as the ratio of the difference of the zero shear viscosities on day 40 and day 1
to the zero-shear viscosity on day 1. A negative value means that a decrease in ηo took
place. Conversely, an increase in ηo yields a positive value. Two different trends were
observed. There is a decrease in zero shear viscosity for 65/35 and 70/30 emulsions,
which is consistent with an increase in the droplet sizes. The higher viscosity values of
these emulsions at 1-day aging time may not be only attributed to a droplet size effect,
but also to a flocculation process, which in turn led to coalescence upon aging due to the
disruption of the O/W interface under compression. On the contrary, the increase in zero
shear viscosity for 75/25, 80/20 and 85/15 emulsions may indicate the onset of
creaming.
CONCLUSIONS
Submicron emulsions were obtained using an optimised mixture of eco-friendly
solvents. All emulsions exhibited shear-thinning behaviour. Monitoring calculated
56

values of zero shear viscosity with aging allowed us to detect the onset of two different
destabilization processes. 85/15, 80/20 and 75/25 emulsions underwent incipient
creaming, whereas 65/35 and 70/30 emulsions shows coalescence. Hence, this work has
demonstrated that the use of mixture of solvents is a powerful tool to reduce the energy
input to prepare emulsions with submicron mean diameters.
100/0 85/15 80/20 75/25 70/30 65/35 50/50 25/75 0/1000.0
0.5
1.0
1.5
2.0
2.5
3.0Sa
uter
dia
met
er ( µ
m)
Ratio of solvents (AMD-10/D-Limonene)
Submicron emulsions
FIGURE 1. Sauter´s diameter as a function of ratio of solvents for the emulsions studied. FIGURE 2.A) Flow curves for studied emulsions as a function of ratio of solvents at 20oC. B) Normalized increase of the zero shear viscosity from day 1 to day 40. ACKNOWLEDGEMENTS
The financial support received (Project CTQ2011-‐27371) from MINECO (Spain), the European Commission (FEDER Programme) and from the V Plan Propio Universidad de Sevilla is kindly acknowledged.
REFERENCES 1. Hofer, R.; Bigorra, J., Green Chemistry, 2007,9,203–212. 2. Tadros, T. F., Rheology of dispersions: principles and applications. John Wiley & Sons, 2011. 3. Santos, J.; Trujillo-‐Cayado, L. A.; Calero, N.; & Muñoz, J,AIChE Journal, 2014, 60, 2644-‐2653.
0 20 40 60 80 100 1200.0
0.5
1.0
65/35 70/30 75/25 80/20 85/15 Cross Model
τ(Pa
)
shear rate(s-1)
Day 1
-‐100 -‐80 -‐60 -‐40 -‐20 0 20 40
Δη0 (%)
RaYo of solvents (AMD/D-‐Limonene)
A) B)
57

58

59

60
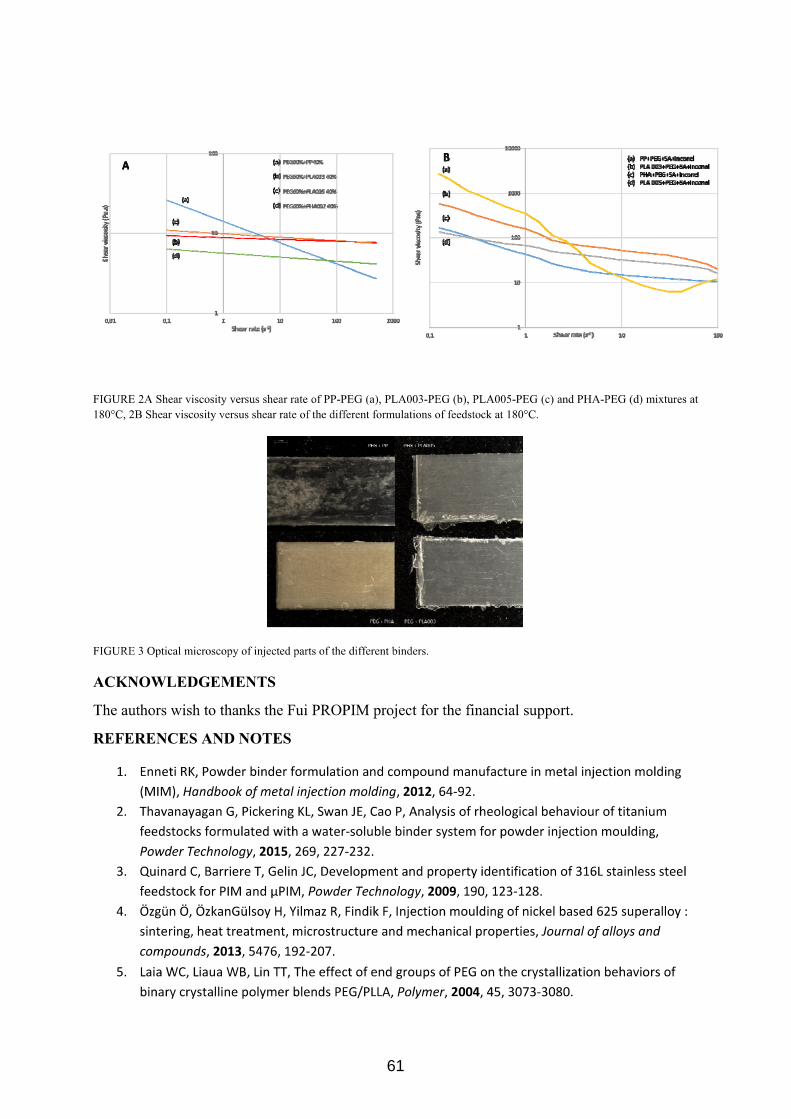
61
Rheological properties of biopolymer-‐stabilized emulsions formulated with a nonionic eco-‐friendly surfactant
Luis A. Trujillo-‐Cayado1*, Mª Carmen Alfaro1, José Muñoz1, A. Raymundo2, I. Sousa2
1 Reología Aplicada. Tecnología de Coloides. Departamento de Ingeniería Química. Facultad de Química. Universidad de Sevilla. C/ P. García González, 1, 41012, Sevilla, Spain.
2 LEAF – Linking Landscape Environment Agriculture and Food. Instituto Superior de Agronomia, University of Lisbon, Tapada da Ajuda, 1349-‐017 Lisboa, Portugal
Correspondence to: Luis Alfonso Trujillo Cayado (E-‐mail: [email protected])
ABSTRACT
The influence of surfactant and gum concentrations, as well as rhamsan/welan gum ratio on
rheological properties, droplet size distribution and physical stability of eco-friendly O/W
emulsions stabilized by an ecological surfactant were studied in the present work. The gum
concentrations in the aqueous solutions of rhamsan, welan and blends of both gums were
selected to ensure the formation of weak gel matrices. Flow curves at steady shear demonstrated
the lack of synergism between rhamsan and welan gums, whose ratio controlled the shear
thinning properties of these emulsions. Mechanical spectra exhibited G´ values higher than those
of G´´ in the whole frequency range studied, indicating the formation of a network supported by
the cooperative contribution of the biopolymer continuous phase and the packing effect due to
the great number of α-pinene droplets.
KEYWORDS: Eco-friendly, Emulsion, Rhamsan gum, Rheology, Welan gum
INTRODUCTION
Polysaccharides are frequently employed to stabilize oil-in-water emulsions for their
biocompatibility, biodegradability and nontoxicity1. The efficiency depends on the concentration
of hydrocolloids in the aqueous phase and on the characteristics of the structure formed by the
biopolymer. Microbial polysaccharides can be manufactured under controlled conditions,
resulting in commercial batches with outstanding reproducibility of their functional properties.
O9
62

Welan gum and rhamsan gum are exopolysaccharides that act as thickening and stabilizer
agents. They have a wide range of commercial applications in food, ink, petroleum and other
industries. The role of surfactants is also essential to provide long-term stability to emulsions,
since they adsorb at the oil/water interface preventing droplet coalescence. Interactions between
surfactants and polysaccharides can affect the macroscopic properties of emulsions.
Polyoxyethylene glycerol esters derived from cocoa oil are ecological surfactants with good
emulsifying properties2. This study focuses on the rheological properties of emulsions
formulated with a biosolvent (α-pinene) as oil phase, an eco-friendly surfactant as emulsifier and
two exopolysaccharides (welan and rhamsan gums) as thickeners.
MATERIALS AND METHODS
Oil-in-water emulsions using α-pinene (30 wt%) as dispersed phase was prepared using a
rotor-stator device (Ultraturrax T25) at 9500 rpm for 120 s. Seven emulsions were prepared
using different surfactant concentrations (0.0, 3.5 and 7.0 wt%), gum concentrations (0.33, 0.56
and 0.80 wt%) and rhamsan/welan gum ratios (100/0, 50/50 and 0/100) as can be seen in table 1.
TABLE 1. Values of surfactant concentration, gum concentration and rhamsan/welan gum ratio for all studied emulsions.
Emulsion name Surfactant
concentration (wt%)
Gum
concentration (wt%)
Rhamsan/Welan
gum ratio
0.0 - 0.56 - 50R/50W 0.0 0.56 50/50
7.0 - 0.56 - 50R/50W 7.0 0.56 50/50
3.5 - 0.33 - 50R/50W 3.5 0.33 50/50
3.5 - 0.80 - 50R/50W 3.5 0.80 50/50
3.5 - 0.56 - 100R/0W 3.5 0.56 100/0
3.5 - 0.56 - 0R/100W 3.5 0.56 0/100
3.5 - 0.56 - 50R/50W 3.5 0.56 50/50
The rheological characterization involved stress and frequency sweeps in small amplitude
oscillatory shear experiments (SAOS) and steady shear flow tests at 20ºC. Rheological
experiments were conducted for emulsions aged for 24 hours with a Haake MARS III controlled-
stress rheometer (Thermo-Scientific), using a serrated plate-plate sensor (60 mm diameter, gap: 1
mm) to prevent wall slip effect.
63
RESULTS AND DISCUSSION
Figure 1A shows the frequency dependence of the linear viscoelastic functions of all
emulsions to illustrate the influence of the studied variables. First, it should be noted that there
are no results for the emulsion with 0.0 wt% surfactant because it could not be prepared due to
the lack of surface-active ingredients. All samples display clear viscoelastic properties with a
predominance of the elastic over the viscous component in the frequency range studied. The
emulsion with central values of all variables, which contains 3.5 wt% surfactant, shows higher
values of the storage modulus than the emulsion that contains 7 wt% surfactant for all the
frequency range studied. This supports the decrease of the viscoelastic properties with increasing
surfactant concentration; probably due to the higher mean diameters (coalescence) induced by
depletion flocculation. Furthermore, the addition of gum yielded the formation of a much
stronger and more elastic structure, demonstrating the high influence of gum concentration on
viscoelastic properties. It should be also noted that the slope of G´ with frequency for the
emulsion containing only rhamsan gum as thickener is lower than that of welan gum. The use of
rhamsan and welan in identical percentages does not lead to a positive synergistic effect on the
mechanical spectrum. This means that the resulting dispersion does not show higher elastic
properties. The results obtained are consistent with the occurrence of enhanced solid-like
viscoelastic properties in emulsions containing rhamsan gum. Furthermore, this fact may suggest
that rhamsan gum predominates over welan gum when both gums are used.
All samples exhibited shear thinning behavior and a trend to reach a Newtonian region at low
shear rate enabling the estimation of a zero-shear viscosity (η0). The shear rate dependence of
viscosity fitted fairly well the Cross model. Figure 1B displays flow curves for all samples. The
increase of η0 with gum concentration may be explained by the fact that polysaccharides exert a
thickening effect on the continuous phase. The emulsions formulated with rhamsan gum show
higher zero-shear viscosity values than those shown by emulsions with welan gum. Furthermore,
the mixture of both gums gives rise to intermediate values of zero-shear viscosity and power law
index. Finally, it should be noted that the zero shear viscosity is not affected significantly by
surfactant concentration
64

FIGURE 1. (A) Mechanical spectra and (B) flow curves of emulsions aged for one day, at 20°C, as a
function of all studied variables.
CONCLUSIONS
Linear viscoelastic properties of emulsions formulated with rhamsan and/or welan gum and a
non-ionic emulsifier strongly depend on all studied variables. The elastic component dominates
over the viscous one in all samples. The use of rhamsan and welan gums in identical percentages
does not yield a positive synergistic effect on the mechanical spectrum. Mechanical spectra
suggest that the rheological properties of emulsions formulated with both gums as thickeners are
essentially controlled by rhamsan better than welan gum. All samples showed shear thinning
behavior above a critical shear rate. Zero-shear viscosity values strongly depend on the gum
concentration and rhamsan/welan gum ratio.
ACKNOWLEDGEMENTS
The financial support received (Project CTQ2011-27371) from the Spanish Ministerio de
Economía y Competitividad (MINECO) and from the European Commission (FEDER
Programme) is kindly acknowledged.
REFERENCES
1. Phillips, G.O., Williams, P.A., Handbook of hydrocolloids; Elsevier, Amsterdam, 2009. 2. Trujillo-Cayado, L. A.; Ramírez, P.; Alfaro, M. C.; Ruíz, M.; Muñoz, J., Adsorption at
the biocompatible α-pinene–water interface and emulsifying properties of two eco-friendly surfactants. Colloids and Surfaces B: Biointerfaces, 2014, 122, 623-629.
65
On the yield stress of Ca(2+)
M.C. García1, M.C. Alfaro
1, J. Muñoz
1 Reología Aplicada. Tecnología de Coloides. Departamento de Ingeniería Química. Facultad de Química.
Universidad de Sevilla. C/ P. García González, 1, 41012, Sevilla, Spain.
Correspondence to: J.Muñoz (E-mail:
ABSTRACT
The goal of this work was
determine the yield stress of very shear thinning materials free of previous memory effects
method is assessed with a fluid gel prepared with low
at shear stresses around the yield stress
like behaviours were observed
creep test. The lack of reproducibility observed at 2.25 Pa was attributed to shear banding effects
promoted by the use of a serrated plate
viscosities provided by the rheometer were
KEYWORDS: yield stress, torsional flow, fluid gel, gellan gum, very shear thinning
INTRODUCTION
Gellan gum is among the biopolymers capable of forming fluid gels from very low gum
concentrations. Fluid gels are
i.e. they are “flowable” materials, but they simultaneously possess significant elastic properties.
Confocal laser scanning microscopy reveals that the microstructure of gellan fluid gel
of a dispersion of gel-like domains in an aqueous continuous phase [1]. Therefore, they are prone
to undergo wall-depletion (slip) phenomena under shear. For this reason, the parallel plate
geometry with serrated surfaces is one of the measuring
characterization of fluid gels under shear flow. However, torsional flow poses the problem that
neither shear stress nor shear rate are constant along the plate radius
must be made. Determining a practical yield stress is quite important for the onset of flow
On the yield stress of Ca(2+)-induced gellan fluid gels under torsional shear flow
J. Muñoz1
Aplicada. Tecnología de Coloides. Departamento de Ingeniería Química. Facultad de Química.
. C/ P. García González, 1, 41012, Sevilla, Spain.
mail: [email protected])
to check the efficiency of creep-recovery-creep tests
very shear thinning materials free of previous memory effects
h a fluid gel prepared with low-acyl gellan gum. The rheological response
around the yield stress turned out to be rather unstable. Yet
observed by just changing the stress by 0.25 Pa or by
creep test. The lack of reproducibility observed at 2.25 Pa was attributed to shear banding effects
promoted by the use of a serrated plate & plate measuring system. Nominal shear stresses and
viscosities provided by the rheometer were corrected using standard equations.
ield stress, torsional flow, fluid gel, gellan gum, very shear thinning
Gellan gum is among the biopolymers capable of forming fluid gels from very low gum
concentrations. Fluid gels are interesting materials insofar as they exhibit fluid
i.e. they are “flowable” materials, but they simultaneously possess significant elastic properties.
Confocal laser scanning microscopy reveals that the microstructure of gellan fluid gel
like domains in an aqueous continuous phase [1]. Therefore, they are prone
depletion (slip) phenomena under shear. For this reason, the parallel plate
geometry with serrated surfaces is one of the measuring systems of choice when dealing with the
characterization of fluid gels under shear flow. However, torsional flow poses the problem that
neither shear stress nor shear rate are constant along the plate radius, such that stress corrections
termining a practical yield stress is quite important for the onset of flow
induced gellan fluid gels under torsional shear flow
Aplicada. Tecnología de Coloides. Departamento de Ingeniería Química. Facultad de Química.
creep tests to accurately
very shear thinning materials free of previous memory effects. This
acyl gellan gum. The rheological response
Yet, solid-like or fluid-
by just changing the stress by 0.25 Pa or by conducting a second
creep test. The lack of reproducibility observed at 2.25 Pa was attributed to shear banding effects
& plate measuring system. Nominal shear stresses and
corrected using standard equations.
ield stress, torsional flow, fluid gel, gellan gum, very shear thinning
Gellan gum is among the biopolymers capable of forming fluid gels from very low gum
interesting materials insofar as they exhibit fluid-like consistency,
i.e. they are “flowable” materials, but they simultaneously possess significant elastic properties.
Confocal laser scanning microscopy reveals that the microstructure of gellan fluid gels consists
like domains in an aqueous continuous phase [1]. Therefore, they are prone
depletion (slip) phenomena under shear. For this reason, the parallel plate
systems of choice when dealing with the
characterization of fluid gels under shear flow. However, torsional flow poses the problem that
uch that stress corrections
termining a practical yield stress is quite important for the onset of flow
O14
Experimental Methods
66

calculations. This study was carried out by checking that samples were free of thermo-
mechanical history effects. Therefore, standard flow curves were not run but independent tests at
constant shear stress. Series of creep-recovery-creep tests allowed the viscosity recovery to be
estimated.
MATERIALS AND METHODS
Fluid gels were prepared with deionised water at 0.2 wt% with low-acyl gellan gum (Kelcogel
FTM
) kindly provided by CP Kelco and 0.2 wt % calcium chloride (Panreac) as reported
elsewhere [2]. The effects of sample loading and those associated to reach the measuring gap
(1mm) were counterbalanced by an equilibration time above 1200 s, as determined by
SAOS/time tests. Creep-recovery-creep tests were carried out at 20ºC in the (2 – 6) Pa range.
Stress and viscosity corrections were made using standard methods [2].
RESULTS AND DISCUSSION
Imposing a shear stress of 2 Pa for about 45 s resulted in a very low shear rate which is by far
below the minimum shear rate guaranteeing observable flow (Figure 1).
0 2 0 4 0 6 0 8 0 1 0 0 1 2 0 1 4 0
0 ,0
0 ,5
1 ,0
1 ,5
2 ,0
2 ,5
3 ,0
R un 1
R un 2
R un 3
R un 4
γ
t (s )
0 2 0 40 6 0 80 1 00 12 0 14 0
0
50
100
150
200
250
300
350
400
R un 1
R un 2
R un 3
R un 4
γ
t (s )
(a) (b)
FIGURE 1. Creep-recovery-creep results at 2 Pa (figure a) and 2.5 Pa (figure b) (strain versus shear time)
for a fluid gel containing 0.2 wt % LA-gellan gum 0.2 wt % CaCl2 and 0.1 wt % sodium azide. T = 20º C.
Runs 1, 2, 3 and 4.
In fact, the response is controlled by the viscoelasticity of gellan fluid gel as supported by the
great recovery and the similar response after the second creep test. Figure 2 illustrates that
67

chaotic results were obtained at 2.25 Pa. While some results were closer to those typical of linear
creep flow, others supported the onset of clear shear flow. The variability of results also
influenced the recovery step and the resulting strain range.
FIGURE 2. Creep-recovery-creep test at 2.25 Pa (strain versus shear time) for a fluid gel containing 0.2
wt % LA-gellan gum 0.2 wt % CaCl2 and 0.1 wt % sodium azide. T = 20º C. Runs 1, 2, 3 and 4.
FIGURE 3. Shear stress versus shear rate for a fluid gel containing 0.2 wt% gellan gum, 0.2 wt% CaCl2 and
0.1 wt% sodium azide. Note: all data derive from creep-recovery-creep tests. T=20ºC. (1): data derived
from the first creep test. (2): data derived from the creep test conducted after the recovery step.
Results obtained at 2.50 Pa were clearly consistent with the development of a significant shear
flow since straight lines were quickly obtained and the recovery degree was null. Figure 3
68

illustrates that the practical yield stress was 2.25Pa and above this value, the longer the shear
time at constant shear stress, the higher the shear rate, i.e. the lower the viscosity.
CONCLUSIONS
Series of independent creep-recovery-creep tests carried out at several shear stresses on
samples free of thermo-mechanical history effects allowed a practical yield stress to be
accurately determined. This yield stress located the onset of the so-called very shear thinning
behaviour more accurately than flow curves and resulted in rather unstable results in the case of
gellan fluid gels. This indicated the occurrence of shear banding, which was promoted by the use
of torsional flow. A serrated-surface parallel plate measuring geometry was used since fluid gels
are prone to show slip effects. A slight decrease by 0.25 Pa below the yield stress gives rise to
quite reproducible and extremely low shear rates. Conversely, a slight increase by just 0.25 Pa
above the yield stress resulted in clear fluid-like behaviour as demonstrated by the 4-decade rise
of shear rate.
ACKNOWLEDGEMENTS
The financial support received (Project CTQ2011-27371) from the Spanish Ministerio de
Economía y Competitividad (MINECO) and from the European Commission (FEDER
Programme) is kindly acknowledged.
REFERENCES
1. García, M.C; Alfaro, M.C; Calero, N.; Muñoz, J., Influence of gellan gum concentration
on the dynamic viscoelasticity and transient flow of fluid gels, Biochemical Engineering
Journal, 2011, 55, 73-81.
2. García, M.C; Alfaro, M.C; Muñoz, J., Yield stress and onset of nonlinear time-dependent
rheological behaviour of gellan fluid gums. Journal of Food Engineering, 2015, 42-47.
69

Utilisation of Optical Coherence Tomography in Rheological Characterisation ofMontmorillonite Dispersions
Martina Lille1, Ari Jäsberg!, Sanna Haavisto2, Seppo Kasa2, and Antti Koponen1
VTT Technical Research Centre of Finland Ltd., P.O. Box 1000, FI-02044 VTT, Finland; 2Spinnova Ltd.,Kankitie 3, FI-40320 Jyväskylä, Finland;2 Posiva Oy, Olkiluoto, FI-27160 Eurajoki, Finland
Correspondence to: Antti Koponen (E-mail: [email protected])
ABSTRACT
In this work the flow behaviour of aqueous sodium montmorillonite dispersions (0.1 – 4.0 vol%) was investigatedin a parallel plate geometry with a rheometer. During the rheometer measurements, true velocity profiles in thewhole gap (1000 µm) were determined with Optical Coherence Tomography (OCT), which revealed that wall slipand deviations from laminar flow gave rise to artefacts in the flow profiles measured with the rheometer.
KEYWORDS montmorillonite, rheology, flow, wall slip, optical coherence tomography, OCT
INTRODUCTION
Dispersions of clay particles, such as bentonite, are widely applied as rheology modifiers1 and
underground sealing agents1,2. The rheological characterisation of clay dispersions is not always
straightforward as they (like many multiphase materials) may behave non-ideally in the meas-
uring geometry. The flow may manifest, e.g., apparent wall slip and wall depletion3 or devia-
tions from laminar flow and radial migration especially at high shear rates4. In this work we
studied the flow behaviour of bentonite dispersions in parallel plate geometry. Optical Coher-
ence Tomography (OCT)5,6 was used to measure the true velocity profiles in the geometry gap
and thus to identify possible challenges in the used measurement method.
MATERIALS AND METHODS
Aqueous sodium montmorillonite (NaMt) dispersions with solids contents ranging from 0.1 to
4.0 vol% were used in the experiments. The dispersions were prepared in the presence of 17
mM NaCl according to the procedure described by Eriksson and Schatz2. Shear flow measure-
ments were carried out in a parallel plate geometry with a Discovery Hybrid rheometer (DHR-2)
O18
70

from TA Instruments. An optics plate accessory (OPA) with a transparent glass plate as lower
plate was used in the experiments; this enabled OCT scanning (Telesto Spectral Domain,
Thorlabs) of the velocity profiles in the gap. A hard anodised aluminium plate with a diameter
of 20 mm (for 1.5 to 4.0 vol% NaMt samples) or 40 mm (for water and 0.1 to 1.0 vol% NaMt
samples) was used as upper plate. The gap between the plates was set to 1000 µm. In the shear
sweep experiments, a logarithmic flow sweep was carried out at room temperature with shear
rate increasing from 1 to 1500 s-1. Each shear rate was applied for a total of 35 s and the result
was calculated as the average of the last 30 s. Velocity profiles were measured at one radial
position close to the outer rim of the parallel plate geometry, at each single shear rate of the
flow sweep, just after the initial conditioning time of 5 s.
FIGURE 1 The impact of NaMt concentration (vol%) on flow properties of NaMt dispersions: A) shearstress versus shear rate and B) apparent viscosity versus shear rate.
RESULTS
The results of the shear flow measurements carried out in the rheometer are shown in Figure 1.
The flow behaviour of the most dilute NaMt dispersions, up to a volume fraction of 0.5%, was
comparable to that of pure water. The apparent viscosity was constant (Newtonian) up to a
critical shear rate of about 100 s-1, after which an increase in the viscosity curve was detected.
The 1.0 vol% NaMt dispersion showed a clearly higher apparent viscosity than water and the
viscosity increased gradually with further increase in NaMt concentration. The 1.0-2.0 vol%
NaMt dispersions showed slightly shear-thinning. The dispersions were liquid-like (pourable) up
to a volume fraction of 2.0%. At a volume fraction of 4.0%, NaMt formed a gel, which resulted
71

in a great increase in apparent viscosity and shear-thinning behaviour. Interestingly the shear
stress slightly decreased with increasing shear rate for the 4.0 vol% sample (Figure 1A).
FIGURE 2 Velocity profiles measured with OCT inside the rheometer gap (1 mm) for 0.1, 2.0 and 4.0 vol%
NaMt dispersions. The shear rates applied on the rheometer are shown on the right in the velocity
graphs. The stationary plate was at z=0 m and the rotating plate at z=1000 m. Structural OCT- images
(cross sections from sample edge) are shown for three different solids contents. Notice that the bending
of the velocity profiles is not likely to be caused by shear banding effects – it is probably due to the de-
crease of the quality of the OCT beam as the distance from the OCT-probe increases.
Some examples of velocity profiles measured with OCT are shown in Figure 2. No slippage was
found to take place at the plates for NaMt dispersions having a concentration of 2.0 vol% or
lower. All the samples were sheared throughout the rheometer gap even at the lowest shear
rate of 1 s-1. The velocity profile of the 4.0 vol% NaMt sample (Figure 2) differed from that of
the more dilute samples. No flow was detected at a shear rate of 10 s-1 or below, but the sam-
ple showed slippage at the rotating plate. At a shear rate of 40 s-1 the sample was sheared in
narrow layers next to each plate. Increasing the shear rate widened these shearing layers until
72

they met inside the gap. At a shear rates of 631 s-1 and above, shearing took place throughout
the sample. The non-ideal velocity profiles of the 4.0 vol% NaMt dispersion indicate that its
flow profiles presented in Figure 1 do not reflect the true flow behaviour of the whole disper-
sion but are affected by wall slip and local deviations from ideal flow, which may partly origi-
nate from the elastic, gel-like nature of the material. With the most dilute NaMt dispersions
(0.1 and 0.5 vol%), a sudden transition in the shape of the velocity profile was found as the
shear rate was increased above 200 s-1. Above this threshold, the velocity profiles exhibited
fluctuations in various length scales, which were most probably caused by secondary flow vorti-
ces and/or by temporal flow instabilities. These flow instabilities may have been the cause for
the increase in apparent viscosity seen in Figure 1 for the most dilute NaMt samples at highest
shear rates. All liquid-like NaMt dispersions (up to 2 vol-%) showed sedimentation over time,
which may have introduced some additional error to the shear flow measurements, especially
for the most dilute dispersions (0.1-0.5 vol-%) which sedimented very fast. Sedimentation was
markedly slower in the 1.5 and 2.0 vol-% samples.
CONCLUSIONS
Acquiring rheological data with multiphase materials, such as clay dispersions, is not always
straightforward due to possible non-ideal behavior of the material in the measuring geometry.
By combining the rheometer with OCT one can often overcome this problem, as direct infor-
mation is then obtained both on the velocity profile and the structure of the analyzed material.
ACKNOWLEDGEMENTS
B+Tech Oy, Posiva Oy, The Academy of Finland (project ReCoF), and Euratom (BELBaR project) areacknowledged for financially supporting this work. Rasmus Eriksson and Timothy Schatz (B+Tech Oy) areacknowledged for providing the montmorillonite samples and for planning of the test matrix.
REFERENCES
1. Abend, S.; Lagaly, G., Applied Clay Science, 2000, 16, 201-2272. Eriksson, R.; Schatz, T., Applied Clay Science, 2015, 108, 12-183. Barnes, H.A., Journal of Non-Newtonian Fluid Mechanics, 1995, 56, 221-2514. Dakhil, H.; Wierschem, A., Applied Rheology, 2014, 24, 63795: 1-65. Haavisto, S.; Koponen, A.I.; Salmela, J., Frontiers in Chemistry, 2014, 2, 27: 1-66. Haavisto, S.; Salmela, J.; Koponen, A., Experiments in Fluids, 2015, 56, 96: 1-6
73

Linear viscoelasticity and microstructure of bioactive gels made from crayfish
protein concentrate and hydrolysates
Manuel Felix1, Alberto Romero1, Turid Rustad2, Antonio Guerrero1
1Departamento de Ingeniería Química. Facultad de Química. U de Sevilla. Sevilla. Spain 2Department of Biotechnology, Norwegian university of science and technology (NTNU), Trondheim.
Correspondence to: Antonio Guerrero (E‐mail: [email protected])
ABSTRACT The freshwater red-swamp crayfish (Procambarus Clarkii) has undergone a fast increase in
population over the last decades due to favourable weather conditions, abundant food and the
lack of predators. Obtaining a protein concentrate from the crayfish meat may be a useful method
to benefit from the crayfish surpluses through applications such as gels with bioactive properties.
The main objective of this work is to evaluate the potentials of crayfish protein concentrate
(CF2L) as well as two hydrolysates obtained from this concentrate (CF2LH1, CF2LH2) in gel
products and evaluate their bioactivity by means of their antioxidant activity.
KEYWORDS Bioactive Properties, Crayfish, Protein Gelation, SAOS, Thermal Enhancement.
INTRODUCTION In the last few years, there has been an increasing interest in both the functional and nutritional
value of by-products from the food industry that might be used in the development of food
products showing benefits in the human health2. Antioxidant activity is regarded as one of the
primary functional properties contributing to increase the quality of these by-products.
The overall objective of this is to evaluate the gelling properties and bioactive potentials of gels
made from non-denatured crayfish protein concentrate and hydrolisate at two different pH values
(2 and 8). To achieve these objectives, rheological measurements of aqueous protein dispersions
were performed in order to follow the gelation process by means of temperature ramp tests.
Protein interactions were characterized in different buffers. Finally, antioxidant activity of the
gels were evaluated and expressed as Propyl Gallate (PG) equivalent units.
EXPERIMENTAL SECTION Materials
O17
Applications (Polymers and Biopolymers)
74

Crayfish (CF) meat was separated from the shell by grinding and sieving. CF pulp was
homogenized and subjected to centrifugation at 15,000 x g for 15 minutes, obtaining three
different phases: CF1, CF2 which consists of mainly water soluble proteins, and CF3. Finally,
the intermediate phase CF2 was freeze-dried, obtaining the protein concentrate CF2L.
Characterization of gelation process
Small amplitude oscillatory shear (SAOS) measurements
Dynamic viscoelasticity measurements were performed in a controlled-stress rheometer
(Kinexus Ultra + from Malvern, UK). The gelation process was simulated through heating in situ
in the rheometer with three different stages: (i) a temperature ramp carried out at constant
heating rate (5 °C/min) from 20 °C to 90 °C; (ii) an isothermal stage, performed at 90ºC for 30
min; (iii) a cooling stage carried out at constant rate (5 °C/min) from 90 °C to 20 °C.
Protein interactions
Solubility of CF2L gels in selected solutions was measured to determine electrostatic,
hydrophobic, hydrogen and disulfide interactions according to the method of Gomez-Guillen3.
Antioxidant activity
DPPH, ABTS and Folin-Ciocalteu (FC) assays were carried out according to the procedures of
Brand-Williams4, Nenadis4 and Singleton5, respectively. Results were expressed as equivalent
activity of the gel compared to the reference (PG).
RESULTS
Small amplitude oscillatory shear (SAOS)
Figure 1 shows the evolution of the elastic modulus (G’) of the samples over the thermal cycle
applied at constant protein concentration (12 wt. %) for two different pH values (2 and 8).
Different thermal responses can be observed. For CF2LH1 and CF2LH2 at pH 8, three different
regions can be described, basically corresponding to the three heating stages carried out. Initially
(T < 45º C), a smooth decrease in G’ takes place that is associated to an increase in mobility of
the protein chains with increasing temperature3. Subsequently, all systems show a strong increase
in G’ as the temperature increases above 60ºC. This effect may be related to structural changes of
the helical rod segments of myosin proteins. During the isothermal stage, an increase in the
elastic modulus can be observed, which suggests that disulphide bonds increase during this stage.
Finally, during the cooling stage, an increase in G’ occurs associated to the recovery of physical
interactions.
75

0 500 1000 1500 2000 2500 3000 350010-3
10-2
10-1
100
101
102
pH2 pH8CF2L CF2LH1 CF2LH2
G
' / (P
a)
Time (s)
Figure 1: Storage modulus over thermal cycle of protein concentrate (CF2L) and hydrolysates
(CF2LH1 and CF2LH2) dispersions at 12 wt. % at two different pH values (2 and 8).
CF2L dispersion at pH 8 does not exhibit thermal-enhancement potential during the second stage.
This result indicates that all possible sulphide-bonds have been formed during the first stage.
Finally, systems at pH 2 do not show any remarkable increase in elastic modulus, neither for
protein concentrate nor hydrolysates. At this pH value, proteins form a weak gel-like network.
The gel structure has been evaluated by quantifying the interactions between different protein
chains present in gels at pH 2 (Figure 2A) and pH 8 (Figure 2B).
Figure 2: Physical interactions for all the systems studied A) at pH 8; B) at pH 2
Interactions depend strongly on the pH value. At acidic pH, interactions are small such that gel
structures are weak, which is consistent with the moderate values obtained for G’. At alkaline pH,
hydrophobic forces become the most important interactions, in spite of the fact that disulphide
bonds are also noticeable, compared to pH 2. As a general rule, hydrolysis tends to reduce
physical interactions, excepting for disulphide bonds that become larger for CF2LH1.
0
5
10
15
Prot
ein
solu
bilit
y (w
t. %
)
CF2L CF2LH1 CF2LH2
Ionic bonds
Hydrogen bonds
Hydrofobic interactions
Disulphide bonds
B pH 8
5
10
15
Ionic bonds
Prot
ein
solu
bilit
y (w
t. %
)
CF2L CF2LH1 CF2LH2
A pH 2
Hydrogen bonds
Hydrofobic interactions
Disulphide bonds
76

Table 1 shows the antioxidant activity of the gels formed at different pH values compared to the
reference (PG), measured with three different methods: DPPH, FC and ABTS. It can be observed
that the antioxidant activity is present in any case. DPPH activity is constant for all the systems.
FC activity is also quite constant (with a slight increase in hydrolysates systems at pH 2),
whereas the activity behind ABTS is quite pH-dependent. Thus, the ABTS activity is higher at
pH 8 than at pH 2. This fact is probably related to the different effect that pH exerts on protein
denaturation that seems to be more remarkable at pH2.
DPPH (PPG mEq) Folin (PPG mEq) ABTS (PPG mEq)
pH 8 CF2L pH 8 302.1 ± 0.8 16.2 ± 0.1 5504.3 ± 17.1 CF2LH1 pH 8 292.7 ± 0.7 16.9 ± 0.7 7504.7 ± 29.6 CF2LH2 pH 8 302.1 ± 0.8 15.1 ± 0.3 5514.3 ± 22.1
pH 2 CF2L pH 2 310.8 ± 0.8 12.4 ± 0.1 466.9 ± 15.1 CF2LH1 pH 2 314.4 ± 3.8 18.8 ± 0.1 696.3 ± 16.1 CF2LH2 pH 2 313.9 ± 0.8 19.9 ± 0.2 547.3 ± 22.7
Table 1: Antioxidant activity by using DPPH, Folin reagent and ABTS for all studied systems.
CONCLUSIONS
Systems at pH 2 do not show any remarkable increase in elastic modulus during the gelation
process, neither for the protein concentrate nor for any of the hydrolysates. As a result, a rather
weak gel is formed. CF2LH1 at pH 8 is the system showing the best ability for gel formation,
which is consistent with the protein interactions found from the solubility of gels in different
buffers. Finally, as regards to the antioxidant activity, all systems exhibit antioxidant activity,
where the most remarkable effect is the increase in antioxidant activity for ABTS at pH 8.
ACKNOWLEDGEMENTS
Authors were sponsored by Andalousian Government, (Spain) (project TEP-6134). The authors
also were supported by a grant from Iceland, Liechtenstein and Norway through the EEA
Financial Mechanism. Operated by Universidad Complutense de Madrid
REFERENCES AND NOTES
1- Geiger, W.; Alcorlo, P.; Baltanas, A.; Montes, C., Biological Invasions, 2005, 7, 49-73.
2- Glew, R.H.; Glew, R.S.; Chuang, L.T., Plant Foods for Human Nutrition, 2006, 61, 51-56.
3- Gomez-Guillen, M.C., Borderias, A.J.;Montero, P., F. Scic. and Tech, 1997, 30, 602-608.
4- Singleton, V.L.; Orthofer, R, Oxidants and Antioxidants, 1999, 299, 152-178.
5- Nenadis, N., Lazaridou, O., J. of Agr. and Food Chemistry, 2007, 55,: 5452-5460.
77

Rheological properties and microstructure of a bitumen modified by
phosphogypsum waste
Antonio Abad Cuadri, F. Javier Navarro, Moisés García‐Morales, Pedro Partal
Departamento de Ingeniería Química, Centro de Investigación en Tecnología de Productos y Procesos
Químicos (Pro2TecS), Campus de ‘El Carmen’, Universidad de Huelva, 21071, Huelva (Spain)
Correspondence to: F. Javier Navarro ([email protected])
ABSTRACT
Nowadays, a widely accepted and environmentally friendly option of reusing many waste materials is its incorporation to asphaltic pavements as a bitumen modifier1. Here we consider phosphogypsum that is a waste/by-product of the wet-acid process for producing phosphoric acid from phosphate rock. In this sense, the potential utilization of phosphogypsum, as a bitumen modifier for paving industry was evaluated and compared with natural gypsum. It was found that, when activated with a small quantity of sulfuric acid (0.5 wt.%), the addition of 10 wt.% phosphogypsum leads to a notable improvement in the rheological response of the resulting material, especially at high in-service temperatures2. Instead, poor level of modification was noticed when in such a formulation, phosphogypsum was substituted by the same concentration of commercial gypsum. This result is mainly attributed to de development of a more complex microstructure in the resulting binder as a consequence of chemical reactions involving phosphorus compounds3.
KEYWORDS (Bitumen, waste, phosphogypsum, reactive modification, FTIR)
INTRODUCTION
Phosphogypsum (PG) is the by-product of the wet manufacturing process of phosphoric acid. PG
consists mainly of calcium sulphate dehydrated (CaSO4·2H2O or gypsum) but also contains a
high levels of impurities including fluorides, sulphates, natural radionuclides, metals, and other
trace elements
PG is usually stored in huge open piles exposed to various weathering conditions in which
contaminants may be carried away from the waste by rainwater, leading to serious environmental
Applications (Cosmetic, Bitumen)
O26
78

problems. Unfortunately, the presence of impurities can negatively affect the valorization of
phosphogypsum in some applications except for road construction. In this context, the aim of the
present study was to evaluate the feasibility of using a phosphogypsum waste from a fertilizers
factory as a modifier of bitumen for the paving industry.
EXPERIMENTAL
Bitumen (Construcciones Morales), with a penetration of 40dmm and R&B softening
temperature of 52 ºC was mixed, in a low shear device, with different additives at concentrations
and processing conditions shown in Table 1. Phosphogypsum (PG) sample was supplied by the
Fertiberia Huelva factory (Spain), and H2SO4 and commercial gypsum, CaSO4·2H2O (CG), were
supplied by Panreac, S.A. (Spain). For the sake of comparison, a reference bituminous sample
containing 3 wt.% commercial SBS Kraton D1101 (“SBS-reference” sample) was also prepared.
Table 1. Nomenclature, additive concentration and processing conditions of the samples studied.
Name Additive [wt.%] Proces. T (ºC) Proces. time (min)
SBS SBS 3 150 120 PG-150 PG 10 150 60
CG-150 CG 10 150 60 PG- H2SO4-150 PG
H2SO4 10 0.5
150 60
CG- H2SO4-150 CG H2SO4
10 0.5
150 60
H2SO4-150 H2SO4 0.5 150 60
RESULTS AND DISCUSSION
The viscous flow curves, at 60 ºC (maximum expectable temperature reached in a pavement), for
the binders are presented in Figure 1. All the samples present a Newtonian region, at low shear
rates, followed by a shear-thinning drop beyond a threshold value of shear rate.
As shown in Figure 1, the addition of 10 wt.% PG (“PG-150”) or CG (“CG-150”) results in a
poor viscosity increase which suggests that PG and CG act merely as a “filler” and does not
interact with the bituminous matrix. However, a very remarkable increase in viscosity is noticed
if 0.5 wt.% sulfuric acid is added to the PG sample (“PG-H2SO4-150” sample).
In order to explore the cause behind the high level of modification observed after addition of
sulfuric acid to the phosphogypsum sample, the viscous flow behavior of a binder containing
commercial gypsum (major component of phosphogypsum) and sulfuric acid, mixed at 150 ºC,
79

was also evaluated (“CG- H2SO4-150” sample). As can be deduced from Figure 1, the viscous
response shown for this binder is similar to that of a sample of bitumen to which only 0.5 wt.%
sulfuric acid was added (“H2SO4-150” sample). From this result, it can be deduced that some of
the compounds contained in the PG fraction (not CaSO4 which is about 8 wt.%) are the
responsible for the viscosity increase observed, if compared to the increase due to the mere
addition of sulfuric acid (“H2SO4-150” sample). In addition, this modification is probably due to
the activation of those “modifying” compounds present in the phosphogypsum by means of
sulfuric acid. This provokes a viscosity enhancement, at 60 ºC, of more than one order of
magnitude if compared to the “SBS-reference” sample. This result represents by far a larger
degree of modification than that corresponding to the “SBS-reference” sample.
10-2 10-1 100 101102
103
104
105
Neat PG-150 CG-150 H
2SO
4-150 PG-H
2SO
4-150
SBS CG-H2SO
4-150
60ºC
(Pa·
s)
(s-1)·
Figure 1. Viscous flow curves, at 60 ºC, for the neat bitumen and the different modified binders studied.
Moreover, FTIR spectroscopy carried out on selected samples (Figure 2) points out that only the
“PG- H2SO4-150” sample displays a new absorption band, from 1060 to 1180 cm-1, related to
C−O−P vibrations 2-3, providing evidences of chemical reactions between phosphorus contained
in the PG fraction and some bitumen compounds (only with the presence of small amount of
sulfuric acid). This fact would explain the enhancement in the rheological behavior 2-3.
CONCLUSIONS
The addition of 10 wt.% phosphogypsum to a bitumen (activated with a small quantity of
sulfuric acid) leads to a notable improvement in the rheological response of the resulting material
80

at high temperatures. This result is related to the existence of chemical reactions involving
phosphorus and bitumen compounds.
2000 1750 1500 1250 1000
1. Neat 2. PG-150 3. PG-H
2SO
4-150
3
2
C-O-P
Abs
orb
ance
Wavenumber (cm-1)
1
Figure 2.FTIR spectra for the neat bitumen and selected modified binders.
ACKNOWLEDGEMENTS
This work is part of a research project sponsored by a Junta de Andalucía Programme (TEP
6689). The authors gratefully acknowledge their financial support. A.A. Cuadri thanks
“University of Huelva” for the concession of a postdoc research grant “Programa de
Fortalecimiento de las Capacidades en I+D+i de la Universidad de Huelva” (2014/215).
REFERENCES AND NOTES
1. García‐Morales M., Partal P., Navarro F.J., Martínez‐Boza F., Gallegos C., González, N. González O., Muñoz M.E., Fuel, 2004, 83, 31 – 38.
2. Cuadri A.A., Navarro F.J., García‐Morales M., Bolívar J.P., Journal of Hazardous Materials, 2014, 279, 11–16.
3. Masson J. F., Energy and Fuels 22, 2008, 2637‐2640.
81

Evaluation of the stability of a novel w/o emulsion for topical administration
using a rheological approach
Joana Marto1, Sérgio M. C. Silva
1,2, Filipe E. Antunes
2, Luís Filipe Gouveia
1, Alberto Canelas Pais
2,
Eduardo Oliveira3, António José Almeida
1, Helena Margarida Ribeiro
1
1 iMed.ULisboa, Faculty of Pharmacy, University of Lisbon, Av. Professor Gama Pinto, 1649-003 Lisboa,
Portugal 2 Chemistry Department, University of Coimbra, Coimbra, Portugal
3 Laboratórios Atral S.A., Rua da Estação 42, Vala do Carregado, 2600 – 726 Castanheira do Ribatejo,
Portugal
E-mail: [email protected]
ABSTRACT
Pickering emulsions differ from classical emulsions because they are stabilized by solid particles. These
emulsions has been widely investigated in pharmaceutical and cosmetic fields since they present less
adverse effects than the classical emulsions. In this work, the rheological and mechanical behaviour was
evaluated on three innovative w/o emulsions, differing only in concentration of starch (ASt) (2.5%, 5%
and 7.5%). Rotational viscosity was determined using a C35 mm cone geometry, with an angle of 1º.
Dynamic viscosity measurements were carried out between 1 and 1000 Pa and oscillation frequency
sweep tests were performed at frequencies ranging between 0.01 and 1 Hz. A Texture Analyzer TA.XT
Plus was used to examine the texture properties of the emulsions, using an analytical probe (P/10, 10 mm
Delrin). It was observed that, for each formulation tested, G’ increases with ASt content. This indicates
that the structure of the emulsions become more robust with higher content of ASt, which assured
stability during the stress tests and exhibited long-term storage stability. The hardness, compressibility
and adhesiveness increased markedly for higher amounts of ASt, what contributes to increase the
formulation shelf-life and skin adhesiveness. The results obtained suggest that ASt-stabilized emulsions
are therefore an attractive, robust and a novel template for the production of pharmaceutical and
cosmetics vehicles.
KEYWORDS Pickering emulsions; Starch; Stability; Skin application; texture analysis; rheology
INTRODUCTION
Concerning conventional topical drug delivery systems, pharmaceutical emulsions emerge as a
good solution for skin drug deposition. Current pharmaceutical emulsions are mostly stabilized
by synthetic surfactants, which can be intrinsically toxic or may alter the distribution and
elimination of drugs 1. Consequently, solid-stabilized emulsions, i.e. the Pickering emulsions,
constitute an interesting strategy for encapsulating drugs in pharmaceutical formulations. Many
types of solid particles, either organic or inorganic can be used for stabilizing Pickering
O27
82

emulsions 2. The use of starch to stabilize emulsions has been attracting substantial research
interest due to their distinctive characteristics and promising technological applications. These
solid-stabilized emulsions show improved stability, especially at high internal phase ratio,
allowing easy fabrication of stable large droplets up to millimeter size, when compared to
classical surfactant-based emulsions 3. Additionally, Pickering emulsions can be considered
either as a new dosage form for topical drug delivery or as a new targeting system in
pharmaceutical and cosmetic products.
METHODS
Preparation of emulsions
A w/o emulsion stabilized by aluminium starch octenylsuccinate (ASt) was prepared using
purified water as disperse phase. The continuous phase consisted of liquid paraffin (LP) and the
solid particles were ASt granules at different concentrations (2.5%, 5.0% and 7.5%, w/w). The
oil and aqueous phases of the emulsion were then mixed together with an UltraTurrax® T25
homogeniser (20 krpm for 5 minutes).
Dynamic viscosity - Flow curves
Shear rate vs shear stress measurements were performed at 25°C using a HAAKE MARS III
Rotational Rheometer, equipped with automatic gap setting. Rotational viscosity was determined
using a C35 mm cone geometry, with an angle of 1º.
Oscillation measurements
Oscillation frequency sweep tests were performed at frequencies ranging between 0.01 and 1 Hz.
Prior to the oscillation tests, stress sweep tests were performed to determine the values of shear
stress for which the viscoelastic functions are independent from the magnitude of the applied
stress.
Texture profile analysis (TPA)
A Texture Analyzer TA.XT Plus was used to examine textural characteristics (hardness,
elasticity, compressibility, adhesiveness and cohesiveness) of the emulsions. TPA mode was
carried out using an analytical probe (P/10, 10 mm Delrin). Data collection and calculation were
performed using the Texture Exponent 3.0.5.0 software package of the instrument.
83

RESULTS AND DISCUSSION
Dynamic viscosity - Flow curves
The apparent viscosity values were determined at 1s-1
(Table 1). As expected, an increase in the
concentration of ASt promotes the increase in viscosity of the formulations due to the interaction
between ASt particles. Since the emulsions behave as a shear-thinning fluid, they are suitable for
topical administration and the apparent viscosity values provide a good comparison between
formulations regarding the resistance to structural collapse.
TABLE 1 - Apparent viscosity values were obtained at a shear rate of 1s-1
(mean ± SD, n=2).
ST granules (%) Apparent Viscosity (Pa.s) 2.5 54.18±0.38
5 78.33±0.11
7.5 86.61±0.20
Oscillation measurements
The results presented in Figure 1 show the variation of the G’ and G’’ with shear stress. For each
formulation tested, G’ increases with an increase in the amount of ST. This behavior is typical of
a viscoelastic liquid and indicates that the structures of the ASt-stabilized emulsions with high
concentration of ASt and LP as external phase are robust 4.
FIGURE 1 - Dependence of storage (G’) and loss (G’’) moduli with shear stress for ASt-
stabilized emulsions.
TPA
The TPA technique is relevant and adequate for the mechanical characterization of
pharmaceutical semisolid formulations, in order to determine interactions between formulation
components, and a good complement the rheological information. The hardness, compressibility
84

and adhesiveness increased markedly for high amounts of ST, what contributes to increase the
formulation shelf-life and skin adhesiveness (Table 2). Once more, the results reflect an easier
application and a higher adhesion, which is suitable to the compliance and to retain the
emulsions in contact with the skin.
TABLE 2 - Mechanical properties of the ASt-stabilized emulsions (mean ± SD, n=3).
ASt granules
(%)
Compressibility
(g.sec)
Hardness
(g)
Adhesiveness
(g.sec) Elasticity Cohesiveness
2.5 112.97±5.84 79.14±5.72 80.56±4.27 0.99±0.01 0.55±0.02
5 146.83±1.71 102.93±0.80 109.77±8.35 1.00±0.01 0.56±0.03
7.5 161.54±5.09 109.75±5.26 103.04±9.13 0.99±0.01 0.52±0.02
CONCLUSIONS
The results showed that the amount of ST influenced the rheological and mechanical properties
of the Pickering emulsions, confirming a robust microstructure and suggesting that these
emulsions are stable vehicles with a high potential for topical drug delivery. The selection of the
ASt granules amount is an important aspect to consider in the development of this type of topical
formulations.
ACKNOWLEDGEMENTS
This work was supported by FEDER, the Portuguese government (FCT; grant
SFRH/BDE/51599/2011), strategic project Pest-OE/SAU/UI4013/2011 and Laboratórios Atral
S.A., Portugal.
REFERENCES
1. Bouyer, E.; Mekhloufi, G.; Rosilio, V.; Grossiord, J. L.; Agnely, F., Proteins, polysaccharides, and
their complexes used as stabilizers for emulsions: alternatives to synthetic surfactants in the
pharmaceutical field? Int J Pharm, 2012, 436(1-2), 359-378.
2. Chevalier, Y.; Bolzinger, M.A.; Emulsions stabilized with solid nanoparticles: Pickering emulsions.
Colloids Surf., A, 2013, 439(0), 23-34.
3. Frelichowska, J.; Bolzinger, M. A.; Pelletier, J.; Valour, J. P.; Chevalier, Y., Topical delivery of
lipophilic drugs from o/w Pickering emulsions. Int J Pharm, 2009, 371(1-2), 56-63.
4. Raposo, S., Salgado, A., Eccleston, G., Urbano, M., & Ribeiro, H. M. (2014). Cold processed oil-
in-water emulsions for dermatological purpose: formulation design and structure analysis. Pharm
Dev Technol, 2014, 19(4), 417-429.
85

F.J
1Depto2DEC
Correspo ABSTR
The was stutemperatshear-thishear raactivatiomoleculain a suspviscosityapplicati KEYWOdepende INTRO
The
solid ph
characte
suspensi
expected
temperat
suspensi
main con
concentr
base liqu
in the in
phase14.
fluids, a
phenome
fluids at
controlle
. Rubio-Her
o. de Física ApCEM, Univer
ondence to:
RACT viscosity o
udied in thture and ininning regiates when on energy, iar movemenpension impy temperations.
ORDS: Parence; Conce
DUCTION
mechanical
hase, whic
eristics or
ion increase
d the visco
ture. For ex
ions with te
nclusion is
ration. The
uid as heat
ndustry has
However, t
a more det
enon is nec
t different s
ed stress rhe
Activatrnández1, S
plicada II, Unisidad de las F
F.J. Rubio-
of polyprope temperat
ncreasing paons was obtemperatur
interpreted nt, increaseproves the pture depen
rticle suspenentration dep
N
l and therm
ch must h
reduce und
es the distor
sity of the
xample, the
emperature
the viscosi
presence of
exchange fl
been relate
to increase t
tailed study
cessary. In
solid conce
eometer (M
tion energ. Murillo-G
iversidad de MFuerzas Armad
-Hernández
pylene glycoture range article concbserved. Thre increasesas a measus with solid
performancendence of
nsions; Shependence
mal propertie
have the p
desirable b
rtion of the
suspension
e dependen
and particle
ty increases
f solid parti
fluid12-13. Th
ed to the na
the possible
y on the p
this study
entration wa
MARS III, Th
gy in partGonzález1, A
Málaga, C/Dodas, Avda. Gra
z (E-mail: fj
ol-based Si10-50oC. T
centration. he onset ofs and parti
ure of the pod concentrate of the basthese flui
ear-thickenin
es of pure fl
proper phy
behaviours1.
e flow field
n is higher
nce of the v
e concentra
s with decre
icles in a su
his useful te
ature and si
e technical a
physical m
y, the visco
as studied i
hermo-Haak
ticle suspA.I. Gómez-
ctor Ortiz Ramal. Rumiñaui
jrubio@uma
iO2 fluids aThe viscosShear-thick
f the shear-icle concenotential enetion. Despitse liquid as ds should
ng; Molar a
fluids can be
ysical featu
. The pres
when the s
than that o
viscosity of
ation has ex
easing temp
uspension im
echnical dev
ize of the p
applications
mechanisms
osity of pol
in the temp
ke).
ensions -Merino1, N
mos s/n, Málas/n, Sangolqu
a.es)
at different sity increaskening beha-thickening ntration decergy barrier e the presenheat exchan
be consid
activation e
e modified
ures to en
sence of s
system flow
of the pure
f water-bas
xtensively b
perature and
mproves the
velopment f
particles dis
s of suspens
that are i
lypropylene
perature ran
N.M. Páez-F
aga (Spain) CPuí (Ecuador) C
solid concses with deaviour betwdisplaces t
creases. Threquired fo
nce of solid nge fluid, thdered in
energy; Tem
by the addi
nhance ap
olid partic
ws, therefore
e solvent at
sed Al2O3 a
been studied
d increasing
e performan
for the therm
spersed in th
sions as hea
n the basi
e glycol-bas
nge 10-50oC
Flor2
P 29071 CP 170501
centration ecreasing
ween two to higher he molar or a fluid particles
he higher technical
mperature
ition of a
propriate
les in a
e, as it is
t a given
and TiO2
d2-11. The
g particle
nce of the
mal tasks
he liquid
at transfer
s of the
sed SiO2
C using a
Moddeling and Simulation in Rheology
O29
86

MATERIALS AND METHODS
A commercially available hydrophobic fumed silica, Aerosil®R816 (Degussa A.G.), which
is obtained from Aerosil®200 (Degussa A.G.) by means of replacing silanol (Si-OH) groups
by alkyl groups (C16H33), was used as solid phase. Its specific surface area BET is
≈190±20m2/g and its primary spherical particles size is 12nm. The continuous phase here
considered is polypropylene glycol (HO-[CH2-CH(CH3)-O]n-H) with a molecular weight of
400g/mol (PPG400) on average (Sigma-Aldrich, Chemical GmbH, Düsseldorf, Germany). This
is a low-viscosity Newtonian media having, under ambient conditions, a viscosity of
100mPa·s. The suspension with the higher solid content (20wt.%) was prepared by adding the
0.1 1 10 1000.1
1
10
100
Appa
rent
vis
cosi
ty (P
a·s)
Shear rate (1/s)
10 ºC 20 ºC 30 ºC 40 ºC 50 ºC
(a)
0.1 1 10 1000.1
1
10
100
Appa
rent
vis
cosi
ty (P
a·s)
Shear rate (1/s)
20 wt. % 19 wt. % 18 wt. % 16 wt. % 14 wt. %
(b)
liquid to the silica. Afterwards they were
mixed in a stirrer for 10min at 796rpm.
Samples were made in batches of 35cm3 and
placed under vacuum and sonication at
room temperature for about 1h in order to
remove air bubbles. The sample was
allowed to rest for 12h in an airtight plastic
bottle before starting measurements. The
other suspensions (19, 18, 16 and 14 wt.%)
were obtained by diluting the more
concentrated suspension with the liquid
phase (PPG400). Rheological experiments were carried out with a Peltier system for the
control of the temperature, on a MARS III (Thermo-Haake, Germany) using a cone-plate
sensor system with a cone angle of 1o and a diameter of 20mm. Experiments were conducted
under steady shear.
Figure 1. Influence of (a) temperature (18 wt.%) and (b) particle concentration (30 ºC) on the steady viscosity curve of R816/PPG400 suspensions.
0.0031 0.0032 0.0033 0.0034 0.0035 0.0036-2.0
-1.5
-1.0
-0.5
0.0
0.5
1.0
1.5
2.0
2.5
3.0
3.5
4.0
ln (η
o(Pa·
s))
1/T (1/K)
14 wt% 16 wt% 18 wt% 19 wt% 20 wt%
Figure 2. Temperature dependence of the zero shear viscosity of R816/PPG400 suspensions.
87
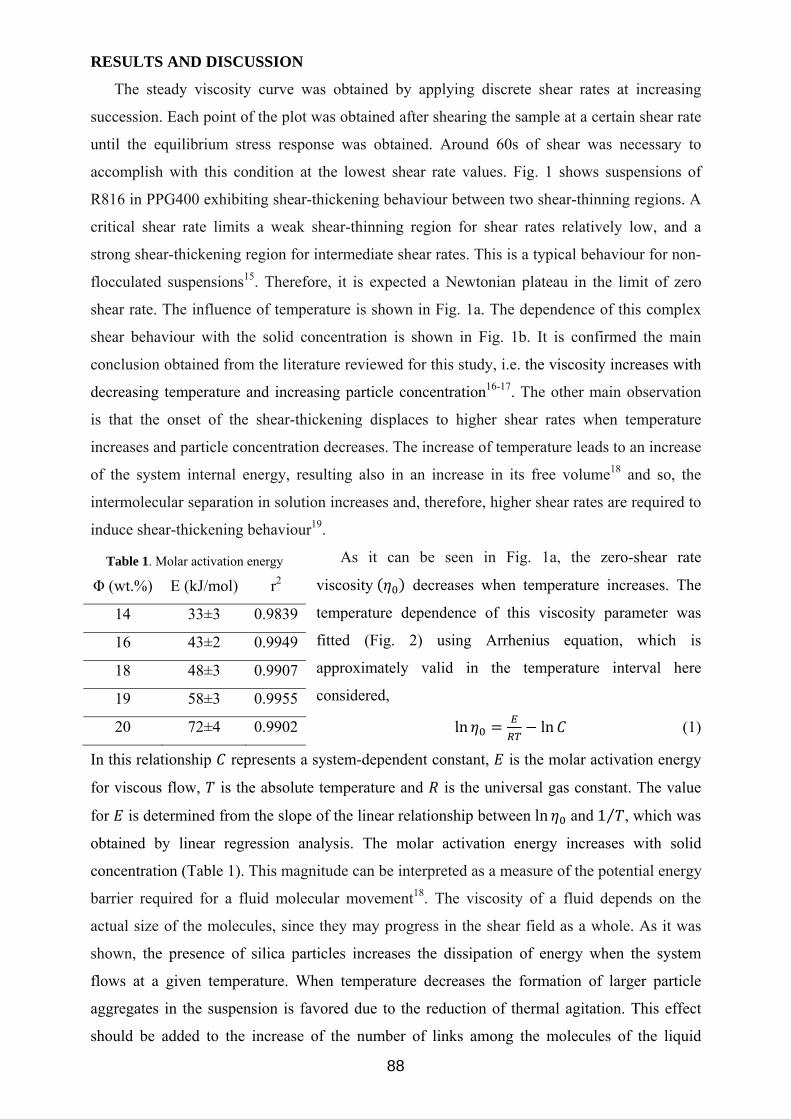
RESULTS AND DISCUSSION
The steady viscosity curve was obtained by applying discrete shear rates at increasing
succession. Each point of the plot was obtained after shearing the sample at a certain shear rate
until the equilibrium stress response was obtained. Around 60s of shear was necessary to
accomplish with this condition at the lowest shear rate values. Fig. 1 shows suspensions of
R816 in PPG400 exhibiting shear-thickening behaviour between two shear-thinning regions. A
critical shear rate limits a weak shear-thinning region for shear rates relatively low, and a
strong shear-thickening region for intermediate shear rates. This is a typical behaviour for non-
flocculated suspensions15. Therefore, it is expected a Newtonian plateau in the limit of zero
shear rate. The influence of temperature is shown in Fig. 1a. The dependence of this complex
shear behaviour with the solid concentration is shown in Fig. 1b. It is confirmed the main
conclusion obtained from the literature reviewed for this study, i.e. the viscosity increases with
decreasing temperature and increasing particle concentration16-17. The other main observation
is that the onset of the shear-thickening displaces to higher shear rates when temperature
increases and particle concentration decreases. The increase of temperature leads to an increase
of the system internal energy, resulting also in an increase in its free volume18 and so, the
intermolecular separation in solution increases and, therefore, higher shear rates are required to
induce shear-thickening behaviour19.
As it can be seen in Fig. 1a, the zero-shear rate
viscosity decreases when temperature increases. The
temperature dependence of this viscosity parameter was
fitted (Fig. 2) using Arrhenius equation, which is
approximately valid in the temperature interval here
considered,
ln ln (1)
In this relationship represents a system-dependent constant, is the molar activation energy
for viscous flow, is the absolute temperature and is the universal gas constant. The value
for is determined from the slope of the linear relationship between ln and 1⁄ , which was
obtained by linear regression analysis. The molar activation energy increases with solid
concentration (Table 1). This magnitude can be interpreted as a measure of the potential energy
barrier required for a fluid molecular movement18. The viscosity of a fluid depends on the
actual size of the molecules, since they may progress in the shear field as a whole. As it was
shown, the presence of silica particles increases the dissipation of energy when the system
flows at a given temperature. When temperature decreases the formation of larger particle
aggregates in the suspension is favored due to the reduction of thermal agitation. This effect
should be added to the increase of the number of links among the molecules of the liquid
Table 1. Molar activation energy Φ (wt.%) E (kJ/mol) r2
14 33±3 0.9839
16 43±2 0.9949
18 48±3 0.9907
19 58±3 0.9955
20 72±4 0.9902
88

phase. Therefore, a reduction of temperature must give place to two collaborative effects in the
suspension viscosity. First, an increase of the viscosity because of the higher molecular links,
and second, an increase of the viscosity owing to the formation of larger particle aggregates.
As the solid concentration increases, the number of particles that take part in the formation of
larger aggregates increases. This contribution to the temperature dependence of the viscosity is
more and more dominant on the effect of the liquid phase when the solid concentration
increases. The fact that the molar activation energy was larger with the increasing of solid
concentration means the size of the particle aggregates must be more sensitive to temperature
changes than to the number of molecule links. This is a reasonably result that can be assumed
from the preliminary results of this research. However, deeper and extensive studies should be
made to get conclusive statements.
CONCLUSION
Despite it has been claimed that the presence of solid particles in a suspension improves the
performance of the base liquid as heat exchange fluid, the higher viscosity temperature
dependence of these fluids should be considered in technical applications.
ACKNOWLEDGEMENT
NMPF expresses his gratitude to SENESCYT (Ecuador) for a pre-doctoral grant.
REFERENCES
1. SK Das, SU Choi, W Yu, T Pradeep. Nanofluids: Science and Technology. Wiley, New York, 2008.
2. BC Pak, YI Cho. Exp. Heat Transfer 1998, 11, 151-170. 3. Y He, Y Jin, H Chen, Y Ding, D Cang, H Lu. Int. J. Heat Mass Transfer 2007, 50, 2272-2281. 4. W Duangthongsuk, S Wongwises. Exp. Therm. Fluid. Sci. 2009, 33, 706-714. 5. M Silambarasan, S Manikandan, KS Rajan. 2012, 55, 7991-8002. 6. L Fedele, L Colla, S Bobbo. Int. J. Refrig. 2012, 35, 1359-1366. 7. S Bobbo, L Fedele, A Benetti, L Colla, M Fabrizio, C Pagura, S Barison. Exp. Therm. Fluid.
Sci. 2012, 36, 65-71. 8. T Teng, YH Hung, CS Jwo, CC Chen, LY Jeng. Particuology 2011, 9, 486-491. 9. CT Nguyen, F Desgranges, G Roy, N Galanis, T Maré, S Boucher, HA Mintsa. Int. J. Heat
Mass Transfer 2007, 28, 1492-1506. 10. M Hosseini, S Ghader. J. Mol. Liq. 2010, 153, 139-145. 11. M Jarahnejad, EB Haghighi, M Saleemi, N Nikkam, R Khodabandeh, B Palm, MS Toprak, M
Muhammed. Rheol. Acta 2015, 54, 411-422. 12. A Ijam, R Saidur. Appl. Therm. Eng. 2012, 32, 76-82. 13. SUS Choi, ZG Zhang, W Yu, FE Lockwood, EA Grulke. Appl. Phys. Lett. 2001, 79, 2252-
2254. 14. M Chandrasekar, S Suresh, AC Bose. Exp. Therm. Fluid. Sci. 2010, 34, 210-216. 15. SR Raghavan, HJ Walls, SA Khan. Langmuir 2000, 16, 7920–7930. 16. T Tian, G Peng, W Li, J Ding, M Nakano. Korea-Australia Rheol. J. 2015, 27, 17-24. 17. FJ Rubio-Hernández, AI Gómez-Merino, MH Spillman-Daniele, NM Páez-Flor. J. Non-
Newtonian Fluid Mech. (under review). 18. B Briscoe, P Luckham, S Zhu. J. Appl. Polym. Sci. 1998, 70, 419–429. 19. D Rivero, LM Gouveia, AJ Müller, AE Sáez. Solutions 2012, 51, 13–20.
89

Cell necklaces behave as a soft glassy material
José M. Franco1, Pedro Patrício2,3, Pedro Almeida2,4, Raquel Portela5, Rita G. Sobral5 and Catarina R. Leal2,6
1Dpt. Ingeniería Química, Facultad de Ciencias Experimentales, Universidad de Huelva, Spain
2ISEL – Instituto Superior de Engenharia de Lisboa, Instituto Politécnico de Lisboa, Portugal
3CEDOC, Faculdade de Ciências Médicas, Universidade Nova de Lisboa, Portugal
4CENIMAT/I3N, Faculdade Ciências e Tecnologia, Universidade Nova de Lisboa, Portugal
5UCIBIO@REQUIMTE, Faculdade de Ciências e Tecnologia, Universidade Nova de Lisboa, Portugal
6Centro de Investigação em Agronomia, Alimentos, Ambiente e Paisagem, LEAF, Instituto Superior de Agronomia, Universidade de Lisboa, Portugal
Correspondence to: Catarina R. Leal (E-‐mail: [email protected])
ABSTRACT
Previously we have reported a complex and rich viscoelastic behavior observed during the planktonic growth of S. aureus strain COL1. In particular, in stationary shear flow, the viscosity keeps increasing during the exponential phase and returns close to its initial value for the late phase of growth, where the bacteria population stabilizes. In oscillatory flow, the elastic and viscous moduli exhibit power-‐law behaviors whose exponents are dependent on the bacteria growth stage. These power-‐law dependencies of G’ and G’’ match a Soft Glassy Material behavior. To describe this behavior, we have hypothesized a microscopic model considering the formation of a dynamic web-‐like structure, where percolation phenomena can occur, depending on growth stage and cell density. We describe the formation of these web-‐like structures, resembling cell necklaces at a specific time interval during bacterial growth. These findings were obtained by combining the previous data with new measurements performed in a rheometer with real-‐time image acquisition.
KEYWORDS Real-‐time image rheology, bacteria, SGM
INTRODUCTION
Complex and rich viscoelastic behavior was revealed in active bacterial Staphylococcus aureus cultures during growth1. These behaviors can be associated with cell density and aggregation patterns that are developed during culture growth, showing a collective behavior. At a given moment of the exponential phase of growth the shear viscosity increases steeply (∼30x the initial value) and returns to close to the
Miscellaneous
O31
90

initial value. This behavior has no counterpart in the bacterial growth curve obtained by optical density monitorization. In oscillatory flow, the elastic and viscous moduli exhibit power-‐law behaviors whose exponents are dependent on the bacteria growth stage. These power-‐law dependencies of G’ and G’’ can be described in the framework of the Soft Glassy Material2 model. The microscopic model proposed to describe this behavior considers the formation of a dynamic web-‐like structure, where percolation phenomena can occur, depending on growth stage and cell density. Below we present new results obtained from rheological measurements in-‐line with real-‐time image acquisition that will show the formation of such structures during shear flow.
EXPERIMENTAL
The human pathogen Staphylococcus aureus was used as a study model due to its coccoid shape, regular morphology and clinical relevance: methicillin-‐resistant Staphylococcus aureus (MRSA) strain COL3 was chosen. Bacterial growth and rheological measurements are described in detail elsewhere1.
Real-‐time image acquisition was performed during steady-‐state shear flow measurements in a Haake RheoScope equipment, which combines the principles of a conventional controlled-‐stress rheometer with an optical microscope. A constant shear rate of 10 s-‐1 was imposed using a cone-‐plate geometry with 70mm diameter and 1o and a gap of 25µm, at 37 oC. The cone had a mirror surface and the plate a cover glass, to allow optical microscopic observations (20x) during shear (schematic details are enclosed in Fig. 2), at an intermediate radius plate fixed position. Video image acquisition was performed during 150 min. A photo image was selected from the video at each minute. In these tests, the growth of a S. aureus culture was followed starting measurements already at the exponential phase (approximately at an OD600nm=2.5).
THEORY
Based on the Soft Glassy Material2 (SGM) model, the elastic and the viscous moduli present the same weak power law dependence on the angular frequency, as given by eqs. (1) and (2).
G’~ ωx and G’’~ ωx (1) G’’/G’~ tan πx/2 (2) where the exponent x is an effective noise-‐temperature factor, taking values in the range 0<x<1. When x=0 one obtains the ideal solid, perfect elastic body; when x=1 one obtains the ideal liquid, perfect viscous fluid system; when 0<x<1 the system has an intermediate behavior.
RESULTS AND DISCUSSION
The viscosity growth curve and the oscillatory measurements were reported previously1. In Table 1, the angular frequency exponent values of G’ and G’’ are compared with the SGM model predictions. A good agreement between experimental measurements and theory is obtained.
91

In Figure 1 the steady-‐state shear viscosity growth curve of a S. aureus culture, measured at a constant shear rate of 10 s−1 is represented in relative values. An increase of ∼40x the initial viscosity value was observed and the recovery to the initial one occurred in approximately 50 min. These results reproduce the essential features already observed1 in a different experimental set-‐up (equipment and geometry).
TABLE 1 Growth-‐time dependency of the angular frequency exponent, x, experimental and theoretical SGM predictions
Growth stage
time (min)
x tan πx/2 G’’/G’
lag phase 250 ~0.80 3.1 ~2.4
exponential phase
350 ~0.79 2.9 ~2.2
475 ~0.23 0.4 ~0.6
late phase 550 ~0.39 0.8 ~0.9
FIGURE 1 Relative steady-‐state shear viscosity growth curve of a S. aureus culture, measured at a constant shear rate of 10 s−1; measurements were started with a culture already at the exponential phase of growth; inset: schematic details on the image acquisition set-‐up at an intermediate radius-‐plate position. Measurements were performed at 37◦C.
During this measurement a video was recorded and images were taken at specific/representative times, which are included in Figure 2. It can be clearly observed the formation of a web-‐like structure in the time interval 17 – 28 min: the bacteria present a dynamic self-‐organization where wave rows are formed, with dozens of cells, resembling cell necklaces. This structure can only be maintained during the exponential phase and starts to collapse as the bacteria culture approaches the lag phase, see image for 38min. For longer times, a cell deposition process is initiated and small aggregates sediment, as dark regions in images at 75 min and 125 min (more and bigger aggregates formed). This explains the viscosity decrease in the lag phase of growth, although the number of cells present in the culture is high they are no longer suspended in the culture medium.
92

FIGURE 2 Real-‐time images obtained during steady-‐state viscosity growth curve measurements of a S. aureus culture, with correspondent times to η/ηo curve represented in Figure 1; in images collected at 11, 17 and 38 min, percolated structures can be observed; in images collected at 75 and 125 min cell aggregates are observed (dark areas), which correspond to cell deposition in the fixed bottom glass-‐plate of the RheoScope. Images width: 100 µm.
CONCLUSIONS
We have observed the formation of web-‐like structures, resembling cell necklaces at a specific time interval during the exponential phase of the bacteria growth, followed by, during the stationary phase, the sedimentation and subsequent enlargement of bacterial aggregates. These findings were essential to corroborate our microscopic model previously proposed1.
ACKNOWLEDGEMENTS
Strain COL was a kind gift from H. de Lencastre. We acknowledge the support from FCT (Portugal) through Grant No. PEst-‐C/CTM/LA0025/2011 (CENIMAT/I3N), UID/Multi/04378/2013 (UCIBIO) and through Project PTDC/BIA/MIC/3195/2012 (awarded to RGS).
REFERENCES AND NOTES
1. R. Portela, P. L. Almeida, P. Patrício, T. Cidade, R. G. Sobral and C. R. Leal, Real-‐time rheology of actively growing bacteria, Physical Review E, 2013, 87, 030701(R).
2. P. Sollich, F. Lequeux, P. Hebraud, and M. E. Cates, Phys. Rev. Lett., 1997, 78, 2020.
3. S. R. Gill et. al., J. Bacteriol., 2005, 187, 2426-‐38.
93

Poster Presentations
94

Effect of pressure treatment on the rheological properties of aqueous glucomannan dispersions at low deacetylation degree
Clara. A. Tovar1,Verónica Bargiela1, Beatriz Herranz2, A.Javier Borderías2
1 Departamento de Física Aplicada, Facultad de Ciencias de Ourense. As Lagoas, 32004 Ourense, (Spain).
2 Departamento de Productos, Instituto de Ciencia y Tecnología de los Alimentos y Nutrición (CSIC), José
Antonio Novais, 28040 Madrid, (Spain).
Clara A. Tovar ([email protected])
ABSTRACT
This study reports an analysis of the effect of different rates of high hydrostatic pressure (HHP) on the viscoelastic properties of a 3% aqueous glucomannan dispersion (AGD). Glucomannan (GM) was weakly deacetylated (pH=9.8). The samples analysed were: A0 (0 MPa), A1 (100 MPa), A2 (200 MPa), A4 (400MPa) and A6 (600MPa). All samples were weak viscoelastic gels with storage (G’) and viscous (G’’) moduli low and strongly frequency‐dependent. There were significant differences in stress (σmax) and strain (γmax) amplitudes modulated by the oscillation frequency. The influence of HHP on σmax and γmax was also strongly frequency‐dependent. Mechanical spectra showed the critical transition‐point (gel‐sol), whose crossover frequency increased slightly with HHP, suggesting that HHP partially weakened the physical cross‐links in AGDs reducing the cross‐link density in GM network. In summary, HHP weakened the gel network slightly as compared with control sample, particularly at 200‐600 MPa. All measurements were made at 25°C.
KEYWORDS glucomannan high pressure viscoelastic properties
INTRODUCTION
Konjac glucomannan (GM), a polysaccharide derived from the tuber of Amorphophallus konjac
C. Koch, can be used to improve food protein functionality, namely in surimi type products.
Eliminating acetyl groups produces deacetylated GM after addition of 0.6N KOH as an alkaline
agent1. The importance of GM gels lies in their ability to extensively modify the rheology of
aqueous media to which they are added, even at fairly low concentrations, and that is the basis of
their functional properties as thickening and gelling agents. Previous papers explored the
influence of thermal conditions2 on the rheological and structural characteristics of aqueous GM
dispersions (AGD). It may therefore be useful to analyse how the pressure affects the dynamic
Applications: Food
P1
95

behaviour of GM molecules in AGD dispersions, since pressure has a broad range of applications
in the food industry. Other previous research has analysed the influence of the deacetylation ratio
on the structural and rheological properties of AGDs with a 3% GM concentration3. The physical
networks behaved in either of two different ways depending on the pH, in terms of the phase
transition (sol to gel) between pH ≤9 and pH≥10 when samples were true gels according to the
deacetylation ratio. The aim of this work was thus to explore the influence of HP on viscoelastic
properties of AGD dispersions with a 3% GM concentration at an intermediate pH (9.8) which
produces a low deacetylation ratio near the point of gelation, to choose the most suitable pressure
conditions for making restructured seafood products.
EXPERIMENTAL METHODS
AGD dispersions (3%) (w/v) from konjac GM were prepared as was reported by Herranz et al.,
20121. AGDs were subjected to 0 (lot control A0), 100 (lot A1), 200 (lot A2), 400 (lot A4) and
600MPa (lot A6), for 10 min at 25ºC. Small amplitude oscillatory shear (SAOS) were gathered
as Herranz et al., 2012 reported. The temperature was kept at 25.0±0.1 ºC.
RESULTS AND DISCUSSION
Stress sweeps
An initial study showed that AGD with a 3% GM concentration and pH=9.8 had produced soft
viscoelastic materials. For that reason the linear viscoelastic (LVE) range was reached at two
frequencies, 0.05 and 1Hz, to determine the change in the limit magnitudes of the LVE range as
stress (σmax) and strain (γmax) amplitudes, with frequency at several HP levels. At low frequency
(0.05 Hz), σmax significantly (p<0.05) increased with pressure in the lower HP range (100-200
MPa) and remained constant between 400 and 600 MPa comparing with control (Figure 1).
Conversely, at the higher frequency (1Hz) σmax increased strongly with increasing HP from 100
to 400-600 MPa, but σmax at 100-200 MPa was significantly lower than in the control (Figure 1).
These results showed the strong effect of frequency in the stress amplitude of AGDs, evidencing
their transient nature3. The γmax values were significantly (p<0.05) greater at low (0.05 Hz) than
at high frequency (1 Hz), but there was no definite trend with increasing HP (data not shown).
96
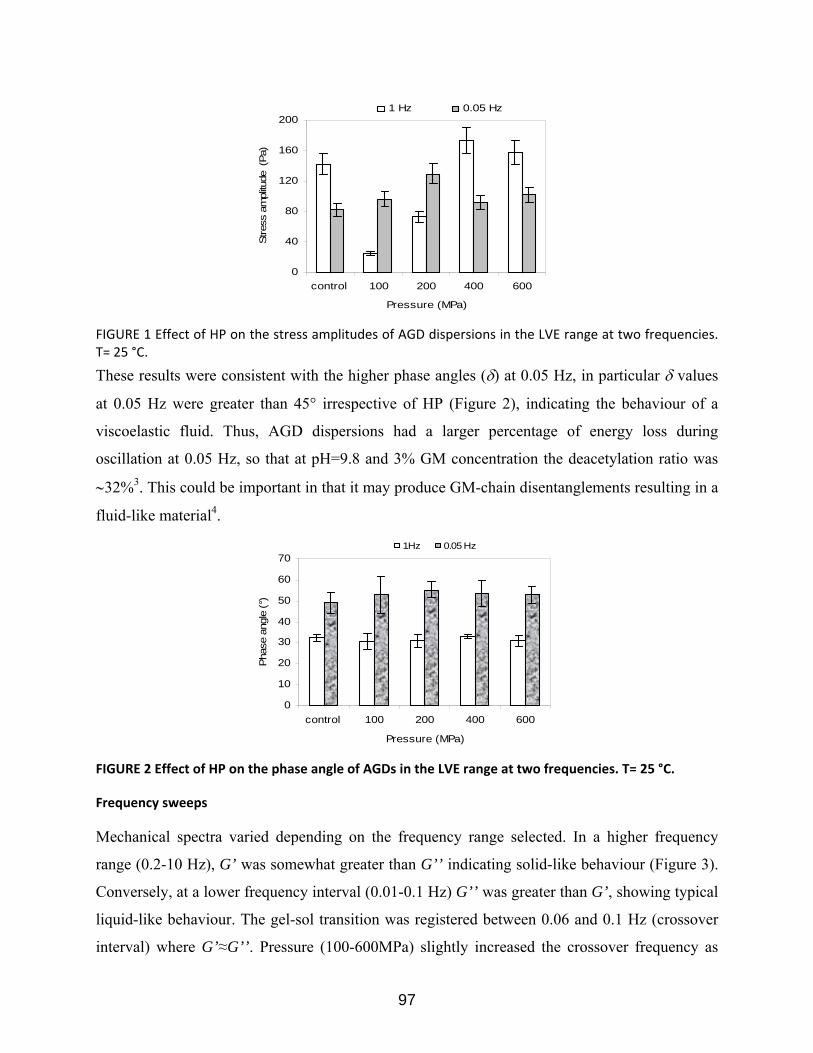
0
40
80
120
160
200
control 100 200 400 600
Pressure (MPa)
Stre
ss a
mpl
itude
(Pa
)
1 Hz 0.05 Hz
FIGURE 1 Effect of HP on the stress amplitudes of AGD dispersions in the LVE range at two frequencies. T= 25 °C.
These results were consistent with the higher phase angles (δ) at 0.05 Hz, in particular δ values
at 0.05 Hz were greater than 45° irrespective of HP (Figure 2), indicating the behaviour of a
viscoelastic fluid. Thus, AGD dispersions had a larger percentage of energy loss during
oscillation at 0.05 Hz, so that at pH=9.8 and 3% GM concentration the deacetylation ratio was
∼32%3. This could be important in that it may produce GM-chain disentanglements resulting in a
fluid-like material4.
0
10
20
30
40
50
60
70
control 100 200 400 600
Pressure (MPa)
Phas
e an
gle
(°)
1 Hz 0.05 Hz
FIGURE 2 Effect of HP on the phase angle of AGDs in the LVE range at two frequencies. T= 25 °C.
Frequency sweeps
Mechanical spectra varied depending on the frequency range selected. In a higher frequency
range (0.2-10 Hz), G’ was somewhat greater than G’’ indicating solid-like behaviour (Figure 3).
Conversely, at a lower frequency interval (0.01-0.1 Hz) G’’ was greater than G’, showing typical
liquid-like behaviour. The gel-sol transition was registered between 0.06 and 0.1 Hz (crossover
interval) where G’≈G’’. Pressure (100-600MPa) slightly increased the crossover frequency as
97

compared with A0 (data not shown), suggesting that HP partially weakened the physical cross-
links in AGDs. Thus, the viscoelastic response from frequency sweeps clearly showed the
primacy of the temporal (frequency) over the mechanical (pressure) effect, indicating that at a
GM deacetylation ratio of 32%3, HP can induce new rearrangements in AGDs, producing a
minor rupturing of hydrogen bonds, ionic and dipolar interactions and thus reducing the firmness
of samples.
10
100
1000
10000
0 0 1 10 100ω (rad/s)
Visco
elas
tic m
odul
i (Pa)
G'' A0 G'' A1 G'' A2 G'' A4 G'' A6 G' A0
G' A1 G' A2 G' A4 G' A6
FIGURE 3 Influence of high pressure on mechanical spectra of the AGDs at T=25°C.
CONCLUSIONS
The effect of high-pressure treatment on the viscoelastic properties of 3% aqueous glucomannan
dispersions at pH=9.8 was weak. Samples were strongly time-dependent. Mechanical spectra
were practically pressure- independent, showing that at pH=9.8 there was phase transition from
gel to sol when frequency diminished. The crossover frequency interval was near 0.1Hz and
shifted slightly to higher frequencies at greater pressures.
REFERENCES
1. Herranz, B.; Tovar, C.A.; Solo‐de‐Zaldívar, B.; Borderias, A.J., Food Hydrocolloids, 2012a, 27, 145‐153.
2. Herranz, B.; Borderias, A.J.; Solo‐de‐Zaldívar, B.; Solas, M.T.; Tovar, C.A., Food Hydrocolloids, 2012 b, 29, 85‐92.
3. Solo‐de‐Zaldivar, B.; Tovar, C.A.; Borderías, A.J.; Herranz, B., Food Hydrocolloids, 2014, 35, 59‐68.
4. V dit, S. In Physical Networks Polymers and Gels. London Burchard, W.; Ross‐Murphy,S.B., Eds.; Elsevier applied Science, 1990; Chapter 10, pp 125‐132.
98

Influence of frozen storage on the viscoelasticity of suwari gels made with pressurized flying fish (Parexocoetus brachyterus) surimi
Verónica Bargiela,1 Helena M. Moreno2, Beatriz Herranz2 , Javier Borderías2, Clara A. Tovar1
1 Departamento de Física Aplicada, Facultad de Ciencias de Ourense. As Lagoas, 32004 Ourense, (Spain).
2 Departamento de Productos, Instituto de Ciencia y Tecnología de los Alimentos y Nutrición (CSIC), José
Antonio Novais, 28040 Madrid, (Spain).
Clara A. Tovar ([email protected])
ABSTRACT
The effect of frozen storage on the viscoelastic properties of five lots of suwari gels (SG) made using flying fish surimi (FFS) has been analysed. FFS had been subjected to low‐intensity pressures (0 control‐C), 40 (A), 80 (B), 125 (D) and 200MPa (E) at ‐15°C/10min. Viscoelastic properties of SG (5°C/24h) were determined after 5 months of frozen storage at ‐20°C and compared with unfrozen gels. After frozen
storage the trend of stress (σmax) and strain (γmax) amplitudes remained the same with pressure as with
the unfrozen suwari gels, except in sample D; in this case σmax was significantly larger after frozen storage, evidencing the increase of the structural stabilization. Mechanical spectra showed that frozen storage reduced the values of storage (G’) and viscous (G’’) moduli, except in sample D, where G’ and G’’ increased with respect to t=0. A new viscoelastic parameter was proposed based on G’ and G’’ data: the fraction of ideal network (fin). Naturally, in C sample fin was lower after frozen storage, but in the pressurized gels, frozen storage produced some structural improvement (high fin), particularly in samples D (125 MPa) and E (200 MPa).
KEYWORDS flying, fish, frozen, suwari, gel
INTRODUCTION
The surimi industry is constantly changing, so new resources have to be found for use as species
with lower-quality protein such as flying fish (Parexocoetus brachyterus), to process surimi-
based products with suitable gel properties. One possible alternative to improve the gel forming
ability is hydrostatic high pressure (HHP)1. When surimi is subjected to low temperatures (0 to
40 °C), the resulting suwari gel (SG) is soft, elastic and deformable2. Moreno et al., 2015
reported that low-intensity HHP was more suitable for improving the gelling ability of proteins
in frozen flying fish surimi (FFS). The aim of the present study was to analyse how the
P2
99

application of HHP to frozen FFS preserves the protein functionality in suwari gels after 5
months of frozen storage at -20°C.
EXPERIMENTAL METHODS
SGs were made as Moreno et al., 2015 reported. The HHP treatments were: 0, 40, 80, 125 and
200MPa for 10 min at -15±3 ºC by Stansted Fluid Power CTD, FPG 7100:-2C. SGs were called:
A (40MPa), B (80MPa), D (125MPa) and E (200MPa), along with a control sample (C) made
with unpressurized frozen FFS. SGs were frozen at -20°C in a blast-freezer and stored for 5
months. Frozen gels were called FA (40), FB (80), FD (125) and FE (200). The viscoelastic
parameters were obtained following the method reported by Moreno et al., 2015.
RESULTS AND DISCUSSION
Linear viscoelastic (LVE) range
Stress sweeps were used to determine the stress (σmax) and strain (γmax) amplitudes in the linear
viscoelastic (LVE) range for SGs before3 and after frozen storage. σmax and γmax maintained the
same trend as in fresh gels with increasing HHP (data not shown). Gel stiffness (G*) decreased
slightly in FC comparing with C, the same trend was observed in FA vs A and FB vs B.
However, in E gels G* was significantly higher in FE vs E (Figure 1). Thus, frozen storage
enhanced the rigidity of SGs with pressurized FFS at 200MPa, and consequently the loss of
firmness undergone by fresh suwari gels with increasing HHP was reduced in FE (Figure 1).
0.0
1.8
3.6
5.4
7.2
9.0
0 40 80 125 200Pressure (MPa)
G* (
kPa)
Fresh Frozen
FIGURE 1 Complex modulus after 5 months of frozen storage for Suwari gels made with pressurized‐ frozen FFS ν=1Hz,T=25°C. G* of fresh suwari gels were reproduced from [3].
100

Frequency sweeps
A new viscoelastic parameter derived from mechanical spectra was proposed to determine
whether a SG network was ideal and how it evolved with the oscillation frequency. A SG
network is a soft structure stabilized by covalent (non-disulphide) bonds forming non-ideal
structures4. It is possible to determine the ratio of stored energy (G’) to total (stored-G’ and
dissipated-G’’) energy to derive the ideal-network fraction (fin), by means of equation 1.
''''GG
Gfin += (1)
Figure 2 compares mechanical spectra of fresh (A-E) with frozen (FA-FE) SGs in terms of fin vs angular frequency (ω). The structural damage (frozen storage) was evidenced in FC gel as compared with C gel. Thus, fin values decreased with decreasing frequency (Figure 2).
60
65
70
75
80
85
90
0 10 20 30 40 50 60 7ω (rad/s)
fin
0
C FC A FA B FB D FD E FE
⎯power law fit
FIGURE 2 Influence on ideal‐network fraction of 5 months of frozen storage of suwari gels made with pressurized‐frozen FFS, T=25°C.
The same trend of fin vs ω was observed in less pressurized samples (FA vs A and FB vs B)
(Figure 2). However in D and E samples pressure produced some viscoelastic benefit, since after
frozen storage FD and FE gels exhibited greater values of fin with less frequency dependence
than D and E respectively (Figure 2).
thermal gelation profiles of suwari gels
The thermal gelation profiles for control (C) and pressurized samples (A, B, D and E) are shown
in terms of changes of fin with T. The influence of the HHP treatment was evident in A and E, in
which fin was higher and lower respectively than C (Figure 3a). At 35<T<50°C, fin rapidly
101

increased due to the unfolding of myofibrillar protein in the suwari gels, promoting
intermolecular interaction among hydrophobic fragments2 to form a three-dimensional gel
network (end of first stage of gelation). The subsequent increase of fin (T>50°C) is the second
age of gelation, which involves actin denaturation as part of the gel strengthening stage2. The
principal difference in thermal profiles of frozen gels was the practical disappearance of the
second stage of thermal gelation. Thus, at T> 50°C, fin remained practically constant up to 90 °C
(Figure 3b). This could be a consequence of structural damage in the protein network caused by
freezing and frozen storage, since myofibrillar proteins were partially denatured and aggregated,
principally by non-covalent interactions2. The benefit produced by HHP was reflected by the fact
that values of fin were higher in pressurized samples than in the control at higher T (Figure 3b).
a)
60
67
74
81
88
95
20 30 40 50 60 70 80 90
T (°C)
f in
(%)
C A B D E
b)
60
67
74
81
88
95
20 30 40 50 60 70 80 90T (°C)
f in
(%)
FC FA FB FD FE
FIGURE 3 Influence of frozen storage of suwari gels on their thermal gelation profiles ν=0.1Hz, 1°C/min.
CONCLUSIONS 125 and 200MPa produced viscoelastic benefit in frozen suwari gels enhancing the fractions of
ideal network and giving more time stable structures in gel networks.
REFERENCES
1. Herranz, B.; Tovar, C.A.; Borderias, A.J.; Moreno, H.M., Innovative Food Science and Emerging Technologies,2012, 20, 24-33.
2. Park, J.W., Surimi and Surimi Seafood, Marcel Dekker, Inc. New York, 2005.
3. Moreno, H.M.; Bargiela, V.; Tovar, C.A.; Cando, D.; Borderias A.J.; Herranz, B., Food Hydrocolloids, 2015, 48, 127-134.
4. Nijenhuis, K., Thermoreversible Networks. Viscoelastic Properties and Structure of Gels, Advances in Polymer Sciences, Springer, Berlin, 1997.
102

Thermo-rheological properties of chickpea flour gels
María Dolores Torres Pérez1
1Department of Chemical Engineering, University of Santiago de Compostela, Lope Gómez de Marzoa St.,
Santiago de Compostela E-15782, Spain
Correspondence to: M.D. Torres (E-mail: [email protected])
ABSTRACT
Gels are well known as a basis for food puddings or sweet desserts in gluten-free products, an
actual rising market at surprising rates. In this context, the subsequent gel research focuses on an
alternative gluten-free flour. The main objective was to perform a systematic investigation of the
thermo-mechanical characteristics of chickpea flour (CpF). A parallel objective was to determine
the physicochemical properties of studied gluten-free flours. The evolution of the structure of
these systems was monitored by rheological testing at small-amplitude-oscillatory-shear (SAOS)
using a stress-controlled rheometer. Texture properties of the final gels were determined from the
texture profile analysis. Relevant physicochemical characteristics of the flour were also
determined using standard methods commonly employed in these flours. Rheological results
indicated that thermal profiles on heating of CpF gels were similar to those reported for other
gluten-free flours. Overall, all systems showed stable and strong gel characteristics, however gels
from CpF at 40% present larger stability.
KEYWORDS chickpea flour, gluten-free, gels, viscoelasticity, texture
INTRODUCTION
As celiac disease is becoming more common nowadays the consumers’ demand for gluten-free
foodstuffs with high nutritional and taste quality is considerably increasing. However, the
employed formulations available on the market show low technological and nutritional quality,
particularly compared to their wheat counterparts1. One possibility with a great potential to
improve the quality of available products could be the chickpea flour (CpF) and its starch2.
P3
103

Despite its healthy properties, there are scarce literature concerning the rheological properties of
these systems. The challenge is to understand how the gluten-free flours behave under food
processing conditions since the final structure and texture properties are strongly dependent on
processing temperature/time, cooling rates, flour composition and its content. During gel
formation, these factors affect the dynamic process of competition between phase separation and
gel formation.
The main aim of this study is to perform a systematic investigation of the thermo-rheological and
textural properties of chickpea flour. A parallel objective was to determine the physicochemical
properties of studied gluten-free flours. The evolution of the structure of these systems was
monitored by rheological testing at small-amplitude-oscillatory-shear (SAOS) using a stress-
controlled rheometer. Texture properties of the final gels were determined from the texture
profile analysis (TPA). Preliminary physicochemical properties of the CpF were also determined.
MATERIAL AND METHODS
Samples preparation
Chickpea (Cicer arietinum) materials were purchased in a local market (Galicia, Spain). These
materials were grinded to obtain the corresponding chickpea flour, CpF. Gels were prepared
using CpF at several concentrations (10, 20, 30, 40, 50, 60, 70, 80, 90% w/w). The flour was
dispersed in demineralised water by stirring at 800 rpm for 10 min at room temperature. To
prepare the gels, suspensions were heated up to 90ºC and kept at this temperature for 30 min.
After, samples were placed in a fridge to allow full maturation of gels, which were kept at 5ºC
for 24h before performing colour and texture tests.
Methods
Standard sieves (750, 350, 75 µm) of 200 mm diameter were employed to determine the average
particle size (Dw) of tested flour. The sieving procedure was carried out according to ASAE
Standards3. Initial moisture, fat, dietary fibre, protein and carbohydrate content were determined
according to AOAC methods. The assays were made in triplicate.
104

Colour tests were performed using a Chroma Meter CR-400 (Minolta Co., Japan). Colour
parameters (L*, a* and b*) were assessed by CIELAB, where L* is the lightness and a* and b*
are chromaticity responsible parameters. At least ten measures were carried out for each sample.
Firmness (N) was determined from the texture profile analysis (TPA) using a TA-XT2i (Stable
Micro Systems, UK) texturometer (load cell of 5 kg). Before performing any measurements, gels
were allowed to equilibrate at 20 ºC for around 1 h in a temperature-controlled room.
Rheology was performed at least in duplicate on a controlled-stress rheometer using serrated
parallel plates (35 mm diameter and 0.5 mm gap). Flour suspensions were held at 20ºC between
the plates for 10 min before testing. After, samples were heated to 90ºC at 2ºC/min. Then, time
sweeps were conducted at 90ºC for 60 min at 0.1 Hz. After, samples were cooled down to 5ºC at
1 ºC/min. Temperature sweeps were performed at 0.1 Hz. A constant stress (2 Pa) within the
linear viscoelastic region (LVR) was used in above tests. After cooling, time sweeps were
conducted at 5 ºC, during 60 min at 1 Hz. Without disturbing the gel, frequency sweeps were
made at 20ºC, with oscillation frequencies over the range 0.01 to 100 rad/s. A constant stress (30
Pa) within the LVR of gels was used in the two latter tests.
All experimental data were analysed by one-factor analysis of variance followed by Scheffe test
to differentiate means with 95% confidence (p < 0.05) using PASW Statistics (v.18, NY, USA).
RESULTS AND DISCUSSION
The studied chickpea flour presented an average composition (% w/w) of 8.3 moisture content,
16.3 protein, 4.1 lipids, 9.2 fibre and 62.1 carbohydrates, and of the total grain carbohydrates,
45.9 is starch. These values are consistent with those reported for other chickpea materials2. The
average particle size determined for the studied flour was 71.5 µm.
Texture studies suggested that gels from chickpea flour at 40% gathered the right texture to
develop new savoury gluten-free gelled products, with subsequent multiple advantages from the
nutritional point of view. These results are in harmony with those reported for other gluten-free
flours with similar chemical composition1. Rheological results indicated that the thermal profiles
on heating of chickpea flour gels were similar to those obtained for other gluten-free flours.
Although all systems showed stable and strong gel characteristics, rheological tests suggested
105
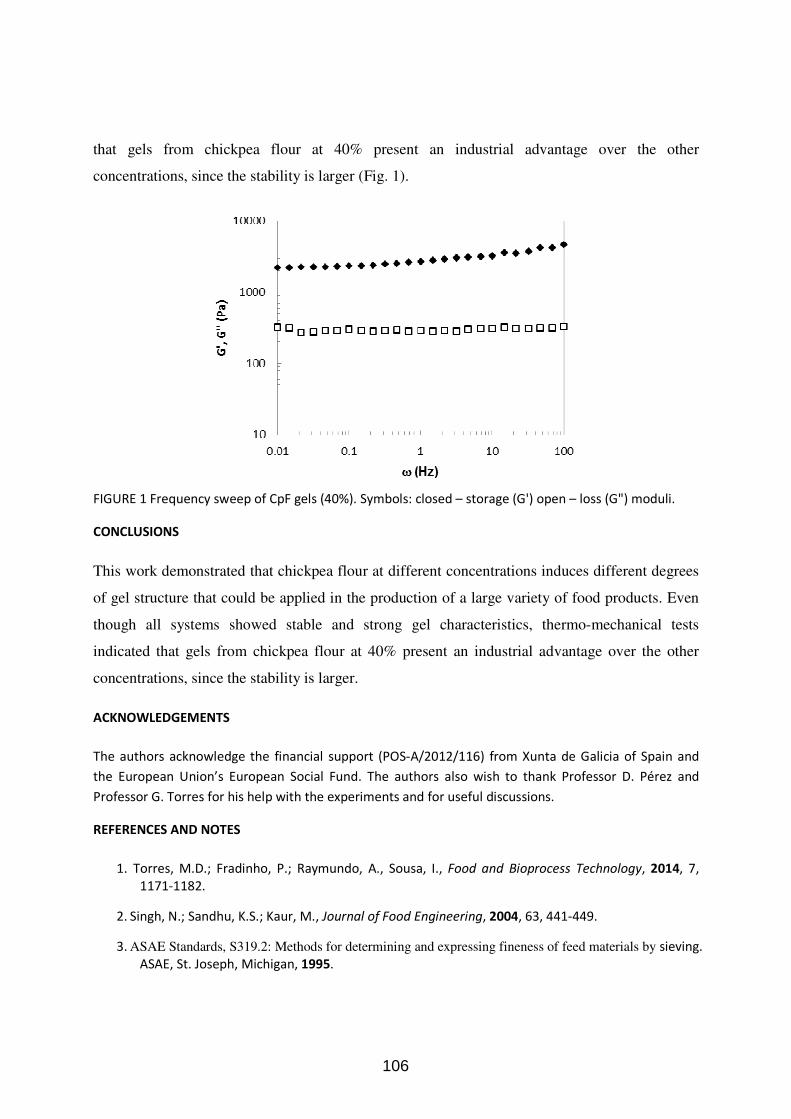
that gels from chickpea flour at 40% present an industrial advantage over the other
concentrations, since the stability is larger (Fig. 1).
FIGURE 1 Frequency sweep of CpF gels (40%). Symbols: closed – storage (G') open – loss (G") moduli.
CONCLUSIONS
This work demonstrated that chickpea flour at different concentrations induces different degrees
of gel structure that could be applied in the production of a large variety of food products. Even
though all systems showed stable and strong gel characteristics, thermo-mechanical tests
indicated that gels from chickpea flour at 40% present an industrial advantage over the other
concentrations, since the stability is larger.
ACKNOWLEDGEMENTS
The authors acknowledge the financial support (POS-A/2012/116) from Xunta de Galicia of Spain and
the European Union’s European Social Fund. The authors also wish to thank Professor D. Pérez and
Professor G. Torres for his help with the experiments and for useful discussions.
REFERENCES AND NOTES
1. Torres, M.D.; Fradinho, P.; Raymundo, A., Sousa, I., Food and Bioprocess Technology, 2014, 7,
1171-1182.
2. Singh, N.; Sandhu, K.S.; Kaur, M., Journal of Food Engineering, 2004, 63, 441-449.
3. ASAE Standards, S319.2: Methods for determining and expressing fineness of feed materials by sieving.
ASAE, St. Joseph, Michigan, 1995.
106

Satiety of vegetable purees thickened with different hydrocolloids
Ana Salvador and Teresa Sanz
1 Instituto de Agroquímica y Tecnología de Alimentos (IATA-CSIC).
Agustín Escardino, 7. 46980 Paterna (Valencia), Spain
e-mail of the presenter: [email protected]
ABSTRACT
Four thickening agents (modified waxy corn starch, -carrageenan, guar gum and HPMC) were
used to prepare vegetable purees. The effect of mouth and stomach in vitro digestion of the
different purees on the viscoelastic properties was studied. After mouth digestion, starch puree
suffered a complete breakdown of the structure whereas practically no changes in G' and G'' were
observed in the other purees. After stomach digestion, the lowest effect in the viscoelastic
properties was found in the carrageenan pure. Consumer acceptability results showed that the
acceptability of the carrageenan puree was similar to the traditional starch puree.
KEYWORDS (puree, rheology, in vitro digestion, hydrocolloid, acceptability)
INTRODUCTION
Satiety and satiation are part of a complex system of appetite control, including cognitive factors,
sensory sensations and post-ingested feedback mechanisms (1). Satiety is defined as the
inhibition of appetite and occurs as a consequence of eating. Satiety signals differ as the meal
moves through the gut but include oral, gastric, and intestinal factors (2). Increasing the viscosity
of nonnutrient meals delays gastric emptying, increases satiety and decreases hunger. Several
human studies indicated that meals containing solids typically have a greater effect on satiety
than liquid meals of equivalent size and energy content (3, 4). Part of this effect can be explained
by the slower gastric emptying of solid meals but unfortunately, highly viscous beverages or
beverages containing unchewed solids are unpalatable and cannot provide a feasible method for
weight control. However, the relation between meal viscosity and satiety remain poorly
understood. So, the aim of this work was to study the viscoelastic properties of vegetable purees
prepared with four different thickening agents after mouth and stomach in vitro digestions as a
P4
107

way to evaluate the structural changes during digestion. Consumers sensory acceptability of
purees was also studied.
MATERIALS AND METHODS
Vegetable purees elaboration
The vegetable puree formulation consisted of zucchini (33.3% w/w), powdered skimmed milk
(6% w/w), olive oil (5% w/w), waxy corn modified starch (3.5% w/w) or -carrageenan (1.7%
w/w) or guar gum (0.9% w/w) or hidroxypropylmethyl celulose (1.6% w/w), salt (0.23% w/w)
and water up to 100% w/w. Zuchinis were cutted into pieces mixing with the oil and heated to
90ºC at 100 rpm for 1min in a cooking device (Thermomix TM 31). After that, the rest of the
ingredients were placed in the cooking device and heated to 90 °C at 600 rpm for 20 min. Finally,
the mix was stirred to 2000 rpm for crushing. The resulting puree was cooled to 37 °C. For in
vitro mouth incubation 25 g of puree were mixed with 0.5ml human stimulated saliva.
Subsequently 6ml H20+1.5ml pepsin solution were added and the pH was adjusted to 2.5 with
HCl (6N) (stomach digestion). The stomach digestion was carried out inside the starch pasting
cell of the rheomether.
Rheological measurements
The linear viscolastic properties of the purees were performed with a controlled stress rheometer
(AR-G2, TA Instruments). A 60-mm diameter plate–plate geometry and a gap of 1 mm was
employed in fresh and saliva samples and a starch pasting cell in stomach digested samples. The
mechanical spectra in the linear region from 10 to 0.01 Hz at 37 °C were recorded in fresh purees
and in purees after mouth and stomach digestion.
Sensorial analysis
Sensory analysis of purees was carried out by 80 untrained assessors in a sensory laboratory
equipped with individual booths. A hedonic test was carried out using a 9-hedonic scale labelled
on the bottom with “dislike extremely” and on the top “like extremely” and the assessors
evaluated their liking of appearance, consistency, taste, and overall acceptability. Data
acquisition and analysis was performed by Compusense five release 5.0.
RESULTS AND DISCUSSION
Viscoelastic properties
108

Before mouth digestion, the starch puree showed the highest viscoelasticity, followed by the
carrageenan pure, the guar pure and the HPMC pure. The effect of frequency in the values of G'
and G'' of the guar, HPMC and carrageenan puress, before and after mixing with saliva is shown
in Figure 1. After mixing with saliva, the starch puree showed, as expected, a complete structure
breakdown, (G' and G'' was not measured) indicating that in this type of puree no effect of satiety
associated to a delay in gastric emptying could be expected. In the guar and HPMC puree only a
very small decrease in the viscoelastic functions was found, and in the carragenan puree no effect
of saliva was observed.
FIGURE 1. Mechanical spectra of purees of fresh samples and after mouth digestion.
After the stomach incubation, a significant decrease in G', G'' and in viscoelasticy was observed,
although the differences were more noticeable for the guar and HPMC puree than for the
carrageenan puree (Figure 2). In conclusion the viscoelastic properties of the carragenan puree
were the least affected after in vitro digestion.
FIGURE 2. Mechanical spectra of purees of fresh samples and after stomach digestion.
109

Sensorial acceptability
The results of the acceptability of purees are shown in Figure 3. Starch puree was the most
acceptable puree in taste, consistency and global acceptability presenting significant difference
with the other purees. On the contrary, the HPMC puree was the worst scored puree. It can be
noticed that carrageenan puree was the closest to the starch puree, showing little difference in the
attributes studied. No differences in appearance were found among all the samples.
FIGURE 3. Acceptability scores of the different purees.
CONCLUSIONS
Viscoelastic properties of carrageenan puree were the less affected by in vitro digestion. This
indicate that this puree has a more resistent structure than the others and could imply a more
saciant effect with similar sensorial properties than traditional starch puree.
REFERENCES AND NOTES
1. Benelam, B. Satiation, satiety and their effects on eating behaviour. Nutrition Bulletin, 2009,
34, 126–173.
2. Read, N., French, S., Cunningham, K. The role of the gut in regulating food- intake in man.
Nutrition Review, 1994, 52: 97-105.
3. Bolton, R. P., Heaton, K. W., Burroughs, L. F. The role of dietary fiber in satiety, glucose, and
insulin—studies with fruit and fruit juice. American Journal of Clinical Nutrition, 1981, 34,
211–217.
4. Himaya, A., Louis-Sylvestre, J. (1998) The effect of soup on satiation. Appetite, 1998, 30,
199–210.
110

Determination of Melting Points of Amylose-Lipid Complexes and Amylose in Gluten Free Flour Doughs by DMTA
Ramón Moreira, Francisco Chenlo, Santiago Arufe
Departamento de Enxeñaría Química, ETSE, Universidade de Santiago de Compostela, Rúa Lope Gómez de Marzoa, s/n, 15782 Santiago de Compostela (Spain)
Correspondence to: Ramón Moreira (E-mail: [email protected])
ABSTRACT
Gluten-free doughs made from white, yellow and purple maize flours and from chestnut flour
were processed in a laboratory kneader (Mixolab®) at the same consistency level (1.10 Nm) and
water content variable. Amylose-lipid complexes melting (M2) and amylose melting (M3) were
studied by means DMTA employing a controlled stress rheometer using parallel plates. The
rheological assays were performed in the LVR of the doughs. Temperature was increased from
90 to 180ºC at heating rate of 4ºC/min. Results showed that M2 (99-122ºC) can be determined
by DMTA by means of thermal behaviour of G´ and M3 (121-146ºC) can be determined by the
monitoring of tan δ. Transitions depended on water content, nature and characteristics of the
starch and the presence of other compounds (mainly sugars) in the flour doughs. Results
obtained by DMTA were also evaluated by comparison to endotherms determined by DSC.
KEYWORDS DMTA, DSC, gluten-free flour, starch, thermal transitions
INTRODUCTION
The use of traditional starch source like maize or alternative source like chestnut is necessary to
increase the supply of gluten-free products with high quality to a growing market. The research
on the transformations experienced by starchy food materials, particularly in flour dough, during
thermal processes is essential to estimate and control the final product properties.
Gelatinization is the main starch transition but other thermal transitions, due to biopolymer
interactions, can take place at higher temperatures as the reversible dissociation of amylose-lipid
complexes, called M2, and also melting amylose, labelled M3.1 Traditionally, DSC is the
P5
111
employed technique to determine these endothermic transitions. Nevertheless, these phase
transitions can give as result modifications of the mechanical properties of the doughs. At these
conditions, DMTA can be a useful experimental technique to determine the corresponding
thermal ranges by the viscoelastic moduli monitoring with temperature.
The aim of this work is to determine the temperatures of M2 and M3 transitions of several
gluten-free flour doughs processed at the same consistency level with different water absorption
by two different experimental techniques (DSC and DMTA) in order to establish comparisons
between the results obtained.
EXPERIMENTAL
Maize (Zea mays) flours obtained from 3 different varieties of Spanish maize kernels, white
(WM, Rebordanes), yellow (YM, Sarreaus) and purple (PM, Meiro) and chestnut (CH, Castanea
sativa Mill) flour were employed as raw material. Flours were placed in a desiccator at 25ºC and
relative humidity 54%, until flours equilibration with constant moisture content (8-10 %, d.b.).
Flours were stored at 4ºC in vacuum sealed bags until use. Doughs for DMTA tests were
prepared by using Mixolab® apparatus (Chopin Technologies, France)2. At the consistency of
1.10 Nm, water absorption (WA, % d.b.) was determined. Samples, at the same WA of doughs
prepared for DMTA, were prepared for DSC studies. The flour (~1g) was put in a glass vial and
water was added to obtain the desired WA. The vial was sealed and sample was equilibrated for
24 h at room temperature. A portion of the sample (< 18 mg) was introduced in a steel pan and
sealed. Thermal properties were determined with a calorimeter (Q200, TA Instruments, USA).
An empty steel pan was used as reference. Samples were heated from 90ºC up to 180ºC at
4ºC/min.
Flour doughs at the target consistency were tested in a controlled stress rheometer (MCR 301,
Anton Paar, Austria) equipped with a chamber (CTD 450, Anton Paar, Austria) using parallel
plates (50 mm diameter, 2 mm gap) by DMTA. The assays were performed in the LVR of the
doughs (0.1 % of strain, 1 Hz). Temperature increased from 90 to 180ºC at 4ºC/min. G´ and tan δ
values were used to determine the temperatures associated with starch transitions. All assays
were performed at least in duplicate. Differences among means were identified by one-factor
analysis of variance with Scheffe test and significant P-values ≤ 0.05 (IBM SPSS Statistics 22).
112

RESULTS AND DISCUSSION
Above 90ºC, the first transition, denominated M2 (94.6-122.2ºC), was observed in all flour
doughs and it corresponds to the melting of amylose-lipid complexes using DSC. At higher
temperatures appeared a new peak, M3, (129-147ºC) corresponding to the melting of amylose3.
This endotherm sets in a narrow interval of temperatures (< 7ºC) and in maize doughs the Tp
showed an inversely relationship with WA. This trend was observed in high amylose starches4.
M3 peak of CH dough was shorter and at intermediate temperature (134.6-136.0ºC) in spite of its
low hydration, indicating the importance of the amylose nature (molecular size, presence of
polymorphs) on its thermal behaviour.
In DMTA, M2 and M3 peaks were observed by means of the evolution of G´ or tan δ with
temperature. M2 peak was difficult to observe because coincides with the water evaporation
from the dough. In these circumstances, simultaneous processes affecting to mechanical
properties take place and G´ data show some dispersion. G´ showed a minimum value, Tp of M2
peak. To and T1 were determined by means of slope changes of G´ before and after Tp,
respectively. The peaks took place in a narrow interval of temperatures, 99-111ºC for WM dough
and 109-122ºC for CH doughs. To and Tp determined by DMTA of M2 peak shifted to higher
temperatures than those measured by DSC. This result indicates that amylose-lipid complexes
melting is retarded when moisture diminishes. Nevertheless, the end of M2 transition, T1, were
the same by means of both methods, see Table.
Above M2 transition, G´ values increase sharply during baking by the complex phenomena
related to the crust formation that give as result a more rigid and stiff material. Regarding to M3
peak, corresponding to the melting of amylose, it was monitored by tan δ. To corresponded to
the slope increase of the tan δ curve, Tp was the temperature with the maximum value of tan δ
and T1 with a later change of the slope, see Figure (illustrated the peaks determination for PM
dough). In the YM and CH doughs no M3 peak was observed in tan δ curve. This fact can be
related to low hydration levels of both doughs. M3 peaks determined by DMTA are broader than
those obtained by DSC due to the associated structural changes and re-arrangements of the
transitions take place in an extensive range of temperatures. In spite of the acceptable agreement
between DSC and DMTA peaks, more experimentation with simultaneous moisture
measurement is needed to confirm these results.
113

TABLE. Onset (To), peak (Tp) and final (T1) temperatures of M2 and M3 transitions determined by DSC and DMTA for tested maize and chestnut flour doughs♣
♣Standard deviations of temperature data for DSC were ±0.2ºC. Data with different letters in rows are significantly different, P ≤ 0.05.
FIGURE. DTMA for purple (PM) and white (WM) maize doughs. Trend of tan δ from 120 to 160ºC.
ACKNOWLEDGEMENTS
The authors acknowledge the financial support to Ministerio de Economía y Competitividad of Spain and FEDER
(CTQ 2013-43616/P).
REFERENCES AND NOTES
1. Torres, M.D.; Moreira, R.; Chenlo, F.; Morel, M.H. Food Hydrocolloids, 2013, 33, 192-198.
2. ICC. Standard Methods. International Association for Cereal Chemistry, Vienna 337, 1996.
3. Liu, H.; Yu, L.; Chen, L.; Li, L. Carbohydrate Polymers, 2007, 69, 756-762.
4. Liu, H.; Xie, F.; Chen, L.; Yu, L.; Dean, K.; Bateman, S. International Journal of Food
Engineering, 2005, 1, 3-8.
YM WM PM CH WA (%, d.b.) 63.0±1.0b 90.0±2.0d 81.1±1.4c 52.9±0.5a
T (ºC) DSC
M2 To 100.7c 94.6a 97.8b 102.8d Tp 109.6c 102.1a 105.0b 114.0d T1 117.6b 112.0a 112.4a 122.2c
M3 To 140.1c 130.2a 129.0a 134.6b Tp 140.2c 130.3a 129.1a 134.7b T1 146.4d 137.9c 132.5a 136.0b
DMTA
M2
To G´ 106.9±0.5b,c 99.1±1.2a 102.8±0.1a,b 109.1±0.4c
tan δ - - - -
Tp G´ 113.7±0.1c 103.7±0.2a 108.5±0.5b 114.9±0.6c
tan δ - - - -
T1 G´ 118.9±0.8a 111.4±2.8a 111.7±2.4a 121.8±1.3a
tan δ - - - -
M3
To G´ - - - - tan δ - 121.9±2.5 126.4±1.5 -
Tp G´ - - - - tan δ - 131.2±2.7 136.8±1.2 -
T1 G´ - - - - tan δ - 138.2±2.7 146.2±0.1 -
114

Rheological Properties of White, Yellow and Purple Maize Flour Doughs
Santiago Arufe, Silvia N. Rubinos, Francisco Chenlo, Ramón Moreira
Departamento de Enxeñaría Química, ETSE, Universidade de Santiago de Compostela, Rúa Lope Gómez de Marzoa, s/n, 15782 Santiago de Compostela (Spain)
ABSTRACT
Three different flours doughs of white (WM), yellow (YM) and purple (PM) maize were studied.
Average particle diameter by mass (Dw) and damaged starch (DS) of flours were determined.
Maize flour doughs were prepared at constant dough consistency with different water
absorptions (WA) by mixing flour and water in a laboratory kneader. Rheological
characterization was carried out at 30ºC by means of oscillatory frequency sweep and creep-
recovery tests using a rheometer. At the same milling conditions, WM flour showed higher Dw
than PM and YM flours. The presence of DS increased WA. The mechanical spectra showed that
G was dominant over G´´ and tanδ varied slightly with angular frequency. From modelled creep-
recovery data it was observed that WM and PM flour doughs showed the highest J0, that varied
with the same trend than G´, Jm increased linearly with WA, λc and λr with increasing DS and no
significant differences in η0.
KEYWORDS maize, flour, dough rheology, damaged starch, Mixolab®
INTRODUCTION
In the northwest of Spain maize is cultivated for self-consumption in small farms. Maize bread is
traditionally made with whole grain of maize, following similar procedures as for manufacturing
the common wheat bread1. Although most consumers prefer white maize (Rebordanes variety),
other types are also used for making bread, like yellow (Sarreaus variety) and purple (Meiro
variety) maize.
The main aim of this work is to characterize rheologically doughs from flours of three different
types of Spanish maize manufactured at the same consistency using a laboratory kneader.
Correspondence to: Santiago Arufe (E-mail: [email protected])
P6
115

EXPERIMENTAL
Maize (Zea mais) kernels (0.40±0.05 kg water/kg dry solid, dry basis (d.b.) of white (WF,
Rebordanes variety), yellow (YF, Sarreaus variety) and purple (PF, Meiro variety) Spanish
maize were dried at 45ºC, 2 m/s of air velocity, 30% of relative humidity and 5 kg/m2 of load
density using a pilot-scale tray dryer (Angelantoni Challenge 250) until average maize moisture
content of 11% d.b. was achieved. Flours were obtained from dried kernels by milling using an
ultra-centrifugal mill (ZM200 Retsch GmbH) with an internal sieve of 200 µm. Mass fraction of
flours particle sizes were obtained by sieving employing standard sieves from 40 up to 200 µm
(Cisa Cedacería Industrial) to obtain the average particle diameter by mass (Dw=xi·Dpi, where Dpi
(µm) is the average diameter of the fraction and xi (%) the mass fraction).
Damaged starch (DS, % g damaged starch/g dry solid) of flours was determined as the starch
fraction that is thermal or mechanically damaged, using a “Starch Damage Kit”2. Flour doughs
preparation were performed in a laboratory kneader (Miloxab®, Chopin Technologies) following
a standard protocol3 until a target consistency of 1.10 ± 0.07 Nm was achieved.
The rheological characterization of doughs, at the target consistency, was carried out using a
controlled stress rheometer (MCR 301, Anton Paar Physica) with parallel plates (50 mm
diameter, 2 mm gap) at 30ºC (±0.1ºC). Two different tests were performed in triplicate: 1)
Oscillatory frequency sweep (1–100 rad/s, 0.1% strain), 2) Creep and recovery (50 Pa/60 s
(creep step), 0 Pa/180 s (recovery step). Experimental data of creep and recovery were analyzed
by means of creep compliance rheological parameters (J(t) (Pa-1)) and modelling by Burgers
model4 using the Eqs. (1) and (2) for creep and recovery steps, respectively:
𝐽𝐽(𝑡𝑡) = 𝐽𝐽0 + 𝐽𝐽𝑚𝑚 �1 − exp �−𝑡𝑡λ𝑐𝑐��+ 𝑡𝑡
𝜂𝜂0 (1)
𝐽𝐽(𝑡𝑡) = 𝐽𝐽𝑚𝑚𝑚𝑚𝑚𝑚 + 𝐽𝐽0 + 𝐽𝐽𝑚𝑚 �1 − exp �−(𝑡𝑡−60)λ𝑟𝑟
�� (2)
where J0, Jm and Jmáx (Pa-1) are the instantaneous, viscoelastic and maximum creep compliance,
respectively, t (s) is the phase time, λc (s) and λr (s) are the mean retardation time of creep and
recovery steps, respectively, ηo (Pa s) is the zero-shear viscosity and Jr (Pa-1) the recovery
compliance (J0 + Jm). The Jr ⁄Jmáx ratio gives information on relative elastic component of the
maximum creep compliance.
116

RESULTS AND DISCUSSION
For flours obtained Dw varied in a narrow interval (90-113 µm), Table 1. Higher values for WM
flours are probably due to the higher hardness of WM kernels regarding to YM and PM kernels.
DS content showed significant differences, WM variety showed the highest (25.0 %) and YM the
lowest (8.6 %). This fact is related to the different hardness and friability of maize variety that
can causes different and thermal damage during milling. Tested doughs showed WA values
significantly different, Table 1. WA increased linearly with increasing DS content (R2 > 0.99).
Figure 1 shows the oscillatory frequency sweep of doughs. In all cases, in the studied range, G´
and G´´ values increased with increasing angular frequency (ω). This behaviour can be attributed
to the absence of binding agents in the dough (absence of gluten) and also because repulsive
forces between starch granules are predominant5. For all maize flour doughs, G´ values were
higher than G´´ indicating that elastic proportion was dominant over the viscous one, (tanδ < 0.5).
YM flour dough showed the highest moduli and WM and PM flour doughs the lowest ones. This
could be related to the high WA required for WM and PM flour doughs.
FIGURE 1. Experimental data of G´ (■), G´´ (▲) and tanδ (♦) of YM (black), WM (blue), PM (red).
In creep step, WM and PM doughs showed the highest J0 (≈14 10-6 Pa-1), Table 1. Jm increased
with increasing DS, indicating that DS modified the viscoelastic behaviour of doughs. λc
decreased with increasing DS. For recovery step, Jmáx increased with WA probably due to
formation of weak material structures related to higher WA6. J0 and Jm values were comparable
and showed the same trend as those observed in creep step. Values of λr were higher than those
observed for λc. This fact could be due to the operation outside the LVER in these tests. The Jr
0.0
0.2
0.4
0.6
0.8
1.0
1.E+03
1.E+04
1.E+05
1.E+06
1 10 100
tanδ
G',
G''(
Pa)
ω (rad/s)
117

⁄Jmax ratio of doughs increased with WA and was higher in comparison to wheat doughs (65%)
indicating a higher elastic character.
TABLE 1. Dw, DS, WA, and parameters of creep and recovery models, Eqs. (1) and (2)* Parameters YM WM PM
Dw (µm) 90 113 93 DS (% w/w, d.b.) 8.6±0.2a 25.0±2.1c 18.2±0.5b WA (%, d.b.) 63.0±1.0a 90.0±2.0c 81.1±1.4b
Creep
J0 (Pa-1)·106 9.1 ± 0.1a 14.1 ± 0.2b 14.2 ± 0.9b Jm (Pa-1)·106 4.8 ± 0.1a 11.2 ± 0.5c 8.0 ± 0.3b λc (s) 5.0 ± 0.1c 1.5 ± 0.1a 2.9 ± 0.2b η0 (Pa·s)·10-6 7.3 ± 0.9a 6.7 ± 0.2a 7.4 ± 0.2a R2 0.98 0.95 0.96
Recovery
Jmax (Pa-1)·106 21.7 ± 0.3a 32.0 ± 1.4b 30.5 ± 0.7b J0 (Pa-1)·106 9.6± 0.2a 17.0 ± 1.4b 18.3 ± 0.4b Jm (Pa-1)·106 8.8 ± 0.1a 11.2 ± 0.1b 8.9 ± 0.2a λr (s) 34.0 ± 1.4c 17.0 ± 0.1a 27.5 ± 0.7b Jr/Jmax (%) 83.1 ± 0.1a 87.6 ± 1.3c 86.5 ± 0.9b R2 0.95 0.85 0.91
*Data presented as means ± standard deviation. Values with different superscript letters in rows are significantly different, P≤0.05.
CONCLUSIONS
The results reveal that rheological properties of the corresponding doughs depend on maize
variety. Water absorption increases linearly with increasing damaged starch even for flour from
different types of maize. Oscillatory frequency sweep reveal that elastic behavior was
predominant in relation to viscous component and viscoelastic moduli decrease with increasing
water absorption.
ACKNOWLEDGEMENTS
The authors acknowledge the financial support to Ministerio de Economía y Competitividad of Spain and FEDER
(CTQ 2013-43616/P).
REFERENCES AND NOTES
1. Revilla, P.; Landa, A.; Rodríguez, V.M.; Romay, M.C.; Ordás, A.; Malvar, R.A., Journal of
Agricultural Research, 2008, 6, 241-247.
2. ICC-Standard Methods. International Association for Cereal Chemistry, Vienna 337, 1996.
3. ICC-Standard Methods. International Association for Cereal Chemistry, Vienna 173, 2008.
4. Burgers, J.M., First Report on Viscosity and Plasticity. Nordemann Pub., New York, 1935.
5. Sivaramakrishnan, H.P.; Senge, B.; Chattopadhyay, P.K., Journal of Food Engineering, 2004,
62, 37-45.
6. Lazaridou, A.; Duta, D.; Papageorgiou, M.; Belc, N.; Biliaderis, C.G., Journal of Food
Engineering, 2007, 79, 1033-1047.
118

Rheology of complex food emulsions with vegetable and animal proteins
Mara Pereira1, Carla Graça1, Sara Alves2, Luís Raimundo2, Anabela Raymundo1, Isabel Sousa1
1 (LEAF) – Centro de Investigação em Agronomia, Alimentos, Ambiente e Paisagem do ISA –
ULisboa, Tapada da Ajuda 1349-017 Lisboa, Portugal 2 CFG – Avda. Europa, 24; 28108 Alcobendas, Madrid, Espanha
ABSTRACT
The emulsions were produced with a mixture of animal and vegetal proteins and different processing
conditions were tested. The values of firmness as the force peak obtained by a puncture test ranged
from 0.85N to 2.80N, for P2 and P3 formulations, respectively. The minimal value for adhesiveness
was -5.65N.s, for P2 formulation, and the highest value, -12.75N.s, was obtained for P3 formulation.
At a controlled temperature of 20ºC, the emulsions produced with different processing methods
presented similar flow behaviour. However, when heated from 20ºC to 90ºC the P4 formulation
showed the highest decrease on viscosity. Therefore, when the flow curves at 40ºC were compared,
the P4 material consistently presented the highest decrease on viscosity. This viscosity decrease was
confirmed with rotation temperature ramps. Nevertheless, when emulsions were cooled back from
90ºC to 20ºC, the viscosity was recovered in all cases. The small amplitude oscillatory system
(SAOS) measurements at 20ºC showed that all emulsions presented storage moduli (G') above loss
moduli (G''), with similar behaviour and values. The mechanical spectra performed at 40ºC revealed
that P3 presents some instability with a crossing point when G'' becomes higher than G'. At the same
conditions, P4, a material closer to a gel, showed the lowest value of G' and G'', and this can be an
advantage in the filling process.
KEYWORDS
Emulsions, animal and vegetal proteins, texture, rheology behavior
INTRODUCTION
Emulsions are complex multiphase systems widely used in different industries, namely in the food
industry. They are heterogeneous systems of two immiscible liquids and do not form spontaneously,
these are metastable systems without thermodynamic stability [1]. Emulsion systems must therefore
be carefully designed to overcome the instability mechanisms and provide sufficient stability over the
lifetime of the product [2]. By adding substances known as emulsifiers and stabilizers, e.g. weighting
agents, ripening inhibitors, or texture modifiers it is possible to form emulsions that are kinetically
stable for a reasonable period of time [2]. Many types of food proteins can be used as emulsifiers due
to their amphiphilic character, polymeric structure, and electrical charge characteristics. The
amphiphilic character means that they are ambivalent with affinity to both water and oil, therefore
they can adsorb to droplet surfaces during homogenization [3] and keeping part of the molecule in
Correspondence to: Isabel de Sousa (E-mail: [email protected])
P7
119

contact with the disperse medium, leading to the formation of a strong layer at the surface of the
droplet. The stability of an emulsion may be explained by rheological properties, an understanding of
the relationship between the rheology and stability of emulsions is important to predict emulsion
stability and to control product quality [4]. There is an interrelation between the rheology of
interfacial surfactant layers and the stability of the emulsions because the latter is determined mainly
by the elasticity (thermodynamic factor) and viscosity (kinetic factor) in droplet interactions [5].
The main goal of this work was to test the impact of different processing conditions on the flow and
viscoelastic behaviour of the emulsions.
METHODS
Preparation of the emulsions
The emulsions were produced with animal and vegetal proteins. Different conditions were tested for
pre-hydration of proteins and olive oil temperature. The emulsions were prepared in a thermo-
processor (Bimby-Worwerk) for about 10 minutes at 6 position and 37 ºC, 3% of glucose and 2% of
sodium ascorbate were added, to decrease the water activity and oxidation, respectively. The
emulsions were coded as: P1 - hydration of proteins and olive oil at 21ºC; P2 - hydration of proteins
at 21ºC and olive oil heating at 45ºC; P3 - hydration of proteins at 21ºC followed by heating at 70
ºC/45 min and olive oil at room temperature; P4 - hydration of proteins at 21ºC followed by heating
at 70ºC/45min and olive oil heating at 45ºC.
Rheological measurements
Texture characterization
Texture parameters were determined from the texture profile analysis (TPA) using a Texturometer
TA XT Plus (Stable Micro Systems), in puncture testing with a 25mm diameter acrylic cylindrical
probe (15mm of penetration, 5s of waiting time and 1mm/ s of crosshead speed with 5kg of
crossload). The experiments were carried out 24h after preparation of the emulsions kept in a cold
room at 5ºC. Before performing any measurements, emulsions were allowed to equilibrate at 20ºC for
1h in a temperature-controlled room. Results of firmness (N) and adhesiveness (-N.s) were replicated
at least four times, for each sample [6].
Rheological measurements
Rheological behaviour of the emulsions was evaluated in a controlled stress rheometer (Haake Mars
III - Thermo Scientific), with an UTC-Peltier system. The flow curves (FC) were obtained at different
temperature conditions, 20ºC and 40ºC, and the range of shear-rate used was 1x10⁻⁶ to 1x10³ s-1. In
rotation temperature ramp (RTR) the viscosity was measured when the emulsions were heated from
20ºC to 90ºC and cooled down from 90ºC to 20ºC. SAOS were performed with frequencies ranging
120

from 1x10⁻³ to 1x10² Hz and 50 Pa for stress. The sensor used for all determinations was a serrated
parallel-plate sensor (20, 1mm gap) system.
RESULTS AND CONCLUSIONS
Macrostructure of the emulsions was evaluated in terms of texture, using the TPA, the results to the
firmness and adhesiveness parameters are presented in FIGURE 1 and FIGURE 2, respectively.
0
0,5
1
1,5
2
2,5
3
3,5
4
P1 P2 P3 P4
Fir
mn
ess
(N)
0
2
4
6
8
10
12
14
16
P1 P2 P3 P4
Ad
hes
iven
ess
(-N
.s)
FIGURE 1 – Firmness of emulsions. FIGURE 2 – Adhesiveness of emulsions.
The values of firmness obtained were between 0.85N and 2.8N, the minimal value corresponding to
emulsion P2 and the highest value of firmness to P3. The minimal value for adhesiveness was -
5.65N.s, for P2 emulsion, and the highest one for P3 with -12.75N.s. The extreme values of firmness
and adhesiveness corresponding to the same samples, as it is usual in these systems.
The flow curves from the controlled stress rheometer were obtained at 20ºC and 40ºC, and are shown
in FIGURE 3.
At 20ºC, the emulsions produced with different processing methods presented similar behaviours.
However, when heated from 20ºC to 90ºC the P4 showed the highest decrease on viscosity.
Therefore, when the FCs at 40ºC were compared, the P4 material consistently presented the highest
decrease on viscosity. This viscosity decrease was confirmed with RTR. When emulsions were
cooled from 90ºC to 20ºC, the viscosity was recovered in all cases (data not showed).
The results of SAOS, at 20ºC and 40ºC are presented in FIGURE 4.
1,00E-01
1,00E+00
1,00E+01
1,00E+02
1,00E+03
1,00E+04
1,00E+05
1,00E+06
1,00E-06 1,00E-05 1,00E-04 1,00E-03 1,00E-02 1,00E-01 1,00E+00 1,00E+01 1,00E+02 1,00E+03
Vis
cosi
ty (
Pa.
s)
Shear rate(s-1)
P1 P2 P3 P4
1,00E-01
1,00E+00
1,00E+01
1,00E+02
1,00E+03
1,00E+04
1,00E+05
1,00E+06
1,00E-06 1,00E-05 1,00E-04 1,00E-03 1,00E-02 1,00E-01 1,00E+00 1,00E+01 1,00E+02 1,00E+03
Vis
cosi
ty (
Pa.
s)
Shear rate (s-1)
P1 P2 P3 P4 A B
FIGURE 3 – Flow curve at 20ºC (A) and 40ºC (B).
121

The SAOS at 20ºC showed that all emulsions present the storage modulus (G') higher than loss
modulus (G''), with similar behaviour and values. The mechanical spectrum performed at 40ºC
revealed that P3 presents some instability with G'' becoming higher than G' with a crossing point. At
the same conditions, P4, a material closer to a gel, showed the lowest value of G' and G'', and this can
be an advantage in the filling process.
1,00E+02
1,00E+03
1,00E+04
1,00E-03 1,00E-02 1,00E-01 1,00E+00
G',
G''
(Pa)
Frequency (Hz)
P1 G' P1 G'' P2 G' P2 G'' P3 G' P3 G'' P4 G' P4 G''
1,00E-02
1,00E-01
1,00E+00
1,00E+01
1,00E+02
1,00E+03
1,00E+04
1,00E-03 1,00E-02 1,00E-01 1,00E+00
G',
G''
(Pa)
Frequency (Hz)
P1 G' P1 G'' P2 G' P2 G'' P3 G' P3 G'' P4 G' P4 G''
A B FIGURE 4 – Mechanical spectra of the emulsions, at 20ºC (A) and 40ºC (B).
ACKNOWLEDGEMENTS
This work was supported by QREN – I&DT Project 38593.
REFERENCES
[1] Homayoonfal, M.; Khodaiyan, F.; Mousavi, M., Modelling and optimising of physicochemical
features of walnut-oil beverage emulsions by implementation of response surface methodology: Effect
of preparation conditions on emulsion stability. Food Chemistry, 2015, 174, 649 - 659
[2] Piorkowski, D.T.; McClements, D.J., Beverage emulsions: Recent developments in formulation,
production, and applications. Food Hydrocolloids, 2014, 42, 5-41
[3] Qiu C.; Zhao, M.; McClements, D.J., Improving the stability of wheat protein-stabilized
emulsions: Effect of pectin and xanthan gum addition. Food Hydrocolloids, 2015, 43, 377-387
[4] Udomrati, S.; Shoichi Gohtani, Tapioca maltodextrin fatty acid ester as a potential stabilizer for
Tween 80-stabilized oil-in-water emulsions. Food Hydrocolloids, 2015, 44, 23-31
[5] Derkach, S.R, Rheology of emulsions. Advances in Colloid and Interface Science, 2009, 151, 1–
23
[6] Nunes. M.C.; Raymundo, A.; Sousa, I., Rheological behaviour and microstructure of pea
protein/k-carrageenan/starch gels with different setting conditions. Food Hydrocolloids, 2006, 20,
106-113
122

Development of a gluten-free mix for pizza base – rheological approach
Diana Narciso, Patrícia Fradinho, Isabel de Sousa, Anabela Raymundo
LEAF – Instituto Superior de Agronomia/Universidade de Lisboa, Tapada da Ajuda-Edifício
Ferreira Lapa, 1349-017 Lisboa, Portugal
Correspondence to: Anabela Raymundo ([email protected])
ABSTRACT
The aim of this study is the development of a mix, for pizza base, designed for home preparation,
increasing the market supply of gluten-free products without the high prices, normally associated
with this kind of products. This is achieved through the use of rice by-products - broken rice and
rice bran, which also contribute to the nutritional enrichment of the final product due to their
dietary fiber content, polyunsaturated fatty acids, vitamins and minerals. The pizza base
formulations were developed according to traditional recipes, replacing wheat flour with rice
flour and rice bran. Other ingredients were also used to enhance the sensory characteristics of the
pizza base developed. Since the manufacturing cost will influence the price of the final product
paid by the consumer, the effect of xanthan gum use was also studied.
The rheological behaviour of developed doughs was assessed and compared with the one from
commercial products and a control formulation with gluten.
The use of xanthan gum did not influence significantly the structure of dough. The storage
modulus G' was greater than the loss modulus G'' for all samples, showing a predominantly
elastic behaviour. The gluten-free formulations showed lower frequency dependence of both
modulli and a stronger structure than gluten doughs.
KEYWORDS: Pizza base, rice flour, xanthan gum, viscoelasticity, doughs
INTRODUCTION
Recently, there has been an increase of both the demand and supply of gluten-free products.
However, the production of gluten-free bakery products presents a technological challenge, due
P8
123

to the limited capacity of the gluten-free doughs in sustaining the CO2 produced during
fermentation, resulting in a poor viscoelastic dough.
To minimize this problem, the industry uses a mixture of hydrocolloids to improve the
rheological characteristics of dough, and texture of products, increasing the costs dramatically.
The aim of this work is the development of a formulation for gluten-free pizza dough through the
use of by-products from the rice industry, namely broken rice and bran. If possible, the use of
hydrocolloids (xanthan gum) will be discarded.
The use of economic ingredients and the reduced used of hydrocolloids will contribute to the
development of a gluten-free product accessible to everyone, and also to the nutritional value of
the final product, since rice bran is an excellent source of dietary fiber and oil rich in
polyunsaturated acids.
EXPERIMENTAL
The ingredients used were selected based on their specific characteristics, market cost and
gluten-free warranty. The dough was prepared with flour ground from broken rice and rice bran,
both supplied from a rice industry. The other ingredients - egg, corn starch, oil, yeast, salt, sugar
and xanthan gum – were purchased at local market.
The solid ingredients were placed in a food processor (Bimby, Vorwerk) and mixed. Then, water
(37ºC), oil and egg were added and mixed together during 3 min. The fermentation took place at
ambient temperature for 40 min. These conditions were chosen in order to be easily replicated by
consumers at home.
The rheological behaviour of developed doughs – with xanthan gum (RXD) and without xanthan
gum (RD) - was assessed and compared with the one from two commercial products: a gluten-
free mix (CM) and whole flour mix with gluten (GM). A control formulation (GC) with wheat
flour prepared in similar conditions as the developed doughs was also used.
The rheological behaviour of the doughs was assessed by small-amplitude oscillatory shear
measurements in a Haake RS-75 controlled-stress rheometer. A serrated parallel plate sensor
system with 20 mm diameter was used and a 1.5mm gap was applied.
After preparation the dough was transferred to the bottom plate. A stress sweep test was
performed and the maximum shear stress amplitude value within the viscoelastic linear region
(range of stress in which the structure is not destroyed) was used for the mechanical spectra.
124

1.E-02
1.E-01
1.E+00
1.E+01
1.E+02
1.E+03
1.E+04
1.E+05
1.E+06
1.E+07
1.E-07 1.E-05 1.E-03 1.E-01 1.E+01 1.E+03
h(P
a.s
)
shear rate (1/s)
Flow curves were determined using the same conditions, using a MARS III (Haake). Each
formulation was tested at least in duplicate.
RESULTS AND DISCUSSION
The appearance of the developed doughs after preparation is presented in Figure 1. The effect of
xanthan gum in the dough is clear, since the one with the hydrocolloid is moldable, an important
characteristic because the consumer will have to shape the dough into a pizza-like form.
FIGURE 1. Pizza dough with (RXD) and without xanthan gum (RD).
The effect of xanthan gum addition on the dough viscosity is presented in Figure 2.
FIGURE 2. Flow curves of pizza base doughs with xanthan gum (◆ - RXD)
and without xanthan gum (◆ - RD).
Both doughs show a similar flow curve pattern, with a newtonian plateau region at lower shear
rates, followed by a shear-thinning zone. Gluten-free dough presents a slightly higher viscosity
than the dough without hydrocolloid use. However, since xanthan gum has a high cost that will
greatly influence the price of final mix, the subsequent product development was conducted
without xanthan gum (RD).
RXD RD
125

4.E+02
4.E+03
4.E+04
4.E+05
0.0001 0.001 0.01 0.1 1 10 100 1000
G'
; G
'' (
Pa
)
f (Hz)
The rheological behaviour of the gluten-free and commercial doughs was assessed and is
depicted in Figure 3.
FIGURE 3. Mechanical spectra of the commercial and gluten-free doughs
(● Gluten control (GC); ● Commercial gluten mix (GM); ▲ Commercial gluten-free
mix (CM); ▲ Rice dough (RD); closed symbols-G’; open symbols–G’’)
From the mechanical spectra of the doughs, it is observed that the elastic component (G') is
always higher than the viscous component (G''), revealing a predominantly elastic behaviour of
all doughs.
Regarding the rheological properties of the doughs, gluten formulations have a greater
dependence of viscoelastic parameters (G 'and G' ') with frequency. Unlike the gluten-free
formulations that have the most stable structures as the frequency increases. The gluten-free
formulation developed shows values of G 'and G'' similar to the commercial gluten-free
formulation (CM). Gluten-free dough also presents a wider gap between G' and G'' values,
meaning that this dough has a stronger structure than gluten doughs.
CONCLUSIONS
It was possible to develop gluten-free dough without hydrocolloids, with similar rheological
characteristics to commercial mix. This product is designed for easy preparation by the consumer.
In this case, the consumer just adds water, oil and egg to the mix.
ACKNOWLEDGEMENTS
This work was supported by COMPETE program: QREN - “Arroz +“ project n.38749.
126

Rheological study on slimming custards and milkshakes: Comparison of
several commercial products
Manuel Muñoz1, Alfonso Sánchez-Vicent
1, María Jesús Hernández
1, Jose Antonio Picó
2
1 Dep. Earth Physics and Thermodynamics, Fac. Physics, Univ. Valencia, 46100 Valencia (Spain).
2 Korott, S.L. Research and Development, Polígono Santiago Payá, 03801 Alcoy (Spain).
Correspondence to: Jose Antonio Picó (E-mail: [email protected])
ABSTRACT
Slimming milkshakes and custards with different flavors, manufactured by several trademarks, are
compared in this work. Rheological properties measured at room temperature with a controlled stress
rheometer (RS1, Thermo Haake) were analyzed. Important differences between brands were shown,
especially in milkshakes. Most of milkshakes presented liquid consistencies; Newtonian or very low shear
thinning. Custards were strongly shear thinning fluids, with gel like structure, and significant yield
stresses and relative thixotropic areas. One of the brands distributed custards with different texture
characteristics for the various flavors offered, while the custards of the other ones are more similar from
the textural point of view. This fact could be responsible of a different sensation of satiety on the
consumer, according to previous studies.
KEYWORDS: slimming food, satiating power, hydrocolloid, custard, milkshake
INTRODUCTION
Slimming foods are intended for use as a meal replacement in a weight-loss diet. These products
do not in themselves contribute to weight loss, although they have the effect of not feeling
hungry for a certain period of time, and they also provide a sufficient intake of nutrients1. Sales
of enhanced satiety products had become more important in recent years in food market2. The
composition of this kind of products normally includes milk, proteins, lipids, carbohydrates, fiber
and hydrocolloids1 among others. Texture of slimming foods plays a significant role in consumer
acceptance, particularly since their satiating power seems to be directly related to their
rheological properties3,4
. In this work we compare some of these products in custard or in
milkshake forms, developed by several commercial brands distributed in mass markets in Spain.
P9
127

MATERIAL AND METHODS
Milkshakes and custards were prepared by dissolving the appropriated amount of commercial
powder in skimmed milk with manual agitation. Products with different flavors manufactured by
Korott
, SpecialLine
, MyBestFood
and biManán
were analyzed (Table 1).
Rheological measurements were carried out in a controlled stress rheometer (RS1, Thermo
Haake) with a thermostatic bath K10 and software Rheowin 4.2. A cone-plate 60 mm/2º sensor
was used for milkshakes and 35 mm serrated parallel plates for custards. All measurements were
performed in duplicate at 25 ºC. For all the systems, step flow curves in CR mode were
performed between 1 and 100 s-1
. Then, after 1 min of shearing at 100 s-1
, down curves were
recorded. For custards, steady flow curves in CS mode were also performed. Moreover,
frequency sweeps in linear viscoelastic region (previously determined) were carried out.
RESULTS AND DISCUSSION
Texture of milkshakes and custards chosen was completely different, since milkshakes were
liquid systems, and therefore, drinkable, while custards had a spoon-like consistency.
When comparing milkshakes, we observed the three Korott products presented similar textural
characteristics, as they were slightly shear thinning fluids (fitting well to power law), while My
Best Food milkshakes were much more liquid-like and almost Newtonian, just 10 times more
viscous than water (Fig 1A).
On the other hand, it stands out the Special Line strawberry milkshake, with a behavior similar to
custards (Fig 2A). Both in this case and custards flow curves were fitted to Carreau model
s
2
0 c1
(1)
with similar shear thinning indexes, s0.4, and zero viscosities ranging from 1000 to 20000 Pa s.
Custards presented predominant elastic characteristics (G’ > G”), as loss tangent indicated (Fig
2B), typical of gel like systems. Frequency dependence of storage modulus was satisfactorily
fitted to power law functions
G’ = G’1 m
(2)
Values of the parameter G’1 (G’ for 1 Hz) and m are shown in Table 1. It is interesting to point
out that both lemon custards, from the two brands, were less firm, with lowest values of G1’ and
highest m. They also presented the highest values of tan and the lowest values for 0 (Fig. 2).
128

10-3
10-2
10-1
100
101
102
103
104
10-4
10-3
10-2
10-1
100
101
102
103
(
Pa
s)
(s-1
).
A
0
5
10
15
20
25
0 20 40 60 80 100
(
Pa)
(s-1
).
B
FIGURE 1. A ) Steady flow curves in CS mode. B) Up flow curves and down curves after 1 min shearing.
MILKHAKES: A) Vanilla MyBestFood; ;Chocolate MyBestFood; Strawberry SpecialLine;
Strawberry Korott; ; Chocolate Korott; Cappuccino Korott.
10-1
100
101
102
103
104
105
10-4
10-3
10-2
10-1
100
101
102
103
(
Pa
s)
(s-1
).
A
0.0
0.2
0.4
0.6
0.8
1.0
10-2
10-1
100
101
tan ()
(Hz)
B
FIGURE 2. A) Flow curves fitted to Carreau model. B) Loss tangent versus frequency. CUSTARDS:
Vanilla Korott; Lemon Korott; Chocolate Korott; Lemon BiManán; Yogurt Cream BiManán.
Regarding to up and down curves performed in CR model, all systems measurements were fitted
to Herschel Bulkley model (Fig. 1A)
n
0 K (2)
with the aim of estimating yield stresses. They were negligible for milkshakes, except for Special Line
strawberry (Fig. 1B), on the contrary what happened for custards, which presented important values for
these stresses (Table 1), especially for chocolate and vanilla custards.
129

Tarrega et al (2014) found viscosity at 100 s-1
and thixotropic area, ST, were related to satiating
power in semi-solid milk-based snacks1, so we considered interesting to analyze these
parameters in our custards (Table 1). Due to the differences in area enclosed by up curve, relative
thixotropic areas4 were considered (SR). In our case it seemed that chocolate and vanilla custards
could be the most satiating products, although sensory studies should be done to test it properly4.
TABLE 1. Mean values and standard deviations of rheological parameters for milkshakes and custards.
Custards σ0 (Pa) η100 (Pa s) ST (Pa s-1) SR (%) G1’ (Pa) m
Chocolate Korott 227 ± 12 3.08 ± 0.14 5600 ± 700 21.1 400 ± 30 0.188 ± 0.001
Vanilla Korott 184 ± 6 2.52 ± 0.06 5600 ± 500 24.1 450 ± 40 0.183 ± 0.014
Lemon Korott 42 ± 3 1.12 ± 0.05 1900 ± 500 21.1 58 ± 3 0.269 ± 0.015
Lemon BiManán 65.6 ± 0.3 1.81 ± 0.16 2600 ± 300 18.7 130 ± 10 0.220 ± 0.005
Yogurt Cream BiManán 85 ± 13 2.02 ± 0.12 2500 ± 200 14.7 350 ± 50 0.167 ± 0.003
CONCLUSIONS
The differences observed in milkshakes would be due to the hydrocolloids included in their formulation
(guar gum in Special Line, and Xanthan gum in Korott –maybe in a smaller amount). These milkshakes
are sold as a substitute of a meal, but although they provide the adequate amount of calories, they
wouldn’t have satiating power due to their low consistencies2.
On the other hand, lemon custards (from the two brands analyzed) presented different textural properties
than the rest of custards analyzed. This should be related to the preferences of consumers about texture
associated to this flavor, what could determine the satiating power of the product3.
REFERENCES AND NOTES
1. Tárrega, A.; Martínez, M.; Vélez-Ruiz, J.F.; Fiszman, S., Hydrocolloids as a tool for modulating
the expected satiety of milkbased snacks. Food Hydrocolloids, 2014, 39, 51-57.
2. Chambers, L.; McCrickerd, K.; Yeomans, M. R. Optimising foods for satiety. Trends in Food
Science & Technology, 2015 ,41, 149-160.
3. Hogenkamp, P. S.; Stafleu, A.; Mars, M.; Brunstrom, J. M.; de Graaf, C. Texture, not flavor,
determines expected satiation of dairy products. Appetite, 2011, 57, 635-641.
4. Morell, P.; Fiszman, S.M.; Varela, P.; Hernando, I. Hydrocolloids for enhancing satiety: Relating
oral digestion to rheology, structure and sensory perception. Food Hydrocolloids, 2014, 41, 343-
353.
130

1DepartaIngenier
Multipro
Correspo
ABSTR
Due to pharmacmany forheologiused in continuoperformfrom 5%flow cur
KEYWO
INTRO
Aloe V
pharma
plant, th
into det
diet. It i
corn wh
product
presents
Rh
amento de ría Mecánica
ofesional de
ondence to: F
RACT
the potentceutical and ood- productical behavior
Canary Islaous phase ined in order t
% to 30%. Trves, from wh
ORDS Aloe
ODUCTION
Vera juice is
aceutical and
hey all have
termining th
is highly nu
hich suffer d
ts combined
s different r
heological
E. García-LF.
Física Aplica y Mecánica
Atención Fa
F.J. Rubio-H
tial applicafood industr
t producers hr when is assands (Spain)n which Goto study stea
The steady shhich a non-N
vera juice, G
a rich sour
d cosmetic
e been relate
heir rheolog
utritious, wi
different m
d result in
rheological
study on
López1, J.F. .J. Rubio-He
cada II, Una de Fluidos
amiliar y Com
Hernández (E
tion of Alory, the studyhave includesociated with) diet. The ofio is addeady shear behear responsNewtonian sh
Gofio, Steady
rce of essen
products. D
ed to the stu
gical behavi
ith mealy ap
anufacturin
a mixture w
behaviours
the Gofio
Velázquez-Nernández1, A.
niversidad ds, Universida
munitaria Dis
E-mail: fjrubi
oe barbade of its rheolo
ed it as nutrith Gofio, a tosamples hav
ed forming ehavior of the of the syst
hear-thinning
y shear flow
ntial micron
Despite mult
udy of its co
or1. Additio
ppearance a
ng processes
with possib
which resu
o/Aloe Ve
Navarro2, J. R.I. Gómez-M
de Málaga, ad de Málag
strito Málaga
nsis Miller ogy has becotional supple
oasted grain ve been prea suspensioe samples, vtem has bee
g behavior is
w curves, She
nutrients, so
tiple investi
omponents
onally, gofio
and produce
s, such as ro
ble food app
ult interestin
era juice s
Rubio-MerinMerino1
Málaga (Spa, Málaga (S
a-Guadalhor
(Aloe verome in an imement. The pmix (corn, w
epared with n. Rheologi
varying its men analyzed t shown in ev
ar-thinning,
o it has wid
igations to t
and functio
o is a basic
ed primarily
oasting, coo
plications, b
ng to study b
system
no3,
pain), 2DepaSpain), 3Uni
rce, Málaga (
ra) plant inmportant toppresent studywheat and ba
Aloe Vera ical measure
mass percentathrough the very sample.
SEM .
de applicatio
the extracte
onality, with
food in Can
y with wheat
oling and m
besides the
by itself.
artamento dedad Docente
(Spain)
n cosmeticsic. Recentlyy reports thearley) widelyjuice as the
ements wereage of Gofiosteady shear
ons in food
ed gel of the
hout delving
nary Islands
t grains and
milling. Both
fact that it
e e
, , e y e e o r
,
e
g
s
d
h
t
P10
131

MATER
The sam
Barbad
ensure t
acid (PA
Trujillo
(SEM),
be obse
comput
The rhe
(Englan
during
the essa
shear ra
dispersi
distribu
RIALS AND
mples prepa
densis Miller
that the con
ANREAC)
o Cordero”
which show
erved in the
tational proc
eological m
nd) with co
the experim
ays to ensu
ate of 10 s-
ions are su
ution, from 0
FIGURE
D METHOD
ared for thi
r), citric aci
ntent of pol
was analyt
brand. Thi
ws that the
e figure 1.
cessing ima
measuremen
axial cylind
ments thank
ure its repe-1 during 30
ubjected to
0.1 s-1 to 20
1. Gofio part
DS
s study are
id and cana
lysaccharide
tical grade.
is material
material m
Likewise,
ages techniq
nts have be
ders geome
ks to a Pelti
atability an
0 seconds.
a series o
00 s-1.
ticles (SEM)
composed
ary gofio. It
es and flavo
Finally, the
has been s
morphology
particles av
ques, resultin
een carried
etry. The tem
ier system.
nd reproduc
After this,
of discrete
).
of 3 comp
has been u
onoids reac
e canary go
subjected to
is very sim
verage size
ng in (11.6
To form
leaf was
separating
it was ad
equivalent
equal to 0
Vera. The
ingredient
where the
supplying
dispersion
d out in a
mperature h
A pre-shea
cibility. Thi
the steady
shear rate
ponents: pla
used a 3 yea
h its maxim
fio has been
o Scanning
milar to sphe
has been c
± 1.6) µm.
the dispers
cut from
g the gel fro
dded an a
t to obtain
0.089% so a
e homogene
ts by using
e gofio is g
the necess
ns of 0-30%
Malvern G
has kept co
ar protocol h
is protocol
shear flow
values fo
ant of Aloe
ars old plant
mum levels2
n supplied
g Electron M
erical geom
calculated b
sions a fres
the Aloe V
om the epide
amount of
n a mass
as to stabili
eous mixtu
a beater is t
going to be
sary quantit
w/w.
Gemini 150
onstant at (2
has been se
consists in
w curve beg
llowing a
Vera (Aloe
t in order to2. The citric
by “Ramón
Microscope
metry, as can
by mean of
sh and ripe
Vera plant
ermis. Later
citric acid
percentage
ze the Aloe
ure of these
the medium
e dispersed
ty to make
0 rheometer
20.0±0.1)ºC
et before all
n a constant
gins and the
logarithmic
e
o
c
n
e
n
f
e
,
r,
d
e
e
e
m
,
e
r
C
l
t
e
c
132

RESULTS AND DISCUSSION
Steady shear viscosity of Gofio/Aloe Vera system
The results for steady shear flow curves obtained for each dispersion with different gofio %w/w
is shown in Figure 2. Shear-thinning behavior is observed for all samples, being more evident
and monotonous as the gofio mass percentage is greater. This behavior can be justified by the
phenomena deriving from the manifestation of hydrodynamic resistance forces that arise due to
displacement of gofio suspended in Aloe juice system when a shear rate is applied. These forces
cause the break of the initial agglomerates into smaller aggregates, which suffer reorganization
within the dispersing medium. This particles orient along the flow lines and, therefore, the
apparent viscosity of the system decreases. In order to characterize the rheological properties in
steady state of the suspensions of gofio in Aloe Vera, results have been fitted to Ostwald-de
Waele model or power-law. This model is represented by equation (1).
1· nKη γ −= & (1)
FIGURE 2. Viscosity evolution in steady flow curve
133

As it can be observed in the Table 1, K is higher than 1 when the gofio concentration is
22.5 %w/w or higher. As it was expected, the flow behavior index is lower than the unit in all
cases, confirming the shear-thinning response for all samples. On the other hand, the larger the
gofio concentration is, the higher the K values are. It is interesting to note that a small shear-
thickening effect is observed in the dispersant phase, which disappears when the gofio
concentration increases. Future works will be made in order to seek an explanation for this result.
TABLE 1. Ostwald de Waele parameters for different gofio-aloe juice systems.
Gofio (%w/w)
K (Pa·sn)
n
5.0 0.095±0.004 0.556±0.003
7.5 0.125±0.004 0.56±0.02 10.0 0.256±0.005 0.51±0.0112.5 0.279±0.006 0.46±0.0115.0 0.278±0.008 0.39±0.02 17.5 0.588±0.008 0.52±0.0120.0 0.775±0.008 0.481±0.00822.5 1.156±0.007 0.601±0.004 25.0 2.99±0.01 0.615±0.00430.0 4.20±0.03 0.685±0.005
CONCLUSIONS
Aloe vera/gofio systems show shear-thinning behaviour for all the concentration range evaluated
in this study, being satisfactory fitted by power law. This is due to the prominence of the
hydrodynamics forces during shearing process.
REFERENCES AND NOTES
1. Lad, V.N.; Murthy, Z.V.P., Journal of Food Engineering, 2013, 115, 279-284.
2. Hu, Y.; Xu, J.; Hu, Q., Extracts. J. Agric. Food Chem. , 2003, 51 (26), 7788–7791.
134
Th
F.J. 1DEC2Dep
Corresp
ABSTR
Somviscositystudied plate geo
Our processe
It hatemperatNewtoniboth oilsmaterial
KEYWOrate
INTRO
Biofuel
and a c
causes c
compris
process
and em
studies
blends 9
the oils
hermo-me
LRubio-Hern
CEM, Universpto. de Física A
pondence to
RACT
me experimeny variation oat shear rateometry. The
interest fores for which
as been obseture resultinian behaviors, under the l. More preci
ORDS: strai
ODUCTION
ls have an i
cleaner ene
combustion
se heating,
ses demand
mulsions to
were perfo9-11 but alw
present a N
echanical
L. Goyos-Pénández2, N.
sidad de las FAplicada II, U
o: N.M. Páez
nts have beeof castor and es close to 50
temperature
r this specifwe are check
rved that theng in a decrer if it is assum
same test coisely, the effe
ight vegetab
N
important r
ergy perspe
n problems i
blending w
a precise k
control the
ormed to ch
ways limited
Newtonian b
l behavior
érez1, A.J. PM. Páez-Fl
uerzas ArmadUniversidad de
z-Flor (E-m
en designed tcoconut oils
0000 use of the samp
fic research king several
e internal fricease in the vmed the proconditions, haect is more m
ble oil, castor
role in the f
ective1,2. Un
in diesel eng
with diesel fu
knowledge
e oil flow t
haracterize
d to low she
behavior wh
r of veget
Pazmiño-Renor1, L.M. C
das, Avda. Grae Málaga, C/D
mail: nmpaez
to discriminas at very higing a DH Rh
ples has been
is because fluid materia
ction that devviscosity, whcess is isotheas shown tha
marked in the
r oil, coconu
future energ
nfortunately
gines and bu
fuel and mo
of thermo-
through the
the rheolog
ear rate valu
hile some bl
table oils a
ntería1, R. DCarrión-Mat
al. Rumiñaui sDoctor Ortiz R
ate the thermgh shear ratesheometer (T
n controlled w
these high als.
velops in thehich could bermal. The coat the relevae castor oil th
ut oil, viscos
gy matrix b
y the viscos
urners3-5. E
re recently
physical pr
e fuel syste
gical behav
ues, below 5
lends show
at very hi
Delgado-Gatamoros1, A
s/n, SangolquRamos s/n, Má
u.ec)
mal and the ms. The mech
TA Instrumenwith a Peltier
shear rates
e material cabe erroneousomparison o
ance of this bhan in cocon
sity, plate-pla
because the
sity of the
xplored sol
the emulsif
roperties of
em and its
ior of strai
5000 s-1. Th
non-Newto
igh shear
arcía1, A.I. Gómez-
í (Ecuador) Cálaga (Spain) C
mechanical canical behavnts) equippedr system.
are present
auses a rise inly confused
of the results behavior dep
nut oil.
ate geometry
eir renewabl
straight ve
utions for th
fication6-8. A
f the oil and
atomization
ght vegetab
hese studies
onian behav
rates
-Merino2
CP 170501
CP 29071
causes of thevior has beend with plate-
in spraying
n the samplewith a non-obtained for
pends on the
y, high shear
le character
egetable oil
his problem
All of these
d its blends
n. Different
ble oils and
s concluded
vior12,13. The
e n -
g
e -r e
r
r
l
m
e
s
t
d
d
e
P11 P11
P11
135

present study has the aim to characterize the oils behavior under shear rates close to the
atomization conditions and to establish the potential sources of erroneous behavior interpretation
to properly evaluate the rheological test.
MATERIALS AND METHODS
Tests were performed using medical-grade of two oils: coconut and castor. The coconut oil was
used to visualize the differences in relation with the castor oil, base of this study. The thermo-
rheological properties were determined by using the rotational rheometer RH-2 Discovery (TA
Instruments), with plate-plate geometry of 25 mm in diameter. Torque measurement resolution
was 0.05 nNm. This configuration was able to reduce the gap till a value which ensures a shear
rate value as high as 49000 s-1. This configuration also minimizes the possibilities of secondary
flows which could appear in the concentric cylinders and cone-plate geometries. The temperature
measurement and control was performed by a Peltier device with an accuracy of ± 0.1 °C. All
measurements were repeated at least three times and the results were averaged for the subsequent
analysis.
RESULTS AND DISCUSSION
A flow ramp test was performed to castor oil at 20, 25, 50 and 80 o C. Results are shown in Fig. 1
(viscosity curve). Castor oil behaves as a Newtonian fluid at temperature of 80 oC, as it is
expected. The slight decrease in the viscosity at the beginning of the test is probably due to the
flow-out of the oil from the geometry because the little gap used and the high temperature
applied. During the rest of the test there are only very small changes in the viscosity value.
However, the flow ramp at 20 oC shows a continuous and significant reduction in viscosity,
changing from 0.822 Pa·s to 0.433 Pa·s. This viscosity reduction could be erroneously confused
with shear thinning behavior14. The explanation we propose for this result lies in the
characteristics of the test itself and the density of the oil. Certainly, the “isothermal test” is not
really isothermal. The equipment ensures the temperature settled only in the surroundings of the
Peltier device or, in a most specific manner, in the surroundings of the temperature sensor
position. As well a zone is far away from this position the possibility of a different temperature
increases. This risk may be negligible under typical gaps values but, when an extremely little gap
136
is used
high str
increase
Figure 1
To con
started
but with
the sam
Figure
reached
value c
depende
isotherm
fluid sta
The sam
behavio
Newton
to achieve
ress rate tes
es the tempe
1. Steady vis
nfirm this h
at room tem
hout any tem
mple during
1. During t
d a value of
orrespondin
ence of the
mal tests eli
atus and enh
me test was
or of cocon
nian behavio
high shear
st on high d
erature in zo
scosity curve
hypothesis a
mperature (2
mperature c
g the test. R
this test the
f 26.7 oC. T
ng to the 25
e viscosity
iminates the
hances the r
s performed
nut oil whe
or. The non
stress rate,
density fluid
ones not co
e for castor an
a non-contr
21 oC) and
control. The
Results obta
e temperatu
The viscosity
5 oC isothe
of a liqui
e possibility
role of the t
d using coco
en an isothe
n-controlled
the risk can
ds enhance
ontiguous to
nd coconut o
rolled temp
has been pe
e Peltier dev
ained for c
ure of the c
y drops to a
ermal flow t
id. This ag
y to think ab
emperature
onut oil. Re
ermal test a
d temperatur
n becomes
s the intern
the Peltier
oils.
perature test
erformed in
vice only lim
oconut and
castor oil in
a value of 0
test, which
greement b
bout a beha
increase in
esults are o
at 20 oC is
re test show
greater. Ad
nal friction
device.
t (Tm) was
n the same w
mited to rec
d castor oils
ncreased co
0.273 Pa·s,
is coheren
etween the
vior intrinsi
n the behavi
ver impose
s applied ev
ws, however
dditionally, t
forces in th
s performed
way the isot
cord the tem
s are over
ontinuously
slightly low
nt with the t
e isotherma
ically depen
or.
ed in the Fig
vidences th
r, the same
the use of a
he fluid and
d. This test
thermal one
mperature of
imposed in
and finally
wer than the
temperature
al and non-
ndent of the
gure 1. The
he expected
Newtonian
a
d
t
e
f
n
y
e
e
-
e
e
d
n
137

behavior but reflects an increase of the temperature in the sample (around 2 oC). This different
result is due to that there was no remarkable internal friction because the lower density of the
coconut oil.
CONCLUSIONS
A flow ramp test was performed to castor oil at 20, 25, 50 and 80 o C. The flow ramp at 20 oC
shows a continuous and significant reduction in viscosity which could be erroneously confused
with shear thinning behavior. We have justified this result showing that the assumed “isothermal
test” is not really isothermal. This hypothesis has been confirmed making a non-controlled
temperature test with castor oil and also with coconut oil. These results have lead to the main
conclusion of this work, i.e. the assumption of “isothermal test” in shear rheometry tests at very
high shear rates is wrong. This result is enhanced in materials with a higher density value.
ACKNOWLEDGEMENTS
The authors acknowledge the contribution of Programa Prometeo, SENESCYT, by the
scholarship granted to L.G.P.
REFERENCES
1 A. K. Hossain, P. A. Davies, Renewable Energy 2010, 35, 1-13. 2 A. S. Ramadhas, S. Jayaraj, C. Muraleedharan, Renewable Energy 2004, 29, 727–742. 3 J. Galle, S. Verhelst, R. Sierens, L. Goyos, R. Castaneda, M. Verhaege, L. Vervaeke, M. Bastiaen, Biomass & Bioenergy 2011, doi:10.1016/j.biombioe.2012.01.041. 4 R. D. Misra, M. S. Murthy, Renewable and Sustainable Energy Reviews 2010, 14, 3005-3013. 5 S. Nettles-Anderson, D. Olsen, SAE Tech. Paper Ser. 2009. 6 E. A. Melo-Espinosa, R. Piloto-Rodríguez, L. Goyos-Pérez, R. Sierens, S.Verhelst, Renewable and Sustainable Energy Reviews 2015, 47, 623–633. 7 S. Bajpai, P. K. Sahoo, L. M. Das, Fuel 2009, 88, 705–711. 8 S. Bari, T. H. Lim, C. W. Yu, Renewable Energy 2002, 27, 339-351. 9 L. M. Diamante, T. Lan, Journal of Food Processing 2014, 2014, Article ID 234583, 6 pages. 10 B. Esteban, J.-R. Riba, G. Baquero, A. Rius, R. Puig, Biomass and bioenergy 2012, 42, 164-171. 11 H. Yalcin, O. S. Toker, M. Dogan, Journal of Oil Science 2012, 61, 181-187. 12 W. W. Focke, L. Moyo, F. J. W. J. Labuschagne, N. G. Hoosen, S. Ramjee, M. Saphiannikova, Colloids and Surfaces A: Physicochemical and Engineering Aspects 2014, 443, 391–397. 13 C. Bower, C. Gallegos, M. R. Mackley, J. M. Madiedo, Rheol. Acta 1999, 38, 145-159. 14 C. J. Pipe, T. S. Majmudar, G. H. McKinley, Rheol. Acta 2008, 47, 612–642.
138

Rheological characteristics of chia - flaxseed composite paste
F.G. Gómez-Merino1, J. Aguiar, J.M. Jiménez-Delgado
1, J. Rubio-Merino
3, N.M. Páez-Flor
2, A.I. Gómez-
Merino1, F.J. Rubio-Hernández
1
1Departamento de Física Aplicada II, Universidad de Málaga, Málaga (Spain) CP 29071
2DECEM, Universidad de las Fuerzas Armadas, Sangolquí (Ecuador) CP 170501
3 Unidad Docente Multiprofesional de Atención Familiar y Comunitaria Distrito Málaga-Guadalhorce, Málaga (Spain)
Correspondence to: A.I. Gómez-Merino (E-mail: [email protected])
ABSTRACT
The flow and viscoelastic characteristics of chia-flaxseed composite paste were determined.
Moreover, the effects of pH (4.4-5.5) and olive oil concentration (0-0.5) on rheology and physical
stability of the resulting emulsions were studied. Oscillatory measurements showed that the mixture
exhibited gel-like behaviour.
KEYWORDS: Functional food, Flaxseeds, Chia seeds, Hydrocolloids, Rheology
INTRODUCTION
Due to the increased awareness of consumers towards health; a demand for functional
foods has risen dramatically. Flaxseed (Linum usitatissimum) and Chia (Salvia hispanica L.)
seeds are used as a potential source for functional food due to its unique nutrient profile. Chia
seeds are composed of proteins, lipids, carbohydrates and have high fiber content. These seeds
contain a large amount of antioxidants, minerals and vitamins. Both chia and flaxseeds are rich
in polyunsaturated omega-3 and omega-6 fatty acids, which constitute the central nervous system,
total fatty acids, α-linolenic acid (ALA)1.
Hydrocolloids are a diverse group of long-chain polymers that are readily dispersive,
fully or partially soluble, and prone to swell in water. They change the physical properties of the
solution to form gels, or enable thickening, emulsification, coating, and stabilization2. The aim of
the present work is to characterize the rheological properties of chia-flaxseed composite paste as
a possible substitute of eggs, yoghurt, etc. or to enhance the nutritional and sensorial properties
P12
139

of foods. The effect of some conditions such as olive
oil concentration, pH, and ionic strength was
evaluated.
MATERIALS AND METHODS
Commercially ecological chia and flaxseed
were used in this study. The content of chia was: fat
31.0 % (omega-3-18.6%) ; protein 20.0, carbohydrates 39.9 %;
salt content 0.04 %; and flaxseed was: fat 42.2 %;
carbohydrates 28.8%; protein 18.3 %; salt content 0.0075; milled chia-flaxseed particles
presented a size distribution between 200-1000 µm, obtained by DLS measurements. Samples
were prepared by mixing 250 g of chia:flaxseed (1:1) composite flour in 20 ml of deionised
water. The mixture was stirred for two hours at 500 rpm. For all samples 1M of NaCl was added
and the influence of acetic acid and olive oil was tested. The resulting paste was left overnight
stored at 4 ºC. Rheological experiments were carried out with a Peltier system for the control of
the temperature, on a MARS III (Thermo-Haake, Germany) using a plate-plate sensor system
with a diameter of 20 mm. Experiments were conducted under steady shear. Flow curves were
conducted under steady shear. Strain sweep was performed to determine the linear viscoelastic
region at 1 Hz. Frequency sweep was carried out at a range of 0.01-10 Hz. Three measurement
replicates were recorded for each sample. All measurements were performed at 25.0±0.1 ºC.
RESULTS AND DISCUSSION
It has been described elsewhere a tentative structure of the basic unit of the chia
polysaccharide (Lin et al. (1994)) as a tetrasaccharide with 4-O-metil-α-D-glucoronopyranosyl
residues occurring as branches of β-D-xylopyranosyl on the main chain and the flaxseed
mucilage components3 as pectic-like polisaccharides containing L-rhamnose, D-galactose and D-
galacturonic acid as well as β-D-1,4-xylan backbone of the arabinoxylan component. When the
composite milled seeds are in contact with water the mucilage small filaments appear as a
completely developed filiform structure which is uniformly distributed forming a framework
where other molecules could be coupled4. Fig. 1 shows the viscosity curve of the chia-flaxseed
Figure 1. Viscosity curve of the
chia-flaxseed composite paste.
140

composite paste. In all cases [NaCl] 1 M was added and the total volume of the liquid phase was
kept constant. It exhibits pseudoplastic flow behaviour, as described elsewhere5. Besides, the oil
addition leads to an increase in the viscosity of the paste. This result is reasonable because the
water-oil emulsion increments the system viscosity. Although rigid hydrocolloids are not
considered classical emulsifiers they can be regarded as stabilizers due to their hydrophilicity,
high molecular weight and gelation behavior. However, they retard precipitation of dispersed
solid particles and coalescence of oil droplets3. Therefore, the increasing of viscosity can be
tentatively explained considering the mucilage structure as the framework in which the oil drops
are trapped. The proteins present in chia and flaxseed can possess flexible molecular structures
(spheroproteins) which, when denatured, result in rapid adsorption and rearrangement at the
interface to give a coherent macromolecular protective layer surrounding the oil drop and
preventing coalescence. But when the amount of oil increases and the continuous phase is olive
oil the hydrocolloid gel structure is not able to trap all the available oil drops and the emulsion
becomes unstable. On the other hand, the addition of acetic acid affects also the viscosity of the
paste. Thus, from Fig 1, the pH effect can also be observed. It was always kept under the protein
isoelectric point (IEP), pH 7, which promotes the system stability. The less viscous paste
corresponds to the lowest pH value, 4.4. The explanation of this behaviour resides in the higher
charge of the protein molecules due to the protonation of the carboxyl group which facilitate its
emulsifier action. As a result, rigid gels are formed at acidic pH values. In some cases,
denaturation can be shifted to lower temperatures with decreasing pH. Another interesting result
is the compatibility of protein-hydrocolloid even at high ionic strength, 1 M NaCl. Figs. 2 and 3
depict the frequency sweep in the linear elastic region of the same samples shown in Fig.1. In all
Figure 3. Frequency sweep, γ=0.05. pH effect. Figure 2. Frequency sweep, γ=0.05. Oil addition effect.
141

cases a gel-like structure is formed since the elastic modulus is always greater than the loss
modulus. In fact, it is the emulsion structure and in this case the system is weakly structured. Fig.
2 compares the influence of the olive oil addition to the mixture. Despite the rheological
characteristics of the tested samples are quite similar to that of chia-flaxseed composite the
increase of olive oil reinforces the gel-like structure until the limit of the emulsion stability. In
this system, oil volume fractions higher than 0.5 make the mixture unstable. Likewise, the pH
slightly modifies the elastic properties of the mixture. But if a denaturation of the proteins occurs
an increase in the elastic modulus, G´, will be expected6. Therefore, according to Fig. 3 moderate
conditions of pH and ionic strength do not considerably affect the elastic properties of this
system.
CONCLUSIONS
The flow behaviour and microstructure characterization of the chia-flaxseed composite
paste as a possible functional food was studied. The addition of olive oil, sodium cloride and
acetic acid (pH) was examined for different purposes: salad dressing, beverages, egg white
replacement, etc. Under the pH and olive oil volume fraction conditions studied a good
compatibility of the different components (hydrocolloids and proteins) was found.
Although this previous work suggests promising results a more detailed study should be
carried out in order to get better knowledge of the different processes that take place during
mixing components, heating, etc. Under this point of view temperature influence as well as
interface and spectroscopic studies will be considered.
REFERENCES
1. Ayerza, R.; Coates, W., Tropical Science, 2004, 44, 131–135.
2. Pin, J.M.; Nie, S.P., Food Hydrocolloids, 2015, doi:10.1016/j.foodhyd.2015.01.035
3. Cui, W., Mazza G.; Biliaderis C.G., J. Agric. Food Chem., 1994, 42, 1891–1895.
4. Muñoz, L.A.; Cobos A.; Diaz, O.; Aguilera, J.M., Journal of Food Engineering, 2012,108, 216-224.
5. Qian, K.; Cui, S.; Wu, Y.; Goff, H., Food hydrocolloids, 2012, 28, 275-283.
6. Nishinari, K.; Fang, Y.; Guo, S.; Phillips, G. O., Food Hydrocolloids, 2012, 39, 301-318.
142

Acorn bread development – texture characterization
Nuno Alvarenga1,2
, Bruno Nunes1, Nuno Burrica
1, Bárbara Candeias
1, Neide Loução
1
João Dias1
e Maria João Carvalho1
1IPBeja - Escola Superior Agrária Rua Pedro Soares, 7801-902 Beja – Portugal
2LEAF – ISA-UL, Tapada da Ajuda, 1349-017 Lisboa, Portugal
Correspondence to: Nuno Alvarenga ([email protected])
ABSTRACT
In Portugal, bread is a food historically indispensable on daily diet, present in all
regions, under different recipes. Since acorn it’s a product that isn’t much used in
human diet, was decided to produce a different type of bread. It were produced three
types of bread: one with 25% of acorn flour and 75% of wheat flour with 1.5% of salt
(Sodium chloride), a second one with 50% of acorn flour and 50% of wheat flour with
1.5% of salt, and a third one with 50% of acorn flour and 50% of wheat flour with 2.0%
of salt. So the main goal was to compare the differences between the breads with
different acorn flour percentages and how the salt could affect the bread, mainly its
texture, nutritional and hedonic sensory analysis. Nutritionally it’s possible to find some
differences between moisture and proteins content in all breads (P<0.05). The driest
bread was the bread with 2.0% of salt and the bread with more water was the bread with
50% of acorn flour with 1.5% of salt. The bread with 25% of acorn flour had the highest
protein content, due to the high content on wheat flour. Analysing the color, the bread
with 25% of acorn flour is the lighter bread, but there are no significate difference
between this one and the bread with 2% of salt, as expected. In terms of the breads
rheology behaviour, it’s possible to see that the bread with 25% of acorn flour was the
softest of all three breads, with a 9.90 N of hardness and only 56.31 N.mm of
compression work. Comparing the breads with 50% of acorn bread, it’s possible to see
that the bread with 2.0% of salt was harder than the bread with 1.5% of salt. The
compression work was also higher in the bread with 2.0% of salt than the bread with
1.5% of salt. Finally, the bread with more sensory acceptance was the bread with 50%
of acorn flour and with 1.5% of salt.
KEYWORDS: Acorn, Bread, Rheology, Sensory Analysis, Salt
INTRODUCTION
Worldwide bread consumption accounts for one of the largest consumed foodstuffs, it’s
over 20 billion pounds (9 billion kg) of bread being produced annually [1]. In Portugal,
bread is a food historically indispensable on daily diet, present in all regions, under
different recipes, manufacturing, shapes and flavour. The whole wheat bread offers a
substantial amount of mineral salts and fibres, because of economical and nutritional
P13
P13
143

reasons, with a constant increase of consumption [2]. Wheat is a very important cereal
crop for human food production. This reflects the unique ability of wheat flour to
produce viscoelastic dough when it is mixed with water. The principal characteristic
that governs the wide usage of wheat flour is the viscoelasticity of the gluten network
formed by its major protein fractions: the polymeric glutenins and the monomeric
gliadins [3]. The structure of gluten proteins and their interactions can also be affected
by solvent environment upon hydration, including the presence of salt. This is because
salt acts as a co-solute and influences the hydration of wheat proteins and starch under
the particular moisture conditions during the manufacture of a diverse range of products
including bread, breakfast cereal, pasta, and Asian noodles [3]. Salt plays an important
role in baked dough products and related processes. It is generally used at levels of
about 1–2% (based on flour weight), and acts as a flavour enhancer and as stabilizer for
the yeast fermentation rate, but it also plays an important role in baked dough products.
Up until now, most of the studies have been focused on the effects of salt on the
rheological properties of wheat flour dough, however, it seems that firstly, salt affects
the formation of the gluten network during the initial hydration of the gluten proteins
when wheat flour is mixed with water and then the rheological properties as a result of
the gluten network formed in the presence of salt [3]. Acorn have been a part of the
local diet for some time, furnishing up to 25% of the food consumed by the poorer
classes of Italy and Spain, and are consumed in the form of bread cake and as a coffee
substitute [4]. The use of acorn in local diet and empirical treatment of some human
diseases such as diarrhea can be use by some people, like the Iranians, but due to its
bitter constituents, wooden texture and astringent taste, acorn is scarcely used in normal
diet. However, it’s wide spread availability and empirical use for medical purposes
suggest some possibilities of using acorn in food and drug industries [5]. Analysing the
microstructure of rehydrated water-wash (WW), salt-wash (SW) and fresh wet gluten,
the gluten network formed when NaCl was used in the mixing of the flour, a fibrous
structure was observed in contrast to those without NaCl for which large aggregates of
gluten were seen. This study also showed, by dynamic oscillatory rheology, that the
gluten structure exhibited relatively less elastic behaviour or more viscous behaviour
when gluten was prepared in presence of NaCl [3].
The sensory quality of bread, an important component of total product quality, can be
evaluated by analytical (objective) methods, namely with texture instrumental methods,
however, it’s also required a well-trained testing panel and the use of specific and
144

adequate attributes that are easily perceived and differentiated for different bread
samples [6]. So the main goal of this project was to see and compare the differences
between the breads with different acorn flour percentages and how the salt could affect
the bread, mainly its texture, nutritional and hedonic sensory analysis.
MATERIAL AND METHODS
It were produced three types of bread: one with 25% of acorn flour and 75% of wheat
flour with 1.5% of salt (Sodium chloride), a second one with 50% of acorn flour and
50% of wheat flour with 1.5% of salt, and a third one with 50% of acorn flour and 50%
of wheat flour with 2.0% of salt. The hedonic method was carried out in a single day
and the subjects were asked to rate each sample using a numerical scale with the
extremes from 1- “Extremely disliked” and 9 - “Extremely liked” [7]. In this sensory
session it was tend to be perceived in the following order: appearance, color, crust
hardness, crumb texture and flavour [8].
A texture analyser TAHDi (Stable Micro Systems, Godalming, UK), equipped with a
250 N load cell, was used to perform the texture analysis at 20±1 °C. The procedure
was implemented by slices of 20 mm compression, with a 20 mm diameter aluminium
cylindrical probe, being the depth of compression 10mm. The crossed speed was 1mm
s-1
. Texture measurements were performed in quintuplicate. Hardness values were
obtained from the force vs. time texturograms [9].
RESULTS DISCUSSION
Nutritionally it’s possible to find some differences between moisture and proteins
content in all breads (P<0.05). The driest bread was the bread with 2.0% of salt and the
bread with more water was the bread with 50% of acorn flour with 1.5% of salt. Related
with proteins content the bread with 25% of acorn flour had the highest content, due to
the high content on wheat flour. Relatively to ash content, fat, fibre and carbohydrates
there are no significate difference in all three breads. Analysing the color, the bread with
25% of acorn flour is the lighter bread, but there are no significate difference between
this one and the bread with 2% of salt, as expected. In terms of the breads rheology
behaviour, it’s possible to see that the bread with 25% of acorn flour was the softest of
all three breads, with a 9.90 N of hardness. Comparing the breads with 50% of acorn
flour, it’s possible to see that the bread with 2.0% of salt was harder than the bread with
145

1.5% of salt (Figure 1a) but the bread with 50% of acorn flour and with 1.5% of salt
The most accepted in sensory analysis (Fig 1b).
Figure 1. (a) Texture profile and (b) sensory analysis of breads with i) 50% of acorn
flour and 2% salt , ii) 50% of acorn flour and 1.5 % salt
and iii) 25% of acorn flour and 1.5 % salt .
CONCLUSIONS
In terms of the breads rheology behaviour, it’s possible to see that the bread with 25%
of acorn flour was the softest of all three breads. Comparing the breads with 50% of
acorn bread, it’s possible to see that the bread with 2.0% of salt was harder than the
bread with 1.5% of salt. Finally, the bread with more sensory acceptance was the bread
with 50% of acorn flour and with 1.5% of salt.
REFERENCES
[1] – Heenan, S., Dufour, J., Hamid, N., Harvey, W., Delahunty, C. (2008). Food
Research International, 41 989-997
[2] – Battochio, J., Cardoso, J., Kikuchi, M., Macchione, M., modolo, J., Paixão, A.,
Pinchelli, A., Silva, A., Sousa, V., Wada, J., Wada, J., Bolini, H. (2006). Ciênc. Tecnol.
Aliment., 26 428-433
[3] – Tuhumury, H.C.D., Small.D.M., Day. L. (2014). Journal of Cereal Science, 60
229-237
[4] – Rakić, S., Povrenović, D., Tešević, V., Simić, M., Maletić, R. (2006). Journal of
Food Engineering, 74 416-423
[5] – Tadayoni, M., Sheikh-Zeinoddin, M., Soleimanian-Zad, S. (2015). International
Journal of Biological Macromolecules, 72 179-185
[6] – Callejo, M., Vargas-Kostiuk, M., Rodríguez-Quijano, M. (2015). Journal of
Cereal Science, 61 55-62
[7] M. Laureati B. Giussani, E. Pagliarini (2012). Food Research International 46
326–333.
[8] – Kihlberg, I., Ӧström, Å., Johansson, L., Risvik, E. (2006). Journal of Cereal
Science, 43 15-30.
[9] – Alvarenga, N., Canada, J. Sousa, I. (2011). Journal of Dairy Research, 78 80–87.
i
ii
iii
(a) (b)
146

Effect of chia flour addition on rheological behaviour of quinoa flour dough
F.G. Gómez-Merino1, J. Aguiar, J.M. Jiménez-Delgado
1, J. Rubio-Merino
3, N.M. Páez-Flor
2, A.I. Gómez-
Merino1, F.J. Rubio-Hernández
1
1Departamento de Física Aplicada II, Universidad de Málaga, Málaga (Spain) CP 29071
2DECEM, Universidad de las Fuerzas Armadas, Avda. Gral. Rumiñaui s/n, Sangolquí (Ecuador) CP 170501
3 Unidad Docente Multiprofesional de Atención Familiar y Comunitaria Distrito Málaga-Guadalhorce,Málaga (Spain)
Correspondence to: A.I. Gómez-Merino (E-mail: [email protected])
ABSTRACT
The flow and viscoelastic properties of quinoa-chia flour for bread making were studied.
The addition of chia flour was 5, 10, 20 and 30 % of the solid weight. The viscosity of the
mixtures was higher than the wheat dough. Oscillatory measurements showed that the doughs
with chia presented gel-like behaviour due to its elastic properties. Compared to quinoa this
formulation exhibited an increase in the volume and good sensory acceptance.
KEYWORDS: Functional food, Quinoa, Chia seeds, Hydrocolloids, Rheology
INTRODUCTION
Quinoa (Chenopodium quinoa Willd.), which is considered a pseudocereal or
pseudograin, has been recognized as a complete food due to its protein content (15%) but also
from its great amino acid balance. Besides, it is an important source of minerals, vitamins,
polyphenols, phytosterols, and flavonoids with possible nutraceutical benefits. For that reason
and for the absence of gluten, quinoa has recently been used as a novel functional food1. But the
absence of gluten, in these flours, results in major problems for many pasta and bakery products.
Attempts to use proteins from alternative flours as a partial substitute in wheat products have
generally been unsuccessful, accounted for the viscoelastic properties of wheat gluten proteins.
Hydrocolloids are a diverse group of long-chain polymers that are readily dispersive, fully or
partially soluble, and prone to swell in water and can form gels, or enable thickening,
emulsification, coating, and stabilization. Chia (Salvia hispanica L.) seeds are used as a potential
source for functional food due to its unique nutrient profile. It contains proteins, lipids,
P14
147

carbohydrates, high fiber content (hydrocolloids) and polyunsaturated omega-3 and omega-6
fatty acids. The main objetive of this work is to study the rheological characteristics of quinoa-
chia for bread making. Thus, steady shear and dynamic oscillatory tests were performed.
MATERIALS AND METHODS
Commercially ecological chia seeds were used in this study. The content of chia is: fat
31.0% (omega-3-18.6%); protein 20.0%, carbohydrates 39.9 %; salt content 0.04 %.
Commercially ecological quinoa flour has protein 20.0%, carbohydrates 60.8 %; fat 5% and fiber
6.6 %. Samples with different content of chia flour were prepared mixing a certain amount of
chia flour in 10 ml of deionised water. The mixture was stirred for two hours at 500 rpm until the
mucilage was released. An adequate amount of quinoa flour was added until 8.5 g of solid was
completed and stirred for 2 more hours. The resulting dough was left overnight and stored at 4 ºC.
The samples contained 5, 10, 20 and 30 % of chia flour. Rheological experiments were carried
out with a Peltier system for the control of the temperature, on a MARS III (Thermo-Haake,
Germany) using paralel plate (serrated) sensor system with a diameter of 20mm. Flow curves
were conducted under steady shear. Strain sweep was performed to determine the linear
viscoelastic region at 1 Hz. The frequency sweep was carried out at a range of 0.01-10 Hz.
Three measurement replicates were recorded for each sample. All measurements were performed
at 25.0±0.1 ºC.
RESULTS AND DISCUSSION
The rheological behaviour of gluten dough depends on its composition and
microstructure i.e. spatial arrangement of its constituents. Dough development involves the
hydration of gluten protein, the predominant fraction controlling the viscoelastic properties of
dough. A very simplified model of gluten at the molecular level consists of two classes of protein:
linear proteins, glutenins, and globular proteins, gliadins, which can be represented as spheres.
The linear proteins interact with each other via the loop and train mechanism and by disulphide
bonding2. As a first approximation, the chains are imagined to interact with the globular proteins
by non-bonding forces such as Van de Waals interactions. During mixing, glutenins tend to align
and form cross-links between gliadins molecules, leading to an increase in dough strength. The
amount of glutenin in flour was found to be positively correlated with dough strength while
148

Figure 1. Viscosity curve of quinoa-chia dough. Figure 2. Frequency sweep, γ=0.05.
gliadin promotes elongational resistance and dough extensibility. The hydrated gluten protein
network provides a framework for holding starch granules and trapping air cells. Wheat flour
dough is regarded as a composite material of starch granules embedded in a continuous gluten
protein network, which confers viscoelastic properties. However, quinoa proteins are mainly
globulin or spheroproteins (70 % of total proteins) which do not provide dough elasticity. Chia
seeds contain a significant quantity of oil as a linolenic acid (omega 3) and also dietary fiber, a
polysaccharide with a high molecular weight. A tentative structure of the basic unit of the
polysaccharide was proposed by as a tetrasaccharide with 4-O-metil-α-D-glucoronopyranosyl
residues occurring as branches of β-D-xylopyranosyl on the main chain. Immediately the milled
seeds are in contact with water, small filaments appear on the surface that began to stretch slowly
until they become fully extended. When the seeds are totally hydrated, these filaments (mucilage
fibers) are completely developed in a filiform structure which is uniformly distributed forming a
framework where other molecules, i.e. globulins, starch, etc. can be trapped3, 4
. The presence of
elongated branched aggregates results in an increasing of the system viscosity. Fig. 1 shows the
viscosity curves of the different tested samples. Considering the microstructure above explained,
the high viscosity of gluten can be easily explained due to the solid-like behaviour of the gluten
protein network. Chia mucilage has a similar rheological behaviour to gluten although is not as
rigid as gluten. This characteristic improves the texture quality of the dough. As we can see in
this figure, wheat dough is less viscous than gluten or chia and quinoa-water paste is the least
viscous, for the same solid concentration. Actually, the viscosity of the mixtures quinoa-chia is
in the suitable values taking into account that chia needs water to release the mucilage. Therefore,
for commercial purposes, in the mixtures quinoa-chia, for the same solid quantity, more water
should be added to prepare the dough. The results of the strain sweep are shown in Table 2.
Gluten has the largest linear elastic region and the highest crossover stress value, which is
149

consistent with its elastic
solid-like behaviour. On the
other hand, quinoa flour
exhibits the smallest values
of these parameters as a
consequence of the major content of spheroproteins in its microstructure which do not provide
elastc properties to the dough. Fig. 2 shows the frequency sweep of the different doughs. Gluten
and chia display similar values of the elastic and viscous moduli while quinoa shows the smallest
values. In all cases, the elastic modulus (G´) is higher than the viscous modulus (G´´). But wheat
flour presents a cross point at low frequencies in which G´´ exceeds G´, in agreement with the
Maxwell elastic model. The mixtures quinoa-chia display values of G´ and G´´ between those
exhibited by quinoa and chia, as it can be expected5,6
. The explanation of this fact can be found
in the interaction of the hydrocolloid filiform framework with the spheroproteins and starch
present in quinoa flour giving place to a more consistent cross-linked structure.
CONCLUSIONS
The flow properties of quinoa-chia dough were studied. In all the tested samples, the
elastic properties of the resulting dough were improved. After baking, the addition of chia
increased the volume of the loaf and exhibited good sensory acceptance. In future work the
temperature influence as well as salt addition and flavour enhancers will be considered.
REFERENCES
1. Lilian E. Abugoch J., Advances in Food and Nutrition Research, 2009, 58 1-31.
2. Shewry, P-S.; Popineau, Y.; Lafiandrax, D.; Belton, P., Trends in Food Science & Technology 11,
2001, 433–441.
3. Muñoz, L.A.; Cobos A.; Diaz, O.; Aguilera, J.M., Journal of Food Engineering, 2012, 108, 216–
224.
4. Nishinari, K.; Fang, Y.; Guo, S.; Phillips, G. O., Food Hydrocolloids, 2012, 39, 301-318.
5. Qian, K.; Cui, S.; Wu, Y.; Goff, H., Food hydrocolloids, 2012, 28, 275-283.
6. Lamacchia, C.; Chillo, S.; Lamparelli, S.; Suriano, N., La Notte, E.; Del Nobile, M. A., Journal of
food engineering, 2010, 96, 97-106
Quinoa 5% Chia 10% Chia
20% Chia 30% Chia
Chia Wheat
Gluten
γlinear-limit
(10-4) (-)
39.5±0.1 46.3±0.1 (41.2±0.1) (46.5±0.1) (55.9±0.1) 46.6±0.1 69.2±0.1 315±1
τcrossoverpoint
(Pa)
18.5±0.2 20.8±0.2 43.8±0.2 61.2±0.2 81.5±0.2 115.4±0.2 23.8±0.2 15330±1
TABLE 1. Strain sweep at 1 Hz
150

Influence of Modified Atmosphere Packing in texture of a typical Portuguese whey cheese cake “queijadas”
Nuno Alvarenga1,2
, Sara Nunes1, Manuela Costa
1, Carlos Ribeiro
1 e Maria João
Carvalho1
1IPBeja - Escola Superior Agrária Rua Pedro Soares, 7801-902 Beja – Portugal
2LEAF – ISA-UL, Tapada da Ajuda, 1349-017 Lisboa, Portugal
Correspondence to: Nuno Alvarenga ([email protected])
ABSTRACT
The objective of this work, was determinate the shelf life of a typical Portuguese whey cheese
cake named “Queijadas” produced with ewe’s whey cheese, honey and lemon. After
manufacture of samples, Modified Atmosphere Packaging (MAP) was used, with different
gases, like CO2, N2 and O2 on samples, in two different storages temperatures (20ºC and 26ºC).
During 30 days it was studied the water activity, the texture, the microbiology, moisture, ash
content, fat content, protein, fiber, the level of O2 and CO2 on the different samples in different
modified atmosphere packaging and the sensory analysis to see the overall acceptability from
the consumers. In this work it will be emphasized the texture and sensory analysis. It was
concluding that the suitable modified atmosphere packaging was the CO2 for 22 days of storage
at 20ºC, which allowed to stablish its shelf life, since this sample showed more acceptance and
hardness stability, during the time of work. It is important to remark that the only samples that
preserved the textural and sensory quality during 30 days were the samples packed in MAP with
CO2 (at 20 and 26 ºC).
KEYWORDS: “Queijadas”, Modified Atmosphere Packaging (MAP), Water Activity,
Texture and Sensory Analysis
INTRODUCTION
In the last few years there had been a huge research of traditional products made with
raw materials from each region, and one of those final products applications can be for
instance cakes manufacturing. Cakes are baked products highly appreciated by the
consumers worldwide, being characterized by a dense, tender crumb and sweet taste [1].
Among several traditional recipes from Alentejo province, there are specific cakes
named “Queijadas” which are considered stuffing cakes, being the stuff made with
whey cheese and eggs. These ingredients make those cakes very perishable, which fact
led to one of this research study goals, the evaluation of shelf life in different Modified
Atmosphere Packaging (MAP) at different storage temperatures. MAP may be defined
as ‘the enclosure of food products in gas-barrier materials, in which the gaseous
environment has been changed’ [2] in order to inhibit spoilage agents and therefore
P15
151

either maintain a higher quality within a perishable food during its natural life or
actually extend the shelf-life. This technique was specifically designed to overcome
some of the problems associated with (or in fact caused by) vacuum packaging, namely
to inhibit a wider range of microbiological spoilage agents and avoid compression
damage. With vacuum packaging the products are usually chill stored to maximise the
inhibitory effect. Three gases are generally used-oxygen (O2) nitrogen (N2) and carbon
dioxide (CO2), each of which has a specific function.
Texture is defined as the attributes of a substance resulting from a combination of
physical properties and perceived as the senses of touch, sight and hearing and the
evaluation of the foods texture is driven in the cause of mastication [3]. A product
texture can be evaluated by physicochemical properties measured objectively and by
sensory methods, and thus the relationship between consumer preferences and
rheological properties of foods is a key part of the science of rheology [4]. The objective
of this work, was to develop a typical Portuguese whey cheese cake named “Queijadas”
produced with ewe’s whey cheese, honey and lemon and research the influence of
package time and conditions in texture and acceptability.
MATERIAL AND METHODS
These “Queijadas” were considered stuffing cakes, being the stuff made with traditional
ewe’s whey cheese and eggs, which make it very perishable. Due to rights of enterprise,
the formula cannot be reported. After samples manufacture, Modified Atmosphere
Packaging (MAP) was used, with different gases mixtures of CO2, N2 and O2 on
samples, and storage at two different temperatures (20ºC and 26ºC). During 30 days it
was studied the water activity, the texture, total count microorganisms at 30ºC, moisture
content, ash content, fat content, protein, fibber, the level of O2 and CO2 on the samples
with different modified atmosphere packaging and sensory analysis to evaluate the
overall acceptability from the consumers. In this work it will be emphasized the texture
and sensory analysis.
Cake acceptability was conducted with 70 volunteer panellists of 18–60 years of age
from staff, undergraduate and postgraduate students and employees from IPBeja. All
the panellists, who were regular cake consumers, were asked to evaluate the samples on
the basis of acceptance of cake appearance, aroma, taste, texture and overall liking on a
seven-point hedonic scale (1=very disliked, 7=very liked) in manufacturing day.
152

A texture analyser TAHDi (Stable Micro Systems, Godalming, UK), equipped with a
250 N load cell, was used to perform the texture analysis at 20±1 °C. The procedure
was implemented by puncture with a 3 mm diameter aluminium cylindrical probe, at a
penetration depth of 10mm (the height of the sample was 30 mm), with a crossed speed
of 1mm s-1
. Texture measurements were performed in quintuplicate. Hardness values
were obtained from the force vs. time texturograms [5].
RESULTS DISCUSSION
In Table 1, it was established that the favourite sample was the QM with the traditional
ingredients, which had the highest scores in appearance, colour, texture and aroma, and
then preceded by sample K with the same recipe but without traditional products.
Table 1- Sensory Parameters on samples K and QM
SAMPLE APPEARANCE COLOUR TEXTURE AROMA FLAVOUR OVERALL
ACCEPTABILITY
K 6,08(1,15) 6,04(1,22) 6,02(1,16) 6,26(1,01) 6,51(0,83) 6,36(0,64)
QM 6,63(0,56) 6,45(0,58) 6,31(0,81) 6,36(0,71) 6,40(0,77) 6,40(0,98)
Legend: K – receipt without traditional whey cheese and honey. QM – receipt with traditional whey cheese and
honey
Figure 1 shows a texture profile of all samples storage at 20ºC and 26ºC in MAP CO2,
N2 e O2 through 30 days. It was noticeable that CO2 samples were very stable in
hardness along time but at 30 days and at both storage temperature the increase in
hardness was remarkable.
Figure 1- Hardness values on samples storage at 20ºC and 26ºC in MAP CO2, N2 e O2.
In the figure 2, it’s perceptible that the samples in general terms with more hardness in
terms of the average along time were the samples with the O2 atmosphere at 26ºC,
153

concluding that this is not an ideal gas in terms of results in texture. The packaging with
N2 atmosphere had the steadiest results during the storage days at both temperatures.
Figure 2 – Average texture profile of samples storage at 20ºC and 26ºC in MAP CO2, N2 e O2.
CONCLUSION
It was concluding that the suitable modified atmosphere packaging was the CO2 for 22
days of storage at 20ºC, which allowed to stablish its shelf life, since this sample had
shown more acceptance and hardness steadiness, during this research time. It is
important to remark that the only samples that preserved the textural and sensory quality
during 30 days were the samples Package in MAP with CO2 (at 20 and 26 ºC). Even in
terms of hardness the samples package in MAP with N2 was stablish, in terms of
microbiology analysis (data not shown) it was observed high microbiological
contamination and, for that reason, it wasn’t acceptable.
REFERENCES
[1] Paraskevopoulou, A., Amvrosiadou, S., Biliaderis, C., & Kiosseoglou, V. (2014).
Food Research International, 62 492–499.
[2] Young H, MacFie H, Light, N. (1988) Effect of packaging and storage Technology:
A Review.
[3] Jowitt, R. (1974). Journal of Texture Studies, 5 351–358.
[4] Menjivar, J. A. (1990). Fundamental aspects of dough rheology. In H. Faridi & J. M.
Faubion (Eds.), Dough rheology and baked product texture (pp. 1–28). New York: Van
Nostrand Reinhold.
[5] Alvarenga, N., Canada, J. Sousa, I. (2011). Journal of Dairy Research, 78 80–87.
154

Luis G. Baltazar1, Fernando M.A. Henriques1, Tiago Cardoso1, Maria Teresa Cidade2
1 Dpto Engenharia Civil, Faculdade de Ciências e Tecnologia, Universidade Nova de Lisboa, 2829-516
Caparica, Portugal
2Dpto. Ciência dos Materiais and Cenimat/I3N, Faculdade de Ciências e Tecnologia, Universidade
Nova de Lisboa, 2829-516 Caparica, Portugal
Correspondence to: Luis G. Baltazar ([email protected])
ABSTRACT In this study, the degree of wall slip on rheological measurements of injection grouts is investigated. Grouts can be seen as suspensions of binder particles in water which have a considerable fluidity in order to be successfully injected in many applications in civil engineering works such as consolidation of stone masonry walls. For the determination of wall slip in a rotational rheometer with parallel plates, stress controlled measurements at various gaps and different shear stress were carried out. Overall, our results revealed that wall slip is function of the shear stress and the grout composition. It was also found that the parallel plate with emery paper glued can be a solution to mitigate the slip. Results from this study can help to define an adequate measurement protocol to correctly infer the rheological properties of injection grouts by using parallel plates.
KEYWORDS: wall slip, injection grout, parallel plates, stone masonry
INTRODUCTION Stone masonry is a constructive technique invented thousands of years ago. Its simplicity and durability lead to an extensive use and it represents the large majority of old buildings in many urban centers across Europe. Stone masonry, a non-homogeneous and non-monolithic composite material, has particular weakness which, associated with the absence of maintenance, increase the vulnerability of its structural integrity. Grout injection is an interesting solution to repair and reinforce old stone masonry walls, particularly those built with two exterior skins of stonework and a ruble core (see Fig 1a). This consolidation method is defined as the introduction of a fluid material injected under pressure into the masonry inner core (Fig. 1). Injection grouts aim to fill cracks, voids and at same time enable the bonding between masonry elements which is essential towards masonry integrity (monolithic behavior). Grouts can be represented as biphasic system consisting of suspended particles (binder) in a continuous fluid phase (water). The efficacy of the grouts depends mainly on the injectability properties. Therefore, it is essential to evaluate the effectiveness of the injection grouts in terms of keeping their adequate properties. For that purpose controlling the rheological properties of grouts is crucial for successfully grouting process 1,2. Notwithstanding, during rheological measurements many phenomena can arise which can lead to test results having no value at all. Several authors 3,4,5 have shown that wall slip can play a significant role during the rheological measurements of cementitious materials leading to an underestimation of the yield stress values and inaccurate viscosity results. The aim of the present research is to determine the degree of wall slip effect during rheological measurements of injection grouts in order to define an adequate measurement protocol.
P41
P41
Multiphase Systems
155

FIGURE 1 a) Example of a section of stone masonry wall core being grouted. b) Stone masonry with
injection pipes. METHODS Rheological measurements were performed with a rotational rheometer (Bohlin Gemini HRnano), equipped with a plate-plate geometry (with Ø = 40mm). The best way to confirm the presence of wall slip is taking measurements with smooth and serrated plates. However, in this case the authors did not have both geometry types available for such a comparison and so they have used an application note of Malvern6, which says that evidence of slip can be obtained by performing stress controlled measurements at different gaps. If slip occurs then the slip velocity (Vs) will depend only on the applied shear stress (σ) but not on the gap (h). Thus by varying the gap and keeping the stress constant it is possible to determine the slip velocity and the true shear rate using Equation 1. This can be performed by plotting the measured shear rate against 1/h which should result in a straight line with gradient 2.Vs and intercept .
(1)
Where V is the velocity of the upper plate; is the measured shear rate and is the true shear rate. All rheological measurements were carried out at 20oC. Single shear measurements at various gaps of 1mm, 1.5mm, 2mm and 3mm using constant applied stresses of 10 Pa, 15 Pa and 20 Pa were conducted. The measured shear rate was then plotted against the inverse gap and a linear regression model fitted. This way the slip velocity and true shear rate can be estimated from the gradient and intercept respectively. MATERIALS The experimental program was conducted using a natural hydraulic lime (NHL) produced according to the European standard EN459-1:2010 and the following water/binder ratios (w/b) 0.45, 0.50 and 0.55 was used. NHL was chosen as binder, since it is a hydraulic binder that presents chemical and physical properties closer to those of preexisting materials in old masonries. A commercially available polycarboxylate ether superplasticizer (conforming to ASTM C494-05 Type F) with a constant dosage of 1wt% was used. RESULTS AND DISCUSSION Example of measured shear rate versus inverse gap is presented in Fig. 2 for NHL-based grout with water/binder ratio of 0.45 at different shear stresses. As previously mentioned to estimate the slip velocity a linear model fit was applied to the data with gradient of the line equal to 2.Vs and the intercept equal to the true shear rate. For the grout with water/binder of 0.45 the slip velocity was estimated to be 2.2mm/s, 3.8mm/s and 5.2mm/s and the true shear rate 0.7s-1, 1.4s-1 and 1.7s-1 for the shear stress of 10Pa, 15Pa and 20Pa, respectively. This is quite lower than the measured shear rate range 2-5 s-1, 4-9 s-1 and 5-12 s-1 for each shear stress, which suggest a significant degree of wall slip.
a) b)
156

FIGURE 2 Measured shear rate vs 1/gap at different shear stress for the grout with w/b of 0.45.
The profiles of measured shear rate versus gap obtained for the other water/binder ratios are presented in Fig 3 and Fig. 4. From Fig 3, it can be seen that for the shear stress of 10Pa an approximately constant shear rate at each gap was obtained, which means no wall slip occurred. On the contrary, the higher shear stresses show a slight gradient (slip velocity) with higher shear rate reported at bigger gaps which is attributed to wall slip. It should be noted that for the shear stress of 15Pa the wall slip only begins at the biggest gap.
FIGURE 3 Measured shear rate vs 1/gap at different shear stress for the grout with w/b of 0.50.
From the results presented it is clear that the degree of wall slip (i.e. slip viscosity) increases with increasing shear stress. Moreover, it can also be observed that the trend of the curve shear rate vs 1/gap is function of the water/binder content. At the lower water/binder content (w/b=0.45) the slope is positive which means that the wall slip is likely to cause an overestimation of rheological parameters. As the water/binder content is increased the slope of the curve becomes negative meaning a tendency to underestimation of the parameters as result of the wall slip. This behavior is associated with greater tendency to segregation as the amount of free water in the suspension increases. This can be explained by the uniform settlement of binder particles, leaving a thin layer of water over the surface. Therefore local properties are changed, leading to an improper evaluation of yield stress, which can be over or under estimated as evidenced by the different slope sign of the linear models.
FIGURE 4 Measured shear rate vs 1/gap at different shear stress for the grout with w/b of 0.55.
y = 10.413x + 1.705 R² = 0.99
y = 7.6801x + 1.422 R² = 0.98
y = 4.4364x + 0.711 R² = 0.97
0
2
4
6
8
10
12
14
0,0 0,5 1,0 1,5M
easu
red
sh
ear
rate
(s^
-1)
1/gap (mm)
w/b=0.45 Shear stress 20 Pa
Shear stress 15 Pa
Shear stress 10 Pa
y = -37.111x + 98.479 R² = 0.84
y = 0.6824x + 18.985 0
20
40
60
80
100
0,0 0,5 1,0 1,5
Mea
sure
d s
hea
r ra
te (
s^-1
)
1/gap (mm)
w/b=0.50
Shear stress 20Pa
Shear stress 15Pa
Shear stress 10Pa
y = -41.81x + 114.48 R² = 0.83
y = -40.205x + 95.91 R² = 0.94
y = -31.571x + 48.35 R² = 0,77
0
20
40
60
80
100
120
0,0 0,5 1,0 1,5
Mea
sure
d s
hea
r ra
te (
s^-1
)
1/gap (mm)
w/b=0.55
Shear stress 20 Pa
Shear stress 15 Pa
Shear stress 10 Pa
157

Considering the above results, serrated plates should be used to avoid slip. Since the authors did not have serrated plates available, some measurements with plates with emery papers glued were performed. This is an ongoing work but the preliminary results are quite promising. From Fig 5 it is clear the difference between the flow curves obtained with smooth parallel plate and the one with emery paper glued. There is no doubt that the sharp change in trend of the flow curve obtained with smooth plates (see Fig 5a) is related to slip at plate-grout interface. While for the plate with emery paper glued a gradual deviation of the stress curve from linearity as the shear rate increases is verified. Thus, it can be stated that the emery paper glued to the smooth plates can be a good solution to avoid slip during rheological measurements of injection grouts. FIGURE 5 Influence of geometry roughness on the flow curve behavior for the grout with w/b=0.50 at a gap of 3mm a) smooth parallel plate and b) parallel plate with emery paper glued. CONCLUSIONS In the light of the achieved results, it is clear that for rheological measurements of injection grouts using a rotational rheometer equipped with smooth parallel plates some aspect have to be taken into account in order to avoid getting significant error in the results. A suitable choice of shear stress range applied during the rheological measurement should be made, since the higher shear stress increases the degree of wall slip. Moreover, a proper formulation of the grout is also recommended in order to avoid grouts with higher tendency to segregate that promote the wall slip. Preliminary measurements performed with parallel plate with emery paper glued reveal to be a viable way to avoid the slip. The results and procedures reported in this paper can therefore be used to estimate the degree of slip of a specific grout composition and indicate whether the use of roughened plates is required. REFERENCES
1. Baltazar, L.G., Henriques, F.M.A., Jorne, F., Cidade, M.T., Rheologica Acta, 2013, 50(2), 127-
138.
2. Baltazar, L.G., Henriques, F.M.A., Jorne, F., Cidade, M.T., Construction and Building
Materials, 2014, 50, 584-597.
3. Banfill P.F.G., Rheology of fresh cement and concrete, In Rheol. Rev., British Society of
Rheology, Uk, 2006.
4. Nehdi M., Rahman M-A., Cement and Concrete Research, 2004, 34, 1993-2007.
5. Saak, A.W., Jennings, H.M., Shah, S.P., Cement and Concrete Research, 2001, 31, 205-212.
6. Malvern - Application Note. Overcoming and quantifying ‘Wall Slip’ in measurements made
on a rotational rheometer. Malvern Instruments – Spectris plc - the Precision
Instrumentation and Controls Company, 2012.
y = -0,0016x2 + 0,3343x + 3,3412 R² = 0,94
0
5
10
15
20
25
30
35
0 20 40 60 80 100
Shea
r st
ress
(P
a)
Shear rate (s^-1)
a)
y = -0,0008x2 + 0,2896x + 10,529 R² = 0,99
0
5
10
15
20
25
30
35
0 20 40 60 80 100Sh
ear
stre
ss (
Pa)
Shear rate (s^-1)
b)
158

RHEOLOGICAL BEHAVIOR OF KAOLIN DISPERSIONS IN A NON-NEWTONIAN
FLUID
F.J. Sánchez-Luque1, J.F. Velázquez-Navarro2, F.J. Rubio-Hernández1, A.I. Gómez-Merino1, N.M. Páez-
Flor3
1Departamento de Física Aplicada II, Universidad de Málaga, Málaga (Spain) , 2Departamento de
Ingeniería Mecánica y Mecánica de Fluidos, Universidad de Málaga, Málaga (Spain) , 3DECEM,
Universidad de las Fuerzas Armadas, Sangolquí (Ecuador)
Correspondence to: J.F. Velázquez-Navarro (E-mail: [email protected])
ABSTRACT
Kaolin is one of the most used clays in a very wide range of industries. One of the most widespread ways
to use it is by forming a suspension in different liquid mediums. The efficiency of these types of
suspensions will depend on two main factors: as its homogeneity and stability, as its mechanical
response under varied conditions1. The suspensions are composed of a liquid medium (silica sol) and
floating particles (kaolin). The silica sol is composed by of deionised water and of
silica oxide. The kaolin concentration varies between and , so as to observe how this fact
affects to the rheological behaviour shown under different conditions.The stationary responses of the
samples has been measured by mean of stationary flow curves. They have clearly shown a shear-
thinning behaviour in all cases, and as it was expected, an increase of the viscosity while the kaolin
concentration rises. Mooney fitting curves have been applied in order to characterize the behavior and
main characteristics of the dispersions through their intrinsic viscosity values.
KEYWORDS : Diluted suspensions , kaolin, Mooney model, stationary flow curve, shear-thinning.
INTRODUCTION
Kaolin is normally applied in suspensions by using different liquid media, whose performance
will depend mainly on the homogeneity and stability of the dispersion2, and also, in the
mechanical response under different conditions. In order to ensure that these properties are
optimal, dispersants are widely used, such as silica sol3. Regarding of this, the aim of the present
work is to determine the influence of the kaolin concentration on the rheological behavior and
suspension properties for these materials.
P42
159

MATERIALS AND METHODS
The materials involved in this study were kaolin (NC-35), silica fumed (DEGUSSA) and
deionized water. The following samples have been analyzed: silica sol, 5% kaolin w/w, 10%,
15%, 20%, 25%. To prepare the dispersions, the silica sol (10% w/w silica oxide) has been
stirred 2 hours and then sonicated about 20 minutes to avoid aggregates formation. After that the
amount of kaolin has been added and stirred 3-5 minutes additionally. Malvern Gemini 150
rheometer (coaxial cylinders geometry) has been employed to measure the suspensions up to 15%
w/w kaolin. For the most concentrated suspensions (20 and 25% w/w), due to their high viscosity,
a Haake RS600 rheometer with a plate-plate geometry were used.
In order to ensure the homogeneity and stability of the studied samples, it has been set a strict
protocol to prepare them, with the purpose of standardize the whole process avoiding
randomness factors. Firstly, all samples were pre-sheared 60 s at 50 s-1
, making sure that the
stationary state was always reached. Then the stationary flow curves were performed in which
the material will be subjected to different increasing shear rates, until reach the maximum rate.
Each step will remain time enough until the stationary state is reached.
RESULTS AND DISCUSSION
Figure 1 shows the evolution of the viscosity in all suspensions in function of the shear rate.
FIGURE 1 Evolution of the viscosity in the stationary flow curve.
160

A shear-thinning behavior is observed in all samples and it also shown that, the higher the kaolin
concentration is, more pronounced is this response. For this, in order to understand better the
material performance, Mooney model (equation 1) was fitted for different shear rates for all
dispersions up to 15% w/w kaolin.
(1)
The curves obtained in this way are shown in the figure 2. According to these trends, table 1
values has been computed from the fit parameters for each case.
FIGURE 2 Relative viscosity-volumetric fraction curves.
TABLE 1 Parameters fitted using Mooney equation.
(s-1) R2
0.6 64,3 0.20 0,99989
1.9 49,5 0.20 0.89150
3.4 40.7 0.15 0.97355
10.9 28.0 0.11 0.99893
26.5 19.1 0.10 0.99864
64.0 22.0 0.13 0.99660
154.4 12.4 0.11 0.99351
It can be claimed that a critical shear rate exists ( ), which limits two regions: the low shear
rates zone where the shear thinning is more evident (more pronounced curves in the figure 2),
161

and high shear rates zone where the response is almost typical Newtonian one. This critical shear
rate is in this case around 2 s-1
. The curves belonging to the low shear rates trends to a vertical
asymptote, which is located at 0,075 (the maximum volume concentration accepted by the
medium). The samples of 20 and 25% of kaolin, corresponding to equal to 0,09 and 0,12
respectively, are over this medium limit. In that situation, there is more kaolin mass than which
the liquid phase is able to remain, so the homogeneity and stability of the samples are lost. On
the other hand, the values of [ ] (table 1) are very high (inversely proportional to the shear rate),
and the maximum packing fraction ( M) values are low in all cases. The high values of [ ] are
the evidence of high poly-disperse suspension. The kaolin particles are planes, like oval “plates”
with a very high relation between its length and thickness. On the other side, silica oxide
particles are spheroids of a non-regular shape and surface, in consequence, both of these
parameters (M and []) will keep in low and high values respectively4.
CONCLUSIONS
The silica sol could be a proper dispersant for dispersions up to 15% kaolin w/w, from this
amount, the samples turn to thick mixtures where the homogeneity and stability cannot be
guaranteed and, therefore, they are not suitable for industrial purposes. On the other side, these
dispersions has demonstrated to be vey poly-disperse due to particles relative shapes as is shown
by Mooney fit parameters.
REFERENCES AND NOTES
1. M. Loginov, O. Larue, N. Lebovka, E. Vorobiev, Fluidity of highly concentrated kaolin suspensions:
influence of particle concentration and presence of dispersant. Colloids Surfaces A , 2008, 325,
64-71.
2. Le Bell, J.C., Hurskainen, V.T., Stenius, P.J. The influence of sodium lignosulphonates on the
stability of kaolin dispersions. J. Colloid Interface Sci., 1976, 55, 60-68.
3. Zhi, Z., Xuxhen, L., Peng, S. Dispersion of kaolin powders in silica sols. Appl. Clay Sci., 2010, 49,
51-54.
4. Larson. R.G., The Structure and Rheology of Complex Fluids; Keith E. Gubbins, Ed.;
Oxford University Press: New York, Oxford, 1999
162

Rheological characterization of green emulsions developed with several
emulsification methods
M. José Martín-Piñero1, Luis A. Trujillo
1 Reología Aplicada. Tecnología de Coloides. Departamento de Ingeniería Química. Facultad de
Universidad de Sevilla. C/ P. García González, 1,
Correspondence to: M. Carmen Alfaro
ABSTRACT
The goal of this work was to investigate the influence of the emulsification method on the
rheological properties and physical stability of
mixture of two green solvents
rotor-stator devices and pressure in a
physical stability of emulsions
and viscoelastic responses could not be d
and shear thinning were the emulsions.
apparent viscosities and higher
valve homogenizer used. The
highest physical stability was achieved using the high
KEYWORDS: Emulsion, Shear thinning, Non
INTRODUCTION
Droplet size distribution is one of the most important factors in determining properties like
rheology and physical stability of emulsions. Current equipment
rotor-stator devices, membranes, colloid mills
formulated with a fatty acid dimethylamide
solvents because they are obtained
excellent EHS properties. α-Pinene is
distillation and can be formulated as
Rheological characterization of green emulsions developed with several
, Luis A. Trujillo-Cayado1, M. Carmen García
1, M. Carmen Alfaro
Reología Aplicada. Tecnología de Coloides. Departamento de Ingeniería Química. Facultad de
. C/ P. García González, 1, 41012, Sevilla, Spain.
M. Carmen Alfaro (E-mail: [email protected])
oal of this work was to investigate the influence of the emulsification method on the
rheological properties and physical stability of 30 % oil-in-water emulsions formulated with
mixture of two green solvents as oil phase. We report the effect of homogenization speed
pressure in a high-pressure valve homogenizer on the rheo
stability of emulsions. Flow curves of emulsions showed slight shear thinning
and viscoelastic responses could not be detected. The higher the energy input the more viscous
and shear thinning were the emulsions. Samples prepared with rotor-stator devices showed lower
apparent viscosities and higher power law indexes than those developed with
. The emulsion with the highest fraction of smaller droplets
was achieved using the high-pressure valve homogenizer
Shear thinning, Non-Newtonian, Shear flow, Rheology
Droplet size distribution is one of the most important factors in determining properties like
stability of emulsions. Current equipments used for emulsi
stator devices, membranes, colloid mills and high-pressure homogenizers.
fatty acid dimethylamide (FAD). FADs have been recognized as green
solvents because they are obtained from renewable raw materials and
Pinene is a biosolvent that may be obtained from pine resins or
distillation and can be formulated as stable oil-in-water (O/W) emulsions with the
Rheological characterization of green emulsions developed with several
Carmen Alfaro1*
, José Muñoz1
Reología Aplicada. Tecnología de Coloides. Departamento de Ingeniería Química. Facultad de Química.
oal of this work was to investigate the influence of the emulsification method on the
water emulsions formulated with a
homogenization speed in two
pressure valve homogenizer on the rheology and
emulsions showed slight shear thinning behavior
The higher the energy input the more viscous
stator devices showed lower
indexes than those developed with the high-pressure
highest fraction of smaller droplets and the
pressure valve homogenizer at 15000 psi.
Rheology, Green solvent.
Droplet size distribution is one of the most important factors in determining properties like
used for emulsification involve
pressure homogenizers. Emulsions were
. FADs have been recognized as green
renewable raw materials and in addition exhibit
may be obtained from pine resins or
emulsions with the help of
P44
P44
163

biopolymers2. The goal of this work was to investigate the influence of emulsification method on
the rheological properties, droplet size distribution and physical stability of O/W emulsions
formulated with a mixture of green solvents as oil phase and an emulsifier useful for eco-labeling.
We compare the properties of emulsions prepared using two rotor-stator devices to those
prepared with a high-pressure valve homogenizer (HPvH) at several processing variables.
MATERIALS AND METHODS
Lauryl N,N-dimethylamide (Agnique AMD-12TM
) and α-pinene, supplied by BASF and
Sigma-Aldrich respectively, were used as the oil phase using an AMD-12TM
/α-pinene mass ratio
of 75/252. A polyoxyethylene glycerol ester (HLB: 13) derived from cocoa oil (glycereth-17
cocoate, Levenol C-201TM, from KAO) was used as emulsifier. Emulsions were produced by
homogenizing 30 wt% oil (total concentration) with 70 wt% aqueous phase containing 3 wt%
surfactant. Samples were prepared with rotor-stator devices by applying a rotational speed in the
(4000 - 8000) rpm range for 120 s at room temperature. The performance of the Ultraturrax T50
(UT-T50) equipped with a G45F toothed dispersion unit was compared to that of the Silverson
L5M (SL5M) equipped with a high shear screen. Coarse emulsions prepared using the UT-T50
at 4000 rpm were immediately passed once through the Avestin Emulsiflex C5 HPvH.
Homogenization pressures considered were 5000 and 15000 psi (34.5 & 103 MPa, respectively).
A heat exchanger was used with water flowing at inlet temperature of 20ºC to cool the emulsions.
The rheological measurements were carried out with a controlled-stress rheometer (Haake-
MARS) using a sandblasted Z20 coaxial cylinder geometry to avoid slip-effects (T = 20°C).
Droplet size distribution measurements were performed using a laser diffraction instrument
(Malvern Mastersizer X). Multiple light scattering scans were carried out with a Turbiscan Lab-
expert to obtain information on the destabilization kinetics and the main mechanism involved.
RESULTS AND DISCUSSIONS
Figure 1A shows the droplet size distributions (DSDs) of emulsions aged for 24 h prepared
with the processing variables that yielded the lowest droplet mean diameter for each
emulsification method used. All emulsions prepared with rotor-stator devices exhibited
monomodal DSDs. The SL5M, which is equipped with a high shear screen, yielded slightly
lower oil droplet diameters than the UT-T50/G45F at the same homogenization rates. By contrast,
164

samples prepared with the HPvH showed a small second peak due to the occurrence of
recoalescence which, in turn, is a consequence of some over-processing. Fortunately, the HPvH
provided a markedly higher fraction of droplets with smaller diameters.
FIGURE 1. (A) Droplet size distributions at room temperature and (B) flow curves (T = 20°C) for selected
emulsions aged for 24 hours as a function of the different emulsification processes.
All the emulsions exhibited shear-thinning flow behavior (see figure 1B), which fitted the
power-law equation:
τ = τ1 ⋅γ.
1s−1
n
Eq. (1)
where τ is the shear stress, τ1 is the shear stress value at 1s-1
, is the shear rate and n is the
power law index. The fluid-like behaviour of these emulsions was supported by their low
apparent viscosity values (η2Pa ranged from 7.21 to 9.82 mPa·s at 20°C). τ1 values were similar
for all emulsions prepared with HPvH but slightly higher than those obtained for emulsions
prepared with rotor-stator devices. These results are consistent with the occurrence of lower
mean diameters (data not shown). Power law indexes for emulsions prepared with rotor-stator
devices were significantly higher (i.e. they are less shear thinning) than those of emulsions
prepared with HPvH. None of these emulsions showed measurable linear viscoelastic properties.
Multiple light scattering demonstrated that the emulsions with smaller droplet sizes exhibited
enhanced stability against creaming. The most stable emulsion was that prepared with the
Avestin Emulsiflex C5 at 15000 psi.
165

TABLE 1. Power law fitting parameters for flow curves of the emulsions studied at 20ºC.
Method τ1
(Pa) n
η2Pa (mPa·s)
UT50 4000 rpm 0.013 0.89 7.21
8000 rpm 0.017 0.86 8.21
SL5M 4000 rpm 0.013 0.89 7.13
8000 rpm 0.019 0.85 8.49
EC5 5000 psi 0.042 0.70 8.79
15000 psi 0.056 0.67 9.82
CONCLUSIONS
The higher fractions of smaller droplets were achieved by using the high-pressure valve
homogenizer. Flow curves were sensitive to emulsification method and all emulsions exhibited
shear-thinning behaviour. None of them exhibited linear viscoelastic properties. The emulsions
obtained by high-pressure valve homogenizer showed higher apparent viscosity and more
marked shear-thinning properties than those prepared with rotor-stator homogenizers, which is
consistent with their lower mean droplet diameters. These properties resulted in enhanced
physical stability against creaming. The optimum results were those of the emulsion prepared
with the high-pressure valve homogenizer at 15000 psi (103 MPa).
ACKNOWLEDGEMENTS
The financial support received (Project CTQ2011-27371) from the Spanish Ministerio de
Economía y Competitividad (MINECO) and from the European Commission (FEDER
Programme) is kindly acknowledged.
REFERENCES
1. García, M.C; Alfaro, M.C; Calero, N.; Muñoz, J., Influence of polysaccharides on the
rheology and stabilization of α-pinene emulsions. Carbohydrate polymers, 2014, 105,
177-183.
2. Santos, J.; Trujillo-Cayado, L. A.; Calero, N.; Muñoz, J., Physical characterization of
eco-friendly O/W emulsions developed through a strategy based on product engineering
principles. AIChE Journal, 2014, 60, 2644-2653.
166

Rheological Properties of Muffin Batter Reformulated with Chickpea Flour
María Dolores Alvarez1, Raúl Fuentes1, Beatriz Herranz1, Francisco Cuesta2, Wenceslao Canet1
1Department of Characterization, Quality, and Safety, Institute of Food Science, Technology and
Nutrition (ICTAN-CSIC), José Antonio Novais 10, 28040 Madrid, Spain
2Department of Products, Institute of Food Science, Technology and Nutrition (ICTAN-CSIC), José
Antonio Novais 10, 28040 Madrid, Spain
Correspondence to: María Dolores Alvarez (E-mail: [email protected])
ABSTRACT
The effect on the rheological properties of muffin batter of replacing wheat flour (WF) with chickpea
flour (CF) was studied by using oscillatory and steady state shear tests. CF was used to replace the WF in
the batter partially (25, 50, and 75% w/w; 25%CF, 50%CF, and 75%CF samples) or totally (100% w/w,
100%CF batter), and compared with a control made only with wheat flour (100%WF batter). SAOS
measurements indicate that 100%WF batter can be characterized as a weak gel, while batters with
partial and total WF replacement presented a structure between those of a concentrated biopolymer
and a weak gel with higher loss tangent (tan δ) values. Zero-order reaction kinetics described batter
gelatinization process well, and activation energies were obtained for all the batters. Extent of
thixotropy and rebuild time decreased significantly with increases in the WF replacement level. Complex
and apparent viscosities failed to follow the Cox–Merz rule.
KEYWORDS Chickpea flour, Muffin batter, Viscoelasticity, Thixotropy, Viscosity; Cox–Merz rule
INTRODUCTION
Muffin batter is a complex fat-in-water emulsion composed of an egg–sucrose–water–fat
mixture as the continuous phase and bubbles as the discontinuous phase in which flour particles
are dispersed1. A muffin recipe is mainly composed of WF, sucrose, vegetable oil, egg, and milk
2.
People with celiac disease are unable to consume this type of baked product. Moreover, many
gluten-free products available on the market are often of poor technological quality3. Chickpea
(Cicer arietinum L.) is one of the top five important legumes on the basis of whole grain
production4. Potential for increased use of chickpea is related to its relatively low cost, relatively
high protein content (~18.3–28.9%), high protein digestibility (76–78%), and other desirable
functionalities5.
The aim of this work was to evaluate the suitability of CF to replace different percentages of
WF in muffins, and to study its functionality in the linear viscoelastic properties (oscillatory tests)
Product Formulation
P45
167

and the flow behavior (steady-state shear tests) of the batter as a prior step to evaluating other
properties (texture and sensory acceptability) of the baked muffin.
EXPERIMENTAL DATA
Batter Preparation
Five muffin formulations were prepared with the ingredients and amounts shown in Table 1.
The batter was prepared in a KPM5 professional mixer (Kitchen Aid, St. Joseph, Michigan,
USA).
TABLE 1 Formulations of control muffin batter prepared with 100% of wheat flour (WF) and batters
prepared with increasing quantities of chickpea flour (CF) as WF replacer
Ingredients
(g 100 g–1
flour)
100%WF 25%CF 50%CF 75%CF 100%CF
WF 100 75 50 25 0 CF 0 25 50 75 100 Whole egg 81 81 81 81 81 Sucrose 100 100 100 100 100 Salt 0.75 0.75 0.75 0.75 0.75 Milk 50 50 50 50 50 Oil 46 46 46 46 46 Natural lemon juice 3 3 3 3 3 Sodium bicarbonate 4 4 4 4 4
Rheological Properties of Muffin Batter (SAOS and Steady Shear Rheological Measurements)
SAOS and flow tests were performed using either a Bohlin CVR 50 controlled stress
rheometer (Bohlin Instruments Ltd., Cirencester, UK) or a Kinexus pro rotational rheometer
(Malvern Instruments Ltd, Worcestershire, UK). Measurements were obtained using parallel-
plate geometry (40 mm diameter, 1 mm gap). Stress sweep, frequency sweep, and temperature
sweep tests were carried out under SAOS mode. To study flow time dependence, the hysteresis
loop was obtained. Before analyzing flow behavior, the structure responsible for thixotropy was
previously destroyed by shearing6. Viscometry rebuild analysis was also carried out.
RESULTS AND DISCUSSION
SAOS Measurements and Viscous Shear Flow of Muffin Batter
Batters made with CF at 25–100% levels are more deformable, with a higher degree of
conformational flexibility than 100%WF batter, reflecting loss of both rigidity and elasticity
(high tan δ) as higher WF percentages are replaced by CF. Increase in the G'0 and G"0 values
168

(intercepts of linear regressions of power-type relationship of lnω vs. lnG'0 and lnG"0,
respectively) with increasing WF replacement was accompanied by an increase in the n' and n"
values (slopes of the cited linear regressions), therefore reflecting higher ω dependence
associated with reduced stability of the protein network7. Power law fits showed that there were
no significant differences between the G' and G" values of 100%WF and 100%CF batters
throughout the ω range studied. Both batters, with 0 and 100% replacement levels, also had
similar gel points.
FIGURE 1 Mechanical spectra data for muffin control batter and batters with wheat flour (WF) replaced
by different percentages of chickpea flour (CF).
Batter gelatinization under non-isothermal conditions was well described by first-order
reaction kinetics. The lower activation energy (113.43 kJ mol–1
) of 100%WF batter implies that
it was more favorable for gelatinization. Under viscous flow, 100%WF batter was the most
thixotropic (Table 2), with the lowest viscosity recovery percentage and resistance to flow, the
longest rebuild time, and the highest fluidity. Shearing reduced 94% of the flow time dependence
in 100%WF batter, whereas in 100%CF sample the hysteresis loop increased. All four CF
formulae exhibited a short, rapid build-up of viscosity to a highly structured state after shearing.
169

Flow data fitted well to Herschel–Bulkley model, which showed that gluten-free batter had the
highest yield stress, pseudoplasticity, and viscosity. Power type modification of the Cox–Merz
rule can be successfully used for all the muffin batters studied. Specific gravity values (data not
shown) would appear to indicate a higher incorporation of air into the 100%CF batter. However,
100% WF replacement is accompanied by an increase in the weakening of the muffin crumb
structure, associated with inadequate gas retention.
TABLE 2 Effect of wheat flour replacement on hysteresis areas and rheological parameters of Herschel–
Bulkley model describing flow curves of the muffin batter at 25 °C.
Formula Hysteresis area before shearing (Pa s
–1)
Hysteresis area after shearing (Pa s
–1)
σ0 (Pa) K (Pa sn) n R2
100%WF 1974.3±353.1a 115.8±47.2
b 4.23±0.47
b 8.60±0.64
b 0.760±0.013
b,c 1.000
25%CF 1438.5±65.9b 191.9±73.7
b 4.49±1.56
b 8.56±1.76
b 0.780±0.031
a,b 0.999
50%CF 1034.4±281.8b 202.0±118.6
b 3.22±0.29
b 8.65±0.26
b 0.804±0.006
a 1.000
75%CF 504.1±145.7c 297.5±105.8
a,b 4.89±0.69
b 10.02±1.34
b 0.793±0.023
a,b 1.000
100%CF 357.0±71.1c 428.8±44.9
a 12.57±0.81
a 19.91±2.00
a 0.729±0.005
c 0.999
a-c Different letters in the same column mean significant differences (P < 0.05) among samples according to Bonferroni multiple
range test. WF: wheat flour; CF: chickpea flour. σ0, yield stress; n, flow behavior index; K, consistency index.
ACKNOWLEDGEMENTS
The authors wish to thank the Spanish Ministry of Economy and Competitiveness (AGL2011-
28569).
REFERENCES
1. Matos, M.E.; Sanz, T.; Rosell, C.M., Food Hydrocolloids, 2014, 35, 150-158.
2. Sanz, T.; Salvador, A.; Baixauli, R.; Fiszman, S.M, European Food Research and Technology, 2009, 229, 197-204.
3. Mariotti, M.; Lucisano, M.; Pagani, M.A.; Ng, P.K.W., Food Research International, 2009, 42, 963-975.
4. Matos, M.E.; Rosell, C.M., Plant Food for Human Nutrition, 2011, 66, 224-230.
5. Hefnawy, T.M.H.; El-Shourbagy, G.A.; Ramadan, M.F., International Food Research Journal, 2012, 19, 521-525.
6. Tárrega, A.; Durán, L.; Costell, E., International Dairy Journal, 2004, 14, 345–353.
7. Moresi, M.; Brubo, M.; Parente, E., Journal of Food Engineering, 2004, 64, 179–186.
170

Viscous flow behavior of polyethylene modified bitumen emulsions
Claudia Roman, Antonio Abad Cuadri, Moisés García-Morales, Francisco Javier Navarro,
Francisco José Martínez-Boza and Pedro Partal
Dpto de Ingeniería Química, Centro de Investigación en Tecnología de Productos y Procesos
Químicos (Pro2TecS), Campus de ‘El Carmen’, Universidad de Huelva, 21071, Huelva (Spain)
Correspondence to: Claudia Roman (E-mail: [email protected])
ABSTRACT
With the goals of preventing the phase separation which may occur when polymer modified
bitumens (PMBs) are stored at very high temperatures and minimizing the energy consumption
involved in the fabrication of their asphalt mixes, PMBs can be conditioned in the form of their
corresponding O/W emulsions. With this regard, five polyethylene modified bitumen emulsions
were prepared and their viscous flow behavior at 25ºC evaluated. The resultant emulsions
presented a low Sauter mean diameter (2-4 m). Likewise, all flow curves firstly showed a
shear-thinning behavior, followed by a high-shear-rate-limiting viscosity, which increased as
bitumen-polymer phase concentration increased.
KEYWORDS
Bitumen, emulsion, polyethylene, viscosity, product formulation.
INTRODUCTION
Bitumen has been largely used as a binder of mineral aggregates in road paving 1. Traditional
asphalt mixtures are always produced at high temperatures, never below 150ºC. Very often, the
performance of bitumen is improved by addition of different types of substances, among which
polymers are mostly utilized. Polyethylenes have shown to improve the high temperature
performance of bitumen, by reducing the formation of ruts in the pavement. However, bitumen
modified with polyethylenes may encounter serious problems: a) its application involves even
higher paving temperatures than plain bitumen; b) there exists a high risk of polymer separation
when these binders are stored at high temperature.
P46
171

Alternatively, different types of reduced-temperature technologies have emerged over the last
decades. In particular, cold-mix asphalts consist in coating the mineral aggregates with an
emulsion formed by very fine bitumen droplets dispersed in water and stabilized with a
surfactant. This technology may prevent phase segregation, since the polymer is embedded in
bitumen droplets suspended in aqueous phase 2. Moreover, PMB emulsions present much lower
viscosities than bitumen itself and can be applied at temperatures between 25 and 60ºC.
With a view to their potential application, five PMB emulsions modified with recycled LDPE
were prepared and the influence of bitumen phase polymer concentration and solids content on
their viscous flow behavior, at 25ºC, was evaluated.
EXPERIMENTAL
Bitumen with penetration grade 160/220, supplied by Repsol S.A., and recycled LDPE, kindly
donated by Cordoplas S.A., were the main materials for the PMB emulsions. The surfactant, an
alkyltrimethylenediamine derived from N-tallow, was also provided by Repsol S.A.
The preparation of the PMB emulsions consisted of a first step of bitumen modification with
recycled LDPE (bitumen phase) and a further step of emulsification into an aqueous solution of
surfactant (water phase). The bitumen modification was conducted with a Silverson L5M (U.K.)
high-shear homogeneizer, under optimized blending conditions of 170ºC, 1 hour and 5000 rpm.
Recycled LDPE concentrations (in the bitumen phase) studied ranged from 2 to 5 wt.%. The
emulsification was carried out in a continuous plant equipped with a Denimotech DT 03
(Denmark) colloidal mill, and a sample collector vessel which can be pressurized. Optimized
emulsifying conditions were temperatures in the range 165-175ºC (depending on polymer
concentration), pressure of 7.5 bar and speed of 9000 rpm. In any case, the water phase flow rate
was fixed and the LDPE-bitumen phase flow rate was varied so that different solids contents
were obtained. The surfactant content was always set to between 0.75 and 1 wt.%. A non-
modified emulsion is included for reference.
With respect to characterization, steady viscous flow curves, droplet size distribution and solids
content were evaluated. Viscous flow curves, at 25ºC, were performed with a controlled stress
Thermo-Haake MARS II (Germany) rheometer equipped with concentric cylinders geometry
type Z20 DIN-53019. The droplet size distribution and Sauter average diameters were measured
172

with a Malvern Mastersizer 2000 (U.K.) laser diffraction analyzer, with previous dilution of the
emulsion into water. The solids content, in wt.%, was calculated from the weights of an emulsion
sample and its residue when it was set in an oven at 110ºC overnight.
RESULTS AND DISCUSSION
The different emulsions in Table 1 are identified by the bitumen phase polymer concentration: 0,
2, 4 and 5 wt.% (E0, E2, E4 and E5, respectively). Three different emulsions with varying solid
contents were prepared for 5 wt.% polymer (E5-1, E5-2 and E5-3).
With regard to the droplet size distribution (DSD), PMB emulsions up to 4 wt.% LDPE showed
one single peak, whilst a multimodal distribution was observed for 5 wt.%. Also, the former
emulsions presented Sauter mean diameters (D3,2) between 4.1-4.4 m, whilst the latter ones
demonstrated smaller values (2.1-1.8 m).
TABLE 1 Values of solids content, D3,2 and limiting viscosity for the five PMB emulsions studied.
E0 E2 E4 E5-1 E5-2 E5-3
Polymer in bitumen phase (wt.%) 0 2 4 5 5 5
Solids content (wt.%) 50.6 50.0 55.0 48.2 55.7 62.8
Sauter mean diameter (m) 4.1 4.2 4.4 2.1 1.8 1.8
∞ (mPa·s) 5 15 24 10 16 25
On the other hand, the evolution of viscosity, at 25ºC, with shear rate shown in Figure 1
consisted of a shear thinning drop followed by a constant high-shear-rate-limiting viscosity
beyond a threshold value of shear rate, which can be described by the Sisko’s model:
1)( n
sk (1)
Values of ∞ have been calculated from Figure 1 and presented in Table 1. According to this
table, these limiting viscosities seem to be influenced by both polymer concentration in the
bitumen phase and the solids content in the emulsion. Thus, by comparing emulsions E0 and E2
(with similar solids contents and Sauter mean diameters), the addition of 2 wt.% LDPE led to a
limiting viscosity increase from 5 to 15 mPa·s. On the other hand, the limiting viscosity
increased further, from 15 to 24 mPa·s when the polymer concentration was raised to 4 wt.%,
also affected by a higher solid content of 55 wt.%. As for, the three emulsions with the same
polymer concentration in the bitumen phase of 5 wt.% (with comparable Sauter average
173

diameters), the effect of the solids content is clearly observed. Hence, E5-3 (solids content of
62.5 wt.%) presents the highest limiting viscosity, of 25 mPa·s, followed by E5-2 (solids content
of 55.7 wt.%) and E5-1 (solids content of 48.4 wt.%), with limiting viscosities of 16 and 10
mPa·s, respectively.
10-2
10-1
100
101
102
103
100
101
102
103
104
E0
E2
E4
E5-1
E5-2
E5-3
2
5ºC
(m
Pa·s
)
(s-1)·
102
101
25ºC
(m
Pa·s
)
(s-1)·
FIGURE 1 Viscosity curves in steady state, at 25ºC, for the five PMB emulsions studied.
CONCLUSIONS
The fabrication of O/W emulsions of LDPE-modified bitumens was accomplished by an in-line
emulsification procedure at high temperature and pressure. The resultant emulsions presented a
low Sauter mean diameter (2-4 m) and a shear-thinning behaviour followed by a high-shear-
rate-limiting viscosity, which increased as bitumen-polymer phase concentration increased .
ACKNOWLEDGEMENTS
This work was funded by MINECO-FEDER (Subprogram INNPACTO project IPT-2012-0316-
370000). Authors gratefully acknowledge their support.
REFERENCES
1. Read, J., Whiteoak, D., The Shell Bitumen Handbook (Fifth Ed.); Thomas Telford
Publishing: London, 2003
2. Lesueur, D. In Polymer Modified Bitumen; McNally, T., Ed.; Woodhead Publishing:
Cambridge, 2011; Chapter 2, pp 25-42.
174

Autoplasticised PVC using the strategy of PVC/PBA copolymers: Rheology
María Eugenia Muñoza, Itxaso Calafel
Belén Pascualb. a POLYMAT, Departamento de Ciencia y Tecnología de Polímeros, UPV/EHU.
Tolosa 72,b ERCROS SA, Departamento de Innovación y Tecnología de la Divi
Correspondence to: Maria Eugenia Muñoz
ABSTRACT
The synthesis of poly (vinyl chloride), PVC, copolymers by living radical polymerization
constitutes a novel strategy
problems derived from the migration of conventional
random and block copolymers,
the block copolymers, microphase separation and the presence of crystals lead to a
thermorheologically complex behaviour, in contrast with the simplicity observed for random
copolymers. The viscosity of the copolymers determined by extrusion capillary rheomet
conditions similar to polymer processing, was also investigated sh
self-plasticised material.
KEYWORDS
PVC Copolymers; Thermorheological complexity; Dynamic viscoelasticity; Viscosity function;
Self-plasticization
INTRODUCTION
PVC particles have crystallites of varying sizes, which only melt completely above
approximately 230ºC1. This factor, together with its low
Autoplasticised PVC using the strategy of PVC/PBA copolymers: Rheology
and microestructure
, Itxaso Calafela, Antxon Santamaríaa, Miquel Boix
POLYMAT, Departamento de Ciencia y Tecnología de Polímeros, UPV/EHU.
Tolosa 72, E-20018, San Sebastián. Spain
ERCROS SA, Departamento de Innovación y Tecnología de la División de Plásticos, Diagonal
595, 08014, Barcelona. Spain
Maria Eugenia Muñoz (E-mail: [email protected]
ynthesis of poly (vinyl chloride), PVC, copolymers by living radical polymerization
developed to obtain self-pasticised PVCs, that can avoid the
problems derived from the migration of conventional plasticisers, like phthalates.
random and block copolymers, with 0-40% weight of BA content, are investigated
microphase separation and the presence of crystals lead to a
thermorheologically complex behaviour, in contrast with the simplicity observed for random
of the copolymers determined by extrusion capillary rheomet
conditions similar to polymer processing, was also investigated showing the advantages of the
PVC Copolymers; Thermorheological complexity; Dynamic viscoelasticity; Viscosity function;
have crystallites of varying sizes, which only melt completely above
. This factor, together with its low thermal stability above 190ºC,
Autoplasticised PVC using the strategy of PVC/PBA copolymers: Rheology
, Miquel Boixb, Jose Ignacio Condeb,
POLYMAT, Departamento de Ciencia y Tecnología de Polímeros, UPV/EHU. Avenida de
sión de Plásticos, Diagonal
ynthesis of poly (vinyl chloride), PVC, copolymers by living radical polymerization
pasticised PVCs, that can avoid the
plasticisers, like phthalates. In this work,
, are investigated. In the case of
microphase separation and the presence of crystals lead to a
thermorheologically complex behaviour, in contrast with the simplicity observed for random
of the copolymers determined by extrusion capillary rheometry, under
owing the advantages of the
PVC Copolymers; Thermorheological complexity; Dynamic viscoelasticity; Viscosity function;
have crystallites of varying sizes, which only melt completely above
thermal stability above 190ºC, obliges
P47
175

to process PVC in a partially crystalline state. To avoid this difficulty, plasticisers such as
diethyl- (2-ethylhexyl) phthalate (more known as DOP) have been traditionally used, but the
migration of these low molecular weight molecules causes salubriousness problems.
Plasticisation or reduction of the glass transition temperature, Tg, of PVC has been also reached
by means of blends, for instance with EVA copolymer2 or by internal plasticisation with PBA in
PVC-PBA copolymers obtained by radical block polymerization3.
A very interesting success of the Single Electron Transfer-Degenerative Chain Transfer Living
Radical Polymerization (SET- DTLRP) concerns the synthesis of tri-block copolymers (ABA) of
poly(vinyl chloride) (PVC) and poly(n-butyl acrylate) (PBA), that is, PVC-b-PBA-b-PVC4. In
contrast with the relatively known block copolymers, the synthesis of PVC-PBA based random
copolymers by living radical polymerization (SET-DTLRP) has been very recently claimed5.
The aim of this paper is to investigate both block and random PVC-PBA copolymers,
considering them as self-plasticised materials. This implies a rheological study focusing on the
correlation microestructure-rheology-processing, which involves linear viscoelastic
measurements, as well as continuous capillary flow tests.
EXPERIMENTAL PART
Samples preparation and Characterization
Details of the synthesis and polymerization, as well as methods used for characterization, are
given elsewher4,5.
Rheological measurements
The dynamic viscoelastic behavior of the samples in the molten state was investigated using a
ARG-2 rheometer with a parallel-plate fixture (25mm diameter).
Extrusion flow experiments were performed in a Göttfert 2002 rheometer. The viscosity curves,
i.e. viscosity as a function of shear rate, were obtained.
RESULTS AND DISCUSSION
In block copolymers, phase separation and the presence of small crystals, detected by DSC, is
reflected in the viscoelastic behavior, at temperatures above the melting of the main crystals4. To
the difference to random copolymers, block copolymers give a thermorheologically complex
behavior, since time-temperature superposition does not hold (Figure 1).
176

10
100
1000 104 105 106
δ
G* (Pa)
Figure 1: Loss factor (δ) vs complex modulus (G*) for 60PVC-40BA random copolymer (open
symbols) and 30PVC-40PBA-30PVC block copolymer (full symbols).
For random copolymers, plots like those shown in Figure 1 allow determining the entanglement
modulus, ���, which is the value of the elastic modulus as δ tends to zero. This in turn leads to
obtain the packing length and other structural parameters. However, block copolymers act as
complex fluids and so the correlation between rheology and chain structure cannot be
investigated. Alternatively, in Figure 2 the continuous flow viscosity function, ���, is shown,
together with the complex viscosity, η* (ω), determined in oscillatory flow (Cox-Merz rule).
100
1000
104
105
106
107
0,01 0,1 1 10 100 1000 104
Block copolymerPVCPVC/35DOP
η∗ (ω
) η∗
(ω)
η∗ (ω
) η∗
(ω)
(ope
n sy
mb
ols)
, η(γ)
η(γ)
η(γ)
η(γ)
(ful
l sym
bols
) (P
a·s)
ω (rad·s-1); γ (s-1 )
.
.
Figure 2: Test of the Cox-Merz rule for 30PVC-40PBA-30PVC block copolymer (�,�).
For comparison purposes ��� vs ��(s-1) of conventional PVCs are included: PVC (�) and
PVC/35DOP (�).
�� Random copolymer (T=120, 140, 150ºC) ��� Block copolymer (T= 120, 140, 160ºC)
177

CONCLUSIONS
The main feature of the investigated materials is their capacity to self-plasticise, owed to the
presence of PBA. Extrusion flow results demonstrate that the viscosity can be reduced to the
levels of conventional PVC which contains 35% DOP plasticiser. Phase separation and rheology-
microestructure correlation is analysed using oscillatory flows. Two remarks can be done:
a) No concordance between both viscosities is observed, as could be expected for a complex
system.
b) The self-plasticised effect is noted, as low viscosity values are observed in the block
copolymer, as compared with pure PVC and plasticised PVC/DOP.
ACKNOWLEDGEMENTS
UPV/EHU (UFI 11/56) and GIC IT-586-13 (Basque Government).
REFERENCES AND NOTES
1. A. M. Zdilar, R. I. Tanner, J. Rheol. 1994, 38, 909-920.
2.- R. Hernández, J. A. del Agua, J. J. Peña, A. Santamaría, J. Polym. Eng. Sci. 1996, 36, 2570-2578.
3. N. Overberg, G. Weinand, G. Smets, J. Polym. Sci., Part A: Polym. Chem. 2006, 16, 3107-3121.
4. I. Calafel, M. E. Muñoz, A. Santamaría, M. Boix, J. I. Conde, B. Pascual, J. Vinyl Addit. Technol. 2015, 21, 24-32.
5. R. Obeso, B. Pascual, J. M. Asua, (Ercros S.A.). WO2013014158A1, Jun 19, 2014.
178

Improving the rheological performance of bituminous mastics by LDPE and SBS
modification
Antonio Abad Cuadri, Claudia Roman, Ievgenii Liashenko, Moisés García-Morales, Inmaculada
Martínez, Pedro Partal
Departamento de Ingeniería Química, Centro de Investigación en Tecnología de Productos y
Procesos Químicos (Pro2TecS), Campus de “El Carmen”, Universidad de Huelva, 21071, Huelva,
Spain
Correspondence to: Pedro Partal (E-mail: [email protected])
ABSTRACT
This research presents a comparative analysis between asphaltic mastics, containing a
filler/bitumen ratio of 65/35, from bituminous binders which were previously modified by
addition of either a thermoplastic elastomer Styrene-Butadiene-Styrene (SBS) or recycled low
density polyethylene (LDPE). LDPE-mastic showed an enhancement in the linear viscoelastic
behaviour at medium-high temperature range (45-65 ºC), if compared to SBS-mastic.
Additionally, if a deformation outside the linear viscoelastic (LVE) range is applied,
LDPE-mastics present an improved capacity of recovery when they return to the LVE.
KEYWORDS
Bituminous mastics; polymer modification; rheological properties; product design.
INTRODUCTION
In bituminous asphalt mixes, mineral fillers (with a particle size below 75 m) typically
represent from 2 to 12 wt.% on their total mineral matter1. Hence, a bitumen/filler blend
(commonly referred to as mastic) naturally forms when bitumen and aggregates are mixed.
Consequently, bitumen is the only deformable component and forms the continuous matrix of the
mastic (and, the asphalt mixtures) contributing significantly to road performance2.
Not much work has been done on polymer-modified bituminous mastics, and the effect that
polymer modification exerts on the mastic performance. With the aim of improving knowlegde
P48
179

on this subject, asphaltic mastics, containing a filler/bitumen ratio of 65/35, were prepared from
bituminous binders which were previously modified by addition of either a thermoplastic
elastomer SBS or recycled LDPE. Rheological characterization, through linear and non-linear
viscoelasticy tests, revealed that polymer type exerts a significant influence on the binder
contribution to the overall rheological properties of the mastics.
EXPERIMENTAL SECTION
Materials
Two base bitumens with penetrations values (according to EN 1426:2007) of 50 and 73 dmm,
respectively, were selected. In addition, two different types of polymers have been considered as
bitumen modifying agents: a) a thermoplastic elastomer SBS triblock copolymer (trade name “C-
401”), supplied by Dynasol S.A.; and b) a recycled LDPE, provided by Cordoplas S.A. Finally,
the mineral filler obtained from a stone quarry, with a particle size between 45 and 105 µm, has
been used as reinforcing filler in the preparation of the asphaltic mastics.
Samples processing
Prior to the preparation of the mastics, bitumen 70/100 was modified by addition of either SBS
or LDPE. Bitumen modification was carried out with a Silverson L5M homogenizer at 3500 rpm
by mixing bitumen 70/100 and 3 wt.% SBS or LDPE, for 1.5 h, and at a processing temperature
of 180 or 170 ºC, respectively (under these conditions, the loss of highly components from the
bitumen may be considered negligible). After this stage, the adequate amount of filler was mixed
with the modified binders for 1 h, getting asphaltic mastics with a filler/bitumen ratio of 65/35.
These mastics are compared to an unmodified mastic prepared from bitumen 50/70. Thus, the
three base binders present similar penetrations (50, 48 and 63 dmm), and the comparison of the
overall rheological properties is not influenced by binders with different hardnesses.
Tests and measurements
Frequency sweep tests, in shear mode, within the linear viscoelasticity region (LVE), from 0.03
to 100 rad/s, and recoverability tests, were performed using a controlled-stress rheometer Physica
MCR-301 (Anton Paar, Austria) at 55 ºC. Recoverability tests were proposed to assess material
nonlinear viscoelastic performance, by means of three 30 min intervals of dynamic loading at a
180

fixed frequency and different deformations, with the one in between outside the LVE region. In
order to ensure accurate results, at least two replicates were conducted for every sample.
RESULTS AND DISCUSSION
Dynamic mechanical spectra, at 55 ºC, of the different mastics studied are shown in Figures 1A
and 1B. At 55 ºC, bitumen softens sufficiently, and hence, the polymer significantly contributes
to the bulk rheological behaviour of the bituminous mastics.
0 20 40 60 80 10010
4
C
SBS-mastic
0.01 %1.5 %
|G*|
(P
a)
t (min)
0.01 %
FIGURE 1. Frequency sweep tests in the linear viscoelastic range, at 55 ºC, for unmodified and polymer-modified mastics (Fig 1A,1B). Evolution of the Complex modulus decay after changing
deformation values for SBS-mastic (Fig. 1C).
As can be observed, at 55 ºC, unmodified mastic curves tend to a terminal flow region at the
lowest frequencies studied, being G’ and G’’ nearly proportional to ω2 and ω1, respectively. The
addition of polymers (recycled LDPE or SBS) to the neat bitumen increases both moduli over the
entire range of frequency studied for their corresponding mastics. It is well known that the
polymer may dissolve and/or disperse into the maltenic medium, enhancing the properties of the
blends1. It can be noticed that, for the SBS-mastic, both moduli are parallel lines, as supported by
a relatively constant value of loss tangent, tan δ, shown in Figure 1B. In addition, LDPE-mastic
shows the highest values of both moduli at low/intermediate frequencies. This observation
indicates a remarkable enhancement of the rheological properties for LDPE-mastic in relation to
those shown by unmodified mastic or SBS-mastic. Thus, the results obtained with the LDPE-
mastic could be attributed to a binder with enhanced elasticity, as can be seen in Figure 1B,
where the values of the loss tangent (tan δ) are the lowest within the entire frequency range
studied.
181

The non-linear viscoelastic behaviour of mastics was studied through recoverability tests, which
display the evolution of the complex modulus (|G*|) with the elapsed time, at 55 ºC, submitted at
different deformation cycles (see Figure 1C). The percentage values of recovery and destruction
(Table 1) were calculated from the steady-state complex modulus ( , and ) attained for
the first, second and third deformation value applied, being and obtained at deformations
within LVE and measured in the non-linear viscoelasticity region.
TABLE 1 Rheological destruction and recovery percentages for the asphaltic mastics studied.
Destructiona
(%)
Recoveryb
(%)
Unmodified -mastic 29.6 17.3
SBS-mastic 38.4 29.3
LDPE-mastic 66.6 63.9
a (%)Destruction = [(G*0 - G*1) / G*0] × 100 ; b (%)Recovery= [(G*2 - G*1) / (G*0 - G*1)] × 100
As can be deduced from Table 1, the highest destruction and recovery percentages values are
observed for the LDPE-mastics. Thus, if a deformation outside the LVE is applied, mastics
prepared from a binder modified with recycled LDPE present a higher capacity of recovery to
SBS-mastic, when they return to the LVE range.
CONCLUSIONS
Asphaltic mastics prepared from LDPE and SBS modified binders showed a significant
enhancement in the rheological properties at medium-high (45-60 ºC) in-service temperatures.
Such an improvement can be deduced from both dynamic mechanical spectra conducted in the
linear viscoelastic region and recoverability tests at 55 ºC.
ACKNOWLEDGEMENTS
This work was funded by MINECO-FEDER (Subprogram INNPACTO project IPT-2012-0316-
370000). Authors gratefully acknowledge their support.
REFERENCES
1. Lesueur, D., Advances in Colloid and Interface Science, 2009, 145, 42-82.
2. Adedeji, A.; Grünfelder, T.;Macosko, C.W.; Stroup-Gardiner, M.; Newcomb, D.E.,
Polymer Engineering Science, 1996, 36, 1707-1723.
182

Stability and rheology of ecological submicron emulsions as influenced by dispersed phase concentration
Luis A. Trujillo-‐Cayado1, Mª Carmen Alfaro1, José Muñoz1
1 Reología Aplicada. Tecnología de Coloides. Departamento de Ingeniería Química. Facultad de Química. Universidad de Sevilla. C/ P. García González, 1, 41012, Sevilla, Spain.
Correspondence to: María Carmen Alfaro Rodríguez (E-‐mail: [email protected])
ABSTRACT
In this study, we examined the influence of dispersed phase concentration on the rheology,
droplet size distribution and physical stability of submicron emulsions. The formulation consists
of a mixture of green solvents (N,N dimethyldecanamide and α-pinene) as dispersed phase and a
non-ionic polyoxyethylene glycerol ester as emulsifier. Rheology provides useful information on
the physical stability and handling properties of emulsions. We report the effect of aging time on
a) steady shear flow, b) viscoelasticity, c) droplet size distribution and d) physical stability of
emulsions. The rheological properties assessed were significantly influenced by the dispersed
phase concentration. All emulsions exhibited shear thinning behavior and viscoelastic properties
above of 35 wt% dispersed phase. The laser diffraction technique revealed submicron droplet
sizes for all studied emulsions, which tended to grow with aging time by coalescence in the most
concentrated emulsions.
KEYWORDS: Emulsion, Dispersed phase, Green solvent, Rheology, Viscoelasticity
INTRODUCTION
The oil phase of an emulsion is one the points of current progress in innovate formulations.
From this point of view the use of green solvents is now an area of great interest. Different
organic solvents vary in their molecular characteristics that lead to changes in their properties
such as density, melting point, polarity, viscosity and solubility in water. Many of these
properties have a major influence on the formation, stability and functionality of emulsions1. For
example, the solubility in water of an oil phase determines the physical stability of an emulsion
P49
183

to Ostwald ripening phenomenon due to diffusion of solvent molecules through the continuous
phase. In addition, the concentration of oil droplets in an oil-in-water emulsion influences its
physical stability and rheological properties. Droplet concentration is usually characterized in
terms of the dispersed phase mass fraction (φm), which is the mass of the oil phase (moil) divided
by the total mass of emulsion (mE):
φm (%) =100·moil
mE
Eq. (1)
An eco-friendly emulsion may contain a variety of different green solvents as oil phase, such
as essential oils, terpenes and fatty acid dimethylamides. In this study, we examined the
influence of dispersed phase concentration on the rheology, droplet size distribution and physical
stability of submicron emulsions.
MATERIALS AND METHODS
Oil-in-water emulsions with 3 wt% surfactant (glycereth-17 cocoate) and different dispersed
phase concentrations (from 30 wt% to 50 wt%) were prepared using as a oil phase a mixture of
green solvents, N,N-dimethyl decanamide (AMD-10TM) and α-pinene, with a mass ratio of
75/25 respectively. Emulsions were produced by homogenization with a rotor-stator device
(Silverson L5M) using a rotational speed of 7500 rpm for 120 s at room temperature.
Characterization of the flow behavior was carried out with a controlled stress rheometer
(Haake-MARS) using a sandblasted Z20 coaxial cylinder geometry (Ri=1cm, Re/Ri=1.085) to
avoid slip-effects. The same rheometer with a sandblasted double-cone sensor (60 mm, 1°) was
used to perform frequency sweep tests from 20 to 0.05 rad/s by selecting a stress within the
linear range. Equilibration time prior to rheological tests was 5 min. Test temperature = 20°C.
Droplet size distribution measurements were performed using a static light scattering
instrument (Malvern Mastersizer X) for about 30 days.
RESULTS AND DISCUSSIONS
Figure 1 shows the Sauter mean diameters (D3,2) of emulsions with different dispersed phase
concentration aged for 1 and 30 days. For all emulsions submicron mean diameters were
184

achieved. The emulsions aged 24 hours show a marked increase of D3,2 by increasing the
concentration of dispersed phase from 45 to 50wt%. Taking into account the time evolution for
30 days of D3,2 for the five emulsions, the results obtained pointed to the occurrence of some
coalescence for emulsions containing 45 and 50 wt% oil phase.
FIGURE 1. Sauter mean diameter (D3,2) for all emulsions aged for 1 and 30 days as a function of the
dispersed phase concentration.
Figure 2A shows the viscosity curves fitted to the Cross model for the emulsions studied aged
for 24 hours as a function of oil phase concentration. All emulsions in the studied concentration
range exhibited shear-thinning behaviour. An increase of the dispersed phase concentration from
30 to 45 wt% yielded an increase of the zero shear viscosity and a decrease of the flow index.
The decrease in viscosity values for the 50 wt% emulsion aged for 1 day may be due to the
higher mean droplet diameter.
Figure 2B shows the frequency influence on the linear viscoelastic functions, G’ and G”, for
the emulsions aged that exhibited measurable linear viscoelastic range as a function of time. The
results obtained corresponded to the so-called plateau relaxation zone. The emulsion containing
35 wt% of dispersed phase shows lower values of G'' than G' in the higher frequency regime and
G'' is greater than G' in the lower frequency regime as a consequence of a crossover point
between G' and G''. All samples above 35 wt% dispersed phase displayed clear viscoelastic
properties with a predominance of the elastic over the viscous component in the frequency range
studied. G´ turned out to be relatively independent of frequency, which is typical of gel-like
materials. The addition of oil phase caused the formation of a weaker structure above 45 wt%,
185

which is consistent with laser diffraction and flow curves results.
FIGURE 2. (A) Flow curves and (B) mechanical spectra for all emulsions aged for 24 hours as a function of
dispersed phase concentration.
CONCLUSIONS
The rheological properties assessed were significantly influenced by the dispersed phase
concentration. All emulsions exhibited shear thinning behavior, which fitted the Cross model. An
increase the dispersed phase concentration from 30 to 45 wt% yielded an increase of the zero
shear viscosity and a decrease of the flow index. All samples above 35 wt% dispersed phase
displayed clear viscoelastic properties with a predominance of the elastic over the viscous
component in the frequency range studied. The laser diffraction technique revealed submicron
droplet sizes for all studied emulsions, which tended to grow with aging time by coalescence in
the most concentrated emulsions.
ACKNOWLEDGEMENTS
The financial support received (Project CTQ2011-27371) from the Spanish Ministerio de
Economía y Competitividad and from the European Commission (FEDER Programme) is kindly
acknowledged.
REFERENCES AND NOTES
1. McClements, DJ.; Rao, J., Food-grade nanoemulsions: formulation, fabrication, properties, performance, biological fate, and potential toxicity. Critical Reviews in Food Science and Nutrition, 2011, 51, 285-330.
186

Influence of homogenization rate on the rheology and stability of emulsions formulated with a mixture of green solvents.
Nuria Calero1, Jenifer Santos1, José Muñoz1. 1Reología Aplicada. Tecnología de Coloides. Departamento de Ingeniería Química. Facultad de
Química. Universidad de Sevilla c/ P. García González, 1, E41012, Sevilla España.
Correspondence to: Nuria Calero (E-‐mail: [email protected])
ABSTRACT
There is a need to replace the traditional organic solvents by more environmentally
favourable solvents in process engineering, cleaning as well as in other formulated
products1. The goal of this study was to assess the processing conditions which slow
down the destabilization kinetics of green emulsions by means of rheological
techniques, assisted by laser diffraction. Fatty acid dimethylamides (FAD) are green
solvents derived from biomass that find application in agrochemical emulsificable
concentrates. D-Limonene (D-L) is a naturally occurring hydrocarbon which can be
derived from the rinders of citrus fruits and shows good biodegradability. In this
research an optimised ratio of FAD and D-L solvents was used as dispersed phase of
O/W emulsions2. Lab-scale emulsions were prepared, with a Silverson homogenizer
equipped with an emulsor mesh screen, at several rotational speeds (Ω). The specific
target of this study was to determine the optimum Ω which results in enhanced stability.
Regardless of the Ω used, flow curves of emulsions at 20ºC showed Cross-type
behaviour. Emulsions processed above a critical Ωc exhibited weak-gel viscoelastic
properties when studied under SAOS. A decrease of plateau modulus was a clear
indication of the occurrence of some coalescence, which was also confirmed by the
increase in droplet sizes measured by laser diffraction. We demonstrate that the
optimum homogenization rate was around 4000 rpm on account of the lack of
coalescence.
KEYWORDS: eco-friendly emulsions, rheology, laser diffraction, stability.
INTRODUCTION
The toxicity of traditional organic solvents limits its application in emulsions for
agrochemical use. Hence, in order to avoid the use of toxic solvents in the production of
P50
187

agrochemical products, active ingredient used in pesticides should be dissolved in a
natural and nontoxic solvent. In this regards, L-limonene, a safe, highly effective, and
biodegradable natural extraction from peel of citrus fruits, is a good solvent alternative
for this application. In addition, N,N-dimethyldecanamide has attracted the attention
recently due to its good characteristics like eco-friendly solvent.
The main objective of this work was the study of the influence of homogenization rate
on the physical stability of slightly concentrated O/W emulsions formulated with two
green solvents (N,N-dimethyldecanamide and D-limonene) and a polyoxyethylene
glycerol ester as emulsifier.
MATERIALS AND METHODS
Materials
N,N-Dimethyldecanamide (Agnique AMD-10TM, BASF), D-Limonene (Sigma Aldrich)
and Glycereth-17 Cocoate (HLB:13)(KAO) as emulsifier, were used. Its trade name is
Levenol C-201TM. RD antifoam emulsion (DOW CORNING®) was used as antifoaming
agent. Deionized water was used for the preparation of all emulsions.
Methods
Emulsions development
Emulsions containing 4 wt % Levenol C-201 as emulsifier, 0.1 wt % antifoam emulsion
and 40 wt% mixture of solvents were prepared. The ratio used was 75 wt% AMD-10
and 25 wt% D-Limonene, which was previously demonstrated to be the optimum.
These O/W emulsions were carried out using a Silverson L5M at different
homogenization rates (4000-8000 rpm) during 60 s.
Laser diffraction measurements
Size distribution of oil droplets were determined by laser diffraction using Mastersizer
X (Malvern, Worcestershire, UK). The mean droplet diameters was expressed as Sauter
diameter (D2,3) an volumetric diameter (D4,3):
𝐷 𝑀,𝑁 =𝐷! 𝑛 𝐷 𝑑𝐷𝐷!𝑛 𝐷 𝑑𝐷
!!!!
(1)
Rheological measurements
188

Rheological experiments were conducted with a Haake MARS controlled-stress
rheometer (Thermo-Scientific, Germany), equipped with a sand-blasted double cone/1º
to avoid slip effects. Flow curves were carried out from 0.05 to 5 Pa at 20ºC. Frequency
sweeps were conducted from 0.05 to 20 rad/s selecting a stress well within the linear
range.
RESULTS AND DISCUSSION
Figure 1A shows flow behavior for studied emulsions as a function of homogenization
rate. All emulsions showed shear-thinning behavior that fitted fairly well to Cross
model.
𝜂 = !!
!! !!!
!!! (2)
Where ηo is zero shear viscosity, 𝛾! , critical shear rate and n the flow index. Two levels
in zero shear viscosity were observed. Emulsions processed above 6000 rpm showed
higher ηo than emulsions processed at lower homogenization rates. This supports laser
diffraction results. In addition, only emulsions processed above 5000 rpm exhibited
viscoelastic properties where storage modulus are higher than loss modulus in every
frequency. This fact may be explained by a flocculation process. Plateau zone was
observed in all frequency sweeps with a characteristic plateau modulus, 𝐺!! . Figure 1B
shows plateau modulus as a function of homogenization rate with aging time. 𝐺!! for 1-
day.aged emulsions processed at 6000 and 7000 rpm did not show any significant
differences. However, 8000 rpm emulsion showed lower 𝐺!! than the others. This fact
may be related to a break of flocs since the volumetric diameter was very similar (see
fig 2). Furthermore, all emulsions exhibited a decrease of 𝐺!! with aging time. Thus, a
coalescence phenomenon could be taking place.
Figure 2 shows volumetric diameter as a function of homogenization rate at 1 and 30
days of aging time. There is a decrease of volumetric diameter with homogenization rate
at one-day aging time. However, a trend to level off at higher homogenization rates was
also observed. In addition, there is an increase in the droplet size from day 1 to 40 for
emulsions processed above 5000 rpm. This fact may be related to a flocculation process,
which explains the higher viscoelastic properties of these emulsions.
CONCLUSIONS
189

Submicron emulsions were obtained using a rotor-stator device. All emulsions exhibited
shear-thinning behaviour and emulsions above 5000 rpm showed viscoelastic
properties. These viscoelastic emulsions showed an increase of droplet size by laser
diffraction. Rheology measurements supports this fact. Taking into account these
results, we demonstrated that the optimum homogenization rate for these 40 wt% eco-
friendly emulsions was 4000 rpm due to the lack of coalescence.
0 50 100 1500
1
2
3
4
5
8000 rpm 7000 rpm 6000 rpm 5000 rpm 4000 rpm Cross Model
τ (P
a)
shear rate (s-1)
0 5 10 15 20 25 300
5
10
15
20 8000 rpm 7000 rpm 6000 rpm
G0 N
(Pa)
Aging time (days)
Figure 1.A) Flow curves for 40 wt% emulsions as a function of homogenization rate. B) Influence of aging time on plateau modulus for emulsions processed at different homogenization rate.
4000 5000 6000 7000 80000
1
2
3
4
5
D4.
3(µm
)
Homogenization rate (rpm)
day 1 day 30
Figure 2.Volumetric mean diameter for emulsions processed at different homogenization rates at 1 and 40 days of aging time.
ACKNOWLEDGEMENTS
The financial support received (Project CTQ2011-‐27371) from the Spanish Ministerio de Economía y Competitividad, the European Commission (FEDER Programme) and from V Plan Propio Universidad de Sevilla is kindly acknowledged.
REFERENCES 1. Gani, R.; Jiménez-‐González, C.; ten Kate, A.; Crafts, P. A.; Jones, M.; Powell, L; & Cordiner, J. L., Chemical engineering, 2006, 113, 30-‐43. 2. Santos, J.; Trujillo-‐Cayado, L. A.; Calero, N.; & Muñoz, J., AIChE Journal, 2014, 60, 2644-‐2653.
190

Small and large amplitud oscillatory shear measurements of Advanced
Performance xanthan gum solutions. Effect of xanthan gum concentration
Pablo Ramírez1, Aurora Lucas Curado1, José Antonio Carmona1, Nuria Calero1, José Muñoz1
1Departamento de Ingeniería Química. Facultad de Química. Universidad de Sevilla c/ P. García González,
1, E41012, Sevilla, Spain.
Correspondence to: Pablo Ramírez (E-mail: [email protected])
ABSTRACT
The idea behind LAOS is an attempt to describe the mechanical behaviour of complex fluids at
large deformations, well beyond the linear viscoelastic region, which are closer to real
processing conditions. Furthermore, large amplitude oscillatory shear (LAOS) has proven to be a
sensitive technique in order to detect microstructural changes in complex fluids such as
biopolymer networks, colloidal gels, etc. We illustrate the applications of LAOS with an
"advanced performance" xanthan gum aqueous dispersions at different concentrations (from
0.15% (m/m) to 0.40% (m/m)), on account of the great technological interest of this bacterial
polysaccharide. The influence of concentration on the viscoelastic properties of aqueous xanthan
gum dispersions was studied by means of both techniques, SAOS and LAOS. Within linear
viscoelastic range, the "advanced performance" xanthan gum demonstrated that possesses less
fluid-like behaviour than conventional gum. More interestingly, the combination of the use of
both rheological measurements allowed us to detect a structural transition within the
concentration range studied.
KEYWORDS: Xanthan gum; LAOS; Non-linear viscoelasticity; Chebyshev coefficients; Weak-gel.
INTRODUCTION
Although SAOS tests are a useful tool to obtain a convenient rheological characterization of
complex fluids in most real operations the deformation is well beyond the linear viscoelastic
region and therefore linear viscoelastic characterization lacks information to fully understand
practical polymer processing. Thus, LAOS tests are being increasingly important due to their
usefulness in describing the elastic and viscous properties of complex fluids at large
deformations1,2
.
The objective of this work was to study the influence of polymer concentration on the
rheological properties of aqueous solutions of a commercial “advanced performance” xanthan
gum (APXG). This rheological study involves small amplitude oscillatory shear (SAOS) and
Experimental Methods
P30
191

large amplitude oscillatory shear (LAOS). The non-linear oscillatory response was analyzed
using the third-order Chebyshev coefficients (e3 and υ3) may then be used to determine material
nonlinear viscoelastic behaviour. Thus, material viscoelastic behaviour is classified in six
categories: strain-softening (e3<0), strain-stiffening (e3>0), linear elastic e3=0, shear thinning
(υ3<0), shear thickening (υ3>0) and linear viscous υ3=0 3.
MATERIALS
KELTROL® Advanced Performance “Food Grade” xanthan gum, generously donated by CP
Kelco, was used to prepare xanthan gum solutions. Xanthan gum solutions with concentrations
ranging from 0.15% to 0.40% (m/m) were prepared by slowly adding the required amount of
polymer powder. The solutions studied were prepared with ultrapure Milli-Q water. 0.1% (m/m)
sodium azide was added to the solutions to prevent the growth of microorganisms. All
ingredients were used as received.
RESULTS AND DISCUSSION
SAOS
Figure 1 shows G*and tan() as a function of frequency within LVR (strain = 5%) for the two
limiting concentrations studied. When increasing polymer concentration G* increases whereas
tan() decreases with values lower than one in all the frequency range studied, corresponding to
a weak-gel behaviour. Nevertheless, there is a tendency to reach the crossover frequency that
determines the onset of the terminal relaxation zone when moving towards lower frequencies for
the lowest xanthan gum concentration. Furthermore a comparison of frequency sweeps for both
the APXG used in the present study and a conventional one produced by the same Company (CP
Kelco) for the same concentration of xanthan gum 0.40% (m/m) and ionic strength4 showed that
the conventional xanthan gum has a more fluid-like behaviour.
It is interesting to note that the Cox- Merz rule was followed for the lowest concentration of
xanthan gum (0.15 % (m/m)), while it failed for the rest of concentrations studied. In this case
the departure could be related to the occurrence of a structured system, supporting that the weak-
gel structure was clearly set.
LAOS
Further information on the influence of the xanthan gum concentration on the microstructure of
xanthan gum can be obtained by analysing the third-order Chebyshev coefficients (e3 and υ3).
Figures 2a and 2b show the parameters e3 and 3 used to evaluate the intracycle elastic and
viscous non-linearities for the two limiting concentrations studied. Thus, the non-linear
viscoelastic region can be divided into three parts according to the intracycles parameters.
Region (A) Strain softening (e3 < 0) + Shear thickening (3 > 0); Region (B) Strain stiffening
(e3 > 0) + Shear thickening (3 > 0) and Region (C) Strain stiffening (e3 > 0) + Shear thinning
192

(3 < 0). Furthermore, when 3 was plotted as a function of xanthan gum concentration two
linear tendencies were observed, which could be related to a change in the behaviour of the
polymer solution indicating the occurrence of two regimes. The drastic change in the slope was
found in the 0.20% to 025% (m/m) range.
[rads-1]
0.1 1 10
G*[
Pa
], t
an
()
0.1
1
10
FIGURE 1. Complex modulus, G*(close symbols) and loss tangent, tan() (open symbols) as a function of
frequency for xanthan gum concentrations of 0.15 %(m/m) (circles) and 0.40 %(m/m) (triangles)T=20ºC.
CONCLUSIONS
All the studied systems showed a weak-gel behaviour that increase with concentration. The
comparison of the mechanical spectrum for the Advanced Performance Xanthan Gum with a
conventional one showed that the viscous component of the latter was more important than the
one for the Advanced Performance.
The second evidence supporting a structural change was the deviations from the Cox-Merz rule
for the concentrations above 0.20% (m/m), which indicates the occurrence of a more
development structure.
A complete rheological characterization of the systems was achieved by analysing the
parameters deduced from local methods. The plot of the maximum value of third-order –viscous
Chebyshev coefficient (3) obtained by LAOS against concentration supported the
aforementioned change of the viscoelastic behaviour associated to the modification of the gum
structure.
Finally, the non-linear viscoelastic region can be divided into three parts according to the
intracycles parameters. Thus, region (A) Strain softening (e3 < 0) + Shear thickening (3 > 0);
Region (B) Strain stiffening (e3 > 0) + Shear thickening (3 > 0) and Region (C) Strain
stiffening (e3 > 0) + Shear thinning (3 < 0).
193

Strain
0.1 1 10
e3
-1.0e-3
-5.0e-4
0.0
5.0e-4
1.0e-3
1.5e-3
2.0e-3
2.5e-3
Strain rate
1 10 100
3
-3e-4
-2e-4
-1e-4
0
1e-4
2e-4
3e-4
4e-4
5e-4
A
B
FIGURE 2. Oscillatory shear tests of xanthan gum at 4 rad/s analysed by means of LAOS parameters for
0.15 % (m/m) (triangles) and 0.40% (m/m) (diamonds). A) Third-order elastic Chebyshev coefficient, e3.
B) Third-order viscous Chebyshev coefficient, . T = 20ºC. The error bars are included in the figure.
ACKNOWLEDGEMENTS
The financial support received (Project CTQ2011-27371) from the Spanish Ministerio de Economía y
Competitividad (MINECO) and from the European Commission (FEDER Programme) is kindly
acknowledged.
REFERENCES
1. Carmona, J.A. ; Ramírez, P. ; Calero, N. ; Muñoz, J. Journal of Food Engineering, 2014, 126, 165.
2. Ewoldt, R.H. ; Winter, P. ; Maxey, J. ; McKinley, G.H. Rheologica Acta 2010, 49, 191.
3. Ewoldt, R.H. ; Hosoi, A.E. ; McKinley, G.H. Journal of Rheology 2008, 52, 1427.
4. Wyatt, N. B. ; Gunther, C. M.; Liberatore, M. W. Journal of Non-Newtonian Fluid Mechanics,
2011, 166, 25.
194

Correlation of glycerol viscosity with temperature
Abel G. M. Ferreira1, Ana P. V. Egas1, Ana C. Costa2, Danielly C. Abreu2
1Department of Chemical Engineering, University of Coimbra, Polo II, Rua Silvio Lima, 3030-970 Coimbra,
Portugal. 2 Departamento de Engenharia Química, Universidade Federal de São João del-Rei Campus Alto Paraopeba
- C.A.P,Rod.: MG 443, KM 7 Ouro Branco - MG 36420-000, Brasil.
Correspondence to: Abel G. M. Ferreira (E-mail: [email protected])
ABSTRACT
The dynamic viscosity of glycerol was measured in the range T= (293 to 394) K and atmospheric pressure
using a Brookfield Thermosel system. To produce an extensive viscosity database for this substance, the data
obtained in this study were combined with published data from the literature covering the range of
temperature from near the glass transition temperature (190 K) up to 394 K. The Vogel-Tamman-Fulcher
(VTF) equation and the Bond Strength-Coordination Number Flutuation (BSCNF) model, were both used to
correlate the values selected in the database. From BSCNF the structural effects taking place near the glass
transition were discussed.
KEYWORDS: Glycerol, Viscosity, Glass transition, BSCNF model, VTF equation
INTRODUCTION
Glycerol is one of the most extensively studied hydrogen-bonded systems. The presence of three
hydroxy groups in the molecule gives rise to particularly rich and complex conformational and
structural behaviour and it is one of the archetypal glass-forming liquids. The nature of its glass
transition has been the object of several experimental investigations. In particular, the viscosity has
been measured using different type of viscometers and consequently there is some disagreement in
data from the various sources.
EXPERIMENTAL
Glycerol was obtained from ACROS (Cas No: 142-82-5) with mass fraction purity of 0.9987. Since
glycerol is highly hygroscopic, samples were further degassed ultrasonically and dried over freshly
activated molecular sieves supplied by Aldrich. Dynamic viscosity measurements were made in the
range 20 to 121 ºC using a Brookfield Thermosel system with a rotational DV-II+ (model LVDV-11)
viscometer. Temperature was controlled to ±0.5 K.
THEORY
The glass-forming liquid is formed by an agglomeration of clusters or structural units which are
P31
195

bound to others by a certain bond strength retaining its spatial random connectivity. Thermally
activated viscous flow occurs due to bond-breaking and bond-switching. Aniya et al.1 developed the
BSCNF viscosity model which is characterized by Gaussian distributions of the binding energy (E)
and the coordination number (z) between structural units. The binding energy and coordination
number are E=E0+∆E and z= z0+∆z, respectively, where E0 and z0 are average values and ∆E and ∆z
are fluctuations. The viscosity in BSCNF is
)1ln(5.01
11
)1ln(5.0ln
ln 2
2
2
BxBx
C
BBCxCx
g
(1)
where 2
gRT
))((B
ZE ,g
00
RTC
ZE , x = Tg/T (Tg is the glass transition temperature, ηg=1012 Pa.s and
η∞=10-5 Pa.s. The fragility index, m=[d log η /d(Tg/T)]T=Tg , from equation (1) is
B
BCB
m
g
1
)1ln(5.0ln2
)10ln(
1
(2)
According to BSCNF theory, parameters B and C obey the relation1
)1ln(5.0ln)1(2
)1(22
BB
BC
g
, 0
0
/
/
zz
EE
(3)
When γ= 1, equation (1) simplifies and the only parameter to be found is B (=B*) ( ln(ηg /η∞) can be
considered also as a varying parameter). This model will be referred here as BSCNF1. The Vogel-
Fulcher-Tammann (VFT) equation2-4
0
logTT
BA VTF
VTF
(4)
is one of the most commonly used expressions for the analysis of the temperature dependence of
viscosity. AVTF = log (η∞) is the value of the viscosity at the high temperature limit. BVTF (=DT0) and
T0 are fitting parameters. D is the strength parameter and T0 is the Vogel temperature. An important
quantity obtained from BSCNF model is the number of structural units broken NB= Eη / (E0z0) where
Eη is the activation energy for the viscous flow and (E0z0) is the average total binding energy per one
structural unit. Following Ikeda and Aniya5 NB gives the number of the structural units involved in
196
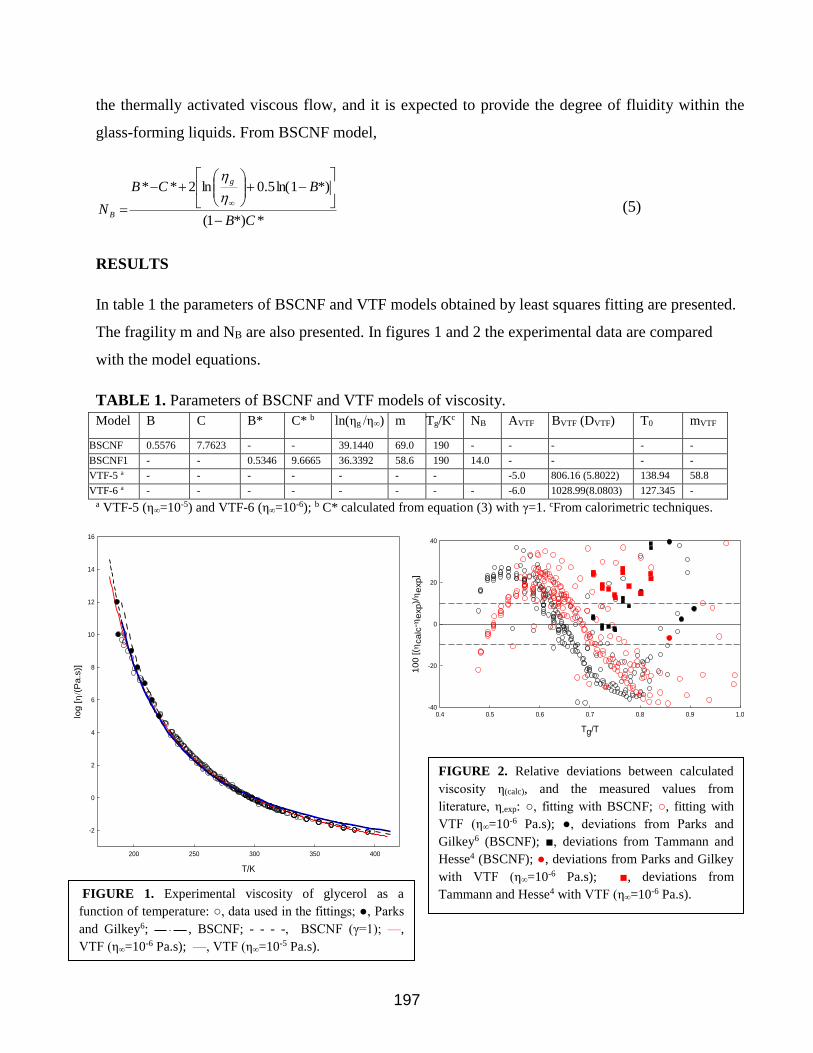
the thermally activated viscous flow, and it is expected to provide the degree of fluidity within the
glass-forming liquids. From BSCNF model,
**)1(
*)1ln(5.0ln2**
CB
BCB
N
g
B
(5)
RESULTS
In table 1 the parameters of BSCNF and VTF models obtained by least squares fitting are presented.
The fragility m and NB are also presented. In figures 1 and 2 the experimental data are compared
with the model equations.
TABLE 1. Parameters of BSCNF and VTF models of viscosity.
Model B C B* C* b ln(ηg /η∞) m Tg/Kc NB AVTF BVTF (DVTF) T0 mVTF
BSCNF 0.5576 7.7623 - - 39.1440 69.0 190 - - - - -
BSCNF1 - - 0.5346 9.6665 36.3392 58.6 190 14.0 - - - -
VTF-5 a - - - - - - - -5.0 806.16 (5.8022) 138.94 58.8
VTF-6 a - - - - - - - - -6.0 1028.99(8.0803) 127.345 -
a VTF-5 (η∞=10-5) and VTF-6 (η∞=10-6); b C* calculated from equation (3) with γ=1. cFrom calorimetric techniques.
T/K
200 250 300 350 400
log
[(
Pa
.s)]
-2
0
2
4
6
8
10
12
14
16
Col 2 vs Col 5
Col 7 vs Col 8
Col 13 vs Col 15
Col 18 vs Col 19
Col 26 vs Col 28
Col 42 vs Col 44
Tg/T
0.4 0.5 0.6 0.7 0.8 0.9 1.0
100 [(
calc
-exp
)/
exp
]
-40
-20
0
20
40
Col 51 vs Col 55
Col 63 vs Col 67
Col 69 vs Col 70
Col 69 vs Col 71
Col 69 vs Col 72
Col 83 vs Col 84
Col 107 vs Col 111
Col 121 vs Col 122
Col 132 vs Col 133
FIGURE 2. Relative deviations between calculated
viscosity η(calc), and the measured values from
literature, η,exp: ○, fitting with BSCNF; ○, fitting with
VTF (η∞=10-6 Pa.s); ●, deviations from Parks and
Gilkey6 (BSCNF); ■, deviations from Tammann and
Hesse4 (BSCNF); ●, deviations from Parks and Gilkey
with VTF (η∞=10-6 Pa.s); ■, deviations from
Tammann and Hesse4 with VTF (η∞=10-6 Pa.s).
FIGURE 1. Experimental viscosity of glycerol as a
function of temperature: ○, data used in the fittings; ●, Parks
and Gilkey6; , BSCNF; - - - -, BSCNF (γ=1); —,
VTF (η∞=10-6 Pa.s); —, VTF (η∞=10-5 Pa.s).
197

CONCLUSIONS
From figure 2 it can be seen that the BSCNF and VTF models can represent the experimental
viscosity data from literature with variable performance with relative deviations from zero up to 20%.
This variation is explained in part by the discrepancy of data from the various authors and in other
hand by the fail of models to describe data in wide range of temperature starting from Tg. Despite the
scarcity of data in the approach to the glass transition temperature the tested models give reasonable
results in the medium temperature range. It is interesting to note that the old data of Parks and Gilkey
(1929) can be represented by BSCNF model close to the glass transition. The fragility index obtained
in this work (m=59) (m=53)7 characterizes glycerol as a moderate fragile liquid. The physical basis
of BSCNF theory is an important aspect possibly more significant than the intrinsic precision of
fitting with this model. The value NB=14 suggests that bonds corresponding to about 14 structural
units must be broken in order to observe the viscous flow in the glass transition range.
ACKNOWLEDGEMENTS
The authors are grateful to Prof. K. Schröter (Institute of Physics, University Halle, Germany), Prof.
M. E. Möbius (Scholl of Physics, Trinity College, Dublin, Ireland) and Prof. Stefan Klotz, CNRS,
Université Pierre et Marie Currie, Paris, France) for having sent the viscosity data.
REFERENCES
1. Ikeda, M.; Aniya, M., Bond Strength-Coordination Number Fluctuation Model of Viscosity: An
Alternative Model for the Vogel-Fulcher-Tammann Equation and an Application to Bulk Metallic Glass
Forming Liquids, Materials, 2010, 3, 5246-5262.
2. Vogel, H., Das Temperaturabhängigkeitsgesetz der Viskosität von Flüssigkeiten, Phys. Z 1921, 22, 645–
646 .
3. Fulcher, G. S., Analysis of recent measurements of the viscosity of glasses, J. Am. Ceram. Soc. 1925, J 8,
339–355.
4. Tammann, G.; Hesse, W., Die Abhängigkeit der Viscosität von der Temperatur bie unterkühlten
Flüssigkeiten, Z. Anorg. Allg. Chem. 1926, 156, 245–257.
5. Ikeda, M.; Aniya, M., Correlation between fragility and cooperativity in bulk metallic glass-forming
liquids, Intermetallics, 2010, 18, 1796-1799.
6. Parks, G. S.; Gilkey, W. A., Studies on glass.IV. Some viscosity data on liquid glucose-glycerol
solutions. J. Phys. Chem. 1929, 33, 1428-1437.
7. Huang, D.; McKenna, G. B., New insights into the fragility dilemma in liquids, J. Chem. Phys. 2001, 114,
5621-5630.
198

Rheological Implementation of the Joule Effect in Conductive liquids.
Application to thermosets curing.
C. Gracia Fernández1,S. Gómez Barreiro
2, J. López Beceiro
2, R. Artiaga
2
1TA Instruments-Waters Cromatografía, 28108 Alconbendas Madrid, Spain
2University of A Coruña, Higher Polytechnic School, Campues de Esteiro, Ferro 15403, Spain
Correspondence to: Author Name ([email protected])
ABSTRACT
The main target of the present work is to monitorize the curing of a bicomponent thermoset by
rheology when an electrical current going trought the sample produces heat by the Joule effect. So the
first point was to increase the conductivity of the material. In order to get the necessary minimum
electrical conductivity, Multiwall carbon nanotubes (MWCNTs) where introduced in the thermoset
Matrix. The concentration used was 3 %. Rheological experiments ensure that that concentration is
higher than the percolation concentration. In order to motorize the curing, at the same time that the DV
voltaje is applied, the system has being integrated in a Rheometer DHR2 (TA Instruments, DE, USA). The
geometry used has being 25 mm disposable parallel plates. Both plates have being soldered to the
negative and positive sides of a DC source. The voltage difference up to 75 V produces the current
intensity that will produce the heat by joule effect. Multifrequency time sweep experiments provide the
viscoelastic profile during the curing process.
KEYWORDS thermoset, MWCNTs, Joule effect, gelification, conductivity
INTRODUCTION
The curing of thermosets is a research field widely studied in the literature. Most of them are heat
induced typically by convection. Moreover, there are curing applications that use UV light. One of the
main disadvantages of this technique is the low penetration index of the UV light. Therefore, the curing
is produced mainly in the Surface what it is useful in coatings but not so much is structural parts.
The Joule effect is another way to produce heat that has not being deeply studied in the thermoset field.
Some authors have used the carbon fibbers that are present in some composites to conduct the
electricity that finally produces the heat by Joule effect.
Materials
Epoxy/Hardener: BEPOX 1622 (Gairesa, Valdoviño Spain). Proportion 2.38 to 1 in weight.
P32
P32
199

10 2 10 3 10 4 10 5 10 6
DE (Hz)
10 -7
10 -6
10 -5
10 -4
10 -3
10 -2
10 -1
10 0
Powder MWCNTs
Only resin without MWCNTs
Resin + 3 % MWCNTs 100 % conversion
Resin + 3 % MWCNTs zero conversion
MWCNTs: from Aldrich; 6-9 nm x 5 microns
Rheometer: DHR TA Instruments (DE USA).
DETA accessory: Disposable geometries 25 mm. Agilent brigde LCRmeter 4980A, freq range from 20 Hz
to 2 MHz. Voltage range from 0.005 to 20 V. maximum output Intensity 200 mA.
DC voltage source: MYWAVE MPD-7505 POWER SUPPLY. 0 – 75 V. 0 – 5 A.
Dispersion machine: heidolph diax 900, 8,000-26,000 rpm
MATLAB: control the DC source through t the intensity. P = 0.05, I = 0.01; D = 0.01
The final mixture between the 3 components, epoxy resin, hardener and MWCNTs has being made by
mechanical agitation and ultrasounds.
RESULTS
As it is shown in Figure 1, the 3 % of MWCNTs increases the resin conductivity around 4 orders of
magnitude. It is very interesting to observe that the complete cured sample has the highest conductivity
200
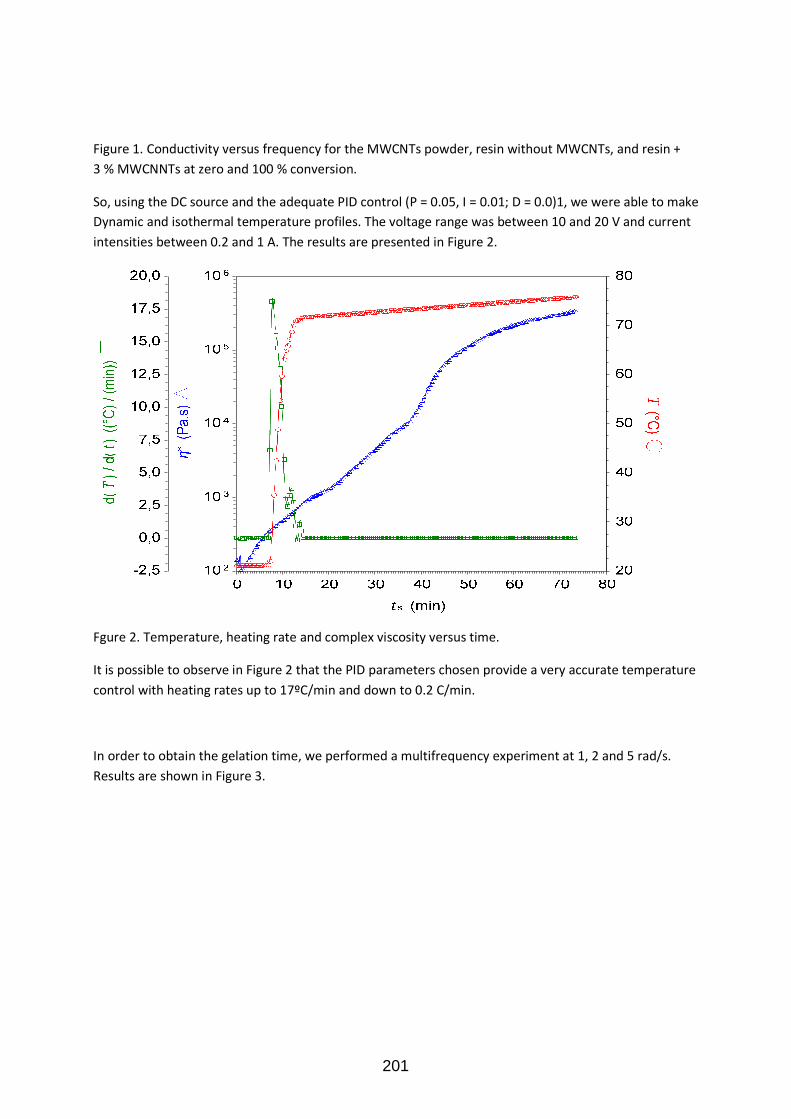
Figure 1. Conductivity versus frequency for the MWCNTs powder, resin without MWCNTs, and resin +
3 % MWCNNTs at zero and 100 % conversion.
So, using the DC source and the adequate PID control (P = 0.05, I = 0.01; D = 0.0)1, we were able to make
Dynamic and isothermal temperature profiles. The voltage range was between 10 and 20 V and current
intensities between 0.2 and 1 A. The results are presented in Figure 2.
Fgure 2. Temperature, heating rate and complex viscosity versus time.
It is possible to observe in Figure 2 that the PID parameters chosen provide a very accurate temperature
control with heating rates up to 17ºC/min and down to 0.2 C/min.
In order to obtain the gelation time, we performed a multifrequency experiment at 1, 2 and 5 rad/s.
Results are shown in Figure 3.
201

31,4198 min; 0,0524387
Figure3. Tan delta and Temperature versus time.
It is possible to observe in Figure 2 that the crossover of tan delta at the 3 frequencies occurs at 31. 41
min so 6 min after to reach the isothermal temperature at 90º C
CONCLUSIONS
The curing by Joule effect was successfully implemented in The Rheometer DHR using the Disposable
plates of the DETA accessory. This technique allows the rheological measurement at one frequency or in
multifrequency of a conductive thermoset.
In order to increase the conductivity, MWCNTs were successfully added at a concentration of 3 %. The
conductivity increased around 4 decades.
REFERENCES
[1] B. Mas, J. P. Fernández-Blazquez, J. Duval, H. Bunyan; J.J. Vilatela, Carbon, 63: 523-529 (2013).
202

Characterization of polyelectrolytes through dilution viscometry
Raquel Costa1 , Anita Lourenço1,2, Rita Garrido1, David Hunkeler2, Manuel Banobre3, Maria G. Rasteiro1
1Chemical Engineering Department, University of Coimbra, Rua Sílvio Lima, 3030-790 Coimbra,
Portugal
2AquaTech, 1237 Avully, Geneva, Switzerland
3International Iberian Nanotechnology Laboratory, 4715-330 Braga, Portugal
Correspondence to: Maria G. Rasteiro (E-mail: [email protected])
ABSTRACT
Charged macromolecules with high molar mass tend to pose characterization difficulties.
Dilution viscometry can be a reliable technique to characterize polyelectrolytes providing their
intrinsic viscosity. The intrinsic viscosity can be considered a ”lumped parameter”, giving
information on the polymer’s conformation in solution, which is an important characteristic, in
particular if the intention is to compare the impact of polyelectrolytes of different molar mass,
charge density, chemistry and/or chain architecture on technological processes. The intrinsic
viscosity of three copolymers was determined by two different techniques: capillary viscometry
and rolling ball viscometry. In this presentation, we show the comparative analysis of the
intrinsic viscosity measurements obtained through these two alternative methods. Huggins
correlation was used to extract intrinsic viscosity values from the raw experimental data.
KEYWORDS: intrinsic viscosity; polyelectrolytes; capillary viscometry; rolling ball viscometry
INTRODUCTION
Water-soluble synthetic polyelectrolytes are key compounds in a number of fields, including
drinking water treatment, papermaking and personal care products manufacturing.1 As charged,
high molar mass molecules, these compounds often pose characterization difficulties.
Polyelectrolyte intrinsic viscosity is amongst the parameters whose determination may turn into a
challenge.2 The intrinsic viscosity can be seen as a “holistic” parameter, giving information on
the conformation, and hence the hydrodynamic volume, of the polymer chains in the solution.
This information is particularly relevant to compare the impact of multiple variables (e.g.
P33
203

molecular weight, charge density, chemistry, chain architecture) on technological processes
where the polymer coil dimensions are important, providing a basis to envisage the relative
performance of different polyelectrolytes.
Polymer intrinsic viscosity is determined by dilution viscometry. The gravimetric capillary
principle is widely applied through Ubbelohde viscometers. The main advantage of this
technique is that gravity is employed as a reliable, not artificially generated driving force, which
reduces potential experimental errors. Alternatively, intrinsic viscosity values may be obtained
by implementing the rolling/falling ball principle, where gravity is also used as driving force, but
the inclination angle of the capillary where a ball rolls has to be defined within the measurement
procedure.
As part of an ongoing project aimed at describing the toxic potential and biological activity of
cationic acrylamide/dimethylaminoethylacrylate methyl chloride copolymers (AM-co-DMAEA),
the intrinsic viscosity has been determined for a variety of polyacrylamides with varying
AM/DMAEA ratio.3
Here, intrinsic viscosity values obtained by the gravimetric capillary and rolling ball principles
are reported and compared for three linear AM-co-DMAEA polyelectrolytes with different
molecular weight and charge density (Table 1). The polyelectrolytes’ molecular weights have
been determined experimentally by static light scattering (SLS).
MATERIALS AND METHODS
Molecular weight determination
The molecular weights of the three polyelectrolytes under study were estimated based on SLS
measurements in a Zetasizer Nano ZS, model number ZEN3600. Stock solutions (1.5 mg/mL) of
each polymer were prepared by stirring purified samples in previously filtered (0.45 µm) 0.05M
NaCl aqueous solution for at least 6h. The stock solutions were left to rest overnight prior use.
Dilution series of 5 solutions in the concentration range 0.1-1.5 mg/mL were employed in the
molecular weight measurements.
Intrinsic viscosity determination
The intrinsic viscosities of the polyelectrolytes were determined in both an automatic capillary
viscometer Viscologic TI1 (Sematech, France) with a 0.58-mm capillary and a rolling ball Lovis
2000 M/ME microviscosimeter (Anton Paar, Austria). For the rolling ball technique, the angle of
204

inclination of the capillary was selected to 48 and several replicate measurements were taken by
alternating the angle from +48 to -48 until the variation coefficient of the readings was below
0.05 %. The measurements had to be carried out at 20º C and 25 ºC for the gravimetric capillary
and rolling ball techniques, respectively.
The dilution viscometry principle was applied. Intrinsic viscosity values [η] were obtained by
determining the specific viscosities (ηsp) of polymer solutions of different concentrations and then
extrapolating to zero concentration conditions. ηsp values were calculated either from the
capillary running times or ball rolling times. From the ηsp, reduced viscosities could be
calculated as the ratio ηsp/c (c being the polymer concentration). The limit of the reduced
viscosity for infinitely diluted polymer solutions defined the intrinsic polymer viscosity. The
Huggins fit (equation 1) was employed for the extrapolation to zero concentration:4
cH
Kc
sp
red
2'
(1)
The Huggins coefficient, KH, is a constant for a given polymer-solvent system; the intercept (at
the origin) for the plot reduced viscosity versus concentration gives the intended intrinsic
viscosity.
Experimental polymer stock solutions were prepared by dissolving isolated (purified)
polyelectrolyte samples in 0.05M NaCl aqueous solution. The stock solutions were stirred at
least for 6 hours until complete dissolution. At least 4 concentrations in the range 10-5 to 10-4
g/mL per polyelectrolyte sample were prepared from the stock solutions. The dilution series used
were selected so that the range of relative viscosities varied between 1.2 and 2.5 (values lower
than 1.2 would lead to high uncertainty). Pure solvent running and rolling ball times were also
measured.
Capillary cleanness was an essential aspect in both measurement techniques, and hence the
solutions were injected in increasing concentration order and the capillaries were thoroughly
washed between each measurement. Furthermore, in the non-automatic rolling ball viscometer,
special care was taken when injecting the test solutions to avoid the formation of air bubbles that
could disturb the regular movement of the ball through the viscous fluid.
RESULTS AND DISCUSSION
205

Table 1 summarizes the experimental data obtained. In all cases the Huggins correlation lead to a
correlation coefficient above 90%. Consistent intrinsic viscosity trends were obtained by the two
measuring techniques, with the 2 lower charge polyelectrolytes having lower intrinsic viscosities
than the 50% charged E1. Since E1 and FHMW possess similar molar mass, charge density must
be the main effect affecting the intrinsic viscosity. In absolute terms, however, the two
alternative methods provided fairly different values, those obtained by rolling ball capillary
viscometry being around 30% for all polymers. This “offset” may be reduced by selecting a
lower angle of inclination of the capillary in the rolling ball viscometer. In fact the running time
values in the rolling ball viscometer are much dependent on the angle of inclination and it is
necessary to tune it considering the viscosity of the solution and the accuracy of the
measurement of the running time. Also, the fact that this technique forced measurements to be
carried at room temperature must have influenced the results.
TABLE 1 Chain characteristics and intrinsic viscosity values for the three polyacrylamides
Polyelectrolyte Chain characteristics Intrinsic viscosity values (ml/g)
Molecular weight (kDa) Charge density (%) Gravimetric capillary viscometry Rolling ball viscometry
F1 Not determined 40 2547±13 1847 FHMW 644±165 40 2311±70 1630 E1 830±92 50 2982±66 2084
CONCLUSIONS
Both capillary viscometry and rolling ball viscometry allowed us to identify trends in the
intrinsic viscosity of polyelectrolytes which could be correlated with the chain architecture,
namely polymer charge density. An offset between both methods was systematically detected.
This may be the result of the selection of the inclination angle in the case of the rolling ball
technique, this parameter requiring a criterious tuning.
ACKNOWLEDGEMENTS
Financial support from the Portuguese Foundation for Science (Pest/C/EQB/UI0102/2013) and
Marie-Curie Actions (PEOPLE-2013-ITN/EID 604825) is acknowledged.
REFERENCES
1. Harford, A.J.; Hogan, A.C.; van Dam, R.A., Ecotoxicological Assessment of a
Polyelectrolyte Flocculant. Internal Report 575. Australian Government, Department of
Environment, Water, Heritage and the Arts, Supervising Scientist Division: Darwin, 2010
2. Bourdillon, L.; Hunkeler, D.; Wandrey,C., Progress in Colloid Polymer Science, 2006,
131, 141-149.
3. Barajas, J. H.; Wandrey, C.; Hunkeler, D., Polymer News, 2004, 29, 239-246.
4. Huggins, M. L., Journal of the American Chemical Society, 1942, 64, 2716–2718.
206

Adjusting the low critical solution temperature of poly(N-isopropylacrylamide)
solutions by salts: A rheological study
Maria Carolina Morando Costa, Sérgio Manuel Campos da Silva, Filipe João Cotovio Eufrásio Antunes
Department of Chemistry, University of Coimbra, Rua Larga, 3004-535 Coimbra, Portugal
Correspondence to: Filipe Antunes (E-mail: [email protected])
ABSTRACT
The control over the Low Critical Solution Temperature (LCST) and the rheological properties of
thermosensitive polymers is of crucial interest for various applications including drug delivery systems
and temperature sensors. In this study we follow the LCST by rheology and show how the onset of LCST
can be adjusted by chemical species that are able to change polymer solubility, such as salts. For this
purpose a thermo-responsive polymer, poly(N-isopropyl acrylamide) or PNIPAM, and different salts like
KCl, KBr and KSCN, were used. The LCST was investigated by means of rotational rheology, as it has
been shown a good correlation between the LCST and the onset of the thickening-induced temperature. It
was observed that salts can both increase and decrease the temperature at which the LCST occurs. This is
attributed to the affinity of the different salts to the polymer. Hydrophobic salts such as KSCN shift the
LCST of PNIPAM to higher temperature values while the opposite scenario is observed when hydrophilic
salts such as KCl are added.
KEYWORDS
PNIPAM; LCST; Phase transition; Rheology; Viscosity; Salts.
INTRODUCTION
Thermo-responsive polymers comprise a class of stimuli-responsive polymers which have the ability to
respond to thermal changes in solution and therefore can be used as temperature sensors. These polymers
undergo a coil-to-globule transition at the LCST, the threshold of the change in the solubility in the
solvent. Below the LCST, the polymer chains are hydrated and the polymer solution is clear. Above the
P34
207

LCST, the polymer chains collapse and adopt a compact conformation. The hydrophobic effect is the
main driving force for the polymer-polymer associations. This leads to the formation of polymer
aggregates which are able to scatter light and dramatically decrease the transparency of the solutions.
Previous studies report that the polymer solubility can be influenced by the presence of chemical species
added to the system1.
Above the LCST it happens the formation of a three dimensional network composed
by the segments of the polymers which became more hydrophobic. This investigation aims to understand
how to control the change of the LCST of a thermo-responsive polymer, in particular how to shift the
LCST to a desired temperature. Rheological measurements has shown to be valuable to identify the LCST
of the polymeric systems2. PNIPAM is a non-ionic homopolymer comprising both hydrophilic (amide)
and hydrophobic (isopropyl) groups with great potential in biomedical applications since it shows a LCST
close to the human body temperature. In literature, the LCST of PNIPAM is generally reported to be close
to 33°C3. There are still many uncertainties about the mechanisms under the solubility/insolubility of
PNIPAM and of other thermosensitive polymers. The LCST of thermoresponsive polymers is known to
be dependent on the solubility of the macromolecules. Salts can increase or decrease the solubility of
nonionic macromolecules such as PNIPAM, depending on the hydrophilic/hydrophobic character of the
salts and their ability to change the organization of neighboring water molecules. Consequently, the type
of salts added is expected to have a strong influence in the process of adjusting the LCST of PNIPAM.
Phase transition phenomena were assessed by means of rheological studies carried out for various
PNIPAM-salt-water systems. Salting-in and salting-out effects vary with the type of anion, according to
the Hofmeister series4. In this work, a series of three different potassium salts (KCl, KBr and KSCN) in
aqueous solutions of PNIPAM(20k) were used.
EXPERIMENTAL
PNIPAM was synthesized at the Department of Chemical Engineering of the University of
Coimbra(Coimbra, Portugal). Molecular weight (Mn= 20 262 Da) was determined by gel permeation
chromatography and size exclusion chromatography. KCl (≥99%), KBr (≥99%) and KSCN (≥99%) were
purchased from Sigma-Aldrich. Polymer aqueous solutions were prepared by adding dry polymer and
additives to Millipore water. The solutions were kept stirring until complete dissolution and were allowed
to rest for a period of an hour, prior use. Rotational tests were performed using a Thermo Scientific
HAAKE MARS III rheometer, with automatic gap setting and with a cone and plate geometry (35 mm,
1º), equipped with a solvent trap to prevent evaporation. Newtonian viscosity was investigated within 20-
208

50°C at a heating rate of 0.5°C/ min. The temperature control was achieved using a circulating water bath
system. Dynamic or shear viscosity was analyzed by rotational shear experiments. Prior to this, a
viscometry test was carried out in order to determine both Newtonian and non-Newtonian regimes. The
stress applied to the samples was 10Pa.
RESULTS AND DISCUSSION
Effect of salts on PNIPAM aqueous solutions
FIGURE 1 Dependence of Newtonian viscosity on temperature (heating system). Effect of anions in 5wt% PNIPAM(20k) solutions. The depicted lines are a guide to the eyes.
FIGURE 1 illustrates the role played by individual salts in PNIPAM systems. Below the LCST, the
viscosity of the solutions slightly decreases with temperature in the presence of any salt due to increased
dynamic effects. By heating, the polymer becomes more hydrophobic and LCST is attained. The direction
to which LCST is shifted depends on the nature of the salt used.
TABLE 1 LCST values for the three salt systems. Control refers to 5%
PNIPAM aqueous solution.
solutions
PNIPAM
5%
+
KCl
1%
KBr
1%
KSCN
1%
LCST / (°C) 33.5 ± 0.5
30.5
± 0.5
33.5
± 0.5
34.5
± 0.5
209

TABLE 1 shows the LCST for the different salt systems. The presence of KCl promotes a decrease in the
LCST, KBr has a negligible effect, while KSCN increases the LCST. Chaotrope anions such as SCN-
show a weak interaction with water molecules and a substantial affinity to the polymer. This causes the
adsorption of salt onto the polymer and the formation of a charged complex. The formed polyanion
complex possesses higher water solubility than the salt-free polymer, mainly due to the entropy of the
counterions, and thus exhibits a higher LCST. Kosmotrope anions such as Cl- are more hydrophilic and
do not adsorb onto the polymer chains. Instead, these species compete with the polymer for the water and
cause polymer dehydration and promote the decrease in the LCST. The ion Br- is in the middle of the
Hofmeister series and therefore shows an intermediate effect, comparatively to Cl- and SCN
-.
Interestingly, it can be observed a second plateau above the LCST, suggesting the existence of a second
transition temperature. At rest, i.e., without being under a constant stress, the samples are turbid before
the first plateau and phase separate near the second plateau. These results are in agreement with the two-
step transition reported elsewhere5.
CONCLUSIONS
It was concluded that the hydrophobicity of the salt added is crucial for the shift of the LCST. More
hydrophobic salts bind to the polymer chains and shift the LCST to higher temperatures. More
hydrophilic salts do not bind to the polymer and promote water competition with the polymer, which
causes a decrease in LCST. The presented sets of results provide additional input to understand how to
control the LCST and the rheological properties of PNIPAM solutions.
ACKNOWLEDGEMENTS
M.Sc. Luis Alves, M.Sc. Rose Cordeiro and Prof. Jorge Coelho are acknowledge for scientific assistance.
REFERENCES AND NOTES
1. Hofmann, C.; Schönhoff, M. Colloid and Polymer Science, 2009, 1369-1376.
2. Aubry, T.; Bossard, F.; Staikos, G.; Bokias, G., Journal of Rheology, 2003, 47, 577-587.
3. Okano, M.N.T.; Winnik, F.M., Material Matters, 2010.
4. Zhang, Y.; Furyk, S.; Bergbreiter, D.; Cremer, P.S., JACS, 2005, 127, 14505-14510.
5. Cho, Y.; Zhang, Y.; Christensen, T.; Sagle, L.B.; Chilkoti, A.; Cremer, P.S., The Journal of
Physical Chemistry, 2008, B112, 13765.
210

Thermo-rheological properties of polyvinyl acetate based adhesives films
Miguel Hermida1, Francisco López-Suevos1, Beatriz Lagares1, Ramón Moreira2, Francisco Chenlo2,
Santiago Arufe2
1Centro de I + D + i, FORESA, Avda. De Doña Urraca 91, 36650 Caldas de Reis (Spain)
2Departamento de Enxeñaría Química, Universidade de Santiago de Compostela, Rúa Lope Gómez de
Marzoa, s/n, 15782 Santiago de Compostela (Spain)
Correspondence to: Santiago Arufe (E-mail: [email protected])
ABSTRACT
The influence of a plasticizer and an adhesive promoter on the viscoelastic properties of a
polyvinyl acetate based adhesive was evaluated by parallel-plate rheometry. The resulting
analyzed films showed clearly that the plasticizer reduced the polymer’s Tg around 3-4ºC making
the films more flexible and with enhanced damping capabilities at room temperature. Also, the
adhesion promoter did not alter the polymer’s Tg but caused a significant reinforcing effect,
especially at higher temperatures (60-150ºC). The presence of the plasticizer and the adhesion
promoter resulted in a film with combined properties, i.e. flexibility and mechanical strength.
KEYWORDS DMTA, PVAc, adhesive, promoter, plasticizer
INTRODUCTION
The main application of polyvinyl acetate (PVAc) resins is bonding of high porosity materials
such as wood (veneered, furniture assembly, etc), cork and paper. Among the advantages in a
PVAc resin are a high pot-life (higher than 6 months), the capability to bond multiple porous
materials, very low toxicity (organic solvent free), ease of cleaning with a brush or water, and it
develops an outstanding shear strength in dry conditions. On the other hand, it shows a thermo-
plastic behavior, which means that above its glass transition, Tg, (e.g. typically T>35ºC) the
formed PVAc film dramatically reduces its adhesive strength (i.e. a major softening occurs).
Therefore, bonded materials with a PVAc resin cannot hold a heavy load for a long period of
Applications: Polymer and Biopolymer
P17
211

time at T>Tg, and consequently, PVAc are not suitable for structural use applications. Also,
PVAc generally cannot be used outdoor since they present poor water durability.
PVAc adhesives form a stiff film below the Tg which can break easily by applying a small
strength. When a higher flexibility of the film is required, a plasticizer in the range between 1-
7% wt. (on total PVAc composition) is commonly added. Low porosity materials might be also
bonded with PVAc resins but the addition of adhesion promoters (1-5% wt.) is required to
enhance the adhesion strength. Usually, these promoters are added to the PVAc prior to the
intended application to avoid a dramatic decrease in the adhesive’s pot life.
The objective of this study is to evaluate the influence of an adhesion promoter and a plasticizer
in a PVAc based resin on the viscoelastic properties of the resulting films.
EXPERIMENTAL METHODS
Four commercial PVAc liquid based adhesives were formulated: 1) AB Plus (copolymer of vinyl
acetate and other monomers with surfactants and a protective colloid), 2) ABF Plus, the same
copolymer as AB PLUS with the addition of a plasticizer, 3) AB Plus + 4% (wt.) of a silane-
based adhesion promoter and 4) ABF Plus + 4% (wt.) of a silane-based adhesion promoter.
To prepare the samples an adhesive film was extended with an applicator with a thickness of 350
m on a Teflon sheet and after drying the film was removed and placed in a desiccator filled
with silica gel for 5 days. Obtained films (thickness ≈ 100 m) were studied by DMTA
employing the same method reported in literature1. Rheological assays were carried out in a
controlled stress rheometer (MCR 301, Anton Paar, Physica). Analyses were conducted in
parallel-plate mode using plates with 8 mm of diameter from 10ºC to 150ºC (±0.1ºC). Five films
were placed between the plates for each experiment. A normal force of 3 ± 0.2 N was applied
through the whole experiment to ensure a perfect contact between the films and the plates. All
samples were initially conditioned at 150ºC for 15 min in the rheometer before the experiments.
A strain sweep (, 0.01 - 10%) at standard frequency of 6.28 rad/s (1 Hz) and different
temperatures (10, 30, 70, 110, 150ºC) were conducted to identify the LVER of every sample.
DMTA were carried out within the LVER (.1%) from 150ºC to 10ºC with a constant
cooling/heating rate of 4ºC/min. Experiments were carried out at least in triplicate.
212

RESULTS AND DISCUSSION
Figure 1 shows the evolution of the storage modulus (G´) and tan with temperature for the four
PVAc-based formulations prepared in this study. As it can be observed, three regions can be
identified (from low to high temperature): 1) the glassy region, 2) the glass transition and 3) the
rubbery plateau. In general, the typical viscoelastic behavior for a PVAc film is a constant value
of G´ in the glassy region where the film shows maximum elasticity and, thus, a very low tan
(<0.1) since the elastic component clearly dominates the viscoelastic behavior. In this low
temperature range, the film is very fragile and, depending on the intended industrial application,
it might be problematic. At higher temperature, a dramatic decrease in the G´ modulus of up to
3-4 decades indicates the presence of a major softening transition (glass transition), where the
polymer film losses its mechanical strength. This is also observed in the tan peak where the
viscous component (G´´) becomes increasingly dominant over the elastic component up to the Tg
and, above the Tg, gradually less dominant. Tan is useful to evaluate the damping behavior of a
material. The higher the intensity or the broader the peak, the higher the capability to dissipate
energy (e.g. from an impact). Finally, in the high temperature range (aprox. T>80ºC, depending
on the PVAc system) and above the polymer’s Tg, the film behaves as a rubber (solid-liquid like
behavior). This region provides insights on the polymer’s crosslinking and reinforcement degree.
The addition of a plasticizer to the base copolymer of this study (AB Plus) has shifted the Tg to a
lower temperature (from the tan peak: 46.7 vs. 42.3ºC). As a result, a film more flexible/less
elastic was obtained at lower temperature. For instance, if the G’ moduli of both curves are
compared at 35ºC, the film that lacks the plasticizer is still very stiff whereas the plasticized one
has nearly lost one decade of modulus. This is very interesting for post forming processes where
the adhesive cannot be very rigid at the working temperature.
The presence of the adhesion promoter in the AB Plus polymer film has caused a significant
increase in the G’ modulus in the entire temperature range, i.e. the promoter is acting as a
reinforcing agent. Interestingly, it has not significantly altered the Tg (from the tan peak: 46.7 vs.
45.9ºC) but it considerably reduced the intensity of tan and, therefore, its damping capability.
Consequently, the AB plus + 4% Promoter has effectively increased the mechanical strength of
the base film but it might be still too brittle at room temperature.
213

The plasticized film (ABF Plus) and the plasticized + reinforced film (ABF Plus + 4% Promoter)
behaved similarly up to the Tg (aprox. 42-43 ºC) but differed at higher temperatures, thus
confirming the reinforcing effect caused by the adhesive promoter.
Finally, a combined action of both the plasticizer and the adhesion promoter led to a reinforced
effect above 60ºC (see the G’ modulus) and a less fragile film at the low temperature range (from
the tan peak Tg=42.9ºC). This type of behavior is desirable for applications that need high
mechanical strength at high temperatures and high flexibility of the film at room temperature
such as ballast stabilization.
FIGURE 1. G’ (left) and tan (right) experimental curves. AB PLUS (♦), AB PLUS + 4% Promotor (♦), ABF
PLUS (♦), ABF PLUS + 4% Promotor (♦).
CONCLUSIONS
Mechanical properties of PVAc films can be modified depending on final application. In this
sense, the addition of the plasticizer is advisable when adhesives with damping capabilities at
lower temperatures (25-40ºC) are required. The addition of adhesion promoter is useful to
increase mechanical strength but it makes the adhesive more brittle. The combined action of the
adhesion promoter and the plasticizer results in more flexible films with higher damping
capabilities at low temperatures (20-40ºC) and higher mechanical resistance at high temperatures
(80-150ºC).
ACKNOWLEDGEMENTS
Authors acknowledge the financial support to FEDER and Ministerio de Economía y Competitividad (AEROVIAV-
Interconnecta).
REFERENCES AND NOTES
1. López-Suevos, F.; and Frazier, C. E., Holzforschung, 2006, 60, 561-566.
214

Influence of EVA concentration and vegetable oil on the rheology, tribology and microstructure of oleogels for lubricant purposes
J.E. Martín‐Alfonso1,2, C. Valencia1,2 and J.M. Franco1,2
Departamento de Ingeniería Química, Química Física y Química Orgánica. Campus de “El Carmen”. Universidad de Huelva. 21071 Huelva. Spain.
Correspondence to: J.E. Martín‐Alfonso1 (E‐mail: [email protected])
ABSTRACT
This work has been focused on the development of oleogels based on conventional (SO) and
high-oleic sunflower (HOSO) vegetable oils and ethylene-vinyl acetate copolymer (EVA) for
lubricant applications. The influence of EVA concentration was analyzed. Linear viscoelasticity
functions with frequency for these oleogels were very similar to that obtained with a commercial
lithium lubricating grease. EVA-HOSO oleogels present friction coefficient values slightly lower
than EVA-SO oleogels but similar to the ones obtained with the commercial greases.
KEYWORDS (Vegetable oils; Ethylene‐vinyl acetate copolymer; Oleogels; Rheology, Tribology)
INTRODUCTION
Oleogels are soft material systems comprising of oil as continuous phase that is physically
entrapped in a threedimensional network of dispersed gelling agent. In previous work1,
rheological, thermal, and tribological studies of oleogels based on mineral oils and blends such
as amorphous/recycled PP and organo-bentonite/recycled PP for lubricant purposes were
reported. Nonetheless, due to the interest on development of new “green” products, in a recent
work, we have studied the influence of vinyl acetate (VAc) content on the rheological properties
and microstructure of oleogels based on conventional and high-oleic sunflower vegetable oils
and EVA copolymer2. As this research goes on, this work explores the possibility of using EVA
copolymer with 28% VAc content in different concentrations as thickener agent to formulate
oleogels with high-oleic sunflower (HOSO) and sunflower (SO) oils, potentially applicable as
lubricating greases. With this aim, rheological, tribological and microstructural characterization
has been performed on oleogels.
P19
215

EXPERIMENTAL
Materials
Two vegetable oils were used as base stocks, a refined high-oleic (85 wt.% oleic acid) sunflower
(HOSO) oil, kindly supplied by the Instituto de la Grasa, CSIC (Seville, Spain), and sunflower
(SO) oil, purchased in a local supermarket. Poly (ethylene-co-vinyl acetate), EVA, with 28%
vinyl acetate content was kindly supplied by Repsol S.A. (Spain).
Preparation of oleogel formulations
The processing of oleogels was performed in an open vessel using an IKA RW-20 mixer
(Germany) with a four-blade propeller to disperse the polymer and vegetable oil. Batches of 150
g were processed for 60 min in the molten state at 160ºC and rotation speed of 400 rpm. Polymer
concentrations in the blends were 14, 19, 24, and 29 (% w/w).
Tests and measurements
Rheological measurements were carried out in controlled-strain (ARES, Rheometric Scientific,
U.K.) rheometer, using a serrated plate and plate geometry (25 mm diameter, 1 mm gap) to avoid
possible wall-slip phenomena. Small-amplitude oscillatory shear (SAOS) measurements, inside
the linear viscoelasticity regime, were performed in a frequency range between 10-2 and 102 rad/s,
at 25ºC. Strain sweep tests, at a frequency of 6.23 rad/s, were previously performed to determine
the linear viscoelastic regime. Viscous flow measurements were performed at 25 °C, in a shear
rate range of 10-2-102 s-1. At least two replications were performed on fresh samples.
Tribological tests were performed using a tribological cell coupled with a Physica MCR-501-
Rheostress rheometer (Anton Paar, Austria). The tribology cell deals with a 1/2 in. diameter steel
ball (1.4401 Grade 100, roughness = 0.10 μm) rotating on three 45º inclined steel plates (1.4301,
roughness = 0.21 μm).
RESULTS AND DISCUSSION
Figure 1 shows the mechanical spectra of oleogels as a function of EVA concentration and type
of vegetable oil, as well as a commercial grease. As can be observed, the linear viscoelastic
response is qualitatively similar for all the oleogels studied and the commercial grease and to that
found with other similar systems3. As can be observed in Figure 1a-b, the values of G’ and G’’
increase with EVA concentration, which is indicative of a stronger microstructural network.
216

10-2 10-1 100 101 102
101
102
103
104
105
10-1 100 101 102
101
102
103
104
105
G' G''
G',G
'' (Pa)G
',G''
(Pa)
29% EVA-HOSO24% EVA-HOSO
19% EVA-HOSO Commercial grease
14% EVA-HOSO29% EVA-SO24% EVA-SO
19% EVA-SO Commercial grease
14% EVA-SOG' G'' G' G''G' G''
ω (rad/s)
ω (rad/s)
Figure 2 depicts the viscous flow behaviour of oleogels, as a function of EVA concentration.
Shear fracture for oleogels with higher EVA concentration was observed. However, the Sisko
model describes fairly well the flow behaviour observed within the shear rate range tested for
oleogels with 14% and 19% of EVA copolymer. Viscosity clearly increases with EVA
concentration, yielding higher values of the consistency index. The lubrication properties of
oleogels were tested by tribological experiments. Table 1 shows the friction coefficient values
obtained for all the oleogels studied. As can be observed, in both oleogels formulated with
HOSO and SO the friction coefficient values became slightly lower when EVA content was
decreased.
Oleogels Friction coefficient
Oleogels Friction coefficient
14% EVA-HOSO 0.076 14% EVA-SO 0.101
19% EVA-HOSO 0.082 19% EVA-SO 0.113
24% EVA-HOSO 0.084 24% EVA-SO 0.107
29% EVA-HOSO 0.094 29% EVA-SO 0.115
Commercial grease 0.106
FIGURE 1. Frequency dependence of the storage and loss moduli for oleogels containing different EVA concentrations as function of type vegetable oil and commercial grease.
TABLE 1 Friction coefficient for all samples
217

10-2 10-1 100 101 102100
101
102
103
104
105
106
Power law model parameters k(Pa*sn) n 14% EVA-HOSO 201 0.110 19% EVA-HOSO 493 0.041
.γ (s-1)
η (P
a s)
14% EVA-HOSO19% EVA-HOSO24% EVA-HOSO29% EVA-HOSO
power law model
CONCLUSIONS
From the result obtained, it can be deduced that EVA copolymer can be potentially used as an
effective thickener agent for lubricating greases. The evolution of the linear viscoelasticity
functions with frequency for these oleogels was very similar to that obtained with a commercial
lithium lubricating grease. Linear viscoelasticity functions increase with EVA concentration,
which is an indicative of a stronger microstructural. On the contrary, the relative elasticity of the
oleogel is not affected by EVA concentration. The oleogels studied exhibited shear-thinning
behaviour which fitted the power law model at concentrations of 19% and 14%. Conversely,
above this value all the oleogels showed fracture and expelling of sample in viscous flow
behaviour. All oleogels studied showed successfully tribological responses, with values of the
friction coefficient lower for EVA-HOSO oleogels.
ACKNOWLEDGEMENTS
J.E. Martín-Alfonso received a Postdoctoral Research Grant from “Fortalecimiento de las
Capacidades I+D+I” Programme of University of Huelva (Spain). The authors gratefully
acknowledge their financial support.
REFERENCES AND NOTES
1. Martín‐Alfonso, J.E.; Valencia, C.; Franco, J.M., Applied Clay Science, 2014,87, 265‐271.
2. Martín‐Alfonso, J.E.; Franco, J.M., Polymer Testing, 2014,37, 78‐85.
3. Martín‐Alfonso, Romero, A.; Valencia, C.; J.E.; Franco, J.M., Journal of Industrial and Engineering Chemistry, 2013, 19, 580‐588.
FIGURE 2. Viscous flow curves for EVA‐HOSO based oleogels containing different EVA concentrations.
218

Shear and extensional rheology of xanthan and guar gum solutions
J.E. Martín‐Alfonso1, C. Valencia1, M. Stading2 and M. Berta2
1Departamento de Ingeniería Química, Química Física y Química Orgánica. Campus de “El Carmen”. Universidad de Huelva. 21071 Huelva. Spain.
2SIK (The Swedish institute for Food and Biotechnology), PO Box 5401, SE‐402 29 Gothenburg, Sweden.
Correspondence to: J.E. Martín‐Alfonso (E‐mail: [email protected])
ABSTRACT
Small-amplitude oscillatory shear and extensional rheology of aqueous guar and xanthan gum
solutions were studied for concentrations, ranging from 1 wt.% to 2 wt.%. Extensional rheometry
measurements were successfully performed using a hyperbolic contraction flow method. The
extensional viscosity exhibited an extensional-thinning behaviour over the entire extensional
strain range used. Furthermore, the extensional viscosity diminished with decreasing
concentration of the solutions, similarly to the shear properties of the samples.
KEYWORDS (Guar gum; Xanthan gum; Viscoelasticity; Extensional viscosity)
INTRODUCTION
Solutions of polysaccharides in water such as xanthan and guar gums are widely used as
thickeners, stabilisers or gelling agents for food applications as well as in pharmaceutical,
biomedical, chemical and cosmetic products. The molecular interactions between the polymer
and water as well as polymer chain length determine the rheology of these solutions;
polysaccharide chemical structure can, therefore, be exploited to develop new products, control
processing quality and optimise the design of process equipment1. The majority of rheological
studies of xanthan and guar gums have considered shear rheology: relatively few studies have
investigated the extensional rheology of these solutions despite its importance in many food
processing operations, consumer perception studies and product quality evaluation. Extensional
viscosity characterizes how a material (fluid) behaves when subjected to an extensional strain
with dependency on the type of material. Different experimental methods have been employed
for quantifying the extensional viscosity2. The objective of this study was to examine the effects
P20
219

of gum concentration on the shear and extensional rheology of xanthan and guar gum solutions.
The aim is to improve the understanding of the rheological behaviour of these solutions in
extension to allow these materials to be used more efficiently.
EXPERIMENTAL
Materials
Food grade powders of xanthan (X, Danisco, Sweden) and guar (G, Sigma-Aldrich, India) were
used as the gelling agent.
Preparation of solutions
Aqueous solutions of xanthan and guar gums at concentrations of 1, 1.5 and 2 wt.%. were
prepared. The polymer was dispersed in water by stirring at 1400 rpm on a magnetic stirrer at
room temperature, between 20 and 23ºC, overnight to ensure complete hydration of the gums.
Tests and measurements
Rheological measurements were carried out in controlled-strain (ARES-G2, TA Instruments,
New Castle, USA) rheometer, using a plate and plate geometry (40 mm diameter, 1 mm gap).
Small-amplitude oscillatory shear (SAOS) measurements, inside the linear viscoelastic regime,
were performed in a frequency range between 10-2 and 102 rad/s, at 23ºC. Strain sweep tests, at a
frequency of 6.23 rad/s, were previously performed to determine the linear viscoelastic regime.
At least two replications were performed on fresh samples. The extensional rheological
properties were measured using a Hyperbolic Contraction Flow2 mounted in an Instron 5542
Universal Testing Instrument (Instron Corporation, Canton, USA). The extensional viscosity was
measured at 23ºC using different speeds of the piston.
RESULTS AND DISCUSSION
Figure 1 shows the mechanical spectra (G’ and G’’ vs. angular frequency) of guar and xanthan
aqueous solutions. The mechanical behaviour of the guar gum solutions (Figure 1a) was
dependent on frequency and followed the shape reported elsewhere for similar guar gum
solutions3. In all cases, both moduli increased with frequency by roughly three orders of
magnitude between 0.01 and 100 rad/s. There is a crossover in the moduli and the elastic
response prevails at higher frequencies. The crossover frequency decreased from 6.3 rad/s to 1
220

rad/s as the concentration increased from 1 wt.% to 2 wt.%., as a consequence of longer
relaxation time. On the other hand, the mechanical behaviour of xanthan gum solutions is
reported in Figure 1b. As can be observed, xanthan solution exhibits the typical pattern of a
xanthan solution at such concentrations4 where G’ remains larger than G’’, on the frequency on
the whole range of frequency investigated. This indicates that the xanthan solution behaves like a
weak gel with a low frequency dependence for both moduli at low frequencies G’ ~ ω0.3 and G’’
~ω0.2. This viscoelastic behaviour and its effective increase with the concentration is a result of
the rigid elongated nature and the entanglement of the xanthan molecules.
10-2 10-1 100 101 102
10-1
100
101
102
10-2 10-1 100 101 102100
101
102
G' G'' 1% G 1.5% G 2% G
G',G
'' (P
a)
a) b)
G',G
'' (Pa)
G' G'' 1% X 1.5% X 2% X
ω (rad/s)
ω (rad/s)
The extensional viscosity for aqueous guar and xanthan solutions is shown in Figure 2. The
extensional viscosity decreased with increasing extensional strain rate, and it also diminished
with lower gum concentration. As can be observed, guar solutions present higher viscosity than
xanthan solutions on the whole range of extensional rate studied. It is worth noting that the
extensional viscosity was much higher than the shear viscosity (result not shown) at all rates
used here, i.e. the Trouton ratio was significantly higher than 3. The samples were allowed to
recover for one minute upon applying every extensional strain rates in order to minimize
memory effects. These memory effects were observed as a non-zero load at the beginning of the
measurement, but after one minute of recovery the load was negligible. Such effects were more
pronounced at higher rates as a result of the higher stresses.
FIGURE 1 Frequency dependence of the storage and loss moduli for aqueous guar (a) and xanthan (b) solutions.
221

100 101102
103
104
1% G 1% X 1.5% G 1.5% X 2% G 2% X
Exte
nsio
nal v
isco
sity
(Pa)
Extensional strain rate (s-1)
CONCLUSIONS
SAOS tests within the linear viscoelastic region showed that xanthan gum solutions studied
behaved as a weak gel, whereas guar gum solutions exhibit gel-like response and suggest the
presence of physical entanglement. An increase in the viscoelastic moduli of the solutions can be
explained by the increase of gum concentration. On the other hand, guar and xanthan gum
solutions were successfully measured using a hyperbolic contraction flow method. It was
demonstrated that the solutions exhibited a rather high extensional viscosity which is related to
the concentration of the gum. Guar gum solutions showed higher viscosities than xanthan gum
solutions.
ACKNOWLEDGEMENTS
J.E. Martín-Alfonso received a Postdoctoral Research Grant from “Ayudas para estancias de
investigación postdoctorales” Programme of Campus de Excelencia Internacional
Agroalimentario (ceiA3). The authors gratefully acknowledge their financial support.
REFERENCES AND NOTES
1. Torres, M.D., Hallmark, B., Wilson, D.I., Food Hydrocolloids, 2013, 32: 331‐340.
2. Moberg, T., Rigdahl, M., Stading, M., Bragd. E.L., Carbohydrate Polymers, 2014, 102, 409‐412.
3. Chenlo, F., Moreira, R., Silva, C., Journal of Texture Studies, 2010, 41, 396‐415.
4. Choppe, E.; Puaud, F.; Nicolai, T.; Benyahia, L., Carbohydrate Polymers, 2010, 82, 1228‐1235.
FIGURE 2 The extensional viscosity as a function of the extensional strain rate for aqueous guar and xanthan solutions.
222
Bioplastics from proteins: A comparison between different protein
concentrates to obtain bioplastics by injection moulding
Manuel Félix, Víctor Pérez, Alberto Romero, Antonio Guerrero
1Departamento de Ingeniería Química, Universidad de Sevilla, Facultad de Química, Profesor
García González 1, 41012, Sevilla. Spain
Correspondence to: Antonio Guerrero (E-mail: [email protected])
ABSTRACT
Bioplastic materials from proteins, are becoming highly attractive for important industrial
applications, in which thermo-mechanical techniques are increasingly being used. This study
assesses injection moulding to produce bioplastic materials from blends previously mixed with
glycerol and different protein systems. Results from dynamic mechanical thermal analysis,
tensile tests and water uptake tests were compared for those protein-based specimens, indicating
that protein content exerts a strong influence on the properties of the final plastic materials.
KEYWORDS Bioplastic, Injection moulding, Mechanical properties, Water-uptake capacity
INTRODUCTION
Nowadays, there is a growing interest in the use of bio-based packaging1, such that bioplastics
market has suffered an exponential increase since 2011. Proteins from different sources are
among the most interesting raw materials used in the production of bioplastics. In fact, the need
for cost-competitive2 and biodegradable materials has led to products from agricultural sources
as eco-friendly alternatives to oil-based polymers3. This interest for protein-based plastics is
further increased when using surpluses and wastes (e.g. from the food industry). Protein systems
are mixed with a plasticizer (e.g. glycerol) to reduce the glass transition temperature4. Injection
moulding, which is one of the most useful polymer processing techniques, it is typically
performed in two stages at lab-scale (a mixing process to form a blend, followed by an injection
process with a plunger-type injection moulding machine). It is crucial to select suitable
processing parameters to obtain specimens with suitable properties. The overall objective of this
work is to evaluate the high potentials of different protein concentrates in order to produce
P22
223

bioplastic materials, which may exhibit some comparable properties with regard to synthetic
polymers. This study could be useful to validate the use of food industry surpluses, by-products
and wastes in order to manufacture bioplastics.
EXPERIMENTAL SECTION
Materials
Albumen protein isolate (API, 83.2 wt%) was provided by OVOSEC S.A, soy protein isolate
(SPI, 91.0 wt%) by Protein Technologies International (SUPRO 500E, Leper, Belgium), pea
protein isolate (PPI, 91.0 wt%) by Roquette (Lestrem, France) and rice protein concentrate from
rice husk (RPC, 78.2 wt%) by Remy Industries (Leuven-Wijgmaal, Belgium. Crayfish flour
concentrate (CFC, 64.9 wt%) was supplied by ALFOCAN S.A. (Isla Mayor, Seville, Spain).
Samples preparation
Preparation of blends
Blends with constant protein/plasticiser ratio were manufactured by a two-stage thermo-
mechanical procedure. Blends were mixed in a Haake Polylab QC two-blade counter-rotating
batch mixer (Thermo Haake, Karlsruhe, Germany) at 25ºC and 50 rpm for 60 min. Two different
protein/plasticiser ratios (wt%/wt%) were analysed in order to select a suitable proportion of
each compound: 70/30, for concentrates (RPC, CFC), and 60/40 for isolates (API, SPI, PPI).
Preparation of biocomposites
Protein/GL blends were subsequently processed by injection moulding, using a MiniJet Piston
Injection Moulding System II (Thermo Haake, Germany), to obtain bioplastic specimens. A
temperature of 60°C and residence time of 100 s were selected for the pre-injection cylinder, in
order to prevent thermally-induced protein crosslinking effects before the injection stage. The
processing pressure and time selected were 50 MPa for 20 s for the injection stage and 20 MPa
for 200 s over the packing stage. The temperature of the mould was 120ºC.
Characterization of biocomposites
Dynamic mechanical thermal analysis (DMTA)
DMTA was carried out by using rectangular specimens under dual cantilever bending with a
RSA3 equipment (TA Instruments, New Castle, DE, USA). All the tests were carried out at
constant frequency (6.28 rad s-1) and strain within the linear viscoelastic region (0.01-0.30%).
The selected heating rate was 3ºC min−1 and the temperature range covered was from -30 to
130ºC. All the samples were coated with Dow Corning high vacuum grease to avoid water loss.
224

Tensile strength measurements
Tensile tests were carried out with the 10-kN Insight Electromechanical Testing System (MTS,
Eden Prairie, MN, USA), according to ISO 527-25 for tensile testing of plastics. Five duplicates
of each product were tested using type IV specimens at 1 mm min−1 strain rate and 20ºC.
Water uptake capacity
Water uptake capacity was measured according to ASTM D5706, as well as the loss of soluble
matter. Both parameters are determined by the following equations:
%
100 1
%
100 2
RESULTS
Dynamic mechanical thermal analysis (DMTA)
Fig 1A shows how the values of E’ change with temperature depending on the protein used for
obtaining the bioplastics. Almost all the systems exhibit similar behaviour where E’ modulus
decreases with temperature until a minimum value (between 80 and 100ºC), remaining constant
at higher temperatures. However, the profile for CFC protein differs in that E’ decreases to
markedly lower values and then increases again, reflecting a remnant thermosetting potential.
0 20 40 60 80 100 120105
106
107
108
109
1010 API/GL (60/40) SPI/GL (60/40) PPI/GL (60/40) RPC/GL (70/30) CFC/GL (70/30)
Temperature (ºC)
E' /
(Pa)
A
1
2
3
4
5
6
7
8
9
Pea RiceSoyAlbumen
Max
imun
Stre
ss (M
Pa)
B
Stra
in a
t bre
ak X
10
(mm
/mm
)
Crayfish0
10
20
30
40
50
60
70
80
90 Maximun Stress Strain at break Young's modulus Young's M
odulus (MPa)
FIGURE 1. Results from mechanical tests carried out for different protein/glycerol biobased specimens:
(A) Storage modulus (E’) from Dynamic Mechanical Analysis (DMA) measurements and (B) parameters
from tensile strength measurements: Young’s modulus, maximum stress and strain at break.
Tensile strength measurements
Fig. 1B shows the values of the tensile parameters from tensile tests performed on these
bioplastics. Systems with the 70/30 protein/plasticizer ratio show the highest values of Young’s
225

Modulus and maximum stress, while systems based on the 60/40 protein/plasticiser ratio display
the highest values for the strain at break
Water uptake capacity
As can be observed, PPI-based bioplastic shows the highest water uptake capacity, followed by
SPI and API systems. It is worth noting the extremely low values found for CFC-based
specimens compared to those shown by the plant protein-based specimens.
TABLE 1. Water absorption capacity (%) after immersion for 2 h and 24 h and loss of soluble matter (%)
for different protein/glycerol systems
% Water uptake (2h) % Water uptake (24h) % soluble matter Loss
API/GL (60/40) 30.4 ± 1.9 34.4 ± 1.1 40.2 ± 1.9 SPI/GL (60/40) 66.9 ± 3.6 67.4 ± 0.4 45.7 ± 3.6 PPI/GL (60/40) 105.7 ± 0.9 84.7 ± 0.2 38.1 ± 0.8 RFC/GL (70/30) 20.3 ±0.6 22.5 ± 0.6 28.9 ± 1.1 CFC/GL (70/30) 2.4 ± 0.5 0.7 ± 0.2 48,4 ± 2.1
CONCLUSIONS
Protein-based bioplastics processed by a two-stage thermo-mechanical process (mixing and
injection moulding) are very promising materials for the substitution of conventional petroleum
plastics in certain applications, since they have suitable mechanical properties, as well as
processability and biodegradability.
ACKNOWLEDGEMENTS
This work is part of a research project sponsored by MINECO, “Ministerio de Economía y
Competitividad”, from the Spanish Government (Ref. MAT2011-29275-C02-02/01) and by the
Andalousian Government, (Spain) (project TEP-6134).
REFERENCES AND NOTES
1. Kowalczyk, D., Baraniak, B., Journal of Food Engineering, 2011, 105, 295-305.
2. Zheng, H., Tan, Z., Zhan, Y.R., Huang J., Journal of Applied Polymer Science, 2003,90,
3676-3682 (2003).
3. Gonzalez-Gutierrez J, Partal P, Garcia-Morales M., Gallegos C, Bioresource Technology,
2011,101, 2007–2013.
4. Irissin-Mangata, J., Bauduin, G., Boutevin, B., Gontard, N., European Polymer Journal,
2011,37, 1533-1541
5. ISO U-E. Plastics, International Organization for Standardization, In. Switzerland, 2012.
6. ASTM D638-14, ASTM International, West Conshohocken, PA, 2014.
226

Rheological properties of kefiran compared to other neutral gums
Judith Piermaría, 2, Carlos Bengoechea
1, Analía Graciela Abraham
2, Antonio Guerrero
1
1Departamento de ingeniería química, Universidad de Sevilla, España
2Centro de Investigación y Desarrollo en Criotecnología de Alimentos – 47 y 116 (s/n) – La Plata (1900),
Argentina
Correspondence to: Carlos Bengoechea (E-mail: [email protected])
ABSTRACT
Kefiran is a water-soluble branched glucogalactan containing equal amounts of D-glucose and D-
galactose produced by microorganisms present in kefir grains.
Aqueous dispersions of kefiran (K) were compared to three selected neutral gums used as reference:
methylcellulose (MC), locust bean gum (LBG) and guar gum (GG). Their rheological behaviour is
characteristic of low concentrated polysaccharide dispersions, in which a fluid-like behaviour is
predominant at most frequencies studied. The neutral gums 2% solutions may be ranked, matching their
molecular weights, according to their viscoelastic behaviour: GG > LBG > MC > K. Moreover, an increase
in the gum concentration from 0.5 to 2% wt generally yields a strengthening of the structure.
Cross model is properly used to describe the shear-thinning behaviour of all the neutral gum solutions
studied. Moreover, if log η0 is represented versus log (polymer concentration) for the four gums, a linear
fitting may be properly applied.
Kefiran solutions do not show important extensional properties at 2%, displaying a behaviour close to
the Newtonian at low Hencky strains.
Thus, regarding the potential of kefiran as functional additive in food products, it may be necessary to
consider the future addition of another ingredient into the formulation if higher viscoelastic properties
are needed.
KEYWORDS Kefiran, rheology, apparent viscosity, extensional viscosity, Hencky strain
INTRODUCTION
Kefiran is a heteropolysaccharide synthetized by Lactobacillus kefiranofaciens, lactic acid
bacteria present in kefir grains1. It improves the rheological properties of fermented milk2, is able
to form cryogels3 and edible films with good mechanical and barrier properties
4. Also, it has
P23
227

been demonstrated that kefiran has the ability to protect epithelium against Bacillus cereus in
vitro and has immunomodullatory effect5.
Most of the rheological studies in the literature were conducted under a pure shear flow.
Nevertheless, many industrial applications often involve a component of extensional mode of
deformation and not always shear flow results can be extrapolated directly to the extensional
behavior. The extensional properties of the fluid can be quantified by monitoring the kinetics of
filament thinning6.
The main objective of this research has been to study the shear and extensional rheological
properties of kefiran suspensions in relation with other neutral polysaccharides used in food
industry.
RESULTS
Shear Viscosity
When submitted to steady shear, all gums show a shear-thinning behaviour (Figure 1A),
consequence of modifications in macromolecular organisation in the solution as the shear rate
changes. First, a Newtonian plateau region, characterized by a zero-shear rate apparent viscosity,
η0, is found at low shear rates. This region is broader in the shear rate range studied when the
molecular weight (MW) is lower (e.g. kefiran). When increasing shear rate, the disruption
predominates over the formation of new entanglements, and then, molecules get aligned in the
direction of flow and the viscosity decreases. As may be observed in Figure 1A, for all gums
studied, the shear-thinning behaviour increases with concentration, since the critical shear rate
( ) at which the flow behaviour becomes shear-thinning decreases as concentration increases.
A simplified Cross model has been used to describe the shear-thinning behaviour of all the
neutral gum solutions studied
(1)
where is the shear rate (s-1
), η is the viscosity (Pa·s), η0 is the zero-shear rate viscosity (Pa·s),
τ(s) is a time constant, and m is a dimensionless constant.
228

FIGURE 1 Shear flow curves (A) and dimensionless filament diameter versus time (B) for 2% neutral
gums
Table 1 show how the simplified Cross model describe properly the experimental data of the
kefiran solutions, as well as the rest of the neutral gums studied. As observed, kefiran, which
shows the lowest MW (Table 1), also shows the lowest values for η0 at all concentrations studied,
as well as the lowest slope. Typical slopes for biopolymers range from 3 to 5, though some
deviations have been found. The low values found for kefiran are in agreement with a system
where the individual polysaccharide coils are free to move independently as they are well
separated from each other. Anyway, the rate of formation of new entanglements seems to
diminish as the molecular weight of the gum increases.
Extensional Viscosity
Figure 1B displays the normalized mid-filament diameter, Dmid, versus time profiles for the 2%
solutions of the four neutral gums studied.
It may be observed how in all cases the polymer filament passes through four stages (rest-
strecth-relaxation-breaking). Similar trends have been found previously. Very large differences
exist between the different polysaccharides. The break-up time ranged between 61.67 ms
(kefiran) and 6530.88 ms (methylcellulose) for the samples, being the relaxation phase less
pronounced for Kefiran than for the rest. The reason of this may be in the possible mechanisms
that oppose to the capillary forces after stretching. While for the 2% solutions of galactomannans
10-1
100
101
102
103
10-2
10-1
100
101
102
103
η,
η* /
(P
a·s
)
γ. / (s
-1)
η ηCross
Kefiran
η ηCross
Methylcellulose
η ηCross
Locust bean gum
η ηCross
Guar gum
A
10 100 1000 10000
0,01
0,1
1
Dm
id/D
0
global time (ms)
Kefiran Methylcellulose Locust Bean Gum
Guar Gum
B
229

and methylcellulose the mid-filament evolution is basically controlled by the balance of surface
tension and viscous/elastic forces, with viscous forces stabilizing the filament and surface
tension destabilizing it, the 2% solution of kefiran, approach a nearly Newtonian fluid behaviour
in comparison, with the diameter decaying almost linearly after the stretch stage.
TABLE 1 Molecular weights and Cross fitting parameters for 2% neutral gums
Gum MW (kDa)
η0 (Pa·s)
τ (s)
m R2
Kefiran 6.0·103 ± 3.6·10
3 0.083 ± 0.00028 123.81 ± 11.93 0.36 ± 0.02 0.8962
Methylcellulose 4.1·103 ± 3.4·10
2 4.01 ± 0.050 14.13 ± 1.47 0.50 ± 0.02 0.9985
Locust Bean Gum 1.0·104 ± 5.7·10
2 43.54 ± 0.63 2.20 ± 0.13 0.75 ± 0.00 0.9884
Guar gum 2.2·104 ± 3.0·10
3 374.011 ± 2.08 0.10 ± 0.002 0.77 ± 0.00 0.9996
CONCLUSIONS
This study has shown that kefiran solutions show a flow behaviour in shear qualitatively
similar than other representative neutral gums. Nevertheless, it presents much lower viscosity
values, which is explained on terms of its microstructure. This also would explain that kefiran
solutions do not show important extensional properties at 2%, displaying a behaviour close the
Newtonian.
ACKNOWLEDGEMENTS
The authors gratefully acknowledge the financial support provided by CONICET of Argentina,
Universidad de La Plata (UNLP); Agencia Nacional de Promoción Científica y Tecnológica (Project
PICT 0910).
REFERENCES
1. Micheli, L., Ucelletti, D., Palleschi, C., Crescenzi, V., Applied Microbiology and Biotechnology, 1999,
53, 69-74
2. Rimada, P.S., Abraham, A.G., International Dairy Journal, 2006,16 (1), 33–39.
3. Zavala, L., Roberti, P., Piermaria, J.A., Abraham, A.G., Journal of Food Science and Technology,
2014, http://dx.doi.org/10.1007/s13197-014-1577-2
4. Piermaria, J., Bosch, A., Pinotti, A., Yantorno, O., Garcia, A. A., Abraham, A. G., Food Hydrocolloids,
2011, 25, 1261- 1269.
5. Vinderola, C.G., Perdigón, G., Duarte, J., Farnworth, E., Matar, C., Cytokines, 2006, 36(5-6):254-60
6. Rodd, L.E., Scott, T.P., Cooper-White, J.J. McKinley, G.H., Appl. Rheol., 15 (1), 2005, 12-27
230

Evaluation of rheological behavior of some polyethylene-polypropylene
concentrated solutions
Ioana Stanciu
University of Bucharest, Faculty of Chemistry/Department of Physical Chemistry, 4-12 Elisabeta Blvd,
030018, Bucharest, Romania
ABSTRACT
This paper presets the study of the rheological characteristics of the concentrated polyethylene-
polypropylene copolymer solutions over the temperature range of 313-363 K and for shear rates
between 3 and 1312 s-1. The measurements were performed on a Haake VT 550 rotational rheometer
with a HV1 sensor. The rheology of the concentrated solutions is influenced by the shear rate,
temperature and concentration of the tested copolymer. We have used a successful model that
describes the rheological behaviour of the concentrated solutions in comparison to other models that
do not consider the copolymer’s concentration. The parameter A reaches a peak for the 10 g/dL solution
and a minimum for the 3 g/dL solution. The parameter B displays close values for all of the studied
solutions
KEYWORDS relationship, dynamic viscosity, concentrated solutions
INTRODUCTION
The base oils have a Newtonian behaviour in that the viscosity is independent of the temperature and
the shear rate. The polymers that are added into the oil may change the solution’s rheological
parameters and influence the oil’s viscosity according to the concentration and the shear rate. At high
shear rates of 106 s-1, in many industrial applications1,2 we notice a temporary reduction in the viscosity
due to the alignment of those polymer molecules with the shear rate and the temperature. High shear
rates are important for the starting resistance and those shear rates are related to the oil pumping into
the carter. In order to understand the performance of the viscous polymer solution over a wide range of
shear rates, it is necessary to determine the efficacy of a certain additive.3-5The polyethylene-propylene
polymer that is being used here is formed of some 45% units of ethylene concentrated in the middle of
the chain (the polymer is produced inside a tubular reactor that provides for the control of the ethylene
units positions along the chain). At low temperatures, the polymer’s segments tend to connect
Modelling and Simulation in Rheology
P39
231

considerably and the solution’s viscosity decreases. The rheological behaviour of the polyethylene-
propylene copolymer has been studied by many researchers. The rheological behaviour depends on the
shear rate at temperatures above 240oC and on the aggregation of various solvents. All those studies
were performed at high temperatures and low shear rates. The equation models in the speciality
literature showing the dependence of the dynamic viscosity natural logarithm on the absolute
temperature are:5
Fulcher
ln η = A +B/(T +C) (1)
Litovitz
ln η = A +a/RT3 (2)
Girifalco
ln η = C +(B/T)+(A/T2) (3)
Valzen
ln η = B[(1/T) - (1/T0)] (4)
The purpose of this study is to research the dependence of the dynamic viscosity natural logarithm on
the inverse absolute temperature for the polyethylene-propylene copolymer in the SAE 10W oil. At
concentrations of 3, 6, 10 and 12 g/dL of the polyethylene-propylene additive, we measured the
viscosity for some shear rates from 105 to 106 s-1 using a rotational rheometer. The experimental results
have been interpreted with other rheological models that are not available in the speciality literature.
Using a linear fitting of the lines, we obtained the parameters A and B and the correlation coefficient R2.
EXPERIMENTAL
The polyethylene-propylene copolymer is Paratone 8900 marketed by Exxon Chemical. The utilized SAE
10W oil is mostly paraffinic and contains 75% saturated hydrocarbons. The 3, 6, 10 and 12 g/dL solutions
have been prepared at the room temperature for several weeks, using continuous mixing. To find the
rheological characteristics of the concentrate polymer solutions, we made use of a Haake VT 550
rotational rheometer. This Haake VT 550 rheometer includes an HV1 sensor that provides for the
application of some shear rates from 3 to 1312 s-1 over the 313-363 K temperature range.
232

RESULTS AND DISCUTION
The figure 1 shows the dependence of the dynamic viscosity natural logarithm on the inverse absolute
temperature for the 3 g/dL solution of the polyethylene-polypropylene copolymer over the 313-363K
temperature range and the said shear rates.
1/313 1/323 1/333 1/343 1/353 1/363
-3.5
-3.0
-2.5
-2.0
-1.5
-1.0
-0.5
ln (
Dyn
am
ic v
isco
sity,
Pa
s)
T -1 / K
-1
B
C
D
E
Figure 1. Dependence ln dynamic viscosity versus inverse absolute temperature for the 3 g/dL solution at shear
rates: B – 243 s-1, C – 437.9 s-1, D – 729 s-1 and E – 1312 s-1
The dependence of the dynamic viscosity natural logarithm on the inverse absolute temperature, we
have used the experimental database to determine the equation (5) where the parameters A and B
depend on the solution’s concentration and the solvent’s and the polymer’s nature and type.
The equation that shows the dependence of the dynamic viscosity natural logarithm on the inverse
absolute temperature is:
lnη=A +B/T (5)
where A is lnη0 and B is the slope.
The table 1 shows the shear rates range for which we represented the dependence of the dynamic
viscosity natural logarithm on the inverse temperature for the 3 g/dL solution of polyethylene-
polypropylene copolymer, the parameters A and B derived from the equation (5), the correlation
coefficients derived from that equation and the statistical correlation coefficients.
The shear rates range for which the dependence of the dynamic viscosity natural logarithm on the
inverse temperature for the 3, 6, 10 and 12 g/dL solutions of polyethylene-polypropylene copolymer,
the parameters A and B derived from the equation (5), the correlation coefficients derived from that
equation and the statistical correlation coefficients.
233

Table 1. The shear rate, the parameters A and B derived from the equation (5), the correlation coefficients
obtained by polynomial fitting and the statistical correlation coefficients for the 3 g/dL copolymer polyethylene-
polypropylene solution
Shear rate, s-1 A B Correlation coefficient, R2
(equation 5)
Correlation coefficient, R2
statistical
243 -0.3426 -0.3710 -1.0000 -
437.9 -0.0286 -0.4874 -0.9976 0.9714
729 -0.0895 -0.5017 -0.9973 0.9430
1312 -0.3065 -0.4702 -0.9889 0.9303
CONCLUSIONS
The rheological characteristics of the polyethylene-polypropylene copolymer solution have been
calculated over the temperature range of 313 - 363K shear rates from 3 to 1312 s-1. The rheology of the
concentrate solutions is influenced by the shear rate, the temperature and the concentration of the
tested copolymer. The paper presents a model that describes the rheological behaviour of the
concentrated solutions in comparison to other models that do not take into account the copolymer’s
concentration. The parameter A reaches a peak for the 10 g/dL solution and a minimum for the 3 g/dL
solution. The parameter B has similar values for all of the solutions.
REFERENCES AND NOTES
1. McMillan, M.L.; Murphy, C.K.; Temporary viscosity loss and its relationship to journal bearing
performance, SAE 780374. The relationship between engine oil viscosity and engine
performances part III; SAE SP-429 (ASTM STP-621-52), 1978.
2. Bartz, W.J.; Wiemann, W.; Determination of the cold flow behaviour of multigrade engine oils,
SAE 770630. The relationship between engine oil viscosity and engine performances part II; SAE
SP-419 (ASTM STP 621-51), 1977.
3. Metznew, A.B., Adv. Chem. Eng., 1956, 1, 77-79.
4. Erickson, D.C.; Dongqing, L.; White, T.M.; Gao, J., Ind. Eng. Chem. Res., 2001, 40, 3523-3529.
5. Govindan, S.; Vasanthakumari, R.; Radja Sacravarthy, P., International Journal of Emerging Technology and Advanced Engineering, 2012, 2(7).
234

Comparison of the rheological properties of artists' oil-based mediums
manufactured by Natural Pigments and Winsor and Newton
María del Pilar Aguilar1, María Jesús Hernández
2, Margarita San Andrés
1
1 Departamento de Pintura y Restauración. Universidad Complutense de Madrid, 28040, Spain.
2 Departament de Física de la Terra i Termodinàmica.Universitat de Valencia, 46100, Spain.
Correspondence to: M.J. Hernández ([email protected])
ABSTRACT
Mediums are a combination of drying oils and other materials such as varnish, wax, gums and dryers,
used to modify the texture of the oil paint. The aim of this work was to analyse the rheological properties
of some artists' oil based mediums (labelled as thixotropic) created by two modern brands with different
scale manufacturing: Winsor and Newton with Liquin Original, Liquin Light Gel and Liquin Impasto,
based on alkyd resin and Natural Pigments that sells Oleogel, Oleoresgel and Impasto Medium, based on
linseed oil and different thickening silica. Rheological characterization of the mediums was carried out at
20ºC with a RS1 Rheostress (TermoHaake, Germany). All mediums presented high shear thinning
behaviour and important yield stresses, with different zero shear viscosities. They also showed a
predominant elastic behaviour. Some differences were observed in time evolution of viscosity and the
recovery of elastic modulus, which is related to the supposed thixotropy of these mediums.
KEYWORDS oil painting, oil based mediums, structure recovery, yield stress, thixotropy.
INTRODUCTION
Mediums are a combination of drying oils used in milling the colours (linseed oil, walnut oil,
alkyd resin or modified oils) and other materials such as varnish, wax, gum, dryers...etc, that are
mixed together to modify the way the paint handless straight from the tube.
At the XIX century some treatise writers and artists showed their interest in different oil painting
mediums1
that are supposed to be thixotropic. According to those texts some contemporary
brands of fine arts materials have retaken these recipes to recreate old masters' brushstrokes.
Winsor & Newton is a big UK company founded in 1832 that sells a wide variety of artists'
materials. Liquin family is one of the best-selling oil painting mediums: “This Liquin
formulation is a slight gel that breaks down on brushing (thixotropic) and flows out to give a
non-drip effect when mixed with color 2”.
Applications: Miscellaneous
P25
235

Natural Pigments is a limited liability company founded in 2003 in California (USA) that
supplies artists' materials used in historical painting: “Oleogel and Oleoresgel are thixotropic
painting. When a thixotropic gel is agitated, such as manipulated with a palette knife or brush, it
begins to flow, but when the agitation is stopped it regains its former viscosity and stiffens3”.
As time factor is not clearly established, some confusion between shear thinning, thixotropic and
viscoelastic behaviour could be present when describing them4. The aim of this work is to
analyse these rheological properties in some mediums manufactured by the two brands5.
EXPERIMENTAL METHODS
The oil based mediums studied are shown in Table 1 according to their visual appearance: from
matte and thick to glossy and transparent mediums.
TABLE 1. Name of the tested mediums of each brand and composition indicated in labels.
Brand Binder Basic Composition
Winsor & Newton
Liquin Impasto alkyd resin, drying oil and dryers
Liquin Original alkyd resin, drying oil and dryers
Liquin Light Gel alkyd resin, linseed oil and dryers
Natural Pigments
Impasto Medium finely ground calcite, silica and bentonite in bodied linseed oil
Oleoresgel bodied linseed oil, alkyd resin, odorless mineral spirits, pyrogenic (fumed) silica
Oleogel linseed oil and pyrogenic silica
Rheological measurements were carried out with a controlled stress rheometer RS1 Rheostress
(Haake), at 20ºC. Serrated plates (35mm, 60mm diameter) to avoid slippage were used. Before
measurements, samples were kept at rest for 15 min. Step flow curves in controlled stress mode
and frequency sweeps in linear viscoelastic region were performed. To analyse thixotropy,
samples were sheared at 10 s-1
during 1 min, and storage modulus at 1 Hz and 10 Pa (within
LVR) was recorded with time, before and after shearing, in order to evaluate their recovery.
RESULTS AND DISCUSSION
All the binders had a strong shear thinning behavior, similar in all binders. Flow curves were
satisfactory fitted to Carreau model (1). The mean values for the parameters are shown in table 1.
s
2
0 c1
(1)
236

10-1
100
101
102
103
104
105
106
107
100
101
102
103
104
Vis
cosi
ty,
(P
a s
)
Shear stress, (Pa)
A
0.0
0.2
0.4
0.6
0.8
1.0
10-2
10-1
100
101
Lo
ss t
an
gen
t, t
an
Frequency, (Hz)
B
FIGURE 1 A) Flow curves obtained for the binders studied. B) Loss tangent (G”/G’) as a function of
frequency for the different mediums. Winsor & Newton: Liquin Impasto, Liquin Original, Liquin
Light Gel; Natural Pigments: Impasto medium; Oleoresgel; Oleogel.
Important differences were observed in zero shear viscosity. The highest viscosity at rest
corresponded to both Impastos and Oleogel (Figure 1A). These mediums were also the most
structured systems, with lowest values of tan (Figure 1B) and high yield stresses ( 1000 Pa).
On the other hand, consistency at rest was similar for Oleoresgel and Liquin Original, but the
binder from Natural Pigments flowed more smoothly (lowest values of s). Liquin Light Gel was
the less viscous medium, with a weaker structure (tan highest values and G’ lowest values).
TABLE 2. Mean values ± standard deviation for: Carreau model (1) parameters for flow curves fits and
storage modulus fits to a power law model (G’ = G’1 m), and loss tangent (G”/G’) at 1 Hz.
Flow curves Dynamic spectra
Brand Binder 10-3 ×0 (Pa s) 103 × c (s-1) s ± 0.01 G’1 (Pa) m tan (1 Hz)
Winsor &
Newton
Liquin Impasto 3110±50 0.099±0.005 0.45 26000±2000 0.052±0.005 0.097±0.009
Liquin Original 36±2 0.20±0.03 0.44 100±6 0.02±0.03 0.20±0.07
Liquin Light Gel 1.6±0.3 1.5±0.2 0.40 13±10 0.21±0.05 0.56±0.17
Natural
Pigments
Impasto Medium 1800±800 0.031±0.018 0.41 41000 ± 14000 0.130±0.013 0.21 ±0.02
Oleoresgel 44±19 0.46±0.06 0.37 1100±200 0.282±0.018 0.505±0.004
Oleogel 1400±600 0.11±0.02 0.45 10000±1600 0.049±0.007 0.09±0.01
Regarding shearing time dependence, viscosity (Fig 2 A) was fitted to Weltman model (2)
= A –B ln t (2)
and viscoelastic moduli were recorded as a function of time before and after agitation (Fig. 2B).
237

0
20
40
60
80
100
120
0 10 20 30 40 50 60
Time, t (s)
Vis
cosi
ty,
(P
a s
)A
100
101
102
103
104
105
0 200 400 600 800 1000 1200
Sto
rage
mod
ulu
s, G
' (P
a)
Time, t (s)
B
FIGURE 2. A) Evolution of viscosity with shear time at =10 s-1
. Lines correspond to Weltmann model.
B) Evolution of G’ with time after shearing (dashed area) and rest. Winsor & Newton: Liquin Impasto,
Liquin Original, Liquin Light Gel; Natural Pigments: Impasto medium; Oleoresgel; Oleogel.
Both Impastos had about 75 % of reduction of G’ because of shear, but while Winsor & Newton
presented a slow variation of h and about 30 % of recovery of G’, Natural Pigment medium had
an abrupt decay of and almost no recovery (6%). The other intermediate viscosity mediums
(Oleoresgel and Liquin Original) also presented a significant recovery (20-30%).
CONCLUSIONS
Both Winsor & Newton and Natural Pigments provide binders with not only different visual
appearance, but also rheological properties: zero shear viscosity, stress necessary to flow and
recovery of elastic modulus. In addition, Natural Pigments mediums measurements are less
reproducible, maybe due to inhomogeneity induced by small-scale rolling machinery.
ACKNOWLEDGEMENTS
The authors would like to thank Natural Pigments for providing free samples of each medium.
REFERENCES AND NOTES
1. De Viguerie, L.; Cotte, M.; Lequeux, F.; Walter, P.; Moutard-Martin, T.: Historical evolution of
oil painting media: A rheological study; Comptes Rendus Physique, 2009, 10, 612-621.
2. Winsor and Newton website http://www.winsorandnewton.com
3. Natural Pigments website http://www.naturalpigments.com
4. Barnes, H.A: Thixotropy, a review, Journal of Non-Newtonian Fluid Mechanics, 1997, 7, 1-33
5. Osterhold, M.M.; Rheological methods for characterising modern paint systems, Progress in
Organic Coatings, 2000, 40, 131–137.
238

Understanding the role of EVA in the rheological properties of EVA modified bitumen for lower temperature application
Avido Yuliestyan, Antonio Abad Cuadri, Moises Garcia-Morales, Pedro Partal
Departamento de Ingenieria Quimica, Centro de Investigacion en Tecnologia de Productos y Procesos Quimicos (Pro2TecS), Campus de 'El Carmen', Univeridad de Huelva, 21071, Huelva (Spain)
Correspondence to: Avido Yuliestyan (E-mail: [email protected])
ABSTRACT
This research studies the influence of vinyl acetate (VA) content and Melt Flow Index (MFI) of
ethylene vinyl acetate copolymer (EVA) in the rheological performance of bituminous binders.
The results suggest that the combination of these two EVA properties could balance the in-
service performance and the ease of processing required by bituminous binders for lower
temperature application.
KEYWORDS Rheology, EVA, polymer modified bitumen, binder design, pavement material
INTRODUCTION
Bitumen, a petroleum derivative used as a binder for asphalt pavements, demands an enhanced
in-service performance. In this sense, binder design through polymer modified bitumen (PMB) is
an alternative to improve temperature susceptibility by means of higher stiffness at high service
temperature1. The addition of polymer results in an increase in viscosity that leads to difficulties
at coating the mineral aggregates during the road making. On top of that, hot mix asphalt (HMA)
helps reduce the binder viscosity, but it is less favored concerning the health and environmental
issues (ie. higher toxic compound emission and higher energy consumption). Development of
reduced temperature technology, such as warm mix asphalt (WMA), is encouraged. The
selection of a low melting point polymer, such as EVA copolymer, may provide an alternative
which is not merely improving the in-service performance but also its process-ability in WMA
temperature region. Previous comprehensive studies on the rheological behavior of EVA binders
focused on the influence of neat bitumen type and EVA percentage1. In this work, two EVA
parameters, VA content and MFI, are studied.
P26
239

EXPERIMENTAL
Sample and Preparation
Binders were obtained by modifying bitumen 70/100 with EVAs, at VA contents of 18 and 28
wt.%, labeled as EVA-VA-18 and EVA-VA-28, respectively. MFI of 2 and 500 for VA18 and
MFI of 7 and 400 for VA28 were selected to study MFI influence. Bitumen and EVA were
supplied by Repsol SA (Spain). During process, 5 wt.% EVA was dispersed into 150 °C molten
bitumen in two steps that consist of 1) melting at 3500 rpm for 15 mins and 2) mixing at 5000
rpm for 1 hr.
Tests and Measurements
Temperature sweep tests were conducted in CS HAAKE RS600 from 30 to 100 °C at 10 rad/s
and 100 Pa by using PPR20 in oscillatory mode. Before that, stress sweeps were done to specify
the LVE regime and the stress applied. Calorimetry scans (DSC), with Q100 TA instrument,
were performed to witness any thermal event that affects the binder microstructural behavior.
Additionally, binder microstructure at room temperature was seen from optical microscopy.
RESULTS AND DISCUSSIONS
Binder thermorheological properties at the medium-to-high temperature window were assessed
by means of temperature sweeps.
20 30 40 50 60 70 80 90 100100
101
102
103
104
105
106
107
EVA-VA18 MFI=2 MFI=500
EVA-VA28 MFI=7 MFI=400
UNMOD
G' (
Pa)
20 30 40 50 60 70 80 90 100100
101
102
103
104
105
106
107
T (oC)
40 60 80 100100
101
102
tan
(δ)
T (oC)40 60 80 100
100
101
102
tan
(δ)
T (oC)
FIGURE 1 Dynamic shear temperature sweeps for the four EVA modified binders studied
240

Figure 1 presents the evolution of storage modulus (G´) and loss tangent (tanδ=G´´/G´) with
temperature. EVA binders present higher G´ and lower tanδ values than neat bitumen, which
suggests better elastic performance at in service temperature. Within EVA binders, each of them
exhibits a decrease in G´ with increasing temperature which varies in behavior, depending on the
VA content and MFI. Thus, VA content seems to control the LVE behavior at the low-to-
medium temperatures studied, whilst MFI results to be the key parameter at the highest
temperatures, when the polymer phase start to flow. On the other hand, an abrupt G’ slope
change, at 60 ºC approximately, can be clearly observed for the EVA-VA18 binder. However,
EVA-VA28 binder does not show this event. The same response is observed in the evolution of
tanδ with temperature.
TABLE 1 DSC data for EVA copolymers and their corresponding EVA modified binders
Type MFI Polymer Binder
Tm (°C)
χc (%)
Tm (°C)
χc (%)
EVA-VA18 500 84.1 26.1 64.7 22.7
2 84.5 25.9 65.0 23.7
EVA-VA28 400 68.8 17.6 -- --
7 69.5 17.6 -- --
Moreover, Table 1 summarizes the melting temperatures (Tm) and crystallinity degrees (χc) of the
EVA copolymers and their corresponding binders. In binders, EVA Tm is found lower than its
pure polymer, that may be attributed to the smaller size crystallites due to the migration of the
lightest compounds from the bitumen rich to the polymer rich phase. Hence, EVA melting event
would be related to the sharp decrease in G´ observed for EVA-VA18 and the flattening in tan δ
shown in Figure 1 for both EVA-VA18 and EVA-VA28 between 30 and 60ºC.
Interestingly, it was seen that the rheological behavior changes after the melting event, and
depends more on MFI (in Figure 1). Similarly, binder viscous flow behavior at 135 °C (result not
shown), above EVA melting point, is also affected by MFI variation. Knowing that EVA
copolymer molecular weight and MFI values are inversely proportional, the chain entanglement
and the friction affects the flow behavior2, by means of high flowing effort as MFI values
decrease and vice versa.
241

FIGURE 2 Optical microscopy observations, at 25°C, for selected EVA modified binders
Optical micrographs, in Figure 2, may deliver useful information on the binders microstructure at
ambient temperature. EVA-VA18 modified bitumen appears having lightly toned region
assigned to EVA rich region containing crystallites fraction, which is clearly different from neat
bitumen (unmodified). The polymer three dimensional network, with a larger and more
uniformly distributed crystals, is the responsible for the improvement in the rheological behavior
of this binder, shown by previous dynamic shear temperature sweeps. On the other hand, EVA-
VA28 binder presents a slightly different architecture, with a polymer network formed by highly
dispersed polymer phase. This is in accordance to DSC data in Table 1, where χc could not be
determined for this binder as a result of a high percentage of non-crystallizable fraction3.
CONCLUSIONS
The experimental results suggest that considering the combination of these two EVA properties
could balance the in-service performance and the ease of processing, that are assigned to the
influence of VA content and MFI, respectively. In particular, the selection of low melting point
polymer and the consideration of higher MFI may promote the reduction in binder application
temperature.
ACKNOWLEDGEMENTS
The research is a part of the Marie Curie ITN (FP7-PEOPLE-2013-ITN) and financially
supported by European Union’s Seventh Framework Programme under grant agreement 607524.
REFERENCES AND NOTES
1. Airey, G.D., Constr Build Mater , 2002, 16, 473–87. 2. Ravve, A., Principle of Polymer Chemistry; 3rd ed; Springer, 2012. 3. Somrang N., Nithitanakul M., Grady B. P., Supaphol P., European Polymer Journal, 2004, 40,
829–38.
242

Starch-based innovative topical formulations: rheological and
thermoanalytical preformulation studies
Joana Marto1, Sérgio M. C. Silva
1,2, Filipe E. Antunes
2, Luís Filipe Gouveia
1, Alberto Canelas Pais
2,
Eduardo Oliveira3, António José Almeida
1, Helena Margarida Ribeiro
1
1 iMed.ULisboa, Faculty of Pharmacy, University Lisbon, 1649-003 Lisboa, Portugal
2 Chemistry Department, University of Coimbra, Coimbra, Portugal
3 Laboratórios Atral S.A., Rua da Estação 42, 2600 – 726 Castanheira do Ribatejo, Portugal
E-mail: [email protected]
ABSTRACT
Exploring novel applications for approved excipients with a history of safe use in medicine is a smart
strategy to obtain improved medicinal products. Due to its unique properties, starch has been extensively
used in various topical pharmaceutical applications as a sensorial enhancer, stabilizer and drug delivery
polymer. The effects of the temperature on the physicochemical properties of five different native types of
starch (rice, wheat, potato, corn and pre-gelatinized starch) were studied by means of DSC, hot-stage
microscopy and rheological experiments, with both large strain (rotational) at different shear rates and
small strain (oscillatory) tests. Native starches showed endothermic peaks between 60 and 80 °C and the
transition temperatures and enthalpies of gelatinization were found dependent on the type of starch. The
light microscopy images revealed that the morphology of all starches were affected by heat treatment. The
viscoelasticity of heated starch dispersions was found to be strongly dependent on the type of starch. Thus,
starch has an enormous potential for innovative applications in pharmaceutical formulation.
KEYWORDS Starch; DSC; Microscopy; Rheology; Pharmaceutical application
INTRODUCTION
Nowadays, scientists and technologists need to develop not only new delivery systems that are
substantially better than the existing ones, but also to explore new ways of using well known
excipients. For that reason, exploring novel applications for approved excipients with a history of
safe use in medicine is a smart strategy to obtain improved medicinal products. Natural
excipients still have an important role and application in the pharmaceutical industry, since they
are, in most cases biodegradable, non-toxic and abundant compared to synthetic materials. Starch,
unlike some synthetic compounds, ensures all these characteristics and has a low price. Due to its
unique properties, starch has been extensively used in various topical pharmaceutical
applications as a sensorial enhancer, a stabilizer and a drug delivery polymer1.
P28
243

METHODS
Sample preparation
Aqueous suspensions of different starches (rice, wheat, potato, corn and pre-gelatinized starch
(Pre G)) were prepared by adding 2% of dry polymer to water. Due to the long hydration times,
suspensions were kept stirring (200 rpm) for 24h before use.
Differential Scanning Calorimetry (DSC)
Thermoanalytical measurements were performed with a TA Instruments DSC Q200 system (TA
Instruments, New Castle, USA). The sample and the reference (air) were placed in opened pans.
A scan speed of 10 °C/ min and 10-20 mg of sample (aqueous solution of each starch) allowed
an optimal response regarding resolution, temperature, accuracy and attenuation.
Hot stage microscopy
A light microscope (Olympus BX51, Japan) equipped with a THMS350V (Linkam, Surrey,
England) hot stage was used to visualize the behavior of the emulsions under stress conditions.
The system was equipped with a digital camera (Olympus XC30, Japan) and the software
Olympus Stream Essentials®. Contact thermal microscopy was conducted by heating the samples
from 25 °C to 80 °C using a 10 °C/min heating rate.
Dynamic and Oscillation measurements
Dynamic viscosity measurements were carried out between 1 and 1000 Pa on a logarithmic
increment with a scan speed of 10°C/min. Oscillation frequency sweep tests were performed at
frequencies ranging between 0.01 and 1 Hz with a scan speed of 10°C/min from 25 °C to 80 °C.
RESULTS AND DISCUSSION
DSC
The gelatinization of starch is an endothermic process, meaning that it can be measured with
DSC. Native starches showed endothermic peaks between 60°C and 80°C and the transition
temperatures and enthalpies of gelatinization were found dependent on the type of starch (Figure
1).
244

FIGURE 1 – DSC scanning thermograms of different starches.
Hot stage microscopy
As can be seen in Table 1, an increase in the temperature from 25 to 70ºC, caused the swelling
and morphology alteration of the five types of granules of starch. It was observed that the
granules gelatinized at different temperatures. Additionally the light microscopy images revealed
that the morphology of all starches was affected by heat treatment.
TABLE 1 - Micrographs of different starches at different temperatures (25 and 70 °C) during the
heating process.
Temperature
(°C)
Pre-gelatinized
starch Wheat starch Potato starch Corn starch Rice starch
25
70
Dynamic and Oscillation measurements
It has been reported that concentration, volume fraction of the swollen granules, the
deformability of the granules, and the degree of molecular entanglement influence the viscosity
of starch gelatinization during heating2. For all starches suspensions, the viscosity started to
increase at temperatures between 60 and 75°C (Figure 2 (a)). The increasing viscosity of starches
245

dispersions during heating was attributed to the swelling of the starch granules, supported by
DSC and hot stage microscopy data.
The viscoelasticity of heated starch dispersions was found to be strongly dependent on the type
of starch. For wheat, corn, potato and rice starch, G' is much higher than G'', meaning a dominant
elastic behavior (Figure 2 (b)). The G’ and G’’ increased upon heating, probably due to the onset
gelatinization of the polymer. As expected, for pregelatinized starch, during the heating, the G’
decreased and the G’’ increased due to the previous treatment.
(a) (b)
FIGURE 2 – (a) Viscosity of different starches at different temperatures. (b) Dependence of
storage (G’) and loss (G’’) moduli for different starches at different temperatures.
CONCLUSIONS
Starch has an enormous potential for use in innovative applications in pharmaceutical
formulations. The results confirmed a high variability related to its origin. Therefore,
comprehensive preformulation studies are crucial to select the best starch type for the intended
purpose.
ACKNOWLEDGEMENTS
This work was supported by FEDER, the Portuguese government (FCT; grant
SFRH/BDE/51599/2011), strategic project Pest-OE/SAU/UI4013/2011 and Laboratórios Atral
S.A., Portugal.
REFERENCES
1. Röper, H., Starch, 2015. 54(3-4): 89-99.
2. Yongfeng, A.i., Jay-lin Jane, Starch, 2015, 67, 213-224.
246
Assessment of the fatigue resistance of asphalt binders
Rui Micaelo1, André Pereira1, Luís Quaresma1, Maria Teresa Cidade2
1 Department of Civil Engineering, Universidade Nova de Lisboa, Caparica, PORTUGAL
2 Department of Materials and CENIMAT/I3N, Universidade Nova de Lisboa, Caparica, PORTUGAL.
Correspondence to: Rui Micaelo ([email protected])
ABSTRACT
Asphalt fatigue cracking is a very important distress type in road pavements. Cracking occurs due to
repeated traffic loading, within the bitumen or at the bitumen-aggregate interface. Over the last three
decades many researchers investigated the fatigue properties of the bitumen, using different test
apparatus and protocols.
This paper compares and discusses the application of several methods for the analysis of testing results
and for quantifying fatigue resistance. A neat and a polymer modified bitumen (PMB) were tested with
continuous and discontinuous loading and with incremental load amplitude.
The results showed that the test conditions and methods used to determine the fatigue resistance have
a significant effect in the estimated bitumen fatigue life. The indexes obtained from dissipated energy
methods show a very good correlation with Nf,50 obtained from the time sweep tests. The fatigue life law
obtained from the linear amplitude sweep test is highly affected by the analysis method and the failure
criterion. Healing during non-loading periods has a significant impact on the PMB fatigue life while no
significant effect is observed in the neat bitumen fatigue life for small to intermediate rest periods.
KEYWORDS (asphalt binders; fatigue resistance; dynamic shear rheometer; failure criteria; damage
mechanics)
INTRODUCTION
Asphalt mixtures have a complex microstructure comprising randomly oriented aggregate
particles (large range-size variation), bitumen and air voids. The bitumen is a viscoelastic
material at normal conditions (temperature, loading, etc) and, despite the low volume proportion
in final mixture, defines the material’s stress-strain response to loading.
Fatigue cracking results from repeated loading cycles which are below the ultimate stress of the
material. Asphalt cracking occurs due to repeated traffic loading, within the bitumen or at the
bitumen-aggregate interface. Hence, over the last three decades many researchers investigated
the fatigue properties of the bitumen, using different test apparatus and protocols. Furthermore,
P29
247

several methods were proposed for the analysis of the experimental results and for the estimation
of the bitumen’s fatigue life1. This paper compares and discusses the application of several
methods proposed in literature to quantify the fatigue strength of two different bitumens, which
were tested with two different test procedures.
MATERIALS AND TESTING PROGRAM
Two different bitumens were selected for this study: (i) paving grade 35/50; (ii) polymer
modified bitumen PMB 45/80-65. The PMB is modified with 2-4% of SBS polymer using an
undisclosed procedure by the supplier. The samples tested were not subject to any planned
ageing effect. The binders were first characterized in terms of their behaviour under oscillatory
shear and, afterwards, subjected to the fatigue tests. Measurements were performed with a Bohlin
Gemini HRnano
rotational rheometer, which under dynamic tests is equivalent to a Dynamic
Shear Rheometer. The samples were fabricated and prepared for testing in accordance with the
EN 14770 standard. A minimum of three samples were used for each testing condition.
The tests were performed with the 8 mm (2 mm gap) and 25 mm (1 mm gap) parallel plate set-up.
Two types of fatigue tests were performed: (i) time sweep tests (TST); (ii) linear amplitude
sweep tests (LAS). The TST consisted in repeated cycles of oscillatory shear with constant
amplitude (shear strain 1.2%, 1.6% and 2%), which were stopped when the complex shear
modulus has fallen more than 50% of the initial value. The tests at the shear strain of 1.2% were
repeated with the introduction of rest periods (4, 8 and 16s) after every 10 seconds of loading
with the objective of studying the healing effect from periodic rest periods. The LAS 2,3
consists
in a cyclic loading at systematically increasing loading amplitudes (shear strain 1 to 20%, with 1%
step increments every 10 seconds). Both tests were performed at the temperature of 15 ºC and
with a loading frequency of 10 Hz.
Pereira 1 gives the complete information about the materials and the testing program.
RESULTS
Fig. 1 shows the evolution of the complex shear modulus (|G*|) of the two bitumens in both tests.
There is a significant decrease of |G*| with the loading cycles, which are significantly lower in
LAS because the procedure was defined to cause damage rapidly. The same way as in TST test,
the neat bitumen shows a quick decrease of the modulus with repeated loading. Table 1 lists the
number of loading cycles (average and standard deviation) before failure in TST tests that is
248

defined as |G*| reducing 50% of the initial value. The PMB shows, as expected, to hold much
more cycles before failure. Healing during rest periods has a significant impact on the PMB
fatigue life while no significant effect was observed in the neat bitumen fatigue life for small to
intermediate rest periods (4 and 8 s).
FIGURE 1 Evolution of the complex shear modulus in TST and LAS tests.
TABLE 1 Time sweet test results
Time-sweep
35/50 PMB 45/80-65
50% G*ini
Strain (%) Rest period
(sec) Average
Nf,50 St.Dev
Nf,50 (%) Average
Nf,50 St.Dev
Nf,50 (%)
1.2 - 12,567 2.0% 103,033 5.5%
1.6 - 7,233 0.8% 34,100 7.2%
2 - 5,100 5.2% 21,600 2.3%
1.2 4 11,367 3.3% 172,000 5.8%
1.2 8 12,000 2.9% 228,267 10.1%
1.2 16 15,133 2.7% - -
Asphalt materials show a strong power law relationship between load stress or strain amplitude
(X) and fatigue life (Nf),
(1)
where, A and B are constants. In case of the TST test, the values of the constants A and B were
obtained from fitting the model to test results. The LAS test results were analysed using the
method proposed by Johnson 2 based on the Viscoelastic Continuum Damage Mechanics
0.E+00
1.E+07
2.E+07
3.E+07
0.E+00 5.E+04 1.E+05 2.E+05
G* (Pa)
Loading cycles
γ=1.2% γ=1.6% γ=2.0% γ=1.2% rest 4s γ=1.2% rest 8s γ=1.2% rest 16s
35/50
PMB
TST
0
5
10
15
20
25
0.E+00
1.E+07
2.E+07
3.E+07
0 500 1,000 1,500 2,000
Sh
ear
stra
in (
%)
G* (Pa)
Loading cycles
G* 35/50
G* PMB 45/80-65
Strain
LAS
249

approach. The damage progression variable α is determined as 1/m or 1+(1/m), with m being the
maximum slope of creep, log J(t), or relaxation, log G(t), curves. Due to the ambiguity in
literature, both equations are used. Regarding fatigue failure, Jonhson 2 recommended defining
failure when there is a 35% decrease in |G*|∙sin (δ), where δ is the phase angle. Recently, Bahia3
recommended using instead the point of the peak shear stress. Table 2 presents the fatigue laws
obtained from the two tests. There are significant differences between models. The shear rate
dependency (B) shows very similar values for the two bitumens, based on the LAS test results,
while from the TST test it is concluded that the neat bitumen is less load amplitude dependent.
The value of A is very sensitive to the value of α, being approximately 15 and 25 times higher
with α=1+(1/m) for the 35/50 and the PMB, respectively. Regarding the failure criteria, for both
binders the peak shear stress occurs when |G*|∙sin δ has decreased more than 35%.
TABLE 2 Estimated fatigue laws
TST test LAS test
Bitumen
Failure criterion:
50% G* initial m
α Failure criterion:
Cf = 65%
Failure criterion:
τmax
A B (1/m) 1+1/m
A B A B
35/50 17,144 -1.774
0.435 1.297 6,657.7 -2.593 8,320.5 -2.593
2.297 106,794.1 -4.593 145,770.2 -4.593
PMB
45/80-65 169,418 -3.094
0.410 1.437 26,345.1 -2.875 62,895.3 -2.875
2.437 622,540.0 -4.875 2,273,468.9 -4.875
CONCLUSIONS
The fatigue life estimated from the time sweep tests, at constant amplitude, and from the linear
amplitude sweep tests have substantial differences. Furthermore, the fatigue life is highly
affected by the method used for the results analysis. Healing during non-loading periods has a
large effect on the PMB fatigue life while no significant effect is observed in the neat bitumen
fatigue life for small to intermediate rest periods.
REFERENCES
1. Pereira, A. Rheological characterization and evaluation of the fatigue resistance of bitumens with the Dynamic Shear Rehometer, MSc thesis, Universidade Nova de Lisboa, 2014.
2. Johnson, C.M. Estimating Asphalt Binder Fatigue Resistance Using an Accelerated Test Method. PhD Thesis, University of Wisconsin – Madison, 2010.
3. Bahia H., Tabatabaee H.A., Mandal T., Faheem A. Field Evaluation of Wisconsin Modified Binder
Selection Guidelines - Phase II. University of Wisconsin Madison, Modified Asphalt Research
Center, 2013.
250

Laminar blood flow in stenotic microchannels
Joana A. C. Calejo, Valdemar Garcia, Carla S. Fernandes
School of Technology and Management, Polytechnic Institute of Bragança, Campus de Santa Apolónia,
5301-857 Bragança, Portugal
Correspondence to: Carla S. Fernandes (E-mail: [email protected])
ABSTRACT
In this work, Newtonian and non-Newtonian laminar blood flow in rectangular microchannels with
symmetric and asymmetric atheroma were numerically studied. It was observed that the impact of
symmetry of the atheroma is almost negligible and the non-Newtonian properties of blood leads to
higher pressure drops and wall shear stresses than the ones obtained for Newtonian flows.
KEYWORDS : Microchannel; Atheroma; Computational Fluid Dynamics; Wall Shear Stress; Pressure Drop
INTRODUCTION
Over the past few decades, the interest in the atherosclerosis’s studies has assumed a prominent
place in medicine since this cardiovascular pathology has become one of the major causes of
death. The dominant pattern is atherosclerosis, characterized by the formation of atheromas.
Most of the times, the formation of an atheroma is accomplished by a thrombus formation. It is
thought that the location of higher pressures and velocities promote the endothelium lesion and
hence the formation of a thrombus, which normally conduce to a thromboembolism due to the
high speeds and pressures1. Microfluidic devices are becoming one of the most promising new
tools for diagnostic applications and treatment of several chronic diseases and the microchannels
used in these devices usually have rectangular shape. Hence, it is essential to understand the
blood flow behaviour involved in this kind of microchannels.
NUMERICAL SIMULATIONS
The simulations were carried out using the commercial finite-volume package FLUENT®(v
15.0.7). In the calculations, blood was considered both Newtonian and non-Newtonian fluid, its
rheology being described, in the second case, by the Carreau model2. The simulations were
Microrheology
P38
251

carried out in 3D rectangular geometries, Fig. 1. Six channels with distinct stenosis degrees -
15%, 30% and 50% - were studied, 3 of them with symmetric atheroma and the other 3 with
asymmetric atheroma.
(a) (b)
FIGURE 1 Example of computational domains. (a) Asymmetric atheroma and (b) Symmetric atheroma.
Due to the symmetry of the studied microchannels, a symmetry plane was established leading to
thinner computational domains. The discretization of these domains was made using meshes
constituted by rectangular elements, the mesh being more refined close to the walls, where zero
velocity was imposed. In addition to the referred boundary conditions, 6 distinct entry velocities,
u, were imposed in the plane x = 0.
In order to validate the computational fluid dynamics calculations, two tests in the region before
the atheroma were performed. First, velocity profiles were compared with the analytical
solutions for the Newtonian fully developed flow in a rectangular microchannel3 and it was
observed a mean deviation lower than 0.8% for all the channels and operation conditions, Fig. 2.
0
0.05
0.1
0.15
0.2
0.25
0.3
0.35
0 100 200 300 400 500
v (
mm
/s)
y (mm)
Numerical Results
Analytical Profile
0
0.05
0.1
0.15
0.2
0.25
0.3
0.35
0 10 20 30 40 50
v (
mm
/s)
z (mm)
Numerical Results
Analytical Profile
(a) (b)
FIGURE 2 Velocity profiles for fully developed flow in the region before the atheroma and u = 0.198
mm/s. (a) Symmetry plane (z = 50 mm); (b) Central plane (y = 250 mm).
252

The pressure drop, ΔP, was estimated resorting to the correlation 1Ref Po , where f is the
Fanning friction factor, Re the Reynolds number and Po the Poiseuille's number, which assumes
the value 19.0 4 for the studied region. The relative errors for ΔP ranged between 0.01 and 0.1%.
RESULTS
As expected, the influence of the symmetry of the atheroma in the pressure decrease with the
decrease of the stenosis degree (Fig. 3(a)). In Fig. 3(a) it can be observed that pressure for
Newtonian flow is higher than the one obtained for the non-Newtonian flow. Fig. 3(b) shows that
pressure drops are higher for the non-Newtonian flows and the impact of non-Newtonian
properties on this flow property decrease with the increase of mean velocity, u.
101200
101225
101250
101275
101300
101325
0 1000 2000 3000 4000 5000 6000 7000
P(P
a)
x (mm)
Non-Newtonian fluidStenosis degree of 15%
Newtonian fluidStenosis degree of 50%
Non-Newtonian fluidStenosis degree of 50%
Newtonian fluidStenosis degree of 15%
1.0
1.2
1.4
1.6
1.8
2.0
2.2
2.4
2.6
2.8
0 50 100 150 200
DP
Carr
eau
/ DP
New
tonia
n
u (mm/s)
Stenosis degree = 15%
Stenosis degree = 30%
Stenosis degree = 50%
(a) (b)
FIGURE 3 (a) Pressure along channels for u = 1.98 mm/s: (---) symmetric atheroma; () asymmetric
atheroma. (b) Ratio between pressure drop of non-Newtonian and Newtonian fluids.
The wall shear stress (WSS) along the channels for both Newtonian and non-Newtonian flows
have been analyzed and it was verified that the maximum value was reached at the symmetry
plane in the corner of the atheroma (Fig. 4).
The asymmetry of the WSS profile is more pronounced for the asymmetric atheroma, being this
asymmetry less pronounced for lower velocities (Fig. 4). In the opposite side of the atheroma,
Line 2 (Fig.4(b)), the presence of this obstruction is also felt, as can be observed in Fig.4(b).
The impact of non-Newtonian blood properties in the WSS was studied and it was concluded
that WSS for Carreau fluid are higher than the ones developed for the Newtonian fluid and this
impact increases with the decrease of mean velocity.
253

0
10
20
30
40
50
60
70
80
90
0 1000 2000 3000 4000 5000 6000 7000
WS
S (
Pa)
x (mm)
Asymmetric Atheroma
Symmetric Atheroma
0
5
10
15
20
0 1000 2000 3000 4000 5000 6000 7000
WS
S (
Pa)
x (mm)
Line 1
Line 2
(a) (b)
FIGURE 4 (a) WSS along Line 1 for 30% of stenosis degree, Newtonian fluid for u = 79.2mm/s. (b) WSS in
top and bottom of the channel with 50% of stenosis degree for the Carreau fluid for u = 9.9 mm/s.
CONCLUSIONS
With this study, the influence of blood’s non-Newtonian properties, stenosis degree and
symmetry of atheroma in laminar flow’s properties in stenotic rectangular microchannels were
analyzed. It was possible to conclude that in the range of studied mean velocities, local velocity
is not affected by the used rheological model or symmetry of the atheroma. The non-Newtonian
properties of blood leads to higher pressure drops and wall shear stress being this effect more
pronounced for lower velocities.
ACKNOWLEDGEMENTS
The authors acknowledge the financial support provided by: EXPL/EMS-SIS/2215/2013 and PTDC/SAU-
ENB/116929/2010 from FCT (Science and Technology Foundation), COMPETE, QREN and FEDER.
REFERENCES AND NOTES
1. Robbins, S.L.; R.S. Cotran; R.S., Kumar, V.; Collins, T., Fundamentos de Robbins – Patologia
estrutural e funcional; Nova Guanabara: Rio de Janeiro, 2001.
2. Johnston, B.M.; Johnston, P.R.; Corney, S.; Kilpatrick, D., Journal of Biomechanics, 2004, 37, 709-
720.
3. Bruus H., Theoretical Microfluics; Henrik Bruus, Ed.; Oxford University Press: New York, Oxford,
2008.
4. White M. F., Viscous Fluid Flow; Lyn Beamesderfer, John M. Morriss, Eds.; Mc Graw Hill: New
York, 2005.
254

Rheological characterisation of low denatured crayfish protein concentrates in a
fluid interface
M. Felix1, A. Romero1, J. Vermant2, A. Guerrero1
1Departamento de Ingeniería Química. Facultad de Química. Universidad de Sevilla. Profesor García
González 1, 41012, Sevilla. Spain
2 Department of Materials, ETH Zürich, Vladimir-Prelog-Weg 4, CH-8093 Zürich, Switzerland
Correspondence to: Antonio Guerrero (E-mail: [email protected])
ABSTRACT
The interfacial behaviour of adsorbed crayfish protein (CFP) has been studied at the air/water
and oil/water interfaces for two different crayfish protein derivatives: crayfish sarcoplasmic
proteins (CFS) and crayfish hydrolysates (CFH) a function of time, concentration and pH. An
analysis of the the adsorption kinetics determined by pendant drop tensiometry and shear
measurements using a highly sensitive magnetic air bearing stress-controlled rheometer, have
been carried out. A relationship between parameters from O/W and A/W interfaces, which
depends on pH values and concentration below interfacial saturation, has been found. Crayfish
proteins confer an elastic dominant behaviour to O/W interfaces showing low interfacial tension
values. CFS fraction yields lower surface pressure but enhanced 2D gel-like behaviour, which
should prevent droplet recoalescence and, as a result, would yield enhanced long-term stability.
KEYWORDS: Crayfish protein, interfacial pressure, interfacial shear rheology, double-wall ring.
INTRODUCTION
The key role of proteins in both the emulsification process and emulsion stability has been
widely recognised over the last decades. The ability to emulsify is related to the reduction of
interfacial tension as the protein molecules adsorb to the interface, which facilitates the breakup
of droplets during emulsion formation. The interfacial ability and the ability of the protein to
form an interface is mainly governed by the entropy (in terms of gain) which takes place due to
the adsorption and denaturation of the protein at the interface1. Emulsion stability is rather
associated to the formation of a viscoelastic film that helps to stabilize the newly formed droplets
against coalescence, and possibly also Ostwald ripening2. Obtaining meaningful interfacial
Interfacial Rheology
P35
255

rheological material functions is challenging. This is firstly due to the small magnitude of the
forces and torques associated with the deformation of an interface, but secondly and more
fundamentally to the intimate coupling between the flow and deformation in bulk and at the
interface, which often makes the fluid mechanics analysis very complex to be accomplished3.
This study has been conducted with the overall objective of analysing the ability of protein
systems from crayfish by-products to display enhanced techno-functional properties (i.e.
emulsification and foaming). The specific aim has been to study the interfacial behaviour of two
protein derivatives obtained from CF surpluses, both showing little or no exposure to heat-
induced protein denaturation at two different pH values (2 and 8), selected on the basis of their
surface charges and protein solubility. The protein derivatives have been a globular protein
fraction mainly consisting of sarcoplasmic proteins (CFS); and a protein hydrolysate, (CFH).
EXPERIMENTAL SECTION
Materials
Crayfish (CF) meat was separated from the shell by grinding and sieving and supplied as CF
pulp by ALFOCAN (Isla Mayor, Sevilla, Spain). CF pulp was kept frozen until its use. First of
all, the thawed CF pulp was subjected to alkaline solubilisation at pH 9 and then precipitated at
pH 5. The supernatant was spray dried to obtain a fraction rich in globular sarcoplasmic proteins
(CFS). The thawed CF pulp was also submitted to controlled enzymatic hydrolysis and then it
was spray-dried to obtain a CF protein hydrolysate (CFH) with a hydrolysis degree of 50%. The
protein content of both protein derivatives was determined in quadruplicate as % N x 6.25 using
a LECO CHNS-932 nitrogen micro analyser (Leco Corporation, St. Joseph, MI, USA), being
52.6 ± 0.4 wt.% for CFS and 67.9 ± 0.9 wt.% for CFH.
Interfacial characterization
Determination of oil–water interface properties. Transient interfacial pressure (Π) was carried
out using a pendant drop tensiometer from CAM200 (KSV, Finland). A single batch of
commercial n-hexadecane oil was used to measure oil–water kinetic adsorption at 20ºC.
Determination of interfacial shear rheological properties. Measurements of interfacial shear
rheology were performed using a double-wall-ring geometry (DWR) according to Vandebril et
al4. Creep tests were performed at constant stress ranging from 6.5·10-6 to 1.35·10-5 Pa in
water/n-hexadecane interface to evaluate interfacial behaviour.
RESULTS
256

Figure 1 shows the transient surface pressure response for the adsorption kinetics of CFS and
CFH at the n-hexadecane/water interface at two different protein concentrations (1 and 2 mg
flour/mL) and two pH values (figure 1A for pH 2 and figure 1B for pH 8). The adsorption is
always characterized by a rapid increase in surface pressure followed by a slow evolution
towards an equilibrium value (Πeq). This evolution is likely due to the occurrence of different
stages, starting with an initial stage where fast protein diffusion to the interface takes place,
followed by a slower step, where penetration of protein molecules through the interfacial layer as
well as some conformational rearrangements of proteins at the interface slow down the kinetics.
The manner in which these stages contribute to the overall adsorption process depends on pH,
protein concentration and molecular properties.
FIGURE 1: Adsorption of CFS and CFH at the n-hexadecane/water interface at two different
protein concentrations (1 and 2 mg derivative/mL): (A) at pH 2; (B) at pH 8.
As may be observed, creep profiles (Figure 2), by means of interfacial creep compliance (Ji), for
both CFS and CFH are highly sensitive to pH and the creep data really emphasize the differences
between the underlying microstructures at pH 2, CFS and CFH both show significant viscoelastic
response with both a nonlinear compliance and significant recoil. The slope Ji is initially
decreasing showing a tendency towards constant slope. The values of Ji are independent on the
stress applied to the interface, which confirms that the response is under the linear deformation
regime. At this pH, a marked recovery response takes place, which is also consistent with the
elastic-dominant behaviour. On the other hand, the response in creep at pH 8 exhibits an
apparent Newtonian fluid response and no recovery is observed is shown for both CFS and CFH-
adsorbed interfacial layers with practically nil recovery. This means that the maximum
Concentration
System 1mg/mL 2mg/mL
CFF
CFH
0 2000010
15
20
25
30
35
40
Time (s)
(
mN
/m)
A
pH 2
0 2000010
15
20
25
30
35
40
Time (s)
Concentration
System 1mg/mL 2mg/mL
CFF
CFH
(m
N/m
)
B
pH 8
257

deformation reached is also very different, being much higher at pH 8 (350 after 15 min) than at
pH 2 (which is lower than 0.001), at the same interfacial shear stress.
FIGURE 2. Results from creep tests performed at the oil/water interface by means of the DWR
tool for protein derivatives CFS and CFH: (A) at pH 2; (B) at pH 8.
CONCLUSIONS
Two alternative procedures have been successfully used to obtain highly soluble protein systems,
over a wide range of pH range studied, from crayfish pulp. A strong influence of the behaviour
of protein at the complex fluid-fluid interfaces formed on pH and concentration has been found.
The response to the application of an interfacial shear stress under creep and recovery
measurements depend strongly on pH value. Hence, an elastic-dominant structure was found at
pH 2, but at pH 8 the shear response for both protein derivatives shows a Newtonian response,
indicating the absence of significant microstructure. This different behaviour must be related to
electrostatic/hydrophobic association which are very pH-dependent. Finally, it should be pointed
out that although crayfish proteins have shown a good potential for its use as food emulsifier, the
complexity of the system makes difficult to carry out any prediction on emulsion stability.
ACKNOWLEDGEMENTS
Authors were sponsored by Andalousian Government, (Spain) (project TEP-6134). The authors
gratefully acknowledge their financial support.
REFERENCES AND NOTES
1. Mezzenga, R. Fishcer, P, Reports Progr. Phys, 2013, 76.
2. McClements, D. J. Food Emulsions: Principles, Practice and Techniques. CRC Press: Florida,
Boca Raton, 2004.
3. Sagis, L. M. C. European Physical Journal-Special Topics, 2013,222, 39-46.
4. Vandebril, S., Franck, A., Fuller, G.G., Vermant, J, Rheologica Acta, 2010,49, 131-144
0 400 800 1200 16000
20
40
60
80Recovery
Ji(t
) (1
/Pa m
)
Time (s)
CFS
CFH
CreepA
pH 2
0 400 800 1200 1600 2000
0.0
5.0x10⁷
1.0x10⁸
1.5x10⁸
Recovery
Time (s)
CFS
CFH
BJ(t) (1
/Pa
m)
Creep
pH 8
258

Emulsion-like and suspension
Mercedes Fernández1, Leire Sangroniz
1 Institute of Polymer Materials (POLYMAT) and Polymer Science and Technology Department, Faculty of Chemistry, University of the Basque Country (UPV/EHU), Paseo Manuel de
Lardizabal 3, 20018 Donostia
2 IKERBASQUE, Basque Foundatio
Correspondence to: [email protected]
ABSTRACT
Polypropylene (PP) mixtures with polyamide (PA) are investigated and compared with PP/PA blends that contain 5% of nanosilica (NS). The terminal viscoelastic zone iamplitude oscillatory shear, SAOS, measurements in the linear regime. To investigate the nonlinear viscoelastic behaviour, large amplitude oscillatory shear, LAOS, experiments are carried out. It is shown that alterations of the termaccount for the interfacial effects of drops and drops surrounded by nanoparticles.
KEYWORDS BLENDS, EMULSIONS, INTERFACIAL TENSION, DYNAMIC VISCOELASTICITY, NON-LINEARITY
INTRODUCTION
Blending polymers constitutes an efficient strategy to obtain new materials which combine the
best properties of each component. In most of the cases, the corresponding solubility parameters
of the involved polymers differ considerably, which leads to immiscible mixtures. Pr
conditions and mechanical properties depend on the morphology developed in thes
phase/multiphase systems. In the case of an emulsion
remarkable as smaller is the size of the dispersed droplets. To achieve t
tension should be reduced using compatibilizers. Recently
of 5% nanosilica to polypropylene/polyamide and polypropylene/polycarbonate blends,
respectively, produces a strong reduction of the
emplacement at the interface.
like and suspension-like interfaces in PP/PA blends and PP/PA/NS blend nanocomposites
Leire Sangroniz1, Jordana Palacios1, Antxon SantamariaMuller 1,2
Institute of Polymer Materials (POLYMAT) and Polymer Science and Technology Department, Faculty of Chemistry, University of the Basque Country (UPV/EHU), Paseo Manuel de
Lardizabal 3, 20018 Donostia-San Sebastián, Spain
IKERBASQUE, Basque Foundation for Science, E-48011 Bilbao, Spain
Correspondence to: [email protected]
Polypropylene (PP) mixtures with polyamide (PA) are investigated and compared with PP/PA blends that contain 5% of nanosilica (NS). The terminal viscoelastic zone i
oscillatory shear, SAOS, measurements in the linear regime. To investigate the nonlinear viscoelastic behaviour, large amplitude oscillatory shear, LAOS, experiments are carried out. It is shown that alterations of the terminal zone and deviations observed in nonaccount for the interfacial effects of drops and drops surrounded by nanoparticles.
BLENDS, EMULSIONS, INTERFACIAL TENSION, DYNAMIC VISCOELASTICITY,
onstitutes an efficient strategy to obtain new materials which combine the
best properties of each component. In most of the cases, the corresponding solubility parameters
of the involved polymers differ considerably, which leads to immiscible mixtures. Pr
conditions and mechanical properties depend on the morphology developed in thes
In the case of an emulsion-like morphology, the effect is more
remarkable as smaller is the size of the dispersed droplets. To achieve this goal, the interfacial
tension should be reduced using compatibilizers. Recently1, it has been proved that the addition
of 5% nanosilica to polypropylene/polyamide and polypropylene/polycarbonate blends,
respectively, produces a strong reduction of the droplet size, as a consequence of the NS
emplacement at the interface.
like interfaces in PP/PA blends and PP/PA/NS blend
Antxon Santamaria1, Alejandro
Institute of Polymer Materials (POLYMAT) and Polymer Science and Technology Department, Faculty of Chemistry, University of the Basque Country (UPV/EHU), Paseo Manuel de
48011 Bilbao, Spain
Polypropylene (PP) mixtures with polyamide (PA) are investigated and compared with PP/PA blends that contain 5% of nanosilica (NS). The terminal viscoelastic zone is analysed using small
oscillatory shear, SAOS, measurements in the linear regime. To investigate the non-linear viscoelastic behaviour, large amplitude oscillatory shear, LAOS, experiments are carried
inal zone and deviations observed in non-linearity, account for the interfacial effects of drops and drops surrounded by nanoparticles.
BLENDS, EMULSIONS, INTERFACIAL TENSION, DYNAMIC VISCOELASTICITY,
onstitutes an efficient strategy to obtain new materials which combine the
best properties of each component. In most of the cases, the corresponding solubility parameters
of the involved polymers differ considerably, which leads to immiscible mixtures. Processing
conditions and mechanical properties depend on the morphology developed in these two
like morphology, the effect is more
his goal, the interfacial
, it has been proved that the addition
of 5% nanosilica to polypropylene/polyamide and polypropylene/polycarbonate blends,
droplet size, as a consequence of the NS
P36
259

In this paper, the rheological consequences of the morphological changes, associated to the size
of the droplets and to the location of the nanosilica particles, are investigated. A careful analysis
of dynamic viscoelastic data in the linear (SAOS), as well as in the non-linear (LAOS) regime,
reveals the strong capacities of rheology to characterise polymer blends.
EXPERIMENTAL PART
Blends preparation
The materials were dried under vacuum at 80ºC overnight prior to extrusion and the polymer
powders were mixed with silica. The blends and nanocomposites were prepared in a Collins co-
rotating twin screw extruder with a profile temperature range from 200 to 240 °C in the extrusion
zone was used at 40 rpm.
TABLE 1. Compositions (expressed in wt%) of the blends nanocomposites
PP PA NS with respect to the total weight
PP/PA 80 20
PP/PA/NS 80 20 5
Rheological measurements
The dynamic viscoelastic functions were evaluated using two TA Instruments rheometers: ARG2
and ARES with parallel plate geometries (25 mm diameter) under nitrogen atmosphere. Dynamic
frequency sweeps, SAOS, were performed in ARG2 at 220ºC in the linear viscoelastic regime
from 628.3 to 0.03 rad/s. Non linear viscoelastic properties were carried out in the ARES
rheometer using large amplitude oscillatory shear, LAOS, flow from 5% to 1000% at 220ºC at a
fixed frequency of 0.2 Hz.
RESULTS AND DISCUSSION
The so-called Han plots2, i.e. the double logarithmic plot of the storage modulus versus the loss
modulus, constitute an old but very interesting rheological technique to investigate polymer
blends. In Figure 1a) such plots are shown, revealing the deviations at low frequencies (low
values of G’ and G’’) observed in emulsion like PP/PA blends, as well as in PP/PA/NS blend
260

nanocomposites. For the latter, the deviation is a consequence of a suspension-like behavior. But
in the case of the emulsion like PP/PA blends the deviation is due to the elastic contribution of
the interfacial tension.
FIGURE 1. a) The so-called Han plots for PP/PA blend and PP/PA/NS blend nanocomposite, as
well as neat PP and PA. The arrow indicates the frequency that corresponds to the inverse of the
relaxation time obtained in Equation 1. b) The so-called Cole Cole plots for PP/PA blend and
PP/PA/NS blend nanocomposite, as well as neat PP and PA. The arrow indicates the frequency
that corresponds to the inverse of the relaxation time obtained in Equation 1.
Using the model proposed by Gramespacher and Meissner3 (Equation 1) the relaxation time
associated to the interfacial tension can be determined.
α = mη R
0τ(19k +16)(2k+ 3)
40(k+1)1+φ 5(19k+16)
4(k +1)(2k+ 3)
(1) where,
R is the radius of the dispersed phase, τ0 is the shape relaxation time and the viscosities are the
Newtonian viscosities.
According to literature results4 the interfacial tension between PP and PA at T=220ºC is
approximately α=9.2 mN/m. Applying Equation 1 this value leads to a relaxation time τ0 =0.51s,
which corresponds to a frequency of ω =1.98 rad/s. In Figure 1a) the arrow indicates the G’ and
G’’ values that correspond to this frequency. It is observed that the position of the arrow comes
10-1
100
101
102
103
104
105
106
101 102 103 104 105 106
PP PAPP/PAPP/PA/NS
G´(
Pa)
G´´(Pa)
k = dispersed−phaseη
matrixη
261

to coincide with the start of the deviation noticed for emulsion-like blends. Concomitant to the
effect of the interfacial tension observed in the Han plots, the so-called Cole-Cole plots5 (real
part, η´´, versus imaginary part, η´ of the complex viscosity, η*) also show a peculiarity
associated to the interfacial tension. This can be observed in Figure 1b).
As a corollary of these results, a novel rheological method to evaluate the interfacial tension can
be postulated. This consists in calculating the frequency at which deviation in the Han or Cole
Cole plots takes place and subsequently use the equation of the Gramespacher and Meissner
model to determine α.
Our current work indicates that LAOS experiments (not shown here) are not so conclusive as
SAOS tests, so far, since only qualitative results about the interfacial tension can be obtained
from their analysis.
CONCLUSIONS
The analysis of the dynamic viscoelastic results in the terminal zone reveals the effect of the
interfacial tension in PP/PA blends. In particular, Han plots and Cole Cole plots show
discontinuities that treated according to the Gramespacher and Meissner model can allow to
evaluate the interfacial tension.
ACKNOWLEDGEMENTS
UPV/EHU (UFI 11/56), GIC IT-586-13 (Basque Government) and MAT 2014-53437-C2-2-P
(Spanish Government).
REFERENCES AND NOTES
1.-Laoutid, F.; Estrada, M.; Michell, R.M.; Bonnaud, L.; Müller, A.J.; Dubois, P., Polymer,
2012, 31, 3982-3990.
2.-Han, J.H.; Feng, D.; Choi-Feng, C.; Han, C.D., Polymer, 1995, 36, 155-170.
3.-Gramespacher, H.; Meissner, J., Journal of Rheology, 1992, 36, 1127-1141.
4.-Shi, D.; Ke, Z.; Yang, J.; Gao, Y.; Wu, J.; Yin, J., Macromolecules, 2002, 35, 8005-8012.
5.-Cole, K.S.; Cole, R.H., The Journal of Chemical Physics, 1941, 9, 341-352.
262

Interfacial rheology at the -pinene/water interface and emulsifying properties
of two eco-friendly surfactants
Luis Alfonso Trujillo-Cayado1, Pablo Ramírez1, María Carmen Alfaro1, Manuela Ruiz1, José Muñoz1
1Departamento de Ingeniería Química. Facultad de Química. Universidad de Sevilla c/ P. García González,
1, E41012, Sevilla, Spain.
Correspondence to: Pablo Ramírez (E-mail: [email protected])
ABSTRACT
In this work, an accurate study of two commercial non-ionic polyoxytheylene glycerol ester
surfactants at the -pinene/water interface was carried out, comprising a systematic analysis of
dynamic adsorption properties, interfacial rheology and emulsifying properties. Polyoxyethylene
glycerol esters were obtained from a renewable source (cocoa oil) and fulfil the environmental
and toxicological requirements to be used as ecofriendly emulsifying agents1. -Pinene is also a
renewable biosolvent completely insoluble in water, which could find numerous applications.
The dilatational rheology of these surfactants at the oil/water interface was studied by means of
step area perturbations. The surfactant with the highest number of EO groups (Levenol C-201)
turned out to be more surface active at the -pinene/water interface. Furthermore, the surfactant
with the lowest number of EO groups (Levenol H&B) was partly solubilized into the oil phase.
Both surfactants allowed obtaining slightly concentratedpinene emulsions. Nevertheless, the
results obtained demonstrated that the emulsions prepared using Levenol C-201 had smaller
droplet sizes, lower polidispersity and showed higher physical stability than the emulsions
prepared by using Levenol H&B.
KEYWORDS -pinene; adsorption equilibrium; Levenol, surface rheology; emulsion
INTRODUCTION
In this work, emulsions were produced by using surfactants (polyoxyethylene glycerol esters
derived from cocoa oil) and a solvent (-pinene) obtained from renewable natural materials,
which are more eco-friendly than traditional ones2.
P37
P37
263

The main objective is to provide a systematic characterization of the interfacial rheological and
emulsifying properties of two eco-friendly polyoxyethylene glycerol ester surfactants with
different numbers of EO groups at the -pinene/water interface.
MATERIALS AND METHODS
Two commercial polyoxyethylene glycerol ester surfactants derived from cocoa oil have been
studied: Levenol® C201 (Glycereth-17 cocoate) and Levenol® H&B (Glycereth-2 cocoate).
They were kindly provided by KAO and used as received. -Pinene (0.84 g/mL at 25ºC) was
purchased from Sigma–Aldrich® and purified with Florisil® resins (Fluka, 60–10 mesh).
Interfacial tension and dilatational rheology measurements were performed with a drop profile
analysis tensiometer (CAM200, KSV, Finland).
Droplet size distribution measurements were performed using a static light scattering instrument
(Malvern Mastersizer X). Multiple light scattering measurements carried out over 21 days at
20ºC with a Turbiscan Lab Expert were used in order to study the destabilization of the
emulsions by creaming. To characterize the creaming process, the creaming index was used.
RESULTS AND DISCUSSION
Interfacial properties
Figure 1 shows the dynamic surface tension response of both surfactants at a bulk concentration
of 1 gL-1
. Levenol C201 adsorbed faster and to a higher extent than Levenol H&B. Furthermore,
the minimum value in surface tension obtained for Levenol H&B can be ascribed to the
occurrence of a fast diffusion and adsorption of surfactant molecules at the interface followed by
a slower solubilization of the previously adsorbed surfactants into the adjacent oil phase.
The interfacial behaviour of both surfactants at the -pinene/water interface was studied by
means of step area perturbations. The limiting elasticity E0 was calculated using the following
equation3,4
:
00
AE
A
(Eq. 1)
264

where is the interface tension increase after the step, A0 is the initial surface area and ∆A is
the surface area step. Figure 2 show E0 values as a function of Levenol C201 and Levenol H&B
concentrations. It is worth noting that the presence of a minimum indicated the occurrence of
conformational changes of the adsorbed layer, being more noticeable for the surfactant with
higher number of ethoxylated units.
FIGURE 1. (a) Dynamic interfacial tension for Levenol C-201 (circles) and Levenol H&B (triangles) at the
-pinene/water interface for 1 g·L-1 concentration. (b) Interfacial limiting elasticity versus concentration
for Levenol C-201 (open squares) and Levenol H&B (open circles) at the -pinene/water interface.
T=20C.
Emulsifying properties
The emulsifying properties values for both surfactants are summarized in Table 1. Firstly, it
should be stated that both emulsions showed a monomodal distributions pattern but the final size
distribution of the emulsion is highly sensitive to the emulsifier used. Emulsion containing
Levenol H&B aged for 1 day has a higher span value (span = 1.833) than those containing
Levenol C201 (span = 1.491). These results may be interpreted taking into account the better
surface properties of Levenol C201. This is in agreement with the results obtained from laser
diffraction measurements because emulsions became more stable against creaming due to the
combination of the reduction of the droplet size and the lower polidispersity. Results provided by
laser diffraction and multiple light scattering demonstrated that both surfactants could be used as
emulsifiers. However, Levenol C201 has better emulsifying properties, as smaller droplet sizes
are more easily obtained and it has enhanced stability against creaming.
265

TABLE 1 Emulsifying properties of -pinene/water emulsions of Levenol H&B and Levenol C201
D3,2 [m] Span Creaming rate, [mm/day]
Levenol H&B 1.75 1.833 0.48
Levenol C201 1.85 1.491 0.08
CONCLUSIONS
We have carried out a detailed study of the interfacial properties at the biocompatible -
pinene/water interface and of the emulsion stabilizing properties of two polyoxyethylene
glycerol ester surfactants derived from cocoa oil, which has recently become commercially
available.
Dynamic surface tension measurements showed that Levenol H&B adsorbs more slowly and to a
lesser extent than Levenol C201. Moreover, a minimum in the DST curve for Levenol H&B
indicated a partly solubilization of Levenol H&B in the -pinene oil phase.
Dilatational rheology measurements showed a conformational change of the adsorbed surfactants
being more marked for the one with more EO units. (Levenol C201).
-pinene-in-water emulsion produced by using Levenol C201 are more stable and with lower
droplet size and span values than the ones obtained with Levenol H&B.
ACKNOWLEDGEMENTS
The financial support received (Project CTQ2011-27371) from the Spanish Ministerio de
Economía y Competitividad (MINECO) and from the European Commission (FEDER
Programme) is kindly acknowledged. The authors are also grateful to KAO for providing
materials for this research.
REFERENCES
1. Trujillo-Cayado, L.A. ; Ramírez, P. ; Pérez-Mosqueda, L.M. ; Alfaro, M.C. ; Muñoz, J. Colloids and
Surfaces A. 2014, 458, 195.
2. Santos, J. ; Trujillo-Cayado, L.A. ; Calero N. ; Muñoz, J. Aiche J. 2014, 60, 2644.
3. Calero, N. ; Muñoz, J. ; Ramírez P. ; Guerrero, A. Food Hydrocoll, 2010, 24, 659.
4. Pérez-Mosqueda, L.M. ; Ramírez, P. ; Alfaro, M.C. ; Rincón, F. ; Muñoz, J. Food Hydrocoll., 2013,
32, 440.
266

Author Index
267

Abraham, Analía Graciela – P23 Abreu, Danielly C. – P31 Aguilar, María del Pilar - P25 Alfaro, Mª Carmen - O9, O14, P37, P44, P49 Almeida, António José – O27, P28 Almeida, Pedro – O31 Alvarenga, Nuno – P13, P15 Alvarez, María Dolores – P45 Alves, Sara – P7 Andrés, Margarita San – P25 Antunes, Filipe E. – O27, P28, P34 Artiaga, R. – P32 Arufe, Santiago – O3, P5, P6, P17 Baltazar, Luis G. – P 41 Banobre, Manuel – P33 Bargiela, Verónica – P1, P2 Barreiro, S. Gómez – P32 Barrière, Thierry - O8 Batista, Vanessa – O22 Beceiro, J. López – P32 Bengoechea, Carlos – O21, P23 Berta, M. – P20 Boix, Miquel – P47 Borderías, .Javier – P1, P2 Branco, Fernando – O24 Burrica, Nuno – P13 Calafel, Itxaso – P47 Calejo, Joana A. C. – P38 Calero, Nuria – O7, P30, P50 Candeias, Bárbara – P13 Canet, Wenceslao – P45 Cardoso, Tiago – P41 Carmona, José Antonio – P30 Carrión-Maramoros, L.M. – P11 Carvalho, Maria João – P13, P15 Chenlo, Francisco – O3, P5, P6, P17 Cidade, Maria Teresa – O5, P29, P41 Conde, Jose Ignacio – P47 Cordobés, Felipe – O21 Costa, Ana C. – P31 Costa, Manuela – P15 Costa, Maria Carolina Morando – P34 Costa, Raquel – P33 Cuadri, Antonio Abad - O26, P26, P46, P48 Cuesta, Francisco – P45 Curado, Aurora Lucas - P30 Delgado-García, R. – P11 Diañez, Isabel – O34 Dias, João – P13 Duretek, Ivica - O25
Egas, Ana P. V. – P31 Faísca, Margarida – O22 Felix, Manuel – O17, P22, P35 Fernandes, Carla S. – P38 Fernández, C. Gracia – P32 Fernández, Mercedes – O4, O23, P36 Fernández-Espada, Lucia – O21 Ferreira, Abel G. M. – P31 Fradinho, Patrícia – O22, O33, P8 Franco, José M. – O31, P19 Fuentes, Raúl – P45 García, M. Carmen – O14, P44 Garcia, Valdemar - P38 García‐Morales, Moisés – O6, O26, P26, P46, P48 Garrido, Rita – P33 Gelin, Jean‐Claude – O8 Gomes, David Manuel Gama Simões - O20 Gómez-Merino, A.I. – O29 Gonçalves, Paulo – O5 Gonzalez-Gutierrez, Joamin – O25 Gooneie, Ali – O25 Goswami, Sumita – O5 Gouveia, Luís Filipe – O27, P28 Goyos-Pérez, L. – P11 Graça, Carla – P7 Guerrero, Antonio – O17, O21, P22, P23, P35 Haavisto, Sanna – O18 Henriques, Fernando M.A. – P41 Henriques, Marta Helena Fernandes - O20 Hernández, María Jesús - P9, P25 Herranz, Beatriz – P1, P2, P45 Holzer, Clemens – O25 Hunkeler, David – P33 Jäsberg, Ari – O18 Kasa, Seppo – O18 Koponen, Antti – O18 Kukla, Christian – O25 Landa, Maite – O4 Leal, Catarina R. – O31 Liashenko, Ievgenii – P48 Lille, Martina – O18 Loução, Neide – P13 Lourenço, Anita – P33 Martín‐Alfonso, J.E. – P19, P20 Martínez, Inmaculada - O34, P48 Martínez-Boza, Francisco José - P46 Martín-Piñero, M. José - P44 Marto, Joana – O27, P28 Micaelo, Rui – P29
268

Moreira, Ramón – O3, P5, P6, P17 Moreno, Helena M. – P2 Muller, Antxon Santamaria – P36 Muñoz, José – O7, O9, O14, P30, P37, P44, P49, P50 Muñoz, Manuel – P9 Muñoz, María Eugenia – O4, O23, P47 Murillo-González, S. – O29 Narciso, Diana – P8 Navarro, F. Javier – O6, O26, P46 Nunes, Bruno - P13 Nunes, Sara - P15 Oliveira, Eduardo – O27, P28 Ortega, F.J. – O6 Páez-Flor, N.M. – O29, P11 Pais, Alberto Canelas – O27, P28 Palacios, Jordana – P36 Partal, Pedro – O6, O26, O34, P26, P46, P48 Pascual, Belén – P47 Patrício, Pedro – O31 Pazmiño-Renteria, A.J. – P11 Pereira, André – P29 Pereira, Carlos José Dias – O20 Pereira, Mara – P7 Pérez, María Dolores Torres – O1, P3 Pérez, Víctor - P22 Picó, Jose Antonio – P9 Piermaría, Judith - P23 Portela, Raquel – O31 Quaresma, Luís - P29 Raimundo, Luís – P7 Ramírez, Pablo – P30, P37 Rasteiro, Maria Graça G. – O24, P33 Raymundo, Anabela – O9, O22, O33, P7, P8 Ribeiro, Carlos – P15 Ribeiro, Helena Margarida – O27, P28 Rocha, Ana Filipa – O33 Rodriguez, Estibaliz – O23 Roman, Claudia – P46, P48 Romero, A. – P35 Romero, Alberto - O17, P22 Royer, Alexandre – O8 Rubio-Hernández, F.J. – O29, P11 Ruiz, Manuela – P37 Rustad, Turid – O17 Salvador, Ana – P4 Sánchez-Vicent, Alfonso – P9 Sangroniz, Leire – P36 Santamaría, Antxon – O4, O23, P47 Santos, Jenifer – O7, P50 Sanz, Teresa – P4
Schuschnigg, Stephan - O25 Silva, Sérgio M. C. – O27, P28, P34 Sobral, Rita G. – O31 Sousa, Isabel de – O9, O22, O33, P7, P8 Stading, M. – P20 Stanciu, Ioana – P39 Tovar, Clara. A – P1, P2 Trujill-Cayado, Luis A. – O9, P37, P44, P49 Valencia, C. – P19, P20 Vermant, J. – P35 Yuliestyan, Avido – P26
269