Safety devices for protection against excessive pressure -Part 1: Safety valves (ISO 4126-1:2004
Upload
khangminh22Category
view
0download
0
FRONT UNDERRIDE PROTECTION DEVICES: METHODS FOR DESIGN
AND TESTING
by
Todd MacDonald
A Thesis Submitted in Partial Fulfillment
of the Requirements for the Degree of
Master of Applied Science
In
The Faculty of Engineering and Applied Science
University of Ontario Institute of Technology
April 2014
© 2014 Todd MacDonald
ii
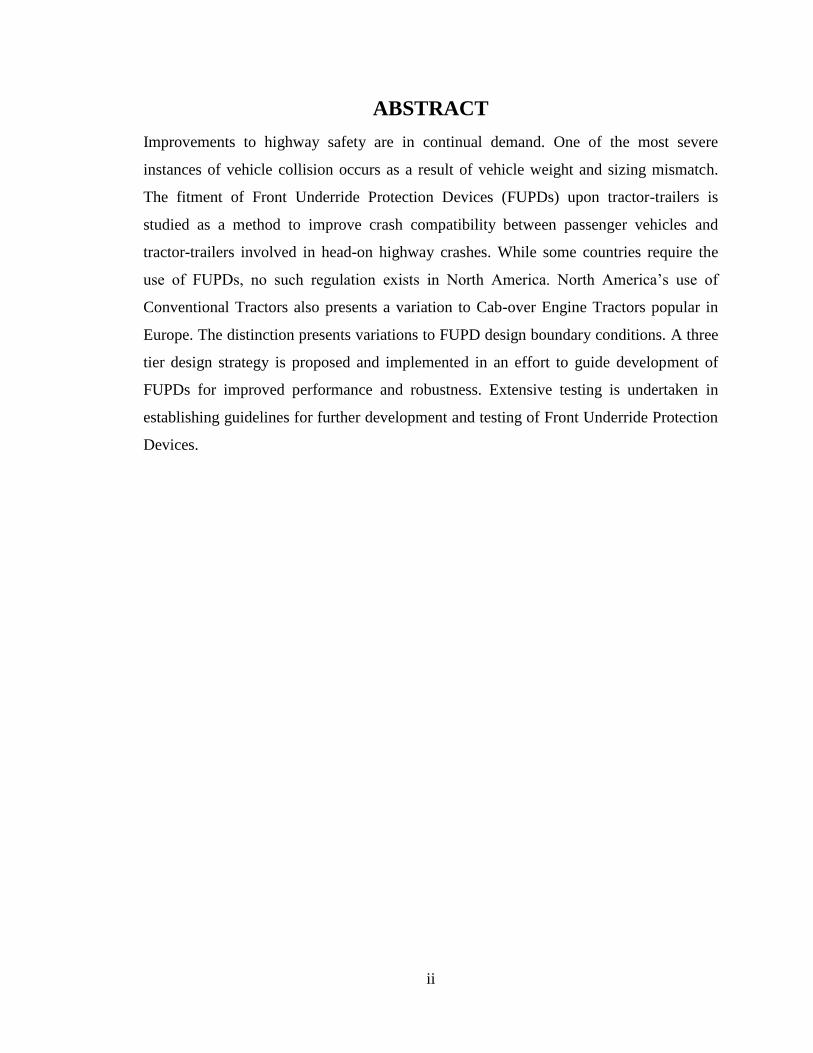
ABSTRACT
Improvements to highway safety are in continual demand. One of the most severe
instances of vehicle collision occurs as a result of vehicle weight and sizing mismatch.
The fitment of Front Underride Protection Devices (FUPDs) upon tractor-trailers is
studied as a method to improve crash compatibility between passenger vehicles and
tractor-trailers involved in head-on highway crashes. While some countries require the
use of FUPDs, no such regulation exists in North America. North America‟s use of
Conventional Tractors also presents a variation to Cab-over Engine Tractors popular in
Europe. The distinction presents variations to FUPD design boundary conditions. A three
tier design strategy is proposed and implemented in an effort to guide development of
FUPDs for improved performance and robustness. Extensive testing is undertaken in
establishing guidelines for further development and testing of Front Underride Protection
Devices.
iii
CONTENTS
ABSTRACT ........................................................................................................................ ii
CONTENTS ....................................................................................................................... iii
LIST OF FIGURES ........................................................................................................... vi
LIST OF TABLES ............................................................................................................. ix
ACKNOWLEDGEMENTS ................................................................................................ x
CHAPTER 1 INTRODUCTION ..................................................................................... 1
1.1 MOTIVATION .................................................................................................... 1
1.2 LITERATURE REVIEW ..................................................................................... 2
1.2.1 Existing FUPD Regulations .......................................................................... 2
1.2.2 Variations in Tractor Design ......................................................................... 4
1.2.3 Rigid and Energy Absorbing Underride Protection ...................................... 5
1.2.4 Working Foundation ..................................................................................... 6
1.2.5 Rear Underride Protection Devices............................................................... 7
1.3 LS-DYNA ............................................................................................................ 9
1.4 OPTIMIZATION TECHNIQUES ..................................................................... 10
1.4.1 Topology, Shape and Size Optimization..................................................... 10
1.4.2 Solution Strategy ......................................................................................... 11
CHAPTER 2 TESTING METHODS ............................................................................ 14
2.1 TESTING SETUP .............................................................................................. 14
2.2 PASSENGER VEHICLE MODELS ................................................................. 17
2.3 TRACTOR TRAILER MODELS ...................................................................... 19
2.3.1 Full Tractor-Trailer Model .......................................................................... 19
2.3.2 Simplified Tractor Models .......................................................................... 21
2.4 PERFORMANCE EVALUATION METRICS ................................................. 23
CHAPTER 3 GROUND CLEARANCE AND CONTACT SECTION HEIGHT ....... 26
3.1 EXPERIMENT I JUSTIFICATION .................................................................. 26
3.2 EXPERIMENT I – TIER 1 ................................................................................ 26
3.2.1 Results – Yaris vs. Rigid Bar ...................................................................... 27
3.2.2 Discussion – Yaris vs. Rigid Bars ............................................................... 30
3.3 EXPERIMENT 1 – TIER 2 ................................................................................ 32
iv
3.4 EXPERIMENT I – TIER 3 ................................................................................ 34
3.4.1 Results – Yaris vs. FUPDs .......................................................................... 35
3.4.2 Discussion – Yaris vs. FUPDs .................................................................... 37
3.5 CONCEPT EVALUATION ............................................................................... 38
CHAPTER 4 INCREASED LOADING ....................................................................... 40
4.1 EXPERIMENT II JUSTIFICATION ................................................................. 40
4.2 EXPERIMENT II – TIER 2 ............................................................................... 40
4.3 EXPERIMENT II – TIER 3 ............................................................................... 43
4.3.1 Results ......................................................................................................... 44
4.3.2 Discussion ................................................................................................... 47
4.4 CONCEPT EVALUATION ............................................................................... 48
CHAPTER 5 DESIGN FOR ENHANCED ROBUSTNESS ........................................ 50
5.1 EXPERIMENT III JUSTIFICATION ............................................................... 50
5.2 EXPERIMENT III – TIER I .............................................................................. 50
5.2.1 Phase 1 ........................................................................................................ 52
5.2.2 Phase 2 ........................................................................................................ 54
5.2.3 Results – Tier I – Phase 1 ........................................................................... 55
5.2.4 Results – Tier I – Phase 2 ........................................................................... 56
5.2.5 Discussion ................................................................................................... 58
5.3 EXPERIMENT III – TIER 2 .............................................................................. 60
5.4 EXPERIMENT III – TIER 3 .............................................................................. 62
5.4.1 Results ......................................................................................................... 62
5.4.2 Discussion ................................................................................................... 65
5.5 CONCEPT EVALUATION ............................................................................... 66
CHAPTER 6 ADDITIONAL SENSITIVITY CONSIDERATIONS ........................... 67
6.1 INITIAL CONDITIONS .................................................................................... 67
6.2 HEAVY BRAKING ........................................................................................... 67
6.3 PASSENGER VEHICLE COMPARISON ........................................................ 70
CHAPTER 7 CONCLUSIONS AND FUTURE WORK ............................................. 73
7.1 CONCLUSIONS ................................................................................................ 73
7.2 FUTURE WORK ............................................................................................... 75
PUBLICATIONS .............................................................................................................. 76
v
REFERENCES ................................................................................................................. 77
APPENDIX – PROPOSED MODIFICATIONS TO ECE R93 FOR NORTH AMERICA
........................................................................................................................................... 81
vi
LIST OF FIGURES
Figure 1-1 ECE R93 Geometry and Test Points [13] ..................................................... 3
Figure 1-2 P2 Point Load Testing for Whitlock Bull Bars FD263 (left) [14] and
KW188 (right) [15] ....................................................................................... 3
Figure 1-3 Conventional Tractor (North America) and Cab-over Engine Tractor (EU)
Measurement Standards [19] ........................................................................ 4
Figure 1-4 VC-Compat's Volvo eaFUPD (left) and Special eaFUPD (right) [23] ......... 6
Figure 1-5 CMVSS 223 Loading Points for RUPDs [29] .............................................. 8
Figure 1-6 IIHS Test of Failed RUPD [30] .................................................................... 8
Figure 1-7 Use of LS-DYNA in Studying Oblique Car-to-Car Frontal Impacts [33] .... 9
Figure 2-1 FUPD Design Space Refinement ................................................................ 15
Figure 2-2 Three Tier Design Strategy ......................................................................... 16
Figure 2-3 Tier 2: FUPD Design Map .......................................................................... 17
Figure 2-4 NCAC‟s 2010 Toyota Yaris and 2001 Ford Taurus FEA Models .............. 18
Figure 2-5 2001 Ford Taurus Validation Testing [40] ................................................. 19
Figure 2-6 KingPin Oscillations for Initial and Modified Stationary Tractor-Trailer
Models ......................................................................................................... 20
Figure 2-7 NTRCI Tractor-trailer vs. Roadside Barrier Validation [42] ...................... 21
Figure 2-8 Primary (left) and Secondary (right) Component Level VNL Tractor
Models ......................................................................................................... 22
Figure 2-9 Comparisons of Collisions Involving Toyota Yaris with Closing Speed of
64km/h and 50% Overlap versus the Primary Component Level VNL
Tractor (left) and complete NTRCI Tractor-Trailer Model (right) ............. 22
Figure 2-10 IIHS Occupant Compartment Intrusion Thresholds [43] ........................... 25
Figure 3-1 Depiction of FUPD Cross Section Height and Ground Clearance ............. 26
Figure 3-2 100% and 50% Overlap Test Conditions .................................................... 27
Figure 3-3 64km/h 100% Overlap: Wall, 120mm and 240mm Rigid Bar with 400mm
Ground Clearance ............................................................................................................. 28
Figure 3-4 64km/h-100%-120mm ................................................................................ 28
Figure 3-5 64km/h-100%-240mm ................................................................................ 28
Figure 3-6 64km/h-50%-120mm .................................................................................. 28
Figure 3-7 64km/h-50%-240mm .................................................................................. 28
Figure 3-8 80km/h 100% Overlap: Wall, 120mm and 240mm Rigid Bar with 400mm
Ground Clearance ............................................................................................................. 29
Figure 3-9 80km/h-100%-120mm ............................................................................... 29
Figure 3-10 80km/h-100%-240mm ............................................................................... 29
Figure 3-11 80km/h-50%-120mm ................................................................................. 29
Figure 3-12 80km/h-100%-240mm ............................................................................... 29
Figure 3-13 64km/h-100%-120mm with 350mm Ground Clearance at Time of Primary
(Left) and Secondary (Right) Impact Force Peaks .................................. 31
Figure 3-14 64km/h-100%-120mm with 400mm Ground Clearance at Time of .Primary
(Left) and Secondary (Right) Impact Force Peaks .................................. 31
vii
Figure 3-15 Initialization for Topology Optimization ................................................ 32
Figure 3-16 Result of Topology Optimization ............................................................ 33
Figure 3-17 FUPD Designs ......................................................................................... 33
Figure 3-18 64km/h-100% .......................................................................................... 35
Figure 3-19 64km/h-100%-B120 ................................................................................ 35
Figure 3-20 64km/h-100%-V3-120 ............................................................................ 36
Figure 3-21 64km/h-100%-V4-240 ............................................................................ 36
Figure 3-22 64km/h-50% ............................................................................................ 36
Figure 3-23 64km/h-50%-B120 .................................................................................. 36
Figure 3-24 64km/h-50%-V3-120 .............................................................................. 36
Figure 3-25 64km/h-50%-V4-240 .............................................................................. 36
Figure 3-26 Concept B120 Following a 50% Overlap Collision at 64km/h ............... 38
Figure 4-1 System J11 – Supported (Left) and Unsupported (Right) ....................... 42
Figure 4-2 Optimization with Simultaneous Quasi-Static Loading .......................... 43
Figure 4-3 Initial Test Conditions ............................................................................. 44
Figure 4-4 64km/h-100%-0D .................................................................................... 45
Figure 4-5 64km/h-50%-0D ...................................................................................... 45
Figure 4-6 64km/h-30%-0D ....................................................................................... 46
Figure 4-7 64km/h-30%-15D ..................................................................................... 46
Figure 4-8 64km/h-30%-30D ..................................................................................... 46
Figure 4-9 64km/h-100%-0D ..................................................................................... 46
Figure 4-10 64km/h-50%-0D ....................................................................................... 47
Figure 4-11 64km/h-30%-0D ....................................................................................... 47
Figure 4-12 64km/h-30%-15D ..................................................................................... 47
Figure 4-13 64km/h-30%-30D ..................................................................................... 47
Figure 5-1 Simplified FUPD Constrained by Spring System .................................... 51
Figure 5-2 Yaris 64km/h – 100% Overlap: Justification of Utilizing Spring System ..
Simplification ............................................................................................ 52
Figure 5-3 Concept 1 ................................................................................................... 53
Figure 5-4 Concept 2 ................................................................................................... 53
Figure 5-5 Concept 3 ................................................................................................... 54
Figure 5-6 Concept 2 with Extension Variations: 0mm, 100mm and 200mm (Bottom
View) ......................................................................................................... 55
Figure 5-7 Occupant Compartment Intrusion – 100% Overlap .................................. 55
Figure 5-8 Occupant Compartment Intrusion – 50% Overlap .................................... 56
Figure 5-9 Occupant Compartment Intrusion – 30% Overlap .................................... 56
Figure 5-10 Modified Occupant Compartment Intrusion – Concept 1 – 50% Overlap ..
................................................................................................................. 57
Figure 5-11 Modified Occupant Compartment Intrusion – Concept 2 – 50% Overlap ..
................................................................................................................. 57
Figure 5-12 Modified Occupant Compartment Intrusion – Concept 3 – 50% Overlap ..
................................................................................................................. 58
Figure 5-13 Simultaneous Quasi-Static Loading for Shape and Size Optimization ... 61
viii
Figure 5-14 FUPD Model F8 Mounted on the Secondary Simplified Component
Level VNL Tractor Model ...................................................................... 61
Figure 5-15 dsFUPD Model F9 (Top View) ............................................................... 62
Figure 5-16 Modified Occupant Compartment Intrusion – 100% Overlap ................ 63
Figure 5-17 Compatibility Profiles – 100% Overlap .................................................. 63
Figure 5-18 Modified Occupant Compartment Intrusion – 50% Overlap .................. 64
Figure 5-19 Modified Occupant Compartment Intrusion – 30% Overlap .................. 64
Figure 6-1 CarSim and LS-DYNA Deceleration Profiles (Wheels Locked) ............ 68
Figure 6-2 Yaris 55km/h vs. Rigid Bar ..................................................................... 69
Figure 6-3 Yaris 55km/h vs J11 Concept FUPD ....................................................... 70
Figure 6-4 Force Height Comparison with ECE R93 (narrow) and Author (broad) ...
Recommended Geometry ......................................................................... 71
Figure 6-5 Initial Stiffness Comparison .................................................................... 71
Figure 6-6 Average Force and Peak Force ................................................................ 72
ix
LIST OF TABLES
Table 2-1 Occupant Compartment Intrusion Measurement Points ............................. 24
Table 3-1 Optimization History Classified by FUPD ................................................. 34
Table 4-1 FUPD Design Specifications I .................................................................... 41
Table 4-2 FUPD Design Specifications II ................................................................... 41
Table 5-1 FUPD Mass ................................................................................................. 60
x
ACKNOWLEDGEMENTS
The author expresses his appreciation to Auto21 and Volvo Group Trucks Technology
for financial support, as well as technical guidance provided by Srikanth Ghantae, David
Critchley and Sarathy Ramachandra. My advisor, Dr. Moustafa El-Gindy, has been a well
of unparalleled support, enthusiasm and guidance, for which I am thankful.
My parents and grandparents have given me great sources of inspiration and motivation.
They have also given me the opportunity to pursue my dream of studying Automotive
Engineering, and for that I am thankful.
“Don‟t be denied” – N.Y.
1
CHAPTER 1 INTRODUCTION
1.1 MOTIVATION
Passenger vehicle safety and occupant protection has improved by leaps and bounds
in a relatively short period of time. These improvements are a direct result of the transient
nature of safety tests and requirements demanded by governing bodies. There exists no
point of rest in the search for improved safety, only relative performance increases. The
state-of-possible philosophy summarizes the relentless demand for research in this area. It
suggests vehicle safety improves continuously based upon technological and economic
conditions [1]. The combination of these variables has provided interest and funding
towards resolving issues presented in collisions involving severe vehicle mismatches.
Specifically, the vehicles selected for study are chosen from both ends of the size
spectrum. Instances of head-on type collisions between tractor-trailers and small
passenger vehicles have proven to be of high severity. The use of Front Underride
Protection Devices (FUPD) is a proposed method of decreasing the severity of these
collisions. In general terms, the FUPD mounts to the front of the tractor and provides the
colliding passenger vehicle with a structure against which it may react. The term
„underride‟ describes the sliding of the passenger car beneath the tractor-trailer‟s
structural members. In the case of severe underride, large values of intrusion are
introduced to the passenger vehicle‟s occupant compartment. There are regulations in
place in Europe [2], Australia [3], Japan [4] and India [5] necessitating the use of FUPDs.
No such regulation currently exists in North America. Criticism can be found directed at
the ineffectiveness of underride protection devices in regulated regions. The type of
tractor utilized in North America is also distinct. A demand for understanding the
possible benefits and design strategies of FUPDs for use in North America is therefore
present.
Whether the use of FUPDs will or will not become a requirement in North America,
the demand for improved safety is ever-present. The consideration of small passenger
vehicles continues to be of importance, as cars makeup 55.4% of all light vehicles on
Canadian roads. On these same roads tractors-trailers record the majority of total travel
2
kilometers [6]. The instances of interaction between the two vehicle types are high as a
result. Transport Canada‟s National Collision Database averages indicate 12.4% of all
road fatalities involve tractor-trailers. Similarly, 18.3% of all fatalities involve collisions
with heavy trucks. The term „heavy truck‟ groups together data consisting of straight
trucks and tractor-trailers. Of the recorded fatalities, 73.6% were occupants of the vehicle
colliding with the heavy truck. Further statistical analysis indicates 30.8% of the
collisions mentioned may be classified as involving two vehicles in a head on orientation
[7]. The total economic cost resultant from motor vehicle collisions throughout the year
2000 in the United States was an estimated $230.6 billion. This expense includes the loss
of 41,821 lives, 5.3 million injuries and 28 million damaged vehicles [8]. The Insurance
Institute for Highway Safety (IIHS) in association with the Fatality Analysis Reporting
Systems (FARS) reported 3,413 fatalities involving heavy trucks in 2010 on American
roads. This accounted for 9% of all vehicle collisions at the time. Fatalities resulted to
occupant(s) of the passenger vehicle in 97% of these accidents. Of the heavy trucks
involved, 75% were recorded as tractor-trailers with the remaining 25% were classified as
straight trucks [9]. The Large Truck Crash Causation Study in the United States was
published to further stress the significance of the vehicle underride problem [10].
There is belief that a properly designed FUPD would aid in reducing North American
highway fatality and injury rates. The process of properly designing an FUPD to
accomplish this goal houses many unknowns. The European based industry driven
Vehicle Crash Compatibility Project (VC-Compat) has highlighted the need for increased
understanding of vehicle to vehicle structural interactions in collisions as well [11].
Hence with demands from public and industry sectors, the FUPD project was undertaken.
1.2 LITERATURE REVIEW
1.2.1 Existing FUPD Regulations
Global regulation of Front Underride Protection Devices was pioneered by the
Economic Commission for Europe (ECE). The initial fitment and compliance regulation
set forth by this organization may be found within document ECE R93 [2]. The demand
for application of ECE R93 is directed by requirement 2000/40/EC, as of the year 2000
3
[12]. Direct adoptions of this regulation ensued with: India as AIS-069 in 2006 [5], Japan
in 2007 [4] and Australia as ADR84/00 in 2009 [3]. There remains no such regulation
requiring the use of FUPDs in North America.
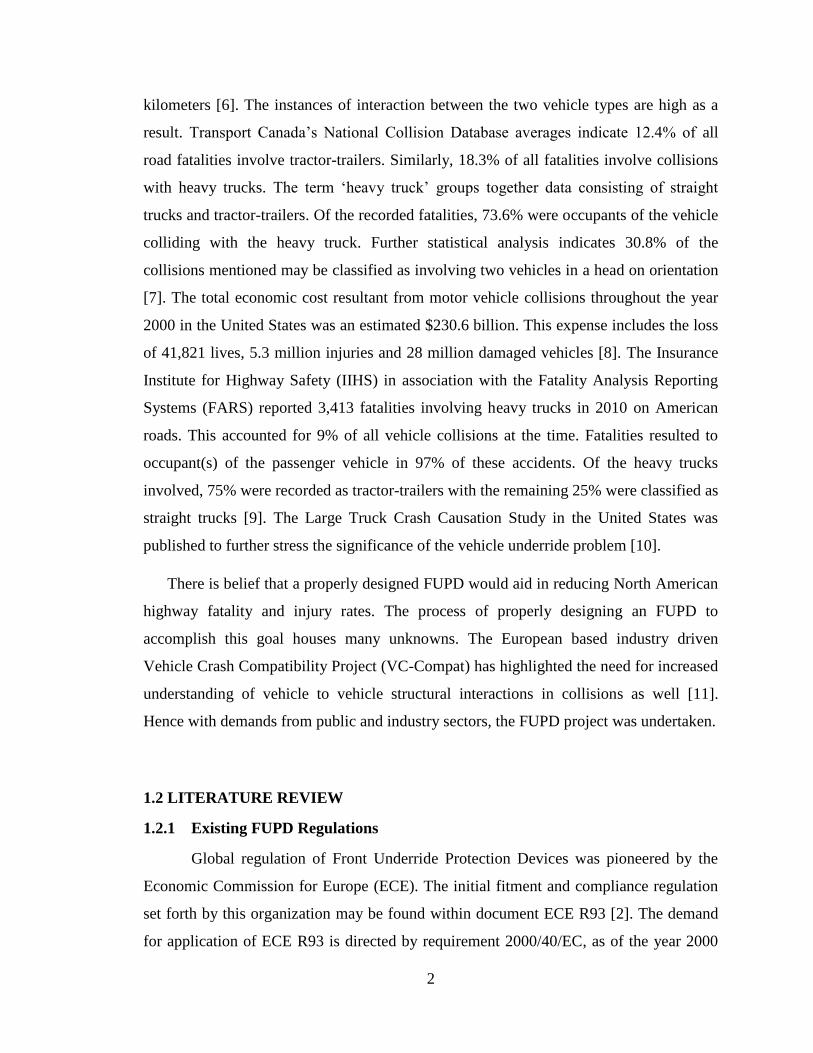
ECE R93 details a number of geometric and load compliance requirements for the
FUPD. Geometrically, the FUPD must have a maximum ground clearance of 400mm,
and a minimum frontal cross section height of 120mm. Quasi-static load testing is
performed to ensure stiffness compliance. In such testing cases, the FUPD may be
mounted upon a tractor or in a pre-equipped state on a test bench. Three load points
(denoted as P1, P2 and P3) are tested sequentially. These test points are as indicated in
Figure 1-1. A ram is to apply the designated load amount in the tractor‟s longitudinal
direction for a minimum 0.2 seconds. Load points P1 and P3 are assigned a value of
80kN, while point P2 is assigned 160kN. Upon completion of loading, the device is not to
have exceeded 400mm of deformation measured from the front of the tractor [2].
Figure 1-1 ECE R93 Geometry and Test Points [13]
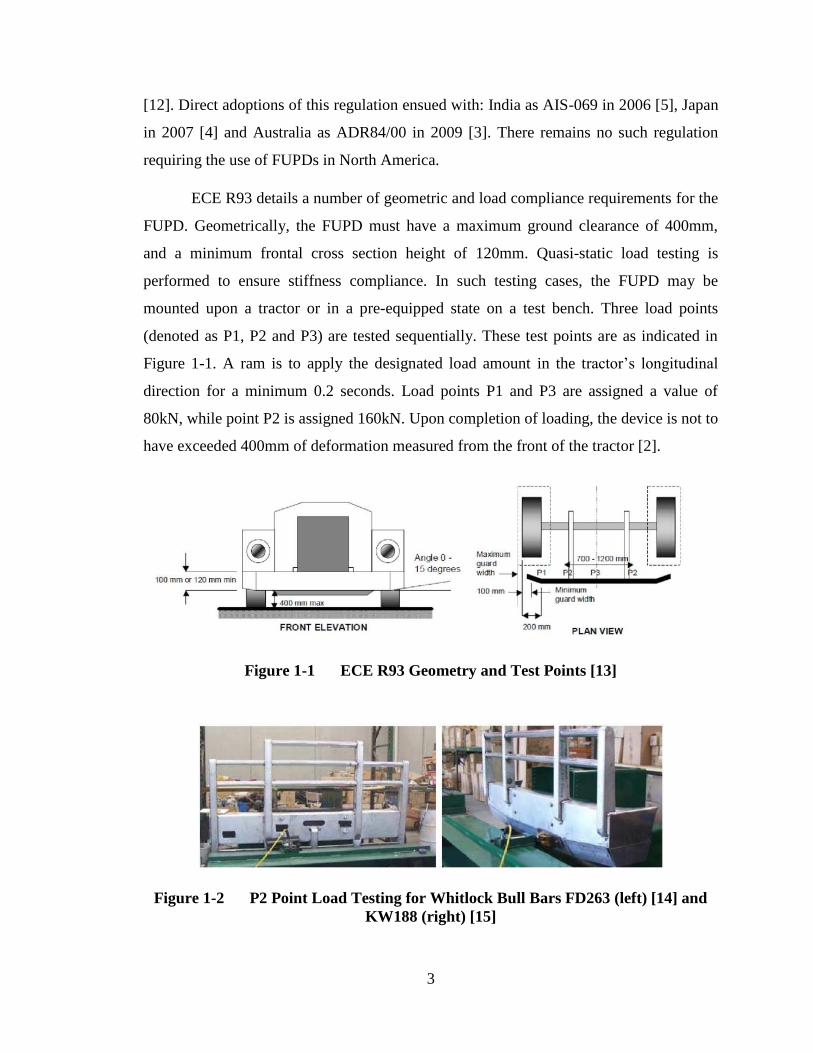
Figure 1-2 P2 Point Load Testing for Whitlock Bull Bars FD263 (left) [14] and
KW188 (right) [15]
4
An attempt was made to determine the effectiveness of mandatory FUPD fitment
in Europe. Unfortunately due to a lack of properly classified statistical data, the results
were found to be inconclusive [16]. Previous work from industry sponsored academic
sources has provided commentary on the effectiveness of FUPDs designed to meet ECE
R93 specifications. The resultant findings suggested setting a minimal ground clearance
height in addition to demanding higher stiffness out of the devices [17]. A secondary
work group has suggested implementing increased point load magnitudes, in an effort to
improve reliability of the device. Under such conditions, it was advised to upgrade P1, P2
and P3 to 400kN, 300kN and 200kN respectively [13]. Clearly there exists some concern
regarding the insufficiencies of ECE R93, and resulting poor FUPD performance. The
regulation‟s inadequacies have also been addressed internally by industry leaders such a
Volvo, Mercedes-Benz and Scania. An external review of FUPDs set forth by these
companies for testing indicated measured deformation values well shy of the maximum
allowable 400mm. In most cases the maximum deformation experienced by the loaded
devices lie within the 50mm to 150mm range [18].
1.2.2 Variations in Tractor Design
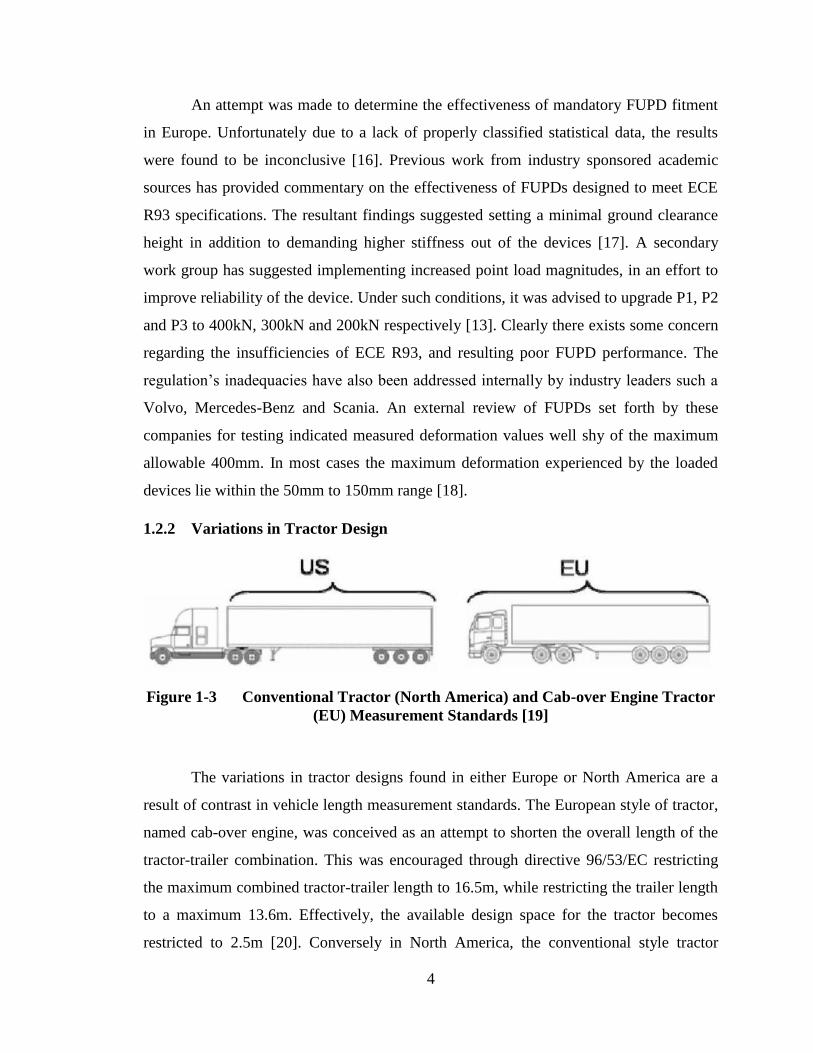
Figure 1-3 Conventional Tractor (North America) and Cab-over Engine Tractor
(EU) Measurement Standards [19]
The variations in tractor designs found in either Europe or North America are a
result of contrast in vehicle length measurement standards. The European style of tractor,
named cab-over engine, was conceived as an attempt to shorten the overall length of the
tractor-trailer combination. This was encouraged through directive 96/53/EC restricting
the maximum combined tractor-trailer length to 16.5m, while restricting the trailer length
to a maximum 13.6m. Effectively, the available design space for the tractor becomes
restricted to 2.5m [20]. Conversely in North America, the conventional style tractor
5
remains the popular choice. The Surface Transportation Assistance Act implemented by
the United States in 1982, limits only the length of the trailer [21]. The present body of
work will investigate Front Underride Protection Devices from a North American
perspective, and only conventional style tractors are to be considered.
1.2.3 Rigid and Energy Absorbing Underride Protection
There are two main design concepts in the development of underride protection.
The rigid FUPD concept consists of stiff structural components. Sufficiently stiff FUPD
components provide the inherit crashworthiness features of the passenger vehicle with a
reaction interface. With the design of an ideally rigid FUPD, all energy absorbed
throughout the collision would be experienced by the components of the passenger
vehicle. In reality the rigid FUPD will experience some form of deformation, and may
still be termed as rigid on a relative basis. An alternative approach taken by energy
absorbing FUPDs (eaFUPD), attempts to further reduce crash severity by allowing both
the passenger vehicle and tractor to absorb energy in the collision. One analysis of such
energy absorbing systems has suggested a design with the ability to absorb 130kJ may
provide protection at vehicle closing speeds elevated by 25-30% over a rigid application
[22]. Additional research performed within the VC-Compat work groups further analyzed
the functionality of both rigid and energy absorbing FUPDs. The database analysis
suggested the implementation of theoretical eaFUPDs in place of rigid FUPDs could
result in the saving of 160 lives, while mitigating 1200 serious injuries per year. In effort
to put theory to practice, physical studies were also conducted. The conceived energy
absorption was to result from deformation experienced by metallic foam components
built into the FUPD. Unfortunately the device showed minimal performance gains in
physical testing. The poor performance was attributed to difficulty in proper activation of
energy absorbing elements [23]. In effect, even under ideal test conditions and vehicle
alignment, the device did not perform as designed. Actual highway collisions experience
a long list of unknowns including vehicle to vehicle alignment and closing speed. In such
instances, the robustness of an eaFUPD would become even more important.
6
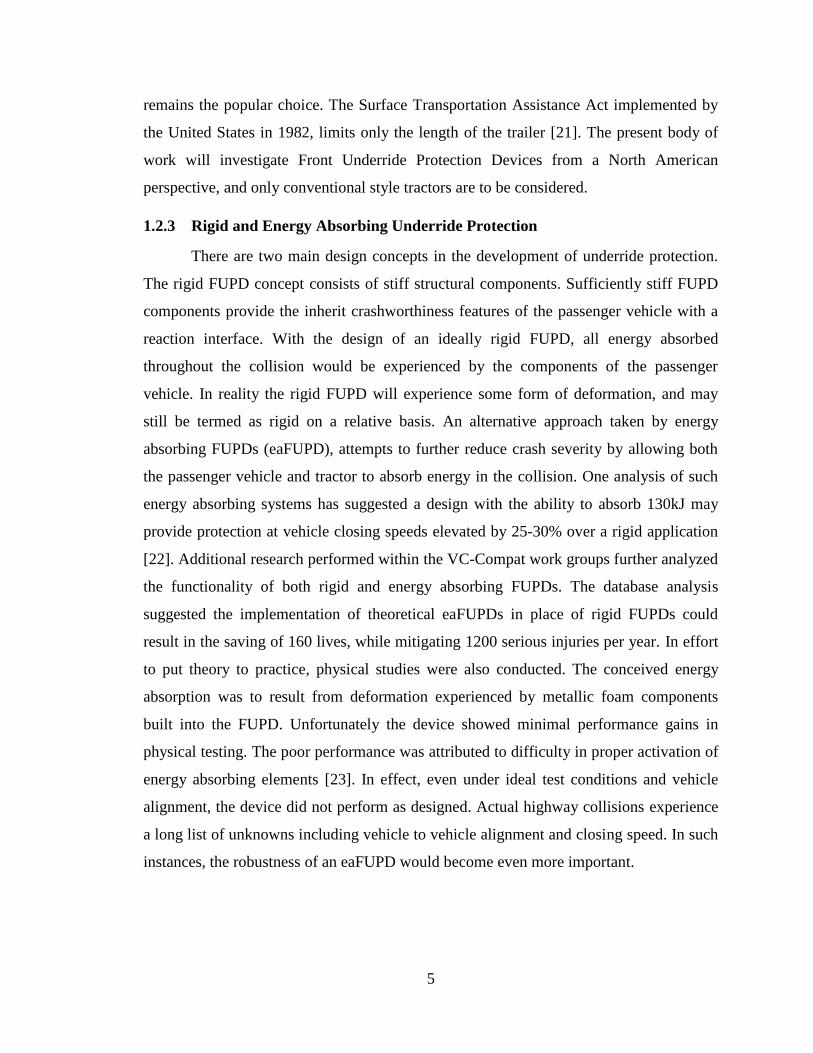
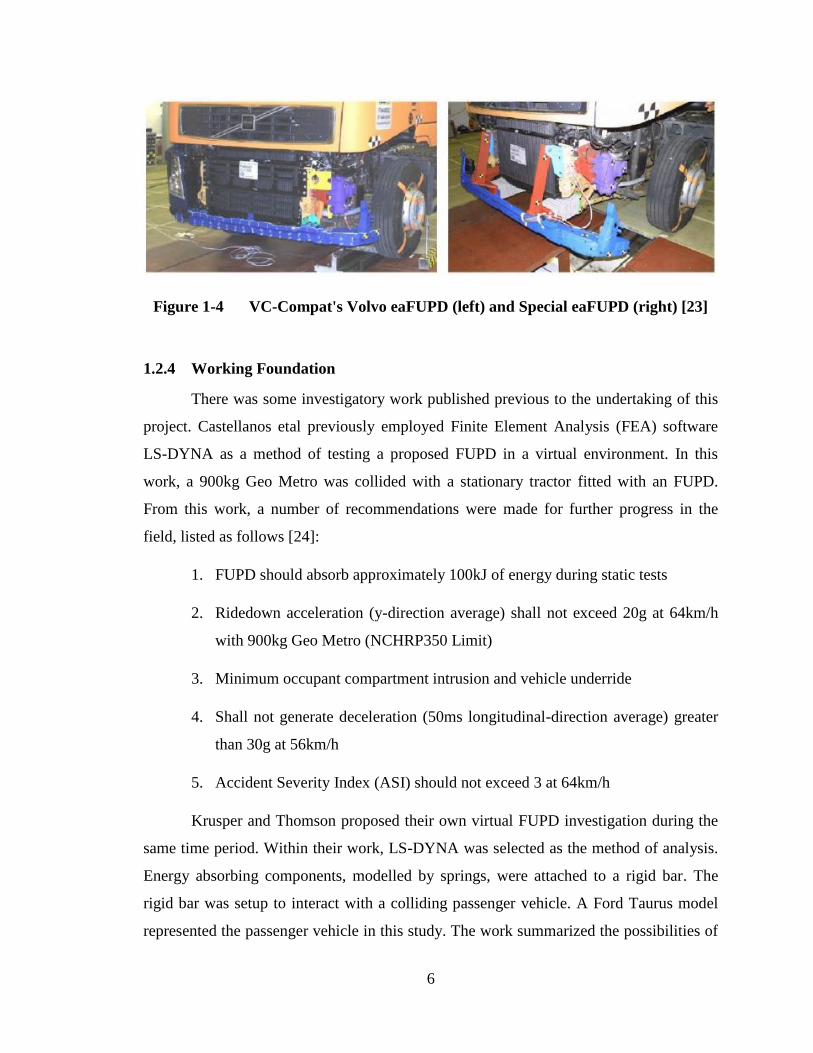
Figure 1-4 VC-Compat's Volvo eaFUPD (left) and Special eaFUPD (right) [23]
1.2.4 Working Foundation
There was some investigatory work published previous to the undertaking of this
project. Castellanos etal previously employed Finite Element Analysis (FEA) software
LS-DYNA as a method of testing a proposed FUPD in a virtual environment. In this
work, a 900kg Geo Metro was collided with a stationary tractor fitted with an FUPD.
From this work, a number of recommendations were made for further progress in the
field, listed as follows [24]:
1. FUPD should absorb approximately 100kJ of energy during static tests
2. Ridedown acceleration (y-direction average) shall not exceed 20g at 64km/h
with 900kg Geo Metro (NCHRP350 Limit)
3. Minimum occupant compartment intrusion and vehicle underride
4. Shall not generate deceleration (50ms longitudinal-direction average) greater
than 30g at 56km/h
5. Accident Severity Index (ASI) should not exceed 3 at 64km/h
Krusper and Thomson proposed their own virtual FUPD investigation during the
same time period. Within their work, LS-DYNA was selected as the method of analysis.
Energy absorbing components, modelled by springs, were attached to a rigid bar. The
rigid bar was setup to interact with a colliding passenger vehicle. A Ford Taurus model
represented the passenger vehicle in this study. The work summarized the possibilities of
7
accident mitigation through to the tuning of energy absorption stiffness parameters [25].
More imaginative work suggested the addition of an energy absorbing honeycomb
structure beyond the front of a tractor. Tractor length limitations combined with
aerodynamic requirements diffused the practicality of such designs [26]. An adaptive
frontal structure, equipped with a full braking system was also conceived. Hydraulic
brakes activated by cylinders equipped with controllable flow valves were suggested as
part of this theoretical approach. The system would replace plastic deformation with
hydraulic dissipation to absorb energy during the collision. Feasibility for application
became an issue not to be overcome by this concept [27]. The idea of designing underride
guards to generate deflection in the passenger vehicle away from the tractor was also
investigated. Large device overhangs coupled with excessive design space requirements
plagued this concept. The post-deflection case was also considered, where it was
proposed an out-of-control passenger vehicle heading towards traffic would not be an
appropriate solution to the underrride problem [13].
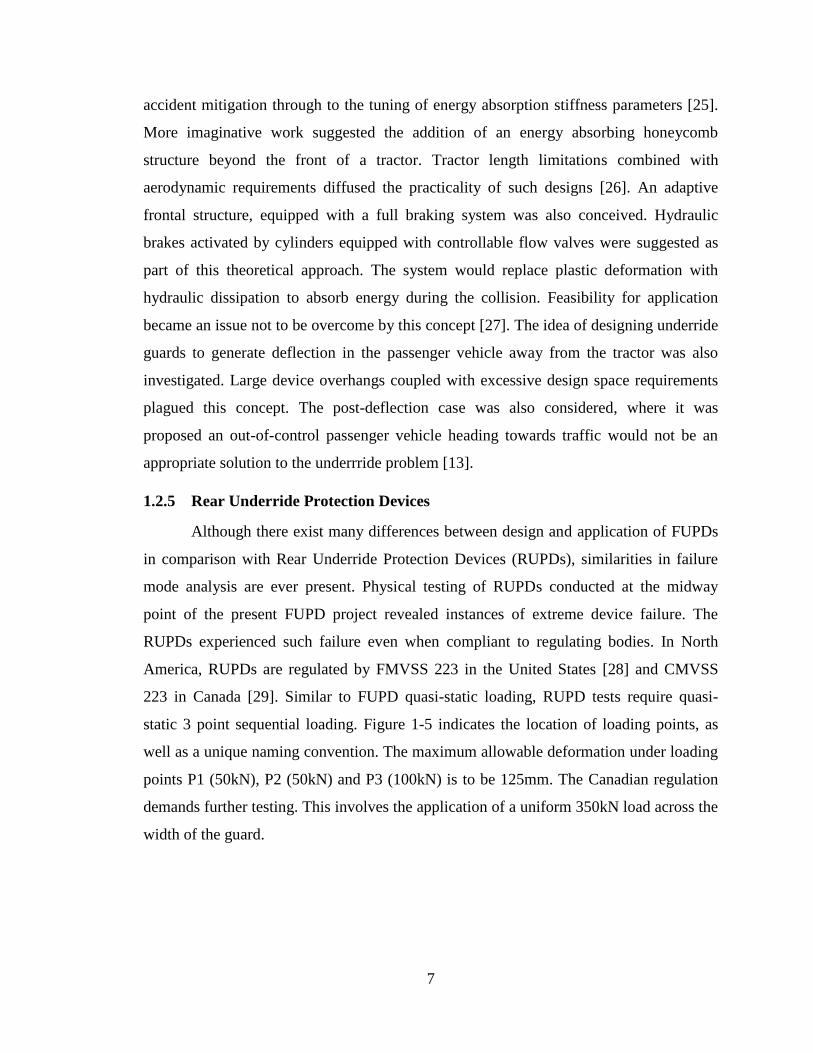
1.2.5 Rear Underride Protection Devices
Although there exist many differences between design and application of FUPDs
in comparison with Rear Underride Protection Devices (RUPDs), similarities in failure
mode analysis are ever present. Physical testing of RUPDs conducted at the midway
point of the present FUPD project revealed instances of extreme device failure. The
RUPDs experienced such failure even when compliant to regulating bodies. In North
America, RUPDs are regulated by FMVSS 223 in the United States [28] and CMVSS
223 in Canada [29]. Similar to FUPD quasi-static loading, RUPD tests require quasi-
static 3 point sequential loading. Figure 1-5 indicates the location of loading points, as
well as a unique naming convention. The maximum allowable deformation under loading
points P1 (50kN), P2 (50kN) and P3 (100kN) is to be 125mm. The Canadian regulation
demands further testing. This involves the application of a uniform 350kN load across the
width of the guard.
8
Figure 1-5 CMVSS 223 Loading Points for RUPDs [29]
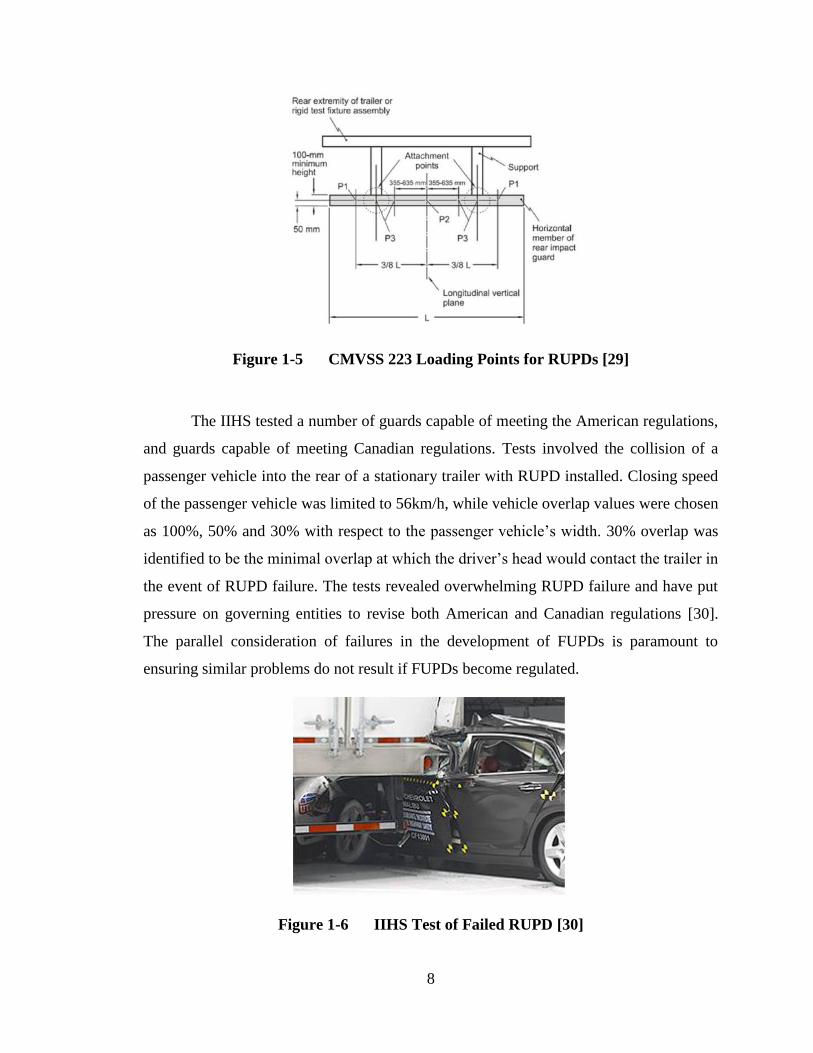
The IIHS tested a number of guards capable of meeting the American regulations,
and guards capable of meeting Canadian regulations. Tests involved the collision of a
passenger vehicle into the rear of a stationary trailer with RUPD installed. Closing speed
of the passenger vehicle was limited to 56km/h, while vehicle overlap values were chosen
as 100%, 50% and 30% with respect to the passenger vehicle‟s width. 30% overlap was
identified to be the minimal overlap at which the driver‟s head would contact the trailer in
the event of RUPD failure. The tests revealed overwhelming RUPD failure and have put
pressure on governing entities to revise both American and Canadian regulations [30].
The parallel consideration of failures in the development of FUPDs is paramount to
ensuring similar problems do not result if FUPDs become regulated.
Figure 1-6 IIHS Test of Failed RUPD [30]
9
1.3 LS-DYNA
LS-DYNA is a powerful non-linear finite element analysis software. The software is
capable of providing analytical solutions to problems, both static and dynamic,
undergoing high values of deformation. Multi-body components with varying types of
interaction properties may be modelled for analysis. Both explicit and implicit solutions
types are offered. Implicit solutions are generally applied to static and quasi-static states
of loading, as a method of overcoming inertial effects. Explicit solutions are applied to
dynamic problems experiencing relatively higher loading frequencies. LS-DYNA
incorporates a number of features beneficial to those within the automotive industry. The
inclusion of airbags, sensors and seatbelts are just a few of these features [31]. The
validity in using such a program to investigate vehicle collisions resides within the details
of verified modelling techniques, which is to be addressed. Relative cost comparison
between the two testing alternatives, physical and computational, is astronomical.
Availability of extensively detailed computational models validated with physical testing
provides an unparalleled resource to research projects, as in the case presented. LS-
DYNA has been employed to investigate FUPD performance variables with high
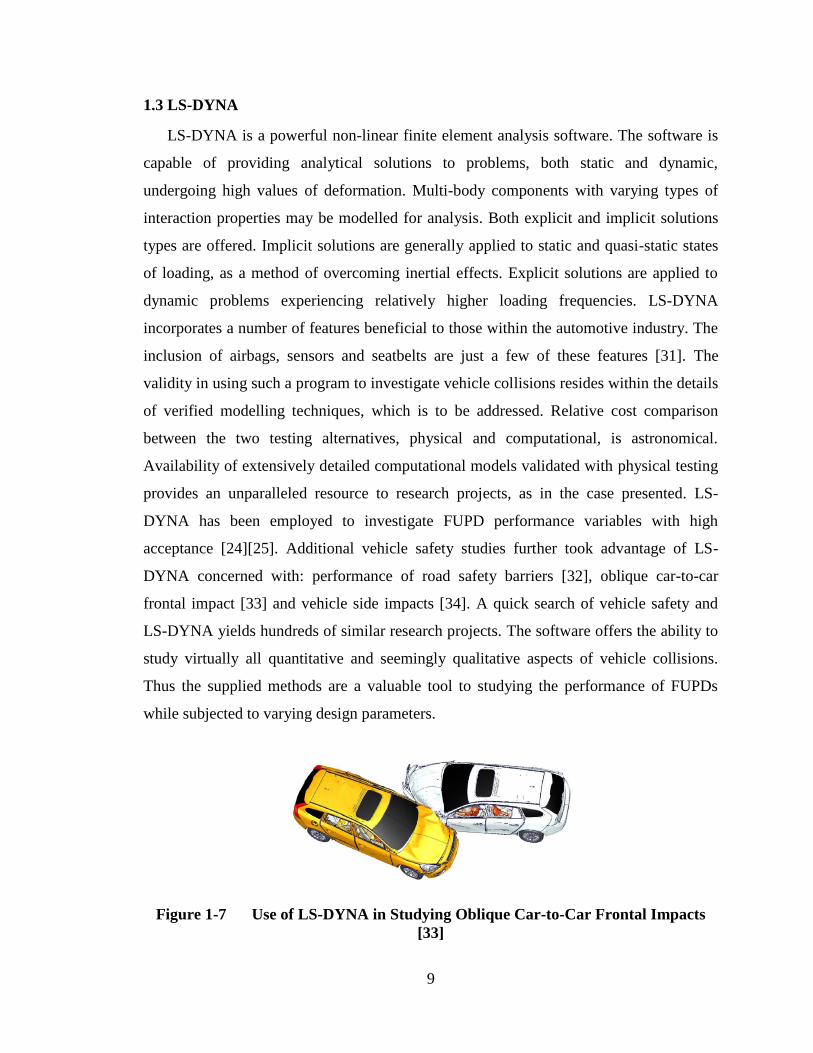
acceptance [24][25]. Additional vehicle safety studies further took advantage of LS-
DYNA concerned with: performance of road safety barriers [32], oblique car-to-car
frontal impact [33] and vehicle side impacts [34]. A quick search of vehicle safety and
LS-DYNA yields hundreds of similar research projects. The software offers the ability to
study virtually all quantitative and seemingly qualitative aspects of vehicle collisions.
Thus the supplied methods are a valuable tool to studying the performance of FUPDs
while subjected to varying design parameters.
Figure 1-7 Use of LS-DYNA in Studying Oblique Car-to-Car Frontal Impacts
[33]

10
1.4 OPTIMIZATION TECHNIQUES
1.4.1 Topology, Shape and Size Optimization
There are a number of optimization tools which work hand-in-hand with LS-DYNA
and complement the process of designing structural support components. Structural
optimization establishes new designs which maintain performance requirements at
reduced cost. Cost in this sense may indicate and is not limited to monetary investment,
total weight, or some combination. Three strands of optimization are of high significance
herein: Topology Optimization, Shape Optimization and Size Optimization [35].
Topology Optimization yields initial insight in determining distribution of material
within a loaded and constrained component. A design envelope may be assigned to
describe the physical space available for the desired component. The block residing
within the design envelope is meshed, to be composed of a number of smaller solid
elements. A goal of relative mass savings (termed mass fraction) is set within the
optimizer. The optimizer attempts to reduce the mass of the block to a value equal to the
product of the initial mass and the mass fraction. Mass reduction is accomplished by
removing solid elements from the block in an iterative process. The elements removed
are those which have minimal contribution to the design constraint. The design constraint
may be set as a restriction to the amount of deformation resulting from the applied load
(other options are also available). The use of such a procedure provides unequalled
insight into the appropriate positioning of structural support components at the initiation
of a design process. Ls-TaSc interfaces with LS-DYNA when Topology Optimization is
desired.
Shape Optimization may be undertaken once the structural support locations have
become somewhat established. The roughly designed support components are then
loaded, and allowed to change shape. Restrictions on shape variation are set by the user.
Size Optimization is more restrictive, allowing only variation in section thickness rather
than shape.
Shape and Size Optimization may be combined into a singular process to ensure
simultaneous consideration of all design possibilities. Such a technique is employed by
the author and facilitated by LS-OPT in integration with Hypermorph. Hypermorph
11
provides a relatively simplistic approach to structural component shape variation via node
transformations. The variations in shape, whether incremented discretely or continuously,
are parameterized by the user. The optimizer may then explore these changes in shape
and the resultant influence on performance. Performance in this sense describes the
component‟s abilities to meet predefined goals and constraints. For the majority of work
presented, section thickness and shape are the only design variables. The selection of
material type is investigated, however total monetary considerations lie beyond the scope
of this research. Because of this material selection is attempted as a proof-of-principle
only.
1.4.2 Solution Strategy
There are many methods of numerical based optimization which lie at the core of
both LS-OPT and LS-TaSc toolboxes. While the techniques were mainly developed by
Mathematicians and Computer Scientists, Engineers have begun to see benefits in design
applications. Between these two communities is a disconnect, which often results in
confusion based on expectation. The disconnect arises as a result of the difference in
problem type under investigation by each community. From personal observation, it
appears that while Mathematicians and Computer Scientists are mainly concerned with
the „means‟ to a problem, Engineers apply greater value in the „ends‟. While attempting
to solve strictly numeric multi-objective optimization problems, search approaches such
as Genetic Algorithm (GA) or Particle Swarm Optimization (PSO) compete to find
minimal values within a certain number of function calls. These processes are highly
stochastic and thus must be repeated to prove validity in declaring one search algorithm
superior to the other. Such approaches have limited application to structural design
Engineers. Therefore the majority of these codes (including those in LS-OPT) have
removed the inherent stochastic property from the optimization process. This ensures that
repeated runs of the same optimization problem produce the same result each time (when
initial conditions are unaltered). Search time may be extended in search of the absolute
optimum. There are many approaches to reach similar „ends‟ in the structural design
process. Practical design variables (such as physically available material thickness sizes)
can help to discretize the inputs and greatly reduce problem complexity. As such, the
„means‟ used generally converge on similarly performing „ends‟. While some algorithms
12
(„means‟) may be quicker or require less computational expense, the comparison is not of
general interest herein.
This being said, the comprehension for optimization methods remains of high
importance prior to any attempt at implementation. Local Search and Global Search are
two classifications of optimization algorithm search techniques. Local Search often
provides quick convergence on local optima, however requires multiple restarts from
different starting points. The optimal value in these cases is chosen as the best local
optimum found across the series of runs. Global Search approaches are capable of
escaping local minima and yielding true optimal solutions, often at the expense of
extended convergence times [45].
One body of work constructed a crashworthiness optimization problem in order to
evaluate the performance of two Global Search algorithms. The Genetic Algorithm (GA)
applies the principle of „survival of the fittest‟ through the use of selection, crossover and
mutation operations. A search involving GA halts once a fixed number of generations are
reached, or once improvements towards an optimum has ceased. GA is also suitable in
investigating the Pareto Frontier of the solution set [45]. Simulated Annealing (SA)
mimics the metallurgical annealing process [46]. The objective function, known as
energy, is related to the optimization state (temperature) by a probability distribution. The
optimization process converges as the temperature „cools‟. The original version of SA
was subjected to slow cooling rates, resulting in extended convergence times. A series of
modifications were proposed and implemented within the Adaptive Simulated Annealing
(ASA) algorithm. The modifications increased cooling rates, which further improved
convergence efficiency [47].
The effectiveness of GA and ASA was compared when applied to a multi-objective
crashworthiness optimization problem. Full-frontal vehicle collisions were simulated
through the use of an NHTSA vehicle modelled in LS-DYNA. The section thicknesses of
nine structural support members were parameterized as design variables. The objective
function sought to minimize peak acceleration and intrusion values amongst a few other
performance criteria. While both GA and ASA provided similar optimal solutions, ASA
provided quicker convergence [45].

13
The above provides justification for using either GA or ASA in the development of
Front Underride Protection Devices. Throughout this work, both are applied in seeking
optimal designs. GA is initially chosen with commentary based on viewing the Pareto
Frontier. Later work adopts the use of ASA based on increased program robustness in
outlier cases involving failed simulations.
14
CHAPTER 2 TESTING METHODS
2.1 TESTING SETUP
The testing of underride protection devices undertaken within this work relies solely
and completely on finite element analysis. Highly detailed publically available open
source vehicle models provide the source of testing validation. The methods undertaken
to provide relatively inexpensive physical FUPD compliance testing involve the use of
point loading as described by ECE R93. Alternatively the device could be subjected to
costly full vehicle collisions. Similar computational expense savings are experienced
when using point load evaluation in a simulation environment. The comprehension of
these two distinct types of FUPD testing procedures highlight the design strategy
proposed.
In order to simplify the design process and boost project outcome, an effective design
strategy must be clearly outlined. In the work presented, this strategy takes advantage of
both sequential and simultaneous parameter isolation. The procedure is often repeated
building upon that which has come before. With each level of parameter isolation, the
design scope is reduced according to the simplification made. The reduction in design
scope within this case is determined through three sequential experiments. The
experiments within this body of work are conducted virtually with LS-DYNA. Each
experiment refines FUPD design search space with a goal of converging on ultimate
performance. The selection of experiment type must therefore be initially broad enough
to investigate a global perspective, and transition to a narrower region in the later phases.
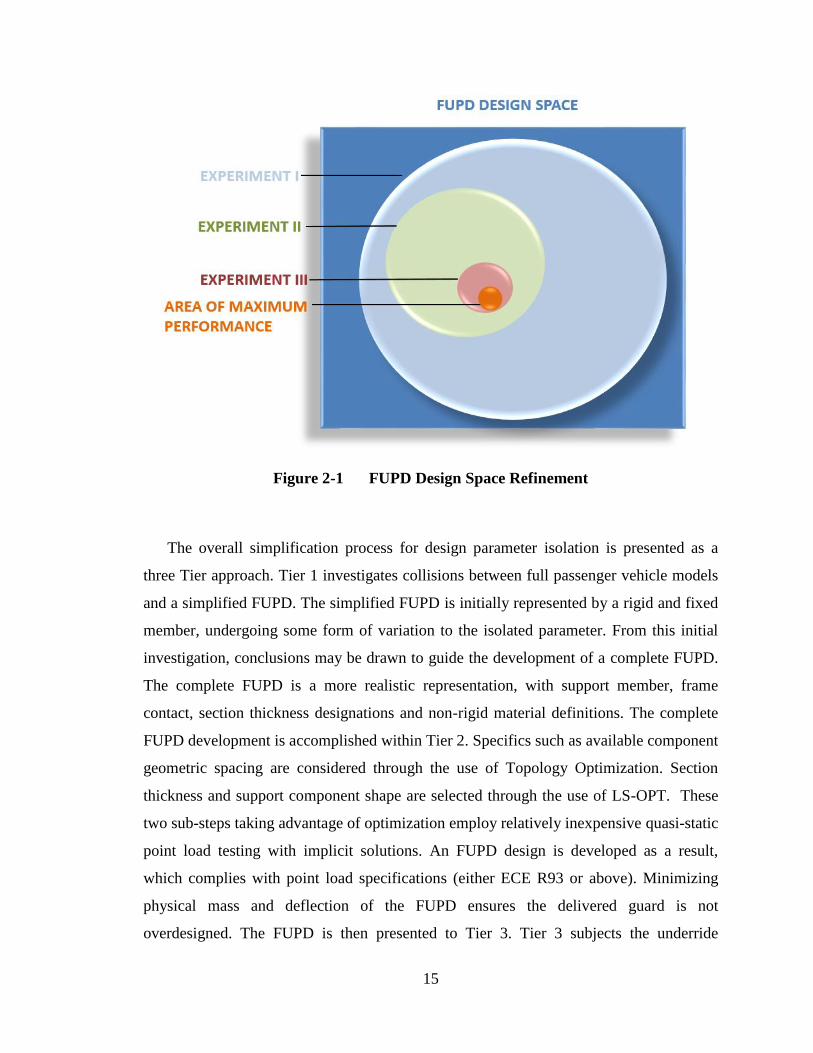
Figure 2-1 provides a visual of the sequential experimental approach in designing FUPDs
for maximum performance.
15
Figure 2-1 FUPD Design Space Refinement
The overall simplification process for design parameter isolation is presented as a
three Tier approach. Tier 1 investigates collisions between full passenger vehicle models
and a simplified FUPD. The simplified FUPD is initially represented by a rigid and fixed
member, undergoing some form of variation to the isolated parameter. From this initial
investigation, conclusions may be drawn to guide the development of a complete FUPD.
The complete FUPD is a more realistic representation, with support member, frame
contact, section thickness designations and non-rigid material definitions. The complete
FUPD development is accomplished within Tier 2. Specifics such as available component
geometric spacing are considered through the use of Topology Optimization. Section
thickness and support component shape are selected through the use of LS-OPT. These
two sub-steps taking advantage of optimization employ relatively inexpensive quasi-static
point load testing with implicit solutions. An FUPD design is developed as a result,
which complies with point load specifications (either ECE R93 or above). Minimizing
physical mass and deflection of the FUPD ensures the delivered guard is not
overdesigned. The FUPD is then presented to Tier 3. Tier 3 subjects the underride
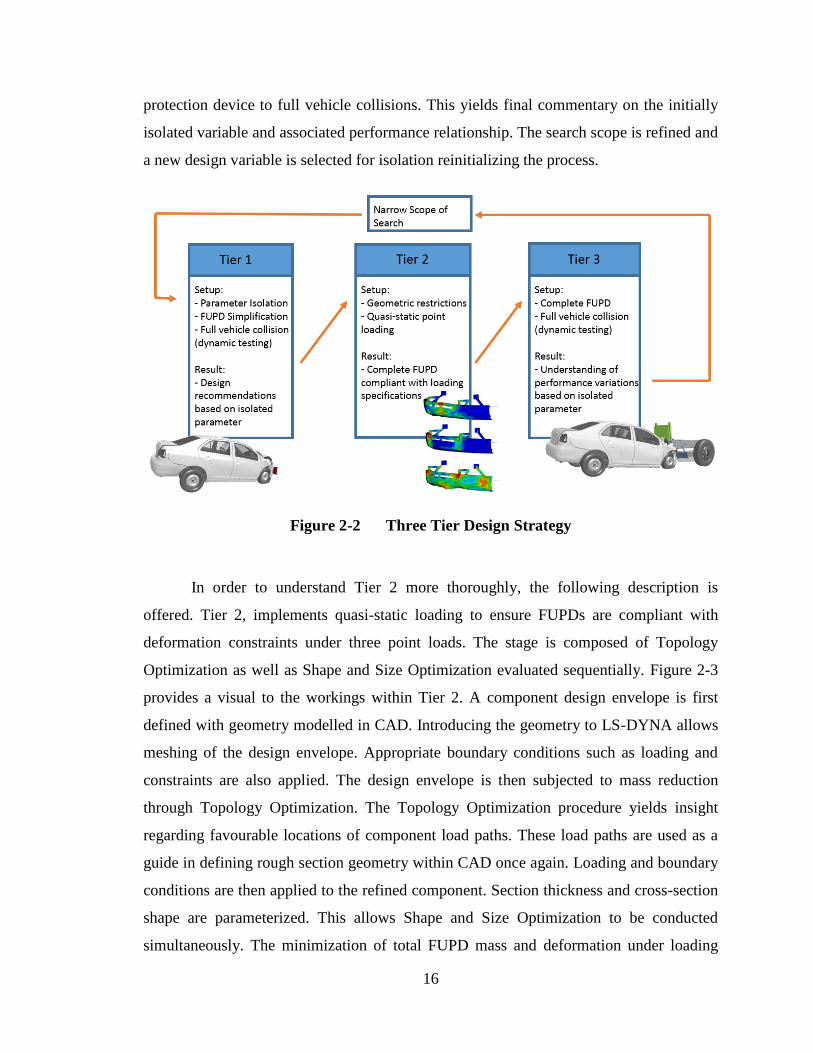
16
protection device to full vehicle collisions. This yields final commentary on the initially
isolated variable and associated performance relationship. The search scope is refined and
a new design variable is selected for isolation reinitializing the process.
Figure 2-2 Three Tier Design Strategy
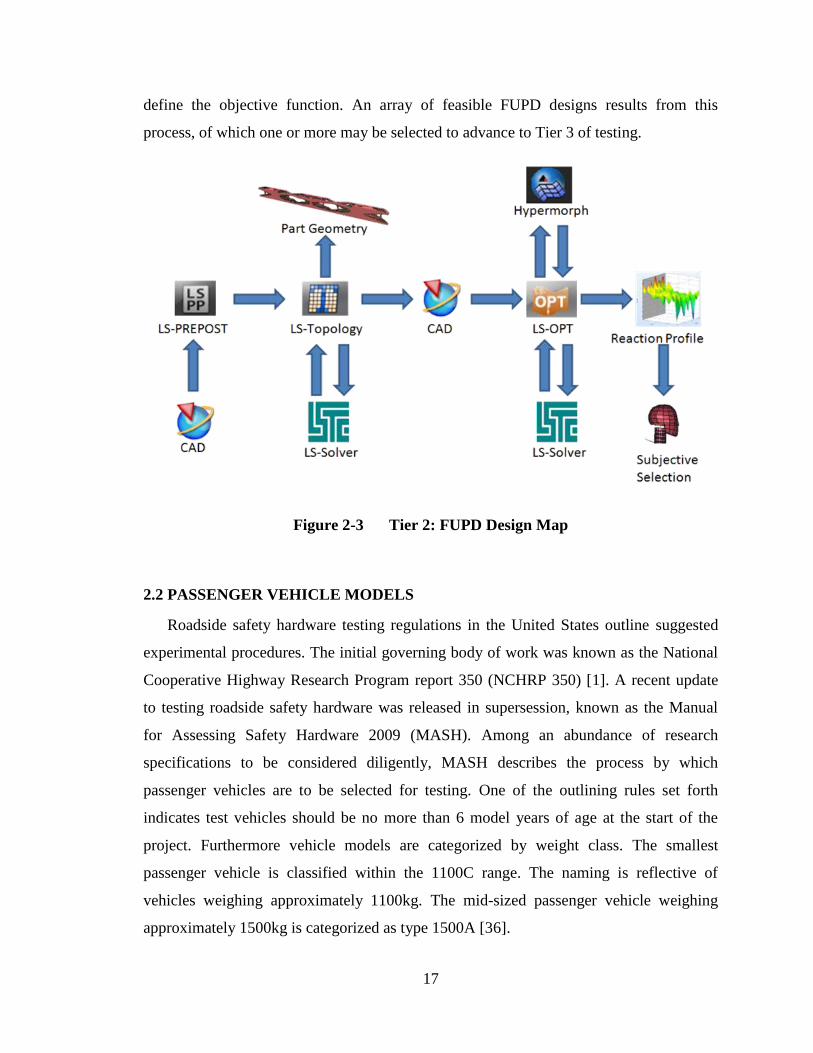
In order to understand Tier 2 more thoroughly, the following description is
offered. Tier 2, implements quasi-static loading to ensure FUPDs are compliant with
deformation constraints under three point loads. The stage is composed of Topology
Optimization as well as Shape and Size Optimization evaluated sequentially. Figure 2-3
provides a visual to the workings within Tier 2. A component design envelope is first
defined with geometry modelled in CAD. Introducing the geometry to LS-DYNA allows
meshing of the design envelope. Appropriate boundary conditions such as loading and
constraints are also applied. The design envelope is then subjected to mass reduction
through Topology Optimization. The Topology Optimization procedure yields insight
regarding favourable locations of component load paths. These load paths are used as a
guide in defining rough section geometry within CAD once again. Loading and boundary
conditions are then applied to the refined component. Section thickness and cross-section
shape are parameterized. This allows Shape and Size Optimization to be conducted
simultaneously. The minimization of total FUPD mass and deformation under loading
17
define the objective function. An array of feasible FUPD designs results from this
process, of which one or more may be selected to advance to Tier 3 of testing.
Figure 2-3 Tier 2: FUPD Design Map
2.2 PASSENGER VEHICLE MODELS
Roadside safety hardware testing regulations in the United States outline suggested
experimental procedures. The initial governing body of work was known as the National
Cooperative Highway Research Program report 350 (NCHRP 350) [1]. A recent update
to testing roadside safety hardware was released in supersession, known as the Manual
for Assessing Safety Hardware 2009 (MASH). Among an abundance of research
specifications to be considered diligently, MASH describes the process by which
passenger vehicles are to be selected for testing. One of the outlining rules set forth
indicates test vehicles should be no more than 6 model years of age at the start of the
project. Furthermore vehicle models are categorized by weight class. The smallest
passenger vehicle is classified within the 1100C range. The naming is reflective of
vehicles weighing approximately 1100kg. The mid-sized passenger vehicle weighing
approximately 1500kg is categorized as type 1500A [36].
18
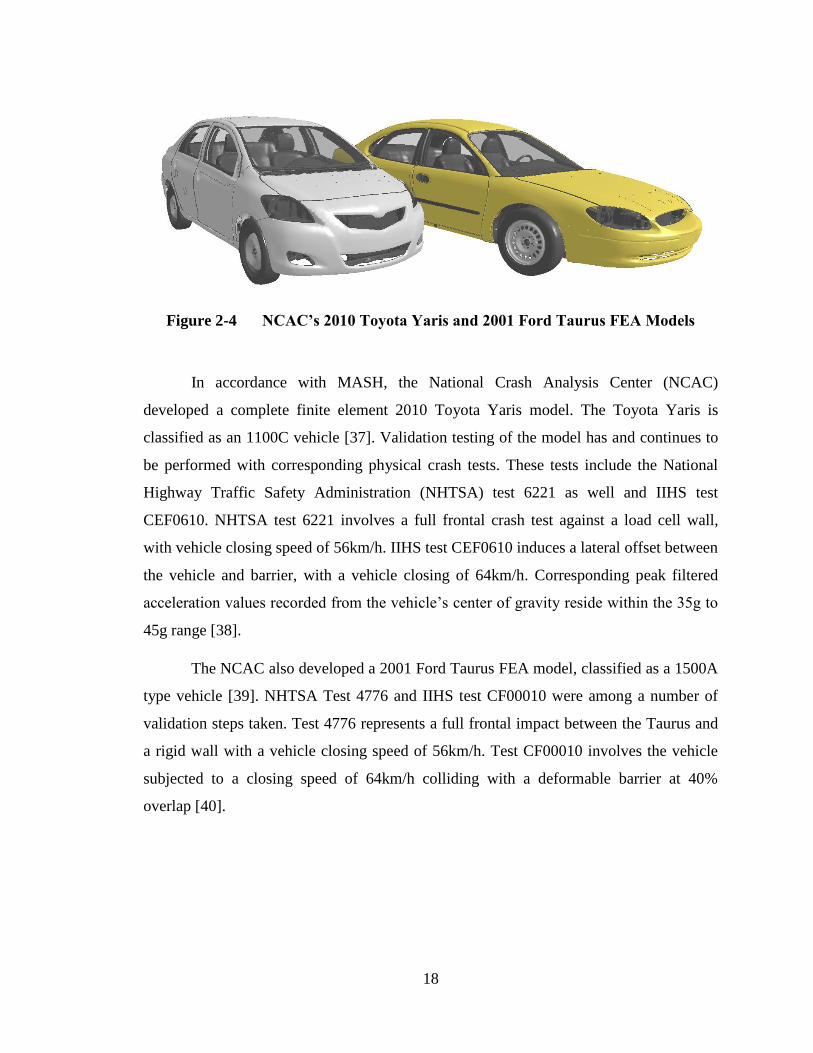
Figure 2-4 NCAC’s 2010 Toyota Yaris and 2001 Ford Taurus FEA Models
In accordance with MASH, the National Crash Analysis Center (NCAC)
developed a complete finite element 2010 Toyota Yaris model. The Toyota Yaris is
classified as an 1100C vehicle [37]. Validation testing of the model has and continues to
be performed with corresponding physical crash tests. These tests include the National
Highway Traffic Safety Administration (NHTSA) test 6221 as well and IIHS test
CEF0610. NHTSA test 6221 involves a full frontal crash test against a load cell wall,
with vehicle closing speed of 56km/h. IIHS test CEF0610 induces a lateral offset between
the vehicle and barrier, with a vehicle closing of 64km/h. Corresponding peak filtered
acceleration values recorded from the vehicle‟s center of gravity reside within the 35g to
45g range [38].
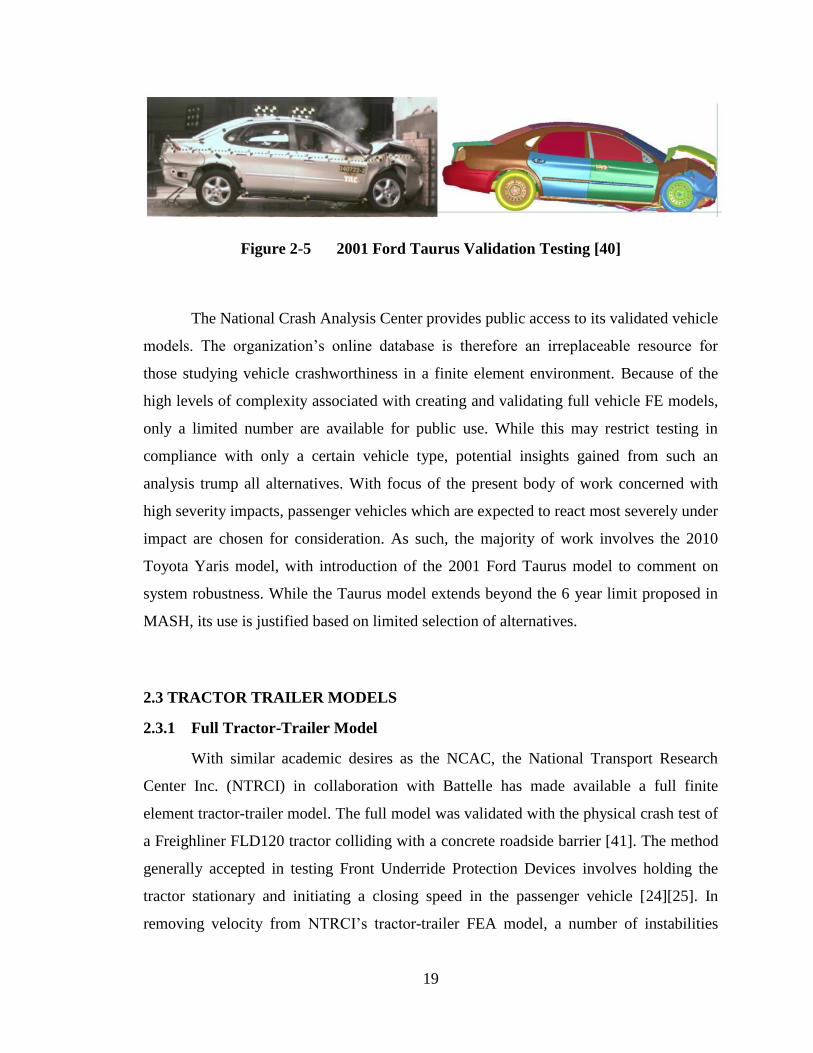
The NCAC also developed a 2001 Ford Taurus FEA model, classified as a 1500A
type vehicle [39]. NHTSA Test 4776 and IIHS test CF00010 were among a number of
validation steps taken. Test 4776 represents a full frontal impact between the Taurus and
a rigid wall with a vehicle closing speed of 56km/h. Test CF00010 involves the vehicle
subjected to a closing speed of 64km/h colliding with a deformable barrier at 40%
overlap [40].
19
Figure 2-5 2001 Ford Taurus Validation Testing [40]
The National Crash Analysis Center provides public access to its validated vehicle
models. The organization‟s online database is therefore an irreplaceable resource for
those studying vehicle crashworthiness in a finite element environment. Because of the
high levels of complexity associated with creating and validating full vehicle FE models,
only a limited number are available for public use. While this may restrict testing in
compliance with only a certain vehicle type, potential insights gained from such an
analysis trump all alternatives. With focus of the present body of work concerned with
high severity impacts, passenger vehicles which are expected to react most severely under
impact are chosen for consideration. As such, the majority of work involves the 2010
Toyota Yaris model, with introduction of the 2001 Ford Taurus model to comment on
system robustness. While the Taurus model extends beyond the 6 year limit proposed in
MASH, its use is justified based on limited selection of alternatives.
2.3 TRACTOR TRAILER MODELS
2.3.1 Full Tractor-Trailer Model
With similar academic desires as the NCAC, the National Transport Research
Center Inc. (NTRCI) in collaboration with Battelle has made available a full finite
element tractor-trailer model. The full model was validated with the physical crash test of
a Freighliner FLD120 tractor colliding with a concrete roadside barrier [41]. The method
generally accepted in testing Front Underride Protection Devices involves holding the
tractor stationary and initiating a closing speed in the passenger vehicle [24][25]. In
removing velocity from NTRCI‟s tractor-trailer FEA model, a number of instabilities
20
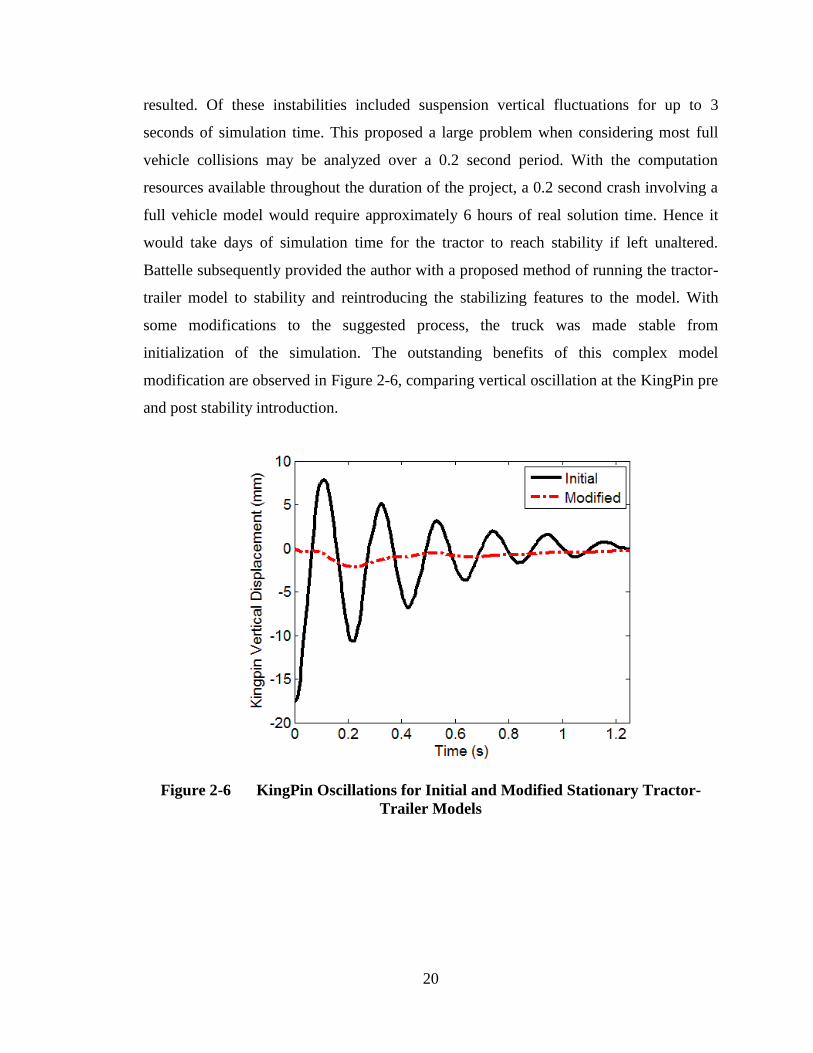
resulted. Of these instabilities included suspension vertical fluctuations for up to 3
seconds of simulation time. This proposed a large problem when considering most full
vehicle collisions may be analyzed over a 0.2 second period. With the computation
resources available throughout the duration of the project, a 0.2 second crash involving a
full vehicle model would require approximately 6 hours of real solution time. Hence it
would take days of simulation time for the tractor to reach stability if left unaltered.
Battelle subsequently provided the author with a proposed method of running the tractor-
trailer model to stability and reintroducing the stabilizing features to the model. With
some modifications to the suggested process, the truck was made stable from
initialization of the simulation. The outstanding benefits of this complex model
modification are observed in Figure 2-6, comparing vertical oscillation at the KingPin pre
and post stability introduction.
Figure 2-6 KingPin Oscillations for Initial and Modified Stationary Tractor-
Trailer Models
21
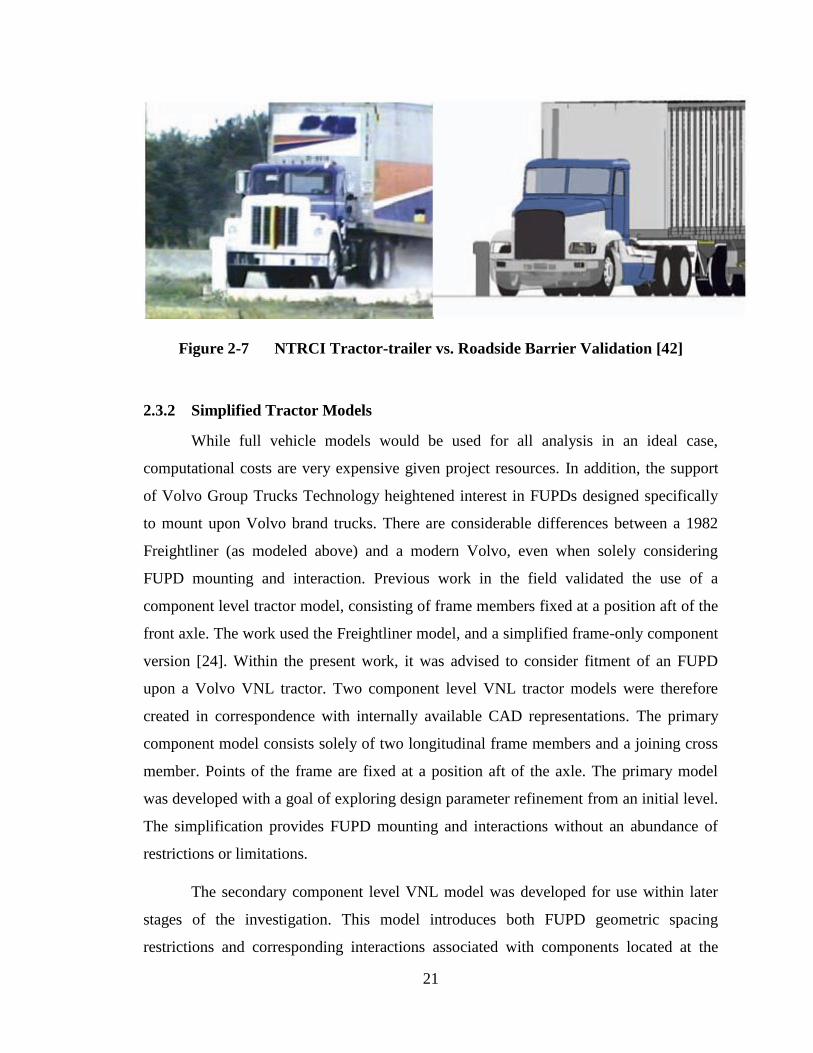
Figure 2-7 NTRCI Tractor-trailer vs. Roadside Barrier Validation [42]
2.3.2 Simplified Tractor Models
While full vehicle models would be used for all analysis in an ideal case,
computational costs are very expensive given project resources. In addition, the support
of Volvo Group Trucks Technology heightened interest in FUPDs designed specifically
to mount upon Volvo brand trucks. There are considerable differences between a 1982
Freightliner (as modeled above) and a modern Volvo, even when solely considering
FUPD mounting and interaction. Previous work in the field validated the use of a
component level tractor model, consisting of frame members fixed at a position aft of the
front axle. The work used the Freightliner model, and a simplified frame-only component
version [24]. Within the present work, it was advised to consider fitment of an FUPD
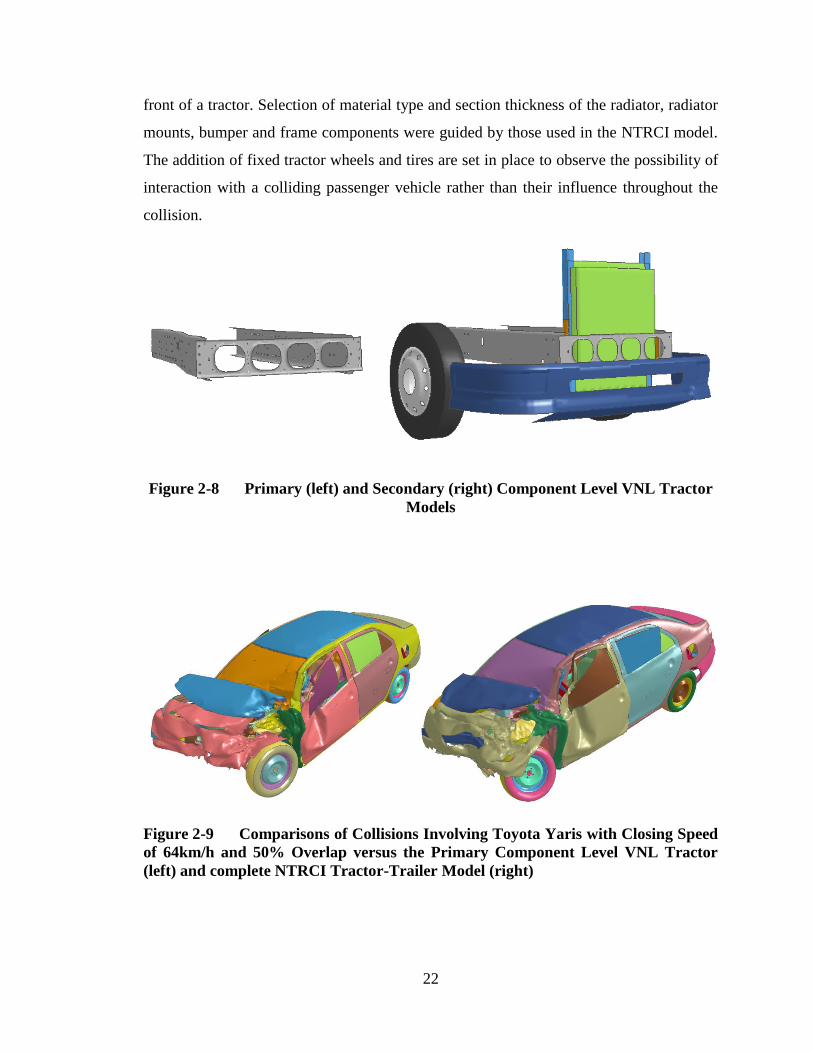
upon a Volvo VNL tractor. Two component level VNL tractor models were therefore
created in correspondence with internally available CAD representations. The primary
component model consists solely of two longitudinal frame members and a joining cross
member. Points of the frame are fixed at a position aft of the axle. The primary model
was developed with a goal of exploring design parameter refinement from an initial level.
The simplification provides FUPD mounting and interactions without an abundance of
restrictions or limitations.
The secondary component level VNL model was developed for use within later
stages of the investigation. This model introduces both FUPD geometric spacing
restrictions and corresponding interactions associated with components located at the
22
front of a tractor. Selection of material type and section thickness of the radiator, radiator
mounts, bumper and frame components were guided by those used in the NTRCI model.
The addition of fixed tractor wheels and tires are set in place to observe the possibility of
interaction with a colliding passenger vehicle rather than their influence throughout the
collision.
Figure 2-8 Primary (left) and Secondary (right) Component Level VNL Tractor
Models
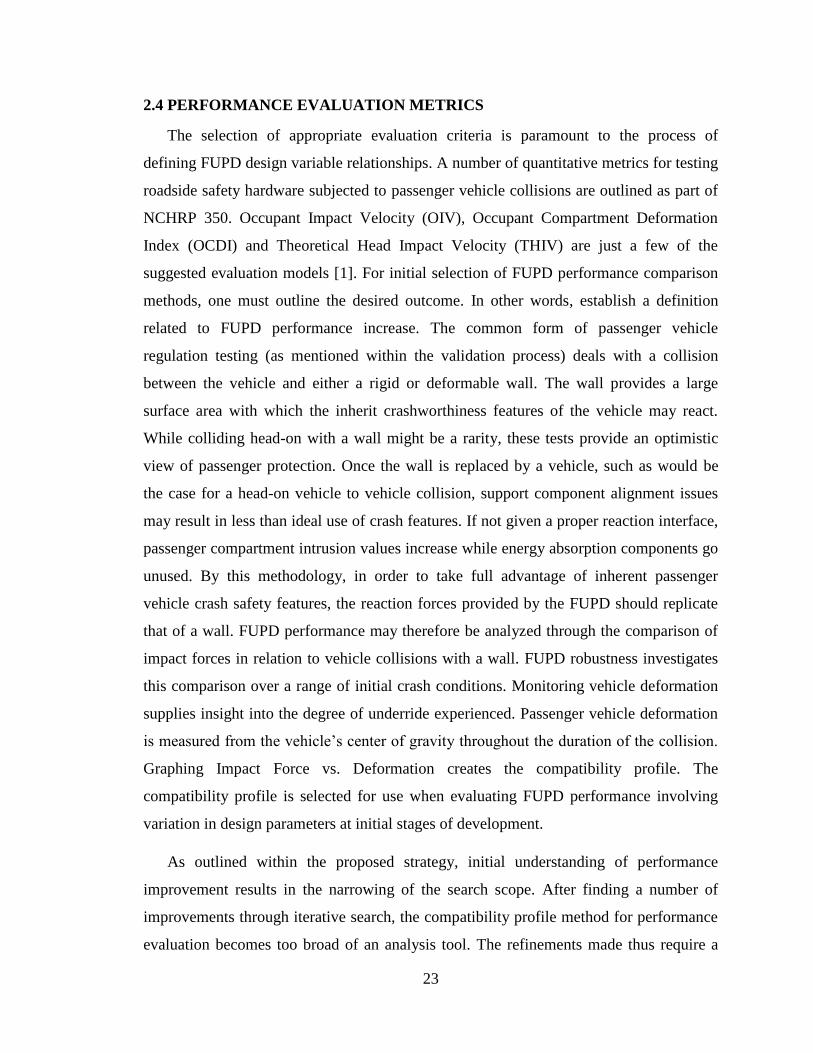
Figure 2-9 Comparisons of Collisions Involving Toyota Yaris with Closing Speed
of 64km/h and 50% Overlap versus the Primary Component Level VNL Tractor
(left) and complete NTRCI Tractor-Trailer Model (right)
23
2.4 PERFORMANCE EVALUATION METRICS
The selection of appropriate evaluation criteria is paramount to the process of
defining FUPD design variable relationships. A number of quantitative metrics for testing
roadside safety hardware subjected to passenger vehicle collisions are outlined as part of
NCHRP 350. Occupant Impact Velocity (OIV), Occupant Compartment Deformation
Index (OCDI) and Theoretical Head Impact Velocity (THIV) are just a few of the
suggested evaluation models [1]. For initial selection of FUPD performance comparison
methods, one must outline the desired outcome. In other words, establish a definition
related to FUPD performance increase. The common form of passenger vehicle
regulation testing (as mentioned within the validation process) deals with a collision
between the vehicle and either a rigid or deformable wall. The wall provides a large
surface area with which the inherit crashworthiness features of the vehicle may react.
While colliding head-on with a wall might be a rarity, these tests provide an optimistic
view of passenger protection. Once the wall is replaced by a vehicle, such as would be
the case for a head-on vehicle to vehicle collision, support component alignment issues
may result in less than ideal use of crash features. If not given a proper reaction interface,
passenger compartment intrusion values increase while energy absorption components go
unused. By this methodology, in order to take full advantage of inherent passenger
vehicle crash safety features, the reaction forces provided by the FUPD should replicate
that of a wall. FUPD performance may therefore be analyzed through the comparison of
impact forces in relation to vehicle collisions with a wall. FUPD robustness investigates
this comparison over a range of initial crash conditions. Monitoring vehicle deformation
supplies insight into the degree of underride experienced. Passenger vehicle deformation
is measured from the vehicle‟s center of gravity throughout the duration of the collision.
Graphing Impact Force vs. Deformation creates the compatibility profile. The
compatibility profile is selected for use when evaluating FUPD performance involving
variation in design parameters at initial stages of development.
As outlined within the proposed strategy, initial understanding of performance
improvement results in the narrowing of the search scope. After finding a number of
improvements through iterative search, the compatibility profile method for performance
evaluation becomes too broad of an analysis tool. The refinements made thus require a

24
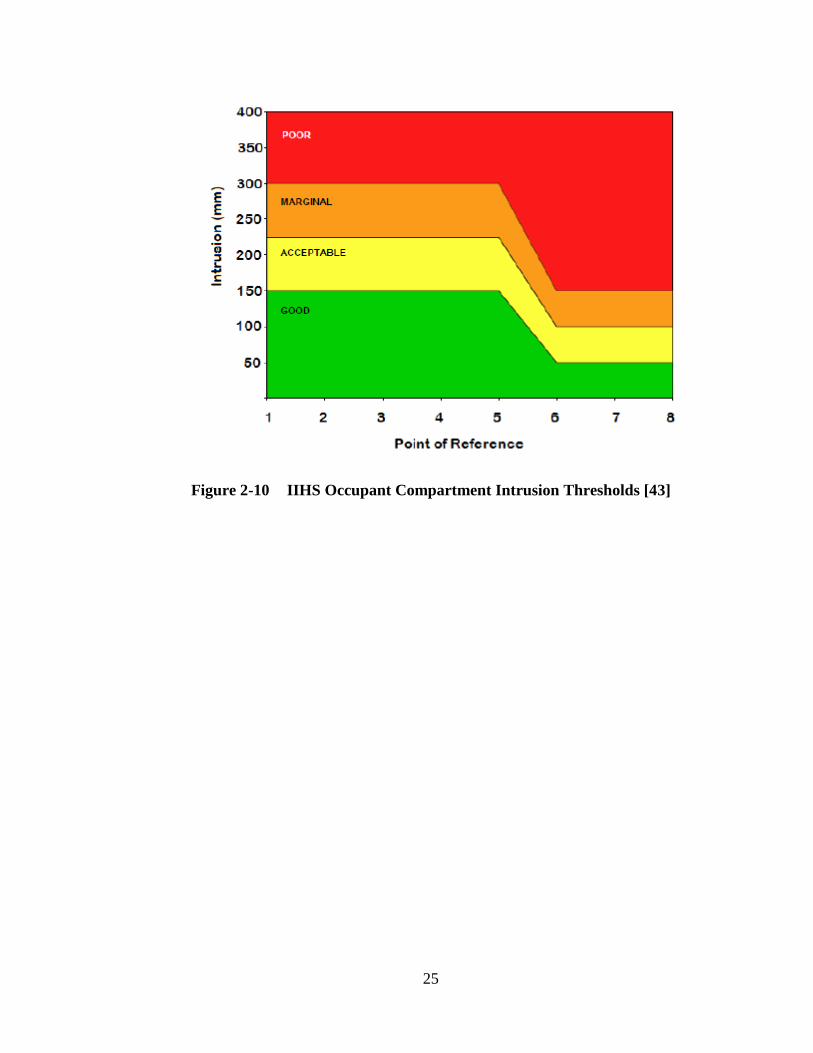
more sensitive method of evaluation. Occupant Compartment Intrusion is capable of
filling this need. The IIHS maintains guidelines for the measurement of Occupant
Compartment Intrusion for moderate overlap frontal collisions. Select locations from
inside the passenger compartment surrounding the seated driver are monitored. Residual
deformation values are measured. In total, eight points are evaluated, yielding an
overview of the deformations experienced by the passenger vehicle safety cage [43]. In
most instances, the residual values are calculated with respect to measurements made
between the point of interest and a coordinate system near the rear seats [44]. Threshold
ratings for performance evaluation are established on a per point basis. Table 1 outlines
the points under scrutiny. A slight modification to the intrusion points of measurement is
additionally set forth to better reflect the characteristics of an underride crash. In the cases
denoted as „modified‟, measurement point 8 is taken from the A-Pillar instead of the
door. The values from Table 1 are referenced within the adjacent figure. The figure also
classifies severity of intrusion based on measurement location with respect to known
thresholds. LS-DYNA‟s IIHS card enables analysis of this data post-crash.
Table 2-1 Occupant Compartment Intrusion Measurement Points
Point of Reference Measurement Point
1 Footrest
2 Left Toepan
3 Center Toepan
4 Right Toepan
5 Brake Pedal
6 Left Instrument Panel
7 Right Instrument Panel
8 Door or A-Pillar (Modified Case)
25
Figure 2-10 IIHS Occupant Compartment Intrusion Thresholds [43]
26
CHAPTER 3 GROUND CLEARANCE AND
CONTACT SECTION HEIGHT
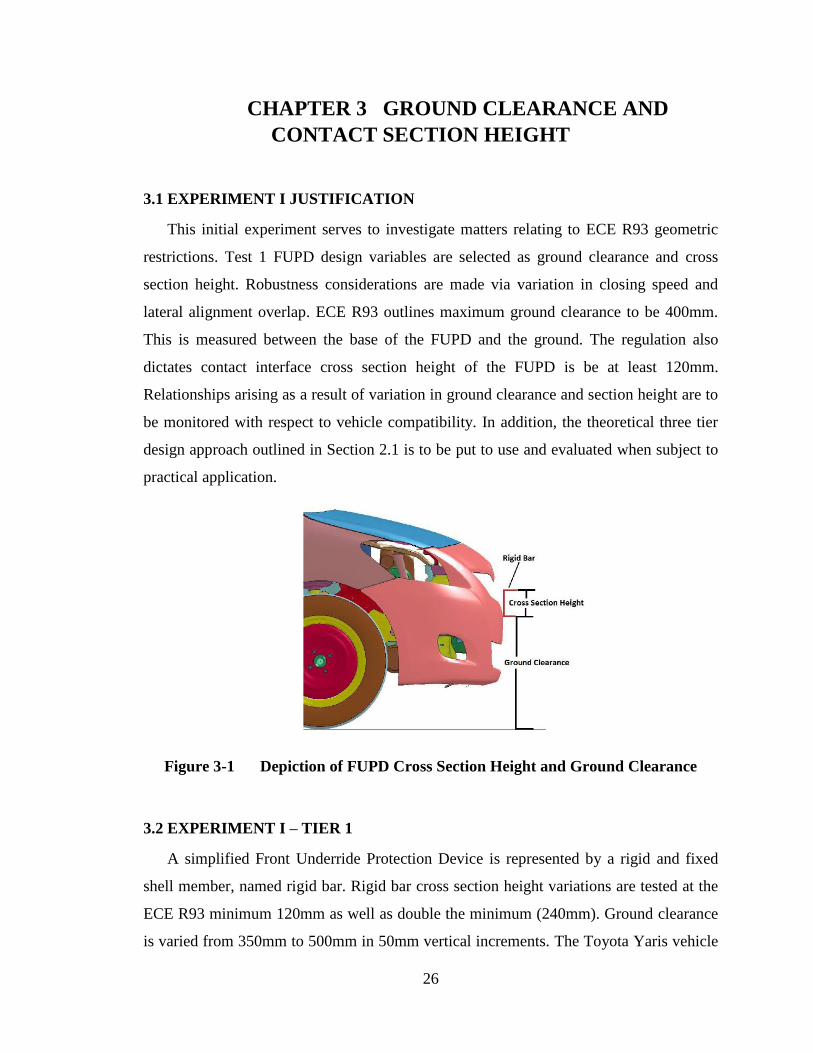
3.1 EXPERIMENT I JUSTIFICATION
This initial experiment serves to investigate matters relating to ECE R93 geometric
restrictions. Test 1 FUPD design variables are selected as ground clearance and cross
section height. Robustness considerations are made via variation in closing speed and
lateral alignment overlap. ECE R93 outlines maximum ground clearance to be 400mm.
This is measured between the base of the FUPD and the ground. The regulation also
dictates contact interface cross section height of the FUPD is be at least 120mm.
Relationships arising as a result of variation in ground clearance and section height are to
be monitored with respect to vehicle compatibility. In addition, the theoretical three tier
design approach outlined in Section 2.1 is to be put to use and evaluated when subject to
practical application.
Figure 3-1 Depiction of FUPD Cross Section Height and Ground Clearance
3.2 EXPERIMENT I – TIER 1
A simplified Front Underride Protection Device is represented by a rigid and fixed
shell member, named rigid bar. Rigid bar cross section height variations are tested at the
ECE R93 minimum 120mm as well as double the minimum (240mm). Ground clearance
is varied from 350mm to 500mm in 50mm vertical increments. The Toyota Yaris vehicle
27
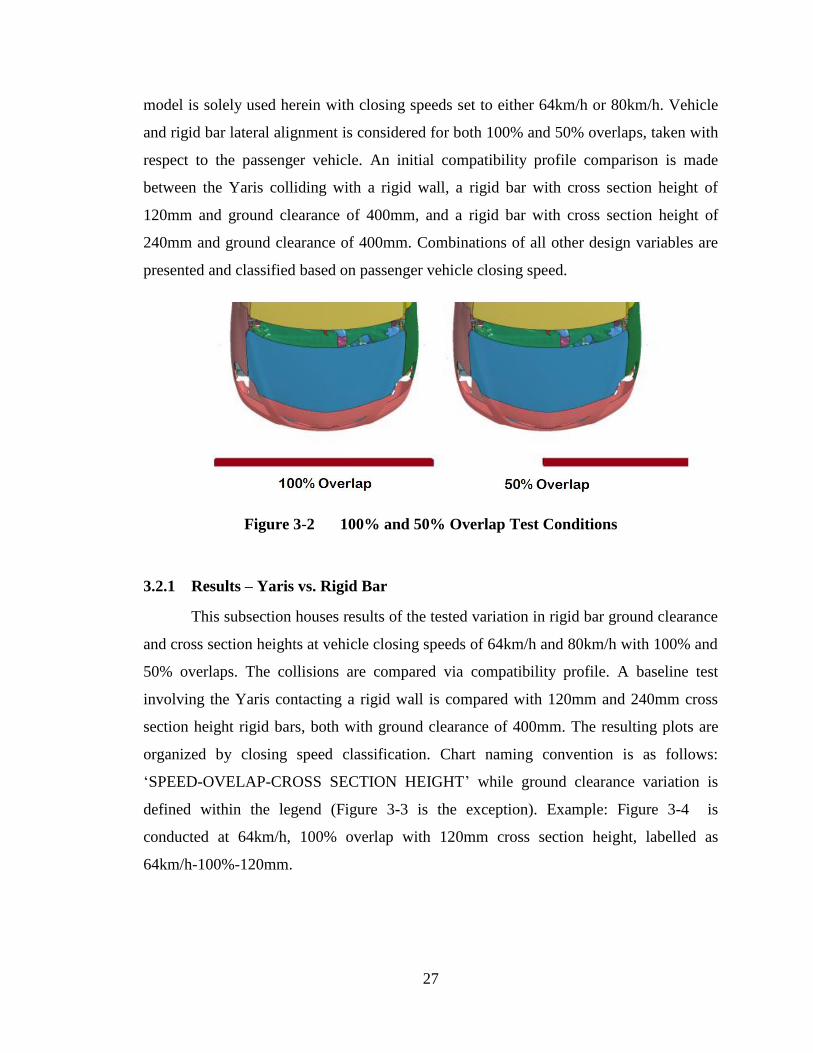
model is solely used herein with closing speeds set to either 64km/h or 80km/h. Vehicle
and rigid bar lateral alignment is considered for both 100% and 50% overlaps, taken with
respect to the passenger vehicle. An initial compatibility profile comparison is made
between the Yaris colliding with a rigid wall, a rigid bar with cross section height of
120mm and ground clearance of 400mm, and a rigid bar with cross section height of
240mm and ground clearance of 400mm. Combinations of all other design variables are
presented and classified based on passenger vehicle closing speed.
Figure 3-2 100% and 50% Overlap Test Conditions
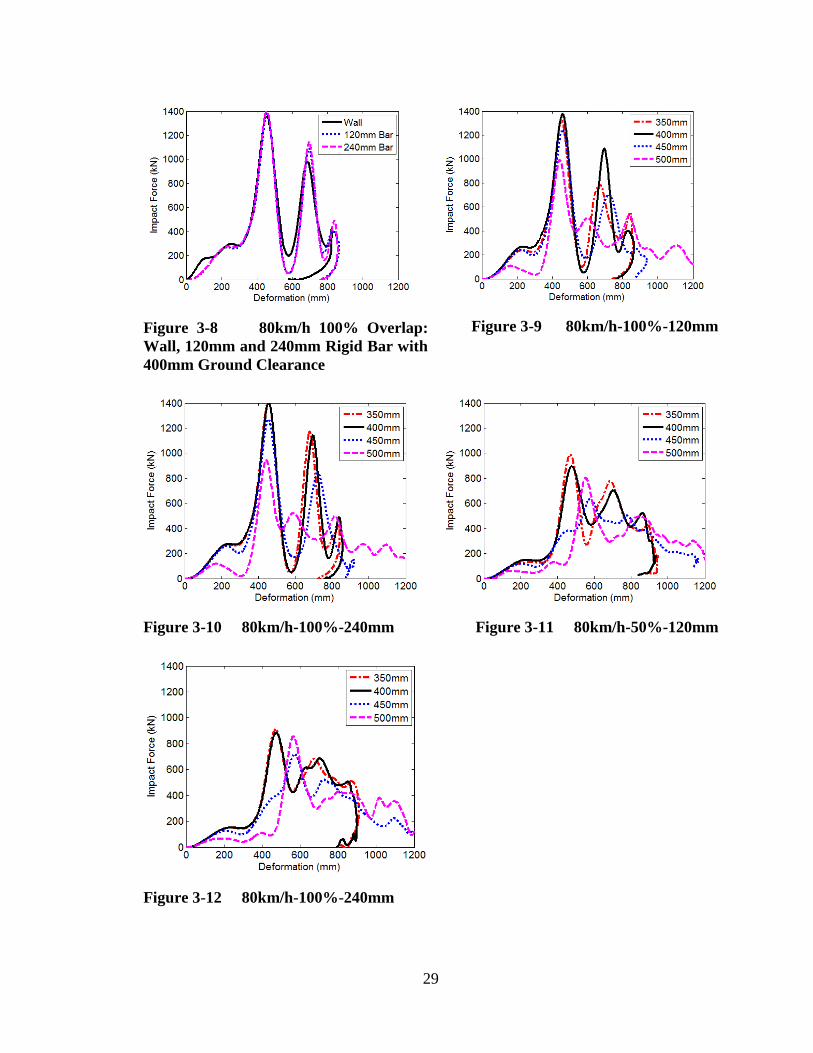
3.2.1 Results – Yaris vs. Rigid Bar
This subsection houses results of the tested variation in rigid bar ground clearance
and cross section heights at vehicle closing speeds of 64km/h and 80km/h with 100% and
50% overlaps. The collisions are compared via compatibility profile. A baseline test
involving the Yaris contacting a rigid wall is compared with 120mm and 240mm cross
section height rigid bars, both with ground clearance of 400mm. The resulting plots are
organized by closing speed classification. Chart naming convention is as follows:
„SPEED-OVELAP-CROSS SECTION HEIGHT‟ while ground clearance variation is
defined within the legend (Figure 3-3 is the exception). Example: Figure 3-4 is
conducted at 64km/h, 100% overlap with 120mm cross section height, labelled as
64km/h-100%-120mm.

28
Figure 3-3 64km/h 100% Overlap:
Wall, 120mm and 240mm Rigid Bar with
400mm Ground Clearance
Figure 3-4 64km/h-100%-120mm
Figure 3-5 64km/h-100%-240mm
Figure 3-6 64km/h-50%-120mm
Figure 3-7 64km/h-50%-240mm
29
Figure 3-8 80km/h 100% Overlap:
Wall, 120mm and 240mm Rigid Bar with
400mm Ground Clearance
Figure 3-9 80km/h-100%-120mm
Figure 3-10 80km/h-100%-240mm
Figure 3-11 80km/h-50%-120mm
Figure 3-12 80km/h-100%-240mm
30
3.2.2 Discussion – Yaris vs. Rigid Bars
The preceding figures reveal the relationship between FUPD design variables
ground clearance and cross section height with respect to vehicle compatibility. Figure 3-
3 presents a baseline for compatibility evaluation. The Yaris is separately subjected to
contact with a rigid wall, a rigid bar with a 120mm cross section height and 400mm of
ground clearance, and a rigid bar with a 240mm cross section height and 400mm of
ground clearance. The resultant compatibility profiles display no large variation. This
indicates that both rigid bars mounted with 400mm of ground clearance provide a
sufficient reaction interface, allowing the passenger vehicle‟s crash components to
respond effectively.
Figure 3-4 subjects a rigid bar with a cross section height of 120mm to variations
in ground clearance of: 350mm, 400mm, 450mm and 500mm. Quite revealing is the
degree to which the rigid bar is unable to provide an appropriate reaction interface to the
passenger vehicle with ground clearances other than 400mm. The large decrease in
secondary impact force peak when comparing these profiles indicates deflection of the
Yaris‟ crash support components. This deflection occurs in the vertical plane and hinders
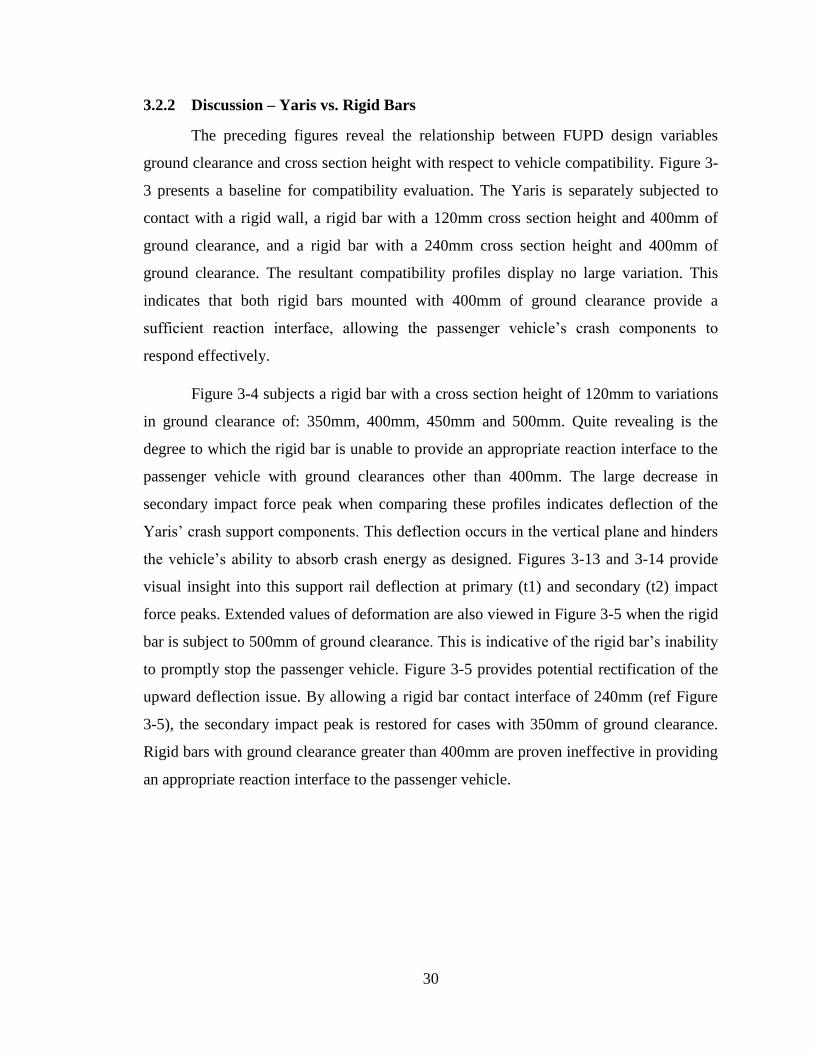
the vehicle‟s ability to absorb crash energy as designed. Figures 3-13 and 3-14 provide
visual insight into this support rail deflection at primary (t1) and secondary (t2) impact
force peaks. Extended values of deformation are also viewed in Figure 3-5 when the rigid
bar is subject to 500mm of ground clearance. This is indicative of the rigid bar‟s inability
to promptly stop the passenger vehicle. Figure 3-5 provides potential rectification of the
upward deflection issue. By allowing a rigid bar contact interface of 240mm (ref Figure
3-5), the secondary impact peak is restored for cases with 350mm of ground clearance.
Rigid bars with ground clearance greater than 400mm are proven ineffective in providing
an appropriate reaction interface to the passenger vehicle.
31
Figure 3-13 64km/h-100%-120mm with 350mm Ground Clearance at Time of
Primary (Left) and Secondary (Right) Impact Force Peaks
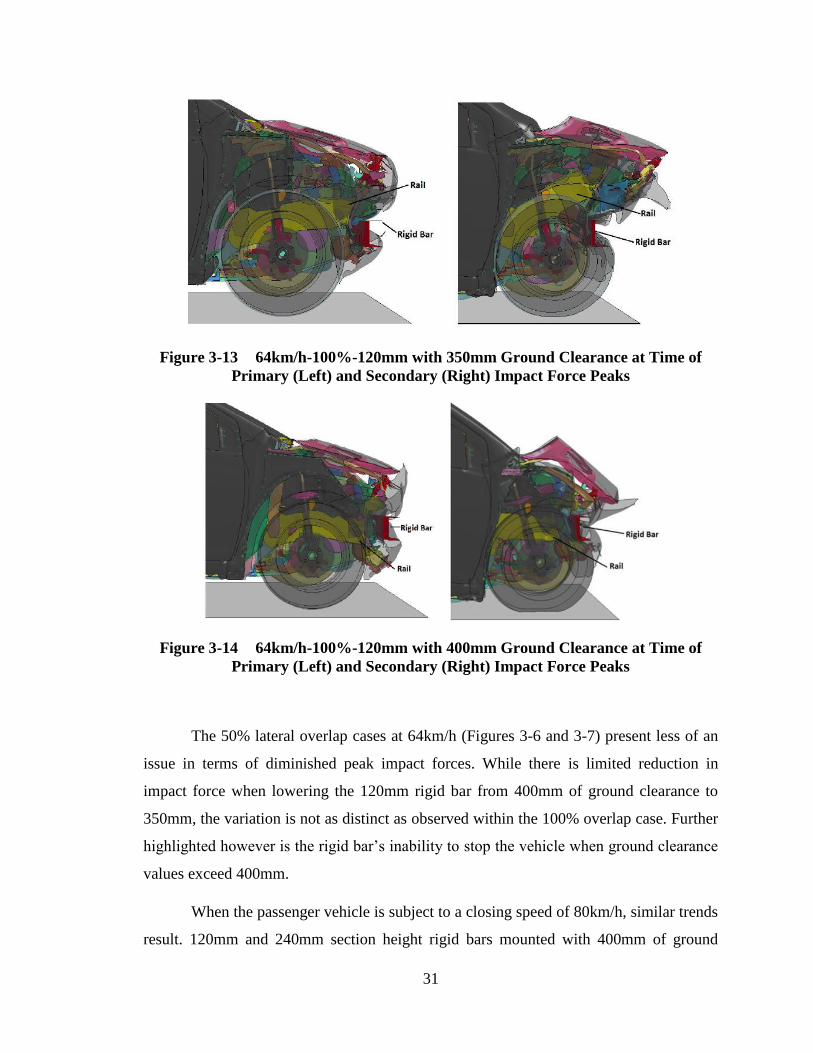
Figure 3-14 64km/h-100%-120mm with 400mm Ground Clearance at Time of
Primary (Left) and Secondary (Right) Impact Force Peaks
The 50% lateral overlap cases at 64km/h (Figures 3-6 and 3-7) present less of an
issue in terms of diminished peak impact forces. While there is limited reduction in
impact force when lowering the 120mm rigid bar from 400mm of ground clearance to
350mm, the variation is not as distinct as observed within the 100% overlap case. Further
highlighted however is the rigid bar‟s inability to stop the vehicle when ground clearance
values exceed 400mm.
When the passenger vehicle is subject to a closing speed of 80km/h, similar trends
result. 120mm and 240mm section height rigid bars mounted with 400mm of ground
32
clearance provide support reflective of contact with a rigid wall (Figure 3-8). In general
those trends presented as part of the 64km/h study appear at 80km/h with heightened
magnitudes of impact force and deformation. Replacing a 120mm section height rigid bar
with a 240mm section height rigid bar continues to provide appropriate reaction support
when ground clearance is decreased to 350mm (Figures 3-9 and 3-10).
From this analysis, it appears ECE R93 geometric design requirements hinder the
robustness of underride guards to some degree. Of course, the current analysis stage
remains a simplification involving completely rigid bars. Nevertheless it is worth
investigating whether or not enhanced system robustness can be achieved by designing a
guard with a 240mm cross section height set to 350mm of ground clearance. These values
represent double the required cross section and 50mm lower than the maximum allowed
ground clearance in ECE R93.
3.3 EXPERIMENT 1 – TIER 2
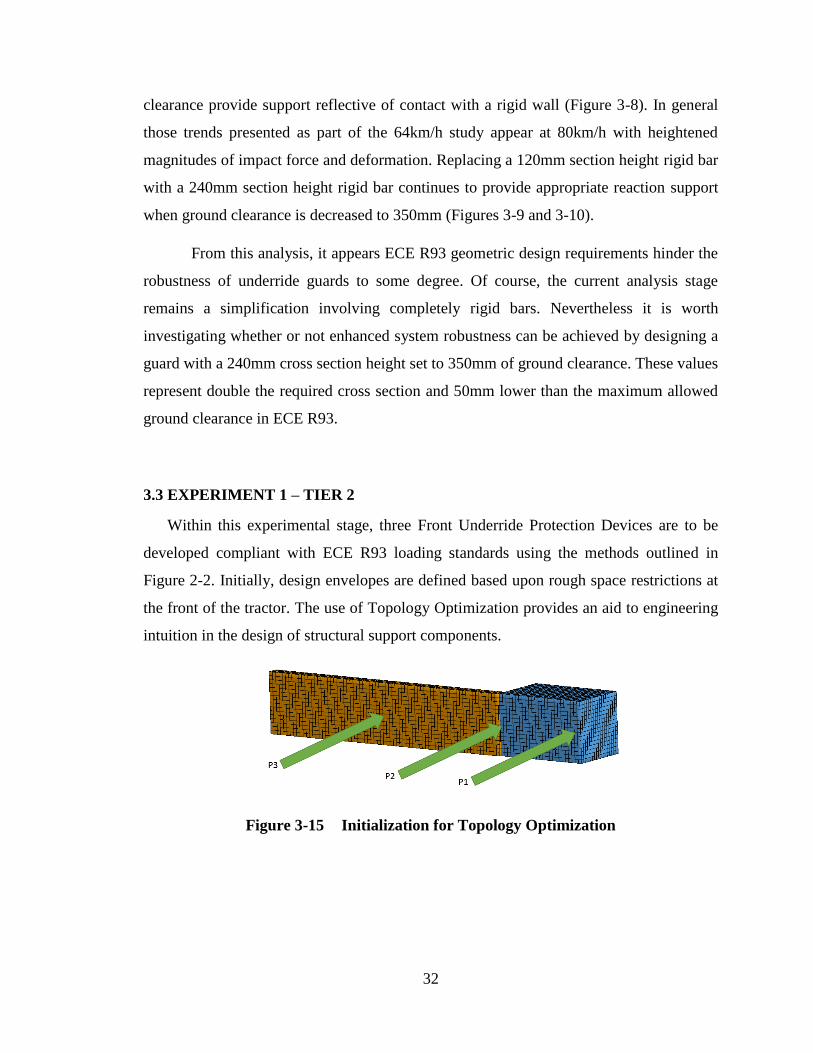
Within this experimental stage, three Front Underride Protection Devices are to be
developed compliant with ECE R93 loading standards using the methods outlined in
Figure 2-2. Initially, design envelopes are defined based upon rough space restrictions at
the front of the tractor. The use of Topology Optimization provides an aid to engineering
intuition in the design of structural support components.
Figure 3-15 Initialization for Topology Optimization
33
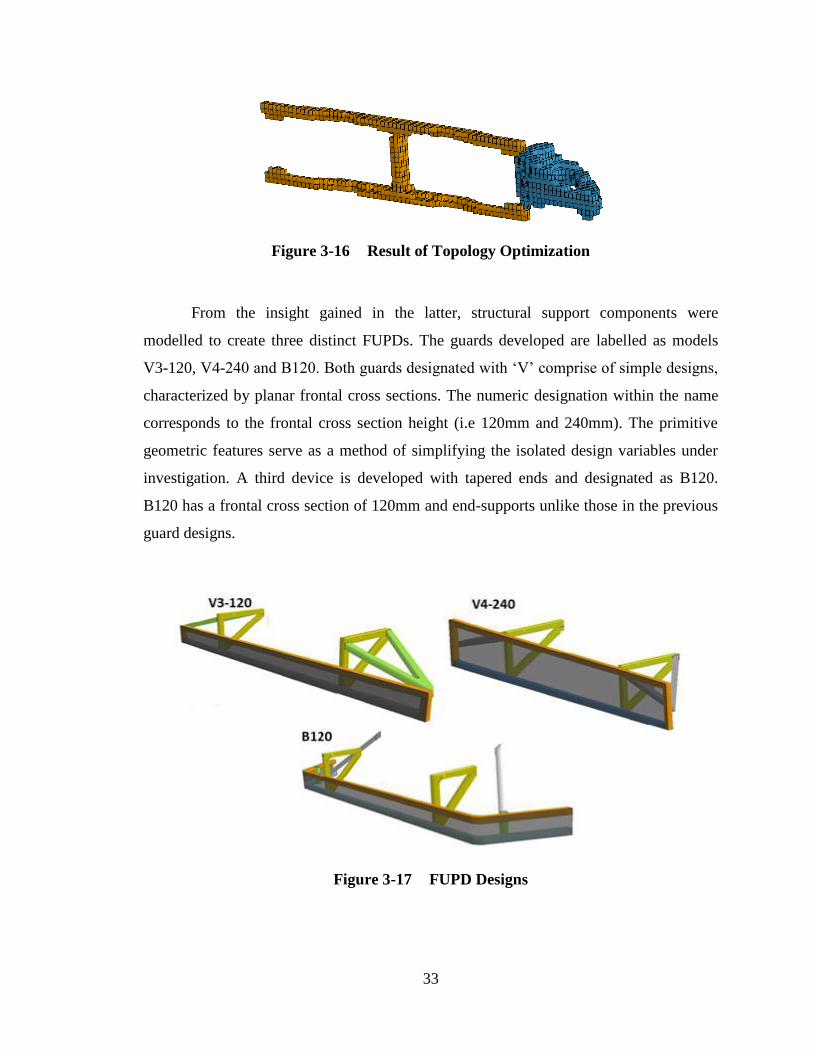
Figure 3-16 Result of Topology Optimization
From the insight gained in the latter, structural support components were
modelled to create three distinct FUPDs. The guards developed are labelled as models
V3-120, V4-240 and B120. Both guards designated with „V‟ comprise of simple designs,
characterized by planar frontal cross sections. The numeric designation within the name
corresponds to the frontal cross section height (i.e 120mm and 240mm). The primitive
geometric features serve as a method of simplifying the isolated design variables under
investigation. A third device is developed with tapered ends and designated as B120.
B120 has a frontal cross section of 120mm and end-supports unlike those in the previous
guard designs.
Figure 3-17 FUPD Designs
34
To comply with ECE R93 loading standards, each design is subjected to implicit
solutions involving P1 (80kN), P2 (160kN) and P3 (80kN). For initial considerations, this
loading is considered in a sequential manner. Overall guard deformation is monitored and
kept well away from the maximum allowable 400mm. In general, guard deformation
values are kept within the 50mm to 150mm range. Section thickness is parameterized in
discrete steps based on manufacturability. Material definitions are borrowed from those
found applied to support components within the Yaris model. While material selection
may be parameterized for variation within the optimization procedure, the lack of a
material/manufacturing cost function has led the authors to omit this step. Additionally,
cross-section shape variation is parameterized. This is initially done through the
definition of node transformations.
Table 3-1 Optimization History Classified by FUPD
FUPD Name Optimization History Total Mass
(kg)
V3-120 Initially failed under P3 loading,
Mass increase resulted in a „pass‟,
Shape Optimization provided weight
savings of approximately 22%
22.14
V4-240 Passed all loading originally,
Optimization reallocated mass to reduce
magnitudes of deformation
26.92
B120 Failed to support load P3,
Increasing section thickness resolved this
issue
33.37
3.4 EXPERIMENT I – TIER 3
Tier 2 resulted in the development of three FUPDs compliant with ECE R93. In
addition, guards were developed with both 120mm and 240mm cross section heights in
order to further investigate the relationship between this variable and resultant
compatibility. Tier 3 will mount the FUPDs to the simplified VNL tractor frame, and
35
collide the full vehicle Toyota Yaris model with closing speed restricted to 64km/h.
Passenger vehicle lateral overlap conditions remain in sync with Tier 1 of this chapter,
initialized as 100% and 50% overlap. Recall both FUPD frontal cross section height and
ground clearance are the variables chosen for isolation within this chapter. In order to
investigate variation in ground clearance, the complete frame system will be transitioned
vertically to allow the FUPD either 350mm or 400mm of ground clearance.
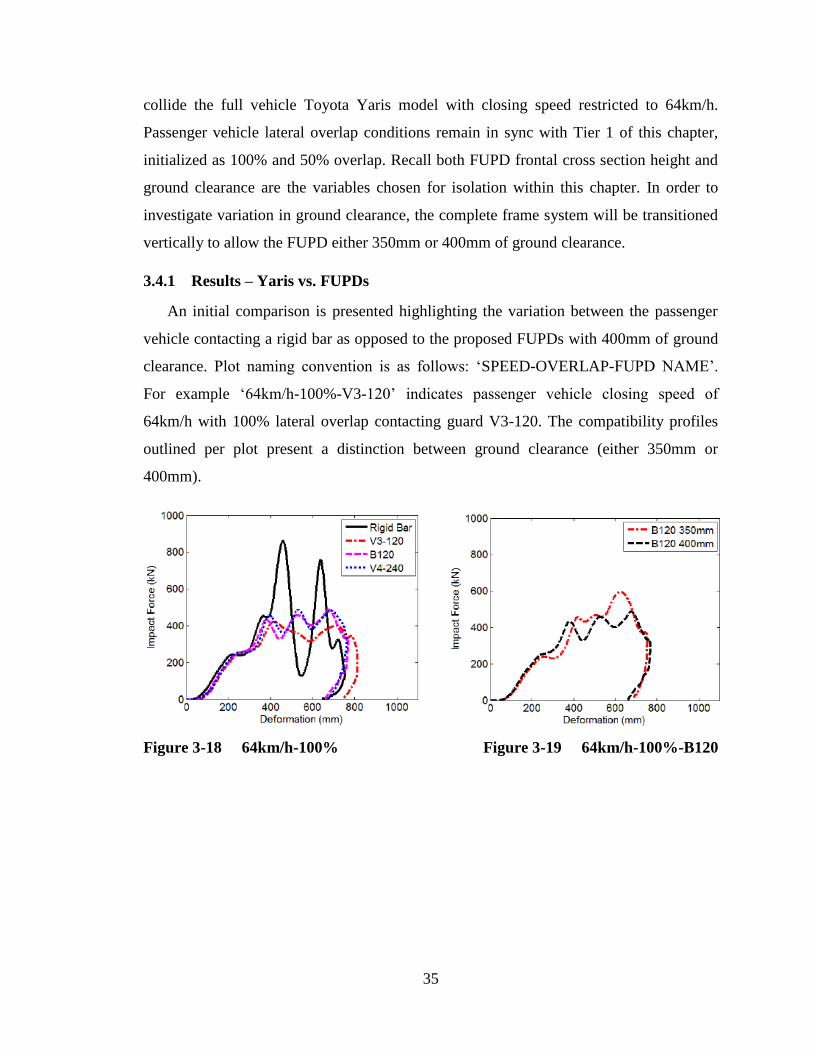
3.4.1 Results – Yaris vs. FUPDs
An initial comparison is presented highlighting the variation between the passenger
vehicle contacting a rigid bar as opposed to the proposed FUPDs with 400mm of ground
clearance. Plot naming convention is as follows: „SPEED-OVERLAP-FUPD NAME‟.
For example „64km/h-100%-V3-120‟ indicates passenger vehicle closing speed of
64km/h with 100% lateral overlap contacting guard V3-120. The compatibility profiles
outlined per plot present a distinction between ground clearance (either 350mm or
400mm).
Figure 3-18 64km/h-100%
Figure 3-19 64km/h-100%-B120
36
Figure 3-20 64km/h-100%-V3-120
Figure 3-21 64km/h-100%-V4-240
Figure 3-22 64km/h-50%
Figure 3-23 64km/h-50%-B120
Figure 3-24 64km/h-50%-V3-120
Figure 3-25 64km/h-50%-V4-240
37
3.4.2 Discussion – Yaris vs. FUPDs
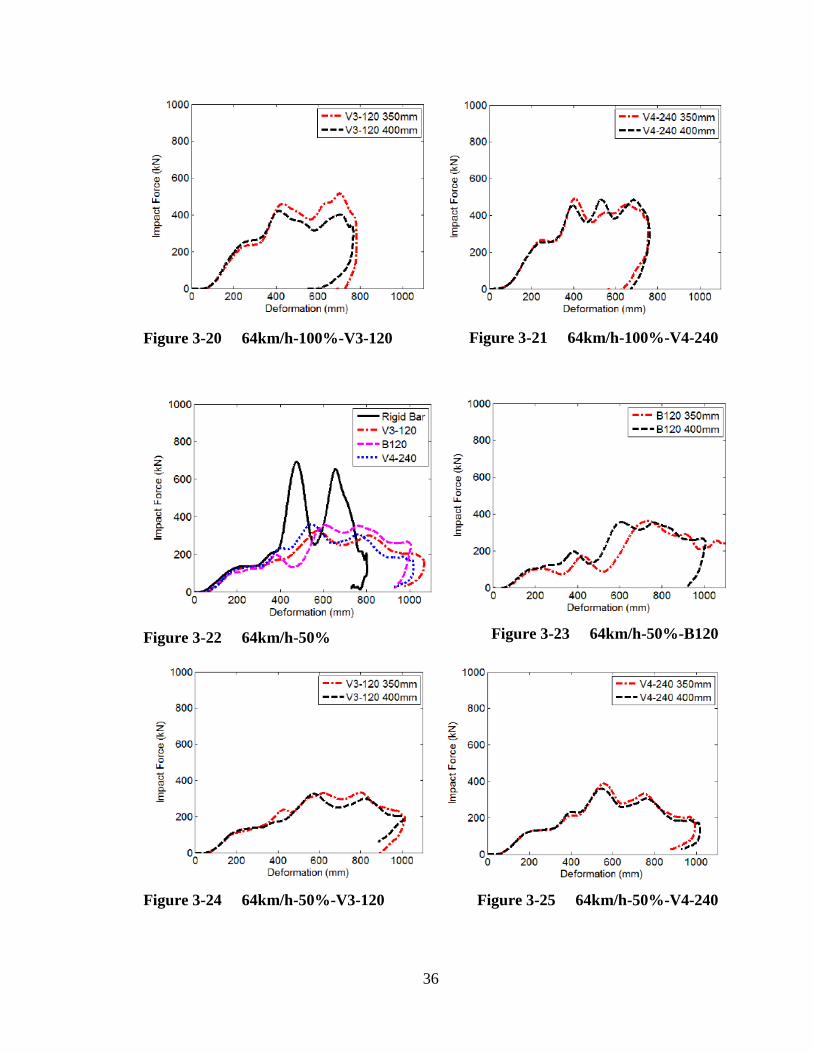
From the results presented above, a number of significant observations may be
drawn regarding FUPD design. Most outstanding is the variation presented in Figures 3-
18 comparing compatibility profiles induced by the FUPD designs with respect to a rigid
bar all with ground clearance heights of 400mm. The variation in impact force is
substantial, indicating guards designed to ECE R93 standards offer performance well
away from that experienced when contacting a rigid bar or rigid wall. All FUPDs
designed herein also supply increased rigidity beyond ECE R93 specifications. This was
set by limiting deformation due to test loads well away from the maximum 400mm.
Nevertheless, the guards provided the colliding passenger vehicle model with
significantly less reaction force than was expected. Observing Figures 3-19 and 3-20
allows for a comparison between both guards designed with 120mm frontal cross
sections. Interestingly, reduced ground clearance provides an increase in impact force
within both cases. This relationship is opposite of that found when testing against the
rigid bar. The closer proximity of the tractor frame in contacting the Yaris when ground
clearance is reduced yields the increase in reaction force. FUPD robustness appears to
increase across variation in ground clearance when the frontal cross-section height is set
to 240mm. This may be directly seen in Figure 3-21, with nearly identical compatibility
profiles observed between the two cases presented.
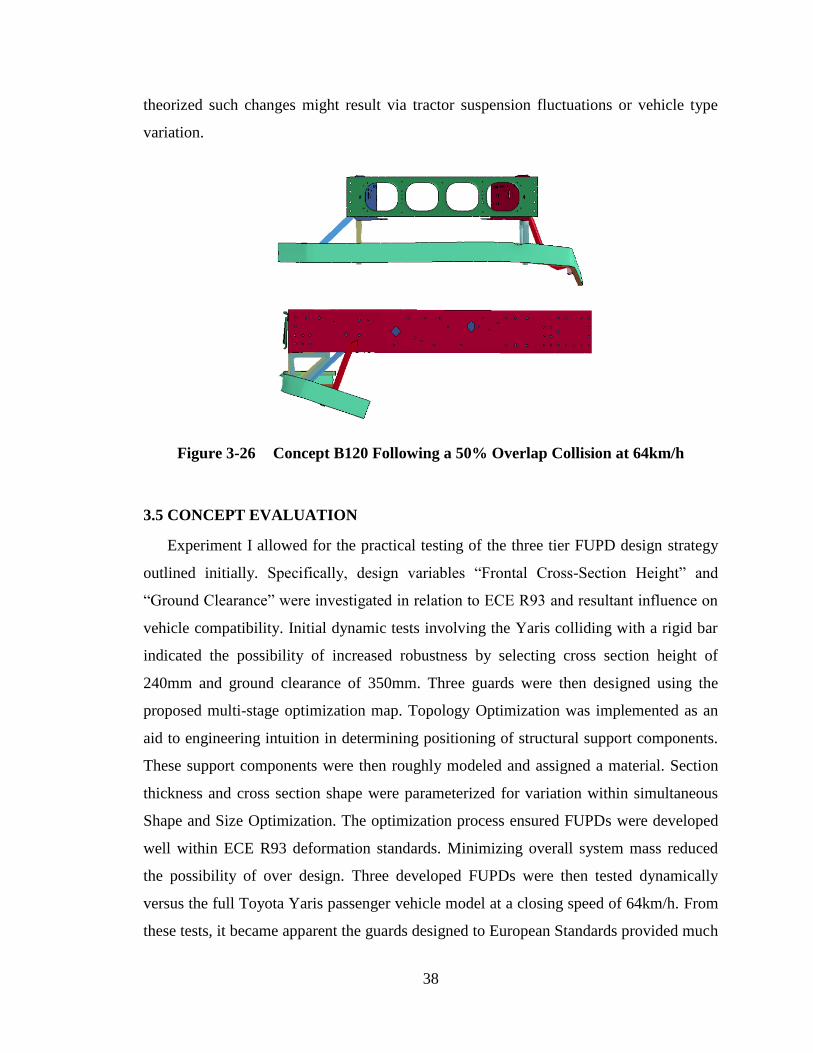
Instances involving the passenger vehicle model with 50% lateral overlap to the
FUPD highlight additional areas of concern. With 50% overlap, not only are force
magnitudes reduced in comparison with contacting a rigid bar, but deformations are also
extended as a result (see Figure 3-22). This indicates that the FUPDs have difficulty
stopping the vehicle in less-than-perfect lateral alignment. Such case of failure may draw
parallels to the catastrophic RUPD tests previously discussed. Figures 3-23, 3-24 and 3-
25 report performance of the proposed FUPDs; often failing to provide sufficient support
to the colliding Yaris. In one instance involving guard B120 set to 350mm of ground
clearance, the FUPD fails to stop the passenger vehicle altogether. Similar to the above,
the tests involving guard V4-240 (240mm frontal cross-section) provides the smallest
variation in compatibility profile when altering ground clearance. This indicates increased
robustness when subjected to this type of change in initial condition. It is further
38
theorized such changes might result via tractor suspension fluctuations or vehicle type
variation.
Figure 3-26 Concept B120 Following a 50% Overlap Collision at 64km/h
3.5 CONCEPT EVALUATION
Experiment I allowed for the practical testing of the three tier FUPD design strategy
outlined initially. Specifically, design variables “Frontal Cross-Section Height” and
“Ground Clearance” were investigated in relation to ECE R93 and resultant influence on
vehicle compatibility. Initial dynamic tests involving the Yaris colliding with a rigid bar
indicated the possibility of increased robustness by selecting cross section height of
240mm and ground clearance of 350mm. Three guards were then designed using the
proposed multi-stage optimization map. Topology Optimization was implemented as an
aid to engineering intuition in determining positioning of structural support components.
These support components were then roughly modeled and assigned a material. Section
thickness and cross section shape were parameterized for variation within simultaneous
Shape and Size Optimization. The optimization process ensured FUPDs were developed
well within ECE R93 deformation standards. Minimizing overall system mass reduced
the possibility of over design. Three developed FUPDs were then tested dynamically
versus the full Toyota Yaris passenger vehicle model at a closing speed of 64km/h. From
these tests, it became apparent the guards designed to European Standards provided much
39
less reaction force than a wall or rigid bar. Improved robustness (as observed through
only slight variation in compatibility profile) when inducing variation in ground clearance
appeared with guards having a 240mm frontal cross section height. This same conclusion
was drawn from the initial simplified experimental stage, and holds true for both overlap
cases investigated. Furthermore, in cases of 50% overlap, extended deformation values
resulted, indicating the inability of ECE R93 end load (P1 of 80kN) to provided sufficient
support in stopping the vehicle. The overall three tier process has resulted in an efficient
method of testing and implementing variations to FUPD design, from start to finish in a
virtual environment.
40
CHAPTER 4 INCREASED LOADING
4.1 EXPERIMENT II JUSTIFICATION
The design of three Front Underride Protection Devices with implementation of the
three tier design approach highlighted a number of areas worth further investigation. Of
most importance, ECE R93 end load case P1 of 80kN failed to provide adequate support
with 50% lateral overlap initial conditions. In addition, all FUPDs were designed well
away from the maximum 400mm deformation under static loading allowed by the
European regulation. An attempt should be made to avoid similar failures experienced by
RUPD in small overlap tests. Experiment II will therefore design FUPDs in compliance
with loading standards beyond the ECE R93, with full passenger vehicle dynamic tests
used as the method for comparison. An additional tractor frame height is also studied for
FUPD application. The initial VNL frame residing at a height 600-650mm is tested in
addition to a VNL frame within the 720-770mm range. The frame height ranges
correspond to VC-Compat‟s tractor survey involving manufacturers such as Volvo and
Mercedes-Benz [48]. Elevated frame heights reduce interaction between the tractor frame
and passenger vehicle. This reduced interaction places a higher demand on FUPD support
components, and the comprehension of performance under these conditions is of high
interest. Hence the design variables set forth for investigation within this section are: load
magnitudes and tractor frame height. Due to the nature of this experiment considering
variation in static loading, Tier 1 of the design approach is omitted within this stage.
4.2 EXPERIMENT II – TIER 2
Two distinct types of underride protection devices are under consideration herein.
The variation comes as a result of changes in frame height. The lower tractor frame
height range (600-650mm) aligns with previously designed guards (V3-120, V4-240 and
B120). Guards V3-120 and V4-240 are subjected to increased static loads and subsequent
redesign. Table 4-1 outlines the variation in loading magnitudes introduced. The
simultaneous Shape and Size Optimization procedure provides an efficient method of
redesigning the FUPDs. Worth noting are variations in total mass between FUPD
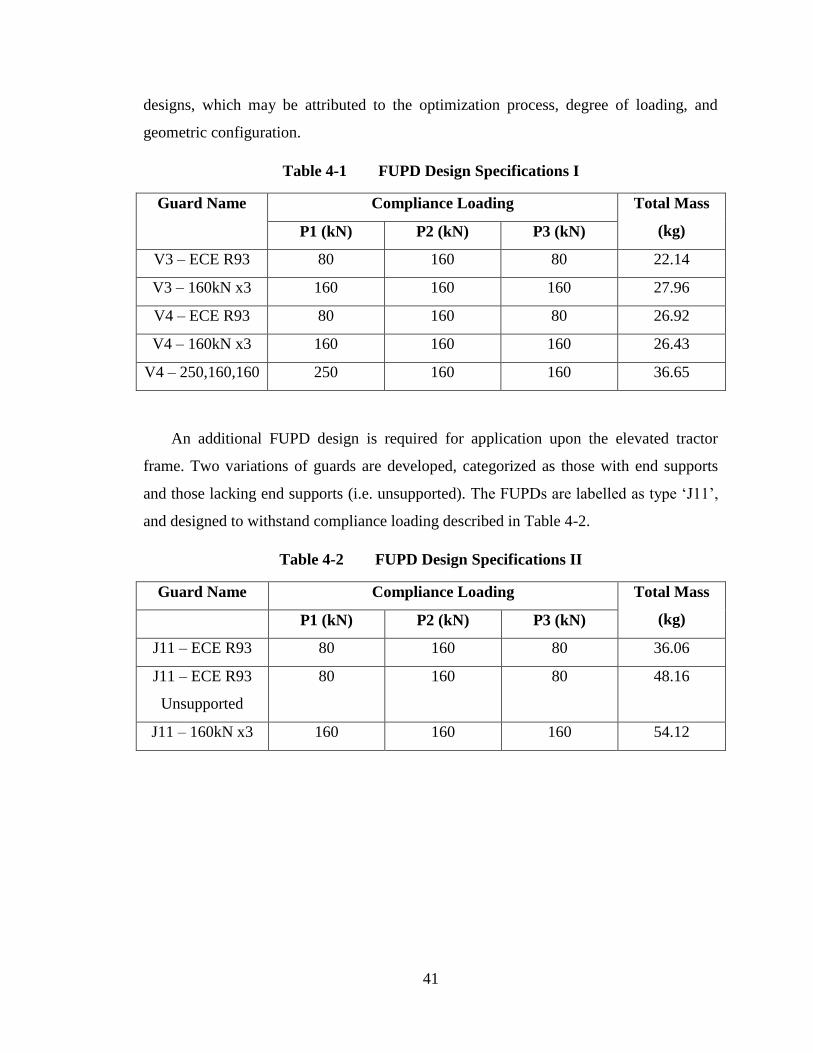
41
designs, which may be attributed to the optimization process, degree of loading, and
geometric configuration.
Table 4-1 FUPD Design Specifications I
Guard Name Compliance Loading Total Mass
(kg) P1 (kN) P2 (kN) P3 (kN)
V3 – ECE R93 80 160 80 22.14
V3 – 160kN x3 160 160 160 27.96
V4 – ECE R93 80 160 80 26.92
V4 – 160kN x3 160 160 160 26.43
V4 – 250,160,160 250 160 160 36.65
An additional FUPD design is required for application upon the elevated tractor
frame. Two variations of guards are developed, categorized as those with end supports
and those lacking end supports (i.e. unsupported). The FUPDs are labelled as type „J11‟,
and designed to withstand compliance loading described in Table 4-2.
Table 4-2 FUPD Design Specifications II
Guard Name Compliance Loading Total Mass
(kg) P1 (kN) P2 (kN) P3 (kN)
J11 – ECE R93 80 160 80 36.06
J11 – ECE R93
Unsupported
80 160 80 48.16
J11 – 160kN x3 160 160 160 54.12
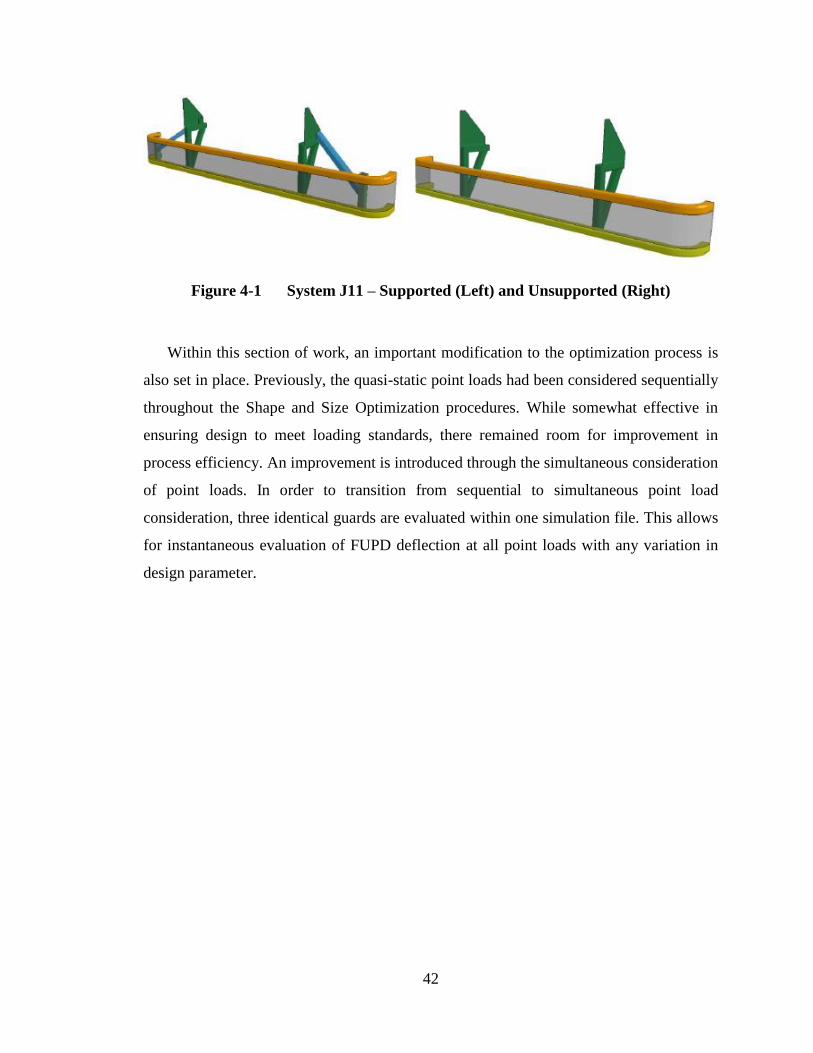
42
Figure 4-1 System J11 – Supported (Left) and Unsupported (Right)
Within this section of work, an important modification to the optimization process is
also set in place. Previously, the quasi-static point loads had been considered sequentially
throughout the Shape and Size Optimization procedures. While somewhat effective in
ensuring design to meet loading standards, there remained room for improvement in
process efficiency. An improvement is introduced through the simultaneous consideration
of point loads. In order to transition from sequential to simultaneous point load
consideration, three identical guards are evaluated within one simulation file. This allows
for instantaneous evaluation of FUPD deflection at all point loads with any variation in
design parameter.
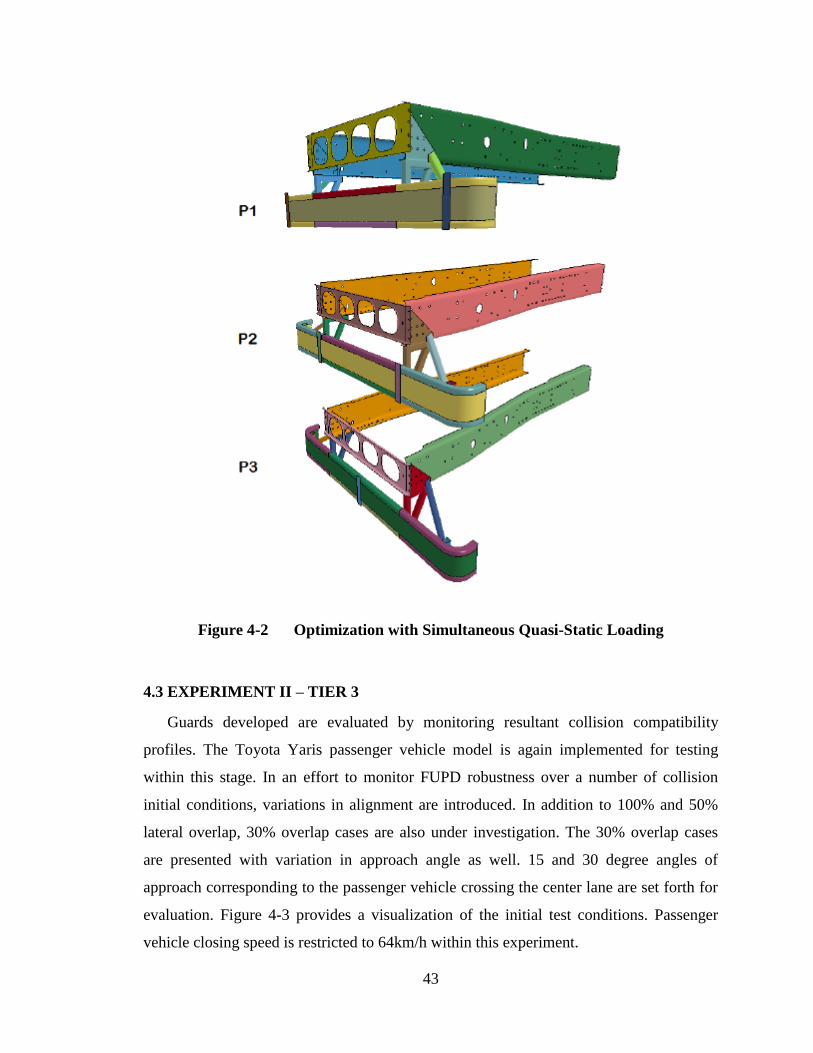
43
Figure 4-2 Optimization with Simultaneous Quasi-Static Loading
4.3 EXPERIMENT II – TIER 3
Guards developed are evaluated by monitoring resultant collision compatibility
profiles. The Toyota Yaris passenger vehicle model is again implemented for testing
within this stage. In an effort to monitor FUPD robustness over a number of collision
initial conditions, variations in alignment are introduced. In addition to 100% and 50%
lateral overlap, 30% overlap cases are also under investigation. The 30% overlap cases
are presented with variation in approach angle as well. 15 and 30 degree angles of
approach corresponding to the passenger vehicle crossing the center lane are set forth for
evaluation. Figure 4-3 provides a visualization of the initial test conditions. Passenger
vehicle closing speed is restricted to 64km/h within this experiment.
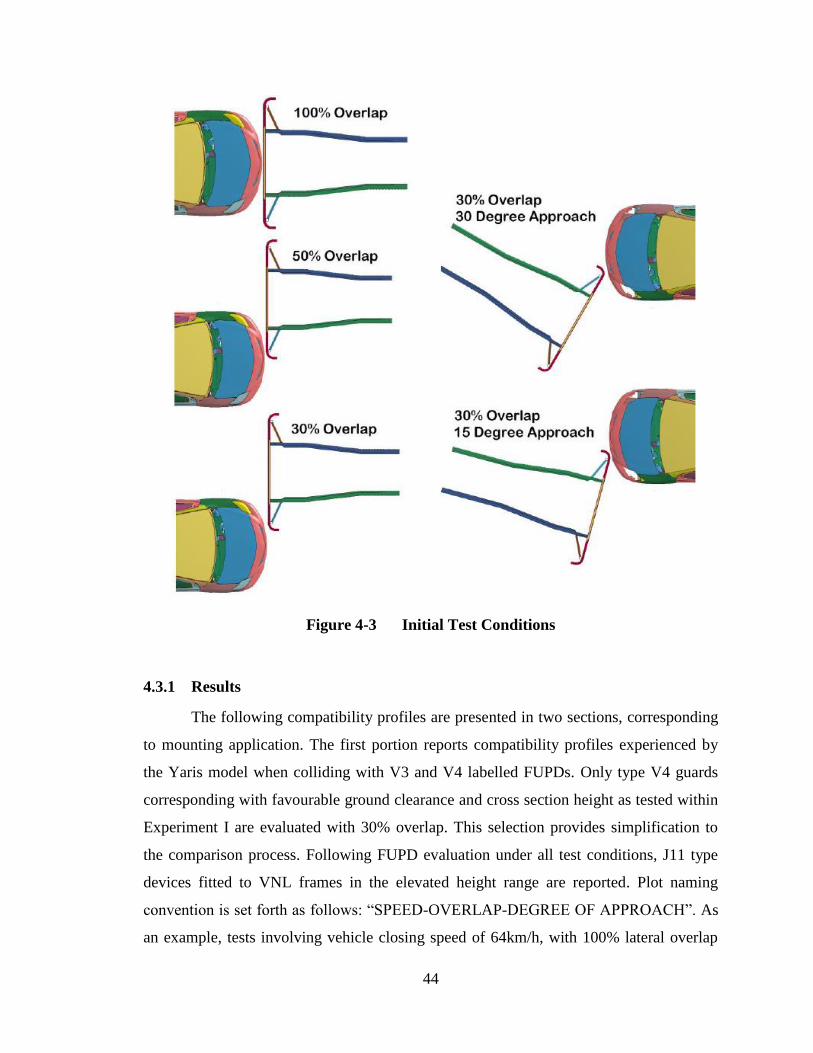
44
Figure 4-3 Initial Test Conditions
4.3.1 Results
The following compatibility profiles are presented in two sections, corresponding
to mounting application. The first portion reports compatibility profiles experienced by
the Yaris model when colliding with V3 and V4 labelled FUPDs. Only type V4 guards
corresponding with favourable ground clearance and cross section height as tested within
Experiment I are evaluated with 30% overlap. This selection provides simplification to
the comparison process. Following FUPD evaluation under all test conditions, J11 type
devices fitted to VNL frames in the elevated height range are reported. Plot naming
convention is set forth as follows: “SPEED-OVERLAP-DEGREE OF APPROACH”. As
an example, tests involving vehicle closing speed of 64km/h, with 100% lateral overlap
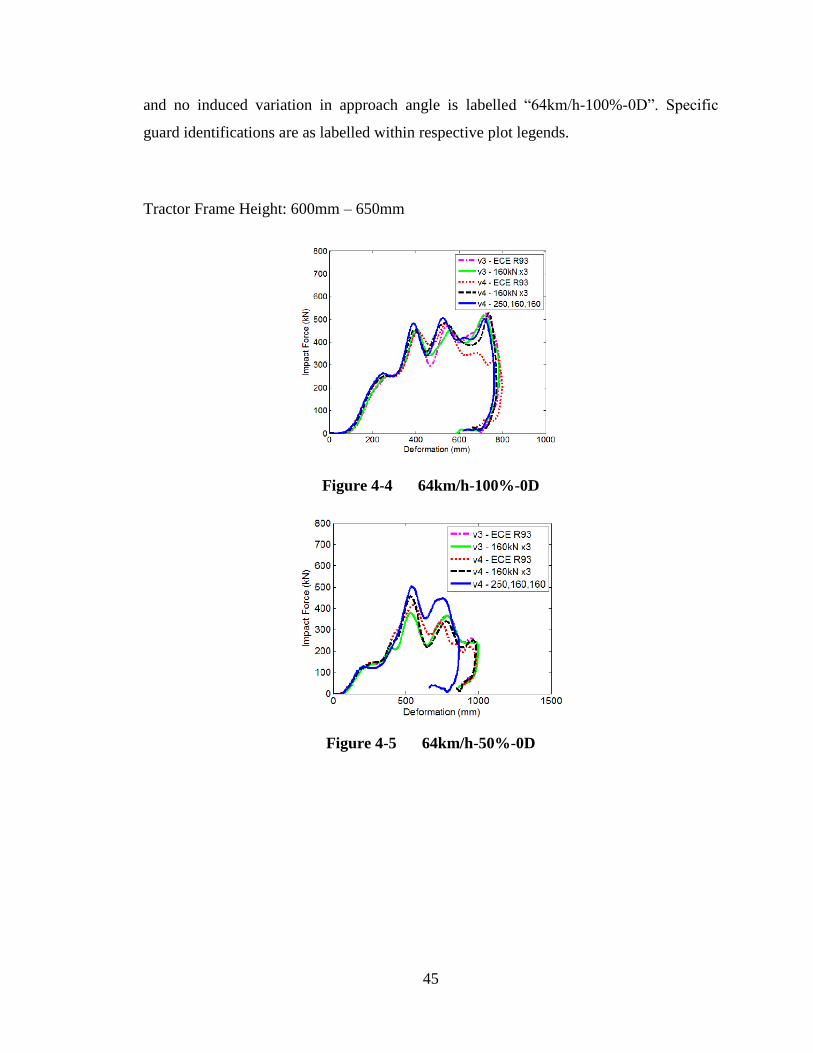
45
and no induced variation in approach angle is labelled “64km/h-100%-0D”. Specific
guard identifications are as labelled within respective plot legends.
Tractor Frame Height: 600mm – 650mm
Figure 4-4 64km/h-100%-0D
Figure 4-5 64km/h-50%-0D
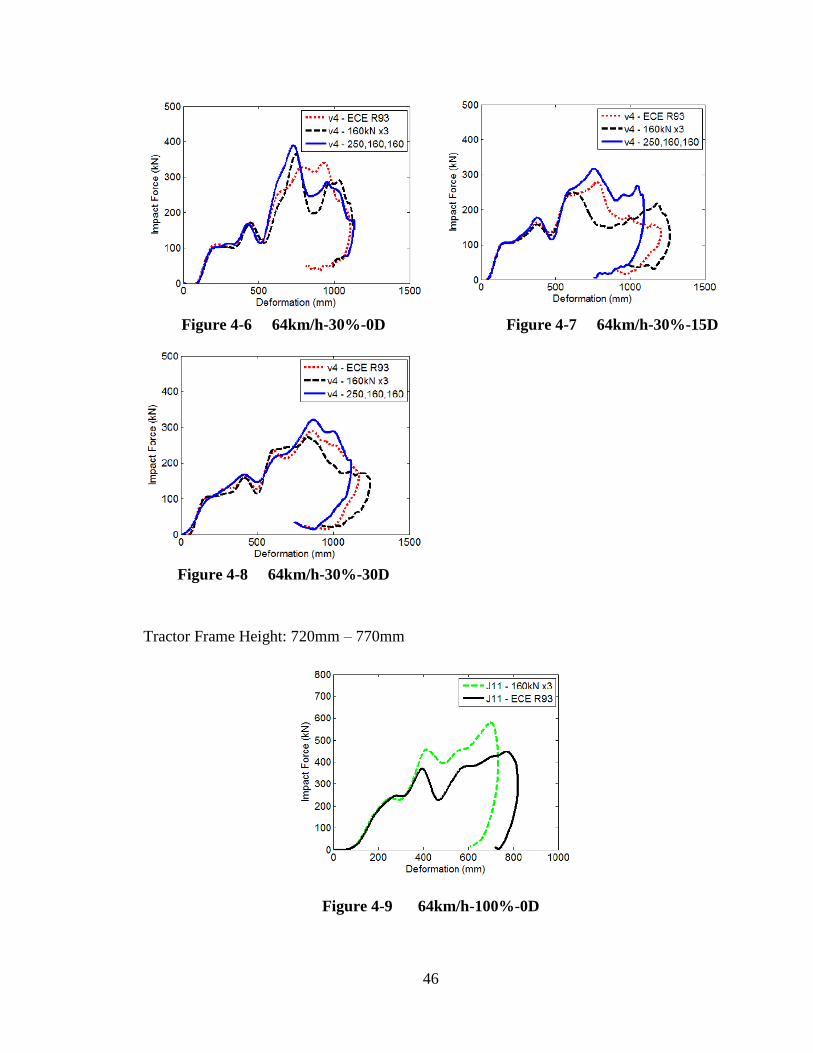
46
Figure 4-6 64km/h-30%-0D
Figure 4-7 64km/h-30%-15D
Figure 4-8 64km/h-30%-30D
Tractor Frame Height: 720mm – 770mm
Figure 4-9 64km/h-100%-0D
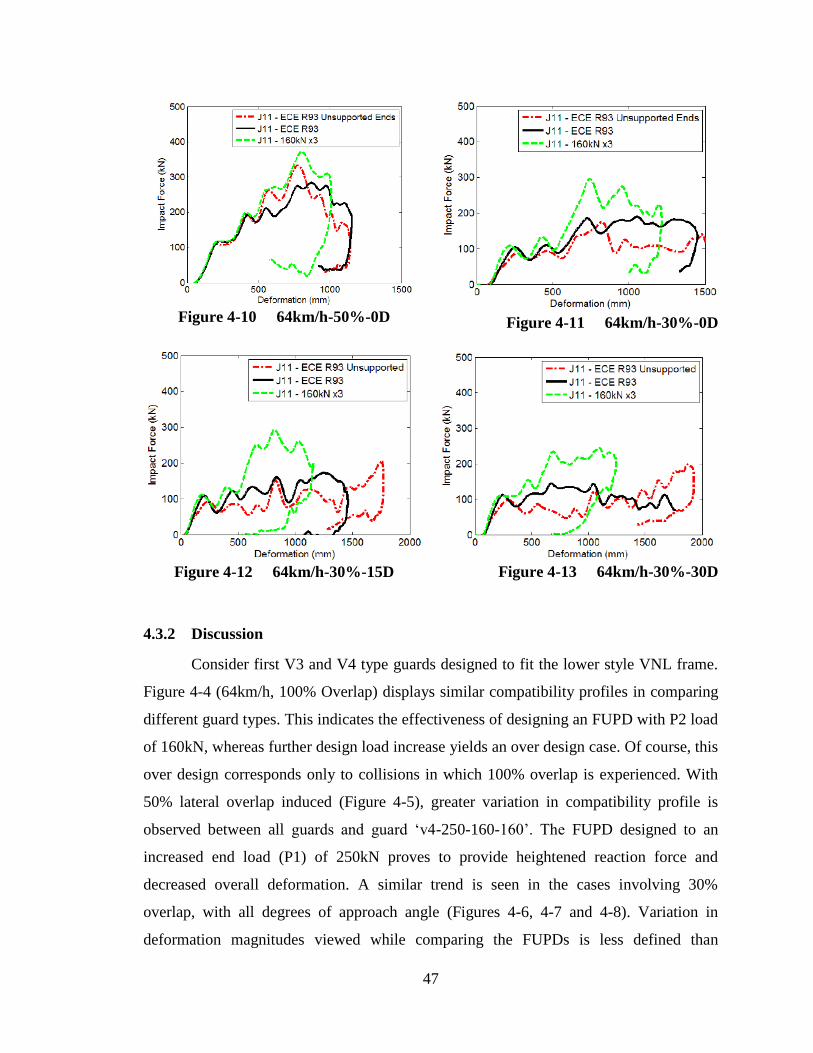
47
Figure 4-10 64km/h-50%-0D
Figure 4-11 64km/h-30%-0D
Figure 4-12 64km/h-30%-15D
Figure 4-13 64km/h-30%-30D
4.3.2 Discussion
Consider first V3 and V4 type guards designed to fit the lower style VNL frame.
Figure 4-4 (64km/h, 100% Overlap) displays similar compatibility profiles in comparing
different guard types. This indicates the effectiveness of designing an FUPD with P2 load
of 160kN, whereas further design load increase yields an over design case. Of course, this
over design corresponds only to collisions in which 100% overlap is experienced. With
50% lateral overlap induced (Figure 4-5), greater variation in compatibility profile is
observed between all guards and guard „v4-250-160-160‟. The FUPD designed to an
increased end load (P1) of 250kN proves to provide heightened reaction force and
decreased overall deformation. A similar trend is seen in the cases involving 30%
overlap, with all degrees of approach angle (Figures 4-6, 4-7 and 4-8). Variation in
deformation magnitudes viewed while comparing the FUPDs is less defined than
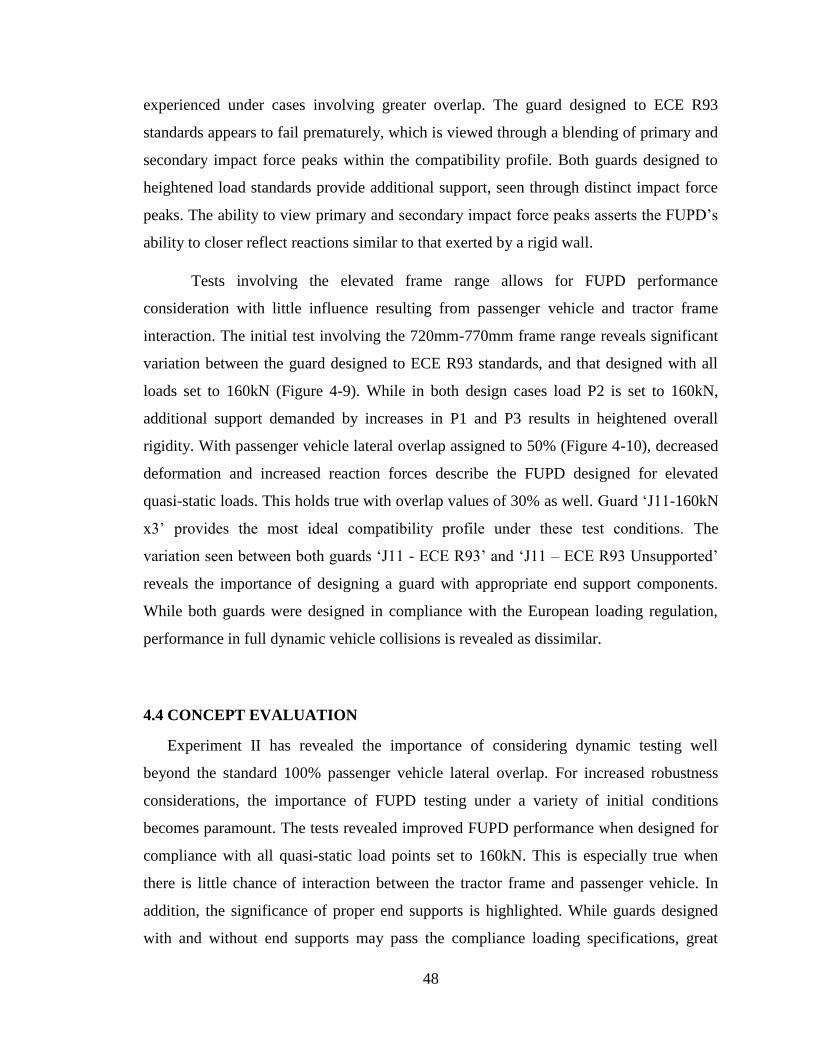
48
experienced under cases involving greater overlap. The guard designed to ECE R93
standards appears to fail prematurely, which is viewed through a blending of primary and
secondary impact force peaks within the compatibility profile. Both guards designed to
heightened load standards provide additional support, seen through distinct impact force
peaks. The ability to view primary and secondary impact force peaks asserts the FUPD‟s
ability to closer reflect reactions similar to that exerted by a rigid wall.
Tests involving the elevated frame range allows for FUPD performance
consideration with little influence resulting from passenger vehicle and tractor frame
interaction. The initial test involving the 720mm-770mm frame range reveals significant
variation between the guard designed to ECE R93 standards, and that designed with all
loads set to 160kN (Figure 4-9). While in both design cases load P2 is set to 160kN,
additional support demanded by increases in P1 and P3 results in heightened overall
rigidity. With passenger vehicle lateral overlap assigned to 50% (Figure 4-10), decreased
deformation and increased reaction forces describe the FUPD designed for elevated
quasi-static loads. This holds true with overlap values of 30% as well. Guard „J11-160kN
x3‟ provides the most ideal compatibility profile under these test conditions. The
variation seen between both guards „J11 - ECE R93‟ and „J11 – ECE R93 Unsupported‟
reveals the importance of designing a guard with appropriate end support components.
While both guards were designed in compliance with the European loading regulation,
performance in full dynamic vehicle collisions is revealed as dissimilar.
4.4 CONCEPT EVALUATION
Experiment II has revealed the importance of considering dynamic testing well
beyond the standard 100% passenger vehicle lateral overlap. For increased robustness
considerations, the importance of FUPD testing under a variety of initial conditions
becomes paramount. The tests revealed improved FUPD performance when designed for
compliance with all quasi-static load points set to 160kN. This is especially true when
there is little chance of interaction between the tractor frame and passenger vehicle. In
addition, the significance of proper end supports is highlighted. While guards designed
with and without end supports may pass the compliance loading specifications, great

49
variations in performance in considering full dynamic collisions are experienced. Not
only is FUPD performance improved through the addition of appropriate end supports,
but large mass reductions also result. From this stage of work, it is suggested that guards
be designed to withstand at least 160kN in all quasi-static point load cases, and apply
some form of end support.

50
CHAPTER 5 DESIGN FOR ENHANCED
ROBUSTNESS
5.1 EXPERIMENT III JUSTIFICATION
The European Front Underride Protection Device regulation ECE R93 restricts
maximum deformation as a result of quasi-static loading to 400mm measured from the
front of the tractor. This restriction conflicts with the curved shape of aerodynamically
designed bumpers. Specifically, bumper extremities tend to curve longitudinally
rearward. In fitting an FUPD behind such bumper designs, measurements taken between
the tractor front and FUPD extremity point would exceed the allowable 400mm, even in a
pre-loading case. Experiment III therefore investigates the influence of FUPD extremity
proximity and resulting influence on passenger vehicle occupant compartment intrusion.
In an effort to further understand FUPD performance issues as a result of contact profile
interface geometric variation, three distinct simplified FUPD concepts are presented for
testing. The concepts provide insight into the relationship between collision overlap
percentage and possible advantages of instigating passenger vehicle deflection. Tier I of
the design phase applies the use of the Secondary Component Level VNL Tractor model
in an effort to study the possible influence of the tractor radiator. This influence may
come as a result of energy absorption as well as further refined packaging limitations.
Tier II will take full advantage of the insight gained in Tier I in designing a final
suggested FUPD for the VNL application. Also developed in this stage is a newly
conceptualized dual stage Front Underride Protection Device. Tier II will test both FUPD
concepts at varying passenger vehicle alignment initial conditions. The Toyota Yaris and
Ford Taurus passenger vehicle models are to be employed within this phase of testing.
5.2 EXPERIMENT III – TIER I
As previously applied, Tier I presents a simplified test towards guiding FUPD
development at a later stage. The FUPD design parameters under scrutiny within this
level of analysis are chosen as extremity proximity with respect to the front of the tractor,
contact interface geometric profile and lateral frontal contact interface extension with
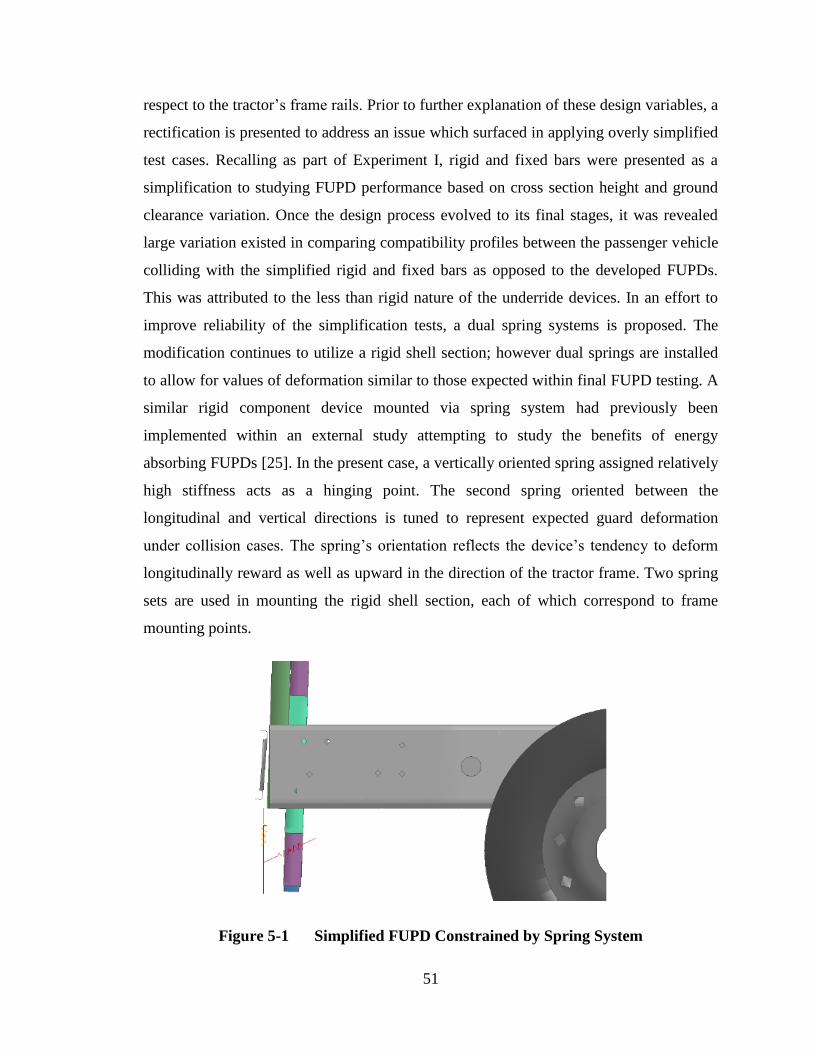
51
respect to the tractor‟s frame rails. Prior to further explanation of these design variables, a
rectification is presented to address an issue which surfaced in applying overly simplified
test cases. Recalling as part of Experiment I, rigid and fixed bars were presented as a
simplification to studying FUPD performance based on cross section height and ground
clearance variation. Once the design process evolved to its final stages, it was revealed
large variation existed in comparing compatibility profiles between the passenger vehicle
colliding with the simplified rigid and fixed bars as opposed to the developed FUPDs.
This was attributed to the less than rigid nature of the underride devices. In an effort to
improve reliability of the simplification tests, a dual spring systems is proposed. The
modification continues to utilize a rigid shell section; however dual springs are installed
to allow for values of deformation similar to those expected within final FUPD testing. A
similar rigid component device mounted via spring system had previously been
implemented within an external study attempting to study the benefits of energy
absorbing FUPDs [25]. In the present case, a vertically oriented spring assigned relatively
high stiffness acts as a hinging point. The second spring oriented between the
longitudinal and vertical directions is tuned to represent expected guard deformation
under collision cases. The spring‟s orientation reflects the device‟s tendency to deform
longitudinally reward as well as upward in the direction of the tractor frame. Two spring
sets are used in mounting the rigid shell section, each of which correspond to frame
mounting points.
Figure 5-1 Simplified FUPD Constrained by Spring System
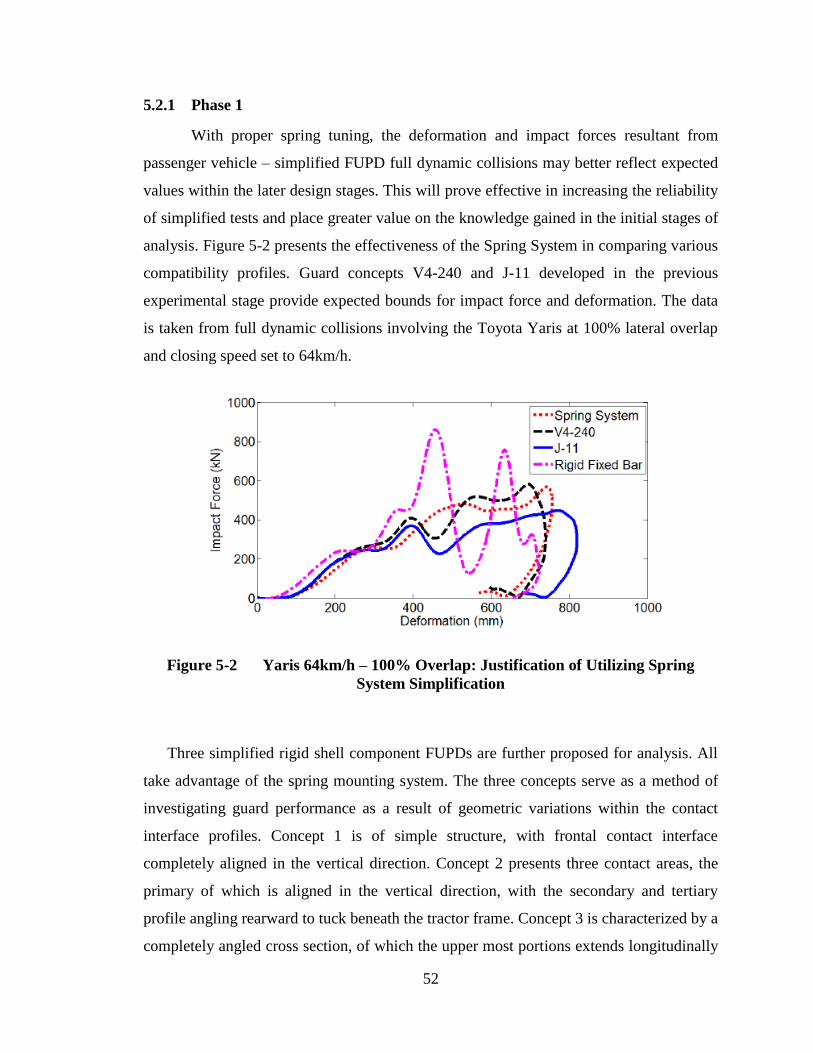
52
5.2.1 Phase 1
With proper spring tuning, the deformation and impact forces resultant from
passenger vehicle – simplified FUPD full dynamic collisions may better reflect expected
values within the later design stages. This will prove effective in increasing the reliability
of simplified tests and place greater value on the knowledge gained in the initial stages of
analysis. Figure 5-2 presents the effectiveness of the Spring System in comparing various
compatibility profiles. Guard concepts V4-240 and J-11 developed in the previous
experimental stage provide expected bounds for impact force and deformation. The data
is taken from full dynamic collisions involving the Toyota Yaris at 100% lateral overlap
and closing speed set to 64km/h.
Figure 5-2 Yaris 64km/h – 100% Overlap: Justification of Utilizing Spring
System Simplification
Three simplified rigid shell component FUPDs are further proposed for analysis. All
take advantage of the spring mounting system. The three concepts serve as a method of
investigating guard performance as a result of geometric variations within the contact
interface profiles. Concept 1 is of simple structure, with frontal contact interface
completely aligned in the vertical direction. Concept 2 presents three contact areas, the
primary of which is aligned in the vertical direction, with the secondary and tertiary
profile angling rearward to tuck beneath the tractor frame. Concept 3 is characterized by a
completely angled cross section, of which the upper most portions extends longitudinally
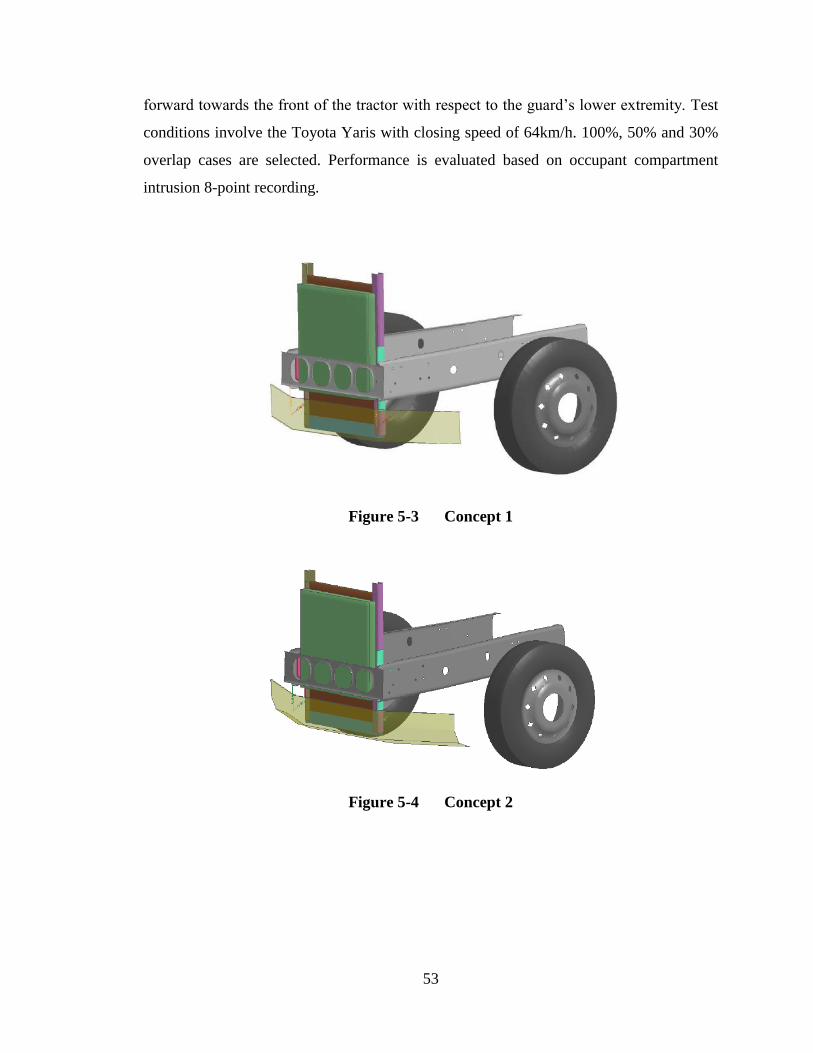
53
forward towards the front of the tractor with respect to the guard‟s lower extremity. Test
conditions involve the Toyota Yaris with closing speed of 64km/h. 100%, 50% and 30%
overlap cases are selected. Performance is evaluated based on occupant compartment
intrusion 8-point recording.
Figure 5-3 Concept 1
Figure 5-4 Concept 2
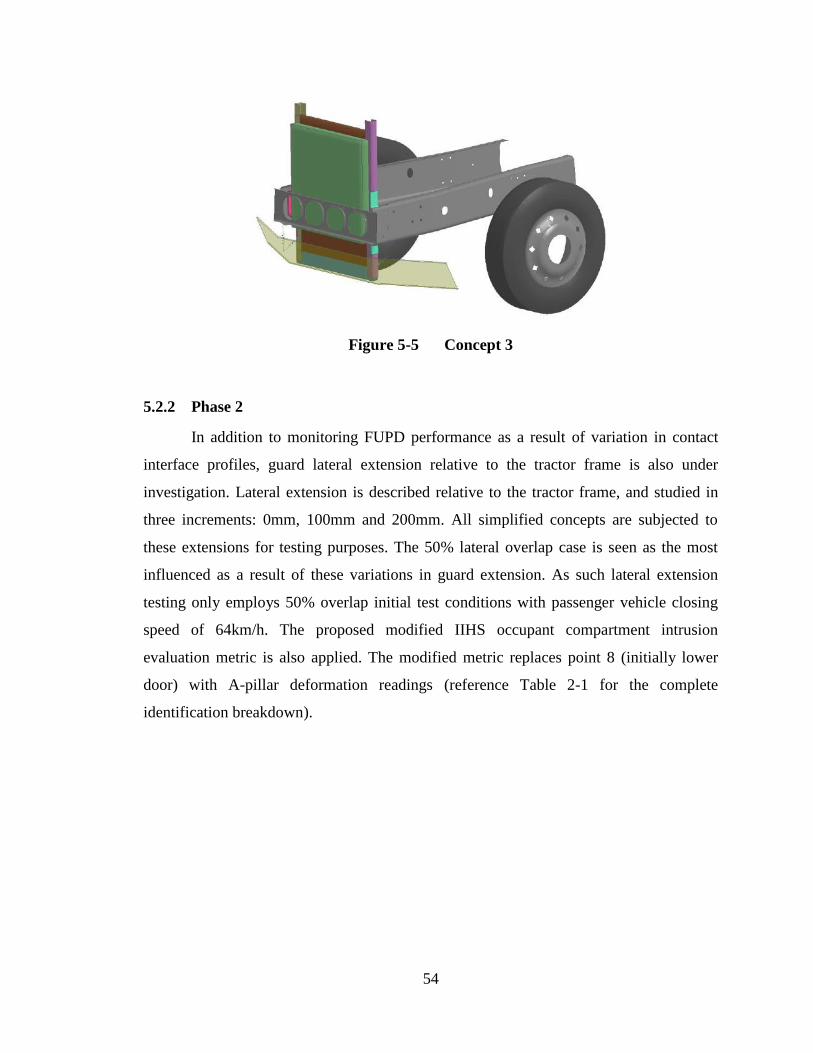
54
Figure 5-5 Concept 3
5.2.2 Phase 2
In addition to monitoring FUPD performance as a result of variation in contact
interface profiles, guard lateral extension relative to the tractor frame is also under
investigation. Lateral extension is described relative to the tractor frame, and studied in
three increments: 0mm, 100mm and 200mm. All simplified concepts are subjected to
these extensions for testing purposes. The 50% lateral overlap case is seen as the most
influenced as a result of these variations in guard extension. As such lateral extension
testing only employs 50% overlap initial test conditions with passenger vehicle closing
speed of 64km/h. The proposed modified IIHS occupant compartment intrusion
evaluation metric is also applied. The modified metric replaces point 8 (initially lower
door) with A-pillar deformation readings (reference Table 2-1 for the complete
identification breakdown).
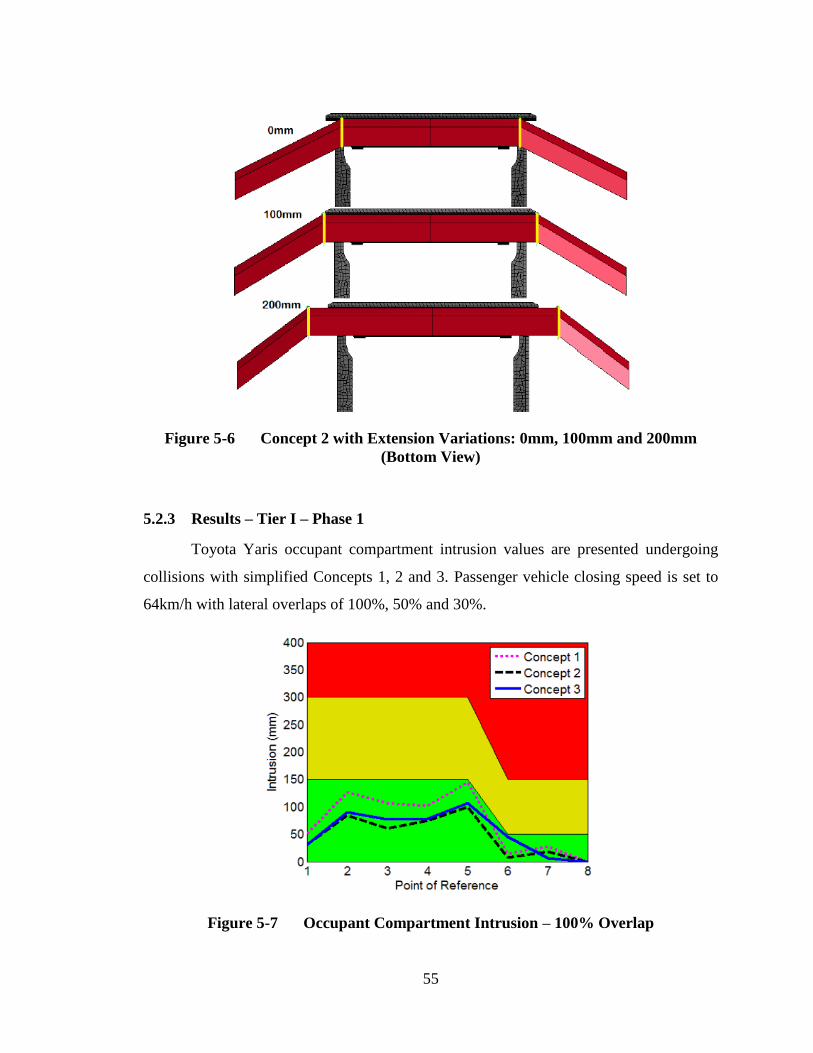
55
Figure 5-6 Concept 2 with Extension Variations: 0mm, 100mm and 200mm
(Bottom View)
5.2.3 Results – Tier I – Phase 1
Toyota Yaris occupant compartment intrusion values are presented undergoing
collisions with simplified Concepts 1, 2 and 3. Passenger vehicle closing speed is set to
64km/h with lateral overlaps of 100%, 50% and 30%.
Figure 5-7 Occupant Compartment Intrusion – 100% Overlap
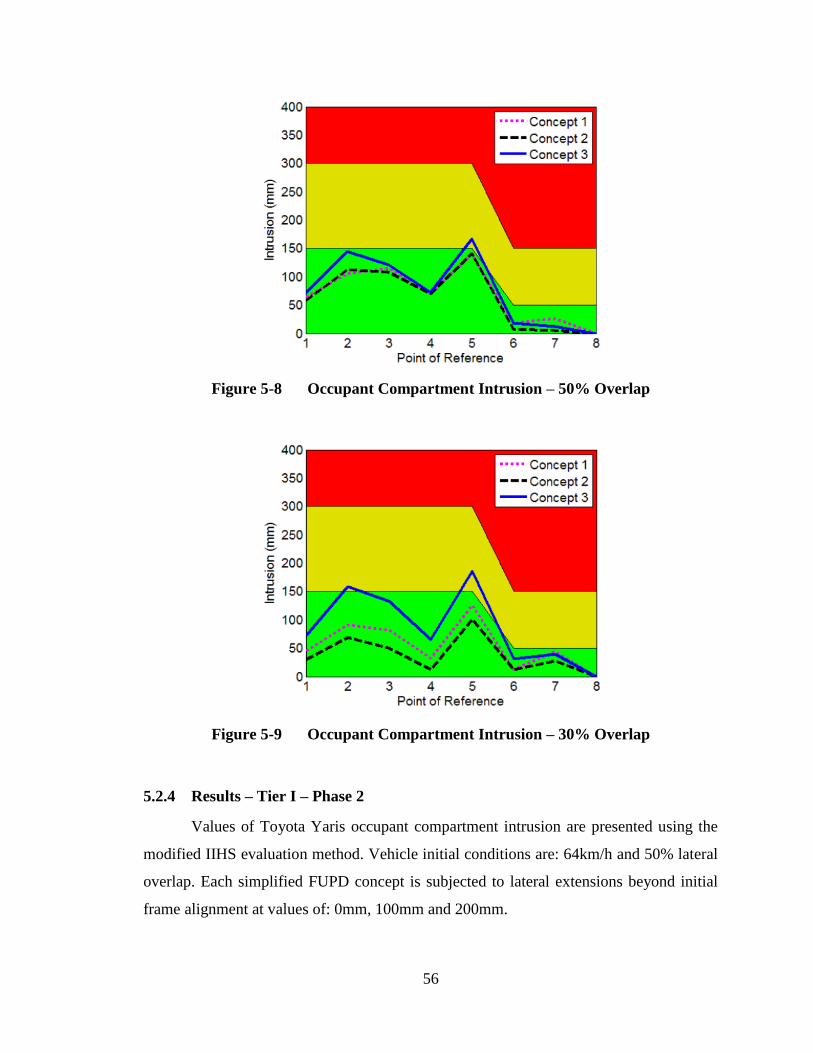
56
Figure 5-8 Occupant Compartment Intrusion – 50% Overlap
Figure 5-9 Occupant Compartment Intrusion – 30% Overlap
5.2.4 Results – Tier I – Phase 2
Values of Toyota Yaris occupant compartment intrusion are presented using the
modified IIHS evaluation method. Vehicle initial conditions are: 64km/h and 50% lateral
overlap. Each simplified FUPD concept is subjected to lateral extensions beyond initial
frame alignment at values of: 0mm, 100mm and 200mm.
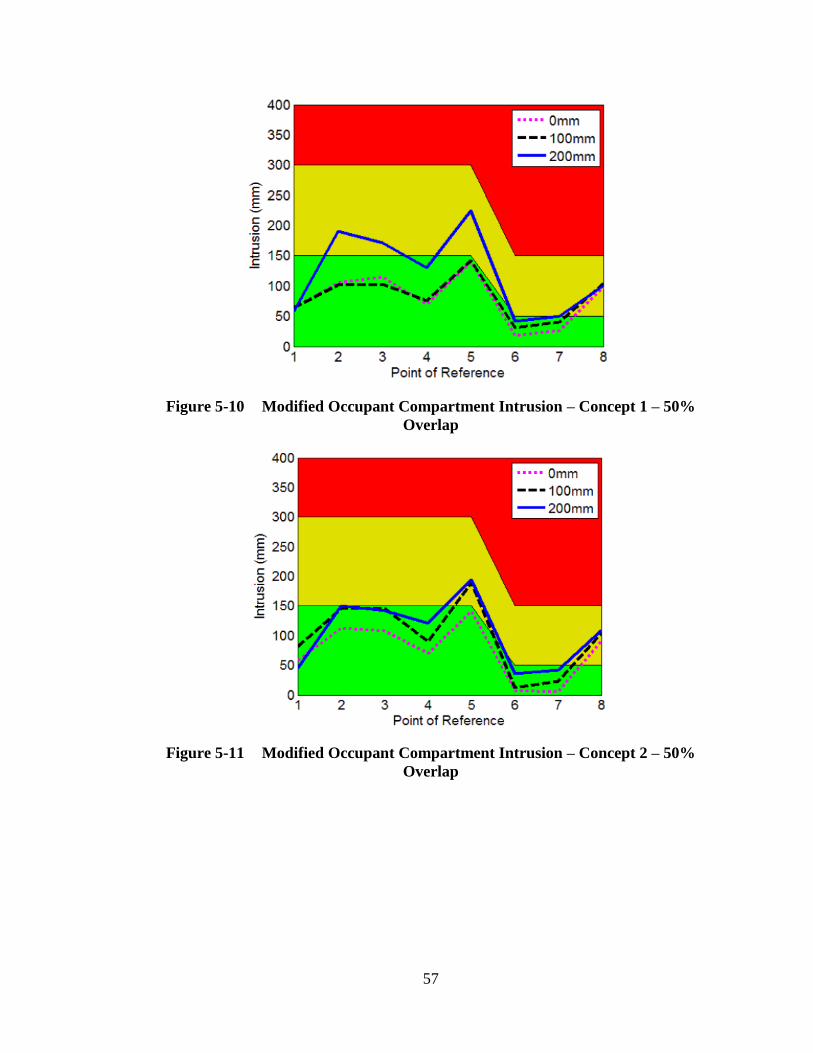
57
Figure 5-10 Modified Occupant Compartment Intrusion – Concept 1 – 50%
Overlap
Figure 5-11 Modified Occupant Compartment Intrusion – Concept 2 – 50%
Overlap
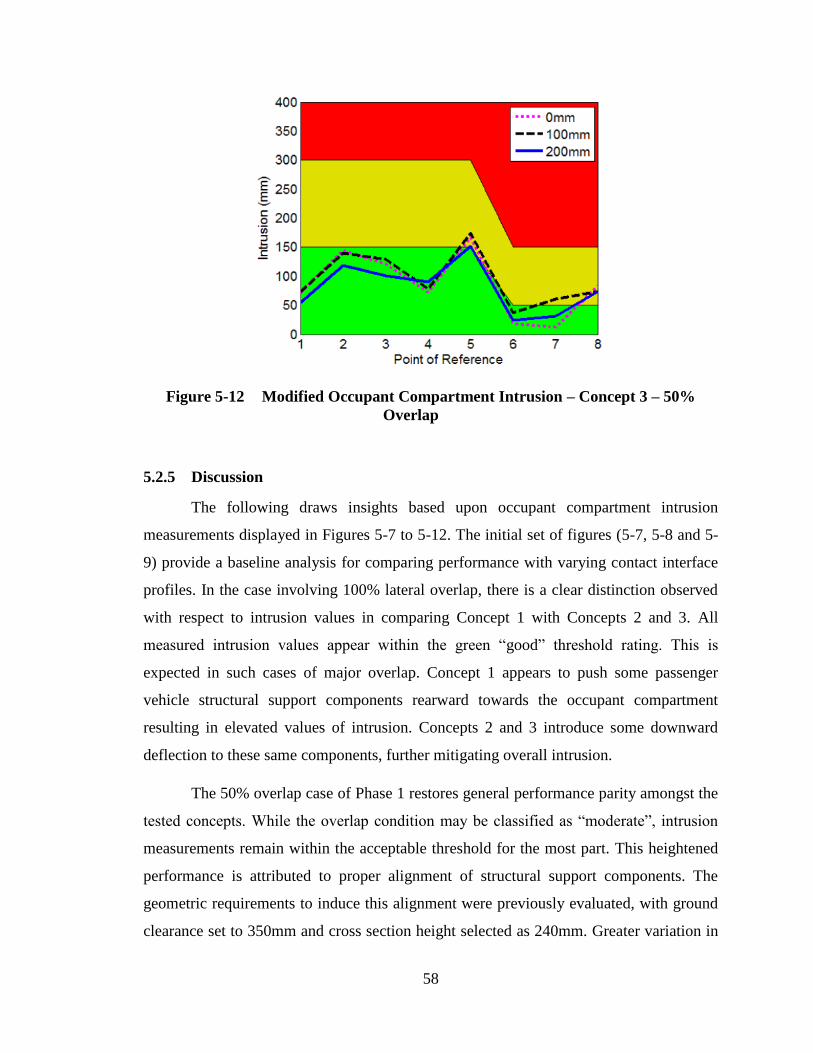
58
Figure 5-12 Modified Occupant Compartment Intrusion – Concept 3 – 50%
Overlap
5.2.5 Discussion
The following draws insights based upon occupant compartment intrusion
measurements displayed in Figures 5-7 to 5-12. The initial set of figures (5-7, 5-8 and 5-
9) provide a baseline analysis for comparing performance with varying contact interface
profiles. In the case involving 100% lateral overlap, there is a clear distinction observed
with respect to intrusion values in comparing Concept 1 with Concepts 2 and 3. All
measured intrusion values appear within the green “good” threshold rating. This is
expected in such cases of major overlap. Concept 1 appears to push some passenger
vehicle structural support components rearward towards the occupant compartment
resulting in elevated values of intrusion. Concepts 2 and 3 introduce some downward
deflection to these same components, further mitigating overall intrusion.
The 50% overlap case of Phase 1 restores general performance parity amongst the
tested concepts. While the overlap condition may be classified as “moderate”, intrusion
measurements remain within the acceptable threshold for the most part. This heightened
performance is attributed to proper alignment of structural support components. The
geometric requirements to induce this alignment were previously evaluated, with ground
clearance set to 350mm and cross section height selected as 240mm. Greater variation in
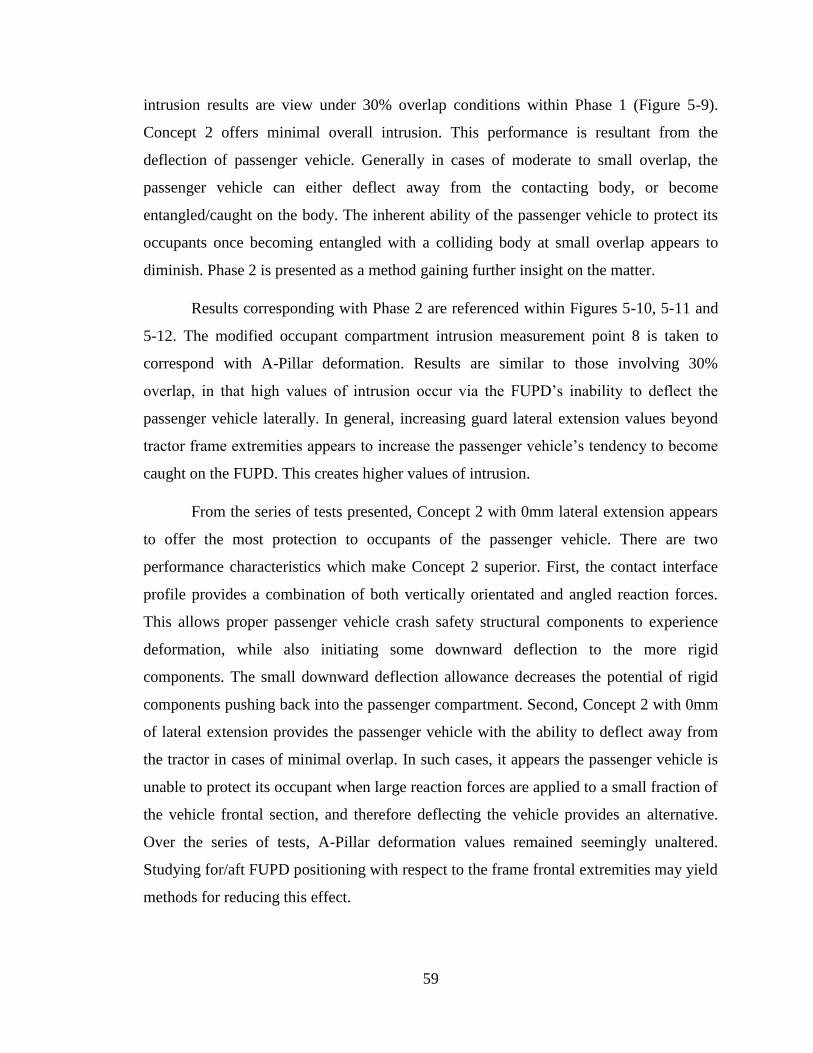
59
intrusion results are view under 30% overlap conditions within Phase 1 (Figure 5-9).
Concept 2 offers minimal overall intrusion. This performance is resultant from the
deflection of passenger vehicle. Generally in cases of moderate to small overlap, the
passenger vehicle can either deflect away from the contacting body, or become
entangled/caught on the body. The inherent ability of the passenger vehicle to protect its
occupants once becoming entangled with a colliding body at small overlap appears to
diminish. Phase 2 is presented as a method gaining further insight on the matter.
Results corresponding with Phase 2 are referenced within Figures 5-10, 5-11 and
5-12. The modified occupant compartment intrusion measurement point 8 is taken to
correspond with A-Pillar deformation. Results are similar to those involving 30%
overlap, in that high values of intrusion occur via the FUPD‟s inability to deflect the
passenger vehicle laterally. In general, increasing guard lateral extension values beyond
tractor frame extremities appears to increase the passenger vehicle‟s tendency to become
caught on the FUPD. This creates higher values of intrusion.
From the series of tests presented, Concept 2 with 0mm lateral extension appears
to offer the most protection to occupants of the passenger vehicle. There are two
performance characteristics which make Concept 2 superior. First, the contact interface
profile provides a combination of both vertically orientated and angled reaction forces.
This allows proper passenger vehicle crash safety structural components to experience
deformation, while also initiating some downward deflection to the more rigid
components. The small downward deflection allowance decreases the potential of rigid
components pushing back into the passenger compartment. Second, Concept 2 with 0mm
of lateral extension provides the passenger vehicle with the ability to deflect away from
the tractor in cases of minimal overlap. In such cases, it appears the passenger vehicle is
unable to protect its occupant when large reaction forces are applied to a small fraction of
the vehicle frontal section, and therefore deflecting the vehicle provides an alternative.
Over the series of tests, A-Pillar deformation values remained seemingly unaltered.
Studying for/aft FUPD positioning with respect to the frame frontal extremities may yield
methods for reducing this effect.
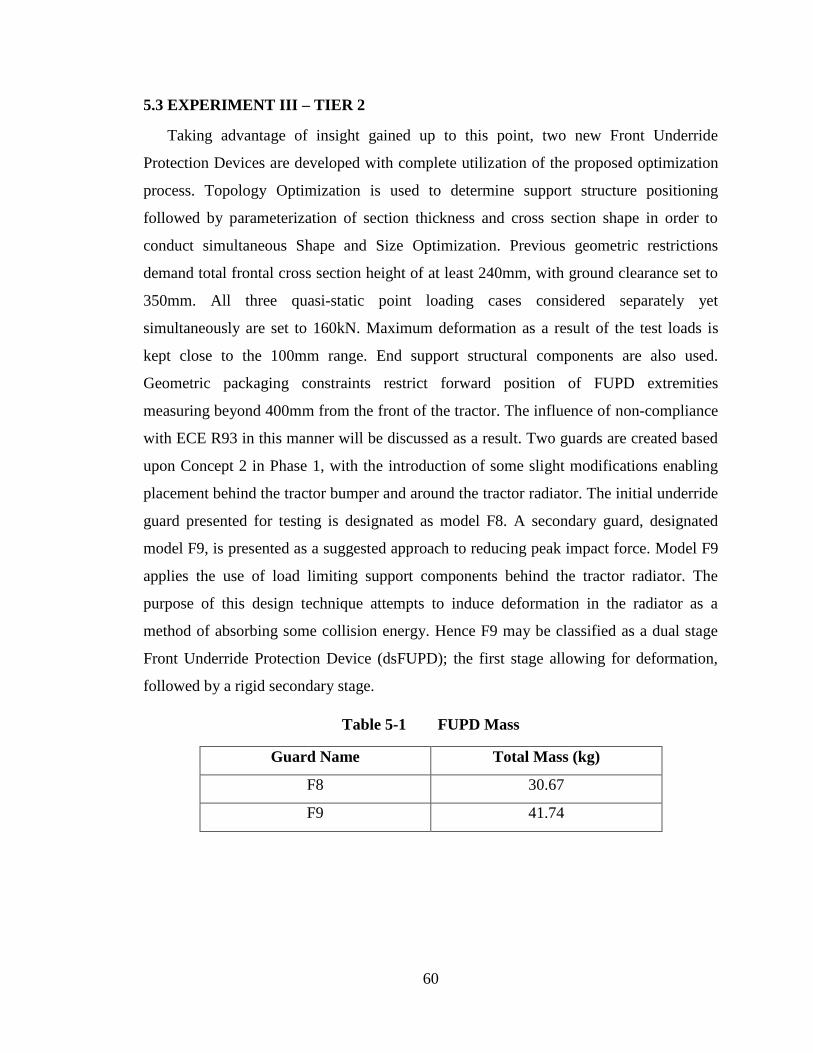
60
5.3 EXPERIMENT III – TIER 2
Taking advantage of insight gained up to this point, two new Front Underride
Protection Devices are developed with complete utilization of the proposed optimization
process. Topology Optimization is used to determine support structure positioning
followed by parameterization of section thickness and cross section shape in order to
conduct simultaneous Shape and Size Optimization. Previous geometric restrictions
demand total frontal cross section height of at least 240mm, with ground clearance set to
350mm. All three quasi-static point loading cases considered separately yet
simultaneously are set to 160kN. Maximum deformation as a result of the test loads is
kept close to the 100mm range. End support structural components are also used.
Geometric packaging constraints restrict forward position of FUPD extremities
measuring beyond 400mm from the front of the tractor. The influence of non-compliance
with ECE R93 in this manner will be discussed as a result. Two guards are created based
upon Concept 2 in Phase 1, with the introduction of some slight modifications enabling
placement behind the tractor bumper and around the tractor radiator. The initial underride
guard presented for testing is designated as model F8. A secondary guard, designated
model F9, is presented as a suggested approach to reducing peak impact force. Model F9
applies the use of load limiting support components behind the tractor radiator. The
purpose of this design technique attempts to induce deformation in the radiator as a
method of absorbing some collision energy. Hence F9 may be classified as a dual stage
Front Underride Protection Device (dsFUPD); the first stage allowing for deformation,
followed by a rigid secondary stage.
Table 5-1 FUPD Mass
Guard Name Total Mass (kg)
F8 30.67
F9 41.74
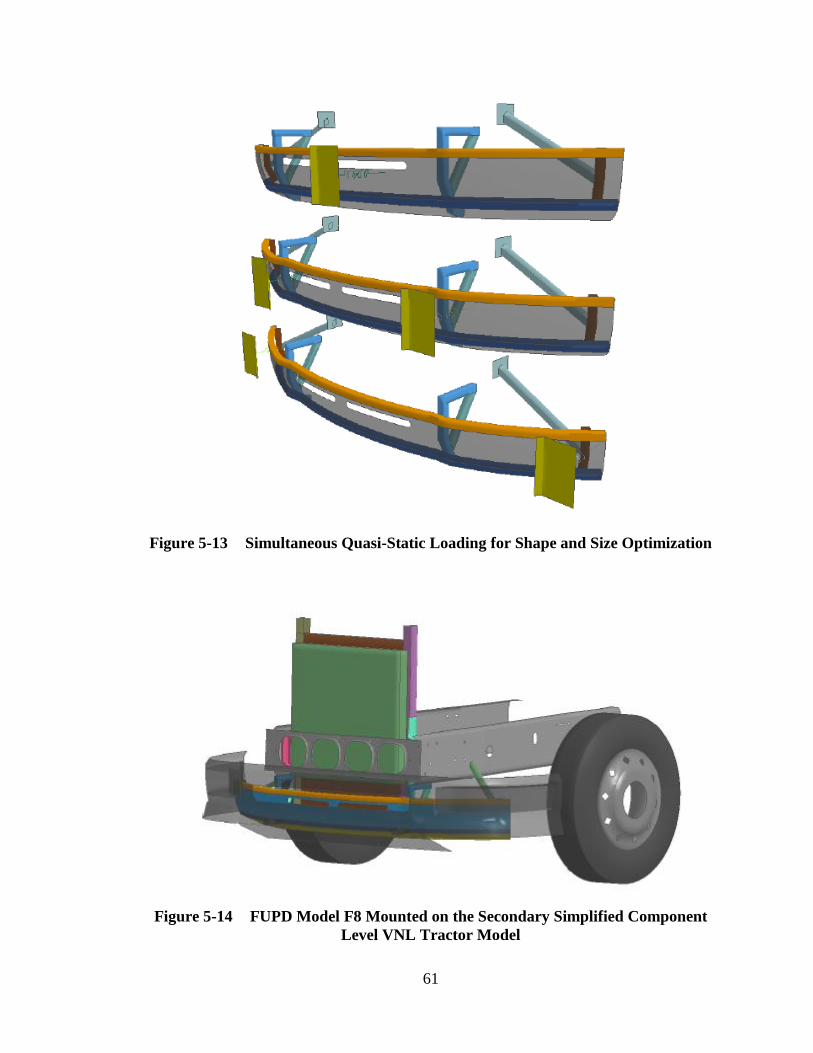
61
Figure 5-13 Simultaneous Quasi-Static Loading for Shape and Size Optimization
Figure 5-14 FUPD Model F8 Mounted on the Secondary Simplified Component
Level VNL Tractor Model
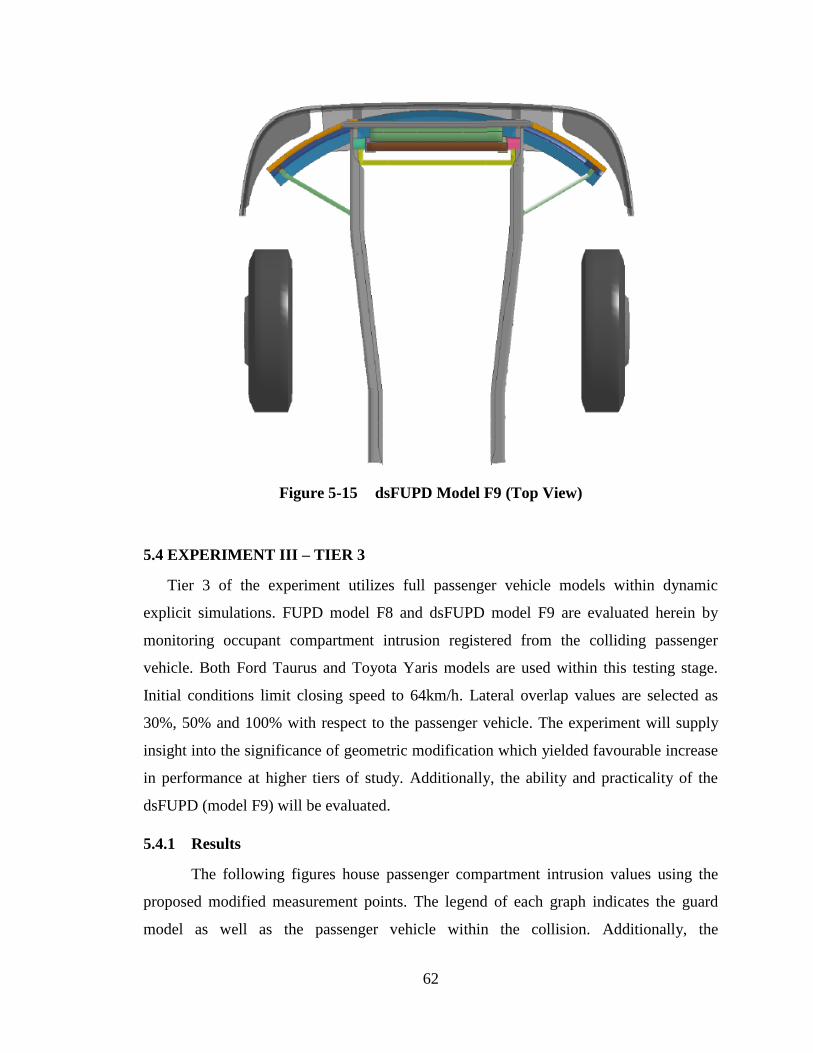
62
Figure 5-15 dsFUPD Model F9 (Top View)
5.4 EXPERIMENT III – TIER 3
Tier 3 of the experiment utilizes full passenger vehicle models within dynamic
explicit simulations. FUPD model F8 and dsFUPD model F9 are evaluated herein by
monitoring occupant compartment intrusion registered from the colliding passenger
vehicle. Both Ford Taurus and Toyota Yaris models are used within this testing stage.
Initial conditions limit closing speed to 64km/h. Lateral overlap values are selected as
30%, 50% and 100% with respect to the passenger vehicle. The experiment will supply
insight into the significance of geometric modification which yielded favourable increase
in performance at higher tiers of study. Additionally, the ability and practicality of the
dsFUPD (model F9) will be evaluated.
5.4.1 Results
The following figures house passenger compartment intrusion values using the
proposed modified measurement points. The legend of each graph indicates the guard
model as well as the passenger vehicle within the collision. Additionally, the
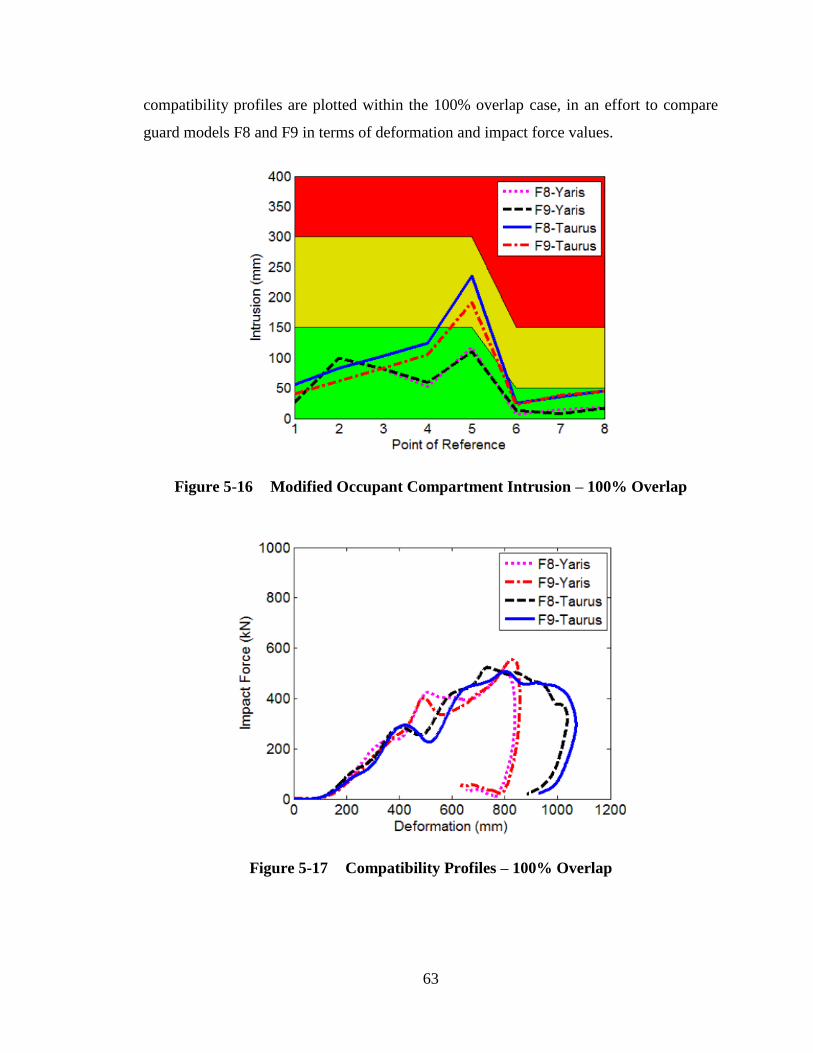
63
compatibility profiles are plotted within the 100% overlap case, in an effort to compare
guard models F8 and F9 in terms of deformation and impact force values.
Figure 5-16 Modified Occupant Compartment Intrusion – 100% Overlap
Figure 5-17 Compatibility Profiles – 100% Overlap
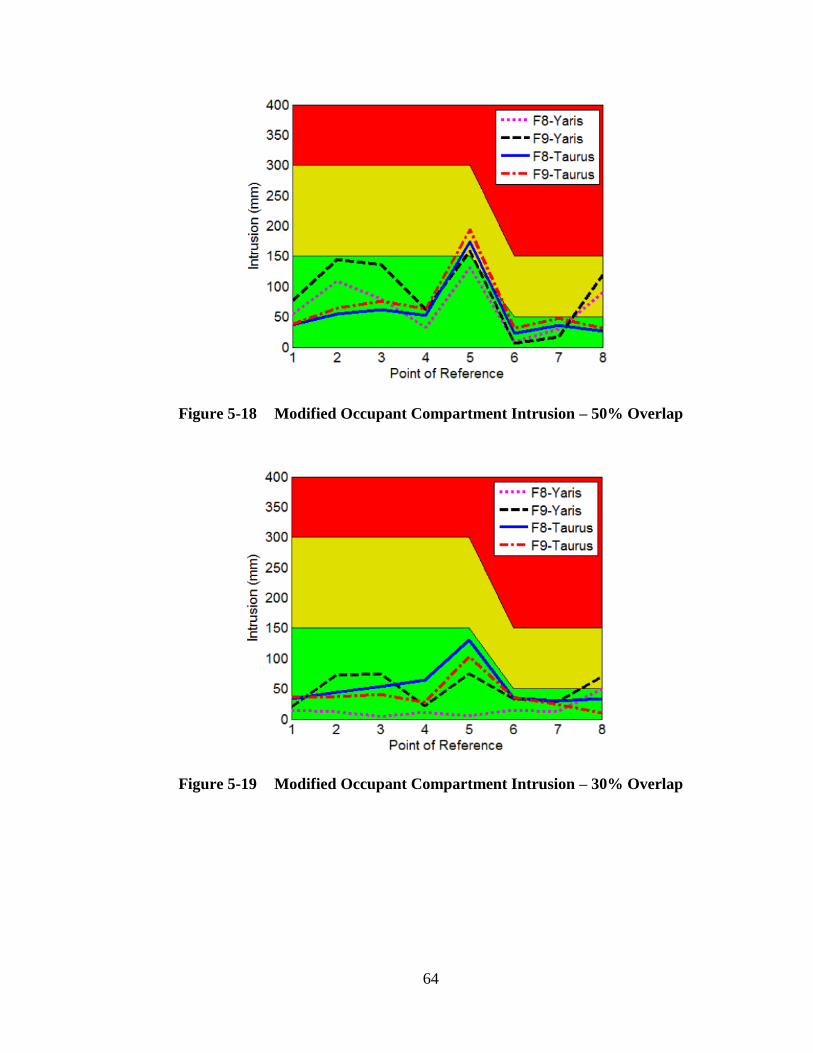
64
Figure 5-18 Modified Occupant Compartment Intrusion – 50% Overlap
Figure 5-19 Modified Occupant Compartment Intrusion – 30% Overlap
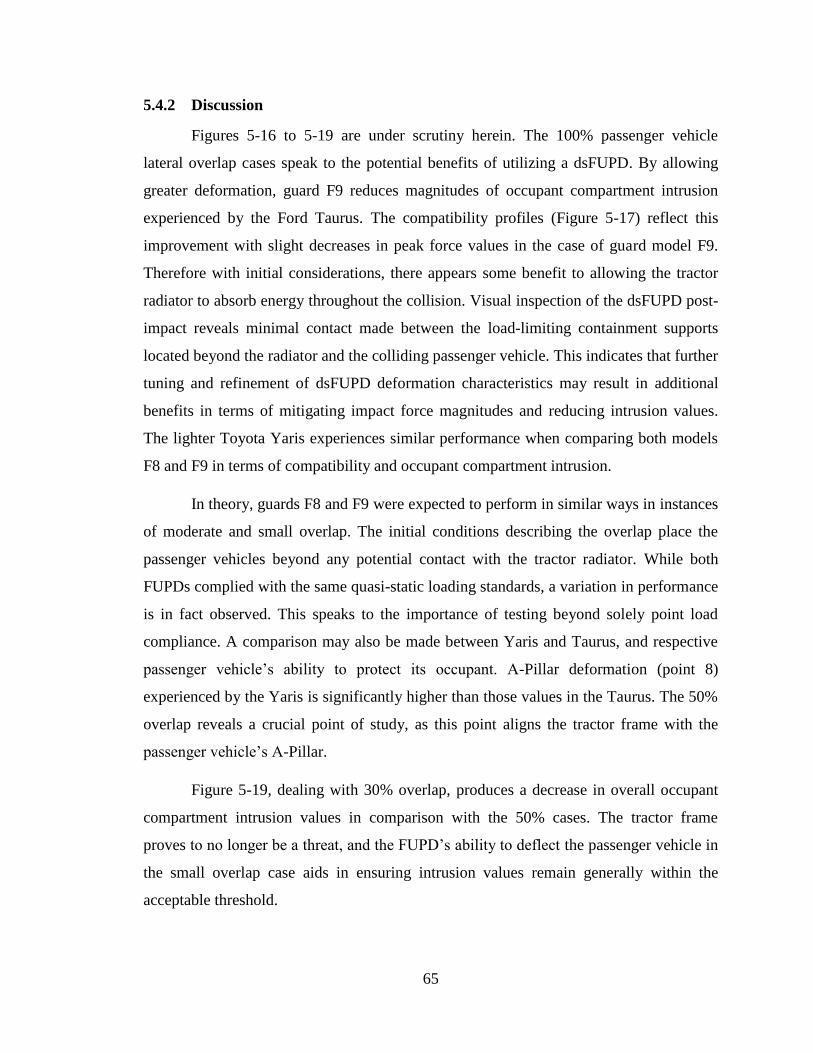
65
5.4.2 Discussion
Figures 5-16 to 5-19 are under scrutiny herein. The 100% passenger vehicle
lateral overlap cases speak to the potential benefits of utilizing a dsFUPD. By allowing
greater deformation, guard F9 reduces magnitudes of occupant compartment intrusion
experienced by the Ford Taurus. The compatibility profiles (Figure 5-17) reflect this
improvement with slight decreases in peak force values in the case of guard model F9.
Therefore with initial considerations, there appears some benefit to allowing the tractor
radiator to absorb energy throughout the collision. Visual inspection of the dsFUPD post-
impact reveals minimal contact made between the load-limiting containment supports
located beyond the radiator and the colliding passenger vehicle. This indicates that further
tuning and refinement of dsFUPD deformation characteristics may result in additional
benefits in terms of mitigating impact force magnitudes and reducing intrusion values.
The lighter Toyota Yaris experiences similar performance when comparing both models
F8 and F9 in terms of compatibility and occupant compartment intrusion.
In theory, guards F8 and F9 were expected to perform in similar ways in instances
of moderate and small overlap. The initial conditions describing the overlap place the
passenger vehicles beyond any potential contact with the tractor radiator. While both
FUPDs complied with the same quasi-static loading standards, a variation in performance
is in fact observed. This speaks to the importance of testing beyond solely point load
compliance. A comparison may also be made between Yaris and Taurus, and respective
passenger vehicle‟s ability to protect its occupant. A-Pillar deformation (point 8)
experienced by the Yaris is significantly higher than those values in the Taurus. The 50%
overlap reveals a crucial point of study, as this point aligns the tractor frame with the
passenger vehicle‟s A-Pillar.
Figure 5-19, dealing with 30% overlap, produces a decrease in overall occupant
compartment intrusion values in comparison with the 50% cases. The tractor frame
proves to no longer be a threat, and the FUPD‟s ability to deflect the passenger vehicle in
the small overlap case aids in ensuring intrusion values remain generally within the
acceptable threshold.
66
5.5 CONCEPT EVALUATION
The adjusted simplified initial test procedure using a dual spring mounting system to
reflect expected FUPD deformation proved to be a valuable tool in the investigation of
contact profile geometry. From this testing it was conceived that occupant compartment
intrusion could be reduced by instigating some downward deflection of rigid passenger
vehicle components. The alternative to this deflection results in a push-back, which
heightens intrusion values. Downward deflection may be initiated by an angled FUPD
frontal interface. It also became apparent two types of reaction may result from moderate
and small overlap collisions. In such scenarios, the passenger vehicle may become
caught/entangled on the FUPD, or may deflect and slide laterally away from the tractor. It
was found that the passenger vehicle‟s ability to protect its occupants decreases when the
vehicle becomes caught on the FUPD. Therefore allowing some degree of outward
deflection is favourable. To induce this deflection, the FUPD should be angled
longitudinally rearward, without sharp changes in geometric profile. The necessity of
such a curved profile is further demanded in fitting the device within aerodynamically
conscience bumper designs. The combination of these factors results in FUPD extremities
lying beyond 400mm from the front of the tractor. This is outside allowable
measurements set forth by ECE R93. From the guards tested, there appears to be no
detrimental performance factors associated with this type of FUPD design. Of course for
the specific application, no significant structural components reside within the area
between the frame and tires of the tractor, which might cause this conclusion to otherwise
differ.
67
CHAPTER 6 ADDITIONAL SENSITIVITY
CONSIDERATIONS
6.1 INITIAL CONDITIONS
The initial conditions set forth for the evaluation of FUPDs remains bounded by areas
of validation. The complete vehicle finite element models made public within the NCAC
database have been validated with physical tests involving the passenger vehicle colliding
with some form of rigid or deformable barrier at a variety of lateral overlaps. Passenger
vehicle closing speeds are generally held within the 56km/h to 64km/h range dependant
on the validation process undertaken. Subjecting the passenger vehicle models to
additional applications, such as FUPD testing, presents some challenges. In order to
gather and study valid collision properties and reactions, a conscious effort is required in
establishing test conditions. The initial test conditions are therefore set forth to replicate
the zones within which the passenger vehicle models have proven to be valid. As such,
holding the component level tractor stationary and inducing a closing speed in the
passenger vehicle replicates the physical vehicle-barrier tests as much as possible.
Vehicle closing speeds (except for one case) were set to 64km/h to ensure test validation.
The single case which considered a heightened speed resides in Experiment I, in which
case the Yaris closing speed was set to 80km/h in order to investigate changes in rigid
simplified FUPD cross-section height and ground clearance variation. While this phase of
work extended beyond the validation zone, no explicit quantitative results were used in
defining FUPD performance considerations. The test simply provided a broader
perspective of the reactions expected at heightened speed. The significance of these
considerations speaks to the desired integrity and practical application of project
outcomes.
6.2 HEAVY BRAKING
In an effort to study FUPD robustness over a variety of reasonable test conditions, the
instance of heavy braking was considered. The case set forth considers similar test
conditions to those previously described; however the passenger vehicle is subjected to
heavy braking prior to collision with the FUPD. The test strives to determine the
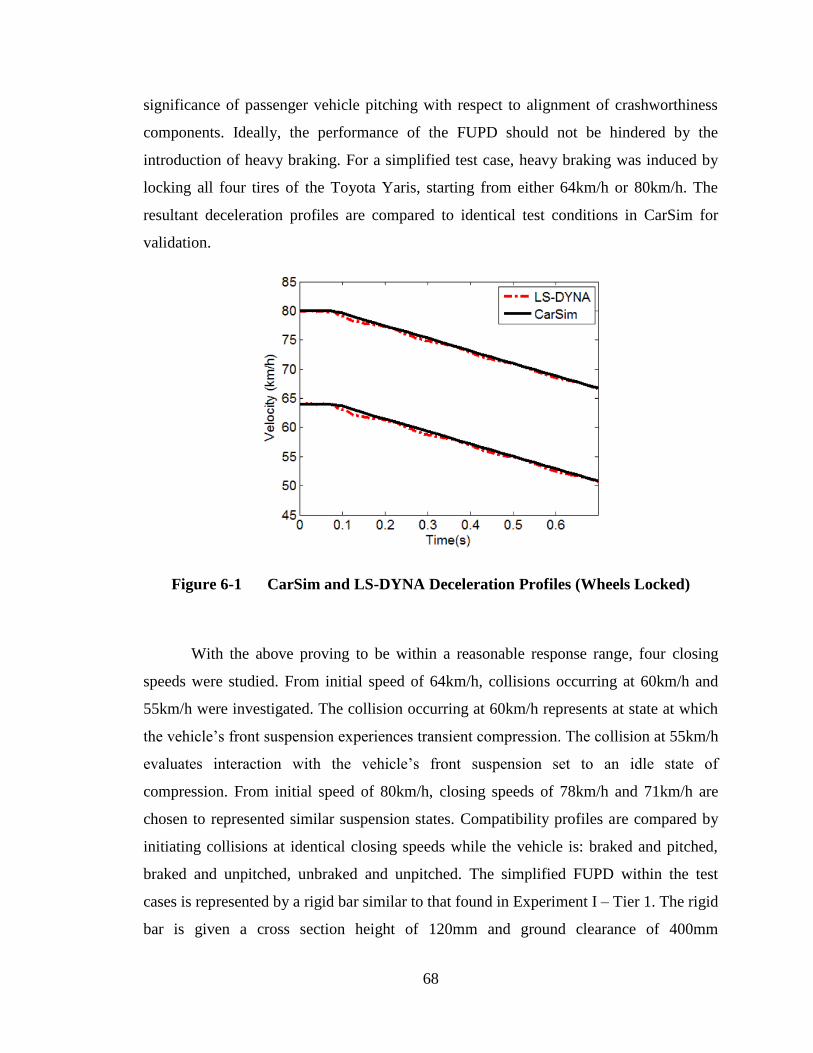
68
significance of passenger vehicle pitching with respect to alignment of crashworthiness
components. Ideally, the performance of the FUPD should not be hindered by the
introduction of heavy braking. For a simplified test case, heavy braking was induced by
locking all four tires of the Toyota Yaris, starting from either 64km/h or 80km/h. The
resultant deceleration profiles are compared to identical test conditions in CarSim for
validation.
Figure 6-1 CarSim and LS-DYNA Deceleration Profiles (Wheels Locked)
With the above proving to be within a reasonable response range, four closing
speeds were studied. From initial speed of 64km/h, collisions occurring at 60km/h and
55km/h were investigated. The collision occurring at 60km/h represents at state at which
the vehicle‟s front suspension experiences transient compression. The collision at 55km/h
evaluates interaction with the vehicle‟s front suspension set to an idle state of
compression. From initial speed of 80km/h, closing speeds of 78km/h and 71km/h are
chosen to represented similar suspension states. Compatibility profiles are compared by
initiating collisions at identical closing speeds while the vehicle is: braked and pitched,
braked and unpitched, unbraked and unpitched. The simplified FUPD within the test
cases is represented by a rigid bar similar to that found in Experiment I – Tier 1. The rigid
bar is given a cross section height of 120mm and ground clearance of 400mm
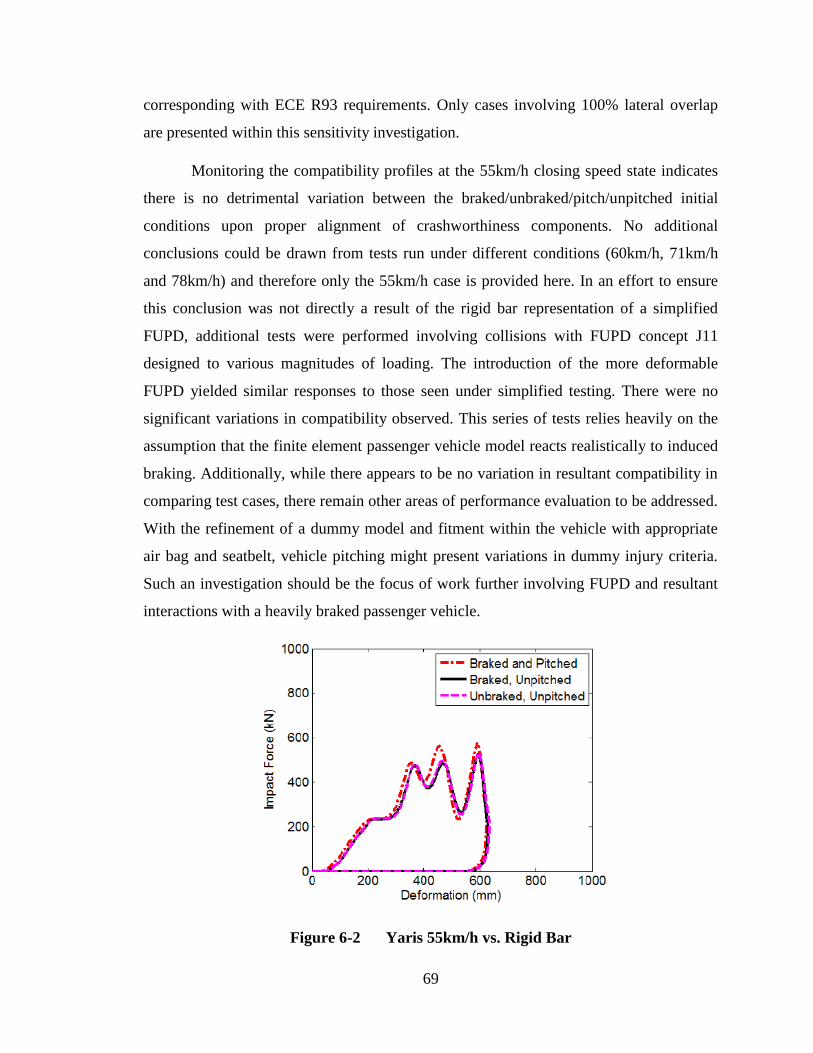
69
corresponding with ECE R93 requirements. Only cases involving 100% lateral overlap
are presented within this sensitivity investigation.
Monitoring the compatibility profiles at the 55km/h closing speed state indicates
there is no detrimental variation between the braked/unbraked/pitch/unpitched initial
conditions upon proper alignment of crashworthiness components. No additional
conclusions could be drawn from tests run under different conditions (60km/h, 71km/h
and 78km/h) and therefore only the 55km/h case is provided here. In an effort to ensure
this conclusion was not directly a result of the rigid bar representation of a simplified
FUPD, additional tests were performed involving collisions with FUPD concept J11
designed to various magnitudes of loading. The introduction of the more deformable
FUPD yielded similar responses to those seen under simplified testing. There were no
significant variations in compatibility observed. This series of tests relies heavily on the
assumption that the finite element passenger vehicle model reacts realistically to induced
braking. Additionally, while there appears to be no variation in resultant compatibility in
comparing test cases, there remain other areas of performance evaluation to be addressed.
With the refinement of a dummy model and fitment within the vehicle with appropriate
air bag and seatbelt, vehicle pitching might present variations in dummy injury criteria.
Such an investigation should be the focus of work further involving FUPD and resultant
interactions with a heavily braked passenger vehicle.
Figure 6-2 Yaris 55km/h vs. Rigid Bar
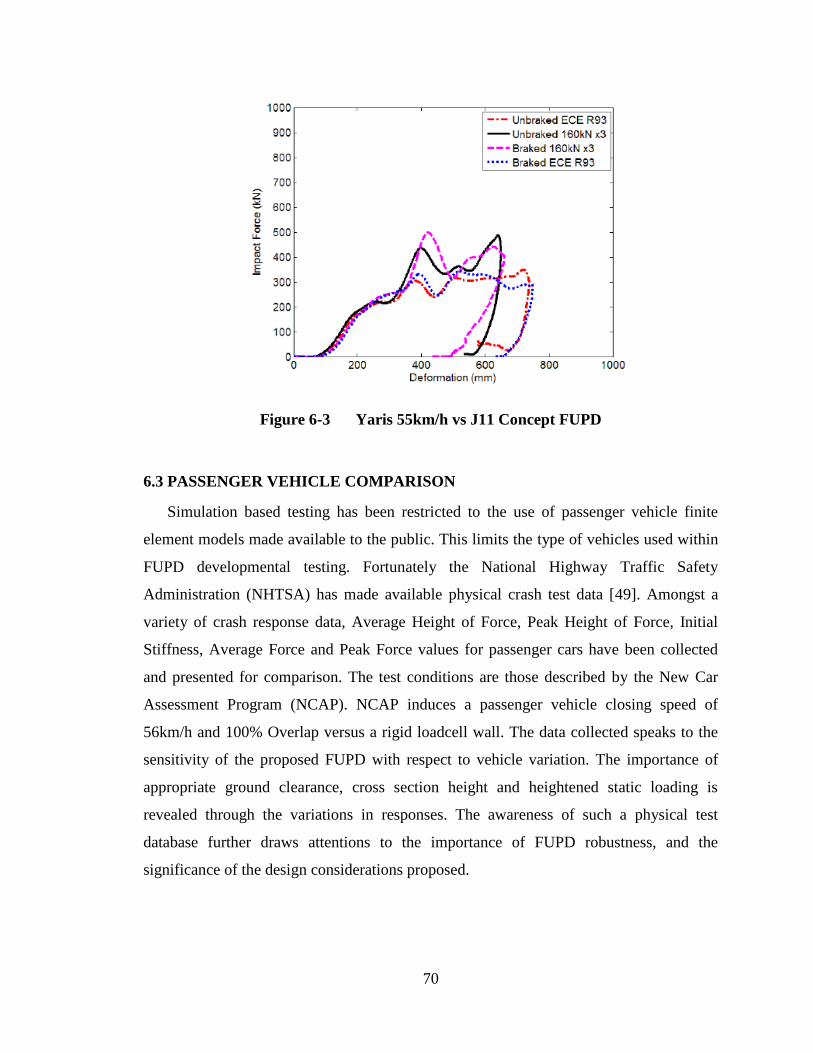
70
Figure 6-3 Yaris 55km/h vs J11 Concept FUPD
6.3 PASSENGER VEHICLE COMPARISON
Simulation based testing has been restricted to the use of passenger vehicle finite
element models made available to the public. This limits the type of vehicles used within
FUPD developmental testing. Fortunately the National Highway Traffic Safety
Administration (NHTSA) has made available physical crash test data [49]. Amongst a
variety of crash response data, Average Height of Force, Peak Height of Force, Initial
Stiffness, Average Force and Peak Force values for passenger cars have been collected
and presented for comparison. The test conditions are those described by the New Car
Assessment Program (NCAP). NCAP induces a passenger vehicle closing speed of
56km/h and 100% Overlap versus a rigid loadcell wall. The data collected speaks to the
sensitivity of the proposed FUPD with respect to vehicle variation. The importance of
appropriate ground clearance, cross section height and heightened static loading is
revealed through the variations in responses. The awareness of such a physical test
database further draws attentions to the importance of FUPD robustness, and the
significance of the design considerations proposed.
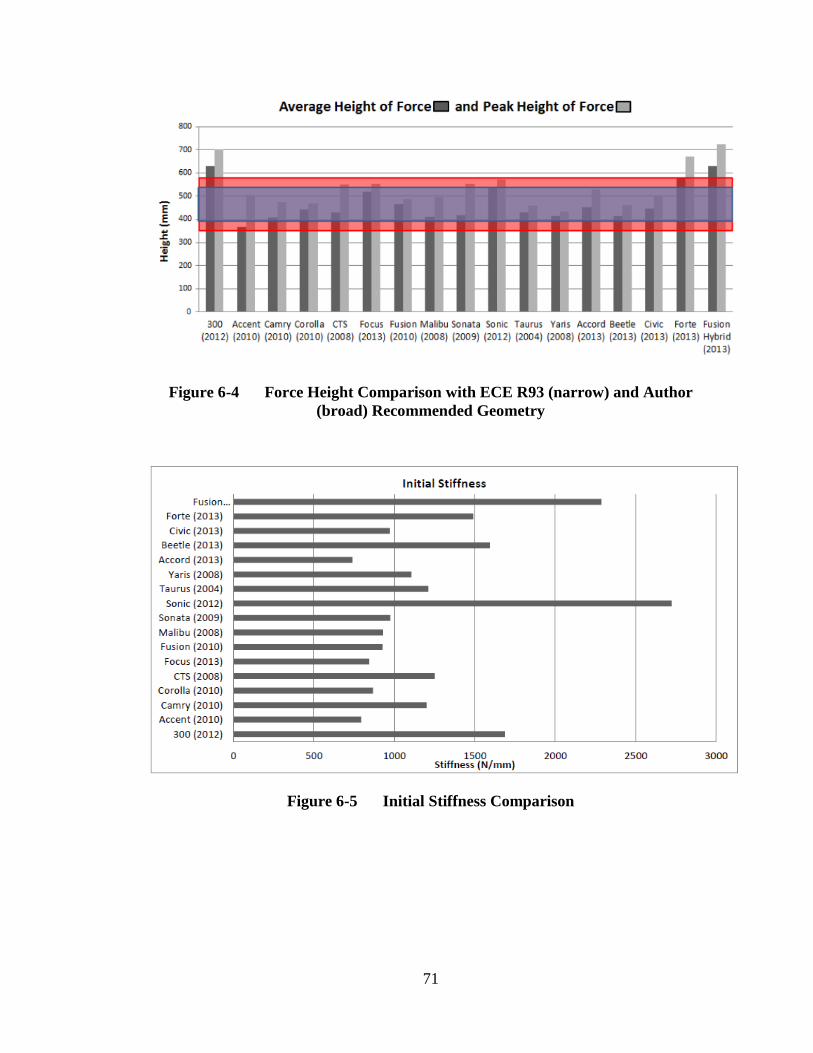
71
Figure 6-4 Force Height Comparison with ECE R93 (narrow) and Author
(broad) Recommended Geometry
Figure 6-5 Initial Stiffness Comparison
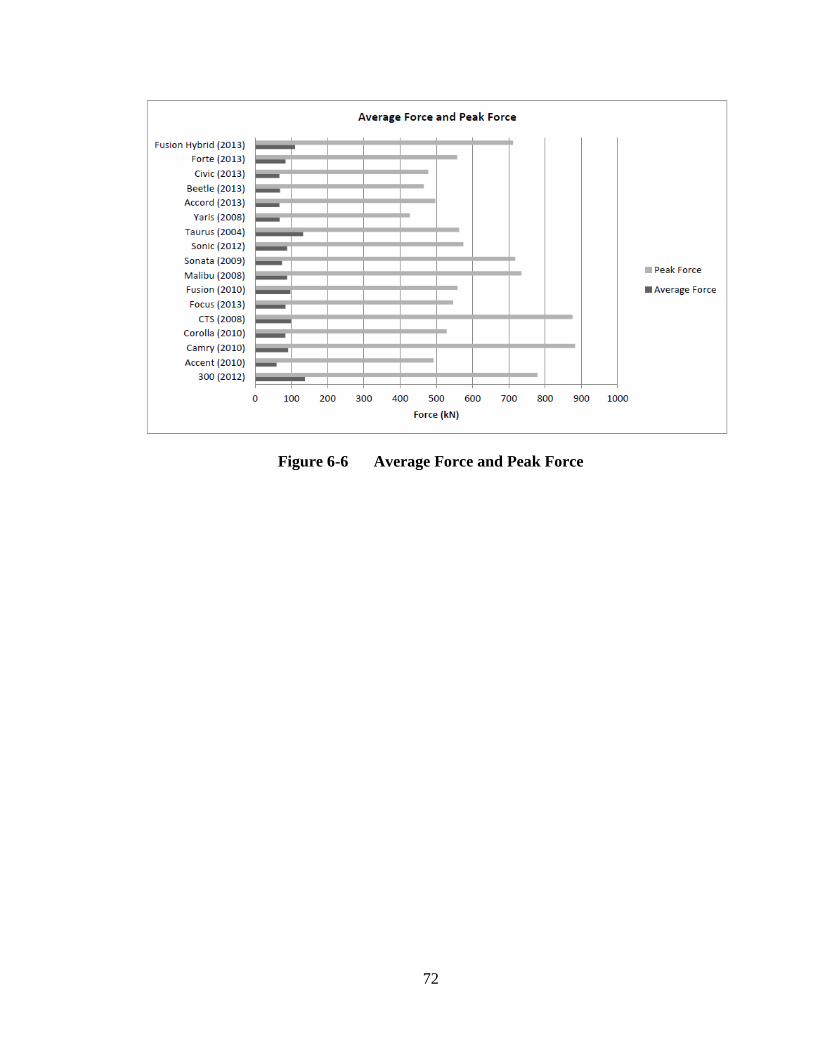
72
Figure 6-6 Average Force and Peak Force
73
CHAPTER 7 CONCLUSIONS AND FUTURE
WORK
7.1 CONCLUSIONS
The Front Underride Protection Device project was initiated in an effort to study
the potential benefits of installing FUPDs on North American Conventional style
Tractors. The European regulation for FUPDs (ECE R93) served as a foundation for
testing procedures. Aside from some physical variations between North American and
European style tractors, a number of external researchers had also presented work
revealing inadequacies of ECE R93. The project as an entirety therefore sought to
understand potential sources of improvement in all aspects of front underride. A meta-
level design approach was also proposed to ensure effective performance improvements
from one experimental stage to the next.
The proposed design approach was applied for use in seeking FUPD design
parameter refinement. The suggested method isolated a number of related design
parameters for sequential study over a course of experiments. The conclusions drawn
from each experiment further refined the design space boundary conditions and provided
insight into the next potential stage worth investigation. Each experiment applied a three
tier approach. Tier I described and isolated design parameters of interest. Full vehicle
model dynamic testing was conducted with some simplified form of FUPD revealing
relationships between the influencing parameters and crash performance. Tier II was
driven from conclusions drawn in Tier I, and applied a number of optimization
procedures in developing FUPDs for further testing. The use of Topology Optimization
followed by simultaneous Shape and Size Optimization proved to be a valuable aid to
engineering intuition throughout the design phase. Tier II applied solely quasi-static
loading with loads equal or beyond those proposed by ECE R93. This ensured all systems
developed were not over designed. An over designed case might provide a false sense of
collision performance. Point loads within the optimization procedure were considered
simultaneously for section thickness and shape assignment under quasi-static implicit
solution types. Tier II delivered FUPD(s) to Tier III, which were then subject to full
74
passenger vehicle model dynamic testing. The results of the final set of tests provided
more realistic insight into FUPD performance gains with respect to the simplifications
assumed in the initial Tier.
The design approach proved to be an effective method of studying and developing
Front Underride Protection Devices. The proposed design approach allowed for
resolution of disconnected parameter consideration which may have been present in the
design of previous structural support systems. The continuous improvement and search
scope refinement method produced further contributions to general design efficiency.
One such case involved the suggestion of simultaneous rather than sequential quasi-static
point loads, allowing for improved design continuity. An additional concept for
simplified FUPD testing involved the use of a dual spring component level system.
Tuning of the springs provided a more realistic collision response in comparison with
simplified rigid and fixed systems. The refinement allows one to draw greater insight into
the relationship of parameter variation in question with respect to its influence on
collision performance.
Considering the physical design of Front Underride Protection Devices, a number
of recommendations have been made in an effort to offer consistent performance over a
variety of collision states. In almost all cases, suggestions extend beyond limitations set
by ECE R93. Geometric variations regarding frontal cross section height as well as
ground clearance were investigated. The test cases and subsequently developed FUPDs
revealed designing with 350mm of ground clearance and 240mm of frontal cross section
height provides elevated robustness. Testing also revealed the benefit to increasing point
loading magnitudes while reducing maximum deformation under quasi-static evaluation.
Setting all loading points (P1, P2 and P3) to 160kN and restricting resultant deformation
to around 100mm resulted in the creation of guards which provided superior reaction
force under the collision cases while maintaining device mass within a reasonable range.
The use of support components for FUPD extremities proved to be a valuable method of
providing increased performance under small and moderate overlap collisions while
significantly reducing overall system mass.
75
The influence of collision interface geometric profile was also studied in relation
to induced occupant compartment intrusion. The demand for curved aerodynamically
efficient bumpers conflicts with FUPD extremity positioning relative to the front of the
tractor. Under the specified design case, developing a structural support system within the
bounds of the curved bumper proved beneficial to deflecting the passenger vehicle aside
in instances of small overlap collisions. While it appears that passenger vehicles are
unable to properly protect their occupants when loaded directly in small overlap collision,
inducing some outward deflection reduces magnitudes of passenger compartment
intrusion.
It is the hope that this work may provide a point of reference and discussion in the
future development of Front Underride Protection Devices and high impact structural
support components alike. While potential performance increases extend as governed by
the State-of-Possible philosophy, may this work be a stepping stone towards such
heightened levels of roadway safety.
7.2 FUTURE WORK
Future work should take advantage of the design scope refinement approach in an
effort to further investigate areas of improved FUPD performance and robustness. This
includes the consideration of occupant dummy related injury criteria, if and when
validated reliable models become available for use. Work must continue to utilize the
most recent passenger vehicle and tractor-trailer finite element models, in order to remain
relevant in terms of application and design.
The proposed FUPDs were tested when mounted upon a component level tractor. The
nature of this simplified tractor neglects potential frame-dependant support
considerations. Work should therefore study with elevated scrutiny the influence on
frame mounting procedures and subsequent responses to both quasi-static and dynamic
load types. Studying variations in frame application may also reveal benefits to directly
integrating the FUPD with the frame, as opposed to the current bolt/weld installation
method.

76
PUBLICATIONS
MacDonald, T. El-Gindy, M. Ghantae, S. Critchley, D. Ramachandra, S. “A
Comprehensive Review of Front Underride Protection Device Design and Evaluation”.
International Journal of Vehicle Systems Modelling and Testing, 2013 Vol 8, No.3, 282-
294.
MacDonald, T. El-Gindy, M. Ghantae, S. Critchley, D. Ramachandra, S. “Rigid Front
Underride Protection Devices (FUPD): Compatibility and Development via
Optimization”. 2013 ASME International Design Engineering Technical Conference &
Advanced Vehicle Technologies, August 4-7 2013, Portland, Oregon, DETC2013-12009.
MacDonald, T. El-Gindy, M. Ghantae, S. Critchley, D. Ramachandra, S. “Front
Underride Protection Device (FUPD) Development: Design Strategy with Simultaneous
Loading”. International Journal of Crashworthiness, February 2014. DOI:
10.1080/13588265.2014.887432
MacDonald, T. El-Gindy, M. Ghantae, S. Critchley, D. Ramachandra, S. “Dual Stage
Front Underride Protection Devices (dsFUPDs): Collision Interface and Passenger
Compartment Intrusion”. SAE 2014 World Congress & Exhibition, Occupant Protection:
Structural Crashworthiness and Occupant Safety, April 8-10 2014, Detroit, Michigan,
2014-01-056.7
77
REFERENCES
[1] Transportation Research Board. (1993). NCHRP Report 350 . Washington:
National Academy Press.
[2] UNECE. (1994). Regulation No. 93 - Front Underrun Protection.
[3] Australia. (2009). Vehicle Standard (Australian Design Rule 84/00 - Front
Underrun Impact Protection) 2009. Minister for Infrastructure, Transport,
Regional Development and Local Government.
[4] Sukeawa, Y. (2006). Japan's Approach to FUPD. Final Workshop Invitation of
VC-COMPAT. Japan Automobile Research Institute.
[5] Government of India. (2006). Automotive Industry Standard AIS-069. Pune:
Automotive Research Association of India.
[6] 2009 Canadian Vehicle Survey Summary Report. (2012, 09). Retrieved from
Natural Resources Canada:
http://oee.rncan.gc.ca/publications/statistics/cvs09/pdf/cvs09.pdf
[7] Road Safety and Motor Vehicle Regulation Directorate. (2010). Heavy Truck
Casualty Collisions 2001-2005. Retrieved from Transport Canada:
http://www.tc.gc.ca/eng/roadsafety/tp-tp2436-rs201003-1042.htm
[8] Blincoe, L., Seay, A., Zaloshnja, E., Miller, T., Romano, E., Luchter, S., &
Spicer, R. (2002). The Economic Impact of Motor Vehicle Crashes, 2000.
Washington: U.S Department of Transportation.
[9] Insurance Institute for Highway Safety. (2012). Fatality Facts 2010 - Large
Truck. Retrieved from
http://www.iihs.org/research/fatality.aspx?topicName=Largetrucks &year=2010
[10] Blower, D., & Woodrooffe, J. (2012). Survey of the Status of Truck Safety: Brazil,
China, Australia and the United States. Ann Arbor: The University of Michigan,
Transportation Research Institute.
[11] R. Dam, P.J.A de Coo, Report detailing final test procedure(s) and performance
criteria for car to truck underrun, BASt, VC-Compact, 2007.
[12] European Parliament and the Council of the European Union, Directive
2000/40EC of the European Parliament and of the Council, Official Journal of
the European Communities, (2000), pp. 9-28.
[13] J. Lambert, G. Rechnitzer, Review of Truck Safety: Stage 1: Frontal, Side and
Rear Underrun Protection, Monash University – Accident Research Centre, 2002.
[14] Prain Consulting PTY. LTD. (2007). Front Underrun Protection Device For Ford
LTL. National Transport Commission.
78
[15] Prain Consulting PTY. LTD. (2006). Front Underrun Protection Device For
Kenworth K104. National Transport Commission.
[16] Chislett, W., & Robinson, T. L. (2010). Investigating the real-world effectiveness
of introducing mandatory fitment of front underrun protection to heavy goods
vehicles. Transport Research Laboratory.
[17] Krusper, A., & Thomson, R. (2008). Crash Compatibility Between HGVs and
Passenger Cars: Structural Interaction Analysis and In-Depth Accident Analysis.
10th International Symposium on Heavy Vehicle Transport Technology.
[18] J. Anderson, Inventory of Current Underrun Devices, Cranfield Impact Centre,
VC-Compat, 2003.
[19] Hjelm, L., & Bergqvist, B. (2009). European Truck Aerodynamics - A
Comparison Between Conventional and CoE Truck Aerodynamics and a Look
into Future Trends and Possibilities. The Aerodynamics of Heavy Vehicles II:
Trucks, Buses and Trains, 469-477.
[20] FKA. (2011). Final Report: Design of a Tractor for Optimised Safety and Fuel
Consumption. Retrieved from Transport and Environment:
http://www.transportenvironment.org/sites/te/files/media/2012%20
02%20FKA%20Smart%20Cab%20study_web.pdf
[21] Freund, D. (2010). HVTT11. Retrieved from What a Difference a Quarter-Century
Makes: http://hvttconference.com/hvtt11/proceedings/papers/2b1/2b1%20
Paper.pdf
[22] Berg, A., Krehl, M., Riebeck, L., & Breitling, U. (2003). Passive Safety of truck
in Frontal and Rear-End Collisions with Cars. 18th ESV Conference on the
Enhanced Safety of Vehicles. Negoya: DEKRA Automobil GmbH, MAN
Nutzfahrzeuge AG.
[23] TRL, TNO, Chalmers, BASt, UTAC, Volvo, GDV, DAF, DC, Scania, UPM,
CIM. (2007). Improvement of Vehicle Crash Compatibility through the
Development of Crash Test Procedures. TRL and TNO.
[24] Castellanos, M., El-Gindy, M., Fedishen, C., Maciejewski, D., & Atahan, A.
(2010). Truck Front Underride Development: Literature Survey. International
Journal of Heavy Vehicle Systems, 18-34.
[25] Krusper, A., & Thomson, R. (2010). Energy-Absorbing FUPDs and their
Interactions with Fronts of Passenger Cars. International Journal of
Crashworthiness, 635-647.
[26] Lefer, B., & Rebolloso, I. (2012). Car-to-Truck Frontal Crash Compatibility.
Goteborg: Chalmers University of Technology.
79
[27] Witteman, W. (2005). Adaptive Frontal Structure Design to Achieve Optimal
Deceleration Pulses. 19th International Technical Conference on the Enhanced
Safety of Vehicles. Washington.
[28] NHTSA, FMVSS 223, Available at http://www.gpo.gov/fdsys/pkg/CFR-2008-
title49-vol6/pdf/CFR-2008-title49-vol6-sec571-223.pdf
[29] Transport Canada, Test Method 223 Rear Impact Guard, Standards Research and
Development Branch, Ottawa, 2003.
[30] IIHS, New crash tests: underride guards on most big rigs leave passenger vehicle
at risk in certain crashes, Arlington, 2013.
[31] Goel, T., & Stander, N. (2009). Adaptive Simulated Annealing for Global
Optimization in LS-OPT. 7th European LS-DYNA Conference. Livermore
Software Technology Corporation.
[32] Vesenjak, M., Borovinsek, M., & Ren, Z. (2007). Computational simulations of
road safety barrier using LS-DYNA. LS-DYNA Anwenderforum. Frankenthal :
University of Maribor, Slovenia.
[33] Wagstrom, L. (2012). LS-DYNA Simulations of Oblique Car-to-Car Frontal
Impacts. LS-DYNA Nordic Users' Forum.
[34] Kral, J., Setru, P., & Rajeswaran, S. (n.d.). IIHS Side Impact Analysis Using LS-
DYNA/Madymo Coupling. 8th International LS-DYNA Users Conference, (pp.
47-54).
[35] Livermore Software Technology Corporation. (2011). LS-TaSC Topology and
Shape Computations for LS-DYNA User's Manual. Livermore, California
[36] AASHTO, Manual for Assessing Safety Hardware, 2009.
[37] NCAC. (2011). Development & Validation of a Finite Element Model for the
2010 Toyota Yaris Passenger Sedan - Technical Summary. Retrieved from
http://www.ncac.gwu.edu/vml/models.html
[38] NCAC. 2010 Toyota Yaris FE Model - Report. Retrieved from
http://www.ncac.gwu.edu/vml/models.html
[39] National Crash Test Analysis Center. Technical Summary 2007-T-06 NCAC
Vehicle Model Development Update. NCAC, 2007.
[40] Marzougui, D., Samaha, R., Cui, C., & Kan, C.-D. (2012). Extended Validation of
the Finite Element Model for the 2001 Ford Taurus Passenger Sedan. George
Washington University, Ashburn, VA: The National Crash Analysis Center.
[41] National Transportation Research Center. (2008). U01: Enhanced Finite Element
Analysis Crash Model of Tractor-Trailers (Phase A).
80
[42] National Transportation Research Center. (2014). FEM Models for Semitrailer
Trucks. Retrieved from
http://thyme.ornl.gov/FHWA/draft/ntrci/index.cgi?model=1&navv=0
[43] IIHS. "Moderate Overlap Frontal Crashworthiness Evaluation - Guidelines for
Rating Structural Performance." Arlington, VA, 2011.
[44] IIHS. "Moderate Overlap Frontal Crashworthiness Evaluation Test Protocol
(Version XIV)." Arlington, VA, 2012.
[45] Goel, T., & Stander, N. (2009). Adaptive Simulated Annealing for Global
Optimization in LS-OPT. 7th European LS-DYNA Conference. Livermore
Software Technology Corporation.
[46] Kirkpatrick, S., Gelatt, C., & Vecchi, M. (1983). Optimization by Simulated
Annealing. Science, 671-680.
[47] Ingber, I. (1989). Very Fast Simulated Re-annealing. Mathematical Computer
Modeling, 967-983.
[48] P. de Coo, R. Schram, A Wrige, I. Knight, R. Hashemi, Report detailing
recommendations for evaluation method, i.e static or dynamic test or use of
numerical simulation, TNO Automotive, VC-Compat, 2006.
[49] National Highway Traffic Safety Administration. 2013. http://www.nhtsa.gov/.
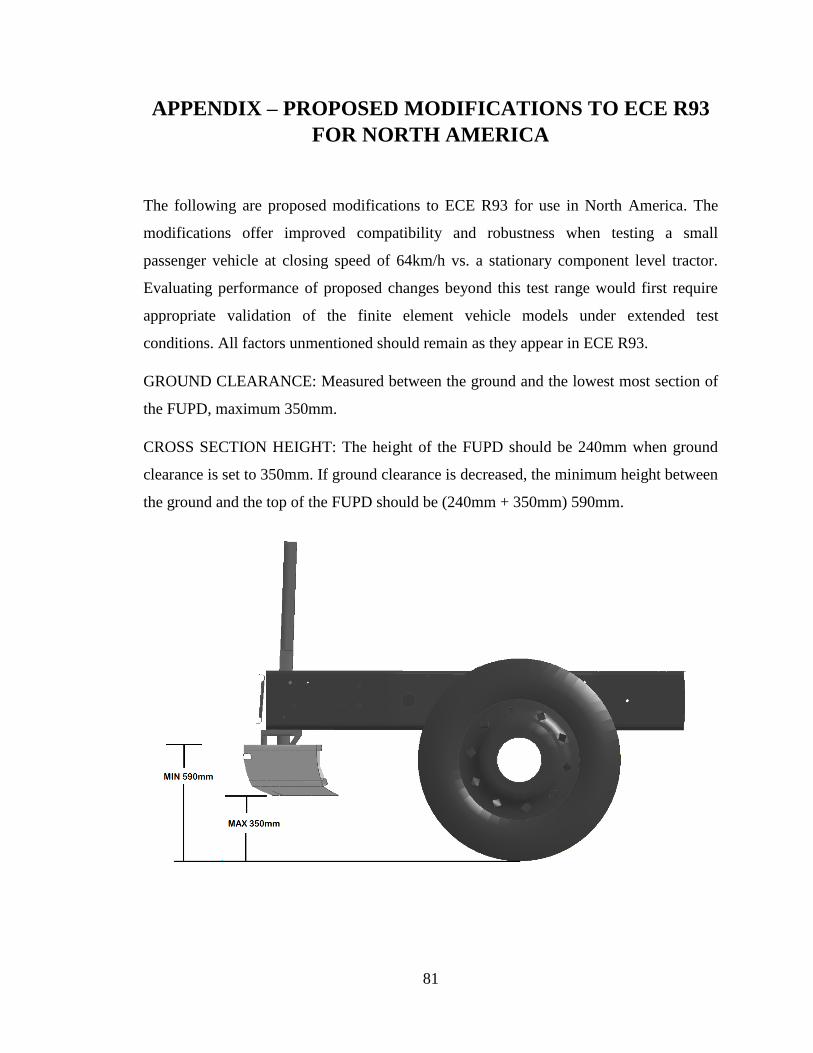
81
APPENDIX – PROPOSED MODIFICATIONS TO ECE R93
FOR NORTH AMERICA
The following are proposed modifications to ECE R93 for use in North America. The
modifications offer improved compatibility and robustness when testing a small
passenger vehicle at closing speed of 64km/h vs. a stationary component level tractor.
Evaluating performance of proposed changes beyond this test range would first require
appropriate validation of the finite element vehicle models under extended test
conditions. All factors unmentioned should remain as they appear in ECE R93.
GROUND CLEARANCE: Measured between the ground and the lowest most section of
the FUPD, maximum 350mm.
CROSS SECTION HEIGHT: The height of the FUPD should be 240mm when ground
clearance is set to 350mm. If ground clearance is decreased, the minimum height between
the ground and the top of the FUPD should be (240mm + 350mm) 590mm.
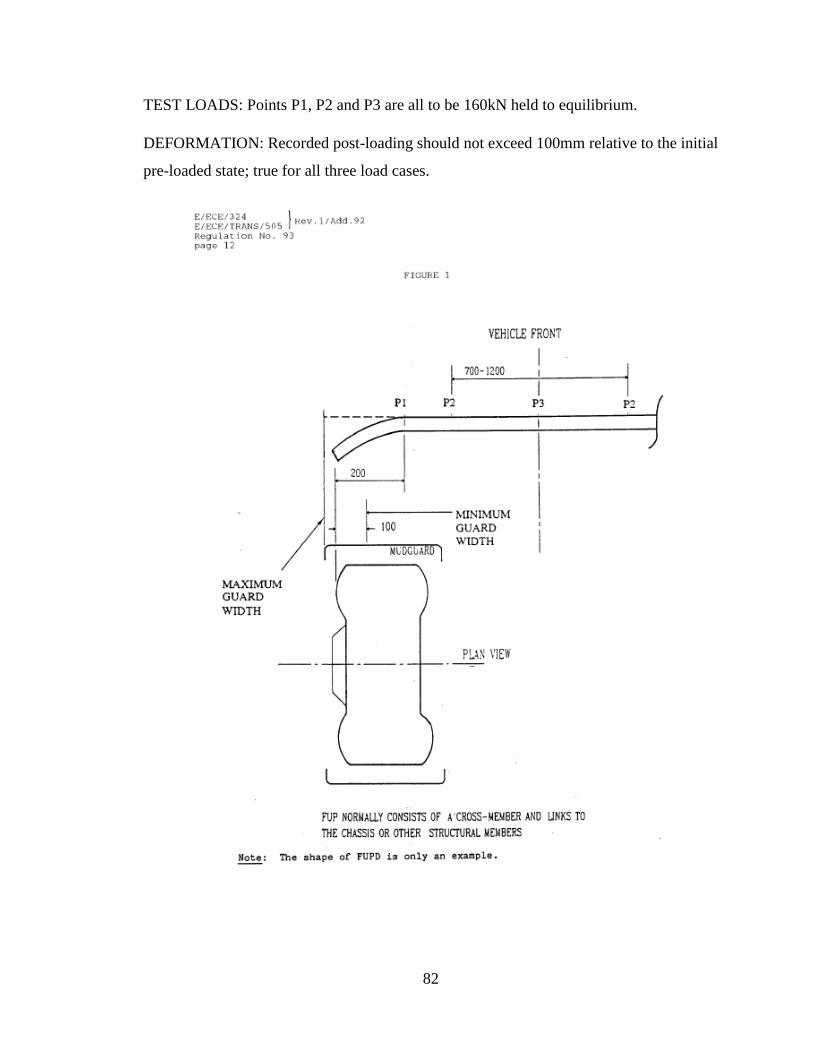
82
TEST LOADS: Points P1, P2 and P3 are all to be 160kN held to equilibrium.
DEFORMATION: Recorded post-loading should not exceed 100mm relative to the initial
pre-loaded state; true for all three load cases.
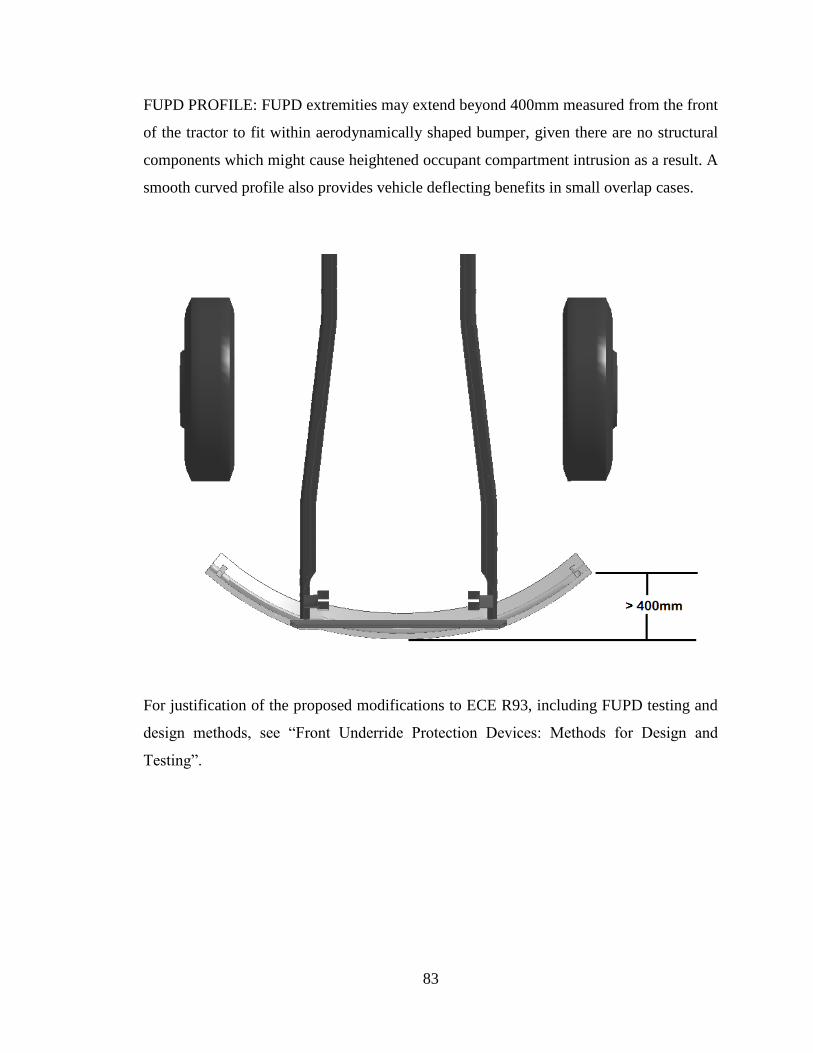
83
FUPD PROFILE: FUPD extremities may extend beyond 400mm measured from the front
of the tractor to fit within aerodynamically shaped bumper, given there are no structural
components which might cause heightened occupant compartment intrusion as a result. A
smooth curved profile also provides vehicle deflecting benefits in small overlap cases.
For justification of the proposed modifications to ECE R93, including FUPD testing and
design methods, see “Front Underride Protection Devices: Methods for Design and
Testing”.
Copyright © 2022 FDOKUMEN