Instrumentos y criterios de evaluación y recuperación (3º ESO)
Upload
khangminh22Category
view
2download
0
Security & Quality of Supply Standards
Frequency Risk and Control Report Report – April 2021 (v2)
1. Foreword
Following the power disruption on 09 August 2019, the ESO has worked with industry to
implement changes to the codes and frameworks which govern the management of frequency
risks on the GB system. The outcome of these changes is the following Report, which was
consulted on in March 2021 and which was produced in line with the Methodology1 which was
consulted on in January 2021.
Large sudden changes in supply and demand can cause the frequency of the GB electricity
system to change. This Report and consultation sets out the parameters for how often, for how
long and how large those frequency changes should be and sets out the criteria by which the
ESO shall approach risks to frequency changes. The focus of the Report is to set out the right
balance between risk and cost to the consumer to ensure the network is effectively and
appropriately protected from frequency events for the following year.
This is the first time the process has been carried out and aims to be more transparent to
industry and stakeholders, setting out clear and objective criteria by which the ESO balances
cost and risk to ensure the end consumer receives efficient security of supply. As the energy
system transitions to a low carbon system, the regular review of response, reserve and inertia
holding will be important and this Report allows the ESO to review and manage emerging risks
with our stakeholders.
The consultation seeks stakeholder views on four proposals. If these recommendations are
implemented, our assessment indicates the risk of a frequency deviation exceeding:
• 48.8Hz is 1-in-270 years (Activation of Low Frequency Demand Disconnection)
• 49.2Hz is 1-in-22 years (Frequency Standard set out in System Operator Guidelines)
• 50.5Hz is 1-in-1,100 years (Frequency standard set out in the Grid Code)
The cost of frequency control in recent years has ranged from £275m to £360m2. The
combined impact of the recommendations, delivery of the Accelerated Loss of Mains Change
Programme and the introduction of Dynamic Containment is a reduction in risk. The
recommendations will for the first time establish a clear benchmark which will allow us to
measure the costs and risks of frequency control from now and into the future. The indicative
cost for 2021/22 after adopting the proposals is £244m.
This Report also identifies the current value of the Accelerated Loss of Mains Change
Programme and clarifies how the ESO manages the risk of inadvertent operation of the Loss
of Mains protection. In addition, the Report confirms the value of the continuing growth of fast
acting response through Dynamic Containment, a product launched in October 2020, and
presents a suite of proposals which will reduce the requirement for the ESO to intervene in the
market dispatch of power stations.
1 Methodology: https://www.nationalgrideso.com/document/185856/download 2 Data source: NGESO Monthly Balancing Services Summary (MBSS)

Frequency Risk and Control Report – Report – April 2021 (v2)
2 of 49
2. Executive Summary
2.1. Purpose
The requirement for a Frequency Risk and Control Report (Report) has been newly introduced
following the approval of Security and Quality of Supply Standards (SQSS) modification
GSR027: Review of the NETS SQSS Criteria for Frequency Control that drive reserve,
frequency response and inertia holding on the GB electricity system3.
This Report sets out the assessment results of the operational frequency risks on the system,
and has been prepared following the Methodology.
It includes an assessment of the magnitude, duration and likelihood of transient frequency
deviations, forecast impact and the cost of securing the system and confirms which risks will
or will not be secured operationally by NGESO under paragraphs 5.8, 5.11.2, 9.2 and 9.4.2 of
the SQSS, and the expectations for unacceptable frequency conditions.
The final Report will be submitted to the Authority for approval on 01 April 2021. This document
builds upon the Policy and Methodology document NGESO consulted on in January 2021.
2.2. Events and loss risks
The Report covers the following three categories of loss risks, all of which are considered by
current Policy:
BMU-only • an event that disconnects one or more BMUs, and may or
may not also cause a consequential RoCoF loss
(no Vector Shift loss)
VS-only • an event that causes a consequential Vector Shift (VS) loss
and may or may not also cause a consequential RoCoF
loss (no BMU loss)
BMU+VS • an event that disconnects one or more BMUs and causes
a consequential VS loss, and may or may not also cause a
consequential RoCoF loss
The BMU-only events can be caused by a Loss of Power Infeed or Loss of Power Outfeed,
and the VS-only and BMU+VS events can be caused by fault outages of primary transmission
equipment on the National Electricity Transmission System (i.e. a single transmission circuit,
a busbar or mesh corner, or; a double circuit overhead line).
3 link to GSR027 documentation

Frequency Risk and Control Report – Report – April 2021 (v2)
3 of 49
2.3. Main Recommendation
2.3.1. Proposals
Proposal 1: minimum national inertia requirement
• Continue with current Policy:
o Minimum inertia at 140GVA.s
Proposal 2a: Frequency limit for different size infeed loss risks
• Don’t apply individual loss risk controls to BMU-only, BMU+VS outage and BMU+VS
intact events to keep resulting frequency deviations within 49.5Hz
Proposal 2b: individual loss risk controls
• Update current Policy to:
o Apply individual loss risk controls to BMU-only events to keep resulting frequency
deviations within 49.2Hz and 50.5Hz
o Do not apply individual loss risk control to BMU+VS outage or BMU+VS intact
events
2.4. Other recommendations
2.4.1. Proposals
Proposal 3: Dynamic Containment Low
• The new fast acting service, Dynamic Containment launched in October 2020, is
delivering value today and continues to provide value into the future.
• The ESO should continue to increase its use of the Dynamic Containment low
frequency service (Dynamic Containment Low) beyond 500MW in line with the
anticipated pipeline4
Proposal 4: ALoMCP
• The ALoMCP programme has been running for over a year and has already created
significant value by removing nearly 10GW of Vector Shift protection settings. There is
still a substantial volume of protection changes to be made to minimise the risk posed
by the VS and RoCoF protection on distributed generation.
• The ALoMCP should continue during 2021 for both RoCoF and Vector Shift
4 The anticipated pipeline reaches 500MW in May 2021 and 900MW in July 2021. This is a
best view based on the information the ESO has at the time of writing, and so is subject to
change.

Frequency Risk and Control Report – Report – April 2021 (v2)
4 of 49
2.5. Result of applying the proposals
By applying the above proposals to current Policy, the results are:
• total costs are indicated to be around £244m for the 2021/22
o £240m for system-wide response and inertia controls
o £ 4m for individual loss risk actions on BMU-only events
• the level of frequency risk on the system will be:
# Deviation Duration Likelihood
H1 50.5 > Hz _____ Any 1-in-1,100 years
L1 49.2 ≤ Hz < 49.5 up to
60 seconds 2 times per year
L2 48.8 < Hz < 49.2 Any 1-in-22 years
L3 47.75 < Hz ≤ 48.8 Any 1-in-270 years
Table 1 – level of risk on the system
Table 1 forms the expectations for unacceptable frequency conditions as set out in the SQSS.
Having system-wide response and inertia controls in place means that loss risks of a size up
to and including the largest BMU-only will be managed.
The cost of frequency control in recent years has ranged from £275m to £360m5. The
combined impact of the recommendations, delivery of the Accelerated Loss of Mains Change
Programme and the introduction of Dynamic Containment is a reduction in risk.
The recommendations establish a clear benchmark which will allow us to measure the costs
and risks of frequency control from now and into the future. The indicative cost for 2021/22 is
£244m.
The FRCR is an assessment of all events across 2021, made using assumptions as to the
likelihood and impact to system security based on the controls the ESO expects to have
available. If there are circumstances whereby a specific event would lead to overall system
risk being significantly different to the expected case, the ESO reserves the right to take actions
to ensure that system risk remains in line with the risk appetite outlined in the FRCR.
If and when this occurs, and as appropriate, the ESO will inform the Authority of such actions
after they have been taken, and report relevant details in the following FRCR process.
5 Data source: NGESO Monthly Balancing Services Summary (MBSS)
Frequency Risk and Control Report – Report – April 2021 (v2)
5 of 49
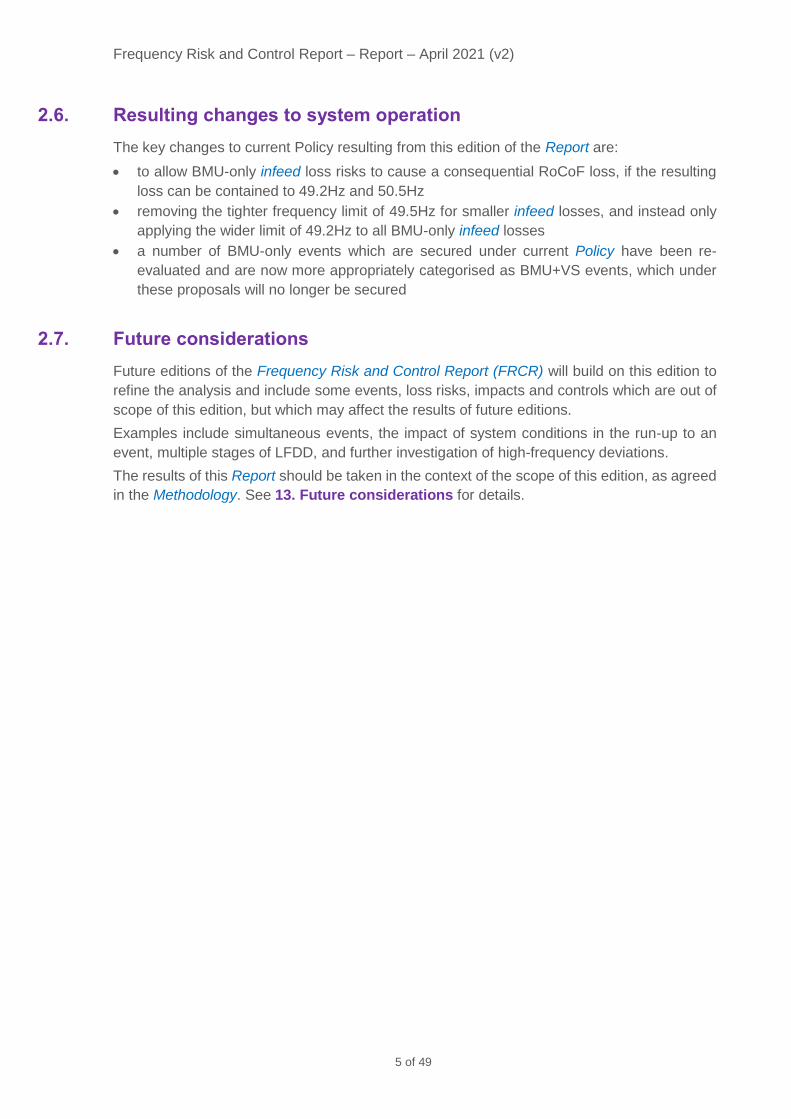
2.6. Resulting changes to system operation
The key changes to current Policy resulting from this edition of the Report are:
• to allow BMU-only infeed loss risks to cause a consequential RoCoF loss, if the resulting
loss can be contained to 49.2Hz and 50.5Hz
• removing the tighter frequency limit of 49.5Hz for smaller infeed losses, and instead only
applying the wider limit of 49.2Hz to all BMU-only infeed losses
• a number of BMU-only events which are secured under current Policy have been re-
evaluated and are now more appropriately categorised as BMU+VS events, which under
these proposals will no longer be secured
2.7. Future considerations
Future editions of the Frequency Risk and Control Report (FRCR) will build on this edition to
refine the analysis and include some events, loss risks, impacts and controls which are out of
scope of this edition, but which may affect the results of future editions.
Examples include simultaneous events, the impact of system conditions in the run-up to an
event, multiple stages of LFDD, and further investigation of high-frequency deviations.
The results of this Report should be taken in the context of the scope of this edition, as agreed
in the Methodology. See 13. Future considerations for details.
Frequency Risk and Control Report – Report – April 2021 (v2)
6 of 49
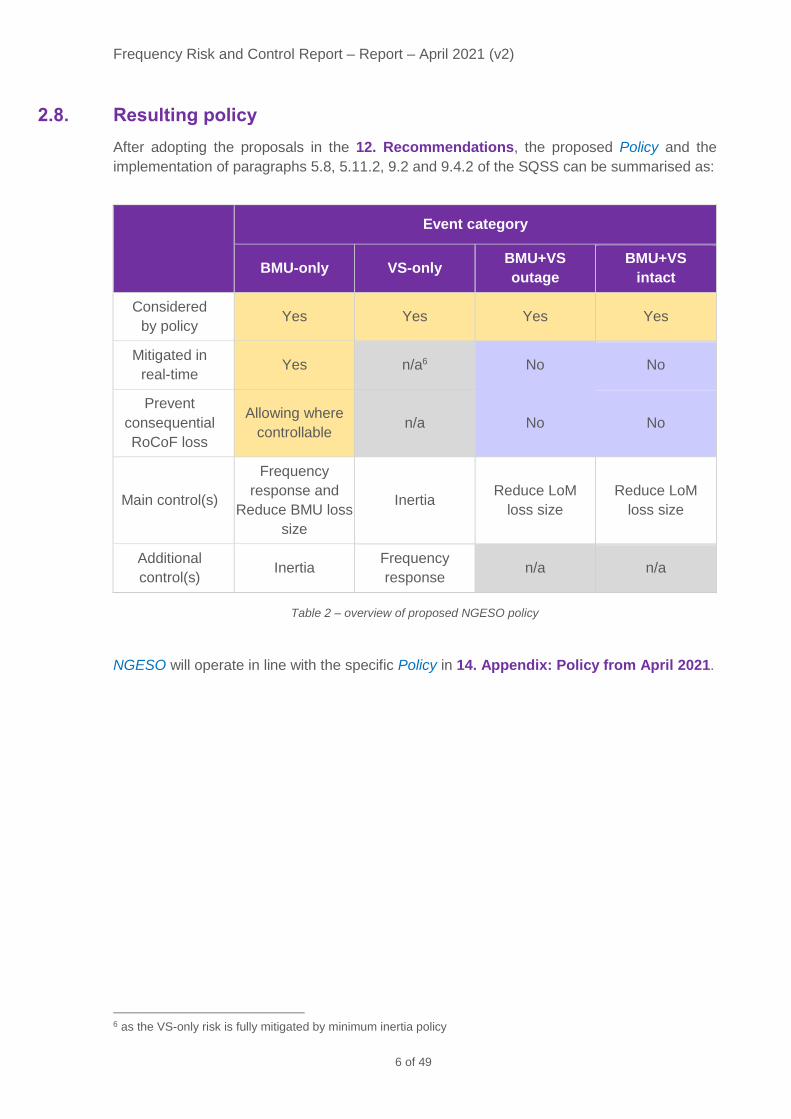
2.8. Resulting policy
After adopting the proposals in the 12. Recommendations, the proposed Policy and the
implementation of paragraphs 5.8, 5.11.2, 9.2 and 9.4.2 of the SQSS can be summarised as:
Event category
BMU-only VS-only BMU+VS
outage
BMU+VS
intact
Considered
by policy Yes Yes Yes Yes
Mitigated in
real-time Yes n/a6 No No
Prevent
consequential
RoCoF loss
Allowing where
controllable n/a No No
Main control(s)
Frequency
response and
Reduce BMU loss
size
Inertia Reduce LoM
loss size
Reduce LoM
loss size
Additional
control(s) Inertia
Frequency
response n/a n/a
Table 2 – overview of proposed NGESO policy
NGESO will operate in line with the specific Policy in 14. Appendix: Policy from April 2021.
6 as the VS-only risk is fully mitigated by minimum inertia policy

Frequency Risk and Control Report – Report – April 2021 (v2)
7 of 49
3. Contents
1. Foreword ........................................................................................................................ 1
2. Executive Summary ........................................................................................................ 2
2.1. Purpose ................................................................................................................... 2
2.2. Events and loss risks ............................................................................................... 2
2.3. Main Recommendation ............................................................................................ 3
2.4. Other recommendations .......................................................................................... 3
2.5. Result of applying the proposals .............................................................................. 4
2.6. Resulting changes to system operation ................................................................... 5
2.7. Future considerations .............................................................................................. 5
2.8. Resulting policy ....................................................................................................... 6
3. Contents ......................................................................................................................... 7
4. Overview......................................................................................................................... 9
4.1. Suite of documents .................................................................................................. 9
4.2. Defined terms ........................................................................................................ 10
5. Aim ............................................................................................................................... 11
5.1. Role of the Frequency Risk and Control Report ..................................................... 11
5.2. Scope of the Frequency Risk and Control Report .................................................. 13
6. Specific considerations for this edition .......................................................................... 14
6.1. Impacts .................................................................................................................. 14
6.2. Events ................................................................................................................... 15
6.3. Controls ................................................................................................................. 17
6.4. Metrics ................................................................................................................... 20
7. Assessment .................................................................................................................. 21
7.1. Current policy ........................................................................................................ 21
7.2. Assessment steps.................................................................................................. 22
7.3. Control scenarios ................................................................................................... 23
8. Proposal 1: Minimum national inertia requirement ........................................................ 25
8.1. Aim ........................................................................................................................ 25
8.2. Assessment ........................................................................................................... 25
8.3. Results .................................................................................................................. 25
8.4. Conclusions ........................................................................................................... 26
8.5. Proposal ................................................................................................................ 26

Frequency Risk and Control Report – Report – April 2021 (v2)
8 of 49
9. Proposal 2: Individual loss risk controls ........................................................................ 27
9.1. Aim ........................................................................................................................ 27
9.2. Assessment ........................................................................................................... 27
9.3. Results .................................................................................................................. 28
9.4. Conclusions ........................................................................................................... 31
9.5. Proposals .............................................................................................................. 32
10. Proposal 3: Dynamic Containment Low ........................................................................ 33
10.1. Aim ........................................................................................................................ 33
10.2. Assessment ........................................................................................................... 33
10.3. Results .................................................................................................................. 33
10.4. Conclusions ........................................................................................................... 34
10.5. Proposal ................................................................................................................ 34
11. Proposal 4: Reduce Loss of Mains capacity .................................................................. 35
11.1. Aim ........................................................................................................................ 35
11.2. Assessment ........................................................................................................... 35
11.3. Results .................................................................................................................. 35
11.4. Conclusions ........................................................................................................... 36
11.5. Proposal ................................................................................................................ 36
12. Recommendations ........................................................................................................ 37
12.1. Main Recommendation .......................................................................................... 37
12.2. Other recommendations ........................................................................................ 38
12.3. Result of applying the proposals ............................................................................ 39
12.4. Resulting changes to system operation ................................................................. 40
12.5. Stakeholder impacts .............................................................................................. 40
13. Future considerations ................................................................................................... 41
13.1. Events and loss risks ............................................................................................. 41
13.2. Impacts .................................................................................................................. 42
13.3. Controls ................................................................................................................. 42
13.4. Metrics ................................................................................................................... 43
13.5. Analysis and data .................................................................................................. 43
14. Appendix: Policy from April 2021 .................................................................................. 44
14.1. Summary of policy ................................................................................................. 44
14.2. Specific policy ........................................................................................................ 45
15. Appendix: Minimum inertia scenarios ............................................................................ 47
15.1. Minimum inertia at 140GVA.s ................................................................................ 47
15.2. Minimum inertia at 160GVA.s ................................................................................ 48
16. Appendix: Individual loss risk controls ........................................................................... 49
16.1. Across all impacts (48.8Hz, 49.2Hz, 49.5Hz and 50.5Hz) ...................................... 49

Frequency Risk and Control Report – Report – April 2021 (v2)
9 of 49
4. Overview
4.1. Suite of documents
There are three main documents in this process, which link together as follows:
Frequency Risk and Control Policy (Policy)7
• states current National Grid Electricity System Operator (NGESO) policy for frequency
risks and controls, and
• provides a baseline for the first edition of the Frequency Risk and Control Report
It is written to provide clarity and transparency to how NGESO operates the system
concerning frequency control. It is a necessary start-point for the process of developing the
first edition of the Frequency Risk and Control Report.
↓
Frequency Risk and Control Report Methodology (Methodology)8
The Methodology document builds on the Policy document and lays out: what will be
assessed in the April 2021 edition of the Report, how it will be assessed, and the format of
the outputs. The Methodology comprises these steps:
Define inputs
Impacts Events & loss risks Controls Metrics for reliability
vs. cost
↓
Conduct assessment
↓
Produce outputs
Conclusions Main recommendations Other recommendations
↓
↓
Frequency Risk and Control Report (Report)
This document is the Report. The Report sets out the assessment results of the operational
frequency risks on the system and has been prepared per the Methodology.
It includes an assessment of the magnitude, duration and likelihood of transient frequency
deviations, forecast impact and the cost of securing the system and confirms which risks will
or will not be secured operationally by NGESO under paragraphs 5.8, 5.11.2, 9.2 and 9.4.2
of the SQSS.
The target date for the Report to be submitted to the Authority for approval is 01 April 20219.
7 Frequency Risk and Control Policy - https://www.nationalgrideso.com/document/183426/download 8 FRCR Methodology - https://www.nationalgrideso.com/document/185856/download 9 NB: once approved by the Authority, the ESO will require an implementation period

Frequency Risk and Control Report – Report – April 2021 (v2)
10 of 49
4.2. Defined terms
This document contains technical terms and phrases specific to transmission systems and the
Electricity Supply Industry. The meaning of some terms or phrases in this document may also
differ from this commonly used. For this reason, defined terms from the SQSS have been
identified in the text using blue italics.

Frequency Risk and Control Report – Report – April 2021 (v2)
11 of 49
5. Aim
5.1. Role of the Frequency Risk and Control Report
5.1.1. What is the Frequency Risk and Control Report?
The Frequency Risk and Control Report, as defined in the SQSS:
• sets out the results of an assessment of the operational frequency risks on the system
• includes an assessment of:
o the magnitude, duration and likelihood of transient frequency deviations
o the forecast impact
o the cost of securing the system, and
o confirms which risks will or will not be secured operationally by NGESO under
paragraphs 5.8, 5.11.2, 9.2 and 9.4.2.
5.1.2. What is the Report trying to achieve?
In the context of system frequency, there are two key objectives:
• a reliable supply of electricity
• at an affordable cost
There is a balance between those objectives:
• higher reliability requirements result in higher direct costs to meet that requirement
• lower reliability requirements result in lower direct costs to meet that requirement but
have higher indirect costs and impacts arising from the lower reliability requirement
These objectives are formalised through the Security and Quality of Supply Standards (SQSS),
the Frequency Risk and Control Report.
This Report provides an assessment and recommendation on the right balance between the
two competing objectives of reliability and cost, focusing on the risks, impacts and controls for
managing the frequency.
5.1.3. What is meant by “reliability”?
The SQSS refers to unacceptable frequency conditions as a measure of reliability.
This encompasses whether transient frequency deviations outside the range 49.5Hz to 50.5Hz
are considered infrequent and tolerable. Whether frequency deviations are acceptable
depends on the exact combination of three factors:
• how often they occur
• how long they last for, and
• how large they are
as each of these affects the Impacts of an event (see Ch 6.1).
For example, larger or longer deviations that happen very rarely might be acceptable, but
smaller or shorter deviations that occur very often might not.
The Recommendations (Ch 12) proposes what should be considered reasonable as
infrequent and tolerable for each of these criteria for transient frequency deviations.

Frequency Risk and Control Report – Report – April 2021 (v2)
12 of 49
5.1.4. What drives direct costs?
NGESO uses a set of Ancillary Services to control frequency deviations. Some are automatic,
like frequency response. Others are manually dispatched, like reserve, the Balancing
Mechanism, services to increase the inertia or services to pre-emptively decrease the size of
potential loss risks. In this document, we refer to the Ancillary Services as “controls”.
The size, duration and likelihood of transient frequency deviations depend on:
• the size of the event that caused the frequency deviation
• how much of each of these controls are used, and the effectiveness of the controls
Scenario Direct costs Frequency deviations
Small event / more controls Higher Shorter, smaller, occur less often
Large event / fewer controls Lower Longer, larger, occur more often
The Report has considered relevant controls which NGESO currently has access to, or which
NGESO anticipates having access to during 2021.
5.1.5. How to balance between reliability and cost?
The Methodology sets out an objective and transparent framework for NGESO to assess risks
associated with frequency deviations, the events which could cause them, their size, the
impacts they have, and the cost and mix of controls to mitigate them.
The assessment has been used to determine the appropriate balance between reliability and
cost, as described in this Report.
Consultation and ongoing engagement with industry stakeholders is key to achieving this
openly and transparently: the role of NGESO is to analyse the risks, impacts and controls, their
impact on reliability and cost, and present a recommendation for where the appropriate
balance might lie. This enables the Authority to make an informed decision on the right balance
between the reliability of electricity supplies and cost to end consumers.
NGESO will then update their operational Policy and procurement of controls to implement the
outcome. This can be found in 14. Appendix: Policy from April 2021.

Frequency Risk and Control Report – Report – April 2021 (v2)
13 of 49
5.2. Scope of the Frequency Risk and Control Report
5.2.1. Scope of this edition
This first edition of the Frequency Risk and Control Report is focusing on the following key
areas:
• establishing the FRCR process to deliver a clear, objective, transparent process for
assessing reliability vs cost to ensure the best outcome for consumers
• assessing the risk from the inadvertent operation of Loss of Mains protection
• identifying quick, short-term improvements for reliability vs cost, including:
o the delivery of the Dynamic Containment and Accelerated Loss of Mains Change
programmes,
o assessing the frequency standard that various size loss risks are held to, and
o the impact of transmission network outages on radial connection loss risks
This Report covers system operation in 2021; the 13. Future considerations section at the
end of the Report outlines opportunities to address other considerations in future editions in
future years.
5.2.2. Wider considerations out of scope of the FRCR
This Report is not intended to develop future controls or consider other topics such as wider
system interactions, market design, whole-system costs and interactions with other markets.
There are projects ongoing to address these wider industry considerations10.
The Report may inform these developments and use them as inputs to future editions, but the
Report is not the vehicle for these wider considerations.
The Report will be updated at least annually. As the wider industry projects develop,
consideration will be given to whether they should be included and if so, how and when they
will be included in future versions of the Methodology.
10 More information on the development of new solutions can be found in the Operability Strategy
Report

Frequency Risk and Control Report – Report – April 2021 (v2)
14 of 49
6. Specific considerations for this edition
As described in the Methodology, this edition is considering the following:
6.1. Impacts
The Report has assessed four levels of impact to cover these considerations and allow
comparison to historical performance:
# Deviation Duration Relevance
H1 50.5 < Hz _____ Any • SQSS implementation prior to FRCR
• Plant performance prescribed in detail by
Grid Code, but not often tested in real-life
conditions
L1 49.2 ≤ Hz < 49.5 up to
60 seconds
• SQSS implementation prior to FRCR and
SOGL definition for maximum frequency
deviation
• Infrequent occurrence, but reasonable
certainty over plant performance
L2 48.8 < Hz < 49.2 Any • Beyond SQSS implementation prior to FRCR
and SOGL definition for maximum frequency,
but without triggering LFDD
• Plant performance prescribed in detail by
Grid Code but not often tested in real-life
conditions
L3 47.75 < Hz ≤ 48.8 Any • First stage of LFDD
Table 3 – Impacts that have been assessed
These levels align to current frequency response holding policies but provide more detail for
the likelihood of triggering Low-Frequency Demand Disconnection.

Frequency Risk and Control Report – Report – April 2021 (v2)
15 of 49
6.2. Events
6.2.1. Which events have been considered?
6.2.1.1. Categories of loss risk
One of the aims of this first edition is to bring transparency to our assessment of the risk from
the inadvertent operation of Loss of Mains protection.
The Report covers the following three categories of loss risks, all of which are considered by
current Policy:
BMU-only • an event that disconnects one or more BMUs, and may or
may not also cause a consequential RoCoF loss
(no Vector Shift loss)
VS-only • an event that causes a consequential Vector Shift (VS) loss
and may or may not also cause a consequential RoCoF
loss (no BMU loss)
BMU+VS • an event that disconnects one or more BMUs and causes
a consequential VS loss, and may or may not also cause a
consequential RoCoF loss
The BMU-only events can be caused by a Loss of Power Infeed or Loss of Power Outfeed,
and the VS-only and BMU+VS events can be caused by fault outages of primary transmission
equipment on the National Electricity Transmission System (i.e. a single transmission circuit,
a busbar or mesh corner, or; a double circuit overhead line).
NB: a number of BMU-only events which are secured under current Policy have been re-
evaluated and are now more appropriately categorised as BMU+VS events

Frequency Risk and Control Report – Report – April 2021 (v2)
16 of 49
6.2.1.2. Impact of planned transmission network outages on radial connection loss risks
In some regions of the National Electricity Transmission System, loss risks exist on radial
connections. In the case of a double circuit radial connection, as depicted in Figure 1, the
likelihood of an event occurring increases during transmission network outage conditions.
This is because planned transmission networks outages leave these loss risks exposed to a
single circuit fault, which is more likely than a double circuit fault.
Figure 1 - potential double circuit faults on an illustrative network
The Report has investigated the materiality of the change in likelihood of these events under
outage conditions, and what specific consideration (if any) should be given during these
periods.
NB: any change to current Policy in this area would be likely to have an impact on the current
Network Access Planning process
6.2.2. New loss risks
Several new loss risks are connecting to the system during the Report period (new
interconnectors, new large offshore wind farms and new CCGT units).
New connections have been added to our event definitions if they can cause a transient
frequency deviation, either by themselves or as part of a group.
The impact of new connections on system inertia has also been factored into the datasets used
for the assessment, as outlined in the Methodology.

Frequency Risk and Control Report – Report – April 2021 (v2)
17 of 49
6.3. Controls
There are four main controls for mitigating transient frequency deviations:
• holding frequency response
• reducing BMU loss size
• reducing LoM loss size
• increasing inertia
The Report has investigated variations to the current Policy for all four controls:
• holding frequency response:
→ Dynamic Containment: anticipating this market to grow during the Report period
→ Frequency limit for different size loss risks: applying the wider limit of 49.2Hz to all
infeed losses
• reducing BMU loss size: using controls to reduce the size of BMU-only and BMU+VS
events
• reducing LoM loss size: anticipating a reduction as ALoMCP delivers during the reporting
period
• increasing inertia: the effect of increasing the minimum-inertia limit.
6.3.1. Frequency response
The Report has investigated two variations to the current Policy:
6.3.1.1. Dynamic Containment and controlling consequential RoCoF losses
Current Policy is not to allow infeed losses to cause a consequential RoCoF loss, as the
resulting losses have been too large and too quick to cover with existing response products,
before the introduction of Dynamic Containment.
As the supply of Dynamic Containment increases and adds to the existing supply of Primary,
Secondary and High-frequency response, the overall frequency response holding can begin
to cover BMU+VS loss risks and any loss risk that also cause a consequential RoCoF loss.
The Report has looked the role Dynamic Containment can play in securing larger loss risks,
including consequential RoCoF losses.
The assessment explicitly looks at allowing consequential RoCoF losses to occur, if they can
be contained to the relevant Impacts: 50.5Hz, 49.5Hz, 49.2Hz, and 48.8Hz, with an
expectation that Policy can be updated to allow infeed losses to cause a consequential RoCoF
loss in circumstances where the overall loss can be secured.

Frequency Risk and Control Report – Report – April 2021 (v2)
18 of 49
6.3.1.2. Frequency limit for different size loss risks
Frequency Risk and Control Policy currently has two frequency limits for infeed losses,
depending on their size:
• smaller losses (≤ 1000MW) are held to 49.5Hz
• larger losses (> 1000MW) are held to 49.2Hz
Historically, the amount of frequency response required to secure smaller losses to tighter
limits had been approximately equal to the amount of frequency response needed to secure
larger losses to wider limits. This has resulted in savings in balancing costs by allowing a wider
limit for the less frequent, larger losses.
Decreasing system inertia means that the equality in the requirement often no longer holds,
with the tighter limit for smaller losses, often the driving factor.
However, decreasing system inertia and the risk of consequential RoCoF losses has also
meant that most loss risks over 700MW have been curtailed for a large proportion of the last
few years.
The result of this is that system frequency has only dropped below 49.5 Hz once11 since 2014.
This is much less often than the historic expectation of four-times per year noted in the
consultation responses to SQSS modification GSR01512.
The Report has investigated the cost and impact of removing the tighter limit for smaller losses,
and instead only applying the wider limit of 49.2Hz to all infeed losses and consequential
RoCoF losses.
6.3.2. Reducing LoM loss size
The Accelerated Loss of Mains Change Programme (ALoMCP) is reducing the capacity of
Distributed Energy Resources (DER) at risk of consequential loss of RoCoF and Vector Shift
by de-sensitising the protection relays.
As the size of the consequential loss risks decreases, it will enable frequency response to
cover BMU+VS loss risks and any loss risk that also causes a consequential RoCoF loss.
The Report has assessed benefit of further delivery of the ALoMCP.
11 09 August 2019 12 https://www.nationalgrideso.com/document/15126/download

Frequency Risk and Control Report – Report – April 2021 (v2)
19 of 49
6.3.3. Reducing BMU loss size
This control is currently only applied to BMU-only loss risks under current Policy, as they
represent good value. Current Policy is not to apply this control to BMU+VS risks, as they
generally represent poor-value to mitigate13.
As the volume of Dynamic Containment increases, it will allow more significant loss risks to be
secured. Equally, as the LoM loss size goes down, the size of the largest loss risks will reduce.
These two factors will change the cost vs risk balance, and so the Report has looked at
reducing BMU loss size as a “targeted control” across both loss risks categories containing a
BMU element.
6.3.4. Increasing inertia
6.3.4.1. Minimum inertia
The Report has looked at the potential benefit of increasing the minimum inertia limit above
the current level of 140 GVA.s.
6.3.4.2. Inertia for VS-only loss risk
The inertia control for the “largest VS-only loss risk” has been applied, but does not result in
any costs or change to overall risk. This is because delivery of Vector Shift relay changes
through the Accelerated Loss of Mains Change Programme has significantly reduced the
maximum VS-only loss risk size, from over 1000MW to below 700MW.
This means that the VS-only loss risks are fully covered by the minimum inertia policy, and so
cannot pose a transient frequency deviation risk in 2021.
NB: VS-only loss risks are covered by system-wide controls.
13 see Policy > 6.2 Cost vs. Risk for more information

Frequency Risk and Control Report – Report – April 2021 (v2)
20 of 49
6.4. Metrics
6.4.1. What principles can be applied?
At its simplest, for each level of impact:
• good value risks are likely to be those which are:
o low cost to mitigate, or
o likely to occur, or
o which have a large impact
• poor value risks are likely to be those which are:
o high cost to mitigate, or
o unlikely to occur, or
o which have a small impact
There is a whole spectrum of costs and likelihoods across each of the events, meaning a clear-
cut judgement of the balance between reliability and cost can be challenging to reach for one
event in isolation. Instead, the assessment must look at the total risk and total cost across all
events.
Where risks are deemed to be of poor value and not actively mitigated, the backup measures
prescribed through the Grid Code will act to minimise overall disruption to the system should
they occur14.
6.4.2. Which metrics have been applied?
Based on industry feedback to the Methodology, two metrics have been considered in this
Report for assessing cost vs. risk. These are:
• how often each impact is expected to occur?
• what is the total cost of controls for managing frequency to the different impact levels?
14 e.g. Low Frequency Demand Disconnection (LFDD) and Limited Frequency Sensitive Mode (LFSM)

Frequency Risk and Control Report – Report – April 2021 (v2)
21 of 49
7. Assessment
7.1. Current policy
The starting point for the assessment is current Policy, which can be summarised as:
BMU-only VS-only BMU+VS
Considered
by policy Yes Yes Yes
Mitigated in
real-time Yes Yes No
Prevent
consequential
RoCoF loss
Infeed: Yes
Outfeed: No Yes No
Main control(s)
Frequency
response and
Reduce BMU loss
size
Inertia Reduce LoM
loss size
Additional
control(s) Inertia
Frequency
response n/a
Table 4 – Overview of current NGESO policy

Frequency Risk and Control Report – Report – April 2021 (v2)
22 of 49
7.2. Assessment steps
The Methodology describes in detail the steps in the assessment; below is a high-level
overview of these steps:
Setup
Starting with current Policy as a baseline:
• Define a range of “Control scenarios”
• Define Events and loss risks
↓
For each “Control scenario”
Apply “system-wide” controls
These are the frequency response, inertia and LoM loss size
controls. These are applied first as they affect all events and loss
risks.
• Determine the required quantity of additional controls
(with respect to the baseline)
• Calculate the cost of controls
• Calculate loss sizes
• Calculate baseline scenario risk
↓
Apply “individual loss risk” controls
This is the BMU loss size control and is applied after the “system-
wide” controls to address any specific remaining risks
• Determine the required quantity of additional controls
• Calculate the cost of controls
• Calculate residual risk
• Calculate risk reduction
↓
Determine overall cost vs risk vs impact for the “Control
scenario”
↓

Frequency Risk and Control Report – Report – April 2021 (v2)
23 of 49
7.3. Control scenarios
7.3.1. Dataset
The assessment requires data to assess the cost versus risk of different scenarios, and has
used historic scenarios adjusted for known or expected changes in 2021, as described in the
Methodology.
Given the latest available information15 on COVID-19 restriction roadmaps heading through
spring and summer, the 2019 dataset (pre-COVID) has been used as the baseline for the
Report. Where relevant, the 2020 dataset (COVID) has been used as a sensitivity to test the
Proposals.
The impact of new connections on system inertia has also been factored in to the datasets
used for the assessment, as outlined in the Methodology.
7.3.2. Scenarios
7.3.2.1. Baseline Control Scenario
The analysis has taken the expected position for frequency response volumes and loss of
mains risks and assessed how the minimum inertia policy impacts the overall cost and baseline
level of system risk. Specifically, this means:
• Minimum inertia maintained at 140GVA.s
• Frequency response per current Policy, with the addition of the expected
pipeline of Dynamic Containment Low in 2021 (allowing
larger losses including consequential RoCoF losses to be
secured)
• LoM capacity as the forecast for 01 April 2021, for both RoCoF and
Vector Shift
15 The analysis has been performed as a time series (at Settlement Period granularity) for the 2019
(pre-COVID) and 2020 (COVID) calendar years, adjusted for the expected changes in 2021, to allow
a comparison for the impact of COVID restrictions on demand and consequential operation of the
system in 2020.
The demand and inertia in the 2020 data set (COVID) is significantly reduced during the spring and
summer period, with demands up to 20% lower than would have been expected without the impact
of COVID restrictions.
In February 2021 COVID restriction are only reducing demand by 5%, a significantly smaller impact
than in spring/summer 2021.

Frequency Risk and Control Report – Report – April 2021 (v2)
24 of 49
7.3.2.2. Individual loss risk controls
For many events, the system-wide controls are sufficient to prevent transient frequency
deviations. Where they are not, ‘individual loss risk controls’ can be used to:
• prevent a consequential RoCoF loss from occurring by making sure the total BMU /
Vector Shift loss stays within the Rate of Change of Frequency threshold, or
• still allow a consequential RoCoF loss but making sure the total BMU / Vector Shift /
RoCoF loss stays within the level secured by the system-wide controls
The Report considers the total risk and total cost posed by each of the event categories:
• BMU-only
• BMU+VS intact
• BMU+VS outage
7.3.2.3. Other control scenarios
The Report looks at the following control scenarios, which feed into each of the Proposals in
the subsequent chapters:
• Proposal 1: Minimum national inertia
o looking at whether a change to the minimum inertia to increase from 140GVA.s to
160GVA.s should be adopted
• Proposal 2: Individual loss risk controls
o looking at the frequency limit for different size infeed loss risks (49.5HZ Vs 49.2Hz),
assessing whether to apply the wider limit of 49.2Hz to all infeed losses
o looking at whether to apply separate loss risk controls to each of the event
categories:
▪ BMU-only
▪ BMU+VS intact
▪ BMU+VS outage
• Proposal 3: Dynamic Containment Low
o looking at how changes in the level of Dynamic Containment Low can impact the
cost vs risk balance
• Proposal 4: Reduce Loss of Mains
o looking at how future delivery of the ALoMCP can impact the cost vs risk balance
Proposals 1 and 2 form the Main Recommendation. Proposals 3 and 4 form the Other
recommendations.

Frequency Risk and Control Report – Report – April 2021 (v2)
25 of 49
8. Proposal 1: Minimum national inertia requirement
8.1. Aim
Proposal 1 assesses whether a change to the minimum inertia policy is beneficial.
8.2. Assessment
The assessment compares two scenarios:
• maintaining minimum inertia at 140GVA.s
• increasing minimum inertia at 160GVA.s
8.3. Results
Table 5 shows the difference in cost and risk for the 140GVA.s and 160GVA.s scenarios before
any further individual loss risk controls are applied:
Scenario 140 GVA.s 160 GVA.s
Cost system-wide controls £ 240m £ 340m
Remaining risk: 48.8Hz 1-in-240 years 1-in-240 years
Remaining risk: 49.2Hz 1-in-7 years 1-in-7 years
Remaining risk: 49.5Hz 2 times per year 2 times per year
Remaining risk: 50.5Hz 1-in-3.6 years 1-in-3.6 years
Table 5 – 140GVA.s vs. 160GVA.s without further individual loss risk controls
Table 6 shows how this then changes if the current Policy to secure BMU-only risks is applied:
Scenario 140 GVA.s 160 GVA.s
System-wide controls cost £ 240m £ 340m
Individual loss risk controls cost £ 27m £ 20m
Total cost £ 267m £ 360m
Remaining risk: 48.8Hz 1-in-270 years 1-in-275 years
Remaining risk: 49.2Hz 1-in-22 years 1-in-22 years
Remaining risk: 49.5Hz 1-in-4.6 years 1-in-5 years
Remaining risk: 50.5Hz 1-in-1,100 years 1-in-1,100 years
Table 6 - 140GVA.s vs. 160GVA.s with individual loss risk controls for BMU-only events
NB: Appendix: Minimum inertia scenarios contains full detail of the scenarios

Frequency Risk and Control Report – Report – April 2021 (v2)
26 of 49
8.4. Conclusions
The assessment shows that increasing minimum inertia to 160GVA.s:
• would result in little to no benefit in risk reduction
• would result in a significant increase in cost
This would not present good value to the end consumer, and so is not recommended.
8.5. Proposal
Proposal 1: minimum national inertia requirement
• Continue with current Policy:
o Minimum inertia at 140GVA.s

Frequency Risk and Control Report – Report – April 2021 (v2)
27 of 49
9. Proposal 2: Individual loss risk controls
9.1. Aim
Proposal 2 assesses whether applying the wider limit of 49.2Hz to all infeed losses is
beneficial, as well as assessing whether to apply individual loss risk controls to each of the
event categories:
• BMU-only
• BMU+VS outage
• BMU+VS intact
9.2. Assessment
9.2.1. Considerations
Current Policy applies individual loss risk controls to BMU-only events, but not to BMU+VS
events in either intact or outage conditions. The assessment considers:
• not applying individual loss risk control to BMU-only events
(i.e. only applying the system-wide response and inertia controls)
• continuing to apply individual loss risk control to BMU-only events
(per current Policy)
• enhancing the Policy to also cover BMU+VS outage and BMU+VS intact events
9.2.2. Assumptions
The assessment is based on:
• Proposal 1: Minimum national inertia – 140 GVA.s minimum inertia
As noted in 6.3.1.1 Dynamic Containment and controlling consequential RoCoF losses,
the assessment explicitly looks at allowing consequential RoCoF losses to occur, if they can
be contained to the relevant Impacts: 50.5Hz, 49.5Hz, 49.2Hz, and 48.8Hz, with an
expectation that Policy can be updated to allow infeed losses to cause a consequential RoCoF
loss in circumstances where the overall loss can be secured.

Frequency Risk and Control Report – Report – April 2021 (v2)
28 of 49
9.2.3. Value-order
The tables below rank the event categories from the best value to least value, determined by
the cost of the required controls and the resulting reduction in the remaining risk at each of the
different impact levels.
When assessing the impact levels, the controls for managing high frequency (50.5Hz) can be
considered separately from low frequency (48.8Hz, 49.2Hz and 49.5Hz).
For low frequency, the System Operator Guidelines (SOGL) states that the maximum
frequency deviations in GB shall be 0.8Hz. The assessment therefore considers the low
frequency impacts in two steps:
• the risk of a frequency deviation exceeding 49.2Hz, corresponding to a 0.8Hz deviation
under SOGL, and the equivalent risk of frequency reaching 48.8Hz and triggering the
first-stage of the LFDD scheme, then
• the risk of a frequency deviation exceeding 49.5Hz, and the additional cost that would
be required to apply extra control over and above those needed for 49.2Hz
9.3. Results
9.3.1. Impact level 49.2Hz and 48.8Hz
Analysis shows the remaining risk of low frequency events on the system is:
Event category
Cost to
mitigate
(per year)
Cumulative
cost
(per year)
Remaining risk
49.2Hz
Remaining risk
48.8Hz
Start point n/a n/a 1-in-7 years 1-in-240 years
BMU-only £ 0.5m £ 0.5m 1-in-22 years 1-in-270 years
BMU+VS outage £ 2.3m £ 2.8m 1-in-28 years 1-in-460 years
BMU+VS intact £ 44.3m £ 47.1m 1-in-31 years 1-in-600 years
Taking actions to secure BMU-only events costs £0.5m, and reduces the risk of a frequency
deviation exceeding 49.2Hz from 1-in-7 years to 1-in-22 years. This is equivalent to the risk of
a frequency deviation exceeding 48.8Hz being reduced from 1-in-240 years to 1-in-270 years.
For an additional £2.3m securing BMU+VS events in outage conditions to 49.2Hz further
reduces the risk to 1-in-28 years (equivalent risk of 1-in-460 years for 48.8Hz).
Securing BMU+ VS intact events would cost a further £44.3 m to reduce the risk to 1-in-31
years. This is approximately fifteen times more than the spend to get the risk to 1-in-28 years
for very minimal risk reduction and as such is deemed low value and not recommended.

Frequency Risk and Control Report – Report – April 2021 (v2)
29 of 49
9.3.2. Impact level 49.5Hz
After applying the system-wide controls, and in addition to the cost of securing the 49.2Hz
risks, the remaining the risk of low frequency events on the system is:
Event category
Cost to
mitigate
(per year)
Cumulative
cost
(per year)
Remaining risk
49.5Hz
Start point n/a n/a 2 times per year
BMU-only £ 23m £ 23m 1-in-4.6 years
BMU+VS outage £ 13m £ 36m 1-in-5.6 years
BMU+VS intact £ 330m £ 366m 1-in-6.5 years
Taking actions to secure BMU-only events costs £23m and reduces the risk of a frequency
deviation exceeding 49.5Hz from 2 times per year to 1-in-4.6 years.
For an additional £13m, securing BMU+VS events in outage conditions to 49.5Hz further
reduces the risk to 1-in-5.6 years.
Securing BMU+ VS intact events would cost a further £330m to reduce the risk to 1-in-6.5
years.
9.3.3. Impact level 50.5Hz
After applying the system-wide controls, the remaining the risk of high frequency events on the
system is:
Event category
Cost to
mitigate
(per year)
Cumulative
cost
(per year)
Remaining risk
50.5Hz
Start point n/a n/a 1-in-3.6 years
BMU-only £ 3.8m £ 3.8m 1-in-1,100 years
BMU+VS outage £ 2.1m £ 5.9m 1-in-2,800 years
BMU+VS intact £ 21.2m £ 27.1m n/a
Taking control actions on BMU-only events costs £3.8m and reduces the risk of a frequency
deviation exceeding 50.5Hz from 1-in-3.6 years to 1-in-1,100 years.
For an additional £2.1m securing BMU+VS events in outage conditions to 50.5Hz further
reduces the risk to 1-in-2800 years.
Securing BMU+ VS events intact would cost a further £21.2m to reduce the risk entirely. This
is ten times more than the spend to get the risk to 1-in-2800 years and as such is deemed low
value and not recommended.

Frequency Risk and Control Report – Report – April 2021 (v2)
30 of 49
9.3.4. Summary
9.3.4.1. Without applying control to the 49.5Hz impact
Table 7 summarises the results above, applying individual loss risk control to 48.8Hz, 49.2Hz
and 50.5Hz:
System-wide
controls
plus BMU-only plus BMU+VS
outage
plus BMU+VS
intact
Extra n/a £ 4m £ 5m £ 65m
Total £ 240m £ 244m £ 249m £ 314m
48.8Hz 1-in-240 years 1-in-270 years 1-in-460 years 1-in-600 years
49.2Hz 1-in-7 years 1-in-22 years 1-in-28 years 1-in-31 years
49.5Hz 2 times per year 2 times per year 2 times per year 2 times per year
50.5Hz 1-in-3.6 years 1-in-1,100 years 1-in-2,800 years n/a
Table 7 – effect of apply individual loss risk controls for each event category
9.3.4.2. Applying control to the 49.5Hz impact
Table 8 summaries the results above, applying individual loss risk control to 49.5Hz as well as
48.8Hz, 49.2Hz and 50.5Hz:
System-wide
controls
plus BMU-only plus BMU+VS
outage
plus BMU+VS
intact
Extra n/a £ 27m £ 18m £ 395m
Total £ 240m £ 267m £ 285m £ 680m
48.8Hz 1-in-240 years 1-in-270 years 1-in-460 years 1-in-600 years
49.2Hz 1-in-7 years 1-in-22 years 1-in-28 years 1-in-31 years
49.5Hz 2 times per year 1-in-4.6 years 1-in-5.6 years 1-in-6.5 years
50.5Hz 1-in-3.6 years 1-in-1,100 years 1-in-2,800 years n/a
Table 8 – effect of apply individual loss risk controls for each event category

Frequency Risk and Control Report – Report – April 2021 (v2)
31 of 49
9.4. Conclusions
9.4.1.1. Frequency limit for different size infeed loss risks (49.2Hz vs. 49.5Hz)
The cost-risk benefit of securing the loss risks to 49.5Hz rather than 49.2Hz is as follows:
• Taking actions to secure BMU-only events costs £23m and reduces the risk of a
frequency deviation exceeding 49.5Hz from 2 times per year to 1-in-4.6 years.
• For an additional £13m, securing BMU+VS events in outage conditions to 49.5Hz
further reduces the risk from 1-in-4.6 years to 1-in-5.6 years.
• Securing BMU+ VS intact events would cost a further £330m to reduce the risk from 1-
in-5.6 years to 1-in-6.5 years.
The historic expectation has been for transient frequency deviations below 49.5Hz to occur
around four times per year. As the expected rate is only two times per year without applying
controls to BMU-only, BMU+VS outage or BMU+VS intact events, they all represent poor value
for money.
9.4.1.2. Across the 48.8Hz, 49.2Hz and 50.5Hz impacts
Across these impacts (excluding 49.5Hz):
• applying individual loss risk controls to the BMU-only events all provide good value for
money, at an indicative cost of £4m in 2021 to reduce the risk of a frequency deviation
exceeding:
• 48.8Hz from 1-in-240 years to 1-in-270 years
• 49.2Hz from 1-in-7 years to 1-in-22 years
• 49.5Hz remains at 2 times per years
• 50.5Hz from 1-in-3.6 years to 1-in-1,100 years
• applying individual loss risk controls to the BMU+VS outage events provides less value,
at an indicative additional cost of £5m in 2021 to reduce the risk of a frequency deviation
exceeding:
• 48.8Hz from 1-in-270 years to 1-in-460 years
• 49.2Hz from 1-in-22 years to 1-in-28 years
• 49.5Hz remains at 2 times per years
• 50.5Hz from 1-in-1,100 years to 1-in-2,800 years
• Applying the individual loss risk controls to the BMU+VS intact events are poor value,
at an indicative additional cost of £65m in 2021 to reduce the risk of a frequency
deviation exceeding:
• 48.8Hz from 1-in- 460 years to 1-in-600 years
• 49.2Hz from 1-in-28 years to 1-in-31 years
• 49.5Hz remains at 2 times per years
• 50.5Hz from 1-in-2,800 years to being fully mitigated

Frequency Risk and Control Report – Report – April 2021 (v2)
32 of 49
Securing BMU-only events to 49.2Hz and 50.5Hz is good value for money, BMU+VS outage
events are lower value for money, and the BMU+VS intact events are poor value for money.
NB: Appendix: Individual loss risk controls summarises the results if 49.5Hz was also
secured
9.5. Proposals
Proposal 2a: Frequency limit for different size infeed loss risks
• Don’t apply individual loss risk controls to BMU-only, BMU+VS outage and BMU+VS
intact events to keep resulting frequency deviations within 49.5Hz
Proposal 2b: individual loss risk controls
• Update current Policy to:
o Apply individual loss risk controls to BMU-only events to keep resulting frequency
deviations within 49.2Hz and 50.5Hz
o Do not apply individual loss risk control to BMU+VS outage or BMU+VS intact
events

Frequency Risk and Control Report – Report – April 2021 (v2)
33 of 49
10. Proposal 3: Dynamic Containment Low
10.1. Aim
Proposal 3 assesses how changes in the level of Dynamic Containment Low can impact the
cost vs. risk balance.
10.2. Assessment
10.2.1. Considerations
The assessment considers two scenarios:
• 500MW of Dynamic Containment Low
• growing Dynamic Containment Low further with the anticipated MW pipeline
The anticipated pipeline reaches 500MW in May 2021 and 900MW in July 2021. This is a best
view based on the information the ESO has at the time of writing, and so is subject to change.
This informs whether it is valuable to procure more than 500MW of Dynamic Containment Low
in 2021.
10.2.2. Assumptions
The assessment is based on:
• Proposal 1: Minimum national inertia – 140 GVA.s minimum inertia, and
• Proposal 2: Individual loss risk controls – applying individual loss risk controls to
BMU-only events for 49.2Hz and 50.5Hz, but not applying individual loss risk control to
BMU+VS outage or BMU+VS intact events
10.3. Results
Scenario DC at 500MW DC Pipeline
System-wide controls cost £ 220m £ 240m
Individual loss risk controls cost £ 8m £ 4m
Total cost £ 228m £ 244m
Remaining risk: 48.8Hz 1-in-63 years 1-in-270 years
Remaining risk: 49.2Hz 1-in-10 years 1-in-22 years
Remaining risk: 49.5Hz 3 times per year 2 times per year
Remaining risk: 50.5Hz 1-in-1,100 years 1-in-1,100 years
Table 9 – effect of different levels of Dynamic Containment Low

Frequency Risk and Control Report – Report – April 2021 (v2)
34 of 49
10.4. Conclusions
Growing the Dynamic Containment Low pipeline in 2021:
• reduces the risk of a frequency deviation exceeding:
• 48.8Hz from 1-in-63 years to 1-in-270 years
• 49.2Hz from 1-in-10 years to 1-in-22 years
• 49.5Hz from 3 times per year to 2 times per year
• results in an increase total costs by £16m from £ 228m to £ 244m
• system-wide controls costs increase by £20m
• this is offset by a decrease in the cost of individual loss risk controls by £4m
Overall, growing the Dynamic Containment Low pipeline in 2021 represents good value for
money.
It should also be noted that a wider benefit of growing the pipeline is to reduce in the scale of
intervention the ESO must take in market dispatch through trades and Balancing Mechanism
actions, moving those to the system-wide response and inertia controls and competitive
markets16.
10.5. Proposal
Proposal 3: Dynamic Containment Low
• The new fast acting service, Dynamic Containment launched in October 2020, is
delivering value today and continues to provide value into the future.
• The ESO should continue to increase its use of the Dynamic Containment low
frequency service (Dynamic Containment Low) beyond 500MW in line with the
anticipated pipeline
16 NGESO actions to curtail RoCoF risks totalled 3.8TWh in 2019, and 7.4TWh in 2020. Under the
FRCR proposals for 2021, this drops significantly to 0.2TWh

Frequency Risk and Control Report – Report – April 2021 (v2)
35 of 49
11. Proposal 4: Reduce Loss of Mains capacity
11.1. Aim
Proposal 4 assesses how future delivery of the ALoMCP can impact the cost vs. risk balance.
This informs the value of continued delivery of RoCoF and Vector Shift relay changes through
the ALoMCP and their resultant reduction to system risk in 2021.
11.2. Assessment
11.2.1. Considerations
The assessment considers three scenarios:
• no changes to the Loss of Mains risk baseline for 2021
• a 50% reduction to the Vector Shift risk but no change to the RoCoF baseline for 2021
• a 50% reduction to the Vector Shift risk and a 50% reduction to the RoCoF risk for
2021.
11.2.2. Assumptions
The assessment is based on:
• Proposal 1: Minimum national inertia – 140 GVA.s minimum inertia, and
• Proposal 2: Individual loss risk controls – applying individual loss risk controls to
BMU-only events for 49.2Hz and 50.5Hz, but not applying individual loss risk control to
BMU+VS outage or BMU+VS intact events, and
• Proposal 3: Dynamic Containment Low – continuing to grow the Dynamic
Containment Low pipeline beyond 500MW
11.3. Results
Scenario
Remaining capacity
100% Vector Shift
100% RoCoF
50% Vector Shift
100% RoCoF
50% Vector Shift
50% RoCoF
Remaining risk: 48.8Hz 1-in-270 years 1-in-400 years 1-in-16,000 years
Remaining risk: 49.2Hz 1-in-22 years 1-in-25 years 1-in-275 years
Remaining risk: 49.5Hz 2 times per year 2 times per year 1-in-1.4 years
Remaining risk: 50.5Hz 1-in-1,100 years 1-in-850 years 1-in-700 years
Table 10 – effect of reducing LoM capacity
NB: the increase in the 50.5Hz risks associated with the reduced capacity scenarios is
because the now smaller RoCoF and Vector Shift (generation) losses have a lower
offsetting impact against the initial demand loss

Frequency Risk and Control Report – Report – April 2021 (v2)
36 of 49
11.4. Conclusions
Consequential RoCoF and Vector Shift loss are a key driver of system risk. Continued delivery
of the ALoMCP during 2021 for both RoCoF and Vector Shift provides a significant reduction
in the low frequency 48.8Hz, 49.2Hz and 49.5Hz risks.
These risk levels are achieved by a combination of Dynamic Containment and delivery of the
ALoMCP. It is important to note that there will be an enduring requirement and cost of holding
additional Dynamic Containment until a one-off change to relays are made. At current prices,
1MW of Dynamic Containment Low costs around £150k per year. The average cost of
changing 1MW of capacity under the ALoMCP has been under £2k as a one-off cost.
Therefore, the ALoMCP should continue to pursue RoCoF and Vector Shift relay changes in
2021.
NB: This analysis is only valid for 2021, and does not consider the likely increasing future
value of continued relay change. The electricity system is in transition, with larger infeed
loss risks connecting to the system and lower inertia periods anticipated more often.
Consequential RoCoF and Vector Shift losses will continue to be a key driver of system
risk as a result. Future editions of the Report will continue to assess these risks.
11.5. Proposal
Proposal 4: ALoMCP
• The ALoMCP programme has been running for over a year and has already created
significant value by removing nearly 10GW of Vector Shift protection settings. There is
still a substantial volume of protection changes to be made to minimise the risk posed
by the Vector Shift and RoCoF protection on distributed generation.
• The ALoMCP should continue during 2021 for both RoCoF and Vector Shift.

Frequency Risk and Control Report – Report – April 2021 (v2)
37 of 49
12. Recommendations
The following proposals are recommendations to apply controls to prevent an event having a
defined unwanted impact, where our assessment tells us these are good value, and not to
apply controls where they are not good value. The proposals cover policies relating to the use
of controls such as increasing or decreasing inertia (the electricity system’s ability to dampen
frequency changes) and automatic or manual actions. Examples of these controls are to curtail
the output of large generation or interconnector infeed, or to curtail the amount of export on an
interconnector. The various options and combinations of generation and interconnector losses
have been grouped according to likelihood.
12.1. Main Recommendation
12.1.1. Proposals
12.1.1.1. Minimum inertia
Conclusions
The assessment shows that increasing minimum inertia to 160GVA.s:
• would result in little to no benefit in risk reduction
• would result in a significant increase in cost
This would not present good value to the end consumer, and so is not recommended.
Proposal 1: minimum national inertia requirement
• Continue with current Policy:
o Minimum inertia at 140GVA.s
12.1.1.2. Individual loss risk controls
Conclusions
The historic expectation has been for transient frequency deviations below 49.5Hz to occur
four times per year. As the expected rate is only two times per year without applying controls
to BMU-only, BMU+VS outage or BMU+VS intact events, they all represent poor value for
money.
Securing BMU-only events to 49.2Hz and 50.5Hz is good value for money, BMU+VS outage
events are lower value for money, and the BMU+VS intact events are poor value for money.

Frequency Risk and Control Report – Report – April 2021 (v2)
38 of 49
Proposal 2a: Frequency limit for different size infeed loss risks
• Don’t apply individual loss risk controls to BMU-only, BMU+VS outage and BMU+VS
intact events to keep resulting frequency deviations within 49.5Hz
Proposal 2b: individual loss risk controls
• Update current Policy to:
o Apply individual loss risk controls to BMU-only events to keep resulting frequency
deviations within 49.2Hz and 50.5Hz
o Do not apply individual loss risk control to BMU+VS outage or BMU+VS intact
events
The term BMU (Balancing Mechanism Units) is used to describe a generator, relevant
collection of generators, or interconnector. Planned outages for maintenance or construction
(“outage”) and consequential generation losses due to the operation of Vector Shift protection
(VS) or Rate of Change of Frequency (RoCoF) protection on distributed generation were found
to be key groupings for this assessment.
12.2. Other recommendations
12.2.1. Proposals
12.2.1.1. Dynamic Containment
Conclusions
Growing the Dynamic Containment Low pipeline in 2021 represents good value for money,
and has a wider benefit reducing the scale of intervention the ESO must take in market
dispatch through trades and Balancing Mechanism actions.
Proposal 3: Dynamic Containment Low
• The new fast acting service, Dynamic Containment launched in October 2020, is
delivering value today and continues to provide value into the future.
• The ESO should continue to increase its use of the Dynamic Containment low
frequency service (Dynamic Containment Low) beyond 500MW in line with the
anticipated pipeline
12.2.1.2. Loss of Mains
Conclusions
Consequential RoCoF and Vector Shift loss are a key driver of system risk. Continued delivery
of the ALoMCP during 2021 for both RoCoF and Vector Shift provides a significant reduction
in the low frequency 48.8Hz, 49.2Hz and 49.5Hz risks.

Frequency Risk and Control Report – Report – April 2021 (v2)
39 of 49
Proposal 4: ALoMCP
• The ALoMCP programme has been running for over a year and has already created
significant value by removing nearly 10GW of Vector Shift protection settings. There is
still a substantial volume of protection changes to be made to minimise the risk posed
by the Vector Shift and RoCoF protection on distributed generation.
• The ALoMCP should continue during 2021 for both RoCoF and Vector Shift.
12.3. Result of applying the proposals
By applying the above proposals to current Policy, the results are:
• total costs are indicated to be around £244m for 2021/22
o £240m for system-wide response and inertia controls
o £4m for individual loss risk actions on BMU-only events
• the level of frequency risk on the system will be:
# Deviation Duration Likelihood
H1 50.5 > Hz _____ Any 1-in-1,100 years
L1 49.2 ≤ Hz < 49.5 up to
60 seconds 2 times per year
L2 48.8 < Hz < 49.2 Any 1-in-22 years
L3 47.75 < Hz ≤ 48.8 Any 1-in-270 years
Table 11 – level of risk on the system
Table 11 forms the expectations for unacceptable frequency conditions as set out in the SQSS.
The cost of frequency control in recent years has ranged from £275m to £360m17. The
combined impact of the recommendations, delivery of the Accelerated Loss of Mains Change
Programme and the introduction of Dynamic Containment is a reduction in risk.
The recommendations establish a clear benchmark which will allow us to measure the costs
and risks of frequency control from now and into the future. The indicative cost for 2021/22 is
£244m.
17 Data source: NGESO Monthly Balancing Services Summary (MBSS)

Frequency Risk and Control Report – Report – April 2021 (v2)
40 of 49
12.4. Resulting changes to system operation
As the FRCR proposed changes to policy, there needs to be a period of implementation for
NGESO to update internal tools, process and documentation.
Implementation of these changes will be done in two stages, to ensure that the benefits are
realised as soon as is reasonably achievable:
12.4.1. Phase 1
Changes
• removing the tighter frequency limit of 49.5Hz for smaller infeed losses, and instead only
applying the wider limit of 49.2Hz to all BMU-only infeed losses
• a number of BMU-only events which are secured under current Policy have been re-
evaluated and are now more appropriately categorised as BMU+VS events, which under
these proposals will no longer be secured
Implementation timescale
Within two weeks of approval from the Authority.
12.4.2. Phase 2
Changes
• to allow BMU-only infeed loss risks to cause a consequential RoCoF loss, if the resulting
loss can be contained to 49.2Hz and 50.5Hz
Implementation timescale
Within three months after implementing Phase 1.
12.5. Stakeholder impacts
12.5.1. Balancing market participants
As well as the direct benefit of reduced risk, growing the Dynamic Containment pipeline will
also reduce the scale of intervention the ESO must take in market dispatch through trades and
Balancing Mechanism actions.
12.5.2. Distributed Energy Resources
Distributed Energy Resources who have yet to change their Loss of Mains protection setting
to comply with the latest standards will have an increase likelihood of their protection being
activated due to events on the National Electricity Transmission System.
12.5.3. Transmission Network Owners
As proposal 2 is to maintain current Policy, there should be no impact on the current Network
Access Planning process.

Frequency Risk and Control Report – Report – April 2021 (v2)
41 of 49
13. Future considerations
There are a number of events, loss risks, impacts and controls which are not explicitly
considered in this edition of the Report. They will be prioritised for future inclusion in future
reports, based on consultation with the industry and the Authority.
Examples include:
13.1. Events and loss risks
Simultaneous events • as the new frequency response services come on line,
being able to assess the value of securing simultaneous
events, and also defining what would be classed as co-
incident and simultaneous losses
e.g. coincident faults in parts of the network
• assessing simultaneous losses will require a step-change
in analysis, due to the scale of the data processing and
complexity of how events can and can’t interact
e.g. 300 individual events become 44,850 pairs of
simultaneous events
• once the Report, Methodology and NGESO processes are
established through the first edition, it will be possible to
expand the analysis
Other events driven by
planned transmission
network outages
• the change in the likelihood of existing events or new
events created during outages on the NETS, other than
those outages already considered by the Methodology
Weather conditions • the change in the likelihood of events during adverse
conditions
• the key complexity is how to quantify the increase in risk
New causes of events • such as Active Network Management schemes (AMNs),
single control points for multiple-BMUs, IP risks
• more work is required to understand and quantify these
events
Generation connections • assets owned by generators that connect them to the
NETS, but which are not covered by the SQSS
e.g. short double circuit routes from a power station to a
substation
New causes of distributed
resource losses
• any new causes that come to light as the power system
evolves

Frequency Risk and Control Report – Report – April 2021 (v2)
42 of 49
New infeed and outfeed
losses
• connections in coming years, including new
interconnectors, offshore wind, and nascent technologies
• the key question to address is how to forecast the running-
pattern and reliability of new connections
Impact of system
conditions in the run-up to
an event
• how this impacts on the ability of the system to cope with
events
e.g. more onerous starting frequency, sustained high or
low frequency and the impact on energy-limited controls
13.2. Impacts
Multiple stages of LFDD • if events could cause more than one stage of LFDD, and
how often this could happen
• the duration of LFDD events and the time taken to recover
Further investigation of
high frequency deviations
• historically the focus has been on low frequency, but as
more large outfeed losses connect this may need to
change
Further investigations of
frequency deviations
closer to 50 Hz
• how smaller deviations18 impact users, and how often they
should be allowed to occur
13.3. Controls
Response and Reserve • future services developed under the Response and
Reserve roadmap
Inertia • future stages of the Stability Pathfinder and new market
mechanisms for accessing inertia
• reducing the level of minimum inertia below 140GVA.s
ALoMCP delivery • cost and risk reduction achievable through full delivery of
the programme
18 of the order of operational limits (49.8Hz to 50.2Hz)

Frequency Risk and Control Report – Report – April 2021 (v2)
43 of 49
13.4. Metrics
Other approaches to
valuing cost vs. risk
• whether there are other projects, initiative or research
which can help to inform the metrics and the tolerability of
events to end consumers
e.g. the Black Start Task Force
Ongoing updates • regularly updating the metrics to incorporate the effect of
changes in the value of security of supply as electricity
demand changes
e.g. due to the electrification of heat, electric vehicles
Implementation • the time and costs associated with implementing a change
in policy
13.5. Analysis and data
Improvements in
statistical data inputs
• whether there is the opportunity for better quality or more
accurate input data on the probability of the various types
of faults, and how to reflect any uncertainties
• whether to model a range of possible weather scenarios
to understand the variance this introduces
Consideration of costs
other than BSUoS charges
• whether to assess the wider costs of procuring controls
over and above the direct Balancing Use of System
(BSUoS) charges

Frequency Risk and Control Report – Report – April 2021 (v2)
44 of 49
14. Appendix: Policy from April 2021
14.1. Summary of policy
After adopting the proposals in the 12. Recommendations, the proposed Policy and
implementation of paragraphs 5.8, 5.11,2, 9.2 and 9.4.2 of the SQSS can be summarised as:
Event category
BMU-only VS-only BMU+VS
outage
BMU+VS
intact
Considered
by policy Yes Yes Yes Yes
Mitigated in
real-time Yes n/a19 No No
Prevent
consequential
RoCoF loss
Allowing where
controllable n/a No No
Main control(s)
Frequency
response and
Reduce BMU loss
size
Inertia Reduce LoM
loss size
Reduce LoM
loss size
Additional
control(s) Inertia
Frequency
response n/a n/a
Table 12 – Overview of proposed NGESO policy
19 as the VS-only risk is fully mitigated by minimum inertia policy

Frequency Risk and Control Report – Report – April 2021 (v2)
45 of 49
14.2. Specific policy
After adopting the proposals in the 12. Recommendations, the specific Policy would be:
14.2.1. Frequency response
NGESO will:
a) Infeed losses
• prevent BMU-only and VS-only infeed losses
causing a frequency deviation below 49.2Hz and restore
frequency above 49.5Hz within 60s
→ typically, this means securing a 1260MW infeed loss
with Primary, Secondary and High frequency
response (per Policy prior to the implementation of
this edition of the FRCR, and as set out in the
Methodology)
→ as the supply of Dynamic Containment increases and
adds to the existing supply of Primary, Secondary
and High-frequency response, the overall frequency
response holding will be used to cover larger loss
risks including consequential RoCoF losses
b) Demand losses • prevent all BMU-only outfeed losses causing a frequency
deviation above 50.5Hz
• prevent the loss of Super Grid Transformer supplies to
Distribution Networks causing a frequency deviation
above 50.5Hz20
NB: VS-only losses can’t cause outfeed losses, only
infeed losses
14.2.2. Inertia
NGESO will:
a) Minimum inertia • maintain system inertia at or above 140 GVA.s
→ this prevents all BMU-only, VS-only and BMU+VS
loss risks up to approximately 700MW from causing
a consequential RoCoF loss21
b) Largest VS-only
loss risk
• ensure system inertia is maintained at or above the level
that will prevent the largest VS-only loss from causing a
consequential RoCoF loss
20 these are a loss of power outfeed and are typically smaller than 560MW 21 for some loss risks, the inertia lost with the event means the threshold is slightly below 700MW

Frequency Risk and Control Report – Report – April 2021 (v2)
46 of 49
14.2.3. Reduce Loss of Mains loss size
NGESO will;
Accelerated
Loss of Mains
Change Programme
(ALoMCP)
• update operational tools with latest programme delivery,
as a reduction against the initial baseline capacity
estimate at the start of the programme
14.2.4. Reduce BMU loss size
NGESO will;
a. Infeed loss risks • allow BMU-only infeed loss risks to cause a
consequential RoCoF loss where the resulting loss can
be contained to 49.2Hz
→ if the resulting loss cannot be contained to 49.2Hz,
then take bids to reduce the BMU-only infeed loss to
prevent a frequency deviation below 49.2Hz, either
by preventing the consequential RoCoF loss or
reducing the overall BMU+RoCoF loss
b. Outfeed loss risks • consider allowing BMU-only outfeed loss risks to cause
a consequential RoCoF loss, as the two losses will
partially offset each other22
→ this is only permissible if the resulting high frequency
and/or low frequency deviations are acceptable
→ if they are not acceptable, then do not let BMU-only
outfeed losses cause a consequential RoCoF loss, by
taking offers to reduce the demand loss
14.2.5. Variations to this policy
There are specific, limited variations to these policies based on technical, probabilistic and
economic grounds, applied under paragraphs 5.11.2 and 9.4.2 of the SQSS. This includes
additional actions where appropriate during times of increased system risk, such as during
severe weather, and exceptions where risks cannot feasibly occur23.
The FRCR is an assessment of all events across 2021, made using assumptions as to the
likelihood and impact to system security based on the controls the ESO expects to have
available. If there are circumstances whereby a specific event would lead to overall system
risk being significantly different to the expected case, the ESO reserves the right to take actions
to ensure that system risk remains in line with the risk appetite outlined in the FRCR.
If and when this occurs, and as appropriate, the ESO will inform the Authority of such actions
after they have been taken, and report relevant details in the following FRCR process.
22 the BMU-only outfeed loss would make frequency rise, but the consequential RoCoF loss would
make the frequency fall, so the net effect of the combined loss is smaller 23 e.g. due to the configuration of a BMU making the loss of the whole BMU at once not credible

Frequency Risk and Control Report – Report – April 2021 (v2)
47 of 49
15. Appendix: Minimum inertia scenarios
15.1. Minimum inertia at 140GVA.s
15.1.1. System-wide controls
The indicative total cost of the system-wide response and inertia controls is £240m per year.
15.1.2. Individual loss risk and impacts
After applying the system-wide controls, the remaining risk on the system is:
Event category
Cost to
mitigate
(per year)
Cumulative
cost
(per year)
Remaining risk
50.5Hz
Start point n/a n/a 1-in-3.6 years
BMU-only £ 3.6m £ 3.6m 1-in-1,100 years
BMU+VS outage £ 2.1m £ 5.7m 1-in-2,800 years
BMU+VS intact £ 21.0m £ 26.7m n/a
Event category
Cost to
mitigate
(per year)
Cumulative
cost
(per year)
Remaining risk
49.2Hz
Remaining risk
48.8Hz
Start point n/a n/a 1-in-7 years 1-in-240 years
BMU-only £ 0.5m £ 0.5m 1-in-22 years 1-in-270 years
BMU+VS outage £ 2.3m £ 2.8m 1-in-28 years 1-in-460 years
BMU+VS intact £ 44.3m £ 47.1m 1-in-31 years 1-in-600 years
Event category
Cost to
mitigate
(per year)
Cumulative
cost
(per year)
Remaining risk
49.5Hz
Start point n/a n/a 2.4 times per year
BMU-only £ 23m £ 23m 1-in-4.6 years
BMU+VS outage £ 15m £ 38m 1-in-5.6 years
BMU+VS intact £ 380m £ 418m 1-in-6.5 years

Frequency Risk and Control Report – Report – April 2021 (v2)
48 of 49
15.2. Minimum inertia at 160GVA.s
15.2.1. System-wide controls
In this scenario, the total cost of the system-wide response and inertia controls is approximately
£340m.
15.2.2. Individual loss risk and impacts
After applying the system-wide controls, the remaining risk on the system is:
Event category
Cost to
mitigate
(per year)
Cumulative
cost
(per year)
Remaining risk
50.5Hz
Start point n/a n/a 1-in-3.6 years
BMU-only £ 3.7m £ 3.7m 1-in-1,100 years
BMU+VS outage £ 2.2m £ 5.9m 1-in-2,900 years
BMU+VS intact £ 22.0m £ 27.9m n/a
Event category
Cost to
mitigate
(per year)
Cumulative
cost
(per year)
Remaining risk
49.2Hz
Remaining risk
48.8Hz
Start point n/a n/a 1-in-7 years 1-in-240 years
BMU-only £ 0.5m £ 0.5m 1-in-22 years 1-in-275 years
BMU+VS outage £ 2.1m £ 2.7m 1-in-28 years 1-in-470 years
BMU+VS intact £ 43.0m £ 45.6m 1-in-31 years 1-in-610 years
Event category
Cost to
mitigate
(per year)
Cumulative
cost
(per year)
Remaining risk
49.5Hz
Start point n/a n/a 2 times per year
BMU-only £ 16m £ 16m 1-in-5 years
BMU+VS outage £ 14m £ 30m 1-in-6 years
BMU+VS intact £ 321m £ 351m 1-in-7 years

Frequency Risk and Control Report – Report – April 2021 (v2)
49 of 49
16. Appendix: Individual loss risk controls
16.1. Across all impacts (48.8Hz, 49.2Hz, 49.5Hz and 50.5Hz)
Across each of the impacts:
• applying individual loss risk controls to the BMU-only events all provide good value for
money, at an indicative cost of £27m in 2021 to reduce the risk of a frequency deviation
exceeding:
• 48.8Hz from 1-in-240 years to 1-in-270 years
• 49.2Hz from 1-in-7 years to 1-in-22 years
• 49.5Hz from 2 times per years to 1-in-4.6 years
• 50.5Hz from 1-in-3.6 years to 1-in-1,100 years
• applying individual loss risk controls to the BMU+VS outage events provides less value,
at an indicative additional cost of £18m in 2021 to reduce the risk of a frequency
deviation exceeding:
• 48.8Hz from 1-in-270 years to 1-in-460 years
• 49.2Hz from 1-in-22 years to 1-in-28 years
• 49.5Hz from 1-in-4.6 years to 1-in-5.6 years
• 50.5Hz from 1-in-1,100 years to 1-in-2,800 years
• Applying the individual loss risk controls to the BMU+VS intact events are poor value
for money, at an indicative additional cost of £395m in 2021 to reduce the risk of a
frequency deviation exceeding:
• 48.8Hz from 1-in- 460 years to 1-in-600 years
• 49.2Hz from 1-in-28 years to 1-in-31 years
• 49.5Hz from 1-in-5.6 years to 1-in-6.5 years
• 50.5Hz from 1-in-2,800 years to being fully mitigated
Copyright © 2022 FDOKUMEN