French, Russell L. TITLE Assessing School Climate. PUB ...
19
DOCUMENT RESUME ED 340 738 TM 017 799 AUTHOR Bobbett, Gordon C.; French, Russell L. TITLE Assessing School Climate. PUB DATE NoV 91 NOTE 21p.; Paper presented at the Annual Meeting of the Mid-South Educational Research Association (20th, Lexington, KY, November 12-15, 1991). PUB TYPE Reports - Research/Technical (143) -- Speeches/Conference Papers (150) -- Tests/Evaluation Instruments (160) EDRS PRICE MF01/PC01 Plus Postage. DESCRIPTORS Educational Assessment; *Educational Environment; Factor Analysis; High Schools; Organizational Climate; *Rating Scales; Rural Schools; *Secondary School Teachers; Test Reliability; *Test Use; Test Validity IDENTIFIERS Alpha Coefficient: Appalachia; *Internal Consistency; Kentucky; Split Half Test Reliability; Tennessee; *Wayson School Climate and Content Inventory ABSTRACT Use of the School Climate and Context Inventory (SCCI) as a measure of school climate was investigated. The SCCI had previously been used as a measure of climate in a study of six rural high schools in Kentucky and Tennessee; in the current study, the SCCI was administered to 20 faculty members from each school._ Split-half correlation and Cronbach's alpha were used to eyaluate internal consistency of the SCCI. Factor analysis was also used to evaluate the 45 items and 8 clusters of the SCCI. The evaluation of internal consistency indicates that the SCCI as a whole measures something in a consistent manner. No individual items need to be removed because they consistently lend themselves to multiple interpretations. One of the factor analyses indicates that almost all SCCI items load on one factor. Consequently, the climate of a school may be a whole, ratner than a series of parts. The results suggest that there may be as many as 11 distinct factors being measured by the SCCI, although further study is needed to clarify the issue of school climate. Seven data tables and a six-item list of references are included. Appendices present the SCCI and a table of Guttman's partial correlations. (SLD) *********************************************************************** Reproductions supplied by EDRS are the best that can be made from the original document. ***********************************************************************
-
Upload
khangminh22 -
Category
Documents
-
view
5 -
download
0
Transcript of French, Russell L. TITLE Assessing School Climate. PUB ...
DOCUMENT RESUME
ED 340 738 TM 017 799
AUTHOR Bobbett, Gordon C.; French, Russell L.TITLE Assessing School Climate.PUB DATE NoV 91NOTE 21p.; Paper presented at the Annual Meeting of the
Mid-South Educational Research Association (20th,Lexington, KY, November 12-15, 1991).
PUB TYPE Reports - Research/Technical (143) --Speeches/Conference Papers (150) -- Tests/EvaluationInstruments (160)
EDRS PRICE MF01/PC01 Plus Postage.DESCRIPTORS Educational Assessment; *Educational Environment;
Factor Analysis; High Schools; OrganizationalClimate; *Rating Scales; Rural Schools; *SecondarySchool Teachers; Test Reliability; *Test Use; TestValidity
IDENTIFIERS Alpha Coefficient: Appalachia; *Internal Consistency;Kentucky; Split Half Test Reliability; Tennessee;*Wayson School Climate and Content Inventory
ABSTRACT
Use of the School Climate and Context Inventory(SCCI) as a measure of school climate was investigated. The SCCI hadpreviously been used as a measure of climate in a study of six ruralhigh schools in Kentucky and Tennessee; in the current study, theSCCI was administered to 20 faculty members from each school._Split-half correlation and Cronbach's alpha were used to eyaluateinternal consistency of the SCCI. Factor analysis was also used toevaluate the 45 items and 8 clusters of the SCCI. The evaluation ofinternal consistency indicates that the SCCI as a whole measuressomething in a consistent manner. No individual items need to beremoved because they consistently lend themselves to multipleinterpretations. One of the factor analyses indicates that almost allSCCI items load on one factor. Consequently, the climate of a schoolmay be a whole, ratner than a series of parts. The results suggestthat there may be as many as 11 distinct factors being measured bythe SCCI, although further study is needed to clarify the issue ofschool climate. Seven data tables and a six-item list of referencesare included. Appendices present the SCCI and a table of Guttman'spartial correlations. (SLD)
***********************************************************************Reproductions supplied by EDRS are the best that can be made
from the original document.***********************************************************************
,f
. . 1.1.1.1.I
ASSESSING SCHOOL CLIMATEU.S. DEPARTMENT OF EDUCATION
Ofte of Educational Research and lotPtchisment
EDUCATIONAL RESOURCES INFORMATIONCENTER (ERIC)
Wthis document has been reproduced esreceived born the person or organizationoriginating it
(1 Minor changes have been made to improvereproduction quality
Points ot view or upin.ons slated in thisdocument do not necessarily represent officialOERI position or policy
L I 1.1, ]
Dr. Gordon C. BobbettEducational Consultant
8325 Richland Colony Rd.Knoxville, TN 37923
"PERMISSION TO REPRODUCE THISMATERIAL HAS BEEN GRANTED BY
60,9 C. 13066677
TO THE EDUCATIONAL RESOURCESINFORMATION CENTER (ERIC)."
Dr. Russell L FrenchUniversity of Tennessee-Knoxville
Knoxville, TN 37996
DescriptorsSchool Climate
EvaluationRural Appalachian Schools
1991 Mid-South Educational Research Association(MSERA)
Annual MeetingLexington, KY
11,1
Discussion SessionWednesday, November 15, 1991
"" .r ... ...1.
2
BEST COPY AVAILABLE
ASSESSING SCHOOL CLIMATE
I. INTRODUCTION
In a recent study of "good" Appalachian high schools (Bobbett, et al, 1991), Wayson's School
Climate and Context Inventory (see Appendix A) was used as a measure of climate in the six high
schools investigated. The original intent of this study was simply to provide more complete
analysis of the climate fack rs originally found. However, statistical analyses of the available data
also produced new findings about the Wayson instillment and new questions about the
measurement of school climate. It is those findings That are reported and discussed here.
II. METHODOLOGY
A. Data From the Schools
The six high schools included in the original study were selected by means of a double-loop
process. First, the Chief State School Officers (CSSO) in Kentucky and Tennessee were asked
to identify the rural Appalachian districts in their states where the best high schools could be
found. (Tennessee has 46 Appalachian rural county school districts; Kentucky has 32 county and
16 rural independent Appalachian school districts). The Kentucky CSSO identified six districts. In
Tennessee, the researchers selected six districts based on their pedormance on the measures in
Tennessee's Report Card on schools. The superintendent of each district agreed to participate in
the study and nominated one high school within his/her district. The following data were colbcted
for the twelve schools in the study:
1. average student performance on state competency tests;2. average student performance on ACT/SAT examinations;3. dropout rates;4. percentage of students continuing on to post-secondary educaton (defined as any
institution qualifying for federal student financial aid);5. responses to a 16-item survey by all teachers in each school, by a sample of students in
each school, and by a sample of members of the community served by each school(School Effectiveness Inventory (SEI)(Bobbett et al., 1990)).
Perceptions and identifiable, measurable school attributes were collectively evaluated. To
narrow the field of schools from each state from six to three, a point ranking of the available data
was developed using weights based on a scheme of relative importance:
The total points available were divided by six (the number of schools to be used in the study).
Then, points were awarded to each school based on its performance relative to the other five
3
schools in its state (six schools were initially selected from Kentucky and six from Tennessee)
Total points for each school were calculated, and the final school selection was based on the
overall point total.
Wayson's SCCI was one of the instruments administered by researchers in their visits to each
of the six finalist schools. The SCCI was administered to 20 faculty members from each school,
thereby creating 120 total responses.
B . THE WAYSON SCHOOL CLIMATE AND CONTEST INVENTORY (SCCI)
The SCCI consists of 45 items which Wayson clustered into eight areas (1988), a priori.
These cluster areas and their corresponding items are:
1. Staff members in good schools work together to solve problems and to improve thelearning environment and outcomes (items 1-5, 37);
2. Staff members in good schools involve more people in making decisions, and theyeliminate the status barriers that inhibit communication, teaching and learning (items 6-
9, 41, 42, 44);3. Staff in good schools make every student feel that he or she belongs in the school and
is served well by it (items 10-15, 39, 40);4. Staff members in good schools consider discipline to be a set of learned attitudes and
behaviors and they teach them primarily by engaging students in the norms governing
school life (items 16-19, 38, 45);5. Staff members in good schools seek out and use curricula and instructional methods
designed to reach all their students (items 20-23);6. Staff members in good schools deal directly with students' personal problems before
they manifest themselves in antisocial or unproductive behaviors (items 24-27);
7. Staff members in high Lionfidence schools use the physical facilities in ways thatenhance the learning environment and reinforce productme and effective relationships
(items 28-31, 36, 43);8. Staff members in good schools relate well with parents and other community members,
welcoming them into the school and classrooms and meeting them comfortably in theirhomes and neighborhoods (items 32-35).
The investigators posed ma research question (among several) as a means to studying the
SCCI from the perspective of the data collected with it in the six schools:
What do the data produced in this study of "good" Appalachian high schoolstell us about the SCCI and about the measurement of school climate?
In developing a response to the research question, two different types of analyses were
conducted. First, the Split-half correlation and the rdonbackAbta were used to evaluate the
SCCI's internal consistency. Second, Factor Analyses was used to evaluate the SCCI's 45 items
and 8 clusters which included "four" related statistical procedures--each portraying different
2
aspects of the instrument. First, Guttman's Partial Correlation was used to evaluate the relative
weight of each of the 45 SCCI items (i.e., the item's correlation with itself). Second, the
Orihogonal Transformation Solution and Qbfigulaoldon Reference Structure-
OrthotranNarimax were used to evaluate each of the 45 items and their related Factors. The 45
SCCI questions and 8 corresponding clusters were compared to the Factors and their
corresponding questions. Third, the frimmanlerciargiatiompligirataarimax was used to
compare each Factor to all other Factors. Fourth, the Proportionate Variance Contributions were
used to determine each Factors comparative weight.
III. FINDINGS
1 . Internal Consistency of the instrument
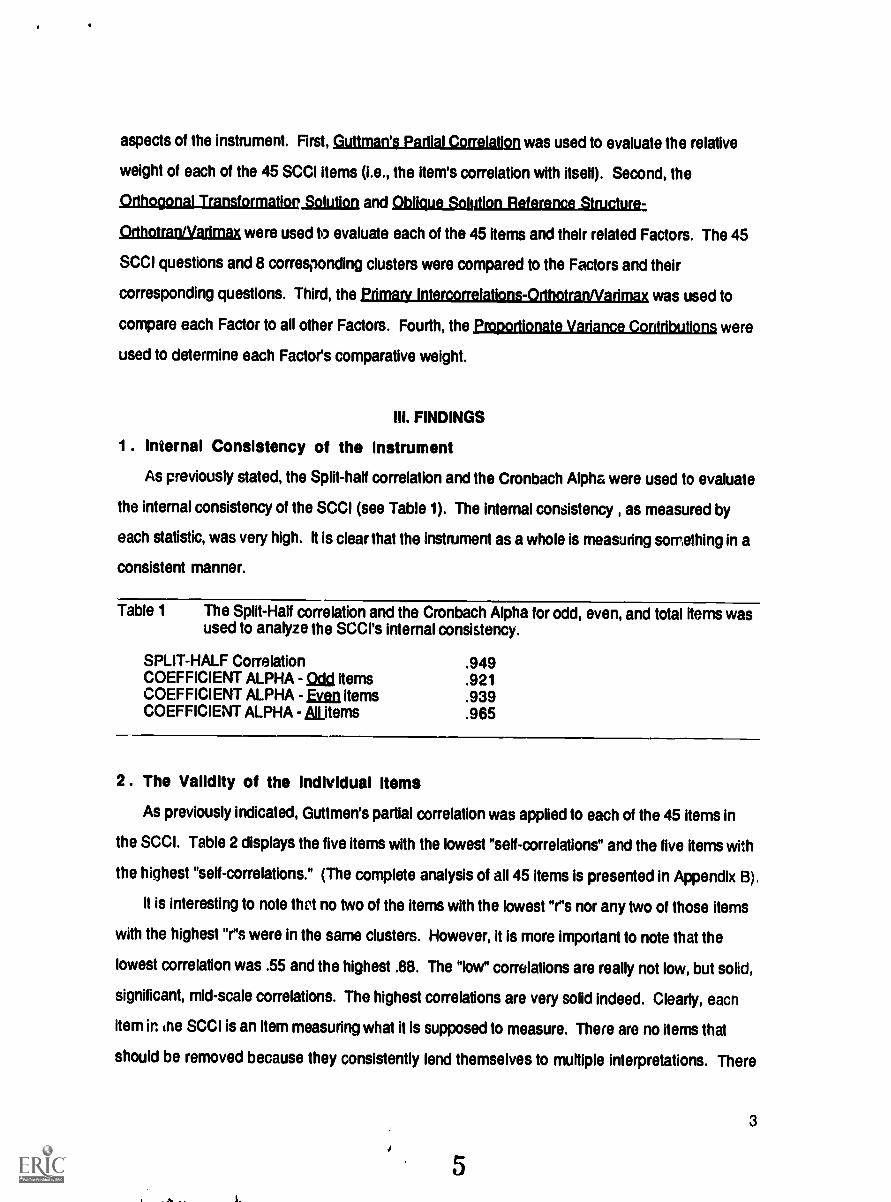
As previously stated, the Split-half correlation and the Cronbach Alpha were used to evaluate
the internal consistency of the SCCI (see Table 1). The internal consistency , as measured by
each statistic, was very high. It is clear that the instrument as a whole is measuring something in a
consistent manner.
Table 1 The Split-Half correlation and the Cronbach Alpha for odd, even, and total items wasused to analyze the SCCI's internal consistency.
SPLIT-HALF Correlation .949COEFFICIENT ALPHA - Qcici items .921COEFFICIENT ALPHA - Eyen items .939COEFFICIENT ALPHA - laems .965
2 . The Validity of the Individual Items
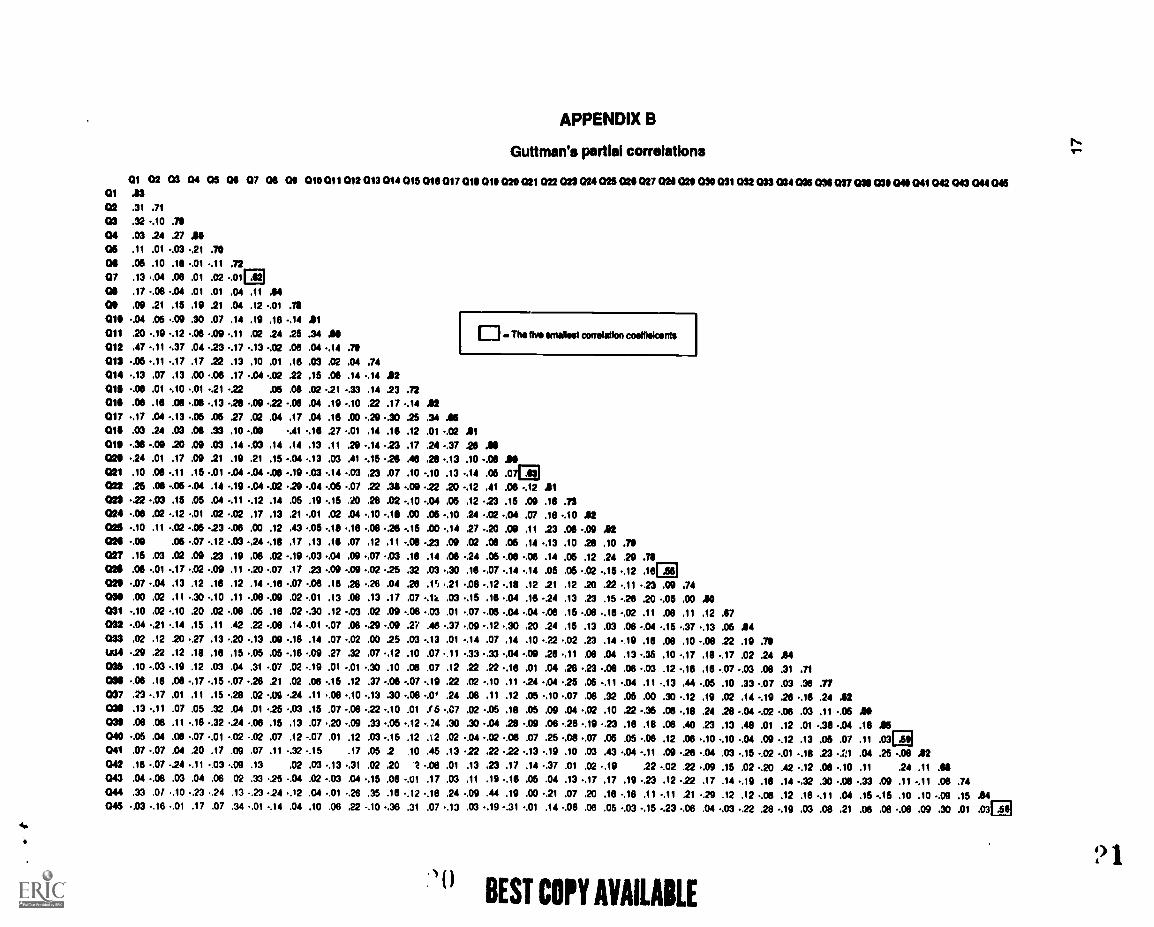
As previously indicated, Guttmen's partial correlation was applied to each of the 45 items in
the SCCI. Table 2 displays the five items with the lowest "self-correlations" and the five items with
the highest "self-correlations." (The complete analysis of all 45 items is presented in Appendix B).
It is interesting to note thil no two of the items with the lowest "r's nor any two of those items
with the highest "r's were in the same clusters. However, it is more important to note that the
lowest correlation was .55 and the highest .88. The low" correlations are really not low, but solid,
significant, mid-scale correlations. The highest correlations are very solid indeed. Clearly, eacn
item in the SCCI is an item measuring what it is supposed to measure. There are no items that
should be removed because they consistently lend themselves to multiple interpretations. There
5
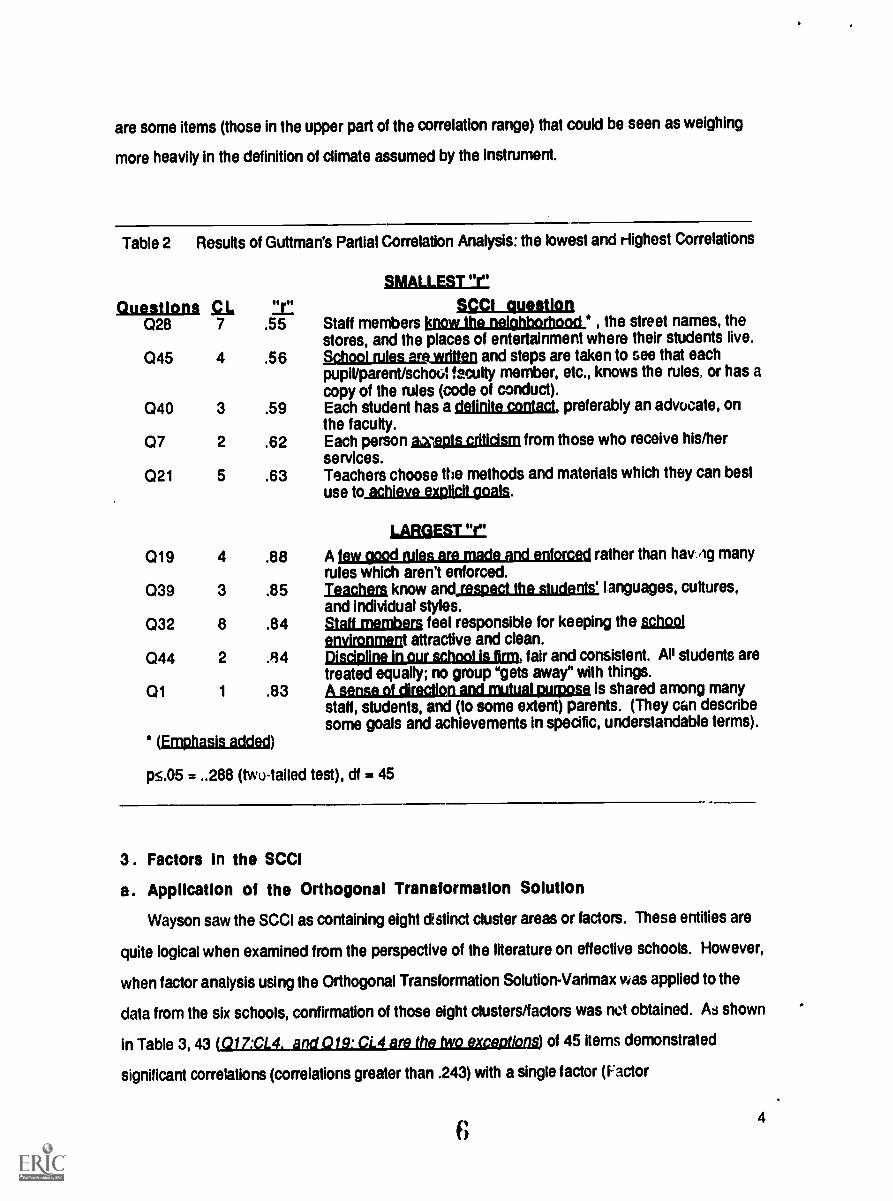
are some items (those in the upper part of the correlation range) that could be seen as weighing
more heavily in the definition of climate assumed by the instrument.
Table 2 Results of Guttman's Partial Correlation Analysis: the lowest and Highest Correlations
SMALLEST"r"
Questions na, SCCI question028 7 .55 Staff members know the neighborhood , the street names, the
stores, and the places of entertainment where their students live.045 4 .56 School mies ere_wtten and steps are taken to see that each
pupWparent/schoot faculty member, etc., knows the rules, or has acopy of the rules (code of conduct).
040 3 .59 Each student has a dafinfiaggniaa, preferably an advocate, onthe faculty.
07 2 .62 Each person axepls.rakism from those who receive his/herservices.
021 5 .63 Teachers choose the methods and materials which they can bestuse to_agigamexpliamais.
LARGEST "r
01 9 4 .88 A igg_goggligiunachundilligread rather than hav Ag manyrules which aren't enforced.
039 3 .85 Teachers know andiespect the students' languages, cultures,and indMdual styles.
032 8 .84 Staff menthers feel responsible for keeping the schoo(environment attractive and clean.
044 2 .84 Disdoline in our school is firm, fair and consistent. Ali students aretreated equally; no group "gets away" with things.
01 1 .83 AzimagifinagnAndriguitpumma is shared among manystaff, students, and (to some extent) parents. (They can describesome goals and achievements in specific, understandable terms).
(Emphasis added)
135.05 ...288 (two-tailed test), df 45
3. Factors In the SCCI
a. Application of the Orthogonal Transformation Solution
Wayson saw the SCCI as containing eight distinct cluster areas or factors. These entities are
quite logical when examined from the perspective of the literature on effective schools. However,
when factor analysis using the Orthogonal Transformation Solution-Varimax was applied to the
data from the six schools, confirmation of those eight clusters/factors was netobtained. As shown
in Table 3, 43 (017:CL4. and 019: CL4 are the two exceptigni) of 45 items demonstrated
significant correlations (correlations greater than .243) with a single factor (Factor
64
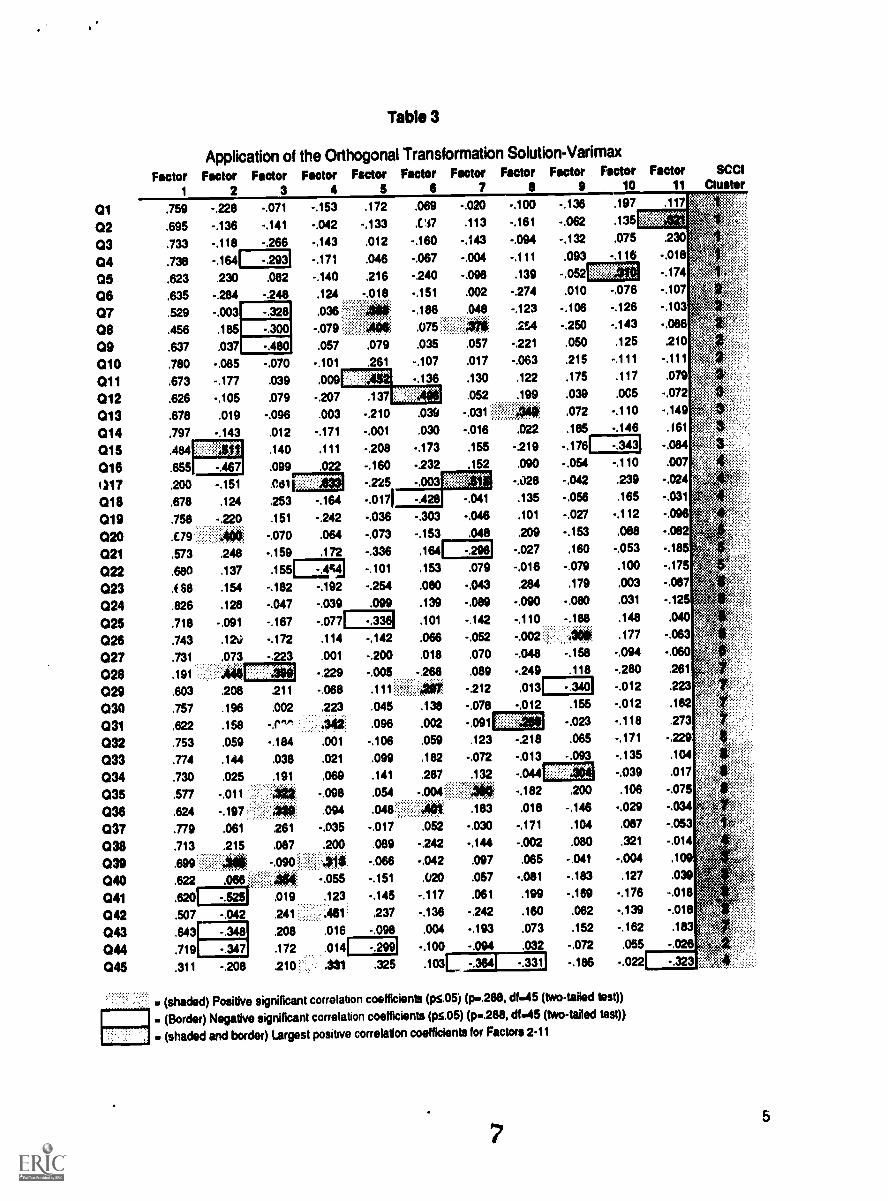
Table 3
Application of the Orthogonal Transformation Solution-Varimax
Factor Factor Factor Factor Factor Factor Factor Factor Factor Factor
1 2 3 4 5 6 7 8 9 10
01 .759 -.228 -.071 -.153 .172 .069 -.020 -.100 -.138 .197
02 .695 -.136 -.141 -.042 -.133 .0 37 .113 -.161 -.062
03 .733 -.118 -.266 -.143 .012 -.160 -.143 -.094 -.132 .075
04 .738 -.164 -.293 -.171 .046 -.067 -.004 -.111 .093 -.116
05 .623 .230 .082 -.140 216 -.240 -.098 .139 -.052 InrE06 .635 -.284 -.248 .124 -.018 -.151 .002 -.274 .010 -.076
07 .529 -.003 -.328 .036 :.!: ANII -.186 .048 -.123 -.108 -.126
08 .456 .185 -.300 -.079 :::.:.:...,.,.:As. .075 ::::! :., .2S4 -.250 -I 43
09 .637 .037 -.480 .057 .079 .035 .057 -.221 .050 .125
010 .780 -.085 -.070 -.101 .261 -.107 .017 -.063 .215 -.111
011 .673 -.177 .039 .009alr= -.136 .130 .122 .175 .117
012 .626 -.105 .079 -.207 .137 M1.,.1 .052 .1.99. .039 .005
013 .678 .019 -.096 .003 -.210 .039 -.031 :::.::0 :: .072 -.110
014 .797 -.143 .012 -.171 -.001 .030 -.016 .022 .185 -.146
015 .484 .140 .111 -208 -.173 .155 -.219 -.176 -.343
016 .655 -.467 .099 .022 -.160 -232 .152 .090 -.054 -.110
1)17 200 -.151 .04311 -.22$ -.003 -.028 -.042 .239
018 .678 .124 253 -.164 -.0171 -428 -.041 .135 -.058 .165
019 .758 7.220 .151 -.242 -.036 -.303 -.046 .101 -.027 -.112
020 .E79 ::::.::::..::,:.:400i, -.070 .064 -.073 -.153 .048 209 -.153 .088
021 .573 .248 -.159 .172 -.336 .164 -.298 -.027 .160 -.053
022 .680 .137 .155=4 -.101 .153 .079 -.016 -.079 .100
023 .( 68 .154 -.182 -.192 -.254 .080 -.043 .284 .179 .003
024 .826 .128 -.047 -.039 .099 .139 -.089 -.090 -.080 .031
025 .718 -.091 -.167 -.077 -.336 .101 -.142 -.110 .148
026 .743 .12v) -.172 .114 -.142 .066 -.052 -.002 :.:.::..
.-.188
401 .177
027 .731 .073 -.223 .001 -.200 .018 .070 -.048 -.158 -.094
028 .191 :AO NW" -.229 -.005.... .089 -.249 .118 -.280
029 .603 208 211 -.068
..-.266.
.111 :::...:,:.::. 29 212 .013 -.340 -.012
030 .757 .196 .002 .223 .045 .138 -.078 -.012 .155 -.012
031 .622 .158 -.0,-, ....362 .096 .002 -.091 inr7.3 -.023 -.118
032 .753 .059 -.184 .001 -.106 .059 .123 -.218 .065 -.171
033 .774 .144 .038 .021 .099 .182 -.072 -.013 -.093 -.135
034 .730 .025 .191 .069.. ....
.141 .287 .132 -.044 Ogrli -.039
182 200035 .577 -.011 332 098 .054 004 .106
036 424 -.197 339 044 .048 .183 418 -.146 -.029
037 .779 .061 261 -.035 -.017 .052 -.030 -.171 .104 .087
038 .713 .215 .087 .200 .089 -.242 -.144 -.002 .080 .321
039 .699 -.066 -.042 497 465 -441 -.004
040 .622 066 .,., -455 -.151 .020 .057 -481 -.183 .127
041 .620 -.525 .019 .123 -.145 -.117 .061 .199 -.169 -.176
042 .507 -.042 241 .: ::......:: A61'. 237 -.136 -242 .160 .062 -.139
043 .643 -.348 .208 .016 -.098 .004 -.193 .073 .152 -.162
044 .719 -.347 .172 .014 -.299 -.100 -.094 .032 -.072 .055
045 .311 -.208 210,. .321 .325 .103L -.384 -.331 -.186 -.022
(shaded) Positive significant correlation coefficients (ps.05) (p..288, df.45 (two-tailed test))
. (Border) Negative significant correlation coefficients (0.05) (p.288, df.45 (two-talled test))
(shaded and border) Largest positive correlation coefficients for Factors 2-11
Factor SCCI11 Cluster
.117 is A
-.018 .,:.
-.174
-.107
-.103
-.088
.210
-.111
.079
-.072
-.149
.161
-.084
.007
-.024
-.031
-.096
-.082
-.185
-.175
-.087
-.125
.040
-.063
-.060
261
223.162
.273
-.229
.104
.017
-.075
-.034
-.053
-.014
.109
.039
-.018
-.018
.183
-.026
5
1). Ten items demonstrated higher correlations with "factors" other than factor 1, but none of
these items loaded on the same factor.
This analysis hints of 11 facton within the SCCI but more strongly suggests that the
instrument consists of a single factor. As the cluster column in Table 3 indicates, there was no
pattern suggesting the clusters/factors identified by Wayson.
b . Application of the Oblique Solution Primary Pattern Matrix-Orthotran/Varimax
Because the Orthogonal Transformation Solution-Varimax analysis hinted at the possible
presence of eleven factors in the SCCI, the Oblique Solution Primary Pattern Matrix-
Orthotran/Varimax procedure was applied to the data. This second procedure differs from the first
in that it rotates the "x" and "y" axes. Through this rotation process, it finds the angle that
produces the largest correlation coefficients for each of the factors collectively. Although a typical
research using factor analyses selects ME the Orthogonal or the Oblique, this study used both
procedures in order to evaluate the data from both perspectives. Table 4 displays the results of
this second factor analysis. In this analysis, 11 factors containing one to twelve items each clearly
emerge. Table 5 presents the factors, items within each and the relationships of those items to
the clusters defined a priori by Wayson.
Obviously, factors 1 and 2 are the most dominant. Nine items loaded on factor 1, and 12 items
loaded on factor 2. A review of the content of items clustering in these two factors suggests that
factor 1 appears to address in a variety of ways a value tor 'individuality and inclusion of persons
within the school, both faculty/staff and students. Factor 1! includes these of equity, equality,
shared decision-making and shared responsibility.
The third most dominant factor was factor 6 containing six items. Two items with significant
correlations to this factor (items 21 and 23) overlap with factor 1. A major emphasis in this factor
appears to be regular varied interactions among home, school and community.
Two other factors (factors 3 and 5) contain three or more items. Factor 5, containing four items
appears to focus on the presence in the school of a participatory environment. Factor 3,
encompassing three items, stresses teacher knowledge of community and students and, shared
problem soMng by adufts and students in the school.
The remaining six factors contain no more than two items each. Factor 4 emphasizes due
process and staff participation in community organizations capable of supporting students. Factor
s6
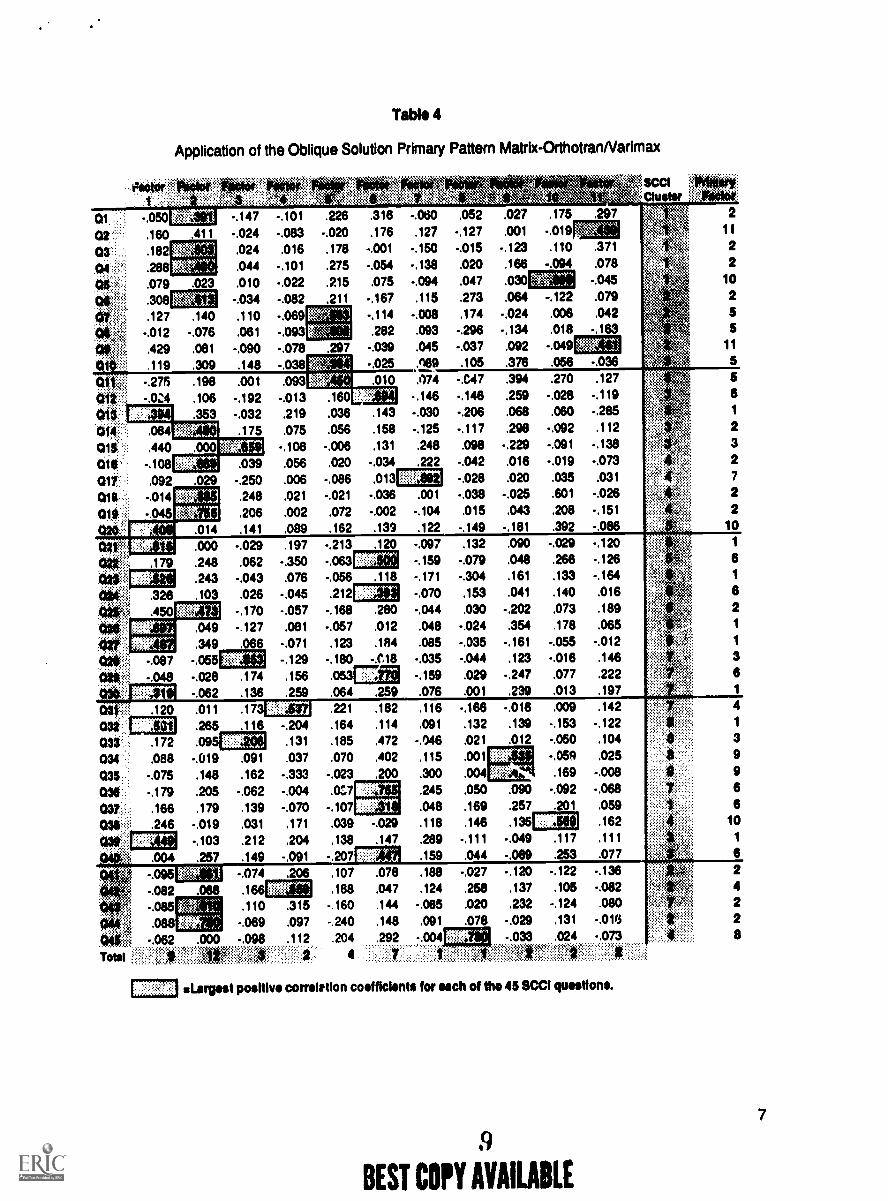
Table 4
Application of the Oblique Solution Primary Pattern Matrix-OrthotranNarimax
:"".*:. "..:
zs
%".
......
"&k.
m
"
.411
034035038'.
.084
.440
-.108[e..:Aei .039
.092 .029 -.250-.014 .248
-.045 11 .206.141
.023
.140-.076.081
.309
.198
.106
.353
-.147-.024.024.044
.010-.034.110.061
-.090.148.001
-.192-.032.175
-.101 .226 .316 -.060
-.083 -.020 .176 .127
.016 .178 -.001 -.150
-.101 .275 -.054 -.138
-.022 .215 .075 -.094
-.082 .211 -.167 .115
- .069 MCS1, -.114 -.008
prEn .282 .093
-.076 .297 -.039 .045
- .038 -.025 .069
to.014
.093 .010 .074
-.013 .160 .146
.219 .036 .143 -.030
.075 .056 .158 -.125
-.108 -.006 .131 .248
.056 .020 -.034 .222
.006 -.086 .013
.021 -.021 -.036
.002 .072 -.002
.089 .162 .139
WTI.001
-.104
.122
.052 .027-.127 .001
-.015 -.123.020 .166
.047 .030
.273 .064
.174 -.024-.296 -.134-037 .092
.105 .376
-.C47 .394
-.146 .259-.206 .068
-.117 .298
.098 -.229-.042 .016
-.028 .020
-.038 -.025.015 .043
-.149 -.181
.175
-.019.110
-.094
-.122.006.018
-.049.056
.270
-.028.060
-.092-.091
-.019.035.601
.208.392
.297
.371
.078-.045.079.042
-.163
gerr3,1-.036.127
-.119-.285.112
-.138-.073.031
-.026-.151
-.086
;;.
.000 -.029 .197 -.213 .120 -.097 .132 .090 -.029 -.120
.179 .248 .062 -.350 -.063 Mr,, -.159 -.079 .048 .266 -.126
.243 -.043 .076 -.056 .118 -.171 -.304 .161 .133 -.164
.328 .103 .026 -.045 .212 MCI: -.070 .153 .041 .140 .016
.450 -.170 -.057 -.168 .280 -.044 .030 -.202 .073 .189
.049 -.127 .081 -.057 .012 .048 -.024 .354 .178 .065
.349 .066 -.071 .123 .184 .085 -.035 -.161 -.055 -.012
-.087 -.055 -.129 -.180 -.C18 -.035 -.044 .123 -.016 .146
-.048 -.028 .174 .156 .0537151 -.159 .029 -.247 .077 .222
LE -.062 .136 .259 .064 .259 .076 .001 .239 .013 .197
oral.NETTA
SIE.120
.172
.088
-.075
-.179.166.246
MEM
:e
Total
.004-.095-.082-.085.088
.011
.265
.095-.019.148.205
.179
-.019-.103.257
.173
.116 -.204.131
.037-.333
-.004-.070.171
.204
-.091
.091
.162
-.062.139.031
.212
.149
INC13.068
MEE
-.074.166.110
-.069
2 .000 7..098
INNOI
.206
.315
.097
.112
.221
.164
.185
.070
-.023
.0C.7
-.107.039
.138-.207.107
.188- 160- 240
204
4
.182
.114
.472
.402
.200
wan-.029
.116
.091
-.046.115
.300
.245
.048
.118
.147 .289
.159
.188
.124
-.065.091
-.004
WI;.078.047.144
.148
.292
-.166.132.021
.001
.004
.050
.169
.146-.111
.044
-.027.256.020.078
-.016.139.012
.090
.257
.135
-.049-.089
.039
-.153-.050
.169
-.092.201
.142-.122.104.025
-.008-.068.059.162
.117 .111
.253 .077-.120 -.122 -.136
.137 .105 -.082
.232 -.124 .080
-.029 .131 -.01(3
-.033 .024 -.073
....... . .
Largest positive correirtion coefficients for mon of the 45 WO questions.
9
BEST COPY AVAILABLE
211
22
255
11
$
1
2327
22
101
1
621
1
361
41
3
9966
101
62422
7
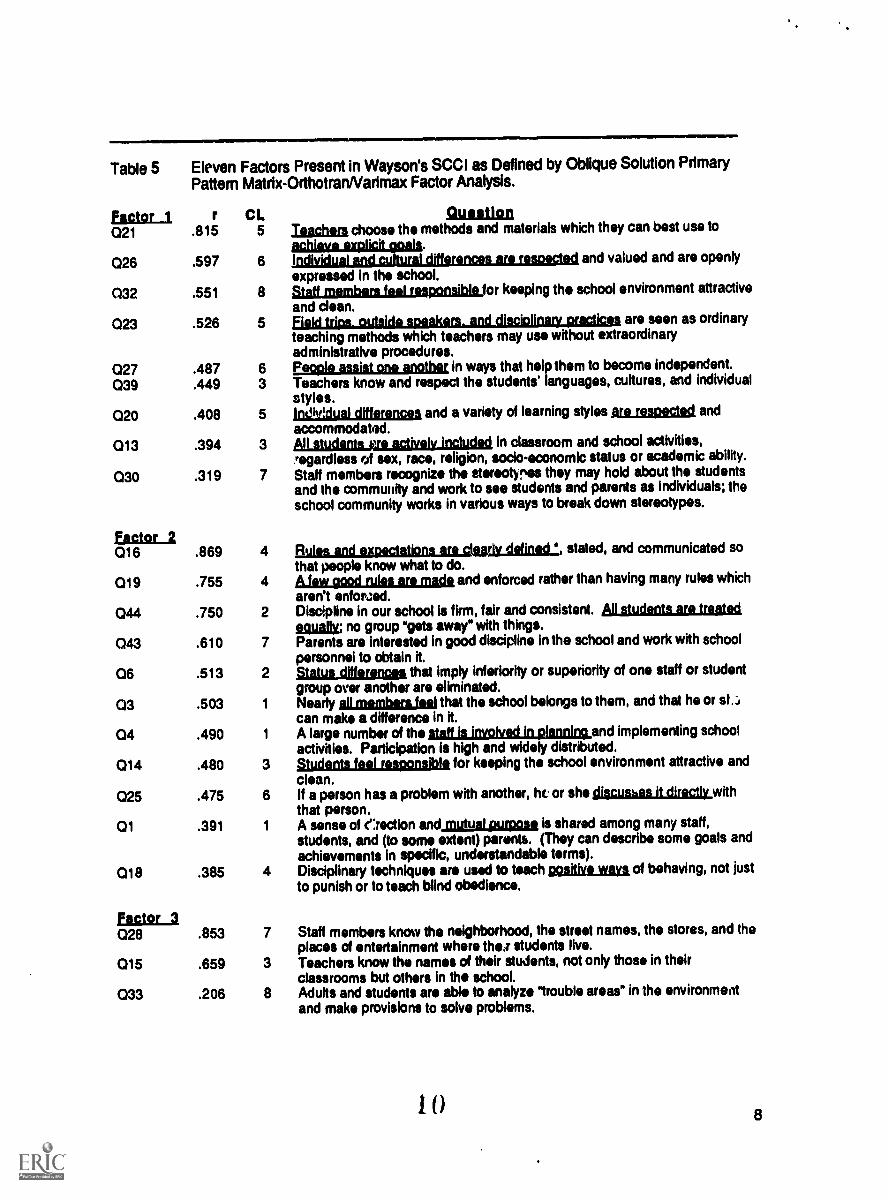
Table 5Pattern Matrix-OrthotranNarimax Factor Analysis.Eleven Factors Present in Wayson's SCCI as Defined by Oblique Solution Primary
fifitQL-1 r CL QuestionTeachers choose the methods and materials which they can best use to021 .815 5
026 .597 6
032 .551 8
023 .526 5
027 .487 6039 .449 3
020 .408 5
013 .394 3
030 .319 7
Factor 2016 .869 4
019 .755 4
044 .750 2
043 .610 7
06 .513 2
03 .503 1
04 .490 1
014 .480 3
025 .475 6
01 .391 1
018 .385 4
factor 3028 .853 7
015 .659 3
033 .206 8
Indivldual and cultural differences are resoectad and valued and are openlyexpressed in the school.Staff members feel responsible for keeping the school environment attractiveand dean.Field trips, outside speakers. and disciolinatv practices are seen as ordinaryteaching methods which teachers may use without extraordinaryadministrative procedures.People assist one another in ways that help them to become independent.Teachers know and respect the students' languages, cultures, and individualstyles.Indy:dual difference% and a variety of learning styles aramsegpled andaccommodated.Algisliniumagilagyjndgesi in classroom and school activities,regardless of sex, race, religion, socio-economic status or academic ability.Staff members recognize the stereotynes they may hold about the studentsand the community and work to see students and parents as individuals; theschool community works in various ways to break down stereotypes.
BylniandelpardstgaLsaaludzAdinse, stated, and communicated sothat people know what to do.Mew good rules are made and enforced rather than having many rules whicharen't enforzed.Discipline in our school is firm, fair and consistent. AistudenisArgIreafsdeaually; no group 'Vets away" with things.Parents are interested in good discipline in the school and work with schoolpersonnel to obtain it.Status differences that imply inferiority or superiority of one staff or studentgroup over another are eliminated.Nearly ill members feet that the school belongs to them, and that he or st..-,can make a difference in it.A large number of the saltAktobatiagignololand implementing schoolactivities. Participation is high and widely distributed.Students feel responsible for keeping the school environment attractive andclean.If a person has a problem with another, hc or she discussant directly withthat person.A sense of e:rection and mutual purpose is shared among many staff,students, and (to some extent) parents. (They can describe some goals andachievements in specific, understandable terms).Disciplinary techniques are used to teach ogaillyeium of behaving, not justto punish or to teach blind obedience.
Staff members know the neighborhood, the street names, the stores, and theplaces of entertainment where thee students live.Teachers know the names of their students, not only those in theirclassrooms but others in the school.Adults and students are able to analyze trouble areas" in the environmentand make provisions to solve problems.
1 0 8
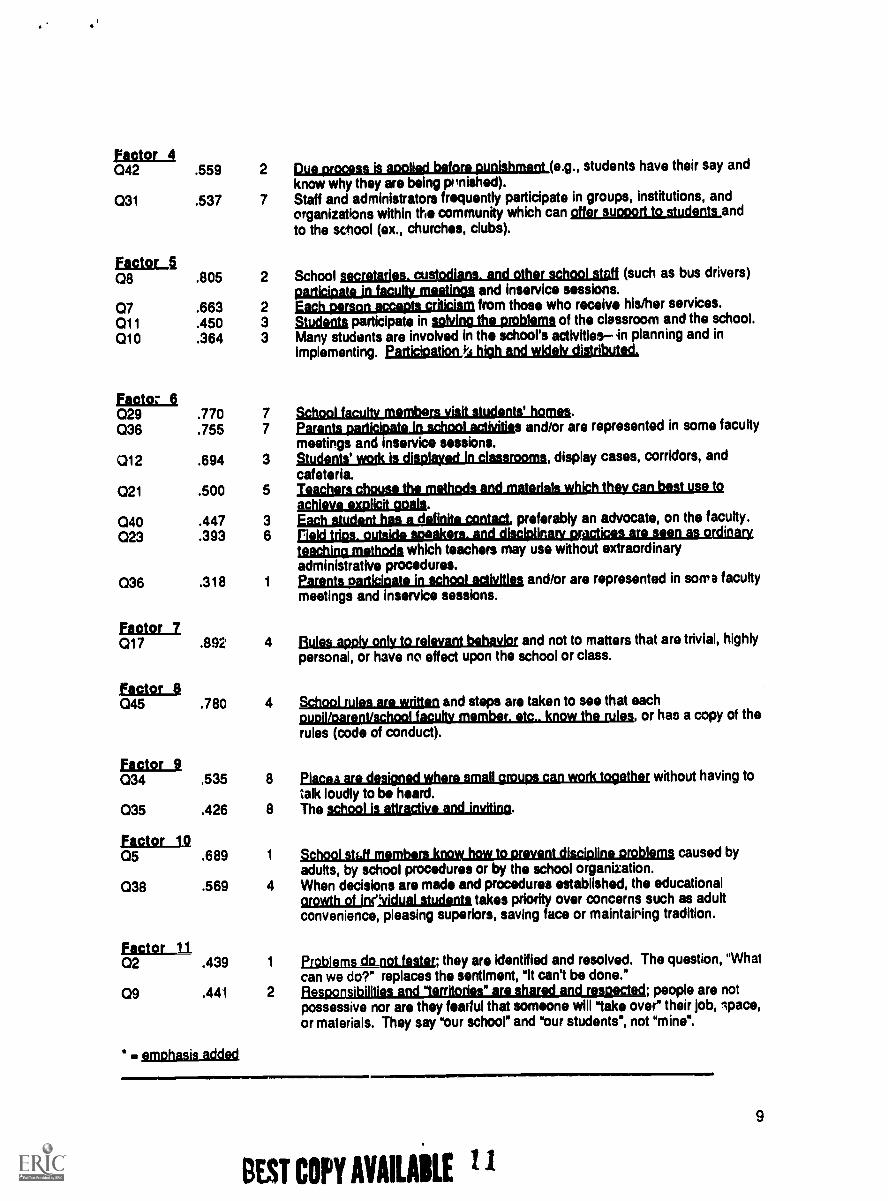
Factor 4042 .559 2
031
figiaLl
.537 7
08 .805 2
07 .663 2011 .450 3010
fasts/Li
.364 3
029 .770 7036 .755 7
012 .694 3
021 .500 5
040 .447 3023 .393 6
036 .318 1
Factor 7017
factor 8
.892 4
045 .780 4
EILGI2Li034 .535 8
035 .426 8
Factor 1005 .689 1
038
fifill2L.il
.569 4
02 .439 1
09 .441 2
. emphasis added
gazgaujimashithbauguaunignma(e.g., students have their say andknow why they are being prinished).Staff and administrators frequently participate in groups, institutions, andorganizations within the community which can offer support to students andto the school (ex., churches, clubs).
School secretaries. custodians. and other school staff (such as bus drivers)participate in faculty meeting& and inservice sessions.fach person accepts criticism from those who receive his/her services.Student& participate in soMng the problem of the classroom and the school.Many students are involved in the school's activities in planning and inimplementing. Participation kJ high and widely distribuied,
Schoollaculty members visitstudents' hum.ParanlaAgrligioataimachadiabfilim and/or are represented in some facultymeetings and inservice sessions.Students' work is displayed in classrooms, display cases, corridors, andcafeteria.Teachers chousa the methods and materials which they can best use toachieve egplicit goals.Emil student has a definite contact preferably an advocate, on the faculty.field trips, outside maskers, and disciplinary plactices are seen as ordinaryteaching methoda which teachers may use without extraordinaryadministrative procedures.Parents participate in school activities and/or are represented in soma facultymeetings and inservice sessions.
aulek.apoly_only_kunleyantinhayjor and not to matters that are trivial, highlypersonal, or have no effect upon the school or class.
&Imam las are writtaq and steps are taken to see that eachpupil/pareptischool facu4 member. etc.. know the rules, or has a copy of therules (code of conduct).
Elarifutgaislithiliaznallgrawagaosadslagethic without having totalk loudly to be heard.The school is affractive and inviting.
1 - i i i i li 1,. t- i t i \ I i l il caused byadults, by school procedures or by the school organization.When decisions are made and procedures established, the educationalarowth of incishiaLaludanla takes priority over concerns such as adultconvenience, pleasing superiors, saving face or maintairing tradition.
Problems do_not fester; they are identified and resolved. The question, "Whatcan we do?" replaces the sentiment, "It can't be done."assmasitilliglinil; people are notpossessive nor are they fearful that someone will "take over their job, ;pace,or materials. They say "our school" and "our students", not "mine".
9
BEST COPY MAILAILE
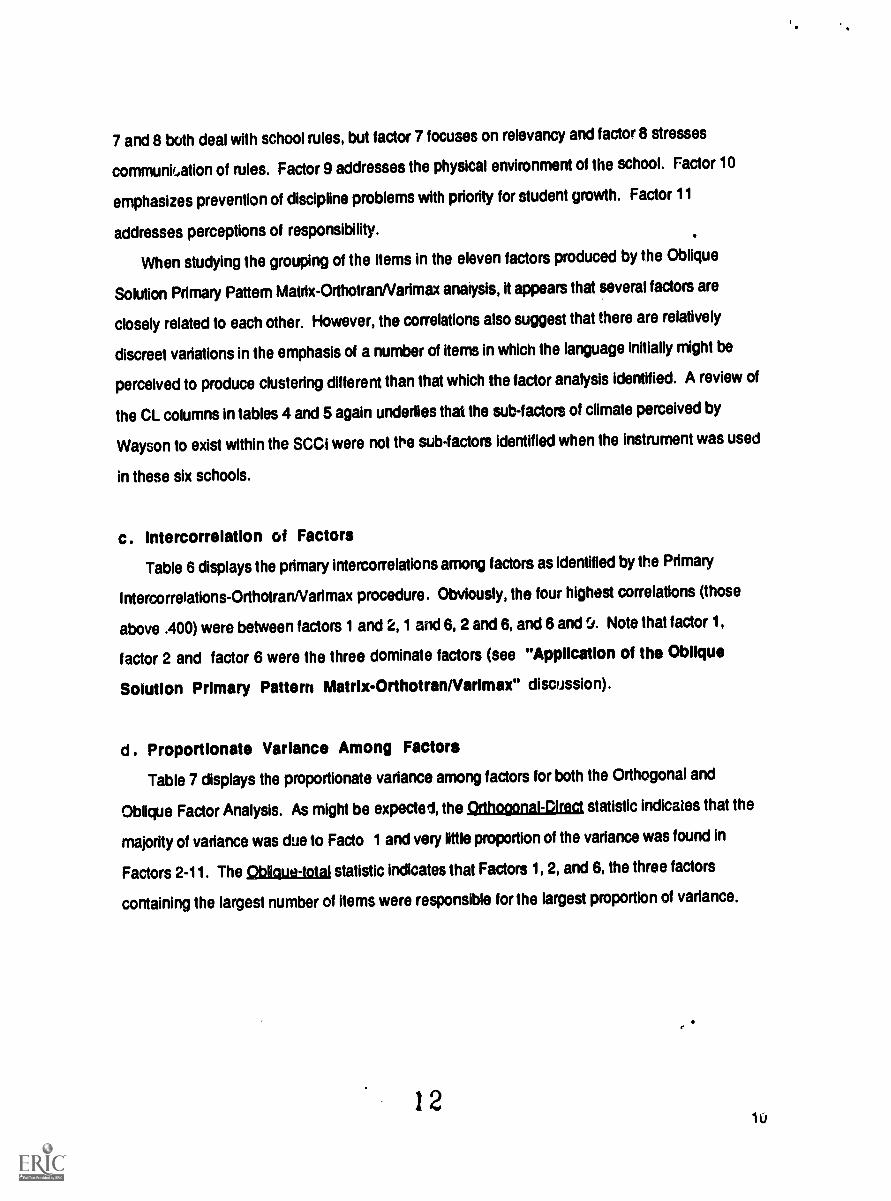
7 and 8 both deal with school rules, but factor 7 focuses on relevancy and factor 8 stresses
communication of rules. Factor 9 addresses the physical environment of the school. Factor 10
emphasizes prevention of discipline problems with priority for student growth. Factor 11
addresses perceptions of responsibility.
When studying the grouping of the items in the eleven factors produced by the Oblique
Solution Primary Pattern Matrix-OrthotranNarimax analysis, it appears that several factors are
closely related to each other. However, the correlations also suggest that there are relatively
discreet variations in the emphasis of a number of items in which the language initially might be
perceived to produce clustering different than that which the factor analysis identified A review of
the CL columns in tables 4 and 5 again underlies that the sub-factors of climate perceived by
Wayson to exist within the SCC1 were not the sub-factors identified when the instrument was used
in these six schools.
c . IntercorrelatIon of Factors
Table 6 displays the primary intercorrelations amorg factors as identified by the Primary
intercorrelations-OrthotranNarimax procedure. Obviously, the four highest correlations (those
above .400) were between factors 1 and 2, 1 and 6, 2 and 6, and 6 and 5. Note that factor 1,
factor 2 and factor 6 were the three dominate factors (see "Application of the Oblique
Solution Primary Pattern Matrix-Orthotran/Varimax" discussion).
d . Proportionate Variance Among Factors
Table 7 displays the proportionate variance among factors for both the Orthogonal and
Oblique Factor Analysis. As might be expected, the Orthogonal-Direct statistic indicates that the
majority of variance was due to Facto 1 and very Nttle proportion of the variance was found in
Factors 2-11. The Oblique-total statistic indicates that Factors 1, 2, and 6, the three factors
containing the largest number of items were responsible for the largest proportion of variance.
1 210
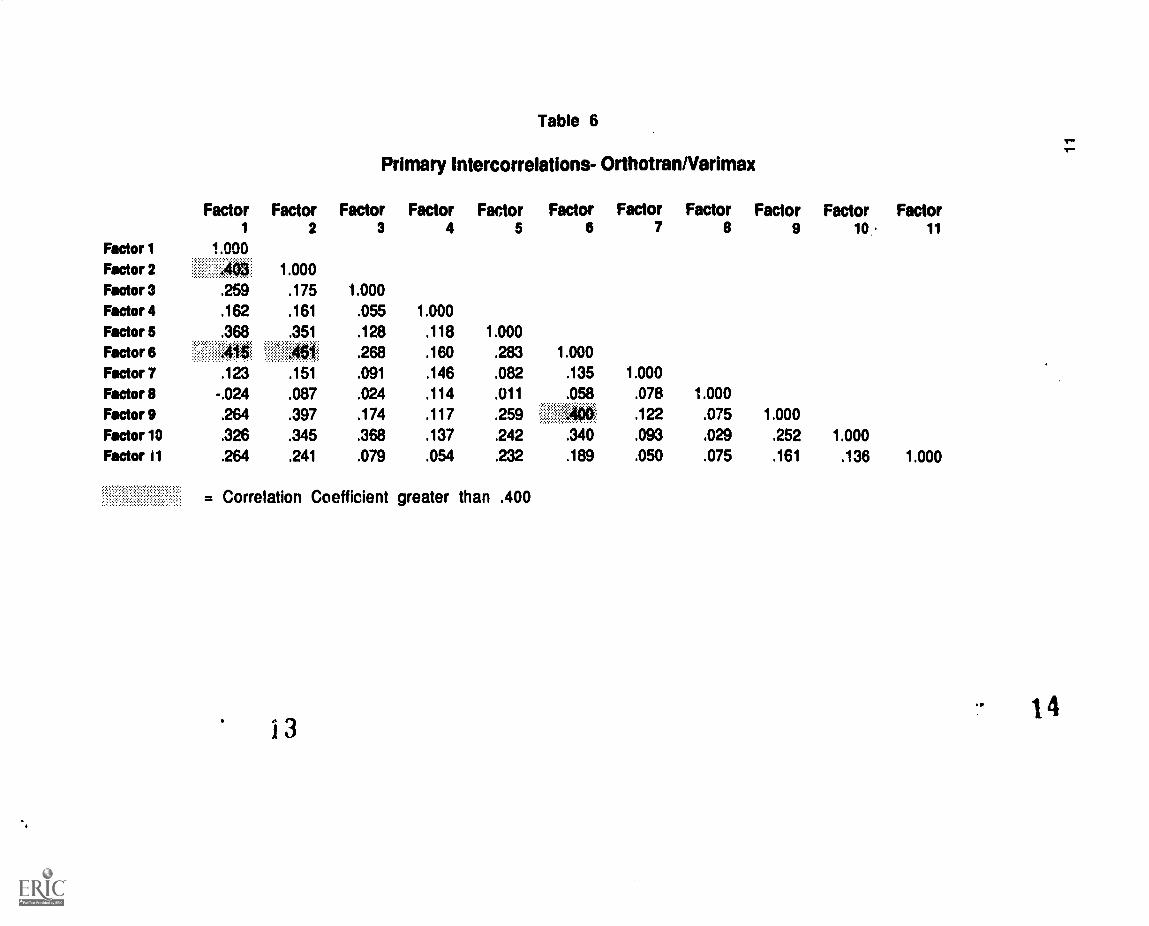
Table 6
Primary intercorrelations- OrthotranNarimax
Factor Factor Factor Factor Factor Factor Factor Factor Factor Factor Factor
1 2 3 4 5 6 7 8 9 10 11
Factor 1 1.000
Factor 2 1.000
Factor 3 .259 .175 1.000
Factor 4 .162 .161 .055 1.000
Factor 5 .368 .351 .128 .118 1.000Factor 6 .268 .160 .283 1.000
Factor 7 .123 .151 .091 .146 .082 .135 1.000
Factor 8 -.024 .087 .024 .114 .011 .058 .078 1.000
Factor 9 .264 .397 .174 .117 .259 .122 .075 1.000
Factor 10 .326 .345 .368 .137 .242 .340 .093 .029 .252 1.000Factor 11 .264 .241 .079 .054 .232 .189 .050 .075 .161 .136 1.000
= Correlation Coefficient greater than .400
1314
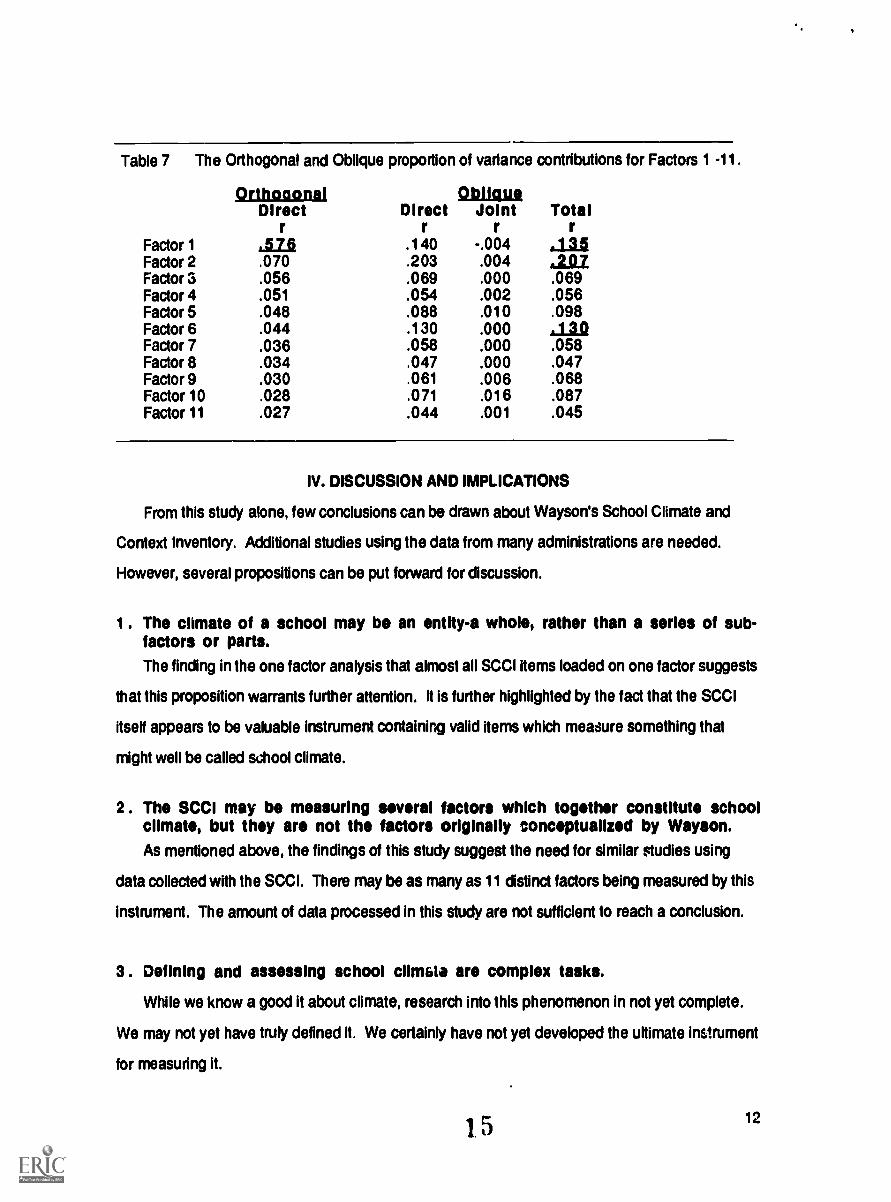
Table 7 The Orthogonal and Oblique propodion of variance contdbutions for Factors 1 -11.
OrthogonalDirect
rFactor 1 anFactor 2 .070Factor 3 .056Factor 4 .051Factor 5 .048Factor 6 .044Factor 7 .036Factor 8 .034Factor 9 .030Factor 10 .028Factor 11 .027
Directr
=hatJoint
r.140 -.004.203 .004.069 .000.054 .002.088 .010.130 .000.058 .000.047 .000.061 .006.071 .016.044 .001
Totalrauau
.069
.056
.098aan.058.047.068.087.045
IV. DISCUSSION AND IMPLICATIONS
From this study alone, few conclusions can be drawn about Wayson's School Climate and
Context Inventory. Additional studies using the data from many administrations are needed.
However, several propositions can be put forward for discussion.
1 . The chmate of a school may be an entity-a wholes rather than a series of sub-factors or parts.The finding in the one factor analysis that almost all SCCI items loaded on one factor suggests
that this proposition warrants further attention. It is further highlighted by the fact that the SCCI
itself appears to be valuable instrument containing valid items which measure something that
might well be called school climate.
2 . The SCCI may be measuring several factors which together constitute schoolclimate, but they are not the factors originally tonceptualized by Wayson.As mentioned above, the findings of this study suggest the need for similar studies using
data collected with the SCCI. There may be as many as 11 dstinct factors being measured by this
instrument. The amount of data processed in this study are not sufficient to reach a conclusion.
3. Defining and assessing school climfita are complex tasks.
While we know a good it about climate, research into this phenomenon in not yet complete.
We may not yet have truly defined it. We certainly have not yet developed the ultimate instrument
for measuring it.
1 512
X. REFERENCES
Bobbett, G. C., Henry, Kenneth J., & French, Russell L. (1991) A Comprehensive Evaluation ofSix Rural Appalachian High Schools in Kentucky and Tennessee, American EducationalResearch Association (AERA), Annual Meeting, Chicago, IL (ERIC ??????) .
Bobbett, G. C., Henry, Kenneth J.,& French, Russell L. (1990) "Measuring EducationalPerceptions in Rural Appalachian School Districts." Tennessee Education, Knoxville, TN,
Vol. 20, No. 1.
Bobbett, G. C., Henry, Kenneth J. & French, Russell L. (1990) A study of six Appalachian high
schools, (AEL Minigrant Report No. 41), Charleston: WV: Appalachian Educational
Laboratory (AEL) Minigrant Report.
Wayson, W.W. (1982). Handbook for developing schools with 000d discipline. Bloomington, IN:
Phi Delta Kappa, International.
Wayson, W.W., Mitchell, Pinnell, G.S., & Landis, D. (1988). Up fronvexcellence: The impact of
the excellence movement on schoolg. Bloomington, IN: Phi Delta Kappa Educational
Foundation.
Wayson W.W., Achilles, C., Pinnell, G.S., Lintz, M.N., Carol, L.N., & Cunningham, L. (1988).Handbook for developing public confidence in schools Bloomington, IN: Phi Detta Kappa
Educational Foundation.
1613
Appendices
1714
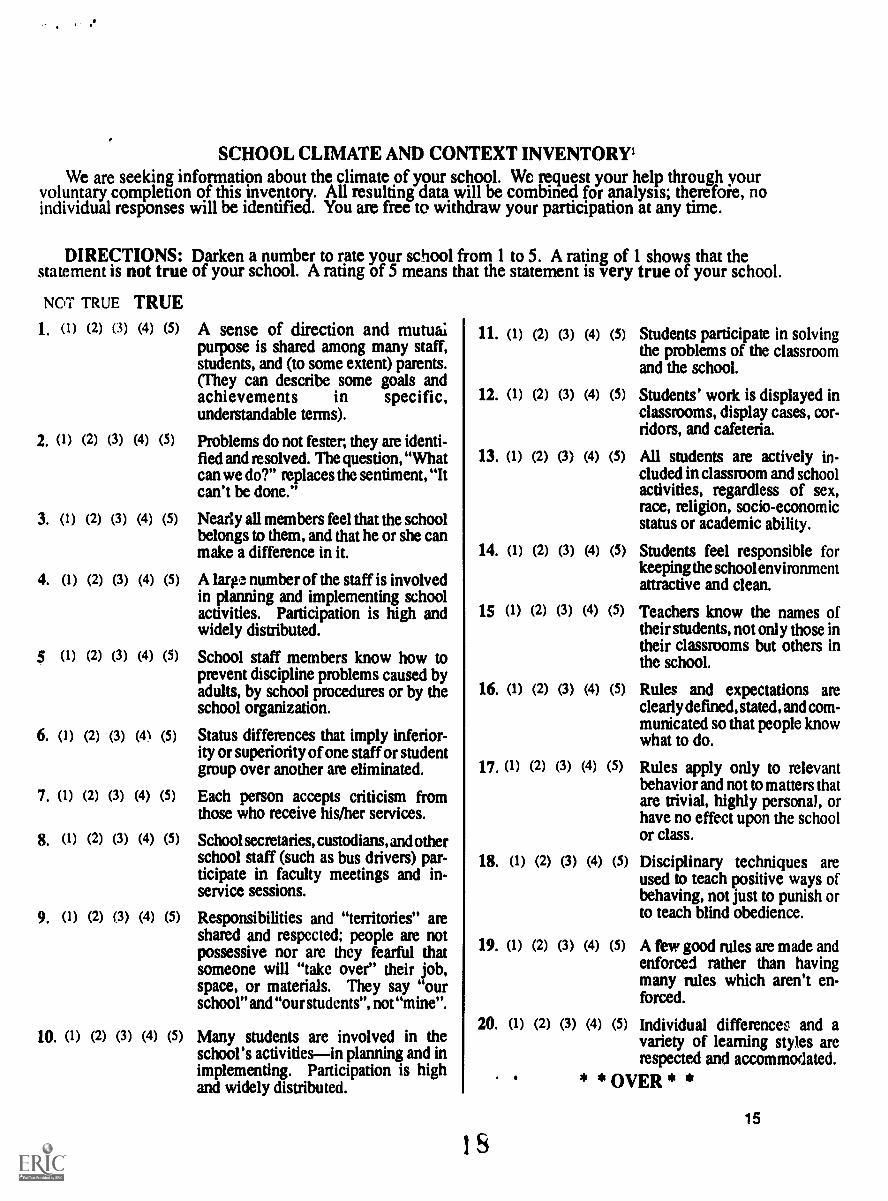
SCHOOL CLIMATE AND CONTEXT INVENTORY'We are seeking information about the climate of your school. We request your help through your
voluntary completion of this inventory. All resulting data will be combined for analysis; therefore, noindividual responses will be identified. You are free to withdraw your participation at any time.
DIRECTIONS: Darken a number to rate your school from 1 to 5. A rating of 1 shows that thestatement is not true of your school. A rating of 5 means that the statement is very true of your school.
NOT TRUE TRUE
1. (1) (2) (3) (4) (5)
2. (1) (2) (3) (4) (5)
3. (1) (2) (3) (4) (5)
4. (1) (2) (3) (4) (5)
5 (1) (2) (3) (4) (5)
6. (1) (2) (3) (4) (5)
7. (1) (2) (3) (4) (5)
8. (1) (2) (3) (4) (5)
9, (1) (2) (3) (4) (5)
10. (1) (2) (3) (4) (5)
A sense of direction and mutualpurpose is shared among many staff,students, and (to some extent) parents.(They can describe some goals andachievements in specific,understandable terms).
Problems do not fester, they am identi-fied and resolved. The question, "Whatcan we do?" replaces the sentiment, "Itcan't be done."
Nearly all members feel that the schoolbelongs to them, and that he or she canmake a difference in it.
A larp., number of the staff is involvedin planning and implementing schoolactivities. Participation is high andwidely distributed.
School staff members know how toprevent discipline problems caused byadults, by school procedures or by theschool organization.
Status differences that imply inferior-ity or superiority of one staff or studentgroup over another are eliminated.
Each person accepts criticism fromthose who receive his/her services.
School secretaries, custodians, and otherschool staff (such as bus drivers) par-ticipate in faculty meetings and in-service sessions.
Responsibilities and "territories" areshamd and respected; people are notpossessive nor are they fearful thatsomeone will "take over" their job,space, or materials. They say "ourschool" and "our students", not "mine".
Many students are involved in theschool's activitiesin planning and inimplementing. Participation is highand widely distributed.
11. (1) (2) (3)
12. (1) (2) (3)
13. (1) (2) (3)
14. (1) (2) (3)
15 (1) (2) (3)
16. (1) (2) (3)
17. (1) (2) (3)
18. (1) (2) (3)
19. (1) (2) (3)
20. (1) (2) (3)
S
(4) (5) Snidents participate in solvingthe problems of the classroomand the school.
(4) (5) Students' work is displayed inclassrooms, display cases, cor-ridors, and cafeteria.
(4) (5) All students am actively in-cluded in classroom and schoolactivities, regardless of sex,race, religion, socio-economicstatus or academic ability.
(4) (5) Students feel responsible forkeeping the school env i ronmentattractive and clean.
(4) (5) Teachers know the names oftheir students, not only those intheir classrooms but others inthe school.
(4) (5) Rules and expectations areclearly defmed, stated, and com-municated so that people knowwhat to do.
(4) (5) Rules apply only to relevantbehavior and not to matters thatare trivial, highly personal, orhave no effect upon the schoolor class.
(4) (5) Disciplinary techniques areused to teach positive ways ofbehaving, not just to punish orto teach blind obedience.
(4) (5) A few good rules are made andenforced rather than havingmany rules which aren't en-forced.
(4) (5) Individual differences and avariety of learning styles arerespected and accommodated.
* * OVER * *
15
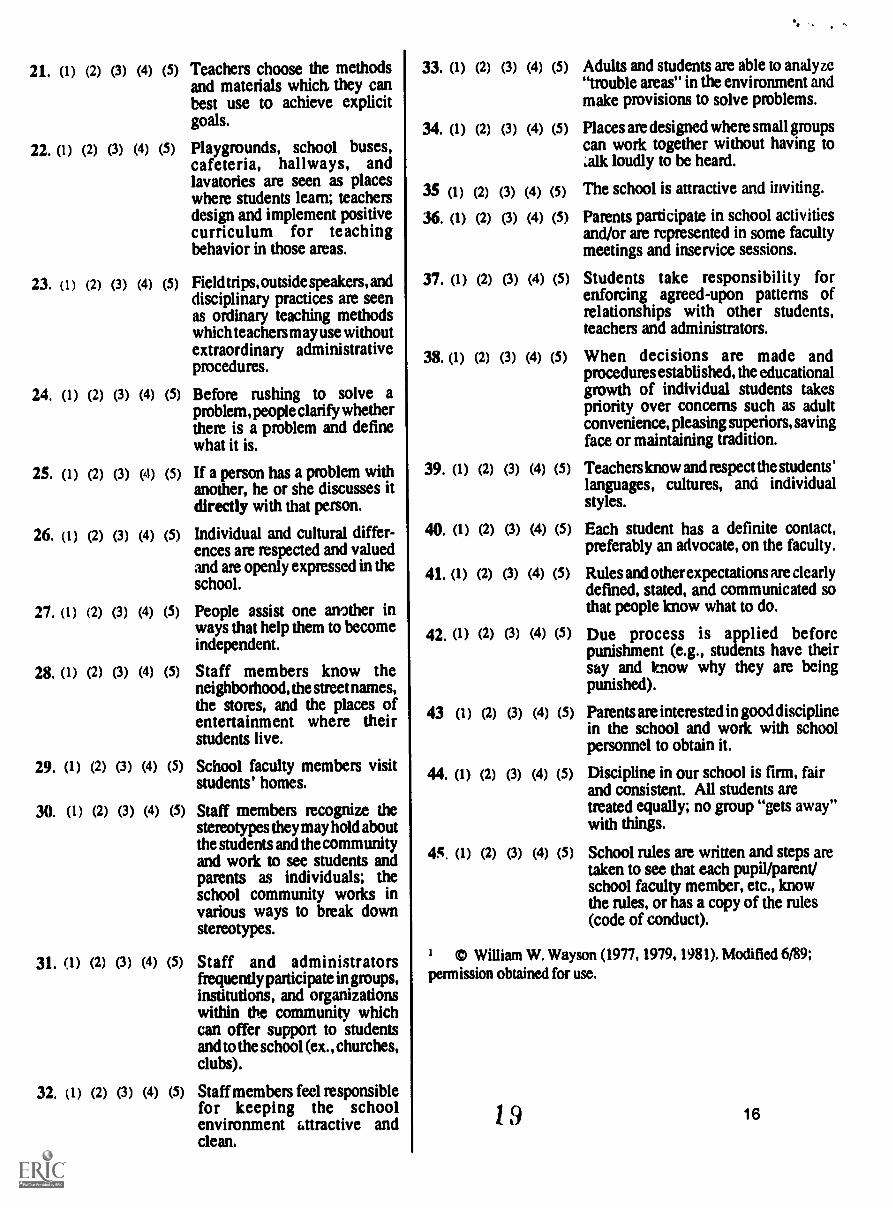
21. (1) (2) (3) (4)
22. (1) (2) (3) (4)
23. (1) (2) (3) (4)
24. (1) (2) (3) (4)
25. (1) (2) (3) (4)
26. (1) (2) (3) (4)
27. (1) (2) (3) (4)
28. (1) (2) (3) (4)
29. (1) (2) (3) (4)
30. (1) (2) (3) (4)
31. (1) (2) (3) (4)
32. (1) (2) (3) (4)
(5) Teachers choose the methodsand materials which they canbest use to achieve explicitgoals.
(5) Playgrounds, school buses,cafeteria, hallways, andlavatories are seen as placeswhere students learn; teachersdesign and implement positivecurriculum for teachingbehavior in those areas.
(5) Fieldtrips,outsidespeakers,anddisciplinary practices are seenas ordinary teaching methodswhich teachers may use withoutextraordinary administrativeprocedures.
(5) Before rushing to solve aproblem, people clarify whetherthere is a problem and definewhat it is.
(5) If a person has a problem withanother, he or she discusses itdirectly with that person.
(5) Individual and cultural differ-ences are respected and valuedand are openly expressed in theschool.
(5) People assist one another inways that help them to becomeindependent.
(5) Staff members know theneighborhood, the street names,the stores, and the places ofentertainment where theirstudents live.
(5) School faculty members visitstudents' homes.
(5) Staff members recognize thestereotypes they may hold aboutthe students and the communityand work to see students andparents as individuals; theschool community works invarious ways to break downstereotypes.
(5) Staff and administratorsfrequently participate in groups,institutions, and organizationswithin the community whichcan offer support to studentsand to the school (ex., churches,clubs).
(5) Staff members feel responsiblefor keeping the schoolenvironment attractive andclean.
33. (1) (2) (3) (4)
34. (1) (2) (3) (4)
35 (1) (2) (3) (4)
36. (1) (2) (3) (4)
37. (1) (2) (3) (4)
Mt (1) (2) (3) (4)
39. (1) (2) (3) (4)
40. (1) (2) (3) (4)
41. (1) (2) (3) (4)
42. (1) (2) (3) (4)
43 (1) (2) 0) (4)
44. (1) (2) (3) (4)
45. (1) (2) (3) (4)
..
(5) Adults and students are able to analyze"trouble areas" in the environment andmake provisions to solve problems.
(5) Places are designed where small groupscan work together without having to.alk loudly to be heard.
The school is attractive and inviting.
Parents participate in school activitiesand/or are represented in some facultymeetings and inservice sessions.
(5) Students take responsibility forenforcing agreed-upon patterns ofrelationships with other students,teachers and administrators.
(5) When decisions are made andprocedures established, the educationalgrowth of individual students takespriority over concerns such as adultconvenience, pleasing superiors, savingface or maintaining tradition.
(5) Teachers know and respect the students'languages, cultures, and individualstyles.
(5) Each student has a definite contact,preferably an advocate, on the faculty.
(5) Rules andotherexpectations are clearlydefined, stated, and communicated sothat people know what to do.
(5) Due process is applied beforepunishment (e.g., students have theirsay and Icnow why they are beingpunished).
(5) Parents are interested ingooddisciplinein the school and work with schoolpersonnel to obtain it.
(5) Discipline in our school is firm, fairand consistent. All students aretreated equally; no group "gets away"with things.
(5) School rules are written and steps aretaken to see that each pupil/parent/school faculty member, etc., knowthe rules, or has a copy of the rules(code of conduct).
(5)
(5)
1 © William W. Wayson (1977, 1979, 1981). Modified 6/89;permission obtained for use.
19 16
1D. The five smallest conehelon coefileicents
APPENDIX B
Guttman's partial correlations
01 02 03 04 os of 07 as oe 010 011 012 013 014 015 015 017 015 015 020 021 on 023 024 025on 027 on on 03001 .83
02 .31 .71
03 .32 -.10 .7904 .03 .24 .27 AO06 .11 .01 -.03 -.21 .70
06 .05 .10 .18 -.01 -.11 .72
07 .13 -.04 .06 .01 .02 -.ela .17 -.06 -.04 .01 .01 .04 .11 .64OS .09 .21 .15 .19 .21 .04 .12 -.01 .75
010 -.04 .05 -.09 .30 .07 .14 .19 .16 -.14 .51011 .20 -.19 -.12 -.06 -.09 -.11 .02 24 25 .34 .80012 .47 -.11 -.37 .04 -.23 -.17 -.13 -.02 .08 .04 -.14 .75013 -.05 -.11 -.17 .17 .22 .13 .10 .01 .16 .03 .02 .04 .74014 -.13 .07 .13 .00 -.06 .17 -.04 -.02 .22 .15 .08 .14 ,14 52015 -.08 .01 -.10 -.01 -.21 -.22 .06 .08 .02 -.21 -.33 .14 23 .72016 .06 .16 .08 -.06 -.13 -28 -.09 -22 -.06 .04 .19 -.10 .22 .17 -.14 .12017 -.17 .04 -.13 -.05 .05 27 .02 .04 .17 .04 .16 .00 -.29 -.30 .25 .34 .6501$ .03 .24 .03 .06 .33 .10 -.03 -.41 -.16 .27 -.01 .14 .16 .12 .01 -.02 .11
019 -.38 -.09 20 .09 .03 .14 -.03 .14 .14 .13 .11 .29 -.14 -.23 .17 .24 -.37 .26 AS025 -24 .01 .17 .09 .21 .19 .21 .15 -.04 -.13 .03 .41 -.15 -.26 .46 .28 -.13 .10 -.06 AO021 .10 .08 -.11 .15 -.01 -.04 -.04 -.06 -.19 -.03 -.14 -.03 .23 .07 .10 -.10 .13 -.14 .06 .07022 .25 .06 -.06 -.04 .14 -.19 -.04 -.02 -.29 -.04 -.06 -.07 22 .35 ,09 -22 .20 -.12 .41 .06 ,12 51023 -.22 -.03 .15 .05 .04 -.11 -.12 .14 .05 .19 -.16 20 .28 .02 ,10 -.04 .06 .12 -23 .15 .09 .16 .73024 -.06 .02 -.12 -.01 .02 -.02 .17 .13 21 -.01 .02 .04 -.10 -.15 .00 .06 -.10 24 -.02 -.04 .07 .18 -.10 .82021 -.10 .11 -.02 -as -23 -.06 .00 .12 .43 -.05 -.18 -.15 -.08 -.26 -.15 .00 -.14 .27 -.20 .09 .11 23 .08 -.09 .112
021 -.09 .06 -.07 -.12 -.03 -.24 -.16 .17 .13 .16 .07 .12 .11 -.08 -.23 .09 .02 .08 .06 .14 -.13 .10 .28 .10 .79027 .15 .03 .02 .09 .23 .19 .00 .02 -.19 -.03 -.04 .09 ,07 -.03 .16 .14 .06 -24 .05 -.06 -.06 .14 .06 .12 .24 .29 .750211 .08 -.01 -.17 -.02 -.09 .11 -.20 -.07 .17 .23 -.09 -.09 -.02 -.25 .32 .03 -.30 .16 -.07 -.14 -.14 .05 .05 -.02 -.15 -.12 .160211 -.07 -.04 .13 .12 .16 .12 .14 -.16 -.07 -.08 .16 .25 -.28 .04 .26 .1r, -.21 -.08 -.12 -.18 .12 21 .12 .20 .22 -.11 -.23 .09 .74OW .00 .02 .11 -.30 -.10 .11 -.06 -.09 .02 -.01 .13 .06 .13 .17 .07 -.IL .03 -.15 .16 -.04 .16 -24 .13 .23 .16 -.26 20 ,05 .00 AO031 -.10 .02 -.10 .20 .02 -.06 .05 .18 .02 -.30 .12 -.03 .02 .09 -.08 -.03 .01 -.07 -.05 -.04 -.04 -.08 .15 -.08 -.16 -.02 .11 48 .11 .12032 -.04 -21 -.14 15 .11 .42 .22 -.06 14 -.01 -.07 .06 -29 -.09 27 .46 -.37 -.09 -.12 -.30 20 .24 .15 .13 .03 .06 -.04 -.15 -.37 -.13033 .02 12 .20 -27 .13 -20 -.13 .09 -.16 .14 .07 -.02 .00 .25 .03 -.13 .01 -.14 .07 .14 .10 -.22 -.02 23 .14 -19 .16 .06 .10 -.06U34 -.29 22 .12 .18 16 .15 -.05 .05 -.16 -.09 .27 .32 .07 -.12 .10 .07 . 11 -.33 -.33 -.04 -.09 .28 -.11 .05 .04 .13 -.35 .10 ,17 .18036 .10 -.03 ,19 .12 .03 .04 .31 -.07 .02 -.19 .01 -.01 -.30 .10 .08 .07 .12 .22 .22 -16 .01 .04 .26 -23 -.06 .08 -.03 .12 ,16 .16031 -.06 .16 .06 -.17 -.15 -.07 -.26 .21 .02 .06 ,15 .12 .37 -.08 -.07 -.19 .22 .02 -.10 .11 -24 -.04 -.25 46 -.11 -.04 .11 -.13 .44 -45037 .23 -.17 .01 .11 .15 -.28 .02 -.09 -24 .11 -.06 -.10 -.13 .30 -.08 ,0+ .24 .06 .11 .12 .05 -.10 -.07 .00 .32 .05 .00 .30 -.12 .190311 13 -.11 .07 .05 .32 .04 .01 -.25 -.03 .15 .07 -.00 -.22 -10 .01 /5 -.07 .02 -.05 .18 .05 .09 .04 -.02 .10 .22 -26 .08 -.18 .24039 .06 .06 .11 -.16 -.32 -24 -46 15 13 .07 -20 -.09 23 -45 -12 -.24 .36 20 -.04 28 -.09 .06 -28 -.19 -.23 .18 .18 .06 .40 .23040 -.05 .04 .06 -.07 -.01 -.02 -.02 47 .12 -.07 .01 .12 .03 -.15 .12 .12 .02 -.04 -.02 -.06 .07 25 -.08 -.07 45 .05 -.06 .12 .06 -.10041 .07 -.07 .04 .20 .17 .09 .07 .11 -22 -.15 .17 .06 2 .10 .45 .13 -22 .22 -22 -.13 -.19 .10 .03 .43 -.04 -.11 49 -.26 -.04042 .16 -.07 ,24 -.11 -.03 -.09 .13 .02 43 -.13 -.31 42 20 -.OS 41 .13 .23 .17 .14 -27 .01 .02 -.19 .22 -.02 22 -49043 04 -A6 .03 .04 .08 02 .33 -25 -.04 .02 ,03 .04 -.15 .08 -.01 .17 .03 .11 .19 -.16 .05 .04 .13 -.17 .17 .19 -23 .12 -22 .17044 .33 .0/ -.10 -23 -.24 .13 -.23 -.24 -.12 .04 ,01 -.26 .35 .16 -.12 -.18 .24 -.09 .44 19 .00 -.21 .07 20 .16 -.16 .11 -.11 .21 -.29046 -.03 -.16 -.01 .17 .07 .34 -.01 -.14 .04 .10 .06 22 -.10 -26 .31 .07 -.13 .03 -19 -.31 -.01 .14 -.08 .06 .05 -.03 -.15 ,23 -.06 .04
.62
.63
) BEST COPY AVAILABLE
031 032 033 034 on on 037038 035 041 041 042 043 044 oes
.67
.05 .114
.22 .19 .79
-.17 .02 .24 14-07 -.03 .06 .31 .71
.10 .33 -.07 .03 .36 .77
.02 .14 -.19 .26 -16 .24 .112
28 -.04 -42 -46 .03 11 -.05 AO
.13 .48 .01 .12 .01 -.38 -.04 .18 AS
,10 -.04 .09 -.12 .13 .05 .07 .11 .03
.03 -.15 -.02 -.01 -15 .23 -21 .04 25 -48 A215 .02 -.20 .42 -.12 .06 -.10 .11 .24 .11 AS.14 -.19 .16 .14 -.32 .30 -.06 -.33 .09 .11 -.11 .06 .74
.12 .12 -46 .12 .18 -.11 .04 .15 ,15 .10 .10 -.08 .15 .14,03 -22 .28 -.19 43 .08 .21 .06 me %Oil .09 .30 .01 .03