Franklin-et-al-Pharm World Sc29-2007
38
Pharm World Sci (2007) 29:240–277 DOI 10.1007/s11096-007-9100-8 PROGRESS IN PRACTICE UKCPA RESIDENTIAL SYMPOSIUM Hotel Metropole, Leeds Friday 18 th – Sunday 20 th November 2005 Lilly UK Critical Care Award 2005 Monitoring a high cost drug in critical care units Wells H 1 , Batra R 2 , McKenzie CA 1 , Yassin S 1 , Offord R 1 , McLuckie A 3 1 Pharmacy Department Guy’s and St. Thomas’ NHS Foundation Trust, London, UK, 2 School of Medicine, University of Maryland, Baltimore, USA, 3 Intensive Care Unit, Guy’s and St. Thomas’ NHS Foundation Trust, London, UK Introduction Drotrecogin alfa (activated), or recombinant human activated protein C (APC) is licensed for the treatment of severe sepsis in patients already receiving optimum intensive care support. It acts by modulating the coag- ulation cascade and systemic inflammatory response during severe sepsis 1 . In this disorder, the ability to produce APC is impaired, and patients are at increased risk of inappropriate intra-vascular coagulation, multi-organ failure and death 1 . Efficacy data for APC comes primarily from PROWESS, a multi-centre, placebo-controlled study of 1728 patients. PROWESS demonstrated a statistically significant absolute risk reduction in 28 day mortality of 6.5% with a number needed to treat 16 patients 1 . Despite po- sitive outcomes in the PROWESS study, the price of using APC is high, both financially and in terms of possible adverse effects. The cost of a course of APC for a 70 kg patient is estimated as £4,905 excluding VAT. The drug has, however, been proven to be cost-effective if targeted to patients who meet the PROWESS criteria 1 (Table 1). The incidence of severe bleeding events was higher in PROWESS but did not reach statistical significance 1 . Its use is therefore contra-indicated in patients at high risk for bleeding 1 (Table 1). Upon European Licensing in 2002, the South East London Critical Care Network (SELCCN) successfully bid for funding to use APC in the setting of severe sepsis. Due to the high cost of use and risk of adverse events, the SELCCN believed it was essential to collect prescribing, mortality and adverse effect data on all patients who received the drug. Objective To collect post-licence surveillance data of APC use in severe sepsis across a network of six intensive care units (SELCCN). To certify adherence to agreed prescribing guidelines, monitor outcome (mortality), adverse events and financial data, thus ensuring best clinical practice and continued funding. Method Guidelines for APC were agreed upon by the SELCCN. A reporting tool and supporting database reflecting these guidelines were designed and implemented to prospectively collect clinical and financial data. The data were then analysed for adherence to established guidelines, patient out- come, adverse events and appraisal of performance against established expenditure aims. The collated data were reported monthly and progress was discussed at network meetings. Results Data were collected and analysed for 249 patients from November 2002 to June 2005. A total of 87% of patients met the agreed criteria (Table 1) for APC with an average expenditure of £5,210.80 ± £2,348.08 per patient. During treatment, 30 haemorrhagic events were cited with 4 reported as serious. Additionally, 8 cases of administration errors occurred, consisting of miscalculated dosing and incorrect preparation. Of 249 patients receiving APC, 85(34%) died in the ICU, 9(4%) died as post-ICU patients, 126(51%) were discharged home and 29(11%) were still in-patients or lost to follow- up. Of the 119 patients 48 with four or more organs in failure at the time of APC administration survived their hospital stay (Figure 1). Table 1 Summary of SELCCN inclusion criteria (based on PROWESS 1 ) Infection criteria: Modified SIRS criteria Criteria for organ dysfunction Suspected or proven infection. Patients had to meet at least two of the following: core temperature ‡38 or £36 °C; heart rate of ‡90/min; a respiratory rate ‡20/min or PaCO 2 £4 kPa, or mechan- ical ventilation; white cell count of ‡12 · 10 9 /l or £4 · 10 9 /l. Patients had to meet at least two of the following criteria: hypotension despite adequate fluid and/or requirement for vasopressors to achieve satisfactory blood pressure, persistent oliguria despite adequate fluid resuscitation; acute hypoxaemia as measured by a PaO2/ FiO 2 ratio £33 kPa (£26.6 in the setting of pneumonia); platelet count £80 · 10 9 /l or a 50% decrease over last 3 days; sepsis induced metabolic acidosis (lactate >1.5 times upper limit of normal plus either pH < 7.3 or base deficit >5 mEq/l). *Exclude if patient has any of the following: active internal bleeding or GI bleed in the last 6 weeks with no correcting intervention, intracranial pathology including surgery in the last 3 months or recent trauma or haemorrhagic stroke, surgery within the last 12 h, concurrent heparin therapy >15 IU/kg/h, known bleeding diathesis, platelet count of <30 · 10 9 /l, epidural catheter, probable survival of less than 24 h or terminal medical condition. Figure 1 Hospital survival in patients receiving APC stratified by organ failure. A240
-
Upload
iamoecenter -
Category
Documents
-
view
0 -
download
0
Transcript of Franklin-et-al-Pharm World Sc29-2007

Pharm World Sci (2007) 29:240–277DOI 10.1007/s11096-007-9100-8
PROGRESS IN PRACTICE UKCPA RESIDENTIAL SYMPOSIUM
Hotel Metropole, Leeds Friday 18th– Sunday 20
thNovember 2005
Lilly UK Critical Care Award 2005
Monitoring a high cost drug in critical care units
Wells H1, Batra R
2, McKenzie CA
1, Yassin S
1, Offord R
1, McLuckie A
3
1PharmacyDepartmentGuy’sandSt.Thomas’NHSFoundationTrust,London,
UK, 2School ofMedicine, University of Maryland, Baltimore, USA, 3Intensive
Care Unit, Guy’s and St. Thomas’ NHS Foundation Trust, London, UK
Introduction
Drotrecogin alfa (activated), or recombinant human activated protein C
(APC) is licensed for the treatment of severe sepsis in patients already
receiving optimum intensive care support. It acts by modulating the coag-
ulation cascade and systemic inflammatory response during severe sepsis1. In
this disorder, the ability to produce APC is impaired, and patients are at
increased risk of inappropriate intra-vascular coagulation, multi-organ
failure and death1. Efficacy data for APC comes primarily from PROWESS,
a multi-centre, placebo-controlled study of 1728 patients. PROWESS
demonstrated a statistically significant absolute risk reduction in 28 day
mortality of 6.5% with a number needed to treat 16 patients1. Despite po-
sitive outcomes in the PROWESS study, the price of using APC is high, both
financially and in terms of possible adverse effects. The cost of a course of
APC for a 70 kg patient is estimated as £4,905 excluding VAT. The drug has,
however, been proven to be cost-effective if targeted to patients whomeet the
PROWESS criteria1 (Table 1). The incidence of severe bleeding events was
higher in PROWESS but did not reach statistical significance1. Its use is
therefore contra-indicated in patients at high risk for bleeding1 (Table 1).
Upon European Licensing in 2002, the South East London Critical Care
Network (SELCCN) successfully bid for funding to use APC in the setting
of severe sepsis. Due to the high cost of use and risk of adverse events, the
SELCCN believed it was essential to collect prescribing, mortality and
adverse effect data on all patients who received the drug.
Objective
To collect post-licence surveillance data of APC use in severe sepsis across a
network of six intensive care units (SELCCN). To certify adherence to agreed
prescribing guidelines, monitor outcome (mortality), adverse events and
financial data, thus ensuring best clinical practice and continued funding.
Method
Guidelines for APC were agreed upon by the SELCCN. A reporting tool
and supporting database reflecting these guidelines were designed and
implemented to prospectively collect clinical and financial data. The data
were then analysed for adherence to established guidelines, patient out-
come, adverse events and appraisal of performance against established
expenditure aims. The collated data were reported monthly and progress
was discussed at network meetings.
Results
Data were collected and analysed for 249 patients from November 2002 to
June 2005. A total of 87% of patients met the agreed criteria (Table 1) for
APC with an average expenditure of £5,210.80 ± £2,348.08 per patient.
During treatment, 30 haemorrhagic events were cited with 4 reported as
serious. Additionally, 8 cases of administration errors occurred, consisting
of miscalculated dosing and incorrect preparation. Of 249 patients receiving
APC, 85(34%) died in the ICU, 9(4%) died as post-ICU patients, 126(51%)
were discharged home and 29(11%) were still in-patients or lost to follow-
up. Of the 119 patients 48 with four or more organs in failure at the time of
APC administration survived their hospital stay (Figure 1).
Table 1 Summary of SELCCN inclusion criteria (based on PROWESS1)
Infection criteria: Modified SIRS criteria Criteria for organ dysfunction
Suspected or proven infection. Patients had to meet at least two of the following: core
temperature ‡38 or £36 �C; heart rate of ‡90/min; a
respiratory rate ‡20/min or PaCO2 £4 kPa, or mechan-
ical ventilation; white cell count of ‡12 · 109/l or
£4 · 109/l.
Patients had to meet at least two of the following
criteria: hypotension despite adequate fluid and/or
requirement for vasopressors to achieve satisfactory
blood pressure, persistent oliguria despite adequate fluid
resuscitation; acute hypoxaemia as measured by a PaO2/
FiO2 ratio £33 kPa (£26.6 in the setting of pneumonia);
platelet count £80 · 109/l or a 50% decrease over last
3 days; sepsis induced metabolic acidosis (lactate >1.5
times upper limit of normal plus either pH < 7.3 or
base deficit >5 mEq/l).
*Exclude if patient has any of the following: active internal bleeding or GI bleed in the last 6 weeks with no correcting intervention, intracranial pathology
including surgery in the last 3 months or recent trauma or haemorrhagic stroke, surgery within the last 12 h, concurrent heparin therapy >15 IU/kg/h,
known bleeding diathesis, platelet count of <30 · 109/l, epidural catheter, probable survival of less than 24 h or terminal medical condition.
Figure 1 Hospital survival in patients receiving APC stratified by organ failure.A240

Discussion
These results suggest that it is possible to develop and ensure excellent
adherence to consensus guidelines for the use of a high cost life saving
drug. By producing a simple reporting tool and database, selection cri-
teria, patient outcome, and adverse events was easily monitored across
the critical care network. As the ICU represents one of the most chal-
lenging patient populations, it is clear that this level of surveillance could
be duplicated easily in any situation requiring the use of high cost drugs.
The data suggest favourable patient outcome especially in those with
greater than 4 organs in failure (40.3% surviving) when compared to the
average survival (19.4%) of a similar group of patient in the 5 years
prior to APC introduction as measured in 91 ICU’s throughout the UK1.
The adverse event rate (1.6%), was acceptable but highlighted the
importance of strict adherence to the exclusion criteria (Table 1). Due to
excellent monitoring, administration errors were noted and have been
brought to the attention of the SELCCN and manufacturer for possible
solutions. The precise collection of both financial allowed the SELCCN
to reclaim a majority of the expenditure for APC use from the relevant
Primary Care Trusts.
References1. Green C, Dinnes J, Takeda A et al. Clinical effectiveness and cost-effectiveness
of drotrecogin alfa (activated) (Xigris�) for the treatment of severe sepsis inadults: a systematic review and economic evaluation. Health Technol Assess2005; 9: 1–126, iii–iv.
Oral Communications
1 Communication regarding medication changes in outpatient
haemodialysis patients between secondary and primary care: a risk
evaluation
Goodchild A1, Gerrett D
2
Nottingham City Hospital NHS Trust, Nottingham (now at Sherwood Forest
Hospitals NHS Trust), 2Pharmacy Academic Practice Unit, Derby
Introduction
Evidence is accumulating that errors in communication across the primary
secondary care divide may lead to patient harm.
In the largest study1 of communication across the primary secondary
care divide, researchers found 52.7% (n = 1,328) of prescribable items
had unintentional discrepancies following the standard discharge process.
Four medical consultants reviewed these discrepancies and found 3.1%
and 6.3% were classified as having a definite or possible adverse effect,
respectively.
The need for better communication between hospitals, General Medical
Practices (GPs) and community pharmacists in order to lessen the all too
frequent unintended changes in medication after hospital discharge is a
current Government priority for pharmacy intervention2.
In November 2002, a change in prescribing practice at Nottingham City
Hospital NHS Trust (NCH) meant that all chronic, long-term, oral medi-
cation for haemodialysis outpatients would subsequently be obtained from
the GP. The potential for unintentional discrepancies in this group has been
described in a small sample3 but not risk assessed.
Objectives
The present study was undertaken to quantify the number of medication
changes initiated in outpatient haemodialysis patients that were not suc-
cessfully communicated to primary care over the study period. The risk to
individual patients of any unsuccessful communication between Notting-
ham City Hospital NHS Trust (NCH) and General Medical Practice (GP)
surgeries regarding medication changes was assessed.
Method
This study was conducted in outpatient haemodialysis patients attending
for dialysis at the Main Dialysis Unit at NCH. For 6 weeks all changes to
long-term oral medication in this patient group were documented. The
investigator followed up these medication changes by telephone with the
patient’s GP surgery at an allocated follow up date. A medication change
was categorised as being successfully communicated to the GP if the
computerised medication record held at the GP practice had been updated.
Communication between NCH and the GP was deemed unsuccessful if one
of the following had occurred: the computerised medication record had not
been updated at the GP practice, no letter from NCH detailing the medi-
cation change had been received by the GP practice, a letter had been
received from NCH but had been filed by the GP practice with no action
taken to update the computer record. All cases of unsuccessful communi-
cation were documented and presented to a risk assessment panel. The
panel assessed the cases for ‘‘potential clinical significance’’ using a visual
analogue scale with 11 numbers from 0 (no effect) to 10 (death). Cronbach’s
alpha was used to determine inter-rater reliability4. Assessors were asked to
indicate the number on the scale above which the implication of
unsuccessful communication would warrant prompt intervention to prevent
patient harm.
The nature of the study was deemed to be an Audit by the Local Area
Ethics Committee. At the time of this investigation there were no clear audit
standards from either local practice guidelines or other literature that
proposed the proportion of changes made to medication in secondary care
that should be communicated accurately to primary care. All published
literature states that any medication changes made in secondary care should
be communicated to primary care. As no ‘target’ is stated we assumed this
means that 100% of changes should be communicated.
Results
During the 6 week (30 day) collection from April to June 2003, 74 medi-
cation changes made at Nottingham City Hospital for haemodialysis out-
patients were identified. Of these, 23 were excluded as the items were not
supplied in primary care or the course was started and completed in the
secondary care setting. The remaining 51 items for 40 patients were inten-
sively followed up and 11 (21.5%) medication changes were not successfully
communicated to the patient’s GP surgery. The potential clinical signifi-
cance of these cases were assessed by a panel comprising a consultant
nephrologist, a renal nurse consultant, a renal pharmacist and a staff grade
physician. Cronbach’s alpha was maximised by excluding the latter assessor
(alpha = 0.7962, F = 0.9077, p = 0.4194). The remaining three judges
assigned a mean score of 6.66 (median 7.33, range 3–7.85) for the 11 cases.
All three independently assigned seven as the value above which an inter-
vention was necessary to prevent patient harm. Of the 11 cases 6 were
assigned an average above this value.
Discussion
This is the first study known to the authors that assesses the risk of
unintentional miscommunication of medication changes specifically in
patients with renal disease. The audit finds that the current system of
communicating medication changes in outpatient haemodialysis patients
from NCH to patients’ GPs results in errors of communication, which
necessitate action to prevent patient harm. Potential remedies lie in first
identifying where a failure to communicate is likely to be important.
Having identified areas of risk, a reduction may be achieved by;
reviewing and refining communication mechanisms to include a feedback
loop to ensure that information transfer has occurred; involving and
empowering patients using constructs of concordance and written records
of changes; directly involving community pharmacists as a fulcrum
between primary care surgeries and secondary care; and, designing
Information Technology to identify risk situations and ensure accurate,
timely transfer of information.
Acknowledgements
Nottingham City Hospital NHS Trust: Shelagh French, for financial
assistance, Sandy Beatty for peer support and Dr Cassidy for access to
notes for audit purposes.
References1. Duggan C, Feldman R, Hough J et al. Reducing adverse prescribing discrep-
ancies following hospital discharge. Int J Pharmacy Prac 1998; 6: 77–82.2. Department of Health. Pharmacy in the Future–Implementing the NHS Plan.
London: Stationery Office, 2000.3. Myers E. Non-compliance with prescribed medication in patients with chronic
renal failure. Pharm World Sci 2003; 25(1): A40–1.4. MacLennan RN. Interrater reliability with SPSS for Windows 5.0. Am Statis
1993; 47(4): 292–6.
2 An audit of antibiotic use and supply under patient group directions at
a primary care centre
Bishop S
Tower Hamlets Primary Care Trust, London
A241

Introduction
The local primary care centre uses Patient Group Directions (PGDs) to
allow nurses to supply medication to patients for various conditions, based
on approved local clinical guidelines. Currently, PGDs for co-amoxiclav,
erythromycin and flucloxacillin are in place for treating animal bites and
cellulitis. Drug expenditure reports indicated that the use of co-amoxiclav,
erythromycin and flucloxacillin under PGD within the local primary care
centre was dramatically increasing.
Objectives
The aim of this audit was to determine if these PGDs were adhered to,
(100% of legal requirements followed and 100% adherence to local clinical
guidelines). The objectives were to:
� Audit the documentation of inclusion and exclusion criteria, cautions,
drug history, allergy status and records of supply against the set standard
� Make recommendations for improvement if required.
Method
A data collection form was designed based on criteria specified for each of
the three PGDs. The PGD issue record book used at the centre was used to
record antibiotic supplies made during the previous 3 months. Patient
demographics of the selected records were recorded on the data collection
form and the centre’s electronic record system was used to retrieve addi-
tional relevant information, i.e., consultation details, drug history and
treatment.
Results
A total of 82 records were identified. Of these, 11 were ineligible or partially
incorrect and were excluded from the final analysis. Medication was sup-
plied under PGD to all 71 patients despite criteria not being met in all cases,
e.g., antibiotic supplied for indication other than as specified on PGD. The
supply of individual antibiotics was as follows: co-amoxiclav to 7 patients,
erythromycin to 8 patients and flucloxacillin to 56 patients.
Table 1 shows adherence to the legal requirements in the 71 cases audited.
Forty-five patients (63%) met the inclusion criteria specified in the PGD’s.
A total of 58 patients (82%) did not have an exclusion criterion present,
however the remaining 13 patients had a criterion excluding them from
supply under the PGDs audited. Both patients who had criteria for referral
were appropriately referred to a doctor.
Adherence to patient safety criteria is shown in Table 2. Sixty-four of the
71 patients seen (90%), had a documented drug history. Among these, five
potential interactions were identified and an appropriate course of action
documented in 3 of the cases. In 2 cases, a broad-spectrum antibiotic was
supplied to women taking oral contraception (type unspecified) with no
documentation of advice given regarding additional contraception. Allergy
status was checked in 63 patients (89%). One patient with a documented
penicillin allergy received flucloxacillin – the nature of the allergy was not
specified. Of the 8 patients without a documented allergy status, 6 were
supplied a penicillin.
Documentation of all criteria required in the PGD record book ranged
from between 70% and 87%. Documentation in the electronic patient re-
cord for the required parameters varied between 66% and 96%.
Discussion
This audit found documentation to be poor when antibiotics were supplied
under PGD. The importance of documenting a complete and full drug
history, allergy status (including reaction), details of the consultation (and
advice sought) and an accurate and legible record of supply, needs to be
reinforced to the medical and nursing staff working within the centre. A
possible way to improve documentation could be to replace the current
electronic record with a template-based electronic record, which would
prompt the practitioner on exactly what needs to be recorded and flag up
any problems.
In many of the cases assessed, the antibiotics were being supplied for
conditions outside of the PGD indication. The legal limitations of
PGDs should be reiterated to centre staff to ensure that they are
working within the law, and discrepancies in working practices clarified.
Discussions should also take place to establish which other common
conditions they are treating with these antibiotics and if appropriate,
set-up PGDs for these conditions. Finally, it is important that root
cause analysis is carried out on all consultations not meeting the legal
requirements of a PGD and/or which may have compromised patient
safety in order to establish the true cause and enable corrective actions
to be implemented.
Following implementation of recommendations within the centre, the use
of these antibiotics should be re-audited in 1 year’s time.
3 An audit of the prescribing of lipid-lowering drugs in North
Glamorgan NHS Trust
Cooper SM1, Hodson KL
2, Malik UA
1, Scott-Thomas S
1, Cassidy D
3
1Department of Pharmacy, North Glamorgan NHS Trust, Merthyr Tydfil,2Welsh School of Pharmacy, Cardiff, 3Department of Biochemistry, North
Glamorgan NHS Trust, Merthyr Tydfil
Introduction
Statins are the main group of lipid-lowering drugs that are generally pre-
scribed in practice. Evidence suggests that statins benefit patients with an
increased risk of coronary heart disease (CHD) but also those patients
without CHD who have diabetes or non-occlusive arterial disease1. The
National Institute for Clinical Excellence (NICE) guidance for lipid-low-
ering is within diabetic patients and postmyocardial infarction patients2,3.
Merthyr Tydfil is a designated ‘‘black spot’’ with regards to CHD in
Wales. Anecdotal evidence suggested that not all patients who should re-
ceive a lipid-lowering drug were being prescribed one. In addition, there was
no consistency to which drug or dose was prescribed. This was acknowl-
edged by the All Wales Medicines Strategy Group in 2003/2004 who wanted
to develop a statin prescribing policy to be implemented across Wales4.
It was therefore decided to audit the prescribing of the lipid-lowering
drugs within North Glamorgan NHS Trust to identify current prescribing
patterns against the evidence. The standards developed for the audit were
100% of patients would be prescribed simvastatin 40 mg daily or an
equivalent.
Objectives
To identify the indications for the use of lipid-lowering drugs within the
hospital; to describe and compare to trial data the prescribing patterns of
these drugs; to identify whether the initiation of the lipid-lowering drugs
was by the general practitioner or the hospital doctor and to assess whether
appropriate monitoring parameters were being carried out.
Method
Permission to carry out the audit was granted by North Glamorgan NHS
Trust. A data collection form was developed and piloted on five patients;
minor amendments were made. All patients admitted onto six medical
wards and the coronary care unit from 16th February to 12th March 2004
were screened, using the prescription charts, to identify if a lipid-lowering
drug was prescribed. Further data was collected for those patients who were
either receiving the drug prior to admission or were initiated the drug dur-
ing their admission, using the prescription charts, discharge prescriptions,
Table 1 Adherence to legal requirements (n = 71)
Legal requirement No. of
patients
Standard (%) % of
standard met
Patients meeting inclusion
criteria
45 100 63
Patients without a criteria
for exclusion
58 100 82
Patients with a criteria for
referral who were referred
2 100 100
Table 2 Adherence to patient safety criteria (n = 71)
Criteria No. of
patients
Standard (%) % of
standard met
Drug history documented 64 100 90
Potential interaction 5 – –
Appropriate course of
action documented in
cases of potential interaction
3 100 60
Allergy status documented 63 100 89
Patients who received a drug
to which they were not allergic
70 100 98
A242

patient’s notes and biochemical data. Data included demographic data, the
lipid-lowering drug prescribed, reasons for the drug, patient’s past medical
history, who initiated the medication, the patient’s lipid profile and liver
function tests. All data was collected by the researcher. Data was then
coded and analysed using SPSS 11.5.1.
Results
Over the 4 week period, 90% of current in-patient prescription charts were
reviewed (1806 prescription charts reviewed from 2015 beds occupied).
From these, 155 patients on lipid-lowering agents were identified. The pa-
tient ages ranged from 23 to 91 years with the majority between 70 and
79 years. Sixty-three percent of patients were admitted to hospital with
cardiac problems; over 50% of patients had 3 or more conditions which
warranted a lipid-lowering drug to be prescribed. Ninety-four percent (147/
156) of patients were prescribed a statin and 6% (9) a fibrate. Simvastatin
was the statin most commonly prescribed (n = 71), followed by pravastatin
(n = 41) and then atorvastatin (n = 30). Simvastatin 20 mg daily was the
most frequent dose prescribed (n = 40/147); only 11% (n = 16/147) were
prescribed the recommended simvastatin 40 mg daily. Sixteen patients were
taking atorvastatin 10 mg daily compared to nine prescribed 20 mg daily.
The majority (49%) of lipid-lowering drugs were initiated by hospital
doctors; simvastatin 20 mg daily was the most frequent drug initiated
(35.5%) compared to atorvastatin 10 mg daily by general practitioners
(22.8%). Liver function tests (LFTs) for statins and fibrates were not
completed as recommended with only 77.6% having LFTs performed prior
to commencing treatment and the percentage of appropriate LFTs per-
formed decreasing for the subsequent tests.
Discussion
The results of this audit clearly demonstrated that the prescribing of lipid-
lowering drugs did not reach the required standard and therefore was not
reflecting the evidence. The choice of statin prescribed was different in
primary and secondary care and the recommendations for monitoring the
drug therapy were not being adhered to. Education with respect to the
evidence, recommended monitoring and cost of the different drugs was
required. This was undertaken by presenting the results of the audit to the
Medical Directorate at the Hospital and the Local Health Board. As a
result of a discussion during the presentation a statin–patient information
leaflet has been produced by the Trust.
Subsequent to this audit, a template on the use of statins in primary and
secondary prevention of CHD has been produced by the All Wales Medi-
cines Strategy Group4. These guidelines have recommended simvastatin
40 mg daily as first line and atorvastatin 20 mg daily as second line, based
on the combination of evidence, lipid-lowering potency, cost and safety.
This template and the specific results from the audit have been used to
produce Trust guidelines and it is the hospital’s intention to re-audit in the
next 12–18 months.
References1. Heart Protection Study Collaborative Group. MRC/BHF Heart Protection
Study of cholesterol lowering with simvastatin in 20, 536 high-risk individuals: arandomised placebo-controlled trial. Lancet 2002; 360: 7–22.
2. National Institute for Clinical Excellence (NICE). 2001. Prophylaxis forpatients who have experienced a myocardial infarction. Drug treatment, cardiacrehabilitation and dietary manipulation. [www] http://www.nice.org.uk/pdf/clinicalguidelinemiguidance.pdf (accessed March 2004).
3. National Institute for Clinical Excellence (NICE). 2002. Management of type 2diabetes. Management of blood pressure and blood lipids. [www] http://www.nice.org.uk/pdf/NICE_INHERITE_Hv8.pdf (accessed February 2004).
4. All Wales Medicines Strategy Group. 2003. Minutes of meeting held on 2ndDecember 2003. [www] http://www.wales.nhs.uk/sites/documents/371/ACFD032.pdf (accessed 24th January 2004).
4 Use of herbal remedies by patients admitted to hospital
Franklin BD1,2, Seedat H2, Heinrich M2
1Academic Pharmacy Unit, Hammersmith Hospitals NHS Trust, London,2School of Pharmacy, University of London
Introduction
Many people use herbal remedies for different health problems. However,
we currently have little understanding of what is used, whether our current
approach to obtain a medication history on admission uncovers details of
these products, and whether any of these products are likely to interact with
the conventional remedies prescribed during the patient’s admission. Our
aim was to better understand the use of herbal remedies among inpatients at
our trust.
Objectives
� To estimate the percentage of inpatients who use herbal remedies, and
establish which products are used;
� To determine whether or not these products were documented as part of
the patient’s medication history for their current admission and pre-
scribed on their current medication chart;
� To determine how many of these products may interact with conventional
remedies.
� To understand the patients’ reasons for using such products.
Method
A sample of 15 wards was selected using a random number table. The
intensive care units, private wards and wards belonging to the mental health
trust were excluded. For each ward selected, an undergraduate student
obtained a list of all patients on the ward, and spoke to the nurse in charge
to identify and exclude any who had learning difficulties or mental illness,
were terminally ill or deemed too unwell to take part in a 15 minute
interview. Patients who do not meet any of these exclusion criteria were
asked if they would be happy to answer a series of questions about their use,
if any, of herbal remedies. Patients gave written consent to be included; the
study was approved by the local research ethics committee.
A questionnaire comprising both closed and open questions, adapted
from previous use1 was used to obtain details of any herbal remedies used.
We then used the patients’ medical notes and their current drug chart to
identify whether any of the remedies cited were prescribed and/or docu-
mented in the patient’s medication history relating to their current admis-
sion. All pharmacognostical identifications were based on the popular
names and were therefore tentative as no samples could be collected.
Results
A total of 96 patients were approached, and 88 (92%) consented to take
part. Of these, 49 (56%) were female; 58 (65%) described themselves as
White British, 9 (10%) as Asian British, 7 (8%) as Black Caribbean, 6 (7%)
as European and 4 (5%) each as African and Chinese.
Of the 88 interviewees, 45 (51%) had used herbal remedies in the last
year. Most of these related to herbal teas such as chamomile (Matricaria
recutita or possibly Anthemis nobilis) and peppermint (Mentha piperita).
Others had taken products such as ginkgo (Ginkgo biloba; n = 7), St John’s
Wort (Hypericum perforatum; n = 9), and ginseng (Panax quinquefolium;
n = 2). Specific interactions with conventional medicines have been re-
corded for some of these botanicals. Four patients had taken herbal rem-
edies on the advice of a non-conventional health care professional. These
were Echinacea purpurea for a viral infection, stinging nettle (Urtica dioica)
and benzoin (Styrax benzoin) for joint pains, milk thistle (Silybum maria-
num) for use as a laxative, and an unspecified traditional chinese medicine
for hypertension. The other herbal remedies used were all based on the
patient’s or their family’s own experience or knowledge.
Of the 45 patients who had used herbal remedies, 20 (44%) had pur-
chased one or more product from a health food store, 25 (56%) from a
supermarket and 10 (22%) from a pharmacy. Four patients grew plants at
home for medicinal use; these included coriander (Coriandrum sativum) used
for colds and influenza, sage (Salvia officinalis) for gastrointestinal com-
plaints, thyme (Thymus vulgaris) for anxiety and depression, and basil
(Ocimum basilicum) to reduce fever.
None of the remedies cited were documented in the patient’s medical
history or prescribed on their current medication chart.
Discussion
A surprisingly high proportion of the patients interviewed had used herbal
remedies in the last year. Unfortunately we do not know how many of these
were being taken at the time of admission to hospital. This was because
most patients responded ‘‘no’’ to a question asking whether they had used
any herbal remedies in the last week, month or year, but then on further
questioning later in the interview schedule, listed a range of products used.
As well as highlighting changes required to the questionnaire for future use,
this has important implications for pharmacists taking patients’ medication
histories, suggesting that patients use a range of different terms for the
products that they use. We elicited most responses from questions such as
‘‘have you used any herbal remedies based on the advice of a non-con-
ventional health care provider?’’ and ‘‘have you used any herbal remedies
based on your own experience or knowledge?’’
In conclusion, about half of the patients interviewed had used one or
more herbal remedy in the last year. These were of a wide range, and
A243
included products that can interact with conventional medicines. Our re-
sults suggest that details of the herbal remedies used are not elicited by
standard approaches to medication history taking. Further work, using a
revised questionnaire, is needed to find out how many patients were actively
taking herbal remedies at the time of admission to hospital, and to better
explore the role of herbal remedies for patients who want to manage their
own health related problems.
Reference1. Sandhu DS, Heinrich M. The use of health foods, spices and other botanicals
within the Sikh community in London. Phytother Res (in press) 2005.
Boehringer-Ingelheim Respiratory Award 2005
The pharmacist led asthma clinic a new delivery care system
Oates C, Holden K, Tadros L, Ledger-Scott M, Foden A, Williams G, Pradip
D, Alcock S
County Durham Health Care Trust, Darlington Memorial Hospital,
Darlington
Background
The Global Burden of Asthma Report1 reveals that a global increase in
asthma has occurred in both children and adults in recent decades and this
increase is likely to continue over the next 20 years. In the UK, about
20,000 new episodes of asthma are dealt with by GPs each week. An average
primary care organisation can expect to treat 25,000 people with asthma,
with over 400 people admitted to hospital and eight asthma deaths each
year.
The UK now has one of the highest prevalence rates of asthma in the
world, with a mean prevalence of 16.1% Case fatality rates per 100,000
asthma patients are 3.2 in England.
The report identified numerous areas for improvement, including
improving patient education, ensuring appropriate use of inhaler devices,
encouraging the use of peak expiratory flow meter (PEFM) and identifying
those patients who over or under use their inhalers.
An educational programme was designed around those areas identified as
causing poor asthma management with the objective of giving patients the
knowledge and skills they need to manage their own illness and share
responsibility for their treatment2,3.
Aim
To evaluate the effect of a pharmacist-led educational programme on
asthma self management, quality of life and related morbidity in adults.
Method
A total of 97 asthma patients (age 24–66) were recruited for the study.
Recruitment criteria were that the patient had more than two exacerbations
of severe asthma attack and required hospitalisation within 2003. Among
these patients, 49 (22 females and 27 males) were assigned to the inter-
vention group (pharmacist led asthma clinic) and 48 (21 females and 27
males) the control group (traditional care). The group were matched with
age, sex, severity of asthma and medications
In the intervention group the pharmacist provided three separate edu-
cational sessions (20 min each session) to each individual patient and in-
cluded information about asthma, instruction on the appropriate use of
medication, training in the use of peak flow meter, metered dose inhaler
(MDI) technique, and information about the identification and control of
asthma attacks and the recognition of early signs of exacerbation. The
pharmacist identified medicine related problems and provided individua-
lised management plans based on the disease severity, the patient’s envi-
ronment, exercise levels, any compliance problems, understanding of the
disease and the treatment to each patient.
The control group received normal traditional care either from asthma
practice nurse or medical staff.
Spirometry test results were collected at three stages: enrolment (base-
line), then at 6 and 12 months after enrolment. Peak expiratory flow volume
(PEFV) was measured in the clinic every 3 months.
Outcome measurements
The primary outcome measure was change in pulmonary function as
measured by forced expiratory volume (FEV1) and peak expiratory flow
(PEFR). Secondary outcome measures included hospital admission, and
acute asthmatic attacks, which led to unscheduled visits to either the
emergency department or hospital admission.
Results
At the end of 12 months the respiratory consultant reviewed all patients
and outcomes.
At base line there was no significant difference between both groups in
PEFR and FEV1. However at the end of the study, in the intervention
group both females and males showed a significant improvement in PEFR
(P > 001) when compared with the control group. Furthermore 58% in the
intervention group scored more than 20% improvement in FEV1 of pre-
dicted value compared to 12% in the control group.
Discussion
The patients in the intervention group showed significant improvement in
outcome measures compared to the control group.
The patients in the intervention group received individualised self man-
agement plans and three individual educational sessions from the phar-
macist. All patients were educated to use BTS guideline ‘‘step wise’’
approach with reference to their symptoms and PEFR. The control group
received traditional care, which consisted of much less individual patient
education and counselling.
The patients in the intervention group showed improved compliance with
their medication regimen, which resulted in improved lung function.
Questionnaires showed that patients knowledge improved on the appro-
priate use of medication, metered dose inhaler (MDI) technique, identifi-
cation and control of asthma attacks, recognition of early signs of
exacerbation, how to deal with attacks, and how to control the environ-
mental trigger factors. They also reported feeling more in control, an in-
crease in physical exercise, a reduction in smoking and a reduction in the
number of disturbed nights.
The results indicate that the pharmacist clinic provided the type of sup-
port that enabled patients to improve the management of their asthma in
comparison to the way care is traditionally delivered.
Conclusion
The pharmacist led asthma clinic empowered patients with the skills and
knowledge they needed to manage their condition resulting in improved
PEFR, reduced asthmatic attacks and hospital admissions and improved
quality of life. The pharmacist led asthma clinic provides evidence that
patient education and counselling in asthma management are essential
elements in effective asthma management.
References1. The Global Burden of Asthma Report. Pharm J. May 8, 2004; 272; 562.2. Cole O. Introduction to asthma. Hosp Pharm. October 2001; 8: 237–240.3. Weinberger M, Murray MD, Marrero DG, Brewer N, Lykens M, Harris L,
Seshardi R, Caffrey H, Roesner JF, Smith F, Newell J, Collins JC, McDonaldCJ, Tierney WM. Effectivenss of pharmacist care for patients with reactiveairways disease: a randomized controlled trial. JAMA October 2, 2002; 288(13).
5 Evaluation of clinical and economic impact of antibiotic pharmacist
input in microbiology ward round to patient care in antimicrobial
prescribing
Liu A1, Reddy S
2
1Pharmacy Department, Blackpool, Fylde and Wyre Hospital NHS Trust,
Microbiology, 2Microbiology Department, Blackpool Victoria Hospital,
Blackpool
Total number of consultation over the past
12 month study
Intervention group 356 visits
Control group 292 visits
Total number of asthmatic attacks which required
medical attention
Intervention group 3 patients
Control group 27 patients
Total number of asthmatic attack
which required hospitalization
Intervention group 2 patients
Control group 11 patients
A244

Introduction
A microbiology ward round was set up in October 2004 to monitor anti-
microbial use and promote prudent antimicrobial prescribing within the
Trust in supporting the recent Department of Health (DoH) initiatives. It
was aimed to increase microbiology input in clinical areas and reduce the
unnecessary use of expensive antibiotics. The ward round was attended
weekly twice by Microbiology Specialist Registrar and Antibiotic Phar-
macist.
Objective
To evaluate the impact of Microbiology ward round over a 4-month period
(October 2004–January 2005) in terms of appropriateness of antibiotic
prescribing.
To assess the potential for cost-saving in antimicrobial drug budgets
during the Microbiology Ward Round.
Method
The Antimicrobial Alert System was set up in Summer 2004. Restricted use
of antibiotics including Tazocin�, Teicoplanin and Linezolid were reserved
for serious infections or the failure of 1st or 2nd line treatments on the
recommendation of Consultant Microbiologists. Linezolid could only be
prescribed with Microbiologist’s approval.
Patients who were on those three antibiotics during the study period were
obtained from the Pharmacy Ascribe� System twice a week (Tuesdays and
Fridays). Patients from peripheral hospitals were excluded from the study.
Interventions by the Microbiology Ward Round team were reported on a
designated audit form. The results of all findings were presented in alpha-
numeric tables and graphic charts.
Results
Sixty-eight patients were seen in the Microbiology Ward Round during
study period, 29 (43%) from the Medical Directorate and 22 (32%) from
the Surgical Directorate.
Of 68 patients 58 were on restricted-use antibiotics: Tazocin (16), Tei-
coplanin (36) and Linezolid (6). One patient who was on Linezolid was not
discussed with Microbiology.
Of the 36 patients who were on teicoplanin, 83% needed microbiology
intervention during ward round. A 63% of them were requested to dis-
continue teicoplanin treatment or change to other antibiotics, which were
expected to save £727.7 daily in total. The following table summarizes the
type of interventions.
Of the 16 patients who were on Tazocin�, only one third consulted the
Microbiologist before treatment. A 62.5% needed microbiology interven-
tion during the ward round. Of them 90% were requested to discontinue
Tazocin� or changed to other antibiotics, which were expected to save
£430.11 daily in total. The following table summarizes the type of inter-
ventions.
Discussion
This study demonstrated that teicoplanin and Tazocin� were not used
appropriately in the infections. The high incidence of microbiology inter-
vention in the use of teicoplanin was due to its inappropriate use for col-
onisation or local infection with Methicillin resistant Staphylococcus aureus
(MRSA), which illustrated that prescribers’ knowledge of basic microbiol-
ogy was limited. Six patients were recommended to adjust teicoplanin
dosage due to poor clinical response at sub-therapeutic assay level.
Tazocin was reserved as a second or third-line antibiotic therapy at the
study hospital in consultation with microbiology. In half of the patients Ta-
zocin was used as a first-line therapy and in nearly two thirds it was started
withoutmicrobiologist’s advice. This prompted an investigation intowhether
the doctors were aware of the existence of the local antibiotic guidelines and a
review of the accessibility of the current microbiology on-call service.
Encouragingly, 12 patients were able to change from intravenous anti-
biotics to oral formulation on the recommendation of microbiology during
the ward round, which showed that the ward round could potentially speed
up the discharge process and contribute cost-savings in the antimicrobial
drug budget.
Conclusion
Microbiology Ward Round is a new service in the study hospital, which has
proved to make a significant contribution to patient care by enhancing
communication between prescribers and microbiology. A collaborative
work relationship with other critical care teams should be considered as a
future development plan in order to provide high standard, multidisci-
plinary work, which promotes the prudent use of antibiotics.
References1. Department of Health. Getting ahead of the curve: a strategy for combating
infectious diseases (including other aspects of health protection). A report bythe Chief Medical Officer. London: Department of Health, 2002.
2. Department of Health. Winning ways: working together to reduce healthcareassociated infection in England. A report by the Chief Medical Officer. London:Department of Health, 2003.
3. Department of Health. 2003. Hospital Pharmacy Initiative for PromotingPrudent Use of Antibiotics in Hospitals. Professional Letter. Chief MedicalOfficer: PLCMO (2003) 3. Department of Health, London, UK.
4. Department of Health. A Vision for Pharmacy in the New NHS. London, UK:Department of Health, 2003.
5. Department of Health. Medicines Management in NHS Trusts: HospitalMedicines Management Framework. London, UK: Department of Health,2003.
Types of Intervention with Teicoplanin Prescription During Microbiology Wardround
02468
101214161820222426283032
Microbiology Intervention? Dose adjustment? Stop Teicoplanin? Alternative treatment? Oral Recommended?
No
. of
pat
ien
ts
Types of intervention with Tazocin Prescription During Microbiology Wardround
02468
1012141618
Total
Empir
ical th
erap
y?
On ot
her A
b be
fore
?
Cultur
e se
nt?
Micr
obiol
ogist
cons
ulted
?
Appro
priat
e tre
atm
ent?
Micr
obiol
ogy I
nter
vent
ion?
Stop
Tazoc
in/r/v
trea
t...
Altern
ative
trea
tmen
t?
Oral R
ecom
men
ded?
No
. of
pat
ien
ts
A245

GSK Advanced Practitioner Award 2005
Supplementary prescribing in intensive care
Tomlin M
Consultant Pharmacist, Southampton University Hospitals NHS Trust
Background
Nurses gained independent prescribing rights in 1992, but the formulary was
limited. In 2001, nurses could become supplementary prescribers and phar-
macists gained this right in 2003. The first Supplementary prescriber training
courses for Pharmacists became available in 2003 with the first registrations
in 2004. The focus of this legislation and training was in primary care. The
strategy was to increase access of patients to prescribers in the NHS. The
vision was that pharmacists could manage medicines for chronic conditions
as a delegated duty, releasing GP time. There was no perception that this
facility could be used for acute care, or that pharmacists would improve the
quality of the prescribing and therapeutic choices. No one believed that
supplementary prescribing had application in Intensive Care.
Many doctors still believe that pharmacists are not skilled sufficiently to
prescribe parenteral nutrition. I had previously attended a week long course
in parenteral nutrition designed for doctors. I have chosen formulations of
parenteral nutrition on Intensive Care for the last 8 years.
Aims and Objectives
The aim of my service development was to show that supplementary
prescribing by pharmacists was feasible in an acute secondary care setting.
Key objectives:
1. Finding a suitable course that was adaptable to what I do, not running a
clinic.
2. Understanding the patient consent issues of Supplementary Prescribing.
3. Investigate the consent issues in patients on ITU who were often
unconscious.
Methods
I wanted to establish a more efficient way of prescribing parenteral nutrition
and drugs that required therapeutic monitoring. These involve key phar-
maceutical skills – formulation, interactions, incompatibilities and phar-
macokinetics. I used the Workforce Development Confederation to identify
a course at Kings College London.
I chose parenteral nutrition and I was already part of a team of phar-
macists at Southampton who prescribe parenteral nutrition (PN). I was the
first to write a prescription for PN in April 2004 and the first to prescribe
PN in Intensive Care.
I chose as my designated medical practitioner a senior consultant with
experience in research and practice ethics and law. Several sessions were
spent solely on the consent issue. I also took the principle of ‘‘necessity’’ to a
patient involvement forum and gained their unanimous assent.
I achieved authorisation, from the intensive care consultants, to undertake
dose modification for drugs requiring therapeutic drug monitoring (the-
ophylline, digoxin, phenytoin, vancomycin, gentamicin, and teicoplanin).
Results
I am a registered supplementary prescriber pharmacist. I have been pre-
scribing for a year. The principle of necessity is well accepted, and has been
tested with a patient forum. Relatives are informed of what is happening
and why. I inform patients when they have recovered (retrograde consent). I
am not aware of any interference with doctor–patient relationships. The
pharmacist is cemented as a member of the clinical team, recognised as a
prescriber and not a threatening advisor to other prescribers.
All 98 patients requiring parenteral nutrition in the last had their for-
mulation and rate decided by the pharmacist. In the first 6 months a one-
third were prescribed used Supplementary prescribing. Jan 05–Apr 05, 65%
(13/20) used supplementary prescribing. Standard formulas of parenteral
nutrition are licensed products but formulations constructed individually
are not. The pharmacists formulation advice is most valued in these special
bags but the law required a doctors’ signature. Now that unlicensed med-
icines can be authorised by a supplementary prescriber, virtually 100% of
all parenteral nutrition prescriptions are ordered using this process.
Discussion
The parenteral nutrition prescribing has worked most effectively but delays
for CMP authorisation has reduced efficiency and prevented all prescrip-
tions being written by the pharmacist. The TDM prescribing has been
shown to work and seamless change from pharmacist and doctor has been
achieved, especially over the weekend. During the week the doctors wait for
the pharmacists’ advice. Showing that the doctors value the skills of the
pharmacist and assent to them undertaking the prescribing.
This work shows that Supplementary Prescribing Pharmacists (SPP) are a
reality in secondary care. That SPP can manage acute and dynamic pre-
scribing scenarios including within Intensive Care. Pharmacists not only
prescribe parenteral nutrition but also improve the quality of prescribing.
Previously the pharmacist had chosen the formulation and the doctor had
signed the form. Confidence in the pharmacists ability had reached a level
so that signing contained no added value.
This project has demonstrated an improved access for patients to pre-
scribers and made the process more efficient. In addition, because knowl-
edge of this area of therapeutics by doctors is poor, the project has
improved the quality of prescribing. The junior doctors find it more con-
venient and assists in managing their hours.
Supplementary prescribing for parenteral nutrition is suitable for because
it continues for several days. It is less suitable where clinical management
plan and consent authorisation delay treatment. It is hoped that indepen-
dent prescribing by pharmacists will be less bureaucratic and facilitate single
item prescribing.
References1. Bellingham C. How supplementary prescribing helps in both acute and chronic
hospital care. Pharm J 2004; 272: 640–2.2. Tomlim M. A year in the life of a supplementary prescriber. Hosp Pharm 2005;
12: 182–3.
Napp Pain Award 2005
Prescribing and clinical outcomes after strong opioid recommenda-
tion for chronic non-cancer pain from a pain clinic
Knaggs RD, Hobbs GJ
Pain Management Service, Queen’s Medical Centre University Hospital NHS
Trust, Nottingham
Background
Opioids have been a topic of much debate and controversy for centuries.
Use of strong opioids in cancer pain is advocated by the World Health
Organisation and is widely accepted; however, their use in chronic non-
cancer pain is more controversial. Some clinical studies have suggested that
some types of chronic non-cancer pain do not respond to strong opioids
(e.g., ref. 1), whilst others contradict this opinion (e.g. ref. 2). A recent
systematic review3 suggested a 30% mean pain intensity reduction when
used in chronic neuropathic and musculoskeletal non-cancer pains.
Concerns over safety of long-term opioid administration include adverse
effects, development of tolerance, addiction and drug diversion4. Several
guidelines for the appropriate and responsible use of opioids in chronic non-
cancer pain are available to encourage good prescribing practice (e.g., ref. 5).
Aims and Objectives
The aim of the study was to assess the prescribing and clinical outcomes in
primary care after recommendation of a trial of strong opioid therapy for
chronic non-cancer pain by our tertiary referral pain management centre.
The principal objectives were to define the clinical pathway and barriers to
prescribing for patients recommended strong opioids and assess their clin-
ical efficacy.
Methods
A retrospective cohort study was designed. All patients newly recommended
a trial of strong opioid therapy for chronic non-cancer pain over an
18 month period were invited to participate in a telephone questionnaire
administered by one investigator. The questionnaire assessed prescribing
and clinical outcomes at least 6 months after the written recommendation
was sent to the designated General Practitioner (GP). Local GPs were also
contacted to determine their views and experience of prescribing opioids for
chronic non-cancer pain.
Results
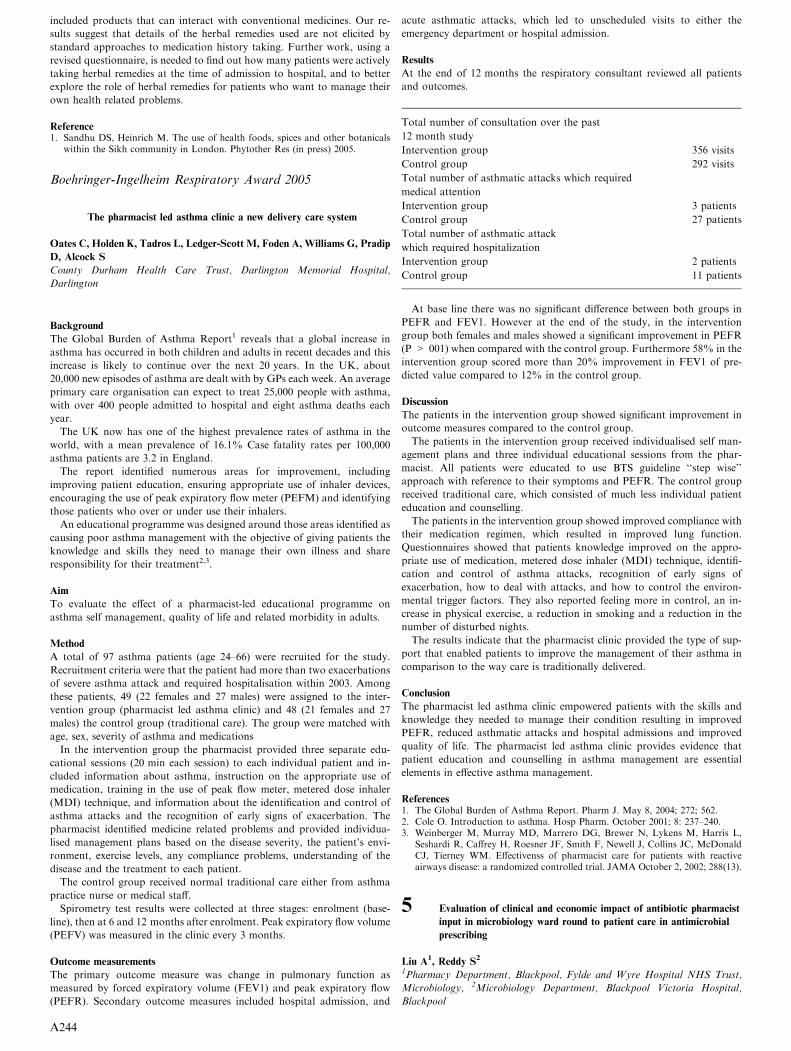
Figure 1 shows the study profile. Sixty-six patients were newly recommended
strong opioids during the 18 month study period. The mean patient age was
58 years (range 24–96 years). Most patients either had diagnoses of neuro-
pathic pain or musculoskeletal pain, largely failed back surgery syndrome.A246

Forty-one patients were willing to participate in the telephone question-
naire. Of these, 12 patients (29%) had never received the opioid recom-
mended. Either patients were unable to recall the recommendation (seven
patients) or the GP had failed to act on the clinical recommendations. The
newly recommended strong opioids by the Pain Management Service are
shown in Figure 2.
At the time of interview 20 patients (71%) were still taking a strong
opioid, either the original, or an alternative. Opioid therapy produced at
least 50% pain relief for 15 (54%) of patients, however three patients ob-
tained no pain relief from the strong opioid.
Interference with daily activities was markedly less during opioid therapy
(14% vs. 61%), although there were no improvements in sleep and mood. A
majority of patients expected a marked reduction in pain (19 patients, 68%)
on 5-point Likert scale. Twenty-five patients (89%) reported the occurrence
of adverse effects with opioid therapy, the most common being nausea or
vomiting (17 patients), drowsiness (14 patients) and constipation (11 pa-
tients). Eight patients (29%) discontinued therapy, primarily due to intol-
erable adverse effects.
All GPs felt their ability to supervise and monitor patients on strong
opioids for chronic non-cancer pain would be improved by increased
understanding of the increasing evidence for strong opioid use in non-
cancer pain. The majority of GPs thought the provision of a local guideline
for the use of strong opioids would be beneficial. Improved access to pain
management staff by telephone, electronic mail or letter, may improve
management of these patients.
Discussion and Conclusion
Strong opioid therapy markedly improved analgesia in our selected pa-
tients, as documented in randomised controlled studies (e.g., ref. 6). Overall
this increased analgesic benefit was associated with improved physical,
psychological and social functioning. In contrast to other studies, our pa-
tients did not benefit from improvements in sleep or mood. Most patients
continued strong opioid therapy despite adverse effects, primarily because
the analgesic benefit outweighed adverse effects.
Several different opioids and different opioid combinations were recom-
mended by our Pain Management Service reflecting clinician preference. At
present there are no high quality randomised controlled trials that would
support choice of one drug or formulation over another7.
We are now developing a specific guideline for pain management staff and
GP colleagues aiming to give patients realistic expectations of opioid
therapy. In those patients who do not achieve agreed treatment goals during
a trial of strong opioid, the drug should be withdrawn. Adequate infor-
mation must be provided for patients, preferably using a variety of media.
Where appropriate, we are providing our primary care colleagues with
more information about the rationale for our recommendation of a strong
opioid and providing information on how to manage these patients. We
now offer GPs greater support when recommending strong opioids or
managing these trials from our clinic where requested by the GP.
References1. Arner S, Meyerson BA. Lack of analgesic effect of opioids on neuropathic and
idiopathic forms of pain. Pain 1988; 33: 11–23.2. Moulin DE, Iezzi A, Amireh R, Sharpe WK, Boyd D, Merskey H. Randomised
trial of oral morphine for chronic non-cancer pain. Lancet 1996; 347: 143–7.3. Kalso E, Edwards JE, Moore RA, McQuay HJ. Opioids in chronic non-cancer
pain: systematic review of efficacy and safety. Pain 2004; 112: 372–80.4. Ballantyne JC, Mao J. Opioid therapy for chronic pain. New Eng J Med 2003;
349: 1943–53.5. The Pain Society. Recommendations for the appropriate use of opioids for
persistent non-cancer pain. March 2004.
Figure 1 Study profile.
Figure 2 Strong opioids recommended for chronic non-cancer pain (n = 66 patients).
A247

6. Watson CPN, Moulin D, Watt-Watson J, Gordon A, Eisenhoffer J. Controlled-release oxycodone relieves neuropathic pain: a randomized controlled trial inpainful diabetic neuropathy. Pain 2003; 105: 71–8.
7. Chou R, Clark E, Helfand M. Comparative efficacy and safety of long-actingoral opioids for chronic non-cancer pain: a systematic review. J Pain SymptomManage 2003; 26: 1026–43.
Posters Research
1 The impact of spaced review of learning on subsequent recall of
information by hospital pharmacists, following teaching on antibiotics
Hand KSP, Jubraj B
Department of Pharmacy, Chelsea & Westminster Healthcare NHS Trust,
London
Introduction
Misuse of antibiotics in hospitals is a recognised problem, with up to 50%
of antibiotic prescribing in this setting considered inappropriate1. A role for
hospital pharmacists has been promoted in the Winning Ways report on
healthcare associated infection in England, which stipulates that support for
prudent antibiotic prescribing in hospitals will be provided by clinical
pharmacists, along with medical microbiologists and infectious diseases
physicians2. However, anecdotal evidence from members of the UKCPA
Infection Management practice interest group suggests that many phar-
macists express a lack of confidence on the subject of antibiotic therapeu-
tics, often citing poor knowledge of pathogen epidemiology and antibiotic
spectrum of activity as a contributing factor.
In view of increasing government expectations that hospital pharmacists
will act as custodians of antibiotic policy and advocates of prudent pre-
scribing, it is imperative that education and training strategies in this area of
therapeutics deliver competent practitioners. A potential strategy for
improving knowledge, as one element of competency, is to utilise the
learning phenomenon known as the spacing effect. There is robust evidence
from educational psychology literature that memory for facts can be sus-
tained by revision or review at spaced time intervals following the initial
learning period, allowing students to recall information successfully,
months or years later3.
Objective
The objective of the current study is to explore the feasibility of providing
spaced review of learning in a practice setting following post-graduate
teaching for junior-grade hospital pharmacists, and to evaluate the outcome
of medium-term recall of knowledge in the intervention group in compar-
ison with a control-matched cohort.
Methods
This randomised, parallel group, case-controlled, assessor-blinded study
was carried out in NHS acute hospital Trusts in London, England, from
January to June 2005. Participants were registered pharmacists enrolled in
the post-graduate course at the School of Pharmacy, University of London,
leading to a Certificate in Pharmacy Practice. Ethics approval for the study
was granted by a multi-region ethics committee prior to study start and all
participants gave informed consent. On the first day of the study at each
site, the investigator attended the site to invigilate a 20-min assessment of
baseline knowledge of antibiotic therapeutics. Following the baseline
assessment, the investigator delivered baseline teaching in the form of a 90-
min interactive lecture on antibiotics. Participants were then randomly as-
signed to intervention or control groups in a ratio of one-to-one, stratified
by site. All participants were given a handout containing copies of the slides
from the lecture for future reference and revision. Participants randomised
to the intervention group attended review sessions at intervals spaced 1 day,
1 week and 1 month, after the original teaching. Review sessions consisted
of 30 min of protected time to read the lecture handout, followed by a 10-
min assessment with immediate feedback. At approximately 3 months fol-
lowing the initial teaching, all participants completed a 30-min final
assessment, invigilated by the investigator. Data were analysed using paired
t-tests and analysis of covariance (ANCOVA).
Results
A total of 46 pharmacists were recruited to the study from six NHS
acute hospital trusts in Greater London, incorporating eight hospital
sites. All 46 participants undertook the baseline assessment but only 39
participants completed an investigator-invigilated final assessment and
were thus eligible for inclusion in the intention-to-teach (ITT) analysis. A
significant improvement in mean assessment result was apparent between
baseline and final assessments for both the intervention and control
groups (Table 1). However, there was no significant difference in the
absolute (17%, 17%) or relative (44%, 42%) improvement in results
from baseline between the intervention and control groups, respectively
(ITT population, ANCOVA).
The distribution of results for the intervention group showed a clear shift
to the right between the baseline (range 27–61%) and final assessments
(range 41–79%). Final assessment results for the control group by contrast
were more widely variable, resulting in considerable overlap between the
baseline (range 27–58%) and final (range 28–88%) result distributions and a
failure of some individuals to substantially improve their results between
assessments.
Discussion
This study failed to find an effect of spaced review of learning upon recall
of information 3 months after a teaching session on antibiotics. This out-
come is not consistent with the literature describing the spacing effect but
may have been influenced by a number of confounding factors. Firstly, the
intervention was unblinded and participants were aware of the date of the
final assessment and may have revised the teaching material specifically to
improve performance in this assessment. Secondly, concurrent participation
in the Certificate in Pharmacy Practice introduced a strong motivation for
all participants to revise the lecture material around the same time as the
final assessment for this study. Thirdly, participants were not penalised for
guessing answers to assessment questions. Any future studies to evaluate the
spacing effect in pharmacy education should avoid recruiting from a pop-
ulation enrolled in concurrent formal education courses, should employ
negative marking to discourage guessing and should consider the use of pre-
consented covert final assessment.
References1. House of Lords Select Committee on Science and Technology. Resistance to
antibiotics and other antimicrobial agents. Lord Soulsby. London: The Sta-tionery Office, 1998.
2. Chief Medical Officer. Winning ways: working together to reduce healthcareassociated infection in England. London, Department of Health (UK), 2003.
3. Rea CP, Modigliani V. Educational implications of the spacing effect. In:Gruneberg MM, Morris PE, editors. Practical aspects of memory: Current re-search and issues, Vol. 1: Memory in everyday life. New York: John Wiley andSons, 1988: 402–406.
2 Electronic prescribing: do doctors hold the plug to its success?
Considine A, Cavell G, Dilks T
Pharmacy Department, King’s College Hospital, London.
Introduction
The government is investing heavily, through the National Programme for
Information Technology (NPfIT), in electronic solutions to improve patient
care and the efficiency of the healthcare system1. Electronic prescribing (EP)
is one solution which has been highlighted as a goal for the NHS and it is
expected that EP will be progressively rolled out across England by 20072.
Table 1 Mean (95% confidence intervals) baseline and final assessment results
Group Baseline Final Absolute improvement Relative# improvement p value
Intervention (ITT) n = 20 40%
(36–44)
57%
(52–63)
17%
(14–21)
44%
(35–53)
p<0.0001
Control (ITT) n = 19 40%
(36–44)
57%
(49–66)
17%
(12–23)
42%
(30–55)
p<0.0001
Paired t-test, Baseline versus Final results, # Relative to baseline result
A248

The benefits of electronic prescribing have been described3,4. These in-
clude a reduction in the incidence of medication errors, improved clinical
decision making and easier access to medication records. Despite these
advantages few trusts in the UK have successfully implemented EP on a
large scale. The barriers to successful implementation are multifactorial and
include physician resistance, problems with computer software, lack of
multidisciplinary working and lack of funds.
In our hospital an electronic patient record (EPR) system – iSOFT
Clinical Manager (ver 1.0) is well established. An electronic prescribing
system, which is a module of the EPR is currently being piloted on one
medical ward. However it is not achieving the level of success that initially
had been hoped for. The aim of this project is to identify the barriers to
electronic prescribing in this hospital.
Objectives
To identify what junior doctors perceive to be the advantages and disad-
vantages of the electronic prescribing system.
To identify reasons that the electronic prescribing system is not being uti-
lized.
To identify how the junior doctors feel the system could be improved.
Methods
A semi-structured questionnaire targeted at junior medical staff who are
most likely to have used the system was designed. The questionnaire aimed
to establish the extent to which they use the EP system, what motivates
them to use the system, their views of the system compared to manual
prescriptions, the usefulness of the system and how they felt it could be
improved.
Results
Out of 20 questionnaires 16 were returned representing a response rate of
80%. Three respondents had not worked on the pilot ward and had never
needed to use the EP system. A group of 13 respondents had used the
system for either 6 weeks or 8 weeks. Only one respondent was actively
using the EP system for four patients under his care. All other patients were
prescribed medication on the handwritten medication administration record
(MAR).
Respondents listed advantages of electronic prescribing as accessibility,
inclusion of useful prompts (n = 5), fewer rewrite errors (n = 4) and leg-
ibility (n = 2). Four respondents considered electronic prescribing to
confer no benefits on the medicine use process. Disadvantages described
included the system being too time consuming (n = 11), lack of computer
terminals (n = 9), unreliability (n = 6), time taken to log onto the system
(n = 3) concerns that the system is unsafe (n = 3) and difficult to use
(n = 2). Two respondents stated that they would choose writing a manual
inpatient drug chart over an electronic prescription. (Table 1).
Discussion
The results of this small study suggest that doctors do present a barrier to
implementation of EP as they perceive that there are more disadvantages to
the system than advantages. In fact some junior doctors are actively
choosing not to use the electronic prescribing system.
The results show that the doctors are opposed to the EP system for a
number of reasons, primarily that writing an electronic prescription took
longer writing a manual prescription. This makes EP difficult to use in a
ward round situation and potentially conflicts with other pressures on their
time. Time constraints have been identified as barriers by other hospitals
who have tried to implement EP systems. However this becomes less of an
obstacle when doctors become more familiar with the system. The range of
disadvantages expressed in this audit are comparable to findings in other
hospitals who have implemented an EP system and we are able to use
experiences of other hospitals to be able to tackle some of the issues at this
pilot stage5.
It is clear that the respondents do understand the potential advantages of
the EP system, especially of the benefits of clinical decision support. This
has the potential to reduce the incidence of prescribing errors and reduces
the need to find and interpret information in a reference source especially if
the system has electronic links to the hospital formulary or the British
National Formulary .
The results of this project indicate that doctors are resistant to over-
coming perceived barriers and are hence delaying the progression of the
electronic prescribing initiative. Whilst they seem aware of some of the
benefits their perceptions of its disadvantages have resulted in them being
unwilling to use it. The challenge remains to convince them that although
electronic prescribing is daunting at first they will be rewarded with per-
severance and the positive aspects of the system will be realised.
References1. Brennan S. The NHS IT Project; The Biggest Computer Project in the World
Ever; Radcliffe Publishing, 2005.2. ‘The Way Forward’. The Pharmaceutical Journal 2002; 268.3. Protti D. The Use of Computers in Health Care can Reduce Errors, Improve
Patient Safety and Enhance the Quality of Service 2004.4. ‘Electronic Prescribing and Clinical Decision Support at Southmead Hospital’
www.nhsia.nhs.uk.5. Electronic prescribing and patient records – getting the balance right. The
Pharmaceutical Journal 2005; 274.
Posters Innovation/Professional Development
Development of an electronic method for recording clinical pharma-
cist activity
McVerry M, McCoy A, Kelly P, Nelson L, Murphy L, Gribben N,
McGarrity N
Pharmacy Department, Greenpark Healthcare Trust, Belfast
Introduction
‘‘Clinical pharmacist’s activities that contribute to patient care should be
appropriately documented’’. This is one of the standards included in the
first draft of Northern Ireland Clinical Pharmacy Standards (2005)1. His-
torically pharmacists made clinical interventions that improved patient’s
quality of life and reduced the risks of drug therapy, but did not routinely
document them2. Initial records of clinical pharmacist’s interventions were
recorded using simple paper forms or intermittently to justify pharmacist’s
time on wards, to reinforce requests for increased clinical pharmacy services
and as litigation increased3. These paper records are space consuming and
retrieval of specific records can also prove problematic unless much time
and effort has been invested in efficient archiving systems.
At Greenpark Healthcare Trust, clinical pharmacists were recording their
clinical activity manually on paper. Interventions were recorded in a
booklet and activity was documented on a paper pro forma, with calcula-
tion required at the end of each month to summarise activity. The pharmacy
department applied for funding for dedicated software to deliver a personal
digital assistant (PDA) based wireless system for the recording of clinical
pharmacist interventions and clinical activities. The application was not
approved as a priority for action, therefore the pharmacy department
decided to develop an alternative affordable system for electronically
recording clinical pharmacist activity until funding for the PDA system
could be secured.
Objectives
To develop and evaluate an electronic method of recording clinical phar-
macist activity to supersede the paper-based system, with the following
attributes:
� No extra cost to the trust.
� User-friendly format.
� Easy data retrieval.
� Reproducible.
Method
The following key areas of clinical pharmacist activity were identified: hours
spent on ward, monitoring of kardexes, confirmation of drug histories,
patient counselling, generation of electronic discharge prescriptions, gen-
eration of electronic patient drug information leaflets, ward round atten-
dance, medication interventions, medicines information (MI) queries,
meetings, continuing professional development, lectures presented, medical
Table 1 Perceived advantages and disadvantages of the EP system (n = 16)
Disadvantages % Advantages %
Time consuming 69 Accessible 31
Difficult to use 69 Useful prompts 30
Lack of computers 53 Fewer rewrite errors 23
Unsafe 22 Legible 15
Time to log in 21
Lack of security 15 None 23
A249

representative visits and dispensary cover. These were then used to design a
simple template in Microsoft Excel. The template consisted of four pages:
(1) summary, (2) interventions, (3) MI enquiries and (4) other. The template
was designed so that the summary page numerically displayed a breakdown
of daily clinical activity for the given month. It automatically calculated the
total number of each activity carried out by that pharmacist in the given
month. The intervention page documented each pharmacist intervention
qualitatively with details of date, patient name, hospital number, consultant
and description of the intervention. The record of MI enquiries also dis-
played a qualitative record of queries received and responses given.
The page titled ‘‘Other’’ allowed for the qualitative description of other
activities that do not easily fit into any of the given categories. Clinical
pharmacists were trained on how to use the electronic clinical activity
recording system and the package was installed on each of their personal
computers in the pharmacy department. Clinical pharmacists were required
to input their activity data on a daily basis and the package was initially
piloted for 1 month.
A satisfaction survey was designed to evaluate the electronic method of
recording clinical pharmacy activity. The survey asked clinical pharmacists
to state whether they agreed or disagreed with five statements comparing
the electronic system favourably to the paper method in terms of (1)
comprehensiveness, (2) legibility, (3) reproducibility, (4) ease of use and (5)
time to complete. The survey also gave pharmacists an opportunity to
comment on any aspect they particularly liked, or would change about the
electronic method.
Results
Out of seven clinical pharmacists surveyed the majority preferred the
electronic system to the paper method. Around 71% of pharmacists
thought that the electronic method of recording clinical activity produced a
more comprehensive report and was faster to use than the paper method,
with 29% disagreeing. A 100% of pharmacists thought that the electronic
method of recording clinical pharmacy activity was more legible and en-
abled reproducibility/transfer of data more readily than the paper method.
On average, On average, 86% of pharmacists felt that the electronic method
of recording clinical pharmacist activity was overall easier to use than the
paper method but 14% thought the paper method, was easier to use. The
results of the survey are illustrated in Table 1.
Positive comments about the electronic method of recording clinical
activity included: ‘‘It is a useful tool for clinical pharmacy business plans
when requesting extra staff cover’’ and ‘‘ the method has plenty of potential
to be extended and developed if funds permit – currently a useful starting
point.’’ Comments regarding possible future changes to the electronic
method of recording clinical pharmacy activity included: ‘‘ It would be
useful if we could further enhance the system to grade the severity of
medication errors/interventions reported.’’
Discussion
The electronic method of recording clinical pharmacy activity has clearly
been an improvement on current working practice at no additional cost. It
enables the production of an individual monthly report of clinical activity
that is fully comprehensive of work undertaken. It is legible and enables
data to be easily electronically transferred and retrieved. The electronic
method of recording clinical pharmacy activity is overall easier to use than
the paper method and is less time consuming as it is programmed to
automatically calculate monthly activity totals. It also avoids the need for
storing cumbersome paper records.
Although the electronic method is a forward step for clinical activity
reporting, it has several shortcomings. The entry of data is retrospective and
the programme is not accessible at the point of need e.g. on the ward. The
interventions are not graded according to severity, acceptance rates or
according to type of intervention, which would be useful audit tools.
However the programme is proving useful until funding can be secured for
the purchase of handheld computers with dedicated pharmacy intervention
software.
References1 Draft Northern Ireland clinical pharmacy standards ( No.15) 2005.2 Goddard J. PDA-based audit of pharmacist interventions. Hosp Pharm Eur
2003; 9: 16—18.3 Dean P, Robson, J, Waters P. Pharmacy intervention monitoring - A clinical
tool. Hosp Pharm 2004; 11: 201—202.
4 Investigating the contribution of community pharmacists in meeting
the needs of patients with atopic eczema, in collaboration with GPs.
Tinkler C, Herkes D, Holden M, Amin K, Sharma M
Pharmacy Alliance, Chessington, Surrey
Introduction
In the UK, atopic eczema affects 15% of children1,2 and up to 10% of
adults2. Treatment regimens are often complex and confusing, and patients’
concerns about using topical corticosteroids have important implications
for compliance with treatment3. Therefore, it is extremely important that
patients are appropriately educated about eczema and its treatment to
empower them to make informed decisions about their condition and self-
management. Few published studies evaluate the role of community phar-
macists in identifying and addressing the needs of patients with atopic
eczema. Therefore the Community Pharmacy Eczema Programme pilot was
developed with this in mind.
Objectives
The aim of the programme was for community pharmacists to meet the
needs of patients with atopic eczema, in collaboration with GPs. Specific
objectives were to:
1. Identify and address patients’ needs and concerns and evaluate the nature
of pharmacists’ interventions;
2. Evaluate pharmacist to GP referrals.
Method
Forty-eight community pharmacists and their staff attended a training
workshop covering therapy update and programme delivery. Group work
and case studies formed a core part of this training.
Patients aged from 2 to 18 years (patients over 18 years could also
register, however atopic eczema must be present on a sensitive area of the
body), diagnosed with atopic eczema and using a topical corticosteroid
to manage their eczema, were invited to join the programme. After an
initial consultation with the pharmacist, patients were followed-up after
8 weeks.
A written protocol, incorporating a ‘‘Patient Questionnaire’’ was used as
a tool to assist pharmacists in identifying and addressing patients’ needs and
concerns, provided a systematic patient-centred approach. A formal phar-
macist to GP referral process was followed, when patients’ needs could not
be met in the pharmacy.
Results
Three hundred and seventy patients were recruited (93% response rate,
target 400) and 61% (n = 225) subsequently followed-up.
Addressing patients’ needs and concerns� A total of 1,597 problems were identified. Of these, 20% (n = 322) in-
volved steroid concerns, 15% (n = 238) required lifestyle advice, 12%
(n = 193) unmet treatment goals, and 11% (n = 177) poor under-
standing of atopic eczema.
� Pharmacists made a total of 1,747 interventions, consisting mostly
of verbal advice (76%, n = 1,332) and written information (18%,
n = 321).
� On average pharmacists made 3.8 interventions per consultation at
recruitment, decreasing to 1.5 interventions per consultation at follow-up.
� Patients’ responses to the Patient Questionnaire improved significantly
Wilcoxon Signed Rank Test p < 0.05 following pharmacists’ interven-
tions (Figure 1); Steroid concerns reduced from 68% (n = 252) at
recruitment to 30% (n = 70) at follow up, lifestyle advice from 51%
(n = 191) to 20% (n = 47), and poor understanding of atopic eczema
from 43% (n = 162) to 6% (n = 15).
GP ReferralsPharmacists referred 9% (n = 32) of patients to their GP. Of these, 59%
(n = 19) were referred for uncontrolled symptoms and 38% (n = 12) for a
review of treatment.
Table 1 User satisfaction survey comparing the electronic method of
recording clinical activity with paper method: (n = 7 clinical pharmacists)
Pharmacist More
comprehensive
More
legible
More
reproducible
Easier
to use
Faster
to use
Agree 5 (71%) 7(100%) 7(100%) 6(86%) 5(71%)
Disagree 2(29%) 0(0%) 0(0%) 1(14%) 2(29%)
A250

Discussion
All objectives set for the programme were met. Patients/carers have access
to professional advice and support in Community Pharmacy, without an
appointment. This pilot indicated that many of the problems or concerns
patients experience with their condition or its management, particularly
around the use of topical corticosteroids, can be suitably addressed by
Community Pharmacists. However, on occasions, it is appropriate for
pharmacists to refer patients to their GP for a review of their medication
and/or to address their unmet treatment goals.
Feedback was sought from patients and pharmacists at the end of the
programme using pre-printed ‘‘feedback forms’’ in order to evaluate and
adapt the programme for future roll-out.
Over 80% of patients:
� ‘‘knew more about their condition and treatments’’ after taking part in the
eczema programme;
� ‘‘would recommend the programme to others with atopic eczema’’.
At least 70% of pharmacists thought the programme:
� ‘‘built professional GP relationships and would like to be involved in
similar programmes in the future’’;
� ‘‘should be made available to more of their patients’’.
References1. Graham-Brown R, Bourke J. Mosby’s colour atlas and text of dermatology.
Pub Mosby, London 1998: 160–9.2. McHenry P, Williams H, Bingham E. Fortnightly review: management of atopic
eczema. BMJ 1995; 311: 843–7.3. Charman CR, Morris AD, Williams HC. Topical corticosteroid phobia in
patients with atopic eczema. British Journal of Dermatology 2000; 142: 931–6.
5 Cost effective prescribing: The impact of a community pharmacy
Prescription Intervention Programme
Amin K1, Herkes D
1, Tinkler C
1, Holden M
1, Hardy N
2, Chessington, Surrey
1Pharmacy Alliance, 2Eastleigh & Test Valley South PCT
Introduction
In the UK in 2002, over 700 million prescriptions were written by GPs for
patients with a net ingredient cost of over £8 billion1–3. Repeat prescriptions
account for 75% of all prescriptions4, which patients often receive without a
consultation or medication review. This can lead to inappropriate ordering
and use of medicines, poor compliance and wastage. Ensuring that medi-
cines are used safely, avoiding wastage and supporting patients to gain the
maximum benefit from their medicines is therefore, more important than
ever.
Prescription Intervention Programmes, involving community pharmacists
and general practitioners, implemented within Primary Care Organisations
(PCOs) can successfully reduce prescribing costs, assist GP practices with
their targets, improve patient compliance with prescribed medication and
reduce medicines wastage5,6. Community pharmacists are an integral part
of the primary healthcare team and it has been widely recognised that better
use can be made of their skills and knowledge for the successful provision of
high quality, patient-centred services and the rational, cost-effective use of
medicines.
Objectives
The primary aim of this 6-month pilot was for community pharmacists to
facilitate and promote high quality, rational and cost-effective prescribing,
in line with PCT Prescribing Guidelines and local GP targets. The specific
objectives were to:
� facilitate high quality, rational and cost-effective prescribing;
� facilitate a review of therapy and referral to a GP if appropriate, in line
with PCT targets;
� support GPs in meeting their targets.
Method
Prior to service delivery, pharmacists and support staff from the 10 par-
ticipating community pharmacies attended a bespoke workshop providing
training on the programme delivery process and Pharmaceutical Care &
Consultation Skills, delivered through group work, role plays and case
studies. Pharmacists were required to brief their local GPs on the pro-
gramme and their involvement, and agree intervention criteria.
Intervention Criteria� Strength or dose optimisation, where two lower strength tablets are pre-
scribed, and cost-effectiveness and patient compliance would be better
achieved using a single, higher dose formulation (e.g. replace 2x10 mg
tablets with 1x20 mg tablet).
� Generic/brand substitution where cost savings can be made for selected
medication(s).
� Amlodipine substitution where amlodipine is prescribed as the ‘‘besilate’’
salt or as Istin�, change to ‘‘mesilate’’ or simply ‘‘amlodipine’’.
Prescriptions presented in participating community pharmacies were re-
viewed for items meeting the intervention criteria. Pharmacists discussed
any recommendations with the patient (or parent/guardian if under
18 years). Any recommendations together with potential cost savings to be
made were subsequently recorded by pharmacists on an ‘‘Intervention
Form’’ and forwarded to the patients GP for consideration and action,
prior to issue of each patient’s next prescription.
Results
Seven months into the pilot, a total of 71 prescription interventions have
been carried out in community pharmacy: 7% (n = 5) were for amlodipine
substitution; 11% (n = 8) for generic substitution (Figure 1); and the
remaining 82% (n = 58) for strength optimisation. The most frequent
Figure 1 Problems identified by community pharmacists.
A251

strength optimisations were for levothyroxine (19%, n = 11) and atenolol
(19%, n = 11).
The total potential savings identified to date amount to £8,131, equating
to an average of £114.50 per intervention made. Actual savings to date total
£5,566 (68.5% of the potential savings identified) however, as there is a time
delay between recommendations being made in the pharmacy and being
actioned at the GP practice, actual savings may increase further given more
time.
Discussion
Cost savings from the Prescription Intervention Programme to date are
encouraging and it is predicted that over 12 months this will amount to in
excess of £14,000. Reviewing patients’ prescriptions is a means of facili-
tating cost-effective prescribing, ensuring that patients get the maximum
benefit from their medicine(s) as a direct result of increased patient com-
pliance and concordance. Due to the initial success of this pilot, a 3-month
extension has been granted by the PCT. Full analysis will be undertaken
upon programme completion.
References1. Prescription Cost Analysis: England 2002. London: Department of Health;
2002. Available at: http://www.doh.gov.uk/prescription statisics/index.htm2. Prescription Cost Analysis: Scotland 2002. NHS Scotland 2003. Available at:
http://www.isdsscotland.org3. Prescriptions dispensed in the community: Wales 2002. National Assembly for
Wales, 2003. Available at: http://www.wales.gov.uk4. National Service Framework for Older People: a guide for community phar-
macists. PSNC 2002.5. Leach R et al. Investigation into the effectiveness of the Dudley prescribing
efficiency programme. Pharm J 2003; 270: 276–277.6. Galloway C. Involving pharmacists in medicines management. Prescriber 2002;
13:16–21.
6 ‘The missing million’: the crucial role of community pharmacy in
early detection of Type-2 diabetes
Amin K1, Herkes D1, Tinkler C1, Holden M1, Sharma M1, Forward J2
1Pharmacy Alliance, Chessington, Surrey; 2Durham Dales PCT, County
Durham
Introduction
Diabetes affects up to 2 million people in the UK, with numbers escalating,
as an estimated 1 million people in the UK with Type-2 diabetes remain
undiagnosed1. There is evidence to show that the onset of Type-2 diabetes
can be delayed or even prevented2. Early identification and control of
diabetes can reduce the risk of heart disease by 44%, stroke by 46%, kidney
disease by 33% and eye disease by 33%1. Therefore, early detection and
advice on preventative measures (e.g. modifiable lifestyle factors) are of
paramount importance to patients and their families, health professionals,
and to the NHS, to prevent long-term complications and premature death.
It is recognised that utilising the skills and knowledge of Community
Pharmacists, can improve patient accessibility to high quality, patient-
centred services and assist primary care organisations to achieve local and
national diabetes targets.
Objectives
The overall aim of the project was to provide a community pharmacy-based
Diabetes Screening Service that identified and supported at-risk patients,
and facilitated early diagnosis through appropriate referrals to GPs. The
specific objectives were to:
� identify patients at risk of undiagnosed diabetes;
� educate patients in healthy living;
� explore the role of community pharmacists in the primary health care
team and provision of clinical pharmacy services;
� ensure prompt referral to the appropriate health professionals.
At-risk groups were defined as:
� Caucasians >40 years and people from Afro-Carribean/African, Asian
and minority ethnic groups >25 years who have:
j a First degree family history of diabetes;
j BMI ‡25 and lead a sedentary lifestyle;
j ischaemic heart disease, cerebrovascular disease, peripheral vascular
disease or hypertension.
�Women who have had gestational diabetes or polycystic ovary syndrome
and are obese;
� Those known to have impaired glucose tolerance/ impaired fasting
glycaemia;
� Symptomatic patients (e.g. thirst, weight loss, lethargy, recurrent thrush,
cystitis, neuropathy)
Method
Pharmacists and support staff from the six participating pharmacies at-
tended specialised training consisting of clinical updates, consultation skills,
use of monitoring equipment and case studies, to ensure effective service
delivery. Following training, pharmacists were required to brief local GPs
about the service, including their involvement and the process and referral
criteria. A written protocol provided a systematic approach and included:
1. Identifying suitable patients, providing them with a patient information
leaflet and obtaining their written consent to participate;
2. Conducting a random capillary blood glucose (RCBG) test;
3. Eliciting lifestyle information from the patient;
4. Interpreting results and providing appropriate counselling including
patient advice (e.g. on modifiable risk factors such as smoking cessation/
nicotine replacement therapy, healthy eating, weight loss and exercise)
and documenting the outcome(s) of the intervention and action(s) taken,
on the Screening Form;
5. Providing patient with relevant information leaflets dependant upon the
result;
6. Inviting the patient to return for a fasting capillary blood glucose test
(FCBG) if appropriate;
7. Referral, if appropriate (Figure 1);
8. Forwarding test results to the GP Practice for input into patient records,
whether the patient is referred or not.
Figure 1. Nature of generic substitution interventions made.
Figure 1 Patient referral criteria for patients screened.A252

Results
To date, 101 patients have accessed the community pharmacy-based service
and, subsequently, been screened for Type-2 diabetes. Patient ages ranged
from 18 to 100 years, with the mean age being 56 years.
In addition to RCBG/FCBG test(s), information on contributory
lifestyle risk factors such as smoking, alcohol and exercise was also
collected from patients. A 22% (n = 22) of patients confirmed that they
smoked; 60% (n = 60) stated that they drank alcohol, ranging from
1 unit to 50 units/week (the average weekly consumption being 7.5 units).
Around 55% (n = 55) of patients stated that they exercised, the average
being three times per week. Pharmacists provided appropriate advice on
maintaining a healthy lifestyle and reducing their risks based on patients’
responses.
RCBG ranged from 3.9 to 22.5 mmol/l; 49.5% (n = 50) had a reading
<5.5 mmol/l, 49.5% (n = 50) had a reading between 5.6 to 11 mmol/l. One
patient had a measurement greater than 11 mmol/l; this patient was ‘fast-
tracked’ to their GP for an appointment.
In line with the protocol, all patients above 5.5 mmol/l were invited back
for a FCBG test. Of the 50 patients requiring a FCBG test, 96% (n = 48)
returned to the pharmacy. FCBG ranged from 1 to 10.4 mmol/l; 71%
(n = 34) had a reading <5.5 mmol/l, and the remaining 29% (n = 14)
between 5.6mmol/l and 11 mmol/l.
A total of 15 patients were referred to their GP for further tests. GPs have
consequently seen and returned data for 33% (n = 5) of these patients.
Sixty percent (n = 3) had reduced to <5.5 mmol/l. Two patients had
measurements of 6.2 and 6.4 mmol/l, respectively. GP data for the other 10
referred patients remains outstanding.
Discussion
This project demonstrates that Community Pharmacists and their support
staff are suitably placed and have the skills and knowledge to provide a
Diabetes Screening Service. Patients can access a professional and confi-
dential service in Community Pharmacy, without a formal appointment, at
a time convenient to them. This greatly increases the prospect of early
diagnosis of Type-2 diabetes, in turn, reducing any associated long-term
complications.
References1. News Update. Diabetes UK, London. 1st September 2005.2. National Service Frameworks. Diabetes. Modern Standards and Service
Models. Department of Health: London. 2002.
7 Practical prescribing the development and delivery of a teaching
package for 5th year medical students
Bowden J1, Pepperrell M
2
1Department of Pharmacy, Royal Bournemouth & Christchurch Hospitals
NHS Foundation Trust, Bournemouth; 2Southampton University Hospitals
Trust (SUHT), Southampton
Introduction
The undergraduate course is the first stage of medical education, providing
the baseline for further development as a pre-registration house officer. An
important part of the medical student education involves the understanding
of the effective and safe use of medicines as a basis for prescribing including
side-effects, interactions and antibiotic resistance1. The requirement for this
additional teaching about prescribing was identified in 2001 by South-
ampton Medical School, which felt the teaching should be practice based
whilst the fifth year students were on placement. The pharmacy depart-
ments at SUHT and the Royal Bournemouth Hospital were approached to
develop and co-ordinate a teaching package for all fifth year medical stu-
dents on placement at 13 local hospitals.
Objectives
To develop and co-ordinate the delivery of a pharmacist-led teaching
package (on practical prescribing and intravenous drug therapy) for fifth
year medical students based at Southampton Medical School and to assess
the impact of the teaching sessions.
Method
In February 2002, 13 hospital pharmacies where Southampton medical
students undertook medical placements were contacted by e-mail or letter to
assess whether they would be happy to undertake the teaching. A working
party was set up to identify the key objectives for the sessions and a draft
teaching package was produced for the practical prescribing along with
guidelines for the intravenous drug therapy session. Each medical student
undertakes a 10-week medical placement in the fifth year, so the format of
the sessions was set as two afternoon sessions on practical prescribing and
one afternoon session on intravenous drug therapy during this placement.
Due to the logistics and numbers of students the decision was made to
centralise the intravenous sessions at four locations (Bournemouth,
Chichester, Southampton and Winchester), but to hold the practical pre-
scribing sessions at each hospital. In May 2002, a demonstration of the
teaching package was given at Southampton with the lead pharmacist in-
vited from each hospital. At the end of the presentation all but one hospital
pharmacy agreed to undertake the teaching sessions.
Students were given a handbook explaining the objectives of the sessions,
listing contact numbers and including a teaching pack for intravenous
therapy to be read before the practical afternoon. As part of the review and
continual development of the teaching sessions the medical students were
required to complete an assessment of the practical prescribing and the
intravenous drug therapy at the end of the session.
The teaching sessions commenced in July 2002 and have continueduntil the
present date. The number of sessions was increased in 2005/6 to four after-
noons, with an increased emphasis on the management of risk and drugs.
Results
A total of 493 students have attended the sessions since 2002. Results of the
feedback questionnaires from the students is shown in Table 1.
Discussion
The feedback from all of the cohorts of students has been very positive and
shows that their confidence with prescribing has been increased.
The group size for the sessions ranges from 2 to 8 students, this enables
the pharmacists to adapt the teaching to the groups needs, especially during
ward visits. The design of the teaching pack which provides Powerpoint
presentations, case examples and suggested lesson plans contributes to
consistency of the training provided, which is possibly unique as it is
Table 1 Results of feedback questionnaires from fifth year medical students 2003–4
Practical prescribing sessions (%) Strongly agree Agree Not sure Disagree Strongly disagree Number
Holding the sessions during the medicine attachment
was appropriate
46 52 0 2 0 119
Quality of the teaching was mostly good 38 61 0 2 0 120
The content of the sessions was mostly good 48 48 3 0 0 120
The content increased my confidence in prescription writing 41 53 3 3 0 120
I would have liked more pharmacist-led teaching 20 49 27 2 3 120
The sessions gave me more confidence in communicating
about medicines
18 67 15 0 0 118
The sessions increased my confidence in prescription writing
about controlled drugs
33 60 6 2 0 119
The sessions helped me understand the clinical pharmacy
management of patients within medicine
48 50 3 0 0 120
very good good fair poor very poor
My overall rating for the sessions 46 53 2 0 0 118
A253

co-ordinated across 12 NHS trusts. When the authors suggested adding an
extra session to incorporate more information on reducing risk in pre-
scribing the medical school were supportive. The teaching pack was then
substantially revised, incorporating principles and examples from ‘‘Building
a Safer NHS for Patients’’2. Funding for development of the teaching packs
and pharmacists time to deliver the training was obtained from the medical
school and amounts to £34,000 for 2005–6. Although the pharmacist’s time
is funded, it still remains a challenge to incorporate the teaching into a
hectic timetable.
Future developments include discussions with an educationalist on
delivery of the training and assessment of its impact, and incorporation of
OSCE questions into the final exams to be based on ‘‘Practical Prescribing’’.
Acknowledgements
All the pharmacists involved in the teaching at the hospitals in Basingstoke,
Bournemouth, Chichester, Dorchester, Frimley Park, Isle of Wight, Poole,
Portsmouth, Salisbury, Southampton, Winchester and Worthing.
Dr Keith Hillier, Senior Lecturer, Clinical Pharmacology, Dr Chris Ste-
phens, Director of Education, School of Medicine, University of South-
ampton.
References1. General Medical Council. Tomorrow’s doctors: recommendations on under-
graduate medical education. London:GMC, 2003.2. Department of Health. Building a safer NHS for patients. London:Stationary
Office, 2001.
8 Levosimendan: safety, effectiveness and patient outcomes. The
experience of an adult intensive care unit
Lippett S1, Batra R
2, McKenzie CA
1, Beale R
3, Wyncoll D
3
1Pharmacy, Guy’s & St Thomas’ NHS Foundation Trust, London, UK;2School of Medicine, University of Maryland, Baltimore, USA; 3Intensive
Care Unit, Guy’s & St Thomas’ NHS Foundation Trust, London, UK
Introduction
The prognosis of patients with cardiogenic shock admitted to the intensive
care unit (ICU) is poor. In-house data (2003/4) indicates an annual ICU
mortality rate of 72.4% in this population. Levosimendan is a novel cal-
cium-sensitizing agent that increases myocardial contractility without
increasing oxygen consumption. It also possesses vasodilatory properties.
Studies have shown levosimendan to be effective in reducing the risk of
worsening heart failure and death in patients with left ventricular failure
(LVF) complicating acute myocardial infarction and to be well tolerated in
terms of hypotensive and ischaemic episodes1. The LIDO study2 showed an
improvement in cardiac output by ‡30% at 24 h (28% v 15%, p = 0.022)
and an improvement in mortality at 180 days significantly better than do-
butamine (26% v 38%, p = 0.029). Although levosimendan remains unli-
censed in the UK, use of this expensive drug in our high-risk ICU
population is prevalent, without any formal evaluation of benefit.
Objective
To describe the use of levosimendan on an adult intensive care unit.
Method
Data were collected retrospectively from patients who received levosimen-
dan on the ICU between January 2004 and June 2005. Details recorded
included age, reason for admission to the ICU, levosimendan dose and
duration, dose of inotropes/vasopressors and cardiac studies pre-, at end of
and 24 h post- levosimendan infusion, concurrent anti-failure drugs, ad-
verse effects and mortality. Cardiac studies and use of inotropes/vasopres-
sors were evaluated using regression analysis and wilcoxon matched pairs
testing.
Results
In total 30 patients received levosimendan on the ICU of which data were
available for 25; one patient had levosimendan on two separate admissions.
The median age was 67 years (range 30–84 years). Cardiogenic shock was
the primary reason for admission to the ICU for 20 (76.9%) of the patients,
R2 = 0.93,*p=0.029
R2 = 0.99,*p=0.041
0.0
0.5
1.0
1.5
2.0
2.5
3.0
3.5
t=0 t=end of infusion t=24 hr post infusionTime
CI (
Lmin
-1m
-2)
0
500
1000
1500
2000
2500
SVR
I (dy
ne s
-1 c
m-5
m-2
)
CI SVRI
*p=baseline vs. t=24 post infusion, n=17
Figure 1 Levosimendan increases cardiac index (CI) while lowering the systematic vascular resistance index (SVRI).
R2 = 0.933, *p=0.005
R2 = 0.916, *p=0.031
R2 = 0.911, *p=0.031
0.00
0.05
0.10
0.15
0.20
0.25
0.30
0.35
0.40
0.45
Time
Inot
rope
dos
e(µ
g kg
-1m
in-1
)
Dobutamine x10–²(n=7) Milrinone (n=8) Noradrenaline (n=17)
t=0 t=end of infusion t=24 hr post infusion
*p=baseline vs. t=24 hr post infusion
Figure 2 Levosimendan decreases inotropic requirements.
A254

of which 13 were post-cardiac surgery and 5 post-acute myocardial
infarction. The mean APACHE II score at time of receiving levosimendan
was 19 (n = 19, SE = 0.96). Eight patients (30.8%) did not undergo formal
cardiac studies, 12 (46.2%) had PiCCO� monitoring, 3 (11.5%) had LiD-
CO� monitoring and three had a pulmonary artery catheter. No patients
were given a loading dose of levosimendan. The mean maintenance dose
received was 0.12 mcg/kg/min for a median of 24 h (range 3–58 h). Thirteen
(50%) of patients were concurrently prescribed anti-failure medication, five
were prescribed only one medicine, three were prescribed two medications
and five were prescribed three. b-blockers were the most commonly pre-
scribed. A significant increase in mean cardiac index (CI) was observed
from time of starting levosimendan and 24 h post-infusion (2.49 l min-1m-2
(SE = 0.24) v 3.06 l min-1m-2 (SE = 0.19), p = 0.041). A significant de-
crease in systemic vascular resistance index (SVRI) was also observed
(1,948 dyne s-1cm-5m-2 (SE = 198) v 1,363 dyne s-1cm-5m-2 (SE = 129),
p = 0.029) (Figure 1). A reduction in mean doses of noradrenaline n = 17,
(0.3 mcg/kg/min SE = 0.08) v 0.09 mcg/kg/min SE = 0.03), p = 0.005),
dobutamine n = 7, (8.26 mcg/kg/min (SE = 0.023) v 3.77 mcg/kg/min
(SE = 0.028), p = 0.031), and milnirone n = 8, (0.22 mcg/kg/min
(SE = 0.08) v 0.12 mcg/kg/min (SE = 0.09), p = 0.031), was demon-
strated over the same time period (Figure 2). One patient developed atrial
fibrillation during administration of levosimendan. There were no reports of
new ischaemia or ECG changes. The ICU mortality was 58% of which two
patients died during administration of levosimendan.
Discussion
Levosimendan at infusion rates of 0.1–0.2 mcg/kg/min had a favourable
impact upon CI, SVRI and inotrope/vasopressor doses for patients in our
ICU. It was well tolerated in terms of arrhythmias and ischaemic events.
Our ICU has witnessed more than a 14% decrease in mortality for car-
diogenic shock since the introduction of levosimendan, suggesting benefit.
However other strategies have been implemented during this period,
including tight glycaemic control. The LIDO study2 showed a clear benefit
when levosimendan was used as an alternative to dobutamine and we were
able to replicate similar positive outcomes in a non-controlled setting. In
our experience, due to the unlicensed status and associated cost pressure,
levosimendan was never used as first-line therapy but was often employed as
a ‘rescue-agent’. We would highlight the need to possibly consider the use of
levosimendan at an earlier stage or as an alternative to dobutamine. This
retrospective review of the safety and efficacy of levosimendan has also
demonstrated a model that can be widely applied to monitor use, develop
guidelines and bid for funding of a high cost, unlicensed drug.
References1. Moiseyev VS, Poder P, Andrejevs N et al. Safety and efficacy of a novel calcium
sensitizer, levosimendan, in patients with left ventricular failure due to an acutemyocardial infarction. A randomized, placebo-controlled, double-blind study(RUSSLAN). Eur Heart J 2002; 23: 1422–32.
2. Follath F, Cleland JGF, Just H et al. Efficacy and safety of intravenous levo-simendan compared with dobutamine in severe low-output heart failure (theLIDO study): a randomised double-blind trial. Lancet 2002; 360: 196–202.
Posters Audit
9 An audit of the pharmacy admissions service at a teaching hospital
Bracey G, Miller G, Franklin BD
Hammersmith Hospitals NHS Trust, London
Introduction
Several studies have demonstrated the potential benefits of having a spec-
ialised admissions pharmacist. A recent study found that only 12.5% of
patients seen by a doctor in Accident and Emergency (A&E) had a complete
drug history (DH) taken, compared to 100% of those seen by a clinical
pharmacist1. Another study found that by attending the medical post-take
ward round (PTWR), pharmacists made an average of 1.84 contributions
per patient seen2.
Two specialised medical admissions pharmacists were established at our
hospital in August 2004. The aims of the service were to attend the medical
PTWR; confirm and document. DHs for emergency admissions and to
ensure the timely supply of medication for inpatients and at the point of
discharge (this involves the use of patients own drugs and the one-stop
dispensing system wherever possible). The aim of this audit was to measure
the impact of this service on an acute medical admissions ward.
Objectives
To measure the number and types of contributions to patient care made
during the PTWR; to determine the percentage of patients on the admis-
sions wards with drug histories checked by a pharmacist and the number
and nature of interventions made as a result; to evaluate how discharge
medications are supplied.
Method
Both pharmacists collected data over a period of 7 days, using a piloted
data collection form, relating to: number and nature of contributions made
on the PTWR; number and nature of interventions made as a result of DH
taking; the source of any items needed for the dispensing of discharge
prescriptions (TTAs) screened by the pharmacist on the ward. Contribu-
tions to the PTWR were classified using the method of Bednall et al2.
Audit standards were: (1) At least one contribution per patient should be
made on the PTWR; (2) 75% of all patients admitted to the acute medical
admissions ward should have their DH checked by an admissions phar-
macist; (3) No more than 25% of all medication should be dispensed by the
pharmacy on discharge (the rest should be available on the ward).
Results
A total of 74 patients were seen on the PTWR during the week of data
collection and a total of 83 contributions made by the pharmacist; an
average of 1.1 per patient. The most common type of contribution made
was ‘‘therapeutic choice’’, meaning that the class and dose of drug was
prescribed as advised by the pharmacist (Table 1).
Of the 93 patients admitted to the admissions ward during the audit
period (mean of 13.2 patients per day), 56% (n = 52) of patients had their
DH checked by a pharmacist – this resulted in 61 interventions; again an
average of 1.1 per patient (Table 2). The most common intervention was the
addition of a drug that had been unintentionally omitted.
In total, 19 Nineteen TTAs were screened over the 7 days, with a total of
121 items prescribed. Of these, 33% (n = 41) were patients’ own drugs
(either at home or on the ward), 30% (n = 36) had already been dispensed
for discharge and were available on the ward, and only 24% (n = 29) had
to be dispensed in pharmacy.
Discussion
The number of contributions made on the PTWR was above the audit
standard of one per patient. A large proportion of these were ‘‘therapeutic
choice’’ – suggesting that the pharmacists are making appropriate contri-
butions. Pharmacists also intervened to stop medication due to adverse
drug reactions in 12% (n = 10) of contributions, which shows they are
highlighting the potential for drug-induced problems.
The audit standard was not met for the proportion of patients with a drug
history checked by an admissions pharmacist. This was probably due to the
high number of patients admitted and the fast patient turnover (one patient
was transferred after just 2 h). It was noted that 75% may therefore be an
unrealistic target and that length of stay also needs to be considered. It is
reasonable to expect that all patients on the ward for 24 h or more have a
DH checked by a pharmacist.
Finally, the audit standard (<25%) for the proportion of items that were
dispensed by pharmacy on discharge was met, with just 24% of items
Table 1 Types of contribution made to medical PTWR (n=83 patients)
TD TC Advice on
route/formulation
DA ADR TDM Allergy status C Total
Number(%) 9(11%) 33(40%) 1(1%) 17(20%) 10(12%) 3(4%) 9(11%) 1(1%) 83(100%)
TD, therapeutic discussion; TC, therapeutic choice; DA, dose adjustment; ADR, adverse drug reaction/advised stopping; TDM, therapeutic drug
monitoring; C, counselling2.
A255

needing to be dispensed. Before the admissions team were in post most of
these would have been dispensed by the dispensary.
Several limitations to the study were identified. For ease, the audit
standards were arbitrary, and may not be entirely appropriate; rather than
specify a particular number of contributions per patient it would be more
meaningful, but much more difficult, to determine whether they were made
when appropriate. This study was conducted over 1 week and involved just
two consultants, it is likely that the type and number of interventions
change depending on the specialist knowledge of the consultant, the speed
of their PTWR and their receptiveness towards pharmacist contributions. A
longer audit period would be preferable.
Consideration needs to be given to ways to prioritise patients to ensure
those who really need a DH and medication review receive one early in their
admission. The installation of a labeller on the ward and encouraging
doctors to bleep the admissions pharmacists as soon as a complex patient
arrives in A&E should help to achieve more in the time available.
Acknowledgement
Laura Whitney for data collection.
References1. Cavin A, Sen B. Improving medication history recording and the identification
of drug-related problems in an A&E department. Hosp Pharm 2005; 12: 109–11.2. Bednall R, McRobbie D, Russell SJ. A prospective evaluation of pharmacy
contributions to post-take ward rounds. Pharm J 2003; 271: 2.
10 Audit of the supply of domiciliary oxygen from community
pharmacies in the Greater Glasgow Area
Reilly V, Millar H, Thomson DAM
Greater Glasgow Primary Care Division, Gartnavel Royal Hospital, Glasgow,
Greater Glasgow Community Pharmacy Clinical Governance Audit and
Public Health Teams
Introduction
A project conducted in the Lothian Primary Care Trust Area to assess the
management of patients receiving domiciliary oxygen (O2) from community
pharmacies1 suggested that many patients were receiving sub-optimal
standards of care compared to those recommended in professional guide-
lines 2,3. In particular not all patients received written information regarding
handling of oxygen equipment, safe storage, smoking, and emergency
contact numbers.
The O2 module from the Greater Glasgow Pharmacy Audit Programme
‘Quality in Practice’ clinical governance package which relates to the
management of domiciliary oxygen supply in community pharmacies
available at www.show.scot.nhs.uk/gghbpharmacy was used to audit the
supply of domiciliary oxygen in the Glasgow area following a collaborative
model successfully used in previous audits of ‘Advice to locums’ and
‘Dispensing’.
Objectives
To audit the supply of oxygen from community pharmacies, present results
at a multidisciplinary meeting and address any action points before
re-audit.
Method
Greater Glasgow pharmacy oxygen (O2) contractors completed the self-
audit ‘Domiciliary Oxygen’ from the Greater Glasgow Pharmacy Audit
programmes ‘Quality in Practice’ clinical governance package4 and sub-
mitted their results for analysis by facilitators.
The audit required participants to respond with ‘yes’, ‘no’ or not-appli-
cable (n/a) to 52 recommendations in 10 categories and answer additional
questions in a semi-structured questionnaire.
O2 contractors, project facilitators, Fire Safety officers and a Health
Promotion officer were invited to a meeting for presentation and discussion
of results.
Recommendations were made and re-audit was conducted after
6 months.
Greater Glasgow Ethics Committee granted approval of the project.
Results
Of 92 O2 contractors completed 43 (47%) the audit and re-audit cycle.
Around 31 (61%) contractors and 25 (58%) drivers had received oxygen
safety training. And 32 (63%) contractors had an oxygen safety and
information leaflet available for patients.
In total 17 contractors, 5 Health Promotion/Audit Facilitators, 2 Fire
Safety Officers and a Senior Health Promotion Officer for Accident Pre-
vention from Greater Glasgow NHS Health Board attended an audit
feedback meeting at which action points were identified. These involved
recommendations for contractor and staff training, transport of cylinders
and supply of patient safety leaflets and emergency contact numbers.
Table 1. demonstrates the percentage change to positive (yes) responses to
recommendations in categories after re-audit.
Discussion
The audit and meeting identified areas of practice that could be improved,
in particular the transport of oxygen cylinders, provision of service to pa-
tients and training and staff education subsequent re-audit demonstrated
improvements in practice to these areas and others.
Paediatric oxygen supply demonstrated a large change because O2 con-
tractors who considered it not applicable to their practice prior to the
feedback meeting reassessed their need for information after hearing col-
leagues report that they had such patients. Administration achieved 100%
at re-audit because a relatively minor point concerning return of a form to
the Primary Care Division (PCD) was clarified.
It was useful to have the Fire Brigade represented at the feedback
meeting. Fire Safety officers were able to highlight oxygen transport safety
points and offer assistance with oxygen storage queries. The Fire Safety
Officers felt that they too had benefited from attending the meeting.
Although it was disappointing that less than half active O2 contractors
took part in the audit and not for all of those who attended the meeting it
was possible to disseminate action points identified and training informa-
tion distributed at the meeting to all O2 contractors by Board mail out.
Community pharmacists were pro-active with other professionals to ad-
dress change and re-audit demonstrated an improvement in practice. Fur-
ther audit work suggested would focus on emergency demand for oxygen
cylinders for palliative care patients.
References1. Boyle A, Renton J, Kinnear M. An evaluation of the provision of advice to
patients receiving domiciliary oxygen. Lothian Pharmacy Practice Unit,Departments of Pharmacy, Lothian Primary Care NHS Trust, Lothian Uni-versity Hospitals NHS Trust, Edinburgh.
2. Medicines, Ethics and Practice. A guide for pharmacists (27) July 2003.3. Domiciliary Oxygen therapy services: clinical guidelines and advice for pre-
scribers. Summary of a report of the Royal College of Physicians Lond 1999; 33:445–7.
Table 2 nterventions made as a result of DH taking (n = 61 interventions)
Allergy status Drug omitted Incorrect dose Incorrect formulation Incorrect frequency Route Total
Number(%) 11 (18%) 39 (64%) 3 (5%) 1 (2%) 7 (11%) 0 (0%) 61 (100%)
Table 1 Comparison of positive (yes) responses at re-audit of ‘Domiciliary
oxygen’ self audit module
Domiciliary oxygen
self-audit module category
% Yes response % Change
Audit Re-audit
Receipt of cylinders 80 94 18
Storage of cylinders 78 78 –
Maintenance of cylinders 69 83 20
Transport of cylinders 61 80 31
Service to patients 81 93 15
Paediatric oxygen supply – 59 59
Administration 80 100 25
Education of all staff 66 83 26
Training of staff handling cylinders 82 94 15
Training of staff delivering cylinders 89 92 3
Chi squared analysis indicates p < 0.05
A256

11 An Audit of how prescribing of Zaleplon, Zolpidem & Zopiclone (‘Z’
drugs) complies with NICE guidance No. 77
Druce LA
Department of Pharmacy, North West Wales NHS Trust, Ysbyty Gwynedd
Introduction
The National Institute for Clinical Excellence (NICE) guidance document
(No. 77) states that published estimates of the prevalence of insomnia vary
from 10 to 38%1.
A drug used to induce sleep is described as a ‘hypnotic’. Although hyp-
notic agents are licensed for the treatment of insomnia, they do not treat
any underlying cause.
The level of prescribing of hypnotics in Wales is a matter of concern and
has been identified by the All Wales Medicines Strategy Group as a key area
for review due to the potential adverse effects, especially in the elderly and
due to increased cost issues.
At Ysbyty Gwynedd, Bangor, the main problem with hypnotics appears
to be that these drugs are included on discharge prescriptions as regular
medicines, which get transferred onto the repeat system without adequate
review to assess whether there is a continued need for them. Such drugs are
not always required on long-term repeat basis if only prescribed on an ‘as
required’ basis in hospital. Ongoing therapy without review is also a com-
mon problem in nursing homes and community hospitals2.
A number of hypnotic agents are licensed for the treatment of insomnia
including Zaleplon, Zolpidem and Zopiclone (‘Z’ drugs), the non-benzo-
diazepine hypnotics.
Based on a population of 250,000 for North West Wales, approximately
£200,000 was spent on ‘Z’ drugs over a 12 month period 2003/20043. The
most commonly prescribed ‘Z’ drug during this period was Zopiclone
(87%), which reflects current Joint Formulary guidance, followed by
Zolpidem, and Zaleplon was the least prescribed3.
The NICE guidance is expected to provide cost savings to the NHS with a
possible reduction in inappropriate prescribing of hypnotics.
Objectives
The main aim of this audit is to review current prescribing of ‘Z’ drugs for
people with insomnia. Adherence with criteria/standards set out by NICE
Technology Appraisal Guidance 77 were measured.
Method
A qualitative and quantitative research method was chosen for this study to
satisfy the aim of providing statistical results as well as exploring the
information given to patients from the prescriber about their medicine.
A prospective study was carried out including patients prescribed ‘Z’ drugs
on all medical wards (approximately 160 beds) which carried out the Patients
Own Drugs system (PODs) over a 10-day-period (excluding weekends).
Ward-based technicians and pharmacists identified patients for inclusion.
All patients of all ages were included whether treatment started on current
admission, previous admission or in PrimaryCare.A ‘patient detail’ formwas
developed to answer the criteria based in the NICE Technology Appraisal.
Once identified, the researcher completed a ‘patient detail’ form, which in-
cluded demographic data so patients could be followed through to discharge.
Results
A total of 62 patients were recruited for inclusion in this audit. Of these
patients, 65% were male, aged between 65 and 80 years. All patients, n=62
(100%) were prescribed Zopiclone.
It was found that Zopiclone was prescribed on an ‘as required’ basis for
47 patients (77%).
The NICE guidance states that the ‘Z’ drug of lowest cost should be
prescribed. Results were as seen in Table 1.
In the majority of patients (97%), treatment was started by Secondary
care and in 42 patients (68%) therapy began on this current admission. No
information was given to 24 patients (39%) regarding the medicine by the
prescriber.
The maximum licensed duration for use of Zopiclone is 4 weeks. Eighty-
five percent of patients were prescribed Zopiclone for a longer duration.
This took into consideration of prescription prior to admission, as inpatient
and on discharge from hospital.
Discussion
Hypnotic agents should, in general, be given only for very short periods to
alleviate distressing insomnia caused by short lasting events, illness or
upsets2. Hypnotics should be offered only as an adjunct to non-drug
treatment of insomnia such as ‘sleep hygiene’, and should ideally be re-
served for patients with the most severe symptoms.
Encouragingly, for the majority of the patients included, 77% (n = 47),
Zopiclone was prescribed on an ‘as required’ basis and not prescribed as
regular treatment whilst inpatient. As Zolpidem was not found to be pre-
scribed for any patient included, prescribing does not adhere with NICE
guidance, where the cheapest drug should be chosen; that being Zolpidem.
If these prescriptions were replaced with Zolpidem or with hypnotics with
lower acquisition costs, it could possibly signify a great cost saving to the
National Health Service.
This issue will be resolved by updating the current guidelines in the Joint
Formulary, and through newsletters to prescribers and prescribing advisers
in Primary and Secondary care.
Recommendations from this audit are to provide leaflets to inpatients
regarding non-pharmacological methods to aid sleep, to address the issue
specifically during junior doctor induction and nurse training. Discussions
with the clinical pharmacy team have resulted in a change of endorsement
for all hypnotics, encouraging them to be questioned if continued on dis-
charge from hospital.
Acknowledgement
Audit undertaken as part of Diploma in Clinical Pharmacy with Cardiff
University, Wales.
References1. Zaleplon, Zolpidem and Zopiclone for the short-term management of insomnia,
National Institute for Clinical Excellence, Technology Appraisal Guidance 77,April 2004.
2. Benzodiazepines and ‘Z’ drugs for insomnia, WeMeReC Bulletin Vol. 10, No. 3,October 2003.
3. Health Solution Wales, CASPA Data. Available from: http://howis.wales.nhs.uk [Revised 09/2004; Accessed 12/1/2005].
12 Management of potential drug-induced upper gastrointestinal
bleeding
Willms A
Department of Pharmacy, NWW NHS Trust, Ysbyty Gwynedd, Bangor
Introduction
A recent report by Pirmohamed1 highlighted that adverse drug reactions
(ADRs) still considerably contribute to hospital admissions. This study
revealed that low-dose aspirin was the drug causing the highest number of
ADRs. Upper gastrointestinal (GI) bleeding was the most common ADR
and occurred in 72% of all aspirin related admissions.
Other drugs that were identified to cause hospital admissions due to
upper GI bleeding are non-steroidal anti-inflammatory drugs (NSAIDs),
cyclo-oxygenase-2 (COX-2) inhibitors, clopidogrel, anti-coagulants, selec-
tive serotonin re-uptake inhibitors (SSRIs) and systemic corticosteroids.
As mild GI symptoms poorly correlate with the development of major
upper GI complications it is important to identify patients at risk for
developing NSAID induced upper GI bleeding2. The National Institute of
Clinical Excellence (NICE) clearly defines risk factors for serious GI ADRs
to NSAID therapy3. Although it is generally agreed that gastroprotection
should be offered to patients at high risk of developing ADRs with NSA-
IDs, national or local guidance on the number of risk factors justifying
gastroprotective medication is lacking.
Besides the identification of potentially offending drugs, clear documen-
tation, communication to primary care and reporting to the Committee on
Safety of Medicines (CSM) are important steps in the management of
ADRs.
Objectives
This audit was undertaken to assess the need for local guidelines on the use
of gastroprotection in patients at high risk of NSAID induced upper GI
Table 1 Results for NICE standard when drug of lowest cost should be
chosen
The most appropriate/lowest cost drug according to: % Achieved
Joint Formulary July 2004 ZOPICLONE 100%
Drug Tariff September 2004 ZOLPIDEM 0%
A257

bleeding. Also to identify educational needs among clinicians regarding
documentation and reporting of ADRs.
Method
Over 9 weeks (15/09/2004 to 17/11/2004) inpatients with symptoms of up-
per GI bleeding were identified on 7 medical and 3 surgical wards in Ysbyty
Gwynedd, a district general hospital.
A comprehensive drug history was undertaken to identify potentially
offending drugs and gastroprotective agents. Data on risk factors were
obtained.
For all cases of drug-induced upper GI bleeding International Statistical
Classification of Disease and Related Problems (ICD-10) codes were ob-
tained from the clinical coding department to assess the documentation of
ADRs. CSM Wales provided the number of yellow card reports on drug-
induced upper GI bleeding submitted from Ysbyty Gwynedd during the
audit period.
Results
Table 1 shows individual drugs that potentially caused upper GI ADRs.
Fifty percent of patients taking NSAIDs, of which one patient was taking a
gastroprotective agent before admission presented with at least one risk
factor.
ICD-10 codes were obtained for 21 patients. No hospital admission was
coded to be a result of an ADR.
No yellow card reports completed by a clinician were reveived by CSM
Wales during the audit period. A total of 21 yellow card reports were
submitted to the CSM by the auditor.
Discussion
Drugs contribute considerably to hospital admissions due to upper GI
bleeding in Ysbyty Gwynedd. Compared to data published in the litera-
ture1,4 the incidence of upper GI bleeding potentially caused by aspirin and
NSAIDs was found to be lower, while clopidogrel had a similar impact on
causing this ADR.
This lower incidence may be due to a difference in data collection
methods,e.g. days on which data was collected, inclusion of accident and
emergency departments, duration of audit.
The number of patients presenting with NSAID-induced upper GI
bleeding was not high enough to assess the need for local guidelines on the
use of gastroprotection in high risk patients [extrapolation of audit data to
1 year: 12 non-aspirin NSAIDs induced upper GI bleeding in patients over
65 years of age compared to an estimation of 45 cases for a Primary Care
Trust of similar size in Bandolier4] . However, after the worldwide with-
drawal of Rofecoxib in September 2004 and the current analysis of trial
data on celecoxib by the European Medicines Agency (EMEA) and the
Medicines and Healthcare products Regulatory Agency (MRHA), an
increase in the use of traditional NSAIDs may be expected.
In five cardiovascular prevention trials, low dose aspirinwas shown to have
an increased incidence ofGIADRs, includingmajorGIbleeding compared to
placebo5. However, low dose aspirin is excluded from most references
discussing risk factors for NSAID-included upper GI bleeding. Local dis-
cussions on the development of strategies to reduce the incidence of upper GI
bleeding caused by aspirin used as an anti-platelet drug are required.
Adverse drug reactions can only be coded as such with ICD-10 codes if
they are clearly documented as such in medical case notes or discharge
summaries. The lack of admissions coded as drug-related may be inter-
preted as poor documentation by clinicians.
The fact that no yellow card reports were submitted by clinicians to the
CSMWales shows the needof education onADRreporting among clinicians.
Pharmacists should establish their role in documenting and reporting ADRs
and increase the awareness of drugs as a potential cause of upper GI
bleeding in discussions of individual cases with clinicians.
Acknowledgement
This audit was undertaken as part of the Postgraduate Diploma in Clinical
Pharmacy, University Cardiff, Wales.
References1. Pirmohamed M, James S, Meakin S et al. Adverse drug reactions as cause of
admissions to hospital: prospective analysis of 18, 820 patients. BMJ 2004; 329:15–19.
2. Singh G, Triadafilopoulos G. Epidemiology of NSAID induced gastrointestinalcomplications. J. of Rheumatol. 1999; 26 Supplement (56): 18–24.
3. NICE. Technology Appraisal Guidance No 27: Guidance on the use of cyclo-oxygenase (COX) II selective inhibitors, celecoxib, rofecoxib, meloxicam andetodolac for osteoarthritis and rheumatoid arthritis, July 2001.
4. Moore A, McQuay H (eds), More on NSAID adverse effects, Bandolier 79, sep2000; 7(9): 6–8.
5. Isles C, Norrie J, Paterson J, Ritchie L et al. Risk of major gastrointestinalbleeding with aspirin, Lancet 1999; (353): 148–150.
13 Insulin prescribing by medical staff is unsafe, and education results in
a significant but insufficient improvement
Clarke NR1, Narendran P2
1Department of Pharmacy North Bristol NHS Trust, Bristol; 2Department of
Endocrinology North Bristol NHS Trust, Bristol
Introduction
Insulin prescribing is not safe in the UK1,2. Nor is it safe in the USA where
it tops the list of drugs involved in medication errors3. Common errors
involve the abbreviation of ‘units’ to ‘U’ or ‘IU’ such that 4 units can be
misread as 40 or 41 units, respectively. Alternatively insulin ratio may not
be specified, for example ‘Humulin’ or ‘Mixtard’ may be written in place of
‘Humulin M3’TM or ‘Mixtard 30’TM, respectively. The Chief Pharmaceu-
tical Officer4 and the British National Formulary have discouraged these
practices.
Objective
To audit accuracy and safety of hospital inpatient insulin prescriptions in
the North Bristol NHS Trust (NBT). To see whether education of doctors
had any effect on insulin prescribing as measured by re-audit.
Method
We audited inpatient insulin prescriptions across three hospitals in our
health authority involving 1488 beds. A total of 1156 inpatient charts were
reviewed on 1 day and scored for prescribing accuracy with respect to
abbreviation of the term ‘units’, specification of insulin ratio, and overall
accuracy.
Results
In total 57 inpatients (5%) were prescribed insulin, of which some were
prescribed more than one insulin, resulting in a total of 95 insulin pre-
scriptions (Table 1). Of these, only 33 and 74 prescriptions, respectively,
used the term ‘units’ and specified the insulin ratio correctly. The reviewing
pharmacist deemed only 28 of the 95 prescriptions (29%) accurate overall.
We undertook an education program for doctors in our trust in light of
these poor results. The audit results were presented verbally at the junior
doctors hospital induction and clinical risk meetings. They were circulated
through the pharmacy newsletter and in their own right to all doctors and
wards. Insulin prescribing practice was re-audited 6 months later. Insulin-
prescribing practice was shown to have improved considerably in all
respects following the education program (Table 1).
Table 1 Drugs potentially causing upper GI bleeding (n = 23)
Drug class Individual drug (number of cases)
Antiplatelets Aspirin [antiplatelet dose] (10); Clopidogrel (4)
NSAIDs Ibuprofen (3); Aspirin [dose for pain relief] (3);
Ketoprofen (1)
COX-2 inhibitors Rofecoxib (2); Etoricoxib (1)
Anticoagulants Warfarin (2); Enoxaparin (1)
Corticosteroids Prednisolone (2); Hydrocortisone (1)
SSRIs Fluoxetine (1)
Table 1 Total number and accuracy of insulin prescriptions across three
hospitals
Primary audit Follow-up audit
Total Inpatients 1156 1245
Inpatients prescribed insulin 57 (5%*) 55 (4%*)
Total insulin prescriptions 95 92
Prescriptions specifying ‘units’ 33 (35%+) 55 (60%+)
Prescriptions specifying insulin ratio 74 (78%+) 83 (90%+)
Prescriptions accurate overall 28 (29%+) 50 (54%+)
* Expressed as a percent of the number of in patients.+ Expressed as a percent of the number of prescriptions.
A258

Discussion
Our audit is limited by omission of outpatient and discharge prescriptions.
We also did not audit accurate prescription of insulin injection devices and
time of administration in relation to meals.
In summary, our study shows that insulin prescribing to inpatients is
unsafe but can be improved through education of prescribers. However,
only half of the prescriptions were accurate following education, and this
remains unacceptably poor. Further education may result in yet further
improvement in prescribing practice, though we suspect measures such as
non-dispensing of incorrectly prescribed insulin, or electronic prescribing,
will be required to achieve the necessary improvements. In the absence of
electronic prescribing in most NHS Trusts in the UK, we would advocate
regular education of all medical staff of this potentially lethal error.
Acknowledgement
We would like to thank all pharmacists at Southmead, Frenchay and
Blackberry Hill hospitals who helped with the execution of this audit project.
References1. Miles M, Sweeney S. Insulin dose interpretation errors. Pharm J 2001; 267: 193.2. Ridley SA, Booth SA, Thompson CM and the Intensive Care Society’s Working
Group on Adverse Incidents Prescription errors in UK critical care units.Anaesthesia 2004; 59: 1193–1200.
3. Santell JP, Cousins DD, Hicks R. Top 10 drug products involved in medicationerrors. Drug Topics Health-System 2003 December 8; 23–24.
4. Department of Health. Building a Safer NHS for Patients: Improving Medi-cation Safety. Jan 2004.
14 Veno thromboembolism prophylaxis audit
Morris DL1, Dr Britton C2
1Department of Pharmacy, 2PRHO, Royal Albert Edward Infirmary Wigan
Royal Albert Edward Infirmary Wigan;
Introduction
Patients who undergo a surgical procedure are at risk of developing a Ve-
nous Thromboembolism (VTE) due to the trauma of tissue and venous
stasis1. The risk is increased 10-fold in patients who are then hospitalised2.
The SIGN Guidelines and the THRIFT II consensus group make recom-
mendations concerning the management of VTE prophylaxis based on the
clinical trial data available2,3. The evidence suggests that routine prophy-
laxis decreases morbidity, mortality and cost4.
Patients who are admitted to hospital for trauma or surgery should be
individually assessed for their risk of VTE. The national clinical guidelines
state that it is the responsibility of each NHS Trust to implement such
guidelines as an essential part of clinical governance2.
Objectives
To audit the appropriateness of prescribing of enoxaparin (Clexane) for
VTE prophylaxis in patients undergoing surgery. To compare the pre-
scribing of Clexane on the wards to that stated in the Trust guidelines.
Method
Target population – all inpatients admitted to the surgical wards at the
Royal Albert Edward Infirmary (RAEI) over a 5-day-period. Exclusions
were any non-surgical outliers.
An audit sheet was completed for each suitable patient over the stated
period. Information collected included age, individual risk factors and
surgical procedure.
Results
A total of 97 patients were audited over the 5 days, 55% of which under-
went a surgical procedure.
The risk assessment was based on the following table, which was taken from
the Trust guidelines.
The actual risk factors of each patient were documented on the audit sheet.
In total, 22 patients were classed as high risk of which only 27% received
the appropriate prophylaxis dose.
Cancer/malignancy was the most common under prescribed patient risk
factor. Only four out of 19 patients received the appropriate 40 mg dose
and 3 of who had other risk factors.
Discussion
The audit was designed to show how Clexane was being prescribed on the
surgical wards in comparison to the current Trust guidelines. Graph 1
shows the variance of prescribing for patients classified into the risk
assessment categories. The majority of patients were prescribed Clexane
20 mg when in fact 40 mg or even no Clexane would have been more
appropriate. For patients who did not undergo a surgical procedure (no risk
group) the majority still received Clexane.
This inappropriate prescribing could have disastrous consequences
leading to prolonged hospitalisation and increased morbidity. It was
apparent that the doctors were unaware of the risk factors and that the
Trust guidelines were not being followed. A reason for this was that the
majority of junior doctors did not know the guidelines existed or if they did,
found them too complicated to follow. The outcome is therefore to simplify
and publicise the guidelines and through the use of an assessment tool on
admission, ensure that all risk factors are documented. Once implemented,
the aim was to re-audit and compare the results.
References1. Offord R, Perry D. Anticoagulation Handbook. Science Press 2002, p. 26.2. Scottish Intercollegiate Guidelines Network (SIGN). Prophylaxis of venous
thromboembolism – A national clinical guideline. Number 62 Oct. 2002.3. THRIFT II Consensus Group. Risk of and prophylaxis for venous thrombo-
embolism in hospital patients. Phlebotomy 1998; 1387–97.4. Sixth ACCP Consensus Conference on Antithrombic Therapy: Prevention of
venous thromboembolism. Chest 2001; 119: 132s–75s.
15 An audit of prescribing errors in a hospital setting
Cavell GF, Chai M-O, Scutt G
Pharmacy Department, King’s College Hospital
Table 1 Trust guidelines for VTE prophylaxis using Clexane
{Private} Definition of group Prophylaxis
Low risk Minor surgery (<30 min) + No risk factors OR
Major surgery (>30 min) AND age < 40 years + No other risk factors
Early mobilisation
Moderate Risk Minor surgery + Risk factors other than age OR
Major surgery + age >40 years OR other risk factor(s)
Clexane (enoxaprin) 20 mg starting 2 h preop and daily
until discharge
High risk Major pelvic/abdominal surgery for cancer OR
Major surgery in patients with previous DVT, PE or risk factors or
thrombophilia OR
Hip surgery/fractures, knee surgery, Plaster of Paris
Clexane (enoxaprin) 40 mg starting 12 hrs preop and daily
for 5–14 days + TED stockings
A risk assessment was assigned for each patient based on Table 1. The dose of Clexane prescribed in each case was compared to the guidelines. The
number of Clexane doses that corresponded to the Trust guidelines was 27 (28%).
0
5
10
15
20
25
30
35
Nu
mb
er o
f p
atie
nts
no risk low moderate high
Risk assessment
none
20mg
40mg
Graph 1. Barchart to show the dose of Clexane prescribed and the surgical
risk.
A259

Introduction
The Audit Commission Report A spoonful of sugar – medicines management
in NHS hospitals1 raised awareness of medication error rates and
acknowledged the role of pharmacists in promoting safe prescribing. The
report also proposed that, as much of the prescribing in hospitals is done by
inexperienced junior medical staff, which may be prone to error.
Pharmacists often collect data on contributions they make to the medi-
cation use process including medication history taking, patient counselling
and changes to drug therapy regimens. However, such ‘intervention mon-
itoring’ activity is non-specific and data collected varies with the clinical
setting, the experience of the pharmacy practitioner and the level of clinical
service provided. A definition of a prescribing error has been published2.
Auditing prescribing errors using this definition enables intervention
monitoring to be targeted to the prescribing process. This study aims to
establish the number and types of prescribing errors identified by phar-
macists in a teaching hospital using a standard definition of a prescribing
error.
Objectives
To identify common types of prescribing errors.
To identify common drugs implicated in prescribing errors.
Methods
Pharmacy staff attending a series of seminars were informed of the agreed
definition and categories of prescribing error and the process of the audit.
Pharmacy staff were asked to document all prescribing errors identified, and
any contribution made to the prescribing process resulting in a prescription
being written, dose/frequency being changed, or drug being discontinued on
a standard data collection form. Data were collected for a period of 7 days
in November 2002. The errors were categorised by the pharmacists and a
brief description of each event was included. The data were analysed by
drug and error category.
Results
Two hundred and twenty-six prescribing errors were identified during the
study period.
One hundred and sixty-three of the errors identified were on inpatient
prescriptions, 33 were on outpatient prescriptions and 30 were on discharge
prescriptions (TTAs). Eighty-five errors were identified after one or more
doses had been given and 120 were identified before the patient received a
dose. In 20 cases where the error was an omission a prescription had not
been written. One hundred and fifty different drugs were implicated in the
226 errors. Drugs most frequently implicated included paracetamol (8),
aspirin (7), dalteparin (7), warfarin (6) ranitidine (6), beclomethasone,
coamoxiclav (4) and flucloxacillin (4). In 127 cases the prescription was
cancelled and a new prescription initiated. A new prescription was written
in 38 cases and a prescription was cancelled in 36 cases. On 7 occasions no
change was made to the prescription.
One hundred and seventeen errors were ‘errors in decision making’ (type
A), and 84 errors were ‘errors in prescription writing’ (type B). Twenty-five
errors were classified as prescribing errors due to the individual patient’s
clinical condition (type C). The 10 most frequently occurring error cate-
gories are described in Table 1.
Discussion
During the audit period 226 prescribing errors were identified and averted
by pharmacists, mostly through ward-based activities. Whilst pharmacists
aim to review prescriptions as soon as possible after they are written there is
no guarantee that patients will not receive incorrectly prescribed medicines
before their prescriptions have been reviewed. To reduce the risk of patients
receiving wrongly prescribed medicines pharmacists need to be available at
the point of prescribing to offer advice on drug therapy regimens and safe
medicines use. This will require a change in practice to enable pharmacists
to be available when patients are admitted, attend more ward rounds and
become more integrated into multidisciplinary ward-based teams.
Although the severity of the errors was not formally assessed a number
had the potential for patient harm, e.g. prescription of flucloxacillin to a
patient with a documented penicillin allergy, tacrolimus toxicity as a result
of a drug interaction, intravenous nimodipine prescribed at one-tenth of the
intended infusion rate, chlorpromazine 100 mg prescribed instead of 10 mg.
The Audit commission report1 suggests that junior doctors do not receive
sufficient training in prescribing skills before starting to work on busy
wards. The results of this audit have been disseminated within the Trust and
used to develop a pharmacy-led prescribing skills training programme for
pre-registration house officers in conjunction with the Department for
Postgraduate Medical and Dental Education.
References1. Audit Commission. A spoonful of sugar – medicines management in NHS
hospitals. Audit Commission December 2001.2. Dean B, Barber N, Schachter M. What is a prescribing error? Qual. in Health
Care 2000; 9: 232–237.
16 An initial audit of supplementary prescribing in a multi-disciplinary
specialist heart failure clinic
Williams H, deCourcey J, Kearney M
King’s College Hospital, London
Introduction
The multidisciplinary heart failure service at King’s College Hospital has
been running for the past 2 years, led by a nurse consultant with input from
a specialist cardiac pharmacist and supervision from a consultant cardiol-
ogist. Legislation to allow prescribing by nurses and pharmacists within the
context of a clinical management plan (CMP), known as supplementary
prescribing, was approved in 20031. Both nurse consultant and pharmacist
qualified as supplementary prescribers in 2004. The Trust requires that at an
audit of prescribing practice is undertaken after 6 months for presentation
to the Non-Doctor Prescribing Group. The results of this audit and an
overview of the first 8 months of supplementary prescribing within the HF
clinic are presented.
Objectives
To assess prescribing by supplementary prescribers looking specifically at:
� Drugs or drug classes prescribed
� Compliance with the CMP
� Issues related to off-CMP prescribing (i.e. issuing prescriptions for drugs
not specifically agreed by the independent prescriber)
Method
Data was collected from Nov 2004 to June 2005. Copies of all prescriptions
issued from the HF clinic were collated by the prescribing nurse and
pharmacist. Data was entered onto a spreadsheet and analysed manually.
Results
A total of 275 patients have been treated by the HF team over the past
2 years. Of these, 143 patients have been offered and agreed to management
by the supplementary prescribers. Individualised CMP’s were then drawn
up for approval by the independent prescriber. Since the implementation of
supplementary prescribing, no patient has refused to be managed by the
supplementary prescribers, although the prescribers themselves have on rare
occasions decided not to offer supplementary prescribing based on the
complexity of the case.
Table 1 Most common categories of prescribing error (n = 226)
Error
type
Definition Number of
errors (%)
A Prescription of a drug in a dose below that
recommended for the patient’s clinical condition
33 (15%)
A Prescription of a drug in a dose above that
recommended for the patient’s clinical condition
27 (12%)
B Writing a prescription for discharge medication that
unintentionally deviates from the medication pre-
scribed on the inpatient drug chart
26 (12%)
B Omitting the dose/route/frequency 17 (8%)
A Prescribing two drugs for the same clinical condition
when only one drug is necessary
12 (5%)
A Prescribing a drug for which there is no indication
for that patient
11 (5%)
B On admission to hospital writing a medication order
that unintentionally deviates from the patient’s
admission prescription
10 (4%)
B Omission of the prescriber’s signature 9 (4%)
B Writing illegibly 8 (3.5%)
C Unintentionally not prescribing a drug for a clinical
condition for which medication is indicated
8 (3.5%)
A260

During the 8 months of the audit, 284 items were prescribed by the
supplementary prescribers – 168 items by the nurse consultant and 116 by
the clinical pharmacist. On average, 2.3 items were prescribed per
prescription issued (median 2; mode 1). The most frequently prescribed
items were those used in the management of heart failure symptoms and to
improve long-term outcome. Beta-blockers, loop diuretics, angiotensin-
converting enzyme inhibitors, angiotensin receptor blockers and spirono-
lactone accounted for over 60% of all items prescribed.
Over the course of the 8-month-period, 263 items were prescribed in
accordance with the CMP (263/284, 92.6%) and 21 items were prescribed
off-CMP (21/284, 7.4%). Agents prescribed off-CMP included oral hypo-
glycaemic agents, proton pump inhibitors, laxatives, low molecular weight
heparin, vitamins and minerals. The majority of these episodes were for
continuation of non-HF related therapy in patients reporting that they had
no further supplies available or were known to the clinic to be poorly
compliant (see Table 1).
Discussion
During the audit, more prescribing was undertaken by the nurse than the
pharmacist. This reflects a difference in the time commitment to managing
heart failure between the two supplementary prescribers. The nurse runs up
to 3 clinic sessions a week, while the pharmacist is only available to attend
one clinic session.
Since implementation, the need to refine the template CMP used for this
patient group has become evident – in particular, the addition of laxatives
for symptom control and low molecular weight heparin for thrombopro-
phylaxis on long haul flights. The CMP is constantly under review as new
therapeutic options are made available. Despite that, off-CMP prescribing
did occur during the course of the audit. This may reflect the desire of the
clinicians to offer a more holistic approach to patient management. Off-
CMP prescribing has been flagged as an issue for the clinical team and will
be monitored over the next 3–6 months.
The role of supplementary prescriber is a new one for nurses and phar-
macists and there is, as yet, little data to demonstrate that this process
improves patient outcomes. For this reason, future audits will focus on
frequency and appropriateness of referral back to the independent pre-
scriber and on longer-term heart failure outcomes, such as readmission rates
and mortality.
Currently the nurse consultant has more flexibility in prescribing as, in
addition to being a supplementary prescriber, she can practice as an inde-
pendent prescriber using the nurse prescribers’ extended formulary. The
Department of Health recently consulted on extending prescribing
arrangements for nurses and pharmacists. A variety of different options are
being considered, from no change to the current arrangements to granting
full independent prescribing rights. The limitations of the supplementary
prescribing system, particularly the constraints of the CMP, make inde-
pendent prescribing appear to be an attractive option for this clinical team.
References1. Department of Health. Supplementary prescribing by nurses and pharmacists
within the NHS in England: a guide for implementation. March 2003.
17 The self-reported adherence, perceptions of and attitudes to taking
medicines in renal transplant recipients
Chai MO, Ellis P
King’s College Hospital, London
Introduction
Non-compliance or non-adherence with medication after organ transplan-
tation is emerging as a major healthcare issue with implications for future
chronic rejection and potential allograft loss1. The provision of renal
replacement therapy currently accounts for 2% of the NHS budget2. It is
predicted that there will be at least a 50% increase in the number of patients
receiving renal replacement therapy in the next 10 years1.
Early identification of non-compliant renal transplant patients therefore
may help healthcare professionals to devise interventions or alternative
treatment regimes before any damage is done to the newly transplanted
kidney. This may in turn delay patients returning to dialysis programmes,
which are expensive and associated with increased morbidity and mortal-
ity2.
It is important for healthcare professionals to understand that not all
patients are non-compliant. By understanding patients’ attitudes to and
perceptions of medicine taking, it allows healthcare professionals to devise
and to identify suitable interventions with the patient. This facilitates the
development of a medicines partnership thereby encouraging concordance
with treatment regimens3.
Objective
The aim of this exploratory study is to obtain a preliminary insight into self-
reported adherence in renal transplant recipients and into their perceptions
of and attitudes to taking medicines.
Method
A literature review was performed, and applications to undertake the
project were made to the Ethics Committee and The Research and Devel-
opment Committee. Once approved, a letter detailing the project was sent
out to patients, identified using the transplant clinic planned appointments
record, 10 days before their scheduled clinic appointment. A letter detailing
the project was also sent to the patient’s general practitioners, in case the
patient wanted to discuss the project before agreeing to participate.
Data collection was planned for Wednesdays and Fridays of each week
for a period of 5 weeks, with the aim of recruiting 30–50 patients if time
permitted. Patients were excluded from the project if English was not their
first language. To prevent bias, patients completed the questionnaires
anonymously. The data was analysed using Pearson’s, Spearman’s or
Mann–Whitney tests to identify associations between variables and a 5%
statistical significance level was applied to all results.
Results
Forty-five patients were included in the study of which 21 were male. The
mean age of the patients was 51.3 years (standard deviation 11.73). Thirty
patients (30/45, 67%) were within 3 years of renal transplantation. Forty
patients (40/45, 89%) had undergone cadaveric transplant and 5 (5/45,
11%) were living-related recipients.
Thirty-four (34/45, 76%) patients reported being satisfied with the
information provided by the clinic about medicines and 44 (44/45, 98%)
patients scored highly on the self-report adherence questionnaire. Forty
(40/45, 91%) patients held strong beliefs about the necessity of taking
medicines to maintain their health. Of these 40 (40/45, 91%) patients, 13
(13/41, 31%) were concerned about the long-term effects of taking
medicines. Of 41 patients (12/41, 29%) 12 believed that doctor’s over-
prescribed medicines and 7 (7/41, 7%) patients believed that medicines
are generally harmful.
Discussion
No association was found between satisfaction with information provided
about medicines and beliefs about medicine. However, moderate positive
correlation (Pearson’s correlation coefficient = 0.55) and a statistically
significant (p < 0.001) association was found between patients’ concerns
about their prescribed medicines and beliefs about the potential problems of
taking medicines. Patients with concerns about prescribed medication have
negative views about medicines in general. They believed that medicines are
generally overused and are harmful poisons. However, these patients still
scored highly on the self-reporting adherence questionnaire and believed in
the necessity of taking prescribed medications.
Table 1 Episodes of off-CMP prescribing
Drug or drug class Frequency
prescribed
Comments
Laxatives 5 Symptom associated with HF –
CMP template amended
Low molecular
weight heparin
2 For prophylaxis on long-haul
flights – CMP amended
Vitamins and minerals 7 Continuation therapy – available
for independent prescribing by
nurse consultant
Oral hypoglycaemic
agents
4 Continuation therapy – patients
had run out of supply
Proton pump inhibitors 1 Newly initiated in clinic – Patient
recently started on aspirin and
clopidogrel and at high risk of
gastric bleeding
Vitamin B Co Strong 1 Newly initiated in clinic – patient
malnourished and had high alcohol
intake
Proton pump inhibitors 1 Switched to formulary agent to
minimise adverse effects
A261

Results from this study also demonstrate that being better informed
about medicines does not influence adherence rates. This supports findings
from other studies, which demonstrated adherence rates may be influenced
by other patient factors, such as beliefs and social issues4.
This study has several limitations, due to the timeframe given to complete
the project. We excluded non-English speaking patients, and the number of
patient recruited may be too small to allow the results to be extrapolated to
the general renal transplant population. In addition the results may have
been biased by the greater number of cadaveric recipients recruited.
These results demonstrate the value of recognising other patient factors
that may influence adherence rates. It is therefore justifiable to conclude
that providing information about medicines only forms part of the process
of achieving good adherence.
In response to these results, the renal transplant team will aim to reinforce
all verbal information with writing information on medicines and will be
more active in referring patients to the renal counsellor when concordance
is not achieved.
References1. Butler J, Cairns H. Non-adherence in renal transplant recipients. Br. J. Renal
Med. Summer 2000; 21–4.2. Chisholm MA. Issues of adherence to immunosuppressant therapy after solid-
organ transplantation. Drugs 2002; 62(4): 567–75.3. Laederach-Hofmann K, Bunzel B. Non-compliance in organ transplant recip-
ients: a literature review. Gen. Hosp. Psy. 2000; 22: 412–24.4. Dhillon S, Duggan C, Joshua AE. What part pharmacists should play in pro-
viding medicine-related information? Pharm. J. 2001; 266(7139): 364–6.
18 Antibiotic Point Prevalence Studies – results of three annual surveys
Cooley N1, Onatade R
1, Gilchrist E
2, Cavell G
1, Perrott R
1
1Pharmacy Department, King’s College Hospital NHS Trust, London2Pharmacy Department, Guy’s and St Thomas’ NHS Foundation Trust,
London
Introduction
In 2003, the Department of Health announced funding for clinical phar-
macy services to improve antibiotic usage and prescribing within secondary
care1. As the focus of the initiative was clearly on improving quality and not
necessarily a reduction in expenditure, Trusts had a significant amount of
discretion in how they used the funding. At King’s College Hospital, it was
decided that in the first instance, in order to be able to determine where to
focus our efforts, an understanding of antibiotic prescribing patterns and
usage was necessary. A point prevalence study was deemed the best way of
accomplishing this. It was also agreed that changes in trends should be
tracked by regular annual surveys.
Objectives
� To describe the frequency with which antimicrobials (AMs) are prescribed
at King’s.
� To describe the types of antimicrobial agents being prescribed at King’s.
� To describe the routes being used for the administration of antimicrobials
at King’s.
� To describe the duration of antimicrobial courses used at King’s.
� To highlight areas where antimicrobial usage could be optimized.
Method
The surveys were conducted in November 2003, November 2004 and March
2005. Each time, all wards were surveyed over a period of 2 days. Data
collected included:
� Patient demographics
� For each ward visited, number of beds and occupied beds
� Whether drug allergies had been documented
� For each antimicrobial agent prescribed
� Name
� Dose and frequency
� Route of administration
� The number of days the patient had been on this antimicrobial by the
day of the study
� If specified, the intended length of course
Results
Unless specified, all results exclude prophylactic treatment (Table 1).
The most commonly prescribed antimicrobials were similar across all
3 years – metronidazole, vancomycin, cefuroxime, ciprofloxacin, amoxicil-
lin, clarithromycin, flucloxacillin, meropenem, piperacillin/tazobactam,
fluconazole and gentamicin. The main differences were in the numbers of
prescriptions – in 2005, the use of flucloxacillin had declined, while piper-
acillin/tazobactam was much more frequently prescribed. Gentamicin usage
also decreased. Metronidazole had the highest proportion of prescriptions
each year.
As a result of the first two studies, and after comparison with other
published results2, it was decided that areas of focus for improving pre-
scribing would be reducing course lengths, switching from the IV to oral
route and promoting antibiotic prescribing guidelines. Some of the out-
comes of the various initiatives can be seen in the 2005 results.
Discussion
The serial point prevalence studies have enabled the tracking of anti-
microbial usage over the years. King’s is a large teaching hospital and
some of its specialties, notably Liver and Haematology/Oncology mean
that we may use significantly more antimicrobials than other similarly-
sized Trusts. However, we now have a comprehensive picture of anti-
microbial prescribing and can compare with other Trusts to identify
where we fall outside the norm. We can then assess whether or not this
is justifiable. Whenever new initiatives or policies are launched, the re-
sults of the point prevalence studies can be used as baseline markers, as
well as outcome indicators. Point prevalence studies are now established
as annual surveys and in 2005, the results were linked with infectious
diseases data to prove that increased expenditure on certain antibiotics
had resulted in better quality prescribing, and a fall in some hospital-
acquired infections. Further work will include working more closely with
medical microbiologists to extend this link, including documenting indi-
cations for antimicrobials, and ensuring the surveys take place on the
same 2 days every year, to reduce variation.
References1. Department of Health. Hospital pharmacy initiative for promoting prudent use
of antibiotics in hospitals (PL/PhO/2003/3), London, 2003.2. Dean B, Lawson W, Jacklin A, Rogers T et al. The use of serial point prevalence
studies to investigate antiinfective prescribing. IJPP 2002; 10:121–5.
19 An audit of antibiotic prescribing on cardiothoracic wards at Barts
and The London Heart Centre
Virdee J1, Antoniou S1, Das S2
1Department of Pharmacy, Barts and The London Heart Centre, Barts and
The London NHS Trust, London 2Consultant Microbiologist, Barts and The
London Heart Centre, Barts and The London NHS Trust, London
Table 1 Comparative results
2003 2004 2005
Number of occupied beds 764 678 797
Gender Male 51% 52% 50%
Female 49% 48% 50%
Mean age (years) Male 52 47.5 52
Female 49 51.7 55.3
Percentage of pts on AMs 35.7% 36.6% 34.0%
2003 2004 2005
Mean no. of AMs per
treated pt
1.79 1.83 1.68
Numbers of different
types of antimicrobials
59 48 52
Allergy documentation
(inc prophylactic prescriptions)
78.9% 76.6% 83.8%
Route of administration IV:PO 55:45 52:48 53:47
Course length (oral) 5 days or fewer 58% 62% 68%
10 days or fewer 73% 77% 92%
Course length (IV) Less than 48 h 35% 35% 41%
Percentage of prescriptions
with course length specified
21.5% 13.3% 19.5%
Number of patients on
>3 antimicrobials
15.8% 17.7% 12%
Percentage of restricted
antimicrobials approved
by microbiology
76% 85%
A262

Introduction
A staggering 2.7 million people are estimated to be living with coronary
heart disease in the United Kingdom (UK). It is the most common cause of
death, causing more than 117,000 deaths in 2002 in the UK alone1.
In coronary artery disease, plaque deposits on the inner walls and lining
of the coronary arteries lead to a hardening and narrowing of the arteries
and subsequently decreased oxygen supply to the heart. This may cause
angina or myocardial infarction, and long-term weakening of the heart
muscle leading to heart failure or arrhythmia. Depending on the type and
extent of damage, cardiac surgery may need to be performed. The most
common cardiac procedures performed at Barts and The London Heart
Centre are coronary artery bypass graft (CABG) and valve surgery.
Infections are a particular complication of all types of surgery. Risk
factors contributing to post-operative infections can be divided up into host
risk factors and surgical risk factors. Host risk factors have been described
extensively in the literature and include; obesity, diabetes, advanced age,
male gender, smoking, steroids and pre-operative hospital stay >5 days.
Surgical risk factors include; duration of surgery, perfusion time and post-
operative bleeding. Readmission, prolonged treatment with antibiotics,
sternal debridement and death are some of the consequences of post-
operative infections2.
Cardiothoracic (CT) Surgery is generally considered to be a clean oper-
ation, with the reported risk of post-operative wound infection being from 2
to 20% and the accepted rate of infection being between 11 and 15%3.
The most commonly experienced infections post-CT surgery include
surgical site infections (SSIs), chest infections and urinary tract infections.
Currently, at Barts and The London Heart Centre, guidelines for both
prophylaxis and empirical treatment of post-operative infections on Car-
diothoracic wards are in place4. Empirical treatment is aimed at the most
likely causative pathogens for that specific infection. The purpose of this
audit is to establish whether such guidelines are appropriate and whether
they are being followed.
Objective
To ascertain whether prophylactic and post-operative empirical treatment
antibiotic guidelines for bypass/valve replacement surgery are being fol-
lowed at Barts and The London Heart Centre.
Method
A brief literature search confirming recommended prophylactic and
empirical antibiotic treatment for common infections encountered post-
bypass/valve replacement surgery was undertaken. A data collection tool
after a one-week pilot was then designed. Data collection over a 1-month-
period was then undertaken at both Barts and The London Chest sites with
confirmation of indication sought from the Microbiology team where
antibiotics had been started. All patients undergoing bypass/valve
replacement surgery during this period were followed up until discharge.
Results
A total of 90 patients underwent CABG/valve replacement surgery during
the audit period. In total 80 data collection forms were completed of which
56 patients (70%) had a CABG, 14 patients (17.5%) had a valve replace-
ment, 9 patients (11.25%) had a CABG and a valve replacement and 1
patient (1.25%) had a valve repair operation. It was found that antibiotic
prophylactic guidelines were followed in 87.5% of patients (n = 70);
inappropriate administration of prophylactic antibiotics lead to one definite
and possibly two post-operative infections. Of the 80 patients, 30% of
patients (n = 24) experienced a post-operative infection of which 9 patients
experienced a SSI; with the overall incidence of a SSI being 11.25%. Only
25% of all patients (n = 6) experiencing a post-operative infection received
appropriate empirical antibiotic treatment as per current guidelines.
Discussion
Most patients received appropriate antibiotic prophylaxis. The incidence of
a SSI at Barts and The London Heart Centre was found to be 11.25%
(n = 9), within the accepted range quoted in the literature3. Initial analysis
implies that CABG patients are more likely to experience a SSI than those
undergoing a valve replacement procedure. Only 25% of patients (n = 6)
experiencing a post-operative infection received appropriate empirical
treatment. It was found that guidelines for the empirical treatment of a
chest infection in particular, need to be reviewed and should specify risk
factors for Pseudomonas aeruginosa (such as a prolonged inpatient stay;
hospital acquired chest infection) where administration of ciprofloxacin
may be appropriate. Effective communication between Cardiothoracic
doctors, microbiology and pharmacy personnel is a key part to the suc-
cessful implementation of such guidelines and should be undertaken on a
regular basis. Future work undertaken in this area should involve audit
work around post-operative infections following Cardiothoracic Surgery,
with a particular reference to the appropriate empirical treatment of post-
operative chest infections; classification in addition to appropriate treat-
ment strategies for community and hospital acquired chest infections. Once
guidelines are amended, approved and implemented, future audit work can
then be carried out to assess adherence to such guidelines.
Acknowledgement
I would like to thank Luis Lorenco and the cardiac team for their help with
data collection.
References1. Peterson et al. Coronary Heart Disease Statistics June 2004; British Heart
Foundation Statistics Database. www.heartstats.org. Last accessed 16th April2005.
2. Hollenbeak et al. The clinical and economic impact of deep chest surgical siteinfections following coronary artery bypass graft surgery. Chest, (Aug 2000);118 (2): 397–402.
3. Bhatia et al. Post-operative wound infection in patients undergoing coronaryartery bypass graft surgery: a prospective study with evaluation of risk factors.Indian J. Med. Microbiol., 2003 21 (4): 246–251.
4. Das S. Management of Infections in Cardiothoracic Surgery-Guidelines forDoctors December 2003. (Refer also to: Empirical Antibiotic Therapy forCardiothoracic Surgery Patients and Barts and LCH-guidelines for MedicalMicrobiology SpRs).
20 A survey of non-antiretroviral prescribing for HIV positive patients at
two HIV clinics
Khachi H, Ladenheim D, Scott K
Barts and the London NHS Trust, London
Introduction
Barts and the London (BLT) NHS Trust comprises two HIV satellite
pharmacies; one at St. Bartholomews (SBH) and The Royal London (RLH)
Hospitals. Annually, just under 1300 patients are seen within the outpatient
HIV clinics at BLT. Following on from publications such as the NHS Plan1
and A Spoonful of Sugar2, the focus in pharmacy is to provide a service that
is patient centred and to ensure prescribing competence by ensuring
clinicians prescribe within their speciality. It has been identified that a
proportion of antiretroviral drug budget is being allocated to non-HIV
specific conditions. In line with this, and in response to an increased
workload within the HIV satellite pharmacies, we conducted a survey of
non-antiretroviral (ARV) prescribing within BLT to establish the extent of
non-ARV prescribing within the HIV outpatient clinics.
Objectives
The objectives of the survey were as follows:
� To establish the extent of non-ARV prescribing within the HIV outpatient
clinics
� To provide a breakdown of HIV specific and non-HIV specific prescribing
� To compare non-ARV expenditure with other London HIV centres
Method
Prescribing information was collated by a retrospective survey of all out-
patient prescriptions received in the HIV satellite pharmacies at SBH and
RLH. All HIV positive patients prescribed medication in an outpatient
setting from September 1st 2004 to September 30th 2004 (inclusive) had
their prescription included in the survey. Cost data were collated using data
submitted to the London Specialised Commissioning Group. HIV specific
medicines were classified as ARVs, medicines for opportunistic infections
(OIs) and antibiotics.
Data were categorised as follows: ARV medicines, medicines for Ois,
antibiotics and other medicines (as defined as all drugs in therapeutic cat-
egories, for example topical and endocrinology medicines).
Results
At SBH, 188 prescriptions were collected, containing 329 medicines.
At RLH, 363 prescriptions were collected, containing 714 medicines.
Overall, 551 prescriptions were collected, containing 1043 medicines.
(a) Prescribing habitsOur results showed disparities in prescribing between the two satellite
pharmacies as well as between clinicians within each site. These differences
were not tested statistically.A263

(b) Prescribing costsThe average expenditure across London for non-ARV drugs (for the 2004/
05 financial year) is 6.8% of the total HIV expenditure, accounting for in
and outpatient. Non-ARV medicines accounted for 13.9% of the total
annual HIV expenditure at BLT for the 2004/05 financial year, i.e. over
twice the average of our peers in London. The total HIV drug expenditure
at BLT is £9.5 million per year.
Thus 13.9% of total drug expenditure constitutes £1.31 million per year
and non-ARV drug cost at BLT does not include any Hepatitis C medi-
cation.
The most common non-ARV medicines prescribed and dispensed can be
seen in table (see below).
Discussion
There are limitations to comparisons made between HIV departments
across London. The data used is solely based on cost and may not corre-
spond to that of dispensing volume. Furthermore there is an assumption
that all HIV departments offer a comparable service and have comparable
patient cohorts.
The results of the survey showed that medicines are prescribed across a
range of clinical areas, perhaps not within the clinician’s speciality, as
originally suspected. The survey also highlighted differences in prescribing
practice between sites (SBH & RLH). In order to ensure clinical governance
and to provide a standardised service that is truly patient centred, a HIV
formulary should be developed. The benefits of such a formulary include a
standardised approach to prescribing between prescribers and sites,
appropriate utilisation of resources and expertise of the HIV team, and
would reduce the potential for clinical risk associated with clinicians pre-
scribing outside of their speciality. The cost impact of this formulary will
need to be evaluated with future audits.
As a result of this survey, an HIV formulary is being developed. Fur-
thermore, we are expanding our roles within the multidisciplinary team, and
exploring the role of the HIV pharmacists as supplementary prescribers in
chronic stable patients. This would allow greater access to patients, reduce
clinician workload, giving them the opportunity to see more complicated
patients, and utilising pharmacists’ skills to its full potential.
References1. Department of Health, NHS Plan, The Stationary Office, 2000.2. Audit Commission, A Spoonful of Sugar-Medicines Management in NHS
Hospitals, 2001.3. London Specialised Commissioning Group 2004–2005 financial year.
21 Management of hypertension and cardiovascular risk in general
medicine patients at point of discharge
Tickner N, McRobbie D
Pharmacy Department, Guy’s & St. Thomas’ NHS Foundation Trust, London
Introduction
Hypertension is the most important treatable risk factor for cardiovascular
disease1
yet in European countries less than 10% of hypertensive patients
are controlled to optimal blood pressure (BP) (<140/90 mmHg)2
. Recently,
the National Institute for Clinical Excellence and British Hyperten-
sion Society (BHS) have both published guidance on hypertension
management3, 4
. The aim of this audit was to establish how well hyperten-
sion was controlled and managed on discharge from general medicine wards
in comparison to the guidelines.
Objectives
To determine:
� Proportion of patients being discharged that have sub-optimal BP control
� Prescribing habits around the use of anti-hypertensive agents
� Co-prescribing of aspirin and statins with respect to the guidelines
� Extent of general practitioner (GP) referrals/follow-ups with respect to
anti-hypertensive therapy
Audit standards for BP levels for hypertensive patients recommended by
BHS are:
� Diabetic patients: SBP < 140 mmHg, DBP < 80 mmHg
� Non-diabetic: SBP < 150 mmHg, DBP < 90 mmHg
Method
Patients were identified via discharge prescriptions dispensed over a 14-day
period on general medicine wards. Demographic information, BP control
(lowest of previous three readings) and information about anti-hyperten-
sives, anti-platelet agents and statins were collected from medical notes and
analysed using Microsoft Access.
Results
One-fifth of patients were diabetic and two-thirds were aged over 60 years
(Table 1). A total of 11 (5.9%) patients discharged from hospital during the
data collection period had unsatisfactory BP control as defined by the audit
standards.
Of 84 patients discharged on anti-hypertensives, 48 (57%) received
mono-therapy, 26 (31%) double therapy and 10 (12%) three or more
agents. Forty-two (50%) of these patients underwent changes to their
anti-hypertensive medication during hospital stay.
Over two-thirds of type 2 diabetic patients over 50 years of age received
anti-hypertensives and a similar proportion statins, however less than half
of these were prescribed aspirin compared to 71% a statin and four were
receiving neither agent (Table 2).
Of all patients taking anti-hypertensives 18 (18/84, 21%) had recom-
mendations on the discharge prescription for the GP relating to ongoing
management of their hypertension.
Of the 11 patients who had unsatisfactory hypertension on discharge,
only one (1/11, 9%) had recommendations to the GP.
Discussion
Not all discharges from medical wards were reviewed due to time con-
straints, however demographic and prescribing data captured are in line
with local and national data. Blood pressure readings over a short time
period may not have given an accurate picture of the patients’ long-term
antihypertensive control.
Blood pressure management in this audit was generally good, but potential
improvements to practice were highlighted:
� As half of the patients underwent changes to BP medication, better
information could be given to GPs on discharge communications
regarding changes to medication, dose titration and BP monitoring.
� In particular GPs should receive more information for patients not
achieving target BP before discharge
Prescribing breakdown from the outpatient clinics at sbh & RLH
ARV Medicines: Medicines for OIs: Antibiotics: Others:
SBH, % 19 (n = 62) 11 (n = 36) 2 (n = 7) 68 (n = 224)
RLH, % 35 (n = 249) 11 (n = 79) 6 (n = 43) 48 (n = 343)
Top 5 (as an expression of cost) non-ARV drugs prescribed for HIV in and
outpatients at BLT
Drugs prescribed Percent of total non-ARV
drug cost 2004/05
Valaciclovir & aciclovir 5
Gabapentin 2
Valganciclovir, ganciclovir,
foscarnet and cidofovir
13
Doxorubicin 4
Ambisome & caspofungin 11
Other 65
Table 1 Demographics of patient sub-groups
Patient demographics n = 188 (%)
Diabetics 40 (21%)
Type 1 10 (5%)
Type 2 (including diet-controlled) 30 (16%)
Ethnic origin
Black (African or Caribbean) 25 (13.3%)
Asian 8 (4.3%)
White 155 (82.4%)
Age
<50 years 48 (25.5%)
50–59 years 19 (10.1%)
>60 years 121 (64.4%)
A264

� Recognised guidelines should be utilised when prescribing and reviewing
medication that modifies cardiovascular risk, especially in the older and
diabetic population.
Education of junior medical and pharmacy staff is currently being under-
taken to raise the awareness of the new guidelines, including choice of
therapy and prescribing of aspirin and statins, particularly in diabetic
patients.
References1. He FJ, MacGregor GA. Cost of poor blood pressure control in the UK: 62,000
unnecessary deaths per year. J Hum Hypertens. 2003 Jul; 17(7): 455–7.2. Wolf-Maier K et al. Hypertension treatment and control in five European
countries, Canada, and the United States. Hypertension. 2004; 43: 10–17.3. Williams B et al. Guidelines for management of hypertension: Report of the
fourth working party of the British Hypertension Society, 2004 – BHS IV. JHum Hypertens. 2004; 18: 139–85.
4. NICE Guidance No. 18. Management of hypertension in adults in primary care.August 2004.
22 The impact of a patients’ own drugs scheme on drug expenditure and
medication error rates on a renal ward
Curwood R
Pharmacy Department, King’s College Hospital
Introduction
The optimisation of medicines use in hospitals is essential for quality
pharmaceutical care of patients. Following the publication of ‘‘A Spoonful
of Sugar’’1 the use of patients’ own drugs (PODs) has been implemented in
many NHS hospitals. It has also been identified that due to increased de-
mand for services, the use of medicines in hospital is not always optimised.
The Department of Health stated that hospital pharmacists must ensure
that all patients have a medication review on admission, and patients have
access to their medication as soon as they are ready to be discharged2. To be
able to implement these tasks, the traditional role of pharmacists solely as
prescription monitors needs to be further developed, to assure effective
clinical practice and minimise the risk of medication errors.
At King’s College Hospital (KCH) the need to introduce the use of PODs
on the renal ward was identified. Renal patients have long medication lists
often resulting in long waiting times for discharge prescriptions (TTAs),
which could be reduced by reusing PODs and dispensing for discharge
newly prescribed items (DFD). The use of PODs on the ward could also
reduce the cost to the renal care group of medication issued at discharge
and prevent missed, or late administration of doses on the ward. The
scheme, supported by a technician, was implemented in November 2004
following a training programme for nursing staff. The aim of this audit is to
investigate the impact of a POD policy on discharge drug expenditure on a
renal ward.
Objectives
The objective of the audit is to identify the cost implications of the use of
PODs and DFD for the renal care group.
Method
Data were collected between 1st November 2004 and 24th December 2004
using a newly designed data collection form. The inclusion criteria for the
audit were: admission and discharge from the renal ward between 1st
November and 24th December 2004. The exclusion criteria were: outliers on
renal ward (medication prescribed on TTAs of outliers is charged to
appropriate care group) transfer to another hospital, hospice or death. All
discharge prescriptions for patients meeting the inclusion criteria were as-
sessed.
On admission to the renal ward, each patient had a drug history taken by
the renal pharmacist. The pharmacy technician assessed the PODs for
suitability for reuse in line with the local POD policy. The audit data col-
lection form was initiated for each renal patient on admission to the ward.
During the hospital admission medication was supplied to the patient,
either as an inpatient item, or as a pack suitable for discharge (DFD) at the
discretion of the renal pharmacist. At the point of discharge, after the TTA
had been clinically screened, either the renal pharmacist or technician
assessed the contents of the POD locker against the discharge prescription
and items were either dispensed or the POD reissued. A record was made of
all PODs brought into hospital and reused by the patient, during the
inpatient stay and on discharge on the audit data collection sheet. The audit
data was completed by recording the values of PODs reused, items prepared
in advance for discharge and medicines dispensed against TTAs. The
costing of medication was calculated using the dispensary computer system,
Ascribe, which gives the most recent price as received by the procurement
department. VAT at 17.5% was added. Savings were calculated by
recording the total cost saved by reusing PODs on the ward and at
discharge for all patients included in the audit as these medicines would
previously have been supplied at discharge. Erythropoietin classified as
POD was not included in the costing process as prior to the implementation
of the POD scheme, patients were not routinely redispensed this item on
discharge.
Results
During the study period 906 items were prescribed on 101 discharge pre-
scriptions. Fourty-four percentage of items (393/906) prescribed on TTAs
needed to be dispensed at the time of discharge. Fifty-one percentage of
items (469/906) prescribed on discharge prescriptions were re-issued from
PODs. The remaining 5% of items (4/906) were prepared during hospital
admission as DFD.
The value of PODs reused by the patients during the inpatient stay was
calculated to be £6669.28 (excluding erythropoietin classified as POD). The
value of drugs dispensed for discharge for use during the inpatient stay and
dispensed against TTAs were £1.939.84 and £4750.34 respectively (Table 1).
Reasons that patients needed medication to be dispensed at the time of
discharge instead of reusing PODs included change of dose when a POD
could not be relabelled and reused or change of therapy at the point of
discharge. Other reasons included short length of stay in hospital (<1 day)
giving no opportunity to prepare medication in advance of discharge, and
medication supplied to the ward as inpatient items requiring redispensing at
discharge, for example antibiotics.
Table 2 Aspirin, statin and anti-hypertensive prescribing at discharge
Patient group Total
patients (%)
Aspirin
prescribed (%)
Statin
prescribed (%)
Neither aspirin nor
statin prescribed (%)
Anti-hypertensive(s)
prescribed (%)
All Patients 188 71 (38%) 52 (28%) 102 (54%) 84 (45%)
<50 years 48 1 3 45 11 (22.9%)
>50 years 140 70 49 57 73 (52.1%)
Type 2 diabetic 28 11 (39%) 19 (68%) 6(21%) 18(64%)
<50 years 4 0 2 2 1 (25%)
>50 years 24 11 17 4 17 (70.8%)
Type 1 diabetic 10 2 (20%) 1 (10%) 8 (80%) 2 (20%)
<50 years 7 0 0 7 2 (28.6%)
>50 years 3 2 1 1 0 (0%)
Table 1 Cost of medication excluding patients’ own erythropoietin
(n = 101)
POD DFD Dispensed
Cost of medication £6669.28 £1939.84 £4750.34
VAT at 17.5% £1167.124 £339.472 £831.301
Total cost £7836.40 £2279.31 £5581.65
Grand total cost £7836.40 £7860.96
Saving to renal care group
by using PODs (excluding
patients own erythropoietin)
£7836.40
A265

Discussion
The renal care group saved £7,836.40 on TTA medication over the 2
month audited period by using PODs even though these only accounted
for 14.85% of total discharge prescriptions when patients did not require
further medication dispensed at discharge. In order to maximise savings
achieved by the scheme there is a need for patient education to ensure
that PODs are brought into hospital with them, or by their relatives for
emergency admissions. A high percentage of items required dispensing at
the point of discharge (44%) thus increasing the waiting time for TTAs
(average time taken to dispense TTAs was 151 min, Std. dev. of mean
166 min). To reduce this waiting time the proportion of DFD items will
need to be increased so that TTAs are ready in advance of the patients
needing them. The saving was achieved by increasing the amount of time
spent by pharmacy staff, including the renal specialist pharmacist and a
technician, on the wards who specifically targeted discharge counselling.
However, in addition to the financial advantages of the scheme there were
concerns about the way in which the POD lockers were being used espe-
cially failure to empty the POD lockers when patients were transferred and
to remove items discontinued during the inpatient stay. This identified a
need for further training of the nursing staff and an area for further audit in
the future.
References1. Audit Commission 2001. A Spoonful of Sugar – Medicines Management in
NHS Hospitals.2. Department of Health. Pharmacy in the Future. London 2001.
23 The use of clopidogrel in the secondary prevention of stroke
Mok P, Maule E
Sunderland Royal Hospital
Introduction
Stroke is the third highest cause of death as well as the largest cause of
major disability in the United Kingdom, continuing to increase the
burden on the National Health Service (NHS) expenditure each year.
Subsequently, stroke became one of the set standards within the National
Service Framework (NSF) for the elderly. Aspirin is the recommended
drug choice for anti-platelet therapy in secondary prevention of stroke as
it is cost effective with an evidence base according to the recent National
Institute of Clinical Excellence (NICE) guidelines. The cost of aspirin for
1 year at a dose of 75 mg is £2.37 whereas the cost of prescribing
clopidogrel 75 mg is £460.29 (Drug Tariff, November 2004). Their role
and effectiveness in secondary prevention of stroke are similar; to prevent
further occlusion of blood supply to the surrounding areas of brain
tissue. Due to the cost effectiveness and weight of evidence base, aspirin
is the drug of choice unless patients are allergic, have a history of gas-
trointestinal (GI) bleeding, or are suffering from peripheral vascular
disease. However, a trend has been identified recently of increased use of
clopidogrel at Sunderland Royal Hospital (SRH), hence it was appro-
priate to audit the use of clopidogrel as it increases the cost of pre-
scribing and it only confers additional benefit to a small group of
patients.
Objectives
To identify the extent of clopidogrel initiation on the stroke unit, and its use
in accordance with current NICE guidelines and best evidence.
Method
A retrospective observational analysis of anti-platelet treatment in sec-
ondary stroke prevention on an acute stroke unit over a 4-week period in
December 2004. A data collection form was used to record relevant infor-
mation from the patient case note review.
Results
One hundred and eight patients were admitted during the 4-week period.
Ages ranged from 36 to 94, with the average age being 72.3. Eighty-three
percentage (n = 90) of patients were admitted having suffered their first
event.
Forty patients were discharged on clopidogrel, with 80% of this being
newly prescribed. Sixty-two percentage of this new prescribing (n = 20)
was not appropriate. The unsuitable indications for the prescribing are
detailed above in Figure 1.
Discussion
The prescribing of clopidogrel was found not to be satisfactory. In partic-
ular almost two thirds of new prescribing was inappropriate and over 50%
of this cited aspirin failure as an indication. There is no proven evidence or
publication that suggests clopidogrel is more effective than aspirin, resulting
in an unnecessary increase in drug costs.
Since this study, however, a new local guideline in the use of anti-platelet
therapy in the secondary prevention of stroke have been devised and
implemented. In the near future, the prescribing of clopidogrel should be re-
audited to ensure the guidelines are followed.
For patients taking clopidogrel on admission, it was not possible to
determine if the prescribing was appropriate or not. This was a limitation of
the study and in a reaudit the data collection forms would be extended to
include this information. The accuracy of the study is also dependent on the
indications for prescribing being accurately documented in the notes.
References1. World Health Organisation: http://www.who.int/csr/sars/en/. Accessed March
2005.2. NICE: Clopidogrel and modified-release dipyridamole in the prevention of
occlusive vascular events, October 2004.3. Medline Plus Health Information from the National Library of Medicine.
http://www.nlm.nih.gov/medlineplus/encyarticle/000170.htm. Accessed March2005.
4. CAPRIE Steering Committee. A randomised, blinded, trial of clopidogrelversus aspirin in patients at risk of ischaemic events (CAPRIE). Lancet 1996;348: 1329–39.
5. Weil J et al. Prophylactic aspirin and risk of peptic ulcer bleeding. Brit. Med. J.1995; 310: 827–30.
6. Chen M et al. CAST: Randomised placebo-controlled trial of early aspirin usein 20,000 patients with acute ischaemic stroke. Lancet 1997; 349: 1641–9.
7. Sandercock P et al. The International Stroke Trial: A randomised trial ofaspirin, subcutaneous heparin, both, or neither among 19 435 patients withacute ischaemic stroke. Lancet 1997; 349: 1569–81.
8. Diener H et al. Management of Atherothrombosis with Clopidogrel in High-risk patients. Lancet 2004; 364: 331–7.
9. Sacco R, Sivenius J, Diener H. Efficacy of aspirin plus extended-release dipy-ridamole in preventing recurrent stroke in high-risk patients. Arch. Neurol.2005; 62/3: 403–8.
10. Chan F et al. Clopidogrel versus aspirin and esomeprazole to prevent recurrentulcer bleeding. N Eng J Med 2005; 352: 238–44.
24 The use of pharmacist managed discharge prescriptions distributed to
community pharmacists
Fleck L, Holden K
County Durham & Darlington Acute Hospitals NHS Trust, Bishop Auckland
General Hospital
Introduction
One of the key roles for modern clinical pharmacy services is ‘to contribute
to seamless and safe medicines management throughout the patient jour-
ney3.’ To achieve this information flow between secondary and primary care
needs to be improved in order to benefit patients by helping to reduce
medication errors. Problems often occur when doctor written discharge
prescriptions are illegible or include inaccurate prescribing information,
which can be misinterpreted easily by GPs and therefore can have a
Reasons for inappropriate
prescribing of clopidogrel30%,6
10%,2
5%,1
55%,11
Aspirin failure
Aspirin + dipyridamole failure
GI intolerance but PPI was not prescribed
Unknown reason
Figure 1 Reasons for inappropriate prescribing of clopidogrel.
A266

detrimental effect on patient’s care. It has been recognised that hospital
pharmacists have an important role in the effective communication of pa-
tients’ treatment when they are discharged from hospital. Providing GP
surgeries and community pharmacies with information on medication
changes, dosage changes and discontinuation plans, helps to smooth the
transition from secondary to primary care. The lack of such information
may result in inappropriate prescribing or unintended discontinuation of
treatment1.
Pharmacists working within the County Durham and Darlington Acute
Hospitals NHS Trust have been empowered to manage patients’ hospital
discharge prescriptions. This allows pharmacists working on medicine
management wards to transcribe any given patient’s hospital kardex onto a
specially designed pharmacist discharge prescription and letter. The phar-
macist can add any additional clinical information if necessary and also
provide information on the patient’s pharmaceutical needs. Medication
changes are indicated clearly on the prescription. A copy of this prescription
is forwarded to the patient’s GP surgery and the patient’s regular com-
munity pharmacist, if known. At present it is uncertain if community
pharmacists have robust systems in place or if they are prepared to use
information available to them to ensure that patients’ current therapy is
accurately prescribed.
Objectives
To assess whether or not community pharmacists are using the pharmacist
written discharge letters. As a secondary aim it is intended to explore how
the information on the discharge letters is being used and to consider
pharmacists’ views on the system and how they think the system could be
improved from their perspective.
Method
A postal questionnaire was designed to establish how community phar-
macists are using the discharge letters and to find out their views on the
service. The questionnaire was sent to 36 community pharmacies in two
local Primary Care Trusts (Dales PCT and Sedgefield PCT). The patients of
these two local PCTS are the main consumers of the secondary care facil-
ities at Bishop Auckland General Hospital. The data from the question-
naires that were returned was entered into the Microsoft Excel package and
descriptive and quantitative methods were used to analyse the results.
Results
Seventy-five percentage of the questionnaires were returned.
(1) Are community pharmacists using the pharmacist discharge letters?
Yes, the majority of the community pharmacists are using the discharge
letters.
On average the community pharmacists are receiving 1–20 discharge letters
(in 6 months). Seventy percentage estimated that they had used the dis-
charge letters between 1 and 10 times (in the last 6 months). Ninety-six
percentage of the pharmacists are willing to query prescriptions if they differ
from the discharge letter.
(2) How is the information on the letters being used?
The information is mostly being used to clarify medicines, dose, frequency,
strength and medicines stopped. This was confirmed when the respondents
reported that they think that details of discharge medicines and medication
stopped are the most important information on the letter. Seventy per-
centage of the respondents do not have systems in place to indicate letters
have been received for patients.
(3) What are pharmacists’ views on the system?
The majority of the pharmacists (93%) find it useful to receive discharge
letters and 89% of the pharmacists think it is worthwhile continuing the
service.
Some pharmacists were concerned that they often do not receive dis-
charge letters before patients first visit post discharge.Most of the respon-
dents think it would be worthwhile patients having a copy of the discharge
letter to give to their community pharmacist.
Discussion
It is encouraging to find that the majority of the community pharmacists in
the two local PCTs are using the pharmacist managed discharge prescrip-
tions and think that the service is worthwhile. Most of the pharmacists
questioned do not have systems in place to indicate discharge letters have
been received for patients, this may mean that a large number of possible
interventions are being overlooked, as the information is not available at
the point of dispensing. A number of pharmacists reported that they often
do not receive discharge letters before the patients first visit post discharge,
which prevents the pharmacists from using the information effectively. To
improve the service, it is necessary to assess why the letters are not being
sent out straightaway. (Faxing the letters may be a possibility to speed up
the service.) Further research is required to decide whether giving a copy of
the discharge letter to the patient to give to the community pharmacist
would be feasible. To encourage community pharmacists to use the dis-
charge letters, an information sheet could be sent out to remind the phar-
macists of the benefits of using the discharge prescriptions and also to
provide practical advice on how to use the prescriptions effectively.
References1. Morrison P, Abu-Arafeh I, Davison J, Chapman S. Optimum prescribing of
discharge medicines: roles of hospital and community pharmacists. Pharm J2004; 272: 224–7.
2. Audit Commission. A Spoonful of Sugar. London, April 2001.3. Department of Health. A Vision for Pharmacy in the New NHS. Crown
Copyright, London, July 2003.4. Department of Health. Pharmacy in the Future-Implementing the NHS Plan.
Crown Copyright, London. September 2000.5. Edgar C, Oates C, Holden K. Prescribing continuity following hospital dis-
charge: the Impact of a pharmacist managed discharge service. 2004. Proceed-ings of the UKCPA Symposium, November 2004.
A An audit into prophylactic enoxaparin prescribing for hospital
in-patients with suspected venous thromboembolism
Chiu M
Pharmacy Department, University Hospital of North Durham, Durham
Background
Venous thromboembolism (VTE) is a common complication in hospitalised
patients. In a report by the House of Commons Health Committee it was
identified that hospital in-patients were 25 times more likely to die from
VTE than with Methicillin resistant Staphylococcus aureus (MRSA) infec-
tion1. Clearly thromboprophylaxis prescribing practices are subjective and
guidance is needed.
Objectives
Identify current national or local guidelines or recommendations for VTE
prophylaxis.
Identify patients with suspected or confirmed events.
Identify risk factors in hospitalised patients with suspected or confirmed
VTE.
Identify hospitalised patients who were and were not prescribed prophy-
laxis.
Determine whether prophylaxis has been prescribed appropriately accord-
ing to protocols.
Method
Performed web-based search for national and local guidelines or recom-
mendations for thromboprophylaxis prescribing. January to March 2005
were assigned for data collection. In a web-based search and of The
Pharmaceutical Journal2 in particular, risk factors associated with VTE
were identified. Davis’s Textbook of Adverse Drug Reactions3 and the
British National Formulary4 identified medicines associated with VTE.
Designed a pro-forma to record patient name, risk factors, current medi-
cation, test results and whether enoxaparin was prescribed. Liased with
haematology, X-ray and medical physics departments to identify patients
with high d-dimers, ultrasound (US) and ventilation perfusion (VQ) scans.
Excluded patients from General Practitioner (GP) referrals, Accident and
Emergency and outpatient clinics. Medical notes of identified patients were
analysed and appropriate information was recorded.
Results
Scottish Intercollegiate Guideline Network (SIGN) recommendations based
on clinical trials were identified. No formal local guidelines were identified
but reminder cards issued to all wards of the hospital provided the stan-
dards to audit. Patients at risk included those with immobility, cardiac
disease, respiratory disease, infectious disease/sepsis and active cancer.
Thromboprophylaxis should be considered unless contra-indicated. Contra-
indications included major bleeding disorders, active gastric/duodenal ulcer,
hypersensitivity to enoxaparin, stroke (unless due to systemic emboli) and
other patients with increased risk of haemorrhage.
In total, 301 patients were identified, with 262 patients excluded leaving
39 patient profiles for analysis. Of 39 patients, 17 received prophylaxis ofA267

which three experienced confirmed events and had at least two risk factors.
One patient received prophylaxis 14 days after admission and if prophylaxis
was prescribed earlier the event could have been prevented.
Twenty two patients did not receive prophylaxis. Of these, nine patients
had contraindications (56% suspected stroke, 33% low haemoglobin and
11% rectal bleed). Thirteen patients had no clearly documented contrain-
dications (40% were immobile and had at least one additional risk factor)
and should have been prescribed enoxaparin according to the protocol on
the reminder card.
Out of 22 patients not receiving prophylaxis, 12 did not have an event,
one was transferred to another hospital and nine had confirmed events
(with US or VQ scans) or high clinical suspicion. Of these, five patients had
contraindications (40% suspected stroke, 40% low haemoglobin and 20%
rectal bleed). Three patients experienced deep vein thrombosis (DVT), one
experienced pulmonary embolism (PE) and one experienced both DVT and
PE. Of the four patients without contraindications (25% had two risk
factors and 75% had three risk factors), three patients experienced PE and
died and one patient experienced DVT.
Discussion
It is unclear whether deaths were as a result of PE but enoxaparin should
have been prescribed and the events could have been prevented. Most
common risk factors include malignancy, severe infection and immobility.
These were all listed in the reminder card suggesting that prescribing of
enoxaparin from the recommendations has not been adhered to. Three
patients were taking corticosteroids. VTE contributory medicines were not
included in the reminder card. Therefore, these risk factors were overlooked
on admission and enoxaparin was not prescribed, which may have con-
tributed to one patient’s event.
There are a number of changes, which could be initiated. Publish results
into trust wide bulletin allowing prescribers to be more aware of option of
prophylactic enoxaparin. Issue re-designed reminder cards to include VTE
contributory medicines. Develop Risk Assessment Models to help identify
patients most likely to benefit from prophylactic enoxaparin. Include
checklist in the Integrated Care Pathways to prompt risk assessment when
clerking on admission and clear documentation. Initiate changes and collect
data in 3 months time to complete audit cycle.
Thirty-three percentage (13 patients) had at least one risk factor, with no
clearly documented contraindications and did not receive thrombopro-
phylaxis. Enoxaparin prescribing can be improved through increasing
awareness of risk factors and current medication.
References1. Great Britain. The House of Commons Health Committee. The prevention of
Venous Thromboembolism in Hospitalised Patients. London: The StationaryOffice Limited, 2005, pp. 1–112.
2. Elwood, P. An update on risk factors for vascular disease. Pharm. J. 2001; 267:194–6.
3. Davies, D.M. et al. Davies’s Textbook of Adverse Drug Reactions, 5th edition.London: Chapman and Hall Medical 1998, pp. 184–186.
4. British Medical Association and Royal Pharmaceutical Society of Great Britain2004. The British National Formulary, 48th edition September 2004.
B An assessment of packing materials and development of evidence
based guidelines for transport of cold chain vaccines
Warren A
Department of Pharmacy, Raigmore Hospital, Inverness
Introduction
Many vaccines require continual storage between 2 and 8 �C. The cold
chain ensures that this temperature range is maintained during trans-
portation to minimise loss of potency. This is important because once
lost potency cannot be regained or restored, thus reducing the success of
vaccinations. Potency loss due to breaks in the cold chain has been
identified as the cause of a polio outbreak in South Africa and a measles
outbreak in New York.1
Proper packing of a vaccine carrier box is crucial to maintain cold chain
temperatures and many factors need to be considered to ensure that a
suitable temperature is sustained throughout the journey.
Objective
The purpose of this study was to develop evidence-based guidelines for the
packing of cold chain vaccines for transport from Raigmore hospital.
Method
The study was carried out from November 2004 – March 2005. Data were
collected using electronic temperature recording devices (Comark Diligence
EV model N2001) and processed using Evolution software.
Time–temperature graphs were produced.
The current method of packing vaccines (cardboard or polystyrene box,
containing one fridge temperature ice pack and insulating chips) for
transport from Raigmore hospital was evaluated. This was done by mon-
itoring the temperature of a dummy package (empty boxes in a paper bag)
sent to hospitals and surgeries in Highland.
Variables (Table 1) were then assessed for their ability to maintain cold
chain temperatures. Tests ran for at least 48 h at room temperature. From
the collected data recommendations on packing vaccines for transport were
made and incorporated into a standard operating procedure (SOP).
Results
Periods of elevated temperature (>8 �C) were experienced in all transport
runs when testing the current method of packing vaccines. Assessing the
effects of different variables found that:
� Direct contact with a frozen ice pack (Figure 1) resulted in subzero
temperatures.
� Temperature varies throughout the load if a single ice pack is located at
the bottom of the container (Figure 1).
� Increasing the number of ice packs in the carrier box increases the vaccine
‘‘cold time’’.
� The polystyrene carrier boxes’ thicker walls provided better insulation
than the cardboard and plastic boxes.
� Cardboard was the best insulating material.
� Pre-cooling both the polystyrene box and insulating chips increases vac-
cine cold life.
Discussion
This study highlighted that there are many factors to consider when packing
a vaccine for transport. Insulating materials are necessary to prevent vac-
cine – ice pack contact. Frozen ice packs should be warmed to 0 �C in the
fridge overnight to reduce the risk of freezing the vaccine load. Ice packs
should be evenly distributed in the box to ensure a uniform temperature
within the load. Suitably packed cardboard and plastic boxes can be used to
deliver vaccines to destinations requiring shorter journeys. Polystyrene
boxes can be used to maintain temperatures below 8 �C for longer than
12 h. Ambient temperatures2 affect the temperature of the vaccine load. To
ensure relevance of the packing recommendations in all seasons the cold
chain should be audited in a variety of weather conditions.
References1. Hedenstrom M, Kahler W. The cold chain from manufacturer to vaccinator:
experiments and experiences. Vaccine 1992; 10(13): 949–51.2. Brown DR, Sansum CJ. The transportation of vaccines: Is the cold chain
integrity maintained? Pharm J 1992; 249: 267–9.
Table 1 Variables considered when packing vaccines for cold chain
transport
Ice pack � Number
� Position in box
� Temperature
Carrier box � Size� Material: polystyrene, cardboard and plastic
� Temperature
Insulating material � Material: polystyrene chips, bubble wrap and
cardboard
� Temperature
0
2
4
6
8
10
10 30 50 70 90
Time (minutes)
Tem
pera
ture
(D
eg C
)
BottomTop
Figure 1 Temperature distribution of a vaccine load in a carrier box.
A268

C Audit of drug history taking, prescribing and documentation of
changes to anti-convulsant drugs within Royal Hallamshire Hospital,
Sheffield
Badham H.J., Dorward B.J., Thomas N
Pharmacy Department, Royal Hallamshire Hospital, Sheffield Teaching
Hospitals
Introduction
Epilepsy seizure control is obtained by the use of anti-convulsant drugs
(ACD). There are several types of ACD and a modification in ACD regime
may lead to loss of seizure control or toxicity1. Recent guidelines state all
changes to an ACD should be planned and undertaken with adequate
medical supervision2–4.
Objectives
To assess the continuation of ACD therapy for patients diagnosed with
epilepsy during hospitalisation by reviewing drug history taking, drug cards
and medical records.
Drug history� To investigate when patients admitted taking ACD have a drug history
taken.
� Standard: 100% of patients will have a drug history documented in
the notes within 24 h of admission4
� To assess the completeness and accuracy of the ACD history documented.
� Standard: 100% of ACD drug histories will state the brand, dose,
form, formulation, generic name and strength2,3.
Drug cards� To assess completeness of the prescription for ACD.
� Standard: 100% of drug cards will state ACD brand, dose, form,
formulation, generic name and strength2,3
Patient records� To identify cases where ACD prescription is different to the drug history
taken
� To identify all documented reasons that justify changes to ACD therapy.
� Standard: 100% of medical notes will contain documented reasons
for changes in ACD2–4.
Method
An anonymous pro forma was designed to gather information on the
accuracy of written drug documentation in the medical notes and drug card.
The pro forma also recorded interventions made by the pharmacist. An
exclusion criterion was adopted (ACD use other than epilepsy, cerebral
malignancies and under 18-year olds). The pro forma was successfully
piloted.
Patients admitted to the Royal Hallamshire Hospital receiving an ACD
during a 3-week period in December 2004 were identified via the pharmacy
dispensing system. Patients who met the inclusion criteria were visited to
review ACD history documentation in the medical notes and on drug cards.
Medication discrepancies were highlighted to the clinical pharmacist for
action in the same episode of patient care.
All data collected was coded and entered into a password-protected
database. Data was analysed using Microsoft Access� and individual case
analysis.
Results
In total, 68 patients met the inclusion criteria and a pharmacist had seen 62
(91%) of these patients. A total of 108 ACD were prescribed. A summary of
the results can be found in table one.
Discussion
Pharmacists have an important role in accuracy of drug history documen-
tation and highlighting medication discrepancies. The audit results have
been summarised and presented to the epilepsy multidisciplinary team for
assessment and to potentially implement change in practice. Following the
meeting, it was decided to review the training in drug history collection
skills as part of the junior doctor induction programme and all pharmacists
to receive a presentation on the project plus guideline updates. Following
these actions it is recommended that the audit will be repeated in 1 year
across the Trust sites.
References1. Hall W. Switching anti-epileptics; a change for the worse. Prescriber 1996; 6; 23.2. Drugs for adults with epilepsy. National institute for clinical excellence. Health
technology appraisal. January 2002. www.nice.org.uk (accessed 15/09/05).3. Department of Health. Long Term Conditions National Service Frameworks.
Quality requirements. www.dh.gov.uk/policyandguidance/healthandsocialcare-topics/longtermconditions (accessed 15/9/05).
4. Sheffield Teaching Hospitals National Health Service. Clinical PharmacyStandards. Clinical Endorsing standards. March 2001.
D An audit into the quality of chart endorsing by pharmacists
in the Gwent NHS Trust
Llewellyn KJ
Royal Gwent Hospital, Newport
Introduction
Clinical audit is a key mechanism for facilitating the continuous improve-
ment of health services. It involves the systematic measuring of clinical
performance against agreed standards, and thus the action taken to correct
any shortfalls found1. The quality of chart endorsing by pharmacists is a
prime example of clinical performance that requires continuous monitoring
to ensure consistently high standards are achieved. Pharmacists have a duty
of care to patients to ensure all prescribed drugs are safe and effective2 and
in concordance with the ‘Pharmacy procedures for Chart Endorsing’ set out
by the Gwent NHS Trust, they are responsible for endorsing this infor-
mation on patient charts. In order to ensure that the endorsing procedures
carried out by all pharmacists within the trust are consistent and of an
acceptably high quality, a clinical audit has been implemented to monitor
and record these actions.
Objective
This study was undertaken to assess the quality of chart endorsing by
pharmacists at the Royal Gwent Hospital, whilst addressing any areas that
are unsatisfactory and suggesting any possible improvements to the pro-
cedures. The results produced can then be used as a comparison with the
chart endorsing audit carried out simultaneously at Nevill Hall Hospital, in
the Gwent NHS Trust.
Methods
A data collection form addressing the 11 standards outlined in the trust’s
‘Pharmacy Procedures for Chart Endorsing’ was designed and piloted. A
total of 204 in-patient medication charts were chosen at random and au-
dited across each of the 29 wards at the Royal Gwent Hospital base
(including all medical, surgical and critical care departments). For each of
the medication charts collected over the 14-day period, they were assessed
for quality of endorsing by pharmacists using this data collection form. In
Table 1 Summary of the standards and results obtained
Standard Result
100% of patients will have a drug
history documented in the notes
within 24 h of admission4
36 (53%) patients had a drug
history documented in the notes
within 24 h of admission
100% of ACD drug histories will
state the brand, dose, form, for-
mulation, generic name and
strength2, 3
34 (32%) of ACD drug histories
stated the brand, 57 (53%) stated
the dose, 13 (12%) stated the form,
21 (19%) stated the formulation,
59 (87%) stated the generic name
and 99 (92%) stated the strength.
100% of drug cards will state ACD
brand, dose, form, formulation,
generic name and strength2, 3
56 (52%) of drug cards stated the
brand, 108 (100%) stated the dose,
19 (18%) stated the form, 36 (33%)
stated the formulation, 95 (88%)
stated the generic name and 98
(91%) stated the strength.
100% of medical notes will contain
documented reasons for changes in
ACD2–4
42 (62%) patients had a difference
between the drug history and med-
ication on the drug card. 27 (64%)
of these patients with a difference
in documentation had explanations
in the notes.
A269
addition to this, an anonymous questionnaire was designed and handed out
to all pharmacists within the hospital and used as a tool to obtain feedback
on the trust’s procedures for chart endorsing.
Results
The major findings of the audit project involved parts 1, 2, 4, 5 and 6 of the
pharmacy procedures for chart endorsing. The results for part 1 of the
procedures showed that only 35% of the overall charts were endorsed in
green ink. In contrast, for standard 2, which requires the generic name of
the drug to be written in full this revealed consistently high results
throughout all wards; achieving an average of 80.5% on the ‘as required’
section of charts and 77.7% on the regular side. Further results relating to
standard 3 of the procedures demonstrated that only 57.5% of the ‘as
required’ and 64.4% of the ‘regular’ side of charts had the supply boxes
endorsed by pharmacists, with the endorsement of liquid strengths
achieving only 8.3%.
The results produced from all wards for standard 4 of the procedures,
requiring the dose, route, and frequency of administration to be present and
clear were excellent, with the majority of wards achieving 100% for all three
criteria.
A significant observation from the audit is that there are no guidelines to
assist pharmacists with parts 5 and 6 of the pharmacy procedures for chart
endorsing. Consequently, there were no standards to audit the requirement
for additional drug information to be provided (standard 5) and parenteral
administration advice (standard 6). In order to overcome this part of the
audit, 3 drugs commonly endorsed with extra administration details i.e.
NSAIDs (with food), aspirin (with food) and bisphosphonates (full
administration details as according to the BNF) were chosen and audited.
Similarly, part 6 of the procedures involving parenteral administration
advice had no guidelines in the pharmacy procedures and the results showed
variation in the type of drugs and parenteral administration advice provided
by different pharmacists.
Discussion
The audit demonstrated that the majority of pharmacists do not fulfil every
requirement set out by the trusts ‘pharmacy procedures for chart endorsing’
and that there is substantial variation between their endorsements. For
procedure 1, whereby pharmacists are required to endorse using green ink
for the purpose of differentiating between information provided by the
doctor and the pharmacist, 65% overlooked this requirement. Also, the
endorsement of liquid strengths (standard 3) was an unacceptable 8.3% and
I therefore strongly recommend all pharmacists familiarising themselves
with these parts of the procedures and including them in their daily chart
endorsing routines.
Due to the lack of guidance with procedure 5 (requiring the provision of
extra administration details) major recommendations are to compile an
agreed list of drugs together with the additional information required for
pharmacists to use as a reference when endorsing charts. The results from
the 3 drugs audited were unacceptably low and the consequences of omit-
ting this information includes possible GI irritation/bleeds with NSAIDS
and aspirin, and oesophageal erosion if the bisphosphonates are not
properly administered. These were just three examples of many and even
though it would make ward rounds more time consuming, it would mean all
pharmacists consistently providing the correct and appropriate adminis-
tration details for drugs, and thus optimising patient care.
Similarly for procedure 6, requiring parenteral administration advice, I
strongly recommend producing a list of drugs that require this extra
information to enable pharmacists to consistently endorse charts with the
relevant and accurate details. Further recommendations from the audit are
to list the drugs or patient types requiring patient weight to be present on
the charts and also to address any drug-monitoring strategies. Communi-
cation of any amendments with all pharmacists working within the trust is
also essential to encourage chart endorsing procedures to be carried out
effectively and consistently on all wards.
References1. http://www.show.scot.nhs.uk/isdonline/clinical_gov/clinical_audit/
clinical_audit.htm2. Royal Pharmaceutical Society of Great Britain. Medicines, Ethics and Practice,
29th edn, July 2005: 85.
E Audit of nebuliser prescribing for acute exacerbations of chronic
obstructive pulmonary disease on specialist respiratory wards
Russell-Hobbs K
Pre-registration Pharmacist, Department of Pharmacy, Leeds Teaching
Hospitals NHS Trust, Leeds.
Introduction
Chronic Obstructive Pulmonary Disease (COPD) is the fourth most com-
mon cause of death in the world1. The progressive course of the disease is
complicated by exacerbations of symptoms, which if severe, require hos-
pitalisation. The historical mainstay of treatment involves the use of neb-
ulised short acting b2 agonists such as salbutamol and/or anticholinergics
such as ipratropium.
Objectives
� To quantify the quality of prescribing & administration of nebulised
bronchodilators for acute exacerbations of COPD on specialist respiratory
wards compared to recommended best practice over a 2 month period.
� To produce recommendations to improve practice.
Method
A set of four audit standards were developed using national clinical
guidelines.1–3
Audit standard 1: All patients with a severe exacerbation require nebulised
treatment with both salbutamol and ipratropium.
Audit standard 2: Patients receiving ipratropium to manage chronic disease
require both nebulised salbutamol and ipratropium to manage an exacer-
bation.
Audit standard 3: All non-severe exacerbations should initially be prescribed
nebulised salbutamol alone (i.e. not with ipratropium) and their response
reviewed.
Audit standard 4: All prescriptions for nebulised drugs must specify a
driving gas, fill volume and flow rate.
Patients were targeted on the specialist respiratory wards at the Leeds
General Infirmary. A standardised data collection sheet was developed and
piloted to ensure it was suitable for use. The severity of each patient’s
exacerbation disease was staged according to GOLD criteria.3 Patients’
drug charts, notes and the nursing staff were used to collect data including;
how the nebules were administered and which driving gas was used to drive
the nebuliser unit. The main outcome measure was deviation from the audit
standards. The results were analysed using Fischer’s Exact Test.
Results
Out of 23 patients audited 39% (9) patients were classed as having a severe
exacerbation.
Audit standard 1: 78% (7) of severe exacerbations were initially prescribed
ipratropium and salbutamol. This was not statistically significant different
from the audit standard (p>1).
Audit standard 2: One patient prescribed ipratropium at home was not
prescribed ipratropium in hospital.
Audit standard 3: All patients were prescribed regular nebulised salbutamol.
Around 93% (13) of non-severe exacerbations were initially prescribed
ipratropium. This is a statistically significant deviation from audit standard
3 (p<0.001).
Audit standard 4: A 0% of drug charts stated a driving gas or fill volume and
2 drug charts specified a flow rate.
Discussion
Actual practice complied with only one of the audit standards; for the
prescribing of salbutamol and ipratropium nebules in combination for
severe exacerbations of COPD, therefore the prescribing met the national
guidelines1–3. One patient who was prescribed ipratropium at home but not
in hospital could potentially be an oversight and may have been corrected
during their inpatient stay.
Table 1 % of charts endorsed with additional administration details for
NSAIDS, aspirin and bisphosphonates
Drug % of charts containing
appropriate additional
information
Additional information
provided
NSAIDS 20 With food
Aspirin 33.5 With food
Bisphosphonates 25 Full administration details
A270

One of the main deviations of the audit standards was the inappropriate
prescribing of ipratropium nebules for non-severe excerbations of COPD.
This study has shown that ipratropium nebules are generally prescribed in
combination with salbutamol nebules in the vast majority of exacerbations.
This is not necessary for mild exacerbations, since there is minimal evidence
that the addition of ipratropium to salbutamol in the treatment of exac-
erbations of COPD has any further benefit4.
The need for the correct driving gas in COPD patients is well docu-
mented. If oxygen is given to a carbon dioxide retaining COPD patient then
this could potentially cause a suppression of respiratory drive, worsening
hypercapnia and ultimately worsen to respiratory failure. On discussion
with the nurses on the specialist respiratory wards, it was found that they
always use air to drive nebulisers for COPD patients. However it should be
noted that this may not be common practice on non-specialist wards.
The fill volume and airflow rate can both alter the properties of respirable
particles. If the fill volume is increased then the proportion of drug nebu-
lised is increased. After interviewing the nurses on the wards it was found
that if the ipratropium and salbutamol are prescribed as concomitant
therapy, then the nebules are always mixed together, thereby increasing the
fill volume, which is a good practice. The optimum flow rate of 6–8 l/min is
used to nebulise 50% of particles to 2–5 lm 2. If the flow rate is increased,
then the drug output is increased with a decrease in particle size. The size of
nebulised particles is important because it affects where the drug particles
are deposited in the airways, particles in the range 2–5 lm will be deposited
in the small airways, where they exert the desired therapeutic effect2.
Despite the air flow rate never being prescribed, it was found the Hospital’s
Medical Physics department test the compressor and nebuliser unit for the
optimum flow rate to ensure that they work at the optimal flow rates,
therefore it is not necessary for the drug chart to be endorsed with pre-
scribed flow rate.
In conclusion there were deviations from audit standards. In order to
streamline patient care it is suggested that a standardised care pathway with
treatment algorithms derived from best practice are developed and audited.
An area of future study would be to audit the use of nebulisers in ambu-
lances and other specialities in order to compare practice with cinical
guidelines in non-specialist areas.
References1. National Institute for Clinical Excellence (NICE). Chronic Obstructive pul-
monary disease: national clinical guideline for management of chronicobstructive pulmonary disease in adults in primary and secondary care. Thorax2004; 59(Suppl 1): 1–232
2. British Thoracic Society. BTS guidelines for the use of nebulisers for chronicobstructive pulmonary disease. Thorax 1997; 52(Suppl 2): S49–52.
3. Global Initiative for Chronic Obstructive Lung Disease. Global strategy for thediagnosis, management and prevention of Chronic Obstructive PulmonaryDisease-Executive summary updated 2004:Accessible from www.goldcopd.com
4. Brown CD, McCrory D, White J. Inhaled short-acting b2 agonists versusipratropium for acute exacerbations of chronic obstructive pulmonary disease(Cochrane Review). The Cochrane Library, Issue 3, 2004. John Wiley & SonsLTD: Chichester, UK.
F A survey of patient satisfaction with the information they receive
about their medicines
Mohammadi L, Voruganti R
Whiston Hospital, Prescot, Merseyside
Introduction
At any time, a third of the population is self-medicating and another third is
taking prescribed medicines. An essential part of such health care delivery is
the communication of information on safety, appropriateness and efficacy
of medicines2. Studies have shown that satisfactory levels of communication
between health care professionals and patients result in increased patient
concordance3,4. In providing patients with information about medicines, we
must work out how much a patient wants to be involved so that the level of
information is tailored to suit them5.
The government has launched initiatives to ensure public access to infor-
mation when they need it3. Projects such as ‘‘ Ask about medicines week’’
promote better use of medicines5. As a result patients are more aware of the
availability of medicines information and their right to knowledge.
Consumer surveys report that health professionals are the most popular
source of drug advice5 but that they are often unwilling to provide patients
with as much advice as they would like1. This project seeks to investigate
patients’ views on the way in which medicines information is given.
Objectives
� To assess the satisfaction of hospital inpatients with the information that
they had received about their medicines
� To assess how various factors may affect a patients level of satisfaction
� To obtain patients’ views on additional services that could be provided to
improve the way in which information about medicines is provided within
the hospital setting
Method
This study was carried out within the discharge lounge at Whiston Hospital.
Two questionnaires were used to carry out the research.
The first questionnaire (Appendix 1) used the ‘satisfaction with information
about medicines scale’ (SIMS). This validated questionnaire consists of 17
questions derived from the ABPI recommendations for the ‘type of infor-
mation that patients require in order to self-manage medication’6. The re-
sponse to each question is converted into a score and the total score
calculated. A low score indicates a low level of satisfaction and conversely a
high score indicates a high level of satisfaction. The maximum score that
can be achieved is 17.
The second questionnaire (Appendix 2) was designed to map the demo-
graphic details of each patient. This included who had provided patients
with information, in what form that information was provided, how useful
they found that information, and how well informed they felt about med-
icines.
Data was collected over a 10-day period in February 2005. The study was
carried out in the discharge lounge, where patients from all wards are
transferred to prior to discharge, to provide a cross section of patients from
all specialities. This also ensured that patients were seen at the end of their
hospital stay when all counselling should have taken place. The nurse in
charge was asked to identify unsuitable patients and those that were unfit or
unable to answer questions were excluded from the study. Data was anal-
ysed using Microsoft Excel.
Results
Of the 52 patients that were received into the discharge lounge 81% were
suitable to be interviewed. Patients deemed as unsuitable were confused
patients (6), patients not feeling well enough (3), and a patient who did not
speak English (1).
Around 34% of patients had a low SIMS score, 44% had a medium
SIMS score, and 22% had a high SIMS score. Using the second ques-
tionnaire patients were asked ‘‘how well informed do you feel?’’ A 30% felt
that they were not well informed, 2% felt moderately informed, and 55%
felt well informed.
When asked which sources of information they would like to be made
available to them, patients responded as follows: 64% wanted a pharmacist
present on the ward for longer periods, 43% wanted a private area on the
ward for discussion, 31% wanted leaflets made available to them, 7%
wanted a helpline, 2% wanted to be able to access information via the
internet, and 2% wanted to text queries. None of the patients chose the
option of faxing queries, or gave any other suggestions. Of those dissatisfied
(low SIMS score), 100% wanted a pharmacist present on the ward for a
longer period, 79% wanted a private area on the ward, 43% wanted leaflets,
and 21% wanted a helpline available.
There was a correlation between patients’ age and their level of satis-
faction. A 75% of patients in the age range 16–30 and 50% of patients in
the 31 –45 age range had a low score compared to only 25% of the patients
aged over 65 years. None of the patients in the 16–45 age group had a high
satisfaction score, compared to 25% of those in the over 65 group and 25%
of those in the 46–65 group.
Of those who felt uninformed (according to second questionnaire), 67%
had not received any information about their medicines, 17% had been
given information by a doctor only, 8% had been given information by a
nurse only, and 8% had been given information by a pharmacist only. Of
those who felt well informed, 21% had received no information, 17% had
received information from a pharmacist only, 13% from a doctor only,
13% from a nurse only, and 36% from a combination of two or more of a
doctor, nurse or pharmacist.
The average SIMS score was 7.32 for patients who had been newly pre-
scribed medicines and 7.5 for those who had not.
Discussion
The SIMS questionnaire assessed a number of factors determining patient
satisfaction, whereas the second questionnaire enquired how informed the
patient felt, and aimed to achieve a more simple indicator as to whether they
had received enough information or not. There was a correlation between
the responses to the two questionnaires, in that most patients who had a low
A271

SIMS score said that they felt uninformed. There were, however, some
patients who had a low SIMS score who felt that they were well informed.
This suggests that not all patients want to receive information about their
medicines in order to feel satisfied, and therefore patient counselling must
be tailored to patients needs.
A higher proportion of patients had low SIMS scores than had high
scores with a large proportion of patients in the medium score band. This
suggests that the way in which information is provided to inpatients needs
to be improved. This could be done by implementation of the resources that
patients felt would be helpful (as stated above).
Patients who felt well informed about medicines had usually received
information from a healthcare professional, in 36% of cases they had been
counselled by more than one member of staff. This suggests that receiving
information from a number of different members of the multidisciplinary
team is beneficial and improves patients’ knowledge.
Older patients tended to feel less of a need for information to be pro-
vided, and were generally more satisfied than younger patients. This was
reflected in the younger patients having lower SIMS scores and further
suggests that the level of information that is provided should be patient
specific.
Patients felt that having a pharmacist on the ward would improve the way
in which they received medicines information, and this indicates that there is
a clear role for ward pharmacists to identify inpatients who require coun-
selling and provide them with the information they need.
The fact that the average SIMS score was similar for patients who had
been newly prescribed medicines, and for those who had no new prescribed
medication, suggests that patients want more information about their
medicines whilst in hospital, irrespective of whether or not they have been
given new medication to take.
The findings from this study could be used to guide further research into
the economic effects that patient counselling could have on hospital trusts
e.g. the effect that patient counselling has on reducing re-admission rates.
References1. Semchuk W. Empowering providers to meet patient information needs, reduce
patient anxiety to support adherence. CPJ/RPC 2004;137: 46–9.2. Dhillon S, Duggan C, Joshua AE. What part pharmacists should play in pro-
viding medicines information. Pharm J 2001;266: 364–6.3. Gibbs S, Waters WE, George CF. The benefits of prescription information
leaflets. Br J Clin Pharm 1989; 27: 723–39.4. Oborne CA, Dodds LJ. The quality and quantity of drug related information
provided to hospital inpatients and its effect on seamless care. Pharm J 1993;251 (Suppl): R5.
5. Dickinson D, Raynor DKT. Ask the patients- they want to know more thanyou think. BMJ 2003; 327: 861.
6. Horne R, Hankins M, Jenkins R. The satisfaction with information aboutmedicines scale (SIMS): a new measurement tool for audit and research. QualHealth Care 2001; 10: 135–40.
G An audit of prescribing of prophylaxis against venous thromboem-
bolism in medical patients
MacLeod LM
Royal United Hospital, Bath
Introduction
Pulmonary emboli remain a significant cause of death amongst hospital
patients in the developed world. The Thromboembolic Risk Factors
(THRIFT) Consensus Group recommend that all patients should be as-
sessed for risk of venous thromboembolism (VTE) on admission to hospital
and patients should receive prophylaxis appropriate for this risk1. In
addition the guideline stipulates that individual hospitals in the United
Kingdom should develop written policies for prophylaxis and these should
be included in clinical audit and plans for patient care. Since the publication
of the THRIFT guidance, further evidence has been published in the
MEDENOX study2 and this has been reflected in the International Con-
sensus Group (ICG) statements3. Anecdotal evidence from the Royal
United Hospital (RUH), suggested that whilst surgical patients are rou-
tinely considered for prophylaxis, its role in medical patients is frequently
overlooked. Necropsy studies have shown that only one in four patients
dying of pulmonary embolism have had recent surgery, highlighting the
necessity for guidance in medical patients1.
Objective
This study aims to assess current practice of risk assessment and prescribing
of prophylaxis in medical patients admitted to the RUH against interna-
tionally published standards.
Method
Data was collected over a 7-day period in February; all patients admitted to
the RUH Medical Assessment Unit were reviewed after examination by a
senior house officer and a consultant physician. Patients under 40 years of
age, who were fully mobile, were excluded, as were patients receiving a
treatment dose of enoxaparin, heparin or oral anticoagulant therapy. A risk
assessment tool founded on the ICG Guidelines3 was used to design data
collection forms. The key standards state that all patients should have a risk
assessment on admission and all moderate to high risk patients should
receive prophylaxis with enoxaparin 40 mg daily unless they have a con-
traindication to enoxaparin4. Patients at risk of VTE with concurrent
chronic renal failure should have their dose of enoxaparin reduced to 20 mg
daily4. Patients diagnosed with one or more risk factors were categorised as
moderate to high risk. Evidence based risk factors were: acute myocardial
infarction, acute heart failure, active cancer requiring therapy, severe
infection/sepsis, respiratory disease, rheumatic disease, ischaemic stroke,
paraplegia, history of VTE, history of cancer and aged over 75 years1,3.
Results
There were 188 patients admitted to MAU reviewed by medical staff and
pre-registration pharmacist. After exclusions, data was collected on 127
patients. Risk assessment was carried out according to the ICG guidelines,
the results are summarised in Table 1. Of the patients identified as moderate
to high risk for whom prophylaxis was appropriate 12 (6%) received some
form of prophylaxis, only 6 (8%) received prophylaxis appropriate to their
risk.
Discussion
This study showed that the current practice does not meet the standards set
by THRIFT or the International Consensus Group. Medical staff docu-
mented risk assessments for 15 (12%) patients; by comparison the pre-
registration pharmacist reviewed the same group and identified 118 (63%)
at moderate to high risk of a VTE. The medical staff may have undertaken
more risk assessment but without documentation these could not be in-
cluded. The audit results imply that awareness of the evidence - based risk
factors for VTE in medical patients should be raised. In addition a prompt
in the clerking documentation or drug chart may help to prompt risk
assessment by medical staff on admission.
The MEDENOX study has shown that enoxaparin 40 mg once daily is
effective in reducing VTEs in medical patients2. The medical staff identified
15 (12%) patients at moderate to high risk of VTE of which 9 (5%) had no
contraindications to enoxaparin. Out of this group, 3 were prescribed an
inappropriate dose of enoxaparin for their risk. The audit identified 76
(40%) patients who should have received prophylaxis with enoxaparin but
observed appropriate prescribing of prophylaxis in 6 (3%) cases. These
results show that prophylaxis should have been prescribed in a greater
number of cases. In addition, where medical staff successfully assessed the
risk of a patient, the prophylaxis prescribed was not entirely appropriate for
the patient. These results suggest there is a need to educate all staff of the
appropriate dose of enoxaparin to prescribe for medical patients.
Local guidance for RUH patients based on the ICG guidelines and the
results of this audit are due for distribution this autumn. Re-audit has been
proposed for March 2006 to investigate the impact of guidelines on practice.
References1. Lowe GDO, Greer IA, Cooke TG, Dewar EP et al. Risk of and prophylaxis for
venous thromboembolism in hospital patients. Br Med J 1992; 305: 567–74.
Table 1 Results of venous thromboembolism risk assessment
Medical staff
admitted
Pre-registration pharmacist
reviewed
Total patients 188 (100%) 188 (100%)
Patient assessed for risk 15 (12%) 127 (68%)
Moderate to high risk
patients identified
15 (12%) 118 (63%)
Moderate to high risk
patients identified
with contraindication
to enoxaparin
6 (3%) 42 (22%)
Patients suitable for
prophylaxis with enoxaparin
9 (5%) 76 (40%)
A272

2. Samama MM, Cohen AT, Darmon J-Y, Desjardins L et al. A comparison ofenoxaparin with placebo for the prevention of venous thromboembolism inacutely ill patients. New England J Med 1999; 341(11): 793–800.
3. Nicolaides AN. Prevention of venous thromboembolism. International Con-sensus Statement. Guidelines compiled accordance with the scientific evidence.Inte Angiol 2001; 20(1): 1–37.
4. www.emc.medicines.org.uk, summary of product characteristics for Clexane,accessed 12/05/055.
H An audit of the prescribing of clopidogrel for patients seen on
post-take ward rounds and medical admissions unit at University
Hospital Lewisham
Hoad M, Eagle M, Cairns CJ
Department of Pharmacy, University Hospital Lewisham NHS Trust,
London
Introduction
Clopidogrel is licensed for the prevention of ischaemic events in patients with
a history of symptomatic atherosclerotic disease defined by ischaemic stroke,
myocardial infarction or established peripheral arterial disease; and in
combination with low-dose aspirin for acute coronary syndromes without
ST-segment elevation1. For management of non-ST-segment elevation acute
coronary syndromes, a 300 mg loading dose of clopidogrel should be given
immediately and then a maintenance dose of 75 mg daily thereafter2, 3, (in
addition to a 300 mg stat dose of aspirin and 75 mg daily thereafter).
The need for an audit of clopidogrel prescribing was identified by phar-
macists working on the medical admissions unit (MAU). It was observed
that clopidogrel was not being prescribed according to guidelines or subject
to the available evidence base.
Objectives
The objective of this audit was to evaluate the prescribing of clopidogrel to
establish if NICE guidance2 and local guidelines3 were being followed, and,
in response to findings, make recommendations to improve prescribing and
identify education requirements.
Method
Anauditwasundertakenon theprescribingof clopidogrel for patients seenon
post-take ward rounds and on the medical admissions unit, whether newly
started on, or already taking, the medication. The primary standard set was
that 100% of patients diagnosed with Acute Coronary Syndromes (ACS)
should be prescribed and administered a loading dose of 300 mg immediately
and then 75 mg daily doses of clopidogrel, unless contraindicated. Data was
collected over a total of 4 weeks during which time a total of 36 prescriptions
were analysed for 18 females (aged 44–93) and 18 males (aged 28–90).
A data collection form was used to gather information on the presenting
complaint, past medical history and diagnosis of the patient, and the
indication for clopidogrel and the time at which it was commenced (i.e.
based on present diagnosis or prior to admission). The prescription was
assessed for loading dose 300 mg stat (if required) and maintenance dose
75 mg daily of clopidogrel. Details were recorded of any monitoring con-
siderations, side effects or potential drug interactions. It was also docu-
mented on the form if the period to take clopidogrel had been defined and
whether a pharmacist was involved in initiation of the drug.
Results
A total of 36 prescriptions were assessed during the audit period. Twenty-
nine patients were newly diagnosed with ACS, requiring a loading dose
(300 mg) of clopidogrel, however only 69.0% of the patients were admin-
istered that dose. In total 33 patients were being treated with clopidogrel for
ACS and required a maintenance dose of 75 mg daily, however only 90.9%
of patients received these doses. Three patients were started on clopidogrel
for secondary prevention of atherothrombotic events, requiring only the
75 mg daily dose of clopidogrel, however one patient was prescribed a
loading dose unnecessarily.
It was found that minimal consideration was given to the safety of pre-
scribing clopidogrel as no documentation was made in patient notes con-
cerning additional monitoring that should be carried on initiating
clopidogrel, and potential drug interactions had remained unidentified. In
addition, the period for which clopidogrel was to be taken was rarely
documented on initiation of the therapy.
Discussion
Information was gathered on the prescribing of clopidogrel for patients seen
on post-take ward rounds and medical admissions unit. From the data
collected it was identified that prescriptions for clopidogrel were not always
correct or considered for safety prior to initiation. In particular 31.0% of
the patients newly diagnosed with ACS did not receive the appropriate
loading dose. Additional monitoring was rarely undertaken and the period
to take the medication largely undefined.
Recommendation has been made to arrange education sessions for doc-
tors and nurses on the importance of accurately prescribing clopidogrel and
the safety issues that must be considered when prescribing the drug. Also, it
has been suggested that a quick reference guide to the prescribing of
clopidogrel be provided to doctors such that they have access to informa-
tion at the point of prescribing. Finally, it would be prudent to form an
agreement between doctors and pharmacists, such that, on discharge the
period for which the patient should remain taking clopidogrel is defined on
the discharge letter, to prevent continuation of the medication indefinitely.
References1. British Medical Association and Royal Pharmaceutical Society of Great Britain.
British National Formulary 48 September 2004.2. NICE Technology Appraisal 80. Clopidogrel in the treatment of non-ST-seg-
ment elevation acute coronary syndrome July 2004.3. King’s College Hospital Cardiac Care Group. Guidelines for the management
of cardiology patients September 2003.
I An audit of one stop dispensing (OSD) for in-patients at Darent
Valley Hospital
Williams M
Department of Pharmacy, Darent Valley Hospital, Dartford
Introduction
In response to the implementation of patient-focused pharmacy services as
described in ‘‘The NHS plan: pharmacy in the future’’, (DOH, pharmacy in
the future)1, several United Kingdom hospitals have implemented a one-
stop/near patient dispensing service, whereby inpatient and discharge dis-
pensing have been combined into a single supply on admission, already
labelled with administration instructions for the patient2.
Traditionally, medicines for the patient to take home after leaving hos-
pital are usually dispensed just before discharge. Using one stop dispensing,
(OSD), medicines labelled with full patient directions can be supplied upon
admission to hospital.
Such OSD schemes generally involve the use of patient own drugs
(PODs), so that following assessment by pharmacy staff these can be used
during the inpatient stay and at discharge. If all medicines are either
available as a POD or dispensed with administration instructions, patients
should not have to wait for a separate supply of medicines to be dispensed
at discharge, thus speeding up the discharge process2.
The use of PODs and OSD are two schemes promoted by both the ‘‘NHS
plan’’ and ‘‘A spoonful of sugar’’ as mechanisms which act to enhance
medicines management
Objectives
� To determine the percentage of TTO’s written which do not require any
dispensary input when the patient is ready to be discharged.
� To ascertain the percentage of dispensed items on a TTO which are ready
24 h prior to discharge in accordance with the trust OSD guidelines.
� To ascertain the percentage of items on a TTO which require dispensing
on the day of discharge.
Standard of auditing
� 90% of items on a discharge letter should be ready 24 h before discharge
� Local Guidelines: guidelines on one stop dispensing (DVH Trust guide-
lines)
Method
After carrying out a pilot study, Data was collected to include discharge
summaries of patients that were discharged between 04-01-05 and 11-01-05.
Of the patients that were discharged over this period, 49 of these were
randomly chosen and their discharge summaries were analysed for the
number of items that were ready, the number of items that could have been
ready and the number of items that were outside the one stop dispensing
(OSD) guidelines.
Results
Only 16% of the discharge summaries included in the audit required no
further dispensary input on the day of discharge. A total of 318 items were
A273

present on the 49 discharge summaries included in the audit. Of the 318
items, 169 (53%) item were ready and did not require further dispensing, 53
(17%) items could have been ready following OSD guidelines and 96 (30%)
items were outside the OSD guidelines.
Discussion
Time constraint is the biggest factor leading to items not being ready.
Locker top ups are carried out by the ward-based technicians once a week.
These technicians have allocated wards times they need to carry out this
task, they also have periods during the day in which they need to carry out
dispensary duties. Most technicians complain that the time they need to
carry out a thorough locker top up is not available and most times will only
see those patients who are priority as opposed to everyone. This in addition
to staff shortages and holidays mean that the technicians do not have en-
ough time to do a thorough locker top up for all the wards allocated to
them. The ward pharmacists endeavour to look through every patient’s
drug chart on a daily basis but due to time constraint, more than one ward a
day to cover, dispensary duties and resolving clinical issues on the wards,
they are unable to thoroughly look through each drug chart everyday and
usually prioritise work which means medication which can be one stopped
are missed.
The patient’s length of stay in hospital will determine whether one stop
dispensing can be implemented. If a patient is admitted on a Friday evening
and is discharged on Monday afternoon, it is unlikely that this patient will
have been seen by either a technician or a pharmacist and their PODs (if
they have any) will not have been assessed and none of their medications
will have been dispensed. Therefore, in this category of patients, OSD
cannot be implemented and in this audit, they account for 5% of the dis-
charge summaries not ready.
Some of the items that are outside the guidelines could have been ready
but due to lack of training, some of the technicians are unaware of this. For
instance, for a patient admitted to a surgical ward for a procedure and who
normally takes ACE inhibitors, it is highly unlikely that the surgical team
will alter the dose of his/her ACE inhibitors but as the guidelines state that
technicians should not supply ACE inhibitors as one stop items as the dose
can be variable in an acute admission setting, this is not done. If appro-
priate training is given, the technicians will know in what circumstances
such as above where they should be dispensing the items which normally
they will not and which could in turn can speed up the discharge process.
Only 16% of TTO’s were ready as opposed to the 90% standard set at the
start of the audit. As a result of the factors listed above, OSDwill only work if
these can be eliminated or minimised. Some of them are unavoidable while
others can be tackled. OSD only works in straightforward circumstances
when none of the factors listed above are present or when the patients have
brought all their PODs in and they have not had any medication changes
during admission. Availability of pre-packs of certain medication especially
on the surgical wards can also improve one-stop dispensing.
Acknowledgement
Susan Boorman (Clinical Services Pharmacist) Dartford and Gravesham
NHS Trust, Darent Valley Hospital.
References1. Department of Health. Pharmacy in the Future – Implementing the NHS Plan.
London: Crown Copyright, 2000.2. Franklin et al. One-stop dispensing – does one size fit all? Pharmaceut J 2003;
271: 365.3. The Audit Commission. A Spoonful of Sugar – Medicines Management in NHS
Hospitals. London: Audit Commission Publications, 2001.
J Audit on the preparation of intravenous antibiotics at ward level (with
the introduction of a CIVA service)
Chan SM, Evans N, Walton, R
Warwick Hospital, Warwickshire
Introduction
The use of aseptic technique during the preparation of intravenous (IV)
infusions or injections is essential to avoid the risk of contamination from
the surrounding environment. A major factor to take into consideration is
the operator’s technique. It is important to determine whether the operators
are appropriately trained and deemed competent by a suitable supervisor.
Their method must be correct, efficient and safe. An appropriate method of
assessing each operator throughout their career may also be required to
ensure appropriate standards are maintained.
It is important to adopt an aseptic technique when preparing IV products
as it is essential to ensure that all steps are taken to minimise contamination.
Major types of contamination may include microbiological, particulate or
others. Sources of contamination may include the operator, equipment, the
ingredients, preparation surface and particles in the surrounding environ-
ment1, 2. A contaminated product can potentially cause great harm to the
recipient. This is especially important in immunocompromised patients.
The possibility of providing a dispensing service for IV products to be
aseptically prepared in a pharmacy environment needs to be carefully
examined. Pharmacists are traditionally used to the idea of being held
accountable for their actions. Risk management, audit and monitoring are
established activities within pharmacy3. Therefore, the preparation of IV
products that are commonly prepared and used at ward level could rea-
sonably be undertaken by pharmacy. The exact products to be prepared as
part of a centralised intravenous additive (CIVA) service from pharmacy
need to be identified. It would not be possible to provide a CIVA service for
every product required for every ward within a busy hospital environment.
Therefore, this audit concentrates on the provision of intravenous antibiotic
products for in-patients within the oncology department.
Objectives
(1) To determine the opportunities for risk to patients occurring during the
preparation of IV antibiotics at ward level.
(2) To identify which IV antibiotics are used within the oncology depart-
ment (for inpatients) and the level of usage of each antibiotic.
(3) To establish whether a CIVA service provided by the pharmacy
department may reduce the risks to patients and whether the service
would be suitable for this department.
Method
(1) The standard operating procedure (SOP) for IV preparation written by a
senior nurse for a nurse at ward level and the SOP written by a phar-
macist for a pharmacy technician in an aseptic suite were compared and
contrasted on a step-by-step basis. The standard was set to be the pro-
cedure followed in an aseptic suite. Each step omitted in the nursing
procedure that could potentially cause harm to the patient was measured
as a risk. The risk of bias may occur if the procedures were to be com-
pared on an observational basis, as one staff member may follow the same
SOP differently to another staff member. Therefore, by comparing the
two written SOPs, the risk of bias for either procedure was avoided.
(2) A survey was carried out daily during the pharmacist’s ward visit over 6
weeks. The usage of IV antibiotics was measured by counting the number
of IV antibiotics prescribed each day on each inpatient drug chart. The
results of this survey would aid the identification of suitable drugs to pilot
in a CIVA service.
Results
On comparing the two SOPs, 15 potential risks that could lead to micro-
biological or particulate contamination were identified in the nursing pro-
cedure.
The survey on IV antibiotics (prepared at ward level) showed that in a
total of 64 patients that were prescribed IV antibiotics within a 6 week
period, the most commonly prescribed antibiotic was ceftazidime 2 g
infusion (for 20 patients).
Discussion
A simple review of the nursing procedure to incorporate additional steps is
required. This would enable each potential risk of contamination identified
to be addressed and therefore reduce the risk to patients. Reducing the
opportunities of risk to patients would also impact on other considerations
such as the length of hospital stay and total costs of medication received
during admission per patient.
A CIVA service should be considered for the most commonly used IV
antibiotics (in this case, ceftazidime) in order to improve sterility of the
products. This would be a better and more efficient use of both nursing time
and the available resources within pharmacy.
The variation between the SOPs highlights the differences in approach to
the meaning of ‘aseptic technique’ during IV preparation. It also shows the
difference in methods of producing SOPs by different healthcare profes-
sionals.
Aseptic pharmacy is a department within itself that focuses on aseptic
manufacturing with guidelines that specify appropriate standards. How-
ever, the preparation of IV products at ward level is one of many tasks
conducted by trained nurses. The pharmacy department have the capacity
to provide an aseptic environment not available at ward level along with
specially trained staff.
A274

In summary, a review of the nursing procedure is required in an attempt
to minimise the opportunities of risks to patients. Also, a CIVA service
should be considered for the oncology department. It is an opportunity to
fully utilise the aseptic manufacturing service available from the pharmacy
department, freeing up valuable nursing time for direct patient care.
References1. http://www.allaboutpharmacy.co.uk/aseptics.htm <24.04.05>2. Munro MJ, Millar BW, Radley AS. A risk assessment of the preparation of
parenteral medicines in clinical areas. Hospital Pharmacist 2003;10: 303–5.3. Clinical governance in aseptic compounding. Hospital Pharmacist 2000;7: 192.
K Retrospective audit of actions taken following the receipt of toxic
medication blood levels report
Goh SY*
Pharmacy Department, Queen Mary’s Sidcup NHS Trust
*Audit was conducted during pre-registration in Royal Hospital Belfast
Introduction
Therapeutic drug monitoring (TDM) is an application of clinical pharma-
cokinetics and is a process of observing drug effects on a patient. It is
undeniable that TDM plays a great role in ensuring therapeutic efficacy as
well as preventing adverse drug reactions. This in turn contributes to risk
management process, which is one of the fundamental components of
clinical governance. However there are potentially major clinical manage-
ment and resource implications if TDM is performed inappropriately. An
audit to assess the appropriateness of digoxin TDM in Christchurch Hos-
pital, New Zealand found that 19% of the samples did not represent steady
state concentrations. In 5% of occasions, the subsequent decisions
regarding dose adjustment was felt to be clearly inappropriate1. A similar
study performed at Brigham and Women’s Hospital in Boston discovered
that 87% of patients underwent early routine monitoring before steady
state was achieved2.
Objectives
This audit was undertaken to assess how medical staff addresses toxic
medication blood levels, to evaluate the appropriateness of their actions and
to identify measures to improve TDM service.
Methods
Toxic digoxin and phenytoin levels recorded between 1st Nov 04 and 30th
Apr 05 were provided by Belfast Link Laboratory Service. Relevant
patients’ case notes were then obtained from Medical Records Department.
For practical reasons, paediatric patients were excluded from this study.
Patients’ details recorded included age, gender, medical history, drug his-
tory, laboratory data and issues relating to TDM such as sampling time.
Data collected were analysed and compared against the audit standards set.
It is expected that all actions taken by medical staff achieved 100% when
measured against the following standards:
1. Blood results are signed and acknowledged by medical staff
2. A record is made in patient’s notes
3. Actions are taken following the receipt of toxic medication blood levels
4. Plasma drug concentration is back to target range within a reasonable
time
5. Plasma drug concentration measured represents steady state
6. Actions taken are appropriate
Results
Between 1st Nov 04 and 30th Apr 05, 70 adult patients (median age
82 years) had toxic digoxin levels (>2 mcg/l) detected while another 23
adult patients (median age 46 years) had toxic phenytoin levels (>20 mg/l).
However, only 29 digoxin patients and 9 phenytoin patients were audited.
The patients’ notes for the rest of the patients were unavailable from
medical records as they were either being used by other researchers or have
been transferred to other hospitals.
As evident from Table 1, blood results are not routinely signed and re-
corded in patients’ notes. Although actions were taken in all cases implying
that medical staffs were indeed aware of toxic blood results, this is only a
small audit with a total sample size of 38 patients hence it may not be a true
reflection of what really happens in practice. It is encouraging to note that
majority of toxic blood results return to target range within a reasonable
time (defined as five half-lives). The reason why the remaining 7.1% (di-
goxin) did not meet the audit standard was because the patient concerned
was being treated under palliative care whereas the remaining 11.1%
(phenytoin) was unaccountable for due to patient being discharged and
followed up by his GP.
The results of this audit also revealed that sampling time is not routinely
recorded. This is not ideal because sampling time is one of the crucial
factors that need to be considered when evaluating plasma drug concen-
tration especially with digoxin. Inappropriate sampling time can lead to
falsely high or low plasma drug concentrations and subsequently erroneous
clinical decision. Due to the lack of information on sampling time, it is
inconclusive whether steady state concentrations were measured and whe-
ther actions taken were appropriate. Hence this explains the low score when
measured against the audit standards.
Discussion
Interventions to improve TDM could potentially save substantial resources
without missing important clinical results. Possible measures to improve the
practice of TDM include having a standard operating procedure which
outlines the procedure that needs to be taken upon receipt of toxic blood
level as well as the relevant sampling time for specific drugs; setting up a
toxic blood level alert between the pharmacy and the laboratory as a form
of safety net; and having ward pharmacists to follow up on patients with
toxic blood levels to ensure appropriate actions have been taken.
References1. Sidwell A, Barclay M, Begg E et al. Digoxin therapeutic drug monitoring: an
audit and review, NZ Med J 2003; 116; 708–13.2. Canas F, Tanasijevic M, Maluf N et al. Evaluating the appropriateness of
digoxin level monitoring, Arch Intern Med 1999; 159; 363–8.
L An audit on the monitoring of intravenous vancomycin at a district
general hospital
Odubanjo E
Milton Keynes General Hospital, Milton Keynes
Introduction
The increasing rate of antimicrobial drug resistance is a significant public
health issue worldwide. The World Health Organisation (WHO) has defined
the appropriate use of antimicrobial agents as ‘‘the cost effective use of
antimicrobials which maximizes clinical therapeutic effect while minimising
both drug related toxicity and the development of antimicrobial resis-
tance’’1.
In England, antibiotic resistance has been identified as a priority by the
present government in a report by the Chief Medical Officer in 2002
‘‘Getting ahead of the curve’’2. In addition, in December 2003, a new
Department of Health (DoH) hospital pharmacy initiative – ‘‘Winning
ways’’ has seen the injection of additional funds (£12 million over a period
of 3 years) to promote the prudent prescribing and monitoring of antibiotic
use3. These publications amongst others highlight a number of roles for
clinical pharmacists in tackling anti-microbial resistance and improving the
prudent use and monitoring of antibiotics in hospitals.
Vancomycin is a glycopeptide antibiotic with a narrow spectrum of
activity primarily against aerobic and anaerobic Gram-positive bacteria1–4.
Clinical use of vancomycin has increased significantly over the years with
the emergence of Methicillin Resistant Staphylococcus Aureus (MRSA)
and there have been reports of the emergence of vancomycin resistance
among microorganisms4,5. Coagulase-negative staphylococci, enterococci
and more recently, staphylococcus aureus have all been reported to exhibit
varying degrees of resistance to vancomycin6. Given its therapeutic
importance, it is vital that vancomycin resistance does not become
unmanageable. As optimal use of antibiotics is required to dampen the
emergence of bacterial resistance, it is imperative that vancomycin is
Table 1 Summary of audit results
Audit Standards Digoxin Phenytoin
Blood results are signed off 50.0% 36.8%
Blood results recorded in patients’ notes 35.7% 47.3%
Actions are taken following receipt of results 100% 100%
Levels return to target range within reasonable time 92.9% 88.9%
Steady state concentration measured 62.0% 31.6%
Actions taken appropriate 57.0% 31.6%
Sample size 29 9
A275

prescribed and monitored appropriately as the success of therapy may hinge
increasingly on this4,5.
In view of the above, various hospitals across England have developed
and implemented strategies such as hospital policies and guidelines
regarding the use of antibiotics/antimicrobial agents.
In a bid to incorporate the national strategies for prudent use and moni-
toring of antimicrobial agents into the ‘‘local setting’’ at Milton Keynes
General Hospital (MKGH), an audit of the prescribing of vancomycin as a
narrow spectrum antibiotic was identified as a priority.
Objective
To evaluate the prescribing and monitoring of vancomycin therapy at
Milton Keynes General NHS trust against the local trust protocol with a
view of making recommendations if the current hospital practice does not
meet the required standards set in the trust protocol.
Method
A prospective study was carried out on patients who were prescribed
intravenous (IV) vancomycin between October 2004 and January 2005. A
data collection tool was used to record details of drug dosing, frequency and
monitoring for each patient during the study period.
The main outcome measure was the consistency of the prescribing and
monitoring of intravenous vancomycin with the trust protocol.
Results
A total of 20 patients were recruited through the various wards at Milton
Keynes General NHS trust (MKGH) during the study period, of these;
� Seventy percent (70%) of the IV vancomycin doses prescribed complied
with the local protocol.
� Sixty percent (60%) of blood samples for TDM were done according to
local guidelines
� Fifty-five percent (55%) of patients on IV vancomycin had their dosages
adjusted according to the local guidelines in response to blood levels.
Discussion
The prescribing and monitoring of intravenous vancomycin was not fully
compliant with the recommendations from the trust protocol. The results of
this audit show that a lack of understanding of therapeutic drug monitoring
(TDM) and subsequently its application to clinical practice in the area of
vancomycin are the main issues affecting the optimal use of IV vancomycin
at MKGH.
References1. World Health Organisation (WHO). Global Strategy for Containment of
Antimicrobial Resistance, Executive summary, 2001. whqlibdoc.who.int/hq/2001/WHO_CDS_CSR_DRS_2001.2a.pdf. Date accessed 5th December 2004.
2. Chief Medical Officer. Getting ahead of the curve: a strategy for combatinginfectious diseases (including other aspects of health protection). A report bythe Chief Medical Officer, Department of Health, January 2002. http://www.publications.doh.gov.uk/cmo/idstrategy/index.htm. Date accessed: 5thDecember 2004.
3. Chief Medical Officer. Winning Ways: Working together to reduce healthcareassociated infection in England. Report from Chief Medical Officer. Depart-ment of Health, December 2003. http://www.dh.gov.uk/assetRoot/04/06/46/89/04064689.pdf. Date accessed: 13th November 2004.
4. Palmer –Toy DE. Therapeutic monitoring of vancomycin. Arch Pathol lab Med2000; 124: 322–3.
5. Robertson MB, Dartnell JGA, Koran TM. Vancomycin and Teicoplanin use inVictorian hospitals. Med J Aust 1997; 17:127–31.
6. Keyserling HL, Sinkowitz-Cochran RL, Harris JM, Levine GL, Siegel JD,Stover BH et al. Vancomycin use in hospitalised paediatric patients. Paediatrics2003; 112(2): 104–111.
M The prescribing of enoxaparin for the treatment of deep vein
thromboses, pulmonary emboli, and unstable angina
Lynch PJ, Print A
Addenbrookes Hospital, Cambridge University Hospitals NHS Foundation
Trust
Introduction
Effective and efficient thrombolysis is essential to provide a favourable
outcome in patients diagnosed with deep vein thromboses (DVT) or pul-
monary emboli (PE). Similarly, anticoagulant cover during episodes of
unstable angina (UA) is a proven success1. Enoxaparin is a commonly used
agent for this purpose. Low molecular weight heparins have become a
standard as a means to treatment of DVTs and PEs. Their efficacy, cost and
safety has allowed them to enjoy extensive clinical usage in comparison to
standard heparins and other thrombolytic agents such as streptokinase and
the rt-PAs (plasminogen activators). However, appropriate dosing is key to
providing a good outcome in potentially life-threatening conditions, in
addition to avoiding morbid complications of dosing – such as bleeding. Up
until recently enoxaparin dosing regimes were standardised and did not take
into consideration the mass of the patient and or the patient with impaired
renal function2, 3. These two important parameters must be assessed in
order to provide effective and safe thrombolysis with enoxaparin. To this
regard the staff prescribing and administering this therapy must have clear
and comprehensive guidance. Therefore the design of the relevant areas of
the anticoagulant chart could have potentially serious ramifications for the
safe and efficacious use of enoxaparin. Indeed if the charts were difficult to
interpret or convey information on then this could lead to serious compli-
cations via sustained emboli or haemorrhage, increased inpatient residency,
increased costs and increased mortality potential. This audit was conducted
across the entire directorate of medicine. Patients receiving enoxaparin
treatment doses for DVT/PE or UA were identified. The anti-coagulant
charts were assessed for appropriate completeness. A relevant qualitative
data study of medical and nursing staff was run in parallel.
Objectives
To assess the degree to which enoxaparin sections of the anticoagulant
charts are being completed correctly and fully.
To determine if the charts design is misleading practitioners into making
errors.
To determine if renal function is being taken into consideration when
prescribing enoxaparin.
To ascertain the medical and nursing staffs level of competence using the
chart and to acquire their feedback regarding it.
To identify ‘off label’ usages of enoxaparin being prescribed on the
anticoagulant chart.
Methods
A data acquisition form was designed in conjunction with the clinical audit
and risk governance department. This form was piloted on a short-stay
medical ward and on the cardiology ward over a one day audit. The data
form collected information on the indication for treatment, weight, serum
creatinine, drug chart cross referencing, in addition to assessing the quality
of chart endorsement. The post pilot analysis revealed that the data form
was sufficient to use during the main audit. All pharmacists covering the
medical wards were issued with audit packs containing questionnaires for
the respective medical and nursing staff and data acquisition forms. The
audit was run over 1 week across the entire directorate of medicine. Phar-
macists whom identified patients on treatment doses of enoxaparin com-
pleted the forms and returned the completed forms in the pack at the end of
the audit week. In order to assess the staff comprehension and contentment
with the chart a qualitative data study was run in parallel. A cohort sample
of medical and nursing staff were given MCQ style questionnaires to
complete. These data forms also included sections whereby the staff could
give their written opinion of the chart and its ease of use.
Results and discussion
Collected data was analysed. It was found that only 7 (25%) charts were
completed fully, and without error. Poor and inconsistent recording of the
patients weight, thus leading to an ambiguous and/or an inappropriate
dose, accounted for 70% of the errors recorded. Interestingly, the majority
of errors occurred in the DVT/PE group patients which accounted for 66%
of total errors. This group exhibited an 83% error rate in comparison to the
UA group at 38%.
Administration of enoxaparin for treatment regimes is reported to be
difficult and confusing, most probably due to the wide range of syringe
sizes, volumes and concentrations available. Nursing staff have also com-
plained over the misleading ‘air bubble’ in enoxaparin syringes that causes
further confusion. Misinterpreting the weight of a patient leads to errors in
dose calculations; poor guidance on syringe strength and size can also lead
No. patients Charts with errors Weight related errors
DVT 9 9 8
UA 13 7 3
Off License 5 n/a n/a
Total 27 16 11
A276

to dosing errors, for example: a volumatic administration error of just
0.2 ml of the 150 mg/ml strength 120 mg syringe in a 70 kg patient can
result in a 30 mg (28%) dose variation. Taking into consideration the
confounding problems the aim of the anticoagulant chart should be to
provide medical and nursing staff with clear, unambiguous dosing schema
with a view to minimising risk and maximising beneficial clinical outcomes.
However the qualitative study run in parallel with the main audit showed
that whilst most medical and nursing staff used the chart on a daily or
weekly basis, 90 and 85% respectfully, few exhibited competence when
asked to derive dosing schema and endorse these on the chart, 35 and 0%,
respectfully. The qualitative data study indicated the DVT/PE chart section
to cause the most confusion and this probably accounts for the relatively
large error rates attributable to this section. Another key finding of the
qualitative audit was that medical staff were being lead to believe that the
maximal dose of enoxaparin prescribable was 150 mg. This was probably
due to the fact that the chart gave no clear guidance on dosing schema for
patient greater than 100 kg in weight.
Conclusions
The standard of prescribing and administration accuracy is less than
optimal when enoxaparin is being used at treatment doses for UA and
this is especially true in the clinical settings of DVT and PE. Accurate,
consistent and up-to-date recording of the patients’ weight is key in
providing the patient with maximal benefit from enoxaparin thrombolytic
therapy. Whilst medical and nursing staff deem themselves familiar with
the chart, many find it confusing. This audit has shown that the charts’
design could mislead medical staff into prescribing under-doses, especially
in patients greater that 100 kg. This audit has invoked remedial concepts,
such as limiting the ranges of Clexane� and Clexane Forte� syringes
available, staff education, redesign of the trusts’ anticoagulant chart and
treatment monitoring via factor Xa levels4. Unfortunately this audit is
limited in statistical power and an ability to relate its findings to any
definitive clinical endpoint. To this regard, post-remedial audits should
be executed over longer periods and the clinical outcome of risk events
should be quantifiable.
References1. Hodgson J. An audit of enoxaparin usage in the management of unstable an-
gina. Pharm world Sci 2002; 24(3): A36–7.2. Antman EM, McCabe CH et al. Circulation 1999: 100: 1593–6013. Nagge J, Crowther M, Hirsch J. Is impaired renal function a contraindication to
the use of Low-molecular-weight heparins? Arch Intern Med 2002; 132:Dec 9/23.
4. Committee on Safety of Medicines, Dose adjustment and monitoring of lowmolecular weight heparins. Curr. Prob. Pharmacovig 2004; 30(Oct): 11.
N Baseline measurements and ongoing monitoring of valproate
in psychiatry
McManus J, Sie M
Hammersmith Hospitals NHS Trust, London
Background
Valproate is being increasingly used in psychiatry for the treatment of acute
mania. Semi-sodium valproate has been licensed for this indication and
sodium valproate liquid is also used off-license as well. Due to valproate’s
possible serious adverse effects of liver failure and blood dycrasias, proper
liver function and blood count monitoring should be conducted at the
baseline and at least every 6 months throughout treatment. For good
therapeutic response to occur a steady state plasma level of between 50 and
100 mg/l is required. Therefore valproate monitoring should also be
undertaken until a plasma level between these parameters has been reached.
Objectives
This audit sets out to investigate if valproate therapy is being properly
monitored within the West London Mental Health Trust. To achieve this
the following audit standards were developed:
(1) 100% of patients who are started on valproate must have their full blood
count and liver function assessed at baseline and at least every 6 months
thereafter.
(2) Patients’ valproate levels should be monitored until a therapeutic steady
state plasma concentration of 50 and 100 mg/l has been achieved.
Both these standard should have been reached in a patient to achieve proper
monitoring of an individual’s valproate therapy.
Method
The data required was gathered by first flagging up all mental health in-
patients that were on valproate by checking the drug charts on each ward.
The start date of each patient’s valproate was elucidated from the notes.
The lab result dates of each patient were then investigated against this start
date to assess whether proper therapeutic monitoring had occurred (at the
baseline and at every 6 months there after). For valproate; the laboratory
results were scrutinised to see if monitoring had occurred and if the patient’s
plasma levels had reached the required level above.
Results
As regards standard one, out of a total of 18 patients who had definite start
dates only 10 (55%) had correct baseline monitoring conducted and out of
19 patients who had been using valproate over prolonged periods, only 12
(63%) had had proper on-going monitoring. Out of the total sample of 24
patients’ 20 (83.33%) had valproate plasma monitoring done, of these only
14(58%) had returned plasma levels of between 50 and 100 mg/l. Required
therapeutic monitoring is when a patient’s monitoring achieves both stan-
dards in the audit; only 3(12.5%) of the 24 patients’ valproate monitoring
met the two audit standards.
Conclusions
The valproate monitoring of the patients fell far short of the 100% de-
manded by the audit standards. There needs to be action to address these
serious shortfalls in monitoring to prevent both harm to the patient and
potential waste of money caused by sub therapeutic doses and treatment of
adverse effects. There needs to be staff awareness as regards the proper
monitoring of valproate. Staff education and guideline development will be
needed to address the problem, followed by further auditing of the situation.
A277