Fragmentation Resistant Measures of Chipped Stone Abundance and Size: Results of an Experimental...
14
353 Plains Anthropologist, Vol. 57, No. 224, pp. 353–365, 2012 Fragmentation Resistant Measures of Chipped Stone Abundance and Size: Results of an Experimental Investigation of the Impact of Cattle Trampling on Surface Chipped Stone Scatters Matthew Douglass and LuAnn Wandsnider This study reports on the execution of a controlled experiment designed to address the impacts of cattle trampling on surface scatters of chipped stone found in Great Plains contexts. A key focus of the experiment’s design is an evaluation of the relationship between trampling duration and substrate compaction on the severity of artifact breakage. Results indicate that post-depositional artifact frag- mentation can significantly distort common analytical approaches found within the archaeological literature. Namely, measures of artifact abundance, raw material proportions, and average artifact dimensions are all affected by the impacts of trampling fragmentation. Beyond a consideration of key variables in the process of trampling fragmentation and its effects on analysis, this study outlines analytical means to identify and control for this bias. Tell-tale indicators of trampling damage are described and prescriptive measures designed to mitigate against the effects of trampling are evaluated. Results indicate that if dealt with appropriately, fragmented assemblages should not to be dismissed as distorted beyond usefulness, but instead can be utilized to reveal latent information about past human behavior. Keywords: lithic technology, taphonomy Matthew Douglass, Department of Anthropology, University of Nebraska, 810 Oldfather Hall, P.O. Box 880368, Lincoln, NE 68588-0368, [email protected] LuAnn Wandsnider, Department of Anthropology, University of Nebraska, 810 Oldfather Hall, P.O. Box 880368, Lincoln, NE 68588-0368 Recent exploration of chipped stone artifacts within surface deposits in the Oglala National Grass- lands and Nebraska National Forest (Wandsnider et al. 2008) has brought the effects of taphonomy into sharp focus. Identified scatters have conspicu- ously high amounts of artifact fragmentation and it is our suspicion that much of the fragmentation may be associated with cattle that frequent these areas. Indeed, on several occasions we have wit- nessed cattle trampling artifact scatters we have studied. The potential impact of trampling to surface chipped stone assemblages is of considerable con- cern given that such assemblages often represent the primary information we have about past use of semi-arid areas like the Great Plains. Owing to dense grass cover, small windows of visibility (e.g., blow outs, wallows, animal burrows, livestock trails, and paths and roadways) play a primary role as units of discovery and analysis in many Plains contexts. The limited scale and thus limited size of the lithic assemblages documented for these features makes them particularly susceptible to sources of data bias and it is often an evaluation of such remains
-
Upload
un-lincoln -
Category
Documents
-
view
4 -
download
0
Transcript of Fragmentation Resistant Measures of Chipped Stone Abundance and Size: Results of an Experimental...

353
Matthew Douglass and LuAnn Wandsnider Cattle Trampling Impacts on Chipped Stone
Plains Anthropologist, Vol. 57, No. 224, pp. 353–365, 2012
Fragmentation Resistant Measures of Chipped StoneAbundance and Size: Results of an Experimental
Investigation of the Impact of Cattle Trampling onSurface Chipped Stone Scatters
Matthew Douglass and LuAnn WandsniderThis study reports on the execution of a controlled experiment designed to address the impacts of
cattle trampling on surface scatters of chipped stone found in Great Plains contexts. A key focus of theexperiment’s design is an evaluation of the relationship between trampling duration and substratecompaction on the severity of artifact breakage. Results indicate that post-depositional artifact frag-mentation can significantly distort common analytical approaches found within the archaeologicalliterature. Namely, measures of artifact abundance, raw material proportions, and average artifactdimensions are all affected by the impacts of trampling fragmentation. Beyond a consideration of keyvariables in the process of trampling fragmentation and its effects on analysis, this study outlinesanalytical means to identify and control for this bias. Tell-tale indicators of trampling damage aredescribed and prescriptive measures designed to mitigate against the effects of trampling are evaluated.Results indicate that if dealt with appropriately, fragmented assemblages should not to be dismissed asdistorted beyond usefulness, but instead can be utilized to reveal latent information about past humanbehavior.
Keywords: lithic technology, taphonomy
Matthew Douglass, Department of Anthropology, University of Nebraska, 810 Oldfather Hall, P.O. Box880368, Lincoln, NE 68588-0368, [email protected]
LuAnn Wandsnider, Department of Anthropology, University of Nebraska, 810 Oldfather Hall, P.O. Box880368, Lincoln, NE 68588-0368
Recent exploration of chipped stone artifactswithin surface deposits in the Oglala National Grass-lands and Nebraska National Forest (Wandsnideret al. 2008) has brought the effects of taphonomyinto sharp focus. Identified scatters have conspicu-ously high amounts of artifact fragmentation and itis our suspicion that much of the fragmentationmay be associated with cattle that frequent theseareas. Indeed, on several occasions we have wit-nessed cattle trampling artifact scatters we havestudied.
The potential impact of trampling to surface
chipped stone assemblages is of considerable con-cern given that such assemblages often representthe primary information we have about past use ofsemi-arid areas like the Great Plains. Owing to densegrass cover, small windows of visibility (e.g., blowouts, wallows, animal burrows, livestock trails, andpaths and roadways) play a primary role as units ofdiscovery and analysis in many Plains contexts.The limited scale and thus limited size of the lithicassemblages documented for these features makesthem particularly susceptible to sources of databias and it is often an evaluation of such remains

354
PLAINS ANTHROPOLOGIST VOL. 57, NO. 224, 2012
upon which decisions about subsurface testing andmanagement are predicated.
This study, therefore, has two goals. The firstis to experimentally evaluate the impacts of tram-pling fragmentation on the formal characteristicsof surface scatters of chipped stone. In particular,this study evaluates the relationship between arti-fact breakage, trampling duration, and substratecompaction and how this process affects descrip-tive measures commonly reported within the ar-chaeological literature. Results confirm that cattletrampling does indeed cause significant fragmen-tation to lithic remains, and that this can poten-tially bias archaeological interpretation. In particu-lar, we find that the impacts of trampling can greatlycomplicate interpretations of artifact abundance,raw material proportions, and average artifact di-mensions, especially when samples are small. Asecond goal is to explore the analytic means tocorrect or control for the effects of trampling. Weevaluate two measures that have been proposedas resistant to the biasing effects of trampling.
BACKGROUNDPrevious research has examined the effects of
trampling (both human and animal) on replicatedlithic assemblages. The results conclude that bothforms of trampling can produce damage that in manyways mimics deliberate retouch (Flenniken andHaggerty 1979; Gifford-Gonzalez et al. 1985;Knudson 1979; Lopinott and Ray 2007; McBreartyet al. 1998; Tringham et al. 1974), removes traces ofuse-wear (Shea and Klenck 1993), and increasesamounts of artifact breakage (Boot 1987; Osborn etal. 1987; Roney 1977). The effects of trampling dam-age can subsequently affect measures of flake com-pleteness, the proportion of flakes with dorsal cor-tex, and average flake size (Rasic 2004: 132). Fur-thermore, the severity of this modification is owedto a combination of substrate variability and tram-pling time (McBrearty et. al 1998; Nielsen 1991; Pryor1988).
Pryor’s (1988) study is of particular importanceto the experiment reported here. In evaluating theeffects of human trampling, Pryor noted the impor-tance of substrate as a variable influencing the in-teraction between artifacts and trampling. In whathe termed the “Soil Penetrability Loop,” Pryor con-cluded that the degree of penetrability for a given
substrate greatly influenced the overall severity oftrampling damage. He asserted that artifact dam-age on harder, more compact surfaces would begreater than that found on surfaces that were softerand less compact. According to Pryor, this was aresult of substrate penetrability, where softer sedi-ments, with their tendency to cover artifacts, actedto reduce contact between artifacts and the agentof trampling, a finding similar to that of Gifford-Gonzalez et al. (1985).
The study reported here expands animal tram-pling studies in a number of important ways. Thecontrolled nature of the study allows a clear pic-ture of the trampling process in staged intervalswhile expanding understanding of the relationshipbetween sediment compaction and trampling dura-tion on the formation of artifact damage. Beyond ademonstration and evaluation of potential impacts,this study offers an important consideration of theeffect this phenomenon has on interpretation ofpast human behavior. Our focus is specifically de-signed to address a common predicament faced byresearchers in the Plains; how to analyze surfacescatters of chipped stone where high rates of arti-fact breakage point to the effects of post-deposi-tional fragmentation. This issue is not unique tothe Plains, but is also a pervasive problem faced inmany regions of the world where livestock or wildherbivores come in contact with the surface ar-chaeological record. To aid researchers faced withthis situation, we describe a number of commontell-tale signs of trampling damage and outline ananalytical approach for diminishing the biasing ef-fects these impacts have on common measures re-ported in the archaeological literature.
RESEARCH DESIGN AND METHODSIn order to evaluate the effect of cattle tram-
pling on chipped stone, we designed and executeda controlled experiment in which scatters of experi-mentally replicated flakes, situated on substratesvarying in penetrability or consolidation, were trod-den on for varying intervals of time. The experi-ment was completed within a fenced cattle lot atthe Hammons Family Farm in Weeping Water, Ne-braska. The lot had a clayey-loam substrate withroughly level ground and the surface was free ofvegetation and obstructing stones.
Three different experimental stations with dif-

355
Matthew Douglass and LuAnn Wandsnider Cattle Trampling Impacts on Chipped Stone
fering degrees of substrate compaction were se-lected for monitoring the effects of trampling. Tenreadings of substrate compaction, measured inpounds per square inch (psi) with a Lange Pen-etrometer, were averaged for each station yieldinga mean measure of substrate compaction. Scatter 1was placed on a loose, unconsolidated surface withan average compaction of 230 psi. Scatter 2 had amoderately consolidated surface with a mean com-paction of 370 psi, and Scatter 3 was placed on anindurated surface with a substrate compaction of710 psi.
A two-part enclosure constructed of cattlefence was erected to surround the three experimen-tal scatters (Figure 1). The main component of theenclosure consisted of a roughly 2-m wide “alley”that ran a course along all three scatters. The sec-ond part of the enclosure was a small holding penwhere the cattle were kept between tramplingevents. Gates leading into the holding pen wereplaced at either end of the alley forming a continu-ous circuit. Within each scatter location, flakes wereplaced within a 1-x-1- m square, with approximately3 cm between each specimen.
Experimental MaterialsThe experimental assemblages consisted of
213 flakes and flake fragments produced by a vari-ety of different reduction strategies by local flint-knappers. Maximum dimensions weremeasured for all specimens, which werethen ordered into three approximatelyequal groupings and assigned to oneof three experimental assemblages.Each assemblage was composed of 34novaculite specimens and 37 obsidianspecimens.
A coding system based on over-lapping coats of spray paint was de-veloped in order to provide a fractureresistant form of artifact identificationas well as to facilitate the location ofany damage caused through trampling.In this system, each artifact received abase coat on both its dorsal and ven-tral surfaces with one color of spraypaint, and an outer coating on its dor-sal surface with a different color. Eachof the 10 paint colors was assigned a
number from zero to nine and each raw materialtype was assigned a number from one to four (ob-sidian was separated into three categories basedon color). The combination of an artifact’s spraypaint coatings and its material type thus produceda unique three digit identification: stone raw mate-rial types (hundreds); outer paint coating (tens);inner paint coating (ones). This three digit numberwas then written on each flake to assist in the rapididentification of specimens that remained unalteredbetween trampling events.
With this system, an account of new damagecould be recorded for every artifact (and fragmentsthereof) at the end of each interval in theexperiment’s operation (see below). This facilitateda detailed understanding of the relationship be-tween trampling duration and the formation of dam-age for individual artifacts, while simultaneouslydiminishing the chance of observer error as addi-tional measurements were not needed unless a flakereceived new damage.
Experimental ProcedureThe experiment consisted of three separate
trampling events. In Event 1, 20 individual cattlepasses were completed over each of the experi-mental scatters (i.e., one cow walked over each scat-ter 20 times). In Event 2, 40 passes were completedfor a combined total for the first two events of 60
Figure 1. Schematic representation of the experimental cattle enclosure:(a) enclosure gates were opened to create a circuit where cattle were herdedover the experimental scatters; (b) after each trampling event, the gateswere closed. The cattle remained in a holding pen while the experimentalscatters were analyzed.

356
PLAINS ANTHROPOLOGIST VOL. 57, NO. 224, 2012
cattle passes. Eighty passes were completed inEvent 3, for a total of 140 cattle passes at the con-clusion of the trampling experiment.
Each event proceeded in the following man-ner. The gates to the holding pen were opened cre-ating a continuous circuit around which the cattlecould be driven. Five cattle were then herded intothe alley so that they could pass over all three scat-ters, and then walk back into the pen from the otherside. This process continued until the desired num-ber of passes had been completed. At the conclu-sion of each event, the gates were closed and thecattle were once again held within the holding pen.Each experimental artifact was then located, ana-lyzed, and returned to the location from which itwas found. Table 1 provides summary data of theexperimental assemblages by event. The variable“snap” refers to any artifact damage equal to orgreater than 1 cm in the maximum dimension.
RESULTSThe results of this study confirm that tram-
pling fragmentation can be extensive, even afterencounters with the hooves of 20 cattle, and thatvariation in substrate compaction affects the se-verity of this breakage (Table 1). Assemblage char-acteristics after 140 cattle passes illustrate the ex-tent of this impact: Scatter 1 (230 psi) shows theleast impact with .56 snaps per specimen, followedby Scatter 2 (370 psi) with .84 snaps per specimen,and Scatter 3 (710 psi) with 1.09 snaps per speci-men. Mean artifact dimensions for each scatter dem-onstrate a similar relationship. Again from less com-pact to more compact substrate, Scatter 1 sufferedthe smallest reduction (-20.9 percent) in artifactlength (maximum dimension) followed by Scatter 2(-24.8 percent) and Scatter 3 (-31.1 percent). Thesefindings confirm that substrate compaction plays asignificant role in the degree of artifact fragmenta-tion as a result of trampling.
Data from each of the three events make it pos-sible to monitor alterations to the three scatters asthe experiment proceeded (Table 1), allowing anexamination of the relationship between tramplingduration and the severity of trampling damage. Fig-ure 2 depicts the average artifact snap frequencyand average artifact length for each scatter througheach trampling event. This representation of thedata clearly illustrates that artifact breakage in-
creases with continued trampling and, concomi-tantly, mean artifact dimension decreases.
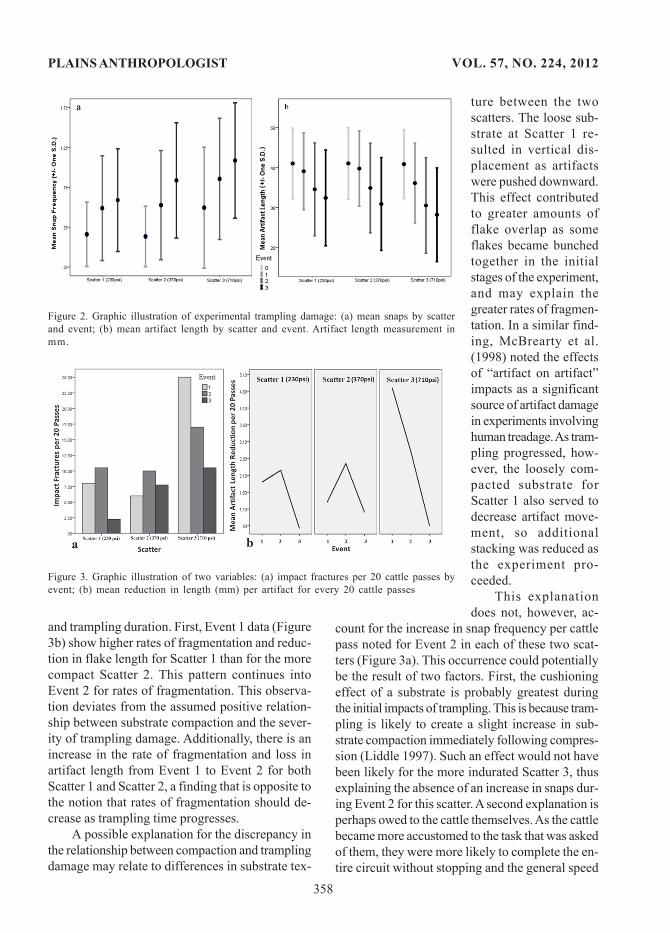
The trends noted for snap frequency and meanspecimen length are not found to be directly pro-portional to the number of cattle passes. Instead,there is a general decrease in the rate with whichalteration occurs as trampling time increases. As aresult, the variables “impact fractures per 20passes” and “mean length reduction per artifactper 20 cattle passes” (measured in mm) were cre-ated to monitor this trend.
The impact fracture variable measures new frac-tures rather than the number of broken edges (mea-sured by the snap variable), and thus provides aclearer indication of the rate of fragmentation. Forinstance, splitting a flake into two separate frag-ments produced two snaps, while a fracture alonga flake’s margin would result in only one snap. Inthe new variable, one new fracture would be re-corded in each of these cases. Furthermore, thisvariable refers only to new damage that occurredduring each trampling event rather than the cumu-lative variable snaps. Finally, in order to make di-rect comparisons of the amount of damage incurredthrough time, the new variable is standardized by20 passes. The mean length reduction per artifactvariable reflects a similar conversion used to moni-tor the decrease in artifact size as measured bymaximum flake dimensions. This variable is alsostandardized by 20 cattle passes.
A graph representation of the new variables(Figure 3) demonstrates that the number of newimpact fractures decreased from Event 2 to Event 3for each scatter and that mean reduction in lengthat the conclusion of the experiment was lower thanthat noted between Events 1 and 2.
These findings mirror those reported by Pryor(1988). To explain this pattern, he suggests that asflakes decrease in size through edge damage, theyapproach a size equilibrium where they become re-sistant to further breakage given substrate com-paction. The results presented here support thisassertion, though this equilibrium had yet to bereached at the conclusion of 140 cattle passes.
Other FindingsThere are a number of peculiar findings that
are at odds with the relationship assumed to existbetween trampling damage, substrate compaction,

357
Matthew Douglass and LuAnn Wandsnider Cattle Trampling Impacts on Chipped StoneTa
ble
1. A
vera
ge E
xper
imen
tal A
rtifa
ct D
imen
sion
and
Sna
p Fr
eque
ncy.
Ban
ded
Obs
idia
nB
lack
Obs
idia
nR
ed O
bsid
ian
Nov
acul
iteTo
tal
EV
EN
T0
12
30
12
30
12
30
12
30
12
3Ex
peri
men
tal
Scat
ter
1N
2121
2628
910
1616
79
1010
3435
3842
7175
9096
LE
N36
.836
.831
.128
.949
.043
.332
.132
.038
.431
.729
.129
.142
.141
.239
.535
.841
.139
.134
.632
.5S.
D.
7.8
7.8
9.8
10.0
7.0
9.1
13.4
13.3
7.8
11.3
12.1
12.1
8.6
9.3
10.3
12.1
8.8
9.6
8.8
12.0
WID
24.0
24.0
21.1
20.2
30.7
27.0
18.7
18.7
19.9
19.0
17.7
17.7
27.3
26.5
25.2
23.3
26.0
25.0
22.0
21.0
S.D
.8.
18.
18.
58.
56.
98.
711
.811
.86.
55.
96.
46.
46.
56.
76.
98.
57.
57.
68.
79.
1T
HK
3.2
3.2
2.9
2.8
5.1
4.9
3.8
3.8
3.9
3.9
3.3
3.3
4.6
4.6
4.4
4.1
4.2
4.2
3.7
3.6
S.D
.1.
11.
11.
21.
23.
43.
43.
03.
02.
21.
71.
91.
91.
71.
71.
82.
02.
02.
02.
02.
0SN
PS-
-10
15-
416
14-
48
8-
410
19-
1244
56Ex
peri
men
tal
Scat
ter
2N
2121
3336
910
1114
77
910
3437
4050
7175
9311
0L
EN
35.9
35.5
28.3
26.0
48.4
46.7
43.2
35.5
39.0
39.0
35.7
32.3
42.8
40.5
37.9
32.9
41.1
39.8
34.9
30.9
S.D
.8.
17.
99.
28.
44.
66.
011
.315
.111
.111
.19.
912
.38.
39.
710
.411
.59.
09.
511
.211
.6W
ID23
.823
.618
.317
.528
.726
.224
.422
.022
.222
.223
.021
.928
.827
.726
.723
.026
.725
.823
.121
.0S.
D.
4.4
4.5
6.6
6.6
8.7
7.8
9.3
9.2
5.1
5.1
6.6
7.1
7.5
7.9
8.4
9.7
7.1
7.0
8.5
8.7
TH
K3.
12.
92.
52.
55.
85.
35.
24.
54.
14.
14.
13.
84.
34.
34.
23.
74.
14.
13.
73.
4S.
D.
1.3
1.3
1.2
1.3
2.2
2.0
2.0
2.2
2.5
2.5
2.3
2.3
2.0
1.9
1.9
2.0
2.0
2.0
2.0
1.9
SNPS
-2
2737
-2
410
--
610
-6
1235
-10
4992
Expe
rim
enta
l Sc
atte
r 3
N21
2340
389
1417
227
88
1134
4246
5671
8711
112
7L
EN
36.1
34.4
25.2
25.0
48.8
38.6
34.5
31.3
39.3
33.9
31.6
24.2
42.1
36.8
33.5
30.0
40.9
36.2
30.6
28.2
S.D
.6.
27.
311
.010
.58.
511
.812
.411
.47.
910
.910
.69.
38.
510
.611
.512
.68.
610
.012
.011
.7W
ID23
.122
.717
.216
.030
.724
.320
.416
.919
.519
.316
.614
.927
.124
.122
.320
.425
.623
.319
.818
.0S.
D.
4.5
5.1
7.6
8.0
8.2
10.0
10.0
8.1
5.4
5.3
4.0
5.4
7.7
8.3
8.3
8.6
7.3
7.7
8.4
8.3
TH
K3.
43.
42.
72.
85.
64.
44.
03.
84.
03.
33.
82.
93.
93.
73.
83.
54.
03.
73.
43.
3S.
D.
1.6
1.5
1.5
1.6
2.9
2.8
2.7
2.4
2.3
2.1
1.9
1.8
1.9
1.8
1.8
2.4
2.0
1.9
1.9
2.2
SNPS
-5
3641
-12
1831
-3
612
-23
3554
-43
9513
8N
ote:
All
mea
sure
men
ts i
n m
illim
eter
s. R
ow h
eadi
ng c
odes
: N
=num
ber
of s
peci
men
s; L
EN=l
engt
h; S
.D.=
stan
dard
dev
iatio
n; W
ID=w
idth
; TH
K=
thic
knes
s;SN
PS=s
naps
(da
mag
e eq
ual
to o
r gr
eate
r th
an 1
cm
in
max
imum
dim
ensi
on).
358
PLAINS ANTHROPOLOGIST VOL. 57, NO. 224, 2012
and trampling duration. First, Event 1 data (Figure3b) show higher rates of fragmentation and reduc-tion in flake length for Scatter 1 than for the morecompact Scatter 2. This pattern continues intoEvent 2 for rates of fragmentation. This observa-tion deviates from the assumed positive relation-ship between substrate compaction and the sever-ity of trampling damage. Additionally, there is anincrease in the rate of fragmentation and loss inartifact length from Event 1 to Event 2 for bothScatter 1 and Scatter 2, a finding that is opposite tothe notion that rates of fragmentation should de-crease as trampling time progresses.
A possible explanation for the discrepancy inthe relationship between compaction and tramplingdamage may relate to differences in substrate tex-
ture between the twoscatters. The loose sub-strate at Scatter 1 re-sulted in vertical dis-placement as artifactswere pushed downward.This effect contributedto greater amounts offlake overlap as someflakes became bunchedtogether in the initialstages of the experiment,and may explain thegreater rates of fragmen-tation. In a similar find-ing, McBrearty et al.(1998) noted the effectsof “artifact on artifact”impacts as a significantsource of artifact damagein experiments involvinghuman treadage. As tram-pling progressed, how-ever, the loosely com-pacted substrate forScatter 1 also served todecrease artifact move-ment, so additionalstacking was reduced asthe experiment pro-ceeded.
This explanationdoes not, however, ac-
count for the increase in snap frequency per cattlepass noted for Event 2 in each of these two scat-ters (Figure 3a). This occurrence could potentiallybe the result of two factors. First, the cushioningeffect of a substrate is probably greatest duringthe initial impacts of trampling. This is because tram-pling is likely to create a slight increase in sub-strate compaction immediately following compres-sion (Liddle 1997). Such an effect would not havebeen likely for the more indurated Scatter 3, thusexplaining the absence of an increase in snaps dur-ing Event 2 for this scatter. A second explanation isperhaps owed to the cattle themselves. As the cattlebecame more accustomed to the task that was askedof them, they were more likely to complete the en-tire circuit without stopping and the general speed
Figure 2. Graphic illustration of experimental trampling damage: (a) mean snaps by scatterand event; (b) mean artifact length by scatter and event. Artifact length measurement inmm.
Figure 3. Graphic illustration of two variables: (a) impact fractures per 20 cattle passes byevent; (b) mean reduction in length (mm) per artifact for every 20 cattle passes

359
Matthew Douglass and LuAnn Wandsnider Cattle Trampling Impacts on Chipped Stone
with which they moved through the enclosure in-creased slightly. This learning process on the partof the cattle is likely to have resulted in a slightincrease in trampling intensity, and could in part beresponsible for the increase in fragmentation fromEvent 1 to Event 2.
These three factors are likely to have resultedin the unusual findings noted for Scatters 1 and 2.The general trend noted by Pryor (1988) in whichthe rate of subsequent damage is likely to decreasewith increased trampling duration, would appear tostill hold for this experiment. The rates of fragmen-tation noted for Event 3, however, suggest that theexperimental scatters may have still been vulner-able to additional trampling damage even after 140cattle passes had been completed.
IMPLICATIONSThe analysis presented here confirms that the
modification of chipped stone assemblages as aresult of cattle trampling is far from negligible. Tram-pling causes severe fragmentation and diminishedartifact size irrespective of substrate compactionand trampling duration. The near ubiquity of cattle(and other sources of impact fragmentation) withinPlains contexts means that impacts are likely wide-spread and likely influence interpretation. The fol-lowing outlines a number of meaningful avenueswith which researchers can identify the presenceof trampling damage and mitigate its effects oninterpretation.
Identification of Trampling DamageBeyond the frequency of artifact breakage,
there are a number of diagnostic traces that arefound on chipped stone artifacts that have beentrampled. A major set of marks are the scuffage,striations, and abrasion tracks that form along aflake’s surface (e.g., Shea and Klenck1993: Fig-ure 8) as a result of artifacts being pushed downagainst the substrate during trampling. Severalresearchers have noted such wear in assem-blages subject to human trampling in both ex-perimental (Bordes 1961; McBrearty et al.1998)and archaeological contexts (Shea and Klenck1993). The results of this experiment indicatethat scuffage is also indicative of cattle tram-pling, having been readily identified on experi-mental artifacts from all substrate compactions.
Trampling also propagates small flake removals—mimicking retouch—that are found along flakeedges and on dorsal ridges. This retouch can beexceedingly small and results in the general blunt-ing of flake edges and dorsal ridges. The fact thatthese breaks also occur on dorsal ridges and areseldom continuous on flake edges makes them atell-tale sign of post-depositional breakage, a con-clusion drawn in other investigations (McBreartyet al. 1998; Odell and Cowan 1987). A final identifiercomes in the form of unique crescent-shaped break-age along flake margins (Figure 4). The unique arch-ing shape of these breaks is unlikely to be createdduring reduction, and is perhaps owed to the shapeand hardness of the trampler’s hooves.
Effects on InterpretationIn order to address the effects of trampling
damage on the interpretation of lithic assemblagepatterning, we now turn to an evaluation of thecharacteristics of the three experimental assem-blages as they changed throughout the experiment.The similarity in assemblage composition (Table 1)is of great value in its ability to shed light on anappropriate methodology for mitigating the effectsof prolonged trampling. By monitoring the effec-tiveness of a variety of common analytical proce-dures, these data comment on the most appropri-ate analytic techniques.
Assemblage SizeEven the most basic of lithic analyses includes
Figure 4. Crescent-shaped fragmentation.

360
PLAINS ANTHROPOLOGIST VOL. 57, NO. 224, 2012
an estimate of artifact abundance. It is this estimatethat forms the basis from which are derived sum-mary measures such as relative raw material fre-quencies, tool proportions, and artifact density.Within the discipline, however, there is no one pre-ferred technique for such descriptions, and more-over, not all techniques are robust enough to notbe heavily affected by taphonomic processes.
The simplest approach is to report the fre-quency of all lithic artifacts within an assemblageregardless of completeness. The result is a descrip-tion of the number of artifactual specimens (NAS),which is an equivalent to the number of individualspecimens (NISP) used in faunal analysis. An alter-native is to limit estimates only to complete arti-facts, including both unretouched flakes and tools.A number of more complex and seemingly morerobust measures rely on the ordering of flakes andflake fragments into categories based on readilyidentifiable landmarks. One approach relies on theminimum number of impacts (MNI), calculated bycounting all platform-bearing specimens (completeflakes and proximal fragments) within an assem-blage. Because all flakes will contain a point of frac-ture initiation, it is assumed that an inventory ofthe total number of initiations will result in a mea-sure of the total number of flakes withinan assemblage. In practice, however,there are instances in which counts ofcomplete flakes and proximal fragmentswill underestimate true values (e.g.,obliterated platforms and the vagariesof archaeological sampling).
In an effort to avoid this effect,Hiscock (2002) developed an estimatefor the minimum number of flakes(MNF), which includes the use of dis-tal and longitudinal fragments. Longi-tudinal fragment are flake fragmentsthat are formed as a result of fracturealong the axis of percussion duringflake formation (Figure 5). These frag-ments retain both a portion of the plat-form and a portion of the terminationand are divided into split right and splitleft longitudinal portions. These twolongitudinal fragment types can sub-sequently be transversely fracturedinto proximal and distal portions, thus
adding additional variability to the entire suite offragment types. The computation of MNF is orga-nized into the equation:
MNF = C + T + L,where C represents the number of complete flakes;T represents the greater of either proximal or distalfragments; and, L is the sum of the greater of eitherleft or right complete longitudinal fragments plusthe greater of the four transversely fractured longi-tudinal fragments.
MNF was measured in this experiment, how-ever, with modification so as to include an addi-tional flake fragment type not recorded in Hiscock’staxonomy. This fragment type retains the fractureinitiation along with either the right or left intersec-tion of the flake termination and lateral margin andis labeled proximal distal left (PDL) or proximal dis-tal right (PDR; Figure 5). This fragment type is adirect result of trampling damage where a portionof the flake termination has been snapped off. Theapplication of MNF presented here allows thesefragments to be counted as either proximal frag-ments or distal portions within the MNF equation.
Results from the experiment, presented in Table2, show the effects of trampling on the variousmeasures of artifact frequency. The instability of
Figure 5. Fragment taxonomy utilized in generating MNI (minimum num-ber of impacts) and MNF (minimum number of flakes) estimates.

361
Matthew Douglass and LuAnn Wandsnider Cattle Trampling Impacts on Chipped StoneTa
ble
2. N
AS,
MN
I, M
NF,
and
Com
plet
e Fl
akes
.
Ban
ded
Obs
idia
nB
lack
Obs
idia
nR
ed O
bsid
ian
Nov
acul
iteTo
tal
EVEN
T0
12
30
12
30
12
30
12
30
12
3Ex
perim
enta
l Sca
tter 1
NA
S21
2126
289
1016
167
910
1034
3538
4271
7590
96M
NI
1717
1615
87
77
55
55
2828
2828
5857
5655
MN
F21
2121
218
88
86
66
633
3333
3368
6868
68C
ompl
ete
1717
1311
76
44
44
44
2726
2522
5553
4641
Expe
rimen
tal S
catte
r 2N
AS
2121
3336
910
1114
77
910
3437
4050
7175
9311
0M
NI
1616
1616
88
88
66
66
2424
2423
5454
5454
MN
F20
1919
188
88
87
77
730
3030
3065
6464
63C
ompl
ete
1514
97
77
65
66
55
2018
1713
4845
3730
Expe
rimen
tal S
catte
r 3N
AS
2123
4038
914
1722
78
811
3442
4656
7187
111
127
MN
I17
1717
174
44
45
55
521
2121
2147
4747
47M
NF
2020
1919
88
88
66
66
3131
3030
6565
6363
Com
plet
e16
1412
104
22
25
44
319
1713
1244
3731
27N
ote:
Row
-hea
ding
cod
es—
NA
S=nu
mbe
r of a
rtifa
ctua
l spe
cim
ens;
MN
I=m
inim
um n
umbe
r of i
mpa
cts;
MN
F=m
inim
um n
umbe
r of f
lake
s.

362
PLAINS ANTHROPOLOGIST VOL. 57, NO. 224, 2012
specimen and complete artifact counts is clearlyindicted. Trampling fragmentation increases totalartifacts and therefore measures of NAS while de-creasing the number of complete specimens. Theseverity of these effects is further influenced bydifferences in substrate compaction. Calculatedmeasures of MNI and the MNF, on the other hand,show stability even through numerous tramplingevents. On average, MNI estimates of abundancedecreased by only 1.89 percent and MNF estimatesdecreased by only 1.99 percent. This would sug-gest that both of these measures provide very stableestimates of assemblage abundance even whenfragmentation is severe. While MNI is easier toestimate, for assemblages in which the ratio of plat-form-bearing specimens to termination-bearingspecimens results in a value less than one, MNFwill provide an estimate that is closer to true as-semblage abundance. Differences between the per-formance of the two estimates become less signifi-cant once assemblage size increases, but are im-portant when samples are small, meaning the addedmeasurements required for an estimate of MNF arelikely justified where limitations in surface expo-sure preclude the analysis of large assemblages.
The variable performance of the different esti-mates of assemblage size also affects interpreta-tion of relative raw material proportions. Becausefiner-grained materials are more prone to fragmen-tation, they are likely to be overrepresented in rela-tion to more durable materials based on artifactcounts alone. Relative raw material proportionsbased on NAS can thus dramatically inflate theperceived utilization of high-quality materials whilematerial proportions based on complete flakeswould have the opposite effect. The stability ofMNI and MNF, therefore, makes them a more ap-propriate measure of relative raw material propor-tions for assemblages affected by fragmentation.
Finally, the different measures of artifact abun-dance can be used to assess the integrity of as-semblage contents. The ratio of NAS to MNF pro-vides a measure of the number of fragments pro-duced for each flake, in effect providing a measureof the potential for fragmentation to bias measuresof artifact composition.
Artifact SizeAnother important measure of assemblage
variability is average artifact size. As noted, suchmeasures are greatly affected by the impacts oftrampling. Several authors have noted the occur-rence of significant amounts of fragmentation withintheir assemblages and have offered means of over-coming bias in estimates of artifact size.
Roth (1995), when analyzing assemblages insouthern Arizona, noted severe breakage, much ofit likely the result of cattle trampling. To gain anestimate of premodification artifact size, she reliedon measurements obtained from the remaining com-plete flakes, but noted the possibility that suchestimates were skewed towards larger size classes.Similarly, Baumler and Speth (1993) reported on aMiddle Paleolithic cave assemblage in Iran in which40 percent of the unretouched flakes were broken.They too relied on the use of complete flake esti-mates for measures of artifact size.
The experimental assemblages provide an op-portunity to test the reliability of this approach.Measurements of length, width, and thickness forcomplete flakes in the experimental assemblagesare presented in Table 3. Results obtained through-out the experiment’s completion indicate that aver-age dimensions do change with increased tram-pling, but they are a considerable improvement overthe dimensions gained from comparisons of allspecimens regardless of completeness (Figure 2b).These findings suggest that descriptions of meanartifact size within chipped stone assemblages thatare measured on complete flakes are in many re-spects resistant to the effects of trampling damage.As a qualification, however, the degree of assem-blage completeness (C:MNF) should be reportedwith these values in instances where fragmenta-tion rates are high along with the caveat that thehigh degree of fragmentation may affect the accu-racy of the results. For instance, of the differentvalues obtained at the completion of the experi-ment, the .25 ratio for black obsidian in Scatter 3 isthe lowest (Table 2). This would suggest that thereis considerable potential for bias to exist in mea-surements of complete flakes for these materials inScatter 3. The .71 value for Scatter 2 red obsidian is,however, the highest proportion recorded for anymaterial within the experimental assemblages (Table2). This would suggest that measurements madeon complete flakes from this material type in Scat-

363
Matthew Douglass and LuAnn Wandsnider Cattle Trampling Impacts on Chipped StoneTa
ble
3. D
imen
sion
s of
Com
plet
e Fl
akes
fro
m E
xper
imen
tal S
catte
rs.
Ban
ded
Obs
idia
nB
lack
Obs
idia
nR
ed O
bsid
ian
Nov
acul
iteTo
tal
EV
EN
T0
12
30
12
30
12
30
12
30
12
3Ex
peri
men
tal
Scat
ter
1N
1717
1311
76
44
44
44
2726
2522
5553
4641
LE
N36
.836
.834
.633
.848
.647
.247
.547
.541
.541
.541
.541
.543
4343
.641
.741
.741
.441
.240
.2S.
D.
7.2
7.2
5.1
4.6
5.9
5.1
5.9
5.9
9.3
9.3
9.3
9.3
9.2
9.3
98.
58.
98.
88.
88.
7W
ID24
2423
.523
.530
.731
.833
.833
.821
.321
.321
.321
.327
.326
.927
27.3
26.3
26.1
26.1
26.2
S.D
.7.
47.
46.
16.
77.
17.
17.
97.
98.
88.
88.
88.
86.
46.
56.
66.
47.
27.
37.
27.
2T
HK
3.2
3.2
3.4
3.3
5.4
5.6
7.2
7.2
4.7
4.7
4.7
4.7
4.7
4.7
4.8
4.9
4.3
4.4
4.6
4.5
S.D
.1.
11.
11
13.
94.
24.
34.
32.
42.
42.
42.
41.
81.
81.
81.
92.
12.
22.
22.
2Ex
peri
men
tal
Scat
ter
2N
1514
97
77
65
66
55
2018
1713
4845
3730
LE
N36
.937
.236
.233
.847
.747
.747
.148
39.8
39.8
37.9
36.7
44.2
44.2
43.3
43.1
41.9
44.2
41.5
40.7
S.D
.8.
58.
89.
65.
14.
64.
64.
74.
611
.911
.912
.413
.88
8.3
8.3
7.8
99.
19.
39.
3W
ID23
.623
.823
22.6
26.1
26.1
27.7
28.4
22.3
22.3
21.9
21.8
29.5
29.5
29.9
29.6
26.3
26.2
26.8
26.5
S.D
.4.
64.
74.
34.
87.
27.
26.
36.
85.
65.
66.
26.
37.
78.
28.
28.
57
7.2
7.4
7.7
TH
K3.
33.
23.
33.
65.
25.
25.
45.
94.
14.
34.
74.
84.
14.
24.
24.
74
44.
34.
7S.
D.
1.2
1.3
1.5
1.5
2.1
2.1
2.1
2.1
2.8
2.9
3.1
31.
61.
61.
61.
51.
81.
92
2Ex
peri
men
tal
Scat
ter
3N
1614
1210
42
22
54
43
1917
1312
4437
3127
LE
N35
.335
.335
.334
.945
.841
4141
40.2
38.8
34.3
26.3
4442
.442
.442
.240
.539
.238
.537
.6S.
D.
5.2
5.1
5.5
5.2
5.9
2.8
2.8
2.8
77.
28.
91.
58.
68.
79.
19.
58.
17.
68.
18.
7W
ID22
.322
22.6
22.1
27.8
22.3
22.3
22.3
19.6
20.9
17.5
20.1
30.1
30.1
30.2
30.9
25.9
25.6
25.1
25.8
S.D
.3.
73.
73.
54.
88
.3.3
.35.
55.
24.
94.
47.
37.
57.
67.
57.
27.
17.
27.
4T
HK
3.3
3.1
3.2
3.4
4.9
6.2
6.2
6.2
3.8
3.3
3.9
3.2
4.3
4.4
4.1
4.3
3.9
3.9
3.9
4S.
D.
1.8
.81.
11.
5.3
.3.3
2.1
21.
81.
22.
32.
42.
12.
11.
81.
91.
71.
7N
ote:
All
mea
sure
men
ts i
n m
m.
Row
-hea
ding
cod
es—
Num
ber
of s
peci
men
s; L
EN=l
engt
h; S
.D.=
stan
dard
dev
iatio
n; W
ID=w
idth
; TH
K=
thic
knes
s.

364
PLAINS ANTHROPOLOGIST VOL. 57, NO. 224, 2012
ter 2 are likely to be fairlyrepresentative of thelarger assemblage.
For description ofmean artifact thicknesswhere fragmentation ishigh, calculations shouldinclude thickness mea-sures of both completeflakes and proximal frag-ments. Table 2 demon-strates the general trendwhere increased frag-mentation results in anincrease in average com-plete flake thickness.When complete flakes and proximal fragments arecombined this effect is diminished (Figure 6). Al-though values fluctuate, they are less prone to over-estimation than measures of complete flakes alone.Because of this, a combination of complete flakesand proximal fragments is a better representationof mean flake thickness when fragmentation is se-vere.
CONCLUSIONThe results of this study support the follow-
ing conclusions: (1) trampling does result in con-siderable modification to chipped stone assem-blages; (2) this damage both inflates assemblagesize and deflates mean specimen size; and, (3) thereis a positive relationship between both substratecompaction and the severity of trampling damageas well as between trampling time and the degree oftrampling alteration. These factors are likely to havea significant effect on interpretations of artifactabundance, raw material proportions, and meanspecimen size unless corrective measures are taken.Minimum flake estimates (MNI and MNF) are likelyto provide a better estimation of assemblage sizeand true material proportions than do simple countsof artifacts or complete flake frequencies. Addition-ally, mean flake size can be reasonably measuredby limiting measures of length and width to com-plete flakes, and by limiting flake thickness mea-sures to complete flakes and proximal fragments.These measures, however, need qualification whenfragmentation is high.
These techniques warrant further research. In
retrospect, the flakes used for this study have littlein the way of primary reduction. This has resultedin a great deal of uniformity in terms of flake thick-ness. Additionally, the average durability of theraw materials used for this study is quite low. Hadthe experimental assemblage been composed of amore diverse range of artifacts and material types,the results of this study may have been slightlydifferent. It is unlikely that the overall utility of thesemethods would have been diminished, but greatervariety in artifact form and material durability mayhave more thoroughly demonstrated the differen-tial effects of the trampling process. Future researchon the effects of fragmentation on assemblage sizeand material proportions can further evaluate thesetechniques.
While this study has focused on the impactsof cattle trampling on the Great Plains, there are amultitude of other agents that may have similar ef-fects on surface scatters of chipped stone aroundthe world. When confronted with chipped stoneassemblages that have been exposed to fragmen-tation, no matter the agent, identification of theparticular cause of the fragmentation is not the onlygoal. In addition, deploying appropriate analyticprotocols can go a long way towards mitigatingthe effects of these alterations. The primary signifi-cance of this study is not simply greater insightinto the effects of cattle trampling, but also includesthe realization that, if dealt with appropriately, frag-mented assemblages should not to be dismissedas distorted beyond usefulness. Rather, they re-
Figure 6. Thickness (mm) error bars: (a) complete flakes; (b) complete flake and proximalfragments.

365
Matthew Douglass and LuAnn Wandsnider Cattle Trampling Impacts on Chipped Stone
quire special treatment to reveal the latent informa-tion in them about past human behavior.
ACKNOWLEDGMENTSWe would like to thank the Hammons family for
allowing the completion of this work on their farm.Execution of the experiment would not have happenedwithout the help of Ben Koziol, Matthew Dooley, andMike Hammons. Simon Holdaway and Sam Lin haveprovided comments on earlier drafts of this paper. Thisresearch has been funded by a grant from the University ofNebraska Center for Great Plains Studies.
REFERENCES CITEDBaumler, Mark. F., and John D. Speth
1993 The Middle Paleolithic Assemblage from KunjiCave, Iran. In The Paleolithic Prehistory of theZagros-Taurus, edited by D. I. Olszewski and H. L.Dibble, pp. 3–74. The University Museum ofArchaeology and Anthropology, University ofPennsylvania, Philadelphia.
Boot, Phillip1987 Trampling Damage on Stone Artefacts - Some
Experimental Results. Australian Archaeology 24:10–15.
Bordes, Francois1961 Typologie du Paléolithique ancien et moyen.
Delmas, Publications de l’Institut de Préhistoire del’Université de Bordeaux, Bordeaux, France.
Flenniken, James, and Jeffrey Haggerty1979 Trampling as an Agency in the Formation of Edge
Damage: An Experiment in Lithic Technology.Northwest Anthropological Research Notes 13:208–214.
Gifford-Gonzalez, Diane P., David B. Damrosch, Debra R.Damrosh, John H. Pryor, and Robert L. Thunen
1985 The Third Dimension in Site Structure: AnExperiment in Trampling and Vertical Dispersal.American Antiquity 50:803–818.
Hiscock, Peter2002 Quantifying the Size of Artefact Assemblages.
Journal of Archaeological Science 29:251–258.Knudson, Ruthann
1979 Inference and Imposition in Lithic Analysis. InLithic Use-Wear Analysis, edited by Bryan Hayden,pp. 269–281. Academic Press, New York.
Liddle, Michael1997 Recreation Ecology: The Ecological Impact of
Outdoor Recreation and Ecotourism. Chapman andHall, New York.
Lopinot, Neal H., and Jack H. Ray2007 Trampling Experiments in the Search for the
Earliest Americans. American Antiquity 72: 771–782.McBrearty, Sally, Laura Bishop, Thomas Plummer, Robert
Dewar, and Nicholas Conrad1998 Tools Underfoot: Human Trampling as an Agent
of Lithic Artifact Edge Modification. AmericanAntiquity 63:108–129.
Nielsen, Axel E.1991 Trampling the Archaeological Record: An
Experimental Study. American Antiquity 56: 483–503.
Odell, George, and Frank Cowan1987 Estimating Tillage Effects on Artifact Distribution.
American Antiquity 52:456–484.Osborn, Alan, Susan Vetter, Ralph Hartley, L. Walsh, and J.
Brown1987 Impacts of Domestic Livestock Grazing on the
Archaeological Resources of Capitol Reef NationalPark, Utah. Occasional Studies in Anthropology No.20, Midwest Archaeological Center, Lincoln,Nebraska.
Pryor, John H.1988 The Effects of Human Trample Damage on Lithics:
A Consideration of Crucial Variables. Lithic Technology17:45–50.
Rasic, Jeffrey2004 Debitage Taphonomy. Aggregate Analysis in
Chipped Stone, edited by Christopher T. Hall andMary Lou Larson, pp. 112–138. The University ofUtah Press, Salt Lake City.
Roney, John1977 Livestock and Lithics: Effects of Trampling.
Manuscript on file, Bureau of Land Management,Nevada State Office, Reno.
Roth, Barbara J.1995 Late Archaic Occupation of the Upper Bajada:
Excavations at AZ AA:12:84 (ASM), Tucson Basin.Kiva 61:189–206
Shea John, and Joel Klenck1993 An Experimental Investigation of the Effects of
Trampling on the Results of Lithic MicrowearAnalysis. Journal of Archaeological Science 20:175–194.
Tringham, Ruth, Glenn Cooper, George Odell, BarbaraVoytek, and Anne Whitman
1974 Experimental in the Formation of Edge Damage:A New Approach to Lithic Analysis. Journal of FieldArchaeology 1:171–196.
Wandsnider, LuAnn, Elisha A. Mackling, and Matthew J.Douglass.
2008 Cultural Resources Inventory for the Ash Creekand Roundtop Hazardous Fuels Reduction ProjectAreas of the Nebraska National Forest, Dawes andSioux County, Nebraska. Submitted to USDA ForestService. Copies available from Nebraska NationalForest, Chadron, Nebraska.

366
PLAINS ANTHROPOLOGIST VOL. 57, NO. 224, 2012