Contribution of Non-Timber Forest Products in Rural ... - CORE
Upload
khangminh22Category
view
1download
0
Geneva, 2021
Forest Products Annual Market Review 2020-2021

ii
UNECE/FAO Forest Products Annual Market Review, 2020-2021
COPYRIGHT AND DISCLAIMER
Copyright © 2021 United Nations and the Food and Agriculture Organization of the United Nations.
All rights reserved worldwide.
The designations employed in publications of the United Nations Economic Commission for Europe (UNECE) and the Food and Agriculture Organization of the United Nations (FAO), which are in conformity with United Nations practice, and the presentation of material therein do not imply the expression of any opinion whatsoever on the part of UNECE or FAO concerning the legal status of any country, area or territory or of its authorities, or concerning the delimitation of its frontiers. The responsibility for opinions expressed in studies and other contributions rests solely with their authors, and publication does not constitute an endorsement by UNECE or FAO of the opinions expressed. Reference to names of firms and commercial products and processes, whether or not these have been patented, does not imply their endorsement by UNECE or FAO, and any failure to mention a particular firm, commercial product or process is not a sign of disapproval.
This work is copublished by the United Nations (UNECE) and FAO.
ABSTRACT
The Forest Products Annual Market Review 2020-2021 provides a comprehensive analysis of markets in the UNECE region and reports on the main market influences beyond the region. It covers products from the forest to the end user and from roundwood and primary processed products to value-added, housing and wood energy. Statistics-based chapters analyse the markets for wood raw materials, sawnwood, wood-based panels, paper, paperboard and woodpulp. Underlying the analysis is a comprehensive collection of data. The Review highlights the role of sustainable forest products in international markets, discusses policies concerning forests and forest products, assesses the main trends and drivers, and analyses the effects of the current economic situation on forest product markets.
ECE/TIM/SP/52
UNITED NATIONS PUBLICATION
Sales No. E.22.II.E.2
ISBN 978-92-1-117279-9
eISBN 978-92-1-001047-4
ISSN 1020-2269
eISSN 2518-6450

iii
Foreword
The COVID-19 pandemic brought great uncertainty to forest product markets in the UNECE region in 2020, and both production and consumption were subject to rapid and extreme fluctuations. By the end of the year, however, there had been only a slight overall contraction in the sector, which turned out to be an above-average performer compared with other economic segments. This good news for forest products has continued into 2021.
Another encouraging development in 2020 was the opportunity for people to gain a greater appreciation of forests and their diverse roles and benefits. With widespread lockdowns in the UNECE region and the temporary closure of many urban facilities, people spent much more time than usual in their nearby forests and woodlands. For many, experiencing nature and rediscovering forests and their possibilities has been one of the most positive effects of the pandemic.
Forests are both a source of well-being and a provider of livelihoods, and the forest sector continues to sustainably manage and harvest its resource across the UNECE region. Most forestry operations in the region strike a daily balance between economic, social and environmental demands to ensure maximum benefits for society and minimum impacts on forest ecosystems. Thus, the UNECE region is the world leader – by far – in the area of forests certified as sustainably managed.
Pandemic-related lockdown measures meant that people spent less money on travel and leisure activities and therefore had more money at their disposal. Many took the opportunity for do-it-yourself remodelling and repairs in their homes, including home offices, and the construction sector also performed strongly. Demand for wood products, therefore, recovered quickly after the first quarter of 2020, particularly for sawnwood and structural panels, and increasingly exceeded supply.
The positive upward trajectory continued into 2021, with higher-than-expected demand. This, paired with depleted inventories and a slow supply, led to higher prices, including record highs for certain types of panels and for sawn softwood. The upward price rise had come to an end by mid-2021, however.
As reported in this edition of the Forest Products Annual Market Review, innovative and future-oriented wood products are emerging and gaining traction in the region, from wood-based fibres for sustainable clothing to new building materials, such as cross-laminated timber. Nevertheless, the potential of such products remains barely tapped.
The Review assesses the extraordinary movements in forest product markets in 2020 – the turbulent first year of the COVID-19 pandemic – and the first half of 2021. Now, as the world adjusts to the pandemic and forest product markets and outlets stabilize, the opportunity exists to place much more emphasis on the forest sector as a means for building back better – and greener.
The Review provides important information for assessing progress towards the achievement of several of the UN’s Sustainable Development Goals, including goals 15, “life on land” (chapter 2); 12, “responsible consumption and production” (all chapters but particularly chapter 5); 7, “affordable and clean energy” (chapter 6); and 13, “climate action” (all chapters).
As always, the Review has benefited from the inputs of a group of leading experts and authors, who combined their own market intelligence and knowledge with data gathered by the UNECE and FAO. We thank them all.
FOREWORD
Vladimir RAKHMANIN
Assistant Director-General,
Regional Representative for Europe and Central Asia of the Food and Agriculture Organization of the United Nations
Olga ALGAYEROVA
Under-Secretary-General of the United Nations,
Executive Secretary of the United Nations Economic Commission for Europe

iv
UNECE/FAO Forest Products Annual Market Review, 2020-2021
CONTENTS
Economic overview and policies .................................................................................................. 1Economic developments and the pandemic response in the UNECE region .....................................................................................................................2Construction in the UNECE region, with a focus on housing .........................................................................................................................................................3Policy and regulatory developments .............................................................................................................................................................................................................6Certified forests and products ............................................................................................................................................................................................................................9Summary of regional and subregional markets ...................................................................................................................................................................................10
Wood raw materials ......................................................................................................................12Europe ............................................................................................................................................................................................................................................................................14Eastern Europe, Caucasus and Central Asia ............................................................................................................................................................................................16North America ...........................................................................................................................................................................................................................................................17Extraregional influences on the UNECE ....................................................................................................................................................................................................19UNECE subregional data summary and forecast .................................................................................................................................................................................20
Sawnwood ......................................................................................................................................22Europe ............................................................................................................................................................................................................................................................................24Eastern Europe, Caucasus and Central Asia ............................................................................................................................................................................................26North America ...........................................................................................................................................................................................................................................................27Extraregional influences on the UNECE ....................................................................................................................................................................................................30UNECE subregional data summary and forecast .................................................................................................................................................................................31
Wood-based panels......................................................................................................................34Europe ............................................................................................................................................................................................................................................................................36Eastern Europe, Caucasus and Central Asia ............................................................................................................................................................................................37North America ...........................................................................................................................................................................................................................................................38Extraregional influences on the UNECE ....................................................................................................................................................................................................40UNECE subregional data summary and forecast .................................................................................................................................................................................41
Pulp and paper ...............................................................................................................................44Europe ............................................................................................................................................................................................................................................................................46Eastern Europe, Caucasus and Central Asia ............................................................................................................................................................................................47North America ...........................................................................................................................................................................................................................................................48Extraregional influences on the UNECE ....................................................................................................................................................................................................50UNECE subregional data summary and forecast .................................................................................................................................................................................51
1
2
3
4
5
ACKNOWLEDGEMENTS ...................................................................................................................................................................................................................................... viiiCONTRIBUTORS TO THE PUBLICATION .........................................................................................................................................................................................................ixSTATISTICAL CORRESPONDENTS ....................................................................................................................................................................................................................... xDATA SOURCES ...........................................................................................................................................................................................................................................................xiEXPLANATORY NOTES.............................................................................................................................................................................................................................................xiACRONYMS, ABBREVIATIONS AND SYMBOLS .........................................................................................................................................................................................xii

v
Contents
Wood energy ..................................................................................................................................54Europe ............................................................................................................................................................................................................................................................................56Eastern Europe, Caucasus and Central Asia ............................................................................................................................................................................................58North America ...........................................................................................................................................................................................................................................................59Extraregional influences on the UNECE ....................................................................................................................................................................................................60UNECE subregional data summary and forecast .................................................................................................................................................................................61
Value-added wood products ......................................................................................................64Furniture ........................................................................................................................................................................................................................................................................66Builders’ joinery and carpentry, and profiled wood ...........................................................................................................................................................................67Engineered wood products ..............................................................................................................................................................................................................................69
References.....................................................................................................................................72
Annexes ........................................................................................................................................74
6
7

vi
UNECE/FAO Forest Products Annual Market Review, 2020-2021
LIST OF TABLES
LIST OF GRAPHS
TABLE 1.1 Construction spending forecast, Euroconstruct region, 2021-2023 ...................................................................................................................... 4TABLE 1.2 Construction of new dwellings and floor area, EECCA other than the Russian Federation, 2019-2020 .......................................... 5TABLE 1.3 Apparent consumption of industrial roundwood, sawnwood, wood-based panels, and paper and paperboard,
UNECE region by subregion, 2016-2020 ...............................................................................................................................................................................11TABLE 2.1 Top five intra-European trade flows of coniferous industrial roundwood, 2020 ..........................................................................................15TABLE 2.2 Top ten industrial roundwood exporters worldwide, 2020.......................................................................................................................................19TABLE 2.3 Top ten extraregional industrial roundwood importers, 2020 ................................................................................................................................20TABLE 2.4 Industrial roundwood production, imports, exports, net apparent consumption and unit value, UNECE subregions,
2016-2020 .................................................................................................................................................................................................................................................21TABLE 3.1 Top ten extraregional sawnwood importers, 2020 .........................................................................................................................................................30TABLE 3.2 Top ten sawnwood exporters globally, 2020......................................................................................................................................................................30TABLE 3.3 Sawnwood production, imports, exports, net apparent consumption and traded unit value, UNECE subregions,
2016-2020 .................................................................................................................................................................................................................................................32TABLE 4.1 Top ten extraregional wood-based panel importers, 2020 .......................................................................................................................................41TABLE 4.2 Top ten wood-based panel exporters globally, 2019 ....................................................................................................................................................41TABLE 4.3 Wood-based panels production, imports, exports, net apparent consumption and traded unit value, UNECE
subregions, 2016-2020 .....................................................................................................................................................................................................................42TABLE 5.1 Top ten extraregional woodpulp and paper importers, 2020 .................................................................................................................................51TABLE 5.2 Top ten woodpulp and paper exporters worldwide, 2020........................................................................................................................................51TABLE 5.3 Woodpulp and paper production, imports, exports, apparent consumption and unit values, UNECE subregions,
2016-2020 .................................................................................................................................................................................................................................................52TABLE 6.1 Global top ten wood fuel and wood pellet exporters, 2020 ....................................................................................................................................61TABLE 6.2 Top wood fuel and wood pellet importers outside the UNECE region, 2020................................................................................................61TABLE 6.3 Wood fuel and wood pellets production, imports, exports, net apparent consumption and traded unit value,
UNECE subregions, 2016-2020 ....................................................................................................................................................................................................62TABLE 7.1 Value of wooden furniture imports, and market share of supplying regions, top five importing countries,
2019-2020 .................................................................................................................................................................................................................................................66TABLE 7.2 Value of builders’ joinery and carpentry imports, and market share of supplying regions, top five importing
countries, 2019-2020 .........................................................................................................................................................................................................................67TABLE 7.3 Value of profiled-wood imports, and market share of supplying regions, top five importing countries, 2019-2020 ...........68TABLE 7.4 Glulam production and consumption, North America, 2019-2021 .....................................................................................................................69TABLE 7.5 Laminated veneer lumber consumption and production in North America, 2019-2021 ......................................................................70TABLE 7.6 Estimated CLT production capacity for structural applications of North American manufacturers, 2020 ..................................71
GRAPH 1.1 Major currencies used to trade forest products, indexed against the US dollar, January 2020-April 2021 ................................... 3GRAPH 1.2 Building permits, starts and completions, Euroconstruct region, 2002-2023 .................................................................................................. 4GRAPH 1.3 United States housing permits, starts and completions, 2011-2021 ..................................................................................................................... 5GRAPH 1.4 FSC- and PEFC-certified forest area, 2013-2020 ................................................................................................................................................................10GRAPH 2.1 Europe: Coniferous industrial roundwood production, trade and consumption, 2016-2020 .............................................................14GRAPH 2.2 Europe: Industrial non-coniferous roundwood production, trade and consumption, 2016-2020 ..................................................14GRAPH 2.3 Europe: Traded industrial roundwood unit value, 2016-2020 ..................................................................................................................................15GRAPH 2.4 European Quarterly Sawlog Price Index, 1999-2021 ......................................................................................................................................................15GRAPH 2.5 EECCA: Coniferous industrial roundwood production, trade and consumption, 2016-2020 ..............................................................16GRAPH 2.6 EECCA: Industrial non-coniferous roundwood production, trade and consumption, 2016-2020 ....................................................16GRAPH 2.7 EECCA: Traded industrial roundwood unit value, 2016-2020 ...................................................................................................................................17

vii
Contents
GRAPH 2.8 North America: Coniferous industrial roundwood production, trade and consumption, 2016-2020 ............................................17GRAPH 2.9 North America: Non-coniferous industrial roundwood production, trade and consumption, 2016-2020 .................................18GRAPH 2.10 North America: Traded industrial roundwood unit values, 2016-2020 ..............................................................................................................18GRAPH 2.11 Sawlog price indices for North America, 2011-2021 .....................................................................................................................................................18GRAPH 3.1 Europe: Sawn softwood production, trade and consumption, 2016-2020 .....................................................................................................24GRAPH 3.2 Europe: Change in sawn softwood consumption, by country, 2019-2020 .....................................................................................................24GRAPH 3.3 Europe: Sawn hardwood production, trade and consumption, 2016-2020 ...................................................................................................25GRAPH 3.4 Europe: Traded sawnwood unit value, 2016-2020 ..........................................................................................................................................................25GRAPH 3.5 EECCA: Sawn softwood production, trade and consumption, 2016-2020 ......................................................................................................26GRAPH 3.6 EECCA: Sawn hardwood production, trade and consumption, 2016-2020 ....................................................................................................26GRAPH 3.7 EECCA: Traded sawnwood unit value, 2016-2020 ...........................................................................................................................................................27GRAPH 3.8 Quarterly prices for sawn softwood in China, Europe, Japan and the United States, 2010-June 2021..........................................27GRAPH 3.9 North America: Sawn softwood production, trade and consumption, 2016-2020....................................................................................28GRAPH 3.10 North America: Traded sawnwood unit value, 2016-2020 .........................................................................................................................................28GRAPH 3.11 North America: Sawn hardwood production, trade and consumption, 2016-2020 ..................................................................................29GRAPH 3.12 Price indices for sawn hardwood products in the United States, first-half 2004 to first-half 2021 ...................................................30GRAPH 4.1 Europe: Structural panels production, trade and consumption, 2016-2020 ..................................................................................................36GRAPH 4.2 Europe: Non-structural panels production, trade and consumption, 2016-2020 .......................................................................................36GRAPH 4.3 Europe: Traded wood-based panels unit values, 2016-2020 ....................................................................................................................................37GRAPH 4.4 EECCA: Structural panels production, trade and consumption, 2016-2020 ...................................................................................................37GRAPH 4.5 EECCA: Non-structural panels production, trade and consumption, 2016-2020 ........................................................................................38GRAPH 4.6 EECCA: Traded wood-based panels unit value, 2016-2020 .......................................................................................................................................38GRAPH 4.7 North America: Structural panels production, trade and consumption, 2016-2020 .................................................................................39GRAPH 4.8 North America: Non-structural panels production, trade and consumption, 2016-2020 ......................................................................39GRAPH 4.9 North America: Traded wood-based panels unit value, 2016-2020 .....................................................................................................................39GRAPH 4.10 North America: Wood-based panel prices, 2016-2021 .................................................................................................................................................40GRAPH 5.1 Europe: Woodpulp production, trade and consumption, 2016-2020 ................................................................................................................46GRAPH 5.2 Europe: Paper production, trade and consumption, 2016-2020............................................................................................................................46GRAPH 5.3 Europe: Traded woodpulp and paper unit value, 2016-2020 .................................................................................................................................47GRAPH 5.4 EECCA: Woodpulp production, trade and consumption, 2016-2020 .................................................................................................................47GRAPH 5.5 EECCA: Paper production, trade and consumption, 2016-2020 .............................................................................................................................48GRAPH 5.6 EECCA: Traded woodpulp and paper unit value, 2016-2020 ....................................................................................................................................48GRAPH 5.7 North America: Woodpulp production, trade and consumption, 2016-2020 ...............................................................................................49GRAPH 5.8 North America: Paper production, trade and consumption, 2016-2020 ..........................................................................................................49GRAPH 5.9 North America: Traded woodpulp and paper unit value, 2016-2020 .................................................................................................................50GRAPH 6.1 Europe: Wood fuel production, trade and consumption, 2016-2020 .................................................................................................................56GRAPH 6.2 Europe: Wood pellet production, trade and consumption, 2016-2020 .............................................................................................................56GRAPH 6.3 Europe: Unit value of traded wood fuel and wood pellets, 2016-2020 .............................................................................................................57GRAPH 6.4 EECCA: Wood fuel production, trade and consumption, 2016-2020 ..................................................................................................................58GRAPH 6.5 EECCA: Wood pellet production, trade and consumption, 2016-2020 ..............................................................................................................58GRAPH 6.6 EECCA: Unit value of traded wood fuel and wood pellets, 2016-2020 ..............................................................................................................59GRAPH 6.7 North America: Wood fuel production, trade and consumption, 2016-2020 ................................................................................................59GRAPH 6.8 North America: Wood pellet production, trade and consumption, 2016-2020 ...........................................................................................59GRAPH 6.9 North America: Declared unit value of traded wood fuel and wood pellets, 2016-2020 .......................................................................60GRAPH 7.1 Wooden furniture imports, top five importing countries, 2016-2020 ................................................................................................................66GRAPH 7.2 Builders’ joinery and carpentry imports, top five importing countries, 2016-2020 ....................................................................................68GRAPH 7.3 Profiled-wood imports, top five importing countries, 2016-2020.........................................................................................................................68

viii
UNECE/FAO Forest Products Annual Market Review, 2020-2021
ACKNOWLEDGEMENTS
The UNECE/FAO Forestry and Timber Section expresses its deep gratitude to everyone who contributed to this edition of the Forest Products Annual Market Review.
The Forest Products Annual Market Review is the result of a cooperative effort involving a network of official country correspondents, authors, reviewers, editors, the UNECE/FAO Team of Specialists on Sustainable Forest Products, and a team of people working in the Forestry and Timber Section in Geneva and at FAO in Rome. In combination, this network provides an unrivalled source of expertise and knowledge, which is the hallmark of the Review.
Many of the people involved in producing the Review volunteer their time and expertise; others are supported by companies, universities, industry associations and various other organizations. Without the help of all these people and institutions, it would not be possible to produce this annual publication.
The Review benefited greatly from the work of Per Eriksson (Swedish University of Agricultural Sciences (SLU)), Oliver Wolf (Bern University of Applied Sciences (BFH)) and Zhenxi (Fred) Zhu (University of British Columbia (UBC)) who undertook market research; prepared price data; generated all the graphics and revised the Graphics Production System; and reviewed and prepared data. Their input has been critical for ensuring the quality of the publication and meeting deadlines.
We acknowledge the authors who wrote the chapters and, in so doing, shared their expertise and knowledge. They not only provided much of the market intelligence contained in their own chapters, but they also assisted with data and information used elsewhere in the publication. You can find contact details and affiliations of all authors in the annex.
The authors are as follows:
The project was managed by Florian Steierer. In the UNECE/FAO Forestry and Timber Section, Alex McCusker analysed the data and trends. The chapters were reviewed at FAO by Iana Arkhipova, Lyndall Bull, Thais Juvenal, Ashley Steel, Zuzhang Xia and Ekrem Yazici.
The manuscript was checked by Eoin O’Driscoll, Marketing Consultant, Drima Marketing Research, and edited by Alastair Sarre.
In all, about 31 people were directly involved in the preparation of this publication, not including the additional contributors and statistical correspondents listed separately on the following pages.
The manuscript was completed on 08 October 2021.
Orifjon Abidov Per Erikson Igor Novoselov
Francisco Aguilar Kathryn Fernholz Tapani Pahkasalo
Eduard Akim Christopher Gaston José Palacín
Delton Alderman Branko Glavonjić Russ Taylor
Consuelo Brandeis Antti Koskinen Michel Valois
Matthew Bumgardner William Luppold Johan Vinterbäck
Ivan Eastin Warren Mabee Zhenxi (Fred) Zhu
Håkan Ekström Frances Maplesden

ix
Contributors to the publication
CONTRIBUTORS TO THE PUBLICATION
The UNECE/FAO Forestry and Timber Section expresses its appreciation for the information and assistance received from the following people in preparing the Forest Products Annual Market Review 2020-2021. Authors are acknowledged separately. The base data for the Review were supplied by national statistical correspondents, who are acknowledged in a separate listing. We regret any omissions.
Yngve Abrahamsen, Euroconstruct, Swiss Economic Institute, Switzerland
Diego Benedetti, European Sawmilling Organization (EOS), Belgium
Cristina Calderón, Bioenergy Europe, Belgium
Jean Christophe Claudon, International Tropical Timber Organization (ITTO), Japan
Ariane Crevecoeur, Confederation of European Paper Industries (CEPI), Belgium
Melinda Dosa, Eurostat, Luxembourg
Henric Endoff, AB Global, Sweden
Bernard Lombard, Confederation of European Paper Industries (CEPI), Belgium
Jeremy Wall, deputy leader of the Team of Specialists on Sustainable Forest Products, Belgium

x
UNECE/FAO Forest Products Annual Market Review, 2020-2021
STATISTICAL CORRESPONDENTS
The national statistical correspondents listed below are the key suppliers of data for this publication. We are grateful for their essential contributions and significant efforts in collecting and preparing the data.
Olena Andrushkevych, State Statistics Service of Ukraine Giorgi Balakhadze, Agricultural and Environment Statistics Department, National Statistics Office of Georgia Natalia Barten, National Statistical Committee, Belarus Resat Benli, General Directorate of Forestry, Turkey Consuelo Brandeis, USDA Forest Service, United States Katarina Ekberg, Policy and Analysis Division, Swedish Forest Agency, Sweden Thomas Erhart, Office of Statistics, Liechtenstein Philippe Français-Demay, Statistiques forêt bois, Ministère de l’Agriculture et de l’alimentation, France Spela Gale, Statistical Office of the Republic of Slovenia Branko Glavonjić, Faculty of Forestry, Belgrade State University, Serbia Caroline Gosselin, Natural Resources, Canada Jón Guðmundsson, Statistics IcelandSabina Guliyeva, State Statistical Committee, Azerbaijan Johannes Hangler, Forest Policy and Forest Information, Federal Ministry for Agriculture, Regions and Tourism, Austria Sherali Juraev, State Committee of the Republic of Uzbekistan on StatisticsBoro Kovacevic, Agency for Statistics of Bosnia and Herzegovina, Bosnia and Herzegovina Miroslav Kovalčík, Department of Forest Policy and Economics, National Forest Centre, Slovakia Ewa Leszczyszyn, Wood Technology Institute, Poland Graça Louro, Institute of Nature and Forest Conservation, Portugal Ludmila Lungu, National Bureau of Statistics, Republic of Moldova Kohut Mickiewicz, Forestry Department, Belarus Girgina Nikoleva, National Statistical Institute, Bulgaria Olivian Nutescu, National Institute of Statistics, Romania Jan Oldenburger, Probos Foundation, Netherlands Thierry Palgen, Nature and Forest Administration, Luxembourg George Panagiotou, Aristotle University of Thessaloniki, GreeceEwa Ratajczak, Wood Technology Institute, Poland Madis Raudsaar, Department of Forestry Statistics, Estonian Environment Information Centre, EstoniaGuy Robertson, USDA Forest Service, United States Anahit Safyan, International Statistical Cooperation, National Statistical Service, Armenia Andrea Savvas, Department of Forests, Ministry of Agriculture, Natural Resources and Environment, Cyprus Giovanni Seri, National Statistical Institute, Italy Biljana Stefanova, Dissemination, State Statistical Office, North Macedonia Trond Steinset, Statistics Norway Tamás Tobisch, National Land Centre, HungaryJukka Torvelainen, Statistical Services, Natural Resources Institute FinlandEmmanuel Treeby, National Statistics Office, Malta Mario Valentić, Animal Production, Forestry and Fisheries Statistics Unit, Croatian Bureau of Statistics Darius Vizlenskas, State Forest Service, Lithuania Dinko Vusic, Faculty of Forestry, University of Zagreb, Croatia Sheila Ward, Economics and Statistics, Forestry Commission, United Kingdom of Great Britain and Northern Ireland Holger Weimar, Federal Research Institute for Rural Areas, Forestry, and Fisheries, “Thünen Institut (vTI)”, Germany Arthur Zesiger, Federal Statistical Office, Switzerland Zhanar Zhanuzakova, Statistics Agency, Kazakhstan Belén Zubieta de Piquer, Directorate-General of Biodiversity, Forests and Desertification, Ministry of Ecological Transition and Demographic Challenge, Spain

xi
Data sources
DATA SOURCES
The statistical correspondents mentioned on the previous page supplied the data and statistics for this publication, which can be found in the UNECE/FAO timber database. In those cases where there is no official source of information, numbers are based on author estimates; information from trade journals and research papers; data from the Committee on Forests and the Forest Industry Timber Forecast Questionnaire; and information from the United Nations trade database, Comtrade.
EXPLANATORY NOTES
“Apparent consumption” is calculated by adding imports to a country’s production and subtracting exports. Apparent consumption volumes are not adjusted for levels of stock. “Apparent consumption” is synonymous with “demand” and “use” and is often referred to as “consumption”. Consumption is the sum of a country’s (or subregion’s) production, imports and exports.
For ease of reading, the publication mostly provides value data in United States dollars (indicated by the sign “$” or as “dollars”). Unless specific for a given period, the applied exchange rate for the euro in 2020 is €0.8775 = $1 and for the Russian rouble is RUB 72.11 = $1. Both these exchange rates are based on the annual average rate provided by the UNECE (http://w3.unece.org/PXWeb/en).
Trade data for the 27 European Union (EU) countries include intra-EU trade, which is often estimated by the countries themselves. Export data usually include re-exports. Subregional trade aggregates in tables include trade occurring between countries in the subregion. Declared unit values shown in tables and graphs are included as an indicator of price trends and are derived by dividing the declared monetary value of imported and exported products by the volume of these products.
Forecasts for 2021 and 2022 in this publication are based on the implied rate of change for 2020 to 2021 and 2022 from forecasts submitted by member States before the November 2021 Joint Session of the UNECE Committee on Forest and the Forest Industry and the FAO European Forestry Commission.
See the map in the annex for a breakdown of the region into its subregions. References to EU27 refer collectively to the 27 country members of the European Union. The term Eastern Europe, Caucasus and Central Asia (EECCA) is used for reasons of geographic proximity and similarities in economic structure and refers collectively to 12 countries: Armenia, Azerbaijan, Belarus, Georgia, Kazakhstan, Kyrgyzstan, Republic of Moldova, Russian Federation, Tajikistan, Turkmenistan, Ukraine and Uzbekistan. It is used solely for the reader’s convenience.
The term industrial roundwood is used interchangeably with logs. The term softwood is used synonymously with coniferous. Hardwood is used synonymously with non-coniferous and broadleaved. Lumber is used synonymously with sawnwood.
All references to tonnes in this text represent the metric unit of 1,000 kilograms unless otherwise indicated.
A billion refers to a thousand million (109). One trillion refers to one million million, or 1012.
All volumes of United States and Canadian sawn softwood production and trade are given in actual m3, converted from nominal m3.
All data and statistics in this publication are derived from the UNECE/FAO timber database unless otherwise noted. Tables based on the database are available in the statistical annex at www.unece.org/forests/fpamr2021-annex.
Please note that the Review publication is published annually, and the latest version and its references should be preferred. The references, while being an integral part of the publication, have been made available exclusively online under the links indicated in the References at the back of the publication.

xii
UNECE/FAO Forest Products Annual Market Review, 2020-2021
ACRONYMS, ABBREVIATIONS AND SYMBOLS(Infrequently used abbreviations spelled out in the text may not be listed again here)
… unavailable
$ United States dollar(s) unless otherwise specified
€ euro(s)
APA The Engineered Wood Association
APHIS The United States Department of Agriculture’s Animal and Plant Health Inspection Service
BIS Bank of International Settlements
BJC builders’ joinery and carpentry
C&F cost and freight (Incoterm)
CEPI Confederation of European Paper Industries
CLT cross-laminated timber
COVID-19 coronavirus disease of 2019
CSIL Centre for Industrial Studies
EECCA Eastern Europe, Caucasus and Central Asia1
EIA Energy Information Administration
EPF European Panel Federation
EU European Union
EWP engineered wood product
FOB free on board (Incoterm)
FSC Forest Stewardship Council
GDP gross domestic product
ha hectare(s)
HDF high-density fibreboard
IMF International Monetary Fund
ITTO International Tropical Timber Organization
LVL laminated veneer lumber
m2 square metre(s)
m3 cubic metre(s)
Mbf million board feet
MDF medium-density fibreboard
MW megawatt(s)
NEPA National Environmental Policy Act
PEFC Programme for the Endorsement of Forest Certification
SFI Sustainable Forestry Initiative
SPF spruce-pine-fir assortment
TDM Trade Data Monitor
USDA United States Department of Agriculture
USFS United States Forest Service
USITC United States International Trade Commission
USMCA United States–Mexico–Canada Agreement
WRI Wood Resources International
WTO World Trade Organization
1 The acronym EECCA replaces the name of the UN subregion formerly known as the Commonwealth of Independent States and comprises the following countries: Armenia, Azerbaijan, Belarus, Georgia, Kazakhstan, Kyrgyzstan, Republic of Moldova, Russian Federation, Tajikistan, Turkmenistan, Ukraine and Uzbekistan.

xiii

ECONOMIC OVERVIEW AND POLICIES
Lead author: Kathryn Fernholz
Contributing authors: Delton Alderman, Igor Novoselov, José Palacín
Chapter 1

1
The COVID-19 pandemic resulted in a large contraction in economic activity across the UNECE region in 2020, albeit with differences between countries due to the diversity of economic structures and policy responses. Output bounced back strongly in late 2020, and global merchandise trade rose to exceed pre-pandemic levels.
The economic outlook has brightened considerably in 2021, and rapid recovery and growth can be expected. Pent-up consumer demand is set to be released, and fiscal and monetary policies to support economic activity are likely to continue in most countries in the region.
Investor interest in the residential sector has increased, with a survey in the Euroconstruct region finding that 68% of repurposed buildings were converted to residential in 2020. This sector’s subsectors are seen to have solid demographic demand, and residential real estate fits within many environmental, social and corporate governance plans.
Total housing starts in the United States was estimated at 1.38 million in 2020, an increase of 6.9% over 2019 and higher than the historical average of 1.01 million units. Total Canadian housing starts increased by 3.8% in 2020, year-on-year. About 57% of the total in Canada were apartments.
The new European Union (EU) Reconstruction Plan is anchored in the European Green Deal. Through its links to the EU’s Biodiversity Strategy and Climate Policy, the strategy is expected to have a medium- and long-term influence on forest product markets.
Although the forest products’ industry in Eastern Europe, Caucasus and Central Asia (EECCA) was not one of the most affected sectors in the early stages of the pandemic, it did encounter significant reductions in the production, trade and consumption of wood products. The furniture and wood-based panels segments experienced the biggest declines.
Port closures reduced exports of wood-based products from the United States by 32% in 2020 compared with 2019, and the country’s imports dropped by 26%. Exports of wood-based products in March 2021 were, however, nearly identical to those in March 2020, and imports were about 36% higher.
The area of certified forests worldwide increased by 0.8% (3.5 million ha) between mid-2019 and mid-2020. The two major schemes reported a combined total of 530 million ha of certified forest, or 435.5 million ha after accounting for double-certification (i.e. forest areas certified by both schemes).
Chapter 1 Economic overview and policies
Introduction and UNECE region overview

2
UNECE/FAO Forest Products Annual Market Review, 2020-2021
The 2021 edition of the UNECE/FAO Forest Products Annual Market Review provides a statistical review of market developments in the UNECE region in 2020 and the first half of 2021 and the policies driving those developments. The Review also includes forecasts for 2021 and 2022. The UNECE region has three subregions: Europe; the EECCA; and North America. It encompasses about 1.7 billion ha of forest, which is more than 40% of the world’s total forest area.
The Review presents the best available annual statistics for 2020-2021 collected by the Joint UNECE/FAO Forestry and Timber Section from official national statistical correspondents, expert estimates and published information.
The trends discussed in this publication comprise a mix of data from the UNECE/FAO TIMBER database (presented for the UNECE region as a whole and for each of the three subregions) and information from other cited sources. The Review also includes information on other markets with influence on the UNECE region.
References to “Europe”, “EECCA” and “North America” in this publication always pertain to the standard subregions (see the map, “Countries in the UNECE region, and its subregions”, in the annex of this publication). The electronic annexes provide additional statistical information, and the full UNECE/FAO database is available on the web.
The subchapters on economic developments, and construction and housing, describe the broad macro-economic situation affecting demand in the UNECE region. In this chapter, the subchapters on policy and regulatory developments and forest certification address other factors affecting forests and forest product markets in the region in 2020 and beyond.
Economic developments and the pandemic response in the UNECE region
The COVID-19 pandemic resulted in a large contraction in economic activity across the UNECE region in 2020, albeit with differences between countries due to the diversity of economic structures and policy responses. Services suffered most because of mobility restrictions and changes in consumer behaviour, and the industrial sector fared comparatively better. Output bounced back strongly in the third quarter of 2020 as constraints eased. Although new COVID-19 outbreaks required the re-introduction of restrictions in some countries, the negative impact of these was more limited than during the first wave, and economies proved increasingly able to adapt to the limitations.
The external environment also improved as global merchandise trade rose to exceed pre-pandemic levels in late 2020. In the United States, a large fiscal stimulus and an
acceleration of vaccination rates provided significant impetus to growth in early 2021. After a sharp decline in output, recovery in the EU was more tentative, reflecting disruptions from new COVID-19 outbreaks. The constraining effect of restrictions hit Europe’s service sectors, particularly tourism and hospitality, which are significant in many countries. The output decline in the Russian Federation in 2020 was relatively small, given the absence there of generalized lockdown measures.
The overall contraction of economic activity in the UNECE region had a differentiated impact on labour markets. In the United States, unemployment soared, reaching 14.8% in May 2020, up from 3.5% in February, and the participation rate plummeted to 60.2% in April 2020, down from 63.3% in February. These trends reversed in the last quarter of 2020, however, with the unemployment rate more than halving from its recent peak. Nevertheless, the impact on employment remains significant. In the EU, labour-retention schemes and wage subsidies mitigated the worst effects of the crisis on unemployment. The pandemic disrupted cross-border labour flows, resulting in depressed incomes in countries where remittances from migrant labour are significant. Looking ahead, strong growth will reduce unemployment further across the UNECE region in 2022, although labour shortages could arise in some areas, given expected sectoral shifts.
Monetary policy loosened across the region. The United States Federal Reserve cut its target for the federal funds rate by 1.5 percentage points in 2020, bringing the lower bound to zero. Action included resumed quantitative easing, resulting in the rapid growth of the Federal Reserve’s balance sheet. Forward guidance indicated that rates will remain low for some time – until inflation is on track to moderately exceed 2%. In the euro area, the European Central Bank launched a new asset purchase programme and reaffirmed its commitment to maintaining favourable financing conditions well beyond the end of the pandemic. In contrast, some EECCA economies started in 2021 to reverse the policy-loosening that marked the initial stages of the crisis.
Consumer price growth slowed through 2020, leading to temporary deflation in the euro area. Strong inflationary pressure has re-emerged recently, however, due to cost pressures driven by higher commodity prices, supply disruptions and increasing demand. In some EECCA countries, the depreciation of national currencies has added to inflationary pressures. Spare capacity suggests that the acceleration of inflation may be transitory, boosted by base effects and temporary supply bottlenecks. Monetary authorities in more advanced economies continue to underline their commitment to expansionary policies, but concerns about possible future inflation dynamics are starting to be reflected in financial markets.

Chapter 1 Economic overview and policies
3
The US dollar weakened against the euro through 2020, strengthened in early 2021 and weakened again. These movements, which put an end to a two-year trend in which the US dollar generally strengthened against the euro, can be explained by narrowing interest-rate differentials arising from the United States’ expansive monetary policy and improved market sentiment about the euro area’s economic performance. The US dollar has also been weakening on a trade-weighted basis since the second quarter of 2020 (graph 1.1).
The economic outlook has brightened considerably in the UNECE region in 2021, and rapid recovery and growth is expected. The gradual easing of restrictions in all sectors, paired with more social interaction and an improving outlook, is expected to release pent-up consumer demand. Fiscal and monetary policies to support economic activity are likely to continue for some time in most countries in the region. Concerns remain, however, including the slow pace of vaccination in some countries, which will limit the general elimination of restrictions and facilitate the spread of new COVID-19 variants. Moreover, as the economic recovery advances, exiting from ultra-loose fiscal and monetary policies could become challenging in terms of timing, the ability of some businesses to adapt to new conditions, and impacts on financial markets. Although the general economic outlook for the next few years is positive, the pandemic has exposed
existing fragilities across the region, and recovery is expected to be uneven.
Construction in the UNECE region, with a focus on housing
Housing construction and sales as well as residential markets in the UNECE region varied at a frenetic pace in 2020. In the EU, construction activity plummeted in the first quarter due to lockdowns in many countries. Although activity bounced back strongly in the second quarter of 2020, it remained well below pre-pandemic levels, as of early 2021. In the Russian Federation, added-value in the construction sector was flat in 2020, recovering from midyear falls. In the United States, residential investment rose in 2020 after two years of contraction, with strong growth in the second half of the year offsetting earlier declines.
In 2020, housing prices generally performed better than economies in most countries in the UNECE region. In the EU, house-price increases were significant in many countries but unchanged in others. In the Russian Federation, growth in house prices, which gathered speed throughout the year, was facilitated by an expansion of housing loans. Price growth also accelerated in the United States in the second half of 2020, supported by eased access to finance.
Economic projections and house-price analysis provide insights into the housing construction, sales and remodelling markets and subsequently into wood product demand. The Bank of International Settlements (BIS) reported that residential house prices increased by 4.0% globally in 2020, year-on-year, by 10.7% in Canada, by 6.1% in the euro area, by 9.1% in the Russian Federation and by 7.8% in the United States. According to BIS, real residential prices (adjusted for inflation) are about 20% higher now than the average reported immediately after the global financial crisis in 2007-2009 (BIS, 2021).
� EUROPEResidential output and remodelling construction were greatly constrained in the Euroconstruct region in 2020.2 Construction volume decreased by 7.0% and remodelling was down by 2.9% (Euroconstruct, 2021). European housing markets improved in the first quarter of 2021, however, and housing investment is expected to show a positive trend to 2023 (table 1.1).
2 The Euroconstruct region comprises 19 countries: Austria, Belgium, the Czech Republic, Denmark, Finland, France, Germany, Hungary, Ireland, Italy, the Netherlands, Norway, Poland, Portugal, Slovakia, Spain, Sweden, Switzerland and the United Kingdom.
GRAPH 1.1
Major currencies used to trade forest products, indexed against the US dollar, January 2020-April 2021
Jan-20
Mar-20
May-20
Jul-2
0Sep-20
Nov-20
Jan-21
Mar-21
70
80
90
100
110
120
Inde
x (J
anua
ry 2
020
= 10
0)
Russian Federation BrazilCanada JapanEuro area SwedenChina UKTurkey
Note: A diminishing index value indicates a weakening of the currency value against the US dollar; an increasing index value indicates a strengthening of the currency value against the US dollar.
Source: IMF, 2021.

4
UNECE/FAO Forest Products Annual Market Review, 2020-2021
seen as having solid demographic demand, and residential real estate also fits within many environmental, social and corporate governance plans (PwC, 2020, 2021).
Building-permit forecasts for 2021-2023 in the Euroconstruct region indicate a reduction in applications – although nowhere near the low levels seen in 2009-2014 (when the annual average was 1,378,000). Forecasts of total housing starts and completions indicate a modest improvement through 2023 (graph 1.2) (Euroconstruct, 2021).
� EASTERN EUROPE, CAUCASUS AND CENTRAL ASIA
The housing market in the EECCA is dominated by the Russian Federation and, to a lesser extent, Ukraine and Uzbekistan. The available data indicate that the number of new dwellings constructed dropped significantly in the EECCA in 2020, as did total new floor space (table 1.2).
Russian Federation housing-price data indicate that aggregate prices there increased by 24.5% between the third quarter of 2018 and the fourth quarter of 2021 (FRED, 2021a). Moscow and St Petersburg recorded year-on-year increases of 22.4% and 22.1%, respectively (first-quarter 2020 to first-quarter 2021) (Gerrity, 2021).
Lossan (2021) reported that the Russian Federation has approximately 3.8-4.0 billion m2 of residential floor space, with
In the short term, supply and labour constraints are expected to limit housing construction and remodelling. Consumer survey data indicate that near-term plans to buy or build houses have attained their highest level since 2003, and the intention to remodel houses is at its highest on record (ECB, 2021). New residential building is a value driver in the Euroconstruct region, accounting for nearly 25% (€342 billion) of the construction market value in 2020, with residential remodelling comprising 26.9% of expenditure. New residential spending increased by 24.0% (€65.0 billion) between 2015 and 2020 (Euroconstruct, 2021).
Although housing construction estimates and forecasts are somewhat tempered, the interest of investors in the residential sector appears to have increased. A survey found that 68% of repurposed buildings in Europe were converted to residential in 2020. Investment capital is being directed to residential (real estate), or “beds and sheds”, with the sector holding six of the top ten places in Europe’s investment rankings. The residential subsectors include retirement and assisted living; affordable housing; rented residential; student accommodation; co-living; and serviced apartments. All are attracting significant interest from investors – they are
TABLE 1.1
Construction spending forecast, Euroconstruct region, 2021-2023
Note: In 2018 prices; e = estimate; f = forecast.
Source: Euroconstruct, 2021.
2021e 2022f 2023f 2020- 2021
2021- 2022
2022- 2023
BILLION (€) CHANGE (%)
New residential construction
353.5 363.6 369.3 5.4 2.8 1.6
Residential remodelling
465.2 474.9 480.2 5.1 2.1 1.1
Non-residential – new
271.7 281.3 289.4 0.7 3.5 2.9
Non-residential – remodelling
240.1 247.3 252.8 2.5 3.0 2.3
Civil engineering – new
211.1 221.1 228.6 4.8 4.8 3.4
Civil engineering – remodelling
160.4 164.3 168.8 2.5 2.5 2.7
Total 1,702.0 1,752.5 1,789.1 3.8 3.0 2.1
GRAPH 1.2
Building permits, starts and completions, Euroconstruct region, 2002-2023
0
0,5
1
1,5
2
2,5
3
20022004
20062008
20102012
20142016
20182020
2022f2023f
mill
ions
Building permits Starts Completions
Note: e = estimate; f = forecast.
Sources: Euroconstruct, 2004, 2021.

Chapter 1 Economic overview and policies
5
Moscow accounting for about 7% of this (280-300 million m2). This quantity, and an average annual construction of about 76 million m2 of additional space, is insufficient to meet the Russian Federation’s future housing needs. In response to the economic effects of the pandemic and projected housing needs, the government launched the Action Programme for the Development of Residential Housing Construction and Mortgage Lending, including the Housing and Urban Environment project. The programme envisioned the commissioning of 82 million m2 of residential floor space in 2020, with the aim of putting in place 80 million m2 of multi-apartment housing per year (from a baseline of 46.2 million m2) and increasing private housing construction (housing constructed by private citizens from 33 million m2 annually to 40 million m2 (Blokhina et al., 2021). It is estimated that 15-18% of new Russian housing construction is wooden.
� NORTH AMERICAPandemic-related work-at-home orders have accelerated outmigration from large urban areas in the United States and led to robust remodelling demand (Metropolitan Policy Program, 2021). Outmigration, low interest rates, a limited supply of houses for sale, remodelling, and favourable demographics, including pent-up demand, were the primary factors driving housing construction activities and sales in the United States in 2020 (FRED, 2021b). The housing market in Canada was affected by immigration, favourable demographics, pent-up demand, low interest rates, and a record low supply of houses for sale (CREA, 2021).
The United States housing construction market grew robustly in 2020 and through the first half of 2021, despite pandemic effects and record-high construction product prices. New housing construction was strong in early 2020 but declined precipitously in March and April with the onset of the pandemic and associated restrictions. From June onward, both new construction and remodelling activity expanded near-exponentially. Forest products such as framing lumber, structural panels and appearance-based hardwood species were in limited supply in the second half of 2020 and the first half of 2021, as they were difficult to procure and expensive (see chapters 3 and 4).
Total housing starts in the United States was estimated at 1.38 million in 2020, up by 6.9% compared with 2019 (graph 1.3) (US Census Bureau, 2021a) and well above the historical average of 1.01 million units.
TABLE 1.2
Construction of new dwellings and floor area, EECCA other than the Russian Federation, 2019-2020
Note: The total comprises only those countries with complete national datasets.
Sources: Statistical Committee of the Republic of Armenia, 2021; State Statistical Committee of the Republic of Azerbaijan, 2021; National Statistical Committee of the Republic of Belarus, 2021; Ministry of the National Economy of the Republic of Kazakhstan Committee on Statistics, 2021; National Statistical Committee of the Kyrgyz Republic, 2021; National Bureau of Statistics of the Republic of Moldova, 2021; TAJSTAT, 2021; State Statistics Service of Ukraine, 2021; State Committee of the Republic of Uzbekistan on Statistics, 2021.
GRAPH 1.3
United States housing permits, starts and completions, 2011-2021
0
0,3
0,6
0,9
1,2
1,5
1,8
20112012
20132014
20152016
20172018
20192020
2021e
mill
ion
units
Single-family permits Multifamily permitsSingle-family starts Multifamily startsTotal completions
Note: f = forecast; January-June 2021 data; seasonally annualized adjusted rate.
Sources: US Census Bureau, 2021a; MBA, 2021.
2019 2020 2019-2020
2019 2020 2019-2020
New dwellings (units)
Change (%)
New floor space
(1,000 m2)
Change (%)
Armenia 1,015 … … 288 … …
Azerbaijan 87,400 47,200 -46 9,469 4,957 -48
Belarus 47,600 48,800 3 4,062 4,152 2
Georgia … … … … … …
Kazakhstan 33,024 21,336 -35 364 373 2
Kyrgyzstan … 9,311 … 1,380 903 -35
Republic of Moldova
9,955 6,906 -31 763 546 -29
Tajikistan … … … 2,700 … …
Turkmenistan … … … N/A … …
Ukraine 188,964 65,916 -65 11,029 5,750 -48
Uzbekistan 79,200 79,800 1 14,483 12,677 -12
Total 446,143 269,958 -39 40,170 28,455 -29

6
UNECE/FAO Forest Products Annual Market Review, 2020-2021
Canadian new-housing construction and sales were robust in 2020 and the first half of 2021. Total housing starts in 2020 increased by 3.8%, year-on-year (to 216,652 units). The housing market in Canada has shifted over the last decade from one dominated by single-detached housing before 2009 to a multifamily housing market dominated by the construction of new apartments. Fifty-seven percent of new housing starts in Canada in 2020 were apartments (CMHC, 2021).
Hogue (2021) stated that, “exceptionally low interest rates, changing housing needs and high household savings continue to stoke homebuyer demand at this stage”; these are primary factors in the current robust housing market in Canada. The main concerns are affordability, housing overvaluation (with prices at historic highs, even after adjusting for inflation), household debt, a lack of inventory available for sale, and price rises.
The number of new Canadian housing starts is projected at 258,000 units in 2021 and 213,000 units in 2022 (averaged from BMO, 2021; RBC, 2021; Scotia Bank, 2021; TD Bank, 2021). The forecast for 2023 is for 208,000 starts (TD Bank, (2021).
Policy and regulatory developments
The policy focus throughout the UNECE region in 2020 was on mitigating the impacts of the pandemic. Significant economic policy was enacted to support business sectors, including the forest and forest product sectors. Most notably in the EU, policy improvements were aimed at addressing identified vulnerabilities in global value chains, strengthening markets and supporting a transition to a climate-neutral economy. Governments in the EECCA also made investments in the forest products sector, and Canada and the United States both announced initiatives related to investment in green infrastructure that could benefit forest product markets.
� EUROPETo respond to the economic and health crises caused by the pandemic, the EU upped its 2021-2027 budget and, in May 2020, adopted the temporary recovery instrument, Next Generation EU (EU, 2020a), which will provide €750 billion in funding designed to protect lives and livelihoods, repair the EU single market and build a lasting and prosperous recovery. Affordable public housing and building renovation – often linked to energy-efficiency improvements and the use of renewable energy sources such as woody biomass – feature prominently in the national recovery plans of more than half the EU member countries.3 In conjunction with the EU’s Renovation Wave, it is expected that markets will be strong in coming years for various forest products used in construction and renovation (EU, 2020b). Markets will be further bolstered by investments in information technology and skills and underpinned by the New European BauHaus (EU, 2021a), an interface of technical, social and cultural aspects of buildings.
The pandemic has highlighted vulnerabilities in global value chains and shown the pivotal role played by a functional single EU market with global links. Thus, the EU further revised its Industrial Policy in May 2021 to help reach the twin goals of a green and digital transition to a low-carbon economy with net-zero greenhouse-gas emissions by 2030 (EU, 2021a; EU, 2021b). The aim of the policy is to strengthen the resilience of the single market and address strategic industrial dependencies. Forest-based industries in the EU can participate in both the broad and short-term initiatives in the EU (COVID-19) Recovery Plan, backed by the EU Industrial Policy.
The new EU Forest Strategy for 2030 is anchored in the European Green Deal (EU, 2019) and builds on the revised EU Biodiversity Strategy for 2030 (EU, 2020c). It aims to help attain the EU’s biodiversity objectives and the EU’s revised Climate Policy greenhouse-gas emission reduction (and hence Green Deal) target of at least 55% by 2030 and net climate neutrality by 2050. The Forest Strategy is also designed to contribute to attaining the UN’s Sustainable Development Goals, especially goal 15. With its links to the EU’s Biodiversity Strategy and Climate Policy, the EU Forest Strategy will have indirect medium- and long-term influences on forest product markets via its impacts on upstream forest resources (EU, 2021c). The strategy confirms the importance of forestry and forest-based industries in the EU27 in providing up to 4 million jobs and generating over €160 billion in gross added value.4 Together
3 The national plans of Croatia, the Czech Republic, Denmark, France, Germany, Greece, Ireland, Italy, Luxembourg, Portugal, Slovakia, Slovenia and Spain earmark at least €45 billion, of which a significant portion might be expected to use wood-based materials and products.
4 2018 figures, including forestry and logging, sawmilling, wood-based products, cork, pulp and paper, furniture and paper-based printing.

Chapter 1 Economic overview and policies
7
with actors across the entire forest-based value chain, the multifunctional role of forests is a key component of the EU Forest Strategy to help achieve climate goals sustainably by contributing to lively and prosperous rural areas.
The main elements of the EU Forest Strategy likely to ultimately affect the EU’s and hence the UNECE’s forest product markets are as follows:5
� protecting, restoring and enlarging the EU’s forests to combat climate change, reverse biodiversity loss and ensure resilience in multifunctional forest ecosystems;
� conducting strategic forest monitoring, reporting and data collection;
� supporting the socio-economic functions of forests for thriving rural areas and boosting the forest-based bioeconomy within sustainability boundaries;
� promoting a sustainable forest bioeconomy for long-lived wood products;
� developing skills and empowering people for a sustainable forest-based bioeconomy;
� ensuring the sustainable use of wood-based resources for bioenergy;
� strengthening the EU’s research and innovation agenda to improve knowledge of forests;
� establishing an inclusive and coherent EU forest governance framework; and
� stepping up the implementation and enforcement of existing EU laws.
Sustainable materials, including forest products, are key to the EU’s transition to a sustainable climate-neutral economy. The EU Forest Strategy recognizes that carbon removal initiated in trees can be “significantly extended” by processing woody biomass into materials and products with long lifecycles; harvested wood products6 are estimated to comprise a carbon sink of around 40 million tonnes of carbon dioxide equivalent (MtCO2e) per year, and the material substitution effect of wood is estimated in the range of -18 to -43 MtCO2e per year (Grassi et al., 2021). Downstream, the “cascading
5 This is an incomplete list of market-relevant components of the EU Forest Strategy.
6 The harvested wood product categories are sawnwood, wood panels and paper. In greenhouse-gas mitigation, these are assigned first-decay functions with half-life values of 35, 25 and 2 years, respectively. Thus, paper decays much faster (i.e. has much lower mitigation potential over time) than the other two categories. Any harvested wood product that does not fall into these categories is regarded as instantaneously oxidized.
principle”7 using market incentives is seen as crucial, and the “circular” role of shorter-lived wood products that can be re-used or recycled is also important. Accordingly, the EU Forest Strategy aims to further increase (quantitatively and qualitatively) the supply of sustainably grown and legally harvested wood for materials and energy (EU, 2018).
The strategy reiterates the important role for wood products in turning the construction sector from a source of greenhouse-gas emissions into a carbon sink. In the context of the revision of the Construction Products Regulation (EU, 2011), the European Commission will develop a standard, robust and transparent methodology to quantify the climate benefits of wood construction products and other building materials.
The Forest Strategy states that 60% of the EU’s renewable energy comes directly or indirectly from wood and that wood energy will continue to play a role, but it also indicates that the use of whole trees for energy production should be minimized. This is in line with the EU Biodiversity Strategy for 2030 and applies to all trees, whether from the EU or imported.
� EASTERN EUROPE, CAUCASUS AND CENTRAL ASIA
Although the timber industry in the EECCA was not one of the most affected sectors in the early stages of the pandemic, it did encounter significant reductions in the production, trade and consumption of wood products. The furniture industry and wood-based panels segments experienced the biggest declines.
Based on a defined set of criteria, some countries developed and implemented distinct actions and policies in response to the pandemic. For example, the Government of the Russian Federation adopted measures to support important enterprises by providing them with targeted aid. Under the scheme, 35 timber enterprises and 18 furniture companies were considered eligible for state aid, including tax and insurance contribution deferrals; state guarantees for loans; and subsidies for production operations. Mechanisms included (WhatWood, 2021a):
� low-interest loans for working-capital financing and saving jobs. About 400 billion roubles ($5.5 billion) is estimated to have been allocated for this programme;
� a six-month moratorium on bankruptcy;
7 The “cascading principle” can be described as: successive uses of a resource, e.g wood, through its re-use, recycling and possibly ultimate energy generation, so as to retain its material status and solid carbon for as long as practicably possible, compatible with market forces and logistics

8
UNECE/FAO Forest Products Annual Market Review, 2020-2021
� deferred or instalment payments for taxes due in 2020;
� government guarantees to cover business losses; and
� in some regions, allocations by authorities to forest enterprises with an option to defer payments for forest use.
Other significant measures adopted regionally for the timber industry were supporting forest tenure-holders with forest regeneration and the provision of materials for road rehabilitation. In some regions, the adopted measures included a requirement to use only locally produced wood for construction.
The Government of Ukraine adopted a range of financial and economic aid measures in 2020 to support citizens and businesses affected by the pandemic. The Cabinet of Ministers of Ukraine introduced initiatives aimed at supporting small and medium-sized enterprises in April and May 2020 and modified existing support programmes that also apply to companies in the forest and wood-processing sector (UNECE/FAO, 2021a).
Independent of these measures, the Russian Federation introduced new duties on exports of green lumber with a moisture content exceeding 22% for the period 1 July to 31 December 2021. The duty on softwood and oak lumber is 10% but not less than €13 and €15 per m3, respectively. Duties were previously not charged on these species. Export duties on beech and ash lumber also amount to 10% but not less than €50 per m3 (previously they were €10 and €12 per m3, respectively) (Lesprom, 2021).
� NORTH AMERICAEconomic contractions and disruptions to global transportation networks affected the wood product trade in the United States in the early stages of the pandemic. Some ports were closed in 2020, affecting shipping. As of October 2020, United States exports of wood-based products were 32% lower than in 2019 and imports were
down by 26%. Exports of wood-based products in March 2021 were, however, nearly identical to those in March 2020, and imports were about 36% higher (CRS, 2021). The United States Congress provided $200 million in assistance to timber harvesters and haulers in response to the pandemic. Other forest-sector industries have also been eligible for assistance under various economic policies in the form of loans, tax relief and other financial support (CRS, 2021).
The Softwood Lumber Agreement between Canada and the United States expired on 12 October 2015. In place since 2006, this agreement addressed tariffs on lumber traded between the two countries as part of a decades-long trade dispute covered in earlier editions of the Review. In June 2020, the United States Department of Commerce submitted the Softwood Lumber Subsidies Report to the United States Congress, as per the reporting provision of the Softwood Lumber Act of 2008, covering the period 1 January 2019 to 30 June 2019. The report found that 43 countries exported softwood lumber and softwood lumber products to the United States over the period, with Canada accounting for 89.7% of the total, Germany for 3.78%, Brazil for 1.43% and Sweden for 1.01% (US DOC, 2020). Lumber trade in North America has been under scrutiny in response to pricing trends during the pandemic. Prices increased for softwood lumber by 121.1% between April 2020 and April 2021 and for hardwood lumber by 31.6% (US BLS, 2021a). In April 2021, Canada and the United States announced a joint initiative addressing green infrastructure investments and efforts to advance net-zero emission targets, including opportunities for wood, pulp and paper and lower-carbon forest bioproducts (FPAC, 2021; The White House, 2021).
The United States Department of Agriculture (USDA) Animal and Plant Health Inspection Service (APHIS) announced the implementation of phase 6 of the Lacey Act enforcement schedule, which was to go into effect on 1 October 2020. First enacted in 1900, the Lacey Act combats trafficking in illegal wildlife, fish and plants. The Food, Conservation, and Energy Act of 2008 amended the Lacey Act to require importers to submit declarations for certain products at the time of importation. APHIS ensures compliance with the declaration requirement, and products needing declarations have been phased in since enforcement began in 2009. The additional products proposed to be covered by the phase-6 enforcement schedule include certain essential oils (e.g. cedarwood and sandalwood), wood cases and trunks, oriented strandboard, boxes, crates, pallets and musical instruments (e.g. clarinets and drums) (US Federal Register, 2020). In August 2020, the USDA announced a decision to delay implementation of phase 6 of the Lacey Act enforcement schedule due to the pandemic (USDA, 2020).
In November 2020, the United States Forest Service completed amendments to the regulations of the National

Chapter 1 Economic overview and policies
9
Environmental Policy Act (NEPA) governing environmental analysis and decision-making in the agency, including management and harvesting activities. The United States Forest Service last updated its NEPA regulations in 2008, and the most recent updates are expected to expedite operations with new tools allowing for categorical exclusions and additional flexibility (USFS, 2020a). Many foundational elements of the NEPA regulations remain unchanged, including requirements for scoping, public engagement and categories of the actions normally requiring an environmental impact statement (USFS, 2020b).
Certified forests and products
The area of certified forests worldwide increased by 0.8% (3.5 million ha) between mid-2019 and mid-2020, to 435.5 million ha, a new all-time high (graph 1.4). The two major schemes, the Forest Stewardship Council (FSC) and the Programme for the Endorsement of Forest Certification (PEFC), reported a combined total of 530 million ha of certified forest as of mid-2020; this amounts to 435.5 million ha of actual forest after accounting for double-certification (i.e. forest areas certified by both certification schemes) (FSC, 2020; PEFC, 2020; PEFC, 2021a).
The PEFC’s revised Sustainable Forest Management and Group Certification benchmark standard published in November 2018 extended PEFC certification to encompass trees outside forests; the PEFC benchmark can therefore now be applied to agroforestry and urban forestry (PEFC, 2018). The Sustainable Forestry Initiative (SFI), a PEFC-endorsed programme operating in Canada and the United States, has announced its intention to complete, by 2022, an urban and community forest certification standard (SFI, 2021). Four countries (China, India, Indonesia and the Netherlands) have applied to the PEFC for endorsement assessments that include trees outside forests within the scope of their national standards (PEFC, 2021b).
It is estimated that about 46 million tonnes of fresh-weight merchantable wood, equivalent to 7.2 billion board feet of lumber or 16 million cords of firewood, is generated annually in urban forests in the United States, which could produce substantial annual revenue if used while also providing valuable social and environmental goods and services (Nowak et al., 2019). These materials currently appear within waste streams and, when recovered, are most commonly used for bioenergy and panel production and composting. The management of wood waste streams is variable in the UNECE region and often depends on regulations and

10
UNECE/FAO Forest Products Annual Market Review, 2020-2021
classification systems. More universal or mutually recognized international classification systems could aid in quantifying the available material more accurately and support improved recovery to meet circular-economy objectives. In March 2021, the UNECE and FAO published a draft catalogue of wood waste classifications in the UNECE region that takes stock of existing classifications; it could support the development of a practical tool for facilitating wood waste trade in the region (UNECE/FAO, 2021b).
Summary of regional and subregional markets
The overall consumption of primary forest products declined modestly in all general categories in the UNECE region in 2020: by 3.3% for industrial roundwood; by 1.9% for sawnwood; by 4.3% for wood-based panels; and by 3.9% for paper and paperboard (table 1.3).
GRAPH 1.4
FSC- and PEFC-certified forest area, 2013-2020
0
50
100
150
200
250
300
2013 2014 2015 2016 2017 2018 2019 2020
mill
ion
ha
PEFC only FSC only Double-certi�ed
Note: Double-certified area as of mid-2020; area certified by certification scheme as of December 2020. The total actual area of certified forest is the sum of the area certified solely by the FSC, the area certified solely by the PEFC, and the area of double-certified forest. FSC = Forest Stewardship Council; PEFC = Programme for the Endorsement of Forest Certification.
Sources: FSC, 2020; PEFC, 2020, 2021a; UNECE/FAO, 2020.

Chapter 1 Economic overview and policies
11
TABLE 1.3
Apparent consumption of industrial roundwood, sawnwood, wood-based panels, and paper and paperboard, UNECE region by subregion, 2016-2020
Note: Sawnwood does not include sleepers through 2016. Wood-based panels do not include veneer production.
Sources: FAOSTAT, 2021; UNECE/FAO database, 2021.
(1,000) 2016 2017 2018 2019 2020
Change (volume/weight)
2019-2020
Change (%)
2019-2020
Change (%)
2016-2020
Industrial roundwood
Europe m³ 410,172 409,358 440,141 431,209 420,245 -10,964 -2.5% 2.5%
EECCA m³ 194,721 198,419 226,336 213,290 211,911 -1,379 -0.6% 8.8%
North America m³ 516,384 513,350 534,285 517,736 491,767 -25,969 -5.0% -4.8%
Total m³ 1,121,277 1,121,127 1,200,762 1,162,236 1,123,923 -38,312 -3.3% 0.2%
Sawnwood
Europe m³ 107,552 110,809 113,159 110,628 109,523 -1,105 -1.0% 1.8%
EECCA m³ 16,689 17,792 16,746 17,933 16,777 -1,156 -6.4% 0.5%
North America m³ 117,570 118,392 120,097 117,076 114,726 -2,350 -2.0% -2.4%
Total m³ 241,811 246,992 250,001 245,637 241,026 -4,611 -1.9% -0.3%
Wood-based panels
Europe m³ 71,704 74,210 75,854 74,961 71,528 -3,432 -4.6% -0.2%
EECCA m³ 16,687 18,351 21,204 19,364 18,204 -1,160 -6.0% 9.1%
North America m³ 54,270 56,603 54,771 55,249 53,421 -1,827 -3.3% -1.6%
Total m³ 142,662 149,165 151,829 149,573 143,154 -6,420 -4.3% 0.3%
Paper and paperboard
Europe tonnes 88,407 89,959 89,555 86,296 82,741 -3,554 -4.1% -6.4%
EECCA tonnes 9,561 9,507 10,007 10,103 9,998 -105 -1.0% 4.6%
North America tonnes 75,602 75,037 74,055 71,520 68,587 -2,933 -4.1% -9.3%
Total tonnes 173,571 174,503 173,617 167,919 161,326 -6,593 -3.9% -7.1%

Author: Håkan Ekström
WOOD RAW MATERIALS
Chapter 2

Introduction and UNECE region overview
The total timber harvest in the UNECE region fell by 3.4% in 2020, to 1.40 billion m3, of which 82% was industrial roundwood and 18% was wood fuel. The most significant decline from 2019 was in North America, while there was minimal change in the EECCA.
The consumption of industrial roundwood in the UNECE region declined in 2020 for the second consecutive year, to 1.12 billion m3. Non-coniferous industrial roundwood consumption fell by 10%, to 229 million m3, the lowest level since 2009. The reduction in the use of coniferous industrial roundwood was more modest, at only -1.3%, for a total of 895 million m3.
The UNECE region is a major exporter of industrial roundwood, and it accounted for 78% of the coniferous and 58% of the non-coniferous industrial roundwood traded globally in 2020. Exports totalled 93 million m3, the highest level in 13 years. The trend for exports over the last five years has been upward for Europe (+53%) and downward for the EECCA (-33%) and North America ( 34%). The largest industrial roundwood exporters in the UNECE region are the Czech Republic, the Russian Federation, Germany, the United States, Canada, Belgium, Poland and Norway (in descending order, by volume).
European harvests of industrial roundwood fell by 2% in 2020, to 426 million m3, after eight consecutive years of increase. The most significant declines in 2020 were in Finland, Italy, Poland, Austria and Slovakia (in descending order, by volume), predominantly because of increased log imports from neighbouring countries with ample supplies of insect- and storm-damaged timber.
Strong sawnwood markets in Europe and North America moved sawlog prices upward in 2020 and early 2021, with the most significant increases occurring in eastern and central Europe, western Canada and the western United States. In July and August 2021, however, lumber prices plummeted in the United States and, in the absence of major reductions in the cost of sawlogs, profit margins fell for sawmills throughout the country.
Total industrial roundwood exports from the Russian Federation increased slightly in 2020, reversing a downward trend that had lasted more than ten years, although the decreasing trend applied only to coniferous industrial roundwood. The volume of non-coniferous industrial roundwood exports has been increasing steadily, reaching 8.1 million m3 in 2020, up by 80% from 2010. The most significant increases in roundwood exports have been for non-coniferous sawlogs to China and for pulplogs to Finland.
Removals of industrial roundwood in the United States amounted to 370 million m3 in 2020, the lowest volume in six years, while Canadian removals were at 130 million m3, an 11-year low. The decline in timber harvests was driven mainly by the impact of the COVID-19 pandemic, which interrupted log supply chains.
China, the world’s largest importer of logs, has relied for a long time on the Russian Federation for a significant volume of raw material for its wood industry. This relationship may change in 2022, however, should the Russian Federation implement its proposed ban on log exports. The ban could have far-reaching impacts on global trade flows of industrial roundwood and sawnwood, with China likely to source more sawlogs from Europe, North America and Oceania.
Chapter 2 Wood raw materials
13

14
UNECE/FAO Forest Products Annual Market Review, 2020-2021
Europe
The European harvest of industrial logs fell by 2% in 2020, to 426 million m3 (graphs 2.1 and 2.2), after eight consecutive years of increase. The most significant decreases were in Finland, Italy, Poland, Austria and Slovakia (in descending order, by volume), mainly because of increased log imports from countries in central Europe with ample insect- and storm-damaged timber supply. Germany was the only country in the subregion to substantially increase its harvest in 2020; its annual removals have risen by 40% over the last five years, to a record high of 62 million m3.
In addition to log removals for industrial purposes, Europe harvested an estimated 143 million m3 for fuel, a volume that is practically unchanged from 2016.
The consumption of coniferous industrial roundwood (which accounted for 78% of total roundwood consumption) fell slightly in 2020, year-on-year, but was almost 3% higher than in 2016. Five countries – Sweden, Germany, Finland, Poland and Austria (in descending order, by volume) – were the biggest consumers of coniferous industrial roundwood in Europe, accounting for almost two-thirds of the subregion’s total.
Europe has long been a net importer of coniferous industrial roundwood. This changed in 2019 and 2020, however, when log exports to China took off and Europe reduced imports from the Russian Federation. The subregion’s net exports reached almost 12 million m3 in 2020, with China the key destination outside Europe.
-50
0
50
100
150
200
250
300
350
4002016 2017 2018 2019 2020
mill
ion
m3
Production Imports Exports Consumption
GRAPH 2.1
Europe: Coniferous industrial roundwood production, trade and consumption, 2016-2020
Note: Exports are shown as negative numbers.
Source: UNECE/FAO database, 2021.
-20
0
20
40
60
80
100
1202016 2017 2018 2019 2020
mill
ion
m3
Production Imports Exports Consumption
GRAPH 2.2
Europe: Non-coniferous industrial roundwood production, trade and consumption, 2016-2020
Note: Exports are shown as negative numbers.
Source: UNECE/FAO database, 2021.
Table 2.1 shows the top five intra-European trade flows of coniferous logs in 2020. The Czech Republic and Germany were the major exporting countries in Europe in 2020, and both shipped logs to markets in which they were absent five years ago. In addition to the strong intraregional trade, Germany and the Czech Republic started exporting coniferous roundwood to China in 2019. Together, these two countries exported more than 10 million m3 of coniferous industrial roundwood to China in 2020 (Wood Resources International, 2021). It is important to note, however, that the steep increase in exports in 2019 and 2020 was caused by the large volume of insect- and storm-damaged timber in central Europe and, therefore, much of the current log trade is temporary and will decline in coming years.
Sawn softwood production in Europe has increased steadily in the last five years. Consequently, additional volumes of sawmill byproducts, such as wood chips, shavings and sawdust, have become available to other sectors. Manufacturers of pulp, panels and pellets usually prefer residuals as fibre furnish over costlier small-diameter logs.
The annual volume of residuals generated in European sawmills has grown considerably in the last five years, to an estimated 17 million m3, resulting in an increased wood-chip trade in the subregion, particularly in northern European countries. The softwood chip trade around the Baltic Sea increased by over 80% between 2015 and 2020, with significant exports from the Russian Federation to Finland, from Norway to Sweden, and from the Baltic states to Denmark and Sweden.

Chapter 2 Wood raw materials
15
60
70
80
90
100
110
2016 2017 2018 2019 2020
$/m
3Coniferous imports Coniferous exportsNon-coniferous imports Non-coniferous exports
GRAPH 2.3
Europe: Traded industrial roundwood unit value, 2016-2020
Source: UNECE/FAO database, 2021.
50
100
150
200
1Q/99
1Q/01
1Q/03
1Q/05
1Q/07
1Q/09
1Q/11
1Q/13
1Q/15
1Q/17
1Q/19
1Q/21
Europe Nordic Central East
GRAPH 2.4
European Quarterly Sawlog Price Index, 1999-2021
Source: Wood Resource Quarterly, 2021.
Source: Wood Resources International, 2021.
TABLE 2.1
Top five intra-European trade flows of coniferous industrial roundwood, 2020
Origin–destination million m3 Change 2015-2019 (%)
Czech Republic–Austria 6.3 110
Germany–Austria 3.2 78
Czech Republic–Germany 2.7 12
Norway–Sweden 2.6 8
Czech Republic–Poland 2.5 N/A
With weaker pulp markets, wood-fibre consumption by European pulpmills declined to its lowest level in five years in 2020, according to the Confederation of European Paper Industries (CEPI). The sector consumed an estimated 146 million m3 of wood fibre in 2020, down by 6% from the previous year, comprising industrial coniferous roundwood (49%), non-coniferous industrial roundwood (27%), coniferous wood chips (23%), and a negligible amount of non-coniferous wood chips. The volume of coniferous wood chips in 2020 was down by more than 1 million m3 from 2019, which is surprising given the increase in sawn softwood production and generated byproducts in 2020 (CEPI, 2021).
The traded unit value of industrial roundwood has been decreasing in Europe since 2018 (graph 2.3).
The downward trend in sawlog prices was interrupted in the fourth quarter of 2020 as the sawnwood market improved. Consequently, the European Sawlog Price Index rose by 9% in the fourth quarter of 2020, quarter-on-quarter, and by 7% in the first quarter of 2021, with the most significant increases occurring in eastern and central Europe (graph 2.4).

16
UNECE/FAO Forest Products Annual Market Review, 2020-2021
Eastern Europe, Caucasus and Central Asia
Industrial roundwood production in the EECCA was steady in 2020, year-on-year, at 228 million m3, comprising 182 million m3 of coniferous and 46 million m3 of non-coniferous logs (graphs 2.5 and 2.6). Although production and consumption were stable overall, trends diverged between countries.
In Belarus, industrial roundwood removals doubled between 2010 and 2020, driven mostly by higher raw-material consumption in the expanding export-oriented sawmilling industry. Belarus is the only country in the subregion that has significantly expanded coniferous sawn softwood exports in the last five years, predominantly to neighbouring countries and to China.
The Russian Federation’s harvests have decreased for the last two years, to an estimated 202 million m3 in 2020. Most of the decline has been in coniferous industrial roundwood, driven by reduced export demand and falling consumption among domestic sawn softwood producers. Despite this recent reduction in industrial roundwood demand in the Russian forest industry, the long-term trend is upward. Total log consumption for industrial uses was almost 50% higher in 2020 than in 2010.
Removals of non-coniferous industrial roundwood in the Russian Federation have been relatively stable for the last five years, at around 40 million m3 annually. Just over 20% of the harvest in 2020 was exported in log form to sawmills in China and pulpmills in Finland and Sweden. Domestic hardwood consumption has been mainly in three sectors: pulp, plywood and “other industrial roundwood”, a category comprising posts, poles, pitprops and other products.
Total industrial roundwood exports from the Russian Federation increased slightly in 2020, reversing a downward trend that lasted more than ten years. Only coniferous industrial roundwood exports have declined in the past decade, however: non-coniferous industrial roundwood exports have increased steadily, reaching 8.1 million m3 in 2020, up by 80% from 2010. The most significant increases have been for non-coniferous sawlogs to China and for pulplogs to Finland.
The Russian Federation exported 16 million m3 of industrial roundwood in 2020, which accounted for almost 12% of globally traded industrial roundwood. Much of this trade could come to a halt next year, however, when a new law proposed by the Russian president would ban exports of softwood logs and high-value hardwood logs from 1 January 2022. The government is also considering new regulations aimed at reducing exports of green sawn softwood. If the law is enacted, it will affect the forest industry most significantly in
Production Imports Exports Consumption
-20
020406080
100
120140160180200
2016 2017 2018 2019 2020
mill
ion
m3
GRAPH 2.5
EECCA: Coniferous industrial roundwood production, trade and consumption, 2016-2020
Note: Exports are shown as negative numbers.
Source: FAOSTAT, 2021.
Production Imports Exports Consumption
-10
0
10
20
30
40
50
602016 2017 2018 2019 2020
mill
ion
m3
GRAPH 2.6
EECCA: Non-coniferous industrial roundwood production, trade and consumption, 2016-2020
Note: Exports are shown as negative numbers.
Source: FAOSTAT, 2021.

Chapter 2 Wood raw materials
17
40
50
60
70
80
90
100
1102016 2017 2018 2019 2020
$/m
3
Coniferous imports Coniferous exports
Non-coniferous imports Non-coniferous exports
GRAPH 2.7
EECCA: Traded industrial roundwood unit value, 2016-2020
Source: FAOSTAT, 2021.
Production Imports Exports Consumption
-40
0
4080
120
160200
240
280320
360400
2016 2017 2018 2019 2020
mill
ion
m3
GRAPH 2.8
North America: Coniferous industrial roundwood production, trade and consumption, 2016-2020
Note: Exports are shown as negative numbers.
Source: UNECE/FAO database, 2021.
the country’s eastern parts, where an estimated 10% of the timber harvest is exported in log form. In the short term, the Chinese sawmilling industry will be affected most directly because exports of softwood logs, mainly from the Russian Far East and Siberia, are likely to be prohibited.
Declared export unit values in the EECCA decreased by 14.1% (to an average of $63 per m3) for coniferous and by 7.4% (to an average of $60 per m3) for non-coniferous industrial roundwood in 2020. Import volumes of industrial roundwood decreased by 25.9%, with unit values of non-coniferous industrial roundwood dropping by 15.3% (to an average of $75 per m3). Contrary to the overall trend, the import unit value of coniferous industrial roundwood increased by 8.7% in 2020, year-on-year (to an average of $89/m3) (graph 2.7).
North America
Removals of industrial roundwood fell by 5.3% in North America in 2020, partly because of the impact of the COVID-19 pandemic, which interrupted log supply chains. Removals of industrial roundwood in the United States totalled 370 million m3 in 2020, the lowest level in six years, and Canadian removals were at 130 million m3, an 11-year low. Consumption fell much more for non-coniferous than for coniferous industrial roundwood in both Canada and the United States. The production of coniferous industrial roundwood declined by 1.8% (graph 2.8). The production of non-coniferous roundwood dropped dramatically – by 17.3% – in 2020 (graph 2.9). The slump in sawn hardwood production and consumption is discussed further in chapter 3.
A shortage of labour in the forest, for transportation, and in processing facilities resulted in a decline in industrial roundwood consumption of 5% in the United States in 2020, even though demand for semifinished products such as coniferous sawnwood and panels was surprisingly strong.
In Canada, the decline was predominantly because of a reduction in the use of non-coniferous industrial roundwood by the pulp industry. In the United States, demand for hardwood sawlogs fell dramatically as hardwood lumber production plunged to its lowest level since 2010. Conversely, the consumption of softwood roundwood in the United States has trended upward for the last decade, driven mainly by a

18
UNECE/FAO Forest Products Annual Market Review, 2020-2021
Production Imports Exports Consumption
-55
152535455565758595
105115125
2016 2017 2018 2019 2020
mill
ion
m3
GRAPH 2.9
North America: Non-coniferous industrial roundwood production, trade and consumption, 2016-2020
Note: Exports are shown as negative numbers.
Source: UNECE/FAO database, 2021.
25
75
125
175
225
275
325
2016 2017 2018 2019 2020
$/m
3
Coniferous imports Coniferous exportsNon-coniferous exportsNon-coniferous imports
GRAPH 2.10
North America: Traded industrial roundwood unit values, 2016-2020
Source: UNECE/FAO database, 2021. 50
100
150
200
20112012
20132014
20152016
20172018
20192020
2021e
US South Western US Western Canada
GRAPH 2.11
Sawlog price indices for North America, 2011-2021
Note: Index 2011 = 100; e = estimate.
Source: Wood Resource Quarterly, 2021.
rapidly expanding sawmilling sector in the southern states. As a result, the use of softwood sawlogs increased from about 100 million m3 in 2011 to just over 140 million m3 in 2020.
North American declared export unit values decreased by 4.6% (to an average of $109 per m3) for coniferous and by 0.9% (to an average of $302 per m3) for non-coniferous industrial roundwood in 2020. Declared unit values for imports decreased by 7.4% (to an average of $56 per m3) for coniferous and by 7.6% (to an average of $73 per m3) for non-coniferous industrial roundwood (graph 2.10).
Record-high prices for sawn softwood in the United States in late 2020 and early 2021 (see chapter 3) moved the cost of sawlogs upward throughout North America. The only exception was in the southern United States, where average prices have been practically unchanged for most of the last decade. The most significant sawlog price increases between the first quarter of 2020 and the equivalent period in 2021 were in western Canada and the western United States, where average prices rose by 33% and 20%, respectively (Wood Resource Quarterly, 2021) (graph 2.11).
High demand and rising prices for industrial roundwood in domestic markets resulted in a continued decline in industrial roundwood exports from North America in 2020. The United States exported only 5.6 million m3 of coniferous industrial roundwood in 2020, down by 40% compared with 2016 and the lowest volume in over 30 years. The most significant declines in the five years from 2016 were in exports to Canada (-73%) and China (36%); on the other hand, the volume

Chapter 2 Wood raw materials
19
exported to Japan – the United States’ third-largest market – has been relatively stable.
Canadian industrial roundwood exports declined to all its key markets – China, Japan and the United States (in descending order, by volume) – in 2020, continuing a downward trend that started in 2017. For example, Canada’s coniferous industrial roundwood exports in 2020 were almost 60% lower than in 2016, and net exports have fallen in the last five years from nearly 4 million m3 to below 1 million m3.
Extraregional influences on the UNECE
Eight of the top ten industrial-roundwood-exporting countries worldwide are in the UNECE region (table 2.2).
A large proportion of globally traded industrial roundwood is destined for one market, China, which imported a record 60.2 million m3 of industrial roundwood in 2020, of which 46.9 million m3 was coniferous. Table 2.3 shows the top ten extraregional industrial roundwood importers in 2020; China imported almost five times more industrial roundwood (by volume) than the other nine countries in the top ten combined.
China’s imports of sawn softwood fell by 11% in 2020, and the country’s total imports of industrial roundwood and sawnwood (in roundwood equivalent) declined in 2020 for the first time in five years. It has been anticipated that
Sources: FAOSTAT, 2021; UN Comtrade, 2021; UNECE/FAO database, 2021.
TABLE 2.2
Top ten industrial roundwood exporters worldwide, 2020
Coniferous Non- coniferous Total
1,000 m3 1,000 m3 1,000 m3 $ million
New Zealand 20,269 35 20,303 2,011
Czech Republic 17,898 265 18,163 893
Russian Federation 8,200 8,076 16,276 1,022
Germany 11,493 1,008 12,501 950
United States 5,609 1,746 7,355 1,523
Canada 5,525 446 5,971 349
Australia 3,422 687 4,110 392
Belgium 1,936 1,801 3,737 282
Poland 3,198 369 3,568 291
Norway 3,352 208 3,560 214

20
UNECE/FAO Forest Products Annual Market Review, 2020-2021
China’s shift from importing wood raw material to importing manufactured products would continue but, instead, the decline in sawnwood imports in 2020 was the biggest on record. All the major sawnwood-supplying countries except Germany, Sweden and Ukraine reduced their sales to China in 2020. Exports from the Russian Federation to China declined by 26% for industrial roundwood and by 15% for sawnwood (Wood Resources International, 2021).
The Russian Federation has been a significant industrial roundwood supplier to China in past decades. The relationship could change in 2022, however, if the Russian Federation implements its proposed ban on exports of coniferous industrial roundwood and valuable non-coniferous industrial roundwood while also introducing export taxes on green (undried) sawnwood.
China’s log sourcing has shifted from Russian and North American to European suppliers in the last few years as insect- and storm-damaged timber in central Europe has been in temporary abundance. Softwood log imports from Europe increased from 1.3 million m3 in 2018 to 12.3 million m3 in 2020, including 8.5 million m3 from Germany and 2.8 million m3 from the Czech Republic; Russian-supplied
Note: * 2019 data; UNECE region countries are not included.
Sources: FAOSTAT, 2021; UN Comtrade, 2021.
TABLE 2.3
Top ten extraregional industrial roundwood importers, 2020
Coniferous Non-coniferous Total
1,000 m3 1,000 m3 1,000 m3 $ million
China 46,940 13,293 60,233 8,462
Republic of Korea 3,100 147 3,247 369
India 1,130 1,547 2,677 588
Viet Nam* 174 2,450 2,624 722
Japan 2,070 117 2,187 541
Indonesia* 1 791 792 55
Egypt* 221 55 276 48
Malaysia* 2 149 150 22
Pakistan* 56 158 214 42
United Arab Emirates 121 26 147 19
softwood log imports fell from 7.8 million m3 to 4.2 million m3 over the same period.
It is highly unlikely that the large exports from Europe will be economically viable in the long term. According to the study, “Russian Log Export Ban in 2022 – Implications for the Global Forest Industry” (Wood Resources International and O’Kelly Acumen, 2021), China is expected to source more sawlogs from Europe, North America and Oceania in the short term. In the longer term, the study anticipates that China will continue shifting its imports from unprocessed raw material to semifinished products from a range of countries, including the Russian Federation.
UNECE subregional data summary and forecast
Table 2.4 summarizes data on industrial roundwood production, consumption, trade and declared value of cross-border trade. Additional information and the complete forest products database are available at www.unece.org/forests/fpamr2021-annex.
Initial data supplied by UNECE member States (all figures are year-on-year) indicate that removals of industrial roundwood will increase in the UNECE region by 1.2% in 2021 and decrease by 0.6% in 2022. Subregionally, the forecast is for European removals to increase by 0.9% in 2021 and to decrease by 0.8% in 2022; EECCA removals to increase by 1.6% in 2021 and shrink by 3.1% in 2022; and North American removals to increase by 1.2% in 2021 and by 0.6% in 2022.

Chapter 2 Wood raw materials
21
Note: Unit values are included as an indicator of price trends and are derived by dividing the declared monetary value of imported and exported products by the volume of these products.
Sources: FAOSTAT, 2021; UNECE/FAO database, 2021.
TABLE 2.4
Industrial roundwood production, imports, exports, net apparent consumption and unit value, UNECE subregions, 2016-2020
2016 2017 2018 2019 2020 Change 2019-2020
EUROPE
ConiferousProduction (1,000 m3) 309,977 313,600 337,813 341,595 339,049 -0.7%Imports (1,000 m3) 35,585 34,127 39,603 37,502 38,777 3.4%Exports (1,000 m3) 29,283 30,844 35,870 44,491 50,387 13.3%Consumption (1,000 m3) 316,279 316,883 341,546 334,607 327,440 -2.1%Import unit value ($/m3) 69 71 75 67 60 -9.9%Export unit value ($/m3) 70 70 77 69 65 -5.2%
Non-coniferousProduction (1,000 m3) 87,162 87,857 93,461 91,723 86,812 -5.4%Imports (1,000 m3) 18,665 16,777 18,725 19,020 18,542 -2.5%Exports (1,000 m3) 11,933 12,159 13,590 14,140 12,548 -11.3%Consumption (1,000 m3) 93,893 92,475 98,596 96,603 92,806 -3.9%Import unit value ($/m3) 70 79 85 77 71 -7.8%Export unit value ($/m3) 91 103 110 97 95 -2.1%
EECCA
ConiferousProduction (1,000 m3) 174,220 174,864 195,217 182,475 181,977 -0.3%Imports (1,000 m3) 395 390 389 556 365 -34.4%Exports (1,000 m3) 16,424 13,025 11,168 9,365 8,507 -9.2%Consumption (1,000 m3) 158,190 162,230 184,438 173,666 173,834 0.1%Import unit value ($/m3) 90 93 98 82 89 8.7%Export unit value ($/m3) 68 80 82 73 63 -14.1%
Non-coniferousProduction (1,000 m3) 45,093 44,498 49,957 46,419 46,355 -0.1%Imports (1,000 m3) 69 84 93 101 122 21.1%Exports (1,000 m3) 8,631 8,393 8,153 6,895 8,400 21.8%Consumption (1,000 m3) 36,531 36,189 41,898 39,624 38,077 -3.9%Import unit value ($/m3) 75 79 91 88 75 -15.3%Export unit value ($/m3) 50 60 68 65 60 -7.4%
NORTH AMERICA
ConiferousProduction (1,000 m3) 411,937 409,311 422,708 407,896 400,685 -1.8%Imports (1,000 m3) 5,214 3,420 4,995 3,880 4,017 3.5%Exports (1,000 m3) 17,308 16,204 17,834 13,103 11,134 -15.0%Consumption (1,000 m3) 399,842 396,527 409,869 398,673 393,567 -1.3%Import unit value ($/m3) 43 62 59 61 56 -7.4%Export unit value ($/m3) 108 138 122 114 109 -4.6%
Non-coniferousProduction (1,000 m3) 117,233 118,194 125,431 119,623 98,920 -17.3%Imports (1,000 m3) 2,219 2,027 1,915 1,806 1,472 -18.5%Exports (1,000 m3) 2,911 3,398 2,929 2,366 2,192 -7.4%Consumption (1,000 m3) 116,542 116,823 124,417 119,063 98,200 -17.5%Import unit value ($/m3) 70 72 82 79 73 -7.6%Export unit value ($/m3) 264 264 319 305 302 -0.9%

Lead author: Russ Taylor
Contributing authors: Matthew Bumgardner, Antti Koskinen, William Luppold, Fran Maplesden, Igor Novoselov
SAWNWOODChapter 3

23
Chapter 3 Sawnwood
Introduction and UNECE region overview
COVID-19 has been an unexpected catalyst for surging wood-product demand – first in the United States in mid-2020 and then in other countries around the world. Demand has increased again in 2021.
Sawn softwood. The three UNECE subregions recorded mixed results in sawn softwood consumption in 2020 because of the pandemic, with declines in Europe (-0.4%) and the EECCA (-5.1%) and a gain in North America (+3.5%). The production of sawn softwood was also varied, increasing in Europe (+1.6%) and North America (+0.8%) but decreasing in the EECCA (-5.0%).
In Europe, lower domestic demand and higher production meant that sawn softwood exports increased in volume (by 3.9%) in 2020, to 58.9 million m3, with ample supplies of low-cost beetle-damaged timber enabling central European countries to expand both production and exports. Average export prices increased only slightly overall (+0.8%) in 2020 but rose fast in the second half of the year.
The EECCA produced 47.3 million m3 of sawn softwood in 2020. The subregion’s sawn softwood exports declined by 4.4%, to 36.8 million m3; the Russian Federation exported 29.8 million m3 of this product in 2020.
North America produced 101.6 million m3 of sawn softwood in 2020. Exports dropped significantly (by 5.2%), to 28.2 million m3, with declines in both Canada ( 4.3%, -1.2 million m3) and the United States (-15.2%, -350,000 m3). North American imports increased by 4.3%, to 26.3 million m3. Lumber prices recorded all-time highs in May 2021.
Sawn hardwood. The consumption and production of sawn hardwood in the UNECE region were hit hard by the pandemic in 2020. Apparent consumption declined in the region overall by 18.3% and by 4.8% in Europe, 17.0% in the EECCA and 27.7% in North America.
Sawn hardwood production dropped by 2.9% in Europe in 2020, to 13.5 million m3, and by 15.9% in the EECCA, to 3.64 million m3. Production decreased most in North America, plummeting by 24.7% to 17.7 million m3. The overall decline in the UNECE region was 16.5%.
China continued to dominate imports of temperate and tropical sawnwood in 2020, with a total volume of 33.9 million m3 (valued at $7.6 billion). UNECE-region countries dominated global exports of sawnwood in 2020, led by Canada and the Russian Federation.

24
UNECE/FAO Forest Products Annual Market Review, 2020-2021
Europe
� SAWN SOFTWOOD
Despite the COVID-19 pandemic, the production of sawn softwood increased by 1.6% in Europe in 2020, to 114 million m3 (graph 3.1). Production especially increased in the second half of the year after some mills curtailed production in the early months of the pandemic and reduced inventories.
Production volumes varied within the subregion, with most of the increase in 2020 contributed by Germany, where production was up by nearly 2 million m3, partly because of a surplus of salvage logs arising from damage caused by the spruce bark beetle. Production increases were also reported in other central European countries with spruce-bark-beetle outbreaks, such as Austria and the Czech Republic. On the other hand, production was down by 0.7% in Sweden and by 4.2% in Finland, the latter due mainly to mill labour disputes.
European net apparent consumption of sawn softwood declined marginally (by 0.4%) in 2020, to 95.9 million m3. Demand was relatively strong despite the pandemic: the construction market did not suffer much from the lockdowns, and the do-it-yourself sector was strong as people stayed home and focused more than usual on home improvements. With sawmill inventories depleted in 2020, it is likely that actual consumption increased in many countries during the
Note: Exports are shown as negative numbers.
Source: UNECE/FAO database, 2021.
GRAPH 3.1
Europe: Sawn softwood production, trade and consumption, 2016-2020
Production Imports Exports Consumption
-60-40-20
020406080
100120140160
2016 2017 2018 2019 2020
mill
ion
m3
year. Among the big importers, Italy clearly suffered from the pandemic, with apparent consumption down by 30%; on the other hand, consumption rose by 1.6% in the United Kingdom. There were large variations among countries in the extent of change in apparent consumption in 2020 (graph 3.2). The pandemic has caused a severe imbalance between supply and demand, which is still visible in the European and global markets in 2021.
GRAPH 3.2
Europe: Change in sawn softwood consumption, by country, 2019-2020
-30% -20% -10% 0% 10% 20%
ItalyPortugalSwedenIcelandCyprus
SlovakiaNorth Macedonia
LithuaniaCroatiaGreece
LatviaSpain
RomaniaPolandFrance
NorwayLuxembourgEurope total
BulgariaUnited Kingdom
SwitzerlandAustriaSerbia
GermanyCzechiaFinlandEstonia
SloveniaTurkey
Belgium
Note: Countries with unchanged apparent consumption are not shown.
Source: UNECE/FAO database, 2021.

Chapter 3 Sawnwood
25
Note: Exports are shown as negative numbers.
Source: UNECE/FAO database, 2021.
GRAPH 3.3
Europe: Sawn hardwood production, trade and consumption, 2016-2020
Production Imports Exports Consumption
-7.5-5.0-2.50.02.55.07.5
10.012.515.017.520.022.5
2016 2017 2018 2019 2020
mill
ion
m3
Source: UNECE/FAO database, 2021.
GRAPH 3.4
Europe: Traded sawnwood unit value, 2016-2020
150
200
250
300
350400
450
500
550
600
6502016 2017 2018 2019 2020
$/m
3
Coniferous imports Coniferous exports
Non-coniferous imports Non-coniferous exports
The European sawnwood trade was again very export-driven in 2020, with overseas markets developing dynamically. Exports of sawn softwood increased by more than 2.02 million m3, with roughly half the increase shipped to China and the other half to the United States. Major contributors to the increase in exports were Sweden (+10.9%, or 1.4 million m3) and Germany (+8.2%, or 0.7 million m3). Overall, Europe increased exports of sawn softwood to China and gained market share, despite a drop in total Chinese imports. European exports of sawn softwood declined to Japan by 7% and to North Africa by 13%. Overall European imports were steady in 2020 (Woodstat AB, 2021).
Average annual unit values were steady in 2020 for European sawn softwood exports and imports, but the negative price trend that started in 2018 changed direction in 2020. Prices started to surge in Europe towards the end of 2020, partly in response to escalating prices in North America. In some markets, prices for European sawn softwood more than doubled in the third quarter of 2020 compared with those in the second quarter.
Production and demand were still strong for sawn softwood in the early months in 2021. Supply has been tight and German buyers reported shortages; sawlog supply has become a concern. Germany recorded an all-time-high production volume in the first quarter of 2021, at 6.5 million m3, and Sweden had its highest-ever monthly production in March 2021, at 1.9 million m3 (Svenskt Trä, 2021). Despite high production, stock volumes remained low.
Demand for European sawn softwood was strong in the United States in January-May 2021, with exports up by 33%; intra-European exports also increased. On the other hand, exports to China, Japan and North Africa were well down compared with 2020. Europe exported more sawn softwood to the United States than to China in the first five months of 2021 (Timber online, 2021a).
� SAWN HARDWOOD
As a result of the pandemic, sawn hardwood consumption in Europe declined by 4.8% in 2020, to 13.6 million m3, and production dropped by 2.9%, to 13.5 million m3 (graph 3.3). About one-third of countries in the subregion recorded declines in sawn hardwood production, but available data indicate that there were gains in Bosnia and Herzegovina (+33%), Turkey (+4.8%) and Romania (+0.9%) – the three largest producers in the subregion.
European sawn hardwood exports dropped by 3.2% in 2020 due to slowing consumption in most countries in the subregion, and imports dropped even more (by 7.2%) due to the pandemic.
Sawn hardwood import unit values were stable in 2020 (down by 0.6% compared with 2019), and export unit values
decreased by 4.2% (graph 3.4). European hardwood sawmills are highly dependent on the international hardwood market (about 45% of production is exported). At the same time, a significant amount of hardwood lumber is imported: about 45% of wood consumption in Europe originates in another country.

26
UNECE/FAO Forest Products Annual Market Review, 2020-2021
Eastern Europe, Caucasus and Central Asia
� SAWN SOFTWOOD
The EECCA subregion produced 47.3 million m3 of sawn softwood in 2020, a drop of 5.0% over 2019 (graph 3.5). Production declined by 5.7% in the Russian Federation, to 38.9 million m3. Apparent sawn softwood consumption decreased in the EECCA by 5.1% in 2020, to 15.1 million m3, and exports dropped by 4.4%, to 36.8 million m3. Export unit prices for sawn softwood were stable in 2020, at $133 per m3 (graph 3.7).
Note: Exports are shown as negative numbers.
Source: FAOSTAT, 2021.
GRAPH 3.5
EECCA: Sawn softwood production, trade and consumption, 2016-2020
Production Imports Exports Consumption
-40
-30
-20
-10
0
10
20
30
40
50
602016 2017 2018 2019 2020
mill
ion
m3
Note: Exports are shown as negative numbers.
Source: FAOSTAT, 2021.
GRAPH 3.6
EECCA: Sawn hardwood production, trade and consumption, 2016-2020
Production Imports Exports Consumption
-3,0
-2,0
-1,0
0,0
1,0
2,0
3,0
4,0
5,02016 2017 2018 2019 2020
mill
ion
m3
Russian sawn softwood producers successfully handled the restrictions imposed by measures to mitigate the spread of COVID-19, such as a lockdown by the Russian government in the second quarter of 2020. Large sawmills did not stop production completely but reduced volumes slightly over the year. Transport restrictions and an increase in container rates further reduced shipments of sawn timber from the Russian Federation, with exports falling by 5.2%, to 29.8 million m3
(WhatWood, 2021b, c).
The volume of Russian sawn softwood sales to non-EECCA countries decreased strongly (by 9%) in 2020, to 23.8 million, while exports to countries in the subregion increased by 16%, to 6.0 million m3. Key export markets in 2020 were China (18.1 million m3, down by 12%), Uzbekistan (2.7 million m3, up by 9%), Azerbaijan (1 million m3, up by 7%) and Egypt (0.96 million m3, down by 16%) (WhatWood, 2021d).
� SAWN HARDWOOD
Sawn hardwood production and consumption in the EECCA contracted by 15.9% (to 3.6 million m3) and 17.0% (to 1.7 million m3), respectively, in 2020. Sawn hardwood exports from the EECCA amounted to 2.0 million m3 (down by 15.3% compared with 2019) (graph 3.6), even though unit values for exported sawn hardwood dropped by 4.5% (graph 3.7). The Russian Federation exported 1.5 million m3 of sawn hardwood in 2020 (down by 18.2%).

Chapter 3 Sawnwood
27
GRAPH 3.7
EECCA: Traded sawnwood unit value, 2016-2020
100
150
200
2502016 2017 2018 2019 2020
$/m
3
Coniferous imports Coniferous exports
Non-coniferous imports Non-coniferous exports
Source: FAOSTAT, 2021.
GRAPH 3.8
Quarterly prices for sawn softwood in China, Europe, Japan and the United States, 2010-June 2021
0
250
500
750
1 000
2010 2015 2020
Japan US Europe ChinaU
S$/m
3
Note: Data to June 2021, delivered-to-market prices. Japan: BC W-SPF 2x4, J-grade, C&F; Europe: Swedish spruce 47x100, C&F; United States: 2x4 W-SPF #2&Better, KD, S4S, Random Length (8’-16’ and longer); China: SPF/Hem-Fir, green, grade #3&Btr 1-7/8x4-12, C&F.
Sources: Random Lengths, 2021a; Russ Taylor Global, 2021.North America
North American production of sawn softwood increased by 0.8% in 2020, to 101.6 million m3. Sawn hardwood production fell dramatically (by 24.7%), however, to 17.7 million m3. The net apparent consumption of sawn softwood and sawn hardwood combined decreased by 2.0% in 2020, and the export volume dropped by 5.2% for sawn softwood and by 7.0% for sawn hardwood.
� SAWN SOFTWOOD
The onset of the pandemic caused sawn softwood demand in North America to plummet in March 2020 before a surge of do-it-yourself demand across the subregion. Many sawmills went into voluntary curtailment until customers started ordering more sawnwood in April 2020, when the market came back to life. Coupled with an upswell in new-home building, sawn softwood demand has continued to accelerate in 2021, with record prices achieved through to late May (graph 3.8). The bellwether price of the spruce-pine-fir assortment (SPF, FOB British Columbia) (W-SPF 2x4 #2&Better) peaked at $1,630 per Mbf ($1,050/m3, net), almost $1,000 per Mbf ($650 per m3) above the previous record set in 2018 (Random Lengths, 2021a). W-SPF prices plunged thereafter, declining to only $500 per Mbf ($325 per m3) in late July 2021 (not shown in graph 3.8).
United States residential construction markets sparked a surge in demand as the pandemic caused central-city
dwellers in apartments to flee to suburbs for the safety of detached homes complete with backyards, home offices and workout spaces and better-suited to the home-schooling of children. New residential housing starts increased by 6.9% in 2020, surging even faster in the second half of the year and into 2021 (US Census Bureau, 2021a). Sales of new and existing homes, as well as home prices, skyrocketed as a result and continued to increase through to the middle of 2021 (US Census Bureau, 2021b).
Robust repair and remodelling (R&R) activity since the start of the pandemic continued through to the end of May 2021 before a slowdown (Harvard Joint Center for Housing Studies, 2021a). Do-it-yourself consumers at big-box stores (e.g. Home Depot and Lowes) became wary of the exorbitant prices of building materials; moreover, with half the United States population vaccinated by June 2021, consumers were able to choose to spend disposable income on travel and entertainment rather than their homes. Nevertheless, R&R activity is expected to increase in the fourth quarter of 2021 as larger projects involving contractors commence.
Countervailing and antidumping duties continue to be imposed on Canadian sawn softwood exports to the United States, although high prices have allowed the duties to be passed on to consumers rather than absorbed by mills. The import duty will be 9% for most of 2021 but, based on the Second Administrative Review by the United States

28
UNECE/FAO Forest Products Annual Market Review, 2020-2021
Department of Commerce, it will rise to over 18% at the end of the year (Global Affairs Canada, 2021). With high sawnwood prices, there is less urgency for either country to negotiate a new agreement. However, pressure from the National Association of Home Builders and other lobby groups suggests that the import duties are only raising the cost of lumber in a supply shortage, and this is being passed on entirely to consumers.
The net apparent consumption of sawn softwood in North America increased by 3.5% in 2020, to 99.7 million m3, while the export volume dropped by 5.2% (graph 3.9). Canada recorded a drop in offshore exports of 28.7% in 2020 but managed a small gain of 0.2% to the United States; China and Japan represent 80% of Canada’s offshore exports. United States exports declined by 15.2% due to strong domestic prices.
North American imports of sawn softwood increased by 4.3% in 2020 as strong domestic prices favoured imports and discouraged exports. United States imports grew by 4.5%, with large gains for European product; nevertheless, Canada still dominated supply.
Declared unit prices for Canadian and United States sawn softwood exports and imports declined in the first half of 2020 and soared in the second half of the year. Consequently, prices remained essentially unchanged in 2020 compared with 2019 (graph 3.10).
GRAPH 3.9
North America: Sawn softwood production, trade and consumption, 2016-2020
Production Imports Exports Consumption
-40
-20
0
20
40
60
80
100
120
1402016 2017 2018 2019 2020
mill
ion
m3
Note: Exports are shown as negative numbers.
Source: UNECE/FAO database, 2021.
� SAWN HARDWOOD
North American sawn hardwood production decreased by 5.79 million m3 (24.7%) in 2020, while apparent consumption declined by 5.68 million m3 (27.6%) (graph 3.11). These changes coincided with drops of 0.19 million m3 (13.5%) in imports and 0.30 million m3 (7.0%) in exports. The declines were associated with lower prices for higher-quality hardwood sawn products used in appearance applications (e.g. cabinets, furniture, millwork and flooring), as well as in industrial applications (pallets and sleepers) and exported sawn products.
Apparent sawn hardwood consumption declined in the United States and Canada in 2020. Apparent United States consumption of sawn hardwood was down for both industrial and appearance applications. Reactions by market actors to the pandemic caused a reduction in appearance-based demand as well as product manufacturing in the second and third quarters of 2020. Although housing starts realized large increases in the second half of 2020, there can be a time lag between initial home construction and the installation of hardwood flooring and cabinets. A large proportion of the projected increase in apparent consumption in the United States market in 2021 is associated with anticipated increases in kitchen-cabinet and flooring demand.
The decline in sawn hardwood consumption by industrial users in both pallet and sleeper production was also influenced by lower demand by industrial consumers. This had a negative impact on producers at the beginning of the COVID-19 outbreak and affected United States industrial
GRAPH 3.10
North America: Traded sawnwood unit value, 2016-2020
200
250
300
350
400
450
500
550
6002016 2017 2018 2019 2020
$/m
3
Coniferous imports Coniferous exports
Non-coniferous imports Non-coniferous exports
Source: UNECE/FAO database, 2021.

Chapter 3 Sawnwood
29
GRAPH 3.11
North America: Sawn hardwood production, trade and consumption, 2016-2020
Production Imports Exports Consumption
-10
-5
0
5
10
15
20
25
302016 2017 2018 2019 2020
mill
ion
m3
Note: Exports are shown as negative numbers.
Source: UNECE/FAO database, 2021.
output both at that time and during the recovery towards the end of 2020 (Federal Reserve Bank of St. Louis, 2020). Wood consumption in United States sleeper production in 2020 continued a decline that began in 2017 (Hardwood Market Report, 2021).
United States imports of temperate sawn hardwood dropped by 11.2% in 2020 because of a continued reduction in interregional trade between the United States and Canada. Imports of tropical sawn hardwood into the United States were down by more than 34.1%, with both the United States and Canada experiencing large declines.
Although North American imports of sawn hardwood declined in 2020 to levels last seen in 2012, United States imports of ipé (Handroanthus lapacho) increased in both volume and value between 2019 and 2020. In volume terms, ipé displaced balsa as the most important tropical timber import. It accounted for 37% of United States tropical imports by value in 2020 and 20% of total sawn hardwood imports.
The decline in North American exports of sawn hardwood in 2020 was the result of decreased United States and Canadian production and shipments (USDA, 2021; Statistics Canada, 2021a). The largest decline in United States trade was a 19.1% reduction in exports to Canada, while United States exports to Viet Nam and China increased by 2.1% and 1.4%, respectively. The decline in United States exports to Canada and an increase in United States exports to Viet Nam meant that Viet Nam was the second-largest market for United States sawn hardwoods in 2020 behind China. The value of Canadian exports to China declined by over 30%.
The price of sawn hardwoods used in appearance applications is reflected in the movement of the aggregate (multi-species) price index of mid-grade or Number 1 Common (1C) boards shown in graph 3.12. The index was developed from the Hardwood Market Report for the central United States, deflated by the United States producer price index (US BLS, 2021b).

30
UNECE/FAO Forest Products Annual Market Review, 2020-2021
The index shows a significant decline in price for 1C lumber and pallet cants through 2020 and then a sharp increase in the first half of 2021 as both domestic and international markets rebounded after the pandemic-influenced decline. Pandemic-related production and supply-chain disruptions also affected supply.
Extraregional influences on the UNECE
China remains a powerhouse in the global sawnwood trade, importing considerably more sawnwood in 2020 than the next top nine extraregional importers combined (table 3.1). United States exports of sawn hardwood to China dropped by 786,000 m3 (39%) in 2020 but increased to Viet Nam by 16,000 m3 (3%) (ITTO, 2021a).
Globally, eight of the top ten sawnwood exporters in 2020 were in the UNECE region, with Chile and Thailand the only countries outside the region in the top ten (table 3.2).
Asia is the main driver of the world’s tropical sawnwood trade, accounting for 86% of imports and 61% of exports by volume. China and to a lesser extent Viet Nam, India and Thailand are the major importers and Thailand and Malaysia are the major exporters. African suppliers – particularly Cameroon and Gabon – are also important in the tropical sawnwood trade, and Brazil has emerged recently as a major exporter.
GRAPH 3.12
Price indices for sawn hardwood products in the United States, first-half 2004 to first-half 2021
50
75
100
125
2004 2006 2008 2010 2012 2014 2016 2018 2020
No. 1 Common Pallet cants
Note: Semi-annual inflation-adjusted Index, January 2004=100.
Sources: Luppold and Bumgardner, 2016; Hardwood Market Report, 2021.
TABLE 3.1
Top ten extraregional sawnwood importers, 2020
Note: * 2019 data; UNECE region countries are not included.
Sources: UN Comtrade, 2021; FAOSTAT, 2021.
Coniferous Non- coniferous Total
1,000 m3 1,000 m3 1,000 m3 $ million
China 26,078 9,071 33,867 7,645
Japan 4,888 195 5,083 1,728
Mexico 2,679 252 2,931 466
Egypt 2,378 297 2,675 737
Viet Nam* 777 1,880 2,657 1,439
Republic of Korea 1,825 213 2,037 576
Saudi Arabia* 1,822 58 1,880 403
Algeria* 1,563 52 1,616 324
Morocco* 918 78 997 281
India 610 280 890 356
TABLE 3.2
Top ten sawnwood exporters globally, 2020
Note: * 2019 data.
Sources: UN Comtrade, 2021; FAOSTAT, 2021; UNECE/FAO database, 2021.
Coniferous Non- coniferous Total
1,000 m3 1,000 m3 1,000 m3 $ million
Russian Federation 29,833 1,544 31,377 4,227
Canada 26,243 495 26,738 7,742
Sweden 13,976 37 14,013 3,370
Germany 9,618 688 10,306 2,550
Finland 8,198 20 8,218 1,775
Austria 5,939 140 6,079 1,426
United States 1,959 3,511 5,470 2,721
Belarus 3,937 159 4,096 503
Thailand* - 3,924 3,924 1,048
Chile* 3,663 13 3,676 817

Chapter 3 Sawnwood
31
UNECE imports of tropical sawnwood comprised 12% of world imports by volume in 2020; United States imports were minimal, however, at 0.161 million m3, which is less than 2% of the world total. Tropical sawnwood imports by UNECE countries were more affected by supply than demand in the first quarter of 2021, with supply tightened by a chronic shortage of container space and soaring freight rates caused by pandemic-related supply-chain disruptions (ITTO, 2021b).
China is the largest tropical sawnwood importer by a big margin, absorbing 63% of world imports by volume in 2020, up by 9% compared with 2019. Demand for tropical sawnwood has been driven by a decline in the availability of tropical logs, with producer countries imposing restrictions on log exports; moreover, rising manufacturing costs in China have increased the competitiveness of tropical sawnwood imports. With the COVID-19 virus effectively controlled in China in the first quarter of 2020, China’s economy recovered more strongly than other importing countries; by the first quarter of 2021, measures to rebuild the economy had led to a rebound in construction activity and a resumption of imports.
Viet Nam’s tropical sawnwood imports increased by 15% in 2020, to 0.67 million m3. The country’s successful early control of the pandemic enabled the secondary processed wood products sector to respond as export demand recovered more rapidly than expected in the United States, which is the major market for Viet Nam’s wooden furniture exports.
Thailand was the top-ranked exporter of tropical sawnwood – mostly plantation rubberwood – in 2020, although the volume declined marginally compared with 2019, to 3.6 million m3. The sawmilling industry was severely affected by restrictions in the first half of 2020 designed to control COVID-19, but production and exports both recovered in the second half of the year. Malaysia’s sawnwood exports contracted by one-third in 2020, and production levels had not reached pre-pandemic levels by early 2021. The country’s exports have been affected by raw-material shortages, escalating freight rates and shortages of containers and skilled labour (ITTO, 2021b).
Cameroon’s export volumes dropped in 2020, to 0.94 million m3. The industry was affected by COVID-19 safe-work practices, extended lead times to the market, crackdowns on illegal activities, and logistical problems in delivering logs to sawmills (ITTO, 2020).
In contrast to all other major tropical sawnwood exporters, the volume of Brazil’s exports more than doubled in 2020 compared with 2019, reaching 0.8 million m3. The surge in exports followed the relaxation of controls on timber exports from the states of Amazonas and Pará (ITTO, 2021a).
UNECE subregional data summary and forecast
Table 3.3 summarizes data on sawnwood production, consumption, trade and the declared value of cross-border trade. Additional information and the complete forest products database are available at www.unece.org/forests/fpamr2021-annex.
Initial data supplied by UNECE member States (all figures are year-on-year) indicate that the production of sawnwood will increase in the UNECE region by 3.9% in 2021 and by 2.4% in 2022. Subregionally, the forecast is for Europe to increase by 3.9% in 2021 and by 1.2% in 2022; the EECCA to increase by 3.0% in 2021 and by 5.1% in 2022; and North America to grow by 4.2% in 2021 and by 2.5% in 2022.

32
UNECE/FAO Forest Products Annual Market Review, 2020-2021
TABLE 3.3
Sawnwood production, imports, exports, net apparent consumption and traded unit value, UNECE subregions, 2016-2020
2016 2017 2018 2019 2020 Change 2019 to 2020
EUROPE
Sawn softwood
Production (1,000 m3) 108,418 110,972 112,771 112,287 114,040 1.6%
Imports (1,000 m3) 35,975 38,562 40,073 40,736 40,774 0.1%Exports (1,000 m3) 49,872 52,040 53,790 56,702 58,919 3.9%Consumption (1,000 m3) 94,521 97,493 99,054 96,321 95,895 -0.4%Import unit value ($/m3) 227 232 253 217 218 0.4%Export unit value ($/m3) 213 223 243 214 215 0.8%
Sawn hardwood
Production (1,000 m3) 13,913 14,461 14,188 13,913 13,515 -2.9%
Imports (1,000 m3) 4,960 5,320 6,117 6,634 6,155 -7.2%Exports (1,000 m3) 5,841 6,465 6,201 6,240 6,043 -3.2%Consumption (1,000 m3) 13,031 13,315 14,104 14,307 13,627 -4.8%Import unit value ($/m3) 596 570 564 482 479 -0.6%Export unit value ($/m3) 451 446 506 463 444 -4.2%
EECCA
Sawn softwood
Production (1,000 m3) 39,689 44,551 47,144 49,815 47,346 -5.0%
Imports (1,000 m3) 4,781 4,720 4,600 4,565 4,527 -0.8%Exports (1,000 m3) 29,099 33,006 36,754 38,482 36,787 -4.4%Consumption (1,000 m3) 15,372 16,265 14,990 15,898 15,087 -5.1%Import unit value ($/m3) 106 111 117 121 119 -1.4%Export unit value ($/m3) 116 131 139 132 133 0.3%
Sawn hardwood
Production (1,000 m3) 3,381 3,718 4,121 4,329 3,639 -15.9%
Imports (1,000 m3) 111 236 241 124 97 -21.5%Exports (1,000 m3) 2,176 2,427 2,607 2,418 2,047 -15.3%Consumption (1,000 m3) 1,317 1,527 1,756 2,036 1,690 -17.0%Import unit value ($/m3) 210 149 157 230 242 5.0%Export unit value ($/m3) 192 179 188 198 189 -4.5%
NORTH AMERICA
Sawn softwood
Production (1,000 m3) 103,788 103,892 105,696 100,837 101,618 0.8%
Imports (1,000 m3) 28,031 27,624 26,278 25,174 26,261 4.3%Exports (1,000 m3) 35,413 33,946 32,516 29,740 28,202 -5.2%Consumption (1,000 m3) 96,405 97,571 99,458 96,271 99,677 3.5%Import unit value ($/m3) 232 249 264 218 297 36.3%Export unit value ($/m3) 241 270 279 233 294 26.2%
Sawn hardwood
Production (1,000 m3) 24,101 24,343 23,905 23,462 17,673 -24.7%
Imports (1,000 m3) 1,557 1,564 1,779 1,652 1,383 -16.3%Exports (1,000 m3) 4,493 5,086 5,046 4,308 4,006 -7.0%Consumption (1,000 m3) 21,165 20,822 20,639 20,805 15,049 -27.7%Import unit value ($/m3) 486 545 482 546 550 0.9%Export unit value ($/m3) 567 580 587 551 543 -1.5%
Note: Sawnwood data for 2016 do not include sleepers. Unit values are included as an indicator of price trends and are derived by dividing the declared monetary value of imported and exported products by the volume of these products.
Sources: UNECE/FAO database, 2021; FAOSTAT 2021.

Chapter 3 Sawnwood
33

Lead author: Ivan Eastin
Contributing authors: Orifjon Abidov, Fran Maplesden, Igor Novoselov
WOOD-BASED PANELS
Chapter 4

35
Chapter 4 Wood-based panels
Introduction and UNECE region overview
The wood-based panels sector in the UNECE continued to decline in 2020. Panel production decreased by 3.3% overall and apparent consumption was down by 4.3%, due mainly to the impact of the COVID-19 pandemic on the region’s economies. The consumption of structural panels fell by 2.2%, while the consumption of non-structural panels dropped by 5.6%.
Total wood-based panel production in Europe registered a better performance ( 3.1%) than real GDP in the EU27 (-6.1%) in 2020, driven by a relatively stable construction sector and a strong recovery in furniture production in the second half of the year. Higher output of oriented strandboard (OSB) (+3.5%) partly offset drops in the production of other panel types. The outlook for 2021 is upbeat, with growth of 5.8% forecast in Europe for wood-based panels production, given political support for increasing the use of wood in construction embodied in initiatives such as the European Green Deal, the Renovation Wave and the New European Bauhaus.
The apparent consumption of wood-based panels decreased by 6.7% in the EECCA in 2020, to 19.0 million m3, and production declined by 3.4%, to 23.4 million m3. The production of wood-based panels fell by -1.0% in the Russian Federation, to 17.4 million m3.
The apparent consumption of wood-based panels declined by 3.3% in North America in 2020, despite a recovery in housing starts and remodelling activities in the United States. Production capacity increased slightly (by 0.3%) in the North American structural panel industry in 2020, although capacity utilization decreased from 75.3% in 2019 to 74.5% in 2020. Pandemic-related impacts on supply chains, coupled with strong demand, caused prices for structural panels to soar to record levels.
Imports of tropical plywood by Japan, the world’s largest importer of this product, contracted in volume by 29% in 2020, while the share of domestic plywood increased to 67% of total plywood consumption. In contrast to other major exporters (China, Indonesia and Malaysia), the volume of Viet Nam’s tropical plywood exports rose significantly (by 32%) in 2020 in response to growth in demand in the United States, the major market.

36
UNECE/FAO Forest Products Annual Market Review, 2020-2021
Europe
Total wood-based panels production decreased by 3.1% in Europe in 2020, to 71.6 million m3, which was still a much better performance than the 6.1% contraction of real GDP in the EU27 in 2020. A relatively resilient construction output and a strong recovery in furniture production in the second half of 2020 supported demand for wood-based panels in 2020. Strong growth in the production of oriented strandboard (OSB) (+3.5%) and softboard (+5.7%) as a subcategory of fibreboard (+1.9%) partly offset declines in the output of other panel types.
The furniture industry remained the largest end-user of wood-based panels in the European subregion in 2020, despite contractions in furniture production and construction output (see chapters 1 and 7). Forty-seven percent of overall wood-based panels production in Europe went to the furniture sector in 2020 (compared with 49% in 2019). The building industry, including doors and flooring applications, accounted for 38% of overall production. The remaining demand for wood-based panels went to packaging (4%) and other applications, such as moulding and do-it-yourself (11%) (EPF, 2021).
The construction industry in Europe was less affected than the furniture end-use sectors during the pandemic crisis, enabling the structural panels market there to grow slightly (by 1.4%), in contrast to a decline of 2.8% for non-structural panels (EPF, 2021). Graph 4.1 summarizes structural panels
production, trade and consumption between 2016 and 2020, and graph 4.2 presents data for non-structural panels.
The outlook for the European wood-based panels industry in 2021 appears favourable thanks to political support (as outlined in chapter 1) for increasing the use of wood in construction (e.g. via the European Green Deal, the European Renovation Wave and the New European Bauhaus). At the same time, household furniture is benefiting from strong demand as people shift increasingly to home-working in response to the COVID-19 pandemic.
The European Panel Federation (EPF) forecasts that wood-based panels production in the subregion will rise by 5.8% in 2021, the highest rate in the last ten years. Unit values increased for both imports and exports of non-structural panels in 2020 but decreased for structural panels (graph 4.3).
Production Imports Exports Consumption
-10
-5
0
5
10
15
20
252016 2017 2018 2019 2020
mill
ion
m3
GRAPH 4.1
Europe: Structural panels production, trade and consumption, 2016-2020
Note: Exports are shown as negative numbers.
Source: UNECE/FAO database, 2021.
Production Imports Exports Consumption
-30
0
30
60
902016 2017 2018 2019 2020
mill
ion
m3
GRAPH 4.2
Europe: Non-structural panels production, trade and consumption, 2016-2020
Note: Exports are shown as negative numbers.
Source: UNECE/FAO database, 2021.

Chapter 4 Wood-based panels
37
250
350
450
5502016 2017 2018 2019 2020
$/m
3
Structural panels importsStructural panels exportsNon-structural panels importsNon-structural panels exports
GRAPH 4.3
Europe: Traded wood-based panels unit values, 2016-2020
Source: UNECE/FAO database, 2021.
Eastern Europe, Caucasus and Central Asia
The wood-based panels sector was one of the less-affected industries in the EECCA in 2020. Challenges arose in selling finished products, however, primarily for producers of plywood, other wood-based panels and furniture. The production of furniture and wood-based panels dropped by 40-50% in the Russian Federation during a COVID-19 lockdown in April-May 2020. Several wood-based panel manufacturing plants shut down completely. Many enterprises used the downtime for preventive maintenance, which made the best of a bad situation and helped avoid additional employee layoffs. The net result was that forest product production, including panels, rebounded strongly in the last quarter of 2020, almost making up for the declines experienced in the second and third quarters.
A large shortage of particle board/laminated particle board, medium-density fibreboard (MDF), high-density fibreboard (HDF) and flooring materials occurred in the Russian market in the third quarter of 2020. According to WhatWood (2021e) estimates, the particle-board shortage amounted to 30,000-40,000 m3 per month. The shutdown of several producers for reasons unrelated to the pandemic also contributed to the shortage, causing prices to roughly double in August.
The increased demand for wood-based panels was the result of two factors: seasonal demand, and demand unique to 2020. Typically, demand for wood-based panels, furniture and
decorative elements increases at the end of the construction season and on the commissioning of housing towards the end of each year. Atypically, in 2020, there was pent-up demand for wood-based panels in the furniture sector stemming from earlier pandemic restrictions as well as unused disposable household income that was not spent on travel or purchases (stifled by pandemic measures). Many households used their unspent funds for home improvements and repairs and to purchase furniture. Significant pressure on the panels market was also caused by the closure of some wood-based panel plants, limiting supply and driving prices up.
Apparent consumption decreased in the EECCA in 2020 for both structural panels (down by 8.6%, to 3.5 million m3) and non-structural panels (down by 6.7%, to 15.4 million m3) (graphs 4.4 and 4.5). The apparent consumption of all wood-based panels fell by 6.7% in the EECCA in 2020, to 19.0 million m3. The production of wood-based panels decreased by 3.4% in EECCA, to 23.4 million m3, and decreased by 1.0% in the Russian Federation, to 17.4 million m3.
The trade volume of wood-based panels grew in the EECCA for three consecutive years (2016–2018), driven mainly by trade developments in the Russian Federation; this growth plateaued in 2019 but resumed in 2020 (graphs 4.4 and 4.5). Russian imports of structural wood-based panels increased in 2020 (plywood by 60%, to 120,000 m3, and OSB by 43%, to 351,000 m3); imports of non-structural panels also grew (particle board by 25%, to 299,000 m3, and fibreboard by 7%, to
Production Imports Exports Consumption
-6
-4
-2
0
2
4
6
82016 2017 2018 2019 2020
mill
ion
m3
GRAPH 4.4
EECCA: Structural panels production, trade and consumption, 2016-2020
Note: Exports are shown as negative numbers.
Source: FAOSTAT, 2021.

38
UNECE/FAO Forest Products Annual Market Review, 2020-2021
Production Imports Exports Consumption
-8
-4
0
4
8
12
16
20
242016 2017 2018 2019 2020
mill
ion
m3
GRAPH 4.5
EECCA: Non-structural panels production, trade and consumption, 2016-2020
Note: Exports are shown as negative numbers.
Source: FAOSTAT, 2021.
150
200
250
300
350
400
4502016 2017 2018 2019 2020
$/m
3
Structural panels importsStructural panels exportsNon-structural panels importsNon-structural panels exports
GRAPH 4.6
EECCA: Traded wood-based panels unit value, 2016-2020
Source: FAOSTAT, 2021.
460,000 m3). Russian exports increased for most wood-based panel products: OSB exports grew by 30.0% (to 362,390 m3), fibreboard exports were up by 3.6% (to 1.24 million m3), and plywood exports rose by 5.7% (to 2.90 million m3) (WhatWood, 2021f ). In contrast, particle-board exports fell by 12.1%, to 1.74 million m3. The unit value of traded panels decreased for all panel products in 2020, with the exception of non-structural panel imports, for which unit prices were flat (graph 4.6).
There was a particularly sharp surge in prices for wood-based panels in the Russian Federation in the third quarter of 2020. Retail prices for particle board increased by at least 88% between July 2020 and May 2021, MDF prices grew by 83%, laminated MDF prices rose by 55%, HDF prices leapt by 95%, OSB prices soared by 145% and plywood prices were up by 71% (WhatWood, 2021f ). The main peak in prices occurred in May-June 2021, after which they were flat or even began to decline.
North America
Although the apparent consumption of wood-based panels declined by 3.3% in North America in 2020, a combination of rapidly rising prices and United States trade actions caused the total value of North American wood-based panel exports to increase by 18.9%. Total wood-based panel production in North America fell by 3.5% in 2020, to 45.5 million m3 (graphs 4.7 and 4.8). Production capacity in the North American structural panel industry increased by 0.3% and the utilization rate decreased from 75.3% in 2019 to 74.5% in 2020 (APA, 2021a).
The consumption of structural wood-based panels increased overall by 1.1% in North America in 2020 (graph 4.7), with demand rising for OSB by 2.6% and falling for plywood by 0.7% (graph 4.8).
Trends in the consumption of wood-based structural panels were mixed across the four major end-use markets – consumption was up by 5.5% in the residential construction market and by 2.5% in the remodelling market but down by 13.2% in the industrial market and by 1.1% in the non-residential market (APA, 2021b).
North American consumption of non-structural panels (particle board and MDF) fell by 5.9% in 2020, with MDF dropping by 8.9% and particle board down by 5.2%. With North American housing starts projected to rise again as the two countries emerge from pandemic-related lockdowns, the production of non-structural wood-based panels is expected to increase by 11% in 2021 (CPA, 2021a).
The value of North American imports of wood-based panels was up sharply (+13.9%) in 2020, to $6.6 billion. The value of imports to the United States rose by 16.6%, with the exception

Chapter 4 Wood-based panels
39
Production Imports Exports Consumption
-10
0
10
20
30
40
502016 2017 2018 2019 2020
mill
ion
m3
GRAPH 4.7
North America: Structural panels production, trade and consumption, 2016-2020
Note: Exports are shown as negative numbers.
Source: UNECE/FAO database, 2021.
Production Imports Exports Consumption
-5
0
5
10
15
20
2016 2017 2018 2019 2020
mill
ion
m3
GRAPH 4.8
North America: Non-structural panels production, trade and consumption, 2016-2020
Note: Exports are shown as negative numbers.
Source: UNECE/FAO database, 2021.
200
250
300
350
400
4502016 2017 2018 2019 2020
$/m
3
Structural panels importsStructural panels exportsNon-structural panels importsNon-structural panels exports
GRAPH 4.9
North America: Traded wood-based panels unit value, 2016-2020
Source: UNECE/FAO database, 2021.
of particle board, which fell by 12.0%. In Canada, the value of panel imports was flat (0.9%) in 2020; imports rose for particle board (+9.8%) and were steady for OSB (+0.7%).
The value of wood-based panel exports from North America jumped by 18.9% in 2020, to $3.3 billion, with Canada accounting for 81.6% of the total. The value of exports from North America (including trade between Canada and the United States) leapt by 51% for OSB but fell by 3.0% for plywood, by 5.3% for fibreboard and by 11.5% for particle board.
North American production capacity for non-structural panels fell by 3% in 2020, to about 15.6 million m3, with most of the decrease occurring in Canada. The capacity utilization rate decreased in the particle-board subsector from 67% in 2019 to 61% in 2020; it also fell in the MDF subsector, from 78.4% in 2019 to 76.4% in 2020 (CPA, 2021b).
Strong demand for wood-based panels, coupled with COVID-19-related supply constraints, led to unprecedented price increases through 2020 and the first half of 2021. By the middle of 2021, prices had leapt for western plywood (+417%,) southern plywood (377%) and OSB (455%); particle board (+21%) and MDF (+23%) registered smaller price hikes (Random Lengths, 2021b). These trends are clearly visible in the price data and declared unit prices of traded structural and non-structural panels (graphs 4.9 and 4.10).

40
UNECE/FAO Forest Products Annual Market Review, 2020-2021
Extraregional influences on the UNECE
Outside the UNECE region, Japan, China and the Republic of Korea are the largest importers of wood-based panels by both volume and value (table 4.1).
China is the world’s largest wood-based panels exporter (by volume and value), followed by Canada (in volume) and Germany (in value). Five countries in the UNECE region are among the top ten exporters globally (table 4.2).
Outside the UNECE region, imports by Japan and the Republic of Korea and exports from Indonesia and Malaysia continue to dominate the global trade of tropical plywood by volume. In 2020, the UNECE region absorbed 35% of total tropical plywood imports, although imports by EU countries declined compared with 2019 and United States imports grew rapidly, with that country accounting for 25% of world imports in 2020, compared with only 11% in 2016.
Japan’s imports of tropical plywood have contracted year-on-year since 2013, and the volume dropped by 29% in 2020 (to 1.2 million m3) due to declining construction activity; dropping overall demand for tropical plywood; re-investment in Japanese plywood processing capacity and technology focused on using domestic species; and the reduced availability of South Sea plywood. Plywood imports from Indonesia and Malaysia, Japan’s major suppliers, were constrained in 2020 by production shortages caused
3
0
500
1 000
1 500
2016 2017 2018 2019 2020 2021
$/m
West plywood Southern plywoodOSB Particle boardMDF
GRAPH 4.10
North America: Wood-based panel prices, 2016-2021
Note: m3 per 1,000 square feet: western plywood: 1.180; southern plywood: 1.106; OSB: 1.032; particle board and MDF: 1.475.
Source: Random Lengths, 2021b.

Chapter 4 Wood-based panels
41
Structural Non-structural Total (all panels)
1,000 m3 1,000 m3 1,000 m3 $ million
Japan 2,122 723 3,080 1,643
China 1,213 1,626 3,191 1,040
Republic of Korea 1,787 1,273 3,173 960
Malaysia* 1,022 654 1,676 362
Mexico* 609 621 1,230 498
Viet Nam* 656 572 1,228 531
Egypt 792 507 1,299 372
Philippines* 925 194 1,119 507
Saudi Arabia* 443 721 1,165 435
Australia 488 241 754 478
TABLE 4.1
Top ten extraregional wood-based panel importers, 2020
Note: * 2019 data; UNECE region countries are not included.
Sources: FAOSTAT, 2021; UN Comtrade, 2021.
TABLE 4.2
Top ten wood-based panel exporters globally, 2019
Note: * 2019 data.
Sources: FAOSTAT, 2021; UN Comtrade, 2021; UNECE/FAO database, 2021.
Structural Non-structural Total (all panels)
1,000 m3 1,000 m3 1,000 m3 $ million
China 9,607 2,325 12,073 5,221
Canada 5,794 1,589 7,383 2,700
Russian Federation 3,266 3,048 6,315 1,807
Germany 874.07 5,131 6,005 2,758
Thailand* 54 5,401 5,456 972
Brazil 2,783 1,313 4,285 989
Belarus 906 2,468 3,374 585
Malaysia* 1,775 1,538 3,313 1,180
Poland 645.74 2,610 3,256 1,053
Indonesia* 2,732 519 3,251 1,813
by COVID-19-related safe-work practices, extended lead times, labour shortages, and the rise in global container shipping rates due to disruptions in distribution caused by the pandemic. The market share of domestically produced plywood in Japan increased to 67% of total plywood consumption in 2020 (ITTO, 2021a).
Indonesia’s exports declined in volume by 28% in 2020 (to 2.3 million m3), but the country remained the world’s largest exporter of tropical plywood, shipping 35% of global exports. Although exports declined to Japan by 19% (by volume) in 2020, they increased to the United States by 10%, benefiting (as Malaysia and Viet Nam have done) from the trend among United States importers to diversify supply sources from China to other Asian suppliers. Malaysia’s plywood production and exports continued to be affected by chronic supply shortages of peeler logs to plywood mills, and production levels have not yet returned to pre-pandemic levels.
In contrast to all other major tropical plywood exporters, Viet Nam’s exports rose by 32% (to 1.5 million m3) in 2020, reflecting the quick and sustained resumption of production following the first wave of the pandemic, aided by government stimulus, and the resumption of growth in the housing and do-it-yourself sectors in the United States, Viet Nam’s major market. China’s exports of tropical plywood have declined year-on-year from a peak in 2017, contracting by one-third in 2020 to 0.495 million m3. This is mainly in response to the imposition of countervailing measures and tariffs by the United States on plywood imports from China and a surge in domestic demand as the economy bounced back from the effects of the pandemic in the second half of 2020 (ITTO, 2021a).
UNECE subregional data summary and forecast
Table 4.3 summarizes data on wood-based panels production, consumption, trade and declared value of cross-border trade. Additional information and the complete forest products database is available at www.unece.org/forests/fpamr2021-annex.
Initial data supplied by UNECE member states (all figures are year-on-year) indicate that the production of wood-based panels in the UNECE region will increase by 3.3% in both 2021 and 2022. Subregionally, the forecast is for production to grow in Europe by 2.3% in 2021 and by 2.1% in 2022; expand in the EECCA by 12% in 2021 and by 7.2% in 2022; and increase in North America by 3.0% in 2021 and by 1.3% in 2022.

42
UNECE/FAO Forest Products Annual Market Review, 2020-2021
TABLE 4.3
Wood-based panels production, imports, exports, net apparent consumption and traded unit value, UNECE subregions, 2016-2020
Note: Structural panels consist of plywood and OSB and non-structural panels consist of particle board and fibreboard. Unit values are included as an indicator of price trends and are derived by dividing the declared monetary value of imported and exported products by their volume.
Sources: FAOSTAT, 2021; UNECE/FAO database, 2021.
2016 2017 2018 2019 2020 Change 2019-2010
EUROPE
Structural panels
Production (1,000 m3) 11,996 12,705 12,703 12,448 12,497 0.4%
Imports (1,000 m3) 11,042 11,857 12,626 12,063 12,012 -0.4%Exports (1,000 m3) 8,433 9,038 8,966 8,858 8,864 0.1%Consumption (1,000 m3) 14,605 15,523 16,363 15,653 15,645 0.0%Import unit value ($/m3) 448 467 500 459 440 -4.1%Export unit value ($/m3) 454 475 540 510 495 -2.9%
Non-structural panels
Production (1,000 m3) 60,341 61,407 61,367 61,463 59,128 -3.8%
Imports (1,000 m3) 21,998 23,897 24,584 24,654 23,350 -5.3%Exports (1,000 m3) 25,240 26,617 26,459 26,809 26,596 -0.8%Consumption (1,000 m3) 57,099 58,687 59,491 59,308 55,883 -5.8%Import unit value ($/m3) 315 309 327 301 310 3.1%Export unit value ($/m3) 347 351 379 351 352 0.1%
EECCA
Structural panels
Production (1,000 m3) 5,665 6,027 6,684 6,660 6,724 1.0%
Imports (1,000 m3) 1,060 1,188 1,150 983 1,139 8.3%Exports (1,000 m3) 3,481 3,696 3,947 3,842 4,316 12.3%Consumption (1,000 m3) 3,243 3,519 3,888 3,801 3,473 -8.6%Import unit value ($/m3) 324 311 322 316 271 -14.2%Export unit value ($/m3) 341 379 437 376 353 -6.2%
Non-structural panels
Production (1,000 m3) 14,445 16,556 19,226 17,513 16,640 -5.0%
Imports (1,000 m3) 3,690 3,846 3,954 5,187 4,844 1.0%Exports (1,000 m3) 4,690 5,569 5,864 6,146 6,040 -1.7%Consumption (1,000 m3) 13,444 14,832 17,316 16,554 15,444 -4.7%Import unit value ($/m3) 280 276 279 235 229 -2.6%Export unit value ($/m3) 158 173 193 181 172 -4.7%
NORTH AMERICA
Structural panels
Production (1,000 m3) 32,767 33,936 32,665 32,913 32,594 -1.0%
Imports (1,000 m3) 11,303 12,930 14,471 12,587 11,493 -8.7%Exports (1,000 m3) 7,072 7,708 7,898 7,098 6,517 -8.2%Consumption (1,000 m3) 36,999 39,158 39,238 38,402 37,570 -2.2%Import unit value ($/m3) 388 373 369 314 413 31.7%Export unit value ($/m3) 288 305 319 258 373 44.6%
Non-structural panels
Production (1,000 m3) 15,203 14,645 13,876 14,235 12,900 -9.4%
Imports (1,000 m3) 4,890 5,351 5,908 5,536 5,592 1.0%Exports (1,000 m3) 2,821 2,551 4,251 2,925 2,641 -9.7%Consumption (1,000 m3) 17,272 17,445 15,533 16,847 15,851 -5.9%Import unit value ($/m3) 408 399 342 339 337 -0.4%Export unit value ($/m3) 312 344 218 325 332 2.1%

Chapter 4 Wood-based panels
43

Lead author: Michel Valois
Contributing author: Eduard Akim
PULP AND PAPER
Chapter 5

45
Chapter 5 Pulp and paper
Introduction and UNECE region overview
The global pulp, paper and paperboard industry experienced general weakness in 2020 due to fallout from the COVID-19 pandemic.
The production of graphic paper declined due to papermill closures and reduced consumption, the result of increased electronic communication. In contrast, growth continued in the consumption of sanitary and household papers, certain paperboard products and specialty papers, and pulps, including fluff and dissolving pulp.
Prices for printing and writing papers and newsprint remained weak in the EECCA in 2020 due to low demand. Prices were relatively stable in the subregion for paperboard and tissue but increased marginally for market pulp due to closures and very low levels of incremental capacity. A significant rebound in market-pulp prices began in early 2021, aided by stronger demand from China.
The production of graphic papers declined by 16.3% in Europe in 2020 and by 24.0% in North America but rose by 4.0% in the EECCA. Apparent consumption also fell in Europe (by 2.7%) and North America (by 25.6%) but increased in the EECCA (by 14.8%), in part due to capacity closures in Europe.
The production of packaging materials rose throughout the UNECE region in 2020 – it increased in Europe by 1.2%, in the EECCA by 4.1% and in North America by 0.6%. The apparent consumption of packaging material fell in Europe by 0.7% and in the EECCA by 5.4%, but it increased in North America by 0.3%.
Export and import unit values fell for all graphic grades throughout the UNECE region in 2020.
Prices for market pulp, graphic and specialty papers and packaging materials rose on stronger demand in 2021 as economies began to open up following the downturn in global activity caused by the pandemic. Challenges in the re-opening of global economies will likely persist well into 2021, however, such as those associated with returning to places of work.
The COVID-19 measures had a significant impact on the flow of recovered paper and paperboard throughout the UNECE region in 2020. China implemented a complete ban on imports of recovered paper from any country across all grades. As a result, it imported 2.5 million tonnes of recycled pulp (replacing production from recovered paper) in 2020, three times as much as in 2019.

46
UNECE/FAO Forest Products Annual Market Review, 2020-2021
Production Imports Exports Consumption
-20
-10
0
10
20
30
40
50
60
702016 2017 2018 2019 2020
mill
ion
tonn
es
GRAPH 5.1
Europe: Woodpulp production, trade and consumption, 2016-2020
Note: Exports are shown as negative numbers.
Source: UNECE/FAO database, 2021.
Europe
Total woodpulp production fell by 3.5% in Europe in 2020 (graph 5.1) due to weaker graphic-paper demand caused mainly by the COVID-19 pandemic. The strongest decline was in Finland, where production fell by 9.3%, to 10.5 million tonnes, due to mill closures, labour disputes and overall reduced demand. Finland was also the main driver behind the subregion’s reduced consumption of woodpulp; its consumption fell by 15.7% in 2020, to 6.4 million tonnes.
Europe’s apparent consumption of chemical woodpulp fell by 2.8% in 2020, to 31.1 million tonnes. The apparent consumption of chemical market pulp fell by 5.0%, to 15.9 million tonnes (CEPI, 2021).
Falling demand for printing and writing paper, and larger margins on chemical and mechanical pulp, enabled integrated mills to fill machine time by running pulp for the market. As demand for market pulp waned through 2020, however, the additional volumes from integrated players added to overcapacity; consequently, pricing weakness persisted to the end of the year.
Europe’s production of paper and paperboard was down by 4.7% in 2020, at 91.8 million tonnes (graph 5.2). The drop was due mainly to Finland, where production fell by 15.5%, to 8.2 million tonnes. Graphic-paper production fell by 16.3% in the subregion due to reduced consumption in the United Kingdom and Germany (down by 25.8% and 13.8%,
respectively), resulting in several machine closures. Production fell by 19.9% for newsprint, to 4.2 million tonnes; by 13.4% for uncoated mechanical papers, to 4.7 million tonnes; by 11.0% for uncoated wood-free papers, to 7.3 million tonnes; and by 19.6% for coated papers, to 9.8 million tonnes.
The subregion’s apparent consumption of paper declined by 4.1% in 2020, to 82.7 million tonnes, with the trend driven mainly by reduced consumption in the United Kingdom (down by 10.4%), France (-9.2%) and Germany (3.3%), the three countries experiencing a combined drop in apparent consumption of 2.2 million tonnes. Europe’s paper consumption declined by 22.5% for newsprint, to 3.9 million tonnes; by 7.0% for uncoated mechanical papers, to 3.9 million tonnes; by 9.0% for uncoated wood-free papers, to 6.8 million tonnes; and by 13.0% for coated papers, to 7.7 million tonnes.
Europe’s apparent consumption increased in 2020 by 1.0% for sanitary and household papers (on a rise in production of 0.4%) but fell by 0.7% for paperboard (packaging sub-segment), by 4.1% for paper and paperboard, by 2.7% for graphic papers and by 0.7% for packaging material.
Europe’s production of chemical market pulp fell by 1.3% in 2020, to 4.1 million tonnes, and the consumption of this product dropped by 5.0%, to 15.9 million tonnes (CEPI, 2021).
Woodpulp exports declined by 0.4% in 2020 and imports fell by 3.2%. Germany was the main driver behind the drop, with its imports falling by 15.2% (to 4.0 million tonnes). Europe’s exports were flat, but the gap closed between the two main
Production Imports Exports Consumption
-75
-50
-25
0
25
50
75
100
125
150
1752016 2017 2018 2019 2020
mill
ion
tonn
es
GRAPH 5.2
Europe: Paper production, trade and consumption, 2016-2020
Note: Exports are shown as negative numbers.
Source: UNECE/FAO database, 2021.

Chapter 5 Pulp and paper
47
exporters, with exports increasing for Sweden by 2.1% (to 4.3 million tonnes) and declining for Finland by 4.1% (to 4.3 million tonnes). Exports of graphic paper fell by 16.0% in Europe in 2020, and imports were down by 11.7%.
There was considerable volatility in the volume and type of paper recycling in Europe in 2020, with an overall drop in volume of 3.0%, to 58.6 million tonnes. Many schools and businesses were closed and office buildings were mostly deserted; thus, paper recycling fell in the institutional and commercial segments in 2020 and well into 2021 but increased in residential areas as people were encouraged or forced to stay home. Increased online shopping caused a spike in demand of old corrugated containers (Lombard, 2021).
Unit values were lower for virtually every traded woodpulp and paper type in Europe in 2020 (as they were in 2019, too), the result of lower demand (graph 5.3). There was an 11.5% decline in the unit value of woodpulp exports, and the import unit value dropped by 15.0%. Graphic-paper unit values fell by 4.5% for exports and by 4.2% for imports.
Eastern Europe, Caucasus and Central Asia
Chemical woodpulp production rose by 9.9% in the EECCA in 2020, to 6.6 million tonnes, due mainly to capacity expansion in Belarus (graph 5.4). There was a corresponding increase in apparent consumption in the EECCA of 6.1%, to 4.4 million tonnes.
500
600
700
800
900
1 0002016 2017 2018 2019 2020
$/to
nne
Pulp imports Pulp exportsPaper imports Paper exports
GRAPH 5.3
Europe: Traded woodpulp and paper unit value, 2016-2020
Source: UNECE/FAO database, 2021.
Production Imports Exports Consumption
-4,0
-2,0
0,0
2,0
4,0
6,0
8,0
10,02016 2017 2018 2019 2020
mill
ion
tonn
es
GRAPH 5.4
EECCA: Woodpulp production, trade and consumption, 2016-2020
Note: Exports are shown as negative numbers.
Source: FAOSTAT, 2021.
Paper and paperboard production rose by 4.2% in the EECCA in 2020, to 11.4 million tonnes (graph 5.5). The pulp industry grew in parts of the subregion – such as Belarus and the Russian Federation – with new capacity. The Russian Federation was by far the EECCA’s biggest producer of paper and paperboard in 2020, at 9.5 million tonnes, up by 4.4% compared with 2019.
The production of packaging materials rose by 4.1% in the EECCA in 2020, with case materials increasing by 4.1%, cartonboard up by 5.4% and wrapping papers higher by 1.6%. Newsprint production fell by 13.2% and exports dropped by 15.3%; the domestic consumption of this product was down by 7.1%, to 348,000 tonnes. The production of coated papers rose by 29.5% but consumption fell by 10.7%. The production of uncoated wood-free papers leapt by 30.8% and consumption was also significantly higher (+40.1%). The apparent consumption of sanitary and household papers grew by 4.2%.

48
UNECE/FAO Forest Products Annual Market Review, 2020-2021
Production Imports Exports Consumption
-4
-2
0
2
4
6
8
10
12
142016 2017 2018 2019 2020
mill
ion
tonn
es
GRAPH 5.5
EECCA: Paper production, trade and consumption, 2016-2020
Note: Exports are shown as negative numbers.
Source: FAOSTAT, 2021.
400
500
600
700
800
900
1 000
1 100
1 2002016 2017 2018 2019 2020
$/to
nne
Pulp imports Pulp exports
Paper imports Paper exports
GRAPH 5.6
EECCA: Traded woodpulp and paper unit value, 2016-2020
Source: FAOSTAT, 2021.
Unit values for exported woodpulp and paper declined significantly in the EECCA in 2020 – by 10.8% and 16.9%, respectively (graph 5.6). Unit values dropped by 5.1% for woodpulp imports but rose slightly (by 1.6%) for paper imports.
In the Russian Federation, chemical market-pulp production grew by 8.4% in 2020, to 3.0 million tonnes (RAO Bumprom, 2021), aided by capacity expansions. Exports grew by 12.4% on stronger demand from China.
North America
Woodpulp production dropped by 3.7% in North America in 2020, to 66.3 million tonnes (graph 5.7). Chemical pulp production was down by 1.1% (to 53.7 million tonnes), but its apparent consumption rose by 0.4% (to 46.0 million tonnes).
The production of paper and paperboard dropped by 3.5% in the subregion in 2020, to 74.9 million tonnes. The apparent consumption of paper and paperboard continued its downward trend, declining by 4.1%, to 68.6 million tonnes (graph 5.8).
The production of graphic papers fell by 24.0% in North America in 2020 (to 12.8 million tonnes); it has fallen by 42.2% since 2016, leading to significant – and mostly permanent – capacity reductions. The drop in demand has been fuelled largely by a move by end-users towards electronic communication, including the internet, but it was accentuated by the pandemic in 2020. Imports of graphic papers fell by 22.2%, and exports were down by 17.8%.
Production increased by 0.6% in the subregion in 2020 for packaging materials, to 51.8 million tonnes, but fell by 25.7% for newsprint, to 2.5 million tonnes. Low prices and poor profitability resulted in significant capacity rationalization. Production dropped by 21.2% for uncoated mechanical paper, to 1.8 million tonnes; by 21.5% for uncoated wood-free paper, to 5.3 million tonnes; and by 27.9% for coated papers, to 3.3 million tonnes. The production of sanitary and household papers rose by 3.1%, to 8.0 million tonnes.

Chapter 5 Pulp and paper
49
Production Imports Exports Consumption
-20
-10
0
10
2030
40
50
60
7080
2016 2017 2018 2019 2020
mill
ion
tonn
es
GRAPH 5.7
North America: Woodpulp production, trade and consumption, 2016-2020
Note: Exports are shown as negative numbers.
Source: UNECE/FAO database, 2021.
Production Imports Exports Consumption
-20
0
20
40
60
80
1002016 2017 2018 2019 2020
mill
ion
tonn
es
GRAPH 5.8
North America: Paper production, trade and consumption, 2016-2020
Note: Exports are shown as negative numbers.
Source: UNECE/FAO database, 2021.
North America’s apparent consumption of graphic paper dropped by 25.6% in 2020 (more than double the decline in 2019), to 12.5 million tonnes. The apparent consumption of newsprint fell by 25.8%, to 1.6 million tonnes. Apparent consumption also declined for uncoated mechanical paper, by 23.0% (to 1.8 million tonnes); for uncoated wood-free paper, by 22.5% (to 5.5 million tonnes); and for coated papers, by 30.8% (to 3.7 million tonnes). With many parts of the subregion subject to travel restrictions, an increase in electronic communication led to a faster drop in paper consumption than in previous years.
For sanitary and household papers, apparent consumption was up by 4.1% in 2020 (to 8.3 million tonnes), and production rose by 3.1% (to 8.0 million tonnes).
Apparent consumption grew by 0.3% for packaging materials, to 45.8 million tonnes; by 2.2% for cartonboard, to 6.4 million tonnes; and by 2.6% for case materials, to 32.2 million tonnes. It fell by 34.4% for wrapping papers (to 1.5 million tonnes) due to retail and restaurant/hospitality closures in much of the subregion.
China completely banned the importation of recovered papers from any country across all grades effective from January 2021, including newsprint, pulp substitutes, old corrugated containers and mixed papers (People’s Republic of China Ministry of Ecology and Environment, 2020). In 2018, 45.6% of Chinese recovered-paper imports came from the United States, but the volume had been dropping since 2013. China’s recovered-paper imports from the United States nearly halved from a high of 30.1 million tonnes in 2012 to 17.0 million tonnes in 2018 and had fallen to 10.6 million tonnes by 2019 as the Government of China restricted certain shipments based on contaminant levels. As a result, much of what was collected in the United States waste stream had no market, and reports began to surface of the burning or landfilling of waste paper and a cessation of collection. The COVID-19 pandemic reduced both demand and supply in 2020, and prices fell and volumes collapsed. The United States exported 14.4 million tonnes of recovered paper in 2020, down by 12.7% compared with 2019; data for the first four months of 2021, on the other hand, show a surge in United States exports of recovered paper to Indonesia (+505%), India (+356%), Mexico (+131%) and Viet Nam (+106%), while exports to China fell by 87% (US Census Bureau, 2021c).
The declared unit values of traded woodpulp and papers were both lower across all grades in North America in 2020, the result of lower apparent consumption (graph 5.9 and table 5.3). Declared unit values declined for woodpulp by 11.2% for exports and 18.8% for imports and for paper by 7.6% for exports and 7.2% for imports.

50
UNECE/FAO Forest Products Annual Market Review, 2020-2021
400
500
600
700
800
900
1 000
1 100
1 2002016 2017 2018 2019 2020
$/to
nne
Pulp imports Pulp exports
Paper imports Paper exports
GRAPH 5.9
North America: Traded woodpulp and paper unit value, 2016-2020
Source: UNECE/FAO database, 2021.
Extraregional influences on the UNECE
� CHINAPaper production and consumption increased in China in 2020, despite early lockdowns in parts of the country as an anti-COVID-19 measure and a continued drop in recovered-paper imports (China Paper Association, 2021). Overall, paper production reached 112.6 million tonnes in 2020, up by 4.6% compared with 2019, and consumption was 118.3 million tonnes, up by 10.5%.
Chinese production declined by 26.7% in 2020 for newsprint (to 1.1 million tonnes) and by 5.9% for coated printing and writing paper (to 6.4 million tonnes). Consumption also dropped for newsprint, by 10.3% (to 1.75 million tonnes), but increased by 5.4% for coated printing and writing paper (to 5.6 million tonnes).
Chinese production of uncoated printing and writing paper declined by 2.8% in 2020, to 17.3 million tonnes.
An increase in the consumption of coated and uncoated printing and writing paper in 2020 can be attributed in part to a strong publishing sector, with the Chinese Communist Party celebrating its one-hundredth anniversary in 2021. The increased consumption of these grades was facilitated by stronger imports to compensate for lower domestic production arising from plant closures, as well as by a
reduction in exports driven by the pandemic (China Customs Bureau, 2021; China Paper Association, 2021).
China’s production and consumption of boxboard also grew in 2020 – by 5.7% (to 14.7 million tonnes) and 7.5% (to 13.7 million tonnes), respectively. This was aided by a surge in demand: with many countries opting for lockdowns to minimize the spread of COVID-19, work-from-home measures and business retail closures drove online shopping and package-delivery services.
China’s containerboard sector posted strong growth in 2020. Mills in China produced 24.4 million tonnes of linerboard and 23.9 million tonnes of fluting, up by 11.4% and 7.7%, respectively, compared with 2019; consumption grew even more strongly, with linerboard up by 18.1% and fluting rising by 16.9%.
China imported only 6.9 million tonnes of recovered paper in 2020, a drop of 33.5% (3.5 million tonnes) compared with 2019, due to strict import quotas and in anticipation of a total ban starting in 2021. China imported 2.5 million tonnes of recycled pulp (replacing production from recovered paper) in 2020, three times as much as in 2019 (China Paper Association, 2021). China’s market-pulp imports reached a record high of 29.6 million tonnes in 2020. The country also imported 13.8 million tonnes of paper and paperboard in 2020 (table 5.1), a surge of 84.6% over 2019.
Market-pulp prices first started creeping higher in China in the third quarter of 2020, providing a catalyst for even stronger pricing in 2021 as other world economies began recovering from the pandemic. Also adding to higher prices were shipping and logistical issues, including lower producer stocks and a shortage of containers.

Chapter 5 Pulp and paper
51
� BRAZILBrazil produced 21.0 million tonnes of woodpulp (integrated and market) in 2020, an increase of 6.4% compared with 2019, and 10.1 million tonnes of paper and paperboard, a drop of 3.3%. The stronger pulp production was due mainly to a recovery of demand in global markets, with prices rising from cyclical lows.
Brazil exported 16.2 million tonnes of pulp in 2020 (table 5.2). Its pulp imports fell by 26.9%, due mainly to a sharp devaluation of the currency against the US dollar driven by the economic impact of the pandemic (Ibá, 2021).
� CHILEChile’s exports of pulp, paper and paperboard fell by 6.6% in 2020, due mainly to increased competition from Brazilian pulp exports, mainly in Asian markets. The country’s aggregate pulp exports fell by 8.3%, with bleached radiata-pine pulp down by 13.7% and unbleached radiata-pine pulp lower by 5.7%. Bleached eucalyptus kraft pulp exports fell by 4.3%.
Chile’s folding-boxboard exports rose by 17.1% in 2020 on stronger global demand (Infor, 2021).
TABLE 5.1
Top ten extraregional woodpulp and paper importers, 2020
Note: * 2019 data; UNECE region countries not included.
Source: FAOSTAT, 2021; UN Comtrade, 2021.
Woodpulp imports
Paper imports
Total woodpulp and paper imports
1,000 tonnes
1,000 tonnes
1,000 tonnes $ million
China 29,609 13,805 43,414 23,321
India 1,387 2,102 3,489 2,237
Republic of Korea 2,122 1,110 3,231 2,334
Japan 1,514 1,226 2,741 2,344
Mexico 388 2,087 2,474 3,095
Singapore* 834 1,388 2,222 1,356
Indonesia* 1,444 772 2,216 1,991
Malaysia* 457 1,670 2,127 1,783
Viet Nam* 403 1,597 2,000 1,711
Egypt* 493 1,236 1,729 1,462
UNECE subregional data summary and forecast
Table 5.3 summarizes data on woodpulp and paper production, consumption, trade and declared value of cross-border trade by UNECE subregion for the period 2016–2020. Additional information and the complete forest products database is available at www.unece.org/forests/fpamr2021-annex.
Initial data supplied by UNECE member States (all amounts are year-on-year) indicate that the production of paper and paperboard will increase by 3.2% in the UNECE region in 2021 and 1.3% in 2022. Subregionally, the forecast is that paper and paperboard production will increase in all three subregions. In Europe by 2.5% in 2021 and by 0.3% in 2022; in the EECCA by 7.0% in 2021 and by 5.0% in 2022; and in North America by 3.4% in 2021 and 1.8% in 2022.
Woodpulp production is forecast to increase by 1.0% in 2021 and decline by 0.3% in 2022. Woodpulp production is forecasted to grow in Europe by 2.5% in 2021 and remain stable in 2022 (0.1%). Woodpulp is forecasted to increase in the EECCA by 1.0% (2021) and 2.0 % (2022) while in North America it is forecasted to increase by 0.2% (2021) and decline by 0.7% (2022).
TABLE 5.2
Top ten woodpulp and paper exporters worldwide, 2020
Note: * 2019 data.
Sources: UNECE/FAO database, 2021; FAOSTAT, 2021.
Woodpulp exports
Paper exports
Total woodpulp and paper exports
1,000 tonnes
1,000 tonnes
1,000 tonnes $ million
United States 7,806 10,314 18,120 13,195
Brazil 16,153 1,921 18,074 7,477
Canada 9,018 5,961 14,979 9,071
Germany 1,146 13,632 14,778 12,576
Sweden 4,331 9,081 13,412 9,852
Finland 4,333 7,832 12,165 8,507
Indonesia* 5,385 4,853 10,238 7,015
China 150 6,223 6,373 6,786
Russian Federation 2,444 3,601 6,046 2,900
Chile* 4,719 542 5,261 3,247

52
UNECE/FAO Forest Products Annual Market Review, 2020-2021
TABLE 5.3
Woodpulp and paper production, imports, exports, apparent consumption and unit values, UNECE subregions, 2016-2020
Note: Unit values are included as an indicator of price trends and are derived by dividing the declared monetary value of imported and exported products by the volume of these products.
Sources: UNECE/FAO database, 2021; FAOSTAT, 2021.
2016 2017 2018 2019 2020 Change 2019-2020
EUROPE
Woodpulp
Production (1,000 tonnes) 38,963 39,722 40,345 39,558 38,159 -3.5%
Imports (1,000 tonnes) 20,728 20,862 21,506 20,020 19,373 -3.2%Exports (1,000 tonnes) 14,305 14,811 15,192 16,260 16,187 -0.4%Consumption (1,000 tonnes) 45,386 45,773 46,659 43,319 41,344 -4.6%Import unit value ($/tonne) 582 620 743 652 554 -15.0%Export unit value ($/tonne) 583 626 755 620 549 -11.5%
Paper
Production (1,000 tonnes) 97,688 99,058 98,741 96,246 91,752 -4.7%
Imports (1,000 tonnes) 56,270 57,082 57,241 55,144 52,624 -4.6%Exports (1,000 tonnes) 65,550 66,181 66,427 65,094 61,635 -5.3%Consumption (1,000 tonnes) 88,407 89,959 89,555 86,296 82,741 -4.1%Import unit value ($/tonne) 801 820 896 858 827 -3.6%Export unit value ($/tonne) 816 851 929 877 839 -4.3%
EECCA
Woodpulp
Production (1,000 tonnes) 8,368 8,301 8,613 8,421 9,063 7.6%
Imports (1,000 tonnes) 248 241 240 305 322 5.4%Exports (1,000 tonnes) 2,300 2,259 2,276 2,305 2,660 15.4%Consumption (1,000 tonnes) 6,316 6,284 6,577 6,421 6,725 4.7%Import unit value ($/tonne) 731 704 783 733 696 -5.1%Export unit value ($/tonne) 458 516 695 488 435 -10.8%
Paper
Production (1,000 tonnes) 10,219 10,333 10,948 10,942 11,404 4.2%
Imports (1,000 tonnes) 2,544 2,583 2,681 2,726 2,550 -6.5%Exports (1,000 tonnes) 3,201 3,410 3,622 3,565 3,956 11.0%Consumption (1,000 tonnes) 9,561 9,507 10,007 10,103 9,998 -1.0%Import unit value ($/tonne) 1,117 1,059 1,106 1,045 1,062 1.6%Export unit value ($/tonne) 618 599 707 628 522 -16.9%
NORTH AMERICA
Woodpulp
Production (1,000 tonnes) 66,571 66,085 70,023 68,877 66,294 -3.7%
Imports (1,000 tonnes) 5,902 5,720 5,916 5,700 6,079 6.7%Exports (1,000 tonnes) 17,702 17,887 17,584 17,526 16,825 -4.0%Consumption (1,000 tonnes) 54,771 53,918 58,356 57,051 55,549 -2.6%Import unit value ($/tonne) 522 558 647 627 509 -18.8%Export unit value ($/tonne) 599 648 750 651 578 -11.2%
Paper
Production (1,000 tonnes) 81,813 82,003 81,033 77,630 74,906 -3.5%
Imports (1,000 tonnes) 12,123 11,852 12,086 11,158 9,955 -10.8%Exports (1,000 tonnes) 18,335 18,817 19,064 17,267 16,274 -5.8%Consumption (1,000 tonnes) 75,602 75,037 74,055 71,520 68,587 -4.1%Import unit value ($/tonne) 893 899 955 988 945 -4.3%Export unit value ($/tonne) 762 795 852 833 771 -7.4%

Chapter 5 Pulp and paper
53

Lead author: Francisco X. Aguilar
Contributing authors: Consuelo Brandeis, Per Eriksson, Branko Glavonjić, Warren Mabee, Johan Vinterbäck
WOOD ENERGY
Chapter 6

55
Chapter 6 Wood energy
Introduction and UNECE region overview
Wood energy plays a significant role in the renewable-energy portfolios of nations across the UNECE region. According to official reports, wood fuel production and consumption decreased slightly (by about 13.9 million m3) in the region in 2020, to 246 million m3.
Much of the recent new demand for wood energy in the UNECE region has been triggered by commercial electricity production; future growth might focus on industrial and residential heating and combined heat and power.
The consumption of wood pellets is increasing steadily, both for industrial applications (electricity and heat production) and in the residential heating sector. The UNECE region accounts for 80% of world production and 90% of global exports.
A total of 35.6 million tonnes of wood pellets was produced in the UNECE region in 2020, an increase of 4.8% over 2019. Among the subregions, Europe was the largest consumer and leading exporter in 2020. Wood pellet production in the Russian Federation grew by 6.5%, year-on-year.
Worldwide production of ENplus-certified pellets exceeded 12 million tonnes in 2020 and is expected to surpass 14 million tonnes in 2021. Germany led global production of certified wood pellets, producing more than 3 million tonnes in 2020.
Policies promoting renewable energy and economic recovery in the wake of the COVID-19 pandemic could spur additional growth in wood-energy demand and production. The evolution of public policy, including sustainable supply and the efficient conversion of biomass into renewable energy, continues to shape wood-energy systems, as illustrated by recent government actions in the Netherlands, Sweden and the United States.
Outside the UNECE region, Viet Nam has become the world’s third-largest producer (behind the United States and Canada) of wood pellets and second second-largest exporter (behind the United States). It produced nearly 3.1 million tonnes of wood pellets in 2020, all of which was exported.
The Republic of Korea (3 million tonnes) and Japan (2 million tonnes) were the world’s third- and fourth-largest wood-pellet importers, respectively, in 2020.

56
UNECE/FAO Forest Products Annual Market Review, 2020-2021
Europe
The most recent available data show that 23% of the EU27’s roundwood production was used for energy generation in 2019 – a large increase from the 17% reported in 2000. In Cyprus, Italy and the Netherlands, close to 60% of roundwood production was destined for energy purposes in 2019. The share of roundwood used for energy increased by 58% in the Netherlands between 2000 and 2019 and by 52% in Cyprus (Eurostat, 2020). European wood fuel8 consumption decreased slightly (by 1.5%) in 2020 (graph 6.1).
The deployment of renewables in Europe was slower in the heating-and-cooling sector than in the electricity sector between 2004 and 2018. Over that period, the annual average increase in deployed capacity was 0.66 percentage points in the heating-and-cooling sector compared with 1.27 percentage points in the electricity sector (Bioenergy Europe, 2020). An annual increase of 1.3 percentage points for renewables in final heat consumption has been set as an indicative target in the revised EU Renewable Energy Directive (RED II). How much this target promotes the greater use of renewable wood fuel depends partly on how much heat is generated from waste – which has an upper cap of 40% in RED II (Bioenergy Europe, 2020).
Europe produced about 22.5 million tonnes of wood pellets in 2020, with imports decreasing slightly (by 0.3%) compared with 2019, to 21.7 million tonnes (graph 6.2). Europe has a large number of ENplus-certified companies.9 Germany was the world’s biggest producer of ENplus-certified pellets in 2020, at more than 3 million tonnes, and Austria and Poland were the second- and third-largest producers in Europe (ENplus, 2021). Worldwide production of ENplus-certified pellets exceeded 12 million tonnes in 2020 and is expected to surpass 14 million tonnes in 2021.
8 Wood fuel is defined in the Joint Eurostat/FAO/ITTO/UNECE Forest Sector Questionnaire as, “roundwood that will be used as fuel for purposes such as cooking, heating or power production. It includes wood harvested from main stems, branches and other parts of trees (where these are harvested for fuel), round or split, and wood that will be used for the production of charcoal, wood pellets and other agglomerates. It also includes wood chips to be used for fuel that are made directly (i.e. in the forest) from roundwood. It excludes wood charcoal, pellets and other agglomerates. It is reported in cubic metres solid volume underbark (i.e. excluding bark)”. This definition corresponds with code 313 of the Central Product Classification Version 2.1 of the United Nations Statistics Division and the sum of codes 4401.11 and 4401.12 of the Harmonized System of the World Customs Organization.
9 ENplus certification, established in 2011, comprises quality classes and requirements to complement those set by the European (EN 14961-2) and international (ISO 17225-2) standards (ENplus, 2021). Certification assures compliance with technical specifications, including length and diameter, mechanical durability, percentage of fines, bulk density, ash and moisture content, calorific values, and the percentage of additives.
Production Imports Exports Consumption
-25
0
25
50
75
100
125
150
2016 2017 2018 2019 2020
mill
ion
m3
GRAPH 6.1
Europe: Wood fuel production, trade and consumption, 2016-2020
Note: Exports are shown as negative numbers.
Source: UNECE/FAO database, 2021.
Production Imports Exports Consumption
-15
0
15
30
452016 2017 2018 2019 2020
mill
ion
tonn
es
GRAPH 6.2
Europe: Wood pellet production, trade and consumption, 2016-2020
Note: Exports are shown as negative numbers.
Source: UNECE/FAO database, 2021.

Chapter 6 Wood energy
57
The import volume of wood pellets doubled in the Netherlands in 2020, year-on-year, to 2.4 million tonnes, and wood-pellet-generated energy accounted for about 10% of the total renewable energy used (Flach, 2021). Dutch wood-pellet consumption was estimated at about 2.9 million tonnes in 2020, of which about 2 million tonnes were used in co-firing with coal. The Dutch parliament voted in February 2021 to stop issuing new subsidies under the Stimulation of Sustainable Energy Production (SDE+) scheme for 50 planned forest-biomass-for-heat plants. It kept in place annual subsidies of €578.5 million for existing Dutch biomass plants primarily combusting wood pellets imported from the southeastern United States and eastern Europe (Catanoso, 2021). As reported by Flach (2021), the Government of the Netherlands plans to end subsidies for biomass-generated power in 2027 but maintain them for combined heat and power (CHP). In other developments, the Government of Finland announced that the use of peat for energy will be at least halved by 2030 as part of its emissions-cutting programme (Yle, 2021). This decision could create opportunities in the heating sector for the greater use of wood fuel sourced domestically and from the Russian Federation and the Baltic countries.
In Sweden, the wood-energy sector was less affected by the COVID-19 pandemic in 2020 than were other sectors across the wider economy (Swedish Energy Agency, 2021). The number of operating CHP plants using bioenergy sources increased from 230 in 2019 to 242 in 2020 (Svebio, 2020). Electricity generation was not as profitable for CHPs in 2020, however, due to low prices for electricity certificates resulting from an expansion of wind-power capacity and warmer-than-average temperatures (Statistics Sweden, 2021). Most of the wood damaged by spruce bark beetles in Sweden – about 8 million m3, in total – was used for energy in 2020 (Swedish Forest Agency, 2020). The Swedish Energy Agency has proposed an overhaul of policy instruments to protect CHP and fulfil article 14.1 of the EU Energy Efficiency Directive.
$ 50
$ 75
$ 100
$ 125
$ 150
$ 175
$ 2002016 2017 2018 2019 2020
Wood pellet imports [$/tonne]Wood pellet exports [$/tonne]Wood fuel imports [$/m³]Wood fuel exports [$/m³]
GRAPH 6.3
Europe: Unit value of traded wood fuel and wood pellets, 2016-2020
Source: UNECE/FAO database, 2021.
CHP generation is crucial in winter when demand peaks. The common location of CHP plants near final users reduces the need for powerlines and supports the stability of electricity grids, thereby reducing the risk of local power shortages. But low profitability can discourage new investment in CHP in favour of hot-water boilers. The Swedish Energy Agency will conduct an integrated assessment of the policy instruments affecting CHP, analyse their joint effects, and propose any needed changes (Swedish Energy Agency, 2020).
Unit values for traded wood fuel and wood pellets declined slightly in Europe in 2020, except for wood fuel imports, which increased marginally (graph 6.3).
Wood fuel production declined in the Western Balkans10 in 2020, with the exception of wood pellets (Agency for Statistics of Bosnia and Herzegovina, 2021; Croatian Bureau of Statistics, 2021; Institute for Statistics of Albania, 2021; Statistical Office of Montenegro, 2021; State Statistical Office of the Republic of North Macedonia, 2021; Statistical Office of the Republic of Serbia, 2021; Statistical Office of the Republic of Slovenia, 2021). Overall wood fuel production in the Western Balkans fell by about 0.8%, year-on-year, but still exceeded 29 million m3. Wood briquettes experienced the biggest fall, dropping by about 9%. The production of
10 The Western Balkans comprise Albania, Bosnia and Herzegovina, Croatia, North Macedonia, Montenegro, Serbia and Slovenia.

58
UNECE/FAO Forest Products Annual Market Review, 2020-2021
firewood and charcoal also declined, by 1.5% and 1.0%, respectively; wood-chip production fell by about 2%, to 1.64 million tonnes, but wood-pellet production rose by nearly 9%, to 1.6 million tonnes. Serbia remains the leading producer of wood pellets in the Western Balkans, and Croatia leads the production of wood chips. The pandemic has affected wood-pellet manufacturing, halting production for 2-3 weeks in April 2020; it also had an impact in the first five months of 2021.The lifting of pandemic restrictions will ease pressure, and a recovery in production is expected by the end of the year. In public policy, most Western Balkan countries have abandoned feed-in tariffs as an intervention to promote renewables, instead switching to more market-oriented tools such as auctions and concessions. Countries in the Western Balkans are introducing pathways for a clean-energy transition that will phase out coal-fired power plants (B. Glavonjić, personal communication, 2021).
Eastern Europe, Caucasus and Central Asia
After achieving record highs in 2018, wood fuel production and consumption in the EECCA continued to decline in 2020, both falling by 4.4%. Most production was used domestically or traded among EECCA countries; thus, subregional production and consumption in 2020 were similar to 2019 values, at 40.5 million m3 and 40.0 million m3, respectively (graph 6.4).
The situation was much more dynamic in the wood pellet market, with production increasing by 7% in the EECCA in 2020, to 4.5 million tonnes. The production of wood pellets has increased by about 70% in the subregion in the last five years (graph 6.5), driven mostly by demand elsewhere – about two-thirds of production is exported to Asia and Europe. The Russian Federation remains the main player in the EECCA for wood pellets, although the biggest increase in production in 2020 was in Belarus, with a leap of 35.2% (to 557,000 tonnes).
Wood pellet production in the Russian Federation grew by 6.5% in 2020, to 1.96 million tonnes. Output jumped by 17.6% between January and May 2021, year-on-year, to 874,000 tonnes. Russian wood pellet exports increased by 21.9% in the first quarter of 2021, with the top export markets in January being Denmark (205,700 tonnes), Belgium (89,600 tonnes) and the Republic of Korea (52,800 tonnes). In value terms, total Russian wood-pellet exports grew by 12.1% year-on-year, to $64.7 million (WhatWood, 2021g). Current investments in pellet plants could increase annual production capacity in the Russian Federation by 118,000 tonnes. The intention of the Government of the Russian Federation is to reduce the number of wood-waste landfills and encourage exports of wood pellets and briquettes. VTK Invest plans to increase the recovery of residues from wood processing to produce 5,000 tonnes of wood charcoal briquettes and 25,000 tonnes of wood pellets annually (WhatWood, 2020b).
Production Imports Exports Consumption
-505
10
1520253035
404550
2016 2017 2018 2019 2020
mill
ion
m3
GRAPH 6.4
EECCA: Wood fuel production, trade and consumption, 2016-2020
Note: Exports are shown as negative numbers.
Source: FAOSTAT, 2021.
Production Imports Exports Consumption
-3,0
-2,0
-1,0
0,0
1,0
2,0
3,0
4,0
5,02016 2017 2018 2019 2020
mill
ion
tonn
es
GRAPH 6.5
EECCA: Wood pellet production, trade and consumption, 2016-2020
Note: Exports are shown as negative numbers.
Source: FAOSTAT, 2021.

Chapter 6 Wood energy
59
The average export unit value for wood fuel in the Russian Federation in 2020 was $70 per m3 (graph 6.6). The export price of wood pellets decreased slightly, to $121 per tonne, due mainly to a relatively stable exchange rate between the Russian rouble and the euro.
North America
According to UNECE/FAO statistics, North America produced 62.3 million m3 of wood fuel in 2020, down by 14.9% compared with 2019, and 12.24 million tonnes of wood pellets, up by 5.4% (graph 6.7 and graph 6.8).
Other than pulping liquor and solid wood wastes produced and consumed in the wood products industry, wood pellets are the only commercial wood fuel produced in Canada at an industrial scale (Statistics Canada, 2021b). Wood pellet production continues to lag behind installed capacity, which the industry reported at 5.05 million tonnes per year in 2020 (Canadian Biomass, 2021). The retail price of wood pellets in Canada is averaging C$340 per tonne; most pellets for retail use are sold in 18.1-kg (40-lb) bags for C$6-7 per bag. Wholesale prices for export-oriented pellets have been steady, at approximately C$143 per tonne (Statistics Canada, 2021a).
The Canadian energy policy is dominated by the Clean Fuel Standard, which is designed to reduce national greenhouse-
$ 0
$ 200
$ 4002016 2017 2018 2019 2020
Wood pellet imports [$/tonne]Wood pellet exports [$/tonne]
Wood fuel imports [$/m³]
Wood fuel exports [$/m³]
GRAPH 6.6
EECCA: Unit value of traded wood fuel and wood pellets, 2016-2020
Source: FAOSTAT, 2021.
Production Imports Exports Consumption
-10
0
10
20
30
40
50
60
70
802016 2017 2018 2019 2020
mill
ion
m3
GRAPH 6.7
North America: Wood fuel production, trade and consumption, 2016-2020
Note: Exports are shown as negative numbers.
Source: UNECE/FAO database, 2020
Production Imports Exports Consumption
-12
-8
-4
0
4
8
12
162016 2017 2018 2019 2020
mill
ion
tonn
es
GRAPH 6.8
North America: Wood pellet production, trade and consumption, 2016-2020
Note: Exports are shown as negative numbers.
Source: UNECE/FAO database, 2020.

60
UNECE/FAO Forest Products Annual Market Review, 2020-2021
gas emissions by 13% by 2030 (ECCC, 2018). The Clean Fuel Standard is focused on liquid fuels, and concerns have been raised that this will limit the contributions of solid wood fuels and stationary energy plants using biomass (Murray, 2019). Other policies at the provincial and federal levels could have a larger impact on wood-energy markets, to the extent that an additional 2-5 million m3 of wood resources could be required nationally to meet various policy initiatives by 2030. This might result in an increase in forest removals of 3.1-5.6% compared with levels in 2015 (Giuntoli, 2020).
Energy production from renewable sources continues to increase in the United States. Renewable-energy production grew by 13% over the five years from 2016 to 2020, but energy from wood fuels was 4% lower in 2020 compared with 2016 (EIA, 2021a). The production of wood fibre densified into pellets is distributed over 84 facilities in the United States, with more than 70% of milling capacity located in the country’s southeast to supply the European market (EIA, 2021b). United States wood pellet production was down by 7% in the first quarter of 2021 compared with the same period in 2020.
The average price of wood pellets in the United States in domestic and export markets showed an overall upward trend between 2016 and 2020, with the average domestic price rising by 16% in real terms (constant 2020 US dollars) (from $166 per tonne to $192 per tonne) and the average export price increasing by 21% (from $152 per tonne to $183 per tonne). The residential consumption of wood energy for heating in the United States could be stimulated by the Biomass Thermal Utilization (BTU) Act under the Omnibus appropriations and COVID-19 relief package of 2020, which expands energy tax credits to residential investments to install high-efficiency biomass heating units (NCSL, 2021).
The sustainability of wood-pellet production in the United States southeast destined for the EU and the United Kingdom continues to be debated in public media and other forums (e.g. Popkin, 2021; Hodgson, 2021). Science-based reports assessing the integrity of carbon pools from forests used to procure fibre for pelletization suggest that carbon stocks are not being negatively affected, and new demand could contribute to the growth and regrowth of wood fibres (Aguilar et al., 2020; Cowie et al., 2021).
Graph 6.9 shows a gap between declared unit values for imported and exported pellets, which arises because of the export of utility-grade pellets and the import of premium bagged product.
Extraregional influences on the UNECE
The UNECE region dominates global trade in wood energy. The United States is the world’s top exporter, with a total export value exceeding $1 billion in 2020 (table 6.1). Viet Nam’s wood-pellet production is expanding rapidly, however, reaching nearly 3.1 million tonnes, all of which is exported. This country has now overtaken Canada as the world’s second-largest exporter by volume (Canada remains the second largest producer of wood pellets).
Vietnamese production is exported to the two main markets for wood pellets outside the UNECE region – the Republic of Korea and Japan, which imported about 3 million and 2 million tonnes of wood pellets in 2020, respectively (table 6.2).
Wood pellet imports [$/tonne]Wood pellet exports [$/tonne]
Wood fuel imports [$/m³]
Wood fuel exports [$/m³]
$ 0
$ 50
$ 100
$ 150
$ 200
$ 250
$ 300
$ 3502016 2017 2018 2019 2020
GRAPH 6.9
North America: Declared unit value of traded wood fuel and wood pellets, 2016-2020
Source: UNECE/FAO database, 2021.

Chapter 6 Wood energy
61
Note: UNECE-region countries not included; * 2019 data.
Sources: Comtrade, 2021; FAOSTAT, 2021.
TABLE 6.2
Top wood fuel and wood pellet importers outside the UNECE region, 2020
Wood fuel Wood pellets Total
1,000 m3 $ million
1,000 tonnes
$ million
$ million
Japan 1.7 1.2 2,028 343.6 344.8
Republic of Korea 0.5 0.1 3,004 329.1 329.1
South Africa 666.3 23.2 1.3 0.3 23.5
Eswatini* 261.1 7.2 0.0 0.0 7.2
China 17.5 1.6 18.7 2.9 4.5
Australia 0.9 0.9 5.5 2.5 3.4
India* 15.2 2.4 1.2 0.3 2.7
Malaysia* 0.9 0.8 6.1 1.9 2.6
Thailand* 18.0 0.8 17.3 1.1 1.9
Saudi Arabia* 8.5 1.4 0.4 0.2 1.6
Note: * 2019 data.
Sources: Comtrade, 2021; FAOSTAT, 2021; UNECE/FAO database, 2021.
TABLE 6.1
Global top ten wood fuel and wood pellet exporters, 2020
Wood fuel Wood pellets Total
1,000 m3 $ million
1,000 tonnes
$ million
$ million
United States 366* 21.7* 7,257 982 1,004
Latvia 490 58,9 2,350 373 432
Canada 110 4.7 2,901 406 410
Viet Nam* 3 0.4 3,077 309 310
Russian Federation 175 8.9 2,294 290 299
Estonia 206 19 1,070 184 203
Denmark 46 1.3 1,064 194 195
Austria 11 0.9 848 192 193
Germany 166 7.3 751 182 190
Lithuania 318 32 610 112 144
UNECE subregional data summary and forecast
Table 6.3 summarizes data on the production, consumption, trade and declared value of cross-border trade of wood fuel and wood pellets in the UNECE subregions. Additional information and the complete forest products database is available at: www.unece.org/forests/fpamr2021-annex.
Initial data supplied by UNECE member States (all figures are year-on-year) indicate that the production of wood pellets in the UNECE region will increase by 6.3% in 2021 and by 4.9% in 2022. Subregionally, the forecast is for wood-pellet production to grow in Europe by 5.0% in 2021 and by 4.6% in 2022; to increase in the EECCA by 15% in 2021 and 2022; and to increase in North America by 6.1% in 2021 and by 2.7% in 2022.

62
UNECE/FAO Forest Products Annual Market Review, 2020-2021
Note: Unit values are included as an indicator of price trends and are derived by dividing the declared monetary value of imported and exported products by the volume of these products.
Sources: UNECE/FAO database, 2021; FAOSTAT, 2021.
TABLE 6.3
Wood fuel and wood pellets production, imports, exports, net apparent consumption and traded unit value, UNECE subregions, 2016-2020
2016 2017 2018 2019 2020 Change 2019-2020
EUROPE
Wood fuel
Production (1,000 m3) 139,734 139,903 142,892 144,306 143,187 -0.8%
Imports (1,000 m3) 4,928 4,117 4,367 4,202 3,094 -26.4%Exports (1,000 m3) 5,868 5,402 5,132 4,850 4,834 -0.3%Consumption (1,000 m3) 138,794 138,617 142,128 143,658 141,446 -1.5%Import unit value ($/m3) 66 78 86 87 89 2.0%Export unit value ($/m3) 58 66 82 80 77 -4.0%
Wood pellets
Production (1,000 tonnes) 17,366 18,349 19,666 21,852 22,506 3.0%
Imports (1,000 tonnes) 14,852 17,050 19,841 21,721 21,651 -0.3%Exports (1,000 tonnes) 7,979 9,543 10,483 11,821 11,891 0.6%Consumption (1,000 tonnes) 24,240 25,856 29,025 31,752 32,265 1.6%Import unit value ($/tonne) 172 170 186 185 181 -2.5%Export unit value ($/tonne) 167 163 191 184 182 -1.5%
EECCA
Wood fuel
Production (1,000 m3) 41,882 43,673 47,037 42,394 40,537 -4.4%
Imports (1,000 m3) 9 9 44 42 44 3.9%Exports (1,000 m3) 1,961 1,573 1,227 539 520 -3.6%Consumption (1,000 m3) 39,930 42,108 45,854 41,898 40,061 -4.4%Import unit value ($/m3) 55 63 89 91 90 -0.6%Export unit value ($/m3) 32 35 42 74 70 -5.1%
Wood pellets
Production (1,000 tonnes) 2,573 3,607 3,624 4,199 4,495 7.0%
Imports (1,000 tonnes) 14 17 17 22 14 -35.4%Exports (1,000 tonnes) 1,694 2,223 2,563 3,302 3,773 14.2%Consumption (1,000 tonnes) 893 1,401 1,078 919 737 -19.8%Import unit value ($/tonne) 222 269 250 192 237 23.2%Export unit value ($/tonne) 97 100 122 129 121 -6.5%
NORTH AMERICA
Wood fuel
Production (1,000 m3) 64,206 65,904 72,782 73,177 62,276 -14.9%
Imports (1,000 m3) 153 149 165 92 76 -17.4%Exports (1,000 m3) 352 356 401 125 111 -11.0%Consumption (1,000 m3) 64,006 65,696 72,547 73,144 62,241 -14.9%Import unit value ($/m3) 122 124 78 212 310 46.1%Export unit value ($/m3) 66 66 64 50 52 2.6%
Wood pellets
Production (1,000 tonnes) 9,300 9,824 10,628 11,724 12,354 5.4%
Imports (1,000 tonnes) 338 429 336 468 400 -14.6%Exports (1,000 tonnes) 7,238 7,663 8,919 9,673 10,316 6.6%Consumption (1,000 tonnes) 2,399 2,590 2,045 2,519 2,437 -3.2%Import unit value ($/tonne) 207 182 199 211 253 20.1%Export unit value ($/tonne) 130 135 139 142 139 -1.9%

Chapter 6 Wood energy
63

Lead authors: Chris Gaston, Tapani Pahkasalo
Contributing author: Zhenxi (Fred) Zhu
VALUE-ADDED WOOD PRODUCTS
Chapter 7

65
Chapter 7 Value-added wood products
Introduction and UNECE region overview
Value-added wood products are primary wood products that have been further processed into secondary products such as furniture, builders’ joinery and carpentry (BJC), profiled wood, and engineered wood products (EWPs). Demand is linked to drivers such as economic growth; housing and construction; home renovation; fashion and design; and demographics.
BJC comprises a wide array of wood products, including wooden windows and doors; pre-assembled wooden flooring; posts and beams; and shakes and shingles. EWPs include I-beams (also called I-joists); finger-jointed sawnwood; glulam (sawnwood glued into beams); laminated veneer lumber (LVL); and mass timber panels, including cross-laminated timber (CLT). Profiled wood is wood shaped by machines, such as mouldings, tongue-and-groove, and lap siding.
The COVID-19 pandemic has had a surprising impact on value-added wood product demand, with people suddenly having more time for do-it-yourself projects. Initially, this was channelled into demand for terrace boards and support structures, and later it developed into house-expansion projects, driving demand for home-renovation products such as window and door frames, mouldings and various EWPs.
Improvements and repairs of owner-occupied homes will remain solid in the United States through 2021 and into 2022.
The office-furniture segment has been a clear loser in the pandemic, with stay-at-home orders reducing demand. On the other hand, such orders have meant that workers have focused on their homes and comfort, and many have adapted their spaces to the needs of working from home. This will likely have longer-term effects on office workspace design and use and could lead to a reduction in total required space as more people work remotely at least part of the time.
Building with wood has been boosted by the introduction of CLT, particularly in markets with a lower share of wood construction. Global CLT production capacity was estimated at 2.8 million m3 in 2020, and actual production likely exceeded 2 million m3. Capacity continues to expand rapidly and could reach 4 million m3 by 2025.
Combined, Austria, the Czech Republic, Germany, Italy and Switzerland are reported to have produced slightly more than 1 million m3 of CLT in 2020, an increase of 15% over 2019. Growth is expected to continue in these countries at a similar or even slightly higher rate in 2021. The five countries account for more than half of global CLT production, and their capacity is projected to expand by 650,000 m3 across 2021 and 2022.

66
UNECE/FAO Forest Products Annual Market Review, 2020-2021
Source: UN Comtrade, 2021.
GRAPH 7.1
Wooden furniture imports, top five importing countries, 2016-2020
0
4
8
12
16
20
24
US Germany UK France Japan$
billi
on2016 2017 2018 2019 2020
Source: UN Comtrade, 2021.
TABLE 7.1
Value of wooden furniture imports, and market share of supplying regions, top five importing countries, 2019-2020
United States Germany France United Kingdom Japan
2019 2020 2019 2020 2019 2020 2019 2020 2019 2020
Total value of imports ($ billion) 20.7 21.2 5.2 5.4 4.1 3.6 3.8 3.6 2.3 2.3
Origin (%)
Asia 77.2 79.1 18.5 20.0 55.0 56.8 25.2 22.2 93.1 93.9
Europe 9.3 8.3 80.0 78.4 38.3 36.4 73.1 76.9 6.4 5.6
North America 7.2 6.0 0.1 0.1 3.5 3.6 0.2 0.2 0.4 0.4
Latin America 6.3 6.7 0.3 0.3 2.0 1.9 0.8 0.7 0.0 0.0
Other 0.0 0.0 1.2 1.2 1.1 1.4 0.6 0.0 0.0 0.0
Furniture
The furniture sector is a global industry, with specialized sourcing, design, manufacturing, sales and logistics, and it is also a significant consumer of wood raw material. Wooden furniture is classified here as part of value-added wood products, a term used synonymously with secondary wood products (i.e. primary products that have been reprocessed into new products with added value).
The furniture sector had a challenging year in 2020, with the pandemic hitting both demand and supply. The office-furniture segment was the clear loser, with stay-at-home orders reducing the demand for office-furniture. Many workers have had the opportunity to focus on home and comfort and to adapt their spaces to the needs of working from home. Even if this becomes a more permanent phenomenon, however, it is unlikely to lead to significant spending on office furniture. Most urban people do not have dedicated workspaces at home or, if they do, the space is relatively small. Moreover, teleworkers often need to furnish their workspaces at their own cost, and those companies and people with dedicated budgets for home offices often turn to standard office furniture. The impacts on office spaces and demand for office furniture is expected to unfold in three phases: the adoption of urgent solutions in the emergency; medium-term solutions; and long-term changes in office and public spaces. This will likely lead to a reduction in the total required office space as more people work remotely at least part of the time.
Worldwide, the consumption of furniture contracted by 10% ($40 billion) in 2020, to about $400 billion. Nevertheless, growth in furniture production and trade is expected to
resume in 2021, with pre-pandemic import levels likely to be attained in 2022 (CSIL Milano, 2021). The top five countries for wood-furniture imports accounted for about $36 billion of global imports in 2020, albeit with varying trends (graph 7.1 and table 7.1).
A rebound in furniture consumption will depend on economic stimulus packages and the extent of new housing construction. More than 50% of global furniture manufacturing takes place in Asia – mainly China and Viet Nam, which lack abundant high-quality domestic hardwood

Chapter 7 Value-added wood products
67
production and thus import large volumes of raw materials (logs). Demand has clearly shifted to temperate hardwoods for their visual appearance and sustainability, making Europe, North America and the Russian Federation the main supply regions. Uncertainty about future supplies from the Russian Federation, mainly because of announced roundwood export tariffs in 2022, combined with tensions in United States-China trade, make global hardwood log supply a challenge for Asian furniture manufacturers. Furniture producers in the UNECE region are counting on local wood supply, increased automation in production, a higher-end-market focus and shorter delivery times to obtain a competitive advantage.
The pandemic has had significant effects on the production and consumption of furniture in the EECCA. furniture and wood-based panels production in the Russian Federation, and thus the EECCA, dropped by 40-50%, year-on-year, during the April-May 2020 lockdowns, with many enterprises using the downtime for preventive maintenance (UNECE/FAO, 2021a). Many households had disposable household income that was not spent on travel or purchases (stifled by COVID-19 measures) and used it for home improvements, repairs and furniture purchases (in the middle price segment) (WhatWood, 2020b). The net result was that wooden furniture production rebounded strongly in the EECCA in the second half of 2020 and finished the year with an overall increase of about 8% (UNECE/FAO, 2021a).
Wood is an important raw material for furniture production and consumption in the Russian Federation, with 55-57% of furniture made of wood or wood-based materials (Russian Timber Industry, 2021). The Russian Federation is reported to have reduced furniture imports by 6.8% in 2020 (Russian Timber Industry, 2021).
Furniture e-commerce has developed steadily in recent years, but pandemic-related closures of traditional furniture stores and showrooms meant that even more people started shopping online in 2020. This partially compensated for a sharp decrease in traditional furniture sales, with the global value of furniture sold online registering a double-digit increase (and now representing up to 10% of total sales value). The most significant growth in e-commerce furniture sales was in the United States and Europe, followed by China. North America is the largest e-commerce market, followed by China and Europe; combined, these markets represented over 90% of e-commerce furniture sales worldwide in 2020 (CSIL Milano, 2021).
Builders’ joinery and carpentry, and profiled wood
Pessimistic early predictions about the impact of the pandemic on forest product markets have mostly proved wrong. Forecasts in early 2020 were particularly negative for the BJC and profiled-wood segments. But stay-at-home orders meant that people had more time for home-improvement projects and more available funds due to a lack of travel and other entertainment options. Do-it-yourself projects started as soon as lockdowns commenced, first to accommodate home workspaces and then, over the northern summer, to expand outside terraces, both for personal and restaurant use, and, finally, to expand houses to satisfy demand for more space. The top five markets for BJC imports accounted for more than half the global trade and showed mixed results (graph 7.2 and table 7.2). Home renovation is a key demand driver for BJCs and mouldings because upgrading projects tend to use higher-end materials.
United States Germany France United Kingdom Japan
2019 2020 2019 2020 2019 2020 2019 2020 2019 2020
Total value of imports ($ billion) 2.3 2.4 1.3 1.3 1.0 0.9 0.6 0.6 1.6 1.4
Origin (%)
Asia 23.1 21.1 11.9 11.9 34.8 37.8 8.7 8.0 74.2 68.9
Europe 7.1 6.8 86.5 86.5 60.9 58.2 85.5 86.0 21.5 27.1
North America 51.5 49.9 0.2 0.1 0.7 0.7 0.8 0.5 1.2 0.8
Latin America 17.2 21.7 0.0 0.0 1.8 1.5 2.2 2.5 0.0 0.0
Other 0.9 0.5 1.4 1.5 1.8 1.7 2.9 3.0 3.1 3.2
TABLE 7.2
Value of builders’ joinery and carpentry imports, and market share of supplying regions, top five importing countries, 2019-2020
Source: UN Comtrade, 2021.

68
UNECE/FAO Forest Products Annual Market Review, 2020-2021
TABLE 7.3
Value of profiled-wood imports, and market share of supplying regions, top five importing countries, 2019-2020
Source: UN Comtrade, 2020
United States Germany France United Kingdom Japan
2019 2020 2019 2020 2019 2020 2019 2020 2019 2020
Total value of imports ($ billion) 1.3 1.3 0.3 0.3 0.2 0.2 0.3 0.3 0.3 0.2
Origin (%)
Asia 27.4 23.2 19.3 15.8 42.6 45.7 8.1 6.1 76.1 75.6
Europe 4.4 3.4 71.2 75.5 51.6 50.0 54.3 59.2 7.2 8.2
North America 8.2 8.9 0.6 0.5 2.1 1.4 0.9 0.6 8.9 8.5
Latin America 58.4 62.4 5.0 3.0 2.0 1.5 34.3 30.4 5.5 6.0
Other 1.6 2.1 4.0 5.1 1.8 1.5 2.4 3.8 2.2 1.6
Source: UN Comtrade, 2021.
GRAPH 7.3
Profiled-wood imports, top five importing countries, 2016-2020
2016 2017 2018 2019 2020
0
0,25
0,5
0,75
1
1,25
1,5
US Germany UK France Japan
$ bi
llion
Source: UN Comtrade, 2021.
GRAPH 7.2
Builders’ joinery and carpentry imports, top five importing countries, 2016-2020
2016 2017 2018 2019 2020
0
0,5
1
1,5
2
2,5
US Germany UK France Japan
$ bi
llion
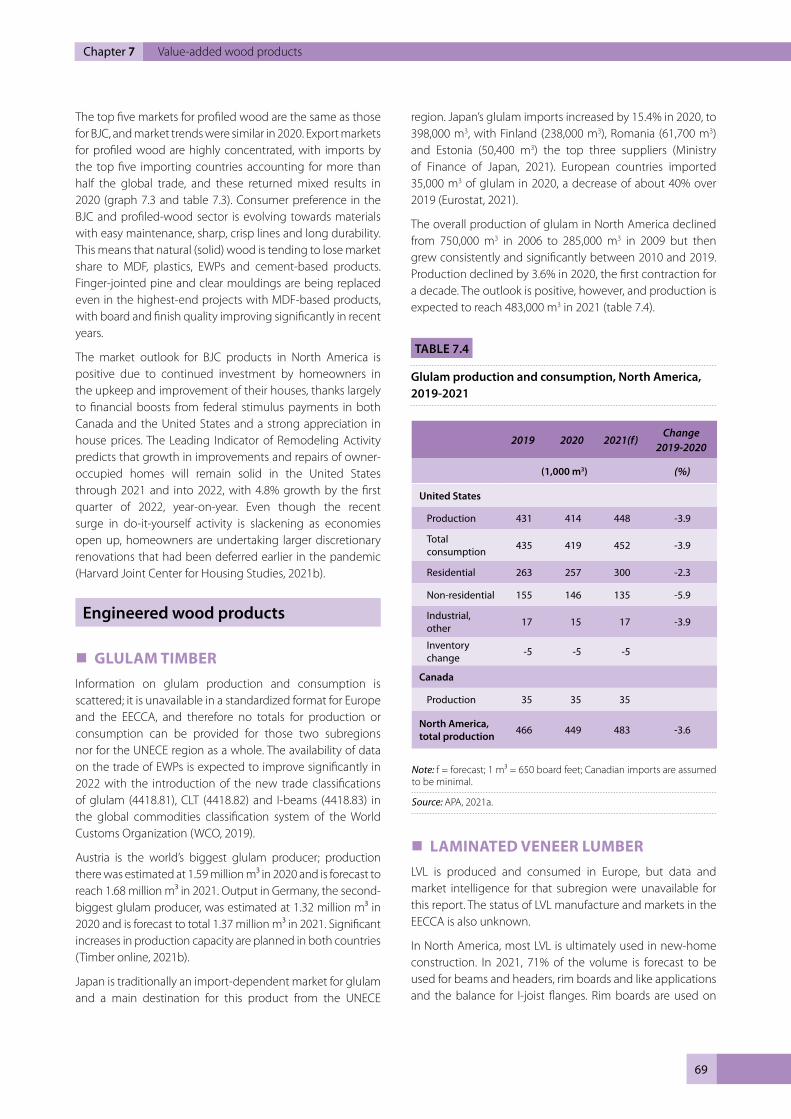
Chapter 7 Value-added wood products
69
The top five markets for profiled wood are the same as those for BJC, and market trends were similar in 2020. Export markets for profiled wood are highly concentrated, with imports by the top five importing countries accounting for more than half the global trade, and these returned mixed results in 2020 (graph 7.3 and table 7.3). Consumer preference in the BJC and profiled-wood sector is evolving towards materials with easy maintenance, sharp, crisp lines and long durability. This means that natural (solid) wood is tending to lose market share to MDF, plastics, EWPs and cement-based products. Finger-jointed pine and clear mouldings are being replaced even in the highest-end projects with MDF-based products, with board and finish quality improving significantly in recent years.
The market outlook for BJC products in North America is positive due to continued investment by homeowners in the upkeep and improvement of their houses, thanks largely to financial boosts from federal stimulus payments in both Canada and the United States and a strong appreciation in house prices. The Leading Indicator of Remodeling Activity predicts that growth in improvements and repairs of owner-occupied homes will remain solid in the United States through 2021 and into 2022, with 4.8% growth by the first quarter of 2022, year-on-year. Even though the recent surge in do-it-yourself activity is slackening as economies open up, homeowners are undertaking larger discretionary renovations that had been deferred earlier in the pandemic (Harvard Joint Center for Housing Studies, 2021b).
Engineered wood products
� GLULAM TIMBERInformation on glulam production and consumption is scattered; it is unavailable in a standardized format for Europe and the EECCA, and therefore no totals for production or consumption can be provided for those two subregions nor for the UNECE region as a whole. The availability of data on the trade of EWPs is expected to improve significantly in 2022 with the introduction of the new trade classifications of glulam (4418.81), CLT (4418.82) and I-beams (4418.83) in the global commodities classification system of the World Customs Organization (WCO, 2019).
Austria is the world’s biggest glulam producer; production there was estimated at 1.59 million m³ in 2020 and is forecast to reach 1.68 million m³ in 2021. Output in Germany, the second-biggest glulam producer, was estimated at 1.32 million m³ in 2020 and is forecast to total 1.37 million m³ in 2021. Significant increases in production capacity are planned in both countries (Timber online, 2021b).
Japan is traditionally an import-dependent market for glulam and a main destination for this product from the UNECE
region. Japan’s glulam imports increased by 15.4% in 2020, to 398,000 m3, with Finland (238,000 m3), Romania (61,700 m3) and Estonia (50,400 m3) the top three suppliers (Ministry of Finance of Japan, 2021). European countries imported 35,000 m3 of glulam in 2020, a decrease of about 40% over 2019 (Eurostat, 2021).
The overall production of glulam in North America declined from 750,000 m3 in 2006 to 285,000 m3 in 2009 but then grew consistently and significantly between 2010 and 2019. Production declined by 3.6% in 2020, the first contraction for a decade. The outlook is positive, however, and production is expected to reach 483,000 m3 in 2021 (table 7.4).
� LAMINATED VENEER LUMBERLVL is produced and consumed in Europe, but data and market intelligence for that subregion were unavailable for this report. The status of LVL manufacture and markets in the EECCA is also unknown.
In North America, most LVL is ultimately used in new-home construction. In 2021, 71% of the volume is forecast to be used for beams and headers, rim boards and like applications and the balance for I-joist flanges. Rim boards are used on
TABLE 7.4
Glulam production and consumption, North America, 2019-2021
Note: f = forecast; 1 m³ = 650 board feet; Canadian imports are assumed to be minimal.
Source: APA, 2021a.
2019 2020 2021(f)Change
2019-2020
(1,000 m3) (%)
United States
Production 431 414 448 -3.9
Total consumption 435 419 452 -3.9
Residential 263 257 300 -2.3
Non-residential 155 146 135 -5.9
Industrial, other 17 15 17 -3.9
Inventory change -5 -5 -5
Canada
Production 35 35 35
North America,total production 466 449 483 -3.6

70
UNECE/FAO Forest Products Annual Market Review, 2020-2021
TABLE 7.5
Laminated veneer lumber consumption and production in North America, 2019-2021
Note: f = forecast; 35.315 cubic feet = 1 m3.
Source: APA, 2021a.
2019 2020 2021(f) Change 2019-2020
(1,000 m3) (%)
Consumption
I-beam flanges 561 592 702 5.6
Beams, headers, other 1,532 1,543 1,699 0.7
Total consumption 2,093 2,135 2,401 2.0
Production
United States 1,909 1,954 2,208 2.4
Canada 184 181 198 -1.5
Total production 2,093 2,135 2,407 2.0
the perimeter of I-beam floor systems to provide fastening points for I-beams and to assist in the distribution of loads from walls. LVL production peaked along with the United States housing market in 2005 at 2.6 million m3 but has since declined along with I-beam production and the housing market. An estimated 2.4 million m3 of LVL is forecast to be produced in 2021 (table 7.5) – which would be the fourth-highest annual volume ever manufactured in North America (APA, 2021a).
LVL is well-accepted for use in beams and headers, and growth should return with an improving housing market. Like other EWPs, LVL enables the use of longer spans and fewer
pieces to carry the same loads compared with conventional wood products.
In addition to the EWPs discussed in this chapter, a number of structural composite lumber products are manufactured in North America, including parallel strand lumber (PSL), laminated strand lumber (LSL) and oriented strand lumber (OSL). Each of these is made from strands of wood of varying lengths and widths to achieve different strength and stiffness properties. PSL and LSL have been manufactured for several years, primarily by one company, and production volumes have been relatively low compared with other EWPs. Uses for OSL are expected to be the same as for solid sawn lumber, timbers and glulam, such as posts, beams, headers, rim boards and structural framing lumber.
� CROSS-LAMINATED TIMBERCLT11 is an inexpensive, flexible and time-saving substitute for conventional construction materials such as concrete, steel and masonry. Often referred to in North America as “mass timber”, CLT was first developed in Europe in the early 1990s and is now an important construction material in the UNECE region. CLT has great potential to substitute for energy- and carbon-intensive materials in midrise multifamily and non-residential construction.
The prefabrication of CLT to desired dimensions and shapes reduces on-site waste and installation time. An interesting dynamic is “adhesive-free” or mechanically fastened CLT production, which uses nails, wooden dowels and other alternative panel integration systems. There are some 30 manufacturers of nailed cross-laminated panels in Europe, marketed as MassivHolzMauer, or MHM; another ten manufacturers produce panels bonded with wooden dowels (Forest Business Network, 2020).
Global CLT production capacity was estimated at 2.8 million m3 in 2020, comprising 48% in Europe, 43% in North America, 6% in Oceania and 3% in Asia; actual production likely exceeded 2 million m3 in 2020. CLT production capacity continues to expand rapidly and is projected to reach 4 million m3 by 2025 (Forest Business Network, 2020).
Combined, producers in Austria, the Czech Republic, Germany, Italy and Switzerland are reported to have produced slightly more than 1 million m3 of CLT in 2020, an increase of 15% over 2019. The sector in these five countries is expected to continue growing in 2021 at a similar or even slightly higher rate (Holzkurier, 2021). Production in these countries accounts for more than half of the produced volume of CLT, and further
11 CLT includes nail-laminated timber, dowel-laminated timber and mass plywood panel.

Chapter 7 Value-added wood products
71
expansions of capacity (+650,000 m3) are expected in 2021 and 2022 (Timber online, 2021c).
The production of CLT is set to extend to other countries in Europe, with large new lines to begin operation. The reported current capacity of 227,000 m3 is expected to increase to 462,000 m3 in 2022.
Two CLT plants are being built or are in the testing phase in the Russian Federation and Ukraine (Ledinek, 2021a; 2021b).
Various products categorized as mass timber products are in production in North America. In 2018, ten CLT-manufacturing plants were reportedly in operation (five each in Canada and the United States), with a combined annual production capacity of about 400,000 m3 (Beck Group, 2018). In early 2021, 15 plants were producing mass timber panels in North America, with a further three under construction and three more announced. The current practical capacity of these plants is 1.7 million m3, but the majority (slightly over half ) of this production continues to be aimed at non-structural applications, mainly industrial matting (platforms for equipment to work on in muddy or environmentally sensitive areas). Thus, the practical capacity of CLT production for structural application for use in buildings in North America was about 439,000 m3 in 2019, and this is expected to increase by another 62,000 m3 in 2021, excluding proposed new plants (Beck Group, 2020, 2021). Table 7.6 provides an estimate of actual CLT capacities for structural applications in 2020.
Company LocationEstimated CLT
production capacity (1,000 m3)
DR Johnson Wood Innovations
Oregon, United States 280
Element 5Ontario & Quebec, Canada
50
Freres Oregon, United States 96
KalesnikoffBritish Columbia, Canada
50
KaterraWashington, United States
185
LEAF Engineered Wood Products
Ontario, Canada …
Nordic Structures
Quebec, Canada 80
Smartlam North America
Montana & Alabama, United States
70
Sterling Solutions
Illinois & Texas, United States
…
StructureCraftBritish Columbia, Canada
…
StructurlamBritish Columbia, Canada
70
Texas CLT Arkansas, United States …
Vaagen TimberWashington, United States
25
TABLE 7.6
Estimated CLT production capacity for structural applications of North American manufacturers, 2020
Sources: Beck Group, 2020; Brandt et al., 2021; Forest Business Network, 2020; Katerra, 2020.

72
UNECE/FAO Forest Products Annual Market Review, 2020-2021
REFERENCESAll references can be found online at:
https://unece.org/forestry-timber/documents/2021/11/reports/references-forest-products-annual-market-review-2020-2021
SCAN ME

73
References

ANNEXES

ANNEXES
75
COMPONENTS OF WOOD PRODUCTS GROUPS ....................................................................................................................... 76
Roundwood flowchart ............................................................................................................................................................................................................................76
Wood-based panels flowchart ...........................................................................................................................................................................................................76
Woodpulp flowchart.................................................................................................................................................................................................................................77
Paper and paperboard flowchart......................................................................................................................................................................................................77
COUNTRIES IN THE UNECE REGION AND ITS SUBREGIONS ................................................................................................... 78
LIST OF AUTHORS ............................................................................................................................................................................ 79
SOME FACTS ABOUT THE EUROPEAN FORESTRY COMMISSION .......................................................................................... 80
SOME FACTS ABOUT THE COMMITTEE ON FORESTS AND THE FOREST INDUSTRY ........................................................ 81
UNECE/FAO PUBLICATIONS .......................................................................................................................................................... 82

76
UNECE/FAO Forest Products Annual Market Review, 2020-2021
COMPONENTS OF WOOD PRODUCTS GROUPS(Based on Joint Forest Sector Questionnaire nomenclature)
The diagrams below show the important breakdowns of the major groups of primary forest products. In addition, some sub-items (all roundwood products; sawnwood; and veneer and plywood) are further divided into softwood and hardwood. Items that do not fit into listed aggregates are not shown. These are wood charcoal; wood chips and particles; wood residues; recovered wood; pellets and agglomerates; sawnwood; veneer; other pulp; and recovered paper.
ROUNDWOOD
WOOD-BASED PANELS
Industrial wood in the rough
Plywood Particle board
OSB Hardboard
MDF/HDF
Other fibreboard
Fibreboard
Sawlogs and veneer logs
Pulpwood (round & split)
Other industrial roundwood
Wood fuel

ANNEXES
77
WOODPULP
PAPER AND PAPERBOARD
Mechanical & Semi-chemical
Sulphate
Bleached sulphate
Sulphite
Chemical Dissolving grades
Graphic papers
Household and sanitary paper Other paper and paperboard
Newsprint Case materials
Uncoated mechanical Folding boxboard
Uncoated woodfree Wrapping papers
Coated paper Other papers mainly for packaging
Packaging material
Sources for images in these diagrams are databanks of Metsä Group (2012), Raunion Saha (2012), Stora Enso (2012) and UPM (2012).

78
UNECE/FAO Forest Products Annual Market Review, 2020-2021
COUNTRIES IN THE UNECE REGION AND ITS SUBREGIONS
Eastern Europe, Caucasus and Central Asia
ArmeniaAzerbaijan
BelarusGeorgia
KazakhstanKyrgyzstan
Republic of MoldovaRussian Federation
TajikistanTurkmenistan
UkraineUzbekistan
AustriaBelgiumBulgariaCroatiaCyprus
Czech RepublicDenmarkEstoniaFinlandFrance
GermanyGreece
HungaryIreland
ItalyLatvia
LithuaniaLuxembourg
MaltaNetherlands
PolandPortugalRomaniaSlovakiaSlovenia
SpainSweden
AlbaniaAndorra
Bosnia and HerzegovinaIcelandIsrael
LiechtensteinMonaco
MontenegroNorth Macedonia
NorwaySan Marino
SerbiaSwitzerland
TurkeyUnited Kingdom of Great
Britain and Northern Ireland
European Union Europe other countries
North America
CanadaUnited States of America
North America
Europe
European Union
Eastern Europe, Caucasus and Central Asia
Other countries

ANNEXES
79
LIST OF AUTHORS
Given name Family name Chapter(s) Affiliation Email address
Orifjon Abidov 4 European Panel Federation, Brussels, Belgium [email protected]
Francisco Aguilar 6 Swedish University of Agricultural Sciences (SLU), Uppsala, Sweden [email protected]
Eduard Akim 5 State Technological University of Plant Polymers, St Petersburg, Russian Federation [email protected]
Delton Alderman 1 USDA Forest Service, Princeton, West Virginia, USA [email protected]
Consuelo Brandeis 6 USDA Forest Service, Knoxville, Tennessee, United States [email protected]
Matthew Bumgardner 3 USDA Forest Service, Delaware, Ohio, USA [email protected]
Ivan Eastin 4 University of Washington, Seattle, Washington, USA [email protected]
Håkan Ekström 2 Wood Resources International LLC, Seattle, Washington, USA [email protected]
Kathryn Fernholz 1 Dovetail Partners, Minneapolis, Minnesota, USA [email protected]
Per Eriksson 6 Swedish University of Agricultural Sciences (SLU), Uppsala, Sweden [email protected]
Christopher Gaston 7 University of British Columbia, Vancouver, Canada [email protected]
Branko Glavonjić 6 Faculty of Forestry, Belgrade State University, Belgrade, Serbia [email protected]
Antti Koskinen 3 AFRY management consulting, Vantaa, Finland [email protected]
William Luppold 3 USDA Forest Service, Princeton, West Virginia, USA [email protected]
Warren Mabee 6 Queens University, Kingston, Ontario, Canada [email protected]
Frances Maplesden 3, 4 Maplesden Consulting, Rotorua, New Zealand [email protected]
Igor Novoselov 1, 3, 4 WhatWood, Moscow, Russian Federation [email protected]
Tapani Pahkasalo 7 [email protected]
José Palacín 1 UNECE, Geneva, Switzerland [email protected]
Russ Taylor 3 https://russtaylorglobal.com/, Vancouver, British Columbia, Canada [email protected]
Michel Valois 5 Valois Vision Marketing, Vancouver, British Columbia, Canada [email protected]
Zhenxi (Fred) Zhu 7 University of British Columbia, Vancouver,
Canada [email protected]

80
UNECE/FAO Forest Products Annual Market Review, 2020-2021
SOME FACTS ABOUT THE EUROPEAN FORESTRY COMMISSION
The European Forestry Commission (EFC), which was created in 1947, is one of six regional forestry commissions established by FAO to provide a policy and technical forum for countries to discuss and address forest issues on a regional basis.
The purpose of the EFC is to advise on the formulation of forest policies and to review and coordinate their implementation at the regional level; exchange information; advise on suitable practices and actions to address technical and economic problems (generally through special subsidiary bodies); and make appropriate recommendations in relation to the foregoing. The EFC meets every two years, and its official languages are English, French and Spanish.
The EFC has a number of associated subsidiary bodies, including the Working Party on the Management of Mountain Watersheds; the UNECE/FAO Working Party on Forest Statistics, Economics and Management; and seven UNECE/FAO Teams of Specialists. The Committee on Mediterranean Forestry Issues (Silva Mediterranea) informs the EFC.
FAO encourages the wide participation of government officials from forestry and other sectors as well as representatives of international, regional and subregional organizations that deal with forest-related issues in the region, including non-governmental organizations and the private sector. Accordingly, the EFC is open to all members and associate members whose territories are situated wholly or in part in the European Region or who are responsible for the international relations of any non-self-governing territory in that region. Membership comprises such eligible member nations as have notified the Director-General of their desire to be considered as members.
The EFC is one of the technical commissions serving the FAO Regional Office for Europe and Central Asia (REU), and the EFC Secretariat is based in Geneva. EFC work is regulated by its Rules of Procedures, which were adopted by the FAO Conference in 1961 and amended at the Eighteenth Session of the EFC in 1977.

ANNEXES
81
SOME FACTS ABOUT THE COMMITTEE ON FORESTS AND THE FOREST INDUSTRY
The UNECE Committee on Forests and the Forest Industry (COFFI) is a principal subsidiary body of the UNECE based in Geneva. It constitutes a forum for cooperation and consultation between member countries on forestry, the forest industry and forest product matters. All countries of Europe and the EECCA, as well as the United States, Canada and Israel, are members of the UNECE and participate in its work.
The UNECE Committee on Forests and the Forest Industry shall, within the context of sustainable development, provide member countries with the information and services needed for policymaking and decision-making with regard to their forest and forest industry sectors, including the trade and use of forest products and, where appropriate, it will formulate recommendations addressed to member governments and interested organizations. To this end, it shall:
1. with the active participation of member countries, undertake short-, medium- and long-term analyses of developments in, and having an impact on, the sector, including those developments offering possibilities for facilitating international trade and for enhancing the protection of the environment;
2. Iin support of these analyses, collect, store and disseminate statistics relating to the sector, and carry out activities to improve their quality and comparability;
3. provide a framework for cooperation, for example by organizing seminars, workshops and ad hoc meetings and setting up time-limited ad hoc groups, for the exchange of economic, environmental and technical information between governments and other institutions of member countries required for the development and implementation of policies leading to the sustainable development of the sector and the protection of the environment in their respective countries;
4. carry out tasks identified by the UNECE or the Committee on Forests and the Forest Industry as being of priority, including the facilitation of subregional cooperation and activities in support of the economies in transition of central and eastern Europe and of the countries of the region that are developing from an economic perspective; and
5. keep under review its structure and priorities and cooperate with other international and intergovernmental organizations active in the sector, particularly FAO and its European Forestry Commission and the International Labour Organization, in order to ensure complementarity and avoid duplication, thereby optimizing the use of resources.
More information about the work of the EFC and COFFI may be obtained by contacting:
UNECE/FAO Forestry and Timber SectionForests, Land and Housing DivisionUnited Nations Economic Commission for Europe/Food and Agriculture Organization of the United NationsPalais des NationsCH-1211 Geneva 10, Switzerland
www.unece.org/forests

82
UNECE/FAO Forest Products Annual Market Review, 2020-2021
UNECE/FAO PUBLICATIONS
Geneva Timber and Forest Study Papers
Forest Products Annual Market Review 2019-2020 ECE/TIM/SP/50Forests in a Circular Economy ECE/TIM/SP/49Forest Products Annual Market Review 2018-2019 ECE/TIM/SP/48State of Forests of the Caucasus and Central Asia ECE/TIM/SP/47Forest Products Annual Market Review 2017-2018 ECE/TIM/SP/46Forests and Water ECE/TIM/SP/44Forest Ownership in the ECE Region ECE/TIM/SP/43Wood Energy in the ECE Region ECE/TIM/SP/42Forest Products Annual Market Review 2016-2017 ECE/TIM/SP/41Forest Products Annual Market Review 2015-2016 ECE/TIM/SP/40Forest Products Annual Market Review 2014-2015 ECE/TIM/SP/39Promoting sustainable building materials and the implications on the use of wood in buildings ECE/TIM/SP/38Forests in the ECE Region: Trends and Challenges in Achieving the Global Objectives on Forests ECE/TIM/SP/37Forest Products Annual Market Review 2013-2014 ECE/TIM/SP/36Rovaniemi Action Plan for the Forest Sector in a Green Economy ECE/TIM/SP/35The Value of Forests: Payments for Ecosystem Services in a Green Economy ECE/TIM/SP/34Forest Products Annual Market Review 2012-2013 ECE/TIM/SP/33The Lviv Forum on Forests in a Green Economy ECE/TIM/SP/32Forests and Economic Development: A Driver for the Green Economy in the ECE Region ECE/TIM/SP/31Forest Products Annual Market Review 2011-2012 ECE/TIM/SP/30The North American Forest Sector Outlook Study 2006-2030 ECE/TIM/SP/29European Forest Sector Outlook Study 2010-2030 ECE/TIM/SP/28Forest Products Annual Market Review 2010-2011 ECE/TIM/SP/27Private Forest Ownership in Europe ECE/TIM/SP/26Forest Products Annual Market Review 2009-2010 ECE/TIM/SP/25Forest Products Annual Market Review 2008-2009 ECE/TIM/SP/24Forest Products Annual Market Review 2007-2008 ECE/TIM/SP/23Forest Products Annual Market Review 2006-2007 ECE/TIM/SP/22Forest Products Annual Market Review, 2005-2006 ECE/TIM/SP/21European Forest Sector Outlook Study: 1960 – 2000 – 2020, Main Report ECE/TIM/SP/20Forest policies and institutions of Europe, 1998-2000 ECE/TIM/SP/19Forest and Forest Products Country Profile: Russian Federation ECE/TIM/SP/18(Country profiles also exist on Albania, Armenia, Belarus, Bulgaria, former Czech and Slovak Federal Republic, Estonia, Georgia, Hungary, Lithuania, Poland, Romania, Republic of Moldova, Slovenia and Ukraine)
Forest resources of Europe, CIS, North America, Australia, Japan and New Zealand ECE/TIM/SP/17
Note: Additional market-related information is available in electronic format at www.unece.org/forests.

ANNEXES
83
Geneva Timber and Forest Discussion Papers (original language only)
COVID-19 Impacts on the Forest Sector in Countries in countries in the Western Balkans *ECE/TIM/DP/89COVID-19 Impacts on the Forest Sector in Countries in countries Eastern Europe, Caucasus and Central Asia *ECE/TIM/DP/88Forest Landscape Restoration in Eastern and South-East Europe ECE/TIM/DP/87Overview of the State of Forests and Forest Management in Uzbekistan ECE/TIM/DP/85Overview of the State of Forests and Forest Management in Turkmenistan ECE/TIM/DP/84Overview of the State of Forests and Forest Management in Tajikistan ECE/TIM/DP/83Overview of the State of Forests and Forest Management in Kyrgyzstan ECE/TIM/DP/82Overview of the State of Forests and Forest Management in Kazakhstan ECE/TIM/DP/81Overview of the State of Forests and Forest Management in Georgia ECE/TIM/DP/80Overview of the State of Forests and Forest Management in Azerbaijan ECE/TIM/DP/79Overview of the State of Forests and Forest Management in Armenia ECE/TIM/DP/78Guidelines on the Promotion of Green Jobs in Forestry ECE/TIM/DP/77Forest Sector Workforce in the UNECE Region ECE/TIM/DP/76Rovaniemi Action Plan for the Forest Sector in a Green Economy: Mid-term Review ECE/TIM/DP/75Trends in green jobs in the forest sector in the UNECE region ECE/TIM/DP/74Guidelines for the Development of a Criteria and Indicator Set for Sustainable Forest Management ECE/TIM/DP/73Forest Landscape Restoration in the Caucasus and Central Asia ECE/TIM/DP/72Green Jobs in the Forest Sector *ECE/TIM/DP/71Measuring the Value of Forests in a Green Economy *ECE/TIM/DP/70Forecast of the Committee on Forests and the Forest Industry: Forest Products Production and Trade 2016-2018 *ECE/TIM/DP/69Forecast of the Committee on Forests and the Forest Industry: Forest Products Production and Trade 2015-2017 *ECE/TIM/DP/68ECE Committee on Forests and the Forest Industry and European Forestry Commission: 70 years working in the Service of Forests and people ECE/TIM/DP/67Pilot project on the System for the Evaluation of the Management of Forests (SEMAFOR) ECE/TIM/DP/66Comparative assessment of wood biomass for energy in Europe *ECE/TIM/DP/65Forecast of the Committee on Forests and the Forest Industry: Forest Products Production and Trade 2014-2016 ECE/TIM/DP/64Forecast of the Committee on Forests and the Forest Industry: Forest Products Production and Trade 2013-2015 ECE/TIM/DP/63Competitiveness of the European Forest Sector ECE/TIM/DP/62Forecast of the Committee on Forests and the Forest Industry: Forest Products Production and Trade 2012-2014 ECE/TIM/DP/61Forecast of the Committee on Forests and the Forest Industry: Forest Products Production and Trade 2011-2013 ECE/TIM/DP/60Econometric Modelling and Projections of Wood Products Demand, Supply and Trade in Europe ECE/TIM/DP/59Swedish Forest Sector Outlook Study ECE/TIM/DP/58The Importance of China’s Forest Products Markets to the UNECE Region ECE/TIM/DP/57Good Practice Guidance on Sustainable Mobilisation of Wood: Proceedings from the Grenoble Workshop *ECE/TIM/DP/56Harvested Wood Products in the Context of Climate Change Policies: Workshop Proceedings - 2008 *ECE/TIM/DP/55The Forest Sector in the Green Economy ECE/TIM/DP/54National Wood Resources Balances: Workshop Proceedings *ECE/TIM/DP/53Potential Wood Supply in Europe *ECE/TIM/DP/52Wood Availability and Demand in Europe *ECE/TIM/DP/51Forest Products Conversion Factors for the UNECE Region ECE/TIM/DP/49Mobilizing Wood Resources: Can Europe's Forests Satisfy the Increasing Demand for Raw Material and Energy Under Sustainable Forest Management? Workshop Proceedings - January 2007 *ECE/TIM/DP/48European Forest Sector Outlook Study: Trends 2000-2005 Compared to the EFSOS Scenarios ECE/TIM/DP/47Forest and Forest Products Country Profile; Tajikistan *ECE/TIM/DP/46Forest and Forest Products Country Profile: Uzbekistan ECE/TIM/DP/45Forest Certification – Do Governments Have a Role? ECE/TIM/DP/44International Forest Sector Institutions and Policy Instruments for Europe: A Source Book ECE/TIM/DP/43Forests, Wood and Energy: Policy Interactions ECE/TIM/DP/42Outlook for the Development of European Forest Resources ECE/TIM/DP/41

84
UNECE/FAO Forest Products Annual Market Review, 2020-2021
Forest and Forest Products Country Profile: Serbia and Montenegro ECE/TIM/DP/40Forest Certification Update for the UNECE Region, 2003 ECE/TIM/DP/39Forest and Forest Products Country Profile: Republic of Bulgaria ECE/TIM/DP/38Forest Legislation in Europe: How 23 Countries Approach the Obligation to Reforest, Public Access and Use of Non-Wood Forest Products ECE/TIM/DP/37Value-Added Wood Products Markets, 2001-2003 ECE/TIM/DP/36Trends in the Tropical Timber Trade, 2002-2003 ECE/TIM/DP/35Biological Diversity, Tree Species Composition and Environmental Protection in the Regional FRA-2000 ECE/TIM/DP/33Forestry and Forest Products Country Profile: Ukraine ECE/TIM/DP/32The Development of European Forest Resources, 1950 To 2000: a Better Information Base ECE/TIM/DP/31Modelling and Projections of Forest Products Demand, Supply and Trade in Europe ECE/TIM/DP/30Employment Trends and Prospects in the European Forest Sector ECE/TIM/DP/29Forestry Cooperation with Countries in Transition ECE/TIM/DP/28Russian Federation Forest Sector Outlook Study ECE/TIM/DP/27Forest and Forest Products Country Profile: Georgia ECE/TIM/DP/26Forest certification update for the UNECE region, summer 2002 ECE/TIM/DP/25Forecasts of economic growth in OECD and central and eastern European countries for the period 2000-2040 ECE/TIM/DP/24Forest Certification update for the UNECE Region, summer 2001 ECE/TIM/DP/23Structural, Compositional and Functional Aspects of Forest Biodiversity in Europe ECE/TIM/DP/22Markets for secondary processed wood products, 1990-2000 ECE/TIM/DP/21Forest certification update for the UNECE Region, summer 2000 ECE/TIM/DP/20Trade and environment issues in the forest and forest products sector ECE/TIM/DP/19Multiple use forestry ECE/TIM/DP/18Forest certification update for the UNECE Region, summer 1999 ECE/TIM/DP/17A summary of “The competitive climate for wood products and paper packaging: the factors causing substitution with emphasis on environmental promotions” ECE/TIM/DP/16Recycling, energy and market interactions ECE/TIM/DP/15The status of forest certification in the UNECE region ECE/TIM/DP/14The role of women on forest properties in Haute-Savoie (France): Initial research ECE/TIM/DP/13Interim report on the Implementation of Resolution H3 of the Helsinki Ministerial Conference on the protection of forests in Europe (Results of the second enquiry) ECE/TIM/DP/12Manual on acute forest damage ECE/TIM/DP/7
* signifies electronic publication only
Many of the above publications can be downloaded free of charge at:
www.unece.org/forests
Publications and subscriptions are available through United Nations Publications Offices as follows:
Sales and Marketing Section, Room DC2-853United Nations2 United Nations PlazaNew York, NY 10017United States of AmericaFax: + 1 212 963 3489
E-mail: [email protected]
Web site: https://shop.un.org/

85

Fore
st P
rodu
cts
Ann
ual M
arke
t Rev
iew
202
0-20
21
The Forest Products Annual Market Review 2020-2021 provides a comprehensive analysis of markets in the UNECE region and reports on the main market influences beyond the region. It covers products from the forest to the end user and from roundwood and primary processed products to value-added, housing and wood energy. Statistics-based chapters analyse the markets for wood raw materials, sawnwood, wood-based panels, paper, paperboard and woodpulp. Underlying the analysis is a comprehensive collection of data. The Review highlights the role of sustainable forest products in international markets, discusses policies concerning forests and forest products, assesses the main trends and drivers, and analyses the effects of the current economic situation on forest product markets.
The Review forms the basis of the Market Discussions held at annual sessions of the UNECE Committee on Forests and the Forest Industry, and it provides valuable objective information for other policymakers, researchers and investors.
Further information on forest product markets, as well as on the UNECE Committee on Forests and the Forest Industry and the FAO European Forestry Commission, is available at: www.unece.org/forests.
The Review has an extensive statistical annex, which is available at: www.unece.org/forests/fpamr2021-annex
Information ServiceUnited Nations Economic Commission for Europe
UN
ECEU
NITED
NATIO
NS
Designed and Printed at United Nations, Geneva – 2114516 (E) – November 2021 – 1,084 – ECE/TIM/SP/52
Palais des NationsCH - 1211 Geneva 10, SwitzerlandTelephone: +41(0)22 917 12 34Fax: +41(0)22 917 05 05E-mail: [email protected]: http://www.unece.org
ISBN 978-92-1-117279-9
Copyright © 2022 FDOKUMEN