Food labels – an exploratory study into label information and what consumers see and understand
16
This article was downloaded by: [Copenhagen Business School] On: 21 May 2012, At: 04:48 Publisher: Routledge Informa Ltd Registered in England and Wales Registered Number: 1072954 Registered office: Mortimer House, 37-41 Mortimer Street, London W1T 3JH, UK The International Review of Retail, Distribution and Consumer Research Publication details, including instructions for authors and subscription information: http://www.tandfonline.com/loi/rirr20 Food labels – an exploratory study into label information and what consumers see and understand Henrik Selsøe Sørensen a , Jesper Clement b & Gorm Gabrielsen c a Department of International Culture and Communication Studies, Copenhagen Business School, Dalgas Have 15, Frederiksberg, 2000, Denmark b Department of Marketing, Copenhagen Business School, Solbjerg Plads 3C, Frederiksberg, 2000, Denmark c Center for Statistics, Copenhagen Business School, Solbjerg Plads 3, Frederiksberg, 2000, Denmark Available online: 02 Feb 2012 To cite this article: Henrik Selsøe Sørensen, Jesper Clement & Gorm Gabrielsen (2012): Food labels – an exploratory study into label information and what consumers see and understand, The International Review of Retail, Distribution and Consumer Research, 22:1, 101-114 To link to this article: http://dx.doi.org/10.1080/09593969.2011.634072 PLEASE SCROLL DOWN FOR ARTICLE Full terms and conditions of use: http://www.tandfonline.com/page/terms-and- conditions This article may be used for research, teaching, and private study purposes. Any substantial or systematic reproduction, redistribution, reselling, loan, sub-licensing, systematic supply, or distribution in any form to anyone is expressly forbidden. The publisher does not give any warranty express or implied or make any representation that the contents will be complete or accurate or up to date. The accuracy of any instructions, formulae, and drug doses should be independently verified with primary sources. The publisher shall not be liable for any loss, actions, claims, proceedings,
-
Upload
independent -
Category
Documents
-
view
1 -
download
0
Transcript of Food labels – an exploratory study into label information and what consumers see and understand
This article was downloaded by: [Copenhagen Business School]On: 21 May 2012, At: 04:48Publisher: RoutledgeInforma Ltd Registered in England and Wales Registered Number: 1072954 Registeredoffice: Mortimer House, 37-41 Mortimer Street, London W1T 3JH, UK
The International Review of Retail,Distribution and Consumer ResearchPublication details, including instructions for authors andsubscription information:http://www.tandfonline.com/loi/rirr20
Food labels – an exploratory study intolabel information and what consumerssee and understandHenrik Selsøe Sørensen a , Jesper Clement b & Gorm Gabrielsen ca Department of International Culture and CommunicationStudies, Copenhagen Business School, Dalgas Have 15,Frederiksberg, 2000, Denmarkb Department of Marketing, Copenhagen Business School, SolbjergPlads 3C, Frederiksberg, 2000, Denmarkc Center for Statistics, Copenhagen Business School, SolbjergPlads 3, Frederiksberg, 2000, Denmark
Available online: 02 Feb 2012
To cite this article: Henrik Selsøe Sørensen, Jesper Clement & Gorm Gabrielsen (2012): Foodlabels – an exploratory study into label information and what consumers see and understand, TheInternational Review of Retail, Distribution and Consumer Research, 22:1, 101-114
To link to this article: http://dx.doi.org/10.1080/09593969.2011.634072
PLEASE SCROLL DOWN FOR ARTICLE
Full terms and conditions of use: http://www.tandfonline.com/page/terms-and-conditions
This article may be used for research, teaching, and private study purposes. Anysubstantial or systematic reproduction, redistribution, reselling, loan, sub-licensing,systematic supply, or distribution in any form to anyone is expressly forbidden.
The publisher does not give any warranty express or implied or make any representationthat the contents will be complete or accurate or up to date. The accuracy of anyinstructions, formulae, and drug doses should be independently verified with primarysources. The publisher shall not be liable for any loss, actions, claims, proceedings,

demand, or costs or damages whatsoever or howsoever caused arising directly orindirectly in connection with or arising out of the use of this material.
Dow
nloa
ded
by [
Cop
enha
gen
Bus
ines
s Sc
hool
] at
04:
48 2
1 M
ay 2
012
Food labels – an exploratory study into label information and what
consumers see and understand
Henrik Selsøe Sørensena, Jesper Clementb* and Gorm Gabrielsenc
aDepartment of International Culture and Communication Studies, Copenhagen Business School,Dalgas Have 15, Frederiksberg 2000 Denmark; bDepartment of Marketing, CopenhagenBusiness School, Solbjerg Plads 3C, Frederiksberg 2000 Denmark; cCenter for Statistics,
Copenhagen Business School, Solbjerg Plads 3, Frederiksberg 2000 Denmark
(Received 21 October 2010; final version received 7 July 2011)
The food industry develops tasty and healthy food but fails to deliver the messageto all consumers. The consumers’ background knowledge is essential for how theyfind and decode relevant elements in the cocktail of signs which fight for attentionon food labels. In this exploratory study, we find evidence for dividing consumersinto two profiles: one relying on general food knowledge and another usingknowledge related to signpost labels. In a combined eyetracking and ques-tionnaire survey we analyse the influence of background knowledge and identifydifferent patterns of visual attention for the two consumer profiles. Thisunderlines the complexity in choosing and designing the ‘right’ elements for afood package that consumers actually look at and are able to make rational useof. In spite of any regulation of food information provided by authorities,consumers will still be confronted with information which puzzles them. Giventhat the notion of being mislead must refer to information printed on thepackaging and which has actually caught the given consumer’s visual attention,this exploratory study intends to pave the way for using eyetracking tools tobetter understand the link between regulations, package information, andconsumer understanding. Implications and further research are discussed.
Keywords: food labelling; consumer knowledge; signpost labels; eyetracking
Introduction
Food labels are one of the major key communication channels between the foodindustry and the consumer (Urbany et al. 1996). This channel is put under pressurebecause it must accommodate increasing legal obligations and at the same timeenable consumers to choose healthy, environmentally friendly and safe foodproducts (Selsøe Sørensen, 2008) and still make the food product look appealing. Itis a general assumption that consumers can read and interpret the informationprinted on the labels, but this cannot be taken for granted (Rothman et al. 2006).Consumers with low-level literacy and numeracy skills are more likely to give upunderstanding food labels and thus risk being misled. A review by the FoodStandards Agency found 38% of the consumers to have difficulties in understandinginformation on the packaging (Harper et al. 2007). Similar research on labelling
*Corresponding author. Email: [email protected]
The International Review of Retail, Distribution and Consumer Research
Vol. 22, No. 1, February 2012, 101–114
ISSN 0959-3969 print/ISSN 1466-4402 online
� 2012 Taylor & Francis
http://dx.doi.org/10.1080/09593969.2011.634072
http://www.tandfonline.com
Dow
nloa
ded
by [
Cop
enha
gen
Bus
ines
s Sc
hool
] at
04:
48 2
1 M
ay 2
012
design found only one in three consumers to have sufficient knowledge to understandthe information (Dutch Ministry of Health Welfare and Sport 2005). Recent studieshave focused on the understanding of health claims (Fullmer, Geiger, and Parent1991; Williams 2005; Grunert and Wills 2007; Grunert et al. 2009; Grunert, Wills,and Fernandez-Celemın 2010), or on the effect of particular labelling schemes(Malam et al. 2009), but little attention has been paid by researchers to howconsumers actually react when exposed to the multitude of signs which fight forattention on each and every food label.
Research question
The main objective of this study is to investigate possible links between differentlevels of knowledge and patterns of visual attention when people look at food labelsin order to make a purchase decision and thus gain new insight into what consumersactually see and understand. This is expected to prove useful for three mainstakeholders: (1) food producers including designers of labels, (2) consumers andtheir organizations, (3) authorities dealing with information on food labels. Theadoption of the EU proposal on the provision of food information to consumers(European Commission Proposal, 2008) will only make studies like the one proposedhere even more relevant, because it will not reduce the complexity of the informedchoices which the consumers are expected to make.
Making sense of food labels
In the European Union, rules are being put in place on how to label foodstuffs toenable consumers to get comprehensive information on the contents and thecomposition of food products, and help them to make well informed and healthierchoices (European Commission Proposal, 2008). This proposal, which has not yetbeen adapted, makes it mandatory to provide nutrition information at the front ofthe package. There, the consumer would be able to find information such as theproduct’s energy, contents of fat, saturated fat, salt, and carbohydrates with specificreference to the content in sugars. These will be expressed in terms of content per 100ml/100 g or per portion. The essential information has to be presented in a legibleway. The draft regulation stipulates that the minimum print size would be 3 mm.Although the proposal represents a much needed modernization of food informationregulations, it must be accompanied by more research on how consumers see andunderstand the complex message.
The cocktail of signs on packaging comprise design elements such as texts andsingle terms, illustrations, brand-elements, content descriptions, regulated as well asunregulated signposts, and the packaging material itself (Orth and Malkewitz, 2008).The scenario is further complicated by an increase in the number of alternativeproducts to choose amongst in-store, each carrying an overwhelming number ofvisual stimuli, leading to an information overload which in the end may makeconsumers take less deliberate decisions (Schwartz, 2004). The conflict betweeninformation overload and limited information processing capacity in the purchasesituation results in information interference and a reduction of the consumers’attention level. Some consumers may become immune to the information (Iyengarand Lepper, 2000; Iyengar, Ansari, and Gupta, 2003). With this discrepancy between
102 H. Selsøe Sørensen et al.
Dow
nloa
ded
by [
Cop
enha
gen
Bus
ines
s Sc
hool
] at
04:
48 2
1 M
ay 2
012
the volume of product stimuli and consumers’ needs for information, they may missout or misinterpret information and in the end make an inappropriate purchasedecision.
As a supplement to mandatory food label information, independent or voluntaryfood declarations and quality assurance schemes are seen as a way to helpconsumers, but the information overload is augmented, and such schemes may causeconfusion and scepticism because consumers find it difficult to understand what agiven certification involves (Eden, Bear and Walker, 2008). Transferring complexinformation to a group of consumers under conditions of time pressure and spaceconstraints is a non-trivial task for knowledge engineers (Selsøe Sørensen, 2008), andit is a key issue, since it does not make sense to require specialized information forthe benefit of the consumer, if the latter is unable to make use of it. This has in someways been taken into consideration in the Directive EU 2005/29/EC on unfaircommercial practices (2005) by referring to the ‘average consumer’, who is describedas a ‘consumer who is reasonably well-informed and reasonably observant andcircumspect’. The directive refers to consumers below average level as those ‘whosecharacteristics make them particularly vulnerable to unfair commercial practices’,but nothing is said about well-informed consumers and their risk of being mislead.The Directive does not go into details with the risk that non-expert consumers maymisinterpret information and thus be misled even by a completely ‘fair commercialpractice’ on a food label.
The approach of the Directive assumes that consumers with a certain level ofknowledge see and understand all information given on the packaging in the sameway.These kind of generic recommendations tend to neglect peoples’ abilities to decodeinformation unambiguously (Yarbus, 1967). Textual and graphic design of food labelsmay not attract visual attention of all consumers in a uniformway and consumers mayhave different interpretations of what is perceived depending on his or her cognitivecapital. It has also been known for years that consumers only spend very few secondslooking at food labels (Hoyer, 1984) and they are not always fully aware of whatattracts their visual attention and what influences their buying decision (Ambler et al.2004; Clement, 2007). Time pressure forces customers to rush through the process ofinformation search and has an impact on the amount of information collected for thedecision process (Iyer, 1989; Fasolo, Carmeci andMisuraca, 2009) and even influencesthe way in which different design elements on the label are analyzed and weighted(Pieters andWarlop, 1999; Clement, 2008). Empirical evidence for what is required torelate purchase decisions in-store to ‘understanding’ is scanty.
Methodology and research design
In order to understand the human visual system, it is important to realize that visionand cognitive attention are guided by the eye, and thus eye fixations are vital fordirecting visual attention to an object and subsequently for cognitive perception(Henderson et al. 2007). Eye movements may thus provide insight into the humanselective attention, and eye movements have the opportunity to uncover connectionsbetween cognition and the visual field. In fact, eye movements can give real-timebehavioural insight into cognitive processes better than other traditional methods(Horowitz and Wolfe, 1998).
Eyetracking is the technology used for measuring eye movements by combining acomputer screen with an infrared camera recording pupil and corneal reflection. The
The International Review of Retail, Distribution and Consumer Research 103
Dow
nloa
ded
by [
Cop
enha
gen
Bus
ines
s Sc
hool
] at
04:
48 2
1 M
ay 2
012
method reveals fixations and saccades and thus identifies areas of visual attentioninterest, which can be interpreted as the visual attention of a given test person. Theeyetracking method has been used in multiple research contexts since it wasintroduced for studies relating to reading and general visual experience (Buswell,1935).
In order to identify links between consumers’ visual search strategies and theirlevels of knowledge, a combined eyetracking and questionnaire survey wasconducted from May to July 2007 at the Copenhagen Business School. Patterns ofvisual attention were recorded individually on a Tobii 1750 eyetracker while therespondent went on a virtual shopping trip for food products shown on the screen.
Visual attention and eye-movements are influenced by the task (Yarbus, 1967).All respondents were given the same task, namely a plausible reason for shopping,they were told to imagine buying foods for a weekend trip with family or friends. Theintention was to observe their shopping habits when they were looking for productsthat they did not buy on an everyday basis. They should not consider planningcomplete meals or particular recipes but just decide whether the product shownwould be a candidate for their weekend trip. The respondents were asked to look atthe series of 28 popular daily food products and decide which ones they might buy.The number of products in the series was chosen to give enough variety to cover amix of bread, meat and vegetables, and not being too long. Both branded goods andprivate labels were included. The respondents were brought to believe that it was atest of their preferences for the particular product and were allowed to spend thetime needed on each food product. Once they said ‘yes’ or ‘no’, the next product wasshown on the screen. It was not considered an important bias that some test personsmight know some products beforehand. The alternative, namely to use unusual orheavily manipulated food labels, was discarded.
For the purpose of this survey, the actual buying decision was not taken intoaccount and no post-shopping interview was conducted, given that focus was only onthe fixations and the eye movements. This study thus only allows us to conclude,whether a givendesign element has attracted any attention, and if no visual attentiononagiven elementwas registered, then this element cannothavebeenused for the decision.
The complete label and package of each product were shown. Products withinformation only on the front were preferred for the experiment, but in cases whereinformation on the sides or the back was found, the package had been split open, sothat all information was visible on the same screen, thus neutralizing problemsrelated to front/back and side information.
The test persons were seated in front of the screen with an average screen-to-eyedistance of 60 cm. The text font used on the original packages varied, generallybecause the sizes of the packages were different, but in order to make even smallfonts readable from that distance, most labels were resized 130%, a few 150% andeven 200%. The reason for the flexible resizing was to make small fonts readable onthe screen.
The eyetrack session started with a 5-point calibration in order to adjust thetracker to the characteristics of the subject. Each calibration was evaluated andredone if not complying with the standards of the Tobii-software. Given that thesessions were rather short, on the average less than 3 min, no recalibration wasperformed during the presentation.
After having been eyetracked, the test persons were asked to fill in aquestionnaire aimed at rating them according to his/her knowledge about food
104 H. Selsøe Sørensen et al.
Dow
nloa
ded
by [
Cop
enha
gen
Bus
ines
s Sc
hool
] at
04:
48 2
1 M
ay 2
012
and health information commonly found on Danish food labels. The eyetrackingsession deliberately preceded this survey in order not to bias the subjects and theirspontaneous interest for certain design elements while looking at the products on thescreen.
The notion of ‘an average consumer’ as defined in the EU-directive is ratherimprobable and of limited use, if it cannot be operationalized and defined moreconcretely thus giving a more multifaceted view of what ‘well-informedness’ meansat the individual level. This exploratory study proposes a method to evaluate thegeneral level of knowledge of individual consumers based on a measure of two typesof consumer knowledge, namely factual food knowledge and familiarity withsignpost labels. These two parameters reflect different cognitive approaches whichare both relevant for understanding food labels. Factual knowledge is what is usedfor answering ‘how and why’ questions, whereas signpost labels like road signs areintended for quick recognition, given that the consumer has the relevant knowledgeto draw upon (Romiszowski, 1984).
The level of general food knowledge was measured through 9 open-endedquestions going from easy questions over medium to difficult questions, all related tothemes, which had recently been issues in public debate. The questions which weredeliberately limited in number were of the following types (with the correct answergiven between brackets).
(1) Unsaturated fats are considered to be good or bad fats? (good fats)(2) What is a free ranch egg? (egg from a cage-free hen)(3) Why are some foods enriched with plant sterols? (to prevent cardiovascular
diseases).
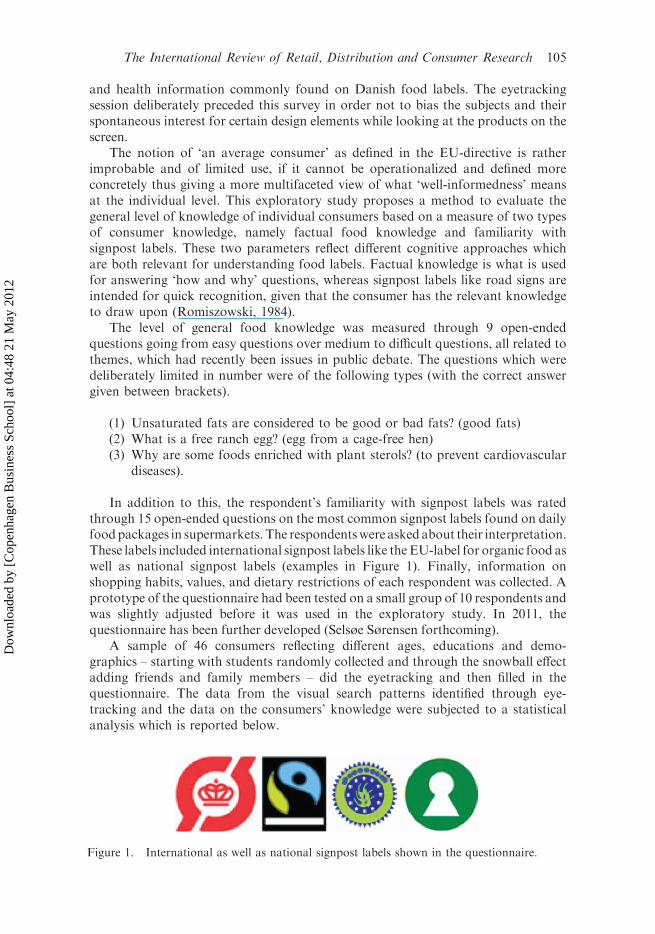
In addition to this, the respondent’s familiarity with signpost labels was ratedthrough 15 open-ended questions on the most common signpost labels found on dailyfoodpackages in supermarkets. The respondentswere asked about their interpretation.These labels included international signpost labels like the EU-label for organic food aswell as national signpost labels (examples in Figure 1). Finally, information onshopping habits, values, and dietary restrictions of each respondent was collected. Aprototype of the questionnaire had been tested on a small group of 10 respondents andwas slightly adjusted before it was used in the exploratory study. In 2011, thequestionnaire has been further developed (Selsøe Sørensen forthcoming).
A sample of 46 consumers reflecting different ages, educations and demo-graphics – starting with students randomly collected and through the snowball effectadding friends and family members – did the eyetracking and then filled in thequestionnaire. The data from the visual search patterns identified through eye-tracking and the data on the consumers’ knowledge were subjected to a statisticalanalysis which is reported below.
Figure 1. International as well as national signpost labels shown in the questionnaire.
The International Review of Retail, Distribution and Consumer Research 105
Dow
nloa
ded
by [
Cop
enha
gen
Bus
ines
s Sc
hool
] at
04:
48 2
1 M
ay 2
012
Analyzing consumer knowledge and visual attention
As a point of departure, we analysed the survey data to see if we could construct scalesreflecting two kinds of consumer knowledge: (1) general food knowledge and (2)knowledge on signpost labels. Checking the reliability of the scales by the use ofCronbach’s alpha value (Bland and Altman, 1997), we found the value for the generalfood knowledge to be 0.740, which is acceptable. The Cronbach’s Alpha value for theknowledge related to signpost labels was 0.841, indicating acceptable data useful forrating consumer knowledge along these two dimensions. Correlation between the twoscales was low and insignificant (Pearson Correlation ¼ 0.249, p ¼ 0.095).
In general, 40% of the signpost labels were recognized by the respondents. Onlythe official regulated Danish label for organic products was known to almosteverybody (93.5%), while the official regulated EU label for organic products wasonly recognized by 19.5%. Among all respondents, 45% answered correctly to sixout of nine factual questions, namely those with a degree of difficulty which had beenprojected to be easy or medium, whereas only 9% had seven or more correctanswers. Correlations between the two kinds of knowledge and either shoppinghabits, food values, diet, or demography are shown in Table 1.
No significant correlation was found between the dimensions of food knowledgeand shopping frequency, price, preference for organic food, preference for highquality, search for taste, or gender. We found, however, a significant positivecorrelation between age and general food knowledge and an inverse correlationbetween age and recognition of signpost labels, indicating age to identify the twoconsumer profiles. As we found a significant negative correlation between age andeducation (p 5 0.001) we chose education to be a descriptive variable of age in ourinterpretation. This indicates that an average consumer’s ability to recognize and usesignpost labels in the decision process decreases with age, whereas the use of generalfood knowledge during the decision process increases with age. Furthermore, a highlevel of general food knowledge does not co-occur with a good score on recognitionof signpost labels.
Data from the eyetracker for each subject for each of the 28 products revealed thenumber of fixations on a certain area, time to first fixation on the particular area, andfor how many milliseconds definable areas of the screen had been looked at. Theseareas of interest (AOI) were identified for each of the 28 different food products andcoded according to what specific design element they represented, cf. Figure 2. Thedesign elements were classified into one of three major groups with related sub-groups:
(1) Product information with subgroups, i.e. product name, brand-logo, brand-name, product description, ingredients.
(2) Verbal claims with subgroups, i.e. product-related, health-related, content-related, quality-related.
(3) Illustrations with subgroups, i.e. regulated signpost labels, unregulatedsignpost labels, renderings of product, pictures not related to product.
For the 28 products, AOIs vary from four to 25 with a total of 344. For each AOI,the eyetrack data were analyzed in relation to three parameters of visual attention:
. Time in milliseconds (ms) to first fixation. This data reveals the order in whichthe design elements on each product attracted the consumer’s visual attention.
106 H. Selsøe Sørensen et al.
Dow
nloa
ded
by [
Cop
enha
gen
Bus
ines
s Sc
hool
] at
04:
48 2
1 M
ay 2
012

Table
1.
Correlation
between
two
dim
ensionsofconsumer
knowledge(generalfood
knowledgeand
knowledgeofsignpost
labels)
and
consumer
characteristics.
Shopping
frequency
Searchfora
goodprice
Searchfor
organic
food
Searchfor
highquality
Search
fortaste
Gender
Education
Age
Generalfoodknowledge
70.126
70.086
70.141
70.004
70.107
70.155
70.244
0.361
p¼
0.404
p¼
0.570
p¼
0.351
p¼
0.980
p¼
0.477
p¼
0.305
p¼
0.102
p¼
0.014
Recognitionofsignpost
labels
70.008
0.276
0.005
0.180
0.060
70.075
0.398
70.387
p¼
0.957
p¼
0.063
p¼
0.975
p¼
0.231
p¼
0.690
p¼
0.622
p¼
0.006
p¼
0.008
The International Review of Retail, Distribution and Consumer Research 107
Dow
nloa
ded
by [
Cop
enha
gen
Bus
ines
s Sc
hool
] at
04:
48 2
1 M
ay 2
012

. Mean gaze time measured in milliseconds expressing the weight of visualattention for each type of design element.
. Number of fixations. These data represent each design element’s ability toattract and re-attract the consumer’s visual attention.
Literature places the average human fixation duration in the range from 150 msto 600 ms (Duchowski, 2003). The minimal duration fixation was set to 80 ms, whichgave a margin up to shortest fixation time and excluded fixations not long enough forlinguistic processing and language comprehension (Rayner, 1978).
In general, and irrespective of the profiles, consumers’ search strategy can betested in relation to the specific design elements on the packaging. Without surprise,the product name has the highest probability of attracting visual attention. It was sixtimes higher than the probability for claims on organic production to attractattention. Illustrations with no relation to the product frequently attracted more
Table 2. Odds ratios for packaging design elements to get consumer’s visual attention.
Design element Sub-group Chi-square1 df p Odds ratios
Product information Product name 156.0 1 0.000 6.136Illustration Picture not related to product 100.8 1 0.000 5.262Illustration Rendering of product 76.4 1 0.000 3.832Product information Description 67.0 1 0.000 3.108Claim Product-related 16.9 1 0.000 1.929Claim Health-related 12.1 1 0.000 1.707Product information Brand-logo 12.1 1 0.001 1.630Product information Ingredients 9.3 1 0.002 1.567Illustration Unregulated signpost label 13.6 1 0.000 0.432Illustration Regulated signpost label 91.7 1 0.000 0.182Claim (reference) Organic production – – – 1
Note: Data from all subjects and at least one fixation. 1Wald’s test statistics.
Figure 2. One in 28 food products used for the eyetracking test, and with marked areas ofinterest – AOI (marking not visible for subjects).
108 H. Selsøe Sørensen et al.
Dow
nloa
ded
by [
Cop
enha
gen
Bus
ines
s Sc
hool
] at
04:
48 2
1 M
ay 2
012
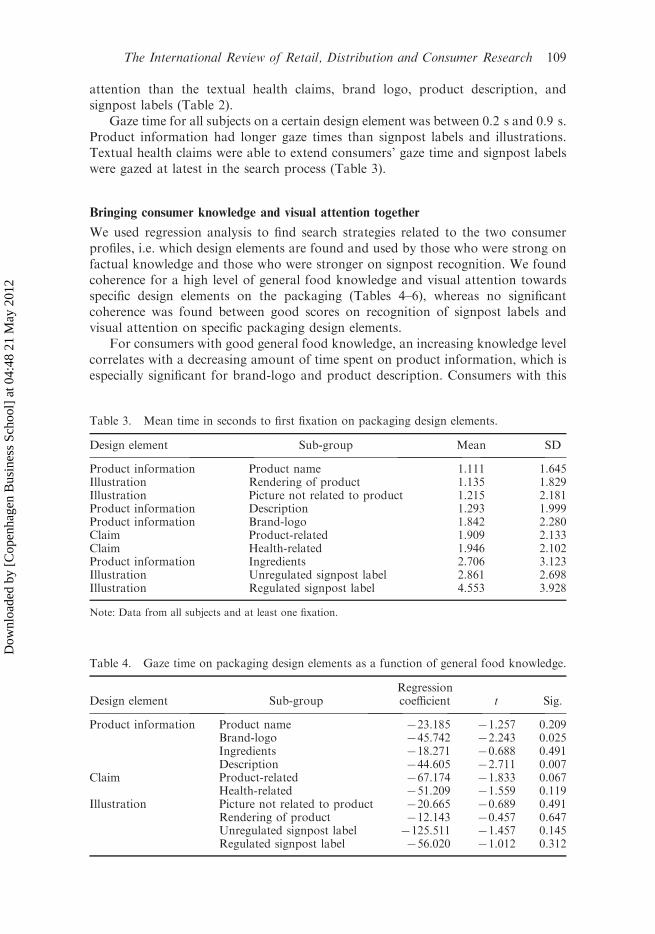
attention than the textual health claims, brand logo, product description, andsignpost labels (Table 2).
Gaze time for all subjects on a certain design element was between 0.2 s and 0.9 s.Product information had longer gaze times than signpost labels and illustrations.Textual health claims were able to extend consumers’ gaze time and signpost labelswere gazed at latest in the search process (Table 3).
Bringing consumer knowledge and visual attention together
We used regression analysis to find search strategies related to the two consumerprofiles, i.e. which design elements are found and used by those who were strong onfactual knowledge and those who were stronger on signpost recognition. We foundcoherence for a high level of general food knowledge and visual attention towardsspecific design elements on the packaging (Tables 4–6), whereas no significantcoherence was found between good scores on recognition of signpost labels andvisual attention on specific packaging design elements.
For consumers with good general food knowledge, an increasing knowledge levelcorrelates with a decreasing amount of time spent on product information, which isespecially significant for brand-logo and product description. Consumers with this
Table 3. Mean time in seconds to first fixation on packaging design elements.
Design element Sub-group Mean SD
Product information Product name 1.111 1.645Illustration Rendering of product 1.135 1.829Illustration Picture not related to product 1.215 2.181Product information Description 1.293 1.999Product information Brand-logo 1.842 2.280Claim Product-related 1.909 2.133Claim Health-related 1.946 2.102Product information Ingredients 2.706 3.123Illustration Unregulated signpost label 2.861 2.698Illustration Regulated signpost label 4.553 3.928
Note: Data from all subjects and at least one fixation.
Table 4. Gaze time on packaging design elements as a function of general food knowledge.
Design element Sub-groupRegressioncoefficient t Sig.
Product information Product name 723.185 71.257 0.209Brand-logo 745.742 72.243 0.025Ingredients 718.271 70.688 0.491Description 744.605 72.711 0.007
Claim Product-related 767.174 71.833 0.067Health-related 751.209 71.559 0.119
Illustration Picture not related to product 720.665 70.689 0.491Rendering of product 712.143 70.457 0.647Unregulated signpost label 7125.511 71.457 0.145Regulated signpost label 756.020 71.012 0.312
The International Review of Retail, Distribution and Consumer Research 109
Dow
nloa
ded
by [
Cop
enha
gen
Bus
ines
s Sc
hool
] at
04:
48 2
1 M
ay 2
012

profile furthermore tend to gaze on product information elements late in the searchprocess, whereas they pay attention to signpost labels early in the search process,even though their ability to recognize and decode these elements is limited. We founda correlation between general food knowledge and visual attention on illustrationswith no relation to the product late in the process.
For consumers with a high level of knowledge on signpost labels, we only found asignificant correlation to their overall number of fixations, showing the tendency thatthe higher the score on factual knowledge, the more fixations.
Conclusions and implications
Our exploratory survey identified two consumer profiles differentiated by theirgeneral food knowledge and their ability to recognize signpost labels. The twoprofiles were further characterized by age, given that respondents under the age of 30scored higher in signpost label recognition and those over 30 scored better on generalfood knowledge. The survey further demonstrated differences in visual searchstrategies for the two profiles. Consumers scoring high on general food knowledge
Table 6. Number of fixations on packaging design elements as a function of general foodknowledge.
Design element Sub-groupRegressioncoefficient t Sig.
Product information Product name 70.148 0.0959 0.124Brand-logo 70.112 0.1176 0.342Ingredients 0.291 0.129 0.024Description 70.095 0.079 0.236
Claim Product-related 0.404 0.233 0.084Health-related 0.134 0.167 0.421
Illustration Picture not related to product 0.369 0.160 0.021Rendering of product 70.068 0.147 0.644Unregulated signpost label 0.224 0.551 0.685Regulated signpost label 0.277 0.424 0.513
Table 5. Time to first fixation in seconds, on packaging design elements as a function ofgeneral food knowledge.
Design element Sub-groupRegressioncoefficient t Sig.
Product information Product name 767.501 2.199 0.020Brand-logo 266.165 0.690 0.490Ingredients 1588.725 3.164 0.000Description 545.959 1.754 0.080
Claim Product-related 1099.388 1.586 0.110Health-related 617.669 0.994 0.320
Illustration Picture not related to product 1082.830 1.908 0.050Rendering of product 698.234 1.390 0.160Unregulated signpost label 71128.694 70.693 0.480Regulated signpost label 72817.245 72.688 0.000
110 H. Selsøe Sørensen et al.
Dow
nloa
ded
by [
Cop
enha
gen
Bus
ines
s Sc
hool
] at
04:
48 2
1 M
ay 2
012
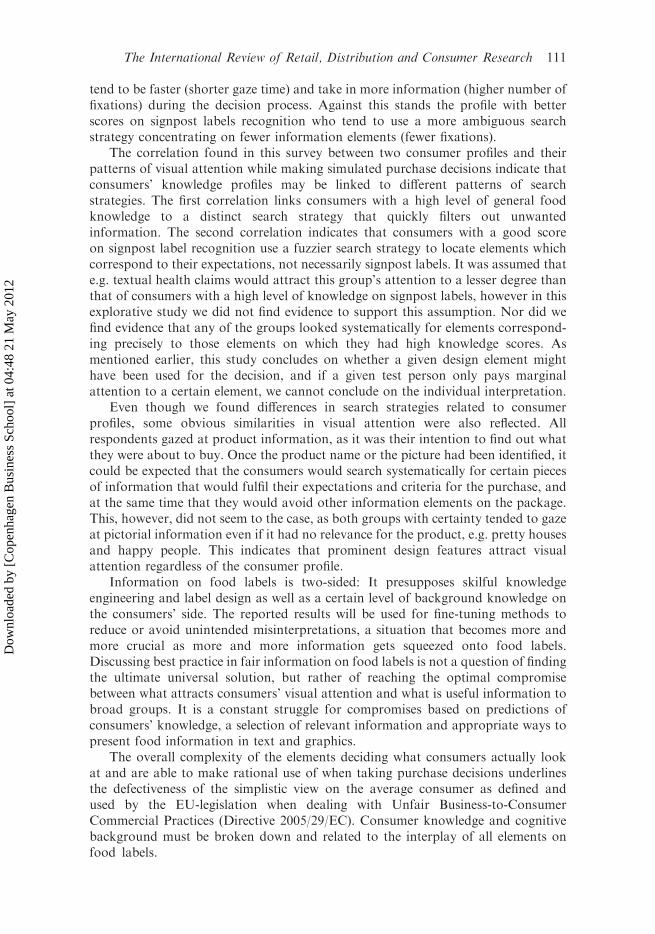
tend to be faster (shorter gaze time) and take in more information (higher number offixations) during the decision process. Against this stands the profile with betterscores on signpost labels recognition who tend to use a more ambiguous searchstrategy concentrating on fewer information elements (fewer fixations).
The correlation found in this survey between two consumer profiles and theirpatterns of visual attention while making simulated purchase decisions indicate thatconsumers’ knowledge profiles may be linked to different patterns of searchstrategies. The first correlation links consumers with a high level of general foodknowledge to a distinct search strategy that quickly filters out unwantedinformation. The second correlation indicates that consumers with a good scoreon signpost label recognition use a fuzzier search strategy to locate elements whichcorrespond to their expectations, not necessarily signpost labels. It was assumed thate.g. textual health claims would attract this group’s attention to a lesser degree thanthat of consumers with a high level of knowledge on signpost labels, however in thisexplorative study we did not find evidence to support this assumption. Nor did wefind evidence that any of the groups looked systematically for elements correspond-ing precisely to those elements on which they had high knowledge scores. Asmentioned earlier, this study concludes on whether a given design element mighthave been used for the decision, and if a given test person only pays marginalattention to a certain element, we cannot conclude on the individual interpretation.
Even though we found differences in search strategies related to consumerprofiles, some obvious similarities in visual attention were also reflected. Allrespondents gazed at product information, as it was their intention to find out whatthey were about to buy. Once the product name or the picture had been identified, itcould be expected that the consumers would search systematically for certain piecesof information that would fulfil their expectations and criteria for the purchase, andat the same time that they would avoid other information elements on the package.This, however, did not seem to the case, as both groups with certainty tended to gazeat pictorial information even if it had no relevance for the product, e.g. pretty housesand happy people. This indicates that prominent design features attract visualattention regardless of the consumer profile.
Information on food labels is two-sided: It presupposes skilful knowledgeengineering and label design as well as a certain level of background knowledge onthe consumers’ side. The reported results will be used for fine-tuning methods toreduce or avoid unintended misinterpretations, a situation that becomes more andmore crucial as more and more information gets squeezed onto food labels.Discussing best practice in fair information on food labels is not a question of findingthe ultimate universal solution, but rather of reaching the optimal compromisebetween what attracts consumers’ visual attention and what is useful information tobroad groups. It is a constant struggle for compromises based on predictions ofconsumers’ knowledge, a selection of relevant information and appropriate ways topresent food information in text and graphics.
The overall complexity of the elements deciding what consumers actually lookat and are able to make rational use of when taking purchase decisions underlinesthe defectiveness of the simplistic view on the average consumer as defined andused by the EU-legislation when dealing with Unfair Business-to-ConsumerCommercial Practices (Directive 2005/29/EC). Consumer knowledge and cognitivebackground must be broken down and related to the interplay of all elements onfood labels.
The International Review of Retail, Distribution and Consumer Research 111
Dow
nloa
ded
by [
Cop
enha
gen
Bus
ines
s Sc
hool
] at
04:
48 2
1 M
ay 2
012
The two consumer profiles which have been identified and linked to visual searchstrategies based on our small sample are certainly only to be considered a first steptoward developing a methodology for describing and analyzing more sophisticatedprofiles, and better understand how food labels may be improved in order to enhancethe interaction between consumers, food industry and authorities, who regulatecertain elements on food labels and endeavour to e.g. make consumers make ‘ahealthier choice’. The numerous information elements found on food packages varynot only in shapes and sizes but also presuppose a good deal of pre-existing cognitiveskills on the consumer side.
This study reflects a decision process in a non real-world situation, and calls forfurther research in real supermarkets, where people ‘see’ and ‘read’ the products inrelation to the category, the in-store atmosphere, and not least other shoppers. Theseinterrupting stimuli might influence both visual scan paths and final decisions, thusnot making the interpretation of the package design easier.
Perspectives
The complexity of the task consisting in creating optimal and fair communicationwith incongruent groups of consumers and still make a package which sells for theright reasons is huge. Given that the notion of being mislead must refer toinformation printed on the packaging and which has actually caught the givenconsumer’s visual attention, only consumers who see and try to interpret andunderstand the potentially misleading design feature risk being misled. Thisstatement may only be tested, if we know what consumers gaze at, and furtherresearch must document if this means that e.g. less informed consumers who onlylook at the price tag may not claim to have been misled.
The potential of the proposed survey must be further developed and tested on alarge number of consumers possibly in other countries and the next fine-tunedversion must be supplemented with post-shopping interviews of the respondents. Ifthe use of methods based on this exploratory study can be turned into more stabletools, they may contribute to the development of a standardized quality and fairnesscheck of on-label food information to consumers. This goes for in-store decisionsknow for decades and for on-line purchase with quite a different approach toinformation findings.
We have to bear in mind that our sample of 46 subjects is not appropriate forcategorical conclusions and this survey has to be considered exploratory. Thequestionnaire used in this survey has been developed further and will be discussedfurther in Selsøe Sørensen et al. (forthcoming). The palette of different methodscombined with eyetracking is however likely to provide an important link betweenregulations and consumer understanding.
References
Ambler, T., S. Braeutigam, J. Stins, S. Rose, and S. Swithenby. 2004. Salience and choice:Neural correlates of shopping decisions. Psychology & Marketing 21: 247–61.
Bland, J.M., and D.G. Altman. 1997. Statistics notes: Cronbach’s alpha. British MedicalJournal 314: 572.
Buswell, G.T. 1935. How people look at pictures: A study of the psychology of perception in art.Chicago: The University of Chicago Press.
112 H. Selsøe Sørensen et al.
Dow
nloa
ded
by [
Cop
enha
gen
Bus
ines
s Sc
hool
] at
04:
48 2
1 M
ay 2
012
Clement, J. 2007. Visual influence on in-store buying decisions: An eyetrack experiment on thevisual influence of packaging design. Journal of Marketing Management 23, no. 9: 917–28.
Clement, J. 2008. Visual influence of packaging design on in-store buying decisions. PhD diss.,Copenhagen Business School, PhD Series, 2.
Duchowski, A.T. 2003. Eye tracking methodology, theory and practice. London: SpringerVerlag.
Dutch Ministry of Health Welfare and Sport. 2005. Desk research report on labelling. TheHague, the Netherlands: Schuttelaar & Partners.
Eden, S., C. Bear, and G. Walker. 2008. Understanding and (dis)trusting food assuranceschemes: Consumer confidence and the ‘knowledge fix’. Journal of Rural Studies 24: 1–14.
EuropeanCommission Proposal. 2008. Proposal for a regulation of the European Parliament andof the Council on the provision of food information to consumers (COM/2008/0040 final).
Fasolo, B., F.A. Carmeci, and R. Misuraca. 2009. The effect of choice complexity onperception of time spent choosing: When choice takes longer but feels shorter. Psychologyand Marketing 26, no. 3: 213–28.
Fullmer, S., C.J. Geiger, and C.R.M. Parent. 1991. Consumers’ knowledge, understanding,and attitudes towards health claims on food labels. Journal of American Diet Association91: 166–71.
Grunert K.G., L. Lahteenmaki, Y. Boztug, E. Martinsdottir, Ø. Ueland, A. Astrom, and P.Lampila. 2009. Perception of health claims among Nordic consumers. Journal ofConsumer Policy 32, no. 3: 269–87.
Grunert, K., and J.M. Wills. 2007. A review of European research on consumer response tonutrition information on food labels. Journal of Public Health 15: 385–99.
Grunert, K.G., J.M. Wills, and L. Fernandez-Celemın. 2010. Nutrition knowledge, and useand understanding of nutrition information on food labels among consumers in the UK.Appetite 55, no. 2, 177–189.
Harper, L., P. Souta, J. Ince, and J. Mckenzie. 2007. Food labelling consumer research, whatconsumers want. Food Standards Agency: Labelling, Standards and Allergy Division.UK.http://www.food.gov.uk/multimedia/pdfs/labellinglitreview07.pdf.
Henderson, J.M., J. Brockmole, M. Castelhano, and M. Mark. 2007. Visual saliency does notaccount for eye movements during visual search in real-world scenes. In Eye movements: Awindow on mind and brain, ed. R. van Gompel, M. Fischer, W. Murray, and R. Hill, 537–62. Oxford: Elsevier.
Horowitz, Todd S., and J.M. Wolfe. 1998. Visual search has no memory. Nature 394, no.6693: 575–7.
Hoyer, W.D. 1984. An examination of consumer decision making for a common repeatpurchase product. Journal of Consumer Research 11, no. 3: 822–9.
Iyengar, R., A. Ansari, and S. Gupta. 2003. Leveraging information across categories.Quantitative Marketing and Economics 1, no. 4: 425–65.
Iyengar, S.S., and M.R. Lepper. 2000. When choice is demotivating: Can one desire too muchof a good thing? Journal of Personality and Social Psychology 79, no. 6: 995–1006.
Iyer, E.S. 1989. Unplanned purchasing: Knowledge of shopping environment and timepressure. Journal of Retailing 65: 40–57.
Malam, S., S. Clegg, S. Kirwin, and S. McGinigal. 2009. Comprehension and use of UKnutrition signpost labelling schemes. British Market Research Bureau. http://www.food.gov.uk/multimedia/pdfs/pmpreport.pdf.
Orth, U.R., and K. Malkewitz. 2008. Holistic package design and consumer brandimpressions. Journal of Marketing 72, no. 3: 64–81.
Pieters, R., and L. Warlop. 1999. Visual attention during brand choice: The impact of timepressure and task motivation. International Journal of Research in Marketing 16, no. 1: 1–16.
Rayner, K. 1978. Eye movements in reading and information processing. PsychologicalBulletin 85, no. 3: 618–60.
Romiszowski, A.J. 1984. Designing instructional systems. New York: Nichols PublishingCompany.
Rothman, R.L., R. Housam, H. Weiss, D. Davis, R. Gregory, T. Gebretsadik, A. Shintani,and T.A. Elasy. 2006. Patient understanding of food labels: The role of literacy andnumeracy. American Journal of Preventive Medicine 31, no. 5: 391–8.
The International Review of Retail, Distribution and Consumer Research 113
Dow
nloa
ded
by [
Cop
enha
gen
Bus
ines
s Sc
hool
] at
04:
48 2
1 M
ay 2
012
Schwartz, B. 2004. The tyranny of choice. Scientific American 290, no. 4: 70–5.Selsøe Sørensen, H. 2008. Extreme knowledge engineering – the intricacy of food label
communication. In Managing Ontologies and Lexical Resources, ed. B.N. Madsen andH.E. Thomsen, 291–302. Copenhagen: Proceedings of TKE 2008.
Selsøe Sørensen, H., L. Holm, V. Smith, P. Møgelvang-Hansen, F. Qvistgaard, and D.Barratt. Forthcoming. Consumer understanding of food labels: Towards a generic tool foridentifying the average consumer on empirical grounds.
The European Parliament and the Council. 2005. Directive 2005/29/EC on unfair business-to-consumer commercial practices in the internal market (‘Unfair Commercial PracticesDirective’). Official Journal of the European Union, L 149/22 (11 June 2005). http://eur-ex.europa.eu/LexUriServ/LexUriServ.do?uri¼OJ:L:2005:149:0022:0022:EN:PDF.
Urbany, E.J., P.R. Dickson, and R. Kalapurakal. 1996. Price search in the retail grocerymarket. Journal of Marketing 60, no. 2: 91–104.
Williams, P. 2005. Consumer understanding and use of health claims for foods. NutritionReviews, 63, no. 7: 256–64.
Yarbus, A.L. 1967. Eye movements and vision. New York: Plenum Press.
114 H. Selsøe Sørensen et al.
Dow
nloa
ded
by [
Cop
enha
gen
Bus
ines
s Sc
hool
] at
04:
48 2
1 M
ay 2
012