Folding thermodynamics of model four-strand antiparallel beta-sheet proteins
14
Folding Thermodynamics of Model Four-Strand Antiparallel -Sheet Proteins Hyunbum Jang,* Carol K. Hall,* and Yaoqi Zhou † *Department of Chemical Engineering, North Carolina State University, Raleigh, North Carolina 27695-7905; and † Department of Physiology and Biophysics, State University of New York at Buffalo, 124 Sherman Hall, Buffalo, New York 14214 ABSTRACT The thermodynamic properties for three different types of off-lattice four-strand antiparallel -strand protein models interacting via a hybrid Go-type potential have been investigated. Discontinuous molecular dynamic simulations have been performed for different sizes of the bias gap g, an artificial measure of a model protein’s preference for its native state. The thermodynamic transition temperatures are obtained by calculating the squared radius of gyration R g 2 , the root-mean- squared pair separation fluctuation B , the specific heat C v , the internal energy of the system E, and the Lindemann disorder parameter L . Despite these models’ simplicity, they exhibit a complex set of protein transitions, consistent with those observed in experimental studies on real proteins. Starting from high temperature, these transitions include a collapse transition, a disordered-to-ordered globule transition, a folding transition, and a liquid-to-solid transition. The high temper- ature transitions, i.e., the collapse transition and the disordered-to-ordered globule transition, exist for all three -strand proteins, although the native-state geometry of the three model proteins is different. However the low temperature transitions, i.e., the folding transition and the liquid-to-solid transition, strongly depend on the native-state geometry of the model proteins and the size of the bias gap. INTRODUCTION We have been engaged in a computational study aimed at understanding the basic physical principles underlying pro- tein aggregation, a phenomenon with serious biomedical problems that include a host of ultimately fatal protein deposition diseases (Clark and Steele, 1992; Eaton and Hofrichter, 1990; Gallo et al., 1996; Massry and Glasscock, 1983; Moore and Melton, 1997; Selkoe, 1991; Simmons et al., 1994). The long-term goal of our work is to reveal molecular-level mechanisms underlying protein aggregation and fibril formation. Because protein aggregation often in- volves the association of -strands, or the conversion of -helices to -strands (Benzinger et al., 1998, 2000; Burkoth et al., 1998; Esler et al., 1996, 2000; Lazo and Cowning, 1998; Lynn and Meredith, 2000; Sunde et al., 1997; Zhang et al., 2000), we have focused part of our efforts on the development of models of -strand proteins. These models must be capable of capturing the essential physical features of real -strand proteins and at the same time be simple enough to allow the simulation of multi- protein systems with current computer capability. In this paper we introduce one such model, a four-strand protein interacting via a hybrid Go-type potential (Go and Take- tomi, 1978, 1979; Taketomi et al., 1975; Ueda et al., 1978) and describe the folding properties of an isolated model chain as a function of temperature. This sets the stage for a later paper in which we examine the folding of several of these model -strand proteins into fibrils. Low-resolution or simplified protein models are best suited to our purpose because they allow us to study the behavior of single or multi-protein systems over relatively long time scales. These models provide numerous insights into the thermodynamic and kinetic properties of protein folding. The low-resolution models used in simulation stud- ies of protein folding can be divided into two classes: on-lattice models (Bratko and Blanch, 2001; Chan and Dill, 1994; Dill and Stigter, 1995; Go and Taketomi, 1978, 1979; Gupta and Hall, 1997, 1998; Gupta et al., 1999; Harrison et al., 1999, 2001; Kolinski et al., 1995; Lau and Dill, 1989; Miller et al., 1992; Skolnick and Kolinski, 1991; Taketomi et al., 1975; Ueda et al., 1978) and off-lattice models (Dok- holyan et al., 1998, 2000; Guo and Thirumalai, 1995, 1996; Guo and Brooks, 1997; Guo et al., 1997; Nymeyer et al., 1998; Pande and Rokhsar, 1998; Shea et al., 2000; Takada et al.,. 1999; Zhou and Karplus, 1997a, 1997b, 1999). The first low-resolution lattice models of proteins were intro- duced by Go et al. (Go and Taketomi, 1978, 1979; Taketomi et al., 1975; Ueda et al., 1978) in the late 1970s. In their models, the protein was treated as a sequence of beads on a two- or three-dimensional lattice with the native tertiary structure being determined by a set of preassigned attractive residue-residue pairs at the nearest-neighbor lattice sites. Another class of lattice model used to describe protein folding is the HP lattice model proposed by Lau and Dill (1989). To mimic the hydrophobic effect, the protein is modeled as a chain of polar (P) and hydrophobic (H) resi- dues with an attractive potential between nonbonded H beads and zero potential between nonbonded H and P or P and P residues. Simulation results for H-P models have provided useful information on protein folding-refolding pathways for isolated chains (Chan and Dill, 1994; Gupta and Hall, 1997; Gupta et al., 1999; Miller et al., 1992). In Submitted June 20, 2001, and accepted for publication October 17, 2001. Address reprint requests to Dr. Hyunbum Jang, Department of Chemical Engineering, North Carolina State University, Raleigh, NC 27695-7905. Tel.: 919-513-2454; Fax: 919-513-2470; E-mail: [email protected]. © 2002 by the Biophysical Society 0006-3495/02/02/646/14 $2.00 646 Biophysical Journal Volume 82 February 2002 646 – 659
Transcript of Folding thermodynamics of model four-strand antiparallel beta-sheet proteins

Folding Thermodynamics of Model Four-Strand Antiparallel�-Sheet Proteins
Hyunbum Jang,* Carol K. Hall,* and Yaoqi Zhou†
*Department of Chemical Engineering, North Carolina State University, Raleigh, North Carolina 27695-7905; and †Department ofPhysiology and Biophysics, State University of New York at Buffalo, 124 Sherman Hall, Buffalo, New York 14214
ABSTRACT The thermodynamic properties for three different types of off-lattice four-strand antiparallel �-strand proteinmodels interacting via a hybrid Go-type potential have been investigated. Discontinuous molecular dynamic simulations havebeen performed for different sizes of the bias gap g, an artificial measure of a model protein’s preference for its native state.The thermodynamic transition temperatures are obtained by calculating the squared radius of gyration Rg
2, the root-mean-squared pair separation fluctuation �B, the specific heat Cv, the internal energy of the system E, and the Lindemann disorderparameter �L. Despite these models’ simplicity, they exhibit a complex set of protein transitions, consistent with thoseobserved in experimental studies on real proteins. Starting from high temperature, these transitions include a collapsetransition, a disordered-to-ordered globule transition, a folding transition, and a liquid-to-solid transition. The high temper-ature transitions, i.e., the collapse transition and the disordered-to-ordered globule transition, exist for all three �-strandproteins, although the native-state geometry of the three model proteins is different. However the low temperature transitions,i.e., the folding transition and the liquid-to-solid transition, strongly depend on the native-state geometry of the model proteinsand the size of the bias gap.
INTRODUCTION
We have been engaged in a computational study aimed atunderstanding the basic physical principles underlying pro-tein aggregation, a phenomenon with serious biomedicalproblems that include a host of ultimately fatal proteindeposition diseases (Clark and Steele, 1992; Eaton andHofrichter, 1990; Gallo et al., 1996; Massry and Glasscock,1983; Moore and Melton, 1997; Selkoe, 1991; Simmons etal., 1994). The long-term goal of our work is to revealmolecular-level mechanisms underlying protein aggregationand fibril formation. Because protein aggregation often in-volves the association of �-strands, or the conversion of�-helices to �-strands (Benzinger et al., 1998, 2000;Burkoth et al., 1998; Esler et al., 1996, 2000; Lazo andCowning, 1998; Lynn and Meredith, 2000; Sunde et al.,1997; Zhang et al., 2000), we have focused part of ourefforts on the development of models of �-strand proteins.These models must be capable of capturing the essentialphysical features of real �-strand proteins and at the sametime be simple enough to allow the simulation of multi-protein systems with current computer capability. In thispaper we introduce one such model, a four-strand proteininteracting via a hybrid Go-type potential (Go and Take-tomi, 1978, 1979; Taketomi et al., 1975; Ueda et al., 1978)and describe the folding properties of an isolated modelchain as a function of temperature. This sets the stage for alater paper in which we examine the folding of several ofthese model �-strand proteins into fibrils.
Low-resolution or simplified protein models are bestsuited to our purpose because they allow us to study thebehavior of single or multi-protein systems over relativelylong time scales. These models provide numerous insightsinto the thermodynamic and kinetic properties of proteinfolding. The low-resolution models used in simulation stud-ies of protein folding can be divided into two classes:on-lattice models (Bratko and Blanch, 2001; Chan and Dill,1994; Dill and Stigter, 1995; Go and Taketomi, 1978, 1979;Gupta and Hall, 1997, 1998; Gupta et al., 1999; Harrison etal., 1999, 2001; Kolinski et al., 1995; Lau and Dill, 1989;Miller et al., 1992; Skolnick and Kolinski, 1991; Taketomiet al., 1975; Ueda et al., 1978) and off-lattice models (Dok-holyan et al., 1998, 2000; Guo and Thirumalai, 1995, 1996;Guo and Brooks, 1997; Guo et al., 1997; Nymeyer et al.,1998; Pande and Rokhsar, 1998; Shea et al., 2000; Takadaet al.,. 1999; Zhou and Karplus, 1997a, 1997b, 1999). Thefirst low-resolution lattice models of proteins were intro-duced by Go et al. (Go and Taketomi, 1978, 1979; Taketomiet al., 1975; Ueda et al., 1978) in the late 1970s. In theirmodels, the protein was treated as a sequence of beads on atwo- or three-dimensional lattice with the native tertiarystructure being determined by a set of preassigned attractiveresidue-residue pairs at the nearest-neighbor lattice sites.Another class of lattice model used to describe proteinfolding is the HP lattice model proposed by Lau and Dill(1989). To mimic the hydrophobic effect, the protein ismodeled as a chain of polar (P) and hydrophobic (H) resi-dues with an attractive potential between nonbonded Hbeads and zero potential between nonbonded H and P or Pand P residues. Simulation results for H-P models haveprovided useful information on protein folding-refoldingpathways for isolated chains (Chan and Dill, 1994; Guptaand Hall, 1997; Gupta et al., 1999; Miller et al., 1992). In
Submitted June 20, 2001, and accepted for publication October 17, 2001.
Address reprint requests to Dr. Hyunbum Jang, Department of ChemicalEngineering, North Carolina State University, Raleigh, NC 27695-7905.Tel.: 919-513-2454; Fax: 919-513-2470; E-mail: [email protected].
© 2002 by the Biophysical Society
0006-3495/02/02/646/14 $2.00
646 Biophysical Journal Volume 82 February 2002 646–659

recent years these models have been extended to the treat-ment of protein aggregation for multichain systems (Bratkoand Blanch, 2001; Dill and Stigter, 1995; Gupta and Hall,1998; Harrison et al., 1999, 2001).
Recently, off-lattice models have gained attention as theycan more accurately represent the real features of proteins.Guo et al. (Guo and Thirumalai, 1995, 1996; Guo andBrooks, 1997; Guo et al., 1997) have investigated the ther-modynamics and kinetics of protein folding using Langevinsimulations on off-lattice protein models. Their heteropoly-mer models consist of N connected beads, which correspondto three types of residues: hydrophobic, hydrophilic, andneutral. They found two characteristic temperatures, a col-lapse transition temperature T� and a folding transitiontemperature Tf in their thermodynamic studies of �-barreland four-helix bundle proteins. Zhou and Karplus (1997a,1997b, 1999) recently introduced an off-lattice heteropoly-mer model for a three-helix bundle protein with a hybridGo-type potential. They used a bias gap parameter, g, tovary the strength of native contacts relative to that of non-native contacts. Despite the model’s simplicity, thermody-namic studies on this protein-like model exhibit complexprotein transitions that have been observed experimentallyincluding a collapse transition, a disordered globule to or-dered globule transition, an ordered globule to native tran-sition, and a transition to a surface frozen inactive state(Ptitsyn, 1995).
In this paper we investigate the thermodynamic phasebehavior of three different four-strand antiparallel �-strandpeptides: the �-sheet, the �-clip, and the �-twist. These�-strand peptides each have 39 connected residues (beads)and have different native state conformations as shown inFig. 1. Nonbonded beads can interact through a hybridGo-type potential (Go and Taketomi, 1978, 1979; Taketomiet al., 1975; Ueda et al., 1978) modeled as a square-well or
square-shoulder potential depending on the value of the biasgap parameter g. Discontinuous molecular dynamic (DMD)simulations (Alder and Wainwright, 1959; Rapaport, 1978;Smith et al., 1996) were performed on model protein sys-tems with bias gaps ranging from 0.3 to 1.5. The bias gapmeasures the difference in interaction strength between thenative and nonnative contacts: the larger it is the more thenative state is favored over the nonnative state. Intermediatevalues of the bias gap are thought to be the most represen-tative of a real protein in their equilibrium and dynamicbehavior. By exploring how variations in our model pro-tein’s bias gap, an artificial measure of its “preference” forthe native state, influence the types of phase behavior ob-served, we can get a feeling for how a real protein’s pref-erence for its native state, as measured for example by theenergy difference between the denatured and native state, ismanifested in the protein’s phase diagram and vice versa.
MODELS AND SIMULATION METHOD
We consider three different off-lattice protein models whose native statesare four-strand antiparallel �-strand peptides. The global energy minimalstructures for the three different �-strand models are shown in Fig. 1. The“zig-zag” shaped native protein in Fig. 1 a is called a �-sheet; sometimesit is known as betabellin (Lim et al., 2000). The paper clip and helix-shapednative structures in Fig. 1, b and c are called �-clip and �-twist, respec-tively (Kolinski et al., 1995). A qualitative difference between the �-sheetstructure and the other two structures is immediately apparent. In the nativestate, the �-sheet is two-dimensional (planar), whereas the �-clip and�-twist have well-defined three-dimensional four-barrel structures. Thereduced squared radius of gyration per bead, Rg
2/�2N, the total number ofnative contacts, Nnative
total , and the reduced squared end-to-end distance,r1–39
2 /�2, for the three global energy minimal structures are summarized inTable 1. Here N is the number of beads and � is the diameter of each beadalong the chain. Note that chains with a large number of native contacts aregenerally more compact and consequently have a small value of thesquared radius of gyration.
Each model protein contains 39 connected beads. Each bead representsan amino acid residue that can be regarded as being localized at the C�
atom. Nonbonded beads can interact with each other through a square-wellor square-shoulder potential (Zhou et al., 1996, 1997),
uij�r� � ��Bij�,0,
r � �� � r � �r �
(1)
in which � is the bead diameter, � is an energy parameter with � � 0, �is the square-well diameter with � 1.5 throughout, and r is the distancebetween residues i and j. The quantity Bij�, the square-well depth or
FIGURE 1 Global energy minimal structures for: (a) the �-sheet, (b) the�-clip, and (c) the �-twist model proteins.
TABLE 1 Reduced squared radius of gyration per bead,Rg
2/�2N, the total number of native contacts, Nnativetotal , and the
reduced squared distance between beads number 1 and 39,r1–392 /�2, in the global energy minimal structure for the three
different �-strand models
�-sheet �-clip �-twist
Rg2/�2N 0.2350 0.2164 0.2163
Nnativetotal 75 125 130
r1–392 /�2 9 1 3
Folding Thermodynamics 647
Biophysical Journal 82(2) 646–659

square-shoulder height represents the interaction strength between non-bonded residue pair i and j and is defined as
Bij� � �BN�BO�
Native contactNonnative contact, (2)
in which BN and BO are measures of the relative strengths of the energiesassociated with the native and nonnative pair interactions in this Go-typepotential (Go and Taketomi, 1978, 1979; Taketomi et al., 1975; Ueda et al.,1978). Nonbonded pairs of beads that are in contact in the global energyminimal structure experience an attractive interaction, i.e., BN � 0, whentheir square-wells overlap. On the other hand, nonbonded pairs of beadsthat are not in contact in the global energy minimal structure experienceeither an attractive interaction (BO � 0) or a repulsive interaction (BO � 0).The parameter BO can be either positive or negative depending on the sizeof the bias gap parameter g,
BO � �1 � g�BN, �BN � 0, g 0�, (3)
in which g is the bias gap (Zhou and Karplus, 1997a, 1997b, 1999). Thebias gap measures the ratio of the interaction strength between the nativecontacts and nonnative contacts. Note that for g � 1, BO � 0; in this casenonnative contacts are repulsive so that the native state structure is stronglyfavored over any nonnative state structure. For 0 � g � 1, BO � 0; allnonbonded contact pairs are attractive, but native contacts are always morefavorable than nonnative contacts. For g � 0, native and nonnative contactsare equally favorable, BO � BN; the model reduces to a homopolymer. Thebias gap is an artificial measure of a model protein’s preference for itsnative state; in a real protein this preference for the native state might bemeasured for example by the energy difference between the native andnonnative state.
The interaction between two bonded beads, i and i � 1, is given by aninfinitely deep square-well potential,
ui,i�1bond �r� � ��,
0,�,
r � �1 � ����1 � ��� � r � �1 ���r �1 ���,
(4)
in which � is a flexibility parameter that controls the bond length. The bondlength between neighboring beads can be varied over a small distancebetween the infinitely high potential barriers at (1 �)� and (1 � �)�.This method for creating a flexible bond length was introduced by Belle-mans et al. (1980). The flexible bond-length parameter is set to � � 0.1through the paper.
Simulations were performed using the DMD algorithm (Alder andWainwright, 1959; Rapaport, 1978; Smith et al., 1996). All simulationswere started from randomly generated configurations, which were obtainedfrom self-avoiding random walks. The initial velocities were chosen atrandom from a Maxwell-Boltzmann distribution at the simulation temper-ature. This DMD algorithm is very efficient for calculating the propertiesof systems containing hard spheres or square-well spheres (Smith et al.,1996; Zhou et al., 1997) and is significantly faster than standard moleculardynamics on Lennard-Jones chains. The algorithm proceeds by searchingfor the next collision time and collision pair, advancing all beads in time tothe next collision event, and then calculating the velocity change of thecolliding pair. The DMD simulation was conducted in the canonicalensemble with a constant number of particles, volume, and temperature. Tomaintain constant temperature, the Anderson stochastic collision method(Anderson, 1980) was used. In this method the system’s particles collidewith imaginary or ghost particles, which serve as an effective heat bath. Inthe collision with the imaginary particles, the velocity of each bead isreassigned from a Maxwell-Boltzmann distribution at the simulation tem-perature. A reduced ghost particle density of ng* ng�3 � 0.1, in whichng is the number density of ghost particles, was used to ensure that 1% �10% of the collisions were ghost particle collisions (Zhou and Karplus,1999; Zhou et al., 1997).
To determine the location of the collapse transition, the mean-squaredradius of gyration, Rg
2, was determined in which
Rg2 � �1
N �i�1
N
��xi � xc�2 �yi � yc�
2 �zi � zc�2 �
cf
, (5)
with N equal to the number of beads, xi, yi, zi equal to the coordinates ofbead i, xc, yc, zc equal to the center of mass coordinates of the chain, and��cf denoting a configurational average. To save computing time, thesummation is taken over configurations sampled every 1000 collisionsafter equilibration. Other transitions were determined by calculating thereduced specific heat,
C*v �Cv
kB�
�E2� � �E�2
kB2 T2 (6)
and the reduced internal energy,
E* ��E�
�(7)
in which kB is Boltzmann’s constant and � � denotes an average over allcollisions after equilibration. In calculating the specific heat and energyaccording to Eqs. 6 and 7, the weighted histogram method (Ferrenberg andSwendsen, 1989; Zhou et al., 1997) was used. In this method, temperature-independent degeneracy factors are extracted from the energy probabilitydistribution in simulation runs at different temperatures. Once the degen-eracy factors are known, a partition function is obtained for any tempera-ture, and consequently all thermodynamic quantities can be calculated.Details of the method were reported elsewhere (Zhou et al., 1997). Byplotting Cv* versus T*, in which T* is the reduced temperature, T* kBT/�, one can determine the equilibrium transitions from the locations ofthe peaks and plateaus.
The degree of bead mobility can be characterized by the root-mean-squared pair separation fluctuation, �B, defined by
�B �2
N�N � 1� �i�j��rij
2�cf
�rij�cf2 � 1�
12, (8)
in which rij denotes the separation between beads i and j, and � �cf denotesthe configurational average. To characterize the liquid-to-solid transition ofthe system, the root-mean-squared fluctuation for bead i, �Li, defined to be
�Li � ����ri� � ��ri��cf�2�cf
�2 �12, (9)
yields the Lindemann disorder parameter,
�L � ��i
�Li2
N �12
(10)
in which bead positions, ri (i � 1 to N), are obtained by shifting the centerof mass coordinates to the origin. The quantity �Li in Eq. 9 defines theLindemann disorder parameter for an individual bead, and �L in Eq. 10defines the Lindemann disorder parameter. The Lindemann criterion (Lin-demann, 1910) is applied to the system to determine the solid or liquidphase. A system is regarded as a solid if its Lindemann disorder parameter,�L, is in the range of 0.1 to 0.15 (Bilgram, 1987; Lowen, 1994; Stillinger,1995; Zhou et al., 1999b), whereas a substance with �L � 0.15 is consid-ered liquid.
648 Jang et al.
Biophysical Journal 82(2) 646–659

The progression of a conformation toward the native state can bemonitored by introducing the fraction of native contacts formed (Lazaridisand Karplus, 1997; Sali et al., 1994), Q, defined by
Q �Nnative
Nnativetotal , (11)
in which Nnative represents the number of native contacts in a givenconformation and Nnative
total is the total number of native contacts in the globalenergy minimal structure. The fraction of native contacts Q has a valuebetween 0 and 1. When Q � 1 the model system can be regarded as beingin the native structure, whereas when Q3 0 the chain becomes a randomcoil that indicates the denatured state.
Simulations were performed for up to 109 collisions to ensure equili-bration. Each simulation was started from a different initial configurationat the temperature of interest. Equilibrium averages were typically taken bydiscarding the first one-half of the simulation data. All equilibrium resultswere averaged over at least four independent runs. For simulations at lowtemperature, a random initial configuration was generated at a relativelyhigh temperature of T* � 1.0 and then gradually annealed toward the targettemperature after which the equilibrium simulation was performed. Thisprocedure can prevent the system from becoming trapped in a metastablestate, i.e., a local free-energy minimum. Simulations were performed forbias gaps in the range of g � 0.3 to 1.5 at reduced temperatures in the rangeT* � 0.07 to 5.0.
RESULTS AND DISCUSSION
Thermodynamic properties of �-sheet
DMD simulations were performed for the �-sheet protein toinvestigate phase behavior as a function of the size of thebias gap. At bias gaps of g � 0.3, 0.7, 0.9, and 1.3,thermodynamic averages including the squared radius ofgyration Rg
2, the root-mean-squared pair separation fluctu-ation �B, the specific heat Cv, and the internal energy Ewere calculated as a function of temperature. These resultsfor g � 0.3, 0.7, 0.9, and 1.3 are shown in Fig. 2 (a–d),respectively. All quantities are described in terms of re-duced units in the figures. Statistical averages were obtainedover at least four independent simulations. The error barsare the standard deviation in the measured values and areonly shown for values larger than the size of the symbol.The results for the specific heat and the energy were ob-tained using the same weighted histogram method (Ferren-berg and Swendsen, 1989) that was introduced in the studyof homopolymers (Zhou et al., 1997). The equilibrium tran-sition temperatures of the model can be identified from themaximal value of the temperature derivative of the squaredradius of gyration, dRg
2/dT*, and/or from peaks or plateausin the specific heat.
To determine the collapse transition, the temperaturederivative of the squared radius of gyration, dRg
2/dT*, iscalculated along a spline fit of the data in Rg
2 versus T*graphs as shown in Fig. 2. For a small bias gap, g � 0.3, inFig. 2 a the maximal value of dRg
2/dT* occurs at T* � 1.47,indicating the collapse transition temperature. For g � 0.7,0.9, and 1.3 in Fig. 2, b, c, and d, the collapse transitionsoccur at T* � 1.0, 0.95, and 0.88, respectively. The chain
has a conformational change from a random coil to thedisordered globule state at the collapse transition. The dis-ordered globule has more native contacts than the randomcoil, but due to the disordered nature of the state, none of thestructures appear to be well ordered or native-like. Theproperties of disordered globule are similar to those ob-served experimentally for a premolten globule (Uversky andPtitsyn, 1996a). Additional evidence for the existence of thecollapse transition at g � 0.3 is that the ��B� versus T*curve possesses a broad, but clear, maximum located at atemperature just above T* � 1.47. In addition, a plateau inthe specific heat is observed near this temperature. In con-trast to the broad peak for g � 0.3 in the ��B� curve, for g �0.7, 0.9, and 1.3, there is a well-defined peak in the ��B�curve that evidently supports the collapse transition. Thecollapse transition peak in the ��B� versus T* curve can beexplained in the following way. The root-mean-squared pairseparation fluctuation ��B� increases, as expected, as T*increases but then decreases above the collapse transitiontemperature because the stretched chain in the random coilstate is constrained by chain connectivity, resulting in lessfluctuations in the bead-bead separations.
The transition from the disordered globule state to theordered globule state is associated with a distinct peak in thespecific heat. This transition is strong with large energychange indicating a large conformational change. For g �0.3, the peak is found at a temperature of T* � 0.58, farbelow the collapse transition. This indicates that the disor-dered globule is a stable state over a wide temperaturerange, a trend characteristic of smaller values of g. How-ever, for g � 1.3 the peak is found at a temperature of T* �0.80, only slightly below the collapse transition tempera-ture. The collapse transition will eventually coincide withthe disordered-to-ordered transition for g � 1.5. The or-dered globule is similar to the molten globule, a liquid-likephase that exists at temperatures between the native and theunfolded coil state. This molten globule is a thermodynamic(not kinetic) intermediate that has a native-like secondarystructure but has deficient side-chain interactions (Ptitsyn,1995; Ptitsyn and Uversky, 1994; Schulman and Kim, 1996;Uversky and Ptitsyn, 1996b).
The folding transition from the ordered globule state tothe native state can be identified from the plateaus in thespecific heat. At this transition, there are no major changesin structure, but the chain has a subtle conformationalchange toward the native state. For the smaller gap models,g � 0.3, no evidence for the folding transition was ob-served. This is because for g � 0.7, a well-ordered nativestate does not appear to exist; instead kinked or rolledstructures were observed. Consequently, no plateaus asso-ciated with the folding transition were observed for thesmaller gap models. For the g � 0.7 model, although a peakin the specific heat is found at a temperature of T* � 0.35,the peak is not related to the folding transition. It is asso-ciated with the transition from the ordered globule state to a
Folding Thermodynamics 649
Biophysical Journal 82(2) 646–659

FIGURE 2 Average values of the reduced squaredradius of gyration per bead, �Rg
2/�2N�, the root-mean-squared pair separation fluctuation, ��B�, the reducedspecific heat per bead, �Cv*/N�, and the reduced in-ternal energy per bead, �E*/N�, as a function of thereduced temperature, T*, for the �-sheet at four se-lected values of the bias gap, (a) g � 0.3, (b) g � 0.7,(c) g � 0.9, and (d) g � 1.3.
650 Jang et al.
Biophysical Journal 82(2) 646–659
more-collapsed ordered globule state that we will call thepartially ordered globule state. For the larger gap models,g � 0.9 and 1.3, the plateaus at T* � 0.40 in the specificheat are associated with the folding transition. This foldingtransition temperature is much lower than the disordered-to-ordered globule transition. This indicates that the orderedglobule is a stable state over a wide temperature range forthe larger gap models.
The thermodynamic results presented in Fig. 2 differfrom those found in real proteins in that the specific heat inthe unfolded state (random coil) is lower than in the foldedstate (ordered globule) even for the larger gap models, g �0.9; the opposite is true for real proteins (Makhatadze andPrivalov, 1995). The low value for the random-coil specificheat is due to the absence of protein-solvent interactions(Privalov, 1992) in this model, which diminishes the size offluctuations in the energy in the unfolded state and results ina more stable energy state (Zhou et al., 1999a).
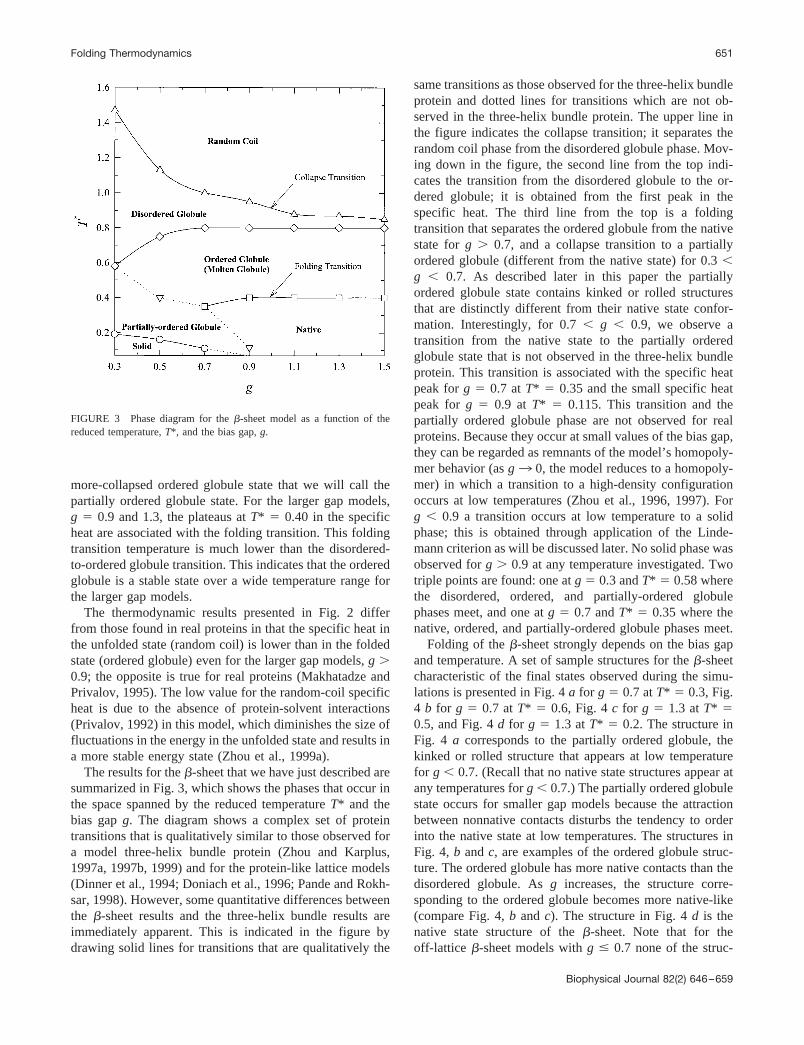
The results for the �-sheet that we have just described aresummarized in Fig. 3, which shows the phases that occur inthe space spanned by the reduced temperature T* and thebias gap g. The diagram shows a complex set of proteintransitions that is qualitatively similar to those observed fora model three-helix bundle protein (Zhou and Karplus,1997a, 1997b, 1999) and for the protein-like lattice models(Dinner et al., 1994; Doniach et al., 1996; Pande and Rokh-sar, 1998). However, some quantitative differences betweenthe �-sheet results and the three-helix bundle results areimmediately apparent. This is indicated in the figure bydrawing solid lines for transitions that are qualitatively the
same transitions as those observed for the three-helix bundleprotein and dotted lines for transitions which are not ob-served in the three-helix bundle protein. The upper line inthe figure indicates the collapse transition; it separates therandom coil phase from the disordered globule phase. Mov-ing down in the figure, the second line from the top indi-cates the transition from the disordered globule to the or-dered globule; it is obtained from the first peak in thespecific heat. The third line from the top is a foldingtransition that separates the ordered globule from the nativestate for g � 0.7, and a collapse transition to a partiallyordered globule (different from the native state) for 0.3 �g � 0.7. As described later in this paper the partiallyordered globule state contains kinked or rolled structuresthat are distinctly different from their native state confor-mation. Interestingly, for 0.7 � g � 0.9, we observe atransition from the native state to the partially orderedglobule state that is not observed in the three-helix bundleprotein. This transition is associated with the specific heatpeak for g � 0.7 at T* � 0.35 and the small specific heatpeak for g � 0.9 at T* � 0.115. This transition and thepartially ordered globule phase are not observed for realproteins. Because they occur at small values of the bias gap,they can be regarded as remnants of the model’s homopoly-mer behavior (as g3 0, the model reduces to a homopoly-mer) in which a transition to a high-density configurationoccurs at low temperatures (Zhou et al., 1996, 1997). Forg � 0.9 a transition occurs at low temperature to a solidphase; this is obtained through application of the Linde-mann criterion as will be discussed later. No solid phase wasobserved for g � 0.9 at any temperature investigated. Twotriple points are found: one at g � 0.3 and T* � 0.58 wherethe disordered, ordered, and partially-ordered globulephases meet, and one at g � 0.7 and T* � 0.35 where thenative, ordered, and partially-ordered globule phases meet.
Folding of the �-sheet strongly depends on the bias gapand temperature. A set of sample structures for the �-sheetcharacteristic of the final states observed during the simu-lations is presented in Fig. 4 a for g � 0.7 at T* � 0.3, Fig.4 b for g � 0.7 at T* � 0.6, Fig. 4 c for g � 1.3 at T* �0.5, and Fig. 4 d for g � 1.3 at T* � 0.2. The structure inFig. 4 a corresponds to the partially ordered globule, thekinked or rolled structure that appears at low temperaturefor g � 0.7. (Recall that no native state structures appear atany temperatures for g � 0.7.) The partially ordered globulestate occurs for smaller gap models because the attractionbetween nonnative contacts disturbs the tendency to orderinto the native state at low temperatures. The structures inFig. 4, b and c, are examples of the ordered globule struc-ture. The ordered globule has more native contacts than thedisordered globule. As g increases, the structure corre-sponding to the ordered globule becomes more native-like(compare Fig. 4, b and c). The structure in Fig. 4 d is thenative state structure of the �-sheet. Note that for theoff-lattice �-sheet models with g � 0.7 none of the struc-
FIGURE 3 Phase diagram for the �-sheet model as a function of thereduced temperature, T*, and the bias gap, g.
Folding Thermodynamics 651
Biophysical Journal 82(2) 646–659

tures correspond to the global energy minimal state, but for0.7 � g � 1.0 the geometry in the native state is verysimilar to the global energy minimal structure shown in Fig.1 a so that the number of native contacts is very close to thatof the global energy minimal structure. For highly opti-mized models, g � 1.0, the native state is the global energyminimal state (Zhou and Karplus, 1999).
It is interesting to consider the variation in structuralproperties as folding progress. Fig. 5 shows the averagevalue of the fraction of global energy minimal contactsformed (Lazaridis and Karplus, 1997; Sali et al., 1994), �Q�,as a function of temperature T * and bias gap g. The collapsetransition occurs at �Q� � 0.2 for g � 0.3 and at �Q� � 0.3for g � 1.3. The transition from the disordered globule tothe ordered globule occurs at �Q� values in the range of �Q�� 0.4 � 0.5 for all values of g. In the native state, we findthat �Q� � 0.9 for g � 0.7, whereas for the partially orderedglobule, �Q� has values in the range from 0.6 to 0.9 depend-ing on the size of g. In the three-dimensional graph, the flatsurface at the top of the rear edge corresponds to the nativestate with �Q� � 1 for g � 0.7.
Further information on the nature of the transition at lowtemperature can be obtained by calculating the Lindemanndisorder parameter (Lindemann, 1910). This parameter isoften used to analyze the liquid-to-solid transition (Bilgram,
1987; Lowen, 1994; Stillinger, 1995; Zhou et al., 1999b).The solid phase corresponds to the inactive glassy state thatcan be observed in many proteins (Ferrand et al., 1993;Frauenfelder and McMahon, 1998; Green et al., 1994; Reatet al., 1998; Tilton et al., 1992). Fig. 6 a shows the averagevalue of the Lindemann disorder parameter, ��L�, as afunction of temperature for two selected values of the biasgap, g � 0.3 and 1.3. Each result for �L at given temper-ature is a sum of the average of the root-mean-squaredfluctuations over all beads. A form of the Lindemann cri-terion for melting is adopted here in which systems with �L
� 0.15 are considered solid-like, whereas systems with �L
� 0.15 are considered liquid. The dotted line in Fig. 6 aindicates the criterion for the liquid-to-solid transition. Itcan be seen that for g � 1.3, as was seen in the phasediagram, no solid phase is found at any investigated tem-peratures because �L � 0.15, whereas, for g � 0.3 theliquid-to-solid transition occurs at T* � 0.19. This agreeswell with the temperature at which the inflection in theroot-mean-squared pair separation, ��B�, curve is found inFig. 2 a.
Fig. 6, b and c, shows the Lindemann disorder parameterfor the individual beads i, �Li, as a function of the reduceddistance of bead i from the origin, �ri�/�, for Fig. 6 b, g � 0.3at T* � 0.1, 0.3, and 0.6, and Fig. 6 c, for g � 1.3 at T* �0.2, 0.6, and 0.8. Note that the bead positions, ri, are definedwith respect to the origin at the chain’s center of mass. InFig. 6 b, which corresponds to g � 0.3, the three selectedtemperatures correspond to the three different phases of thechain: the solid-like phase, partially ordered globule, anddisordered globule, respectively. At high temperature, T* �0.6, a large degree of freedom in the bead motion is ob-served. At low temperature, T* � 0.1, the small beadfluctuations and small bead-bead separations give rise to asolid-like phase for the chain. In Fig. 6 c, which correspondsto g � 1.3, the three selected temperatures correspond to the
FIGURE 4 Final chain conformations of the �-sheet (a) for g � 0.7 at T*� 0.3 (the partially ordered globule state), (b) for g � 0.7 at T* � 0.6 (theordered globule state), (c) for g � 1.3 at T* � 0.5 (the ordered globulestate), and (d) for g � 1.3 at T* � 0.2 (the native state).
FIGURE 5 Average value of the fraction of global energy minimalcontacts, �Q�, for the �-sheet as a function of the reduced temperature, T *,and the bias gap, g.
652 Jang et al.
Biophysical Journal 82(2) 646–659

three different phases of the chain: the native state, orderedglobule, and disordered globule, respectively. At high tem-perature, T* � 0.8, the large bead fluctuations in the �Li
graph indicate that the chain undergoes a transition from thedisordered globule to the ordered globule. At low temper-ature, T* � 0.2, the results of the individual bead fluctua-tions correspond to the native state. The native protein isregarded as a surface-molten solid, which means that theinterior of native protein is solid-like, but the surface isliquid-like phase (Zhou et al., 1999b). However we find thatthe native �-sheet at T* � 0.2 is not a surface-molten solid,because all the values of �Li are greater than 0.15, whichmeans that the system is considered liquid. Therefore, thenative �-sheet is more like a molten globule because all ofthe beads exhibit liquid-like motion. The reason that thenative �-sheet is not a surface-molten solid is that it isplanar, and consequently core beads have considerable free-dom in their motion; they can move perpendicular to themolecular plane even in the native state. This can be re-garded as a case in which the topology determines the phasebehavior.
It is of interest to determine the extent to which thismodel displays thermodynamic two-state cooperativity(Ptitsyn, 1995). The most direct way to do this is to examinethe shape of the free energy distribution in the transitionregion to see if it is bimodal. Accordingly, the energydistributions in the vicinity of transitions displayed in Fig. 3have been investigated. Fig. 7 shows the energy distributionin Fig. 7 a for g � 0.9 at T* � 0.7949 (the disordered-to-ordered globule transition), in Fig. 7 b for g � 0.9 at T* �0.3998 (the folding transition), and in Fig. 7 c for g � 0.3at T* � 0.5848 (the disordered-to-partially-ordered globuletransition). Fig. 7 a seems to indicate that the g � 0.9 modelhas a bimodal free energy distribution. As pointed out byZhou and Karplus (1999), the logarithm of the energydistribution as calculated via the weighted histogrammethod is directly proportional to the free energy, and theexistence of a bimodal shape in the free energy distributionindicates the presence of a two-state transition (Zhou et al.,1996, 1997). Nevertheless, to further verify the existence ofa two-state transition, it is useful to also apply the calori-metric criterion for chain models of protein. The criterionsays that to have two-state cooperativity in protein folding,�HvH/�Hcal � 1 around the transition, where �HvH is thevan’t Hoff enthalpy around the peak of the specific heatafter baseline subtraction and �Hcal is the calorimetric en-thalpy change associated with the entire transition (Jackson
FIGURE 6 (a) Lindemann disorder parameter, ��L�, for the �-sheet as afunction of the reduced temperature, T*, for two selected values of the biasgap, g � 0.3 and 1.3. (b) Lindemann disorder parameter for an individualbead, �Li, for the �-sheet as a function of the reduced distance of bead ifrom the origin, �ri�/�, for g � 0.3 at T* � 0.1, 0.3, and 0.6. (c) Same as(b) but for g � 1.3 at T* � 0.2, 0.6, and 0.8.
Folding Thermodynamics 653
Biophysical Journal 82(2) 646–659

and Brandts, 1970; Freire, 1995). We evaluate the criterionfor the collapse transition of the large bias gap models usingtwo different equations for the van’t Hoff enthalpy,�HvH(T) � 2T�kBCp(T) (Chan, 2000; Kaya and Chan,2000) and �HvH
� (T) � 4kBT2Cp(T)/�Hcal (Zhou et al.,1999a). For the transition in Fig. 7 a, we find that �HvH/�Hcal � 0.48 and �HvH
� /�Hcal � 0.23 at the midpointtemperature. These ratios are significantly smaller thanunity, indicating that either the collapse transition is notcalorimetrically two-state or the baseline for the specificheat curve is not accurate (Zhou et al., 1999a). The ratiosincrease with the size of the bias gap, indicating that thecollapse transition becomes more cooperative, but none ofthem becomes equal to or close to unity for the �-sheetmodels we investigated. We suspect that for highly opti-mized models, i.e., even larger bias gaps, the transition willbecome more protein-like, displaying the two-state “all-or-none” character associated with temperature-induced pro-tein denaturation.
The folding transition in Fig. 7 b for g � 0.9 is nottwo-state because no bimodal energy distribution occurs.
This indicates that the ordered globule and native states ofthe �-sheet are geometrically similar to each other. Hence,the folding transition is weak with small energy change andis continuous between the two states. Note that this transi-tion is associated with the plateaus in the specific heat asseen in Fig. 2, c and d. For the transition from the disorderedglobule state to the partially ordered globule state in Fig. 7c at g � 0.3, the transition is continuous even though it isassociated with a distinct peak in the specific heat as seen inFig. 2 a. The lack of a bimodal energy distribution for g �0.3 suggests that the disordered and partially ordered glob-ule structures are similar to each other.
Thermodynamic properties of �-clip and �-twist
The thermodynamic averages, �Rg2/�2N�, ��B�, �Cv*/N�,
and �E*/N� for the �-clip and �-twist models, are shown asa function of T* in Fig. 8, a and b (�-clip) and Fig. 8, c andd (�-twist). For brevity the figures only show results for twoselected values of the bias gap, g � 0.3 and 1.3. For thesmall bias gap, g � 0.3, the results in Fig. 8 a for the �-clipand Fig. 8 c for the �-twist are qualitatively similar to thosein Fig. 2 a for the �-sheet model at g � 0.3. However, forthe large bias gap, g � 1.3, the thermodynamic averages forboth the �-clip model and the �-twist model (Fig. 8, b andd, respectively) are qualitatively different from those of the�-sheet model at g � 1.3 in Fig. 2 d. The differences are thatkinks in the �Rg
2/�2N� and ��B� curves at low temperaturesand a second peak in the specific heat in Fig. 8, b and d areobserved for both the �-clip model and the �-twist model,but not for the �-sheet model in Fig. 2 d. The small peak inthe specific heat is related to the folding transition, whereasthe kinks in the �Rg
2/�2N� and ��B� curves at low temper-atures are connected with the liquid-to-solid transition. Thereason for the increases in �Rg
2/�2N� at low temperatures forboth the �-clip model and the �-twist model at g � 1.3 isthat the Rg
2 value of the native protein is larger than that ofthe ordered globule, indicating that the collapsed chainundergoes a subtle conformational change from the orderedglobule to the native state by elongating its strand.
The Lindemann disorder parameters are shown as a func-tion of temperature and the bias gap for the �-clip and�-twist in Fig. 9, a and b, respectively. It can be seen thatfor both models the locations of the kinks in the ��L� curvesat low temperatures and large g are consistent with those atlow temperatures found in the �Rg
2/�2N� and ��B� curves asseen in Fig. 8, b and d. The solid-like phase with �L � 0.15is prevalent at low temperature for the �-clip and �-twistmodels. Sharp increases at high temperatures in the ��L�curves for the large gap models are also consistent withthose found in the �Rg
2/�2N� curves and with the peaks inthe ��B� curves in Fig. 8, b and d, indicating the collapsetransition.
Fig. 10, a and b, show the Lindemann disorder parameterfor an individual bead, �Li, a for the �-clip model with g �
FIGURE 7 Energy distribution in the transition region for the �-sheet asa function of energy (a) for g � 0.9 at T* � 0.7949 (the disordered-to-ordered globule transition), (b) for g � 0.9 at T* � 0.3998 (the foldingtransition), and (c) for g � 0.3 at T* � 0.5848 (the disordered-to-partially-ordered globule transition).
654 Jang et al.
Biophysical Journal 82(2) 646–659

FIGURE 8 Average values of the reduced squaredradius of gyration per bead, �Rg
2/�2N�, the root-mean-squared pair separation fluctuation, ��B�, the reducedspecific heat per bead, �Cv*/N�, and the reduced inter-nal energy per bead, �E*/N�, as a function of thereduced temperature, T*, for the �-clip model at (a)g � 0.3 and (b) g � 1.3, and for the �-twist model at(c) g � 0.3 and (d) g � 1.3.
Folding Thermodynamics 655
Biophysical Journal 82(2) 646–659

0.9 at T* � 0.1, 0.26, and 0.5, and b for the �-twist modelwith g � 0.7 at T* � 0.1, 0.28, and 0.6. For both the �-clipand �-twist models, the three selected temperatures corre-spond to the three different phases of the chain: the solid-like phase, the native state, and the ordered globule, respec-tively. In the native states near the liquid-to-solid transition(�-clip with g � 0.9 at T* � 0.26 in Fig. 10 a and �-twistwith g � 0.7 at T* � 0.28 in Fig. 10 b), we find that theinteriors of the chains are solid-like with �Li � 0.15, but thesurfaces are liquid-like with �Li � 0.15. Thus the nativeproteins for the �-clip and �-twist are surface-molten solids.At low temperature, T* � 0.1, for both the �-clip and�-twist models, the bead motions are frozen with all �Li �0.1, indicating an inactive solid-like phase.
Fig. 11 a for the �-clip and Fig. 11 b for the �-twistsummarize the protein phases that occur in the space spannedby the reduced temperature T* and the bias gap g. The quali-tative differences between the phase behavior results for the�-clip and �-twist models and those for the �-sheet model(Fig. 3) are immediately apparent. For example, the native
states for the �-clip and �-twist models exist at low tempera-tures for g � 0.5, whereas the native state for the �-sheet existsat low temperatures for g � 0.7. For the �-clip and �-twistmodels at even lower temperatures, the liquid-to-solid transi-tion exists for all values of g, but for the �-sheet it exists onlyfor g � 0.9. For the �-clip and �-twist models at g � 0.9,although not shown in the figures, the energy distribution forthe collapse transition is bimodal, indicating that the transition
FIGURE 9 Lindemann disorder parameter, ��L�, as a function of thereduced temperature, T*, and the bias gap, g, for (a) the �-clip and (b) the�-twist.
FIGURE 10 Lindemann disorder parameter for an individual bead, �Li,as a function the reduced distance of bead i from the origin, �ri�/�, for (a)the �-clip with g � 0.9 at T* � 0.1, 0.26, 0.5, and (b) the �-twist with g �0.7 at T* � 0.1, 0.28, 0.6.
656 Jang et al.
Biophysical Journal 82(2) 646–659

is two-state-like. However, the calorimetric criterion showsthat at g � 1.3, �HvH/�Hcal � 0.8 for the �-clip and �-twistmodels, a ratio that is still smaller than the value of �HvH/�Hcal � 0.96 observed in experimental studies on small pro-teins (Privalov, 1979). This indicates that the collapse transi-tion is only weakly cooperative.
CONCLUSIONS
We have studied the folding thermodynamics for three differ-ent types of off-lattice four-strand antiparallel �-strand protein
models: the �-sheet, the �-clip, and the �-twist. DMD simu-lations of these models have been performed for different sizesof the bias gap g, a measure of the strength of the nativecontacts relative to that of the nonnative contacts. Although allthree �-strand model proteins are simple, they undergo acomplex set of protein transitions as observed in experimentalstudies on real proteins (Ptitsyn, 1995). A qualitative differencebetween results for this model and those for the three-helixbundle (Zhou and Karplus, 1997a, 1997b, 1999) is the exis-tence of a partially ordered globule state, which was notobserved in the three-helix bundle protein. This partially or-dered globule state exists for all three �-strand proteins at smallvalues of the bias gap because the attraction between nonnativecontacts disturbs the tendency to order into the native state atlow temperatures.
The high temperature transitions, i.e., the collapse tran-sition and the disordered-to-ordered globule transition, existfor all three �-strand proteins, although the native-stategeometry of the three model proteins is different. Howeverthe low temperature transitions, i.e., the folding transitionand the liquid-to-solid transition, strongly depend on thenative-state geometry of the model proteins and the size ofthe bias gap. The bias gap g in the models is clearly seen tobe an important factor in controlling the phase behavior ofthe model proteins. For small bias gaps at low temperatures,g � 0.7 for the �-sheet, and g � 0.5 for the �-clip and�-twist, no native structures are observed at any tempera-ture; instead all three �-strand proteins fold into a partiallyordered globule state, which is geometrically different fromthe native state. For small bias gaps at even lower temper-atures, all protein motions are frozen, indicating an inactivesolid-like phase. For large bias gaps at low temperatures,g � 0.7 for the �-sheet and g � 0.5 for the �-clip and�-twist, all three �-strand proteins fold into the native state.For large bias gaps at even lower temperatures, the �-sheetmodel exhibits no solid-like phase at any temperature in-vestigated, whereas the �-clip and �-twist models exhibit asolid-like phase for all values of g. The transition from thedisordered globule state to the ordered globule state isaccompanied by a large energy change whereas the transi-tion from the ordered globule state to the native state isaccompanied by a small energy change for the larger gapmodels, g � 0.9. The Lindemann criterion suggests that thenative �-sheet is a liquid-like phase, whereas the nativestates of the other two model proteins near the liquid-to-solid transition are surface-molten solids, i.e., they have aninactive solid-like phase inside and liquid-like phase out-side. The reason for this is that core beads on the native�-sheet are arranged in a plane and hence have considerablefreedom in their motion. Further studies on the foldingkinetics of the present models and the aggregation of multi-chain systems are being conducted to further our under-standing of the complex behaviors of protein systems.This work was supported by the National Institutes of Health (grantGM-56766) and the National Science Foundation (grant CTS-9704044).
FIGURE 11 Phase diagram as a function of the reduced temperature, T*,and the bias gap, g, for (a) the �-clip model and (b) the �-twist model.
Folding Thermodynamics 657
Biophysical Journal 82(2) 646–659

The work at Buffalo is supported in part by a grant from HHMI to SUNYBuffalo.
REFERENCES
Alder, B. J., and T. E. Wainwright. 1959. Studies in molecular dynamics:I. General method. J. Chem. Phys. 31:459–466.
Anderson, H. C. 1980. Molecular dynamics simulations at constant pres-sure and/or constant temperature. J. Chem. Phys. 72:2384–2393.
Bellemans, A., J. Orban, and D. V. Belle. 1980. Molecular dynamics ofrigid and non-rigid necklaces of hard discs. Mol. Phys. 39:781–782.
Benzinger, T. L. S., D. M. Gregory, T. S. Burkoth, H. Miller-Auer, D. G.Lynn, R. E. Botto, and S. C. Meredith. 1998. Propagating structure ofAlzheimer’s �amyloid(10–35) is parallel �sheet with residues inexact register. Proc. Natl. Acad. Sci. U.S.A. 95:13407–13412.
Benzinger, T. L. S., D. M. Gregory, T. S. Burkoth, H. Miller-Auer, D. G.Lynn, R. E. Botto, and S. C. Meredith. 2000. Two-dimensional structureof �amyloid(10-35) fibrils. Biochemistry. 39:3491–3499.
Bilgram, J. H. 1987. Dynamics at solid liquid transition-experiments at thefreezing-point. Phys. Rep. 153:1–89.
Bratko, D., and H. W. Blanch. 2001. Competition between protein foldingand aggregation: a three-dimensional lattice-model simulation. J. Chem.Phys. 114:561–569.
Burkoth, T. S., T. L. S. Benzinger, D. N. M. Jones, K. Hallenga, S. C.Meredith, and D. G. Lynn. 1998. C-terminal PEG blocks the irreversiblestep in �amyloid(10-35) fibrillogenesis. J. Am. Chem. Soc. 120:7655–7656.
Chan, H. S. 2000. Modeling protein density of states: additive hydrophobiceffects are insufficient for calorimetric two-state cooperativity. Proteins.40:543–571.
Chan, H. S., and K. A. Dill. 1994. Transition states and folding dynamicsof proteins and heteropolymers. J. Chem. Phys. 100:9238–9257.
Clark, J., and J. Steele. 1992. Phase separation inhibitors and prevention ofselenite cataract. Proc. Natl. Acad. Sci. U.S.A. 89:1720–1724.
Dill, K. A., and D. Stigter. 1995. Modeling protein stability as heteropoly-mer collapse. Adv. Prot. Chem. 46:59–104.
Dinner, A., A. Sali, M. Karplus, and E. I. Shakhnovich. 1994. Phasediagram of a model protein derived by exhaustive enumeration of theconformations. J. Chem. Phys. 101:1444–1451.
Dokholyan, N. V., S. V. Buldyrev, H. E. Stanley, and E. I. Shakhnovich.1998. Discrete molecular dynamics studies of the folding of a protein-like model. Fold. Design. 3:577–587.
Dokholyan, N. V., S. V. Buldyrev, H. E. Stanley, and E. I. Shakhnovich.2000. Identifying the protein folding nucleus using molecular dynamics.J. Mol. Biol. 296:1183–1188.
Doniach, S., T. Garel, and H. Orland. 1996. Phase diagram of a semiflex-ible polymer chain in a � solvent: application to protein folding. J. Chem.Phys. 105:1601–1608.
Eaton, W. E., and J. Hofrichter. 1990. Sickle cell hemoglobin polymeriza-tion. Adv. Prot. Chem. 40:63–279.
Esler, W. P., A. M. Felix, E. R. Stimson, M. J. Lachenmann, J. R. Ghilardi,Y. Lu, H. V. Vinters, P. W. Mantyh, J. P. Lee, and J. E. Maggio. 2000.Activation barriers to structural transition determine deposition rates ofAlzheimer’s disease A� amyloid. J. Struct. Biol. 130:174–183.
Esler, W. P., E. R. Stimson, J. R. Ghilardi, H. V. Vinters, J. P. Lee, P. W.Mantyh, and J. E. Maggio. 1996. In vitro growth of Alzheimer’s disease�amyloid plaques displays first- order kinetics. Biochemistry. 35:749–757.
Ferrand, M., A. J. Dianoux, W. Petry, and G. Zaccai. 1993. Thermalmotions and function of bacteriorhodopsin in purple membranes: effectsof temperature and hydration studied by neutron scattering. Proc. Natl.Acad. Sci. U.S.A. 90:9668–9672.
Ferrenberg, A. M., and R. H. Swendsen. 1989. Optimized Monte Carlodata analysis. Phys. Rev. Lett. 63:1195–1197.
Frauenfelder, H., and B. McMahon. 1998. Dynamics and function ofproteins: the search for general concepts. Proc. Natl. Acad. Sci. U.S.A.95:4795–4797.
Freire, E. 1995. Differential scanning calorimetry. In Protein Stability andFolding. B. A. Shirly, editor. Humana Press, New Jersey.
Gallo, G., F. Goni, F. Boctor, R. Vidal, A. Kumar, F. J. Stevens, B.Frangione, and J. Ghiso. 1996. Light chain cardiomyopathy: structuralanalysis of the light chain tissue deposits. Am. J. Pathol. 148:1397–1406.
Go, N., and H. Taketomi. 1978. Respective roles of short range and longrange interactions in protein folding. Proc. Natl. Acad. Sci. U.S.A.75:559–563.
Go, N., and H. Taketomi. 1979. Studies on protein folding, unfolding andfluctuations by computer simulation: IV. Hydrophobic interactions. Int.J. Protein Res. 13:447–461.
Green, J. L., J. Fan, and C. A. Angell. 1994. The protein-class analogy:some insights from homopeptide comparisons. J. Chem. Phys. 98:13780–13790.
Guo, Z., and C. L. Brooks, III. 1997. Thermodynamics of protein folding:a statistical mechanical study of a small all� protein. Biopolymers.42:745–757.
Guo, Z., C. L. Brooks, III., and E. M. Boczko. 1997. Exploring the foldingfree energy surface of a three-helix bundle protein. Proc. Natl. Acad. Sci.U.S.A. 94:10161–10166.
Guo, Z., and D. Thirumalai. 1995. Kinetics of protein folding: nucleationmechanism, time scales, and pathways. Biopolymers. 36:83–102.
Guo, Z., and D. Thirumalai. 1996. Kinetics and thermodynamics of foldingof a de novo designed four-helix bundle protein. J. Mol. Biol. 263:323–343.
Gupta, P., and C. K. Hall. 1997. Effect of solvent conditions upon refoldingpathways and intermediates for a simple lattice protein. Biopolymers.42:399–409.
Gupta, P., and C. K. Hall. 1998. Effect of denaturant and protein concen-trations upon protein refolding and aggregation: a simple lattice model.Protein Sci. 7:2642–2652.
Gupta, P., C. K. Hall, and A. Voegler. 1999. Computer simulation of thecompetition between folding and aggregation. Fluid Phase Equilib.158:87–93.
Harrison, P. M., H. S. Chan, S. B. Prusiner, and F. E. Cohen. 1999.Thermodynamics of model prions and its implications for the problem ofprion protein folding. J. Mol. Biol. 286:593–606.
Harrison, P. M., H. S. Chan, S. B. Prusiner, and F. E. Cohen. 2001.Conformational propagation with prion-like characteristics in a simplemodel of protein folding. Protein Sci. 10:819–835.
Jackson, W. M., and J. F. Brandts. 1970. Thermodynamics of proteindenaturation: a calorimetric study of the reversible denaturation ofchymotrypsinogen and conclusions regarding the accuracy of the two-state approximation. Biochemistry. 9:2294–2301.
Kaya, H., and H. S. Chan. 2000. Polymer principles of protein calorimetrictwo-state cooperativity. Proteins. 40:637–661.
Kolinski, A., W. Galazka, and, J. Skolnick. 1995. Computer design ofidealized �motifs. J. Chem. Phys. 103:10286–10297.
Lau, K. F., and K. A. Dill. 1989. A lattice statistical mechanics model ofthe conformational and sequence spaces of protein. Macromolecules.22:3986–3997.
Lazaridis, T., and M. Karplus. 1997. “New view” of protein foldingreconciled with the old through multiple unfolding simulations. Science.278:1928–1931.
Lazo, N. D., and D. T. Cowning. 1998. Amyloid fibrils may be assembledfrom �helical protofibrils. Biochemistry. 37:1731–1735.
Lim, A., A. M. Makhov, J. Bond, H. Inouye, L. H. Connors, J. D. Griffith,B. W. Erickson, D. A. Kirschner, and C. E. Costello. 2000. Betabellins15D and 16D, de novo designed �sandwich proteins that have amy-loidogenic properties. J. Struct. Biol. 130:363–370.
Lindemann, F. A. 1910. The calculation of molecular vibration frequen-cies. Physik. Z. 11:609–612.
Lowen, H. 1994. Melting, freezing and colloidal suspensions. Phys. Rep.237:249–324.
Lynn, D. G., and S. C. Meredith. 2000. Review: model peptides and thephysicochemical approach to �amyloids. J. Struct. Biol. 130:153–173.
658 Jang et al.
Biophysical Journal 82(2) 646–659

Makhatadze, G. I., and P. L. Privalov. 1995. Energetics of protein structure.Adv. Prot. Chem. 47:307–425.
Massry, S., and R. Glasscock. 1983. Textbook of Nephrology. Williamsand Wilkins, Baltimore, MD.
Miller, R., C. A. Danko, M. J. Fasolka, A. C. Balazs, H. S. Chan, and K. A.Dill. 1992. Folding kinetics of proteins and copolymers. J. Chem. Phys.96:768–780.
Moore, R. C., and D. W. Melton. 1997. Transgenic analysis of priondiseases. Mol. Hum. Reprod. 3:529–544.
Nymeyer, H., A. E. Garcıa, and J. N. Onuchic. 1998. Folding funnels andfrustration in off-lattice minimalist protein landscapes. Proc. Natl. Acad.Sci. U.S.A. 95:5921–5928.
Pande, V. S., and D. S. Rokhsar. 1998. Is the molten globule a third phaseof proteins? Proc. Natl. Acad. Sci. U.S.A. 95:1490–1494.
Privalov, P. L. 1979. Stability of proteins: small globular proteins. Adv.Prot. Chem. 33:167–241.
Privalov, P. L. 1992. Physical basis of the stability of the folded confor-mations of proteins. In Protein Folding. T. E. Creighton, editor. W. H.Freeman and Company, New York. 83–126.
Ptitsyn, O. B. 1995. Molten globule and protein folding. Adv. Prot. Chem.47:83–230.
Ptitsyn, O. B., and V. N. Uversky. 1994. The molten globule is the thirdthermodynamical state of protein molecules. FEBS Lett. 341:15–18.
Rapaport, D. C. 1978. Molecular dynamics simulation of polymer chainswith excluded volume. J. Phys. A. Math. Gen. 11:L213–L216.
Reat, V., H. Patzelt, M. Ferrand, C. Pfister, D. Oesterhelt, and G. Zaccai.1998. Dynamics of different functional parts of bacteriorhodopsin: H-H-2 labeling and neutron scattering. Proc. Natl. Acad. Sci. U.S.A.95:4970–4975.
Sali, A., E. Shakhnovich, and M. Karplus. 1994. Kinetics of proteinfolding: a lattice model study of the requirements for folding to thenative state. J. Mol. Biol. 235:1614–1636.
Schulman, B. A., and P. S. Kim. 1996. Proline scanning mutagenesis of amolten globule reveals non-cooperative formation of a protein’s overalltopology. Nat. Struct. Biol. 3:682–687.
Selkoe, D. J. 1991. Alzheimer’s disease: a central role for amyloid.J. Neuropathol. Exp. Neurol. 53:438–447.
Shea, J. -E., J. N. Onuchic, and C. L. Brooks III. 2000. Energetic frustrationand the nature of the transition state in protein folding. J. Chem. Phys.113:7663–7671.
Simmons, L. K., P. C. May, K. J. Tomoselli, R. E. Rydel, K. S. Fuson, B. F.Brigham, S. Wright, I. Lieberburg, G. W. Becker, D. N. Brems, andW. Y. Li. 1994. Secondary structure of amyloid � peptide correlateswith neurotoxic activity in vitro. Mol. Pharmacol. 45:373–379.
Skolnick, J., and A. Kolinski. 1991. Dynamic Monte Carlo simulations ofa new lattice model of globular protein folding, structure and dynamics.J. Mol. Biol. 221:499–531.
Smith, S. W., C. K. Hall, and B. D. Freeman. 1996. Molecular dynamicstudy of entangled hard-chain fluids. J. Chem. Phys. 104:5616–5637.
Stillinger, F. H. 1995. A topographic view of super-cooled liquids andglass formation. Science. 267:1935–1939.
Sunde, M., L. C. Serpell, M. Bartlam, P. E. Fraser, M. B. Pepys, andC. C. F. Blake. 1997. Common core structure of amyloid fibrils bysynchrotron X-ray diffraction. J. Mol. Biol. 273:729–739.
Takada, S., Z. Luthey-Schulten, and P. G. Wolynes. 1999. Folding dynam-ics with nonadditive forces: a simulation study of a designed helicalprotein and a random heteropolymer. J. Chem. Phys. 110:11616–11629.
Taketomi, H., Y. Ueda, and N. Go. 1975. Studies on protein folding,unfolding and fluctuations by computer simulation: the effect of specificamino acid sequence represented by specific inter-unit interactions. Int.J. Pept. Protein Res. 7:445–459.
Tilton, R. F., J. C. Dewan, Jr., and G. A. Petsko. 1992. Effects oftemperature on protein structure and dynamics: x-ray crystallographicstudies of the protein ribonuclease-A at nine different temperatures from98 to 320 K. Biochemistry. 31:2469–2481.
Ueda, Y., H. Taketomi, and N. Go. 1978. Studies on protein folding,unfolding and fluctuations by computer simulation: II. A three-dimensional lattice model of lysozyme. Biopolymers. 17:1531–1548.
Uversky, V. N., and O. B. Ptitsyn. 1996a. Further evidence on the equi-librium “pre-molten globule state”: four-state guanidinium chloride-induced unfolding of carbonic anhydrase B at low temperature. J. Mol.Biol. 255:215–228.
Uversky, V. N., and O. B. Ptitsyn. 1996b. All-or-none solvent-inducedtransitions between native, molten globule and unfolded states in glob-ular proteins. Fold. Design. 1:117–122.
Zhang, S., K. Iwata, M. J. Lachenmann, J. W. Peng, S. Li, E. R. Stimson,Y. Lu, A. M. Felix, J. E. Maggio, and J. P. Lee. 2000. The Alzheimer’speptide A� adopts a collapsed coil structure in water. J. Struct. Biol.130:130–141.
Zhou, Y., C. K. Hall, and M. Karplus. 1996. First-order disorder-to-ordertransition in an isolated homopolymer model. Phys. Rev. Lett. 77:2822–2825.
Zhou, Y., C. K. Hall, and M. Karplus. 1999a. The calorimetric criterion fora two-state process revisited. Protein Sci. 8:1064–1074.
Zhou, Y., and M. Karplus. 1997a. Folding thermodynamics of a modelthree-helix bundle protein. Proc. Natl. Acad. Sci. U.S.A. 94:14429–14432.
Zhou, Y., and M. Karplus. 1997b. Interpreting the folding kinetics ofhelical proteins. Nature. 401:400–403.
Zhou, Y., and M. Karplus. 1999. Folding of a model three-helix bundleprotein: a thermodynamic and kinetic analysis. J. Mol. Biol. 293:917–951.
Zhou, Y., M. Karplus, J. M. Wichert, and C. K. Hall. 1997. Equilibriumthermodynamics of homopolymers and clusters: molecular dynamicsand Monte Carlo simulations of systems with square-well interactions.J. Chem. Phys. 107:10691–10708.
Zhou, Y., D. Vitkup, and M. Karplus. 1999b. Native proteins are surface-molten solids: application of the Lindemann criterion for the solid versusliquid state. J. Mol. Biol. 285:1371–1375.
Folding Thermodynamics 659
Biophysical Journal 82(2) 646–659