Jeju Island, ‘The Blessed Isle,’ and Phantasmal Destination Tourism.
Upload
khangminh22Category
view
0download
0
University of Massachusetts Amherst University of Massachusetts Amherst
ScholarWorks@UMass Amherst ScholarWorks@UMass Amherst
Open Access Dissertations
9-2011
Flagship Species, Tourism, and Support for Rubondo Island Flagship Species, Tourism, and Support for Rubondo Island
National Park, Tanzania National Park, Tanzania
Sadie S. Stevens University of Massachusetts Amherst, [email protected]
Follow this and additional works at: https://scholarworks.umass.edu/open_access_dissertations
Recommended Citation Recommended Citation Stevens, Sadie S., "Flagship Species, Tourism, and Support for Rubondo Island National Park, Tanzania" (2011). Open Access Dissertations. 487. https://scholarworks.umass.edu/open_access_dissertations/487
This Open Access Dissertation is brought to you for free and open access by ScholarWorks@UMass Amherst. It has been accepted for inclusion in Open Access Dissertations by an authorized administrator of ScholarWorks@UMass Amherst. For more information, please contact [email protected].

FLAGSHIP SPECIES, TOURISM, AND
SUPPORT FOR RUBONDO ISLAND NATIONAL PARK, TANZANIA
A Dissertation Presented
by
SADIE S. STEVENS
Submitted to the Graduate School of the
University of Massachusetts Amherst in partial fulfillment
of the requirements for the degree of
DOCTOR OF PHILOSOPHY
September 2011
Wildlife and Fisheries Conservation

© Copyright by Sadie S. Stevens 2011
All Rights Reserved

FLAGSHIP SPECIES, TOURISM, AND
SUPPORT FOR RUBONDO ISLAND NATIONAL PARK, TANZANIA
A Dissertation Presented
by
SADIE S. STEVENS
Approved as to style and content by:
__________________________________________
John F. Organ, Co-chair
__________________________________________
Thomas L. Serfass, Co-chair
__________________________________________
Jan E. Dizard, Member
__________________________________________
Todd K. Fuller, Member
__________________________________________
Robert L. Ryan, Member
_____________________________________
Paul R. Fisette, Department Head
Department of Environmental Conservation

DEDICATION
To my parents, for always being there

v
ACKNOWLEDGMENTS
I am grateful to my advisors, John Organ and Tom Serfass, and committee members, Jan
Dizard, Todd Fuller, and Robert Ryan, for their invaluable advice, encouragement, and guidance.
I thank TANAPA, TAWIRI, and COSTECH for allowing me to conduct this research, as well as
the Frankfurt Zoological Society for providing housing on Rubondo Island National Park. This
research was made possible by funding graciously provided by Tom Serfass from a University of
Maryland Wilson H. Elkins Professorship, and my degree also through an internship with the
U.S. Fish and Wildlife Service. For both I am thankful. Funding from the Pittsburgh Zoo and
PPG Aquarium was valuable in enabling students participating in surveys to have a meaningful
experience. Bridget Amulike was integral to the completion of this project, and her help with
field work and translation have been invaluable. Maggie Triska provided much appreciated last-
minute help with mapping. I am proud to have had an opportunity to work with the amazing staff
of Rubondo Island National Park, who were all so gracious in assisting throughout this project,
from driving boats and helping with housing maintenance to collecting surveys, introducing me to
local village officers, and answering continuous questions. Hobokela Mwamjengwa was a
wonderful asset to the project and I am grateful for the hours she spent assisting with arranging
and administering surveys, as well as providing background information on Park outreach. I am
also thankful for the support of the Chief Park Warden at Rubondo, Steria Ndaga, during all
phases of this research. I thank Arthur Ogada, the very talented artist who drew the otter, genet,
silver cyprinid, sitatunga, hippopotamus, monkey, fish eagle, little egret, Egyptian goose,
crocodile, and monitor lizard images used on children‘s survey. I am grateful to the local
governments in the villages surrounding Rubondo and the Kilimanjaro International Airport for
allowing me to ask their citizens and patrons to participate in this research. Perhaps most
importantly, I thank the people who were willing to take part in and inform this research,
including residents of communities surrounding Rubondo, travelers in and visitors to Tanzania,
members of the tourism industry, staff of TANAPA, and many others who shared their opinions
about Rubondo Island National Park with me. I hope they will find the results worthy of their
time. Finally, I thank my my fiancé, Pete, family, and friends for their endless support and
encouragement.

vi
ABSTRACT
FLAGSHIP SPECIES, TOURISM, AND
SUPPORT FOR RUBONDO ISLAND NATIONAL PARK, TANZANIA
SEPTEMBER 2011
SADIE S. STEVENS, B.A., UNIVERSITY OF MAINE
M.S., FROSTBURG STATE UNIVERSITY
Ph.D., UNIVERSITY OF MASSACHUSETTS AMHERST
Directed by: Adjunct Associate Professor John F. Organ and Adjunct Professor Thomas L. Serfass
Two major goals of managers of Rubondo Island National Park (Rubondo), Tanzania are
to increase the number of international visitors to the Park (and thereby increase revenue
generated) and to increase support for the Park among residents of nearby communities. I
investigated species preferences among children living around Rubondo and the wildlife viewing
preferences of international visitors to Tanzania in an attempt to identify flagship species that
Park management could use in marketing and outreach campaigns designed to meet their goals. I
also assessed local interest in visiting the Park. As local flagships for Rubondo, the Egyptian
goose (Alopochen aegyptiacus) and silver cyprinid (Rastrineobola argentea) appear to have the
most potential among the species that I assessed (i.e., fish eagle [Haliaeetus vocifer], Egyptian
goose, silver cyprinid, little egret [Egretta garzetta], sitatunga [Tragelaphus speki], genet
[Genetta tigrina], monitor lizard [Varanus niloticus], spotted-necked otter [Lutra maculicollis],
vervet monkey [Cercopithecus pygerythrus], crocodile [Crocodylus niloticus], hippopotamus
[Hippopotamus amphibius], giraffe [Giraffa camelopardalis], and elephant [Loxodanta
africana]). However, based on either range or limited aesthetic/behavioral appeal, I considered
neither species useful as an international flagship. Among species on Rubondo included in
investigations of potential international flagships for the Island (including the chimpanzee [Pan
troglodytes], crocodile, elephant, giraffe, hippopotamus, vervet monkey, bushbuck, fish eagle,
large-spotted genet, goliath heron [Ardea goliath], monitor lizard, sitatunga, and spotted-necked

vii
otter), few were concluded to have potential, either because participating visitors had limited
―awareness‖ of and ―interest‖ in viewing the species, local people had strong negative opinions of
the species, the animals are not native to the Island, and/or the animals are more easily viewed in
more readily-accessible locations. Local people generally had not visited Rubondo but wanted to
visit. Not having visited the Park appeared to influence perceptions of the Park, wildlife tourism,
and conservation among some participants. Recommendations for local and international
marketing and outreach strategies for Rubondo are made based on the outcomes of the
aforementioned investigations of local and international species preferences and interest in
visiting the Park.

viii
CONTENTS
Page
ACKNOWLEDGMENTS ............................................................................................................ v
ABSTRACT ................................................................................................................................. vi
LIST OF TABLES ...................................................................................................................... xii
LIST OF FIGURES ................................................................................................................... xvi
CHAPTER
1. INTRODUCTION .................................................................................................................. 1
National Parks ......................................................................................................................... 1
Protected Areas in Tanzania ................................................................................................... 2
Rubondo Island National Park ................................................................................................ 3
History .......................................................................................................................... 3
Habitat and Wildlife ...................................................................................................... 6
Challenges for Rubondo Island National Park ........................................................................ 7
Tourism on Rubondo .................................................................................................... 8
Marketing Wildlife Viewing ............................................................................... 8
Relationship Between Rubondo and Surrounding Communities ................................ 11
Community Outreach ........................................................................................ 11
Increasing ―Local‖ and ―International‖ Support: Flagship Species ...................................... 12
The Research Project ............................................................................................................ 13
Background ................................................................................................................. 14
Components ................................................................................................................ 15
Local Communities ........................................................................................... 15
International Visitors ........................................................................................ 16
Tour Operators .................................................................................................. 18
Otter ―Viewability‖ ........................................................................................... 18
Structure of the Dissertation ................................................................................................ 19
2. OPINIONS REGARDING WILDLIFE IN COMMUNITIES SURROUNDING
RUBONDO ISLAND NATIONAL PARK, TANZANIA: INFORMING
OUTREACH ........................................................................................................................ 27

ix
Abstract ................................................................................................................................. 27
Introduction ........................................................................................................................... 28
Methods ................................................................................................................................ 30
Study Area .................................................................................................................. 30
Survey Protocol ........................................................................................................... 31
Data Analysis ............................................................................................................. 32
Participation and Survey Statistics ................................................................... 32
Familiarity ......................................................................................................... 33
Opinions and Preferences ................................................................................. 33
Flagship Potential ............................................................................................. 33
Results ................................................................................................................................... 34
Participation and Survey Statistics .............................................................................. 34
Familiarity ................................................................................................................... 36
Opinions and Preferences ........................................................................................... 36
Flagship Potential........................................................................................................ 37
Discussion ............................................................................................................................. 38
Familiarity ................................................................................................................... 38
Opinions and Preferences ........................................................................................... 39
Flagship Potential........................................................................................................ 40
3. FAMILIARITY WITH WILDLIFE AND SPECIES PREFERENCES OF
CHILDREN NEAR RUBONDO ISLAND NATIONAL PARK, TANZANIA: DO
DEMOGRAPHICS MATTER? ............................................................................................ 58
Abstract ................................................................................................................................. 58
Introduction ........................................................................................................................... 59
Methods ................................................................................................................................ 62
Study Area .................................................................................................................. 62
The Survey .................................................................................................................. 62
The Data ...................................................................................................................... 63
Data Analysis .............................................................................................................. 63
Modeling ........................................................................................................... 63
Model Building .......................................................................................... 64
Model Selection .......................................................................................... 65
Model Interpretation ................................................................................... 65
Univariate Analyses .......................................................................................... 66
Results ................................................................................................................................... 66
Modeling ..................................................................................................................... 66

x
Model Building and Selection .......................................................................... 66
Affinity ....................................................................................................... 66
Abundance .................................................................................................. 67
Model Interpretation ......................................................................................... 69
Familiarity .................................................................................................. 69
Affinity ....................................................................................................... 69
Abundance .................................................................................................. 70
Univariate Analyses .................................................................................................... 71
Discussion ............................................................................................................................. 71
Summary and Conclusions ................................................................................................... 79
4. LOCAL INTEREST IN VISITING RUBONDO ISLAND NATIONAL PARK:
IMPLICATIONS FOR CONSERVATION.......................................................................... 91
Abstract ................................................................................................................................. 91
Introduction ........................................................................................................................... 92
Methods ................................................................................................................................ 95
Study Area .................................................................................................................. 95
Study Design ............................................................................................................... 97
Data Analysis .............................................................................................................. 99
Results ................................................................................................................................... 99
Interest and Past Visitation ....................................................................................... 100
Barriers to Visitation ................................................................................................. 101
Visitation and Support for the Park, Conservation, and Tourism ............................. 103
Visitation and Learning ............................................................................................. 105
Discussion ........................................................................................................................... 105
Interest and Past Visitation ....................................................................................... 105
Barriers to Visitation ................................................................................................. 106
Visitation and Support for the Park, Conservation, and Tourism ............................. 107
Visitation and Learning ............................................................................................. 108
Conclusions and Recommendations ................................................................................... 108
5. THE WILDLIFE VIEWING PREFERENCES OF VISITORS TO TANZANIA ............. 120
Abstract ............................................................................................................................... 120
Introduction ......................................................................................................................... 121
Methods .............................................................................................................................. 126
Focal Region and Audience ...................................................................................... 126
The Survey ................................................................................................................ 127

xi
Statistical Analysis .................................................................................................... 128
Results ................................................................................................................................. 131
Non-response Rates .................................................................................................. 131
Demographics, Travel Purposes, and Interests ......................................................... 132
Knowledge of Wildlife Species ................................................................................ 133
Interest in Wildlife Viewing Experiences ................................................................. 133
Relationship Between Knowledge and Interest ........................................................ 135
Discussion ........................................................................................................................... 136
Knowledge of Wildlife Species ................................................................................ 136
Interest in Wildlife Viewing Experiences ................................................................. 137
Relationship Between Knowledge and Interest ........................................................ 139
Implications for Wildlife Tourism ............................................................................ 140
Implications for Rubondo Island National Park ....................................................... 142
6. SUMMARY, CONCLUSIONS, AND RECOMMENDATIONS ...................................... 171
Summary ............................................................................................................................. 171
The Study Area and Research ................................................................................... 171
The Results................................................................................................................ 173
Children‘s Preferences Regarding Various Wildlife Species ......................... 173
Visitors‘ Interest in Viewing Various Wildlife Species.................................. 175
Local Visitation of Rubondo ........................................................................... 177
Recommendations from Previous Chapters .............................................................. 178
Local Flagship Species and Local Support ..................................................... 178
International Support Through Tourism ......................................................... 179
Putting it all Together – Conclusions and Recommendations ............................................ 180
APPENDICES
A. THE CONSERVATION STATUS AND FISHERY OF LAKE VICTORIA ..................... 185
B. CHILD SURVEY INSTRUMENT ...................................................................................... 188
C. THE CONFUSION OF COLLOQUIAL NAMES: A WILDLIFE-SPECIFIC
METHODOLOGICAL CHALLENGE IN CROSS-CULTURAL RESEARCH ............... 205
D. TOP AFFINITY AND ABUNDANCE MODELS BY SPECIES ....................................... 222
E. ADULT INTERVIEW PROTOCOL ................................................................................... 263
F. TOURIST SURVEY INSTRUMENT .................................................................................. 274
BIBLIOGRAPHY ..................................................................................................................... 279

xii
LIST OF TABLES
Table Page
1.1. Questions regarding individual animals that were included in the interview
protocol used to assess local adults‘ perceptions regarding wildlife, conservation,
tourism, and National Parks in the communities surrounding Rubondo Island
National Park, Tanzania. ................................................................................................... 21
2.1. Names accepted for each species in my 2008/2009 survey regarding the opinions
and preferences about wildlife of school children in communities surrounding
Rubondo Island National Park, Tanzania. ........................................................................ 44
2.2. The number of students in the communities surrounding Rubondo Island
National Park, Tanzania, participating in 2008/2009 survey about opinions and
preferences regarding wildlife, by year, school, and standard (grade). ............................ 45
2.3. Numbers and percentages of students not responding to animal naming questions
(a) and not asked questions for which sampling was partial (b) in 2008/2009
survey regarding wildlife preferences of children in communities surrounding
Rubondo Island National Park, Tanzania. All percentages reported are based on
the total number of participants (n = 932). ....................................................................... 46
2.4. Tribal affiliations listed by ≥10 participants in my 2008/2009 survey of 932
schoolchildren in communities surrounding Rubondo Island National Park,
Tanzania. ........................................................................................................................... 47
2.5. Familiarity, attractiveness, usefulness, likeability, and desirability scores for each
of 13 wildlife species I asked 932 schoolchildren in communities surrounding
Rubondo Island National Park, Tanzania, about in my 2008/2009 survey. ...................... 48
3.1. Opinion variables measured in my 2008/2009 survey regarding wildlife
knowledge and preferences of children in communities around Rubondo Island
National Park, Tanzania, as well as the size of the sample of respondents
included in these analyses (i.e., those participants both able to correctly name the
species and asked the question), and the number/percent of students responding
negatively to each (i.e., that ―dislike‖ or want ―few‖ of the species). .............................. 81
3.2. The demographic variables measured in 2008/2009 surveys of students in
communities surrounding Rubondo Island National Park, Tanzania; the sample of
students asked to provide information regarding the variable; and the frequency
of positive responses to each in the sample of students. ................................................... 82
3.3. Check marks () indicate dependent variables included only in the revised
version of my 2008/2009 survey of students in communities surrounding
Rubondo Island National Park, Tanzania. ........................................................................ 83
3.4. Models describing the influences of demographic variables on familiarity with 9
wildlife species among students living around Rubondo Island National Park,
Tanzania. ........................................................................................................................... 84

xiii
3.5. The optimal affinity model developed for each species (if any model was
considered useful) from the results of my 2008/2009 survey of school children
around Rubondo Island National Park, Tanzania. ............................................................ 85
3.6. The optimal abundance model developed for each species (if any model was
considered useful) from the results of my 2008/2009 survey of school children
around Rubondo Island National Park, Tanzania. ............................................................ 87
3.7. The results of Pearson‘s Chi-square tests to determine the effect of gender on
―disliking‖ and wanting ―few‖ of each of the species included in my 2008/2009
survey of school children in communities surrounding Rubondo Island National
Park, Tanzania. ................................................................................................................. 89
4.1. Questions specific to visitation of Rubondo Island National Park, Tanzania that
were included in 2008/2009 surveys of school children and interviews with
adults, both of which were conducted in communities surrounding the Park. ............... 112
4.2. Open-ended questions asked in 2008 interviews with adults living around
Rubondo Island National Park, Tanzania for which responses relevant to local
tourism were obtained. .................................................................................................... 113
5.1. The types of questions included for each species in my 2009 survey of the
wildlife viewing interests of non-East African travelers at Kilimanjaro
International Airport, Tanzania (a), as well as samples of each question type (b). ........ 145
5.2. The questions or types of questions included in my 2009 survey of travelers at
Kilimanjaro International Airport, and levels of non-response for each among
non-East African participants. ........................................................................................ 146
5.3. The number of respondents to questions regarding interest in viewing animals, by
species, for my survey of non-East African travelers at Kilimanjaro International
Airport, Tanzania regarding wildlife viewing preferences. ............................................ 147
5.4. The number and percentage of non-East African participants (n = 146) in my
2009 survey at Kilimanjaro International Airport, Tanzania, that did not indicate
having ―seen‖ the animal or an image of it, yet considered themselves
―somewhat‖ or ―very‖ knowledgeable about the species. .............................................. 148
5.5. The country of origin of the 146 non-East African participants participating in
my 2009 survey of travelers at Kilimanjaro International Airport, Tanzania,
regarding wildlife viewing interests. ............................................................................... 149
5.6. The most and least interesting wildlife species according to various groups of
non-East African respondents to my 2009 survey of travelers at Kilimanjaro
International Airport in Tanzania. ................................................................................... 150
C.1. List of names considered ―acceptable,‖ ―unacceptable,‖ and ―unclassifiable‖ for
each species included in my 2008/2009 survey regarding the wildlife preferences
and opinions of children in communities surrounding Rubondo Island National
Park, Tanzania. ............................................................................................................... 217

xiv
D1.1. Top models for ―dislike‖ of fish eagles (2009). .............................................................. 224
D1.2. Top models for ―dislike‖ of fish eagles (2008 & 2009). ................................................. 225
D1.3. Top models for ―dislike‖ of genets (2009)...................................................................... 226
D1.4. Top models for ―dislike‖ of genets (2008 & 2009). ....................................................... 227
D1.5. Top models for ―dislike‖ of monitor lizards (2009). ...................................................... 228
D1.6. Top models for ―dislike‖ of monitor lizards (2008 & 2009). ......................................... 229
D1.7. Top models for ―dislike‖ of spotted-necked otters (2008 & 2009). ................................ 230
D1.8. Top models for ―dislike‖ of sitatunga (2009). ................................................................ 231
D1.9. Top models for ―dislike‖ of sitatunga (2008 & 2009). ................................................... 232
D1.10. Top models for ―dislike‖ of silver cyprinids (2009). ...................................................... 233
D1.11. Top models for ―dislike‖ of silver cyprinids (2008 & 2009). ......................................... 234
D1.12. Top model for ―dislike‖ of vervet monkeys (2009). ....................................................... 235
D1.13. Top model for ―dislike‖ of vervet monkeys (2008 & 2009). .......................................... 236
D1.14. Top models for ―dislike‖ of hippopotamuses (2009). ..................................................... 237
D1.15. Top models for ―dislike‖ of hippopotamuses (2008 & 2009). ........................................ 238
D1.16. Top models for ―dislike‖ of crocodiles (2009). .............................................................. 239
D1.17. Top models for ―dislike‖ of crocodiles (2008 & 2009). ................................................. 240
D1.18. Top models for ―dislike‖ of little egrets (2009). ............................................................. 241
D1.19. Top models for ―dislike‖ of little egrets (2008 & 2009). ................................................ 242
D1.20. Top models for ―dislike‖ of Egyptian geese (2009). ...................................................... 243
D1.21. Top models for ―dislike‖ of elephants (2009). ................................................................ 244
D1.22. Top models for ―dislike‖ of giraffes (2009).................................................................... 245
D2.1. Top models for wanting ―few‖ fish eagles (2009). ......................................................... 247
D2.2. Top models for wanting ―few‖ fish eagles (2008 & 2009). ............................................ 248
D2.3. Top models for wanting ―few‖ genets (2009). ................................................................ 249
D2.4. Top models for wanting ―few‖ genets (2008 & 2009). ................................................... 250

xv
D2.5. Top models for wanting ―few‖ monitor lizards (2009). .................................................. 251
D2.6. Top models for wanting ―few‖ monitor lizards (2008 & 2009)...................................... 252
D2.7. Top models for wanting ―few‖ spotted-necked otters (2008 & 2009). ........................... 253
D2.8. Top models for wanting ―few‖ sitatunga (2009). ........................................................... 254
D2.9. Top models for wanting ―few‖ sitatunga (2008 & 2009). .............................................. 255
D2.10. Top models for wanting ―few‖ silver cyprinids (2009). ................................................. 256
D2.11. Top models for wanting ―few‖ silver cyprinids (2008 & 2009). .................................... 257
D2.12. Top models for wanting ―few‖ vervet monkeys (2009). ................................................ 258
D2.13. Top models for wanting ―few‖ hippopotamuses (2009). ................................................ 259
D2.14. Top models for wanting ―few‖ Egyptian geese (2009). .................................................. 260
D2.15. Top models for wanting ―few‖ elephants (2009). ........................................................... 261
D2.16. Top models for wanting ―few‖ giraffes (2009). .............................................................. 262

xvi
LIST OF FIGURES
Figure Page
1.1. The location of Rubondo Island National Park, Tanzania, and nearby travel
hubs.. ................................................................................................................................. 22
1.2. The sitatunga is the only animal consistently pictured in recent marketing
materials for Rubondo Island National Park. .................................................................... 23
1.3. Schematic of components involved in my assessment of potential flagship
species for Rubondo Island National Park, as well as the influencing factors that I
considered for each. .......................................................................................................... 24
1.4. Example of the questions regarding each animal that were included in the survey
I administered to children and adults in communities surrounding Rubondo
Island National Park, Tanzania, in 2008 and 2009. .......................................................... 24
1.5. Communities surrounding Rubondo Island National Park where I conducted
surveys and interviews to assess local opinions and preferences regarding
wildlife, conservation, tourism, and National Parks. ........................................................ 26
2.1. The communities around Rubondo Island National Park, Tanzania, where
surveys of school children were conducted in 2008 and 2009. ........................................ 49
2.2. The number of students enrolled in each target school and standard that did and
did not participate in my 2008/2009 survey regarding the wildlife opinions and
preferences of children living near Rubondo Island National Park, Tanzania.................. 50
2.3. The number of the 932 participants in my 2008/2009 survey of school children in
communities surrounding Rubondo Island National Park, Tanzania, who have
parents in various professions. .......................................................................................... 51
2.4. For each opinion/preference question in my 2008/2009 survey of school children
in communities surrounding Rubondo Island National Park, Tanzania, the
percentage of students who were able to name the species that did not respond,
did not have an opinion, were not sure of their opinion, or provided an invalid
response. ........................................................................................................................... 52
2.5. The number of participants in my 2008/2009 survey of schoolchildren in
communities surrounding Rubondo Island National Park, Tanzania, able to
provide an ―acceptable‖ name for each of 13 wildlife species (n = 932). ........................ 53
2.6. The percentage of students participating in my 2008/2009 survey in communities
surrounding Rubondo Island National Park, Tanzania, that considered each of 13
species attractive. .............................................................................................................. 54
2.7. The percentage of students participating in my 2008/2009 survey in communities
surrounding Rubondo Island National Park, Tanzania, that considered each of 13
wildlife species useful. ...................................................................................................... 55

xvii
2.8. The percentage of students participating in my 2008/2009 survey in communities
surrounding Rubondo Island National Park, Tanzania, that reported ―liking‖ each
of 13 wildlife species. ....................................................................................................... 56
2.9. The percentage of students participating in my 2008/2009 survey in communities
surrounding Rubondo Island National Park, Tanzania, that wanted each of 13
wildlife species to be abundant in their communities. ...................................................... 57
3.1. The number of students that ―dislike‖ and want ―few‖ of each of 13 selected
species present in Rubondo Island National Park, Tanzania, based on 2008/2009
survey results (see Chapter 2). .......................................................................................... 90
4.1. The location of Rubondo Island National Park, Tanzania. ............................................. 114
4.2. The location of the ranger posts on Rubondo Island National Park, Tanzania
(with the exception of Nkome, which is located on the mainland). ................................ 115
4.3. Rubondo Island National Park and the surrounding communities in Tanzania
where surveys of school children and interviews with adults were conducted in
2008/2009. ...................................................................................................................... 116
4.4. The professions of the heads of household (HOHs) of responding children who
participated in 2008/2009 survey in communities surrounding Rubondo Island
National Park, Tanzania (n = 922), as well as the professions of adults who
participated in 2008 interviews (n = 48). ........................................................................ 117
4.5. The proportion of representatives from different tribes in the sample of
responding children (a, n = 917) and adults (b, n = 48) that participated in
2008/2009 surveys/interviews. ....................................................................................... 118
4.6. The percentage (%) of 932 children and 48 adults participating in 2008/2009
surveys and interviews in communities near Rubondo Island National Park,
Tanzania, that have visited and would like to visit the Park. .......................................... 119
5.1. Monthly trends in international visitation to Tanzania from 1996 to 2006. (Data
from Tanzania Ministry of Natural Resources and Tourism 2007). ............................... 151
5.2. The locations of Tanzania‘s national parks. ................................................................... 152
5.3. The number of non-respondents to questions in my 2009 survey of Non-East
African travelers at Kilimanjaro International Airport, Tanzania, regarding level
of interest in viewing various wildlife species, and whether those non-
respondents also indicated having not ―heard of‖ the species prior to the survey. ......... 153
5.4. Participants who indicated not having ―heard of‖ each of the wildlife species
asked about in my 2009 survey of non-East African travelers at Kilimanjaro
International Airport, Tanzania, and whether those participants provided a
response to questions regarding their interest in viewing the species or not. ................. 154

xviii
5.5. The general importance of wildlife viewing opportunities in the planning of
vacations among the 139 non-East African visitors to Tanzania who responded to
the question in my 2009 survey at Kilimanjaro International Airport regarding
wildlife viewing preferences. .......................................................................................... 155
5.6. The self-reported level of wildlife knowledge among the 141 non-East African
visitors to Tanzania who responded to the question in my 2009 survey at
Kilimanjaro International Airport regarding wildlife viewing preferences. ................... 156
5.7. The percentage of the 146 non-East African visitors to Tanzania who participated
in my 2009 survey at Kilimanjaro International Airport regarding wildlife
viewing preferences that indicated not having ―heard of‖ the listed species. ................. 157
5.8. The percentage of the 146 non-East African visitors to Tanzania who participated
in my 2009 survey at Kilimanjaro International Airport regarding wildlife
viewing preferences indicating having ―seen‖ (in the wild, in captivity, in photos,
on television, etc.) the 7 species about which the question was asked. .......................... 158
5.9. The self-reported levels of knowledge regarding 7 wildlife species of non-East
African travelers at Kilimanjaro International Airport, Tanzania, that participated
in my 2009 survey. .......................................................................................................... 159
5.10. The level of interest in viewing various wildlife species expressed by non-East
African visitors to Tanzania who participated in my 2009 survey at Kilimanjaro
International Airport regarding wildlife viewing preferences. ....................................... 160
5.11. The percentage of the non-East African males and females participating in my
2009 survey at Kilimanjaro International Airport, Tanzania, who were
―interested‖ or ―very interested‖ in viewing various wildlife species. ........................... 161
5.12. The percentage of the non-East African respondents with Bachelor‘s degrees and
above participating in my 2009 survey at Kilimanjaro International Airport,
Tanzania, who were ―interested‖ or ―very interested‖ in viewing various wildlife
species in comparison with participants holding less than a Bachelor‘s degree. ............ 162
5.13. The percentage of the residents of African countries (excluding East African
Community member countries) who participated in my 2009 survey at
Kilimanjaro International Airport that were ―interested‖ or ―very interested‖ in
viewing various wildlife species compared to respondents from other countries. ......... 163
5.14. The percentage of first-time visitors to Africa who participated in my 2009
survey at Kilimanjaro International Airport that were ―interested‖ or ―very
interested‖ in viewing various wildlife species compared to return visitors. ................. 164
5.15. The percentage of non East-African participants in my 2009 survey at
Kilimanjaro International Airport, Tanzania, that reported having gone on
vacation for the primary purpose of viewing wildlife and were ―interested‖ or
―very interested‖ in viewing various wildlife species compared to those who had
not gone on vacation for such a purpose. ........................................................................ 165

xix
5.16. The percentage of non-East African participants in my 2009 survey at
Kilimanjaro International Airport, Tanzania, that consider opportunities to view
wildlife ―important‖ or ―very important‖ in the planning of their vacations and
were ―interested‖ or ―very interested‖ in viewing various wildlife species
compared to all other respondents (i.e., those who are neutral, consider wildlife
unimportant, or are unsure). ............................................................................................ 166
5.17. The percentage of non-East African participants in my 2009 survey at
Kilimanjaro International Airport, Tanzania, that were traveling solely for
pleasure and with a tour group as opposed to those traveling solely for pleasure
but independently that consider opportunities to view wildlife ―important‖ or
―very important‖ in the planning of their vacations and were ―interested‖ or ―very
interested‖ in viewing each wildlife species. .................................................................. 167
5.18. Box and whisker plots showing the distribution of rankings given to each of the
species by non-East African visitors to Tanzania who participated in my 2009
survey at Kilimanjaro International Airport regarding the wildlife viewing
preferences (n = 139-142). .............................................................................................. 168
5.19. The level of interest in viewing animals classified as ―well-known‖ (buffalo,
chimpanzee, crocodile, elephant, giraffe, hippopotamus, leopard, lion,
rhinoceros, and jackal) and ―little-known‖ (the bushbuck, fish eagle, genet,
goliath heron, mongoose, monitor lizard, serval, sitatanga, spotted-necked otter,
and vervet monkey) based on responses of non-East African visitors to Tanzania
who participated in my 2009 survey at Kilimanjaro International Airport. .................... 169
5.20. The level of interest in viewing animals included in my 2009 survey at
Kilimanjaro International Airport, Tanzania, among non-East African
participants arranged in order of least to most known by participants. .......................... 170
C.1. The location of Rubondo Island National Park in Lake Victoria, Tanzania (a), as
well as the surrounding communities where I conducted surveys regarding the
wildlife preferences of primary school children (b). ....................................................... 221

1
CHAPTER 1
INTRODUCTION
National Parks
Places considered special by communities around the world have been protected for over
a millennium (Eagles et al. 2002). National parks are 1 of 6 types of protected area defined by the
IUCN as especially dedicated to the protection and maintenance of biological diversity, and of
natural and associated cultural resources (Eagles et al. 2002). The first national park
(Yellowstone) was developed in the United States in 1872 (Jacoby 2001, Boyd and Butler 2002,
Eagles et al. 2002), largely as a result of the work of citizens living thousands of miles away on
the East coast and with limited local support (Jacoby 2001, Terborgh and Van Shaik 2002). The
governments of Australia, Canada, New Zealand, and South Africa later followed suit to create
their own national parks (Eagles et al. 2002). Most Parks encompassed large, natural areas, were
open to all people, and were developed with an expectation of tourism (Eagles et al. 2002). Both
of the first Park agencies (in the United States and Canada) advocated getting people into the
parks to enjoy and financially support them (Butler and Boyd 2002, Eagles et al. 2002). In the
United States, the National Park Organic Act of 1916, which established the United States
National Park Service, defined the purpose of the parks as being ―to conserve the scenery and the
natural and historic objects and the wild life therein and to provide for the enjoyment of the same
in such manner and by such means as will leave them unimpaired for the enjoyment of future
generations‖ (Eagles et al. 2002:7-8). Today, every continent except Antarctica contains national
parks (Dixon and Sherman 1990, Eagles et al. 2002). Countries have learned from one another
about how to establish and administer parks (Eagles et al. 2002), and, as a result, most are similar
to the first model developed in the US (Boyd and Butler 2002).
Although National Parks have succeeded in protecting vast amounts of land in many
countries, the ―fortress‖ (Brockington 2002) system of conservation embodied by national parks

2
has received criticism (e.g., see Sarker and Montoya 2011), particularly in relation to use in the
developing world, and is currently at the center of recent discussions regarding the ethics of
conservation (commonly referred to as ―parks vs. people‖) (Miller et al. 2011). Undeniably, the
creation of national parks has often resulted in hardships for local people. Communities in areas
slated for national parks were commonly evicted, hunting and gathering activities critical to
parks‘ neighbors regularly curtailed, and, even near long-established Parks in some areas, crops
continue to be raided and livestock killed by resident animal populations (Jacoby 2001, Dowie
2009, Duffy 2010, Harter and Goldman 2011, Miller et al. 2011). However, national parks also
have strong advocates (e.g., Terborgh and Van Shaik 2002), are widely publicly supported in
many countries (Terborgh and Van Shaik 2002), and have proven positive effects on populations
of some wildlife species (e.g., Stoner et al. 2009). In addition, parks can provide a variety of
ecosystem services (e.g., protection of watersheds that supply public drinking water) and the
tourism they generate can result in economic benefits (although these are not always realized
locally—Walpole and Thouless 2005) (Nepal 2002).
Protected Areas in Tanzania
In Tanzania, 260,808.29 km2 of land, or 27.5% of the terrestrial area, is in protected status
(IUCN and UNEP-WCMC 2011). Terrestrial protected areas in the country encompass 6 different
forms, including game reserves (of which there are 31), forest reserves (463), nature reserves (2),
game-controlled areas (41), wildlife management areas (16), and national parks (16) (Caro et al.
2009). As described by Caro et al. (2009), game reserves are managed by the Wildlife Division of
the Ministry of Tourism and Natural Resources (MTNR) for sport hunting by tourists and are
irregularly patrolled by game scouts. Forest reserves are managed by the MTNR‘s Forestry and
Beekeeping Division for extraction forestry and receive ―only sporadic law enforcement at best‖
(Caro et al. 2009:179). The Forestry and Beekeeping Division also manages Tanzania‘s 2 nature
reserves (originally forest reserves, but converted to protect biodiversity). Like the forest reserves

3
they were derived from, the nature reserves receive only sporadic law enforcement. Game-
controlled areas are managed by MNRT‘s Wildlife Division for resident hunting (although now
most also are used for tourist hunting). They are patrolled by game scouts only during the hunting
season and only when those scouts are accompanying tourist hunters. Wildlife management areas
are designed to serve as buffers for other protected areas and as a way for local communities to
engage in and benefit from conservation. They are managed by local institutions and patrolled
irregularly by village game scouts. The parastatal Tanzania National Parks Authority (TANAPA)
manages national parks largely for photographic tourism. No resource extraction is permitted, and
the parks are patrolled regularly by rangers (Caro et al. 2009). Not included among these
categories is the Ngorongoro Conservation Area (NCA), which is similar to a national park in
management and purpose but allows cattle grazing by pastoralists (Stoner et al. 2007).
Rubondo Island National Park
History
Rubondo Island National Park, consisting of 456.8 km2 of land and water in the
southwest corner of Lake Victoria (Figure 1.1), was a forest reserve in German colonial times
(TANAPA 2003). In 1965, the Island was declared a game reserve for the purpose of creating a
sanctuary where species threatened with extinction could be introduced and protected (TANAPA
2003). The Island was deemed appealing as a game sanctuary based on its wide variety of
habitats and absence of large predators. In addition, protecting an island in comparison to other
areas was considered relatively easy and Rubondo was thought to have a large number of
unoccupied ecological niches (TANAPA 2003). The Frankfurt Zoological Society (FZS)
supported Rubondo as a game reserve (and still does today—as a national park), and played a
prominent role in the introduction of species to the Island (TANAPA 2003). Species introduced
when the Island was a game reserve were: chimpanzees (Pan troglodytes), giraffes (Giraffa
camelopardalis), ―black-and-white colobus‖ monkeys (Colobus geureza), suni and roan antelope

4
(Nesotragus moschatus and Hippotragus equinus, respectively), African elephants (Loxodanta
africana), and black rhinoceros (Diceros bicornis) (TANAPA 2003).
In 1977 Rubondo Island was declared a National Park (TANAPA 2003). Although the
purpose of neither Rubondo nor Tanzania‘s National Parks in general were originally stated in
establishment documents (TANAPA 2003), TANAPA, with input from park managers, planners,
community conservation experts, scientists, and tour operators, has identified many ―purposes‖
for the Park. Those are, as listed in TANAPA (2003):
To protect and preserve the primary forest, which is unique and one of the last
remaining representatives of lowland Congolese forest.
To protect and preserve unique and important fish-breeding grounds that serve
the local community fishing industry.
To protect and preserve unique and important bird-breeding grounds.
To protect Rubondo Island National Park as a refuge for endangered species of
Tanzania.
To protect and preserve the population of sitatunga (Tragelaphus spekeii),
endemic to Rubondo Island National Park in Tanzania.
To protect and preserve the high density of fish eagles (Haliaeetus vocifer).
To influence protection and preservation of Maisome Forest Reserve and the
channel [in Lake Victoria] that connects it to Rubondo Island National Park.
To protect and preserve the only island national park in the fresh waters of Lake
Victoria.
To protect and preserve a unique habitat mosaic.
To protect and preserve an area of high biodiversity value.
To preserve and develop the park as a tourist destination in the Tanzanian
section of Lake Victoria.

5
To preserve cultural sites; i.e., the Solo sites and “Maji Matakatifu.”
To protect the integrity of the migratory route for birds from Europe to southern
and central Africa.
To protect and preserve an area for the study and monitoring of the introduction
and exotic animal species.
TANAPA has also identified a series of characteristics that are thought to give the Park
significance (i.e., identify the importance of the Park for natural and cultural heritage). These are,
as identified in TANAPA (2003):
Rubondo:
Is the only national park in a fresh water lake in Africa.
Possesses the deepest point in Lake Victoria at Irumo.
Is the only national park with the highest number of mammal and bird species
successfully introduced for conservation purposes in Africa.
Is the only national park with an endemic and viable population of sitatunga and
with the highest sitatunga population density in East Africa.
Is the only national park in the world in which captive chimpanzees have been
successfully introduced into a natural and protected area.
Is the largest protected breeding ground for fish in Lake Victoria; the majority of
fish caught by the surrounding communities are bred in Rubondo.
Contains the highest density of fish eagles in Africa.
Has one of the highest diversities and concentrations of birds in Tanzania.
Offers unique Nile perch sport-fishing opportunities in Tanzania.
Boasts a number of sport-fishing world records for Nile perch.
Is one of the most threatened protected areas due to over-fishing and population
encroachment in Tanzania.

6
Is the only national park in East Africa threatened by the impacts of water
hyacinth (Eichhornia crassipes).
Contains one of the most unique protected wetlands in East Africa.
Is the only national park and protected area in Lake Victoria.
Is the only national park in Tanzania with grey parrots (Psittacus e. erithacus).
In addition,
Rubondo’s shoreline is highly susceptible to pollution.
Rubondo and Serengeti National Park are the only places in Tanzania where
lowland Congolese tropical primary forest is represented.
The remoteness of the Park ensures visitors will prefer low-impact activities.
Although some of the items listed above may be debatable, and certainly many are not among the
usual features considered important to natural heritage, they do provide some understanding of
the aspects of the Park considered unique by managers, scientists, planners, community
conservation experts, and tour operators familiar with it.
Habitat and Wildlife
The main vegetation types on Rubondo Island include papyrus (Cyperus papyrus L.)
swamp, loudetia grassland (dominated by Loudetia simplex), acacia valley open woodland, forest
grassland mixture (once heavily cultivated in many areas), and 3 types of forest thicket
communities (TANAPA 2003). Eighty percent of the Island is forested (TANAPA 2003). Waters
surrounding the Island are also protected and considered important breeding ground for fish
(TANAPA 2003, TANAPA 2008a). The climate of Rubondo is mild, with temperatures ranging
from 16° to 26°C. The rainy season is from October to May, with peaks in December and
April/May. From June to September there is little to no precipitation. The average annual rainfall
is approximately 120 cm (TANAPA 2003).

7
Native animal species noted as present on the Island in the Park‘s General Management
Plan (TANAPA 2003) include the sitatunga, bushbuck (Tragelaphus scriptus), vervet monkey
(Cercopithecus pygerythrus), hippopotamus (Hippopotamus amphibius), crocodile (Crocodylus
niloticus), large-spotted genet (Genetta tigrina, although Park staff have suggested that the
species may actually be the common genet, Genetta genetta—G.D. Moshi, Rubondo Island
National Park, personal communication), spotted-necked otter (Lutra maculicollis), marsh
mongoose (Atilax paludinosus), cane rat (Thryonomyidae spp.), monitor lizard (Varanus
niloticus), python (Python spp.), and about 200 bird species. Other species that have been seen on
the Island include clawless otter (Aonyx capensis—Kruuk 2006, J. Reed-smith, George Mason
University, personal communication), forest cobra (Naja melanoleuca), water cobra (presumably
Boulengerina annulata although no official reports exist for the species in Lake Victoria—Spawls
et al. 2006), and vipers (Bitis spp.—G.D. Moshi, Rubondo Island National Park, personal
communication). Many of the species introduced during the Island‘s time as a game reserve are
still present (i.e., chimpanzees, giraffes, ―black-and-white colobus‖ monkeys, suni antelope, and
elephants), although the introduced roan antelope and black rhinoceros are thought to have been
extirpated (TANAPA 2003). More recently (in 2000), 50 confiscated grey parrots were released
on Rubondo (TANAPA 2003). A complete biological inventory of the Island has not been
completed, but is planned (G.D. Moshi, Rubondo Island National Park, personal communication).
Challenges for Rubondo Island National Park
Like many protected areas, Rubondo faces several challenges. Two of those challenges
that have important implications for conservation and the future of the park are low numbers of
visitors, resulting in lack of funds, and limited local support, resulting in antagonism toward
conservation and possibly a lack of compliance with Park regulations.

8
Tourism on Rubondo
TANAPA is a parastatal organization funded largely by wildlife tourism, and has recently
been under pressure to increase revenue (Bonine et al. 2004). One of the goals of TANAPA‘s
current corporate plan (TANAPA 2008b) is to increase income generation to the point of self-
sufficiency in operations. Nearly all of TANAPA‘s revenue is generated by visitor fees (Bonine
et al. 2004), with the majority coming from international visitors—both because those visitors
constitute the majority (Bonine et al. 2004) and because entrance fees for international visitors are
much higher than fees for citizens of countries in the East African Community (TANAPA 2007).
Rubondo has the infrastructure necessary for tourism in place, including several types of
accommodation (i.e., a privately-owned luxury tented camp, several Park bandas, and a tent site),
some hiking trails, and boats available for sightseeing trips. The Island‘s location, however,
makes it a difficult destination for international tourists to access. Currently, visitors must either
charter a plane or make a long journey generally involving a flight, several hours in a vehicle, and
a boat ride of up to 2 hours (Figure 1.1). However, in the past, access to the Island was simplified
by scheduled flights from Mwanza to the Island. Of the 318,419 visitors to Tanzania that entered
the country‘s 13 National Parks in 2001, only 266 visited Rubondo (Ministry of Natural
Resources and Tourism 2007). Rubondo captured a similar percentage of visitors to the Park in
subsequent years (Ministry of Natural Resources and Tourism 2007). Increasing tourism to
Rubondo is an important goal of TANAPA, and Park management cites the Island‘s lack of
visibility and promotion as a tourist destination as their biggest challenge. Faced with costs that
are nearly 8 times its earnings (TANAPA 2003), Park management often finds that funding is
insufficient for important activities such as poaching patrols (S. Ndaga, Rubondo Island National
Park, personal communication).
Marketing Wildlife Viewing
Marketing materials developed by TANAPA for Rubondo Island National Park
(including a calendar, poster, brochure, webpage, and 2-page layout in the booklet ―Tanzania

9
National Parks‖) have not focused heavily on particular species or consistently marketed the same
suite of species. In addition, consistent names are not always applied to the same species (e.g.,
yellow-spotted otter instead of spotted-necked otter). In all of the most recent versions of the
marketing materials mentioned above, sitatunga (Figure 1.2) was the only consistently pictured
animal. Species pictured in 2 of the 5 aforementioned marketing materials include fish eagle, reed
frog (unknown Hyperolius spp.), elephant, crocodile, and little egret (Egretta garzetta). Several
other wildlife species, including the Egyptian goose (Alopochen aegyptiacus), pied kingfisher
(Ceryle rudis), goliath heron (Ardea goliath), and little bittern (Ixobrychus sturmii), are pictured
in 1 of the marketing materials only. (It is important to note, however, that images of anglers,
which imply the presence of sport fish species, are included in all but the poster.) Text does,
however, contain mention of a more diverse array of species. For example, the most recent
version of the Park‘s brochure, the item likely most often distributed for marketing purposes,
contains mention of the fishery surrounding the Island, as well as hippopotamuses, bushbucks,
vervet monkeys, ―genet cats‖ (i.e., genets), sitatungas, crocodiles, and otters. Also mentioned are
the introduced chimpanzees, elephants, giraffes, ―black and white colobus‖ monkeys, suni, and
grey parrots, as well as the over 200 species of indigenous and migrant birds that live or stop over
on the Island. Visitor activities mentioned include sport fishing, bird watching, and chimp
trekking (although the Island‘s chimpanzees are notoriously hard to observe, even for researchers,
and no trained guides are employed by the Park). The brochure also notes best times to visit the
Park for visitors interested in wildflowers, butterflies, and migratory birds.
TANAPA is not the only entity whose marketing efforts are important to Tanzania‘s
national parks. The Tanzania Tourist Board‘s role is to promote the country itself as a destination
(D. E. Rwehimbuza, TANAPA, personal communication). Owners of lodges within or nearby
National Parks also are relied on to market Tanzania‘s national parks (TANAPA 2008b). In fact,
in the case of Rubondo, the Island‘s only privately owned accomodation has a noticeable
influence on tourist numbers to the Island. Tour operators also are highly influential in the tourist

10
market in Tanzania (D. E. Rwehimbuza, TANAPA, personal communication). They are expected
to promote parks (TANAPA 2008b), and have the ability to distribute tourists among the
protected areas; however, tour operators are said to want ready-made markets and be reluctant to
venture into new destinations (D. E. Rwehimbuza, TANAPA, personal communication).
Currently, very few tour operators include Rubondo in their itineraries.
Tourists are an incredibly diverse group in nearly every characteristic, from age to
income to preferred activities during travel (Pearce 2005). They represent a wide variety of
cultures (Reisinger 2009) and their travel is motivated by many factors (Pearce 2005). Their
considerations in choosing a destination also are varied (e.g., see Woodside et al. 2005) and their
travel decision-making processes are complicated (Pearce 2005). Different tourists therefore
clearly place differing levels of emphasis on each facet (e.g., activities, amenities, etc.) of a
destination. However, opportunities to view wildlife, which are known to be important to a large
percentage of people generally (see Moscardo et al. 2001 for review), are of primary interest and
importance to visitors to Africa (Goodwin and Leader-Williams 2000, Okello 2005, Mladenov et
al. 2007). Tourist destinations, unlike basic consumer products, are not just promoted by the
tourism industry, but are often ―shaped‖ by marketing efforts (Pearce 2005). Therefore, if those
promoting Rubondo Island National Park are including wildlife species of little appeal to tourists
in marketing materials, the Park may not only be missing opportunities to attract tourists in the
present, but the materials may actually be contributing to the ―creation‖ of an unappealing
destination. Also, by not consistently promoting the same species, Park management may be
unintentionally minimizing tourists‘ perceptions of the abundance and likelihood of seeing
species or groups of species. This approach could be particular damaging if certain species are
substantially more appealing to visitors than others.

11
Relationship Between Rubondo and Surrounding Communities
Like the American and South African Parks they were modeled after, permanent human
settlement or economic activity was disallowed in Tanania‘s National Parks (Neumann 1992), a
characteristic not generally appreciated by those living within or near Park boundaries (Neumann
1992, Jacoby 2003). Rubondo Island was made a national park, and its former residents
subsequently evicted, in fairly recent history (1977). The former residents of Rubondo, many of
whom relocated to surrounding communities, were placed in difficult, sometimes fatal,
circumstances (Kiwango et al., in prep), likely resulting in negative perceptions toward
conservation (e.g., see Dowie 2009). Park reports (e.g., TANAPA 2003) suggest that today
residents of surrounding communities perceive Park staff and Park management as insensitive to
the needs and interests of local people and communities, and also suggest that the members of
communities surrounding Rubondo have negative attitudes toward conservation and the
proponents of conservation. Although Park staff has cited conflict over fishing in Rubondo‘s
waters as the cause of these perceptions (TANAPA 2003), poaching may be a result of larger
underlying issues. Without the support of local people, parks and reserves often are subject to
intense poaching, pilfering, and other forms of damage (Jacoby 2003, Kafarowski 2003).
Community Outreach
One of the objectives of Rubondo‘s management plan involves gaining support for the
Park from surrounding communities (TANAPA 2003). Currently, the Park employs 2 full-time
outreach staff members, although budgetary constraints (largely due to the cost of boat travel
from the Island) limit activities in nearby communities. The Outreach Program of TANAPA
seeks to achieve its mission ―to improve and maintain good relationships with adjacent
communities and key stakeholders in order to protect the integrity of National Parks‖ through
activities such as support for community initiated projects (SCIP), income generating projects,
and conservation education (TANAPA 2007). SCIP funding for each Park amounts to 7.5% of its
operating budget (TANAPA 2011a). Around Rubondo recent SCIP activities have included the

12
building of public schools and community dispensaries. Conservation education activities, when
they take place, are focused on imparting general wildlife or environmental knowledge. Recent
activities around Rubondo have, for example, included involving students in the development of
tree nurseries at public schools (H. Mwamjengwa, Rubondo Island National Park, personal
communication). TANAPA‘s contributions to communities surrounding the national parks are a
result of the revenue accrued by tourism (i.e., a form of ―benefit sharing‖) (TANAPA 2008b), and
therefore are limited in communities surrounding Rubondo because of the low number of
international visitors to the Park.
Increasing “Local” and “International” Support: Flagship Species
A variety of approaches (e.g., education, social marketing, and economic incentives) have
been used in attempts to gain public support for conservation. One technique for gaining such
support is the use of flagship species (flagships), which research has shown can positively
influence conservation intentions (Smith and Sutton 2008, Barua et al. 2010). Flagships, defined
as ―popular, charismatic species that serve as symbols and rallying points to stimulate
conservation awareness and action….‖ (Heywood 1995) 1, can range from lobsters (Panulirus
argus) (Davis 1994) to lion tamarins (Leontopithecus spp.) (Dietz et al. 1994) and have been used
around the world (for examples, see Dietz et al. 1994, Leader-Williams and Dublin 2000, and
Bowen-Jones and Entwistle 2002). Choosing an appropriate flagship, however, is critical to the
method‘s effectiveness, and the results of choosing an inappropriate species could range from
ambivalence to antagonism toward conservation.
1 By definition flagship species serve a ―strategic socio-economic role‖—inspiring engagement in, support,
and awareness of conservation activities—and should not be confused with umbrella, keystone, or indicator
species, all of which serve ecological roles (Leader-Williams and Dublin 2000, Walpole and Leader-
Williams 2002). Unfortunately, the term ―flagship species‖ has not always been used in this way (see
Leader-Williams and Dublin 2000 for review) and such incorrect usage has led to a subsequent lack of
support for the method among some (e.g., Simberloff 1998, Andelman and Fagan 2000).

13
Many factors should be weighed when choosing which species to use to gain support for
a given conservation problem or in a specific area, and the preferences and opinions of all
potential audiences should be considered. Flagships often are used to raise support from 2 very
different audiences—people living within or near the areas where conservation activities are
taking place and potential donors or supporters living far from the area. Choosing an appropriate
flagship species requires consideration of the perceptions, preferences, and attitudes of the people
whose support is being sought (Dietz et al. 1994, Bowen-Jones and Entwistle 2002). Great care
must be taken to ensure that an appropriate species—one that will not engender ambivalence or
ill-will among the target audience(s)—is used (Bowen-Jones and Entwistle 2002, Kaltenborn et
al. 2006). Although some species may effectively be used to gain support from both audiences,
others (e.g., large carnivores) may not serve this dual role (Entwistle 2000, Bowen-Jones and
Entwistle 2002). Using potentially dangerous species as flagships, for example, can appear
illogical to stakeholders living near the animals and possibly cause antagonism toward
conservation (Bowen-Jones and Entwistle 2002). However, species that may be feared in many
areas, such as bats (the flying fox, Pteropus voeltzkowi), are popular flagship species in other
areas (Bowen-Jones and Entwistle 2002). Similarly, species that may not be internationally
considered charismatic have led to high levels of positive response to conservation initiatives, as
is the case for Bermuda‘s endemic skink (Eumeces longirostris) (Entwistle 2000).
The Research Project
The primary intention of my research was to help Rubondo‘s management team achieve
their stated goals (TANAPA 2003) of increasing tourism to the Park (a major source of revenue)
and increasing support for the Park among surrounding communities (expected to help limit
poaching and other conflicts regarding Park resources) by enabling informed outreach, education,
and marketing efforts.

14
Background
The evolution of the research project this dissertation is based upon took place over the
course of time spent in Rubondo Island National Park, surrounding communities, and other areas
of Tanzania, and discussions with Rubondo Island National Park staff, TANAPA staff, and
members of the tourist industry. I became involved in research on Rubondo because of the
Island‘s spotted-necked otter population, which was studied formally for the first time in the
1980s (Kruuk and Goudswaard 1990). Fourteen years after Kruuk and Goudswaard published
their research on Rubondo‘s otters, members of the IUCN Otter Specialist Group agreed on the
need to increase efforts to study African otter species (IUCN OSG 2004). Rubondo‘s little-
studied and highly visible population of spotted-necked otters provided a unique opportunity to
learn more about the species, and became the focus of the East African Otter Project headed by
Dr. Tom Serfass. In 2007, several years after the project was initiated and following my
involvement in grant writing for educational aspects of the project, I first visited Rubondo Island
National Park. The limited local support for the Park and low tourism, as well as the prevalence
of fish poaching, became obvious over the course of the trip. The use of flagship species as a tool
for increasing public support appeared to have potential for helping the Park meet its several of its
management goals (increased local and international support).
Given the EAOP‘s focus, some members of the team were interested in promoting the
Island using the spotted-necked otter as a flagship. However, little was known about local
perceptions of the otter and interest in viewing the species among tourists. As noted above, the
choice of a flagship species is complicated by many considerations. In the case of Rubondo,
potential audiences include neighboring communities, tourists, and tour operators (Figure 1.3).
Within those audiences preferences and opinions regarding individual species are likely
influenced not only by demographic and other variables, but also by the characteristics of the
potential flagship species themselves. The purpose of the research this dissertation is based upon
was to address the interest in and preferences and opinions regarding a variety of wildlife species

15
among each of those audiences, and, given the particular interest of the EAOP in promoting
otters, assess the visibility and habitat use patterns of that species in the case that it was
determined to have potential as a flagship species.
Components
I designed my research to investigate the opinions and preferences regarding Rubondo
and its wildlife among 3 main audiences: local people, tour operators, and tourists. The study
populations and questions addressed, as outlined in Figure 1.3, were based on information derived
from previous research related to flagship species, human attitudes toward wildlife, and wildlife
tourism.
Local Communities
Through surveys and interviews, local people around Rubondo were asked general
questions about wildlife conservation, for their favorite wildlife in general, and then specific
questions about the following 13 species: fish eagle (Haliaeetus vocifer), Egyptian goose
(Alopochen aegyptiacus), silver cyprinid (Rastrineobola argentea), little egret (Egretta garzetta),
sitatunga, large-spotted genet, monitor lizard (Varanus niloticus), spotted-necked otter, vervet
monkey, crocodile, hippopotamus, elephant, and giraffe. Species were chosen for inclusion in the
investigation based on a combination of factors, including their uniqueness to Rubondo,
appearance, dangerousness, nuisance, competition for resources, and usefulness as a food source.
Questions regarding each species were chosen based on published research on influences on
wildlife preferences. Surveys administered to both children and adults, included a line drawing of
each animal (created by a Kenyan artist), followed by a series of questions about the animal (e.g.,
Figure 1.4). Interviews conducted with adults included the same types of questions, but also
enabled explanation of responses (e.g., see Table 1.1 for animal questions asked during adult
interviews). All survey and interview participants were asked several demographic questions
including whether any of their ancestors had lived on Rubondo. Participants also were asked

16
about their interest in visiting Rubondo and past visitation, and adults were asked for their
opinions about wildlife tourism and national parks.
The first surveys were administered to school children at public schools in 6 communities
surrounding Rubondo in May and June, 2008 (Butwa, Ikuza, Izumacheli, Katemwa, Maisome,
and Nkome—Figure 1.5) by American and Tanzanian team members and a Park Outreach staff
member known by teachers. After preliminary analysis of the data obtained during the first round
of surveying, changes were made to the initial survey instrument to address concerns that arose.
The revised survey was administered to children in 3 schools during February, 2009 (Butwa—
February 17; Katemwa—February 5; Muganza—February 16). During the same time period,
other students filled out the old forms, some concurrent with classmates using the new forms.
The revised version of the survey developed for school children (with minor language
changes to make it age-appropriate) was administered to adults using the household drop-off
method (i.e., a self-administered survey was left at the household and collected later—Stover and
Stone 1974, Lovelock et al. 1976) in February, 2009. Two communities, Katemwa and Butwa,
were chosen for the adult surveys based on size, geography, and availability of short-term
assistants, who administered the surveys.
In part to gain deeper understanding of the topics that I asked about in surveys, in-depth
interviews with adult community members also were conducted in several areas. The adult
interviews were completed by an EAOP team member (B. Amulike) (who, although Tanzanian, is
from a different region) in Katemwa and Nkome in August, 2008, using a combination of
snowball and random sampling.
International Visitors
I focused assessments of species‘ potential to serve as international flagships on wildlife
watching appeal because of Tanzania National Parks‘ heavy reliance on wildlife tourism for
revenue generation (Bonine et al. 2004). (Although other types of niche tourism exist—e.g.,
invertebrate—I focused on vertebrate species, which are generally more popular than

17
invertebrates [e.g., Fredline and Faulkner 2001, Green et al. 2001, Moscardo et al. 2001], and are
more commonly of interest to tourists, particularly in Africa [Kerley et al. 2003, Boshoff et al.
2007, Lindsey et al. 2007, Okello and Yerian 2009].) Two surveys were used to assess the
wildlife preferences of tourists and their knowledge of and interest in Rubondo. The first was
developed for visitors to Rubondo to enable a better understanding of the type of tourist visiting
the Island, as well as obtain information on what those visitors view as the Park‘s highlights and
challenges. That survey additionally assessed the wildlife viewing preferences of Park visitors.
The second survey targeting travelers (mostly international) in Tanzania also assessed wildlife
viewing preferences—this time of potential Park visitors. The survey additionally asked about
awareness of Rubondo as a wildlife viewing destination. Because fewer questions were asked
about each species in the tourist surveys in comparison to local ones, I was able to include several
additional animal species, both found in Rubondo (i.e., bushbuck, goliath heron [Ardea goliath],
chimpanzee) and not (i.e., African buffalo [Syncerus caffer], jackal [black-backed—Canis
mesomelas], leopard [Panthera pardus], lion [Panthera leo], mongoose [banded—Mungos
mungo], black rhinoceros [Diceros bicornis], and serval [Felis serval]) on those surveys. The
little egret, Egyptian goose, and silver cyprinid, were not included because they were considered
too widespread or common to have potential as a tourist attraction. Questions asked of visitors
regarding specific animals included the participant‘s familiarity with the animal and the
participant‘s interest in seeing the animal on safari (on a 5-point Likert scale—Likert 1932).
Participants were additionally asked to rank their interest in viewing 7 of the species: the
chimpanzee, crocodile, elephant, fish eagle, giraffe, sitatunga, and spotted-necked otter.
Between June 2009 and July 2010, visitors to Rubondo completed 165 surveys. I
administered 250 other surveys at Kilimanjaro International Airport during December 2009. A
graduate of Mweka College of African Wildlife Management was hired to administer surveys
from that point until July 2010, but all data obtained during that period were discarded due to
concerns regarding reliability.

18
Tour Operators
Interviews and surveys were conducted with representatives of wildlife tour companies to
further assess: their interest and their perceptions of their clients‘ interest in animal species
thought to have potential for marketing wildlife tourism, impediments to visitation to Rubondo,
and potential solutions to low visitation of the Island. Arusha is heavily populated with tourism-
related industry and is the most common starting place for tourists following the Northern Circuit
(the northern-most one of 3 ―clusters‖ of National Parks popularly visited over the course of 1 trip
by tourists) where Rubondo could likely be an add-on (i.e., secondary destination). Between
January and March, 2009, interviews were conducted with tour company directors (generally) in
Mwanza and Arusha (Figure 1.1). All licensed tour operators located in Mwanza were
interviewed, as Mwanza is the closest major city to Rubondo, and a typical stopping or
changeover location for tourists going to the Island. Often, companies based in other areas
cooperate with those in Mwanza when tourists travel to the region. In Arusha, companies were
chosen for interviews based on accessibility, availability of appropriate personnel, and size.
Generally, the size or client base of an operation was unknown before the interview. However,
when such information was available, attempts were made to ensure inclusion in the sample of
small, medium, and large companies, as well as those providing budget, mid-range, and high-end
tours.
Questionnaires similar to the interview protocol used also were distributed to all
Tanzanian tour operators with displays at the Karibu Fair (a travel trade event originally designed
to promote Tanzania—but now also including other East African companies and destinations—
and serving to connect buyers and suppliers of tourism-related products) in June, 2009.
Otter Viewability
Lastly, data were collected on the behavior and habitat use of Rubondo‘s population of
spotted-necked otters. Although outcomes of flagship species investigations were unknown at the
time, due to the interest of the EAOP in promoting the spotted-necked otter and the limited

19
amount of information known about species, the collection of data on the ―viewability‖ of the
species that would be necessary were the otter determined to have potential to serve as a flagship
species was completed concurrently with other investigations.
Structure of the Dissertation
The chapters of this dissertation focus on the results from the investigations above
deemed most critical to primary discussions regarding ways in which support for Rubondo could
be increased. Following this introduction, the dissertation contains 4 main research chapters; a
summary, recommendations, and conclusions chapter; and one methodological note (as an
appendix). Other appendices provide additional information on Lake Victoria and its environs,
model results, and the survey instruments used.
Chapter 2 describes the results of the survey of school children relevant to the students‘
perceptions of the attractiveness, usefulness, likeability, and desirability of animal species
present in Rubondo.
Chapter 3 explores how demographic variables may affect some of the perceptions and
preferences summarized in Chapter 1, namely ―dislike‖ and desire for ―few‖ of each
species.
Chapter 4 explores local interest in visiting Rubondo, the perceived barriers to doing so,
and the influence limited local visitation and perceived barriers to visitation may have on
support for Rubondo, National Parks, wildlife tourism, and conservation.
Chapter 5 addresses tourist interest in viewing various wildlife species, and the
implications of those wildlife viewing preferences for wildlife tourism generally and
Rubondo in particular.

20
The Summary, Conclusions, and Recommendations chapter (6) summarizes the results
reported in Chapters 2 through 5, and discusses their collective implications for the future
of Rubondo.
Appendix C illuminates one of the methodological challenges faced in this research—the
ambiguity created by local and colloquial names for wildlife species.

21
Table 1.1. Questions regarding individual animals that were included in the interview protocol
used to assess local adults‘ perceptions regarding wildlife, conservation, tourism, and National
Parks in the communities surrounding Rubondo Island National Park, Tanzania. (All animal
questions are centered around illustrations of the following species: fish eagle, large-spotted
genet, monitor lizard, spotted-necked otter, sitatunga, silver cyprinid, vervet monkey,
hippopotamus, crocodile, little egret, and Egyptian goose.)
Questions asked about 11 wildlife species during adult interviews
1. Which of these animals have you seen or heard about?
2. Which of these animals live near your village or sometimes come to your village?
3. Which of these animals do you think are attractive?
4. Which of these animals do you think are useful?
5. Which of these animals do you like?
For animal liked: What about this animal do you like?
6. Which of these animals do you not like?
For each animal disliked: What about this animal do you not like?
7. If you had to pick one of these animals that you like the most, which would it be?
Why?
8. If you had to pick one of these animals that you like the least, which would it be?
Why?
9. Which of these animals would you like there to be more of?
10. Which of these animals would you like there to be less of?
11. What does each of these animals eat? (Participants were asked to match the animal
illustrations up with the following food cards, as appropriate: wild plants, plants that people
grow, wild animals, animals that belong to people, fish, other, and not sure.)

22
Figure 1.1. The location of Rubondo Island National Park, Tanzania, and nearby travel hubs.
Charter flights to Rubondo are available from Mwanza for a cost of $1,600 USD round trip for a
5-seat plane. Driving time from Mwanza to the Park‘s ranger station at Nkome is advertised by
the Park as 4-5 hours. Reaching the Island from Nkome by boat takes up to 2 hours and costs
$100 USD each way. Alternatively, visitors can drive past Nkome to Muganza (advertised
driving time: 8-9 hours), from where a boat trip to the Island takes less than 30 minutes and costs
$50 USD each way. All driving trips require a ferry crossing.

23
Figure 1.2. The sitatunga is the only animal consistently pictured in recent marketing materials
for Rubondo Island National Park.

24
Figure 1.3. Schematic of components involved in my assessment of potential flagship species for
Rubondo Island National Park, as well as the influencing factors that I considered for each.
.

25
Figure 1.4. Example of the questions regarding each animal that were included in the survey I administered to children and adults in communities
surrounding Rubondo Island National Park, Tanzania, in 2008 and 2009
25

26
Figure 1.5. Communities surrounding Rubondo Island National Park where I conducted surveys
and interviews to assess local opinions and preferences regarding wildlife, conservation, tourism,
and National Parks.

27
CHAPTER 2
OPINIONS AND PREFERENCES REGARDING WILDLIFE AMONG CHILDREN IN
COMMUNITIES SURROUNDING RUBONDO ISLAND NATIONAL PARK,
TANZANIA: INFORMING OUTREACH
Abstract
Flagship species can positively influence conservation intentions and have been used
around the world to increase support for conservation efforts. However, understanding the target
audience is critical before using any species as a flagship intended to raise support for
conservation. I surveyed 932 children in public primary schools in 7 communities surrounding
Rubondo Island National Park, Tanzania, regarding the familiarity, attractiveness, usefulness,
likeability, and desirability of 13 wild animals. Species included in the survey were: fish eagle
(Haliaeetus vocifer), Egyptian goose (Alopochen aegyptiacus), silver cyprinid (Rastrineobola
argentea), little egret (Egretta garzetta), sitatunga (Tragelaphus speki), genet (Genetta tigrina),
monitor lizard (Varanus niloticus), spotted-necked otter (Lutra maculicollis), vervet monkey
(Cercopithecus pygerythrus), crocodile (Crocodylus niloticus), hippopotamus (Hippopotamus
amphibius), giraffe (Giraffa camelopardalis), and elephant (Loxodanta africana). More than 50%
of the students were able to correctly identify illustrations of all but 5 of the species (the spotted-
necked otter, sitatunga, genet, Egyptian goose, and fish eagle). Animals that a high percentage of
students wanted to be locally abundant were also generally considered attractive and useful, and
were well-liked. However, participants did always want to live near species that were generally
well-liked and considered attractive and useful. The only species that received high scores on all
measures (familiarity, attractiveness, usefulness, liking, and desirability) was the silver cyprinid.
Other highly liked and desired species were the Egyptian goose and little egret. This is one of the
first assessments of wildlife preferences conducted in Africa that focuses mostly on less well-

28
known African wildlife species, and the results have implications for the future direction of
marketing and community outreach for protected areas.
Introduction
One of the major goals of managers at Rubondo Island National Park (Rubondo) in Lake
Victoria, Tanzania, and likely managers of many Parks around the world, is to increase local
support for conservation (TANAPA 2003). The use of flagship species—popular, charismatic
species that serve as symbols and rallying points to stimulate conservation awareness and action
(Heywood 1995)—is 1 avenue management may pursue their goals through. However, although
wisely chosen flagship species can positively influence conservation intentions (Smith and Sutton
2008), poorly chosen species may have the opposite effect (Bowen-Jones and Entwistle 2002,
Barua et al. 2010). Several researchers have suggested factors that should be considered when
choosing a flagship species (e.g., Dietz et al. 1994, Bowen-Jones and Entwistle 2002). The
following have been suggested as critical to the choice of a locally-used flagship.
Familiarity: The species should be distinctive, readily associated with locally important
habitats, and known to the target audience (Bowen-Jones and Entwistle 2002).
Associations: The species should not already be used to convey conflicting messages or
those that may potentially be confused with the conservation message (Bowen-Jones and
Entwistle 2002). For example, in the USA a blue jeans- and ranger hat-wearing, shovel-
toting character called ―Smokey Bear‖ spreads a public service message about fire
prevention in the country‘s longest-running public service campaign (Ad Council 2008).
Ninety-eight percent of Americans shown Smokey‘s picture can identify him, and 95%
can finish his slogan when given the first words (―Remember only YOU…) (U.S. Forest
Service 1984). Based on this widespread association of Smokey Bear with fire
prevention, using bears as a symbol to spread a different message in the USA may
confuse the target audience.

29
Visibility: To be useful for engendering local support for conservation, the flagship
species should be one that local residents can view and, therefore, directly relate to
conservation goals (Dietz et al. 1994).
Attitudes: A flagship species should be one with which the focal audience has positive
associations (Bowen-Jones and Entwistle 2002), and should have behavioral and physical
traits that endear it to the people whose support is sought (Feistner and Mallinson 2000).
Kaltenborn et al. (2006) suggest that the best flagship species will be regarded highly and
not feared by the target audience.
Unfortunately, whether or not a species fits the above criteria is not always readily apparent, and
because each species has its own unique natural history, associated set of positive and negative
interactions with humans, and place in local mythology, making assumptions about a species
based on generalizations—or research with other species—is unwise.
In Tanzania, few assessments have been conducted regarding local perceptions of the
country‘s less well-known animals, although 2 studies did report that the species most well-liked
by Tanzanian adults and children were those that were also aesthetically pleasing, useful (e.g.,
provided meat or tourism revenue), and/or non-threatening (Entwistle and Stephenson 2000,
Kaltenborn et al. 2006a). Rubondo has several species of wildlife that are readily seen,
distinctive, and occupy important habitats, and are considered useful, non-threatening, and
aesthetically pleasing by people in other areas. However, little is known about local perceptions
of those species‘ attractiveness, usefulness, likeability, and desirability. I used group-administered
surveys to obtain information on perceptions among local children (the most frequent audience
for the Park‘s outreach activities—H. Mwamjengwa, Rubondo Island National Park, personal
communication) of a suite of species occupying Rubondo. Information I obtained will help Park
officials to make informed decisions about outreach efforts and may also improve understanding

30
of the relationship between the included species and people in other areas with similar
demographics.
Methods
Study Area
This research was conducted in 7 communities near Rubondo that contain public primary
schools: Butwa, Ikuza, Izumacheli, Maisome, Muganza, Katemwa, and Nkome (Figure 2.1). The
first 4 of those communities are islands, and the remainder on the mainland. Although the villages
vary in size and population statistics are not always available, all are rural. On Butwa, in 2007,
for example, there were 2,220 residents, 524 of whom were under the age of 14 (M. Chiweki, R.
Magessa, and C. Billing; Butwa Island; personal communication). Katemwa had 1,580 residents
in 2008 (C. Matonange, Katemwa Village Government, personal communication).
Over 75% of households in Tanzania‘s rural areas are headed by an individual who works
in agriculture or fishing (National Bureau of Statistics 2002). Based on household statistics
available from local communities, dependence on fishing and agriculture appears to be prevalent
throughout the study area. On Butwa in 2007, for example, the adult working population was
divided into farmers (260), registered fishermen (200), small-scale businessmen (31), livestock
keepers (47), and traditional healers /―witch doctors‖ (3) (M. Chiweki, R. Magessa, and C.
Billing; Butwa Island; personal communication). In Tanzania, a large percentage of rural
households (around 89%) also report owning land for agriculture or grazing (National Bureau of
Statistics 2002).
Most rural Tanzanians attend public schools, and only complete the primary standards
(i.e., grades) of 1-7 (National Bureau of Statistics 2002, 2007). Less than 3% of adults living in
rural Tanzania have completed secondary school (National Bureau of Statistics 2002), and in
2002 secondary school enrollment was comprised of only 5% of 14 to 17-year-olds (National
Bureau of Statistics 2002). However, a much larger percentage—56 (rural) to 71% (urban)—of

31
all Tanzanian 7-13 year olds attend primary school (National Bureau of Statistics 2002).
Throughout Tanzania, only about 1% of students in primary school attend private institutions
(National Bureau of Statistics 2007).
Survey Protocol
My survey instrument included questions about a suite of animal species chosen based on
factors such as uniqueness to Rubondo and perceived potential to also serve as a tourist attraction.
I selected the following species, representing diversity in attractiveness (based on my own
perceptions and the results of previous research), known usefulness, dangerousness, and history
of conflicts with humans: fish eagle (Haliaeetus vocifer), Egyptian goose (Alopochen
aegyptiacus), silver cyprinid (Rastrineobola argentea), little egret (Egretta garzetta), sitatunga
(Tragelaphus speki), genet (Genetta tigrina), monitor lizard (Varanus niloticus), spotted-necked
otter (Lutra maculicollis), vervet monkey (Cercopithecus pygerythrus), crocodile (Crocodylus
niloticus), and hippopotamus (Hippopotamus amphibius). Participants were asked to identify an
illustration of each species (as a measure of 1 aspect of the ―familiarity‖ of the species) and then
answer a series of questions about the animal including:
Is this animal attractive?
Is this animal useful?
Do you like this animal?
Would you like this animal to be many where you live?
Two versions of the survey instrument were used (see Appendix B). The second, revised version
included 2 additional species (the giraffe [Giraffa camelopardalis] and elephant [Loxodanta
africana]) and the full suite of questions listed above for every species, whereas the first did not
ask about attractiveness, usefulness, and desirability of approximately half of the species.
Demographic data collected from participants included tribe, standard, school, the profession of
the student‘s head of household (HOH) and, in 2009 surveys only, gender.

32
School children were chosen as participants in this study because youth often are targeted
by environmental education activities (Eagles and Demare 1999, Vaughan et al. 2003) and are the
most frequent audience for Rubondo‘s outreach efforts (H. Mwamjengwa, Rubondo Island
National Park, personal communication), surveys can be administered to large numbers of
students at one time, and teachers were eager to facilitate youth participation. Public primary
school students in particular were targeted because they are more representative of the general
population in terms of demographics than students in secondary and private schools. Students in
the highest 2 primary standards (6 and 7) were invited to participate in the survey.
The survey instrument was developed in English and translated to Swahili (the language
used in Tanzanian public primary schools) by a Tanzanian fluent in both languages. Reviewers,
several of whom were native Swahili speakers and Park employees, assessed the English and
Swahili versions of the survey for content and face validity. Surveys were administered in
classrooms by members of the research team and the Park‘s outreach staff, with assistance from
teachers in some schools. All directions were given in Swahili.
Data Analysis
The children‘s survey instrument and responses were translated into English prior to data
analysis. Quantitative data were analyzed using Stata/IC 11.0 (StataCorp, College Station, Texas
77845, USA). Descriptive statistics were used to assess each measured variable individually.
Tribe, the only open-ended variable discussed here, was categorized prior to being quantified.
Participation and Survey Statistics
Participation rates (based on teachers‘ records of the number of students in each standard)
and response rates were calculated. I compared response rates among questions, presupposing
that a low response rate for any question in comparison with others in the survey was an indicator
of a potential problem with wording, translation, or subject. I also assumed that a pattern of
increasing non-response from initial to concluding survey questions was a potential indicator of
fatigue among participants. Lastly, in an attempt to identify any potential validity and reliability

33
issues, I combined all non-negative responses (i.e., yes, not sure, and no opinion) and calculated
average inter-item correlations for each type of question (e.g., ―Do you like this animal?). I
determined a priori that consistently high correlations (i.e., lack of variation in response to
questions of 1 type) would be considered problematic. For example, I assumed consistently high
inter-item correlations among liking questions (which would be obtained if individual students
consistently chose the same answer regardless of the species in question) were a possible
indication that students did not understand the questions, the questions were not formatted in a
culturally appropriate manner, or the topic was not salient.
Familiarity
Names provided by participants for each illustration were classified as acceptable or
unacceptable (see Appendix C for more detail). In general, the following were accepted (Table
2.1): the Swahili and tribal names specific to the species, names used to refer to a group of similar
species the animal is part of (e.g., monkey), and name(s) commonly used for the species locally
(although those names are not always formally correct). Some names classified as acceptable
under this scheme did not refer only or specifically to the intended species, and this was
considered in interpretation of results.
Opinions and Preferences
For opinion and preference questions (i.e., Is this animal attractive? Is this animal useful?
Do you like this animal? Would you like this animal to be many where you live?), only the
responses of individuals who were able to provide an ―acceptable‖ name for the species were
included in the analysis. Therefore, the opinions and preferences of a different sample of
respondents are shown for each species, and consequently results are not strictly comparable
among them.
Flagship Potential
To facilitate comparisons of flagship potential among the 13 species, I gave each ―scores‖
for familiarity, attractiveness, usefulness, likeability, and desirability, of low (0-50% of

34
participants provided acceptable labels or affirmative responses), medium (51-75%), or high (76-
100%). For familiarity only, a score ―range‖ was also calculated by adding the percentage of
students who incorrectly labeled the illustration to the original score mentioned above. (The upper
range for the familiarity score consequently includes all but those students who provided a blank
or invalid response.) I used this method in an attempt to more accurately represent those species
that participants commonly mislabeled, as I was concerned that such mislabeling was partially a
product of the illustrations used (e.g., the illustrations may not have contained enough
distinguishing features) in combination with the similarity of the included species to others
present in the area. I determined a priori that a score of ―low‖ in any category should be
considered a potential impediment to the use of that species as a flagship.
Results
Participation and Survey Statistics
Nine hundred and thirty-two students at 7 public schools in communities surrounding
Rubondo participated in surveys. Six hundred and eighty six of those students from 6 schools
participated between May 27 and June 3, 2008, and 246 children in 3 schools (1 of which was not
included in the previous round of surveys) participated during February, 2009. One hundred and
forty-one of the 2009 participants completed the revised version of the survey. The majority of
participants were in standards 6 and 7 (Table 2.2), but students in 2 non-target standards (4 and 5)
also participated when space in classrooms was available, and their responses were included in
analyses. Overall, between 21% and 92% of students in target standards participated in the survey
(Figure 2.2). In some schools, due to my travel delays or school schedules only 1 class within
standard 6 or 7 was available during the visit. Additionally, space limitations in some schools
during visits prevented me from inviting all target classes to participate. Within participating
classes, generally all children who were present at school completed surveys. I am aware of only

35
1 school in which some parents did not allow students to participate (n = 8). Surveys generally
took about 1 hour to complete, but the length of time required varied among schools.
Farming was by far the most common profession for student HOHs, followed by business
(assumed to be nearly all small-scale [e.g., selling vegetables at the open-air market or running a
roadside stall], as is common in the area—M. Chiweki, R. Magessa, and C. Billing; Butwa Island;
personal communication), fishing and livestock keeping (Figure 2.3). Ten percent of HOHs in
farming, 20% in fishing, 15% in business, 47% in livestock keeping, and 41% in other
occupations also practiced > 1other profession. Students listed at least 31 different tribal
affiliations. Eleven additional names were provided but those could not be confirmed as not
being, for example, the product of spelling errors. Ninety-three percent of participants belong to 1
of the 10 most common tribes (Table 2.4). Of the 246 participants asked, 119 were female and
121 were male (6 did not respond).
Response rates were high for demographic variables. Among them, the lowest was for
gender (98%). For other variables, response rates were the lowest for questions in which students
were asked to name the species (Table 2.3). Also, as expected, many of the students who could
not name a species skipped ensuing questions regarding the animal. However, ensuing questions
were also skipped in some cases by students who provided a label for a species. For example,
every student using the revised survey form in 2009 (n = 141) provided a label for the monkey,
crocodile, elephant, and giraffe, but 6-12% of those students (depending on the species) skipped
subsequent opinion and preference questions about the individual animals.
Throughout all species and all opinion and preference questions, non-response and not
sure, no opinion, and invalid answers among students who were able to provide an ―acceptable‖
name for a species ranged from 2% in response to the question about abundance of the Egyptian
goose to 28% in regard to usefulness of the genet (Figure 2.4a-d). Responses of unsure and no
opinion, as well as missing and invalid responses were greatest on average for questions
regarding usefulness of species (x̄ = 20% [range: 10% to 28%]). Twelve percent of responses for

36
attractiveness fell into those categories (range: 4% to 18%), as did 9% for liking (range: 5% to
15%) and 11% for abundance (range: 2% to 17%).
Response rates did not appear to decrease as students progressed through the survey.
Although such underlying patterns are difficult to assess because non-response for animal
questions apparently depended largely on respondents‘ familiarity with the particular species,
response rates for several species on the last page of the survey was 100%. The average inter-item
correlations for each of the opinion/preference questions also were low (within attractiveness:
0.18, usefulness: 0.22, liking: 0.11, and abundance: 0.28).
Familiarity
Over 90% of participants provided an ―acceptable‖ label for the elephant (100%), giraffe
(95%), crocodile (95%), and vervet monkey (93%) (Figure 2.5). The monitor lizard, silver
cyprinid, and hippopotamus were recognized by >75% of participants (82%, 80%, and 79%
respectively). Students were least able to name the spotted-necked otter (with only 18% of
participants able to ―correctly‖ label the illustration), followed by the sitatunga (21%), genet
(31%), Egyptian goose (33%), and fish eagle (44%).
Opinions and Preferences
The species most frequently considered attractive by those able to individually name
them were the Egyptian goose (considered attractive by 88% of those able to name it), silver
cyprinid (87%), giraffe (84%), and little egret (83%) (Figure 2.6). The elephant, sitatunga, and
fish eagle also were generally considered attractive by those able to name them (76%, 74% and
73%, respectively), whereas the crocodile, monitor lizard, and genet were considered attractive by
less than half of students able to name them (30%, 41%, and 44%, respectively).
The silver cyprinid and Egyptian goose were the only species considered useful (Figure
2.7) by >75% of the students able to individually name them (86% and 81%, respectively).
However, the giraffe, little egret, and sitatunga all were considered useful by >66% of the
students able to name them (68%, 67%, and 66%, respectively). The species least considered

37
useful were: crocodile (considered useful by 30%), genet (33%), monitor lizard (40%), and vervet
monkey (42%).
The Egyptian goose and silver cyprinid were highly liked by participants who were able
to name them (91% and 87%, respectively), as was the giraffe (81%—Figure 2.8). The species
most disliked by those able to name them were: crocodile (disliked by 77%), genet (48%),
monitor lizard (43%), hippopotamus (42%), spotted-necked otter (34%), and vervet monkey
(29%).
More than 75% of the respondents who were able to name the silver cyprinid wanted it to
be abundant nearby (Figure 2.9). A similar percentage wanted the little egret and Egyptian goose
to be abundant nearby. Fewer than 50% wanted many of the crocodile, genet, monitor lizard,
vervet monkey, hippopotamus, and spotted-necked otter nearby. For each of those species, ≥40%
of the students able to label them specifically did not want the animal to be abundant nearby.
Flagship Potential
Several species received scores of ―high‖ in all or most measured categories (Table 2.5).
The best scoring species, the silver cyprinid, scored ―high‖ across all categories. The Egyptian
goose received ―high‖ scores in all categories except familiarity. (In that category, the Egyptian
goose, like the fish eagle and genet, received a score ―range‖ of low-medium, indicating that
students commonly misidentified the species.) The little egret and giraffe obtained scores of
―high‖ in all but 2 measured categories as well, and no scores of ―low.‖ Also scoring reasonably
well were the fish eagle, sitatunga, and elephant, none of which received scores of ―low‖ in any
of the opinion and preference categories. The genet, monitor lizard, spotted-necked otter, vervet
monkey, hippopotamus, and crocodile, however, all received ―low‖ for desirability, and all of
those species except the hippopotamus also received a ―low‖ in ≥1 other measured category.

38
Discussion
Familiarity
Participants were generally most familiar with iconic African wildlife species (elephant
and giraffe), as well as those that are commonly used for food (silver cyprinid) or pose a threat to
lives (crocodile and hippopotamus) or livelihoods (monkey). The last of the well-known species,
the monitor lizard, is similar in size and morphology to the more dangerous crocodile, and ability
to distinguish between the 2 is likely an important skill for children living within the range of
both species. The students‘ overall unfamiliarity with spotted-necked otter, fish eagle, Egyptian
goose, sitatunga, and genet is not particularly surprising, given the species‘ habitat requirements
and activity patterns. The spotted-necked otter, although active during the day, can be elusive. In
addition, the animal would only be known to students who spend time near the Lake. The fish
eagle and Egyptian goose, although also active during the day, generally remain close to Lake
Victoria as well. Similarly, the sitatunga is a wetland species (Games 1983) that is not present in
the immediate vicinity of most of the communities included in my study area (G. Moshi,
Rubondo Island National Park, personal communication), where shores are heavily human-
impacted. The genet, although not restricted to aquatic areas, is nocturnal (Ikeda et al. 1983,
Palomares and Delibes 2000). Therefore, although the animal has a pervasive reputation among
adults in the area for preying upon chickens (unpublished data), relatively few people may have
actually seen a genet.
As is typical in Tanzanian public primary schools, students were heavily crowded into
classrooms during survey administration, resulting in opportunities to share answers, which may
have inflated the percentage of students able to correctly name each species. However, the
sharing of answers may also have served to moderate difficulties caused by students‘ lack of
familiarity with activities of this type. Regardless, the sharing of answers should not have a
substantial influence on general comparisons of familiarity among species.

39
Opinions and Preferences
The results of my research, which show that the silver cyprinid is more commonly
considered attractive among children in the study area than the genet, fish eagle, spotted-necked
otter, sitatunga, and vervet monkey, suggest that attractiveness of animals, like charisma (Lorimer
2007), is complex and perceived differently among people and cultures—a suggestion also
previously made by Roque de Pinho (2009). Such differences in perceptions among people and
cultures further highlights the problems that could be caused by choosing a flagship species
without adequate research on opinions and preferences of the target audience: a species that is
considered ―attractive‖ in one culture may not be considered so in another.
The percentage of students who liked a species was often similar to the percentage
considering the species useful and attractive, although this was not always the case. The
crocodile, for example, was considered useful by 30% of participants, and also considered
attractive by 30% of participants. However, only 16% of participants liked the animal.
Conversely, 63% of students liked the vervet monkey, although only 53% considered the monkey
useful and only 42% considered it attractive. Roque do Pinho (2009) also reported complex
relationships between people‘s perceptions of a species and their affinity for the species. A
number of other factors likely also influence affinity for and desire to live near a species, such as
an individual‘s: background and general wildlife values; interactions with and exposure to
animals; level of dependence on local resources, knowledge and understanding of wildlife;
perceptions of the animal‘s intelligence, similarity to humans, dangerousness, and likelihood of
inflicting property damage; and the species‘ cultural and historical relationships with people, all
of which affect general preferences for and attitudes toward wildlife (Kellert 1985a, Kellert and
Berry 1987, Kellert 1994, Bjerke et al. 1998b, Czech et al. 2001, Ericsson and Heberlein 2003,
Kaltenborn et al. 2003, Tisdell et al. 2006, Røskraft et al. 2007). An individual‘s wildlife value
orientation (Manfredo 2008) likely also influences the relative importance of attractiveness and
usefulness in forming opinions and preferences regarding a species. And in rural Tanzania, where

40
over one-third of the population falls below the basic needs poverty line (National Bureau of
Statistics 2002), usefulness of an animal may be particularly important in influencing opinions
about the species, regardless of wildlife value orientations.
As might be expected, school children in Tanzania have little desire to live near the
hippopotamus and crocodile (likely because of the danger posed by both, although the
hippopotamus also does raid crops in at least some of my study communities [unpublished data])
or the spotted-necked otter, vervet monkey, or genet (possibly because those species are
respectively known to raid fishing nets and crops and prey upon chickens—unpublished data).
However, species that are little desired are not always little liked. For example, 40% of the
children living around Rubondo would like few vervet monkeys to live nearby, but only 29%
dislike the species. These results highlight the importance of asking the ―right‖ questions in
investigations of flagship species. For many practical purposes, such as the choice of a potential
local flagship for an area designated for species protection (and from where such species may
disperse), basing decisions on reported ―liking‖ of a species is probably not appropriate:
―Liking‖ a species does not always translate to wanting to live with a species.
Flagship Potential
Among the species included in my survey, the Egyptian goose and silver cyprinid may
have the most potential as local flagships. Both scored ―high‖ for attractiveness, usefulness,
likeability, and desirability, but the goose received only a ―low-medium‖ for familiarity, whereas
the silver cyprinid also scored ―high‖ in that category. (Although I accepted the very general label
―fish‖ for the silver cyprinid, based on the size of the fish illustrated and the importance of silver
cyprinid in the local diet I suspect the majority of students using the label ―fish‖ were familiar
with and thinking of the silver cyprinid, and therefore I believe my results accurately portray
students‘ comparative familiarity with each species.) Regardless of the silver cyprinid and
Egyptian goose receiving the highest scores, several other species may have potential to serve as
even more effective local flagships for Rubondo. For example, given that the species are

41
generally liked and desired by the children familiar with them, the little-known sitatunga and the
also poorly-known or distinguished fish eagle may serve as effective flagships for the Park if
management is willing to invest in education and outreach. These species may have the advantage
of also serving the dual role of an international flagship for Rubondo—a role not suited to a small,
plain fish, such as the silver cyprinid, or a widespread waterfowl naturalized on several other
continents (Sutherland and Allport 1991, Lensink 1998, Braun 2004), such as the Egyptian goose.
Communication and persuasion techniques can be effective tools for influencing
attitudes, and are well-studied in social science disciplines (Petty et al. 1992, Eagly and Chaiken
1993, Bohner and Wänke 2002, Johnson et al. 2005). Within the field of wildlife conservation,
Tisdell et al. (2006) reported increases in support for survival of particular species after
information was provided. Additionally, a study of the effectiveness of various education
strategies showed that information provision in combination with other typical components of
wildlife education programs positively influenced children‘s attitudes toward wildlife (Morgan
and Gramann 1989). An excellent example of the ability of education to enable a once little-
known animal to serve as an effective flagship—and a potentially useful model to follow—may
be found in The Golden Lion Tamarin Conservation Program in Brazil (Dietz et al. 1994, Dietz
and Nagagata 1995). However, regardless of the amount of education and outreach undertaken,
there may still be few strong cultural or historic attachments to those species—and this should be
considered in choosing flagship species.
Conversely, some species that scored reasonably well may not be wise choices for
flagship species for Rubondo. The elephant and giraffe, both fairly well-known, largely
considered attractive and useful, and reasonably well-liked and desired, are 2 such species. The
animals in the Park were introduced in the 1960s and 1970s (TANAPA 2003), and are not present
in nearby communities or immediately adjacent areas. Using an introduced species to represent

42
conservation of a National Park may not be an ecologically or socially wise choice, given the
potential problems caused by introductions of species into previously unoccupied areas.
Several additional species, although popular in some parts of the world, also have limited
potential as local flagships for Rubondo. Crocodiles and hippopotamuses, both fairly popular
among tourists (Chapter 5), are little desired by children in the area. Other species that are
considered attractive and charismatic by many in the Western world, such as the genet and
spotted-necked otter, received lower than expected scores in all measures. In considering choices
for flagship species, practitioners should remember that changing strong negative attitudes
through communication may not be possible, as increased knowledge is not necessarily congruent
with more positive attitudes. People with strong attitudes on a particular topic often use any new
knowledge to build arguments to further support their existing attitude (Petty et al. 1992).
Therefore, assessing the strength of negative attitudes among those who report disliking and
wanting few of any species considered as a flagship would be wise. In addition, further research
should be conducted to determine whether those people disliking or not wanting to live near the
species share certain characteristics.
In other parts of Africa, species‘ roles as tourist attractions have apparently led to more
positive perceptions of those species among local people benefitting from tourism (e.g., Hemson
et al. 2009). However, such associations should not lead managers to conclude that we can always
make a species more well-liked by proving its usefulness as a tourist attraction. In addition, prior
to casting species with tourism potential in roles as attractions, the risks and potential benefits of
doing so should be very carefully considered. Local people benefitting from or supportive of
tourism could likely be convinced to adopt more positive attitudes toward a previously little-liked
or desired species if that species was shown to be a tourist attraction. That animal could,
consequently, become more well-known and well-liked based on this role. However, should
tourist numbers decline as a result of a crisis (as happened, for example, in response to the events
of September 11 and foot and mouth disease—Goodrich 2002, Luvanga and Shitundu 2003,

43
Eugenio-Martin 2006), a species mainly valued in local communities because of its appeal to
international tourists could become a symbolic scapegoat for a frustrated local public.
The most pragmatic next step in flagship selection for Rubondo may be to allow nearby
communities to ―elect‖ a local flagship, or even a suite of flagships, for the Park. Rubondo‘s
management could select and include for voting only those species with most potential—perhaps
not only locally, but internationally as well—to highlight the Park‘s most important conservation
needs. Management could also use the opportunity such a vote would create to educate local
communities about the species included. Involving nearby communities in choosing local
flagship(s) for Rubondo will not only ensure the species used will engender local support, but
also likely help to build goodwill between the Park and those communities.

44
Table 2.1. Names accepted for each species in my 2008/2009 survey regarding the opinions and
preferences about wildlife of school children in communities surrounding Rubondo
Island National Park, Tanzania.
English & scientific names for
the species
Swahili/tribal names
accepted for the species
Species (or types of species)
referred to by the accepted
names
Fish eagle
(Haliaeetus vocifer)
kwazo (kwezi), tai, tai samaki fish eagle, eagle
Genet
(Genetta tigrina)
cheche, kicheche, nyalukala,
paka pori
genet, genet/mongoose*
Monitor lizard
(Varanus niloticus)
kenge, mbulu kenge, mjusi monitor lizard, lizard
Spotted-necked otter
(Lutra maculicollis)
fisi maji, fina otter
Sitatunga
(Tragelaphus speki)
nyesanga, nzobe, nzohe,
swala
sitatunga, antelope
Silver cyprinid
(Rastrineobola argentea)
dagaa, samaki, soga silver cyprinid, fish
Vervet monkey
(Cercopithecus pygerythrus)
kima, ngedere, nyani, tumbili vervet monkey, monkey
Hippopotamus
(Hippopotamus amphibius)
kiboko, enzubha hippopotamus
Crocodile
(Crocodylus niloticus)
mamba crocodile
Little egret
(Egretta garzetta)
nyangenyange, yangeyange little/cattle egret*
Egyptian goose
(Alopochen aegyptiacus)
lyoyo, bata maji, bata pori Egyptian goose, waterfowl
Elephant
(Loxodonta africana)
tembo elephant
Giraffe
(Giraffa camelopardalis)
twiga giraffe
* One term is used to refer to these species collectively.

45
Table 2.2. The number of students in the communities surrounding Rubondo Island National
Park, Tanzania, participating in 2008/2009 survey about opinions and preferences regarding
wildlife, by year, school, and standard (grade).
School 2008 2009 Total
Std. 6 Std. 7 Std. 4 Std. 5 Std. 6 Std. 7
Ikuza 7 24 - - - - 31
Izumacheli 59 47 - - - - 106
Maisome 57 46 - - - - 103
Nkome 86 123 - - - - 209
Butwa 29 34 3 13 23 3 105
Katemwa 96 78 - - 133 - 307
Muganza - - - - 33 38 71
Total 334 352 3 13 189 41 932

46
Table 2.3 (a and b). Numbers and percentages of students not responding to animal naming
questions (a) and not asked questions for which sampling was partial (b) in 2008/2009 survey
regarding wildlife preferences of children in communities surrounding Rubondo Island National
Park, Tanzania. All percentages reported are based on the total number of participants (n = 932).
a. The number of students that failed to provide a label for each animal illustration.
Non-response
Species No. %
Elephant 0 0
Giraffe 0 0
Crocodile 15 1.6
Vervet monkey 23 2.5
Hippopotamus 51 5.5
Monitor lizard 120 12.9
Silver cyprinid 178 19.1
Little egret 227 24.4
Fish eagle 239 25.6
Egyptian goose 269 28.9
Genet 370 39.7
Spotted-necked otter 496 53.2
Sitatunga 497 53.3
b. The number of students not asked questions with partial sampling
Question No. %
Gender 686 73.6
For vervet monkey, hippopotamus, crocodile, little egret, and Egyptian
goose:
Is it attractive?
Is it useful?
Do you like this animal to be many where you live?
791 84.9
For elephant and giraffe:
All questions, including naming
791 84.9

47
Table 2.4. Tribal affiliations listed by ≥10 participants in my 2008/2009 survey of 932
schoolchildren in communities surrounding Rubondo Island National Park, Tanzania.
.
Tribe Participants
Hangaza 10
Subi 12
Sweta 16
Luo 17
Kuria 23
Ha 33
Kara 36
Haya 49
Kerewe 78
Jita 136
Zinza 220
Sukuma 241
Total 871

48
Table 2.5. Familiarity, attractiveness, usefulness, likeability, and desirability scores for each of 13 wildlife species I asked 932 schoolchildren in
communities surrounding Rubondo Island National Park, Tanzania, about in my 2008/2009 survey. Attractiveness, usefulness, likeability, and
desirability were each given a score of Low (0-50% of students able to name the species answering affirmatively), Medium (50-75%), or High
(75-100%). Familiarity was categorized in the same way, but unlike other variables, is reported as a range for some species. The lowest category
listed is based solely on the percentage of students able to correctly name the species. If adding the percentage of students who incorrectly labeled
the illustration to the percentage of students able to provide an acceptable name the species moves the rating into the next highest category, that
category is listed as well.
Fish
Eagle Genet
Monitor
Lizard
S-N
Otter Sitatunga
Silver
Cyprinid
Vervet
Monkey
Hippo-
potamus Crocodile
Little
Egret
Egyptian
Goose Elephant Giraffe
Familiarity Low-Med Low-Med High Low Low High High High High Med Low-Med High High
Attractiveness Med Low Low Med Med High Med Med Low High High High High
Usefulness Med Low Low Med Med High Low Med Low Med High Med Med
Likeability High Low Low Med Med High Med Med Low High High Med High
Desirability Med Low Low Low Med High Low Low Low High High Med Med
48

49
Figure 2.1. The communities around Rubondo Island National Park, Tanzania, where surveys of
school children were conducted in 2008 and 2009.

50
Figure 2.2. The number of students enrolled in each target school and standard that did and did
not participate in my 2008/2009 survey regarding the wildlife opinions and preferences of
children living near Rubondo Island National Park, Tanzania.
*Sampled in both 2008 and 2009, and sums are reported.
0
100
200
300
400
500
600
Std. 6 Std. 7 Std. 6 Std. 7 Std. 6 Std. 7 Std. 6 Std. 7 Std. 6 Std. 7 Std. 6 Std. 7 Std. 6 Std. 7
Butwa* Ikuza Izumacheli Maisome Muganza Nkome Katemwa*
Stu
de
nts
Did not participate Participated

51
Figure 2.3. The number of the 932 participants in my 2008/2009 survey of school children in
communities surrounding Rubondo Island National Park, Tanzania, who have parents in various
professions.
0
100
200
300
400
500
600
700
800
900
1000
Farmer Fisherman Businessman Livestock Keeper
Other
Par
tici
pan
ts
Occupations of heads of households
Not involved One of Several Occupations Sole Occupation

52
Figure 2.4. For each opinion/preference question in my 2008/2009 survey of school children in
communities surrounding Rubondo Island National Park, Tanzania, the percentage of students
who were able to name the species that did not respond, did not have an opinion, were not sure of
their opinion, or provided an invalid response. Sample size is included inside the appropriate bar
for each species and variable.
0
20
40
60
80
100
Re
spo
nd
en
ts (
%)
a. Attractiveness
0
20
40
60
80
100
Re
spo
nd
en
ts (
%)
b. Usefulness
0
20
40
60
80
100
Re
spo
nd
en
ts (
%)
c. Likability
0
20
40
60
80
100
Re
spo
nd
en
ts (
%)
d. Desirability
No Answer Not sure No opinion Invalid Answer Other
412 290 764 164 198 746 131 109 135 111 52 141 134
412 290 764 164 198 746 867 740 886 577 305 141 134
412 290 764 164 198 746 131 109 135 111 52 141 134
412 290 764 164 198 746 131 109 135 111 52 141 134

53
Figure 2.5. The number of participants in my 2008/2009 survey of schoolchildren in communities surrounding Rubondo Island National Park,
Tanzania, able to provide an ―acceptable‖ name for each of 13 wildlife species (n = 932).
0
100
200
300
400
500
600
700
800
900
1000
Resp
on
se
s
Unacceptable, invalid, or blank Acceptable
53

54
Figure 2.6. The percentage of students participating in my 2008/2009 survey in communities surrounding Rubondo Island National Park,
Tanzania, that considered each of 13 species attractive. Only the responses of participants able to name the individual species are shown, and the
relevant sample size is indicated at the top of each bar.
0
10
20
30
40
50
60
70
80
90
100
Responses (
%)
Not sure, no opinion, no or invalid answer Unattractive Attractive
412 290 764 164 198 746 131 109 135 111 52 141 134
54

55
Figure 2.7. The percentage of students participating in my 2008/2009 survey in communities surrounding Rubondo Island National Park,
Tanzania, that considered each of 13 wildlife species useful. Only the responses of participants able to name the individual species are shown, and
the relevant sample size is indicated at the top of each bar.
0
10
20
30
40
50
60
70
80
90
100
Responses (
%)
Not sure, no opinion, no or invalid answer Useless Useful
412 290 764 164 198 746 131 109 135 111 52 141 134
55

56
Figure 2.8. The percentage of students participating in my 2008/2009 survey in communities surrounding Rubondo Island National Park,
Tanzania, that reported ―liking‖ each of 13 wildlife species. Only the responses of participants able to name the individual species are shown, and
the relevant sample size is indicated at the top of each bar.
0
10
20
30
40
50
60
70
80
90
100
Responses (
%)
Not sure, no opinion, no or invalid answer Dislike Like
412 290 764 164 198 746 867 740 885 577 305 141 134
56

57
Figure 2.9. The percentage of students participating in my 2008/2009 survey in communities surrounding Rubondo Island National Park,
Tanzania, that wanted each of 13 wildlife species to be abundant in their communities. Only the responses of participants able to name the
individual species are shown, and the relevant sample size is indicated at the top of each bar.
0
10
20
30
40
50
60
70
80
90
100
Responses (
%)
Not sure, no opinion, no or invalid answer Do not want species to be many Want species to be many
412 290 764 164 198 746 131 109 135 111 52 141 134
57

58
CHAPTER 3
FAMILIARITY WITH WILDLIFE AND SPECIES PREFERENCES OF CHILDREN
NEAR RUBONDO ISLAND NATIONAL PARK, TANZANIA: DO DEMOGRAPHICS
MATTER?
Abstract
Conservation and environmental education programs are often developed for children and
employ focal species or mascots. However, knowledge regarding children‘s wildlife
preferences—particularly how demographic variables influence their familiarity with, affinity for,
and opinions regarding many wildlife species—is limited. Such knowledge, however, could prove
useful in choosing the most appropriate mascots for educational programs, and even flagship
species for a broader campaign. In this chapter, I assess the influence of demographic variables
(gender, school, standard [grade], and select professions held by heads of households) on
children‘s ability to name 13 species (the spotted-necked otter [Lutra maculicollis], sitatunga
[Tragelaphus speki], large-spotted genet [Genetta tigrina], Egyptian goose [Alopochen
aegyptiacus], fish eagle [Haliaeetus vocifer], little egret [Egretta garzetta], hippopotamus
[Hippopotamus amphibious], silver cyprinid [Rastrineobola argentea], monitor lizard [Varanus
niloticus], vervet monkey [Cercopithecus pygerythrus], crocodile [Crocodylus niloticus], giraffe
[Giraffa camelopardalis], and elephant [Loxodanta Africana]) using binary logistic regression
descriptively. In addition, I evaluate the influence of each demographic variable on children‘s
―dislike‖ for and desire to live near ―few‖ of each species using binomial logistic regression and
an information-theoretic approach. All demographic variables included, with the exception of
having a head of household involved in farming, explained some variation in students‘ ability to
name at least 1 species. No model explained ―dislike‖ for sitatunga, Egyptian geese, elephants,

59
and giraffes, nor preferences for ―few‖ crocodiles, Egyptian geese, and little egrets better than the
respective null models. However, other models for ―disliking‖ and wanting ―few‖ of a species
explained variation in the data better than the null. Each demographic variable measured
explained some variation in children‘s affinity and preferences regarding wildlife. Regardless,
measurement and modeling of the demographic variables included in this study appears to hold
little promise as a method for predicting children‘s wildlife preferences.
Introduction
Conservation and environmental education programs often are developed for children
(Eagles and Demare 1999, Vaughan et al. 2003) and, in conservation education in particular,
specific species are regularly used as foci or mascots for such programs (e.g., Jacobson and Padua
1995). However, understanding factors influencing children‘s wildlife preferences—and
particularly how demographic variables influence those preferences—is limited. Available
information suggests there often are differences in children‘s wildlife familiarity and preferences
between genders, with researchers often reporting boys to be more positive about (Westervelt and
Llewellyn 1985, Kellert and Westervelt 1983, Bjerke et al. 1998a, Prokop and Tunnicliffe 2008),
more knowledgeable about (Kellert 1985b, Kassilly 2006), and less afraid (e.g., reporting certain
animals to be less ―scary‖ or ―dangerous‖—Bjerke et al. 1998a) of many animals than girls.
Other research has shown younger children to have more affinity for animals (wild and domestic)
and more interest in wildlife than older children (e.g., Bjerke et al. 1998a). Younger children also
have been reported to have more favorable attitudes toward the environment (e.g., Leeming and
Dwyer 1995, Alp et al. 2006) (although this has been contradicted—see Alp et al. 2006 for
review) and different wildlife value orientations (e.g., Kellert and Westervelt 1983, Bjerke et al.
1998a) than older children. Among locations and cultures, environmental attitudes (Skogen 1999,
Zecha 2010) and wildlife values (Kellert and Westervelt 1983, Bjerke et al. 1998a), preferences

60
(Entwistle and Stephenson 2000, Bjerke et al. 1998a), and knowledge (Kassilly 2006) among
youth have been reported to differ as well.
Children‘s attitudes toward other topics (e.g., politics, race, and gender roles) often are
influenced by the attitudes of their parents (Branch and Newcombe 1986, Cunningham 2001,
Kent Jennings et al. 2009). Adults‘ professions can put them into direct conflict with wildlife.
Ranchers, for example, lose livestock to large predators, farmers lose crops to herbivores
(summary in Thirgood et al. 2005), and hatchery owners lose fish to piscivores (e.g., otters—
Ludwig et al. 2002, Kruuk 2006). Although the effect of such interactions and their influence on
individuals‘ attitudes likely widely varies, people experiencing conflict with a species have been
reported to have more negative attitudes toward the offending species (e.g., American beavers
[Castor canadensis], Jonker et al. 2006) or living with the offending species (African lions
[Panthera leo], Hemson et al. 2009) than people not experiencing conflict. In North America,
negative attitudes toward bears have been described among livestock producers, loggers, and
miners (Kellert 1994), and, in Norway, living on a livestock-producing farm during youth has
been associated with negative attitudes toward wolves (Canis lupus) (Bjerke et al. 1998b).
However, people involved in professions that put them in more regular contact with wildlife, like
farming, fishing, and livestock keeping, likely also have increased knowledge of various species.
Results of a survey I conducted around Rubondo Island National Park (Rubondo),
Tanzania, suggest that children in the area are comparatively least familiar with (i.e., least able to
name an animal based on an illustration) the spotted-necked otter (Lutra maculicollis), sitatunga
(Tragelaphus speki), large-spotted genet (Genetta tigrina), and Egyptian goose (Alopochen
aegyptiacus); fairly familiar with the fish eagle (Haliaeetus vocifer), and little egret (Egretta
garzetta); and quite familiar with the hippopotamus (Hippopotamus amphibius), silver cyprinid
(Rastrineobola argentea), monitor lizard (Varanus niloticus), vervet monkey (Cercopithecus
pygerythrus), crocodile (Crocodylus niloticus), giraffe (Giraffa camelopardalis), and elephant
(Loxodanta africana) (Chapter 2; Figure 3.1). Children in the study showed little affinity for or

61
desire to live near genets, monitor lizards, spotted-necked otters, vervet monkeys, crocodiles and
hippopotamuses; some affinity for and desire to live near giraffes, elephants, fish eagles, and
sitatunga; and high affinity for and desire to live near Egyptian geese, silver cyprinids, and little
egrets (Chapter 2; Figure 3.1). My survey was the first I am aware of to ask about several of the
species mentioned above. Consequently, to my knowledge, nothing is known about how
demographic variables (e.g., gender) affect children‘s familiarity with and preferences regarding
those species. Such knowledge, however, could be of great use. For example, if children disliking
a particular species are part of a cohesive group (such as living in the same community or having
parents involved in the same professions), no matter how small the group may be, using that
species as a mascot for environmental education programs, or especially more generally as a
flagship species intended to increase support for conservation, could be unwise. A flagship
species about which the target audience‘s attitudes are polarized may, in fact, become a
―mutinous‖ flagship (Barua et al. 2010). Understanding commonalities among those disliking a
species may also help to elucidate the source of that dislike (e.g., conflicts specific to the local
area or culture). In addition, such knowledge may enable managers of other protected areas to
better understand reactions to wildlife among their local constituencies and thereby respond most
appropriately to conflicts.
I assessed the relationship of several demographic variables I hypothesized to be
associated with wildlife preferences—school (also representing community), standard (grade),
parental profession (particularly farming, fishing, and livestock keeping), and gender—on
students familiarity with, affinity for and desire to live near 13 wildlife species present at
Rubondo. I expected that girls would be less likely to be familiar with all species, and more likely
than boys to dislike potentially dangerous species and want few of them. I did not expect
differences in affinity for and preferences regarding a species among communities in cases where
abundance of the animals or interactions with those animals were similar, or among standards
generally because the age range was narrow. However, I did expect some differences in

62
preferences among standards and schools based on varying levels of previous exposure to
environmental education efforts or curriculum. Lastly, I expected that children whose heads of
household (HOH) were in professions that come into contact with a wildlife species would more
likely be familiar with those species, and children with HOHs in professions likely to come into
conflict with a species would be more likely to dislike that species and want few of the animals to
live nearby.
Methods
Study Area
The survey was conducted in 7 communities surrounding Rubondo (see Chapter 2 for
detail). Livelihoods in such rural regions of Tanzania are largely dependent on fishing and
agriculture; 89% of people in those regions report owning land for agricultural purposes (National
Bureau of Statistics 2002). At least 35 of Tanzania‘s >130 different ethnic groups (Ndembwike
2006) are represented in the study area, the most common of which are Sukuma, Zinza, Jita, and
Kerewe (Chapter 2).
The Survey
The survey was administered to 686 children in public primary school Standards 6 and 7
among 6 of the study communities in May-June, 2008, and to 246 additional Standard 4, 5, 6, and
7 children in 3 public primary schools (1 of which was also included in 2008 surveys) in
February, 2009. One hundred and forty-one of the 2009 participants were given a revised version
of the survey instrument. Each version asked that students name the animal species depicted in a
series of illustrations, and then answer ―opinion‖ questions about the illustration, including: ―Do
you like this animal?‖ and ―Would you like many of these animals where you live?‖ The original
version of the survey included questions about 11 wildlife species: the fish eagle, large-spotted
genet, monitor lizard, spotted-necked otter, sitatunga, silver cyprinid, vervet monkey,
hippopotamus, crocodile, little egret, and Egyptian goose. However, students were not asked for

63
their preferences regarding abundance (i.e., if they would like many of the animals where they
live) for the last 5 species. In the revised version of the survey, students were asked for their
abundance preferences regarding those 5 species as well as all others previously included. In
addition, students were asked about 2 new species: the elephant and giraffe. I collected the
following demographic information from students in both 2008 and 2009: standard, school, and
profession of HOH. In addition, all students participating in surveys in 2009 were asked for their
gender (whereas in 2008 they were not).
The Data
Individual animal labels provided by each student were classified as ―acceptable‖ or
―unacceptable‖ (see Chapter 2 and Appendix C). For each species, the responses to ―opinion‖
questions (i.e., ―Do you like this animal?‖ and ―Would you like many of these animals where you
live?‖) of students unable to correctly identify the illustration were discarded. Therefore, sample
size for each ―opinion‖ variable differed based on children‘s ability to identify the species, as well
as whether the species/question was included in the original version of the survey (Table 3.1). In
preparing the ―opinion‖ variables for use in analysis, I combined responses of ―yes‖, ―not sure‖,
and ―no opinion‖ because I was most interested in children with negative perceptions of a species
(i.e., not liking the species and not wanting many of the animals nearby). I also created individual
variables for common HOH professions most likely to come into contact with or have potential
conflict with wildlife (i.e., farmers, fishers, and livestock keepers). Because of the 2 versions of
the survey and the inclusion of the question regarding gender on all surveys administered in 2009,
the sample of students asked various demographic questions differed (Table 3.2).
Data Analysis
Modeling
Binary logistic regression was used descriptively (Berk 2004) to assess demographic
influences on ability to name the fish eagle, large-spotted genet, monitor lizard, spotted-necked
otter, sitatunga, silver cyprinid, vervet monkey, hippopotamus, little egret, and Egyptian goose

64
(i.e., species that <90% of participants were able to ―correctly‖ name—Figure 3.1). Binary
logistic regression also was used to model the influence of demographic variables on ―disliking‖
and wanting ―few‖ of each species among students able to name that species (Vaske 2008).
Unlike for models describing ability to name species, the information-theoretic approach
(Burnham and Anderson 1998) was used to select the ―best‖ model for ―disliking‖ and wanting
―few‖ of each species. The 2 different approaches to modeling were used for familiarity models
(i.e., models that describe the influence of demographic variables on ability to name species)
versus affinity models (i.e., models that describe the influence of demographic variables on
―dislike‖ for a species) and abundance models (i.e., models that describe the influence of
demographic variables on wanting ―few‖ of a species) because I saw little utility in attempting to
predict familiarity with each species (and therefore little incentive to develop the most
parsimonious model for explaining the data), but being able to predict disliking and not wanting
to live near different species could be useful in informing outreach campaigns. The analyses done
here represent the first steps toward the potential development of predictive models for those
variables.
Model Building. Familiarity models, as well as sets of candidate affinity models and
abundance models were developed. Sets of candidate models included all possible relevant
combinations of independent variables. Because participants were only asked for their gender in
2009, I developed 2 model sets for each of the 3 types of dependent variables (familiarity,
affinity, and abundance) for all species included in both the original and revised versions of the
survey (Table 3.3). One set included only responses of 2009 participants, enabling the inclusion
of the independent variable ―gender‖, and the other included data from 2008 as well as 2009, but
not the independent variable ―gender‖ (which was not measured in 2008). In 2009 affinity and
abundance model sets, interaction terms for gender and each of the included HOH professions
also were developed and included in the list of potential independent variables.

65
Model Selection. Akaike‘s Information Criterion (AIC) was used to select the most
parsimonious models in each affinity and abundance set (Burnham and Anderson 1998). A small
sample bias correction (AICc) was used whenever the number of observations per variable was
<40 for the global model (Burnham and Anderson 1998). For each type of dependent variable
(e.g., fish eagle ―dislike‖), I began assessments with the model set based on 2009-only data. If
gender was not included as a variable in the 2009 model with the lowest AIC/AICc value, the
whole set of models that contained only 2009 data was discarded and I focused all further
assessments on the model set based on the combined 2008 and 2009 data. Because there is
substantial support for all models ≤2 AIC/AICc units from that with the lowest AIC/AICc value
(Burnham and Anderson 2004), each model in the set within that range was considered a ―top
candidate model‖ and included in interpretation. I calculated Akaike weights (wi) for all top
candidate models (or the top 5 models of each set, if the number of top candidate models was <5)
(Burnham and Anderson 1998). Using the metrics above and knowledge regarding the variables
included in each model, an ―optimal model‖ given the data (if any) was then chosen from among
the set of top candidates for each model set.
Model Interpretation. For all of the familiarity models the significance of individual
coefficients was assessed using z-tests (Long and Freese 2006), with an outcome considered
significant at α = 0.10. For the optimal affinity and abundance models, Likelihood Ratio χ2 and
Hosmer-Lemeshow goodness-of-fit statistics (Hosmer and Lemeshow 2000, Long and Freese
2006) were calculated whenever ties did not result in the number of distinct quantiles being <6
(which frequently happens when predictor variables are categorical and few—Becketti 1995), as
were several pseudo-R2 statistics, including McFadden‘s, McKelvey and Zavoina‘s, Cragg-
Uhler‘s (Nagalkerke‘s), Effron‘s, and Adjusted Count. Although generally not considered reliable
for making decisions regarding models (Long and Freese 2006, UCLA undated) and not
acceptable for diagnostic tests, empirical researchers often explicitly or implicitly make rough

66
comparisons of "goodness of fit" based on pseudo-R2 measures across similar empirical models
with similar samples (Veall and Zimmerman 1996). Reporting of these values, regardless of their
incomparability (Long and Freese 2006, UCLA undated) was deemed important in this case
because many indicated very poor levels of explanation in the model.
Univariate Analyses
In addition to modeling, I used separate Pearson‘s chi-square analyses to further assess
the effect of the variable ―gender‖ on ―disliking‖ and wanting ―few‖ individuals of each species
nearby (Vaske 2008). Although such mixing of univariate and multivariate techniques is
generally not recommended, chi-squared analyses were particularly useful in interpreting results
when sample sizes fell below levels recommended for binary logistic regression.
Data were analyzed using Stata/IC 11.0 (StataCorp, College Station, Texas 77845, USA)
with the SPost add-on (Long and Freese 2006) for analyses related to logistic regression and
estout (Jann 2005, 2007) for associated tables.
Results
Modeling
Model Building and Selection
For each of the affinity and abundance data sets, up to 47 candidate models were created
using listwise deletion. For most affinity and abundance dependent variables, I considered
between 1 and 12 models top candidates (Appendix D1 and D2). Generally, the choice of the
optimal model from among the top candidate models was clear, with the top model having a
substantially greater wi and being more parsimonious than the next best model. Further detail is
given below when that was not the case.
Affinity. ―Gender‖ was not included in the top model based on 2009 data only for any
species also included in the 2008 survey, other than the vervet monkey. For the 2 species with
only 2009 data available—the elephant and giraffe—none of the top models were considered
67
―optimal.‖ The 7 models for elephant that were ≤2 AICc units of the top model contained among
them most of the possible variables in differing combinations (all resulting in wi ranging from
0.187 to 0.113), indicating that each of the variables made a similar, and likely insubstantial,
contribution. Similarly, for the giraffe, the 12 top candidate models, together containing each of
the possible variables, all had wi between 0.127 and 0.050, suggesting that none has a
substantially greater level of support than any other and, therefore, none were likely useful in a
practical sense.
Given that ―gender‖ only appeared to be an important variable for the vervet monkey
model and no model was optimal for the elephant and giraffe, I was left with only model sets
created from the combined 2008 and 2009 data with the exception of the vervet monkey. Within
each model set, the model with the lowest AIC/AICc score was considered optimal for all species
but the sitatunga and little egret (Appendix D1). In the case of the sitatunga, the 2 top candidate
models from the combined 2008/2009 dataset had lower AICc scores than the null. However, each
also had nearly the same wi as the null (range: 0.211 for the lowest scoring model to 0.202 for the
null), and consequently I did not consider any affinity models ―optimal‖ for that species. For the
little egret, the 2 lowest-scoring of the 5 top models had very similar wi (0.272 vs. 0.265), and the
top model contained an additional variable (―HOH livestock keeper‖). I chose the model with the
second-lowest AIC value as the optimal model based on knowledge of that additional variable‘s
relationship to the most commonly accepted name for the speciesi.
Abundance. Among the species with top abundance models based on 2009 data that I
also asked about in 2008 (i.e., fish eagle, genet, monitor lizard, sitatunga, and silver cyprinid—
see Table 3.3), ―gender‖ was a significant variable for the silver cyprinid and fish eagle.
Consequently, only the top 2009 candidate models were considered in the choice of an optimal
model for those 2 species. The optimal models for the vervet monkey, hippopotamus, crocodile,
little egret, Egyptian goose, giraffe, and elephant also were chosen among the top 2009 candidate

68
models only due to limited sampling for those variables/species (i.e., questions about their
abundance only being included in the revised version of the survey) (Table 3.3).
I considered 1 abundance model optimal for 10 of the 13 species included in the survey.
No model described abundance preferences regarding the crocodile or little egret better than their
respective nulls. Additionally, although 1 of my Egyptian goose models had an AICc score lower
than the null and was fairly well-supported (wi = 0.364, Appendix D2), I did not consider any
model optimal for the species because the model with the lowest score included only the static
variable ―son of a fisher‖ (likely because of the low frequency of fishermen HOHs in the sample
and the prevalence of participants wanting many Egyptian geese generally),and the model with
the second-lowest AICc score (∆ AICc = 1.090, wi = 0.211) was the null.
In contrast to the above, the giraffe model with the lowest AICc value was included
among the optimal models, although also including variables with no variation (―Standards 4 &
5‖ and ―Standard 7‖). However, the model should be approached with skepticism, as these 2
perfect predictor variables resulted in the very high wi (0.886, Appendix D2) of the model. In
addition, the number of students from each standard that participated in the survey was uneven
among schools for questions regarding this species and therefore the effective difference may be
more accurately attributed to variation among schools. The next best model for giraffe abundance
did contain only the variables for ―school,‖ but had a wi of only 0.036 and was 6.392 AIC values
larger than the optimal model (Appendix D2).
For the hippopotamus, the model with the lowest AICc value was not strongly supported.
The wi was only 0.282 for that model versus >0.220 for the next 2 models (Appendix D2).
Additionally, 9 models were ≤2 AICc values from that with the lowest score. However, the
lowest-scoring model was the most parsimonious of all the top candidate models, and so was
chosen as the optimal model although it was not strongly supported.

69
Model Interpretation
Familiarity. Boys were more likely to provide an acceptable name for the fish eagle,
genet, monitor lizard, spotted-necked otter, hippopotamus, and little egret than girls (Table 3.4a).
The odds ratio was greatest for genets, with the odds of a boy being able to name the species >4
times greater than the odds of a girl being able to do so. (Note: The influence of gender on ability
to name the vervet monkey was not assessed because in 2009, when gender was measured, >90%
of participants were able to name the species.)
For every species, at least some of the ―school‖ variables had detectable influence on
students‘ familiarity with a species, and students from different schools often varied greatly in
their ability to name a species (Table 3.4b). For example, the students from Katemwa were much
less likely than those from Butwa to be able to name the genet (Odds Ratio [OR]: 0.156; CI =
0.089, 0.274; p < 0.001), but were more likely to be able to name the sitatunga (OR: 3.091; CI =
1.478, 6.464; p = 0.003). At least 1 of the ―standard‖ variables (i.e., 4 & 5, 6 or 7) had detectable
influence on students‘ ability to name every species but the fish eagle, silver cyprinid, vervet
monkey, and hippopotamus (Table 3.4b).
Children whose HOHs were farmers generally were no more or less likely to be able to
name any species than those with HOHs in other professions. Although a difference was detected
for 1 species, the monitor lizard, even in that case the confidence interval for the odds ratio
included 1 (OR: 0.708; CI = 0.476, 1.053; p = 0.088). Children whose HOHs were fisherman
were more likely than those without a HOH involved in fishing to be able to name the spotted-
necked otter (OR: 2.128; CI = 1.139, 3.974; p = 0.018) and the Egyptian goose (OR: 1.994; CI =
1.223, 3.251; p = 0.006). Children whose HOHs were livestock keepers were less likely than
those without livestock keeping HOHs to be able to name the genet (OR: 0.353; CI = 0.168,
0.742; p = 0.006) and the Egyptian goose (OR: 0.509; CI = 0.264, 0.979; p = 0.043).
Affinity. In total, I considered 9 species to have optimal affinity models: fish eagle,
genet, monitor lizard, spotted-necked otter, silver cyprinid, vervet monkey, hippopotamus,

70
crocodile, and little egret (Table 3.5). The model for fish eagle included ―school‖ and ―standard‖
variables. ―School‖ alone was in the best model for genet, and ―standard‖ alone was in the best
model for monitor lizard, crocodile, and little egret. ―Standard‖ and ―HOH fisherman‖ (with
children of fishermen less likely to ―dislike‖ the species) were in the optimal model for the
spotted-necked otter, whereas ―HOH fisherman‖ was the only variable in the optimal model for
the silver cyprinid (with those students more likely to ―dislike‖ the species). The best model for
hippopotamus included only ―HOH livestock keeper‖ (with students with HOHs involved in the
profession less likely to ―dislike‖ the species). The best model for vervet monkey included
―gender‖ and ―HOH farmer,‖ as well as the interaction term for those 2 variables. Females and
those with HOHs involved in farming were more likely to ―dislike‖ vervet monkeys.
The Hosmer-Lemeshow statistic indicated that fit was good for the fish eagle optimal
model, but could not be reliably assessed for the genet (although other top candidate models were
shown to have an acceptable fit, and each contained only 1 additional variable), monitor lizard,
spotted-necked otter, hippopotamus, crocodile, silver cyprinid, vervet monkey, and little egret
optimal models because ties resulted in the number of distinct quantiles being <6. The 5 pseudo-
R2 values calculated for each optimal model all suggested that the silver cyprinid, hippopotamus,
and crocodile models explained a very small amount of the variance in the data (Table 3.5).
Abundance. I considered the fish eagle, genet, monitor lizard, spotted-necked otter,
sitatunga, silver cyprinid, vervet monkey, hippotamus, elephant, and giraffe to have optimal
abundance models (Table 3.6). The optimal models for fish eagle and silver cyprinid both
included only ―gender‖, with males more likely not to want to live near many of both species.
However, in the case of the silver cyprinid the confidence intervals for the odds ratios included 1
(Appendix D2). The only other species for which ―gender‖ was a significant variable was the
vervet monkey, with males less likely to want ―few‖ of the species. ―School‖ was included in the
optimal models for the genet, monitor lizard, spotted-necked otter, vervet monkey, and
hippopotamus. ―Standard‖ was included in the optimal models for the monitor lizard, spotted-

71
necked otter, sitatunga, elephant, and giraffe. Parental profession variables were included in the
optimal models only for the genet, monitor lizard, and vervet monkey. The genet was less likely
to be unwanted by children with a farmer as the HOH, and was more likely to be unwanted by
children with a livestock keeper as the HOH (although only 10 such participants properly named
the species, none of them wanted genets to be abundant nearby). The monitor lizard was more
likely to be unwanted by children with a livestock keeper as the HOH. The optimal abundance
model for the vervet monkey contained all 3 measured professions, and students with HOHs in
each were more likely not to want the species nearby.
The Hosmer-Lemeshow goodness-of-fit statistic was valid (i.e., there were not too few
ties for the statistic to be reliable) for the optimal genet, monitor lizard, spotted-necked otter, and
vervet monkey models. In all cases the statistic indicated that fit was acceptable. The optimal
abundance models generally had higher pseudo-R2 values than the optimal affinity models. The
only species that had no pseudo-R2 values >0.100 for the optimal abundance models were the
silver cyprinid and hippopotamus.
Univariate Analyses
Differences between genders were detected in ―dislike‖ and/or desire for ―few‖ of the
elephant, vervet monkey, and fish eagle. Males were less likely to ―dislike‖ the elephant and less
likely to both ―dislike‖ and want ―few‖ of the vervet monkey (Table 3.7). Females were less
likely to want ―few‖ of the fish eagle.
Discussion
Models I developed using the measured variables ―school,‖ ―standard,‖ ―gender,‖ and
―HOH profession‖ provide useful insights regarding students‘ familiarity with and perceptions of
many of the species included in my surveys. Variation in ―dislike‖ among children from different
schools for fish eagles, genets, and vervet monkeys, and in preference for ―few‖ genets, monitor
lizards, and spotted-necked otters likely are a combined result of local interactions with each of

72
the species, local abundance, and perhaps slight differences in behavior or livestock/farming
practices between communities. Each of the species is thought, at least to some extent, to either
raid crops or fishing nets or prey upon or otherwise negatively impact livestock (S. S. S.,
unpublished data). As was reported by Bjerke et al. (1998a) in regards to children‘s perceptions
of carnivores among different regions of Norway, children in communities within my study area
that experience more intense conflicts with a species may have less preference for that species.
Students in none of the Standards (4 and 5, 6 or 7) (which appeared as variables in the
optimal abundance models for the sitatunga, elephant, and giraffe; in the affinity models for fish
eagle, crocodile, and little egret; and in both types of models for the monitor lizard and spotted-
necked otter) were consistently more likely to ―dislike‖ animals or want them to be ―few.‖ For
example, participants in Standard 6 were less likely than those in Standard 7 to ―dislike‖ the
crocodile and little egret, but more likely to ―dislike‖ the fish eagle, monitor lizard, and spotted-
necked otter. In all cases except ―dislike‖ for the fish eagle and wanting ―few‖ of the monitor
lizard and spotted-necked, ―school‖ was not also included as a variable in the optimal models.
Therefore, these differences likely cannot be fully attributed to the influence of individual
teachers, peer groups, or the survey administration environment. Additionally, the pattern of
differences among standards did not align with any known conservation education activities or
the national curriculum (H. Mwamjengwa, Rubondo Island National Park, personal
communication). Unequal sampling among standard and school further complicates interpretation
of the variable‘s influence. In most cases, sample size among schools and standards was dictated
largely by the availability of students in target standards (6 and 7) at the time of my visit.
However, in Butwa, teachers requested to fill additional classroom space during survey
administration with students from Standards 4 and 5. Although that was not the intended survey
audience, I included Standard 4 and 5 students‘ responses in analysis to help counter small
sample sizes caused by the generally limited ability of participants to name several of the

73
included species. Consequently, however, the variable ―Standards 4 and 5‖ contains only students
from Butwa handpicked by the teacher for participation.
Because of unequal sampling, interpretation of the differences among standards in
perceptions of the wildlife species discussed here should be approached with caution. The
inclusion of ―standard‖ as a variable in the optimal model for a species may be indicative of the
generally poor descriptive ability of the model, or another variable that I did not measure may be
fluctuating in a similar pattern and thereby making ―standard‖ appear more important than it
otherwise would (e.g., participants in the same standard—and therefore of similar age—may
share an experience I did not measure). However, differences in attitudes among children of
similar ages have been reported for other topics. For example, differences in environmental
attitudes were reported among younger and older children (Leeming and Dwyer 1995), and even
among 6th and 7
th/8
th grade students (Şahin and Erkal 2010). Complex fluctuations with age also
have been reported in regard to wildlife value orientations (Kellert and Westervelt 1983, Kellert
1985b, Bjerke et al. 1998a).
The apparently greater familiarity with nearly all species included in the survey among
boys is similar to the results of others who also reported that boys were more knowledgeable
about wildlife (Kellert 1985b, Kassilly 2006). Gender also appeared to be important in
influencing affinity for vervet monkeys, as well as abundance preferences regarding that species,
the fish eagle, and the silver cyprinid. The increased likelihood of girls ―disliking‖ and wanting
―few‖ of the vervet monkey is not surprising given other researchers‘ reports suggesting that girls
tend to be more fearful and hold more negative attitudes toward wildlife (Westervelt and
Llewellyn 1985, Kellert and Westervelt 1983, Bjerke et al. 1998a, Prokop and Tunnicliffe 2008).
In addition, girls in Tanzania are said to complain of being chased by vervet monkeys more than
boys (B. Amulike, personal communication, Frostburg State University). The increased
likelihood of boys wanting ―few‖ fish eagles and silver cyprinid, however, is more unexpected.

74
Children with fishing HOH‘s being less likely than others to ―dislike‖ the spotted-necked
otter, which takes fish from nets (Lejeune 1989), and more likely to ―dislike‖ the silver cyprinid
initially appears counterintuitive. However, ―like‖ is a widely encompassing term that does not,
for example, exclude responses to opinions of that animal as a food—a food that is likely more
regularly eaten by the children of fishermen. ―Dislike‖ of fish could also stem from factors as
seemingly extraneous as the HOH‘s time spent away on fishing trips, or the participant‘s dislike
of associated chores. As for spotted-necked otters, although the species is known by local people
to take fish from nets (S. S. S., unpublished data), the behavior may not occur often enough to be
considered problematic. In addition, research conducted on adults in other areas of the world
suggests that conflict does not always lead to ―dislike‖ of a species.ii For example, researchers in
an area of southern Brazil reported that most livestock owners in their study liked jaguars,
commonly considered predators of livestock, and liking did not decrease among those owning
herds that had experienced predation problems (Amorim Conforti and Cascelli de Azevedo
2003). Researchers in Botswana also reported that local people who had lost stock to lions were
no more likely than others to dislike the species (Hemson et al. 2009). In my study, children with
a HOH involved in fishing were, however, just as likely as participants in general to want ―few‖
otters, which is a more practical and specific measure.
Children with HOHs involved in farming were more likely to ―dislike‖ and want ―few‖
vervet monkeys. This result was not unexpected based on the species‘ reputation as crop raiders
and history of conflict with farmers (Saj et al. 2003; S. S. S., unpublished data). Children with a
HOH involved in farming also were less likely to want ―few‖ genets, which could indicate belief
among those students that genets control populations of small mammals that are crop pests. In
Britain, adult farmers‘ negative attitudes toward polecats (Mustela putorius) are balanced by a
belief that the animals control pest species (Packer and Birks 1999). Regardless of the reason,
children with a HOH involved in farming do clearly exhibit some differences in wildlife
preferences in comparison with their peers.

75
Similar distinctions were discovered for children with livestock keeper HOHs, who were
more likely to want ―few‖ genets (known to eat chickens—S. S. S., unpublished data), monitor
lizards (known to eat eggs and are thought to break the legs of cows—S. S. S., unpublished data),
and vervet monkeys. Children of livestock keepers were less likely than others to ―dislike‖
hippopotamuses, which are feared both in my study area (S. S. S., unpublished data) and
elsewhere in Tanzania (Kaltenborn et al. 2006b). Fear of and dislike for the species appear to be
related, as local adults reported that the reason for their dislike of hippopotamuses was the
animals‘ ―attacks‖ on people (S. S. S., unpublished data). Like pet ownership, which is known to
influence children‘s wildlife values (Kellert and Westervelt 1983, Eagles and Muffitt 1990,
Bjerke et al. 1998a), constant contact with animals—often large animals—among children of
livestock keepers may result in those children being less fearful of, and therefore less likely to
―dislike,‖ hippopotamuses. The increased familiarity of children of livestock keepers with animal
behavior, for example, may result in those children better understanding the circumstances that
result in humans being harmed by hippopotamuses.
The regular involvement of guardians in multiple professions and the raising of food for
personal consumption may have in some instances led to HOH professions appearing less or more
important than expected. With almost 90% of Tanzanian households owning land (World Bank
1999, National Bureau of Statistics 2002), many people who do not consider themselves farmers
likely grow fruits and vegetables for personal consumption, potentially putting them in conflict
with vervet monkeys. Keeping 1 to several chickens is also common among Tanzanian
households, and likely has a great influence on perceptions of genets, commonly thought to prey
upon poultry (S. S. S., unpublished data). Future surveys should also include questions about
whether each participant‘s household has a home garden or owns chickens. Additional useful
measures regarding children‘s preferences may include how much the children assist with fishing,
farming, or livestock keeping chores, and professions of additional adults they spend considerable
time with. The influence of the professions measured here on the wildlife opinions and

76
preferences of adults practicing them also should be assessed. Regardless, these results indicate
that students with HOHs involved in farming, fishing, and livestock keeping do have some
different preferences regarding wildlife than their peers. In addition, children‘s perceptions of
several species are influenced by gender, standard, and school.
Akaike‘s information criterion indicated that my optimal models were all better than the
null models for their respective data sets, and, when considered reliable, the Hosmer-Lemoshow
statistic indicated that fit was acceptable. However, there is some indication that the models may
have limited explanatory power. This limitation is not unexpected given that attitudes, which
inform opinions and preferences, are often still developing in youth and subject to change
(Branch and Newcombe 1986). This may also help explain in part why some of the preferences
and opinions regarding species differ among the Standards (4 and 5, 6, and 7) in my study.
Researchers have suggested that as children age (in the context of this study, progress to higher
standards), they may be better able to understand and process messages provided by family
members, and also may become more highly influenced by peers (Branch and Newcombe 1986).
In addition, an abundance of factors not included in my models likely influence wildlife
preferences.
The purpose of my study was to assess the variation in children‘s preferences in relation
to readily available demographics that could potentially be used to predict wildlife preferences
with minimal effort. However, aside from sociodemographic influences, species preferences (as
described here, among adultsii) have also been reported to vary with: an individual‘s general
attitudes toward wildlife, childhood environment, and type and amount of exposure to animals in
general; how the individual perceives an animal‘s usefulness, likeability, and attractiveness; and
the similarity of the animal to humans (Kaltenborn et al. 2003, Tisdell et al. 2006). Adults‘
perceptions of a wildlife species also are reported to be influenced by the species‘ cultural and
historic relationships with people, and its size, dangerousness, and likelihood of inflicting
property damage (Kellert 1985a)—all of which are likely variable depending on whether the

77
animal lives in the vicinity of an individual‘s home. Perceptions of danger, conflict, and risk,
known to influence adults‘ attitudes toward wildlife species (Kellert 1994, Kaczensky et al.
2004), may also be particularly important influences on the wildlife preferences measured in my
study. Based on results from research in related disciplines focusing on children, still other factors
likely also influence preferences regarding wildlife. General environmental attitudes among
children, for example, have been reported to be significantly related to education level of parents,
monthly income status (Şahin and Erkal 2010), talking about the environment at home, watching
nature films, and reading about the environment (Eagles and Demare 1999).
In Tanzania, an additional sociodemographic variable that may be particularly important
is tribal background. Unfortunately, the high level of tribal diversity in my study area limited the
usefulness of the variable in models. Additional research should be conducted to assess tribal
beliefs about individual species, though, because those beliefs could help explain several
demographic influences suggested by my results. For example, beliefs held by the former
inhabitants of Rubondo, the Banyarubondo (a section of the larger Zinza tribe—Kiwango et al., in
prep), could help explain why males were both more able to name the fish eagle than females and
more likely to want the species to be ―few.‖ Members of the tribe, many of whom relocated to
communities in my study area after Rubondo became a National Park, considered some eagle
cries to be bad luck, and an indicator of impending misfortunes. When the cry was heard by a
fisherman just prior to embarking on a fishing trip, it meant he would not catch any fish. In
Banyarunbondo culture, women going fishing or living in fishing camps was taboo (Kiwango et
al., in prep). Were such beliefs common in my study area, males would have more reason to be
able to identify an eagle and more reason to want eagles to be ―few.‖ However, if the beliefs were
common, having a HOH involved in fishing also should have been an important variable in
affinity and abundance models for the fish eagle and, at least in cases where it was included, the
interaction term between HOH fisherman and gender should have been important. Neither was
the case. In addition, since girls also are less likely to be able to name the fish eagle than boys, the

78
girls‘ seemingly increased affinity for and desire to live near fish eagles may instead be the result
of the sample of girls able to name the species being especially biased toward those with interest
in wildlife generally, or this species in particular. Regardless, the example serves to elucidate the
complexities of tribal influence and illustrate the need for additional understanding of cultural
relationships with wildlife.
Another consideration in any discussion of the influences on preferences regarding
wildlife is that regardless of the number and types of variables included in models of opinions
regarding a species, useful results are unlikely if participants have little contact with a species or
if all participants have similar experiences with a species. The 2 considerations above likely
explain the lack of useful affinity models for the sitatunga, Egyptian goose, elephant, or giraffe,
or useful abundance models for the crocodile, little egret, and Egyptian goose. Elephants and
giraffes do not occur in any of the communities surveyed, and therefore few, if any, of the
children surveyed would have direct experiences with the species. (The populations present on
Rubondo were introduced to the Island in the 1960s and 1970s [TANAPA 2003].) The sitatunga
occurs in wetland areas (Games 1983), and therefore likely comes into little contact with people
in my study area. Adults interviewed in the study area also did express strong feelings about the
sitatunga (S. S. S., unpublished data). The little egret and Egyptian goose are both widely popular
and considered attractive (Chapter 2), and neither is locally known for causing conflict with
humans (S. S. S., unpublished data). The crocodile is highly ―disliked‖ locally (Chapter 2), and
the main reason cited by adults for disliking the species is attacks on people (S. S. S., unpublished
data). The crocodile‘s local fame for attacking people (S. S. S., unpublished data) likely results in
ubiquitous fear of the species among children in all demographic categories. Crocodiles also are
highly feared by adults around Tanzania‘s Serengeti National Park, regardless of gender, age, or
education (Kaltenborn et al. 2006b).
Although necessary to ensure that I was measuring perceptions regarding the species
intended, limiting these analyses to the responses of participants who provided an ―acceptable‖

79
name for the included illustration led to samples of <100 for 2009 abundance models for the
hippopotamus, fish eagle, genet, sitatunga, and little egret, as well as the 2009 affinity models for
the latter 4. Such sample sizes are considered risky for maximum likelihood estimation (Long
1997), and models built with them—or in my case the discarding of such models based on
indications that gender was not important—should therefore be approached with caution.
However, results of univariate analyses also indicated that gender did not influence the dependent
variables for which 2009 models were discarded. Regardless, analyses for variables with samples
of <100 ideally should be repeated with a larger sample size to further assess the contributions of
each variable included. Similar steps may be wise for particularly well- or poorly-liked species
also, because larger samples may be required when the dependent variable varies little (Long
1997).
Summary and Conclusions
Models developed provide some insight into children‘s familiarity, affinity, and
preferences regarding most of the 13 species of wildlife included in my survey. The only 1 of the
species previously determined to have the most potential to serve as effective local flagships
based on general attractiveness, usefulness, likeability, desirability, and status as native to the
area (Chapter 2)—i.e., the fish eagle, sitatunga, little egret, Egyptian goose, and silver cyprinid—
that no model was useful in describing either ―disliking‖ or wanting ―few‖ of was the Egyptian
goose. At least some demographic variables appear to influence ―dislike‖ and/or desire for ―few‖
of each of the other species. Models suggest that children‘s standard and school influence their
―dislike‖ for the fish eagle, and that males are more likely to want ―few‖ of the species (although
this may not be reliable because of the sample size of <100). No variables were useful in
describing ―dislike‖ for the sitatunga, but males were more likely to want ―few‖ of the species.
The silver cyprinid affinity model may be of particularly limited use (having no pseudo-R2 values
≥0.04), but nonetheless suggested children with fishermen HOHs were more likely to ―dislike‖

80
the species than others. Males also were more likely to not want many silver cyprinids. No
variables appeared to be useful in explaining wanting ―few‖ of the little egret, and only the
variable ―standard‖ appeared to influence ―dislike‖ for the species. Based on the above, additional
consideration of the variables included in models should be made before the fish eagle, sitatunga,
silver cyprinid, or little egret are used as flagships, given that a species disliked or unwanted by a
cohesive group could be a mutinous flagship (Barua et al. 2010)—no matter how small the group
may be.
The lack of useful models for some of the 13 species/variables discussed herein may be
related to small sample size, which also led to some concern over the reliability of decisions to
discard 2009 models (and therefore the variable ―gender‖) for 5 species, including the fish eagle,
sitatunga, and little egret. In addition, pseudo-R2 levels (which, although not generally considered
reliable, are often used as some indication of the amount of variance explained [Long and Freese
2006, UCLA undated, Veall and Zimmerman 1996]) were often low—particularly so in several
cases. Although the demographic variables I measured do influence children‘s affinity and
abundance preferences for some species, the variables may not exert enough influence to make
their measurement and modeling a practically useful tool for determining wildlife preferences.
i As noted in Chapter 1, the locally-used name for little egret is the same as that for similar-looking cattle
egret (Bulbulcus ibis). The children of livestock keepers probably are more likely than peers to spend time
in the habitat of cattle egrets (i.e., dry or wet open areas with large herbivores—Zimmerman et al. 2005).
Therefore the additional information provided by the lowest-scoring model—which suggests that a child
with a livestock keeping HOH was nearly 2 times more likely to dislike the animal (CI = 0.82, 4.39; p =
0.132)—probably most applies to cattle egrets. ii Although research on adults cannot be assumed directly applicable to children, given the limited amount
of research on children‘s attitudes, preferences, and perceptions regarding wildlife, I believe seeking
understanding from research with other audiences is reasonable as long as such comparisons are
approached with caution and awareness that results are not directly transferrable.

81
Table 3.1. Opinion variables measured in my 2008/2009 survey regarding wildlife knowledge and
preferences of children in communities around Rubondo Island National Park, Tanzania, as well
as the size of the sample of respondents included in these analyses (i.e., those participants both
able to correctly name the species and asked the question), and the number/percent of students
responding negatively to each (i.e., that ―dislike‖ or want ―few‖ of the species). Except for
affinity and abundance variables for the elephant and giraffe and abundance variables for the
vervet monkey, hippopotamus, crocodile, little egret, and Egyptian goose (all of which only 2009
participants were asked about), the ―potential‖ sample size for each variable was 932.
1 Only included in 2009 surveys, in which 141 students participated.
Opinion variables Sample size
(i.e., number of
students asked
and able to name
the species)
Number of
negative responses
(i.e., “dislike” or want
“few” of the species)
in the sample
Percentage of
negative
responses in
the sample
Affinity for:
Fish Eagle 412 63 15.3%
Genet 290 138 47.6%
Monitor Lizard 764 331 43.3%
Spotted-necked Otter 164 55 33.5%
Sitatunga 198 30 15.2%
Silver cyprinid 746 30 4.0%
Vervet monkey 867 253 29.2%
Hippopotamus 740 313 42.3%
Crocodile 885 681 76.9%
Little Egret 577 79 13.7%
Egyptian Goose 305 13 4.3%
Elephant1 141 21 14.9%
Giraffe1 134 8 6.0%
Abundance preferences regarding:
Fish Eagle 412 104 25.2%
Genet 290 166 57.2%
Monitor Lizard 764 375 49.1%
Spotted-necked Otter 164 74 45.1%
Sitatunga 198 38 19.2%
Silver cyprinid 746 39 5.2%
Vervet monkey1 131 53 40.5%
Hippopotamus1 109 45 41.3%
Crocodile1 135 91 67.4%
Little Egret1 111 14 12.6%
Egyptian Goose1 52 4 7.7%
Elephant1 141 47 33.3%
Giraffe1 134 25 18.7%

82
Table 3.2. The demographic variables measured in 2008/2009 surveys of students in communities
surrounding Rubondo Island National Park, Tanzania; the sample of students asked to provide
information regarding the variable; and the frequency of positive responses to each in the sample
of students. Sample size used to calculate frequency for all except male (gender) was 932. Only
246 students were asked for their gender, of which 240 provided a response.
*Only students participating in surveys in 2009 were asked for their gender.
** Only sampled in 2008, and so are not included in the 2009 models that include gender.
***Only sampled in 2009. † Participants commonly listed >1 profession for their HOH. For example, 36% of livestock
keeping HOHs farmed, as did 13% of fishing HOHs.
Demographic variable Number of
occurrences
in the sample
Percentage of
occurrences
in the sample
Gender*
Female 119 49.6%
Male 121 49.2%
School
Ikuza** 31 3.3%
Izumacheli** 106 11.4%
Maisome** 103 11.1%
Nkome** 209 22.4%
Butwa 105 11.3%
Katemwa 307 32.9%
Muganza 71 7.6%
Standard
4 & 5* 16 1.7%
6 523 56.1%
7 393 42.2%
HOH profession†
Farmer 553 59.3%
Fisher 109 11.7%
Livestock keeper 61 6.5%

83
Table 3.3. Check marks () indicate dependent variables included only in the revised version of
my 2008/2009 survey of students in communities surrounding Rubondo Island National Park,
Tanzania. Because the revised version of the survey was only administered in 2009, when
participants were also asked for their gender, only 1 model (or set of models) was developed for
each of the indicated variables.
Dependent Variable/Model Type
Species Familiarity Affinity Abundance
Fish Eagle
Genet
Monitor Lizard
Spotted-necked Otter
Sitatunga
Silver cyprinid
Vervet monkey
Hippopotamus
Crocodile
Little Egret
Egyptian Goose
Elephant
Giraffe

84
Table 3.4 (a and b). Models describing the influences of demographic variables on familiarity with 9 wildlife species among students living around
Rubondo Island National Park, Tanzania. Models were developed using results from a 2008/2009 survey of children in communities surrounding
the Park. Two models were developed for each animal—the first from 2009 data only and including gender as a variable (a), and the second from
2008 and 2009 data combined, but not including gender as a variable (b). (Gender information was not collected in 2008.) The second model for
each species also contains additional dummy variables for school because sampling was conducted in more villages in 2008. Confidence intervals
are shown in brackets. (Note: LR = Likelihood Ratio.)
a. 2009 Fish Eagle Genet M. Lizard S-N. Otter Sitatunga S.Cyprinid Hippo L. Egret E. Goose
Odds Ratio Odds Ratio Odds Ratio Odds Ratio Odds Ratio Odds Ratio Odds Ratio Odds Ratio Odds Ratio
Able to name spp.
Male 3.479*** 4.326*** 2.110* 1.985* 1.115 2.003 2.230** 1.843** 1.593
[1.757,6.889] [1.794,10.428] [0.877,5.073] [0.952,4.138] [0.646,1.922] [0.756,5.380] [1.051,4.735] [1.010,3.362] [0.821,3.090]
Muganza Sch. 0.083*** 0.010*** 0 0 0.48 0.064** 0.149* 0.823 0.115***
[0.024,0.289] [0.002,0.051] [0.000,.] [0.00,.] [0.159,1.444] [0.006,0.622] [0.022,1.020] [0.262,2.586] [0.035,0.380]
Katemwa Sch. 0.057*** 0.026*** 0 0.274** 1.054 0.667 0.188* 1.359 0.049***
[0.018,0.183] [0.007,0.099] [0.000,.] [0.096,0.786] [0.411,2.706] [0.068,6.590] [0.034,1.041] [0.487,3.794] [0.016,0.154]
Std. 6 2.244 3.129 0.928 0.406 0.574 0.260** 0.394 0.349* 2.464*
[0.761,6.618] [0.568,17.238] [0.207,4.157] [0.031,5.361] [0.217,1.523] [0.071,0.960] [0.036,4.215] [0.120,1.007] [0.846,7.181]
Std. 4 & 5 0.645 8.545 0.943 0.453 0.392 4.55E+05 0.203 0.978 1.082
[0.111,3.736] [0.558,130.746] [0.00,.] [0.032,6.465] [0.074,2.066] [0.000,.] [0.014,2.979] [0.130,7.381] [0.190,6.147]
HOH fisherman 1.563 0.744 0.708 1.265 0.924 0.432 2.337 1.491 1.296
[0.524,4.658] [0.197,2.804] [0.133,3.768] [0.378,4.235] [0.353,2.416] [0.084,2.213] [0.607,8.991] [0.488,4.560] [0.442,3.801]
HOH farmer 1.552 0.400** 0.711 1.004 0.98 0.917 2.062* 1.22 0.633
[0.762,3.165] [0.165,0.971] [0.289,1.747] [0.428,2.355] [0.545,1.762] [0.316,2.660] [0.947,4.490] [0.647,2.301] [0.308,1.301]
HOH livestock keeper 0.578 0.317 1.552 0.875 1.138 1.084 3.12 0.534 0.285
[0.147,2.275] [0.047,2.133] [0.181,13.300] [0.133,5.769] [0.379,3.416] [0.196,6.003] [0.334,29.109] [0.176,1.626] [0.059,1.373]
Constant 0.806 1.836 5.26E+7 1.488 0.994 102.436*** 22.639*** 3.850* 1.665
[0.182,3.573] [0.274,12.322] [0.000,.] [0.114,19.389] [0.270,3.650] [7.373,1423.009] [2.693,190.330] [0.912,16.259] [0.391,7.084]
LR Chi2 55.073*** 106.216*** 14.274* 53.185*** 3.880 22.525*** 29.286*** 11.923 54.049***
McFadden’s R2 0.189 0.390 0.0867 0.230 0.012 0.158 0.133 0.043 0.190
n = 240 for all models
*p < 0.10 **p < 0.05 ***p < 0.01
84

85
Table 3.5. The optimal affinity model developed for each species (if any model was considered useful) from the results of my 2008/2009 survey of
school children around Rubondo Island National Park, Tanzania. Independent variables included in any optimal model are listed in the first
column, and the species‘ name in the first row. If no value is shown in a cell corresponding to a particular variable/species, that variable was not
included in the optimal model for that species. Standard error is shown in parentheses.
b. 2008 & 2009 Fish Eagle Genet M. Lizard S-N. Otter Sitatunga S. Cyprinid V. Monkey Hippo. L. Egret E. Goose
Odds Ratio Odds Ratio Odds Ratio Odds Ratio Odds Ratio Odds Ratio Odds Ratio Odds Ratio Odds Ratio Odds Ratio
Able to name
spp.
Ikuza Sch. 0.725 0 3.925 1.424 3.175** 4.684** 2.842 4.942 2.299* 0.142***
[0.311,1.689] [0.000,.] [0.471,32.729] [0.486,4.172] [1.095,9.211] [1.007,21.800] [0.336,24.009] [0.612,39.906] [0.933,5.669] [0.049,0.414]
Izumacheli Sch. 1.838* 0.443*** 0.725 8.306*** 1.966 0.935 0.364** 0.954 1.477 0.943
[0.977,3.461] [0.238,0.822] [0.292,1.805] [4.088,16.876] [0.850,4.543] [0.459,1.906] [0.152,0.869] [0.425,2.144] [0.812,2.687] [0.520,1.711]
Katemwa Sch. 0.220*** 0.156*** 0.382** 0.896 3.091*** 2.039** 1.803 0.628 0.812 0.160***
[0.129,0.375] [0.089,0.274] [0.174,0.837] [0.454,1.765] [1.478,6.464] [1.054,3.945] [0.717,4.536] [0.317,1.243] [0.487,1.354] [0.091,0.281]
Maisome Sch. 0.160*** 0.093*** 0.270*** 1.084 1.609 0.472** 2.435 0.505* 1.384 1.034
[0.082,0.312] [0.042,0.203] [0.116,0.623] [0.496,2.368] [0.680,3.807] [0.240,0.930] [0.699,8.486] [0.236,1.080] [0.758,2.525] [0.567,1.886]
Muganza Sch. 0.179*** 0.050*** 0.859 0 3.476*** 1.174 2.38E+06 6.163** 2.536*** 0.269***
[0.087,0.369] [0.016,0.154] [0.306,2.409] [0.000,.] [1.468,8.233] [0.523,2.632] [0.000,.] [1.327,28.628] [1.265,5.087] [0.130,0.556]
Nkome Sch. 1.221 1.17 0.459* 0.264*** 1.5 1.057 2.38 0.457** 2.777*** 0.477***
[0.708,2.105] [0.677,2.022] [0.207,1.021] [0.109,0.641] [0.681,3.303] [0.556,2.010] [0.846,6.694] [0.229,0.914] [1.596,4.833] [0.277,0.820]
Std. 4 & 5 0.835 17.618*** 1.03E+06 5.120*** 3.496* 1.91E+06 1.376 0.358 7.203** 1.486
[0.277,2.515] [2.191,141.672] [0.000,.] [1.570,16.695] [0.916,13.337] [0.000,.] [0.155,12.187] [0.104,1.238] [1.519,34.152] [0.460,4.798]
Std. 6 1.06 2.094*** 1.460** 1.541** 1.576** 1.329 0.887 0.923 1.465** 0.713**
[0.778,1.446] [1.470,2.984] [1.017,2.096] [1.004,2.365] [1.105,2.248] [0.938,1.884] [0.498,1.580] [0.648,1.315] [1.090,1.970] [0.521,0.976]
HOH farmer 0.798 0.844 0.708* 1.291 1.237 1.033 0.896 1.093 1.168 1.011
[0.574,1.109] [0.588,1.210] [0.476,1.053] [0.817,2.040] [0.858,1.783] [0.703,1.518] [0.478,1.680] [0.757,1.578] [0.857,1.592] [0.714,1.429]
HOH 1.145 0.862 0.826 2.128** 1.213 1.265 0.813 1.138 1.343 1.994***
fisherman [0.700,1.874] [0.504,1.475] [0.444,1.538] [1.140,3.974] [0.682,2.156] [0.695,2.303] [0.340,1.943] [0.638,2.031] [0.828,2.177] [1.223,3.252]
HOH livestock 1.258 0.353*** 0.976 1.446 0.893 1.798 0.545 0.83 0.932 0.509**
keeper [0.691,2.289] [0.168,0.742] [0.457,2.083] [0.676,3.089] [0.442,1.804] [0.818,3.952] [0.228,1.304] [0.415,1.660] [0.532,1.630] [0.264,0.979]
Constant 1.693* 0.974 9.584*** 0.109*** 0.080*** 2.748*** 12.238*** 5.655*** 0.83 1.261
[0.939,3.055] [0.524,1.810] [4.100,22.402] [0.049,0.243] [0.036,0.181] [1.376,5.488] [4.317,34.693] [2.674,11.960] [0.470,1.467] [0.695,2.287]
LR Chi2 176.610*** 226.213*** 38.319*** 171.726*** 32.149*** 50.020*** 45.796*** 40.862*** 54.780*** 140.411***
McFadden’s R2 0.140 0.198 0.044 0.200 0.034 0.055 0.101 0.044 0.0447 0.120
n = 922 for all models
*p < 0.10 **p < 0.05 ***p < 0.01
85

86
Table continued from previous page
―Dislike‖ spp. Fish Eagle Genet M. Lizard S-N Otter S. Cyprinid V. Monkey† Hippo Crocodile L. Egret
Mod3bBESTRef Mod11 Mod14b Mod5 Mod9 Mod5 Mod19 Mod14b Mod8B
HOH fisherman -0.931* 1.089**
(0.538) (0.435)
HOH livestock keeper -0.660**
(0.33)
HOH farmer 0.854**
(0.431)
Son of a farmer 0.333
(Option only for 2009 models) (0.685)
Constant -1.332*** -0.406 -0.589*** -1.254*** -3.379*** -1.153*** -0.167** 1.833*** -1.604***
(0.339) (0.646) (0.121) (0.344) (0.227) (0.331) (0.079) (0.155) (0.183)
LR Chi2 37.612*** 21.037*** 25.429*** 11.833*** 5.360** 16.020*** 4.258** 9.008** 5.227*
Log Likelihood -153.201 -175.847 -472.367 -95.968 -114.635 -113.652 -475.174 -380.384 -218.325
McFadden’s R2 0.109 0.056 0.026 0.058 0.022 0.066 0.004 0.012 0.012
McKelvey & Zavoina’s R2 0.854 0.456 0.043 0.108 0.038 0.125 0.008 0.021 0.639
Cragg-Uhler’s (Nagalkerke’s) R2 0.156 0.100 0.048 0.099 0.027 0.106 0.008 0.018 0.017
Efron’s R2 0.097 0.073 0.036 0.066 0.010 0.072 0.006 0.012 0.006
Adjusted Count R2 0.000 0.198 0.119 0.019 0.000 0.000 0.000 0.000 0.000
Hosmer-Lemeshow (groups, Ĉ, p) 7, 6.27, 0.281 ‡ ‡ ‡ ‡ ‡ ‡ ‡ ‡
n 397 269 702 159 694 213 694 824 527
*p < 0.10 **p < 0.05 ***p < 0.01 † Model based on 2009 data only ‡ Ties resulted in too few groups for statistic to be reliable
86

87
Table 3.6. The optimal abundance model developed for each species (if any model was considered useful) from the results of my 2008/2009
survey of school children around Rubondo Island National Park, Tanzania. Independent variables included in any optimal model are listed in the
first column, and the species‘ name in the first row. If no value is shown in a cell corresponding to a particular variable/species, that variable was
not included in the optimal model for that species. Standard error is shown in parentheses.
Want ―few‖ of spp. Fish
Eagle† Genet
M.
Lizard S-N Otter Sitatunga
S.
Cyprinid†
V.
Monkey† Hippo† Elephant† Giraffe†
Mod25 Mod5 Mod10b Mod3 Mod5b Mod13 Mod2 Mod 23 Mod40b Mod3
Male 2.497** 0.944* -1.038**
(Option only for 2009 models) (1.070) (0.553) (0.444)
Std. 7 -0.598*** -0.303 -17.177
(0.167) (1.240) (.)
Std. 4 & 5 1.426** 1.735* -12.561 -2.175** -17.177
(0.632) (0.978) (706.448) (1.056) (.)
Std. 6 0.832** 0.906**
(0.391) (0.435)
Butwa Sch. 0.079 -1.060**
(0.733) (0.453)
Katemwa Sch. 0.897 0.259 1.407** 0.977* 0.969**
(0.754) (0.408) (0.630) (0.504) (0.469)
Muganza Sch. -15.181 -0.806* 0.000
(Option only for multi-year models) (1387.616) (0.465) (.)
Nkome Sch. -0.451 -0.742* 0.263
(Option only for multi-year models) (0.706) (0.408) (0.901)
Izumacheli Sch. 0.709 -0.709 0.827
(Option only for multi-year models) (0.783) (0.436) (0.599)
Maisome Sch. 0.000 -0.782* -0.923
(Option only for multi-year models) (.) (0.449) (0.936)
Ikuza Sch. -0.333
(Option only for multi-year models) (1.245)
87

88
Table continued from previous page
Want ―few‖ of spp.
Fish Eagle† Genet M. Lizard S-N Otter Sitatunga
S.
Cyprinid† V. Monkey† Hippo† Elephant† Giraffe†
Mod25 Mod5 Mod10b Mod3 Mod5b Mod13 Mod2 Mod 23 Mod40b Mod3
HOH livestock keeper 28.957 0.508 1.743
(1969.918) (0.323) (1.091)
HOH farmer -0.619** 2.403***
(0.278) (0.566)
HOH fisherman 2.342***
(0.784)
Constant -2.996*** 0.710 0.732* -1.448** -1.946*** -2.901*** -2.163*** -0.847** -0.390** -1.217***
(1.025) (0.711) (0.394) (0.611) (0.378) (0.459) (0.663) (0.398) (0.195) (0.232)
LR Chi2 9.638*** 34.291*** 69.456*** 25.582*** 6.684** 3.169* 28.785*** 4.512** 7.325** 6.764
Log Likelihood -33.854 -162.334 -459.462 -98.106 -87.869 -55.945 -65.166 -63.952 -79.029 -56.442
McFadden’s R2 0.125 0.095 0.070 0.115 0.037 0.028 0.181 0.034 0.044 0.057
McKelvey & Zavoina’s R2 0.294 0.901 0.115 0.207 0.547 0.064 0.298 0.058 0.125 0.904
Cragg-Uhler’s (Nagalkerke’s) R2 0.197 0.162 0.124 0.196 0.057 0.036 0.294 0.061 0.077 0.087
Efron’s R2 0.119 0.111 0.094 0.148 0.032 0.016 0.233 0.046 0.047 0.034
Adjusted Count R2 0.000 0.087 0.223 0.233 0.000 0.000 0.392 0.091 0.000 0.000
H-L (groups, Ĉ, p) ‡ 8, 2.77, 0.838 9, 2.50, 0.927 6, 1.10, 0.895 ‡ ‡ 7, 3.05, 0.693 ‡ ‡ ‡
n 66 269 714 161 179 193 116 96 126 119
*p < 0.10 **p < 0.05 ***p < 0.01 † Model based on 2009 data only ‡ Ties resulted in too few groups for statistic to be reliable
88

89
Table 3.7. The results of Pearson‘s Chi-square tests to determine the effect of gender on
―disliking‖ and wanting ―few‖ of each of the species included in my 2008/2009 survey of school
children in communities surrounding Rubondo Island National Park, Tanzania.
“Dislike” Want “few”
Species χ2 p n χ
2 p n
Fish eagle 2.761 0.097 67 7.869 0.005* 66
Genet 1.831 0.176 58 0.732 0.392 57
Monitor Lizard 0.001 0.970 188 0.158 0.691 191
Spotted-necked Otter 0.548 0.459 44 0.834 0.361 44
Sitatunga 3.622 0.057 72 0.126 0.722 69
Silver Cyprinid 0.479 0.489 190 3.082 0.079 193
Vervet Monkey 6.509 0.011* 213 5.107 0.024* 116
Hippopotamus 0.373 0.541 187 1.161 0.281 96
Crocodile 0.355 0.551 219 0.096 0.757 123
Little Egret 0.735 0.391 165 0.588 0.443 100
Egyptian Goose 0.078 0.780 67 0.028 0.867 50
Elephant 5.800 0.016* 124 3.107 0.078 126
Giraffe 3.453 0.063 116 0.352 0.553 119

90
Figure 3.1. The number of students that ―dislike‖ and want ―few‖ of each of 13 selected species present in Rubondo Island National Park,
Tanzania, based on 2008/2009 survey results (see Chapter 2). Students were asked to identify an illustration of each species prior to being asked a
series of questions about the illustration. Only the opinions of students able to correctly identify a species were included in analyses. Nine hundred
and thirty-two students were asked to identify every species except the giraffe and elephant, which only 141 students were asked to identify. Each
student who was asked to identify an illustration was asked if s/he liked the species. Therefore, the total at the top of each ―dislike‖ column
represents the number of students who were able to correctly identify the corresponding species. Only a portion (n =141) of participants were
asked for their opinions regarding the population sizes for some species.
90

91
CHAPTER 4
LOCAL INTEREST IN VISITING RUBONDO ISLAND NATIONAL PARK:
IMPLICATIONS FOR CONSERVATION
Abstract
Support from members of local communities can greatly enhance the long-term success
of protected areas. However, residents living near many national parks around the world have
negative attitudes toward those areas, and even conservation in general. In Tanzania, where
negative attitudes toward national parks and conservation have been previously reported,
visitation to national parks by citizens is low, although visits to protected areas can increase
ecological and conservation knowledge, and increased knowledge has been associated with
greater support for protected areas. Rubondo Island National Park (Rubondo), in Lake Victoria,
Tanzania, receives limited local support and local residents are reported to have negative attitudes
toward conservation and its proponents. I used a survey of 932 school children and interviews
with 48 adults to assess past visitation and interest in future visits to the Park. In addition, I
analyzed all comments made by adult interviewees that were directly relevant to local visitation
of Rubondo. Ninety percent of children and 83% of participating adults had not visited Rubondo,
although 92% of children and 98% of adults desired to visit. Most adult participants (71%) also
did not know anyone who had visited the Park. Adult participants indicated that lack of
information was a major barrier to visitation. Cost also was mentioned as a barrier, although to a
lesser extent. Interviewees who showed ambivalence to conservation, wildlife tourism generally,
or Rubondo cited not having visited the Park as a reason, as did others whose responses were
more negative. In contrast, some participants saw value in protecting wildlife and the places they
live or wildlife tourism on Rubondo because of the potential for themselves or their children to
visit the Park and/or learn about the environment. Adult participants also associated visiting the
Park with opportunities for themselves and others to learn about the environment. The results of

92
my research suggest a great need for Park management to continue, and increase, efforts to
promote local tourism to Rubondo. Several recommendations are made for how local tourism
may be encouraged and promoted.
Introduction
Without support from local residents, parks and reserves in many areas of the world can
be subject to intense poaching, pilfering, and various forms of damage (Jacoby 2003, Kafarowski
2003, Moorman 2006). In Tanzania, reports of negative attitudes toward conservation and
protected areas emerged as early as the conflicted beginnings of the country‘s first parks in the
1930s (Neumann 1992), likely because for local people the implementation of wildlife
conservation policies typically resulted in cultural disruptions and less access to traditionally used
natural resources (Neumann 1992, Shibia 2010). Tanzania‘s National Parks, like the American
and South African Parks they were modeled after, did not allow for permanent human settlement
or economic activity (Neumann 1992)—a characteristic often not appreciated by those living
within or near the boundaries of either American or African Parks (Neumann 1992, Jacoby 2003).
Perhaps related to these beginnings and attitudes, domestic tourism to Tanzania‘s National Parks
(and National Parks in East Africa in general—Sindiga 1996, Kassilly 2003) has been
consistently low, and the majority of visitors have been international (Ministry of Natural
Resources and Tourism 1999, Bonine et al. 2004). In Kenya, Kassilly (2003) reported a common
belief that wildlife viewing was only for foreigners and a few wealthy citizens. Tourism has been
said to be of little interest to people in other parts of Africa as well, and representative of
different, often competing interests (Jones 2006).
Interest in promoting local tourism, however, is on the rise in East Africa (e.g., see
Ministry of Natural Resources and Tourism 1999, Tanzania Tourist Board 2009, Toroka 2011)
and local negativity toward the area‘s National Parks may be declining. For example, by the late

93
1980s, the majority of local people living adjacent to 5 National Parks in Tanzania were opposed
to the abolishment of the neighboring Parks, a sentiment that was most common among residents
newer to the area (Newmark et al. 1993). In neighboring Kenya, which has a similar history in
regard to protected area development, and where negative attitudes toward National Parks were
reported as recently as 2010 (Shibia 2010), negative attitudes also were less common among
younger residents (Shibia 2010).
Increased local visitation to National Parks may benefit conservation. Researchers in
Costa Rica reported that local residents who had visited a nearby protected area had greater
ecological knowledge than their neighbors who had not visited (Moorman 2006). Additionally,
Moorman (2006) and other researchers (e.g., Fiallo and Jacobson 1995) have reported that people
with greater ecological knowledge are more supportive of or see more value in protected areas.
Therefore encouraging local tourism to National Parks may be important to the long-term success
of conservation in Tanzania.
Sometimes tourists seeking wildlife or nature tourism experiences are already more
knowledgeable about and have more positive attitudes toward the subject of their trip than the
average public (e.g., for wildlife see Smith et al. 2009). However, many people in Tanzania may
want to visit nearby National Parks because of the unique experience, the fame of the areas for
international tourism purposes, or simply because other tourism opportunities are limited—not
necessarily because of a previous interest in nature or wildlife. Visits to Parks by people not
already knowledgeable and positive about conservation provide a unique opportunity for
conservation education. Research has shown that education provided during natural area and
wildlife tourism experiences can increase knowledge [e.g., about the environment (Tisdell and
Wilson 2005) or wildlife (e.g., Smith et al. 2009, Lück 2003)]. In addition, knowledge and
experience with a topic can positively influence related attitudes (e.g., in regard to wildlife:
Morgan and Gramman 1989, Yore and Boyer 1997, Tomažič 2008). Education provided in
conjunction with tourism experiences (e.g., interpretation during tours) also has been reported to
94
impact behavioral intent or actual behaviors. For example, visitors to a National Park in Australia
who took part in turtle watching reported an increased desire and intent to engage in behaviors
congruent with conservation as a result of the visit (Tisdell and Wilson 2005). Minimal-impact
education (i.e., teaching Park visitors to minimize noise, litter and shortcutting) was also reported
effective in curbing undesirable behaviors in Australia (Buckley and Littlefair 2007). Facilitating
visits by local residents to National Parks where education activities are held or interpretation is
available may therefore be an important step toward reaching conservation goals.
Rubondo Island National Park (Rubondo), in the southwest corner of Lake Victoria,
Tanzania (Figure 4.1), is one example of a National Park that receives little support from nearby
residents (TANAPA 2003). The relationship between the Park and local communities was likely
influenced greatly by the eviction of the Island‘s original inhabitants (Kiwango et al., in prep)
soon after the Park‘s inception in 1977 (TANAPA 2003). Those evicted, many of whom relocated
to surrounding communities, were put in difficult, sometimes fatal, living situations (Kiwango et
al., in prep). Although Park-community relations have improved in recent years (W. Mamuya,
Rubondo Island National Park, personal communication), tensions between local people and Park
management still exist. The prohibition of fishing in the Park‘s waters is one source of discontent
for many in the nearby communities, and poaching of fish is a frequent occurrence (TANAPA
2003). Poaching of other wildlife in the Park also takes place, but to a much lesser extent
(TANAPA 2003). As part of efforts to improve Park-community relations and promote positive
attitudes toward conservation, the Park employs 2 full-time outreach staff. Park managers also
encourage visits by local schools to the Park through cost sharing, and overnight facilities were
built for such groups (S. Ndaga, Rubondo Island National Park, personal communication).
Unfortunately, outreach activities often are limited by budgetary constraints (largely due to the
cost of boat travel from the Park to nearby communities). The ability to subsidize the cost of
visits—and, consequently, their regularity—fluctuates with the Park‘s budget. Additionally, for
some schools, paying the required portion of the costs associated with visiting the Island,

95
although small, is too much of a financial burden. To enable increased visitation by school
groups, Park outreach staff have been seeking grant funding to increase the frequency and amount
of financial aid that can be provided to visiting schools (S. Ndaga and H. Mwamjengwa, Rubondo
Island National Park, personal communication).
Visitation to parks is often considered important for building the support necessary to
ensure that such places continue to exist (e.g., Bushell et al. 2007). Therefore, in conducting
surveys of school children and interviews with adults about perceptions regarding wildlife and
conservation, both as part of a larger project intended to inform Park staff in their efforts to build
support for the Park, I measured past visitation to Rubondo and interest in visiting in the future
among participants. No further questions were asked specifically about local tourism or local
visitation to Rubondo in either surveys or interviews. However, adult interviewees were asked
about general perceptions of conservation, wildlife tourism, and national parks, and were
provided opportunity to comment freely on those topics. Unexpectedly, participants often used
that opportunity to make comments relevant to local visitation to Rubondo. This chapter focuses
on those reponses, as well as responses to survey and interview questions specifically about local
visitation to Rubondo, and how those both relate to wildlife conservation. The connections
between local visitation and wildlife conservation presented in this chapter are largely inductive,
as I did not set out to test specific hypotheses about the relationship between the 2 topics.
Methods
Study Area
Rubondo Island National Park consists of 236.8 km2 of dry land, comprised of the main
island of Rubondo and 11 smaller islets (TANAPA 2003). The Park also includes 220 km2 of
protected waters that are considered important breeding ground for fish (TANAPA 2003,
TANAPA 2008a). Many rare tree species and >20 types of orchids occur in the largely-forested
interior of the Park. Native animal species confirmed as present in the Park include the sitatunga

96
(Tragelaphus speki), bushbuck (Tragelaphus scriptus), vervet monkey (Cercopithecus
pygerythrus), hippopotamus (Hippopotamus amphibius), crocodile (Crocodylus niloticus), genet
(likely Genetta genetta), spotted-necked otter (Lutra maculicollis), marsh mongoose (Atilax
paludinosus), cane rat (Thryonomyidae spp.), monitor lizard (Varanus niloticus), python (species
unlisted), and >200 bird species (TANAPA 2003, G.D. Moshi, Rubondo Island National Park,
personal communication). Other native species that have been seen on the Island include clawless
otter (Aonyx capensis—Kruuk and Goudswaard 1990, J. Reed-Smith, George Mason University,
personal communication), forest cobra (Naja melanoleuca), water cobra (presumably
Boulengerina annulata, although no official reports exist for the species in Lake Victoria—
Spawls et al. 2006), and vipers (unknown spp.—G.D. Moshi, Rubondo Island National Park,
personal communication). Introduced chimpanzees (Pan troglodytes), giraffes (Giraffa
camelopardalis), ―black-and-white colobus‖ monkeys (Colobus geureza), suni antelope
(Nesotragus moschatus), elephants (Loxodanta africana), and grey parrots (Psittacus e. erithacus)
also are present on the Island. Roan antelope (Hippotragus equinus) and black rhinoceros
(Diceros bicornis) were introduced but are thought to have been extirpated (TANAPA 2003).
Easily-viewed wildlife is just one of Rubondo‘s visitor attractions. The Park also offers
picturesque views of white sand beaches, rocky shores, and papyrus swamps (TANAPA 2003).
Additionally, the Park provides opportunities for hiking, which are fairly rare in Tanzanian
National Parks. Perhaps of particularly great local importance (especially for those who once
lived on Rubondo, or whose ancestors did), the Park includes several cultural and spiritual sites.
Rubondo is managed by Tanzania National Parks Authority (TANAPA). TANAPA is a
parastatal organization funded largely by international wildlife tourism (Bonine et al. 2004).
Because of the importance of tourism, Rubondo, like other Tanzanian National Parks, contains
several types of tourist accommodations, including a privately-owned luxury tented camp, several
Park bandas, and a tent site. In addition, the Park‘s youth hostel (built to accommodate visiting
school groups) is available for local visitors. According to the most recent Park brochure, the

97
entrance fee for East Africans >16 years old is < $1 USD per day. For non-East Africans, the fee
is $20 USD. Similar fee structures exist for Park-owned accommodations as well, and the cost for
staying in the hostel is < $2 USD per visitor/night. Five ranger posts are distributed almost evenly
around the Island‘s shoreline (Figure 4.2), and one is on the mainland in Nkome. The main
offices for the Park, the entry point for most visitors, and all permanent accommodations are
located near the ranger post midway along the Island‘s east coast (Kageye). Vehicle travel on the
Island is largely confined to one road that crosses from Kageye to Mlaga Ranger Post on the
west-central part of the Island and, consequently, the majority of travel around the Island
(excluding patrols) is by boat.
Although the villages in the areas surrounding the Park vary in size, the landscape is
generally rural. For example, in 2007 on one of the Islands included in my study area (Butwa),
there were 2,220 residents, 524 (24%) of whom were under the age of 14 (M. Chiweki, R.
Magessa, and C. Billing; Butwa Island; personal communication). Another of the mainland
communities (Katemwa) had 1,580 residents in 441 households in 2008 (C. Matonange,
Katemwa Village Government, personal communication). Over 75% of households in Tanzania‘s
rural areas are headed by an individual who works in agriculture or fishing (National Bureau of
Statistics 2002), and the information available in local communities suggests that this is true in
the study area. On Butwa, for example, the adult working population is divided into farmers
(260), registered fishermen (200), small-scale businessmen (31), livestock keepers (47), and
traditional healers/―witch doctors‖ (3) (M. Chiweki, R. Magessa, and C. Billing; Butwa Island;
personal communication—June 2007). Over 39% of the population in Tanzania‘s rural areas falls
below the basic needs poverty line (National Bureau of Statistics 2002).
Study Design
Surveys of school children were completed in 7 communities surrounding Rubondo
Island National Park: Butwa, Ikuza, Izumacheli, Maisome, Muganza, Katemwa, and Nkome
(Figure 4.3); all are between 5.5 km and 20.7 km from the nearest point of the Park. The survey

98
instrument (Appendix B) largely assessed local children‘s perceptions of species occurring on
Rubondo, as well as the children‘s general wildlife preferences (see Chapter 2 for more detail).
However, the survey also included 2 questions regarding visitation to Rubondo (Table 4.1).
Demographic variables measured by the survey included standard (grade), school, tribe/ethnic
group (of which there are >130 in Tanzania—Ndembwike 2006), and profession of the head of
the students‘ household (HOH). A subsample of students also was asked for their gender. Surveys
were administered in classrooms by myself, other project team members, and a Park staff
member, with assistance from teachers in some cases.
In-depth interviews with adult community members also were conducted in the mainland
villages of Katemwa and Nkome by a project team member (who was Tanzanian, although from a
different region) using a combination of nonprobability sampling techniques (Henry 1998). In
Katemwa, a temporary employee of the village suggested prospective participants based on my
request for people of varying gender, age, and profession, and introduced the interviewer to each.
In Nkome, the interviewer was given a letter from the local governmental office providing
permission for the research, but selected, approached, and interviewed participants alone,
showing the letter to each potential participant when introducing herself. The interviewer asked
people she encountered throughout Nkome village to participate in interviews, again trying to
include participants from a diversity of backgrounds. No Park personnel or other researchers were
present during any of the interviews.
Interviews were semi-structured, and generally lasted about 1 hour. The interviewer did
not collect the names of participants, but did ask for and record each participant‘s age, gender,
profession, and village of residence. Questions included in the adult interview protocol (Appendix
E) were similar to those in the children‘s survey, largely focusing on perceptions of animal
species, and also including questions about whether participants had ever visited or were
interested in visiting Rubondo (Table 4.1). Additional open-ended questions also were asked
regarding respondent‘s perceptions of Rubondo, wildlife conservation, and tourism. ―Local‖

99
tourism was not mentioned specifically in interviews, with the exception of early questions about
the participants‘ own visitation to Rubondo. However, those initial questions may have primed
some participants to put subsequent questions in a local context.
Both surveys and interviews were conducted in Swahili. Responses to open-ended
survey questions were translated into English prior to analyses, but interviewee responses were
translated directly into English by the interviewer. Initial surveys were captured with a digital
voice recorder, but those recordings were lost when the recorder was stolen and subsequent
interviews were not recorded. Therefore, quotes included here are based solely on the
interviewer‘s notes.
Data Analysis
Descriptive statistics were calculated for demographic questions and for those regarding
visitation to Rubondo using Stata/IC 11.0 (StataCorp, College Station, Texas 77845, USA).
Initially, all interview questions that resulted in a response relative to (1) the participant
themselves or (2) others in the community visiting the Park, or (3) local tourism generally were
isolated. As repetitive elements related to local tourism were identified within those responses,
themes were developed, and responses were thematically coded. Throughout the process, all
responses were continually re-assessed for relevance to, and support and opposition of, the
developing theme.
Results
Students at public schools in 7 communities surrounding Rubondo Island National Park
participated in surveys between May 27, 2008, and February 16, 2009. The majority of
participants were in Standard 6 (n = 523) and 7 (n = 393), although 16 students from Standards 4
and 5 also completed surveys. Overall, between 21% and 92% of the students enrolled in
Standards 6 and 7 in each school participated. In most schools, not all classes in each grade were
invited to take part in the survey due to space and staff limitations. However, in all but 1 school,

100
where 8 students declined to participate at their parents‘ request, all children in participating
classes who were present at school completed surveys. Forty-eight adults participated in
interviews in August, 2008; 30 were from the Katemwa area and 18 from Nkome area (although
all interviews were conducted in those 2 villages, some participants approached resided in nearby
areas). The few adults that declined to participate in interviews cited only the length of the
interview as the reason. In addition, 8 of the 48 people who did participate did not finish the
interview. All 8 did, however, complete the section on visitation to Rubondo. Responses relevant
to local tourism were obtained for 15 separate adult interview questions beyond those specific to
visitation of Rubondo (Table 4.2).
Both adult participants and the students‘ HOHs were commonly involved in >1
profession. Farming was the most common profession for students‘ HOHs and adult participants
(553 HOHs, 34 adult participants) (Figure 4.4). Participants and their families were also involved
in (from most to least common) business (227 HOHs, 18 adults), fishing (109 HOHs, 9 adults),
and livestock keeping (61 HOHs, 6 adults). Sixty-eight HOHs and 10 adults were involved with
other professions, including teaching, short-term jobs (piece work), employment in the local
government, home making, and various others. Students listed at least 31 different confirmed
tribal affiliations, and possibly as many as 41 (although the additional 11 could not be confirmed)
(Figure 4.5a). Adult participants identified themselves as belonging to 11 different tribes (Figure
4.5b). Among the 246 student participants asked for their gender, 119 were female, 121 were
male, and 6 were invalid or nonresponses. Males and females were equally represented in the
sample of adult interviewees.
Interest and Past Visitation
The majority of participants (83% of adults and 90% of children) had not visited
Rubondo Island National Park (Figure 4.6). Twelve of the adult participants responded, ―not yet‖
when asked if they had visited, possibly suggesting a desire or intention to visit the Park in the
future. When specifically asked if they would like to visit, nearly all (98% of adult participants

101
and 95% of responding children) answered affirmatively (Figure 4.6). One participant, a farmer
from the Nkome area who also does piece work, added ―… I would love to so much.‖ Of the 8
adults that had visited Rubondo, 1 noted that her visit was ―a long ago time ago, about when I
was 16 years old‖ (approximately 24 years earlier). Two participants that had previously been to
Rubondo also immediately added that they would like to visit again.
All adult participants wanted their children to be able to visit Rubondo. Several people
associated that desire with opportunities for children to learn about wildlife and the environment.
For example, a male agriculturalist and fisherman in his 60s from Katemwa area noted, ―I would
like them to be able [to visit] because they'll be able to see the animals they have never seen
before.‖ A male agriculturalist and village employee in his 40s from Katemwa area said he
―would love children to be able to go [to Rubondo Island National Park] so that they learn.‖
Lastly, a male farmer and piece worker in his 40s from Nkome area noted that he would like his
children to be able to visit "so that they understand the environment surrounding them." Most
adult participants (71%) did not know anyone who had visited Rubondo. Among those who
provided details regarding the individuals they knew who had visited, all but 1 of the described
visitors (who got married on the Island) went with organized school or religious groups or
worked on the Island.
Barriers to Visitation
During the course of adult interviews, several of the topics that participants hinted at
when asked about visitation to the Island were further elucidated. For example, the indication by
1 participant that she would like to visit Rubondo if she gets an opportunity illustrates a theme
that became common throughout interviews. Participants made clear that barriers, generally in the
form of information and cost, impeded their ability to visit the Park. Thirteen different adult
participants mentioned lack of information about how to visit the Park, nearly always in
conjunction with an expressed desire for the information. This sentiment was captured by a male
in his 30s involved in agriculture who emphasized: ―Procedures should be put openly, by the

102
Park, so that the citizens understand how to get there. People are very old and don't even know
how to get there.‖ Three of the participants who mentioned a lack of information about how to
visit as well as a desire for that information also expressed fear of being shot for trying to enter
the Park without knowing the proper procedures. A male agriculturalist and fisherman in his 60s
from Katemwa said, ―Local people do not understand how to get there as local tourists but fear
they may be shot dead.‖ A businessman in his 30s from Katemwa also stated, ―They should let
people know openly that the Park can be visited by local people because we are scared that we'll
be shot to death.‖ Another male in his 50s from Muganza area involved in agriculture noted,
―They should put an office for easy communication with the Park, rather than people going to see
people far away with the canoes and end up being shot.‖
This desire for a Park office in Muganza was echoed by another participant, a male in his
30s from Nyabugera involved in agriculture, business, and fishing, who said, ―The Park should
make offices at Muganza, so that people can get the information about the Park and how to get
there.‖ Generally, however, participants were not specific about how information about visitation
should be transmitted. Comments were often general appeals, such as those of a male in his late
teens from Nkome working in well-respected profession, who said ―People who work there [at
Rubondo] should be able to educate the local people about the Park, so that they visit it, as
procedures of visiting the Park are not known.‖ Another male in his 30s from Nkome involved in
fishing and sports emphasized a desire for priority to be placed on local visitation, saying:
―People at Nkome would love to visit the Park but they don't know how the procedures and
people who know the procedure are tourists only…. Through wildlife tourism, the Park should
have given the first priority to the people of Nkome.‖ This perceived lack of information likely
also accounts for the majority of participants having no response or indicating that they did not
know when asked generally for their opinions about wildlife tourism on Rubondo. As one
individual, a female in her 20s from Muganza involved in agriculture and business, explained,
―People do not know much about the tourism there, especially local tourism.‖ It should, however,

103
be noted that 1 teacher from Nkome did say that ―the Park holds seminars to encourage the
community to visit the Park,‖ although no other participants mentioned this form of outreach.
Costs were mentioned by 5 adults as a barrier to visitation, and implicated by another as
something with which help was needed. For some people those cost barriers were associated with
reaching the Island, and for others with Park entry fees. For example, a male in his 60s from
Muganza area working in agriculture and fishing noted the following when asked how wildlife
tourism benefitted him: ―TANAPA should minimize the cost of entry fees so that we local people
can visit the Park.‖ A female agriculturalist in her 30s from Nkome, when asked if she would like
to visit, replied ―Yes, but we have no money to get there.‖
Visitation and Support for the Park, Conservation, and Tourism
Twenty-six interviewees specifically stated that they were uncertain or lacked knowledge
regarding the topics of conservation and/or wildlife tourism. References participants made to not
having visited the Park have added importance when explaining their opinions (or lack thereof)
on tourism, conservation, and Rubondo. Seven people who showed ambivalence toward
conservation, wildlife tourism generally, or Rubondo cited having never been to the Park as the
reason. A male in his 40s from Katemwa area involved in farming and local governance
remarked, ―We haven't seen any importance [of wildlife tourism in Tanzania]; we haven't had a
chance to see the Parks and how important they are.‖ A male in his 30s involved in agriculture
evoked a similar sentiment when asked how protecting wildlife and the places they live benefits
him, stating ―I personally don't know about how it benefits me, as I've never visited the Parks.‖ A
female in her 30s from Nkome area involved in agriculture also related not having visited the
Park to uncertainty about increased tourism on Rubondo when she noted, ―[I‘m] not sure [if I
would like there to be more tourism on Rubondo], because I have never been to the Park.‖
Another 4 people conveyed more negative feelings toward the Park, conservation, or tourism
because of having never been to Rubondo. For example, a male in his 20s living in Nyabugera

104
and involved in agriculture and fishing said, ―Wildlife tourism has affected me negatively
because I've never seen the wildlife at Rubondo National Park.‖ A female professional in her 40s
from Katemwa similarly maintained, ―For now I haven't benefited [from the protection of wildlife
and the places they live] because I have never visited the Park.‖
In contrast to some of the negative and ambivalent impressions mentioned above, 9 of the
adults interviewed saw value in protecting wildlife and the places they live or wildlife tourism on
Rubondo because of the potential for themselves or their children to visit the Park and/or to learn
about the environment. A male from Nyabugera in his 30s involved in agriculture, fishing, and
business stated, ―Yes [wildlife tourism is important in or near this community], because our open
areas do not have wildlife and it will be great if our children will have the Parks to see different
wildlife.‖ The female professional from Katemwa quoted previously who said she had not
benefited from the protection of wildlife and the places they live because she had never visited
the Park also noted that wildlife tourism on Rubondo benefits her ―by going to see wildlife.‖ A
female agriculturalist from Nkome stated, ―Yes [protecting wildlife and the places they live is
important to me] because students will get an opportunity to learn about it when they visit the
parks.‖ A similar sentiment also was shared by the male from Nkome in his late teens who noted
when asked if protecting wildlife and the places they live benefits or harms him ―No harm, but
has benefits, have seen animals—wildlife at Rubondo National Park, the beautiful environment.
I've seen the animals I never knew.‖
Lastly, several people hold or alluded to local misconceptions regarding what happens at
the Park. These misconceptions appear to apply to both researchers and tourists. A male from
Nyabugera in his 30s involved in fishing, farming, and business maintained, ―[When people come
to Rubondo or Tanzania to study wildlife] they come to view wildlife, but the community, some
say they come to get minerals that were hidden during the colonial era.‖ In Katemwa, a
businessman in his 30s asked for his opinion of wildlife tourism, replied ―I hear that when tourists
go to the parks they go there to get some minerals and see wildlife.‖

105
Visitation and Learning
The association of visiting the Park with learning was common throughout interviews,
and not only associated with the positive feelings toward wildlife and conservation or desire for
children to visit the Park, as mentioned above. For example, a male in his 30s from Muganza area
working in agriculture and fishing also tied visiting Rubondo to learning when, in response to
being asked if wildlife tourism is important in Tanzania, he replied, ―We learn a lot when we visit
the Park and we learn about the benefits.‖ He later added, ―The prices of entering the Park are
high for the community … so they don't learn about wildlife.‖ Another, a professional in his 20s
from Nkome, noted, when asked if he would like to visit Rubondo, ―I always want to visit the
Park so that I see the animals and answer the questions I always ask myself.‖
Discussion
Interest and Past Visitation
Most participants (90% of children and 83% of adults) had not visited Rubondo, and
most adults (71%) did not know anyone who had visited either. However, nearly all participants
reported a desire to visit the Park. I also saw this eagerness to visit the Park among local adults
that I hired to assist with another aspect of my larger project. In addition, all adults wanted their
children to have an opportunity to visit Rubondo, and many mentioned the learning opportunities
such a visit presents. The high levels of interest in visiting Rubondo among local people may be
related in part to the uniqueness of the mainly-forested Park in relation to the more open
environment around nearby communities, as well as the more diverse assemblage of wildlife
present in the Park. In addition, because Rubondo (unlike most protected areas) cannot be readily
seen from nearby areas, residents of neighboring communities may have elevated levels of
curiosity about the Park.

106
Barriers to Visitation
Although the overwhelming majority of participants (92% of children and 98% of adults)
desired to visit Rubondo, many factors beyond interest, including time and money, influence
people‘s destination decisions (Pearce 2005). Cost, in particular, can have a negative influence on
Park visitation (e.g., Schwartz and Lin 2006). Five adult participants considered cost a barrier to
visiting Rubondo. Cost also was cited by Kenyans living around Lake Nakuru National Park as a
reason for not having visited (Kassily 2003). However, my interview protocol did not include
questions regarding knowledge of Park entry fees, nor did it specifically explore satisfaction with
pricing. I did see anecdotal evidence that the lack of information regarding Park procedures
extends to the fee structure for Park entry. For example, after administration of surveys to
students at Izumacheli Primary School one student asked why mzungus (white people, and in this
case more specifically white tourists) could enter the Park for free, but he (i.e., local people) had
to pay. Although these data clearly are not a complete and accurate representation of the level of
concern or contentment with pricing of the Park, they do illustrate a need for additional research
regarding local awareness of Park entry fees and their affordability, and, at a minimum, better
distribution of pricing information. Based on the results obtained here, lack of information seems
to be a more immediate barrier to visitation than existing entry fees. However, several people also
did mention getting to the Island as a problem, and most local people likely have an idea of the
cost of such transportation. Therefore, additional attention should likely be given to transportation
issues.
Park management has not been insensitive to many of the cost and transportation issues
brought up by local people during interviews. Because Rubondo is an Island, visitors face
somewhat unique transportation challenges in reaching the Park. Rubondo‘s management has
addressed some transportation issues by allowing local visitors to enter the Park through any
ranger post. Park management‘s flexibility has greatly minimized necessary travel distances from
most locations. For example, distance from Butwa to the Park Headquarters is approximately 28.2

107
km. However, if able to enter through the nearest ranger post, the distance the local visitor must
travel decreases to approximately 6.8 km. Similarly, the distance that would need to be traveled
from Izumacheli decreases from 26.5 km to 5.5 km. Additionally, the Park allows local people to
enter for free with a letter from local government. My results, however, suggest that both fee
waiver and entry point information need to be better communicated. Although 1 individual was
aware of outreach activities around Rubondo, the vast majority of adult interviewees were not. A
similar lack of awareness about Park programs was reported around Marasbit National Reserve in
Kenya (Shibia 2010).
Visitation and Support for the Park, Conservation, and Tourism
The lack of knowledge about Rubondo among local people and the paucity of local
visitation to the Park apparently contribute to ambivalence or negativity toward the Park, tourism,
and conservation. By enabling visitation and, consequently, opportunities to learn about wildlife
and the environment, Park management may have an opportunity to greatly increase support and
proponents for both Rubondo and conservation efforts more generally. Local people around
Rubondo clearly have some level of distrust for Park employees, given several participants‘
concerns that they would be shot for trying to visit using incorrect procedures. (This sentiment
probably results from park rangers carrying firearms, which are feared and very uncommon in the
area—S. Ndaga, Rubondo Island National Park, personal communication.) Distrust can
negatively influence local support for parks (Stern 2004, 2008). By making local visitation more
common, Park management would have opportunity to allay the fears mentioned above, as well
as misperceptions about tourism, which potentially may help to create distrust.
In addition, by increasing local visitation to the Park, management may be able to
increase and diversify the types of benefit local people perceive themselves accruing from the
Park. Although Rubondo does have an outreach program designed to support community initiated
activities, such as the building of schools and dispensaries, and these were recognized and often
appreciated by interviewees, Rubondo, tourism, and conservation were also often not perceived

108
as providing any personal benefits to participants. Having the opportunity to enjoying the Park
would certainly be a personal benefit.
Visitation and Learning
Lück (2003) reported that wildlife viewing tourists in New Zealand generally enjoyed
learning about wildlife during their holiday and considered learning new things an important
component for holidays generally. Similarly, adult participants in my study commonly associated
visiting Rubondo with opportunities for either their own or others‘ (typically children‘s) learning.
Providing opportunities for children living around Rubondo to learn about wildlife may be
particularly important, given that the children‘s familiarity with many wildlife species is quite
low (Chapter 2). Many animals are easily viewed in the Park, including a sitatunga population
that has been called ―internationally important‖ (IUCN 1990). The wetlands inhabited by the
sitatunga (Games 1983) are limited near the villages my research was conducted in, and therefore
local people likely have little, if any, opportunity to see the species outside of Rubondo. Visiting
the Park would allow local people an opportunity to view sitatunga and learn more about the
species‘ dependence (Games 1983) on environmentally critical and increasingly threatened
wetland habitats (Kassenga 1997, Kiwango and Wolanski 2008).
Conclusions and Recommendations
Participants generally had not visited Rubondo, but wanted to visit. Adult participants
perceived barriers to visitation, primarily the lack of information regarding the procedures for
visiting. Several were fearful of dire consequences of trying to visit without fully knowing the
proper procedures. Not having visited and lack of knowledge regarding the Park were associated
with ambivalence or even negative attitudes toward Rubondo, conservation, or wildlife tourism.
Some participants also held, or suggested that others held, misperceptions about what happens
when people visit Parks. These results suggest that providing opportunities for local tourism is
likely to be an important mechanism for building trust, improving ecological knowledge, and

109
raising support for conservation and Tanzania‘s National Parks. The following suggestions may
assist managers of Rubondo in providing that opportunity and may also be useful to managers of
other protected areas in similar situations.
1. Information should continuously be distributed to the communities surrounding the
Park regarding procedures for visiting. The information should be provided through
multiple avenues, including written materials and presentations, and, specifically for
Rubondo, should make clear that local people (unlike international visitors) are able to
access the Park through the nearest ranger station and even for free with appropriate
documentation from local officials. Information about the availability and cost of
overnight accommodations should also be shared, as for some visitors without
motorized transport the distance to the Park may be too great for travel in 1 day. To
allay fears about the unknown among potential visitors, the information provided
should be very clear about what visitors can expect upon reaching the Island—perhaps
in part by including images of previous local visitors experiencing the Park. Although
not mentioned by participants in my interviews, wildland environments often elicit
fear among people unused to such areas (see Bixler 1997), and that fear may result in
trepidation about visiting Rubondo among local people.
2. Because interactions with Park staff also are critical for building trust, support, and
positive attitudes toward Parks (Newmark et al. 1993; Holmes 2003; Stern 2004,
2008), other more informal methods of outreach (e.g., conversations with individual
community members and presence at community gatherings) also are important—not
only for information distribution, but for developing a sense of security regarding
visiting the Park among local people.
3. Additionally, because some participants in my study feared dire consequences for not
following the right procedures for Park entry (e.g., being ―shot dead‖), Rubondo might

110
be wise to establish and highly advertise a free visit day each year for local people
similar to those provided in other areas (e.g., the United States: National Park Service
2001, Associated Press 2009, National Park Service 2010, Ng 2010; and Costa Rica:
Moorman 2006). Because Rubondo is an island, visitors not only face a very real
barrier to visitation in the form of a required water crossing, but likely a psychological
barrier as well; crossing the span of open water to reach the Park may be particularly
intimidating for those who have not visited before. First-time visitors may feel most
comfortable making the first trip on a highly advertised free day. If the Park does
institute a free visit day, managers should also consider providing discounts on
accommodation during those times, or opening the youth hostels for a minimal fee to
local individuals and families who have made advance arrangements.
4. Another important step in increasing local people‘s comfort with making the trip to
visit the Park may be to improve signage at entry points to the Park. Because local
people are allowed to enter through any ranger post, Park management may want to
consider outfitting the landing area for each post with welcoming signage clearly
visible from outside of the Park boundaries. In addition, Park management should
consider adding bouys and floating signs demarcating ―entry lanes‖ that start at the
edge of the protected waters of the Park and continue to each ranger post landing.
Such lanes would provide local visitors a ―safe‖ entry point to landings where rangers
or other Park staff can be found, and minimize fears of being mistaken for poachers.
5. Barriers in the form of transportation costs should not be ignored. In the case of
Rubondo, managers should work within local communities to establish and advertise a
network of boat owners willing and able to provide locally-affordable transportation to
the Island.
6. Finally, to ensure that future generations will feel comfortable visiting the Park,
Rubondo‘s management team should continue to seek grant funding for bringing

111
school children to the Island, and consider setting up a fund that international visitors
can contribute to for the same purpose. Park management may also be wise to
consider organizing visits for groups of adults as well.
The most effective way to alleviate fears and encourage Park visitation may be through word of
mouth, and that requires getting visits to the Park by local people started. Therefore, facilitating
visits by local residents, even on a small scale, should be an immediate priority for Park
management. As the effectiveness of various activities and programs for increasing local
visitation becomes apparent, the process can then be further developed, refined, and integrated
into the Parks management plan.

112
Table 4.1. Questions specific to visitation of Rubondo Island National Park, Tanzania that were
included in 2008/2009 surveys of school children and interviews with adults, both of which were
conducted in communities surrounding the Park.
Questions
Children’s Survey (closed-ended)
Have you been to Rubondo Island National Park?
(Options: yes, no, not sure)
If not, would you like to go?
(Options: yes, no, maybe)
Adult Interviews (open-ended)
Have you ever visited Rubondo?
Would you like to visit Rubondo?
Would you like your children to be able to visit Rubondo?
Do you know anyone that has been to Rubondo?

113
Table 4.2. Open-ended questions asked in 2008 interviews with adults living around Rubondo
Island National Park, Tanzania for which responses relevant to local tourism were obtained.
Open-ended Interview Questions
Rubondo General
What do you think about Rubondo Island National Park?
Protection of Wildlife
Is protecting wildlife and the places they live important to you? Why or why not?
Does protecting wildlife and the places they live benefit you or harm you?
Wildlife Tourism
What do you think about wildlife tourism?
Do you think wildlife tourism is important in Tanzania?
Do you think wildlife tourism is important in or near your community?
How does wildlife tourism affect you?
What do you think about wildlife tourism on Rubondo?
How does wildlife tourism on Rubondo benefit you?
How does wildlife tourism on Rubondo harm you?
Would you like for there to be more tourism on Rubondo?
Wildlife Research
What are some things you think are important for people who are working with wildlife in
National Parks in Tanzania to understand about you or how wildlife affects you?
Many people come to Tanzania—and some to Rubondo, which is very close to you—to
study wildlife. Do you know much about what these people do and learn?
General Invitations for Additional Comment
Is there anything else you would like to share with me about anything I talked about?
What about more general things like wildlife, the environment, or what it is like to live
near a National Park like Rubondo?

114
Figure 4.1. The location of Rubondo Island National Park, Tanzania.

115
Figure 4.2. The location of the ranger posts on Rubondo Island National Park, Tanzania (with the
exception of Nkome, which is located on the mainland).

116
Figure 4.3. Rubondo Island National Park and the surrounding communities in Tanzania where
surveys of school children and interviews with adults were conducted in 2008/2009.

117
Figure 4.4. The professions of the heads of household (HOHs) of responding children who
participated in 2008/2009 survey in communities surrounding Rubondo Island National Park,
Tanzania (n = 922), as well as the professions of adults who participated in 2008 interviews (n =
48).
0
10
20
30
40
50
60
70
80
90
100
Farmer Businessman Fisherman Other Livestock Keeper
% in
volv
ed in
pro
fess
ion
Children's HOH Adults

118
Figure 4.5. The proportion of representatives from different tribes in the sample of responding
children (a, n = 917) and adults (b, n = 48) that participated in 2008/2009 surveys/interviews.
Only the names of tribes to which ≥20 children or ≥2 adults belong are listed separately; the
remaining responses are grouped under the category ―Other.‖
a. Tribes of Participating Children
Zinza
Sukuma
Other
Kuria
Kerewe
Kara
Jita
Haya
Ha
b. Tribes of Participating Adults
Zinza
Sukuma
Other
Nyamwezi
Jita
Haya
Ha

119
Figure 4.6. The percentage (%) of 932 children and 48 adults participating in 2008/2009 surveys
and interviews in communities near Rubondo Island National Park, Tanzania, that have visited
and would like to visit the Park. Children were only asked to respond to the question regarding
desire to visit Rubondo if they had not previously been to the Park, although generally
participants responded to the question regardless of previous visitation.
Have Visited Would Like to Visit
Adults
Children
17%
83% 98%
2%
7%
90%
2% 1%
92%
3%2% 3%

120
CHAPTER 5
THE WILDLIFE VIEWING PREFERENCES OF VISITORS TO TANZANIA
Abstract
Wildlife viewing tourism is of substantial economic importance to Tanzania, and a major
source of revenue for the country‘s National Parks. However, little is known about visitors‘
interest in viewing many of the country‘s wildlife species. In an attempt to learn more about the
wildlife viewing interests of international visitors to Tanzania, I assessed the awareness of and
interest in viewing 20 wildlife species (Cape buffalo [Syncerus caffer], chimpanzee [Pan
troglodytes], crocodile [Crocodylus niloticus], elephant [Loxodanta africana], giraffe [Giraffa
camelopardalis], hippopotamus [Hippopotamus amphibius], leopard [Panthera pardus], lion
[Panthera leo], white rhinoceros [Ceratotherum simum], vervet monkey [Cercopithecus
pygerythrus], bushbuck [Tragelaphus scriptus], fish eagle [Haliaeetus vocifer], large-spotted
genet [Genetta tigrina], goliath heron [Ardea goliath], black-backed jackal [Canis mesomelas],
banded mongoose [Mungos mungo], monitor lizard [Varanus niloticus], serval [Felis serval],
sitatunga [Tragelaphus speki], and spotted-necked otter [Lutra maculicollis]) among travelers at
Kilimanjaro International Airport. I also compared the wildlife viewing preferences of various
demographic and interest groups within the sample of participants. The species the lowest
percentage of participants had ―heard of‖ were the: sitatunga (known to 47.3% of participants),
genet (37.0%), spotted-necked otter (33.6%), serval (29.5%), and goliath heron (26.0%).
Participants indicated a fairly high level of interest in seeing all species included in the survey;
none were of viewing interest to <50% of participants. Over 75% of participants were
―interested‖ or ―very interested‖ in seeing the leopard, lion, giraffe, elephant, hippopotamus,
rhinoceros, chimpanzee, jackal, buffalo, crocodile, and serval. The lion and leopard tied as the
species the greatest percentage of participants were ―very interested‖ in seeing. Participants who
were residents of African countries were less interested in viewing most species. All ―well-

121
known‖ species (leopard, lion, giraffe, elephant, hippopotamus, rhinoceros, chimpanzee, jackal,
buffalo, and crocodile) were considered ―interesting‖ or ―very interesting‖ to greater proportions
of participants than species considered ―little-known.‖ Results have implications for the
marketing of protected area tourism and are applied to the little-visited Rubondo Island National
Park as a case study.
Introduction
The wildlife tourism industry is of substantial economic importance in many areas of the
world, from small, rural towns to entire countries (e.g., Tisdell and Wilson 2004, Smith et al.
2006). Tourism is an important revenue earner for Tanzania (Kweka et al. 2003), and wildlife
viewing tourism in particular is a major revenue earner for the country‘s National Parks (Bonine
et al. 2004). Tanzania contains 15 National Parks managed by the parastatal Tanzania National
Parks Authority (TANAPA) (TANAPA 2011b). Some of those Parks are very famous and highly
visited (e.g., Serengeti National Park). Others, however, like Rubondo Island National Park
(Rubondo) in the southwest corner of Lake Victoria, have low numbers of visitors, which leads to
insufficient funding for important activities such as poaching patrols (S. Ndaga, Rubondo Island
National Park, personal communication). Although wildlife tourism potentially could have
various negative effects on an ecosystem or particular species (Prescott-Allen and Prescott-Allen
1996, Newsome et al. 2005) and its ability to offset the cost sometimes associated with living
near wildlife (e.g., loss of crops) has been criticized (Walpole and Thouless 2005), wildlife
tourism also is thought to benefit conservation in various ways. The benefits of wildlife tourism
to conservation include direct participation by tour operators or tourists in conservation activities
(e.g., removing invasive plants), lobbying for the conservation of natural resources by tour
operators, deterring wildlife disturbance through the maintenance of a continuous presence in an
area (e.g., people hunting illegally are likely to avoid areas frequented by tourists and tour
operators), and the development of tourists into advocates and donors for wildlife conservation

122
(Higginbottom et al. 2001, Moscardo et al. 2001, Lilieholm and Romney 2002, Higginbottom and
Tribe 2004, Valentine and Birtles 2004). In Mauritius, for example, wildlife tourism led to greater
recognition by government officials of the importance of wildlife and the subsequent creation of
the National Parks and Conservation Service (Lilieholm and Romney 2002), and in several
communities in Belize, tourism was cited by local people as the primary reason for support of
protected areas (Lindberg and Enriquez 1994).
Africa‘s National Parks were largely developed for wildlife-based tourism (Lilieholm and
Romney 2002), and wildlife viewing is of primary interest and importance to visitors to the
Continent‘s protected areas (Goodwin and Leader-Williams 2000, Okello 2005, Mladenov et al.
2007). Consequently, marketing materials for protected areas in Africa generally include
information about the wildlife viewing experiences available. Generally, marketers have focused
on the ―big 5‖ (African elephant [Loxodanta africana], black rhinoceros [Diceros bicornis],
leopard [Panthera pardus], Cape buffalo [Syncerus caffer], and lion [Panthera leo]) (Goodwin
and Leader-Williams 2000, Okello et al. 2008), although Okello et al. (2008) suggest that each
protected area should also market other animals. However, in the case of Rubondo Island
National Park, no members of the ―big 5‖ naturally occur (although the elephant was introduced
to the Island in the 1960s and 1970s [TANAPA 2003]). Marketers must therefore focus on other
species without a history of successfully attracting tourists. Unfortunately, little attention has been
given overall to assessments of the species or experiences of interest to tourists (Fredline and
Faulker 2001, Moscardo et al. 2001, Moscardo and Saltzer 2004, Valentine and Birtles 2004),
although tourists‘ interests and expectations are widely acknowledged to be diverse (e.g., Green
et al. 2001, Moscardo et al. 2001, Tremblay 2002, Lindsey et al. 2007).
Various researchers have investigated factors contributing to the enjoyment of tourists
visiting specific destinations, and the resulting conclusions provide insight into wildlife viewing
preferences in general. The factors thought to affect people‘s species preferences include the
animals‘ characteristics and behaviors, as well as symbolic features a species may be associated

123
with (e.g., for many people in the USA the bald eagle [Haliaeetus leucocephalus], the country‘s
national symbol, represents freedom), which are likely to differ across culture and time, and be
influenced by education and portrayal in the mass media (Moscardo et al. 2001, Moscardo and
Saltzer 2004). Large mammals often are indicated as important for various wildlife tourism
destinations. For example, visitors to Great Smoky Mountains National Park in Tennessee, USA,
focused on viewing large mammals (e.g., white-tailed deer [Odocoileus virginianus] and black
bears [Ursus americanus]—Hammit et al. 1993), and tourists in Kenya particularly wanted to see
large herbivores and carnivores (Okello 2005). Visitors to South Luangwa National Park in
Zambia also most wanted to see large animals (Goodwin and Leader-Williams 2000). Seeing ―big
game,‖ and, more particularly, elephants, was important to 47% and 77%, respectively, of self-
guided tourists in Addo Elephant National Park, South Africa. Tourists also tended to focus on
opportunities to view mammals when visiting the Park (Kerley et al. 2003). Tour operators
marketing southern Africa thought their clients would be most interested in seeing the ―big 5,‖
and would not be interested in birds or smaller mammals (Goodwin and Leader-Williams 2000,
Okello et al. 2008). However, this focus on large mammals certainly is not the case among tour
operators everywhere. In Australia, for example, birds (68%) and reptiles (49%) were the 2 taxa
most sought on tours by operators, likely because both groups include large numbers of species
and are more reliably seen than local mammals (Rodger et al. 2007).
Factors that have been suggested by Green et al. (2001) as important to tourist appeal
(based on a review of the literature about the publics‘ general species preferences, research to
determine the species most appealing to visitors in specific areas, and the perceptions of tourism
experts) include: size, bright colors, charisma or ―cuteness,‖ elegance, relatedness to humans
(actual or perceived based on appearance), presence of young, oddities (e.g., the scales of
pangolins [Manis spp.]), or attention-attracting sounds. However, the factors important to a
species‘ appeal likely vary by venue (e.g., a zoo versus a national park) and tourist demographics,
and extrapolating tourists‘ preferences based on a particular place or type of experience can prove

124
erroneous—e.g., the popularity of animals in zoo exhibits also may be partly a function of the
way different species are displayed and interpreted, not solely the result of characteristics
exhibited by that particular species (Moscardo et al. 2001). In addition, tourists seeking
connections with the culture or environment of an area may be attracted to species that are
culturally, ecologically, and economically relevant, not necessarily appealing based on
appearance or behavior (Tremblay 2002). Recently, new groups of species, including small
invertebrates (e.g., butterflies), have emerged as subjects for wildlife watching (Valentine and
Birtles 2004).
The behavior of a species likely also influences tourists‘ perceptions of its appeal. Okello
et al. (2008) reported that tourists in Amboseli National Park, Kenya, responded not only to
extraordinary abundance of single or mixed grazing species, very rare species, and carnivores, but
also to animals that were interacting with one another (e.g., allogrooming). Behaviors such as
impressive courtship displays or unusual nest-building behavior also may attract tourist interest
when the species‘ appearance alone likely would not do so (Green et al. 2001). In addition,
potentially dangerous animals also may be enticing for tourists seeking thrills or adventure
(Trembley 2002). Visitors to protected areas in South Africa, for example, rated the presence of
large predators as the second most important feature of protected areas (behind mammal
diversity) (Lindsey et al. 2007).
Some species, such as kangaroos in Australia (which are recognized as Australian by
98% of Americans—Hill et al. 2000), are widely associated with a specific destination. Such
species (i.e., wildlife tourism icons—Stevens et al. 2007) may, through their physical or
behavioral characteristics, representativeness of a specific area, or cultural significance, serve as
an attraction for a contextually significant number of tourists. In Madagascar, for example,
tourists most wanted to see lemurs (Goodwin and Leader-Williams 2000), and in Australia, they
most wanted to view koalas (Phascolarctos cinereus), estuarine crocodiles (Crocodylus porosus),
and red kangaroos (Macropus rufus), and were less interested in viewing less well-known

125
animals, such as platypuses (Ornithorhynchus anatinus) (Fredline and Faulkner 2001, Tremblay
2002, Prideaux and Cogland 2006).
Visitor interest in viewing various species likely differs not only among destinations, but
also among market segments (e.g., male vs. female [Prideaux and Cogland 2006], resident versus
foreign, older versus younger, and experienced versus inexperienced visitors [Lindsey et al.
2007]). The factors reported important for a quality wildlife viewing experience also can vary by
nationality (Fredline and Faulkner 2001, Moscardo and Saltzer 2004), gender, or status as a first-
time visitor to an area (Hammit et al. 1993, Fredline and Faulkner 2001). Understanding the
―type‖ of visitor entering the area to be marketed and how demographics variables may influence
wildlife viewing preferences is critical to choosing flagship species for wildlife tourism. For
example, tourists who travel to less popular National Parks in Tanzania (like Rubondo) tend not
to be first-time visitors to the country (Bonine et al. 2004). Important distinctions also have been
noted in the wildlife viewing preferences of first-time and returning tourists in other areas. For
example, first-time visitors to Australia were most interested in viewing iconic marsupials,
whereas return visitors were more likely to seek opportunities to view other types of animals
(Fredline and Faulkner 2001). Lindsey et al. (2007) likewise reported that local visitors,
experienced wildlife viewers, and sometimes older guests showed a greater interest in less high-
profile mammal species than foreign and inexperienced guests in protected areas in South Africa.
I assessed the wildlife viewing preferences and interests of visitors to Tanzania from
outside East Africa, and whether those interests differ among various demographic and interest
groups. An important element of my assessments included comparisons of participants‘ levels of
interest in more and less well-known species. This is the first assessment that I am aware of
regarding tourists‘ wildlife viewing interest that focused in large part on lesser-known African
wildlife species. The immediate practical application of this research is to inform marketing
efforts for Rubondo. Consequently, I included many of the species occupying the Park in my
survey, and apply the results obtained to Rubondo as a case study.

126
Methods
Focal Region and Audience
In 2006, 644,124 international visitors entered Tanzania, generating $862 million USD in
receipts (Ministry of Natural Resources and Tourism 2007). Of those visitors, the largest non-
East African contingency came from Europe (~35% of visitors) and North America (~10% of
visitors) (Ministry of Natural Resources and Tourism 2007). Eighty-one percent of international
visitors were in the country for the purpose of leisure, recreation, or holiday (Ministry of Natural
Resources and Tourism 2007). Visitation to Tanzania is generally lowest in April and May and
highest in August and September (Ministry of Natural Resources and Tourism 2007—Figure
5.1); visitation to the famed Serengeti National Park follows similar trends (D. Nuhu, Serengeti
National Park, personal communication). The average number of days in Tanzania per visit in
2006 for international tourists was about 12 (Ministry of Natural Resources and Tourism 2007).
Most international tourists to Tanzania travel and organize travel with tour companies (Bonine et
al. 2004).
There are 3 tourism ―circuits‖ (i.e., clusters of protected areas within reasonable driving
distance of one another that are often marketed together) in Tanzania (Wade et al. 2001, Okello
and Yerian 2009). The most popular, the ―Northern Circuit,‖ includes 6 protected areas:
Ngorongoro Conservation Area and Tarangire, Lake Manyara, Serengeti, Arusha, and Mt.
Kilimanjaro National Parks (Okello and Yerian 2009, Figure 5.2). Some ―Northern Circuit‖
tourists also visit Zanzibar and Dar Es Salaam. Less traveled are the ―Southern‖ and ―Western‖
circuits. The ―Southern Circuit‖ includes Ruaha and Mikumi National Parks and the Selous Game
Reserve, and the ―Western Circuit‖ includes the famed Gombe National Park (Wade et al. 2001).
Rubondo Island National Park is generally considered part of the ―Western Circuit‖ (Tanzania
Tourist Board 2011), although the Park is similarly close to the popular Northern circuit.

127
Non-residents represent the largest percentage of visitors to Tanzania‘s National Parks
(TANAPA, unpublished data). The importance of non-resident tourists for National Park revenue
generation is compounded by the differences in fees paid by residents of the East African
community countries (Kenya, Uganda, Tanzania, Rwanda and Burundi) versus visitors from other
areas. The daily entry fee for Serengeti National Park, for example, is close to $1 USD for
Tanzanians over 16, whereas for non-Tanzanians of the same age group it is $50 USD (TANAPA
2011c).
Because the immediate practical application of this research was informing marketing
strategies for Rubondo Island National Park, surveys were administered at the nearest Tanzanian
international airport to Rubondo (i.e., Kilimanjaro International Airport—KIA). KIA is also the
closest airport to the tourist-attracting ―Northern Circuit,‖ and where I expected to find the most
diverse group of tourists with the potential to visit Rubondo. Conducting surveys at the airport
enabled inclusion of travelers who may not have visited or intended to visit any protected areas
during their visit.
The Survey
The survey (Appendix F) administered to travelers included questions about participants‘
country of residence, age, gender, level of education, and whether they were retired. In addition, I
asked whether participants were traveling with children or a tour company, the purpose for the
day‘s travel (i.e., business, pleasure, volunteering, other), whether participants had ever
vacationed for the primary purpose of wildlife viewing, the importance of wildlife viewing in
their vacation planning, and their self-assessed general level of wildlife knowledge. In addition,
residents of countries outside Africa were asked if this was their first visit, and if so, the number
of days on the Continent so far.
I asked participants about their interest in viewing 20 wildlife species, and if they had
―heard of‖ each species (Table 5.1). For some of those species, I also asked participants: to rate
their level of knowledge, to rank their interest in viewing the animal in relation to other animals

128
(by giving a 1 to the animal of most interest and a 7 to the animal of least interest), and whether
they had seen the animal (either in the wild, in captivity, in photos, or on television) (Table 5.1).
Along with the survey, all participants were given an additional sheet that contained labeled
images of each of the 20 species. I specifically chose species for inclusion in the survey to
represent varying: sizes; levels of endemism, fame, and danger posed; diets; attractiveness;
uniqueness; and taxonomies (i.e., bird, mammal, or reptile). All of the ―big 5‖ species were
included. I asked about 10 species that I expected to be fairly well-known to participants (buffalo
[Syncerus caffer], chimpanzee [Pan troglodytes], crocodile [Crocodylus niloticus], elephant
[Loxodanta africana], giraffe [Giraffa camelopardalis], hippopotamus [Hippopotamus
amphibius], leopard [Panthera pardus], lion [Panthera leo], rhinoceros [as pictured, white
rhinoceros: Ceratotherum simum], and vervet monkey [Cercopithecus pygerythrus]), and 10
(bushbuck [Tragelaphus scriptus], fish eagle [Haliaeetus vocifer], genet [as pictured, large-
spotted: Genetta tigrina], goliath heron [Ardea goliath], jackal [as pictured, black-backed: Canis
mesomelas], mongoose [as pictured, banded: Mungos mungo], monitor lizard [Varanus niloticus],
serval [Felis serval], sitatunga [Tragelaphus speki], and spotted-necked otter [Lutra
maculicollis]) that I expected to be little-known. Because an immediate applied purpose of this
research was to gain better understanding of the species that may be used to market Rubondo, I
included 13 species present on the Island.
Surveys were administered in the departure lounges of KIA. All travelers not otherwise
occupied (e.g., talking on a cell phone), regardless of nationality, were approached and asked to
complete surveys. However, for the purpose of these analyses only participants who were
residents of countries that are not part of the East African Community (i.e., that pay non-resident
rates for Park entry) were included.
Statistical Analysis
Descriptive statistics were calculated for responses to each question using Stata/IC 11.0
(StataCorp, College Station, Texas 77845, USA). For the 2 types of questions regarding having

129
―seen‖ and ―heard of‖ each species (Table 5.1b [2 and 4]), non-response rates could not be
assessed directly, because participants were asked only to check a box on the survey if they had
either ―seen‖ the animal (as opposed to not having ―seen‖ it) or not ―heard of‖ the animal (as
opposed to having ―heard of‖ it). Therefore, non-respondents could not be differentiated from
respondents that had not ―seen‖ or that had ―heard of‖ an animal. Consequently, to gain some
understanding participants‘ awareness of the series of questions (i.e., if they had seen that section
of the survey), I calculated the percentage of participants who indicated having ―seen‖ at least 1
of the animals asked about, and the percentage of participants that indicated having not ―heard of‖
at least 1 of the animals asked about.
I determined the percentage of participants ―interested‖ or ―very interested‖ in viewing
each species, and made descriptive comparisons of participants‘ levels of viewing interest among
species. I then compared the proportion of participants ―interested‖/‖very interested‖ in viewing
each species among groups sharing various demographic characteristics and interests.
Comparisons included:
males versus females,
retirees versus non-retirees,
those holding Bachelor‘s degrees and above versus those without,
African residents versus residents of other continents,
first-time versus return visitors to the African continent,
respondents who had gone on vacation with the primary purpose of wildlife
viewing versus those who had not,
those who considered wildlife important or very important in planning of
vacations versus those who did not, and
pleasure travelers using tour companies versus those traveling independently.

130
Residents of African countries were differentiated from other participants because the
ranges of most of the animals in the survey include many other countries on the continent
(Sinclair and Ryan 2003, Kingdon 2004), and participants from Africa may therefore have more
familiarity with many included species. When sample size allowed, I further partitioned
categories to facilitate comparisons. For example, I also made comparisons between only those
males and females who had been on vacation with the primary purpose of wildlife viewing, and
compared first-time visitors who had been on the continent <15 days to all other respondents. For
all comparisons, I used Pearson‘s chi-square analysis of contingency tables (Zar 1999, Vaske
2008) to detect differences in the proportion of interested and very interested respondents
between groups, using a significance level of α = 0.05.
I also calculated the mean rank given to each of the 7 species participants were asked to
put in order of viewing interest, and then made descriptive comparisons among the species. As
above, I subsequently assessed whether respondents belonging to each of the groups mentioned
gave the species a different rank (based on mean scores).
I characterized species as ―well-known‖ or ―little-known‖ based on whether <10 or ≥10
participants indicated having or not having ―heard of‖ the species, respectively. (A fairly small
number was chosen as the cutoff because of my inability to exclude non-respondents from data
regarding having ―heard of‖ species, which had the potential to make survey participants appear
more familiar with the included species than they actually were.) I descriptively compared
average interest levels for species considered ―well-known‖ versus ―little-known.‖ In addition,
when distributions allowed (i.e., for the—otter, sitatunga, serval, goliath heron, and genet), I used
Pearson‘s chi-square (Zar 1999, Vaske 2008) to determine whether there were differences in the
frequencies of participants interested or very interested in viewing the species (versus all other
categories) between those who indicated not having ―heard of‖ the species and others (α = 0.05).
(This was not done for species >20% of participants had heard of because the number of people
not knowing those species was not large enough to allow for comparison.)

131
Results
Two hundred and eighty-six travelers were asked to complete questionnaires. Thirty-six
(12.6%) declined to participate, most commonly giving poor English as the reason (n = 15).
Among the 250 participants, 146 (58.4% of the total) were from outside East Africa and therefore
included in these analyses. (All subsequent references to African participants consequently refer
only to the participants from countries other than Kenya, Uganda, Tanzania, Rwanda and
Burundi.)
Non-response Rates
The average non-response rate for survey questions that could be measured (i.e., not
including the questions regarding ―having seen‖ and ―having heard‖ about the species) was 3.4%
(range: 0-30.1%) (Table 5.2). The greatest non-response rates occurred among the questions
regarding interest in viewing particular species (Table 5.1b[3]). Within those questions, non-
response rates were above the survey average of 3.4% only for species not heard of by >20% of
participants. For those species with high non-response rates, participants that also indicated not
having ―heard of‖ the species comprised most of the non-responses (Figure 5.3). On average,
41.8% (range = 0-75.0%, sd = 18.9) of participants who indicated not having ―heard of‖ the
species did provide their level of interest in seeing that species (Figure 5.4). The resulting number
of respondents for each question regarding viewing interest ranged from a low of 102 (69.9% of
participants) for the sitatunga to a high of 146 (100%) for the giraffe (Table 5.3).
Most participants (95.9%) indicated having ―seen‖ at least 1 species the question was
asked about, suggesting, at a minimum, that those participants were aware of the presence of that
series of questions. In contrast, the fact that 2.7% to 7.5% of participants (depending on the
species) did not indicate that they had seen the species or an image of it, yet reported having at
least some knowledge of the species does suggest that there was some level of non-response (as
participants that have some knowledge of a species likely have seen at least an image of the

132
species) (Table 5.4). Over half of participants (61.0%) indicated not having ―heard of‖ at least 1
species included in the survey, suggesting at the least that they were aware of that portion of the
questionnaire.
Demographics, Travel Purposes, and Interests
The 146 non-East African participants represented 27 different countries (Table 5.5). The
largest percentage of participants (39.7%) were from the United States (n = 58). The next-most
commonly represented country was Germany with 10.3% of participants (n = 15). Thirteen
participants (8.9%) were from 6 different African countries. Participants ranged in age from 11 to
82 (x = 42.5, sd = 14.8). Just over half were female (52.1%). Participants were generally highly
educated, with 48.0% holding a graduate degree and 30.1% a Bachelor‘s degree. The majority
were not traveling with children (96.6%), nor were they retired (79.5%). Among the 133 residents
of countries outside of Africa, 53 (39.9%) had not previously been to the continent. The number
of days spent on the continent at the time of the survey for those first-time visitors ranged from 1
to 150 (x = 27.1, sd = 29.8). Only 1 survey participant was a first-time visitor who had spent <5
days on the continent prior to participation in the survey; 30 of the first-time visitors (56.6%) had
spent <15 days on the continent.
The majority of participants (n = 89, 61.0%) were traveling solely for pleasure on the day
they completed the survey, although 25 (17.1%) were traveling solely for business, 19 (13.0%)
solely as part of a volunteer experience, and 9 (6.2%) solely for other reasons (most commonly
educational [e.g., courses, trainings, school]). An additional 9 participants (6.2%) indicated >1
reason for day‘s travel; for 5 of those 9 participants the purposes included pleasure. Among the
participants who were traveling for pleasure, 49.2% were using a tour company.
Just under half of respondents (49.0%) had ever (including this trip) gone on vacation
with the primary purpose of viewing wildlife. Eighty-two respondents (59.0%) considered
wildlife viewing opportunities important or very important in their vacation planning (Figure 5.5).

133
Knowledge of Wildlife Species
Most participants (84.25%) considered themselves at least somewhat knowledgeable
about wildlife (Figure 5.6), although 61.0% indicated that they had not previously ―heard of‖ ≥1
of the 20 species included in the survey and only 11.6% had previously seen at least an image of
all of the 7 species the question was asked about (chimpanzee, crocodile, elephant, fish eagle,
hippopotamus, sitatunga, and spotted-necked otter). Many of the species included in the survey
were ―well-known.‖ All participants had heard of the buffalo, chimpanzee, crocodile, elephant,
giraffe, hippopotamus, leopard and lion; all but 1 had heard of the rhinoceros, and all but 4 the
jackal. The remaining 10 species—the bushbuck, fish eagle, genet, goliath heron, mongoose,
monitor lizard, serval, sitatunga, spotted-necked otter, and vervet monkey—were ―little-known.‖
Among the ―little-known‖ species, those that the lowest percentage of participants had ―heard of‖
were the: sitatunga (known to 52.7% of participants), genet (63.0%), spotted-necked otter
(66.4%), serval (70.6%), and goliath heron (74.0%) (Figure 5.7). The sitatunga, spotted-necked
otter, and fish eagle had also been previously seen by the lowest percentage of participants
(Figure 5.8). (Participants were not asked if they had seen the rest of the ―little-known‖ species—
i.e., the genet, goliath heron, and serval). Among the species for which ―knowledge‖ questions
were included (Table 5.1b[1]) (the chimpanzee, crocodile, elephant, fish eagle, hippopotamus,
sitatunga, and spotted-necked otter), participants generally considered themselves at least
somewhat knowledgeable about all but the spotted-necked otter, sitatunga, and fish eagle (about
which 84.9%, 84.3%, and 58.2% of participants, respectively, considered themselves not at all
knowledgeable) (Figure 5.9).
Interest in Wildlife Viewing Experiences
Respondents‘ ―interested‖ or ―very interested‖ in viewing various species ranged from a
low of 53.7% for the goliath heron to a high of 90.3% for the leopard (Figure 5.10). At least 75%
of respondents were ―interested‖ or ―very interested‖ in viewing 11 of the species asked about.

134
Those species that <75% of people were ―interested‖ or ―very interested‖ in seeing were, in order
of increasing interest: goliath heron (53.7%), spotted-necked otter (59.5%), sitatunga (59.8%),
fish eagle (65.6%), genet (67.0%), mongoose (69.6%), monitor lizard (69.9%), bushbuck
(71.6%), and vervet monkey (73.6%).
Differences were detected in the proportions of males versus females ―interested‖/―very
interested‖ in viewing the chimpanzee, fish eagle, genet, giraffe, hippopotamus, jackal, leopard,
vervet monkey, spotted-necked otter, and serval (Figure 5.11, p ≤ 0.04). However, among
participants who had gone on vacation with the primary purpose of wildlife viewing, there were
no detectable differences in the percentage of ―interested‖/―very ―interested‖ males and females.
There were no detectable differences either between interest levels of retirees and non-retirees.
When comparing those with higher degrees (Bachelor‘s and above) to those without, the only
detectable difference in levels of interest was for the spotted-necked otter (p = 0.04), with those
having less education more likely than expected to be ―interested‖/―very ―interested‖ (Figure
5.12). Among participants that vacation for wildlife, the only detectable differences in interest
levels between those with Bachelor‘s degrees or above versus those without were for the
hippopotamus and the rhinoceros (p = 0.01 for both), with those without Bachelor‘s degrees or
above being more likely than expected to be disinterested.
Differences in interest distributions between African and non-African residents were
detectable for all species but the monitor lizard, fish eagle, spotted-necked otter, sitatunga, and
goliath heron (Figure 5.13; for species with differences, p ≤ 0.03). There were no differences in
levels of interest in viewing any wildlife species among visitors who previously had been to
Africa and those who had not (Figure 5.14), nor among first-time visitors who have been there
<15 days in comparison to all other respondents (i.e., first-time and return). Respondents who
reported having gone on vacation with the primary purpose of viewing wildlife were more
―interested‖ in seeing the buffalo, giraffe, and serval than those who had not (Figure 5.15; p ≤
0.03 for all). Respondents who considered wildlife important or very important to planning of

135
vacations were more ―interested‖ than all other respondents in viewing all but 7 species:
bushbuck, fish eagle, monitor lizard, mongoose, monkey, sitatunga, and otter (Figure 5.16, for
those species showing differences, p ≤ 0.05). Within the participants traveling only for pleasure
the day of participation, there were no differences in interest levels for any species between
clients of tour companies and independent travelers (Figure 5.17).
Of species that participants were asked to rank their interest in (the chimpanzee,
crocodile, elephant, fish eagle, giraffe, sitatunga, and spotted-necked otter), respondents were
most ―interested‖ in seeing the elephant (x rank = 2.25), followed by the giraffe (2.70), chimpanzee
(3.26), crocodile (4.10), sitatunga (5.02), fish eagle (5.05), and spotted-necked otter (5.19)
(Figure 5.18). Among all of the groups considered (i.e., retirees, African residents, females, etc.),
the order of the 3 species of greatest interest did not change. The crocodile also remained the 4th
most interesting species among all groups except African residents, who considered the crocodile
of the least viewing interest of all the species. However, the order of viewing interest ascribed to
the 3 species of least interest—the sitatunga, fish eagle, and spotted-necked otter—regularly
changed among participant groups (Table 5.6).
Relationship Between Knowledge and Interest
Respondents were generally less ―interested‖ in viewing the ―little-known‖ species than
the ―well-known‖ ones, and the average percent of ―neutral‖ and ―not sure‖ responses were also
higher for the former (Figure 5.19). In addition, interest generally increased, with a few
exceptions, as the number of participants who had ―heard of‖ the species increased (Figures 5.18
and 5.20). However, the respondents who had ―heard of‖ a least-known species (i.e., spotted-
necked otter, sitatunga, serval, goliath, and genet) were no more or less likely to be ―interested‖
or ―very interested‖ in viewing the species than respondents who had not ―heard of‖ it (p ≥ 0.09).

136
Discussion
Survey participants represented many countries, and were diverse in age, gender, interest
in wildlife viewing, and self-reported levels of wildlife knowledge. Most participants were fairly
highly educated, not traveling with children, and not retired. Nearly 40% were first-time visitors
to Africa. Although 61.0% of participants were traveling for pleasure, others were traveling for
business, to volunteer, and for other reasons. Among the pleasure travelers, independent travelers
and those using tour companies were nearly evenly represented.
Knowledge of Wildlife Species
The most well-known animals included members of the ―big 5‖ and other large species
often associated with Africa (e.g., giraffe and hippopotamus). Many of the smaller, less
publicized species were little-known. Over 25% of participants had not ―heard of‖ the sitatunga,
genet, spotted-necked otter, serval, and goliath heron; >10% had not ―heard of‖ the fish eagle,
monitor lizard, and bushbuck. Also unknown to >1 participant were the vervet monkey,
mongoose, and jackal. Most of these results were expected, with the exception of the vervet
monkey being less well-known than the mongoose and jackal.
Participants‘ apparently greater unfamiliarity with the vervet monkey in comparison to
the mongoose and jackal may have been influenced by the specificity of the names used in the
survey. Although, for example, I specified the type of monkey (vervet), I did not specify the
banded mongoose or black-backed jackal, although those were the species pictured. Similarly, I
specified the spotted-necked otter, but not the African buffalo, or large-spotted genet. Had I
simply asked about otters and monkeys more people may have indicated having ―heard of‖ them.
Conversely, had I included ―black-backed‖ in the name of the jackal or ―banded‖ in the name of
the mongoose, more people likely would indicated not knowing the species. Using more
comparably specific names could have resulted in the outcome I had initially expected: i.e.,
vervet monkey being in the ―well-known‖ category and jackal in the ―little-known.‖

137
For those species I asked participants about having ―heard of,‖ having ―seen‖, and having
knowledge of, trends were generally consistent (i.e., species that participants indicated having
little knowledge of were also little ―seen‖ and little ―heard of‖). One difference, however, is that
although similar percentages of participants indicated having knowledge of and having ―seen‖ the
sitatunga and spotted-necked otter, nearly 15% more participants indicated not having ―heard of‖
the sitatunga. I suspect this difference is related to the presence of various species of otters on
other continents.
Another slight discrepancy is evidenced by the percentage of participants that indicated
they had some knowledge of a species, but also indicated that they had not ―seen‖ the species or
an image of it. With the exception of having learned about an animal through word-of-mouth, I
suspect people having knowledge of a species have seen an image of it at a minimum. Therefore,
I believe it is likely that at least some of the participants indicating knowledge of species but not
indicating having seen even an image of it were actually unidentifiable nonrespondents to the
question regarding having ―seen‖ the species. Alternatively, some of the participants indicating
knowing about but not having seen an image of a species may not have read the directions fully
and instead had not seen the animal in the wild. Overall, however, this discrepancy should not
compromise conclusions because inability to eliminate non-respondents and those not following
directions properly for the 2 types of questions indicating familiarity with a species (having
―seen‖ and ―heard of‖ the species) would bias results in opposite directions.
Interest in Wildlife Viewing Experiences
Participants indicated a fairly high level of interest in seeing all species included in the
survey; none were of viewing interest to ≤50% of participants. Over 80% of participants were
―interested‖ or ―very interested‖ in seeing the leopard, lion, giraffe, elephant, hippopotamus,
rhinoceros, and chimpanzee. The lion and leopard tied as the species the greatest percentage
(73.8%) of participants were ―very interested‖ in seeing. Those species were followed by
rhinoceros (69.9%), elephant (66.2%), and giraffe (63.7%). Less than 30% of participants were

138
―very interested‖ in seeing the spotted-necked otter (23.3%), goliath heron (25.6%), sitatunga
(26.5%), and mongoose (29.6%). Perhaps most noteworthy is that the percentage of participants
indicating they were ―uninterested‖ or ―very uninterested‖ in each species varied by just 6.6%,
whereas the percentage of participants who were ―neutral‖ or ―not sure‖ varied by 30.0%.
Participants‘ apparent tendency to choose ―neutral‖ or ―not sure‖ instead of indicating disinterest
in viewing a species suggests that many visitors could possibly be readily interested in species
currently receiving little attention.
Levels of ―interested‖ and ―very interested‖ participants varied somewhat among
demographic/interest groups and species. However, these results may be of little consequence
outside of very specific marketing purposes. Likely of greatest interest is the finding is that
participants from Africa were less interested in nearly all species, and any lack of difference seen
appears to be a function of interest decreasing among participants from other continents. This
may, however, have been a function of the small number of Africans included in the sample, and
perhaps the fact that a smaller percentage were traveling for pleasure. I suspect, given a larger
sample, other patterns may have been detected, such as particular groups showing more interest in
less high-profile species (as was reported for local residents, older participants, and experienced
wildlife viewers by Lindsey et al. [2007]).
In addition to influencing participants‘ indications of their familiarity with a species, the
difference in the specificity of names used for different species in the survey may have influenced
interest levels (although I suspect potential effects were largely minimized by the photo provided
for each species; see Appendix F). Using very specific names for species may lead certain
tourists, such as ―serious‖ wildlife tourists, who often seek specific species and are motivated by
the desire to learn about the species seen (Curtin 2010), to indicate a greater level of interest in
those species. In addition, had the fish eagle been labeled African fish eagle or the buffalo African
buffalo, or had, for example, range maps showing the limited distributions of certain species been
included in the survey, participants may have shown additional interest in those species. Such was

139
the case in choice experiments designed to assess the potential of various bird species for
international flagships; one of the characteristics held by the species determined most effective
was endemism (Veríssimo et al. 2009).
Relationship Between Knowledge and Interest
All ―well-known‖ species (leopard, lion, giraffe, elephant, hippopotamus, rhinoceros,
chimpanzee, jackal, buffalo, and crocodile) were considered interesting or very interesting to
greater proportions of participants than species considered ―little-known.‖ It is unknown whether
well-known species have become famous because of some intrinsic quality that appeals to tourists
or whether the species appeal to tourists because they are famous. The quality of a wildlife
tourism experience has been suggested to be influenced by the species‘ popularity and status (i.e.,
rarity) (Reynolds and Braithwaite 2001), and tourists have been suggested to be interested in
seeing rare, large, unusual, unique or new species (Leuschner et al. 1989, Davis et al. 1997,
Moscardo et al. 2001, Saltzer 2002, Saltzer 2003a-d, Moscardo and Saltzer 2004, Lindsey et al.
2007). The most popular species among participants in this study all share at least some of the
aforementioned characteristics (rarity, uniqueness, large size, and popularity [i.e., fame]). The
species that were of less interest to participants in my survey are generally smaller than the more
popular species and less rare. However, no characteristic alone explained levels of interest
perfectly, likely because participants‘ levels of interest were based on many factors in
combination. In addition, to be interested in a species based on its rarity tourists must know that
the species is rare. The sitatunga, for example, is often considered rare in some areas of Africa
(IUCN SSC Antelope Specialist Group 2008), but was among the species of least interest to
participants. Additional research to determine the effect the provision of such information has on
people‘s viewing preferences may be wise.
Participants regularly neglected to answer questions about their interest in viewing
species that they also indicated not having ―heard of.‖ Unfortunately, I believe this is a problem
with survey design. My suspicion that some participants who did not read directions completely

140
assumed only 1 item in the survey row (i.e., only their level of interest in viewing the species or
―I have not heard of this animal‖—Table 5.1b [3 and 4]) should be checked was confirmed by
later trials. Others may have felt unable to provide their level of viewing interest having not
―heard of‖ a species, but the provision of a picture sheet likely minimized such occurrences. The
lower response rates among participants that had not ―heard of‖ a species apparently did not
affect results because there were no differences in interest levels between participants that had
and had not ―heard of‖ the species I assessed.
Implications for Wildlife Tourism
The results from my relatively small sample likely should not be generalized to all
visitors, nor any market segment, but do provide a basis for understanding the wildlife viewing
preferences of visitors to Tanzania. In addition to knowing how interested a sample of tourists
generally are in viewing various wildlife species, however, people desiring to market a protected
area based on wildlife viewing experiences need to consider several other practical factors. For
example, one factor that has been suggested as important to the wildlife viewing experience is the
ability to get close to animals (Davis et al. 1997, Moscardo et al. 2001) (although ―close‖ is a
subjective term and likely interpreted differently among individuals). Therefore, depending on the
tolerance for disturbance of the various species most popular among tourists, managers may be
more or less willing to allow or enable viewing of the animals.
For an area to be a successful wildlife tourism destination, not only do people need to be
interested in viewing the species present and protected area authorities willing to allow tourism
focused on those species, but in areas like Tanzania where independent travel is unusual (Bonine
et al. 2004) and can be difficult, tour operators should be willing to provide tours to see the
species. This is particularly important because tour operators also help market wildlife viewing
attractions (e.g., Okello 2005). However, tour operators‘ interest in marketing and providing tours
to see species may not hinge only on tourists‘ interest in species, such as is reported here, but also
factors such as the chances of seeing a species, and how, where, and when the species is best

141
seen—in part because viewing the desired species is important to satisfaction among their clients
(i.e., wildlife viewing tourists; Hammit et al. 1993, Fredline and Faulkner 2001). Possibly as a
result of the considerations of tour operators, predictability (e.g., regular use of particular habitat
features) has been suggested as a key feature of better-known species for wildlife watching and a
critical element in the success of marketing wildlife tourism (Goodwin and Leader-Williams
2000, Valentine and Birtles 2004). Researchers in Tasmania included in their inventory of the
Island‘s wildlife viewing opportunities only those species that tourists had ≥80% chance of
viewing (Kriwoken et al. 2002), although others have suggested that an animal does not always
need to be seen to be included on a tour as long as evidence of the animal‘s current (e.g., a bird‘s
song) or past (e.g., sign such as tracks) presence is available (Green et al. 2001). Therefore, when
considering the choice of a species to market as a tourist attraction it is important to consider the
state of knowledge about the animal‘s geographic range, habitat, and seasonal availability, as well
as the habitat features (e.g., a watering hole) that cause the animals to congregate. Tour operators
may be less willing to provide tours highlighting species that are more difficult to view.
Finally, although the role of well-known species in initially attracting tourists to an area
should be recognized, diversity has also been reported as important to the visitor experience (e.g.,
Lindsey et al. 2007). Researchers in Australia suggest that although visitor satisfaction probably
depends in part on seeing animals the visitor is already aware of and associates with Australia,
promised sightings of those species can be used to encourage tourists to visit areas where, through
appropriate interpretation, interest in lesser-known species can be fostered (Green et al. 2001). In
South America, for instance, although few people traveled to Manu National Park, Peru, with the
intent of viewing the giant otter (Pteronura brasiliensis), almost all who did see the animals
considered the experience the highlight of their trip (Dunstone and O‘Sullivan 1996). Therefore,
the smaller and less well-known species included in my survey may be critical to the satisfaction
of wildlife viewing tourists even though not of the highest interest to them.

142
Implications for Rubondo Island National Park
As noted by Veríssimo et al. (2009), many areas important for biodiversity conservation,
such as tropical islands, lack the charismatic megafauna typically used as international flagships.
Such appears to be the case with Rubondo Island National Park, which does not contain many of
the species shown to be highly popular by this research (e.g., leopard, lion, rhinoceros, jackal,
buffalo, or serval). Species asked about on this survey that occur in Rubondo and were of the
most interest to tourists are likely of limited use as flagship species for the area. The elephant and
giraffe, both ―interesting‖ or ―very interesting‖ to a high percentage of participants, are present on
the Island, but were introduced, as was the chimpanzee. Using these species to market Rubondo
would neglect the importance of cultural or historical representativeness to tourists seeking
connections with the area (Tremblay 2002). In addition, the sustainability of using an introduced
species to market tourism in a national park is questionable. In the case of the chimpanzee, the
animals also are rarely seen on Rubondo. Basing advertising on species that tourists are unlikely
to see may have negative implications for tourist satisfaction. The hippopotamus and crocodile,
both of high interest as well, are native to the area, but, like the elephant, giraffe, and chimpanzee,
can been seen more easily and likely better (e.g., in the case of the hippopotamus—spend more
time out of the water and in plain view) in other national parks that are easier to access. Because
novelty and seeing unique or unusual species is an important motivation for tourists (Moscardo et
al. 2001, Pearce 2005), Park officials at Rubondo may be wise to choose species for international
flagships that are not also used as tourism flagships in more easily accessed areas.
Rubondo contains all of the species of interest to <75% of tourists (the vervet monkey,
bushbuck, monitor lizard, genet, fish eagle, sitatunga, spotted-necked otter, goliath heron, and
mongoose [although the Island has only the marsh [Atilax paludinosus] and not the banded
mongoose pictured in the survey, I expect the interest levels would be similar for both species]).
Of those species, the spotted-necked otter, sitatunga, and fish eagle probably are the most unique
viewing experiences that are not marketed in more readily-accessible areas. The otter is unusually

143
visible in Rubondo‘s waters, the sitatunga has a limited range and is also very easily viewed on
the Island, and the fish eagle occurs at high densities and is easily viewed along the shore.
A final consideration in choosing species to market as international tourism flagships is
local attitudes toward those species. Using a controversial species as a tourist attraction likely
could be problematic (Tremblay 2002), and therefore local and international attitudes toward the
species in question should be definitively determined. Support from host communities, which is
imperative to the sustainability of wildlife tourism activities, also may depend on how local
people value the species around which tourism is (or will be) based (Burns 2004). Communities
around Rubondo have little affinity for or desire to live near 2 of the species (the hippopotamus
and crocodile) that were of interest to >75% of tourists surveyed and 4 of the species of lesser
interest (monitor lizards, vervet monkeys, spotted-necked otters, and large-spotted genets—
although the latter 2 species also were little-known locally) (Chapter 2). The implications for
conservation of using any species that is little liked or desired locally as an international flagship
should be given serious consideration.
Perhaps if, after additional consideration and consultation with local people, Park
management were interested in focusing marketing efforts on little-known species such as the
spotted-necked otter, fish eagle, or sitatunga, they could entice potential visitors to travel to
Rubondo to see those species by increasing awareness of them among target market segments.
This, however, is likely neither practical nor feasible in the near-term. A more likely alternative
may be to focus marketing strategies on tourist segments that would be particularly interested in
viewing opportunities for those species (e.g., for the otter and sitatunga, members of their
respective IUCN SSC Specialist Groups). Rubondo‘s management should also consider as
flagships species not included in my survey. The Parks‘ >200 bird species (TANAPA 2003) may
be of great interest to birders (subgroups of which make substantial investments in related
travel—e.g., Eubanks et al. 2004) , and its diversity of orchid (family Orchidaceae) and butterfly

144
(order Lepidoptera) species (TANAPA 2003) are also likely of interest to specific market
segments.
Park management may also want to consider how wildlife could be advertised not as
flagships for a wildlife tourism destination, but instead to add value to other types of tourism
experiences. Wildlife viewing is known to be of importance to many tourists—even if not always
the primary consideration in vacation planning (Moscardo et al. 2001)—and seeing wildlife is
thought to positively affect outdoor recreation experiences for many people (Leuschner et al.
1989). Rubondo could target travelers interested in the island environment (including the sandy
beaches, which 35% of European tourists seek in combination with a safari—Wade et al. 2001),
using wildlife to add value to that setting. While advertising the Park as a relaxing beach
destination to be added on to the end of a safari, for example, the Park could market a suite of
species related to the aquatic environment, such as fish eagles, spotted-necked otters, sitatunga,
hippopotamuses, and kingfishers (family Alcedinidae) (should investigations find that those
species would not be locally-controversial attractions). Rubondo is also unique among Tanzania‘s
national parks in that it can be explored on foot because of the absence of large predators
(TANAPA 2003). Rubondo‘s managers may find that the best option is advertising the Park as a
destination for people interested in outdoor adventures. Another potential pool of visitors to
Rubondo for whom many of the Island‘s wildlife species would be of value, particularly given the
limited amount known about many of the populations, is researchers and their university courses
or other institutions providing field experiences. Rubondo has a variety of valuable resources;
appropriately marketing those resources with the goal of attracting a sustainable number of
tourists to fund education, outreach, and patrol efforts will ensure the future protection of the
Park. A logical next step in choosing a marketing strategy for the Park may be to assess current
visitors‘ motivations for visiting and their perceptions of the destination‘s highlights, as well as
the perceptions and preferences of tour operators.

145
Table 5.1 (a and b). The types of questions included for each species in my 2009 survey of the
wildlife viewing interests of non-East African travelers at Kilimanjaro International Airport,
Tanzania (a), as well as samples of each question type (b).
a. Species Questions asked
1. Buffalo Interest, heard of
2. Bushbuck Interest, heard of
3. Chimpanzee Interest, heard of, knowledge, seen, rank
4. Crocodile Interest, heard of, knowledge, seen, rank
5. Elephant Interest, heard of, knowledge, seen, rank
6. Fish eagle Interest, heard of, knowledge, seen, rank
7. Genet Interest, heard of
8. Giraffe Interest, heard of, rank
9. Goliath heron Interest, heard of
10. Hippopotamus Interest, heard of, knowledge, seen
11. Jackal Interest, heard of
12. Leopard Interest, heard of
13. Lion Interest, heard of
14. Mongoose Interest, heard of
15. Monitor Lizard Interest, heard of
16. Rhinoceros Interest, heard of
17. Serval Interest, heard of
18. Sitatunga Interest, heard of, knowledge, seen, rank
19. Spotted-necked otter Interest, heard of, knowledge, seen, rank
20. Vervet monkey Interest, heard of
b.1. Knowledge 2. Seen A. How knowledgeable do you consider yourself
about each of the animals listed below?
(Please check the appropriate box.)
B. Please place a check mark in the
appropriate box below if you had seen the
animals listed on the left before
participating in this survey (in the wild,
in captivity, in photos, on television, etc.). Not at all Somewhat Very
Species
3. Interest 4. Heard of
Very
Uninterested Uninterested Neutral Interested
Very
interested
Not
sure
I have not
heard of this
animal
Species
5. Rank Please rank the following animals from 1 to 7, giving a 1 to the animal you would be most interested in viewing
and a 7 to the animal you would be least interested in viewing. Please see the box below for an example.
_____Chimpanzee
_____Crocodile
_____Elephant
_____Fish eagle
_____Giraffe
_____Sitatunga
_____Spotted-necked otter
Example:
2 Pineapple
3 Orange 4 Mango
7 Lemon
1 Watermelon 5 Papaya
6 Apple

146
Table 5.2. The questions or types of questions included in my 2009 survey of travelers at
Kilimanjaro International Airport, and levels of non-response for each among non-East African
participants. Non-response for questions that are repeated for multiple species, such as those
about interest in viewing different animals, is presented as averages, with range in parentheses. I
was unable to ascertain rates of non-response for 2 questions: ―having seen the species or an
image of it prior to participation‖ and ―having ‗heard of‘ the species prior to participation.‖
Variable or Variable Type
Percent non-
response (as an
average with range
for multi-part
questions)
Level of knowledge about various species* 1.47 (0.68 - 2.74)
Having seen the species or an image of it prior to participation* -
Level of interest in viewing each species† 8.22 (0 - 30.14)
Having ―heard of‖ the species prior to participation† -
Ranking of species by interest in viewing them‡ 3.72 (2.74 - 4.79)
Age 13.01
Gender 0
Level of education 0
Traveling with children 1.37
Traveling with a tour company 2.06
Retired 3.42
Having been on vacation with primary purpose of wildlife viewing 2.06
Having been to Africa before (excluding African residents) 2.74
Number of days on continent as of survey (excluding African
residents and previous visitors)
1.89
Purpose of travel 2.74
The importance of wildlife in planning vacations 4.79
Level of wildlife knowledge 3.42
*species included: chimpanzee, crocodile, elephant, fish eagle, hippopotamus, sitatunga, and
spotted-necked otter.
† species included: buffalo, bushbuck, chimpanzee, crocodile, elephant, fish eagle, genet, giraffe,
goliath heron, hippopotamus, jackal, leopard, lion, mongoose, monitor lizard, rhinoceros, serval,
sitatunga, spotted-necked otter, and vervet monkey.
‡species included: chimpanzee, crocodile, elephant, fish eagle, giraffe, sitatunga, and spotted-
necked otter.

147
Table 5.3. The number of respondents to questions regarding interest in viewing animals, by
species, for my survey of non-East African travelers at Kilimanjaro International Airport,
Tanzania regarding wildlife viewing preferences.
Species Respondents
Buffalo 145
Bushbuck 134
Chimpanzee 144
Crocodile 144
Elephant 145
Fish eagle 131
Genet 106
Giraffe 146
Goliath heron 121
Hippopotamus 144
Jackal 141
Leopard 145
Lion 145
Mongoose 135
Monitor Lizard 133
Rhinoceros 143
Serval 119
Sitatunga 102
Spotted-necked otter 116
Vervet monkey 140

148
Table 5.4. The number and percentage of non-East African participants (n = 146) in my 2009
survey at Kilimanjaro International Airport, Tanzania, that did not indicate having ―seen‖ the
animal or an image of it, yet considered themselves ―somewhat‖ or ―very‖ knowledgeable about
the species.
Species
Respondents who consider themselves ―somewhat‖ or
―very‖ knowledgeable about the species and also
report not having ―seen‖ the species or an image of it
Number Percent of Participants
Chimpanzee 11 7.5
Crocodile 8 5.5
Elephant 4 2.7
Fish eagle 6 4.1
Hippopotamus 5 3.4
Sitatunga 5 3.4
Spotted-necked otter 7 4.7

149
Table 5.5.The country of origin of the 146 non-East African participants participating in my 2009
survey of travelers at Kilimanjaro International Airport, Tanzania, regarding wildlife viewing
interests.
Country Number of
participants
Percent of
participants
Australia 6 4.1
Austria 2 1.4
Cameroon 1 0.7
Canada 4 2.7
China 1 0.7
Cote d'Ivoire 2 1.4
Dominican Republic 1 0.7
Ethiopia 2 1.4
Finland 1 0.7
France 2 1.4
Germany 15 10.3
Ghana 2 1.4
Holland 3 2.0
Iceland 1 0.7
India 1 0.7
Ireland 3 2.1
Italy 1 0.7
Mexico 5 3.4
Netherlands 4 2.7
Norway 2 1.4
South Africa 4 2.7
Spain 2 1.4
Sudan 2 1.4
Sweden 8 5.5
Thailand 1 0.7
United Kingdom 12 8.2
United States 58 39.7

150
Table 5.6. The most and least interesting wildlife species according to various groups of non-East African respondents to my 2009 survey of
travelers at Kilimanjaro International Airport in Tanzania.
All
Respondents
Return visitors (n = 72-73); Have vacationed primarily to view wildlife (n = 68-70)
First-time visitors (n = 53); Short-
term visitors (n = 30); Non-African
residents (n = 129-130); ≥ Bachelor’s
degree (n = 110)
Consider wildlife important or
very in vacation planning (n = 81-82), Females (n
= 75)
Independent (n = 39-40) and tour company (n =
47-48) pleasure travelers, < Bachelor’s
degree (n = 32)
Males African
residents Retirees
Most (n = 139-142) (n = 66) (n = 10-12) (n = 21)
interested Elephant
Giraffe Chimpanzee
Chimpanzee Giraffe
Crocodile Sitatunga Crocodile
Sitatunga S-N otter F. eagle S-N otter Sitatunga Sitatunga S-N Otter / F. eagle*
Sitatunga
Least F. eagle1 Sitatunga Sitatunga F. eagle S-N otter F. eagle F. eagle
Interested S-N otter2 F. eagle S-N otter Sitatunga F. eagle S-N otter Crocodile S-N Otter
* Tied 1 Fish eagle
2 Spotted-necked otter
15
0

151
Figure 5.1. Monthly trends in international visitation to Tanzania from 1996 to 2006. (Data from Tanzania Ministry of Natural Resources and
Tourism 2007).
.
15
1

152
Figure 5.2. The locations of Tanzania‘s national parks.

153
Figure 5.3. The number of non-respondents to questions in my 2009 survey of Non-East African travelers at Kilimanjaro International Airport,
Tanzania, regarding level of interest in viewing various wildlife species, and whether those non-respondents also indicated having not ―heard of‖
the species prior to the survey.
0
5
10
15
20
25
30
35
40
45
50
Nu
mb
er o
f n
on
-res
po
nd
ents
Had not heard of the species Had heard of the species
15
3

154
Figure 5.4. Participants who indicated not having ―heard of‖ each of the wildlife species asked about in my 2009 survey of non-East African
travelers at Kilimanjaro International Airport, Tanzania, and whether those participants provided a response to questions regarding their interest in
viewing the species or not. (If all participants provided their level of interest in viewing a species, that species is not included in the chart.)
0
10
20
30
40
50
60
70
80
Nu
mb
er
of
par
tici
pan
ts
Did provide level of interest in viewing species Did NOT provide level of interest in viewing species
15
4

155
Figure 5.5. The general importance of wildlife viewing opportunities in the planning of vacations
among the 139 non-East African visitors to Tanzania who responded to the question in my 2009
survey at Kilimanjaro International Airport regarding wildlife viewing preferences.

156
Figure 5.6. The self-reported level of wildlife knowledge among the 141 non-East African
visitors to Tanzania who responded to the question in my 2009 survey at Kilimanjaro
International Airport regarding wildlife viewing preferences.

157
Figure 5.7. The percentage of the 146 non-East African visitors to Tanzania who participated in
my 2009 survey at Kilimanjaro International Airport regarding wildlife viewing preferences that
indicated not having ―heard of‖ the listed species.

158
Figure 5.8. The percentage of the 146 non-East African visitors to Tanzania who participated in
my 2009 survey at Kilimanjaro International Airport regarding wildlife viewing preferences
indicating having ―seen‖ (in the wild, in captivity, in photos, on television, etc.) the 7 species
about which the question was asked.

159
Figure 5.9. The self-reported levels of knowledge regarding 7 wildlife species of non-East
African travelers at Kilimanjaro International Airport, Tanzania, that participated in my 2009
survey. Sample size for each question is included at the top of the appropriate bar.
0
10
20
30
40
50
60
70
80
90
100
Pe
rce
nt
of
par
tici
pan
ts
"Very" knowledgeable "Somewhat" knowledgeable
145 145 143 145 144 141 142

160
Figure 5.10. The level of interest in viewing various wildlife species expressed by non-East African visitors to Tanzania who participated in my
2009 survey at Kilimanjaro International Airport regarding wildlife viewing preferences. The number of participants providing their level of
interest in viewing each animal range from 102-146, depending on the species.
16
0

161
Figure 5.11. The percentage of the non-East African males and females participating in my 2009 survey at Kilimanjaro International Airport,
Tanzania, who were ―interested‖ or ―very interested‖ in viewing various wildlife species. For males, n = 55-76; females, n = 47-70 (depending on
species).
16
1

162
Figure 5.12. The percentage of the non-East African respondents with Bachelor‘s degrees and above participating in my 2009 survey at
Kilimanjaro International Airport, Tanzania, who were ―interested‖ or ―very interested‖ in viewing various wildlife species in comparison with
participants holding less than a Bachelor‘s degree. For those with Bachelor‘s degrees and above, n = 84-114; for those without, n = 18-32
(depending on species).
162

163
Figure 5.13. The percentage of the residents of African countries (excluding East African Community member countries) who participated in my
2009 survey at Kilimanjaro International Airport that were ―interested‖ or ―very interested‖ in viewing various wildlife species compared to
respondents from other countries. For African residents, n = 9-13; for residents of other continents, n = 93-133 (depending on species).
0
10
20
30
40
50
60
70
80
90
100
Pe
rce
nt
of
resp
on
de
nts
Residents of African countries Residents of all other countries
16
3

164
Figure 5.14. The percentage of first-time visitors to Africa who participated in my 2009 survey at Kilimanjaro International Airport that were
―interested‖ or ―very interested‖ in viewing various wildlife species compared to return visitors. For first-time visitors, n = 36-53; for return
visitors, n = 56-75 (depending on species).
16
4

165
Figure 5.15. The percentage of non East-African participants in my 2009 survey at Kilimanjaro International Airport, Tanzania, that reported
having gone on vacation for the primary purpose of viewing wildlife and were ―interested‖ or ―very interested‖ in viewing various wildlife species
compared to those who had not gone on vacation for such a purpose. For those who have gone on vacation with the primary purpose of wildlife
viewing, n = 48-70; for those who have not, n = 53-73 (depending on species).
16
5

166
Figure 5.16. The percentage of non-East African participants in my 2009 survey at Kilimanjaro International Airport, Tanzania, that consider
opportunities to view wildlife ―important‖ or ―very important‖ in the planning of their vacations and were ―interested‖ or ―very interested‖ in
viewing various wildlife species compared to all other respondents (i.e., those who are neutral, consider wildlife unimportant, or are unsure). For
those who consider wildlife ―important‖ or ―very important‖ in the planning of their vacations, n = 56-82; for others, n = 41-64 (depending on
species).
0
10
20
30
40
50
60
70
80
90
100
Pe
rce
nt
of
par
tici
pan
ts
Participants who consider opportunities to view wildlife "important" or "very important" to vacation planning
All other respondents
16
6

167
Figure 5.17. The percentage of non-East African participants in my 2009 survey at Kilimanjaro International Airport, Tanzania, that were traveling
solely for pleasure and with a tour group as opposed to those traveling solely for pleasure but independently that consider opportunities to view
wildlife ―important‖ or ―very important‖ in the planning of their vacations and were ―interested‖ or ―very interested‖ in viewing each wildlife
species. For tour group travelers, n = 34-49; for independent travelers, n = 24-38 (depending on species).
0
20
40
60
80
100
120
Pe
rce
nt
of
par
tici
pan
ts
Independent travelers Clients of tour companies
16
7

168
Figure 5.18. Box and whisker plots showing the distribution of rankings given to each of the
species by non-East African visitors to Tanzania who participated in my 2009 survey at
Kilimanjaro International Airport regarding the wildlife viewing preferences (n = 139-142).
.
1 Spotted-necked otter

169
Figure 5.19. The level of interest in viewing animals classified as ―well-known‖ (buffalo,
chimpanzee, crocodile, elephant, giraffe, hippopotamus, leopard, lion, rhinoceros, and jackal)
and ―little-known‖ (the bushbuck, fish eagle, genet, goliath heron, mongoose, monitor lizard,
serval, sitatanga, spotted-necked otter, and vervet monkey) based on responses of non-East
African visitors to Tanzania who participated in my 2009 survey at Kilimanjaro International
Airport.

170
Figure 5.20. The level of interest in viewing animals included in my 2009 survey at Kilimanjaro International Airport, Tanzania, among non-East
African participants arranged in order of least to most known by participants. Percentages under each animal name indicate participants who had
heard of each species prior to participation in the survey. The number of participants providing their level of interest in viewing each animal range
from 102-146, depending on the species.
50
55
60
65
70
75
80
85
90
95
100
Per
cen
t o
f p
arti
cip
ants
inte
rest
ed o
r ve
ry in
tere
sted
Known to the lowest percentof participants
Known to more
participants
17
0

171
CHAPTER 6
SUMMARY, CONCLUSIONS, AND RECOMMENDATIONS
Summary
The Study Area and Research
Rubondo Island is one of 16 (Caro et al. 2009) national parks in Tanzania. The Park,
established fairly recently, receives limited local support and few of the international visitors
(TANAPA 2003) that the managing parastatal organization (Tanzania National Parks Authority
[TANAPA]) relies on for revenue generation (Bonine et al. 2004). However, increasing support
for the Park from both local and international audiences is an important goal of TANAPA
(TANAPA 2003). The research that informed this dissertation was intended to assist Park
management in reaching that goal by investigating opinions regarding the Park and its wildlife
among 3 main audiences: local people, tourists, and tour operators.
A unifying theme for much of the research discussed in the preceding chapters was that
of flagship species, ―popular, charismatic species that serve as symbols and rallying points to
stimulate conservation awareness and action….‖ (Heywood 1995). Flagship species have been
used around the world to gain support for conservation among both local and international
audiences (for examples, see Dietz et al. 1994, Leader-Williams and Dublin 2000, and Bowen-
Jones and Entwistle 2002). However, choosing an appropriate flagship species—one that will not
engender ambivalence or ill-will among the target audience(s)—is not always an easy task. In
choosing a flagship species, the perceptions, preferences, and attitudes of the people whose
support is being sought must be considered (Dietz et al. 1994, Bowen-Jones and Entwistle 2002).
Several researchers have made suggestions about the characteristics that should be held
by an effective local flagship. Bowen-Jones and Entwistle (2002), for example, suggested that the
species should be: distinctive, readily associated with locally important habitats, known to the
target audience, and one with which the audience has positive associations. In addition, they

172
suggested that the species should not be one used to convey conflicting messages or those that
may potentially be confused with the conservation message. Dietz et al. (1994) suggested that to
be useful for engendering local support for conservation, a flagship species should be one that
local residents can view and, therefore, directly relate to conservation goals. Feistner and
Mallinson (2000) believed the species also should have behavioral and physical traits that endear
it to the people whose support is sought. Kaltenborn et al. (2006) suggested that the best flagship
species for any area would be regarded highly and not feared by the target audience.
The choice of flagship species for international audiences is typically less complex, as
generally the target audiences (foreign donors, tourists, etc.) neither live near the species nor have
any personal experience with the species. Often such flagship species are chosen on the basis of
―intuition‖ (Home et al. 2009). However, for protected areas dependent on wildlife tourism for
income, any flagship species should ideally serve as an attraction for tourists.
I focused my research about potential flagship species for Rubondo on investigations of
preferences and opinions regarding wildlife among local people and interest in viewing various
wildlife species among international visitors. In investigations of the opinions and preferences of
children around Rubondo regarding wildlife, I used a survey to assess the following as a measure
of flagship species potential: whether or not participants were familiar with the species (i.e., able
to name the species); if participants thought the species was attractive and useful (2 things cited
by others [e.g., Entwistle and Stephenson 2000, Kaltenborn et al. 2006a] as being important
characteristics of the most favored species in Tanzania); if participants ―liked‖ the species; and if
participants wanted ―many‖ of the species to live nearby. I also asked similar questions during
interviews with adults, and although those results are not reported here they did provide insight
into the reasons behind some of the perceptions of local species. To assess the interest of visitors
to Tanzania in various viewing experiences, I asked travelers at the nearest Tanzanian
international airport to Rubondo (Kilimanjaro International Airport) to rate and also rank their
interest in viewing various wildlife species. In addition, I asked participants to indicate their

173
awareness and knowledge about those species. My research also explored another factor
important to support for national parks: local visitation. Visitation is a key component of the
national park model (see Chapter 1), and is important in generating public support for those
protected areas (e.g., Bushell et al. 2007). I therefore asked local children and adults participating
in the surveys and interviews mentioned above if they had visited Rubondo and desired to visit.
In addition, I asked adult interviewees if they knew anyone who had visited the Island. Although I
did not ask any other questions specific to local tourism, interviewees regularly brought up
visitation to Rubondo in response to open-ended survey questions about the Park, conservation,
and wildlife tourism generally.
The Results
Children’s Preferences Regarding Various Wildlife Species
Nine hundred and thirty-two primary school students in Standards 4, 5, 6, and 7 from 7
communities surrounding Rubondo completed surveys regarding wildlife preferences and
opinions during 2008 and 2009. Results (reported in Chapters 2 and 3) included the following:
Students in communities around Rubondo are least familiar with (i.e., less than 33% of
students are able to name based on an illustration) the spotted-necked otter (Lutra
maculicollis), sitatunga (Tragelaphus speki), large-spotted genet (Genetta tigrina), and
Egyptian goose (Alopochen aegyptiacus); fairly familiar with (44 - 62% are able to name)
the fish eagle (Haliaeetus vocifer) and little egret (Egretta garzetta); and quite familiar
with (>79% are able to name) the hippopotamus (Hippopotamus amphibius), silver
cyprinid (Rastrineobola argentea), monitor lizard (Varanus niloticus), vervet monkey
(Cercopithecus pygerythrus), crocodile (Crocodylus niloticus), giraffe (Giraffa
camelopardalis), and elephant (Loxodanta africana).
Animals considered most attractive by students were not always the type typically
preferred in other areas (e.g., the ―cute‖ or ―athletic‖ species preferred by children in the
USA and the United Kingdom [Kellert and Westervelt 1983, Entwistle and Stephenson

174
2000]). The Egyptian goose was considered the most attractive by students able to name
the species (with 88% finding the species attractive), followed by the silver cyprinid
(86%), giraffe (84%), and little egret (83%). Less than 50% of students considered the
crocodile, monitor lizard, or large-spotted genet attractive.
Over 80% of students able to name them considered the silver cyprinid and Egyptian
goose useful. Less than 50% considered the crocodile, genet, monitor lizard, and vervet
monkey useful.
The students showed little affinity for or desire to live ―near‖ large-spotted genets,
monitor lizards, spotted-necked otters, vervet monkeys, crocodiles, and hippopotamuses;
some affinity for and desire to live near giraffes, elephants, fish eagles, and sitatunga; and
high affinity for and desire to live near Egyptian geese, silver cyprinids, and little egrets.
Animals that a high percentage of students wanted to be locally abundant were also
generally considered attractive and useful, and were well-liked, although participants did
not always want to live near species that were generally well-liked and considered
attractive and useful.
The only species that received high scores on all measures used to assess flagship species
potential (familiarity, attractiveness, usefulness, liking, and desirability) was the silver
cyprinid. However, familiarity was the only category in which the Egyptian goose did not
receive a score of ―high.‖
All of the demographic variables I measured except having a head of household (HOH)
involved in farming (i.e., school, standard [grade], gender, having a HOH in livestock
keeping and having a HOH in fishing) explained some variation in students‘ ability to
name at least 1 species.

175
No variables appeared to be useful in explaining ―dislike‖ for sitatunga, Egyptian geese,
elephants, and giraffes, nor preferences for ―few‖ crocodiles, Egyptian geese, and little
egrets.
For all other cases, ―dislike‖ and preferences for ―few‖ of a species were explained in
part by at least 1 of the measured demographic variables (school, standard [grade],
gender, and having a HOH in livestock keeping, in fishing, or in farming).
Among the species determined to have the highest potential to serve as effective local
flagships based on general attractiveness, usefulness, likeability, desirability, and status
as native to the area—i.e., the fish eagle, sitatunga, little egret, Egyptian goose, and silver
cyprinid—the measured variables appeared useful in describing either ―disliking‖ or
wanting ―few‖ of all but the Egyptian goose. Children‘s standard and school appear to
influence their ―dislike‖ for the fish eagle, and males are apparently more likely to want
―few‖ of the species. No variables were useful in describing ―dislike‖ for the sitatunga,
but males were more likely to want ―few‖ of the species. Children with fishing HOHs
were more likely to ―dislike‖ the silver cyprinid than other children. Males also were
more likely to want ―few‖ silver cyprinids. No variables appeared to be useful in
explaining wanting ―few‖ of the little egret, and only the variable ―standard‖ appeared to
influence ―dislike‖ for the species.
Visitors’ Interest in Viewing Various Wildlife Species
One hundred and forty-six non-East African travelers participated in interviews at
Tanzania‘s Kilimanjaro International Airport in 2009. Findings (reported in Chapter 5) included
the following:
All participants had ―heard of‖ the buffalo (Syncerus caffer), chimpanzee (Pan
troglodytes), crocodile, elephant, giraffe, hippopotamus, leopard (Panthera pardus) and
lion (Panthera leo); all but 1 had ―heard of‖ the rhinoceros (Diceros bicornis), and all but

176
4 the jackal (Canis mesomelas). More than 10 participants (6.8%) had not ―heard of‖ the
remaining 10 species—the bushbuck, fish eagle, genet, goliath heron (Ardea goliath),
mongoose (Mungos mungo), monitor lizard, serval (Felis serval), sitatunga, spotted-
necked otter, and vervet monkey.
The least known species were the: sitatunga (which 47.3% of participants had not ―heard
of‖), genet (37.0%), spotted-necked otter (33.6%), serval (29.5%), and goliath heron
(26.0%).
Participants indicated a fairly high level of interest in seeing all species included in the
survey; none were of viewing interest to less than 50% of participants.
Over 75% of participants were ―interested‖ or ―very interested‖ in seeing the leopard,
lion, giraffe, elephant, hippopotamus, rhinoceros, chimpanzee, jackal, buffalo, crocodile,
and serval.
The lion and leopard tied as the species the greatest percentage of participants were ―very
interested‖ in seeing.
Participants who were residents of African countries were less interested in viewing most
species.
All ―well-known‖ species (leopard, lion, giraffe, elephant, hippopotamus, rhinoceros,
chimpanzee, jackal, buffalo, and crocodile) were considered ―interesting‖ or ―very
interesting‖ to greater proportions of participants than ―little-known‖ species.
The percentage of participants ―neutral‖ or ―not sure‖ about their interest in viewing a
species were generally greater for ―little-known‖ species and interest generally increased
(with a few exceptions) as the number of participants who had ―heard of‖ the species
increased. However, the respondents who had ―heard of‖ a least-known species were no
more or less likely to be ―interested‖ or ―very interested‖ in viewing the species than
respondents who had not ―heard of‖ the species.

177
Local Visitation of Rubondo
Forty-eight adults in the communities of Nkome and Muganza participated in interviews
during 2008. In addition to responses to specific questions about previous visitation to Rubondo
and interest in visiting in the future, participants often offered information relevant to local
tourism in response to open-ended questions about conservation, wildlife tourism, and national
parks. Results from those interviews and from questions regarding visitation to the Park in the
survey of school children (reported in Chapter 4) include the following:
Ninety percent of children and 83% of adult participants had not visited Rubondo,
although 92% of children and 98% of adults desired to visit.
Most adult participants (71%) did not know anyone who had visited the Park.
Adult participants indicated that lack of information was a major barrier to visitation.
Cost also was mentioned as a barrier to visiting Rubondo, although to a lesser extent than
lack of information.
Seven interviewees who showed ambivalence to conservation, wildlife tourism generally,
or Rubondo cited not having visited the Park as a reason, as did 4 others whose responses
were more negative.
In contrast, 9 participants saw value in protecting wildlife and the places they live or
wildlife tourism on Rubondo because of the potential for themselves or their children to
visit the Park and/or learn about the environment.
Adult participants associated visiting the Park with opportunities for themselves and
others to learn about the environment.
Several respondents held or alluded to the misconception that tourists or researchers who
visit Tanzanian parks take minerals, and others mentioned fear of being shot if they tried
to enter Rubondo without complete understanding of the proper procedures.

178
Recommendations from Previous Chapters
The choice of flagship species is complicated and multi-faceted, and the effectiveness of
using such a technique depends not only on the species used, but also on other components of the
relationship between the protected area and local people and, for an international tourism
flagship, the uniqueness of the experience. Based on the results of the various investigations
reported here, I made the following suggestions and observations for Rubondo in individual
chapters:
Local Flagship Species and Local Support
I suggested that among the species included in the survey, the Egyptian goose and silver
cyprinid possibly have the most potential for immediate use as local flagships for
Rubondo based on the characteristics evaluated. However, because those species likely
would not serve the dual role of tourism flagships, I noted that Park management may
want to consider the sitatunga and fish eagle (which are expected to be more useful as
international flagships based on uniqueness to Rubondo) as well. Before using either of
those species, however, I suggested based on my interpretation of models that further
assessments of perceptions of the species among certain demographic groups would be
wise. In addition, to use either the sitatunga or fish eagle as a flagship, Park management
would likely need to invest in an outreach campaign that would heighten awareness of the
species.
I indicated that some species (including the elephant and giraffe) that scored reasonably
well based on the familiarity and opinion indicators used to assess flagship potential are
probably poor choices for flagship species for Rubondo because they are not native to the
Island.
I noted that inviting nearby communities to ―elect‖ a local flagship, or even a suite of
flagships, for the Park—ideally from among a selection of species generally considered
useful, attractive, likeable, and desirable locally, and that Rubondo‘s management feel

179
best highlight the Park‘s most important conservation needs—is one way that Park
management could increase local involvement in, and, consequently, likely support for
the Park.
I suggested that Park management should take immediate steps to increase local visitation
to Rubondo by providing information regarding procedures for visiting (e.g., appropriate
entry points) through multiple formal and informal avenues. I proposed the following as
possible additional steps to take: establishing and highly advertising a free visit day each
year for local people (possibly in conjunction with discounted accommodations); more
clearly demarcating entry points into the Park; working within local communities to
establish and advertise a network of boat owners willing and able to provide locally-
affordable transportation to the Island; continuing to seek grant funding for bringing
school children, and perhaps in the future even adults, to the Island; and setting up a fund
that international visitors could contribute to for the same purpose.
International Support Through Tourism
I suggested the spotted-necked otter, sitatunga, and fish eagle as probably the most
potentially appealing viewing experiences for native species on Rubondo that are not
available in more readily-accessible areas. Although none of the 3 species were among
the most interest to visitors that participated in my survey, all species I asked about
garnered fairly high levels of interest.
I noted that by supplying information about little-known species such as the spotted-
necked otter, sitatunga, and fish eagle, managers could possibly entice potential visitors
to travel to Rubondo to see them. However, I suggested that a likely more feasible
alternative might be to focus marketing strategies on tourist segments that would already
be particularly interested in viewing opportunities for those species (e.g., for the otter and
sitatunga, members of their respective IUCN SSC Specialist Groups).

180
In addition, I proposed that Rubondo may want to consider other wildlife and nature
viewing opportunities that I did not measure interest levels in, such as its >200 bird
species and diversity of orchid (family Orchidaceae) and butterfly (order Lepidoptera)
species that are also likely of interest to specific market segments.
I indicated that Park management might want to consider how wildlife could be
advertised not as flagships for a wildlife tourism destination, but instead to add value to
other types of tourism experiences. For example, Rubondo could target travelers
interested in the island environment (including the sandy beaches, which 35% of
European tourists seek in combination with a safari—Wade et al. 2001), using a suite of
species related to the aquatic environment, such as fish eagles, spotted-necked otters,
sitatunga, hippopotamuses, and kingfishers (family Alcedinidae), to add value to that
setting. Rubondo‘s managers may alternatively find that the best option is advertising the
Park as a destination for people interested in outdoor adventures or as a ―classroom‖ for
field courses.
I emphasized the importance of considering how any choice of an international flagship
species would affect local perceptions of Rubondo.
In addition, I suggested that an important immediate next step in designing a marketing
strategy for Rubondo would be to determine tour operators‘ and Park visitors‘
perceptions of the Park‘s best features.
Putting it all Together - Conclusions and Recommendations
The chapters of this dissertation explored several different aspects of increasing support
for Rubondo. Surveys and interviews revealed that support for the Park in nearby communities
may be increased by promoting and enabling local visitation to the Park. Investigations of local
preferences and opinions suggested that 2 species that might be the best flagships for immediate
local use are the silver cyprinid and Egyptian goose. Results from investigations of potential

181
international flagships led me to conclude that the Park‘s native species may not have immediate
potential to entice visitors from other countries to visit the Park.
None of the species for which I measured interest and preferences appeared to be an ideal
flagship for both local and international audiences. The species with the most immediate local
promise based on the criteria used have little potential as an international wildlife viewing
attraction; using such species as flagships could help create and perpetuate an internationally
unappealing image for the Park. The species on Rubondo included in my survey of visitors to
Tanzania that were most popular are introduced to the Island and I therefore consider them
questionable flagships for a national park. The 2 native species that produced the most interest
among participating visitors to Tanzania (the crocodile and hippopotamus) are feared and
undesired locally (see Chapters 2 and 3); using those species as flagship for the Park could lead to
negative local perceptions of the Park. Managers of Rubondo might be wise to consider other
species I did not assess as flagships or how wildlife could be used in other strategies for gaining
support for the Park (e.g., by highlighting ecosystem services the Park provides to local
communities, or to add value to the Park as an adventure or beach destination [although practical
issues like water quality may be problematic for the latter]).
Because opportunities to view wildlife are of primary interest and importance to visitors
to Africa (Goodwin and Leader-Williams 2000, Okello 2005, Mladenov et al. 2007) and
marketing of the continent‘s national parks generally focuses on wildlife viewing opportunities
(e.g., Goodwin and Leader-Williams 2000, Okello et al. 2008), the assessments of tourist interest
included in this dissertation focused on the potential of various wildlife species on the Island to
serve as tourism flagships for Rubondo. However, tourists also are interested in a variety of
experiences besides wildlife viewing. National parks in other countries created around and
famous for unique geological or environmental features attract millions of visitors each year (e.g.,
Grand Canyon, Yosemite, and Zion National Parks, which were among the top 10 most visited
National Parks in the USA in 2010—Sheail 2010, NPCA 2011). Those marketing Rubondo may

182
want to deviate from typical approaches for Tanzania‘s National Parks that appear to focus on
wildlife viewing opportunities and instead focus their efforts on highlighting the Park‘s island
environment. Rubondo is a beautiful and serene setting, the only protected area in Lake Victoria
and, with the exception of Serengeti National Park, the only area of Tanzania with lowland
Congolese tropical primary forest (TANAPA 2003). Perhaps what tourists would find most
appealing about Rubondo is this unique setting. Wildlife may best be advertised as adding value
to a tropical island in a world-famous lake, not as serving the star attraction.
Finally, the currently limited support coming from tourism and reportedly limited local
support for the Park do raise questions about the effectiveness of the national park model (i.e.,
dependence on tourism and regulations prohibiting resource extraction) for a location like
Rubondo. Prior to any such discussion, an understanding of the types of land protection in
Tanzania is important. As outlined in Chapter 1, national parks in Tanzania have the most
protection of any other area. I suggest that the prevalence of poaching in Rubondo‘s waters
(TANAPA 2003, personal observations) in combination with the degraded state of Lake Victoria
fisheries (see Appendix A) and shorelines, makes any move that would weaken protection of the
land and water currently contained in the Park, particularly the only protected fish breeding
grounds in Tanzanian Lake Victoria, imprudent. Losing the fish breeding grounds would have
unknown, but potentially disastrous consequences for the communities surrounding Rubondo,
and, because of the importance of Lake Victoria‘s fish as a protein source within other areas of
the country and as an export (e.g., RWG-Monitoring Control and Surveillance 2005, Luilo 2008),
perhaps even national effects. Although certainly there are many forms of effective community-
regulated natural resource management (e.g., lobster trapping in Maine, USA—Acheson 2006),
any sanctions prohibiting behaviors harmful to natural resources that were imposed by previous
inhabitants of the Island have been eliminated. And although harvest can clearly be done
sustainably, other types of protected areas do not receive the attention needed to enforce the
regulations that would be needed for sustainability. Also, with harvest, the amount of fish

183
recruiting to other areas could decrease. Consequently, I believe any decrease in regulations now,
given the local situation, would lead to, at least in the short-term, a ―tragedy of the commons‖
(Hardin 1968) of great proportions. Creating a national park is a long-term commitment.
Although some members of the conservation community are asking what I believe are important
questions about how parks are created and interact with nearby communities (e.g., Duffy 2010,
Mcshane et al. 2011, Miller et al. 2011, Sarkar and Montoya 2011), I also do not believe we
should give up on young parks that are already established, even if they must be accepted as a
―losing‖ proposition financially and even if local support is not currently overwhelming. Many
national parks in prosperous countries had similar problems of local support early in their history
(e.g., Jacoby 2003), but now receive high levels of public support (Terborgh and Van Shaik
2002).
Perhaps more importantly, I believe that any discussions of the appropriateness of
Rubondo as a national park are premature. Not long ago, tourism was greater on Rubondo and
generally steady (Steria Ndaga, Rubondo Island National Park, personal communication).
Although the decline in visitation to Rubondo may be partially that felt by many in Tanzania‘s
tourism industry in recent years (e.g., tour operators—S. S. S., unpublished data), it has also been
heavily influenced by changes in ownership of the Island‘s tented camp, particularly a period of
vacancy (Steria Ndaga, Rubondo Island National Park, personal communication). As is typical
(D. E. Rwehimbuza, TANAPA, personal communication), the owners of the camp play an
important role in advertising the Park and attracting tourists (Steria Ndaga, Rubondo Island
National Park, personal communication). The former tented camp owner had worked with
Rubondo staff and an airline to alleviate transportation challenges by arranging regularly
scheduled flights to the Island. However, when tourism declined offering these flights became a
loss to the airline and they were cancelled, leaving Rubondo in the current position of low
tourism and limited transportation options.

184
Rubondo‘s landscapes, wildlife species, and cultural sites are of considerable local,
national, and international value as a national park. By appropriately marketing the Park both
locally and internationally, and increasing the benefits local communities receive from the Park
by removing perceived barriers to visitation, managers can help ensure the future of the resources
contained by the Park. A variety of people and organizations have a stake in Rubondo‘s future,
including residents of nearby communities, members of the tourism industry, Park and TANAPA
staff, the Frankfurt Zoological Society, and visitors. Practical next steps in formulating a
marketing strategy for Rubondo may include further investigation of tour operators‘ perceptions
of the Park and visitors‘ opinions about its most enticing features, and bringing together Park
stakeholders to discuss those results, the information contained here, and the implications of both
for increasing support for Rubondo.

185
APPENDIX A
THE CONSERVATION STATUS AND FISHERY OF LAKE VICTORIA
Lake Victoria is the largest lake in Africa and, by area (68,800 km2), the largest tropical
lake in the world (Ogwang et al. 2005, Luilo 2008). Although large in area, the Lake is shallow,
with an average depth of 40 m and a maximum depth of 60 m (Luilo 2008). The Lake‘s waters
are shared by Kenya (43%), Tanzania (51%), and Uganda (6%) (Odada et al. 2004, Ogwang et al.
2005, Luilo 2008), and the Lake‘s catchment is also shared by Burundi and Rwanda (Odada et al.
2004, Luilo 2008). However, because Lake Victoria is the source of the Nile River, the health of
the lake is of interest to many other countries as well, including Egypt and Sudan (Odada et al.
2004, Luilo 2008, Matshanda 2008).
In 2000, the Lake Victoria basin was estimated to have a population of 30 million people
with an annual growth rate of 3% (Awange and Ong‘ong‘a 2006). The dense population lives in
extreme poverty and relies heavily on fishing and subsistence farming, which is supported by
water from the Lake (Odada et al. 2004, Ogwang et al. 2005). Lake Victoria is said to be the most
productive lake fishery in the world (Owange et al. 2005), producing 350,000 metric tons of fish
per year and having an annual gross economic product of 3-4 million USD (RWG-Monitoring
Control and Surveillance 2005). The Lake is the major source of fish landed in the bordering
countries (Luilo 2008), and employs 3 to 4 million people (LVFO 2006a), 175,000 of which are
full-time fishers (Ogwang et al. 2005). The Lake also meets the annual fish consumption needs of
almost 22 million people in surrounding regions (LVFO 2006e). Lake Victoria also is used as a
supply of water, for hydroelectric power generation, for transportation, and as a dumping grounds
for often-untreated industrial and municipal wastes (Ogwang et al. 2005, LVFO 2006d, Richard
2006, Luilo 2008). These factors, in combination, place a great deal of pressure on the Lake‘s
environment.
The Lake Victoria fishery has gained fame since the 1950‘s introduction of Nile perch
(Lates niloticus—a voracious predator) led to a drastic change in the fishery, including the

186
extinction of many native fish species (LVFO 2005, Shoko et al. 2005, Goudswaard et al. 2008).
Subsequent increases in Nile perch catches led to a boom in the Nile perch fishery (Shoko et al.
2005). The boom in the fishery resulted in investment in a Nile perch export industry and a loss
of local management control by fishing communities (RWG-Monitoring Control and Surveillance
2005). The Nile perch fishery also attracted more fishers with greater amounts of more
sophisticated fishing gear and vessels, and led to the establishment of fish filleting factories
(Odada et al. 2004). Many people moved to the area to engage in what appeared to be a lucrative
profession, an influx speculated to have forced traditional fishers to resort to the use of
destructive fishing methods to sustain their level of livelihood and food requirements (Odada et
al. 2004). The Nile perch quickly became the focus of a huge market of worldwide significance
(Odada et al. 2004). The once-diverse subsistence fishery of the Lake is now dominated by
market-oriented exploitation of Nile perch, as well as Nile tilapia (Oreochromis niloticus—
another introduced species) and silver cyprinid (Rastrineobola argentea) (Odada et al. 2004,
Luilo 2008). The number of fishers has increased dramatically while concurrently the size of fish
caught and catch-per-unit-effort has declined (Odada et al. 2004, LVFO 2005, Mulisa 2008). A
recent census showed that between 2002 and 2006, fishers increased from 129,000 to 196,000,
fishing crafts from 42,000 to 69,000, gillnets from 650,000 to 1.2 million, and hooks from 3.5 to
9 million (LVFO 2006b). The increase in the hook fishery has also led to an increased need for
bait, especially the live fish preferred by Nile perch, which is generally collected from the Lake
using small mesh size gill nets, traps and seine nets—all of which threaten other species and their
breeding areas (LVFO 2006f). Fishers have been forced to move further offshore and have felt the
need to use more intensive fishing practices, such as gillnets with smaller mesh sizes (LVFO
2005) to continue to catch enough fish to make a living. The Nile perch, which used to be
considered food for poor people in communities around the Lake because of its less preferred
taste (e.g., 85% of fishermen prefer tilapia—LVFO 2006b), has become too expensive for the

187
average area resident (Shoko et al. 2005). Government officials attribute the declining fish stocks
in part to the continued use of banned fishing gear and practices (Magubira 2008, Mulisa 2008).
According to the Lake Victoria Fisheries Organization (2006c), controlling fishing on
Lake Victoria is hampered by an ―open access‖ policy, which allows for easy entry to the fishery
(i.e., makes it easy to become a fisher). This unrestricted access and lack of fishing quotas is said
to lead to high fish harvesting rates and a large influx of fishers, which threatens the sustainability
of the fisheries resource (Odada et al. 2004). There also is a known disregard for fishing
regulations and a lack of enforcement of regulations that is said to be the result of corruption,
weak regional integration of laws, institutions, and implementation, and absence of an effective
monitoring and control system (Odada et al. 2004, RWG-Monitoring Control and Surveillance
2005). As a result of all of the above, there is no effective legal limit on the number of boats on
Lake Victoria or the amount of fishing gear a boat can carry (LVFO 2006c). More specifically,
problems beyond unrestricted access include: unlicensed fishers; the use of illegal mesh sizes,
gear, and techniques; landings below permitted sizes; fishing in areas closed for breeding; illegal
trans-border trade (which results in a loss of tax revenue); and lack of knowledge and awareness
about environmental and conservation management (RWG-Monitoring Control and Surveillance
2005). The prevalence of fishing nets below size limits, for example, ranges between 3 and 50%,
depending on the area (Odada et al. 2005). In spite of limitations in the enforcement of
regulations, in only 6 months of 2005 1,612 beach seines, 777 small seines, 17,656 undersized
gillnets, 1,360 monofilament gill nets, 564 fishing crafts and 93 tons of immature fish were
impounded and 1,760 suspects apprehended on the Lake (LVFO 2006a). Management is further
complicated by the large number of fishers and large area open to fishing (RWG-Monitoring
Control and Surveillance 2005). According to some, there also is a notable lack of involvement of
stakeholders in decision-making processes, and a low level of education and awareness about the
consequences of unregulated fishing and use of destructive fishing practices (Odada et al. 2004).

188
APPENDIX B
CHILD SURVEY INSTRUMENT
The children‘s survey instruments used in public schools in communities surrounding Rubondo
Island National Park, Tanzania, during 2008 and 2009 (in Swahili) and English translations.
Areas where translation issues were discovered after surveys were administered are highlighted,
although results from those questions have not been reported here. Revisons to the initial survey
instrument include the following: 1) questions involving general opinions about animals and
conservation were reworded because of concern that agree/disagree statements were not
culturally/age appropriate; 2) a question that asked for the participant‘s ―favorite animal‖ was
divided into 3 parts to differentiate between favorite domestic and wild animals; 3) specific
questions were added about 2 of the species students had most commonly listed as favorites to
allow for direct comparison of participants‘ affinity levels for those iconic species and others; 4)
the survey format was simplified; 5) I differentiated between wild fish and farmed or already-
caught fish (i.e., fish that belong to people) in questions regarding the diet of each animal to gain
an understanding of why some piscivores are more well-liked than others; and 6) a drawing of a
pineapple scaled to the appropriate size was added next to each animal drawing to provide
students a culturally-relevant size reference. Larger copies of each illustration also were made
available to students during the second round of surveying to increase the ease of identification.
In both cases, the surveys used were printed slightly larger than they appear here.

189
B(1). Original survey (version 1) in Swahili.

190

191

192

193
B(2). Original survey (version 1) backtranslated to English.

194

195

196

197
B(3). Revised survey (version 2) in Swahili.

198

199

200

201
B(4). Revised survey (version 2) backtranslated to English.

202

203

204

205
APPENDIX C
THE CONFUSION OF COLLOQUIAL NAMES: A WILDLIFE-SPECIFIC
METHODOLOGICAL CHALLENGE IN CROSS-CULTURAL RESEARCH
Abstract
Researchers working in cultures different than their own face many documented
methodological challenges, and often undocumented ones as well. One challenge specific to
wildlife-related research is that created by the variation in local and colloquial names ascribed to
various species. Such variation in local names transcends countries and continents, and can result
in a single species being known by multiple names in the same area or by different names in
communities with little separation, or can result in many species being known by 1 name. As part
of a research project intended to assess local perceptions of wildlife species present in Tanzania‘s
Rubondo Island National Park, I administered a survey to 932 school children in public primary
schools in 7 surrounding communities during 2008 and 2009. In the survey, participants were
asked to name the species represented by animal illustrations, with my intent being to classify the
labels provided based on whether they were indicative of respondents‘ familiarity with the
species in question. Participants provided up to 37 different names for each species (x = 19.8, sd
= 13.3). Determining whether many of the names indicated familiarity with the species among
respondents proved challenging. I discuss these challenges, the methods used for navigating
them, and approaches other researchers could apply to avoid them in the future.
Introduction
Researchers working in cultures different from their own face many documented
methodological challenges including, for example, differences in language, difficulties of
translation, and issues of trust (Triandis and Brislin 1984, Harkness 2003, Browne-Nũnez and
Jonker 2008, Hennink 2008, Irvine et al. 2008, Liamputtong 2008a). Cross-cultural research

206
issues specific to individual disciplines (e.g., wildlife/conservation—Manfredo and Dayer 2004,
Zinn and Shen 2007, Browne-Nũnez and Jonker 2008, Drury et al. 2011) and techniques (e.g.,
surveys—Harkness et al. 2003, Liamputtong 2008b) also have been discussed in the literature. In
the case of survey research, differences have been documented across cultures in: the level of
influence exerted by survey format (e.g., the type of response scale used—Schwarz 2003) and
social desirability bias (Johnson and Van de Vijver 2003), appropriate types and measurement of
demographic variables (Braun and Mohler 2003), non-response rates (Couper and de Leeuw
2003), the sensitivity of topics (Skjåk and Harkness 2003), and the appropriateness of survey
methods (e.g., mail vs. telephone) (Skjåk and Harkness 2003).
Such literature provided guidance for many of the challenges related to the cross-cultural
nature of my research on the preferences and opinions regarding wildlife among people living
around Rubondo Island National Park, Tanzania. One challenge that has received little attention,
however—perhaps because it is often limited to those working in human dimensions of wildlife
conservation and management—is that created by the variation in colloquial and local names
ascribed to individual species. Although the problem of dueling names for a species has been
minimized within the scientific community through the development and use of various ordering
and naming systems (e.g., Cantino et al. 1999, Mayer and Boch 2002), ambiguity persists among
common vernaculars. For example, in the United States, the American goldfinch (Carduelis
tristis) is also commonly known as the wild canary, yellow-bird, thistle-bird, and beet-bird (Gill
1995). Likewise, the fisher (Martes pennanti) has also been called the fisher cat, black cat,
Pennant‘s marten, pekan, pequam, and wejack, among others (Powell 1993, Powell et al. 2003).
Surprisingly though, given the widespread use of local or colloquial names for wildlife, I was
unable to find mention in the research literature of the confusion that can be created when species
are known by many different names. The issues that this variation in names can create, however,
are doubtlessly faced by many researchers studying the human dimensions of wildlife
conservation and management—not only those considering themselves to be working ―cross-

207
culturally.‖ Here, I discuss the largely-unexpected challenges associated with the diversity of
colloquial and local names for wildlife that I faced in a survey of students in public primary
schools in Tanzania, the methods I used for navigating those challenges, and approaches other
researchers could apply to avoid them.
Scope of the Investigation—A Brief Overview
As part of a research project intended to assess local perceptions of wildlife species
present in Tanzania‘s Rubondo Island National Park (Figure C.1a), I administered a survey to 932
public primary school students in 7 surrounding communities (Figure C.1b) during 2008 and
2009. The original version of the survey that I distributed to 791 of the 932 participants contained
a series of questions about 11 of the wildlife species present in Rubondo (fish eagle [Haliaeetus
vocifer], Egyptian goose [Alopochen aegyptiacus], silver cyprinid [Rastrineobola argentea], little
egret [Egretta garzetta], sitatunga [Tragelaphus speki], large-spotted genet [Genetta tigrina],
monitor lizard [Varanus niloticus], spotted-necked otter [Lutra maculicollis], vervet monkey
[Cercopithecus pygerythrus], Nile crocodile [Crocodylus niloticus], and hippopotamus
[Hippopotamus amphibious]. A revised version of the survey that I administered to 141 of the
932 participants also included questions about 2 additional species present in the Park: the
African elephant [Loxodanta africana] and giraffe [Giraffa camelopardalis])(Appendices B[1-
4]). I was interested in assessing participants‘ familiarity with each of the included species, as
well as participants‘ knowledge, opinions, and preferences regarding each. The following species-
specific questions were included in the survey:
Does this animal live near your village or visit your village?
What does this animal eat?
Is this animal attractive?
Is this animal useful?

208
Do you like this animal?
Would you like many of this animal where you live?
To assess familiarity with the included species, I placed a line drawing of each animal prior to a
set of the above questions, along with a request that students label that image (i.e., provide a
name for the animal). In addition to serving as an assessment of participants‘ familiarity with
each species, the request for students to label the illustration (instead of providing one myself)
enabled me to exclude the responses of students unfamiliar with each species from analyses of
participants‘ knowledge and opinions about the animal. Consequently, I assessed each
participant‘s familiarity with each species prior to analyzing responses to knowledge and opinion
questions.
Diversity of Names
Participants provided between 1 and 37 names for each animal (x = 19.8, sd = 13.3)
(Table C.1); ≥30 different names were provided for 5 of the species included. The elephant was
the only species students did not provide more than 1 name for.
Classifying Names – Approaches and Challenges
To classify the variety of names provided by students for each species, I used my own
limited knowledge of the Swahili language; suggestions and information provided by informants
(i.e., Tanzanian Swahili speakers, including Rubondo Island National Park staff and project team
members); Swahili dictionaries (Awde 2000, Snoxall and Mshindo 2002, kamusiproject.org, and
africanlanguages.com/swahili); and lists of Swahili animal names created by safari companies.
The specific Swahili and tribal names for each intended species were classified as ―acceptable‖
(i.e., considered to demonstrate familiarity with the species). In addition, names commonly used
locally to refer to the intended species were accepted, even if the names in ―proper‖ usage refer to

209
a different species. In addition, more general names used to refer to the ―type‖ of animal were
accepted in specific cases when the term was commonly used for the intended species locally and
other locally-present species comprised a guild similar in appearance and interactions with
humans, such that participants likely perceived them similarly (see below for examples). A name
was classified as ―unacceptable‖ if used to refer specifically to a different species or if it was too
generic to demonstrate familiarity among respondents‘ with the specific species intended (e.g.,
―bird‖). Responses that could not be confidently classified as ―acceptable‖ or ―unacceptable‖
were placed into a 3rd
category: ―unclassifiable.‖ This category was included because I was
concerned about appropriately making classification for some tribal names, and also because the
students‘ spelling and handwriting were sometimes uninterpretable.
The challenges of classifying the various names provided by students were varied and
often unique. The following are some specific examples of decision-making regarding
classifications:
1. The general name tai [eagle] was considered ―acceptable‖ for fish eagle because no
specific name is commonly used for the species and other species of eagles are less
common in the area. However, I did not accept ndege [bird] for any of the bird species
because the label was considered too broad. A student writing ndege could be answering
later questions about any 1 of many species with very different food habits and
interactions with people. In addition, the label ―bird‖ does not demonstrate any
familiarity with the intended species.
2. For the silver cyprinid, specifically called dagaa, samaki [fish] was accepted as an
answer, although seemingly directly in contrast with the justification cited above for the
rejection of ndege. Given the size of the fish illustrated (depicted in relation to a person‘s
hand—see Table C.1) and the ubiquity of the silver cyprinid as a food, I expect most
students writing ―samaki‖ were answering later questions with dagaa in mind, regardless
of the generic nature of their response. However, if a student answered, for example,

210
―samaki sangara‖ [Nile perch, Lates niloticus], I classified the response as
―unacceptable‖ because the student would be answering questions with a distinctly
different fish in mind. Nile perch occupy a niche in the aquatic food web dissimilar to
that of silver cyprinids, and the 2 species also are drastically different in size and how
they are used by people (e.g., expensive export versus common local food, respectively).
More difficult to classify was ―furu‖ (haplochromine fishes) because both
haplochromines and the silver cyprinid are smaller, native species. However, because the
2 species occupy different habitats within Lake Victoria and are caught using different
methods, and because haplochromines were not as ubiquitous a food item, furu was
classified as ―unacceptable.‖
3. Swala [antelope] was accepted for sitatunga. This response was considered ―acceptable‖
because the species is a type of antelope rare enough that students may not be familiar
with the specific name. However, when a student specifically listed the name of a
different species of antelope (e.g., nyumbu [wildebeest, Connochaetes spp.]), this was not
considered ―acceptable‖ because the student was no longer likely to be answering
questions generically about ―antelope.‖ Conversely, paa, although occasionally translated
as antelope (e.g., Awde 2000), was not accepted because the name is widely used in the
study area to refer to the bushbuck (Tragelaphus scriptus), which, although similar in
appearance, is a much more common species. Because of this difference in rarity, ―paa‖
was not accepted for sitatunga.
4. For the vervet monkey, nyani was accepted even though this name generally translates to
―baboon‖ or ―ape‖ because nyani is commonly used to refer to the vervet monkey in the
study area.
5. For the little egret, ndege mweupe [white bird] was classified as ―unacceptable‖ because
the term was considered by some informants to be specific to the cattle egret (Bulbulcus
ibis). However, the most commonly used word for the cattle egret (nyangenyange) is

211
used to refer to both that species and the little egret, and therefore my results are not
specific to the little egret regardless of the exclusion of responses specific to ―ndege
mweupe.‖
6. Maji [water] and ndege wa maji [water bird] were both put in ―unclassifiable‖ columns
when offered by students for the name of the otter [fisi maji] and Egyptian goose,
respectively. The most common ―acceptable‖ name for the otter contains the word
―water‖ [maji] and the species is most often found there, so the student using the term
may have been trying to communicate some knowledge of the species. The student who
wrote ndege wa maji for the Egyptian goose may have been thinking of the correct
species but simply did not know the name. Conversely, that student may have been
thinking of another water bird, and for the otter, the single student who wrote ―maji‖ may
have been thinking of some other species associated with the water (e.g., marsh
mongoose, Atilax paludinosus).
7. Kicheche was considered ―acceptable‖ because it is the most commonly used name for
genet in the area. However, kicheche is not strictly translated to ―genet‖ nor does it refer
only to the genet (the name also is used locally to refer to other species of similar size,
such as the marsh mongoose).
Assessing classifications. Whenever the classification of a name given by a substantial number
of students was questionable, I conducted further assessments prior to any analysis dependent on
that classification. For example, 138 of the 932 students who were asked to label the illustration
of the Egyptian goose wrote ―bata mzinga,‖ which formally translates to ―turkey.‖ However, 2 of
my informants believed that the students may have meant for this name to refer to the Egyptian
goose because there is no commonly known Swahili name specific to the species. Because my
informants were not all in agreement about a name that such a substantial number of students
provided, I was especially concerned about the effect the classification would have on my results.

212
In particular, I was concerned that by eliminating students who provided the name ―bata mzinga,‖
I was eliminating a particular type of participant (e.g., those from 1 island community).
To better understand the effects of challenging classifications, such as that mentioned
above, and to increase my comfort level with all classifications, I conducted further analytical
assessments. For example, I used binary logistic regression models (Vaske 2008) to assess the
influence of measured demographic variables on students‘ ability to ―acceptably‖ name each
species (see Chapter 3). If students from certain communities or backgrounds (e.g., with parents
in the same professions) were less likely to provide what I classified as an ―acceptable‖ name for
a species, I then assessed whether those students provided any specific name I had classified as
―unacceptable.‖ If students from, for example, the same community appeared to provide a
particular ―unacceptable‖ name for a species often, I conducted Pearson‘s chi-square analysis
(Vaske 2008) to test whether they were doing so more frequently than students from other
communities. Additionally, in the case of particularly challenging classifications (such as that of
bata mzinga) I repeated analyses of variables for which the sample to be included depended on
my determination of students‘ familiarity with the species using all opposing classification
schemes. As an example, one type of analysis I conducted on the data collected was to model,
using binary logistic regression, the effect of demographic variables on ―dislike‖ and ―desire for
few individuals of a species nearby‖ among students familiar with the species (see Chapter 3). In
that case, I developed sets of models for ―disliking‖ and ―wanting few‖ of the species using 2
different subsamples of the data collected, each based on 1 of the 2 opposing classification
schemes (e.g., including ―bata mzinga‖ among the ―acceptable‖ responses vs. among the
―unacceptable‖ ones). After building the 2 sets of candidate models and choosing the best of each
using the Akaike‘s Information Criterion (Burnham and Anderson 1998), I re-assessed each
opposing classification scheme based on how demographics included in the models changed. The
additional analyses gave me insight into how much influence the different classifications of
particular names had on results. Generally, the results of such analyses supported my inclinations

213
to be conservative with classification by discarding responses I was not absolutely confident
referred to the species intended. However, these steps were far from ideal and also quite time
consuming.
The above examples demonstrate some of challenges associated with classification of
students‘ labels for animal illustrations, as well as some of the decisions regarding classification
that were unique to each species. In addition, decisions were largely influenced by my specific
research questions. Were those questions to change many of my classifications would need to be
revisited. For example, if interested mainly in students‘ levels of competency in wildlife
identification, I would likely have categorized names provided for the silver cyprinid quite
differently. The provision of the label ―fish,‖ which I classified among the ―acceptable‖ responses
given knowledge of local circumstances, does not indicate a high level of competency in wildlife
identification. However, although classified as labeling the image ―unacceptably,‖ the students
providing names specific to fish species indistinguishable from the intended based on the image
provided likely have a fairly high level of knowledge about fish.
Decisions about classification were complicated by my limited familiarity with the
languages spoken locally and the need to complete my data analyses away from the study site,
which limited contact with the people who were the focus of my research. Because of the limited
contact, I could not easily follow up when questions arose during analysis. Those in my study
communities whose contact information I did have (e.g., teachers at the schools where surveys
conducted) were not necessarily those with the most knowledge of wildlife. In addition, few Park
staff, who I relied on heavily as informants, were from the local area and even those that were
local likely did not know all names used for each species by tribes and villages other than their
own. Finally, as noted in the case of the acceptability of ―bata mzinga‖ for the Egyptian goose,
informants did not always agree on whether a name should be considered ―acceptable.‖

214
Avoiding Ambiguity
A fairly low percentage of participants were able to name many species included in my
survey (see Chapter 2), perhaps in part because most children in the area likely had seen few
illustrations of less famous African wildlife (e.g., spotted-necked otter and sitatunga, which only
18% and 21% of participants, respectively, were able to provide ―acceptable‖ labels for—Chapter
2) or because of the limitations of the black and white illustrations used (e.g., the lack of colors
that could help in identification). Including several color illustrations and/or photographs of each
species, perhaps from different vantages, may have increased students‘ ability to name the
animals. The revised version of my survey, which I administered to a subsample of participants,
did include an illustration of a locally common fruit (a pineapple) in each frame as a size
reference, which seemed to increase students‘ ability to ―correctly‖ name the illustrations.
One approach that could be used to avoid the ambiguity of colloquial or local names
while maintaining the integrity of the survey‘s assessment of children‘s familiarity with and
opinions about wildlife may be to provide participants a list of names to choose among for the
labeling section of the survey. To develop such a list, the researcher ideally would work with a
sample of members of the study community to document all the ―acceptable‖ names for each
species to be included in the survey. A secondary step within that process (analogous to ―back
translation‖—Harkness 2003) that could help ensure the accuracy of the information used would
be to ask a separate sample of community members to match the names provided by the first
sample with images. This step would also provide an opportunity to test various images for use in
the final survey. Such a process would ideally result in a list of vetted, mutually exclusive names
matching the species intended for inclusion in the survey (i.e., a list that included several
unambiguous names for each species). Such a process would also be preferable to traditional
multiple choice options provided for each species (which I had avoided due to the increased
potential for participants to randomly choose the correct answer) because the proportion of
responses correct by chance would be minimized. In addition, being able to include several

215
―acceptable‖ options for each species in a larger list would improve the likelihood of participants
familiar with the species finding the name by which they know the species.
Conclusions
Variation in names used for an individual species among locations is not specific to
Tanzania. Neither is the extremely ―local‖ nature of such names. For example, around
Pennsylvania, USA‘s Pymatuning Swamp, the eastern massasauga (Sistrurus catenatus
catenatus) used to be known almost invariably as the ―black snapper,‖ and only occasionally the
―swamp rattler‖ and ―pygmy rattler.‖ However, in more western areas, although sometimes called
the ―black snapper,‖ the species was also commonly called the ―black massasauga,‖ ―black
rattler,‖ and ―prairie rattlesnake‖ (Gresh 1931). Also not restricted to Tanzania is the use of the
same name for >1 species. In fact, in the USA, the sharp-shinned hawk (Accipiter striatus),
Cooper‘s hawk (Accipiter cooperi), and northern goshawk (Accipiter gentilis) have all been
commonly called ―chicken hawk.‖ In addition, all 3 go by some variation on ―blue darter‖ (i.e.,
―big blue darter,‖ ―little blue darter,‖ or, simply, ―blue darter‖), and the sharp-shinned and
Cooper‘s hawks also are called ―pigeon hawk‖ (Pearson 1917). Clearly, the problem of multiple
local names for a species transcends continents and countries. The problem is likely also not
faced only by researchers working in far different cultures, but also those working within their
own communities with people from different backgrounds.
Researchers need to be prepared for the challenges associated with colloquial and local
names when studying the human dimensions of wildlife conservation or management in a cross-
cultural context, and develop strategies for addressing potential ambiguity prior to beginning
work. Such preparation is particularly important when researchers want to assess participants‘
familiarity with the species in question but will not have personal contact with each participant
and so must build some ―test‖ of familiarity into the survey instrument. Some of the suggestions I
developed as a result of the challenges I faced in classifying the local and colloquial wildlife

216
names provided by children participating in my survey in communities surrounding Rubondo
Island National Park are to:
Include multiple illustrations or pictures of each species to be named (with at least 1 in
color).
Include a size reference within each frame to assist participants in identifying the species.
Work with members of the study community a priori to create a list of mutually
exclusive names specific to each of the species of interest, and ask survey participants to
use that list for animal labeling activities, instead of allowing open-ended responses.
These suggestions are intended as a starting point for researchers assessing familiarity or
preferences regarding wildlife in a cross-cultural context, but as each situation is unique,
appropriate approaches will vary widely.

217
Table C.1. List of names considered ―acceptable,‖ ―unacceptable,‖ and ―unclassifiable‖ for each species included in my 2008/2009 survey
regarding the wildlife preferences and opinions of children in communities surrounding Rubondo Island National Park, Tanzania. Although
common, most spelling variations for identifiable answers are not noted here. In addition, the list of ―acceptable‖ names only includes those
offered by participants and is not an exhaustive review of the names used for the given species.
Ilustration Included in Survey English & Scientific
Names for Intended
Species
Names Considered
―Acceptable‖ (i.e., names expected to
result in respondents
answering later questions
about the species intended)
Names Considered
―Unacceptable‖ (i.e., names expected to result in
respondents answering later
questions about a species not
intended)
Names Considered
―Unclassifiable‖ (i.e., names that
could not be
identified/translated)
Fish eagle
(Haliaeetus vocifer)
kwazo (kwezi), tai, tai
samaki
bundi, bwana afya, kasuku, kenge,
kicheche, kuku, kunguru, kanga,
kunguni, kwale, mabundi, mbuni,
mbweha, mwewe, njiwa, paa,
tausi
bukwali, bwa,
kahumi, kunmulu,
kuyugu, mburu, taiga,
tani, tayinga, teger
Large-spotted genet
(Genetta tigrina)
cheche, kicheche, nyalukala,
paka pori
bundi, bweha, chiriku, chita, chui,
duma, fina, fisi, fisi maji, kaa,
kaka kuona, kangaruu, kima,
kuchakulo, kwale, mbweha, mbwa
mwitu, mondo, paka, paka kuona,
paka mifupa, paka shume, panya,
panya buku, tausi
chun, fengi, hui
21
7

218
Monitor lizard (Varanus
niloticus)
kenge, mbulu kenge,
mjusi
dinosaria, fina, kiboko, kicheche,
kijusi, kimbulu, mamba, mtoto wa
mamba, mwewe, tembo
Spotted-necked otter
(Lutra maculicollis)
fisi maji, fina cheche, chui, fisi, fisi mtu, kenge,
kima, kimbulu, kinyonga, kiwi,
kobe, kima, mamba, mbwa,
ngedere, nyarukala, nyumbu, paka,
paka pori, panya, panya buku,
panya pori, papa, sokwe mtu,
nungunungu, nyani, nyumbu,
nyamgumi, kinyonga
chutu, kui, maji,
pnam
Sitatunga
(Tragelaphus speki)
nyesanga, nzobe, nzohe,
swala
choroa, chui, digidigi, farasi, fisi,
kifaru, mbogo, mbuni, mbuzi,
ngamia, ng'ombe, ng'ombe mwitu,
nungunungu, nyati, nyumbu, paa,
pongo, puma, punda, punda milia,
simba, sokwe, sokwe mtu, swoko,
tandala, twiga
fwata, mbulu,
nyahufahu, swa,
tui tui
Silver cyprinid
(Rastrineobola argentea)
dagaa, samaki, soga fulu, mamba, samaki sangara, swala ningu, smio
21
8

219
Vervet monkey
(Cercopithecus
pygerythrus)
kima, ngedere, nyani,
tumbili
mbega, ngami, nyati, simba chani, maidi, nclepe,
nyoui, sbakam,
tubbau
Hippopotamus
(Hippopotamus
amphibius)
kiboko, enzubha kifaru, kobe, faru, kondoo,
mbogo, nguruwe, nyati, samaki,
tembo
kamwbo, koma, ng
Nile crocodile
(Crocodylus niloticus)
mamba kenge, kimboko, simba nyawgeny
Little egret (Egretta
garzetta)
nyangenyange,
yangeyange
bata maji, bwana afya, chiriku,
kasuku, korongo, kunguru,
mbuni, mumbi, mwewe, ndege,
ndege mweupe, njiwa, tai, tausi
balwa, balwe,
bwanata, bwanaaa,
gogi, mamukolo,
mrobi, nlse, nyenye,
nzela nzela,
nyamukola, zerazera,
ndege maji
21
9

220
Egyptian goose
(Alopochen
aegyptiacus)
lyoyo, bata maji, bata pori bata, bata mzinga, bwana afya,
flamingo, kanga, kasuku, kenge,
kuku, kunguru, mbuni, mwewe,
ndege, njiwa pori, paa, puku
puku, tai, tausi, yangeyange
balwe, bata mzima,
bata nyange,
chimbara,
kilimanzoka, mboata,
mime, nsazu, nsozu,
nudendi, nyawawa,
nyawewe, sonzu,
sozu, sozo, ndege wa
maji
African elephant
(Loxodonta africana)
tembo
Giraffe (Giraffa
camelopardalis)
twiga punda milia, swala nlunga
22
0

221
Figure C.1. The location of Rubondo Island National Park in Lake Victoria, Tanzania (a), as well
as the surrounding communities where I conducted surveys regarding the wildlife preferences of
primary school children (b).
a.
b.

222
APPENDIX D
TOP AFFINITY AND ABUNDANCE MODELS BY SPECIES
The top models for explaining ―dislike‖ for and wanting ―few‖ of each species included in
surveys of public primary school students in communities surrounding Rubondo Island National
Park, Tanzania, in 2008 and 2009.

223
D(1). Top models for explaining ―dislike‖ for each species of wildlife included in a 2008/2009
survey of schoolchildren in communities surrounding Rubondo Island National Park, Tanzania.
The first set for each species is developed from 2009 data only, and includes ―gender‖ as a
variable. The second set includes 2008 data as well, but not the ―gender‖ variable (which was not
collected during 2008). The second set also contains additional dummy variables for ―school,‖ as
sampling was conducted in more villages in 2008. All models for each species within 2 units of
the lowest AIC/AICc score are shown here, unless the null model is within 2 units, in which case
no models with scores above that of the null model are shown regardless of whether they are
within 2 units of the model with the lowest AIC/ AICc value. No results are shown here for a
species when the null model has the lowest AIC/AICc value. (Notes: Head of household is
abbreviated H.O.H. The pseudo R2 measure used is McFadden‘s R
2. LR Chi
2 is an abbreviation
for Likelihood Ratio Chi2 test. AIC is Akaike‘s Information Criterion, and AICc is the small
sample bias adjustment for that value. wi is the Akaike weight for the model.)

224
D1.1. Top models for ―dislike‖ of fish eagles (2009).
Mod21 Mod16 Mod23
Odds Ratio Odds Ratio Odds Ratio
-----------------------------------------
Do not like spp.
Att. Katemwa Sch. 8.26** 4.42** 4.61**
[1.56,43.59] [1.15,16.96] [1.21,17.65]
Att. Muganza Sch. 0 0 0
[0.00,.] [0.00,0.00] [0.00,.]
H.O.H. fisherman 5.60*
[0.95,33.15]
H.O.H. livestock keeper 0
[0.00,.]
Constant 0.08*** 0.17*** 0.17***
[0.02,0.35] [0.06,0.50] [0.06,0.48]
-----------------------------------------
LR Chi2 18.29*** 14.54*** 14.23***
Pseudo R2 0.27 0.21 0.21
AIC 58.40 60.14 60.46
AICC 59.04 60.79 60.84
∆ AICC 0 1.75 1.80
wi 0.40 0.17 0.16
n 67 67 67
-----------------------------------------
Confidence intervals in parentheses
*p < 0.10 **p < 0.05 ***p < 0.01

225
D1.2. Top models for ―dislike‖ of fish eagles (2008 & 2009).
Mod3bBESTRef Mod7bBESTRef
Odds Ratio Odds Ratio
-----------------------------------------
Do not like spp.
Att. Ikuza Sch. 0 0
[0.00,.] [0.00,.]
Att. Muganza Sch. 0 0
[0.00,.] [0.00,.]
Att. Butwa Sch. 0.37** 0.36**
[0.15,0.89] [0.15,0.87]
Att. Maisome Sch. 0.13* 0.13*
[0.02,1.04] [0.02,1.02]
Att. Izumacheli Sch. 0.23*** 0.23***
[0.10,0.57] [0.10,0.57]
Att. Nkome Sch. 0.40** 0.40**
[0.20,0.81] [0.20,0.81]
Std. 6 2.51*** 2.52***
[1.34,4.73] [1.34,4.74]
Std. 4 & 5 1.28 1.333
[0.13,12.26] [0.14,12.91]
H.O.H. fisherman 1.17
[0.52,2.61]
Constant 0.26*** 0.26***
[0.14,0.51] [0.13,0.51]
-----------------------------------------
LR Chi2 37.61*** 37.75***
Pseudo R2 0.11 0.11
AIC 324.40 326.26
AICC 324.87 326.83
∆ AICC 0 1.97
wi 0.51 0.19
n 397 397
-----------------------------------------
Confidence intervals in parentheses
*p < 0.10 **p < 0.05 ***p < 0.01

226
D1.3. Top models for ―dislike‖ of genets (2009).
Mod31 Null
Odds Ratio Odds Ratio
-----------------------------------------
Do not like spp.
Att. Katemwa Sch. 1.01
[0.33,3.08]
Att. Muganza Sch. 0
[0.00,.]
Constant 1.62 1.42
[0.81,3.23] [0.84,2.39]
-----------------------------------------
LR Chi2 5.53* 0.00
Pseudo R2 0.07 0.00
AIC 79.14 80.67
AICC 79.59 80.74
wi 0.35 0.20
n 58 58
-----------------------------------------
Confidence intervals in parentheses
*p < 0.10 **p < 0.05 ***p < 0.01

227
D1.4.Top models for ―dislike‖ of genets (2008 & 2009).
Mod11 Mod10 Mod5
Odds Ratio Odds Ratio Odds Ratio
-----------------------------------------
Do not like spp.
Att. Katemwa Sch. 2.45 1.68 2.33
[0.62,9.69] [0.39,7.22] [0.58,9.32]
Att. Muganza Sch. 0 0 0
[0.00,.] [0.00,.] [0.00,.]
Att. Butwa Sch. 1.67 1.37 1.61
[0.42,6.56] [0.33,5.70] [0.41,6.35]
Att. Nkome Sch. 1.00 0.89 0.98
[0.27,3.79] [0.23,3.40] [0.26,3.69]
Att. Izumacheli Sch. 2.82 2.22 2.81
[0.65,12.15] [0.50,9.91] [0.65,12.11]
o.Att. Maisome Sch. 1 1 1
[1.00,1.00] [1.00,1.00] [1.00,1.00]
H.O.H. livestock keeper 6.39* 5.78 6.12*
[0.77,53.06] [0.69,48.50] [0.73,51.05]
Std. 6 1.62
[0.89,2.94]
Std. 4 & 5 1.39
[0.40,4.78]
H.O.H. farmer 0.85
[0.51,1.43]
Constant 0.67 0.60 0.76
[0.19,2.36] [0.17,2.16] [0.20,2.86]
-----------------------------------------
LR Chi2 21.04*** 23.58*** 21.406***
Pseudo R2 0.06 0.06 0.06
AIC 365.69 367.15 367.32
AICC 366.25 367.10 368.02
∆ AICC 0 1.75 1.77
wi 0.428369 0.18 0.18
n 269 269 269
-----------------------------------------
Confidence intervals in parentheses
*p < 0.10 **p < 0.05 ***p < 0.01

228
D1.5. Top models for ―dislike‖ of monitor lizards (2009).
Mod23 Mod16
Odds Ratio Odds Ratio
-----------------------------------------
Do not like spp.
Att. Katemwa Sch. 1.62 1.66
[0.76,3.44] [0.78,3.53]
Att. Muganza Sch. 0.70 0.68
[0.31,1.61] [0.29,1.56]
H.O.H. livestock keeper 1.66
[0.53,5.18]
Constant 0.95 0.91
[0.51,1.78] [0.48,1.73]
-----------------------------------------
LR Chi2 6.19** 6.95*
Pseudo R2 0.02 0.03
AIC 260.09 261.33
AICC 260.23 261.55
∆ AICC 0 1.32
wi 0.39 0.20
n 188 188
-----------------------------------------
Confidence intervals in parentheses
*p < 0.10 **p < 0.05 ***p < 0.01

229
D1.6. Top models for ―dislike‖ of monitor lizards (2008 & 2009).
Mod14b Mod8b Mod12b Mod6b
Odds Ratio Odds Ratio Odds Ratio Odds Ratio
-----------------------------------------
Do not like spp.
Std. 6 2.18*** 2.17*** 2.17*** 2.16***
[1.60,2.97] [1.59,2.96] [1.59,2.96] [1.58,2.94]
Std. 4 & 5 2.32 2.41* 2.36* 2.45*
[0.84,6.40] [0.87,6.68] [0.85,6.51] [0.88,6.79]
H.O.H. fisherman 0.73 0.73
[0.46,1.17] [0.46,1.17]
H.O.H. livestock keeper 1.32 1.31
[0.72,2.40] [0.72,2.39]
Constant 0.56*** 0.58*** 0.55*** 0.57***
[0.44,0.70] [0.45,0.74] [0.43,0.69] [0.44,0.73]
-----------------------------------------
LR Chi2 25.43*** 27.14*** 26.24*** 27.93***
Pseudo R2 0.03 0.03 0.03 0.03
AIC 950.73 951.02 951.92 952.23
∆ AIC 0 0.29 1.19 1.50
wi 0.32 0.28 0.18 0.15
n 702 702 702 702
-----------------------------------------
Confidence intervals in parentheses
*p < 0.10 **p < 0.05 ***p < 0.01

230
D1.7. Top models for ―dislike‖ of spotted-necked otters (2008 & 2009).
Mod5 Mod13LSTK Mod9
Odds Ratio Odds Ratio Odds Ratio
-----------------------------------------
Do not like spp.
Std. 6 2.73** 2.56** 2.69**
[1.25,5.97] [1.17,5.59] [1.24,5.84]
Std. 4 & 5 4.67* 5.64** 5.33**
[0.90,24.13] [1.09,29.04] [1.04,27.39]
H.O.H. fisherman 0.39*
[0.14,1.13]
H.O.H. livestock keeper 2.27
[0.76,6.83]
Constant 0.29*** 0.24*** 0.25***
[0.15,0.56] [0.12,0.46] [0.13,0.48]
-----------------------------------------
LR Chi2 11.83*** 10.58** 8.44**
Pseudo R2 0.06 0.05 0.04
AIC 199.94 201.19 201.33
AICC 200.20 201.45 201.48
∆ AICC 0 1.25 1.29
wi 0.37 0.20 0.20
n 159 159 159
-----------------------------------------
Confidence intervals in parentheses
*p < 0.10 **p < 0.05 ***p < 0.01
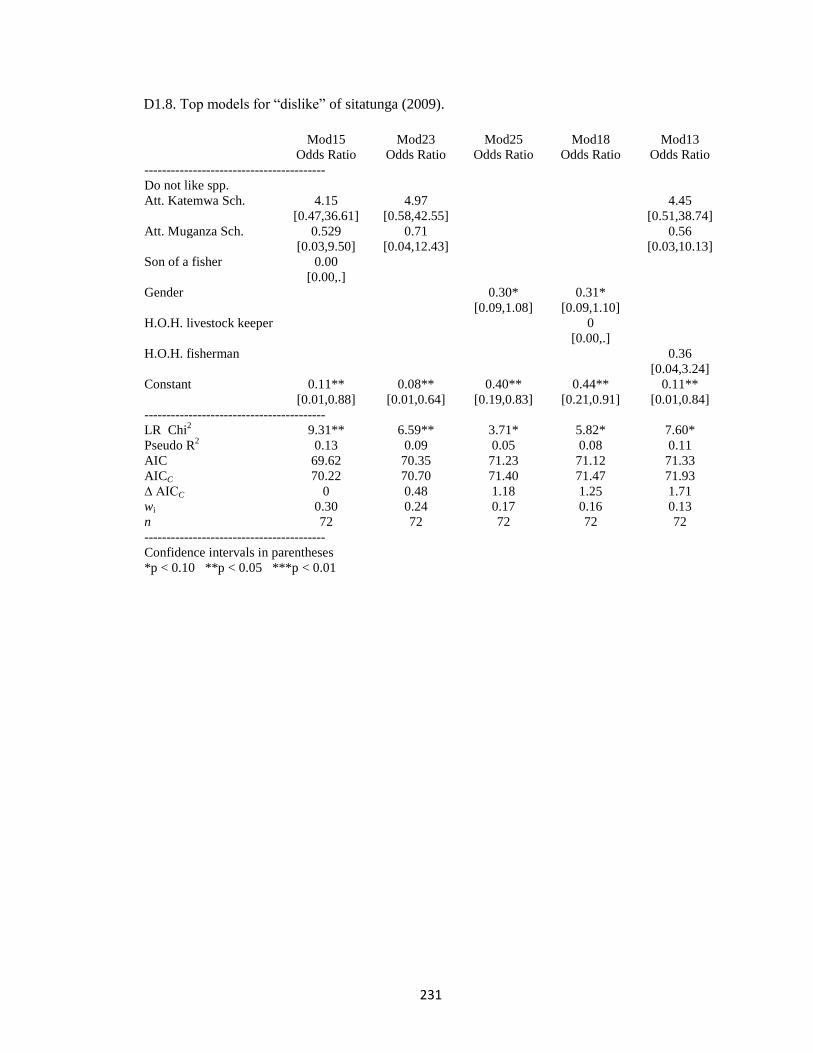
231
D1.8. Top models for ―dislike‖ of sitatunga (2009).
Mod15 Mod23 Mod25 Mod18 Mod13
Odds Ratio Odds Ratio Odds Ratio Odds Ratio Odds Ratio
-----------------------------------------
Do not like spp.
Att. Katemwa Sch. 4.15 4.97 4.45
[0.47,36.61] [0.58,42.55] [0.51,38.74]
Att. Muganza Sch. 0.529 0.71 0.56
[0.03,9.50] [0.04,12.43] [0.03,10.13]
Son of a fisher 0.00
[0.00,.]
Gender 0.30* 0.31*
[0.09,1.08] [0.09,1.10]
H.O.H. livestock keeper 0
[0.00,.]
H.O.H. fisherman 0.36
[0.04,3.24]
Constant 0.11** 0.08** 0.40** 0.44** 0.11**
[0.01,0.88] [0.01,0.64] [0.19,0.83] [0.21,0.91] [0.01,0.84]
-----------------------------------------
LR Chi2 9.31** 6.59** 3.71* 5.82* 7.60*
Pseudo R2 0.13 0.09 0.05 0.08 0.11
AIC 69.62 70.35 71.23 71.12 71.33
AICC 70.22 70.70 71.40 71.47 71.93
∆ AICC 0 0.48 1.18 1.25 1.71
wi 0.30 0.24 0.17 0.16 0.13
n 72 72 72 72 72
-----------------------------------------
Confidence intervals in parentheses
*p < 0.10 **p < 0.05 ***p < 0.01

232
D1.9. Top models for ―dislike‖ of sitatunga (2008 & 2009).
Mod11B Mod5B NullB
Odds Ratio Odds Ratio Odds Ratio
--------------------------------------
Do not like spp.
Std. 6 2.39* 2.29*
[0.90,6.32] [0.88,5.97]
Std. 4 & 5 0 0
[0.00,.] [0.00,.]
H.O.H. livestock keeper 3.22
[0.73,14.21]
Constant 0.09*** 0.10*** 0.18***
[0.04,0.22] [0.04,0.24] [0.12,0.27]
-----------------------------------------
LR Chi2 6.30* 4.18 0.00
Pseudo R2 0.04 0.03 0.00
AIC 157.98 158.09 158.27
AICC 158.20 158.22 158.30
∆ AICC 0 0.022 0.09
wi 0.21 0.21 0.20
n 182 182 182
-----------------------------------------
Confidence intervals in parentheses
*p < 0.10 **p < 0.05 ***p < 0.01
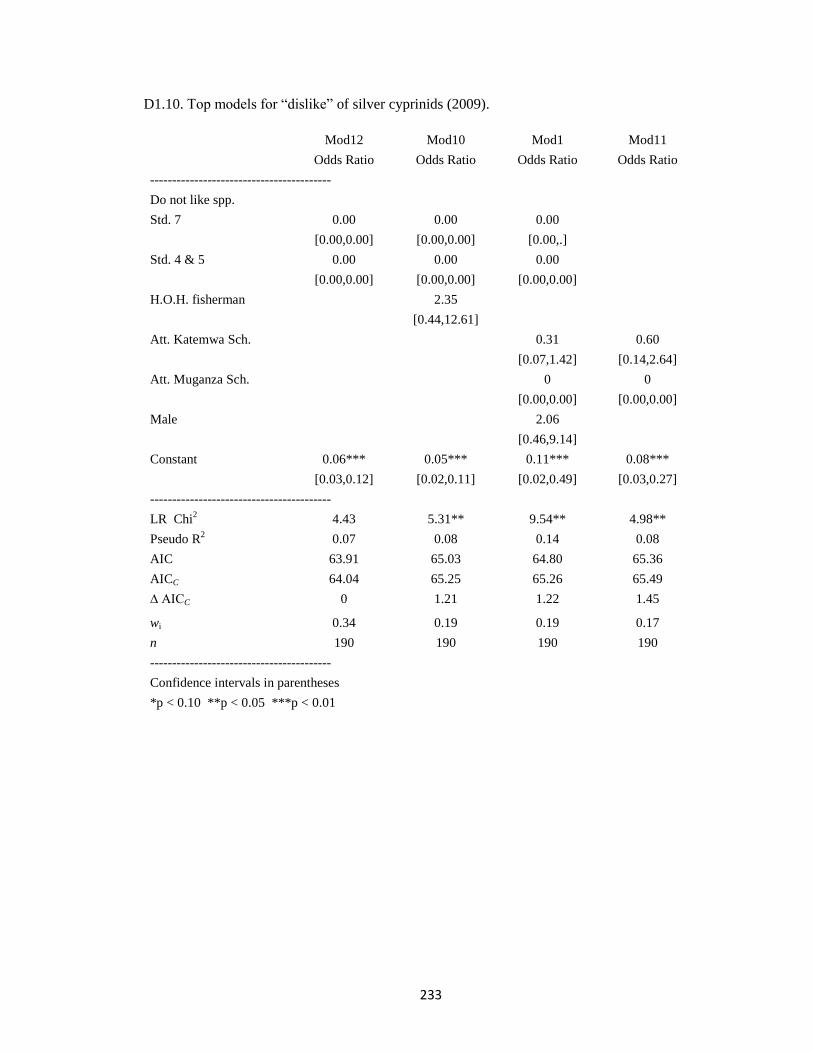
233
D1.10. Top models for ―dislike‖ of silver cyprinids (2009).
Mod12 Mod10 Mod1 Mod11
Odds Ratio Odds Ratio Odds Ratio Odds Ratio
-----------------------------------------
Do not like spp.
Std. 7 0.00 0.00 0.00
[0.00,0.00] [0.00,0.00] [0.00,.]
Std. 4 & 5 0.00 0.00 0.00
[0.00,0.00] [0.00,0.00] [0.00,0.00]
H.O.H. fisherman 2.35
[0.44,12.61]
Att. Katemwa Sch. 0.31 0.60
[0.07,1.42] [0.14,2.64]
Att. Muganza Sch. 0 0
[0.00,0.00] [0.00,0.00]
Male 2.06
[0.46,9.14]
Constant 0.06*** 0.05*** 0.11*** 0.08***
[0.03,0.12] [0.02,0.11] [0.02,0.49] [0.03,0.27]
-----------------------------------------
LR Chi2 4.43 5.31** 9.54** 4.98**
Pseudo R2 0.07 0.08 0.14 0.08
AIC 63.91 65.03 64.80 65.36
AICC 64.04 65.25 65.26 65.49
∆ AICC 0 1.21 1.22 1.45
wi 0.34 0.19 0.19 0.17
n 190 190 190 190
-----------------------------------------
Confidence intervals in parentheses
*p < 0.10 **p < 0.05 ***p < 0.01

234
D1.11. Top models for ―dislike‖ of silver cyprinids (2008 & 2009).
Mod9 Mod6
Odds Ratio Odds Ratio
-----------------------------------------
Do not like spp.
H.O.H. fisherman 2.97** 3.10***
[1.27,6.97] [1.32,7.28]
Std. 6 1.37
[0.62,3.02]
Std. 4 & 5 0
[0.00,.]
Constant 0.03*** 0.03***
[0.02,0.05] [0.01,0.06]
-----------------------------------------
LR Chi2 5.36** 7.57*
Pseudo R2 0.02 0.03
AIC 233.27 235.06
∆ AIC 0 1.80
wi 0.50 0.20
n 694 694
-----------------------------------------
Confidence intervals in parentheses
*p < 0.10 **p < 0.05 ***p < 0.01

235
D1.12. Top model for ―dislike‖ of vervet monkeys (2009).
Mod5
Odds Ratio
-----------------------------------------
Do not like spp.
Male 0.37*
[0.13,1.06]
H.O.H. farmer 2.35**
[1.01,5.46]
Son of a farmer 1.40
[0.36,5.35]
Constant 0.32***
[0.17,0.60]
-----------------------------------------
LR Chi2 16.02***
Pseudo R2 0.07
AIC 235.30
AICC 235.50
∆ AICC 0
wi 0.50
n 213
-----------------------------------------
Confidence intervals in parentheses
*p < 0.10 **p < 0.05 ***p < 0.01

236
D1.13. Top model for ―dislike‖ of vervet monkeys (2008 & 2009).
Mod6b
Odds Ratio
-----------------------------------------
Do not like spp.
Att. Katemwa Sch. 4.57**
[1.34,15.59]
Att. Muganza Sch. 2.84
[0.76,10.68]
Att. Butwa Sch. 4.76**
[1.33,17.02]
Att. Maisome Sch. 6.58***
[1.85,23.43]
Att. Izumacheli Sch. 6.01***
[1.67,21.65]
Att. Nkome Sch. 3.35*
[0.96,11.62]
H.O.H. farmer 1.55***
[1.13,2.14]
Constant 0.08***
[0.02,0.28]
-----------------------------------------
LR Chi2 27.65***
Pseudo R2 0.03
AIC 987.49
∆ AIC 0
wi 0.68
n 803
-----------------------------------------
Confidence intervals in parentheses
*p < 0.10 **p < 0.05 ***p < 0.01

237
D1.14. Top models for ―dislike‖ of hippopotamuses (2009).
Mod31 Null
Odds Ratio Odds Ratio
-----------------------------------------
Do not like spp.
Son of a livestock keeper 0.18
[0.02,1.44]
Constant 0.62*** 0.59***
[0.46,0.84] [0.43,0.79]
-----------------------------------------
LR Chi2 3.95** 0.00
Pseudo R2 0.02 0.00
AIC 246.29 248.25
AICC 246.36 248.27
∆ AICC 0 1.91
wi 0.46 0.18
n 187 187
-----------------------------------------
Confidence intervals in parentheses
*p < 0.10 **p < 0.05 ***p < 0.01
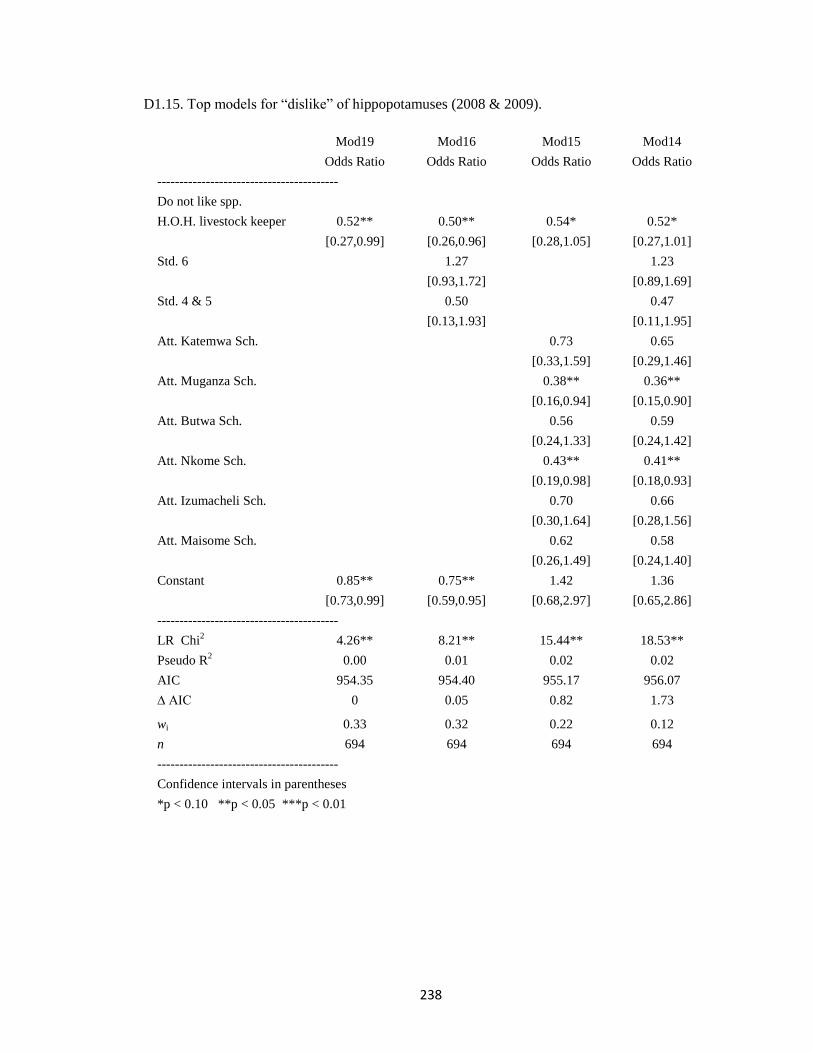
238
D1.15. Top models for ―dislike‖ of hippopotamuses (2008 & 2009).
Mod19 Mod16 Mod15 Mod14
Odds Ratio Odds Ratio Odds Ratio Odds Ratio
-----------------------------------------
Do not like spp.
H.O.H. livestock keeper 0.52** 0.50** 0.54* 0.52*
[0.27,0.99] [0.26,0.96] [0.28,1.05] [0.27,1.01]
Std. 6 1.27 1.23
[0.93,1.72] [0.89,1.69]
Std. 4 & 5 0.50 0.47
[0.13,1.93] [0.11,1.95]
Att. Katemwa Sch. 0.73 0.65
[0.33,1.59] [0.29,1.46]
Att. Muganza Sch. 0.38** 0.36**
[0.16,0.94] [0.15,0.90]
Att. Butwa Sch. 0.56 0.59
[0.24,1.33] [0.24,1.42]
Att. Nkome Sch. 0.43** 0.41**
[0.19,0.98] [0.18,0.93]
Att. Izumacheli Sch. 0.70 0.66
[0.30,1.64] [0.28,1.56]
Att. Maisome Sch. 0.62 0.58
[0.26,1.49] [0.24,1.40]
Constant 0.85** 0.75** 1.42 1.36
[0.73,0.99] [0.59,0.95] [0.68,2.97] [0.65,2.86]
-----------------------------------------
LR Chi2 4.26** 8.21** 15.44** 18.53**
Pseudo R2 0.00 0.01 0.02 0.02
AIC 954.35 954.40 955.17 956.07
∆ AIC 0 0.05 0.82 1.73
wi 0.33 0.32 0.22 0.12
n 694 694 694 694
-----------------------------------------
Confidence intervals in parentheses
*p < 0.10 **p < 0.05 ***p < 0.01

239
D1.16. Top models for ―dislike‖ of crocodiles (2009).
Mod21
Odds Ratio
-----------------------------------------
Do not like spp.
Att. Katemwa Sch. 2.50**
[1.07,5.80]
Att. Muganza Sch. 3.77***
[1.46,9.71]
H.O.H. fisherman 3.66**
[1.10,12.14]
Constant 1.06
[0.50,2.23]
-----------------------------------------
LR Chi2 10.35**
Pseudo R2 0.04
AIC 248.77
AICC 248.96
∆ AICC 0
wi 0.33
n 219
-----------------------------------------
Confidence intervals in parentheses
*p < 0.10 **p < 0.05***p < 0.01

240
D1.17. Top models for ―dislike‖ of crocodiles (2008 & 2009).
Mod14b Mod8b Mod12b
Odds Ratio Odds Ratio Odds Ratio
-----------------------------------------
Do not like spp.
Std. 6 0.64** 0.64** 0.64**
[0.44,0.94] [0.44,0.94] [0.44,0.94]
Std. 4 & 5 0.27** 0.26** 0.26**
[0.09,0.77] [0.09,0.75] [0.09,0.76]
H.O.H. fisherman 1.27
[0.71,2.29]
H.O.H. livestock keeper 0.84
[0.42,1.67]
Constant 6.25*** 6.08*** 6.33***
[4.61,8.48] [4.46,8.30] [4.65,8.61]
-----------------------------------------
LR Chi2 9.01** 9.67** 9.25**
Pseudo R2 0.01 0.01 0.01
AIC 766.77 768.11 768.52
∆ AIC 0 1.34 1.75
wi 0.47 0.24 0.19
n 824 824 824
-----------------------------------------
Confidence intervals in parentheses
*p < 0.10 **p < 0.05 ***p < 0.01

241
D1.18. Top models for ―dislike‖ of little egrets (2009).
Mod41 Mod14 Null
Odds Ratio Odds Ratio Odds Ratio
-----------------------------------------
Do not like spp.
Son of a livestock keeper 5.61* 6.84*
[0.87,35.97] [0.99,47.18]
Att. Katemwa Sch. 0.22**
[0.06,0.80]
Att. Muganza Sch. 0.40
[0.09,1.73]
Std. 6 2.32
[0.48,11.22]
Std. 4 & 5 0.00
[0.00,.]
Constant 0.12*** 0.19* 0.130***
[0.07,0.20] [0.03,1.06] [0.08,0.21]
-----------------------------------------
LR Chi2 2.78* 11.05* 0.00
Pseudo R2 0.02 0.09 0.00
AIC 119.08 118.81 119.86
AICC 119.16 119.34 119.88
∆ AICC 0 0.18 0.73
wi 0.27 0.25 0.19
n 165 165 165
-----------------------------------------
Confidence intervals in parentheses
*p < 0.10 **p < 0.05 ***p < 0.01

242
D1.19. Top models for ―dislike‖ of little egrets (2008 & 2009).
Mod14B Mod8B Mod20B Mod12B Null
Odds Ratio Odds Ratio Odds Ratio Odds Ratio Odds Ratio
-----------------------------------------
Do not like spp.
Std. 6 0.81 0.82 0.80
[0.50,1.31] [0.50,1.32] [0.49,1.30]
Std. 4 & 5 0.00 0.00 0.00
[0.00,.] [0.00,.] [0.00,.]
H.O.H. livestock keeper 1.90 1.94
[0.82,4.39] [0.84,4.47]
H.O.H. farmer 0.78
[0.47,1.27]
Constant 0.19*** 0.20*** 0.24*** 0.17*** 0.17***
[0.13,0.28] [0.14,0.29] [0.15,0.38] [0.13,0.21] [0.14,0.22]
-----------------------------------------
LR Chi2 7.28* 5.23* 6.25* 2.18 0.00
Pseudo R2 0.02 0.01 0.01 0.00 0.00
AIC 442.60 442.65 443.62 443.70 443.88
∆ AIC 0 0.05 1.03 1.10 1.28
wi 0.27 0.26 0.16 0.16 0.14
n 527 527 527 527 527
Confidence intervals in parentheses
*p < 0.10 **p < 0.05 ***p < 0.01

243
D1.20. Top models for ―dislike‖ of Egyptian geese (2009).
Mod5 Mod6 Mod9 Null
Odds Ratio Odds Ratio Odds Ratio Odds Ratio
-----------------------------------------
Do not like spp.
Son of a fisher 0
[0.00,0.00]
Att. Katemwa Sch. 0.41
[0.04,4.26]
Att. Muganza Sch. 0
[0.00,0.00]
H.O.H. livestock keeper 10.17*
[0.71,146.17]
Constant 0.07*** 0.12*** 0.05*** 0.06***
[0.03,0.20] [0.03,0.38] [0.02,0.16] [0.02,0.17]
-----------------------------------------
LR Chi2 1.05 2.88* 2.27 0.00
Pseudo R2 0.03 0.09 0.07 0.00
AIC 31.25 31.43 32.04 32.30
AICC 31.44 31.81 32.23 32.37
∆ AIC 0 0.37 0.79 0.93
wi 0.29 0.24 0.20 0.18
n 67 67 67 67
-----------------------------------------
Confidence intervals in parentheses
*p < 0.10 **p < 0.05 ***p < 0.01

244
D1.21. Top models for ―dislike‖ of elephants (2009).
Mod26 Mod15 Mod5 Mod40 Mod37 Mod32 Mod21
Odds Ratio Odds Ratio Odds Ratio Odds Ratio Odds Ratio Odds Ratio Odds Ratio
-----------------------------------------
Do not like spp.
Son of a livestock keeper 0.00 0.00
[0.00,0.00] [0.00,0.00]
Std. 4 & 5 0.00 0.00 0.00 0.00 0.00 0.00 0.00
[0.00,0.00] [0.00,.] [0.00,.] [0.00,0.00] [0.00,.] [0.00,.] [0.00,.]
Son of a farmer 0.18 0.18
[0.02,1.42] [0.02,1.46]
Att. Katemwa Sch. 0.66
[0.22,2.00]
Male 0.26** 0.27** 0.26**
[0.08,0.83] [0.08,0.85] [0.08,0.85]
H.O.H. farmer 1.13
[0.43,3.01]
H.O.H. livestock keeper 1.04
[0.10,10.43]
Constant 0.24*** 0.29*** 0.50 0.24*** 0.29*** 0.34*** 0.36***
[0.15,0.39] [0.18,0.48] [0.18,1.35] [0.15,0.38] [0.17,0.47] [0.16,0.72] [0.21,0.64]
-----------------------------------------
LR Chi2 6.40 10.54*** 12.05*** 5.55 9.52*** 11.59*** 11.53***
Pseudo R2 0.06 0.09 0.11 0.05 0.08 0.10 0.10
AIC 108.40 108.27 108.75 109.26 109.29 109.21 109.27
AICC 108.60 108.61 109.09 109.36 109.49 109.55 109.61
∆ AICC 0.00 0.00 0.49 0.76 0.89 0.95 1.01
wi 0.19 0.19 0.15 0.13 0.12 0.12 0.11
n 124 124 124 124 124 124 124
-----------------------------------------
Confidence intervals in parentheses
*p < 0.10 **p < 0.05 ***p < 0.01
24
4

245
D1.22. Top models for ―dislike‖ of giraffes (2009).
Mod12 Mod1 Mod37 Mod28 Mod33 Mod7 Mod17 Mod32 Mod5 Mod21 Mod35 Mod26
Odds
Ratio
Odds
Ratio
Odds
Ratio
Odds
Ratio
Odds
Ratio
Odds
Ratio
Odds
Ratio
Odds
Ratio
Odds
Ratio
Odds
Ratio
Odds
Ratio
Odds
Ratio
----------------------
Do not like spp.
Std. 4 & 5 0.00 0.00 0.00 0.00 0.00 0.00
[0.00,0.00] [0.00,0.00] [0.00,.] [0.00,0.00] [0.00,0.00] [0.00,.]
-----------------------------------------
Confidence intervals in parentheses
*p < 0.10 **p < 0.05 ***p < 0.01
Male 0.17 0.17* 0.18 0.18 0.18 0.17*
[0.02,1.44] [0.02,1.39] [0.02,1.52] [0.02,1.53] [0.02,1.57] [0.02,1.40]
H.O.H. livestock 0.00 0.00 0.00
keeper [0.00,0.00] [0.00,0.00] [0.00,.]
H.O.H. farmer 4.89 3.18 3.44 3.03 3.48 3.77
[0.55,43.35] [0.60,16.76] [0.65,18.28] [0.57,16.11] [0.67,18.02] [0.72,19.61]
H.O.H. fisherman 3.30
[0.18,59.54]
Son of a livestock 0.00 0.00
keeper [0.00,0.00] [0.00,0.00]
Son of a fisher 0.00 0.00
[0.00,0.00] [0.00,0.00]
Son of a farmer 0.53
[0.06,4.61]
Att. Katemwa Sch. 2.76 1.92
[0.32,24.08] [0.22,16.51]
Constant 0.04*** 0.12*** 0.06*** 0.08*** 0.06*** 0.08*** 0.10*** 0.03*** 0.03*** 0.05*** 0.04*** 0.13***
[0.01,0.33] [0.06,0.26] [0.01,0.25] [0.04,0.17] [0.01,0.27] [0.04,0.17] [0.05,0.23] [0.00,0.28] [0.01,0.14] [0.01,0.37] [0.01,0.15] [0.06,0.27]
------------------------------
LR Chi2 8.93** 3.96** 6.07** 1.98 8.01** 1.65 4.06** 7.10* 2.55 2.71* 4.53 4.51
Pseudo R2 0.15 0.07 0.10 0.03 0.14 0.03 0.07 0.12 0.04 0.05 0.08 0.08
AIC 57.29 58.26 58.15 58.25 58.21 58.57 58.17 59.12 59.67 59.52 59.69 59.72
AICC 58.06 58.37 58.36 58.46 58.57 58.67 58.71 59.48 59.78 59.88 59.90 59.93
∆ AIC 0 0.31 0.30 0.40 0.51 0.61 0.65 1.42 1.72 1.81 1.84 1.87
wi 0.13 0.11 0.11 0.10 0.10 0.09 0.09 0.06 0.05 0.05 0.05 0.05
n 116 116 116 116 116 116 116 116 116 116 116 116
24
5

246
D(2). Top models for explaining the desire of primary school students in communities
surrounding Rubondo Island National Park, Tanzania, to live near ―few‖ animals of each species
of wildlife included in my 2008/2009 survey. The first set is developed from 2009 data only and
includes ―gender‖ as a variable. The second set includes 2008 data as well, but not the ―gender‖
variable (which was not collected during 2008). The second set also contains additional dummy
variables for ―school,‖ as sampling was conducted in more villages in that year. (Notes: Head of
household is abbreviated H.O.H. The Pseudo R2 measure used is McFadden‘s R
2, and LR Chi
2 is
an abbreviation for Likelihood Ratio Chi2 test. AIC is Akaike‘s Information Criterion, and AICc is
the small sample bias adjustment for that value. wi is the Akaike weight for the model.)

247
D2.1. Top models for wanting ―few‖ fish eagles (2009).
Mod25 Mod14 Mod3 Mod5
Odds Ratio Odds Ratio Odds Ratio Odds Ratio
-----------------------------------------
Don't want many of spp.
Male 12.14** 11.34** 18.37** 1.20E+15
[1.49,98.85] [1.38,92.85] [1.58,213.81] [0.00,.]
H.O.H. livestock keeper 0.00 2.71E+13
[0.00,.] [2.71e+13,2.71e+13]
Att. Katemwa Sch. 1.68 1.38
[0.34,8.34] [0.19,10.16]
Att. Muganza Sch. 0.10 0.00
[0.00,2.37] [0.00,.]
Std. 6 0.05* 0.00
[0.00,1.14] [0.00,.]
Std. 4 & 5 0.23 0.00
[0.01,7.20] [0.00,.]
H.O.H. fisherman 6.83E+14
[0.00,.]
Son of a fisher 0.00
[0.00,.]
Son of a livestock keeper 0.00
[0.00,0.00]
Constant 0.05*** 0.06*** 0.44 0.00
[0.01,0.37] [0.01,0.42] [0.02,10.34] [0.00,.]
-----------------------------------------
LR Chi2 9.64*** 10.81*** 17.17*** 23.67***
Pseudo R2 0.12 0.14 0.22 0.31
AIC 71.71 72.54 72.18 69.67
AICC 71.90 72.93 73.60 73.67
∆ AICC 0 1.03 1.70 1.78
wi 0.36 0.22 0.15 0.15
n 66 66 66 66
-----------------------------------------
Confidence intervals in parentheses
*p < 0.10 **p < 0.05 ***p < 0.01

248
D2.2. Top models for wanting ―few‖ fish eagles (2008 & 2009).
Mod10b Mod3b Mod4b
Odds Ratio Odds Ratio Odds Ratio
-----------------------------------------
Don't want many of spp.
Std. 6 2.52*** 2.57*** 2.50***
[1.50,4.22] [1.54,4.30] [1.49,4.20]
Std. 4 & 5 6.34** 6.96** 5.97**
[1.21,33.32] [1.33,36.47] [1.12,31.73]
H.O.H. livestock keeper 0.39* 0.38*
[0.13,1.18] [0.12,1.16]
Att. Katemwa Sch. 3.55* 3.28* 3.61*
[0.91,13.90] [0.84,12.81] [0.92,14.18]
Att. Muganza Sch. 0.60 0.52 0.62
[0.08,4.38] [0.07,3.82] [0.08,4.55]
Att. Butwa Sch. 0.48 0.44 0.52
[0.11,2.21] [0.10,2.03] [0.11,2.42]
Att. Maisome Sch. 0.44 0.41 0.46
[0.06,3.13] [0.06,2.90] [0.07,3.29]
Att. Izumacheli Sch. 1.24 1.09 1.26
[0.31,5.00] [0.27,4.37] [0.31,5.10]
Att. Nkome Sch. 1.27 1.25 1.28
[0.33,4.87] [0.33,4.78] [0.33,4.92]
H.O.H. fisherman 0.80
[0.38,1.68]
Constant 0.16*** 0.16*** 0.17***
[0.04,0.60] [0.04,0.59] [0.05,0.61]
-----------------------------------------
LR Chi2 47.01*** 43.68*** 47.36***
Pseudo R2 0.10 0.10 0.10
AIC 427.79 429.13 429.45
AICC 428.36 429.59 430.14
∆ AICC 0 1.23 1.77
wi 0.43 0.23 0.18
n 394 394 394
-----------------------------------------
Confidence intervals in parentheses
*p < 0.10 **p < 0.05 ***p < 0.01

249
D2.3. Top models for wanting ―few‖ genets (2009).
Mod34 Null
Odds Ratio Odds Ratio
-----------------------------------------
Don't want many
H.O.H. livestock keeper 3.45E+06
[0.00,.]
Constant 2.18*** 2.35***
[1.23,3.86] [1.33,4.15]
-----------------------------------------
LR Chi2 2.20 0.00
Pseudo R2 0.03 0.00
AIC 71.27 71.47
AICC 71.50 71.54
∆ AICC 0 0.046
wi 0.24 0.24
n 57 57
-----------------------------------------
Confidence intervals in parentheses
*p < 0.10 **p < 0.05 ***p < 0.01

250
D2.4. Top models for wanting ―few‖ genets (2008 & 2009).
Mod5 Mod2
Odds Ratio Odds Ratio
-----------------------------------------
Don't want many of spp.
Att. Katemwa Sch. 2.45 2.47
[0.56,10.76] [0.56,10.80]
Att. Muganza Sch. 0.00 0.00
[0.00,.] [0.00,.]
Att. Butwa Sch. 1.08 1.01
[0.26,4.55] [0.23,4.34]
Att. Nkome Sch. 0.64 0.63
[0.16,2.54] [0.16,2.51]
Att. Izumacheli Sch. 2.03 2.01
[0.44,9.43] [0.43,9.31]
o.Att. Maisome Sch. 1.00 1.00
[1.00,1.00] [1.00,1.00]
H.O.H. livestock keeper 3.76E+12 4.78E+12
[0.00,.] [0.00,.]
H.O.H. farmer 0.54** 0.58*
[0.31,0.93] [0.32,1.06]
H.O.H. fisherman 1.26
[0.52,3.07]
Constant 2.03 1.92
[0.50,8.20] [0.47,7.86]
-----------------------------------------
LR Chi2 34.29*** 34.56***
Pseudo R2 0.10 0.10
AIC 340.67 342.40
AICC 341.36 343.25
∆ AIC 0 1.89
wi 0.55 0.21
n 269 269
-----------------------------------------
Confidence intervals in parentheses
*p < 0.10 **p < 0.05 ***p < 0.01

251
D2.5. Top models for wanting ―few‖ monitor lizards (2009).
Mod16 Mod21 Mod23 Mod9
Odds Ratio Odds Ratio Odds Ratio Odds Ratio
-----------------------------------------
Don't want many of spp.
Att. Katemwa Sch. 1.49 1.19 1.44 1.25
[0.68,3.26] [0.52,2.71] [0.66,3.12] [0.54,2.88]
Att. Muganza Sch. 0.42** 0.38** 0.45* 0.36**
[0.18,0.97] [0.16,0.91] [0.20,1.03] [0.15,0.87]
H.O.H. livestock keeper 2.58 2.34
[0.73,9.09] [0.66,8.36]
H.O.H. fisherman 0.51 0.55
[0.21,1.25] [0.22,1.36]
Constant 1.57 2.13** 1.67 1.97*
[0.82,3.00] [1.03,4.43] [0.88,3.16] [0.94,4.13]
-----------------------------------------
LR Chi2 13.66*** 13.48*** 11.30*** 15.34***
Pseudo R2 0.05 0.05 0.04 0.06
AIC 250.25 250.43 250.62 250.57
AICC 250.46 250.64 250.74 250.90
∆ AICC 0 0.18 0.28 0.43
wi 0.25 0.23 0.22 0.20
n 191 191 191 191
-----------------------------------------
Confidence intervals in parentheses
*p < 0.10 **p < 0.05 ***p < 0.01

252
D2.6. Top models for wanting ―few‖ monitor lizards (2008 & 2009).
Mod10b Mod3b Mod4b Mod7b
Odds Ratio Odds Ratio Odds Ratio Odds Ratio
-----------------------------------------
Don't want many of spp.
Std. 7 0.55*** 0.55*** 0.55*** 0.55***
[0.40,0.76] [0.39,0.76] [0.40,0.77] [0.40,0.76]
Std. 4 & 5 4.16** 3.83** 4.04** 3.73**
[1.21,14.36] [1.12,13.16] [1.17,13.98] [1.08,12.83]
H.O.H. livestock keeper 1.66 1.64
[0.88,3.13] [0.87,3.09]
Att. Katemwa Sch. 1.30 1.32 1.26 1.29
[0.58,2.88] [0.59,2.94] [0.57,2.81] [0.58,2.87]
Att. Muganza Sch. 0.45* 0.48 0.44* 0.47
[0.18,1.11] [0.19,1.19] [0.18,1.10] [0.19,1.17]
Att. Butwa Sch. 0.35** 0.37** 0.37** 0.40**
[0.14,0.84] [0.16,0.90] [0.15,0.90] [0.16,0.96]
Att. Maisome Sch. 0.46* 0.46* 0.45* 0.45*
[0.19,1.10] [0.19,1.12] [0.19,1.09] [0.19,1.10]
Att. Izumacheli Sch. 0.49 0.52 0.48* 0.51
[0.21,1.16] [0.22,1.22] [0.21,1.14] [0.22,1.20]
Att. Nkome Sch. 0.48* 0.48* 0.47* 0.47*
[0.21,1.06] [0.22,1.07] [0.21,1.04] [0.21,1.05]
H.O.H. fisherman 0.76 0.74
[0.46,1.23] [0.46,1.21]
Constant 2.08* 2.09* 2.17* 2.19**
[0.96,4.50] [0.97,4.53] [1.00,4.73] [1.01,4.77]
-----------------------------------------
LR Chi2 69.46*** 66.93*** 70.73*** 68.35***
Pseudo R2 0.07 0.07 0.07 0.07
AIC 938.92 939.45 939.65 940.03
AICC 0 0.52 0.73 1.11
∆ AICC 0.33 0.25 0.23 0.19
wi 0.30 0.23 0.21 0.17
n 714 714 714 714
-----------------------------------------
Confidence intervals in parentheses
*p < 0.10 **p < 0.05 ***p < 0.01

253
D2.7. Top models for wanting ―few‖ spotted-necked otters (2008 & 2009).
Mod3 Mod7 Mod6 Mod8
Odds Ratio Odds Ratio Odds Ratio Odds Ratio
-----------------------------------------
Don't want many of spp.
Att. Katemwa Sch. 4.08** 3.32* 2.80* 3.11**
[1.19,14.04] [0.93,11.81] [0.97,8.03] [1.10,8.78]
Att. Muganza Sch. 1.00 1.00 1.00 1.00
[1.00,1.00] [1.00,1.00] [1.00,1.00] [1.00,1.00]
Att. Ikuza Sch. 0.72 0.62 0.33 0.33
[0.06,8.22] [0.05,7.34] [0.03,3.31] [0.03,3.33]
Att. Izumacheli Sch. 2.29 1.77 1.33 1.56
[0.71,7.40] [0.52,6.02] [0.49,3.58] [0.60,4.10]
Att. Maisome Sch. 0.40 0.32 0.19* 0.22*
[0.06,2.49] [0.05,2.04] [0.03,1.07] [0.04,1.21]
Att. Nkome Sch. 1.30 0.93 0.65 0.83
[0.22,7.60] [0.15,5.72] [0.13,3.35] [0.17,4.18]
Std. 6 2.30** 2.32**
[1.07,4.95] [1.08,5.02]
Std. 4 & 5 5.67* 4.80
[0.83,38.57] [0.58,28.89]
H.O.H. fisherman 0.47 0.44*
[0.17,1.29] [0.17,1.15]
Constant 0.24** 0.33* 0.77 0.60
[0.07,0.78] [0.09,1.16] [0.32,1.86] [0.26,1.37]
-----------------------------------------
LR Chi2 25.58*** 27.81*** 22.29*** 19.36***
Pseudo R2 0.12 0.13 0.10 0.09
AIC 212.21 211.99 213.51 214.44
AICC 213.40 213.46 214.46 215.17
∆ AICC 0 0.05 1.05 1.77
wi 0.30 0.29 0.18 0.12
n 161 161 161 161
-----------------------------------------
Confidence intervals in parentheses
*p < 0.10 **p < 0.05 ***p < 0.01

254
D2.8. Top models for wanting ―few‖ sitatunga (2009).
Mod26 Mod18 Null
Odds Ratio Odds Ratio Odds Ratio
-----------------------------------------
Don't want many of spp.
H.O.H. livestock keeper 0.00 0.00
[0.00,.] [0.00,0.00]
Male 0.84
[0.26,2.68]
Constant 0.31*** 0.33*** 0.28***
[0.17,0.55] [0.15,0.74] [0.16,0.49]
-----------------------------------------
LR Chi2 2.56 2.64 1.42E-14
Pseudo R2 0.03 0.04 2.22E-16
AIC 73.70 73.61 74.25
AICC 73.88 73.98 74.31
∆ AICC 0 0.10 0.34
wi 0.26 0.25 0.22
n 69 69 69
-----------------------------------------
Confidence intervals in parentheses
*p < 0.10 **p < 0.05 ***p < 0.01

255
D2.9. Top models for wanting ―few‖ sitatunga (2008 & 2009).
Mod5B Mod14B
Odds Ratio Odds Ratio
-----------------------------------------
Don't want many of
Std. 6 2.48** 2.43**
[1.05,5.81] [1.03,5.72]
Std. 4 & 5 0.00 0.00
[0.00,.] [0.00,.]
H.O.H. fisherman 1.33
[0.44,4.08]
Constant 0.14*** 0.14***
[0.07,0.30] [0.07,0.30]
-----------------------------------------
LR Chi2 6.68** 6.93*
Pseudo R2 0.04 0.04
AIC 181.74 183.49
AICC 181.87 183.72
∆ AICC 0 1.85
wi 0.42 0.17
n 179 179
-----------------------------------------
Confidence intervals in parentheses
*p < 0.10 **p < 0.05 ***p < 0.01

256
D2.10. Top models for wanting ―few‖ silver cyprinids (2009).
Mod13 Mod15 Mod14 Null
Odds Ratio Odds Ratio Odds Ratio Odds Ratio
-----------------------------------------
Don't want many of spp.
Male 2.57*
[0.87,7.60]
H.O.H. farmer 0.41
[0.14,1.20]
H.O.H. livestock keeper 0.00
[0.00,.]
Constant 0.06*** 0.14*** 0.10*** 0.10***
[0.02,0.14] [0.08,0.25] [0.06,0.17] [0.06,0.16]
-----------------------------------------
LR Chi2 3.17* 2.86* 2.49 0.00
Pseudo R2 0.03 0.02 0.02 0.00
AIC 115.89 116.20 116.57 117.06
AICC 115.95 116.26 116.64 117.08
∆ AICC 0.00 0.31 0.68 1.13
wi 0.28 0.24 0.20 0.16
n 193 193 193 193
-----------------------------------------
Confidence intervals in parentheses
*p < 0.10 **p< 0.05 ***p< 0.01

257
D2.11. Top models for wanting ―few‖ silver cyprinids (2008 & 2009).
Mod13
Odds Ratio
-----------------------------------------
Don't want many of spp.
Att. Katemwa Sch. 1.44
[0.47,4.39]
Att. Muganza Sch. 1.29
[0.28,6.08]
Att. Nkome Sch. 1.41
[0.43,4.58]
Att. Ikuza Sch. 0.62
[0.07,5.76]
Att. Izumacheli Sch. 0.25
[0.03,2.33]
Att. Maisome Sch. 0.00
[0.00,0.00]
H.O.H. livestock keeper 0.00
[0.00,.]
Constant 0.06***
[0.02,0.16]
-----------------------------------------
LR Chi2 18.34***
Pseudo R2 0.06
AIC 290.88
wi 0.56
n 699
-----------------------------------------
Confidence intervals in parentheses
*p < 0.10 **p < 0.05 ***p < 0.01

258
D2.12. Top models for wanting ―few‖ vervet monkeys (2009).
Mod2
Odds Ratio
-----------------------------------------
Don't want many of
Att. Katemwa Sch. 2.66*
[0.99,7.13]
Male 0.35**
[0.15,0.85]
H.O.H. livestock keeper 5.72
[0.67,48.48]
H.O.H. farmer 11.06***
[3.65,33.54]
H.O.H. fisherman 10.41***
[2.24,48.35]
Constant 0.12***
[0.03,0.42]
-----------------------------------------
LR Chi2 28.79***
Pseudo R2 0.18
AIC 142.33
AICC 143.10
wi 0.72
n 116
-----------------------------------------
Confidence intervals in parentheses
*p < 0.10 **p < 0.05 ***p < 0.01

259
D2.13. Top models for wanting ―few‖ hippopotamuses (2009).
Mod23 Mod12 Mod8 Mod15 Mod16
Odds Ratio Odds Ratio Odds Ratio Odds Ratio Odds Ratio
-----------------------------------------
Don't want many of species
Att. Katemwa Sch. 2.63** 2.73** 4.02** 6.43** 3.14**
[1.05,6.60] [1.08,6.90] [1.34,12.07] [1.42,29.05] [1.10,8.94]
H.O.H. farmer 1.72 2.37*
[0.75,3.96] [0.92,6.12]
H.O.H. fisherman 3.10 0.24 1.66
[0.67,14.27] [0.01,3.93] [0.44,6.30]
Std. 6 0.06*
[0.00,1.13]
Std. 4 & 5 0.10
[0.00,2.19]
Male 0.40*
[0.15,1.03]
Son of a fisher 30.70**
[1.15,822.51]
H.O.H. livestock keeper
Son of a livestock keeper
Son of a farmer
Constant 0.43** 0.32** 0.18*** 4.64 0.35**
[0.20,0.94] [0.13,0.80] [0.05,0.62] [0.29,73.58] [0.13,0.92]
-----------------------------------------
LR Chi2 4.51** 6.17** 8.34** 14.35** 5.08*
Pseudo R2 0.03 0.05 0.06 0.11 0.04
AIC 131.90 132.25 132.08 132.07 133.34
AICC 132.03 132.51 132.52 133.34 133.60
∆ AICC 0 0.47 0.49 1.31 1.57
wi 0.28 0.22 0.22 0.15 0.13
n 96 96 96 96 96
25
9

260
D2.14. Top models for wanting ―few‖ Egyptian geese (2009).
Mod4 Null
Odds Ratio Odds Ratio
-----------------------------------------
Don't want many of spp.
Son of a fisher 0.00
[0.00,0.00]
Constant 0.10*** 0.09***
[0.04,0.29] [0.03,0.24]
-----------------------------------------
LR Chi2 1.26 0.00
Pseudo R2 0.05 0.00
AIC 28.62 29.88
AICC 28.87 29.96
∆ AICC 0 1.09
wi 0.36 0.21
n 50 50
-----------------------------------------
Confidence intervals in parentheses
*p < 0.10 **p < 0.05 ***p < 0.01

261
D2.15. Top models for wanting ―few‖ elephants (2009).
Mod40b Mod26b Mod21b Mod23b Mod32b Mod5b
Odds Ratio Odds Ratio Odds Ratio Odds Ratio Odds Ratio Odds Ratio
-----------------------------------------
Don't want many of spp.
Std. 4 & 5 0.11** 0.11** 0.11** 0.11** 0.12** 0.18*
[0.01,0.90] [0.01,0.87] [0.01,0.89] [0.01,0.87] [0.01,0.93] [0.01,1.07]
Std. 7 0.74 0.72 0.66 0.71 0.70 0.70
[0.06,8.40] [0.06,8.14] [0.06,7.75] [0.06,8.07] [0.06,8.15] [0.05,9.20]
Son of a livestock keeper 0.00
[0.00,.]
Male 0.51* 0.51* 0.52*
[0.23,1.11] [0.24,1.12] [0.24,1.12]
H.O.H. livestock keeper 0.34 0.36
[0.04,3.22] [0.04,3.28]
Att. Katemwa Sch. 1.02
[0.39,2.65]
H.O.H. farmer 0.97
[0.45,2.07]
Constant 0.68** 0.70* 0.93 0.71* 0.90 0.87
[0.46,0.99] [0.48,1.03] [0.56,1.53] [0.48,1.04] [0.48,1.68] [0.35,2.18]
-----------------------------------------
LR Chi2 7.32** 9.42** 11.26** 8.31** 10.23** 10.22**
Pseudo R2 0.04 0.06 0.07 0.05 0.06 0.06
AIC 164.06 163.97 164.12 165.07 165.16 165.16
AICC 164.26 164.30 164.62 165.40 165.66 165.66
∆ AICC 0 0.04 0.37 1.15 1.40 1.41
wi 0.23 0.22 0.19 0.13 0.11 0.11
n 126 126 126 126 126 126
-----------------------------------------
Confidence intervals in parentheses
*p < 0.10 **p < 0.05 ***p < 0.01
26
1

262
D2.16. Top models for wanting ―few‖ giraffes (2009).
Mod3 Mod2†
Odds Ratio Odds Ratio
-----------------------------------------
Don't want many of spp.
Std. 7 0.00
[0.00,0.00]
Std. 4 & 5 0.00
[0.00,0.00]
Att. Katemwa Sch. 2.31
[0.73,7.34]
Constant 0.30***
[0.19,0.47]
-----------------------------------------
LR Chi2 6.76 2.27
Pseudo R2 0.06 0.02
AIC 114.88 121.38
AICC 115.10 121.48
∆ AICC 0 6.39
wi 0.89 0.03
n 119 119
-----------------------------------------
Confidence intervals in parentheses
*p < 0.10 **p < 0.05 ***p < 0.01
† Shown although not within 2 AICC units of the model with the lowest score because of violations in the
aforementioned model.

263
APPENDIX E
ADULT INTERVIEW PROTOCOL
Protocol used during interviews with adults in communities surrounding Rubondo Island National
Park, Tanzania, during 2008.

264

265
.

266

267

268

269

270

271

272

273

274
APPENDIX F
TOURIST SURVEY INSTRUMENT
Survey instrument used to assess the interests of travelers at Tanzania‘s Kilimanjaro International
Airport during 2009.

275

276

277

278

279
BIBLIOGRAPHY
Ad Council. 2008. Forest fire prevention—Smokey Bear (1944-Present). <http://www.adcouncil.
org/default.aspx?id=129>. Accessed February 8, 2008.
Acheson, J. A. 2006. Lobster and groundfish management in the Gulf of Maine: a rational choice
perspective. Human Organization 65:240-252.
Alp, E., H. Ertepinar, C. Tekkaya, and A. Yilmaz. 2006. A statistical analysis of children‘s
environmental knowledge and attitudes in Turkey. International Research in
Geographical and Environmental Education 15: 210-223.
Amorim Conforti, V., and C. Cascelli de Azevedo. 2003. Local perceptions of jaguars (Panthera
onca) and pumas (Puma concolor) in the Iguaçu National Park area, south Brazil.
Biological Conservation 111:215-221.
Andelman, S. J., and W. M. Fagan. 2000. Umbrellas and flagships: efficient conservation
surrogates or expensive mistakes? Proceedings of the National Academy of Sciences
97:5954-5959.
Associated Press. 2009. Temporary waivers for National Park entrance fees. New York Times.
June 3: A18. <http://query.nytimes.com/gst/fullpage.html?res=9E04E5D61F3CF93
0A35755C0A96F9C8B63>. Accessed November 19, 2010.
Awange, J. L., and O. Ong‘ang‘a. 2006. Lake Victoria: ecology, resources, environment.
Springer, Heidelberg, New York, USA.
Awde, N. 2000. Swahili-English English-Swahili dictionary. Hippocrene Books, New York, New
York, USA.
Barua, M., J. Tamuly, and R. A. Ahmed. 2010. Mutiny or clear sailing? Examining the role of the
Asian elephant as a flagship species. Human Dimensions of Wildlife 15:145-160.
Becketti, S. 1995. New lfit, lroc, and lstat commands. Stata Technical Bulletin. 28:2-5.
Berk, R. 2004. Regression analysis: A constructive critique. Sage, Thousand Oaks, California,
USA.
Bixler, R. D., and M. F. Floyd. 1997. Nature is scary, disgusting and uncomfortable. Environment
and Behavior 29:443-467.
Bjerke, T., T. S. Ødegårdstuen, and B. P. Kaltenborn. 1998a. Attitudes toward animals among
Norwegian children and adolescents: Species preferences. Anthrozoös 11:227-25.
Bjerke, T., O. Reitman, and S. R. Kellert. 1998b. Attitudes towards wolves in southeastern
Norway. Society and Natural Resources 11:169-178.
Bohner, G., and M. Wänke. 2002. Attitudes and attitude change. Psychology Press, New York,
USA.

280
Bonine, K., B. Chang, E. Dembe, B. Loibooki, and N. Mndeme, A. Mziray, B. Neary, L.
Pendleton, J. Reid, and M. Tamanaha. 2004. Maximizing revenues and conservation in
Tanzanian National Parks. Conservation Strategy Fund/Tanzania National Parks, Arusha,
Tanzania.
Bowen-Jones, E., and A. Entwistle. 2002. Identifying appropriate flagship species: the
importance of culture and local contexts. Oryx 36:189-195.
Boyd, S. W., and R. W. Butler. 2002. Tourism and national parks: the origin of the concept.
Pages 13-27 in R. W. Butler and S. W. Boyd, editors. Tourism and national parks: issues
and implications. John Wiley and Sons, New York, New York, USA.
Branch, C. W., and N. Newcombe. 1986. Racial attitude development among young black
children as a function of parental attitudes: a longitudinal and cross-sectional study. Child
Development 57:712-721.
Braun, D. G. 2004. First documented nesting in the wild of Egyptian geese in Florida. Florida
Field Naturalist 32:138-143.
Braun, M., and P. P. Mohler. 2003. Background variables. Pages 101-115 in J. A. Harkness, F. J.
R. Van de Vijver, and P. P. Mohler, editors. Cross-cultural survey methods. John Wiley
& Sons, Inc., Hoboken, New Jersey, USA.
Brockington, D. 2002. Fortress conservation: the preservation of Mkomazi Game Reserve,
Tanzania. Indiana University Press, Bloomington, Indiana, USA.
Browne-Nũnez, C., and S. A. Jonker. 2008. Attitudes toward wildlife and conservation across
Africa: a review of survey research. Human Dimensions of Wildlife 13:49-72.
Buckley, R., and C. Littlefair. 2007. Minimal-impact education can reduce actual impacts of park
visitors. Journal of Sustainable Tourism 15:324-325.
Burnham, K. P., and D. R. Anderson. 1998. Model selection and multimodal inference: a
practical information-theoretic approach. Springer, New York, New York, USA.
Burnham, K. P., and D. R. Anderson. 2004. Multimodal inference: understanding AIC and BIC in
model selection. Sociological methods and research 33: 261-304.
Burns, G. L. 2004. The host community and wildlife tourism. Pages 125-142 in K. Higginbottom,
editor. Wildlife tourism: impacts, management, and planning. Common Ground
Publishing Pty Ltd., Altona, Victoria, Australia.
Bushell, R., R. Staiff, and P. F. J. Eagles. 2007. Tourism and protected areas: benefits beyond
boundaries. Pages 1-11 in R. Bushell and P. F. J. Eagles, editors. Tourism and protected
areas: benefits beyond boundaries. CAB International, Cambridge, Massachusettt, USA.
Cantino, P.D., H. N. Bryant, K. de Queiroz, M. J. Donoghue, T. Eriksson, D. M. Hillis, and M. S.
Y. Lee. 1999. Species names in phylogenetic nomenclature. Systematic Biology 48:790-
807.
Caro, T., T. A. Gardner, C. Stoner, E. Fitzherbert, and T. R. B. Davenport. 2002. Assessing the
effectiveness of protected areas: paradoxes call for pluralism in evaluating conservation
performance. Diversity and Distributions 15:178-182.

281
Couper, M.P., and E. D. de Leeuw. 2003. Nonresponse in cross-cultural and cross-national
surveys. Pages 157-177 in J. A. Harkness, F. J. R. Van de Vijver, and P. P. Mohler,
editors. Cross-cultural survey methods. John Wiley & Sons, Inc., Hoboken, New Jersey,
USA.
Cunningham, M. 2001. The influence of parental attitudes and behaviors on children‘s attitudes
toward and household labor in early adulthood. Journal of Marriage and Family 63:111-
122.
Curtin, S. 2010. The self-presentation and self-development of serious wildlife tourists.
International Journal of Tourism Research 12:17-33.
Czech, B., P. K. Devers, and P. R. Krausman. 2001. The relationship of gender to species
conservation attitudes. Wildlife Society Bulletin 29:187-194.
Davis, D., S. Banks, A. Birtles, P. Valentine, and M. Cuthill. 1997. Whale sharks in Ningaloo
Marine Park: managing tourism in an Australian marine protected area. Tourism
Management 18(5): 259-271.
Davis, G. E. 1994. Spiny lobsters as flagship species for marine ecosystems. Wings 27(2):16-19.
Dietz, L. A. H., L. A. Dietz, and E. Y. Nagagata. 1994. The effective use of flagship species for
the conservation of biodiversity: the example of lion tamarins in Brazil. Pages 32-49 in P.
J. S. Olney, G. M. Mace, and A. T. C. Feistner, editors. Creative conservation: interactive
management of wild and captive mammals. Chapman & Hall, London, United Kingdom.
Dietz, L. A., and E. Y. Nagagata. 1995. Golden lion tamarin conservation program: a community
education effort for forest conservation in Rio de Janeiro State, Brazil. Pages 64-86 in S.
K. Jacobson, editor. Conserving wildlife: international education and communication
approaches. Columbia, University Press, New York, USA.
Dixon, J. A., and P. B. Sherman. 1990. Economics of protected areas: a new look at benefits and
costs. Island Press, Washington, D.C., USA.
Dowie, M. 2009. Conservation refugees: the hundred-year conflict between global conservation
and native peoples. MIT Press, Cambridge, Massachusetts, USA.
Drury, R., K. Homewood, and S. Randall. 2011. Less is more: the potential of qualitative
approaches in conservation research. Animal Conservation 14:18-24.
Duffy, R. 2010. Nature crime: how we‘re getting conservation wrong. Yale University Press,
New Haven, Connecticut, USA.
Dunstone, N., and J. N. O‘Sullivan. 1996. The impact of ecotourism on rainforest mammals.
Pages 313-333 in N. Dunstone and V.J. Taylor, editors. The exploitation of mammal
populations. Chapman and Hall, London, United Kingdom.
Eagles, P. F. J., and S. Muffitt. 1990. An analysis of children‘s attitudes toward animals. Journal
of Environmental Education 21(3):41-44.
Eagles, P. F. J., and R. Demare. 1999. Factors influencing children‘s environmental attitudes.
Journal of Environmental Education 30(4):33-37.

282
Eagles, P. F. J., S. F. McCool, and C. D. A. Haynes. 2002. Sustainable tourism in protected areas:
guidelines for planning and management. IUCN, Gland, Switzerland.
Eagly, A. H., and S. Chaiken. 1993. The psychology of attitudes. Harcourt Brace Jovanovich
College Publishers, New York, USA.
Entwistle, A. 2000. Flagships for the future? Oryx 34:239-240.
Entwistle, A. C., and P. J. Stephenson. 2000. Small mammals and the conservation agenda. Pages
119-139 in A. Entwistle and N. Dunstone, editors. Priorities for the conservation of
mammalian diversity: has the panda had its day? Cambridge University Press, United
Kingdom.
Ericsson, G., and T.A. Heberlein. 2003. Attitudes of hunters, locals, and the general public in
Sweden now that wolves are back. Biological Conservation 111:149-159.
Eubanks, T. L., Jr., J. R. Stoll, and R. B. Ditton. 2004. Understanding the diversity of eight birder
sub-populations: socio-demographic characteristics, motivations, expenditures, and net
benefits. Journal of Ecotourism 3: 151-172.
Eugenio-Martin, J. L., M. T. Sinclair, and I. Yeoman. 2005. Quantifying the effects of tourism
crises: an application to Scotland. Journal of Travel & Tourism Marketing 19(2/3): 21-34.
Feistner, A. T., and J. J. C. Mallinson. 2000. A recipe for species conservation: multidisciplinary
ingredients. Pages 309-323 in A. Entwistle and N. Dunstone, editors. Priorities for the
conservation of mammalian diversity: has the panda had its day? Cambridge University
Press, United Kingdom.
Fiallo, E. A., and S. K. Jacobson. 1995. Local communities and protected areas: attitudes of rural
residents toward conservation and Machalilla National Park, Ecuador. Environmental
Conservation 22:241-249.
Fredline, L., and B. Faulkner. 2001. International market analysis of wildlife tourism. Wildlife
Tourism Report Series No. 22. Cooperative Research Centre for Sustainable Tourism,
Gold Coast MC, Queensland, Australia.
Games, I. 1983. Observations of the sitatunga Tragelaphus spekei selousi in the Okavango Delta
of Botswana. Biological Conservation 27:157-170.
Gill, F. B. 1995. Ornithology. Second edition. W. H. Freeman and Company, New York, USA.
Goodrich, J. N. 2002. September 11, 2001 attack on America: a record of the immediate impacts
and reactions in the USA travel and tourism industry. Tourism management 23:573-580.
Goodwin, H. J., and N. Leader-Williams. 2000. Tourism and protected areas – distorting
conservation priorities toward charismatic megafauna? Pages 256-275 in A. Entwistle
and N. Dunstone, editors. Priorities for the conservation of mammalian diversity.
Cambridge University Press, Cambridge, United Kingdom.
Goudswaard, K. C. P, F. Witte, and E. F. B. Katunzi. 2008. The invasion of an introduced
predator, Nile perch (Lates niloticus, L.) in Lake Victoria (East Africa): chronology and
causes. Environmental Biology of Fish 81:127-139.

283
Green, R., H. Higginbottom, and C. Northrope. 2001. A tourism classification of Australian
Wildlife. Wildlife Tourism Report Series No. 7. Cooperative Research Centre for
Sustainable Tourism, Gold Coast MC, Queensland, Australia.
Gresh, W. A. 1931. The massasauga in Pennsylvania. As printed in B. Bell, T. Williams, and B.
Maugans, editors. 1979. Pennsylvania Game News Treasury. Pennsylvania Game
Commission, Harrisburg, Pennsylvania, USA.
Hammit, W. E., J. N. Dulin, and G. R Wells. 1993. Determinants of quality wildlife viewing in
Great Smokey Mountains National Park. Wildlife Society Bulletin 21:21-30.
Hardin, G. 1968. The tragedy of the commons. Science 162:1244.
Harkness, J.A. 2003. Questionnaire translation. Pages 35-56 in J. A. Harkness, F. J. R. Van de
Vijver, and P. P. Mohler, editors. Cross-cultural survey methods. John Wiley & Sons,
Inc., Hoboken, New Jersey, USA.
Harkness, J.A., F. J. R. Van de Vijver, and P. P. Mohler, editors. 2003. Cross-cultural survey
methods. John Wiley & Sons, Inc., Hoboken, New Jersey, USA.
Hemson, G., S. Maclennan, G. Mills, P. Johnson, and D. Macdonald. 2009. Community, lions,
livestock and money: A spatial and social analysis of attitudes to wildlife and the
conservation value of tourism in a human–carnivore conflict in Botswana. Biological
Conservation 142: 2718–2725.
Hennink, M. M. 2008. Language and communication in cross-cultural qualitative research. Pages
21-34 in P. Liamputtong, editor. Doing cross-cultural research: ethical and
methodological perspectives. Springer Science and Business Media, B.V., New York,
USA.
Henry, G. T. 1998. Practical sampling. Pages 101-126 in L. Bickman and D. J. Rog, editors.
Handbook of applied social research methods. Sage, Thousand Oaks, California, USA.
Heywood, V. H. 1995. Global biodiversity assessment. Cambridge University Press, Cambridge,
United Kingdom.
Higginbottom, K., and A. Tribe. 2004. Contributions of wildlife tourism to conservation. Pages
99-118 in K. Higginbottom, editor. Wildlife tourism: impacts, management, and
planning. Common Ground Publishing Pty Ltd., Altona, Victoria, Australia.
Higginbottom, K., K. Rann, G. Moscardo, D. Davis, and S. Muloin. 2001. Status assessment of
wildlife tourism in Australia: an overview. Wildlife Tourism Research Report Series,
Cooperative Research Centre for Sustainable Tourism, Gold Coast MC, Queensland,
Australia.
Hill, B., T. Arthurson, and L. Chalip. 2000. Kangaroos in the marketing of Australia: potentials
and practice. Wildlife Tourism Report Series No. 19. Cooperative Research Centre for
Sustainable Tourism Gold Coast MC, Queensland, Australia.
Holmes, C. M. 2003. The influence of protected area outreach on conservation attitudes and
resource use patterns: a case study from western Tanzania. Oryx 37:305-315.

284
Home, R., C. Keller, P. Nagel, N. Bauer, N. Hunziker. 2009. Selection criteria for flagship
species by conservation organizations. Environmental Conservation 36:139-148.
Hosmer, D. W., and S. Lemeshow. 2000. Applied logistic regression. Second edition. John Wiley
& Sons. New York, New York, USA.
Ikeda, H., M. Izawa, M. Baba, M. Takeishi, T. Doi, and Y. Ono. 1983. Range size and activity
patterns of three nocturnal carnivores in Ethiopia by radio-telemetry. Journal of Ethology
1:109-111.
Irvine, F., G. Roberts, and C. Bradbury-Jones. 2008. The researcher as insider versus the
researcher as outsider: enhancing rigour through language and cultural sensitivity. Pages
35-48 in P. Liamputtong, editor. Doing cross-cultural research: ethical and
methodological perspectives. Springer Science and Business Media, B.V., New York,
USA.
IUCN. 1990. Biodiversity in sub-Saharan Africa and its islands: conservation, management and
sustainable use. Occasional papers of the IUCN Species Survival Commission No. 6,
Gland, Switzerland. <www.iucn.org/dbtw-wpd/edocs/SSC-OP-006.pdf>. Accessed
January 30, 2011.
IUCN and UNEP-WCMC. 2011. The World Database on Protected Areas (WDPA): January
2011. Cambridge, UK: UNEP-WCMC.
IUCN OSG. 2004. Results and recommendations of the IXth International Otter Colloquium,
Frostburg, Maryland, USA. < http://www.iucnosg.org/Library/Colloquium_XI_
Recommendations.html>. Accessed August 8, 2011.
IUCN SSC Antelope Specialist Group 2008. Tragelaphus spekii. In: IUCN 2011. IUCN Red List
of Threatened Species. Version 2011.1. Accesssed June 19, 2011. www.iucnredlist.org>.
Jacobson, S. K., and S. M. Padua. 1995. A systems model for conservation education in parks:
examples from Malaysia and Brazil. Pages 3-15 in S. K. Jacobson, editor. Conserving
wildlife: international education and communication approaches. Columbia University
Press, New York, New York, USA.
Jacoby, K. 2003. Crimes against nature: squatters, poachers, thieves, and the hidden history of
American conservation. University of California Press, London, England.
Jann, B. 2005. Making regression tables from stored estimates. The Stata Journal 5: 288-308.
Jann, B. 2007. Making regression tables simplified. The Stata Journal 7: 227-244.
Jennings, M. K., L. Stokers, and J. Bowers. 2009. Politics across generations: family transmission
reexamined. The Journal of Politics 71:782-799.
Johnson, B. T., G. R. Maio, and A. Smith-McLallen. 2005. Communication and attitude change:
causes, processes, and effects. Pages 617-669 in D. Albarracín, B. T. Johnson, and M. P.
Zanna, editors. The handbook of attitudes. Lawrence Erlbaum Associates, Mahwah, New
Jersey, USA.

285
Johnson, T. P., and F. J. R. Van de Vijver. 2003. Social desirability in cross-cultural research.
Pages 195-204 in J. A. Harkness, F. J. R. Van de Vijver, and P. P. Mohler, editors. Cross-
cultural survey methods. John Wiley & Sons, Inc., Hoboken, New Jersey, USA.
Jones, S. 2006. A political ecology of wildlife conservation in Africa. Review of African Political
Economy 33(109):483-495.
Jonker, S. A., R. M. Muth, J. F. Organ, R. R. Zwick, and W. F. Siemer. 2006. Experience with
beaver damage and Massachusetts residents toward beaver. Wildlife Society Bulletin 34:
1009-1021.
Kaczensky, P., M. Blazic, and H. Gossow. 2004. Public attitudes toward brown bears (Ursus
arctos) in Slovenia. Biological Conservation 118:661-674.
Kafarowski, J. 2003. How attitudes and values shape access to National Parks. The George
Wright Forum 20(4):53-63.
Kaltenborn, B. P., J. W. Nayahongo, and M. Mayengo. 2003. People and wildlife interactions
around Serengeti National Park, Tanzania. Project Report 22. Norwegian Institute for
Nature Research, Trondheim, Sweden.
Kaltenborn, B. P., T. Bjerke, J. W. Nyahongo, and D. R. Williams. 2006a. Animal preferences
and acceptability of management actions around Serengeti National Park, Tanzania.
Biodiversity and Conservation 15:4633-4649.
Kaltenborn, B. P., T. Bjerke, and J. Nyahongo. 2006b. Living with problem animals—self-
reported fear of potentially dangerous species in the Serengeti Region, Tanzania. Human
Dimensions of Wildlife 11:397-409.
Kassenga, G. R. 1997. A descriptive assessment of the wetlands of the Lake Victoria basin in
Tanzania. Resources, Conservation and Recycling 20:127-141.
Kassilly, F. N. 2003. Toward promotion of local tourism: the case of Lake Nakuru National Park
in Kenya. African Journal of Ecology 41:187-189.
Kassilly, F. N. 2006. Region and gender influence on wildlife knowledge among Kenyan youth.
Human Dimensions of Wildlife 11:297-298.
Kellert, S. R. 1985a. Public perceptions of predators, particularly the wolf and coyote. Biological
Conservation 31:167-189.
Kellert, S. R. 1985b. Attitudes toward animals: age-related development among children. Journal
of Environmental Education 16(3):29-35.
Kellert, S. R. 1994. Public attitudes toward bears and their conservation. International Conference
on Bear Research and Management 9:43-50.
Kellert, S. R., and M.O. Westervelt. 1983. Children‘s attitudes, knowledge and behaviors toward
animals. Phase V of the U.S. Fish and Wildlife Study, Washington, D.C., USA.
Kellert, S. R., and J. K. Berry. 1987. Attitudes, knowledge, and behaviors toward wildlife as
affected by gender. Wildlife Society Bulletin 15:363-371.

286
Kerley, G. I. H., B. G. S. Geach, and C. Vial. 2003. Jumbos or bust: do tourists‘ perceptions lead
to an under-appreciation of biodiversity? South African Journal of Wildlife Research
33:13-21.
Kingdon, J. 2004. The Kingdon pocket guide to African mammals. Russel Friedman Books,
South Africa.
Kiwango, Y. A., and E. Wolanski. 2008. Papyrus wetlands, nutrients balance, fisheries collapse,
food security, and Lake Victoria level decline in 2000–2006. Wetlands Ecology and
Management 16:89-96.
Kiwango, Y. A., H. R. Mwamjengwa, and S. R. Ndaga. In prep. Draft report on ethnoecology
study. Rubondo Island National Park, Geita, Mwanza, Tanzania.
Kriwoken, L., S. Lennox, and C. Ellis. 2002. Tasmanian wildlife tourism inventory: developing
an inventory of wildlife viewing opportunities. Wildlife Tourism Report Series No. 26.
Cooperative Research Centre for Sustainable Tourism, Gold Coast MC, Queensland,
Australia.
Kruuk, H. 2006. Otters: ecology, behavior, and conservation. Oxford University Press, New
York, USA.
Kruuk, H., and P. C. Goudswaard. 1990. Effects of changes in fish populations in Lake Victoria
on the food of otters (Lutra maculicollis Schinz and Aonyx capensis Lichtenstein).
African Journal of Ecology 28:322-329.
Kweka, J., O. Morrissey, and A. Blake. 2003. The economic potential of tourism in Tanzania.
Journal of International Development 15:335-351.
Leader-Williams, N., and H. T. Dublin. 2000. Charismatic megafauna as ‗flagship species.‘ Pages
53-81 in A. Entwistle and N. Dunstone, editors. Priorities for the conservation of
mammalian diversity: has the panda had its day? Cambridge University Press,
Cambridge, United Kingdom.
Leeming, F. C., and W. O. Dwyer. 1995. Children‘s environmental attitude and knowledge scale:
Construction and validation. Journal of Environmental Education 26(3): 22-32.
Lejeune, A. 1989. Les loutres, Lutra (Hydrictis) maculicollis Lichtenstein, et la pêche artisanale.
Journal of African Ecology 103:215-223.
Lensink, R. 1998. Temporal and spatial expansion of the Egyptian goose Alopochen aegyptiacus
in the Netherlands. Journal of Biogeography 25:251-263.
Leuschner, W. A., V. P. Ritchie, and D. F. Stauffer. 1989. Opinions on wildlife: responses of
resource managers and wildlife users in the Southeastern United States. Wildlife Society
Bulletin 17:24-29.
Liamputtong, P. 2008a. Doing research in a cross-cultural context: methodological and ethical
issues. Pages 3-18 in P. Liamputtong, editor. Doing cross-cultural research: ethical and
methodological perspectives. Springer Science and Business Media, B.V., New York,
USA.

287
Liamputtong, P. 2008b. Doing cross-cultural research: ethical and methodological perspectives.
Springer Science and Business Media, B.V., New York, USA.
Lilieholm, R. J., and L. R. Romney. 2002. Tourism, national parks, and wildlife. Pages 137-151
in R.W. Butler and S.W. Boyd, editors. Tourism and national parks: issues and
implications. John Wiley & Sons, Ltd., West Sussex, England.
Lindberg, K., and J. Enriquez. 1994. An analysis of ecotourism‘s economic contribution to
conservation and development in Belize. Volume 2. World Wildlife Fund, Washington,
D.C., USA.
Lindsey, P. A., R. Alexander., M. G. L. Mills., S. Romanach, and R. Woodroffe. 2007. Wildlife
viewing preferences of visitors to protected areas in South Africa: implications for the
role of ecotourism in conservation. Journal of Ecotourism 6:19-33.
Long, J. S. 1997. Regression models for categorical and limited dependent variables. Sage,
Thousand Oaks, California, USA.
Long, J. S., and J. Freese. 2006. Regression models for categorical dependent variables using
Stata. Second Edition. State Press. College Station, Texas, USA
Lorimer, J. 2007. Nonhuman charisma. Environment and Planning D: Society and Space. 25:911-
932.
Lovelock, C. H., R. Stiff, D. Cullwick, and I. M. Kauffman. 1976. An evaluation of the
effectiveness of drop-off questionnaire delivery. Journal of Marketing Research 13: 358-
364.
Ludwig, G. X., V. Hokka, R. Sulkava, and H. Ylönen. 2002: Otter Lutra lutra predation on
farmed and free-living salmonids in boreal freshwater habitats. Wildlife Biology 8:193-
199.
Lück, M. 2003. Education on marine mammal tours as agent for conservation—but do tourists
want to be educated? Ocean & Coastal Management 46:943-956.
Luilo, G. B. 2008. Lake Victoria water resources management challenges and prospects: a need
for equitable and sustainable institutional and regulatory frameworks. African Journal of
Aquatic Science 33:105-113.
Luvanga, N., and J. Shitundu. 2003. The role of tourism in poverty alleviation in Tanzania.
Research Report No. 03.4. Research on Poverty Alleviation, Dar es Salaam, Tanzania.
LVFO (Lake Victoria Fisheries Organization). 2005. The state of the fisheries resources of Lake
Victoria and their management. Proceedings of the Regional Stakeholders Conference,
February 24-25, 2005. Entebbe, Uganda. LVFO, Jinja, Uganda.
LVFO (Lake Victoria Fisheries Organization). 2006a. Managing the fishery of Africa‘s largest
lake. The Mputa 5(1):1-2.
LVFO (Lake Victoria Fisheries Organization). 2006b. Fish stocks health but under increasing
pressure, studies show. The Mputa 5(1):4.

288
LVFO (Lake Victoria Fisheries Organization). 2006c. Fishing communities now partners in
managing Lake Victoria. The Mputa 5(1):5.
LVFO (Lake Victoria Fisheries Organization). 2006d. Partner states tackle declining Lake
Victoria water level as it is likely to affect fish production. The Mputa 5(1):9.
LVFO (Lake Victoria Fisheries Organization). 2006e. LVFO working with fish community to
fish poverty. The Mputa 5(1):10.
LVFO (Lake Victoria Fisheries Organization). 2006f. Fish farmers can cash in by supplying bait
for hook fishery. The Mputa 5(1):13.
Magubira, P. 2008. Dwindling fish stocks alarm JK. The Citizen. May 14, 2008. Accessed
October 10, 2008. <www.thecitizen.co.tz/newe.php?id=5201>
Manfredo, M. J. 2008. Who cares about wildlife? Springer, New York, New York, USA.
Manfredo, M. J., and A. A. Dayer. 2004. Concepts for exploring the social aspects of human-
wildlife conflict in a global context. Human Dimensions of Wildlife 9:317-328.
Matshanda, N. 2008. 7 November 2008: The ―scramble for fish‖ in Lake Victoria. ISS Today.
<http://www.issafrica.org/index.php?link_id=4056&slink_id=6853&link_type
=12&slink_type=12&tmpl_id=3>. Accessed October 15, 2009.
Mayer, E., and W. J. Bock. 2002. Classifications and other ordering systems. Journal of
Zoological Systematics and Evolutionary Research 40:169-194.
McShane, T.O., P. D. Hirsch, T. C. Trung, A. N. Songorwa, A. Kinzig, B Monteferri, D.
Mutekanga, H. Van Thang, J. L. Dammert, M. Pulgar-Vidal, M. Welch-Devine, J. P.
Brosius, P. Coppolillo, and S. O‘Connor. 2011. Hard choices: making trade-offs between
biodiversity conservation and human well-being. Biological Conservation 144:966-972.
Miller, T. R., Minteer, B. A., and Malan, L-C. 2011. The new conservation debate: the view from
practical ethics. Biological Conservation 144:948-957.
Ministry of Natural Resources and Tourism. 1999. National tourism policy. Dar Es Salaam,
Tanzania.
Ministry of Natural Resources and Tourism. 2007. Tanzania tourism statistical bulletin: 2006.
Dar es Salaam, Tanzania.
Mladenov, N., J. R. Gardner, N. E. Flores, J. E. Mbaiwa, G. Mmopelwa, and K. M. Strzepek.
2007. The value of wildlife-viewing tourism as an incentive for conservation of
biodiversity in the Okavango Delta, Botswana. Development South Africa 24:409-423.
Moorman, R.S. 2006. Benefits of local residents visiting La Selva Biological Station, Costa Rica.
Environmental Conservation 33:89-99.
Morgan, J. M., and J. H. Gramann. 1989. Predicting effectiveness of wildlife education programs:
a study of students‘ attitudes and knowledge toward snakes. Wildlife Society Bulletin
17:501-509.

289
Moscardo, G., and R. Saltzer. 2004. Understanding wildlife tourism markets. Pages 189-207 in K.
Higginbottom, editor. Wildlife tourism: impacts, management, and planning. Common
Ground Publishing Pty Ltd., Altona, Victoria, Australia.
Moscardo, G., B. Woods, and T. Greenwood. 2001. Understanding visitor perspectives on
wildlife tourism. Wildlife Tourism Report Series No. 2. Cooperative Research Centre for
Sustainable Tourism, Gold Coast MC, Queensland, Australia.
Mulisa, M. 2008. Lake Victoria dwindling fish stocks worrisome, says RC. Daily News, June 26,
2008. <http://dailynews.habarileo.tz/home/?id-5467>. Accessed October 10, 2008.
National Bureau of Statistics. 2002. Household budget survey: 2000/01. Ministry of Planning,
Economy and Empowerment, Dar es Salaam, Tanzania. July.
National Bureau of Statistics. 2007. Tanzania in figures 2006. Ministry of Planning, Economy
and Empowerment, Dar es Salaam, Tanzania. June.
National Park Service. 2001. National Park entrance fees to be waived over Veterans Day
weekend to inspire national unity, hope and healing. Press Release. October 4.
<https://home.nps.gov/news/release.htm?id=167>. Accessed November 19, 2010.
National Park Service. 2010. Free entrance days in the National Parks. < http://www.nps.gov/
findapark/feefreeparks.htm>. Accessed November 19, 2010.
Ndembwike, J. 2006. Tanzania: the land and its people. New Africa Press, Dar es Salaam,
Tanzania.
Nepal, S. K. 2002. Tourism, national parks and local communities. Pages 73-94 in R. W. Butler
and S. W. Boyd, editors. Tourism and national parks: issues and implications. John Wiley
and Sons, New York, New York, USA.
Neumann, R. P. 1992. Political ecology of wildlife conservation in the Mt. Meru area of
Northeast Tanzania. Land Degradation and Rehabilitation 3:85-98.
Newmark, W. D., N. L. Leonard, H. I. Sariko, and D. M. Gamassa. 1993. Conservation attitudes
of local people living adjacent to five protected areas in Tanzania. Biological
Conservation 63:177-183.
Newsome, D., R. Dowling, and S. Moore. 2005. Wildlife tourism. Channel View Publications,
Tonawanda, New York, USA.
Ng, D. 2010. National Parks across America will waive entrance fees on Veterans Day,
November 11. September 10. KCSG Television. < http://www.kcsg.com/view/full_story/
10221466/article-National-Parks-Across-America-Will-Waive-Entrance-Fees-on-
Veterans-Day--November-11->. Accessed November 19, 2010.
NPCA. 2011. Park visitation figures. National Parks Conservation Association. < http://www.
npca.org/parks/visitation.html>. Accessed August 26, 2011.
Odada, E. O., D. O. Olago, K. Kulindwa, M. Mtiba, and S. Wandiga. 2004. Mitigation of
environmental problems in Lake Victoria, East Africa: causal chain and policy option
analyses. Ambio 33(1-2):13-23

290
Ogwang, V., M. Medard, E. Kilosa, J. I. Nyeko, and A. Bakunda. 2005. Guidelines for beach
management units (BMUs) on Lake Victoria. Lake Victoria Fisheries Organization, Jinja,
Uganda.
Okello, M. M. 2005. A survey of tourist expectations and economic potential for a proposed
wildlife sanctuary in a Maasai group ranch near Amboseli, Kenya. Journal of Sustainable
Tourism 13:566-589.
Okello, M. M., and S. Yerian. 2009. Tourist satisfaction in relation to attractions and implications
for conservation in the protected areas of the Northern Circuit, Tanzania. Journal of
Sustainable Tourism 17:605-625.
Okello, M. M., S. G. Manka, and D. E. D‘Amour. 2008. The relative importance of large
mammal species for tourism in Amboseli National Park, Kenya. Tourism Management
29:751-760.
Packer, J. J., and J. D. S. Berks. 1999. An assessment of British farmers‘ and gamekeepers‘
experiences, attitudes and practices in relation to the European polecat Mustela putorius.
Mammal Review 29:75-92.
Palomares, F., and M. Delibes. 2000. Mongooses, civets and genets – carnivores in southern
latitudes. Pages 119-129 in N. C. Stenseth and S. Halle, editors. Activity patterns in small
mammals: an ecological approach, Springer-Verlag, Heidelberg, Germany.
Pearce, P. L. 2005. Tourist behaviour: themes and conceptual schemes. Channel View, Clevedon,
United Kingdom.
Pearson, T. G., editor. 1917. Birds of America. Garden City Publishing Company, Inc., Garden
City, New York, USA.
Petty, R. E., R. H. Unnava, and A. J. Strathman. 1992. Theories of attitude change. Pages 241-
268 in T. S. Robertson and H. H. Kassarjian, editors. Handbook of consumer behavior.
Prentice-Hall, Englewood Cliffs, New Jersey, USA.
Powell, R. A. 1993. The fisher: life history, ecology, and behavior. Second edition. University of
Minnesota Press. Minneapolis, USA.
Powell, R. A., S. W. Buskirk, and W. J. Zielinski. 2003. Fisher and marten (Martes pennanti
and Martes americana). Pages 635-649 in G. A. Feldhamer, B. C. Thompson, and J. A.
Chapman, editors. Wild mammals of North America: biology, management, and
conservation. The Johns Hopkins University Press, Baltimore, Maryland, USA.
Prescott-Allen, R., and C. Prescott-Allen. 1996. Assessing the impacts of uses of mammals: the
good, the bad and the neutral. Pages 45-61 in V. J. Taylor and N. Dunstone, editors. The
exploitation of mammal populations. Chapman and Hall, London, England.
Prideaux, B., and A. Coghland. 2006. Wildlife tourism in tropical North Queensland: an overview
of visitor preferences for wildlife experiences. Tourism Research Report 3. James Cook
University, Cairns, Queensland, Australia.

291
Prokop, P., and S. D. Tunnicliffe. 2008. ―Disgusting‖ animals: primary school children‘s attitudes
and myths of bats and spiders. Eurasia Journal of Mathematics, Science & Technology
Education 4:87-97.
Reisinger, Y. 2009. Cross-cultural differences in tourist behavior. Pages 237-256 in M. Kozak
and A. Decrop, editors. Handbook of tourist behavior: theory and practice. Routledge,
New York, New York, USA.
Reynolds, P. C., and D. Braithwaite. 2001. Towards a conceptual framework for wildlife tourism.
Tourism Management 22:31-40.
Richard, O. 2006. Managing the fishery of Africa‘s largest lake. The Mputa 5(1):2.
Rodger, K., S. A. Moore, and D. Newsome. 2007. Wildlife tours in Australia: characteristics, the
place of science and sustainable futures. Journal of Sustainable Tourism 15 (2):160-179.
Roque de Pinho, J. 2009. ―Staying together‖: people-wildlife relationships in a pastoral society in
transition, Amboseli Ecosystem, Southern Kenya. Dissertation (Vol. 2), Colorado State
University, Fort Collins, USA.
Røskraft, E., B. Händel, T. Bjerke, and B. Kaltenborn. 2007. Human attitudes towards large
carnivores in Norway. Wildlife Biology 13:172-185.
RWG-Monitoring, Control and Surveillance. 2005. Strategy and action plan for monitoring,
control and surveillance of Fisheries on Lake Victoria. EDF Project No. 8 ACP ROR
029. Lake Victoria Fisheries Organization, Jinja, Uganda.
Şahin, H., and S. Erkal. 2010. The attitudes of middle school students toward the environment.
Social Behavior and Personality 38:1061-1072.
Saj, T. L., P. Sicotte, and J. D. Paterson. 2003. The conflict between vervet monkeys and farmers
at the forest edge in Entebbe, Uganda. African Journal of Ecology 39:195-199.
Saltzer, R. 2002. Understanding visitor wildlife interactions: Kangaroo Island. Data summary
report, August. Cooperative Research Centre for Sustainable Tourism, Gold Coast MC,
Queensland, Australia.
Saltzer, R. 2003a. Understanding visitor-wildlife interactions: a case study of penguin tourism at
Kingscote, Kangaroo Island, South Australia. Data summary report, January. Cooperative
Research Centre for Sustainable Tourism, Gold Coast MC, Queensland, Australia.
Saltzer, R. 2003b. Understanding visitor-wildlife interactions: a case study of the Royal Albatross
Centre, Otago Peninsula, New Zealand. Data summary report, March. Cooperative
Research Centre for Sustainable Tourism, Gold Coast MC, Queensland, Australia.
Saltzer, R. 2003c. Understanding visitor-wildlife interactions: a case study of Monarch Wildlife
Cruises, Otago Peninsula, New Zealand. Data summary report, March. Cooperative
Research Centre for Sustainable Tourism, Gold Coast MC, Queensland, Australia.
Saltzer, R. 2003d. Understanding visitor-wildlife interactions: a case study of The Penguin Place,
Otago Peninsula, New Zealand. Data summary report, March. Cooperative Research
Centre for Sustainable Tourism, Gold Coast MC, Queensland, Australia.

292
Sarker, S., and M. Montoya. 2011. Beyond parks and reserves: the ethics and politics of
conservation with a case study from Perú. Biological Conservation 144:979-988.
Schwarz, N. 2003. Culture-sensitive context effects: a challenge for cross-cultural surveys. Pages
93-100 in J. A. Harkness, F. J. R. Van de Vijver, and P. P. Mohler, editors. Cross-cultural
survey methods. John Wiley & Sons, Inc., Hoboken, New Jersey, USA.
Schwarz, Z., and L. Lin. 2006. The impact of fees on visitation of national parks. Tourism
Management 27:1386-1396.
Sheail, J. 2010. Nature‘s spectacle: the world‘s first national parks and protected places.
Earthscan, Washington, D.C., USA.
Shibia, M. G. 2010. Determinants of attitudes and perceptions on resource use and management
of Marsabit National Reserve, Kenya. Journal of Human Ecology 30:55-62.
Shoko, A. P. A., R. R. Ngowo, and R. K. Waya. 2005. Deleterious effects of non-native fish
introduced into Lake Victoria, East Africa. NAGA 28(3&4):27-32.
Simberloff, D. 1998. Flagships, umbrellas, and keystones: is single-species management passé in
the landscape era? Biological Conservation 83:247-257.
Sinclair, I., and P. Ryan. 2003. Birds of Africa south of the Sahara. Princeton University Press,
Princeton, New Jersey, USA.
Sindiga, I. 1996. Domestic tourism in Kenya. Annals of Tourism Research 23:19-31.
Skjåk, K. K., and J. Harkness. 2003. Data collection methods. Pages 179-193 in J. A. Harkness,
F. J. R. Van de Vijver, and P. P. Mohler, editors. Cross-cultural survey methods. John
Wiley & Sons, Inc., Hoboken, New Jersey, USA.
Skogen, K. 1999. Another look at culture and nature: how culture patterns influence
environmental orientation among Norwegian youth. Acta Sociologica 42:223-239
Smith, A. M., and S. G. Sutton. 2008. The role of flagship species in the formation of
conservation intentions. Human Dimensions of Wildlife 13:127-140.
Smith, A., D. Newsome, D. Lee, and N. Stoeckl. 2006. The role of wildlife icons as major tourist
attractions. Case studies: Monkey Mia dolphins and Hervey Bay whale watching.
Technical report. Cooperative Research Centre for Sustainable Tourism, Gold Coast MC,
Queensland, Australia.
Smith, K., M. Scarr, and C. Scarpaci. 2009. Does grey nurse shark (Carcharias taurus) diving
tourism promote biocentric values within participants? Journal and Proceedings of the
Royal Society of New South Wales 142:31-44.
Snoxall, R. A., and H. B. Mshindo. 2002. A concise English Swahili dictionary. Oxford
University Press, Dar Es Salaam, Tanzania.
Spawls, S., K. M., Howell, and R. C. Drews. 2006. Reptiles and amphibians of East Africa.
Princeton University Press, Princeton, New Jersey, USA.

293
Stern, M. J. 2004. Understanding local reactions to protected areas. Pages 40-45 in D. Hamú, E.
Auchincloss, and W. Goldstein, editors. Communicating protected areas. Commission on
Education and Communication, IUCN, Gland, Switzerland.
Stern, M. J. 2008. The power of trust: toward a theory of local opposition to neighboring
protected areas. Society and Natural Resources 21:859-875.
Stevens, S. S., T. L. Serfass, and J. F. Organ. 2007. Pages 488-504 in J. D. Keyyu and V.
Kakengi, editors. Proceedings of the Sixth Tanzania Wildlife Research Institute Scientific
Conference. 3-6 December, 2007, Arusha, Tanzania.
Stoner, C., T. Caro, S. Mduma, C. Mlingwa, G. Sabuni, and Borner, M. 2009. Assessment of
effectiveness of protection strategies in Tanzania based on a decade of survey data for
large herbivores. Conservation Biology 21:635-646.
Stover, R. V., and W. J. Stone. 1974. Hand delivery of self-administered questionnaires. The
Public Opinion Quarterly 38:284-287.
Sutherland, W. J., and G. Allport. 1991. The distribution and ecology of naturalized Egyptian
geese Alopochen aegyptiacus in Britain. Bird Study 38:128-134.
TANAPA. 2007. Tanzania National Parks: tariffs. Tanzania National Parks, Arusha, Tanzania.
July. <http://www.tanzaniaparks.com/parkfees/Tariffs_8%20.pdf>. Accessed October 21,
2009.
TANAPA. 2008a. Tanzania National Parks. Dodoma Road, Arusha, Tanzania.
TANAPA. 2008b. Corporate plan (2008/2009-2012/2013): optimization of TANAPA potential.
Arusha, Tanzania.
TANAPA. 2011a. Tanzania National Parks corporate information: community conservation
service. <http://www.tanzaniaparks.com/corporate_information.html>. Accessed August
5, 2011.
TANAPA. 2011b. Tanzania National Parks homepage. < http://www.tanzaniaparks.com/>.
Accessed June 28, 2011.
TANAPA. 2011c. Tanzania National Parks: tariffs. Tanzania National Parks, Arusha, Tanzania.
May. < http://www.tanzaniaparks.com/parkfees/Tariffs-Amended-2011-05.pdf>.
June 28, 2011.
Tanzania Ministry of Natural Resources and Tourism. 2007. Tanzania tourism statistical bulletin
2006. Dar es Salaam, Tanzania.
Tanzania Tourist Board. 2009. Tanzania domestic tourism gets a new twist. <http://www.tanzania
touristboard.go.tz/pages/ttb_domestictourism.php>. Accessed January 28, 2011.
Tanzania Tourist Board. 2011. The Northern Circuit. <http://tanzaniatouristboard.com/
places_to_go/safari_circuits>. Accessed July 11, 2011.
Terborgh, J., and C. Van Schaik. 2002. Why the world needs parks. Pages 3-14 in J. Terborgh, C.
Van Schaik, L. Davenport, and M. Rao, editors. Making parks work: strategies for
preserving tropical nature. Island Press, Washington, D.C., USA.

294
Thirgood, S., R. Woodroffe, and A. Rabinowitz. 2005. The impact of human-wildlife conflict on
human lives and livelihoods. Pages13-26 in R. Woodroffe, S. Thirgood, and A.
Rabinowitz, editors. People and wildlife: conflict or coexistence. Cambridge University
Press, London, England.
Tisdell, C. and C. Wilson. 2004. Economics, wildlife tourism and conservation: three case
studies. Technical Report. Cooperative Research Centre for Sustainable Tourism, Gold
Coast MC, Queensland, Australia.
Tisdell, C., and C. Wilson. 2005. Perceived impacts of ecotourism on environmental learning and
conservation: turtle watching as a case study. Environment, Development, and
Sustainability 7:291-302.
Tisdell, C., C. Wilson, and H. S. Nantha. 2006. Public choice for species for the ‗ark‘:
phylogenetic similarity and preferred wildlife species for survival. Journal for Nature
Conservation 14:97-105.
Tomažič, I. 2008. The influence of direct experience on students‘ attitudes to, and knowledge
about amphibians. Acta Biologica Slovenica 51:39-49.
Toroka, E. 2011. Tourism board goes for massive domestic tourism promotion. Business Times.
January 14. <http://www.businesstimes.co.tz/index.php?option=com_content&view=
article&id=659:tourism-board-goes-for-massive-domestic-tourism-promotion
&catid=1:latest-news&Itemid=57>. Accessed January 28, 2011.
Tremblay, P. 2002. Tourism wildlife icons: attractions or marketing symbols? Journal of
Hospitality and Tourism Management 9:164-180.
Triandis, H. C., and R. W. Brislin. 1984. Cross-cultural psychology. American Psychologist
39:1006-1016.
U.S. Forest Service. 1984. ―Remember only you…‖ United States Department of Agriculture
Forest Service Report FS-390, Washington, D.C., USA.
UCLA. Undated. FAQ: What are pseudo R-squareds? Academic Technology Services, Statistical
Consulting Group. <http://www.ats.ucla.edu/stat/mult_pkg/
faq/general/Psuedo_RSquareds.htm>. Accessed October 14, 2010.
Valentine, P., and A. Birtles. 2004. Wildlife watching. Pages 15-34 in K. Higginbottom, editor.
Wildlife Tourism: Impacts, Management, and Planning. Common Ground Publishing Pty
Ltd., Altona, Victoria, Australia.
Vaske, J. J. 2008. Survey research and analysis: applications in parks, recreation, and human
dimensions. Venture Publishing, State College, Pennsylvania, USA.
Vaughan, C., J. Gack, H. Solorazano, and R. Ray. 2003. The effect of environmental education
on schoolchildren, their parents, and community members: a study of intergenerational
and intercommunity learning. Journal of Environmental Education 34(3):12-21.

295
Veall, M. R., and K. F. Zimmermann. 1996. Pseudo-R2 measures for some common limited
dependent variable models. Paper 18, Collaborative Research Center 386, Department of
Statistics, Ludwig-Maximilians-University Munich. <http://epub.ub.uni-
muenchen.de/1421/>. Accessed January 28, 2011.
Veríssimo, D., I. Fraser, J. Groombridge, R. Bristol, and D. C. MacMillan. 2009. Birds as tourism
flagship species: a case study of tropical islands. Animal Conservation 12:549-558.
Wade, D. J., B. C. Mwasaga, P. F. J. and Eagles. 2001. A history and market analysis of tourism
in Tanzania. Tourism Management 22: 93-101.
Walpole, M. J., and N. Leader-Williams. 2002. Tourism and flagship species in conservation.
Biodiversity and Conservation 11:543-547.
Walpole, M. J., and A. Thouless. 2005. Increasing the value of wildlife through non-consumptive
use? Deconstructing the myths of ecotourism and community-based tourism in the
tropics. Pages 122-139 in R. Woodroffe, S. Thirgood, and A. Rabinowitz, editors. People
and wildlife: conflict or coexistence. Cambridge University Press, London, England.
Westervelt, M. O., and L. G. Llewellyn. 1985. The beliefs and behaviors of fifth and sixth grade
students regarding non-domestic animals. United States Government Printing Office,
Washington, D.C., USA.
Woodside, A. G., R. MacDonald, and M. Burford. 2005. Holistic case-based modeling of
customers‘ thinking-doing destination choice. Pages 72-111 in R. March and A. G.
Woodside, editors. Tourism behavior: travelers‘ decisions and actions. CABI Publishing,
Cambridge, Massachusetts, USA.
World Bank. 1999. Tanzania social sector review: A World Bank country study. Washington,
DC, USA.
Yore, L. B., and S. Boyer. 1997. College students‘ attitudes towards living organisms: the
influence of experience and knowledge. The American Biology Teacher 59:558-563.
Zar, J.H. 1999. Biostatistical analysis. Fourth edition. Prentice-Hall, Upper Saddle River, New
Jersey, USA.
Zecha, S. 2010. Environmental knowledge, attitudes and actions of Bavarian (southern Germany)
and Asturian (northern Spain) adolescents. International Research in Geographic and
Environmental Education 19:227-240.
Zimmerman, D. A., D. A. Turner, and D. J. Pearson. 2005. Birds of Kenya and Northern
Tanzania. Christopher Helm, London, England.
Zinn, H. C., and X. S. Shen. 2007. Wildlife value orientations in China. Human Dimensions of
Wildlife 12:331-338.
Copyright © 2022 FDOKUMEN