
Final Study Report 28th May 2009 - Cineuropa
562
1 Contract Number: 30-CE-0153799/00-42 “Study on the application of measures concerning the promotion of the distribution and production of European works in audiovisual media services (i.e. including television programmes and non-linear services)” Final Study Report 28 th May 2009 Neither the European Commission nor any person acting on behalf of the European Commission is responsible for the use which might be made of the information contained in the following report. The views expressed are those of the authors. The report does not necessarily reflect the views of the European Commission, nor does the European Commission accept responsibility for the accuracy of the information contained herein.
-
Upload
khangminh22 -
Category
Documents
-
view
1 -
download
0
Transcript of Final Study Report 28th May 2009 - Cineuropa

1
Contract Number: 30-CE-0153799/00-42
“Study on the application of measures concerning the promotion of the distribution and production of European
works in audiovisual media services (i.e. including television programmes and non-linear services)”
Final Study Report
28th May 2009
Neither the European Commission nor any person acting on behalf of the European Commission is responsible for the use which might be made of the information contained in the following report. The views expressed are those of the authors. The report does not necessarily reflect the views of the European Commission, nor does the European Commission accept responsibility for the accuracy of the information contained herein.

This report was completed by the following people: Attentional: David Rolfe, David Graham, Farid El-Husseini Rambøll Management: Claus Adamsen, Helle Troelsgaard Pedersen Oliver & Ohlbaum Associates: Godfrey McFall, Theresa Vimmerslev, Sean McGuire Headway International: Arnaud Dupont, Marion Dupeyrat

1. Executive Summary / Résumé / Zusammenfassung.................- 7 - 1.1. English............................................................................- 7 - 1.2. Français ........................................................................ - 19 - 1.3. Deutsch ........................................................................ - 33 -
2. Project Overview ............................................................... - 47 - 2.1. Introduction................................................................... - 47 - 2.2. Modes of Implementation: Legal Report ............................ - 48 - 2.3. The European Supply Chain and Audiovisual Content Creation- 52 - 2.4. Linear data analysis........................................................ - 57 - 2.5. Views from Inside the Audiovisual Industry : Qualitative Research on Linear and Non-Linear Services............................................. - 59 - 2.6. Monitoring of Article 3i .................................................... - 64 -
3. Introduction...................................................................... - 69 - 3.1. The Remit ..................................................................... - 69 - 3.2. Sections of this Report .................................................... - 71 -
4. Modes of Implementation ................................................... - 73 - 4.1. Approach and Methodology.............................................. - 74 - 4.1.1. How Articles 4 and 5 are implemented ........................ - 74 - 4.1.2. On-demand audiovisual services and European Works .. - 75 -
5. How Articles 4 and 5 are Implemented................................. - 76 - 5.1. Transposition of Articles 4 and 5 ...................................... - 76 - 5.1.1. Total qualifying hours ............................................... - 76 - 5.1.2. Qualifying European hours (definition of European works)- 78 - 5.1.3. The ‘where practicable’ clause.................................... - 78 - 5.1.4. European works by independent producers.................. - 80 - 5.1.5. Independent productions – a percentage of turnover or programme hours?................................................................ - 84 -
5.2. Application of Articles 4 and 5.......................................... - 86 - 5.2.1. Monitoring and verification of channel outputs ............. - 86 - 5.2.2. Sanctions ................................................................ - 87 -
5.3. Stricter Measures Applied to Broadcasters ......................... - 89 - 5.3.1. Introduction ............................................................ - 89 - 5.3.2. Measures to increase the Quantity of Production .......... - 89 - 5.3.3. Measures to enhance the Quality of Productions........... - 92 - 5.3.4. Additional funding to Promote European and Independent Production ........................................................................... - 95 -
5.4. Implementation Modes.................................................... - 98 - 6. On-Demand Audiovisual Services and European Works ........ - 104 - 6.1. Introduction................................................................. - 104 - 6.2. Pre-Existing National Legislation..................................... - 104 - 6.2.1. Belgium (French Community) .................................. - 105 - 6.2.2. France .................................................................. - 106 -
6.3. Implementation of Directive 2007/65 and Pending National Legislation ............................................................................ - 108 -
7. The European TV Supply Chain and Audiovisual Content Creation.... ..................................................................................... - 111 - 7.1. Market Structure and the Supply Chain Framework .......... - 112 - 7.1.1. TV content creation and related rights trading............ - 113 - 7.1.2. Channel management ............................................. - 115 -

7.1.3. On-demand services ............................................... - 115 - 7.1.4. Distribution ........................................................... - 116 -
7.2. Current Market Structure and Flow of Funds Along the Supply Chain .................................................................................. - 117 - 7.2.1. Industry income..................................................... - 117 - 7.2.2. TV distribution and delivery ..................................... - 123 - 7.2.3. On-demand services ............................................... - 131 - 7.2.4. TV broadcasting market .......................................... - 138 - 7.2.5. TV programming .................................................... - 140 - 7.2.6. TV content creation ................................................ - 142 - 7.2.7. Terms of trade ....................................................... - 144 - 7.2.8. Current flow of funds along the supply chain.............. - 145 - 7.2.9. Vertical integration along the value chain .................. - 147 - 7.2.10. Trade................................................................. - 148 -
8. Linear Data Analysis ........................................................ - 150 - 8.1. Methodology................................................................ - 150 - 8.1.1. Overall objective and approach ................................ - 150 - 8.1.2. Country selection ................................................... - 151 - 8.1.3. Channel selection ................................................... - 151 - 8.1.4. Week selection....................................................... - 156 -
8.2. Classification of programmes ......................................... - 157 - 8.2.1. Origin and contents of primary linear data................. - 157 - 8.2.2. Overall approach to further coding of linear data ........ - 158 - 8.2.3. Determining ‘qualifying programmes’........................ - 159 - 8.2.4. Determining ‘European works’.................................. - 160 - 8.2.5. Determining ‘Independent productions’ ..................... - 163 - 8.2.6. Adequate proportion of ‘Recent works’ ...................... - 165 - 8.2.7. Peak-time definition................................................ - 165 - 8.2.8. Adding ‘viewing’ to ‘transmission’ hours .................... - 165 -
8.3. EU-wide Analysis.......................................................... - 167 - 8.3.1. Contents and objectives .......................................... - 167 - 8.3.2. Classification of Member States / broadcasters........... - 168 - 8.3.3. Qualifying hours..................................................... - 169 - 8.3.4. European works ..................................................... - 171 - 8.3.5. Non-domestic European works ................................. - 174 - 8.3.6. Independent European works................................... - 175 - 8.3.7. Recent independent European works ........................ - 177 - 8.3.8. Stock vs flow programmes ...................................... - 178 - 8.3.9. Analysis of specific regulatory situations.................... - 179 - 8.3.10. A note on the impact of operating within larger markets .... ......................................................................... - 182 -
8.4. Summary of Outputs by Member State ........................... - 184 - 8.4.1. Flemish Community of Belgium ................................ - 184 - 8.4.2. French Community of Belgium ................................. - 191 - 8.4.3. Estonia ................................................................. - 199 - 8.4.4. France .................................................................. - 208 - 8.4.5. Germany............................................................... - 219 - 8.4.6. Ireland.................................................................. - 230 - 8.4.7. Italy ..................................................................... - 238 - 8.4.8. Poland .................................................................. - 247 - 8.4.9. Romania ............................................................... - 257 - 8.4.10. Spain................................................................. - 266 -
8.4.11. Sweden.............................................................. - 277 - 8.4.12. United Kingdom .................................................. - 286 -
9. Views from Inside the Audiovisual Industry......................... - 297 - 9.1. Interview Sample ......................................................... - 297 - 9.2. Building a European On-Demand Sample ........................ - 300 - 9.2.1. A ‘lighter’ regulation ............................................... - 300 - 9.2.2. Collecting on-demand data ...................................... - 301 -
9.3. Objectives of Qualitative Information Gathering ............... - 302 - 9.4. Determinants of Programme Spending Decisions.............. - 304 - 9.4.1. Overall programming spend and the balance between commissions and acquisitions ............................................... - 304 - 9.4.2. Commissioning new programmes ............................. - 307 - 9.4.3. Decisions about programme acquisitions ................... - 309 -
9.5. Financing of New Programmes ....................................... - 311 - 9.6. Co-Production between Member States and Intra-Community Trade in European Works........................................................ - 313 - 9.7. Terms of Trade ............................................................ - 314 - 9.8. The Balance of Trade in Programming............................. - 316 - 9.9. The Development of On-Demand Services ....................... - 318 - 9.9.1. Distribution and content of on-demand services ......... - 318 - 9.9.2. Sourcing of on-demand services’ content .................. - 322 - 9.9.3. Promoting European works through on-demand services- 327 - 9.9.4. Funding of on-demand services................................ - 328 - 9.9.5. Compensation mechanisms for producers.................. - 330 - 9.9.6. Influences on on-demand programme decisions ......... - 331 - 9.9.7. Importance of European programmes ....................... - 333 - 9.9.8. ‘Prominence’ on On-Demand Services Today: Results Based on Additional Desk Research ................................................ - 335 -
10. Monitoring of Article 3i ..................................................... - 340 - 10.1. Introduction.............................................................. - 340 - 10.1.1. Methodology for assessing procedures and indicators - 340 - 10.1.2. Awareness of Article 3i......................................... - 341 -
10.2. Operational Procedures .............................................. - 341 - 10.3. Performance Indicators .............................................. - 344 - 10.3.1. Six performance indicators ................................... - 344 - 10.3.2. What this section will show................................... - 345 - 10.3.3. Initial thoughts from respondents.......................... - 345 -
10.4. Evaluation of Specific Indicators .................................. - 347 - 10.4.1. Title-level data.................................................... - 347 - 10.4.2. Hour-level data ................................................... - 349 - 10.4.3. ‘Prominence’....................................................... - 350 - 10.4.4. Financial Contribution .......................................... - 352 - 10.4.5. Consumption data ............................................... - 354 -
10.5. Application of indicators to self-declarations from non-linear services ............................................................................... - 357 - 10.5.1. A note of confidentiality of data............................. - 358 - 10.5.2. Grouping the results from application of indicators .. - 358 - 10.5.3. Application of key indicators ................................. - 358 -
11. Key Findings ................................................................... - 366 - 11.1. Modes of Implementation ........................................... - 366 -

11.2. Market Overview ....................................................... - 369 - 11.3. EU-wide Analysis....................................................... - 375 - 11.4. Views from the Industry............................................. - 375 - 11.5. Non-Linear Services................................................... - 379 - 11.6. Procedures and Indicators for Monitoring Article 3i of the AVMS Directive ............................................................................... - 380 -
12. Conclusions/ Conclusions / Schlussfolgerungen ................... - 383 - 12.1. English..................................................................... - 383 - 12.2. Français ................................................................... - 386 - 12.3. Deutsch ................................................................... - 390 -
13. Appendix I: Genre Classifications ...................................... - 395 - 14. Appendix II: Questionnaire for regulatory authorities........... - 397 - 15. Appendix III: Broadcaster’s questionnaire .......................... - 411 - 16. Appendix IV: Producers’ questionnaire ............................... - 443 - 17. Appendix V: On-demand services’ questionnaire ................. - 469 - 18. Appendix VI: National Implementation of Articles 4 and 5; and Other National Language and Production Requirements................. - 486 - 19. Appendix VII: Application of Articles 4 and 5 – Scoring by Member State ..................................................................................... - 518 - 20. Appendix VIII: Additional Requirements on Broadcasters – Scoring by Member State...................................................................... - 521 - 21. Appendix IX: Comparing Estimates with Declarations........... - 524 -
21.1.1. Overview by country............................................ - 524 - 21.1.2. Overview by channel and over time ....................... - 528 - 21.1.3. Conclusions on differences ................................... - 533 -
22. Appendix X: Bibliography ................................................. - 534 - 23. Appendix XI: Comments from Stakeholders........................ - 535 - 23.1. Madigan Cluff............................................................ - 535 - 23.2. EBU......................................................................... - 537 - 23.3. European Audiovisual Observatory .............................. - 538 - 23.4. Swedish Broadcasting Commission .............................. - 551 - 23.5. Mediaset .................................................................. - 552 -
24. Appendix XII: Note on Definition of Independent Producer ... - 558 - 24.1. Definition of independent producer .............................. - 558 - 24.1.1. Economic vs. cultural objective ............................. - 558 - 24.1.2. Impact of methodological choice ........................... - 559 -
7
1. Executive Summary / Résumé / Zusammenfassung
1.1. English
Introduction
• On 11 December 2007, the European Parliament and Council
adopted Directive 2007/65/EC amending the “Television Without Frontiers Directive” (TVWF) and renaming it into the “Audiovisual Media Services Directive” (AVMS). The new Directive must be implemented by the Member States by 19 December 2009.
• The new Directive did not make any amendments to Articles 4 and 5 of TVWF. Articles 4 and 5 place requirements on Member States to ensure that broadcasters under their jurisdiction devote a majority of transmission time to European works and at least 10% of transmission time (or programme budget) to European independent productions.
• The new Directive includes non-linear audiovisual media services within the scope of the Directive. Its Article 3i places requirements on Member States to ensure that non-linear service providers under their jurisdiction promote the production of and access to European works.
• In order to provide the European Commission with the elements required to continue monitoring and evaluating Articles 4 and 5, and to commence monitoring Article 3i, the Commission requested this independent study to be carried out, covering the situation as regards promotion of European works on linear and non-linear services at the end of 2007.
• This study builds on the previous study on Articles 4 and 5 from 2005, completed by Attentional Limited (then known as David Graham and Associates), Oliver & Ohlbaum, Carat Expert and Arena Audiovisual.
• Core objectives of the study are: • Description and analysis of the implementing measures taken by Member States pursuant to Articles 3i, 4 and 5 of the Directive as of the end of 2007. • Description and analysis of the production industry and market for audiovisual works. • Independent evaluation of the application of Articles 4 and 5 to specific linear broadcast channels. • Review of non-linear audiovisual media services in Europe in 2007.

8
• Recommendations for operational procedures and performance indicators for monitoring the application of Article 3i to non-linear services.
The Final Study Report
• The Final Study Report contains work from all Parts of the study, covering all the study objectives.
• In November 2008 a workshop was held in Brussels where the Draft Final Report was presented to key stakeholders. Comments received at, and subsequent to, the workshop have been carefully considered in the preparation of the Final Study Report.
Modes of Implementation
• AIM: To identify and analyse national legal measures implementing
Articles 4 and 5 of the Directive, and stricter requirements placed on broadcasters, as well as already existing national legal measures regarding on-demand services adopted pursuant to Article 3i, or which may have a similar effect.
• METHODOLOGY: Questionnaires to national regulatory authorities, supplemented by telephone interviews to resolve unclear responses.
• SOME DIFFERENCES BETWEEN NATIONAL TRANSPOSITIONS OF ARTICLES 4 AND 5: A few Member States have adopted a definition of ‘total qualifying hours’ that is more restrictive than the Directive. Some Member States have incorporated the Directive’s qualifying term ‘where practicable’, or other specific measures allowing lower proportions of European works and independent productions to be achieved in certain exceptional situations.
• DEFINITIONS OF ‘INDEPENDENT PRODUCER’ VARY GREATLY BETWEEN MEMBER STATES: Most, but not all, Member States have defined the term in their legislation. These definitions consist of a combination of different elements, mostly based on the factors suggested by the Directive (ownership of production company, amount of programmes supplied to the same broadcaster, ownership of secondary rights), but some also contain other elements that concern the actual ability of the producer to conduct their business autonomously from a broadcaster. The thresholds set for each element also very significantly between Member States.
• TARGET FOR INDEPENDENT PRODUCTIONS IS USUALLY BASED ON TRANSMISSION TIME: Only a few examples were found where a specific proportion of programming budget must always be assigned to independent productions. France and Italy go further in their approach, since they require broadcasters to reserve a certain percentage of their entire annual turnover (which will always be higher than the programming budget).
• DIFFERENT APPROACHES FOR MONITORING AND SANCTIONING ADHERENCE TO ARTICLES 4 AND 5: Most Member States simply require broadcasters to submit statements of the achieved proportions of European works and independent
9
productions, but some Member State authorities do take additional steps to verify the submitted data or carry out independent monitoring of broadcasts. Some Member States have not established any sanctions for failure to achieve the required proportions, but authorities in most Member States have a range of sanctions at their disposal. Typically, sanctions may be warnings and fines, but in some Member States, it is possible to shorten or revoke broadcasting licences in the most serious cases.
• MOST MEMBER STATES APPLY SOME MEASURES STRICTER THAN ARTICLES 4 AND 5: Some Member States apply higher percentage requirements for European works or independent productions than those contained in the Directive (on some or all broadcasters). Almost all Member States place some form of additional content requirements on broadcasters to reflect linguistic or cultural specificities in a Member State. Several Member States require that a certain proportion of broadcasting time shall be allocated to programmes originally produced in a national language.
• PRIOR TO THE ADOPTION OF THE NEW ARTICLE 3i, VERY FEW MEMBER STATES HAD NATIONAL RULES WITH SIMILAR EFFECTS: The French Community of Belgium have adopted a “technology neutral” approach without any distinction between distribution platforms, and this was interpreted to mean that non-linear television services were subject to the same obligations as other television broadcasting services, including the obligations on European works and independent productions. France had placed a tax on Video-on-Demand (VOD) service providers, in order to secure a financial contribution to film production.
• IMPLEMENTATION OF ARTICLE 3i WILL MOSTLY TAKE PLACE IN 2009: The deadline for implementation is 19 December 2009. From our interviews with national regulatory bodies we discovered only a few Member States expected national implementation to be completed in 2008, with the majority of those interviewed expecting this to take place in 2009.
The European Supply Chain and Audiovisual Content Creation
• AIM: To provide an analysis and description of the current market
structure and revenue of the EU audiovisual (linear and non-linear) sector.
• METHODOLOGY: Combined a wide array of macro and micro data in order to create as accurate a picture as possible of the whole sector and its three main component parts – content creation, channel management and TV delivery.
• MARKET STRUCTURE AND THE SUPPLY CHAIN IS BECOMING INCREASINGLY COMPLEX: New distribution channels such as on-demand services, new funding models for content creation and increased levels of fragmentation in the traditional broadcasting market, have all altered the overall structure of the market.
• CONSUMER PAYMENTS HAVE DRIVEN GROWTH IN THE MARKET: Total TV industry revenue of €78.1 billion in 2006, of which licence fees accounted for 23%, advertising and associated

10
sponsorship for 36% and consumer payments to pay TV, cable relay and VoD services for 34%. The main source of growth in the E17 countries is in consumer payments, which have grown 10.1% year-on-year since 2002.
• MARKET STRUCTURE AND REVENUE DRIVERS VARY SIGNIFICANTLY BY MEMBER STATE: Contribution of advertising, public finance and subscription payments varies significantly by Member State.
• MARKET FOR CHANNELS HAS THREE DISTINCT TYPES: Free TV channels (available to all, both publicly and commercially funded), basic tier pay-TV channels (available to subscribers as part of a pay-TV subscription), and premium pay-TV channels (requiring an additional subscription fee).
• FREE TV REMAINS THE MOST POPULAR BUSINESS MODEL: Despite significant migration to pay-TV services, pay-TV homes still represent less than a third of all European TV homes. There has been a significant fall in the number of analogue homes as households move to DTT platforms. By the end of 2007, free DTT reached over 28 million homes.
• ON-DEMAND REPRESENTS A SMALL PROPORTION OF THE OVERALL INDUSTRY: The number of on-demand services available by market varies considerably (between 2 and 32). We estimate that in 2006 on-demand services generated approximately €400m of revenue in the E30, representing just 0.5% of TV industry revenues.
• THERE ARE THREE BASIC PROGRAMMING CHOICES FOR CHANNELS: Where to source programming (commissions vs. acquisitions vs. repeats); what genre to broadcast (drama, news, comedy, factual, stock vs. flow1); and what sub-genre to broadcast (e.g. a drama-soap-opera versus a one-off film).
• EUROPEAN CONTENT CREATION SECTOR VALUED AT €18.3BN: Of this, €16.5 billion came from commissions by network channels and €1.8 billion from commissions by smaller channels. Of this €18.3 billion, about €2.6 billion was spending on national and local news and sports coverage (spending on sports rights is excluded). Of the remaining €15.7 billion, an estimated 43% (€6.8bn) was spent on commissions from external producers and around 57% was invested in in-house production2.
• NETWORK CHANNELS3 ACCOUNT FOR THE MAJORITY OF ALL NEW COMMISSIONING: Main network channels account for about 57% of gross industry revenue but over 90% of spend on all new commissions.
1 A stock programme has repeat value and can be shown again at a later date, while flow programmes have little or no further value after the first showing (narrative repeats excluded). Examples of flow programming include news, sport, games, and some entertainment programming. 2 External production includes broadcaster affiliates such as UFA and Studio Hamburg in Germany, and Fremantle across RTL’s group of channels. 3 For this analysis, ‘network channels’ were defined as any channel with an average share of over 5% of its domestic audience.

11
• INDEPENDENT PRODUCTION COMPANY PROFITABILITY IS CYCLICAL: Margins are heavily influenced by successful commissioned programmes that in the long term (depending on terms of trade), can generate significant ancillary and overseas revenue for the producer. By contrast, a failed commission will adversely impact profit margins.
• CONSIDERABLE VERTICAL INTEGRATION ALONG THE VALUE CHAIN: Our analysis suggests that 57% of non-news programming is made by in-house departments within broadcasters. Similarly, a very high proportion of premium pay-TV channels are owned by pay-TV platform owners.
• ACQUISITIONS FROM USA REMAIN POPULAR: Almost all European broadcasters acquire popular US programming (both TV series and Hollywood movies). Recently there has been an increase in the number of imports from Asian nations, especially Japan and South Korea.
EU-Wide Analysis of Linear Data
• AIM: Produce a consistent measure of Articles 4 and 5 across
Member States, and apply this to a sample of broadcast (linear) channels in Europe.
• METHODOLOGY: A sample of 54 channels operating in 11 Member States was selected, designed to represent the diversity of the EU30 in terms of market size, geography and recency of EU membership, while also favouring the larger Member States in order to cover the largest possible share of the EU in terms of population and economic scale. Channels were selected to represent the diversity of European broadcasters in terms of audience size, ownership and revenue model, while also favouring leading channels in order to cover the largest possible share of European TV viewing4. Channels were monitored during two non-consecutive weeks of 2007, one in March, one in November.
A single approach has been used to codify all the programmes broadcast during this period and allow comparisons between channels across Member States in terms of the proportion of qualifying, European, non-domestic European, independent and recent independent works, including in peak-time. Data have been compared to past findings when available, and to national declarations when available.
4 The 11 Member States and 54 channels that form the sample are: Belgium (Flemish and French Communities: VRT, VTM, La Une, RTL-TVI), Estonia (ETV, Kanal2, TV3), France (France2, France3, TF1, M6, Canal+, Direct8), Germany (ARD1, ZDF, RTL, Sat.1, Pro7, Vox), Ireland (RTE1, RTE2, TV3), Italy (Rai1, Rai2, Canal5, Italia1, La7, Fox Life), Poland (TVP1, TVP2, TVN, Polsat, TV4, Canal+), Romania (TVR1, Pro TV, Prima TV, Antena1), Spain (TVE1, La2, Antena3, TeleCinco, Cuatro, La Sexta), Sweden (SVT1, Kanal5, TV3, TV4) and the United Kingdom (BBC1, BBC2, ITV1, Channel4, Five, Sky One).

12
For the first time, indicators have been produced and analysed not only as a proportion of transmission hours, but also as a proportion of viewer hours.
• QUALIFYING WORKS: Across our sample, qualifying programmes (to which Articles 4 and 5 apply) make up 68.3% of the total transmission hours and 65% of the total viewer hours on all channels studied in 2007.
• EUROPEAN WORKS: Across our sample, European works made up 62.4% of the total qualifying transmission hours in 2007. Most European broadcasters among those analysed met the 50% requirement of Article 4. European works also make up an average of 74% of the total viewer hours across all studied channels in 2007. The figures are even higher when looking at peak-time only. Channels with the highest proportions of European works are the leading, publicly funded5 channels from Southern, old and large European Member States.
• INDEPENDENT WORKS: Independent European works make up 31% of the total qualifying transmission hours in 2007, compared to 33.4% of total qualifying viewer hours. Proportions are higher in peak-time. Pay-TV typically shows significantly fewer independent productions than free-to-air channels. More independent productions can be found on private channels from Northern, old and large Member States. When we look specifically at the peak-time situation we see leading, private channels from small and old Member States offering significantly more independent productions.
• RECENT WORKS: Across our sample, recent independent European works make up an average of 84.4% of the total independent European hours in 2007, compared to 91.7% of total independent viewer hours.
• BROADCASTERS INDIVIDUAL SITUATIONS: Individual channels depend heavily on their local market environment and cultural dynamics. A complete analysis of each Member State is provided in this report.
Views from the Industry: Broadcasters and Producers
• AIM: To further our understanding, based on views from
stakeholders, of the implications of Articles 4 and 5. • METHODOLOGY: We issued tailored questionnaires to over 230
key stakeholders6 in the European audiovisual industry and received 71 responses representing 24 Member States.
5 ‘Publicly-funded’ includes mixed funded broadcasters, where some funding is public. 6 Stakeholders included broadcasters (publicly – including mixed funded broadcasters - and commercially funded), independent producers, trade bodies, regulators and pure VoD players (Pure VoD player: a provider of a VoD service not linked to a service run by traditional linear broadcasters offering catch-up (and sometimes broadcaster-specific library content), generally operated by cable companies, telecommunications companies, film industries or independent internet players).

13
• AMOUNT OF COMMISSIONING IS RELATED TO BROADCASTER’S REVENUE STRUCTURE: Commercial broadcasters tend to allocate a relatively higher proportion of their programme budget (51%) to acquired programmes, and a significantly lower proportion (18%) to in-house production. Contrastingly, publicly funded broadcasters tend to invest heavily in in-house production (58%) and spend less on acquisitions (16%).
• MAJORITY OF FORMAT COMMISSIONING IS BY COMMERCIAL BROADCASTERS: An average of 10% of commercial broadcasters’ total programming budget is invested in commissioning formatted programming.7 For the publicly funded broadcasters, the level of investment on formats was typically between 0% and 3%.
• THERE HAS BEEN A SHIFT TOWARDS MORE EXTERNAL COMMISSIONING: Over 70% of respondents (both commercial and publicly funded) stated that the proportion of external commissioning had increased over the last five years
• COMMISSIONING DECISIONS VARY BY GENRE: The vast majority of news programming is produced in-house, while cinema film and documentaries tend to be produced externally. Fiction, entertainment and factual magazine programming have a more balanced mix in terms of sourcing, with 20% to 50% produced in-house and 40% to 70% produced independently.
• ACQUISITIONS GENERALLY CHEAPER THAN COMMISSIONS: Across all genres, except sport and fiction, over 65% of broadcasters stated that acquired programming cost over 80% less than commissioned programming.
• US PRODUCED ACQUISITIONS REMAIN POPULAR: Just over half of the broadcaster’s acquisitions were sourced from the US and just under 25% from content owners in another European country. All broadcasters stated feature films and fiction from outside Europe (mainly from the US) were attractive and tended to be very successful in primetime schedules.
• PRIMARY BROADCASTER IS STILL THE MAIN SOURCE OF PROGRAMME FUNDING: Across all genres, over 85% of funding comes from the primary broadcaster, with between 1% and 7% from a secondary broadcaster or a co-producer8.
• OVER THREE QUARTERS OF RESPONDENTS ARE INVOLVED IN CO-PRODUCTIONS – MAJORITY ARE DOMESTIC OR INTRA EUROPE: Approximately 86% of broadcasters and 75% of independent producers co-produce programmes. Both producers and broadcasters identified domestic co-productions and co-productions with other European producers as the most commonplace.
7 A format is defined as any programme locally adapted for broadcast in at least one other market than the market of origin and for which a licensing fee is payable, e.g. Who Wants to Be a Millionaire, Betty la Fea. 8 The primary broadcaster is the main commissioner of the programme and will typically retain the first showing domestic rights, while the secondary broadcaster or co-producer may finance some of the production in order to retain other domestic and international rights.

14
• BROADCASTERS EXPECT TO RETAIN THE MAJORITY OF DOMESTIC RIGHTS: All broadcasters stated that they expect first (and repeat) showing domestic terrestrial and new media rights (including on-demand rights) when commissioning programmes externally, while around 81% stated that they expect repeat showings in the domestic secondary market and domestic ancillary rights.
• FICTION AND FEATURE FILMS IDENTIFIED AS SUCCESSFUL EUROPEAN EXPORTS AND IMPORTS: Fiction and feature films were assessed by broadcasters as being the most successful in the international market, while news and factual magazines were seen as inherently local and therefore unlikely to sell well abroad. Sport, documentaries, fiction and feature films were all rated highly as potential European imports, while news and factual magazines were given low ratings. Only entertainment and factual entertainment/reality formats were rated above 50% as potentially exportable.
View from the Industry: On-demand Services
• AIM: Explore the views of key stakeholders on the programming
strategies and offerings of on-demand services, as well as their views on content strategies and regulatory issues.
• METHODOLOGY: Questionnaires were designed to collect quantitative and qualitative data from 50 non-linear (on-demand) services (35 broadcasters and 15 pure VoD players). In addition, 29 non-linear services were analysed independently in order to investigate the concept of “prominence”.
• MAJORITY OF RESPONDENT ON-DEMAND SERVICES OFFERED VIA INTERNET OR IPTV: Almost all respondents, both broadcasters and pure VoD players, have content available via on-demand services distributed via the internet or IPTV. While broadcasters also use mobile (40%) and cable (32%), pure VoD players rely primarily on cable (25%) as their secondary distribution technology.
• GENRE OFFERING VARIES BETWEEN BROADCASTERS AND PURE VOD PLAYERS: Broadcasters generally offer a balanced mix of live, archive and, more recently, catch-up material on their VoD services, with a balanced mix of genres. Pure VoD players show a clear preference for archive material, with a focus on cinema, TV fiction and documentaries.
• IN GENERAL, EUROPEAN CONTENT IS KEY COMPONENT OF ON-DEMAND CATALOGUES: Among those interviewed for this survey, only 17% of pure VoD players and 12% of broadcasters said that their catalogues consisted of less than 25% European titles. Broadcasters typically have 100% European content, as they generally replicate their linear schedules in their on-demand services, minus the titles for which they do not own the on-demand rights. By contrast, 33% of pure VoD players said their catalogues comprise between 25% and 75% of European titles.
15
• PURE VOD PLAYERS DO NOT SPEND MONEY ON COMMISSIONS: Our respondent pure VoD players allocated 100% of their programme budget to acquisitions, with non-European imports representing almost half of the total. By contrast, on-demand services operated by broadcasters say they spend around 75% of their on-demand budgets on national commissions, although this figure is a proportion of a very limited budget.
• MAJORITY OF BROADCASTERS’ NON-LINEAR SERVICES ARE FREE-TO-USE FOR THE CONSUMER: Of the respondent broadcasters, 41% use advertising to fund all or part of their on-demand service. Public subsidy is used as the sole revenue stream by 23% of the broadcasters who responded. Conversely, the majority of the revenue of pure VoD players who took part in our survey comes only from direct payments from consumers either as subscription fees or as pay-per-view.
• EUROPEAN PROGRAMMING CONSIDERED IMPORTANT BY PROVIDERS: The majority of on-demand services surveyed, whether broadcaster-run or pure VoD players, think that European programming is all-in-all a very good option for their services. There are however some caveats: European programmes are seen as expensive, no easier to acquire than non-European content, and not necessarily the best way to attract European consumers.
• PROMINENCE: Prominence is a key concept in addressing how European works are being promoted by on-demand services. Prominence may be analysed in two dimensions: active prominence (does the service offer the possibility of searching titles by origin of production and does it provide information on the origin of production together with the description of the titles?); and passive prominence (what is the proportion of European works among the titles that are pushed to the consumers when they access the service via its homepage and browse its main sections?) As far as active prominence is concerned, our analysis shows that on-demand services rarely enable consumers to select titles by origin of production (nor by language). However, half the services from our sample indicate the country of origin in the description of the titles. When considering the origin of the titles that appeared “by default” on the screen (passive prominence), the proportion of titles of European origin that were ‘pushed’ by the 29 on-demand services from our sample was 54%, on average. There were, however, large differences between services.
Monitoring Methods for Article 3i
• AIM: To identify and evaluate possible performance indicators and
operational procedures for monitoring Article 3i. • METHODOLOGY: Various procedures and indicators were
researched and discussed. Questions designed to collect stakeholder views on the appropriateness of procedures and indicators, as well as to collect actual data based on all proposed indicators, were included in the survey of stakeholders.

16
• SELF-DECLARATIONS APPROPRIATE OPERATIONAL PROCEDURE FOR NON-LINEAR: At this time, self-declarations are the most appropriate operational procedure within which to collect data on the application of Article 3i. It proved possible to acquire data through self-declarations via the survey. We believe that the amount of data received will improve once requested via legislation.
• INDEPENDENT EVALUATION OF NON-LINEAR SERVICES NOT APPROPRIATE AT THIS TIME: Data equivalent to the robust Television Audience Measurement (TAM) data available for the independent evaluation of linear services is not currently available for non-linear services. Alternatives to TAM data, such as using ‘web-harvesting’ software to copy information from on-demand catalogues into databases, or having consultants do this manually, are inappropriate, for legal reasons in the first case, and time and cost considerations in the second case. However, we do not preclude the development of an agreed technology for harvesting appropriate data in future, once the legal concerns have been successfully addressed.
• CATALOGUE LEVEL INDICATORS MOST APPROPRIATE: All types of respondents ranked the proportion of catalogue titles as the most appropriate indicator (with the exception of producers, who favoured financial and consumption indicators). It provides a clear indication of the proportion of European content available on a non-linear service. Proportion of catalogue hours was also considered to be a good indicator by most respondents, addressing the concern that catalogues could be filled with short-form content to meet a title-level indicator alone. Applying these indicators to specific services, we found that the majority of services had over 80% European titles and hours, with many having 100%. Pure VoD players typically had a smaller proportion of European titles on their services than broadcaster-run services. Broadcaster-run services are often replicating their linear offering through their non-linear service, minus the programming that they do not own the on-demand rights for (typically non-European content). This is not the case for pure VoD players, offering a possible reason for the higher proportion of EU content on broadcaster-run services than services from pure VoD players.
• FINANCIAL CONTRIBUTION REQUIRES A CAREFUL APPROACH: This indicator split opinion, with producers favouring it and broadcasters and pure VoD players strongly opposing it. Such data is considered highly confidential, and as the figures being discussed at this time are relatively small, such data may tell us little at this time. However, data on financial contribution is explicitly mentioned as an option in the Directive, so we suggest a simple indicator at this time: Member State authorities could ask providers to supply an amount spent on content in a year, and a figure for the approximate proportion spent on European works.
• CONSUMPTION DATA NOT APPROPRIATE AT THIS TIME: With the exception of producers, consumption data was an unpopular indicator with respondents, largely because it is highly commercially sensitive, and is not requested of linear providers. Lack of a
17
comparable data source to TAM data, as is available for linear services, means that robust consumption data for independent verification or monitoring are currently very difficult to acquire. TAM-style data sources for non-linear may become available in future, when they may be used as an indicator.
• ‘PROMINENCE’ IS AN OPEN TERM WITH MANY POSSIBLE INDICATORS, AND SHOULD NOT BE APPLIED TOO STRICTLY AT THIS TIME: A wide variety of indicators, such as the ability to search by country-of-origin through to proportions of pages dedicated to European content, are possible ‘prominence’ indicators. There was a concern, from the survey and at the workshop, that being overly prescriptive could potentially limit the creative development of non-linear services. Comments at the workshop made clear that this subject would require further discussion within the Member States. At this time, we therefore propose relatively broad guidelines.
General Conclusions
• Transposition of Articles 4 and 5 varies from Member State to Member State by the strictness of the application of the legislation, and the number of additional requirements.
• The transposition of Articles 4 and 5 has remained largely similar in Member States covered in the 2005 Study.
• On-demand services and increased fragmentation are making the €78.1bn television industry in Europe more complex. But on-demand remains a relatively small component of this revenue, at €400m.
• For linear services, free TV remains the most popular business model. For broadcaster-run non-linear services this trend is continuing, with most offering some or all of their content for free. However, non-linear services not attached to broadcasters strongly favour business models based on consumer payments.
• Although there is some variation in the amount spent on acquisitions and commissions for linear broadcasters, the picture for their non-linear services is more consistent, with 75% of the budget for broadcaster-run non-linear services being spent on commissions. Broadcasters typically require the on-demand rights for commissioned content, but gaining new media rights for acquisitions is more difficult. The picture is different for pure VoD players though, who rely substantially on acquisitions.
• Broadcaster-run non-linear services typically have near or exactly 100% European content in their catalogues, whereas pure VoD players have a much greater reliance on non-European content. This is largely because of pure VoD player’s greater reliance on acquisitions to populate their services.
• In our analysis of linear services, we found that the majority of channels surveyed met the requirements of Articles 4 and 5. Across our sample, 62.4% of qualifying transmission hours were

18
European content and 31% were independent European works, of which 84.4% were less than five years old.
• In applying viewing figures as an indicator for the first time in this study, we found that proportions for viewer hours are consistently higher than the proportions for transmission hours for European content (62.4% of qualifying transmission hours are European across our entire sample, compared with 74% of viewer hours; 31% of qualifying transmission hours are European independent productions, compared with 33.4% of viewer hours). This indicates that European and independently produced content are popular with audiences in the Member States surveyed.
• We found that with a December 2009 deadline for implementation of the new Directive and a non-linear industry still at a nascent stage, few Member States have implemented Article 3i or defined measures to this effect, and much discussion on the application of Article 3i is still to take place during 2009. The workshop indicated that further discussions within Member States and with stakeholders are required.
• At this time, we believe that self-declarations are the most suitable operational procedure for acquiring data to monitor adherence to Article 3i. Independent evaluation will require data similar to that available for linear services (Television Audience Measurement data), which is not currently available for non-linear services. However calls were made at the workshop for the development of these services, and for assistance here by the Commission and by Member States, for example towards the development of industry standards for data to help service providers report to Member State authorities, using key performance indicators.
• At this time we believe the performance indicators that will provide the most robust data on European content on non-linear services are: proportion of catalogue titles that are European, proportion of catalogue hours that are European, proportion of the total amount spent on content devoted to European works.
• Consumption data is not appropriate at this time, largely because of its confidential nature and the lack of a robust independent data source. However, if a robust data source (similar to that currently available for linear services) for consumption data is successfully developed in the future, then consumption data for non-linear services should be strongly considered as an indicator.
• ‘Prominence’ has been found to be the most contentious performance indicator we looked at, and was widely discussed at the workshop. The term is loosely defined, meaning that multiple interpretations are possible, and there are concerns from stakeholders that strict rules here could limit creative freedom for new services. We believe that prominence indicators require more discussion within Member States.

19
1.2. Français Introduction
• Le 11 décembre 2007, le Parlement européen et le Conseil
européen ont adopté la Directive 2007/65/CE modifiant la directive sur la «Télévision sans frontières » (TVSF) pour l’intituler la directive «Services de médias audiovisuels » (SMA). La nouvelle Directive doit être mise en œuvre par les États membres avant le 19 décembre 2009.
• La nouvelle directive ne modifie pas les Articles 4 et 5 de la directive TVSF. Les Articles 4 et 5 établissent des exigences vis-à-vis des États membres visant à garantir que les diffuseurs sous leur compétence consacrent une majorité du temps de transmission à des œuvres européennes et au moins 10 % du temps de transmission (ou budget des programmes) à des productions européennes indépendantes.
• Le domaine d'application de la nouvelle directive s’étend aux services médias audiovisuels non linéaires. Son Article 3i établit des exigences vis-à-vis des États membres visant à garantir que les prestataires de services non linéaires sous leur compétence promeuvent la production et l’accès à des œuvres européennes.
• Afin de fournir à la Commission européenne les éléments nécessaires pour procéder au contrôle et à l’évaluation du respect des Articles 4 et 5 et de commencer à contrôler le respect de l’Article 3i, la Commission a demandé la réalisation de cette étude indépendante, traitant de la situation de la promotion des œuvres européennes sur les services linéaires et non linéaires à la fin de l’année 2007.
• Cette étude se base sur l’étude précédente effectuée sur les Articles 4 et 5 de 2005, réalisée par Attentional Limited (connu alors sous le nom de David Graham and Associates), Oliver&Ohlbaum, Carat Expert et Arena Audiovisual.
• Les objectifs principaux de l’enquête sont les suivants : • Description et analyse des mesures de mise en œuvre prises par les États membres conformément aux Articles 3i, 4 et 5 de la Directive à la fin de l'année 2007. • Description et analyse de l'industrie de la production et du marché des œuvres audiovisuelles. • Évaluation indépendante de l’application des Articles 4 et 5 sur les chaînes de diffusion linéaires spécifiques. • Examen des services médias audiovisuels non linéaires en Europe en 2007. • Recommandations concernant les procédures opérationnelles et indicateurs de performance en vue du contrôle de l’application de l’Article 3i par les services non linéaires.

20
Rapport définitif de l'étude
• Le Rapport définitif de l’étude contient des travaux émanant de toutes les parties et couvrant tous les objectifs de l’étude.
• Au mois de novembre 2008, un atelier s'est tenu à Bruxelles au cours duquel un Projet de rapport définitif a été présenté aux parties prenantes. Les commentaires émis pendant et après l'atelier ont été passés en revue avec attention dans la préparation du Rapport définitif de l'étude.
Modes de mise en œuvre
• OBJECTIF : Identifier et analyser les mesures législatives
nationales de mise en œuvre des Articles 4 et 5 de la Directive et les exigences plus strictes imposées aux diffuseurs ainsi que les mesures législatives nationales existantes concernant les services à la demande adoptées en vertu de l'Article 3i, ou susceptibles d'avoir un effet similaire.
• MÉTHODOLOGIE : Questionnaires à l’attention des autorités nationales de régulation, entretiens par téléphone pour résoudre les réponses peu claires.
• DIFFERENCES ENTRE LES TRANSPOSITIONS NATIONALES DES ARTICLES 4 ET 5 : Quelques États membres ont adopté une définition de «l'assiette des heures totales prises en compte » plus restrictive que la directive. Certains États membres ont intégré le terme de la Directive « dans la mesure du possible » ou autres mesures autorisant des proportions inférieures d'œuvres européennes et de productions indépendantes à réaliser dans certaines situations exceptionnelles.
• LES DEFINITIONS DE « PRODUCTEUR INDEPENDANT » VARIENT LARGEMENT ENTRE LES ETATS MEMBRES : La plupart des États membres ont défini le terme dans leur législation. Ces définitions sont constituées d'association de différents éléments, reposant principalement sur les facteurs suggérés par la directive (propriété de la société de production, volume de programmes fournis au même diffuseur, propriété des droits secondaires) mais certaines contiennent également d'autres éléments qui concernent la capacité réelle du producteur à procéder à ses activités sans être lié à un diffuseur. Les seuils fixés pour chaque élément varient également de façon significative entre les États membres.
• LA PROMOTION DES PRODUCTIONS INDEPENDANTES REPOSE GENERALEMENT SUR LE TEMPS DE TRANSMISSION : On trouve seulement quelques exemples dans lesquels une proportion spécifique de budgets de programmation doit toujours être affectée à des productions indépendantes. La France et l’Italie vont plus loin dans leur approche puisqu’ils exigent des diffuseurs de réserver un certain pourcentage de leur chiffre d’affaires annuel (qui sera toujours supérieur au budget de programmation).
• DIFFERENTES APPROCHES DE CONTROLE ET DE SANCTION VIS-À-VIS DU RESPECT DES ARTICLES 4 ET 5 : La plupart des États membres exigent simplement des diffuseurs de déclarer les

21
proportions d'œuvres européennes réalisées et productions indépendantes, mais certains États membres vont plus loin en vérifiant les données présentées et en procédant à des contrôles indépendants des diffusions. Certains États membres n'ont pas établi de sanctions concernant les manquements aux proportions requises, mais les autorités de la plupart des États membres disposent d'une série de sanctions. Les sanctions sont le plus souvent des avertissements et des amendes mais, dans certains États membres, il est possible d'écourter ou de révoquer les licences de diffusion dans les cas les plus graves.
• LA PLUPART DES ETATS MEMBRES APPLIQUENT DES MESURES PLUS STRICTES QUE LES ARTICLES 4 ET 5 : Certains États membres exigent des pourcentages d'œuvres européennes ou productions indépendantes supérieurs à ceux figurant dans la directive (à certains ou à tous les diffuseurs). La plupart des États membres imposent des exigences aux diffuseurs relatives à certaines formes de contenus additionnels afin de refléter les spécificités linguistiques ou culturelles d’un État membre. Plusieurs États membres exigent qu’une certaine proportion de temps de diffusion soit attribuée à des programmes produits à l’origine dans la langue du pays.
• AVANT L’ADOPTION DU NOUVEL ARTICLE 3i, TRES PEU D'ETATS MEMBRES DISPOSAIENT DE REGLES NATIONALES AYANT DES EFFETS SIMILAIRES : La communauté française de Belgique a adopté une approche de « neutralité technologique» sans distinction entre les plateformes de distribution et ceci a été interprété dans le sens où les services non linéaires de télévision étaient soumis à des obligations similaires à celles des autres services de télévision notamment les obligations concernant les œuvres européennes et productions indépendantes. La France a imposé une taxe sur les prestataires de services de la Vidéo à la demande (VOD) afin de percevoir une contribution financière pour la production de films.
• LA MISE EN ŒUVRE DE L’ARTICLE 3i AURA PRINCIPALEMENT LIEU EN 2009 : Le délai de mise en œuvre est le 19 décembre 2009. A partir des entretiens menés avec des organismes nationaux de régulation, nous avons remarqué que seuls quelques États membres estimaient pouvoir achever la mise en œuvre en 2008, la majorité des États interrogés prévoyant une mise en œuvre pour 2009.
La chaîne de valeur européenne et la création de contenu audiovisuel
• OBJECTIF : Fournir une analyse et une description de la structure
actuelle du marché et des revenus du secteur de l'audiovisuel de l'UE (linéaire et non linéaire).
• MÉTHODOLOGIE : Associer une large gamme de données macro et micro afin de créer une image aussi précise que possible de l’intégralité du secteur et de ses trois composantes principales - la
22
création de contenu, la gestion des chaînes et la fourniture de programmes TV.
• LA STRUCTURE DU MARCHE ET LA CHAÎNE DE VALEUR DEVIENNENT DE PLUS EN PLUS COMPLEXES : Les nouveaux canaux de distribution tels que les services à la demande, les nouveaux modèles de financement de création de contenu et l'augmentation des niveaux de fragmentation du marché classique de la diffusion ont modifié la structure générale du marché.
• LES PAIEMENTS DES CONSOMMATEURS ONT GENERE UNE CROISSANCE DU MARCHE : Les revenus totaux de l’industrie télévisuelle de 78,1 milliards d’euros en 2006, dont des redevances de licence de 23%, publicité et parrainage associé 36% et les paiements des consommateurs pour régler la TV, le relais câblé et les services VOD de 34%. La source principale de croissance dans les pays E17 réside dans les paiements des consommateurs, qui ont augmenté de 10,1 % d’une année sur l’autre depuis 2002.
• LA STRUCTURE DU MARCHE ET LES MOTEURS DE REVENUS VARIENT LARGEMENT SELON LES ETATS MEMBRES : La contribution de la publicité, du financement public et des paiements des abonnements varient largement en fonction des États membres.
• LE MARCHE DES CHAÎNES SE COMPOSE DE TROIS TYPES DISTINCTS : Les chaînes de TV gratuites (accessibles à tous, financées par les pouvoirs publics et la publicité), les chaînes de TV payantes de base (accessibles aux abonnés dans le cadre d'un abonnement TV payant) et les chaînes de TV payantes premium (nécessitant un abonnement supplémentaire).
• LA TV GRATUITE RESTE LE MODELE ECONOMIQUE LE PLUS POPULAIRE : Malgré une migration significative vers des services de TV payante, les foyers équipés de TV payante représentent moins d’un tiers de tous les foyers équipés de TV de l'Union européenne. On a constaté une chute significative du nombre de foyers équipés d'analogique alors que les foyers migrent vers les plateformes TNT. A la fin de l’année 2007, la TNT gratuite a atteint plus de 28 millions de foyers.
• LA TV A LA DEMANDE REPRESENTE UNE FAIBLE PROPORTION DE L'INDUSTRIE GENERALE : Le nombre de services à la demande proposés sur le marché varie largement (de 2 à 32). Nous estimons qu’en 2006, les services à la demande ont généré environ 400 millions € de revenus dans les pays E30, représentant seulement 0,5 % des revenus de l’industrie télévisuelle.
• ON RECENSE TROIS QUESTIONNEMENTS CONCERNANT LA PROGRAMMATION POUR LES CHAÎNES : Où trouver les programmes (commissions / acquisitions / rediffusions); quel genre programmer (films dramatiques, informations, comédies, factuel, stock/ débit9); et quel genre subsidiaire programmer (p.e. série dramatique /film à un épisode).
9 Un programme stock a une valeur de rediffusion et peut être regardé à nouveau ultérieurement, alors que les programmes de débit ont peu de valeur ultérieure après le premier visionnage (hormis les rediffusions narratives). Les

23
• LE SECTEUR DE LA CRÉATION DE CONTENU EUROPÉEN EST EVALUE A 18,3 MILLIARDS € : Sur ces derniers, 16,5 milliards € proviennent des commissions des chaînes réseau et 1,8 milliard € des commissions des chaînes de moindre envergure. Sur ces 18,3 milliards €, environ 2,6 milliards € ont été dépensés pour les informations nationales et locales et la couverture sportive (les dépenses pour les droits sportifs sont exclus). Sur les 15,7 milliards € restants, environ 43 % (6,8 milliards €) ont été dépensé pour des commandes émanant de producteurs extérieurs et environ 57 % a été investi dans la production en interne10.
• LES "NETWORK CHANNELS"11 REPRESENTENT LA MAJORITE DES NOUVELLES COMMANDES : Les chaînes principales de réseau participent à hauteur d’environ 57% du revenu brut de l’industrie mais représentent plus de 90 % des dépenses sur toutes les nouvelles commandes.
• LA RENTABILITE DES SOCIETES INDEPENDANTES DE PRODUCTION EST CYCLIQUE : Les marges sont largement influencées par les programmes commandés et qui rencontrent le succès qui, à long terme (en fonction des conditions du marché) peuvent générer des revenus accessoires et internationaux significatifs pour le producteur. Au contraire, une commande qui n'a pas eu le succès escompté va avoir une incidence négative sur les marges de bénéfices.
• INTÉGRATION VERTICALE CONSIDÉRABLE LE LONG DE LA CHAÎNE DE VALEUR : Notre analyse souligne que 57% des programmations autres que les informations sont réalisées par les services internes des diffuseurs. De façon similaire, une très large proportion de TV payantes premium sont détenues par des propriétaires de plateformes de TV payantes.
• LES ACQUISITIONS AUX ETATS-UNIS RESTENT POPULAIRES: La plupart des diffuseurs européens achètent des programmes populaires aux États-Unis (séries TV et films hollywoodiens). Récemment, on a constaté une augmentation du nombre d'importations depuis l'Asie, en particulier le Japon et la Corée du Sud.
Analyse des données linéaires à l’échelle européenne
• OBJECTIF : Produire une mesure cohérente des Articles 4 et 5 chez
les États membres et l'appliquer à un échantillon de chaînes (linéaires) de diffusion en Europe.
• MÉTHODOLOGIE : Un échantillon de 54 chaînes opérant dans 11 États membres a été sélectionné, conçu pour représenter la diversité de l’UE 30 en termes de taille de marché, géographie et
programmes de débit comprennent les informations, le sport, les jeux et certains programmes de divertissement. 10 La production extérieure comprend les filiales des diffuseurs tels que UFA et Studio Hambourg en Allemagne et Freemantle sur le groupe de chaînes de RTL. 11 Pour cette analyse les « chaînes de réseau » sont définies comme toute chaîne ayant une part moyenne de plus de 5% l’audience nationale.

24
date d'entrée dans l'UE ; tout en favorisant les États membres les plus grands afin de couvrir la part la plus large possible de l'UE en termes de population et d'échelle économique. Les chaînes ont été sélectionnées afin de représenter la diversité des diffuseurs européens en termes de taille d’audience, propriété et modèle de revenus, tout en favorisant les chaînes leader pour couvrir la part la plus importante de l'audience européenne12. Les chaînes ont été contrôlées au cours de deux semaines non consécutives de 2007, une en mars et une en novembre.
Une approche unique a été utilisée pour codifier toutes les diffusions de programmes au cours de cette période et permettre des comparaisons entre les chaînes au sein des États Membres en termes de proportions d’œuvres européennes, européennes non domestiques, indépendantes et indépendantes récentes, cela pendant les heures de plus grande audience. Les données ont été comparées aux résultats précédents et aux déclarations nationales lorsque ceux-ci étaient disponibles. Pour la première fois, des indicateurs ont été produits et analysés non seulement en fonction de la proportion des heures de transmission, mais également en fonction de la proportion d’heures téléspectateur.
• L'ASSIETTE DES HEURES PRISES EN COMPTE : Dans notre échantillon, les programmes auxquels s’appliquent les Articles 4 et 5 constituent 68,3 % des heures totales de transmission et 65% des heures totales d’heures téléspectateur sur toutes les chaînes étudiées en 2007.
• ŒUVRES EUROPEENNES : Dans notre échantillon, les œuvres européennes constituaient 62,4 % du total des heures de transmission prises en compte en 2007. La plupart des diffuseurs européens parmi ceux analysés ont respecté 50% des exigences de l’Article 4. Les œuvres européennes ont également constitué une moyenne de 74% des heures totales téléspectateur sur toutes les chaînes étudiées en 2007. Ces chiffres sont plus importants si l'on ne tient compte que des heures de forte audience. Les chaînes ayant les proportions les plus importantes d’œuvres européennes sont les chaînes leaders dotées de financement public13 des anciens et importants États membres européens du sud.
• ŒUVRES INDEPENDANTES : Les œuvres européennes indépendantes constituent 31% des heures de transmission prises
12 Les 11 États membres et 54 chaînes constituant l’échantillon sont les suivants : Belgique (Communautés flamande et française : VRT, VTM, La Une, RTL-TVI), Estonie (ETV, Kanal2, TV3), France (France2, France3, TF1, M6, Canal+, Direct8), Allemagne (ARD1, ZDF, RTL, Sat.1, Pro7, Vox), Irlande (RTE1, RTE2, TV3), Italie (Rai1, Rai2, Canal5, Italia1, La7, Fox Life), Pologne (TVP1, TVP2, TVN, Polsat, TV4, Canal+), Roumanie (TVR1, Pro TV, Prima TV, Antena1), Espagne (TVE1, La2, Antena3, TeleCinco, Cuatro, La Sexta), Suède (SVT1, Kanal5, TV3, TV4) et le Royaume-Uni (BBC1, BBC2, ITV1, Channel4, Five, Sky One). 13 « dotés de financement public » comprend les diffuseurs à financement mixte chez lesquels une partie du financement est public.

25
en compte en 2007, par rapport à 33,4 % d'heures totales téléspectateur prises en compte. Les proportions sont plus importantes au cours des heures à forte audience. Les chaînes payantes diffusent beaucoup moins de productions indépendantes que les chaînes gratuites. Davantage de productions indépendantes sont diffusées sur les chaînes privées des anciens et importants États membres du nord. Si nous regardons plus spécifiquement les situations aux heures de plus grande audience, nous voyons que les chaînes privées leader des petits et anciens États membres proposent beaucoup plus de productions indépendantes.
• ŒUVRES RECENTES : Dans notre échantillon, les œuvres européennes indépendantes récentes constituent une moyenne de 84,4 % des heures totales indépendantes européennes en 2007, par rapport à 91% des heures totales téléspectateur indépendantes.
• SITUATIONS INDIVIDUELLES DES DIFFUSEURS : Les chaînes indépendantes dépendent fortement de leur environnement local de marché et de la dynamique culturelle. Une analyse complète de chaque État membre est fournie dans ce rapport.
Points de vue de l’Industrie : Diffuseurs et producteurs
• OBJECTIF : Améliorer notre compréhension des implications des
Articles 4 et 5 sur la base des points de vue des parties prenantes. • MÉTHODOLOGIE : Nous avons publié des questionnaires sur
mesure à destination de plus de 230 parties prenantes clés14 de l’industrie audiovisuelle européenne et reçu 71 réponses représentant 24 États membres.
• LE VOLUME DE COMMANDE EST LIE À LA STRUCTURE DES REVENUS DU DIFFUSEUR : Les diffuseurs commerciaux ont tendance à affecter une part relativement plus importante de leur budget de programmes (51%) aux programmes acquis, et une proportion largement inférieure (18%) à la production interne. Au contraire, les diffuseurs dotés de financement public ont tendance à procéder à des investissements lourds dans des productions en interne (58%) et dépenser moins pour les acquisitions (16%).
• LA MAJORITE DES COMMANDES DE FORMATS EST EFFECTUEE PAR LES DIFFUSEURS COMMERCIAUX : Une moyenne de 10% du budget total de programmation des diffuseurs commerciaux est investie dans la programmation de commandes de formats.15 Pour
14 Les parties prenantes comprennent des diffuseurs (à financement public et diffuseurs à financement mixte), producteurs indépendants, organismes de commerce, organismes de réglementation et fournisseurs de contenus exclusivement VoD (Un prestataire de service VoD non lié à un service exécuté par un diffuseur linéaire classique proposant un rattrapage (et parfois un contenu de bibliothèque spécifique au diffuseur), généralement exploité par des sociétés du câble, sociétés de télécommunication, industries du film ou acteurs Internet indépendants). 15 Un format signifie tout programme adapté localement et diffusé dans au moins un autre marché que le marché d’origine et assorti de frais de licence, par exemple Qui veut gagner des millions, Ugly betty.

26
les diffuseurs publics, le niveau d’investissement sur les formats est généralement de 0 à 3 %.
• ON A CONSTATE UNE AUGMENTATION DES COMMANDES EXTERIEURES : Plus de 70% des contributeurs (tant commerciaux que financés par les pouvoirs publics) ont indiqué que la proportion des commandes extérieures avait augmenté au cours des cinq dernières années.
• LES DECISIONS DE COMMANDE VARIENT EN FONCTION DU GENRE : La grande majorité des programmes d'information est produite en interne alors que les films de cinéma et les documentaires sont plutôt produits en externe. Les fictions, les divertissements et les magazines de société sont plus mélangés en termes d’approvisionnement avec 20 à 50 % produits en interne et 40 à 70% produits de façon indépendante.
• LES ACQUISITIONS SONT GENERALEMENT MOINS CHERES QUE LES COMMANDES : Dans tous les genres, sauf pour le sport et la fiction, plus de 65% des diffuseurs indiquent que les programmes acquis coûtent 80% moins cher que les programmes commandés.
• LES ACQUISITIONS PRODUITES AUX ÉTATS-UNIS RESTENT POPULAIRES : Plus de la moitié des acquisitions des diffuseurs ont été achetées aux États-Unis et moins de 25% auprès de propriétaires de contenus d’autres pays européens. Tous les diffuseurs ont indiqué que les films de long métrage et les fictions produits hors d’Europe (principalement aux États-Unis) sont attractifs et ont tendance à connaître du succès en programmation de début de soirée.
• LE PREMIER DIFFUSEUR EST TOUJOURS LA SOURCE PRINCIPALE DE FINANCEMENT DES PROGRAMMES : Parmi tous les genres, plus de 85% des financements proviennent du premier diffuseur avec entre 1% et 7% provenant d’un diffuseur secondaire ou un coproducteur16.
• PLUS DE TROIS QUART DES PARTIES INTERROGEES PARTICIPENT A DES COPRODUCTIONS – LA MAJORITE SONT DOMESTIQUES OU INTRAEUROPEENS : Environ 86 % des diffuseurs et 75% des producteurs indépendants coproduisent des programmes. Les producteurs et les diffuseurs ont identifié les coproductions domestiques et les coproductions avec d’autres producteurs européens comme étant le cas le plus général.
• LES DIFFUSEURS COMPTENT CONSERVER LA MAJORITE DES DROITS DOMESTIQUES : Tous les diffuseurs ont indiqué s'attendre à disposer d'abord des droits de diffusion terrestres domestiques et des nouveaux médias (dont les droits des programmes à la demande) lorsqu'ils commandent des programmes en externe, alors que 81 % environ ont indiqué s'attendre à disposer des rediffusions sur le marché domestique secondaire et des droits domestiques accessoires.
16 Le diffuseur principal est le commanditaire principal du programme et va généralement conserver les premiers droits de diffusion nationale, alors que le diffuseur secondaire ou coproducteur peut financer une partie de la production pour conserver d’autres droits domestiques ou internationaux.

27
• LA FICTION ET LES FILMS SONT IDENTIFIES COMME DES IMPORTATIONS ET DES EXPORTATIONS REUSSIES POUR L’EUROPE : Les films de fiction et les long métrages ont été évalués par les diffuseurs comme étant les plus prospères sur le marché international, alors que les informations et les magazines de société ont été considérés comme locaux principalement et, par conséquent, peu à même de bien se vendre à l'étranger. Les documentaires sportifs, les fictions et les longs métrages ont été bien identifiés comme des possibles importations européennes, alors que les informations et les magazines de société ont obtenus des notes basses. Seuls les formats de divertissement et dits factuels ou de réalité ont reçu des notes supérieures à 50% comme étant potentiellement exportables.
Points de vue de l’Industrie : Services à la demande
• OBJECTIF : Étudier les points de vue des parties prenantes clés sur
les stratégies de programmation et les propositions de services à la demande, et leur point de vue sur les stratégies de contenu et les questions réglementaires.
• METHODOLOGIE : Les questionnaires ont été conçus pour recueillir des données quantitatives et qualitatives émanant de 50 services non linéaires (à la demande) (35 diffuseurs et 15 fournisseurs de contenus exclusivement en VoD). En outre, 29 services non linéaires ont été analysés de façon indépendante afin d’analyser le concept de « proéminence ».
• LA MAJORITE DES REPONDANTS DES SERVICES A LA DEMANDE SONT PROPOSES PAR INTERNET OU IPTV : La plupart des parties interrogées, diffuseurs et fournisseurs de contenus exclusivement en VoD disposent de contenus disponibles sur des services à la demande diffusés sur l’Internet ou IPTV. Les diffuseurs utilisent également les dispositifs mobiles (40%) et câblés (32%), les fournisseurs de contenus exclusivement en VoD se reposent principalement sur le câble (25%) en tant que technologie secondaire de distribution.
• LES OFFRES DE GENRE VARIENT ENTRE LES DIFFUSEURS ET LES FOURNISSEURS DE CONTENUS EXCLUSIVEMENT EN VoD : Les diffuseurs proposent généralement un mélange de diffusion en direct, archives et plus récemment de programmes de rattrapage sur leurs services VoD, avec un mélange de genres équilibré. Les fournisseurs de contenus exclusivement en VoD préfèrent clairement les matériels d’archive, avec une préférence pour le cinéma, les fictions TV et les documentaires.
• EN GENERAL LE CONTENU EUROPEEN EST LA COMPOSANTE CLÉ DES CATALOGUE A LA DEMANDE : Parmi les personnes interrogées pour cette étude, seules 17% des fournisseurs de contenus exclusivement en VoD et 12% des diffuseurs ont déclaré que leurs catalogues étaient constitués de moins de 25% de titres européens. Les diffuseurs, disposent généralement de 100 % de contenu européen, puisqu’ils dupliquent généralement leur

28
programmation linéaire dans leurs services à la demande, moins les titres pour lesquels ils ne disposent par de droits à la demande. Au contraire, 33% des fournisseurs de contenus exclusivement en VoD indiquent que leurs catalogues comprennent entre 25 et 75 % de titres européens.
• LES FOURNISSEURS PROPOSANT DES CONTENUS EXCLUSIVEMENT EN VoD NE DEPENSENT PAS D’ARGENT DANS DES COMMANDES : Les parties interrogées, fournisseurs de contenus exclusivement en VoD, ont affecté 100% de leur budget de programme aux acquisitions, dont les importations non européennes représentent presque la moitié du total. Au contraire, les services à la demande opérés par les diffuseurs indiquent dépenser environ 75% de leurs budgets à la demande pour des commandes nationales, bien que ce chiffre représente une proportion très limitée du budget.
• LA MAJORITE DES SERVICES NON LINEAIRES DES DIFFUSEURS SONT GRATUITS POUR LE CONSOMMATEUR : Sur les diffuseurs répondants, 41% utilisent des publicités pour financer tout ou partie de leur service à la demande. Les subventions publiques sont utilisées comme un flux de revenu unique par 23% des diffuseurs répondants. Au contraire, la majorité des revenus des fournisseurs de contenus exclusivement en VoD qui ont participé à notre enquête provient uniquement des paiements directs émanant des consommateurs soit sous forme d’abonnement, soit de paiement à la carte.
• LA PROGRAMMATION EUROPEENNE EST CONSIDEREE COMME IMPORTANTE PAR LES FOURNISSEURS : La majorité des services à la demande interrogés, exécutés par des diffuseurs ou des fournisseurs de contenus exclusivement en VoD, estime que la programmation européenne est, l'un dans l'autre, une bonne option pour leurs services. On constate tout de même quelques oppositions : les programmes européens sont considérés comme onéreux, pas plus facile à acquérir que les contenus non européens et pas nécessairement comme la meilleure façon d'attirer les consommateurs européens.
• PROEMINENCE : La proéminence est un concept clé pour comprendre comment les œuvres européennes sont promues par les services à la demande. La proéminence peut être analysée dans deux dimensions : Proéminence active (Le service offre-t-il la possibilité de rechercher des titres par origine de production et fournit-il des informations sur l’origine de la production avec la description des titres ?), et la proéminence passive (quelle est la proportion d'œuvres européennes parmi les titres proposés aux consommateurs lorsqu’ils accèdent à leur page d'accueil et naviguent dans les sections principales ?) S’agissant de la proéminence active, notre analyse indique que les services à la demande permettent rarement aux consommateurs de sélectionner des titres par origine de production (ni par langue). Toutefois, la moitié des services de notre échantillon indiquent le pays d'origine dans la description des titres.

29
Lorsque l’on considère l’origine des titres figurant « par défaut » sur l’écran (proéminence passive), la proportion des titres d’origine européenne qui ont été « mis en avant » par les 29 services à la demande de notre échantillon est de 54 % en moyenne. On constate toutefois, de grandes différences entre les services.
Méthodes de contrôle de l'Article 3i
• OBJECTIF : Identifier et évaluer les indicateurs de performance et
procédures opérationnelles possibles pour le contrôle de l’Article 3i. • MÉTHODOLOGIE : Diverses procédures et indicateurs ont été
recherchés et discutés. Les questions conçues pour recueillir les points de vue des parties prenantes sur le caractère approprié des procédures et indicateurs et pour recueillir les données réelles sur la base de tous les indicateurs proposés ont été incluses dans l'enquête auprès des parties prenantes.
• L'AUTO-DECLARATION, UNE PROCEDURE OPERATIONNELLE APPROPRIEE POUR LES SERVICES NON LINEAIRES : Pour le moment, les auto-déclarations sont la procédure opérationnelle la plus appropriée pour recueillir des données sur l’application de l’Article 3i. Il a été prouvé par l’enquête qu’il est possible d’acquérir des données via les auto-déclarations. Nous estimons que le volume de données reçues s'améliorera une fois la mise en œuvre requise par la législation.
• LES EVALUATIONS INDEPENDANTES DES SERVICES NON LINEAIRES NE SONT ACTUELLEMENT PAS APPROPRIEES : Des données équivalentes aux données de la Mesure de l’audience télévisuelle (TAM) disponibles pour l’évaluation indépendante des services linéaires, ne sont actuellement pas disponibles pour les services non linéaires. Des alternatives aux données TAM, telle que l'utilisation d’un logiciel « web-harvesting » pour copier des informations sur les catalogues à la demande sur des bases de données, ou disposer de consultants qui réalisent ceci manuellement, ne sont pas appropriées, pour des raisons, dans le premier cas, juridiques et des considérations de temps et d'argent dans le second cas. Toutefois, le développement d'une technologie agréée de collecte appropriée des données à l'avenir n'est pas impossible, une fois les questions juridiques convenablement réglées.
• LES INDICATEURS DE NIVEAU DU CATALOGUE LES PLUS APPROPRIES : Tous les types d'acteurs interrogés ont identifié la proportion de titres du catalogue comme l’indicateur le plus approprié (à l’exception des producteurs, qui ont favorisé les indicateurs financiers et de consommation). Elle fournit une indication claire sur la proportion du contenu européen disponible sur les services non linéaires. La proportion des heures de catalogue a également été considérée comme un bon indicateur par la plupart des contributeurs, car ceci répond à la préoccupation selon laquelle les catalogues peuvent être remplis par des contenus courts pour respecter le seul indicateur de niveau de titre. En appliquant ces indicateurs à des services spécifiques, nous avons

30
décelé que la majorité des services disposaient de 80 % de titres et horaires européens, nombre d’entre eux disposant de 100%. Les fournisseurs de contenus exclusivement en VoD disposent généralement d’une proportion de titres européens proposés par leurs services inférieure à celle des services proposés par les diffuseurs. L'offre proposée par les diffuseurs correspond souvent à l'offre linéaire via leur service non linéaire, moins la programmation pour laquelle ils ne disposent pas de droits à la demande (généralement des contenus non européens). Ceci ne concerne pas les fournisseurs de contenus exclusivement en VoD, offrant une explication possible à la proportion plus élevée des contenus européens sur les services des diffuseurs que sur les services proposés par les fournisseurs de contenus exclusivement en VoD.
• LA CONTRIBUTION FINANCIERE NECESSITE UNE APPROCHE PRUDENTE : Cet indicateur divise l’opinion, les producteurs la favorisant et les diffuseurs et fournisseurs de contenus exclusivement en VoD s’y opposant fortement. De telles données sont considérées comme hautement confidentielles et, puisque les chiffres en cours de discussion sont relativement peu nombreux, de telles données nous en disent peu pour le moment. Toutefois, puisque les données sur la participation financière sont explicitement mentionnées comme une option dans la Directive, nous suggérons donc un simple indicateur pour le moment. Ainsi, les autorités des pays membres pourraient demander aux fournisseurs de fournir le montant dépensé sur les contenus une fois par an, et un chiffre correspondant à la proportion dépensée pour les œuvres européennes.
• LES DONNEES DE CONSOMMATION NE SONT PAS APPROPRIEES POUR LE MOMENT : A l’exception des producteurs, les données de consommation ont été un indicateur peu populaire parmi les parties interrogées, principalement parce qu'il est très sensible au niveau commercial et n'est pas demandé aux prestataires linéaires. Un manque de sources de données comparables aux données TAM, comme il en existe pour les services linéaires, signifie que des données de consommation solides de vérification ou de contrôle indépendant sont actuellement très difficiles à obtenir. Les sources de données de type TAM pour les non linéaires seront disponibles à l’avenir, elles pourront alors servir d’indicateur.
• LA « PROEMINENCE » EST UN TERME OUVERT, AVEC DE NOMBREUX INDICATEURS POSSIBLES ET NE DOIT PAS ETRE APPLIQUE DE FACON TROP STRICTE POUR LE MOMENT : De nombreux indicateurs, tels que la capacité de rechercher par le pays d’origine à travers la proportion de pages consacrées aux contenus européens, sont des indicateurs possibles de « proéminence ». Une inquiétude émane de l’enquête et de l’atelier et indique qu'une position trop normative pourrait potentiellement limiter le développement créatif de services non linéaires. Les commentaires émis lors de l’atelier ont clairement indiqué que ce sujet nécessitait des discussions complémentaires au sein des États membres. Pour le moment, nous proposons par conséquent des lignes directrices relativement larges.

31
Conclusions générales
• La transposition des Articles 4 et 5 varient d'un État membre à l'autre, s'agissant du niveau d'exigence dans l'application de la législation et du nombre de contraintes additionnelles.
• La transposition des Articles 4 et 5 est restée largement similaire dans les États membres examinés dans l’étude menée en 2005.
• Les services à la demande et l’augmentation de la fragmentation font de l'industrie de la télévision, d’une valeur de 78,1 milliards d’euros, une industrie plus complexe en Europe. Mais les contenus à la demande restent un composant relativement faible de ce revenu, à hauteur de 400 millions €.
• Pour les services linéaires, la TV gratuite reste le modèle économique le plus populaire. Pour les services non linéaires fournis par les diffuseurs, cette tendance est constante, la plupart proposent une partie ou l'intégralité de leur contenu gratuitement. Toutefois, les services non linéaires non rattachés à des diffuseurs favorisent largement les modèles économiques reposant sur les paiements des consommateurs.
• Bien que l’on constate des variations des montants dépensés pour les acquisitions et les commandes des diffuseurs linéaires, leurs services non linéaires sont plus cohérents avec 75 % du budget des services non linéaires proposés par les diffuseurs dépensés en commandes. Les diffuseurs ont généralement besoin des droits à la demande des contenus commandés, mais l'obtention de nouveaux droits pour les acquisitions est plus difficile. La situation est différente pour les fournisseurs de contenus exclusivement en VoD qui s’appuient largement sur les acquisitions.
• Les services non linéaires proposés par les diffuseurs disposent généralement de 100% de contenu européen ou presque dans leurs catalogues, alors que les fournisseurs de contenus exclusivement en VoD s'appuient beaucoup plus sur les contenus non européens. Ceci s'explique par le fait que les fournisseurs de contenus exclusivement en VoD s'appuient plutôt sur les acquisitions pour leur offre de services.
• Il ressort de notre analyse des services linéaires que la majorité des chaînes étudiées sont conformes aux exigences des Articles 4 et 5. Dans notre échantillon, 62,4 % des heures de transmission prises en compte étaient constituées de contenu européen et 31% étaient des œuvres européennes indépendantes, dont 84,4% dataient de moins de cinq ans.
• En appliquant des chiffres d'audience comme un indicateur pour la première fois dans cette étude, nous avons trouvé que les proportions des heures téléspectateur sont de façon constante plus importantes que les proportions des heures de transmission des contenus européens (62,4% des heures de transmission prises en compte sont européennes dans l’intégralité de notre échantillon, par rapport à 74% des heures téléspectateur ; 31 % des heures de
32
transmission prises en compte sont des productions indépendantes européennes, par rapport à 33,4 % des heures téléspectateur). Ceci indique que les contenus européens et les contenus produits de façon indépendante sont populaires auprès des publics des États membres analysés.
• Nous avons décelé qu'avec la date limite de mise en œuvre de la nouvelle directive en décembre 2009 et une industrie non linéaire se trouvant encore à un stade précoce, peu d'États membres ont mis en œuvre l'Article 3i ou défini des mesures à cet égard. De nombreuses discussions sur l'application de l'Article 3i doivent encore être menées au cours de l'année 2009. L’atelier a permis de constater que des discussions supplémentaires au sein des États membres avec les parties prenantes sont nécessaires.
• Pour le moment, nous estimons que la procédure d' auto-déclaration est la procédure opérationnelle la plus appropriée pour recueillir des données permettant de contrôler l’application de l’Article 3i. Une évaluation indépendante nécessitera la production de données similaires à la Mesure de l’audience télévisuelle (TAM), qui ne sont actuellement pas disponibles pour les services non linéaires. Toutefois, lors de l’atelier, certains ont appelé au développement de ces services et ont demandé une assistance de la Commission et des États membres, par exemple, en vue du développement de normes de l’industrie pour des données visant à aider les prestataires de service à fournir des rapports aux autorités des États membres, au moyen d’indicateurs de performance clé.
• Pour le moment, nous estimons que les indicateurs de performance qui vont fournir les données les plus solides sur les contenus européens sur les services non linéaires sont les suivants : proportion des titres européens du catalogue, proportion horaire des contenus européens dans le catalogue, proportion du montant total dépensé pour le contenu consacré aux œuvres européennes.
• Les données relatives à la consommation ne sont pas appropriées pour le moment, largement à cause de leur nature confidentielle et le manque de sources solides indépendantes. Toutefois, si une source de données robustes (similaires à celle actuellement proposée pour les services linéaires) concernant les données de consommation est développée avec succès à l’avenir, les données de consommation pour les services non linéaires devraient être fortement considérées comme un indicateur pertinent.
• « La proéminence » a été considérée comme l’indicateur le plus controversé que nous avons examiné et a été largement abordée lors de l’atelier. Le terme est mal défini, ce que signifie que de multiples interprétations sont possibles et les parties prenantes sont préoccupées par la possible limitation de la liberté créative des nouveaux services par des règles strictes. Nous estimons que les indicateurs de proéminence nécessitent une discussion plus approfondie au sein des États membres.

33
1.3. Deutsch Einleitung
• Am 11. Dezember 2007 haben das Europaparlament und der Rat
die Richtlinie 2007/65/EC angenommen, dabei wurde die "Fernseh-Richtlinie" in die "Richtlinie über audiovisuellen Mediendienste" (TVWF-Richtlinie) umbenannt. Die neue Richtlinie muss von den Mitgliedstaaten bis 19. Dezember 2009 umgesetzt werden.
• In der neuen Richtlinie gibt es keine Änderungen bei Artikel 4 und 5 der TVWF-Richtlinie. In Artikel 4 und 5 wird von den Mitgliedstaaten die Gewähr gefordert, dass Rundfunksender unter ihrer Rechtshoheit die Mehrheit ihrer Sendezeit europäischen Produktionen widmen, und mindestens 10% der Sendezeit (oder des Programmbudgets) auf unabhängige europäische Produktionen aufwenden.
• Die neue Richtlinie gilt auch für nicht-lineare audiovisuelle Medien. Artikel 3i fordert von Mitgliedstaaten die Gewähr, dass nichtlineare Serviceanbieter unter ihrer Rechtshoheit die Produktion von und den Zugang zu europäischen Werken fördern.
• Um zu gewährleisten, dass der Europäischen Kommission die zur Überwachung und Auswertung von Artikel 4 und 5 erforderlichen Mittel zur Verfügung stehen und um mit der Kontrolle bezüglich Artikel 3i zu beginnen, hat die Kommission diese unabhängige Studie in Auftrag gegeben. Darin wird der Stand der Dinge bezüglich der Förderung Europäischer Produktionen von linearen und nicht-linearen Diensten Ende 2007 untersucht.
• Diese Studie baut auf der vorhergehenden Studie zu Artikel 4 und 5 von 2005 auf, die von den Firmen Attentional Limited (vormals David Graham and Associates), Oliver & Ohlbaum, Carat Expert und Arena Audiovisual durchgeführt wurde.
• Die Hauptzielsetzungen der Studie sind: • Beschreibung und Analyse der von den Mitgliedstaaten getroffenen Maßnahmen zur Umsetzung von Artikel 3i, 4 und 5 der Richtlinie am Ende des Jahres 2007. • Beschreibung und Analyse der Produktionsindustrie und des Marktes für audiovisuelle Werke. • Unabhängige Bewertung der Anwendung von Artikel 4 und 5 auf spezifische lineare Rundfunkkanäle. • Überblick über die nicht-linearen audiovisuellen Mediendienste in Europa in 2007. • Empfehlungen für Verfahrensweisen und Leistungsindikatoren zur Überwachung der Anwendung von Artikel 3i auf nicht-lineare Dienste.
Abschlussbericht der Studie
• Der Abschlussbericht enthält Ergebnisse aus allen Teilen der Studie und deckt alle Zielsetzungen der Studie ab.
• Im November 2008 wurde in Brüssel ein Workshop abgehalten, bei dem der Entwurf des Abschlussberichts den wichtigsten
34
Interessenvertretern vorgelegt wurde. Kommentare, die während des und nach dem Workshop abgegeben wurden, wurden bei der Erstellung des Abschlussberichts der Studie genau berücksichtigt.
Arten der Umsetzung
• ZIELSETZUNG: Bestimmung und Analyse nationaler gesetzlicher
Maßnahmen zur Umsetzung von Artikel 4 und 5 der Richtlinie und strengerer Anforderungen an Rundfunksender sowie bestehender nationaler gesetzlicher Maßnahmen bezüglich nicht-linearer Dienste, die gemäß Artikel 3i eingeführt wurden oder Maßnahmen, die eine ähnliche Wirkung haben könnten.
• METHODIK: Fragebögen an nationale Aufsichtsbehörden, ergänzt durch telefonische Interviews zur Abklärung unklarer Antworten.
• UNTERSCHIEDE ZWISCHEN NATIONALEN UMSETZUNGEN VON ARTIKEL 4 UND 5: Einige Mitgliedstaaten haben eine Definition von ‘anrechnungsfähigen Gesamtstunden’ übernommen, die einschränkender ist, als es die Richtlinie vorschreibt. Andere Mitgliedstaaten haben den qualifizierenden Begriff "soweit durchführbar" oder andere Ausnahmeregelungen gemäß den Bestimmungen in die Richtlinien mit aufgenommen, nach denen in bestimmten Ausnahmefällen niedrigere Anteile von europäischen Werken und unabhängigen Produktionen zulässig sind.
• DEFINITIONEN VON ‘UNABHÄNGIGER PRODUZENT’ SIND IN DEN EINZELNEN MITGLIEDSTAATEN SEHR UNTERSCHIEDLICH: Die meisten, aber nicht alle Mitgliedstaaten, definieren diesen Begriff in ihrer Gesetzgebung. Die Definitionen bestehen aus einer Kombination verschiedener Merkmale. Diese basieren meist auf in der Richtlinie enthaltenen Faktoren (Besitzverhältnis der Produktionsfirma, Anzahl der an einen Sender gelieferten Programme, Besitzverhältnisse von Zweitverwertungsrechten), enthalten aber auch andere Elemente, die die Fähigkeit der Produzenten, ihr Geschäft unabhängig von Rundfunksendern abzuwickeln, betreffen. Auch die festgelegten Grenzwerte für die einzelnen Elemente sind in den einzelnen Mitgliedstaaten sehr unterschiedlich.
• DIE VORGABE FÜR UNABHÄNGIGE PRODUKTIONEN BEZIEHT SICH ÜBLICHERWEISE AUF DIE SENDEZEIT: Es wurden nur wenige Beispiele gefunden, bei denen ein bestimmter Anteil der Haushaltsmittel stets unabhängigen Produktionen zugewiesen werden muss. Frankreich und Italien gehen in ihrem Ansatz noch weiter, da sie ihre Rundfunksender verpflichten, einen bestimmten Prozentsatz ihres gesamten Jahresumsatzes (der immer höher ist als die Haushaltsmittel) unabhängigen Produktionen zuzuweisen.
• VERSCHIEDENE ANSÄTZE FÜR DIE ÜBERWACHUNG UND SANKTIONIERUNG DER EINHALTUNG VON ARTIKEL 4 UND 5: Die meisten Mitgliedstaaten verlangen von Rundfunksendern nur eine Selbstauskunft zu den erzielten Anteilen europäischer Werke und unabhängiger Produktionen. Einige Mitgliedstaaten ergreifen aber zusätzliche Maßnahmen zur Überprüfung der eingereichten Daten oder führen unabhängige Kontrollen von Sendungen durch.

35
Manche Mitgliedstaaten haben noch keine Sanktionen festgelegt, wenn die erforderlichen Anteile nicht erzielt wurden, doch in den meisten Mitgliedstaaten stehen den Behörden eine Reihe von Sanktionen zur Verfügung. Die Sanktionen bestehen meist aus Warnungen und Geldstrafen, doch in einigen Mitgliedstaaten ist es in den schwerwiegendsten Fällen auch möglich, Sendelizenzen zu verkürzen oder zu widerrufen.
• DIE MEISTEN MITGLIEDSTAATEN WENDEN EINIGE MASSNAHMEN AN, DIE STRENGER SIND ALS ARTIKEL 4 UND 5: In einigen Mitgliedstaaten gelten bei den Prozentsätzen für europäische Werke oder unabhängige Produktionen höhere Anforderungen als in der Richtlinie (für einige oder alle Rundfunksender). In fast allen Mitgliedstaaten gibt es zusätzliche Anforderungen für Rundfunksender in Bezug auf den Inhalt, die die sprachlichen oder kulturellen Ausprägungen in einem Mitgliedstaat widerspiegeln. In mehreren Mitgliedstaaten muss ein bestimmter Anteil der Sendezeit Sendungen zugeteilt werden, die ursprünglich in einer Landessprache produziert wurden.
• VOR DER ANNAHME DES NEUEN ARTIKELS 3i GAB ES NUR IN SEHR WENIGEN MITGLIEDSTAATEN NATIONALE VORSCHRIFTEN MIT ÄHNLICHEN AUSWIRKUNGEN: Die Französische Gemeinschaft Belgiens hat einen “technologieneutralen” Ansatz ohne Unterscheidung zwischen Distributionsplattformen übernommen und dieser wurde so ausgelegt, dass nicht-lineare Fernsehdienste denselben Verpflichtungen unterliegen wie andere Fernsehsender, einschließlich der Verpflichtung zu europäischen Werken und unabhängigen Produktionen. In Frankreich mussten Anbieter von Abrufdiensten (Video-on-Demand - VoD) eine Steuer entrichten, um einen finanziellen Beitrag zur Filmproduktion zu leisten.
• DIE UMSETZUNG VON ARTIKEL 3i WIRD VOR ALLEM IN 2009 STATTFINDEN: Die Frist für die Umsetzung ist der 19. Dezember 2009. Bei unseren Interviews mit nationalen Genehmigungsbehörden haben wir festgestellt, dass nur einige Mitgliedstaaten erwarteten, dass die nationale Umsetzung in 2008 abgeschlossen sein werde, während die Mehrheit davon ausging, dass dies in 2009 stattfinden werde.

36
Die europäische Lieferkette und die Herstellung von audiovisuellen Inhalten
• ZIELSETZUNG: Bereitstellung einer Analyse und Beschreibung der
derzeitigen Marktstruktur und der Einnahmen des audiovisuellen Sektors (linear und nicht-linear) in der EU.
• METHODIK: Eine Vielzahl von Makro- und Mikrodaten wurde kombiniert, um eine möglichst genaues Bild des gesamten Sektors und seiner drei Hauptbestandteile – Herstellung von Inhalten, Sendermanagement und Programmausstrahlung - zu erstellen.
• DIE MARKTSTRUKTUR UND DIE LIEFERKETTE WERDEN IMMER KOMPLEXER: Neue Absatzkanäle wie etwa Abrufdienste, neue Finanzierungsmodelle für die Herstellung von Inhalten und eine zunehmende Fragmentierung des traditionellen Rundfunkmarktes haben die Gesamtstruktur des Marktes geändert.
• ZAHLUNGEN DURCH VERBRAUCHER HABEN DAS WACHSTUM IM MARKT VORANGETRIEBEN: Die Gesamteinnahmen der Fernsehindustrie lagen 2006 bei 78.1 Mrd. €, davon entfielen 23% auf Fernsehgebühren, 36% auf Werbung und Sponsoring und 34% auf Zahlungen von Verbrauchern für Pay-TV, Kabel and VoD-Dienste. Den größten Anteil des Wachstums in den E17 Ländern machen die Zahlungen von Verbrauchern aus, bei denen seit 2002 jedes Jahr ein Zuwachs von 10,1% verzeichnet werden konnte.
• GROSSE UNTERSCHIEDE IN DEN EINZELNEN MITGLIEDSTAATEN IN BEZUG AUF MARKTSTRUKTUR UND EINFLUSSFAKTOREN FÜR DIE EINNAHMEN: Die Beiträge durch Werbung, die öffentliche Hand und Abonnementzahlungen sind in den einzelnen Mitgliedstaaten sehr unterschiedlich.
• MARKT FÜR FERNSEHSENDER UMFASST DREI SEHR UNTERSCHIEDLICHE TYPEN: Kostenlose Fernsehsender (zugänglich für alle, Finanzierung öffentlich-rechtlich und durch Werbeeinnahmen), Pay-TV-Sender (für Abonnenten im Rahmen ihres Pay-TV Abonnements) und Premium Pay-TV Sender (mit zusätzlicher Abonnementsgebühr).
• KOSTENLOSES FERNSEHEN BLEIBT DAS BELIEBTESTE GESCHÄFTSMODELL: Trotz erheblicher Migration zu Pay-TV machen Haushalte mit Pay-TV immer noch weniger als ein Drittel der europäischen Fernsehhaushalte aus. Die Anzahl der analogen Haushalte ging wesentlich zurück, da immer mehr Haushalte auf DVB-T-Plattformen (Digitalfernsehen) wechseln. Bis Ende 2007 wurden kostenloses DVB-T von über 28 Millionen Haushalten empfangen.
• ABRUFDIENSTE MACHEN NUR EINEN KLEINEN ANTEIL DER GESAMTEN BRANCHE AUS: Die Anzahl der im Markt erhältlichen Abrufdienste schwankt stark (zwischen 2 und 32). Nach unserer Schätzung wurden in 2006 in den E30 mit Abrufdiensten Einnahmen von ca. 400 Mio. € erzielt, das macht nur 0,5% der Einnahmen der TV-Branche aus.
• FÜR DIE SENDER STEHEN DREI VERSCHIEDENE ARTEN DER PROGRAMMGESTALTUNG ZUR WAHL: Ursprung der Sendungen (Auftragsproduktionen, Zukäufe oder Wiederholungen); Auswahl

37
des Genres (Film, Nachrichten, Komödie, Factual Entertainment, Stock- oder Flow-Programme17) und des Untergenres (z.B. Drama-Seifenoper oder ein Einzelfilm).
• DER EUROPÄISCHE SEKTOR DER HERSTELLUNG VON INHALTEN WURDE AUF 18,3 MRD. € BEZIFFERT: Davon entfielen 16,5 Milliarden € auf Auftragsproduktionen durch größere Rundfunksender und 1,8 Milliarden € auf Auftragsproduktionen durch kleinere Sender. Von den 18,3 Milliarden € entfielen etwa 2,6 Milliarden € auf nationale und regionale Nachrichten und Sportsendungen (Übertragungsrechte für Sportveranstaltungen ausgenommen). Von den übrigen 15,7 Milliarden € wurden nach Schätzungen 43% (6,8 Mrd. €) auf Auftragsproduktionen von externen Produzenten aufgewendet und etwa 57% in Eigenproduktionen investiert18.
• GRÖSSERE RUNDFUNKSENDER19 MACHEN DIE MEHRZAHL ALLER NEUEN AUFTRAGSPRODUKTIONEN AUS: Die größeren Rundfunksender verzeichnen etwa 57% der Bruttoeinnahmen der Branche, machen aber über 90% der Ausgaben für alle neuen Auftragsproduktionen aus.
• DIE RENTABILITÄT VON UNABHÄNGIGEN PRODUKTIONSFIRMEN IST ZYKLISCH: Die Margen hängen stark vom Erfolg der Auftragsproduktionen ab, die langfristig (abhängig von Handelsbedingungen) erhebliche zusätzliche Einnahmen und Einnahmen aus dem Ausland für den Produzenten bringen können. Erfolglose Auftragsproduktionen wirken sich dagegen negativ auf die Margen aus.
• ERHEBLICHE VERTIKALE INTEGRATION ENTLANG DER WERTSCHÖPFUNGSKETTE: Unsere Analyse deutet darauf hin, dass 57% aller Sendungen (Nachrichten ausgenommen) von den Rundfunksendern im eigenen Haus erstellt werden. Ein sehr hoher Anteil von Premium Pay-TV Sendern gehört den Eigentümern von Pay-TV-Plattformen.
• ZUKÄUFE AUS DEN USA IMMER NOCH WEIT VERBREITET: Fast alle europäischen Rundfunksender kaufen beliebte US-Sendungen zu (sowohl Fernsehserien als auch Hollywood-Filme). In letzter Zeit ist auch ein Anstieg bei der Anzahl der Importe aus asiatischen Ländern festzustellen, vor allem aus Japan und aus Südkorea.
17 Ein Stock-Programm hat einen Wiederholungswert und kann zu einem späteren Zeitpunkt erneut ausgestrahlt werden, während Flow-Programme nach der ersten Ausstrahlung nur einen geringen oder gar keinen Wert mehr haben (narrative Wiederholungen ausgenommen). Beispiele für Flow-Programme sind Nachrichten, Sportsendungen, Spielsendungen und bestimmte Unterhaltungssendungen. 18 Zu den externen Produktionen gehören an Rundfunksender angeschlossene Unternehmen wie etwa UFA und Studio Hamburg in Deutschland und Fremantle und die RTL-Gruppe von Rundfunksendern. 19 Für die Zwecke dieser Analyse wurden alle Fernsehsender mit einem durchschnittlichen Anteil von über 5% des Inlandpublikums als ‘größerer Rundfunksender’ definiert.

38
EU-weite Analyse von linearen Daten
• ZIELSETZUNG: Erstellen eines einheitlichen Maßstabs für Artikel 4
und 5 in allen Mitgliedstaaten und Anwendung auf eine Stichprobe von (linearen) Rundfunksendern in Europa.
• METHODIK: Es wurde eine Stichprobe von 54 Sendern, die in 11 Mitgliedstaaten tätig sind, ausgewählt. Damit sollte die Vielfalt der EU30 in Bezug auf die Größe des Marktes, geographische Aspekte und die Dauer der EU-Mitgliedschaft berücksichtigt und die größeren Mitgliedstaaten begünstigt werden, um den größtmöglichen Anteil der EU in Bezug auf Einwohnerzahl und wirtschaftliche Größenordnung abzudecken. Die Sender wurden so ausgewählt, dass die Vielfalt der europäischen Rundfunksender im Hinblick auf Zuschauerzahlen, Eigentümer und Einnahmenmodell repräsentiert wird, gleichzeitig wurden führende Sender bevorzugt mit aufgenommen, um den größtmöglichen Anteil des europäischen Fernsehkonsums abzudecken20. Die Sender wurden für zwei nicht aufeinanderfolgende Wochen im Jahr 2007 überwacht, eine Woche im März und eine Woche im November.
Ein einheitlicher Ansatz wurde zur Einordnung aller während dieses Zeitraums gesendeten Programme in Kodes verwendet und um Vergleiche zwischen den Sendern in den Mitgliedstaaten im Hinblick auf den Anteil von anrechnungsfähigen, europäischen Werken, Werken aus dem europäischen Ausland, unabhängigen und neuen unabhängigen Werken, einschließlich der Hauptsendezeit zu ermöglichen. Die Daten wurden mit früheren Erkenntnissen und nationalen Angaben verglichen, sofern verfügbar. Zum ersten Mal wurden damit Indikatoren erstellt und analysiert, nicht nur im Verhältnis zu den Sendestunden, sondern auch im Verhältnis zu den Zuschauerstunden.
• ANRECHNUNGSFÄHIGE WERKE: Bei unserer Stichprobe machen qualifizierende Sendungen (für die Artikel 4 und 5 gelten) bei allen Sendern, die in 2007 untersucht wurden, 68,3% der gesamten Sendezeit und 65% der Zuschauerstunden aus.
• EUROPÄISCHE WERKE: Bei unserer Stichprobe entfielen in 2007 62,4% der gesamten anrechnungsfähigen Sendestunden auf europäische Werke. Die meisten der analysierten europäischen Rundfunksender erfüllten die Vorgabe von 50% in Artikel 4. Europäische Werke machen in 2007 im Durchschnitt auch 74% der gesamten Zuschauerstunden bei allen analysierten Sendern aus.
20 Die Stichprobe setzt sich aus dem folgenden 11 Mitgliedstaaten und 54 Sendern zusammen: Belgien (Flämische und Französische Gemeinschaft: VRT, VTM, La Une, RTL-TVI), Estland (ETV, Kanal2, TV3), Frankreich (France2, France3, TF1, M6, Canal+, Direct8), Deutschland (ARD1, ZDF, RTL, Sat.1, Pro7, Vox), Irland (RTE1, RTE2, TV3), Italien (Rai1, Rai2, Canal5, Italia1, La7, Fox Life), Polen (TVP1, TVP2, TVN, Polsat, TV4, Canal+), Rumänien (TVR1, Pro TV, Prima TV, Antena1), Spanien (TVE1, La2, Antena3, TeleCinco, Cuatro, La Sexta), Schweden (SVT1, Kanal5, TV3, TV4) und Großbritannien (BBC1, BBC2, ITV1, Channel4, Five, Sky One).

39
Wenn man nur die Hauptsendezeit betrachtet, liegen die Zahlen sogar noch höher. Die Sender mit den höchsten Anteilen an europäischen Werken sind öffentlich-rechtliche21 Sender in südlichen, älteren und größeren europäischen Mitgliedstaaten.
• UNABHÄNGIGE WERKE: Unabhängige europäische Werke machen 31% der gesamten qualifizierenden Sendestunden in 2007 aus im Vergleich zu 33,4% der gesamten anrechnungsfähigen Sendestunden. In der Hauptsendezeit liegen die Anteile höher. Bei Pay-TV werden normalerweise wesentlich weniger unabhängige Produktionen gezeigt als bei Sendern mit freiem Empfang. Mehr unabhängige Produktionen werden auf den Privatsendern in nördlichen, älteren und größeren Mitgliedstaaten gezeigt. Bei genauerer Betrachtung der Situation zur Hauptsendezeit wird ersichtlich, dass führende Privatsender aus kleinen und älteren Mitgliedstaaten wesentlich mehr unabhängige Produktionen bieten.
• NEUE WERKE: Bei unserer Stichprobe machten in 2007 unabhängige europäische Werke durchschnittlich 84,4% der gesamten Sendezeit von unabhängigen europäischen Werken aus im Vergleich zu 91,7% der gesamten Zuschauerstunden bei den Zuschauerstunden für völlig unabhängige Werke.
• SITUATION EINZELNER RUNDFUNKSENDER: Die einzelnen Sender hängen stark von den Marktbedingungen und der kulturellen Dynamik vor Ort ab. Eine vollständige Analyse der einzelnen Mitgliedstaaten ist in diesem Bericht enthalten.
Ansichten aus der Branche: Rundfunksender und Produzenten
• ZIELSETZUNG: Unser Verständnis der Auswirkungen von Artikel 4
und 5 auf der Basis der Meinungen von Interessenvertretern zu erweitern.
• METHODIK: Wir haben maßgeschneiderte Fragebögen an über 230 der wichtigsten Interessenvertreter22 in der europäischen Branche der audiovisuellen Medien versandt und über 71 Antworten aus 24 Mitgliedstaaten erhalten.
• UMFANG VON AUFTRAGSPRODUKTIONEN IST VON DER EINNAHMENSTRUKTUR DES RUNDFUNKSENDERS ABHÄNGIG: Kommerzielle Rundfunksender neigen dazu, einen etwas höheren Anteil ihres Programmbudgets (51%) auf zugekaufte Sendungen aufzuwenden und einen wesentlich niedrigeren Anteil (18%) auf Eigenproduktionen. Im Gegensatz dazu neigen öffentlich-rechtliche
21 ‘Öffentlich-rechtlich’ schließt Rundfunksender mit Mischfinanzierung ein. 22 Zu den Interessenvertretern gehören Rundfunksender (öffentlich-rechtlich – einschließlich Rundfunksender mit Mischfinanzierung - und privat finanziert), unabhängige Produzenten, Handelsgremien, Aufsichtsbehörden und reine VoD-Anbieter (Reiner VoD-Anbieter: Anbieter eines VoD-Dienstes (Abrufdienstes) ohne Anbindung an traditionelle lineare Rundfunksender, die Catch-up-Dienste anbieten (und in manchen Fällen Archivinhalte nur für diesen Rundfunksender anbieten), wird im allgemeinen von Kabelunternehmen, Telekommunikationsfirmen, der Filmindustrie oder unabhängigen Internetanbietern angeboten).

40
Rundfunksender zu starken Investitionen in Eigenproduktionen (58%) und geben weniger (16%) für den Zukauf von Produktionen aus.
• MEHRZAHL DER AUFTRAGSPRODUKTIONEN FÜR PROGRAMMFORMATE ERFOLGT DURCH KOMMERZIELLE RUNDFUNKSENDER: Im Durchschnitt wird 10% des gesamten Programmbudgets von kommerziellen Rundfunksendern in Auftragsproduktionen in Programmformate investiert.23 Bei öffentlich-rechtlichen Rundfunksendern liegt die Investitionsquote meist zwischen 0% und 3%.
• DER TREND GEHT ZU MEHR EXTERNEN AUFTRAGSPRODUKTIONEN: Über 70% der Befragten (sowohl private als auch öffentlich-rechtliche Sender) gaben an, dass der Anteil der externen Auftragsproduktionen in den letzten fünf Jahren zugenommen habe.
• WAHL VON AUFTRAGSPRODUKTIONEN HÄNGT VOM GENRE AB: Nachrichten sind großteils Eigenproduktionen, während Kino- und Dokumentarfilme meist extern produziert werden. Bei Fernsehfilmen und Unterhaltungs- und Magazinsendungen ist der Ursprung etwas ausgeglichener, zwischen 20% und 50% sind Eigenproduktionen und zwischen 40% und 70% sind unabhängige Produktionen.
• ZUKÄUFE SIND IM ALLGEMEINEN BILLIGER ALS AUFTRAGSPRODUKTIONEN: Über alle Genres gesehen, mit Ausnahme von Sport und Fernsehspielen, gaben über 65% der Rundfunksender an, dass die Kosten für zugekaufte Sendungen über 80% geringer seien als für Auftragsproduktionen.
• IN DEN USA PRODUZIERTE ZUKÄUFE WEITERHIN BELIEBT: Etwas über die Hälfte der Zukäufe von Rundfunksendern kamen aus den USA und etwas unter 25% aus anderen europäischen Ländern. Alle Rundfunksender gaben an, dass Spielfilme und Fernsehfilme von außerhalb Europas (hauptsächlich aus den USA) attraktiv und zur Hauptsendezeit sehr erfolgreich seien.
• ERSTAUSSTRAHLER IMMER NOCH DIE HAUPTQUELLE BEI DER FINANZIERUNG VON SENDUNGEN: Bei allen Genres stammt die Finanzierung zu über 85% vom Erstausstrahler und zwischen 1% und 7% von einem Zweitausstrahler oder einem Koproduzenten24.
• ÜBER DREI VIERTEL DER BEFRAGTEN WIRKEN BEI KOPRODUKTIONEN MIT – MEIST IM INLAND ODER INNERHALB EUROPAS: Etwa 86% der Rundfunksender und 75% der unabhängigen Produzenten wirken an Koproduktionen mit. Sowohl Produzenten als auch Rundfunksender nannten
23 Format wird definiert als eine Sendung, die zur regionalen Ausstrahlung in mindestens einem anderen Markt als dem ursprünglichen Markt vor Ort überarbeitet wird, wobei eine Lizenzgebühr zu entrichten ist, z.B. Wer wird Millionär, Alles Betty. 24 Der Erstausstrahler ist der Hauptauftraggeber und behält meist die Erstausstrahlungsrechte bei, während der Zweitausstrahler oder Koproduzent einen Teil der Produktion mitfinanziert, um sich andere Ausstrahlungsrechte für das In- und Ausland zu sichern.

41
einheimische Koproduktionen und Koproduktionen mit anderen europäischen Produzenten als die gängigste Variante.
• RUNDFUNKSENDER ERWARTEN, DASS SIE DIE MEISTEN IHRER RECHTE IM EINHEIMISCHEN MARKT BEIBEHALTEN: Alle Rundfunksender gaben an, dass sie bei externen Auftragsproduktionen die Rechte für die Erstausstrahlung (und Wiederholungen) für terrestrische Ausstrahlung und für neue Medien (einschließlich der Abrufrechte) erwarten, während etwa 81% angaben, dass sie Zweitausstrahlungen im einheimischen Markt und sonstige Rechte im einheimischen Markt erwarten.
• FIKTION UND SPIELFILME WURDEN ALS ERFOLGREICHE EUROPÄISCHE EXPORTE UND IMPORTE ERMITTELT: Fiktion und Spielfilme wurden von den Rundfunksendern als am erfolgreichsten im internationalen Markt eingestuft, während Nachrichten und Magazinsendungen als regional betrachtet wurden, deren Verkauf ins Ausland unwahrscheinlich sei. Sport, Dokumentarfilme, Fiktion und Spielfilme wurden alle als mögliche europäische Importe eingestuft, während Nachrichten und Magazinsendungen niedrig bewertet wurden. Nur das Unterhaltungsformat und das Format Factual Entertainment/Reality-TV wurden zu über 50% als exportierbar eingestuft.
Ansichten aus der Branche: Abrufdienste
• ZIELSETZUNG: Untersuchung der Ansichten der Haupt-
Interessenvertreter zu den Programmstrategien und zum Angebot von Abrufdiensten sowie ihrer Ansichten zu Inhaltsstrategien und regulatorischen Fragen.
• METHODIK: Es wurden Fragebögen zum Sammeln von quantitativen und qualitativen Daten von 50 nicht-linearen (Abruf) Diensten (35 Rundfunksender und 15 reine VoD-Anbieter) erstellt. Zusätzlich wurden zur Untersuchung des Konzepts “Herausstellung” unabhängig davon 29 nicht-lineare Dienste analysiert.
• DIE MEHRZAHL DER ABRUFDIENSTE DER BEFRAGTEN WURDE ÜBER DAS INTERNET ODER ÜBER IPTV ANGEBOTEN: Fast alle Befragten, sowohl Rundfunksender als auch reine VoD-Anbieter bieten Inhalt über Abrufdienste an, die über das Internet oder über IPTV vertrieben werden. Während Rundfunksender auch Mobilfunk (40%) und Kabel (32%) nutzen, verwenden reine VoD-Anbieter hauptsächlich Kabel (25%) als ihre sekundäre Distributionstechnologie.
• DIE ANGEBOTENEN GENRES UNTERSCHEIDEN SICH BEI RUNDFUNKSENDERN UND REINEN VOD-ANBIETERN: Rundfunksender bieten im Allgemeinen eine ausgeglichene Mischung von Live-, Archiv- und seit neuestem auch Catch-up-Material im Rahmen ihrer VoD-Dienste an, mit einer ausgeglichenen Mischung von Genres. Reine VoD-Anbieter zeigen eine deutliche Vorliebe für Archivmaterial mit Schwerpunkt auf Kino, Fernsehspiele und Dokumentarfilme.

42
• IM ALLGEMEINEN IST DER EUROPÄISCHE INHALT DER WICHTIGSTE BESTANDTEIL DER KATALOGE VON ABRUFDIENSTEN: Bei dieser Umfrage gaben von den Befragten nur 17% der reinen VoD-Anbieter und 12% der Rundfunksender an, dass ihre Kataloge weniger als 25% europäischen Titel enthielten. Rundfunksender haben normalerweise 100% europäische Inhalte, da sie im Allgemeinen ihre linearen Programme in ihren Abrufdiensten wiederholen außer den Titeln, für die sie nicht über die Abrufrechte verfügen. Im Gegensatz dazu gaben 33% der reinen VoD-Anbieter an, dass ihre Kataloge zwischen 25% und 75% europäische Titel enthalten.
• REINE VOD-ANBIETER GEBEN KEIN GELD FÜR AUFTRAGSPRODUKTIONEN AUS: Die reinen VoD-Anbieter unter den Befragten teilten 100% ihres Programmbudgets für Zukäufe zu, davon entfielen mindestens die Hälfte auf außereuropäische Importe. Im Gegensatz dazu gaben die Abrufdienste der Rundfunksender an, dass sie etwa 75% ihrer Abrufbudgets auf nationale Auftragsproduktionen verwenden, obwohl diese Zahl einen Anteil eines sehr begrenzten Budgets darstellt.
• DIE MEISTEN NICHT-LINEAREN DIENSTE SIND FÜR DEN VERBRAUCHER KOSTENLOS: Von den Rundfunksendern, die an der Umfrage teilnahmen, benutzen 41% Werbung zur Finanzierung ihres gesamten oder eines Teil ihres Abrufdienstes. Öffentliche Subventionen sind für 23% der Rundfunksender, die an der Umfrage teilnahmen, die einzige Einnahmequelle. Im Gegensatz dazu stammt der Großteil der Einnahmen von reinen VoD-Anbietern, die an unserer Umfrage teilnahmen, nur aus direkten Zahlungen von Verbrauchern, entweder als Abonnement oder als Pay-per-View.
• ANBIETER ERACHTEN EUROPÄISCHE PROGRAMME ALS WICHTIG: Die meisten der Abrufdienste, die an der Umfrage teilnahmen, unabhängig davon, ob es sich bei diesen um Rundfunksender oder reine VoD-Anbieter handelte, sind der Ansicht, dass europäische Programme insgesamt eine sehr gute Wahl für ihre Dienste darstellen. Es gibt dazu jedoch einige Vorbehalte: Europäische Programme werden als teuer betrachtet, die nicht einfacher zu erwerben sind als außereuropäische Inhalte und werden nicht unbedingt als der beste Weg zur Werbung europäischer Verbraucher betrachtet.
• HERAUSSTELLUNG: Herausstellung ist ein wesentliches Konzept, wenn man sich damit befasst, wie europäische Werke von Abrufdiensten gefördert werden. Herausstellung kann in zwei Dimensionen analysiert werden: aktive Herausstellung (bietet der Dienst die Möglichkeit, Titel nach dem Ursprungsland der Produktion zu durchsuchen und werden die Informationen zum Ursprung der Produktion zusammen mit der Beschreibung der Titel angeboten?) und passive Herausstellung (wie hoch ist der Anteil der europäischen Werke unter den Titeln, die dem Verbraucher beim Zugriff auf den Dienst über dessen Homepage und beim Blättern durch die verschiedenen Abschnitte gezeigt werden?)

43
In Bezug auf die aktive Herausstellung zeigt unsere Analyse auf, dass Abrufdienste es Verbrauchern nur selten ermöglichen, Titel nach dem Ursprungsland der Produktion (oder nach Sprache) auszuwählen. Bei der Hälfte der Dienste in unserer Stichprobe wird das Ursprungsland in der Beschreibung der Titel angegeben. Bei der Berücksichtigung des Ursprungs der Titel, die “automatisch” auf dem Bildschirm erscheinen (passive Herausstellung), lag der Anteil der Titel europäischen Ursprungs, die von den 29 Abrufdiensten in unserer Stichprobe ‘angepriesen’ wurden, im Durchschnitt bei 54%. Es gab jedoch große Unterschiede zwischen den Diensten.
Überwachungsmethoden für Artikel 3i
• ZIELSETZUNG: Bestimmung und Beurteilung möglicher
Leistungsindikatoren und Verfahrensweisen für die Überwachung gemäß Artikel 3i.
• METHODIK: Es wurden verschiedene Verfahren und Indikatoren untersucht und besprochen. Fragen, die zur Erfassung der Ansichten von Interessenvertretern zur Angemessenheit von Verfahrensweisen und Indikatoren ausgelegt waren sowie die Erfassung von tatsächlichen Daten, die auf allen vorgeschlagenen Indikatoren basieren, wurden in die Umfrage unter den Interessenvertretern mit aufgenommen.
• IST SELBSTAUSKUNFT ANGEMESSENE VERFAHRENSWEISE FÜR NICHT-LINEAR: Derzeit sind Selbstauskünfte die geeignetste Verfahrensweise zur Erfassung von Daten zur Anwendung von Artikel 3i. Die Umfrage hat gezeigt, dass die Erfassung von Daten durch Selbstauskunft möglich ist. Wir sind der Ansicht, dass sich die Anzahl der empfangenen Daten verbessern wird, wenn es gesetzlich vorgeschrieben ist.
• UNABHÄNGIGE BEURTEILUNG VON NICHT-LINEAREN DIENSTEN DERZEIT NICHT ANGEMESSEN: Daten, wie sie bei der bewährten Fernsehzuschauerforschung (Television Audience Measurement - TAM) für die unabhängige Beurteilung von linearen Diensten zur Verfügung stehen, gibt es für nicht-lineare Dienste derzeit noch nicht. Alternativen zu TAM-Daten wie etwa ‘Web-Harvesting’ Software zum Kopieren von Informationen von Abrufkatalogen in Datenbanken oder Berater, die diese Aufgabe manuell durchführen, sind im ersten Fall aus rechtlichen Gründen und im zweiten Fall aus zeitlichen und finanziellen Erwägungen nicht angemessen. Wir wollen jedoch die Entwicklung einer vereinbarten Technologie zum Sammeln entsprechender Daten in der Zukunft nicht ausschließen, wenn die rechtlichen Einwände ganz ausgeräumt sind.
• INDIKATOREN AUF KATALOGEBENE AM BESTEN GEEIGNET: Von allen Befragten wurde der Anteil an den Katalogtiteln als der beste Indikator bezeichnet (mit Ausnahme der Produzenten, die finanzielle Aspekte und Nutzung als die wichtigsten Indikatoren erachteten). Daraus ist der Anteil der europäischen Inhalte, die als nichtlineare Dienste erhältlich sind, klar erkennbar. Der Anteil der

44
Katalogstunden wurde von den meisten Befragten ebenfalls als ein guter Indikator betrachtet, damit wurden Bedenken ausgeräumt, dass Kataloge mit Inhalten in Kurzform gefüllt werden, nur um den Indikator auf Titelebene zu erfüllen. Als diese Indikatoren auf einzelne Dienste angewendet wurden, stellten wir fest, dass die meisten Dienste über 80% europäische Titel und Stunden aufweisen und viele sogar 100%. Reine VoD-Anbieter führten meist einen kleineren Anteil von europäischen Titeln in ihrem Angebot als die von Rundfunksendern angebotenen Dienste. Die von Rundfunksendern angebotenen Dienste wiederholten oft ihr lineares Angebot über ihren nicht-linearen Dienst außer den Sendungen, bei denen sie nicht über die Abrufrechte verfügen (meist außereuropäischer Inhalt). Das ist bei reinen VoD-Anbietern nicht der Fall und möglicherweise der Grund dafür, dass der Anteil von EU-Inhalten bei den Diensten der Rundfunksender höher liegt als bei den Diensten von reinen VoD-Anbietern.
• BEIM FINANZIELLEM BEITRAG MUSS VORSICHTIG VORGEGANGEN WERDEN: Bei diesem Indikator waren die Meinungen geteilt, von den Produzenten wurde er befürwortet, bei den Rundfunksendern und reinen VoD-Anbietern traf er dagegen auf starke Ablehnung. Diese Daten werden als streng vertraulich betrachtet und da die Zahlen, die derzeit im Gespräch sind, relativ niedrig sind, können die Daten zu diesem Zeitpunkt wenig aussagen. Da Daten zu finanziellen Beiträgen jedoch in der Richtlinie ausdrücklich als eine Möglichkeit genannt werden, schlagen wir zu diesem Zeitpunkt einen einfachen Indikator vor: Die zuständigen Behörden in den Mitgliedstaaten könnten von den Anbietern verlangen, dass sie einen Betrag für die jährlichen Aufwendungen für den Inhalt angeben und einen Betrag für den ungefähren Anteil, der auf europäische Werke aufgewendet wurde.
• NUTZUNGSDATEN ZU DIESEM ZEITPUNKT NOCH NICHT ANGEMESSEN: Mit Ausnahme der Produzenten wurden Nutzungsdaten als Indikator von den Befragten nicht befürwortet, vor allem deshalb, weil es sich dabei um vertrauliche Daten handelt und sie von linearen Anbietern nicht verlangt werden. Da es keine Datenquelle gibt, die mit den TAM-Daten für lineare Dienste vergleichbar ist, sind zuverlässige Nutzungsdaten zur unabhängigen Überprüfung oder Kontrolle derzeit nur sehr schwer erhältlich. Datenquellen für nicht-lineare Dienste, die denen nach TAM ähnlich sind, können in Zukunft zur Verfügung stehen und dann als ein Indikator verwendet werden.
• ‘HERAUSSTELLUNG’ IST EIN OFFENER BEGRIFF MIT VIELEN MÖGLICHEN INDIKATOREN UND SOLLTE ZU DIESEM ZEITPUNKT NOCH NICHT ZU STRENG ANGEWENDET WERDEN: Viele verschiedene Indikatoren wie etwa die Möglichkeit, nach Ursprungsland zu suchen bis hin zum Anteil der Seiten nur mit europäischen Inhalten sind mögliche Indikatoren zur ‘Herausstellung’. Es gab Bedenken bei der Umfrage und im Workshop, dass zu viele Verordnungen die kreative Entwicklung von nicht-linearen Diensten beschränken könnten. Aus den Kommentaren beim Workshop wurde deutlich, dass dieses Thema von den Mitgliedstaaten noch genauer erörtert werden muss. Zu
45
diesem Zeitpunkt schlagen wir daher vor, die Richtlinien relativ weit zu fassen.
Allgemeine Schlussfolgerungen
• Die Umsetzung von Artikel 4 und 5 ist in den einzelnen Mitgliedstaaten in Bezug auf die Anwendung der gesetzlichen Bestimmungen und die Anzahl der zusätzlichen Anforderungen unterschiedlich.
• Die Umsetzung von Artikel 4 und 5 ist in den Mitgliedstaaten, die an der Studie in 2005 beteiligt waren, zum großen Teil gleich geblieben.
• Durch die Abrufdienste und die zunehmende Fragmentierung wird die 78,1 Mrd. € Fernsehindustrie in Europa komplexer. Abrufdienste machen mit 400 Mio. € jedoch nur einen geringen Teil dieser Einnahmen aus.
• Bei linearen Diensten bleibt Fernsehen mit freiem Empfang das beliebteste Geschäftsmodell. Bei den von Rundfunksendern angebotenen nicht-linearen Diensten setzt sich dieser Trend fort, die meisten bieten einen Teil des Inhalts oder den gesamten Inhalt kostenfrei an. Nicht-lineare Dienste, die nicht an Rundfunksender angebunden sind, bevorzugen jedoch Geschäftsmodelle, bei denen Verbraucher für ihre Dienste bezahlen.
• Obwohl es bei den Beträgen, die lineare Rundfunksender auf Zukäufe und Auftragsproduktionen aufwenden, Unterschiede gibt, zeigt sich bei ihren nicht-linearen Diensten ein einheitlicheres Bild, d.h., 75% des Budgets für nicht-lineare Dienste von Rundfunksendern entfallen auf Auftragsproduktionen. Rundfunksender benötigen normalerweise die Rechte für Abrufdienste bei Auftragsproduktionen, aber der Erwerb von neuen Medienrechten für Zukäufe ist schwieriger. Bei reinen VoD-Anbietern, die sich stark auf Zukäufe verlassen, sieht es wieder anders aus.
• Nicht-lineare Dienste haben meist nahezu oder genau 100% europäische Inhalte in ihren Katalogen, während sich reine VoD-Anbieter wesentlich mehr auf nicht-europäische Inhalte verlassen. Das ist vor allem darauf zurückzuführen, dass reine VoD-Anbieter mehr Zukäufe für ihre Dienste verwenden.
• Bei unserer Analyse von linearen Diensten haben wir festgestellt, dass die meisten der befragten Sender die Anforderungen von Artikel 4 und 5 erfüllt haben. In unserer Stichprobe wiesen 62,4% der anrechnungsfähigen Sendestunden einen europäischen Inhalt auf und bei 31% handelte es sich um unabhängige europäische Werke, von denen 84,4% weniger als fünf Jahre alt waren.
• Durch die erstmalige Aufnahme von Zuschauerzahlen als ein Indikator in dieser Studie stellten wir fest, dass die Anzahl der Zuschauerstunden durchgehend höher liegt als der Anteil für die Sendezeit mit europäischen Inhalten (62,4% der anrechnungsfähigen Sendestunden sind in unserer gesamten
46
Stichprobe europäisch, im Vergleich zu 74% der Zuschauerstunden; 31% der qualifizierenden Sendestunden entfallen auf europäische unabhängige Produktionen im Vergleich zu 33,4% der Zuschauerstunden). Damit wird angezeigt, dass europäische Inhalte und unabhängige Produktionen bei Zuschauern in den an der Umfrage beteiligten Mitgliedstaaten beliebt sind.
• Wir haben festgestellt, dass trotz der Frist für die Umsetzung der neuen Richtlinie im Dezember 2009 und einer nicht-linearen Branche, die noch im Entstehen begriffen ist, nur wenige Mitgliedstaaten Artikel 3i umgesetzt oder entsprechende Maßnahmen festgelegt haben und im Lauf von 2009 noch viele Gespräche zur Anwendung von Artikel 3i stattfinden müssen. Aus dem Workshop hat sich ergeben, dass weitere Gespräche in den Mitgliedstaaten und mit den Interessenvertretern notwendig sind.
• Zu diesem Zeitpunkt sind wir der Ansicht, dass Selbstauskünfte die geeignetste Verfahrensweise zur Erfassung von Daten zur Kontrolle der Einhaltung von Artikel 3i darstellen. Für unabhängige Beurteilungen sind ähnliche Daten erforderlich wie sie für lineare Dienste erhältlich sind (Fernsehzuschauerforschung - Television Audience Measurement), für nicht-lineare Dienste stehen sie derzeit noch nicht zur Verfügung. Beim Workshop wurden die Erarbeitung dieser Dienste und die Unterstützung durch die Kommission und Mitgliedstaaten gefordert, zum Beispiel bei der Erarbeitung von Industriestandards für Daten, die den Anbietern bei der Berichterstattung an die zuständigen Behörden in den Mitgliedstaaten mit Leistungsindikatoren behilflich sind.
• Zu diesem Zeitpunkt sind wir der Ansicht, dass die folgenden Leistungsindikatoren die zuverlässigsten Daten zu europäischen Inhalten auf nicht-linearen Diensten liefern: Anteil der Katalogtitel europäischen Ursprungs, Anteil der Katalogstunden europäischen Ursprungs, Anteil der Gesamtaufwendungen für Inhalte für europäische Werke.
• Nutzungsdaten sind zu diesem Zeitpunkt noch nicht geeignet, vor allem weil sie vertraulich sind und keine zuverlässige, unabhängige Datenquelle vorliegt. Wenn in Zukunft jedoch eine zuverlässige Datenquelle für Nutzungsdaten vorliegt (wie sie für lineare Dienste bereits zur Verfügung steht), sollten Nutzungsdaten für nicht-lineare Dienste auf jeden Fall als ein Indikator in Betracht gezogen werden.
• ‘Herausstellung’ war der umstrittenste Leistungsindikator, der von uns beurteilt wurde und wurde beim Workshop ausführlich besprochen. Der Begriff ist nicht eindeutig definiert, d.h., dass mehrere Interpretationen möglich sind und es bestehen Bedenken bei den Interessenvertretern, dass strenge Vorschriften die kreative Freiheit für neue Dienst einschränken könnten. Wir sind der Ansicht, dass zu den Indikatoren zu ‘Herausstellung’ weitere Gespräche unter den Mitgliedstaaten erforderlich sind.
47
2. Project Overview The following pages summarise the key sections of the study in detail. The numbers in brackets refer to the appropriate section of the main report.
2.1. Introduction
Article 25(a) of the Television Without Frontiers Directive (‘TVWF’) included a provision for “an independent study on the impact of measures concerning the promotion of distribution and production of television programmes at Community and national levels”. The measures at Community level to promote programme making and programme distribution are contained within Articles 4 and 5 of the TVWF. Articles 4 and 5 place requirements on Member States to ensure that broadcasters under their jurisdiction devote a majority of transmission time to European works and at least 10% of transmission time (or programme budget) to European independent productions. The independent study was completed in 2005 by a consortium led by Attentional Limited (then known as David Graham & Associates), which included Oliver & Ohlbaum, Carat Expert and Arena Audiovisual.
On 11 December 2007, the European Parliament and Council adopted Directive 2007/65, amending the TVWF Directive. Further to Directive 2007/65, the name of the amended TVWF was changed to the “Audiovisual Media Services Directive”. Directive 2007/65 must be implemented by the Member States by 19 December 2009. It may be noted that Directive 2007/65 did not make any amendments to Articles 4 and 5 of TVWF.
A notable aim of the amendments contained in Directive 2007/65 was to include non-linear audiovisual media services within the scope of the Directive. One of the new provisions introduced in this regard is Article 3i, which places requirements on Member States to ensure that non-linear service providers under their jurisdiction promote the production of and access to European works.
In order to provide the European Commission with the elements required to continue monitoring and evaluating Articles 4 and 5, and to commence monitoring Article 3i, the Commission requested this independent study to be carried out, covering the situation as regards promotion of European works on linear and non-linear services at the end of 2007.
This study builds on the previous study on Articles 4 and 5 from 2005. The 2005 study covered 17 countries; these countries are referred to as

48
“the E17”.25 The remit of the present study covers the 27 Member States of the European Union as of 2007 and the 3 Member States of the European Free Trade Association who participate in the European Economic Area. Collectively, these 30 countries are referred to as “the E30”.26 These 30 Member States were investigated for the legal and economic overview components of the study. For the specific analysis of the promotion of European and Independent European works on linear services, and the promotion of European works on non-linear services, a representative sample of 11 Member States was selected after careful discussions between the consortium and the Commission's steering group.27
2.2. Modes of Implementation: Legal
Report Description and analysis of the implementing measures taken by the EU and EEA Member States pursuant to Articles 4 and 5, and any measure currently adopted pursuant to Article 3i
The report identifies how the 30 Member States covered in the legal analysis have implemented Articles 4 and 5 in national legislation as of 1 January 2008 and describes the additional content requirements that some Member States place on broadcasters. [4]
The report also identifies any national provisions regarding on-demand audiovisual services which were in effect as of 1 January 2008, and have the effect of promoting European Works within non-linear services, in line with Article 3i of the Directive.
Key findings
How Articles 4 and 5 are implemented
Articles 4 and 5 of the Directive exist to create minimum standards for the national measures on linear services. Member States have transposed Articles 4 and 5 into national law using a combination of primary legislation and secondary legislation. [5.1]
25 E17 countries include: UK, Germany, France, Italy, Spain, Portugal, Denmark, Finland, Norway, Iceland, Ireland, The Netherlands, Belgium, Luxembourg, Austria, Greece and Sweden. 26 E30 countries include: E17 + Latvia, Lithuania, Liechtenstein, Bulgaria, Poland, Slovenia, Slovakia, Czech Republic, Malta, Cyprus, Estonia, Romania and Hungary. 27 The sample Member States are Belgium, Estonia, France, Germany, Ireland, Italy, Poland, Romania, Spain, Sweden and the United Kingdom.

49
The Directive defines total qualifying hours as a channel’s transmission time “excluding the time appointed to news, sports events, games, advertising, teletext services and teleshopping”. The majority of the E30 have transcribed the definition directly into national legislation. Only France, Germany, Italy and the UK have adopted approaches significantly different to the Directive, with the major differences found in France and Germany. France distinguishes between audiovisual works and cinematographic works and applies different requirements to each of these two groups. Germany defines what is included as qualifying hours: feature films, television movies, series, documentaries and comparable productions. [5.1.1]
Articles 4 and 5 of The Directive contain the qualifying term ‘where practicable’. Certain Member States – for example Austria, Belgium (Flemish Community), Czech Republic, Denmark, Greece, Iceland, Luxembourg, Spain and Sweden – have incorporated the wording ‘where practicable’ into national legislation, which we consider to be a more flexible approach than when this phrase is absent. [5.1.3]
The Directive does not contain a definition of ‘independent producer’, but states that the definition applied by Member States should take account of criteria “such as the ownership of the production company, the amount of programmes supplied to the same broadcaster and the ownership of secondary rights”.28 Some Member States do not define the term ‘independent producer’ in their legislation.29 The remaining Member States utilise a combination of elements when creating their national definitions of ‘independent producer’. Requirements on ownership are applied by a clear majority of these Member States. For example, in France, in order for a production company to qualify as independent, a broadcaster may hold no more than 15% of the share capital in the company, and the company may hold no more than 15% of the share capital of a broadcaster. Programme supply requirements are found in about half of the Member States, and a comparable number of Member States have adopted other elements that concern the actual ability of the producer to conduct his business unhindered by intervention from a broadcaster (e.g. capacity to exercise actual control over the production, or the producer not being an employee, board member, etc. of the broadcaster). Criteria based on secondary rights are only applied by Norway, Latvia and France. [5.1.4]
Article 5 of the Directive establishes that Member States may choose whether broadcasters must reserve either at least 10% of their transmission time or at least 10% of their programming budget for independent productions. Nearly all Member States have chosen to apply a transmission time requirement, or to let the broadcasters choose between adherence to a percentage of programming budgets or a percentage of transmission time. However, Hungary requires broadcasters to reserve both 10% of transmission time and 12% of programming budget, and Portugal requires the public service channel RTP 2 to reserve at least 10% of its programming budget. France and Italy have a very 28 Directive 2007/65, Recital 49 29 Austria, Belgium (Flemish Community), Cyprus, Denmark, Germany, Malta and Sweden.

50
different approach, since they require broadcasters to reserve a certain percentage of their entire annual turnover (a figure which will always be higher than the broadcasters’ programming budget); Italy requires broadcasters to reserve 10% of their turnover for independent productions, while France generally requires broadcasters to reserve 10.66% of turnover for audiovisual independent productions and 2.4% of turnover for cinematographic independent productions. [5.1.5]
The standard methodology employed by Member States to monitor adherence to Articles 4 and 5 is to require broadcasters to submit transmission returns, giving the volume of European works and independent productions they broadcast. Some Member States take additional steps to verify the accuracy of the data provided by broadcasters, either by verifying the returns received from broadcasters or by direct monitoring of broadcasts: this includes Belgium, Bulgaria, Cyprus, Czech Republic, Estonia, France, Ireland, Italy, Netherlands, Spain, Poland and Portugal. For example, in France, the Conseil Supérieur de l’Audiovisuel (CSA) categorises every programme broadcast on public service TV to check the broadcasters’ statements, and collects samples of contracts between broadcasters and producers. In Italy, the regulator (AGCOM) has commissioned a service provider to monitor all terrestrial analogue channels and a smaller sample of satellite and DTT channels, and this data is then compared with the transmission returns from the broadcasters. [5.2.1]
In certain Member States – Austria, Cyprus, Iceland, Ireland and Sweden – the regulator has no legal powers to apply sanctions. In Austria, the regulator may fine a broadcaster who fails to submit returns, but cannot apply sanctions on a failure to meet the requirements of Articles 4 and 5. In the remaining Member States, regulatory authorities have a range of powers at their disposal to encourage adherence to the Directive, from warnings to the imposition of fines and – in some Member States, and for the most serious cases – regulatory authorities can shorten or revoke a broadcaster’s licence. [5.2.2]
Article 3 of The Directive states that “Member States shall remain free to require television broadcasters under their jurisdiction to comply with more detailed or stricter rules in the areas covered by this Directive.” [5.3.1]
Seven Member States – Finland, France, Hungary, Italy, The Netherlands, Spain and the United Kingdom – apply higher percentage requirements for European works or independent productions than those contained in the Directive on some, or all, of their broadcasters. For example, France requires broadcasters to reserve at least 60% of transmission to European works. The United Kingdom has also set higher requirements on European works in some channel licences. Finland applies a 15% independent productions requirement on all broadcasters, while the UK, Slovakia and the Netherlands apply higher proportions on public service broadcasters. [5.3.2]
Almost all Member States place additional content requirements on broadcasters to reflect linguistic or cultural specificities in a Member State. Several Member States require that a certain proportion of broadcasting

51
time shall be programmes originally produced in the national language (or one of the national languages); examples include the Netherlands, Portugal, Latvia, France, Hungary, Poland and Greece. In addition, France requires terrestrial analogue channels to invest at least 16% of their turnover into such productions. [5.3.3]
The application of Articles 4 and 5 (whether the measures are applied flexibly or prescriptively), and the additional requirements placed on broadcasters in national legislation (low or high additional requirements), define four ‘implementation modes.’ [5.4]
Each Member State’s implementation mode is given below:
Application of Directive
Flexible Prescriptive
Hig
h
Spain Sweden
Bulgaria Finland France
Italy Netherlands
Poland Portugal Romania
United Kingdom
Ad
dit
ion
al
Req
uir
em
en
ts
Lo
w
Austria Cyprus
Czech Republic Denmark Germany Iceland Ireland
Lithuania Luxembourg
Malta
Belgium Estonia Greece Hungary Latvia
Norway Slovakia Slovenia
Only 3 Member States that were covered in the 2005 Study – Belgium, the Netherlands and Norway - have been assigned a different implementation mode from that which they had previously. The Netherlands and Norway have switched from “Flexible” to “Prescriptive”, while Belgium and Norway have been moved from “High” to “Low”. These alterations are due to a combination of changes in the legislation and an adjustment in the classification methodology since the 2005 Study.
On-demand audiovisual media services and European works
The report identifies any national provisions regarding on-demand audiovisual services which were in effect as of 1 January 2008 and have the effect of promoting European works within non-linear services, in line with Article 3i of the Directive (introduced by Directive 2007/65 of 19 December 2007, which must be implemented by the Member States by 19 December 2009). [6.1]

52
As of 1 January 2008, none of the Member States have implemented Article 3i, although Italy has adopted a provision that authorises the regulator AGCOM to carry out the implementation through the subsequent issuing of secondary legislation (such secondary legislation was, however, not issued in the first half of 2008). [6.2]
However, a few Member States (the French Community of Belgium and France) have adopted legislation that, although not adopted with the intention of implementing Article 3i, nevertheless in some way could have a similar objective and effect to Article 3i.
The 2003 legislation of the French Community of Belgium is based on a principle of technological neutrality, without any distinction between distribution platforms. This has led the regulator to consider non-linear television services as being subject to the same obligations as other television broadcasting services, including the obligations on European works, independent productions, French language programming and spending on audiovisual production. The regulator has actively applied these obligations to the first non-linear audiovisual service within its jurisdiction. [6.2.1]
France collects a 2% tax from Video-on-Demand service providers, calculated on the fees paid by consumers (exclusive of VAT). A voluntary inter-professional agreement of 20 December 2005 had also placed investment quotas for EU and French-originated cinematographic works on cinema-on-demand providers (between 3% and 10% of revenue, depending on the turnover of each provider), but this agreement expired on 20 December 2006 without being renewed. [6.2.2]
2.3. The European Supply Chain and Audiovisual Content Creation
This section of the report provides an analysis and description of the current market structure and revenue of the EU audiovisual (linear and non-linear) sector – encompassing both broadcasting and production - and the flow of funds through the European TV supply chain. [7]
The section updates a similar study completed for the European Commission in 2005 (“the 2005 study”)30 and regularly makes reference to the countries included in that previous study as E1731 in order to show comparable growth rates and highlight any changes in market structure.
30 Study on the impact of measures concerning the promotion of the distribution and production of television programs provided for under Art 25 (a) of the Directive on Television without Frontiers, 24 May 2005. 31 E17 countries include: UK, Germany, France, Italy, Spain, Portugal, Denmark, Finland, Norway, Iceland, Ireland, The Netherlands, Belgium, Luxembourg, Austria, Greece and Sweden.

53
The study also makes reference to the E30, which includes the 13 countries that were not included in the 2005 study32. [7]
Key findings
Market structure and the supply chain framework
The supply of TV services to viewers is made up of three broad and interrelated functions: the creation of new content; the management of individual TV broadcast channels; and the distribution of a channel, or group of channels, to viewing households by either terrestrial, satellite, cable or internet delivery systems. Sources of value added along this supply chain vary considerably. Original content can range from continuous studio-based programming with a handful of contributors to full action dramas shot in multiple locations with a large cast and crew. Distribution may simply be a technical transmission service (UHF/VHF terrestrial) while pay TV distribution can involve the packaging, retailing and marketing of a group of channels in encrypted form and entails subscriber management and billing services. Equally channel management varies at the level of value added: from large-scale commissioning of new programming and acquisitions from a number of sources, to the use of a limited number of already available programme libraries. The management of on-demand services varies yet further, from aggregating the on-demand services (particularly “catch-up”) offered by broadcasters, to negotiating separate rights deals with movie studios, content producers and rights holders, and packaging them into a service for users. [7.1]
Current market structure and flow of funds along the supply chain
Analysing each of the E30’s individual market structure and flow of funds in detail, we calculated total TV industry revenue of €78.1 billion in 2006, 93% (€72.8 billion) of which came from three main sources: licence fees (€17.8 billion – 23%); advertising and associated sponsorship (€28.3 billion – 36%); and consumer payments to pay TV, cable relay and VoD services (€26.2 billion – 34%). The main source of growth in the E17 countries is in consumer payments, which have grown 10.1% year-on-year since 2002. Both advertising and licence fees grew at just over 3% year-on-year, slightly above inflation. [7.2.1]
Considering each of the individual states in more detail, we identified significant variations in market structure and the drivers of revenue. The UK and Germany are by far the two largest TV markets in Europe; France and Italy – which have similar sized economies to that of the UK – are somewhat smaller. The UK and Italy have the most developed advertising markets among the larger nations, while France and the UK have the
32 E30 countries include: E17 + Latvia, Lithuania, Liechtenstein, Bulgaria, Poland, Slovenia, Slovakia, Czech Republic, Malta, Cyprus, Estonia, Romania and Hungary.

54
largest proportionate pay-TV markets. Public funding through licence fees is highest in Germany and the UK. TV revenue per household is highest in Norway and the UK due to their highly developed cable and satellite pay-TV markets. Among the next nine largest markets, pay TV is most developed in Ireland, Portugal and Romania, all of which enjoy pay TV penetration rates of over 50%. It is in these smaller markets that VoD revenues are proportionately highest, due to their developed pay-TV sectors. In the 10 smallest markets there are significant variations in market structure: the licence fee in Bulgaria, Slovenia and Iceland contributes over 25% to the overall TV market; in Slovakia, Lithuania and Latvia, pay and network advertising accounts for over 50% of the total market; and in Cyprus and Estonia, the pay TV market accounts for over 50% of total TV revenue. [7.2.1]
We also looked at how television services were distributed and delivered in each of the member states and found a complex combination of different systems. Each system in turn varies in the degree to which it provides free delivery or extracts a monthly charge. The four main delivery systems are UHF/VHF terrestrial frequencies, direct-to-home satellite, cable, and IPTV services using telecom networks. Analogue terrestrial still remains the most common form of distribution with 21% of homes receiving television signals through an analogue aerial receiver, however all Member States now have firm plans to move to digital terrestrial television (DTT), with switchover dates ranging from December 2008 (Germany) to December 2014 (Poland). The key trend emerging from our analysis of pay TV was a drive to digitise cable networks in Germany, Benelux and Scandinavia, which currently can only carry 20 to 40 analogue channels. Post digitisation these networks should be able to carry 100+ channels. Complementing this drive to digital has been the emergence of a new broadcast delivery platform over DSL broadband services, known as IPTV, which has already proved popular in France, Sweden and Norway. Direct-to-home satellite’s transfer to digital has been rapid and has increased the number of channels to well over 600 channels for the main national markets. [7.2.2]
The technical mix of distribution systems across Europe is, however, perhaps less important than the business models adopted across and within different TV systems. Free TV, where the signal is available to the consumer for no extra monthly charge once they have bought the necessary reception equipment, is available via satellite and terrestrial TV systems throughout Europe. Cable relay services are not quite free, as a small monthly charge is made – often through the local utility or housing association bill but – as they are charging just for technical delivery, rather than the TV channel or channels – it could be regarded as nearer free TV than pay TV. Subscription pay TV is available through all types of delivery system – cable, satellite, terrestrial and DSL – throughout Europe, and mainly in digital forms. Generally, pay TV consists of a basic package of news, children's, lifestyle, factual and specialist entertainment channels – anywhere from 30 to 400 – which cost between €15 and €25 a month, and a series of premium sports and movie channels that can be purchased on an à la carte basis – albeit with discounts for a larger

55
number of channels. Across the E30, average pay-TV penetration33 is approximately 31% and varies widely across markets. [7.2.2]
We also considered the influence of on-demand services on the overall structure of the TV market. We found that a substantial part of current on-demand offerings in the larger European markets are “catch-up” services from the main broadcasters (such as VRT’s Net Gemist service in Belgium and RTV’s internet service in Slovenia). In 2006, services had only been established in a small number of developed markets and even by the end of 2007 were generating almost no revenue – while it is feasible to insert advertising into these services, many are provided by the public broadcaster (and are thus advertising-free) and commercial services have only limited ability to measure audiences (and hence monetise them with advertisers). The number of services available varies considerably by market. France, the Netherlands and Germany have 32, 30 and 26 services available respectively, while some of the smaller nations, such as Estonia, Iceland and Slovenia, have only 2 or 3 services. We estimate that in 2006 on-demand services generated approximately €400m of revenue in the E30, representing just 0.5% of the TV industry. Within the report we profile four individual on-demand services. [7.2.3]
Considering channel management in more detail, we found that the market can be broken down into three main types – free TV channels (available to all the audience), basic tier pay-TV channels (which are available to subscribers as part of a pay-TV subscription), and premium pay-TV channels (for which an additional subscription fee is paid). Free TV channels can be divided into publicly funded channels and commercial, or advertiser funded channels34. Pay-TV channels also take advertising, but have an element of subscription fees – paid to them by the platform operators - in their revenue mix. Premium pay-TV channels often only take a very limited amount of advertising – their main selling point is to offer uninterrupted access to sport or movies – and subscription fees form the overwhelming majority of their revenue mix. [7.2.4]
We identified three basic programme scheduling choices for TV channels: from where to source programming (commissions vs. acquisitions vs. repeats); what genre to broadcast (drama, news, comedy, factual, stock vs. flow35); and sub-genre choices (e.g. a drama soap opera versus a one-off film). [7.2.5]
33 Pay-TV penetration in France and The Netherlands is skewed slightly due to very low subscription costs for households to access IPTV and digital cable services in these markets. In the Netherlands, low cost digital cable packages were promoted to encourage households to move from analogue cable during the digital switchover, while in France, fierce competition between broadband providers resulted in a number of free IPTV services being made available on the market. 34 Some, for example France Television and ARD/ZDF, take a mixture of public funding and advertising revenue. 35 A stock programme has repeat value and can be shown again at a later date, while flow programmes have little or no further value after the first showing (narrative repeats excluded). Examples of flow programming include news, sport, games, and some entertainment programming.
56
The European TV content creation sector was worth approximately €18.3 billion in 2006. Of this, €16.5 billion came from commissions by network channels and €1.8 billion from commissions by smaller channels36. Of this €18.3 billion, about €2.6 billion was spending on national and local news and sports coverage (spending on sports rights is excluded). Of the remaining €15.7 billion, an estimated 43% (€6.8bn) was spent on commissions from external producers and around 57% was invested in in-house production37. [7.2.6]
Main network channels account for about 57% of gross industry revenue but over 90% of all new commission spending. Secondary channels tend to be carried within pay-TV packages, where a large proportion of revenues either go to the platform providers or is spent on premium acquisitions, such as top feature films or sport. [7.2.6]
Within the content creation section we also considered the profitability of production. The profitability of an individual production company tends to follow a cyclical trend in terms of profit margin. Margins are disproportionately impacted by hit commissions that in the long term (depending on terms of trade) generate significant ancillary and overseas revenue for the producer. Contrastingly, a ‘flop’ commission will adversely impact profit margins. Over the last few years, independent producers have become increasingly reliant on secondary and ancillary revenues to drive profits, with commission spending by broadcasters generally only covering the production cost for the producer. The position of the production company when it comes to retaining a financial interest in the content varies significantly by Member State. Many states do not have explicit terms of trade – all exploitation rights pass to the commissioning broadcaster. However, a small number of states (typically those with the most developed independent production sectors) allow the producer to retain some rights and for those rights to revert to the producer after a certain period of time. The UK and France are the markets where producers have most rights retention. Other markets are known to be studying the relative success of the production sector in these two markets with a view to potential changes to their own position on rights. [7.2.6]
There is considerable vertical integration along the TV value chain. Our analysis suggests that 57% of non-news programming is made by in-house departments within broadcasters, with the remaining 43% split between independent producers and some third-party producers owned by broadcasters38. Similarly, a very high proportion of premium pay-TV channels are owned by pay-TV platform owners, while both main network channel broadcasters and pay-TV platform owners are the main owners of smaller basic tier and free-to-air channels across Europe. [7.2.9]
36 Revenue from direct subsidies (of approximately €0.3m), and direct income to producers from the exploitation of ancillary rights such as international programme sales, DVDs, licensing and merchandising (approx €0.8m) has been accounted for in the content creation figure detailed in the main text. 37 External production includes broadcaster affiliates such as UFA and Studio Hamburg in Germany and Fremantle across RTL’s group of channels. 38 Sources: OBS, TVI, PWC, Kagan, National Regulators, company reports, screen digest, O&O Models, O&O Analysis, Broker Reports, Press, Interviews.

57
Finally we considered trade issues. Traditionally there has been significant deficit in the balance of trade for programming between Europe and the rest of the world. Almost all European broadcasters acquire popular US programming (both TV series and Hollywood movies) and more recently there has been an increase in the number of imports from Asian nations, especially Japan and South Korea. [7.2.10]
2.4. Linear data analysis
A sample of 54 channels operating in 11 Member States has been designed to conduct an analysis of linear services along the lines of that conducted in the 2005 Study. Member States have been selected to represent the diversity of EU30 in terms of market size, geography and recency of EU membership while also favouring the larger Member States in order to cover the largest possible share of EU in terms of population and economics. Channels have been selected to represent the diversity of European broadcasters in terms of audience size, ownership and revenue model while also favouring leading channels in order to cover the largest possible share of European TV viewing39. Channels have been monitored during two non-consecutive weeks of 2007, one in March, one in November. [8.1]
The methodology used to analyse the programming of these channels in the 2005 Study was adapted to the 2007 situation and could in fact be applied to 2007 data almost identically, enabling comparisons over time for the 36 channels which were part of the sample of the 2005 Study [8.1.3]. In essence, a single approach has been used to codify all the programmes broadcast during this period and allow comparisons between channels across Member States in terms of their proportion of qualifying, European, non-domestic European, independent and recent independent works, including in peak-time. Data have been compared to past findings when available, and to national declarations when available [8.2]. For the first time, indicators have been produced and analysed not only as a proportion of transmission hours, but also as a proportion of viewer hours [8.2.8].
Key findings
Across our sample, qualifying programmes make up 68.3% of the total transmission hours and 65% of the total viewer hours on all channels studied in 2007. These proportions are very similar across channel and country types, so we can say with confidence that, as a general rule, the
39 The 11 Member States and 54 channels part of the sample are: Belgium (Flemish and French Communities: VRT, VTM, La Une, RTL-TVI), Estonia (ETV, Kanal2, TV3), France (France2, France3, TF1, M6, Canal+, Direct8), Germany (ARD1, ZDF, RTL, Sat.1, Pro7, Vox), Ireland (RTE1, RTE2, TV3), Italy (Rai1, Rai2, Canal5, Italia1, La7, Fox Life), Poland (TVP1, TVP2, TVN, Polsat, TV4, Canal+), Romania (TVR1, Pro TV, Prima TV, Antena1), Spain (TVE1, La2, Antena3, TeleCinco, Cuatro, La Sexta), Sweden (SVT1, Kanal5, TV3, TV4) and the United Kingdom (BBC1, BBC2, ITV1, Channel4, Five, Sky One).
58
requirements of Articles 4 and 5 of the Directive cover approximately two thirds of all hours either transmitted over television channels or watched by television viewers. [8.3.3]
As a general rule, European broadcasters are significantly above the 50% requirement for European works and the 10% requirement for independent works. Also, a vast majority of independent works are less than 5 years old. Considering that the channels of our sample are mostly aiming for mass television audiences, they tend to favour fresh programming to attract viewers.
Across our sample, European works made up 62.4% of the total qualifying transmission hours in 2007. Most European broadcasters met the 50% requirement of Article 4. European works also make up an average of 74% of the total viewer hours across all studied channels in 2007, indicating the strong appeal of European works to European audiences, and the broadcasters’ reliance on European content to build their ratings. The figures are even higher when looking at peak-time only: 62.8% of the total qualifying transmission hours and 75.5% of the total viewer hours. Channels with the highest proportions of European works are leading, public channels from Southern, old and large European countries. Among the 9 channels falling below the 50% requirement, according to both our methodology and national declarations, we found all types of channels (private and public) in all types of country type (large or small, old or new, North or South), with a bias towards pay-TV channels and free-to-air channels broadcasting from a Member State other than that of reception. [8.3.4]
Across our sample, independent European works make up 31% of the total qualifying transmission hours in 2007, compared to 33.4% of total qualifying viewer hours. Proportions are higher when looking specifically at peak-time: 34.6% of the total qualifying transmission hours and 36.9% of the total viewer hours. Pay-TV shows significantly fewer independent productions than free-to-air channels. Apart from that, differences between channel types are rather small across all-day, although more independent productions can be found on private channels from Northern, old and large Member States. But there are important differences when we look specifically at the peak-time situation with leading, public channels from Southern, small and old Member States offering significantly more independent productions. [8.3.6]
Larger markets like France, Germany, Spain and the UK, rank higher in terms of European and independent works, than for example Ireland, Estonia, Romania or Sweden. Countries with large populations typically benefit from relatively more revenue to finance local production, as they have more viewers, which can explain why these large markets have relatively large proportions of European and independent production. Although being large markets, Poland and Italy rank relatively low, which we explain by the fact that Poland is a relatively poorer market and Italy is a relatively less competitive market. Although being small markets, the Flemish Community of Belgium ranks high on both criteria, which we explain by the fact that this market is very dynamic economically and culturally, with independent producers developing many formats which then travel internationally.

59
The situations of individual channels depend heavily on their market environment and cultural dynamics. A complete analysis of each Member State, covering all criteria and including an analysis of the channels’ programming policies on the level of their requirement, is provided in section [8.4] of this report.
2.5. Views from Inside the Audiovisual
Industry : Qualitative Research on Linear and Non-Linear Services
As part of our overall study, we issued tailored questionnaires to over 230 key stakeholders40 in the European audiovisual industry. Through the 71 responses we received we were able to further our understanding of the implications of Articles 4 and 5 (the key focus of the 2005 study) and consider in more detail Article 3i and its implications for the stakeholder’s on-demand activities. [9.1]
Key findings
Determinants of programme spending decisions
This section of the report focuses on three important decisions made by broadcasters: the balance between commissioned and acquired programming; from whom broadcasters commission new programmes; and the source of acquired programmes (particularly the balance between European-made programmes and programmes from the US).41 Overall programming spend and the balance between commissions and acquisitions
We found that fiction, entertainment and news programming account for almost two thirds of total programming spend. In addition, these genres were identified by the majority of broadcasters (over 60%) as cheaper to produce in-house42. We also established that broadcasters invest the majority (61%) of their programme budget on commissioned programmes (external commissions, 32% and in-house, 29%), with the remainder (39%) spent on the acquisition of ready-made programmes. Commercial broadcasters tend to allocate a higher proportion of their programme budget (51%) to acquired programmes, and a significantly lower proportion (18%) to in-house production. Contrastingly, publicly funded
40 Stakeholders included broadcasters (publicly and commercially funded), independent producers, trade bodies, regulators and pure VoD players 41 All figures pertain to 2007 42 The only genre all respondents felt is cheaper to produce externally was cinema film.

60
broadcasters tend to invest heavily in in-house production (58%) and far less on acquisitions (16%). [9.4]
In order to assess how the development of formatted programming has impacted the programme portfolio, we asked broadcasters specifically what proportion of their programming budget was spent on commissioning formats.43 We found the majority of format commissioning is by commercial broadcasters, with an average of 10% of their total programming budget invested in commissioning formatted programming. For the publicly funded broadcasters, only 6%44 of their programming budget was spent on commissioning formats. [9.4]
This part of the questionnaire also identified that there has been a general shift across both publicly and commercially funded broadcasters towards external commissioning, with over 70% of respondents stating that the proportion of external commissioning had increased over the last five years. [9.4]
Commissioning new programmes
Broadcasters have three basic sources of new programmes: internal in-house production; commissioning programmes from the in-house production unit of another broadcaster; or commissioning a producer independent of the broadcasters. [9.4.2]
The vast majority of news programming is produced in-house, while cinema film and documentaries tend to be produced externally. Fiction, entertainment and factual magazine programming have a more balanced mix in terms of sourcing, with 20% to 50% produced in-house and 40% to 70% produced by independent producers. Documentaries are rarely produced in-house and cinema film is always sourced from the external market (typically Hollywood studios or local/domestic independent producers). In news, games and sport over 15% of programming is made by other broadcasters e.g. Five in the UK sourcing their news programming from Sky. 82% of broadcasters reported that external spend has grown, and 38% reported that in-house spend has fallen in the past five years [9.4.2]
We also found that over 64% of format commissioning was invested in entertainment and games formats such as Pop Idol or Deal Or No Deal, while over a third of broadcasters stated they had spent less on format commissioning over the last few years, both in-house and externally. [9.4.2]
43 A format is defined as any programme locally adapted for broadcast in at least one other market than the market of origin and for which a licensing fee is payable, e.g. Who Wants to Be a Millionaire, Betty la Fea. 44 This figure was skewed slightly by two publicly funded broadcasters who both reported high levels of investment in formatted programming. Generally, the level of investment sits between 0% and 3%.

61
Decisions about programme acquisitions
Across all genres, except sport and fiction, over 65% of broadcasters stated that acquired programming cost over 80% less than commissioned programming. Within this group, 75% of respondents felt that acquiring factual magazine and entertainment programming cost less than 20% of the investment required to commission a similar program. The response for fiction was more mixed, with over 23% of respondents stating that acquired fiction programmes can cost over 50% of the cost of commissioning. With the exception of fiction and cinema film, over 95% of acquisition spend was on programming produced in the last five years. [9.4.3]
Just over half of the broadcaster’s acquisitions were from the US and just under 25% from content owners in another European country. Only 19% of acquired programming was from the broadcasters’ respective domestic market and just over 3% of acquired programming was from content owners outside Europe and the US (mostly from Asia). [9.4.3]
Financing of New Programmes Across all genres, over 85% of funding comes from the primary broadcaster, with between 1% and 7% from a secondary broadcaster or a co-producer45. Only in sport does funding flow from merchandising advances. All genres benefit from limited public funding, although the large majority of this comes from licence fees rather than direct public funding. [9.5]
Co-production between Member States and intra-community trade in European works Approximately 86% of broadcasters and 75% of independent producers co-produce programmes. Entertainment is the most commonly co-produced genre, shortly followed by fiction and cinema film. Factual magazine programming and games are rarely co-produced, while news and sport are never produced in partnership with a third party.
Both producers and broadcasters identified domestic co-productions and co-productions with other European producers as the most commonplace. For broadcasters this was closely followed by multi-country European co-productions, with broadcasters in the larger Member States often producing programming with each other and neighbouring countries. [9.6]
45 The primary broadcaster is the main commissioner of the programme and will typically retain the first showing domestic rights, while the secondary broadcaster or co-producer may finance some of the production in order to retain international rights.

62
Terms of Trade All broadcasters stated that they expect first (and repeat) showing domestic terrestrial and new media rights (including on-demand rights) when commissioning programmes externally, while around 81% stated that they expect repeat showings in the domestic secondary market and domestic ancillary rights.
The majority of broadcasters felt that the terms of agreements negotiated with independent producers were about as favourable to both parties as agreements for other programmes commissioned externally. In asking producers about similar rights issues, we found that around a third of respondents felt that the payment they receive for rights is less than the value they could create from them over a given period. [9.7]
The balance of trade in programming Fiction and feature films were assessed by broadcasters as being the most successful in the international market, while news and factual magazines were seen as inherently local and therefore unlikely to sell well abroad. Sport, documentaries, fiction and feature films were all rated highly as potential European imports, while news and factual magazines were given low ratings, with under 25% of broadcasters viewing the genres as potential imports. All broadcasters stated feature films and fiction from outside Europe (mainly from the US) were attractive and tended to be very successful in primetime schedules, driving audiences and consequently advertising revenue. Again, news and factual magazines were not seen as particularly appealing imports due to their focus on local issues.
Only entertainment and factual entertainment/reality formats were rated above 50% as potentially exportable formats. The exporting of formats is a fairly recent development in television markets and there is only a small number of countries that have successfully managed to exploit formats on a global scale (UK with Dancing With The Stars, The Netherlands with Big Brother and Sweden with Survivor). [9.8]
The development of on-demand services
In order to collect the data necessary to understand the programming strategies and offerings of on-demand services, as well as their views on content and the related regulatory issues, we issued tailored questionnaires to over 70 key stakeholders from the broadcasting and pure VoD sectors. Twenty-eight stakeholders took part in our survey [9.2]. Also, we conducted an independent analysis of 29 on-demand services, some linked to broadcast groups, some not. This material was collected from non-linear players in the same sample of 11 Member States as for linear services.
It is important to note that whereas linear data analysis in this study is based on independent monitoring, this is not currently possible for non-linear services. For the analysis of non-linear services the consultants

63
have relied on data acquired through self-declarations from on-demand service providers. The majority of data was collected through a survey of on-demand service providers. The consultant’s evaluation of prominence of European content on non-linear services required an additional desk research project, where the consultants looked at the services themselves to evaluate various prominence indicators.
Key findings
Almost all respondents, both broadcasters and pure VoD players, have content available via on-demand services distributed via the internet or IPTV. While broadcasters also use mobile (40%) and cable (32%), pure VoD players rely primarily on cable (25%) as their secondary distribution technology. While broadcasters generally offer a balanced mix of live, archive and, more recently, catch-up material on their VoD services, and a balanced mix of genres, reflecting the fact that a large part of their catalogue is derived from their generalist television schedules, pure VoD players show a clear preference for archive material, with a focus on cinema, TV fiction and documentaries. Entertainment is by far the most popular genre on broadcasters’ on-demand services (39.5%), followed by news (18.7%). For pure VoD players, cinema alone takes 62% of all viewing time spent, followed by entertainment (22.3%). [9.9.1]
European titles are, in general, a key component of on-demand catalogues for both broadcasters and pure VoD players: among those interviewed for this survey, only 17% of pure VoD players and 12% of broadcasters said that their catalogues consisted of less than 25% European titles. The actual proportion for broadcasters is often 100%, as they generally replicate their linear schedules in their on-demand services, minus the titles for which they do not own the on-demand rights (and which are generally not European). By contrast, 33% of pure VoD players said their catalogues comprise between 25% and 75% of European titles. Also, pure players allocate 100% of their programme budget to acquisitions, with non-European imports representing almost half of the total, meaning that the pure VoD players in this survey have spent no money at all on commissioning new programmes. By contrast, on-demand services operated by broadcasters say they spend around 75% of their on-demand budgets on national commissions, although this figure is a proportion of an extremely limited budget. [9.9.2]
Of the respondent broadcasters, 41% use advertising to fund all or part of their on-demand service (both pre/post roll and adverts midway through a programme, although the latter was less commonly used than pre/post roll advertising). Of all these respondents, 18% funded their service only via advertising; 14% also had content available via subscription or pay-per-view along with content supported by advertising; and 9% were funded in part by advertising revenue and in part by public subsidy. Public subsidy was the sole revenue stream for 23% of the broadcasters who responded. 36% of the broadcaster owned on-demand services were funded solely via subscription and pay-per-view charges. Therefore 64% of broadcaster owned services are essentially free-to-use for the viewer to some extent. The vast majority of the revenue of pure VoD players who

64
took part in our survey came only from direct payments from consumers either as subscription fees (92% of pure VoD players who responded) or as pay-per-view. The remaining 8% were in part supported via subscription and pay-per-view fees, but also received some public subsidy. [9.9.3]
The majority of on-demand services surveyed, whether broadcasters or pure VoD players, think that European programming is all-in-all a very good option for their services. There are however some caveats here: European programmes are seen as expensive, no easier to acquire although services are themselves European, and not particularly the best way to attract European consumers. A large portion of on-demand services do not see a clear link between European programmes and regulatory obligations, reflecting the fact that the debate over that part of the AVMS Directive has in most cases not started yet at the national level. [9.9.7]
2.6. Monitoring of Article 3i As part of the current study, the consortium evaluated possible performance indicators and operational procedures for monitoring Article 3i of the AVMS Directive. Conclusions on this followed extensive research via questionnaires, interviews desk research and internal discussions within the consortium and with the Commission's steering group. [10.1.1] Operational Procedures We have identified two distinct legal scenarios within which operational procedures can exist: firstly, self-declaration by service providers, and, secondly, independent evaluation. [10.2]
For linear services, both types of operational procedure are applied. Broadcasters provide self-declarations to Member State authorities, detailing how they have met the requirements of Articles 4 and 5. Independent evaluations of linear broadcast channels are also completed to verify the data supplied via the self-declarations, both at the Member-State level and EU-wide in the context of independent studies. Such an EU-wide independent monitoring has been completed for a sample of linear services in this study, as seen in Chapter 8. For linear services, this sort of independent monitoring is possible largely because robust Television Audience Measurement (TAM) data is available to the consultants. [10.2]
For non-linear services, however, independent monitoring similar to that completed for linear services, is not possible at this time. In order to complete an independent evaluation, consultants require robust data on all the programming available on each service. There is currently no equivalent to TAM data for the non-linear services, meaning that data on programming (including titles, durations, and consumption data) is not available to independent consultants as it is for linear programming.

65
However, we do believe that the development of industry standards for data on non-linear services such as this should be supported at the Member State and European level. [10.2]
We have identified two possible ways in which catalogue data (that is, lists of all the titles available on an on-demand service) could be obtained. However, neither option is appropriate to use at this time. [10.2]
The first involves a process known as ‘web-scraping’ or ‘web-harvesting’, which involves developing software that goes into an on-demand service, and copies information that is required from the website, such as titles, and posts it to another source, such as a database. However, such a methodology raises some legal questions: permission would have to be obtained from the service provider before such software could be legally utilised. We believe that in order to secure this level of permission, legislation at the Member State level will be required. [10.2]
The second approach involves going directly to the services and looking for information on titles and durations of content. But this approach has two main problems. Firstly, there is a possibility that some content in the catalogue will be missed, as there are no set schedules for non-linear services, as there are for linear services. Content has to be searched for, meaning that some programmes could be overlooked during the review. Secondly, this process will be extremely time consuming and expensive. This has put this process beyond the scope of this study. [10.2]
Self-declarations are possible at this time, as has been proven by the responses we have received from providers to our survey. Self-declarations do have their drawbacks: they are unverified data, and data may be collated differently by different providers, making comparisons between data more difficult. However, self-declarations are currently completed by linear service providers for Articles 4 and 5. Also, provided that self-declarations are enforced through Member State legislation, then data can be acquired from all non-linear services. [10.2]
The above has shown that at this time independent evaluation of non-linear services is not a viable operational procedure for the monitoring of Article 3i. Instead, for this study, we have utilised self-declaration, which we believe is the only appropriate and affordable procedure currently available. [10.2]
Performance Indicators for Article 3i After careful review of Article 3i, six possible performance indicators for monitoring Article 3i were proposed to broadcasters, producers, pure VoD players and regulators. These were: ‘Title-level data’, ‘Hour-level data’, ‘Consumption-level data’, reviewing ‘Prominence’ of European content, and ‘Financial Contribution’ data. Respondents were asked to rank these six indicators in terms of preference. [10.3.1] To begin with, all respondents were asked whether they were familiar with Article 3i. All regulators were aware of the article, with 80% of broadcasters and 70% of pure VoD players knowing of its existence prior

66
to this study. Producers were more split, with 50% of those returning questionnaires not being aware of Article 3i. [10.3.3] Title-level data, which for this study reflected a situation whereby all titles in a catalogue would be coded for country of origin, was the most popular indicator from our respondents. All types of respondents ranked it the best indicator for monitoring Article 3i, with the exception of producers, who ranked it third behind financial and consumption data. There are some possible negative implications related to this indicator. Firstly, it does not capture actual consumption of European content on non-linear services. Secondly, on its own, it does not distinguish between various durations of content. However, we expect internal datasets will have information on duration, which could easily be included in any title-based analysis. However, title-level data does give a strong and clear indicator of the proportion of European content in the catalogue of a non-linear service. [10.4.1] Hour-level data is a development of title-level data, adding durations for the titles in the entire on-demand catalogue. This was the second-most popular indicator for all respondents, except for producers, who ranked it slightly lower, mainly because of their higher favour for consumption and financial data. We expect that for the majority of services, duration data will already be integrated in internal data systems. Therefore, once data has been coded for country of origin, any extra administrative burdens should be minimal. Hour-level data would successfully combat the concern that title-level data alone would allow providers to meet Article 3i by filling their catalogue with cheaper, short-form European content. However, it is important to note that, at this stage, it is unclear how relevant duration will be for programming on non-linear services, as content such as that on YouTube and DailyMotion, have shown the popularity of short-form programming on demand. [10.4.2] ‘Prominence’ is a particularly open term that could lead to a wide-variety of indicators and procedures. It was also an indicator that prompted a lot of discussion at the workshop, indicating that further discussion at the Member State and European level is required here before implementation of Article 3i in late 2009. This said, it is important to acknowledge it as the one indicator that requires providers to directly address the issue of how European content is promoted to consumers, and we have researched and evaluated a variety of possible prominence measures. Some prominence measures, such as ‘click-throughs’ from homepages, and relevant search keywords, should be straightforward to apply. However, there is a danger in being overly prescriptive. First of all, monitoring of prominence on a qualitative basis would be relatively subjective. Also, establishing firm fixed prominence indicators (for example, stipulating that a certain proportion of a home page must be dedicated to European content) could potentially limit the creative development of non-linear services. Thus we would suggest that relatively broad rules are set. We would also suggest that the best way forward regarding prominence, at this current stage, is to suggest, in accordance with Article 3(7) and Recital 36 of the AVMS Directive, that it is co- or self-regulated. Thus providers would agree to a set of guidelines, committing them to

67
enhancing the prominence of European content on their services. [10.4.3] Data on the financial contribution of on-demand services to the production of European content was the indicator that split opinion most significantly. Producers strongly approved of it (in particular as it will help them understand where money is being spent), regulators varied between strong support and light opposition, whereas the providers themselves, both broadcasters and pure VoD players, strongly opposed it as an indicator. The main negative connotations of the indicator are that the data is considered highly confidential, and also as non-linear services are still at a nascent stage, and thus very little is spent on new content, the figures may tell us very little. Also, financial data on spend on European programming may in fact be difficult to extract from company accounts: for example content from many different territories may be acquired together within a ‘package’ of content for a single cost. However, financial data is important as it is central to the legislation. Therefore at this stage the most appropriate procedure will be to have providers inform regulators of the annual amount spent on programming, and where possible indicate the proportion that is spent on European works. [10.4.4] Consumption data was, on the whole, an unpopular indicator, being given a low ranking by all respondents, with the exception of producers. Consumption data would, however, have the important benefit of being able to provide an indicator that shows how much European content is actually being viewed on non-linear services. However, there are some major arguments against using consumption data at this time. Firstly, consumption data is more commercially sensitive than catalogue data. Also, there is currently no public source of on-demand audience data, comparable to the TAM data available for liner broadcasting. However, Recital 48 of the Directive asks that Member State reports on non-linear services should take consumption data into account. Therefore, we suggest that although consumption data should not be a performance indicator at this stage, it should be included in Member State reports where possible, to give an indication of the on-demand environment. However, we do believe that once industry-standard robust viewing data for non-linear services becomes available, then consumption data should be considered as a potential indicator for monitoring Article 3i. Support for the development of such industry standard data at the Member State and European level is important here. [10.4.5] Thus, at this time, we suggest that title-level and hour-level data should provide the key quantitative indicators for monitoring Article 3i, with prominence ensured via co- and self-regulation and financial contribution data acquired at a base-level (i.e. requesting data on spend on new programming) where possible. We do not suggest using consumption data as a performance indicator at this time (although where possible it could be included in Member State reports, as an important indicator of change in the non-linear environment), nor strict prominence measures. [11.6]

68
Application of performance indicators The consultants have also provided, where possible, practical applications of key performance indicators for Article 3i to specific services. This is again based on data acquired through self-declarations. [10.5.3] The main quantitative indicators that have been applied are proportion of titles in a catalogue that are European and proportion of hours of content in a catalogue that are European. This has shown that the vast majority of services who supplied data for our study had over 80% European titles in their catalogue (with many having 100%). However, pure VoD players typically had a smaller proportion of European titles than that available on the non-linear services owned by broadcasters. On-demand services provided by private broadcasters have a slightly lower proportion of European titles, when compared with non-linear services provided by public broadcasters. [10.5.3] One financial indicator was applied to specific services, asking for the proportion of the total budget for the non-linear service to be split by source of programming, but data was not forthcoming from service providers. Based on a very limited response, it appears that non-linear services run by broadcasters typically had high proportions of national content, whereas pure VoD players independent from broadcasters relied more on non-European content. [10.5.3] The consultants also applied three prominence indicators to specific services. This was based on additional desk research completed by the consultants. The three indicators were addressed the these questions: 1) Can content be searched for by country of origin?; 2) Is country of origin of an item of content indicated anywhere on the service?; 3) What is the estimated proportion of the homepage dedicated to European works? [10.5.3] We compared the findings on these indicators with the results from the quantitative survey of on-demand services. Based on this initial prominence analysis, for on-demand services owned by private broadcasters, the prominence of European content does not necessarily match the proportion of European content that is actually available. On average, prominence scores are lower than the results from the quantitative indicators, showing that although many European works can be offered on a service, the service may nevertheless promote non-European works (for example US programming) more prominently than European works. This supports the relevance of prominence measures as part of the monitoring of Article 3i. [10.5.3]

69
3. Introduction
3.1. The Remit
Article 25(a) of the Television Without Frontiers Directive (‘TVWF’) included a provision for “an independent study on the impact of measures concerning the promotion of distribution and production of television programmes at Community and national levels”.
The measures at Community level to promote programme making and programme distribution are contained within Articles 4 and 5 of the TVWF. Articles 4 and 5 place requirements on Member States to ensure that broadcasters under their jurisdiction devote a majority of transmission time to European works and at least 10% of transmission time (or programme budget) to European independent productions.
Article 4(1) states:
“Member States shall ensure where practicable and by appropriate means, that broadcasters reserve for European works a majority proportion of their transmission time, excluding the time appointed to news, sports events, games, advertising, teletext services and teleshopping. This proportion, having regard to broadcaster’s informational, educational, cultural and entertainment responsibilities to its viewing public, should be achieved progressively, on the basis of suitable criteria.”
Article 5 states:
“Member States shall ensure, where practicable and by appropriate means, that broadcasters reserve at least 10% of their transmission time, excluding the time appointed to news, sports events, games, advertising, teletext services and teleshopping, or alternatively, at the discretion of the Member State, at least 10% of their programme budget, for European works created by producers who are independent of broadcasters. This proportion, having regard to broadcasters’ informational, educational, cultural and entertainment responsibilities to its viewing public, should be achieved progressively, on the basis of suitable criteria; it must be achieved by earmarking an adequate proportion for recent works, that is to say works transmitted within five years of their production.”
The European Commission conducted a selection process by competitive tender and appointed David Graham and Associates Limited (DGA) to carry out such a study as required by Article 25(a) in November 2003. DGA led a consortium of companies to conduct the project: Oliver & Ohlbaum Associates Limited (O&O), Arena Audiovisual and Carat Expert.
70
The final study report was issued on 24 May 2005 under the title “Impact Study of Measures (Community and National) Concerning the Promotion of Distribution and Production of TV Programmes Provided for Under Article 25(a) of the TV Without Frontiers Directive” (referred to throughout this report as “The 2005 Study”).
On 11 December 2007, the European Parliament and Council adopted Directive 2007/65, amending the TVWF Directive. Further to Directive 2007/65, the name of the amended TVWF was changed to the “Audiovisual Media Services Directive”. Directive 2007/65 must be implemented by the Member States by 19 December 2009. It may be noted that Directive 2007/65 did not make any amendments to Articles 4 and 5 of TVWF.
Throughout this report, the Audiovisual Media Services Directive is referred to as 'AVMS'.
A notable aim of the amendments contained in Directive 2007/65 was to include non-linear audiovisual media services within the scope of the Directive. One of the new provisions introduced in this regard is Article 3i, which places requirements on Member States to ensure that non-linear service providers under their jurisdiction promote the production of and access to European works.
Article 3i states:
“Member States shall ensure that on-demand audiovisual media services provided by media service providers under their jurisdiction promote, where practicable and by appropriate means, the production of and access to European works. Such promotion could relate, inter alia, to the financial contribution made by such services to the production and rights acquisition of European works or to the share and/or prominence of European works in the catalogue of programmes offered by the on-demand audiovisual media service.”
According to Article 26 of the AVMS Directive, the European Commission shall submit a report on the application of the Directive every three years, starting in 2011. Further to this, it is the intention of the Commission to evaluate periodically the impact on the audiovisual sector of the national legislations implementing Articles 3i, including national legislations prior to the adoption of the Directive, which purport a similar objective as Article 3i, as it has been until now the case with Articles 4 and 5 under the TVWF Directive.
In order to provide the European Commission with the elements required for this monitoring and evaluation, the Commission requested an independent study to be carried out, covering the situation as regards promotion of European works at the end of 2007. Through a competitive tender, in December 2007 the Commission appointed Attentional Limited (“Attentional”; formerly known as David Graham and Associates Limited) to carry out this study. Attentional leads a consortium of companies to conduct the project: Oliver & Ohlbaum Associates Limited (O&O), Headway International and Rambøll Management.

71
The 2005 study covered 17 countries; these countries are referred to as “the E17”.46 The remit of the present study covers the 27 Member States of the European Union as of 2007 and the 3 Member States of the European Free Trade Association who participate in the European Economic Area. Collectively, these 30 countries are referred to as “the E30”.47 References in this report to “Member State(s)” include both EU and EEA countries.48
3.2. Sections of this Report
This Final Study Report contains the following sections. An executive summary and project overview above have already presented the key research, with the detail to follow in the rest of the report.
‘Methods of Implementation’ presents the legal research originally completed and accepted in the First Interim Report, now amended following further research on the situation in France.
Following this, the economic overview of the television and non-linear marketplace, originally completed and accepted in the Second Interim Report, has been replicated for the Final Study Report.
The third section of this report covers the extensive analysis of linear services, in particular the review of the extent to which Articles 4 and 5 are being implemented. This significantly develops the work on linear services originally seen in the Second Interim Report, where the methodology was detailed and accepted, and applied to three of the eleven Member States that constitute our sample for this study. The Final Study Report contains both a pan-European analysis and individual profiles for each sample Member State.
The section entitled ‘Views from the Audiovisual Industry’, originally seen in the Second Interim Report, has also been extensively revised. Although the chapters within the section that deal mainly with linear programming have remained very similar to the Second Interim Report, the chapters dealing with non-linear services have been developed, bringing together all the research on non-linear services completed during this study.
46 E17 countries include: UK, Germany, France, Italy, Spain, Portugal, Denmark, Finland, Norway, Iceland, Ireland, The Netherlands, Belgium, Luxembourg, Austria, Greece and Sweden. 47 E30 countries include: E17 + Latvia, Lithuania, Liechtenstein, Bulgaria, Poland, Slovenia, Slovakia, Czech Republic, Malta, Cyprus, Estonia, Romania and Hungary. 48 As noted in section 4.1.1, Liechtenstein is not discussed in section 5 of this report, since there no television channels broadcasting subject to Liechtenstein jurisdiction. For practical purposes, references to E17 and E30 should therefore be understood to exclude Liechtenstein.

72
Regarding on-demand services, a section has been included in the Final Study Report that details our view on the appropriate operational procedures and performance indicators for monitoring the application of Article 3i to non-linear services, as the AVMS Directive is implemented into Member States' legislation. This section also included some practical applications of performance indicators to specific non-linear services.
Finally, we present a section detailing the key findings from each of the above sections, and a chapter covering the overall conclusions of the study.
In November 2008 a workshop was held in Brussels where the Draft Final Report was presented to key stakeholders. Comments received at, and subsequent to, the workshop have been carefully considered in the preparation of the Final Study Report. Written comments following the workshop have, where possible, been included in an appendix to this report.

73
4. Modes of Implementation
This section report covers the legal analysis prepared by Rambøll Management and covers a description and analysis of the implementing measures taken by the E30 pursuant to Articles 4 and 5 of the Directive as of the end of 2007, as well as any measures related to promotion of European works already adopted by the E30 in respect of on-demand services.
This legal report addresses two themes:
Theme one: How Articles 4 and 5 are implemented The report identifies how the E30 have implemented Articles 4 and 5 in national legislation and describes the additional content requirements that some Member States place on broadcasters. In order to assist comparison with the 2005 Study, this section of the report follows a similar structure to that of the legal analysis in Chapter 6 of The 2005 Study.
Theme two: On-demand audiovisual media services and European works The report identifies any existing national provisions with the effect of promoting European Works within non-linear services.

74
4.1. Approach and Methodology
4.1.1. How Articles 4 and 5 are implemented
As with all EU Directives, the provisions of the TVWF Directive have been implemented through different national legislation in each Member State. Differences in the way in which national legislation is framed and the way in which key terms are defined in national legislation can make adherence to Articles 4 and 5 more or less difficult for broadcasters. Also, Article 3(1) of The Directive expressly provides that Member States remain free to apply more detailed or stricter rules in the areas covered by The Directive. Consequently, Articles 4 and 5 constitute the minimum standards that Member States and third parties directly affected (e.g. broadcasters) have to comply with.
We looked at how the TVWF Directive was transposed into national legislation in each Member State to determine whether it was prescriptive or flexible. We looked in particular at the way in which key terms (such as ‘independent producer’49) are defined, and the use of ‘non slip-back clauses’50 to prevent broadcasters reducing the proportion of European and independent productions in their schedule. We also looked at whether or not national legislation contains the ‘where practicable’ clause in framing the requirements of Articles 4 and 5. The use of this phrase, which is contained in the TVWF Directive, allows the Member States to apply the minimum proportions in a flexible way because it gives the Member States a possibility to exempt – on a case-by-case basis - some broadcasters that are unable to meet the requirements of Articles 4 and 5 from the obligation, if substantiated.
We also reviewed the measures in place in each Member State to monitor adherence by broadcasters to the requirements of Articles 4 and 5, and the sanctions (warnings or fines, for example) applied by national authorities when these requirements are not met.
Having reviewed the implementation of the TVWF Directive – the way in which Articles 4 and 5 are transposed into national legislation and monitored – we then looked at any additional requirements placed on broadcasters by national legislation to increase the quantity, or enhance the quality, of European and independent production. Examples of additional requirements include, inter alia, the language and cultural requirements applied to broadcasters in many Member States, and the support for EU and domestic film production that public service broadcasters in several Member States are required to provide.
49 This term is not explicitly defined in the Directive, although recital 49 offers some guidance to the Member Stages. For further details, please refer to section 5.1.4. 50 Clauses requiring broadcasters not to show a lower proportion of European works than shown in the previous year.

75
Taken together, the transposition of Articles 4 and 5 (whether the measures are transposed into national legislation flexibly or prescriptively), their application and the additional requirements placed on broadcasters in national legislation (low or high additional requirements), define four ‘implementation modes’ that are used in this phase of the study.
The data for the review of national legislation has been collected from national authorities using Part I of the questionnaire, which is included in Appendix II (Chapter 14 of this study). Most of the replies have been received in February and March 2008. When the validity of the new data has appeared uncertain (e.g. because it appeared inconsistent with data from the 2005 Study), the issues have been resolved using a combination of telephone interviews and e-mail correspondence.
Similarly to the 2005 Study, Liechtenstein is not discussed in the following report, since there are still no television channels broadcasting subject to Liechtenstein jurisdiction.
4.1.2. On-demand audiovisual services and European
Works
The data for the on-demand part of the legal study has been collected from national authorities through section II of the questionnaire attached as Appendix II. Most of the replies have been received in February and March 2008.
The study “The Development of Video on Demand in Europe”, published by the NPA Conseil in 2006,51 has also been consulted.
51 http://www.npaconseil.com/data/ENG060619final.pdf

76
5. How Articles 4 and 5 are Implemented
5.1. Transposition of Articles 4 and 5
Member States have transposed Articles 4 and 5 into national law using a combination of primary legislation and secondary regulation.52 The degree to which Member States are flexible or prescriptive in transposing The Directive can be determined with reference to certain key terms and phrases.
5.1.1. Total qualifying hours
The TVWF Directive defines total qualifying hours as a broadcaster’s transmission time “excluding the time appointed to news, sports events, games, advertising, teletext services and teleshopping”.53 The majority of the E30 have transcribed the definition directly into national legislation; however, France, Germany, Italy and the UK have adopted approaches significantly different to the TVWF Directive.
France and Germany define what is included in qualifying transmission time.
France distinguishes between audiovisual works and cinematographic works (of long duration, i.e. at least 60 minutes),54 and applies different requirements to each of these two groups. According to the latest statement by the regulator (CSA),55 only the following types of programmes are recognised as audiovisual works: fiction programmes, animation programmes, documentaries, magazine and entertainment programmes produced mainly outside the studio, music videos, cinematographic works shorter than 60 minutes, concerts and retransmissions of theatrical, lyrical or choreographic performances.
Germany defines what is included as qualifying hours: feature films, television movies, series, documentaries and comparable productions. 56
52 Primary legislation refers to Acts issued by the legislative body (parliament) of the relevant Member State. Secondary legislation refers to executive orders, regulations etc, issued by an administrative body in the Member State pursuant to authorization in the relevant primary legislation. 53 See Article 4(1) and Article 5 of the Directive. 54 Decree no. 90-66 of 17 January 1990, Article 4. 55 “Programmes recognized as audiovisual works for January to September 2007”, http://www.csa.fr/actualite/dossiers/dossiers_detail.php?id=19783&chap=2536 56 Interstate Treaty on Broadcasting of 31 August 1991 (as amended), Article 6(2).

77
Italy excludes talk shows,57 making the achievement of a majority proportion of European works more difficult, because it excludes programming that is likely to be made domestically and that would otherwise count as a European work.
The UK applies different calculations for European works and independent productions. While the proportion of European works is calculated as stated in the Directive, a separate definition of “qualifying programmes” is applied to independent productions; this definition excludes acquisitions and repeats.58
By defining what is included in the qualifying hours, France and Germany apply a stricter definition of audiovisual works than The Directive because they exclude programming – particularly current affairs programmes and talk shows – that tends to be produced domestically. The measures contained in Article 4 applying to European production must therefore be achieved in the categories of programmes included in the definition, without the benefit of a high proportion of European qualifying programming in other excluded programme genres.
We can see, therefore, that France and Germany apply a stricter definition than that of Article 4, and require all broadcasters to show more original European works than The Directive (a path followed by the majority of the E30).
The following table provides an overview of the definition of Total Qualifying Hours in the national legislation of the Member States:
Table 1: Definition of Total Qualifying hours
Identical or equivalent with the Directive
Slightly more restrictive
Significantly more restrictive
Austria Lithuania Belgium Luxembourg Italy France Bulgaria Malta Cyprus Netherlands United Kingdom59 Germany
Czech Republic Norway Denmark Poland Estonia Portugal Finland Romania Greece Slovakia Hungary Slovenia Iceland Spain Ireland Sweden Latvia
Source: Member State regulatory authorities
57 Broadcasting Code (legislative decree no. 177 of 31 July 2005, as amended), Article 6. 58 The Broadcasting (Independent Productions) Order 1991, Section 2. 59 Independent productions only.

78
5.1.2. Qualifying European hours (definition of
European works)
Article 6 of Directive 89/552 as amended by Directive 97/36 provides a detailed definition of ‘European works’ as
(a) productions originating in Member States, (b) in countries that are signatories to the European Convention on Transfrontier Television or have concluded a bilateral trade agreement with the EU; or (c) originating from other European third countries, when the works have been made60 by producers established in European third countries with which the EU has concluded agreements relating to the audiovisual sector, and the works have been made mainly with authors and workers residing in one or more European States.
(b) and (c) are conditional on works originating from Member States not being the subject of discriminatory measures in the third countries concerned. Works not included in the above definition shall also be deemed to be European works, if they are produced within the framework of bilateral co-production treaties concluded between Member States and third countries, the participating EU co-producers supply a majority share of the total cost of the production, and the production is not controlled by one or more producers established outside the territory of the Member States. The definition of European works is changed slightly by Directive 2007/65. In particular, co-productions with third countries will in the future be considered European works when they are co-produced within the framework of agreements related to the audiovisual sector concluded between the EU and third countries and fulfilling the conditions defined in each of these agreements.61
5.1.3. The ‘where practicable’ clause
Articles 4 and 5 of The Directive contain the qualifying term ‘where practicable’. Certain Member States – for example Austria, Belgium (Flemish Community), Czech Republic, Denmark, Greece, Iceland, Luxembourg, Spain and Sweden – have incorporated the wording ‘where practicable’ - or expressions to a similar effect - into national legislation, which we consider to be a more flexible implementation of The Directive than when such a phrase is absent.
60 Either exclusively by these producers, or in co-production with producers established in one or more Member States 61 Article 1(n)(i), third indent of Directive 2007/65, replacing the previous Art. 6(1)(c), 6(3) and 6(5).

79
In Austria, Luxembourg, Malta and Spain a ‘non-slip-back’ clause has been incorporated, meaning that broadcasters cannot show a lower proportion of European works than in the previous year (similar to the wording in the TVWF Directive that the proportion should be reached progressively). Other Member States have specifically defined to what extent a lower proportion will be accepted. Poland has set a lower proportion for the first transmission year of a new broadcaster, and lower thresholds for Pay-TV and thematic channels. In Slovakia, national legislation allows the regulator to set a lower proportion in licences for first-time licensees and for broadcasters of monothematic (special interest) programme services.62 In the Netherlands a broadcaster may apply for an exemption, which may be granted by the regulator, particularly to special interest channels and newly established channels. The exemptions can be granted for a maximum of three years, with a minimum percentage of 10%.63 In Romania, broadcasters that have failed to meet the proportion have one year to do so.64 Until 2007, Italy applied the term “where practicable” to both European works and independent productions, but as of 1 January 2008, this qualification has been abolished.65 Some specific exemptions may be applied for, but the scope of the new exemptions regime will only be fully defined during 2008.66
All these measures illustrate a more flexible application of the Directive than having no flexibility at all, but are less flexible than a general reference to ‘where practicable’, since these Member States will have defined in advance what proportion must be achieved.
The following table shows an overview of how “where practicable” clauses and similar measures have been implemented by the Member States:
Table 2: “Where practicable” and similar flexible measures No flexibility Semi-flexible Fully flexible
Belgium (French) Austria Slovakia Belgium (Flemish)
Cyprus Greece Slovenia Bulgaria Estonia Hungary Spain Czech Republic Finland Ireland Denmark France Italy Iceland Germany Luxembourg Lithuania Latvia Malta Sweden Norway Netherlands Portugal Poland
United Kingdom Romania
62 Act No. 308 of 14 September 2000 Coll. On Broadcasting and Retransmission (as amended), Article 23(2). 63 Regulation of the Commisariaat voor de Media of 18 December 2001 (“Policy Guidelines Programme Quota”). 64 National Audiovisual Council Decision no. 187 of 3 April 2006, Article 95. 65 The Broadcasting Code (Legislative decree no. 177 of 31 July 2005) Article 6, as amended by Law 244/2007. 66 According to Law 244/2007, the scope of the new exemptions regime will be established by a regulation issued by the regulator AGCOM. This regulation has not been issued yet.

80
Source: Member State regulatory authorities
The column “fully flexible” contains the Member States which have a general reference to “where practicable” or similar terms in their legislation.
The column “semi-flexible” covers the Member States which offer some, but less flexibility, because their legislation includes a non-slip-back clause or other specific limitations on the extent to which lower proportions may be accepted.
The column “no flexibility" contains the Member States where the legislation contains no form of qualification or limitation to the established proportions. This means that in principle, the proportions must always be fulfilled. However, this does not mean that sanctions will be applied in all cases of failure to fulfil the proportions, as the initiation of a sanctioning procedure may be subject to the discretion of the regulatory authorities.
5.1.4. European works by independent producers
The Directive does not contain a definition of ‘independent producer’, but Recital 49 of Directive 2007/6567 states that the definition should take account of criteria “such as the ownership of the production company, the amount of programmes supplied to the same broadcaster and the ownership of secondary rights”.68
No definition of ‘independent producer’ exists in national legislation in Austria,69 Belgium (Flemish Community), Cyprus, Denmark, Germany, Malta and Sweden.
The remaining E30 countries utilise a combination of four main elements to define ‘independent producer’, as summarised in the following table:
67 The identical wording could previously be found in Recital 31 of Directive 1997/36. 68 It may be noted that during the preparation of Directive 2007/65, the European Parliament suggested that a definition should be inserted in the main body of the Directive, but eventually this proposal was not adopted. 69 Austria has no definition of independent producer that applies to the national implementation of Article 5 of The Directive as such. However, Austria does have a definition of independent producer that applies to funding of television productions through ‘Television Fund Austria’. The definition is based on ownership: for the purposes of applying for a grant, a producer cannot be considered independent if a broadcaster involved in the financing of the project holds a majority share in the production company.

81
Table 3: Criteria for definition of independent producer Criteria for definition of independent producer
Member State Ownership
Programme supply
Secondary rights Autonomy
Belgium (French)
� �
Bulgaria � � Czech Republic �
Estonia �
Finland � �
France � � � �
Greece �
Hungary � Iceland � � Ireland � �
Italy � � Latvia � �
Lithuania � �
Luxembourg �
Netherlands � � �
Norway � � � Poland � �
Portugal � � � �
Romania � �
Slovakia � � �
Slovenia � �
Spain �
United Kingdom
� �
Source: Member State regulatory authorities
Ownership is the most commonly used criterion for defining whether or not a producer is independent. Independence is defined by placing a maximum holding by a broadcaster, or broadcasters, in a production company, or by a production company in a broadcaster, or both. In the Netherlands, for example, a broadcaster must hold less than 25% of the share capital in an independent production company and a combination of broadcasters must hold less than 50% of the share

82
capital.70 Norway applies the same limits – both to the broadcaster’s holdings in the production company, and vice versa.71
In France the rules are more restrictive; a broadcaster may hold no more than 15% of the share capital of an independent producer and a production company that wishes to qualify as independent may hold no more than 15% of the share capital of a broadcaster.72
The programme supply criterion captures the extent to which a producer’s independence may be compromised if too great a proportion of his output is supplied to one broadcaster. In Estonia, for example, to qualify as independent, a production company cannot have produced more than 90% of its programmes for one broadcaster in the previous two years.73 In Slovenia, no more than half of the annual production of an independent producer may be commissioned by a single broadcaster.74
The secondary rights criterion relates to the extent to which an independent producer retains secondary rights when transferring rights to the broadcaster. In Norway75 and Latvia,76 in order to be considered an independent producer it is necessary that the producer holds secondary rights to his productions. In France, the broadcaster may only obtain exclusive rights to a limited number of different exhibition forms.77 Additionally, an independent producer may not license rights to the first showing of an audiovisual work to a broadcaster for a period longer than eighteen months; the maximum duration that repeat rights may be
70 Media Act of 21 April 1987 (as amended), Article 54(2) 71 Broadcasting Regulation 153 of 28 February 1997, Article 2-2 72 Decree no. 2001-609 of 9 July 2001 (as amended), Articles 6(II) and 11(II); Decree no. 2001-1332 of 28 December 2001, Articles 6(II) and 11(II); Decree no. 2001-1333 of 28 December 2001 (as amended), Articles 7(II) and 12(II); Decree no. 2002-140 of 4 February 2002 (as amended), Articles 7(II) and 12(II). 73 Broadcasting Act of 19 May 1994 (as amended), Article 43(3) 74 Mass Media Act of 2001 (as amended), Article 73(1) 75 Broadcasting Regulation 153 of 28 February 1997, Article 2-2 76 The Radio and Television Law of 8 September 1995 (as amended), Article 2(4) 77 For audiovisual works, the broadcaster can only acquire exclusive rights for one distribution platform: terrestrial analogue, digital terrestrial or cable/satellite (with some exceptions, e.g. for integrated and simultaneous transmission on cable/satellite). For cinematographic works, the broadcaster can only acquire rights to one of the following exhibition forms: theatrical exhibition in France, videogramme distribution in France, broadcasting on other French television services, exhibition via on-line services, or foreign exhibition (theatrical, videogramme and broadcasting). However, if 85% of the broadcaster’s required contribution to cinematographic production is dedicated to independent productions (rather than the 75% which is the general requirement, as described in section 5.3.4), he may acquire rights to two of these exhibition forms. Decree no. 2001-609 of 9 July 2001 (as amended), Articles 6(I)(2) and 11(I)(2); Decree no. 2001-1332 of 28 December 2001, Articles 6(I)(2) and 11(I)(2); Decree no. 2001-1333 of 28 December 2001 (as amended), Articles 7(I)(2) and 12(I)(2); Decree no. 2002-140 of 4 February 2002 (as amended), Articles 9(I)(2) and 14(I)(2).

83
licensed is 42 months and 3 broadcasts.78 A cinematographic work can only be licensed exclusively for 2 broadcasts, with a maximum exclusivity period of 18 months for each broadcast.79
The autonomy criterion is not used in the TVWF Directive. This criterion has been created to include other elements in the national definitions of independent producers, which are relevant to determining the extent to which an independent producer may in fact conduct his business unhindered by intervention by a broadcaster. In Ireland80 and Slovakia81 an independent producer is defined by his capacity to exercise control over the actors, production staff, equipment and facilities used in the production. Similarly, in France the broadcaster cannot assume direct or indirect financial, technical or artistic initiative or responsibility for the production of an audiovisual work, or guarantee the outcome of the production.82 Some Member States require that the producer does not hold positions within the broadcaster (employee, board member, etc.). This requirement is found in Greece, Lithuania, Slovenia, the United Kingdom and Poland. In the Netherlands, a former employee of a public service broadcaster cannot be counted as an independent producer before two years have elapsed since the employment ended.83 In Romania, the activity of a producer in creating certain audiovisual productions can only be financially supported to an amount smaller than 25% from the same sources as the program service (channel) within which his production is distributed, if the producer is to be considered independent towards this broadcaster.84
We have allocated Member States to one of three categories of definition for ‘independent producer’. The following table shows how the Member States have been distributed within these categories:
78 Decree no. 2001-609 of 9 July 2001 (as amended), Article 11(I)(1); Decree no. 2001-1332 of 28 December 2001, Article 11(I)(1); Decree no. 2001-1333 of 28 December 2001 (as amended), Article 12(I)(1); Decree no. 2002-140 of 4 February 2002 (as amended), Article 14(I)(1). 79 Decree no. 2001-609 of 9 July 2001 (as amended), Article 6(I)(1); Decree no. 2001-1332 of 28 December 2001, Article 6(I)(1); Decree no. 2001-1333 of 28 December 2001 (as amended), Article 7(I)(1); Decree no. 2002-140 of 4 February 2002 (as amended), Article 9(I)(1). 80 Broadcasting Authority (Amendment) Act, 1993, Article 5 (amending Broadcasting Authority Act, 1960) 81 Act No. 308 of 14 September 2000 Coll. On Broadcasting and Retransmission (as amended), Article 24 82 Decree no. 2001-609 of 9 July 2001 (as amended), Article 11(I)(4); Decree no. 2001-1332 of 28 December 2001, Article 11(I)(4); Decree no. 2001-1333 of 28 December 2001 (as amended), Article 12(I)(4); Decree no. 2002-140 of 4 February 2002 (as amended), Article 14(I)(4). 83 Covenant of 16 November 1999 between the Commissariaat vor de Media and the National Broadcasting Foundation 84 Audiovisual Law (Law no. 504 of 11 July 2002, as amended) Article 24(3)
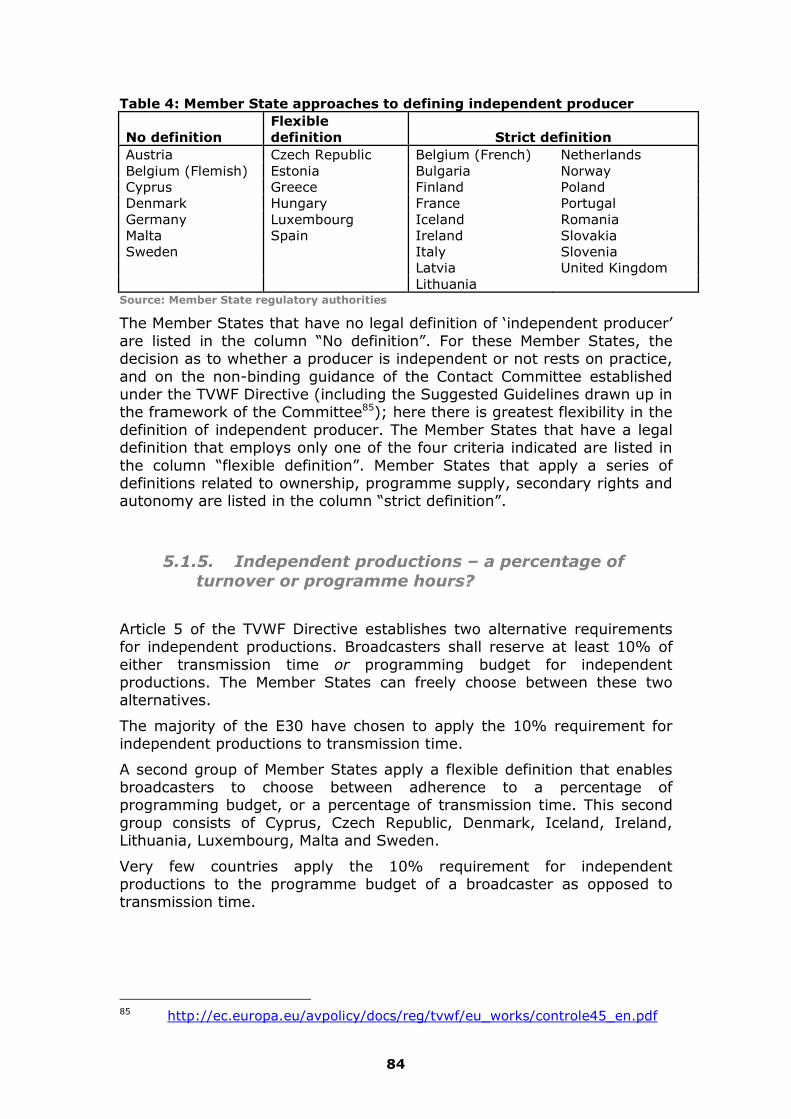
84
Table 4: Member State approaches to defining independent producer
No definition Flexible definition Strict definition
Austria Czech Republic Belgium (French) Netherlands Belgium (Flemish) Estonia Bulgaria Norway Cyprus Greece Finland Poland Denmark Hungary France Portugal Germany Luxembourg Iceland Romania Malta Spain Ireland Slovakia Sweden Italy Slovenia Latvia United Kingdom Lithuania
Source: Member State regulatory authorities
The Member States that have no legal definition of ‘independent producer’ are listed in the column “No definition”. For these Member States, the decision as to whether a producer is independent or not rests on practice, and on the non-binding guidance of the Contact Committee established under the TVWF Directive (including the Suggested Guidelines drawn up in the framework of the Committee85); here there is greatest flexibility in the definition of independent producer. The Member States that have a legal definition that employs only one of the four criteria indicated are listed in the column “flexible definition”. Member States that apply a series of definitions related to ownership, programme supply, secondary rights and autonomy are listed in the column “strict definition”.
5.1.5. Independent productions – a percentage of
turnover or programme hours?
Article 5 of the TVWF Directive establishes two alternative requirements for independent productions. Broadcasters shall reserve at least 10% of either transmission time or programming budget for independent productions. The Member States can freely choose between these two alternatives.
The majority of the E30 have chosen to apply the 10% requirement for independent productions to transmission time.
A second group of Member States apply a flexible definition that enables broadcasters to choose between adherence to a percentage of programming budget, or a percentage of transmission time. This second group consists of Cyprus, Czech Republic, Denmark, Iceland, Ireland, Lithuania, Luxembourg, Malta and Sweden.
Very few countries apply the 10% requirement for independent productions to the programme budget of a broadcaster as opposed to transmission time.
85 http://ec.europa.eu/avpolicy/docs/reg/tvwf/eu_works/controle45_en.pdf

85
Hungary is the only country to apply both criteria to all channels. Broadcasters are required to reserve both 10% of transmission time and 12% of programme budget to independent works.86
Portugal generally applies the 10% requirement to programme hours.87 However, the public service channel RTP 2 is required to reserve at least 10% of its programming budget for independent productions.88
In France, all channels are required to reserve a part of their entire annual turnover to independent productions. The general requirement is to reserve 10.66% of turnover for audiovisual independent productions and 2.4% for cinematographic independent productions.89
Italy applied a transmission time criterion until 2007.90 However, as of 2008, this has been replaced by a requirement that broadcasters must use at least 10% of their entire annual turnover for European works by independent producers.91
86 Act I of 1996, on Radio and Television Broadcasting (as amended), Article 7. 87 Law no. 37 0f 30 July 2007, Article 46. 88 For the period 2008 to 2011, the obligation is stated in the Public Service concession, Article 10(10). This specifies the general obligation for RTP 2 to “include programmes of a strong cultural and educational component, enhancing (… ) independent production of creative works (…)”, which is established in Article 54(1) of Law no. 27 of 30 July 2007. 89 Decree no. 2001-609 of 9 July 2001 (as amended), Articles 8 and 11; Decree no. 2001-1333 of 28 December 2001 (as amended), Articles 9 and 12; Decree no. 2002-140 of 4 February 2002 (as amended), Articles 9 and 14. 90 The Broadcasting Code (Legislative decree no. 177 of 31 July 2005), Article 44. 91 The Broadcasting Code (Legislative decree no. 177 of 31 July 2005) Article 44, as amended by Law 244/2007.

86
5.2. Application of Articles 4 and 5
In section 5.1, above, we looked at substantive issues relating to how Articles 4 and 5 have been transposed into national law. Now we turn to procedural measures relating to how adherence to Articles 4 and 5 is monitored, and the sanctions that are applied when broadcasters do not meet the set requirements.
We explore two differences in the way Member States monitor the application of Articles 4 and 5: first, the methodology for independent evaluation of broadcaster outputs in each Member State and; second, the sanctions that may be applied for non-adherence.
5.2.1. Monitoring and verification of channel outputs
The standard methodology employed by Member States to monitor adherence to Articles 4 and 5 is to require broadcasters to submit transmission returns, giving data on the volume of European works and independent productions that they have broadcast.
Some Member States take additional steps to verify the accuracy of the data provided by broadcasters, either by verifying the returns received from broadcasters or by direct monitoring of broadcasts. Such measures may be carried out in-house or by using an independent research organisation. Member States that take these steps include Belgium, Bulgaria, Cyprus, Czech Republic, Estonia, France, Ireland, Italy, Netherlands, Spain, Poland and Portugal. Some examples of such additional steps are described in the following.
Cyprus relies exclusively on independent monitoring of channel broadcast schedules. In Italy, all broadcasters are required to submit transmission returns. The regulator (AGCOM) has commissioned a service provider to monitor all terrestrial analogue channels and a smaller sample of satellite and DTT channels, and the data from this monitoring is then compared with the transmission returns by the regulator.
In France, the Conseil Supérieur de l’Audiovisuel (CSA) categorises every programme broadcast on public service TV to check the broadcasters’ own statements of performance against the measures. The CSA also collects samples of contracts between broadcasters and producers.
The following table summarises the Member State approaches to monitoring. “No verification” covers the countries which rely on the returns submitted by broadcasters. “Independent verification” covers the countries which carry out some level of independent verification of these returns, while “Independent monitoring” consists of the countries which (also) carry out some degree of independent monitoring of the actual broadcast schedules.

87
Table 5: Member State monitoring
No verification
Independent verification
Independent monitoring
Austria Luxembourg Belgium Cyprus
Denmark Malta Bulgaria Estonia
Finland Norway Czech Republic
France
Germany Romania Ireland Italy
Greece Slovakia Netherlands Portugal
Hungary Slovenia Poland
Iceland Sweden Spain
Latvia United Kingdom
Lithuania Source: Member State regulatory authorities
5.2.2. Sanctions
The sanctions contained in law that may be applied to broadcasters who fail to meet the requirements of Articles 4 and 5 vary between Member States. In five Member States – Austria,92 Cyprus, Iceland, Ireland and Sweden – the regulator has no legal powers to apply sanctions.
In the remaining Member States, regulatory authorities have a range of powers at their disposal to encourage adherence to the TVWF Directive, from warnings to the imposition of fines. In some Member States, and for the most serious cases, regulatory authorities can shorten or revoke a broadcaster’s licence. These various sanctions are listed in Table 6.
In the questionnaires to the regulators we inquired about the number of broadcasters who failed to meet the requirements of Articles 4 and 5 of the TVWF Directive in 2007, and the number of sanctions applied to these broadcasters. Several regulators did not answer these questions, since data for 2007 was not yet available to them – a few of these provided figures from 2006. Of the 14 regulators who answered these questions in whole or in part for 2007, 9 regulators indicated that some channels had not met the requirements. Only 2 regulators indicated that any sanctions had been applied – and only in the form of warnings.93
92 The regulator can issue a fine when a broadcaster fails to submit returns – but cannot apply sanctions on a failure to meet the requirements. 93 3 of the regulators had no authority to impose sanctions.

88
Table 6: Member State sanctions94
Sanction Member State Warning Fine Licence
Austria � � �
Belgium95 � � �
Bulgaria � � �
Cyprus � � �
Czech Rep. � � �
Denmark � � �
Estonia � � �
Finland � � �
France � � �
Germany � � �
Greece � � �
Hungary � � �
Iceland � � �
Ireland � � �
Italy � � �
Latvia � � �
Lithuania � � �
Luxembourg � � �
Malta � � �
Netherlands � � �
Norway � � �
Poland � � �
Portugal � � �
Romania � � �
Slovakia � � �
Slovenia � � �
Spain � � �
Sweden � � �
United Kingdom � � � Source: Member State regulatory authorities
94 In the table, ‘�’ means that the Member State does not have the sanction at their disposal and ‘�' means that the Member State does have the sanction at their disposal. 95 Both Flemish Community and French Community.

89
5.3. Stricter Measures Applied to Broadcasters
5.3.1. Introduction
Article 3 of the TVWF Directive states that “Member States shall remain free to require television broadcasters under their jurisdiction to comply with more detailed or stricter rules in the areas covered by this Directive.”
Some Member States have applied Articles 4 and 5 of the TVWF Directive more strictly than required by the Directive, by setting the percentage requirements for European works and independent production higher than those required by The Directive. Higher requirements are generally applied only to public service broadcasters – in Italy, the Netherlands and the UK, for example. These interventions can be grouped under the general heading ‘Measures to increase the Quantity of Production’.
Member States place other requirements (either legislative or administrative) on broadcasters that are not directly related to Articles 4 and 5 of The Directive, but which affect the output of broadcasters in their jurisdiction. These requirements take two forms:
• Member States impose additional requirements on the content of European and independent productions relating, for example, to the original language of productions, or the portrayal of national or regional cultures.96 These interventions are often achieved through licence agreements or other administrative arrangements with broadcasters, and can be grouped under the general heading ‘Measures to enhance the Quality of Productions’.
• Some Member States increase European or domestic production by requiring broadcasters (usually the public service broadcasters) to allocate a proportion of their income to, for instance, film production.97 These interventions can be grouped under the general heading ‘Additional funding to Promote European and Independent Production’.
5.3.2. Measures to increase the Quantity of Production
Seven Member States – Finland, France, Hungary, Italy, The Netherlands, Slovakia, and the United Kingdom – apply higher percentage requirements than those contained in The Directive on some or all of their broadcasters.
96 Such measures are mentioned in Recital 44 of Directive 97/36. 97 Such measures are mentioned in Recital 45 of Directive 97/36.

90
Proportion of European works In France, legislation requires broadcasters to reserve at least 60% of transmissions to European audiovisual and cinematographic works. 60% of the transmission time dedicated to audiovisual works must be European works.98 For cable, satellite and digital terrestrial channels, the individual licenses may allow the 60% requirement to be reached progressively, but the minimum proportion of European works must be at least 50% of qualifying hours.99 60% of the total number of broadcasts of cinematographic works of long duration must be European works.100
In the United Kingdom, the proportion is set individually for each channel in the licence, which may establish higher requirements for individual channels. For example, high proportions of European works have been set for the BBC channels BBC3 (90%), BBC4 (around 70%), CBeebies (around 90%) and CBBC (around 75%).
Italy is applying the normal 50% proportion to the total (monthly) qualifying transmission time.101 However, the 50% proportion is also applied separately to qualifying transmission time during peak viewing hours.102
Instead of using the term “majority proportion”, some of the remaining Member States have described the proportion as a percentage. These descriptions vary between ‘at least 50%’ (e.g. Bulgaria103), ‘more than 50%’ (e.g. Poland104) and ‘at least 51%’ (e.g. Spain105). We understand these variations to be slightly differing interpretations of “majority proportion”, rather than intentionally stricter proportions, and therefore Member States with a required proportion of 51% have not been considered to employ a stricter requirement than the TVWF Directive.
Proportion of independent productions Hungary requires all broadcasters to reserve 12% of the programme budget to independent works (as well as 10% of transmission time).106
France generally requires broadcasters to reserve 10.66% of their turnover for audiovisual works which are independent productions.107 The proportions to be reserved for audiovisual works are higher for the public 98 Decree no. 90-66 of 17 January 1990 (as amended), Article 13. 99 Decree no. 2001-1333 of 28 December 2001 (as amended), Article 15; Decree no. 2002-140 of 4 February 2002 (as amended), Article 18. 100 Decree no. 90-66 of 17 January 1990 (as amended), Article 7. 101 The Broadcasting Code (Legislative decree no. 177 of 31 July 2005, as amended by Law 244/2007 and Law 31/2008), Articles 6 and 44. 102 Peak viewing hours are defined as 18:30-22:30, but will probably be adjusted during 2008 (likely to 19:30-23:30). 103 Law for the Radio and the Television, SG. 138 of 24 November 1998 (as amended), Article 10(2). 104 Broadcasting Act of 29 December 1992 (as amended), Article 15(3). 105 Act 25/1994, 12th July (as amended), Article 5. 106 Act I of 1996, on Radio and Television Broadcasting (as amended), Article 7. 107 Decree no. 2001-609 of 9 July 2001 (as amended), Articles 8 and 11; Decree no. 2001-1333 of 28 December 2001 (as amended), Articles 9 and 12; Decree no. 2002-140 of 4 February 2002 (as amended), Articles 11 and 14.

91
broadcasters France 2 (12.66%), France 3 (12.33%) and M6 (12%).108 Broadcasters must also invest a minimum of 3.2% of net turnover into French and European films,109 with higher proportions for Canal+ (12%) 110 and other film channels (21%, raised to 26% for first exhibition channels);111 75% of these proportions should be allocated to independent productions.112
The Italian public service broadcaster has been required to reserve at least 20% of qualifying hours for independent productions, and to allocate 15% of the turnover to European works, including independent productions. As of 1 January 2008, this will be replaced by a requirement to allocate 15% of the turnover to independent productions. Similarly, other channels will be required to allocate 10% of turnover.113
It should be added that a broadcaster’s turnover will always be a higher amount than the broadcaster’s programming budget. Therefore, calculating the allocation of funds for independent productions as a proportion of turnover is stricter than calculating the allocation as a proportion of the programming budget (as stated in Article 5 of the Directive).
In Slovakia, public service broadcasters are required to reserve at least 20% of qualifying hours for independent productions.114 In the Netherlands, each public service channel must reserve at least 17.5%, and the average proportion for all public service channels must be at least 25%.115 Additionally, re-runs may only be counted towards the measure when they are shown in peak-time, to prevent the measure being met by broadcasting re-runs in non-peak time.
All BBC and terrestrial analogue channels in the UK are required to reserve at least 25% of qualifying transmission time to independent productions.116
Finland applies a 15% independent works requirement on all broadcasters.117
The following table shows an overview of the Member States that have adopted requirements for higher proportions of European works and/or independent productions.
108 Further to Decree no. 2001-609 of 9 July 2001 (as amended), Article 10 109 Decree no. 2001-609 of 9 July 2001 (as amended), Article 3; Decree no. 2002-140 of 4 February 2002 (as amended), Article 7. 110 Decree no. 2001-1332 of 28 December 2001, Article 5 111 Decree no. 2001-1333 of 28 December 2001 (as amended), Article 20 112 Decree no. 2001-609 of 9 July 2001 (as amended), Article 6; Decree no. 2001-1332 of 28 December 2001, Article 6; Decree no. 2001-1333 of 28 December 2001 (as amended), Article 7; Decree no. 2002-140 of 4 February 2002 (as amended), Article 14. 113 The Broadcasting Code (Legislative decree no. 177 of 31 July 2005, as amended by Law 244/2007 and Law 31/2008), Articles 6 and 44 114 Act No. 308 of 14 September 2000 Coll. On Broadcasting and Retransmission (as amended), Article 25(1) 115 Media Act of 21 April 1987 (as amended), Article 54(2) 116 Communications Act 2003, section 277 117 Act 744/1998 on Television and Radio Operations (as amended), Article 17

92
Table 7: Higher requirements for European works and independent productions
Member State European works Independent productions
Finland ����
France ���� ����
Hungary ����
Italy ���� ����
Netherlands ����
Slovakia ����
United Kingdom ���� ����
Source: Member State regulatory authorities
5.3.3. Measures to enhance the Quality of Productions
With the exception of Luxembourg, all of the E30 place additional requirements on broadcasters regarding the content of European and independent productions. These generally require broadcasters’ programming to reflect linguistic or cultural specificities in a Member State.
For example, in the Netherlands, public service broadcasters must dedicate 50% of relevant transmission time to programmes originally produced in Dutch or Friesian,118 and for private channels the percentage is 40%.119 The language proportions are calculated independently from the required majority proportion of European works - European works originally produced in Dutch and Friesian will count towards achieving both proportions. In Portugal, national channels must broadcast programming originally produced in Portuguese for 50%120 of transmission time (excluding time appointed to advertising, teleshopping and teletext121) and creative programmes originally produced in Portuguese for 20% of all transmission time – only 25% of these quotas can be fulfilled by programmes from other Portuguese-speaking countries.122 These proportions are calculated independently from the required majority proportion of European works - European works will only count towards the other quotas as well when the aforementioned origin requirement is fulfilled. In Latvia, 40% of the European works should be works originally produced in Latvian123 – similar quotas apply for domestic language
118 Media Act of 21 April 1987 (as amended), Article 54a(1) 119 Media Act of 21 April 1987 (as amended), Article 71g 120 Under the Public service concession for 2008 to 2011, the public service channel RTP 1 will be subject to a 60% requirement for programming in the Portuguese language (Article 9(8) of the concession agreement). 121 News, sports events and games are not excluded from this calculation (in contrast to the calculation of the proportion of European works), 122 Television Act (Law no. 27 of 30 July 2007), Article 44 123 The Radio and Television Law of 8 September 1995 (as amended), Article 18(1)(2)

93
production in Hungary124 and Poland (33% of qualifying transmission time in each country). In Greece, 25% of qualifying transmission time should be for works produced in Greek. Additionally, public service broadcaster ERT is required to broadcast programmes showing the correct use of the Greek language.125
French legislation requires that at least 40% of broadcasters’ audiovisual and cinematographic output is originally produced in French.126 Additionally, all terrestrial analogue channels are required to invest at least 16% of turnover into original productions in the French language. Terrestrial channels, except France 5, are also required to provide 120 hours of European or French language works that have never previously been broadcast; these programmes must start between 8 and 9 p.m. and cannot account for more than 180 minutes per night.127 Lower or more flexible requirements are set for France 2, France 3 and M6 in their licences.
In the United Kingdom, public service stations are subject to licence quotas for “original productions”. Original productions are defined as “European programmes”128 which have been commissioned by or for a UK public service channel with a view to their first showing on UK television on a public service channel. The original production quotas for each channel are between 53% (Five) and 90% (BBC News 24, BBC Parliament) in general, and between 42% (Five) and 90% (BBC 1) for peak-time.
Germany, the Netherlands, Spain and the UK also apply regional requirements on broadcasters, either through an extra layer of requirements for linguistic or cultural programming applied at a regional level (Germany129 and Spain130), or through a requirement on national broadcasters to reflect regional differences (The Netherlands131 and the UK132). The UK also imposes specific regional production quotas on public service broadcasters.133
124 Act I of 1996, on Radio and Television Broadcasting (as amended), Article 7(1). 125 Law 2328/1995, Article 3(18-19); Law 2644/1998, Article 10(3) 126 Decree no. 90-66 of 17 January 1990, Article 7(I) 127 Decree no. 2001-609 of 9 July 2001 (as amended), Article 8; Decree no. 2001-1333 of 28 December 2001 (as amended), Article 9. 128 European programmes are European works, plus a proportion of “part-qualifying works”: programmes which are not European works but nevertheless have been made with significant contributions from an EU producer (Broadcasting (Original Productions) Order 2004). 129 The general competence in the area rests with the individual German States. The Interstate Treaty on Broadcasting of 31 August 1991 (as amended) provides a common regulatory framework, but the States may issue supplementary regulations (Article 1(2) of the treaty). 130 The autonomous regions may adopt rules to promote audio-visual production in their regional languages, within the local television services under their jurisdiction. Act 25/1994, 12th July (as amended), Article 2(5) 131 Media Act of 21 April 1987 (as amended), Article 51e 132 BBC Charter and individual licences 133 BBC Charter; individual licences, pursuant to Communications Act 2003, sections 286 through 288

94
The following table provides an overview of the distribution of Measures to enhance the Quality of Production in Member States.
Table 8: Measures to enhance the Quality of Production
Member State Type of content
General Language
Original production language
Regional provisions
Austria � � � �
Belgium (Flemish) � � � �
Belgium (French) � � � �
Bulgaria � � � �
Cyprus � � � �
Czech Republic � � � �
Denmark � � � �
Estonia � � � �
Finland � � � �
France � � � �
Germany � � � �
Greece � � � �
Hungary � � � �
Iceland � � � �
Ireland � � � �
Italy � � � �
Latvia � � � �
Lithuania � � � �
Luxembourg � � � �
Malta � � � �
Netherlands � � � �
Norway � � � �
Poland � � � �
Portugal � � � �
Romania � � � �
Slovakia � � � �
Slovenia � � � �
Spain � � � �
Sweden � � � �
United Kingdom � � � �
Source: Member State regulatory authorities

95
The categories in the table cover the following types of requirements:
Type of content:
Requirements to broadcast a certain proportion of specific programme types, e.g. cultural or creative works.
General Language:
General requirements to reflect national (or minority) culture and language, correct use of the national language, etc.
Original production language:
Requirements that a certain percentage of broadcasts should be dedicated to works originally produced in a certain (national or minority) language. Dubbing and subtitling requirements are not included.
Regional provisions:
Regional requirements on broadcasters, as described above
5.3.4. Additional funding to Promote European and Independent Production
In this section we look at the requirements placed on broadcasters that relate primarily to the funding of indigenous film production, either directly or through a contribution to centrally administered film funds.
Examples where broadcasters are required to contribute directly to film production include France, where terrestrial free-to-air channels must invest a minimum of 3.2% of net turnover into French and European films;134 higher proportions apply to Canal+ (12%)135 and film channels and other film channels (21%, raised to 26% for first exhibition channels).136 75% of these proportions should be independently produced.137 Broadcasters are also required to spend 16% of turnover - not programming budget - on audiovisual production.138 Higher
134 Decree no. 2001-609 of 9 July 2001 (as amended), Article 3; Decree no. 2002-140 of 4 February 2002 (as amended), Article 7. 135 Decree no. 2001-1332 of 28 December 2001, Article 5 136 Decree no. 2001-1333 of 28 December 2001 (as amended), Article 20. 137 Decree no. 2001-609 of 9 July 2001 (as amended), Article 6; Decree no. 2001-1332 of 28 December 2001, Article 6; Decree no. 2001-1333 of 28 December 2001 (as amended), Article 7; Decree no. 2002-140 of 4 February 2002 (as amended), Article 14. 138 Decree no. 2001-609 of 9 July 2001 (as amended), Article 8; Decree no. 2001-1333 of 28 December 2001 (as amended), Article 9.

96
proportions apply to France 2 (19%), France 3 (18.5%) and M6 (18%),139 while lower proportions (4.5%) apply to Canal+.140 Two thirds of these proportions must be independently produced (equivalent to 10.66% for channels subject to the 16% requirement).141 The investment requirements do not apply to the cable, satellite and DTT broadcasters that spend less than 20% of the annual transmission time on audiovisual works.142
Examples of Member States in which broadcasters contribute to a centrally administered film fund include Poland, where broadcasters must pay 1.5% of their income to the Polish Film Institute, and public service broadcasters must earmark at least 1.5% of their annual licence fees for film production purposes. If a broadcaster does not spend the full earmarked amount, the remainder shall be transferred to the Polish Film Institute.143 France applies a 5.5% levy on the part of each broadcaster’s annual revenues from advertising which exceed 11 million EUR, which is distributed to film production through a fund administered by the CNC.144 Portugal places a 4% tax on the sale of television advertising that is directed towards film production.145 In Sweden, the major broadcasting companies are also required to contribute to Swedish film production; SVT must contribute at least 34 million SEK (2006 figures) per year to the Swedish Film Institute, and guarantee to spend at least 36 million SEK per year on co-production, co-financing and purchasing rights for new Swedish feature films and short and documentary films.146 Czech Republic (Czech Television)147 and Norway (TV2)148 also have requirements to contribute fixed amounts to film funds (12.5 million CZK149 monthly and 25 million NOK annually,150 respectively).
139 Licence conditions, further to Decree no. 2001-609 of 9 July 2001 (as amended), Article 10 140 Decree no. 2001-1332 of 28 December 2001, Article 9; 141 Decree no. 2001-609 of 9 July 2001 (as amended), Article 11; Decree no. 2001-1332 of 28 December 2001, Article 11; Decree no. 2001-1333 of 28 December 2001 (as amended), Article 12; Decree no. 2002-140 of 4 February 2002 (as amended), Article 14. 142 Decree no. 2001-1333 of 28 December 2001 (as amended), Article 8; Decree no. 2002-140 of 4 February 2002 (as amended), Article 11. 143 Act on Cinematography of 30 June 2005, Article 19 144 Code général des impôts (the general tax code), Article 302 bis KC 145 Decree-Law no. 227 of 15 November 2006, Articles 50 to 58 146 The obligations follow from The 2006 Film Agreement, an agreement between the Swedish State, several broadcasting companies and several associations (including the associations of Swedish film exhibitors, distributors and producers). The other broadcasting companies that are parties to the agreement have the following obligations: TV 4: 8 million SEK contribution and 8 million SEK guaranteed spending MTG: 4 million SEK contribution and 1 million SEK guaranteed spending Kanal 5: 2 million SEK contribution and 0.5 million SEK guaranteed spending C More Entertainment: 2 million SEK contribution and 0.5 million SEK guaranteed spending 147 Article VI of Amendment 304/2007 to the Czech Television Act 483/1991 148 TV 2 licence terms for 2003-2009, § 2-2 149 Starting in 2008 150 Figure for reference year 2003
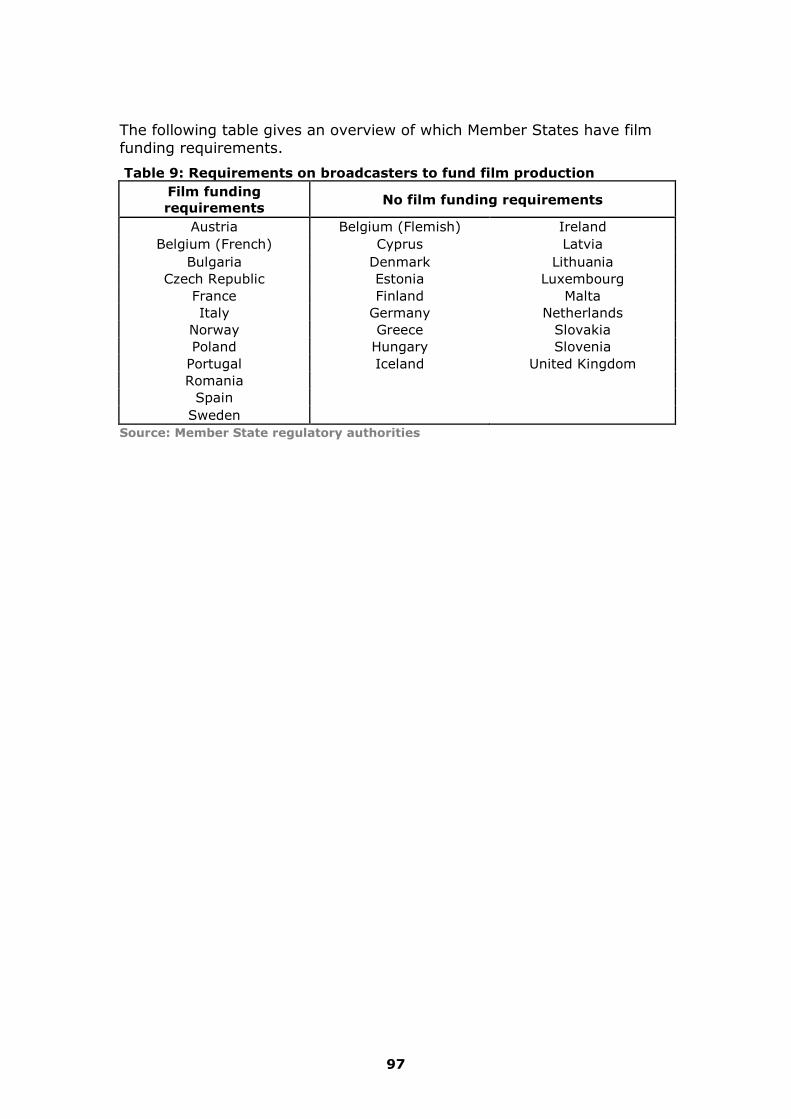
97
The following table gives an overview of which Member States have film funding requirements.
Table 9: Requirements on broadcasters to fund film production Film funding requirements
No film funding requirements
Austria Belgium (Flemish) Ireland Belgium (French) Cyprus Latvia
Bulgaria Denmark Lithuania Czech Republic Estonia Luxembourg
France Finland Malta Italy Germany Netherlands
Norway Greece Slovakia Poland Hungary Slovenia Portugal Iceland United Kingdom Romania Spain Sweden
Source: Member State regulatory authorities

98
5.4. Implementation Modes
Based on the preceding analysis, we can create indices to rank Member States according to: first, the strictness or flexibility with which they apply Articles 4 and 5 of the TVWF Directive; and second, whether or not they place additional requirements on national broadcasters to promote European and independent production. These indices are given for each Member State in the table below.
The scoring method has been inspired by the method applied in The 2005 Study. However, it has been decided to adjust the method in certain areas, to provide a regime that reflects updated opinions on the importance of individual items, and (particularly for “Additional requirements”) is easier to apply consistently. For further details about the scoring method, please refer to Appendix VII and Appendix VIII.
The scoring has been carried out according to our current understanding of the rules of each Member State. Therefore, changes in scores for the Member States that were included in the 2005 Study are due to a combination of the following factors:
- Adjustment of scoring method
- Changes in the Member State regulatory regime
- Revised understanding of the Member State regulatory regime.

99
Table 10: Index of Implementation modes
Application of Articles 4 and 5 Additional Requirements Member
State Index
Implementation
Mode Index
Implementation
Mode
Austria 5 Flexible 1 Low
Belgium 14 Prescriptive 2 Low
Bulgaria 13 Prescriptive 3 High
Cyprus 7 Flexible 2 Low
Czech
Republic 9 Flexible 1 Low
Denmark 7 Flexible 1 Low
Estonia 16 Prescriptive 2 Low
Finland 14 Prescriptive 3 High
France 17 Prescriptive 6 High
Germany 9 Flexible 2 Low
Greece 13 Prescriptive 2 Low
Hungary 14 Prescriptive 2 Low
Iceland 6 Flexible 1 Low
Ireland 8 Flexible 1 Low
Italy 15 Prescriptive 4 High
Latvia 15 Prescriptive 1 Low
Lithuania 8 Flexible 1 Low
Luxembourg 10 Flexible 0 Low
Malta 10 Flexible 1 Low
Netherlands 13 Prescriptive 4 High
Norway 13 Prescriptive 2 Low
Poland 13 Prescriptive 4 High
Portugal 14 Prescriptive 3 High
Romania 13 Prescriptive 4 High
Slovakia 12 Prescriptive 2 Low
Slovenia 14 Prescriptive 1 Low
Spain 10 Flexible 3 High
Sweden 3 Flexible 4 High
United
Kingdom 15 Prescriptive 5 High
100
The second column of the table contains a score that reflects how flexible or prescriptive Member States are in their application of Articles 4 and 5. The score for each Member State has been constructed using the information summarised in sections 5.2 and 5.3 above. For further details about how the scores are reached, please refer to Appendix VII, where a detailed breakdown of the scores can also be found.
Scores in the index range from three points (Sweden) as the Member State that has implemented Articles 4 and 5 of The Directive with greatest flexibility for broadcasters; and 17 points (France) as the Member State with the strictest application of The Directive. The theoretical maximum score is 20.
For the E17 countries, the scores for application of Articles 4 and 5 have only changed moderately since The 2005 Study. The Member States with the highest change in the score are Belgium, Denmark, the Netherlands, Norway and Portugal, which have all changed their scores by 3 points. The Netherlands and Norway were listed as “Flexible” in The 2005 Study, since they received a score of 10. Now, their implementation mode is indicated as “Prescriptive”.
The changes for Norway and Portugal are exclusively due to changes in the legislation. Both countries have introduced a strict definition of an independent producer. At the time of the 2005 Study, neither country had any definition of an independent producer in their legislation.
For Belgium, the change in score is due to a combination of changes in legislation and adjustment of scoring. The changes in legislation, which altogether add 2 points to the score, concern the French Community removing the “where practicable” qualification from their legislation, the Flemish Community no longer having a definition of ‘independent producer’ in their legislation, and both communities now reporting access to all the measured forms of sanctions. The adjusted scoring, which adds 1 point to the score, is due to adjusted methodology for scoring monitoring and verification.151
For the Netherlands, the change in score is due to adjustment of scoring for definition of independent producer,152 monitoring153 and sanctions.154
For Denmark, the change in score is due to adjustment of scoring for the definition of majority proportion of European works and applicable criteria for independent productions.
The third column categorises each Member State as either flexible or prescriptive in its application of Articles 4 and 5, based on whether it has a score of above or below ten.
Column 4 of the table summarises the additional requirements in each Member State, referred to in section 5.3 above, to increase the quantity and enhance the quality of European and independent production. Scores range from zero to six, with a theoretical maximum score of seven. For 151 See Appendix VII (Chapter 19) 152 No changes have occurred, but additional criteria established in the regulatory authority’s policy guidelines have now been included in the scoring. 153 Due to adjusted scoring method 154 Availability of warnings has been reported
101
further details about how the scores are reached, please refer to Appendix VIII, where a detailed breakdown of the scores can also be found. Compared with the 2005 study, the scoring methodology has been changed for “Measures to enhance the Quality of Productions”, so a direct comparison cannot be made.
Column 5 categorises Member States according to whether they place few or many additional requirements on broadcasters. A score of between zero and two is categorised as low, a score of three or more is categorised as high.
For the E17, the scores for each Member State have changed by no more than one point since The 2005 Study.
Belgium and Norway were both listed as “High” in The 2005 Study, since they received a score of 3. Now, their implementation mode is indicated as “Low”. These changes are exclusively due to the changed methodology for scoring of “Measures to enhance the Quality of Productions”.155 For further details about the new methodology, please refer to Appendix VIII.
155 The adjustment of the scoring methodology has meant that when a Member State requires a specific percentage of broadcasts to be dedicated to works originally produced in a certain (national or minority) language, this is scored exclusively as an “Original Production Language” requirement, and dubbing or subtitling requirements are not included in the scoring at all. For Belgium, quotas on works originally produced in a national language was counted twice in the scoring for the 2005 Study (as both a “language” and “origin of production” requirement), and therefore the adjusted methodology has led to a reduction in score by one point. For Norway, the requirement on TV2 to broadcast at least 50% of programmes in the Norwegian language can be fulfilled by dubbing, and therefore it has not been counted as an “Original Production Language” in the present study, resulting in the reduction in score by one point.

102
Using these dimensions enables us to locate each Member State within a matrix that describes four implementation modes:
Table 11: Implementation modes
Application of Directive
Flexible Prescriptive
Hig
h
Spain Sweden
Bulgaria Finland France
Italy Netherlands
Poland Portugal Romania
United Kingdom
Ad
dit
ion
al
Req
uir
em
en
ts
Lo
w
Austria Cyprus
Czech Republic Denmark Germany Iceland Ireland
Lithuania Luxembourg
Malta
Belgium Estonia Greece Hungary
Latvia Norway Slovakia Slovenia
Member States in the bottom left-hand corner of the matrix are characterised as having a flexible approach to implementing Articles 4 and 5 of The Directive, and they do not apply substantial additional requirements on broadcasters. For instance, Austria has implemented Articles 4 and 5 flexibly – the regulator has no power to sanction broadcasters – and the only additional requirement is a film funding requirement on the public service broadcaster.
In the bottom right-hand corner, there are Member States that apply the TVWF Directive strictly, but do not place significant additional content production requirements on broadcasters. Luxembourg, for example, has implemented Articles 4 and 5 of the TVWF Directive strictly – it has powers to revoke a channel’s licence where a broadcaster fails to meet the provisions of these Articles – but it places no additional requirements on broadcasters as regards to the content of qualifying programming or film funding. In Greece, the wording of the Directive is closely followed in national legislation, but the only content-based requirement relates to the use of the Greek language.

103
In the top left-hand corner are Member States that have adopted a flexible approach to the implementation of The Directive, but do place significant additional requirements on broadcasters. For instance, Sweden has implemented Articles 4 and 5 very flexibly - and has in fact obtained the lowest possible score - but broadcasters are required to broadcast a significant portion of programmes in Swedish, programmes with Swedish artists, and works by Swedish authors (with additional cultural and language requirements on the Public Service Broadcaster), and to contribute to the funding of Swedish film production.
In the top right-hand corner of the matrix we identify Member States that have adopted a strict implementation of Articles 4 and 5 of the TVWF Directive, and that also place significant additional requirements on broadcasters. For instance, France and Italy have adopted a strict approach to Articles 4 and 5, which include strict monitoring of compliance. The European works requirements also apply separately to peak hours, the independent productions requirements are based on total turnover, and broadcasters are additionally subject to film funding requirements.

104
6. On-Demand Audiovisual Services and European Works
6.1. Introduction This chapter reviews the existing national legislative measures that have already been adopted by some Member States in respect of on-demand services, and that are in line with Article 3i of the Audiovisual Media Services Directive. Data for this section were obtained through questionnaires sent to the regulatory bodies in each Member State. Article 3i was introduced by Directive 2007/65. This Directive was adopted on 19 December 2007 and must only be implemented by 19 December 2009. Thus we are at a very early stage in the process of implementing Article 3i into national legislation. None of the Member States have currently adopted any specific measures for the implementation of Directive 2007/65, including Article 3i. This chapter outlines the existing national legislative measures that, although not adopted with the intention of implementing Article 3i, nevertheless in some way have a similar effect to / purport a similar objective as Article 3i. As very few Member States have reported any such measures, the findings for the Member States that have such measures are presented as a separate summary for each relevant Member State. This chapter also contains a brief description of any preliminary discussion on the implementation of on-demand measures in the Member States, as reported by the national authorities.
6.2. Pre-Existing National Legislation As of 1 January 2008, the majority of Member States have not adopted any national legislative measures that have any effect similar to Article 3i of the Audiovisual Media Services Directive.156 Only the following Member States have reported to us that they have any current national legislation with an effect somewhat similar to Article 3i:157
156 The same applied when data was collected from national regulatory authorities (mainly in February and March 2008). 157 In previous work on the study we included reference to legislation from Poland here as well that, from a translation available from the Polish Film Institute at the time of writing, indicated that on-demand services may be subject to the same

105
- Belgium (French Community) - France
It should also be noted that Italy has adopted a provision authorising the regulator to implement Article 3i by issuing secondary legislation. However, the on-demand services will only be subject to any obligations in this regard when the secondary legislation has been issued and entered into force. Since such secondary legislation has not yet been issued, it should not be viewed as pre-existing national legislation, but rather as a preliminary step towards national implementation of Article 3i. Therefore, the details on the relevant provision can be found in section 6.3. In the following section, these measures are described separately for each relevant Member State.
6.2.1. Belgium (French Community)
The 2003 legislation of the French Community of Belgium158 has been based on a principle of technological neutrality, without any distinction between distribution platforms. As stated in Article 2 of the Decree, it covers all broadcasting activities and all service providers under the jurisdiction of the French Community. Therefore, the regulator has considered non-linear television services subject to the same obligations as other television broadcasting services. By implication, the on-demand services must respect the same rules as television broadcasters regarding European works, independent productions, programmes in the French language and spending on audiovisual production. In a 2007 ruling,159 the regulator found that these obligations had not been fulfilled by the on-demand service A la demande, operated by Skynet iMotion Activitites (SiA), a company in the Belgacom group. This service was the only true non-linear service under the jurisdiction of the French Community,160 and had originally been licensed according to the general rules for television broadcasting. In respect to European works and independent productions, the regulator found that the operator had not fulfilled his obligation to transmit information
mandatory film fund contributions as other media services. However at the workshop and in subsequent discussion, the legal experts from the Office of the National Broadcasting Council has made clear to the consultants that they do not consider this legislation as applying to non-linear services, and have thus requested that the reference to Poland not be included in the Final Study Report. 158 Broadcasting Decree of 27 February 2003 (as amended). 159 www.csa.be/documents/show/689 160 Two Near Video On Demand services were also in operation (one of them provided by SiA). In the context of the Directive, these are considered to be linear services (see Directive 2007/65, recital 20).
106
on the achieved proportions. The provider stated that it was not in possession of the information, but was examining the technical possibilities for being able to provide the information. According to the regulator, nothing new has happened in the case since the regulator made its ruling in 2007. The ruling did not mention how the achieved proportions of European works and independent productions should be calculated in respect of an on-demand service (since the service provider had submitted no statistical information at all, it was not necessary to consider this specifically in the ruling). However, it is our understanding that according to the preliminary opinion of the regulator, the proportions should be calculated as the proportion of the total offering to the public (share of titles in the catalogue) in the sample weeks established by the regulator. It should be noted that in 2007, a specific definition of non-linear services was inserted in the legislation (which is in line with the definition in Article 1(g) of Directive 2007/65).161 However, this has not been connected with any amendments of the obligations of television broadcasters.
6.2.2. France
France collects a 2% tax from Video-on-Demand service providers. The tax is calculated on the fees paid by consumers (exclusive of VAT).162 The tax was the only measure effectively applied to on-demand services as of the end of 2007. However, two other issues deserve mention: Under the French legislation, the regulatory authority CSA has been authorized to issue “catalogue quotas” that would apply to on-demand services,163 but this authorisation has never been used by the CSA. A voluntary inter-professional agreement on cinema–on-demand (offering of cinematographic works through on-demand audiovisual media services) was concluded on 20 December 2005 between the French government, movie industry operators and Internet access providers. This « Protocole d’accord interprofessionnel sur le cinéma à la demande » was mainly conceived as a means for promoting legal on-line circulation of creative works. Under the agreement, among other requirements, the signatories were required to uphold investment quotas for EU and French-originated cinematographic works. VOD operators with a turnover less than €1.5 million were required to invest 3% of revenue into European film, while operators with a turnover between €1.5 million and €3 million should invest 5% of revenue in European film, of which 3.5% should be allocated to French films. If a VOD operator
161 Broadcasting Decree of 27 February 2003 (as amended), Article 1(45). 162 Code General des Impôts (the general tax code), Article 302 bis KE. 163 Law no. 96-299 of 10 April 1996, Article 5.

107
recorded revenues of more than €5 million, the proportion of revenue going to European and French films increased incrementally to a maximum of 10% and 7% respectively. Since the above agreement was made for a period of one year and expired on 20 December 2006 without being renewed, the obligations mentioned above no longer apply. Eventually, the obligations will be replaced by the measures implementing Article 3i of the Directive (see also section 6.3).

108
6.3. Implementation of Directive 2007/65
and Pending National Legislation This section describes the status of implementation of Directive 2007/65, at the time when replies were received from the national regulators.164 None of the Member States have completed the implementation of Article 3i of the new AVMS Directive as of 1 January 2008.165 However, Italy has adopted a provision that entered into force on 1 January 2008,166 stating that:
“The electronic communications operators providing on-demand services will contribute, gradually and according to the conditions of the market, to the promotion and the funding of European works, dedicating to them a part of their income from audiovisual content offered to the public for a charge, regardless the means of transmission. The criteria and means of this contribution will be established by AGCOM within 6 months from the entry into force of this provision.”
In other words, the Italian regulator has been authorised to issue secondary legislation on the issue, setting requirements for on-demand providers’ financial contributions to the promotion of European works (one of the possible means envisioned by Article 3i). As of the beginning of July 2008, secondary legislation had not yet been issued, and the on-demand services are therefore not yet subject to any obligations in this regard (see also section 6.2). Most Member States have indicated in their reply to our questionnaire that implementation is expected to be carried out during 2009, or that the expected time of implementation is still unknown. Otherwise, only Belgium (Flemish Community), Czech Republic, France and Latvia have indicated that implementation is likely to take place during 2008. Additionally, Cyprus and Hungary have indicated that digital platforms are not yet captured by the current legislation, but that the national legislation is under review and will be amended soon. In the United Kingdom, one of the options being considered for the implementation is to apply a co-regulatory regime, i.e. self-regulation supported with a statutory back-stop (a legal means of State intervention if
164 February to March 2008. 165 The same applied when data was collected from national regulatory authorities (mainly in February and March 2008). 166 Broadcasting Code (legislative decree no. 177 of 31 July 2005, as amended by Law 244/2007), Article 44.
109
the objectives of the regime are not met167). A public consultation is likely to be launched mid-2008. At the moment, a similar approach is applied to the self-regulatory body “The Association for Television On-Demand” (ATVOD), which currently has 7 members. Membership is entirely voluntary, but in the absence of self-regulation, the Secretary of State would be authorised to issue centralised regulation. The current Code of Practice and Guidance Notes issued by ATVOD do not contain any measures that promote the production of and access to European works. The national authorities have given references to a very limited amount of discussion relevant to the promotion of European works on on-demand services. From these, it appears that the discussions in the Member States so far have mainly been focused on providing input for the EU legislative process and assessing the likely impact of amending the TVWF Directive (before the final text of the AVMS Directive was known). For example, references were made to the replies made to the Commission-issued papers published prior to the Liverpool Conference of 2005. Discussions on how to actually implement the AVMS Directive appear to be in the very early stages. Some Member States have established working groups to support the implementation process, but according to the national authorities, none of these working groups have yet held any discussions that are relevant to European works in the context of on-demand audiovisual services. France and the Netherlands have carried out public consultations regarding the implementation of Directive 2007/65, and some other Member States expect to initiate public consultations in mid-2008.168 France has so far carried out two public consultations. The first one was held from February to March 2008 pertaining to the implementation of Directive 2007/65 as such, including potential measures for the implementation of Article 3i. The second one was held from June to July 2008 pertaining to legal evolutions of audiovisual commercial communication issues. The subject matter of the second consultation was not directly relevant to Article 3i, but information of interest has been acquired from the first consultation. In the first public consultation in France, several participants indicated that measures implementing Article 3i should be applied only to the parties with editorial responsibility for the on-demand services, and not to parties who just carry or sell access to these services. It appeared that the type of measure preferred by service providers and some professional associations would be a financial contribution, possibly financed by a relaxation of the restrictions on advertising breaks. Some proposed to combine this contribution with prominence requirements, and possibly even with catalogue quotas. Some participants advocated exclusively for prominence requirements. Other participants, particularly internet service providers, 167 As envisioned by new Article 3(7) AVMS and Recital 36 of Directive 2007/65. 168 This includes the United Kingdom and the French Community in Belgium.
110
argued against any form of regulation in the area. It was also mentioned that catch-up television needed to be dealt with specifically. Based on the results of these wide consultations, a draft bill is to be presented by the French government in October, submitted to Parliament by November, and adopted as law before the end of the year so as to enter into force in January 2009. In the public consultation in the Netherlands, several parties indicated that they found it very difficult to understand the AVMS Directive’s distinction between linear and non-linear services, particularly when the same provider offered both linear and non-linear services. Several providers of new services stated that they believed themselves to fall outside the Directive’s definition of non-linear services. In the French Community of Belgium, the results of a working group advising on the implementation of Directive 2007/65 were published on 17 June 2008.169 The group suggested that a non-linear regime for European works and independent productions, similar to the linear regime, would be appropriate, provided that the higher degree of flexibility allowed by the AVMS Directive for non-linear services was reflected in the regime. For this purpose, the new regime could establish alternative targets for investment and prominence, leaving the choice between the targets to the individual service providers - assuming however that the established targets could be effectively monitored and assessed. It was suggested by the group that the existing additional French language requirements for linear services should also apply to non-linear services. The linear requirements for contribution to the production of audiovisual programming, which employ a progressive scale depending on the turnover of the broadcaster, could also be applied to non-linear services, and the definition of audiovisual productions to be supported through these contributions could be extended to include content exclusively for non-linear use, such as short programmes for mobile TV. Catch-up TV services offer programmes that have already been distributed in linear services and were subject to the broadcasting legislation, including the requirements on European works. At the workshop in November 2008, it was emphasised that it was necessary to consider whether catch-up services should be regulated twice, i.e. whether they should always fulfill the European works requirements for non-linear services when the original broadcast was already subject to the European works requirements for linear services. Additionally, the working group paper mentioned that there would be a special need for defining the distribution of responsibilities in the cases where the non-linear service was offered by a party other than the related linear service. Some national authorities indicated an assumption that on-demand service providers would not welcome additional requirements.
169 http://www.csa.be/system/document/nom/826/CAV_20080617_decret_transposition_SMA.pdf

111
7. The European TV Supply Chain and Audiovisual Content Creation
This chapter provides an analysis and description of the current market structure and revenue of the EU Television sector – encompassing both broadcasting and production - and the flow of funds through the European TV supply chain. It looks at both traditional linear TV and the non-linear (“on-demand”) services that are becoming widespread. It uses a combination of well-known industry sources, such as the OBS, Screen Digest, Kagan, the EBU and the TVI Yearbook; plus access to company accounts and investment bank reports; studies by key national regulators such as Ofcom and the CSA; and some of the bespoke channel survey and interview programme data covered in Chapter 9.170 These are combined to create as accurate a picture as possible of the whole sector and its three main component parts – content creation, channel management and TV delivery. Where individual sources are used, these are detailed in the respective charts. The chapter updates a similar study completed for the EC in 2005 (“the 2005 study”)171 and regularly makes reference to the countries included in that previous study as E17172 in order to show comparable growth rates and highlight any changes in market structure. The study also makes reference to the E30, which includes the 13 countries that were not included in the 2005 study173. The majority of on-demand services reviewed were not available at the time of the 2005 study and hence comparisons are not meaningful. Wherever possible we have looked at the situation in 2007, however data needed to answer some questions is only currently available for 2006. In these cases we have used the most up-to-date data available and have clearly made reference that 2006 is being looked at.
170 A bibliography can be found in Chapter 22. 171 Study on the impact of measures concerning the promotion of the distribution and production of television programs provided for under Art 25 (a) of the Directive on Television without Frontiers, 24 May 2005. 172 E17 countries include: UK, Germany, France, Italy, Spain, Portugal, Denmark, Finland, Norway, Iceland, Ireland, The Netherlands, Belgium, Luxembourg, Austria, Greece and Sweden. 173 E30 countries include: E17 + Latvia, Lithuania, Liechtenstein, Bulgaria, Poland, Slovenia, Slovakia, Czech Republic, Malta, Cyprus, Estonia, Romania and Hungary.

112
7.1. Market Structure and the Supply Chain Framework
The supply of TV services to viewers is made up of three broad and interrelated functions (See Figure 1). Firstly, the creation of new content, such as news, documentaries, gameshows, dramas and entertainment programmes. Second is the management of individual TV broadcast channels (made up of a mixture of: commissions of new programmes; acquired rights to ready-made feature films or existing libraries of ready-made TV programmes; and various promotional and interstitial material, such as programme trails, station idents and advertising breaks), plus on-demand services, which package content for access at the consumer’s convenience. Third is, the distribution of a channel, or group of channels, to viewing households by either terrestrial, satellite, cable or internet delivery systems.
Figure 1: European value chain by function174
DISTRIBUTIONCHANNEL MANAGEMENTCONTENT CREATION
RIGHTS HOLDERSCONTENT
CREATORS
IDEA/ FORMAT/ SCRIPT
DEVELOPMENT
PRODUCTION COMPANIES
IN HOUSE
EXTERNAL
FREE TV CHANNELS
PUBLICLY FUNDED
ADVERTISER FUNDED
PAY TV CHANNELS
PREMIUM
BASIC
PAY PER VIEW
FILM PRODUCTION
FILM LIBRARIES
SPORTS BODIES
RIGHTS SALES
ON DEMAND SERVICES
OPEN SYSTEMS
‘CLOSED’SYSTEMS
PAY TV SYSTEMS
DIGITAL TERRESTRIAL
DTH SATELLITE
CABLE
FREE TO AIR
UHF/ VHF TERRESTRIAL
DTH SATELLITE
CABLE
IPTV
BROADBAND INTERNET
DSL
CABLE
MOBILE
DISTRIBUTIONCHANNEL MANAGEMENTCONTENT CREATION DISTRIBUTIONCHANNEL MANAGEMENTCONTENT CREATION
RIGHTS HOLDERSCONTENT
CREATORS
IDEA/ FORMAT/ SCRIPT
DEVELOPMENT
PRODUCTION COMPANIES
IN HOUSE
EXTERNAL
FREE TV CHANNELS
PUBLICLY FUNDED
ADVERTISER FUNDED
FREE TV CHANNELS
PUBLICLY FUNDED
ADVERTISER FUNDED
PAY TV CHANNELS
PREMIUM
BASIC
PAY PER VIEW
FILM PRODUCTION
FILM LIBRARIES
SPORTS BODIES
RIGHTS SALES
ON DEMAND SERVICES
OPEN SYSTEMS
‘CLOSED’SYSTEMS
ON DEMAND SERVICES
OPEN SYSTEMS
‘CLOSED’SYSTEMS
PAY TV SYSTEMS
DIGITAL TERRESTRIAL
DTH SATELLITE
CABLE
FREE TO AIR
UHF/ VHF TERRESTRIAL
DTH SATELLITE
CABLE
FREE TO AIR
UHF/ VHF TERRESTRIAL
DTH SATELLITE
CABLE
IPTV
BROADBAND INTERNET
DSL
CABLE
MOBILE
BROADBAND INTERNET
DSL
CABLE
MOBILE
Sources of value added along the supply chain vary considerably. Distribution may be simply a technical transmission service, where the viewer receives TV
174 ‘Publicly funded’ refers to broadcasters that receive government finance whether in the form of grants or a licence fee (although it is pertinent to note that the majority of these broadcasters supplement public funding with some level of advertising). Also, please note that in Figure 1, in the ‘Distribution’ column under ‘Free-to-Air’, ‘UHF/VHF Terrestrial’ covers both analogue and digital terrestrial, as both are distributed over ultra-high frequencies.

113
signals free of charge in unencrypted form, while pay-TV distribution can involve the packaging, retailing and marketing of a group of TV channels in encrypted form, where monthly charges are made for reception, with all the associated subscriber management and billing functions provided.
Similarly, channel management can involve the large scale commissioning of new programming and the acquisition of ready-made programming from a large number of sources, the heavy promotion and marketing of the channel to viewers, and significant investment in a station’s brand image through TV and other media promotions. Alternatively, it can involve the use of a limited number of already available programme libraries or the commissioning of a single continuous studio-based programme strand.
The management of on-demand services varies yet further, from aggregating the on-demand services (particularly “catch-up”) offered by broadcasters to negotiating separate rights deals with movie studios, content producers and rights holders and packaging them into a service for users.
Original content creation can range from a continuous studio-based programme with a handful of contributors, to a full action drama made on multiple locations, with a large cast and crew and significant investment in script development.
7.1.1. TV content creation and related rights trading
Creating new TV content usually involves a four-stage process. Firstly, the idea generation stage where the outline programme concept is developed; then initial planning and development (known as pre-production), the recording of the programmes (production), and lastly the editing of the material into its final form (post production).
Once made, an original commissioned programme can be shown a number of times on TV – through both the initial broadcaster (using both the first transmission and repeats), and other broadcasters purchasing rights for broadcast in later “windows.” It can also be shown on various on-demand services; initially in broadcasters’ own “catch-up” services and later as part of on-demand libraries. Lastly, it can be exploited on DVD/VHS. In general – although not always – those programmes with the most effort made in creation are the ones that can be exploited again and again on TV channels, on-demand services or video. Programmes with high initial production effort (or values) that can be reused are sometimes termed “stock” programmes – and are normally specifically commissioned and held for broadcast at a particular time in the schedule. Programmes that use less initial production effort and which are less repeatable are sometimes termed “flow” programmes – these programmes are made as part of long-running slots in the schedule. Drama, narrative comedy and well-researched and filmed documentaries are good examples of stock programmes, while game shows, chat shows and quizzes are good examples of flow programmes.
Some programme types or genres have elements of both stock and flow programmes. For instance, a reality show often has high production values

114
but limited repeat potential. However, the idea and structure of the programme can be exploited again – perhaps for a subsequent series or a new version in another country – although the programme itself has limited repeat value. This re-use of programme concepts, or formats, is now a significant part of the TV industry worldwide. Original commissions (new programming) and local programming – a programme that uses familiar faces, or cultural references - typically attract the largest audiences. However, commissioning new programming is high risk – only a small minority of shows go on to a second series. Using a format that has proven successful elsewhere, yet which can be made and adapted to suit local tastes, significantly reduces the risk associated with commissioning.
In general, typical stock programmes cost more to originate than flow programmes. New drama series and mini series, situation or sketch comedy shows and original documentaries (where a large amount of original material, rather than archive material is used) can cost between €50K and €2 million per hour (and occasionally well in excess of this). In contrast, typical flow programmes such as quiz shows, chat shows or even compilation factual programmes, cost less than €200K per hour even for flagship shows, and can cost as little as €1K to €10K an hour if produced in volume.
Added value in TV programme making comes from meeting the demands of the viewers and subscribers targeted by the channel owners. Programmes that appeal to more than one channel owner will strengthen the producer’s negotiating position. Risks in programme making are high, with perhaps one in eight dramas or comedies becoming a long running success. In general, risks for stock programmes are higher than for flow programmes.
Risks are reduced for the producer when the commissioning channel pays a fixed fee that includes a profit margin, but in return takes the upside should the programme become a success. The channel enjoys unlimited rights to repeat the programme at low (or no) cost and the rights to sell the programme to other channels in the home market and internationally.
Rights trading is done either by a subsidiary of the commissioning broadcaster – if they retain the rights – or an independent rights distribution company (which may be linked to the independent producer), if the independent has chosen to own the rights but accept a smaller upfront fee from the broadcaster. Rights trading companies often have to pre-invest in a new programme in return for the rights. This helps compensate for the lower fees from commissioning broadcasters when they do not retain all rights.
A typical programme contains a large number of rights including, but not limited to:
• the rights to the first few transmissions;
• the rights to subsequent repeats on specific channels for a nominated period of time;
• the rights to sell on to other broadcasters in the same national market (often with a hold-back to allow the original broadcaster a unique period of use);

115
• the rights to use the programme on an on-demand service – potentially in a number of windows;
• the rights to sell the programme on video;
• the rights to sell the programme internationally;
• the rights to exploit the format of the programme (its basic structure and script) in the domestic market and overseas;
• the rights to exploit the programme brand and characters in merchandising and licensing deals;
• the rights to use the programme name and excerpts for internet and mobile clip services.
7.1.2. Channel management
Channel management involves the commissioning of new programming, either from external producers or in-house departments, the acquisition of ready-made TV programmes and feature films, the commissioning of station idents and promotions and, in the case of commercially funded channels, access to relevant advertising tapes. The channel is then run from a play-out centre that mixes together all the different forms of output – commissions, acquisitions, promotions and adverts – and then transmits a broadcast stream to the relevant delivery platform or platforms.
Added value is generated in channel management in three main ways: first, commissioning and acquiring the best mix of programmes for its target audience, and then scheduling these programmes optimally; second, creating a brand image for the channel, or selecting a specific niche audience that creates viewer loyalty to the channel over and above the appeal of the individual programmes; and third, gaining access to relevant distribution systems – especially unique or privileged access to distribution.
7.1.3. On-demand services
On-Demand services differ from normal linear TV broadcasts in that they are accessed by individual consumers at a time of their choosing, and on a programme-by-programme basis. They are thus described as “non-linear” (there is no broadcast schedule to follow). There are two main types of on-demand service: the “closed systems”, generally operated by cable and IPTV service providers, where an on-demand offering is an integral part of the consumer proposition – but is only available to that system’s subscribers; and “open systems”, generally operated by broadcasters, other rights holders and content aggregators, which are available over the internet and are thus available to anyone.

116
Currently there are very limited robust data available covering on-demand services due to the relative immaturity of the market. A number of the bigger service providers are still trialling services and debating the optimum business model to employ. Examples of business models include (although are not limited to): free services, typically catch-up services funded by public monies; pay-per-view (PPV) services whereby a viewer can pick from a selection of programming/movies from a library for a nominal fee (between €1 and €5); add-on subscription, where the user can add on access to a selection of on-demand programming (typically sport, music or movies) to their current pay package; integrated subscription on-demand, where the on-demand service is used to drive subscribers to a premium pay package, increase retention rates and reduce churn; and an ad-funded model, whereby pre-roll (or other types of sponsorship/advertising) are viewed by the user prior to consumption of the programming. A number of these models are discussed in more detail in the four case studies contained in section 7.2.3.
7.1.4. Distribution
There are two distinct value-added activities in distribution. The first is simply the successful delivery of TV signals to the viewer, of a sufficient quality and standard and with minimal interruption. In the case of pay TV this also includes the prevention of unauthorised reception, which requires an effective encryption and authorisation system.
On-demand services also require distribution and, in the case of “open” services, this is over the public internet and the user’s broadband connection. “Closed” services utilise the digital cable or IPTV networks owned by the service providers.
The second area of value-added only applies when a delivery system is also the retailer of a combination of channels or packages. Added value is being created by the mix of channels, the branding and image of the channel package, the pricing of the packages and customer support services such as billing and call centres. These services are often collectively referred to as aggregation.
While free TV distribution usually only involves the first of these value added activities, pay TV often involves both, which makes it a larger and potentially riskier activity – especially where pay TV providers decide to discount the costs of the receiver box technology in order to drive take-up, hoping to recoup the losses from future subscriptions.
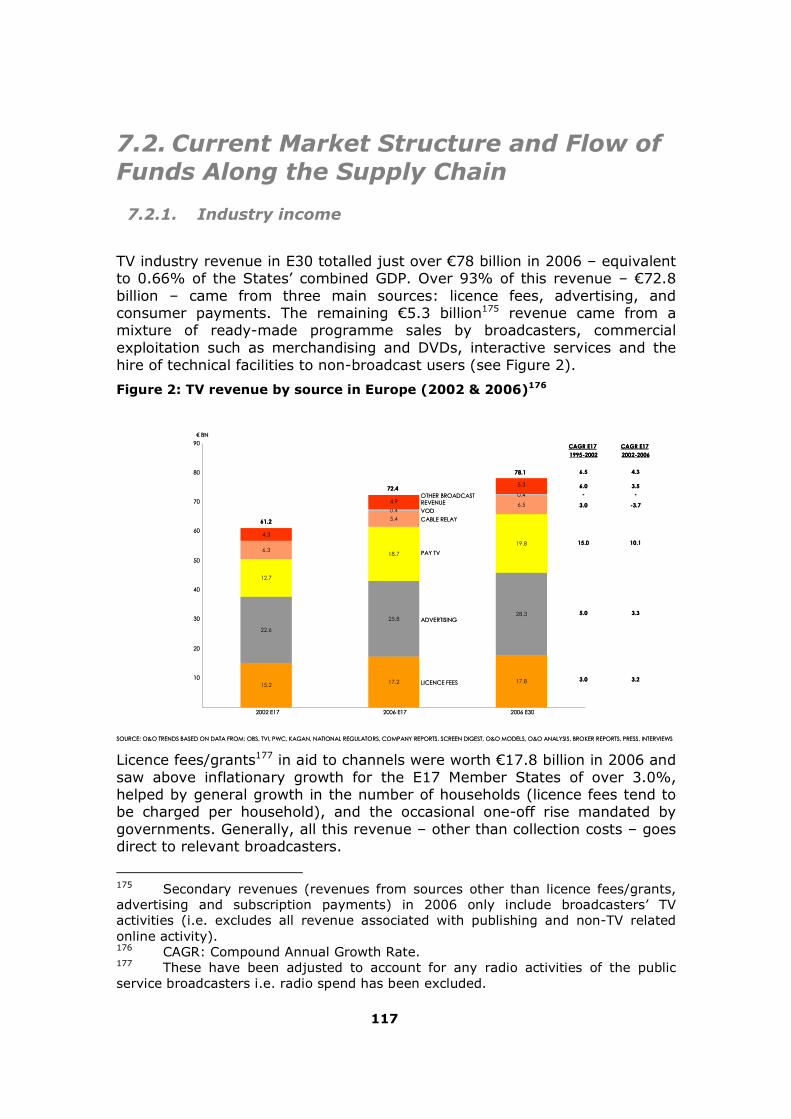
117
7.2. Current Market Structure and Flow of Funds Along the Supply Chain
7.2.1. Industry income
TV industry revenue in E30 totalled just over €78 billion in 2006 – equivalent to 0.66% of the States’ combined GDP. Over 93% of this revenue – €72.8 billion – came from three main sources: licence fees, advertising, and consumer payments. The remaining €5.3 billion175 revenue came from a mixture of ready-made programme sales by broadcasters, commercial exploitation such as merchandising and DVDs, interactive services and the hire of technical facilities to non-broadcast users (see Figure 2).
Figure 2: TV revenue by source in Europe (2002 & 2006)176
15.2 17.2 17.8
22.6
25.828.3
12.7
18.7
19.86.3
5.4
6.50.4
0.4
4.3
4.9
5.3
10
20
30
40
50
60
70
80
90
2002 E17 2006 E17 2006 E30
€ BN
LICENCE FEES
ADVERTISING
PAY TV
CABLE RELAY
VOD
OTHER BROADCAST REVENUE
SOURCE: O&O TRENDS BASED ON DATA FROM: OBS, TVI, PWC, KAGAN, NATIONAL REGULATORS, COMPANY REPORTS, SCREEN DIGEST, O&O MODELS, O&O ANALYSIS, BROKER REPORTS, PRESS, INTERVIEWS
61.2
72.4
78.1
CAGR E17
1995-2002
CAGR E17
2002-2006
6.5
6.0
-
3.0
15.0
5.0
3.0
4.3
-
3.5
-3.7
10.1
3.3
3.215.2 17.2 17.8
22.6
25.828.3
12.7
18.7
19.86.3
5.4
6.50.4
0.4
4.3
4.9
5.3
10
20
30
40
50
60
70
80
90
2002 E17 2006 E17 2006 E30
€ BN
LICENCE FEES
ADVERTISING
PAY TV
CABLE RELAY
VOD
OTHER BROADCAST REVENUE
SOURCE: O&O TRENDS BASED ON DATA FROM: OBS, TVI, PWC, KAGAN, NATIONAL REGULATORS, COMPANY REPORTS, SCREEN DIGEST, O&O MODELS, O&O ANALYSIS, BROKER REPORTS, PRESS, INTERVIEWS
61.2
72.4
78.1
CAGR E17
1995-2002
CAGR E17
2002-2006
6.5
6.0
-
3.0
15.0
5.0
3.0
4.3
-
3.5
-3.7
10.1
3.3
3.2
Licence fees/grants177 in aid to channels were worth €17.8 billion in 2006 and saw above inflationary growth for the E17 Member States of over 3.0%, helped by general growth in the number of households (licence fees tend to be charged per household), and the occasional one-off rise mandated by governments. Generally, all this revenue – other than collection costs – goes direct to relevant broadcasters.
175 Secondary revenues (revenues from sources other than licence fees/grants, advertising and subscription payments) in 2006 only include broadcasters’ TV activities (i.e. excludes all revenue associated with publishing and non-TV related online activity). 176 CAGR: Compound Annual Growth Rate. 177 These have been adjusted to account for any radio activities of the public service broadcasters i.e. radio spend has been excluded.

118
Figure 3: Average amount of licence fee collected per household (2006)178
219
174
166 164
155
146
124120
10196
92
80
70
6058
54
41
29 26 2419
12 11 10 8 8 6
50
100
150
200
250
NO
RW
AY
DEN
MA
RK
FIN
LAN
D
ICEL
AN
D
GER
MA
NY
UK
IREL
AN
D
AU
STR
IA
BELG
IUM
SWED
EN
SLO
VEN
IA
NET
HER
LAN
DS
FRA
NC
E
GR
EEC
E
ITA
LY
PO
RTU
GA
L
CY
PR
US
ESTO
NIA
CZE
CH
REP
UBL
IC
BULG
AR
IA
SLO
VA
KIA
LATV
IA
RO
MA
NIA
PO
LAN
D
LITH
UA
NIA
MA
LTA
HU
NG
AR
Y
SOURCE: O&O TRENDS BASED ON DATA FROM: OBS, TVI, PWC, KAGAN, NATIONAL REGULATORS, COMPANY REPORTS, SCREEN DIGEST, O&O MODELS, O&O ANALYSIS, BROKER REPORTS, PRESS, INTERVIEWS
€
The amount of TV licence fee collected in a country divided by the number of households (see Figure 3 above) was highest in Norway (€219) and Denmark (€174). As
Figure 4 illustrates, however, for a number of reasons the amount collected can deviate significantly from the actual amount each household is expected to pay. The fact that a number of households do not comply with their legal requirement to pay a national licence fee is among these reasons.
178 This is calculated by dividing the total collected licence fee attributable to TV services in a particular Member State and dividing it by the number of TV households in that area.

119
Figure 4: Actual licence fee prices for selected states (2006)
280
255
243
210204 201
189
155
117
100 100
4941
12
0
50
100
150
200
250
300
DEN
MA
RK
NO
RW
AY
AU
STR
IA
SWED
EN
GER
MA
NY
FIN
LAN
D
UK
IREL
AN
D
FRA
NC
E
ITA
LY
PO
RTU
GA
L
PO
LAN
D
CZE
CH
REP
UBL
IC
RO
MA
NIA
*
HU
NG
AR
Y
€
SOURCE: OBS
*2005 FIGURE
280
255
243
210204 201
189
155
117
100 100
4941
12
0
50
100
150
200
250
300
DEN
MA
RK
NO
RW
AY
AU
STR
IA
SWED
EN
GER
MA
NY
FIN
LAN
D
UK
IREL
AN
D
FRA
NC
E
ITA
LY
PO
RTU
GA
L
PO
LAN
D
CZE
CH
REP
UBL
IC
RO
MA
NIA
*
HU
NG
AR
Y
€
SOURCE: OBS
*2005 FIGURE
Advertising and associated sponsorship revenues totalled €28.3 billion in 2006 (after advertising agency commission). Growth in the advertising market for the E17 Member States previously studied has fallen from 5% to 3% in the past four years, while growth in the majority of the new member states and EEA states has been rapid. Advertising and sponsorship revenue is sold directly by broadcasters.
Consumer payments totalled €26.2 billion in 2006 and fall into two very distinct categories. First, small monthly payments of €5 to €8 a month for access to low capacity cable relay services – usually 20 to 40 channels – that were built to supplement the terrestrial over-the-air distribution of the main channels in certain countries such as Germany and the Netherlands, and which have subsequently been used to deliver a small number of extra, more specialist channels. Total revenue from this source was €6.5 billion in 2006. All this revenue flows to the delivery system itself and is not shared with broadcasters179. The second category features larger monthly payments for subscription pay-TV services – either packages of specialist channels or specific high-value premium sports and movie channels. Revenue from subscription pay-TV totalled €19.8 billion in 2006.
179 In fact, in some limited instances, broadcasters pay cable relay systems for access.

120
The dynamics of growth in the pay-TV market have changed significantly in the last four years. This is largely due to three main changes in the pay-TV market: more competition between cable, satellite and telecom providers pushing down the price of pay-TV packages; a major shift towards digital television in all major western markets, with a number of subscribers moving from traditional cable relay to digital services via cable, satellite or DSL; traditional platform operators seeking new revenue streams through the development of bundling services (so called quadruple/triple-play packages).
Another shift in pay TV (and to some extent free TV) has been the proliferation of on-demand services across Europe, however, the majority of these are still in the development stage and generated revenues are very low. We estimate revenues from on-demand services in 2006 were €400m, under 0.5% of total TV revenue (see Figure 15).
Taking into account growth in the E17 Member States only, highlights a decline in cable relay revenues as subscribers shift to digital cable pay services (often for very little extra cost180). In the new Member States, these cable relay systems remain the principal distribution system, accounting for over €1.0bn (50%) of the pay TV market. Over the next few years, as these smaller markets digitise, we anticipate a similar trend, with subscribers shifting away from cable relay to low cost digital pay services. Annual growth for other pay-TV subscriptions in the E17 Member States has fallen by 30% (from the 15% growth seen between 1995 and 2002) to 10.2% a year. With lower growth in TV-related ARPUs (Average Revenue per User), platform operators have been forced to diversify into telecoms, broadband delivery and other services in order to reduce churn and generate higher returns per customer.
Generally, revenue from pay TV is shared between the delivery systems and the broadcast channels. The operators pay the channels they consider key to their service a monthly subscription fee per household; the value of this can range from 1-2c for minor channels to over €1 for a top-rank channel.
While all Member States generate some level of income from all three main sources of revenue, the mix of revenue streams and total amounts of revenue vary considerably – a pattern of variation that can only partially be explained by variations in GDP. (See Figure 5– Figure 7).
180 In some cases (e.g. The Netherlands) the cost of digital cable was reduced below that of analogue cable relay in order to encourage users to transfer to the new digital platform.

121
Figure 5: TV revenue by Member State (2006, 10 largest markets)
3.7
6.1
1.7 1.30.7 0.6 0.1 0.4 0.4 0.4
4.9
4.1
3.44.7
3.3
0.91.3 0.9
0.5 0.6
6.1
1.4
4.31.8
1.9
0.4 0.4 0.20.4 0.5
2.4
0.7 0.70.6 0.7 0.1
0.1
0.0
0.1
0.0
0.7
0.9
1.2
0.5
0.4
0.30.2
0.3 0.20.1
2
4
6
8
10
12
14
16
18
UK GERMANY FRANCE ITALY SPAIN NETHERLANDS POLAND BELGIUM SWEDEN NORWAY
€ BN
15.5
15.0
10.7
8.5
6.3
2.92.6
2.3 2.21.7
SHARE OF GDP
REV PER TV HH €
SOURCE: O&O TRENDS BASED ON DATA FROM: OBS, TVI, PWC, KAGAN, NATIONAL REGULATORS, COMPANY REPORTS, SCREEN DIGEST, O&O MODELS, O&O ANALYSIS, BROKER REPORTS, PRESS, INTERVIEWS
0.82 0.650.60 0.58 0.65 0.56 0.98 0.73 0.72 0.65
608 381 433364 411 417 198 516 518 850
LICENCE FEES
ADVERTISING
PAY TV
CABLE RELAY
VOD
OTHER BROADCAST
REVENUE
The UK and Germany are by far the two largest TV markets in Europe; France and Italy – which have similar sized economies to that of the UK – are somewhat smaller. The UK and Italy have the most developed advertising markets among the larger nations, while France and the UK have the largest proportionate pay-TV markets. Public funding through licence fees is highest in Germany and the UK. TV revenue per household is highest in Norway and the UK due to their highly developed cable and satellite pay-TV markets.

122
Figure 6: TV revenue by Member State (2006, next 9 markets)
1
421
202
417 384
165213
97 8123
322
512
545
243
326
523
279212
242
308
596 60
131 399
143
63309
65
396
220
197
195
125
12
25
1
9
13 2
15
1
123
92
110
4056
41
62 72
35
200
400
600
800
1,000
1,200
1,400
1,600
1,800
DENMARK PORTUGAL AUSTRIA FINLAND IRELAND GREECE CZECH REPUBLIC ROMANIA HUNGARY
€ M
SHARE OF GDP
REV PER TV HH €
SOURCE: O&O TRENDS BASED ON DATA FROM: OBS, TVI, PWC, KAGAN, NATIONAL REGULATORS, COMPANY REPORTS, SCREEN DIGEST, O&O MODELS, O&O ANALYSIS, BROKER REPORTS, PRESS, INTERVIEWS
1,582
1,428
1,353
1,003959
922
696 690
490
0.72 0.92 0.53 0.60 0.55 0.38 0.61 0.71 0.55
654 385 390 435 725 261 188 96 138
LICENCE FEES
ADVERTISING
PAY TV
CABLE RELAY
VOD
OTHER BROADCAST
REVENUE
1
421
202
417 384
165213
97 8123
322
512
545
243
326
523
279212
242
308
596 60
131 399
143
63309
65
396
220
197
195
125
12
25
1
9
13 2
15
1
123
92
110
4056
41
62 72
35
200
400
600
800
1,000
1,200
1,400
1,600
1,800
DENMARK PORTUGAL AUSTRIA FINLAND IRELAND GREECE CZECH REPUBLIC ROMANIA HUNGARY
€ M
SHARE OF GDP
REV PER TV HH €
SOURCE: O&O TRENDS BASED ON DATA FROM: OBS, TVI, PWC, KAGAN, NATIONAL REGULATORS, COMPANY REPORTS, SCREEN DIGEST, O&O MODELS, O&O ANALYSIS, BROKER REPORTS, PRESS, INTERVIEWS
1,582
1,428
1,353
1,003959
922
696 690
490
0.72 0.92 0.53 0.60 0.55 0.38 0.61 0.71 0.55
654 385 390 435 725 261 188 96 138
LICENCE FEES
ADVERTISING
PAY TV
CABLE RELAY
VOD
OTHER BROADCAST
REVENUE
Among the next 9 largest markets (Figure 6), pay TV is most developed in Ireland, Portugal and Romania all of which enjoy pay TV penetration rates of over 50% (see Figure 10 and Figure 11). It is in these smaller markets that VoD revenues are proportionately highest, due to their developed pay-TV sectors. In Ireland there is already over 3% IPTV penetration and over 46% pay cable penetration, while in Romania over 50% of households have a pay cable TV service (see Figure 10 and Figure 12). Ireland also displays the highest revenue per TV household, at €725. In a number of the markets, cable relay revenues still contribute a significant amount to the overall TV market while advertising is most developed in Greece and Austria. Austria (along with Finland) also relies on high levels of public funding, with some of the highest licence fees in Europe (see Figure 3)

123
Figure 7: TV revenue by Member State (2006, 10 smallest markets)
76
40
66
16 11 17 9 181
121
121
95
2554
23 39 23
9 11
107
36
8
4824
49
6 11
19 7
20
44
14
7
8
169
3 3 3
4 26
2
50
100
150
200
250
300
350
BULGARIA SLOVAKIA SLOVENIA CYPRUS LITHUANIA ESTONIA LATVIA ICELAND LUXEMBOURG MALTA
€ M
SHARE OF GDP
REV PER TV HH €
SOURCE: O&O TRENDS BASED ON DATA FROM: OBS, TVI, PWC, KAGAN, NATIONAL REGULATORS, COMPANY REPORTS, SCREEN DIGEST, O&O MODELS, O&O ANALYSIS, BROKER REPORTS, PRESS, INTERVIEWS
311
222233
93 92 92
5754
48
27
1.25 0.750.53 0.64 0.39 0.71 0.36 0.42 0.15 0.53
99 309109 234 66 158 76 494 302 177
LICENCE FEES
ADVERTISING
PAY TV
CABLE RELAY
OTHER BROADCAST
REVENUE
Figure 7 illustrates the 10 smallest markets in the study and illustrates significant variations in market structure: the licence fee in Bulgaria, Slovenia and Iceland contributes over 25% to the overall TV market; in Slovakia, Lithuania and Latvia, pay and network advertising accounts for over 50% of the total market; and in Cyprus and Estonia, the pay TV market accounts for over 50% of total TV revenue.
Overall, the TV sector in Bulgaria is the largest in proportion to GDP – at 1.25%, followed by Portugal, Poland and the UK. The lowest levels compared to GDP are to be found in Greece, Luxembourg and Lithuania. Among the largest nations, Italy has the smallest sized sector in proportion to GDP, at 0.58%.
7.2.2. TV distribution and delivery
TV across Europe is delivered to the home through a complex combination of different systems. Each system in turn varies in the degree to which it provides free delivery or extracts a monthly charge. Both these dimensions of delivery are dealt with in turn below (See Figure 8).

124
Figure 8: TV household by reception method in the European Union (2007)
67
3142
31
31
39
17
23
2928
2819 29
29
16
25
25
5
5
5
2
2
50
100
150
200
250
E17 '02 E17 '07 E30 '07
TV HHS (M)
SOURCE: O&O TRENDS BASED ON DATA FROM: OBS, TVI, TBI, COMPANY REPORTS, SCREEN DIGEST, O&O ANALYSIS
3 TO 7 CHANNELS
10 TO 40 CHANNELS
50 TO 200 CHANNELS
20 TO 40
100 TO 700 CHANNELS
60 TO 200 CHANNELS
20 TO 60 CHANNELS
1 CHANNEL
PAY TV = 62M
FREE TV = 138M
156
174
IPTVPAY TERRESTRIAL
PAY SATELLITE
PAY CABLE
FREE SATELLITE
FREE DTT
CABLE RELAY
ANALOGUE TERRESTRIAL
200
The four main delivery systems are UHF/VHF terrestrial frequencies, direct-to-home satellite, cable, and IPTV services using telecom networks.
Cable systems in both France and the UK were built in the 1980s and 1990s, and tend to have capacity for several hundred digital channels simultaneously. Cable systems in Germany, Benelux, Scandinavia and in other Eastern markets were built earlier and often only have capacity to carry 20 to 40 analogue channels and a similar number of digital channels simultaneously. In many cases, regulation of these older cable relay systems severely restricts any reduction in the number of analogue services in order to introduce even a minimal number of new digital services. In the last few years there has been a drive to digitise these cable networks, with a number of operators offering viewers low cost digital TV packages in order to encourage switchover from traditional analogue cable relay to digital cable.
Complementing this drive to digital has been the emergence of a new broadcast delivery platform over DSL broadband services, known as IPTV. Due to the lack of cable infrastructure, IPTV was initially most popular in Italy, however, in the last few years a significant number of IPTV services have been launched across Europe and the platform now boasts over 5m households. In France particularly, approximately 2.5m households have embraced IPTV, drawn by the free set top boxes originally offered by broadband providers and the availability of new services such as PVR and

125
VoD. The widespread adoption of broadband services also allows open-system on demand services to reach consumers.
Direct-to-home satellite systems have existed in Europe since the late 1980s. Up to the late 1990s they were primarily analogue systems that, through a series of co-located satellites, could offer 50 to 80 channels targeted at individual national markets. The transfer to digital has increased this number to well over 600 channels for the main national markets. Although limited analogue satellite still remains in some markets (Germany and Austria), the switch to digital is rapid.
Analogue terrestrial transmission remains an important part of the broadcasting landscape across Europe, but all Member States now have firm plans to move to digital terrestrial television (DTT) transmission and to switch off the analogue signals by the target date of 2012 (see Figure 9). Many Member States are already a long way through this transition (see Figure 10– Figure 12). Figure 9: Digital switchover timeline in Europe
LUXEMBOURG
NETHERLANDS
AUSTRIA
FINLAND
SWEDEN
GERMANY
BELGIUM
DENMARK
NORWAY
SPAIN
CZECH REPUBLIC
GREECE
SLOVENIA
MALTA
UNITED KINGDOM
ITALY
ROMANIA
PORTUGAL
FRANCE
HUNGARY
BULGARIA
SLOVAKIA
LITHUANIA
IRELAND
LATVIA
ESTONIA
CYPRUS
POLAND
LIECHTENSTEIN
ICELAND
2006 2007 2008 2009 2010 2011 2012 2013 2014 2015
1 SEPTEMBER 2006
11 DECEMBER 2006
1 SEPTEMBER 2007
5 MARCH 2007
15 OCTOBER 2007
31 DECEMBER 2008
1 DECEMBER 2008
1 SEPTEMBER 2009
3 APRIL 2010
1 SEPTEMBER 2010
1 DECEMBER 2011
1 DECEMBER 20101 DECEMBER 2009
1 DECEMBER 2012
1 DECEMBER 2014
-
NO DIGITAL SERVICES
SOURCE:: OBS, EBU, Local regulators, press releases
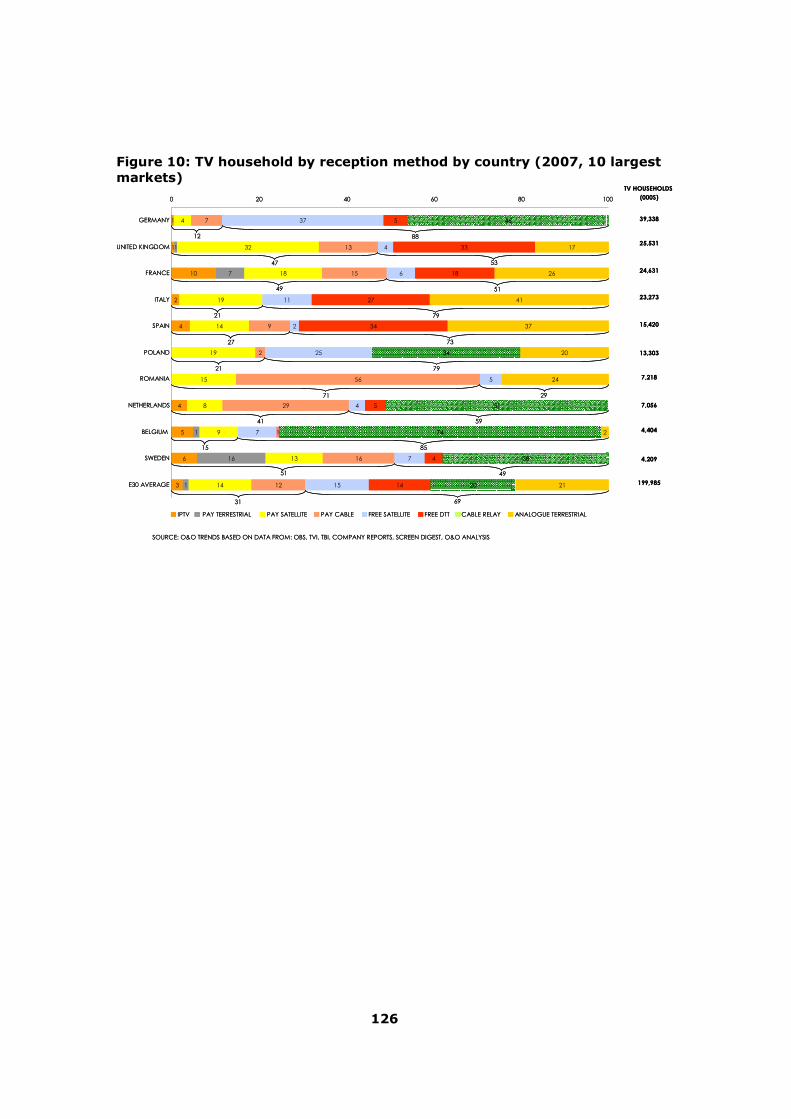
126
Figure 10: TV household by reception method by country (2007, 10 largest markets)
1
1
10
4
4
5
6
3
1
7
16
1
4
32
18
19
14
19
15
8
1
13
14
7
13
15
9
2
56
29
9
16
12
37
4
6
11
2
25
5
4
7
7
15
5
33
18
27
34
5
1
4
14
46
34
51
74
38
20
17
26
41
37
20
24
2
21
0 20 40 60 80 100
GERMANY
UNITED KINGDOM
FRANCE
ITALY
SPAIN
POLAND
ROMANIA
NETHERLANDS
BELGIUM
SWEDEN
E30 AVERAGE
TV HOUSEHOLDS
(000S)
39,338
25,531
24,631
23,273
15,420
13,303
7,218
7,056
4,404
4,209
199,985
SOURCE: O&O TRENDS BASED ON DATA FROM: OBS, TVI, TBI, COMPANY REPORTS, SCREEN DIGEST, O&O ANALYSIS
2
IPTV PAY TERRESTRIAL PAY SATELLITE PAY CABLE FREE SATELLITE FREE DTT CABLE RELAY ANALOGUE TERRESTRIAL
12 88
47 53
51
21
49 51
27 73
79
79
2971
21
41 59
15 85
49
31 69
1
1
10
4
4
5
6
3
1
7
16
1
4
32
18
19
14
19
15
8
1
13
14
7
13
15
9
2
56
29
9
16
12
37
4
6
11
2
25
5
4
7
7
15
5
33
18
27
34
5
1
4
14
46
34
51
74
38
20
17
26
41
37
20
24
2
21
0 20 40 60 80 100
GERMANY
UNITED KINGDOM
FRANCE
ITALY
SPAIN
POLAND
ROMANIA
NETHERLANDS
BELGIUM
SWEDEN
E30 AVERAGE
TV HOUSEHOLDS
(000S)
39,338
25,531
24,631
23,273
15,420
13,303
7,218
7,056
4,404
4,209
199,985
SOURCE: O&O TRENDS BASED ON DATA FROM: OBS, TVI, TBI, COMPANY REPORTS, SCREEN DIGEST, O&O ANALYSIS
2
IPTV PAY TERRESTRIAL PAY SATELLITE PAY CABLE FREE SATELLITE FREE DTT CABLE RELAY ANALOGUE TERRESTRIAL
12 88
47 53
51
21
49 51
27 73
79
79
2971
21
41 59
15 85
49
31 69

127
Figure 11: TV household by reception method by country (2007, next 10 markets)
2
1
2
3
1
1
6
3 1
4
11
13
8
7
3
15
4
2
34
14
1
39
5
9
37
6
21
4
16
12
8
5
8
5
50
22
7
5
24
3
15
1
1
6
1
33
1
14
26
56
29
61
35
32
30
20
59
44
17
79
4
38
7
1
37
11
21
0 20 40 60 80 100
CZECH REPUBLIC
PORTUGAL
HUNGARY
GREECE
AUSTRIA
BULGARIA
DENMARK
FINLAND
SLOVAKIA
NORWAY
E30 AVERAGE
TV HOUSEHOLDS
(000S)
3,709
3,709
3,550
3,528
3,473
3,147
2,420
2,304
2,135
2,029
199,985
IPTV PAY TERRESTRIAL PAY SATELLITE PAY CABLE FREE SATELLITE FREE DTT CABLE RELAY ANALOGUE TERRESTRIAL
6 94
51 49
19 81
10 90
17 83
40 60
24 76
25 75
6 94
56 44
31 69
SOURCE: O&O TRENDS BASED ON DATA FROM: OBS, TVI, TBI, COMPANY REPORTS, SCREEN DIGEST, O&O ANALYSIS
2
1
2
3
1
1
6
3 1
4
11
13
8
7
3
15
4
2
34
14
1
39
5
9
37
6
21
4
16
12
8
5
8
5
50
22
7
5
24
3
15
1
1
6
1
33
1
14
26
56
29
61
35
32
30
20
59
44
17
79
4
38
7
1
37
11
21
0 20 40 60 80 100
CZECH REPUBLIC
PORTUGAL
HUNGARY
GREECE
AUSTRIA
BULGARIA
DENMARK
FINLAND
SLOVAKIA
NORWAY
E30 AVERAGE
TV HOUSEHOLDS
(000S)
3,709
3,709
3,550
3,528
3,473
3,147
2,420
2,304
2,135
2,029
199,985
IPTV PAY TERRESTRIAL PAY SATELLITE PAY CABLE FREE SATELLITE FREE DTT CABLE RELAY ANALOGUE TERRESTRIAL
6 94
51 49
19 81
10 90
17 83
40 60
24 76
25 75
6 94
56 44
31 69
SOURCE: O&O TRENDS BASED ON DATA FROM: OBS, TVI, TBI, COMPANY REPORTS, SCREEN DIGEST, O&O ANALYSIS

128
Figure 12: TV household by reception method by country (2007, 10 smallest markets)
3
2
7
11
6
3 1
3
38
5
16
30
14
24
46
42
6
47
14
10
20
12
4
11
13
15
11
10
10
14
35
60
46
57
80
20
71
11
42
13
54
24
43
20
21
58
0 20 40 60 80 100
LITHUANIA
IRELAND
LATVIA
SLOVENIA
ESTONIA
CYPRUS
LUXEMBOURG
MALTA
ICELAND
LIECHTENSTEIN
E30 AVERAGE
IPTV PAY TERRESTRIAL PAY SATELLITE PAY CABLE FREE SATELLITE FREE DTT CABLE RELAY ANALOGUE TERRESTRIAL
TV HOUSEHOLDS
(000s)
1,392
1,322
752
719
583
398
159
152
110
10
199,985
31 69
100
100
20 80
31 60
36 64
63 37
12 88
42 58
86 14
29 71
SOURCE: O&O TRENDS BASED ON DATA FROM: OBS, TVI, TBI, COMPANY REPORTS, SCREEN DIGEST, O&O ANALYSIS
3
2
7
11
6
3 1
3
38
5
16
30
14
24
46
42
6
47
14
10
20
12
4
11
13
15
11
10
10
14
35
60
46
57
80
20
71
11
42
13
54
24
43
20
21
58
0 20 40 60 80 100
LITHUANIA
IRELAND
LATVIA
SLOVENIA
ESTONIA
CYPRUS
LUXEMBOURG
MALTA
ICELAND
LIECHTENSTEIN
E30 AVERAGE
IPTV PAY TERRESTRIAL PAY SATELLITE PAY CABLE FREE SATELLITE FREE DTT CABLE RELAY ANALOGUE TERRESTRIAL
TV HOUSEHOLDS
(000s)
1,392
1,322
752
719
583
398
159
152
110
10
199,985
31 69
100
100
20 80
31 60
36 64
63 37
12 88
42 58
86 14
29 71
SOURCE: O&O TRENDS BASED ON DATA FROM: OBS, TVI, TBI, COMPANY REPORTS, SCREEN DIGEST, O&O ANALYSIS
The technical mix of distribution systems across Europe is, however, perhaps less important than the business models adopted across and within different TV systems. Free TV, where the signal is available to the consumer for no extra monthly charge once they have bought the necessary reception equipment, is available via satellite and terrestrial TV systems throughout Europe. Free TV signals may still be encoded (or “encrypted”) to prevent reception outside the target national market or markets, which is often demanded by rights holders who have made different rights deals in different national markets.
Cable relay services are not quite free, as a small monthly charge is made – often through the local utility or housing association bill but – as they are charging just for technical delivery, rather than the TV channel or channels – it could be regarded as nearer free TV than pay TV.
The range of free TV (or near free TV) channels available varies considerably across Europe. Countries with high cable relay coverage, or high penetration of free-to-air satellite services, often provide well over 20 free TV channels to most of the population. Countries where analogue terrestrial TV is the only free TV outlet tend to offer just 4 to 7 free TV channels. In several countries with high penetration of 20 to 40 free TV channels, several of the free channels are overspill services from neighbouring countries. Cable relay systems in Belgium and the Netherlands tend to carry free UK, French and German channels; those in Ireland tend to carry free UK TV channels, and those in Austria, free German channels.

129
Subscription pay TV is, again, available through all types of delivery system – cable, satellite, terrestrial and DSL – throughout Europe, and mainly in digital forms. Generally, pay TV consists of a basic package of news, children's, lifestyle, factual and specialist entertainment channels – anywhere from 30 to 400 – which cost between €15 and €25 a month, and a series of premium sports and movie channels that can be purchased on an à la carte basis – albeit with discounts for a larger number of channels. Typically, each additional premium channel costs between €5 and €10 extra. Unusually in France, pay TV services are available from Canal+ over both analogue and digital terrestrial systems, while in the UK, DTT households have the option to upgrade to some premium channels through Top Up TV.
Free TV is available in some form or other to all the 200 million TV households in the E30. Subscription pay TV is taken by 62 million TV households – a penetration rate of 30 per cent (up from 25% for the E17 in 2002). Among the 139 million free-TV-only homes, around 42 million only have access to between 4 and 7 analogue terrestrial free TV services. It is pertinent to note here that, in the E17, the number of analogue terrestrial homes has more than halved (from 67 million to 31 million) with households moving to more affordable digital pay packages or DTT. Over 14% (28 million) of European households now access TV channels through a DTT set top box and, with digital switchover dates nearing, we anticipate the take-up of this platform to continue to grow rapidly to 2012. Of the remaining free TV households, around 28 million have access to 20 to 40 channels through cable relay and 29 million to 50 to 200 channels through free satellite services (most common in Poland, Austria and Germany). In line with digital switchover, analogue cable relay systems will be replaced by digital cable services in the forthcoming years.
Across the E30, average pay-TV penetration181 is approximately 31% and varies widely across markets. The UK, Romania and Portugal all have pay-TV penetration of over 40%, while in Hungary, Slovakia and Germany penetration is less than 20%, due to historically widespread cable relay. Among the 10 largest countries, Germany has the lowest pay-TV penetration at just 12% while amongst the smaller markets, Slovakia has one of the least developed markets with just 6% pay-TV penetration (see Figure 13).
181 Pay-TV penetration in France and The Netherlands is skewed slightly due to very low subscription costs for households to access IPTV and digital cable services in these markets. In the Netherlands, low cost digital cable packages were promoted to encourage households to move from analogue cable during the digital switchover, while in France, fierce competition between broadband providers resulted in a number of free IPTV services being made available on the market.
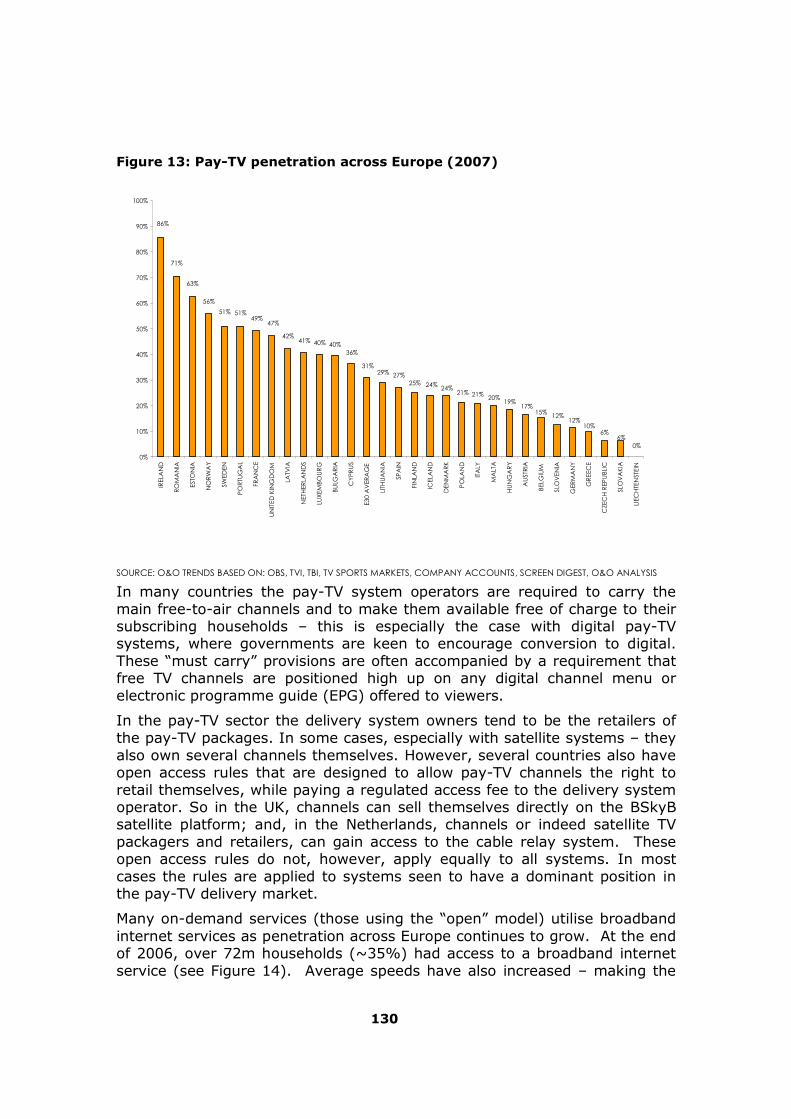
130
Figure 13: Pay-TV penetration across Europe (2007)
0%6%
6%10%
12%12%15%
17%19%
20%21%21%24%24%25%
27%29%31%
36%40%40%41%
42%
47%49%
51%51%
56%
63%
71%
86%
0%
10%
20%
30%
40%
50%
60%
70%
80%
90%
100%
IREL
AN
D
RO
MA
NIA
ESTO
NIA
NO
RW
AY
SWED
EN
PO
RTU
GA
L
FRA
NC
E
UN
ITED
KIN
GD
OM
LATV
IA
NET
HER
LAN
DS
LUX
EMB
OU
RG
BU
LGA
RIA
CY
PR
US
E30
AV
ERA
GE
LITH
UA
NIA
SPA
IN
FIN
LAN
D
ICEL
AN
D
DEN
MA
RK
PO
LAN
D
ITA
LY
MA
LTA
HU
NG
AR
Y
AU
STR
IA
BEL
GIU
M
SLO
VEN
IA
GER
MA
NY
GR
EEC
E
CZE
CH
REP
UB
LIC
SLO
VA
KIA
LIEC
HTE
NST
EIN
SOURCE: O&O TRENDS BASED ON: OBS, TVI, TBI, TV SPORTS MARKETS, COMPANY ACCOUNTS, SCREEN DIGEST, O&O ANALYSIS
In many countries the pay-TV system operators are required to carry the main free-to-air channels and to make them available free of charge to their subscribing households – this is especially the case with digital pay-TV systems, where governments are keen to encourage conversion to digital. These “must carry” provisions are often accompanied by a requirement that free TV channels are positioned high up on any digital channel menu or electronic programme guide (EPG) offered to viewers.
In the pay-TV sector the delivery system owners tend to be the retailers of the pay-TV packages. In some cases, especially with satellite systems – they also own several channels themselves. However, several countries also have open access rules that are designed to allow pay-TV channels the right to retail themselves, while paying a regulated access fee to the delivery system operator. So in the UK, channels can sell themselves directly on the BSkyB satellite platform; and, in the Netherlands, channels or indeed satellite TV packagers and retailers, can gain access to the cable relay system. These open access rules do not, however, apply equally to all systems. In most cases the rules are applied to systems seen to have a dominant position in the pay-TV delivery market.
Many on-demand services (those using the “open” model) utilise broadband internet services as penetration across Europe continues to grow. At the end of 2006, over 72m households (~35%) had access to a broadband internet service (see Figure 14). Average speeds have also increased – making the

131
delivery of video services possible without the additional infrastructure that IPTV providers often require.
Figure 14: Broadband penetration across Europe, 2007182
84%82%
81%79%
72%70%
65%63%
62% 61%58% 58%
54%52%
50%48%
47%
43%41% 40% 40%
38%
34%32% 32%
29%
25%
19%
15%
0%
10%
20%
30%
40%
50%
60%
70%
80%
90%
ICELAND
MALTA
NETHERLANDS
DENMARK
NORW
AY
FINLAND
SWEDEN
FRANCE
BELGIU
M
UNITED K
ING
DOM
IRELA
ND
LUXEM
BOURG
SLOVENIA
SPAIN
GERM
ANY
ESTONIA
AUSTRIA
ITALY
PORTU
GAL
CZECH R
EPUBLIC
ROM
ANIA
HUNGARY
LITHUANIA
LATVIA
CYPRUS
GREEC
E
POLAND
SLOVAKIA
BULGARIA
PENETRATION
SOURCE: O&O TRENDS BASED ON DATA FROM: OBS, TBI, TVI, OECD, EURODATA, POINT TOPIC, O&O ANALYSIS O&O MODELS
7.2.3. On-demand services
A substantial part of current on-demand offerings in the larger European markets are “catch-up” services from the main broadcasters (such as VRT’s Net Gemist service in Belgium and RTV’s internet service in Slovenia). With these services, the majority of a broadcaster’s schedule is made available to users for a limited period (typically seven days). There is usually no charge to access these services; they are offered to give audiences more chances to view content. In 2006, services had only been established in a small number of developed markets. Even by the end of 2007, they were generating almost no revenue – while it is feasible to insert advertising into these services, many are provided by the public broadcaster (and are thus advertising-free) and commercial services have only limited ability to measure audiences (and hence monetise them with advertisers). Below we review four individual on-demand case studies and consider in more detail the business models used and viewer uptake of each service. 182 No data for 2007 broadband penetration is yet available for all Member States, so we report on 2006 data to allow data to be compared for all markets. This data will be updated when 2007 figures become available.

132
The “closed” system operators generally do not charge separately for access to the on-demand service but rather offer it as part of a monthly package (often including TV, telephony and internet). Access to this basic service typically includes a catch-up TV service and an element of archive content. Value-added offerings include movies, adult, children’s and TV archive content. To access this, users typically pay - movies and adult content are generally offered on a pay-per-view basis, while children’s and library content typically form part of a subscription.
We estimate that in 2006 on-demand services generated approximately €400m of revenue in the E30, representing just 0.5% of the TV industry (see Figure 15 below).
Figure 15: The comparable size of the European video-on-demand market, 2006
0.4
78.1
10
20
30
40
50
60
70
80
90
TOTAL E30 TV MARKET TOTAL EST. VOD MARKET
€ BN
SOURCE: O&O TRENDS BASED ON DATA FROM: OBS, TVI, PWC, KAGAN, NATIONAL REGULATORS, COMPANY REPORTS, SCREEN DIGEST, O&O MODELS, O&O ANALYSIS, BROKER REPORTS, PRESS, INTERVIEWS
0.4
78.1
10
20
30
40
50
60
70
80
90
TOTAL E30 TV MARKET TOTAL EST. VOD MARKET
€ BN
SOURCE: O&O TRENDS BASED ON DATA FROM: OBS, TVI, PWC, KAGAN, NATIONAL REGULATORS, COMPANY REPORTS, SCREEN DIGEST, O&O MODELS, O&O ANALYSIS, BROKER REPORTS, PRESS, INTERVIEWS
0.4
78.1
10
20
30
40
50
60
70
80
90
TOTAL E30 TV MARKET TOTAL EST. VOD MARKET
€ BN
SOURCE: O&O TRENDS BASED ON DATA FROM: OBS, TVI, PWC, KAGAN, NATIONAL REGULATORS, COMPANY REPORTS, SCREEN DIGEST, O&O MODELS, O&O ANALYSIS, BROKER REPORTS, PRESS, INTERVIEWS
Of this revenue, very little flowed to content owners. The primary destination of any expenditure by service operators was movie studios to secure rights; most other content was still relatively new and thus the original broadcaster owned the rights. (Typical terms of trade are addressed later in this chapter.) A very small amount of library content was used, for which the rights had reverted to the original producer, but typical payments for this amounted to 1-2c per view.
Every Member State has a number of providers of on-demand services. A report recently published by the European Audiovisual Observatory (OBS)

133
identified 280 VoD services in the 24 countries included in the study183. We estimate a further 20 services in the countries not included in the OBS study i.e. an E30 total of around 300 services. France, the Netherlands and Germany lead in terms of the number of VoD services available with 32, 30 and 26 respectively. Some of the smaller nations, such as Estonia, Iceland and Slovenia, have only 2 or 3 services.
In total, we believe that in 2007 there were approximately 110 closed system on-demand operators and 180 open services available in the E30 (see Table 12).
183 European Audiovisual Observatory's survey did not include Latvia, Liechtenstein, Bulgaria, Romania, Malta, Lithuania and Greece, but included Switzerland and Turkey (excluded from this study).
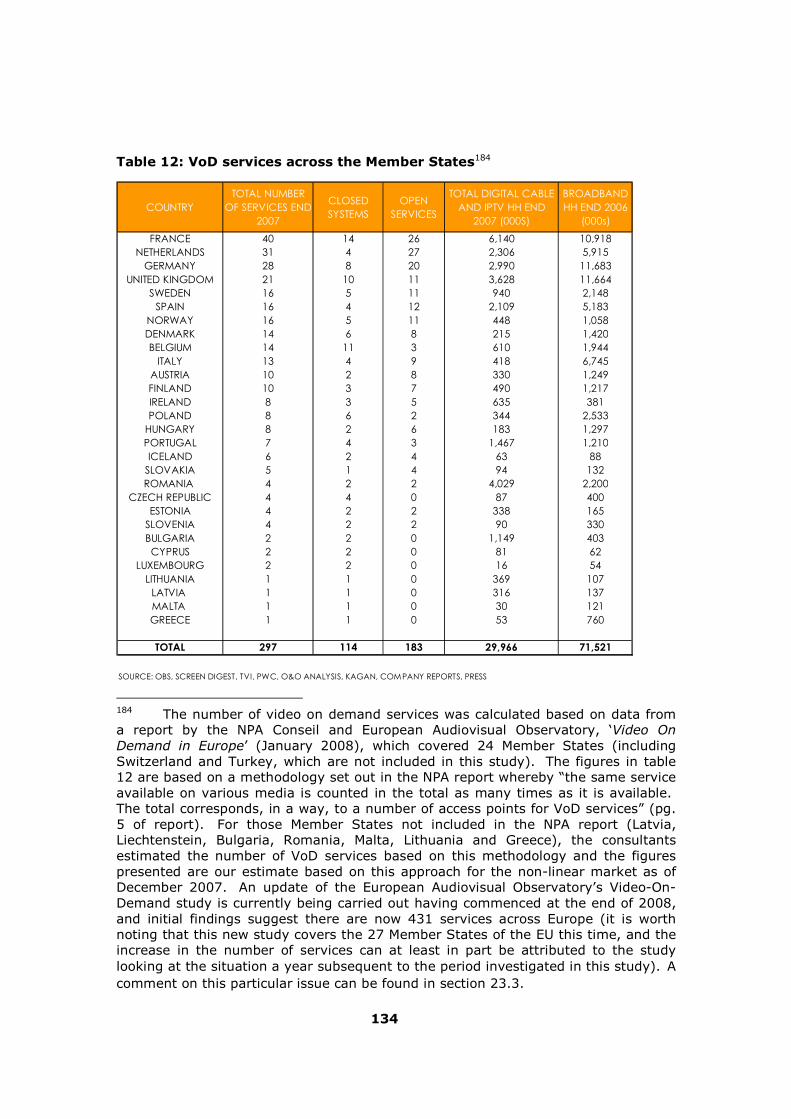
134
Table 12: VoD services across the Member States184
COUNTRYTOTAL NUMBER
OF SERVICES END 2007
CLOSED SYSTEMS
OPEN SERVICES
TOTAL DIGITAL CABLE AND IPTV HH END
2007 (000S)
BROADBAND HH END 2006
(000s)
FRANCE 40 14 26 6,140 10,918NETHERLANDS 31 4 27 2,306 5,915
GERMANY 28 8 20 2,990 11,683UNITED KINGDOM 21 10 11 3,628 11,664
SWEDEN 16 5 11 940 2,148SPAIN 16 4 12 2,109 5,183
NORWAY 16 5 11 448 1,058DENMARK 14 6 8 215 1,420BELGIUM 14 11 3 610 1,944
ITALY 13 4 9 418 6,745AUSTRIA 10 2 8 330 1,249FINLAND 10 3 7 490 1,217IRELAND 8 3 5 635 381POLAND 8 6 2 344 2,533
HUNGARY 8 2 6 183 1,297PORTUGAL 7 4 3 1,467 1,210ICELAND 6 2 4 63 88
SLOVAKIA 5 1 4 94 132ROMANIA 4 2 2 4,029 2,200
CZECH REPUBLIC 4 4 0 87 400ESTONIA 4 2 2 338 165
SLOVENIA 4 2 2 90 330BULGARIA 2 2 0 1,149 403
CYPRUS 2 2 0 81 62LUXEMBOURG 2 2 0 16 54
LITHUANIA 1 1 0 369 107LATVIA 1 1 0 316 137MALTA 1 1 0 30 121GREECE 1 1 0 53 760
TOTAL 297 114 183 29,966 71,521
SOURCE: OBS, SCREEN DIGEST, TVI, PWC, O&O ANALYSIS, KAGAN, COM PANY REPORTS, PRESS
184 The number of video on demand services was calculated based on data from a report by the NPA Conseil and European Audiovisual Observatory, ‘Video On Demand in Europe’ (January 2008), which covered 24 Member States (including Switzerland and Turkey, which are not included in this study). The figures in table 12 are based on a methodology set out in the NPA report whereby “the same service available on various media is counted in the total as many times as it is available. The total corresponds, in a way, to a number of access points for VoD services” (pg. 5 of report). For those Member States not included in the NPA report (Latvia, Liechtenstein, Bulgaria, Romania, Malta, Lithuania and Greece), the consultants estimated the number of VoD services based on this methodology and the figures presented are our estimate based on this approach for the non-linear market as of December 2007. An update of the European Audiovisual Observatory’s Video-On-Demand study is currently being carried out having commenced at the end of 2008, and initial findings suggest there are now 431 services across Europe (it is worth noting that this new study covers the 27 Member States of the EU this time, and the increase in the number of services can at least in part be attributed to the study looking at the situation a year subsequent to the period investigated in this study). A comment on this particular issue can be found in section 23.3.

135
Case study 1 – Digital cable ‘closed’ on-demand (Large Western European Member
State)
LAUNCH: Have been developing service for over five years. Relaunch in 2006 with a full review of the business model. Major rebranding in Feb 2007 with a new ‘dynamic interface’ introduced
AVAILABILITY: All subscribers (3.4m) can access catch-up and pay-per-view content
while only top-tier subscribers (2m) have access to archive content LIBRARY: 4,300 hrs of content as at March ’08: catch-up service with content from
the main networks, 500 hrs of movies from major US studios and some European and US independents; archive content and 500-600 music videos from major music labels
BUSINESS
MODEL: Service offered to drive overall cable subscriptions. PPV Movies priced at around €4.50 per movie and are available in the first pay TV window (currently trialling day and date releases). Subscription models for top tier subscribers for movies are being considered while pre-roll sponsorship and advertising may also become a key part of business strategy moving forward
ORIGINAL
CONTENT: No content commissioned specifically for on-demand service other than a small volume of short films
USAGE: March ’08 - 48% of digital subscribers accessed VoD at least once (Jan ’08 – 35%)
March ’08 – 21.2 VoD views per user (Jan ’08 – 10 views) Breakdown of viewing: catch-up – 35%; music videos – 35%; TV archive –
21%; kids – 5%; movies – 3%; other – 1%
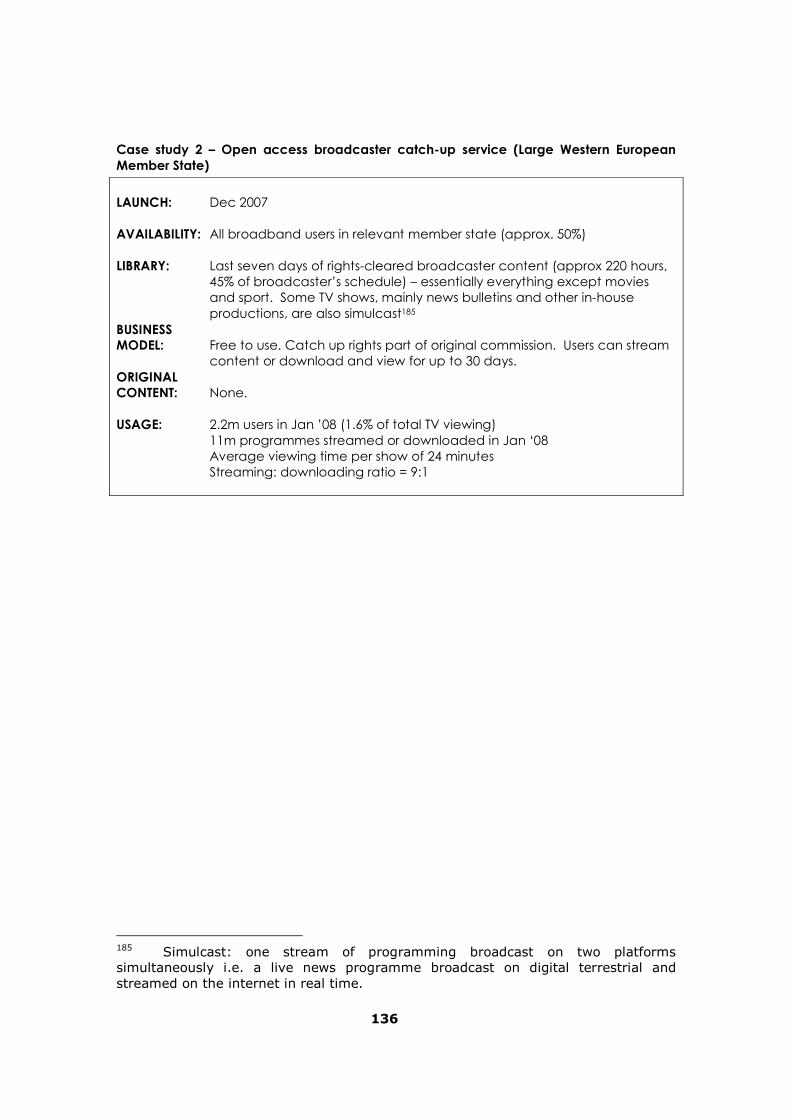
136
Case study 2 – Open access broadcaster catch-up service (Large Western European
Member State)
LAUNCH: Dec 2007 AVAILABILITY: All broadband users in relevant member state (approx. 50%) LIBRARY: Last seven days of rights-cleared broadcaster content (approx 220 hours,
45% of broadcaster’s schedule) – essentially everything except movies and sport. Some TV shows, mainly news bulletins and other in-house productions, are also simulcast185
BUSINESS
MODEL: Free to use. Catch up rights part of original commission. Users can stream content or download and view for up to 30 days.
ORIGINAL
CONTENT: None. USAGE: 2.2m users in Jan ’08 (1.6% of total TV viewing)
11m programmes streamed or downloaded in Jan ‘08 Average viewing time per show of 24 minutes Streaming: downloading ratio = 9:1
185 Simulcast: one stream of programming broadcast on two platforms simultaneously i.e. a live news programme broadcast on digital terrestrial and streamed on the internet in real time.

137
Case study 3 – Digital cable ‘closed’ on-demand service (Large Eastern European
Member State)
LAUNCH: Oct 2007 AVAILABILITY: All digital subscribers - currently around 40,000 (under 10% of total
cable subscribers). No plans to launch a similar service on the web i.e. ‘open access service’ LIBRARY: Majority of content is feature films (approx. 300 with 30/40 high grossing
Hollywood movies) with a limited supply of current documentaries and animations. Also supply a significant amount of adult content. Anticipate in the coming months agreeing terms with a major broadcaster for access to their library of programming.
BUSINESS
MODEL: Strategy behind the launch was to be ‘continually viewed as an innovative platform’, drive extra revenue in the long term and improve customer retention rates. Model is a combination of free content (majority) and a pay rental service (for 24hr-48hr). Typically rental cost is between €1.00 and €2.50.
ORIGINAL
CONTENT: None. USAGE: Free content is around 4 times more popular than paid for content Around 20,000 (50%) digital subscribers regularly use the service 3 to 4 popular feature films account for over 20% of total sales < I rental per customer per month

138
Case Study 4 – Digital cable ‘closed’ on-demand service (Small Western European
Member State)
LAUNCH: Sept 2007 AVAILABILITY: All digital cable subscribers – in excess of 500,000 however certain services
are limited to subscribers of the ‘grand’ pay TV package LIBRARY: Content broken down into three areas: 1) transactional (TVoD) -
dominated by US feature films and adult content with limited European film; 2) catch-up service - content from the publicly funded broadcaster (current rights issues with the commercial broadcasters in the market) and some international channel content; 3) 600 hrs of free on demand content - TV series from a variety of sources (both local and European).
BUSINESS
MODEL: Strategy: to add on demand to the bundle of options in the top pay-TV package and drive subscribers to upgrade, reduce overall churn and seek out new revenue streams through VoD. Films are offered for between €0.99 and €3.99 while the catch-up service and library content is free with access limited to ‘grand’ package subscribers. Interviewee admitted advertising funded on-demand is unlikely to be launched in this market under current market conditions.
ORIGINAL
CONTENT: None. USAGE: 40% of usage has been the catch-up service
Of the TVoD service, 80%-85% of viewing has been movies, while the remaining 15% is library content such as TV series/shows Overall buy rates of 0.5 movies per digital subscriber
7.2.4. TV broadcasting market
The TV channel management market (or broadcasting market, as it is often termed) can be broken down into three main types – free TV channels (available to all the audience), basic tier pay-TV channels (which are available to subscribers as part of a pay-TV subscription) and premium pay-TV channels (for which an additional subscription fee is paid).
Free TV channels can be divided into publicly funded channels and commercially – or advertiser - funded channels (some, for example France Television and ARD/ZDF, take a mixture of public funding and advertising revenue). While the majority of revenue (and viewing) to free TV channels is to the traditional networks, there are two other types of free-TV channel: network affiliated ‘spin-off’ channels, which have been launched in the last few years by broadcasters to combat falling audience shares to their main channels; and a large number of specialist channels, which despite being only available on a pay-TV platform, do not generate a subscription fee.

139
Pay-TV channels also take advertising, but have an element of subscription fees – paid to them by the platform operators - in their revenue mix. Premium pay-TV channels often only take a very limited amount of advertising – their main selling point is to offer uninterrupted access to sport or movies – and subscription fees form the overwhelming majority of their revenue mix.
Including news, sport, games and home shopping channels, there are estimated to be over 1300186 television channels in the E30. The most popular genres – in terms of channel numbers across Europe – are news, sport, movies, music, children’s, documentaries and travel/lifestyle. There are also a number of demographically targeted general entertainment channels which, among the smaller channels, usually obtain the highest audience shares and therefore are closest in scale to the primary channels. They typically have a narrower focus and a smaller programme budget than the main channels in each market, which often means they use more archive programming and imports.
Regional broadcasting exists within the free-to-air sector, as components of the main networks or as stand-alone independent stations. Within the networks, some act as federations of local TV companies and affiliates – such as ITV in the UK and ARD in Germany – while others establish centrally controlled but locally operated local news and regional programming centres, which then opt out of the main schedule at certain points in the day – such as the BBC and FR3. Even the affiliate channels tend to pool most of their monies in order to commission jointly a large proportion of the schedule.
Independent station structures – where each station is autonomous – are found in countries such as Spain, although even here they have formed an association, FORTA, which jointly acquires sport and movie rights. Very small-scale local and regional stations do exist in Italy, France and the UK, but they concentrate mostly on local news supplemented by cheap acquisitions. These regional channels include TeleG and S4C in the UK, and TV Breizh in France.
There are two more features of channels in Europe that have an important impact on overall TV economics and competition: first, the overspill of channels from one country to another – often from a large country to a smaller state sharing the same language (e.g. Germany and Austria, the UK and Ireland, and the French and Flemish Communities of Belgium and France and the Netherlands respectively); second, the existence of pan-European channels (CNN, CNBC and Turner Classic Movies) or networks of channels with slightly different versions for different territories (such as Discovery, Eurosport and MTV). Overspill channels can impact significantly on the ecology of the smaller receiving market, reducing the total audience available to channels in the market. Pan-European and European networked channels, while they only gain small audience share in each market – and therefore qualify as secondary channels in each – may actually have as large a
186 Source: OBS, TVI, PWC, Kagan, National Regulators, Company Reports, Screen Digest, O&O Models, O&O Analysis, Broker Reports, press, interviews.

140
combined audience across Europe as a key network channel has in an individual Member State – especially in smaller Member States.
7.2.5. TV programming
TV channels have three basic choices when putting together their schedule:
(1) Programme sourcing choices between specially commissioned programmes, repeats of their programmes, the use of TV programme archive libraries, or the acquisition of rights to show feature films, international ready-made programming or live events.
(2) Programme genre choices between, for example, drama and news, or comedy and factual programming. Different genres appeal to different tastes and also – especially if specifically commissioned – have very different cost characteristics. Stock programmes tend to cost a great deal more to commission than flow programmes187.
(3) Programme sub-genres exist and there are different approaches and mixes of sub-genres to choose from: a drama soap opera versus a one-off film; or stand-up comedy versus a situation comedy, etc.
For any channel, the cost of a schedule consisting only of newly commissioned programmes is prohibitively expensive and not cost effective. Furthermore viewers tend to like to watch repeats and want a mix of home-grown and acquired material. The mix of programmes is driven by: the quality and price of programming; audience tastes; and the programming decisions of competing channels. In general, the main network channels tend to use more originally commissioned output while smaller channels tend to use more archive and imported acquired material. Premium pay-TV channels tend to use a mix of acquired feature films and sports rights.
Considering the larger markets, German network channels spend approximately €4.4 billion on new commissions (inclusive of news) while UK channels spend about €3.8 billion between them. In France, Italy, and Spain the main channels’ spend on commissions was €2.0 billion, €1.4 billion, and €1.2 billion respectively. As a proportion of total programming spend, investment in originations is still high in the smaller member states. In Poland, Slovakia and the Czech Republic, over 60% of network programming spend is on originations (€298m, €64m and €157 respectively)188.
187 A stock programme has repeat value and can be shown again at a later date, while flow programmes have little or no further value after the first showing (narrative repeats excluded). Examples of flow programming include news, sport, games, and some entertainment programming. 188 Sources: OBS, TVI, PWC, Kagan, National Regulators, Company Reports, Screen Digest, O&O Models, O&O Analysis, Broker Reports, press, interviews
141
Across the rest of Europe, network channel spending on new commissions rarely exceeds €600 million in any single market. The biggest four markets thus account for over 76% of total commissioning.
The average network channel in the UK and Germany spends over €700 million a year on new commissions while in France this falls to around €450 million and in Italy and Spain spending per network is around €250m. Outside the major five markets, the average channel rarely spends more than €150m on new commissions, with some of the smaller nations spending less than €5m on new commissions.
Total spending across the EU on sports rights totalled just over €6 billion in 2006, and spending on TV and film rights acquisitions was about €10.8 billion. Germany is by far the largest market for film and TV acquisitions, where the networks spent approximately €1.3 billion between them in 2006 while networks in the UK continue to push up the price of European sports rights, spending over €550 million on sports rights in 2006189. Belgium’s networks also had a high proportionate spend (38% of total programming spend) on film and TV imports of around €240 million. In some of the smaller markets such as Lithuania, Cyprus and Latvia programming is often sourced from neighbouring countries, therefore acquisition spend can account for over 60% of total programming for some of the networks.
The 1200 or so basic-tier pay-TV and free-to-air smaller channels in the EU (including news, basic sports and games channels) share €7.3 billion in revenue – just over €5 million per channel. While some leading smaller channels might earn €50 million to €100 million (especially pan-European channels), even these channels are unlikely to be able to afford much more than €50 million to €90 million in programming spending. With the majority running on total revenues of less than €10 million a year, many will have programming budgets of less than €5 million, or less than €600 per broadcast hour. Even if they repeat each programme 10 times – as many do – this only allows them €6,000 per purchased or commissioned hour.
Premium pay-TV sport and movie channels earn more revenue per channel – about €150 million to €350 million – but most of this goes on purchasing premium film rights (mostly, but not solely, US films) and the rights to show top sports, rather than being invested in new commissions.
Overall, the non-network190 channel sector in the E30 was estimated to have spent about €5.1 billion on film and TV acquisitions in 2006, and about €3.3 billion on sports rights, while only spending about €1.8 billion on new commissions – and much of that on news, sports coverage and talk shows.
189 Over €100m of this was spent on the 2006 World Cup rights 190 ‘Non-network’ is defined as broadcasters outside those available on traditional analogue terrestrial.
142
7.2.6. TV content creation191
The European TV content creation sector was worth approximately €18.3 billion in 2006. Of this, €16.5 billion came from commissions by network channels and €1.8 billion from commissions by smaller channels192. Of this €18.3 billion, about €2.6 billion was spending on national and local news and sports coverage (spending on sports rights is excluded). Of the remaining €15.7 billion, an estimated 43% (€6.8bn) was spent on commissions from external producers and around 57% was invested in in-house production193.
Main network channels account for about 57% of gross industry revenue but over 90% of all new commission spending. Secondary channels tend to be carried within pay-TV packages, where a large proportion of revenues either go to the platform providers or is spent on premium acquisitions, such as top feature films or sport.
Profitability of production
The profitability of an individual production company tends to follow a cyclical trend in terms of profit margin. Margins are disproportionately impacted by hit commissions that in the long term (depending on terms of trade) generate significant ancillary and overseas revenue for the producer. Contrastingly, a ‘flop’ commission will adversely impact profit margins. Over the last few years, independent producers have become increasingly reliant on secondary and ancillary revenues to drive profits, with commission spending by broadcasters generally only covering the production cost for the producer. A burgeoning programme export market both to the US and intra Europe, combined with increasing secondary revenues, has seen a rise in profit margin for independent producers (see Figure 16) in the larger markets.
191 The estimates in this section utilise some of the evidence from the bespoke survey in Chapter 9, such as the proportions of independent production, the mix of programme types produced in-house and by independents. 192 Revenue from direct subsidies (of approximately €0.3m), and direct income to producers from the exploitation of ancillary rights such as international programme sales, DVDs, licensing and merchandising (approx €0.8m) has been accounted for in the content creation figure detailed in the main text. 193 External production includes broadcaster affiliates such as UFA and Studio Hamburg in Germany and Fremantle across RTL’s group of channels.

143
Figure 16: Independent producer profitability in the largest European markets (01-06)
1.8%
2.0%
3.9%
5.4%
4.6%
6.4%
0%
1%
2%
3%
4%
5%
6%
7%
2001 2002 2003 2004 2005 2006
SOURCE: OBS, AMADEUS, COMPANY ACCOUNTS, O&O ANALYSIS
1.8%
2.0%
3.9%
5.4%
4.6%
6.4%
0%
1%
2%
3%
4%
5%
6%
7%
2001 2002 2003 2004 2005 2006
SOURCE: OBS, AMADEUS, COMPANY ACCOUNTS, O&O ANALYSIS
A number of larger production companies have close relationships with broadcasters and are often shielded from potential uncertainty in the market through output deals with broadcasters. Typically, these affiliated producers tend to report high profit margins due to regular commissions and better terms of trade with the broadcaster (see Table 13 below).
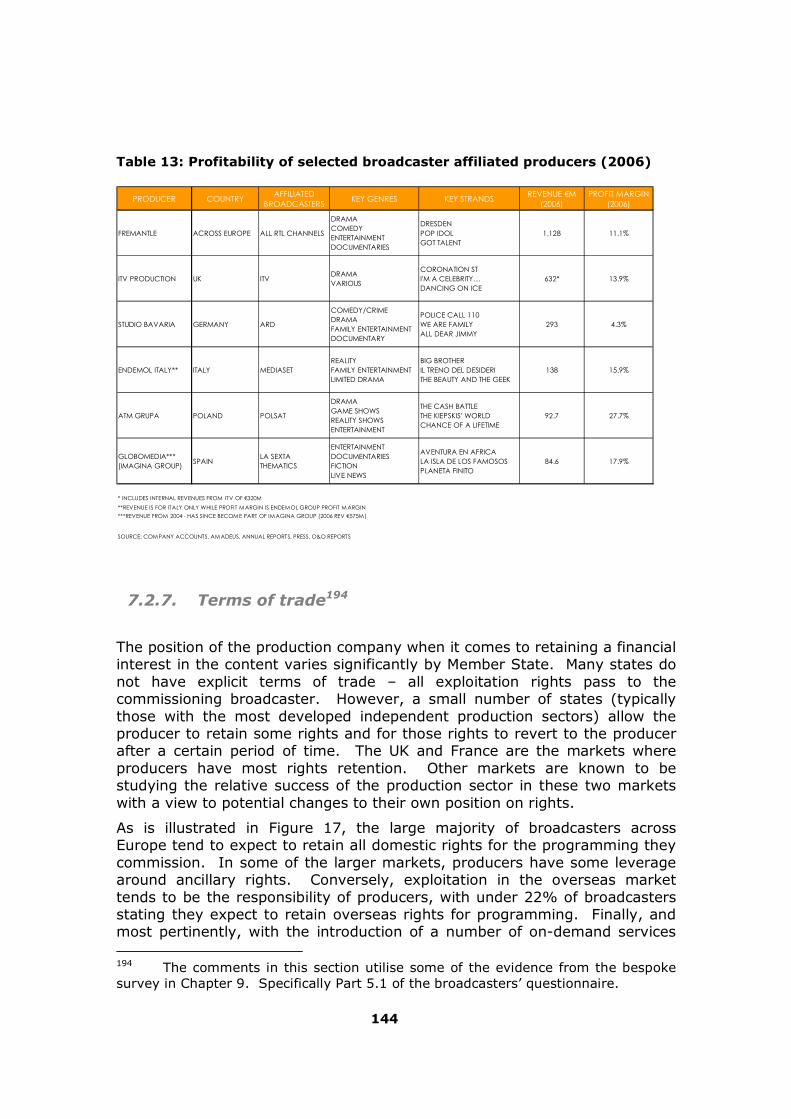
144
Table 13: Profitability of selected broadcaster affiliated producers (2006)
PRODUCER COUNTRY AFFILIATED
BROADCASTERS KEY GENRES KEY STRANDS
REVENUE €M (2006)
PROFIT MARGIN (2006)
FREMANTLE ACROSS EUROPE ALL RTL CHANNELS
DRAMACOMEDY ENTERTAINMENT DOCUMENTARIES
DRESDENPOP IDOL GOT TALENT
1,128 11.1%
ITV PRODUCTION UK ITV DRAMAVARIOUS
CORONATION STI'M A CELEBRITY…DANCING ON ICE
632* 13.9%
STUDIO BAVARIA GERMANY ARD
COMEDY/CRIMEDRAMAFAMILY ENTERTAINMENT DOCUMENTARY
POLICE CALL 110WE ARE FAMILYALL DEAR JIMMY
293 4.3%
ENDEMOL ITALY** ITALY MEDIASET REALITYFAMILY ENTERTAINMENT LIMITED DRAMA
BIG BROTHERIL TRENO DEL DESIDERITHE BEAUTY AND THE GEEK
138 15.9%
ATM GRUPA POLAND POLSAT
DRAMAGAME SHOWSREALITY SHOWS ENTERTAINMENT
THE CASH BATTLETHE KIEPSKIS' WORLDCHANCE OF A LIFETIME
92.7 27.7%
GLOBOMEDIA*** (IMAGINA GROUP)
SPAIN LA SEXTATHEMATICS
ENTERTAINMENTDOCUMENTARIESFICTION LIVE NEWS
AVENTURA EN AFRICALA ISLA DE LOS FAMOSOS PLANETA FINITO
84.6 17.9%
* INCLUDES INTERNAL REVENUES FROM ITV OF €320M
**REVENUE IS FOR ITALY ONLY WHILE PROFIT M ARGIN IS ENDEMOL GROUP PROFIT M ARGIN
***REVENUE FROM 2004 - HAS SINCE BECOM E PART OF IM AGINA GROUP (2006 REV €575M )
SOURCE: COM PANY ACCOUNTS, AM ADEUS, ANNUAL REPORTS, PRESS, O&O REPORTS
7.2.7. Terms of trade194
The position of the production company when it comes to retaining a financial interest in the content varies significantly by Member State. Many states do not have explicit terms of trade – all exploitation rights pass to the commissioning broadcaster. However, a small number of states (typically those with the most developed independent production sectors) allow the producer to retain some rights and for those rights to revert to the producer after a certain period of time. The UK and France are the markets where producers have most rights retention. Other markets are known to be studying the relative success of the production sector in these two markets with a view to potential changes to their own position on rights.
As is illustrated in Figure 17, the large majority of broadcasters across Europe tend to expect to retain all domestic rights for the programming they commission. In some of the larger markets, producers have some leverage around ancillary rights. Conversely, exploitation in the overseas market tends to be the responsibility of producers, with under 22% of broadcasters stating they expect to retain overseas rights for programming. Finally, and most pertinently, with the introduction of a number of on-demand services 194 The comments in this section utilise some of the evidence from the bespoke survey in Chapter 9. Specifically Part 5.1 of the broadcasters’ questionnaire.

145
across Europe, all broadcasters surveyed expect to retain internet and new media rights, which has implications for a producer’s ability to drive revenue through on-demand services195.
Figure 17: Broadcaster rights retention across Europe, 2007196
100 100
81 81
24 24 2420
95
10
20
30
40
50
60
70
80
90
100
FIRSTSHOWING –TERRESTRIAL
REPEATSHOWING(S) –
TERRESTRIAL
REPEATSHOWINGS –SECONDARY
ANCILLARYRIGHTS
INTERNET AND/OR
OTHER NEW MEDIA RIGHTS
DOMESTIC OVERSEAS
% OF BROADCASTERS
ANCILLARYRIGHTS
REPEATSHOWINGS –SECONDARY
FIRSTSHOWING –TERRESTRIAL
REPEATSHOWING(S) –
TERRESTRIAL
SOURCE: O&O SURVEY OF BROADCASTERS
7.2.8. Current flow of funds along the supply chain
Having gone through each activity in the supply chain in turn, we set out a reconciliation of the entire funds flow along the supply chain (Figure 18).
195 Relevant comments from the workshop and comments received subsequent to this can be found in Part 23.2, which relate to terms of trade and their implications for the competitive position of its members. 196 ‘Ancillary rights’ as illustrated in Figure 17 refer to rights such as merchandising, DVD and licensing.

146
Figure 18: Estimated TV value chain in the European Union (€bn, 2006)197
6.5 6.5
20.2
7.1
17.8
28.3
5.3
13.1
6.2
10.4
6.9
2.6
8.9
5.0
59.5 24.5
35.0
6.9
10
20
30
40
50
60
70
80
CONSUMER PAYMENTS
RETAILER’S PLATFORM
REVENUE SHARE
BROADCASTER REVENUE
TRANSMISSION/DISTRIBUTION
COSTS
NET BROADCASTER
REVENUE
PROFTS, ADMIN AND
MANAGEMENT
PROGRAMME CONTENT
EXPENDITURE BY BROADCASTER
RIGHTS ACQUISTION
SPENDING
COMMISSIONS BY BROADCASTERS
TOTAL EXTERNAL MARKET
€ BN
UTILITY CABLE
NET PAY TV REVENUES
LICENCE FEE
ADVERTISING
OTHER REVENUES
SPORTS RIGHTS
FILM AND TV IMPORTS
EXTERNAL
NEWS
IN HOUSE
64.5
16.6
18.4
78.1
SOURCE: O&O TRENDS BASED ON DATA FROM: OBS, TVI, PWC, KAGAN, NATIONAL REGULATORS, COMPANY REPORTS, SCREEN DIGEST, O&O MODELS, O&O ANALYSIS, BROKER REPORTS, PRESS, INTERVIEWS
PAY TV
13.6
Of the €78.1 billion in TV revenue, delivery platforms retain €13.6 billion198 with the remainder of €64.5 billion199 flowing to broadcasters. Approximately €5.0200 billion of this is spent on transmitting the channels and €35.0 billion201 is invested in programming with the remaining €24.5 billion202 covering all profits, administration and management costs.
Of the €35.0 billion programme spend, approximately €16.6 billion203 was spent on acquiring rights of various kinds – €6.2 billion on sports rights and €10.4 billion on film and TV acquisitions (domestic TV and film archive rights, acquisitions of films and TV programmes from the USA, acquisitions of TV programmes and films from other European countries, investment in domestic films in return for TV rights)204. The remaining €18.4 billion205 was invested in original programming in the form of news, in-house and external 197 Following comments from the European Audiovisual Observatory, it is important to note that these figures are as accurate as possible given the limitations of publicly available data on the audiovisual industry. 198 See the 2nd column – ‘Retailer’s platform revenue share.’ 199 See the 3rd column – ‘Broadcaster revenue.’ 200 See the 4th column – ‘Transmission/distribution costs.’ 201 See the 7th column – ‘Programme content expenditure by broadcaster.’ 202 See the 6th column – ‘Profits, admin and management.’ 203 See the 8th column – ‘Rights acquisition spending.’ 204 In practice, co-productions are probably split between the acquisitions total and the new commissions total. 205 See the 9th column – ‘Commissions by broadcasters.’

147
production. Of the €18.4 billion, approximately €6.9 billion flows to the external production market.
7.2.9. Vertical integration along the value chain
There is considerable vertical integration along the value chain. Our analysis suggests that 57% of non-news programming is made by in-house departments within broadcasters, with the remaining 43% split between independent producers and some third-party producers owned by broadcasters206.
Similarly, a very high proportion of premium pay-TV channels are owned by pay-TV platform owners, while both main network channel broadcasters and pay-TV platform owners are the main owners of smaller basic tier and free-to-air channels across Europe.
The other major owners of thematic channels are the US studios, who can link their ownership of film and TV archives and already established secondary channels in the USA with the launch of new, focused European secondary channels, such as 13th Street (NBC Universal), Nickelodeon (Viacom) and Jetix (Disney). There is also some cross-ownership between platform owners and primary channel broadcasters in markets such as France and Portugal.
There are significant competitive advantages to vertical integration between larger networks, pay TV platforms and secondary channels. With their larger audiences, network channels can cross-promote platforms and smaller channels very cost-effectively. The smaller channels can access repeats of original commissions. There are also considerable advantages in the integration of programme making and broadcasting – especially network broadcasting. A regular flow of commissions from an associated channel can reduce the risks involved in programme making. For the network, an associated production house can ensure regular access to new ideas and a better fit between the channel’s positioning and style and the programmes produced for it.
However, there are also disadvantages to vertical integration. Networks can find that tied production houses may have less incentive to innovate. Networks might also find it better to sell to independently owned channels than to ones in their own group, while pay-TV delivery platforms with an interest in primary free-to-air channels might have a conflict of strategic interests.
Competition policy issues may also be raised by vertical integration. Networks with ownership of production and rights libraries might use this to prevent the entry of new channels. Pay-TV platform owners may favour their own channels over those of rivals.
206 Sources: OBS, TVI, PWC, Kagan, National Regulators, company reports, screen digest, O&O Models, O&O Analysis, Broker Reports, Press, Interviews.

148
While many of the traditional (often publicly funded) main networks in Europe began as vertically integrated producers and broadcasters out of necessity – there was no independent supply of programmes – most national markets now exhibit a mix of vertically integrated and independent programme supply, with broadcaster-owned producers also producing for rival broadcasters. This may suggest that the degree of vertical integration depends very much on specific factors in each market and on the specific competitive strategy of each broadcaster, platform and programme producer.
7.2.10. Trade207
Traditionally there has been significant deficit in the balance of trade for programming between Europe and the rest of the world. Almost all European broadcasters acquire popular US programming (both TV series and Hollywood movies) and more recently there has been an increase in the number of imports from Asian nations, especially Japan and South Korea.
In the last few years the European programming export market has strengthened208 with a number of programmes being traded both intra-Europe and elsewhere.
Table 14: European formats broadcast in the United States
SHOW ORIGINAL PRODUCER ORIGIN OF FORMAT NUMBER OF
SEASONSRENEWED?
SURVIVOR PLANET 24 UK/SWEDEN 13 YES BIG BROTHER 8 ENDEMOL THE NETHERLANDS 8 YES AMERICAN IDOL 6 19 TELEVISION UK 6 YES THE OFFICE BBC UK 3 YES DANCING WITH THE STARS BBC UK 3 YES HELL'S KITCHEN 3 ITV UK 3 YES SUPERNANNY RICOCHET UK 3 YES DEAL OR NO DEAL ENDEMOL THE NETHERLANDS 2 YES 1 VS. 100 ENDEMOL THE NETHERLANDS 1 YES SO YOU THINK YOU CAN DANCE 19 TELEVISION UK 3 NOTHE RICH LIST 12 YARD PRODUCTIONS UK 1 NOGREASE: YOU'RE THE ONE THAT I WANT BBC UK 1 NOCREATURE COMFORTS AARDMAN ANIMATIONS UK 1 NOFAT MARCH RICOCHET UK 1 NO
SOURCE: PRESS, VARIETY, IM DB, TV TRACKER, COM PANY WEBSITES, O&O ANALYSIS
As shown in Table 14, a number of European formats (mainly from the UK and The Netherlands) have been exported to the US, where a high proportion of them have been recommissioned for second series.
Within Europe, there is still a significant amount of trade between neighbouring nations where tastes, culture and in some cases language overlap. For example, a significant amount of programming in Belgium is
207 It is not possible to say whether the TV trade deficit has evolved since the 2005 study as data is very limited. In this section we therefore make some qualitative comments based on interviews, press and TV company accounts. 208 Data on programming trade is limited and where available often not comparable so any comments in this section are informed through responses to the industry survey.

149
sourced from French and Dutch broadcasters/producers, while in Sweden programming is regularly imported from Denmark and Norway (as is the case for a number of the Scandinavian nations).
150
8. Linear Data Analysis
8.1. Methodology
8.1.1. Overall objective and approach
Prior to describing the methodology used for this Study, it is important to note its overall objective and approach, and their effect on the findings.
The objective was not to re-do or control the findings provided at Member-State level, which are derived from the specificities of the implementation of the Directive and the methods used in each Member State, to collect and publish the findings. Rather, our objective was to provide a different measure, common to all broadcasters covered in the analysis, using compromise definitions so as to reflect in the best possible way the overall situation for European broadcasters. Also, the aim was to use research techniques that could be implemented practically in the absence of some detailed information and data that are available at Member State level but not accessible to the consultants.
Our definitions are not intended to serve as ‘best practice’ on how Member States should implement the Directive. A Member State’s own practice is linked to its market situation, regulatory framework and political objectives. The findings of this Study should not be used to assess the accuracy or validity of Member States’ declarations and specific approaches, but only as a means to understand the drivers that generally influence the proportions of qualifying, European, independent and recent independent content offered and consumed by European viewers on European channels.
Some of the most relevant reasons for the differences between the findings of this Study and the findings published at Member State level, are to be found below:
• Our findings are based on a selection of broadcasters in a selection of markets, with a focus on the largest broadcasters of each market in order to represent the largest possible share of television viewing. This means that national totals do not take account of all the broadcasters operating within each market; for example our focus on channels with large audience shares mean that niche, thematic broadcasters with (often) very specific programming policies are typically not included.
• In some markets, we have included broadcasters that are regulated by authorities from another Member State than the Member State in which it finds its audience. This is also due to our methodological choice to favour channel choice in terms of viewing. This means that some broadcasters have been included in specific Member State chapters, although from a regulatory point of view they should not

151
have been, for example TV3 and Kanal5 in Sweden. We stress that these channels are under the regulatory responsibility of Member States other than the Member State in which they find their viewers.
• Lastly, while our findings for European programming are very close to Member States’ declarations (notwithstanding sampling distortions), our findings for independent productions sometimes show significant differences compared to Member States’ declarations. The issue of independent production, which is fairly complex, is discussed in more detail later in this section.
Throughout the report, the consultants have attempted to point out specific situations encountered in given markets and broadcasters when it was considered necessary.
8.1.2. Country selection
After careful discussion with the Commission, we have built a representative sample of 11 European Member States in order to cover the main types of European markets:
• All of Europe geographically: North, South, East, West
• New and old Member States
• Varied size of audiovisual industries
• Varied intensities of the implementation measures
Table 15 shows a summary table of the 11 Member States and their characteristics.
8.1.3. Channel selection
For each of the 11 Member States we have selected a sample of channels that are representative of the mainstream market, to be coded by the criteria required for reporting on compliance with Articles 4 and 5. Our choice has been guided according to the following criteria:
• Share of national audience
• Company status (public or private)
• Origin of revenue (advertising, public fees or subscriptions)
• Representative of the main media groups
• Financial contribution to the production market
As the channels that receive the largest share of national audiences have remained largely unchanged over the past five years, a number of channels

152
selected for this Study are the same as those covered in the 2005 Study209, thus allowing us to make useful comparisons.
209 Study on the impact of measures concerning the promotion of the distribution and production of television programs provided for under Art 25 (a) of the Directive on Television without Frontiers, 24 May 2005.

153
Table 15: List of the 11 European Member States covered in the study
Market Indicators Size**** Geography
Recency of EU
membership Neighb.
Language Channels
Member State GDP Per Capita (€)*
Digital TV Penetration**
Broadband Penetration*** Large Medium Small North South West East Old New Yes No National Other Total
Austria 31100 23% 18% X X X X X 2 1 3
Belgium 30000 3% 24% X X X X X 2 2 4
Bulgaria 3300 1% 6% X X X X X 2 0 2
Cyprus 18900 25% 11% X X X X X 2 1 3
Czech Republic 11100 3% 12% X X X X X 2 0 2
Denmark 40500 14% 37% x X X X X 2 1 3
Estonia 9800 2% 20% X X X X X 2 0 2
Finland 31700 44% 29% X X X X X 2 1 3
France 28400 37% 22% X X X X X 4 4 8
Germany 28200 27% 21% X X X X X 4 4 8
Greece 19300 5% 7% X X X X X 2 1 3
Hungary 8900 5% 12% X X X X X 4 2 6
Ireland 41100 45% 16% X X X X X 2 1 3
Italy 25100 31% 16% X X X X X 4 4 8
Latvia 7100 0% 12% X X X X X 2 0 2
Lithuania 7000 0% 13% X X X X X 2 0 2
Luxembourg 71600 2% 25% X X X X X 0 0 0
Malta 12500 10% 14% X X X X X 0 0 0
Netherlands 32700 18% 33% X X X X X 2 2 4
Poland 7100 13% 7% X X X X X 4 2 6
Portugal 14700 16% 15% X X X X X 2 1 3
Romania 4500 0% 7% X X X X X 3 1 4
Slovakia 8300 14% 7% X X X X X 2 0 2
Slovenia 15200 1% 15% X X X X X 2 0 2
Spain 22300 27% 17% X X X X X 4 4 8
Sweden 34500 37% 28% X X X X X 2 3 5
United Kingdom 31600 71% 24% X X X X X 4 4 8
Total EU X 65 39 104
Iceland 43500 48% N/A X X X X 2 0 2
Liechtenstein 17000 7% N/A X X X X 0 0 0
Norway 57500 38% N/A X X X X 2 0 2
Total other EEA 4 0 4
Total sample 69 39 108
All data for year end of 2005 (except for Broadband penetration, where more up-to-date data is available). *Source: Eurostat
**Source: European Audiovisual Observatory, Trends in European Television, 2006, Volume 2, Band 2 ***Source: Eurostat (Data for July 2007) ****Size is based on population. Large=35M+; Medium=Less than 35M but more than 10M; Small=Less than 10M

154
A minimum of 3 (Estonia) and a maximum of 6 channels (France, Germany, Italy, Poland, Spain and the UK) have been covered in each market. Table 16 is a summary table of the 54 channels and their characteristics.
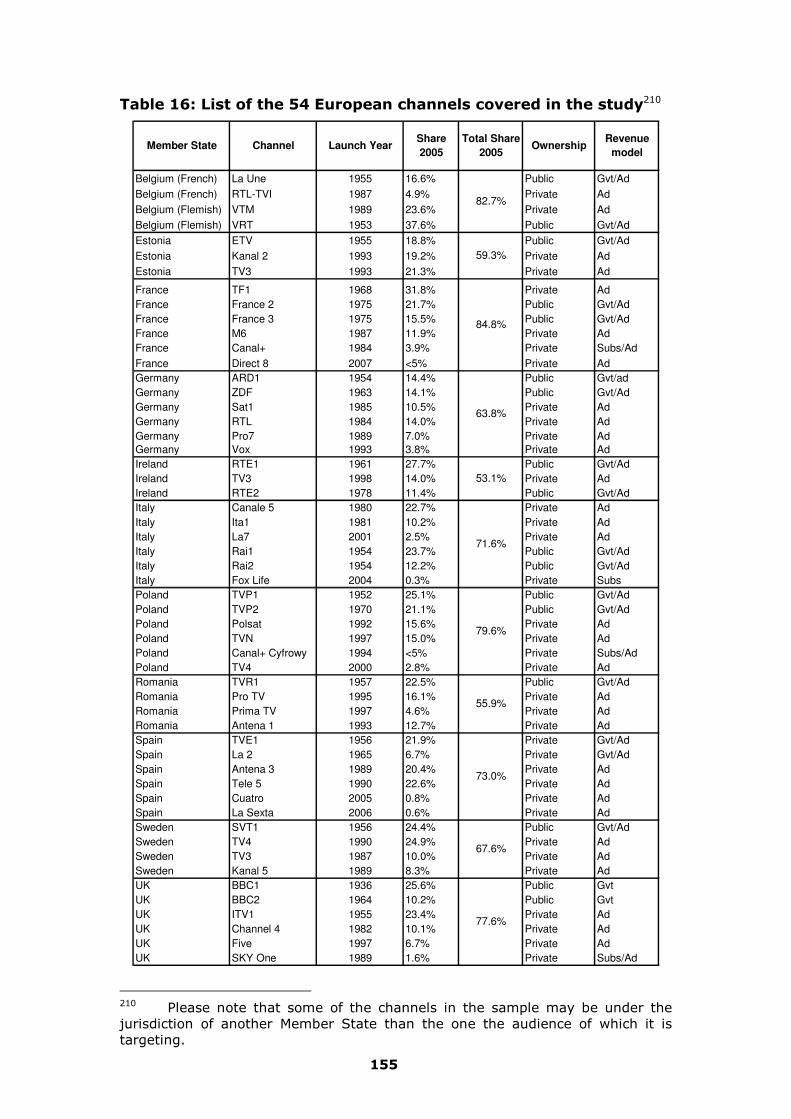
155
Table 16: List of the 54 European channels covered in the study210
Belgium (French) La Une 1955 16.6% Public Gvt/Ad
Belgium (French) RTL-TVI 1987 4.9% Private Ad
Belgium (Flemish) VTM 1989 23.6% Private Ad
Belgium (Flemish) VRT 1953 37.6% Public Gvt/Ad
Estonia ETV 1955 18.8% Public Gvt/Ad
Estonia Kanal 2 1993 19.2% Private Ad
Estonia TV3 1993 21.3% Private Ad
France TF1 1968 31.8% Private Ad
France France 2 1975 21.7% Public Gvt/Ad
France France 3 1975 15.5% Public Gvt/Ad
France M6 1987 11.9% Private Ad
France Canal+ 1984 3.9% Private Subs/Ad
France Direct 8 2007 <5% Private Ad
Germany ARD1 1954 14.4% Public Gvt/ad
Germany ZDF 1963 14.1% Public Gvt/Ad
Germany Sat1 1985 10.5% Private Ad
Germany RTL 1984 14.0% Private Ad
Germany Pro7 1989 7.0% Private Ad
Germany Vox 1993 3.8% Private Ad
Ireland RTE1 1961 27.7% Public Gvt/Ad
Ireland TV3 1998 14.0% Private Ad
Ireland RTE2 1978 11.4% Public Gvt/Ad
Italy Canale 5 1980 22.7% Private Ad
Italy Ita1 1981 10.2% Private Ad
Italy La7 2001 2.5% Private Ad
Italy Rai1 1954 23.7% Public Gvt/Ad
Italy Rai2 1954 12.2% Public Gvt/Ad
Italy Fox Life 2004 0.3% Private Subs
Poland TVP1 1952 25.1% Public Gvt/Ad
Poland TVP2 1970 21.1% Public Gvt/Ad
Poland Polsat 1992 15.6% Private Ad
Poland TVN 1997 15.0% Private Ad
Poland Canal+ Cyfrowy 1994 <5% Private Subs/Ad
Poland TV4 2000 2.8% Private Ad
Romania TVR1 1957 22.5% Public Gvt/Ad
Romania Pro TV 1995 16.1% Private Ad
Romania Prima TV 1997 4.6% Private Ad
Romania Antena 1 1993 12.7% Private Ad
Spain TVE1 1956 21.9% Private Gvt/Ad
Spain La 2 1965 6.7% Private Gvt/Ad
Spain Antena 3 1989 20.4% Private Ad
Spain Tele 5 1990 22.6% Private Ad
Spain Cuatro 2005 0.8% Private Ad
Spain La Sexta 2006 0.6% Private Ad
Sweden SVT1 1956 24.4% Public Gvt/Ad
Sweden TV4 1990 24.9% Private Ad
Sweden TV3 1987 10.0% Private Ad
Sweden Kanal 5 1989 8.3% Private Ad
UK BBC1 1936 25.6% Public Gvt
UK BBC2 1964 10.2% Public Gvt
UK ITV1 1955 23.4% Private Ad
UK Channel 4 1982 10.1% Private Ad
UK Five 1997 6.7% Private Ad
UK SKY One 1989 1.6% Private Subs/Ad
Member State Channel Ownership
55.9%
Share
2005
84.8%
63.8%
Launch Year
77.6%
79.6%
Revenue
model
53.1%
71.6%
73.0%
67.6%
Total Share
2005
59.3%
82.7%
210 Please note that some of the channels in the sample may be under the jurisdiction of another Member State than the one the audience of which it is targeting.

156
Compared to the 2005 Study, this sample has the following similarities and differences:
• With regard to pay TV, the current study emphasises ‘premium’ pay-TV channels211 which play an important role in the funding of production. The following premium channels have been covered: CANAL+ (France and Poland), FOX LIFE (Italy) and SKY ONE (UK).
• DIRECT8 (France), CUATRO (Spain), LA SEXTA (Spain) and FIVE (UK) have been covered here for the first time.
• Channels from new Member States have been covered for the first time: Estonia (ETV, KANAL2 and TV2), Poland (TVP1, TVP2, POLSAT, TVN, CANAL+ and TV4) and Romania (TVR1, PRO TV, PRIMA TV and ANTENA1).
8.1.4. Week selection
In order to be representative of the results for 2007, we built a set of data based on two sample weeks.
While in the 2005 Study the weeks were consecutive212, we chose two non-consecutive weeks for this Study in order to better represent a full calendar year. As is common practice for statistical modelling of this kind, we selected the two weeks in the Spring and Fall periods, where broadcasters’ schedules are more stable, and avoided periods with special events likely to impact on television scheduling or viewing, for example elections, holidays or major sporting events. Where possible we selected the same two weeks for each market, although in some cases a different week had to be selected to avoid special events. Table 17 is a summary table of the 2 weeks selected in each of the 11 sample Member States.
211 Many pay-TV channels originate no new productions, offering a schedule of domestic repeats and acquired programmes. Premium channels are defined as channels on pay television services that offer a significant volume of exclusive content, including sports. 212 In the 2005 Study, the consultants chose to select 2 consecutive weeks from the Spring period to represent each year (1993, 1996, 1999 and 2002). This choice, which was not as representative as the choice to select 2 non-consecutive weeks in the current Study, was explained by the need to keep the work simple, for the data had to be researched up to 10 years back for up to 17 Member States.

157
Table 17: Sample weeks selected to represent the 2007 situation in each market
Dates Member State Spring Fall
Belgium
12-18 March (Flemish
Community) /19-25 March (French Community)213
12-18 November
Estonia 5-11 March 12-18 November France 19-25 March 12-18 November Germany 19-25 March 12-18 November Ireland 19-25 March 12-18 November Italy 19-25 March 12-18 November Poland 19-25 March 12-18 November Romania 12-18 March 12-18 November Spain 19-25 March 12-18 November Sweden 5-11 March 12-18 November UK 19-25 March 12-18 November
8.2. Classification of programmes
8.2.1. Origin and contents of primary linear data
Primary data for analysing the offering of linear audiovisual services have been sourced from the companies and organisations responsible for the so-called Television Audience Measurement (TAM) data in their respective countries. As a reminder, TAM services provide two main sets of information:
• Content information: TAM services provide data on the starting time, duration and genre of each programme aired on the main television channels each day of the year; they either do this independently from broadcasters or rely on broadcasters for part or all of the information (i.e. according to common specifications); in all cases, these data are called ‘verified data’, in the sense that they
213 For TAM data, the Flemish Community of Belgium and French Community of Belgium are considered two separate markets and as a consequence were acquired as two different datasets. Unfortunately, data was unavailable for the 19-25 March for the two Flemish Community of Belgium channels (EEN and VTM), so in this chose the closest possible week where data was available (12-18 March). Before doing this we confirmed that this week did not contain any special events, and that it was thus representative, allowing for the data from the Flemish Community of Belgium channels to be collated alongside the data for the French Community of Belgium channels.

158
are based on what has been actually aired, rather than on advance programme schedules that are subject to last minute scheduling changes;
• Viewing information: TAM services constantly monitor the number of viewers watching each of the aired programmes; they do so by recruiting homes where they install specific measuring systems to record which channels or services the TV sets are tuned to. Household members (and guests) usually have to push their own individual button on a specially designed remote control to identify their ‘presence in the room’ (or ‘actual watching’ in some countries); TAM services extrapolate from these data to provide estimates of viewing behaviour at the national level.
It is worth noticing that TAM providers produce their data in a very consistent way across markets. Most of them are part of international research companies such as Nielsen-AGB, GfK or TNS, and tend to use the same technologies. Even when belonging to separate groups, TAM services in practice apply very similar methodologies, algorithms and statistical models. Also, with very few exceptions, only one source of data is available in a given market, which all players jointly control to provide a single reference for programme viewing and, ultimately, a currency for valuing advertising breaks.
For this project, data have been sourced mainly through Eurodata (which gathers information) and processed by Headway International, apart from the UK, where the job was done by Attentional.
As was stated above, two sample weeks have been selected to represent the 2007 situation for a sample of 54 European television channels, from the Spring and Fall period.
8.2.2. Overall approach to further coding of linear
data
The coding of linear data has been managed by the same teams who coded linear data for the 2005 Study. For the 2005 Study, additional data had been sourced from companies to add to published schedules (ETS and Infomedia). The data had then been further codified using a combination of local experts in each market and the project teams.
For the current project, local experts were of less importance than in the previous project although they were used occasionally, in particular for the new Member States covered for the first time. There are several reasons for this: the team was able to capitalise on its own experience from the 2005 Study, as well as to rely on the data produced in the 2005 Study, while detailed information on recent programmes has become much easier to access thanks to the development of public information on the internet, whether from broadcast organisations, producers, distributors, associations, the press or free databases.
The coding of 2007 has been exhaustive, even when these programmes had already been coded in the 2005 Study, to check that the programmes were still produced by the same companies and that these companies still

159
had the same status in terms of nationality or independence. By the end of the process, the team had coded all the necessary criteria for a minimum of 90% of the programmes in each market.
The basic process involved researching information on the programmes individually, from the websites of broadcasters and those of producers and distributors. In most markets, the number of significant producers and distributors is below 40 companies, most of which publish information on their activities, including which programmes they fully produce, executively produce, co-produce, develop themselves or adapt from licence agreements with other companies. Putting all this information together enabled the consultants to build a good picture of who is producing what in each market, as well as who is linked to whom, which is the starting point of determining the country of origin, independence and recency of individual programmes. Paradoxically, the hardest to research and code were newer or smaller markets, with a less developed independent production sector, and where a limited number of national productions are produced mainly internally by broadcasters, with the help of many small individual producers.
As above, the objective of the work was not to verify the measures released every other year through the broadcasters’ declarations to their regulatory authorities, and then compiled and published by the European Commission. Rather, the research team’s objective was to produce a consistent measure across markets, comparable to the data from the 2005 Study, with a minimum of 90% of the programmes to be coded in order to ensure it is statistically representative, and to establish the viability of monitoring by third parties using available data sources.
8.2.3. Determining ‘qualifying programmes’
The first step in the process of coding linear data was to determine the genre of each individual programme in order to identify ‘qualifying programmes’ – the proportion of the transmission schedule to which Articles 4 and 5 of the Directive apply, that is, all programmes ‘excluding sport events, news and games’ (non-qualifying programmes) as well as ‘advertising, teletext services and teleshopping’ (non-programme material).
TAM services do not use the same genre classification across markets, due to cultural differences. For example, a cartoon intended for children will be classified as ‘fiction/animation’ in one market but as ‘children/series’ in another. So in order to come up with consistent, comparable data across markets the team re-classified the programmes according to ‘qualifying genres’ (Documentary, Factual Magazine, Entertainment, Fiction and Cinema Film) and ‘non-qualifying genres’ (Sports events, News, Games, Teletext and Teleshopping). The genre classification, which had been created for the 2005 Study, was used again for this project after the team reviewed it and concluded that it was still valid. Definitions of these genres are provided in Appendix I (see Chapter 11 of this report).
Using this classification was quite straightforward as the team has strong international experience of programming content and genre classification

160
specificities in Europe. The team experienced the most challenging difficulties at the border between documentary magazines, factual magazines and entertainment, where cultural differences between Southern and Northern markets play a critical role. If this may slightly skew the results for these genres, it did not impact the split between ‘qualifying’ and ‘non-qualifying’ programmes.
8.2.4. Determining ‘European works’
Article 4 of the Directive requires linear services (broadcasters) to ‘reserve a majority proportion of their transmission time, excluding the time appointed to news, sports events, games, advertising, teletext services and teleshopping, for European works’. Article 6 of the TVWF Directive contains a set of four definitions to determine whether a production qualifies as a European work. These are:
• Geographical requirements;
• Workforce requirements;
• Requirements related to the control of production; and
• Co-production requirements.
We referred to this set of definitions when determining whether or not a programme qualified as a European work. Each definition is examined in more detail below.
Geographical requirement
Article 6214 Paragraph 1 of TVWF Directive requires that, to qualify as a European production, a programme must ‘originate’ from a European country that belongs to one of three categories:
• It is one of the 27 European Union Member States; or
• It has ratified the Council of Europe treaty on Transfrontier Television and must fulfil certain conditions (cf. Art. 6(2)); or
• It is a European third country with which the Community has concluded co-production agreements related to the audiovisual sector, under certain conditions (Art 6(3)).
Table 18 lists the countries that qualify on the geographical definition.
214 Article 6 has now become (with some amendments as regards works co-produced with third countries) Article 1(n) of the AVMS Directive. As the new definition will only be transposed in national laws by end 2009, reference to Article 6 of the TVWF Directive is made here.

161
Table 18: List of all countries that qualify on the geographical definition
EU Member States
Countries that have ratified
the European Convention
on Transfrontier Television
Other
Austria Croatia Iceland (EEA country)
Belgium Liechtenstein (did not sign
Denmark Macedonia The convention yet)
Finland Moldova
France Norway
Germany San Marino
Greece Switzerland
Ireland Turkey
Italy
Luxembourg
Netherlands
Portugal
Spain
Sweden
UK
Cyprus
Czech Republic
Estonia
Hungary
Latvia
Lithuania
Malta
Poland
Slovakia
Slovenia
Romania
Bulgaria
Workforce requirement
Article 6 Paragraph 2 of the TVWF Directive adds a workforce requirement: a majority of the writers and production staff employed on a production must live in a Member State or, in cases where the production qualifies under the European Convention on Transfrontier Television or a bilateral Treaty, one of the other qualifying countries.

162
Control of production
Under Article 6 (2) of the TVWF Directive, programmes that originate from an EU Member State or country that has ratified the European Convention on Transfrontier Television are subject to additional controls on production in order to qualify as a European work:
• The programme must be made by one or more producers established in one (or more) of the qualifying countries; or
• The production must be supervised and actually controlled by one or more producers established in one (or more) of the qualifying countries.
Co-production requirements
In the case of co-productions with producers not located in a qualifying country, Article 6 (4) of the TVWF Directive requires that the European co-producer provides a majority of the financing and retains control of the production process if the production is to qualify as a European work.
Coding ‘European Works’
As it is very difficult to find all details on a production, especially on the funding mix (i.e. what the various funding sources are for a particular production), and as Member States further refine these criteria to monitor their national activities and produce their own declarations, the team had to take a consistent and practicable approach across markets and thus elaborated the following rules:
• When local TAM providers reported the origin of production, we relied on it except for stock programmes (fiction, cinema, documentary and children’s animation).
• When the origin of production was not reported, we generally found that flow programmes are most often produced nationally. Even when formats are licensed from another country, the original producer plays a minority role in the local adaptation and production of the programme.
• For stock programmes, in case of a co-production, we considered as indicators the language of the film and the country in which the program was first broadcast.
• We also researched the information displayed by individual co-production partners to find out what was the role of each in the production.
• As a final criteria, if we were unable to define a work’s nationality via the aforementioned rules, we looked at the composition of the workforce. Where a majority of the writers and production staff employed on the project were resident in a Member State, the program qualified as a European work if the work was produced in the framework of a bilateral co-production treaty (Art 6(4)), and the production was controlled by a producer established in one of the Member States.

163
8.2.5. Determining ‘Independent productions’
Article 5 of the AVMS Directive requires broadcasters to allocate at least 10% of qualifying hours to ‘European works created by producers who are independent of broadcasters’. Alternatively, Member States are permitted to require broadcasters to reserve ‘at least 10% of their programming budget’ for European works created by independent producers.
We used transmission time and not programme budget as the unit of analysis. Indeed, effective monitoring of programme budgets would require verifiable data on the direct costs of every programme or series in a channel’s schedule, while payments for production can be manipulated for reporting purposes and may be structured so payments are received in stages, distorting the true value of production. So this was both the only practicable solution and the solution adopted by most Members States, even those who offer a choice, as has already been noted in the legal analysis of First Interim Report.
Definition of independent producer
It is left to Member States to define ‘independent producer’, but Recital 49 of the AVMS Directive (which replicates Recital 31 of the 1997 TVWF Directive) states that the definition should take account of criteria such as ‘ownership of the production company, the amount of programmes supplied to the same broadcaster and the ownership of secondary rights’.
In order to create a single definition of ‘independent producer’ that could be applied by our research team in each Member State, we defined three criteria:
• The production company must be free from a controlling interest by a broadcaster (a broadcaster owns less than 50% of the shares of the production company).
• The programme must have been made by a production company that produces a majority of its programmes outside the broadcaster’s own management structure.
• The production company must provide programmes for different broadcasters (not just one).
If a production company clearly met all of the criteria, it was classified as ‘independent’. If the company did not meet any one of the criteria, it was classified as ‘not independent’.
Producer independence across borders
There are some cases where a production company is independent in one national market but not in another. An example of this is the producer of German police series Derrick, which in Germany is dependent on ZDF, but which, in any other market, is free of all control from national broadcasters. This is also the case with international production houses, such as Grundy/Fremantle (owned by broadcast group RTL, which also owns broadcasters in many European markets).

164
In the absence of specific indication in the TVWF/AVMS Directive regarding this point we decided to consider producers’ independence country-by-country, that is, that a producer can be ‘dependent’ in some markets but ‘independent’ in others. We did so because we felt this was more consistent with the ‘spirit’ of the Directive.
This methodology is not the same as the one used in the 2005 study whereby a producer was considered independent if it was not linked to a broadcaster in any European Member State (a ‘company-by-company’ approach). We however decided to compare the past results of our 2005 Study with our new results to identify the impact of this change of methodology. We believe it does not have an impact on the general trends we mean to analyse in this study215.
Coding ‘independent productions’
In order to obtain the required details on a programme to implement these criteria, we looked for many sources of information for each programme.
For most of the programmes, the qualifying process was quite simple: we studied the offer of every broadcaster, and of the different subsidiary companies they owned and classified all their programmes as ‘dependent’. We studied the catalogue of independent production companies (for this, we referred to information from the regulators, from the associations of independent producers or from the production companies directly) and classified their programmes as ‘independent’.
Final decisions on status required quite extensive enquiries in some cases. For example, French production company Link Production first appeared not to be independent because its owner was an anchor of the broadcaster M6, and because it produced many programmes for M6. But, searching further for information, we learnt this company was also producing programmes for other broadcasters including TF1 and France Télévisions, so we finally classified it as ‘independent’.
Another French example is that of the programme Toute Une Histoire on France 2. This programme is produced by an independent company named Reservoir Prod, historically one of the production companies created in the early 90s when France Télévisions decided to outsource a large share of its production. This production company is not more than 50% owned by a broadcaster and provides programmes to various channels. Reservoir Prod thus meets our criteria 1 and 3 and is considered an independent producer. However, the programme Toute Une Histoire is made within the production structure of France 2, raising a question as whether this production was truly independent. We solved the case by classifying the programme as independent because the AVMS Directive requires not that ‘programmes’ shall be independent, but ‘producers’, and also because the programme itself was launched in 2006, long after Reservoir Prod became independent.
In the case of a co-production (e.g. co-production between an independent production company and a broadcaster), we tried to detect 215 A note of the impact of this methodological choice can be found in Chapter 24 of this report.

165
who had the control of the production. By ‘control of the production’, we refer to the provision of the majority of funding for the production.
As it is very difficult to find the financial details on a co-production, the team had to take a consistent and practicable approach by searching for who held the editorial control of the production.
For this, we searched for details concerning this co-production on the internet, in articles, annual reports, production company websites, etc. We especially tried to find whether the programme was a ‘format’ owned by the independent production company, which would classify the co-production as controlled by the independent company. When we could not find any information via these public resources, we asked the broadcaster or the production company directly.
8.2.6. Adequate proportion of ‘Recent works’
Article 5 of the TVWF Directive also requires that an ‘adequate proportion’ of the transmission time devoted to European independent productions should be of recent works – that is, ‘works transmitted within five years of their production’. To evaluate this requirement we identified the date of production of each independent programme and recorded whether or not the programme was a recent work when broadcast.
8.2.7. Peak-time definition
In order to deepen the analysis, and considering that some European countries specify that requirements be met for peak-time hours, we were able to monitor differences between linear TV content during peak-time and the all-day schedule.
For the 2005 Study, peak-time was defined as 18:00-23:00. This rather broad definition of peak-time enables the use of a common definition for all Member States, even when local habits are different, with northern markets typically having their largest audiences at around 20:00 and southern markets having theirs at around 21:00. The definition is least appropriate for Spain, where viewing peaks at around 22:00. But, to remain consistent with the 2005 Study, we continue to define peak-time as 18:00-23:00.
8.2.8. Adding ‘viewing’ to ‘transmission’ hours
The Tender Specifications of this Study indicated that the Commission were also interested in audiences. ‘Transmission’ hours remain the measure for monitoring Articles 4 and 5, but ‘viewing’ measures have been added as an interesting complement. In the past, transmission hours

166
translated quite directly into viewing hours, as the majority of viewers only had a choice of a few channels. Today viewers have access to hundreds of TV channels when they subscribe to digital pay-TV services, and dozens when they access free, or nearly free, multichannel services. This development will advance even further as on-demand services offer access to thousands of titles from libraries. Thus ‘viewing’ is becoming less of a direct consequence of ‘transmission’, and therefore ‘viewing’ provides a more direct measure of whether works have actually been consumed by audiences.
Programmers’ choices therefore have a less direct impact on consumers’ viewing, and ‘viewing’, as an additional measure, adds value to the performance indicators.
Therefore we have doubled the number of performance indicators compared with the 2005 Study by applying to TV schedules the same performance indicators used for transmission hours (that is, share of qualifying works, share of European works, share of independent works etc.), to ‘viewing’ hours as well. 216
In the tables below for each performance indicator in each Member State, we have detailed the results for both transmission hours and viewer hours, for each channel in the sample. We have also provided a ‘Result for Member State Sample’ figure for transmission hours and viewer hours. It is important to note that this ‘Result for Member State Sample’ is not a simple average of the results for each channel, but a separate figure that has looked at all coded titles for the Member State as a whole. Thus the ‘Result for Member State Sample’ may be significantly different from what would be expected if one were simply to average the channel results, for the ‘Result for Member State Sample’ reflects the fact that channels contribute different proportions of the total qualifying hours (transmission and viewing hours) for a particular Member State. A simple average of the results at channel level would ignore this and present an inaccurate result for the Member State as a whole. For example: if a Member State had two channels, A (with 90 qualifying viewer hours, 80% of which were to European content) and B (with 10 qualifying viewer hours, 50% of which were to European content), a simple average of the ratios would lead to a result that 65% of qualifying viewer hours was devoted to European content. Our approach, taken by looking at all viewer hours for the Member State, would note 72 European viewer hours for channel A and 5 for channel B, giving a much more accurate result for the Member State as a whole, of 77%.217
216 Viewer Hours are a measure of the volume of viewing. A Viewer Hour is equivalent to one viewer watching an hour of a given channel/programme, or two viewers watching 30 minutes, or 60 viewers watching one minute each. If only 2 hours of a channel's daily schedule are dedicated to a certain genre it will only contribute 8.33% to that channels output in terms of hours, but if those two hours get four times the channel's average audience then it will account for 33.3% of the channel's Viewer Hours. 217 For the sake of clarity the process described here to reach our ‘Result for Member State Sample’ figures would give the same result as if we had prepared a weighted average of the results for each channel. This retrospective process (which works back from the channel data, rather than forwards from the individual programme-level data as we have done) would give each result for

167
8.3. EU-wide Analysis
8.3.1. Contents and objectives
This section is designed to offer both an overview of the findings of this study as far as linear services are concerned, and an introduction to the country-by-country analyses that follow. It is based primarily on our own estimates reached from our survey of 54 channels across 11 Member States218. Our objective was to compare situations between different groups or types of Member State and different types of broadcaster.
This section is also designed to compare the situations for various types of broadcasters from across our sample. We have grouped the 54 channels of our sample according to channel types (leadership, ownership, revenue model) and country types (size, geography, recency of EU membership and application of Directive). More explanations about this classification are provided in Section 8.3.2. For most of these categories, the channel sample is large enough to provide robust conclusions. When possible, we also look across criteria to assess the influences of country types on the situations of individual channels, whether or not final results are influenced, for example, by the size of the market they operate in.
This section is not designed to provide findings at EU30 level, but to present the results of our representative sample of 11 Member States. Nor is it designed to compare findings between individual Member States. Although data for each Member State is robust (as can be seen in the country-by-country analysis), there is some variety in the number and type of broadcasters covered. For example the number of broadcasters covered in each market varies from 2 to 6, meaning that average findings by market may not necessarily represent each Member State well enough to allow for satisfactory comparisons between Member States themselves. Moreover, it is important to note that few thematic channels have been included in our sample, as we wanted to cover the largest possible share of European TV viewing. As thematic channels, especially those specialised in fiction, build a large proportion of their schedules with imports, they usually show lower proportions of European works. As a consequence, including more thematic channels would certainly have lowered the average proportions of European transmission hours. However, the impact in terms of European viewer hours would be much less due to thematic channels achieving relatively limited audience ratings.
Analysing findings by individual types must always take into consideration which particular channels have been grouped in each particular type. We
each channel a factor equivalent to its share of audience or share of relevant transmission hours (depending on the performance indicator in question) in order to appropriately ‘weight’ it with respect to the other channels. Thus when calculating the average across the entire sample of channels for a particular Member State, the respective size of a channel’s audience or transmission hours would be taken into account. 218 Please note that this equates to 12 markets, as Belgium counts as two markets (the Flemish and French Communities of Belgium; see Section 8.4 for further explanations).

168
will always highlight such considerations when necessary in the course of this section.
8.3.2. Classification of Member States / broadcasters
Our classification of Members States is based on three criteria: geography, size and recency of EU membership.
• Geography: 7 Member States are located in the Northern part of Europe (Belgium, Estonia, Germany, Ireland, Poland, Sweden and the United Kingdom); 4 Member States are located in the Southern part of Europe (France, Italy, Romania and Spain;
• Size: this criteria takes into account the size of the population of each Member States; 6 are large-size Member States (France, Germany, Italy, Poland, Spain and the United Kingdom); 5 are small-size Member States (Belgium, Estonia, Ireland, Romania and Sweden);
• Recency of EU Membership: 8 Member States joined the EU before 2004 (Belgium, France, Germany, Italy, Ireland, Spain, Sweden and the United Kingdom) and thus are counted as ‘old’ Member States; 3 Member States have joined the EU after 2004 (Estonia, Poland and Romania) and thus are counted as ‘new’ Member States.
Our classification of Broadcasters is based on three criteria: ownership, leadership and revenue model.
• Ownership: this criteria is very straightforward as broadcasters are either privately owned (whether commercial broadcasters such as ITV, TELECINCO or TV3, or pay-TV broadcasters such as CANAL+ or SKY ONE) or publicly owned (BBC, RTE, TVP, RAI, etc.);
• Leadership: this criterion reflects the level of an individual broadcaster’s share of audience, relative to that of other broadcasters in the same market. Thus in this study, a ‘leader’ is a broadcaster with a high share of audience compared to other broadcasters in the same Member State. This does mean that there is no set level of audience share that a broadcaster must reach in order to be classified as a ‘leader’, as this will vary from territory to territory. Instead, each market has been looked at individually to assess which broadcasters are leaders and which are non-leaders in their particular market, by seeing where a significant gap appears between audience shares. Generally, between 2 and 4 broadcasters have been classified as leaders in each market; for example, our German sample consists of 4 leading broadcasters (RTL, SAT1, DAS ERSTE and ZDF), while our French sample consists of 2 leading channels (TF1 and FRANCE2). M6 and FRANCE3, although their audience share is close to that of German leading broadcasters, have been considered non-leading broadcasters due to the gap between them and the leading broadcasters in France. Also, markets where fewer broadcasters have been included in our sample will include only leaders as we decided together with the Commission, to favour broadcasters with a high share of audience in these territories in order to maximize

169
our representativeness of television viewership; for example, the samples for Flemish and French Communities of Belgium consist only of leading broadcasters (respectively VTM/VRT, and LA UNE/RTL-TVI);
• Revenue model: this criterion indicates the primary source of revenue of the broadcasters included in our sample. ‘Advertising’ is the primary source of revenue for all commercial private channels whether leading or not (ANTENA3, TVN, KANAL5, FIVE, DIRECT8, etc.); ‘Subscription’ is the primary source of pay-TV channels, although some may complement this source with some advertising (CANAL+, FOX LIFE, etc.); lastly, all public channels have been grouped as ‘Government’, although it is worth noting that most of them actually rely on a mix of both public funding and advertising (FRANCE2/3, RAI1/2, TVP, etc.), even though some of them collect only a limited amount of advertising revenue (DAS ERSTE, ZDF, etc.), or no advertising revenue at all (BBC)219.
8.3.3. Qualifying hours
Across our sample, qualifying programmes make up 68.3% of the total transmission hours and 65% of the total viewer hours on all channels studied in 2007 (see Table 19). These proportions are very similar across channel and country types, so we can say with confidence that, as a general rule, the requirements of Articles 4 and 5 of the Directive cover approximately two thirds of all hours either transmitted over television channels or watched by television viewers.
219 Later in this report, advertising funded channels are generally referred to as “privately funded channels” while public channels, whether relying solely on public revenue or complementing that with advertising revenues as well, are generally referred to as “publicly funded channels”.

170
Table 19: Ratio of Qualifying Hours to Total Transmission and Viewer Hours, 2007
Ratio of
Qualifying to
Total
Transmission
Hours (%)
Ratio of
Qualifying to
Total Viewer
Hours (%)
No 74.9% 70.7%
Yes 62.6% 63.0%
Private 68.6% 66.9%
Public 67.6% 62.6%
Ad 66.9% 66.6%
Gvt 67.6% 62.6%
Subs 81.8% 81.2%
North 68.3% 67.2%
South 68.2% 62.8%
New 66.6% 57.4%
Old 68.8% 66.6%
Large 69.0% 65.5%
Small 66.8% 59.3%
68.3% 65.0%
Grouping of Sample by:
Revenue
Model
Channel
Type
Result for Member State Sample
Geography
Recency
Size
Country
Type
Leader?
Ownership
A few differences are worth pointing out at this stage:
• Qualifying programmes are less prominent on the television schedules of leaders (62.6%) compared with non-leaders (74.9%), but differences are smaller when looking at the proportion of viewer hours (respectively 63% and 70.7%);
• Qualifying programmes are more prominent on the television schedules of subscription channels (81.8%) compared with both public (67.6%) and commercial channels (66.9%);
• Qualifying programmes are relatively less successful with the audiences of public channels (62.6% of total viewer hours vs. 67.6% of total transmission hours) compared with private channels (66.9% vs. 68.6%);
• Qualifying programmes are relatively less successful with the audiences of channels from southern Member States (62.8% of total viewer hours vs. 68.2% of total transmission hours) compared to channels from northern Member States (67.2% vs. 68.3%);
• Qualifying programmes are relatively less successful with the audiences of channels from new Member States (57.4% of total viewer hours vs. 66.6% of total transmission hours) compared to channels from old Member States (66.6% vs. 68.8%);

171
• Qualifying programmes are relatively less successful with the audiences of channels from small Member States (59.3% of total viewer hours vs. 66.8% of total transmission hours) compared to channels from large Member States (65.5% vs. 69%);
8.3.4. European works
Across our sample, European works made up 62.4% of the total qualifying transmission hours in 2007.220 Most European broadcasters met the 50% requirement of Article 4. European works also make up an average of 74% of the total viewer hours across all studied channels in 2007, which indicates the strong appeal of European works to European audiences, and the broadcasters’ reliance on European content to build their ratings. The figures are even higher when looking at peak-time only: 62.8% of the total qualifying transmission hours and 75.5% of the total viewer hours.
Table 20: Ratio of European qualifying to total qualifying hours, 2007
Ratio of
Qualifying
European to
Total Qualifying
Hours (%)
Ratio of
Qualifying
European to
Total Qualifying
Viewer Hours
(%)
Ratio of
Qualifying
European to
Total Qualifying
Hours (%)
Ratio of
Qualifying
European to
Total Qualifying
Viewer Hours
(%)
No 52.5% 59.7% No 49.7% 59.5%
Yes 72.6% 79.6% Yes 76.6% 81.9%
Private 54.1% 66.4% Private 55.0% 69.0%
Public 78.0% 84.5% Public 78.6% 84.9%
Ad 57.5% 66.7% Ad 59.6% 69.4%
Gvt 78.0% 84.5% Gvt 78.6% 84.9%
Subs 32.7% 53.5% Subs 27.2% 50.9%
North 60.9% 77.8% North 63.1% 78.1%
South 64.6% 70.2% South 62.5% 72.5%
New 56.2% 66.1% New 55.4% 63.7%
Old 64.4% 75.5% Old 64.9% 77.6%
Large 66.9% 74.6% Large 63.7% 75.8%
Small 53.0% 67.4% Small 61.1% 72.6%
62.4% 74.0% 62.8% 75.5%
Recency
Size
Result for Member State SampleResult for Member State Sample
GeographyGeography
Grouping of Sample by: Grouping of Sample by:
Channel
Type
Leader?
Ownership
Revenue
Model
Country
Type
Country
TypeRecency
Size
All Day Peak Time
Channel
Type
Leader?
Ownership
Revenue
Model
Note on channels below the 50% requirement
Our sample estimates show that 13 European channels stand, either slightly or significantly, below the 50% requirement (see Table 21): PRO TV and PRIMA TV in Romania, FOX LIFE and ITALIA1 in Italy, TV3 and KANAL5 in Sweden, FIVE and SKYONE in the UK, KANAL2 and TV3 in Estonia, CANAL+ in Poland, RTL-TVI in the French Community of Belgium and RTE2 in Ireland.
220 Comments from stakeholders received after the workshop referenced data in the European Audiovisual Observatory’s Yearbook, which identifies country-of-origin of Fiction programming and found that 32% of Fiction broadcast was of European origin. However, the consultants note that the approach here appears significantly different to the methodology for this study. The EAO study has looked at total hours of fiction content over a year (2006) across a larger sample of channels than this study. This study has instead looked at entire qualifying schedules (thus containing the full variety of genres) for a smaller sample of channels for two non-consecutive weeks in 2007.

172
Table 21: Channels standing below the 50% European works requirement221
Country Channel 1993 1996 1999 2002 2006/2007
Reported 44.6% 43.7% 49.1% 41.5% 54.6%Sample estimate 25.2% 48.0% 35.7% 37.5% 42.2%Reported N/A N/A N/A N/A 51.0%Sample estimate N/A N/A N/A N/A 35.3%Reported N/A N/A N/A N/A 51.0%Sample estimate N/A N/A N/A N/A 39.3%
Reported 68.0% 88.0% 57.0% 38.0% 43.0%
Sample estimate 54.9% 45.3% 49.0% 36.3% 43.3%
Reported N/A N/A N/A N/A 37.5%Sample estimate N/A N/A N/A N/A 16.3%
Reported 37.6% 38.8% 41.3% 45.3% 37.5%
Sample estimate N/A 31.3% 40.2% 43.6% 21.8%Reported N/A N/A N/A N/A 48.5%Sample estimate N/A N/A N/A N/A 29.0%Reported N/A N/A N/A N/A 53.8%Sample estimate N/A N/A N/A N/A 47.9%Reported N/A N/A N/A N/A 36.8%Sample estimate N/A N/A N/A N/A 43.0%Reported N/A N/A N/A 16.0% 18.0%Sample estimate 11.3% 23.4% 17.8% 24.4% 22.1%Reported N/A N/A N/A N/A 21.0%
Sample estimate 27.2% 33.3% 18.1% 21.3% 12.1%Reported 13.0% 38.0% 46.0% 21.0% 27.0%Sample estimate 6.5% 31.6% 37.9% 18.7% 22.0%Reported N/A N/A N/A N/A 58.0%Sample estimate N/A N/A N/A N/A 47.5%
UK Sky One
IT Italia 1
UK Five
RO Prima TV
RO Pro TV
SE TV 3
EE Kanal 2
EE TV 3
SE Kanal 5
BE RTL-TVI
IE RTE 2
IT Fox Life
PL Canal +
Four of these channels reported proportions above the 50% requirement in 2006, the latest year available, with which we compared our 2007 estimates: these are KANAL2 and TV3 in Estonia, PRIMA TV in Romania and FIVE in the UK. Since the definition of European programmes is quite straightforward, it is likely that our estimates fall below reported data because our two-week sample misrepresents these channels’ yearly schedules. In most of these cases, proportions are close to 50% anyway.
For the 9 remaining channels, although there are sometimes significant differences between our 2007 estimates and the 2006 reported data222, both our estimates and the declarations confirm that the 50%
221 Our sample data for 2007 has been compared to the 2006 reported data from the Eighth Communication, which is the most up-to-date reported data available to the consultants. Please note, as detailed before, some of these channels are not subject to legislation from the Member State in which they find their viewing. For example, Kanal 5 and TV3 are subject to regulation from UK and are therefore not the responsibility of the Swedish regulators. 222 2006 data for RTL-TVI have not been reported by Belgium, following the decision by TVI s.a. not to apply for a licence from the Government of Belgium’s French Community when it expired on 31 December 2005. RTL-TVI’s 2006 declared data have therefore been extracted from the Luxembourgian declarations.
173
requirement is not met by the following channels from our sample: RTL-TVI in the French Community of Belgium, RTE2 in Ireland, FOX LIFE and ITALIA1 in Italy, CANAL+ in Poland, PRO TV in Romania, KANAL5 and TV3 in Sweden, SKY ONE in the UK. The following conclusions can be derived from this finding:
• Channels below the 50% requirement can belong to any type of channel (private and public) and any country type (large or small, old or new, north or south);
• Subscription channels have a higher chance of falling below the 50% requirement (FOX LIFE, CANAL+, SKY ONE);
• Channels broadcasting from another Member State have a higher chance of falling below the 50% requirement (e.g. KANAL5).
Main conclusions on European works
The following conclusions can be derived from the findings of Table 20:
• Leading channels show, on average, higher proportions of European qualifying hours than smaller broadcasters (72.6% vs. 52.5%), a gap that widens even further in peak-time (76.6% vs. 49.7%). This is probably explained by the fact that leading channels tend to favour European programmes as the best way to attract audiences, and have the financial means to pursue such a policy, while non-leading broadcasters lack the resources to compete directly with leaders on such productions, and thus turn to non-European acquisitions to increase profitability. There are some exceptions to this: for example non-leading public channels from large Member States offer high proportions of European work like FRANCE3 (75.9%), RAI2 (82.5%) and BBC2 (85.2%), while a recent private channel like DIRECT8, based on flow entertainment and fiction classics, also shows a very high proportion (92.3%).
• Public channels offer, on average, higher proportions of European qualifying hours (78%) than private channels (54.1%), both during all-day and specifically during peak-time. Their “public service” status makes them natural flagships for the promotion of national culture and the protection of audiovisual heritage, and more open to European works in general. Again there are some exceptions to this general rule: private broadcasters that are in general in a leading position, such as TVN (80.5%), CANALE5 (81.8%), SAT1 (82.5%), TELE5 (83.2%), RTL (83.7%) and ITV1 (85,1%) show a strong appetite for European works. However, some public channels offer lower exposure of European works, such as RTE2 (43.3%), RTE1 (60.9%), LA2 (67.7%) or TVP1 (67.2%).
• Subscription channels typically feature fewer European works in their schedule (32.7% of the total qualifying transmission hours) than privately funded channels (57.5%) or publicly funded channels (78%). They often rely heavily on new American series and movies to build attractive offerings. CANAL+ of France is an exception,

174
though: its strong ties with French movie producers (due to legal obligations of investment in this sector) foster the presence of domestic works in its schedule, leading to a proportion of 61.2%. Also worth noting is that European works are somewhat more attractive to audiences on subscription channels: when expressed in viewer hours instead of transmission hours, the proportion reaches 53.5% across the subscription channels of our sample.
• Channels from Southern, old and large European countries show average proportions of around 65% European works, whereas channels from Northern, new and small European countries show proportions between 53% and 61%. Proportions rise when expressed in viewer hours, especially for channels from Northern countries (60.9% of total qualifying hours to 77.8% of total qualifying viewer hours) while channels from Southern countries rise from 64.6% to 70.2%.
8.3.5. Non-domestic European works
Across our sample, non-domestic European works make up 8.2% of the total qualifying transmission hours in 2007, compared to 4.3% of total qualifying viewer hours. Proportions are lower when looking specifically at peak-time: 7% of the total qualifying transmission hours and 2.9% of the total viewer hours (see Table 22).
Table 22: Ratio of non-domestic qualifying European to total qualifying hours, 2007
Ratio of Non-
Domestic
Qualifying
European to
Total Qualifying
Hours (%)
Ratio of Non-
Domestic
Qualifying
European to
Total Qualifying
Viewer Hours
(%)
Ratio of Non-
Domestic
Qualifying
European to
Total Qualifying
Hours (%)
Ratio of Non-
Domestic
Qualifying
European to
Total Qualifying
Viewer Hours
(%)
No 7.1% 4.4% No 6.8% 3.0%
Yes 9.3% 4.3% Yes 7.1% 2.9%
Private 6.9% 3.6% Private 6.5% 2.7%
Public 10.7% 5.3% Public 7.8% 3.3%
Ad 6.8% 3.6% Ad 6.2% 2.6%
Gvt 10.7% 5.3% Gvt 7.8% 3.3%
Subs 7.0% 5.7% Subs 8.6% 6.2%
North 9.4% 4.1% North 9.3% 3.9%
South 6.5% 4.5% South 3.3% 1.7%
New 11.1% 6.9% New 9.4% 5.6%
Old 7.3% 3.8% Old 6.3% 2.4%
Large 5.1% 4.0% Large 3.7% 2.4%
Small 14.7% 9.1% Small 13.5% 8.3%
8.2% 4.3% 7.0% 2.9%Result for Member State Sample Result for Member State Sample
Geography Geography
Recency Recency
Channel
Type
Leader?
Channel
Type
Leader?
Ownership Ownership
Country
Type
Country
Type
Revenue
Model
Revenue
Model
All Day Peak Time
Size Size
Grouping of Sample by: Grouping of Sample by:
The following conclusions can be derived from the findings of Table 22:
• Leading channels show, on average, higher proportions of non-domestic European qualifying hours than non-leading broadcasters (9.3% vs. 7.1%), a gap that is reduced for peak-time (7.1% vs. 6.8%) and is reversed when looking at viewer hours both across all-day (4.3% vs. 4.4%) and specifically during peak-time (2.9% vs. 3%).

175
• Public channels offer, on average, higher proportions of non-domestic European qualifying hours than private channels (10.7% vs. 6.9%), a gap that is reduced in peak-time (7.8% vs. 6.5%) and reflected by the proportions for viewer hours both across all-day (5.3% vs. 3.6%) and in peak-time (3.3% vs. 2.7%).
• Subscription channels show, on average, the highest proportion of non-domestic European qualifying hours in peak-time (8.6% vs. 7.8% for publicly funded channels and 6.2% for privately funded channels). Interestingly, that strategy is paying off when we look at proportions in viewer hours (6.2% vs. 3.3% for publicly funded channels and 2.6% for privately funded channels).
• Channels from Southern, old and large European countries show average proportions between 5.1% and 7.3% non-domestic European works, whereas channels from Northern, new and small European countries show proportions between 9.4% and 14.7%. Proportions expressed in viewer hours reflect this bias except for the geography criterion, where channels from Northern countries achieve lower proportions than those from Southern countries (4.1% of total qualifying viewer hours vs. 4.5%).
8.3.6. Independent European works223
Across our sample, independent European works make up 31% of the total qualifying transmission hours in 2007, compared to 33.4% of total qualifying viewer hours. Proportions are higher when looking specifically at peak-time: 34.6% of the total qualifying transmission hours and 36.9% of the total viewer hours (see Table 23).
223 It is important to note that the proportions of independent productions have been re-calculated for Italy and Spain following the debates at the public Workshop held in Brussels on November 18. Indeed, in the draft report presented then, Endemol productions had been considered non-independent for the second half of 2007, based on inaccurate information gathered by the consultants that Mediaset owned 50% of the holding company controlling the Endemol group. Further research made clear that as Mediaset owns 33% of that holding company (together with Goldman Sachs and John de Mol owning another 33% each), Endemol cannot be considered to be controlled by Mediaset, according to our criteria as described in the methodological section of this report. It is also worth noting that during preparation of the Final Study Report, all coding was re-checked and a very small number of French programmes were re-coded in the ‘independent works’ criteria as they had been coded incorrectly during previous work on the study. Following these re-calculations, average proportions of independent works for our sample have increased by up to 0.9 percentage points across the Member States sample.

176
Table 23: Ratio of independent European to total qualifying hours, 2007
Ratio of
Qualifying
Independent
European to
Total Qualifying
Hours (%)
Ratio of
Qualifying
Independent
European to
Total Qualifying
Viewer Hours
(%)
Ratio of
Qualifying
Independent
European to
Total Qualifying
Hours (%)
Ratio of
Qualifying
Independent
European to
Total Qualifying
Viewer Hours
(%)
No 31,2% 33,7% No 31,4% 36,4%
Yes 30,8% 33,3% Yes 37,8% 37,1%
Private 31,9% 34,2% Private 34,9% 36,9%
Public 29,3% 32,2% Public 33,8% 36,9%
Ad 33,5% 34,7% Ad 38,2% 37,7%
Gvt 29,3% 32,2% Gvt 33,8% 36,9%
Subs 21,2% 11,6% Subs 15,4% 7,9%
North 32,1% 33,2% North 34,6% 33,4%
South 29,4% 33,6% South 34,5% 41,1%
New 26,7% 23,0% New 29,0% 25,1%
Old 32,3% 35,4% Old 36,2% 38,9%
Large 32,4% 33,5% Large 34,2% 36,5%
Small 28,0% 32,6% Small 35,3% 40,8%
31,0% 33,4% 34,6% 36,9%
Geography Geography
Recency Recency
Channel
Type
Leader?
Ownership Ownership
Result for Member States Sample Result for Member States Sample
Revenue
Model
Revenue
Model
All Day Peak Time
Size Size
Grouping of Sample by: Grouping of Sample by:
Channel
Type
Leader?
Note on channels below the 10% requirement
Only two channels from our sample fall below the requirement of 10%: TV3 in Sweden (4.7%) and TVN in Poland (5.6%). It is worth noting that these two channels are above the 10% requirement according to national definitions224 if we look at the reported data for 2006, according to which TV3 is at 12% and TVN at 22.3%. However, our sample estimates show, as a general rule, that European broadcasters are significantly above the 10% requirement of Article 5 of the Directive.
Main conclusions on independent European works
The following conclusions can be derived from the findings of Table 23:
• Differences between channel types are rather small across all-day. We observe that there are more independent productions on non-leading channels (31.2% non-leading vs. 30.8% leading), private channels (31.9% private vs. 29.3% public) from Northern (32.1% North vs. 29.4% South), old (32.3% old vs. 26.7% new) and large Member States (32.4% large vs. 28% small).
• Proportions in viewer hours reflect those for transmission hours, typically with a few more percentage points, except that independent productions are less successful in new Member States (23% of total qualifying viewer hours vs. 26.7% of total transmission hours) than in old Member States (35.4% of total qualifying viewer hours vs. 32.3% of total transmission hours). We can also see that independent productions are more successful in
224 Discrepancies between our sample estimates and reported data can be explained by the broader national definitions of independent works used in Poland and Sweden compared to the definition we applied to our pan-European study. For example, Poland applies a ‘company-by-company’ definition of ‘independent works’, which means a producer has to be independent from a specific broadcaster. This definition is broader than our definition which sets that ‘independent works’ have to be independent from any broadcasters in a given country (see Legal section of this study).

177
Southern Member States (33.6%) than in Northern Member States (33.2%) whereas it was the opposite in terms of transmission hours.
• Subscription channels show a somewhat different situation than other channels in our sample: their qualifying schedules are made of 21.2% of independent productions vs. 31% for the entire sample, representing 11.6% of total qualifying viewer hours (vs. 33.4% for the entire sample).
• There are important differences when we look specifically at the peak-time situation. Leading channels offer significantly more independent productions (37.8% vs. 30.8% across all-day), as well as public channels (34.5% vs. 29.3% across all-day) and channels from Southern (32.2% vs. 29.4% across all-day), small (35.3% vs. 28% across all-day) and old Member States (36.2% vs. 32.3% across all-day).
8.3.7. Recent independent European works
Across our sample, recent independent European works make up an average of 84.4% of the total independent European hours in 2007, compared to 91.7% of total independent viewer hours. Proportions are higher in peak-time: 92.4% of the total independent transmission hours and 95.5% of the total independent viewer hours (see Table 24).
Table 24: Ratio of recent independent European to total independent European, 2007
Ratio of Recent
Qualifying
Independent
European to
Total Qualifying
Independent
European
Hours(%)
Ratio of Recent
Qualifying
Independent
European to
Total Qualifying
Independent
European Viewer
Hours(%)
Ratio of Recent
Qualifying
Independent
European to
Total Qualifying
Independent
European
Hours(%)
Ratio of Recent
Qualifying
Independent
European to
Total Qualifying
Independent
European Viewer
Hours(%)
No 85,4% 92,3% No 90,7% 96,6%
Yes 83,4% 91,4% Yes 94,0% 95,0%
Private 86,7% 93,1% Private 91,7% 95,5%
Public 79,6% 89,5% Public 94,1% 95,5%
Ad 86,9% 93,1% Ad 91,7% 95,5%
Gvt 79,6% 89,5% Gvt 94,1% 95,5%
Subs 84,8% 96,1% Subs 91,4% 99,3%
North 87,0% 92,9% North 93,3% 95,5%
South 80,2% 90,4% South 91,1% 95,5%
New 78,5% 83,4% New 86,5% 88,1%
Old 86,0% 92,7% Old 93,8% 96,3%
Large 85,5% 91,9% Large 93,3% 95,8%
Small 82,0% 88,8% Small 90,7% 92,7%
84,4% 91,7% 92,4% 95,5%
Geography Geography
Recency Recency
Channel
Type
Leader?
Ownership Ownership
Result for Member States Sample Result for Member States Sample
Revenue
Model
Revenue
Model
All Day Peak Time
Size Size
Grouping of Sample by: Grouping of Sample by:
Channel
Type
Leader?
The following conclusions can be derived from the findings of Table 24:
• Non-leading channels show more recent independent productions than leading channels during all-day (85.4% vs. 83.4%) but fewer of them in peak-time (90.7% vs. 94%).

178
• Private channels show more recent independent productions than public channels during all-day (86.7% vs. 79.6%) but fewer of them in peak-time (91.7% vs. 94.1%).
• Subscription channels show a similar picture to Advertising Funded and Government funded channels, although proportions are based on a much lower proportion of their schedules (84.8% vs. 79.6% for Subscription vs Government funded channels and 86.9% for Advertising funded channels).
• Proportions of recent independent productions are higher on channels from Northern (87% vs. 80.2% South), old (86% vs. 78.5% new) and large Member States (85.5% vs. 82% small).
8.3.8. Stock vs flow programmes
Across our sample, qualifying European stock makes up 45.9% of the total qualifying transmission hours in 2007, compared to 50.4% of total qualifying viewer hours. Proportions are higher when looking specifically at peak-time viewing: 49.1% of the total qualifying peak-time transmission hours and 54.9% of the total qualifying peak-time viewer hours (see Table 25).
Table 25: Ratio of European stock/flow to total European hours, 2007
Qualifying
European Stock
to Total
Qualifying
European Hours
(%)
Qualifying
European Flow
to Total
Qualifying
European Hours
(%)
Total
(%)
Qualifying
European Stock
to Total
Qualifying
European Hours
(%)
Qualifying
European Flow
to Total
Qualifying
European Hours
(%)
Total
(%)
No 48.1% 51.9% 100% No 50.2% 49.8% 100%
Yes 44.2% 55.8% 100% Yes 48.4% 51.6% 100%
Private 43.7% 56.3% 100% Private 47.6% 52.4% 100%
Public 48.7% 51.3% 100% Public 51.2% 48.8% 100%
Ad 41.2% 58.8% 100% Ad 47.1% 52.9% 100%
Gvt 48.7% 51.3% 100% Gvt 51.2% 48.8% 100%
Subs 71.7% 28.3% 100% Subs 54.9% 45.1% 100%
North 50.7% 49.3% 100% North 53.3% 46.7% 100%
South 39.3% 60.7% 100% South 42.5% 57.5% 100%
New 47.8% 52.2% 100% New 48.5% 51.5% 100%
Old 45.4% 54.6% 100% Old 49.3% 50.7% 100%
Large 47.4% 52.6% 100% Large 51.2% 48.8% 100%
Small 41.8% 58.2% 100% Small 44.7% 55.3% 100%
45.9% 54.1% 100% 49.1% 50.9% 100%
Qualifying
European Stock
to Total
Qualifying
European Viewer
Hours (%)
Qualifying
European Flow
to Total
Qualifying
European Viewer
Hours (%)
Total
(%)
Qualifying
European Stock
to Total
Qualifying
European Viewer
Hours (%)
Qualifying
European Flow
to Total
Qualifying
European Viewer
Hours (%)
Total
(%)
No 51.1% 48.9% 100% No 54.7% 45.3% 100%
Yes 50.2% 49.8% 100% Yes 55.0% 45.0% 100%
Private 47.2% 52.8% 100% Private 51.6% 48.4% 100%
Public 53.8% 46.2% 100% Public 58.9% 41.1% 100%
Ad 47.5% 52.5% 100% Ad 52.1% 47.9% 100%
Gvt 53.8% 46.2% 100% Gvt 58.9% 41.1% 100%
Subs 29.4% 70.6% 100% Subs 25.5% 74.5% 100%
North 59.4% 40.6% 100% North 61.9% 38.1% 100%
South 40.3% 59.7% 100% South 46.1% 53.9% 100%
New 58.6% 41.4% 100% New 59.1% 40.9% 100%
Old 49.0% 51.0% 100% Old 54.3% 45.7% 100%
Large 51.4% 48.6% 100% Large 56.4% 43.6% 100%
Small 36.2% 63.8% 100% Small 38.7% 61.3% 100%
50.4% 49.6% 100% 54.9% 45.1% 100%
Leader?
Ownership Ownership
Result for Member State Sample Result for Member State Sample
Geography Geography
Recency Recency
Revenue
Model
Result for Member State Sample Result for Member State Sample
Peak Time
Size Size
Grouping of Sample by: Grouping of Sample by:
Channel
Type
Leader?
Revenue
Model
Geography Geography
Recency Recency
Size Size
All Day
All Day
Grouping of Sample by:
Ownership
Revenue
Model
Grouping of Sample by:
Peak Time
Channel
Type
Leader?
Ownership
Country
Type
Country
Type
Country
Type
Country
Type
Channel
Type
Leader?
Revenue
Model
Channel
Type
The following conclusions can be derived from the findings of Table 25:

179
• Non-leading channels show more European stock programming than leading channels during all-day (48.1% vs. 44.2%) and in peak-time (50.2% vs. 48.4%), but stock programming is relatively less successful on non-leading channels (51.1% of total qualifying viewer hours for non-leaders vs. 50.2% for leaders, when looking at the schedules for the entire day, and 54.7% for non-leaders vs. 55% for leaders, when looking specifically at peak-time).
• Public channels show more European stock programming than private channels during all-day (48.7% vs. 43.7%) and in peak-time (51.2% vs. 47.6%), a strategy that is successful with audiences (53.8% of total qualifying viewer hours for public channels vs. 47.2% for private channels across the all-day schedule, 58.9% vs. 51.6% in peak-time)
• Subscription channels show significantly more European stock programming than publicly funded and privately funded channels during all-day (71.7% vs. 48.7% and 41.2% respectively), although all types of channels show a similar picture in peak-time (54.9%, 51.2% and 47.1% respectively). Proportions are completely reversed when we look at viewer hours, where European stock programming attracts 29.4% of total qualifying European viewer hours to subscription channels during all-day and 25.5% in peak-time.
• Proportions of European stock programming are higher on channels from Northern (59.4% vs. 40.3% South), new (58.6% vs. 49% old) and large Member States (51.4% vs. 36.2% small).
8.3.9. Analysis of specific regulatory situations
In this section, we look at whether the specificities of the implementation of Articles 4 and 5 of the Directive at national level, as analysed in the regulatory Section of this report, have any significant influence on the proportions of European and independent European works broadcast by the channels from our sample. In order to do so, we have used the classifications described in Sections 5.1.3 and 5.1.4 of the report in terms of being flexible or prescriptive, looked at the relative proportions of the channels from our sample belonging to each category of Member State and analysed whether differences, if any, could be explained by the specific regulatory situations, in addition to the other distinguishing factors of the Member States (size, geography, recency of EU membership), or of the broadcasters in each Member State sample (leadership, ownership, revenue model).
Impact of the “where practicable” clause
Table 26 is based upon the legal work in this report (Sections 4 and 5 of this study), except that we have kept only those Member States that are

180
part of our sample of 11 Member States. It indicates whether Member States have included in their regulations clauses that provide broadcasters with some flexibility, often through including the statement “Where Practicable” in the legislation.
Table 26: “Where practicable” and similar flexible measures
No flexibility Semi-flexible Fully flexible
Belgium (French) Ireland Belgium (Flemish)
Estonia Italy Sweden France Poland Germany Romania
United Kingdom Spain Source: Member State regulatory authorities
We first looked at whether the channels enjoying the most flexible regulation (Flemish Community of Belgium and Sweden) showed lower proportions of European and/or independent works. Findings were, however, inconclusive. Indeed, several channels operating in these markets were among the channels showing the highest proportion of European works, notably EEN, SVT and even, though to a lesser extent, VTM. Also, we found that two Swedish channels (TV3 and KANAL5) were among the channels showing the lowest proportions of European works across our sample. But these channels are not regulated in Sweden, but in the UK, where regulation has been classified as “not flexible”. Findings were similar when we looked at their proportions of independent works.
We then did the reverse analysis, this time looking at the channels operating in the markets where regulation has been classified as “not flexible” (French Community of Belgium, Estonia, France, Germany and the UK). This time, a large number of channels ranked among those with the highest proportion of both European and independent works. But these channels are also operating in larger markets, which we think could be a more influential factor than the lack of flexibility in their regulation: Spanish channels, which belong to a market with a “semi-flexible” regulation but in a large country, also rank high in the list, for example. This is supported by the fact that channels from the smaller “not flexible” markets (French Community of Belgium and Estonia) tend to rank lower. Still, one should note that Italian channels, although belonging to a large market, generally score rather low, too.
Impact of higher requirements
As noted in the legal section of this report, three markets set higher requirements in their national regulation compared to the Directive: these were France, Italy and the United Kingdom. We looked at whether the channels operating in these markets were showing higher proportions of

181
European and independent works compared to channels operating in the other markets from our sample.225
While this is the case for French and British channels, this was not the case for Italian channels, as we have noted earlier. As this analysis can only be based on 3 markets with very specific strategic and cultural backgrounds, and as not all of them show higher proportions of European and independent works, conclusions on eventual impact of higher regulatory requirements are difficult to draw.
Impact of definition of independent producer
Table 27 is based upon Table 4 in the legal section of this report, except that we have kept only those Member States that are part of our 11 Member States sample. It indicates whether Member States have a strict or flexible definition of ‘independent producer’, or whether they have no definition at all.
Table 27: Member State approaches to defining ‘independent producer’
No definition Flexible definition
Strict definition
Belgium (Flemish)
Estonia Belgium (French)
Germany Spain France Sweden Ireland Italy Poland Romania United Kingdom
Source: Member State regulatory authorities
We thought a strict definition of an independent producer could possibly influence channels into increasing their proportion of independent works, as they commission productions from producers that are independent according to their national regulation, compared with Member States where there is only a loose or no definition of ‘independent producer’. But in reality, there does not seem to be a clear distinction between the different situations. We have already noted that French and British channels offer high proportions of independent works, but that Italian channels do not. The case of Belgium is also interesting: LA UNE shows a high proportion but it is a public channel and a leading channel too, while RTL-TVI shows a low proportion. Then, while Ireland shows a high proportion of independent works, this is not the case for most channels operating in Poland, and especially not Romania. Important to note, these last two markets are new Member States, where independent production
225 All other markets from the sample fit into the group with ‘basic requirements’ (as opposed to ‘higher requirements’). This group contains a wide variety of markets, unlike the group for ‘higher requirements’. This has meant that conclusions cannot be drawn from this ‘basic requirements’ group, and instead we look to the more specific ‘higher requirements’ group.

182
is typically less developed than in older Member States, where the television environment is more competitive and mature.
In conclusion, we estimate that specific regulatory provisions designed to foster the promotion of European or independent works taken at Member State level do not provide a clear influencing factor on the proportion of such works, as far as we could estimate from the results from our sample. Of course, Articles 4 and 5 are only one part of the regulatory framework of each Member State, and how regulation can impact the realities of the programme market should certainly take into account other elements such as, for example, the mechanisms in place to support production or the policy of public broadcasters in terms of developing internal or external production.
8.3.10. A note on the impact of operating within larger
markets
In general, channels in markets with larger populations have relatively more revenue to finance local production than their counterparts in smaller markets because they have more viewers, which mechanically translates into more advertising, subscription or revenue from public sources such license fees. This is especially true of the genres that are expensive to produce, like fiction programming. Leading channels also benefit from an increased impact inside each market. Not withstanding differences such as GDP, average time spent watching television or audience profile, which also influences advertising revenue, TF1, with 30% audience share in a market of 60 million viewers, has 40 times more revenue to finance production than RTE2, a channel with 10% audience share in a market of 4 million viewers. So, TF1 enjoys the revenue necessary to produce French productions that are able to better compete against American shows, while RTE2 can only attempt that with a limited number of flagship productions, or concentrate on less expensive flow programming. Strategic factors influencing the proportion of independent works are also linked to the size of market. Indeed, you need a large market to have enough production opportunities and volume of production for independent producers to emerge and survive. Historically, channels produced most content in-house. The independent production sector needed years to emerge. Recent EU Member States have fewer independent productions, because these are less mature markets and their independent production sector simply needs more time to develop. If we rank the channels according to their proportions of both European and independent production and take into account the type of country in which channels operate, the overall conclusions are:
• Larger markets like France, Germany, Spain and the UK, rank higher than Ireland, Estonia, Romania or Sweden;
• Although being large markets, Poland and Italy rank relatively low, which we explain by the fact that Poland is a relatively poorer market and Italy is a relatively less competitive market;

183
• Although being small markets, the Flemish Community of Belgium ranks high on both criteria, which we explain by the fact that this market is very dynamic economically and culturally, with independent producers developing many formats which then travel internationally;
• Inside each market, typically, a channel in a leading position will have a higher rank: in the UK for example, Five ranks low, while ITV ranks high.
The situations for individual channels can of course differ from this general rule. For example, DIRECT8 shows the highest proportion of European works in spite of being a very small channel, which is due to their stance on entertainment programming, a genre that is typically cheaper to produce than, for example, fiction programming. Also, SVT shows among the highest proportion of European works although being in a small market, which is explained by their leading position and public service culture. RAI1 (Italy) and TVN (Poland) rank among the lowest for independent productions although they operate in markets where independent production is well developed.

184
8.4. Summary of Outputs by Member
State
8.4.1. Flemish Community of Belgium226
Belgium has been analysed as two separated markets: The Flemish Community of Belgium and the French Community of Belgium. Indeed, the audiovisual landscape of Belgium shows two different communities, with their own language and audience, which are not in competition and, as a consequence, can not be gathered in a single market analysis.
Data summary Our sample consists of the largest public service channel EEN and the leading private commercial channel VTM. Together (see Table 28) they account for 61.2% of total TV viewing in the Flemish Community of Belgium.
Table 28: List of channels covered in the 2007 Flemish Community of Belgium sample227
Country ChannelLaunch
Year
Share of Viewing (2005)
Revenue Model PlatformAverage Daily Transmission
Hours
Sample Weeks
Belgium (Flemish) EEN (ex TV1) 1953 37.60% Gvt/Spon Nat. Terr./C/S 24
Belgium (Flemish) VTM 1989 23.60% Ad Cab/Sat 24
12-18 March (non-standard week) November week is
standard.
Genre analysis VTM base their offering of qualifying programmes (cinema, documentary, entertainment, factual magazines and TV fiction) largely with TV fiction (59.9% of total qualifying hours228) followed by entertainment (17.9%). In peak-time, entertainment becomes more important (32.8%), but fiction remains the central component of the schedule (46.4%). EEN shows a more balanced mix of qualifying genres with entertainment at the top 226 Belgium has been analysed as two markets: The Flemish Community of Belgium and the French Community of Belgium. Indeed, the audiovisual landscapes of Belgium are clearly independent from one another, with their own language, channels and audiences. As a consequence, TAM systems are separate, making it impossible to aggregate viewing statistics at national level. 227 In the ‘Platform’ column, “Terr/C/S” means “Terrestrial, Cable and Satellite”. It is worth noting as well that new technologies develop, channels increasingly use a mix of carriage technologies, with terrestrial, cable and satellite being the most developed, and other technologies such as IPTV or mobile TV being used less frequently at this time. 228 For the rest of the analysis, when we use the term “total qualifying hours” we are referring to transmission hours.

185
(38.7%), followed by factual magazines (27.4%) and fiction (20%). Proportions are similar for peak-time.
Figures in viewer hours reflect the programming choices of both channels. On VTM, fiction and entertainment account for 81.3% of all-day qualifying viewing, with a fairly balanced split between the two genres. On EEN, 86.8% of the qualifying viewer hours are split between fiction, entertainment and factual magazines. The peak-time picture again is similar.
Table 29: Genre proportion of total qualifying hours in the Flemish Community of Belgium, 2007
Channel Genre
Genre
Proportions
of Total
Qualifying
Hours (%)
Genre
Proportions
of Total
Qualifying
Viewer
Hours (%)
Channel Genre
Genre
Proportions
of Total
Qualifying
Hours (%)
Genre
Proportions
of Total
Qualifying
Viewer
Hours (%)
Cinema Film 3.2% 1.7% Cinema Film 0.0% 0.0%Documentary 10.7% 11.5% Documentary 10.3% 9.8%Entertainment 38.7% 28.8% Entertainment 36.2% 33.3%Factual Magazine 27.4% 28.5% Factual Magazine 27.3% 26.5%Fiction 20.0% 29.5% Fiction 26.2% 30.4%Cinema Film 10.7% 6.1% Cinema Film 5.1% 1.9%Documentary 3.1% 5.2% Documentary 5.4% 5.8%Entertainment 17.9% 35.1% Entertainment 32.8% 40.3%Factual Magazine 8.4% 7.5% Factual Magazine 10.3% 6.1%Fiction 59.9% 46.2% Fiction 46.4% 45.9%
VTM VTM
All Day Peak Time
EEN (ex TV1) EEN (ex TV1)
Transmission and viewing ratio analysis In 2007, qualifying programmes (that is, all programmes excluding advertising, teleshopping, teletext, news, sport and games) made up a relatively low average of 43.6% of the total transmission hours of channels sampled (see Table 30). The figure is slightly higher on public channel EEN (45.2%), compared to VTM (41.9%). Qualifying works take a higher proportion of total viewer hours on both channels, especially VTM (57.8%) but also on EEN (53.6%).
Table 30: Ratio of qualifying hours to total transmission and viewer hours in the Flemish Community of Belgium, 2007
Channel
Ratio of Qualifying to
Total Transmission
Hours (%)
Ratio of Qualifying to
Total Viewer Hours (%)
EEN (ex TV1) 45.2% 53.6%
VTM 41.9% 57.8%
Result for Member State Sample
43.6% 55.5%

186
Proportion of European works European works make up an average of 75.5% of the total qualifying transmission hours on all channels in the sample in 2007 (see Table 31), and even more in peak-time (95.7%). EEN pushes European works throughout the day while VTM favours European works particularly during peak-time (91.8%), while the proportion of qualifying works that are European is 57.6% across the all-day schedule.
European works have a larger share of audience than their share of transmission hours, especially in peak-time (98.5 %), and also during all-day (90.9%). For the all-day schedule European works are particularly successful on VTM, where they attract 86% of qualifying viewer hours, as opposed to 57.6% for its transmission hours.
Table 31: Ratio of European qualifying to total qualifying hours in the Flemish Community of Belgium, 2007
Channel
Ratio of
Qualifying
European to
Total Qualifying
Hours (%)
Ratio of
Qualifying
European to
Total Qualifying
Viewer Hours
(%)
Channel
Ratio of
Qualifying
European to
Total Qualifying
Hours (%)
Ratio of
Qualifying
European to
Total Qualifying
Viewer Hours
(%)
EEN (ex TV1) 92.2% 95.3% EEN (ex TV1) 100.0% 100.0%
VTM 57.6% 86.0% VTM 91.8% 96.8%
Result for Member State Sample
75.5% 90.9%Result for Member State Sample
95.7% 98.5%
All Day Peak Time
On average, 12.9% of qualifying works broadcast on the Flemish Community of Belgium channels in our sample during all-day are non-domestic European works (see Table 32), down to 4.8% in peak-time. Non-domestic European works attract a lower share of European viewing, with all-day at 5.9%, and peak-time at 2.9%. The situation is very similar for EEN and VTM, although EEN have somewhat more success turning non-domestic European transmission hours into viewer hours (7.7% during all-day) than VTM (4%).
Table 32: Ratio of non-domestic qualifying European to total qualifying hours in the Flemish Community of Belgium, 2007
Channel
Ratio of Non-
Domestic
Qualifying
European to
Total Qualifying
Hours (%)
Ratio of Non-
Domestic
Qualifying
European to
Total Qualifying
Viewer Hours
(%)
Channel
Ratio of Non-
Domestic
Qualifying
European to
Total Qualifying
Hours (%)
Ratio of Non-
Domestic
Qualifying
European to
Total Qualifying
Viewer Hours
(%)
EEN (ex TV1) 12.1% 7.7% EEN (ex TV1) 6.3% 4.1%
VTM 13.6% 4.0% VTM 3.5% 1.6%
Result for Member State Sample
12.9% 5.9%Result for Member State Sample
4.8% 2.9%
All Day Peak Time

187
Proportion of independent works The average proportion of qualifying works produced by European independent producers and broadcast by the channels in our sample was high, at 40.4% (see Table 33) for all-day and 58.5% in peak-time. The figures expressed in viewer hours are higher or equivalent (51.3% during all-day and 56.1% in peak-time). The situations of EEN and VTM are similar. VTM shows a higher proportion of independent European works with 45% of total qualifying time during all-day and 64.6% in peak-time, and 66.2% of its peak-time qualifying viewer hours.
Table 33: Ratio of independent European to total qualifying in the Flemish Community of Belgium, 2007
Channel
Ratio of Qualifying
Independent
European to Total
Qualifying Hours
(%)
Ratio of
Qualifying
Independent
European to
Total Qualifying
Viewer Hours
(%)
Channel
Ratio of
Qualifying
Independent
European to
Total Qualifying
Hours (%)
Ratio of
Qualifying
Independent
European to
Total Qualifying
Viewer Hours
(%)
EEN (ex TV1) 36.2% 43.6% EEN (ex TV1) 52.1% 46.7%
VTM 45.0% 60.0% VTM 64.6% 66.2%
Result for Member State Sample
40.4% 51.3%Result for Member State Sample
58.5% 56.1%
All Day Peak Time
Proportion of recent independent works On average, 84.2% of all qualifying independent European transmission hours are programmes less than five years old (see Table 34). In peak-time the proportion becomes 100%. Recent works are more attractive to audiences and achieve an even higher share of total qualifying independent viewing (96.2% and 100%).
Table 34: Ratio of recent independent European to total independent European in the Flemish Community of Belgium, 2007
Channel
Ratio of Recent
Qualifying
Independent
European to Total
Qualifying
Independent
European
Hours(%)
Ratio of Recent
Qualifying
Independent
European to Total
Qualifying
Independent
European Viewer
Hours(%)
Channel
Ratio of Recent
Qualifying
Independent
European to Total
Qualifying
Independent
European
Hours(%)
Ratio of Recent
Qualifying
Independent
European to Total
Qualifying
Independent
European Viewer
Hours(%)
EEN (ex TV1) 82.2% 92.9% EEN (ex TV1) 100.0% 100.0%
VTM 85.9% 98.8% VTM 100.0% 100.0%
Result for Member State Sample
84.2% 96.2%Result for Member State Sample
100.0% 100.0%
All Day Peak Time
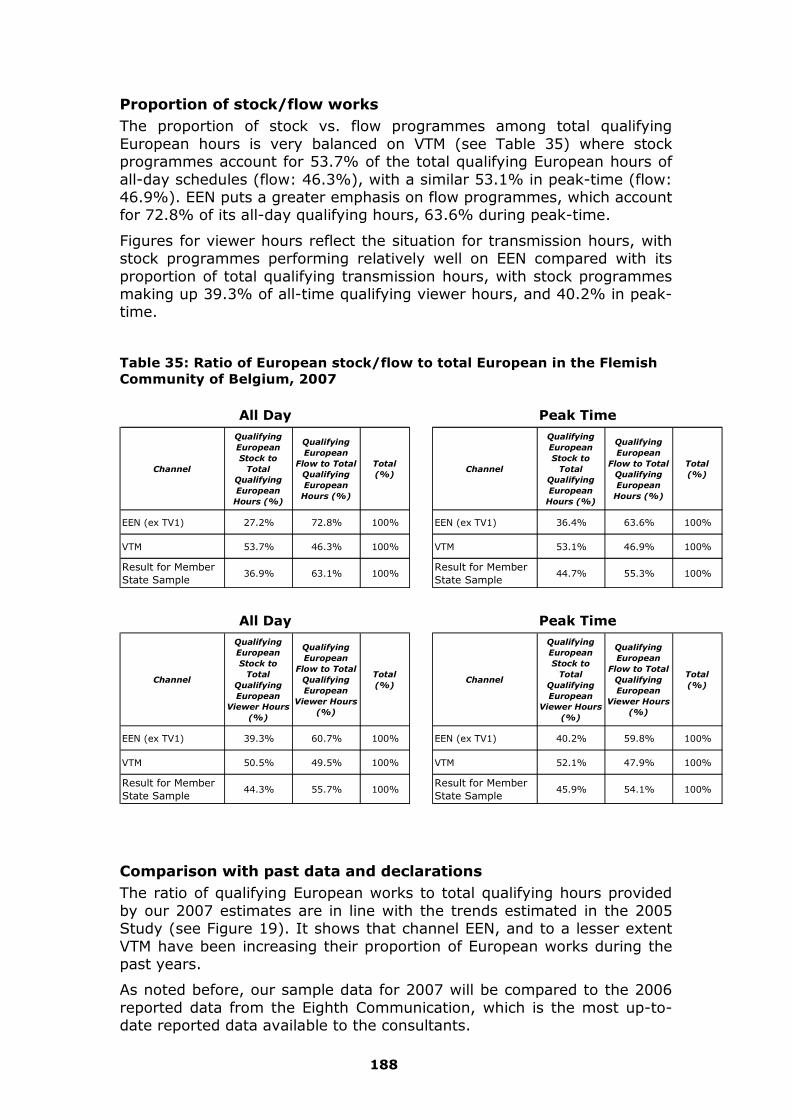
188
Proportion of stock/flow works The proportion of stock vs. flow programmes among total qualifying European hours is very balanced on VTM (see Table 35) where stock programmes account for 53.7% of the total qualifying European hours of all-day schedules (flow: 46.3%), with a similar 53.1% in peak-time (flow: 46.9%). EEN puts a greater emphasis on flow programmes, which account for 72.8% of its all-day qualifying hours, 63.6% during peak-time.
Figures for viewer hours reflect the situation for transmission hours, with stock programmes performing relatively well on EEN compared with its proportion of total qualifying transmission hours, with stock programmes making up 39.3% of all-time qualifying viewer hours, and 40.2% in peak-time.
Table 35: Ratio of European stock/flow to total European in the Flemish Community of Belgium, 2007
Channel
Qualifying
European
Stock to
Total
Qualifying
European
Hours (%)
Qualifying
European
Flow to Total
Qualifying
European
Hours (%)
Total
(%)Channel
Qualifying
European
Stock to
Total
Qualifying
European
Hours (%)
Qualifying
European
Flow to Total
Qualifying
European
Hours (%)
Total
(%)
EEN (ex TV1) 27.2% 72.8% 100% EEN (ex TV1) 36.4% 63.6% 100%
VTM 53.7% 46.3% 100% VTM 53.1% 46.9% 100%
Result for Member State Sample
36.9% 63.1% 100%Result for Member State Sample
44.7% 55.3% 100%
Channel
Qualifying
European
Stock to
Total
Qualifying
European
Viewer Hours
(%)
Qualifying
European
Flow to Total
Qualifying
European
Viewer Hours
(%)
Total
(%)Channel
Qualifying
European
Stock to
Total
Qualifying
European
Viewer Hours
(%)
Qualifying
European
Flow to Total
Qualifying
European
Viewer Hours
(%)
Total
(%)
EEN (ex TV1) 39.3% 60.7% 100% EEN (ex TV1) 40.2% 59.8% 100%
VTM 50.5% 49.5% 100% VTM 52.1% 47.9% 100%
Result for Member State Sample
44.3% 55.7% 100%Result for Member State Sample
45.9% 54.1% 100%
All Day Peak Time
All Day Peak Time
Comparison with past data and declarations The ratio of qualifying European works to total qualifying hours provided by our 2007 estimates are in line with the trends estimated in the 2005 Study (see Figure 19). It shows that channel EEN, and to a lesser extent VTM have been increasing their proportion of European works during the past years.
As noted before, our sample data for 2007 will be compared to the 2006 reported data from the Eighth Communication, which is the most up-to-date reported data available to the consultants.

189
Figure 19: Ratio of reported vs. estimated European qualifying transmission hours to total qualifying transmission hours in the Flemish Community of Belgium, 2007/2006
0.0%
10.0%
20.0%
30.0%
40.0%
50.0%
60.0%
70.0%
80.0%
90.0%
100.0%
1993 1996 1999 2002 2006/7 1993 1996 1999 2002 2006/7
EEN VTM
Channel/Year
(Note: Where there is no column for a particular channel/year, data is unavailable)
Perc
en
tag
e o
f T
ota
l Q
uali
fyin
g T
ran
sm
issio
n H
ou
rs
Reported Sample Estimate
The 2007 ratio of qualifying independent European works to total qualifying hours is also consistent with past findings (see Figure 20). Figures for both channels are going up slowly over time, with VTM standing significantly above EEN. An interesting finding is that sample estimates are consistently above the reported data for EEN, but systematically below them for VTM. So the large gap between EEN and VTM in the reported data is much lower when we look at sample estimates.

190
Figure 20: Ratio of reported vs. estimated independent European qualifying transmission hours to total qualifying transmission hours in the Flemish Community of Belgium, 2007/2006
0.0%
10.0%
20.0%
30.0%
40.0%
50.0%
60.0%
70.0%
1993 1996 1999 2002 2006/7 1993 1996 1999 2002 2006/7
EEN VTM
Channel/Year
(Note: Where there is no column for a particular channel/year, data is unavailable)
Perc
en
tag
e o
f T
ota
l Q
uali
fyin
g T
ran
sm
issio
n H
ou
rs
Reported Sample Estimate
The ratio of recent independent European works to total qualifying independent European hours provided by our 2007 estimates are in line with the trends estimated in the 2005 Study (see Figure 21). It shows that channel EEN has been increasing its proportion of European works during the past years while VTM is relatively stable over the past years. Proportions for 2006/2007 are very similar between EEN and VTM.

191
Figure 21: Ratio of reported vs. estimated recent independent European qualifying transmission hours to total independent European transmission hours in the Flemish Community of Belgium, 2007/2006
0.0%
20.0%
40.0%
60.0%
80.0%
100.0%
120.0%
1993 1996 1999 2002 2006/7 1993 1996 1999 2002 2006/7
EEN VTM
Channel/Year
(Note: Where there is no column for a particular channel/year, data is unavailable)
Pe
rce
nta
ge
of
To
tal
Ind
ep
en
de
nt
Eu
rop
ea
n T
ran
sm
iss
ion
Ho
urs
Reported Sample Estimate
8.4.2. French Community of Belgium229
Data summary Our sample consists of the largest public service channel LA UNE and the leading private commercial channel RTL-TVI. Together (see Table 36) they account for 39.5% of total TV viewing in the French Community of Belgium.
We included RTL-TVI in this chapter as it is the leading channel in the French Community of Belgium and thus accounts for a large share of the Belgian audience. However, it is important to note that both Belgium and Luxembourg claim jurisdiction for RTL-TVI and this is the subject of ongoing legal action.
229 Belgium has been analysed as two markets: The Flemish Community of Belgium and the French Community of Belgium. Indeed, the audiovisual landscapes of Belgium are clearly independent from one another, with their own language, channels and audiences. As a consequence, TAM systems are separate, making it impossible to aggregate viewing statistics at national level.

192
Table 36: List of channels covered in the 2007 French Community of Belgium sample
Country ChannelLaunch
Year
Share of Viewing (2005)
Revenue Model PlatformAverage Daily Transmission
Hours
Sample Weeks
Belgium (French) La1 1955 14.90% Gvt/Ad Nat. Terr. 24
Belgium (French) RTL-TVI 1987 24.60% Ad Cab/Sat 20
Standard
Genre analysis Both LA1 and RTL-TVI base their offering of qualifying programmes (documentary, entertainment, factual magazines and TV fiction) largely around factual magazines and TV fiction, which together account for about 76% of total qualifying genres on each (see Table 37). The proportion of factual magazines loses between 10 and 20 percentage points when proportions are measured in viewer hours. While the rest of the schedule for LA1 is fairly balanced between documentary, entertainment and cinema, RTL-TVI puts a larger emphasis on cinema, which accounts for 18.7% of all qualifying transmission hours across the all-day schedule, and 23.2% in peak-time. Besides cinema, RTL-TVI has a successful offering of entertainment in peak-time, which attracts 20.3% of the total qualifying viewing, compared with 10.7% of its total qualifying transmission hours.
Table 37: Genre proportion of total qualifying hours in the French Community of Belgium, 2007
Channel Genre
Genre
Proportions
of Total
Qualifying
Hours (%)
Genre
Proportions
of Total
Qualifying
Viewer
Hours (%)
Channel Genre
Genre
Proportions
of Total
Qualifying
Hours (%)
Genre
Proportions
of Total
Qualifying
Viewer
Hours (%)
Cinema Film 3.3% 9.1% Cinema Film 13.3% 16.8%Documentary 9.0% 10.4% Documentary 13.7% 14.9%Entertainment 4.7% 9.3% Entertainment 14.1% 15.8%Factual Magazine 43.5% 25.5% Factual Magazine 31.0% 23.8%Fiction 39.5% 45.6% Fiction 27.9% 28.6%Cinema Film 18.7% 19.0% Cinema Film 23.2% 19.7%Documentary 3.7% 4.4% Documentary 5.7% 4.6%Entertainment 6.9% 15.4% Entertainment 10.7% 20.3%Factual Magazine 22.2% 19.0% Factual Magazine 15.2% 17.0%Fiction 48.4% 42.1% Fiction 45.3% 38.3%
RTL-TVI RTL-TVI
All Day Peak Time
La1 La1
Transmission and viewing ratio analysis In 2007, qualifying programmes (that is, all programmes excluding advertising, teleshopping, teletext, news, sport and games) made up a relatively low 49.4% of the total transmission hours across all channels sampled for The French Community of Belgium (see Table 38). The figure is pulled up by public channel LA1 (62.4%), while that of RTL-TVI is

193
particularly low (33.9%), showing the importance of information, teleshopping and game shows on that channel.
The figure becomes higher when we look at the ratio of qualifying viewing, with 62.5% of LA1 total viewer hours coming from qualifying genres, and 50.7% for RTL-TVI, where qualifying programmes thus represent substantially more of the total audience than total transmission time.
Table 38: Ratio of qualifying hours to total transmission and viewer hours in the French Community of Belgium, 2007
Channel
Ratio of Qualifying to
Total Transmission
Hours (%)
Ratio of Qualifying to
Total Viewer Hours (%)
La1 62.4% 62.5%
RTL-TVI 33.9% 50.7%
Result for Member State Sample
49.4% 55.7%
Proportion of European works European works make up an average of 69.4% of the total qualifying transmission hours on all channels in the sample in 2007 (see Table 39) and slightly less in peak-time (67%). Again LA1 is highest, with 82.3% of all-day qualifying hours being European works, and even 87.2% in peak-time, while RTL-TVI has 42.2% for all-day and 42.6% for peak-time.
European works have a larger share of audience than their share of transmission hours in peak-time where they compose 88.8% of LA1’s qualifying viewer hours, while RTL-TVI, though at a lower level, reaches 43.1%.
Table 39: Ratio of European qualifying to total qualifying hours in the French Community of Belgium, 2007
Channel
Ratio of
Qualifying
European to
Total Qualifying
Hours (%)
Ratio of
Qualifying
European to
Total Qualifying
Viewer Hours
(%)
Channel
Ratio of
Qualifying
European to
Total Qualifying
Hours (%)
Ratio of
Qualifying
European to
Total Qualifying
Viewer Hours
(%)
La1 82.3% 80.4% La1 87.2% 88.8%
RTL-TVI 42.2% 41.3% RTL-TVI 42.6% 43.1%
Result for Member State Sample
69.4% 59.3%Result for Member State Sample
67.0% 60.7%
All Day Peak Time
Across all channels in the sample for the French Community of Belgium, a relatively high 25.8% of qualifying works broadcast during the all-day schedule are non-domestic European works (see Table 40), up to 30.1% in peak-time. Non-domestic European works, however, attract a lower

194
share of European viewing in peak-time with 23.1%, and also across the entire day with 25.1%.
The situation is very different for LA1 compared with RTL-TVI. On LA UNE 30.9% of European works broadcast during all-day are non-domestic, up to 38.4% in peak-time. Expressed as viewer hours the figures become 40.9% and 41.1% respectively. In comparison, RTL-TVI offers non-domestic works as 14.8% of all European works during all-day, and 20% in peak-time, attracting a lower share of audience with 11.5% and 11.8% respectively. Looking at these numbers, while keeping in mind that LA1 has twice the amount of European programming and twice as many qualifying transmission hours as RTL-TVI, it shows how the situation is different between the two leaders in the French Community of Belgium.
Table 40: Ratio of non-domestic qualifying European to total qualifying hours in the French Community of Belgium, 2007
Channel
Ratio of Non-
Domestic
Qualifying
European to
Total Qualifying
Hours (%)
Ratio of Non-
Domestic
Qualifying
European to
Total Qualifying
Viewer Hours
(%)
Channel
Ratio of Non-
Domestic
Qualifying
European to
Total Qualifying
Hours (%)
Ratio of Non-
Domestic
Qualifying
European to
Total Qualifying
Viewer Hours
(%)
La1 30.9% 40.9% La1 38.4% 41.1%
RTL-TVI 14.8% 11.5% RTL-TVI 20.0% 11.8%
Result for Member State Sample
25.8% 25.1%Result for Member State Sample
30.1% 23.1%
All Day Peak Time
Proportion of independent works The proportion of qualifying works produced by European independent producers and broadcast across all the channels in our French Community of Belgium sample was 29.9% (see Table 41) during all-day and 33.3% in peak-time. The figures expressed in viewer hours are slightly lower, at 27.8% and 26.7% respectively.
Again the situations of LA1 and RTL-TVI are extremely different from one another. LA1’s share of independent works is high (35.7% for all-day and 41.8% in peak-time) and translates into higher shares of qualifying viewing (44.2% and 45.4%). By contrast, RTL-TVI offers fewer independent European works during all-day (17.2%) and peak-time (22.4%), attracting a lower share of audience with 12.9% and 14.2% respectively.
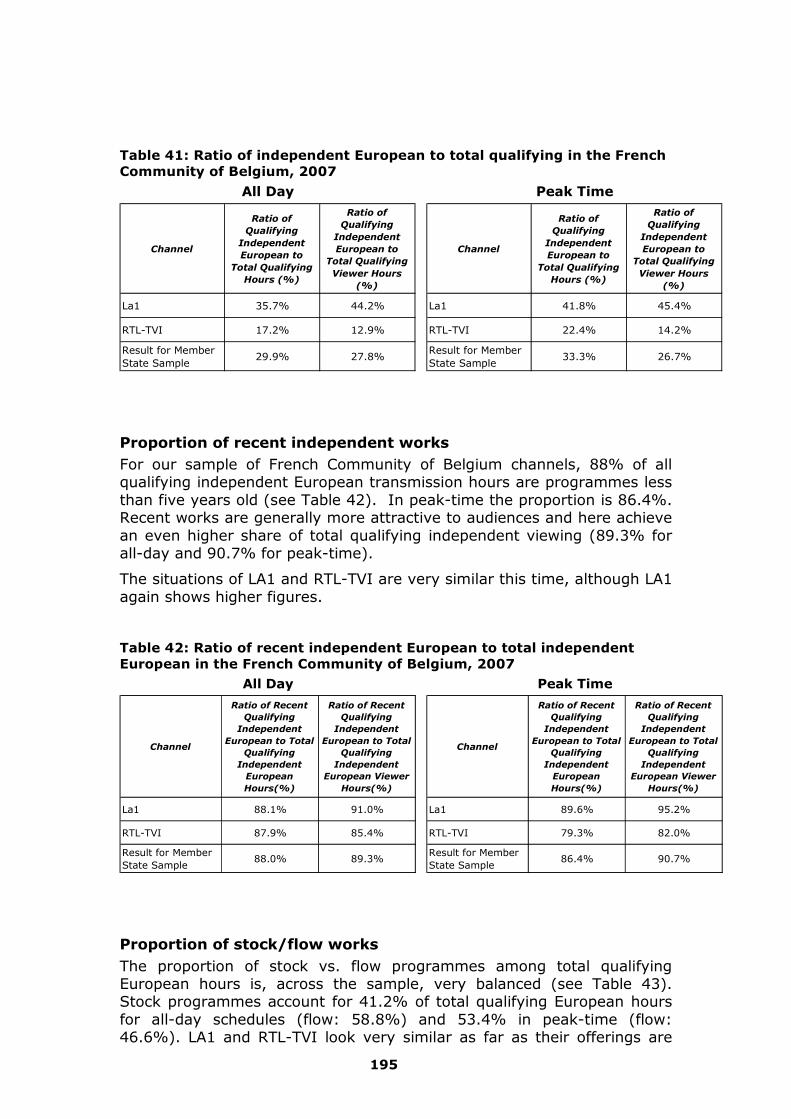
195
Table 41: Ratio of independent European to total qualifying in the French Community of Belgium, 2007
Channel
Ratio of
Qualifying
Independent
European to
Total Qualifying
Hours (%)
Ratio of
Qualifying
Independent
European to
Total Qualifying
Viewer Hours
(%)
Channel
Ratio of
Qualifying
Independent
European to
Total Qualifying
Hours (%)
Ratio of
Qualifying
Independent
European to
Total Qualifying
Viewer Hours
(%)
La1 35.7% 44.2% La1 41.8% 45.4%
RTL-TVI 17.2% 12.9% RTL-TVI 22.4% 14.2%
Result for Member State Sample
29.9% 27.8%Result for Member State Sample
33.3% 26.7%
All Day Peak Time
Proportion of recent independent works For our sample of French Community of Belgium channels, 88% of all qualifying independent European transmission hours are programmes less than five years old (see Table 42). In peak-time the proportion is 86.4%. Recent works are generally more attractive to audiences and here achieve an even higher share of total qualifying independent viewing (89.3% for all-day and 90.7% for peak-time).
The situations of LA1 and RTL-TVI are very similar this time, although LA1 again shows higher figures.
Table 42: Ratio of recent independent European to total independent European in the French Community of Belgium, 2007
Channel
Ratio of Recent
Qualifying
Independent
European to Total
Qualifying
Independent
European
Hours(%)
Ratio of Recent
Qualifying
Independent
European to Total
Qualifying
Independent
European Viewer
Hours(%)
Channel
Ratio of Recent
Qualifying
Independent
European to Total
Qualifying
Independent
European
Hours(%)
Ratio of Recent
Qualifying
Independent
European to Total
Qualifying
Independent
European Viewer
Hours(%)
La1 88.1% 91.0% La1 89.6% 95.2%
RTL-TVI 87.9% 85.4% RTL-TVI 79.3% 82.0%
Result for Member State Sample
88.0% 89.3%Result for Member State Sample
86.4% 90.7%
All Day Peak Time
Proportion of stock/flow works The proportion of stock vs. flow programmes among total qualifying European hours is, across the sample, very balanced (see Table 43). Stock programmes account for 41.2% of total qualifying European hours for all-day schedules (flow: 58.8%) and 53.4% in peak-time (flow: 46.6%). LA1 and RTL-TVI look very similar as far as their offerings are

196
concerned, with slightly more stock on LA1 in peak-time (55.9%), and slightly more flow for RTL-TVI during all-day (65%).
The differences between the two channels grow when we look at the figures expressed as viewer hours. European stock makes up 60.5% of total qualifying European viewing on LA1 during peak-time, while European flow makes up 72.5% of RTL-TVI during peak-time.
Table 43: Ratio of European stock/flow to total European in the French Community of Belgium, 2007
Channel
Qualifying
European
Stock to
Total
Qualifying
European
Hours (%)
Qualifying
European
Flow to Total
Qualifying
European
Hours (%)
Total
(%)Channel
Qualifying
European
Stock to
Total
Qualifying
European
Hours (%)
Qualifying
European
Flow to Total
Qualifying
European
Hours (%)
Total
(%)
La1 42.7% 57.3% 100% La1 55.9% 44.1% 100%
RTL-TVI 35.0% 65.0% 100% RTL-TVI 47.0% 53.0% 100%
Result for Member State Sample
41.2% 58.8% 100%Result for Member State Sample
53.4% 46.6% 100%
Channel
Qualifying
European
Stock to
Total
Qualifying
European
Viewer Hours
(%)
Qualifying
European
Flow to Total
Qualifying
European
Viewer Hours
(%)
Total
(%)Channel
Qualifying
European
Stock to
Total
Qualifying
European
Viewer Hours
(%)
Qualifying
European
Flow to Total
Qualifying
European
Viewer Hours
(%)
Total
(%)
La1 59.8% 40.2% 100% La1 60.5% 39.5% 100.0%
RTL-TVI 27.9% 72.1% 100% RTL-TVI 27.5% 72.5% 100.0%
Result for Member State Sample
47.8% 52.2% 100%Result for Member State Sample
46.0% 54.0% 100.0%
All Day Peak Time
All Day Peak Time
Comparison with past data and declarations230 The ratio of qualifying European works to total qualifying hours provided by our 2007 estimates are in line with the trends estimated in the 2005 Study (see Figure 22). It confirms that public channel LA1 offers approximately twice as much European programming as its private counterpart RTL-TVI, with proportions being relatively stable over the years, although it can be argued that there is a slow upward trend on both channels.
230 2006 data for RTL-TVI have not been reported by Belgium, following the decision by TVI s.a. not to apply for a licence from the Government of Belgium’s French Community when it expired on 31 December 2005. RTL-TVI’s 2006 declared data used in the following graphs have therefore been extracted from the Luxembourgian declarations.

197
Figure 22: Ratio of reported vs. estimated European qualifying transmission hours to total qualifying transmission hours in the French Community of Belgium, 2007/2006
0.0%
10.0%
20.0%
30.0%
40.0%
50.0%
60.0%
70.0%
80.0%
90.0%
1993 1996 1999 2002 2006/7 1993 1996 1999 2002 2006/7
La1 RTL-TVI
Perc
en
tag
e o
f T
ota
l Q
uali
fyin
g T
ran
sm
issio
n H
ou
rs
Channel/Year(Note: Where there is no column for a particular channel/year, data is unavailable)
Reported Sample Estimate
The 2007 ratio of qualifying independent European works to total qualifying hours is very consistent with past findings (see Figure 23) if we look at RTL-TVI, but shows a significant difference for the figures for LA1 in the 2007 sample estimate. However, our sample estimate is very much closer to reported data in 2007 vs. 2006 than it used to be in previous years. On the whole, we observe a general growth in the proportions for both channels, with LA1 offering twice as high a proportion of independent European works as RTL-TVI.
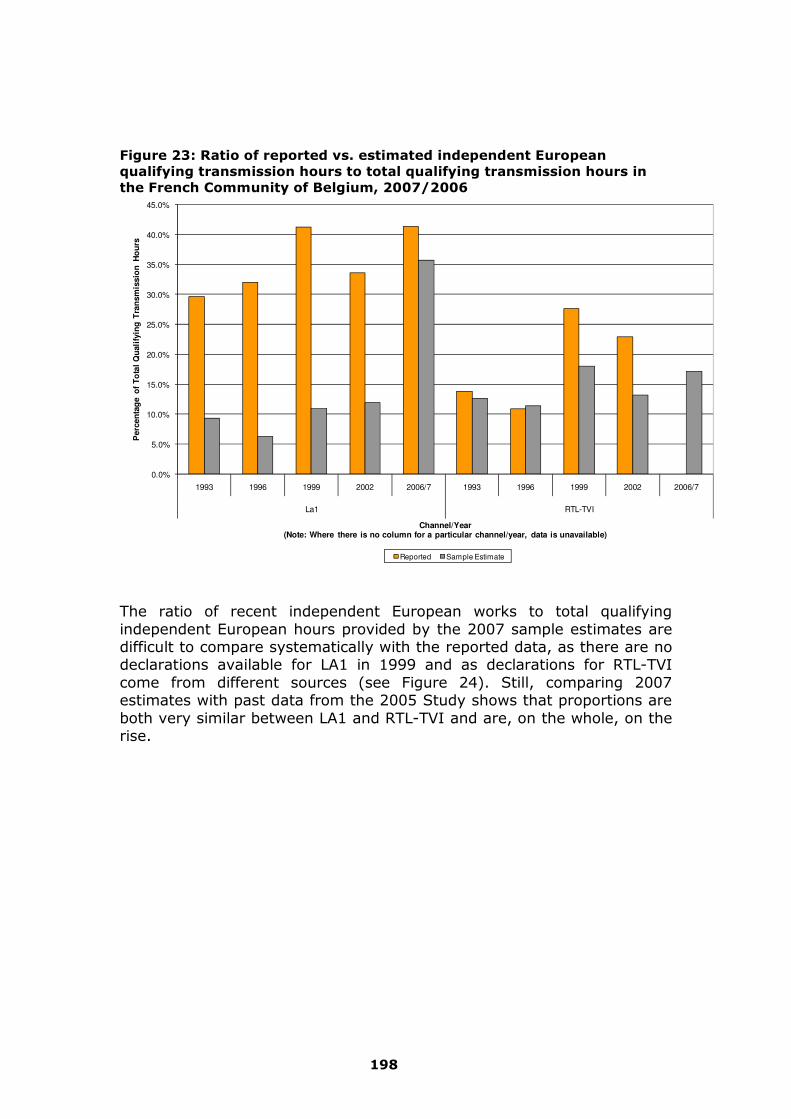
198
Figure 23: Ratio of reported vs. estimated independent European qualifying transmission hours to total qualifying transmission hours in the French Community of Belgium, 2007/2006
0.0%
5.0%
10.0%
15.0%
20.0%
25.0%
30.0%
35.0%
40.0%
45.0%
1993 1996 1999 2002 2006/7 1993 1996 1999 2002 2006/7
La1 RTL-TVI
Perc
en
tag
e o
f T
ota
l Q
uali
fyin
g T
ran
sm
issio
n H
ou
rs
Channel/Year(Note: Where there is no column for a particular channel/year, data is unavailable)
Reported Sample Estimate
The ratio of recent independent European works to total qualifying independent European hours provided by the 2007 sample estimates are difficult to compare systematically with the reported data, as there are no declarations available for LA1 in 1999 and as declarations for RTL-TVI come from different sources (see Figure 24). Still, comparing 2007 estimates with past data from the 2005 Study shows that proportions are both very similar between LA1 and RTL-TVI and are, on the whole, on the rise.

199
Figure 24: Ratio of reported vs. estimated recent independent European qualifying transmission hours to total independent European transmission hours in the French Community of Belgium, 2007/2006
0.0%
20.0%
40.0%
60.0%
80.0%
100.0%
120.0%
1993 1996 1999 2002 2006/7 1993 1996 1999 2002 2006/7
La1 RTL-TVI
Perc
en
tag
e o
f T
ota
l In
dep
en
den
t E
uro
pean
Tra
nsm
issio
n H
ou
rs
Channel/Year(Note: Where there is no column for a particular channel/year, data is unavailable)
Reported Sample Estimate
8.4.3. Estonia
Data summary Our sample consists of one publicly funded channel ETV and two commercial channels, KANAL2 (owned by the Norwegian group Schibsted) and TV3 (MTG). These three leading channels account for 59.3% of total Estonian viewing (see Table 44).
Table 44: List of channels covered in the 2007 Estonian sample
Country ChannelLaunch
Year
Share of Viewing (2005)
Revenue Model PlatformAverage Daily Transmission
Hours
Sample Weeks
Estonia ETV 1955 18.80% Gvt Nat. Terr. 24
Estonia Kanal 2 1993 19.20% Ad Nat. Terr. 24
Estonia TV3 1993 21.30% Ad Nat. Terr. 24
Non-standard sample week for March (05-03-07 to 11-03-07);
November sample week is standard
Genre analysis As shown in Table 45, public free-to-air channel ETV offers a balanced mix of genres with entertainment and fiction at the top (32.2% and 25.9% of
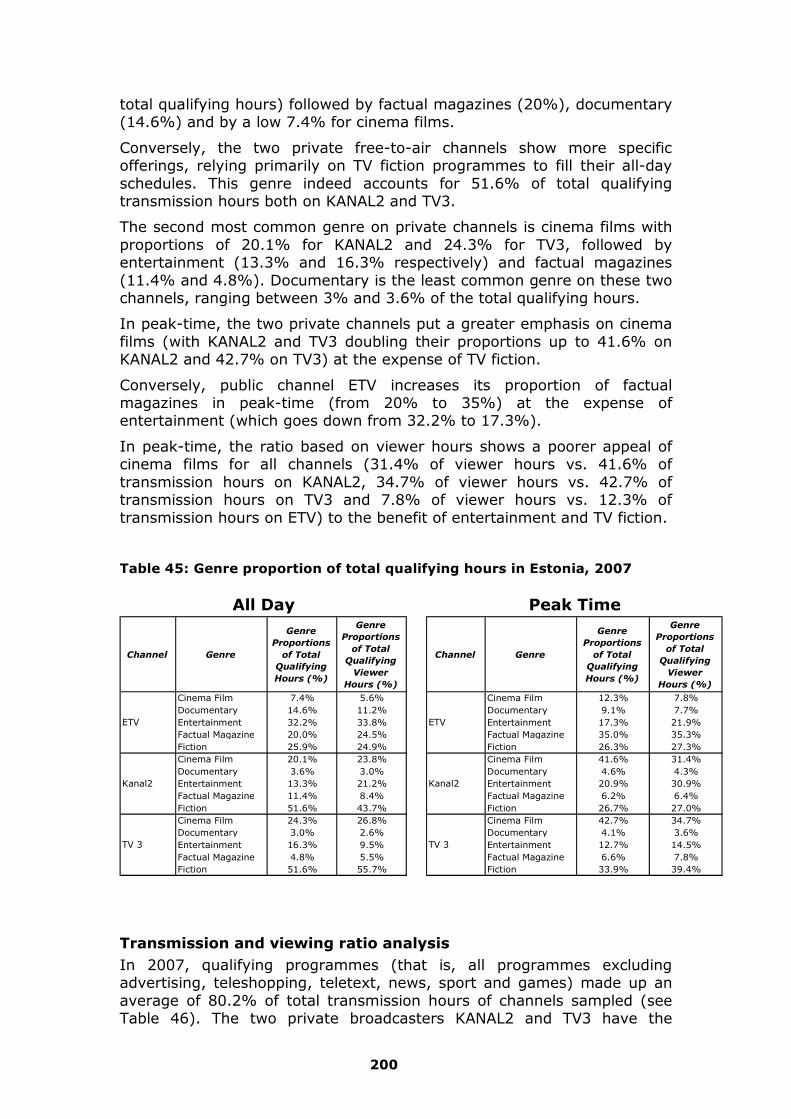
200
total qualifying hours) followed by factual magazines (20%), documentary (14.6%) and by a low 7.4% for cinema films.
Conversely, the two private free-to-air channels show more specific offerings, relying primarily on TV fiction programmes to fill their all-day schedules. This genre indeed accounts for 51.6% of total qualifying transmission hours both on KANAL2 and TV3.
The second most common genre on private channels is cinema films with proportions of 20.1% for KANAL2 and 24.3% for TV3, followed by entertainment (13.3% and 16.3% respectively) and factual magazines (11.4% and 4.8%). Documentary is the least common genre on these two channels, ranging between 3% and 3.6% of the total qualifying hours.
In peak-time, the two private channels put a greater emphasis on cinema films (with KANAL2 and TV3 doubling their proportions up to 41.6% on KANAL2 and 42.7% on TV3) at the expense of TV fiction.
Conversely, public channel ETV increases its proportion of factual magazines in peak-time (from 20% to 35%) at the expense of entertainment (which goes down from 32.2% to 17.3%).
In peak-time, the ratio based on viewer hours shows a poorer appeal of cinema films for all channels (31.4% of viewer hours vs. 41.6% of transmission hours on KANAL2, 34.7% of viewer hours vs. 42.7% of transmission hours on TV3 and 7.8% of viewer hours vs. 12.3% of transmission hours on ETV) to the benefit of entertainment and TV fiction.
Table 45: Genre proportion of total qualifying hours in Estonia, 2007
Channel Genre
Genre
Proportions
of Total
Qualifying
Hours (%)
Genre
Proportions
of Total
Qualifying
Viewer
Hours (%)
Channel Genre
Genre
Proportions
of Total
Qualifying
Hours (%)
Genre
Proportions
of Total
Qualifying
Viewer
Hours (%)
Cinema Film 7.4% 5.6% Cinema Film 12.3% 7.8%Documentary 14.6% 11.2% Documentary 9.1% 7.7%Entertainment 32.2% 33.8% Entertainment 17.3% 21.9%Factual Magazine 20.0% 24.5% Factual Magazine 35.0% 35.3%Fiction 25.9% 24.9% Fiction 26.3% 27.3%Cinema Film 20.1% 23.8% Cinema Film 41.6% 31.4%Documentary 3.6% 3.0% Documentary 4.6% 4.3%Entertainment 13.3% 21.2% Entertainment 20.9% 30.9%Factual Magazine 11.4% 8.4% Factual Magazine 6.2% 6.4%Fiction 51.6% 43.7% Fiction 26.7% 27.0%Cinema Film 24.3% 26.8% Cinema Film 42.7% 34.7%Documentary 3.0% 2.6% Documentary 4.1% 3.6%Entertainment 16.3% 9.5% Entertainment 12.7% 14.5%Factual Magazine 4.8% 5.5% Factual Magazine 6.6% 7.8%Fiction 51.6% 55.7% Fiction 33.9% 39.4%
TV 3 TV 3
All Day Peak Time
ETV ETV
Kanal2 Kanal2
Transmission and viewing ratio analysis In 2007, qualifying programmes (that is, all programmes excluding advertising, teleshopping, teletext, news, sport and games) made up an average of 80.2% of total transmission hours of channels sampled (see Table 46). The two private broadcasters KANAL2 and TV3 have the

201
highest figure with 82.1% and 88.9% respectively, while the public service channel ETV is around 70%.
The picture is significantly different when we look at the ratio of qualifying to total viewer hours. While public broadcaster ETV sees its proportion jump up to 75.4% of viewer hours reflecting the success of its factual magazines and entertainment programming, the two private channels see their proportions go down to 78.2% for KANAL2 and 84% for TV3, showing the relatively higher attractiveness of information, sports and game shows on these channels.
Table 46: Ratio of qualifying hours to total transmission and viewer hours in Estonia, 2007
Channel
Ratio of Qualifying to
Total Transmission
Hours (%)
Ratio of Qualifying to
Total Viewer Hours (%)
ETV 69.6% 75.4%
Kanal2 82.1% 78.2%
TV 3 88.9% 84.0%
Result for Member State Sample
80.2% 79.2%
Proportion of European works European works made up an average of 50.9% of the total qualifying transmission hours on all channels in our sample in 2007 (see Table 47). The public channel allocates the highest proportion of its grid to European programmes (83.4%), whereas private broadcasters show much lower proportions with 35.3% for KANAL2 and 39.3% for TV3. This gap between private and public channels as far as proportions of European works are concerned, is reinforced in peak-time.
European works have a larger share of audience than their share of schedules, especially in peak-time, where they reach 53.5% of total viewer qualifying hours across our sample, compared to 50% of total transmission hours. This trend is true of all three channels in our sample.

202
Table 47: Ratio of European qualifying to total qualifying hours in Estonia, 2007
Channel
Ratio of
Qualifying
European to
Total Qualifying
Hours (%)
Ratio of
Qualifying
European to
Total Qualifying
Viewer Hours
(%)
Channel
Ratio of
Qualifying
European to
Total Qualifying
Hours (%)
Ratio of
Qualifying
European to
Total Qualifying
Viewer Hours
(%)
ETV 83.4% 89.3% ETV 86.4% 91.1%
Kanal2 35.3% 38.0% Kanal2 29.9% 40.9%
TV 3 39.3% 40.6% TV 3 35.4% 39.4%
Result for Member State Sample
50.9% 53.3%Result for Member State Sample
50.0% 53.5%
All Day Peak Time
Across our sample, 17.5% of qualifying works broadcast on the Estonian channels during all-day are non-domestic European works (see Table 48).
Private broadcasters show the lowest proportion in all-day, with 11.5% for KANAL2 and 17.2% for TV3. Proportions go down during peak-time, with only 3.6% for KANAL2 and 11.2% for TV3. Conversely, ETV shows the largest proportion of non-domestic European works during all-day (24.8%) and during peak-time (26.6%) too.
Non-domestic European works attract a lower share of European viewing across the sample both during all-day (15.8%) and in peak-time (10.3%), with the exception of TV3, which shows a higher share for total qualifying viewer hours during all-day (21.6% compared to 17.2% for total qualifying hours).
Table 48: Ratio of non-domestic qualifying European to total qualifying hours in Estonia, 2007
Channel
Ratio of Non-
Domestic
Qualifying
European to
Total Qualifying
Hours (%)
Ratio of Non-
Domestic
Qualifying
European to
Total Qualifying
Viewer Hours
(%)
Channel
Ratio of Non-
Domestic
Qualifying
European to
Total Qualifying
Hours (%)
Ratio of Non-
Domestic
Qualifying
European to
Total Qualifying
Viewer Hours
(%)
ETV 24.8% 19.3% ETV 26.6% 22.6%
Kanal2 11.5% 8.5% Kanal2 3.6% 3.3%
TV 3 17.2% 21.6% TV 3 11.2% 9.7%
Result for Member State Sample
17.5% 15.8%Result for Member State Sample
13.6% 10.3%
All Day Peak Time
Proportion of independent works The average proportion of qualifying works produced by independent European producers and broadcast by the channels across our sample is high, reaching 33.4% during all-day and 30.6% in peak-time (see Table 49).
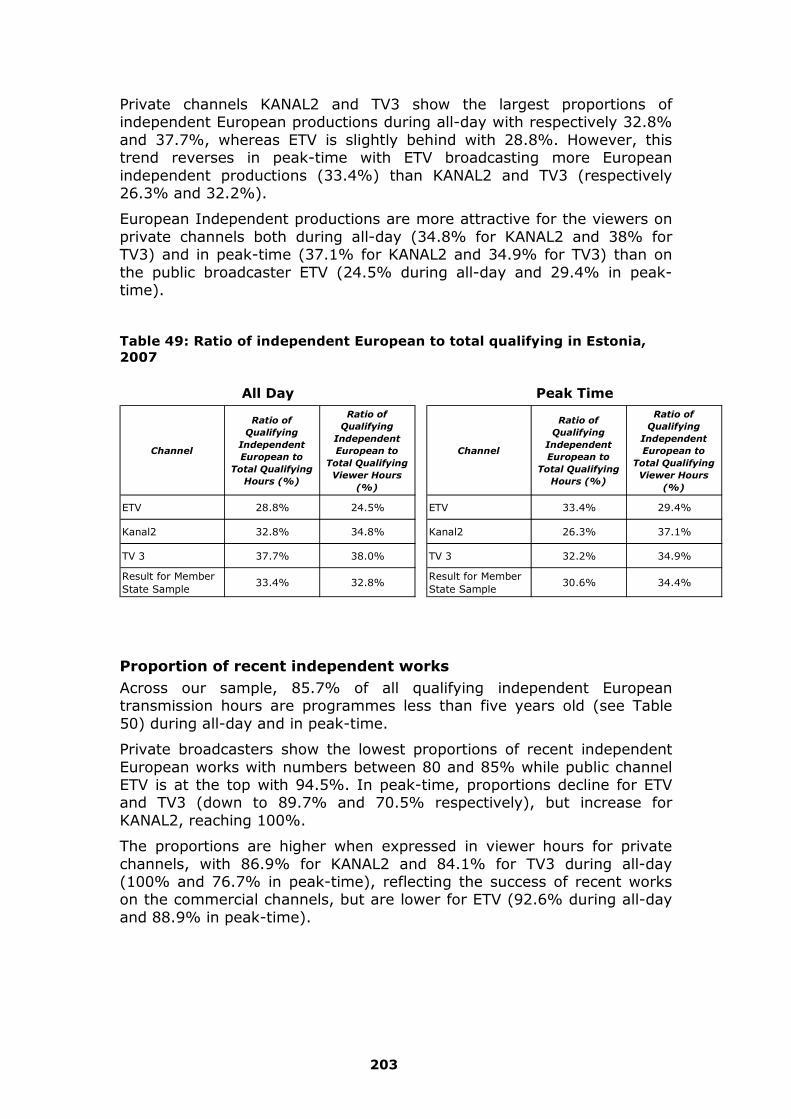
203
Private channels KANAL2 and TV3 show the largest proportions of independent European productions during all-day with respectively 32.8% and 37.7%, whereas ETV is slightly behind with 28.8%. However, this trend reverses in peak-time with ETV broadcasting more European independent productions (33.4%) than KANAL2 and TV3 (respectively 26.3% and 32.2%).
European Independent productions are more attractive for the viewers on private channels both during all-day (34.8% for KANAL2 and 38% for TV3) and in peak-time (37.1% for KANAL2 and 34.9% for TV3) than on the public broadcaster ETV (24.5% during all-day and 29.4% in peak-time).
Table 49: Ratio of independent European to total qualifying in Estonia, 2007
Channel
Ratio of
Qualifying
Independent
European to
Total Qualifying
Hours (%)
Ratio of
Qualifying
Independent
European to
Total Qualifying
Viewer Hours
(%)
Channel
Ratio of
Qualifying
Independent
European to
Total Qualifying
Hours (%)
Ratio of
Qualifying
Independent
European to
Total Qualifying
Viewer Hours
(%)
ETV 28.8% 24.5% ETV 33.4% 29.4%
Kanal2 32.8% 34.8% Kanal2 26.3% 37.1%
TV 3 37.7% 38.0% TV 3 32.2% 34.9%
Result for Member State Sample
33.4% 32.8%Result for Member State Sample
30.6% 34.4%
All Day Peak Time
Proportion of recent independent works Across our sample, 85.7% of all qualifying independent European transmission hours are programmes less than five years old (see Table 50) during all-day and in peak-time.
Private broadcasters show the lowest proportions of recent independent European works with numbers between 80 and 85% while public channel ETV is at the top with 94.5%. In peak-time, proportions decline for ETV and TV3 (down to 89.7% and 70.5% respectively), but increase for KANAL2, reaching 100%.
The proportions are higher when expressed in viewer hours for private channels, with 86.9% for KANAL2 and 84.1% for TV3 during all-day (100% and 76.7% in peak-time), reflecting the success of recent works on the commercial channels, but are lower for ETV (92.6% during all-day and 88.9% in peak-time).

204
Table 50: Ratio of recent independent European to total independent European in Estonia, 2007
Channel
Ratio of Recent
Qualifying
Independent
European to Total
Qualifying
Independent
European
Hours(%)
Ratio of Recent
Qualifying
Independent
European to Total
Qualifying
Independent
European Viewer
Hours(%)
Channel
Ratio of Recent
Qualifying
Independent
European to Total
Qualifying
Independent
European
Hours(%)
Ratio of Recent
Qualifying
Independent
European to Total
Qualifying
Independent
European Viewer
Hours(%)
ETV 94.5% 92.6% ETV 89.7% 88.9%
Kanal2 82.1% 86.9% Kanal2 100.0% 100.0%
TV 3 83.5% 84.1% TV 3 70.5% 76.7%
Result for Member State Sample
85.7% 87.1%Result for Member State Sample
85.7% 90.3%
All Day Peak Time
Proportion of stock/flow works The proportion of stock vs. flow programmes among total qualifying European hours is, across the sample, skewed toward flow (see Table 51). Flow programming accounts for 59.6% of total qualifying European hours of all-day schedules (stock: 40.4%) and 63.4% in peak-time (stock: 36.6%).
However, it is worth noting that, while both ETV and KANAL2 are skewed toward flow (with proportions of 60/70% flow vs. 40/30% stock), TV3 shows quite a balanced mix, with 51.8% of stock vs. 48.2% of flow, a balance mostly due to the higher presence of series on this channel. These proportions are reinforced in peak-time, with a significant rise for KANAL2 (93.6% of flow vs. 6.4% of stock).
During all-day, European stock does better with the audience than European flow on TV3 (with a proportion of 69.7%), reflecting the success of American shows on this channel. On the other hand, flow programming attracts more audience on the two other channels ETV and KANAL2 in all-day. In peak-time, flow increases on KANAL2, up to 94.2%, while TV3 comes back to a more balanced proportion of stock and flow (52.8% stock vs. 47.2% flow).
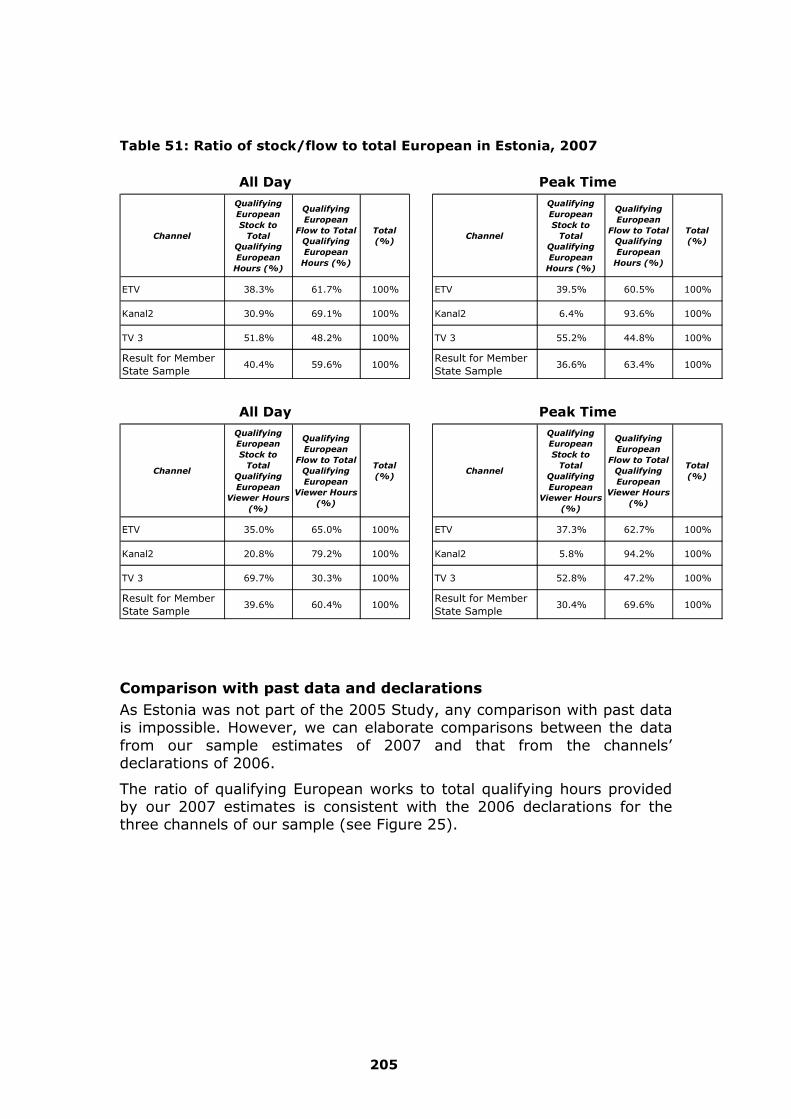
205
Table 51: Ratio of stock/flow to total European in Estonia, 2007
Channel
Qualifying
European
Stock to
Total
Qualifying
European
Hours (%)
Qualifying
European
Flow to Total
Qualifying
European
Hours (%)
Total
(%)Channel
Qualifying
European
Stock to
Total
Qualifying
European
Hours (%)
Qualifying
European
Flow to Total
Qualifying
European
Hours (%)
Total
(%)
ETV 38.3% 61.7% 100% ETV 39.5% 60.5% 100%
Kanal2 30.9% 69.1% 100% Kanal2 6.4% 93.6% 100%
TV 3 51.8% 48.2% 100% TV 3 55.2% 44.8% 100%
Result for Member State Sample
40.4% 59.6% 100%Result for Member State Sample
36.6% 63.4% 100%
Channel
Qualifying
European
Stock to
Total
Qualifying
European
Viewer Hours
(%)
Qualifying
European
Flow to Total
Qualifying
European
Viewer Hours
(%)
Total
(%)Channel
Qualifying
European
Stock to
Total
Qualifying
European
Viewer Hours
(%)
Qualifying
European
Flow to Total
Qualifying
European
Viewer Hours
(%)
Total
(%)
ETV 35.0% 65.0% 100% ETV 37.3% 62.7% 100%
Kanal2 20.8% 79.2% 100% Kanal2 5.8% 94.2% 100%
TV 3 69.7% 30.3% 100% TV 3 52.8% 47.2% 100%
Result for Member State Sample
39.6% 60.4% 100%Result for Member State Sample
30.4% 69.6% 100%
All Day Peak Time
All Day Peak Time
Comparison with past data and declarations As Estonia was not part of the 2005 Study, any comparison with past data is impossible. However, we can elaborate comparisons between the data from our sample estimates of 2007 and that from the channels’ declarations of 2006.
The ratio of qualifying European works to total qualifying hours provided by our 2007 estimates is consistent with the 2006 declarations for the three channels of our sample (see Figure 25).

206
Figure 25: Ratio of reported vs. estimated European qualifying transmission hours to total qualifying transmission hours in Estonia, 2007/2006
0.0%
10.0%
20.0%
30.0%
40.0%
50.0%
60.0%
70.0%
80.0%
90.0%
100.0%
2006/7 2006/7 2006/7
ETV Kanal2 TV3
Perc
en
tag
e o
f T
ota
l Q
uali
fyin
g T
ran
sm
issio
n H
ou
rs
Channel/Year
Reported Sample Estimate
The 2007 ratio of qualifying independent European works to total qualifying hours is very consistent with the 2006 data for the two private Estonian broadcasters KANAL2 and TV3. However, the figure estimate for qualifying independent European works for ETV is far lower than the one reported. The proportion of Independent works on ETV is 75% according to reported data, but 28.8% according to the sample estimate. We provide explanations for this difference in Appendix IX (Part 21 of this report).

207
Figure 26: Ratio of reported vs. estimated independent European qualifying transmission hours to total qualifying transmission hours in Estonia, 2007/2006
0.0%
10.0%
20.0%
30.0%
40.0%
50.0%
60.0%
70.0%
80.0%
2006/7 2006/7 2006/7
ETV Kanal2 TV3
Perc
en
tag
e o
f T
ota
l Q
uali
fyin
g T
ran
sm
issio
n H
ou
rs
Channel/Year
Reported Sample Estimate
The ratio of recent qualifying independent works to total European independent qualifying hours provided by our 2007 estimates show strong differences with the 2006 data for every channel of our sample (see Figure 27), 2007 sample estimates being higher than 2006 reported figures.
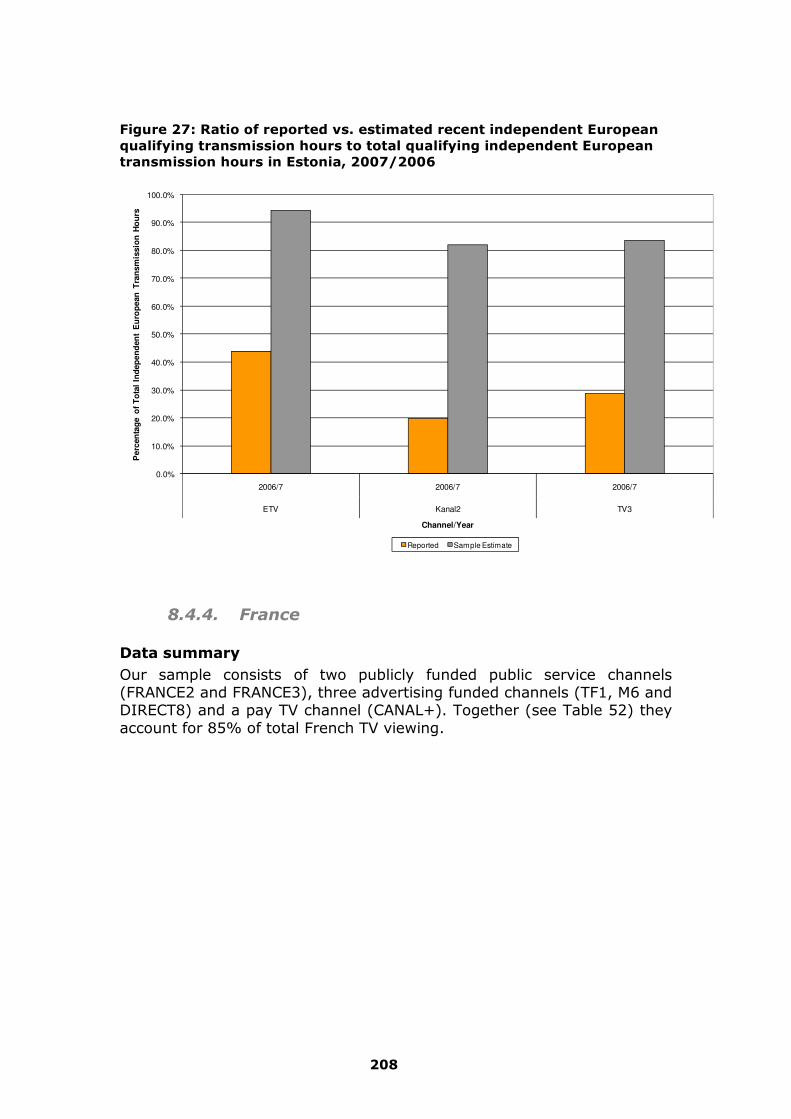
208
Figure 27: Ratio of reported vs. estimated recent independent European qualifying transmission hours to total qualifying independent European transmission hours in Estonia, 2007/2006
0.0%
10.0%
20.0%
30.0%
40.0%
50.0%
60.0%
70.0%
80.0%
90.0%
100.0%
2006/7 2006/7 2006/7
ETV Kanal2 TV3
Perc
en
tag
e o
f T
ota
l In
dep
en
den
t E
uro
pean
Tra
nsm
issio
n H
ou
rs
Channel/Year
Reported Sample Estimate
8.4.4. France
Data summary Our sample consists of two publicly funded public service channels (FRANCE2 and FRANCE3), three advertising funded channels (TF1, M6 and DIRECT8) and a pay TV channel (CANAL+). Together (see Table 52) they account for 85% of total French TV viewing.

209
Table 52: List of channels covered in the 2007 French sample231
Country ChannelLaunch
Year
Share of Viewing (2005)
Revenue Model PlatformAverage Daily Transmission
Hours
Sample Weeks
France TF1 1968 31.80% Ad Terr. 24
France France 2 1975 21.70% Gvt/Ad Terr. 24
France France 3 1975 15.50% Gvt/Ad Terr. 24
France M6 1987 11.90% Ad Terr. 24
France Canal+ 1984 3.90% Subs/Ad Cab/Sat 24
France Direct 8 2005 <5% Ad DTT 24
Standard
Genre analysis Leading free-to-air channels, especially private ones, tend to rely primarily on TV fiction programmes to fill their all-day schedules (see Table 53). This genre indeed accounts for 57.9% of total qualifying transmission hours on TF1, 45.9% on M6, 42.1% on FRANCE3 and 28.2% on FRANCE2. Cinema film is the least common genre on all these channels, ranging between 3.2% and 6% of the total qualifying hours.232
The second most common genre on public channels is factual magazine with FRANCE2 (34.1%) and FRANCE3 (25.4%), followed by documentary (17.6% and 19% respectively). Leading private free-to-air channels put entertainment as their second most important genre (31.2% on M6 and 12.8% on TF1).
In comparison, CANAL+ and DIRECT8 propose more specialised schedules. CANAL+ relies on cinema film for 50.2% of its all-day schedule, while that of DIRECT8 is 66.2% factual magazines.
Channels propose a similar offering in peak-time compared to the all-day schedule, although generally more balanced between the various genres. Another important change in peak-time is that cinema films are generally given a higher share of the schedules. This is especially the case of DIRECT8 (21.6% peak vs. 4.9% all-day) and TF1 (20.3% peak vs. 5.6% all-day), but is also true of FRANCE2 (11% peak vs. 4.8% all-day) and FRANCE3 (11.3% peak vs. 6% all-day).
231 In the ‘Platform’ column, “Terr/Cab/Sat” means “Terrestrial, Cable and Satellite”. “DTT” refers to “Digital Terrestrial.” 232 When we use the term “total qualifying hours” we are referring to transmission hours.

210
Table 53: Genre proportion of total qualifying hours in France, 2007
Channel Genre
Genre
Proportions
of Total
Qualifying
Hours (%)
Genre
Proportions
of Total
Qualifying
Viewer
Hours (%)
Channel Genre
Genre
Proportions
of Total
Qualifying
Hours (%)
Genre
Proportions
of Total
Qualifying
Viewer
Hours (%)
Cinema Film 50.2% 30.0% Cinema Film 43.5% 32.7%Documentary 10.5% 4.6% Documentary 3.8% 1.6%Entertainment 9.4% 24.4% Entertainment 16.6% 27.3%Factual Magazine 14.2% 28.0% Factual Magazine 16.3% 25.4%Fiction 15.6% 13.1% Fiction 19.8% 13.0%Cinema Film 4.9% 26.4% Cinema Film 21.6% 40.8%Documentary 4.3% 2.0% Documentary 0.0% 0.0%Entertainment 10.2% 6.5% Entertainment 10.3% 3.9%Factual Magazine 66.2% 40.7% Factual Magazine 49.3% 29.7%Fiction 14.4% 24.4% Fiction 18.9% 25.6%Cinema Film 4.8% 7.7% Cinema Film 11.0% 12.3%Documentary 17.6% 10.2% Documentary 11.3% 11.5%Entertainment 15.4% 23.7% Entertainment 33.7% 30.3%Factual Magazine 34.1% 22.0% Factual Magazine 11.9% 7.6%Fiction 28.2% 36.4% Fiction 32.1% 38.3%Cinema Film 6.0% 9.4% Cinema Film 11.3% 13.9%Documentary 19.0% 17.3% Documentary 17.4% 16.5%Entertainment 7.5% 4.5% Entertainment 1.3% 0.7%Factual Magazine 25.4% 21.1% Factual Magazine 25.2% 17.0%Fiction 42.1% 47.8% Fiction 44.8% 51.9%Cinema Film 3.2% 4.4% Cinema Film 3.6% 4.1%Documentary 9.6% 14.4% Documentary 13.1% 15.3%Entertainment 31.2% 14.9% Entertainment 20.3% 18.9%Factual Magazine 10.1% 9.7% Factual Magazine 8.4% 9.3%Fiction 45.9% 56.6% Fiction 54.5% 52.4%Cinema Film 5.6% 11.6% Cinema Film 20.3% 23.5%Documentary 17.0% 8.0% Documentary 12.0% 9.9%Entertainment 12.8% 16.7% Entertainment 32.7% 24.0%Factual Magazine 6.7% 5.9% Factual Magazine 2.3% 2.6%Fiction 57.9% 57.8% Fiction 32.7% 40.1%
France 2 France 2
TF1 TF1
France 3 France 3
M6 M6
All Day Peak Time
Canal+ Canal+
Direct 8 Direct 8
Transmission and viewing ratio analysis In 2007, qualifying programmes (that is, all programmes excluding advertising, teleshopping, teletext, news, sport and games) made up an average of 71.9% of the total transmission hours of channels sampled (see Table 54). For the largest free-to-air generalist broadcasters (TF1, FRANCE2, M6 and FRANCE3) the figure was around 65%, while for ‘smaller’ broadcasters (CANAL+ and DIRECT8) the number was around 85%.
When comparing the proportions based on transmission hours to those based on viewing hours, the ratio of qualifying to total hours is nearly identical for CANAL+, DIRECT8 and FRANCE2. For the leading channel TF1 and for the smaller channel FRANCE3, we observe a decrease from around 65% for transmission hours to around 50% for viewing hours. This can be explained by the importance of news and sports programming on these channels, two genres, that do not count as ‘qualifying’ programmes although they attract large audiences, while FRANCE2, another leading channel has a more balanced offer of genres with limited sports contents. M6, on the opposite hand, sees its figure climb from 64.1% (in transmission hours) to 73.9% (in viewing hours), which can be explained by a limited offering of news and sports in general, and a high presence of fiction, entertainment and magazines in peak-time.
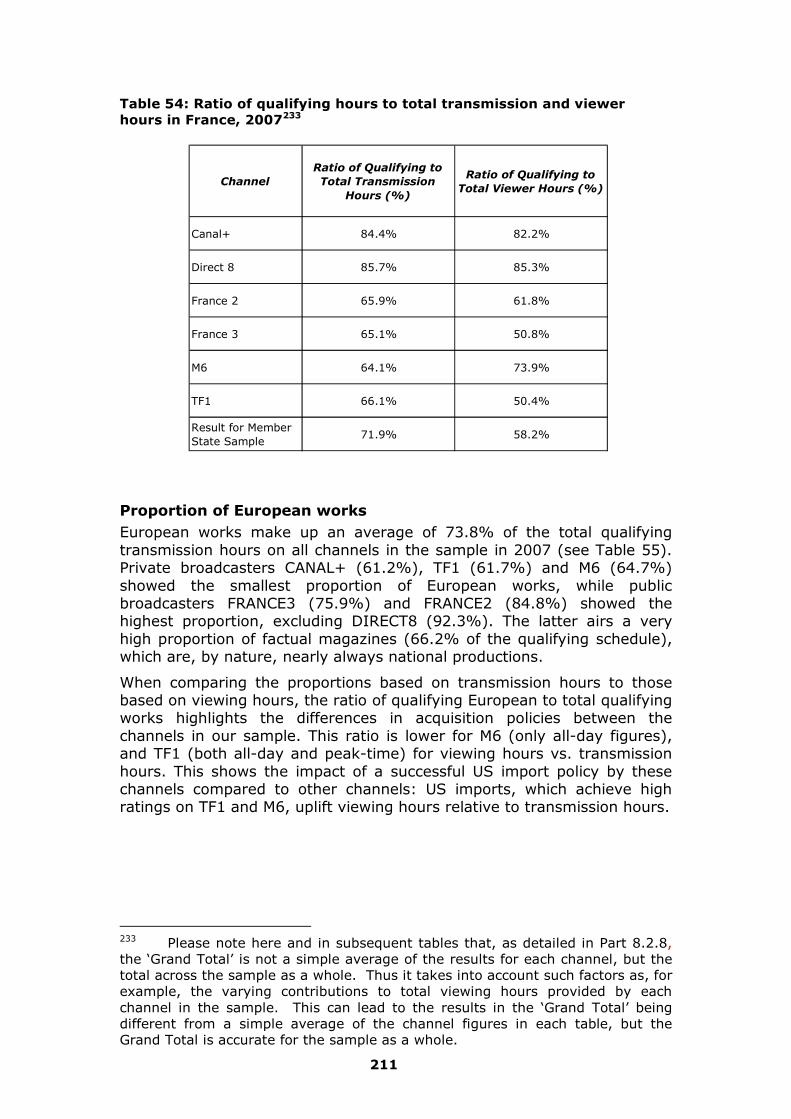
211
Table 54: Ratio of qualifying hours to total transmission and viewer hours in France, 2007233
Channel
Ratio of Qualifying to
Total Transmission
Hours (%)
Ratio of Qualifying to
Total Viewer Hours (%)
Canal+ 84.4% 82.2%
Direct 8 85.7% 85.3%
France 2 65.9% 61.8%
France 3 65.1% 50.8%
M6 64.1% 73.9%
TF1 66.1% 50.4%
Result for Member State Sample
71.9% 58.2%
Proportion of European works European works make up an average of 73.8% of the total qualifying transmission hours on all channels in the sample in 2007 (see Table 55). Private broadcasters CANAL+ (61.2%), TF1 (61.7%) and M6 (64.7%) showed the smallest proportion of European works, while public broadcasters FRANCE3 (75.9%) and FRANCE2 (84.8%) showed the highest proportion, excluding DIRECT8 (92.3%). The latter airs a very high proportion of factual magazines (66.2% of the qualifying schedule), which are, by nature, nearly always national productions.
When comparing the proportions based on transmission hours to those based on viewing hours, the ratio of qualifying European to total qualifying works highlights the differences in acquisition policies between the channels in our sample. This ratio is lower for M6 (only all-day figures), and TF1 (both all-day and peak-time) for viewing hours vs. transmission hours. This shows the impact of a successful US import policy by these channels compared to other channels: US imports, which achieve high ratings on TF1 and M6, uplift viewing hours relative to transmission hours.
233 Please note here and in subsequent tables that, as detailed in Part 8.2.8, the ‘Grand Total’ is not a simple average of the results for each channel, but the total across the sample as a whole. Thus it takes into account such factors as, for example, the varying contributions to total viewing hours provided by each channel in the sample. This can lead to the results in the ‘Grand Total’ being different from a simple average of the channel figures in each table, but the Grand Total is accurate for the sample as a whole.

212
Table 55: Ratio of European qualifying to total qualifying hours in France, 2007
Channel
Ratio of
Qualifying
European to
Total Qualifying
Hours (%)
Ratio of
Qualifying
European to
Total Qualifying
Viewer Hours
(%)
Channel
Ratio of
Qualifying
European to
Total Qualifying
Hours (%)
Ratio of
Qualifying
European to
Total Qualifying
Viewer Hours
(%)
Canal+ 61.2% 70.5% Canal+ 61.4% 68.1%
Direct 8 92.3% 89.6% Direct 8 93.1% 86.0%
France 2 84.8% 84.0% France 2 83.2% 80.1%
France 3 75.9% 79.9% France 3 83.7% 82.2%
M6 64.7% 53.7% M6 55.2% 55.5%
TF1 61.7% 51.4% TF1 72.3% 64.0%
Result for Member State Sample
73.8% 66.0%Result for Member State Sample
75.0% 70.0%
All Day Peak Time
All channels show a similar proportion of European works in peak-time as they do in the rest of their schedule. FRANCE3 (83.7% peak vs. 75.9% all-day) and TF1 (72.3% peak vs. 61.7% all-day) devote more scheduling time to European works in peak-time, whereas M6 does the reverse (55.2% peak vs. 64.7% all-day).
On average, 9% of qualifying works broadcast on the French channels in our sample are non-domestic European works (see Table 56). If we exclude DIRECT8 (0%) and M6 (7.5%), the figure ranges from 10% to 13%. This is consistent with a large broadcasting market that can support indigenous programme production. In peak-time, the ratio of non-domestic qualifying European works is significantly lower (between 2% and 4%), except for FRANCE3 (only slightly higher with 9.9%), and CANAL+ (significantly higher with 17.1%). Non-domestic European programmes represent an even lower proportion of qualifying hours when looking at viewer hours rather than transmission hours, especially in peak-time where it falls to 2.8% of total (compared to 6% when expressed in transmission hours), reflecting the lower appeal of non-domestic programmes to domestic audiences.
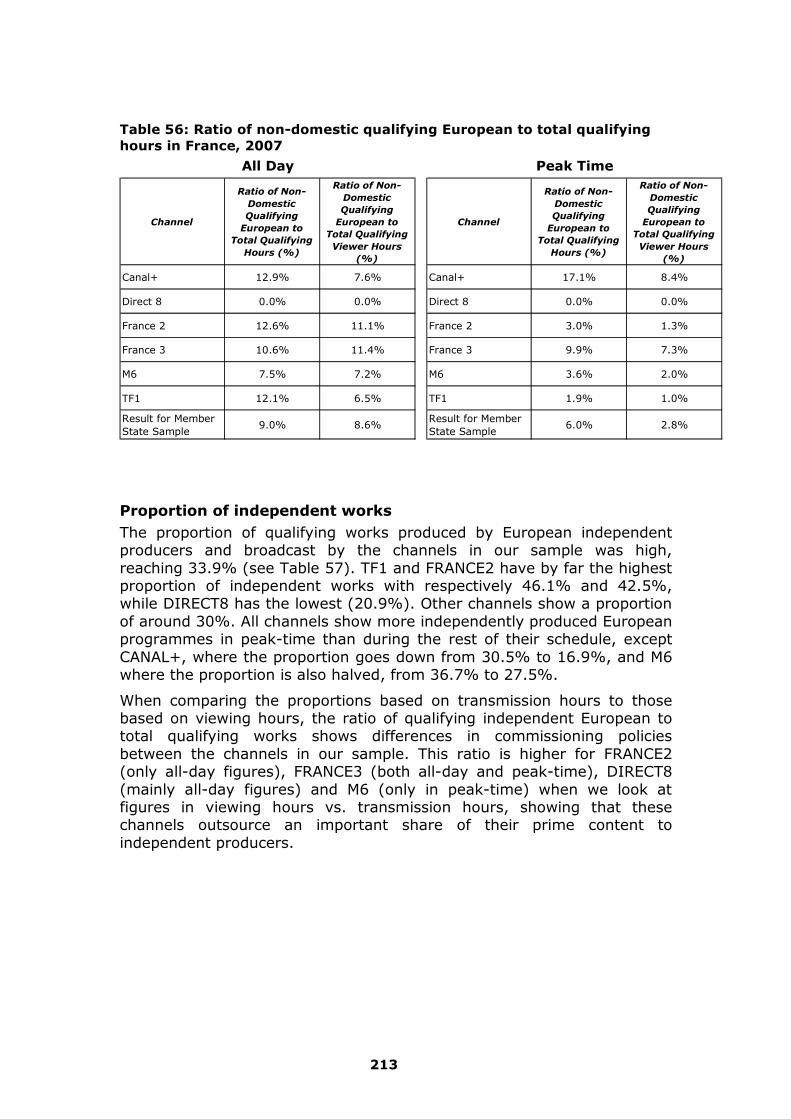
213
Table 56: Ratio of non-domestic qualifying European to total qualifying hours in France, 2007
Channel
Ratio of Non-
Domestic
Qualifying
European to
Total Qualifying
Hours (%)
Ratio of Non-
Domestic
Qualifying
European to
Total Qualifying
Viewer Hours
(%)
Channel
Ratio of Non-
Domestic
Qualifying
European to
Total Qualifying
Hours (%)
Ratio of Non-
Domestic
Qualifying
European to
Total Qualifying
Viewer Hours
(%)
Canal+ 12.9% 7.6% Canal+ 17.1% 8.4%
Direct 8 0.0% 0.0% Direct 8 0.0% 0.0%
France 2 12.6% 11.1% France 2 3.0% 1.3%
France 3 10.6% 11.4% France 3 9.9% 7.3%
M6 7.5% 7.2% M6 3.6% 2.0%
TF1 12.1% 6.5% TF1 1.9% 1.0%
Result for Member State Sample
9.0% 8.6%Result for Member State Sample
6.0% 2.8%
All Day Peak Time
Proportion of independent works The proportion of qualifying works produced by European independent producers and broadcast by the channels in our sample was high, reaching 33.9% (see Table 57). TF1 and FRANCE2 have by far the highest proportion of independent works with respectively 46.1% and 42.5%, while DIRECT8 has the lowest (20.9%). Other channels show a proportion of around 30%. All channels show more independently produced European programmes in peak-time than during the rest of their schedule, except CANAL+, where the proportion goes down from 30.5% to 16.9%, and M6 where the proportion is also halved, from 36.7% to 27.5%.
When comparing the proportions based on transmission hours to those based on viewing hours, the ratio of qualifying independent European to total qualifying works shows differences in commissioning policies between the channels in our sample. This ratio is higher for FRANCE2 (only all-day figures), FRANCE3 (both all-day and peak-time), DIRECT8 (mainly all-day figures) and M6 (only in peak-time) when we look at figures in viewing hours vs. transmission hours, showing that these channels outsource an important share of their prime content to independent producers.

214
Table 57: Ratio of independent European to total qualifying in France, 2007
Channel
Ratio of
Qualifying
Independent
European to
Total Qualifying
Hours (%)
Ratio of
Qualifying
Independent
European to
Total Qualifying
Viewer Hours
(%)
Channel
Ratio of
Qualifying
Independent
European to
Total Qualifying
Hours (%)
Ratio of
Qualifying
Independent
European to
Total Qualifying
Viewer Hours
(%)
Canal+ 30,5% 12,4% Canal+ 16,9% 8,2%
Direct 8 20,9% 35,0% Direct 8 41,4% 43,9%
France 2 42,5% 46,9% France 2 57,6% 51,3%
France 3 32,6% 44,0% France 3 46,6% 54,3%
M6 36,7% 25,8% M6 27,5% 28,3%
TF1 46,1% 36,1% TF1 54,5% 47,1%
Result for Member State Sample
33,9% 36,6%Result for Member State Sample
39,1% 42,7%
All Day Peak Time
Proportion of recent independent works Across the French sample as a whole, 81.4% of all qualifying independent European transmission hours are programmes less than five years old (see Table 58). Leading broadcasters show the highest proportion of recent independent works with M6 reaching 97.9%, CANAL+ reaching 88.9%, TF1 reaching 85.2% and FRANCE2 reaching 79.7%. FRANCE3 and DIRECT8 rely more on older reruns than their competitors (recent productions represent 69.7% and 59.2% respectively of all European independent productions). In peak-time hours, the proportion of recent works reaches 100% for all channels. However, DIRECT8, a newcomer with lower ratings and programme budget, relies more heavily on archive programmes for an important part of its independent works.
Looking at the figures for viewing hours compared to figures for transmission hours, we can see the audience appeal of fresh productions compared to productions older than five years. Indeed, the figures in viewing hours are higher for all broadcasters, with the highest increase for FRANCE3 whose all-day proportion goes from 69.7% if we look at transmission hours, up to 83.2% if we look at viewer hours. The only exception is DIRECT8, showing that this recent channel is comparatively more attractive to viewers for its fiction classics than for its recent productions.
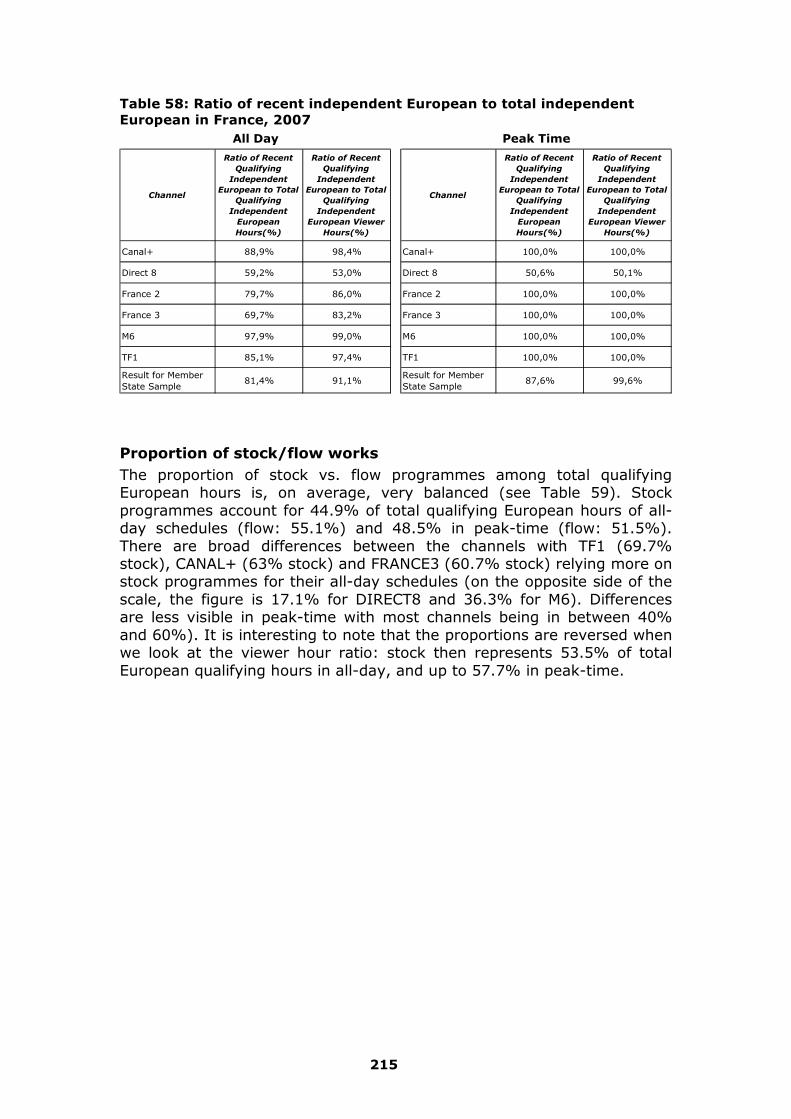
215
Table 58: Ratio of recent independent European to total independent European in France, 2007
Channel
Ratio of Recent
Qualifying
Independent
European to Total
Qualifying
Independent
European
Hours(%)
Ratio of Recent
Qualifying
Independent
European to Total
Qualifying
Independent
European Viewer
Hours(%)
Channel
Ratio of Recent
Qualifying
Independent
European to Total
Qualifying
Independent
European
Hours(%)
Ratio of Recent
Qualifying
Independent
European to Total
Qualifying
Independent
European Viewer
Hours(%)
Canal+ 88,9% 98,4% Canal+ 100,0% 100,0%
Direct 8 59,2% 53,0% Direct 8 50,6% 50,1%
France 2 79,7% 86,0% France 2 100,0% 100,0%
France 3 69,7% 83,2% France 3 100,0% 100,0%
M6 97,9% 99,0% M6 100,0% 100,0%
TF1 85,1% 97,4% TF1 100,0% 100,0%
Result for Member State Sample
81,4% 91,1%Result for Member State Sample
87,6% 99,6%
All Day Peak Time
Proportion of stock/flow works The proportion of stock vs. flow programmes among total qualifying European hours is, on average, very balanced (see Table 59). Stock programmes account for 44.9% of total qualifying European hours of all-day schedules (flow: 55.1%) and 48.5% in peak-time (flow: 51.5%). There are broad differences between the channels with TF1 (69.7% stock), CANAL+ (63% stock) and FRANCE3 (60.7% stock) relying more on stock programmes for their all-day schedules (on the opposite side of the scale, the figure is 17.1% for DIRECT8 and 36.3% for M6). Differences are less visible in peak-time with most channels being in between 40% and 60%). It is interesting to note that the proportions are reversed when we look at the viewer hour ratio: stock then represents 53.5% of total European qualifying hours in all-day, and up to 57.7% in peak-time.

216
Table 59: Ratio of European stock/flow to total European in France, 2007
Channel
Qualifying
European
Stock to
Total
Qualifying
European
Hours (%)
Qualifying
European
Flow to Total
Qualifying
European
Hours (%)
Total
(%)Channel
Qualifying
European
Stock to
Total
Qualifying
European
Hours (%)
Qualifying
European
Flow to Total
Qualifying
European
Hours (%)
Total
(%)
Canal+ 63.0% 37.0% 100% Canal+ 50.9% 49.1% 100%
Direct 8 17.1% 82.9% 100% Direct 8 36.1% 63.9% 100%
France 2 42.3% 57.7% 100% France 2 49.7% 50.3% 100%
France 3 60.7% 39.3% 100% France 3 68.4% 31.6% 100%
M6 36.3% 63.7% 100% M6 48.1% 51.9% 100%
TF1 69.7% 30.3% 100% TF1 51.7% 48.3% 100%
Result for Member State Sample
44.9% 55.1% 100%Result for Member State Sample
48.5% 51.5% 100%
Channel
Qualifying
European
Stock to
Total
Qualifying
European
Viewer Hours
(%)
Qualifying
European
Flow to Total
Qualifying
European
Viewer Hours
(%)
Total
(%)Channel
Qualifying
European
Stock to
Total
Qualifying
European
Viewer Hours
(%)
Qualifying
European
Flow to Total
Qualifying
European
Viewer Hours
(%)
Total
(%)
Canal+ 26.3% 73.7% 100% Canal+ 23.2% 76.8% 100%
Direct 8 47.3% 52.7% 100% Direct 8 61.0% 39.0% 100%
France 2 47.6% 52.4% 100% France 2 56.2% 43.8% 100%
France 3 68.4% 31.6% 100% France 3 78.5% 21.5% 100%
M6 54.2% 45.8% 100% M6 49.2% 50.8% 100%
TF1 56.3% 43.7% 100% TF1 58.4% 41.6% 100%
Result for Member State Sample
53.5% 46.5% 100%Result for Member State Sample
57.7% 42.3% 100%
All Day Peak Time
All Day Peak Time
Comparison with past data and declarations The ratio of qualifying European works to total qualifying hours provided by our 2007 estimates are in line with the trends estimated in the 2005 Study (see Figure 28). It shows that public channels FRANCE2 and FRANCE3, and to a lesser extent CANAL+ continue to increase their proportion of European works, while TF1 and M6 are in slight decline. Comparing data reported by the Member State to our sample estimates shows a strong consistency as far as the ratio of European works is concerned: here, differences between reported data and sample estimates are most of the time below 2-3%.

217
Figure 28: Ratio of reported vs. estimated European qualifying transmission hours to total qualifying transmission hours in France, 2007/2006
0%
10%
20%
30%
40%
50%
60%
70%
80%
90%
100%1993
1996
1999
2002
2006/7
1993
1996
1999
2002
2006/7
1993
1996
1999
2002
2006/7
1993
1996
1999
2002
2006/7
1993
1996
1999
2002
2006/7
1993
1996
1999
2002
2006/7
Canal+ Direct 8 France 2 France 3 M6 TF1
Channel/Year
(Note: Where there is no column for a particular channel/year, data is unavailable)
Perc
en
tag
e o
f T
ota
l Q
ualify
ing
Tra
nsm
iss
ion
Ho
urs
Reported Sample Estimate
The 2007 ratio of qualifying independent European works to total qualifying hours is also consistent with past findings (see Figure 29). On the whole, we observe a general stability in the figures, with a possible long-term decline for TF1 and CANAL+. Comparing data for independent productions shows that our estimates are approximately twice as high as the declarations (nearly 3 times for TF1). This can in part be explained by the fact that the French regulation uses a stricter definition than the one we have designed to be used consistently across all the markets. However, it should also be noted that the reported data in the 8th communication on independent productions for France is calculated on the basis of the channel’s revenues (previous year’s turnover) for these channels, whereas our sample is calculated on the basis of transmission hours.

218
Figure 29: Ratio of reported vs. estimated independent European qualifying transmission hours to total qualifying transmission hours in France, 2007/2006
0%
10%
20%
30%
40%
50%
60%1993
1996
1999
2002
2006/7
1993
1996
1999
2002
2006/7
1993
1996
1999
2002
2006/7
1993
1996
1999
2002
2006/7
1993
1996
1999
2002
2006/7
1993
1996
1999
2002
2006/7
Canal+ Direct 8 France 2 France 3 M6 TF1
Perc
en
tag
e o
f T
ota
l Q
uali
fyin
g T
ran
sm
issio
n H
ou
rs
Channel/Year (Note: Where there is no column for a particular channel/year, data is unavailable)
Reported Sample Estimate
The 2007 ratio of recent qualifying independent European works to total qualifying hours is the most difficult to estimate and thus the most unstable year after year (see Figure 30). On the whole, estimated data are stable over time for CANAL+ and FRANCE3, on the rise for TF1, FRANCE2 and M6. The rise on TF1 and FRANCE2 comes after a relative decline in 1999-2002.

219
Figure 30: Ratio of reported vs. estimated recent independent European qualifying transmission hours to total independent European transmission hours in France, 2007/2006
0%
10%
20%
30%
40%
50%
60%
70%
80%
90%
100%1993
1996
1999
2002
2006/7
1993
1996
1999
2002
2006/7
1993
1996
1999
2002
2006/7
1993
1996
1999
2002
2006/7
1993
1996
1999
2002
2006/7
1993
1996
1999
2002
2006/7
Canal+ Direct 8 France 2 France 3 M6 TF1
Perc
en
tag
e o
f T
ota
l In
dep
en
den
t E
uro
pean
Tra
nsm
issio
n H
ou
rs
Channel/Year (Note: Where there is no column for a particular channel/year, data is unavailable)
Reported Sample Estimate
8.4.5. Germany
Data summary Our sample consists of the main two public service channels (ARD1 and ZDF), the two leading private commercial channel channels (RTL, SAT.1) and two other key channels from the RTL and ProSiebenSat1 portfolios, with VOX and PRO7 respectively. Together (see Table 60) they account for 63.8% of total German TV viewing.

220
Table 60: List of channels covered in the 2007 German sample234
Country ChannelLaunch
Year
Share of Viewing (2005)
Revenue Model PlatformAverage Daily Transmission
Hours
Sample Weeks
Germany ARD 1 1954 14.40% Gvt/Ad Terr./C/S 24
Germany ZDF 1963 14.10% Gvt/Ad Terr./C/S 24
Germany Sat 1 1985 10.50% Ad Terr./C/S 24
Germany RTL 1984 14.00% Ad Terr./C/S 24
Germany Pro 7 1989 7.00% Ad Terr./C/S 24
Germany Vox 1993 3.80% Ad Terr./C/S 24
Standard
Genre analysis As shown in Table 61, private free-to-air leader RTL offers a very balanced mix of genres, other than a low 5.7% for cinema films: the remaining four genres (documentary, entertainment, factual magazines and TV fiction) represent in-between 20-25% of total qualifying genres each. Sister channel VOX’s grid looks fairly similar, with a greater emphasis on documentaries and TV fiction (74.9% in total). SAT.1 offers a mix very similar to that of its direct competitor RTL, except it airs more factual magazines (30.1%) and less entertainment (12.8%). PRO7 also has a balanced mix of genres although it historically offers a large amount of cinema films (21.9%), at the expense of documentaries (6.9%).
In peak-time, all private channels put a greater emphasis on cinema films (up to 30.1% on PRO7 and 14.7% on SAT.1) and TV fiction (35.2% on RTL, 30.8% on SAT.1 and 29.5% on PRO7), except VOX, which puts increased emphasis on entertainment and documentaries. In peak-time, TV fiction accounts for 1/3 of the viewing for these four private channels. Together with cinema viewing, fiction content accounts for 63.7% of PRO7 viewing and 51.5% on SAT.1.
The heart of ARD1 and ZDF’s peak-time grids is TV fiction: this genre represents around 43% of their total qualifying hours and around 52% of their viewing. If you add their second most important genre, factual magazines, these numbers go up to 70% of hours and 73% of viewing. Across the entire day, ZDF puts the emphasis on factual magazines (45% of the grid) while ARD1 offers more documentaries (28.6%) and cinema (15.2%).
234 In the ‘Platform’ column, “Terr/C/S” means “Terrestrial, Cable and Satellite”.

221
Table 61: Genre proportion of total qualifying hours in Germany, 2007
Channel Genre
Genre
Proportions
of Total
Qualifying
Hours (%)
Genre
Proportions
of Total
Qualifying
Viewer
Hours (%)
Channel Genre
Genre
Proportions
of Total
Qualifying
Hours (%)
Genre
Proportions
of Total
Qualifying
Viewer
Hours (%)
Cinema Film 15.2% 7.9% Cinema Film 3.1% 5.1%Documentary 28.6% 17.6% Documentary 7.7% 5.7%Entertainment 8.1% 12.8% Entertainment 15.6% 14.6%Factual Magazine 17.9% 15.2% Factual Magazine 24.1% 17.1%Fiction 30.2% 46.5% Fiction 49.5% 57.5%Cinema Film 21.9% 26.6% Cinema Film 30.1% 35.6%Documentary 6.9% 5.5% Documentary 3.8% 2.0%Entertainment 25.3% 20.7% Entertainment 16.9% 15.2%Factual Magazine 26.3% 24.4% Factual Magazine 19.6% 19.1%Fiction 19.5% 22.9% Fiction 29.5% 28.1%Cinema Film 5.7% 6.1% Cinema Film 8.5% 9.1%Documentary 23.3% 18.7% Documentary 16.9% 16.1%Entertainment 24.0% 27.9% Entertainment 22.4% 24.0%Factual Magazine 21.7% 20.0% Factual Magazine 16.9% 13.3%Fiction 25.2% 27.4% Fiction 35.2% 37.5%Cinema Film 6.7% 7.2% Cinema Film 14.7% 14.1%Documentary 24.9% 35.1% Documentary 19.8% 19.9%Entertainment 12.8% 15.9% Entertainment 18.6% 17.0%Factual Magazine 30.1% 20.8% Factual Magazine 16.0% 11.6%Fiction 25.5% 21.0% Fiction 30.8% 37.4%Cinema Film 7.0% 4.4% Cinema Film 7.4% 4.5%Documentary 30.8% 33.8% Documentary 26.8% 23.6%Entertainment 12.4% 25.1% Entertainment 27.0% 37.6%Factual Magazine 15.7% 10.7% Factual Magazine 16.2% 7.7%Fiction 34.1% 26.0% Fiction 22.6% 26.6%Cinema Film 11.0% 9.5% Cinema Film 13.7% 11.0%Documentary 10.6% 9.3% Documentary 8.7% 7.4%Entertainment 11.1% 10.2% Entertainment 11.5% 10.0%Factual Magazine 45.0% 32.4% Factual Magazine 27.9% 24.8%Fiction 22.3% 38.5% Fiction 38.2% 46.8%
PRO 7 PRO 7
RTL RTL
All Day Peak Time
ARD ARD
ZDF ZDF
SAT.1 SAT.1
VOX VOX
Transmission and viewing ratio analysis In 2007, qualifying programmes (that is, all programmes excluding advertising, teleshopping, teletext, news, sport and games) made up 74.5% of the total transmission hours of all channels sampled (see Table 62). The two public service broadcasters ARD1 and ZDF have the highest figures, with 81.2% and 80.2% respectively, while commercial channels are around 70-75%.
The picture is different when we look at the ratio of qualifying viewer hours. For example, qualifying genres contribute towards 68.9% of ARD’s viewer hours, showing the higher attractiveness of ARD’s information, sports and game shows. However, ZDF only goes down to 75.3% of viewer hours. On the other hand, VOX and PRO7 see their figures jump up to 81.8% and 77.3% respectively, reflecting the success of VOX’s entertainment shows, and PRO7’s cinema and fiction.

222
Table 62: Ratio of qualifying hours to total transmission and viewer hours in Germany, 2007
Channel
Ratio of Qualifying to
Total Transmission
Hours (%)
Ratio of Qualifying to
Total Viewer Hours (%)
ARD 81.2% 68.9%
PRO 7 73.2% 77.3%
RTL 70.0% 70.1%
SAT.1 66.5% 72.4%
VOX 75.9% 81.8%
ZDF 80.2% 75.3%
Result for Member State Sample
74.5% 73.2%
Proportion of European works European works make up 78.2% of the total qualifying transmission hours across all channels in the sample in 2007 (see Table 63). Public broadcasters ARD1 and ZDF are the highest with 91.9% and 90.2% respectively. Even more strikingly, European works account for 100% of both transmission and viewer hours in peak-time on both ARD1 and ZDF during the 2 weeks selected for this sample.
The channels with the lowest proportion of European works in their schedules are VOX (59.8%) and PRO7 (60.9%). PRO7 has 43.4% of its peak-time schedule made up of European works, and even less for its peak-time viewing (38.7%) showing that PRO7’s success is largely based on foreign acquisitions in peak-time.
RTL, SAT.1 and VOX have around 70-80% of their qualifying transmission and viewer hours being European works during peak-time. The figures for RTL and SAT.1 are in the region of 85% for all-day schedules.
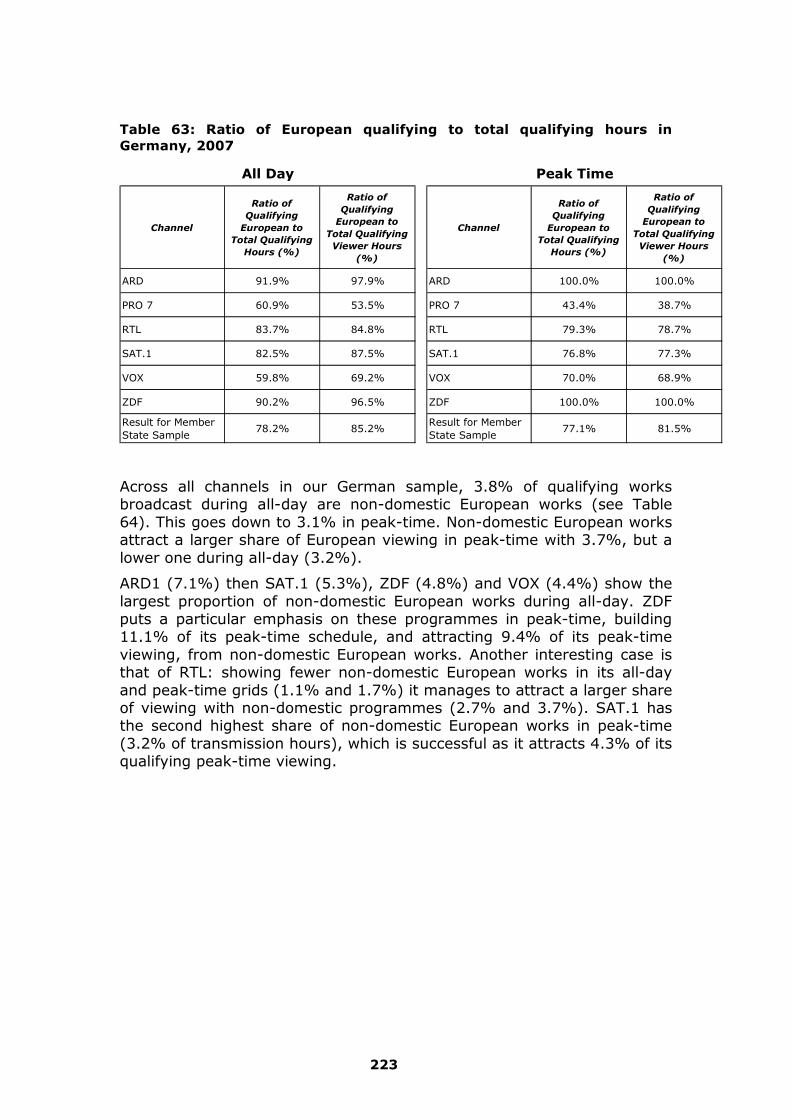
223
Table 63: Ratio of European qualifying to total qualifying hours in Germany, 2007
Channel
Ratio of
Qualifying
European to
Total Qualifying
Hours (%)
Ratio of
Qualifying
European to
Total Qualifying
Viewer Hours
(%)
Channel
Ratio of
Qualifying
European to
Total Qualifying
Hours (%)
Ratio of
Qualifying
European to
Total Qualifying
Viewer Hours
(%)
ARD 91.9% 97.9% ARD 100.0% 100.0%
PRO 7 60.9% 53.5% PRO 7 43.4% 38.7%
RTL 83.7% 84.8% RTL 79.3% 78.7%
SAT.1 82.5% 87.5% SAT.1 76.8% 77.3%
VOX 59.8% 69.2% VOX 70.0% 68.9%
ZDF 90.2% 96.5% ZDF 100.0% 100.0%
Result for Member State Sample
78.2% 85.2%Result for Member State Sample
77.1% 81.5%
All Day Peak Time
Across all channels in our German sample, 3.8% of qualifying works broadcast during all-day are non-domestic European works (see Table 64). This goes down to 3.1% in peak-time. Non-domestic European works attract a larger share of European viewing in peak-time with 3.7%, but a lower one during all-day (3.2%).
ARD1 (7.1%) then SAT.1 (5.3%), ZDF (4.8%) and VOX (4.4%) show the largest proportion of non-domestic European works during all-day. ZDF puts a particular emphasis on these programmes in peak-time, building 11.1% of its peak-time schedule, and attracting 9.4% of its peak-time viewing, from non-domestic European works. Another interesting case is that of RTL: showing fewer non-domestic European works in its all-day and peak-time grids (1.1% and 1.7%) it manages to attract a larger share of viewing with non-domestic programmes (2.7% and 3.7%). SAT.1 has the second highest share of non-domestic European works in peak-time (3.2% of transmission hours), which is successful as it attracts 4.3% of its qualifying peak-time viewing.
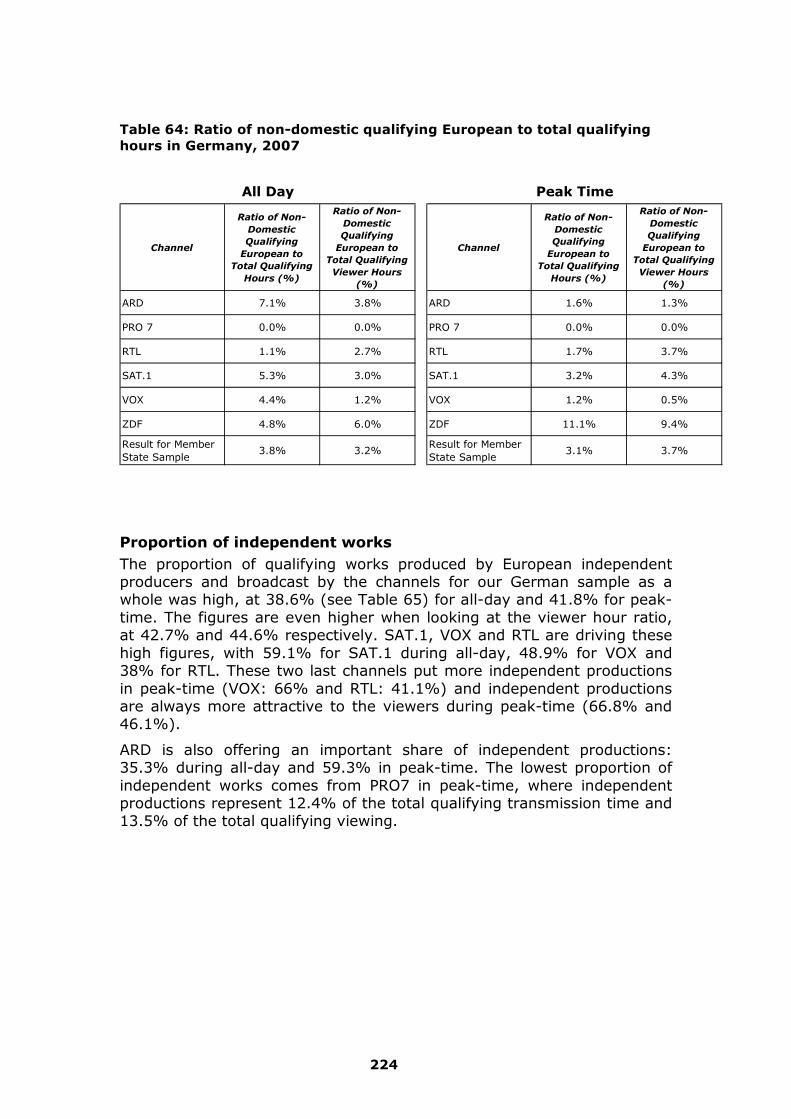
224
Table 64: Ratio of non-domestic qualifying European to total qualifying hours in Germany, 2007
Channel
Ratio of Non-
Domestic
Qualifying
European to
Total Qualifying
Hours (%)
Ratio of Non-
Domestic
Qualifying
European to
Total Qualifying
Viewer Hours
(%)
Channel
Ratio of Non-
Domestic
Qualifying
European to
Total Qualifying
Hours (%)
Ratio of Non-
Domestic
Qualifying
European to
Total Qualifying
Viewer Hours
(%)
ARD 7.1% 3.8% ARD 1.6% 1.3%
PRO 7 0.0% 0.0% PRO 7 0.0% 0.0%
RTL 1.1% 2.7% RTL 1.7% 3.7%
SAT.1 5.3% 3.0% SAT.1 3.2% 4.3%
VOX 4.4% 1.2% VOX 1.2% 0.5%
ZDF 4.8% 6.0% ZDF 11.1% 9.4%
Result for Member State Sample
3.8% 3.2%Result for Member State Sample
3.1% 3.7%
All Day Peak Time
Proportion of independent works The proportion of qualifying works produced by European independent producers and broadcast by the channels for our German sample as a whole was high, at 38.6% (see Table 65) for all-day and 41.8% for peak-time. The figures are even higher when looking at the viewer hour ratio, at 42.7% and 44.6% respectively. SAT.1, VOX and RTL are driving these high figures, with 59.1% for SAT.1 during all-day, 48.9% for VOX and 38% for RTL. These two last channels put more independent productions in peak-time (VOX: 66% and RTL: 41.1%) and independent productions are always more attractive to the viewers during peak-time (66.8% and 46.1%).
ARD is also offering an important share of independent productions: 35.3% during all-day and 59.3% in peak-time. The lowest proportion of independent works comes from PRO7 in peak-time, where independent productions represent 12.4% of the total qualifying transmission time and 13.5% of the total qualifying viewing.
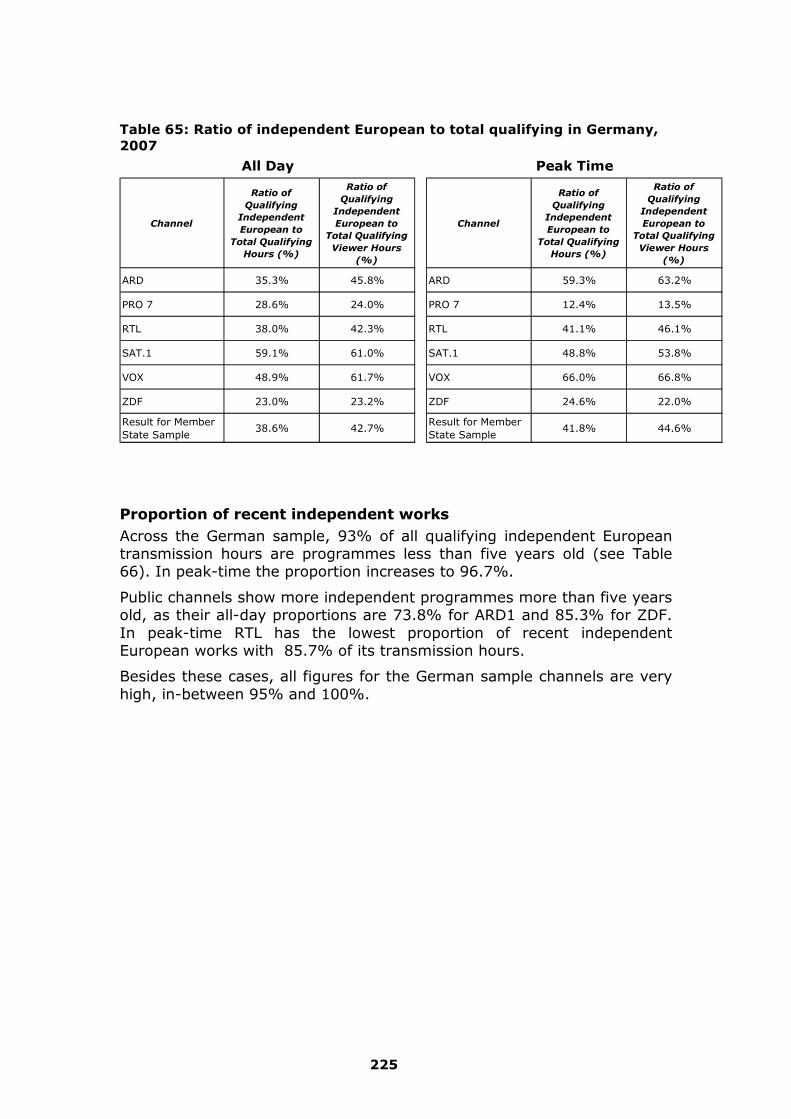
225
Table 65: Ratio of independent European to total qualifying in Germany, 2007
Channel
Ratio of
Qualifying
Independent
European to
Total Qualifying
Hours (%)
Ratio of
Qualifying
Independent
European to
Total Qualifying
Viewer Hours
(%)
Channel
Ratio of
Qualifying
Independent
European to
Total Qualifying
Hours (%)
Ratio of
Qualifying
Independent
European to
Total Qualifying
Viewer Hours
(%)
ARD 35.3% 45.8% ARD 59.3% 63.2%
PRO 7 28.6% 24.0% PRO 7 12.4% 13.5%
RTL 38.0% 42.3% RTL 41.1% 46.1%
SAT.1 59.1% 61.0% SAT.1 48.8% 53.8%
VOX 48.9% 61.7% VOX 66.0% 66.8%
ZDF 23.0% 23.2% ZDF 24.6% 22.0%
Result for Member State Sample
38.6% 42.7%Result for Member State Sample
41.8% 44.6%
All Day Peak Time
Proportion of recent independent works Across the German sample, 93% of all qualifying independent European transmission hours are programmes less than five years old (see Table 66). In peak-time the proportion increases to 96.7%.
Public channels show more independent programmes more than five years old, as their all-day proportions are 73.8% for ARD1 and 85.3% for ZDF. In peak-time RTL has the lowest proportion of recent independent European works with 85.7% of its transmission hours.
Besides these cases, all figures for the German sample channels are very high, in-between 95% and 100%.

226
Table 66: Ratio of recent independent European to total independent European in Germany, 2007
Channel
Ratio of Recent
Qualifying
Independent
European to Total
Qualifying
Independent
European
Hours(%)
Ratio of Recent
Qualifying
Independent
European to Total
Qualifying
Independent
European Viewer
Hours(%)
Channel
Ratio of Recent
Qualifying
Independent
European to Total
Qualifying
Independent
European
Hours(%)
Ratio of Recent
Qualifying
Independent
European to Total
Qualifying
Independent
European Viewer
Hours(%)
ARD 73.8% 86.4% ARD 94.2% 92.4%
PRO 7 100.0% 100.0% PRO 7 100.0% 100.0%
RTL 95.0% 89.7% RTL 85.7% 82.2%
SAT.1 97.1% 99.5% SAT.1 100.0% 100.0%
VOX 100.0% 100.0% VOX 100.0% 100.0%
ZDF 85.3% 92.2% ZDF 100.0% 100.0%
Result for Member State Sample
93.0% 94.0%Result for Member State Sample
96.7% 94.3%
All Day Peak Time
Proportion of stock/flow works The proportion of stock vs. flow programmes among total qualifying European hours is, across the German sample, very balanced (see Table 67). Stock programmes account for 47.9% of total qualifying European hours for all-day schedules (flow: 52.1%) and 50.9% in peak-time (flow: 49.1%). Channels look very much alike, except ARD1, which offers more European stock (72.7% during all-day and 65.8% in peak-time), and PRO7, which offers more flow (83.8% during all-day and 84.2% in peak-time). In total, European stock programming does slightly better with the audience in Germany (55.4% of qualifying viewer hours during all-day, and 58.7% in peak-time) than European flow.

227
Table 67: Ratio of European stock/flow to total European in Germany, 2007
Channel
Qualifying
European
Stock to
Total
Qualifying
European
Hours (%)
Qualifying
European
Flow to Total
Qualifying
European
Hours (%)
Total
(%)Channel
Qualifying
European
Stock to
Total
Qualifying
European
Hours (%)
Qualifying
European
Flow to Total
Qualifying
European
Hours (%)
Total
(%)
ARD 72.7% 27.3% 100% ARD 65.8% 34.2% 100%
PRO 7 16.2% 83.8% 100% PRO 7 15.8% 84.2% 100%
RTL 47.7% 52.3% 100% RTL 56.2% 43.8% 100%
SAT.1 48.2% 51.8% 100% SAT.1 55.6% 44.4% 100%
VOX 56.1% 43.9% 100% VOX 38.3% 61.7% 100%
ZDF 36.8% 63.2% 100% ZDF 57.6% 42.4% 100%
Result for Member State Sample
47.9% 52.1% 100%Result for Member State Sample
50.9% 49.1% 100%
Channel
Qualifying
European
Stock to
Total
Qualifying
European
Viewer Hours
(%)
Qualifying
European
Flow to Total
Qualifying
European
Viewer Hours
(%)
Total
(%)Channel
Qualifying
European
Stock to
Total
Qualifying
European
Viewer Hours
(%)
Qualifying
European
Flow to Total
Qualifying
European
Viewer Hours
(%)
Total
(%)
ARD 73.5% 26.5% 100% ARD 72.5% 27.5% 100%
PRO 7 16.3% 83.7% 100% PRO 7 11.2% 88.8% 100%
RTL 49.3% 50.7% 100% RTL 61.5% 38.5% 100%
SAT.1 58.3% 41.7% 100% SAT.1 63.6% 36.4% 100%
VOX 48.6% 51.4% 100% VOX 34.3% 65.7% 100%
ZDF 53.5% 46.5% 100% ZDF 61.8% 38.2% 100%
Result for Member State Sample
55.4% 44.6% 100%Result for Member State Sample
58.7% 41.3% 100%
All Day Peak Time
All Day Peak Time

228
Comparison with past data and declarations The ratio of qualifying European works to total qualifying hours provided by our 2007 estimates are very consistent with the reported data and the trends estimated in the 2005 Study (see Figure 31). While public channels ARD1 and ZDF offer the highest proportions of European works and seem to have reached a ceiling, private channels in the sample (RTL, VOX, SAT.1) continue to increase their proportion of European works, with RTL and SAT.1 now being nearly at the same level as the two public leaders.
Figure 31: Ratio of reported vs. estimated European qualifying transmission hours to total qualifying transmission hours in Germany, 2007/2006
0.0%
10.0%
20.0%
30.0%
40.0%
50.0%
60.0%
70.0%
80.0%
90.0%
100.0%
1993
1996
1999
2002
2006/7
1993
1996
1999
2002
2006/7
1993
1996
1999
2002
2006/7
1993
1996
1999
2002
2006/7
1993
1996
1999
2002
2006/7
1993
1996
1999
2002
2006/7
ARD1 PRO7 RTL SAT1 VOX ZDF
Perc
en
tag
e o
f T
ota
l Q
uali
fyin
g T
ran
sm
issio
n H
ou
rs
Channel/Year(Note: Where there is no column for a particular channel/year, data is unavailable)
Reported Sample Estimate
On the whole, the ratio of qualifying independent European works to total qualifying hours is also consistent with past findings and between sample and reported data (see Figure 32). It confirms that the proportion of independent European works is increasing on all channels over time, and is higher on private channels that on public channels. Also worth noting is that while reported data are significantly higher than sample estimates on private channels, they are very similar on public channels. As there is no legal definition of an independent producer in Germany, it is possible that private channels use a more flexible definition than the pan-European definition created by the Consortium for this study.

229
Figure 32: Ratio of reported vs. estimated independent European qualifying transmission hours to total qualifying transmission hours in Germany, 2007/2006
0.0%
10.0%
20.0%
30.0%
40.0%
50.0%
60.0%
70.0%
80.0%
90.0%
100.0%
1993
1996
1999
2002
2006/7
1993
1996
1999
2002
2006/7
1993
1996
1999
2002
2006/7
1993
1996
1999
2002
2006/7
1993
1996
1999
2002
2006/7
1993
1996
1999
2002
2006/7
ARD1 PRO7 RTL SAT1 VOX ZDF
Perc
en
tag
e o
f T
ota
l Q
uali
fyin
g T
ran
sm
issio
n H
ou
rs
Channel/Year(Note: Where there is no column for a particular channel/year, data is unavailable)
Reported Sample Estimate
The 2007 ratio of qualifying recent independent European works to total independent European qualifying hours in Germany is relatively consistent over time (see Figure 33). On the whole, the proportion of recent independent Productions is rising on all channels year after year, and was very similar between the channels in our sample in 2006/2007.
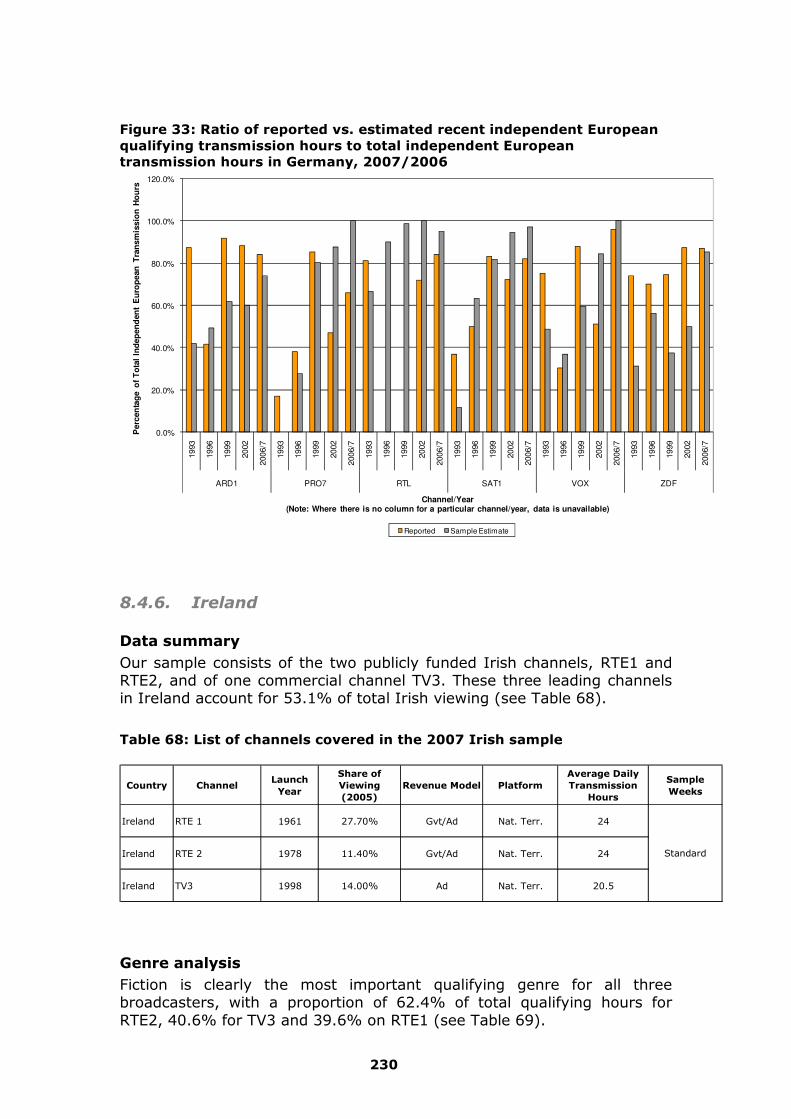
230
Figure 33: Ratio of reported vs. estimated recent independent European qualifying transmission hours to total independent European transmission hours in Germany, 2007/2006
0.0%
20.0%
40.0%
60.0%
80.0%
100.0%
120.0%
1993
1996
1999
2002
2006/7
1993
1996
1999
2002
2006/7
1993
1996
1999
2002
2006/7
1993
1996
1999
2002
2006/7
1993
1996
1999
2002
2006/7
1993
1996
1999
2002
2006/7
ARD1 PRO7 RTL SAT1 VOX ZDF
Perc
en
tag
e o
f T
ota
l In
dep
en
den
t E
uro
pean
Tra
nsm
issio
n H
ou
rs
Channel/Year(Note: Where there is no column for a particular channel/year, data is unavailable)
Reported Sample Estimate
8.4.6. Ireland
Data summary Our sample consists of the two publicly funded Irish channels, RTE1 and RTE2, and of one commercial channel TV3. These three leading channels in Ireland account for 53.1% of total Irish viewing (see Table 68).
Table 68: List of channels covered in the 2007 Irish sample
Country ChannelLaunch
Year
Share of Viewing (2005)
Revenue Model PlatformAverage Daily Transmission
Hours
Sample Weeks
Ireland RTE 1 1961 27.70% Gvt/Ad Nat. Terr. 24
Ireland RTE 2 1978 11.40% Gvt/Ad Nat. Terr. 24
Ireland TV3 1998 14.00% Ad Nat. Terr. 20.5
Standard
Genre analysis Fiction is clearly the most important qualifying genre for all three broadcasters, with a proportion of 62.4% of total qualifying hours for RTE2, 40.6% for TV3 and 39.6% on RTE1 (see Table 69).

231
Factual magazines, entertainment and cinema are the most important genres after fiction. Factual magazines account for 26.8% of all-day qualifying programmes on TV3, and 15% on RTE1. Entertainment accounts for 19.7% of all-day qualifying programming on TV3, 20.3% on RTE1 and 10.9% on RTE2. Lastly, in the Irish schedules, documentary is the least important genre, with a proportion of only 1.5% of all-day qualifying programming on TV3, 9.6% on RTE1 and 7.7% on RTE2.
Proportions are quite different in peak-time. While fiction remains the top genre on all three channels in our sample especially TV3 (43.6%) and RTE2 (43%), documentary is a much more important genre on both public channels RTE1 (22.6%) and RTE2 (23%), and cinema film also increases its share of qualifying transmission hours on TV3 (23%) and RTE2 (20.8%).
These scheduling strategies are reflected in the proportion of qualifying viewer hours acquired by each of the various genres. Fiction accounts for 44.1% of all-day viewer hours on TV3, 33.9% on RTE1 and 57% on RTE2. On TV3, the most important genre after fiction in terms of viewer hours is entertainment (29.7% for all-day). Viewer hours are more balanced on public channels in the all-day schedules, where entertainment is the second most important genre on RTE1 (22.9%), while cinema is the second most important genre on RTE2 (16.6%).
Table 69: Genre proportion of total qualifying hours in Ireland, 2007
Channel Genre
Genre
Proportions
of Total
Qualifying
Hours (%)
Genre
Proportions
of Total
Qualifying
Viewer
Hours (%)
Channel Genre
Genre
Proportions
of Total
Qualifying
Hours (%)
Genre
Proportions
of Total
Qualifying
Viewer
Hours (%)
Cinema Film 15.5% 12.3% Cinema Film 11.8% 10.8%Documentary 9.6% 15.7% Documentary 22.6% 19.7%Entertainment 20.3% 22.9% Entertainment 20.2% 23.7%Factual Magazine 15.0% 15.2% Factual Magazine 17.6% 14.9%Fiction 39.6% 33.9% Fiction 27.7% 30.9%Cinema Film 12.8% 16.6% Cinema Film 20.8% 14.7%Documentary 7.7% 10.0% Documentary 23.0% 15.0%Entertainment 10.9% 10.9% Entertainment 7.6% 8.5%Factual Magazine 6.2% 5.6% Factual Magazine 5.6% 5.2%Fiction 62.4% 57.0% Fiction 43.0% 56.7%Cinema Film 11.4% 10.2% Cinema Film 23.0% 12.4%Documentary 1.5% 1.9% Documentary 3.5% 2.8%Entertainment 19.7% 29.7% Entertainment 24.2% 33.3%Factual Magazine 26.8% 14.1% Factual Magazine 5.7% 2.8%Fiction 40.6% 44.1% Fiction 43.6% 48.6%
RTE 2 RTE 2
TV3 TV3
All Day Peak Time
RTE 1 RTE 1
Transmission and viewing ratio analysis Qualifying programmes account for 78.3% of total transmission hours across our Irish sample (see Table 70). TV3 shows a higher proportion of qualifying hours (82.9%) than the public channels (78.1% for RTE1 and 74.5% for RTE2).
The figures slightly decrease when observing viewer hours, with a proportion of 70.8% for our entire sample. The public channels show the largest drops, falling to 66.4% for RTE1 and 68.9% for RTE2, a decline mostly due to the high proportion of news on RTE1 and sports events on RTE2.

232
Table 70: Ratio of qualifying hours to total transmission hours in Ireland, 2007
Channel
Ratio of Qualifying to
Total Transmission
Hours (%)
Ratio of Qualifying to
Total Viewer Hours (%)
RTE 1 78.1% 66.4%
RTE 2 74.5% 68.9%
TV3 82.9% 80.2%
Result for Member State Sample
78.3% 70.8%
Proportion of European works Across our Irish sample European works account for 54.1% of total qualifying hours (see Table 71). The two leading channels show the highest proportion of European works, which account for around 60% of total qualifying hours on both channels, whereas RTE2 shows a figure of 43.3%, which is explained largely by the importance of non- European imports (for fiction, factual magazines and Entertainment)on this channel.
During Peak-time, the proportions remain the same for RTE2 and TV3. However RTE1, , shows a significant increase in European works during peak-time, up to 81.6% from 60.9% during all-day.
When comparing the proportions based on transmission hours to those based on viewer hours, a general increase can be seen for RTE1 and TV3 (both during all-day and peak-time). Conversely, RTE2 goes from 43.3% of total qualifying hours down to 38.4% of total viewer hours during all-day (the same proportions can be observed in peak-time).
Table 71: Ratio of European qualifying to total qualifying hours in Ireland, 2007
Channel
Ratio of
Qualifying
European to
Total Qualifying
Hours (%)
Ratio of
Qualifying
European to
Total Qualifying
Viewer Hours
(%)
Channel
Ratio of
Qualifying
European to
Total Qualifying
Hours (%)
Ratio of
Qualifying
European to
Total Qualifying
Viewer Hours
(%)
RTE 1 60.9% 76.8% RTE 1 81.6% 84.6%
RTE 2 43.3% 38.4% RTE 2 44.1% 38.7%
TV3 57.8% 69.9% TV3 56.7% 75.0%
Result for Member State Sample
54.1% 65.7%Result for Member State Sample
59.5% 72.3%
All Day Peak Time

233
Non-domestic European works account for 25.1% of total qualifying hours across our entire Irish sample (see Table 72). TV3 show the highest figure of non-domestic works with a proportion of 36% (while RTE1 and RTE2 are around 20%). The gap between the public channels and TV3 becomes more pronounced during peak-time: on TV3, the proportion of non-domestic European works rises to 52.5%, while on RTE1 and RTE2 this proportion is around 9.5%. This difference is largely explained by the importance of UK-originated programmes on private channel TV3.
This difference between public and private channels is more significant when looking at non-domestic European works as a proportion of viewer hours. Non-domestic European works account for 59% of all-day qualifying viewer hours on TV3 (up to 73.5% in peak-time), while they account for 12.9% and 12.8% of all-day qualifying viewer hours on RTE1 and RTE2, respectively. This shows the success of UK-originated programmes on TV3, while non-domestic European works, mostly programmed during the night, are relatively less successful on RTE1 and RTE2, especially across the all-day schedule.
Table 72: Ratio of non-domestic qualifying European to total qualifying hours in Ireland, 2007
Channel
Ratio of Non-
Domestic
Qualifying
European to
Total Qualifying
Hours (%)
Ratio of Non-
Domestic
Qualifying
European to
Total Qualifying
Viewer Hours
(%)
Channel
Ratio of Non-
Domestic
Qualifying
European to
Total Qualifying
Hours (%)
Ratio of Non-
Domestic
Qualifying
European to
Total Qualifying
Viewer Hours
(%)
RTE 1 19.1% 12.9% RTE 1 8.9% 10.0%
RTE 2 21.1% 12.8% RTE 2 9.8% 9.4%
TV3 36.0% 59.0% TV3 52.5% 73.5%
Result for Member State Sample
25.1% 27.5%Result for Member State Sample
26.1% 30.6%
All Day Peak Time
Proportion of independent works Across our Irish sample, 38.5% of total qualifying hours are independent European productions (see Table 73). TV3 shows the highest proportion with 53.3%, mostly due to the numerous Granada productions broadcast on this channel.235 RTE1 and RTE2 are behind this with 33.1% and 29.3% respectively. Peak-time proportions are along the same lines.
Differences between the proportions when based on viewing hours widen further, as independent European productions account for 67.6% of all-day qualifying viewer hours on TV3, compared to 35.8% on RTE1 and 25.1% on RTE2.
235 As a reminder here, for this study we considered the independence criteria at Member State level, that is, a producer with no link to broadcasters in a given market will be considered independent in that market even if it is dependent on a broadcaster in another market, whereas in the previous study, producers were considered dependent in any Member State as soon as they were found dependent in one single Member State.
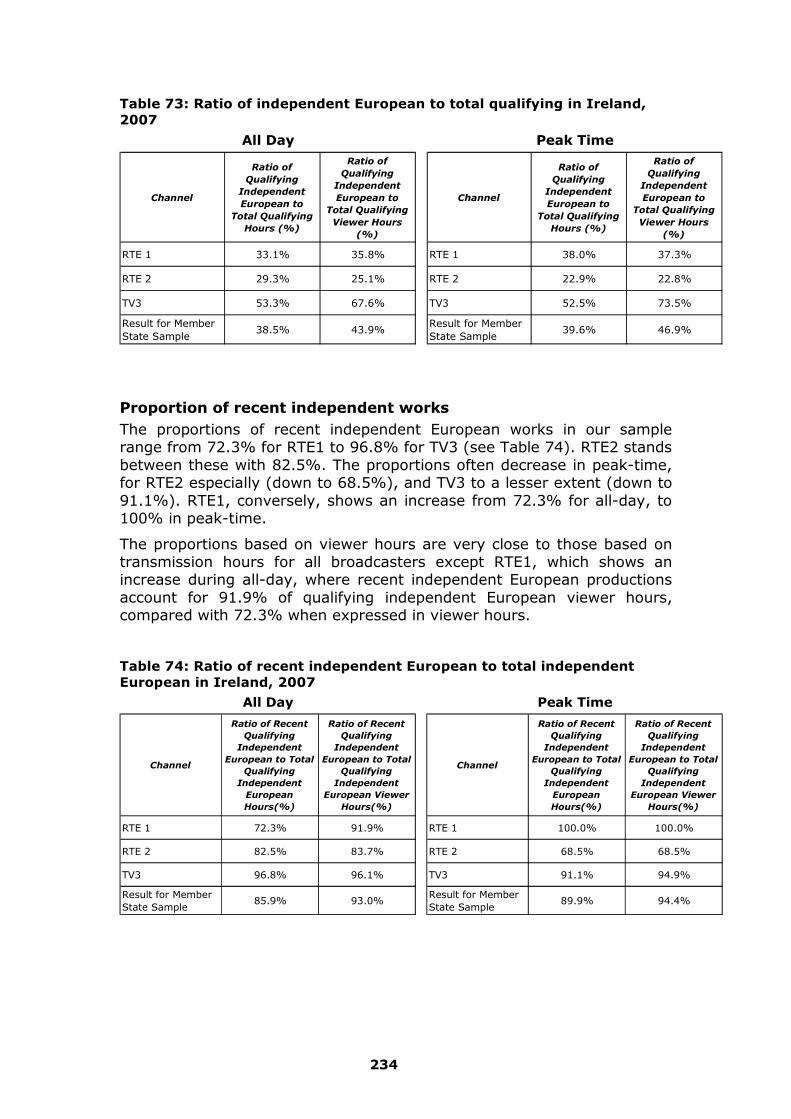
234
Table 73: Ratio of independent European to total qualifying in Ireland, 2007
Channel
Ratio of
Qualifying
Independent
European to
Total Qualifying
Hours (%)
Ratio of
Qualifying
Independent
European to
Total Qualifying
Viewer Hours
(%)
Channel
Ratio of
Qualifying
Independent
European to
Total Qualifying
Hours (%)
Ratio of
Qualifying
Independent
European to
Total Qualifying
Viewer Hours
(%)
RTE 1 33.1% 35.8% RTE 1 38.0% 37.3%
RTE 2 29.3% 25.1% RTE 2 22.9% 22.8%
TV3 53.3% 67.6% TV3 52.5% 73.5%
Result for Member State Sample
38.5% 43.9%Result for Member State Sample
39.6% 46.9%
All Day Peak Time
Proportion of recent independent works The proportions of recent independent European works in our sample range from 72.3% for RTE1 to 96.8% for TV3 (see Table 74). RTE2 stands between these with 82.5%. The proportions often decrease in peak-time, for RTE2 especially (down to 68.5%), and TV3 to a lesser extent (down to 91.1%). RTE1, conversely, shows an increase from 72.3% for all-day, to 100% in peak-time.
The proportions based on viewer hours are very close to those based on transmission hours for all broadcasters except RTE1, which shows an increase during all-day, where recent independent European productions account for 91.9% of qualifying independent European viewer hours, compared with 72.3% when expressed in viewer hours.
Table 74: Ratio of recent independent European to total independent European in Ireland, 2007
Channel
Ratio of Recent
Qualifying
Independent
European to Total
Qualifying
Independent
European
Hours(%)
Ratio of Recent
Qualifying
Independent
European to Total
Qualifying
Independent
European Viewer
Hours(%)
Channel
Ratio of Recent
Qualifying
Independent
European to Total
Qualifying
Independent
European
Hours(%)
Ratio of Recent
Qualifying
Independent
European to Total
Qualifying
Independent
European Viewer
Hours(%)
RTE 1 72.3% 91.9% RTE 1 100.0% 100.0%
RTE 2 82.5% 83.7% RTE 2 68.5% 68.5%
TV3 96.8% 96.1% TV3 91.1% 94.9%
Result for Member State Sample
85.9% 93.0%Result for Member State Sample
89.9% 94.4%
All Day Peak Time

235
Proportion of stock/flow works The proportion of stock vs. flow programmes among total qualifying European hours is, across the sample, very balanced during all-day (52.7% stock vs. 47.3% flow). Stock programmes account for around 48% on the two leading channels RTE1 and TV3, while RTE2 devotes 65.4% of its schedule to stock programmes (see Table 75), another consequence of its focus on fiction.
In peak-time, the balance of stock and flow remains the same for RTE2 but is reversed on RTE1 and TV3. Indeed, the two leading channels both favour stock programmes rather than flow during peak-time (55.1% of stock for RTE1 and 58.1% for TV3).
The proportions expressed in viewer hours show that stock programmes are relatively more successful than flow programmes on RTE1 (52.1% stock vs. 47.9% flow during all-day and 55.9% stock vs. 44.1% flow in peak-time) and TV3 (53.7% stock vs. 46.3% flow during all-day and 57.8% stock vs. 42.2% flow in peak-time). On RTE2 stock programmes are less successful, although they still represent the majority of qualifying viewer hours with proportions nearly identical to its two counterparts (54.7% stock vs. 45.3% flow during all-day and 55.9% stock vs. 44.1% flow in peak-time).
Table 75: Ratio of European stock/flow to total European in Ireland, 2007
Channel
Qualifying
European
Stock to
Total
Qualifying
European
Hours (%)
Qualifying
European
Flow to Total
Qualifying
European
Hours (%)
Total
(%)Channel
Qualifying
European
Stock to
Total
Qualifying
European
Hours (%)
Qualifying
European
Flow to Total
Qualifying
European
Hours (%)
Total
(%)
RTE 1 47.9% 52.1% 100% RTE 1 55.1% 44.9% 100%
RTE 2 65.4% 34.6% 100% RTE 2 64.1% 35.9% 100%
TV3 48.3% 51.7% 100% TV3 58.1% 41.9% 100%
Result for Member State Sample
52.7% 47.3% 100%Result for Member State Sample
58.4% 41.6% 100%
Channel
Qualifying
European
Stock to
Total
Qualifying
European
Viewer Hours
(%)
Qualifying
European
Flow to Total
Qualifying
European
Viewer Hours
(%)
Total
(%)Channel
Qualifying
European
Stock to
Total
Qualifying
European
Viewer Hours
(%)
Qualifying
European
Flow to Total
Qualifying
European
Viewer Hours
(%)
Total
(%)
RTE 1 52.1% 47.9% 100% RTE 1 55.9% 44.1% 100%
RTE 2 54.7% 45.3% 100% RTE 2 55.9% 44.1% 100%
TV3 53.7% 46.3% 100% TV3 57.8% 42.2% 100%
Result for Member State Sample
53.0% 47.0% 100%Result for Member State Sample
56.6% 43.4% 100%
All Day Peak Time
All Day Peak Time
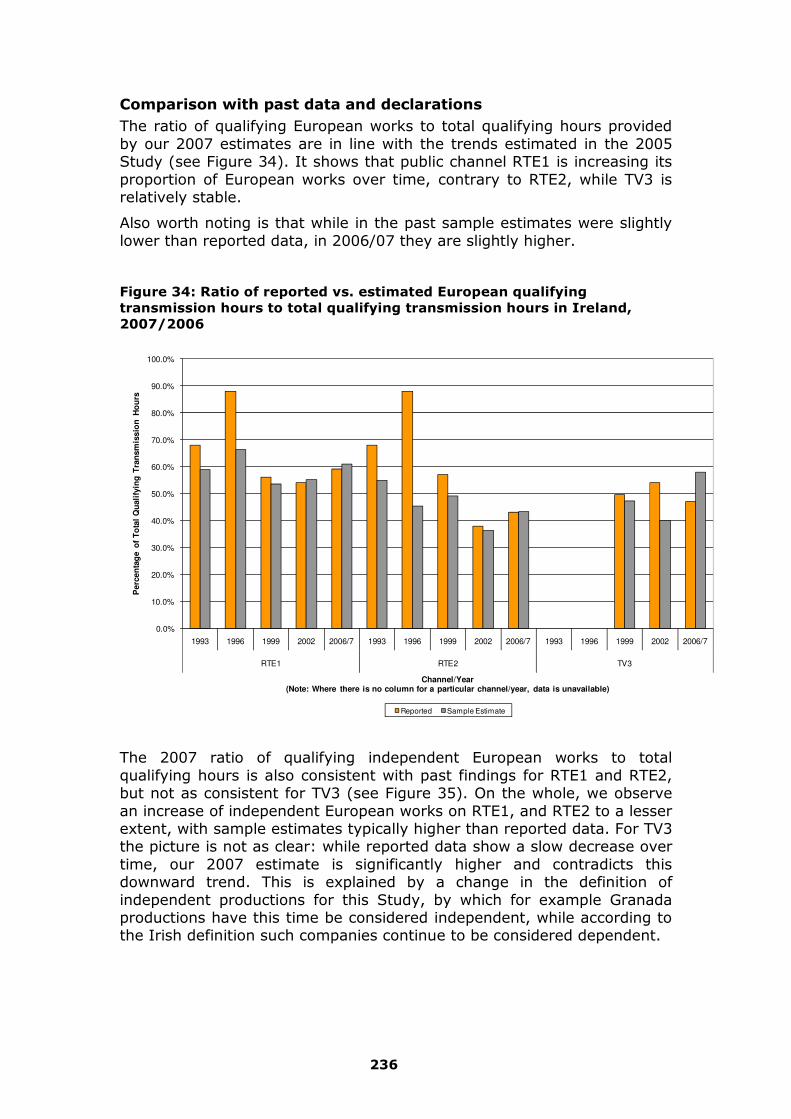
236
Comparison with past data and declarations The ratio of qualifying European works to total qualifying hours provided by our 2007 estimates are in line with the trends estimated in the 2005 Study (see Figure 34). It shows that public channel RTE1 is increasing its proportion of European works over time, contrary to RTE2, while TV3 is relatively stable.
Also worth noting is that while in the past sample estimates were slightly lower than reported data, in 2006/07 they are slightly higher.
Figure 34: Ratio of reported vs. estimated European qualifying transmission hours to total qualifying transmission hours in Ireland, 2007/2006
0.0%
10.0%
20.0%
30.0%
40.0%
50.0%
60.0%
70.0%
80.0%
90.0%
100.0%
1993 1996 1999 2002 2006/7 1993 1996 1999 2002 2006/7 1993 1996 1999 2002 2006/7
RTE1 RTE2 TV3
Perc
en
tag
e o
f T
ota
l Q
uali
fyin
g T
ran
sm
issio
n H
ou
rs
Channel/Year(Note: Where there is no column for a particular channel/year, data is unavailable)
Reported Sample Estimate
The 2007 ratio of qualifying independent European works to total qualifying hours is also consistent with past findings for RTE1 and RTE2, but not as consistent for TV3 (see Figure 35). On the whole, we observe an increase of independent European works on RTE1, and RTE2 to a lesser extent, with sample estimates typically higher than reported data. For TV3 the picture is not as clear: while reported data show a slow decrease over time, our 2007 estimate is significantly higher and contradicts this downward trend. This is explained by a change in the definition of independent productions for this Study, by which for example Granada productions have this time be considered independent, while according to the Irish definition such companies continue to be considered dependent.

237
Figure 35: Ratio of reported vs. estimated independent European qualifying transmission hours to total qualifying transmission hours in Ireland, 2007/2006
0.0%
10.0%
20.0%
30.0%
40.0%
50.0%
60.0%
1993 1996 1999 2002 2006/7 1993 1996 1999 2002 2006/7 1993 1996 1999 2002 2006/7
RTE1 RTE2 TV3
Perc
en
tag
e o
f T
ota
l Q
uali
fyin
g T
ran
sm
issio
n H
ou
rs
Channel/Year(Note: Where there is no column for a particular channel/year, data is unavailable)
Reported Sample Estimate
Figure 36: Ratio of reported vs. estimated recent independent European qualifying transmission hours to total independent European transmission hours in Ireland, 2007/2006
0.0%
20.0%
40.0%
60.0%
80.0%
100.0%
120.0%
1993 1996 1999 2002 2006/7 1993 1996 1999 2002 2006/7 1993 1996 1999 2002 2006/7
RTE1 RTE2 TV3
Perc
en
tag
e o
f T
ota
l In
dep
en
den
t E
uro
pean
Tra
nsm
issio
n H
ou
rs
Channel/Year(Note: Where there is no column for a particular channel/year, data is unavailable)
Reported Sample Estimate

238
8.4.7. Italy
Data summary Our sample consists of two publicly funded public service channels, RAI1 and RAI2, two commercial channels from the Mediaset group, CANALE5 and ITALIA1, Telecom Italia’s commercial channel, LA7, and premium pay channel FOX LIFE. Together they account for more than 71% of total TV viewing in Italy (see Table 76).
Table 76: List of channels covered in the 2007 Italian sample
Country ChannelLaunch
Year
Share of Viewing (2005)
Revenue Model PlatformAverage Daily Transmission
Hours
Sample Weeks
Italy Canale 5 1980 22.70% Ad Terr. 24
Italy Fox Life 2004 0.25% Subs Cab/Sat 24
Italy Ita1 1981 10.20% Ad Terr. 24
Italy La7 2001 2.50% Ad Terr. 24
Italy Rai1 1954 23.70% Gvt/Ad Terr. 24
Italy Rai2 1954 12.20% Gvt/Ad Terr. 24
Standard
Genre analysis Entertainment, fiction and factual magazines are the dominant genres on leading Italian channels (see Table 77). The qualifying programmes of CANALE5 consist of 44% entertainment, 33.7% fiction and 16.1% factual magazines. On RAI1 the proportions are 48.2% factual magazines, 16.7% for fiction and 20.3% for entertainment. RAI2’s schedule is build along similar lines, although it gives the highest share of its qualifying offer to documentary among the channels from our sample: 13.3% compared to 31% for factual magazines, 27.1% for entertainment and 26.9% for fiction.
Each of the three remaining channels in our sample generally have a specific genre emphasis. ITALIA1 is clearly centred on fiction (69.1%) and cinema (18%). FOX LIFE also relies heavily on fiction (67.3%) but this time complemented by entertainment (21.3%). Lastly, LA7 offers a relatively balanced mix of all genres except entertainment, with factual magazines (31%) and documentary (12.1%) on the one hand and fiction (28.4%) and cinema film (22.3%) on the other.
In peak-time, fiction is really put at the forefront of qualifying schedules. Fiction makes up 75.8% of peak-time qualifying programmes on FOX LIFE, 55.5% of ITALIA1, 55.4% of RAI2, 44.1% RAI1, 41.7% of LA7 and 30.3% of CANALE5. Entertainment is the main complement to fiction on leading channels with 56.8% on CANALE5 and 47.2% on RAI1. Entertainment is also important on FOX LIFE (17.2%) and ITALIA1 (18.3%), the latter also proposing an important proportion of cinema (26.2%). Lastly, LA7 complements fiction with essentially factual magazines (35.1%) and some cinema film (10.3%).

239
The genre proportions for total qualifying viewer hours very much reflect the emphasis on fiction and entertainment of most Italian channels, especially in peak-time, and the also specificities of each channel, whether on factual magazines or on cinema film.
Table 77: Genre proportion of total qualifying hours in Italy, 2007
Channel Genre
Genre
Proportions
of Total
Qualifying
Hours (%)
Genre
Proportions
of Total
Qualifying
Viewer
Hours (%)
Channel Genre
Genre
Proportions
of Total
Qualifying
Hours (%)
Genre
Proportions
of Total
Qualifying
Viewer
Hours (%)
Cinema Film 4.9% 5.3% Cinema Film 6.0% 7.9%Documentary 1.3% 0.1% Documentary 0.0% 0.0%Entertainment 44.0% 52.4% Entertainment 56.8% 58.9%Factual Magazine 16.1% 10.9% Factual Magazine 6.9% 6.4%Fiction 33.7% 31.3% Fiction 30.3% 26.8%Cinema Film 6.9% 9.8% Cinema Film 4.2% 4.3%Documentary 4.0% 2.0% Documentary 2.1% 2.8%Entertainment 21.3% 19.5% Entertainment 17.2% 9.9%Factual Magazine 0.5% 0.2% Factual Magazine 0.7% 0.4%Fiction 67.3% 68.4% Fiction 75.8% 82.6%Cinema Film 18.0% 18.0% Cinema Film 26.2% 28.8%Documentary 1.0% 0.8% Documentary 0.0% 0.0%Entertainment 8.9% 12.9% Entertainment 18.3% 20.2%Factual Magazine 3.0% 1.6% Factual Magazine 0.0% 0.0%Fiction 69.1% 66.8% Fiction 55.5% 51.0%Cinema Film 22.3% 27.7% Cinema Film 10.3% 11.3%Documentary 12.1% 11.9% Documentary 5.4% 4.4%Entertainment 6.1% 6.4% Entertainment 7.6% 7.2%Factual Magazine 31.0% 28.8% Factual Magazine 35.1% 42.2%Fiction 28.4% 25.2% Fiction 41.7% 35.0%Cinema Film 6.5% 2.2% Cinema Film 8.7% 5.3%Documentary 8.2% 5.5% Documentary 0.0% 0.0%Entertainment 20.3% 31.8% Entertainment 47.2% 43.5%Factual Magazine 48.2% 40.4% Factual Magazine 0.0% 0.0%Fiction 16.7% 20.2% Fiction 44.1% 51.2%Cinema Film 1.8% 1.5% Cinema Film 5.8% 2.2%Documentary 13.3% 16.6% Documentary 6.7% 7.8%Entertainment 27.1% 30.4% Entertainment 15.5% 22.1%Factual Magazine 31.0% 24.1% Factual Magazine 16.5% 19.4%Fiction 26.9% 27.5% Fiction 55.4% 48.6%
Ita1 Ita1
Rai2 Rai2
La7 La7
Rai1 Rai1
All Day Peak Time
Can5 Can5
Fox Life Fox Life
Transmission and viewing ratio analysis For our Italian sample as a whole, qualifying programmes make up 72% of total transmission hours of the channels in our sample (see Table 78). This proportion is lower on the two leading commercial channels of the Mediaset group as it reaches 62.5% on CANALE5 and 63.8% on ITALIA1, which can be explained by the high proportion of news and teleshopping on these two channels. On the other hand, FOX LIFE, LA7 and RAI2 allocate around 78% of their grids to qualifying programmes.
Qualifying programmes are not as successful with the audience as a whole, representing 64% of total qualifying viewing across the channels of our sample. This total figure is, however, not very representative of individual situations. LA7 and FOX LIFE show much higher figures, going up from 77.5% in transmission hours to 84% in viewer hours for LA7, and from 78.1% to 83.7% for FOX LIFE. Conversely, RAI1 falls from 72.4% to 58.2%, a consequence of the high audiences for the first Italian channel’s news programming.

240
Table 78: Ratio of qualifying hours to total transmission hours in Italy, 2007
Channel
Ratio of Qualifying to
Total Transmission
Hours (%)
Ratio of Qualifying to
Total Viewer Hours (%)
Can5 62.5% 63.5%
Fox Life 78.1% 83.7%
Ita1 63.8% 62.1%
La7 77.5% 84.0%
Rai1 72.4% 58.2%
Rai2 77.5% 73.5%
Result for Member State Sample
72.0% 64.0%
Proportion of European works Leading channels RAI1, RAI2 and CANALE5 reach the highest proportions of European works with 91.9%, 82.5% and 81.8% of total qualifying hours during all-day respectively (see Table 79). While LA7 also allocates a majority proportion of its all-day transmission hours to European works, with 61.7%, FOX LIFE (16.3%) and ITALIA1 (21.8%) are below the 50%. As we have noted previously, these two channels’ schedules are very much centred on fiction and cinema, with an important share of non-European acquisitions. In peak-time, the proportions are very similar, although in slight decline across the sample as a whole, with the two Mediaset group channels presenting a slight increase (88.9% of European works for CANALE5 and 27.6% for ITALIA1) and RAI2 in decline, down to 60.2%.
The proportions of European viewer hours to total qualifying viewer hours are significantly higher, reaching 77.1% during all-day and 75.2% in peak-time for the entire sample. The highest increase can be seen on RAI1 where European viewer hours reach 97.7% during all-day and 94.7% in peak-time, a consequence of its entertainment and factual magazines policy. On the opposite side, the proportion of European works on FOX LIFE is even lower when expressed in viewer hours with 12.5% during all-day and 11.9% in peak-time.
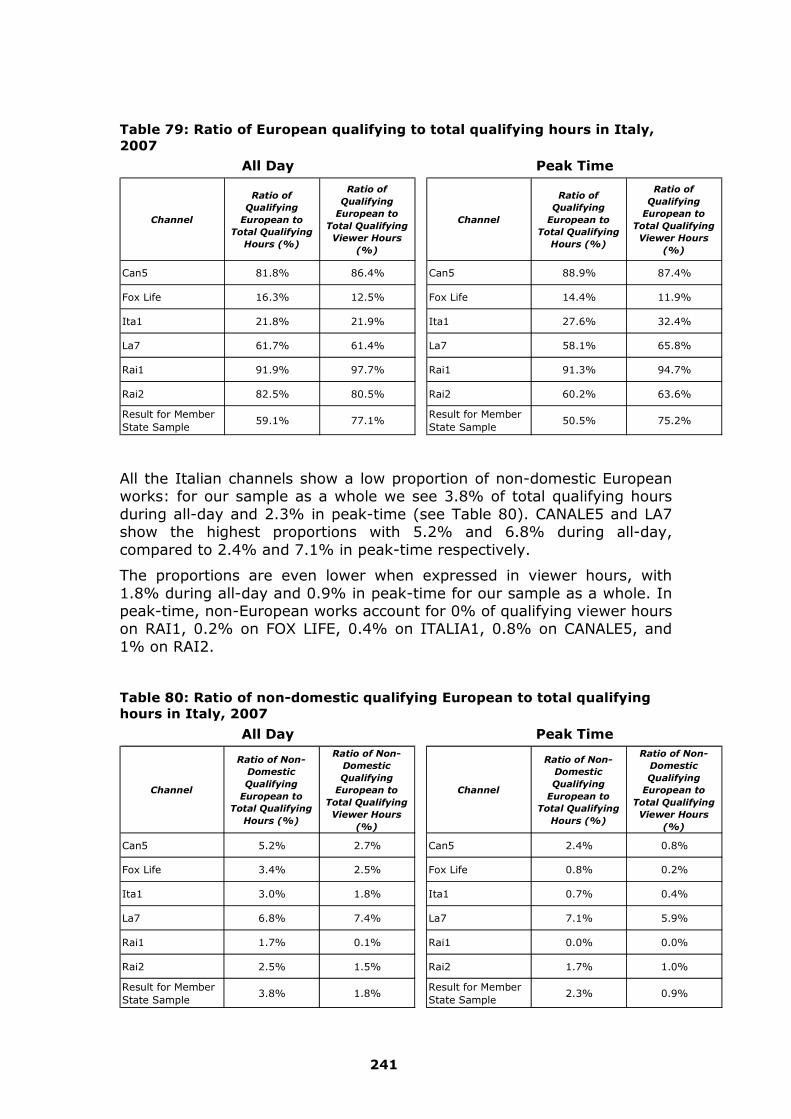
241
Table 79: Ratio of European qualifying to total qualifying hours in Italy, 2007
Channel
Ratio of
Qualifying
European to
Total Qualifying
Hours (%)
Ratio of
Qualifying
European to
Total Qualifying
Viewer Hours
(%)
Channel
Ratio of
Qualifying
European to
Total Qualifying
Hours (%)
Ratio of
Qualifying
European to
Total Qualifying
Viewer Hours
(%)
Can5 81.8% 86.4% Can5 88.9% 87.4%
Fox Life 16.3% 12.5% Fox Life 14.4% 11.9%
Ita1 21.8% 21.9% Ita1 27.6% 32.4%
La7 61.7% 61.4% La7 58.1% 65.8%
Rai1 91.9% 97.7% Rai1 91.3% 94.7%
Rai2 82.5% 80.5% Rai2 60.2% 63.6%
Result for Member State Sample
59.1% 77.1%Result for Member State Sample
50.5% 75.2%
All Day Peak Time
All the Italian channels show a low proportion of non-domestic European works: for our sample as a whole we see 3.8% of total qualifying hours during all-day and 2.3% in peak-time (see Table 80). CANALE5 and LA7 show the highest proportions with 5.2% and 6.8% during all-day, compared to 2.4% and 7.1% in peak-time respectively.
The proportions are even lower when expressed in viewer hours, with 1.8% during all-day and 0.9% in peak-time for our sample as a whole. In peak-time, non-European works account for 0% of qualifying viewer hours on RAI1, 0.2% on FOX LIFE, 0.4% on ITALIA1, 0.8% on CANALE5, and 1% on RAI2.
Table 80: Ratio of non-domestic qualifying European to total qualifying hours in Italy, 2007
Channel
Ratio of Non-
Domestic
Qualifying
European to
Total Qualifying
Hours (%)
Ratio of Non-
Domestic
Qualifying
European to
Total Qualifying
Viewer Hours
(%)
Channel
Ratio of Non-
Domestic
Qualifying
European to
Total Qualifying
Hours (%)
Ratio of Non-
Domestic
Qualifying
European to
Total Qualifying
Viewer Hours
(%)
Can5 5.2% 2.7% Can5 2.4% 0.8%
Fox Life 3.4% 2.5% Fox Life 0.8% 0.2%
Ita1 3.0% 1.8% Ita1 0.7% 0.4%
La7 6.8% 7.4% La7 7.1% 5.9%
Rai1 1.7% 0.1% Rai1 0.0% 0.0%
Rai2 2.5% 1.5% Rai2 1.7% 1.0%
Result for Member State Sample
3.8% 1.8%Result for Member State Sample
2.3% 0.9%
All Day Peak Time

242
Proportion of Independent works236 For the entire Italian sample, 19.2% of total all-day qualifying hours are produced by independent European production companies (see Table 81). Proportions range from 10.8% on ITALIA1, 13.8% on FOX LIFE and 19.6 on RAI1, to 20.6% on RAI2, 25% on LA7 and 26.5% on CANALE5. In peak-time, these proportions reach 30.6% on RAI1, 31.8% on RAI2 and 34.8% on CANALE5, but are lower for some channels, with 12.9% on FOX LIFE and 12% on ITALIA1.
The proportions of independent European works are generally higher when expressed in viewer hours, reaching 22.6% during all-day and 28.6% in peak-time. RAI2 is the channel where the increase is the highest, reaching 26.1% during all-day and 39.6% in peak-time. On the other hand, independent European works take a lower share of viewer hours than transmission hours on FOX LIFE, down to 10.8% during all-day and 10% in peak-time and on CANALE5 in peak-time (down to 30.2%). ITALIA1 also see a decrease during all-day (8.2%), although the proportion is increased in peak-time (13.6%).
Table 81: Ratio of independent European to total qualifying in Italy, 2007
Channel
Ratio of
Qualifying
Independent
European to
Total Qualifying
Hours (%)
Ratio of
Qualifying
Independent
European to
Total Qualifying
Viewer Hours
(%)
Channel
Ratio of
Qualifying
Independent
European to
Total Qualifying
Hours (%)
Ratio of
Qualifying
Independent
European to
Total Qualifying
Viewer Hours
(%)
Can5 26,5% 27,8% Can5 34,8% 30,2%
Fox Life 13,8% 10,8% Fox Life 12,9% 10,0%
Ita1 10,8% 8,2% Ita1 12,0% 13,6%
La7 25,0% 28,9% La7 29,6% 29,7%
Rai1 19,6% 21,5% Rai1 30,6% 30,9%
Rai2 20,6% 26,1% Rai2 31,8% 39,6%
Result for Member State Sample
19,2% 22,6%Result for Member State Sample
23,2% 28,6%
All Day Peak Time
236 It is important to note that the proportions of independent productions have been re-calculated for Italy following the debates at the public Workshop held in Brussels on November 18. Indeed, in the Draft report presented then, Endemol productions had been considered non-independent for the second half of 2007, based on inaccurate information gathered by the consultants that Mediaset owned 50% of the holding company controlling the Endemol group. Further research made clear that as Mediaset owns 33% of that holding company (together with Goldman Sachs and John de Mol owning another 33% each), Endemol cannot be considered to be controlled by Mediaset, according to our criteria as described in the methodological section of this report. Following this re-calculation, proportions of independent works have increased by up to 2.2 percentage points across the Member State sample.
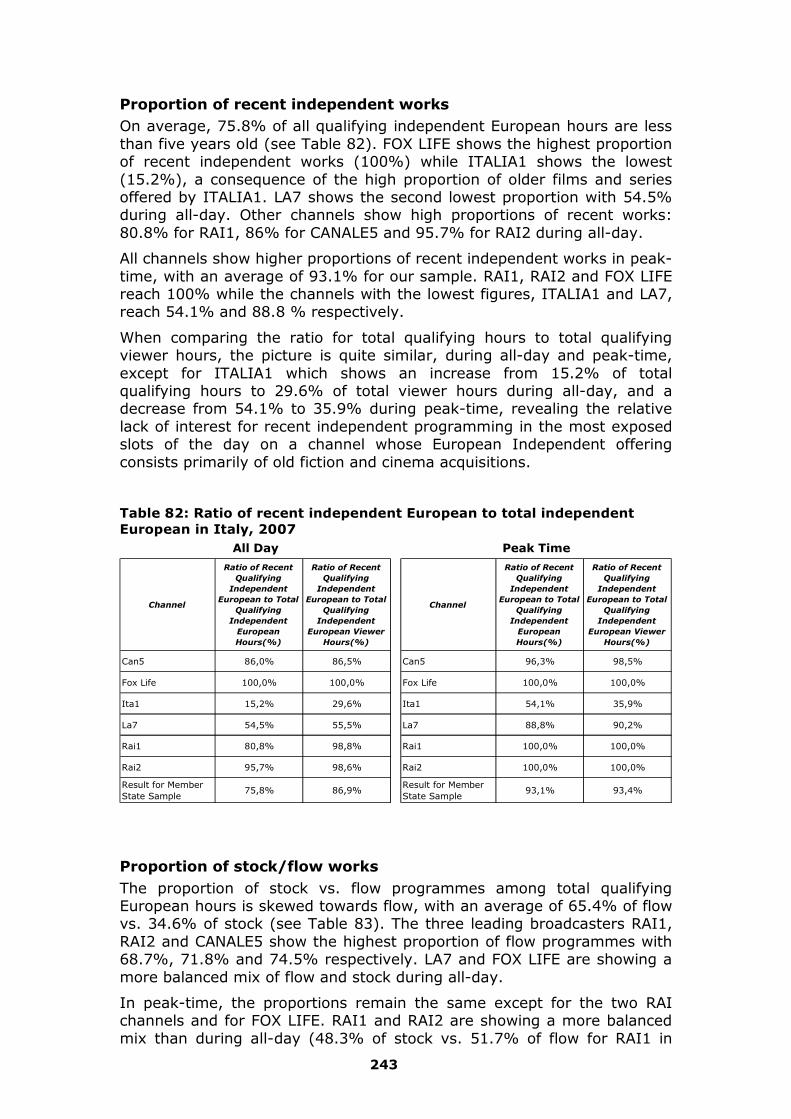
243
Proportion of recent independent works On average, 75.8% of all qualifying independent European hours are less than five years old (see Table 82). FOX LIFE shows the highest proportion of recent independent works (100%) while ITALIA1 shows the lowest (15.2%), a consequence of the high proportion of older films and series offered by ITALIA1. LA7 shows the second lowest proportion with 54.5% during all-day. Other channels show high proportions of recent works: 80.8% for RAI1, 86% for CANALE5 and 95.7% for RAI2 during all-day.
All channels show higher proportions of recent independent works in peak-time, with an average of 93.1% for our sample. RAI1, RAI2 and FOX LIFE reach 100% while the channels with the lowest figures, ITALIA1 and LA7, reach 54.1% and 88.8 % respectively.
When comparing the ratio for total qualifying hours to total qualifying viewer hours, the picture is quite similar, during all-day and peak-time, except for ITALIA1 which shows an increase from 15.2% of total qualifying hours to 29.6% of total viewer hours during all-day, and a decrease from 54.1% to 35.9% during peak-time, revealing the relative lack of interest for recent independent programming in the most exposed slots of the day on a channel whose European Independent offering consists primarily of old fiction and cinema acquisitions.
Table 82: Ratio of recent independent European to total independent European in Italy, 2007
Channel
Ratio of Recent
Qualifying
Independent
European to Total
Qualifying
Independent
European
Hours(%)
Ratio of Recent
Qualifying
Independent
European to Total
Qualifying
Independent
European Viewer
Hours(%)
Channel
Ratio of Recent
Qualifying
Independent
European to Total
Qualifying
Independent
European
Hours(%)
Ratio of Recent
Qualifying
Independent
European to Total
Qualifying
Independent
European Viewer
Hours(%)
Can5 86,0% 86,5% Can5 96,3% 98,5%
Fox Life 100,0% 100,0% Fox Life 100,0% 100,0%
Ita1 15,2% 29,6% Ita1 54,1% 35,9%
La7 54,5% 55,5% La7 88,8% 90,2%
Rai1 80,8% 98,8% Rai1 100,0% 100,0%
Rai2 95,7% 98,6% Rai2 100,0% 100,0%
Result for Member State Sample
75,8% 86,9%Result for Member State Sample
93,1% 93,4%
All Day Peak Time
Proportion of stock/flow works The proportion of stock vs. flow programmes among total qualifying European hours is skewed towards flow, with an average of 65.4% of flow vs. 34.6% of stock (see Table 83). The three leading broadcasters RAI1, RAI2 and CANALE5 show the highest proportion of flow programmes with 68.7%, 71.8% and 74.5% respectively. LA7 and FOX LIFE are showing a more balanced mix of flow and stock during all-day.
In peak-time, the proportions remain the same except for the two RAI channels and for FOX LIFE. RAI1 and RAI2 are showing a more balanced mix than during all-day (48.3% of stock vs. 51.7% of flow for RAI1 in

244
peak-time, and 40.2% of stock vs. 59.8% of flow for RAI2). FOX LIFE which was showing a major proportion of stock during day time (53.6%) switches to a majority of flow during peak-time (79.5%).
In general, the same proportions can be observed in viewer hours during all-day and peak-time, except for FOX LIFE, RAI1 and RAI2. On FOX LIFE, flow programmes are more successful with the audience, reaching 58.5% of all-day European viewer hours compared to 46.4% of transmission hours, reflecting the success of day-time flow programmes on this channel. Situation is similar on RAI2 except this happens in peak-time: there, flow programmes reach 73.4% of total European viewer hours compared to 59.8% of transmission hours. On the opposite, RAI1 show a relatively higher success of its stock programmes, which represent 35.5% of its all-day European viewer hours compared to 31.3% for transmission hours, and 54.1% vs. 48.3% in peak-time.
Table 83: Ratio of European stock/flow to total European in Italy, 2007
Channel
Qualifying
European
Stock to
Total
Qualifying
European
Hours (%)
Qualifying
European
Flow to Total
Qualifying
European
Hours (%)
Total
(%)Channel
Qualifying
European
Stock to
Total
Qualifying
European
Hours (%)
Qualifying
European
Flow to Total
Qualifying
European
Hours (%)
Total
(%)
Can5 25.5% 74.5% 100% Can5 27.4% 72.6% 100%
Fox Life 53.6% 46.4% 100% Fox Life 20.5% 79.5% 100%
Ita1 70.4% 29.6% 100% Ita1 78.3% 21.7% 100%
La7 41.6% 58.4% 100% La7 35.0% 65.0% 100%
Rai1 31.3% 68.7% 100% Rai1 48.3% 51.7% 100%
Rai2 28.2% 71.8% 100% Rai2 40.2% 59.8% 100%
Result for Member State Sample
34.6% 65.4% 100%Result for Member State Sample
38.6% 61.4% 100%
Channel
Qualifying
European
Stock to
Total
Qualifying
European
Viewer Hours
(%)
Qualifying
European
Flow to Total
Qualifying
European
Viewer Hours
(%)
Total
(%)Channel
Qualifying
European
Stock to
Total
Qualifying
European
Viewer Hours
(%)
Qualifying
European
Flow to Total
Qualifying
European
Viewer Hours
(%)
Total
(%)
Can5 26.2% 73.8% 100% Can5 25.0% 75.0% 100%
Fox Life 41.5% 58.5% 100% Fox Life 25.1% 74.9% 100%
Ita1 78.2% 21.8% 100% Ita1 84.8% 15.2% 100%
La7 47.0% 53.0% 100% La7 32.5% 67.5% 100%
Rai1 35.5% 64.5% 100% Rai1 54.1% 45.9% 100%
Rai2 28.9% 71.1% 100% Rai2 26.6% 73.4% 100%
Result for Member State Sample
33.3% 66.7% 100%Result for Member State Sample
38.3% 61.7% 100%
All Day Peak Time
All Day Peak Time
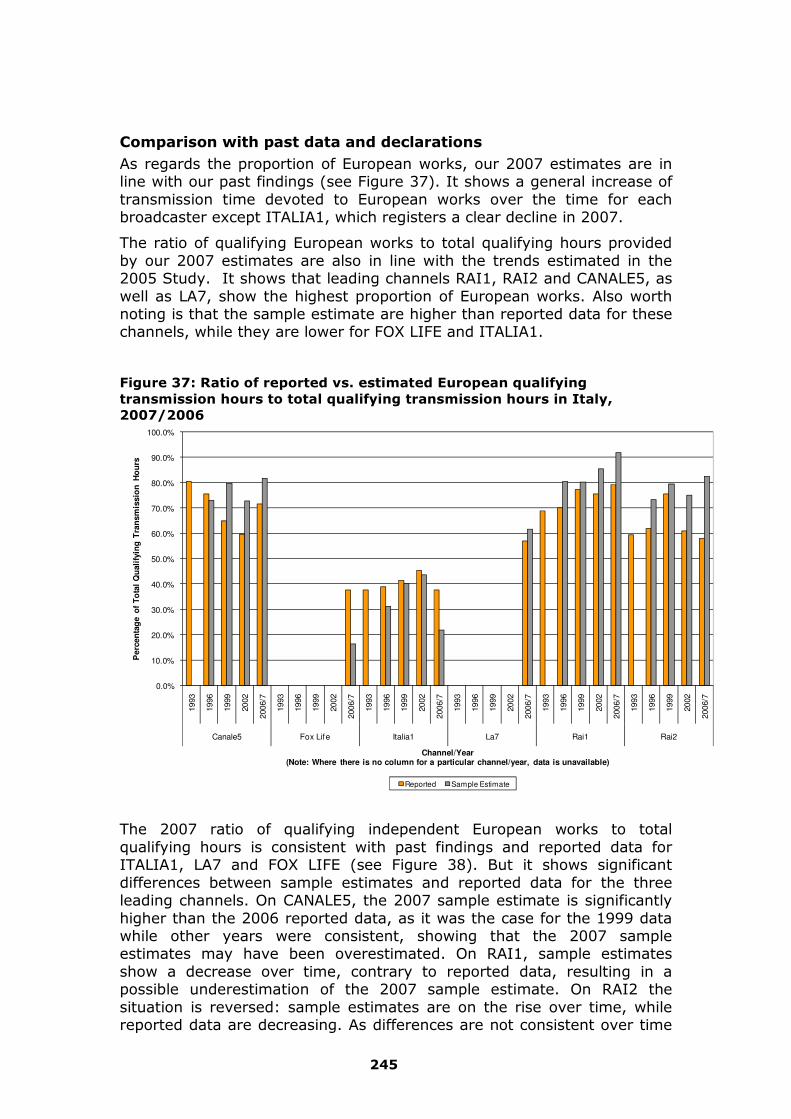
245
Comparison with past data and declarations As regards the proportion of European works, our 2007 estimates are in line with our past findings (see Figure 37). It shows a general increase of transmission time devoted to European works over the time for each broadcaster except ITALIA1, which registers a clear decline in 2007.
The ratio of qualifying European works to total qualifying hours provided by our 2007 estimates are also in line with the trends estimated in the 2005 Study. It shows that leading channels RAI1, RAI2 and CANALE5, as well as LA7, show the highest proportion of European works. Also worth noting is that the sample estimate are higher than reported data for these channels, while they are lower for FOX LIFE and ITALIA1.
Figure 37: Ratio of reported vs. estimated European qualifying transmission hours to total qualifying transmission hours in Italy, 2007/2006
0.0%
10.0%
20.0%
30.0%
40.0%
50.0%
60.0%
70.0%
80.0%
90.0%
100.0%
1993
1996
1999
2002
2006/7
1993
1996
1999
2002
2006/7
1993
1996
1999
2002
2006/7
1993
1996
1999
2002
2006/7
1993
1996
1999
2002
2006/7
1993
1996
1999
2002
2006/7
Canale5 Fox Life Italia1 La7 Rai1 Rai2
Perc
en
tag
e o
f T
ota
l Q
uali
fyin
g T
ran
sm
issio
n H
ou
rs
Channel/Year(Note: Where there is no column for a particular channel/year, data is unavailable)
Reported Sample Estimate
The 2007 ratio of qualifying independent European works to total qualifying hours is consistent with past findings and reported data for ITALIA1, LA7 and FOX LIFE (see Figure 38). But it shows significant differences between sample estimates and reported data for the three leading channels. On CANALE5, the 2007 sample estimate is significantly higher than the 2006 reported data, as it was the case for the 1999 data while other years were consistent, showing that the 2007 sample estimates may have been overestimated. On RAI1, sample estimates show a decrease over time, contrary to reported data, resulting in a possible underestimation of the 2007 sample estimate. On RAI2 the situation is reversed: sample estimates are on the rise over time, while reported data are decreasing. As differences are not consistent over time

246
and between channels, we estimate that sampling may not always reflect yearly situations accurately and that analyses on these three channels should just look at the bigger picture rather than at the detailed findings years after year.
Figure 38: Ratio of reported vs. estimated independent European qualifying transmission hours to total qualifying transmission hours in Italy, 2007/2006
0,0%
5,0%
10,0%
15,0%
20,0%
25,0%
30,0%
35,0%
40,0%
19
93
19
96
19
99
20
02
2006/7
19
93
19
96
19
99
20
02
2006/7
19
93
19
96
19
99
20
02
2006/7
19
93
19
96
19
99
20
02
2006/7
19
93
19
96
19
99
20
02
2006/7
19
93
19
96
19
99
20
02
2006/7
Canale5 Fox Life Italia1 La7 Rai1 Rai2
Perc
en
tag
e o
f T
ota
l Q
uali
fyin
g T
ran
sm
issio
n H
ou
rs
Channel/Year(Note: Where there is no column for a particular channel/year, data is unavailable)
Reported Sample Estimate
When comparisons with past findings are possible, we can observe a general trend towards an increase of qualifying independent European transmission time devoted to recent works (see Figure 39). Sample estimates are in line with past data from the 2005 Study, and with reported data, except for ITALIA1 and LA7 which show strong differences between sample estimates and reported data in 2006/2007.
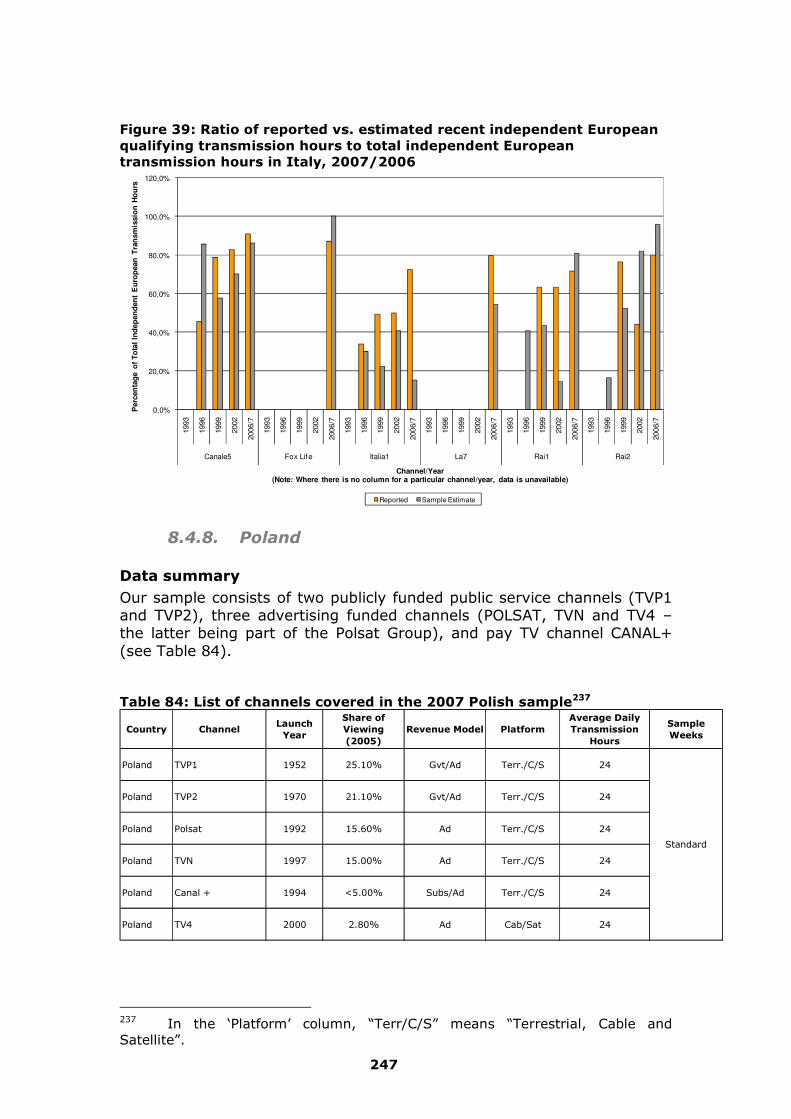
247
Figure 39: Ratio of reported vs. estimated recent independent European qualifying transmission hours to total independent European transmission hours in Italy, 2007/2006
0,0%
20,0%
40,0%
60,0%
80,0%
100,0%
120,0%1993
1996
1999
2002
200
6/7
1993
1996
1999
2002
200
6/7
1993
1996
1999
2002
200
6/7
1993
1996
1999
2002
200
6/7
1993
1996
1999
2002
200
6/7
1993
1996
1999
2002
200
6/7
Canale5 Fox Life Italia1 La7 Rai1 Rai2
Perc
en
tag
e o
f T
ota
l In
dep
en
den
t E
uro
pean
Tra
nsm
issio
n H
ou
rs
Channel/Year(Note: Where there is no column for a particular channel/year, data is unavailable)
Reported Sample Estimate
8.4.8. Poland
Data summary Our sample consists of two publicly funded public service channels (TVP1 and TVP2), three advertising funded channels (POLSAT, TVN and TV4 – the latter being part of the Polsat Group), and pay TV channel CANAL+ (see Table 84).
Table 84: List of channels covered in the 2007 Polish sample237
Country ChannelLaunch
Year
Share of Viewing (2005)
Revenue Model PlatformAverage Daily Transmission
Hours
Sample Weeks
Poland TVP1 1952 25.10% Gvt/Ad Terr./C/S 24
Poland TVP2 1970 21.10% Gvt/Ad Terr./C/S 24
Poland Polsat 1992 15.60% Ad Terr./C/S 24
Poland TVN 1997 15.00% Ad Terr./C/S 24
Poland Canal + 1994 <5.00% Subs/Ad Terr./C/S 24
Poland TV4 2000 2.80% Ad Cab/Sat 24
Standard
237 In the ‘Platform’ column, “Terr/C/S” means “Terrestrial, Cable and Satellite”.

248
Genre analysis Leading public channels TVP1 and TVP2 both present a wide variety of genres in their schedules. However, differences can be seen between the two channels, especially during peak-time (see Table 85). TVP1 airs a high proportion of fiction (36.3% of qualifying hours during peak-time) and cinema films (36.4%), whereas TVP2 concentrates more on entertainment (26.2% peak) than TVP1, but still has a large proportion of cinema films.
The offering of the private free-to-air channels are more varied. Each private channel distinguishes itself via a specific offering. TVN relies more on factual magazines (10.8% peak) and entertainment (18.6% peak) than others, although it also airs a significant volume of fiction (36.7% peak). POLSAT favours cinema films and fiction (respectively 51.6% and 41.4% peak), while TV4 puts the emphasis on entertainment (39.4% peak).
Lastly, CANAL+ presents an extremely specialised schedule, with the proportion of cinema films reaching 70.1% of total qualifying hours during peak-time, to which fiction adds another 18.9%.
As is clear, all Polish channels’ programming specificities are more prominent during peak-time, whereas their schedules present a more balanced offering of genres across the day as a whole (with the exception of Canal+, as noted above).
Table 85: Genre proportion of total qualifying hours in Poland, 2007
Channel Genre
Genre
Proportions
of Total
Qualifying
Hours (%)
Genre
Proportions
of Total
Qualifying
Viewer
Hours (%)
Channel Genre
Genre
Proportions
of Total
Qualifying
Hours (%)
Genre
Proportions
of Total
Qualifying
Viewer
Hours (%)
Cinema Film 78.4% 87.7% Cinema Film 70.1% 85.7%Documentary 6.6% 1.7% Documentary 2.8% 0.2%Entertainment 2.2% 1.0% Entertainment 5.0% 1.2%Factual Magazine 4.1% 0.9% Factual Magazine 3.3% 0.6%Fiction 8.8% 8.6% Fiction 18.9% 12.2%Cinema Film 19.7% 30.0% Cinema Film 51.6% 48.1%Documentary 1.7% 1.9% Documentary 0.0% 0.0%Entertainment 17.7% 11.4% Entertainment 5.3% 7.7%Factual Magazine 2.9% 1.4% Factual Magazine 1.7% 1.1%Fiction 58.1% 55.3% Fiction 41.4% 43.2%Cinema Film 12.8% 25.0% Cinema Film 23.7% 29.3%Documentary 4.6% 5.2% Documentary 7.7% 6.5%Entertainment 38.5% 33.1% Entertainment 39.4% 36.4%Factual Magazine 16.7% 7.7% Factual Magazine 5.3% 4.2%Fiction 27.4% 29.0% Fiction 23.9% 23.7%Cinema Film 14.6% 20.6% Cinema Film 27.5% 24.8%Documentary 13.6% 11.1% Documentary 6.4% 5.5%Entertainment 17.4% 17.1% Entertainment 18.6% 21.8%Factual Magazine 26.8% 18.9% Factual Magazine 10.8% 10.5%Fiction 27.6% 32.4% Fiction 36.7% 37.3%Cinema Film 24.1% 27.3% Cinema Film 36.4% 40.6%Documentary 14.0% 8.5% Documentary 9.1% 4.9%Entertainment 16.3% 16.4% Entertainment 10.5% 5.9%Factual Magazine 17.7% 10.2% Factual Magazine 7.7% 3.4%Fiction 27.9% 37.6% Fiction 36.3% 45.2%Cinema Film 16.5% 16.6% Cinema Film 33.9% 24.9%Documentary 12.1% 9.1% Documentary 7.4% 7.0%Entertainment 15.0% 19.5% Entertainment 26.2% 28.1%Factual Magazine 14.7% 9.8% Factual Magazine 13.7% 8.5%Fiction 41.6% 45.0% Fiction 18.8% 31.5%
TV4 TV4
TVP2 TVP2
TVN TVN
TVP1 TVP1
All Day Peak Time
Canal + Canal +
Polsat Polsat

249
Transmission and viewing ratio analysis In 2007, qualifying programmes (that is, all programmes excluding advertising, teleshopping, teletext, news, sport and games) made up 63.9% of the total transmission hours of the channels sampled (see Table 86).
POLSAT shows a figure of 51.9% of qualifying programmes, which can be explained by the high proportion of sports, a non-qualifying genre, on this channel. On CANAL+ the proportion is 88.8%, a figure which is explained by the dominance of cinema and fiction in this channel’s programming.
When comparing the proportions based on transmission hours to those based on viewing hours, the ratio of qualifying to total hours is nearly identical for CANAL+ and TV4. For leading public channels TVP1 and TVP2, we observe a decrease from around 61% for transmission hours to around 53% for viewing hours. This can be explained by the importance of news programming on these channels, a genre which does not count as ‘qualifying’ programming although it attracts large audiences.
Commercial private channels POLSAT and TVN, on the other hand, see their figures climb (from 51.9% in transmission hours to 63.9% in viewing hours for POLSAT, and from 60.7% to 67% for TVN), an increase explained by a high presence of fiction, cinema films and entertainment in peak-time.
Table 86: Ratio of qualifying hours to total transmission hours in Poland, 2007
Channel
Ratio of Qualifying to
Total Transmission
Hours (%)
Ratio of Qualifying to
Total Viewer Hours (%)
Canal + 88.8% 89.2%
Polsat 51.9% 63.9%
TV4 59.1% 59.2%
TVN 60.7% 67.0%
TVP1 61.4% 50.6%
TVP2 61.4% 57.7%
Result for Member State Sample
63.9% 58.7%
Proportion of European works The majority of the Polish channels show high proportions of European works, with an average of 58.8% of the total qualifying transmission hours for our 2007 sample (see Table 87). The only exception is CANAL+, which shows a low proportion of European works of 29%. This proportion is explained by the high presence of American programming in the

250
CANAL+ offering, as opposed to the situation of their sister channel in France, which funds a wide volume of locally-made cinema films.
TVN and TVP2 air the highest proportion of European works (respectively 80.5% and 71.2% of the total qualifying transmission hours), mostly because of the high proportion of entertainment programming they offer during peak-time.
The leading channel in terms of share of viewing, TVP1, also stands quite high, with the proportion of European works at 67.2% of the total qualifying transmission hours. This figure is, on the one hand, usual for leading public broadcasters who tend to offer a high proportion of national works as part of their public service mission. On the other hand, it is also explained by the exclusive rights over Polish television’s archives, historically held by TVP.
During peak-time, a small decrease can be noticed in the proportion of European works on all the channels, except for TVN and TVP2. This decrease is quite significant for POLSAT with its proportion of European works reducing from 50% for its whole schedule to 39.9% during peak-time. For TVP1, this decrease can be explained by the higher presence of cinema films during peak-time compared to its all-day schedule.
When comparing the proportions of European works based on transmission hours to those based on viewing hours, the viewing ratio is lower than the transmission ratio for the majority of the channels, except for TVN and TVP2, both of which air a lot of entertainment and fewer fiction programmes. On the other hand, CANAL+, which airs 29% European works during all-day, only gets a viewing ratio of 13.4%. The same trends can be observed during peak-time.
Table 87: Ratio of European qualifying to total qualifying hours in Poland, 2007
Channel
Ratio of
Qualifying
European to
Total Qualifying
Hours (%)
Ratio of
Qualifying
European to
Total Qualifying
Viewer Hours
(%)
Channel
Ratio of
Qualifying
European to
Total Qualifying
Hours (%)
Ratio of
Qualifying
European to
Total Qualifying
Viewer Hours
(%)
Canal + 29.0% 13.4% Canal + 27.9% 8.9%
Polsat 50.0% 47.6% Polsat 39.9% 40.9%
TV4 66.7% 54.1% TV4 55.3% 49.1%
TVN 80.5% 82.1% TVN 81.9% 87.5%
TVP1 67.2% 57.7% TVP1 53.0% 47.5%
TVP2 71.2% 78.5% TVP2 71.2% 79.8%
Result for Member State Sample
58.8% 66.0%Result for Member State Sample
52.7% 62.7%
All Day Peak Time
For our sample as a whole, 8.6% of qualifying works broadcast on the Polish channels are non-domestic European works (see Table 88).

251
TVN, POLSAT and TV4 air the lowest proportion of non-domestic European works, with 5% of the total transmission hours for TVN, 3.9% for POLSAT and 6.8% for TV4; whereas the two public channels air around 11% non-domestic European works during their total schedule, as does CANAL+.
In peak-time, the ratio of non-domestic qualifying European works remains approximately the same for POLSAT and TV4. This ratio goes down for TVP1 and TVP2, while CANAL+ and TVN see their proportions of non-domestic European works go up (from 10.8% all-day to 19.5% peak for CANAL+ and 5% all-day to 10.9% peak for TVN).
When comparing the proportions based on transmission hours to those based on viewing hours, the ratio of non-domestic qualifying European to total qualifying viewer hours in our sample as a whole is lower than the ratio to total transmission hours (all-day and peak-time). Only TV4 and TVN see their proportions slightly rising in their all-day schedules (up to 8% for TV4 and 6.6% for TVN). In peak-time, all channels see their ratios go down.
Table 88: Ratio of non-domestic qualifying European to total qualifying hours in Poland, 2007
Channel
Ratio of Non-
Domestic
Qualifying
European to
Total Qualifying
Hours (%)
Ratio of Non-
Domestic
Qualifying
European to
Total Qualifying
Viewer Hours
(%)
Channel
Ratio of Non-
Domestic
Qualifying
European to
Total Qualifying
Hours (%)
Ratio of Non-
Domestic
Qualifying
European to
Total Qualifying
Viewer Hours
(%)
Canal + 10.5% 5.8% Canal + 19.5% 7.1%
Polsat 3.9% 2.7% Polsat 3.4% 1.3%
TV4 6.8% 8.0% TV4 6.0% 4.6%
TVN 5.0% 6.6% TVN 10.9% 10.4%
TVP1 10.5% 8.2% TVP1 7.0% 6.0%
TVP2 13.2% 10.3% TVP2 6.5% 6.0%
Result for Member State Sample
8.6% 7.1%Result for Member State Sample
9.4% 6.0%
All Day Peak Time
Proportion of independent works Across our Polish sample as a whole, 25.6% of qualifying hours are produced by independent production companies (see Table 89). The proportion is approximately the same in peak-time.
However, proportions vary significantly between the channels of our sample. TV4 and TVP2 show the highest proportions of independent works (48.5% and 37.7% during all-day respectively), CANAL+, POLSAT and TVP1 air around 20% of independent works, whereas TVN show the lowest proportion of our sample (5.6%). In peak-time, all channels show slightly lower or same proportions except TVN and TVP2, whose figures rise to respectively 13.1% and 43.2%.

252
When comparing the proportions based on transmission hours to those based on viewing hours, the proportions are generally lower except for TVP2 which shows a significant rise in all-day and peak-time ( 52% during all-day and 61% in peak-time). For the sample as a whole, the proportion of qualifying viewer hours that are captured by independent European works is 21.9% during all-day and 22% in peak-time.
Table 89: Ratio of independent European to total qualifying in Poland, 2007
Channel
Ratio of
Qualifying
Independent
European to
Total Qualifying
Hours (%)
Ratio of
Qualifying
Independent
European to
Total Qualifying
Viewer Hours
(%)
Channel
Ratio of
Qualifying
Independent
European to
Total Qualifying
Hours (%)
Ratio of
Qualifying
Independent
European to
Total Qualifying
Viewer Hours
(%)
Canal + 23.8% 11.5% Canal + 22.7% 7.5%
Polsat 18.6% 16.8% Polsat 19.0% 15.8%
TV4 48.5% 44.6% TV4 40.8% 41.1%
TVN 5.6% 7.1% TVN 13.1% 11.4%
TVP1 20.5% 14.5% TVP1 17.8% 13.3%
TVP2 37.7% 52.0% TVP2 43.2% 61.0%
Result for Member State Sample
25.6% 21.9%Result for Member State Sample
25.4% 22.0%
All Day Peak Time
Proportion of recent independent works For the Polish sample, 77.9% of all qualifying European independent transmission hours comprise programmes less than five years old (see Table 90). However, whereas this high proportion is true for the main private free channels, it is not the case for the leading public channel TVP1 which shows a proportion of recent works of 58.6%., this smaller proportion of recent independent works could be explained by the exclusive access to the Polish film archives that TVP enjoys. CANAL+, because of its strong offering of cinema films, also stays at a quite low proportion of recent independent works (66.2%).
In peak-time hours, the proportion of recent works increases, up to 85.5%. This can be explained by the channels’ willingness to place their more recent, and thus more attractive, works during peak-time slots, where more viewers are likely to be reached.
When comparing the proportions based on transmission hours to those based on viewing hours, the ratio of recent independent European to total qualifying independent European viewer hours is increasing, rising from 77.9% to 84.4% during all-day, and from 85.5% to 90.2% during peak.

253
Table 90: Ratio of recent independent European to total independent European in Poland, 2007
Channel
Ratio of Recent
Qualifying
Independent
European to Total
Qualifying
Independent
European
Hours(%)
Ratio of Recent
Qualifying
Independent
European to Total
Qualifying
Independent
European Viewer
Hours(%)
Channel
Ratio of Recent
Qualifying
Independent
European to Total
Qualifying
Independent
European
Hours(%)
Ratio of Recent
Qualifying
Independent
European to Total
Qualifying
Independent
European Viewer
Hours(%)
Canal + 66.2% 40.5% Canal + 75.7% 66.2%
Polsat 87.3% 94.9% Polsat 100.0% 100.0%
TV4 88.1% 84.7% TV4 85.2% 88.8%
TVN 100.0% 100.0% TVN 100.0% 100.0%
TVP1 58.6% 71.7% TVP1 94.3% 91.9%
TVP2 78.9% 83.6% TVP2 77.5% 83.8%
Result for Member State Sample
77.9% 84.4%Result for Member State Sample
85.5% 90.2%
All Day Peak Time
Proportion of stock/flow works The proportion of stock vs. flow programmes to total qualifying European hours is fairly evenly split (see Table 91). Stock programmes account for 54.6 % of total qualifying European hours of all-day schedules (flow: 45.4%) and 57.4% in peak-time (flow: 42.6%). However, there are differences between the channels, with TVP1 and TVP2 having around 60% stock programming, POLSAT reaching 70.5% stock, but TVN being at 47% stock. TV4 is mostly composed of flow programmes, with a proportion of 81.4% of total qualifying European transmission hours. In peak-time, two channels reverse their trends, TVN and TVP2. TVN, which was skewed towards flow in all-day air more stock in peak-time (65.1% stock in peak vs. 47% all-day). Conversely, TVP2 that airs 37.6% of flow in its all-day schedule switches to 53.3% of flow during peak-time.
When comparing the proportions based on transmission hours to those based on viewing hours, the proportion of stock programmes is 66.3% (flow: 33.7% - with much the same proportion during peak-time). All channels have a higher proportion of stock programmes when looking at viewer hours in all-day. In peak-time, the proportion of stock programmes in terms of viewer hours is slightly lower, except for the two public channels and for CANAL+.

254
Table 91: Ratio of European stock/flow to total European in Poland, 2007
Channel
Qualifying
European
Stock to
Total
Qualifying
European
Hours (%)
Qualifying
European
Flow to Total
Qualifying
European
Hours (%)
Total
(%)Channel
Qualifying
European
Stock to
Total
Qualifying
European
Hours (%)
Qualifying
European
Flow to Total
Qualifying
European
Hours (%)
Total
(%)
Canal + 88.2% 11.8% 100% Canal + 73.7% 26.3% 100%
Polsat 70.5% 29.5% 100% Polsat 82.3% 17.7% 100%
TV4 18.6% 81.4% 100% TV4 19.2% 80.8% 100%
TVN 47.0% 53.0% 100% TVN 65.1% 34.9% 100%
TVP1 59.7% 40.3% 100% TVP1 70.2% 29.8% 100%
TVP2 62.4% 37.6% 100% TVP2 46.7% 53.3% 100%
Result for Member State Sample
54.6% 45.4% 100%Result for Member State Sample
57.4% 42.6% 100%
Channel
Qualifying
European
Stock to
Total
Qualifying
European
Viewer Hours
(%)
Qualifying
European
Flow to Total
Qualifying
European
Viewer Hours
(%)
Total
(%)Channel
Qualifying
European
Stock to
Total
Qualifying
European
Viewer Hours
(%)
Qualifying
European
Flow to Total
Qualifying
European
Viewer Hours
(%)
Total
(%)
Canal + 88.9% 11.1% 100% Canal + 80.4% 19.6% 100%
Polsat 82.2% 17.8% 100% Polsat 78.5% 21.5% 100%
TV4 24.6% 75.4% 100% TV4 17.3% 82.7% 100%
TVN 56.9% 43.1% 100% TVN 63.6% 36.4% 100%
TVP1 70.2% 29.8% 100% TVP1 82.1% 17.9% 100%
TVP2 67.9% 32.1% 100% TVP2 58.8% 41.2% 100%
Result for Member State Sample
66.3% 33.7% 100%Result for Member State Sample
67.3% 32.7% 100%
All Day Peak Time
All Day Peak Time
Comparison with past data and declarations As Poland was not part of the 2005 Study, any comparison with past data is impossible. However, we can elaborate comparisons between the data from our sample estimates of 2007 and that from the channels’ declarations of 2006.
Differences are quite small as far as the ratio of European works to total qualifying hours is concerned (see Figure 40).

255
Figure 40: Ratio of reported vs. estimated European qualifying transmission hours to total qualifying transmission hours in Poland, 2007/2006
0.0%
10.0%
20.0%
30.0%
40.0%
50.0%
60.0%
70.0%
80.0%
90.0%
2006/7 2006/7 2006/7 2006/7 2006/7 2006/7
Canal + Polsat TV4 TVN TVP1 TVP2
Perc
en
tag
e o
f T
ota
l Q
uali
fyin
g T
ran
sm
issio
n H
ou
rs
Channel/Year
Reported Sample Estimate
The 2007 ratio of qualifying independent European works to total qualifying hours is consistent with the 2006 reported data for TVP2, TV4 and CANAL+ (see Figure 41). But for TVP1, TVN and POLSAT, sample estimates are significantly below the 2006 reported data. The broader definition of ‘independent works’ applied in Poland could explain these disparities238.
238 Poland applies a ‘company-by-company’ definition of ‘independent works’, which means a producer has to be independent from a specific broadcaster. This definition is broader than our definition which sets that ‘independent works’ have to be independent from any broadcasters in a given country.

256
Figure 41: Ratio of reported vs. estimated independent European qualifying transmission hours to total qualifying transmission hours in Poland, 2007/2006
0.0%
10.0%
20.0%
30.0%
40.0%
50.0%
60.0%
2006/7 2006/7 2006/7 2006/7 2006/7 2006/7
Canal + Polsat TV4 TVN TVP1 TVP2
Perc
en
tag
e o
f T
ota
l Q
uali
fyin
g T
ran
sm
issio
n H
ou
rs
Channel/year
Reported Sample Estimate
The 2007 ratio of qualifying recent independent European works to total qualifying hours is very consistent with the 2006 reported data (see Figure 42).

257
Figure 42: Ratio of reported vs. estimated recent independent European qualifying transmission hours to total independent European transmission hours in Poland, 2007/2006
0.0%
20.0%
40.0%
60.0%
80.0%
100.0%
120.0%
2006/7 2006/7 2006/7 2006/7 2006/7 2006/7
Canal + Polsat TV4 TVN TVP1 TVP2
Perc
en
tag
e o
f T
ota
l In
dep
en
den
t E
uro
pean
Tra
nsm
issio
n H
ou
rs
Channel/Year
Reported Sample Estimate
8.4.9. Romania
Data summary Our sample consists of the largest public service channel TVR1 and 3 private commercial channels: PRO TV (Central European Media Enterprises), ANTENA 1 (Intact Media Group/ Dan Voiculescu) and PRIMA TV (ProSiebenSat1/SBS). Together all these channels account for 55.9% of total TV viewing in Romania (see Table 92).
Table 92: List of channels covered in the 2007 Romanian sample239
Country ChannelLaunch
Year
Share of Viewing (2005)
Revenue Model PlatformAverage Daily Transmission
Hours
Sample Weeks
Romania TVR1 1957 22.50% Gvt/Ad Nat. Terr./C/S 24
Romania PRO TV 1995 16.10% Ad Nat.Terr/Cab 24
Romania PRIMA TV 1997 4.60% Ad Nat.Terr/Cab 24
Romania Antena 1 1993 12.70% Ad Nat.Terr/Cab 24
Standard
239 In the ‘Platform’ column, “Terr/C/S” means “Terrestrial, Cable and Satellite”.

258
Genre analysis Cinema film accounts for a large share of total qualifying programmes (cinema, documentary, entertainment, factual magazines and TV fiction) on all channels in the sample: around 20-23% for PRIMA TV, TVR1 and ANTENA 1, and up to 34.3% for PRO TV during all-day. PRO TV offers 79% cinema film in its qualifying peak-time schedule, and offers cinema films which are very attractive with the audience, as it represents 55.1% of its total qualifying viewer hours during all-day, 89.7% in peak-time. Each channel then has its specific mix of genres to complement their qualifying schedules.
PRO TV complements cinema film with television fiction, its main genre during all-day with 40.8% of total qualifying hours. In peak-time, cinema film and fiction combined account for 99.3% of PRO TV total qualifying viewing.
TVR1 shows the most balanced sub-mix of qualifying genres with entertainment and factual magazines at the top (24.9% and 23.7% of total), followed by documentaries (18%). The entertainment and factual focus is stronger in peak-time especially for entertainment, which represents 29.6% of the qualifying schedule and attracts 49.8% of the qualifying viewing.
ANTENA 1 has a strong focus on entertainment and fiction (37.5% and 29%) during all-day, and puts a particular emphasis on entertainment in peak-time (51.2% of qualifying transmission hours and 68.2% of viewer hours). Entertainment on this channel accounts for 64.4% of total qualifying viewer hours during all-day.
PRIMA TV is largely focusing on fiction across the all-day schedule (39% of total qualifying hours), and on entertainment in peak-time (46.5%). Entertainment on this channel accounts for 42.6% of total qualifying viewer hours during all-day.
Table 93: Genre proportion of total qualifying hours in Romania, 2007
Channel Genre
Genre
Proportions
of Total
Qualifying
Hours (%)
Genre
Proportions
of Total
Qualifying
Viewer
Hours (%)
Channel Genre
Genre
Proportions
of Total
Qualifying
Hours (%)
Genre
Proportions
of Total
Qualifying
Viewer
Hours (%)
Cinema Film 19.9% 12.0% Cinema Film 27.6% 12.7%Documentary 3.1% 3.9% Documentary 4.5% 6.3%Entertainment 37.5% 64.4% Entertainment 51.2% 68.2%Factual Magazine 10.6% 6.3% Factual Magazine 0.0% 0.0%Fiction 29.0% 13.4% Fiction 16.6% 12.9%Cinema Film 23.9% 11.7% Cinema Film 13.1% 4.7%Documentary 12.2% 20.3% Documentary 17.8% 25.8%Entertainment 20.3% 42.6% Entertainment 46.5% 50.7%Factual Magazine 4.6% 2.9% Factual Magazine 5.6% 3.0%Fiction 39.0% 22.4% Fiction 17.1% 16.0%Cinema Film 34.3% 55.1% Cinema Film 79.0% 89.7%Documentary 5.2% 1.7% Documentary 2.2% 0.7%Entertainment 6.7% 8.5% Entertainment 0.0% 0.0%Factual Magazine 13.0% 5.7% Factual Magazine 0.0% 0.0%Fiction 40.8% 28.9% Fiction 18.9% 9.6%Cinema Film 22.0% 16.5% Cinema Film 17.2% 13.8%Documentary 18.0% 10.2% Documentary 10.4% 6.5%Entertainment 24.9% 44.1% Entertainment 29.6% 49.8%Factual Magazine 23.7% 21.2% Factual Magazine 29.3% 22.1%Fiction 11.5% 8.2% Fiction 13.4% 7.8%
All Day Peak Time
Antena 1 Antena 1
TVR1 (ex Romania 1) TVR1 (ex Romania 1)
Prima TV Prima TV
Pro TV Pro TV

259
Transmission and viewing ratio analysis In 2007, qualifying programmes (that is, all programmes excluding advertising, teleshopping, teletext, news, sport and games) made up 60.6% of the total transmission hours on the channels sampled (see Table 94). Qualifying viewing is in general lower, at 51.5% of total qualifying viewer hours.
While all four channels have a very similar proportion of qualifying transmission hours, ratios for qualifying viewer hours show two interesting cases. PRO TV, leading private channel, is deriving only 41.3% of its total viewing from qualifying programmes, as opposed to 59.2% of its total transmission hours, showing that this channel’s most successful programmes are from non-qualifying genres. The same conclusion can be made observing the lower proportions of TVR1 in terms of viewer hours (54%) that in terms of transmission hours (63.1%).
Table 94: Ratio of qualifying hours to total transmission and viewer hours in Romania, 2007
Channel
Ratio of Qualifying to
Total Transmission
Hours (%)
Ratio of Qualifying to
Total Viewer Hours (%)
Antena 1 59.2% 55.4%
Prima TV 61.0% 65.2%
Pro TV 59.2% 41.3%
TVR1 (ex Romania 1) 63.1% 54.0%
Result for Member State Sample
60.6% 51.5%
Proportion of European works European works make up 57.2% of the total qualifying transmission hours for all-day across all channels in the sample in 2007 (see Table 95), and more in peak-time (66.8%). During all-day, PRO TV and PRIMA TV have a lower proportion of European works, at 43% and 47.9% respectively, while TVR1 and ANTENA 1 reach 72.2% and 64.8%. While PRIMA TV has a higher proportion in peak-time, PRO TV does the reverse, reducing to 26.3%, a consequence of its focus on fiction and cinema imports.
European works have, for most of the sampled Romanian channels, a larger share of audience than their share of schedules, especially during all-day where they reach 67.9% of total viewer qualifying hours compared to 57.7% of total transmission hours. In peak-time 68.9% of the qualifying viewing is made of European works. PRO TV is the only channel to encounter audience issues with its European programmes especially in
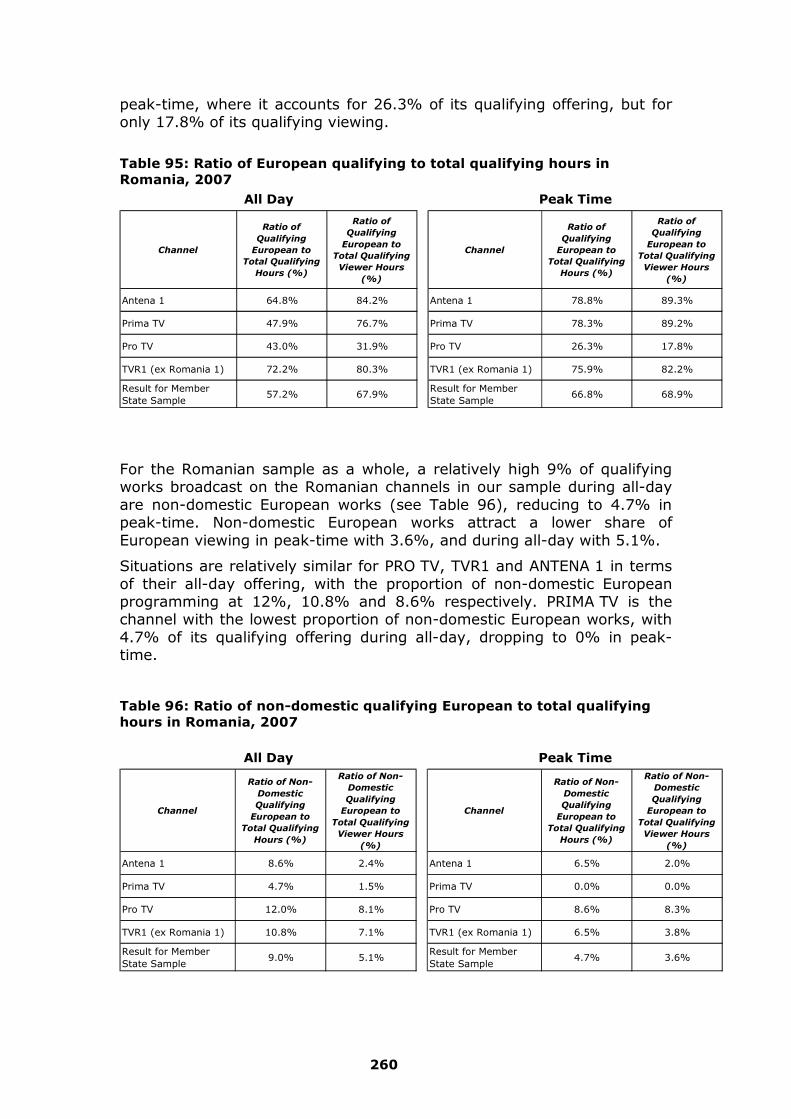
260
peak-time, where it accounts for 26.3% of its qualifying offering, but for only 17.8% of its qualifying viewing.
Table 95: Ratio of European qualifying to total qualifying hours in Romania, 2007
Channel
Ratio of
Qualifying
European to
Total Qualifying
Hours (%)
Ratio of
Qualifying
European to
Total Qualifying
Viewer Hours
(%)
Channel
Ratio of
Qualifying
European to
Total Qualifying
Hours (%)
Ratio of
Qualifying
European to
Total Qualifying
Viewer Hours
(%)
Antena 1 64.8% 84.2% Antena 1 78.8% 89.3%
Prima TV 47.9% 76.7% Prima TV 78.3% 89.2%
Pro TV 43.0% 31.9% Pro TV 26.3% 17.8%
TVR1 (ex Romania 1) 72.2% 80.3% TVR1 (ex Romania 1) 75.9% 82.2%
Result for Member State Sample
57.2% 67.9%Result for Member State Sample
66.8% 68.9%
All Day Peak Time
For the Romanian sample as a whole, a relatively high 9% of qualifying works broadcast on the Romanian channels in our sample during all-day are non-domestic European works (see Table 96), reducing to 4.7% in peak-time. Non-domestic European works attract a lower share of European viewing in peak-time with 3.6%, and during all-day with 5.1%.
Situations are relatively similar for PRO TV, TVR1 and ANTENA 1 in terms of their all-day offering, with the proportion of non-domestic European programming at 12%, 10.8% and 8.6% respectively. PRIMA TV is the channel with the lowest proportion of non-domestic European works, with 4.7% of its qualifying offering during all-day, dropping to 0% in peak-time.
Table 96: Ratio of non-domestic qualifying European to total qualifying hours in Romania, 2007
Channel
Ratio of Non-
Domestic
Qualifying
European to
Total Qualifying
Hours (%)
Ratio of Non-
Domestic
Qualifying
European to
Total Qualifying
Viewer Hours
(%)
Channel
Ratio of Non-
Domestic
Qualifying
European to
Total Qualifying
Hours (%)
Ratio of Non-
Domestic
Qualifying
European to
Total Qualifying
Viewer Hours
(%)
Antena 1 8.6% 2.4% Antena 1 6.5% 2.0%
Prima TV 4.7% 1.5% Prima TV 0.0% 0.0%
Pro TV 12.0% 8.1% Pro TV 8.6% 8.3%
TVR1 (ex Romania 1) 10.8% 7.1% TVR1 (ex Romania 1) 6.5% 3.8%
Result for Member State Sample
9.0% 5.1%Result for Member State Sample
4.7% 3.6%
All Day Peak Time

261
Proportion of independent works Qualifying independent works make up 21.9% of the all-day schedules across all the channels in our sample (see Table 97). In peak-time the figure is 33.5%. Independent works are relatively more successful, as they attract 25.7% of the total qualifying European viewing during all-day, 34.5% in peak-time.
PRIMA TV is offering the largest proportion of independent works, with a proportion of 37.7% during all-day and 58.3% in peak-time. This accounts for 64.2% of total qualifying viewer hours during all-day, and up to 74.9% in peak-time. ANTENA 1 is similar, especially in peak-time, where independent works make up 38.2% of its qualifying offering and 51.3% of its qualifying viewing, showing the attractiveness of its peak-time entertainment produced by independent producers. Conversely, PRO TV and TVR1 have 8.6% and 11.4% independent works among their peak-time European qualifying offering, which attract 8.3% and 7.5% of their peak-time qualifying viewing respectively.
Table 97: Ratio of independent European to total qualifying in Romania, 2007
Channel
Ratio of
Qualifying
Independent
European to
Total Qualifying
Hours (%)
Ratio of
Qualifying
Independent
European to
Total Qualifying
Viewer Hours
(%)
Channel
Ratio of
Qualifying
Independent
European to
Total Qualifying
Hours (%)
Ratio of
Qualifying
Independent
European to
Total Qualifying
Viewer Hours
(%)
Antena 1 19.2% 29.9% Antena 1 38.2% 51.3%
Prima TV 37.7% 64.2% Prima TV 58.3% 74.9%
Pro TV 13.3% 8.4% Pro TV 8.6% 8.3%
TVR1 (ex Romania 1) 17.6% 16.3% TVR1 (ex Romania 1) 11.4% 7.5%
Result for Member State Sample
21.9% 25.7%Result for Member State Sample
33.5% 34.5%
All Day Peak Time
Proportion of recent independent works For our Romanian sample as a whole 69.1% of all qualifying independent European transmission hours are programmes less than five years old (see Table 98). In peak-time the number is significantly higher (88.5%). As would be expected, recent works are more attractive to audiences and achieve a higher share of total qualifying independent viewing during all-day (80.2%), reducing slights when looking only at peak-time (83.3%).
ANTENA 1 and PRO TV, the two private leaders, have smaller proportions of recent independent works, with 37.4% and 37.8% of their all-day independent schedules (but 59.1% and 59.6% of their all-day independent viewer hours). In peak-time, all figures are at 100% except ANTENA 1 (56.5% of transmission hours, and 61% of viewer hours, are recent).

262
Table 98: Ratio of recent independent European to total independent European in Romania, 2007
Channel
Ratio of Recent
Qualifying
Independent
European to Total
Qualifying
Independent
European
Hours(%)
Ratio of Recent
Qualifying
Independent
European to Total
Qualifying
Independent
European Viewer
Hours(%)
Channel
Ratio of Recent
Qualifying
Independent
European to Total
Qualifying
Independent
European
Hours(%)
Ratio of Recent
Qualifying
Independent
European to Total
Qualifying
Independent
European Viewer
Hours(%)
Antena 1 37.4% 59.1% Antena 1 56.5% 61.0%
Prima TV 87.2% 97.1% Prima TV 100.0% 100.0%
Pro TV 37.8% 59.6% Pro TV 100.0% 100.0%
TVR1 (ex Romania 1) 86.6% 91.9% TVR1 (ex Romania 1) 100.0% 100.0%
Result for Member State Sample
69.1% 80.2%Result for Member State Sample
88.5% 83.3%
All Day Peak Time
Proportion of stock/flow works The proportion of stock vs. flow programmes among total qualifying European hours is relatively balanced (see Table 99). Stock programmes account for 43% of total qualifying European hours of all-day schedules (flow: 57%) and 45.3% in peak-time (flow: 54.7%) for the Romanian sample as a whole. PRO TV and PRIMA TV favour stock (56.1% and 62.7% respectively), with a complete focus on stock for PRO TV in peak-time (100%). Conversely, ANTENA 1 and TVR1 favour flow 68.7% and 67.2% during day-time).
Situations for both categories of channels are confirmed by the figures expressed in viewer hours. European stock makes up 57.1% of PRO TV qualifying European viewing and 54% for PRIMA TV during all-day, a lower proportion than their share of the schedule. ANTENA 1 and TVR1 offer 81.2% and 77% of European flow as a proportion of their European all-day viewer hours, higher figures than those for transmission hours.

263
Table 99: Ratio of European stock/flow to total European in Romania, 2007
Channel
Qualifying
European
Stock to
Total
Qualifying
European
Hours (%)
Qualifying
European
Flow to Total
Qualifying
European
Hours (%)
Total
(%)Channel
Qualifying
European
Stock to
Total
Qualifying
European
Hours (%)
Qualifying
European
Flow to Total
Qualifying
European
Hours (%)
Total
(%)
Antena 1 31.3% 68.7% 100% Antena 1 35.0% 65.0% 100%
Prima TV 62.7% 37.3% 100% Prima TV 53.7% 46.3% 100%
Pro TV 56.1% 43.9% 100% Pro TV 100.0% 0.0% 100%
TVR1 (ex Romania 1) 32.8% 67.2% 100% TVR1 (ex Romania 1) 22.3% 77.7% 100%
Result for Member State Sample
43.0% 57.0% 100%Result for Member State Sample
45.3% 54.7% 100%
Channel
Qualifying
European
Stock to
Total
Qualifying
European
Viewer Hours
(%)
Qualifying
European
Flow to Total
Qualifying
European
Viewer Hours
(%)
Total
(%)Channel
Qualifying
European
Stock to
Total
Qualifying
European
Viewer Hours
(%)
Qualifying
European
Flow to Total
Qualifying
European
Viewer Hours
(%)
Total
(%)
Antena 1 23.0% 77.0% 100% Antena 1 23.6% 76.4% 100%
Prima TV 54.0% 46.0% 100% Prima TV 54.2% 45.8% 100%
Pro TV 57.1% 42.9% 100% Pro TV 100.0% 0.0% 100%
TVR1 (ex Romania 1) 18.8% 81.2% 100% TVR1 (ex Romania 1) 12.5% 87.5% 100%
Result for Member State Sample
31.4% 68.6% 100%Result for Member State Sample
33.9% 66.1% 100%
All Day Peak Time
All Day Peak Time
Comparison with past data and declarations As Romania was not part of the 2005 Study, any comparison with past data is impossible. However, we can elaborate comparisons between the data from our sample estimates of 2007 and that from the channels’ declarations of 2006.
The ratio of qualifying European works to total qualifying hours provided by our 2007 estimates are very consistent with the 2006 declarations for all the four channels of our sample (see Figure 43).

264
Figure 43: Ratio of reported vs. estimated European qualifying transmission hours to total qualifying transmission hours in Romania, 2007/2006
0.0%
10.0%
20.0%
30.0%
40.0%
50.0%
60.0%
70.0%
80.0%
2006/7 2006/7 2006/7 2006/7
Antena1 Prima TV Pro TV TVR1
Perc
en
tag
e o
f T
ota
l Q
uali
fyin
g T
ran
sm
issio
n H
ou
rs
Channel/Year
Reported Sample Estimate
The 2007 ratio of qualifying independent European works to total qualifying hours is also consistent with the 2006 data reported by two channels from our sample PRIMA TV and ANTENA1 (see Figure 44). Based on these two channels, sample estimates are slightly lower than reported data in Romania.

265
Figure 44: Ratio of reported vs. estimated independent European qualifying transmission hours to total qualifying transmission hours in Romania, 2007/2006
0.0%
10.0%
20.0%
30.0%
40.0%
50.0%
60.0%
2006/7 2006/7 2006/7 2006/7
Antena1 Prima TV Pro TV TVR1
Perc
en
tag
e o
f T
ota
l Q
uali
fyin
g T
ran
sm
issio
n H
ou
rs
Channel/Year(Note: Where there is no column for a particular channel/year, data is unavailable)
Reported Sample Estimate
The ratio of recent qualifying independent works to total independent qualifying hours provided by our 2007 estimates are not very consistent with the 2006 data reported by the two channels from our sample (see Figure 45). 2007 sample estimates are lower than 2006 reported data for ANTENA1 and higher for PRIMA TV.

266
Figure 45: Ratio of reported vs. estimated recent independent European qualifying transmission hours to total independent European transmission hours in Romania, 2007/2006
0.0%
20.0%
40.0%
60.0%
80.0%
100.0%
120.0%
2006/7 2006/7 2006/7 2006/7
Antena1 Prima TV Pro TV TVR1
Perc
en
tag
e o
f T
ota
l In
dep
en
den
t E
uro
pean
Tra
nsm
issio
n H
ou
rs
Channel/Year(Note: Where there is no column for a particular channel/year, data is unavailable)
Reported Sample Estimate
8.4.10. Spain
Data summary Our sample consists of two publicly funded public service channels (TVE1 and LA2) and four advertising funded channels (ANTENA3, CUATRO, LA SEXTA and TELE5). Together (see Table 100) they account for more than 72.4% of total Spanish TV viewing.
Table 100: List of channels covered in the 2007 Spanish sample
Country ChannelLaunch
Year
Share of Viewing (2005)
Revenue Model PlatformAverage Daily Transmission
Hours
Sample Weeks
Spain Antena 3 1989 20.40% Ad Nat. Terr. 24
Spain CUATRO 2005 0.80% Ad Cab/Sat 24
Spain La 2 1965 6.70% Gvt/Ad Nat. Terr. 24
Spain LA SEXTA 2006 N/A Ad Cab/Sat 24
Spain Tele 5 1990 22.60% Ad Nat. Terr. 24
Spain TVE 1 1956 21.90% Gvt/Ad Nat. Terr. 24
Standard
267
Genre analysis All Spanish channels in our sample (except LA SEXTA) rely strongly on factual magazines and fiction programmes to fill their all-day schedules (see Table 101). The comparative importance of these two genres varies, however, from one channel to another, factual magazines being more prominent on channels commanding a larger proportion of Spanish viewing (it accounts for 35.2% of total qualifying transmission hours on TELE5 and 48.5% on TVE1), while TV fiction is favoured on smaller channels (44.5% on ANTENA3, 41.5% on CUATRO, 32.9% on LA2 and 30.2% on LA SEXTA).
Cinema film, entertainment and documentary offerings allow channels to differentiate themselves from one another more substantially. Cinema is indeed a significant genre on TVE1 (18.1%), LA2 (20%) and ANTENA3 (18%), while entertainment is a major programming component on LA SEXTA (40.3%), TELE5 (31.3%) and, to a lesser extent, CUATRO (17.2%). Documentary has a weaker exposure on all channels except LA2 (17.8%) and LA SEXTA (16.9%).
In peak-time, new scheduling balances occur: cinema and TV fiction often gain ground at the expense of factual magazines and, sometimes, entertainment. TELE5 shifts towards TV fiction (40.8%) while cutting down factual magazines (23.7%). LA SEXTA puts emphasis on cinema (16.9%) and TV fiction (41.1%) at the expense of entertainment (31.5%) and factual magazines (0%). LA2 significantly increases the proportion of TV fiction within its schedule (53% peak, 32.9% all-day), lowering the level of documentary (13.8%), entertainment (4.3%) and factual magazines (7.9%).
The more significant change appears in CUATRO’s peak-time schedule. The channel strongly cuts down on TV fiction (29.4% peak, 41.5% all-day) and gives up factual magazines completely during peak-time (0% peak, 23.3% all-day) to favour cinema (21% peak, 8.8% all-day), and documentary (29.1% peak, 9.2% all-day). ANTENA3 also reduces dramatically the importance of TV fiction (18.8% peak, 44.5% all-day), putting emphasis on factual magazines (43.7% peak, 27.2% all-day) and cinema (28.9% peak, 18% all-day). TVE1’s schedule, on the contrary, hardly changes in peak-time.

268
Table 101: Genre proportion of total qualifying hours in Spain, 2007
Channel Genre
Genre
Proportions
of Total
Qualifying
Hours (%)
Genre
Proportions
of Total
Qualifying
Viewer
Hours (%)
Channel Genre
Genre
Proportions
of Total
Qualifying
Hours (%)
Genre
Proportions
of Total
Qualifying
Viewer
Hours (%)
Cinema Film 18.0% 25.8% Cinema Film 28.9% 26.0%Documentary 2.1% 4.9% Documentary 6.1% 9.5%Entertainment 8.3% 2.9% Entertainment 2.4% 2.3%Factual Magazine 27.2% 27.8% Factual Magazine 43.7% 38.6%Fiction 44.5% 38.5% Fiction 18.8% 23.6%Cinema Film 8.8% 10.3% Cinema Film 21.0% 10.7%Documentary 9.2% 13.0% Documentary 29.1% 25.8%Entertainment 17.2% 17.1% Entertainment 20.6% 21.6%Factual Magazine 23.3% 17.0% Factual Magazine 0.0% 0.0%Fiction 41.5% 42.6% Fiction 29.4% 41.9%Cinema Film 20.0% 15.9% Cinema Film 21.0% 24.7%Documentary 17.8% 30.4% Documentary 13.8% 14.6%Entertainment 10.7% 7.6% Entertainment 4.3% 3.4%Factual Magazine 18.7% 13.1% Factual Magazine 7.9% 7.3%Fiction 32.9% 33.0% Fiction 53.0% 50.0%Cinema Film 4.2% 9.8% Cinema Film 16.9% 23.1%Documentary 16.9% 12.1% Documentary 10.4% 10.0%Entertainment 40.3% 38.8% Entertainment 31.5% 32.3%Factual Magazine 8.4% 2.1% Factual Magazine 0.0% 0.0%Fiction 30.2% 37.3% Fiction 41.1% 34.6%Cinema Film 6.7% 7.4% Cinema Film 3.5% 1.5%Documentary 0.0% 0.0% Documentary 0.0% 0.0%Entertainment 31.3% 33.9% Entertainment 31.9% 27.4%Factual Magazine 35.2% 19.5% Factual Magazine 23.7% 15.1%Fiction 26.8% 39.1% Fiction 40.8% 56.0%Cinema Film 18.1% 24.6% Cinema Film 25.1% 29.5%Documentary 4.1% 1.7% Documentary 0.0% 0.0%Entertainment 8.6% 8.1% Entertainment 13.0% 14.8%Factual Magazine 48.5% 39.9% Factual Magazine 46.7% 38.9%Fiction 20.7% 25.8% Fiction 15.2% 16.8%
CUATRO CUATRO
La 2 La 2
All Day Peak Time
Antena 3 Antena 3
TVE 1 TVE 1
LA SEXTA LA SEXTA
Tele 5 Tele 5
Transmission and viewing ratio analysis In 2007, qualifying programmes (that is, all programmes excluding advertising, teleshopping, teletext, news, sport and games) made up 65.2% of the total transmission hours of the Spanish channels sampled (see Table 102). LA2 was the channel showing the highest proportion of qualifying hours with 72.3%, followed by LA SEXTA (72%) and CUATRO (71.6%). Commercial broadcaster ANTENA3 showed the lowest proportion with only 54.4%, while TVE1 and TELE5 stood in-between (56.3% and 64.8% respectively).
The ratio based on viewer hours is, on the whole, higher than that based on transmission hours (70.7% vs. 65.2%). LA SEXTA and TELE5 show the most important uplift (87.8% of viewer hours versus 72% of transmission hours and 80.3% vs. 64.8% respectively), which is explained largely by the fact that these two channels build their peak-time schedules around very successful TV fiction. On the other hand, public broadcaster LA2, whose peak-time schedule is also dominated by TV fiction, sees its viewing go down to 69% compared to 72.3% for its transmission ratio.

269
Table 102: Ratio of qualifying hours to total transmission and viewer hours in Spain, 2007
Channel
Ratio of Qualifying to
Total Transmission
Hours (%)
Ratio of Qualifying to
Total Viewer Hours (%)
Antena 3 54.4% 65.0%
CUATRO 71.6% 72.9%
La 2 72.3% 69.0%
LA SEXTA 72.0% 87.8%
Tele 5 64.8% 80.3%
TVE 1 56.3% 61.7%
Result for Member State Sample
65.2% 70.7%
Proportion of European works European works made up 65% of the total qualifying transmission hours for all channels in the sample in 2007 (see Table 103). TELE5, which belongs to Mediaset, shows the highest proportion of European qualifying hours with 83.2%. We also observe a clear divide between public broadcasters, who favour European programmes more strongly (74.5% of qualifying hours on TVE1, 67.7% on LA2), and commercial channels that are much closer to the objective of 50% (51.9% on ANTENA3, 54.7% on LA SEXTA and 58.8% on CUATRO).
During peak-time hours, the divide between channels tends to increase: TELE5 keeps the lead with 91.5% and TVE1 rises to 82.3%, while CUATRO and LA SEXTA fall below 50%, with 47% and 39% respectively. ANTENA3 and LA2, though, follow a different path: ANTENA3 rises up to 70.2%, while LA2 drops to 32.4% during peak-time, due to the increased programming of imported TV fictions in this time slot.
The ratio based on viewer hours is very close from that based on transmission hours for all three leading broadcasters during all-day: 83.5% of viewer hours vs. 83.2% of transmission hours for TELE5, 71.3% vs. 74.5% for TVE1 and 53.4% vs. 51.9% for ANTENA3. Smaller channels, on the contrary, see their viewing ratios decrease significantly compared to their transmission ratios: 49.4% of viewer hours vs. 58.8% of transmission hours for CUATRO, 60% vs. 67.7% for LA2 and 46.4% vs. 54.7% for LA SEXTA. This reflects the fact that these broadcasters rely heavily on imports to build their ratings. In peak-time, the difference between the two ratios is minor for all channels (ranging between 0.3% and 4.5%).

270
Table 103: Ratio of European qualifying to total qualifying hours in Spain, 2007
Channel
Ratio of
Qualifying
European to
Total Qualifying
Hours (%)
Ratio of
Qualifying
European to
Total Qualifying
Viewer Hours
(%)
Channel
Ratio of
Qualifying
European to
Total Qualifying
Hours (%)
Ratio of
Qualifying
European to
Total Qualifying
Viewer Hours
(%)
Antena 3 51.9% 53.4% Antena 3 70.2% 71.1%
CUATRO 58.8% 49.4% CUATRO 47.0% 46.7%
La 2 67.7% 60.0% La 2 32.4% 33.2%
LA SEXTA 54.7% 46.4% LA SEXTA 39.0% 40.5%
Tele 5 83.2% 83.5% Tele 5 91.5% 90.7%
TVE 1 74.5% 71.3% TVE 1 82.3% 77.8%
Result for Member State Sample
65.0% 66.6%Result for Member State Sample
61.4% 73.1%
All Day Peak Time
The proportion of non-domestic qualifying European works to total qualifying works is 5% for our Spanish sample as a whole (see Table 104). The figures range during all-day from 1.2% (TVE1) to 9.2% (LA2). They are lower when looking at viewer hours rather than transmission hours, except for LA2 (17.8% for viewer hours vs. 9.2% for transmission hours), which succeeds in appealing to domestic audiences with non-domestic programmes across the all-day schedule. In peak-time, the ratio of non-domestic qualifying European works is often nil (for LA SEXTA, CUATRO, TELE5 and TVE1) or very low (0.7% for LA2). ANTENA3 is the only channel to broadcast a substantial amount of non-domestic European works in peak-time (5.7% of total qualifying transmission hours, and 3.8% of total qualifying viewer hours).

271
Table 104: Ratio of non-domestic qualifying European to total qualifying hours in Spain, 2007
Channel
Ratio of Non-
Domestic
Qualifying
European to
Total Qualifying
Hours (%)
Ratio of Non-
Domestic
Qualifying
European to
Total Qualifying
Viewer Hours
(%)
Channel
Ratio of Non-
Domestic
Qualifying
European to
Total Qualifying
Hours (%)
Ratio of Non-
Domestic
Qualifying
European to
Total Qualifying
Viewer Hours
(%)
Antena 3 7.3% 6.1% Antena 3 5.7% 3.8%
CUATRO 6.9% 2.2% CUATRO 0.0% 0.0%
La 2 9.2% 17.8% La 2 0.7% 0.4%
LA SEXTA 2.2% 1.3% LA SEXTA 0.0% 0.0%
Tele 5 2.8% 1.7% Tele 5 0.0% 0.0%
TVE 1 1.2% 0.7% TVE 1 0.0% 0.0%
Result for Member State Sample
5.0% 3.4%Result for Member State Sample
1.3% 1.0%
All Day Peak Time
Proportion of independent works240 The average proportion of qualifying works produced by independent European producers and broadcast by the channels in our sample is high, reaching 40.2% in transmission hours (see Table 105). TELE5 shows the highest proportion of independent works in all-day schedules (55.4%), with TVE1 the lowest (27.5%); other channels stand between 30% and 50% : LA2 (31%), CUATRO (36.1%), ANTENA3 (40.2%) and LA SEXTA (49.3%). Half of the broadcasters show a higher proportion of independent programmes during their peak-time than is seen when looking at the proportion across the schedule for the entire day (TELE5, ANTENA3, TVE1) and half of them show less independent programmes (CUATRO, LA SEXTA, LA 2). The divide is important between the channel with the largest audiences, TELE5 (which increases to 77%) and the smaller channel LA2 (which decreases to 7.5%). ANTENA3 (58.5% peak-time, 40.2% all-day) and LA SEXTA (32.5% peak-time, 49.3% all-day) also show strong evolutions of their independent production ratios.
When looking at the proportions based on viewer hours, figures tend to increase by a few percentage points compared to the proportion of
240 It is important to note that the proportions of independent productions have been re-calculated for Italy following the debates at the public Workshop held in Brussels on November 18. Indeed, in the Draft report presented then, Endemol productions had been considered non-independent for the second half of 2007, based on inaccurate information gathered by the consultants that Mediaset owned 50% of the holding company controlling the Endemol group. Further research made clear that as Mediaset owns 33% of that holding company (together with Goldman Sachs and John de Mol owning another 33% each), Endemol cannot be considered to be controlled by Mediaset, according to our criteria as described in the methodological section of this report. Following this re-calculation, proportions of independent works have increased by up to 2.7 percentage points across the Member State sample.

272
transmission hours for our sample as a whole, to 45.3% (vs. 40.2%) for all-day and 54.8% (vs. 41.9%) in peak-time.
Table 105: Ratio of independent European to total qualifying in Spain, 2007
Channel
Ratio of
Qualifying
Independent
European to
Total Qualifying
Hours (%)
Ratio of
Qualifying
Independent
European to
Total Qualifying
Viewer Hours
(%)
Channel
Ratio of
Qualifying
Independent
European to
Total Qualifying
Hours (%)
Ratio of
Qualifying
Independent
European to
Total Qualifying
Viewer Hours
(%)
Antena 3 40,2% 48,4% Antena 3 58,5% 64,3%
CUATRO 36,1% 31,4% CUATRO 32,8% 33,7%
La 2 31,0% 31,3% La 2 7,5% 6,6%
LA SEXTA 49,3% 41,3% LA SEXTA 32,5% 34,1%
Tele 5 55,4% 60,0% Tele 5 77,0% 76,7%
TVE 1 27,5% 32,3% TVE 1 33,5% 37,1%
Result for Member State Sample
40,2% 45,3%Result for Member State Sample
41,9% 54,8%
All Day Peak Time
Proportion of recent independent works Across the Spanish sample as a whole, 85.6% of all qualifying independent European transmission hours are programmes less than five years old (see Table 106). LA SEXTA shows the highest proportion of recent independent works with 100% and LA2 the lowest with 36.6%. All other broadcasters in our sample show a ratio between 84.4% (ANTENA3) and 94.2% (TELE5). In peak-time hours, the proportion of recent works reaches 100% for all channels but two, ANTENA3 (90.2%) and TVE1 (77%).
Figures based on viewer hours are higher for all broadcasters except TVE1 across the all-day schedule, reflecting the interest of television audiences in the most recent content. The increased appeal for new productions is clear for LA2 across the all-day schedule (72.4% viewer hours).

273
Table 106: Ratio of recent independent European to total independent European in Spain, 2007
Channel
Ratio of Recent
Qualifying
Independent
European to Total
Qualifying
Independent
European
Hours(%)
Ratio of Recent
Qualifying
Independent
European to Total
Qualifying
Independent
European Viewer
Hours(%)
Channel
Ratio of Recent
Qualifying
Independent
European to Total
Qualifying
Independent
European
Hours(%)
Ratio of Recent
Qualifying
Independent
European to Total
Qualifying
Independent
European Viewer
Hours(%)
Antena 3 84,4% 91,2% Antena 3 90,2% 94,1%
CUATRO 89,9% 95,3% CUATRO 100,0% 100,0%
La 2 36,6% 72,4% La 2 100,0% 100,0%
LA SEXTA 100,0% 100,0% LA SEXTA 100,0% 100,0%
Tele 5 94,2% 97,2% Tele 5 100,0% 100,0%
TVE 1 87,0% 86,4% TVE 1 77,0% 79,4%
Result for Member State Sample
85,6% 93,4%Result for Member State Sample
93,8% 94,8%
All Day Peak Time
Proportion of stock/flow works The proportion of stock vs. flow programmes among total qualifying European hours is skewed towards flow (Table 107). European flow programmes represent 64.9% of total qualifying all-day transmission hours (compared with 35.1% for stock programmes). LA SEXTA shows the highest ratio with 79.1% and LA2 the lowest, with 39.8%. In peak-time the proportion of stock vs. flow programmes is 37.9% vs. 62.1%, and the ratios expressed in viewer hours become more balanced (44.6% stock vs. 55.4% flow).
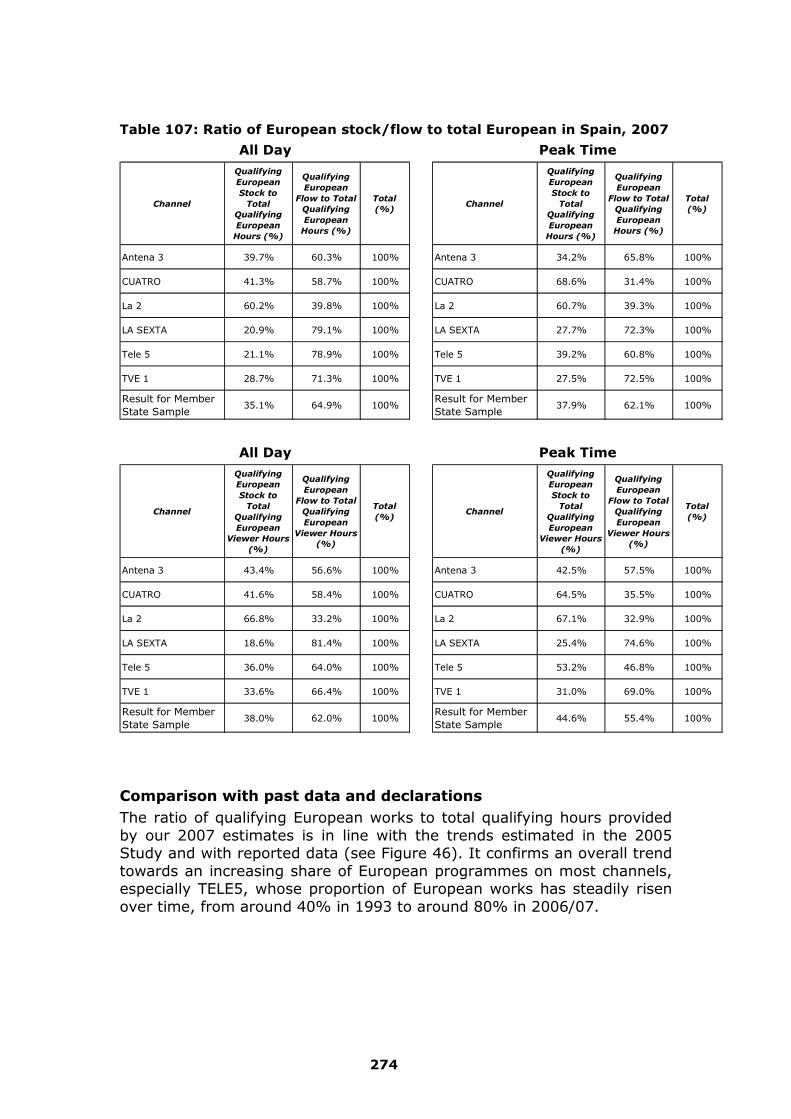
274
Table 107: Ratio of European stock/flow to total European in Spain, 2007
Channel
Qualifying
European
Stock to
Total
Qualifying
European
Hours (%)
Qualifying
European
Flow to Total
Qualifying
European
Hours (%)
Total
(%)Channel
Qualifying
European
Stock to
Total
Qualifying
European
Hours (%)
Qualifying
European
Flow to Total
Qualifying
European
Hours (%)
Total
(%)
Antena 3 39.7% 60.3% 100% Antena 3 34.2% 65.8% 100%
CUATRO 41.3% 58.7% 100% CUATRO 68.6% 31.4% 100%
La 2 60.2% 39.8% 100% La 2 60.7% 39.3% 100%
LA SEXTA 20.9% 79.1% 100% LA SEXTA 27.7% 72.3% 100%
Tele 5 21.1% 78.9% 100% Tele 5 39.2% 60.8% 100%
TVE 1 28.7% 71.3% 100% TVE 1 27.5% 72.5% 100%
Result for Member State Sample
35.1% 64.9% 100%Result for Member State Sample
37.9% 62.1% 100%
Channel
Qualifying
European
Stock to
Total
Qualifying
European
Viewer Hours
(%)
Qualifying
European
Flow to Total
Qualifying
European
Viewer Hours
(%)
Total
(%)Channel
Qualifying
European
Stock to
Total
Qualifying
European
Viewer Hours
(%)
Qualifying
European
Flow to Total
Qualifying
European
Viewer Hours
(%)
Total
(%)
Antena 3 43.4% 56.6% 100% Antena 3 42.5% 57.5% 100%
CUATRO 41.6% 58.4% 100% CUATRO 64.5% 35.5% 100%
La 2 66.8% 33.2% 100% La 2 67.1% 32.9% 100%
LA SEXTA 18.6% 81.4% 100% LA SEXTA 25.4% 74.6% 100%
Tele 5 36.0% 64.0% 100% Tele 5 53.2% 46.8% 100%
TVE 1 33.6% 66.4% 100% TVE 1 31.0% 69.0% 100%
Result for Member State Sample
38.0% 62.0% 100%Result for Member State Sample
44.6% 55.4% 100%
All Day Peak Time
All Day Peak Time
Comparison with past data and declarations The ratio of qualifying European works to total qualifying hours provided by our 2007 estimates is in line with the trends estimated in the 2005 Study and with reported data (see Figure 46). It confirms an overall trend towards an increasing share of European programmes on most channels, especially TELE5, whose proportion of European works has steadily risen over time, from around 40% in 1993 to around 80% in 2006/07.

275
Figure 46: Ratio of reported vs. estimated European qualifying transmission hours to total qualifying transmission hours in Spain, 2007/2006
0.0%
10.0%
20.0%
30.0%
40.0%
50.0%
60.0%
70.0%
80.0%
90.0%1993
1996
1999
2002
2006/7
1993
1996
1999
2002
2006/7
1993
1996
1999
2002
2006/7
1993
1996
1999
2002
2006/7
1993
1996
1999
2002
2006/7
1993
1996
1999
2002
2006/7
Antena3 Cuatro La Sexta La2 Tele5 TVE1
Perc
en
tag
e o
f T
ota
l Q
uali
fyin
g T
ran
sm
issio
n H
ou
rs
Channel/Year(Note: Where there is no column for a particular channel/year, data is unavailable)
Reported Sample Estimate
The 2007 ratio of qualifying independent European works to total qualifying hours is also consistent with past findings and reported data (see Figure 47). It shows an increase of transmission time in recent years devoted to independent productions on most channels except ANTENA3 and TVE1. Also, while sample estimates are generally slightly lower than reported data, this difference is more important for CUATRO and LA SEXTA in 2006/07, which could be explained by a greater seasonality effect on these more recent, smaller channels, whose own production could be concentrated in the heart of the TV season, where our sample weeks were selected, while filling summer schedules with acquisitions from independent producers.
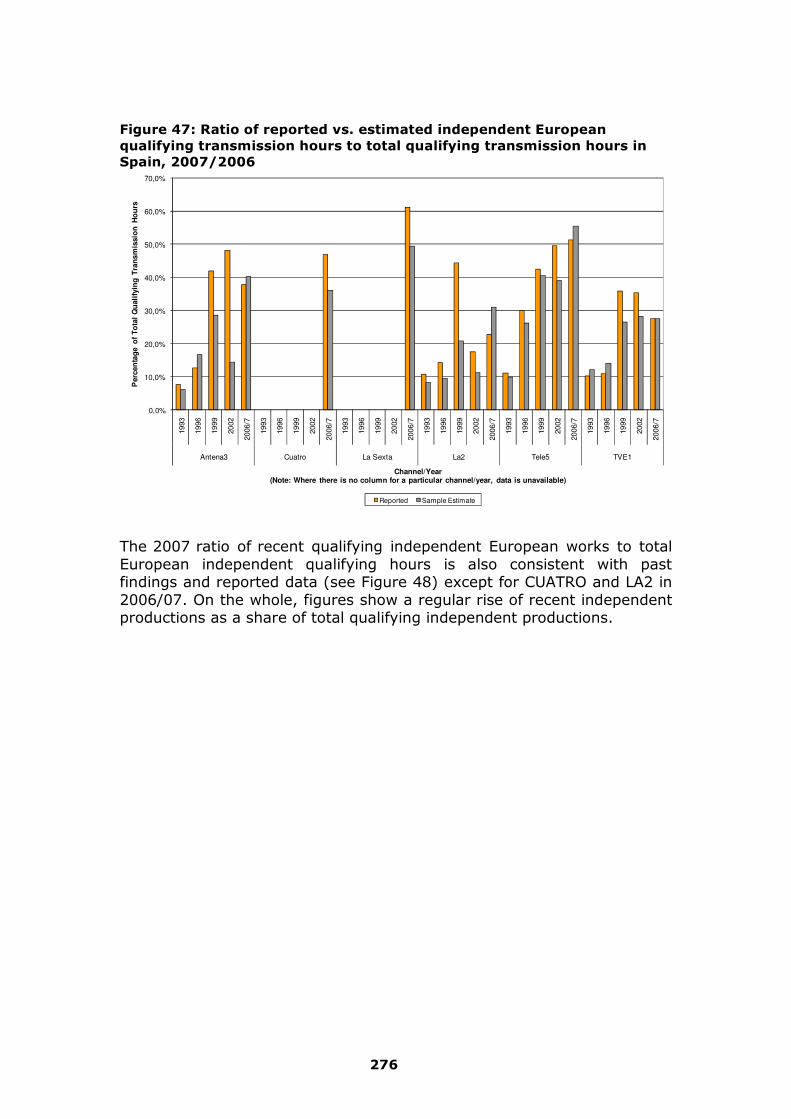
276
Figure 47: Ratio of reported vs. estimated independent European qualifying transmission hours to total qualifying transmission hours in Spain, 2007/2006
0,0%
10,0%
20,0%
30,0%
40,0%
50,0%
60,0%
70,0%19
93
19
96
19
99
20
02
2006/7
19
93
19
96
19
99
20
02
2006/7
19
93
19
96
19
99
20
02
2006/7
19
93
19
96
19
99
20
02
2006/7
19
93
19
96
19
99
20
02
2006/7
19
93
19
96
19
99
20
02
2006/7
Antena3 Cuatro La Sexta La2 Tele5 TVE1
Perc
en
tag
e o
f T
ota
l Q
uali
fyin
g T
ran
sm
issio
n H
ou
rs
Channel/Year(Note: Where there is no column for a particular channel/year, data is unavailable)
Reported Sample Estimate
The 2007 ratio of recent qualifying independent European works to total European independent qualifying hours is also consistent with past findings and reported data (see Figure 48) except for CUATRO and LA2 in 2006/07. On the whole, figures show a regular rise of recent independent productions as a share of total qualifying independent productions.

277
Figure 48: Ratio of reported vs. estimated recent independent European qualifying transmission hours to total independent European transmission hours in Spain, 2007/2006
0,0%
20,0%
40,0%
60,0%
80,0%
100,0%
120,0%
199
3
199
6
199
9
200
2
2006/7
199
3
199
6
199
9
200
2
2006/7
199
3
199
6
199
9
200
2
2006/7
199
3
199
6
199
9
200
2
2006/7
199
3
199
6
199
9
200
2
2006/7
199
3
199
6
199
9
200
2
2006/7
Antena3 Cuatro La Sexta La2 Tele5 TVE1
Perc
en
tag
e o
f T
ota
l In
dep
en
den
t E
uro
pe
an
Tra
nsm
issio
n H
ou
rs
Channel/Year(Note: Where there is no column for a particular channel/year, data is unavailable)
Reported Sample Estimate
8.4.11. Sweden
Data summary Our sample consists of one publicly funded public service channel (SVT1) and three commercial channels (KANAL5, TV3 and TV4). Together (See Table 108), they account for 67.6% of Swedish TV viewing.
We included TV3 and Kanal 5 in this chapter as they account for a large share of the Swedish audience. However, it is important to note that these two channels are not regulated by the Swedish authorities, but are under UK jurisdiction. In Chapter 23 we have printed a copy of a statement from the Swedish Broadcasting Commission concerning this issue.
Table 108: List of channels covered in the 2007 Swedish sample
Country ChannelLaunch
Year
Share of Viewing (2005)
Revenue Model PlatformAverage Daily Transmission
Hours
Sample Weeks
Sweden Kanal 5 1989 8.30% Ad Cab/Sat 24
Sweden SVT 1 1956 24.40% Gvt/Spon Nat. Terr. 24
Sweden TV 3 1987 10.00% Ad Cab/Sat 24
Sweden TV 4 1990 24.90% Ad Nat. Terr. 24
March sample is non-standard: week beginning 05/03/2007

278
Genre analysis Most Swedish channels (SVT1, TV4 and TV3) rely strongly on factual magazines to fill their all-day schedules (see Table 109). This genre accounts for 46.6% of total qualifying transmission hours on SVT1, 43.8% on TV3 and 39.7% on TV4. Entertainment is also a major component of the schedules, representing more than half of the all-day schedule of KANAL5 (55.5%) and a substantial genre on every other channel (29.8% on TV4, 25.1% on TV3 and 17.3% on SVT1).
Documentary is has significant exposure on TV3 (25.7%), but is less visible on SVT1 (13.3%) and KANAL5 (12.9%). TV fiction is relatively low everywhere (15.8% on TV4, 14.6% on SVT1, 10% on KANAL5, 5.4% on TV3) while cinema film is nearly absent (less than 10% on all channels and 0% on TV3).
In peak-time, most channels strengthen their offering of entertainment (25.6% on SVT1, 35.3% on TV3 and 43.7% on TV4), while maintaining their position on factual magazines (except TV4, which reduces this genre down to 14.7%). TV4 also emphasises documentary (18%) and, less so, cinema film (12.5%), while SVT1 increases TV fiction (18.9%) and KANAL5 increases cinema film (18.3%).
The ratio based on viewer hours shows the very strong appeal of entertainment to Swedish audiences to the leading channels (40.4% of viewer hours vs. 17.3% of transmission hours on SVT1 and 41% of viewer hours vs. 29.8% of transmission hours on TV4) and the relatively poor appeal of TV fiction (5.6% on KANAL5, 0.5% on TV3, 7.1% on TV4). Cinema film manages, despite its weak exposure across the all-day schedule, to draw substantial audiences on KANAL5 (20.1% of viewer hours vs. only 7.4% of transmission hours) and TV4 (11.9% viewer hours vs. 6.2% transmission hours).
Table 109: Genre proportion of total qualifying hours in Sweden, 2007
Channel Genre
Genre
Proportions
of Total
Qualifying
Hours (%)
Genre
Proportions
of Total
Qualifying
Viewer
Hours (%)
Channel Genre
Genre
Proportions
of Total
Qualifying
Hours (%)
Genre
Proportions
of Total
Qualifying
Viewer
Hours (%)
Cinema Film 7.4% 20.1% Cinema Film 18.3% 24.9%Documentary 12.9% 9.9% Documentary 4.0% 7.4%Entertainment 55.5% 47.1% Entertainment 51.6% 45.1%Factual Magazine 14.2% 17.3% Factual Magazine 15.7% 16.4%Fiction 10.0% 5.6% Fiction 10.3% 6.1%Cinema Film 8.2% 3.5% Cinema Film 3.6% 1.1%Documentary 13.3% 7.6% Documentary 9.9% 7.3%Entertainment 17.3% 40.4% Entertainment 25.6% 47.4%Factual Magazine 46.6% 35.5% Factual Magazine 42.0% 30.6%Fiction 14.6% 13.0% Fiction 18.9% 13.7%Cinema Film 0.0% 0.0% Cinema Film 0.0% 0.0%Documentary 25.7% 26.6% Documentary 21.4% 26.4%Entertainment 25.1% 26.0% Entertainment 35.3% 27.8%Factual Magazine 43.8% 46.9% Factual Magazine 43.3% 45.9%Fiction 5.4% 0.5% Fiction 0.0% 0.0%Cinema Film 6.2% 11.9% Cinema Film 12.5% 17.1%Documentary 8.5% 9.6% Documentary 18.0% 12.8%Entertainment 29.8% 41.0% Entertainment 43.7% 53.3%Factual Magazine 39.7% 30.5% Factual Magazine 14.7% 11.8%Fiction 15.8% 7.1% Fiction 11.1% 5.0%
All Day Peak Time
Kanal 5 Kanal 5
TV 4 TV 4
SVT 1 SVT 1
TV 3 TV 3

279
Transmission and viewing ratio analysis In 2007, qualifying programmes (that is, all programmes excluding advertising, teleshopping, teletext, news, sport and games) made up 74.5% of the total transmission hours of the Swedish channels sampled (see Table 110). TV3 and KANAL5 show the highest proportion of qualifying hours with 87.2% and 83.8% respectively, while the leading channels showed lower proportions (57.3% on SVT1, 69.5% on TV4).
The ratio based on viewer hours is, on the whole, very similar to that based on transmission hours (74.5% transmission hours vs. 73.4% viewer hours). All broadcasters show an increase except TV4, which falls from 69.5% transmission hours to 63.6% viewer hours.
Table 110: Ratio of qualifying hours to total transmission hours in Sweden, 2007
Channel
Ratio of Qualifying to
Total Transmission
Hours (%)
Ratio of Qualifying to
Total Viewer Hours (%)
Kanal 5 83.8% 91.0%
SVT 1 57.3% 69.9%
TV 3 87.2% 88.1%
TV 4 69.5% 63.6%
Result for Member State Sample
74.5% 73.4%
Proportion of European works European works represent 38.6% of the total qualifying transmission hours across all channels in the Swedish sample in 2007 (see Table 111). We observe a clear divide between leading broadcasters favouring European programmes (85.9% of qualifying hours on SVT1, 52.9% on TV4) and “smaller” broadcasters standing far below the 50% (22.1% on KANAL5 and 12.1% on TV3). The gap reduces when looking only at peak-time: KANAL5 and TV3 indeed go up to 35.3% and 33.9% respectively, while SVT1 lowers (75.9%) and TV4 increases (66%).
The ratio based on viewer hours is higher than that based on transmission hours for all four broadcasters in our sample (26% vs. 22.1% for KANAL5, 88.2% vs. 85.9% for SVT1, 30.1% vs. 12.1% for TV3, 71.2% vs. 52.9% for TV4). European programmes thus help the broadcasters build their ratings. This conclusion is also valid when looking only at peak-time, except for KANAL5, whose ratio slightly decreases (34.4% of viewer hours vs. 35.3% of transmission hours).

280
Table 111: Ratio of European qualifying to total qualifying hours in Sweden, 2007
Channel
Ratio of
Qualifying
European to
Total Qualifying
Hours (%)
Ratio of
Qualifying
European to
Total Qualifying
Viewer Hours
(%)
Channel
Ratio of
Qualifying
European to
Total Qualifying
Hours (%)
Ratio of
Qualifying
European to
Total Qualifying
Viewer Hours
(%)
Kanal 5 22.1% 26.0% Kanal 5 35.3% 34.4%
SVT 1 85.9% 88.2% SVT 1 75.9% 86.2%
TV 3 12.1% 30.1% TV 3 33.9% 46.3%
TV 4 52.9% 71.2% TV 4 66.0% 78.6%
Result for Member State Sample
38.6% 61.1%Result for Member State Sample
50.4% 68.8%
All Day Peak Time
The proportion of non-domestic qualifying European works to total qualifying works for the Swedish sample is 6.2% (see Table 112). But the difference between SVT1’s ratio, the highest (10.9%), and TV3’s, the lowest (0.7%) is substantial. KANAL5 (6.3%) and TV4 (9.3%) stand in-between. In peak-time, KANAL5’s ratio nearly doubles (up to 12.2%), while SVT1’s falls heavily (down to 6.0%), TV3 and TV4 decrease slightly (0% vs. 0.7% and 8.3% vs. 9.3% respectively). KANAL5’s openness to non-domestic European works in peak-time is mostly due to the high presence of British programming on the channel.
When looking at both all-day and peak-time the broadcasting of non-domestic European works does not draw very important audiences to Swedish channels: the viewer hours ratio is in fact half the transmission ratio on both leading channels SVT1 (4.5% vs. 10.9% all-day, 3.2% vs. 6% peak) and TV4 (5.2% vs. 9.3% all-day, 4% vs. 8.3% peak). Only KANAL5’s viewing ratio is higher than the transmission ratio during all-day, and remains stable in peak-time.
Table 112: Ratio of non-domestic qualifying European to total qualifying hours in Sweden, 2007
Channel
Ratio of Non-
Domestic
Qualifying
European to
Total Qualifying
Hours (%)
Ratio of Non-
Domestic
Qualifying
European to
Total Qualifying
Viewer Hours
(%)
Channel
Ratio of Non-
Domestic
Qualifying
European to
Total Qualifying
Hours (%)
Ratio of Non-
Domestic
Qualifying
European to
Total Qualifying
Viewer Hours
(%)
Kanal 5 6.3% 8.3% Kanal 5 12.2% 12.1%
SVT 1 10.9% 4.5% SVT 1 6.0% 3.2%
TV 3 0.7% 0.2% TV 3 0.0% 0.0%
TV 4 9.3% 5.2% TV 4 8.3% 4.0%
Result for Member State Sample
6.2% 4.6%Result for Member State Sample
6.6% 4.4%
All Day Peak Time

281
Proportion of independent works The proportion of qualifying works produced by independent European producers and aired by Swedish channels in our sample reaches 16.4% of total qualifying hours (see Table 113). TV4 has the highest proportion of independent works with 28.3% during all-day and 55.3% in peak-time. SVT1 is the second highest during all-day (23.3%) but is surpassed in peak-time by KANAL5 (31% peak compared to 13.7% all-day). On the opposite side of the scale, TV3 devotes only 4.7% of its schedule to independent European productions during all-day, a proportion that rises up to 12.5% when looking specifically at peak-time.
When looking at the proportions based on viewer hours, the average proportion of qualifying works produced by independent European producers shows a strong uplift: 33.1% (vs. 16.4%) during all-day and 42.9% (vs. 28.3%) in peak-time. The two leading channels show the strongest increase: TV4 reaches 53.1% (vs. 28.3%) during all-day and 7455.3% (vs. 55.374%) in peak-time while SVT1 goes up to 33% (vs. 23.3%) during all-day and 35.3% (vs. 19.3%) in peak-time. KANAL5’s viewing hours ratio is, on the contrary, lower than the transmission hours ratio (29.9% vs. 31%) in peak-time.
Table 113: Ratio of independent European to total qualifying in Sweden, 2007
Channel
Ratio of
Qualifying
Independent
European to
Total Qualifying
Hours (%)
Ratio of
Qualifying
Independent
European to
Total Qualifying
Viewer Hours
(%)
Channel
Ratio of
Qualifying
Independent
European to
Total Qualifying
Hours (%)
Ratio of
Qualifying
Independent
European to
Total Qualifying
Viewer Hours
(%)
Kanal 5 13.7% 20.7% Kanal 5 31.0% 29.9%
SVT 1 23.3% 33.0% SVT 1 19.3% 35.3%
TV 3 4.7% 10.0% TV 3 12.5% 15.3%
TV 4 28.3% 53.1% TV 4 55.3% 74.0%
Result for Member State Sample
16.4% 33.1%Result for Member State Sample
28.3% 42.9%
All Day Peak Time
Proportion of recent independent works Across the entire Swedish sample, 79.1% of all qualifying European independent transmission hours are programmes less than five years old (see Table 114). There is a large difference between ratios for particular channels: TV3, showing the highest ratio, at 100%, and SVT1, showing the lowest one, at 59.1%. TV4 and KANAL5 stand in-between with 82.9% and 85.9% respectively. In peak-time hours, the proportion of recent independent European works reaches 91.5% on average: KANAL5 shows the lowest ratio with 80.8%. Figures based on viewer hours are generally
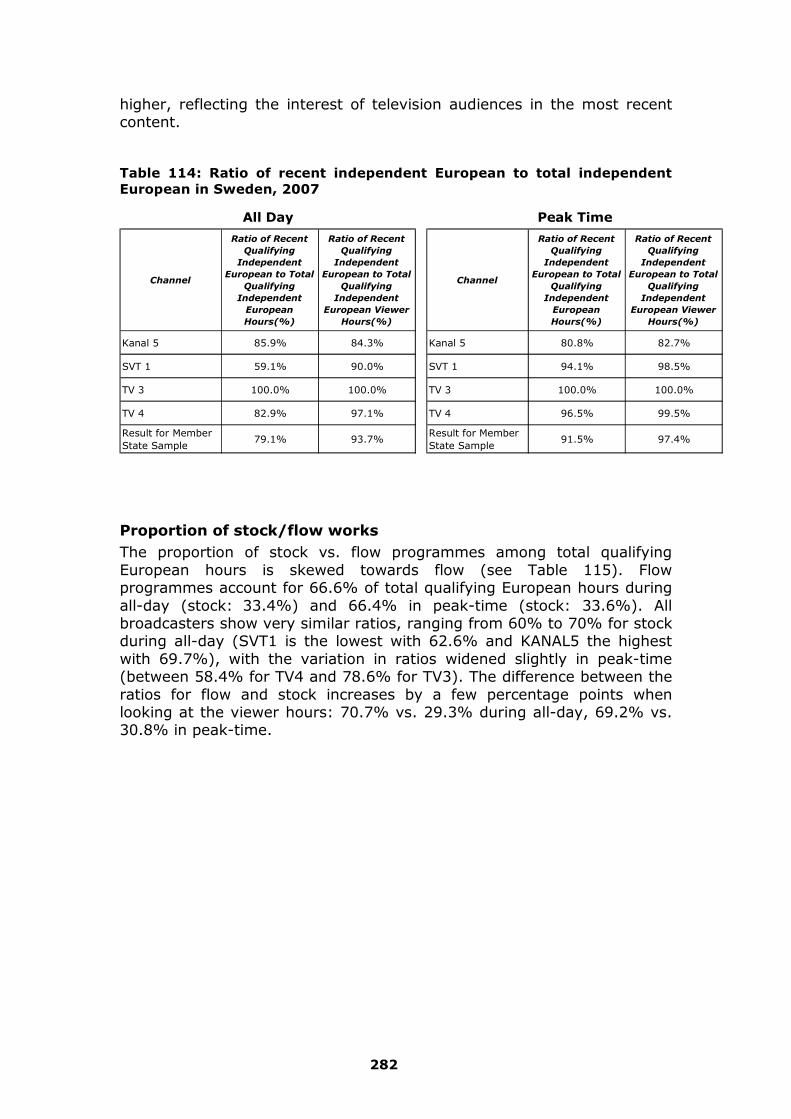
282
higher, reflecting the interest of television audiences in the most recent content.
Table 114: Ratio of recent independent European to total independent European in Sweden, 2007
Channel
Ratio of Recent
Qualifying
Independent
European to Total
Qualifying
Independent
European
Hours(%)
Ratio of Recent
Qualifying
Independent
European to Total
Qualifying
Independent
European Viewer
Hours(%)
Channel
Ratio of Recent
Qualifying
Independent
European to Total
Qualifying
Independent
European
Hours(%)
Ratio of Recent
Qualifying
Independent
European to Total
Qualifying
Independent
European Viewer
Hours(%)
Kanal 5 85.9% 84.3% Kanal 5 80.8% 82.7%
SVT 1 59.1% 90.0% SVT 1 94.1% 98.5%
TV 3 100.0% 100.0% TV 3 100.0% 100.0%
TV 4 82.9% 97.1% TV 4 96.5% 99.5%
Result for Member State Sample
79.1% 93.7%Result for Member State Sample
91.5% 97.4%
All Day Peak Time
Proportion of stock/flow works The proportion of stock vs. flow programmes among total qualifying European hours is skewed towards flow (see Table 115). Flow programmes account for 66.6% of total qualifying European hours during all-day (stock: 33.4%) and 66.4% in peak-time (stock: 33.6%). All broadcasters show very similar ratios, ranging from 60% to 70% for stock during all-day (SVT1 is the lowest with 62.6% and KANAL5 the highest with 69.7%), with the variation in ratios widened slightly in peak-time (between 58.4% for TV4 and 78.6% for TV3). The difference between the ratios for flow and stock increases by a few percentage points when looking at the viewer hours: 70.7% vs. 29.3% during all-day, 69.2% vs. 30.8% in peak-time.

283
Table 115: Ratio of European stock/flow to total European in Sweden, 2007
Channel
Qualifying
European
Stock to
Total
Qualifying
European
Hours (%)
Qualifying
European
Flow to Total
Qualifying
European
Hours (%)
Total
(%)Channel
Qualifying
European
Stock to
Total
Qualifying
European
Hours (%)
Qualifying
European
Flow to Total
Qualifying
European
Hours (%)
Total
(%)
Kanal 5 30.3% 69.7% 100% Kanal 5 32.6% 67.4% 100%
SVT 1 37.4% 62.6% 100% SVT 1 34.9% 65.1% 100%
TV 3 31.1% 68.9% 100% TV 3 21.4% 78.6% 100%
TV 4 30.4% 69.6% 100% TV 4 41.6% 58.4% 100%
Result for Member State Sample
33.4% 66.6% 100%Result for Member State Sample
33.6% 66.4% 100%
Channel
Qualifying
European
Stock to
Total
Qualifying
European
Viewer Hours
(%)
Qualifying
European
Flow to Total
Qualifying
European
Viewer Hours
(%)
Total
(%)Channel
Qualifying
European
Stock to
Total
Qualifying
European
Viewer Hours
(%)
Qualifying
European
Flow to Total
Qualifying
European
Viewer Hours
(%)
Total
(%)
Kanal 5 35.7% 64.3% 100% Kanal 5 38.4% 61.6% 100%
SVT 1 29.3% 70.7% 100% SVT 1 27.7% 72.3% 100%
TV 3 27.1% 72.9% 100% TV 3 26.4% 73.6% 100%
TV 4 28.5% 71.5% 100% TV 4 34.9% 65.1% 100%
Result for Member State Sample
29.3% 70.7% 100%Result for Member State Sample
30.8% 69.2% 100%
All Day Peak Time
All Day Peak Time
Comparison with past data and declarations241 The ratios of qualifying European works to total qualifying hours provided by our 2007 estimates are in line with the trends estimated in the 2005 Study and reported data for channels where reported data is available (see Figure 49), with the exception of TV4 where reported data are regularly increasing but where sample estimates are in decline until 2007. On the whole, figures show a stable share of European programmes over time on SVT1 and KANAL5, and a steady decrease on TV3.
241 As noted earlier, TV3 and Kanal 5 are regulated by the British authorities and are therefore not the responsibility of the Swedish regulatory body. The declared data for these channels used in the following graphs have been extracted from the British declarations.

284
Figure 49: Ratio of reported vs. estimated European qualifying transmission hours to total qualifying transmission hours in Sweden, 2007/2006
0.0%
10.0%
20.0%
30.0%
40.0%
50.0%
60.0%
70.0%
80.0%
90.0%
100.0%
1993 1996 1999 2002 2006/7 1993 1996 1999 2002 2006/7 1993 1996 1999 2002 2006/7 1993 1996 1999 2002 2006/7
Kanal5 SVT1 TV3 TV4
Perc
en
tag
e o
f T
ota
l Q
uali
fyin
g T
ran
sm
issio
n H
ou
rs
Channel/Year(Note: Where there is no column for a particular channel/year, data is unavailable)
Reported Sample Estimate
The 2007 ratio of recent qualifying independent European works to total European independent qualifying hours is very consistent with past findings and reported data (see Figure 50) except for TV4, where sample estimates are significantly lower than reported data. This could be explained by the broader definition of ‘independent works’ used in Sweden. On the whole, figures are either stable or slightly increasing.

285
Figure 50: Ratio of reported vs. estimated independent European qualifying transmission hours to total qualifying transmission hours in Sweden, 2007/2006
0.0%
20.0%
40.0%
60.0%
80.0%
100.0%
120.0%
1993 1996 1999 2002 2006/7 1993 1996 1999 2002 2006/7 1993 1996 1999 2002 2006/7 1993 1996 1999 2002 2006/7
Kanal5 SVT1 TV3 TV4
Perc
en
tag
e o
f T
ota
l Q
uali
fyin
g T
ran
sm
issio
n H
ou
rs
Channel/Year(Note: Where there is no column for a particular channel/year, data is unavailable)
Reported Sample Estimate
The 2007 ratio of recent qualifying independent European works to total qualifying European independent hours is also consistent with past findings and reported data (see Figure 51). It confirms a long-term increase for TV3, some relative stability for SVT1, and a significant decline for KANAL5 and TV4 (after a peak in 2002).

286
Figure 51: Ratio of reported vs. estimated recent independent European qualifying transmission hours to total independent European transmission hours in Sweden, 2007/2006
0.0%
20.0%
40.0%
60.0%
80.0%
100.0%
120.0%
1993 1996 1999 2002 2006/7 1993 1996 1999 2002 2006/7 1993 1996 1999 2002 2006/7 1993 1996 1999 2002 2006/7
Kanal5 SVT1 TV3 TV4
Perc
en
tag
e o
f T
ota
l In
dep
en
den
t E
uro
pean
Tra
nsm
issio
n H
ou
rs
Channel/Year(Note: Where there is no column for a particular channel/year, data is unavailable)
Reported Sample Estimate
8.4.12. United Kingdom
Data summary Our sample consists of two publicly funded public service channels (BBC1 and BBC2), two purely commercial channels (ITV1, and FIVE), one publicly-owned, commercially-funded channel, CHANNEL4242, and one premium pay channel, SKY ONE. Together they account for 64% of total TV viewing in the UK (see Table 116).
242 Within the UK, Channel 4 is considered somewhat different from the BBC channels and from ITV and Five because although it is entirely commercially funded (e.g. via advertising, sponsorship, etc) it is publicly owned. Thus it is considered as something in-between the BBC (publicly owned, publicly funded) and ITV/Five (privately owned, commercially funded). Its special status means it has a specific public service remit that it must meet, but is also afforded free carriage on the terrestrial spectrum, unlike ITV and Five.

287
Table 116: List of channels covered in the 2007 UK sample243
Country ChannelLaunch
Year
Share of Viewing (2007)
Revenue Model PlatformAverage Daily Transmission
Hours
Sample Weeks
UK BBC1 1936 22.03% Gvt Terr./C/S 24
UK BBC2 1964 8.55% Gvt Terr./C/S 24
UK ITV1 1955 19.22% Ad Terr./C/S 24
UK CH4 1982 8.45% Ad Terr./C/S 24
UK Five 1997 5.15% Ad Terr./C/S 24
UK SKY One 1989 0.94% Subs/Ad Sat 24
Standard
Genre analysis All leading free-to-air channels tend to offer a similar share of TV fiction programmes in their all-day schedules (see Table 117). This genre accounts for 28.2% of total qualifying hours on BBC1, 25.5% on BBC2, 26.9% on ITV1 and 26.5% on CHANNEL4. These channels differentiate themselves from one another by their offerings other than TV fiction. BBC channels put the emphasis on documentary (34.1% of total qualifying hours on BBC1 and 38.8% on BBC2), ITV1 prefers entertainment (34%) while CHANNEL4 focuses on documentary (28.7%) and cinema films (19.2%).
In peak-time, these channels adopt slightly different schedules. ITV1 puts the greatest emphasis on TV fiction (47.2%) while maintaining the importance of entertainment (30.7%). BBC1 also shifts towards family programming with a higher proportion of TV fiction (33.5%) and a greater emphasis on entertainment (23.9%). CHANNEL4 gives more room to documentary (36.4%) while maintaining its position on fiction and cinema. BBC2 is oriented towards documentary (40.1%), and factual magazines (25.8%), with also slightly more entertainment (18.7%) than during all-day, while fiction is low at 9.9%.
FIVE’s schedule looks closer to that of CHANNEL4, based on a mix of fiction, cinema and documentary. But this channel puts a greater emphasis on fiction (47.1%) at the expense of entertainment (4.5%). SKY ONE is even more focused on fiction, which represents 69.9% of its schedule and up to 77% in peak-time, together with the only other genre with a significant proportion of its schedule, documentary (18.5% all-day, 12% peak).
243 In the ‘Platform’ column, “Terr/C/S” means “Terrestrial, Cable and Satellite”.

288
Table 117: Genre proportion of total qualifying hours in the UK, 2007
Channel Genre
Genre
Proportions
of Total
Qualifying
Hours (%)
Genre
Proportions
of Total
Qualifying
Viewer
Hours (%)
Channel Genre
Genre
Proportions
of Total
Qualifying
Hours (%)
Genre
Proportions
of Total
Qualifying
Viewer
Hours (%)
Cinema Film 9.3% 3.6% Cinema Film 7.6% 3.3%Documentary 34.1% 21.8% Documentary 21.8% 15.2%Entertainment 14.9% 22.6% Entertainment 23.9% 28.1%Factual Magazine 13.5% 11.5% Factual Magazine 13.2% 9.3%Fiction 28.2% 40.5% Fiction 33.5% 44.1%Cinema Film 8.0% 7.8% Cinema Film 5.6% 4.6%Documentary 38.8% 39.6% Documentary 40.1% 41.2%Entertainment 11.6% 22.3% Entertainment 18.7% 22.8%Factual Magazine 16.1% 17.9% Factual Magazine 25.8% 20.3%Fiction 25.5% 12.4% Fiction 9.9% 11.1%Cinema Film 7.9% 6.0% Cinema Film 7.4% 3.1%Documentary 13.9% 7.2% Documentary 7.9% 4.4%Entertainment 34.0% 36.1% Entertainment 30.7% 33.6%Factual Magazine 17.3% 8.9% Factual Magazine 6.7% 4.1%Fiction 26.9% 41.9% Fiction 47.2% 54.7%Cinema Film 19.2% 13.1% Cinema Film 16.1% 11.2%Documentary 28.7% 33.3% Documentary 36.4% 43.2%Entertainment 18.6% 25.7% Entertainment 14.3% 15.0%Factual Magazine 7.0% 2.6% Factual Magazine 5.2% 2.9%Fiction 26.5% 25.3% Fiction 28.0% 27.6%Cinema Film 18.4% 29.0% Cinema Film 20.9% 20.7%Documentary 17.6% 14.8% Documentary 32.4% 21.8%Entertainment 4.5% 2.3% Entertainment 0.0% 0.0%Factual Magazine 12.4% 5.1% Factual Magazine 5.0% 3.6%Fiction 47.1% 48.8% Fiction 41.7% 54.0%Cinema Film 1.7% 3.2% Cinema Film 7.4% 4.6%Documentary 18.5% 9.2% Documentary 12.0% 5.9%Entertainment 7.9% 3.2% Entertainment 3.6% 2.6%Factual Magazine 2.0% 1.0% Factual Magazine 0.0% 0.0%Fiction 69.9% 83.4% Fiction 77.0% 86.9%
ITV1
CH4
Five
Sky One
ITV1
CH4
Five
Sky One
All Day Peak Time
BBC1
BBC2
BBC1
BBC2
Transmission and viewing ratio analysis In 2007, qualifying programmes (that is, all programmes excluding advertising, teleshopping, teletext, news, sport and games) made up an average of 65.8% of the total transmission hours of the UK channels sampled (see Table 118). BBC2 is the channel showing the highest proportion of qualifying hours with 80%, followed by SKY ONE (72.5%) and CHANNEL4 (67.6%). Commercial broadcaster ITV1 shows the lowest proportion with 51%, while BBC1 and FIVE stood in-between (61.4% and 62% respectively).
The ratio based on viewer hours is, on the whole, higher than that based on transmission hours (66.1% vs. 65.8%). FIVE and ITV1 show the most important uplift (respectively 77.1% of viewer hours vs. 62% of transmission hours and 63.2% vs. 51%), which is explained largely by the fact that these two channels build their peak-time schedules around very successful fiction. On the other hand, BBC2, whose peak-time schedule is dominated by documentary and factual magazines, sees its viewing go down to 73.9% compared to 80% for its transmission ratio.

289
Table 118: Ratio of qualifying hours to total transmission hours in the UK, 2007
Channel
Ratio of Qualifying to
Total Transmission
Hours (%)
Ratio of Qualifying to
Total Transmission
Viewer Hours (%)
BBC1 61.4% 63.3%
BBC2 80.0% 73.9%
ITV1 51.0% 63.2%
CH4 67.6% 64.5%
Five 62.0% 77.1%
Sky One 72.5% 74.2%
Result for Member State Sample
65.8% 66.1%
Proportion of European works European works made up an average of 64.9% of the total qualifying transmission hours on all channels in the sample in 2007 (see Table 119). We observe a clear divide between leading broadcasters overwhelmingly favouring European programmes (85.2% of qualifying hours on BBC2, 85.1% on ITV1, 83.2% on BBC1 and 70.9% on CHANNEL4) and ‘smaller’ broadcasters that stand below 50% (47.5% on FIVE and 22% on SKY ONE). This divide is even larger when looking at peak-time hours: BBC1 and BBC2 go up to 94% and 93.4% respectively, while FIVE and SKY ONE go down to 36.7% and 10.1% respectively.
The ratio based on viewer hours is higher than that based on transmission hours for all four leading broadcasters in our sample: 91.1% of viewer hours vs. 85.1% of transmission hours for ITV1, 89.8% vs. 85.2% for BBC2, 88.8% vs. 83.2% for BBC1 and 76.2% vs. 70.9% for CHANNEL4. This reflects the fact that these leading broadcasters rely heavily on European programming to build their ratings, while ‘smaller’ channels such as FIVE and SKY ONE, who rely more on imports, see their viewing ratios decrease compared to their transmission ratios: respectively from 47.5% of transmission hours to 28.1% of viewing hours and from 22.0% to 10.9%. These conclusions are even more stretched in peak-time, where qualifying European programming accounts for as high as 97.2% of total qualifying viewer hours on BBC1, and as low as 6.4% on SKY ONE.

290
Table 119: Ratio of European qualifying to total qualifying hours in the UK, 2007
Channel
Ratio of
Qualifying
European to
Total Qualifying
Hours (%)
Ratio of
Qualifying
European to
Total Qualifying
Viewer Hours
(%)
Channel
Ratio of
Qualifying
European to
Total Qualifying
Hours (%)
Ratio of
Qualifying
European to
Total Qualifying
Viewer Hours
(%)
BBC1 83.2% 88.8% BBC1 94.0% 97.2%
BBC2 85.2% 89.8% BBC2 93.4% 93.9%
ITV1 85.1% 91.1% ITV1 87.8% 92.7%
CH4 70.9% 76.2% CH4 77.0% 78.6%
Five 47.5% 28.1% Five 36.7% 24.2%
Sky One 22.0% 10.9% Sky One 10.1% 6.4%
Result for Member State Sample
64.9% 81.1%Result for Member State Sample
65.9% 85.3%
All Day Peak Time
The proportion of non-domestic qualifying European works to total qualifying works is particularly low in the UK (see Table 120). Across our sample, it achieves 0.6% of transmission hours and 0.5% of viewer hours. The channel with the highest proportion is BBC2 (1.9% of transmission hours and 2% of viewing hours). Where British channels air non-domestic European works in peak-time (1.1% in our sample as a whole), audiences do not seem to follow, as the peak-time ratio becomes 0.6% when expressed in viewer hours. The only two channels to offer non-domestic European works in peak-time are CHANNEL4 (4.9% of total qualifying transmission hours and 3% of total qualifying viewer hours) and BBC2 (1.4% and 1.7%).

291
Table 120: Ratio of non-domestic qualifying European to total qualifying hours in the UK, 2007
Channel
Ratio of Non-
Domestic
Qualifying
European to
Total Qualifying
Hours (%)
Ratio of Non-
Domestic
Qualifying
European to
Total Qualifying
Viewer Hours
(%)
Channel
Ratio of Non-
Domestic
Qualifying
European to
Total Qualifying
Hours (%)
Ratio of Non-
Domestic
Qualifying
European to
Total Qualifying
Viewer Hours
(%)
BBC1 0.1% 0.0% BBC1 0.0% 0.0%
BBC2 1.9% 2.0% BBC2 1.4% 1.7%
ITV1 0.2% 0.0% ITV1 0.0% 0.0%
CH4 1.1% 1.8% CH4 4.9% 3.0%
Five 0.0% 0.0% Five 0.0% 0.0%
Sky One 0.0% 0.0% Sky One 0.0% 0.0%
Result for Member State Sample
0.6% 0.5%Result for Member State Sample
1.1% 0.6%
All Day Peak Time
Proportion of independent works The proportion of qualifying works produced by independent European producers and broadcast by the channels in our sample was relatively high, reaching 36.3% in transmission hours in 2007 (see Table 121). CHANNEL4 had by far the highest proportion of independent works with 68.7% during all-day schedules and 71.4% in peak-time. FIVE is the second highest in all-day (43.7%) but is surpassed in peak-time by BBC2 and BBC1 (respectively 37.6% and 33.9% peak, compared with 30.3% and 35.4% all-day). On the opposite side of the scale, ITV1 and SKY ONE devote 23.4% and 16.5% of their all-day qualifying schedules to independent European produced programming, a proportion that goes down to 10.9% and 10.1% in peak-time.
When looking at the proportions based on viewer hours, figures tend to decrease by a few percentage points to an average of 29% (vs. 36.3% for all-day) and of 25.4% (vs. 33.1%) in peak-time. It is worth noting that CHANNEL4 and BBC2 manage to improve their all-day ratios, respectively from 68.7% of transmission hours to 70.2% of viewing hours (all-day), and from 30.3% to 35.6% (peak-time).

292
Table 121: Ratio of independent European to total qualifying in the UK, 2007
Channel
Ratio of
Qualifying
Independent
European to
Total Qualifying
Hours (%)
Ratio of
Qualifying
Independent
European to
Total Qualifying
Viewer Hours
(%)
Channel
Ratio of
Qualifying
Independent
European to
Total Qualifying
Hours (%)
Ratio of
Qualifying
Independent
European to
Total Qualifying
Viewer Hours
(%)
BBC1 35.4% 27.4% BBC1 33.9% 25.7%
BBC2 30.3% 35.6% BBC2 37.6% 34.0%
ITV1 23.4% 12.2% ITV1 10.9% 6.7%
CH4 68.7% 70.2% CH4 71.4% 69.4%
Five 43.7% 26.5% Five 31.3% 22.0%
Sky One 16.5% 9.1% Sky One 10.1% 6.4%
Result for Member State Sample
36.3% 29.0%Result for Member State Sample
33.1% 25.4%
All Day Peak Time
Proportion of recent independent works Across the UK sample, 90.3% of all qualifying European independent transmission hours are programmes less than five years old (see Table 122). All broadcasters in our sample show a similar ratio, ranging from 85.6% for CHANNEL4 to 95.9% for SKY ONE. In peak-time hours, the proportion of qualifying European recent independent works reaches 100% for all channels except FIVE, which reaches 95.2%. Figures based on viewer hours are generally higher, reflecting the interest of television audiences in the most recent content.
Table 122: Ratio of recent independent European to total independent European in the UK, 2007
Channel
Ratio of Recent
Qualifying
Independent
European to Total
Qualifying
Independent
European
Hours(%)
Ratio of Recent
Qualifying
Independent
European to Total
Qualifying
Independent
European Viewer
Hours(%)
Channel
Ratio of Recent
Qualifying
Independent
European to Total
Qualifying
Independent
European
Hours(%)
Ratio of Recent
Qualifying
Independent
European to Total
Qualifying
Independent
European Viewer
Hours(%)
BBC1 93.6% 98.5% BBC1 100.0% 100.0%
BBC2 95.3% 99.3% BBC2 100.0% 100.0%
ITV1 94.2% 90.1% ITV1 100.0% 100.0%
CH4 85.6% 96.8% CH4 100.0% 100.0%
Five 86.9% 81.5% Five 95.2% 94.3%
Sky One 95.9% 93.5% Sky One 100.0% 100.0%
Result for Member State Sample
90.3% 95.6%Result for Member State Sample
99.2% 99.6%
All Day Peak Time

293
Proportion of stock/flow works The proportion of stock vs. flow programmes among total qualifying European hours is skewed towards stock (see Table 123). European stock programmes represent 68.1% of total qualifying all-day transmission hours, compared with 31.9% for flow programmes. In peak-time these proportions become 71.8% vs. 28.2%. Similar proportions can be observed when looking at the ratios expressed in viewer hours. While this average imbalance accurately reflects the realities of individual channels, we observe that ‘smaller’ channels rely even more on stock than leading channels (especially in peak-time where stock accounts for 86.5% of transmission time on FIVE, 88% on CHANNEL4 and up to 100% on SKY ONE). ITV1 presents an interesting picture, as its all-day qualifying European schedule is made of a majority of flow programmes (55.8%), while its peak-time schedule goes back to ‘normal’ (62.8% stock).
Table 123: Ratio of European stock/flow to total European in the UK, 2007
Channel
Qualifying
European
Stock to
Total
Qualifying
European
Hours (%)
Qualifying
European
Flow to Total
Qualifying
European
Hours (%)
Total
(%)Channel
Qualifying
European
Stock to
Total
Qualifying
European
Hours (%)
Qualifying
European
Flow to Total
Qualifying
European
Hours (%)
Total
(%)
BBC1 72.0% 28.0% 100% BBC1 67.3% 32.7% 100%
BBC2 74.7% 25.3% 100% BBC2 62.7% 37.3% 100%
ITV1 44.2% 55.8% 100% ITV1 62.8% 37.2% 100%
CH4 70.3% 29.7% 100% CH4 88.0% 12.0% 100%
Five 67.1% 32.9% 100% Five 86.5% 13.5% 100%
Sky One 87.3% 12.7% 100% Sky One 100.0% 0.0% 100%
Result for Member State Sample
68.1% 31.9% 100%Result for Member State Sample
71.8% 28.2% 100%
Channel
Qualifying
European
Stock to
Total
Qualifying
European
Viewer Hours
(%)
Qualifying
European
Flow to Total
Qualifying
European
Viewer Hours
(%)
Total
(%)Channel
Qualifying
European
Stock to
Total
Qualifying
European
Viewer Hours
(%)
Qualifying
European
Flow to Total
Qualifying
European
Viewer Hours
(%)
Total
(%)
BBC1 66.6% 33.4% 100% BBC1 66.8% 33.2% 100%
BBC2 70.8% 29.2% 100% BBC2 66.8% 33.2% 100%
ITV1 55.4% 44.6% 100% ITV1 61.8% 38.2% 100%
CH4 73.4% 26.6% 100% CH4 92.2% 7.8% 100%
Five 75.2% 24.8% 100% Five 85.3% 14.7% 100%
Sky One 88.6% 11.4% 100% Sky One 100.0% 0.0% 100%
Result for Member State Sample
64.7% 35.3% 100%Result for Member State Sample
68.3% 31.7% 100%
All Day Peak Time
All Day Peak Time

294
Comparison with past data and declarations The ratio of qualifying European works to total qualifying hours provided by our 2007 estimates are in line with the trends estimated in the 2005 Study and reported data (see Figure 52). It confirms an overall trend towards an increasing share of European programmes over time on leading channels BBC1, BBC2, ITV1 and CHANNEL4.
Comparing Reported data from broadcasters’ Declarations (2006) to our sample estimates (2007) shows a strong consistency as far as the ratio of European works is concerned: here, differences between reported data and sample estimates are typically below 5%.
Figure 52: Ratio of reported vs. estimated European qualifying transmission hours to total qualifying transmission hours in the UK, 2007/2006
0%
10%
20%
30%
40%
50%
60%
70%
80%
90%
100%
1993
1996
1999
2002
2006/7
1993
1996
1999
2002
2006/7
1993
1996
1999
2002
2006/7
1993
1996
1999
2002
2006/7
1993
1996
1999
2002
2006/7
1993
1996
1999
2002
2006/7
BBC1 BBC2 C4 Five ITV1 Sky One
Channel/Year
(Note: Where there is no column for a particular channel/year, data is unavailable)
Perc
en
tag
e o
f T
ota
l Q
ualify
ing
Tra
nsm
iss
ion
Ho
urs
Reported Sample Estimate
The 2007 ratio of qualifying independent European works to total qualifying hours is also consistent with past findings (see Figure 53). It shows an increase of transmission time devoted to independent producers (apart from FIVE, which has been analysed for the first time in this Study). Comparing data for independent productions shows that our estimates have a difference of typically below 10% (with the exception of CHANNEL4, which has a difference of 18%) compared with the declarations. Sample estimates are higher than reported data for BBC1, BBC2 and CHANNEL4, but lower for ITV1 and SKY ONE.

295
Figure 53: Ratio of reported vs. estimated independent European qualifying transmission hours to total qualifying transmission hours in the UK, 2007/2006
0%
10%
20%
30%
40%
50%
60%
70%
80%
1993
1996
1999
2002
2006/7
1993
1996
1999
2002
2006/7
1993
1996
1999
2002
2006/7
1993
1996
1999
2002
2006/7
1993
1996
1999
2002
2006/7
1993
1996
1999
2002
2006/7
BBC1 BBC2 C4 Five ITV1 Sky One
Channel/Year
(Note: Where there is no column for a particular channel/year, data is unavailable)
Perc
en
tag
e o
f T
ota
l Q
ualify
ing
Tra
nsm
iss
ion
Ho
urs
Reported Sample Estimate
The 2007 ratio of recent qualifying independent European works to total European independent qualifying hours is very consistent with reported data in 2006/07, but differ from the past findings (see Figure 54). The proportion, which ranges from 85.6% to 95.9% in our 2007 estimate, has risen more on ITV1 and CHANNEL4 than on the other channels. It is worth noting that the reported figures are annual, and sample figures are weekly, and given fluctuations in schedules week-on-week, the weekly results will only very rarely match the annual average exactly.

296
Figure 54: Ratio of reported vs. estimated recent independent European qualifying transmission hours to total independent European transmission hours in the UK, 2007/2006
0%
10%
20%
30%
40%
50%
60%
70%
80%
90%
100%1993
1996
1999
2002
2006/7
1993
1996
1999
2002
2006/7
1993
1996
1999
2002
2006/7
1993
1996
1999
2002
2006/7
1993
1996
1999
2002
2006/7
1993
1996
1999
2002
2006/7
BBC1 BBC2 C4 Five ITV1 Sky One
Channel/Year
(Note: Where there is no column for a particular channel/year, data is unavailable)
Pe
rcen
tag
e o
f T
ota
l In
dep
en
den
t E
uro
pean
Tra
nsm
iss
ion
Ho
urs
Reported Sample Estimate

297
9. Views from Inside the Audiovisual Industry
9.1. Interview Sample
In the 2005 study we issued questionnaires, designed with co-operation from all members of the consortium and the European Commission, to broadcasters, producers and some trade bodies in order to develop an understanding of the key implications of Articles 4 and 5 from the TVWF Directive. For this current study, the questionnaire’s focus has been shifted somewhat, with an additional section focusing specifically on the respondents’ on-demand activities (see Part II in the questionnaires in the appendix). The questionnaire has been distributed to a wide variety of stakeholders, including broadcasters, producers, pure video-on-demand providers, regulators and trade bodies. Over 170 broadcasters and independent producers were approached, and we have received responses from 34. In addition, a further 62 organisations – both broadcasters and pure VoD providers, were contacted specifically with regard to their non-linear output. Of these, responses were received from 7 broadcasters (2 public and 5 commercial), and 15 pure VoD providers. The majority of completed questionnaires have been received via electronic mail; however, due to some respondents’ time constraints, a small number were carried out over the telephone. We have also contacted a number of regulators and trade bodies and have received responses from 15. These interviews were in the main carried out to inform the consortium’s thinking on possible monitoring methods for on-demand content. Findings from the interviews with regulators have also been incorporated into the work on monitoring on-demand services, found in Part 10. Currently our sample is weighted heavily towards broadcasters, however this was anticipated, given the limited resources of many of the independent producers we contacted (especially in the smaller nations). Over 83% of the 30 countries included in the study are represented by the current respondents, and together they account for over 88% of the total E30 TV revenue244. The category245 of organisation with whom interviews were
244 See Table 125. 245 Definitions: Publicly funded broadcaster: broadcaster funded in the main by a licence fee or government grant (note that some of these broadcasters carry limited advertising); Commercial broadcaster: a broadcaster whose funding comes primarily from advertising and sponsorship; Independent producer: a producer of television content that is not majority owned by a broadcaster and does not have any affiliations with a broadcaster (note that definitions of independent producer vary by member state e.g. in Germany there is no formal definition of an independent producer). Pure VoD player: a provider of a VoD service not linked to a service run by traditional linear broadcasters offering catch-up (and sometimes broadcaster-specific library content), generally operated by cable companies, telecommunications companies, film industries or independent internet players.

298
conducted or from whom questionnaires were returned is given in Table 124.
Table 124: Interview sample
ORGANISATIONINTERVIEWS CONDUCTED /
QUESTIONNAIRES RETURNED
PUBLICLY FUNDED BROADCASTER 12
COMMERCIAL BROADCASTER 23
INDEPENDENT PRODUCER 6
REGULATOR 13
TRADE BODY 2
PURE VoD PLAYER 15
TOTAL 71

299
Table 125: List of organisations interviewed COUNTRY CLASSIFICATION COMPANY
PUBLICLY FUNDED BROADCASTER ORF
REGULATOR RTR
TRADE BODY FAFO
COMMERCIAL BROADCASTER SBS
REGULATOR CSA
INDEPENDENT PRODUCER SKYLINE ENTERTAINMENT
COMMERCIAL BROADCASTER BeTV
COMMERCIAL BROADCASTER VMMa
PUBLICLY FUNDED BROADCASTER EEN
CYPRUS PUBLICLY FUNDED BROADCASTER CYBC
REGULATOR RRTV
COMMERCIAL BROADCASTER TV NOVA
COMMERCIAL BROADCASTER KANAL 5
REGULATOR BIBLIOTEK OG MEDIER
ESTONIA PUBLICLY FUNDED BROADCASTER ETV
FINLAND PUBLICLY FUNDED BROADCASTER YLE
COMMERCIAL BROADCASTER 13 ÈME RUE
COMMERCIAL BROADCASTER TF1
COMMERCIAL BROADCASTER ARTE
COMMERCIAL BROADCASTER CANAL ACTIVE
PURE VoD PLAYER ZOOLOO KIDS
PURE VoD PLAYER ORANGE
PURE VoD PLAYER VODEO (LBA)
PURE VoD PLAYER W4TCH
PURE VoD PLAYER MK2
PURE VoD PLAYER UNIVERS CINE
COMMERCIAL BROADCASTER PRO7SAT1
REGULATOR BLM
INDEPENDENT PRODUCER CONSTANTIN
INDEPENDENT PRODUCER MME MOVIEMENT
HUNGARY COMMERCIAL BROADCASTER TV2
COMMERCIAL BROADCASTER SKJAR ONE
INDEPENDENT PRODUCER ZIK ZAK FILMWORKS
PUBLICLY FUNDED BROADCASTER RTE
REGULATOR BCI
TRADE BODY ANICA
COMMERCIAL BROADCASTER FOX INTERNATIONAL
PURE VoD PLAYER WIND
PURE VoD PLAYER TISCALI
PURE VoD PLAYER FILM IS NOW
PURE VoD PLAYER FASTWEB
LATVIA INDEPENDENT PRODUCER VFS
REGULATOR MALTA BROADCASTING AUTHORITY
PUBLICLY FUNDED BROADCASTER PBS
COMMERCIAL BROADCASTER* UPC
REGULATOR CVDM
COMMERCIAL BROADCASTER SBS (NL)
REGULATOR NORWEGIAN MEDIA AUTHORITY
COMMERCIAL BROADCASTER TVNORGE AS
PORTUGAL PUBLICLY FUNDED BROADCASTER RTP
REGULATOR KRRiT
COMMERCIAL BROADCASTER* MULTIMEDIA POLSKA
PUBLICLY FUNDED BROADCASTER TVP
PURE VoD PLAYER MULTIMEDIA POLSKA
ROMANIA COMMERCIAL BROADCASTER PRIMA TV
SLOVAKIA PUBLICLY FUNDED BROADCASTER STV
PUBLICLY FUNDED BROADCASTER RTV
REGULATOR APEK
COMMERCIAL BROADCASTER KANAL A
PUBLICLY FUNDED BROADCASTER SVT
COMMERCIAL BROADCASTER SBS (SE)
REGULATOR RTVV
PURE VoD PLAYER COMHEM
PURE VoD PLAYER HEADWEB
COMMERCIAL BROADCASTER ITV
COMMERCIAL BROADCASTER VIRGIN MEDIA
COMMERCIAL BROADCASTER NBC UNIVERSAL
REGULATOR OFCOM
INDEPENDENT PRODUCER ALL3MEDIA
PURE VoD PLAYER BT VISION
PURE VoD PLAYER FILMFLEX
* DENOTES PLATFORM OPERATOR
NORWAY
SWEDEN
MALTA
CZECH REPUBLIC
DENMARK
IRELAND
ITALY
UNITED KINGDOM
AUSTRIA
GERMANY
BELGIUM
ICELAND
SLOVENIA
POLAND
NETHERLANDS
FRANCE

300
9.2. Building a European On-Demand Sample
Whereas for respondents from the linear broadcasting world the 2005 Study provided a good basis for identifying a sample, in order to evaluate on-demand content we had to carefully construct a new sample. As on-demand is a nascent industry, and Article 3i is new legislation, we had to take special care in constructing a questionnaire for the non-linear providers. The following section identifies some key issues regarding the collection of data from on-demand providers.
9.2.1. A ‘lighter’ regulation
Non-linear services are subject to “lighter regulation” under the terms of the AVMS Directive, which sets out criteria for the selection of qualifying on-demand services:
According to the AVMS Directive, “On-demand audiovisual media service” (i.e. a nonlinear audiovisual media service) means an audiovisual media service provided by a media service provider for the viewing of programmes at the moment chosen by the user and at his individual request on the basis of a catalogue of programmes selected by the media service” (Art 1 (g)). As a consequence, catch-up TV will be a non-linear service, along with, for example, on-demand access to archived content, while NVOD is considered to be a linear service, as the consumer must select to watch content at one of a set of pre-defined times (thus not, strictly speaking, ‘at the moment chosen by the user.’).
According to Article 3i of the AVMS Directive, Member States must ensure that on-demand services “promote, where practicable and by appropriate means, production and access to European works”.246 It specifies that such means may include:
• The financial contribution made to the production and rights acquisition of European works;
• The share/prominence of such works in the catalogues of programmes proposed for the service.
It is further suggested that Member States may pay attention to “minimum share in catalogues”, “attractive presentation in electronic programme guides”, and, in a further reference to consumption measures in the context of reports on the application of this provision, “effective users’ consumption of European works by such services” (Recital 48 of AVMS Directive).
One last element to be noticed is that the AVMS Directive has to be implemented in Member States’ national regulation by the end of 2009 so that, apart from a few exceptions (see legal analysis in First Interim
246 Chapter IIb, Article 3i of the AVMS Directive.

301
Report), these definitions have no legal existence and have sometimes not even been fully debated at Member State level yet.
So our general objective, to research the current realities and future prospects of the non-linear world as far as Article 3(i) is concerned, needed to reflect the fact that this Study anticipates a legal reality that will take shape during 2008 and 2009, that definitions are tentative, that market players have no obligations yet, and that they sometimes have no clear view on Article 3i, to help us feed the research with clear facts and opinions.
In light of these considerations, we decided to:
• Research a wider range of digital audiovisual services including, for example, some NVOD or Content Sharing platforms, in order to put our findings regarding non-linear services in the broader context of digital convergence. All our discussions with these players will be taken into account from a qualitative viewpoint, but their questionnaires will not be included in the quantitative analysis.
• Use and apply, where possible, the same performance indicators as those used for linear services in order to build a first picture of the non-linear situation that allows comparisons with the better-known world of linear media;
• Develop a prospective approach to designing performance indicators that could be applied, today and in the future, to the specificities on non-linear services;
9.2.2. Collecting on-demand data
Collecting data on non-linear services presents two important challenges:
• The lack of programme and consumption data available from third-party, independent organisations comparable with that which TAM companies are able to provide on linear services;
• The fact that the AVMS Directive is still at an early stage of being debated and not yet implemented, so players have no obligations to display information, which they sometimes do not even have internally.
We thus had to rely heavily on service providers’ goodwill to share data on the content on offer and its consumption, as well as their views on the most appropriate procedures that could be developed in the future to monitor and assess activities at periodic intervals.
Therefore we prepared an official request to collaborate in the Study, requesting on-demand services to share internal data and views in confidence, focusing on 5 areas247:
247 The complete questionnaire is available in Appendix V (chapter 17 of this report).

302
• The description of their on-demand services;
• The types of programmes available in their catalogue and actually consumed by their consumers;
• The share of European programmes within that;
• Their programming strategies and motivations behind programming decisions;
• Their views on how Article 3(i) of the AVMS Directive should be technically implemented.
It is important to note early on that we have indeed received a number of refusals to take part, from companies who either said that the information needed for the Study was too confidential to be shared, even if strict confidentiality was ensured, or because they felt that they were not concerned with the AVMS Directive, of which they were frequently even unaware. In some markets, the reason was simply that on-demand services had not yet been launched in the market (or, in some cases, had not been launched during 2007).
9.3. Objectives of Qualitative
Information Gathering The objectives of the qualitative information gathering via the surveys of broadcasters, producers, regulators and pure VoD players248 were:
9.3.1. To identify the determinants of programme spending decisions:
• How broadcasters allocate overall programme spending by genre;
• How broadcasters decide on the balance between commissioned and acquired programmes in the schedule;
• Any major changes in budgetary decisions over the last five years;
• How spend varies by programme type i.e. acquisitions versus commissions;
• How funding for programming varies by genre;
• Whether broadcasters have been investing any monies in producing programming specifically for on-demand services.
248 To be specific, all the below objectives were targeted with questions in the survey given to broadcasters and producers. The survey of pure VoD players did not contain questions designed to address points 8.3.1, 8.3.2 or 8.3.3, instead focussing on questions to collect data on the objectives detailed in 8.3.4 and 8.3.5.

303
9.3.2. To understand the dynamics of co-productions
This part of the questionnaire was designed to assess whether broadcasters were participating in more or less co-productions and with whom they tend to work, in terms of the organisation type (film studio, independent producer or broadcaster) and geography of the organisation (domestic, European, US, other).
9.3.3. To find out more about the economic performance of the audiovisual sector and content
producers
We also gathered information and data about the economic performance of the independent production sector along with developments around terms of trade and its impact on the independent sector’s business.
9.3.4. To find out more about the programming
policies of on-demand contents service providers
As detailed above, we collected information on the content available on non-linear services, via the questionnaires for broadcasters, producers and pure VoD players. Data were requested on type of content available, country of origin, consumption of content and financing of content. Respondents were also asked to discuss their programming policies specifically as well, for example being asked what their policy was towards European content. Data acquired from this research will be used to attempt to create a snapshot of on-demand content in Europe as of the end of 2007.
9.3.5. To assess the level of awareness around Article
3i and respondents’ views on methods for monitoring compliance
This section of the questionnaire gave respondents (broadcasters, producers and pure VoD players) the opportunity to comment on potential ways to monitor on-demand services in order to ensure compliance with Article 3i. We invited comments on a number of key areas surrounding new media and asked respondents to include any information currently available about their own on-demand services.
The questionnaires and interviews provide quantitative and qualitative information that add significant depth and colour to our picture of the sector. They enhance our understanding of the commercial imperatives under which the broadcasting and production industries operate, and offer the views of the different constituencies affected by Articles 4 and 5 of the TVWF (and AVMS) Directive and Article 3i of the AVMS Directive.

304
9.4. Determinants of Programme
Spending Decisions
There are three important sets of decisions made by broadcasters that we wanted to explore. The first of these is the balance between commissioned and acquired programmes in the channel schedule; this is influenced by the cost of commissioning programmes compared with the cost of acquiring ready-made programmes. The second decision is from whom broadcasters commission new programmes; and the third decision is the source of acquired programmes (particularly the balance between European-made programmes and programmes from the US).
9.4.1. Overall programming spend and the balance between commissions and acquisitions
Firstly we asked broadcasters about how spending on programming varies by genre. Our study revealed that the most capital-intensive is production of fiction, subsequently entertainment and news programming (see Table 126). In addition, these genres were also identified by a majority of broadcasters (over 60%) as cheaper to produce in-house (see Figure 55).
Table 126: 2007 spend on programmes by genre
GENRE PROPORTION OF TOTAL SPEND
FICTION 32%ENTERTAINMENT 16%NEWS 13%SPORT 10%CINEMA FILM 8%FACTUAL MAGAZINES 8%DOCUMENTARIES 8%GAMES 4%
Within this section, broadcasters were asked how that spend is broken down in terms of programmes produced in-house, externally and acquired programming249. We found that broadcasters invested the majority (61%)
249 Definitions: In-house is defined as programming commissioned by the broadcaster and produced using the broadcaster’s own production facilities, staff and equipment; External is defined as commissioned programming produced by a producer unaffiliated with the commissioning broadcaster (e.g. an independent producer or another broadcaster’s production house); Acquired is ready-made programming, whereby the broadcaster purchases the rights to broadcast a show/film/event a certain number of times (normally specific to a particular territory) e.g. US drama, sporting events, feature films.

305
of their programme budget on commissioned programmes (external commissions and in-house), with the remainder (39%) spent on the acquisition of ready-made programmes.
Commissioning spend of the broadcasters we surveyed was equally balanced between in-house (32%) and external spend (29%). In this case, the external market is defined as both productions by independent producers and productions by the production facilities of other broadcasters250.
One key finding was the difference in programme budget allocation between public and commercial broadcasters. Commercial broadcasters tend to allocate a higher proportion of their programme budget (51%) to acquired programmes, and a significantly lower proportion (18%) to in-house production. Contrastingly, publicly funded broadcasters tend to invest heavily in in-house production (58%) and far less on acquisitions (16%). It is worth noting that the low in-house production spend for commercial broadcasters may simply reflect the fact that many of them have no in-house production capability. The data is summarised in Figure 55.
Figure 55: Channel programme spend allocation (2007)251
58
18
32
26
31
29
16
51
39
10% 20% 30% 40% 50% 60% 70% 80% 90% 100%
PUBLICBROADCASTERS
COMMERCIALBROADCASTERS
ALL CHANNELS
PERCENTAGE OF PROGRAMMING SPEND (EXC. NEWS, SPORT & GAMES)
IN-HOUSE EXTERNAL COMMISSION ACQUIRED
58
18
32
26
31
29
16
51
39
10% 20% 30% 40% 50% 60% 70% 80% 90% 100%
PUBLICBROADCASTERS
COMMERCIALBROADCASTERS
ALL CHANNELS
PERCENTAGE OF PROGRAMMING SPEND (EXC. NEWS, SPORT & GAMES)
IN-HOUSE EXTERNAL COMMISSION ACQUIRED
In order to assess how the development of formatted programming has impacted the programme portfolio, we asked broadcasters more specifically what proportion of their programming budget was spent on 250 Production facilities of other domestic broadcasters do not qualify as independent production spend. 251 Response to Q1.2: ‘What percentage of your programme budget was spent on each of the following categories of programme.’
306
commissioning formats.252 We found the majority of format commissioning is by commercial broadcasters with an average of 10% of their total programming budget invested in commissioning formatted programming. For the publicly funded broadcasters, only 6%253 of their programming budget was spent on commissioning formats. This gap in format investment between publicly funded and advertising funded broadcasters is down to balancing risk. Advertising funded broadcasters typically opt for tried and tested formats in order to guarantee audience share (and thus satisfy advertisers), whereas publicly funded broadcasters often have a remit to adhere to that ensures they must promote innovation, education and invest in local programming. Publicly funded broadcasters are also typically less focussed on audience share and can therefore afford to take on more risk and invest in more ‘risky programming’, such as high quality dramas or controversial documentaries.
This part of the questionnaire also identified that there has been a general shift across both publicly and commercially funded broadcasters towards external commissioning, with over 70% of respondents stating that the proportion of external commissioning had increased over the last five years254. Around 47% of respondents stated that the proportion of acquisition spend had increased over the last five years, while only a quarter of the panel stated that the proportion of in-house spend had increased. We also put the same question to a number of independent producers across Europe and received a similar response, with around 50% of respondents stating that the number of external/independent commissions has increased over the last five years.
We also assessed how the cost of programming for the broadcaster varies by commissions and acquisitions. We found that the majority of broadcasters felt that almost all genres255 were cheaper to produce in-house, with over 60% of respondents stating that news, sport and entertainment are cheaper to produce in-house than externally. The only genre all respondents felt is cheaper to produce externally was cinema film. The results are summarised in Figure 56.
252 A format is defined as any programme locally adapted for broadcast in at least one other market than the market of origin and for which a licensing fee is payable, e.g. Who Wants to Be a Millionaire, Betty la Fea. 253 This figure was skewed slightly by two publicly funded broadcasters who both reported high levels of investment in formatted programming. Generally, the level of investment sits between 0% and 3%. 254 There are a number of potential explanations for increased commissioning spend across Europe including: changing regulation in Member States ensuring broadcasters spend a specific proportion of programme budgets on external production; a more competitive independent environment reducing commissioning prices for broadcasters; a shift of talent into a burgeoning independent sector; and/or a reduction in in-house production capacity forcing broadcasters to ‘outsource’ certain types of production. 255 Entertainment, fiction, documentaries, factual magazine and news programming.

307
Figure 56: Price differentials for commissioned programmes256
CHEAPER EXTERNALLY CHEAPER IN-HOUSE
18
30
33
44
44
45
46
100
82
70
67
56
56
55
54
10% 20% 30% 40% 50% 60% 70% 80% 90% 100%
NEWS
SPORT
ENTERTAINMENT
GAMES
DOCUMENTARIES
FICTION
FACTUAL MAGAZINE
CINEMA FILM
RESPONSE TO QUESTION 5.1
CHEAPER EXTERNALLY CHEAPER IN-HOUSE
18
30
33
44
44
45
46
100
82
70
67
56
56
55
54
10% 20% 30% 40% 50% 60% 70% 80% 90% 100%
NEWS
SPORT
ENTERTAINMENT
GAMES
DOCUMENTARIES
FICTION
FACTUAL MAGAZINE
CINEMA FILM
RESPONSE TO QUESTION 5.1
9.4.2. Commissioning new programmes
We then asked broadcasters to focus on their decisions about commissioning new programmes, and specifically the decision-making processes that determine the mix of programmes produced in-house and commissioned externally.
Broadcasters have three basic sources of new programmes: established broadcasters (particularly publicly funded channels) typically have an in-house production capability; a broadcaster may commission programmes from the in-house production unit of another broadcaster; or alternatively the broadcaster may commission a producer independent of the broadcasters to make a new programme.
256 Response to Q5.1: ‘If you produce programmes in-house, please indicate whether these are cheaper to produce in-house or to commission externally.’

308
Figure 57: Commissioning by production category (2007)257
83
52
45
38
36
26
17
17
9
17
20
10
8
4
40
38
42
53
66
79
1000
10% 20% 30% 40% 50% 60% 70% 80% 90% 100%
NEWS
FACTUAL MAGAZINE
SPORT
GAMES
ENTERTAINMENT
FICTION
DOCUMENTARIES
CINEMA FILM
PERCENTAGE OF TOTAL COMMISSIONING SPEND
IN-HOUSEEXTERNAL NON-INDEPENDENT
PRODUCERINDEPENDENT
PRODUCER
83
52
45
38
36
26
17
17
9
17
20
10
8
4
40
38
42
53
66
79
1000
10% 20% 30% 40% 50% 60% 70% 80% 90% 100%
NEWS
FACTUAL MAGAZINE
SPORT
GAMES
ENTERTAINMENT
FICTION
DOCUMENTARIES
CINEMA FILM
PERCENTAGE OF TOTAL COMMISSIONING SPEND
IN-HOUSEEXTERNAL NON-INDEPENDENT
PRODUCERINDEPENDENT
PRODUCER
Figure 57 illustrates the proportion of commissioned programming spend from each source identified above. The figure shows that the vast majority of news programming is produced in-house, while cinema film and documentaries tend to be produced externally. Fiction, entertainment and factual magazine programming have a more balanced mix in terms of sourcing, with 20% to 50% produced in-house and 40% to 70% produced by independent producers. Documentaries are rarely produced in-house and cinema film is always sourced from the external market (typically Hollywood studios or local/domestic independent producers). In news, games and sport over 15% of programming is made by other broadcasters e.g. Five in the UK sourcing their news programming from Sky.
We also asked broadcasters how commissioning spend has changed over the last five years. Over 82% of broadcasters stated that external spend has grown, with 38% claiming in-house spend has fallen in the past five years. Approximately 79% of the broadcasters polled stated that increased commissioning spend was particularly pronounced in fiction, while 57% said it was also pronounced in entertainment, implying that these genres in particular are being more regularly outsourced to the external production market.
In addition, we were keen to investigate how spending on format-based commissions varied by genre in 2007 and whether there had been a major shift in format spending over the last five years. Over 64% of format commissioning was invested in entertainment and games formats such as 257 Response to Q2.2: ‘Divide commissioned programmes in each genre according to the three production categories of: in-house production, programmes produced externally by non-independent producers, or programmes produced externally by independent producers.’

309
Pop Idol or Deal Or No Deal, while over a third of broadcasters stated they had spent less on format commissioning over the last few years, both in-house and externally.
9.4.3. Decisions about programme acquisitions
We also wanted to understand more about the decision to acquire programming rather than commission, either in-house or externally. In the first section of the questionnaire we asked broadcasters to give a rough estimate of the cost of acquiring ready-made programming as a percentage of the cost of commissioning a similar type of programme. The results are summarised in Figure 58:
Figure 58: Cost of acquisitions as a percentage of the cost of commissions (by genre)258
75
75
75
73
71
67
46
43
17
17
18
14
31
29
25
8
8
9
14
33
23
29
10% 20% 30% 40% 50% 60% 70% 80% 90% 100%
CINEMA FILM
ENTERTAINMENT
FACTUAL MAGAZINE
DOCUMENTARIES
GAMES
NEWS
FICTION
SPORT
COST OF AQUISITION AS A PERCENTAGE OF THE COST OF A COMMISSION
0-20% 21%-50% 51%-100%
75
75
75
73
71
67
46
43
17
17
18
14
31
29
25
8
8
9
14
33
23
29
10% 20% 30% 40% 50% 60% 70% 80% 90% 100%
CINEMA FILM
ENTERTAINMENT
FACTUAL MAGAZINE
DOCUMENTARIES
GAMES
NEWS
FICTION
SPORT
COST OF AQUISITION AS A PERCENTAGE OF THE COST OF A COMMISSION
0-20% 21%-50% 51%-100%
Across all genres, except sport and fiction, over 65% of broadcasters stated that acquired programming cost over 80% less than commissioned programming. Within this, 75% of respondents felt that acquiring factual magazine and entertainment programming cost under 20% of the investment required to commission a similar programme. The response for fiction was more mixed, with over 23% of respondents stating that acquired fiction programmes can cost over 50% of the cost of commissioning. This is probably a reflection of the high cost of American imports such as 24, Lost and CSI, which are acquired at significant cost relative to standard commissioning budgets.
258 Response to Q1.6: ‘For each genre please tell us the cost of acquiring ready-made programmes as a percentage of the cost of commissioning a similar programme.’

310
We also asked the broadcasters about the balance of their acquisition spend between new programming (programming made within the last five years) and library acquisitions (programming made over five years ago). With the exception of fiction and cinema film, over 95% of acquisition spend was on programming produced in the last five years. For fiction and cinema film the proportion of newer programming was slightly lower (81% and 69% respectively). The results are summarised in Figure 59.
Figure 59: The balance between new and library programme acquisitions259
98
97
97
96
96
91
90
84
69
2
3
3
4
4
9
10
16
31
10% 20% 30% 40% 50% 60% 70% 80% 90% 100%
ENTERTAINMENT
SPORT
FACTUAL MAGAZINES
GAMES
NEWS
DOCUMENTARIES
AVERAGE
FICTION
CINEMA FILM
PROPORTION OF TOTAL ACQUISTION SPEND
LESS THAN 5 YRS MORE THAN 5 YRS
98
97
97
96
96
91
90
84
69
2
3
3
4
4
9
10
16
31
10% 20% 30% 40% 50% 60% 70% 80% 90% 100%
ENTERTAINMENT
SPORT
FACTUAL MAGAZINES
GAMES
NEWS
DOCUMENTARIES
AVERAGE
FICTION
CINEMA FILM
PROPORTION OF TOTAL ACQUISTION SPEND
LESS THAN 5 YRS MORE THAN 5 YRS
Finally we asked broadcasters from where they source acquired programming. A summary of the results can be found in Table 127.
259 Response to Q6.2: ‘What percentage of your 2007 spend on programme acquisitions was spent on programmes that are less than five years old.’

311
Table 127: Source of acquired programmes (2007)260
SOURCE OF ACQUIRED PROGRAMMING PROPORTION OF TOTAL
ACQUISTION SPEND
US BROADCASTERS OR PRODUCERS 56%
BROADCASTERS OR PRODUCERS OUTSIDE EUROPE AND THE US 23%
DOMESTIC PRODUCERS 14%
OTHER DOMESTIC BROADCASTERS 5%
BROADCASTERS OR PRODUCERS IN ANOTHER EUROPEAN COUNTRY 3% The broadcasters contributing to the study purchased over half of their acquisitions from the US and just under 25% from content owners in another European country. Only 19% of acquired programming was from the broadcasters’ respective domestic market and just over 3% of acquired programming was from content owners outside Europe and the US (mostly from Asia).
9.5. Financing of New Programmes
We were also keen to understand how the financing of programming has changed in the face of new media developments and a rise in the number of multi-national co-productions. Figure 60 summarises this research.
260 Response to Q6.3: ‘What percentage of the ready-made programmes you acquire do you purchase from the following sources?’

312
Figure 60: Contribution to funding of new programmes261
87
89
93
94
97
97
99
6
2
3
5
0
2
0
1
2
2
0
0
0
0
0
0
0
2
3
7
1
1
1
1
1
3
0
0
0
80% 82% 84% 86% 88% 90% 92% 94% 96% 98% 100%
FICTION
DOCUMENTARY
ENTERTAINMENT
GAMES
SPORT
FACTUAL MAGAZINE
NEWS
PROPORTION OF TOTAL PROGRAMME FUNDING
PRIMARY BROADCASTER
CO-PRODUCTION
SECONDARY BROADCASTER
DISTRIBUTOR FOR OVERSEAS RIGHTS
ADVANCES AGAINST MERCHANDISING
PUBLIC FUNDING BODY
PRIVATE FUNDING LINKED TO TAX BREAKS
NEW MEDIA RIGHTS AND ADVANCES FOR REVENUES
Across all genres, over 85%262 of funding comes from the primary broadcaster, with between 1% and 7% from a secondary broadcaster or a co-producer263. Only in sport does funding flow from merchandising advances, while all genres receive limited public funding, however the large majority of this is licence fee monies rather than direct public funding.
We asked a number of European independent producers a similar question and the response was broadly similar264. For all genres other than fiction, producers stated that over 90% of funding was sourced from the primary broadcaster, with some from various other sources. For fiction programming 88% is sourced from the primary broadcaster, just under 3% from public subsidies and around 10% from private funding linked to tax breaks.
261 Responses to Q3.1 – Q3.7: ‘What are the sources of funding for programmes you commission?’ 262 Please note that on graph, scale starts at 80% 263 The primary broadcaster is the main commissioner of the programme and will typically retain the first showing domestic rights, while the secondary broadcaster or co-producer may finance some of the production in order to retain international rights. 264 Responses to Q3.1 – Q3.7: ‘What are the sources of funding for programmes you produce?’

313
9.6. Co-Production between Member
States and Intra-Community Trade in European Works
We asked both independent producers and broadcasters a number of questions related to co-productions in order to build a better picture of the most popular co-produced genres and most common region for co-productions.
Approximately 86% of broadcasters co-produce programmes, while over three quarters of independent producers in our sample co-produce programming. The broadcasters highlighted entertainment as the most commonly co-produced genre, shortly followed by fiction and cinema film (see Figure 61). Factual magazine programming and games are rarely co-produced, while news and sport are never produced in partnership with a third party.
Figure 61: Genres most commonly co-produced by European broadcasters265
0
0
17
22
44
44
50
56
10% 20% 30% 40% 50% 60%
SPORT
NEWS
FACTUAL MAGAZINE
GAMES
DOCUMENTARIES
CINEMA FILM
FICTION
ENTERTAINMENT
PERCENTAGE OF RESPONDENTS
0
0
17
22
44
44
50
56
10% 20% 30% 40% 50% 60%
SPORT
NEWS
FACTUAL MAGAZINE
GAMES
DOCUMENTARIES
CINEMA FILM
FICTION
ENTERTAINMENT
PERCENTAGE OF RESPONDENTS
Both producers and broadcasters identified domestic co-productions and co-productions with other European producers as the most commonplace. For broadcasters this was closely followed by multi-country European co-productions, with broadcasters in the larger Member States often producing programming with each other and neighbouring countries. Co-productions with Canadian and US producers were far less popular and are
265 Response to Q4.2: ‘Please indicate which genres you mainly co-produce.’

314
probably limited to a small number of French/Canadian co-productions and some between Western European broadcasters and cable networks in the US. These results are summarised in Table 128.
Table 128: Domestic and international co-productions266
CO-PRODUCTION REGION RANKING (1 - MOST, 6 -LEAST)DOMESTIC 1.3OTHER EUROPEAN 1.3MULTI-COUNTRY EUROPEAN CO-PRODUCTIONS 2.3OTHER 2.5CANADA 3.7US 4.5LATIN AMERICA 6.0
9.7. Terms of Trade
Over the last few years the terms of trade around rights ownership have become increasingly more complicated. New media rights (including on-demand) and overseas exploitation rights are fast becoming significant new revenue streams for the rights holder. We asked both broadcasters and producers about this issue in order to get a reflection of what each party expects from negotiations.
The results from one of the questions asked of the broadcasters are summarised in Figure 62.
266 Broadcasters were asked to rank the regions where they co-produce according to the highest number of co-productions i.e. if the majority of co-productions are with domestic producers followed by Latin American producers, the ranking would follow: domestic producers = 1 and Latin America = 2 and so on.

315
Figure 62: Rights ownership267
100 100
81 81
24 24 2420
95
10
20
30
40
50
60
70
80
90
100
FIRSTSHOWING –TERRESTRIAL
REPEATSHOWING(S) –
TERRESTRIAL
REPEATSHOWINGS –SECONDARY
ANCILLARYRIGHTS
INTERNET AND/OR
OTHER NEW MEDIA RIGHTS
DOMESTIC OVERSEAS
% OF BROADCASTERS
ANCILLARYRIGHTS
REPEATSHOWINGS –SECONDARY
FIRSTSHOWING –TERRESTRIAL
REPEATSHOWING(S) –
TERRESTRIAL
SOURCE: O&O SURVEY OF BROADCASTERS
As is illustrated, 100% of respondents stated that they expect first (and repeat) showing domestic terrestrial and new media rights (including on-demand rights) when commissioning programmes externally. Around 81% of respondents stated that they expect repeat showings in the domestic secondary market and domestic ancillary rights. Only around 24% of broadcasters expect to negotiate overseas rights for externally commissioned programming, implying that commercial exploitation in the export market is the producer’s responsibility.
The majority of broadcasters also felt that the terms of agreements negotiated with independent producers were about as favourable to both parties as agreements for other programmes commissioned externally268. Only 17% of broadcasters felt the terms of trade were less favourable for the independent sector.
In asking producers about similar rights issues, we found that around a third of respondents felt the payment they receive for rights is less than the value they could create from them over a given period. This implies that producers believe broadcasters do not exploit programming productions as effectively as they would do themselves, i.e. export opportunities are not currently fully exploited, because broadcasters do not pursue these opportunities as energetically as producers would do. Around three quarters of producers stated that they retain about the same level of rights to programmes as they did five years ago, while 75% of 267 Response to Q 5.1: ‘What exclusive rights would you seek to obtain when you commission programmes from external producers?’ 268 This implies both the broadcasters and the independent sector feel they are receiving an appropriate level of rights retention during the commissioning process.

316
respondents stated the margins they earn on programming rights has fallen over the same period. Three quarters of producers also felt there should be a statutory limit on the period that a broadcaster can have exclusive use of primary rights. The comments from producers around this question were in-depth, with a number of respondents from outside the UK (where terms of trade for producers have improved significantly in the last few years) indicating that the retention of rights for the producer would incentivise producers to improve their creative performance and encourage both producers and broadcasters to take a more international view on programme making, potentially increasing secondary revenues in the long term.
9.8. The Balance of Trade in
Programming In this section we asked broadcasters and independent producers to identify which genres and formats of programming work well in the international market (i.e. highly exportable genres) and whether there are certain genres/formats that can be successfully imported from abroad. Figure 63 and Figure 64 summarise our findings.269
Figure 63: Genres that make successful imports/exports270
83
80
100
89
71
100
62
73
87
42
60
87
40
87
57
55
45
54
17
46
43
20
25
17
20% 40% 60% 80% 100%
SUCCESSFULEXPORTS
SUCCESSFULEURO
IMPORTS
SUCCESSFULNON-EURO
IMPORTS
PERCENTAGE OF RESPONDENTS
FICTIONFEATURE FILMS
DOCUMENTARIES
ENTERTAINMENTSPORT
GAMESFACTUAL MAGAZINES
NEWS
FICTIONFEATURE FILMS
DOCUMENTARIES
ENTERTAINMENTSPORT
GAMESFACTUAL MAGAZINES
NEWS
FICTIONFEATURE FILMS
DOCUMENTARIESENTERTAINMENT
SPORT GAMES
FACTUAL MAGAZINESNEWS
269 Please note that although both broadcasters and independent producers were surveyed on this issue, we have only received one response on this topic from producers. Therefore the figures and discussion in this section deal only with responses from broadcasters. We are currently making strong efforts towards gaining more responses from independent producers on this issue and others. 270 Response to Q7.1 – Q7.3: ‘Which of the following genres: make the most successful exports; can be successfully imported from another European country; can be successfully imported from outside Europe.’

317
The chart above illustrates that fiction and feature films were assessed by broadcasters as being the most successful in the international market, while news and factual magazines were seen as inherently local and therefore unlikely to sell well abroad271. Sport, documentaries, fiction and feature films were all rated highly as potential European imports, while news and factual magazines were given low ratings, with under 25% of broadcasters viewing the genres as potential imports. All broadcasters stated feature films and fiction from outside Europe (mainly from the US) were attractive and tended to be very successful in primetime schedules, driving audiences and consequently advertising revenue. Again, news and factual magazines were not seen as particularly appealing imports due to their focus on local issues.
Figure 64: Formats that make successful imports/exports272
62
93
93
67
81
87
45
86
80
42
67
73
42
63
73
20
63
43
10% 20% 30% 40% 50% 60% 70% 80% 90% 100%
SUCCESSFULEXPORTS
SUCCESSFULEURO
IMPORTS
SUCESSFULNON-EURO
IMPORTS
PERCENTAGE OF RESPONDENTS
ENTERTAINMENT
FACTUAL ENTERNAINMENT/REALITY
GAMES
FACTUAL MAGAZINES
FICTION
OTHER
ENTERTAINMENT
FACTUAL ENTERNAINMENT/REALITY
GAMES
FACTUAL MAGAZINES
FICTION
OTHER
ENTERTAINMENT
FACTUAL ENTERNAINMENT/REALITY
GAMES
FACTUAL MAGAZINES
FICTION
OTHER
As illustrated in Figure 64, only entertainment and factual entertainment/reality formats were rated above 50% as potentially exportable formats. The exporting of formats is a fairly recent development in television markets and there is only a small number of countries that have successfully managed to exploit formats on a global scale (UK with Dancing With The Stars, The Netherlands with Big Brother and Sweden with Survivor). Some of the smaller markets in Europe are still reliant on tried and tested formats from the larger nations and, with very little overall export activity, have little incentive to drive growth in formats that could potentially be sold in the international market. These smaller nations have been far more active in the import market illustrated by over 80% of respondents highlighting reality, entertainment and games as highly successful European imports. These three format genres 271 Example from Figure 9: Top bar representing ‘Fiction’ indicates that 100% of respondents feel imports from non-European countries are successful while middle bar suggests 79% of respondents feel ‘Fiction’ imports from European states are successful. 272 Response to Q7.4 – Q7.6: ‘Which of the following format genres: make the most successful exports; can be successfully imported from another European country; can be successfully imported from outside Europe.’
318
also rated highly when broadcasters were asked about the success of formats from outside Europe (over 80% for each category).
9.9. The Development of On-Demand
Services The survey of on-demand service providers covered a wide range of quantitative and qualitative questions, aiming both to identify appropriate procedures and indicators for monitoring Article 3i (See Chapter 10 for more detail), and to collect data that performance indicators could be applied to. This section of the study presents the aggregate results from the survey of on-demand services. Results at the service-by-service level for key performance indicators are presented in Chapter 10.
Operational procedures for monitoring Article 3i will be discussed in more detail in Chapter 10. At this stage it is important to acknowledge that there are two main legal scenarios for operational procedures: self-declarations from providers, and independent evaluation, be it by a government agency or independent consultant. The work on linear services, detailed in previous chapters, exemplifies the second scenario, specifically the independent monitoring of linear services by an independent consultant (it thus acts to verify the self-declared data from linear broadcasters that the European Commission receives).
However, for non-linear services, we have not replicated this approach, instead evaluating non-linear services on the basis of self-declarations from service providers. The particular reasons for this approach, and why independent evaluation of non-linear services is not feasible at this time, are discussed in Chapter 10.
This chapter presents the aggregate data collected from self-declarations from non-linear services. It thus presents an overview of the non-linear environment, based on our sample. There is both a quantitative and a qualitative component to the research presented. Parts 9.9.1 to 9.9.5 are based on quantitative data from the self-declarations of service providers. Parts 9.9.6 and 9.9.7 present qualitative data based on opinions provided via the self-declarations. While 9.9.6 and 9.9.7 are based on data acquired through the survey of on-demand service providers, the subsequent section on prominence has been approached somewhat differently. It is predominantly based on desk research by the consultants, who looked at a selection of services and evaluated the prominence that European content had on those services (supplemented by qualitative data from the survey).
9.9.1. Distribution and content of on-demand services
Transmission mode
We asked broadcasters, producers and pure VoD players about their on-demand activities. Around two thirds of broadcasters surveyed had some form of on-demand service already implemented, while two thirds of producers supplied content to one or more on-demand services.

319
Obviously, 100% of the pure VoD players said they operate on-demand services.
48% of broadcasters supply content to third-party on-demand providers such as Joost, Telenor Mobile TV in Italy and C-More in Belgium. Only 22% of respondents had user-generated content on their on-demand service, ranging from forums and video uploads to a kiosk for webcam blogs and user participation in games. For pure VoD players the number is even lower, with 17% of them offering user-generated content.
We also asked respondents about the delivery platforms used for their own (or third-party) on-demand services. The results are summarised in Table 129).
Table 129: Transmission mode of on-demand services273
Broadcasters Pure Players
INTERNET/IPTV 92% 92%
MOBILE 40% 0%
CABLE 32% 25%
SATELLITE 4% 0%
DTT 4% 0%
OTHER 0% 0%
TYPEPROPORTION OF RESPONDENTS
Almost all respondents to this question, both broadcasters and pure VoD players, have content available via on-demand services distributed via the internet or IPTV. This is a striking illustration that the internet and IPTV technologies have become the preferred distribution solution for players active in the on-demand sector.
The second most used technology by broadcasters is mobile (40%), followed closely by cable (32%). Broadcasters also report using satellite and DTT (4% each). Conversely, pure VoD players from our sample only mentioned cable (25%) as another distribution technology for their on-demand services beyond the internet or IPTV. However, it is important to note that our sample may be biased here, as in general we received responses from on-demand services using internet and cable platforms. Other distribution technologies are in use by some pure VoD players, such as mobile or DTT.
Type of programming
There is a difference in the programming offered by on-demand services from broadcasters, as compared with pure VoD players. While broadcasters generally offer a balanced mix of live, archive and, more
273 Response to Q10.5 from Broadcasters’ questionnaire: ‘How is the on-demand service distributed.’ (Number of respondents: 25 broadcasters, 12 pure players)

320
recently, catch-up services (see Figure 65) 274, pure VoD players show a clear preference for archive material. Archive is important for broadcasters too, with 87.5% of broadcasters reporting that they have archive content on their on-demand services, while 83.3% have catch-up material (normally for 7 days), and 58.3% live streamed content (normally news, with some sport and flagship series). For pure VoD players the numbers are 100% for archive, 33.3% for catch-up and 16.7% for live.
Figure 65: Type of programming offered on the broadcasters’ on-demand services, 2007275
274 ‘Other’ category in Figure 65 includes contact such as clips, unseen footage, behind-the-scenes specials etc. 275 Response to Q10.6 from Broadcasters’ questionnaire: ‘What type of programming is offered on the on-demand service?’ (Number of respondents: 24 broadcasters, 12 pure players)

321
Genre of programming
With regards to the genre of programming (see Figure 66), the picture again looks different when we look at broadcasters as compared with pure VoD players. Broadcasters offer a more balanced mix of genres on their VoD services, reflecting the fact that a large part of their catalogue is derived from their television schedules. Entertainment, factual magazines, TV fiction, documentaries and news are present on more than 70% of the respondent broadcaster’s on-demand services. Games (25%), cinema film (37.5%) and to a lesser extent sports (37.5%) were less popular, the latter two probably because of rights issues and, in the case of delivery over the internet, bandwidth restrictions. By comparison, pure VoD players predominantly offer the genres that fit with their archive focus, that is, cinema film, TV fiction and documentaries. Cinema film was the most preferred genre for the pure VoD player respondents to our survey, as 100% of them said they offer some films, compared with 83% for TV fiction and 75% for documentaries. Also worth noting, 42% of pure VoD players in this survey said they offer “other” genres of programming, consisting mostly of childrens and adult content.
Figure 66: Genres available in programming catalogue of broadcasters’ on-demand service276
The volume of content, both in terms of hours and titles available on the respondents’ services varied greatly. Some of the services boasted over 10,000 titles in their library, while others were limited to less than 10. In the cases where a large quantity of programming is made available, this is
276 Response to Q10.7 from Broadcasters’ questionnaire: ‘Which of the following genres are offered on the on-demand service?’ (Number of respondents: 24 broadcasters, 12 pure players)

322
typically made up of archive programming and imports, and is heavily skewed towards entertainment, fiction and feature films. A number of services also offered music videos and some short clips (or ‘tasters’) of programming.
Figure 67: Availability and consumption of programme catalogue by genre– on-demand services277
0%
10%
20%
30%
40%
50%
60%
70%
% h
ours
% c
on
su
med
hou
rs
% h
ours
% c
on
su
med
hou
rs
% h
ours
% c
on
su
med
hou
rs
% h
ours
% c
on
su
med
hou
rs
% h
ours
% c
on
su
med
hou
rs
% h
ours
% c
on
su
med
hou
rs
% h
ours
% c
on
su
med
hou
rs
% h
ours
% c
on
su
med
hou
rs
% h
ours
% c
on
su
med
hou
rs
Entertainment Fiction Cinema Film Documentaries Factual Magazines New s Sport Games Other
BROADCASTER PURE VoD PLAYER
Not surprisingly, we found a close relationship between the availability of a particular genre and hours viewed (as shown above in Figure 67). Relative to the number of hours available, entertainment was by far the most popular genre on broadcasters’ on-demand services, with users spending 39.5% of their VoD viewing time watching programmes from this genre, followed by news (18.7%). The on-demand services of pure VoD players were even more skewed to specific genres, with cinema alone taking 62% of all viewing time spent on such services, followed by entertainment (22.3%).
9.9.2. Sourcing of on-demand services’ content
In this section we were keen to find out more about the composition of each respondent’s on-demand offering. In particular, we asked respondents to estimate the amount of European catalogue offered in their total catalogue available on their on-demand service (see Figure 68 and Figure 69).
277 Response to Q10.9 – Q10.10 from Broadcasters’ questionnaire: ‘Please estimate, by genre: the composition of the on-demand programmes in your catalogue; how the consumption of on-demand programmes is distributed.’ (Number of respondents: 8 broadcasters, 3 pure players)

323
European offering
A common feature between the on-demand catalogues of broadcasters and those of pure VoD players is that European titles are, in general, a key component of catalogues: among those interviewed for this survey, only 17% of pure VoD players and 12% of broadcasters said that their on-demand catalogues consisted of less than 25% of European titles (see Figure 68). However, some differences between the two categories of respondent can be seen when we look at which catalogues offer the greatest amount of European titles. Indeed, apart from the broadcasters who offer less than 25% European titles (which include one free-to-air player in a small new Member State and one pay-TV player in a small old Member State), all players said they offer between 75% and 100% European titles (and most of them said they exactly offered 100% European titles), This can be explained by the fact that broadcasters, which generally offer a vast majority of European programming in their TV schedules, will replicate that offering in their on-demand services, minus the titles that they do not own the on-demand rights (and which are generally not European). By contrast, 50% of the pure VoD players said they offer more than 75% European titles, the remaining 33% declaring they offer in-between 25% and 74%.
Figure 68: Proportion of titles in catalogue that are European by type of respondent as the proportion of each type of respondent278
Interestingly, proportions are quite different when we look at the same figures expressed in hours as opposed to titles. This is especially the case for the pure VoD players (see Figure 69): 25% of our pure VoD player respondents say European hours represent less than 25% of their on-
278 Response to Q10.11 from Broadcasters’ questionnaire: ‘Please estimate the
size of the European catalogue of programmes in your on-demand service.’ (Number of respondents: 17 broadcasters, 6 pure players)

324
demand catalogue (compared to 17% in titles) and another 25% say European hours represent between 75% and 100% of their on-demand catalogue (compared to 50% in titles). This could be explained by a combination of factors, including a relatively higher proportion of non-European cinema (with films having, typically, longer durations than other audiovisual genres) and a relatively higher proportion of short format national productions, especially in the comedy genre. These factors seem to be confirmed by Figure 70, which shows that cinema is by far the most important genre in terms of programme spend by pure VoD players (72% of total programme spend on average across our sample) followed by TV fiction and entertainment (respectively 9% and 8%).
Figure 69: Proportion of hours offered by genre and by type of respondent279
Around 90% of broadcasters reported that the composition of their on-demand catalogues is over 75% European content. The proportion is slightly higher when expressed in hours compared to titles. This again reflects the fact that broadcasters tend to make their television offerings available on-demand, except for the content for which they do not own on-demand rights (which includes most of their foreign acquisitions and thus pulls the figures for European content further up).
279 Response to Q10.11 from Broadcasters’ questionnaire: ‘Please estimate the
size of the European catalogue of programmes in you on-demand service.’ (Number of respondents: 15 broadcasters, 4 pure players)

325
Figure 70: On-demand programming spend by genre280
0%
10%
20%
30%
40%
50%
60%
70%
80%
Broadcaster Pure VoD Player
Entertainment Fiction Cinema film
Documentaries Factual magazines News
Sport Games Other
Commissions and acquisitions
We also wanted to understand whether providers of non-linear services were dedicating resources to creating content specifically for these on-demand services. As the majority of content offered via on-demand services operated by broadcasters is programming that has originally appeared on linear services, we anticipated dedicated on-demand programming spend by them would be relatively low. As expected, the respondents stated that only 1.9% of their total programming budget was apportioned to on-demand services. With regards to pure VoD players, respondents did not provide us with clear figures in sufficient numbers for us to be able to create an equivalent robust percentage. Still, as we have seen in various section of this Study, pure VoD players tend to rely heavily on archive material and imports, and also invest a large share of their programming budget on sports rights, making it very likely that they invest even less in new content than broadcasters do. It is also worth remembering that new content is typically very expensive, meaning that the majority of pure VoD services, which are still at a nascent stage, do not have the necessary funds to acquire new content.
It is important to note that, in general, financial data was not forthcoming from respondents. This is in large part because it is considered to be highly confidential. We present the limited results below, and have reflected the difficulty of acquiring financial data in our thinking on suitable performance indicators and operational procedures in Part 10.
280 Response to Q10.17 from Broadcasters’ questionnaire: ‘How is the programme spend (including costs based on pre-defined fees and revenue sharing) on on-demand programmes distributed by genre?’ (Number of respondents: 8 broadcasters, 6 pure players)
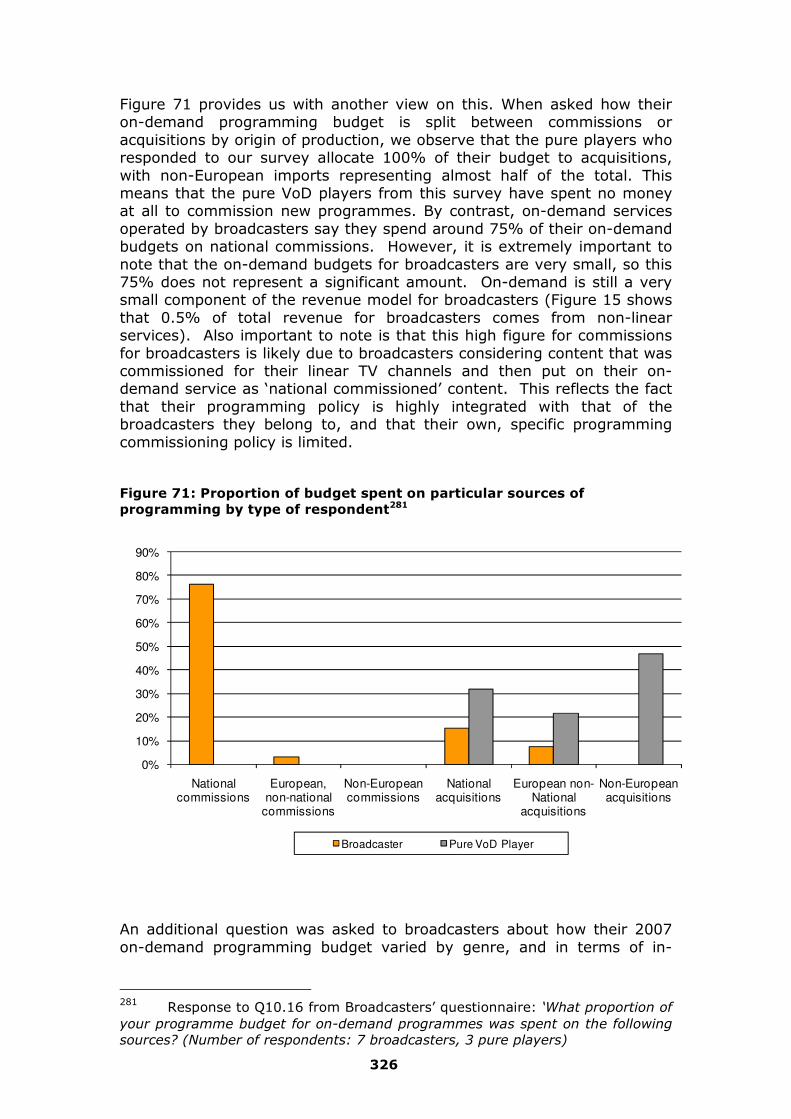
326
Figure 71 provides us with another view on this. When asked how their on-demand programming budget is split between commissions or acquisitions by origin of production, we observe that the pure players who responded to our survey allocate 100% of their budget to acquisitions, with non-European imports representing almost half of the total. This means that the pure VoD players from this survey have spent no money at all to commission new programmes. By contrast, on-demand services operated by broadcasters say they spend around 75% of their on-demand budgets on national commissions. However, it is extremely important to note that the on-demand budgets for broadcasters are very small, so this 75% does not represent a significant amount. On-demand is still a very small component of the revenue model for broadcasters (Figure 15 shows that 0.5% of total revenue for broadcasters comes from non-linear services). Also important to note is that this high figure for commissions for broadcasters is likely due to broadcasters considering content that was commissioned for their linear TV channels and then put on their on-demand service as ‘national commissioned’ content. This reflects the fact that their programming policy is highly integrated with that of the broadcasters they belong to, and that their own, specific programming commissioning policy is limited.
Figure 71: Proportion of budget spent on particular sources of programming by type of respondent281
0%
10%
20%
30%
40%
50%
60%
70%
80%
90%
National commissions
European, non-national
commissions
Non-European commissions
National acquisitions
European non-National
acquisitions
Non-European acquisitions
Broadcaster Pure VoD Player
An additional question was asked to broadcasters about how their 2007 on-demand programming budget varied by genre, and in terms of in-
281 Response to Q10.16 from Broadcasters’ questionnaire: ‘What proportion of your programme budget for on-demand programmes was spent on the following sources? (Number of respondents: 7 broadcasters, 3 pure players)
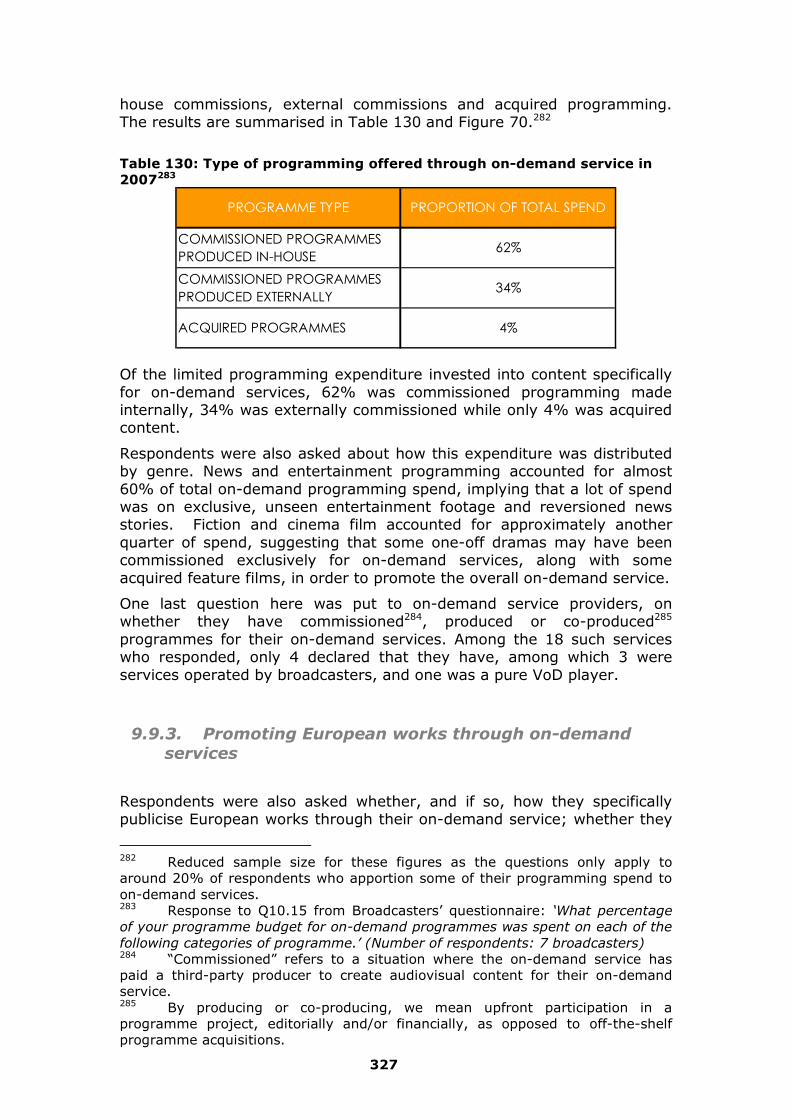
327
house commissions, external commissions and acquired programming. The results are summarised in Table 130 and Figure 70.282
Table 130: Type of programming offered through on-demand service in 2007283
PROGRAMME TYPE PROPORTION OF TOTAL SPEND
COMMISSIONED PROGRAMMES PRODUCED IN-HOUSE
62%
COMMISSIONED PROGRAMMES PRODUCED EXTERNALLY
34%
ACQUIRED PROGRAMMES 4%
Of the limited programming expenditure invested into content specifically for on-demand services, 62% was commissioned programming made internally, 34% was externally commissioned while only 4% was acquired content.
Respondents were also asked about how this expenditure was distributed by genre. News and entertainment programming accounted for almost 60% of total on-demand programming spend, implying that a lot of spend was on exclusive, unseen entertainment footage and reversioned news stories. Fiction and cinema film accounted for approximately another quarter of spend, suggesting that some one-off dramas may have been commissioned exclusively for on-demand services, along with some acquired feature films, in order to promote the overall on-demand service.
One last question here was put to on-demand service providers, on whether they have commissioned284, produced or co-produced285 programmes for their on-demand services. Among the 18 such services who responded, only 4 declared that they have, among which 3 were services operated by broadcasters, and one was a pure VoD player.
9.9.3. Promoting European works through on-demand
services
Respondents were also asked whether, and if so, how they specifically publicise European works through their on-demand service; whether they
282 Reduced sample size for these figures as the questions only apply to around 20% of respondents who apportion some of their programming spend to on-demand services. 283 Response to Q10.15 from Broadcasters’ questionnaire: ‘What percentage of your programme budget for on-demand programmes was spent on each of the following categories of programme.’ (Number of respondents: 7 broadcasters) 284 “Commissioned” refers to a situation where the on-demand service has paid a third-party producer to create audiovisual content for their on-demand service. 285 By producing or co-producing, we mean upfront participation in a programme project, editorially and/or financially, as opposed to off-the-shelf programme acquisitions.

328
have run any successful promotional campaigns around European content; and how marketing spend tends to vary by a title’s (or catalogue’s) country of origin.
The majority of broadcasters stated they made no distinction between the promotion of European and non-European content, especially given that almost 100% of programming available through their services is European. Broadcasters especially commented that most of the key titles on their services were domestic titles (and therefore by default, European).
Pure players also indicated that they made no specific distinction between the promotion of European and non-European content; even if they conversely offered a significant proportion of non-domestic works in their catalogue. They justified this by the fact that they mainly offer search facilities on their websites by title or genre, rather than by country of origin. This classification does not directly help promotion of European works in general, though specific promotions by genre could sometimes lead to a promotion of European works.
One of the pure VoD players, however, indicated that they were already proposing to allow consumers to search for content by country of origin, and another two stated they were actively evaluating this feature for the future.
The majority of the respondents indicated that marketing spend doesn’t currently vary by country of origin. No respondent had run a specific promotional campaign directly to promote European works, although many commented that they indirectly do this through more general marketing campaigns for their on-demand service. Pure players especially emphasized the fact that they could only promote works that had economic ‘potential,’ but this could lead to the promotion of a European work, as national works were often popular.
9.9.4. Funding of on-demand services
Finally we asked respondents how their on-demand services are financed. The results are summarised in Figure 72.

329
Figure 72: How is the on-demand service funded?286
0%
10%
20%
30%
40%
50%
60%
70%
80%
90%
100%
Broadcaster Pure VoD Player
Subscriptions/Pay-Per-View Public subsidy (e.g. licence fee) only
Advertising only Advertising and Subscriptions/PPV
Advertising and public subsidy Public subsidy and Subscription/PPV
Of the respondent broadcasters, 41% use advertising to fund all or part their on-demand service (both pre/post roll and advertisements midway through a programme, although the latter was less commonly used than pre/post roll advertising). Of all the respondents, 18% funded their service only via advertising, with 14% of broadcasters also having content available via subscription or pay-per-view as well as content supported by advertising, and 9% being funded in part by advertising revenue and in part by public subsidy. Public subsidy is used as the sole revenue stream by 23% of the broadcasters who responded. For 36% of the broadcaster owned on-demand services, content was funded solely via subscription and pay-per-view charges. Therefore 64% of broadcaster owned services are essentially free-to-use for the viewer to some extent (i.e. the service is either entirely supported by public subsidy or advertising, or has some content available for free as ad-supported programming, and some content that has to be paid for, either via subscription or on a pay-per-view basis.287.
Pure VoD players show a completely different picture. The vast majority of the revenue of those who took part in our survey comes only from direct payments from consumers either as subscription fees (92% of pure VoD players who responded) or as pay-per-view. The remaining 8% were in part supported via subscription and pay-per-view fees, but also had money from public subsidy.
286 Response to Q10.21 from Broadcasters’ questionnaire: ‘How is the on-demand service funded?’ (Number of respondents: : 23 broadcasters, 12 pure players) 287 Typically these services offer a catch-up service and some limited archive programming for free and then premium content, such as movies and sport, is normally paid for through a subscription or pay-per-view model.

330
With regards to the medium term impact of on-demand services, the majority of broadcasters commented that, despite developing into an important aspect of the business, it will remain an additional service to linear television. Many commented that, although the bulk of viewing remains on traditional linear services, the younger generations are already shifting away from this medium in favour of new media platforms such as IPTV, the internet and mobile. Both publicly funded and commercial broadcasters stressed the importance of embracing on-demand and ensuring a high quality service that would attract and retain viewers.
Among respondents (both producers and broadcasters), there was still a level of uncertainty around terms of trade, rights retention and how funds will flow through the on-demand value chain. Some of the smaller thematic channels (that typically rely on programme acquisitions) registered some concern that they may be marginalised by large third-party aggregated on-demand services with targeted advertising and a wider selection of programming than they can currently offer through their linear channels. Producers also voiced some concern over the fact that the majority of broadcasters retain all domestic video-on-demand rights, and therefore may only exploit programming through their broadcaster-branded service, thus reducing the exposure of a particular strand. Conversely, a number of broadcasters viewed on-demand services as a new way to exploit content and potentially explore new revenue streams.
9.9.5. Compensation mechanisms for producers
We asked respondents how producers are compensated for allowing their programmes to be available on on-demand services. The results are summarised in Figure 73.

331
Figure 73: Compensation mechanisms by type of respondent 288
0%
10%
20%
30%
40%
50%
60%
70%
Revenue sharing Pre-def ined, f ixed fees Mix of both
Broadcaster Pure VoD Player
One clear finding is that not a single respondent declared that producers are being compensated by means of only pre-defined, fixed fees. Generally, compensation mechanisms rely on revenue sharing or a mix of revenue sharing and fixed fees. Interestingly, pure revenue sharing is a more common case on the on-demand services of broadcasters (50% of respondents) than on those of pure VoD players (37%). This could be explained by a better ability of broadcasters to impose revenue-sharing deals to producers thanks to their position in the market, as well as by a higher confidence of producers in the broadcasters’ ability to generate fees thanks to the power of their brands and the size of their television audiences.
9.9.6. Influences on on-demand programme decisions
We asked respondents about some key influences on their programming decisions in connection to their on-demand services. We asked them to say whether they agreed or not with a few assertions. The results are summarised in Figure 74.
288 Response to Q2.5 from On-demand services’ questionnaire: ‘How do you usually compensate the owners of the programmes on your main on-demand service? (Number of respondents : 6 broadcasters, 11 pure players)

332
Figure 74: Key factors influencing on-demand platforms programming decisions289
0%
10%
20%
30%
40%
50%
60%
70%
80%
Don’t
know
Fully
agree
Rather
agree
Rather
disagree
Strongly
disagree
Don’t
know
Fully
agree
Rather
agree
Rather
disagree
Strongly
disagree
Don’t
know
Fully
agree
Rather
agree
Rather
disagree
Strongly
disagree
Don’t
know
Fully
agree
Rather
agree
Rather
disagree
Strongly
disagree
Don’t
know
Fully
agree
Rather
agree
Rather
disagree
Strongly
disagree
Don’t
know
Fully
agree
Rather
agree
Rather
disagree
Strongly
disagree
Programmes must beaffordable because myrevenue, and thus
programming budget, isstill very limited.
Programmes must beexclusive so consumerscan only see them on myplatform but not on
competitors.
Programmes must berecent so there is a higherprobability that consumers
have not seen themalready.
Programmes must be soldon a revenue sharing basisbecause this is my mainacquisitions policy.
Programmes must be well-known to consumers dueto success and promotion
on other windows.
Programmes must help meachieve my regulatory
obligations.
Programming decisions
Broadcasters Pure VoD Players
In general, we observe that broadcasters and pure VoD players tend to provide with similar answers to most propositions. They agree on the importance of contents being affordable and being compensated on a revenue sharing basis. The two go along together as respondents gave the same level of response to both assertions. Pure players seem more concerned by that as 67% fully agreed that programmes must be affordable to meet their limited budgets and the same proportion said they must be sold on a revenue sharing basis, compared to 50% of broadcasters fully agreeing with these assertions. They also tend to agree that the programmes must be well-known thanks to success on other platforms during other release windows: 50% of broadcasters fully agree and 50% rather agree with that assertion, compared to respectively 33% and 42% of pure VoD players. It is worth noting that while all broadcasters thought the programmes on on-demand services should be well-known, 25% of pure players rather disagree with that assertion, indicating their higher trust in the ability of consumers to spend time searching and purchasing programmes they discover for the first time on the service itself.
The assertion on which broadcasters and pure VoD players disagree the most is the one that programmes must be exclusive to their platform. Answers to this assertion are completely reversed: broadcasters either fully agree (50%) or rather agree (33%) with it, while pure VoD players strongly disagree (58%) or rather disagree (33%). This difference is
289 Response to Q4.1 from On-demand services’ questionnaire: ‘Please state whether the factors below influence which type of programmes you prefer to acquire today to feed your on-demand catalogue?’ (Number of respondents : 6 broadcasters, 12 pure players)

333
probably explained by the dominance of subscription culture for pure VoD players, by which exclusivity of content is key to attracting consumers, while broadcasters are more influenced by an audience culture, by which consumers will be attracted to a brand and consume what they find. It is also worth mentioning that broadcasters on-demand services are generally available on many different platforms (i.e. not just via the internet, but via television set-top-boxes), which is not the case for the services of many pure VoD players.
9.9.7. Importance of European programmes
We asked respondents about their views on the importance of European programmes for their on-demand catalogue and how much European programmes help them meet some of their main strategic objectives. Again we asked them to say whether they agreed or not with a few assertions. The results are summarised in Figure 75.
Figure 75: Importance of European programming for on-demand platforms290
0%
10%
20%
30%
40%
50%
60%
70%
Do
n’t
kn
ow
Fu
lly
ag
ree
Ra
the
r
ag
ree
Ra
the
r
dis
ag
ree
Str
on
gly
dis
ag
ree
Do
n’t
kn
ow
Fu
lly
ag
ree
Ra
the
r
ag
ree
Ra
the
r
dis
ag
ree
Str
on
gly
dis
ag
ree
Do
n’t
kn
ow
Fu
lly
ag
ree
Ra
the
r
ag
ree
Ra
the
r
dis
ag
ree
Str
on
gly
dis
ag
ree
Do
n’t
kn
ow
Fu
lly
ag
ree
Ra
the
r
ag
ree
Ra
the
r
dis
ag
ree
Str
on
gly
dis
ag
ree
Do
n’t
kn
ow
Fu
lly
ag
ree
Ra
the
r
ag
ree
Ra
the
r
dis
ag
ree
Str
on
gly
dis
ag
ree
European programming ensures
compliance with national
obligations (and thus will help
me to comply with the AVMS in
the future).
European programming is all-in-
all a very good option for my
service.
European programming is easier
to acquire because we are
European.
European programming is more
affordable and thus enables a
higher profit.
European programming is the
best way to attract European
audiences.
European programming decisions
Broadcasters Pure VoD Players
The majority of respondents think that, all-in-all, European programming is a very good option for their services: 20% of broadcasters and 33% of pure VoD players fully agree with that assertion, while 60% and 33% rather agree with it.
290 Response to Q4.3 from On-demand services’ questionnaire: ‘Please indicate the reasons why European programming, relative to non-European programming, is important or not to the success of your main on-demand service today?’ (Number of respondents : 5 broadcasters, 12 pure players)

334
This does not mean that there are no problems to be solved. First, European programmes are seen as expensive: when asked whether European programming is affordable, 60% of broadcasters and 58% of pure VoD players ‘rather disagree’. When asked whether European programmes are easier to acquire, 60% of broadcasters ‘rather disagree’, while 58% of pure VoD players either ‘rather’ or ‘strongly disagree’. Then, the idea that European programmes are the best way to attract European consumers is not clearly supported by the players we talked to. While two third of the broadcasters tend to agree with that assertion, 33% of pure VoD players ‘rather disagree’, and 17% of them even ‘fully disagree’. This may be because pure VoD players’ feel that access to European programming is difficult for them as rights are already secured by the broadcasters.
Lastly, we asked respondents whether European programming was a way to ensure compliance with national obligations and thus will help comply with the AVMS in the future. Answers to that assertion were very unclear, reflecting the fact that the debate over that part of the AVMS Directive has in most cases not started yet at the national level, so that players do not have a clear view on this: 40% of broadcasters and 36% of pure VoD players said they did not know, although a majority of those who responded tended to agree.

335
9.9.8. ‘Prominence’ on On-Demand Services Today:
Results Based on Additional Desk Research
This section is not derived from stakeholders’ interviews as all previous conclusions on on-demand services have been so far. It is instead based on desk research, the methodology for which is described in more detail below.
Importance and limits of the concept of Prominence
Prominence is a key concept in addressing how European works are being promoted by on-demand services, and one that cannot necessarily be approached in a similar fashion to the promotion of European content on linear services.
The promotion of European works by linear services can be examined by looking at the proportion of their schedules that are European works; viewers can only choose from the programmes that are offered to them, resulting in schedules of programmes translating rather “mechanically” into actual consumption of such programmes. The fact that European viewers can choose from an increasing number of channels should of course be considered, as it provides increasing opportunities to ‘escape’ the European programmes. However, as most European viewers continue to have access to a relatively small number of channels, using the criteria of the proportion of European works in the schedules continues to be a good way to measure the promotion of such works on linear services.
But, as consumers are able to choose from hundreds or thousands of titles from on-demand catalogues, non-linear services have very limited control over which titles the consumers will choose to watch. Hence the introduction of the concept of ‘prominence’ in the AVMS Directive, in an attempt to provide a measure for the promotion of European works on non-linear services. But, as yet, that concept has not yet been precisely defined, although some possible directions have been indicated. Our discussions with on-demand players showed the difficulties of defining it in more detail (see section 10.4).
Contents and objectives of the analysis
This section is thus designed to provide an overview of what prominence looks like in practice today, in order to feed the future discussions that will eventually lead to a more precise definition of such a concept. We have analysed a selection of 29 on-demand services from our sample of Member States. We have identified 3 prominence indicators, which are contained within broad concepts: active prominence and passive prominence. The first two indicators fall within the concept of active prominence and the third indicator is used to review passive prominence.

336
• Active prominence relates to the ability to search for content: it is assessed by asking whether the service offers the possibility of searching titles by origin of production (indicator 1) and/or provides information on the origin of production (indicator 2);
• Passive prominence relates to the “pushing” of specific content: it is assessed by asking what is the proportion of European works among the titles that are pushed to consumers when they access the service via its homepage and browse its main sections (indicator 3).291
We have looked at these findings in light of the search functionalities that we could observe on these on-demand services and what we learned from our discussions with market players.
The list of the 29 on-demand services covered in this analysis is provided in Table 131. Among these, 16 are services operated by pure VoD players, most of them being independent from broadcasters, while 13 are services operated by broadcasters, most of then being catch-up services from the television schedules. We have chosen to focus our analysis on services that are accessible on the public internet, so as not to limit our analysis to markets where the consultants were located. There are services from 8 of the Members States from our sample: Belgium, France, Germany, Italy, Poland, Spain, Sweden and the United Kingdom.
291 For the sake of clarity, the terms ‘active’ and ‘passive’ are in reference to the user of the service, not the provider. So ‘active prominence’ is prominence that requires the user to do something (to be ‘active’), such as search for a programme, whereas ‘passive prominence’, does not require the user to do anything to have European content promoted to them, for example if the homepage is dominated by European content.

337
Table 131: List of on-demand services included in the Prominence analysis Country Name of on-demand
serviceType Link to broadcaster
Belgium Belgacom Pure VoD player IndependentBelgium Carrefour Pure VoD player IndependentBelgium Iwatch Broadcaster VTMFrance Cinezime Pure VoD player IndependentFrance Free Pure VoD player IndependentFrance Glowria (software) Pure VoD player IndependentFrance M6 Replay Broadcaster M6France MK2 Pure VoD player IndependentFrance TF1 Vision Broadcaster TF1France Univers Ciné Pure VoD player IndependentGermany Maxdome Pure VoD player ProSiebenSat1Germany One4movie Pure VoD player IndependentGermany RTLnow Broadcaster RTLGermany ZDF Mediathek Broadcaster ZDFItaly Film is now Pure VoD player IndependentItaly My movies Pure VoD player IndependentItaly RaiClick Broadcaster RaiItaly Rivideo & video.mediaset Broadcaster MediasetPoland Videostrada Pure VoD player IndependentSpain Accine Pure VoD player IndependentSpain Cuatro Videos Broadcaster CuatroSpain Mitele Broadcaster TeleCincoSweden Cinemaone Pure VoD player IndependentSweden Headweb Pure VoD player IndependentSweden Telia Pure VoD player IndependentUnited Kingdom 4oD Broadcaster Channel4United Kingdom BBC iPlayer Broadcaster BBCUnited Kingdom Demand Five Broadcaster FiveUnited Kingdom ITV.com Broadcaster ITV
Key findings
In this section, we first provide some general insight on the common features of the search functionalities and the presence of European works on the on-demand services we have analysed, and then provide detail of active and passive prominence, as we could observe them in our review of these services.
General findings regarding search functionalities and the presence of European works
An important consideration that we should first highlight is that, in general, on-demand services rarely enable consumers to select titles by origin of production. Many players with whom we have discussed this have stressed the fact that consumers are simply not interested in selecting titles based on where they have been produced. Rather, they are interested in selecting them according to genre, title, director, actor or technical criteria such as the language or the technical format in which the content can be viewed.

338
Also, search functionalities are highly influenced by the internet culture, with many typical internet search criteria being applied to non-linear services. So, we found many search criteria based on the “most viewed”, “top rated”, “exclusive” or “film of the month” or “our selection”. The recency of production is also common with search criteria, such as splitting content between “most recent” or “archive”.
Lastly, many on-demand services do not offer a balanced selection in terms of origin of production. As we have noted in previous parts of this report, catch-up services will tend to offer primarily national content, as broadcasters own the on-demand rights for their own productions and will most of the time exclude the foreign acquisitions aired on their television offers because on-demand rights for this content has been retained by foreign producers. For them, nearly all their catalogue will thus be of national origin. By contrast, pure VoD players will offer significantly more foreign content, which can be explained by a variety of reasons including their desire to differentiate themselves from the competing services from broadcasters, their focus on stock films (cinema, fiction and documentaries are often originated from international markets) as opposed to flow entertainment (magazines and variety are mostly national productions), or their possible lack of access to the productions of the television channels in their own country.
Active prominence
Among the 30 on-demand services included in this analysis, only 2 (7%) allow users to select titles by country of origin. It is worth noting that these 2 services are both independent and specialize in cinema films. For the rest of our sample, when we typed the names of countries into a search box, we could not access content from the corresponding country of origin, but instead found content that included the name of the country in the content description, typically because the action took place there.
We also looked at whether the country of origin was indicated in the description of the titles once selected. Half of the services from our sample provided this information, mostly pure VoD players (13), with this happening only very rarely among the services operated by broadcasters (2). It is also worth noting that for 3 of the on-demand services operated by pure VoD players, the information on the country of origin was provided directly on the homepage292, together with the description of the titles, as part of the key information for the content.
Passive prominence
When considering the origin of the titles that appeared “by default” on the screen while we browsed the service without activating any specific search key word, the proportion of titles of European origin that were ‘pushed’ by the 29 on-demand services from our sample was 54%, on average293.
292 ‘Homepage’ refers to the first page a consumer will be able to see when first entering the service, or the pages for the main sections of the service. 293 To get to this result, we applied the following methodology: for each on-demand service, we analysed all the titles appearing on each webpage, researched their country of origin and calculated their proportions of European

339
There were large differences from one service to another though, as this proportion, for our sample, ranged from 0% (on one pure VoD player’s service) to 100% (on several broadcasters’ services). Also, pure VoD players pushed significantly fewer European titles, as their proportion was 39% on average compared with 75% for the services operated by broadcasters.
Proportions were different depending on genres, with entertainment, animation and information typically comprising more European works than cinema and TV fiction. Differences could also be seen within specific genres: for example, in the cinema category, subgenres such as comedies and dramas typically contained more European works than action or horror movies.
Also worth noting is that not all titles were given the same level of importance, with US content being generally given a primary position both in terms of share of the screen and rank of appearance. However, some on-demand services were making significant efforts to promote European works. Some, for example, would propose a majority of European works in their ‘selection’, or ‘film of the month’. We also found some services that put European and American content on an equal basis on their homepage, even though their complete catalogue was composed of a majority of American content.
works compared to their total works on the page. For this study, which was meant to be exploratory, we looked at homepages that were provided to us when we accessed the on-demand service for the first time. However, it is worth noting that the contents of homepages delivered by digital platforms vary depending on users due to the personalisation of profiles either activated by the users or developed by the platforms based on profiling and ‘push’ techniques. Thus, homepages can show different proportions of European works depending on the user.

340
10. Monitoring of Article 3i294
10.1. Introduction
As part of the current study the consortium are required to evaluate possible performance indicators and operational procedures for monitoring Article 3i of the AVMS Directive, and provide a view as to the best procedures and indicators to apply.
As has been presented above, we asked for data and opinions on various performance indicators and operation procedures from our respondents. The data we have managed to acquire has been presented above in an aggregate form. The following sections have used this information to assist us to develop our conclusions as to the most suitable indicators and procedures to monitor Article 3i of the AVMS Directive.
The following chapter has three main sections. Firstly we present an overview of possible operational procedures for monitoring Article 3i. Secondly, we have provided our evaluation of key performance indicators, giving our view on the most appropriate indicators to apply. Finally, we apply, where possible, these performance indicators to specific services. This is, as for the survey of on-demand services in the previous chapter, based on data acquired through self-declarations from the service providers.
10.1.1. Methodology for assessing procedures and indicators
These conclusions follow extensive research via questionnaires, interviews, desk research and internal discussions within the consortium. Taking Article 3i as a starting point, the consortium identified six possible performance indicators, which were included in the questionnaire (after discussion with the Commission) sent to key stakeholders. Questions were constructed around these indicators, alongside questions designed to assist our thinking about possible operational procedures. The responses were then collated, once the deadline for responses passed in early July. Since then several detailed internal teleconferences have taken place to
294 “Member States shall ensure that on-demand audiovisual media services provided by media service providers under their jurisdiction promote, where practicable and by appropriate means, the production of and access to European works. Such promotion could relate, inter alia, to the financial contribution made by such services to the production and rights acquisition of European works or to the share and/or prominence of European works in the catalogue of programmes offered by on-demand audiovisual media service.“

341
discuss which procedures and indicators the consortium believe to be the most appropriate for monitoring Article 3i of the AVMS directive.
Procedures and indicators were further discussed at the public workshop in November 2008, and comments from the workshop, and comments received subsequently from stakeholders, have been taken into account throughout the preparation of the Final Study Report.
10.1.2. Awareness of Article 3i
Before discussing the performance indicators and operational procedures in detail, we present below tables to show the awareness of Article 3i from our respondents.
As Figure 76 makes clear, regulators, unsurprisingly, are fully aware of Article 3i. Broadcasters and Pure VoD Players are in general aware, with a small minority (20% of broadcasters interviewed, 30% of Pure VoD Players interviewed) saying they were unaware of Article 3i. Producers who responded to our questionnaires were equally split between those who were aware of Article 3i and those who were not.
Figure 76: Awareness of Article 3i by type of respondent (number of respondents: 31 broadcasters, 6 producers, 14 pure players, 8 regulators)
10.2. Operational Procedures
After discussion within the Consortium, and with the steering group of the European Commission, we have identified two distinct legal scenarios within which operational procedures can exist: firstly, self-declaration by service providers, and, secondly, independent evaluation. In this section

342
we will provide more detail on the two legal scenarios described, and explain further why we have chosen to follow the route of self-declarations by service providers.
For linear services, both types of operational procedure are applied. Broadcasters provide self-declarations detailing how they have met the requirements of Articles 4 and 5. These are typically presented to the appropriate Member State body, and then collated as a Member State report covering all broadcasters, which is presented to the Commission. The Commission also commissions independent evaluations of linear broadcast channels to verify the data supplied via the self-declarations. Such independent monitoring has been completed for a sample of linear services in this study, as seen in Chapter 8. For linear services, this sort of independent monitoring is possible largely because robust Television Audience Measurement (TAM) data is available to the consultants, which provides schedules of transmitted programmes, which can be used to evaluate the proportion of a schedule that is European, or that is independently produced.
For non-linear services, however, independent monitoring similar to that completed for linear services is not feasible at this time. In order to complete an independent evaluation, consultants require robust data on all the programming available on each service. There is currently no equivalent to TAM data for the non-linear services, meaning that data on programming (including titles, durations, and consumption data295) is not available to independent consultants as it is for linear programming. It is worth noting here that the development of TAM style services for non-linear programming may be limited by two key factors. Firstly, a key reason for TAM data existing for linear programming is to set values for advertising on television channels, by identifying audiences to programmes. As we have seen from our survey, a large number of non-linear services do not carry advertising, so that there will be less incentive for them to participate in a TAM-style system.296 Secondly, non-linear services will likely further fragment audiences, meaning sample sizes for audiences will reduce in size, and thus the data acquired will be less robust.
At the workshop for this study it was made clear by some stakeholders that robust data akin to TAM-style data will very likely become available in the future, especially as on-demand services become more popular, and take an increasingly large proportion of audiences. We are of the view that strong efforts should be made towards the development of these sources of data, and agree with statements at the workshop that support at the European and Member State level will be important here. The Commission and Member State governmental and regulatory bodies could assist non-linear service providers towards developing industry standard data for on-demand services. This process will be helped significantly if both broadcasters and pure VoD players are given clear indications of the
295 Further problems with consumption-level data specifically are discussed below within the section on performance indicators. 296 The difference between advertiser and non-advertiser funded services should be recognised. Existing Pay-per-View services, such as Sky Box Office in UK, are not reported by TAM services. The “buy rates” for films and other content on such services are confidential to Sky.

343
data that is required of them for the Commission and Member States to successfully monitor the services, and if the types of services and non-linear content covered are clearly defined. However, we continue to stress that at the time of this study, we do not consider there to be robust enough data available for independent monitoring of non-linear services, similar to what is done for linear services.
Taking this current lack of TAM-style data into consideration, we have investigated whether there are any other possible ways in which to complete independent monitoring of non-linear services. We have identified two possible ways in which catalogue data (that is, lists of all the titles available on an on-demand service) could be obtained. However, neither option is appropriate to use at this time in our view.
The first involves a process known as ‘web-scraping’ or ‘web-harvesting’, which involves developing software that goes into a website, or on-demand service, and copies information that is required from the website and posts it to another source. Technology such as this is in widespread use by web monitoring services. 297 This could potentially be developed to copy all programme titles from an on-demand service and copy them into a database for an independent body (or consultant) to codify for European content. However, there are problems with this approach. Such a methodology raises some legal questions: permission would have to be obtained from the service provider before such software could be legally utilised. We believe that in order to secure this level of permission, legislation at the Member State level will be required (i.e. to stipulate exactly what will be ‘harvested’ from a website, and for what purpose). The software will also need to be developed by software designers, and in order to create trust in the software, we suspect that Member State bodies will again need to support this process. So, currently, this methodology is unsuitable for monitoring the application of Article 3i, and will require further development at the Member State level. Of course, if permission is acquired at the Member State level in the future, then using technology such as this will become more appropriate. However, one problem that will likely always exist with this system is that not all on-demand services are web-based, with some being accessed via set-top-boxes, meaning that not all services could be covered by this approach, if and when it becomes legally and operationally viable for internet-based services.
The second approach involves going directly to the services and looking for information on titles and durations of content. So, in practice, an independent evaluator (or a consultant) would sign up to a service, and look at every page available and copy every title that can be found into a database, to be analysed and further coded at a later stage. Although technically possible, this approach has two significant drawbacks: firstly it is a process that will take a very long time, and thus will be very expensive, and secondly there is a possibility that some content in the catalogue will be missed. The reason for this second concern is that on-demand services do not have set schedules, as linear services do, but instead have catalogues that can be searched. It is, in general, not possible to simply output a list of everything that is in the services’
297 This was made clear to the consultants in the comments on the Draft Final Report, printed as an Appendix to this study.
344
catalogue. Instead the user must search by various criteria (genre, date, ‘most watched’, etc). It is also possible that some programmes will not be available through set search criteria (such as ‘Drama’, or ‘Kids’), and will instead be available only through title-specific searches, which could mean that some programmes are missed in the review. However, even if these accuracy concerns can be satisfactorily addressed, the fact remains that this process will be extremely time-consuming and expensive. This has put this process beyond the scope of this study. Hence it has not been utilised.
Self-declarations are possible at this time, as has been proven by the responses we have received from providers to our survey. Also importantly, 70% of our respondents explained to us that they would provide data on their on-demand service to a public body, such as a regulator, if its confidentiality was ensured. It is worth remembering that self-declarations do have their drawbacks. Primarily, they are unverified data, meaning that their accuracy cannot be guaranteed. There is also the problem that the data may be collated differently by different providers, making comparisons between data more difficult. On the other hand, self-declarations are currently used by linear service providers for Articles 4 and 5. Also, provided that self-declarations are enforced through Member State legislation, then data can be acquired from all non-linear services within a Member State. This would mean that response rates and completeness of data would be substantially higher than we have experienced from our survey.
The above has shown that at this time independent evaluation of non-linear services is not a viable operational procedure for the monitoring of Article 3i. Instead, for this study, we have utilised self-declarations, which we believe is the only appropriate and affordable procedure currently available. What we have presented for on-demand services, then, is similar to the approach applied to linear services by Member State authorities. The remaining two sections in this chapter present our suggestions on the actual indicators to be applied (essentially the data that providers will need to supply), and then apply these indicators to particular services, based on the data from self-declarations.
10.3. Performance Indicators
10.3.1. Six performance indicators
After careful review of Article 3i and internal discussions, we proposed six possible indicators in our questionnaires to broadcasters, producers, pure on-demand service providers and regulators. These were ‘Title-level data for the entire catalogue’, ‘Hour-level data for the entire catalogue’, ‘Consumption level data at titles level’, ‘Consumption-level data at hours level’, ‘Prominence of European content’ and ‘Financial contribution to European content’. We asked respondents to rank these indicators in terms of their appropriateness for measuring adherence to Article 3i. We also gave them the opportunity to provide us with detailed reasons for

345
their decisions. The results of this have been included in our internal discussions.
10.3.2. What this section will show
This section of the report is designed to:
• Detail the various positive and negative arguments related to each indicator. We have also provided some information on possible ways in which the data could be acquired.
• Detail our thinking on the appropriate indicators to be applied to measure adherence to Article 3i.
We will deal with each indicator in turn. We have decided to approach the issue of consumption data as one indicator (rather than two – one at title-level and one at hours-level), and will discuss all relevant points on consumption data in one section.
10.3.3. Initial thoughts from respondents
Before discussing the performance indicators and operational procedures in detail, we present below tables to show an overview of how respondents ranked each possible indicator.
Table 132 shows the average ranking (from 1 to 6, with 6 being the highest) for each indicator, from each different respondent type. It also gives an indication of the variety in different rankings given for each method of monitoring Article 3i. Table 133 provides some key comments on each method from each type of respondent.

346
Table 132: Average ranking for monitoring method for Article 3i
METHODBROADCASTER
RANKING PRODUCER RANKING
PURE PLAYER
RANKINGREGULATOR RANKING TOTAL AVERAGE
4.5 3.0 3.9 5.5 4.4
Ranked from 1 to 6 Ranked from 1 to 6 Ranked from 2 to 6 Ranked from 4 to 6 Ranked from 1 to 6
3.9 3.2 3.8 4.8 3.9
Ranked from 1 to 6 Ranked from 1 to 5 Ranked from 1 to 5 Ranked from 4 to 6 Ranked from 1 to 6
3.8 4.4 3.2 1.9 3.4
Ranked from 1 to 6 Ranked from 2 to 6 Ranked from 1 to 6 Ranked from 1 to 2 Ranked from 1 to 6
3.0 3.0 2.4 1.4 2.7
Ranked from 1 to 6 Ranked from 2 to 5 Ranked from 1 to 5 Ranked from 1 to 2 Ranked from 1 to 6
2.8 3.0 3.0 3.0 2.9
Ranked from 2 to 5 Ranked from 1 to 4 Ranked from 1 to 6 Ranked from 1 to 5 Ranked from 1 to 6
2.5 4.8 1.6 4.5 2.9
Ranked from 1 to 6 Ranked from 1 to 6 Ranked from 1 to 3 Ranked from 3 to 6 Ranked from 1 to 6
MONITORING PROMINENCE OF EUROPEAN TITLES
PROVIDING EVIDENCE OF THE FINANCIAL CONTRIBUTION TO
THE PRODUCTION AND/OR
RIGHTS ACQUISITION OF
EUROPEAN WORKS
USING TITLE-LEVEL DATA TO MONITOR THE PROPORTION OF AN ON-DEMAND CATALOGUE
THAT IS EUROPEAN
USING DATA ON TOTAL HOURS OF AVAILABLE CONTENT
USING CONSUMPTION DATA
FOR NUMBER OF TITLES VIEWED
USING CONSUMPTION DATA
FOR NUMBER OF HOURS VIEWED

347
Table 133: Comments on the different monitoring methods proposed
PRODUCERS PURE PLAYERS REGULATORS
-DEFINITION OF COMMON METRIC
FOR FINANCIAL CONTRIBUTION
LIKELY TO BE DIFFICULT AND
HIGHLY COMMERCIALLY SENSITIVE.
RISK OF MISREPORTING
- GOOD METHOD FOR MONITORING
THE IMPORTANCE OF THE
INVESTMENT IN EUROPEAN
CONTENT
- VOD SECTOR IS IN ITS INFANCY (AND
THEN ECONOMICALLY FRAGILE) AND
DOES NOT HAVE THE FINANCIAL
CAPABILITY TO SUSTAIN THROUGH
DIRECT FINANCING OF THE
DEVELOPMENT OF EUROPEAN WORKS
- DOES NOT GIVE INDICATIONS ON THE
CATALOGUE AVAILABLE
PROVIDING EVIDENCE OF
THE FINANCIAL
CONTRIBUTION TO THE
PRODUCTION AND/OR
RIGHTS ACQUISITION OF
EUROPEAN WORKS
- VERY INTERESTING ITEM BECAUSE
THE INVESTMENT IN EUROPEAN
RIGHTS ACQUISITION IS THE
PERFECT REFLECTION OF THE
COMMITMENT IN EUROPEAN
CONTENTS
- ALTHOUGH THIS METHOD IS IN
ITSELF INSUFFICIENT AND NEEDS
TO BE COMBINED WITH ANOTHER
METHOD (PROMINENCE AND
NUMBER OF TITLES), IT WILL GIVE
THE BEST VIEW TO SEE WHETHER
A CATALOGUE IS ORIENTED
TOWARDS EUROPEAN CONTENT OR
NOT.
- CONSUMPTION BETTER METHOD
THAN AVAILIBILY AS RECENCY
TENDS TO DRIVE USAGE AND THEN
ECONOMICS.
- NOT A GOOD METHOD: OPERATORS
MIGHT BE RESPONSIBLE FOR
PROMOTING ACCESS BY CREATING
LIBRARIES OF EUROPEAN WORKS BUT
IT IS STLL THE CONSUMER THAT HAS
THE FINAL CHOICE. THIS METHOD WILL
MONITOR THE TASTES OF THE
CONSUMERS RATHER THAN THE
COMPLIANCE OF THE OPERATORS
(AND THEIR EFFORT TO BUILD A
EUROPEAN CATALOGUE)
- ALSO CRITICAL BECAUSE IT EMBEDS
A MARKET EVALUATION OF THE
QUALITY OF THE CONTENTS.
-SERVICE PROVIDER HAS VERY
LITTLE INFLUENCE OVER VIEWING
CHOICES AND TASTES OF AUDIENCE
THEREFORE BROADCASTERS
SHOULD NOT BEAR THE
RESPONSABILITY OF THEIR VIEWERS'
CHOICES. THIS METHOD MAY NOT BE
SUITABLE
- DATA NON AVAILABLE
- IS NOT A GOOD INDICATOR TO
MEASURE EUROPEAN OFFER
- NOT A GOOD METHOD: OPERATORS
MIGHT BE RESPONSIBLE OF
PROMOTING ACCESS BY CREATING
LIBRARIES OF EUROPEAN WORKS BUT
IT IS STLL THE CONSUMER THAT HAS
THE FINAL CHOICE. THIS METHOD WILL
MONITOR THE TASTES OF THE
CONSUMERS RATHER THAN THE
COMPLIANCE OF THE OPERATORS
(AND THEIR EFFORT TO BUILD A
EUROPEAN CATALOGUE)
- ALSO CRITICAL BECAUSE IT EMBEDS
A MARKET EVALUATION OF THE
QUALITY OF THE CONTENTS.
- THE MEASUREMENT OF
CONSUMPTION BY HOURS IS
INTERESTING BECAUSE IT HELPS
TO UNDERSTAND THE BASIC
RELATIONSHIP BETWEEN
AVAILIBILITY AND CONSUMPTION. IF
THERE IS A MISMATCH FURTHER
INVESTIGATION MUST TAKE PLACE
- GOOD METHOD IF COMBINED
WITH THE MEASUREMENT OF
TOTAL EUROPEAN HOURS
- QUALITATIVE TEST AND THEN
SUBJECTIVE
- HARD TO ASSESS THE PROGRESS
YEAR AFTER YEAR
- ONLY MEASURES MARKETING
EFFORTS
- ENFORCING METHODS TO SEARCH
BY ORGIN ARE NOT EFFECTIVE.
CONSUMERS PREFER SEARCHING BY
GENRE OR ARE ATTRACTED BY
POPULARITY RATHER THAN ORIGIN
- HIGH VISUAL IMPACT : GOOD METHOD
TO ASSESS THE CONTINUOUS AND
EFFECTIVE PROMOTION OF EUROPEAN
WORKS
- VAGUE AND HIGHLY
SUBJECTIVE CRITERION VERY
HARD TO MONITOR
- UNFAIR CRITERION : SERVICE
PROVIDER HAS VERY LITTLE
INFLUENCE OVER VIEWING
CHOICES AND TASTES OF
AUDIENCE THEREFORE
BROADCASTERS SHOULD NOT
BEAR THE RESPONSABILITY OF
THEIR VIEWERS' CHOICES.
- UNFAIR CRITERION : SERVICE
PROVIDER HAS VERY LITTLE
INFLUENCE OVER VIEWING
CHOICES AND TASTES OF
AUDIENCE THEREFORE
BROADCASTERS SHOULD NOT
BEAR THE RESPONSABILITY OF
THEIR VIEWERS' CHOICES.
- INTERFERENCE WITH
BROADCASTING FREEDOM
- MUCH MORE COMPLICATED AND
COSTLY
- HIGHLY SENSITIVE DATA
- EASY TO MEASURE AND
MONITOR
USING CONSUMPTION
DATA FOR NUMBER OF
HOURS VIEWED
- VERY USEFUL METHOD AS IT
FAIRLY ASSESSES THE MARKETING
EFFORTS TO PROMOTE EUROPEAN
CONTENTS. GOOD QUALITATIVE
METHOD.
- HIGHLY SUBJECTIVE METHOD
- DIFFICULTY TO OBTAIN DATA
- DIFFICULTY TO IMPLEMENT AND
NOT PERTINENT AS THE SEARCH BY
COUNTRY OF ORIGIN IS NOT USED BY
CONSUMERS
USING DATA ON TOTAL
HOURS OF AVAILABLE
CONTENT
- FIRST STEP OF ANALYSIS
HOWEVER PRODUCERS
COMMENTED THAT IT IS
RELATIVELY EASY TO FILL AN ON-
DEMAND CATALOGUE WITH CHEAP
EUROPEAN PROGRAMMING
THEREFORE THIS METHOD SHOULD
BE USED IN CONJUNCTION WITH
ANOTHER
- GOOD QUANTITATIVE MESURE,
OBJECTIVE
- BUT NOT CONSIDERING
PROMOTION OR DEMAND
- DATA DIFFICULT TO ESTABLISH
USING CONSUMPTION
DATA FOR NUMBER OF
TITLES VIEWED
MONITORING PROMINENCE
OF EUROPEAN TITLES
-SERVICE PROVIDER HAS VERY
LITTLE INFLUENCE OVER VIEWING
CHOICES AND TASTES OF AUDIENCE
THEREFORE BROADCASTERS
SHOULD NOT BEAR THE
RESPONSABILITY OF THEIR VIEWERS'
CHOICES. THIS METHOD MAY NOT BE
SUITABLE
- METHOD THAT MEASURES
CONTENT SUCCESS RATHER THAN
PURE QUANTITATIVE DATA
- IMPOSSIBLE TO MEASURE AND
MONITOR
- A GENERALLY ACCEPTED
INDICATOR OF THE REACH OF THE
OUTPUT AMONG THE CONSUMERS.
EASIEST WAY TO VIEW THE
CATALOGUE
- EASY TO IMPLEMENT FOR THE
BROADCASTERS
- WILL GIVE THE MOST OBJECTIVE
RESULTS
-EASY TO MEASURE (NO
ADDITIONAL
COST,BROADCASTERS USED TO
DO IT) AND TO MONITOR FOR THE
REGULATOR
- IN LINE WITH THE WAY LINEAR
IS REGULATED
METHODCOMMENTS
BROADCASTER
USING TITLE-LEVEL DATA
TO MONITOR THE
PROPORTION OF AN ON-
DEMAND CATALOGUE
THAT IS EUROPEAN
- DISTORTING METHOD: MANY
TITLES CAN REPRESENT VERY FEW
HOURS
-EASY TO MEASURE (NO
ADDITIONAL
COST,BROADCASTERS USED TO
DOING IT) AND TO MONITOR FOR
THE REGULATOR
- EASY TO IMPLEMENT FOR THE
BROADCASTERS
- WILL GIVE THE MOST OBJECTIVE
RESULTS
- EASY TO IMPLEMENT FOR THE
BROADCASTERS
- WILL GIVE THE MOST OBJECTIVE
RESULTS
-LOGICAL, AS THE CATALOGUE IS
DEALT IN TITLES
10.4. Evaluation of Specific Indicators
10.4.1. Title-level data
‘Title-level data’, for this study, reflected a situation whereby all titles in a catalogue would be coded for country-of-origin, so that a figure on the proportion of the catalogue as a whole that was European programming

348
could be ascertained. Thus it aims to serve as an indicator of the “access to European works” referred to in Article 3i.
Essentially this requires the relatively simple addition, if it is not yet in place, of metadata to internal databases, detailing the country-of-origin of a piece of content. Thus the technical requirements to implement this would be relatively straightforward, requiring little additional effort or expense on the part of the provider.
Title-level data was the most popular indicator from our respondents, with broadcasters, regulators and pure on-demand players giving it the highest overall score in our questionnaire. Only producers gave it a lower ranking, mainly because they would like to see more detailed data provided publicly (e.g. consumption data).
Also it is in line with the ‘lighter touch’ approach to regulating on-demand services in comparison to the indicators currently applied to traditional linear media, as it does not ask for data any more complex or revealing than is asked of television broadcasters.
There are, however, some possible negative implications for this indicator. It does not capture the actual consumption of content online (more detail on whether consumption indicators are appropriate will be provided below, in part 10.4.5).298 On its own (i.e. just looking at whether content is European or not) there would be no distinction between long/short content, recent/old content, etc. But since such duration and date of release data are usually included in the internal data sets of platforms which have acquired programmes rights, it would be quite straightforward to link it to the country-of-origin data (e.g. proportion of European titles in the catalogue that are less than five years old), if required.
One weakness to this measure is a consequence of the decreased costs of storage in a digital medium. Holding content in a catalogue is relatively cheap. If title-level data were the main compliance measure, it would be possible for a provider to load their service with many short, and/or cheap, European productions, in order to meet a requirement.
The following caveats, relating to this measure, reflect changes in the media industry resulting from globalisation and digitisation, which are influencing the development of on-demand services.
First in an increasingly globalised media industry, country of origin is not always straightforward and may not always be consistent with conventional industry metadata. Commercial data providers will therefore
298 In comments on the Draft Final Report received subsequent to the workshop, it was affirmed by a respondent that catalogue data alone will not give a reliable result as to the viewing of content on non-linear services, with arguments raised that from current data it can be seen that a small number of titles may in fact translate into a large proportion of viewing. This adds to support voiced from some respondents of utilising consumption data when monitoring non-linear services, our views on which are detailed in part 10.4.5.

349
need some guidance on practice (and the Commission may wish to order reviews from independent consultants from time to time).299
A second caveat concerns sampling. For broadcast (linear) data, total transmissions can be summed and proportions calculated for a given period. However the “catalogue” for a non-linear data service may not be fixed. Some items may only remain in the catalogue for a very short time. It might therefore be appropriate to sample the catalogue format at set intervals, rather than sum total items.
A third caveat concerns the current early stage of the evolution of on-demand services. There are potential models whereby future services are not so much “aggregators of” but “gateways to” content, in which case the notion of a “catalogue” becomes obsolete or irrelevant. If these become important as the locations where viewers make their on-demand choices, the Commission may find title level data inadequate.
However for the services surveyed for this report, which represent the current market, the concept of a “catalogue” of content remains relevant. The procedure for acquiring title-level data could be straightforward, and comparable across services. The service provider could compile the statistic internally and provide declarations to the appropriate Member State body, much in line with current linear data under Article 4 of the Television Without Frontiers Directive. This would therefore limit administrative and financial burden on regulatory and governmental services and be relatively cost effective for market players. On the other hand, as described above, evaluating title-level data from the catalogues may be possible externally of the provider, by Member State authorities or independent consultants, but without the existence of TAM style this will be very time consuming and expensive. It is worth noting as well that 75% of our respondents believed that declarations on proportion of European works were an appropriate procedure for measuring adherence to Article 3i.
10.4.2. Hour-level data
Hour-level data is a development of title-level data, adding duration data for the titles in the entire catalogue. Therefore the indicator would go beyond the proportion of all titles on an on-demand service that are European (that ‘title-level data will provide), looking at the proportion of the total duration of content in the catalogue. Hour-level data was generally a popular performance indicator with all types of respondent. It was the second most popular indicator for all respondents after title-level data, with the exception of producers, who gave it a slightly lower rating 299 In comments on the Draft Final Report, it was noted that the European Audiovisual Observatory’s LUMIERE database contains data on 17,000 feature films, including information on country-of-origin, which could be used to help make identifying a country-of-origin for this genre more straightforward. Other comments also called for data on country-of-origin to be made more readily available, likely through a single common database. However, these comments also made clear that specific metrics for defining country-of-origin would be needed here, which would help rectify the concern we raise here that it can be difficult to accurately assign country-of-origin in some cases.

350
than other respondents, most likely because, as mentioned before, they wanted to see more detailed data (e.g. consumption data) being made publicly available.
We expect that, for the majority of services, duration data will be included in internal data systems (as durations of programmes are typically indicated to the consumer before they are streamed or downloaded). Therefore, once data has been coded for country-of-origin (as required for title-level data) then providing an indicator based on hours should not require substantial extra administrative burdens. Hour-level data also has the benefit of combating the concern raised in the discussion on title-level data, that providers could potentially appear to provide a large amount of European content on their service by, for instance, hosting many small titles, with low average durations, on their services.
However, it is difficult at this early stage to say how important or relevant the duration of content will be to the promotion of European content via on-demand services. It may be that short-form content is more popular than long-form content (one thinks of the popularity of services such as YouTube and DailyMotion here) in the future. This does indicate one weakness of catalogue based data compared to consumption data, which could indicate whether audiences generally watch long or short-form content.
The operational procedure for hour-level data would be very similar to title-level data, essentially being an additional indicator included in a declaration from the provider to the appropriate Member State body. Again, this data could be confidential from the public, and from other service providers, eventually only being provided in an amalgamated format at the Member State level. As with title-level data, if willingness to provide data cannot be secured from the providers, Member States could possibly monitor samples of the providers’ catalogues, or use independent consultants to do so, but the caveats regarding the cost and accuracy of this process that have been discussed above would have to be taken into consideration.
10.4.3. ‘Prominence’
‘Prominence’ is a particularly open, and therefore somewhat vague, term, which could lead to Member States adopting a wide variety of procedures and indicators. At the workshop it appeared that ‘prominence’ was a contentious indicator, with several stakeholders expressing concerns that it was not clear yet how it should be applied, and what form the indicators should take. We consider from this that prominence is a topic that requires further discussions throughout 2009 at the Member State and European level, involving all key stakeholders.
However, it is also the one indicator that requires providers to directly address their customers on the issue of European content and specifically meets a core requirement of the new Directive: it is after all about how European content is “promoted” to the audience, which is a central element of Article 3i. Therefore it is important in our view to find some way of including prominence in the procedures and indicators for monitoring Article 3i. Here, as at the workshop, we present the findings
351
of our research into possible prominence measures, designed to provide an initial view on appropriate ways forward here for further discussion. As detailed above, we believe that these discussions will continue throughout 2009 at the Member State and European level.
Given, as indicated above, that we consider that internal data contain, or will soon contain, country level data (and likely some related data on language and subtitling) it would be relatively easy for providers to supply information via ‘click-throughs’ from home pages and searches on relevant keywords. However, we feel there are also dangers in being prescriptive. Evaluation of prominence on a qualitative basis (for example, having regulators looking at a service to check that European content is clearly promoted on it) would be fairly subjective. Also, care must be taken when establishing fixed quantitative indicators (for example, a particular proportion of the content on the front page must be European) as they could potentially limit the creative development of non-linear services, with services starting to look similar to one another if indicators are too strict. This concern that non-linear services’ ‘editorial’ abilities could be limited by strict rules, creating a sense of uniformity to the way European content is promoted, was echoed by some stakeholders at the workshop. Of course, if any rules set are relatively broad, then any potential limitations would be reduced.
Recital 48 gives “the attractive presentation of European works in electronic programme guides” as another possible way of promoting European content on non-linear services. This is another very open suggestion, which could be applied in a variety of fashions. For linear services, Electronic Programme Guides (EPG’s) typically show what is available in the schedule channel-by-channel, so prominence is achieved by having a channel near the top of the EPG list. It is far less common to search by content, either by genre, title or country-of-origin. In the UK, the regulator Ofcom has attempted to guarantee that public-service channels have ‘appropriate prominence’ in EPG’s.300 However, they only set general principles to do this, in order to avoid being overly prescriptive, given the variety of possible interpretations of ‘prominence.’ For on-demand services, the ways in which European content could be given ‘appropriate prominence’ will likely expand, as it becomes easier to have multiple EPG types on one site (e.g. one by channel, one by genre, one by country-of-origin). Even so, we believe that regulators should only set general principles rather than strict rules, as Ofcom have done for linear EPGs, to avoid limiting the creative development of non-linear services.
It is also unclear at this time what prominence measures will actually be relevant in the future. For example, several of our respondents noted that stipulating that all services should allow consumers to search by country-of-origin was unnecessary, even irrelevant, as people did not do this (they searched by title or genre typically). Once again, since Video-on-Demand models are in their infancy, other, more suitable, solutions may emerge and a better knowledge of consumer behaviour will also certainly develop.
300 http://www.ofcom.org.uk/tv/ifi/codes/EPGcode/

352
Because of these reasons we do not suggest that specific procedures and indicators are set out at this stage, which service providers must adhere to. What we suggest is that prominence of European content on non-linear services is self-regulated, on a model by which Member State regulators consult with stakeholders to produce guidelines. Recital 36 of the AVMS Directive explains that self-regulation is a suitable approach, if it is considered more appropriate than set legislation. Recital 36 explains that “self-regulation constitutes a type of voluntary initiative which enables economic operators, social partners, non-governmental organisations or associations to adopt common guidelines amongst themselves and for themselves.” These guidelines could cover a wide variety of issues, as noted above, including, among others, country-of-origin searching, the appearance of programme-guides, the level to which European content is pushed using recommendation systems and the advertising of European content by the provider. These prominence commitments could go alongside other commitments, for example to ensure the protection of minors. ATVOD in the UK currently have a code-of-practice that ensures the protection of minors, and users in general, that several on-demand providers adhere to.301 These commitments would need to give providers the flexibility to develop their own service in their own way, but would be a strong step towards enforcing some prominence measures on on-demand services. This would also provide the opportunity to alter and develop commitments if changes in the technology, or uses of the service, take place.
10.4.4. Financial Contribution
Article 3i makes clear that on-demand services must promote the production of European content, and that one way to do this is to provide information on the financial contribution made by on-demand services to the production of content and to rights acquisition. Therefore, respondents were asked whether providing evidence of financial contribution to content production or rights acquisition would be a suitable indicator for Article 3i. Of all the indicators, this one split opinion most significantly, with producers strongly approving of it (as it will help them understand if money is being spent on their services), regulators varying between strong support and light opposition, and the providers themselves, broadcasters and pure on-demand players, strongly opposing it. The main negative connotations of this indicator are that the data is highly confidential and that, as this is still a nascent industry that spends little or nothing on new content, the figures may tell us very little. For example, for an on-demand service attached to a broadcaster, the service itself may spend nothing on commissions or acquisitions as it simply presents a catch-up service of content from the broadcast channels. Another concern was that although providers may have data easily available on the amounts spent, however little, on acquisitions, co-productions and commissioned content, it can be difficult (as acknowledged earlier) to
301 http://www.atvod.org.uk/assets/documents/general/pdf/atvod_code_of_practice.pdf

353
ascertain the country-of-origin of catalogue content purchased from distributors or in package deals.302 This is less the case for directly funded or commissioned content, where it is clear which country, or countries, have originated the content. However, content is often acquired in ‘packages’, with the rights to several pieces of content being acquired for a set amount of money. Even if country-of-origin is known here, it may be difficult for the provider to allocate the share of the fee to the content that is European. However, it is still in our view very important to identify a financial procedure and indicator that can be applied, as it is so central to the legislation. Requiring a very strict and detailed financial indicator would seem unlikely to provide useful results. What we suggest therefore, at this stage, is that providers are required to inform regulators of the amount they have spent each year on programming for their service, and, where possible, identify the proportion of this that is spent on European content. This should first of all avoid the problem detailed above pertaining to catch-up services, which currently have little budget for content acquisition or commissioning. But secondly, and more importantly, it will provide an indicator that will clearly show how much is actually being spent by on-demand service providers on new European content.
302 In a speech entitled Should the European Audiovisual Content Industry be Transparent or Translucent, given at the High-Level Seminar on Audiovisual Content Online in Lisbon on 7-9 October 2007, André Lange of the European Audiovisual Observatory detailed a further point of interest here. In discussing the difficulties of obtaining structural economic data from new players in the audiovisual sector, Lange explained that data on non-linear services’ expenditure “is not always clear: subscription income from IPTV or VoD services is often buried under the heading “fixed services”, which is virtually useless for the analysis of an economic services.” This gives an indication that even top-level financial data on VoD services can be difficult to extract from a provider’s accounts, especially if they are linked to a larger broadcaster. In comments on the Draft Final Report for this study it was made clear that, on the other hand, for smaller companies it may be easier to ascertain accounts through their declarations to the national companies register. However, the potentially unbalanced treatment of stakeholders here goes beyond the scope of this study, dealing with more general issues of the regulation of the transparency of economic activities.

354
10.4.5. Consumption data
Consumption data, on the whole, was not a popular indicator with service providers. Consumption-data at the hours-level was generally unpopular across all groups, being given a low ranking by all respondent types. At the titles-level, consumption data was opposed by all groups except producers, who were keen to see some consumption data being made publicly available.
There are positive elements to using consumption data as an indicator that should be considered alongside these negative responses from stakeholders. First of all, data would be acquired that actually showed what people were watching, allowing for a metric that identifies the extent to which European content is being successfully promoted (as we have noted, title and hour-level data at the catalogue level looks more at what is available, rather than what is viewed). Secondly, it is certainly the case that service providers will have some form of internal data on usage of their service, albeit at varying levels of detail. It is important to note that Recital 48 of the AVMS Directive notes that Member State reports on on-demand content should “take into account … the actual consumption of European works offered by such services.” This does not necessarily mean that consumption data has to be a performance indicator that sets a figure that an on-demand service must reach (e.g. a certain percentage of on-demand viewing must be to European content); instead audience data could be included in the reports on on-demand services provided at the Member State level simply give an impression as to the success of other performance indicators (e.g. title-level data indicators).
However, what of the arguments against consumption data as a performance indicator? Firstly, consumption data is more commercially sensitive than catalogue data. This would make it harder to orchestrate a successful operational procedure, as willingness on the part of the providers is often lacking.303
As has been discussed above in the section on procedures, currently, there is no equivalent to the TAM systems for television audiences in place for non-linear services. TAM systems have created both a standard form for such data, and an acceptance by providers that data on the use of their services is in the public domain. Neither of these conditions apply to non-linear data. There is currently little publicly available data on consumption of on-demand content. In addition, although providers will have some internal data on usage, it is unlikely to be in an easily
303 However, at the workshop and in subsequent comments from respondents on the Draft Final Report, it was argued that consumption data was perhaps so important that greater efforts should be made to acquire this data from service providers. Suggestions were made designed to alleviate concerns regarding confidentiality, suggesting that it may be possible to request less than 100% of their consumption data to still collect a useful indicator: for example, service providers could be asked to provide a list of the programming that makes up 50% of their viewing, allowing the central authority to code these for country-of-origin, and then request the provider to supply viewing figures by country-of-origin for these programmes.

355
comparable format across services (for example, does it look at ‘click-throughs’ on its site, or measure the actual viewing of content; Does it look at that use of streamed content, or downloaded content, or both? What demographics does it look at?) meaning that a common metric would need to be found before this could be successfully applied. This would likely require extensive efforts at the Member State level.
It is also currently unclear to what extent the composition of the audience is taken into account with internal non-linear data (is it one person watching or several?). Until this is taken into account (as it is with viewing figures for television), as is likely when panels are set up in Member States to measure on-demand audiences, then consumption data will not reflect the reality of the viewing audience. Providers are also concerned that it is not a ‘fair’ indicator: even if no expense is spared in promoting European content on the service, and even supporting production of European content, there is no guarantee what the audience will choose to watch. Another concern with using consumption data as an indicator is that it would appear to go beyond the deliberate ‘light touch’ approach has been proposed with regards to the regulation on non-linear services.
Considering the unpopularity of the indicator, the lack of comparability of the data in its current form and the increased regulatory work that would be needed to create an efficient operational procedure, we do not believe it would be appropriate to use consumption data as a performance indicator for Article 3i at this time. This being said, it could be asked for in country reports as additional information on the non-linear environment, if the caveats mentioned above (in particular the lack of standardised data for on-demand content) are taken into account.304
We do, however, believe that in the future we will likely see a standardisation of data on non-linear consumption, and that some public-domain data for on-demand consumption will eventually emerge similar to the TAM model. However, we should note that we are not convinced that services entirely funded through consumer payments will be as willing to participate here as services that are largely advertising funded, and therefore need audience data as currency to determine the value of their media time to advertisers. Once standardised data on non-linear viewing is available we do believe that it would be appropriate to include some measure of consumption data as a performance indicator that would remedy the weaknesses of catalogue data, and the development of industry standard data here should be strongly supported. In comments received from subsequent to the workshop on the Draft Final Report, it was made clear that in the coming years, there are interests within the television industry that are likely to promote the need for industry standards for non-linear audience data, in order to maximise advertising revenue and assist the sale and licensing of programming between services. We agree with this point, hence our argument that consumption data should be strongly considered as an option for 304 In comments on the Draft Final Report, services such as Nielsen Netratings were referenced as being services that would be able to provide a global view of the non-linear sectors, which could possibly be used for Member State level reports.
356
monitoring non-linear services in the future, although not at this time when industry standard data is not available. We also believe that the Commission and national governmental and regulatory bodies could help non-linear service providers to reach the industry standards necessary for the development of industry standard data. The Commission and Member State bodies, by clearly defining how they intend to use consumption data in the future, would help providers work towards a robust and comparable audience metric.305 In the meantime, as we have done in this report, on-demand service providers can be asked to provide top-level data to regulators, in order to provide some level of consumption data in the Member State reports, or headline data could potentially be acquired through large web monitoring services such as those provided by Nielsen. If a level of consumption data is required in these country reports, it will allow external evaluators to discover when it has become possible to accurately evaluate the consumption of on-demand content in a Member State, so that it is only considered as a full performance indicator when the consumption data is reliable enough.
305 André Lange has noted in his speech entitled Should the European Audiovisual Content Industry be Transparent or Translucent, given at the High-Level Seminar on Audiovisual Content Online in Lisbon on 7-9 October 2007, that confidentiality issues relating to consumption data on DVD, and likely also to VoD services (generally where confidentiality agreements exist between the distributors and the service providers), pose a major problem standing in the way of measuring the success on works on non-linear services. He notes that these confidentiality issues mean “the problem should be considered political and not just technical”; further evidence that the Commission and other governmental bodies could play an important role here.

357
10.5. Application of indicators to self-
declarations from non-linear services The purpose of this section is to provide, where possible, practical applications of the procedures and indicators described above to monitor the future application on Article 3i to non-linear services. This analysis does not attempt to emulate the independent analysis of Articles 4 and 5 on linear services, detailed earlier in the report. Rather, this section is designed to provide an initial impression of what indicators may provide in terms of data on the application of Article 3i to non-linear services, and how such data could be presented to the Commission for analysis in the future. As we have made clear in previous sections, the only procedure available for monitoring non-linear services at this time is based on self-declarations, that is for the non-linear services themselves to provide the necessary data to evaluate key indicators. Thus in this section we present the findings we have reached when applying key performance indicators to data acquired through self-declarations from service providers. This section provides data at the service-by-service level (the previous analysis from our survey has presented aggregate data), and we have also made efforts to group data where possible as well, to indicate some possible options for analysing data acquired through self-declaration in the future. The application of performance indicators is not possible for all indicators evaluated through the survey. For example, as has been discussed in detail above, consumption data was not forthcoming in enough detail to be evaluated successfully at this time. In this section, we have applied performance indicators to non-linear services in the following way. Quantitative indicators (proportion of titles and hours in a catalogue that are European) have been applied to data acquired from self-declarations, obtained via our survey with stakeholders; a financial indicator (contribution) has also been applied to data acquired via self- declarations, but the data acquired here was much more limited, due a combination of confidentiality concerns, and the fact that financial contributions are relatively limited from on-demand players still in their early stages of development. Qualitative indicators (prominence) have been applied to data acquired by means of independent desk research. This process should be seen more as an exploration into the prominence of European content on on-demand services, rather than a full-scale independent audit of prominence. This study’s objective was more to develop and propose definitions for the concept of prominence. However, we have been able to complete some initial applications of a selection of prominence measures that we have proposed. It is important to note before progressing further, however, that the results presented here cannot be seen as representative. Although

358
providers in all Member States were contacted, the low response rate means that not all countries are covered, and most covered are represented by a very small number of providers. Also, the detail in responses varied a great deal, so, for example, a respondent who provided data on the proportion of the catalogue’s titles that are European may not have provided any data on financial contribution.
10.5.1. A note of confidentiality of data
During the process of collecting data from non-linear service providers, confidentiality of data provided was guaranteed. Therefore we are unable to specify the name of the service, or the country that it is from.
10.5.2. Grouping the results from application of
indicators
In order to distinguish services from one other, without identifying country of origin or the name of the service we have detailed the ‘type’ of respondent (broadcaster or pure VoD player), and assigned a ‘group’ to each based on ownership. The ‘groups’ are as follows: For broadcasters:
• ‘Private’ refers to broadcasters that are privately owned, and privately funded.
• ‘Public’ refers to broadcasters that are publicly owned, and funded through government funds, or licence fee monies. This also refers to broadcasters with mixed funding.
To be clear, these are the same definitions as used in the analysis of linear channels. For Pure VoD Players:
• ‘Independent’ – we have used the term independent to stress the fact that these services are not linked to broadcasters. These services are also privately owned and privately funded companies.
10.5.3. Application of key indicators
Title-level data We have explained before that title-level data (i.e. data on the proportion of all titles in a non-linear service’s catalogue that are European) is an indicator that should be used to monitor Article 3i, as data is robust and more readily available from providers than other data (such as consumption level data). We have previously presented aggregate figures for hour-level data, but what we present here is the application of a title-

359
level indicator at the service-by-service level, based on self-declared data. This had been completed for 23 services. The graph below clearly shows that the vast majority of services we looked at had over 80% European titles in their catalogue. However, the pure VoD players typically had a smaller amount of European content, compared with the broadcasters, although there is a great deal of variety in the responses. Also, on-demand services provided by private broadcasters have a slightly lower proportion of European titles, compared with public broadcasters. We have also presented the acquired data in a table. In this table we have also provided some averages for the various groups of respondents, which indicate an initial level of analysis that could be done with data acquired through self-declaration. Obviously, the results for these averages would be more robust if more data were acquired (in particular if providers were required by law to make self-declarations.) What the below graphs and tables indicate is that by using a self-declaration based procedure, it is possible to collect information on the proportion of titles in particular services’ non-linear catalogues that are European. Figure 77: Proportion of catalogue that are European titles, split by service
0%
10%
20%
30%
40%
50%60%
70%
80%
90%
100%
Bro
ad
ca
ste
r
Pu
re V
oD
Pla
ye
r
Bro
ad
ca
ste
r
Pu
re V
oD
Pla
ye
rP
ure
Vo
D
Pla
ye
rP
ure
Vo
D
Pla
ye
rP
ure
Vo
D
Pla
ye
r
Bro
ad
ca
ste
r
Bro
ad
ca
ste
r
Bro
ad
ca
ste
r
Pu
re V
oD
Pla
ye
r
Bro
ad
ca
ste
r
Bro
ad
ca
ste
r
Bro
ad
ca
ste
r
Bro
ad
ca
ste
r
Bro
ad
ca
ste
r
Bro
ad
ca
ste
r
Bro
ad
ca
ste
r
Bro
ad
ca
ste
r
Bro
ad
ca
ste
r
Bro
ad
ca
ste
r
Bro
ad
ca
ste
r
Bro
ad
ca
ste
r
Pri Ind Pub Ind Ind Ind Ind Pri Pub Pri Ind Pri Pri Pri Pri Pri Pub Pub Pub Pub Pub Pub Pub
(Pri=Private; Pub=Public; Ind=Independent)
Pro
po
rtio
n o
f C
ata
log
ue
th
at
are
E
uro
pe
an
Proportion of EU Titles

360
Table 134: Proportion of catalogue that are European titles, split by service, and with averages for groups of services
Type Group Proportion of EU Titles Average for Group
Pure VoD Player Independent 10%
Pure VoD Player Independent 70%
Pure VoD Player Independent 43%
Pure VoD Player Independent 99%
Pure VoD Player Independent 25%
Pure VoD Player Independent 81%
Broadcaster Private 100%
Broadcaster Private 100%
Broadcaster Private 100%
Broadcaster Private 100%
Broadcaster Private 100%
Broadcaster Private 85%
Broadcaster Private 7%
Broadcaster Private 92%
Broadcaster Public 85%
Broadcaster Public 100%
Broadcaster Public 100%
Broadcaster Public 100%
Broadcaster Public 100%
Broadcaster Public 14%
Broadcaster Public 100%
Broadcaster Public 100%
Broadcaster Public 100%
54.7%
85.4%
88.8%
In order to provide the Commission, regulators and service providers with an idea as to how a declaration would look, we have constructed an example of one below. We have assumed that in this case, country-of-origin is allowed (as this would be a declaration to a Member State body). Country Service
Name Service
Type Service
Business Model
Proportion of titles that
are European Austria Example VoD Pure VoD
Player Independent of Broadcaster; Advertising funded
70%
Hour-level data Hour-level data was only slightly less popular than title-level data, and we managed to acquire proportions of all hours that are European from 19 services. As with title-level data, we have provided the results of the application of the hour-level indicator based on self-declarations both as a graph and as a table.

361
Figure 78: Proportion of catalogue hours that are European, split by service, and with averages for groups of services
0%
10%
20%
30%
40%
50%
60%
70%
80%
90%
100%B
roa
dca
ste
r
Pu
re V
oD
Pla
ye
rP
ure
Vo
DP
lay
er
Pu
re V
oD
Pla
ye
rP
ure
Vo
DP
lay
er
Bro
ad
ca
ste
r
Bro
ad
ca
ste
r
Bro
ad
ca
ste
r
Bro
ad
ca
ste
r
Bro
ad
ca
ste
r
Bro
ad
ca
ste
r
Bro
ad
ca
ste
r
Bro
ad
ca
ste
r
Bro
ad
ca
ste
r
Bro
ad
ca
ste
r
Bro
ad
ca
ste
r
Bro
ad
ca
ste
r
Bro
ad
ca
ste
r
Bro
ad
ca
ste
r
Pub Ind Ind Ind Ind Pub Pri Pri Pri Pri Pri Pri Pub Pub Pub Pub Pub Pub Pub
(Pri=Private; Pub=Public; Ind=Independent)
Pro
po
rtio
n o
f H
ou
rs t
ha
t a
re E
uro
pe
an
Proportion of EU Hours
Table 135: Proportion of catalogue hours that are European, split by service, and with averages for groups of services, with averages for groups of services
Type Group Proportion of EU Hours Average for Group
Pure VoD Player Independent 10%
Pure VoD Player Independent 67%
Pure VoD Player Independent 68%
Pure VoD Player Independent 80%
Broadcaster Private 100%
Broadcaster Private 100%
Broadcaster Private 100%
Broadcaster Private 100%
Broadcaster Private 100%
Broadcaster Private 90%
Broadcaster Public 85%
Broadcaster Public 100%
Broadcaster Public 100%
Broadcaster Public 100%
Broadcaster Public 100%
Broadcaster Public 3%
Broadcaster Public 100%
Broadcaster Public 100%
Broadcaster Public 100%
56.2%
98.3%
87.5%
We can see from this that once again broadcasters typically have well over 80%, usually 100%, European content on their non-linear services. In fact, of the private broadcasters who provided data for this indicator, an average of 98.3% of the hours were European (to be specific, only one of the six private broadcasters that provided data had less than 100% EU hours). On the other hand, pure VoD players have somewhat lower proportion of European hours. Once again, we see a high variance in the figures for Pure VoD Players.

362
Again, we have constructed an example of what a declaration based on this indicator might look like. Country Service
Name Service
Type Service
Business Model
Proportion of hours that
are European France Example
Catch-Up Broadcaster-
owned Private funded (advertising revenue)
70%
Financial data Figure 79 presents data on the source of programming for non-linear services at the service-by-service level. In the previous discussion on potential indicators, we suggested that top level data on financial contribution could be collected by asking service providers to supply information on the total amount spent on programming for their service in a given year, and the proportion of this spent on European content. This should be a fairly straightforward indicator for providers to consider, especially as the amount of new content is likely to remain quite low (as non-linear services typically have very small budgets available to them). In the survey, however, we asked a more general question – “What proportion of your programme budget for on-demand programmes was spent on the following sources?” – and it is the responses to this question that we present below. We have presented the data below as it is useful to show that some top-level financial contribution data can be provided through self-declarations. However, thinking about this issue in terms of a proportion of the budget may have caused some difficulties. First of all, the budgets are very small, making specific delineations between many different sources of content more difficult. Secondly, for some services, for example catch-up services, the budget for non-linear content may be tied in with the budget for linear content. This could explain why the non-linear services linked to broadcasters posted such a high proportion of national commissions: it may be that these are national commissions for the linear broadcast channel, which are subsequently available on catch-up services. As is clear, this data was not generally forthcoming from respondents, and data was only received from 10 respondents. This does limit the extent to which we can draw any conclusions from the data. We have already noted that broadcaster’s non-linear services indicate a very high proportion of national commissions, but it is difficult to ascertain how much of this is content commissioned for the main broadcast channel and then made available on the non-linear service. More interesting is the case for the pure VoD players, where the source of acquisitions can vary a lot from service-to-service. However, they also indicate that non-European acquisitions form a large proportion, regardless of whether national or non-national European acquisitions play an important role on the service.

363
Figure 79: Proportion of total budget for non-linear services spent on different sources of content, split by type of respondent and country
0%
10%
20%
30%
40%
50%
60%
70%
80%
90%
100%
Broadcaster Broadcaster Broadcaster Broadcaster Broadcaster Broadcaster Broadcaster Pure VoD
Player
Pure VoD
Player
Pure VoD
Player
Private Public Public Public Public Public Public Independent Independent Independent
(B=Broadcaster; P=Pure VoD Player)
Pro
po
rtio
n
National commissions European, non-national commissions
Non-European commissions National acquisitions
European non-National acquisitions Non-European acquisitions
As noted above, we suggest that it may be more informative to ask service providers for an actual figure for the amount spent on programming for their on-demand service in a given year, and the proportion of this that was spent on European content. This could be included in self-declarations and could be easily presented. Below is an example of how this could look:
Country Service Name
Service Type
Service Business
Model
Amount spent on
programming (€)
Proportion of this
spent on European content
UK Example Pay Per View VoD
Pure VoD Player
Independent of Broadcaster; Subscription Revenue funded
€10,000 60%
Prominence
As noted before, a separate desk research study was used to complete an exploratory analysis into the issue of prominence of European content on non-linear services. In this section we have applied three prominence indicators, as defined in the earlier discussion on prominence (see section 9.9.8) to specific services. The three indicators are: 1) does the service offer the possibility of searching titles by origin of production; 2 does it provide information on the origin of production together with the
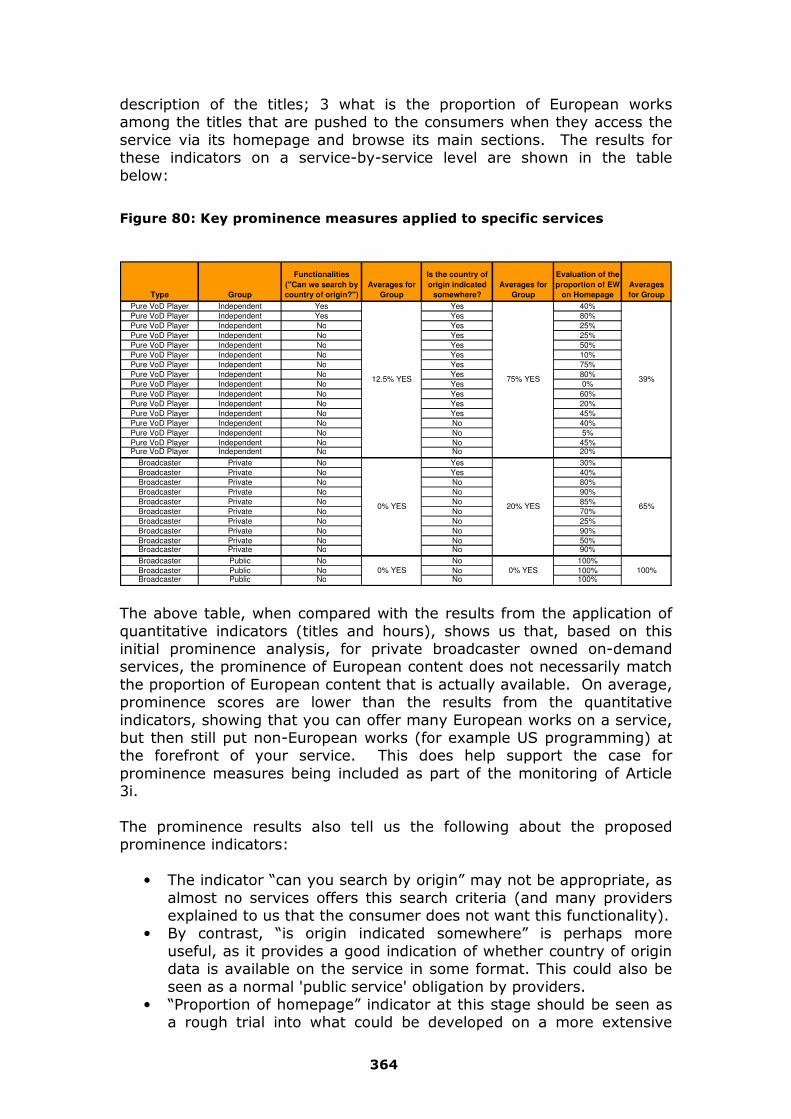
364
description of the titles; 3 what is the proportion of European works among the titles that are pushed to the consumers when they access the service via its homepage and browse its main sections. The results for these indicators on a service-by-service level are shown in the table below:
Figure 80: Key prominence measures applied to specific services
Type Group
Functionalities
("Can we search by
country of origin?")
Averages for
Group
Is the country of
origin indicated
somewhere?
Averages for
Group
Evaluation of the
proportion of EW
on Homepage
Averages
for Group
Pure VoD Player Independent Yes Yes 40%
Pure VoD Player Independent Yes Yes 80%
Pure VoD Player Independent No Yes 25%
Pure VoD Player Independent No Yes 25%
Pure VoD Player Independent No Yes 50%
Pure VoD Player Independent No Yes 10%
Pure VoD Player Independent No Yes 75%
Pure VoD Player Independent No Yes 80%
Pure VoD Player Independent No Yes 0%
Pure VoD Player Independent No Yes 60%
Pure VoD Player Independent No Yes 20%
Pure VoD Player Independent No Yes 45%
Pure VoD Player Independent No No 40%
Pure VoD Player Independent No No 5%
Pure VoD Player Independent No No 45%Pure VoD Player Independent No No 20%
Broadcaster Private No Yes 30%
Broadcaster Private No Yes 40%
Broadcaster Private No No 80%
Broadcaster Private No No 90%
Broadcaster Private No No 85%
Broadcaster Private No No 70%
Broadcaster Private No No 25%
Broadcaster Private No No 90%
Broadcaster Private No No 50%Broadcaster Private No No 90%
Broadcaster Public No No 100%
Broadcaster Public No No 100%Broadcaster Public No No 100%
39%
65%
100%
12.5% YES
0% YES
0% YES
75% YES
20% YES
0% YES
The above table, when compared with the results from the application of quantitative indicators (titles and hours), shows us that, based on this initial prominence analysis, for private broadcaster owned on-demand services, the prominence of European content does not necessarily match the proportion of European content that is actually available. On average, prominence scores are lower than the results from the quantitative indicators, showing that you can offer many European works on a service, but then still put non-European works (for example US programming) at the forefront of your service. This does help support the case for prominence measures being included as part of the monitoring of Article 3i. The prominence results also tell us the following about the proposed prominence indicators:
• The indicator “can you search by origin” may not be appropriate, as
almost no services offers this search criteria (and many providers explained to us that the consumer does not want this functionality).
• By contrast, “is origin indicated somewhere” is perhaps more useful, as it provides a good indication of whether country of origin data is available on the service in some format. This could also be seen as a normal 'public service' obligation by providers.
• “Proportion of homepage” indicator at this stage should be seen as a rough trial into what could be developed on a more extensive

365
scale. For this to be used to provide consistent data across Member States, clear guidelines for measuring this proportion will need to be developed between government bodies and stakeholders. The industry could also think of sub-criteria, in addition to proportion of homepage, such as “proportion of genre pages” and “share of screen.”

366
11. Key Findings
The following section outlines the key findings of the study section-by-section.
11.1. Modes of Implementation How Articles 4 and 5 are implemented Articles 4 and 5 of the Directive are instruments to create minimum standards for the national measures on linear services. As a result, the national implementations of Articles 4 and 5 are different from one another in several respects.
Although most Member States have transcribed the Directive’s definition of total qualifying hours directly, different approaches have been applied by France, Germany, Italy and the UK, with the most significant differences found in France and Germany.
Some Member States have adopted ‘where practicable’ (the qualifying term used in the Directive) or similar qualifications in their national legislation, which we consider to be a more flexible approach than when this phrase is absent.
The Member States apply very different definitions for ‘independent producer’. While some Member States have no definition in their legislation, most Member States utilise a combination of elements in their national definitions. Ownership requirements are applied by a clear majority of these Member States; an example of this is the French rule, where in order for a producer to qualify as ‘independent’, cross-ownership between broadcasters and producers cannot exceed 15% of the share capital. Programme supply requirements, and requirements concerning the actual ability of the producer to conduct his business unhindered by a broadcaster are also found in several Member States, while criteria based on secondary rights are only applied by Norway, Latvia and France.
Nearly all Member States apply the Directive’s 10% requirement for independent productions to the broadcasters’ transmission time, or allow the broadcasters to choose between adherence to a percentage of programming budgets or a percentage of transmission time. Only very few Member States apply stricter approaches. Hungary requires broadcasters to reserve both 10% of transmission time and 12% of programme budget, and Portugal requires the public service channel RTP 2 to reserve at least 10% of its programming budget. France and, since very recently, Italy,306 apply an approach which goes further than the Directive, since they require broadcasters to reserve a certain percentage of their entire annual turnover (a figure which will always be higher than the broadcasters’ programming budget).
306 The new approach in Italy is due to 2007 legislation which only entered into force at the beginning of 2008.

367
Most Member States monitor adherence to Articles 4 and 5 by requiring broadcasters to submit transmission returns, giving the volume of European works and independent productions they broadcast. Some Member States take additional steps to verify the accuracy of the data provided by broadcasters, either by verifying the returns received from broadcasters or by direct monitoring of broadcasts.
Regulatory authorities in most Member States have a range of sanctions at their disposal for sanctioning failure to adhere to Articles 4 and 5 (from warnings to fines and – in some Member States, and for the most serious cases – shortening or revoking a broadcaster’s licence). Only the regulators in Austria, Cyprus, Iceland, Ireland and Sweden have no power to sanction broadcasters not complying with Articles 4 and 5.
Seven Member States – Finland, France, Hungary, Italy, The Netherlands, Spain and the United Kingdom – apply higher percentage requirements for European works or independent productions than those contained in the Directive on some or all of their broadcasters. For example, France requires broadcasters to reserve at least 60% of transmissions to European works, and in the United Kingdom, higher requirements on European works may be set within the individual licenses. Finland applies a 15% independent productions requirement on all broadcasters, while the UK, Slovakia and the Netherlands apply higher proportions on public service broadcasters (25% and 20%, respectively). In the Netherlands, each public service channel must reserve at least 17.5% of qualifying hours for independent productions, with an average proportion for all public service channels of 25 % of qualifying hours, and re-runs may only be counted towards the measure when they are shown in peak time.
Almost all Member States place additional content requirements on broadcasters to reflect linguistic or cultural specificities in a Member State. In particular, it is worth noting that several Member States require that a certain proportion of broadcasting time shall be programmes originally produced in the national language (or one of the national languages).
The application of Articles 4 and 5 (whether the measures are applied flexibly or prescriptively), and the additional requirements placed on broadcasters in national legislation (low or high additional requirements), define four ‘implementation modes’. Each Member State’s implementation mode is given in the following table:

368
Application of Directive
Flexible Prescriptive
Hig
h
Spain Sweden
Bulgaria Finland France
Italy Netherlands
Poland Portugal Romania
United Kingdom
Ad
dit
ion
al
Req
uir
em
en
ts
Lo
w
Austria Cyprus
Czech Republic Denmark Germany Iceland Ireland
Lithuania Luxembourg
Malta
Belgium Estonia Greece Hungary
Latvia Norway Slovakia Slovenia
Only 3 Member States covered in the 2005 Study – Belgium, the Netherlands and Norway - have been assigned a different implementation mode for the one they received in 2005. The Netherlands and Norway have been moved from “Flexible” to “Prescriptive”, while Belgium and Norway have been moved from “High” to “Low”. This is due to a combination of changes in the legislation and an adjustment in the classification methodology since the 2005 Study.
On-demand audiovisual media services and European works
As of 1 January 2008, none of the Member States had implemented Article 3i, although Italy had just adopted a provision which authorises the regulator AGCOM to issue subsequent secondary legislation which could implement the provision.
Only very few Member States (the French Community of Belgium and France) had adopted legislation that, although not adopted with the intention of implementing Article 3i, nevertheless in some way could have a similar objective and effect to Article 3i.
The French Community of Belgium is the only jurisdiction that subjected non-linear television services to the same obligations as other television broadcasting services (including obligations on European works, independent productions, French language programming and spending on audiovisual production).
France applied some film fund tax measures to on-demand services.

369
France also once had a voluntary inter-professional agreement which established investment quotas for EU and French-originated cinematographic works on Cinema-on-Demand providers, but this one-year agreement had expired in December 2006.
Altogether, no Member States had completed the implementation of Article 3i as of 1 January 2008, and only the French Community of Belgium actively applied any form of European works requirement to non-linear services.
11.2. Market Overview Current market structure and flow of funds along the supply chain
The TV market structure and flow of funds across all Member States varies considerably in terms of overall TV income and at all aspects of the value chain: the creation of new content; the management of individual TV broadcast channels; and the distribution of a channel, or group of channels, to viewing households by either terrestrial, satellite, cable or internet delivery systems.
Industry income
Considering TV revenue first, the UK and Germany are by far the two largest TV markets in Europe; France and Italy – which have similar sized economies to that of the UK – are somewhat smaller. The UK and Italy have the most developed advertising markets among the larger nations, while France and the UK have the largest proportionate pay-TV markets. Public funding through licence fees is highest in Germany and the UK. TV revenue per household is highest in Norway and the UK due to their highly developed cable and satellite pay-TV markets. Among the next nine largest markets pay TV is most developed in Ireland, Portugal and Romania, all of which enjoy pay TV penetration rates of over 50%. It is in these smaller markets that VoD revenues are proportionately highest, due to their developed pay-TV sectors. In the 10 smallest markets there are significant variations in market structure: the licence fee in Bulgaria, Slovenia and Iceland contributes over 25% to the overall TV market; in Slovakia, Lithuania and Latvia, pay and network advertising accounts for over 50% of the total market; and in Cyprus and Estonia, the pay TV market accounts for over 50% of total TV revenue.
Analysing each of the E30’s individual market structures and flow of funds in detail we calculated total TV industry revenue of €78.1 billion in 2006 93% (€72.8 billion) of which came from three main sources: licence fees (€17.8 billion – 23%); advertising and associated sponsorship (€28.3 billion – 36%); and consumer payments to pay TV, cable relay and VoD services (€26.2 billion – 34%). The main source of growth in the E17 countries is in consumer payments, which have grown 10.1% year-on-year since 2002. Both advertising and licence fees grew at just over 3% year-on-year, just slightly above inflation.

370
15.2 17.2 17.8
22.6
25.828.3
12.7
18.7
19.86.3
5.4
6.50.4
0.4
4.3
4.9
5.3
10
20
30
40
50
60
70
80
90
2002 E17 2006 E17 2006 E30
€ BN
LICENCE FEES
ADVERTISING
PAY TV
CABLE RELAY
VOD
OTHER BROADCAST REVENUE
SOURCE: O&O TRENDS BASED ON DATA FROM: OBS, TVI, PWC, KAGAN, NATIONAL REGULATORS, COMPANY REPORTS, SCREEN DIGEST, O&O MODELS, O&O ANALYSIS, BROKER REPORTS, PRESS, INTERVIEWS
61.2
72.4
78.1
CAGR E17
1995-2002
CAGR E17
2002-2006
6.5
6.0
-
3.0
15.0
5.0
3.0
4.3
-
3.5
-3.7
10.1
3.3
3.2
TV revenue by source in Europe (2002 &2006)
15.2 17.2 17.8
22.6
25.828.3
12.7
18.7
19.86.3
5.4
6.50.4
0.4
4.3
4.9
5.3
10
20
30
40
50
60
70
80
90
2002 E17 2006 E17 2006 E30
€ BN
LICENCE FEES
ADVERTISING
PAY TV
CABLE RELAY
VOD
OTHER BROADCAST REVENUE
SOURCE: O&O TRENDS BASED ON DATA FROM: OBS, TVI, PWC, KAGAN, NATIONAL REGULATORS, COMPANY REPORTS, SCREEN DIGEST, O&O MODELS, O&O ANALYSIS, BROKER REPORTS, PRESS, INTERVIEWS
61.2
72.4
78.1
CAGR E17
1995-2002
CAGR E17
2002-2006
6.5
6.0
-
3.0
15.0
5.0
3.0
4.3
-
3.5
-3.7
10.1
3.3
3.215.2 17.2 17.8
22.6
25.828.3
12.7
18.7
19.86.3
5.4
6.50.4
0.4
4.3
4.9
5.3
10
20
30
40
50
60
70
80
90
2002 E17 2006 E17 2006 E30
€ BN
LICENCE FEES
ADVERTISING
PAY TV
CABLE RELAY
VOD
OTHER BROADCAST REVENUE
SOURCE: O&O TRENDS BASED ON DATA FROM: OBS, TVI, PWC, KAGAN, NATIONAL REGULATORS, COMPANY REPORTS, SCREEN DIGEST, O&O MODELS, O&O ANALYSIS, BROKER REPORTS, PRESS, INTERVIEWS
61.2
72.4
78.1
CAGR E17
1995-2002
CAGR E17
2002-2006
6.5
6.0
-
3.0
15.0
5.0
3.0
4.3
-
3.5
-3.7
10.1
3.3
3.2
TV revenue by source in Europe (2002 &2006)
TV distribution and delivery TV across Europe is delivered to the home through a complex combination of different systems. Each system in turn varies in the degree to which it provides free delivery, or extracts a monthly charge. Analogue terrestrial still remains the most common form of distribution with 21% of homes receiving television signals through an analogue aerial receiver, however all Member States now have firm plans to move to digital terrestrial television (DTT) with switchover dates ranging from December 2008 (Germany) to December 2014 (Poland). The key trends emerging from our analysis of pay TV was a drive to digitise cable networks in Germany, Benelux and Scandinavia, which currently can only carry 20 to 40 analogue channels. Post digitisation these networks should be able carry 100+ channels. Complementing this drive to digital has been the emergence of a new broadcast delivery platform over DSL broadband services, known as IPTV which has already proved popular in France, Sweden and Norway. Direct-to-home satellite’s transfer to digital has been rapid and has increased the number of channels to well over 600 channels for the main national markets.

371
67
3142
31
31
39
17
23
2928
2819 29
29
16
25
25
5
5
5
2
2
50
100
150
200
250
E17 '02 E17 '07 E30 '07
TV HHS (M)
SOURCE: O&O TRENDS BASED ON DATA FROM: OBS, TVI, TBI, COMPANY REPORTS, SCREEN DIGEST, O&O ANALYSIS
3 TO 7 CHANNELS
10 TO 40 CHANNELS
50 TO 200 CHANNELS
20 TO 40
100 TO 700 CHANNELS
60 TO 200 CHANNELS
20 TO 60 CHANNELS
1 CHANNEL
PAY TV = 62M
FREE TV = 138M
156
174
IPTVPAY TERRESTRIAL
PAY SATELLITE
PAY CABLE
FREE SATELLITE
FREE DTT
CABLE RELAY
ANALOGUE TERRESTRIAL
200
TV households by reception method in the European Union (2002 and 2007)
Across the E30, average pay-TV penetration307 is approximately 31% and varies widely across markets. The UK, Romania and Portugal all have pay-TV penetration of over 40%, while in Hungary, Slovakia and Germany penetration is less than 20%, due to historically widespread cable relay. Among the 10 largest countries, Germany has the lowest pay-TV penetration at just 12%, while amongst the smaller markets, Slovakia has one of the least developed markets, with just 6% pay-TV penetration.
On-demand services A substantial part of current on-demand offerings in the larger European markets are “catch-up” services from the main broadcasters (such as VRT’s Net Gemist service in Belgium and RTV’s internet service in Slovenia). In 2006, services had only been established in a small number of developed markets and even by the end of 2007 were generating almost no revenue – while it is feasible to insert advertising into these services, many are provided by the public broadcaster (and are thus advertising-free) and commercial services have only limited ability to measure audiences (and hence monetise them with advertisers). The
307 Pay-TV penetration in France and The Netherlands is skewed slightly due to very low subscription costs for households to access IPTV and digital cable services in these markets. In the Netherlands, low cost digital cable packages were promoted to encourage households to move from analogue cable during the digital switchover, while in France, fierce competition between broadband providers resulted in a number of free IPTV services being made available on the market.

372
number of services available varies considerably by market. France, the Netherlands and Germany have 32, 30 and 26 services available respectively while some of the smaller nations, such as Estonia, Iceland and Slovenia, have only 2 or 3 services. We estimate that in 2006 on-demand services generated approximately €400m of revenue in the E30, representing just 0.5% of the TV industry. Within the report we profile four individual on-demand services.
0.4
78.1
10
20
30
40
50
60
70
80
90
TOTAL E30 TV MARKET TOTAL EST. VOD MARKET
€ BN
SOURCE: O&O TRENDS BASED ON DATA FROM: OBS, TVI, PWC, KAGAN, NATIONAL REGULATORS, COMPANY REPORTS, SCREEN DIGEST, O&O MODELS, O&O ANALYSIS, BROKER REPORTS, PRESS, INTERVIEWS
Comparable size of the European VoD Market (2006)
0.4
78.1
10
20
30
40
50
60
70
80
90
TOTAL E30 TV MARKET TOTAL EST. VOD MARKET
€ BN
SOURCE: O&O TRENDS BASED ON DATA FROM: OBS, TVI, PWC, KAGAN, NATIONAL REGULATORS, COMPANY REPORTS, SCREEN DIGEST, O&O MODELS, O&O ANALYSIS, BROKER REPORTS, PRESS, INTERVIEWS
0.4
78.1
10
20
30
40
50
60
70
80
90
TOTAL E30 TV MARKET TOTAL EST. VOD MARKET
€ BN
SOURCE: O&O TRENDS BASED ON DATA FROM: OBS, TVI, PWC, KAGAN, NATIONAL REGULATORS, COMPANY REPORTS, SCREEN DIGEST, O&O MODELS, O&O ANALYSIS, BROKER REPORTS, PRESS, INTERVIEWS
Comparable size of the European VoD Market (2006)
TV channel management
The market can be broken down into three main types – free TV channels (available to all the audience), basic tier pay-TV channels (which are available to subscribers as part of a pay-TV subscription) and premium pay-TV channels (for which an additional subscription fee is paid). Free TV channels can be divided into publicly funded channels and commercially, or advertiser funded channels308. Pay-TV channels also take advertising, but have an element of subscription fees – paid to them by the platform operators - in their revenue mix. Premium pay-TV channels often only
308 Some, for example France Television and ARD/ZDF, take a mixture of public funding and advertising revenue).

373
take a very limited amount of advertising – their main selling point is to offer uninterrupted access to sport or movies – and subscription fees form the overwhelming majority of their revenue mix.
The creation of content
Within TV content we identified three basic programme scheduling choices for TV channels: from where to source programming (commissions vs. acquisitions vs. repeats); what genre to broadcast (drama, news, comedy, factual, stock vs. flow309); and sub-genre choices (e.g. a drama soap opera versus a one-off film).
The European TV content creation sector was worth approximately €18.3 billion in 2006. Of this, €16.5 billion came from commissions by network channels and €1.8 billion from commissions by smaller channels310. Of this €18.3 billion, about €2.6 billion was spending on national and local news and sports coverage (spending on sports rights is excluded). Of the remaining €15.7 billion, an estimated 43% (€6.8bn) was spent on commissions from external producers and around 57% was invested in in-house production311.
Main network channels account for about 57% of gross industry revenue but over 90% of all new commission spending. Secondary channels tend to be carried within pay-TV packages, where a large proportion of revenues either go to the platform providers or is spent on premium acquisitions, such as top feature films or sport.
309 A stock programme has repeat value and can be shown again at a later date, while flow programmes have little or no further value after the first showing (narrative repeats excluded). Examples of flow programming include news, sport, games, and some entertainment programming. 310 Revenue from direct subsidies (of approximately €0.3m), and direct income to producers from the exploitation of ancillary rights such as international programme sales, DVDs, licensing and merchandising (approx €0.8m) has been accounted for in the content creation figure detailed in the main text. 311 External production includes broadcaster affiliates such as UFA and Studio Hamburg in Germany and Fremantle across RTL’s group of channels.
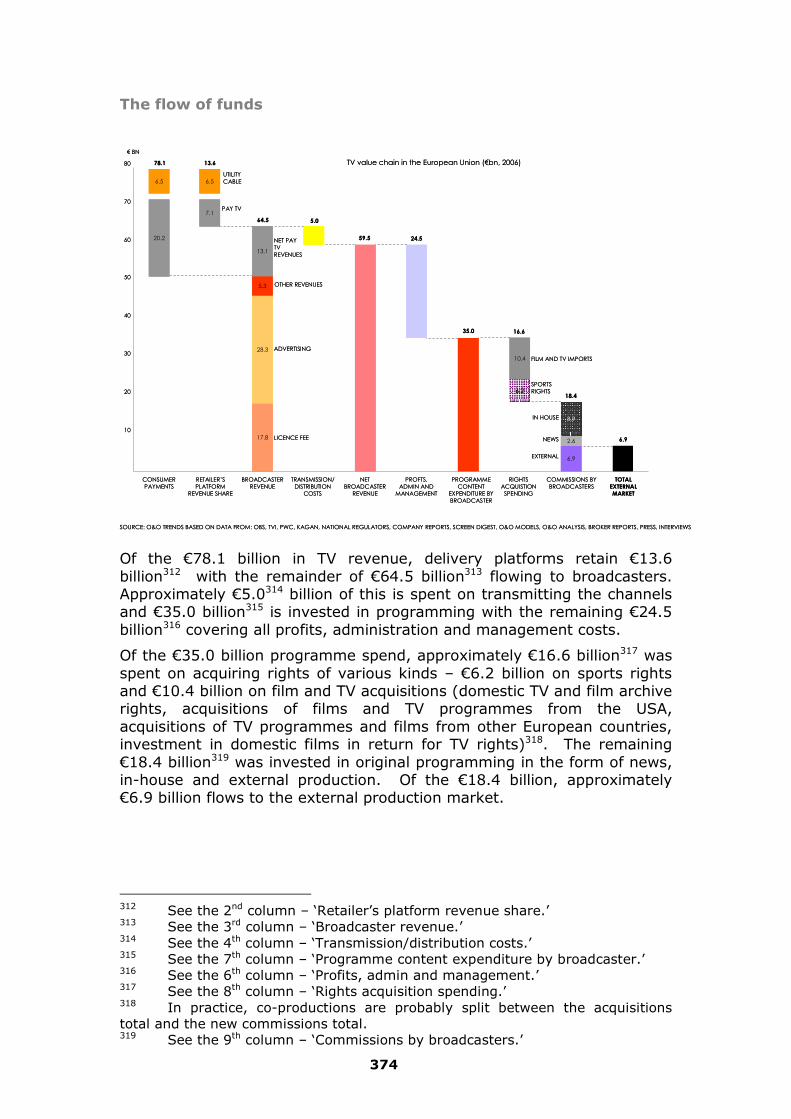
374
The flow of funds
6.5 6.5
20.2
7.1
17.8
28.3
5.3
13.1
6.2
10.4
6.9
2.6
8.9
5.0
59.5 24.5
35.0
6.9
10
20
30
40
50
60
70
80
CONSUMER PAYMENTS
RETAILER’S PLATFORM
REVENUE SHARE
BROADCASTER REVENUE
TRANSMISSION/DISTRIBUTION
COSTS
NET BROADCASTER
REVENUE
PROFTS, ADMIN AND
MANAGEMENT
PROGRAMME CONTENT
EXPENDITURE BY BROADCASTER
RIGHTS ACQUISTION
SPENDING
COMMISSIONS BY BROADCASTERS
TOTAL EXTERNAL MARKET
€ BN
UTILITY CABLE
NET PAY TV REVENUES
LICENCE FEE
ADVERTISING
OTHER REVENUES
SPORTS RIGHTS
FILM AND TV IMPORTS
EXTERNAL
NEWS
IN HOUSE
64.5
16.6
18.4
78.1
SOURCE: O&O TRENDS BASED ON DATA FROM: OBS, TVI, PWC, KAGAN, NATIONAL REGULATORS, COMPANY REPORTS, SCREEN DIGEST, O&O MODELS, O&O ANALYSIS, BROKER REPORTS, PRESS, INTERVIEWS
PAY TV
13.6 TV value chain in the European Union (€bn, 2006)
Of the €78.1 billion in TV revenue, delivery platforms retain €13.6 billion312 with the remainder of €64.5 billion313 flowing to broadcasters. Approximately €5.0314 billion of this is spent on transmitting the channels and €35.0 billion315 is invested in programming with the remaining €24.5 billion316 covering all profits, administration and management costs.
Of the €35.0 billion programme spend, approximately €16.6 billion317 was spent on acquiring rights of various kinds – €6.2 billion on sports rights and €10.4 billion on film and TV acquisitions (domestic TV and film archive rights, acquisitions of films and TV programmes from the USA, acquisitions of TV programmes and films from other European countries, investment in domestic films in return for TV rights)318. The remaining €18.4 billion319 was invested in original programming in the form of news, in-house and external production. Of the €18.4 billion, approximately €6.9 billion flows to the external production market.
312 See the 2nd column – ‘Retailer’s platform revenue share.’ 313 See the 3rd column – ‘Broadcaster revenue.’ 314 See the 4th column – ‘Transmission/distribution costs.’ 315 See the 7th column – ‘Programme content expenditure by broadcaster.’ 316 See the 6th column – ‘Profits, admin and management.’ 317 See the 8th column – ‘Rights acquisition spending.’ 318 In practice, co-productions are probably split between the acquisitions total and the new commissions total. 319 See the 9th column – ‘Commissions by broadcasters.’

375
11.3. EU-wide Analysis
Across our sample of 54 channels in 11 Member States, qualifying programmes make up 68.3% of the total transmission hours and 65% of the total viewer hours on all channels studied in 2007.
In general, European broadcasters are significantly above the 50% requirement for European works and the 10% requirement for independent works.
Across our sample, European works made up 62.4% of the total qualifying transmission hours in 2007. Most European broadcasters met the 50% requirement of Article 4. European works also make up an average of 74% of the total viewer hours across all studied channels in 2007, which indicates the strong appeal of European works to European audiences, and the broadcasters’ reliance on European content to build their ratings. The figures are even higher when looking at peak-time only: 62.8% of the total qualifying transmission hours and 75.5% of the total viewer hours. Channels with the highest proportions of European works are leading, public channels from Southern, old and large European countries.
Across our sample, independent European works make up 31% of the total qualifying transmission hours in 2007, compared to 33.4% of total qualifying viewer hours. Proportions are higher when looking specifically at peak-time: 34.6% of the total qualifying transmission hours and 36.9% of the total viewer hours. Recent independent European works make up an average of 84.4% of the total independent European hours in 2007, compared to 91.7% of total independent viewer hours. Proportions are higher in peak-time: 92.4% of the total independent transmission hours and 95.5% of the total independent viewer hours
Non-domestic European works make up 8.2% of the total qualifying transmission hours in 2007, compared to 4.3% of total qualifying viewer hours. Proportions are lower when looking specifically at peak-time: 7% of the total qualifying transmission hours and 2.9% of the total viewer hours.
Across our sample, qualifying European stock makes up 45.9% of the total qualifying transmission hours in 2007, compared to 50.4% of total qualifying viewer hours. Proportions are higher when looking specifically at peak-time viewing: 49.1% of the total qualifying peak-time transmission hours and 54.9% of the total qualifying peak-time viewer hours. This shows that stock and flow programming is very evenly balanced across the broadcasters in our sample.
11.4. Views from the Industry Determinants of programme spending decisions
In programme scheduling, a broadcaster must decide upon the following: the balance between commissioned and acquired programming; from

376
whom they should commission new programmes; and the source of acquired programmes (particularly the balance between European-made programmes and programmes from the US). In this section we conclude our findings from interviews with 28 broadcasters representing 80% of the Member States researched in the study
Overall programming spend and the balance between commissions and acquisitions
The most capital-intensive genres are fiction, entertainment and news programming which account for almost two thirds of total programming spend. In addition, these genres were also identified by the majority of broadcasters (over 60%) as cheaper to produce in-house320.
Broadcasters invested the majority (61%) of their programme budget on commissioned programmes (external commissions, 32% and in-house, 29%), with the remainder (39%) spent on the acquisition of ready-made programmes.
58
18
32
26
31
29
16
51
39
10% 20% 30% 40% 50% 60% 70% 80% 90% 100%
PUBLICBROADCASTERS
COMMERCIALBROADCASTERS
ALL CHANNELS
PERCENTAGE OF PROGRAMMING SPEND (EXC. NEWS, SPORT & GAMES)
IN-HOUSE EXTERNAL COMMISSION ACQUIRED
58
18
32
26
31
29
16
51
39
10% 20% 30% 40% 50% 60% 70% 80% 90% 100%
PUBLICBROADCASTERS
COMMERCIALBROADCASTERS
ALL CHANNELS
PERCENTAGE OF PROGRAMMING SPEND (EXC. NEWS, SPORT & GAMES)
IN-HOUSE EXTERNAL COMMISSION ACQUIRED
Commercial broadcasters tend to allocate a higher proportion of their programme budget (51%) to acquired programmes, and a significantly lower proportion (18%) to in-house production. Contrastingly, publicly funded broadcasters tend to invest heavily in in-house production (58%) and far less on acquisitions (16%). It is worth noting that the low in-house production spend for commercial broadcasters may simply reflect the fact that many of them have no in-house production capability. We also identified a general shift across both publicly and commercially
320 The only genre all respondents felt is cheaper to produce externally was cinema film.

377
funded broadcasters towards external commissioning, with over 70% of respondents stating that the proportion of external commissioning had increased over the last five years.
The majority of format commissioning is by commercial broadcasters with an average of 10% of their total programming budget invested in commissioning formatted programming. For the publicly funded broadcasters, only 6%321 of their programming budget was spent on commissioning formats. This gap in format investment between publicly funded and advertising funded broadcasters is down to balancing risk. Advertising funded broadcasters typically opt for tried and tested formats in order to guarantee audience share (and thus satisfy advertisers) whereas publicly funded broadcasters often have a remit to adhere to that ensures they must promote innovation, education and invest in local programming.
Commissioning new programmes The vast majority of news programming is produced in-house, while cinema film and documentaries tend to be produced externally. Fiction, entertainment and factual magazine programming have a more balanced mix in terms of sourcing, with 20% to 50% produced in-house and 40% to 70% produced by independent producers. Documentaries are rarely produced in-house and cinema film is always sourced from the external market (typically Hollywood studios or local/domestic independent producers). In news, games and sport over 15% of programming is made by other broadcasters e.g. Five in the UK sourcing their news programming from Sky.
83
52
45
38
36
26
17
17
9
17
20
10
8
4
40
38
42
53
66
79
1000
10% 20% 30% 40% 50% 60% 70% 80% 90% 100%
NEWS
FACTUAL MAGAZINE
SPORT
GAMES
ENTERTAINMENT
FICTION
DOCUMENTARIES
CINEMA FILM
PERCENTAGE OF TOTAL COMMISSIONING SPEND
IN-HOUSEEXTERNAL NON-INDEPENDENT
PRODUCERINDEPENDENT
PRODUCER
83
52
45
38
36
26
17
17
9
17
20
10
8
4
40
38
42
53
66
79
1000
10% 20% 30% 40% 50% 60% 70% 80% 90% 100%
NEWS
FACTUAL MAGAZINE
SPORT
GAMES
ENTERTAINMENT
FICTION
DOCUMENTARIES
CINEMA FILM
PERCENTAGE OF TOTAL COMMISSIONING SPEND
IN-HOUSEEXTERNAL NON-INDEPENDENT
PRODUCERINDEPENDENT
PRODUCER
321 This figure was skewed slightly by two publicly funded broadcasters who both reported high levels of investment in formatted programming. Generally, the level of investment sits between 0% and 3%.

378
Over 82% of respondents stated that external commissioning has grown significantly over the last five years, with 79% stating that the increase was particularly pronounced in fiction. Over 64% of format commissioning was invested in entertainment and games formats such as Pop Idol or Deal Or No Deal, while over a third of broadcasters stated they had spent less on format commissioning over the last few years, both in-house and externally.
Decisions about programme acquisitions The decision to acquire ready-made programming rather than commission a new programme often comes down to budgetary constraints.
75
75
75
73
71
67
46
43
17
17
18
14
31
29
25
8
8
9
14
33
23
29
10% 20% 30% 40% 50% 60% 70% 80% 90% 100%
CINEMA FILM
ENTERTAINMENT
FACTUAL MAGAZINE
DOCUMENTARIES
GAMES
NEWS
FICTION
SPORT
COST OF AQUISITION AS A PERCENTAGE OF THE COST OF A COMMISSION
0-20% 21%-50% 51%-100%
75
75
75
73
71
67
46
43
17
17
18
14
31
29
25
8
8
9
14
33
23
29
10% 20% 30% 40% 50% 60% 70% 80% 90% 100%
CINEMA FILM
ENTERTAINMENT
FACTUAL MAGAZINE
DOCUMENTARIES
GAMES
NEWS
FICTION
SPORT
COST OF AQUISITION AS A PERCENTAGE OF THE COST OF A COMMISSION
0-20% 21%-50% 51%-100%
Across all genres, except sport and fiction, over 65% of broadcasters stated that acquired programming cost over 80% less than commissioned programming. Within this, 75% of respondents felt that acquiring factual magazine and entertainment programming cost under 20% of the investment required to commission a similar program. The response for fiction was more mixed, with over 23% of respondents stating that acquired fiction programmes can cost over 50% of the cost of commissioning. This is probably a reflection of the high cost of American imports such as 24, Lost and CSI, which are acquired at significant cost relative to standard commissioning budgets.
With the exception of fiction and cinema film, over 95% of acquisition spend was on programming produced in the last five years.
With regards the origin of programming, over half of broadcaster’s acquisitions were from the US with just under 25% from content owners in another European country. Only 19% of acquired programming was from the broadcasters’ respective domestic market and just over 3% of acquired programming was from content owners outside Europe and the US (mostly from Asia).

379
SOURCE OF ACQUIRED PROGRAMMING
PROPORTION OF TOTAL ACQUISTION SPEND
US BROADCASTERS OR PRODUCERS 56%
BROADCASTERS OR PRODUCERS OUTSIDE EUROPE AND THE US 23%
DOMESTIC PRODUCERS 14%
OTHER DOMESTIC BROADCASTERS 5%
BROADCASTERS OR PRODUCERS IN ANOTHER EUROPEAN COUNTRY 3%
11.5. Non-Linear Services
Of our respondents, both broadcasters and pure VoD players, the majority have content available via on-demand services distributed via the internet or IPTV. While broadcasters also use mobile (40%) and cable (32%), pure VoD players rely primarily on cable (25%) as their secondary distribution technology. While broadcasters generally offer a balanced mix of live, archive and, more recently, catch-up services on their VoD offerings, and a balanced mix of live, archive and, more recently, catch-up services, and a balanced mix of genres, reflecting the fact that a large part of their catalogue is derived from their generalist television schedules, pure VoD players show a clear preference for archive material with a focus on cinema, TV fiction and documentaries. Entertainment is by far the most popular genre on broadcasters’ on-demand services (39.5%), followed by news (18.7%). For pure VoD players, cinema alone takes 62% of all viewing time spent, followed by entertainment (22.3%).
European titles are, in general, a key component of on-demand catalogues for both broadcasters and pure VoD players: among those interviewed for this survey, only 17% of pure VoD players and 12% of broadcasters said that their catalogues consisted of less than 25% of European titles. The actual number for broadcasters is often 100% as they generally replicate their linear schedules in their on-demand services, minus the titles that they do not own the on-demand rights (and which are generally not European).
Pure VoD players allocate 100% of their programme budget to acquisitions, with non-European imports representing almost half of the total, meaning that the pure VoD players from this survey have spent no money at all to commission new programmes.
Of the respondent broadcasters, 41% use advertising to fund their on-demand service (both pre/post roll and advertising midway through a programme, although the latter was less commonly used than pre/post roll advertising). Of all the respondents, 18% funded their service only via advertising, with 14% of broadcasters also having content available via subscription or pay-per-view as well as content supported by advertising, and 9% being funded in part by advertising revenue and in part by public subsidy. Public subsidy is used as the sole revenue stream by 23% of the broadcasters who responded. For 36% of the broadcaster owned on-demand services, content was funded solely via subscription and pay-per-view charges. Therefore 64% of broadcaster owned services are essentially free-to-use for the viewer to some extent (i.e. the service

380
is either entirely supported by public subsidy or advertising, or has some content available for free as ad-supported programming.
The vast majority of the revenue of pure VoD players who took part in our survey comes only from direct payments from consumers either as subscription fees (92% of pure VoD players who responded) or as pay-per-view. The remaining 8% were in part supported via subscription and pay-per-view fees, but also had money from public subsidy.
11.6. Procedures and Indicators for
Monitoring Article 3i of the AVMS Directive
At this time, the only appropriate operational procedure for monitoring Article 3i involves self-declarations from service providers. Independent evaluation of non-linear services, similar to what is completed for linear services (and has been done so in this study) is not currently an appropriate procedure. This is firstly due to a lack of publicly available data on non-linear services, as there is on linear services via TAM-data providers. This means that to collect data on the content available on non-linear services, an independent consultant cannot simply purchase data as is done for linear services, but instead would have to go to the service directly. Automated ‘web-harvesting’ software could be used to copy title data from a service to a database, but raises some legal questions and would require in any event legislative efforts from Member State bodies to gain permission from service providers for such an approach. Alternatively, consultants would need to access the service themselves and copy lists of titles that are available. However, this process is complicated, in particular because there are no set schedules for non-linear services (as there are for linear services), and so it is unlikely that a list of all content available on a service will be found. Instead content has to be searched for, which opens up the possibility that content will be missed. More importantly, this process will be extremely time-consuming and therefore very expensive. For these reasons, independent monitoring has not been used for this study.
For this study, when looking at non-linear services, the consultants have used data acquired from self-declarations from service providers. At this time, for the reasons given above, we believe this is the appropriate operational procedure for monitoring Article 3i.
Following our analysis of the various indicators for Article 3i, we consider that the following are not appropriate at this time:
• Strict prominence measures – we are concerned that enforcing strict rules on on-demand services as to the way they promote European content will possibly limit the creative development of these services. A lighter touch is favorable (see below).
• Consumption measures – these are not an appropriate performance indicator at this time in our view. The data in currently

381
inconsistent, considered highly confidential by providers and goes beyond what is required of linear broadcasters. Consumption data, however limited, could be included, as noted in Recital 48, in the Member State reports to provide some evidence as to the success of other performance indicators being applied to non-linear services (see below for our suggestions). We do, however, think that consumption measures will become more viable with the future emergence of standard industry measures for On-Demand consumption. We believe that the development of standard industry measures should be supported at the Member State and European level. Once these services are available independent audits will be possible to conduct, by subscribing to these monitoring services.
Our analysis has therefore led us to the conclusion that the following are the appropriate procedures and indicators to be applied at this time, in order to assess the effectiveness of Article 3i:
• Title-level data – coding content in the catalogue for country-of-origin will not be too difficult to complete. Data could be reported confidentially in a declaration to the appropriate government body. Anonymised data could then be provided at the Member State level.
• Hour-level data – we believe that this will be a useful addition to the title-level data, and should already be available to the providers, thus requiring little additional resources. The procedure for this would be largely the same as for title-level data.
• Encouraging prominence of European content – as noted above, strict prominence measures could damage the development of on-demand services. Pushing for co- and self-regulation here, as defined in Article 3(7) and further explained in Recital 36 of the AVMS Directive, whereby providers would sign up to a set of commitments regarding prominence, would allow the Commission to ensure European content is being sufficiently promoted to audiences.
• Financial data on spend on programming – service providers would supply regulatory bodies with financial data on their spend on programming, and the proportion of this that is spent on European programmes. We expect that in the current stage of development for these services data will be limited, as little is spent on programmes, but this indicator will give a good basis for understanding how far on-demand providers support that production of European content.
Where possible, we have applied of key performance indicators for Article 3i to specific services. This is again based on data acquired through self-declarations. The main quantitative indicators that have been applied are proportion of titles in a catalogue that are European, proportion of hours of content in a catalogue that are European. This has shown that the vast majority of services who supplied data for our study had over 80% European titles in their catalogue (with many having 100%). However, pure VoD players typically had a smaller proportion of European titles than

382
that available on the non-linear services owned by broadcasters. On-demand services provided by private broadcasters have a slightly lower proportion of European titles, compared with public broadcasters. One financial indicator was applied to specific services, asking for the proportion of the total budget for the non-linear to be split by source of programming, but data was not forthcoming from service providers. Based on a very limited response, it appeared that non-linear services run by broadcasters typically had high proportions of national content, whereas pure VoD players independent from broadcasters relied more on non-European content. The consultants also applied three prominence indicators to specific services. This was based on additional desk research completed by the consultants. The three indicators are: 1) Can content be searched for by country of origin; 2) is country of origin for a piece of content indicated anywhere on the service; 3) an estimate of the proportion of the homepage that is dedicated to European works. When compared with the results for quantitative indicators we could see that, based on this initial prominence analysis, for private broadcaster owned on-demand services, the prominence of European content does not necessarily match the proportion of European content that is actually available. On average, prominence scores are lower than the results from the quantitative indicators, showing that an on-demand service can contain many European works, but then still put non-European works (for example US programming) at the forefront of the service. This does help support the case for prominence measures being included as part of the monitoring of Article 3i.

383
12. Conclusions/ Conclusions/ Schlussfolgerungen
12.1. English Below we present the core conclusions and recommendations from the study, based on findings from all parts of the study, and taking comments from the workshop into consideration.
• As with the 2005 Study, we found some areas where national transpositions of Articles 4 and 5 differ from Member State to Member State.
• Some Member States include the qualifying term ‘where practicable’, some have created stricter definitions for ‘total qualifying hours’ than others, while the definition of ‘independent producer’ varies greatly between Member States. These variations have allowed us to group Member States according to whether they have a ‘flexible’ or ‘prescriptive’ application of the directive, and whether they have ‘low’ or ‘high’ additional requirements placed on broadcasters.
• It appears that few Member States have altered their implementation of Articles 4 and 5 significantly since the results of the 2005 study. Among the Member States that were covered in the 2005 Study, the only changes of Implementation Modes were the Netherlands and Norway moving from ‘flexible’ to ‘prescriptive’ in the application of Articles 4 and 5, and Belgium moving from ‘high’ to ‘low’ in additional requirements.
• At the time when Directive 2007/65 was adopted, very few Member States applied rules to non-linear services with an effect similar to Article 3i. Only the French Community of Belgium applied a European Works requirement directly to non-linear services.
• The audiovisual market itself in Europe is becoming increasingly complex. New distribution models such as on-demand and increased fragmentation in traditional broadcasting have altered the structure of the market. However, only a very small proportion of the estimated €78.1bn revenue for the TV industry in 2006 was generated by video-on-demand: approximately 0.5%. This clearly indicates that non-linear services are still at an early stage in their development.
• Sources of total TV revenue vary significantly from Member State to Member State, although across the whole industry, 23% came from licence fees, 36% from advertising and sponsorship, and 34% from consumer payments.
• For linear services, free TV remains the most popular business model, and despite a significant migration to pay-TV services, pay-TV homes still represent less than one-third of European TV homes. Our survey of on-demand services showed that the large majority

384
of broadcaster-run non-linear services offer some or all of their content free-of-charge to the user. Interestingly, however, pure VoD players not attached to broadcasters indicated that consumer payments were almost always their main source of revenue. What we are seeing now, then, is a difference in the proposed business models for non-linear services, depending on whether or not they are attached to a broadcaster.
• For linear broadcasters, the split between spend on commissioned and acquired programming appears to vary depending on whether the service is public or private. Public broadcasters spend 58% of their budgets on in-house production (16% on acquisitions), while private broadcasters spend 18% on in-house production (51% on acquisitions). Just over half of all broadcasters’ acquisitions were sourced from the USA. However, there is a different picture on broadcasters’ non-linear services, with almost all surveyed services, both public and private, indicating that 75% of their on-demand budgets’ were spent on commissioned content, and that in most cases their catalogues consisted of near or exactly 100% European content. This reflects the fact that broadcasters are more likely to have the on-demand rights to content they have commissioned themselves. On the other hand, the situation for pure VoD players is quite different, with 100% being spent on acquisitions – indicating the difficulty of affording expensive commissioned content. In their case, however, the proportion of this acquired content that is non-European is closer to that of the situation for linear services, with nearly half of their investment going on content made outside Europe.
• In our analysis of linear services, we found that the majority of channels surveyed met the requirements of Articles 4 and 5. Across our sample, 62.4% of qualifying transmission hours were European content and 31% were independent European works, of which 84.4% were less than five years old.
• We have also applied Articles 4 and 5 to viewing figures for the first time in this study. We have found that these are a useful complement to the study of transmission hours, providing a clearer picture of the actual proportion of content being watched that is European and independently produced. Support for the inclusion of viewing figures was voiced by stakeholders at the workshop. Our findings indicate that the proportions for viewer hours are consistently higher than the proportions for transmission hours at the EU-wide level (62.4% of qualifying transmission hours are European across our entire sample, compared with 74% of viewer hours; 31% of qualifying transmission hours are European independent productions, compared with 33.4% of viewer hours), indicating that European and independently produced content are very popular with audiences in the Member States surveyed.
• The notion of ‘qualifying’ programming was discussed at the workshop. The findings of our study indicate that its application to non-linear services would be unlikely to affect the results substantially. The majority of broadcaster-run non-linear services showed near or exactly 100% European content anyway. This is unsurprising: broadcasters typically expect on-demand rights for their commissioned programming, which will usually be national. It

385
is however more difficult for them to acquire new media rights for acquisitions, for example content from the USA. For pure VoD players we did find a greater propensity to have non-European content available on their services, but we also found that the genres found on them were typically ‘qualifying’ genres, such as cinema film, entertainment and factual (in fact, approximately 89% of the budgets for the pure VoD players who responded to our survey were spent on these 3 genres).
• With the deadline for implementation of the new Directive set for 19 December 2009, we found that only a few Member States had, or expected to have, implemented Article 3i into national legislation during 2008. A small number of Member States (French Community of Belgium and France) had established national rules for application to non-linear servces.
• This, coupled with the fact that the video-on-demand industry is itself still very much at a nascent stage, means that identifying monitoring methods for non-linear services, as well as collecting data on them, is substantially more challenging than has been the case for linear services. At the workshop it was clear that a variety of different stakeholder opinions continue to exist as to how to apply Article 3i to non-linear services, and we expect these discussions to continue throughout 2009.
• We have presented what we consider to be possible and appropriate monitoring methods for Article 3i, based on what can be done at this time. Currently, we do not consider it possible to perform independent evaluation of non-linear services (as has been done for linear services), largely as data akin to Television Audience Measurement (TAM) data is not available for non-linear services at this time. Thus we have relied on self-declarations.
• We believe that at this early stage in the development of non-linear services the following quantitative performance indicators would be appropriate for measuring adherence to Article 3i: proportion of catalogue titles that are European, proportion of catalogue hours that are European, proportion of the total amount spent on content devoted to European works.
• The confidentiality of data such as financial data and consumption data was raised as a concern by interviewed stakeholders, meaning that there was less willingness to provide this sort of information. However, it is worth noting that there were some calls at the workshop for greater pressure to be put on providers to supply this sort of information in the future.
• At this time we do not consider consumption data to be an appropriate performance indicator. This decision is largely based on the fact that this data is highly confidential (see above) and also that there is currently no robust independent data source for consumption of on-demand content (as there is for linear programming with TAM data). This means that acquiring data that could be used to compare services within and across Member States could not be done reliably at this time. This topic was the subject of much debate at the workshop, with several stakeholders demanding a stronger push towards using consumption data to monitor Article 3i. It was clear from the discussion, however, that there is still much discussion needed to decide on the appropriate

386
method of monitoring on-demand audiences. This said we believe that consumption data may well become available for non-linear services in the future, and that the Commission and Member State bodies should look to assist the development of industry standard data here wherever possible.
• ‘Prominence’ has proved perhaps the most contentious performance indicator for Article 3i, with a great deal of discussion on this taking place at the workshop. The term is loosely defined in the legislation, and we have found that this does lead to a wide variety of possible applications of prominence as a monitoring method for Article 3i. There are strong concerns, raised from surveyed stakeholders, and also at the workshop, that applying prominence measures that are too strict could limit the creative development of new services. There were also concerns raised at the workshop that measuring prominence would prove very difficult – for example, a homepage for a non-linear service can be tailored specifically to a user, so it can be difficult for an independent consultant to accurately assess an indicator such as the proportion of a homepage dedicated to European content. We believe that, at this time, having prominence guidelines that on-demand providers can agree to would be an appropriate step, and that further discussion within Member States and with stakeholders is needed to identify the appropriate definition and application of prominence measures.
12.2. Français Nous présentons ici les principales conclusions et recommandations émanant de l'étude. Elles s’appuient sur les conclusions de l’ensemble des chapitres couverts dans l'étude et tiennent compte des commentaires émis lors de l'atelier.
• De façon similaire à l’étude menée en 2005, nous avons identifié un certain nombre de domaines dans lesquels les transpositions nationales des Articles 4 et 5 divergent en fonction des États membres.
• Certains États membres ont intégré le terme de la directive « dans la mesure du possible », certains ont formalisé des définitions plus strictes des « heures totales prises en compte » que les autres, tandis que la définition de « producteur indépendant » varie largement d’un État membre à l’autre. Ces variations nous ont permis de regrouper les États membres selon leur application « souple » ou « stricte » de la directive et leurs exigences « faibles » ou « élevées » imposées aux diffuseurs.
• Il apparaît que peu d'États membres ont modifié leur mise en oeuvre des Articles 4 et 5 de façon significative depuis les résultats de l'étude de 2005. Parmi les États membres étudiés en 2005, les seuls pays à avoir modifié leurs modes de mise en oeuvre sont les Pays-Bas et la Norvège, passant d'une application « souple » à une application « stricte » des Articles 4 et 5, et la Belgique, passant d'exigences supplémentaires « élevées » à « faibles ».
387
• A l’époque où la directive 2007/65 a été adoptée, peu d’États membres appliquaient aux services non linéaires des règles visant un objectif similaire à celui de l’Article 3i. Seule la Communauté française de Belgique a appliqué une exigence relative aux Œuvres européennes directement à ses services non linéaires.
• Le marché audiovisuel en Europe devient de plus en plus complexe. Les nouveaux modèles de distribution tels que les services à la demande et l’augmentation de la fragmentation de la diffusion linéaire classique ont modifié la structure des marchés. Toutefois, seule une faible proportion des revenus de l’industrie télévisuelle, estimés à 78,1 milliards d’€ en 2006, a été générée par les services à la demande : environ 0,5%. Ceci indique clairement que les services non linéaires sont encore à un stade précoce de leur développement.
• Le poids des différentes sources de revenus de l’industrie télévisuelle varie de façon significative d’un État membre à l’autre. Sur l’ensemble de l’Union Européenne, 23 % des revenus proviennent des budgets publics, 36% de la publicité et du parrainage et 34% des paiements directs par les consommateurs.
• S’agissant des services linéaires, la télévision gratuite reste le modèle économique dominant et malgré une migration significative vers des services de télévision payante, les foyers souscrivant à de tels services représentent toujours moins d’un tiers de l’ensemble des foyers équipés TV de l'Union européenne. Notre enquête sur les services à la demande a indiqué que la grande majorité des services non linéaires proposés par les diffuseurs sont gratuits pour l'utilisateur. A l’inverse, les fournisseurs de contenus exclusivement en VoD et non liés à des diffuseurs nous ont indiqué que les revenus issus directement des consommateurs constituent la plupart du temps leur source principale de revenus. Aujourd’hui, nous observons une différence claire de modèles économiques entre les services non linéaires selon leur lien ou leur indépendance vis-à-vis d’un groupe historique de télévision.
• S’agissant des diffuseurs linéaires, la répartition des budgets programmes entre la production et les acquisitions semble varier en fonction du caractère public ou privé du service. Les diffuseurs publics dépensent 58% de leurs budgets pour la production interne (16% d'acquisitions) alors que les diffuseurs privés dépensent 18 % (51 % pour les acquisitions). Un peu plus de la moitié des acquisitions des diffuseurs ont été achetés aux États-unis. Toutefois, le tableau est différent pour les services non linéaires des diffuseurs, avec la presque totalité des services étudiés, tant publics que privé, indiquant que 75% de leurs budgets consacrés aux services à la demande étaient consacrés aux contenus commandés et que, dans la plupart des cas, leurs catalogues étaient constitués à 100 % ou presque de contenus européens. Ceci traduit le fait que les diffuseurs sont plus susceptibles de disposer des droits des programmes à la demande sur les contenus qu’ils ont eux-mêmes commandés. D’autre part, la situation des fournisseurs de contenus exclusivement en VoD est très différente, avec 100 % des budgets consacrés aux acquisitions, indiquant leur difficulté à investir dans de nouvelles productions aux budgets importants. Dans leur cas toutefois, la proportion de ces acquisitions non européennes est

388
plus proche de celle des services linéaires, avec presque la moitié de leurs investissements consacrés à des contenus produits en dehors de l’Europe.
• Notre analyse des services linéaires montre que la majorité des chaînes étudiées respectent les exigences des Articles 4 et 5. Dans notre échantillon, 62,4 % des heures de transmission prises en compte étaient constituées de contenus européens et 31% étaient des œuvres européennes indépendantes parmi lesquelles 84,4% dataient de moins de cinq ans.
• Nous avons également appliqué les Articles 4 et 5 aux données d’audience, ceci pour la première fois à l’occasion de cette étude. Nous avons constaté qu'ils constituent un complément utile à l’étude des heures de transmission, fournissant une image précise de la proportion de contenus réellement consommés, qu’il s’agisse des productions Européennes ou indépendantes. L’ajout à l’analyse des grilles de programmes d’analyses réalisées à partir des données d’audience a reçu un soutien important des participants à l’atelier. Nos résultats indiquent que les proportions d’heures téléspectateur sont généralement supérieures aux proportions d’heures de transmission au niveau de l’ensemble de l'Union Européenne (62,4% des heures de transmission prises en compte sont européennes sur l’intégralité de notre échantillon, par rapport à 74% des heures téléspectateur et 31 % des heures de transmission prises en compte sont des productions indépendantes européennes, par rapport à 33,4 % des heures téléspectateur), indiquant que les contenus européens et produits de façon indépendante sont très populaires auprès des publics des États membres interrogés.
• La notion d’œuvre « prise en compte » a été abordée lors de l’atelier. Les résultats de notre étude indiquent que son application à des services non linéaires serait peu susceptible d'avoir une incidence sensible sur la réalité des offres. La majorité des services non linéaires proposés par les diffuseurs contiennent en effet 100% ou presque de contenus européens. Ceci n’est pas surprenant dans la mesure où les diffuseurs acquièrent généralement les droits à la demande sur les programmes qu’ils produisent, droits qui sont généralement nationaux. Il est par ailleurs plus difficile pour eux d’acquérir les droits nouveaux médias sur leurs acquisitions, notamment sur les contenus originaires des États-unis. Chez les fournisseurs de contenus exclusivement en VoD, nous avons trouvé une plus grande propension à proposer des contenus européens et nous avons également remarqué que les genres que l'on trouve sur ces derniers sont généralement des genres « pris en compte » tels que les films de cinéma, les divertissements et magazines de société (en fait, environ 89% des budgets des fournisseurs de contenus exclusivement en VoD ayant répondu à notre enquête ont été dépensés pour ces 3 genres).
• Compte tenu de l’échéance retenue pour la transposition de la nouvelle directive, fixée au 19 décembre 2009, seuls quelques États membres prévoient de transposer l'Article 3i dans leur législation nationale au cours de 2008. Un petit nombre d'États membres (Communauté française de Belgique et de France) ont établi des règles nationales d'application des services non linéaires.

389
• Ceci, associé au fait que l’industrie de la vidéo à la demande se trouve encore à un stade précoce, signifie que l'identification de méthodes de contrôle des services non linéaires, et la collecte de données afférantes, est sensiblement plus complexe que pour les services linéaires. Lors de l'atelier, il est apparu clairement qu'une variété d'opinions continue d’exister sur la façon d'appliquer l'Article 3i aux services non linéaires et nous estimons que ces discussions vont se poursuivre en 2009.
• Nous avons présenté les méthodes de controle possibles et appropriées pour l’Article 3i en fonction de ce qui est réalisable à ce stade. Actuellement, nous estimons qu’il n’est pas possible de réaliser une évaluation indépendante des services non linéaires (comme ceci a été effectué pour les services linéaires), puisque les données telles que la mesure de l'audience télévisuelle (TAM) ne sont pas disponibles pour les services non linéaires pour le moment. Par conséquent, nous nous sommes appuyés sur les auto-déclarations.
• Nous estimons qu’à ce stade précoce du développement des services non linéaires, les indicateurs de performance quantitatifs suivants seraient les plus appropriés pour mesurer le respect de l'Article 3i : proportion des titres européens du catalogue, proportion horaire des contenus européens dans le catalogue, proportion du montant total dépensé pour le contenu consacré aux œuvres européennes.
• La confidentialité des données telles que les données financières et les données de consommation ont posé un problème aux parties prenantes interrogées, signe d’une volonté limitée de fournir ce type d'informations. Toutefois, il convient de constater que lors de l’atelier, certains ont appelé à l’application d’une pression plus forte sur les fournisseurs en vue de fournir de type d’informations à l’avenir.
• Pour le moment, nous ne considérons pas les données relatives à la consommation comme un indicateur de performance approprié. Cette opinion découle largement du fait que ces données sont hautement confidentielles (voir ci-dessus) et qu'aucune source reconnue de données de consommation des contenus à la demande n’existe actuellement (similaire à celles des programmations linéaires avec les données TAM). Ceci signifie que l’acquisition de données qui pourraient être utilisées pour comparer les services dans les États membres ne peut être effectuée avec une fiabilité suffisante aujourd’hui. Cette question a fait l’objet de nombreux débats lors de l’atelier, de nombreux participants demandant une utilisation plus importante des données de consommation pour controler le respect de l'Article 3i. La discussion a toutefois permis de démontrer clairement que des discussions approfondies seront nécessaires à l’avenir pour choisir la méthode la plus appropriée de contrôle de la consommation des programmes à la demande. Ceci dit, nous estimons que les données de consommation pourraient devenir disponibles pour les services non linéaires à l'avenir et que la Commission et les organismes des États membres devraient chercher à contribuer à l'établissement d'une norme des données de l’industrie dans la mesure du possible.

390
• « La proéminence » a été considérée comme l’indicateur le plus controversé de l’Article 3i et a été largement abordé lors de l’atelier. Le terme est mal défini, ce que signifie que de multiples interprétations sont possibles et les parties prenantes sont préoccupées par la possible limitation de la liberté créative des nouveaux services par des règles strictes. Des doutes ont également été émis lors de l’atelier sur la capacité d’appliquer ce type d’indicateur dans un univers où les services sont de plus en plus personnalisés : par exemple, une page d’accueil d’un service non linéaire pouvant être personnalisée pour un utilisateur spécifique, un consultant indépendant aurait des difficultés pour évaluer un indicateur tel que la proportion d'une page d’accueil dédiée et le contenu européen. Nous estimons que les prochaines étapes nécessaires pour affiner la notion de proéminence passent par le développement de lignes directrices sur lesquelles les fournisseurs de programmes à la demande pourraient se mettre d’accord, suivi de discussions supplémentaires entre les États membres et les parties prenantes afin d’aboutir à une définition et des méthodes d’application appropriées de la notion de proéminence.
12.3. Deutsch Im Folgenden stellen wir die wichtigsten Schlussfolgerungen und Empfehlungen aus der Studie vor, auf der Basis der Ergebnisse in allen Teilen der Studie und unter Berücksichtigung von Kommentaren aus dem Workshop.
• Wie bei der Studie von 2005 stellten wir einige Bereiche fest, bei denen die nationale Umsetzung von Artikel 4 und 5 in den einzelnen Mitgliedstaaten unterschiedlich gehandhabt wird.
• Einige Mitgliedstaaten beziehen den qualifizierenden Begriff ‘soweit durchführbar’ mit ein, einige haben engere Definitionen für ‘anrechnungsfähige Gesamtstunden’ festgelegt und bei der Definition von ‘unabhängiger Produzent’ gibt es große Unterschiede zwischen den einzelnen Mitgliedstaaten. Diese Abweichungen haben es uns ermöglicht, die Mitgliedstaaten danach einzustufen, ob sie die Richtlinie ‘flexibel’ oder ‘verordnend’ anwenden und ob den Rundfunksendern ‘niedrige’ oder ‘hohe’ zusätzliche Vorgaben auferlegt werden.
• Es sieht so aus, als ob nur wenige Mitgliedstaaten ihre Umsetzung von Artikel 4 und 5 seit den Ergebnissen der Studie von 2005 wesentlich geändert haben. Unter den Mitgliedstaaten, die an der Studie von 2005 beteiligt waren, waren die einzigen Änderungen der Umsetzungsmodi in den Niederlanden und in Norwegen festzustellen, die die Anwendung der Artikel 4 und 5 von ‘flexibel’ auf ‘verordnend’ änderten und in Belgien, wo die zusätzlichen Vorgaben von ‘hoch’ auf ‘niedrig’ geändert wurden.
• Zum Zeitpunkt der Annahme von Richtlinie 2007/65 gab es nur in sehr wenigen Mitgliedstaaten Vorschriften zu nicht-linearen

391
Diensten mit ähnlichen Auswirkungen wie Artikel 3i. Nur die Französische Gemeinschaft in Belgien hat die Vorgabe für europäische Werke direkt auf nicht-lineare Dienste angewendet.
• Der audiovisuelle Markt in Europa wird immer komplexer. Neue Distributionsmodelle wie etwa Abrufdienste und zunehmende Fragmentierung beim traditionellen Rundfunk haben die Struktur des Marktes geändert. Nur ein sehr geringer Anteil der geschätzten Einnahmen der TV-Industrie von 78,1 Mrd. € entfiel auf Video-on-Demand: ca. 0,5%. Ein klares Anzeichen, dass sich nicht-lineare Dienste noch im Anfangsstadium befinden.
• Bei den Quellen für die gesamten TV-Einnahmen gibt es große Unterschiede zwischen den einzelnen Mitgliedstaaten. Über die gesamte Branche betrachtet stammten 23% von Fernsehgebühren, 36% aus Werbung und Sponsoring und 34% von Zahlungen von Verbrauchern.
• Bei linearen Diensten bleibt kostenfreies Fernsehen das beliebteste Geschäftsmodell und trotz einer erheblichen Abwanderung zu Pay-TV-Diensten machen Haushalte mit Pay-TV immer noch weniger als ein Drittel der europäischen TV-Haushalte aus. Unsere Umfrage bei Abrufdiensten hat aufgezeigt, dass die Mehrzahl der von Rundfunksendern angebotenen nicht-linearen Dienste einen Teil des Inhalts oder den gesamten Inhalt dem Benutzer kostenlos zur Verfügung stellen. Interessant war jedoch die Angabe reiner VoD-Anbieter ohne Anbindung an einen Rundfunksender, dass Zahlungen von Verbrauchern fast ihre gesamten Einnahmen ausmachten. Hier ist ein Unterschied bei den vorgeschlagenen Geschäftsmodellen für nicht-lineare Dienste festzustellen, abhängig davon, ob sie an einen Rundfunksender angebunden sind.
• Bei linearen Rundfunksendern scheint die Aufteilung zwischen den Ausgaben für Auftragsproduktionen und zugekauften Sendungen davon abhängig zu sein, ob es sich um einen öffentlich-rechtlichen oder einen privaten Dienst handelt. Öffentlich-rechtliche Rundfunksender wenden 58% ihres Budgets auf Eigenproduktionen auf (16% auf Zukäufe), während private Rundfunksender 18% auf Eigenproduktionen aufwenden (51% auf Zukäufe). Etwas über die Hälfte aller Zukäufe von Rundfunksendern stammten aus den USA. Bei den nicht-linearen Diensten von Rundfunksendern sieht es jedoch anders aus: fast alle der an der Umfrage beteiligten Dienste, sowohl öffentlich-rechtliche als auch private, gaben an, dass 75% ihres Budgets für Abrufdienste auf Auftragsproduktionen aufgewendet werde und dass ihre Kataloge in den meisten Fällen aus europäischen Inhalten mit nahezu oder genau 100% bestanden. Das ist auf die Tatsache zurückzuführen, dass Rundfunksender über die Abrufrechte für Auftragsproduktionen verfügen, die sie selbst in Auftrag gegeben haben. Bei reinen VoD-Anbietern verhält es sich jedoch ganz anders - 100% werden auf Zukäufe aufgewendet, dies zeigt den hohen Kostenaufwand für Auftragsproduktionen auf. In ihrem Fall ist der Anteil des zugekauften außereuropäischen Inhalts dem für lineare Dienste ähnlich und fast die Hälfte der Investitionen wird auf Inhalte aufgewendet, die außerhalb Europas hergestellt wurden.
• Bei unserer Analyse von linearen Diensten haben wir festgestellt, dass die meisten der an der Umfrage beteiligten Sender die
392
Vorgaben von Artikel 4 und 5 erfüllen. In unserer Stichprobe hatten, 62,4% der anrechnungsfähigen Sendestunden einen europäischen Inhalt und 31% waren unabhängige europäische Werke, von denen 84,4% weniger als fünf Jahre alt waren.
• Wir haben in dieser Studie auch zum ersten Mal Artikel 4 und 5 auf die Zuschauerzahlen angewendet. Wir haben festgestellt, dass sie eine nützliche Ergänzung zur Untersuchung der Sendestunden darstellen und ein deutlicheres Bild des tatsächlichen Anteils der gesehenen Sendungen, die aus Europa stammen und unabhängig produziert wurden, ergeben. Das Miteinbeziehen der Zuschauerzahlen wurde beim Workshop von den Interessenvertretern unterstützt. Unsere Ergebnisse zeigen auf, dass die Anteile für Zuschauerstunden EU-weit höher sind als die Anteile für Sendestunden (62,4% der anrechnungsfähigen Sendestunden sind in unserer Stichprobe europäisch, im Vergleich zu 74% der Zuschauerstunden; 31% der anrechnungsfähigen Sendestunden sind unabhängige europäische Produktionen im Vergleich zu 33,4% der Zuschauerstunden), dies zeigt an, dass europäische und unabhängig produzierte Inhalte bei den Zuschauern in den an der Umfrage beteiligten Mitgliedstaaten sehr beliebt sind.
• Das Konzept der ‘anrechnungsfähigen’ Programme wurde beim Workshop besprochen. Die Ergebnisse unserer Studie deuten darauf hin, dass die Anwendung auf nicht-lineare Dienste keine wesentlichen Auswirkungen auf die Ergebnisse hätte. Die meisten der von Rundfunksendern angebotenen nicht-linearen Dienste wiesen ohnehin nahezu oder genau 100% europäische Inhalte auf. Das überrascht nicht: Rundfunksender erwarten im allgemeinen Abrufrechte für ihre Auftragsproduktionen, diese sind normalerweise national. Es ist jedoch schwieriger für sie, neue Medienrechte für Zukäufe, z.B. aus den USA, zu erlangen. Bei reinen VoD-Anbietern stellten wir jedoch eine größere Neigung fest, außereuropäische Inhalte auf ihren Diensten anzubieten, wir stellten aber auch fest, dass es sich bei den angebotenen Genres meist um ‘anrechnungsfähige’ Genres handelte, wie etwa Kinofilme, Unterhaltung und Factual Entertainment (in der Tat wurde ca. 89% des Budgets für die reinen VoD-Anbieter, die an unserer Befragung teilnahmen auf diese 3 Genres aufgewendet).
• Im Hinblick auf die Frist für die Umsetzung der neuen Richtlinie am 19. Dezember 2009 stellten wir fest, dass nur einige wenige Mitgliedstaaten die Umsetzung von Artikel 3i in die nationale Gesetzgebung in 2008 abgeschlossen oder geplant hatten. Eine kleine Anzahl von Mitgliedstaaten (die Französische Gemeinschaft in Belgien und Frankreich) hatten bereits nationale Vorschriften für die Anwendung auf nicht-lineare Dienste festgelegt.
• Diese Punkte und die Tatsache, dass sich die Video-on-Demand-Branche noch in der Aufbauphase befindet, bedeuten, dass die Bestimmung von Kontrollverfahren für nicht-lineare Dienste sowie das Sammeln von Daten über diese Dienste wesentlicher schwieriger sein wird als bei linearen Diensten. Beim Workshop wurde deutlich, dass die Meinungen der Interessenvertreter zur Anwendung von Anwendung von Artikel 3i auf nicht-lineare Dienste

393
weit auseinandergehen und wir erwarten, dass diese Gespräche im Verlauf von 2009 weitergeführt werden.
• Wir haben vorgestellt, was wir als mögliche und angemessene Kontrollverfahren für Artikel 3i erachten, auf der Basis des derzeit Machbaren. Unserer Ansicht nach ist es derzeit nicht möglich, eine unabhängige Beurteilung nicht-linearer Dienste durchzuführen (wie sie für lineare Dienste durchgeführt wurde), vor allem deshalb, weil Daten wie die Fernsehzuschauerforschung (Television Audience Measurement - TAM) für nicht-lineare Dienste noch nicht zur Verfügung stehen. Wir haben uns daher auf Selbstauskünfte verlassen.
• Wir sind der Ansicht, dass im Frühstadium der Entwicklung von nicht-linearen Diensten die folgenden quantitativen Leistungsindikatoren zur Messung der Einhaltung von Artikel 3i angemessen wären: Anteil der Katalogtitel, die aus Europa stammen, Anteil der Katalogstunden, die aus Europa stammen und Anteil des Gesamtbetrags, der für Inhalte speziell für europäische Werke aufgewendet wird.
• Zur Vertraulichkeit von Daten wie etwa Finanzdaten und Nutzungsdaten wurden von den befragten Interessenvertretern Bedenken angemeldet, d.h., die Bereitschaft zur Bereitstellung dieser Art von Informationen war geringer. Es sollte hier aber angemerkt werden, dass beim Workshop gefordert wurde, größeren Druck auf die Anbieter auszuüben, damit sie diese Art von Informationen in Zukunft zur Verfügung stellen.
• Zu diesem Zeitpunkt betrachten wir Nutzungsdaten nicht als einen angemessenen Leistungsindikator. Diese Entscheidung basiert vor allem auf der Tatsache, dass diese Daten streng vertraulich sind (siehe oben) und auch darauf, dass es derzeit keine zuverlässige unabhängige Datenquelle für die Nutzung von Abrufdiensten gibt (wie die TAM-Daten bei linearen Diensten). Das heißt, dass die Beschaffung von Daten, die zum Vergleich von Diensten in und zwischen Mitgliedstaaten zu diesem Zeitpunkt noch nicht zuverlässig durchgeführt werden kann. Dieses Thema wurde beim Workshop ausführlich diskutiert, mehrere Interessenvertreter forderten mehr Druck zur Verwendung der Nutzungsdaten zur Kontrolle gemäß Artikel 3i. In den Diskussionen wurde jedoch deutlich, dass weitere umfassende Diskussionen zur Auswahl der richtigen Methode für die Überwachung von Zuschauerzahlen für Abrufdienste notwendig sind. Trotzdem sind wir der Ansicht, dass Nutzungsdaten für nicht-lineare Dienste in der Zukunft zur Verfügung stehen werden und dass die Kommission und die zuständigen Gremien in den Mitgliedstaaten bei der Entwicklung von Daten nach einem Industriestandard soweit wie möglich mitwirken sollten.
• ‘Herausstellung’ hat sich wahrscheinlich als der umstrittenste Leistungsindikator für Artikel 3i herausgestellt, dieses Thema wurde beim Workshop ausführlich diskutiert. Der Begriff ist in der Gesetzgebung nicht genau definiert und wir haben festgestellt, dass dies zu vielen verschiedenen möglichen Auslegungen von Herausstellung als Überwachungsmethode für Artikel 3i führt. Starke Bedenken wurden von den befragten Interessenvertretern und beim Workshop geäußert, dass zu strenge Maßnahmen in

394
Bezug auf ‘Herausstellung’ die kreative Entwicklung von neuen Diensten beschränken könnten. Beim Workshop wurden auch Bedenken geäußert, dass das Messen von ‘Herausstellung’ sich als sehr schwierig erweisen würde – zum Beispiel kann eine Homepage für einen nicht-linearen Service speziell auf einen Benutzer zugeschnitten werden, d.h., die genaue Beurteilung eines Indikators wie etwa der Anteil einer Homepage mit europäischem Inhalt durch einen unabhängigen Berater erschwert werden. Wir sind der Ansicht, dass Leitlinien zur ‘Herausstellung’, denen Anbieter von Abrufdiensten zustimmen können, der richtige Schritt wären und dass weitere Diskussionen in den Mitgliedstaaten und mit Interessenvertretern notwendig sind, um die richtige Definition für den Begriff zu finden und zur Anwendung von Maßnahmen zur ‘Herausstellung’.

395
13. Appendix I: Genre Classifications
13.1. Non-Qualifying Programmes
13.1.1. News
News was defined as separate programmes containing reports of the most important recent events in summary form. A summary of sports results and recent sports news qualified as news but a programme of information confined to one particular sport would not qualify. Feature programmes, current affairs programmes or news magazines were also excluded.
13.1.2. Sport
Sport was defined as live or recorded coverage of sporting events or significant parts of such events. Magazine programmes about sports, even though such programmes may well contain excerpts of live events, were not included in this category.
13.1.3. Games
Defining the games genre offers specific challenges because it is a term that loosely defines a broad range of popular programmes. We sought to identify clearly the boundaries of the term – which is not defined in the Directive – to assist our researchers in each Member State to apply the term consistently.
We therefore defined games as television shows focusing primarily on participants competing for a prize – the game shows and quiz shows that are staples of the early evening schedule in many Member States.
We decided to classify reality shows as entertainment – and therefore as qualifying programming. Many reality shows generate high levels of human interest in the interactions between individuals, and the competition often offers a framework for entertainment-style material. Another indicator that would separate a reality show from a game show is that, where a traditional game show offers a prize every episode, reality shows only generate a winner in the final episode of the series.
13.1.4. Teleshopping
Teleshopping is defined in Article 1 of the Directive as: ‘direct offers broadcast to the public with a view to the supply of goods or services, including immovable property, rights and obligations, in return for payment’.
13.1.5. Teletext
We believe the meaning of this is self-evident. Its main relevance to this particular survey is in those instances where some channels default to teletext for periods of the broadcast day.

396
13.2. Qualifying Programmes
13.2.1. Documentary
The genre comprises: all factual programmes consisting mainly (i.e. more than 50 per cent) of documentary footage; ‘demonstration’ programmes covering subjects such as cooking, do-it-yourself and gardening; ‘Docusoaps’ (for example, fly-on-the-wall documentaries); and traditional observational documentaries. This category may include magazine programmes if more than half the inserts are considered to have long-term interest.
13.2.2. Factual magazine
All programmes in this genre feature multiple items within the same programme and contain less than 50 per cent documentary footage. The majority time of a factual magazine may consist of studio-based links, panel discussions, interviews, reports of topical events, etc. While magazines may get narrative repeats, the majority of the items covered will be topical and not therefore of long-term interest. Sports magazine programmes, current affairs programmes and news magazines that we excluded from the sport and news genres above also belong in this category.
13.2.3. Entertainment
The entertainment genre includes talk shows, reality shows and panel games where there is no prize on offer. It does not include situation comedies (sitcoms) that should be coded as fiction.
13.2.4. Fiction
The fiction genre includes soaps, drama series and serials, single dramas, situation comedies, TV movies and animation.
13.2.5. Cinema film
This genre comprises only those films that have had, or were intended to have, a cinematic release. Made for TV movies are included under fiction. For the purposes of the segmental analysis of fiction works that we will carry out later in the project, we shall treat cinema films as a sub-section of the fiction genre described above. This ignores the small number of films with a cinema release that are documentaries – such as One Day in September or Touching the Void.

397
14. Appendix II: Questionnaire for regulatory authorities
Study on the application of measures concerning the promotion of the distribution and production of European works in audiovisual media services (including television programmes and non-linear (on-demand) services)
Questionnaire for regulatory authorities
Information on respondent
Contact information
Country
Organization
Contact person
Address
Email address
Telephone

398
Part I: Television Broadcasting
1. National legislation to implement Articles 4 and 5
1.1: Implementation of Articles 4 and 5 in national legislation
Please indicate the current national legislation implementing Articles 4 and 5 of the
TV Without Frontiers Directive (Directive 89/552/EEC)
Relevant legislation:
1.2: The legislation since 2002
Has the national legislation implementing Articles 4 and 5 been amended
substantially since 2002? If so, please describe the changes:
Answer:
1.3: Legal requirements placed on smaller channels
Are the requirements of national legislation the same for smaller channels (for
example, channels without a terrestrial analogue licence) as for primary channels? If
they are different, please tell us how they differ and the relevant legislation (if
different to your answer in 1.1).
Answer:
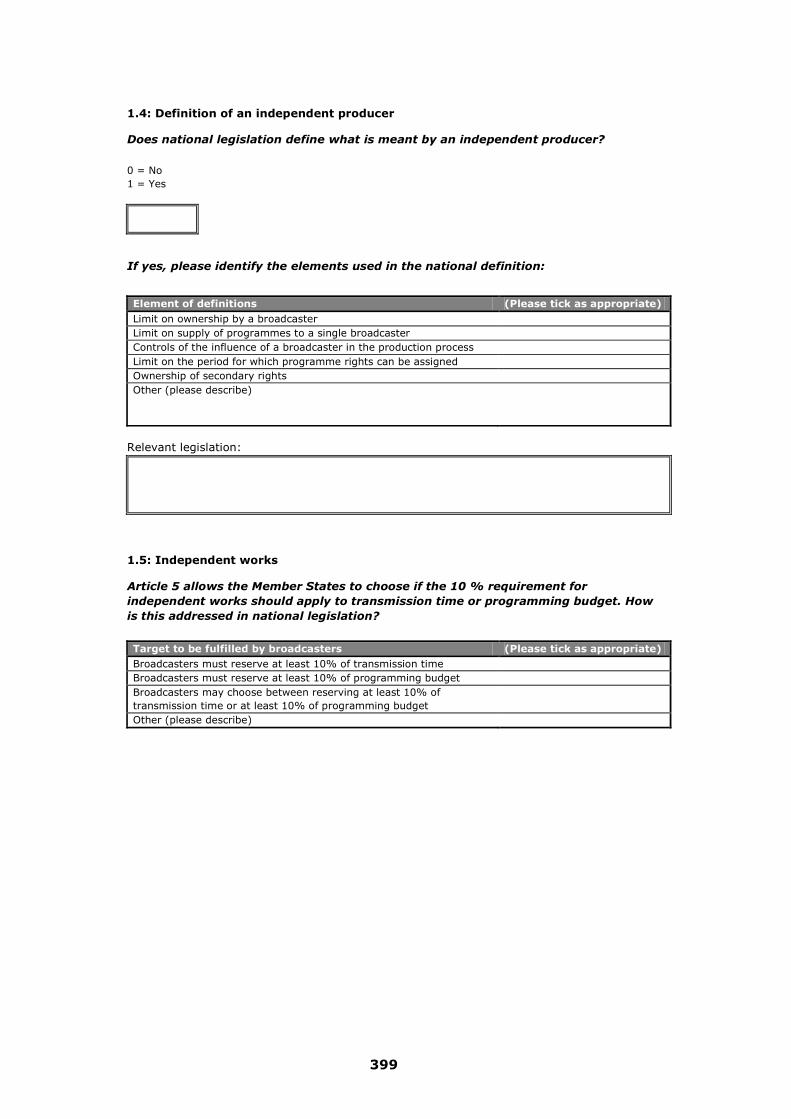
399
1.4: Definition of an independent producer
Does national legislation define what is meant by an independent producer?
0 = No 1 = Yes
If yes, please identify the elements used in the national definition:
Element of definitions (Please tick as appropriate)
Limit on ownership by a broadcaster Limit on supply of programmes to a single broadcaster Controls of the influence of a broadcaster in the production process Limit on the period for which programme rights can be assigned Ownership of secondary rights Other (please describe)
Relevant legislation:
1.5: Independent works
Article 5 allows the Member States to choose if the 10 % requirement for
independent works should apply to transmission time or programming budget. How
is this addressed in national legislation?
Target to be fulfilled by broadcasters (Please tick as appropriate)
Broadcasters must reserve at least 10% of transmission time Broadcasters must reserve at least 10% of programming budget Broadcasters may choose between reserving at least 10% of transmission time or at least 10% of programming budget
Other (please describe)

400
1.6: “Where practicable”
The Directive states that the Member States shall ensure “where practicable” that
broadcasters reserve the proportions set by Articles 4 and 5. How is this reflected in
the national legislation?1
Answer:
1.7: “Total qualifying hours” (relevant transmission time)
Is the definition of “total qualifying hours” different from the definition in the
Directive? 2
0 = No 1 = Yes
If yes, please describe the difference.
Answer:
1.8: Stricter or more detailed requirements
Please identify the areas (if any) in which national legislation places stricter or more
detailed requirements on the amount of European works and works produced by
independent producers of European origin than those laid down in Articles 4 and 5 of
the Directive.
Answer:
1 As examples, the national legislation could:
- State that broadcasters are required to reserve the proportions, but only “where practicable”, - Define the specific circumstances where broadcasters do not need to achieve the proportions, and - Limit these exemptions by stating that a broadcaster may not show a lower proportion of European or
independent works than in the previous year. 2 The Directive defines total qualifying hours as a channel’s transmission time “excluding the time appointed to news, sports events, games, advertising, teletext services and teleshopping”.

401
2. Monitoring the application of Articles 4 and 5
2.1: Monitoring Articles 4 and 5
What system do you have in place to monitor adherence by broadcasters to the
requirements of Articles 4 and 5 of the TV Without Frontiers Directive?
Monitoring system Tick as applicable
Independent monitoring of channel broadcast schedules Independent verification of statistical reports submitted by broadcasters Reliance on statistical reports submitted by broadcasters without verification Other (please specify)
2.2: Available sanctions
Does national legislation contain any sanctions if the broadcasters do not respect
article 4 and 5?
0 = No 1 = Yes
If yes, please describe what types of sanctions are available:
Sanctions Tick as applicable Warning Fines Restrictions on broadcast licence Other (please specify) Relevant legislation:

402
2.3: Number of Channels
How many channels were under your jurisdiction in 2007? Count all channels
(including cable and satellite). Exclude only those channels to which Articles 4 and 5
do not apply1.
Answer:
2.4: Article 4 of the Directive
How many of the channels identified above reserved a majority proportion of their
transmission time for European works, excluding the time appointed to news, sports
events, games, advertising, teletext services and teleshopping in 2007?
Answer:
2.5: Article 5 of the Directive
How many of the channels identified above reserved at least 10 per cent of the
transmission time for works produced by independent producers in 2007?
Answer:
2.6: Sanctions
Of those channels not meeting the requirements of Articles 4 and 5 in 2007, how
many did you apply sanctions to?
Answer:
Number of channels subject to sanctions for failure to meet the requirements of Articles 4 and 5 in 2007: (Additional information on the application of sanctions would be appreciated, e.g. case examples or statistics)
1 Articles 4 and 5 do not apply to news channels, sport channels, advertising or teleshopping channels, local channels, channels broadcasting in a language other than those of the Member States and channels broadcasting exclusively for reception outside the European Union.

403
3. Channel licensing requirements
3.1: Licence requirements placed on channels
Please identify the additional licence requirements (relating to content) that are
placed on channels.
If some requirements are only relevant for some channels (e.g. primary channels),
please indicate this in the table.
Requirement Brief description of requirements and channels to which it applies
Culture and/or national identity
Culture and identity of minorities
Language requirements
Origin of independent productions
Regional provisions
Funding of film

404
4. Cinema1
4.1: Film funding as part of the public service remit
Are broadcasters required to finance or broadcast films produced for a theatrical
release?
0 = No 1= Yes
4.2: Contribution to financing
If the answer to question 4.1 is ‘yes’, please describe the financial contribution
broadcasters are required to make to film funding:
Answer:
4.3: Amount of funding
What was the amount of this funding in 2007?
Answer:
4.4: Objectives of funding
What are the objectives of the requirements to finance film production?
Answer:
1 Note: In this section we are concerned only with cinematographic works, i.e. films intended for theatrical release.
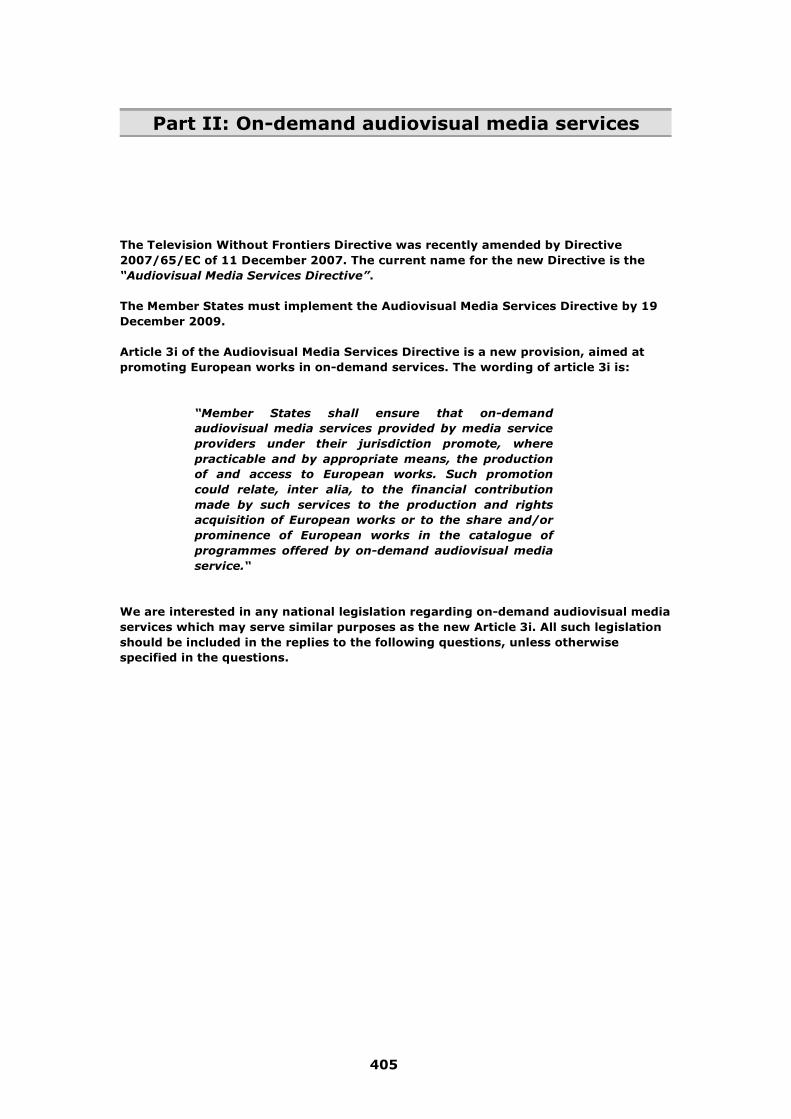
405
Part II: On-demand audiovisual media services The Television Without Frontiers Directive was recently amended by Directive 2007/65/EC of 11 December 2007. The current name for the new Directive is the “Audiovisual Media Services Directive”. The Member States must implement the Audiovisual Media Services Directive by 19 December 2009. Article 3i of the Audiovisual Media Services Directive is a new provision, aimed at promoting European works in on-demand services. The wording of article 3i is:
“Member States shall ensure that on-demand
audiovisual media services provided by media service
providers under their jurisdiction promote, where
practicable and by appropriate means, the production
of and access to European works. Such promotion
could relate, inter alia, to the financial contribution
made by such services to the production and rights
acquisition of European works or to the share and/or
prominence of European works in the catalogue of
programmes offered by on-demand audiovisual media
service.“
We are interested in any national legislation regarding on-demand audiovisual media services which may serve similar purposes as the new Article 3i. All such legislation should be included in the replies to the following questions, unless otherwise specified in the questions.

406
5. National legislation regarding on-demand services
5.1: National legislation regarding on-demand services
Does the Member State have any legislation that requires on-demand audiovisual
media services to promote the production of and access to European works?
0 = No 1= Yes
Relevant legislation:
If yes, please identify the distribution networks that are covered by the legislation:
Distribution network for on-demand service (Please tick as appropriate)
Internet IPTV Cable Satellite Digital terrestrial TV Mobile Other (please specify)
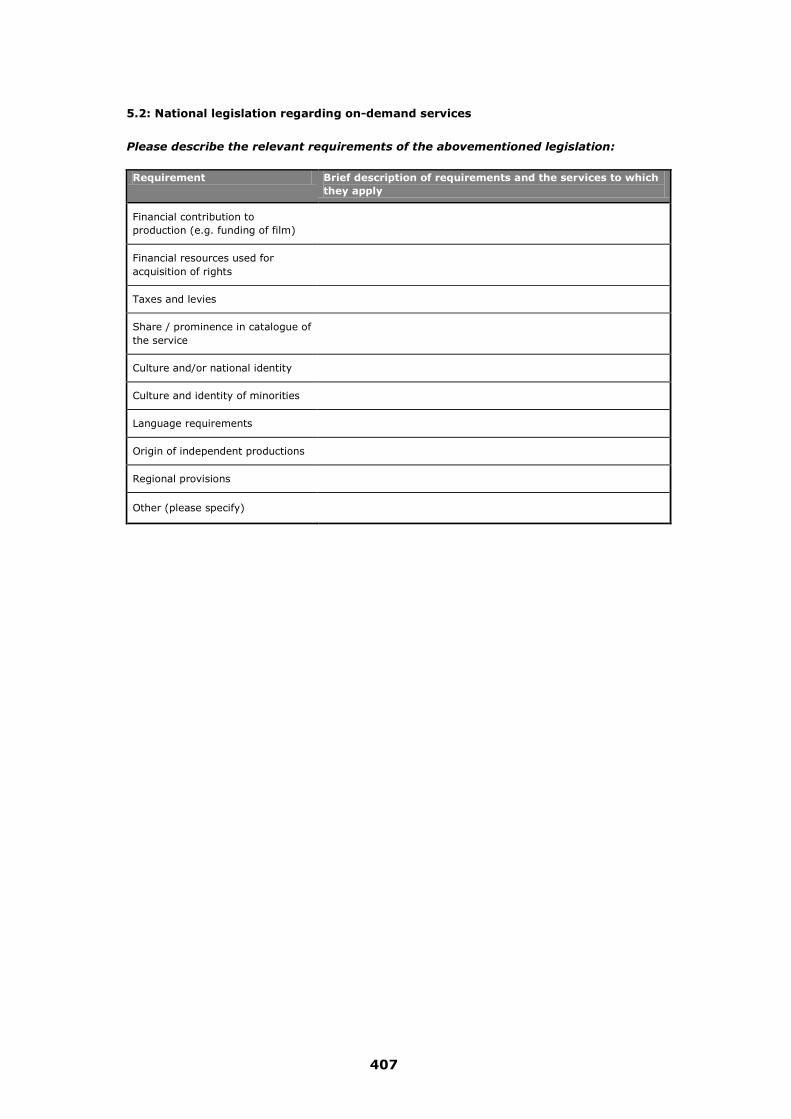
407
5.2: National legislation regarding on-demand services
Please describe the relevant requirements of the abovementioned legislation:
Requirement Brief description of requirements and the services to which they apply
Financial contribution to production (e.g. funding of film)
Financial resources used for acquisition of rights
Taxes and levies
Share / prominence in catalogue of the service
Culture and/or national identity
Culture and identity of minorities
Language requirements
Origin of independent productions
Regional provisions
Other (please specify)

408
6. On-demand licensing requirements
6.1: Requirements for licence to operate on-demand services
Do some on-demand audiovisual media services require a licence in order to operate
in your jurisdiction?
0 = No 1 = Yes
If yes, which types of on-demand services require a licence?
Answer:
On-demand service requiring a licence (Please tick as appropriate)
Internet IPTV Cable Satellite Digital terrestrial TV Mobile Other (please specify)
6.2: Licence requirements
Please identify any (additional) licence requirements which apply to content that is
made available through on-demand services
Licence requirement Brief description of requirements and the services to which they apply
Financial contribution to production (e.g. funding of film)
Financial resources used for acquisition of rights
Taxes and levies
Share / prominence in catalogue of the service
Culture and/or national identity
Culture and identity of minorities
Language requirements
Origin of independent productions
Regional provisions
Other (please specify)

409
7. Monitoring of on-demand services
7.1: Monitoring
Is there a system to monitor whether on-demand services fulfil the obligations
described above?
0 = No 1 = Yes If yes, please indicate which kind of monitoring system is used:
Monitoring system Tick as applicable
Independent monitoring of on-demand catalogues Independent verification of statistical reports submitted by on-demand service providers
Reliance on statistical reports submitted by on-demand service providers without verification
Other (please specify)
7.2: Available sanctions
Does the national legislation contain any sanctions that may be applied against on-
demand services which do not comply with the rules described above?
0 = No
1 = Yes
If yes, please indicate what sanctions are available:
Sanctions Tick as applicable Warning Fines Restrictions on licence Other (please specify)
Relevant legislation:
7.3: Sanctions
Of those on-demand services not meeting the requirements of the national legislation, how
many did you apply sanctions to?
Answer:
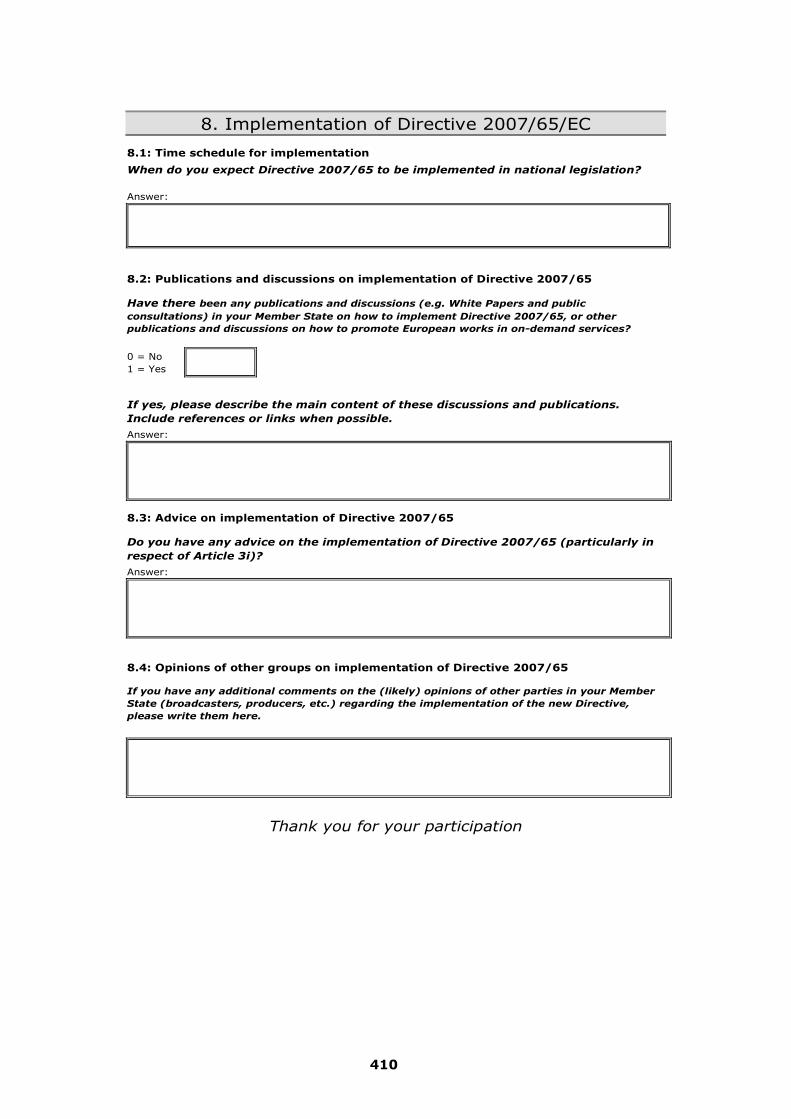
410
8. Implementation of Directive 2007/65/EC
8.1: Time schedule for implementation
When do you expect Directive 2007/65 to be implemented in national legislation?
Answer:
8.2: Publications and discussions on implementation of Directive 2007/65
Have there been any publications and discussions (e.g. White Papers and public
consultations) in your Member State on how to implement Directive 2007/65, or other
publications and discussions on how to promote European works in on-demand services?
0 = No 1 = Yes
If yes, please describe the main content of these discussions and publications.
Include references or links when possible.
Answer:
8.3: Advice on implementation of Directive 2007/65
Do you have any advice on the implementation of Directive 2007/65 (particularly in
respect of Article 3i)?
Answer:
8.4: Opinions of other groups on implementation of Directive 2007/65
If you have any additional comments on the (likely) opinions of other parties in your Member
State (broadcasters, producers, etc.) regarding the implementation of the new Directive,
please write them here.
Thank you for your participation
411
15. Appendix III: Broadcaster’s questionnaire
Study on the application of measures concerning the promotion of the distribution
and production of European works in audiovisual media services (including
television programmes and on-demand services)
Questionnaire for broadcasters
Information on respondent
Contact information
Country
Organization
Contact person
Address
Email address
Telephone

412
FOREWORD
The European Commission recently launched a new Study on the application of measures concerning the promotion and distribution of European works in audiovisual media services. This study is designed to investigate the application of Articles 4 and 5 of the Television without Frontiers Directive, and also to look at the application of rules governing the promotion of the production and access to European works on non-linear, on-demand services, as set out in the recently adopted Audiovisual Media Services Directive. This questionnaire is intended to help the European Commission understand both the linear and non-linear programming policies of European broadcasters and media service providers. The questionnaire consists of two parts: Part I focuses on linear audiovisual media services, and Part II on on-demand audiovisual media services. We are aware that some of the questions may be difficult to answer due to the confidentiality or unavailability of the data needed. To tackle this difficulty, you can either indicate your best estimates, or contact us directly to discuss how to share some of your internal information with us, in a way that safeguards your concerns.

413
Part I: Linear audiovisual media services This part of the questionnaire focuses on traditional linear audiovisual services that mainly fall under Articles 4 and 5 of the Television without Frontiers Directive. It consists of 8 sections: 1. Spending on New and Acquired Programmes (Including Co-Productions) 2. Commissioning Decisions 3. Financing of New Programmes 4. Co-Productions 5. Rights Ownership 6. Programme Acquisitions 7. Trade in Programmes by Genre 8. Cinema Film

414
1. SPENDING ON NEW AND ACQUIRED PROGRAMMES (INCLUDING CO-PRODUCTIONS) 1.1 2007 Spend on programmes by genre
322
What percentage of your 2007 programme budget did you spend on: Programme Genre Percentage of total
programme budget Entertainment
Fiction
Cinema film
Documentaries
Factual magazine programmes
News
Sport (including rights)
Games Total programme budget 100%
322 Entertainment This includes talk shows and studio-based comedies, but not sitcoms (which are included under fiction) or quiz shows/game shows, which are included under “Games”. These are ‘stock’ programmes with repeat value. Fiction This includes soaps, drama series/serials, single dramas, situation comedies, TV movies and animation created for TV. These are ‘stock’ programmes. Cinema Film All films that have had a cinematic release (not TV movies, which should be included under Fiction). Animation for cinematic release is also included in this genre. These are ‘stock’ programmes. Documentaries Programmes consisting mainly (i.e. more than 50%) of documentary footage. These are ‘stock’ programmes. Factual magazine programmes Factual programmes containing less than 50% documentary footage. The remaining time may be studio-based links, discussion etc. Most Current Affairs programmes fall in this category. These are ‘flow’ programmes with no or little repeat value. News Separate programmes containing reports of the most important recent events in summary form. Feature programmes, Current Affairs programmes and even News magazines, which look at stories “behind the news” should not be included. These are ‘flow’ programmes. Sports Events Live or recorded sporting events or significant parts of such events, but not magazine programmes about sports, even though such a programme may well contain excerpts of live events. These are ‘Flow’ programmes. Games TV shows focusing primarily on participants competing for a prize. These are ‘Flow’ programmes. Examples: Big Brother, Who Wants To Be A Millionaire?, The Weakest Link, Survivor, Pop Idol Children’s Children’s programmes are to be included in the genres above according to their relevant sub genres.

415
1.2 2007 Programme budget allocation What percentage of your programme budget was spent on each of the following categories of programme:
Production category Percentage of programme
budget Commissioned programmes produced In-house
Commissioned programmes produced externally
Acquired programmes Total programme budget 100%
1.3 Changes in programme budget allocations over the last five years Please tell us if the percentage of the budget you spend on the following categories of programme has grown, shrunk or stayed the same over the last five years:
Production category Grown (+),
shrunk (-) or stayed the same (><)
Commissioned programmes produced In-house
Commissioned programmes produced externally
Acquired programmes
1.4 2007 Spend on formats
323
What percentage of your 2007 programme budget did you spend on commissioned formats relative to other types of programming? Programme type Percentage of programme
budget Commissioned formats
324
Other commissioned programmes
Acquired programmes Total programme budget 100%
323 A format is defined as any programme locally adapted for broadcast in at least one other market than the market of origin and for which a licensing fee is payable, e.g. Who Wants to Be a Millionaire, Betty la Fea. 324 Excludes ready-tape, i.e. non-domestic and typically non-live versions of formats that will fall under acquisitions.

416
1.5 Price differentials for commissioned programmes Do you produce programmes in-house? 1 = Yes 0 = No
Answer:
If yes, for each of the following genres, all things being equal, please indicate whether these are cheaper to produce in-house or to commission externally (please tick one box per row only for the cheapest cost per hour).
Programme Genre325
In-house produced
programmes are cheaper
Externally commissioned programmes are cheaper
Entertainment
Fiction
Cinema film
Documentaries
Factual magazine programmes
News
Sport (including rights)
Games
1.6 Price differentials for commissions and acquisitions
For each genre please tell us the cost of acquiring ready-made programmes as a percentage of the cost of commissioning a similar programme:
Cost of acquired programme as a percentage of cost of commissioned programme Programme genre
0-20% 21-50% 51%-100%
Entertainment
Fiction
Cinema film
Documentaries
Factual magazine programmes
News
Sport (including rights)
Games
1.7 Your comments
Do you want to add any comments or explanation to the answers given above? Are there any important factors influencing the balance between in-house and externally commissioned programmes and commissioned and acquired programmes that we have omitted?
325 For a complete list of genre definitions, please see 1.1.

417
2. COMMISSIONING DECISIONS 2.1 2007 commissioning by genre
326
What percentage of your commissioning budget in 2007 was spent on:
Genre Percentage of
commissioning budget Entertainment
Fiction
Cinema film
Documentaries
Factual magazine programmes
News
Sport (including rights)
Games
Total commissioned programmes 100%
2.2 2007 commissioning by production category
Divide commissioned programmes in each genre according to the three production categories of: in-house production, programmes produced externally by non-independent producers, or programmes produced externally by independent producers. Each row should sum to 100%.
Genre Programmes produced in-house (%)
Programmes produced externally by non-independent producer (%)
Programmes produced externally by independent producer (%)
Total commissioned programmes
Entertainment 100%Fiction 100%Cinema film 100%Documentaries 100%Factual magazines 100%News 100%Sport (including rights) 100%Games 100%
326 For a complete list of genre definitions, please see 1.1.

418
2.3 2007 Spend on format based commissions by genre327
What percentage of your 2007 programme spend on locally produced formats did you
allocate on: Format Genre
328 Percentage of total spend
on formats Entertainment
Fiction
Factual magazine programmes (e.g. DIY/makeover)
Factual entertainment/reality
Games
Other Total spend on formats 100%
2.4 Changes in commissioning budget allocations over the last five years (2002-2007)
Please tell us if the percentage of your commissioning budget that you spend on each category of production has grown, shrunk or stayed the same over the last five years:
Production category
Grown (+), shrunk (-) or
stayed the same (><)
Programmes produced in-house Programmes produced externally by another broadcaster or broadcaster-owned or controlled producer
Programmes produced externally by independent producers
2.5 Changes in commissioning budgets by genre over the last five years (2002-2007)
Are the changes identified in 2.4 above particularly pronounced in one or more genres? Genre Tick box Entertainment
Fiction
Cinema film
Documentaries
Factual magazines
Formats329
News Sport (including rights)
Games
327 A format is defined as any programme locally adapted for broadcast in at least one other market than the market of origin and for which a licensing fee is payable, e.g. Who Wants to Be a Millionaire, Betty la Fea. 328 Format genre categories vary slightly from the genres used for overall commissioned programmes. This is to reflect typical sub genres within formats. 329 A format may cover a number of genres, the “format” box should be used to identify whether, in general terms, there has been a change in the use of “format” based programming, irrespective of their genre.

419
2.6 Changes in format based commissioning budget allocations over the last five years (2002-2007) Please tell us if the percentage of your format based commissioning budget that you spend on each category of production has grown, shrunk or stayed the same over the last five years:
Production category
Grown (+), shrunk (-) or
stayed the same (><)
Programmes produced in-house Programmes produced externally by another broadcaster or broadcaster-owned or controlled producer
Programmes produced externally by independent producers 2.7 Changes in format based commissioning budgets by genre over the last five
years (2002-2007) Are the changes identified in 2.6 above particularly pronounced in one or more genres? Format Genre Percentage of total spend
on formats Entertainment
Fiction
Factual magazine programmes (e.g. DIY/makeover)
Factual entertainment/reality
Games
Other Total spend on formats 100%
2.8 Your comments
Do you want to add any comments or explanation to the answers given above? Are there any important factors influencing the commissioning of new programmes that we have omitted?

420
3. FINANCING OF NEW PROGRAMMES
Please answer for all commissioned programmes excluding cinema film (treated separately - see Q8).
3.1 Contribution to funding of entertainment programmes
What are the sources of funding for entertainment programmes you commission?
Sources of funding Percentage
of total production
Primary broadcaster330
(that is, your contribution to production)
Co-production
Secondary broadcaster331
(e.g. for pay TV rights)
Distributor for non-domestic rights
Advances against merchandising
Public funding body
Private funding linked to tax breaks
New media rights and advances on revenues (including on-demand) Total 100%
3.2 Contribution to funding of fiction programmes
What are the sources of funding for fiction programmes you commission?
Sources of funding Percentage
of total production
Primary broadcaster (that is, your contribution to production)
Co-production
Secondary broadcaster (e.g. for pay TV rights)
Distributor for non-domestic rights
Advances against merchandising
Public funding body
Private funding linked to tax breaks
New media rights and advances on revenues (including on-demand) Total 100%
3.3 Contribution to funding of documentary programmes
What are the sources of funding for documentary programmes you commission?
Sources of funding Percentage
of total production
Primary broadcaster (that is, your contribution to production)
Co-production
Secondary broadcaster (e.g. for pay TV rights)
Distributor for non-domestic rights
Advances against merchandising
Public funding body
Private funding linked to tax breaks
New media rights and advances on revenues (including on-demand) Total 100%
330 Main commissioning broadcaster, typically holding the first transmission rights 331 Secondary commissioning broadcaster, typically holding rights for a pay TV or a delayed free to air window for a smaller amount of financing than the primary broadcaster

421
3.4 Contribution to funding of factual magazine programmes What are the sources of funding for factual magazine programmes you commission?
Sources of funding Percentage
of total production
Primary broadcaster (that is, your contribution to production)
Co-production
Secondary broadcaster (e.g. for pay TV rights)
Distributor for non-domestic rights
Advances against merchandising
Public funding body
Private funding linked to tax breaks
New media rights and advances on revenues (including on-demand) Total 100%
3.5 Contribution to funding of games programmes
What are the sources of funding for games programmes you commission?
Sources of funding Percentage
of total production
Primary broadcaster (that is, your contribution to production)
Co-production
Secondary broadcaster (e.g. for pay TV rights)
Distributor for non-domestic rights
Advances against merchandising
Public funding body
Private funding linked to tax breaks
New media rights and advances on revenues (including on-demand) Total 100%
3.6 Contribution to funding of news programmes
What are the sources of funding for news programmes you commission?
Sources of funding Percentage
of total production
Primary broadcaster (that is, your contribution to production)
Co-production
Secondary broadcaster (e.g. for pay TV rights)
Distributor for non-domestic rights
Advances against merchandising
Public funding body
Private funding linked to tax breaks
New media rights and advances on revenues (including on-demand) Total 100%

422
3.7 Contribution to funding of sport programmes What are the sources of funding for sport programmes you commission?
Sources of funding Percentage
of total production
Primary broadcaster (that is, your contribution to production)
Co-production
Secondary broadcaster (e.g. for pay TV rights)
Distributor for non-domestic rights
Advances against merchandising
Public funding body
Private funding linked to tax breaks
New media rights and advances on revenues (including on-demand) Total 100%
3.8 Your comments
Do you want to add any comments or explanation to the answers given above? Are there any important factors influencing the financing of new programmes that we have omitted?

423
4. CO-PRODUCTIONS 4.1 Do you co-produce new programmes?
Do you “co-produce” programmes (that is, make joint commissioning decisions and fund the production of a new programme) with another party? 1 = Yes 0 = No
Answer:
4.2 Co-productions by genre
332
If you answered “yes” to question 4.1, please indicate which genres you mainly co-produce: Genre Please tick Entertainment
Fiction
Cinema film
Documentaries
Factual magazine programmes
News
Sport (including rights)
Games
4.3 Domestic and international co-productions If you answered “yes” to question 4.1, please tell us the regions where the
broadcasters with whom you co-produce are located. Rank the regions according to the highest number of co-productions (so if you do most co-productions with US and then with Canadian partners, US = 1, Canada = 2 etc).
Location of broadcaster co-funding production Rank
Domestic
Other European333
Multi-country European co-productions e.g. through EBU
US
Canada
Latin America
Other [please state]
332 For a complete list of genre definitions, please see 1.1. 333 Including other non-domestic EU, EEA and other European countries
424
4.4 European co-productions If you identified “Other European” as the location of a broadcaster co-funding
production, please specify up to three countries where the broadcaster(s) with whom you do most co-funded production are located. Rank the top three countries according to the highest number of co-productions.
Location of party co-funding production Rank
Austria
Belgium
Bulgaria
Cyprus
Czech Republic
Denmark
Estonia
Finland
France
Germany
Greece
Hungary
Iceland
Ireland
Italy
Latvia
Liechtenstein
Lithuania
Luxembourg
Malta
Netherlands
Norway
Poland
Portugal
Romania
Slovakia
Slovenia
Spain
Sweden
United Kingdom
Other European

425
4.5 Your comments Do you want to add any comments or explanation to the answers given above? Are there any important factors influencing co-production that we have omitted?

426
5. RIGHTS OWNERSHIP
5.1 Rights ownership What exclusive rights would you seek to obtain when you commission programmes from external producers (please tick)?
Rights Tick
First showing on terrestrial TV in domestic market
Repeat showing(s) on terrestrial TV in domestic market
Repeat showings on secondary channels in domestic market
Internet and/or other new media rights
First showing on terrestrial TV in overseas markets
Repeat showing(s) on terrestrial TV in overseas markets
Repeat showings on secondary channels in overseas markets
Ancillary rights in domestic market (licensing, merchandising etc)
Ancillary rights in overseas markets
5.2 Independent producers and rights Are the terms of agreements you negotiate with independent producers more
favourable to you, less favourable or about the same as agreements for other programmes commissioned externally, for example in terms of the length of agreement or the share of revenue (please tick)?
Terms of agreement Please tick More favourable to me
About the same
Less favourable to me
5.3 Your comments
Do you want to add any comments or explanation to the answers given above? Are there any important factors regarding programme rights that we have omitted?

427
6. PROGRAMME ACQUISITIONS 6.1 Programme acquisitions by genre
334
What percentage of your spending on programme acquisitions was spent on each genre:
Category of programme Genre Percentage of
total acquisitions Entertainment
Fiction
Cinema film
Documentaries
Factual magazine programmes
News
Sport (including rights)
Programme acquisitions
Games
Total acquired programmes 100%
6.2 Recency of programme acquisitions
What percentage of your 2007 spend on programme acquisitions was spent on programmes that are less than 5 years old?
Genre
Spend on acquisitions less than 5 years old
(%)
Spend on acquisitions more
than 5 years old (%)
Total acquired programmes
Entertainment 100%
Fiction 100%
Cinema film 100%
Documentaries 100%
Factual magazine programmes 100%
News 100%
Sport (including rights) 100%
Games 100%Total acquired programmes 100%
6.3 Sources of acquired programmes
What percentage of the ready-made programmes you acquire do you purchase from the following sources? Programme origination Percentage of
total acquisitions Other domestic broadcasters
Domestic producers
Broadcasters or producers in another European country335
US broadcasters or producers
Broadcasters or producers outside Europe and the US Total 100%
334 For a complete list of genre definitions, please see 1.1. 335 Including other non-domestic EU, EEA and other European countries

428
6.4 Your comments Do you want to add any comments or explanation to the answers given above? Are there any important factors influencing programme acquisitions that we have omitted?

429
7. TRADE IN PROGRAMMES BY GENRE 7.1 Genres that make successful exports
336
Which of the following genres make the most successful exports? 1 = Yes, they sell well abroad 2 = No, they don’t sell well abroad Genre Documentaries
Factual magazines
Entertainment
Fiction
Feature films
News
Sport (including rights)
Games
7.2 Genres that can be successfully imported from other European countries
Which of the following genres can be successfully imported from another European country? 1 = Yes, they work well when imported 2 = No, they don’t sell well abroad Genre Documentaries
Factual magazines
Entertainment
Fiction
Feature films
News
Sport (including rights)
Games
7.3 Genres that can be successfully imported from non-European countries?
Which of the following genres can be successfully imported from outside Europe? 1 = Yes, they work well when imported 2 = No, they don’t sell well abroad Genre Documentaries
Factual magazines
Entertainment
Fiction
Feature films
News
Sport (including rights)
Games
336 For a complete list of genre definitions, please see 1.1.

430
7.4 Formats that make successful exports337
Which of the following format genres make the most successful exports? 1 = Yes, they sell well abroad 2 = No, they don’t sell well abroad Genre
338
Entertainment
Fiction
Factual magazine programmes (e.g. DIY/makeover)
Factual entertainment/reality
Games
Other 7.5 Formats that can be successfully imported from other European countries
Which of the following format genres can be successfully imported from another European country? 1 = Yes, they sell well abroad 2 = No, they don’t sell well abroad Genre Entertainment
Fiction
Factual magazine programmes (e.g. DIY/makeover)
Factual entertainment/reality
Games
Other 7.6 Formats that can be successfully imported from non-European countries
Which of the following format genres can be successfully imported from outside Europe? 1 = Yes, they sell well abroad 2 = No, they don’t sell well abroad Genre Entertainment
Fiction
Factual magazine programmes (e.g. DIY/makeover)
Factual entertainment/reality
Games
Other
337 A format is defined as any programme locally adapted for broadcast in at least one other market than the market of origin and for which a licensing fee is payable, e.g. Who Wants to Be a Millionaire, Betty la Fea. 338 Format genre categories vary slightly from the genres used for overall commissioned programmes. This is to reflect typical sub genres within formats.

431
7.7 Your comments Do you want to add any comments or explanation to the answers given above? Are there any important factors influencing trade in programmes that we have omitted, e.g. is on-demand potential of programmes an important factor when evaluating a programme’s potential for trade across borders?

432
8. CINEMA FILM
Note: In this section we are concerned only with cinematographic works, ie films intended for theatrical release that you commission. Do not include films that you acquire (for example, from the US).
8.1 A public service remit
Are you required as a part of your public service remit (a condition of your licence or through other public service requirements) to finance or broadcast films produced for a theatrical release? 1 = Yes 0 = No
Answer:
8.2 Contribution to financing
What are the sources of financing for the production of films for theatrical release that you fund?
Funder Percentage
of total production
Primary broadcaster (that is, your contribution)
Co-production
Secondary broadcaster (e.g. for pay TV rights)
Domestic cinema distributor
Distributor for overseas rights
Advances against merchandising
Public funding body
Private funding linked to tax breaks Total 100%
8.3 Primary rights ownership
What is the typical duration of the holdback period between theatrical release and first showing on:
Window Months
Pay per view
Pay TV
Free TV
8.4 Ancillary rights ownership Do you typically have access to ancillary rights (e.g. product merchandising etc) as part of the funding deal? 1 = Yes 0 = No
Answer:
433
Part II: On-demand audiovisual media services The Television Without Frontiers Directive was recently amended by Directive 2007/65/EC of 11 December 2007. The current name for the new Directive is the “Audiovisual Media Services Directive”. The Member States must implement the Audiovisual Media Services Directive by 19 December 2009. Article 3i of the Audiovisual Media Services Directive is a new provision, aimed at promoting European works in on-demand services. The wording of article 3i is:
“Member States shall ensure that on-
demand audiovisual media services
provided by media service providers under
their jurisdiction promote, where
practicable and by appropriate means, the
production of and access to European
works. Such promotion could relate, inter
alia, to the financial contribution made by
such services to the production and rights
acquisition of European works or to the
share and/or prominence of European
works in the catalogue of programmes
offered by on-demand audiovisual media
service.“
We are interested in your activities regarding on-demand (including mobile) audiovisual media services that will fall in the future under Article 3i.

434
9. REGULATION In this section, we are interested to understand your thoughts on how Article 3i of the new “AVMS” Directive should be applied in your own market. 9.1 Awareness of the Audiovisual Media Services Directive
Prior to receiving this questionnaire, were you aware that Article 3i of the Audiovisual Media Services Directive requires that “Member States shall ensure that on-demand audiovisual media services provided by media service providers under their jurisdiction promote, where practicable and by appropriate means, the production of and access to European works. Such promotion could relate, inter alia, to the financial contribution made by such services to the production and rights acquisition of European works or to the share and/or prominence of European works in the catalogue of programmes offered by on-demand audiovisual media service”? 1 = Yes 2 = No
Answer:

435
9.2 Methods for monitoring Article 3i of the “AVMS” Directive Below we have detailed a selection of possible alternative methods for monitoring compliance with Article 3i. We would like to assess which method you believe would be most feasible. Please rank each method from 1 to 5 (with 1 being ‘least suitable’ and 5 being ‘most suitable’), without giving two methods the same ranking (e.g. not giving two methods a score of ‘5’). It would also be very helpful if you could give some detail about why you have given each method its rank (e.g. why you have chosen to rank a method as ‘5’ – the highest rank).
Method for monitoring Article 3i Rank Reason behind ranking? Using title-level data (e.g. title name by country of origin) to monitor the proportion of an on-demand catalogue that is European.
Using data on total hours of available content (e.g. total hours of on-demand content, by country of origin) to monitor the proportion of an on-demand catalogue that is European.
Using consumption data for number of titles viewed (e.g. how many titles actually viewed, split by country of origin) to monitor the proportion of on-demand catalogue consumption that is European.
Using consumption data for number of hours viewed (e.g. how many hours of on-demand content is actually viewed, split by country of origin) to monitor the proportion of on-demand catalogue consumption that is European.
Monitoring prominence of European titles in the on-demand service (e.g. checking a service to see how clear the nationality of a piece of content is to a user, or how easy it is to search for content by country of origin).
If there are any alternative methods for monitoring Article 3i that you believe have not been detailed above, please provide more details in the text box below.
9.3 Monitoring Article 3i – your views

436
We would also be interested to know you views on the following issues regarding the future monitoring of Article 3i of the AVMS Directive. Please give your answers in the text boxes below each question. If confidentiality is ensured would you agree to share internal figures about on-demand services with a public body (for example a regulator)? If not, why, and if yes, which internal figures would you share and under what conditions?
In order to monitor Article 3i in the future, do you believe that an external, independent body is required to collect and analyse data? If not, why not, and if yes, what form do you see this independent body taking?
Do you believe that declarations from on-demand services regarding European works will be an appropriate method to monitor Article 3i? If not, do you believe there is a more appropriate alternative?
9.4 Your comments
If you wish to add any comments or explanation to the answers given above, please do so here. We are particularly interested in other ways in which European content could be promoted on your on-demand service, and how this could be monitored.

437
10. ON-DEMAND SERVICES
10.1 Own on-demand audiovisual media service (on-demand service) Do you have an own on-demand service? 1 = Yes 2 = No
Answer:
If yes, please specify what it is:
10.2 Contribution towards other on-demand service
Do you contribute towards a 3rd
party on-demand service? 1 = Yes 2 = No
Answer:
If yes, please specify what it is:
10.3 User generated content
Do you have any user-generated content on your on-demand service? 1=Yes 2=No
Answer
If yes, please specify what it is:

438
10.4 Type of access to on-demand service If you own or contribute towards a 3
rd party on-demand service, what type of access
does it use? 1 = Yes 0 = No
Type of access Please indicate “1” or “0”
Open access339
Closed access340
10.5 Transmission mode of on-demand service
How is the on-demand service distributed? Type Tick box Internet
Cable
Satellite
DTT
Mobile
Other (please specify) 10.6 Type of on-demand service
What type of programming is offered on the on-demand service? Type Tick box Live
Catch-up
Archive
Other (please specify)
10.7 Genres on on-demand service
Which of the following genres are offered on the on-demand service? Genre
341 Tick box
Entertainment
Fiction
Cinema film
Documentaries
Factual magazine programmes
News
Sport
Games
Other (please specify) 10.8 Size of programme catalogue of your on-demand service
Please estimate the size of the on-demand programmes in your catalogue. (If possible, please indicate both the number of titles and the total hours) Any Genre Total number of Total amount of
339 Open access refers to services that are available free-of-charge (sometimes involving a short registration) and using non-proprietary access technology. 340 Closed access refers to services that are only available in an encoded fashion, usually via proprietary access technologies, and that cost money to access, often via a subscription 341 For a complete list of genre definitions, please see 1.1.

439
available titles available hours Total catalogue
10.9 Composition of programme catalogue of your on-demand service
Please estimate, by genre, the composition of the on-demand programmes in your catalogue. (If possible, please indicate the share both in terms of number of titles and total hours) Genre Percentage of
titles Percentage of available hours
Entertainment
Fiction
Cinema film
Documentaries
Factual magazine programmes
News
Sport
Games
Other (please specify)
Total catalogue 100% 100%
10.10 Consumption of programme catalogue of your on-demand service
Please estimate, by genre, how the consumption of on-demand programmes is distributed. (If possible, please indicate the share both in terms of number of titles and total hours) Genre Percentage of
titles Percentage of consumed hours
Entertainment
Fiction
Cinema film
Documentaries
Factual magazine programmes
News
Sport
Games
Other (please specify)
Total output 100% 100%
10.11 Size of European catalogue of on-demand service
Please estimate the size of the European catalogue of programmes of your on-demand service. (If possible, please indicate both the number of titles and total hours.) Any Genre Total number of
European titles Total amount of European hours
Total catalogue

440
10.12 Proportion of European programmes on on-demand service
Please estimate, by genre, the proportion of your on-demand catalogue that is European programmes (works). (If possible, please indicate the share both expressed in terms of number of titles and total hours.) Programme Genre Percentage of all
titles that are European
Percentage of all hours that are
European Entertainment
Fiction
Cinema film
Documentaries
Factual magazine programmes
News
Sport (including rights)
Games
Other (please specify) Total catalogue 100% 100%
10.13 Consumption of European programmes on on-demand service
Please estimate, by genre, the proportion of the total consumption of your on-demand programming that is made up by European programming (works). (If possible, please indicate the share both expressed in terms of number of titles and total hours.) Programme Genre Percentage of all
titles that are European
Percentage of all hours consumed
that are European
Entertainment
Fiction
Cinema film
Documentaries
Factual magazine programmes
News
Sport (including rights)
Games
Other (please specify) Total output 100% 100%
10.14 Programme spend on-demand service in 2007
What proportion of total programme spend was apportioned to on-demand services? Business area Percentage of
spend Traditional linear TV business
On-demand TV services Total programme spend 100%

441
10.15 Spend on programme types on on-demand service in 2007 What percentage of your programme budget for on-demand programmes was spent on each of the following categories of programme: Production category Percentage of
programme budget
Commissioned programmes produced in-house
Commissioned programmes produced externally
Acquired programmes Total programme spend 100%
10.16 Sources of commissioned and acquired programmes in 2007
What proportion of your programme budget for on-demand programmes was spent on the following sources? Programme origination Percentage of
programme budget
National commissions
European, non-national commissions
Non-European commissions
National acquisitions
European, non-national acquisitions
Non-European acquisitions Total 100%
10.17 Programme spend by genre on on-demand service in 2007
How is the programme spend (including costs based on pre-defined fees and revenue sharing) on on-demand programmes distributed by genre? Genre Percentage of
spend Entertainment
Fiction
Cinema film
Documentaries
Factual magazine programmes
News
Sport
Games
Other (please specify) Total programme spend 100%
10.18 Publicity (prominence) for European works
Please explain below how you publicise any European works on your on-demand service. (For example, do you enable users to search by country of origin? Is European content prominent on your on-demand service in any way?) Do you use any other method of ensuring attractive presentation?
10.19 Specific promotions for European works on your on-demand service

442
If you have had specific promotions for European works on your on-demand service, please detail below how these worked, and why you decided to promote European works in this fashion.
10.20 Marketing spend
If possible, could you please indicate below whether your marketing spend varies by country-of-origin (for example, is relatively more marketing money spent promoting European works?)
10.21 Funding of on-demand service
How is the on-demand service funded? Funding Tick box Adverts within programmes
Adverts at beginning/end of programmes
Subscription fee
Public subsidy
Other (please specify)
10.22 Impact of on-demand services
What impact do you anticipate on-demand services will have on broadcaster business models in the medium term (i.e. five years hence)?
Thank you for your participation

443
16. Appendix IV: Producers’ questionnaire
Study on the application of measures concerning the promotion of the distribution
and production of European works in audiovisual media services (including
television programmes and on-demand services)
Questionnaire for producers
Information on respondent
Contact information
Country
Organization
Contact person
Address
Email address
Telephone
444
FOREWORD
The European Commission recently launched a new Study on the application of measures concerning the promotion and distribution of European works in audiovisual media services. This study is designed to investigate the application of Articles 4 and 5 of the Television without Frontiers Directive, and also to look at the application of rules governing the promotion of the production and access to European works on non-linear, on-demand services, as set out in the recently adopted Audiovisual Media Services Directive. This questionnaire is intended to help the European Commission understand the linear and non-linear programming policies of European broadcasters and media service providers and the contribution of European producers to promotion of European works. The questionnaire consists of two parts: Part I focuses on linear audiovisual media services, and Part II on on-demand audiovisual services. We are aware that some of the questions may be difficult to answer due to the confidentiality or unavailability of the data needed. To tackle this difficulty, you can either indicate your best estimates, or contact us directly to discuss how to share some of your internal information with us, in a way that safeguards your concerns.

445
Part I: Linear audiovisual media services This part of the questionnaire focuses on your business and the environment it operates in, and traditional linear audiovisual services that mainly fall under Articles 4 and 5 of the Television without Frontiers Directive. It consists of 7 sections: 1. About your Company 2. Broadcasters’ Programming Budgets 3. Programme Funding 4. Co-Productions 5. Rights Ownership 6. Trade in Programmes by Genre 7. Cinema Film

446
Part I: Television Broadcasting 1. ABOUT YOUR COMPANY 1.1 Turnover and profit
What was your turnover, earnings before interest, tax, depreciation and amortisation (EBITDA) and return on capital employed in 2002, 2004, 2006 and 2007? 2002 2004 2006 2007 State currency: Turnover EBITDA RoC (%)
1.2 Trade
What percentage of your 2007 turnover is from: Destination of sales % of turnover Sales in home market 100%
Sales to other European markets
Sales outside Europe
Total sales
1.3 Employees How many people did you employ in 2002, 2004, 2006 and 2007?
2002 2004 2006 2007 Employees
1.4 Competitors
In your estimation, has the number of independent production companies in your domestic market grown, shrunk or stayed the same between 2002 and 2007? Number of independent production companies Tick one box Grown Shrunk Stayed the same
If the number of competitors has grown or shrunk, please tell us why. If your company is active outside of your own domestic market please also comment on the situation beyond your domestic market:

447
1.5 2007 Revenue by genre342
What percentage of your 2007 revenue from programme making came from the following genres:
Programme Genre Percentage of total
revenue from programme making
Entertainment
Fiction
Cinema film
Documentaries
Factual magazine programmes
News
Sport (including rights)
Games Total revenue from programme making 100% Whereof proportion of total revenue from formats
343
/100%
342 Entertainment This includes talk shows and studio-based comedies, but not sitcoms (which are included under fiction) or quiz shows/game shows, which are included under “Games”. These are ‘stock’ programmes with repeat value. Fiction This includes soaps, drama series/serials, single dramas, situation comedies, TV movies and animation created for TV. These are ‘stock’ programmes. Cinema Film All films that have had a cinematic release (not TV movies, which should be included under Fiction). Animation for cinematic release is also included in this genre. These are ‘stock’ programmes. Documentaries Programmes consisting mainly (i.e. more than 50%) of documentary footage. These are ‘stock’ programmes. Factual magazine programmes Factual programmes containing less than 50% documentary footage. The remaining time may be studio-based links, discussion etc. Most Current Affairs programmes fall in this category. These are ‘flow’ programmes with no or little repeat value. News Separate programmes containing reports of the most important recent events in summary form. Feature programmes, Current Affairs programmes and even News magazines, which look at stories “behind the news” should not be included. These are ‘flow’ programmes. Sports Events Live or recorded sporting events or significant parts of such events, but not magazine programmes about sports, even though such a programme may well contain excerpts of live events. These are ‘Flow’ programmes. Games TV shows focusing primarily on participants competing for a prize. These are ‘Flow’ programmes. Examples: Big Brother, Who Wants To Be A Millionaire?, The Weakest Link, Survivor, Pop Idol Children’s Children’s programmes are to be included in the genres above according to their relevant sub genres. 343 A format is defined as any programme locally adapted for broadcast in at least one other market than the market of origin and for which a licensing fee is payable, e.g. Who Wants to Be a Millionaire, Betty la Fea.

448
2. BROADCASTERS’ PROGRAMMING BUDGETS 2.1 Prices of commissioned and acquired programmes Please list for each genre below which is the most, average and least expensive
comparative price per hour that a broadcaster pays for (a) commissioned programmes produced in-house; (b) commissioned programmes produced externally (e.g. programmes produced by another broadcaster or an independent producer); and (c) acquired programmes. (Please insert a, b and c in each row)
Genre344
Most
expensive Median
Least expensive
Entertainment
Fiction
Cinema film
Documentaries
Factual magazine programmes
News
Sport (including rights)
Games
2.2 Changes in broadcaster programme budget allocations over the last five years
(2002-2007) In your experience, has the percentage of their total programming budget that broadcasters spend on the following categories of programme grown, shrunk or stayed over the last five years:
Programme category Grown (+),
shrunk (-) or stayed the same (><)
Commissioned programmes produced In-house
Commissioned programmes produced by another broadcaster or broadcaster-owned or controlled producer
Commissioned programmes produced by an independent producer
Acquired programmes
News
Sport (including rights)
Games
Locally produced formats345
344 For a complete list of genre definitions, please see 1.5. 345 A format is defined as any programme locally adapted for broadcast in at least one other market than the market of origin and for which a licensing fee is payable, e.g. Who Wants to Be a Millionaire, Betty la Fea.

449
3. PROGRAMME FUNDING Please answer for all commissioned programmes excluding cinema film (treated separately - see Q7).
3.1 Funding of entertainment programmes
346
What are the sources of funding for entertainment programmes you produce?
Sources of funding Percentage
of total production
Primary broadcaster347
Secondary broadcaster348
(e.g. for pay TV rights)
Distributor for non-domestic rights
Advances against merchandising
Public subsidy
Private funding linked to tax breaks Self-funded (e.g. bank loan etc)
New media rights and advances on revenues (including on-demand)
Total 100% 3.2 Funding of fiction programmes
What are the sources of funding for fiction programmes you produce?
Sources of funding Percentage
of total production
Primary broadcaster
Secondary broadcaster (e.g. for pay TV rights)
Distributor for non-domestic rights
Advances against merchandising
Public subsidy
Private funding linked to tax breaks
Self-funded (e.g. bank loan etc)
New media rights and advances on revenues (including on-demand)
Total 100%
346 For a complete list of genre definitions, please see 1.5. 347 Main commissioning broadcaster, typically holding the first transmission rights 348 Secondary commissioning broadcaster, typically holding rights for a pay TV or a delayed free to air window for a smaller amount of financing than the primary broadcaster

450
3.3 Funding of documentary programmes What are the sources of funding for documentary programmes you produce?
Sources of funding Percentage
of total production
Primary broadcaster
Secondary broadcaster (e.g. for pay TV rights)
Distributor for non-domestic rights
Advances against merchandising
Public subsidy
Private funding linked to tax breaks
Self-funded (e.g. bank loan etc)
New media rights and advances on revenues (including on-demand)
Total 100% 3.4 Funding of factual magazine programmes
What are the sources of funding for factual magazine programmes you produce?
Sources of funding Percentage
of total production
Primary broadcaster
Secondary broadcaster (e.g. for pay TV rights)
Distributor for non-domestic rights
Advances against merchandising
Public subsidy
Private funding linked to tax breaks
Self-funded (e.g. bank loan etc)
New media rights and advances on revenues (including on-demand)
Total 100% 3.5 Funding of games programmes
What are the sources of funding for games programmes you produce?
Sources of funding Percentage
of total production
Primary broadcaster
Secondary broadcaster (e.g. for pay TV rights)
Distributor for non-domestic rights
Advances against merchandising
Public subsidy
Private funding linked to tax breaks
Self-funded (e.g. bank loan etc)
New media rights and advances on revenues (including on-demand)
Total 100%

451
3.6 Funding of news programmes What are the sources of funding for news programmes you produce?
Sources of funding Percentage
of total production
Primary broadcaster
Secondary broadcaster (e.g. for pay TV rights)
Distributor for non-domestic rights
Advances against merchandising
Public subsidy
Private funding linked to tax breaks
Self-funded (e.g. bank loan etc)
New media rights and advances on revenues (including on-demand)
Total 100% 3.7 Funding of sport programmes
What are the sources of funding for sport programmes you produce?
Sources of funding Percentage
of total production
Primary broadcaster
Secondary broadcaster (e.g. for pay TV rights)
Distributor for non-domestic rights
Advances against merchandising
Public subsidy
Private funding linked to tax breaks
Self-funded (e.g. bank loan etc)
New media rights and advances on revenues (including on-demand)
Total 100% 3.8 Your comments
Do you want to add any comments or explanation to the answers given above? Are there any important factors influencing the funding of new programmes that we have omitted?

452
4. CO-PRODUCTIONS 4.1 Do you co-produce new programmes?
Do you co-produce programmes with other production companies? 1 = Yes 0 = No
Answer
4.2 Domestic and international co-productions If you answered “yes” to question 4.1, please tell us the regions where the production
company with whom you co-produce is located. Rank the regions according to the highest number of co-productions (so if you do most co-productions with US and then with Canadian partners, US = 1, Canada = 2 etc).
Location of co-producer
Domestic
Other European349
US
Canada
Latin America
Other [please state]
349 Including other non-domestic EU, EEA and other European countries
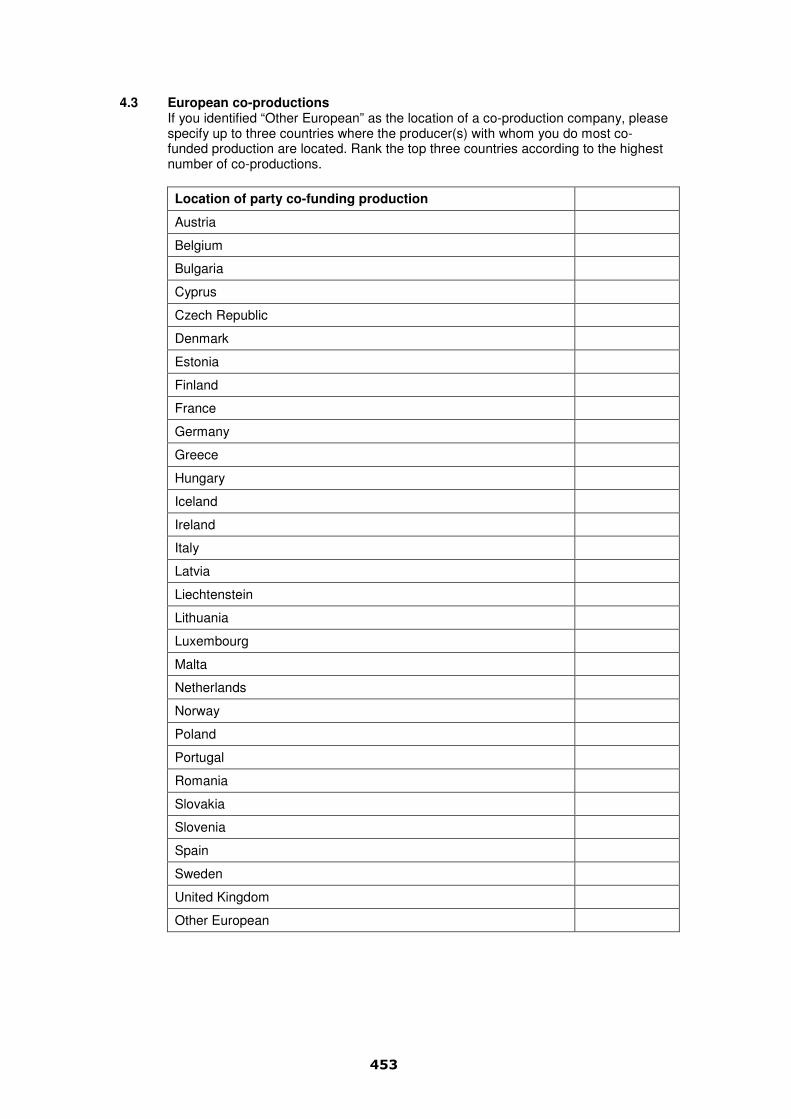
453
4.3 European co-productions If you identified “Other European” as the location of a co-production company, please
specify up to three countries where the producer(s) with whom you do most co-funded production are located. Rank the top three countries according to the highest number of co-productions.
Location of party co-funding production
Austria
Belgium
Bulgaria
Cyprus
Czech Republic
Denmark
Estonia
Finland
France
Germany
Greece
Hungary
Iceland
Ireland
Italy
Latvia
Liechtenstein
Lithuania
Luxembourg
Malta
Netherlands
Norway
Poland
Portugal
Romania
Slovakia
Slovenia
Spain
Sweden
United Kingdom
Other European

454
4.4 Co-productions by genre350
What percentage of your co-productions with domestic or other European co-producers are in each of the following genres:
Genre Percentage of
co-productions Entertainment
Fiction
Cinema film
Documentaries
Factual magazine programmes
News
Sport (including rights)
Games Total co-productions with domestic or other European co-producers
100%
350 For a complete list of genre definitions, please see 1.5.

455
5. RIGHTS OWNERSHIP
5.1 Broadcaster rights For what period do you assign to a broadcaster the rights to a programme it has funded? Rights Period
(Specify years or number of showings)
Primary rights
Secondary rights in the domestic market
Secondary rights in overseas markets
Ancillary rights (licensing, merchandising etc)
New media rights (internet, etc)
5.2 Full value for rights
Does the payment you receive for the rights exceed the value that you could create from them yourself over the same period? 1 = Yes 0 = No
Answer
5.3 Retention of Rights
Do you retain more rights to programmes you have produced than you did five years ago?
2 = Yes, we retain more rights than five years ago 1 = About the same 0 = No, we retain fewer rights than five years ago
Answer
If you answer “Yes” or “No”, please explain the changes.

456
5.4 Margins earned on programme rights Has the price you obtain in exchange for programme rights (i.e. the margin you earn on the rights) grown, shrunk, or stayed about the same over the last five years?
2 = Grown 1 = About the same 0 = Shrunk
Answer
5.5 Retention of rights
Would you like to see a statutory limit on the period that a broadcaster can have exclusive use of primary rights to a programme it has funded? 1 = Yes 0 = No
Answer
If you answer “yes”, please explain your answer, including under which conditions a broadcaster could have exclusive use of primary rights (e.g. lower funding from broadcasters in return for more rights retained by yourself) and how you think various alternatives would impact your profitability?

457
6. TRADE IN PROGRAMMES BY GENRE
6.1 Genres that make successful exports in Europe351
Which of the following genres make the most successful exports to another European country? 1 = Yes, they sell well abroad 2 = No, they don’t sell well abroad
Genre Documentaries
Factual magazines
Entertainment
Fiction
Feature films
News Sport (including rights)
Games
6.2. Formats that make successful exports in Europe
352
Which of the following format genres make the most successful exports? 1 = Yes, they sell well abroad 2 = No, they don’t sell well abroad
Genre Entertainment
Fiction
Factual magazine programmes (e.g. DIY/makeover)
Factual entertainment/reality
Games
Other
351 For a complete list of genre definitions, please see 1.5. 352 A format is defined as any programme locally adapted for broadcast in at least one other market than the market of origin and for which a licensing fee is payable, e.g. Who Wants to Be a Millionaire, Betty la Fea.

458
6.2 Destination of exported programmes in Europe Please rank the countries in Europe to which you export (1, 2, 3 etc).
Destination of exported programmes in Europe
Austria
Belgium
Bulgaria
Cyprus
Czech Republic
Denmark
Estonia
Finland
France
Germany
Greece
Hungary
Iceland
Ireland
Italy
Latvia
Liechtenstein
Lithuania
Luxembourg
Malta
Netherlands
Norway
Poland
Portugal
Romania
Slovakia
Slovenia
Spain
Sweden
United Kingdom
Other European
6.3 Genres that make successful exports outside Europe
Which of the following genres make the most successful exports to countries outside Europe? 1 = Yes, they sell well abroad 2 = No, they don’t sell well abroad

459
Genre Documentaries
Factual magazines
Entertainment
Fiction
Feature films
News
Sport (including rights)
Games
6.4 Formats that make successful exports outside of Europe
Which of the following format genres make the most successful exports to countries outside Europe? 1 = Yes, they sell well abroad 2 = No, they don’t sell well abroad Genre
353
Entertainment
Fiction
Factual magazine programmes (e.g. DIY/makeover)
Factual entertainment/reality
Games
Other
6.5 Destination of exported programmes outside Europe Please rank the countries outside Europe to which you export (1, 2, 3 etc).
Destination for programme exports outside Europe
US
Canada
Latin America
Other [please state]
353 Format genre categories vary slightly from the genres used for overall commissioned programmes. This is to reflect typical sub genres within formats.

460
6.6. Influences of on-demand Is on-demand potential of programmes an important factor when evaluating a programme’s potential for trade across borders? 1 = Yes 0 = No
Answer
If you answer “yes”, please explain your answer.

461
7. CINEMA FILM 7.1 Do you make cinema film?
1 = Yes 0 = No
Answer
7.2 Contribution to funding
If yes, what are the sources of funding for the production of films for theatrical release you produce?
Funder Percentage
of total production
Primary broadcaster
Co-production
Secondary broadcaster (e.g. for pay TV rights)
Domestic cinema distributor
Distributor for overseas rights
Advances against merchandising
Public subsidy
Private funding linked to tax breaks
Self-funded (e.g. bank loan) Total 100%
7.3 Broadcaster rights For what period do you assign to a broadcaster the rights to a cinema film it has funded? Rights Period
(Specify years or number of showings)
Primary rights
Secondary rights in the domestic market
Secondary rights in overseas markets
Ancillary rights (licensing, merchandising etc)
New media (internet, computer games etc)
7.4 Full value for rights
Does the payment you receive for the rights exceed the value that you could create from them yourself over the same period? 1 = Yes 0 = No
Answer

462
7.5 Retention of rights Would you like to see a statutory limit on the period that a broadcaster can have exclusive use of primary rights to a cinema film it has funded? 1 = Yes 0 = No
Answer
If you answer “yes”, please explain your answer.

463
Part II: On-demand audiovisual media services The Television Without Frontiers Directive was recently amended by Directive 2007/65/EC of 11 December 2007. The current name for the new Directive is the “Audiovisual Media Services Directive”. The Member States must implement the Audiovisual Media Services Directive by 19 December 2009. Article 3i of the Audiovisual Media Services Directive is a new provision, aimed at promoting European works in on-demand services. The wording of Article 3i is:
“Member States shall ensure that on-
demand audiovisual media services
provided by media service providers under
their jurisdiction promote, where
practicable and by appropriate means, the
production of and access to European
works. Such promotion could relate, inter
alia, to the financial contribution made by
such services to the production and rights
acquisition of European works or to the
share and/or prominence of European
works in the catalogue of programmes
offered by on-demand audiovisual media
service.“
We are interested in your activities regarding on-demand (including mobile) audiovisual media services that may fall in the future under Article 3i.

464
8. REGULATION In this section, we are interested to understand your thoughts on how Article 3i of the new “AVMS” Directive should be applied in your own market. 8.1 Awareness of the Audiovisual Media Services Directive
Prior to receiving this questionnaire, were you aware that Article 3i of the Audiovisual Media Services Directive requires that “Member States shall ensure that on-demand audiovisual media services provided by media service providers under their jurisdiction promote, where practicable and by appropriate means, the production of and access to European works. Such promotion could relate, inter alia, to the financial contribution made by such services to the production and rights acquisition of European works or to the share and/or prominence of European works in the catalogue of programmes offered by on-demand audiovisual media service”? 1 = Yes 2 = No
Answer:
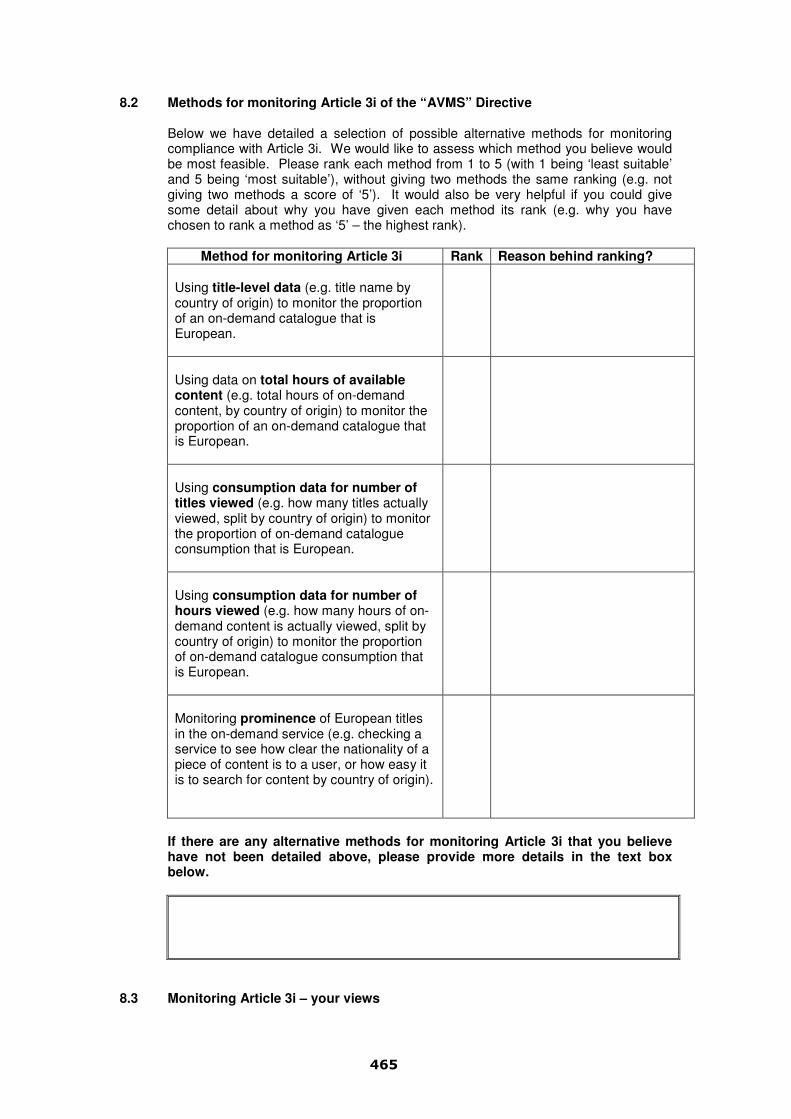
465
8.2 Methods for monitoring Article 3i of the “AVMS” Directive Below we have detailed a selection of possible alternative methods for monitoring compliance with Article 3i. We would like to assess which method you believe would be most feasible. Please rank each method from 1 to 5 (with 1 being ‘least suitable’ and 5 being ‘most suitable’), without giving two methods the same ranking (e.g. not giving two methods a score of ‘5’). It would also be very helpful if you could give some detail about why you have given each method its rank (e.g. why you have chosen to rank a method as ‘5’ – the highest rank).
Method for monitoring Article 3i Rank Reason behind ranking? Using title-level data (e.g. title name by country of origin) to monitor the proportion of an on-demand catalogue that is European.
Using data on total hours of available content (e.g. total hours of on-demand content, by country of origin) to monitor the proportion of an on-demand catalogue that is European.
Using consumption data for number of titles viewed (e.g. how many titles actually viewed, split by country of origin) to monitor the proportion of on-demand catalogue consumption that is European.
Using consumption data for number of hours viewed (e.g. how many hours of on-demand content is actually viewed, split by country of origin) to monitor the proportion of on-demand catalogue consumption that is European.
Monitoring prominence of European titles in the on-demand service (e.g. checking a service to see how clear the nationality of a piece of content is to a user, or how easy it is to search for content by country of origin).
If there are any alternative methods for monitoring Article 3i that you believe have not been detailed above, please provide more details in the text box below.
8.3 Monitoring Article 3i – your views

466
We would also be interested to know you views on the following issues regarding the future monitoring of Article 3i of the AVMS Directive. Please give your answers in the text boxes below each question. If confidentiality is ensured would you agree to share internal figures about on-demand services with a public body (for example a regulator)? If not, why, and if yes, which internal figures would you share and under what conditions?
In order to monitor Article 3i in the future, do you believe that an external, independent body is required to collect and analyse data? If not, why not, and if yes, what form do you see this independent body taking?
Do you believe that declarations from on-demand services regarding European works will be an appropriate method to monitor Article 3i? If not, do you believe there is a more appropriate alternative?
8.4 Your comments
If you wish to add any comments or explanation to the answers given above, please do so here. We are particularly interested in other ways in which European content could be promoted on your on-demand service, and how this could be monitored.

467
9. ON-DEMAND SERVICES
9.1 On-demand services Do you supply content for on-demand services? 1 = Yes 2 = No
Answer:
If yes, please specify what it is:
9.2 Genres on on-demand service
Which of the following genres do you supply to the on-demand service?
Genre354
Tick box Entertainment
Fiction
Cinema film
Documentaries
Factual magazine programmes
News
Sport
Games
Other (please specify) 9.3 Format of content for on-demand service
Is the content you supply specifically produced for on-demand? 1 = Yes 2 = No
Answer:
If yes, please specify what it is:
354 For a complete list of genre definitions, please see 1.5.

468
9.4 Revenue generated from on-demand programmes in 2007 What proportion of total revenue was generated from on-demand programmes? Business area Percentage of
revenue Programmes for traditional linear TV
Programmes for on-demand TV services
Other Total revenue 100%
9.5 Revenue generated from on-demand services by genre in 2007
How is the revenue generated from on-demand programmes distributed by genre? Genre Percentage of
revenue Entertainment
Fiction
Cinema film
Documentaries
Factual magazine programmes
News Sport
Games
Other (please specify) Total revenue from on-demand 100%
9.6 Impact of on-demand services
What effect do you anticipate on-demand services will have on content distribution in the medium term (i.e. five years hence)?
Thank you for your participation

469
17. Appendix V: On-demand services’ questionnaire
Study on the application of measures concerning the promotion of the distribution
and production of European works in audiovisual media services (including
television programmes and on-demand services)
Questionnaire for on-demand service
providers
Information on respondent
Contact information
Country
Organization
Contact person
Address
Email address
Telephone

470
FOREWORD
This questionnaire is intended to help the European Commission understand the programming policies of European on-demand services, which will be subject to the new “Audiovisual Media Services Directive”.355 The “Audiovisual Media Services Directive” 2007/65/EC was adopted on 11 December 2007, and the Member States must implement it by 19 December 2009. Article 3i of the Audiovisual Media Services Directive is a new provision aimed at promoting European works in on-demand services. The wording of Article 3i is:
“Member States shall ensure that on-demand audiovisual media services provided by media service providers under their jurisdiction promote, where practicable and by appropriate means, the production of and access to European works. Such promotion could relate, inter alia, to the financial contribution made by such services to the production and rights acquisition of European works or to the share and/or prominence of European works in the catalogue of programmes offered by on-demand audiovisual media service.“
We are interested in your current activities regarding on-demand (including mobile) audiovisual media services that may fall in the future under the new Article 3i. The questionnaire contains 5 sections: 1. Details of your on-demand content services; 2. Your programming policy; 3. The importance of European programming to you; 4. Current and future programming strategies; 5. European regulation. We are aware that some of the questions may be difficult to answer due to the confidentiality or unavailability of the data needed. This is particularly the case with sections 2 and 3. To tackle this difficulty, you can either indicate your best estimates, or contact us directly to discuss how to share some of your internal information with us, in a way that safeguards your concerns.
355 This questionnaire will be sent to the leading on-demand services in a representative sample of Member States. Data will be considered alongside data from broadcasters (providers of linear audiovisual media services), audiovisual media content producers and regulatory authorities as well.

471
1. ON-DEMAND SERVICES In this section, we are interested in your on-demand audiovisual media services in terms of the technology used and the business models applied. We are only interested in the on-demand services that you “own and operate”, meaning those for which you decide the contents and conditions of service (i.e. for which you have editorial responsibility). 1.1 Type of on-demand service
What type(s) of on-demand video service(s) do you own? Please tick box.
Answer Tick box
Open access356
Closed access357
1.2 Transmission mode of on-demand service
How is the on-demand service distributed? Type Tick box Internet
Cable
Satellite
DTT
Mobile
Other (please specify) 1.3 Content of on-demand service
What type(s) of programming is offered on your on-demand service(s)? Type Tick box
Live
Catch-up
Archive
Other (please specify)
1.4 Funding of on-demand service
How do you fund your on-demand service(s)? Funding Tick box
Adverts within programmes
Adverts at beginning/end of programmes
Subscription fee
Public subsidy
Other (please specify)
356 Open access refers to services that are available free-of-charge (sometimes involving a short registration) and using non-proprietary access technology. 357 Closed access refers to services that are only available in an encoded fashion, usually via proprietary access technologies, and that cost money to access, often via a subscription.

472
1.5 User-generated content Do you have any user-generated content on your on-demand service? 1=Yes 2=No Answer
1.6 Further details on your own on-demand services
If you own several on-demand services which you could not describe in enough detail in the above questions, please provide with further comments here:
IF YOU OWN AND OPERATE SEVERAL ON-DEMAND SERVICES, WE WOULD LIKE YOU FROM NOW ON TO FOCUS ONLY ON YOUR MAIN SERVICE. PLEASE INDICATE WHAT THIS WILL BE BELOW:
From now on, I will focus on the following on-demand service (please specify):

473
2. PROGRAMMING POLICIES In this section, we are interested in the types of content offered and consumed on your MAIN on-demand video services. 2.1 Genres offered on your main on-demand service
358
Which genres were offered on your main on-demand service as of the end of 2007? Programme Genre Tick box Entertainment
Fiction
Cinema film
Documentaries
Factual magazine programmes
News Sport (including rights)
Games
Other (please specify)
2.2 Size of programme catalogue of your main on-demand service
Please estimate the size of the on-demand programmes in your catalogue. (If possible, please indicate both the number of titles and the total hours) Any Genre Total number of
available titles Total amount of available hours
Total catalogue
358 Entertainment This includes talk shows and studio-based comedies, but not sitcoms (which are included under fiction) or quiz shows/game shows, which are included under “Games”. These are ‘stock’ programmes with repeat value. Fiction This includes soaps, drama series/serials, single dramas, situation comedies, TV movies and animation created for TV. These are ‘stock’ programmes. Cinema Film All films that have had a cinematic release (not TV movies, which should be included under Fiction). Animation for cinematic release is also included in this genre. These are ‘stock’ programmes. Documentaries Programmes consisting mainly (i.e. more than 50%) of documentary footage. These are ‘stock’ programmes. Factual magazine programmes Factual programmes containing less than 50% documentary footage. The remaining time may be studio-based links, discussion etc. Most Current Affairs programmes fall in this category. These are ‘flow’ programmes with no or little repeat value. News Separate programmes containing reports of the most important recent events in summary form. Feature programmes, Current Affairs programmes and even News magazines, which look at stories “behind the news” should not be included. These are ‘flow’ programmes. Sports Events Live or recorded sporting events or significant parts of such events, but not magazine programmes about sports, even though such a programme may well contain excerpts of live events. These are ‘Flow’ programmes. Games TV shows focusing primarily on participants competing for a prize. These are ‘Flow’ programmes. Examples: Big Brother, Who Wants To Be A Millionaire?, The Weakest Link, Survivor, Pop Idol Children’s Children’s programmes are to be included in the genres above according to their relevant sub genres.

474
2.3 Composition of programme catalogue of your main on-demand service
Please estimate, by genre, the composition of the on-demand programmes in your catalogue. (If possible, please indicate the share both in terms of number of titles and total hours) Programme Genre Percentage of
titles Percentage of
available hours Entertainment
Fiction
Cinema film
Documentaries
Factual magazine programmes
News
Sport
Games
Other (please specify) Total catalogue 100% 100%
2.4 Consumption of programme catalogue of your main on-demand service
Please estimate, by genre, how the consumption of on-demand programmes is distributed. (If possible, please indicate the share both in terms of number of titles and total hours) Programme Genre Percentage of
titles Percentage of
consumed hours Entertainment
Fiction
Cinema film
Documentaries
Factual magazine programmes
News
Sport (including rights)
Games
Other (please specify) Total catalogue 100% 100%
2.5 Compensation mechanism of programme owners
How do you usually compensate the owners of the programmes on your main on-demand service?
Please tick
Compensation mechanism Revenue sharing
Pre-defined, fixed fees
Mix of both
Answer:
2.6 Programme spend by genre on your main on-demand service in 2007

475
How is the programme spend (including costs based on pre-defined fees and revenue sharing) on on-demand programmes distributed by genre? Programme Genre Percentage of total
spending Entertainment
Fiction
Cinema film
Documentaries
Factual magazine programmes
News
Sport (including rights)
Games
Other (please specify) Total catalogue 100%
2.7 Specific production or commissioning of programmes for your main on-
demand service Have you ever commissioned
359, produced or co-produced
360 programmes for your
on-demand catalogue? 1 = Yes 2 = No
Answer:
If you answered ‘Yes’ to the above question, can you please give further information to describe your production activities (for example, details on specific programmes produced, strategic objectives behind the projects, perspectives of development of your production policy)?
2.8 Type of rights acquired for your main on-demand service
Can you please give some general information on the type of rights you are seeking to acquire for your on-demand service (exclusive or non-exclusive rights, variations depending on windows, genres, origin of productions).
2.9 Your comments
359 Commissioned refers to a situation where the on-demand service has paid a third-party producer to create audiovisual content for their on-demand service. 360 By producing or co-producing, we mean upfront participation in a programme project, editorially and/or financially, as opposed to programme acquisitions from the shelf.

476
If you wish to add any comments or explanation to the answers given above, please do so here:
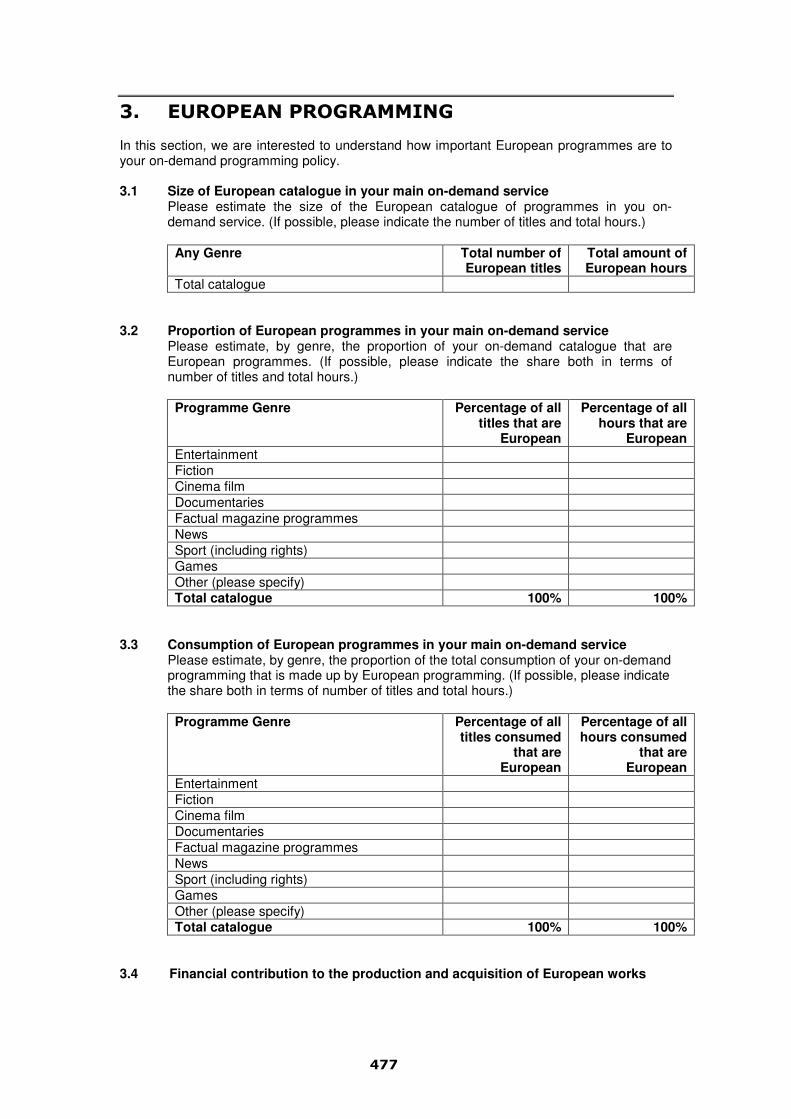
477
3. EUROPEAN PROGRAMMING In this section, we are interested to understand how important European programmes are to your on-demand programming policy. 3.1 Size of European catalogue in your main on-demand service
Please estimate the size of the European catalogue of programmes in you on-demand service. (If possible, please indicate the number of titles and total hours.) Any Genre Total number of
European titles Total amount of European hours
Total catalogue
3.2 Proportion of European programmes in your main on-demand service
Please estimate, by genre, the proportion of your on-demand catalogue that are European programmes. (If possible, please indicate the share both in terms of number of titles and total hours.) Programme Genre Percentage of all
titles that are European
Percentage of all hours that are
European Entertainment
Fiction
Cinema film
Documentaries
Factual magazine programmes
News
Sport (including rights)
Games
Other (please specify) Total catalogue 100% 100%
3.3 Consumption of European programmes in your main on-demand service
Please estimate, by genre, the proportion of the total consumption of your on-demand programming that is made up by European programming. (If possible, please indicate the share both in terms of number of titles and total hours.) Programme Genre Percentage of all
titles consumed that are
European
Percentage of all hours consumed
that are European
Entertainment
Fiction
Cinema film
Documentaries
Factual magazine programmes
News
Sport (including rights)
Games
Other (please specify) Total catalogue 100% 100%
3.4 Financial contribution to the production and acquisition of European works

478
Please estimate the proportion of your programme production and acquisition budget for your main on-demand service that has been spent on European works (excluding news, sports and games). Programme origination Percentage of
programme budget
National commissions
European, non-national commissions
Non-European commissions
National acquisitions
European, non-national acquisitions
Non-European acquisitions Total 100%

479
4. PROGRAMMING STRATEGIES In this section, we are interested to understand the factors that drive your programming decisions today and in the future, in particular with regards to European programming. 4.1 Influences on programme decisions today
Please state whether the factors below influence which type of programmes you prefer to acquire today to feed your on-demand catalogue. Please tick
Programming decisions today Fully agree
Rather agree
Rather disagree
Strongly disagree
Don’t know
Programmes must be well-known to consumers due to success and promotion on other windows.
Programmes must be recent so there is a higher probability that consumers have not seen them already.
Programmes must be exclusive so consumers can only see them on my platform but not on competitors.
Programmes must be affordable because my revenue, and thus programming budget, is still very limited.
Programmes must be sold on a revenue sharing basis because this is my main acquisitions policy.
Programmes must help me achieve my regulatory obligations.
Other

480
4.2 Influences on programme decisions in the medium term
Please state how the factors influencing the type of programmes you prefer to acquire to feed your on-demand catalogue will evolve over the next few years. Please tick
Programming decisions in the medium term Will grow (+),
shrink (-) or stay the same (><)
Programmes must be well-known to consumers due to success and promotion on other windows.
Programmes must be recent so there is a better probability that consumers have not seen them already.
Programmes must be exclusive so consumers can only see them on my platform but not on competitors.
Programmes must be affordable because my revenue, and thus programming budget, is still very limited.
Programmes must be sold on revenue sharing basis because this is my main acquisitions policy.
Programmes must help me achieve my regulatory obligations.
Other 4.3 Your view on the importance of European programming today
Please indicate the reasons why European programming, relative to non-European programming, is important or not to the success of your main on-demand service today. Please tick
European programming today Fully agree
Rather agree
Rather disagree
Strongly disagree
Don’t know
European programming is the best way to attract European audiences.
European programming is more affordable and thus enables a higher profit.
European programming is easier to acquire because we are European.
European programming is all-in-all a very good option for my service.
European programming ensures compliance with national obligations (and thus will help me to comply with the AVMS in the future).

481
4.4 Your view on the importance of European programming in the medium term
Please indicate how the reasons why European programming, relative to non-European programming, is important or not to the success of your main on-demand service will evolve over the next few years. Please tick
European programming in the medium term Will grow (+),
shrink (-) or stay the same (><)
European programming is the best way to attract European audiences.
European programming is more affordable and thus enables a higher profit.
European programming is easier to acquire because we are European.
European programming is all-in-all a very good option for my service.
European programming ensures compliance with the AVMS Directive
4.5 Publicity (prominence) for European works
Please explain below how you publicise any European works on your on-demand service. (For example, do you enable users to search by country of origin? Is European content prominent on your on-demand service in any way?) Do you use any other methods to ensure attractive presentation of European works?
4.6 Specific promotions for European works on your on-demand service
If you have had specific promotions for European works on your on-demand service, please detail below how these worked, and why you decided to promote European works in this fashion.

482
4.7 Marketing spend
If possible, could you please indicate below whether your marketing spend varies by country-of-origin (for example, is relatively more marketing money spent promoting European works?).
4.8 Further comments If you wish to add any comments or explanation to the answers given above, please do so here:

483
5. REGULATION In this section, we are interested to understand your thoughts on how Article 3i of the new AVMS Directive should be applied in your own market. 5.1 Awareness of the Audiovisual Media Services Directive
Prior to receiving this questionnaire, were you aware that Article 3i of the Audiovisual Media Services Directive requires that “Member States shall ensure that on-demand audiovisual media services provided by media service providers under their jurisdiction promote, where practicable and by appropriate means, the production of and access to European works. Such promotion could relate, inter alia, to the financial contribution made by such services to the production and rights acquisition of European works or to the share and/or prominence of European works in the catalogue of programmes offered by on-demand audiovisual media service”? 1 = Yes 2 = No
Answer:

484
5.2 Methods for monitoring Article 3i of the “AVMS” Directive
Below we have detailed a selection of possible alternative methods for monitoring compliance with Article 3i. We would like to assess which method you believe would be most feasible. Please rank each method from 1 to 5 (with 1 being ‘least suitable’ and 5 being ‘most suitable’), without giving two methods the same ranking (e.g. not giving two methods a score of ‘5’). It would also be very helpful if you could give some detail about why you have given each method its rank (e.g. why you have chosen to rank a method as ‘5’ – the highest rank).
Method for monitoring Article 3i Rank Reason behind ranking? Using title-level data (e.g. title name by country of origin) to monitor the proportion of an on-demand catalogue that is European.
Using data on total hours of available content (e.g. total hours of on-demand content, by country of origin) to monitor the proportion of an on-demand catalogue that is European.
Using consumption data for number of titles viewed (e.g. how many titles actually viewed, split by country of origin) to monitor the proportion of on-demand catalogue consumption that is European.
Using consumption data for number of hours viewed (e.g. how many hours of on-demand content is actually viewed, split by country of origin) to monitor the proportion of on-demand catalogue consumption that is European.
Monitoring prominence of European titles in the on-demand service (e.g. checking a service to see how clear the nationality of a piece of content is to a user, or how easy it is to search for content by country of origin).
Providing evidence of to the financial contribution to the production and/or rights acquisition of European works
If there are any alternative methods for monitoring Article 3i that you believe have not been detailed above, please provide more details in the text box below.

485
5.3 Monitoring Article 3i – your views
We would also be interested to know you views on the following issues regarding the future monitoring of Article 3i of the AVMS Directive. Please give your answers in the text boxes below each question.If confidentiality is ensured would you agree to share internal figures about on-demand services with a public body (for example a regulator)? If not, why, and if yes, which internal figures would you share and under what conditions?
In order to monitor Article 3i in the future, do you believe that an external, independent body is required to collect and analyse data? If not, why not, and if yes, what form do you see this independent body taking?
Do you believe that declarations from on-demand services regarding European works will be an appropriate method to monitor Article 3i? If not, do you believe there is a more appropriate alternative?
5.4 Your comments
If you wish to add any comments or explanation to the answers given above, please do so here. We are particularly interested in other ways in which European content could be promoted on your on-demand service, and how this could be monitored.
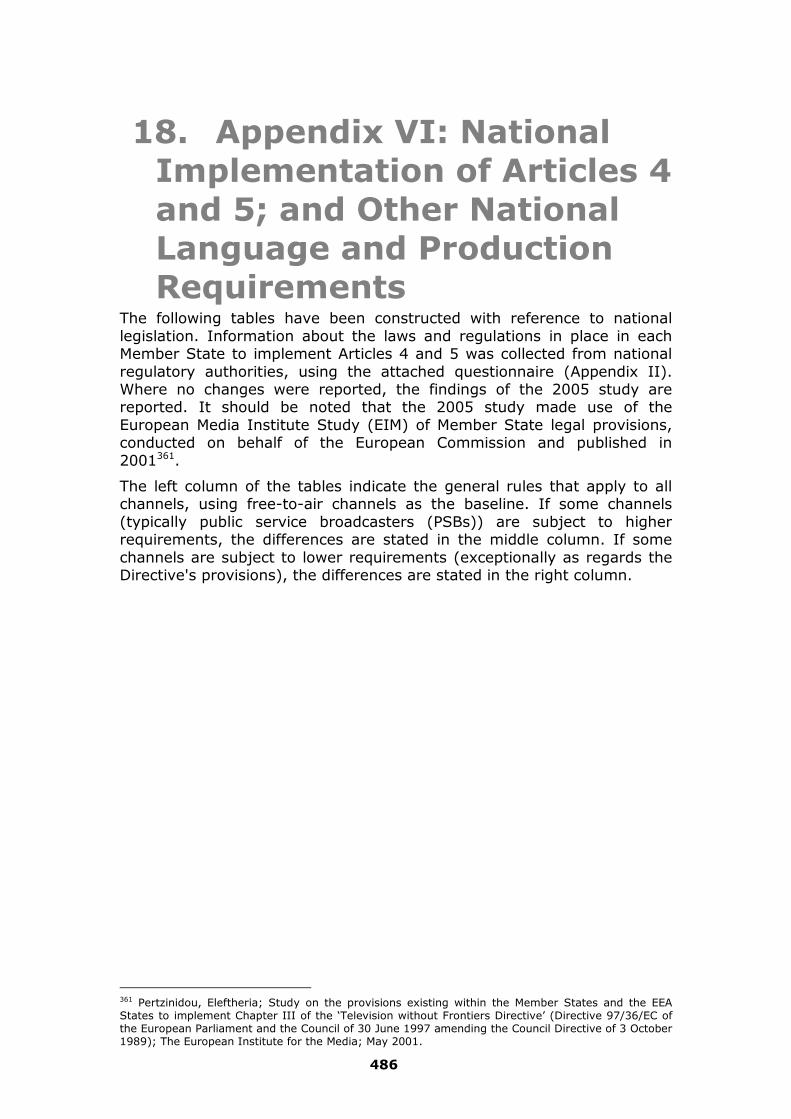
486
18. Appendix VI: National Implementation of Articles 4 and 5; and Other National Language and Production Requirements
The following tables have been constructed with reference to national legislation. Information about the laws and regulations in place in each Member State to implement Articles 4 and 5 was collected from national regulatory authorities, using the attached questionnaire (Appendix II). Where no changes were reported, the findings of the 2005 study are reported. It should be noted that the 2005 study made use of the European Media Institute Study (EIM) of Member State legal provisions, conducted on behalf of the European Commission and published in 2001361.
The left column of the tables indicate the general rules that apply to all channels, using free-to-air channels as the baseline. If some channels (typically public service broadcasters (PSBs)) are subject to higher requirements, the differences are stated in the middle column. If some channels are subject to lower requirements (exceptionally as regards the Directive's provisions), the differences are stated in the right column.
361 Pertzinidou, Eleftheria; Study on the provisions existing within the Member States and the EEA States to implement Chapter III of the ‘Television without Frontiers Directive’ (Directive 97/36/EC of the European Parliament and the Council of 30 June 1997 amending the Council Directive of 3 October 1989); The European Institute for the Media; May 2001.

487
Table 136: National Measures to implement Articles 4 and 5 and other national language and production requirements in Austria
GENERAL REQUIREMENTS (FREE-TO-AIR CHANNELS)
HIGHER REQUIREMENTS FOR CERTAIN CHANNELS
LOWER REQUIREMENTS FOR CERTAIN CHANNELS
European Works
Wording of Directive incorporated directly into national law
Language requirements
Independent Production
10% of qualifying transmission time
Contribution to production
Public service broadcaster ORF is obliged to provide financing to the Austrian film industry through the Film-Television Treaty with the Austrian Film Institute
Legislation
NationalMeasures
Private Television Act (PrTV-G) No. 84/2001, as amended
ORF Act No. 379/1984, as amended
Austria

488
Table 137: National Measures to implement Articles 4 and 5 and other national language and production requirements in Flemish Belgium
GENERAL REQUIREMENTS (FREE-TO-AIR CHANNELS)
HIGHER REQUIREMENTS FOR CERTAIN CHANNELS
LOWER REQUIREMENTS FOR CERTAIN CHANNELS
European Works
Broadcasters must aim for a majority proportion of transmission time
Language requirements
A considerable proportion of European works should be works originally produced in the Dutch language.
Within the quota for independent productions, sufficient space must be made for recent productions in the Dutch language.
Independent Production
10% of qualifying transmission time
Contribution to production
Legislation
NationalMeasures
Decreten Betreffende De Radio-Omroep En DeTelevisie, Gecoördineerd Op 25 Januari 1995
Belgium (Flemish Community)

489
Table 138: National Measures to implement Articles 4 and 5 and other national language and production requirements in French Belgium
GENERAL REQUIREMENTS (FREE-TO-AIR CHANNELS)
HIGHER REQUIREMENTS FOR CERTAIN CHANNELS
LOWER REQUIREMENTS FOR CERTAIN CHANNELS
European Works
Majority proportion of qualifying transmission time
Language requirements
10% of qualifying transmission time must be reserved to audiovisual works originally produced in French
Independent Production
10% of qualifying transmission time
Contribution to production
Broadcasters must use 1.4% to 2.2% of turnover (on a progressive scale) for audiovisual production (cinema & television). The amount can be used through co-productions, pre-purchases or payments to Centre du Cinema et de l'audiovisuel.
Legislation
NationalMeasures
Belgium (French Community)
Décret sur la radiodiffusion du 27 février 2003 (Broadcasting Decree of 27 February 2003, as amended)

490
Table 139: National Measures to implement Articles 4 and 5 and other national language and production requirements in Bulgaria
GENERAL REQUIREMENTS (FREE-TO-AIR CHANNELS)
HIGHER REQUIREMENTS FOR CERTAIN CHANNELS
LOWER REQUIREMENTS FOR CERTAIN CHANNELS
European Works
At least 50% of qualifying transmission time, where practicable
Language requirements
Independent Production
10% of qualifying transmission time
Contribution to production
Bulgarian National Television must allocate at least 5% of the annual budget subsidy to the financing from the Radio and Television Fund for Bulgarian films made for television.
Legislation
NationalMeasures
Law for the Radio and the Television, SG. 138 of 24 November 1998 (as amended)
Bulgaria

491
Table 140: National Measures to implement Articles 4 and 5 and other national language and production requirements in Cyprus
GENERAL REQUIREMENTS (FREE-TO-AIR CHANNELS)
HIGHER REQUIREMENTS FOR CERTAIN CHANNELS
LOWER REQUIREMENTS FOR CERTAIN CHANNELS
European Works
Majority proportion of qualifying transmission time
Language requirements
Independent Production
10% of qualifying transmission time or 10% of annual programme budget
Contribution to production
Legislation
NationalMeasures
Radio and Televisions Stations Law of 30 January 1998
Cyprus

492
Table 141: National Measures to implement Articles 4 and 5 and other national language and production requirements in Czech Republic
GENERAL REQUIREMENTS (FREE-TO-AIR CHANNELS)
HIGHER REQUIREMENTS FOR CERTAIN CHANNELS
LOWER REQUIREMENTS FOR CERTAIN CHANNELS
European Works
Majority proportion of qualifying transmission time, where practicable
Language requirements
Independent Production
10% of qualifying transmission time or 10% of annual programme budget
Contribution to production
Public service broadcaster is required to transfer 12.5 million CKZ of monthly advertising revenue to the Czech Cinematographic Fund.
Legislation
NationalMeasures
Act No. 231/2001 of 4 July 2001 on Radio and Television Broadcasting Operation and on Amendments to Other Acts (as amended)
Act no. 483/1991 of 7 May 1991 on Czech Television (as amended)
Czech Republic

493
Table 142: National Measures to implement Articles 4 and 5 and other national language and production requirements in Denmark
GENERAL REQUIREMENTS (FREE-TO-AIR CHANNELS)
HIGHER REQUIREMENTS FOR CERTAIN CHANNELS
LOWER REQUIREMENTS FOR CERTAIN CHANNELS
European Works
Majority proportion of qualifying transmission time, where practicable
Language requirements
DR and TV2 are required to pay special attention to Danish and other Nordic languages
Independent Production
10% of qualifying transmission time or 10% of annual programme budget
Contribution to production
Legislation
NationalMeasures
Denmark
Lov om radio- og fjernsynsvirksomhed (the Radio And Televisions Broadcasting Act), Consolidated act no. 338 of 11 April 2007 and executive orders ("bekendtgørelse") issued in accordance with the act. The Directive is implemented in the following executive orders:No 338 of 19 April 2006 ("Bekendtgørelse om programvirksomhed ved hjælp af satellit og kable og kort-bølgesendemuligheder"), No. 1629 of 13 December 2006 ("Vedtægter for DR"), No. 1628 of 13 december 2006 ("Vedtægt for de Regionale TV2-virksomheder"), No. 1031 of 11 december 2003 ("Bekendtgørelse for TV2") .

494
Table 143: National Measures to implement Articles 4 and 5 and other national language and production requirements in Estonia
GENERAL REQUIREMENTS (FREE-TO-AIR CHANNELS)
HIGHER REQUIREMENTS FOR CERTAIN CHANNELS
LOWER REQUIREMENTS FOR CERTAIN CHANNELS
European Works
51% of qualifying transmission time
Language requirements
Kanal 2 - One hour Russian language broadcasts per week.
Independent Production
10% of qualifying transmission time
Contribution to production
(At least one hour per month must contain audiovisual works financed from the state budget, Estonian Film Foundation or Cultural endowment)
(For new DTT channels, At least 1.5 hours per month must contain audiovisual works financed from the state budget, Estonian Film Foundation or Cultural endowment)
Legislation
NationalMeasures
Broadcasting Act of 19 May 1994 (as amended)
Estonia

495
Table 144: National Measures to implement Articles 4 and 5 and other national language and production requirements in Finland
GENERAL REQUIREMENTS (FREE-TO-AIR CHANNELS)
HIGHER REQUIREMENTS FOR CERTAIN CHANNELS
LOWER REQUIREMENTS FOR CERTAIN CHANNELS
European Works
Wording of Directive incorporated directly into national law
Language requirements
Legal requirement on the public service broadcaster YLE to reflect minority languages in the programme schedule.
Independent Production
15% of qualifying transmission time or programme budget
Contribution to production
Legislation
NationalMeasures
Act 744/1998 on Television and Radio Operations (as amended)
YLE Act: Act 1380/1993 (as amended)
Finland
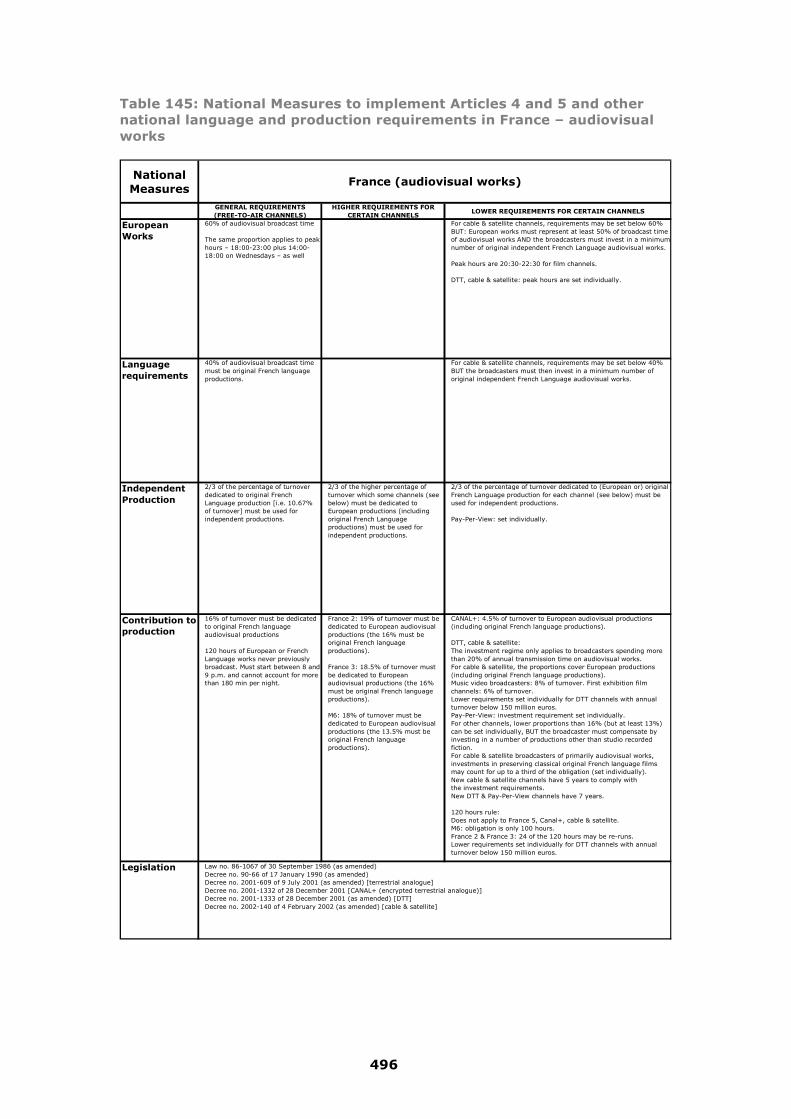
496
Table 145: National Measures to implement Articles 4 and 5 and other national language and production requirements in France – audiovisual works
NationalMeasures
GENERAL REQUIREMENTS (FREE-TO-AIR CHANNELS)
HIGHER REQUIREMENTS FOR CERTAIN CHANNELS
LOWER REQUIREMENTS FOR CERTAIN CHANNELS
European Works
60% of audiovisual broadcast time
The same proportion applies to peak hours – 18:00-23:00 plus 14:00-18:00 on Wednesdays – as well
For cable & satellite channels, requirements may be set below 60% BUT: European works must represent at least 50% of broadcast time of audiovisual works AND the broadcasters must invest in a minimum number of original independent French Language audiovisual works.
Peak hours are 20:30-22:30 for film channels.
DTT, cable & satellite: peak hours are set individually.
Language requirements
40% of audiovisual broadcast time must be original French language productions.
For cable & satellite channels, requirements may be set below 40% BUT the broadcasters must then invest in a minimum number of original independent French Language audiovisual works.
Independent Production
2/3 of the percentage of turnover dedicated to original French Language production [i.e. 10.67% of turnover] must be used for independent productions.
2/3 of the higher percentage of turnover which some channels (see below) must be dedicated to European productions (including original French Language productions) must be used for independent productions.
2/3 of the percentage of turnover dedicated to (European or) original French Language production for each channel (see below) must be used for independent productions.
Pay-Per-View: set individually.
Contribution to production
16% of turnover must be dedicated to original French language audiovisual productions 120 hours of European or French Language works never previously broadcast. Must start between 8 and 9 p.m. and cannot account for more than 180 min per night.
France 2: 19% of turnover must be dedicated to European audiovisual productions (the 16% must be original French language productions).
France 3: 18.5% of turnover must be dedicated to European audiovisual productions (the 16% must be original French language productions). M6: 18% of turnover must be dedicated to European audiovisual productions (the 13.5% must be original French language productions).
CANAL+: 4.5% of turnover to European audiovisual productions (including original French language productions).
DTT, cable & satellite:The investment regime only applies to broadcasters spending more than 20% of annual transmission time on audiovisual works. For cable & satellite, the proportions cover European productions (including original French language productions). Music video broadcasters: 8% of turnover. First exhibition film channels: 6% of turnover. Lower requirements set individually for DTT channels with annual turnover below 150 million euros.Pay-Per-View: investment requirement set individually.For other channels, lower proportions than 16% (but at least 13%) can be set individually, BUT the broadcaster must compensate by investing in a number of productions other than studio recorded fiction. For cable & satellite broadcasters of primarily audiovisual works, investments in preserving classical original French language films may count for up to a third of the obligation (set individually).New cable & satellite channels have 5 years to comply withthe investment requirements. New DTT & Pay-Per-View channels have 7 years.
120 hours rule:Does not apply to France 5, Canal+, cable & satellite. M6: obligation is only 100 hours. France 2 & France 3: 24 of the 120 hours may be re-runs. Lower requirements set individually for DTT channels with annual turnover below 150 million euros.
Legislation
France (audiovisual works)
Law no. 86-1067 of 30 September 1986 (as amended)Decree no. 90-66 of 17 January 1990 (as amended)Decree no. 2001-609 of 9 July 2001 (as amended) [terrestrial analogue]Decree no. 2001-1332 of 28 December 2001 [CANAL+ (encrypted terrestrial analogue)]Decree no. 2001-1333 of 28 December 2001 (as amended) [DTT]Decree no. 2002-140 of 4 February 2002 (as amended) [cable & satellite]

497
Table 146: National Measures to implement Articles 4 and 5 and other national language and production requirements in France – cinematographic works
GENERAL REQUIREMENTS (FREE-TO-AIR CHANNELS)
HIGHER REQUIREMENTS FOR CERTAIN CHANNELS
LOWER REQUIREMENTS FOR CERTAIN CHANNELS
European Works
60% of the annual total number of runs and re-runs of long duration films (of at least 60 minutes).
Applies to peak hours as well – 20:30-22:30.
CANAL+, Pay-Per-View and film channels: Peak hours are 18:00-02:00.
For other film channels than CANAL+ (other than old movies), the requirements can be met on the number of DIFFERENT long duration films broadcast during the year – but European films must represent at least 50% of total runs and re-runs.
Language requirements
40% of the annual total number of runs and re-runs of long duration films (of at least 60 minutes) must be original French language productions.
Applies to peak hours as well – 20:30-22:30.
For other film channels than CANAL+ (other than old movies), the requirements can be met on the number of DIFFERENT long duration films broadcast during the year – but French language films must represent at least 35% of total runs and re-runs, during peak time as well.
Independent Production
75% of the percentage of turnover dedicated to European films [i.e. 2.4% of turnover] must be used for independent productions.
75% of the percentage of turnover dedicated to European films for each channel (see below) must be used for independent productions.
Contribution to production
3.2% of turnover on European films 2.5% of turnover on French Language films
Only applies to broadcasters who are annually broadcasting at least 52 long-duration cinematographic works.
5.5% tax on the part of each broadcaster's annual advertising revenues which exceed 11 million euros.
CANAL+:12% of turnover on acquisition of rights to European Films9% of turnover on acquisition of rights to French Language films
Other film channels (cable, satellite & DTT):21% of turnover on acquisition of rights to European Films(26% for first exhibition channels)17% of turnover on acquisition of rights to French Language films(22% for first exhibition channels)
New cable & satellite channels have 5 years to comply with the investment requirements.
New DTT & Pay-Per-View channels have 7 years to comply with the investment requirements.
Legislation
NationalMeasures
France (cinematographic works)
Law no. 86-1067 of 30 September 1986 (as amended)Decree no. 90-66 of 17 January 1990 (as amended)Decree no. 2001-609 of 9 July 2001 (as amended) [terrestrial analogue]Decree no. 2001-1332 of 28 December 2001 [CANAL+ (encrypted terrestrial analogue)]Decree no. 2001-1333 of 28 December 2001 (as amended) [DTT]Decree no. 2002-140 of 4 February 2002 (as amended) [cable & satellite]
Code général des impôts (the general tax code)

498
Table 147: National Measures to implement Articles 4 and 5 and other national language and production requirements in Germany
GENERAL REQUIREMENTS (FREE-TO-AIR CHANNELS)
HIGHER REQUIREMENTS FOR CERTAIN CHANNELS
LOWER REQUIREMENTS FOR CERTAIN CHANNELS
European Works
RStV Art. 6(2): "In order to present the plurality of the German-speaking regions and of Europe as a whole and to promote European film and television productions television broadcasters should reserve the greater part of their total scheduled broadcast time devoted to feature films, films made for television, series, documentaries and comparable productions for European works in accordance with European law"
("greater part" should be construed as "majority proportion")
Language requirements
"Presentation of the diversity of the German speaking regions" is indicated as a specific purpose to be achieved through the broadcasting of European works (see above).
Independent Production
RStV Art. 6(3): "A significant proportion of full service channels should be own productions as well as commis-sioned and joint productions from the German-speaking regions and Europe as a whole. The same applies to theme television channels insofar as this is feasible with regard to their focus in terms of content."
("Significant proportion" should be construed as at least 10% of qualifying transmission time)
Theme television channels are only subject to the requirement insofar as this is feasible with regard to their focus in terms of content.
Contribution to production
Legislation
NationalMeasures
Germany
Interstate Treaty on Broadcasting of 31 August 1991 (as amended)(Staatsvertrag für Rundfunk und Telemedien (Rundfunkstaatsvertrag - RStV) )

499
Table 148: National Measures to implement Articles 4 and 5 and other national language and production requirements in Greece
GENERAL REQUIREMENTS (FREE-TO-AIR CHANNELS)
HIGHER REQUIREMENTS FOR CERTAIN CHANNELS
LOWER REQUIREMENTS FOR CERTAIN CHANNELS
European Works
Wording of Directive incorporated directly into national law
Pay-TV: 25% in first year of operation, then to be increased by 5% every year until 45% is reached.
Language requirements
25% of qualifying time should be for works produced in Greek. Also requirement to show correct use of Greek.
Independent Production
10% of qualifying transmission time
Contribution to production
Requirement to allocate 1.5% of gross annual income for production of cinematographic works (but the requirement has not been applied in practice)
Legislation Presidential Decree 100/2000Law 2328/1995Law 2644/1998 for the provision of pay TV and radio services
GreeceNationalMeasures

500
Table 149: National Measures to implement Articles 4 and 5 and other national language and production requirements in Hungary
GENERAL REQUIREMENTS (FREE-TO-AIR CHANNELS)
HIGHER REQUIREMENTS FOR CERTAIN CHANNELS
LOWER REQUIREMENTS FOR CERTAIN CHANNELS
European Works
"Over half" of annual transmission time
Language requirements
Over one third of transmission time must be works originally made in the Hungarian language.
At least 7 % of transmission time must be independent productions originally made in the Hungarian language.
The 12% of programming budget reserved for independent productions must be originally made in the Hungarian language, except for cinematographic works.
Independent Production
10% of qualifying transmission time AND 12% of programming budget.
Contribution to production
Legislation
NationalMeasures
Hungary
Act I of (15 January) 1996 on Radio and Television Broadcasting (as amended)

501
Table 150: National Measures to implement Articles 4 and 5 and other national language and production requirements in Iceland
GENERAL REQUIREMENTS (FREE-TO-AIR CHANNELS)
HIGHER REQUIREMENTS FOR CERTAIN CHANNELS
LOWER REQUIREMENTS FOR CERTAIN CHANNELS
European Works
Act refers to "make every effort to ensure that … greater part of transmission time is reserved for Icelandic and other European material"
Language requirements
General formulation to encourage Icelandic culture and language.
Independent Production
"Where practicable", 10% of qualifying transmission time or 10% of annual programme budget
Contribution to production
Legislation
NationalMeasures
Iceland
Broadcasting Act 53/2000 (as amended)Regulation on Broadcasting Activities, No 50/January 16, 2002.

502
Table 151: National Measures to implement Articles 4 and 5 and other national language and production requirements in Ireland
GENERAL REQUIREMENTS (FREE-TO-AIR CHANNELS)
HIGHER REQUIREMENTS FOR CERTAIN CHANNELS
LOWER REQUIREMENTS FOR CERTAIN CHANNELS
European Works
Wording of Directive incorporated directly into national law
Language requirements
General requirement to reflect Irish culture and language
Independent Production
10% of qualifying transmission time or programme budget.
Contribution to production
Public service broadcaster RTE has financial targets for spending on independent productions.
Legislation
NationalMeasures
Radio and Television Act 1988Broadcasting Act 2001Broadcasting Authority Act 1960, as amendedEuropean Communities (Television Broadcasting) Regulations 1999
Ireland

503
Table 152: National Measures to implement Articles 4 and 5 and other national language and production requirements in Italy
GENERAL REQUIREMENTS (FREE-TO-AIR CHANNELS)
HIGHER REQUIREMENTS FOR CERTAIN CHANNELS
LOWER REQUIREMENTS FOR CERTAIN CHANNELS
European Works
Wording of Directive incorporated directly into national law. Applicable to monthly transmission time and in peak time (18:30-22:30). Talk shows are excluded.
[Peak time may be adjusted during 2008, probably to 19:30-23:30]
PSB must use at least 15% of the overall annual revenue for European works (including independent productions).[As of 1 January 2008, replaced by:PSB must use at least 15% of the overall annual revenue for European works by independent producers.]
Thematic channels (70% of output devoted to a particular theme) can apply for an exemption.
[Further to Law 31/2008 which entered into force in February 2008, a new exemptions regime will be established by a new regulation which is due to be issued by AGCOM]
Language requirements
Independent Production
10% of qualifying transmission time. Talk shows are excluded.
[As of 1 January 2008, replaced by:Broadcasters must use at least 10% of the overall annual revenue for European works by independent producers.]
20% of qualifying transmission time for PSB
[As of 1 January 2008, replaced by:PSB must use at least 15% of the overall annual revenue for European works by independent producers.]
Contribution to production
10% of profit from advertising must be devoted to European productions of which 40% should go to film.
[As of 1 January 2008, replaced by:Generalist channels:30% of the 10% of the overall annual revenue reserved for independent productions must be devoted to cinema film expressing Italian origins.
Thematic (non-movie) channels: 35% of the 10% of the overall annual revenue reserved for independent productions must be devoted to works expressing Italian origins, belonging to the theme adopted by the channel.]
[As of 1 January 2008:Pay-TV broadcasters:35% of the 10% of the overall annual revenue reserved for independent productions must be devoted to cinema film expressing Italian origins.]
[As of 1 January 2008:PSB must reserve 10% of programming time to cinema film expressing Italian origins]
Legislation
NationalMeasures
The Broadcasting Code (Legislative decree no. 177 of 31 July 2005, [as amended by Law 244/2007 (entered into force on 1 January 2008) and Law 31/2008 (entered into force in February 2008)].
AGCOM decision 9/99 of 16 March 1999
Italy

504
Table 153: National Measures to implement Articles 4 and 5 and other national language and production requirements in Latvia
GENERAL REQUIREMENTS (FREE-TO-AIR CHANNELS)
HIGHER REQUIREMENTS FOR CERTAIN CHANNELS
LOWER REQUIREMENTS FOR CERTAIN CHANNELS
European Works
51% of weekly qualifying transmission time.
Language requirements
40% of qualifying weekly transmission time shall be European works produced in the Latvian language.
Independent Production
10% of qualifying weekly transmission time
Contribution to production
Legislation
NationalMeasures
Latvia
The Radio and Television Law of 8 September 1995 (as amended)

505
Table 154: National Measures to implement Articles 4 and 5 and other national language and production requirements in Lithuania
GENERAL REQUIREMENTS (FREE-TO-AIR CHANNELS)
HIGHER REQUIREMENTS FOR CERTAIN CHANNELS
LOWER REQUIREMENTS FOR CERTAIN CHANNELS
European Works
At least 50% of qualifying transmission time, where practicable
Language requirements
Independent Production
Wording of Directive incorporated directly into national law
Contribution to production
Legislation
NationalMeasures
Lithuania
Law on provision of information to the public of 2 July 1996 no. I-1418 (as amended)

506
Table 155: National Measures to implement Articles 4 and 5 and other national language and production requirements in Luxembourg
GENERAL REQUIREMENTS (FREE-TO-AIR CHANNELS)
HIGHER REQUIREMENTS FOR CERTAIN CHANNELS
LOWER REQUIREMENTS FOR CERTAIN CHANNELS
European Works
Wording of Directive incorporated directly into national law
Language requirements
Independent Production
Wording of Directive incorporated directly into national law
Contribution to production
Legislation
NationalMeasures
Luxembourg
Loi du 2 Avril 2001 portant modification de la loi du 27 Juillet 1991 sur les médias électroniques et transposition de la directive 97/36/CE du Parlement Européen et du Conseil du 30 Juin 1997, publié au Mémorial A No 42 du 17 Avril 2001.Règlement grand-ducal du 5 Avril 2001 fixant les règles applicables en matière de contenu en oeuvres Européen et en oeuvres de producteurs indépendents des programmes de télévision réputés relever de la compétence du Luxembourg conformément à la directive Européen “Télévision sans frontières”.

507
Table 156: National Measures to implement Articles 4 and 5 and other national language and production requirements in Malta
GENERAL REQUIREMENTS (FREE-TO-AIR CHANNELS)
HIGHER REQUIREMENTS FOR CERTAIN CHANNELS
LOWER REQUIREMENTS FOR CERTAIN CHANNELS
European Works
Wording of Directive incorporated directly into national law
Language requirements
Public service broadcasters PBS Ltd. (channels: TVM and Education 22) are subject to language requirements
Independent Production
Wording of Directive incorporated directly into national law
Contribution to production
Legislation
NationalMeasures
Malta
Broadcasting (Jurisdiction and European Co-operation) Regulations, S.L. 350.04, 15 December 2000 (as amended)

508
Table 157: National Measures to implement Articles 4 and 5 and other national language and production requirements in the Netherlands
GENERAL REQUIREMENTS (FREE-TO-AIR CHANNELS)
HIGHER REQUIREMENTS FOR CERTAIN CHANNELS
LOWER REQUIREMENTS FOR CERTAIN CHANNELS
European Works
At least 50% of qualifying transmission time.
The 50% requirement is applied separately to each public service channel.
Exemptions may be granted, subject to a 10% minimum.
Language requirements
Commercial channels must dedicate 40% of qualifying transmission time to programmes originally produced in in Dutch or Friesian
Public service channels must dedicate 50% of qualifying transmission time to programmes originally produced in in Dutch or Friesian
Temporary exemptions from language requirements for certain secondary and pay TV channels.
Independent Production
10% of qualifying transmission time 25% of qualifying transmission time for PSBs (with each channel broadcasting a minimum of 17.5%). In order to count as independent productions, programmes must be produced at the request of the PSB, and programmes must be broadcast between 16:00 and 24:00. Programmes produced by former employees of a broadcaster will only count two years after the producer left the employment.
Contribution to production
Legislation
NationalMeasures
Netherlands
Media Act of 21 April 1987 as amended (Staatsblad 249 of 1987).
Covenant of 16 November 1999 between the Commissariaat vor de Media and the National Broadcasting Foundation (NOS)
Regulation of the Commisariaat voor de Media of 18 December 2001 (“Policy Guidelines Programme Quota”)

509
Table 158: National Measures to implement Articles 4 and 5 and other national language and production requirements in Norway
GENERAL REQUIREMENTS (FREE-TO-AIR CHANNELS)
HIGHER REQUIREMENTS FOR CERTAIN CHANNELS
LOWER REQUIREMENTS FOR CERTAIN CHANNELS
European Works
50% of qualifying transmission time.
Language requirements
Nationwide broadcasters must transmit some programmes in the Sami language.
Licence conditions on TV2 to contribute to "the preservation and promotion of Norwegian language, culture and identity". At least 50% of programmes must be in Norwegian.
Independent Production
10% of qualifying transmission time
Contribution to production
TV2 must contribute 25 million NOK to film and TV through funding for Norwegian Film Fund.
Legislation
NationalMeasures
Norway
Act No 127 of 4 December 1992 relating to broadcasting (as amended)Broadcasting Regulation 153 of 28 February 1997 (Forskrift om Kringkasting) pursuant to the Act No 127 of 4 December 1992.

510
Table 159: National Measures to implement Articles 4 and 5 and other national language and production requirements in Poland
GENERAL REQUIREMENTS (FREE-TO-AIR CHANNELS)
HIGHER REQUIREMENTS FOR CERTAIN CHANNELS
LOWER REQUIREMENTS FOR CERTAIN CHANNELS
European Works
More than 50% of quarterly qualifying transmission time (more than 40% in first year of transmission).
More than 45% in ensuing years after the first year of transmission, for:- thematic program services where the number of available European works is insufficient,- pay satellite and cable TV.
Language requirements
At least 33% of quarterly qualifying transmission time must be programmes originally produced in the Polish language (at least 26,4% in first year of transmission).
More than 29% in ensuing years after the first year of transmission for:- thematic program services where the number of available European works is insufficient,- pay satellite and cable TV.
Independent Production
10% of qualifying transmission time
Contribution to production
Broadcasters must pay 1.5% of the higher of the revenue earned on broadcasting advertising, telesales and sponsored programmes, and the revenue from payments collected directly from subscribers for access to the broadcast programmes in a given settlement period, to the Polish Film Institute.
Public television broadcasters must earmark at least 1.5% of their annual subscribers' fees for film production purposes. Any unused amount shall be transferred to the Polish Film Institute.
Cable TV and digital TV operators must pay 1.5% of the revenue earned on fees for access to television programmes broadcast or re-aired on the digital platform to the Polish Film Institute.
Legislation
NationalMeasures
Poland
Broadcasting Act of 29 December 1992 (as amended)Regulation of 4 November 2004Act on Cinematography of 30 June 2005

511
Table 160: National Measures to implement Articles 4 and 5 and other national language and production requirements in Portugal
GENERAL REQUIREMENTS (FREE-TO-AIR CHANNELS)
HIGHER REQUIREMENTS FOR CERTAIN CHANNELS
LOWER REQUIREMENTS FOR CERTAIN CHANNELS
European Works
Majority proportion of qualifying transmission time.
Language requirements
Channels must broadcast programming originally produced in Portuguese for 50% of transmission time excluding ads, teleshopping and teletext.
20% of all transmission time must be creative works originally produced in Portuguese.
25% of these quotas may be fulfilled with programmes from other Portuguese-speaking countries.
RTP 1: From 2008, programming originally produced in Portuguese must account for 60% of transmission time excluding ads, teleshopping and teletext.
Independent Production
10% of qualifying transmission time RTP 2: 10% of programme budget
Contribution to production
All channels pay a 4% tax on advertising income to fund Portuguese cinema.
Legislation Television Act: Law no. 27 of 30 July 2007
Decree-Law no. 227 of 15 November 2006(issued pursuant to Law of Cinematographic and Audiovisual Arts: Law no. 42 of 18 August 2004)
PortugalNationalMeasures

512
Table 161: National Measures to implement Articles 4 and 5 and other national language and production requirements in Romania
GENERAL REQUIREMENTS (FREE-TO-AIR CHANNELS)
HIGHER REQUIREMENTS FOR CERTAIN CHANNELS
LOWER REQUIREMENTS FOR CERTAIN CHANNELS
European Works
Majority proportion of qualifying transmission time.
Language requirements
For the PSB, at least 30% of the European works should be Romanian works, and at least 35% of the Romanian works should be cultural works.
Independent Production
Wording of Directive incorporated directly into national law
Contribution to production
4% contribution on advertising income to cinematographic fund
Cable TV: 3% contribution on advertising income to cinematographic fund
Legislation
NationalMeasures
Romania
The Audio-visual law: Law no. 504 of 11 July 2002 (as amended)
National Audiovisual Council Decision no. 187 of 3 April 2006
Government Ordinance no. 39/2005

513
Table 162: National Measures to implement Articles 4 and 5 and other national language and production requirements in Slovakia
GENERAL REQUIREMENTS (FREE-TO-AIR CHANNELS)
HIGHER REQUIREMENTS FOR CERTAIN CHANNELS
LOWER REQUIREMENTS FOR CERTAIN CHANNELS
European Works
Majority proportion of qualifying transmission time.
Smaller shares can be set in licenses for first-time licensees, to be increased during the license period.
Smaller shares can be set in licenses for broadcasters of monothematic programme service, to be increased during the license period.
Language requirements
Requirement to "ensure the use of the state language and the languages of national minorities"
Independent Production
10% of qualifying transmission time.
20% of qualifying transmission time for public-service broadcasters.
Contribution to production
Legislation
NationalMeasures
Slovakia
Act No. 308 of 14 September 2000 Coll. On Broadcasting and Retransmission (as amended)

514
Table 163: National Measures to implement Articles 4 and 5 and other national language and production requirements in Slovenia
GENERAL REQUIREMENTS (FREE-TO-AIR CHANNELS)
HIGHER REQUIREMENTS FOR CERTAIN CHANNELS
LOWER REQUIREMENTS FOR CERTAIN CHANNELS
European Works
Majority of the annual qualifying transmission time
Language requirements
Slovenian works must account for at least 2% of the annual transmission time (excluding advertising). The proportion must be increased annually until it reaches 5%.
For PSB services 1 and 2, Slovenian works must account for at least 25% of annual transmission time; a quarter of which must be independent productions.
Independent Production
10% of qualifying transmission time
Contribution to production
Legislation
NationalMeasures
Slovenia
Mass Media Act of (11 May) 2001 (as amended)

515
Table 164: National Measures to implement Articles 4 and 5 and other national language and production requirements in Spain
GENERAL REQUIREMENTS (FREE-TO-AIR CHANNELS)
HIGHER REQUIREMENTS FOR CERTAIN CHANNELS
LOWER REQUIREMENTS FOR CERTAIN CHANNELS
European Works
51% of annual transmission time.
Language requirements
A majority of the transmission time reserved for European works (see above) should be originally produced in one of the official Spanish languages
Independent Production
10% of qualifying transmission time
Contribution to production
5% of annual income to be allocated to European film(60% of this sum earmarked for films originally produced in one of the official Spanish languages)
Legislation
NationalMeasures
Spain
Act 25/1994, 12th July incorporating into Spanish law Directive 89/552/EEC on the co-ordination of certain provisions laid down by law, regulation or administrative action in member states concerning the pursuit of television broadcasting activities (as amended)

516
Table 165: National Measures to implement Articles 4 and 5 and other national language and production requirements in Sweden
GENERAL REQUIREMENTS (FREE-TO-AIR CHANNELS)
HIGHER REQUIREMENTS FOR CERTAIN CHANNELS
LOWER REQUIREMENTS FOR CERTAIN CHANNELS
European Works
Majority proportion of qualifying transmission time, where practicable.
Language requirements
General requirement to broadcast a significant proportion of programmes in Swedish.
Public service broadcaster SVT is required to reflect linguistic and ethnic minorities.
Independent Production
10% of qualifying transmission time or 10% of programme budget.
Contribution to production
SVT and certain other broadcasting companies are required to contribute to Swedish film production through funding of the Swedish Film Institute.
Legislation
Sweden
Radio and Television Act (SFS 1996:844), as amended
The 2006 Film Agreement
NationalMeasures

517
Table 166: National Measures to implement Articles 4 and 5 and other national language and production requirements in the United Kingdom
GENERAL REQUIREMENTS (FREE-TO-AIR CHANNELS)
HIGHER REQUIREMENTS FOR CERTAIN CHANNELS
LOWER REQUIREMENTS FOR CERTAIN CHANNELS
European Works
Programme licences must require that a "proper proportion" of programmes are of European origin
("Proper proportion" must be construed as a proportion which is at least equal to the requirement of the Directive)
BBC 3: 90%BBC 4: around 70%CBeebies: around 90%CBBC: around 75%
"Where practicable" for DTT, satellite and cable
Language requirements
STV and BBC Scotland have requirements for programming in Gaelic.S4C and BBC have have requirements for programming in Welsh.
Independent Production
10% of qualifying transmission time or 10% of programme budget
25% of qualifying transmission time for all BBC channels and terrestrial analogue channels
Contribution to production
Legislation BBC Charter and Agreement Communications Act 2003Broadcasting Act 1990Broadcasting Act 1996Broadcasting (independent productions) order 1991, as amendedBroadcasting (Original Productions) Order 2004
NationalMeasures
United Kingdom

518
19. Appendix VII: Application of Articles 4 and 5 – Scoring by Member State
The following table shows the breakdown on how the individual Member States have been scored on their application of Articles 4 and 5 of the Directive. The aggregate scores can also be found in section 5.4.
Member State
Qu
ali
fyin
g
hou
rs
Majo
rity
p
rop
ort
ion
Ind
ep
en
den
t p
rod
uct
ion
Min
imu
m
pro
po
rtio
n
Mo
nit
ori
ng
/
veri
fica
tio
n
San
ctio
ns
To
tal
Ind
ex
Imp
lem
en
-ta
tio
n M
od
e
Austria 1 2 0 1 1 0 5 Flexible
Belgium (Flemish) 1 1 0 1 2 6 11 Prescriptive
Belgium (French) 1 3 3 1 2 6 16 Prescriptive
Bulgaria 1 1 3 1 2 5 13 Prescriptive
Cyprus 1 3 0 0 3 0 7 Flexible
Czech Republic 1 1 2 0 2 3 9 Flexible
Denmark 1 1 0 0 1 4 7 Flexible
Estonia 1 3 2 1 3 6 16 Prescriptive
Finland 1 3 3 0 1 6 14 Prescriptive
France 3 3 3 2 3 3 17 Prescriptive
Germany 3 3 0 1 1 1 9 Flexible
Greece 1 2 2 1 1 6 13 Prescriptive
Hungary 1 2 2 2 1 6 14 Prescriptive
Iceland 1 1 3 0 1 0 6 Flexible
Ireland 1 2 3 0 2 0 8 Flexible
Italy 2 2 3 2 3 2 14 Prescriptive
Latvia 1 3 3 1 1 6 15 Prescriptive
Lithuania 1 1 3 0 1 2 8 Flexible
Luxembourg 1 2 2 0 1 4 10 Flexible
Malta 1 2 0 0 1 6 10 Flexible
Netherlands 1 3 3 1 2 3 13 Prescriptive
Norway 1 3 3 1 1 4 13 Prescriptive
Poland 1 3 3 1 2 3 13 Prescriptive
Portugal 1 3 3 2 3 2 14 Prescriptive
Romania 1 2 3 0 1 6 13 Prescriptive
Slovakia 1 3 3 1 1 3 12 Prescriptive
Slovenia 1 2 3 1 1 6 14 Prescriptive
Spain 1 2 2 1 2 2 10 Flexible
Sweden 1 1 0 0 1 0 3 Flexible
United Kingdom 2 3 3 0 1 6 15 Prescriptive

519
The scoring has been carried out by assigning the Member States points in the following categories: Definition of Total Qualifying Hours for European works Definition equal to the Directive 1 point Slightly more restrictive 2 points Significantly more restrictive 3 points Flexibility in reaching assigned majority proportion of European Works362 Fully flexible (“Where practicable”, no non-slip-back clause) 1 point Semi-flexible (“Where practicable” with non-slip-back clause, or specific rules regarding to which extent a lower proportion will be accepted) 2 points No flexibility 3 points
Definition of independent producer in national legislation No definition 0 points Definition using one criterion 2 points Definition using several criteria 3 points Minimum proportion of independent productions, applicable target Broadcasters may choose between transmission time or programme budget targets363 0 points Broadcasters must fulfil transmission time target 1 point Broadcasters must fulfil programme budget target364 2 points Monitoring/verification methods365 Reliance on statistical reports from broadcasters 1 point Independent verification of reports from broadcasters 2 points Independent monitoring of channel broadcast schedules 3 points Available sanctions for non-compliance Warning 1 point Fine 2 points License restriction 3 points
362 Compared to the 2005 study, the definition of the different options have been refined, and Member States have been re-scored according to the new definition. 363 This option has been added to the scoring since the 2005 study, and the Member States applying this option have had their scores reduced by one point. This is considered the most flexible alternative, since broadcasters may individually choose the target which is easiest to fulfil for them. In most cases, this is expected to be transmission time, but occasionally programming budget could be easier to fulfil (e.g. if a broadcaster concentrated his investments on a few, expensive productions). 364 It should be noted that a few Member States have adopted a criterion that refers exclusively to turnover, which is a stricter method than the two alternatives envisioned in the Directive. Regarding the Application of Article 5 (Appendix VII), these Member States have been scored as having a programme budget target. Regarding additional requirements (Appendix VIII), they have been scored as having a stricter proportion of independent productions. 365 Compared to the 2005 study, the definition of the different options have been adjusted, and Member States have been re-scored according to the new definition.

520
The scoring in the first 5 categories is alternative, i.e. each Member State can only receive one score (the highest relevant score in the category). The scoring in the sanctions category is cumulative, i.e. a Member State will receive points for every single sanction form which is available to the national authorities – giving this category a maximum score of 6 points.
In the column “Implementation Mode”, Member States with an aggregate score of 10 or less have been categorised as “Flexible”, and Member States with scores above 10 have been categorised as “Prescriptive”.

521
20. Appendix VIII: Additional Requirements on Broadcasters – Scoring by Member State
The following table shows the breakdown on how the individual Member States have been scored on the additional measures applied to broadcasters. Brief descriptions of the main measures in each Member State can be found in the tables in Appendix VI. EU-wide highlights from the findings can be found in section 5.3.
The scoring has been carried out by assigning each Member State one point for each of the following categories where the Member State has rules that are stricter than The Directive:
Proportion of European works:
Requirements on broadcasters to achieve a higher percentage of European works than the majority proportion required by Article 4 of the Directive. The category also includes requirements that a majority proportion must be achieved separately in peak viewing hours.
Requirements to achieve proportions of ‘more than 50%’, ‘at least 51%’ or similar are not included, as these are viewed as slightly differing interpretations of the Article 4’s term “majority proportion”, rather than intentionally stricter proportions.
Proportion of independent productions:
Requirements on broadcasters to achieve a higher percentage of independent productions than the 10% proportion required by Article 5 of the Directive. The category also includes Member States that apply a criterion for independent productions that refers exclusively to turnover.

522
Type of content:
Requirements to broadcast a certain proportion of specific programme types, e.g. cultural or creative works.366
General Language:
General requirements to reflect national (or minority) culture and language, correct use of the national language, etc.367
Original production language:
Requirements that a certain percentage of broadcasts should be dedicated to works originally produced in a certain (national or minority) language.
The category does not include requirements that programmes are broadcast (dubbed) or subtitled in a specific language.368
Regional provisions:
Regional requirements on broadcasters. This includes extra requirements for linguistic or cultural programming applied at a regional level, requirements on national broadcasters to reflect regional differences, and regional production quotas.
Contribution to film funding:
Requirements on broadcasters to contribute to the funding of indigenous film production, including requirements for direct investments as well as direct or indirect financial contributions to centrally administered film funds.
In the column “Implementation Mode”, Member States with an aggregate score between zero and two have been categorised as “Low”, while Member States with a score of three or more have been categorised as “High”.
The aggregate scores can also be found in section 5.4.
366 The category definition has been adjusted since the 2005 study, and Member States re-scored accordingly. 367 The category definition has been adjusted since the 2005 study, and Member States re-scored accordingly. 368 The category definition has been adjusted since the 2005 study, and Member States re-scored accordingly.

523
Member State
Eu
rop
ean
w
ork
s
Ind
ep
en
den
t p
rod
uct
ion
s
Typ
e o
f co
nte
nt
Gen
era
l Lan
gu
ag
e
Ori
gin
al
Pro
du
ctio
n
Lan
gu
ag
e
Reg
ion
al
pro
vis
ion
s
Fil
m f
un
din
g
Tota
l in
dex
Imp
lem
en
tat
ion
mo
de
Austria � � � � � � � 1 Low
Belgium (Flemish) � � � � � � � 1 Low
Belgium (French) � � � � � � � 3 High
Bulgaria � � � � � � � 3 High
Cyprus � � � � � � � 2 Low
Czech Republic � � � � � � � 1 Low
Denmark � � � � � � � 1 Low
Estonia � � � � � � � 2 Low
Finland � � � � � � � 3 High
France � � � � � � � 6 High
Germany � � � � � � � 2 Low
Greece � � � � � � � 2 Low
Hungary � � � � � � � 2 Low
Iceland � � � � � � � 1 Low
Ireland � � � � � � � 1 Low
Italy � � � � � � � 4 High
Latvia � � � � � � � 1 Low
Lithuania � � � � � � � 1 Low
Luxembourg � � � � � � � 0 Low
Malta � � � � � � � 1 Low
Netherlands � � � � � � � 4 High
Norway � � � � � � � 2 Low
Poland � � � � � � � 4 High
Portugal � � � � � � � 3 High
Romania � � � � � � � 4 High
Slovakia � � � � � � � 2 Low
Slovenia � � � � � � � 1 Low
Spain � � � � � � � 3 High
Sweden � � � � � � � 4 High
United Kingdom � � � � � � � 5 High
524
21. Appendix IX: Comparing Estimates with Declarations
At the meeting on the Second Interim Report the Commission asked the consultants to provide a review of the linear data, once coding for all markets was complete. This was to show the Commission first of all the robustness of our methodology, and secondly to identify any channels or markets in the sample that appeared to have data that needed to be reviewed.
Below we present this review, first of all at a country-by-country level, and then in some more detail at a channel-by-channel level.
21.1.1. Overview by country
We have compared the national averages of the data from our sample to that based on channels declarations. We have done this for the year 2007 (sample estimate) compared to 2006 (channels declarations)369. Averages based on declarations have been calculated using the numbers declared by the same channels as in our sample estimate.
As we compare 2 weeks from the Spring and Autumn of 2007 (sample estimate) to 2006 reported data from mostly a full year, sampling will explain part of the differences. For example, the fact that the reported and sample data come from two different years may provide some explanation for differences, as could the fact that our sample looks at two representative weeks of data, rather than an annual sample. However, comparisons with the national average will be useful to identify Member States where differences between declarations and our estimates are the largest, helping us to identify where possible further analysis may be required in light of the legal and economic findings.
As national averages are based on the selection of 2 to 6 of the largest broadcasters in each country370, the analysis channel-by-channel later in this report will provide more precise explanations for the differences. Similar averages for reported and sample data at the national level could result from opposite differences (positive and negative) at the individual channel level. Also, important differences at national level could result from a larger difference on a specific channel. 369 Channel declarations taken from the Eighth Communication from the Commission on the application of Articles 4 and 5 of the Directive. 370 Belgium is treated as two separate markets, with 2 channels sampled for each market.

525
Proportion of European works The index “Reported divided by Sample estimate” for the proportion of European works, when averaged across the 12 markets of our sample, is 105 (please note that an index of 100 would mean that they match exactly). This indicates that the consistent methodology used and the sample is not systematically biased towards one single side but represents a balanced compromise between national situations.371.
This index varies between 90 and 110 for the Flemish Community of (please apply also below) Belgium, Germany, Spain, France, Ireland, Italy, Poland and the UK, and between 75 and 125 for Flemish Community of Belgium (112), Estonia (123) and Sweden (122).
The delta “Reported minus Sample estimate” for the proportion of European works across the 12 countries of our sample adds up to +29. This indicates that our methodology estimated slightly lower proportions of European works than the channels’ declarations. One explanation for this could be that our week sample does not cover vacation periods, where national productions are often more prevalent.
The 3 countries showing the largest differences are Estonia (62.7%-50.9% reported-sample), Sweden (47.2%-38.6%) and the French Community of Belgium (78.1%-69.4%). Differences are thus below 12 points, a noticeable difference although not affecting the broad picture. Table 167 provides a graphic view on how our estimates are largely consistent with reported data.
371 It should be reminded that the sample is made of the 6 largest Member States along with Estonia, Ireland, Romania, Sweden and the Flemish and French Communities of Belgium.

526
Table 167: Proportion of European works 2007 (sample estimate) vs. 2006 (reported) by country
European Works
0.0%
10.0%
20.0%
30.0%
40.0%
50.0%
60.0%
70.0%
80.0%
90.0%
2006/2007 2006/2007 2006/2007 2006/2007 2006/2007 2006/2007 2006/2007 2006/2007 2006/2007 2006/2007 2006/2007 2006/2007
Belgium
(Flemish)
Belgium
(French)
Estonia France Gemany Ireland Italy Poland Romania Spain Sweden UK
Country/Year
% o
f E
W
Reported
Sample estimate
Proportion of independent works The index “Reported divided by Sample estimate” for the proportion of Independent works is 115, showing that estimates are generally lower than reported data by 15%. Table 2 shows that sample data figures are lower than reported for all but 4 markets (France, Ireland, UK and Italy).
Countries where reported figures are significantly higher than the estimates include Romania (38.6%-21.9% reported-sample), Sweden (28.2%-16.4%), Germany (59%-38.6%), Poland (38.1%-25.6%) and Estonia (48.9%-33.4%). Differences in these countries can be explained by their broader national definitions of ‘Independent works’ compared to the definition we apply to our pan-European study. Romania, Poland and Estonia have indeed been clearly identified in the legal section as countries with broader definitions than ours. Sweden and Germany, on the other hand, have no legal definition of “independent works” but we can consider, as our estimates are systematically lower than the reported figures, that the definitions used in practice in these two countries are broader than our definition.
Countries where reported are significantly lower than the estimates are France (16.2%-33.9% reported-sample) and Ireland (18%-38.5%). These countries have been indicated in the legal section as countries with a stricter definition than the one we designed to use in our study.

527
Table 168: Proportion of independent works 2007 (sample estimate) vs. 2006 (reported) by country
Independent Works
0.0%
10.0%
20.0%
30.0%
40.0%
50.0%
60.0%
70.0%
2006/2007 2006/2007 2006/2007 2006/2007 2006/2007 2006/2007 2006/2007 2006/2007 2006/2007 2006/2007 2006/2007 2006/2007
Belgium
(Flemish)
Belgium
(French)
Estonia France Germany Ireland Italy Poland Romania Spain Sweden UK
Country/Year
% o
f IW
Reported
Sample estimate
Proportion of recent independent works Table 169 shows clearly that reported data and estimates are very consistent for Recent Independent works for all countries except Estonia and Ireland.
Differences are significant for these countries: 30.8%-85.7% (reported-sample) for Estonia and 18.7%-85.9% for Ireland. We will come back to these issues in the following section, which looks at the data channel-by-channel.

528
Table 169: Proportion of recent independent works 2007 (sample estimate) vs. 2006 (reported) by country
Recent Independent Works
0.0%
10.0%
20.0%
30.0%
40.0%
50.0%
60.0%
70.0%
80.0%
90.0%
100.0%
2006/2007 2006/2007 2006/2007 2006/2007 2006/2007 2006/2007 2006/2007 2006/2007 2006/2007 2006/2007 2006/2007 2006/2007
Belgium
(Flemish)
Belgium
(French)
Estonia France Gemany Ireland Italy Poland Romania Spain Sweden UK
Country/Year
% o
f R
W
Reported
Sample estimate
21.1.2. Overview by channel and over time
Following the above overview by country, we have conducted a similar analysis at the channel-by-channel level. Indeed, data at channel level are the fundamental data on which sample estimates and reported data are based on. Also, we have compared the 2006/2007 data with that of the 2005 Study on the Implications of Articles 4 and 5 of the TVWF Directive to see whether a trend was visible. This was possible for 34 channels among our sample of 54, but impossible for the channels operating in the 3 new Member States from our sample (Estonia, Poland, and Romania) and for some channels that have been covered for the first time, in particular some pay TV channels, or recent channels.
Below we look at the channel-level data for each indicator, using graphs to indicate the situation in particular channels that either indicate a divergence we have had to review, or are indicative of the situation in general at the channel level for a particular Member State. Thus we have not presented a separate graph for each individual channel, which we consider unnecessary given the purpose of this report to highlight the robustness of our methodology, and to indicate any areas where we have had to investigate a situation further.

529
Proportion of European works The following graphs show a representative selection of channels with their estimates and reported data for European works compared between 1993 and 2007. These graphs show that despite some differences in specific sample years, generally both sources are extremely consistent.
SKY ONE
46%
27%21%
38%
13%
0,00%
10,00%
20,00%
30,00%
40,00%
50,00%
1993 1996 1999 2002 2006/2007
Year
% o
f E
W
Reported Sample estimate
RTE2
57%
43%38%
88%
68%
0,00%
20,00%
40,00%
60,00%
80,00%
100,00%
1993 1996 1999 2002 2006/2007
Year
% o
f E
W
Reported Sample estimate
PRO7
46%
60%
47%47%39%
0,00%
10,00%
20,00%
30,00%
40,00%
50,00%
60,00%
70,00%
1993 1996 1999 2002 2006/2007
Year
% o
f E
W
Reported Sample estimate

530
LA 2
56%
79%
59%
76%74%
0,00%
20,00%
40,00%
60,00%
80,00%
100,00%
1993 1996 1999 2002 2006/2007
Year
% o
f E
W
Reported Sample estimate
Proportion of independent works In the previous country-by-country section we have noted that five countries report significantly higher figures than the estimates (Romania, Sweden, Germany, Poland and Estonia) while two report significantly lower figures than the estimates (Ireland and France).
If we look at Germany, we see that all 6 channels in the sample show consistent differences over years and that the 2006/2007 difference is in line with the past data. So we are confident that the differences are likely due to consistent differences between the German definition and our own, the German definition (as noted above there is no legal definition in Germany, so here we talk about what we expect the definition to be in practice) having been identified as broader than the definition we apply in our study.
RTL
57% 56%
67%
45%37%
0,00%
20,00%
40,00%
60,00%
80,00%
1993 1996 1999 2002 2006/2007
Year
% o
f IW
Reported Sample estimate
Differences between definitions can also explain discrepancies in Romania, Sweden, Poland (which have a broader definition of independent works than the one we use in this study) and France (which has a much stricter definition than the one we use in this study), where all sample data for channels have been carefully checked, and we are confident that coding has been accurate.

531
15% 18% 18% 15% 19%
0,00%
10,00%
20,00%
30,00%
40,00%
50,00%
60,00%
1993 1996 1999 2002 2006/2007
% o
f IW
Year
FRANCE 2
Reported Sample estimate
In Estonia, on the other hand, we found out that ETV was the only channel to have an unexplained difference, explaining why Estonia was listed among the countries to research further. The proportion of Independent works on ETV is 75% according to reported data, but 28.8% according to the estimate. The Consortium was able to check the 2007 estimate in two ways: firstly, they asked ETV to check their sample data; secondly, as ETV also agreed to be interviewed as part of the study, they provided to us statistics which are consistent with the estimate, but not the reported data. We have therefore identified a difference between our sample figures and the reported figures for independent European works for ETV (we have also found some discrepancies for recent independent European works for the channels in our Estonian sample – which is discussed in more detail below). These discrepancies may possibly be explained by the fact that the reported data and sample estimates come from different years, and that the methodology for the sample estimate and the reported data may be different.
In Ireland, we can see significant differences for the three channels of our sample: RTE1, RTE2 and TV3. This can be explained by the stricter definition of independent works applied by Ireland. Indeed, Irish channels broadcast a high number of British shows (many from the BBC), especially TV3 which has some strong links with the British production company Granada and airs lots of Granada shows. With our methodology, all British works were considered as independent if the production company was not owned by an Irish broadcaster; but the Irish definition of ‘independent producers is: “producers who are independent of broadcasters under the jurisdiction of the State or any other state”, which would classify all Granada or BBC productions as ‘not independent’ in Ireland. This explains our higher figures as far as independent productions are concerned in Ireland.

532
RTE1
17%
23%18%
16%11%
0,00%
5,00%
10,00%
15,00%
20,00%
25,00%
30,00%
35,00%
1993 1996 1999 2002 2006/2007
Year
% o
f IW
Reported Sample estimate
The majority of the other channels show a strong consistency with past data and with declarations. See the following two graphs for examples of this.
TELECINCO
42%51%50%
30%
11%
0,00%
10,00%
20,00%
30,00%
40,00%
50,00%
60,00%
1993 1996 1999 2002 2006/2007
Year
% o
f IW
Reported Sample estimate
ITALIA 1
12% 12%
17%15%
0%
0,00%
5,00%
10,00%
15,00%
20,00%
1993 1996 1999 2002 2006/2007
Year
% o
f IW
Reported Sample estimate
Proportion of recent works
We have identified two countries in the country-by-country analysis that presented consistently different reported figures than our estimates: Ireland and Estonia.

533
Regarding Ireland, we identified a difference between the sample and reported data for 2006/7, with the reported data being significantly lower than the sample data. We considered the possibility that the methodology for the sample estimate and the reported data on recent works may be different. Following discussion with the the Irish authorities we have been able to confirm that the figures in the reported data for recent works were based on proportion of all qualifying works, whereas the sample estimate is based on proportion of all qualifying independent European works.
As far as Estonia is concerned, figures are also extremely low for all the channels. We have identified a difference between our sample figures and the reported figures for for recent independent European works for the channels in our Estonian sample. These discrepancies may possibly be explained by the fact that the reported data and sample estimates come from different years, and that the methodology for the sample estimate and the reported data may be different.
21.1.3. Conclusions on differences
This review has indicated the following key points:
• In large part, our sample figures have returned results consistent with the reported data. At the country-level this is particularly the case for European Works and Recent Works. There is, however, a somewhat higher level of inconsistency for Independent Works, with our sample figures, in general, coming in lower than the reported data.
• An important reason for the differences on Independent Works is that we have applied a consistent definition of Independent Works across all territories. In general, the majority of Member States apply a broader definition than our own, with a minority applying a stricter definition.
• There are further general reasons for differences between the sample results and the reported data: 1) the reported data is for 2006, and the sample data is for 2007; 2) we have looked at two sample weeks, rather than annual figures, meaning that week-on-week fluctuations in the schedule (in terms of quantity of European, Independent and Recent Works) may result in our sample coming in higher or lower than the average.
• We have identified particular channels where differences are particularly significant. We have detailed how we have checked these carefully, and are happy that our coding is correct.
534
22. Appendix X: Bibliography In Part 7 of the report, a wide variety of source materials were used to analyse the audiovisual market in Europe. These are listed below: CNC – ‘L’économie de la VoD en France’ - 2008 Eurodata, General statistics available online – 2005-2008 Eurodata TV Worldwide and relevant partners (CIM/GFK Audimetrie ; TNS EMOR ; Médiamétrie ; AGF/GKF ; AGB NMR Ireland ; Auditel/AGB NMR ; AGB NMR POLSKA ; TNS AGB INTERNATIONAL, copyright ARMADATA SRL ; TNS AUDIENCIA DE MEDIOS ; MMS MEDIAMÄTNING) and BARB. European Audiovisual Observatory, ‘Television in 36 European States’ - 2007 Informa Telecoms & Media, ‘TVI Sourcebook’ –2007 & 2008 Informa Telecoms & Media, ‘TBI Yearbook’ – 2007 Informa Telecoms & Media, ‘TV International’ – 2004-2008 NPA Conseil, ‘Video On Demand in Europe’ - 2006 NPA Conseil, ‘Video On Demand in Europe’ – 2008 Open Society Institute, ‘Television Across Europe’ – 2005 OECD, General statistics available online – 2005-2008 Point Topic, Broadband Statistics - – 2005-2008 PWC, ‘Global Entertainment Outlook’ - 2007 -2011 Screen Digest, ‘Television Intelligence Service’ – 2007 Screen Digest, ‘Fortnightly Newsletter’s – 2004-2008 SNL Kagan, ‘Datasets from online service’ – 2007-2014 TV Sports Markets, ‘European TV and Sports Rights’ – 2008 TV Sports Markets, ‘Fortnightly Newsletters’ – 2004-2008 Various, ‘Company Annual Reports – platform operators, broadcasters and producers’ – 2005 –2007 Various, ‘Regulator Reports’ – 2005-2007 e.g. Ofcom Communications Report, CMT Industry Statistics, CSA Bilans de la chaine Various, ‘Broker Reports’ – 2004-2008 Zenith Optimedia, ‘Advertising Expenditure Forecasts’- June 2007 The consultants also used a number of online sources specific to individual member states. For the legal study (Parts 4 and 5), the following sources were particularly relevant, alongside the results from the questionnaire to regulators: NPA Conseil, ‘Video On Demand in Europe’ - 2006 Pertzinidou, Eleftheria; Study on the provisions existing within the Member States and the EEA States to implement Chapter III of the ‘Television without Frontiers Directive (Directive 97/36/EC of the European Parliament and the Council of 30 June 1997 amending the Council Directive of 3 October 1989)

535
23. Appendix XI: Comments from Stakeholders
After the workshop in November 2008, stakeholders were encouraged to send the consortium comments for consideration in the Final Study Report. Where possible we have printed these comments below, and have also made reference, in bold text in square brackets, to where these comments have been referenced in the main body of the report.
23.1. Madigan Cluff Comments on AMVS Study for the European Commission, DG
Information Society and Media Measurement of the volume of European Television production in the
future Having both attended the recent seminar in Brussels and subsequently reviewed the materials provided, Madigan Cluff has the following thoughts on future measurement of programme content in and across Europe
• Current processes for all measurement of programmes would be significantly more
accurate if there was a single common database utilised to be clear on the country of
origin of programmes. There clearly already exist sources such as Essential Television
Services which hold multi-national data, and it would seem that it is important that this
type of data is more readily available and utilised to ensure accurate statistics. In
addition there should be clear metrics to define how a programme is classified to a
country of origin [Reference to this comment found in: 10.4.5]
• These processes will only become more important as non-linear services (catch-up/
video-on-demand ) become an increasing proportion of total television viewing – where
the number of programmes available will increase without necessarily easy access to the
information on their origin [Reference to this comment found in: 10.4.1]
• The proposals set out on the 18th
November for non- linear feel to us to mislead the
opportunity to measure digital download. Although we understand the desire for this to
be a light touch regime with compliance not requiring the transfer of large volumes of
commercially sensitive information from broadcasters - we have significant reservations
on the priorities placed. Specifically:-
o As presented a straight count of the material held in a download library will give
very little reliable information on the real volume of viewing of titles. From
536
current data it is clear that a small proportion of titles will have the majority of
viewings [Reference to this comment found in: 10.4.1]
o The reliance within the report on reviewing the websites of providers to obtain
a view of the prominence they give to titles is we believe potentially deeply
misleading. The nature of good website design for interactive users should be to
vary front pages (and subsequent pages) so that the individual consumer sees
material which they are more likely to buy or use. Where a company has access
to consumer data (in this case the programs the user is actually viewing) they
can use this data to individualise the user’s front and navigation pages to his/her
actual behaviour. This makes inaccurate any one-off external viewing of the site.
Additionally the web front page is only one aspect of the promotion of
programmes to the consumer, with most companies using e-mail, on-air
promotion and other forms of direct marketing to their consumers. We think it
is very difficult to imagine that any accurate information can be gleaned on the
prominence of promotion [Reference to this comment found in: 10.2]
o The study appeared not to accept the use of spider technology to understand
what is happening on sites. This technology is in widespread use across the web
monitoring business and although there may be untested copyright issues, most
companies in the web metrics business use it extensively [Reference to this
comment found in: 10.2. It is important to note that the consultant’s view is
that spider technology is potentially viable, but the legal concerns must be
addressed first.]
o The underplaying of potential audience data was very surprising. There are
clearly challenges within web measurement as to the most accurate source and
standard of information. However there do exist very clear potential points of
measurement. At an overall global level suppliers like Nielsen Netratings and
ComShare provide overall data with panel sizes massively bigger than
comparable TV peoplemeter systems. It is acknowledged that there are
limitations in the ability of this data to differentiate web applications which are
run by very low proportions of the population, but they will give an accurate
view of the total non-linear market and the constituent companies within it.
Equally all providers will hold server based data which very accurately shows
what was provided out to consumers. This data does not absolutely say that the
consumer was exposed as it may have been hidden by another window as it
played. However, this issue is really only an issue the media measurement
business has always had that with peoplemeters you don’t know if the person
was in the room when the TV was switched on.
There will exist numerous ways in which this data can be explored without
creating either complexity or commercial confidentially issues for stations/ VOD
services. Given that a small proportion of the programs will be the bulk of the
audience if the broadcaster declares the names of the top programs which

537
constitute 50% of viewing, the central authority can code these programs for
country of origin and then request the broadcaster to provide share of viewing
by country of origin to these programs in total.
Over the next two/ three years there are other interests within the television
industry which are likely to promote the need for audience standards. It will be
in the interests of all broadcasters who carry advertising on downloads to have
an audience performance standard in order to maximise advertising revenue,
and equally the sale and licensing of programs between production houses and
broadcasters will need consistent reference points. It strikes us that AVMS
should be aiding the development of these processes which are in the interests
of a vibrant European production industry – not suggesting that these are
difficult to do.
Overall we believe that there is an opportunity to help lead the need for accurate information
and data, which is as yet unfulfilled in the proposals .
[Reference to these comments have been made throughout chapter 10. The consultant’s argument is that robust industry standard audience data for non-linear services is not currently available, and therefore consumption-data based indicators are not suitable at this current time. However, we agree that the development of data of this kind should be supported, so that it can be considered as an indicator in future years, and we have endeavoured to make this clearer in the Final Study Report.]
23.2. EBU
EBU Comments on the draft final Report of 21 October 2008 regarding
the Study on the application of measures concerning the promotion of the distribution
and production of European works in audiovisual media services (i.e. including television programmes and non-linear services)
Further to the workshop held in Brussels on 18 November 2008, the European Broadcasting Union (EBU) welcomes the opportunity to make a few brief comments, especially on the independent production aspect. Public service broadcasters extensively support the production of cinematographic works and television programmes, and contribute directly and indirectly to independent productions. Furthermore, they acquire and broadcast a substantial proportion of independent productions, very often greatly exceeding the quota laid down by law.

538
With respect especially to the terms of trade between broadcasters and producers, it is important to take into account the media convergence between broadcasting and non-linear services. The media landscape, technology, and consumer behaviour have changed. Public service broadcasters have to reach the audience via all platforms, including new media such as the Internet, mobile phones and other digital devices. Consumers increasingly make no distinction between linear and non-linear consumption, and young viewers in particular increasingly use only their personal computer, focusing on the Internet and non-linear services. For this reason, public service broadcasters need linear as well as non-linear rights if they are to fulfil their public service remit and reach all viewers. Digital rights are no longer separable: broadcasting as such will shortly be digital only. Today, in most European countries, broadcasters are finding it increasingly difficult to obtain the rights for exploiting audiovisual productions. New models for terms of trade are needed, not simply distinguishing secondary rights but also finding the right balance between broadcasters’ needs in the digital age and independent producers’ interests in a broader commercial exploitation of their audiovisual works, taking account of the proportion of funding provided by broadcasters and producers in a given production. It is vital for broadcasters to acquire these exploitation rights (such as catch-up services) if they are to maintain their degree of funding of the independent production sector. Otherwise broadcasters could either not help fund independent productions at all or would be obliged to cut the percentage of their funding substantially. Consequently, support for independent audiovisual production in this new media environment must be provided on fair terms as a means of ensuring cultural diversity. These terms need to be clarified, and rights must be acquired in relation to the risks taken. [[Reference to the EBU comments have been made in the section on Terms of Trade in part 7.2.7.]
23.3. European Audiovisual Observatory
Some remarks on the draft final report of the “Study on the application of measures concerning the promotion of the
distribution and production of European works in audiovisual media services (i.e. including television programmes and non-linear services)”
André Lange,

539
Head of the Department for Information on Markets and Financing,
European Audiovisual Observatory. The European Audiovisual Observatory Set up in December 1992, the European Audiovisual Observatory's mission is to gather and
diffuse information on the audiovisual industry in Europe. The Observatory is a European public
service body comprised of 36 member states and the European Community, represented by the
European Commission. It operates within the legal framework of the Council of Europe and
works alongside a number of partner and professional organisations from within the industry and
with a network of correspondents. In addition to contributions to conferences, other major
activities are the publication of a Yearbook, newsletters and reports, the compilation and
management of databases and the provision of information through the Observatory’s Internet
site (http://www.obs.coe.int).
Article 1.2 of the Observatory excludes from its mission any standard-setting or regulatory
activities. The present paper does not, therefore, represent an official contribution from the
Observatory but the personal opinion of an expert with 25 years of experience in collecting data
on audiovisual media services in Europe. For further details on this paper, I can be contacted at
1. General remarks
This report by a consortium led by Attentional represents a very interesting and in-depth
contribution on the methodological issues related to the monitoring of the articles 4 and 5 of the
TVWF Directive and on the future monitoring of article 3i of the new AVMS Directive.
Some general remarks could be made that would help the consultants to further improve the
report.
1.1. Sources
In the report, various tables and graphs cite one or more public bodies and consultancy
companies together as sources (including the Observatory, quoted as OBS). This style of quoting
sources is confusing and could lead to error, as different sources may be using different
methodologies. Either the author sources a table or graph with the name of a single organisation

540
or, if the figures have been produced by the author drawing on multiple sources, which is
perfectly legitimate, then the author should source the table with the authors name, followed by
the mention “on the basis of data provided by…”.
[Where appropriate, the description of the source material has been amended in the
figures found in Chapter 7.]
A bibliography with more details on the sources used would be helpful.
[A bibliography has been added in Chapter 22.]
1.2 Transparency issues
On several occasions the report addresses issues of transparency. These are described as
arising mainly from the confidentiality requirements of service providers. The perspective, as
would be expected in the context of the parameters of this report, is that of the monitoring of
implementation of the relevant articles of the Directive. However the need for greater
transparency should be addressed not only from this point of view but also from that of a more
general requirement for a balanced economy of the audiovisual sector. The necessity of more
accurate economic analysis and for a level playing field between stakeholders, together with the
rights of rights owners and of public bodies financing the industry with public money to obtain
information to make a correct assessment of their policy represent other arguments in favour of
transparency.
In its general economic analysis of the value chain, the report insufficiently underlines the lack of
transparency in the segmentation of the chain. For example, from the data available as published
by companies or public authorities it is often difficult to obtain precise information on:
- breakdown of revenues by activity for the leading integrated companies
involved in various activities (broadcasting, channel distribution, production,
works distribution, VOD);
- financial flows between distributors (satellite, cable, IPTV or DTT packagers)
and broadcasters;
- financial flows between broadcasters and producers.
Therefore Figure 18: TV value chain in the European Union should be considered as a rough
estimate, committing only the authors of the report and not the sources quoted (including the
Observatory). [It has been made clearer in the Final Study Report that this figure is an
estimate.]

541
As I have already argued at various events organised by the Finnish, Portuguese and French
Presidencies of the European Union, the improvement of transparency in the audiovisual sector
should be the object of greater public concern, and probably of ad hoc regulation. Statements
from leading professionals or by representatives of professional organisations clearly indicate the
evident limits of self-regulation in this field.
2. Remarks on the monitoring of television services (linear services) and current
monitoring of articles 4 and 5 of the Directive
2.1. Identification of the channels to be monitored
The report does not address the question of the identification of the channels that ought be
monitored by the Member States. From experience, in particular the channel census undertaken
when the MAVISE database (http://mavise.obs.coe.int) was set up by the Observatory, I can
confirm that discrepancies exist in a number of countries between the list of channels monitored
by the national authorities and the list of channels observed as being available, including
discrepancies in the theoretically relatively straightforward identification of the country of
establishment of channels. Of course this raises the question of the determination of jurisdiction
for certain channels. Generally speaking, the number of channels to be monitored was probably
underestimated on the basis of Member States declarations in earlier implementation reports for
the Commission. In future, the information in the MAVISE database could probably be drawn
upon in drawing up the list of channels to be monitored in each country, even though the
database cannot claim complete accuracy in identifying the country of establishment of channels
and the broadcasting companies providing the channels.
[The consultant’s have now made it clearer in Part 8.3.1 what the exact reasoning was
behind the choice of channels in the sample. For this study, channels were selected
based largely on viewing share, and were not intended to cover every channel monitored
by a Member State.]

542
Number of channels identified in MAVISE by presumed country of establishment at at 21.11.2008 (provisory data)
Country Nationwide channels Other nationwide channels Regional Local stations Windows Channels Total channels
(with terrestrial licences)
(Cable, satellite, IPTV, mobile) or territorial and tarheting established in a country
Public Private Public Private Public Private open channels foreign countries (windows not included)
AT 2 2 5 48 0 2 48 10 5 112
BE 0 0 0 0 0 0 0 0 22 22
BE 5 0 0 61 14 10 0 0 1 91
BG 1 2 1 42 0 0 0 0 0 46
CY 2 6 1 13 0 0 9 0 6 37
CZ 2 6 3 16 0 36 3 0 4 70
DE 6 15 11 209 10 24 85 48 23 383
DK 6 0 4 12 0 0 84 65 0 106
EE 1 2 0 11 0 0 5 0 0 19
ES 5 19 15 110 25 3 148 17 22 347
FI 5 17 1 5 0 5 28 0 0 61
FR 5 24 3 132 2 42 128 22 48 384
GB 20 61 9 447 0 0 23 38 350 910
GR 7 7 2 21 0 2 138 0 9 186
HU 1 2 4 29 0 1 31 6 28 96
IE 3 1 0 2 0 3 3 0 1 13
IT 8 21 11 185 1 26 82 0 38 372
LT 2 3 1 1 0 5 45 0 2 59
LU 0 2 1 2 0 0 2 0 28 35
LV 2 2 0 6 0 3 21 0 0 34
MT 1 3 1 16 0 0 0 0 0 21
NL 3 18 19 74 15 0 8 8 15 152
PL 3 4 4 45 0 0 0 16 2 58
PT 2 2 8 27 0 0 0 0 3 42
RO 2 2 3 70 5 13 0 0 3 98
SE 4 22 3 28 0 13 89 27 65 224
SI 1 5 0 9 2 9 14 0 0 40
SK 3 2 0 11 0 14 6 0 1 37
EUR 27 102 250 110 1632 74 211 1000 257 654 4033 Source : OBS / MAVISE database (shadowed boxes indicated important gaps in data collection)

543
2.2. Biased channel samples and their consequences for the general assessment of the
implementation of article 4.
The country samples constituted for the report can be considered as significantly biased by the
fact that they are generally include the leading generalist channels and exclude thematic
channels, in particular the film, documentary and children’s channels characterised by a
predominance of non-European works. Audience market share for this type of channel is rising in
most countries. The presence of pay-TV channels on many markets has, in addition, a direct
impact on programming by free-to-air channels and on the cost of acquisition of non-European
programmes by all broadcasters. Though non-disclosure of data on revenues of third country
companies operating on the European market makes assessing the audiovisual trade balance
between Europe and third countries (in particular the USA) impossible, there are good reasons to
believe that the European deficit has increased significantly since 1989. This increase would
appear, in particular, to be linked to the growth in the number of thematic channels using US
programmes.
[For this study, channels were selected based largely on viewing share, and therefore the
sample had a bias towards leading generalist channels. The consultant’s have added a
caveat to section 8.3.1 to explain this more clearly in the Final Study Report.]
2.3. Absence of reference to the data published by the Observatory on the origin of fiction
programmes as broadcast by a sample of television channels in Europe
As a corollary to the previous remark, I deeply regret that the report does not make any reference
to the data published annually in the Observatory Yearbook on the origin of fiction (feature films,
short films, animation, TV series, TV films) as broadcast by a sample of channels in Europe. Up
to 2005 the data were provided chiefly by the UK company ETS and covered imported fiction
programmes only. In the 2006, 2007 and forthcoming 2008 editions of the Yearbook, the
Observatory publishes data prepared by the Luxembourg company Infomedia on the origin of 5
categories of fiction programmes as broadcast by 127 channels in 13 European countries,
including national programmes. It is therefore possible to analyse, channel-by-channel, format-by-
format and country-by-country the relative importance of European and non-European
programming in channel broadcasts.
The 127 channels have been selected according to their relative importance on the respective
national markets.

544
To summarise: aggregate figures are elaborated by the Observatory on the basis of the data
provided by Infomedia. The following overview shows that European fiction represents only 32%
of the 527 770 hours of fiction broadcast on the channels included.

545
Origin of fiction programmes broadcast by a sample of 127 TV channels in 13 European countries (2006)
Type of channel
Number of channels
in the sample
(EUR 13)
Total volume
of fiction (in
hours)
National
Non-national European (including
co-productions)
Total European (national +
non-national)
Non-European
Commercial 38 145 582 7,3% 15,6% 22,9% 77,1%
Pay-TV film 22 146 514 9,8% 30,2% 40,0% 60,0%
Thematic 23 131 714 17,3% 16,4% 33,7% 66,3%
Public service 44 103 960 24,2% 35,6% 59,8% 40,2%
Total 127 527 770 15,1% 16,9% 32,0% 68,0%
Source: European Audiovisual Observatory
Evidently this data is not prepared on the basis of the criteria defined by Article 4 of the Directive.
Fiction programmes constitute only one of the categories of programmes which need to be taken
into account in the monitoring of the Article. However if it is admitted that fiction (including feature
films) constitutes the main genre in terms of volume and programming costs, the discrepancy
between the 32% share observed in this category and the general, larger objective of a 50%
share of European origin as fixed by the 1989 Directive, is certainly worth underlining and ought
be a matter of concern for both national and European regulators.
[The consultants note that the approach here appears significantly different to the
methodology for this study. The EAO study has looked at total hours of fiction content
over a year (2006) across a larger sample of channels than this study. This study has
instead looked at entire qualifying schedules (thus containing the full variety of genres) for
a smaller sample of channels for two non-consecutive weeks in 2007. This does make
comparison between the datasets difficult. The consultants consider another of the EAO’s
comments relevant here, that of the issue of the current study’s focus on generalist
channels commanding larger audiences, rather than thematic ones. We have now made
explicit reference to this issue in the report. This does mean that the channels covered in
this study are possibly more varied in terms of genre than some covered in the EAO study
(which may have included more thematic channels). These thematic channels may rely
more on imports than leading generalist channels, which could explain the figures
presented by the EAO.]
3. Monitoring of on-demand services
Chapter 5 of the report, “On-Demand Audiovisual Services and European Works”, is the most
stimulating section, dealing with a field in very rapid evolution where monitoring will have to be
established as part of the implementation of the new AVMS Directive. The problems related to
transparency are even more critical in this field than for the ‘classic’ television activities.
546
Identification of the number of services to be monitored
The first challenge for monitoring is identifying the services to be monitored. There has been a
certain amount of confusion in the data published on the number of services (including in the
statistics published so far by the Observatory and quoted in the report) between an on-demand
service as provided by the provider (as defined in the article 1(a) of the AVMS Directive) and the
distributor of the service (in particular services distributed by cable, IPTV or DTT operators). If the
main criteria for the identification of the provider is editorial responsibility for a catalogue, than the
logical consequence in counting services is that the data should be drawn up by operating (where
feasible) a distinction between the various catalogues distributed by a single cable, IPTV or DTT
operator. IPTV and cable operators distribute different catalogues, which should then be counted
as different services, even if the distributor brands them under a single name in its marketing
offer. As for DTT, there is currently a single operator providing a VOD service (the UK company
Top Up TV Limited, providing the Top Up TV Anytime offer). Though OFCOM consider Top Up
TV Anytime as a single service, the service actually consists of an “à la carte” programme
extracted from the programme schedule of numerous TV channels provided by various
broadcasters. Should the offer be counted as a single service or as a number of services
equivalent to the number of channels from which the “à la carte” service is extracted?
While preparing a report to be published by the Observatory and the French DDM in collaboration
with the French consultant NPA Conseil, I have tried to draw up a much more detailed census of
existing services as at early December 2008. I reach a provisional total of 418 operational
services in the European Union (not including services with news only, trailers, highlights,
programmes for adults…). Services with territorial restrictions may be counted several times in
this census as they appear in various countries. Some of these services are established outside
of the EU (USA or Switzerland) but targeting specific European Union countries..
[The consultant’s have now more clearly explained how their figure for total Video-on-
Demand services was reached in the text of the report. This was based on a methodology
set out in a report by the NPA Conseil and European Audiovisual Observatory dated
December 2007. In this report, the same service on various media is counted in the total
as many times as it is available e.g. the BBC iPlayer service in the UK is counted twice as
it is available both on the web and through a cable operator’s on demand service.
However, the consultant’s would like to note that an alternative definition of a service
could also be considered, based on the editorial responsibility for an on-demand service,
rather than the total number of access points. This would mean that a service that is
distributed on multiple platforms but containing the same content would only count as one

547
service (so in the example above the BBC iPlayer service would only be counted once).
As the results we presented were based on currently available statistics from the NPA
Conseil and European Audiovisual Observatory, our findings are not based on this
‘editorial responsibility’ methodology, but we do think that this approach should be
considered in future research in this area. With regards the Top Up TV example referred
to by Mr Lange above, the consultant’s view is that this service effectively downloads a
selection of content to the consumer’s Personal Video Recorder (PVR) every month, which
can then be watched. Therefore the provider is essentially choosing what is recorded to
the consumer’s PVR, but then the consumer can choose what to watch or not watch from
this selection. ]

548
Number of on-demand services operational in European Union, by country of reception
and network of distribution. (December 2008) – Provisory data.
Services counted on the basis of presumed editorial responsibility (not by company of
distribution)
Not included : VoD with adult content, news only catch-up TV services,
highlights, promotional or trailers only services, company channels in You Tube.
Internet services without territorialisation are counted only in the country of origin.
Total Internet IPTV Câble Satellite TNT
AT 9 4 2 1 2
BE 32 13 4 15
BG 1 1
CY 3 1 2
CZ 6 3 3
DE 36 29 3 1 3
DK 18 13 3 2
EE 5 2 1 2
ES 25 20 3 2
FI 14 10 4
FR 87 53 23 11
GB 41 21 11 6 1 2
GR 3 3
HU 12 5 7
IE 9 7 1 1
IT 22 14 8
LT 1 1
LU 4 4
LV 1 1
NL 41 31 4 6
PL 15 7 2 1 5
PT 3 1 2
SE 21 14 7
SI 3 2 1
SK 6 4 2
Total 418 260 97 47 12 2
Source : European Audiovisual Observatory.
Terminology and bias in the sample of services analysed
The concept of a “pure VOD player” as opposed to broadcasters as used by the consultant is
probably misleading. Various services are provided by single purpose companies established a
VOD service providers. But most of the services are provided by telecommunications companies,
cable companies and, less often, by existing film companies. Those companies should not be

549
considered as “pure VOD players”. It is a bit confusing to group in the same category a small
independent company and a large telecommunications group.
[The consultant’s have now included a definition of pure VoD player within the report to
help clarification of the term.]
The sample of 29 services on which the analysis is based is far from representative of the real
market. It include only 4 telecom operators, while they are clearly the leading category in
providing on demand service. There is no service provided by a cable operator (which may act
indeed as provider and not only as a distributor) in the sample.
[The sample of 29 services for the prominence analysis were largely available on the
public internet in order to not limit the consultants to investigating services in the markets
where the consultants were located. It is important to note also that the prominence
analysis was designed to be exploratory, to identify possible prominence indicators and
assess them, rather than present a representative analysis of all European on-demand
services.]
Analysis of catalogues
Most of the problems well analysed by the report on the monitoring of the implementation of
article 3i of the AVMS Directive result from the observation that it is difficult to obtain information
on their complete catalogue from the operators. It is interesting to note (page 307) that 70% of the
respondents were ready to provide listings of their catalogues to the authorities if they could
remain confidential. The desire for confidentiality on this point should have been analysed further.
Why are the providers of services not keen to divulge the contents of their catalogues when they
are supposed to promote them and when, anyway, this is public as long as some one takes the
time to go through it. The requirement for catalogues to be made public (and for their mandatory
communication in a specific format) could be easily justified for other reasons, in particular the
rights of right owners to be informed on the use of their works.
[The consultants have checked this statistic and have found that it did not specifically
relate to declarations on titles in a catalogue, but declarations concerning any kind of
internal data. It has therefore been moved to the section looking at self-declarations as an
operational procedure: Part 10.2]
The question of the identification of the country of origin of a single programme may be partly
solved by using as an European reference the LUMIERE database
(http://www.lumiere.obs.coe.int) for the identification of the country of origin of feature films.
LUMIERE is not comprehensive but it does includes data on more than 17 000 films. The
identification of country of origin of films is done by the Observatory in collaboration with a

550
network of statisticians of the national film agencies (EFARN), providing a fairly high level of
reliability. The inclusion of the ISAN number in LUMIERE is underway and should, in the future,
allow relatively easy matching that could be used for the analysis of film catalogues, if provided in
an electronic format.
[A reference to the LUMIERE database has been included in Part 10.4.1.]
Analysis of the success of the individual works
The analysis of the success of individual works is probably not a major requirement for the
monitoring of article 3i of the AVMS directive (in the same way as the monitoring of article 3 and 4
of the TWF Directive does not take into consideration audience measurement). However, as I
have already indicated on several occasions, the publication of data on the success (i.e. data on
the number of downloads or orders of a film in the framework of a VOD or a pay-per-view service)
should be considered (at least on the basis of aggregate data drawn up on the basis of providers
declarations). This kind of data, in most of the EU countries, have to be provided by the cinema
operators and the principle of equality of treatment between competitors ought to be applied, in
order to create a level playing field.
Analysis of revenues
As indicated by the report, which quotes rightly a remark from my contribution to the Lisbon
conference, the analysis of revenues resulting from VOD services is very difficult, and even
impossible through the analysis of the accounts of large, multi-activity companies. In contrast, the
accounts of small independent companies with a single VOD activity may be obtained through
their declarations to the national companies register. There is clearly an unbalanced treatment
between stakeholders.
This topic is certainly outside of the remit of the debate on the implementation of the monitoring of
the objectives of the promotion of European works and deals with more general issues of
regulation of the transparency of economic activities.
[The reference to Andre Lange’s previous remarks has been edited to include these new
comments.]

551
23.4. Swedish Broadcasting Commission In accordance with Article 4.3 of the TV-directive, the Member states shall provide the Commission every two years with a report on the application of Articles 4 and 5. That report shall include a statistical statement on the achievement of the proportion referred to in Articles 4 and 5 for each of the television programmes falling within the jurisdiction of the Member State concerned. Sweden joined the EU in 1996 has been reporting on the achievement of Articles 4 and 5 since 1998. The first reports included Kanal 5, but this channel has not been included in the Swedish reports since 2002. Sweden has never reported on TV3. Kanal 5 and TV3 are both established in United Kingdom. They have been granted a license by Ofcom and are obliged to follow British rules. Swedish authorities have no means to influence these channels to increase their number of European productions. We request that Kanal 5 and TV3 are removed from your report on Sweden and instead included in the British report. This would be in line with Article 4.4 of the TV-directive, which states that the Commission’s report to the Council shall be based on the information given by the Member States in accordance with Article 4.3. It would, naturally, also be more in line with the wording in Article 3i p. 1 of the AV-directive, which clearly states “Member states shall ensure that on-demand audiovisual media services provided by media service providers under their jurisdiction promotes…” In any event, Kanal5 and TV3 cannot be included in the Swedish report without further comments on why you have chosen to regard these channels as “Swedish channels” despite the fact that they are established in the United Kingdom and in accordance with both the TV-directive and the AV-directive obey under British law.
[The channels selected by the consultants for each Member State were in large part chosen from the perspective of the viewer, that is that a channel was assigned to the Member State in which it found its audience. Channels were selected to cover the largest possible share of audience for the Member State’s selected. This does however mean that in some cases (for example with Kanal 5 and TV3 in Sweden), channels have been included in the Member State report for the country in which their audience is found, but not the country in which they are regulated. As we have grouped our channels from the perspective outlined above, we do not feel it is appropriate to move Kanal 5 and TV3 to the UK report (these channels do not find their audiences in the UK). However, we agree that it should be made more clear in the Swedish report that these channels are not governed under Swedish law. We have therefore added an statement regarding this in the methodology for the EU-wide analysis, and again within the Swedish report itself.]
552
23.5. Mediaset As part of their reponse to the Draft Final Report, Mediaset asked Prof. Stefania Bariatti to provide advice on how Endemol should be classified in terms of its independence from national broadcasters. This was taken into account by the consultants, and Endemol’s programming was re-coded accordingly (see country profiles for Spain and Italy in particular for reference to this). Below we have inserted the text of the statement from Prof. Bariatti, which Mediaset requested be included in this study.
553

554

555

556

557

558
24. Appendix XII: Note on Definition of Independent Producer
24.1. Definition of independent producer
At the workshop held in Brussels on November 18 2008, there was some debate with the delegates on the best possible definition of an ‘independent producer’. The consultants’ definition of “independent” or “not independent” has already been described in section 8.2.5 of this report. In this section, we provide some further information on why this definition was chosen, and investigate the possible implications of choosing one definition over another, by assessing the impact of choosing another definition on the linear findings for a representative selection of 27 channels from our sample.
24.1.1. Economic vs. cultural objective
In this section we investigate the impact of the choice of our definition of independent producer used for this study, that is, when it is free of any control by a broadcaster in its own national market (the ‘country-by-country’ approach), rather than an alternative definition whereby a producer is considered independent if it is not linked to a broadcaster in any European Member State (the ‘company-by-company’ approach).372
First, in the absence of a clear definition there cannot be one single answer to the question of which is the most appropriate definition. Indeed the right methodology depends on the political objective behind the legislation. If the objective is economic, that is, to ensure that the production business is not controlled by the broadcast business, but that both are kept separate, then the more appropriate definition would be the company-by-company approach: that producers must be free from a broadcaster’s control in any Member State. For example, BBC Productions and BBC Worldwide will remain controlled by the BBC even when they sell or operate outside the UK, and so will be considered under a company-by-company definition as being non-independent regardless of the country in which the programme is being broadcast. But if the objective is ‘cultural’, that is, to ensure a diversity of
372 As has been noted in Section 8.2.5, the country-by-country approach is a different definition from that used in the 2005 Study (where a company-by-company approach was taken).

559
content on-screen for the consumers, then the best definition should be by country-by-country (i.e. whether a producer is independent of the domestic broadcaster). Indeed, watching a BBC show provides French or German viewers with improved cultural diversity compared to another programme by French or German producers. During the course of the study, the decision was made that it was most appropriate to use a country-by-country approach, as it better reflected the objective of Article 5 of the Directive. Further to the Workshop, we decided to assess the impact of that choice on the linear data which have been reported.
24.1.2. Impact of methodological choice
Table 170 shows the impact of the methodological choice on the ratio of independent productions in transmission and viewer hours for a representative selection of 27 channels from our total sample of 54. The channels have been selected to cover a variety of Members States, whether large or small, north or south: Germany, Ireland, Italy, Flemish Community of Belgium, Spain and Sweden. In the table we have identified the result of the country-by-country approach (which is the approach we have taken for this study, and is the result included in the report), and also included the result if the company-by-company definition is used. We have done this for transmission hours and viewer hours. We have also detailed in the table the key production companies that the change in definition affects.

560
Table 170: Ratio of Independent Productions using a definition “country-by-country” (used throughout this study) vs. a “company-by-company” definition, in a selection of 27 channels
AVMS results
(country-by-
country
approach)
New Results
(company-by-
company
approach)
Delta1
Variation2
AVMS results
(country-by-
country
approach)
New Results
(company-by-
company
approach)
Delta1
Variation2
ARD 35.3% 35.0% 0.3% -0.9% 45.8% 45.1% 0.7% -1.5% BBCPRO 7 28.6% 28.6% 0.0% 0.0% 24.0% 24.0% 0.0% 0.0%RTL 38.0% 38.0% 0.0% 0.0% 42.3% 42.3% 0.0% 0.0%SAT.1 59.1% 58.4% 0.6% -1.1% 61.0% 60.3% 0.7% -1.1% GranadaVOX 48.9% 37.9% 11.0% -22.5% 61.7% 34.8% 26.9% -43.7% Granada
ZDF 23.0% 23.0% 0.0% 0.0% 23.2% 23.2% 0.0% 0.0%RTE 1 33.1% 21.8% 11.4% -34.3% 35.8% 24.9% 10.9% -30.4% BBC, Granada, Thames,RTE 2 29.3% 28.4% 0.9% -3.1% 25.1% 23.8% 1.4% -5.4% BBC, Granada
TV3 53.3% 24.1% 29.2% -54.8% 67.6% 13.6% 54.0% -79.9% BBC, Granada, Fremantle, ITV, Thames, Yorkshire Television
Can5 23.8% 22.3% 1.5% -6.2% 24.5% 23.2% 1.3% -5.4% Bavaria Film GmbHFox Life 10.9% 10.9% 0.0% 0.0% 8.4% 8.4% 0.0% 0.0%Ita1 10.8% 10.8% 0.0% 0.0% 8.2% 8.2% 0.0% 0.0%La7 22.4% 22.0% 0.4% -1.9% 23.3% 22.8% 0.4% -1.9% BBCRai1 14.6% 14.6% 0.0% 0.0% 15.8% 15.8% 0.0% 0.0%Rai2 20.6% 20.0% 0.6% -2.9% 26.1% 26.0% 0.2% -0.6% Novel Entertainment Productions, TVE
EEN 36.2% 30.3% 5.9% -16.3% 43.6% 40.7% 2.8% -6.5% BBC
VTM 45.0% 34.3% 10.8% -23.9% 60.0% 47.1% 12.9% -21.5% Fremantle, BBC
Antena 3 40.2% 39.7% 0.5% -1.3% 48.4% 48.2% 0.2% -0.4% BBCCUATRO 27.6% 27.4% 0.1% -0.4% 22.2% 22.2% 0.1% -0.2% BBCLa 2 29.1% 28.9% 0.2% -0.5% 31.0% 30.8% 0.1% -0.4% GranadaLA SEXTA 49.3% 48.1% 1.2% -2.5% 41.3% 40.5% 0.8% -2.0% RTETele 5 55.4% 51.4% 4.0% -7.1% 60.0% 52.7% 7.4% -12.3% FremantleTVE 1 22.7% 22.7% 0.0% 0.0% 25.2% 25.2% 0.0% 0.0%Kanal 5 13.7% 12.5% 1.2% -8.7% 20.7% 20.1% 0.5% -2.6% BBC, Channel 4SVT 1 23.3% 22.8% 0.5% -2.2% 33.0% 31.9% 1.0% -3.1% DRTV 3 4.7% 4.7% 0.0% 0.0% 10.0% 10.0% 0.0% 0.0%TV 4 28.3% 24.1% 4.2% -14.8% 53.1% 46.5% 6.5% -12.3% Fremantle, Granada, Yorkshire
1 Delta represents the difference between the company-by-company value minus the country-by-country value (for ARD : 35.3%-35%=0.3%).
2 Variation represents the ratio of company-by-company value divided by country-by-country value (for ARD: -100%+(35.0 /35.3)=-0.9%).
Production companies
Spain
Italy
Sweden
Germany
Belgium (Flemish)
Ireland
Country Channel
Ratio of Qualifying Independent European to Total
Qualifying Hours (%)
Ratio of Qualifying Independent European to Total
Qualifying Viewer Hours (%)
561
The main findings from this analysis are as follows:
• For 20 out of 27 channels evaluated (74%), the impact on the transmission hour and viewer hour ratios is below 1.5 percentage points.
• The impact is mainly due to British production companies either based in the UK or via their local subsidiaries and production partners. These include BBC, Granada, Fremantle, Thames, etc.
• The impact is the most important in Ireland: using a “company-by-company” definition, the ratio of independent productions for RTE1 would decline from 33.1% (as was found using the country-by-country definition), to 21.8% in transmission hours (from 35.8% to 24.9% in viewer hours) while that of TV3 would decline from 53.3% to 24.1% in transmission hours (from 67.6% to 13.6% in viewer hours). This can be largely explained by the language proximity between Ireland and the UK.
• The Flemish Community of Belgium is also impacted to a relatively large proportion (see below), tending towards showing that markets of a smaller size are generally more strongly impacted by this choice in definition than larger markets.
Reviewing the specific productions in Member States where a relatively large impact was acknowledged is also of interest. We looked at the specific productions impacting the ratios of non-Irish broadcasters beyond 1.5 percentage points: VOX in Germany (from 48.9% to 37.9% in transmission hours and from 61.7% to 34.8% in viewer hours), EEN in Flemish Community of Belgium (from 36.2% to 30.3% in transmission hours and from 43.6% to 40.7% in viewer hours), VTM in Flemish Community of Belgium (from 45% to 34.3% in transmission hours and from 60% to 47.1% in viewer hours), TELE5 in Spain (from 55.4% to 51.4% in transmission hours and from 60% to 52.7% in viewer hours), TV4 in Sweden (from 28.3% to 24.1% in transmission hours and from 53.1% to 46.5% in viewer hours).
On VOX, the change in proportion of independent works is mainly due to two Granada formats (Das Perfeket Dinner and Unter Volldampf) which are re-shot locally in German language. On VTM, it is mainly due to the BBC children show Teletubbies (acquired from the shelf) and two formats from Fremantle (Idol + Ugly Betty/Sara) which are re-shot locally in the Flemish language. On TELE5, it is mainly because of the Fremantle formats Ugly Betty/Yo Soy Bea (re-shot locally in Spanish language in a co-production with TELE5). On TV4, it is mainly due to the Fremantle format Idol (re-shot locally), Granada documentaries (acquired from the shelf) and Yorkshire fiction series Emmerdale (acquired from the shelf).
So we see that in the majority of cases, the productions influenced by the choice of definition are formats, either scripted or unscripted, which are licensed to a local production structure and produced in a local language. For TELE5, the format is even being co-produced by the broadcaster, although Fremantle is controlled by Bertelsmann, themselves controlling TELE5’ main

562
competitor in Spain, ANTENA3. The only pure acquisitions from the shelf which we could find are the children show Teletubbies, fiction series Emmerdale and several Granada documentaries.


![OF No. 15] PERTH: FRIDAY, 28th FEBRUARY [1975](https://static.fdokumen.com/doc/165x107/6320f1b7eb38487f6b0fd6fa/of-no-15-perth-friday-28th-february-1975.jpg)


![arXiv:0905.3978v1 [quant-ph] 25 May 2009](https://static.fdokumen.com/doc/165x107/63268c49cedd78c2b50d2403/arxiv09053978v1-quant-ph-25-may-2009.jpg)
![[ For Wednesday,28th August 2019] - The Gauhati High Court](https://static.fdokumen.com/doc/165x107/6320b460aaa3e1b19f079ef5/-for-wednesday28th-august-2019-the-gauhati-high-court.jpg)