Structural Integrity Assessment of Floating Offshore Wind ...
Upload
khangminh22Category
view
3download
0
July 2021
The Blue Economy CRC is funded in part under the Australian Government’s CRC Program, administered by the Department of Industry, Science, Energy and Resources. The CRC Program supports industry-led collaborations between industry, researchers and the community.
FINAL PROJECT REPORT
Offshore Wind Energy in Australia

1
Report Contributions
The report bought together expertise from CSIRO, Saitec Offshore, Institute for Sustainable Futures, University of Technology Sydney, Maritime Union Australia along with contributions from the Electrical Trades Union, Australian Manufacturing Workers’ Union and Australian Council of Trade Unions.
Offshore Wind Energy in Australia
Report Citation: Briggs, C., M. Hemer, P. Howard, R. Langdon, P. Marsh, S. Teske and D. Carrascosa (2021). Offshore Wind Energy in Australia: Blue Economy Cooperative Research Centre, Launceston, TAS. 92p.
Cover Image Credit: Øyvind Gravås © Equinor - Hywind Scotland

2Offshore Wind Energy in Australia
Executive Summary
Offshore wind energy is booming globally. The industry is rapidly scaling up across the UK, Europe and Asia-Pacif ic as costs have fallen and the size of turbines and projects has increased dramatically.
Globally, 2030 targets for offshore wind total around 200 Gigawatts (GWs), including 40 GW in the UK and US, 60 GW in the EU, 12 GW in Korea and 10 GW in Japan (which has a target of 45 GW by 2040). For the International Energy Agency (IEA), offshore wind energy is now one of the ‘big three’ in its energy scenarios – projected alongside on-shore wind and solar PV to be one of the bulk sources of electricity in the clean energy transition in coming decades. The UK Government project that by 2030, offshore wind will be cost-competitive with onshore wind. The scale of global development in offshore wind energy will translate into major employment growth by 2030. (see GWEC, 2020)
In Australia, there are currently more than 10 projects proposed with a combined capacity of over 25 GW. In this study, we evaluate the potential for offshore wind energy in Australia by undertaking:
∆ High-level mapping to evaluate the quality of Australia’s offshore wind energy resources, investigating 12 locations around the Australian coast that are adjacent to energy infrastructure and demand centres;
∆ A comparative analysis of the generation profile of offshore wind energy with onshore wind and solar energy and load profiles to investigate its potential value within Australia’s electricity market states;
∆ The employment potential for offshore wind energy and the role it could play in a ‘just transition’ for coal, oil and gas workers.
While the potential for offshore wind in Australia has been overlooked for some time, the development of floating offshore wind turbines, the contribution offshore wind can make to the grid through diversity of supply, high capacity factors, very large scale projects, and employment for workers in fossil fuel industries means that the potential for offshore wind must be re-considered. Specif ic recommendations on how to implement this are put forward at the end of the Executive Summary.
Image Courtesy of Saitec Offshore

3 Offshore Wind Energy in Australia
Some of the key f indings from the study include:
Australia has very high quality and abundant offshore wind resources in a range of locations.
Analysis of offshore wind energy resource was undertaken in terms of total resource, potential generation capacity and capacity factors. A bottom-up approach was taken, which used hourly wind speed data and a representative power curve from an International Energy Agency reference 15 megawatt (MW) wind turbine to evaluate offshore wind potential over the entire Australian Exclusive Economic Zone (‘theoretical resource’), which was estimated to be 27,369 GW. We then evaluated the ‘technically-accessible resource,’ which included areas less than 100 km from shore, in water depths less than 1000m, within 100 km of sub-stations and transmission lines and excluding environmentally restricted areas. The technical resource was estimated to be 2,233 GW; far in excess of current and projected electricity demand across the Australian electricity markets (NEM, SWIS and others).
The Australian wind resource is strongest in southern latitudes (Figure ES1):
∆ There are maximum average wind speeds of over 12 metres/second (m/s) found south of Tasmania;
∆ In the Bass Strait between Tasmania and Victoria, along the south-western and south-eastern coast of the continent, off the coast of Western Australia and between Cooktown and Cape York in northern Queensland, there are average wind speeds in the range of 9-10 m/s;
∆ Off the coast of South Australia, much of New South Wales and the north of Queensland, there are also good quality offshore wind resources (8-9 m/s).
Australian offshore wind resources are comparable to areas such as the North Sea where offshore wind is an established industry (Figure ES2). Mean annual 100 m level wind speeds in the North Sea, are in the range of 9-10 m/s (Geyer et al., 2015).
Figure ES1: National average wind speed (m/s) from 2010-2019 within the EEZ study area at 100 m height. White regions represent areas where average wind speeds below 6 m/s or environmental restrictions exist.

4Offshore Wind Energy in Australia
Figure ES2: Mean wind speed (m/s) at 100 m level, derived from ERA-5 reanalysis, showing (a) global and (b) Australian wind distribution. Location of existing offshore wind farms with nameplate capacity > 200 MW in North Sea shown in (c).
Australian offshore wind resources have strong capacity factors, which reflect the consistency of wind and indicate the proportion of the time that the generator can generate electricity. Offshore wind gross capacity factors greater than 80% (excluding losses) are found south of Tasmania (Figure ES3). In the more accessible regions in Bass Strait, along Australia’s western coast and in north Queensland, theoretical capacity factors exceeding 55% are widespread. Off the coastlines of South Australia and New South Wales capacity factors greater then 45% are common.
It is not surprising that the f irst Australian offshore wind farm, the Star of the South, is planned for deployment off the south-east coast of Gippsland given the high average wind speeds, water depth ranges of 20-70 m suitable for both f ixed and floating installations, and proximity to electricity and port infrastructure in the Bass Strait.
However, the picture that emerges from this resource assessment is that there are a range of promising locations for offshore wind including: Western and south-western Western Australia (with good quality wind resources located in shallow waters near to the coast); a small area in northern Queensland with high capacity factors; and off the New South Wales and Queensland coastlines. Many excellent locations are close to areas of large industrial loads, including Port Kembla, Newcastle, Gladstone, and south of Perth.
Figure ES3: Gross capacity factors for offshore wind around Australia.

5 Offshore Wind Energy in Australia
Floating offshore wind technologies will be necessary to access many of the best Australian offshore wind resources
There are two primary technologies for offshore wind energy: f ixed foundation (secured directly to the seabed) or floating turbines (mounted on a floating foundation which is secured by anchored cables to the seabed). Internationally, commercial wind farms are almost exclusively f ixed foundation turbines, but are limited to water depths of up to 50-60 metres. Floating wind turbines, which have now also reached commercialisation and are projected to be deployed in greater numbers over the next decade, (Papalexandrou, 2021), and can be installed at greater depths.
Figure ES4: Fixed and floating offshore wind foundation types (GWEC, 2020).
Image Courtesy of Saitec Offshore

6Offshore Wind Energy in Australia
Queensland, Victoria, Tasmania, South Australia and Western Australia all have offshore wind resources in shallow waters (<60m) that are near to the coast (<50km) suited to f ixed foundation turbines. However, all states also have large resources in deeper waters (>60m depth), suited to floating technologies, and for New South Wales the offshore wind resource is almost entirely in deeper waters.
Figure ES5: Technical energy potential for offshore wind by state and water depth.
The theoretical offshore capacity factors for the potential offshore wind sites examined in this study are given in Table 1. Generally, the capacity factors are higher further away from shore in deeper waters. For Tasmanian, Victorian and Queensland sites especially, capacity factors 100km offshore are around 10 percentage points higher than 25km offshore.
Table 1: Gross Capacity Factors for offshore wind (100-m hub height) at selected sites examined in this study (close to electrical substations, at 25, 50, 100km offshore and in depths of less than 1000m). Capacity factors at 150-m hub height can be up to ~4-5% greater.
Location 25km 50km 100km
Georgetown (Tasmania) 51% 62% 66%
Hobart (Tasmania) 46% 55% -
Latrobe (Victoria) 45% 54% 59%
Portland (Victoria) 55% 57% 59%
Newcastle (NSW) 39% 44% -
Sydney (NSW) 36% - -
Port Kembla (NSW) 35% - -
Maroochydore (QLD) 24% 36% -
Gladstone (QLD) 36% 45% 46%
Adelaide (SA) 47% 48% 49%
Perth (WA) 45% 50% 52%
Karratha (WA) 33% 33% 31%

7 Offshore Wind Energy in Australia
The capacity factors for offshore wind are usually higher than onshore wind.
Capacity factors are generally higher for offshore wind sites relative to onshore wind. The Australian Energy Market Operator (AEMO) publishes low (yellow dots) and high (red dots) capacity factors for onshore wind across all the Renewable Energy Zones (REZs) within the National Electricity Market in the Integrated System Plan. The onshore wind capacity factors are compared to the potential offshore wind sites listed above across Tasmania, Victoria, NSW, Qld, SA and WA (Table 1), and examined further in this report.
Capacity factors for most of the offshore sites are higher than for on-shore wind; typically in the order of 10-15 percentage points, but in some regions by over 25 percentage points. There are a few on-shore REZs where the difference is modest and three where onshore wind has a higher capacity factor. Onshore and offshore capacity factors are most similar in north-west WA, southern Queensland, and in Tasmania.
Figure ES6: Capacity factors for onshore and offshore wind (%). 100-m hub height. Offshore allows larger turbines, where higher hub heights will further increase capacity factor.
Source: On-shore Wind capacity factors are drawn from AEMO Inputs and Assumptions Workbook, Integrated System Plan 2020 (AEMO, 2020a). Offshore wind capacity factors are from this study.
Image Courtesy of Star of the South

8Offshore Wind Energy in Australia
Offshore wind can provide diversity of energy supply due to its availability at times when solar power and onshore wind are not available.
Offshore wind resources were analysed on an hourly basis against the grid electricity load curves of Western Australia, South Australia, Victoria, Tasmania, New South Wales and Queensland and to onshore renewables (solar photovoltaic and wind power) in twelve locations. Most sites exhibit the strong diversif ication value of offshore wind (correlation with onshore wind < 55%, correlation with solar PV ~0), with offshore wind continuing to operate at high capacity during periods when onshore wind and solar is low. A case study provided by offshore wind developer Star of the South showed that in their location off Gippsland (Victoria), meteorological patterns mean that offshore wind is particularly strong on hot days. The contribution of offshore wind to the electricity system is thus a greater capacity and scale, and the provision of renewable electricity when it is otherwise unavailable.
This work should be considered indicative only - off- and on-shore wind resource data used here is derived from coarse resolution global scale meteorological reanalysis and not in-situ observations. Actual wind turbine generation curves are very likely to be different from the data used here. Furthermore, assessing the diversif ication value of offshore wind for potential projects should be considered against both existing and pipeline projects per state. We aim to motivate further analysis, resolving localised features of the resource, and the relationship of this resource to demand, and other renewable generation (existing and pipeline), to better resolve the magnitude and diversif ication value of offshore wind generation in Australia.
Figure ES7: Potential offshore wind sites in Victoria (top), NSW (middle) and Queensland (bottom), the percentage of year during which offshore wind (blue), onshore wind (green) and solar PV (yellow) generation is operating at high capacity (>50%), and others operate at low (<25%) capacity. Where circles do not overlap this indicates the percentage of the year when one energy source is at high capacity while the others are at low capacity. For example, in Newcastle, NSW, Offshore wind is operating at high capacity, with onshore wind and solar PV both operating at low capacity, for 11.2% of the year.
Latrobe, VIC
Newcastle, NSW
Gladstone, Qld
6
18.2
8.6
2
1.8
4.24.2
2.1
2.7
2.3
2.66.6
9.9
11.2
8.5
4.6
1.6
1.2
3.1
8.3
7.3
Wind and wave monitoring equipment off the south coast of Gippsland to conf irm the wind conditions as part of planning and developing Australia’s f irst offshore wind project. Image Courtesy of Star of the South

9 Offshore Wind Energy in Australia
Under ‘energy superpower’ scenarios including mass electrif ication and hydrogen production, offshore wind could become a key strategic resource.
In order to understand the employment potential, two potential scenarios or market segments were considered. Australia is blessed with an abundance of high-quality on-shore solar and wind energy sites which will dominate new renewable energy generation in coming years.
However, the development of an offshore wind industry in Australia for the domestic market would be strategic for two key reasons. Firstly, if the costs of offshore wind continue to fall amidst the global scaling up of the industry (in line with UK projections), offshore wind could become a cost-competitive source of electricity for the Australian domestic electricity market. Secondly, diversifying electricity generation sources to include offshore wind can reduce some of the potential risks, constraints and impacts with the build-out of onshore renewable energy and closure of coal generators. Under the Step Change scenario in AEMO’s Integrated System Plan for the future electricity system, 50 GW of renewable energy generation would be built by 2035. Most of the coal plant closures are scheduled to occur in the late 2020s and early 2030s but there is high uncertainty over the pace and timing of closures. In this context, diversifying to offshore wind would be strategic as:
∆ the combination of high capacity factors and scale enables the construction of capacity equivalent to multiple on-shore projects with lower risk around timeframes. An offshore project could be 1.5-2GW under one set of agreements, whereas onshore wind farms are generally 200 – 600MW.
∆ offshore wind can connect near to existing electricity infrastructure built around coal power plants;
∆ as the scale of on-shore renewable energy development increases towards 50 GW, there may be increased conflicts over land use and community acceptance.
The ability to build and connect a large volume of renewable energy through a single project could be a valuable resource to mitigate against risks of a disorderly transition later in the decade.
The larger opportunity for offshore wind however is as a source of electricity for green hydrogen production for port-based export facilities, local heavy industry (e.g. ‘green steel’) and as a transport fuel. Within the National Hydrogen Strategy, the volume of electricity required for hydrogen production ranges from one-third to as high as four and a half times the size of the current National Electricity Market (COAG Energy Council, 2019, 87). AEMO is currently developing an ‘energy superpower’ scenario for the next ISP with large-scale electricity requirements required for hydrogen production but also electrif ication of industry and transport. There are larger scenarios under development such as the vision of the Australian Renewable Energy Agency for ‘1000% Renewable Energy’ (Miller, 2021).
With electricity requirements of the scale under this type of scenario, hydrogen produced by offshore wind directly or through the supply of electrolysers located in port facilities could play a signif icant role. Offshore produced green hydrogen is currently subject to high costs, particularly relative to grey hydrogen as currently produced (Rystad, 2021). The blending of offshore wind with green hydrogen production is being strongly pursued internationally, recognising the potential economies of scale from offshore wind that could be deployed for commercial competitiveness. Where it is co-located with industrial ports or offshore gas infrastructure, hydrogen produced by offshore wind could have competitive advantages.

10Offshore Wind Energy in Australia
Offshore wind at the scale of an ‘energy superpower’ would also provide alternative employment for workers in the offshore oil and gas industry and to a lesser extent from coal f ired power stations. Four scenarios have been produced to generate employment estimates to understand the employment potential based on a range in labour intensity (or employment factor) and a higher and lower share of local manufacturing. Australia’s share of manufacturing for on-shore renewable energy is low but this could be increased if there is a large pipeline of offshore wind development to service hydrogen and a coordinated industrial strategy to encourage development of local manufacturing and skills.
In the lower scenario, employment scales up to between 3,000 – 4,000 jobs annually from 2030 and in the higher scenario to 5,000 – 8,000 jobs each year. Increasing local manufacturing from 10% to 25% increases jobs per year by 1,000-1,500 (see Figure ES7). This is based on one large project being built mid-2020s and then further projects being developed from 2030. Oil and gas extraction currently employs around 20,000 – 25,000 people and while detailed data is not available for the offshore sector its employment is likely to be less than 10,000.
International experience (see Figure ES8) has found the main pathways into offshore wind are from other technically-related sectors (such as offshore industries and the energy sector), new entrant apprentices and graduates and the workforce with skills that cut across sectors (e.g. business / commercial, IT and data analytics, drone and underwater ROV operators, etc).
Consequently, the development of offshore wind energy could be an important source of alternative employment for the offshore oil and gas workforce and potentially onshore workers in fossil fuels industries.
Offshore wind energy could play a signif icant role in a ‘just transition’ for oil, gas and coal workers
Figure ES8: Possible scenarios for offshore wind employment, 2025-2050
In Australia there are approximately 5,000 jobs in coal-f ired power and 40,000 - 50,000 jobs in coal mining (10,000 of these for domestic coal supply), in addition to the 20,000 - 25,000 jobs in oil and gas. Workforce and community transition programs are needed to successfully achieve a fair and smooth energy transition without causing signif icant social harm and a political backlash.

11 Offshore Wind Energy in Australia
Figure ES9: Occupational match between offshore oil and gas and offshore wind energy (Friends of the Earth; Global Witness and Greener Jobs Alliance, 2019).

12Offshore Wind Energy in Australia
AREA RECOMMENDATION
Establishing a regulatory regime for offshore renewable energy
1. A regulatory regime for the development of offshore renewable energy in Commonwealth waters needs to be established
A major barrier to investment and development of current offshore wind projects in Australia is that Australia currently does not have a regulatory framework to enable timely permitting and leasing decisions for offshore renewable energy. Consultation on a proposed regulatory framework for the Commonwealth Government has been occurring since early 2020. Given offshore wind projects will typically cross Commonwealth and State jurisdictions, consideration needs to be given in the framework on the ways to provide complementary processes for activities that occur in both Commonwealth and State waters.
Government targets for reducing emissions from electricity, for the electrification of other sectors and for building an integrated renewable energy system are also needed to create a clear understanding of the necessary planning, infrastructure, skills and workforce.
2. Marine allocation of space for offshore renewable energy projects should be considered
With many OSW projects already in the development pipeline, Australia would benefit from proactive consideration, via Marine Spatial planning, to resolve potential conflicts in uses of the marine domain and ensuring it remains sustainably managed. This can help Australia meet its international commitments, such as Australia’s pledge through the High Level Panel for a Sustainable Ocean Economy to sustainably manage 100% of the ocean area under national jurisdiction by 2025.
Offshore wind should be incorporated into national and state energy planning
3. The Australian Energy Market Operator’s Integrated System Plan (ISP) should identify and evaluate offshore wind renewable energy zones, and review electricity generation cost assumptions for offshore wind
Offshore wind was not included in the assessment of renewable energy resources used to design the current Renewable Energy Zones (REZs). Offshore wind should be included in the ISP’s cost-benefit analysis for the construction of new transmission and designation of new REZs. Offshore REZs in key locations (e.g. Bass Strait, Port Kembla, Newcastle, Gladstone, Perth) should be modelled to enable transparent comparison of relative costs of offshore wind against other technologies over time, including transmission, storage and grid connection requirements.
This project finds that across all states, offshore wind has potential to provide a significant amount of energy at times that other renewable energy is not producing, along with higher capacity factors. This could impact on the requirement for energy storage and other aspects of system planning.
Current proposed electricity generation cost assumptions (GenCost) for the ISP assign current capital costs of offshore wind projects ~3 times greater than that of onshore wind, reducing to approximately 2.7 times for 2050 commissioning (Graham et al., 2021). This is in contrast to the global weighted mean capital cost projections reported by IRENA, where offshore wind capital costs are projected to be approximately 2.3 times onshore wind in 2050 (IRENA, 2019), and substantially greater that projected in the UK, where offshore wind is a mature sector, costs are better understood, and offshore wind construction costs are projected to be approximately 1.2 times that of onshore wind by the mid-2030’s (BEIS, 2020). Owing to the higher quality of resource and development and deployment of mega-turbines unable to be deployed on land, the UK projects the levelized cost of electricity from offshore wind to be similar to onshore wind in the 2030s (BEIS, 2020).
Recommendations
Our report has recommendations that span 5 key themes for the development of offshore wind in Australia:

13 Offshore Wind Energy in Australia
AREA RECOMMENDATION
Offshore wind should be incorporated into national and state energy planning
4. State energy planning and programs to support the development of renewable energy should also consider the potential for offshore wind energy
State governments play a lead role in operating energy systems and incentivising the development of renewable energy. However, the lack of a regulatory framework for offshore renewables in Commonwealth waters and insufficient consideration of offshore wind in national energy planning has meant that states have also typically not included offshore wind in their energy planning and programs.
State governments should review their future energy planning in light of the potential contribution of offshore wind to their energy systems.
5. Offshore wind energy should be incorporated into planning for the National Hydrogen Strategy and other renewable energy assessments
The opportunity for offshore wind to play an integral role under ‘energy superpower’ demand scenarios should be recognised. With the scale of electricity requirements, offshore wind could be an important source of power located adjacent to many ports and industrial facilities to meet increased demand associated with large industrial loads, electrification of other energy sectors, or for the production of hydrogen to meet the needs of industrial applications such as steel and aluminium production, or for export. Further research is required to understand the potential of offshore wind energy for hydrogen, and offshore wind should be incorporated into planning for the National Hydrogen Strategy.
Future editions of the Australian Energy Resource Assessment should give greater consideration to offshore wind developments, such as the emergence of floating offshore wind, roles in the energy system, and the reduction in cost. Maps of Australian wind resources should include offshore wind.
Offshore wind should be recognised as a strategic resource for innovation and commercialisation funding
6. The Australian Renewable Energy Agency (ARENA) and Clean Energy Finance Corporation (CEFC) should be allocated funding to develop a program to accelerate the commercialisation of offshore wind energy in Australia, with a particular focus on floating offshore wind
The commercialisation of offshore wind energy will be led by global developments and the large programs in the US, Europe and South-East Asia. These regions have invested in research and development of offshore wind technologies, baseline environmental research, offshore wind port hubs and local manufacturing capacity.
Strategic investment in offshore wind via ARENA and/or CEFC should be considered to assist in de-risking and developing local offshore wind, particularly floating offshore wind which is a newer technology with larger opportunity for Australia. There are a range of local barriers that will likely need to be addressed such as port infrastructure, local supply chain and skills development and risk profiles of project financiers. A positive example of how innovation funding can de-risk and accelerate the development of renewable energy is provided by ARENA and the CEFC’s large scale solar program which facilitated the rapid growth of the sector.
The State of Victoria has invested in developing a business case for offshore wind and is supporting the offshore wind sector via the Energy Innovation Program. A national pipeline of projects is required to justify an Australian sector; a national commercialisation program for offshore wind can accelerate the sector.

14Offshore Wind Energy in Australia
AREA RECOMMENDATION
The permitting process should support the development of local supply chain capacity to maximise investment and jobs and community benefit
7. The Australian government should develop local supply chain capacity, including leveraging the permitting process for local content.
Offshore wind can develop into a significant source of employment in the maritime ‘blue economy’. Australia’s share of manufacturing and supply chain activity in most renewable energy sectors is low. Local supply chain development strategies and procurement strategies that include requirements for local supply chain plans are a feature of international programs. For example, in March 2021, the US Biden administration announced three coordinated steps to support rapid offshore wind deployment and job creation (Whitehouse.gov, 2021):
(1) Advancing ambitious offshore wind energy projects to create good paying, jobs
(2) Investing in infrastructure to strengthen the domestic supply chain and deploy offshore wind energy
(3) Supporting critical research and development and data-sharing.
The permitting process for offshore wind should include economic development and local supply chain involvement criteria to create requirements and incentives for industry development. Community benefit including benefits to Traditional Owners should also be incorporated. The use of local content criteria has been successfully used in on-shore renewable energy auctions in the ACT and Victoria and in offshore wind auctions and programs internationally.
8. Skills training and labour market programs should be developed to support oil, gas and coal workers to gain employment and skills in offshore wind energy
Active training and labour market adjustment programs should be developed to maximise the potential for the existing offshore oil and gas workforce and the workforce in coal regions located near offshore wind to transition to employment in offshore wind energy.
Detailed research is required to assess cost-benefits to energy, environmental and social systems
9. Baseline data needs to be collected on environmental and social dimensions of offshore wind energy
The social acceptability of offshore renewable energy in Australia is largely untested, and indeed, environmental effects are largely unknown in the southern hemisphere. More research and collection of baseline data is required to understand the effects of offshore renewable energy on ocean and local communities, and on economies and local environments. Global knowledge gained in reducing the potential environmental effects of offshore wind turbines must be transferred to an Australian context. This work should not be left to individual companies, and the value of shared data agreements should be recognised.
10. Further research is required to understand the energy system value of offshore wind
This report presents a high-level assessment of the grid benefits of offshore wind for Australia. Further industry-focused research activity is required into the diversification benefits and system services that offshore wind could provide. Future assessment should set offshore wind in the context of the pipeline of renewable energy projects, making use of high quality in-situ observations or downscaled simulations to resolve the spatio-temporal resource variability. These considerations would enable high quality techno-economic assessment of what role and impacts offshore wind, given its high consistency and large scale, may have in relation to Frequency Control Ancillary Services (FCAS), and other technical requirements in Australian electricity networks.

15 Offshore Wind Energy in Australia
Contents
1. Introduction 19
2. International Trends and Developments 20
∆ 2.1. Fixed and Floating Offshore Turbines 26
∆ 2.2. Implications for Australia 28
∆ Case Study: Star of the South Offshore Wind: Diversifying Renewable Generation 30
3. Offshore Wind in Australia: National Scale Technical Resource Assessment 32
∆ 3.1. Introduction 32
∆ 3.2. Methodology 32
∆ 3.3. Presentation of Results 35
∆ 3.4. Summary of Australian National Offshore Wind Resources 42
4. Offshore Wind in Australia: Resource Modelling and Grid Integration 43
∆ 4.1. Introduction 43
∆ 4.2. Methodology 43
∆ 4.3. Presentation of Results 44
∆ 4.4. Offshore Wind Resources in Selected Locations 46
∆ 4.5. Offshore Wind Diversifying Renewable Supply 61
∆ 4.6. Summary 62
5. Offshore Wind Employment: What Role can it Play in a Just Transition for the Coal, Oil and Gas Workforce?
64
∆ 5.1. Profile of Australian Fossil Fuel Workforce 65
∆ 5.2. Offshore Wind Employment, including Hydrogen Scenarios 69
6. Social, Environmental and Planning Considerations 77
7. Conclusions & Recommendations 79
8. Acknowledgements 83
9. References 83
Appendix A – Supply Chain Approach 90
Appendix B – Oil and Gas Occupational Composition 92
Underpinning The Growth of Australia's Blue Economy 93

16Offshore Wind Energy in Australia
List of Figures
∆ Figure ES1: National average wind speed (m/s) from 2010-2019 within the EEZ study area at 100 m height. White regions represent areas where average wind speeds below 6 m/s or environmental restrictions exist.
3
∆ Figure ES2: Mean wind speed (m/s) at 100 m level, derived from ERA-5 reanalysis, showing (a) global and (b) Australian wind distribution. Location of existing offshore wind farms with nameplate capacity > 200 MW in North Sea shown in (c)
4
∆ Figure ES3: Gross capacity factors for offshore wind around Australia
4
∆ Figure ES4: Fixed and floating offshore wind foundation types (GWEC, 2020)
5
∆ Figure ES5: Technical energy potential for offshore wind by state and water depth.
6
∆ Figure ES6: Capacity factors for onshore and offshore wind (%)
7
∆ Figure ES7: For example sites in Victoria (left), NSW (middle) and Queensland (right), the percentage of year during which offshore wind (blue), onshore wind (green) and solar PV (yellow) generation is operating at high capacity (>50%), and others operate at low (<25%) capacity
8
∆ Figure ES8: Possible scenarios for offshore wind employment, 2025-2050
10
∆ Figure ES9: Occupational match between offshore oil and gas and offshore wind energy (Friends of the Earth; Global Witness and Greener Jobs Alliance, 2019)
11
∆ Figure 1: New Offshore Wind Installations (MW), 2016-20 (GWEC, 2021)
20
∆ Figure 2: Global Offshore Wind Projections (GW) (IRENA, 2019)
20
∆ Figure 3: Growth in average offshore wind farm size 2010 – 2020. (Wind Europe, 2021)
22
∆ Figure 4: Levelised cost of electricity: fossil fuel and offshore wind technology comparison. Orange circles represent values from the Auction database; Blue circles from the LCOE database. Each circle represents an individual project or an auction result where there was a single clearing price at auction. The thick lines represent the global weighted-average LCOE, or auction values, by year. The band represents the fossil-fuel powered generation cost range (IRENA, 2019)
23
∆ Figure 5: Projected offshore wind construction costs, presented by IRENA (global weighted average - 5-95th percentile range; green), GenCost 2020-2021 (Australian central to high VRE range; red), and UK BEIS (blue)
24
∆ Figure 6: Levelised cost estimate, UK projects commissioning in 2030. Source: BEIS, 2020
25
∆ Figure 7: Offshore wind foundations installed in Europe by type. (Wind Europe, 2021)
26
∆ Figure 8: Fixed and Floating offshore wind foundation types (GWEC, 2020)
27
∆ Figure 9: Semi-submersible foundation under construction at port.(Wind Europe, 2020) (Photo: Navantia)
27
∆ Figure 10: Semi-submersible foundation being towed to location. (Wind Europe, 2020) (Artist: Dock90)
27
∆ Figure CS1: Case Study: Star of the South offshore wind, diversifying renewable generation.
30
∆ Figure 11: Wind resource assessment study area showing categorisation into state area for regions to the EEZ limit. Environmental protected areas, including IUCN I, II and III zones removed from assessment areas are represented by blank (white) areas
34
∆ Figure 12: Mean wind speed (m/s) at 100 m level showing (a) global and (b) Australian wind distribution. Location of existing offshore wind farms with nameplate capacity > 200 MW in North Sea shown in (c)
35
∆ Figure 13: National average wind speed (m/s) from 2010-2019 within the EEZ study area at 100 m height. Regions with average wind speeds below 6 m/s and with environmental restrictions removed.
36
∆ Figure 14: IEC Wind Class defined for average wind speeds from 2010-2019 within the EEZ study area. Regions with average wind speeds below 6 m/s and with environmental restrictions removed.
36
∆ Figure 15: Summary of Theoretical National Offshore Wind Potential (GW) by wind class
37
∆ Figure 16: Gross Capacity Factor determined using ERA5 hourly wind speeds for the NREL 15 MW turbine
38

17 Offshore Wind Energy in Australia
∆ Figure 17: Australian wind resource classif ied by IEC wind rate for 0-1000 m water depths, and distances of less than 100 km to grid connection and coastline
38
∆ Figure 18: Technical and Gross potential capacity (GW) and IEC wind class (I-IV)
39
∆ Figure 19: Technical energy potential (TWh/year) of shallow (<60 m) and deep water (60 m to 1000 m) OSW sites near (<50 km) and far (50 km to 100 km) from the Australian coastline for sites < 100 km from electricity substation and transmission lines.
40
∆ Figure 20: Identif ication of shallow (<60 m) and deep water (60 m to 1000 m) sites near (<50 km) and far (50 km to 100 km) from the Australian coastline for sites < 100 km from electricity substation and transmission lines.
41
∆ Figure 21: Summary of regional OSW potential generation (TWh/year) by UN definition of subregion (Bosch at al., 2018) with comparison with this study
41
∆ Figure 22: Map of potential offshore wind farm locations at water depths of less than 1000 m within 100 km of coastline and pre-existing electricity grid substations and lines
46
∆ Figure 24: Newcastle: InteractionGeneration of 10 GW solar, 9 GW onshore wind and 9GW offshore wind compared to electricity demand for a sample week of maximum and minimum renewable energy production.
53
∆ Figure 25: Percentage of year during which generation is operating at high capacity (>50%), and others operate at low (<25%) capacity. Blue circle represents offshore wind; green circle – onshore wind; yellow circle– solar. A circle without overlap shows the percentage of hours of the year where one technology is operating at high capacity (>50%), while other technologies are operating at low capacity (<25%). Where one circle overlaps with one other circle, both technologies are operating at high capacity, and the third technology is operating at low capacity. Where three circles overlap (dark turquoise), all technologies are operating at high capacity simultaneously. The size of the circles for each location indicate the percentage of the year that the technology is operating at high (>50%) capacity at that location. The locations for onshore wind and solar are the large-scale generation projects located in the same state and used in this study for comparing the value of offshore wind to the energy system, as outlined in Section 4.
63
∆ Figure 26: Coal Mining and Fossil Fuel Generation, Occupational Profile (%)
65
∆ Figure 27: Coal Mining and Fossil Fuel Generation, Age Profile (%)
66
∆ Figure 28: Oil and Gas Extraction, Occupational Composition (1-digit) (%)
68
∆ Figure 29: Oil and Gas Extraction, Age Profile (%). Australian Census (ABS 2016)
68
∆ Figure 29: Offshore Wind Employment, 2025-2050
72
∆ Figure 30: Offshore Wind Employment (annual average), relative to Oil/Gas.
73
∆ Figure 31: Occupational Employment Structure: Offshore Wind compared with Oil/Gas and Coal
73
∆ Figure 32: Offshore wind occupational distribution: development phase. (BVG Associates, 2017)
75
∆ Figure 33: Offshore wind occupational distribution: construction phase. (BVG Associates, 2017)
75
∆ Figure 34: Offshore wind occupational distribution: O&M phase. (BVG Associates, 2017)
75
∆ Figure 35: Occupational Match between Offshore Oil and Gas and Offshore Wind Energy. (Friends of the Earth; Global Witness and Greener Jobs Alliance, 2019)
76
∆ Figure 36: Oil and Gas Extraction, Occupational Composition (disaggregated) (%). (ABS 2016)
92

18Offshore Wind Energy in Australia
List of Tables
∆ Table 1: Capacity Factors for Offshore Wind at Selected Sites Examined in this Study (close to electrical substations, at 25, 50, 100km offshore and in depths of less than 1000m).
6
∆ Table 2: International Offshore Wind Targets 21
∆ Table 3: Offshore Wind Projects Proposed in Australia 29
∆ Table 4: Key Datasets Used for OSW Study 35
∆ Table 5: Comparison of Australian Offshore Wind Energy Potentials With Key Criteria Used With Results From This Study
41
∆ Table 6: Standard Table For Each of the Analysed Locations 45
∆ Table 7: Offshore Wind Location – Proximity to Substations 46
∆ Table 8: Geographical Position for Offshore Wind Resource and Water Depth 47
∆ Table 9: Key Results: Tasmania – George Town 48
∆ Table 10: Key Results: Tasmania – Hobart 49
∆ Table 11: Key Results: Victoria – Latrobe (Bass Link – North) 50
∆ Table 12: Key Results: Victoria – Portland 51
∆ Table 13: Key Results: New South Wales – Newcastle 52
∆ Table 14: Key Results: New South Wales - Sydney 53
∆ Table 15: Key Results: New South Wales – Port Kembla 54
∆ Table 16: Key Results: Queensland – Maroochydore 56
∆ Table 17: Key Results: Queensland – Gladstone 57
∆ Table 18: Key Results: South Australia – Adelaide 58
∆ Table 19: Key Results: Western Australia – Perth 59
∆ Table 20: Key Results: Western Australia – Karratha 60
∆ Table 21: Correlation of Offshore Wind With Onshore Wind at Selected Sites Examined in this Study (close to electrical substations, at 25, 50, 100km offshore and in depths of less than 1000m).
61
∆ Table 22: Employment in Oil and Gas Extraction, Total 66
∆ Table 23: Employment in Oil and Gas Extraction in 2016, by State 67
∆ Table 24: Total Hours Worked in Offshore Oil and Gas, and Estimate of Equivalent Offshore Workforce 67
∆ Table 25: Employment Factors, Offshore Wind Energy 70
∆ Table 26: National Hydrogen Strategy and Offshore Wind 71

19 Offshore Wind Energy in Australia
1. Introduction
Offshore wind energy is booming globally. The industry has rapidly scaled up across the UK, Europe and Asia-Pacif ic in recent years, with ambitious targets elsewhere, as costs have fallen, the size of turbines and projects has increased dramatically, government programs and auctions have expanded and the supply chain has developed.
For the International Energy Agency, offshore wind energy is now one of the ‘big three’ in its energy scenarios – projected alongside on-shore wind and solar PV to be the largest sources of electricity in the clean energy transition.
The conventional wisdom in Australia is that offshore wind energy would not have a role to play in our electricity system. Australia has more sites with good-quality on-shore wind and solar resources without the tighter land space constraints of some other nations. Across many parts of the coastline, the shelf falls away quickly meaning there are less locations in which f ixed bottom offshore wind turbines are viable. In the 2020 Integrated System Plan developed by the Australian Energy Market Operator, offshore wind was not included in the assessment of resources used to allocate Renewable Energy Zones, and was poorly represented in future scenarios for the development of the National Electricity Market (NEM).
The rapid development of the off-shore wind industry around the world merits a more serious re-consideration of the opportunity for Australia. Australia has a coastline of almost 60,000 km with some very high wind resources. As the global development of offshore wind has increased turbine sizes and reduced costs, there are a range of potential benefits that could arise from the development of offshore wind including:
∆ the potential to diversify Australia’s clean energy generation stock with high capacity factors that complement the generation profile of on-shore renewable energy;
∆ delivery of high capacity factor renewable energy in regions close to existing coal-f ired power stations that are scheduled for closure, in turn ensuring optimal use of existing electricity infrastructure, and avoiding stranded or underutilised assets;
∆ easing land-use conflicts that could intensify with the large-scale development of on-shore solar and wind through some very large capacity offshore projects, especially if there is large-scale electrif ication and the development of export opportunities such as green hydrogen;
∆ utilising and redeveloping port infrastructure in locations such as the Port of Newcastle and ports on the Victorian and Tasmanian coasts of Bass Strait;
∆ providing alternative employment, especially to support a ‘just transition’ for fossil-fuel workers in the coal, oil and gas sectors
Consequently, now is a timely moment to investigate the feasibility of offshore wind energy for Australia. This aim of this study is to stimulate discussion of the opportunity for offshore wind energy by:
∆ undertaking high-level mapping of the national Australian wind resource;
∆ analysing and comparing the generation profile at a half-hourly interval with the load profiles of states within the National Electricity Market;
∆ profiling the workforce required to develop, construct and manage an offshore wind farm and the scope for the industry to provide employment for the coal, oil and gas workforce;
∆ developing recommendations for next steps based on international experience and the review of Australian potential for offshore wind.

20Offshore Wind Energy in Australia
2. International Trends and DevelopmentsOffshore wind now plays a major role in the global renewable energy market (Teske et al., 2019). Global installed capacity of offshore wind surpassed 35 GW in 2020 (GWEC, 2021), an average annual growth rate of 24 per cent since 2013 (GWEC, 2020). Offshore wind installed capacity has grown signif icantly over the last four years, and the industry has not showed any signs of slowing in response to COVID-19. 6.1 GW of new offshore wind was installed globally in 2020.
China has led new offshore wind installation for three years running and accounted for 50 per cent of new installed capacity in 2020. 2021 is expected to be another record year for offshore wind installations, with an estimated further 9.89 GW of offshore wind is expected to be installed in China in 2021. This reflects developers seeking to deploy projects before the end of the year when the Chinese government will end its offshore wind subsidy. European developments, including the Netherlands, are also on a high growth trajectory, surpassing the historically strong growth in the UK.
In all of the future energy scenarios by major analysts, offshore wind is projected to grow dramatically to 2030 and beyond (GWEC, 2020, 2021; IEA, 2019; IRENA, 2019; Wind Europe, 2021; World Bank, 2019). Offshore wind is projected to reach 200 GW of installed capacity by 2030 and 1000 GW by 2050 (IRENA, 2019). Predictions are informed by current national targets and energy modelling based on the scale of installations required to meet Paris Agreement commitments. Europe has been the leader in offshore wind, but strong growth is projected for the US and especially Asia which is forecast to become the global leader in offshore wind in coming decades.
Figure 1: New Offshore Wind Installations (MW), 2016-20. (GWEC, 2021)
Figure 2: Global Offshore Wind Projections. (GW) (IRENA, 2019)

21 Offshore Wind Energy in Australia
Country OSW Target Source
UK 40 GW by 2030, 1 GW of floating offshore wind
Ten Point Plan for a Green Industrial Revolution (HM Government, 2020)
US 30 GW by 2030 (Whitehouse.gov, 2021), 2021.
EU 60 GW by 2030, 300 GW by 2050 (Boosting Offshore Renewable Energy, n.d.), EU Strategy on Offshore Renewable Energy, 2020.
India 5 GW by 2020, 30 GW by 2030 (Offshore Wind | Ministry of New and Renewable Energy, Government of India, n.d.), 2015.
Germany 20 GW (12.5% of demand) by 2030 (BMWI, 2020)
Japan 10 GW by 2030, 45 GW by 2040 (METI, 2020)
Korea 12 GW by 2030 (Korea’s Offshore Wind Collaboration Plan - Kim & Chang, n.d.) 2020.
Taiwan 20.5GW by 2030 (Buljan, 2021)
Netherlands 11.5 GW by 2030 (Climate Agreement | Report | Government.Nl, n.d.), 2019.
Ireland 5 GW by 2030 (Gov.Ie - Programme for Government: Our Shared Future, n.d.), 2020
The World Bank ‘Energy Sector Management Assistance Program’ aims to unlock the 3.1-Terawatt generation potential in Brazil, India, Morocco, the Philippines, South Africa, Sri Lanka, Turkey and Vietnam (World Bank, 2019)
Table 2: International offshore wind targets.
The global development of offshore wind and efforts to create good jobs in this sector have been supported by a number of government actions in addition to the targets listed above. These include:
∆ Funding for research and development of offshore wind technologies, for example by the US Department of Energy (US Department of Energy, 2020)
∆ Building of offshore wind training centres, for example the New York Offshore Wind Training Institute (NYSERDA, 2021)
∆ Creation and funding of offshore wind port hubs – for example the port of Esbjerg in Denmark, an offshore wind hub in the port of Leith, Scotland, the New Bedford Marine Commerce Terminal, operated by the Massachusetts Clean Energy Centre, an Energiehaven in the port of Amsterdam, the Able Marine Energy Park in the north of England, and the South Brooklyn Marine Terminal in New York. Danish research shows that these ports can bring substantial local economic benefits (QBIS, 2020)
∆ Assessments of domestic supply chains, investments in increasing local manufacturing capacity, targets for increasing local content in projects, and compliance measures such as audits. A target of 60% local content by 2030 is set out in the UK Sector Deal, alongside a 40GW by 2030 target for installation. This is being implemented through Contract for Difference requirements, with subsequent compliance measures (Ford, 2020; HM Government, 2020).
∆ Baseline environmental research, for example by the US Bureau of Ocean Energy Management and the Netherlands Enterprise Agency (BOEM, 2021; Netherlands Enterprise Agency, 2017)

22Offshore Wind Energy in Australia
∆ Planning for best areas of offshore wind development, and solicitation of project proposals for those areas – for example in the Netherlands, Denmark, UK and USA. New York created an Offshore Wind Master Plan.
∆ National transmission grid operators building transmission grid connections out to the offshore substation, which offshore wind projects can then connect to – for example in the Netherlands (Netherlands Enterprise Agency, 2017) and Denmark (Smith, 2018). Greater coordination of offshore transmission is being reviewed in the UK’s Offshore Transmission Network Review.
∆ Provisions of feed-in tariffs and contracts for difference to offshore wind developers (HM Government, 2020)
The US Department of the Interior has also announced a consultation to include new lease stipulations for sea areas used for offshore wind. These include ‘a requirement to make every reasonable effort to enter into a project labor agreement covering the construction of any project in the lease area’ and ‘mechanisms to provide benefits to underserved communities and investments in a domestic supply chain’ (US Department of the Interior, 2021).
The regulatory frameworks used for offshore wind also vary signif icantly. In some cases, these are modelled on the regulatory frameworks for the offshore oil and gas industry, which is predicated on competitive development of individual projects, and cash auctions for the rights to develop areas of the seabed (Smith, 2018). In countries such as Denmark where the electricity grid is state owned, offshore wind has been planned by government as part of the electricity system, aligned with ambitious plans for decarbonisation (Weghmann, 2019).
Figure 3: Growth in average offshore wind farm size 2010 – 2020. (Wind Europe, 2021)
As the offshore wind industry has grown, so has the size of turbines and projects. In 2020, typical turbine sizes reached 8-10 MW, and the size of turbines is continuing to grow with turbine orders in the 10-13 MW range in 2021 (Wind Europe, 2021). In 2021 Vestas released the largest wind turbine ever made. At 15 MW of generation capacity, this turbine has the potential to generate enough energy for up to 20,000 households each year. The average size of an offshore wind farm built in 2020 (800 MW) is almost triple the size of those constructed a decade ago (Wind Europe, 2021), enabling cost reductions through economies of scale and far greater average wind farm sizes than land-based wind farms.

23 Offshore Wind Energy in Australia
Consequently, the levelised cost of offshore wind is continuing to fall and is now competitive with new fossil fuel generation. Strategic energy planning, commitments to Renewable Energy Targets (RETs) and innovative energy market tariffs have resulted in attracting offshore wind developments to energy markets, signif icantly reducing costs per MWh (GWEC, 2020; Teske et al., 2019; Wind Europe, 2021). Historically offshore wind was more expensive than other generation technologies with a levelized cost of energy (LCOE) between $150 USD and $200 USD per MWh. However, the cost of offshore wind energy has fallen dramatically due to economies of scale, technology development and competitive tendering mechanisms such as Contract for Difference (CfD) auctions by governments across Europe. In 2020 LCOE prices for offshore wind reached record lows at $49.60 USD per MWh (GWEC, 2020; World Bank, 2019).
Offshore wind is now experiencing a global average cost of US$0.108/kWh, signif icantly lower than the average cost for fossil fuel generation at US$0.159/kWh, shown in f igure 4 (fossil fuel generation in blue and offshore wind in orange). However, the LCOE for offshore wind could be
even lower compared to onshore generators if all costs were considered. In the case of new onshore generators, the electricity grid operator assumes responsibility for any grid upgrades associated with new generator connection. The new generator is then responsible for connection to the grid, which tends to be a short, lower cost connection asset. In contrast, the responsibility assumed for offshore wind transmission connection is highly varied, and dependant on the contractual agreement established in each region. In some contract for difference schemes, the wind farm developer assumes responsibility for the connection from the wind farm to a grid-owned offshore substation and the grid operator assumes responsibility for connection to the onshore grid. While for others, the scope of responsibility for developers extends from the wind farm all the way to shore. Typically, the cost of constructing submarine transmission cables and offshore substation equipment is signif icantly higher than onshore transmission assets, contributing to some of the higher costs reported for offshore wind projects in f igure 4. These variations should be considered when comparing the LCOE of onshore and offshore energy generators.
Figure 4: Levelised cost of electricity: fossil fuel and offshore wind technology comparison. Orange circles represent values from the Auction database; Blue circles from the LCOE database. Each circle represents an individual project or an auction result where there was a single clearing price at auction. The thick lines represent the global weighted-average LCOE, or auction values, by year. The band represents the fossil-fuel powered generation cost range. (IRENA, 2019)

24Offshore Wind Energy in Australia
Offshore wind is emerging as a complementary energy source to onshore wind and solar in the new energy systems that are emerging. Offshore wind typically has a lower generation profile variability and a higher capacity factor than onshore wind and solar (IEA, 2019). Globally, offshore wind surpassed the generation capacity factors of onshore renewables in 2018, with an average profile of 33% compared with 25% for onshore wind and 14% for solar PV (IEA, 2019). Hywind Scotland – the world’s f irst floating offshore wind farm – experienced an average capacity factor of 57.1% in the 12 month period to March 2021, and a two-year average of 54% (Skopljak, 2021). Consequently, offshore wind can smooth energy generation and reduce the need for storage.
With no existing offshore wind projects in Australia, the f irst few market entrants will likely be subject
to a cost premium as local capability and supply chains develop. However, beyond that, it could be expected that costs for offshore wind in Australia would be close to the international average. Current proposed electricity generation cost assumptions (GenCost) for the ISP assign current capital costs of offshore wind projects ~3 times greater than that of onshore wind, reducing to approximately 2.7 times for 2050 commissioning (Graham et al., 2021). This is in contrast to the global weighted mean capital cost projections reported by IRENA, where offshore wind capital costs are projected to be approximately 2.3 times onshore wind in 2050 (IRENA, 2019), and substantially greater that projected in the UK, where offshore wind is a mature sector, costs are better understood, and offshore wind construction costs are projected to be approximately 1.2 times that of onshore wind by the mid-2030’s (BEIS, 2020; Figure 6).
Figure 5: Projected offshore wind construction costs, presented by IRENA (global weighted average - 5-95th percentile range; green), GenCost 2020-2021 (Australian central to high VRE range; red), and UK BEIS (blue).
Image Courtesy of Saitec Offshore

25 Offshore Wind Energy in Australia
Owing to the higher quality of resource and development and deployment of mega-turbines unable to be deployed on land, the UK projects the levelized cost of electricity from offshore wind to be similar to onshore wind in the 2030s (Figure 7) (BEIS, 2020)
Figure 6: Levelised cost estimate, UK projects commissioning in 2030. Source: BEIS, 2020.
One challenge facing energy systems with high levels of renewable energy generation is the provision of frequency control and other technical services to stabilise the grid. Investigations are underway in Australia and internationally into the possibility of these services being provided by wind energy (ARENA, 2021; Renews.Biz, 2020; Sidoroff Gryning, 2018). Further research activity is required into the correlation benefits and system services that offshore wind could provide, making use of high quality in-situ observations or downscaled simulations to resolve the spatio-temporal resource variability, and enabling high quality techno-economic assessment of what role and impacts offshore wind, given its high consistency and large scale, may have in relation to Frequency Control Ancillary Services (FCAS), and other technical requirements in Australian electricity networks.
Offshore wind developments have been predominantly connected to grid-connected utility scale markets. However, developments are also looking to how offshore wind can support decarbonisation of offshore industry in off-grid scenarios. Norway, for example, has earmarked
two areas in the North Sea for development of up to 4.5 GW of offshore wind capacity, not to deliver electricity to meet Norway’s utility demand which is already near 100% renewable, but as a means to help the Norwegian Oil and Gas industry transition to a future low-carbon business model. Furthermore, several high-profile companies are exploring the potential of using offshore wind to produce green hydrogen in the North Sea. Norway, Denmark, Germany and the Netherlands all have large scale industrial projects underway, focused on the benefits hydrogen can deliver for a low-carbon economy, including in blue economy ports and shipping sectors. Presently, offshore green hydrogen production is cost-prohibitive relative to grey hydrogen, but GW-scale offshore wind farms may provide the economies of scale required to reduce the cost of green hydrogen.

26Offshore Wind Energy in Australia
2.1. Fixed and Floating offshore turbines
There are two primary technologies for offshore wind energy: f ixed foundation (secured directly to the seabed) or floating (secured by anchored cable to the seabed), with choice highly dependent on the water depth at the development site. Fixed foundations are the dominant choice for commercial scale offshore wind farms to date and of the four main f ixed foundation types, monopile foundations are the design of choice (Figure 6). Deployment of f ixed foundations are typically limited to depths of up to about 50-60m. Installation of f ixed foundation offshore wind turbines is dependent on specialty jackup barges for installation, which would need to be mobilised from other international offshore wind hubs.
Offshore floating wind has also now reached commercialisation (Appleton, 2019; Wind Europe, 2020), unrestricted by the depth constraints associated with f ixed OSW projects, and is expected to be a signif icant component of future growth. Floating wind structures are able to be built for deployment at greater ocean depths and can be positioned further offshore, opening up opportunities for a more consistent wind profile. Australia’s largest electricity market, situated along the east coast, has a predominantly narrow continental shelf, offering limited shallow site opportunities for f ixed offshore wind foundations. Floating turbines overcome this limitation.
Floating foundations share similar design characteristics with offshore oil and gas and shipping industry structures (Wind Europe, 2020). Wind turbines are mounted to the floating foundation, which is then anchored to the seabed via a series of cables and piles. The four main types of floating foundations include barge, semi-submersible, spar-buoy and tension leg platform (TLP) (Wind Europe, 2020). Floating foundations can be constructed of steel, or concrete, or a combination of both.
Figure 7: Offshore wind foundations installed in Europe by type. (Wind Europe, 2021)
Image Courtesy of Saitec Offshore

27 Offshore Wind Energy in Australia
Figure 8: Fixed and Floating offshore wind foundation types. (GWEC, 2020)
Floating foundations are constructed in port and towed into location, which reduces the dependence on specialised offshore installation vessels and allows for domestic foundation production and assembly opportunities. Due to the nature of port-based construction and assembly, floating offshore wind has been recognised as a key enabler for port-based industry reinvigoration, particularly for aging or underutilised docks, shipyards and industrial areas (IRENA, 2018b). An example of a semi-submersible foundation being constructed and towed to offshore location is shown in Figure 9 and Figure 10.
Figure 9: Semi-submersible foundation under construction at port. (Wind Europe, 2020) (Photo: Navantia)
Figure 10: Semi-submersible foundation being towed to location. (Wind Europe, 2020) (Artist: Dock90)

28Offshore Wind Energy in Australia
In analysis of the potential global net-benefits over a 30-year time horizon (2020-2050) of implementing sustainable ocean-based interventions, the High Level Panel for a Sustainable Ocean Economy (of which Australia is a signatory) found that an average benefit of $12 would be generated for every $1 invested in scaling up global offshore wind production (Konar & Ding, 2020). These potential benefits, in addition to the extraordinary development in scale and associated cost reduction of offshore wind merit further consideration for offshore wind in Australia, especially if export scenarios including hydrogen and mass electrif ication come to fruition. The global development in offshore wind, and particularly the growth in Asia, is opening up opportunities for Australia.
Australia’s high-quality on-shore solar and wind resources will continue to dominate new development in coming years but offshore wind is likely to have increasing strategic value. Whilst Australia has less of the terrestrial space constraints of other nations, which has been a key driver for offshore wind especially in Europe, there are still land-use conflicts which may intensify under high-capacity renewable energy scenarios. For example, documents produced by AEMO in preparation for the 2022 ISP note that increases to the resource limits allocated to REZs may be needed, but that REZ expansion could be constrained by social licence issues (AEMO, 2020c). Under those scenarios and constraints, the ability to locate large offshore wind projects near load centres and into strong parts of the grid would prove a valuable resource.
The 2020 Integrated System Plan used Renewable Energy Zones largely based on a 2018 DNV-GL report which did not include offshore wind (AEMO 2020b). Offshore resources for Gippsland were included on the basis of the Star of the South project, but were not comprehensively included to consider other potential developments. The Drafted methodology for the 2022 Integrated System Plan points to continued lack of integration of offshore wind opportunities (AEMO, 2021b). The Draft Methodology outlines the objective to compare ‘development of high-quality renewable resources in REZs, with associated network build, compared
to developing lower quality resources in area with spare hosting capacity’ (AEMO 2021, p.21). As this report shows, it should not be assumed that areas with spare hosting capacity have lower quality renewable resources. Considering the tens of billions potentially involved in building out the ISP, we must ensure that Australia’s offshore wind resources are adequately considered in the assessment.
The ISP’s consideration of offshore wind is consistent with broader consideration of offshore wind for Australia’s energy system. Australia’s low emissions technology statement (DISER, 2020) contains no mention of offshore wind aside from recognising a need for a regulatory environment. Offshore wind resources are not included amongst Australia’s national resource maps, such as Australia’s Renewable Energy Mapping Infrastructure on NationalMap infrastructure, or the Australian Energy Resource Assessment (Geoscience Australia, 2018); Neither ARENA or CEFC have invested in offshore wind R&D; and no regulatory framework exists to allow assessment and development of proposed projects.
To the best of our knowledge, there are more than 10 offshore wind projects under development in Australia, totalling over 25GW.
2.2. Implications for Australia
Opportunities for offshore wind in Australia will be strengthened through a pipeline of projects. This report undertakes a high-level assessment of the resources, generation profile and employment characteristics of offshore wind at national scale, to stimulate discussion on offshore wind and its potential future in Australia.

29 Offshore Wind Energy in Australia
Project Location Capacity
Star of the South Gippsland, Victoria 2.2 GW
Oceanex Newcastle, NSW
Wollongong, NSW
Bunbury, WA
Ulladulla, NSW
Eden, NSW
1.8 GW
2 GW
2 GW
1.8 GW
1.8 GW
Newcastle Offshore Wind Newcastle, NSW 3 GW First Stage
Green Energy Partners Wollongong/Port Kembla, NSW
Bass Strait, Victoria
Western Victoria
South of Perth, WA
Southern Queensland
3 GW grid
5 GW hydrogen
4 GW
500 MW – 1 GW
1 GW
2 GW
Pilot Energy and Triangle Energy Geraldton, Western Australia 1.1 GW
Brookvale Energy Burnie, Tasmania 2 GW
Australis Energy/Warwick Energy Bunbury, Western Australia (state waters)
Portland, Victoria (state waters)
South Australia
300 MW
495 MW
600 MW
Flotation Energy Ninety Mile Beach, Victoria 1.5 GW
Table 3: Offshore wind projects proposed in Australia.
Image Courtesy of Saitec Offshore

30Offshore Wind Energy in Australia
Case study: Star of the South offshore wind, diversifying renewable generation
Star of the South is Australia’s f irst offshore wind project, proposed to be located off the south coast of Gippsland in Victoria. The project is comprised of Australian founders and Copenhagen Infrastructure Partners (CIP), a global leader in offshore wind. If built to its full capacity, Star of the South has the potential to generate up to 2.2GW of electricity. Currently in the feasibility phase, the project is undertaking site investigations and monitoring the offshore conditions in the region.
Star of the South would harness Bass Strait’s world-class wind conditions, allowing Victoria to harvest a diverse and new resource. Offshore wind would also complement other renewable technologies and f irm up the electricity supply into the future.
Today, 2.1 GW of the 2.3 GW operating onshore Victorian wind farms are located in the western and south western regions of Victoria. Additionally, 1.9 GW of new onshore wind projects under construction are mostly located in the same areas resulting in nearly 4.0 GW of co-located onshore wind by the end of 2021.
Offshore wind in Gippsland would be located off the south east coast of the state, allowing access to a different wind profile that complements and f irms up the growing wind portfolio in the state’s west. Due to the diversif ied generation contributed by the project, times of lower onshore wind generation in western Victoria would be complemented by offshore wind generation in eastern Victoria, helping to f ill the gap between higher demand and lower onshore renewable generation levels.
Figure CS1: (Left) Available generation resource1 for Star of the South and representative future renewable projects during residual peak demand. The chart shows the available generation for each project across the same 100 peak demand periods, individually sorted from lowest to highest (duration curves). (Source: Independent analysis commissioned by Star of the South); (Right) Representative high-pressure system over the Tasman Sea, with location of Star of the South displayed.
Case study provided courtesy of Star of the South

31 Offshore Wind Energy in Australia
Peak Demand Periods
Analysis by EY1 shows that Star of the South would provide a high level of generation resource during Victorian peak demand periods compared with onshore wind and solar PV. Figure CS1 (left) shows the difference between the project’s generation profile and that of representative pipeline wind and solar projects in western and northern Victoria during a projection of the top 100 residual peak demand periods to be met by large-scale electricity generation in the data analysed for 2036-2037.
This is based on consumption and weather data over the past nine years. Residual peak demand is the demand not met by other existing or committed solar or wind generation in the state1, and thus Figure CS1 represents the contribution of additional wind or solar generation from different sites to meeting peak Victorian demand.
For half of the potential peak demand periods analysed, Star of the South is projected to have more than 77 per cent of its capacity available. The project’s average capacity availability factor across the top 100 peak demand periods is 60 per cent.
Star of the South also worked with the Bureau of Meteorology (BOM) and EY to identify the underlying weather systems causing the high wind conditions during likely peak electricity demand periods. Peak electricity demand is generally caused by high air conditioner use during heatwaves. BOM and EY both found that the Tasman Sea high pressure systems associated with Melbourne heatwaves consistently caused high offshore wind speeds at the Star of the South site.
Image Credit: Ole Jørgen Bratland © Dudgeon Offshore
1 EY’s analysis was completed in May 2020, based on historical data available from AEMO and the Australian Bureau of Meteorology, AEMO’s demand projections and a set of existing and committed onshore wind and solar projects agreed with Star of the South. Generation availability was analysed from a meteorological perspective only; it does not consider unavailability due to technical reasons such as electricity transmission network constraints. Results could vary under a different set of assumptions.

32Offshore Wind Energy in Australia
3. Offshore Wind in Australia: National Scale Technical Resource Assessment3.1. Introduction
A national Australian Offshore Wind (OSW) resource assessment has been performed that combines the analysis of wind data over the Australian Exclusive Economic Zone (EEZ) based on the generation potential of the IEA 15 MW reference wind turbine and factors such as ocean depth (bathymetry) and environmental constraints. The last similar publicly available assessment took place in 2009 (Messali & Diesendorf, 2009).
The assessment is presented in terms of total resource area, potential generation capacity and capacity factor for varying water depth and distance to infrastructure restrictions. The developed wind resource maps serve as a basis for identifying potential areas for Australian OSW development. To resolve the accessible wind resource assessment, layer data collated from opportune data sources such as governmental and regulatory bodies was input into an ArcGIS model. Factors representing both potential benefactors and/or constraints, including socio-economic, f ishing, shipping density, wave climate and other ocean users were not included as they require complex input from numerous stakeholders, which are beyond the scope of this study. This study produces a high-level assessment of the Australian OSW resource, which can be further ref ined for individual projects as required.
3.2. Methodology
To determine the OSW potential a bottom-up approach was taken, which used hourly wind speed data and an IEA reference OSW wind turbine to calculate capacity factor. This study area included the entire EEZ, constrained by proximity to coast and electricity infrastructure, and key environmental criteria. The capacity factor of OSW was calculated by using a representative power curve taken from the next-generation offshore IEA Wind 15 MW Offshore Reference Wind Turbine (ORWT) (Gaertner et al., 2020). This turbine represents next-generation technology that is currently under development for OSW deployments, with similar-sized turbines currently planned for
installation in 2022 (Hill, 2021). Using the ORWT power curve and the hourly wind speed inputs from the ERA5 wind model (Hersbach et al., 2020), the capacity factor over 2019 was determined. No accounting for wake, electrical losses or availability factor were performed as they are highly dependent on spacing and turbine engineering parameters not accounted for in this high-level study. The potential capacity was determined using an uniform capacity deployment factor of 5 MW/km2 across the domain, approximating a realistic turbine spacing of approximately 8 diameters (Schwartz et al., 2009). This factor is similar to previous national and regional-scale wind resource assessments where ranges of 5-5.4 MW/km2 have been used (Baltic Lines, 2019; Schwartz et al., 2009). The determined capacity factor is then combined with the spatial model in ArcGIS to calculate the technical capacity as:
Technical Capacity = technical area * array power density * capacity factor * 8760 (hours per year)
3.2.1. Study Area
Two study areas were investigated to determine resource estimates:
(i) A depth and distance to grid and coast constrained assessment, considered to be accessible to current viable technologies, and
(ii) A theoretical total resource across the full Australian EEZ, representing the total resource available to future scenarios.
The theoretical national OSW assessment sought to determine the OSW for Australia’s entire Exclusive Economic Zone (EEZ) (extending from the Australian coastline to 200 NM (~370 km) offshore). Previous national and world-based OSW studies have been limited to distances from coastlines of 185 to 300 km (Arent et al., 2012; IEA, 2019), however with the development of cabling technologies enabling power transmission distances of over 740 km (e.g., the Viking Link connecting the British and Danish power systems, https://viking-link.com/), the study area was extended to the edge of the EEZ to cover future development opportunities.

33 Offshore Wind Energy in Australia
This EEZ assessment is also relevant for considerations of potential future floating hydrogen production facilities powered by OSW. To define the Australian wind resource the state and territory lines were extrapolated offshore to allow for the categorisation of study area into states as shown in Figure 10. It must be noted that State and Territory water limits only extend to 3 NM from the coastline, with the regions out to the edge of the EEZ administered by the Commonwealth. Given the diff iculty of dividing Bass Strait into Tasmania and Victorian waters, the analysis for these two states was combined.
A technical national OSW wind assessment was also performed, which limits the potential areas of OSW deployments to areas that may be considered recoverable using current-and near future generation technology. Three key factors were defined to constrain the accessible resource:
∆ Within a 1000 m depth limit: The restriction of water depths to 1000 m accounts for the availability and maturity of both f ixed and floating offshore foundations and installation technology (Bosch et al., 2018).
∆ Within 100 km distance to coast:
∆ Within 100 km of pre-existing grid sub-station and transmission lines.
100 km was chosen, being roughly twice that of the average distance of OSW farms either installed or under development in 2019 of 59 km, covering current and near-term expansion opportunities (Ramirez at al., 2019).
3.2.2. Wind Model
This study uses the ERA5 reanalysis dataset at hourly resolution with a spatial resolution of ~31 km over the defined study area (Hersbach et al., 2020), as downloaded from the Copernicus Climate Change Service https://cds.climate.copernicus.eu/. To estimate the wind resource, hourly wind speeds at a level of 100 m above sea-level were used to estimate the available wind resource at the typical height of a commercial-scale OSW turbine. The accuracy of the ERA5 model in capturing wind climates offshore has previously been demonstrated, slightly underestimating resource in the North Sea (Kalverla et al., 2020), and accurately representing wind farm energy production with hourly country-wide estimates of power output comparing closely with f ield measurements, with correlations of over 0.95 and RMSE values of less than 9% (Olauson, 2018). Verif ication of ERA-5 100 m winds was not able to be carried out for the Australian marine EEZ, with no public data available. OSW profile data is currently being collected by the Star of the South OSW Project using floating LiDAR, but was unavailable to this project for validation purposes. To perform the regional wind resource assessments, hourly ERA5 wind speeds were averaged over a 10-year period from 2010 to 2019. Areas with average wind speeds of less than 6 m/s were removed, with the remaining areas classif ied according to IEC wind resource classes of: I of > 10 m/s, II of 8.5-10 m/s, III of 7.5-8.5 m/s, and IV of 6-7.5 m/s (IEC, 2005).

34Offshore Wind Energy in Australia
3.2.3. Bathymetry
Water depth is a key engineering constraint for OSW development, with current technologies divided between monopole and gravity foundations that can be used in depths of up to approximately 60 m, and floating platforms for water depths over 60 m (Schwartz et al., 2009). Current international trends indicate that OSW farms are moving into deeper waters further offshore as accessible shallower sites become exhausted, impacting transmission distances as well as foundation design. Although deployments in deep water are costly, developments offshore are demonstrating increased capacity factors as shown by the Scottish Hywind array with factors in excess of 56%, as they can access stronger wind resources located further offshore (Skopljak, 2021). The bathymetric data used for this study was generated using the ~250 m gridded Geoscience Australia Bathymetry and Topography Grid dataset for Australian waters (Whiteway, 2009).
3.2.4. Grid and substation inf rastructure
The location of OSW turbine arrays producing electricity for the grid are highly dependent upon the distance to the electrical grid and substations. To determine these distances, both the Australian power grid transmission lines and substation locations were included in the model.
Approximately 85 per cent of the Australian population resides within f ifty kilometres of the coast, providing an indication of the proximity of Australia’s offshore wind resources to demand. Many of Australia’s Renewable Energy Zones (REZ) used within current integrated system plans (AEMO, 2020a) are distant from major high-voltage interconnection points in Australia’s national electricity market. OSW is often much closer to this existing infrastructure, and future economic assessments may identify associated cost-benefits to OSW. Offshore wind could also be used to produce hydrogen or ammonia in locations which are not grid-connected – for example on disused oil production platforms or floating production, storage and offtake facilities similar to those currently in use in the oil and gas industry.
3.2.5. Restricted Areas and Exclusion Zones
The assessment zones were limited to account for areas that have key national environmental restrictions. These areas were taken from the Collaborative Australian Protected Areas Database (DAWE, 2018), a spatial database which lists all Australian protected areas. For this model all IUCN I, II and III areas were removed from the study area, similar to previous wind resource assessments (Arent et al., 2012).
Figure 11: Wind resource assessment study area showing categorisation into state area for regions to the EEZ limit. Environmental protected areas, including IUCN I, II and III zones removed from assessment areas are represented by blank (white) areas.

35 Offshore Wind Energy in Australia
3.3. Presentation of Results
Theoretical and technical offshore wind potential for Australian waters was assessed using the datasets outlined in Table 4. Key datasets used for OSW study are shown in Figure 13.
Dataset Source Description
Wind ERA5 Reanalysis 2010-2019 hourly wind speed (m/s) at 100 m height
Economic Exclusion Zone Geoscience Australia EEZ Limits
Bathymetry Geoscience Australia Water depths over all EEZ
Grid and Substation Infrastructure Geoscience Australia Australian power grid lines, substations database
Protected Areas Australian Government Department of Agriculture, Water and Environment
Marine Protected Areas
3.3.1. Theoretical National Wind Resource and Wind Class
Global mean annual 100 m level wind speeds are shown in Figure 11a. Panel b) displays a zoomed in perspective in the Australian region, in which the high offshore wind speeds relative to those experienced onshore can be clearly resolved. Wind resources of the North Sea, where offshore wind is an established industry sector, is displayed in panel c), with the locations of existing offshore wind farms with nameplate capacities greater than 200 MW displayed. Mean annual wind speeds in the North Sea are in the range of 9-10 m/s (Geyer et al., 2015). These wind conditions are equivalent to the annual wind speeds seen in Bass Strait, around Tasmania, and along the south-western coast of the continent. Commercial wind farms operating in the growth region of the East China and Yellow Seas have lower annual wind speeds ranges than those found in the North Sea or southern Australia, providing perspective on the attractiveness of Australia’s offshore wind resources.
The Australian wind resource is concentrated towards southern latitudes, with high average wind speeds of over 7.5 m/s found for most of the southern coastline, with maximum average wind speeds of over 12 m/s found south of Tasmania. Average wind speeds generally reduce towards the north, with the Kimberly region in north-western Australia demonstrating average wind speeds less than 6 m/s, which were removed from the resource map. In the north east, a region of higher wind speeds exists between Cooktown and Cape York in northern Queensland, with average speeds exceeding 9 m/s. The Australian wind resource was also found to increase with distance offshore from the coast in all regions as expected. Figure 13 (lower) displays categorisation of Australia’s offshore wind resource using the IEC criteria.
Table 4: Key datasets used for OSW study.
Figure 12: Mean wind speed (m/s) at 100 m level showing (a) global and (b) Australian wind distribution. Location of existing offshore wind farms with nameplate capacity > 200 MW in North Sea shown in (c).

36Offshore Wind Energy in Australia
Figure 13: National average wind speed (m/s) from 2010-2019 within the EEZ study area at 100 m height. Regions with average wind speeds below 6 m/s and with environmental restrictions removed.
Figure 14: IEC Wind Class defined for average wind speeds from 2010-2019 within the EEZ study area. Regions with average wind speeds below 6 m/s and with environmental restrictions removed.
3.3.2. Theoretical Resource Capacity and Energy Potential
Using the developed model, the theoretical recoverable resource for Australian OSW energy was estimated at 27,369 GW, with a theoretical energy generation potential of 136,845 TWh/year over the same area. To explore the national distribution of OSW resource, Figure 14 presents the distribution of theoretical offshore capacity for each wind class, as shown in Figure 13, over each Australian State and Territory. Most prospective IEC Class I wind resources are found in Tasmania and Victoria, with a potential capacity of 2199 MW found. More broadly, class II-III wind speeds are found Australia-wide with Western Australia and Queensland dominating due to the large marine domains. Both South Australia and New South Wales demonstrated good resources with high levels of Class II resource found. Results also indicated that Northern Territory had low wind potential capacity due to its reduced average wind speeds when compared to the more southern states.
Image Courtesy of Saitec Offshore

37 Offshore Wind Energy in Australia
Figure 15: Summary of Theoretical National Offshore Wind Potential (GW) by wind class.
3.3.3. Capacity Factor
Using the IEA reference next-generation 15 MW turbine model (Gaertner et al., 2020), capacity factor maps for the study area were generated as shown in Figure 15, with gross capacity factors found to range from 20% in the North to more than 80% south of Tasmania. These highest capacity factors are located offshore south of the Australian continent, in the ‘roaring forties’ of the Southern Ocean. This region is characterised by high, relatively constant wind conditions, resulting in very high theoretical capacity factors approaching 85%. In the more accessible regions in Bass Strait, along Australia’s western coast, and in north Queensland, theoretical capacity factors exceeding 55% are widespread. The best of Australia’s onshore wind farms, typically with state of the art turbines, operate at a capacity factor of 45%, but the majority have capacity factors ranging between 28-38% (AEMO, 2021a). High offshore predicted capacity factors for Australian waters suggest potential performance equivalent to the best of UK offshore wind farms (e.g., the Scottish floating offshore Hywind farm demonstrated capacity factors of 57% for operations over twelve months to March 2021 with average wind speeds of around 10 m/s, (Skopljak, 2021).

38Offshore Wind Energy in Australia
Figure 16: Gross Capacity Factor determined using ERA5 hourly wind speeds for the NREL 15 MW turbine.
Figure 17: Australian wind resource classif ied by IEC wind rate for 0-1000 m water depths, and distances of less than 100 km to grid connection and coastline.

39 Offshore Wind Energy in Australia
3.3.4. Technical National Wind Resource
Here, we assess the technical resource, to provide a representative depiction of the offshore wind resource available with current technology, given considerations of installation depth and distance to coastline and infrastructure, each of which heavily influence project cost and hence feasibility. This technical resource represents only some portion of the theoretical resource presented above, which includes only key environmental restrictions.
Using these technical criteria, the potential resource area reduces from 5,473,836 km2 to 446,671 km2, a reduction of more than 90% in area. The technical resource potential capacity for Australian OSW energy was estimated at 2,233 GW for the region shown in Figure 16, compared to the total theoretical estimate of 27,369 GW presented in Figure 13. Comparisons between the gross and technical potential capacity for each IEC wind class are shown in Figure 17.
Of the Australian resource shown in Figure 16, the region between Victoria and Tasmania encompassing Bass Strait appears prospective, given its high average wind speed, water depth ranges of 50-70 m suitable for both f ixed and floating installations, and short distances to key National Electricity Market power grid lines and substations. Not surprisingly, the f irst Australian OSW farm, the Star of the South, is planned for deployment off the south-east coast of Gippsland in this region. Other promising regions include western and south-western Western Australia, with large areas of Class II wind resource located in shallow waters near to the coast. Off the New South Wales and Queensland coastlines, mainly Class III- IV wind resources exist, however these are located near large coastal populations and key pre-existing electricity infrastructure associated with declining coal powered generating assets.
In northern Queensland a small area of Class II wind resource is seen, however given the reduced population in this region when compared to southern Queensland and New South Wales it maybe not be particularly prospective for large scale grid-connected deployments. The Northern Territory does not exhibit prospective sites for OSW, given the low speed winds and long distances from any potential resource to the substations and transmission lines of the region.
Figure 18: Technical and Gross potential capacity (GW) and IEC wind class. (I-IV)

40Offshore Wind Energy in Australia
Figure 19: Technical energy potential (TWh/year) of shallow (<60 m) and deep water (60 m to 1000 m) OSW sites near (<50 km) and far (50 km to 100 km) from the Australian coastline for sites < 100 km from electricity substation and transmission lines.
3.3.5. Technical Energy Potential
The national technical energy potential was calculated at 9,396 TWh/year over the restricted study area shown in Figure 16, well in excess of Australia’s current electric generation of 265 TWh/year in 2019 (DISER, 2021). To further examine this technical potential, the wind assessment was also categorised into shallow (0-60 m) and deep-water ranges (60 – 1000 m) at distances to the coastline of under 50 km and 50-100 km, for sites located within 100 km of pre-existing electricity substations and lines, as shown in Figure 18 and Figure 19.
The technical potential of Queensland, Victoria, Tasmania, South Australia and Western Australia (western WA coast, parts of Bass Strait, the South Australian Gulfs, and north Queensland) were relatively similar, all exhibiting attractive resources that were near (<50 km) to the coast, in shallow (<60 m) waters suited to f ixed foundation turbines and deep (>60 m depth) waters, suited to floating technologies. In contrast, the resource for New South Wales is found near to the coast (<50 km) in deep (>60 m depth) waters, suggesting a resource f itting for floating technologies only.
The Northern Territory was found to have no technical energy potential, as suitable resources are located far from pre-exiting transmission and substation lines. Given reductions in transmission line cost, these areas may become feasible in the future.
3.3.6. Regional and Previous Study Comparisons
Figure 20 (next page) shows a summary of the world OSW energy potential (Bosch et al., 2018). Australia’s OSW wind technical potential of 9,396 TWh/year is considerable when viewed against regional potentials world-wide. These estimates are well in excess of the world total electricity consumption of 22,315 TWh/year in 2018 (IRENA, 2021).
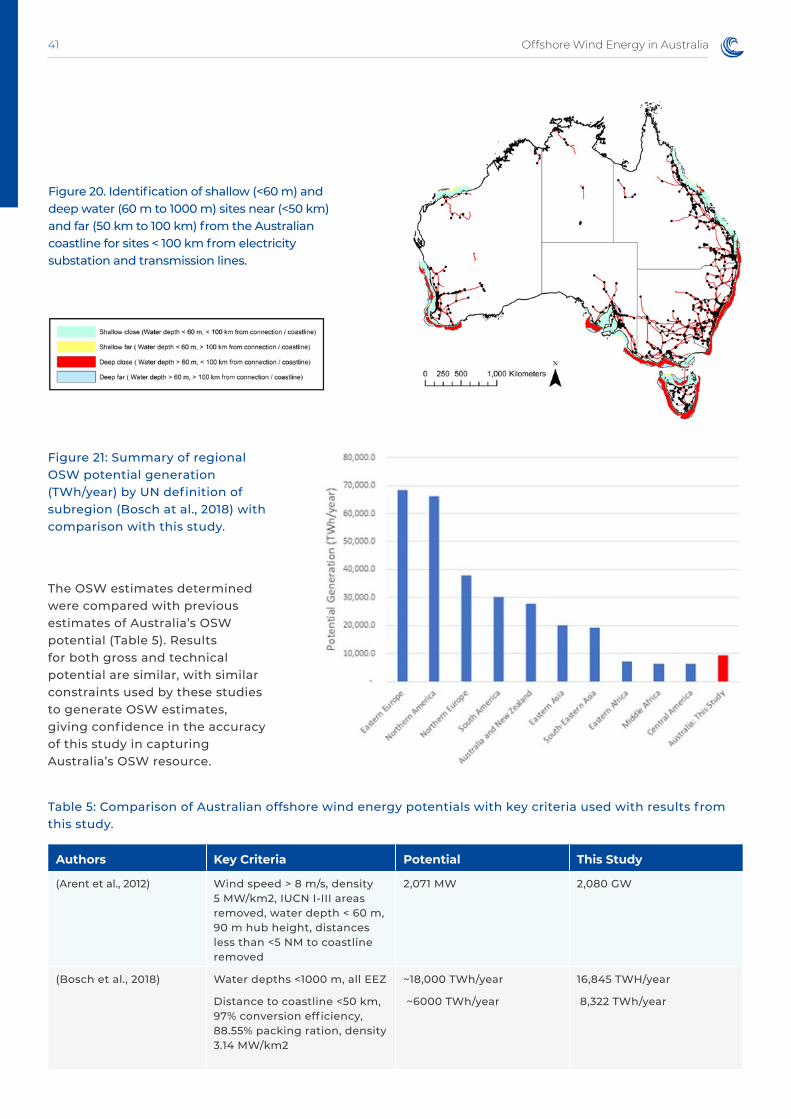
41 Offshore Wind Energy in Australia
The OSW estimates determined were compared with previous estimates of Australia’s OSW potential (Table 5). Results for both gross and technical potential are similar, with similar constraints used by these studies to generate OSW estimates, giving confidence in the accuracy of this study in capturing Australia’s OSW resource.
Figure 21: Summary of regional OSW potential generation (TWh/year) by UN definition of subregion (Bosch at al., 2018) with comparison with this study.
Table 5: Comparison of Australian offshore wind energy potentials with key criteria used with results from this study.
Authors Key Criteria Potential This Study
(Arent et al., 2012) Wind speed > 8 m/s, density 5 MW/km2, IUCN I-III areas removed, water depth < 60 m, 90 m hub height, distances less than <5 NM to coastline removed
2,071 MW 2,080 GW
(Bosch et al., 2018) Water depths <1000 m, all EEZ
Distance to coastline <50 km, 97% conversion eff iciency, 88.55% packing ration, density 3.14 MW/km2
~18,000 TWh/year
~6000 TWh/year
16,845 TWH/year
8,322 TWh/year
Figure 20. Identification of shallow (<60 m) and deep water (60 m to 1000 m) sites near (<50 km) and far (50 km to 100 km) from the Australian coastline for sites < 100 km from electricity substation and transmission lines.

42Offshore Wind Energy in Australia
3.4. Summary of Australian National Offshore Wind Resources
Australia’s offshore wind resource potential is large, with high average wind speeds found offshore around most coastal regions. The gross potential capacity for Australian OSW energy was estimated at 27,562 GW and when constrained by depth (<1000 m) and distance to infrastructure (<100 km), reduced to 2233 GW. Estimates for gross and technical energy generation potential were 136,845 TWh/year and 9,396 TWh/year respectively, with the technical energy generation potential in areas suitable for current-generation offshore wind farm deployments well in excess of Australia’s current electric generation of 265 TWh/year. The offshore wind resources were located at depths accessible to current technology f ixed and floating wind turbines, with opportunity to increase generation potential once deeper sites further from the coastline and existing infrastructure can be accessed. Given that eighty-f ive per cent of Australia’s population lives within 50 km of the coast, and that the associated heavy industry and electricity infrastructure is strongly biased towards these populated regions, offshore wind provides a substantial resource to contribute to Australia’s future energy requirements.
Despite this signif icant resource, wind offshore was included only for the Gippsland REZ (aligned with Star of the South proposed development) in the assessment of renewable energy zones for the 2020 ISP (AEMO, 2020a, 2020b), and the draft assumptions for the 2022 ISP do not consider OSW resources for any further REZs(AEMO, 2020c). Omitting the consideration of OSW resource sees many of the current Renewable Energy Zones considered in the ISP and captured in consequent State Government plans are located inland, requiring a considerable investment in transmission infrastructure in order to make full use of their capacity - alongside the social impact of large geographic shifts in generation capacity. The scale of the offshore wind resource merits reconsideration of the inclusion of the offshore wind resource in planning for Australia’s future electricity system and broader energy needs.

43 Offshore Wind Energy in Australia
4. Offshore Wind in Australia: Resource Modelling and Grid Integration4.1. Introduction
This section focusses on the offshore wind resource in Australian waters and how the temporal variability of the resource relates to the actual grid electricity load curves of Western Australia, South Australia, Victoria, New South Wales and Queensland and to onshore renewables (solar photovoltaic and wind power). The generation curves for solar photovoltaic (utility scale), onshore wind and offshore wind are based on meteorological data and not on actual generation as they were not available. The assumed installed capacities for solar PV and onshore wind are based on current installed capacities for each state. This capacity has been increased to reflect likely additional installations over the next 3 to 5 years on the basis of current project plans and the expected market development of solar PV. However, the main aim for the chosen installed capacities for solar PV and onshore wind was to compare expected generation curves with possible generation curves for offshore wind farms at various locations around Australia to analyse the interaction between the two. The offshore wind data is based on meteorological model reanalysis data and not site specif ic observations and should therefore only be understood as an indicator. Actual generation curves are very likely to deviate from the data used here. The calculated correlation between onshore and offshore wind could be signif icantly lower in practice.
4.2. Methodology
Modelling the energy system involves a variety of methodological requirements, which pose specif ic challenges when addressed on the national and regional level: the quantitative projection of developments in (future) technologies and potential markets; a consistent database of renewable energy potentials and their temporal and spatial distributions; reliable data on the current situations in all regions; an assessment of energy flows and emissions across all energy subsectors,
such as industry, transport, residential, etc.; and a comprehensive assessment of all CO2 emissions, in order to assess the impact of the energy system on climate change. Finally, analysing and assessing the energy transition require a long-term perspective on future developments. Changes to energy markets require long-term decisions to be made because infrastructural changes are potentially required and are therefore independent of short-term market developments. The power market cannot function optimally without long-term infrastructure planning. Grid modif ications and the roll-out of smart metering infrastructure, for example, require several years to implement. These technologies form the basis of the energy market and allow energy trading. Therefore, the time required for infrastructure planning and other substantial transformation processes must be considered in the scenario-building approach.
4.2.1. Meteorological data
Variable renewable power-generation technologies are dependent on the local weather (solar radiation, wind, etc) regimes. Therefore, all installed capacities of this technology group are connected to regional-specif ic time series. The data for solar generation and onshore wind were derived from the database Renewable Ninja (http://renewables.ninja, Staffell & Pfenninger, 2016), which allows the simulation of the hourly power output from wind and solar power plants at specif ic geographic positions throughout the world. Weather data, such as temperature, precipitation, and snowfall, for the year 2019 are also available. The onshore wind indicative site selected for each region was situated in an area with a currently existing wind farm. Meteorological data for solar photovoltaic power generation has been chosen for the location of existing utility scale solar photovoltaic power stations.
Once the indicative sites were chosen, the hourly output values for typical solar arrays and wind farms were selected using the Renewables.ninja.

44Offshore Wind Energy in Australia
The model methodology used by the Renewables.ninja database is described by (Pfenninger & Staffell, 2016; Staffell & Pfenninger, 2016), and is based on weather data from global reanalysis models and satellite observations (Müller et al., 2015; Rienecker et al., 2011). It was assumed that the utility solar sites were optimized, and as such, a tilt angle was selected within a couple of degrees of the latitude of the indicative site. For roof-top solar, this was left at the default 35° because it is likely that the panels matched the roof tilt. For onshore wind, a turbine model of Vestas V90 2000 was used.
Hourly offshore wind data was sourced using the ERA-5 100m hub height wind data, described in Section 3 above, for specif ied locations, proximal to the identif ied demand load and sub-station infrastructure. The offshore wind generation curves are based on (Gaertner et al., 2020) - a 15 MW offshore wind reference turbine model, as used in Section 3.
4.2.2. Analysis – Offshore wind contribution to state-wide supply
Around Australia, 12 potential offshore wind farm location have been selected, on the basis of having good wind resource in water depths less than 1000 m, and being less than 100 km from pre-existing electrical lines, substations and the coastline. The proximity to marine infrastructure e.g. harbour and access to harbours as well as site-specif ic ecological and economical importance of the ocean area were also considered.
Actual demand: For each state, a measured load curve was used (AEMO, 2015), which represents real demand during one full year in hourly resolution.
Power generation: For each state a specif ic potential installed capacity of solar PV (utility scale and roof-top), onshore wind and offshore wind turbines has been selected. In order to assess the contribution of offshore wind with onshore wind and solar power generation, a similar capacity for each technology has been chosen.
Comparison: for each hour, the load, in megawatts, has been compared with the possible power generation curve which has been calculated on the basis of the assumed installed capacity (for solar PV, onshore wind and offshore wind) and the historic solar and wind resource for each hour at a specif ic location.
Furthermore, the capacity factor for each location and generation type has been determined – on the assumption that all generators can feed into the grid and curtailment is not required.
The potential installed capacities for solar PV, onshore wind and offshore wind for each state are not suggested power generation scenarios, but are used to assess and compare the generation profiles for each of the three technologies in the specif ied locations.
4.3. Presentation of Results
The results are presented in the following standard table (see Table 6). The f irst half of the table identif ies the locations (A2 state, D2 – F Offshore Wind location (nearest city). The analysis includes three distances from shore 25 km, 50 km and 100 km. In the case where there is no location name, the water depth is greater than 1000 m, which has been defined as the technical limit for floating turbine installations. The location for onshore wind and utility scale solar PV are defined in G1 and H1. The generation curves are calculated with meteorological data from those locations, and do not represent actual generation data. The selected solar and wind farm projects are among the largest in the analysed states. Column 3 to 6 in row A-H show the assumed installed capacity in MW, the calculated annual generation in MWh per year and capacity factors (in full load hours per year, and percentage). The f ields D6 to F6 show the capacity factor variations of location 50km and 100km offshore in comparison to the 25 km location. This will show whether or not the wind resource increases with distance from the shoreline. Row I shows the total installed capacities for all onshore and offshore wind turbines and solar photovoltaic (I 3), their total combined annual generation (I 4) and what the supply share would be based on the state’s current demand. The installed capacities for all states add up to approximately double of the peak load and would potentially supply the entire demand of each of the analysed states. Requirements for storage have not been assessed and further research is warranted.

45 Offshore Wind Energy in Australia
1 2 3 4 5 6
A State Tasmania
BLocation Type Installed
Capacity Generation Capacity Factor
CF increase (Base +25km)
C [MW] [MWh/a] [h/a] [%]
D Hobart Offshore Wind (+ 25 km)
E Hobart Offshore Wind (+ 50 km)
F Offshore Wind (+ 100 km)
G Musselroe Wind Farm
Onshore Wind
H Beechford PV Solar PV
I Tasmania total Supply (1)
J
K Peak Load [MW]
Demand [MWh/a]
Average Load [MW]
L TAS - 2015
M Onshore Wind Solar Photovoltaic
N Annual per MW
Correlation Annual per MW
Correlation
O Additionality [MWh/a] [%]
P Offshore Wind (+ 25 km)
Q Offshore Wind (+ 50 km)
R Offshore Wind (+ 100 km)
Table 6: Standard table for each of the analysed locations.
The second half of the table shows the expected variation of annual power generation per MW for offshore wind (three distances from shore) compared to onshore wind (P3, Q3, R 3) and solar photovoltaic (P5, Q5, R 5) and the correlation of the calculated hourly generation curves. A low percentage indicates that the expected generation e.g. of solar PV and offshore wind are at different hours of the day, while a high correlation percentage means that the generation is expected at similar time of the day. We note here that the model reanalysis used as input for this model have a relatively coarse resolution (~31 km). As a result, spatial variability of wind resource across the coast is poorly resolved, and onshore/offshore wind resource correlations may be overestimated.

46Offshore Wind Energy in Australia
4.4. Offshore Wind Resources in Selected Locations
The possible offshore wind locations around Australia have been selected based on existing high voltage transmission substation close to the shore line, as a possible interconnection point for offshore wind farm.
Table 7: Offshore wind locations analysed in this study – proximity to substations.
Figure 22: Map of potential offshore wind farm locations at water depths of less than 1000m within 100 km of coastline and pre-existing electricity grid substations and lines.
No. State Nearby City / Region Transmission Substation Voltage Level
1 TAS George Town Bass link Four Mile Bluff 330 kV
2 TAS Hobart Chapel Street 220 kV / 132 kV
3 VIC Portland Portland Aluminium 500 kV
4 VIC Latrobe Bass link 330kV
5 NSW Newcastle Waratah 330 kV / 132 kV
6 NSW Sydney Sydney South 330 kV / 132 kV
7 NSW Port Kembla Dapto 330 kV / 132 kV
8 QLD Gladstone Gladstone Power Station (coal) 275 kV (multiple)
9 QLD Maroochydore (north of Brisbane) H9 Palmwoods 275 kV / 132 kV
10 SA Lincoln (near Adelaide) Sleaford 132 kV
11 WA Perth Kwinana Terminal/Power Station 330 kV
12 WA Karratha NWIS

47 Offshore Wind Energy in Australia
Table 8: Geographical position and water depth for offshore wind locations analysed in this study.
State Location Long Lat Water Depth
QLD Gladstone (Boyne Island) Gladstone25 151.562 -23.827 23
Gladstone (Boyne Island) Gladstone50 151.794 -23.74 35
Gladstone (Boyne Island) Gladstone100 152.254 -23.581 61
Maroochydore (Palmwoods) Maroochydore25 153.211 -26.679 26
Maroochydore (Palmwoods) Maroochydore50 153.47 -26.661 62
NSW Newcastle (Waratha West) Newcastle25 151.968 -33.05 122
Newcastle (Waratha West) Newcastle50 152.186 -33.173 144
Sydney (Sydney South) Sydney25 151.464 -34.083 143
Port Kembla (Dapto) PortKembla25 151.068 -34.602 126
VIC Latrobe (Basslink Trans) Latrobe25 147.279 -38.56 38
Latrobe (Basslink Trans) Latrobe50 147.49 -38.713 55
Latrobe (Basslink Trans) Latrobe100 147.906 -39.011 62
Portland Portland25 141.5791 -38.61069 73
Portland Portland50 141.5279 -38.83473 460
TAS George Town (Basslink) Georgetown25 146.828 -40.896 63
George Town (Basslink) Georgetown50 146.828 -40.661 71
George Town (Basslink) Georgetown100 146.828 -40.207 71
Hobart Tas (Storm Bay) Hobart25 147.527 -43.173 47
Hobart Tas (Storm Bay) Hobart50 147.676 -43.393 109
SA Adelaide (Sleaford) Adelaide25 135.415 -35.029 96
Adelaide (Sleaford) Adelaide50 135.242 -35.203 115
Adelaide (Sleaford) Adelaide100 134.887 -35.526 1000
WA Perth (Kwinana) Perth25 115.46 -32.273 40
Perth (Kwinana) Perth50 115.189 -32.313 137
Perth (Kwinana) Perth100 114.659 -32.386 707
Karratha (Karratha) Karratha25 116.725 -20.43 15
Karratha (Karratha) Karratha50 116.684 -20.202 46
Karratha (Karratha) Karratha100 116.634 -19.758 54

48Offshore Wind Energy in Australia
4.4.1. Tasmania
Tasmania is recognised as having the most attractive offshore wind resources in Australia (Section 3). Tasmania is now 100 per cent self suff icient on renewable energy, and has legislated a target of doubling renewable energy generation by 2040, to build on the state’s competitive resource advantages to establish itself as the renewable energy powerhouse of Australia. Tasmania is part of the NEM, and the proposed Marinus link and Battery of the Nation project motivates additional renewable energy projects for the State. Tasmania has a history of f inding it diff icult to gain approval of onshore wind projects, presenting potential opportunities to utilise the massive offshore wind resource.
For Tasmania, we identif ied two different offshore wind farm locations. The f irst is the southern landing point of the Bass Link – a 500 MW high-voltage direct current cable linking the NEM with Tasmania. This cable with a length of 370 km connects the Loy Yang power station in Victoria to the George Town substation in the north east of Tasmania. The second analysed location for an offshore wind farm in the Tasman Sea is near Hobart. For onshore wind the wind data of the location of the existing Musselroe wind farm has been selected, while the assumed utility scale solar PV plant location is near Beechford, in close proximity to the Bass Link cable connection.
Table 9: Key results: Tasmania – George Town.
State Tasmania
Location Type Installed Capacity Generation Capacity
FactorCF increase (Base +25km)
[MW] [MWh/a] %
Georgetown Offshore Wind (+ 25 km) 500 2,244,072 51.2
Georgetown Offshore Wind (+ 50 km) 500 2,720,055 62.1 10.9
Georgetown Offshore Wind (+ 100 km) 500 2,875,243 65.6 14.4
Musselroe Wind Farm Onshore Wind 500 2,345,429 53.5
Beechford (North East) - not an existing PV project
Solar PV 500 799,125 18.2
Tasmania total 15,000 10,983,925 Supply (1) 115%
(1) Based on demand FY 2015/2016
Peak Load [MW]
Demand [MWh/a]
Average Load [MW]
TAS - 2015 1,612 9,572,850 1,093
Onshore Wind Solar Photovoltaic
Annual per MW
Correlation Annual per MW
Correlation
Additionality [MWh/a] [%]
Offshore Wind (+ 25 km) -202.7 80.55% 2,890 -9.03%
Offshore Wind (+ 50 km) 749.3 75.85% 3,842 -9.86%
Offshore Wind (+ 100 km) 1059.6 73.19% 4,152 -9.27%
Note: On- and Off-shore wind capacity factors are presented for winds at 100-m hub height. Offshore wind allows larger turbines (typical hub height 150-m). Capacity factors can be expected to be up to ~5% greater at 150-m, depending on local resource and technology used.

49 Offshore Wind Energy in Australia
The results show that the offshore wind resource in the northern location near George Town is very comparable to that near Hobart and that the water depth would allow projects as far as 100km offshore. The capacity factor of the George Town offshore wind location (+25 km) is comparable with the excellent onshore wind resources experienced at the Musselroe wind farm location, and only improves with distance offshore, enabling access over a larger area. Onshore and offshore wind display relatively high correlation for the Georgetown farm (~70-80%), but for Hobart the correlation is lower (~45-50%), suggesting greater phasing advantage. Solar PV and wind power generation are well out of phase with each other to provide mutual value.
The current peak load of Tasmania is at around 1.6 GW.The modelled total installed capacity of all variable power generation plants is 2.5 GW, made up of 0.5 GW solar, 0.5 GW onshore wind and 1.5 GW offshore wind. The furthest offshore wind location - +100km – would have a 20% higher output per installed megawatt than an onshore wind turbine.
Table 10: Key results: Tasmania – Hobart.
State Victoria
Location Type Installed Capacity Generation Capacity
FactorCF increase (Base +25km)
[MW] [MWh/a] %
Hobart Offshore Wind (+ 25 km) 750 3,048,874 46.4
Hobart Offshore Wind (+ 50 km) 750 3,618,639 55.1 8.7
Offshore Wind (+ 100 km)
Musselroe Wind Farm Onshore Wind 500 2,345,429 53.5
Beechford (North East) - not an existing PV project
Solar PV 500 799,125 18.2
Tasmania total 15,000 9,812,067 Supply (1) 102%
(1) based on demand FY 2015/2016
Peak Load [MW]
Demand [MWh/a]
Average Load [MW]
TAS - 2015 1,612 9,572,850 1,093
Onshore Wind Solar Photovoltaic
Annual per MW
Correlation Annual per MW
Correlation
Additionality [MWh/a] [%]
Offshore Wind (+ 25 km) -625.7 48.96% 2,467 -5.41%
Offshore Wind (+ 50 km) 134.0 45.17% 3,227 -7.67%
Offshore Wind (+ 100 km)
Note: On- and Off-shore wind capacity factors are presented for winds at 100-m hub height. Offshore wind allows larger turbines (typical hub height 150-m). Capacity factors can be expected to be up to ~5% greater at 150-m, depending on local resource and technology used.
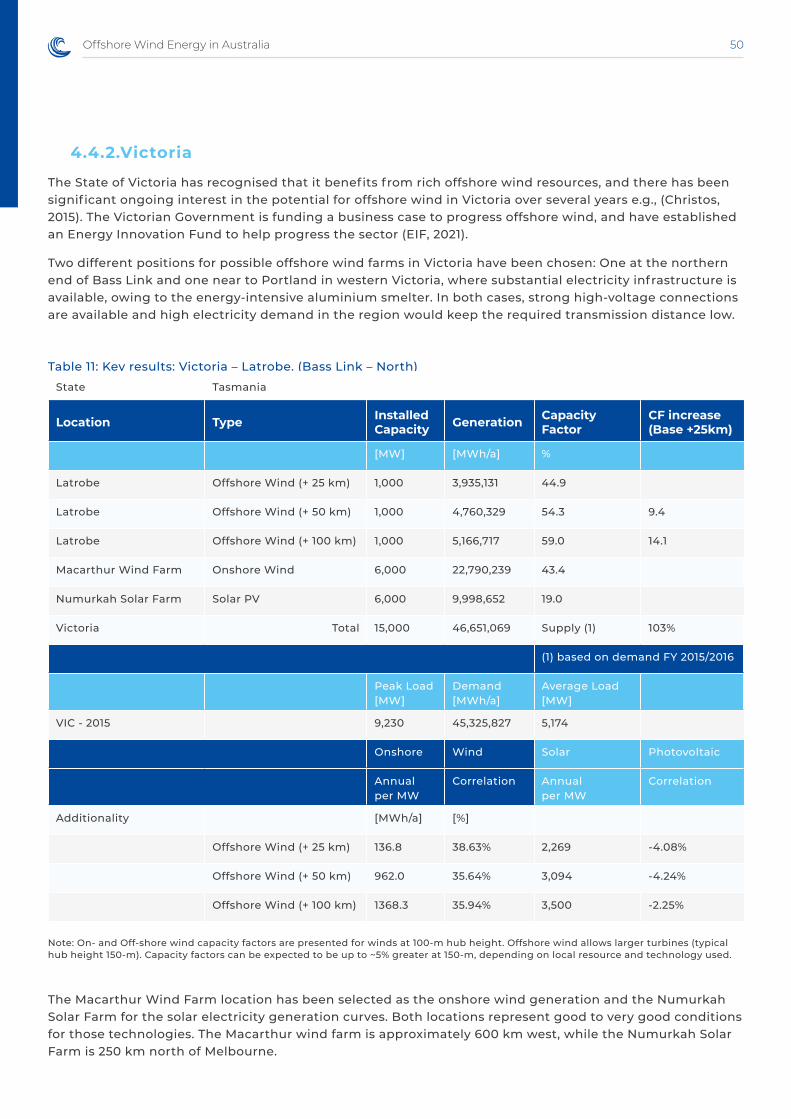
50Offshore Wind Energy in Australia
4.4.2.Victoria
The State of Victoria has recognised that it benefits from rich offshore wind resources, and there has been signif icant ongoing interest in the potential for offshore wind in Victoria over several years e.g., (Christos, 2015). The Victorian Government is funding a business case to progress offshore wind, and have established an Energy Innovation Fund to help progress the sector (EIF, 2021).
Two different positions for possible offshore wind farms in Victoria have been chosen: One at the northern end of Bass Link and one near to Portland in western Victoria, where substantial electricity infrastructure is available, owing to the energy-intensive aluminium smelter. In both cases, strong high-voltage connections are available and high electricity demand in the region would keep the required transmission distance low.
Table 11: Key results: Victoria – Latrobe. (Bass Link – North)
State Tasmania
Location Type Installed Capacity Generation Capacity
FactorCF increase (Base +25km)
[MW] [MWh/a] %
Latrobe Offshore Wind (+ 25 km) 1,000 3,935,131 44.9
Latrobe Offshore Wind (+ 50 km) 1,000 4,760,329 54.3 9.4
Latrobe Offshore Wind (+ 100 km) 1,000 5,166,717 59.0 14.1
Macarthur Wind Farm Onshore Wind 6,000 22,790,239 43.4
Numurkah Solar Farm Solar PV 6,000 9,998,652 19.0
Victoria Total 15,000 46,651,069 Supply (1) 103%
(1) based on demand FY 2015/2016
Peak Load [MW]
Demand [MWh/a]
Average Load [MW]
VIC - 2015 9,230 45,325,827 5,174
Onshore Wind Solar Photovoltaic
Annual per MW
Correlation Annual per MW
Correlation
Additionality [MWh/a] [%]
Offshore Wind (+ 25 km) 136.8 38.63% 2,269 -4.08%
Offshore Wind (+ 50 km) 962.0 35.64% 3,094 -4.24%
Offshore Wind (+ 100 km) 1368.3 35.94% 3,500 -2.25%
Note: On- and Off-shore wind capacity factors are presented for winds at 100-m hub height. Offshore wind allows larger turbines (typical hub height 150-m). Capacity factors can be expected to be up to ~5% greater at 150-m, depending on local resource and technology used.
The Macarthur Wind Farm location has been selected as the onshore wind generation and the Numurkah Solar Farm for the solar electricity generation curves. Both locations represent good to very good conditions for those technologies. The Macarthur wind farm is approximately 600 km west, while the Numurkah Solar Farm is 250 km north of Melbourne.

51 Offshore Wind Energy in Australia
State Victoria
Location Type Installed Capacity Generation Capacity
FactorCF increase (base +25km)
[MW] [MWh/a] %
Portland Offshore Wind (+ 25 km) 1,000 4,827,899 55.1
Portland Offshore Wind (+ 50 km) 1,000 4,982,882 56.9 1.8
Portland Offshore Wind (+ 100 km)
Macarthur Wind Farm Onshore Wind 6,000 22,790,239 43.4
Numurkah Solar Farm Solar PV 6,000 9,998,652 19.0
Victoria total 15,000 42,599,673 Supply (1) 94%
(1) based on demand FY 2015/2016
Peak Load [MW]
Demand [MWh/a]
Average Load [MW]
VIC - 2015 9,230 45,325,827 5,174
Onshore Wind Solar Photovoltaic
Annual per MW
Correlation Annual per MW
Correlation
Additionality [MWh/a] [%]
Offshore Wind (+ 25 km) 1029.5 81.46% 3,161 -5.45%
Offshore Wind (+ 50 km) 1184.5 79.19% 3,316 -5.07%
Offshore Wind (+ 100 km)
The results show that the offshore wind resource for Latrobe, in eastern Victoria, is greater than the high quality onshore wind resource at MacArthur. The capacity factor 25 km offshore exceeds that seen onshore by 1-2%, and by over 15% at the location 100 km offshore . The Latrobe sites display relatively low correlation with onshore wind generation (35-40%) and anti-correlation with solar PV generation, reflecting the potential phasing value of offshore wind in Victoria’s renewable energy mix. The value of energy system diversif ication to include offshore wind in this area has been reported by the Star of the South project, with high offshore generation potential during high temperature days when demand is high, and onshore generation potential is low (Star of the South, personal communication – see Case Study in Section 2).
At Portland in western Victoria, the capacity factors at all distances offshore are substantially greater than the eastern site, exceeding 55% at sites 25 and 50 km offshore. These sites, while displaying greater resource, display higher correlation to onshore generation (~80%). These western Victoria locations are also situated in an energetic wave environment - few offshore wind farms have yet been deployed in such an energetic setting. Note that no measured wind data was available for either location, and values presented should be seen as indicative only.
The current peak load of Victoria is at around 9.2 GW. The modelled total installed capacity of variable power generation plants add up to 15 GW, including 6 GW solar, 6 GW onshore wind and 3 GW offshore wind.
Table 12: Key results: Victoria – Portland.
Note: On- and Off-shore wind capacity factors are presented for winds at 100-m hub height. Offshore wind allows larger turbines (typical hub height 150-m). Capacity factors can be expected to be up to ~5% greater at 150-m, depending on local resource and technology used.

52Offshore Wind Energy in Australia
4.4.3 New South Wales
New South Wales presents some substantial opportunities for OSW. Newcastle is one of the Australia’s centres for coal power generation with strong power grids, and is one of the largest coal export harbours worldwide. The Munmorah coal power station south of Newcastle had a capacity of 1,400 MW and closed in 2012. It was located a few kilometers from the coast. A further four coal f ired power stations with a total capacity of 8.5 GW in the Upper Hunter Valley and Central Coast areas are scheduled to close in future years. Newcastle is home to large industrial loads such as the Tomago Aluminium smelter drawing 950MW, steel makers Molycop and Liberty, and the Orica chemical plant.
Port Kembla, on the south NSW coast, is home to the Bluescope steel mill, which produces 2-3 million tonnes of steel each year. The potential of hydrogen for decarbonising steel production is immense (Christian, 2020). Such scenario would drive substantial electricity demand for hydrogen production that could realistically be met by offshore wind. Using hydrogen to produce Bluescope’s current steel production would require 5-7.5 TWh/year of electricity. We have calculated that within 50km of the Dapto substation there is the potential for 11 TWh of offshore wind generation if the location is restricted to 30-50km from shore, or 38 TWh of offshore wind generation with no restriction on distance from shore.
For New South Wales, we selected three possible sites: one near the capital city Sydney with high electricity demand and two at existing working harbours with strong high-voltage interconnection points (Newcastle to the north and Port Kembla to the south of Sydney). All sites are at depths over 100 m, representing opportunities for floating technologies only.
Table 13: Key results: New South Wales – Newcastle.
State NSW
Location Type Installed Capacity Generation Capacity
FactorCF increase (Base +25km)
[MW] [MWh/a] %
Newcastle Offshore Wind (+ 25 km) 4,500 15,229,447 38.6
Newcastle Offshore Wind (+ 50 km) 4,500 17,232,043 43.7 5.1
Offshore Wind (+ 100 km)
Goulburn Onshore Wind 9,000 24,805,410 31.5
Darlington Point Solar Farm
Solar PV 10,000 17,273,517 19.7
NSW total 15,000 74,540,417 Supply (1) 106%
(1) based on demand FY 2015/2016
Peak Load [MW]
Demand [MWh/a]
Average Load [MW]
NSW - 2015 NEM-NSW 13,459 70,097,989 8,002
Onshore Wind Solar Photovoltaic
Annual per MW
Correlation Annual per MW
Correlation
Additionality [MWh/a] [%]
Offshore Wind (+ 25 km) 628.2 31.74% 1,657 -14.73%
Offshore Wind (+ 50 km) 1073.2 31.22% 2,102 -14.05%
Offshore Wind (+ 100 km)
Note: On- and Off-shore wind capacity factors are presented for winds at 100-m hub height. Offshore wind allows larger turbines (typical hub height 150-m). Capacity factors can be expected to be up to ~5% greater at 150-m, depending on local resource and technology used.

53 Offshore Wind Energy in Australia
State NSW
Location Type Installed Capacity Generation Capacity
FactorCF increase (base +25km)
[MW] [MWh/a] %
Sydney Offshore Wind (+ 25 km) 9,000 28,592,450 36.3
Offshore Wind (+ 50 km)
Offshore Wind (+ 100 km)
Goulburn Onshore Wind 9,000 24,805,410 31.5
Darlington Point Solar Farm
Solar PV 10,000 17,273,517 19.7
NSW total 15,000 70,671,377 Supply (1) 101%
(1) based on demand FY 2015/2016
Peak Load [MW]
Demand [MWh/a]
Average Load [MW]
NSW - 2015 NEM-NSW 13,459 70,097,989 8,002
Onshore Wind Solar Photovoltaic
Annual per MW
Correlation Annual per MW
Correlation
Additionality [MWh/a] [%]
Offshore Wind (+ 25 km) 420.8 32.68% 1,450 -11.49%
Offshore Wind (+ 50 km)
Offshore Wind (+ 100 km)
Goulburn was chosen as the reference location for onshore wind while the Darlington Point Solar Farm was chosen for solar power generation. Both locations already host utility scale power generation plants.
The location of the solar farm is 600 km west of Sydney and enjoys excellent solar resources with around 1700 full load hours per year. The onshore wind farm has an average to good wind resource with a capacity factor of approximately 31%.
The best of the offshore wind resources of the three sites considered is seen at Newcastle, where capacity factor exceeds 39% (44% 50km offshore), with the lowest correlation to the onshore wind resource (31%), and out of phase with solar PV. Sydney and Port Kembla also present good resource, with similar phasing benefits. The narrowness of the NSW coast limits the accessibility to this resource to floating systems, but offers immense opportunity proximal to Australia’s largest energy demand. Existing infrastructure includes not only a strong transmission grid, but highly developed port facilities, steel mills, fabrication and manufacturing facilities and a skilled workforce.
The current actual peak load of New South Wales is at around 13.5 GW. The modelled total installed capacity of all variable power generation plants is 28 GW, including 10 GW solar, 9 GW onshore wind and 9 GW offshore wind.
Table 14: Key results: New South Wales - Sydney.
Note: On- and Off-shore wind capacity factors are presented for winds at 100-m hub height. Offshore wind allows larger turbines (typical hub height 150-m). Capacity factors can be expected to be up to ~5% greater at 150-m, depending on local resource and technology used.

54Offshore Wind Energy in Australia
State NSW
Location Type Installed Capacity Generation Capacity
FactorCF increase (base +25km)
[MW] [MWh/a] %
Port Kembla Offshore Wind (+ 25 km) 9,000 27,218,045 34.5
Offshore Wind (+ 50 km)
Offshore Wind (+ 100 km)
Goulburn Onshore Wind 9,000 24,805,410 31.5
Darlington Point Solar Farm
Solar PV 10,000 17,273,517 19.7
NSW total 15,000 69,296,972 Supply (1) 99%
(1) based on demand FY 2015/2016
Peak Load [MW]
Demand [MWh/a]
Average Load [MW]
NSW - 2015 NEM-NSW 13,459 70,097,989 8,002
Onshore Wind Solar Photovoltaic
Annual per MW
Correlation Annual per MW
Correlation
Additionality [MWh/a] [%]
Offshore Wind (+ 25 km) 268.1 35.46% 1,297 -5.96%
Offshore Wind (+ 50 km)
Offshore Wind (+ 100 km)
Table 15: Key results: New South Wales – Port Kembla.
Note: On- and Off-shore wind capacity factors are presented for winds at 100-m hub height. Offshore wind allows larger turbines (typical hub height 150-m). Capacity factors can be expected to be up to ~5% greater at 150-m, depending on local resource and technology used.
Figure 24 presents two examples of generation curves from solar photovoltaic, onshore wind and offshore wind. The utility scale solar PV plant and the onshore wind farm are located further away from the selected offshore wind location in Newcastle. Rooftop PV (yellow), Utility scale PV (orange), Onshore wind (turquoise) and Offshore wind (at distances offshore of 25, 50 and 100 km shown with different shades of blue) are all represented. The darker the blue, the further away from the coast. The upper panel displays a week with the lowest variable power generation, and the lower panel displays the week with the highest production during the simulated year. Offshore and onshore wind generation display low correlation, and offshore wind is seen to continue generating during periods when onshore wind is not available. Throughout the year, wind generation f ills the solar production gap during nights with a high certainty and increases security of supply and reduces the need for electricity storage.

55 Offshore Wind Energy in Australia
Figure 24: Newcastle: Generation of 10 GW solar, 9 GW onshore wind and 9GW offshore wind compared to NSW electricity demand for a sample week of maximum and minimum renewable energy production.
4.4.4 Queensland
Offshore wind in Queensland offers similar advantages as available in NSW, via proximity to existing grid infrastructure along the coast that has potential to be underutilised in scenarios of future coal power plant closure. It also presents a less variable renewable resource able to balance the issue of high solar penetration creating negative demand during the day and the impacts this has on night-time supply. Queensland offers the largest resource that is both near to grid infrastructure and in waters less than 50m deep, allowed f ixed foundation turbines to be used.

56Offshore Wind Energy in Australia
The two analysed offshore wind locations are both in close proximity to existing energy infrastructure: Maroochydore at the Sunshine Coast 100km north of Brisbane has a transmission substation which is located close to the coastline. The Tarong North Power Station – a 443 MW coal f ired power station is about 180 km west of the suggested offshore wind location.
The second location is off the coast of Gladstone, which is home to Queensland’s largest coal-f ired power stationas well as an energy intensive alumina ref inery and chemicals industry. It is a well developed port with signif icant coal and LNG exports.
State Qld
Location Type Installed Capacity Generation Capacity
FactorCF increase (base +25km)
[MW] [MWh/a] %
Maroochydore Offshore Wind (+ 25 km) 2,000 4,152,297 23.7
Maroochydore Offshore Wind (+ 50 km) 2,000 6,308,788 36.0 12.3
Maroochydore Offshore Wind (+ 100 km)
Coopers Gap Wind Farm Onshore Wind 6,000 16,209,913 30.8
Daydream Solar Farm Solar PV 7,000 12,827,956 20.9
Qld total 15,000 39,498,954 Supply (1) 73%
(1) based on demand FY 2015/2016
Peak Load [MW]
Demand [MWh/a]
Average Load [MW]
QLD- 2015 9,094 54,060,749 6,171
Onshore Wind Solar Photovoltaic
Annual per MW
Correlation Annual per MW
Correlation
Additionality [MWh/a] [%]
Offshore Wind (+ 25 km) -625.5 48.44% 244 -9.54%
Offshore Wind (+ 50 km) 452.7 46.92% 1,322 -11.19%
Offshore Wind (+ 100 km)
Table 16: Key results: Queensland – Maroochydore.
Note: On- and Off-shore wind capacity factors are presented for winds at 100-m hub height. Offshore wind allows larger turbines (typical hub height 150-m). Capacity factors can be expected to be up to ~5% greater at 150-m, depending on local resource and technology used.
The Cooper’s Gap wind farm – 250 km north west of Brisbane - was chosen as the reference location for onshore wind. The Daydream Solar Farm - among the f ive largest solar farms in Queensland – is located in the north of the state west of Airlie Beach.
The solar farm has good to excellent solar resources with a 21% capacity factor. The onshore wind farm represents good to very good wind potential within Queensland with a 30% capacity factor.

57 Offshore Wind Energy in Australia
The difference between capacity factors of onshore and offshore wind are quite signif icant at Gladstone – in favour of offshore wind, with the offshore capacity factor exceeding 45% for the +50km and +100km locations, 50% greater than the reference onshore wind location.
Further to Gladstone possessing the larger offshore wind generation potential, Gladstone also exhibits lower correlation (~35%) with the onshore wind (and decorrelated with solar) generation potential, and thus better able to f ill renewable energy generation gaps.
The current peak load of Queensland is at around 9GW. The modelled total installed capacity of all variable power generation plants is 19 GW, including 7 GW solar, 6 GW onshore wind and 6 GW offshore wind.
State Qld
Location Type Installed Capacity Generation Capacity
FactorCF increase (base +25km)
[MW] [MWh/a] %
Gladstone Offshore Wind (+ 25 km) 2,000 6,260,370 35.7
Gladstone Offshore Wind (+ 50 km) 2,000 7,928,316 45.3 9.5
Gladstone Offshore Wind (+ 100 km) 2,000 7,976,724 45.5 9.8
Coopers Gap Wind Farm Onshore Wind 6,000 16,209,913 30.8
Daydream Solar Farm Solar PV 7,000 12,827,956 20.9
Qld total 15,000 51,203,279 Supply (1) 95%
(1) based on demand FY 2015/2016
Peak Load [MW]
Demand [MWh/a]
Average Load [MW]
QLD- 2015 9,094 54,060,749 6,171
Onshore Wind Solar Photovoltaic
Annual per MW
Correlation Annual per MW
Correlation
Additionality [MWh/a] [%]
Offshore Wind (+ 25 km) 428.5 36.45% 1,298 -10.32%
Offshore Wind (+ 50 km) 1262.5 33.54% 2,132 -12.23%
Offshore Wind (+ 100 km) 1286.7 34.76% 2,156 -13.35%
Table 17: Key results: Queensland – Gladstone.
Note: On- and Off-shore wind capacity factors are presented for winds at 100-m hub height. Offshore wind allows larger turbines (typical hub height 150-m). Capacity factors can be expected to be up to ~5% greater at 150-m, depending on local resource and technology used.
4.4.5 South Australia
South Australia presents abundant offshore wind resource that could be accessed to contribute to the ambitious 500% renewable energy by 2050 target set by the South Australian State Government. The South Australian Gulfs offer significant areas of high quality offshore wind resource in regions with water depths sufficiently shallow for fixed technology, that are also sheltered from the energetic southern ocean wave climate.

58Offshore Wind Energy in Australia
For South Australia, we have chosen only one possible offshore wind location, off the southern tip of Eyre Peninsula. The Lincoln Gap wind farm – 330 km north west of Adelaide, close to Port Augusta, - was chosen as the reference location for onshore wind. The Bungala Solar Farm – one of the largest solar farms in South Australia – close to the chosen wind farm, just north of Port Augusta was selected as the reference solar farm.
The solar farm has excellent solar resources with capacity factor of approximately 21%, while the onshore wind farm has one of the best wind resources available in Australia (excluding Tasmania) with capacity factor of approximately 41%.
However, the difference between capacity factors of onshore and offshore wind are still quite significant: the offshore site would produce with a capacity factor exceeding 47% – for each of the three distances from the shore – 20% higher than the onshore farm. The offshore wind farm also exhibits correlation to onshore production less than 46%, suggesting added value of providing generation when unavailable from onshore wind farms.
The current peak load of South Australia is at around 2.9 GW. The modelled installed capacity of all variable power generation plants is 5.25 GW, with 2.5 GW solar, 2 GW onshore wind and 0.75 GW offshore wind.
State SA
Location Type Installed Capacity Generation Capacity
FactorCF increase (base +25km)
[MW] [MWh/a] %
Adelaide Offshore Wind (+ 25 km) 250 1,025,811 46.8
Adelaide Offshore Wind (+ 50 km) 250 1,048,692 47.9 1.0
Adelaide Offshore Wind (+ 100 km) 250 1,064,095 48.6 1.7
Lincoln Gap Wind Farm Onshore Wind 2,000 7,172,521 40.9
Bungala Solar Power Project
Solar PV 2,500 4,610,554 21.1
SA total 15,000 14,921,673 Supply (1) 121%
(1) based on demand FY 2015/2016
Peak Load [MW]
Demand [MWh/a]
Average Load [MW]
SA - 2015 2,855 12,367,695 1,412
Onshore Wind Solar Photovoltaic
Annual per MW
Correlation Annual per MW
Correlation
Additionality [MWh/a] [%]
Offshore Wind (+ 25 km) 517.0 46.06% 2,259 -8.84%
Offshore Wind (+ 50 km) 608.5 44.44% 2,351 -8.19%
Offshore Wind (+ 100 km) 670.1 40.46% 2,412 -7.03%
Table 18: Key results: South Australia – Adelaide.
Note: On- and Off-shore wind capacity factors are presented for winds at 100-m hub height. Offshore wind allows larger turbines (typical hub height 150-m). Capacity factors can be expected to be up to ~5% greater at 150-m, depending on local resource and technology used.

59 Offshore Wind Energy in Australia
4.4.6 Western Australia
At least three companies are seeking to develop offshore wind projects in Western Australia, attracted by the accessible high quality resource along the west and south-west coasts. OSW is viewed as a growth sector able to exploit the ocean engineering supply chain and expertise that is well established on the back of the WA oil and gas industry.
For Western Australia (WA), two possible offshore wind locations are selected: near the capital city Perth – the demand centre of WA which forms part of the South-West Integrated Systems (SWIS); and Karratha, one of the industrial harbours located in the Pilbara region, connected to the North-West Integrated Systems (NWIS). The Pilbara operates as an important iron ore mining region, with deep-water industrial harbours as well as offshore gas f ields. Karratha is an important mining location for iron ore and hosts production facilities for Ammonia as well as the base for the North West Shelf Natural Gas Project.
State WA
Location Type Installed Capacity Generation Capacity
FactorCF increase (base +25km)
[MW] [MWh/a] %
Perth Offshore Wind (+ 25 km) 600 2,361,781 44.9
Perth Offshore Wind (+ 50 km) 600 2,605,816 49.6 4.6
Perth Offshore Wind (+ 100 km) 600 2,726,611 51.9 6.9
Collgar Wind Farm Onshore Wind 1,800 6,572,899 41.7
Merredin Solar Farm Solar PV 3,000 5,562,617 21.2
WA total 15,000 19,829,724 Supply (1) 107%
(1) based on demand FY 2015/2016
Peak Load [MW]
Demand [MWh/a]
Average Load [MW]
SWIS- 2015 3,779 18,511,134 2,113
Onshore Wind Solar Photovoltaic
Annual per MW
Correlation Annual per MW
Correlation
Additionality [MWh/a] [%]
Offshore Wind (+ 25 km) 284.7 52.51% 2,082 -24.62%
Offshore Wind (+ 50 km) 691.4 50.55% 2,489 -22.28%
Offshore Wind (+ 100 km) 892.7 47.73% 2,690 -18.12%
Table 19: Key results: Western Australia – Perth.
Note: On- and Off-shore wind capacity factors are presented for winds at 100-m hub height. Offshore wind allows larger turbines (typical hub height 150-m). Capacity factors can be expected to be up to ~5% greater at 150-m, depending on local resource and technology used.
The Collgar Wind Farm has been chosen as the reference location for onshore wind, with good to excellent wind resources with a capacity factor of approximately 42%. The Collgar wind farm is 275 km east of Perth.

60Offshore Wind Energy in Australia
With a capacity factor over 21%, the Merridin Solar Farm which is located 250 km east of Perth, has an excellent solar resource. The solar farm is used as a reference solar power plant for Western Australia. Out of the two analysed locations, Perth has the best offshore wind potential with an estimated capacity factor of 45% (+25km), 50% (+50km) and 52% (+100 km). Those excellent conditions are among the best of all analysed sites. In comparison to Perth, the offshore wind data for Karratha displays a lesser resource, with capacity factors of approximately 32%, similar to onshore resources in the region, which have been examined by the Asian Renewable Energy Hub, of about 34%. A Perth offshore wind farm could deliver electricity to the energy intensive alumina ref ineries which are located south of Perth and help replacing the planned closure of the Collie coal power station. At both sites, we see correlation between on- and off-shore wind to be relatively low, at around 50%, pointing to an opportunity for off-shore wind to f ill gaps when onshore wind generation would not be available.
The South West Interconnected System (SWIS) grid does not cover the whole of Western Australia but only the south western tip of the state spanning from Kalgoorlie to Perth and from Albany to Kalbarri. Karratha is 1000 km north of the most northern point of the SWIS grid, and constitutes part of the NWIS grid. The peak load of SWIS grid is currently at 3.7 GW. The modelled installed capacity of all variable power generation plants is 6.6 GW, including 3 GW solar, 1.8 GW onshore wind and 1.8 GW offshore wind. The peak load of the NWIS grid is currently 480 MW, so the modelled total installed capacity of 6.6 GW generates about 340% of NWIS demand.
State WA
Location Type Installed Capacity Generation Capacity
FactorCF increase (base +25km)
[MW] [MWh/a] %
Karratha Offshore Wind (+ 25 km) 100 287,642 32.8
Karratha Offshore Wind (+ 50 km) 100 286,145 32.7 -0.2
Karratha Offshore Wind (+ 100 km) 100 274,896 31.4 -1.5
Pilbara wind (proposed hub)
Onshore Wind 180 533,083 33.8
Gudai Darri solar farm Solar PV 300 574,890 21.9
WA total 15,000 1,956,656 Supply (1) 347%
(1) based on demand FY 2015/2016
Peak Load [MW]
Demand [MWh/a]
Average Load [MW]
NWIS-2015 117 563,812 58
Onshore Wind Solar Photovoltaic
Annual per MW
Correlation Annual per MW
Correlation
Additionality [MWh/a] [%]
Offshore Wind (+ 25 km) -85.2 53.54% 960 -4.13%
Offshore Wind (+ 50 km) -100.1 50.07% 945 -1.12%
Offshore Wind (+ 100 km) -212.6 51.88% 833 3.75%
Table 20: Key results: Western Australia – Karratha.
Note: On- and Off-shore wind capacity factors are presented for winds at 100-m hub height. Offshore wind allows larger turbines (typical hub height 150-m). Capacity factors can be expected to be up to ~5% greater at 150-m, depending on local resource and technology used.

61 Offshore Wind Energy in Australia
4.5. Offshore Wind diversifying renewable supply
In the previous sections, we have presented the hourly correlation of potential offshore wind electricity generation with electricity generation from nearby reference onshore wind farms and solar PV farms. Correlation f igures for each site are summarised in Table 21 below. This is a measure of how offshore wind could f ill gaps in supply provided by existing renewable energy farms at times that offshore wind is generating electricity but onshore wind and solar generation are not. A high correlation of 100% means that the same power is generated at the same times, but lower correlation f igures indicate that offshore wind at that site will generate power at different times to the onshore reference sites. A negative correlation f igure (for example –10%) such as is displayed for most solar sites means that availability of wind and solar resources are out of phase, such that availability of one counters unavailability of another. However, this relation is low. This diversif ication of supply offers another potential benefit of adding offshore wind to Australia’s renewable energy mix, in addition to the high capacity factor, large scale, and location near large energy loads and existing transmisson.
Location 25km 50km 100km
Georgetown (Tasmania) 81% 76% 73%
Hobart (Tasmania) 49% 45% -
Latrobe (Victoria) 39% 36% 36%
Portland (Victoria) 82% 79% -
Newcastle (NSW) 32% 31% -
Sydney (NSW) 33% - -
Port Kembla (NSW) 36% - -
Maroochydore (QLD) 48% 47% -
Gladstone (QLD) 37% 34% 35%
Adelaide (SA) 46% 44% 41%
Perth (WA) 53% 51% 48%
Karratha (WA) 54% 50% 51%
Table 21: Correlation of offshore wind with onshore wind at selected sites examined in this study. (Close to electrical substations, at 25, 50, 100km offshore and in depths of less than 1000m)
Another way to look at the correlation benefit is to compare the contribution of all three energy sources at each of the assessed locations. In Figure 25, we show the percentage of the year that offshore wind, onshore wind, and solar PV operate at capacity greater than 50%, while the other technologies operate at low capacity (less than 25%). The f igures show the extent to which weather and solar patterns overlap and complement each other in a distributed energy system. For example, in all cases solar and wind provide their strongest power at different times of the day and complement each other (consistent with low negative correlations observed). In a number of locations, especially Newcastle, Gladstone, Sydney, Port Kembla, Latrobe, and Georgetown, offshore wind operates at high capacity for substantial periods of time (7.3-11.2% of the year), when other sources, including onshore wind and solar, are operating at low capacity. In contrast, at Portland in western Victoria, where we see an excellent offshore wind resource with offshore wind operating at high capacity for a large fraction of the year (36% of the year), the availability corresponds closely in time with periods when onshore wind at the Victorian 420 MW MacArthur wind farm is also operating at high capacity, with offshore wind f illing ‘gaps’ for only 3% of the year.

62Offshore Wind Energy in Australia
Generally, the larger the Blue portion of the diagram, the greater potential benefit that can be offered by offshore wind in a diversif ied and distributed renewable generation system.
Here, we investigate pairings with only existing onshore renewable energy generation. Further studies are needed to determine the importance of these hours of unique contribution of offshore wind to the energy system, with consideration of availability relative to other renewables projects in the pipeline. Furthermore, investigation of availability relative to demand in each region needs investigation. In any case, they are likely to reduce the need for energy storage, which is a signif icant challenge in a renewable energy system.
4.6. Summary - Contribution of Offshore Wind to a Renewable Energy System
In this section we have analysed the magnitude and temporal variability of the offshore wind resource for several locations around the country, and the value of offshore wind to meet the electrical demand load, given the context of high penetration of other terrestrial based renewable technologies. To summarise:
∆ Australia has excellent offshore wind resources which will be complementary to utility scale solar and onshore wind - although the complementarity varies by location. Offshore wind offers advantages as a distributed variable renewable energy source amongst other technologies.
∆ The low correlation between the estimated times of electricity generation from offshore wind and solar power plant offers additional benefits to security of supply. Offshore wind tends to generate more electricity outside day light hours – when solar power plants do not operate.Good to excellent offshore wind locations exist at strategic locations. These include sites where coal f ired power stations are scheduled for closure (near Newcastle), near major coal export ports (e.g., Gladstone, Port Kembla and Newcastle), and in centres for the offshore oil and gas industry (e.g., Perth).
∆ Heavy industry has been historically developed near power stations, meaning that excellent offshore wind is also located close to areas of large industrial loads, including Port Kembla, Newcastle, Gladstone, and south of Perth.
∆ The entire southern coastline from Perth (WA) to Latrobe (VIC) has excellent offshore wind resources which operate near baseload hours (not in full load mode)
∆ Our analysis suggests that offshore wind is likely to generate power at times when onshore wind generated power is not. It should be noted that this assessment uses public domain, relatively coarse (~31km resolution) model data. Higher resolution information, either observed or downscaled simulations, are required to properly resolve the phasing advantages of offshore wind relative to onshore wind. This critical information is necessary for national system planning, and can be expensive to gather or produce. It should not be left to individual companies to collect.
∆ Offshore wind offers immense opportunity for green hydrogen production for export.
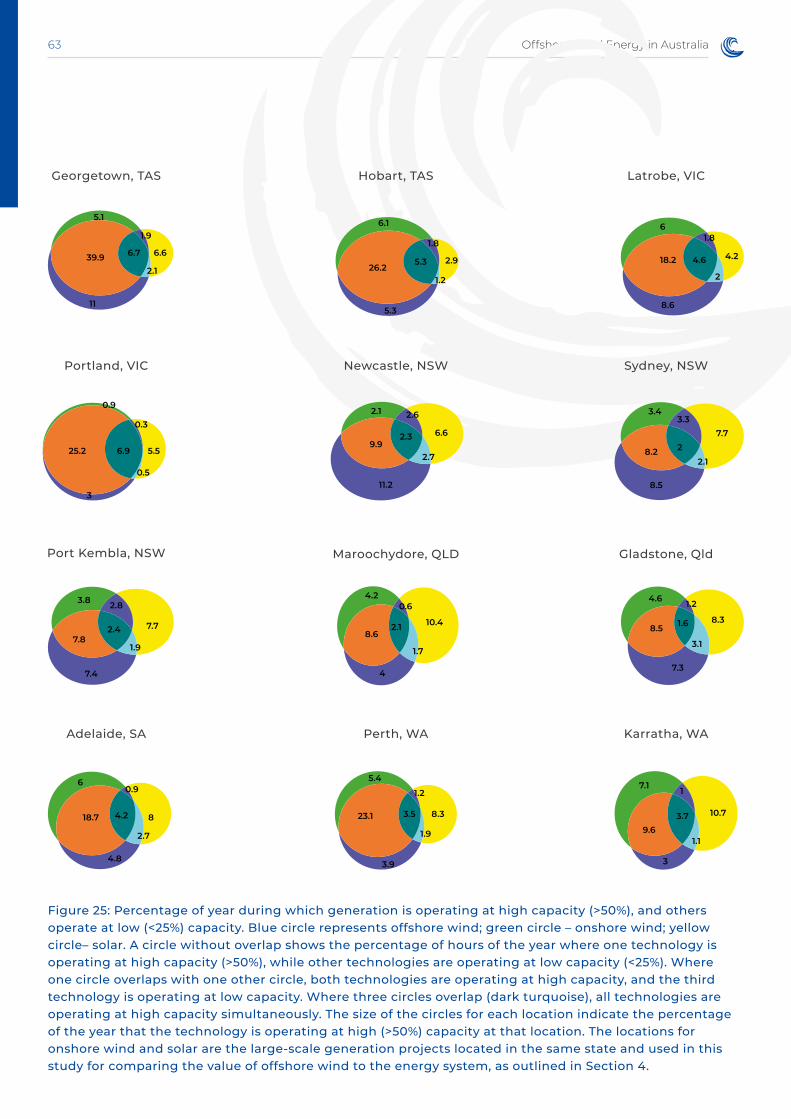
63 Offshore Wind Energy in Australia
Figure 25: Percentage of year during which generation is operating at high capacity (>50%), and others operate at low (<25%) capacity. Blue circle represents offshore wind; green circle – onshore wind; yellow circle– solar. A circle without overlap shows the percentage of hours of the year where one technology is operating at high capacity (>50%), while other technologies are operating at low capacity (<25%). Where one circle overlaps with one other circle, both technologies are operating at high capacity, and the third technology is operating at low capacity. Where three circles overlap (dark turquoise), all technologies are operating at high capacity simultaneously. The size of the circles for each location indicate the percentage of the year that the technology is operating at high (>50%) capacity at that location. The locations for onshore wind and solar are the large-scale generation projects located in the same state and used in this study for comparing the value of offshore wind to the energy system, as outlined in Section 4.
Georgetown, TAS
Portland, VIC
Port Kembla, NSW
Adelaide, SA
Hobart, TAS
Newcastle, NSW
Maroochydore, QLD
Perth, WA
Latrobe, VIC
Sydney, NSW
Gladstone, Qld
Karratha, WA

64Offshore Wind Energy in Australia
One of the objectives of the Paris Agreement is ‘a just transition of the workforce’, that is the creation of ‘decent work and quality jobs’ for coal, oil and gas workers as the energy system shifts away from fossil fuels. The scale of global development in offshore wind could translate into major employment growth, which is creating an alternative source of jobs for offshore oil and gas workers (Jones, 2017). For example, the Global Wind Energy Council (GWEC) estimates 17.3 direct jobs are created in Offshore Wind per MW of generation capacity over the lifetime of the project (GWEC, 2020), equating to just under 900,000 additional jobs in offshore wind globally by 2024 (based on 51 GW of additional installed capacity). A total of 205 GW of global offshore wind is projected to be installed by 2030, based on projects currently in planning stages (GWEC, 2020).
What role can offshore wind play in supporting a just transition for Australian coal, oil and gas workers? Answering this question depends on the volume, type and location of jobs – in other words, to what extent will offshore wind create the ‘right type’ of jobs in the ‘right places’, and what level of support will be in place to assist workers in making a transition? In Australia, there are approximately 45,000 - 55,000 workers in coal mining and power generation (Briggs et. al. 2020) and 25,000 workers in oil and gas exploration and production.
As a new sector, there is relatively little information on employment in offshore wind energy. Consequently, this study uses available secondary international data to provide a preliminary estimate of the volume and types of employment that could be created by offshore wind in Australia. Reflecting the uncertainty, there are several scenarios used:
∆ Employment factors: the study uses the employment factors from IRENA (2019) and an averaged employment factor from other projects and studies in the OECD to provide a range from higher (IRENA) to lower (OECD).
∆ Local manufacturing share: one of the determinants of local employment will be the development of manufacturing and supply chain providers. The Australian share of manufacturing for renewable energy is currently very low – Briggs et. al. (2020) estimated that the local share of supply chain employment for on-shore wind is around 5-10 per cent. A second scenario has been developed, assuming there is a coordinated industrial policy to increase local supply chain involvement. Using the targets and local content of comparable jurisdictions in the UK as a guide, 25 per cent local content is used here as a stretch target.
∆ Domestic and hydrogen-linked growth: if the costs continue to fall, offshore wind could develop as a source of electricity for Australian domestic electricity markets (the National Electricity Market or South Western Interconnected System). However, Australia is blessed with abundant, high quality on-shore solar and wind resources which will dominate new generation in the medium-term at least. The larger opportunity for offshore wind energy is under ‘energy superpower’ scenarios, where mass electrif ication and the growth of hydrogen creates very large increases in demand for electricity production.1 In particular, offshore wind could emerge as a strategic resource for offshore hydrogen production or a source of electricity for hydrogen production for port-based export facilities and local heavy industry (e.g. ‘green steel’). Offshore wind is more likely to be developed under scenarios where large volumes of electricity are required for hydrogen production. Consequently, the development scenario used assumes some production for domestic electricity markets (6 GW) from 2025 – 2040 but that offshore wind provides one-quarter of hydrogen in the high-scenario in the National Hydrogen Strategy (27 GW).
5. Offshore Wind Employment: What Role can it Play in a Just Transition for the Coal, Oil and Gas Workforce?
1 It should be recognised that presently offshore green hydrogen is substantially more expensive than grey hydrogen production - four times, according to Rystad, 2021) - but the economies of scale that can be achieved through offshore wind presents create potential for signif icant cost reduction.

65 Offshore Wind Energy in Australia
5.1. Prof ile of Australian Fossil Fuel Workforce
Australia is one of the largest global producers and exporters of fossil fuels. In the context of the national workforce of over 12 million, coal, oil and gas are not a large-scale source of jobs but the workforce and regions in which the industry is located are vulnerable to structural change. The starting point for this analysis is a prof ile of the fossil fuels workforce to understand the scope for transitioning to offshore wind employment.
5.1.1. Coal Mining and Generation
Currently, there are around 40,000 - 50,000 jobs in coal mining and just over 5,000 jobs in coal-f ired power stations. As around 75 per cent of coal is produced for export, there are just over 10,000 jobs in the domestic coal sector (ABS, 2016; ABS, 2021b). Most of these jobs are in a few regions such as the Bowen Basin (Queensland), Hunter Valley (NSW) and the Latrobe Valley (Victoria). The pay rates for the coal sector are high but the age and occupational prof ile of the workforce combined with regional concentration renders much of the workforce vulnerable to structural change. Over 60 per cent of the power station workforce (in green) are professionals, trades and technicians (Figure 24). However almost half the coal mining workforce (in blue) are either a semi-skilled machine operator (e.g. drillers) or truck drivers which are harder to transfer to other industries.
Figure 26: Coal Mining and Fossil Fuel Generation, Occupational Prof ile. (%)

66Offshore Wind Energy in Australia
Figure 27: Coal Mining and Fossil Fuel Generation, Age Profile. (%)
Table 22: Employment in Oil and Gas Extraction, Total.
Consequently, whereas voluntary early retirement packages have played an important role in transition packages overseas and could do so for Australian coal-f ired power stations, their role will be comparatively limited for Australian coal miners: alternative work will need to be found for a higher proportion of the workforce.
Note: as there is significant volatility in the quarterly series, an average of employment in each quarter is used.
5.1.2. Oil and Gas Extraction
Like coal, oil and gas extraction is a leading source of export revenue for the Australian economy but is not a large employer. Based on the ABS Labour Force series, employment in oil and gas extraction has fluctuated between 21,000 to 28,000 in recent years.
Year Average number of oil and gas workers (onshore and offshore)
2016 21,500
2017 21,400
2018 28,200
2019 28,200
2020 25,200
The power station workforce (in green) is ageing; 40 per cent of the workforce is over 50 years of age (Figure 27). By contrast, over 40 per cent of the coal mining workforce (in blue) are younger workers (25-44 years) and close to half the workforce is under 40 years of age.

67 Offshore Wind Energy in Australia
The ABS does not distinguish between the offshore and onshore oil and gas industry but the workforce size by state gives some indication (Table 23). State based employment are volatile from year-to-year based on construction activity, and the higher employment in Queensland and Western Australia reflect the status of major projects underway at the time of the 2016 census.
Nonetheless, Western Australia and Victoria have an offshore industry whereas NSW and Queensland do not. The offshore industry is therefore likely to be less than 10,000 workers. A significant portion of the offshore oil and gas workforce travels to work from other states, or has moved to WA from other states, especially Victoria. Victoria is where the offshore oil and gas industry was established in Australia.
The National Petroleum Safety and Environmental Management Authority (NOPSEMA) keep statistics on the total hours worked offshore in the oil and gas industry (Table 24, NOPSEMA, 2021). These include workers on facilities, but not seafarers who may be working on vessels that supply the facilities, or managers, professionals, or administrative staff working onshore. Whilst many of the managers and professionals that make up over 55 per cent of the workforce would be located on-shore, NOPSEMA data suggests the offshore oil and gas workforce would generally be under 10,000 in recent years.
Source: (NOPSEMA, 2021). The workforce is estimated on the basis of an equal time roster and 12 hour shift: Working 26 weeks per year, 7 days per week, 12 hours per day = 2,184 hours worked per year for each worker. In 2020 workers are likely to have worked longer hours as a result of roster changes extending the time each worker was on a facility. Note: the figures do not include the office-based workforce or seafarers servicing oil and gas facilities.
Table 23: Employment in Oil and Gas Extraction in 2016, by State.
Table 24: Total hours worked in offshore oil and gas, and estimate of equivalent offshore workforce.
State Employment
NSW 750
Victoria 1800
Queensland 5900
Western Australia 8100
Year Hours worked offshore Offshore Workforce
2016 9,783,492 4,480
2017 12,780,158 5,852
2018 16,935,323 7,754
2019 11,572,480 5,299
2020 8,470,795 3,879
Source: ABS 2016 Census

68Offshore Wind Energy in Australia
Based on the 2016 ABS census, the oil and gas workforce is highly skilled. Almost one-in-two workers are either a manager or a professional. Just over quarter of the workforce is a trade and technician and just under one-in-six are machine operators or labourers.
Using more disaggregated data from the ABS census, the oil and gas sector employs a high proportion of engineers, office professionals (finance, IT, legal etc), environmental professionals, chemical gas, petroleum and power generation plant operators, metals and electrical trades, administrative staff and drillers (see Appendix B for a more detailed profile).
Like the coal mining workforce, there is a high concentration of younger workers who will require alternative employment as the sector declines.
Figure 28: Oil and Gas Extraction, Occupational Composition. (1-digit) (%)
Figure 29: Oil and Gas Extraction, Age Profile (%). Australian Census. (ABS 2016)

69 Offshore Wind Energy in Australia
5.2. Offshore Wind Employment Including National Hydrogen Strategy
5.2.1. Methodology
Offshore wind is a new industry and publicly available data on the level and type of employment is relatively limited. For the purposes of developing a broad estimate to understand the job creation potential for Australia, this study has undertaken these key steps:
Each of these methodological steps are detailed below.
3Job-years are used for construction and manufacturing to reflect the workforce for the duration. For example, with an employment factor of 1.98 job-years/MW for a 1 GW project built over 2-years, that is equivalent to 990 workers employed full-time over the 2-year period. Manufacturing is assumed to occur over a 3-year period. With an employment factor of 0.2/MW for O&M, this is equivalent to 200 workers employed annually for one 1GW.
Employment Factors
A literature review was undertaken to develop employment factors for the development/construction (FTE job-years/MW), operations & maintenance (FTE/MW) and manufacturing phases (FTE job-years/MW). The employment factor for the OECD national studies is somewhat lower than the IRENA employment factor.
∆ Generating an employment factor for project phases, based on international literature, either job-years/MW (development/construction, and manufacturing phases) to jobs/MW (operations & maintenance). A ‘high’ employment factor is used based on an estimate by the International Renewable Energy Agency and a ‘low’ employment factor is used based on a review of recent OECD studies and project data.
∆ The employment factor is applied to a project development scenario from 2025 until 2050 under which 27 GW is installed to generate an estimated range of potential employment. Two sensitivities have been used for local manufacturing share to reflect the different outcomes possible.
∆ To assess the scope for a transfer of workers from the oil and gas and coal sector to offshore wind, occupational employment analysis is undertaken using primary data for employment classif ications for the major occupational groupings such as professionals, managers, trades and technicians etc (or the 1-digit level in the Australian New Zealand Standard Classif ication of Occupations). Data limits prevent a more detailed analysis but secondary sources on the job types and international transition experiences are also analysed.
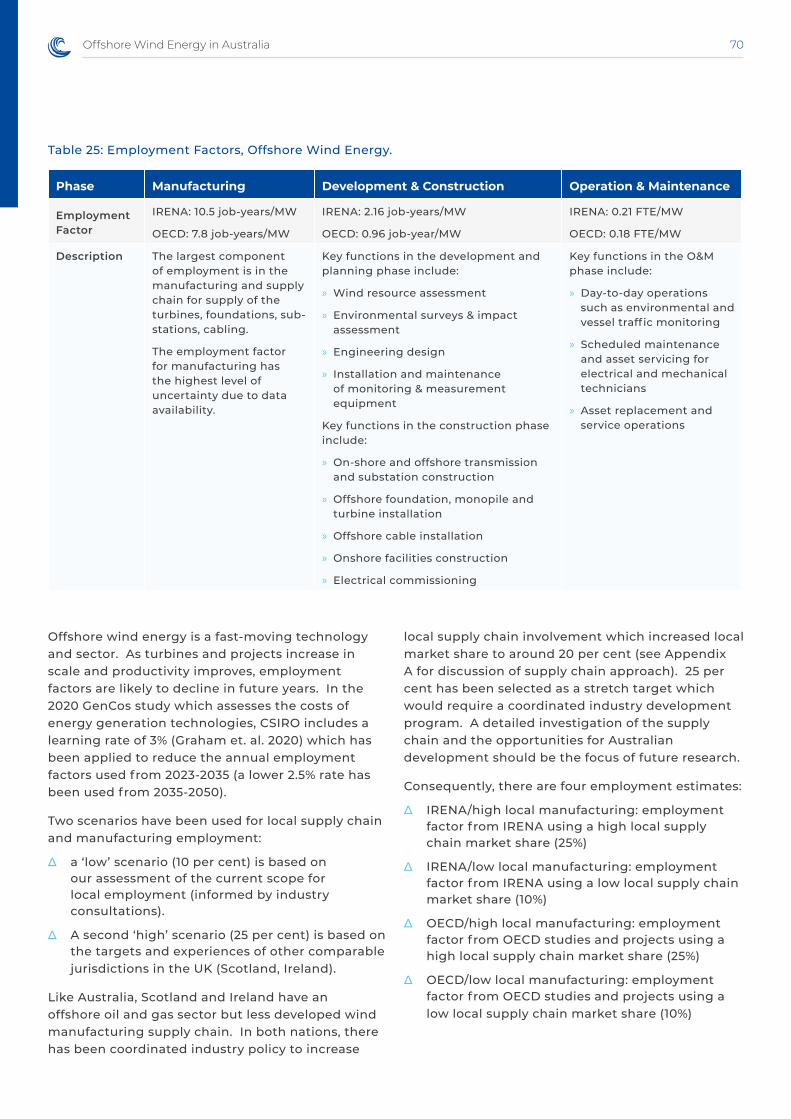
70Offshore Wind Energy in Australia
Table 25: Employment Factors, Offshore Wind Energy.
Phase Manufacturing Development & Construction Operation & Maintenance
Employment Factor
IRENA: 10.5 job-years/MW
OECD: 7.8 job-years/MW
IRENA: 2.16 job-years/MW
OECD: 0.96 job-year/MW
IRENA: 0.21 FTE/MW
OECD: 0.18 FTE/MW
Description The largest component of employment is in the manufacturing and supply chain for supply of the turbines, foundations, sub-stations, cabling.
The employment factor for manufacturing has the highest level of uncertainty due to data availability.
Key functions in the development and planning phase include:
» Wind resource assessment
» Environmental surveys & impact assessment
» Engineering design
» Installation and maintenance of monitoring & measurement equipment
Key functions in the construction phase include:
» On-shore and offshore transmission and substation construction
» Offshore foundation, monopile and turbine installation
» Offshore cable installation
» Onshore facilities construction
» Electrical commissioning
Key functions in the O&M phase include:
» Day-to-day operations such as environmental and vessel traff ic monitoring
» Scheduled maintenance and asset servicing for electrical and mechanical technicians
» Asset replacement and service operations
Offshore wind energy is a fast-moving technology and sector. As turbines and projects increase in scale and productivity improves, employment factors are likely to decline in future years. In the 2020 GenCos study which assesses the costs of energy generation technologies, CSIRO includes a learning rate of 3% (Graham et. al. 2020) which has been applied to reduce the annual employment factors used from 2023-2035 (a lower 2.5% rate has been used from 2035-2050).
Two scenarios have been used for local supply chain and manufacturing employment:
∆ a ‘low’ scenario (10 per cent) is based on our assessment of the current scope for local employment (informed by industry consultations).
∆ A second ‘high’ scenario (25 per cent) is based on the targets and experiences of other comparable jurisdictions in the UK (Scotland, Ireland).
Like Australia, Scotland and Ireland have an offshore oil and gas sector but less developed wind manufacturing supply chain. In both nations, there has been coordinated industry policy to increase
local supply chain involvement which increased local market share to around 20 per cent (see Appendix A for discussion of supply chain approach). 25 per cent has been selected as a stretch target which would require a coordinated industry development program. A detailed investigation of the supply chain and the opportunities for Australian development should be the focus of future research.
Consequently, there are four employment estimates:
∆ IRENA/high local manufacturing: employment factor from IRENA using a high local supply chain market share (25%)
∆ IRENA/low local manufacturing: employment factor from IRENA using a low local supply chain market share (10%)
∆ OECD/high local manufacturing: employment factor from OECD studies and projects using a high local supply chain market share (25%)
∆ OECD/low local manufacturing: employment factor from OECD studies and projects using a low local supply chain market share (10%)

71 Offshore Wind Energy in Australia
Offshore Wind Development Scenario
The employment factors have been applied to a development scenario from 2025-2050 which includes a combination of projects developed to supply either domestic electricity markets or hydrogen production. The development scenario is not a forecast or the product of modelling – it is a hypothetical scenario used for illustrative purposes to estimate potential employment.
Under the development scenario, the dominant sector is offshore wind electricity generation for hydrogen production. Under the scenario, it is assumed there are three large offshore wind energy projects built to supply Australian electricity markets (the National Electricity Market and South-West Interconnected System), one in the mid-2020s and then other projects from 2030 onwards as global development reduces the costs of offshore wind. It is possible that dramatic development of offshore wind could play a larger role in local electricity production, especially via future floating wind projects. However, the more likely scenario and larger opportunity is that offshore wind develops to supply electricity for hydrogen production for domestic heavy industry and export facilities. The size of electricity requirements to supply hydrogen production could be very large – multiples of the current size of the National Electricity Market.
Current consumption for the National Electricity Market is approximately 200 terrawatt-hours. Under the scenarios used for the National Hydrogen Strategy, electricity demand for hydrogen production alone would grow to between 65 terrawatt-hours to over 900 terrawatt-hours – more than four times the current size of the national electricity market. These scenarios for the National Hydrogen Strategy do not include requirements for the electrif ication of transport or industry or domestic production for heavy industry. AEMO is currently developing an ‘energy superpower’ scenario for the next ISP with large-scale electricity requirements required for hydrogen production but also electrif ication. There are also larger scenarios under development such as the vision of the Australian Renewable Energy Agency for ‘1000% Renewable Energy’ (Miller, 2021).
Source: COAG Energy Council (2019: 87)
Year 2030 2050
Hydrogen: Energy of the Future
Hydrogen: Targeted Deployment
Electric Breakthrough
Hydrogen: Energy of the Future
Hydrogen: Targeted Deployment
Electric Breakthrough
Electricity Requirements (Twh)
19 3 3 912 188 65
Land requirements if using 100% on-shore renewable energy (square kilometres)
191 (solar)
1,234 (wind)
32 (solar)
209 (wind)
35 (solar)
209 (wind)
9,291 (solar)
60,160 (wind)
1,917 (solar)
12,415 (wind)
56 (solar)
363 (wind)
Equivalent offshore wind capacity (GW)
1.1 0.2 0.2 214.6 11.1 3.8
Table 26: National Hydrogen Strategy and Offshore Wind.

72Offshore Wind Energy in Australia
With electricity requirements of that scale, hydrogen produced by offshore wind directly or through the supply of electrolysers located in port facilities could play a signif icant role. The high scenario is equivalent to just under 215 GW of offshore wind capacity. For context, the 2020 ISP projected by AEMO involves construction of 26 – 50 GW of generation. Relying solely on onshore renewable energy for electricity generation of this scale is likely to have environmental, social and transmission build implications that would make diversif ication into offshore wind attractive. For the purposes of understanding the employment potential, a development scenario has assumed that builds out 27 GW of offshore wind energy from 2025 to 2050 which is just over 10 per cent of the requirements of the highest scenario.
5.2.2. Offshore Wind Energy: the Opportunity for Oil, Gas and Coal Workers to gain employment in the offshore wind industry
What is the scope for oil, gas and coal workers to gain employment in offshore wind? In the development scenario, offshore wind starts generating employment in the lead-up to construction commencing on the f irst project in 2025 and scales up through the early 2030s and especially the 2040s as Australia’s hydrogen production grows.
Note: employment declines sharply in 2050 because no further construction is assumed. Employment associated with de-commissioning or re-commissioning projects is also not included. Few projects will require recommissioning during this period.
Figure 29: Offshore Wind Employment, 2025-2050.

73 Offshore Wind Energy in Australia
Comparing the average annual employment under the four scenarios against the state-based workforce, the annual FTE created by offshore wind energy is higher than the current oil and gas workforce in NSW and Victoria. The average workforce is lower than the Queensland and WA oil and gas sectors but could still potentially be a meaningful source of alternative employment.
There is interest in the types of jobs that would be created, and what is the scope for workers from the oil, gas or coal sectors to f ill these jobs. The employment structure of oil/gas, coal and offshore wind is compared at a broad occupational group level below. Offshore wind has a similar proportion of trades and technicians and lower but meaningful volumes of managers and professionals than oil and gas. Offshore wind energy requires more machine operators and labourers than offshore oil and gas.
Source: ABS 2016 census for oil & gas, coal & gas power stations and coal mining. The occupational composition of offshore wind has been developed based on a recent survey undertaken by the Offshore Wind Council (2021)
Figure 30: Offshore Wind Employment (annual average), relative to Oil/Gas.
Figure 31: Occupational Employment Structure: Offshore Wind compared with Oil/Gas and Coal.

74Offshore Wind Energy in Australia
In the construction phase for offshore wind farms, the workforce primarily comprises a range of trades and technicians (e.g. electricians, wind farm technicians), machine operators and drivers (construction equipment operators, boat operators).
During the operational phase, there is a great mix across occupational types including engineers, wind technicians (electrical and mechanical), metalworkers, boat operators and operations managers.
Figure 32: Offshore wind occupational distribution: development phase. (BVG Associates, 2017)
Figure 33: Offshore wind occupational distribution: construction phase. (BVG Associates, 2017)

75 Offshore Wind Energy in Australia
A major UK study of offshore wind found there were three main pathways into the industry:
∆ Movers from other, technically-related industries (offshore industries, energy sector)
∆ Apprenticeships and graduates
∆ Movers with cross-sector skills (e.g. business / commercial, IT and data analytics, drone / ROV operators, etc.)
A range of studies have found signif icant movement has occurred from the offshore oil and gas workforce to offshore wind as they often hold the foundation skills required to work on offshore installation vessels, offshore platforms and the specialised knowledge on the environmental challenges associated with operating and maintaining offshore infrastructure (IRENA, 2018a).
A Scottish study found there was only 15 per cent of jobs for which there was no skills match. For around two-thirds of jobs, there was a ‘good’ or ‘some’ skills match including many of the professional jobs, construction and installation, electrical and mechanical trades and technicians, and subsea pipelines. For a range of administrative, quality, logistics and project management jobs there was ‘partial’ skills overlap which suggests they could also be transitioned with training.
Figure 34: Offshore wind occupational distribution: O&M phase. (BVG Associates, 2017)

76Offshore Wind Energy in Australia
Image Credit: Andrew Saunders © Equinor - Sheringham
Figure 35: Occupational Match between Offshore Oil and Gas and Offshore Wind Energy. (Friends of the Earth; Global Witness and Greener Jobs Alliance, 2019)

77 Offshore Wind Energy in Australia
6. Social, environmental and planning considerationsThe conventional wisdom was that Australia’s renewable energy transition could be met with onshore technology. However, as the scale of development increases, there are greater environmental or social considerations, such as community acceptance, environmental impacts climate risks or the use of agricultural land.
The acceptability of offshore wind in Australia is yet to be seriously tested, although the f irst project – the Star of the South – appears to have gained strong support. Experience in other jurisdictions would suggest that displacement of existing marine users, environmental interactions, and visual amenity will be issues of concern to the community if offshore wind is to progress in Australia. Internationally, offshore wind is a mature sector, and consequently there are considerable learnings from which Australia can benefit as it develops an offshore wind sector.
Offshore wind developments should also proceed in consultation with First Nations and Traditional Owners, and benefit them. The importance of empowering Indigenous leadership in oceans and coastal management is emphasised in the recent Future Earth Australia Sustainable Oceans and Coasts National Strategy 2021-2030 (Laubenstein Tayanah et al., 2021). Advice on how to ensure large scale renewable energy projects benefit First Nations and provide good working conditions to all workers is outlined in a recent report by the Australian Congress of Trade Unions (ACTU, 2020).
The growth of an offshore renewable energy industry as a ‘new’ marine industry has been a key driver for maritime spatial planning in those jurisdictions that growth has occurred (e.g., the North Sea, China). The production of offshore wind energy requires substantial allocation of space in the marine domain, and competing uses of that space, and potential environmental effects, are important factors in planning for growth of an offshore wind sector for Australia. With more than 10 offshore wind projects now at some level of development in Australia, the need for considered maritime spatial planning is increasingly important.
Australia's federated system adds complexity in the planning of its marine domain. OSW projects will typically span both Commonwealth and State jurisdictions. The Commonwealth regulatory framework for offshore clean energy projects has been under review since early 2020, and regulation and marine spatial planning for State waters varies by State.
The growth of an OSW industry has potential to impact on other uses of the marine space. Elsewhere, concerns have arisen regarding how an OSW sector interacts with other claims for use or protection of marine space, with particular consideration of shipping routes, f isheries (commercial and recreational), aquaculture, cables, offshore oil and gas installations and pipelines, as well as marine protected areas and other environmental and cultural considerations. These interactions can span strict exclusion (competing use of space) through to complementary applications (multiple use), with partial restrictions between sectors also seen.
At least one project, Cliff Head Offshore Wind off Geraldton, WA, seeks to build wind turbines in an offshore oil and gas lease, and make use of existing onshore and offshore gas infrastructure, potentially for the production of hydrogen (Pilot Energy, 2020). Ports developed for oil and gas and coal exports can be re-purposed for offshore renewables. Offshore platforms that have historically used generators powered by raw fuels or diesel can be re-powered using renewable energy. It is also possible that offshore wind and oil and gas developers could be in competition for use of maritime space, particularly in the Bass Strait and off West Australia.

78Offshore Wind Energy in Australia
In section 2, some general criteria were used to determine suitable sites for offshore wind. These criteria included a number of natural and technical conditions, including wind resource (wind speed), depth &/or seabed conditions, proximity to coast, and grid links and capacity.
Interactions with other sectors are important considerations, requiring further attention in an Australian context. Navigational safety is given precedent, with varying specif ications for siting OSW farms relative to shipping lanes being enforced, with f ixed or variable exclusion zones (of order 500m) applied. Fisheries is an important and well-established marine sector, and siting of OSW farms has created conflict with f ishers in other jurisdictions. In general, passive f ishing and recreational f ishing has been permitted in OSW zones, while trawling is prohibited, although exceptions exist. Aquaculture interactions with OSW vary between dedicated co-location objectives, permitted with restrictions, through to strict exclusions. Marine protected areas are typically excluded from OSW development, as presented in Section 2, however there have been exceptions dependent on the conservation objectives of the MPA.
Species protection has been a concern associated with offshore wind as it has grown internationally, with particular focus on seabirds and marine mammals. The collection of baseline environmental conditions are mandatory prior to licensing, as a requirement of their environmental impact assessment. The Star of the South project is currently fulf illing these requirements to adhere to the EPBC act. During construction and operations, mitigation measures (particularly associated with noise) and ongoing monitoring are typical requirements in other jurisdictions, to monitor and mitigate for any adverse ecological effects. Seabird and marine mammal habitat and migration pathways are key considerations in siting OSW farms to minimise impacts on sensitive species.
As a late adopter of offshore wind technology, Australia can benefit from improved learnings on the environmental effects of OSW farms. The evidence from long term monitoring suggests the most signif icant consequences of offshore wind farm construction and operation on marine mammal populations are associated with avoidance of construction noise (associated with piledriving for f ixed offshore foundations) and the structures themselves, rather than direct
mortality. Impact assessments should be made at the species population level, and situations where multiple farms are located within the home-range of a population should be considered for their cumulative effects. Long term monitoring of the effects of offshore wind farms on birds has guided development of recommended best practice measures for minimising these effects. These include avoiding key areas of conservation importance and sensitivity, grouping turbines to avoid alignment perpendicular to main flight paths or migration corridors, timing construction to avoid sensitive periods, and timing and routing maintenance trips to reduce disturbance (Bailey et al., 2014; Copping et al., 2020). Cumulative effects associated with adjacent OSW farms in the (now) densely developed North Sea is now becoming a concern (Gușatu et al., 2021). Environmental interactions in an Australian context remain unknown.
Visual amenity is an issue that arises in opposition to offshore wind. Visual impact assessments of offshore wind farms are important requirements of planning to minimise impacts on coastal character, scenery and views. The distance turbines are deployed offshore to minimise these impacts are typically about 30km offshore, but will vary dependent on the character of the site, e.g., (Scottish Natural Heritage, 2017).
Australia also has the opportunity to learn from various efforts to regulate the environmental effects of offshore wind. For example, Natural England has just released a review and updated recommendations from its experience after the construction of 10GW of offshore wind, with another 40GW in the pipeline. It recommends more integrated baseline monitoring and planning that aims to have offshore wind developments designed to create improved environments and biodiversity (Natural England, 2021).

79 Offshore Wind Energy in Australia
7. Conclusions & Recommendations
This report outlines the signif icant opportunity that exists for Australia in a promising offshore wind industry. Several offshore wind projects have been proposed for development for Australia, presenting substantial investment opportunities for the nation. The offshore wind opportunity for Australia has historically been poorly assessed in national energy planning. Here we argue that the rapid international growth of the sector and associated cost reductions necessitate a comprehensive reconsideration of offshore wind in these plans. We show that Australia possesses an immense offshore wind resource, that is close to demand, and will be able to utilise assets which may otherwise go underutilised once coal power station closures are realised. With emergence of floating offshore wind technologies, these resource advantages become even more accessible. The offshore resource is more consistent than terrestrial counterparts, offers a diversity of supply and is well suited to meeting Australia’s future energy demands. Finally, we show the opportunity for an Australian offshore wind sector workforce as a transition opportunity for the current skilled workforce that occupies the oil and gas, coal power, and coal mining sectors.
We issue the following recommendations across 5 themes:
1. ESTABLISHING A REGULATORY REGIME FOR OFFSHORE RENEWABLE ENERGY
(i) A regulatory regime for the development of offshore renewable energy in Commonwealth waters needs to be established.
A major barrier to investment and development of current offshore wind projects in Australia is that Australia currently does not have a regulatory framework to enable timely permitting and leasing decisions for offshore renewable energy. Consultation on a proposed regulatory framework for the Commonwealth Government has been occurring since early 2020. Given offshore wind projects will typically cross Commonwealth and State jurisdictions, consideration needs to be given in the framework on the ways to provide complementary processes for activities that occur in both Commonwealth and State waters.
Government targets for reducing emissions from electricity, for the electrif ication of other sectors and for building an integrated renewable energy system are also needed to create a clear understanding of the necessary planning, infrastructure, skills and workforce.
(ii) Marine allocation of space for offshore renewable energy projects should be considered.
With many OSW projects already in the development pipeline, Australia would benefit from proactive consideration, via Marine Spatial planning, to resolve potential conflicts in uses of the marine domain and ensuring it remains sustainably managed. This can help Australia meet its international commitments, such as Australia’s pledge through the High Level Panel for a Sustainable Ocean Economy to sustainably manage 100% of the ocean area under national jurisdiction by 2025.
80Offshore Wind Energy in Australia
2. OFFSHORE WIND SHOULD BE INCORPORATED INTO NATIONAL AND STATE ENERGY PLANNING
(iii) The Australian Energy Market Operator’s Integrated System Plan (ISP) should identify and evaluate offshore wind renewable energy zones, and review electricity generation cost assumptions for offshore wind.
Offshore wind was not included in the assessment of renewable energy resources used to design the current Renewable Energy Zones (REZs). Offshore wind should be included in the ISP’s cost-benefit analyses for the construction of new transmission and designation of new REZs. Offshore REZs in key locations (e.g. Bass Strait, Port Kembla, Newcastle, Gladstone, Perth) should be modelled to enable transparent comparison of relative costs of offshore wind against other technologies over time, including transmission, storage and grid connection requirements.
This project f inds that across all states, offshore wind has potential to provide a signif icant amount of energy at times that other renewable energy is not producing, along with higher capacity factors. This could impact on the requirement for energy storage and other aspects of system planning.
Current proposed electricity generation cost assumptions (GenCost) for the ISP assign current capital costs of offshore wind projects ~3 times greater than that of onshore wind, reducing to approximately 2.7 times for 2050 commissioning (Graham et al., 2021). This is in contrast to the global weighted mean capital cost projections reported by IRENA, where offshore wind capital costs are projected to be approximately 2.3 times onshore wind in 2050 (IRENA, 2019), and substantially greater that projected in the UK, where offshore wind is a mature sector, costs are better understood, and offshore wind construction costs are projected to be approximately 1.2 times that of onshore wind by the mid-2030’s (BEIS, 2020). Owing to the higher quality of resource and development and deployment of mega-turbines unable to be deployed on land, the UK projects the levelized cost of electricity from offshore wind to be similar to onshore wind in the 2030s (BEIS, 2020).
(iv) State energy planning and programs to support the development of renewable energy should also consider the potential contribution of offshore wind energy.
State governments play a lead role in operating energy systems and incentivising the development of renewable energy. However, the lack of a regulatory framework for offshore renewables in Commonwealth waters and insuff icient consideration of offshore wind in national energy planning has meant that states have also typically not included offshore wind in their energy planning and programs.
State governments should review their future energy planning in light of the potential contribution of offshore wind to their energy systems.
(v) Offshore wind energy should be incorporated into planning for the National Hydrogen Strategy and other renewable energy assessments.
The opportunity for offshore wind to play an integral role under ‘energy superpower’ demand scenarios should be recognised. With the scale of electricity requirements, offshore wind could be an important source of power located adjacent to many ports and industrial facilities to meet increased demand associated with large industrial loads, electrif ication of other energy sectors, or for the production of hydrogen to meet the needs of industrial applications such as steel and aluminium production, or for export. Further research is required to understand the potential of offshore wind energy for hydrogen, and offshore wind should be incorporated into planning for the National Hydrogen Strategy.
Future editions of the Australian Energy Resource Assessment should give greater consideration to offshore wind developments, such as the emergence of floating offshore wind, roles in the energy system, and the reduction in cost. Maps of Australian wind resources should include offshore wind.

81 Offshore Wind Energy in Australia
3. OFFSHORE WIND SHOULD BE RECOGNISED AS A STRATEGIC RESOURCE FOR INNOVATION AND COMMERCIALISATION FUNDING
(vi) The Australian Renewable Energy Agency (ARENA) and Clean Energy Finance Corporation (CEFC) should be allocated funding to develop a program to accelerate the commercialisation of offshore wind energy in Australia, with a particular focus on floating offshore wind.
The commercialisation of offshore wind energy will be led by global developments and the large programs in the US, Europe and South-East Asia. These regions have invested in research and development of offshore wind technologies, baseline environmental research, offshore wind port hubs and local manufacturing capacity
Strategic investment in offshore wind via ARENA and/or CEFC should be considered to assist in de-risking and developing local offshore wind, particularly floating offshore wind which is a newer technology with larger opportunity for Australia. There are a range of local barriers that will likely need to be addressed such as port infrastructure, local supply chain and skills development and risk prof iles of project f inanciers. A positive example of how innovation funding can de-risk and accelerate the development of renewable energy is provided by ARENA and the CEFC’s large scale solar program which facilitated the rapid growth of the sector.
The State of Victoria has invested in developing a business case for offshore wind and is supporting the offshore wind sector via the Energy Innovation
The State of Victoria has invested in developing a business case for offshore wind, and is supporting the offshore wind sector via the Energy Innovation Program. A national pipeline of projects is required to justify an Australian sector; a national commercialisation program for offshore wind can accelerate the sector.
4. THE PERMITTING PROCESS SHOULD SUPPORT DEVELOPMENT OF LOCAL SUPPLY CHAIN CAPACITY TO MAXIMISE INVESTMENT AND JOBS AND COMMUNITY BENEFIT
(vii) The Australian government should develop local supply chain capacity, including leveraging the permitting process for local content.
Offshore wind can develop into a signif icant source of employment in the maritime ‘blue economy’. Australia’s share of manufacturing and supply chain activity in most renewable energy sectors is low. Local supply chain development strategies and procurement strategies that include requirements for local supply chain are a feature of international programs. For example, in March 2021, the US Biden administration announced three coordinated steps to support rapid offshore wind deployment and job creation (Whitehouse.gov, 2021):
∆ Advancing ambitious offshore wind energy projects to create good paying, jobs
∆ Investing in infrastructure to strengthen the domestic supply chain and deploy offshore wind energy
∆ Supporting critical research and development and data-sharing.
The permitting process for offshore wind should include economic development and local supply chain involvement criteria to create requirements and incentives for industry development. Community benefit including benefits to Traditional Owners should also be incorporated. The use of local content criteria has been successfully used in on-shore renewable energy auctions in the ACT and Victoria and in offshore wind auctions and programs internationally.

82Offshore Wind Energy in Australia
(vii) Skills training and labour market programs should be developed to transition oil, gas and coal workers to gain employment and skills in offshore wind energy
Active training and labour market adjustment programs should be developed to maximise the potential for the existing offshore oil and gas workforce and the workforce in coal regions located near offshore wind to transition to employment in offshore wind energy.
5. DETAILED RESEARCH IS REQUIRED TO ASSESS COST-BENEFITS TO ENERGY, ENVIRONMENTAL AND SOCIAL SYSTEMS
(ix) Baseline data needs to be collected on environmental and social dimensions of offshore wind energy
The social acceptability of offshore renewable energy in Australia is largely untested, and indeed, environmental effects are largely unknown in the southern hemisphere. More research and collection of baseline data is required to understand the effects of offshore renewable energy on ocean and local communities, and on economies and local environments. Global knowledge gained in reducing the potential environmental effects of offshore wind turbines must be transferred to an Australian context. This work should not be left to individual companies, and the value of shared data agreements should be recognised.
(x) Further research is required to understand the energy system value of offshore wind
This report presents a high-level assessment of the grid benefits of offshore wind for Australia. Further industry-focused research activity is required into the diversif ication benefits and system services that offshore wind could provide. Future assessment should set offshore wind in the context of the pipeline of renewable energy projects, making use of high quality in-situ observations or downscaled simulations to resolve the spatio-temporal resource variability. These considerations would enable high quality techno-economic assessment of what role and impacts offshore wind, given its high consistency and large scale, may have in relation to Frequency Control Ancillary Services (FCAS), and other technical requirements in Australian electricity networks.

83 Offshore Wind Energy in Australia
The authors acknowledge the f inancial support of the Blue Economy Cooperative Research Centre, established and supported under the Australian Government’s Cooperative Research Centres Program, grant number CRC-20180101.
We thank many contributors who provided comment on earlier versions of this report, including: Erin Coldham and Adam Thyboe, Star of the South; Andy Evans and Peter Sgardelis, OceanEx Energy; Simon Corbell, Energy Estate; Tim Sawyer, Flotation Energy; Pat Simons, Yes2Renewables; Dan Hansen, Green Energy Partners; Mark Wakeham, Australian Council of Trade Unions; Trevor Gauld, Electrical Trades Union; Richard Finlay-Jones, Newcastle Offshore Wind Energy Pty ltd.; Cory Wright, Australian Manufacturing Workers Union.
ABS (2016) 2016 Census – Employment, Income and Education. Australian Bureau of Statistics.
ABS (2021a) Labour Force, Employed Persons by Industry Sub-Division of Main Job. Australian Bureau of Statistics. https://www.abs.gov.au/statistics/labour/employment-and-unemployment/labour-force-australia-detailed/latest-release#data-download
ABS (2021b) Labour Account. Australian Bureau of Statistics. https://stat.data.abs.gov.au/Index.aspx?DataSetCode=ABS_LABOUR_ACCT
ACTU. (2020). Sharing the benefits with workers: A decent jobs agenda for the renewable energy industry. https://www.actu.org.au/media/1449336/renewable-energy-report.pdf
AEMO. (2015). AEMO | Load Profiles. https://aemo.com.au/en/energy-systems/electricity/national-electricity-market-nem/data-nem/metering-data/load-profiles
AEMO. (2020a). 2020 Integrated System Plan For the National Electricity Market Important notice PURPOSE.
AEMO. (2020b). 2020 ISP Appendix 5. Renewable Energy Zones Important notice PURPOSE. https://aemo.com.au/-/media/f iles/major-publications/isp/2020/appendix--5.pdf?la=en
AEMO. (2020c). Draft 2021 Inputs, Assumptions and Scenarios Report.
AEMO. (2021a). AEMO | Registrated Participants. https://aemo.com.au/en/energy-systems/electricity/national-electricity-market-nem/participate-in-the-market/registration
AEMO. (2021b). Draft ISP Methodology Important notice PURPOSE. https://aemo.com.au/-/media/f iles/stakeholder_consultation/consultations/nem-consultations/2021/isp-methodology/draft/draft-isp-methodology.pdf?la=en
Appleton, T. (2019). Floating foundations: The next frontier in Offshore Wind Power.
ARENA. (2021). Musselroe Wind Farm FCAS Trial - Australian Renewable Energy Agency (ARENA). https://arena.gov.au/projects/musselroe-wind-farm-fcas-trial/
Arent, D., Sullivan, P., Heimiller, D., Lopez, A., Eurek, K., Badger, J., Ejsing-Jorgensen, H., Kelly, M., Clarke, L., & Luckow, P. (2012). Improved Offshore Wind Resource Assessment in Global Climate Stabilization Scenarios.
8. Acknowledgements
9. References

84Offshore Wind Energy in Australia
Bailey, H., Brookes, K. L., & Thompson, P. M. (2014). Assessing environmental impacts of offshore wind farms: Lessons learned and recommendations for the future. In Aquatic Biosystems (Vol. 10, Issue 1, pp. 1–13). BioMed Central Ltd. https://doi.org/10.1186/2046-9063-10-8
Baltic Lines. (2019). Capacity Densities of European Offshore Wind Farms | European MSP Platform. https://www.msp-platform.eu/practices/capacity-densities-european-offshore-wind-farms
BEIS. (2020). ELECTRICITY GENERATION COSTS 2020.
BMWI. (2020). Referentenentwurf des Bundesministeriums für Wirtschaft und Energie. https://www.bmwi.de/Redaktion/DE/Downloads/E/entwurf-eines-gesetzes-zur-aenderung-des-windenergie-auf-see-gesetzes-und-anderer-vorschriften.pdf?__blob=publicationFile&v=8
BOEM. (2021). Renewable Energy Research | Bureau of Ocean Energy Management. https://www.boem.gov/environment/environmental-studies/renewable-energy-research
Boosting Offshore Renewable Energy. (n.d.). Retrieved May 28, 2021, from https://ec.europa.eu/commission/presscorner/detail/en/IP_20_2096
Bosch, J., Staffell, I., & Hawkes, A. D. (2018). Temporally explicit and spatially resolved global offshore wind energy potentials. Energy, 163, 766–781. https://doi.org/10.1016/j.energy.2018.08.153
Briggs, C., Rutovitz, J., Dominish, E., Nagrath, K. (2020) Renewable Energy Employment in Australia. Prepared for the Clean Energy Council by the Institute for Sustainable Futures at the University of Technology Sydney. https://www.uts.edu.au/sites/default/f iles/2020-06/Renewable-Jobs-Australia-ISF%20F.pdf
Buljan, A. (2021, May 11). Taiwan Drafts Plan for Further 5 GW of Offshore Wind | Offshore Wind. https://www.offshorewind.biz/2021/05/11/taiwan-drafts-plan-for-further-5-gw-of-offshore-wind/
BVG Associates. (2017). U.S. Job creation in Offshore Wind: A report for the Roadmap Project for Multi-State Cooperation on Offshore Wind (Issue October).
Christian, K. (2020). The potential of hydrogen for decarbonising steel production. https://www.europarl.europa.eu/RegData/etudes/BRIE/2020/641552/EPRS_BRI(2020)641552_EN.pdf
Christos, S. (2015). Master thesis in Sustainable Development 228 Examensarbete i Hållbar utveckling Investigation of the Potential to Implement Offshore Wind Energy Technology in Victoria, Australia. http://www.diva-portal.org/smash/get/diva2:823113/FULLTEXT01.pdf
Climate Agreement | Report | Government.nl. (n.d.). Retrieved May 28, 2021, from https://www.government.nl/documents/reports/2019/06/28/climate-agreement
COAG Energy Council (2019) National Hydrogen Strategy, https://www.industry.gov.au/sites/default/f iles/2019-11/australias-national-hydrogen-strategy.pdf
Copping, A. E., Gorton, A. M., May, R., Bennet, F., Degeorge, E., Goncalves, M. R., & Rumes, B. (2020). Enabling renewable energy while protecting wildlife: An ecological risk-based approach to wind energy development using ecosystem-based management values. Sustainability (Switzerland), 12(22), 1–18. https://doi.org/10.3390/su12229352
DAWE. (2018). CAPAD 2018 | Department of Agriculture, Water and the Environment. https://www.environment.gov.au/land/nrs/science/capad/2018
Deloitte. (2019). Australian and Global Hydrogen Demand Growth Scenario AnalysisCOAG Energy Council – National Hydrogen Strategy Taskforce. https://www2.deloitte.com/content/dam/Deloitte/au/Documents/future-of-cities/deloitte-au-australian-global-hydrogen-demand-growth-scenario-analysis-091219.pdf
DISER. (2021). Australian Government Department of Industry, Science, Energy and Resources |Electricity generation | energy.gov.au. https://www.energy.gov.au/data/electricity-generation
DISER, 2020. (2020). TECHNOLOGY INVESTMENT ROADMAP; First Low Emissions Technology Statement – 2020. https://www.industry.gov.au/sites/default/f iles/September 2020/document/f irst-low-emissions-technology-statement-2020.pdf

85 Offshore Wind Energy in Australia
EIF. (2021). Energy Innovation Fund - Invest Victoria. https://www.invest.vic.gov.au/news-and-events/news/2021/february/energy-innovation-fund
Ford, N. (2020, December 9). UK faces tough pricing choices to f ill offshore wind supply gaps | Reuters Events | Renewables. https://www.reutersevents.com/renewables/wind/uk-faces-tough-pricing-choices-f ill-offshore-wind-supply-gaps
Friends of the Earth; Global Witness and Greener Jobs Alliance. (2019). Sea Change: Climate emergency, jobs and managing the phase-out of UK oil and gas extraction (Issue May).
Gaertner, E., Rinker, J., Sethuraman, L., Zahle, F., Anderson, B., Barter, G., Abbas, N., Meng, F., Bortolotti, P., Skrzypinski, W., Scott, G., Feil, R., Bredmose, H., Dykes, K., Shields, M., Allen, C., & Viselli, A. (2020). IEA Wind TCP Task 37: Definition of the IEA 15-Megawatt Offshore Reference Wind Turbine. https://doi.org/10.2172/1603478
Geoscience Australia. (2018). Australian Energy Resource Assessment - Second Edition. https://arena.gov.au/assets/2018/08/australian-energy-resource-assessment.pdf
gov.ie - Programme for Government: Our Shared Future. (n.d.). Retrieved May 28, 2021, from https://www.gov.ie/en/publication/7e05d-programme-for-government-our-shared-future/
Graham, P., Hayward, J., Foster, J., & Havas, L. (2021). GenCost 2020-21. https://www.csiro.au/-/media/EF/Files/GenCost2020-21_FinalReport.pdf
Gușatu, L. F., Menegon, S., Depellegrin, D., Zuidema, C., Faaij, A., & Yamu, C. (2021). Spatial and temporal analysis of cumulative environmental effects of offshore wind farms in the North Sea basin. Scientif ic Reports, 11(1). https://doi.org/10.1038/s41598-021-89537-1
GWEC. (2020). Global Offshore Wind Report 2020.
GWEC. (2021). Global Wind Report 2021.
Hersbach, H., Bell, B., Berrisford, P., Hirahara, S., Horányi, A., Muñoz-Sabater, J., Nicolas, J., Peubey, C., Radu, R., Schepers, D., Simmons, A., Soci, C., Abdalla, S., Abellan, X., Balsamo, G., Bechtold, P., Biavati, G., Bidlot, J., Bonavita, M., … Thépaut, J. N. (2020). The ERA5 global reanalysis. Quarterly Journal of the Royal Meteorological Society, 146(730), 1999–2049. https://doi.org/10.1002/qj.3803
Hill, S. H. (2021). Vestas launches 15MW offshore wind turbine - world’s largest | RenewEconomy. https://reneweconomy.com.au/vestas-launches-15mw-offshore-wind-turbine-worlds-largest/
HM Government. (2020). The Ten Point Plan for a Green Industrial Revolution.
IEA. (2019). Offshore Wind Outlook 2019: World Energy Outlook Special Report.
IEC. (2005). Wind turbines-Part 1: Design requirements including photocopying and microfilm, without permission in writing from the publisher. www.iec.ch
IRENA. (2018a). Offshore wind investment , policies and job creation - Review of key f indings for G7 ministerial meetings (Issue September).
IRENA. (2018b). Renewable Energy Benefits: Leveraging Local Capacity for Onshore Wind. In Irena.
IRENA. (2019). Future of wind: Deployment, investment, technology, grid integration and socio-economic aspects (A Global Energy Transformation paper).
IRENA. (2021). International Renewable Energy Agency Data & Statistics. /Statistics. /Statistics
Jones, V. (2017). More Than 440,000 Global Oil, Gas Jobs Lost During Downturn. Rigzone.
Kalverla, P. C., Holtslag, A. A. M., Ronda, R. J., & Steeneveld, G. J. (2020). Quality of wind characteristics in recent wind atlases over the North Sea. Quarterly Journal of the Royal Meteorological Society, 146(728), 1498–1515. https://doi.org/10.1002/qj.3748
Konar, M., & Ding, H. (2020). A Sustainable Ocean Economy for 2050 Approximating Its Benefits and Costs Secretariat of the High Level Panel for a Sustainable Ocean Economy, World Resources Institute. https://oceanpanel.org/sites/default/f iles/2020-07/Ocean Panel_Economic Analysis_FINAL.pdf

86Offshore Wind Energy in Australia
Korea’s Offshore Wind Collaboration Plan - Kim & Chang. (n.d.). Retrieved May 28, 2021, from https://www.kimchang.com/en/insights/detail.kc?sch_section=4&idx=22153
Laubenstein Tayanah, T. O., Robson, E., Anderson, C., Arabia, A.-M., Crowe, S., Diamond, R., Liu, C., Wheelahan, D., Fulton, B., Chris Cocklin, P., Evans, K., Fidelman, P., Bronwyn Gillanders, P., Professor William Glamore, A., Harley, M., Professor Daud Hassan Director of, A., Hill Chief Scientist, S., Australia Alistair Hobday, G., Emma Johnston FTSE FRSN, P. A., … Professor Rodger Tomlinson, E. (2021). Sustainable Oceans and Coasts National Strategy 2021-2030. https://www.futureearth.org.au/sites/default/f iles/2021-06/sustainable-oceans-and-coasts-national-strategy-2021-2030_0.pdf
Messali, E., & Diesendorf, M. (2009). Potential Sites for OffShore Wind Power in Australia Potential Sites for Off-Shore Wind Power in Australia WIND ENGINEERING MULTI-SCIENCE PUBLISHING COMPANY 5 WATES WAY • BRENTWOOD • ESSEX CM15 9TB • UK Potential Sites for Off-Shore Wind Power in Australi. 33(4). https://doi.org/10.1260/030952409789685744
METI. (2020). Vision for Offshore Wind Power Industry(1st( Public-Private Council on Enhancement of Industrial Competitiveness for Offshore Wind Power Generation provisional translation.
Miller, D. (2021). A Critical Decade | LinkedIn. LinkedIn Blog. https://www.linkedin.com/pulse/critical-decade-darren-miller/?trackingId=90OYFrqSRymhpJtFlFazRQ%3D%3D
Müller, R., Pfeifroth, U., Träger-Chatterjee, C., Trentmann, J., & Cremer, R. (2015). Digging the METEOSAT treasure-3 decades of solar surface radiation. Remote Sensing, 7(6), 8067–8101. https://doi.org/10.3390/rs70608067
Natural England. (2021). Natural England’s Approach to Offshore Wind. Natural England Technical Information Note, TIN181. http://nepubprod.appspot.com/publication/5400620875120640
Netherlands Enterprise Agency. (2017). Landmark cost reductions The Offshore Wind Programme operates using the Stimulation of Sustainable Energy Production (SDE+, Stimulering Duurzame. https://english.rvo.nl/sites/default/f iles/2017/05/Factsheet Driving down offshore wind costs the Dutch way.pdf
NOPSEMA. (2021). NOPSEMA Annual Data Tables. https://www.nopsema.gov.au/sites/default/f iles/documents/2021-05/A777615.pdf
NYSERDA. (2021). SUNY NYSERDA Launch Offshore Wind Training Institute - NYSERDA. https://www.nyserda.ny.gov/About/Newsroom/2021-Announcements/2021-01-13-SUNY-NYSERDA-Launch-Offshore-Wind-Training-Institute
Offshore Wind | Ministry of New and Renewable Energy, Government of India. (n.d.). Retrieved May 28, 2021, from https://mnre.gov.in/wind/offshore-wind/
Olauson, J. (2018). ERA5: The new champion of wind power modelling? Renewable Energy, 126, 322–331. https://doi.org/10.1016/j.renene.2018.03.056
Papalexandrou, M. (2021). Offshore Wind: Staying Ahead of the Curve. In Aspects of the Energy Union (pp. 277–295). Springer International Publishing. https://doi.org/10.1007/978-3-030-55981-6_13
Pfenninger, S., & Staffell, I. (2016). Long-term patterns of European PV output using 30 years of validated hourly reanalysis and satellite data. Energy, 114, 1251–1265. https://doi.org/10.1016/j.energy.2016.08.060
Pilot Energy. (2020). PILOT TO PURSUE DEVELOPMENT OF OFFSHORE WIND PROJECT Mid West Wind and Solar Project. https://www.pilotenergy.com.au/sites/pilotenergy.com.au/f iles/asx-announcements/6994584.pdf
QBIS. (2020). Socio-economic impact study of offshore wind DANISH SHIPPING, WIND DENMARK AND DANISH ENERGY WITH SUPPORT FROM THE DANISH MARITIME FOUNDATION Socio-economic impact study of offshore wind. https://winddenmark.dk/sites/winddenmark.dk/f iles/media/document/Technical report-Socioeconomic impacts of offshore wind-01.07.2020.pdf
Renews.Biz. (2020, November 3). SPR delivers ‘black start’ from onshore wind - reNews - Renewable Energy News. https://renews.biz/64190/spr-delivers-black-start-from-onshore-wind/

87 Offshore Wind Energy in Australia
Rienecker, M. M., Suarez, M. J., Gelaro, R., Todling, R., Bacmeister, J., Liu, E., Bosilovich, M. G., Schubert, S. D., Takacs, L., Kim, G. K., Bloom, S., Chen, J., Collins, D., Conaty, A., Da Silva, A., Gu, W., Joiner, J., Koster, R. D., Lucchesi, R., … Woollen, J. (2011). MERRA: NASA’s modern-era retrospective analysis for research and applications. Journal of Climate, 24(14), 3624–3648. https://doi.org/10.1175/JCLI-D-11-00015.1
Rystad. (2021). Rystad Energy - Good ingredients but bad cocktail: Combining offshore wind and green hydrogen is still too expensive. https://www.rystadenergy.com/newsevents/news/press-releases/good-ingredients-but-bad-cocktail-combining-offshore-wind-and-green-hydrogen-is-still-too-expensive/
Schwartz, M., Heimiller, D., Haymes, S., & Musial, W. (2009). Assessment of Offshore Wind Energy Resources for the United States. http://www.osti.gov/bridge
Scottish Natural Heritage. (2017). Visual Representation of Wind Farms.
Sidoroff Gryning, M. P. (2018). Enhanced Frequency Control Capability (EFCC) Wind Package Report Frequency Support Outlook. https://www.nationalgrideso.com/document/136161/download
Skopljak, N. (2021, March). Equinor’s floating offshore wind project in Scotland posts 57% capacity factor in 2020. Institute for Energy Economics and Financial Analysis.
Smith, S. (2018). To identify leading global practice in offshore renewable regulation for adoption in Australia - Churchill Trust. https://www.churchilltrust.com.au/project/to-identify-leading-global-practice-in-offshore-renewable-regulation-for-adoption-in-australia/
Staffell, I., & Pfenninger, S. (2016). Using bias-corrected reanalysis to simulate current and future wind power output. Energy, 114, 1224–1239. https://doi.org/10.1016/j.energy.2016.08.068
Teske et al. (2019). Achieving the Paris Climate Agreement Goals. Springer International Publishing. https://doi.org/10.1007/978-3-030-05843-2
US Department of Energy. (2020, December 17). Energy Department Announces New Projects for Offshore Wind Energy Technology Demonstration and Resource Characterization | Department of Energy. https://www.energy.gov/eere/articles/energy-department-announces-new-projects-offshore-wind-energy-technology-demonstration
US Department of the Interior. (2021, June 11). Biden-Harris Administration Proposes Competitive Lease Sale for Offshore Wind Development for New York and New Jersey | U.S. Department of the Interior. https://www.doi.gov/pressreleases/biden-harris-administration-proposes-competitive-lease-sale-offshore-wind-development
Weghmann, V. (2019). The failure of energy liberalisation Going Public: A Decarbonised, Affordable and Democratic Energy System for Europe. https://www.epsu.org/sites/default/f iles/article/f iles/Going Public_EPSU-PSIRU Report 2019 - EN.pdf
Whitehouse.gov. (2021). FACT SHEET: Biden Administration Jumpstarts Offshore Wind Energy Projects to Create Jobs | The White House. https://www.whitehouse.gov/brief ing-room/statements-releases/2021/03/29/fact-sheet-biden-administration-jumpstarts-offshore-wind-energy-projects-to-create-jobs/
Whiteway, T. (2009). High resolution coverage of Australia’s sea floor. http://www.ga.gov.au/webtemp/image_cache/GA15004.pdf
Wind Europe. (2020). Ports: a key enabler for the floating offshore wind sector.
Wind Europe. (2021). Offshore wind in Europe: Key trends and statistics 2020.
World Bank. (2019). Going Global-Expanding Offshore Wind to Emerging Markets (Issue October).

88Offshore Wind Energy in Australia
Image Credit: Eskil Eriksen © Equinor - Arkona Wind Farm

89 Offshore Wind Energy in Australia89 Offshore Wind Energy in Australia
Appendices
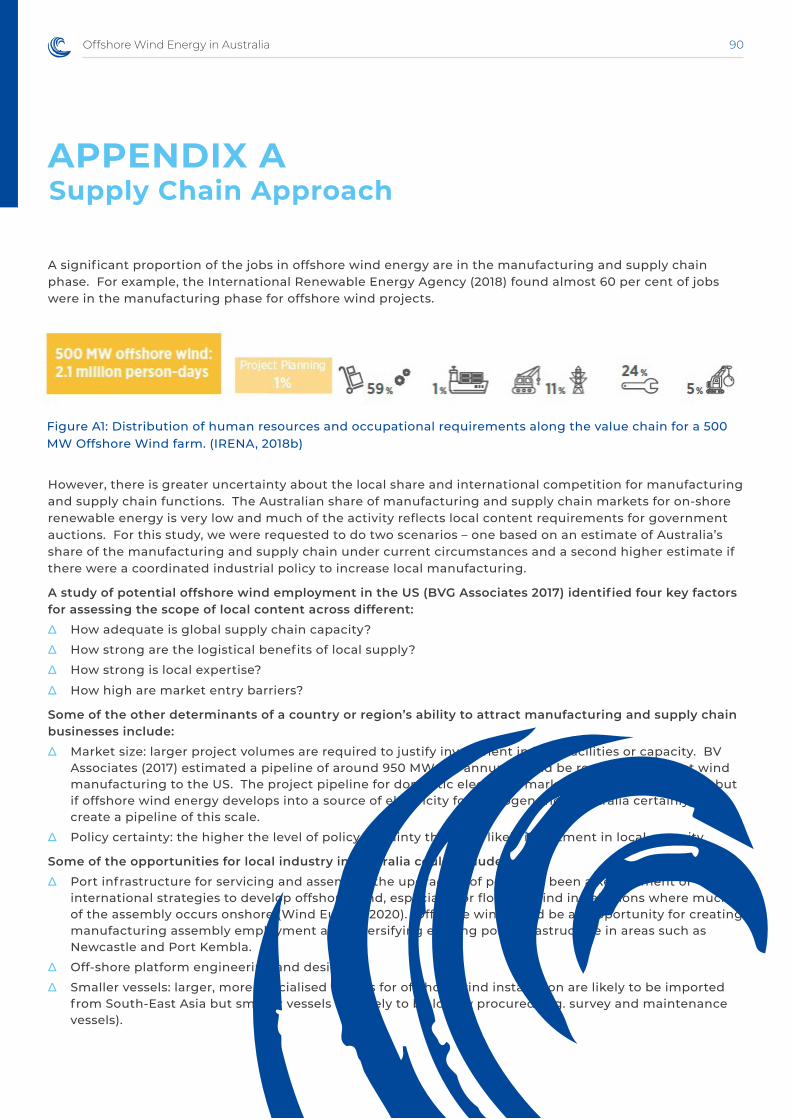
90Offshore Wind Energy in Australia
A signif icant proportion of the jobs in offshore wind energy are in the manufacturing and supply chain phase. For example, the International Renewable Energy Agency (2018) found almost 60 per cent of jobs were in the manufacturing phase for offshore wind projects.
However, there is greater uncertainty about the local share and international competition for manufacturing and supply chain functions. The Australian share of manufacturing and supply chain markets for on-shore renewable energy is very low and much of the activity reflects local content requirements for government auctions. For this study, we were requested to do two scenarios – one based on an estimate of Australia’s share of the manufacturing and supply chain under current circumstances and a second higher estimate if there were a coordinated industrial policy to increase local manufacturing.
A study of potential offshore wind employment in the US (BVG Associates 2017) identif ied four key factors for assessing the scope of local content across different:
∆ How adequate is global supply chain capacity?
∆ How strong are the logistical benefits of local supply?
∆ How strong is local expertise?
∆ How high are market entry barriers?
Some of the other determinants of a country or region’s ability to attract manufacturing and supply chain businesses include:
∆ Market size: larger project volumes are required to justify investment in local facilities or capacity. BV Associates (2017) estimated a pipeline of around 950 MW per annum would be required to attract wind manufacturing to the US. The project pipeline for domestic electricity market may not be suff icient but if offshore wind energy develops into a source of electricity for hydrogen then Australia certainly could create a pipeline of this scale.
∆ Policy certainty: the higher the level of policy certainty the more likely investment in local capacity.
Some of the opportunities for local industry in Australia could include:
∆ Port infrastructure for servicing and assembly: the upgrading of ports has been a key element of international strategies to develop offshore wind, especially for floating wind installations where much of the assembly occurs onshore (Wind Europe 2020). Offshore wind could be an opportunity for creating manufacturing assembly employment and diversifying existing port infrastructure in areas such as Newcastle and Port Kembla.
∆ Off-shore platform engineering and design
∆ Smaller vessels: larger, more specialised vessels for offshore wind installation are likely to be imported from South-East Asia but smaller vessels are likely to be locally procured (e.g. survey and maintenance vessels).
APPENDIX ASupply Chain Approach
Figure A1: Distribution of human resources and occupational requirements along the value chain for a 500 MW Offshore Wind farm. (IRENA, 2018b)

91 Offshore Wind Energy in Australia
∆ On-shore transmission towers and sub-stations: a new factory is being established in South Australia to manufacture transmission towers. There is an opportunity for a second factory. Local manufacturing would create opportunities for local steel production. Australia also has transformer manufacturing capacity.
∆ Towers: Australia has one wind tower manufacturer (Keppel Prince) but its production facilities currently only produce on-shore towers. Investment would be required to expand into off-shore wind towers which are larger with higher-density steel. It is very unlikely Australia could develop or attract manufacturing for other elements of wind turbines such as the nacelle and componentry or blades.
∆ Steel manufacturing: the development of transmission and wind tower manufacturing would create opportunities for local steel production. There are also other smaller elements of steel (e.g. ladders on towers) which could be done locally.
∆ Cement manufacturing for foundations.
∆ Manufacturing of subsea cables

92Offshore Wind Energy in Australia
APPENDIX BOil and Gas Occupational Composition
Figure 36: Oil and Gas Extraction, Occupational Composition (disaggregated) (%). (ABS 2016)

93 Offshore Wind Energy in Australia
Underpinning The Growth Of Australia’s Blue EconomyThe purpose of the Blue Economy CRC is to undertake world class, collaborative, industry focused research and training to underpin the growth of Australia’s Blue Economy through increased offshore sustainable seafood and renewable energy production.
Through targeted and industry focussed research and training, the Blue Economy CRC paves the way for innovative, commercially viable and sustainable offshore developments and new capabilities that will see signif icant increases in renewable energy output, seafood production and jobs that will transform the future of Australia’s traditional blue economy industries.
Bringing together expertise f rom leaders in aquaculture, offshore renewable energy and maritime engineering.
The Blue Economy CRC brings together 40 industry, government, and research partners from ten countries with expertise in aquaculture, offshore renewable energy, and maritime engineering.
The Blue Economy CRC-Co Ltd (ABN 64 634 684 549) is an independent not-for-prof it company limited by guarantee and is a Cooperative Research Centre under the Australian Government’s CRC Program.
OUR PURPOSE
To perform world class, collaborative, industry focused research and training that underpins the growth of the Blue Economy through increased offshore sustainable aquaculture and renewable energy production.
OUR VISION
Australia’s Blue Economy industries in offshore sustainable seafood and collocated renewable energy are globally competitive, at the forefront of innovation and are underpinned by a robust environmental planning and management framework which consumers trust and value.
OUR APPROACH
Research Our research is industry led, world-class, internationally connected and focussed on growing Australia’s Blue Economy.
Engagement Our Partners are engaged. We deliver on our commitments. We have a focus on growing our contribution base.
Adoption & Commercialisation We deliver new and useful knowledge with commercial impact and create industry relevant intellectual property and facilitate its commercialisation by our partners.
Capability & Capacity Building Our education and training program is developing a skilled workforce designed to support the Blue Economy.
Corporate Governance We pursue the highest standards of governance and management, including development of capacity and capability, embracing diversity and equal opportunity.

94Offshore Wind Energy in Australia
Image Credit: © Equinor - Hywind Tampen floating wind farm Gullfaks platform

95 Offshore Wind Energy in Australia
Blue Economy CRC
PO BOX 897 LAUNCESTON, TAS 7250
www.blueeconomycrc.com.au
ABN: 64 634 684 549 Image Courtesy of Star of the South
Copyright © 2022 FDOKUMEN