
FIDERE-July2019-with-Cover.pdf - Adventist University of the ...
180
-
Upload
khangminh22 -
Category
Documents
-
view
5 -
download
0
Transcript of FIDERE-July2019-with-Cover.pdf - Adventist University of the ...


Adventist University of the Philippines
Telephone: (049)-541-1211Website: www.aup.edu.ph
PHILIPPINE COPYRIGHT 2018by AUP Printing Press
All rights reservedNo part of this publication may be produced, stored in a retrieval system, or transmitted in any form or by any means, electronic, mechanical, photocopying, recording, or otherwise, without permission in writing from the publisher.
PRINTED IN THE PHILIPPINES
ISSN

July 2019 | Vol. 1, Issue 1 (Maiden Issue)
Research Office | Adventist University of the Philippines
FidēreJournal of Business, Governance, & Information

EditorJolly S. Balila, PhD, Research Director and Consultant, Research Office, Adventist University of the Philippines (AUP)Dr. Glenda Joy Lopez, CPA, PhD, Dean, College of Business, Adventist University of the Philippines
Associate EditorsMiriam P. Narbarte, PhD, Vice President-Academics, Adventist University of the PhilippinesDr. Reuel E. Narbarte, CPA, PhD, Director, Human Resource, Adventist University of the PhilippinesRobert A. Borromeo, CPA, PhD, Vice President-Finance, Adventist University of the PhilippinesRuben T. Carpizo, PhD, Director, Accreditation Office, Adventist University of the PhilippinesLualhati P. Sausa, PhD, Faculty, College of Business, Adventist University of the PhilippinesMarta B. Macalalad, PhD, Faculty, College of Business, Adventist University of the Philippines
Managing EditorBery Ben C. Mergal, RN, PhD, Research Consultant, Research Office, Adventist University of the Philippines
Copy EditorsArjem Noryn Caringal-Agum, LPT, Research Consultant, Adventist University of the PhilippinesOliveth O. Tolentino, EdD, Editor, Adventist University of the Philippines
Layout ArtistVergel B. Galang, Staff, Research Office Adventist University of the PhilippinesJeramy-Jay Ramos, Northern Luzon Adventist College
Peer ReviewersWayne Hamra, PhD, Asia-Pacific International UniversityDamrong Sattayawaksakul, PhD, Asia-Pacific International UniversityHenry Foster, PhD, Asia-Pacific International UniversityNoah Balraj, PhD, Asia-Pacific International UniversityMarthen Sengkey, PhD, Universitas Klabat, Manado IndonesiaFrancis Hutabarat, PhD, Universitas Advent IndonesiaElvis Ronald Sumanti, PhD, Universitas Klabat, Manado, Indonesia
Research CouncilJolly S. Balila, PhD, Director and Consultant, Research OfficeBeryl Ben C. Mergal, RN, PhD, Research Consultant, Research OfficeSabina Parinas, RN, PhD, Research Consultant Research OfficeLorcelie B. Taclan, PhD, Research Consultant, Research OfficeArjem Noryn Caringal-Agum, LPT, Editor and Research Cosultant
Ethics Review BoardBeryl Ben C. Mergal, RN, PhD, Chair, Research Consultant, Research OfficeJolly S. Balila, PhD, Member, Director, Research OfficeDoris A. Mendoza, MD, FPPS, Member, Dean, College of MedicineRico T. Javien, PhD, Member, Faculty, College of TheologyJacqueline Polancos, RN, DrPH, Member, Faculty, College of NursingJesse Soncayawon, PhD, Chair, History DepartmentMytle C. Orbon, RP, PhD candidate, Chair, Psychology Department

T a b l e o f C o n T e n T s
T e s T i n g T h e M o d e r a T i n g e f f e C T s o f s e x , a g e a n d J o b C l a s s i f i C a T i o n o n W o r k - l i f e b a l a n C e , a n d J o b s a T i s f a C T i o n o f h i g h e r e d u C a T i o n i n s T i T u T i o n W o r k e r s . . . . . . . . . . . . . . . . . . . . . . . . . . . . . . . . . . . . . . . . . . . . . . . . . . . . . . . . . . . . . . . . . . 7 G l e n d a J o y L o p e z , N e d i l y n R e y e s , E v e l y L i n t a o , J o l l y B a l i l a ( A U P )
T h e r e l a T i o n s h i p o f p e r C e i v e d o r g a n i z a T i o n a l s u p p o r T a n d o r g a n i z a T i o n a l C o M M i T M e n T T o W e l l - b e i n g a s M e d i a T e d b y J o b s a T i s f a C T i o n i n n o T - f o r - p r o f i T o r g a n i z a T i o n . . . . . . . . . . . . . . . . . . . . . 1 6 Wa n l e e P u t s o m , D a m r o n g S a t t a y a w a k s a k u l ( A I U )
M e d i a T i o n e f f e C T s o f f i n a n C i a l s a T i s f a C T i o n o n T h e r e l a T i o n s h i p b e T W e e n W o r k - l i f e b a l a n C e a n d J o b s a T i s f a C T i o n . . . . . . . . . . . . . . . . . . . . . . . . . 3 0 J o l l y B a l i l a , R o b e r t B o r r o m e o ( A U P )
M e a s u r i n g v a l u e r e l e v a n C e o f C o r p o r a T e e n v i r o n M e n T a l p e r f o r M a n C e i n i n d o n e s i a . . . . . . . . . . . . . . . . . . . . . . . . . . . . . . . . . . . . . . . . . . . . . . . . . . . . . . . . . . 4 5 D e s k e M a n d a g i ( U P )
e M p l o y e e ’ s p e r C e p T i o n o f e f f e C T i v e n e s s o f M o T i v a T i o n p r o g r a M s f o r r e g u l a r W o r k e r s o f a s i a - p a C i f i C i n T e r n a T i o n a l u n i v e r s i T y p e r f o r M a n C e i n i n d o n e s i a . . . . . . . . . . . . . . . . . . . . . . . . . . . . . . . . . . . . . . . . . . . . . . . . . . . . . . . . . . 5 6 S o r a w i t C h a i p h i s i t , N o a h A n b u r a j B a l r a j ( A I U )
i M p a C T o f f i n a n C i a l p r e s s u r e s o n f o r e i g n s T u d e n T s ’ l e a r n i n g M o T i v a T i o n . . . . . . . . . . . . . . . . . . . . . . . . . . . . . . . . . . . . . . . . . . . . . . . . . . . . . . . . . . . . . . . . . . . . . . . . . . . . . . . 6 9 P r i n c e M b o k a n i , L e n n y S i m a t u p a n g ( A U P )
u n i v e r s i T y s T u d e n T s ’ p u b l i C r e l a T i o n s a n d r e C r u i T M e n T s T r a T e g i e s f o r a s e a n o p e n i n g C o M M u n i T y a n d T h e 2 1 s T C e n T u r y . . . . . . . . . . . . . . . . . . . . . . . . . 7 5 U d o m t h e e r a k h u n , P h a n o m m a s B a m r u n g s i n , S r i s a l a b U p a m a i ( A I U ) M i C r o s o f T o f f i C e C o M p e T e n C i e s r e q u i r e d o f s e C r e T a r i e s i n p o s T M o d e r n a u T o M a T e d o f f i C e s : a C o M p a r a T i v e a n a l y s i s o f C l a s s r o o M a n d a C T u a l o f f i C e p r a C T i C e s . . . . . . . . . . . . . . . . . . . . . . . . . . . . . . . . . . . 8 7 L e n d a M a m b o ( A S M I K )
C o p i n g s T r a T e g i e s d u r i n g l e a n s e a s o n o f s e l e C T e d b e a C h r e s o r T s i n n a s u g b u , b a T a n g a s . . . . . . . . . . . . . . . . . . . . . . . . . . . . . . . . . . . . . . . . . . . . . . . . . . . . . . . . . . . . . . . . 9 5 E d w a r d J o n s o n N i o k o , S a m D e l a C u e s t a V i l l a m a s , M a r j o r i e A r t a j o D e Ve r a , J u l i e t D e C a s t r o , L e i l a B a y o t ( B S U )
d e v e l o p M e n T a n d e v a l u a T i o n o f d y n a M i C C o s T - a v e r a g i n g M o d e l u s i n g r e l a T i v e s T r e n g T h i n d e x a n d s T o C h a s T i C s . . . . . . . . . . . . . . . . . . 1 0 4 E r w i n C a p a r a s ( B S U )
o u T s o u r C i n g i n a C C o u n T i n g a n d e x p e r T f i n a n C i a l C o n T r o l l e r s : e M p i r i C a l s T u d y o f T h e p h i l i p p i n e C a l l C e n T e r b u s i n e s s . . . . . . . . . . . . . . . . . . 1 1 4 D a n i e l K y a m u h a n g i i r e , E v e l y G a r c i a L i n t a o ( A U P )
v i s i o n , M i s s i o n , p o l i C y , a d M i n i s T r a T i v e s u p p o r T , a n d C u s T o M e r d e M a n d a s p r e d i C T o r s o f o r g a n i z a T i o n a l i n n o v a T i o n o f s e l e C T e d h o s p i T a l s i n T h e p h i l i p p i n e s . . . . . . . . . . . . . . . . . . . . . . . . . . . . . . . . . . . . 1 3 2 M a j e e d D r a m a n i M a h a m a , L u a l h a t i P a r u l a n S a u s a ( A U P )
i n d o n e s i a T h r o u g h T h e l e n s o f W o r l d e C o n o M i C f o r u M : g l o b a l C o M p e T i T i v e i n d e x a n a l y s i s 2 0 0 8 / 0 9 - 2 0 1 6 / 1 7 s . . . . . . . . . . . . . . . . . . . 1 4 6 S t a n l e y N a n g o y ( U N K L A B )
f a C T o r s a f f e C T i n g C o n s u M e r b e h a v i o r i n p u r C h a s i n g h o n d a M o T o r C y C l e . . . . . . . . . . . . . . . . . . . . . . . . . . . . . . . . . . . . . . . . . . . . . . . . . . . . . . . . . . . . . . . . . . . . . . . . . . . 1 5 9 H a r t i n y P o p K o a p a h a ( U N K L A B )
C u s T o M e r s e r v i C e s a T i s f a C T i o n o f f r o n T l i n e e M p l o y e e s i n a u n i v e r s i T y i n C a v i T e . . . . . . . . . . . . . . . . . . . . . . . . . . . . . . . . . . . . . . . . . . . . . . . . . . . . . . . . . 1 7 2 M a r t a M a c a l a l a d , J o l l y B a l i l a ( A U P )


Volume 1 Issue 1 | July 2019
7Fidēre: Journal of Business, Governance, and Information Technology
Abstract
Work-life balance (WB) and job satisfaction have become a predominant issue in the workplace especially for those with conflicting responsibil-ities. This study examined the relationship of WB and job satisfaction
of 120 workers of a sectarian higher education institution (HEI). It further tests the effects of sex, age, and job classification on the relationship between WB and job satisfaction. Validated survey questionnaires were used to assess the employees’ WB and job satisfaction. The moderator variables are sex, age classified as above 40 years old and 40 years and below, and job classification in terms of teaching and non-teaching. The study utilized the descriptive and structural equation mod-eling techniques using SPSS version 23 and Partial Least Square applications. The overall results revealed that the employees agree that they have a balanced work and family life. Further, the employees also claimed that they are highly satisfied with their current job. This study established that WB has a positive influence on job satisfaction. The effects of sex, age, and job classification do not moderate the relationship of work life balance and job satisfaction. This research can be bene-ficial not only to academic institutions but also to any organization especially in maintaining the human resources of the institution.Keywords: work life balance, job satisfaction, moderating effects
TesTing The ModeraTing effeCTs of sex, age and Job ClassifiCaTion on Work-life balanCe, and Job saTisfaCTion of higher eduCaTion
insTiTuTion WorkersGlenda B. Joy Lopez1, Nedilyn T. Reyes1, Evely Lintao1, Jolly S. Balila2
College of Business, Research OfficeAdventist University of the Philippines
With the increasing levels of stress, competi-tion, and insecurities in life, work-life balance (WB) issues have become extremely important. Employees are looking for ways that will help them balance between work and personal life effectively. There is a need for individuals to achieve and maintain a balance between their paid work and their life outside of work. This means that WB implies that a person is success-fully managing all the responsibilities they have in both areas of their life.
Balance in work and family life is an emerging challenge for both employees and em-ployers (Meenakshi, Subrahmanyam , & Rav-ichandran, 2013). Studies have identified that
WB leads to positive organizational outcomes (Agha, Azmi, & Irfan, 2017). The finding of the study conducted by Gomez (2013) showed that more than 60% of workforce in Malaysia felt that they are unable to spend time with their families. The long working hours have resulted to dissatisfaction, thus, leaving the workforce just to spend time with their families for those who can afford.
Some organizations have policy on full-time to part-time employment. A research conducted on the part-time work arrangement had shown that employees are volunteering to choose this type of employment and also ac-cepting lower compensation. The outcome is
Volume 1 Issue 1 | July 2019
8 Fidēre: Journal of Business, Governance, and Information Technology
generally positive in terms of productivity and company image, recruitment and retention pro-gram, as well as to the quick response and adap-tation to the current need in the labor market (Bt Bani Hasan & Teng, 2017).
WB is a very important concern of em-ployees in both private and public sectors. It is more than prioritizing the work role and one’s personal life. This issue affects the social, psy-chological, economical, and mental wellbeing of every employee. If not given further atten-tion, it may affect the attitude, behavior, perfor-mance, and the total wellbeing of the workforce, thus, the satisfaction to the task assigned in the workplace may also be affected.
It was revealed in the study of Saeed and Farooqi (2014) that a significant and positive correlation exists between WB and job satis-faction. The study has been undertaken among 171 teachers of a university in Pakistan. The correlation is moderate in strength.
A study on WB is in a university both timely and relevant. It needs to be understood that teachers are the cornerstone of the devel-opment of any society and their well-being is important. Thus, this study was conducted to determine the relationship of WB and job sat-isfaction among higher education institution (HEI) workers and further test the moderating role of sex, age, and job classification. The re-sult of this study contributes to existing body of knowledge by providing an insight into a rela-tionship that exists between WB and job satis-faction among university teachers.
Literature ReviewWork life Balance
Work-life balance (WB) is defined as the time an employee spends both at work and family and friends while attending to other per-sonal interests (Smith, 2010 as cited in Bt Bani Hasan & Teng, 2017). The WB is one of the basic needs for every working adult. It refers to the effective management of multiple respon-
sibilities at work, at home, and within the dif-ferent aspects of life (Naithani, 2010), and a degree to which an individual is involved in and satisfied equally with their job and person-al roles (Saikia, as cited in Saeed & Farooqi, 2014).
According to Agha et al. (2017), “work-life balance (WB) is about finding the right bal-ance between work and life, and about feeling comfortable with both work and family com-mitments.” It is essentially the balance between three components, namely: paid work, unpaid work, and personal time. The term usually re-fers to one of the following factors: organiza-tional support for dependent care, flexible work options, and family or personal leave.
Job SatisfactionMirzaii, Riazi, Vares and Alamgard
(2014) described job satisfaction as one of the crucial ingredients for job accomplishment which related to higher productivity and also in-trinsic motivation of an employee. According to Padma and Reddy (2014) job satisfaction also reflects on how a person’s reaction and what to expect from the job in order to achieve high job satisfaction.
Working in a university especially as teachers is a very dignified yet6 challenging profession. The success of any nation ultimate-ly depends upon its students and how they are getting education. Teachers dissatisfied with the job and have lack of balance in their work and family lives may not produce good students. The impact of these teachers’ concern to stu-dents should be given attention. Thus, a study was conducted by Saeed and Farooqi (2014) to throw light on the relationship among work-life balance, job stress and job satisfaction among university teachers. The knowledge about these issues will lead to the creation of awareness and thus development of solution for the problems faced by university teachers. The result of these study showed a significant
9Testing the Moderating Effects of Sex, Age and Job Classification on Work-life Balance,
and Job Satisfaction of Higher Education Institution Workers
Fidēre: Journal of Business, Governance, and Information Technology Volume 1 Issue 1 | July 2019
relationship existing among job stress, work-life balance, and job satisfaction thus contributing toward the teachers’ performance improvement.
Work-Life Balance andJob Satisfaction
A study was conducted by Varatharaj and Vasantha (2012) among 250 Service Sectors working women in Chennai city to examine the relationship of work-life balance and job satis-faction. The result showed that a strong positive relationship exists between job satisfaction and work-life balance. Similar results was shown in the study conducted by Yadav and Dabhade (2013) on work life balance and job satisfac-tion of the 150 working women from education sector and banking sector. The results indicate that work-life balance and job satisfaction share significant relationship.
Bt Bani Hasan and Teng (2017) exam-ined the relationship between work-life bal-ance and job satisfaction among working adults in Malaysia with sex and race as moderators among 120 respondents. The results revealed that the relationship between work-life balance and job satisfaction is significant. Further re-sults revealed that sex and race do not moderate the relationship between work-life balance and job satisfaction. A study of Mukururi and Ngari (2014) confirmed that work-life balance is a predictor of job satisfaction. A positive relation-ship between work-life balance, job satisfaction and organization commitment were also evident in the result of the study conducted by Azeem and Akhtar (2014).
Another study was conducted by Yadav and Dabhade (2013) to determine the relation-ship that exists between work-life balance and job satisfaction of the 150 women employees of an education sector and a banking sector. The results indicate that work-life balance and job satisfaction shared a significant relationship.
According to Adikaram and Jayatilake (2016), the impact of work-life balance on em-
ployee job satisfaction is an issue that is cen-tral to human resource development. Work-life balance is a measure of how happy employees are with their job and working environment. When employees have high moral, it can be of tremendous benefit to the company, as employ-ees would be more likely to produce more, take fewer days off, and stay loyal to the company. Further, it was explained in this paper that the current work scenario is marked by intense pressure, constant deadlines, changing demo-graphics, fast pace of change, increased use of technology, and the virtual workplace.
Theoretical FrameworkThis study is supported by the following
theories:Spill Over Theory. Guest (2002) in
his Spill over Theory postulates the conditions under which spillover between the work micro system and the family micro system occurs. The spill over can be either positive or nega-tive. Accordingly, if work-family interactions are rigidly structured in time and space, then spill over in terms of time, energy and behavior is negative. Further, when flexibility occurs en-abling individuals to integrate and overlap work and family responsibilities in time and space, it leads to positive spill over which is instrumen-tal in achieving healthy work-life balance.
Affective Event Theory. The affective event theory was developed by Psychologist Howard M. Weiss and Russell Cropanzano to explain how emotions and moods influence job satisfaction. This theory explains the link between employees’ internal influences - cog-nitions, emotions, mental states etc. and their reactions to incidents that occur in their work environment which affect performance, orga-nizational commitment, and job satisfaction (Thompson & Phua, 2001;Wegge, van Dick, Fisher, West, & Dawson, 2006).
This theory further proposes that affec-tive work behaviors are explained by employ-

Volume 1 Issue 1 | July 2019
10 Fidēre: Journal of Business, Governance, and Information Technology
ee mood and emotions, while cognitive-based behaviors are the best predictors of job satis-faction. In addition, the affective events theory emphasized that positive-inducing and nega-tive-inducing emotional incidents at work are distinguishable and have a significant psycho-logical impact upon workers’ job satisfaction. This resulted in lasting internal and external affective reactions exhibited through job per-formance, job satisfaction, and organizational commitment
Social Role Theory. Social role theo-ry explains the origin of sex differences in be-havior of men and women. Originally, women were homemakers. This means they have to as-sume responsibilities at home while men were considered breadwinners. Their responsibilities were outside the home. However, in the later generation, equity or gender roles were encour-aged and promoted. Eagly (1987) stated that the role of women and recognizes the traditional division in labor between women and men in accordance with domestic responsibilities and occupational responsibilities, respectively.
MethodologyThis study utilized the correlational de-
sign. Using purposive sampling, the 120 HEI worker respondents were identified. Question-naires on work-life balance and job satisfaction were developed and content validated. The Cronbach alpha reliability resulted to accept-able reliability indices of .947, .837, and .843 for work-life balance and job satisfaction, re-spectively. The work-life balance and job satis-faction measures used the 4-point Likert scale: 1-strongly disagree (very poor), 2 –disagree (poor), 3-agree (good), and 4-strongly disagree (very good). The Job Satisfaction questionnaire was rated using a 4-point Likert scale of 1 (very low), 2(low), 3 (high), 4 (very high).
The profile analysis revealed that major-ity of the respondents were regular employees (70%), married (73.3%), 50 years old below
(68.1%), male (47.9%) and female (42.1%), with 20 years of service and below (72.3%), re-sides inside the campus (61.7%), and were from the teaching (45.1%) and the non-teaching de-partment (54.9%). To ensure anonymity and confidentiality, the identity of the employees were not revealed. The study utilized the SPSS Version 23 and Partial Least Square Applica-tions
Specific statistical analysis such as mean, standard deviation, correlation, and structural equation modeling techniques were used to descriptively determine the moderat-ing effects of sex, age, and job classification on work-life balance and job satisfaction of HEI workers.
Results and DiscussionWork-life Balance
The descriptive analysis on work-life balance revealed a varied perception among 120 workers of a sectarian HEI. The results revealed that more than 50% of institutional workers of HEIs agree and strongly agree on the follow-ing items of work-life balance: My job is en-abling me to spare a suitable time for my family (68.3%); It is difficult to tell where my work life ends and my family life begins(53.3%);In my life, there is a clear boundary between work and family (74.5%); My current job allows me to get involved in my family as I should be (74.8%); I feel tired because of work (63.3%); and I wor-ry about work when I am not actually at work (62.7%).
On the other hand, less than 50% of workers in sectarian HEIs agree on the follow-ing items: I feel that making a balance among my work, my family and other social respon-sibilities is difficult (49.9%); The time I spend in my job is negatively affecting my social re-sponsibilities (49.6%); I miss out quality time with family due to pressure of work (49.2%); Because of my current job, I do not have a time to take care of my family (22.5%). The results

11Testing the Moderating Effects of Sex, Age and Job Classification on Work-life Balance,
and Job Satisfaction of Higher Education Institution Workers
Fidēre: Journal of Business, Governance, and Information Technology Volume 1 Issue 1 | July 2019
of the study revealed that the imbalance work-life was only true for some institutional workers. In this study, the work-balance issues were more applicable to the teaching workers of the sectarian HEIs. On the overall, the mean resulted to a good work-life balance for the sectarian HEI workers (mean=2.59, SD =.46)
Table 1Work-life Balance of the Institutional Workers
Disagree and Strongly Disagree (%)
Agree/Strongly Agree (%)
1. My job is enabling me to spare a suitable time for my family. 31.7 68.3
2. It is difficult to tell where my work life ends and my family life begins. 46.2 53.8
3. In my life, there is a clear boundary between work and family. 25.5 74.5
4. My current job allows me to get involved in my family as I should be. 25.2 74.8
5. I feel that making a balance among my work, my family and other social responsibilities is difficult.
57.1 49.9
6. The time I spend in my job is negatively af-fecting my social responsibilities (e.g., visiting relatives and friends)
50.4 49.6
7. Because of my current job, I do not have a time to take care of my family. 77.5 22.5
8. I miss out quality time with family due to pres-sure of work. 50.8 49.2
9. I feel tired because of work. 36.7 63.310. I worry about work when I am not actually at
work. 37.3 62.7
Mean 2.59 (Good) SD = .461-1.5 Strongly disagree (Very poor) 1.51-2.5 Disagree (Poor) 2.51-3.5 Agree (Good) 3.51-4 Strongly Agree (Very good)
Job Satisfaction Table 2 revealed that majority of the respondents agree and strongly agree that they have a high level of job satisfaction. These results were supported by more 50% agreement of the items in job satisfaction. The workers were satisfied with the job they have in the university. Further, the top five items with the highest percentage of agreement were: I feel good about working at this University (95%); I feel secure about my job (84.2%); I have the tools and resources I need to do my job (82.5%); I am satisfied with my career progression in this University (82.4%); I am satisfied with the benefits I received (79.50%). On the overall, 95% the respondents are satisfied with their

Volume 1 Issue 1 | July 2019
12 Fidēre: Journal of Business, Governance, and Information Technology
job. The job satisfaction rating is 2.96 (SD =.40) implying a high level of job satisfaction among employees.
Table 2Level of Job Satisfaction Among Institutional Workers
Disagree andStrongly Disagree
Agree/Strongly Agree
1. I am being paid a fair amount for the work I do. 30.50 69.502. I am satisfied with the benefits I received. 20.50 79.503. I am satisfied with my career progression in this
University. 17.60 82.40
4. I am satisfied with the promotion scheme of the University 32.2 67.80
5. I get along well with my colleagues in the work place. 4.20 60.80
6. I am satisfied with the salary I receive monthly 33.90 66.107. I have the tools and resources I need to do my
job. 17.50 82.50
8. I feel secure about my job. 15.80 84.209. I receive recognition for a job well done. 23.70 76.3010. I feel good about working at this University. 5.00 95.0011. Overall, I am satisfied with my job. 5.00 95.00Mean 2.96 (High) SD = .40
1 Strongly disagree (Very low) 2 Disagree (Low) 3 Agree (High) 4 Strongly Agree (Very high)
Work Life Balance and Job performanceTable 3 presents the correlation analysis of work-life balance and job satisfaction. The
degree of relationship between work-life balance and job satisfaction is .238 (p = .009), indicating low but negative relationship. This result implies that employees with a balanced work life family have high job satisfaction.
Table 3Correlation Analysis of Work Life Balance and Job Performance
Work-life balance Job satisfactionWork-life balance Pearson Correlation 1 .238**
Sig. (2-tailed) .009N 120 120
Job satisfaction Pearson Correlation .238** 1Sig. (2-tailed) .009N 120 120
** Correlation is significant at the 0.01 level (2-tailed).

13Testing the Moderating Effects of Sex, Age and Job Classification on Work-life Balance,
and Job Satisfaction of Higher Education Institution Workers
Fidēre: Journal of Business, Governance, and Information Technology Volume 1 Issue 1 | July 2019
This result is supported by the study conducted by Adikaram and Jayatilake (2016) on the impact of work-life balance on employee job satisfaction in private sector commercial banks of Sri Lanka. The findings suggest that work-life balance has a significant impact on employee job satisfaction in private sector commercial banks of Sri Lanka. Balance in work and family life is an emerging challenge for both employees and employers. Work-life balance requires attaining equi-librium between professional work and personal work, so that it reduces friction between official and domestic life.
A similar study was conducted by Azeem and Akhtar (2014), which investigated the in-fluence of work-life balance and job satisfaction on organization commitment of health care em-ployees. The results revealed that there is a positive relationship between work-life balance, job satisfaction, and organization commitment. The result of these studies confirms the results of the current study. The findings of the present study corroborate with previous research evidence. Thus, it can be safely concluded that work and personal life needs to be integrated and balanced by orga-nizations through work-life balance initiatives (Agha et al., 2017).
Testing the Moderating Effect of Sex, Age, and Job Classification on Work-life Balance and Job Satisfaction
The results of moderation analysis as revealed in Table 4 showed that sex does not sig-nificantly moderate work-life balance and job satisfaction. This result was supported the study by Gupta and Hyde (2013) that sexdoes not play a major role in impacting an employee’s work-life balance and job satisfaction. Contrary to the result, Khan, Ramzan and Butt (2013) found that males in the banking industry are more satisfied with their job and able to work genuinely and sys-tematically with fruitful performance at the workplace. In study on job satisfaction of women, it is concluded that organizations with family-friendly policies would affect the job satisfaction and attaining the fulfillment of work-life balance (Ciric, 2010 as cited in Bt Bani Hasan & Teng, 2017).
Table 4Analysis on Moderating Effects of Sex, Age, and Job Classification on Work-life Balance and Job SatisfactionVariables Total Effects-diff P-value InterpretationSex (Male Vs Female) 0.059 .574 No difference on their effectsAge group 0.248 .883 No difference on their effects(Above 40 yrs. Old vs 40 yrs. Above)Job Classification 0.142 0.238 No difference on their effects(Teaching Vs Non-teaching)

Volume 1 Issue 1 | July 2019
14 Fidēre: Journal of Business, Governance, and Information Technology
ReferencesAdikaram. D.S. R & Jayatilake, V.K. (2016)
Impact of work-life balance on employ-ee job satisfaction in private sector com-mercial banks of Sri Lanka. Internation-al Journal of Scientific Research and Innovative Technology , 3(11), pp.17-3. Retrieved from https://www.ijsrit.com/uploaded_all_files/3554395309_n2.pdf
Anuradha, & Pandey, M. (2016). Impact of work-life balance on job satisfaction of women doctors. Problems and Perspec-tives in Management, 14(22), 319-324. doi:10.21511/ppm.14(2-2).2016.07
Azeem, S.A. & Akhtar, N. (2014). The influence of work life balance and job satisfaction on organizational commitment of health-care employees. International Journal of Human Resource Studies, 4(2), 18-24.
Bt Bani Hasan, N.A. & Teng, L.S. (2017). Work-life balance and job satisfaction among working adults in Malaysia: The role of gender and race as moderators. Journal of Economics, Business and Management, 5(1), 18-24.
Agha, K., Azmi, F.T., & Irfan, A. (2017). Work-life balance and job satisfaction: An empirical study focusing on higher edu-cation teachers in Oman. International Journal of Social Science and Humani-ty, 7(3), 164-171.
Eagly, A. H. (1987). Sex differences in social behavior: A social-role interpretation. Hillsdale, NJ: Erlbaum.
Gomez, J. (2013). More than 60% of Malay-sians face work overload, have no time for family, survey reveals. The Malay-sian Insider.
Guest, D. E. (2002). Human resource man man-agement: When research confronts the-ory. International Journal of Human Resource Management, 12(2), 22-38.
Gupta, B., & A. M. Hyde, M. (2013). Demo-graphical study on quality of work life in nationalized banks. Vision, 17(3), 223-231.
Khan, A., Ramzan, M., & M. S. Butt, M.S. (2013). Is job satisfaction of Islam-ic banks operational staff determined through organizational climate, occupa-tional stress, age and gender. Journal of Business Studies Quarterly, 4(3), 14-26.
Meenakshi, S. P., Subrahmanyam C.V., & Rav-ichandran, K (2013). The importance of work-life-balance. IOSR Journal of Business and Management (IOSR-JBM) 14(3) Retrieved from www.iosrjournals.org
Mirzaii, L.H., Riazi, Z., Vares, M. (2014). The relations between working life quality and coping with stress and job satisfac-tion in exceptional schools’ teachers. Arabian Journal of Business and Man-agement Review (Oman Chapter), l(4).
Mukururi, J.N. & Ngari, J.M. (2014). Influ-ence of work life balance policies on employee job satisfaction in Kenya’s Banking Sector: A case of commercial banks in Nairobi Central Business Dis-trict. IOSR Journal of Humanities and Social Science (IOSR-JHSS), 19(3) Ver. II. Retrieved from https://pdfs.seman-ticscholar.org/9aa9/d029b31c89636f-166633018de39317892dc2.pdf
15Testing the Moderating Effects of Sex, Age and Job Classification on Work-life Balance,
and Job Satisfaction of Higher Education Institution Workers
Fidēre: Journal of Business, Governance, and Information Technology Volume 1 Issue 1 | July 2019
Naithani, P. (2010). Overview of work-life bal-ance discourse and its relevance in cur-rent economic scenario. Asian Social Science, 6(6), 148-155.
Padma, S. & M. S. Reddy, M.S, (2014). Work-life balance and job satisfaction among school teachers - A study. The IUP Jour-nal of Organizational Behavior, 13(1).
Saeed1, K., & Farooqi, Y.Y. (2014). Examin-ing the relationship between work life balance, job stress and job satisfaction among university teachers (A case of University of Gujrat). International Journal of Multidisciplinary Sciences and Engineering, 5(6), 9-15.
Thomson, E, R. & Phua, F. T. T. (2012). A brief
index of affective job satisfaction. Orga-nization Management, 37(3), 275-307.
Varatharaj, V. & Vasantha, S. (2012, March). Work-life balances a source of job sat-isfaction - An exploratory study on the view of women employees in the service sector. International Journal of Multi-disciplinary Research, 2(3), 450- 458.
Wegge, J. van Dick, R. Fisher, G.K, West, M.A., & Dawson, J.F (2006). A test of basic assumptions of affective events theory (AET) in call centre work. Brit-ish Journal of Management Behaviour, 21(2),123.
Yadav, R. K., & Dabhade, N. (2013). Work life balance and job satisfaction among the working women of banking and edu-cation sector – A comparative study. International Journal of Advancement in Education and Social Sciences, 1(2), 17-30.
Volume 1 Issue 1 | July 2019
16 Fidēre: Journal of Business, Governance, and Information Technology
Abstract
The concept that perceived organizational support and organizational commit-ment relates to well-being with the mediating effect of job satisfaction has been well accepted, yet it has not been widely tested with the not-for-profit
organization. This study aimed to investigate the mediating role of job satisfaction on the relationship between perceived organizational support and organizational commitment toward well-being in a not-for-profit organization (i.e. educational institution). It randomly collected survey data from 99 respondents working in a not-for-profit organization. The study did not find any mediating effect of job sat-isfaction on the hypothesized relationships. The results were dissimilar from prior studies. The paper sheds a new insight into the existing body of knowledge on job satisfaction and well-being in the context of the not-for-profit organization. Impli-cations of the study are discussed, together with limitations and suggestions for future research.Keywords: Perceived Organizational Support, Organizational Climate, Job Satis-faction, Well-being, Not-for-profit Organization
The relaTionship of perCeived organizaTional supporT
and organizaTional CoMMiTMenT To Well-being as MediaTed
by Job saTisfaCTion in noT-for-profiT organizaTion
Wanlee Putsom, Damrong SattayawaksakulFaculty of Business Administration, Asia-Pacific International University
Attaining employee well-being is al-ways the main concern of behavioral and orga-nizational practitioners and theorists. Employee well-being is crucial in organization. It enhanc-es the willingness of employees to achieve more than their role according to the formal job specifications (Miles et al., 2002; Griffin et al., 2007). Several studies have tried to identify the antecedents of employee well-being. Among these behavior literatures, prior research found organizational support as an important aspect that influences both employee well-being and satisfaction -- which was proved by sever-al studies such as the one by Miao (2011) and Miao and Kim (2010). Other studies found or-ganizational commitment are one of the vital factors and the most generally studied form in
organizational behavior (Proter et al., 1974; Mowday et al., 1979; Meyer & Allen, 1991). Both perceived organizational support and or-ganizational commitment affect the workers’ cooperative behavior and individual training (Wayne et al., 1997). However, only few studies have examined organizational commitment in different cultural contexts such as western set-ting (e.g. Reed et al., 1994; Kirkman & Shapiro, 2001; Chen et al., 2006) and Asia (e.g. Chen et al., 2002; Wahab et al., 2009; Froese & Xiao, 2012). Nevertheless, scholars have discovered that the motivational foundation of perceived organizational support and organizational com-mitment behavior differ in the profit and non-profit organizations (e.g. Moore, 2000; Rhoades et al., 2001; Rojas, 2002). From an employee

17Relationship of Percieived Organizational Support and Organizational Commitment
to Well-being as Mediated by Job Satisfaction in Not-for-profit Organization
Fidēre: Journal of Business, Governance, and Information Technology Volume 1 Issue 1 | July 2019
perspective, perceived organizational support and organizational commitment are simply anteced-ents of job satisfaction or well-being (Thompson & Prottas, 2006; Miao, 2011). They are a kind of service that is typically attributed to personal loyalty and attachment rather than as an imper-sonal form of commitment (Thomas et al., 2005). Hui, Lee, and Rousseau (2004) suggest that it is because people are a relational society that a strong relationship may be sufficient for inducing employee reciprocity. Personal relationships, particularly between subordinates and immediate supervisors, may play a larger role in motivating job satisfaction and performance in organizations. Paine and Organ (2000) also suggest that different cultures/nations may interpret or evaluate job satisfaction and well-being differently. Therefore, there is a need for providing insights on some of the predictions of employees’ work satisfaction and well-being in the nonprofit organization’s context (Benz, 2005; Borzaga & Tortia, 2006; Becker et al., 2011).
The main scope of this study was to confirm the employees’ contentions in nonprofit or-ganizations such as education institutions. The current situations in Thailand’s education sector, including economic changes, education reform, and transitional societies, cause structural instabil-ity and lower number of students. The situation brings about a need to better understand the rela-tionships between perceived organizational support, organizational commitment affects to job sat-isfaction and well-being of employees among employees in nonprofit organizations, particularly the education institutions. This replication may allow previous findings to be generalized beyond the profit organizations. One objective is to examine the extent to which perceived organizational support and organizational commitment are associated with job satisfaction and well-being. An-other is to investigate the relationships between job satisfaction and well-being. Figure 1 shows the conceptual model of this study and the relationship between each independent, mediator, and dependent variables.
Figure 1. A Model of Job Satisfaction as a Mediator
Theoretical foundation and hypotheses developmentWell-being. From the safety and quality of the physical environment perspective, well-be-
ing in the workplace refers to all of the factors in working life -- particularly how employees feel about their job, their working surroundings, the climate at work organization and work (Buffet et al., 2013). In addition, from the Occupational Safety and Health (OSH), the elements of work-place well-being measure with the purpose to ascertain that employees are healthy, safe, engaged, and satisfied with their job. The main factor in deciding an organization’s overall achievement

Volume 1 Issue 1 | July 2019
18 Fidēre: Journal of Business, Governance, and Information Technology
is the worker’s well-being. A direct relationship among the general health conditions, productiv-ity levels and workforce well-being is shown by many studies. The need to focus on employee well-being is increasingly and seriously recog-nized by organizations and enterprises. Organi-zations are appreciative of the progress being done in this direction. It is becoming clearer that many workplace difficulties draw from a lack of commitment to the needs of employees, and for this organizations are beginning to ad-dress well-being issues. Workplace problems, such as conflict, bullying, stress, mental health disorders, drug abuse and alcohol are caused by the lack of recognition of the needs of workers. Anyone dedicated to making the workplace a more satisfying and decent place should have essential solutions or potential solutions, such as leadership, communication, and a focus on development and learning. The stimulus of leg-islative measures to adopt programs targeting specific health difficulties in the workplace as a counterpart to traditional health and safety measures, particularly related to alcohol drug abuse, has become fairly widespread in some industrialized countries. Currently, leaders and their partners covering not only alcohol and drug abuse but also lifestyle issues including diet, smoking, mental and well-being exercise have been a growing trend for global health promotion policies development (Internation-al Labour Organization, 2018). Baluch (2017) confirmed that divergent perceptions among HR system features manifest themselves in un-intended consequences. Thus, this paper intends to investigate the perception of employees on well-being among those working in nonprofit organizations.
Job satisfaction. In both public and business administration, the primary interest of research is job satisfaction, and there is a wide range of publications in many fields, including public service, business, and psychology ad-ministration. Many studies found that job satis-
faction has vital behavioral insinuations which includes retention, performance, and (organi-zational citizenship Clark 1997; Vroom 1964). Many scholars have made attempts to identify motivational determinants of job satisfaction. For example, many work conditions including job pressures, occupational self-direction, orga-nizational positions, and structure influence job satisfaction, as found by Miller (1980). Primary factors in job satisfaction are job specificity, task significance, participation, career development support, and feedback, suggested by Wright and Kim (2004). Prior study suggests that there are many factors that can affect employee job satis-faction. While some aspects may be explicit to occupation or industry, there are main catego-ries of features that can generally influence em-ployee job satisfaction. In some research, schol-ars describe measurable, concrete variables as “hard” variables, and less measurable, subjec-tive variables as “soft” variables. An employ-er’s commitment to work-life balance, benefits, and salary are hard variables (through work-from-home programs or employee daycare), whereas an individual’s perceived value to the organization, relationships with coworkers, and communication are soft variables.
In nonprofit organizations, as Lee (2016) found, workers take pride in their firm and his study shows that in certain organizations, top management and job have affected job satis-faction, but differently between public and non-profit organizations. Lee explains that the data suggest nonprofit organizations should create clear explanations of employees’ tasks and re-sponsibilities and permit employees to be more independent to increase job satisfaction. Other research studied well-being and job satisfaction as related to various factors such as job perfor-mance (Wright & Cropanzano, 2000), work-place turnover (Wright & Bonett, 2007), value of employees (Maxwell, 2016), and investigat-ed both well-being and job satisfaction (Isgor & Haspolat, 2016). The above mentioned studies

19Relationship of Percieived Organizational Support and Organizational Commitment
to Well-being as Mediated by Job Satisfaction in Not-for-profit Organization
Fidēre: Journal of Business, Governance, and Information Technology Volume 1 Issue 1 | July 2019
were done in profit organizations. Meanwhile, there was a lack of studies on job satisfac-tion and well-being in nonprofit organization. Therefore, from the literature review, the first hypothesis was generated as follows:
H1: Job satisfaction is positively related to well-being in not-for-profit organizations.
Perceived organizational supportPerceived organizational support (POS)
means that an employee believes that the or-ganization cares for and values his or her con-tribution to the success of the organization (Krishnan & Mary, 2012). Eisenberger and colleagues (1986) stated that POS has been having important consequences on employee performance and well-being; further, that POS refers to “the extent to which the organization values [employees’] contributions and cares about their well-being.” A supportive organi-zation is committed to its workers (Malatesta & Tetrick, 1996). According to organizational support theorists, high POS tends to improve work attitudes and engender effective work be-havior for two reasons. First, these beneficial effects result from a process of social exchange. Research by Eisenberger and colleagues (1997) suggests that workers examine the actions of discretion that have been done, and then infer that they are being supported. They then seek to repay this favorable treatment. Thus, employees become more committed and harder-working (Eisenberger et al., 1986). In addition, it seems that if an organization is given adequate train-ing, resources, and support from management, it is more likely that members would both want their organization to succeed and for them to be more capable of helping their organization succeed. Therefore, it appears likely that the extent to which the organization perceives that it is supported to that extent, will be positive-ly associated with the display of task perfor-mance and organizational citizenship behavior (Miao, 2011; Eisenberger et al., 2001; Wayne
et al., 2002). The empirical evidence from prior studies found that POS was effected and related to job satisfaction such as Colakoglu and col-leagues (2010), Zumrah & Boyle (2014), and Donald and friends (2016) but again, all stud-ies focused on profit organizations. Hence, this study based on the literature review, generated the second hypothesis as follows:
H2: Perceived organization support is positively related to job satisfaction in not-for-profit organizations.
In addition, Krishnan & Mary (2012) also referred to POS as an employee’s percep-tion concerning the extent to which the organi-zation values their contribution and cares about their well- being. A few of studies have shown POS to predict important organization outcome as increasing employees’ well-being (Caesens et al., 2017; Giorgi et al., 2016). But, there is a lack of research on job satisfaction in the role of mediators. Therefore, this study sets the third and fourth hypotheses as the follows:
H3: Perceived organization support is positively related to well-being in not-for-profit organizations.
H4: The effect of perceived organiza-tional support on a not-for-profit organization’s well-being is mediated by job satisfaction.
Organizational commitmentThe individual’s psychological com-
mitment to an organization is an organizational commitment (Mathieu & Zajac, 1990). Lower levels of intention to leave the organization are usually closely correlated together with job sat-isfaction and organizational commitment. Three types of organizational commitment identified by the researchers are an affective commitment, continuance commitment, and normative com-mitment. Affective commitment is when the employees want to work with the organization because they have created an emotional bond

Volume 1 Issue 1 | July 2019
20 Fidēre: Journal of Business, Governance, and Information Technology
with the organization. The situation where em-ployees feel that they will lose more by leaving than they will gain in the organization is referred to as continuance commitment. Lastly, norma-tive commitment is when employees feel they should work for the organization because they have a responsibility to the organization (Allen & Meyer, 1990). Employees turnover intention (Lum et al., 1998) and organizational values (Williams & Anderson, 1991) are the negative and positive behavior of employees in the orga-nization caused by the relationship between or-ganizational commitment and job satisfaction.
In non-profit contexts, there are not many studies conducted on the connection be-tween job satisfaction and organizational com-mitment. The outcomes and antecedents of organizational commitment were identified by Steers (1977) which led to widely studied re-search. In an organization, both well-being and organizational commitment were the depen-dent variables of employees that were studied by Goulet and Frank (2002). Moreover, it was found that organizational commitment influ-ences job performance and employee retention (Steers, 1977). Similar conclusions were drawn by Judge and Watanabe (1993), Ernst and Ozeki (1998), Avey and colleagues (2010), and Tims and friends (2013). Recent research by Aghdasi, Kiamanesh, and Ebrahim (2011) found a strong correlation between employee commitment and job satisfaction. An organizational commitment in a religious-based non-profit organization mo-tivates people toward a collective shared goal that is likely to be reflective of the social re-sponsibilities of the organization (Vecina et al., 2013). As such, employees are likely to expe-rience a sense of connectedness to the organi-zation as it represents their own religious and social beliefs (McMurray et al., 2009).
Past empirical research has shown some proofs in organizational commitment. For ex-ample, Lok and Crawford (2001) investigated
organizational culture and organizational com-mitment by the arbitrating role of job satisfac-tion in a nonprofit organization, and found that job satisfaction did not considerably lessen the effect on organizational commitment. Organi-zational commitment, which is addressed by Yousef (2000), is an intermediary of leadership behavior with job satisfaction, job performance, and well-being. Therefore, based on the litera-ture review, the fifth and sixth hypotheses were made as follows:
H5: Organizational commitment is posi-tively related to job satisfaction in not-for-profit organizations.
H6: Organizational commitment is pos-itively related to well-being in not-for-profit or-ganizations.
In addition, in the context of this study is set the conceptual model for organizational commitment related to both job satisfaction and well-being. Prior studies give evidence of the related indirect effect of organizational commit-ment on job satisfaction and well-being. But, there is a lack of studies on job satisfaction in its role as mediator in nonprofit organizations. Thus, this study set the seventh hypothesis as:
H7: The effect of Organizational com-mitment on a not-for-profit organization’s well-being is mediated by job satisfaction.
Data and Method The model and hypotheses were tested
using data divided into four parts as follows.Perceived organizational support was
assessed using the model of Eisenberger, Hun-tington, Hutchison, and Sowa (1986). The ques-tions contained eight items and scored using a five-point Likert-type scale (1= “strongly dis-agree,” 5 = “strongly agree”). All of the scales gave test reliabilities averaging 0.83.
Organizational commitment was mea-sured using a tool developed by Allen and Mey-
21Relationship of Percieived Organizational Support and Organizational Commitment
to Well-being as Mediated by Job Satisfaction in Not-for-profit Organization
Fidēre: Journal of Business, Governance, and Information Technology Volume 1 Issue 1 | July 2019
er (1990). The instrument was made up of affective commitment (8 items), continuance commit-ment (8 items), and normative commitment (8 items). All items were scored on a 5-point frequency rating scale ranging from 1 (never) to 5 (always). High scores on affective, continuance and nor-mative commitment were indicative of employee commitment. Internal consistencies (Cronbach’s alphas) for the effective, continuance and normative commitment scales were 0.77, 0.76, and 0.74, respectively.
Job satisfaction was evaluated using the questionnaire developed by MacIntyre, Thivierge, and MacDonald (1997). Ten items were used to examine job satisfaction among nonprofit orga-nization employees (n=99). Answers to the questions were scored on a five-point Likert scale (1= “strongly disagree,” 5 = “strongly agree”). The Cronbach’s alpha for nine items was 0.91. Survey forms were distributed to 120 employees through a questionnaire in a nonprofit organization; 99 employees completed questionnaires, yielding a response rate of 82.5 percent. The independent variable was well-being, which was measured by using the questionnaire developed by Diener, Emmons, Larsen, and Griffin (1985). Five items of well-being (life satisfaction) used a five-point Likert scale (1= “strongly disagree,” 5 = “strongly agree”) and Cronbach’s alphas value of this part was .84 percent.
The majority of respondents were female (73.2 percent) and highly educated with a mas-ter’s degree (61.9 percent); 32 percent were between the ages of 41–50-year old, and 28.9 percent had 6 years to 10 years of work experience. The sample does create an impression that the data would be representative of the population.
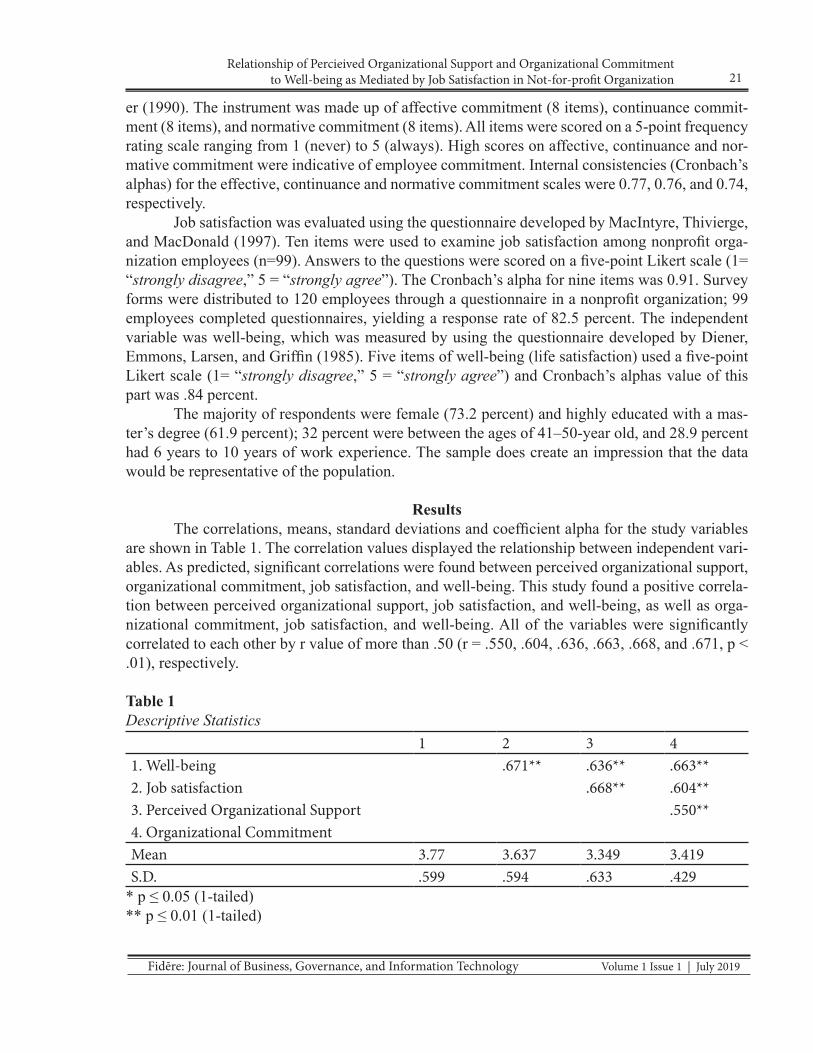
ResultsThe correlations, means, standard deviations and coefficient alpha for the study variables
are shown in Table 1. The correlation values displayed the relationship between independent vari-ables. As predicted, significant correlations were found between perceived organizational support, organizational commitment, job satisfaction, and well-being. This study found a positive correla-tion between perceived organizational support, job satisfaction, and well-being, as well as orga-nizational commitment, job satisfaction, and well-being. All of the variables were significantly correlated to each other by r value of more than .50 (r = .550, .604, .636, .663, .668, and .671, p < .01), respectively.
Table 1Descriptive Statistics
1 2 3 41. Well-being .671** .636** .663**2. Job satisfaction .668** .604**3. Perceived Organizational Support .550**4. Organizational CommitmentMean 3.77 3.637 3.349 3.419S.D. .599 .594 .633 .429
* p ≤ 0.05 (1-tailed)** p ≤ 0.01 (1-tailed)

Volume 1 Issue 1 | July 2019
22 Fidēre: Journal of Business, Governance, and Information Technology
Hypothesis 1 predicted that job satisfaction would have a positive effect on well-being as assessed from employees working in a nonprofit organization. Table 2 shows, for nonprofit workers’ ratings, that job satisfaction involving well-being, by the results exhibited, very strong associations. These were found for all models of job satisfaction (in Model 3) ( β = .712, p < .000). These results provide support for Hypothesis 1.
Hypothesis 2 expected a positive and significant relationship of perceived organizational support to job satisfaction (see Model 6) (β = .668, p < .000) in a nonprofit organization. The result can be evaluated by determining whether a perceived organizational support relationship term sig-nificantly increases the level of explained variation in a hierarchical regression analysis approach. This study provides such an explanation, as derived from the regression results. Therefore, Hy-pothesis 2 is supported.
In testing Hypothesis 3, the results show a positive and significant relationship of perceived organizational support to well-being (see Model 1) (β = .478, p < .000) in a nonprofit organization. The result can be evaluated by determining whether a perceived organizational support relation-ship term significantly increases the level of explained variation in a hierarchical regression anal-ysis approach. Thus, Hypothesis 3 is supported.
Hypothesis 4 suggested positive relationships involving perceived organizational support, job satisfaction, and well-being. We tested the job satisfaction in the role of mediator between per-ceived organizational support and well-being. The results anticipated by Model 4 show perceived organizational support to be related to job satisfaction only (β = .553, p < .000) but not related to well-being and not related to when tested job satisfaction in the role of mediator. Hence, Hypoth-esis 3 is partially supported.
Table 2Regression Resultsa
DV: Well-being DV: Job satisfactionVariables Model 1 Model 2 Model 3 Model 4 Model 5 Model 6 Model 7POS .478*** .1.73 .668***OC .587*** .283** .604***JS .712*** .553* .700***POS*JS .307OC*JS .296R2 .228 .344 .507 .507 .546 .446 .364
R2 .220 .337 .502 .497 .536 .440 .358F 28.676*** 50.895*** 99.747*** 49.361*** 57.645*** 78.152*** 55.630***
Hypothesis 5 and 6 suggested positive relationships involving organizational commitment and job satisfaction as well as organizational commitment and well-being. The results exhibited the relationship between these variables (see Model 7 and 2) (β = .604 and .587, p < .000), re-spectively. The result can be evaluated by determining whether an organizational commitment re-lationship term significantly increases the level of explained variation in a hierarchical regression analysis approach. Thus, Hypothesis 5 and 6 is supported.

23Relationship of Percieived Organizational Support and Organizational Commitment
to Well-being as Mediated by Job Satisfaction in Not-for-profit Organization
Fidēre: Journal of Business, Governance, and Information Technology Volume 1 Issue 1 | July 2019
The results from tested Hypothesis 7 showed partial support as exhibited in Model 5. Model 5 tested organizational commitment and well-being by job satisfaction in the mediator role. The data analysis showed positive signif-icance between organizational commitment to well-being and job satisfaction to well-being (see in Model 5) (β = .283 and .700, p < .000) but not significant when we tested job satisfac-tion in the mediator role between organizational commitment and well-being.
DiscussionThe aim of this study was to examine
interactions between perceived organizational support, organizational commitment, job sat-isfaction, and well-being from employees in a nonprofit organization that influences job per-formance. The result of the study demonstrated strong relationships of direct effect in each of the variables consisting of perceived organiza-tional support, organizational commitment, job satisfaction, and well-being in a nonprofit or-ganization. This study showed different results from those of previous studies on account of it focusing on well-being in the nonprofit organi-zation context. The results confirmed evidence mentioned in the literature review, namely, per-ceived organizational support can be positively and significantly related to both job satisfaction and well-being as well as organizational com-mitment positively and significantly related to both job satisfaction and well-being; and posi-tively and significantly between perceived orga-nizational support, organizational commitment, job satisfaction, and well-being.
Therefore, these results are consistent with those of prior studies between perceived organizational support and job satisfaction in nonprofit organizations (Eisenberger et al., 1997; Scandura & Lankau, 1997), perceived or-ganizational support and well-being in nonprofit organizations (Rhoades et al., 2001; McMurray et al., 2010), organizational commitment and
job satisfaction (Porter et al., 1974; Williams & Anderson, 1991), organizational commitment and well-being (Jain et al., 2009; Panaccio & Vandenberghe, 2009), and job satisfaction and well-being (Pugliesi, 1999; Wright & Cropan-zano, 2000). On the other hand, the results of this study shed new evidence that employees in a nonprofit organization who have one of the perceptions: perceived organizational support; organizational commitment; or job satisfaction lead to employees’ well-being. Therefore, man-agers or leaders need to provide only perceived organizational support, organizational commit-ment, or job satisfaction to motivate the em-ployee to create high performance in a nonprofit organization.
Not all aspects of job satisfaction in non-profit organizations and well-being have been empirically tested or made theoretically explicit. The current study is the first empirical study we are aware of that has sought to integrate the job satisfaction views of individual workers into the emerging picture. The results support the individ-ual-level conceptualization implicit in the litera-ture and suggest that job satisfaction and employ-ee well-being must be considered an important aspect of job satisfaction so as to foster workers’ sense of responsibility towards their tasks in an organization. The significance of perceived or-ganizational, organizational commitment, job satisfaction and well-being is consistent with prior studies and confirms the strong evidence obtained by Eisenberger and colleagues (1997), and McMurray and friends (2010). Job satisfac-tion is positively related to well-being and our results also indicate that perceived organization-al support and organizational commitment affect job satisfaction and well-being. This has import-ant implications for advancing job satisfaction in nonprofit institutions. Surprisingly, the concept of job satisfaction mediating between perceived organizational support and organizational com-mitment was not as clear cut as expected. The relationship between perceived organizational

Volume 1 Issue 1 | July 2019
24 Fidēre: Journal of Business, Governance, and Information Technology
support and organizational commitment affect well-being through job satisfaction as mediator role are involved but absorption is not. This find-ing shed new insights on the influence of organi-zational climate on job performance.
Despite many studies that have been mentioned in this research, limitations must be acknowledged. First, the results may have problems related to the common source used and the common method variance. Second, all variables were observed from an alike source. Last, this research was not exposed to a Harmon one-factor test that was considered essential to empirical studies (Podsakoff & Organ, 1986). Since the results of this were not examined, the present study is questionable on the problem of CMV or common method variance.
In this study, organizational commit-ment is a mediator factor in the nonprofit or-ganizational context and it was caused by job satisfaction being related to well-being. The suggestion for future research is to increase the conceptualization of organizational commit-ment and perceived organizational support used in this study by looking into other managerial structures and practices that might be shared into the perception. A critical question for the study is whether these factors have a precise influence on well-being and job satisfaction in a not-for-profit organization or on a mediated effect on job performance.
ReferencesAllen, N. J., & Meyer, J. P. (1990). The mea-
surement and antecedents of affective, continuance and normative commitment to the organization. Journal of Occupa-tional Psychology, 63(1), 1-18.
Avey, J. B., Luthans, F., Smith, R. M., & Palm-er, N. F. (2010). Impact of positive psy-chological capital on employee well-be-ing over time. Journal of Occupational Health Psychology, 15(1), 17-28.
Baluch, A. M. (2017). Employee perceptions of HRM and well-being in nonprofit or-ganizations: Unpacking the unintended. The International Journal of Human Resource Management, 28(14), 1912-1937.
Becker, K., Antuar, N., & Everett, C. (2011). Im-plementing an employee performance management system in a nonprofit or-ganization. Nonprofit Management and Leadership, 21(3), 255-271.
Benz, M. (2005). Not for the profit, but for the satisfaction?–evidence on worker well-being in non-profit firms. Kyklos, 58(2), 155-176.
Borzaga, C., & Tortia, E. (2006). Worker mo-tivations, job satisfaction, and loyalty in public and nonprofit social services. Nonprofit and Voluntary Sector Quar-terly, 35(2), 225-248.
Buffet, M. A., Gervais, R. L., Liddle, M., & Eechelaert, L. (2013). Well-being at work: creating a positive work envi-ronment. Literature Review. European Agency for Safety and Health at Work. Recuperado de https://osha. europa.eu/en/tools-and-publications/publi-cations/literature_reviews/well-be-ing-at-work-creat ing-a-posi t ive-work-environment.
Caesens, G., Stinglhamber, F., Demoulin, S., & De Wilde, M. (2017). Perceived or-ganizational support and employees’ well-being: The mediating role of or-ganizational dehumanization. Europe-an Journal of Work and Organizational Psychology, 26(4), 527-540.

25Relationship of Percieived Organizational Support and Organizational Commitment
to Well-being as Mediated by Job Satisfaction in Not-for-profit Organization
Fidēre: Journal of Business, Governance, and Information Technology Volume 1 Issue 1 | July 2019
Chen, J. C., Silverthorne, C., & Hung, J. Y. (2006). Organization communication, job stress, organizational commitment, and job performance of accounting professionals in Taiwan and America. Leadership & Organization Develop-ment Journal, 27(4), 242-249.
Chen, Z. X., Tsui, A. S., & Farh, J. L. (2002). Loyalty to supervisor vs. organizational commitment: Relationships to employ-ee performance in China. Journal of Oc-cupational and Organizational Psychol-ogy, 75(3), 339-356.
Clark, A. E. (1997). Job satisfaction and gender: why are women so happy at work?. La-bour Economics, 4(4), 341-372.
Colakoglu, U., Culha, O., & Atay, H. (2010). The effects of perceived organizational support on employees’ affective out-comes: evidence from the hotel indus-try. Tourism and Hospitality Manage-ment, 16(2), 125-150.
Diener, E. D., Emmons, R. A., Larsen, R. J., & Griffin, S. (1985). The satisfaction with life scale. Journal of Personality As-sessment, 49(1), 71-75.
Donald, M. F., Hlanganipai, N., & Richard, S. (2016). The relationship between perceived organizational support and organizational commitment among ac-ademics: the mediating effect of job sat-isfaction. Investment Management and Financial Innovation. 13(3), 267-273.
Eisenberger, R., Armeli, S., Rexwinkel, B., Lynch, P. D., & Rhoades, L. (2001). Re-ciprocation of perceived organizational support. Journal of Applied Psychology, 86(1), 42-51.
Eisenberger, R., Cummings, J., Armeli, S., & Lynch, P. (1997). Perceived organiza-tional support, discretionary treatment, and job satisfaction. Journal of Applied Psychology, 82(5), 812-820.
Eisenberger, R., Huntington, R., Hutchison, S., & Sowa, D. (1986). Perceived organiza-tional support. Journal of Applied Psy-chology, 71(3), 500-507.
Ernst Kossek, E., & Ozeki, C. (1998). Work–family conflict, policies, and the job–life satisfaction relationship: A review and directions for organizational be-havior–human resources research. Journal of Applied Psychology, 83(2), 139-149.
Froese, F. J., & Xiao, S. (2012). Work values, job satisfaction and organizational com-mitment in China. The International Journal of Human Resource Manage-ment, 23(10), 2144-2162.
Giorgi, G., Dubin, D., & Perez, J. F. (2016). Perceived organizational support for enhancing welfare at work: a regression tree model. Frontiers in Psychology, 7, 1770.
Goulet, L. R., & Frank, M. L. (2002). Organi-zational commitment across three sec-tors: Public, non-profit, and for-profit. Public Personnel Management, 31(2), 201-210.
Griffin, M. A., Neal, A., & Parker, S. K. (2007). A new model of work role perfor-mance: Positive behavior in uncertain and interdependent contexts. Academy of Management Journal, 50(2), 327-347.

Volume 1 Issue 1 | July 2019
26 Fidēre: Journal of Business, Governance, and Information Technology
Hui, C., Lee, C., & Rousseau, D. M. (2004). Psychological contract and organiza-tional citizenship behavior in China: Investigating generalizability and in-strumentality. Journal of Applied Psy-chology, 89(2), 311-321.
Jain, A. K., Giga, S. I., & Cooper, C. L. (2009). Employee wellbeing, control and or-ganizational commitment. Leadership & Organization Development Journal, 30(3), 256-273.
Judge, T. A., & Watanabe, S. (1993). Another look at the job satisfaction-life satis-faction relationship. Journal of Applied Psychology, 78(6), 939-948.
International Labour Organization, (2018). Workplace well-being. Retrieved from http://www.ilo.org/safework/areasof-work/workplace-health-promotion-and-well-being/WCMS_118396/lang--en/index.htm
Isgor, I. Y., & Haspolat, N. K. (2016). Inves-tigating the Psychological Well-Being and Job Satisfaction Levels in Different Occupations. International Education Studies, 9(12), 194-204.
Kirkman, B. L., & Shapiro, D. L. (2001). The impact of cultural values on job satisfac-tion and organizational commitment in self-managing work teams: The mediat-ing role of employee resistance. Acade-my of Management Journal, 44(3), 557-569.
Krishnan, J., & Mary, V. S. (2012). Perceived organizational support–an overview on its antecedents and consequences. In-ternational Journal of Multidisciplinary Research, 2(4), 1-13.
Lee, Y. J. (2016). Comparison of job satisfac-tion between nonprofit and public em-ployees. Nonprofit and Voluntary Sector Quarterly, 45(2), 295-313.
Lok, P., & Crawford, J. (2001). Antecedents of organizational commitment and the me-diating role of job satisfaction. Journal of Managerial Psychology, 16(8), 594-613.
Lum, L., Kervin, J., Clark, K., Reid, F., & Sirola, W. (1998). Explaining nursing turnover intent: job satisfaction, pay satisfaction, or organizational commitment?. Journal of Organizational Behavior: The Inter-national Journal of Industrial, Occupa-tional and Organizational Psychology and Behavior, 19(3), 305-320.
MacIntyre, P. D., Thivierge, K. A., & MacDon-ald, J. R. (1997). The effects of audience interest, responsiveness, and evaluation on public speaking anxiety and related variables. Communication Research Re-ports, 14(2), 157-168.
Mathieu, J. E., & Zajac, D. M. (1990). A review and meta-analysis of the antecedents, correlates, and consequences of orga-nizational commitment. Psychological Bulletin, 108(2), 171.
Malatesta, R. M., & Tetrick, L. E. (1996). Un-derstanding the dynamics of organiza-tional and supervisory commitment. Paper presented at the Annual Meeting of the Society for Industrial and Organi-zational Society.
Maxwell, R. L. (2016). A New Way of Exam-ining Job Satisfaction and Employee Well-Being: The Value of Employee Attributed Importance. Retrieved from

27Relationship of Percieived Organizational Support and Organizational Commitment
to Well-being as Mediated by Job Satisfaction in Not-for-profit Organization
Fidēre: Journal of Business, Governance, and Information Technology Volume 1 Issue 1 | July 2019
http://www.eawop.org/ckeditor_assets/attachments/772/rosanna_l_maxwell_final_version.pdf
McMurray, A. J., Pirola-Merlo, A., Sarros, J. C., & Islam, M. M. (2010). Leadership, climate, psychological capital, commit-ment, and wellbeing in a non-profit or-ganization. Leadership & Organization Development Journal, 31(5), 436-457.
Meyer, J. P., & Allen, N. J. (1991). A three-com-ponent conceptualization of organiza-tional commitment. Human resource management review, 1(1), 61-89.
Miao, R. T. (2011). Perceived organizational support, job satisfaction, task perfor-mance and organizational citizenship behavior in China. Journal of Behavior-al and Applied Management, 12(2), 105.
Miao, R., & Kim, H. G. (2010). Perceived orga-nizational support, job satisfaction and employee performance: An Chinese em-pirical study. Journal of Service Science and Management, 3(02), 257.
Miles, D. E., Borman, W. E., Spector, P. E., & Fox, S. (2002). Building an integrative model of extra role work behaviors: A comparison of counterproductive work behavior with organizational citizenship behavior. International Journal of Se-lection and Assessment, 10(1-2), 51-57.
Miller, J. (1980). Individual and occupational determinants of job satisfaction: A fo-cus on gender differences. Sociology of Work and Occupations, 7(3), 337-366.
Moore, M. H. (2000). Managing for value: Or-ganizational strategy in for-profit, non-profit, and governmental organizations.
Nonprofit and Voluntary Sector Quar-terly, 29(1_suppl), 183-204.
Mowday, R. T., Steers, R. M., & Porter, L. W. (1979). The measurement of organiza-tional commitment. Journal of Voca-tional Behavior, 14(2), 224-247.
Paine, J. B., & Organ, D. W. (2000). The cultur-al matrix of organizational citizenship behavior: Some preliminary conceptual and empirical observations. Human Re-source Management Review, 10(1), 45-59.
Panaccio, A., & Vandenberghe, C. (2009). Per-ceived organizational support, organiza-tional commitment and psychological well-being: A longitudinal study. Jour-nal of Vocational Behavior, 75(2), 224-236.
Podsakoff, P. M., & Organ, D. W. (1986). Self-reports in organizational research: Problems and prospects. Journal of Management, 12(4), 531-544.
Porter, L. W., Steers, R. M., Mowday, R. T., & Boulian, P. V. (1974). Organization-al commitment, job satisfaction, and turnover among psychiatric technicians. Journal of Applied Psychology, 59(5), 603-609.
Pugliesi, K. (1999). The consequences of emo-tional labor: Effects on work stress, job satisfaction, and well-being. Motivation and Emotion, 23(2), 125-154.
Reed, S. A., Kratchman, S. H., & Strawser, R. H. (1994). Job satisfaction, organiza-tional commitment, and turnover inten-tions of United States accountants: The impact of locus of control and gender.

Volume 1 Issue 1 | July 2019
28 Fidēre: Journal of Business, Governance, and Information Technology
Accounting, Auditing & Accountability Journal, 7(1), 31-58.
Rhoades, L., Eisenberger, R., & Armeli, S. (2001). Affective commitment to the organization: The contribution of per-ceived organizational support. Journal of Applied Psychology, 86(5), 825-835.
Rojas, R. R. (2000). A review of models for measuring organizational effectiveness among for-profit and nonprofit orga-nizations. Nonprofit Management and Leadership, 11(1), 97-104.
Scandura, T. A., & Lankau, M. J. (1997). Rela-tionships of gender, family responsibil-ity and flexible work hours to organiza-tional commitment and job satisfaction. Journal of Organizational Behavior: The International Journal of Industrial, Occupational and Organizational Psy-chology and Behavior, 18(4), 377-391.
Steers, R. M. (1977). Antecedents and outcomes of organizational commitment. Admin-istrative Science Quarterly, 46-56.
Thomas, J. L., Bliese, P. D., & Jex, S. M. (2005). Interpersonal Conflict and Organiza-tional Commitment: Examining Two Levels of Supervisory Support as Mul-tilevel Moderators. Journal of Applied Social Psychology, 35(11), 2375-2398.
Thompson, C. A., & Prottas, D. J. (2006). Re-lationships among organizational family support, job autonomy, perceived con-trol, and employee well-being. Journal of Occupational Health Psychology, 11(1), 100-118.
Vecina, M. L., Chacón, F., Marzana, D., & Mar-ta, E. (2013). Volunteer engagement and
organizational commitment in nonprofit organizations: what makes volunteers remain within organizations and feel happy?. Journal of Community Psychol-ogy, 41(3), 291-302.
Vroom, V. H. (1964). Work and motivation. New York: John Wiley & sons. Inc. VroomWork and Motivation1964.
Wahab, E., Quaddus, M., Quaddus, M., Nowak, M., & Nowak, M. (2009, May). Per-ceived Organizational Support and Or-ganizational commitment: A study of medium enterprises in Malaysia. In In-ternational Conference on Human Cap-ital Development (ICONHCD 2009) (Vol. 25, p. 27).
Wayne, S. J., Shore, L. M., Bommer, W. H., & Tetrick, L. E. (2002). The role of fair treatment and rewards in perceptions of organizational support and leader-mem-ber exchange. Journal of Applied Psy-chology, 87(3), 590-598.
Wayne, S. J., Shore, L. M., & Liden, R. C. (1997). Perceived organizational sup-port and leader-member exchange: A social exchange perspective. Academy of Management Journal, 40(1), 82-111.
Williams, L. J., & Anderson, S. E. (1991). Job satisfaction and organizational commit-ment as predictors of organizational cit-izenship and in-role behaviors. Journal of Management, 17(3), 601-617.
Wright, B. E., & Kim, S. (2004). Participation’s influence on job satisfaction: The im-portance of job characteristics. Review of Public Personnel Administration, 24(1), 18-40.

29Relationship of Percieived Organizational Support and Organizational Commitment
to Well-being as Mediated by Job Satisfaction in Not-for-profit Organization
Fidēre: Journal of Business, Governance, and Information Technology Volume 1 Issue 1 | July 2019
Wright, T. A., & Bonett, D. G. (2007). Job sat-isfaction and psychological well-being as nonadditive predictors of workplace turnover. Journal of Management, 33(2), 141-160.
Wright, T. A., & Cropanzano, R. (2000). Psy-chological well-being and job satisfac-tion as predictors of job performance. Journal of Occupational Health Psy-chology, 5(1), 84-94.
Zumrah, A. R., & Boyle, S. (2015). The effects of perceived organizational support and job satisfaction on transfer of training. Personnel Review, 44(2), 236-254.
Volume 1 Issue 1 | July 2019
30 Fidēre: Journal of Business, Governance, and Information Technology
Abstract
Studies have identified that work-life balance leads to positive organizational outcomes. Although work-life balance and job satisfaction has been a fre-quent subject of inquiry in any organization, there is a scarcity of studies
on the mediation effects of financial satisfaction. The present study explored the mediating effects of financial satisfaction on the relationship of work-life balance to job satisfaction. The study was conducted among 120 employees in higher ed-ucation sector using a validated-survey questionnaire. The measure include work-life balance, financial satisfaction, job satisfaction with reliability indices of .947, .837, and .843, respectively. The data was analyzed using SPSS and PLS Smart with bootstrapping techniques. The descriptive analysis revealed that employees in higher education sector were moderately satisfied in the financial aspect, have a good work-life balance, and were satisfied with their job. The findings of the study further revealed that the relationship among work-life balance, financial satis faction, and job satisfaction were statistically significant (p< .05), in which it cor-roborate with the previous studies. The mediation effect of financial satisfaction to work-life balance and job satisfaction was partial. Thus, this study concludes that the work-life balance affects job performance. However, the partial media-tion effect of financial satisfaction implies that their job satisfaction can also be attributed be other factors such as work-life balance but not totally due to financial. This study highlights the recommendation on financial management and work-life balance policy and practices be implemented in higher education sector to improve higher job satisfaction.Keywords: Work-Life Balance, financial satisfaction, job satisfaction
MediaTion effeCTs of finanCial saTisfaCTion on The relaTionship beTWeen Work-life balanCe and Job saTisfaCTion
Jolly S. Balila1, Robert Borromeo2
1Research Office, 2College of Business, Adventist University of the Philippines
Workplace and job dissatisfaction may have negative impact on work outcomes and per-sonal life. Employees who have real problems managing their time with work duties and fami-ly responsibilities have the tendency to feel dis-satisfied with work arrangements in the work-place. The result can increase stress due to work overload them job dissatisfaction happen (Agha, Azmi, & Irfan, 2017).
It has been generally noticed that the teachers in private sector colleges are not satis-fied with their jobs due to the issue of job secu-rity and low salary and some other reasons. It was described in the study of Tahir Akbar and Ramzan (2013) that teachers are the backbone of any country. If teachers are fully satisfied with their jobs they would sincerely and pas-sionately teach their students who would then

31Mediation Effects of Financial Satisfaction on the Relationship
Between Work-Life Balance and Job Satisfaction
Fidēre: Journal of Business, Governance, and Information Technology Volume 1 Issue 1 | July 2019
serve the country and the whole world as well. But if teachers are not satisfied with their jobs they can intentionally or unintentionally be a source of loss for the nation because they may not put their fullest attention to this delicate job.
Work life balance and financial aspects of an individual’s work may influence job sat-isfaction of employees. An individual manage conflict between different demands on his or her time and energy in a way that satisfy his or her need for well being. An organization who promotes work life balance attracts and retains employees to stay. Further, they support the well-being of the organization. Work life imbal-ance has negative results for effective function-ing of organization (Raj, 2013).
In the light of the following objectives were identified: 1) assess the work-life balance, financial satisfaction, and job satisfaction; 2) to determine the relationship between work-life balance, financial, satisfaction, and job satisfac-tion; 3) explored the mediating effects of finan-cial satisfaction on the relationship of work-life balance to job satisfaction.
Review of LiteratureWork-life Balance
Work life balance is a very important phenomenon that is of great concern to various employees in both private and public sector. It goes beyond prioritizing the work role and one’s personal life. It also affects the social, psycho-logical, economical and mental well-being of the individual. All these is been reflected in the output of the individual, which affects his or her performance in the work place on the long run. Work life balance has implication on employee attitudes, behaviors, wellbeing as well as or-ganizational effectiveness (Eby, Casper, Lock-wood, Bordeanx and Brindley, 2005).
Work-life balance was described as ‘family-friendly’, but are now extended beyond the scope of the family. It also refers to the flex-
ible working that provide a balance between work responsibilities and personal responsibil-ities (Redmond Valiulis and Drew, 2006)
Financial SatisfactionFinancial Satisfaction is a “a sub-con-
struct of general well-being.” (Campbel, 1980) and added material and non-material aspects to the financial satisfaction (William as cited in Cuskuner, 2016) . Similarly, Joo and Grable as cited in Cuskuner, 2016) stated that financial satisfaction includes contentment with one’s material (objective) and non-material (subjec-tive) financial situation in general. Ali, Rahman, and Abd, Bakar (2015) also described financial satisfaction as “a person’s perception concern-ing his/her current financial situation”
The basis of financial satisfaction is the financial rewards given to employees. Zaraket and Saber (2017) describe financial rewards are pay, bonuses, transportation facility, health insurance, and pensions. Therefore, employees receive financial payments from their employ-ers in the form of salary or commissions. There are different types of financial rewards. A bonus is form of financial reward which can be de-fined as an additional compensation given to an employee as a motivator or a reward for his/her hard work. It is given to workers majorly due to their performance.
According to Bruni and Porta, (2005) as cited in Dale, (2015) ‘financial satisfaction was a subjective measure of how an individual feels they are doing financially’. Income, or some variant of income, has generally been found to be related to the achievement of positive goals, such as education and access to health care, contributing to happiness or satisfaction.
Financial satisfaction is one of the ma-jor components of quality of life [13], and yet, much research has been documented over the years to get better understand of determinants and outcomes of satisfaction from financial sta-tus. It is generally assumed that financial satis-

Volume 1 Issue 1 | July 2019
32 Fidēre: Journal of Business, Governance, and Information Technology
faction would be improved by a lack of finan-cial problems [7].
Job SatisfactionJob satisfaction is defined as the em-
ployee’s attitudes, feelings and behavior to-wards his/her organisation (Chen, 2008). Over a decade researchers examined job satisfaction in some way up to the present to find ways to improve job satisfaction. In the study conducted by Gomez (2013), there are more than 60% of Malaysian workforce felt that they are unable to spend time for their families, thanks to the long working hours.
Zeqiri and Aziri (2010) studied on four different measures of job satisfaction for em-ployees in Republic of Macedonia, which were remuneration, relationship with manager, rela-tionship with peers, and the possibility of career growth. The respondents were satisfied of the three measurements toward the job except for the career growth which resulted the dissatis-faction in their position.
Theoretical FoundationThis study was anchored on the following theories:
Spill Over Theory. This theory postu-lates the conditions under which spillover be-tween the work micro system and the family micro system occurs. It can either positive or negative. According to this theory, if work- family interactions are rigidly structured in time and space, then spill over in term of time, en-ergy and behavior is negative. The situation in the workplace is that there is flexibility enables individuals to integrate and overlap work and family responsibilities in time and space which lead to positive spill over. The effect is instru-mental in achieving healthy work life balance.
According to Guest (2002), the deter-minants of work life balance are located in the work and home contexts. Contextual determi-nants include demands of work, culture of work,
demands of home and culture of home. Individ-ual determinants include work orientation (i.e. the extent to which work (or home) is a central life interest), personality, energy, personal con-trol and coping, gender and age, life and career stage. The variables of the study are under the contextual determinants, which are leave poli-cy and service delivery. The leave policy is the culture of work, while the service delivery is the demand of work.
The nature of work life balance was defined both objectively and subjectively. The objective indicators include hours of work and hours of uncommitted or free time outside work. Subjective Indicators refer to the states of balance and imbalance. He also noted that balance may be reported when equal weight is given both to work and home or, when home or work dominates by choice. Spill over occurs when there is interference of one sphere of life with other. Also, numerous outcomes of work life balance which include personal satisfac-tion and wellbeing at work, home and life as a whole, performance at work and home, impact on others at work, family and friends.
Maslow’s hierarchy of need’s theory. This theory explains the main five needs of peo-ple’s lives needs to be satisfied which are phys-iological, safety, social, self-esteem and self-ac-tualization. In Affat Theory (1976) he found that people are different in their job satisfaction. What makes an employee very satisfied? Maybe he/she is less satisfied than another employee, it depends on their interest and position. In this particular study, the discussion will be mainly in the following five factors which influence job satisfaction: pay, promotion, supervisor style, co-workers and tasks.
MethodologyThis correlational study was conducted
among 120 employees of Higher Education In-stitution which was selected through purposive sampling. Questionnaire was used as the main

33Mediation Effects of Financial Satisfaction on the Relationship
Between Work-Life Balance and Job Satisfaction
Fidēre: Journal of Business, Governance, and Information Technology Volume 1 Issue 1 | July 2019
data gathering tool. The questionnaires were content validated and the reliability indices were computed to be .947, .837, and .843, for work-life balance, financial satisfaction, job satisfaction, respectively. The Work-life Balance and Job Satisfaction measures used the 4-point Likert scale (1 (Strongly Disagree, Disagree, Agree, and Strongly Agree). The Financial Satisfaction question-naires were rated using a 5-point scale of 1 (Not satisfied), 2(Less satisfied), 3(Moderately satis-fied), 4 (Satisfied) and 5 (Very satisfied). On the majority of the respondents were regular employ-ees (70%), married (73.3%), 50 years old below (68.1%), both male (47.9%) and female (42.1), with years of service of 20 years and below (72.3%), resides inside the campus (61.7%), and both were from the teaching (45.1%) and the non-teaching department (54.9%). To ensure anonymity and confidentiality the identity of the employees were not revealed. The study utilized the SPSS Version 23 and AMOS in order to address the objectives of the study. Specific statistical analysis such as mean standard deviation, correlation, and structural equation modeling techniques were used to descriptive determine the mediating effect of financial satisfaction to work-life balance and job satisfaction of the employees.
ResultsFinancial Satisfaction
The results on the financial satisfaction among HEI employees are presented in Table 1. Employees were satisfied on the following: with their spending habits, the employee benefits they received, plans for their children’s education, personal financial education they have attained, with how they respond emotionally to their personal financial issues, that financial issues do not cause stress or strain in the relationships that are important, and the way how they use my credit card/s.
The remaining items in the financial satisfaction items were rated moderately satisfied. The least rate items were: the “extras” that they were able to buy for themselves and family, with their estate plan, amount of money that they save and invest on a regular basis, and the current investment choices they have. This implies that the employees have concerns on the saving and investment issues.
The overall results on work-life balance revealed that the employees were moderately sat-isfied financially (Mean =2,41, SD =.71).
Table 1Financial Satisfaction ProfileFinancial Satisfaction Items Mean Std. Dev.1. with my ability to meet my financial obligations. 3.46 .92 MS2. with the income potential my current job provides me. 3.45 .92 MS3. with my spending habits. 3.60 .89 S4. with the level of debt I carry. 3.47 1.01 MS5. with the “extras” that I am able to buy for myself and family. 3.25 1.04 MS6. with the level and quality of insurance protection I currently have. 3.41 1.10 MS7. with the amount of money that I save and invest on a regular basis. 2.88 1.17 MS8. with my current investment choices. 2.88 1.17 MS

Volume 1 Issue 1 | July 2019
34 Fidēre: Journal of Business, Governance, and Information Technology
9. with my retirement benefits. 3.30 1.14 MS10. with the employee benefits I receive. 3.66 1.00 S11. with my style of personal financial records management. 3.48 0.94 MS12. with my plans for my children’s education. 3.79 1.06 S13. with my estate plan. 3.01 1.09 MS14. with my level of charitable service. 3.38 1.00 MS15. with the level of personal financial education I have attained. 3.54 1.06 S16. with how I respond emotionally to my personal financial issues. 3.52 0.91 S17. with my ability to communicate about financial matters. 3.58 0.85 S18. with the feelings I have about my money life. 3.45 0.93 MS19. that financial issues do not cause stress or strain in the relationships that are important to me. 3.58 0.89 S
20. with the way how I use my credit card/s. 3.32 1.10 SMEAN 3.41 0.71 MS
1 Not satisfied (NS) 2 Less Satisfied (LS) 3 Moderately satisfied (MS) 4 Satisfied (S) 5 Very Satisfied (VS)
Work-life BalanceWork-life balance term is defined as the time an employee spend on both at work as well as
socialises with family, friends and attending to other personal interests In this study, The work-life balance were perceived as good. However, there were specific items that need some attention and improvement because the employees rated them as poor. The poorly rated items were the follow-ing: “difficult to tell where my work life ends and my family life begins”, “I feel that making a balance among my work”, “my family and other, social responsibilities is difficult”, “I feel tired because of work”, and “I worry about work when I am not actually at work”. These items were a reality in the employees work life.
Table 2Work-life Balance
Mean Std. Dev VI1. My job is enabling me to spare a suitable time for my family. 2.78 .80 Good2. It is difficult to tell where my work life ends and my family life begins. 2.44 .74 Poor3. In my life, there is a clear boundary between work and family. 2.89 .71 Good4. My current job allows me to get involved in my family as I should be. 2.85 .73 Good5. I feel that making a balance among my work, my family and other
social responsibilities is difficult. 2.41 .74 Poor
6. The time I spend in my job is negatively affecting my social respon-sibilities (e.g., visiting relatives and friends) 2.50 .74 Good
9. Because of my current job, I do not have a time to take care of my family. 2.88 .65 Good
11. I miss out quality time with family due to pressure of work. 2.52 .80 Good
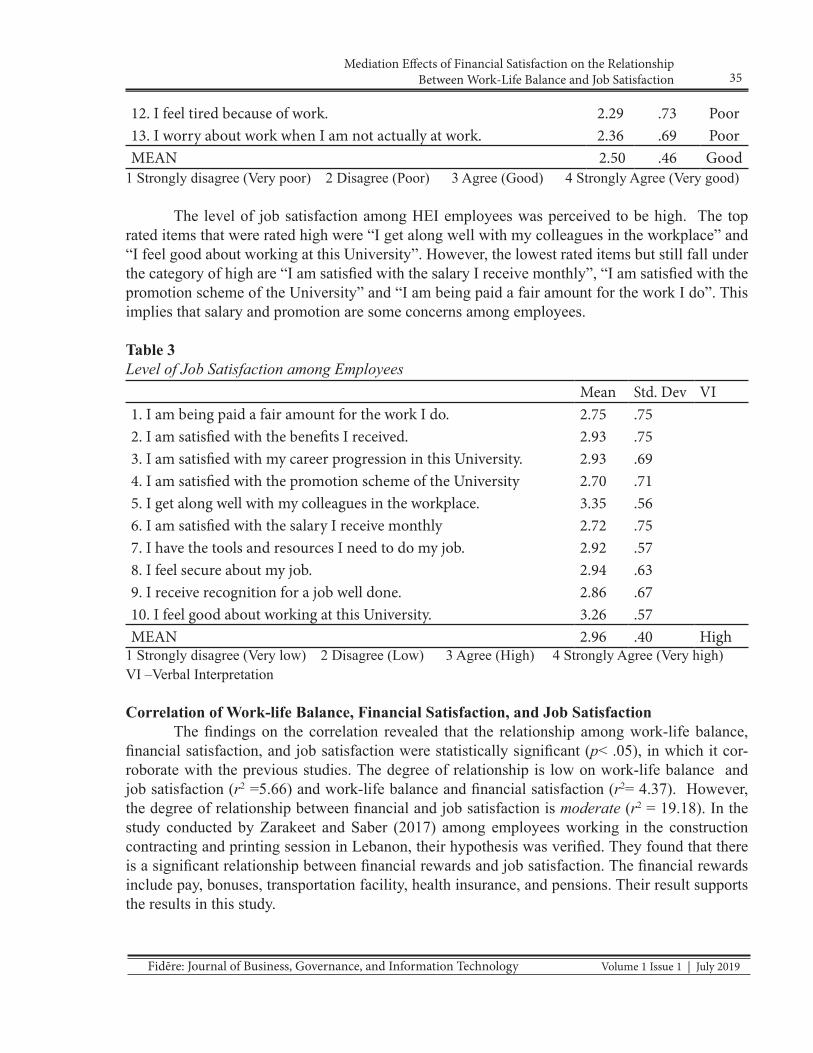
35Mediation Effects of Financial Satisfaction on the Relationship
Between Work-Life Balance and Job Satisfaction
Fidēre: Journal of Business, Governance, and Information Technology Volume 1 Issue 1 | July 2019
12. I feel tired because of work. 2.29 .73 Poor13. I worry about work when I am not actually at work. 2.36 .69 PoorMEAN 2.50 .46 Good
1 Strongly disagree (Very poor) 2 Disagree (Poor) 3 Agree (Good) 4 Strongly Agree (Very good)
The level of job satisfaction among HEI employees was perceived to be high. The top rated items that were rated high were “I get along well with my colleagues in the workplace” and “I feel good about working at this University”. However, the lowest rated items but still fall under the category of high are “I am satisfied with the salary I receive monthly”, “I am satisfied with the promotion scheme of the University” and “I am being paid a fair amount for the work I do”. This implies that salary and promotion are some concerns among employees.
Table 3Level of Job Satisfaction among Employees
Mean Std. Dev VI1. I am being paid a fair amount for the work I do. 2.75 .752. I am satisfied with the benefits I received. 2.93 .753. I am satisfied with my career progression in this University. 2.93 .694. I am satisfied with the promotion scheme of the University 2.70 .715. I get along well with my colleagues in the workplace. 3.35 .566. I am satisfied with the salary I receive monthly 2.72 .757. I have the tools and resources I need to do my job. 2.92 .578. I feel secure about my job. 2.94 .639. I receive recognition for a job well done. 2.86 .6710. I feel good about working at this University. 3.26 .57MEAN 2.96 .40 High
1 Strongly disagree (Very low) 2 Disagree (Low) 3 Agree (High) 4 Strongly Agree (Very high)VI –Verbal Interpretation
Correlation of Work-life Balance, Financial Satisfaction, and Job SatisfactionThe findings on the correlation revealed that the relationship among work-life balance,
financial satisfaction, and job satisfaction were statistically significant (p< .05), in which it cor-roborate with the previous studies. The degree of relationship is low on work-life balance and job satisfaction (r2 =5.66) and work-life balance and financial satisfaction (r2= 4.37). However, the degree of relationship between financial and job satisfaction is moderate (r2 = 19.18). In the study conducted by Zarakeet and Saber (2017) among employees working in the construction contracting and printing session in Lebanon, their hypothesis was verified. They found that there is a significant relationship between financial rewards and job satisfaction. The financial rewards include pay, bonuses, transportation facility, health insurance, and pensions. Their result supports the results in this study.
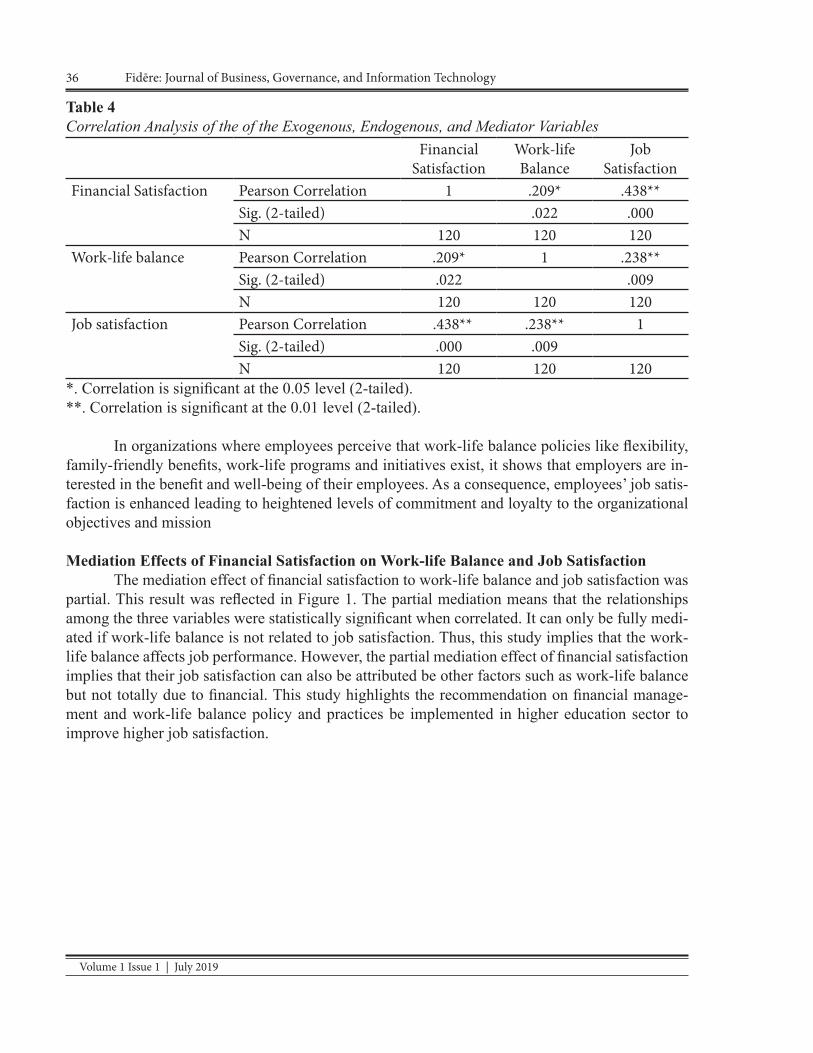
Volume 1 Issue 1 | July 2019
36 Fidēre: Journal of Business, Governance, and Information Technology
Table 4Correlation Analysis of the of the Exogenous, Endogenous, and Mediator Variables
FinancialSatisfaction
Work-lifeBalance
JobSatisfaction
Financial Satisfaction Pearson Correlation 1 .209* .438**Sig. (2-tailed) .022 .000N 120 120 120
Work-life balance Pearson Correlation .209* 1 .238**Sig. (2-tailed) .022 .009N 120 120 120
Job satisfaction Pearson Correlation .438** .238** 1Sig. (2-tailed) .000 .009N 120 120 120
*. Correlation is significant at the 0.05 level (2-tailed).**. Correlation is significant at the 0.01 level (2-tailed).
In organizations where employees perceive that work-life balance policies like flexibility, family-friendly benefits, work-life programs and initiatives exist, it shows that employers are in-terested in the benefit and well-being of their employees. As a consequence, employees’ job satis-faction is enhanced leading to heightened levels of commitment and loyalty to the organizational objectives and mission
Mediation Effects of Financial Satisfaction on Work-life Balance and Job SatisfactionThe mediation effect of financial satisfaction to work-life balance and job satisfaction was
partial. This result was reflected in Figure 1. The partial mediation means that the relationships among the three variables were statistically significant when correlated. It can only be fully medi-ated if work-life balance is not related to job satisfaction. Thus, this study implies that the work-life balance affects job performance. However, the partial mediation effect of financial satisfaction implies that their job satisfaction can also be attributed be other factors such as work-life balance but not totally due to financial. This study highlights the recommendation on financial manage-ment and work-life balance policy and practices be implemented in higher education sector to improve higher job satisfaction.

37Mediation Effects of Financial Satisfaction on the Relationship
Between Work-Life Balance and Job Satisfaction
Fidēre: Journal of Business, Governance, and Information Technology Volume 1 Issue 1 | July 2019
Figure 1. Structure Model for Work Life Balance andWork Satisfaction as Mediated by Financial Satisfaction
The result in Table 5 shows the path coefficients, the total indirect and direct effect of this mediation study.
Table 5Path Coefficient, Total Indirect Effect and Total Effects of the Mediation StudyPath Coefficient Mean(M) SD t-values P-ValuesFinancial Satisfaction -> Job Satisfaction 0.462 0.105 4.285 0Work Life Balance -> Financial Satisfaction 0.286 0.088 2.711 0.007Work Life Balance -> Job Satisfaction 0.279 0.141 1.888 0.06Total Indirect Effects Mean (M) SD t-Values P-ValuesFinancial Satisfaction -> Job SatisfactionWork Life Balance -> Financial SatisfactionWork Life Balance -> Job Satisfaction 0.134 0.055 1.962 0.05Total Effects Mean (M) SD t-Values P-ValuesFinancial Satisfaction -> Job Satisfaction 0.462 0.105 4.285 0Work Life Balance -> Financial Satisfaction 0.286 0.088 2.711 0.007Work Life Balance -> Job Satisfaction 0.413 0.129 2.915 0.004

Volume 1 Issue 1 | July 2019
38 Fidēre: Journal of Business, Governance, and Information Technology
The findings of the study conducted by Agha, Azmi, and Irfan (2017) revealed that work interference with personal life and personal life interference with work had a negative relationship with job satisfaction, work and personal life enhancement had a positive relationship with job satisfaction. This means that work and personal life needs to be integrated and balanced by orga-nizations through work-life balance initiatives.
The Resulting Model
The resulting model explained that financial satisfaction partially mediate the relationship of work-life balance and job satisfaction. The results of the study of Tahir Akbar and Ramzan (2013), from two independent variables only salary of the teachers among the financial-related sat-isfaction variables was significantly affecting the job satisfaction of teachers. It can be concluded in this study that management of these colleges should pay attention to salary of the teachers to increase job satisfaction of the teachers.
Conclusion
The descriptive analysis revealed that employees in higher education sector were moder-ately satisfied in the financial aspect, have a good work-life balance, and were satisfied with their job. The findings of the study further revealed that the relationship among work-life balance, finan-cial satisfaction, and job satisfaction were statistically significant (p< .05). The mediation effect of financial satisfaction to work-life balance and job satisfaction was partial. Thus, this study con-cludes that the work-life balance affects job performance. However, the partial mediation effect of financial satisfaction implies that their job satisfaction can also be attributed be other factors such as work-life balance but not totally due to financial.
RecommendationsThis study highlights the recommendation on financial management and work-life balance
policy and practices be implemented in higher education sector to improve higher job satisfaction.The findings of this study will not only help the organization to implement good work flex-
ibility arrangements, but will also help to implement them in an effective way. In addition, the results of implementation of the recommendations of this study will help
employees have a better life balance and higher job satisfaction. People will have more time with their families and other non-work related activities and achieve greater job satisfaction.
Moreover, this study could provide useful results which can be used for business and gov-ernment leaders when they make policy decisions regarding the implementation of Work Life Bal-ance programs. It can also help human resource professionals to design a better WLB program and policy to help organisations and their employees have a better balance between work and personal life, thus improves financial and job satisfaction.

39Mediation Effects of Financial Satisfaction on the Relationship
Between Work-Life Balance and Job Satisfaction
Fidēre: Journal of Business, Governance, and Information Technology Volume 1 Issue 1 | July 2019
ReferencesAgha, K., Azmi, F.T., & Irfan, A. (2017). Work-
Life Balance and Job Satisfaction: An Empirical study Focusing on Higher Education Teachers in Oman. Interna-tional Journal of Social Science and Humanity, 7(3),pp. 164-171.
Ali, A., Rahman, M.S., and Abd, Bakar, A. (2015). Financial Satisfaction and the Influence of Financial Literacy in Ma-laysia, Soc Indic Res, 120, 2015, pp. 137–156.
Campbell, A. (1981), The Sense of Well-being in America: Recent Patterns and Trends, New York: McGraw-Hill.
Gomez, J. (2013). More than 60% of Malay-sians face work overload, have no time for family, survey reveals. The Malay-sian Insider.
Guest, D. E. (2002). Human resource manage-ment: When research confronts theory. International Journal of Human Re-source Management, 12(2), 22-38.
Kar, S. and K. C. Misra, K. C. (2013). Nexus between work life balance practices and employee retention-the mediating effect of a supportive culture. Asian Social Science, 9(1) , pp. 63-69.
Raj.R, A. (2013). A study of work-life balance
of employees in pharma marketing. In-ternational research journal of pharma-cy, 1-3.
Obiageli, O. L., Uzochukwu, O.C. & Ngozi, C.D (2015). Work Life Balance And Employee Performance In Selected Commercial Banks In Lagos State. Eu-ropean Journal of Research and Reflec-
tion in Management Sciences, 3(4), pp. 63-77. Retrieved from www.idpublica-tions.org
Tahir Akbar, S. M.,Ramzan, M. (2013). Effect of salary and stress on job satisfaction of teachers in District Sialkot, Paki-stan, Journal Of Humanities and Social Science (IOSR-JHSS), 15(2) pp 68-74 e-ISSN: 2279-0837, p-ISSN: 2279-0845. www.Iosrjournals.Org www.ios-rjournals.org
Zeqiri and B. Aziri, “Job satisfaction in the re-public of Macedonia: The role of gender and education,” Journal of Advanced Research in Management, 1(1).

Volume 1 Issue 1 | July 2019
40 Fidēre: Journal of Business, Governance, and Information Technology
Abstract
This study empirically examined the value relevance of corporate environ-mental performance of Indonesian publicly listed companies from 2009 to 2017. Two main hypotheses were tested: first, corporate environmental per-
formance was value relevant; second, corporate environmental performance influ-enced the value relevance of accounting variables, which are Earning Per Share (EPS) and Book Value per Share (BPS). This study utilized a valuation model in which the stock price was a function of accounting variable and environmental variable controlling for firm’s size. The analysis of 343 sample companies from 3 different industries showed that corporate environmental performance is not value relevant. Moreover, the second analysis on the indirect effect of environmental performance on stock price showed that corporate environmental performance does not affect value relevance of accounting information. This study also provided em-pirical evidence that value relevance does not depend on the firm’s size and the industrial sector.Keywords: corporate environmental performance, value relevance, non-financial performance, firm’s value
Measuring value relevanCe of CorporaTe environMenTal
perforManCe in indonesia
Deske W. MandagiVirata School of Business, University of the Philippines
This study focused on the decision-usefulness of non-financial information from investor’s perspective. It contributed to the current ac-ademic debate on value relevance of environ-mental performance by providing empirical evidence that environmental information is not value relevant.
Corporate environmental performance has been a substantial interest of various stake-holders in the last few decades. Management and business practitioners began to pay atten-tion on environmental performance as they realize that environmental performance as im-portant as financial performance affects firm’s value (McWilliams & Siegel, 2000). The grow-ing importance of corporate environmental
performance has also arisen from the external stakeholders, such as the investors. Investor in-terests on corporate environmental performance as well as financial performance for investment decision (Clarkson, Li, Richardson, & Tsang, 2015; de Villiers & van Staden, 2010; Kanter, 2011). Thus, the present study investigates the value relevance of corporate environmental per-formance of Indonesian publicly listed firm by examining how environmental performance rat-ing is reflected on the firm’s shares price.
Current and potential investors rely on relevant information to make a better invest-ment decision. Information is said to be relevant if it influences the investment decision making process. Value relevance can be defined as the

41Measuring Value Relevance of Corporate Environmental Performance in Indonesia
Fidēre: Journal of Business, Governance, and Information Technology Volume 1 Issue 1 | July 2019
ability of information to capture or summarize firm value (Hassel et al., 2005). The primary ob-jective of this study was to examine the value relevance of environmental performance and the influence of environmental performance on the relationship between earnings and the mar-ket value of the firm.
This study employed a valuation model used by Cardamone et al. (2012) and Carnev-ale (2011). This model is an extension of the previous model developed by Ohlson (1995) in which the share price is considered as a function of accounting variable (earnings and book val-ue) and environmental variable. To examine the level of environmental performance, PROPER was utilized in this study. PROPER stands for Program for Pollution Control, and Evaluation Rating. PROPER is a rating administered by the government agency, Indonesia Ministry of En-vironment based on audits conducted on a year-ly basis to Indonesian public companies whose operations and practices have sensitive environ-mental impacts. This rating measures the extent of a company’s compliance to environmental regulation. Since this rating is published for general stakeholders including investors, it is expected to be reflected on a firm’s stock price.
The increase in corporate environmen-tal and social performance and reporting has been accompanied by a growing interest in the study of this subject. Despite the extensive re-search on this subject, evidence from various empirical studies on the value relevance of environmental performance found mixed and ambiguous results. Several studies documented value relevant environmental performance and its positive effects on the firm’s value (Klerk & Villiers, 2012; Schadewitz & Niskala, 2010; Cormier & Magnan, 2007). On the other hand, some studies found evidence that environmen-tal performance is value relevant but negative-ly affects the firm’s value (Hassel et al., 2005; Murray et al., 2006). Meanwhile, in contrast to two previous groups, some researchers found
evidence that environmental information is not value relevant at all (Cardamone et al., 2012; Schmelzer, 2013), while some researchers re-ported limited empirical evidence on the value relevance of environmental information (Mur-ray et al., 2006; Carnevale et al., 2011).
The present study provides empirical evidence that information about corporate en-vironmental performance is not value relevant. The result shows that the effects of environ-mental performance rating on shares price are not statistically significant. The analysis on the effect of environmental performance on the val-ue relevance of financial information (BPS and EPS) gives the same result, that is, the corporate environmental performance does not affect the value relevance of financial information. The result, however, does not change even when the variable firm size and the industry type were considered. Thus, it can be noted that market neither directly nor indirectly assigns value rel-evance to environmental performance informa-tion. The present study contributes to the current academic debate on value relevance of environ-mental performance by providing empirical ev-idence that supports the argument that environ-mental information is not value relevant.
Literature ReviewCorporate EnvironmentalPerformance and Disclosure
Corporate environmental performance has been of fundamental interest to various stakeholders including investors. Both private and institutional investors are concerned with sustainability and environmental performance (de Villiers & van Staden, 2010; Kanter, 2011; Koellner et al., 2005) as investors tend to view corporate environmental performance and re-porting as a tool for portraying a positive image of the firm (Cheng, Green & Ko 2015; Clarkson et al., 2011; Lyon & Maxwell, 2011; Merkl-Da-vies & Brennan, 2007). For instance, social and environmental disclosure attracts investment

Volume 1 Issue 1 | July 2019
42 Fidēre: Journal of Business, Governance, and Information Technology
funds from investors who are concerned with environment and social issues (Deegan, 2002), and environmentally-responsible investors base their investment decisions on both financial and environmental performance (Starr, 2008). Consequently, environmental performance is expected to increase investors’ willingness to invest in the firm.
Likewise, managers have similar rea-sons to appreciate environmental performance. The adoption of environmental policies and ini-tiatives by management is motivated by some factors, including compliance, legitimacy, rep-utational, competition and political cost avoid-ance Delmas, & Toffel, 2004). Some firms en-gage in environmental activity and reporting to comply with existing laws and regulations. In some countries, although corporate envi-ronmental responsibility is regulated, there is still no general mandatory framework for the reports. Environmental reporting is mostly vol-untary, and companies can have different theo-retical incentives to disclose. Corporate envi-ronmental performance and disclosure can also be viewed as a strategy of the management to maintain its relationship with their investors to gain their support and approval (Roberts, 1992).
Corporate environmental activities could also be motivated by legitimacy factor. Under the legitimacy theory, a firm assumes to have a contract to run their operation with-in the boundaries and norms of society (Dee-gan, 2002). The adoption of environmental or sustainability practices and reporting can be viewed as a way to operate within the identified boundaries. By maintaining corporate environ-mental performance, a company can communi-cate its commitment to social and environmen-tal issues, thereby ensuring that the company’s activities are perceived by outside parties as le-gitimate (Deegan, 2002). Thus, environmental performance and disclosure is a way for firms to project a socially responsible image and to gain legitimacy from the external community.
The third incentive is related to repu-tational factor. Corporate environmental per-formance is viewed as a company’s strategy to create a favorable image or reputation in the point of view its primary stakeholder (Roberts, 1992). Maintaining and reporting corporate en-vironmental performance send signals about the environmental image and the reputation of the firm (Cheng et al., 2015). Reputation and im-age created by environmental performance can influence investors’ judgment and perception about the firm’s value. Specifically, a positive environmental performance can increase inves-tors’ willingness to pay more for the equity of the firm (Brown-Liburd & Zamora, 2015).
Another incentive of environmental ini-tiative and disclosure is that it can help organi-zations to innovate on the sustainability of the firm and use that as a competitive advantage. Engagement in activities promoting sustain-able development is increasingly analyzed as a source of competitive advantage for the firm (Porter & Kramer, 2006). Rather than being seen as a cost, environmental and social initiative is perceived as a valuable resource which can be used to improve the future performance of the firm. Previous studies on this matter document a positive relationship between reputation for good sustainability and financial performance (Cheung, 2011; Robinson, Kleffner, & Bertels 2011; Wagner 2010; Consolandi et al., 2009).
The last motive for engaging in envi-ronmental activities is political cost avoidance. From the positive accounting theory perspec-tive, particularly political cost hypothesis, man-agement engages in environmental initiatives to prevent adverse societal actions resulting in fu-ture costs. Positive accounting theory assumes that firms are only concerned with environmen-tal performance to the extent that it contributes to the long-term value for the shareholders of the firm (van Marrewijk, 2003). Under the po-litical cost hypothesis of positive accounting theory, managers as the agent are concerned
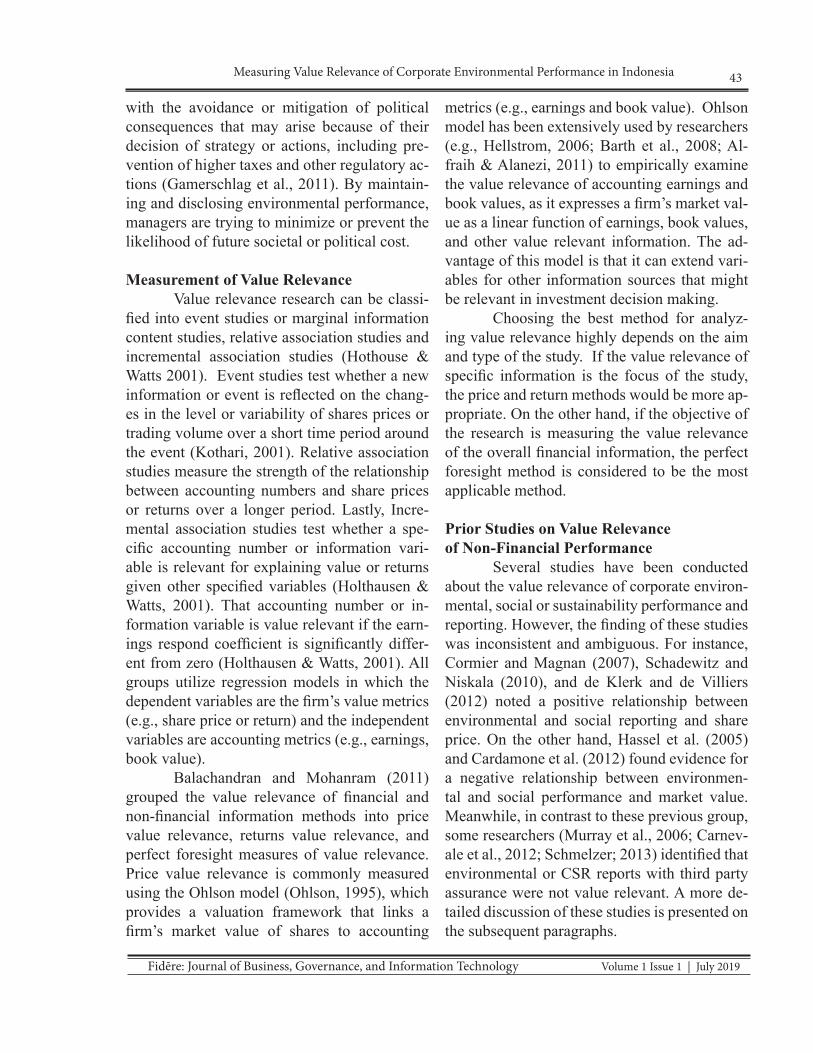
43Measuring Value Relevance of Corporate Environmental Performance in Indonesia
Fidēre: Journal of Business, Governance, and Information Technology Volume 1 Issue 1 | July 2019
with the avoidance or mitigation of political consequences that may arise because of their decision of strategy or actions, including pre-vention of higher taxes and other regulatory ac-tions (Gamerschlag et al., 2011). By maintain-ing and disclosing environmental performance, managers are trying to minimize or prevent the likelihood of future societal or political cost.
Measurement of Value RelevanceValue relevance research can be classi-
fied into event studies or marginal information content studies, relative association studies and incremental association studies (Hothouse & Watts 2001). Event studies test whether a new information or event is reflected on the chang-es in the level or variability of shares prices or trading volume over a short time period around the event (Kothari, 2001). Relative association studies measure the strength of the relationship between accounting numbers and share prices or returns over a longer period. Lastly, Incre-mental association studies test whether a spe-cific accounting number or information vari-able is relevant for explaining value or returns given other specified variables (Holthausen & Watts, 2001). That accounting number or in-formation variable is value relevant if the earn-ings respond coefficient is significantly differ-ent from zero (Holthausen & Watts, 2001). All groups utilize regression models in which the dependent variables are the firm’s value metrics (e.g., share price or return) and the independent variables are accounting metrics (e.g., earnings, book value).
Balachandran and Mohanram (2011) grouped the value relevance of financial and non-financial information methods into price value relevance, returns value relevance, and perfect foresight measures of value relevance. Price value relevance is commonly measured using the Ohlson model (Ohlson, 1995), which provides a valuation framework that links a firm’s market value of shares to accounting
metrics (e.g., earnings and book value). Ohlson model has been extensively used by researchers (e.g., Hellstrom, 2006; Barth et al., 2008; Al-fraih & Alanezi, 2011) to empirically examine the value relevance of accounting earnings and book values, as it expresses a firm’s market val-ue as a linear function of earnings, book values, and other value relevant information. The ad-vantage of this model is that it can extend vari-ables for other information sources that might be relevant in investment decision making.
Choosing the best method for analyz-ing value relevance highly depends on the aim and type of the study. If the value relevance of specific information is the focus of the study, the price and return methods would be more ap-propriate. On the other hand, if the objective of the research is measuring the value relevance of the overall financial information, the perfect foresight method is considered to be the most applicable method.
Prior Studies on Value Relevanceof Non-Financial Performance
Several studies have been conducted about the value relevance of corporate environ-mental, social or sustainability performance and reporting. However, the finding of these studies was inconsistent and ambiguous. For instance, Cormier and Magnan (2007), Schadewitz and Niskala (2010), and de Klerk and de Villiers (2012) noted a positive relationship between environmental and social reporting and share price. On the other hand, Hassel et al. (2005) and Cardamone et al. (2012) found evidence for a negative relationship between environmen-tal and social performance and market value. Meanwhile, in contrast to these previous group, some researchers (Murray et al., 2006; Carnev-ale et al., 2012; Schmelzer; 2013) identified that environmental or CSR reports with third party assurance were not value relevant. A more de-tailed discussion of these studies is presented on the subsequent paragraphs.

Volume 1 Issue 1 | July 2019
44 Fidēre: Journal of Business, Governance, and Information Technology
Hassel et al. (2005) observed the value relevance of environmental performance using a sample of Swedish listed firms for the period of 1998 to 2000. They tested whether the market values of firms reflected both their financial and environmental performance, and they found ev-idence that environmental performance ratings complemented accounting information value relevant for investors, but negatively affected the firms’ value. They further argued that the negative relationship between environmental performance and firm’s value only creates costs for the firms, which will result in a lower market value.
In another study, Murray et al. (2006) investigated the relationship between social and environmental disclosures, and their finan-cial market performance. Using 100 UK listed firms from 1988 to 1997 as an observation sam-ple, social and environmental disclosures were grouped into environmental, CSR, and total vol-untary disclosure, and were measured against the number of pages presented in their financial statements. The results indicated that there is an insignificant correlation between market re-turn and disclosure variables; thus, there is no evidence for value relevance of environmental information.
Cormier and Magnan (2007) examined the influence of environmental reporting on the relation between earnings and market value of the firm and compared the result in France, Ger-many, and Canada. Results showed that envi-ronmental disclosure is the highest in Canada, followed by Germany and France. Environ-mental reporting has a positive influence on the value relevance of earnings in the Canadian and German samples, for in the French sample, the relation was insignificant. The study also found that media exposure and environmen-tal industries are all important determinants of environmental reporting. Further, value rele-vance of environmental reporting is dependent on the institutional context the company faces.
The researcher then provided an argument that German investors incorporate more information from environmental reports in their investment decisions than in the other countries. They re-late this to the socio-political context in Germa-ny where environmental protection and conser-vation is an apparent issue.
Using the model developed by Hassel et al. (2005), Schadewitz and Niskala (2010) in-vestigated the value relevance of CSR report-ing according to the Global Reporting Initiative GRI framework of Finnish listed firms from 2002 to 2005. Results showed that the determi-nant of the dummy variable for GRI reporting is significantly positive indicating that the inclu-sion of GRI reporting increases the explanato-ry power. Thus, GRI reporting has incremental value relevance and has positive effect on share prices.
MethodologyHypotheses Development
The aim of this study was to find the value relevance of corporate environmental per-formance. This study was designed to test two main hypotheses:
H1: Corporate environmental perfor-mance is value relevant.
Following Cardamone et al. (2012) and Carnevale et al. (2012), both the direct and in-direct effects of environmental and social re-porting on share price are investigated through the value relevance of book value and earnings. Therefore, the prediction is that the value rel-evance of both accounting variables increases when a variable for environmental performance reporting is incorporated. This leads to the sec-ond hypothesis:
H2: Corporate environmental perfor-mance influences the value relevance of EPS and BPS.

45Measuring Value Relevance of Corporate Environmental Performance in Indonesia
Fidēre: Journal of Business, Governance, and Information Technology Volume 1 Issue 1 | July 2019
Data and SampleThe data used in this study were col-
lected from two sources. The environmental performance data were obtained from the web-site of the Indonesian Ministry of Environment where it is publicly disclosed. Financial market information, such as stock prices, and account-ing information, such as EPS, BPS and total as-sets, were extracted from DataStream database. Stock prices used in this study were prices 10 days after the publication date. Usually, the fi-nancial statements are published three months after firms’ financial year-end (March 31). Therefore, stock prices used in this study were price on May 10 after the financial year-end. Ten days after the data are published, the in-formation contained in the quarterly report be-comes widespread in the market and therefore will have begun to produce effects (Cardamone et al., 2012; Carnevale, 2011). Both the book value and the earning per share are financial in-formation and are expected to be value relevant that can provide a reliable estimation for the market value of the firms (Ohlson, 1995).
The sample in this study consisted of all Indonesian public companies registered under the PROPER program from 2009 to 2017. To avoid the effect of financial reporting distur-bance because of the global financial crisis in 2008, this study limited the observation only af-ter 2008. Overall, 603 observations were noted. However, the final number of observations used in the analysis was reduced to 343 after remov-ing the incomplete data and outliers. This result in imbalance panel data.
Environmental PerformanceThis study utilized PROPER rating as
a proxy of environmental performance. This rating measures a company’s degree of com-pliance to environmental standards. Under this evaluation scheme, the performance rating is grouped into five color ratings. Each color rank represents the company’s environmental perfor-
mance. The best compliance performance is the gold rating, followed by green, blue, red, and the worst is black. For data analysis purposes, each rating is then assigned a value from 1 to 5. Five is assigned to a company with a gold rating while firm with black rating is assigned value of 1.
The analysis in this study was also ex-tended to test the possible differences in the im-pact of environmental performance across in-dustries. This study followed the classification of industry based on PROPER. Under PROP-ER, companies are classified into manufactur-ing, agroindustry, mining, and industrial areas. For this study, the sample contains observations from three industries only, namely, manufactur-ing, agroindustry, and mining
Research ModelThis study adapted the valuation model
used by Olshon (1995), which is as follows:
Pit= β0+ β1BPSit+β2EPSit+ uit (1)
Where Pit is the stock price of firm i at period t, BPSit is the book value per share of firm i at period t andEPSit is the earnings per share of firm i at period t.
Equation (1) serves as first model in this study to verify the value relevance of account-ing variables, which are book value per share (BPS) and earnings per share of firm (EPS).
The second model in this study includ-ed the environmental performance rating (EPR) variable to analyze the value relevance of en-vironmental performance. The following model (Cardamone et al., 2012) is considered:
Pit = β0+ β1BPSit+β2EPSit+β3EPRit+ uit (2)Where EPRit is the environmental performance rating firm i at period t.

Volume 1 Issue 1 | July 2019
46 Fidēre: Journal of Business, Governance, and Information Technology
A firm’s size might influence the value relevance of earnings and book value (Collins et al., 1997), as well as its environmental per-formance (Setyorini & Ishak, 2012). Thus, to test for the influence of the firm’s size, variable total assets of a firm in logarithm form was add-ed to the model as follow:
Pit= β0+ β1 BPSit+β2 EPSit+β3 EPRit+ β4(LogTOTAS)it+uit (3)
Where logTOTASSit is the logarithm of total as-sets of the firm i at period t.
In addition, interaction variables be-tween environmental performance and BPS and EPS are also introduced to determine whether the environmental performance could affect the value relevance of accounting variable (Wool-dridge, 2006; Carnavale 2011; Cardamone et al. 2012). Thus, we consider the fourth model:
Pit= β0+ β1BPSit+β2EPSit β3 (logTOTASS)it+ β4EPRit + δ1BPSiq*EPRit + δ2EPSit* EPRiq+ uit (4)
Where BPSiq*EPRit is the interaction variableb-etween BPS and EPR and BPSiq*EPRit is the in-teraction variable between EPS and EPR. To investigate the possibility of environ-mental performance having different degrees of value relevance in different industries, two dummy variables, namely, manufacturing and mining sectors, were created to test whether a specific industry is a confounding variable for the value relevance of environmental perfor-mance.
Pit= β0+ β1BPSit+β2EPSit+β3(logTOTASS)it+β4 EPRit + δ1BPSiq*EPRit + δ2 EPSit*EPRiq +β5 MAN+β6 MIN+ uit
Where MAN is the dummy variable for manufacturing sector and MIN is the dummy variable for mining sector.
Different analyses were performed to es-timate equations (1) to (5). First, the coefficients in the equations are estimated using pulled Or-dinary Least Squares (OLS) regression. Second, the Generalized Least Square model is used and the fixed effects for time are taken. Stock mar-ket variables tend to be heteroscedastic (Brook, 2008). Finally, log transformation of all the variable is done to address the heteroscedastici-ty problem of the first two analyses.
Results and Discussion
Descriptive Statistics and Correlation Table 1 shows some descriptive statis-
tics for the entire sample. The sample contains data from manufacturing company (55%), min-ing (20%) and agroindustry (25%).
The environmental performance vari-able (EPR) has a mean of 3.16 and median of 3.00. The actual performance scores range from 2 to 5, which on a theoretical performance scale ranges from 1 to 5. Hence, the sample consists of slightly more high environmental perform-ers.
The variables share prices, EPR, EPS, and BPS are all positively skewed, which means that the top of the distribution is left from the mean. EPS and BPS data in the sample have a high kurtosis, indicating fatter tails and a high-er peak. The data are not normally distributed, which can have consequences for OLS regres-sions. To address this issue, several approaches and a log transformation of the data were ap-plied in the analysis.

47Measuring Value Relevance of Corporate Environmental Performance in Indonesia
Fidēre: Journal of Business, Governance, and Information Technology Volume 1 Issue 1 | July 2019
Table 1Descriptive StatisticVariable Obs. Mean Median Std. Dev. Min Max Skewness KurtosisShare Price 343 456.19 1410 9304.58 .02 65525 4.05 2.62EPR 343 3.16 3.00 .74 1.00 5.00 .69 4.08EPS 343 264.31 90.91 469.56 .02 3470.26 3.63 19.71BPS 343 1927.26 759.08 2999.14 36.28 21917.44 3.45 18.62Log Total Asset 343 22.56 22.71 1.30 19.66 25.36 -0.21 2.28Log Share Price 343 7.02 7.25 2.21 -3.91 11.09 -1.99 10.52Log EPS 343 4.18 4.50 2.15 -3.91 8.15 -1.22 5.54Log BPS 343 6.72 6.63 1.31 3.5 9.99 .07 2.61Manufacturing .55Mining .20Agroindustry .25
Table 2 Correlation Matrix
Price EPR EPS BPS Log TA logP logEPS logBPS MAN MIN AGRPrice 1.00 EPR .095* 1.00EPS .875*** .066 1.00BPS .700*** .010 .862*** 1.00Log TA .349*** .323*** .377*** .387*** 1.00logP .545*** .171** .500*** .271*** 0.356*** 1.00logEPS .472*** .087 .609*** .470*** 0.386*** .432*** 1.00logBPS .443*** .111** .615*** .773*** 0.515*** .346*** .528*** 1.00MAN -.0648 -.021 -.125** -.054 -.294*** -.168** -.111** -.053 1.00MIN -.1212** .267*** -.097* -.119** 0.186** .021 -.073 -.030 -.504*** 1.00AGR .1792*** -.175** .227*** .164** 0.171** .177** .202** .091* -.647*** -.300*** 1.00
Correlations between the variables are presented in Table 2. The correlations between de-pendent variable share price and the independent variables show a first indication of the value relevance of these variables. Earnings per share and book value per share are correlated and they both have a strong correlation with share price. This is consistent with the findings of previous studies on value relevance of accounting information which found the same relation. The correla-tion matrix above also shows that environmental performance (EPR) and share price have a weak correlation.
Regression Analysis
Ordinary Least Square (OLS) Model. The first analysis is based on a pooled Ordinary Least Square regression model. Starting with the regression of the base model (Equation 1) which
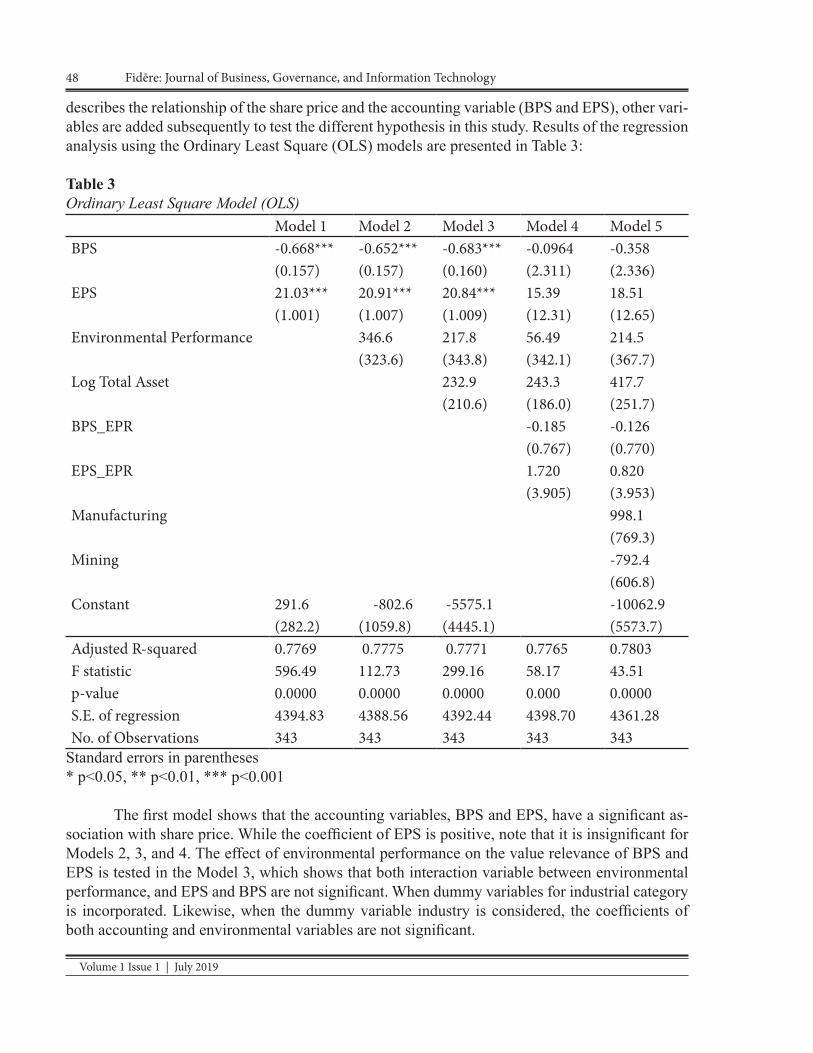
Volume 1 Issue 1 | July 2019
48 Fidēre: Journal of Business, Governance, and Information Technology
describes the relationship of the share price and the accounting variable (BPS and EPS), other vari-ables are added subsequently to test the different hypothesis in this study. Results of the regression analysis using the Ordinary Least Square (OLS) models are presented in Table 3:
Table 3Ordinary Least Square Model (OLS)
Model 1 Model 2 Model 3 Model 4 Model 5BPS -0.668*** -0.652*** -0.683*** -0.0964 -0.358
(0.157) (0.157) (0.160) (2.311) (2.336)EPS 21.03*** 20.91*** 20.84*** 15.39 18.51
(1.001) (1.007) (1.009) (12.31) (12.65)Environmental Performance 346.6 217.8 56.49 214.5
(323.6) (343.8) (342.1) (367.7)Log Total Asset 232.9 243.3 417.7
(210.6) (186.0) (251.7)BPS_EPR -0.185 -0.126
(0.767) (0.770)EPS_EPR 1.720 0.820
(3.905) (3.953)Manufacturing 998.1
(769.3)Mining -792.4
(606.8)Constant 291.6 -802.6 -5575.1 -10062.9 (282.2) (1059.8) (4445.1) (5573.7)Adjusted R-squared 0.7769 0.7775 0.7771 0.7765 0.7803F statistic 596.49 112.73 299.16 58.17 43.51p-value 0.0000 0.0000 0.0000 0.000 0.0000S.E. of regression 4394.83 4388.56 4392.44 4398.70 4361.28No. of Observations 343 343 343 343 343
Standard errors in parentheses* p<0.05, ** p<0.01, *** p<0.001
The first model shows that the accounting variables, BPS and EPS, have a significant as-sociation with share price. While the coefficient of EPS is positive, note that it is insignificant for Models 2, 3, and 4. The effect of environmental performance on the value relevance of BPS and EPS is tested in the Model 3, which shows that both interaction variable between environmental performance, and EPS and BPS are not significant. When dummy variables for industrial category is incorporated. Likewise, when the dummy variable industry is considered, the coefficients of both accounting and environmental variables are not significant.

49Measuring Value Relevance of Corporate Environmental Performance in Indonesia
Fidēre: Journal of Business, Governance, and Information Technology Volume 1 Issue 1 | July 2019
The residual plot of regression in Model 5 indicates the presence of heteroscedasticity in the error terms. To address this, log transformation of all variable is done and presented in section Ordinary Least Square (OLS) model with log transformation.
Generalized Least Square (GLS) Model. This study employed unbalance panel data. Generalized Least Square (GLS) is applicable for linear regression models with heteroscedasticity where OLS is inefficient (Brook, 2008). Hence, GLS was used to estimate the coefficient of each model used in this study (Equations 1 to 5). To test if time effects play a role in the coefficients of firm-specific variables, the fixed effects for time were taken. Furthermore, robust errors are used for each model for the correction of heteroscedasticity and time-series correlations (Field, 2009). The results are presented in Table 4.
Table 4Generalized Least Square (GLS) Model
Model 1 Model 2 Model 3 Model 4 Model 5BPS -0.170 -0.149 -0.178 -3.607 -3.631
(0.430) (0.403) (0.405) (2.066) (2.090)EPS 8.595** 8.474** 8.580** 24.40* 24.46*
(3.158) (2.990) (2.977) (10.87) (10.95)Environmental Performance -393.3 -401.7 -704.7 -709.5
(605.8) (605.9) (554.9) (560.1)logTOTASS 570.4 595.3 588.2
(471.6) (508.8) (512.1)BPS_EPR 1.091 1.098
(0.558) (0.564) EPS_EPR -4.816 -4.838
(2.552) (2.575) MAN 788.0
(1656.6)MIN 1107.0
(1056.5) (1196.4) (10616.2) (10489.4) (11090.5) (11186.2)Adjusted R-squared 0.2564 0.2561 0.2590 0.3102 0.3070F statistic 7.04 8.56 6.91 12.69 . p-value 0.0000 0.0000 0.0000 0.0000 .S.E. of regression 2241.70 2242.17 2237.74 2159.12 2164.07No. of Observations 343 343 343 343 343
Standard errors in parentheses* p<0.05, ** p<0.01, *** p<0.001
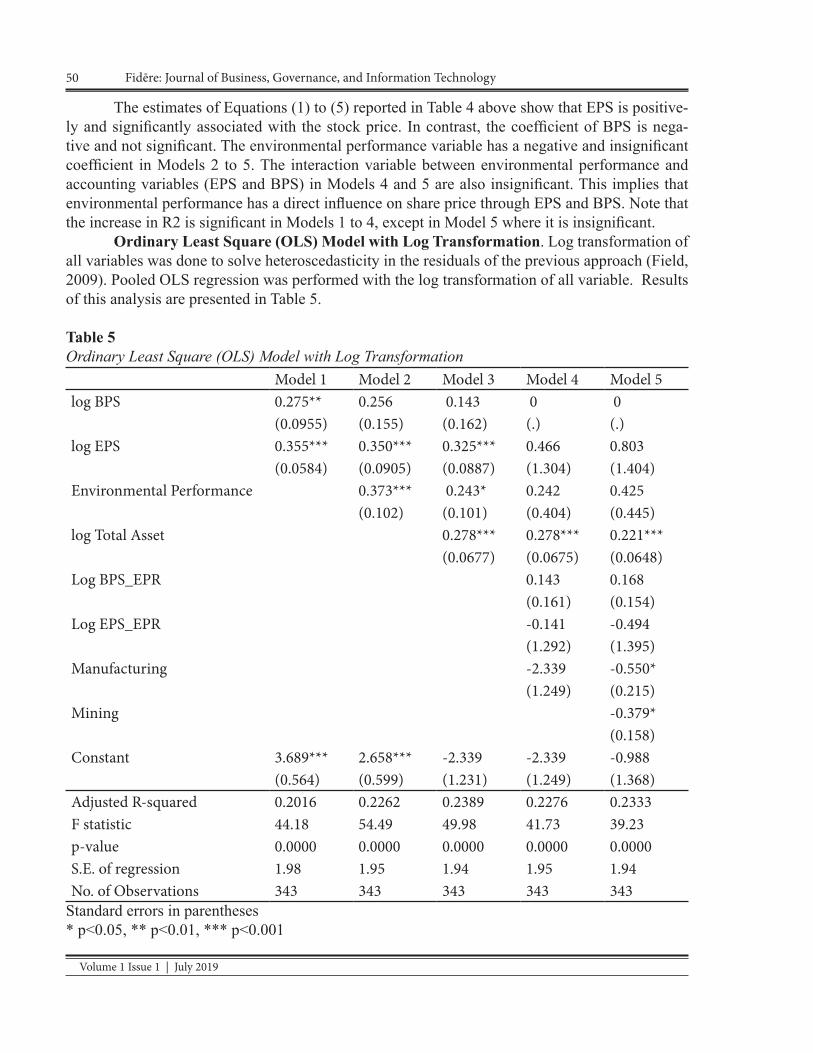
Volume 1 Issue 1 | July 2019
50 Fidēre: Journal of Business, Governance, and Information Technology
The estimates of Equations (1) to (5) reported in Table 4 above show that EPS is positive-ly and significantly associated with the stock price. In contrast, the coefficient of BPS is nega-tive and not significant. The environmental performance variable has a negative and insignificant coefficient in Models 2 to 5. The interaction variable between environmental performance and accounting variables (EPS and BPS) in Models 4 and 5 are also insignificant. This implies that environmental performance has a direct influence on share price through EPS and BPS. Note that the increase in R2 is significant in Models 1 to 4, except in Model 5 where it is insignificant.
Ordinary Least Square (OLS) Model with Log Transformation. Log transformation of all variables was done to solve heteroscedasticity in the residuals of the previous approach (Field, 2009). Pooled OLS regression was performed with the log transformation of all variable. Results of this analysis are presented in Table 5.
Table 5Ordinary Least Square (OLS) Model with Log Transformation
Model 1 Model 2 Model 3 Model 4 Model 5log BPS 0.275** 0.256 0.143 0 0
(0.0955) (0.155) (0.162) (.) (.)log EPS 0.355*** 0.350*** 0.325*** 0.466 0.803
(0.0584) (0.0905) (0.0887) (1.304) (1.404)Environmental Performance 0.373*** 0.243* 0.242 0.425
(0.102) (0.101) (0.404) (0.445)log Total Asset 0.278*** 0.278*** 0.221***
(0.0677) (0.0675) (0.0648)Log BPS_EPR 0.143 0.168
(0.161) (0.154)Log EPS_EPR -0.141 -0.494
(1.292) (1.395)Manufacturing -2.339 -0.550*
(1.249) (0.215)Mining -0.379*
(0.158)Constant 3.689*** 2.658*** -2.339 -2.339 -0.988 (0.564) (0.599) (1.231) (1.249) (1.368)Adjusted R-squared 0.2016 0.2262 0.2389 0.2276 0.2333F statistic 44.18 54.49 49.98 41.73 39.23p-value 0.0000 0.0000 0.0000 0.0000 0.0000S.E. of regression 1.98 1.95 1.94 1.95 1.94No. of Observations 343 343 343 343 343
Standard errors in parentheses* p<0.05, ** p<0.01, *** p<0.001

51Measuring Value Relevance of Corporate Environmental Performance in Indonesia
Fidēre: Journal of Business, Governance, and Information Technology Volume 1 Issue 1 | July 2019
The first conclusion that can be drawn from this the estimates of Model 1 is that both accounting variables, EPS and BPS, have a significant pos-itive relation with share price, which is consis-tent with the established literature on the value relevance of BPS and EPS (Collins et al., 1997; Abayadeera, 2010; Liu & Liu, 2007). The co-efficient of environmental performance is also positive and significant in Models 2 and 3. However, when the interaction variable between the environmental variable and BPS and EPS is considered, the significance disappears. Like-wise, when the dummy variable industry was considered, the coefficients of both accounting and environmental variables are not significant. Variable total asset is positively significant in Models 3 to 5.
Conclusions and Recommendations The purpose of this study was to inves-tigate the value relevance of corporate envi-ronmental performance. Particularly, this study tried to answer four research questions: (1) Does environmental performance rating directly af-fect firm value? (2) Does environmental perfor-mance indirectly affect firm value through EPS and BPS? (3) Does firm size influence the val-ue relevance of environmental performance, as well as EPS and BPS? and (4) Does the value relevance of accounting information, BPS and EPS, and environmental performance depend on the industry? Modified Ohlson (1995) valuation was utilized by including PROPER rating as a proxy of environmental performance. To account for firm size, variable total asset in logarithm form was also included in the model. Interaction vari-able between environmental performance and accounting variable (EPS and BPS) were also included in the model to investigate whether the environmental variable could affect the value rel-evance of this information. In addition, dummy variables for industry, namely, manufacturing and mining, were created to determine if the de-
gree of value relevance depends on the industry. Using three different approaches, pooled OLS regression, GLS regression with fixed time effect, and OLS regression with logarithm transformation, the results showed that there is no consistent evidence for the effect of environ-mental performance on share price. Although Models 2 and 3 under OLS with log transfor-mation show significant and positive effects of environmental performance on share price, nevertheless, there is no consistent evidence in other models, as well as in other approach-es. Hence, the hypothesis has to be rejected. It can be stated that environmental performance does not affect share price and therefore is not value relevant. The findings are consistent with the results of previous studies which found no value relevance for environmental and social information (Schmelzer, 2013; Carnevale et al., 2012). The second hypothesis focused on the effect of environmental performance on the val-ue relevance of accounting information (EPS and BPS). The coefficient of the interaction variable in all of the three analyses and every model is not significant. Therefore, we can con-clude that environmental performance has no influence on the effect of BPS on share prices, as well as in the case of the effect of EPS on share prices. This result is consistent with the findings of Carnevale et al. (2012) and Schmel-zer (2013). Further analysis on the effect of firm size shows that there is no consistent evidence in other approaches. Thus, it can be stated that there is no sufficient evidence to conclude that firm size affects share prices. The same result goes for the influence of industrial sectors on value relevance. Empirical findings show that value relevance does not depends on industrial sector. There are several interpretations to ex-plain the empirical result in this study, that is, no value relevance is found in corporate envi-
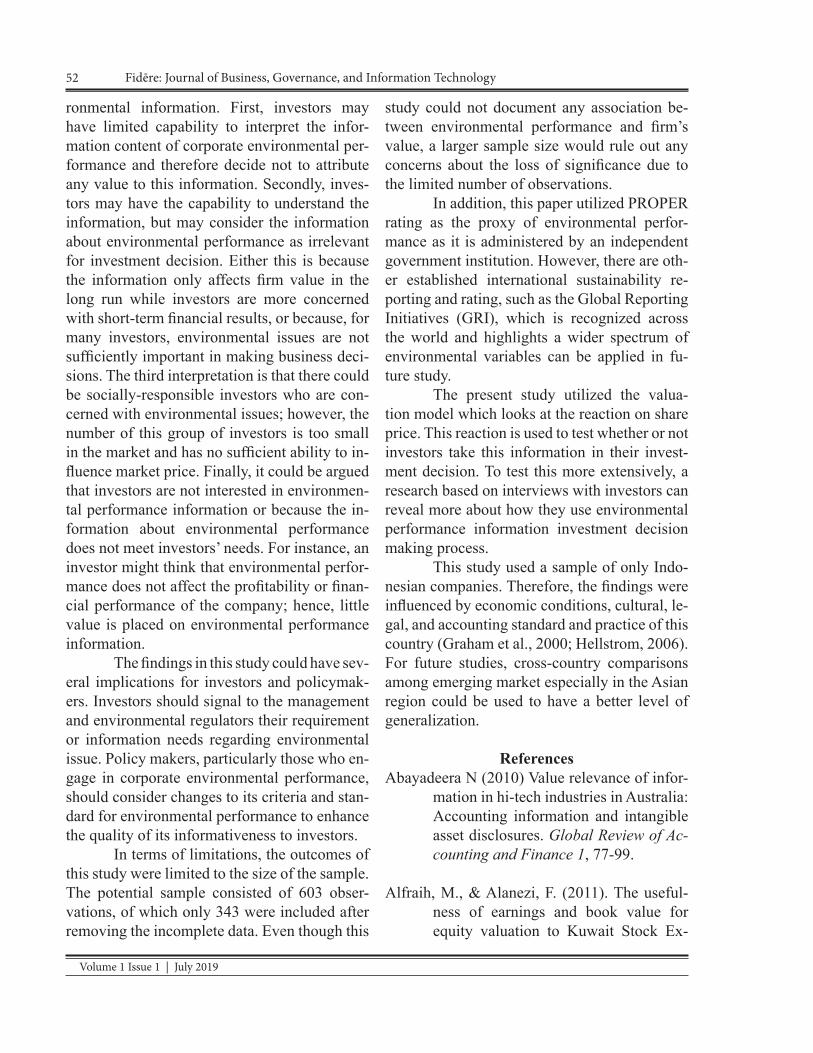
Volume 1 Issue 1 | July 2019
52 Fidēre: Journal of Business, Governance, and Information Technology
ronmental information. First, investors may have limited capability to interpret the infor-mation content of corporate environmental per-formance and therefore decide not to attribute any value to this information. Secondly, inves-tors may have the capability to understand the information, but may consider the information about environmental performance as irrelevant for investment decision. Either this is because the information only affects firm value in the long run while investors are more concerned with short-term financial results, or because, for many investors, environmental issues are not sufficiently important in making business deci-sions. The third interpretation is that there could be socially-responsible investors who are con-cerned with environmental issues; however, the number of this group of investors is too small in the market and has no sufficient ability to in-fluence market price. Finally, it could be argued that investors are not interested in environmen-tal performance information or because the in-formation about environmental performance does not meet investors’ needs. For instance, an investor might think that environmental perfor-mance does not affect the profitability or finan-cial performance of the company; hence, little value is placed on environmental performance information. The findings in this study could have sev-eral implications for investors and policymak-ers. Investors should signal to the management and environmental regulators their requirement or information needs regarding environmental issue. Policy makers, particularly those who en-gage in corporate environmental performance, should consider changes to its criteria and stan-dard for environmental performance to enhance the quality of its informativeness to investors. In terms of limitations, the outcomes of this study were limited to the size of the sample. The potential sample consisted of 603 obser-vations, of which only 343 were included after removing the incomplete data. Even though this
study could not document any association be-tween environmental performance and firm’s value, a larger sample size would rule out any concerns about the loss of significance due to the limited number of observations. In addition, this paper utilized PROPER rating as the proxy of environmental perfor-mance as it is administered by an independent government institution. However, there are oth-er established international sustainability re-porting and rating, such as the Global Reporting Initiatives (GRI), which is recognized across the world and highlights a wider spectrum of environmental variables can be applied in fu-ture study. The present study utilized the valua-tion model which looks at the reaction on share price. This reaction is used to test whether or not investors take this information in their invest-ment decision. To test this more extensively, a research based on interviews with investors can reveal more about how they use environmental performance information investment decision making process. This study used a sample of only Indo-nesian companies. Therefore, the findings were influenced by economic conditions, cultural, le-gal, and accounting standard and practice of this country (Graham et al., 2000; Hellstrom, 2006). For future studies, cross-country comparisons among emerging market especially in the Asian region could be used to have a better level of generalization.
ReferencesAbayadeera N (2010) Value relevance of infor-
mation in hi-tech industries in Australia: Accounting information and intangible asset disclosures. Global Review of Ac-counting and Finance 1, 77-99.
Alfraih, M., & Alanezi, F. (2011). The useful-ness of earnings and book value for equity valuation to Kuwait Stock Ex-
53Measuring Value Relevance of Corporate Environmental Performance in Indonesia
Fidēre: Journal of Business, Governance, and Information Technology Volume 1 Issue 1 | July 2019
change Participants. The International Business & Economics Research Jour-nal, 10(1), 73-89.
Balachandran, S. & Mohanram, P. 2011. Is the decline in the value relevance of ac-counting driven by increased conserva-tism?. Review of Accounting Studies 16, 272-301.
Barth, M. E., Landsman, W. R., & Lang, M. H. (2008). International Accounting Stan-dards and Accounting Quality. Roches-ter: Social Science Research Network.
Brook, C. (2008). Introductory econometrics for finance. Cambridge: Cambridge University Press.
Brown-Liburd, H., Cohen, J. R., & Zamora, V. L. (2012, January 15). The effects of corporate social responsibility invest-ment, assurance, and perceived fair-ness on investors’ judgments. Retrieved March 20, 2018 from http://ssrn.com/abstract=1985839
Cardamone, P., Carnevale, C., & Giunta, F. (2012). The value relevance of social reporting: Evidence from listed Italian companies. Journal of Applied Account-ing Research, 13, 3, 255-269.
Carnevale, C., Mazzuca, M., & Venturini, S. (2012). Corporate social reporting in European Banks: The effects on a firm’s market value. Corporate Social Respon-sibility and Environmental Manage-ment, 19, 159–177.
Cheng, M. M., Green, W. J., & Ko, J. C. W. (2015). The impact of strategic rele-vance and assurance of sustainability indicators on investors’ decisions. Au-
diting: A Journal of Practice & Theory, 34,1, 131-162. doi:10.2308/ajpt-50738
Cheung, A. (2011). Do stock investors value corporate sustainability? Evidence from an event study. Journal of Business Eth-ics, 99, 145–165.
Clarkson, P. M., Li, Y., Richardson, G. D., & Vas-vari, F. P. (2011). Does it really pay to be green? Determinants and consequences of proactive environmental strategies. Journal of Accounting and Public Pol-icy, 30, 2, 122-144. doi:10.1016/j.jac-cpubpol.2010.09.013
Clarkson, P. M., Li, Y., Richardson, G., & Tsang, A. (2015). Voluntary external assurance of corporate social responsibility re-ports and the Dow Jones Sustainability Index Membership: International evi-dence. Retrieved from http://cear.gsu.edu/files/2015/09/Session-6-Richard-son-Paper.pdf
Collins, D. W., Maydew, E. L., & Weiss, I. S. (1997). Changes in the value-relevance of earnings and book values over the past forty years. Journal of Accounting & Economics, 24, 1, 39.
Consolandi, C., Jaiswal-Dale, A., Poggiani, E., & Vercelli, A. (2009). Global standards and ethical stock indexes: The case of the Dow Jones Sustainability STOXX Index. Journal of Business Ethics, 87, 185–197.
Cormier, D., & Magnan, M. (2007). The revisit-ed contribution of environmental report-ing to investors’ valuation of a firm’s earnings: An international perspective. Ecological Economics, 62, 613-626.

Volume 1 Issue 1 | July 2019
54 Fidēre: Journal of Business, Governance, and Information Technology
De Villiers, C. and Van Staden, C.J. (2010). Shareholders’ requirements for corpo-rate environmental disclosures: a cross country comparison British Accounting Review,42, 4, 227-240. doi:10.1016/j.bar.2010.08.002
Deegan, C. (2002). Introduction: The legit-imising effect of social and environ-mental disclosures—A theoretical foundation. Accounting, Auditing & Accountability Journal, 15(3), 282-311. doi:10.1108/09513570210435852
Delmas, M., & Toffel, M. (2004). Stakeholders and environmental management prac-tices: An institutional framework. Busi-ness Strategy and the Environment, 13, 209–222.
Field, A. (2009). Discovering statistics using SPSS. London: Sage.
Gamerschlag, R., Moller, K., & Verbeeten, F. (2011). Determinants of voluntary CSR disclosure: empirical evidence from Germany. Review of Managerial Sci-ence, 5, 233-262.
Graham, R., King, R. and Bailes, J. (2000), The value relevance of accounting informa-tion during a financial crisis: Thailand and the 1997 decline in the value of the baht. Journal of International Financial Man-agement and Accounting, 11, 2, 84-107.
Hassel, L., Nilsson, H., & Nyquist, S. (2005). The value relevance of environmental performance. European Accounting Re-view, 14,1, 41–61.
Hellstrom, K. (2006). The value relevance of financial accounting information in a transition economy: The case of the
Czech Republic. European Accounting Review, 15,3, 325.
Holthausen, R., & Watts, R. (2001). The rele-vance of the value-relevance literature for financial accounting standard set-ting. Journal of Accounting and Eco-nomics, 31, 3-75.
Kanter, R. M. (2011). How great companies think differently. Harvard Business Review, 89,11, 66-78. Retrieved from http://gwmoon.knu.ac.kr/Lecture_Li-brary_Upload/How_great_companies_think_differen tly1.pdf
Klerk de, M., & Villiers de, C. (2012). The val-ue relevance of corporate responsibil-ity reporting: South African evidence. Meditari Accountancy Research, 20,1, 21-38.
Koellner, T., Weber, O., Fenchel, M., & Scholz, R. (2005). Principles for sustainabili-ty rating of investment funds. Business Strategy and the Environment, 14,1, 54-70. doi:10.1002/bse.423
Liu J, Liu C (2007). Value relevance of ac-counting information in different stock market segments: The case of Chinese A-, B-, and H-shares. Journal of Inter-national Accounting Research, 6, 55-81.
Lo, S., & Sheu, H. (2007). Is corporate sustain-ability a value increasing strategy for business?. Corporate Governance, 15,2, 345–358.
Lundholm, R. J. (1995). A tutorial on the Ohlson and Feltham/Ohlson Mod-els: Answers to some frequently asked questions. Contemporary Account-ing Research, 11, 2, 749-761. https://

55Measuring Value Relevance of Corporate Environmental Performance in Indonesia
Fidēre: Journal of Business, Governance, and Information Technology Volume 1 Issue 1 | July 2019
doi.org/10.1111/j.1911-3846.1995.tb00464.x
McWilliams, A., & Siegel, D. (2000). Corpo-rate social responsibility and financial performance: Correlation or misspecifi-cation?. Strategic Management Journal, 21,5, 603-609.
Murray, A., Sinclair, D., Power, D., & Gray, R. (2006). Do financial markets care about social and environmental disclosure?. Further evidence and exploration from the UK. Accounting, Auditing & Ac-countability Journal,19, 2, 228-255.
Ohlson, J. A. (1995). Earnings, book values, and dividends in equity valuation. Con-temporary Accounting Research, 11, 2, 661–686.
Porter, M. E., & Kramer, M. R. (2006). Strategy and society: The link between competi-tive advantage and corporate social re-sponsibility. Harvard Business Review, 84, 12, 78–92.
Roberts, R. W. (1992). Determinants of corpo-rate social responsibility disclosure: An application of Stakeholder Theory. Ac-counting Organizations and Society, 17, 6, 595-612.
Robinson, M., Kleffner, A., & Bertels, S. (2011). Signaling sustainability leader-ship: Empirical evidence of the value of DJSI membership. Journal of Business Ethics, 101, 493–505.
Schadewitz, H., & Niskala, M. (2010). Commu-nication via responsibility reporting and its effect on firm value in Finland. Cor-porate Social Responsibility and Envi-ronmental Management, 17, 96-106.
Schmelzer, P. (2013). Value relevance of cor-porate social responsibility reports: The role of reporting frameworks and third-party assurance in CSR reports’ value relevance. Unpublised Mas-ter Thesis. Retrieved Feb 25, 2018 from https://thesis.eur.nl/pub/14701/MA369-Schmelzer_320064.pdf
Setiadharma S, Machali M (2017). The effect of asset structure and firm size on firm val-ue with capital structure as intervening variable. J Bus Fin Aff 6:298
Setyorini, C. T., & Ishak, Z. (2012). Corporate social and environmental disclosure: A Positive Accounting Theory view point. International Journal of Business and Social Science, 3, 9, pp.1-13
van Marrewijk, M. (2003), Conceptions and
definitions of CSR and corporate sus-tainability: Between agency and com-munion. Journal of Business Ethics, 44, 2/3, 95-105.
Wagner, M. (2010). The role of corporate sus-tainability performance for economic performance: A firm-level analysis of moderation effects. Ecological Econom-ics, 69, 1553–1560.
Wooldridge, J.M. (2006), Introductory Econo-metrics. A Modern Approach (3rd ed.), Thomson South-Western, Cincinnati, OH.

Volume 1 Issue 1 | July 2019
56 Fidēre: Journal of Business, Governance, and Information Technology
Abstract
The study focused on the employee’s perception of the effectiveness of moti-vation programs for regular workers of Asia-Pacific International University (AIU). The sample of the study is 69 employees, both Thai and International,
who worked in AIU, Muak Lek Campus during the academic year, 2017-2018. The data was collected through a survey questionnaire. The researcher used descriptive analysis, Pearson correlation Coefficients, multiple regression, Independent t-test to test the statistically significant difference between the means and one way ANOVA to determine whether there are any statistically significant differences between the means of two or more independent variables. The result showed that both extrinsic and intrinsic motivational factors had a positive effect of the employees’ perception toward their performances. In intrinsic motivational factors, interpersonal relations between employee and employees and employees and their supervisors were the highest with the mean of 4.090 and recognition was the lowest mean of 3.426. In extrinsic motivational factors, conductive work environment and the conditions of work was the highest mean of 4.140 and fringe benefits was the lowest motivational factor with the mean of 3.568. Further study could be done based on other factors of motivational programs in AIU.Keywords: motivation programs, employee’s performance
eMployee’s perCepTion of effeCTiveness of MoTivaTion prograMs for regular Workers of asia-paCifiC inTernaTional universiTy
Sorawit Chaiphisit1, Noah Anburaj Balraj2
1Student Administration, 2Faculty of Business Administration, Asia-Pacific International University, Thailand
According to Ryan and Deci (2000), all organizations, despite their level of sophistica-tion, need motivated employees to be effective and efficient in their functioning and responsi-bilities. Kihara (2013) said “employees who are motivated to work energetically and creatively toward the accomplishment of organizational goals are one of the most important inputs to organization’s success. It is widely accepted by the organizational theorists that manpower is one of the most important assets of an orga-nization because the success of an organization
in realizing its objectives heavily depends on the performance of its employees.” Therefore, it is very important for the organization to en-sure that their employees are highly motivated. Armstrong (2006) noted “the organizations with motivated employee are likely to register better performance and low staff turnover. To achieve this, managers needs to develop motivation pro-cess and a work environment that will help to ensure that individuals deliver results in accor-dance with the expectations of management”.
57Employee’s Perception of Effectiveness of Motivation Programs
for Regular Workers of Asia-Pacific International University
Fidēre: Journal of Business, Governance, and Information Technology Volume 1 Issue 1 | July 2019
In this paper, the researcher studied the perception of the effectiveness of motivation programs toward employee’s performance for regular workers of Asia-Pacific International University (AIU). The two motivating factors or programs that the researcher looked at were extrinsic and intrinsic rewards. Some people believed that not all of the rewards affect the employee’s performance. According to Heath (2006), many managers and supervisors labor under the mistaken impression that the level of employee performance on the job is proportion-al to the size of the employee’s pay packet. Al-though this may be true in a minority of cases, numerous employee surveys have shown, and by large, this to be untrue. In fact, salary in-creases and bonuses for performance, in many instances, have a very limited short-term effect. The extra money soon comes to be regarded not as an incentive but as an “entitlement”.
The result of studying the employee’s perception of the effectiveness of motivation programs of regular employee of AIU produced important information that the university can benefit to use the right rewards to improve the performance of its employee. The result of the study provides important information to help the human resource of the university to recruit and retain the employees with an aim of meet-ing the organization goals. The study unearthed various motivational practices that the human resource managers at AIU could employ to en-sure that the employees are motivated.
Moreover, the study is also important to other employers, as by critically evaluating the findings, they would be provided with a more in-depth understanding of the expectations of their employees, how they can attract them by making their organizations more appealing and how they can retain these employees, hence, providing smoother working relationships in the organizations.
The study is benefitting future research-ers by filling the existing gaps in terms of lit-
erature and also providing research gaps that future studies could focus on. Further, the study contributes to the existing pool of literature and therefore form part of reference materials for literature review for future scholars.
Literature ReviewConcept of Perception
Perception is described by Pun (2002) as the process of receiving and deriving mean-ing from stimuli present in an individual’s inter-nal and external environment. Pun further states that to perceive is to see, hear, touch, taste, smell or sense internally something, event or relation and to organize, interpret and derive meaning from the experience. Skytte and Blunch (2001) further describe perception as the process by which an individual selects, organizes, and in-terprets stimuli into a meaningful coherent pic-ture of the world. It is therefore a process which makes meaning to the environment from expe-rience and varies from one person to another since different individuals see the same things in different ways.
Kurtz (2010) summarizes perception as the process, which attributes meaning to incoming stimuli through the human senses. Therefore, it constitutes two factors, the stimu-li and the individual factors. Knowledge of the perceptual process is essential since the man-ner in which users of information interpret the information is affected by their cognitive un-derstanding that they have established in their minds (Rundh, 2005). When employees per-ceive that the organization’s practices reflect a commitment to quality, and are based on seeing employees as assets, they have higher produc-tivity, commitment, and satisfaction. Some of the factors that can impact employee percep-tion include the nature of working conditions, the policies and procedures of the business in general, and how much trust and respect is pres-ent between managers, employees, the benefits paid and how they relate to the work assigned

Volume 1 Issue 1 | July 2019
58 Fidēre: Journal of Business, Governance, and Information Technology
(Schneider, Erhart, Mayer, Saltz, & Niles-Jolly, 2005).
Employee MotivationKihara (2013) explained that employ-
ee motivation is a major factor in the success or failure for any organization. It is one of the important factors that affect the performance of employees. The term motivation has been defined by various researchers. More, Wegner, and Miller (2003) have described it as some-thing that energizes individuals to take action and which is concerned with the choices indi-viduals make as part of goal-oriented behavior. According to Chowdhury (2007), motivation is a progression of moving and supporting goal-di-rected behavior. Motivation provokes employ-ees to constantly look for ways to meeting their goals and therefore employee motivation is one of the policies of managers to increase effectual job management amongst employees in organi-zations. Motivation is the term used to describe those processes, both instinctive and rational by which people seek to satisfy the basic drives, perceived needs, and personal goals, which trig-ger human behavior (Cole, 2002).
Motivation ProgramsAccording to Tella, Ayeni and Popoo-
la (2007), the management of people at work is an integral part of the management process. To understand the critical importance of people in the organization is to recognize that the hu-man element and the organization are synony-mous. They further note that organizations use various programs to motivate their employees. Bernard (2005) accords due recognition to the needs of workers and notes that the ultimate test of organizational success is its ability to create values sufficient to compensate for the burdens imposed upon resources contributed. Tella, Ayeni and Popoola (2007) noted that organi-zation salary, wages, and conditions of service are the most common motivational programs by
many firms. Akintoye (2000) asserts that mon-ey based programs remains the most significant motivational programs.
Olajide (2000) indicated that organiza-tion use training staff as program of motivating them indicating that training is indispensable no matter how an organization is automated. One way managers stimulate motivation is to give relevant information on the consequences of their actions on others. This serves to remove information asymmetry; by sharing informa-tion, subordinates healthily compete with one another. Colvin (2008) has indicated that firms employ various motivational programs like sal-ary, fringe benefits, job security, physical sur-roundings, and safety to achieve employee’s best performance. Colvin notes that organiza-tions are aware that environmental and motiva-tional factors are predictors of job satisfaction.
There are many effective ways one can use to improve the moral, performance and pro-ductivity of the employees in the organization. According to Mullins (2002), there are two folds of motivation programs: extrinsic motivational programs and intrinsic motivational programs. Intrinsic motivational programs offer psycho-logical rewards. They focus on encouraging employees’ specific types of behaviour, so that appropriate behaviours can be maintained and repeated. Intrinsic motivators include job rede-sign, teamwork and participation, career change, incentives and feedback, recognition, and staff training. On the other hand, xxtrinsic motiva-tional programs offers tangible rewards to the employees. These includes promotion, salary/pay, fringe benefits, and work environment.
Intrinsic motivation programsAccording to Kihara (2013), employ-
ees should be given a greater variety of tasks to perform that are not necessarily more chal-lenging for the work to be more interesting to motivate them. The management should ensure job enrichment, which involves employees be-
59Employee’s Perception of Effectiveness of Motivation Programs
for Regular Workers of Asia-Pacific International University
Fidēre: Journal of Business, Governance, and Information Technology Volume 1 Issue 1 | July 2019
ing given a wider range of more interesting and challenging tasks surrounding a complete unit of work to give a greater sense of achievement. Cole (2002) described job enrichment as the vertical extension of job responsibilities which result to increased job satisfaction. Job enrich-ment could be through job re-design with inten-tion to reverse the effects of tasks that are repet-itive requiring little autonomy. Some of these effects are boredom, lack of flexibility, and em-ployee dissatisfaction. Armstrong (2006) notes that job enrichment provides the employee with variety, decision-making, responsibility, and control in carrying out the work and the worker can identify a series of tasks or activities that will determine the end product.
Kihara (2013) suggests that job rotation be considered as an intrinsic motivator. It in-volves moving a person from one job to another to add variety and help remove boredom, in the short term. Although this may lead to acquisi-tion of additional skills, it may not develop the level of skills. It can be used as a formal training or a means of helping a worker identify with a completed service or product. People should be given the opportunity to use a variety of skills, and perform different kinds of work. The most common way to do this is through job rota-tion. Robbins (2005) suggests to move workers through a variety of jobs that allow them to see different parts of the organization, learn differ-ent skills, and acquire different experiences.
Teamwork can also be considered an intrinsic motivator. Kihara (2013) said that teamwork provides job enrichment at the group level. It sets a goal for a team, and make team members free to determine work assignments, schedules, rest break, and evaluation param-eters. With this method, one significantly cut back on supervisory positions and people gain leadership and management skills. People should know how well, or poorly, they are per-forming their jobs. The more control one gives them for evaluating and monitoring their own
performance, the more enriched their jobs will be (Cole, 2002).
Employees feel more valued when in-centives and feedback are given throughout the year. Hammill (2005) notes that organization should have recognition systems in place for the employees. There are many no cost recogni-tion that can be used to motivate employees like supervisors thanking or congratulating the em-ployee in person for outstanding performance; nominating employees to participate mentor-ship programs; posting inspirational messages around the office; and asking staff how they want to be recognized. Further, Goff and Lon-genecker (2000) noted that there are other low cost recognition method that can serve to moti-vate the employees. They include: implement-ing a peer recognition program in staff meet-ings by utilizing nomination sheets that serve to nominate employees for their work based on the department’s values/vision/mission; create bul-letin board space to laud employees publicly; treat the employee to coffee or soda and a chat; celebrate the completion of projects; develop a departmental recognition program; leave a note in the person’s work area or sendan employee to a seminar related to his/her career goals.
Olajide (2000) highlights that no matter how automated an organization is, high produc-tivity depends on the level of motivation and the effectiveness of the workforce; staff training is an indispensable strategy for motivating work-ers. The organization must have good training program to give the employees opportunities for self-improvement and development to meet the challenges and requirements of new equipment and new techniques of performing a task. Staff training is an important contributor to individual and group motivation. Appropriate training can increase staff involvement in the organization, improve communication between peers, facili-tate change and be part of an appraisal scheme (Hammill, 2005). In an ideal world, training and skill profiling must be relevant and responsive
Volume 1 Issue 1 | July 2019
60 Fidēre: Journal of Business, Governance, and Information Technology
to changing organizational needs. This would suppose a systematic assessment of current and projected needs and training strategies which permit a timely response.
Extrinsic motivation programsThe desire to be promoted and earn en-
hanced pay may also motivate employees. To use salaries effectively as a motivator, person-nel managers must consider four major com-ponents of salary structures. These are the job rate, which relates to the importance the organi-zation attaches to each job; payment, which en-courages workers or groups by rewarding them according to their performance; personal or spe-cial allowances, associated with factors such as scarcity of particular skills or certain categories of information professionals, or with long ser-vice; and fringe benefits such as holidays with pay, pensions, and so on. It is also important to ensure that the prevailing pay in other organi-zation or establishments is taken into consider-ation in determining the pay structure of their organization (Strempel, 2003).
Promotion refers to the advancement of an employee’s rank or position in an orga-nizational hierarchy system (Robbins, 2005). A promotion can involve advancement in terms of designation, salary and benefits, and in some organizations the type of job activities may change a great deal. The amount of salary increase associated with a promotion varies a great deal between industries and sectors, and depends on the parts of the hierarchical ladder an employee is moving between. In some indus-tries or sectors, promotion only changes the title and salary, and there are no additional benefits or privileges. In other industries, especially in private sector companies, a promotion to senior management may carry a number of benefits, such as stock options, a reserved parking space, a corner office with a secretary, and bonus pay for good performance (Sigler, 1999).
Salary can also be another extrinsic mo-tivation programs. Akintoye (2000) asserts that money remains the most significant motivation-al strategy. As far back as 1911, Taylor, with the scientific management associates, described money as the most important factor in motivat-ing the industrial workers to achieve greater pro-ductivity. Taylor advocated the establishment of incentive wage systems as a means of stim-ulating workers to higher performance, com-mitment, and eventually satisfaction. Sinclair, Baker, Wilson and Gibs (2005) demonstrate the motivational power of money through the pro-cess of job choice. He explains that money has the power to attract, retain, and motivate indi-viduals towards higher performance. Banjoko (1996) states that many managers use money to reward or punish workers.
Another way of motivating employees is through offering fringe benefits. According to O’Rand (2006) employee benefit is essential for the development of corporate industrial rela-tions. Fringe benefits are found to motivate the employees as it makes the employees feel that the employer cares about them. These benefits are items such as pension, sickness payments, company cars etc., which are additional to earn-ings; sometimes known as fringe benefits (Cole, 2002). An increasing proportion of individual remuneration is made up of additional perks, allowances and entitlements which are mostly paid in kind rather than cash. common form of fringe benefits include; company cars, sick pay, meals, live-in accommodation, parking facil-ities, private health insurance, mobile phones, staff discounts, relocation expenses and any holiday or maternity allowances paid in excess of the required statutory maxima (Strempel, 2003).
Work environment is another extrinsic motivation programmes that inspires the em-ployee to commit and work for the organization productively. In a research carried out by Maja and Valdete (2007) it was found that there are

61Employee’s Perception of Effectiveness of Motivation Programs
for Regular Workers of Asia-Pacific International University
Fidēre: Journal of Business, Governance, and Information Technology Volume 1 Issue 1 | July 2019
several overlapping work environment factors that determine and influence motivation in the long run. They include proper communication, trust between workers and the management, proper working techniques that minimize stress, injuries and frustration and a unified working culture. There are hygiene HR practices that relate to work environment, which if not sat-isfied de-motivate employees and they include company policy, relationship with supervisor, work conditions, salary and wages, status, secu-rity, relationship with subordinates, and person-al life. Accordingly, (Mullins 2004) notes that managers need to redesign jobs to provide op-portunities for individual achievement, recogni-tion, responsibility, advancement and personal growth. The three HR practices that, together, build enthusiastic work environment, are eq-uity/fairness where people want to be treated fairly at work, achievement where people want to do important useful work and be recognized for this and camaraderie where people want to enjoy good relationships with their co-work-ers. Many, maybe most, people start a new job with high levels of motivation and enthusiasm, and they generally want to enjoy what they do. He argues that this natural state of motivation is then reduced, over time by bad practices and poor conditions within the company (Sinclair, et al., 2005).
RESEARCH METHODOLOGYThe population surveyed in this research
were the regular employees in Asia-Pacific In-ternational University, Thailand. A total of 90 regular employees of Asia-Pacific international University were involved and the response rate of respondents was 76.50 percent.
VariablesIndependent Variables: Demographic
profile, intrinsic rewards and extrinsic rewards Dependent Variable: Employees’ per-
ception
Research Instrumentation The instrumentation used in this re-
search was a questionnaire constructed from various research papers. The questions are closed-ended and divided into two parts.
Part 1 Demographic profile was assessed by using seven items including gender, status, age, education, religion, job position, number of years in service. The questions in the first part were of the multiple choice type.
Part 2 Employees’ perception was mea-sured using a measurement tool developed by Northouse (2001). It contained thirteen items. Responses were scored using a five-point scale Likert-type scale (1= “strongly disagree,” 5 = “strongly agree”). All of the scales are reported to test reliabilities averaging 0.87.
Data Analysis A statistical program (SPSS) was used
to analyze the data. Statistics used in data analy-sis were frequency, percentage, mean, standard deviation, Independent t-test, One-way ANO-VA, and multiple regression. The results were interpreted using Sri-saad (1992)’s method as shown in Table 1.
Table 1Level of decisionScore Range Meaning 4.21 - 5.00 Highest Level 3.41 - 4.20 High Level 2.61 - 3.40 Moderate Level 1.81 - 2.60 Low Level 1.00 - 1.80 Lowest Level
RESULTS AND DISCUSSIONDemographic profile
From the 69 respondents, the results showed that 41 (59.4%) respondents were fe-male, 54 (78.3%) respondents were married, 23 (33.3%) respondents were between 41 to 50

Volume 1 Issue 1 | July 2019
62 Fidēre: Journal of Business, Governance, and Information Technology
years old, 38 (55.1%) respondents were post graduate, 66 (95.7%) respondents were Chris-tian, 47 (68.1%) respondents were staff and 24 (34.8%) respondents had the number of service between 0 to 5 years. Table 2 provides more de-tail on the respondents’ profile.
Table 2Respondents’ demographic profile
Demographic n %1 Gender
Male 28 40.60Female 41 59.40
2 StatusMarried 54 78.30Single 15 21.70
3 AgeLess than or equal to 20 years
0 0.00
21 years to 30 years 11 15.9031 years to 40 years 20 29.0041 years to 50 years 23 33.30More than 50 years 15 21.70
4 Education StatusElementary 0 0.00High School 1 1.40Bachelor Degree 26 37.70Post Graduate 38 55.1Others 4 5.80
5 ReligionBuddhist 3 4.30Christian 66 95.70Others 0 0.00
6 Job PositionFaculty 22 31.90Staff 47 68.10Others 0 0.00
7 Number of years in the service0 – 5 24 34.806-10 13 18.8011 – 15 12 17.4016 – 20 10 14.5021 and above 10 14.50
The results shown in Table 3 reveals that most of the perception of the level of the mo-tivator toward employee’s performance are in high level. The conductive work environment and the conditions of work have the maximum mean of 4.140 and the standard deviation of 0.912. On the other hand, the recognition has the minimum mean of 3.426 and the standard deviation of 0.713.
Table 3Employees’ perception of each category
Item X S.D Level of Scale
Promotion 3.728 0.827 High LevelTeamwork and Employee Participation
3.719 0.701 High Level
ProfessionalDevelopment
3.794 0.757 High Level
Recognition 3.426 0.713 High LevelTraining and development
3.994 0.787 High Level
Job Design 3.428 0.806 High LevelFringe benefits: 3.568 0.780 High LevelPay/ salary 4.000 1.015 High LevelConducive work environment/ conditions of work
4.140 0.912 High Level
Job security 4.010 0.978 High Level
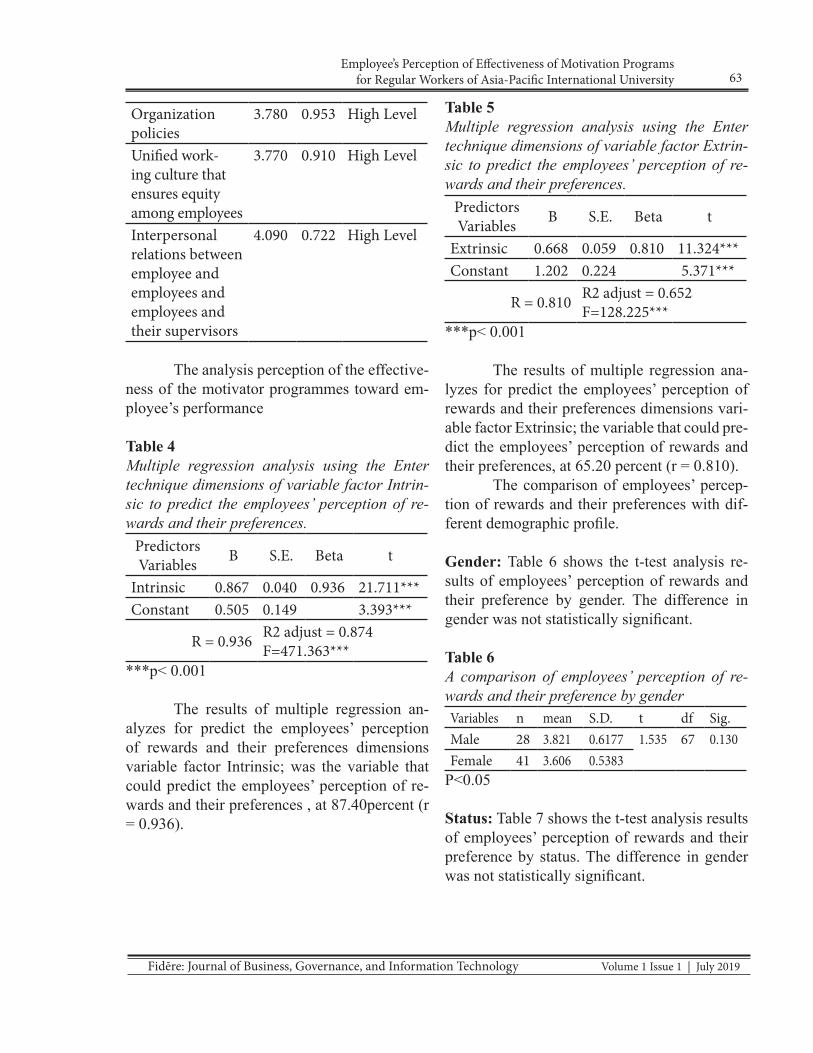
63Employee’s Perception of Effectiveness of Motivation Programs
for Regular Workers of Asia-Pacific International University
Fidēre: Journal of Business, Governance, and Information Technology Volume 1 Issue 1 | July 2019
Organization policies
3.780 0.953 High Level
Unified work-ing culture that ensures equity among employees
3.770 0.910 High Level
Interpersonal relations between employee and employees and employees and their supervisors
4.090 0.722 High Level
The analysis perception of the effective-ness of the motivator programmes toward em-ployee’s performance
Table 4Multiple regression analysis using the Enter technique dimensions of variable factor Intrin-sic to predict the employees’ perception of re-wards and their preferences.
Predictors Variables B S.E. Beta t
Intrinsic 0.867 0.040 0.936 21.711***Constant 0.505 0.149 3.393***
R = 0.936 R2 adjust = 0.874 F=471.363***
***p< 0.001
The results of multiple regression an-alyzes for predict the employees’ perception of rewards and their preferences dimensions variable factor Intrinsic; was the variable that could predict the employees’ perception of re-wards and their preferences , at 87.40percent (r = 0.936).
Table 5Multiple regression analysis using the Enter technique dimensions of variable factor Extrin-sic to predict the employees’ perception of re-wards and their preferences.
Predictors Variables B S.E. Beta t
Extrinsic 0.668 0.059 0.810 11.324***Constant 1.202 0.224 5.371***
R = 0.810 R2 adjust = 0.652 F=128.225***
***p< 0.001
The results of multiple regression ana-lyzes for predict the employees’ perception of rewards and their preferences dimensions vari-able factor Extrinsic; the variable that could pre-dict the employees’ perception of rewards and their preferences, at 65.20 percent (r = 0.810).
The comparison of employees’ percep-tion of rewards and their preferences with dif-ferent demographic profile.
Gender: Table 6 shows the t-test analysis re-sults of employees’ perception of rewards and their preference by gender. The difference in gender was not statistically significant.
Table 6A comparison of employees’ perception of re-wards and their preference by genderVariables n mean S.D. t df Sig.Male 28 3.821 0.6177 1.535 67 0.130Female 41 3.606 0.5383
P<0.05
Status: Table 7 shows the t-test analysis results of employees’ perception of rewards and their preference by status. The difference in gender was not statistically significant.
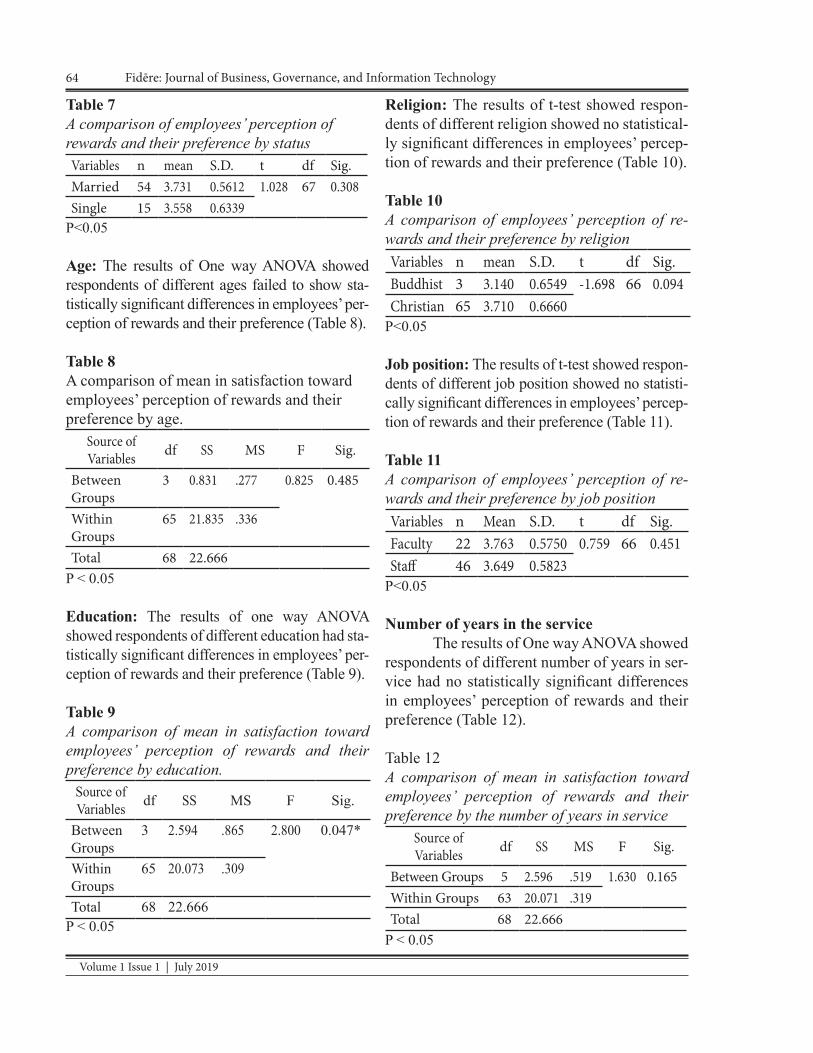
Volume 1 Issue 1 | July 2019
64 Fidēre: Journal of Business, Governance, and Information Technology
Table 7 A comparison of employees’ perception of rewards and their preference by statusVariables n mean S.D. t df Sig.Married 54 3.731 0.5612 1.028 67 0.308Single 15 3.558 0.6339
P<0.05
Age: The results of One way ANOVA showed respondents of different ages failed to show sta-tistically significant differences in employees’ per-ception of rewards and their preference (Table 8).
Table 8A comparison of mean in satisfaction toward employees’ perception of rewards and their preference by age.
Source ofVariables df SS MS F Sig.
Between Groups
3 0.831 .277 0.825 0.485
Within Groups
65 21.835 .336
Total 68 22.666P < 0.05
Education: The results of one way ANOVA showed respondents of different education had sta-tistically significant differences in employees’ per-ception of rewards and their preference (Table 9).
Table 9A comparison of mean in satisfaction toward employees’ perception of rewards and their preference by education.
Source of Variables df SS MS F Sig.
Between Groups
3 2.594 .865 2.800 0.047*
Within Groups
65 20.073 .309
Total 68 22.666P < 0.05
Religion: The results of t-test showed respon-dents of different religion showed no statistical-ly significant differences in employees’ percep-tion of rewards and their preference (Table 10).
Table 10A comparison of employees’ perception of re-wards and their preference by religionVariables n mean S.D. t df Sig.Buddhist 3 3.140 0.6549 -1.698 66 0.094Christian 65 3.710 0.6660
P<0.05
Job position: The results of t-test showed respon-dents of different job position showed no statisti-cally significant differences in employees’ percep-tion of rewards and their preference (Table 11).
Table 11A comparison of employees’ perception of re-wards and their preference by job positionVariables n Mean S.D. t df Sig.Faculty 22 3.763 0.5750 0.759 66 0.451Staff 46 3.649 0.5823
P<0.05
Number of years in the serviceThe results of One way ANOVA showed
respondents of different number of years in ser-vice had no statistically significant differences in employees’ perception of rewards and their preference (Table 12).
Table 12 A comparison of mean in satisfaction toward employees’ perception of rewards and their preference by the number of years in service
Source ofVariables df SS MS F Sig.
Between Groups 5 2.596 .519 1.630 0.165Within Groups 63 20.071 .319Total 68 22.666
P < 0.05

65Employee’s Perception of Effectiveness of Motivation Programs
for Regular Workers of Asia-Pacific International University
Fidēre: Journal of Business, Governance, and Information Technology Volume 1 Issue 1 | July 2019
CONCLUSIONFrom the 69 respondents, the results
showed that 41 (59.4%) respondents were fe-male, 54 (78.3%) respondents were married, 23 (33.3%) respondents were between 41 to 50 years old, 38 (55.1%) respondents were post graduate, 66 (95.7%) respondents were Chris-tian, 47 (68.1%) respondents were staff and 24 (34.8%) respondents had the number of service between 0 to 5 years. The study found that ed-ucation had statistically significant differences in employees’ perception of rewards and their preference. Other demographic factors consist-ing of gender, status, age, religion, job position and number of years in service revealed no statically significant differences in employees’ perception of rewards and the their preferenc-es. The study also found that both intrinsic and extrinsic variables could predict the employees’ perception of rewards and their preferences, at 87.40 percent (r = 0.936) and 65.20 percent (r = 0.810) respectively. Moreover, the study re-vealed most of the perception of the level of the motivator toward employee’s performance are in high level. The conductive work environment and the conditions of work have the maximum mean of 4.140 and the standard deviation of 0.912. On the other hand, the recognition has the minimum mean of 3.426 and the standard deviation of 0.713.
ReferencesAjila, C., & Abiola, A. (2004). Influence of
Rewards on Workers Performance in an Organization. Retrieved on De-cember 11, 2016 from, http://www.krepublishers.com/02-Journals/JSS/JSS-08-0-000-000-2004-Web/JSS-08-1-001-084-2004-Abst-PDF/JSS-08-1-007-012-2004-Ajila/JSS-08-1-007-012-2004-Ajila.pdf
Akintoye, I.R. (2000). The place of financial management in personnel psychology.
A Paper Presented as Part of Personnel Psychology Guest Lecture Series. De-partment of Guidance and Counselling, University of Ibadan, Nigeria.
Aktar, S., Sachu, M. K., & Ali, E. (2012). The Impact of Rewards on Employee Per-formance in commercial Banks of Ban-gladesh: An Empirical Study. Retrieved December 11, 2014 from, https://pdfs.semanticscholar.org/50b1/b9b6e-c885144386a27f7063d6971471f2422.pdf
Armstrong, M. (2006). A Handbook of Human Resource Management Practice, 9thE-dition, Kogan Page, London.
Ashe-Edmunds, S. (2014). The Effect of Job Descriptions on Employee Per-formance. Retrieved December 14, 2016 from, http://work.chron.com/ef-fect-job-descriptions-employee-perfor-mance-23428.html
Banjoko, S.A. (1996). Human Resource man-agement? An Expository Approach. La-gos: Saban Publishers
Benabou, R., & Tirole, J. (2003). Intrinsic and extrinsic motivation. The Review of Economic Studies, 70(244), 489. Retrieved December 14, 2016 from, http://search. proquest.com /docview/ 204348141? accountid=39909
Bernard, C.P. (2005). Motivation and manage-ment styles in the public and private sectors in Taiwan and a comparison with United States. Journal of Applied Social Psychology, 26 (20), 1827-1837.
Bhaduri, S., & Kumar, H. (2011). Extrinsic and intrinsic motivations to innovate: Trac-ing the motivation of ‘grassroot’ inno-
Volume 1 Issue 1 | July 2019
66 Fidēre: Journal of Business, Governance, and Information Technology
vators in India. Mind & Society, 10(1), 27-55. doi:http://dx.doi.org/10.1007/s11299-010-0081-2
Chowdhury, M. S. (2007). Enhancing Moti-vation and Work Performance of the Salespeople: the impact of supervisors behaviour, African journal of business management. 1(9), 238-243. Retrieved from https://www.researchgate.net/publication/228888790_Enhancing_motivation_and_work_performance_of_the_salespeople_The_impact_of_su-pervisors%27_behavior
Cole, G.A (2002), Personnel and Human Re-source Management, 5th Edition, Wiley, New York, NY
Colvin, G. (1998). What money makes you do, Fortune 138(4), 213-214.
Danish, R. Q. (2010). Impact of Reward and Recognition on Job Satisfaction and Motivation: An Empirical Study from Pakistan. Accessed 14/12/2014 from, Dunn, E. & Norton, M. (2013). Happy money. The Science to Smarter Spend-ing. Simon & Schuster.
Floyd, C. L. (2009). The relationship between intrinsic and extrinsic factors and su-perintendent job satisfaction (Order No. 3358175). Available from Pro-Quest Dissertations & Theses Global. (305140927). Retrieved December 14, 2016 from, http://search.proquest.com/docview /305140927? accountid=39909
Goff, S.J. & Longenecker, C.O. (1990). Why performance appraisals still fail. Jour-nal of Compensation and Benefits, No-vember/December, 36-41
Hammill, G. (2005). Mixing and Managing Four Different Generations. Lagos: Sa-ban Publishers.
Heath, V. (2006). Workplace Environment and Its impact on Employee Performance. Retrieved December 14, 2016 from, http://www.leader-values.com/article.php?aid=465
Johnson-Black, E. (1992). Scholarly research productivity as a function of extrinsic and intrinsic motivational factors (Or-der No. 9302536). Available from Pro-Quest Dissertations & Theses Global. (304005607). Retrieved December 14, 2016 from, http://search.proquest.com/docview/304005607?accountid=39909
Kihara, S.W., (2013). Employee perception of effectiveness of motivation programmes for generation Y employees in Sarova chain of hotels. Retrieved December 14, 2016 from, http://chss.uonbi.ac.ke/sites/default/files/chss/Research%20Proj-ect%20-%20D61%20-%2073139%20-%202009%20Susan%20Kihara.pdf
Kurtz, D. (2010). Contemporary Marketing Mason, OH: South-Western Cengage Learning.
Maja, S. & Valdete, J. (2007). How to motivate assembly line workers. MBA Project Jönköping University.
More, H. W., Wegner, F. W. & Miller, L. S. (2003) Effective Police Supervision, Cincinnati, Anderson Publishing.
Mugenda, O.M & Mugenda, A.G (2003) Re-search Methods, Quantitative & Qual-itative Approaches, Acts Press: Nairobi.

67Employee’s Perception of Effectiveness of Motivation Programs
for Regular Workers of Asia-Pacific International University
Fidēre: Journal of Business, Governance, and Information Technology Volume 1 Issue 1 | July 2019
Mullins, L. J. (2002), Management and Organ-isational Behaviour, Pearson Education Limited.
Mullins, Laurie J. (2004), Management and OrganisationalBehaviour (7th ed.), Fi-nancial Times–FT Press–Prentice-Hall–Pearson Education.
Narasimhan, K. (2002). Successful manage-ment by motivation: Balancing intrin-sic and extrinsic incentives. The TQM Magazine, 14(2), 134-135. Retrieved December 14, 2016 from, http://search.proquest.com/docview/227575345?ac-countid=39909
Northouse, P. G. (2001). Leadership theory and practice (2nded.). Thousand Oaks, CA: Sage Publications, Inc.
Ngechu.M. (2004). Understanding the research process and methods. An Introduction to Research Methods. Acts Press, Nairobi.
Olajide, S.B. (2000). Introduction to language teaching methods. In Badmus, A. & S. B. Olajide, (Eds.), A General Introduc-tion to Language Studies. Ilorin: Kwara State College of Education, Ilorin, Ni-geria.
O’Rand, M. A. (2006). The Hidden Payroll: Employee Benefits and the Structure of workplace Inequality. 1(4). 657-683. Retrieved from https://www.jstor.org/stable/684596?seq=1#page_scan_tab_contents
Orodho, A.J. (2003). Essentials of Educational and Social Sciences Research Method. Nairobi: Masola Publishers.
Park, S. M., & Word, J. (2012). Driven to ser-vice: Intrinsic and extrinsic motiva-tion for public and nonprofit manag-ers. Public Personnel Management, 41(4), 705-734. Retrieved December 14, 2016 from, http://search.proquest.com/docview/1664901558?accoun-tid=39909
Prior, Y. (2015). Investigating extrinsic and intrinsic employee needs in hospitality workers (Order No. 3733853). Available from ProQuest Dissertations & The-ses Global. (1746624236). Retrieved 14/12/16 from, http://search.proquest.com/docview/1746624236?accoun-tid=39909
Pun, K. (2002). Development of an integrated total quality management and perfor-mance measurement system for self-as-sessment: a method, Total Quality Management and Business Excellence, 13(6), pp.759-77.
Robbins, S.P. (2005). Organizational Behaviour, 11th Ed, Prentice-Hall, India.
Rundh, B. (2005). The multi-faceted dimension of packaging: Marketing logistics or marketing tool? British Food Journal, 107, 670-684
Ryan, M. R., & Deci, L. E. (2000).Self-deter-mination and the facilitation of intrinsic motivation, social development, and well-being, American Psychologist, 55, 68–78.
Schneider, B., Erhart, M.G., Mayer, D.M., Saltz, J.L., & Niles-Jolly, K. (2005). Un-derstanding organization-customer links in service settings. Academy of Manage-ment Journal, 48(6), 1017-103

Volume 1 Issue 1 | July 2019
68 Fidēre: Journal of Business, Governance, and Information Technology
Sigler, K. (1999). Challenges of Employee Re-tention Management; Research News, Patrington, 22(10).
Sinclair, I., Baker, C., Wilson, K. & Gibbs, I. (2005) Foster Children: Where They Go and How They Get On. Jessica Kings- ley, London.
Skytte, H., & Blunch N. J. (2001) Food Re-tailers’ Buying Behaviour: An Analysis in 16 European Countries, Journal on Chain and Network Science, 1(2), 133-145.
Smith, E., Joubert, P., PhD.,&Karodia, A. M.,
PhD. (2015). THE IMPACT OF IN-TRINSIC AND EXTRINSIC RE-WARDS ON EMPLOYEE MOTI-VATION AT A MEDICAL DEVICES COMPANY IN SOUTH AFRICA. Ku-wait Chapter of the Arabian Journal of Business and Management Review, 5(1), 39-87. Retrieved December 14, 2016 from, https://www.arabianjbmr.com/pdfs/KD_VOL_5_1/3.pdf
Srisa-ard, B. (1992). Preliminary Research. Bangkok: Suveriyasant.
Strempel, P. (2003). Towards strategies for man-aging knowledge workers, (accessed 25 September).
Tella, Adeyinka; Ayeni, C.O.; and Popoola, S.O..Work motivation, job satisfaction and organisational commitment of li-brary personnel in academic and re-search libraries in Oyo State Nigeria (2007), Library Philosophy and Practice (e-journal) paper 118.
Thomas, K. (2009). The Four Intrinsic Rewards that drive Employee Engagement. Retrieved December 14, 2016 from, http://iveybusinessjournal.com/topics/the-workplace/the-four-intrinsic-re-wards-that-drive-employee-engage-ment#.VIyDuSuUd1Z
Tremblay, M. A., Blanchard, C., Villeneuve, M., Taylor, S., & Pelletier, L. G. (2009). Work extrinsic and intrinsic motiva-tion scale: Its value for organizational psychology research. Canadian Jour-nal of Behavioural Science, 41(4), 213-226. Retrieved December 14, 2016 from, http://search.proquest.com/docview/220498089?accountid=39909

Volume 1 Issue 1 | July 2019
69Fidēre: Journal of Business, Governance, and Information Technology
Abstract
International students have been noted to experience stress which affects their learning motivation. This research determined the perceptions of foreign stu-dents in terms of financial stress and learning motivation and distinguished the
relationship between financial stress and learning motivation. One hundred interna-tional students in Cavite, Philippines were randomly sampled as respondents of the study. Results of the study showed that there is a significant relationship between financial stress and learning motivation. International students were moderately experiencing financial stress but disagreed that it was affecting their learning mo-tivation. This paper recommends that further study be done to identify the intrinsic learning motivation of the international students amidst the acceptance that there is a relationship between financial stress and learning motivation.Keywords: financial stress, learning motivation, international student
iMpaCT of finanCial pressures
on foreign sTudenTs’ learning MoTivaTion
Prince Mbokani, Lenny SimatupangAdventist University of the Philippines
Learning motivation has become a significant concern in education. Therefore, its absence characterizes a decline in the learning process (Ferreira, Cardoso, & Abrantes, 2011). This decline results from stress that affects the aca-demics of the students negatively( Lim, Heck-man, Montalto, & Letkiewicz, 2014). Both In-ternational and local students are all faced with stress issues. However, the international student faces more challenge than local students. The stress areas that affect international students in-clude a bicultural challenge, language barriers, loneliness, and financial problems. Moreover, Malaklolunthu and Selan (2011) argued that fi-nancial problem is a significant stressor for in-ternational students.
Previous researches have investigat-ed the issues related to financial stress on ac-ademic outcomes among college students; according to Wharton (2007), the students
who are affected by financial stress have low grades. There are no published studies that show the relationship between financial stress and learning motivation of the international student. One recent study did not measure fi-nancial stress but showed that sense of poverty was associated with the experience of psycho-logical distress among students (Reyes & Yu-juico, 2014).
The objectives of the study are to deter-mine the effect of financial stress on the learn-ing motivations among international students and the respondents’ perceptions of both finan-cial stress and learning motivation.
Financial stressThere is no specific definition of stress,
but its meaning depends on whom you ask and their major field. For example, an economist tends to define stressors in term of economic

Volume 1 Issue 1 | July 2019
70 Fidēre: Journal of Business, Governance, and Information Technology
contexts, such as poverty (Epel et al., 2018). The concept of financial stress was used to determine any objective that described sick-ness-associated to financial problems (Hanratty, Holland, Jacoby, & Whitehead, 2007). North-ern, O’Brien, and Goetz (2010) define financial stress as the incapacity to meet one’s financial obligations. It is influenced by attitude, beliefs, and other psychological factors.
The previous researches concentrated more on the adverse effects of financial stress on academic learning performance, health issues, and financial habits or practices among college students (Heckman, Lim, & Montalto, 2014). According to Lin and Yi (1997), the student’s stress have an impact on the academic success and they point out some factors that cause the stress to students, such as academic require-ment, language challenges, financial problems, lonesomeness, homesickness, companionship problems, individualism, cultural divergence, stereotyping, prejudice, discrimination, and paranoia. Brougham, Zail, Mendoza, and Mill-er (2009) stated that academics pressure, finan-cial problems, family feuds and social issues are sources of stress. Additionally, other sources of financial stress involve an unpredicted expense, e.g., the parents may lose a job and be inca-pable to pay the tuition fees of their children. Moreover, the students may also encounter the emergency cost, such as the hospital bill or car accident cost. Generally, they have few sav-ings; they do not have enough money to face these kinds of unexpected expenses (Fosnacht & Dong, 2013).
In the study of Trombitas (2012), the students reported that financial problems affect-ed their academic performance negatively. Ac-cording to Ferreira et al. (2011), Joo, Durband, and Grable (2008), and Wharton (2007), finan-cial concerns impede the academic progress and also the academic accomplishment in terms of grade and credit hours and sometimes drop course load within the semester.
In the study of Trombitas (2012), results revealed that 20 percent of student respondents said that they had reduced their credit hours and course load due to financial stress. Moreover, great financial assistance or support may pro-vide greater motivation and grades. Ferreira et al. (2011) and Lim et al., (2014) concluded that the student who has high financial self-effica-cy and excessive financial opportunity is likely faced with less financial stress.
The international students are isolated and felt to be lonely and homesick than domes-tic students (Rajapaksa & Dundes, 2003). The problems of international student are not limit-ed to financial stress, but also on other related issues that come such as poor accommodation, language barrier, discrimination, and loneliness (Furnham, 2004).
Learning MotivationLearning concerns the interaction be-
tween learner and environment. A learning sit-uation not only influences but also is a part of the learning. Leaning is group participation in seeking a planned education with well-devel-oped program content. In education, learning motivation has turned out to be an essential is-sue in academic research which the lack of it has caused a decline in learning quality (Ferrei-ra et al., 2011).
The concept motivation is defined as a physical, psychological, or social need that en-courages individuals to attain or realize their tar-get, to satisfy their wants and to ultimately feel pleased in achieving their goals (Tuncel, Sadik-oglu, & Memmedova 2016 ). The educational psychologist has recognized that motivation is essential for supporting student learning. Re-cently the partnership for 21st-century skill has identified initiative as one of the life and career skill necessary to prepare the student to have a good education and career skills. The motiva-tion which is a latin word movere meaning “to move” is a factor in energizing students’ behav-

71Impact of Financial Pressures on Foreign Students’ Learning Motivation
Fidēre: Journal of Business, Governance, and Information Technology Volume 1 Issue 1 | July 2019
ior to accomplish, an educational goal (Ferreira et al., 2011).
Students also are naturally concerned with motivation. It is a factor for students who want to continue their study and aspire to in-volve in the learning process. However, stu-dents may be similarly motivated to execute a task but, their sources of motivation may be dif-ferent (Gregory 2009). Therefore, the teachers must wisely consider the motivation of students in the objective to mobilize their capabilities and possibilities to achieve the academic per-formance (Ferreira eta l., 2011).
Gregory (2009) has also revealed that most students react positively to a good course prepared and taught by a passionate teacher who has real attention to students and what they learn. The way of teaching encourages students to learn and also increases students’ motivation. Some students naturally seem to be encouraged to learn. However, they may want or envisage their lecturer to enthuse, excite, challenge and motivate them.
Methodology
This research used descriptive-correla-tional design. It used a random sampling tech-nique in collecting data from 100 international students in Cavite, Philippines. The researchers used a self-developed instrument with a Cron-bach’s Alpha of 0.927. The research employed Vagais (2006) five levels of agreement Likert-scale to give an interpretation of this research. The scale stated that 1 – strongly disagree, 2 – disagree, 3 – moderately agree, 4 –agree and 5 – strongly agree. The results were analyzed from SPSS 20. The interpretation table is shown below:
The hypothesis for this study is that:Ho: There is no significant relationship between financial stress and learning motivation.
Table 1Likert Scale Interpretation
Response scale
VerbalInterpretation Mean Interval
5 Strongly Agree
>4.50- 5.00
4 Agree >3.50-4.49
3 Moderately Agree
>2.50-3.49
2 Disagree >1.50-2.49
1 StronglyDisagree
>1.00-1.49
Results and DiscussionThe respondents were made up of 54
males and 46 females. The continental rep-resentation is made up 36 Africans, 16 North Americans, 27 Asians excluding Filipinos, 1 South American, 1 European and 19 from other continents. Further, they were 54 international undergraduates students and 46 internation-al graduate students. Regarding their sources of funds, 53 were self-support, 28 funds from relative, nine were institutionally funded, and ten were getting funding from other sources. Their monthly allowance received showed that 48 were receiving less than, ₱9,999, 33 got be-tween ₱10,000 and ₱19,99 , 11 got ₱20,000 – ₱29,999, 3 also received ₱30,000- ₱39,999 and lastly 5 were receiving ₱40,000- ₱49,999.
In the discussion, the perception of in-ternational students on financial stress the table 2 below depicts the results. Financial stress is in term of their monthly allowance, money bor-rowing, and tuition fee. The respondents regis-tered in 6 questions responses of “Moderately agree” which is as moderate experiencing fi-nancial stress, however in 5 questions, they reg-istered responses of “Disagree”, which is as a not experiencing financial stres.
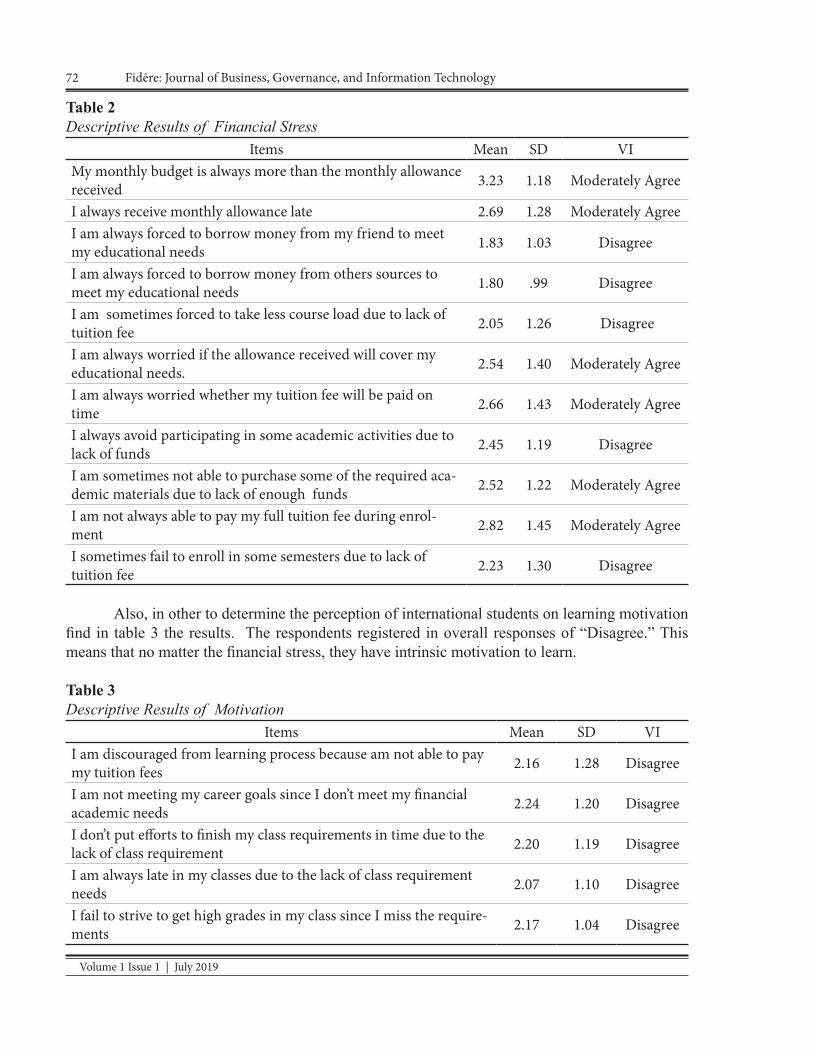
Volume 1 Issue 1 | July 2019
72 Fidēre: Journal of Business, Governance, and Information Technology
Table 2 Descriptive Results of Financial Stress
Items Mean SD VIMy monthly budget is always more than the monthly allowance received 3.23 1.18 Moderately Agree
I always receive monthly allowance late 2.69 1.28 Moderately AgreeI am always forced to borrow money from my friend to meet my educational needs 1.83 1.03 Disagree
I am always forced to borrow money from others sources to meet my educational needs 1.80 .99 Disagree
I am sometimes forced to take less course load due to lack of tuition fee 2.05 1.26 Disagree
I am always worried if the allowance received will cover my educational needs. 2.54 1.40 Moderately Agree
I am always worried whether my tuition fee will be paid on time 2.66 1.43 Moderately Agree
I always avoid participating in some academic activities due to lack of funds 2.45 1.19 Disagree
I am sometimes not able to purchase some of the required aca-demic materials due to lack of enough funds 2.52 1.22 Moderately Agree
I am not always able to pay my full tuition fee during enrol-ment 2.82 1.45 Moderately Agree
I sometimes fail to enroll in some semesters due to lack of tuition fee 2.23 1.30 Disagree
Also, in other to determine the perception of international students on learning motivation find in table 3 the results. The respondents registered in overall responses of “Disagree.” This means that no matter the financial stress, they have intrinsic motivation to learn.
Table 3Descriptive Results of Motivation
Items Mean SD VII am discouraged from learning process because am not able to pay my tuition fees 2.16 1.28 Disagree
I am not meeting my career goals since I don’t meet my financial academic needs 2.24 1.20 Disagree
I don’t put efforts to finish my class requirements in time due to the lack of class requirement 2.20 1.19 Disagree
I am always late in my classes due to the lack of class requirement needs 2.07 1.10 Disagree
I fail to strive to get high grades in my class since I miss the require-ments 2.17 1.04 Disagree

73Impact of Financial Pressures on Foreign Students’ Learning Motivation
Fidēre: Journal of Business, Governance, and Information Technology Volume 1 Issue 1 | July 2019
In answering the research hypothesis question Ho: if there is a significant relationship between financial stress and learning motivation, using ANOVA the results shows that the rela-tionship is significant at .002 as compared to the p-value of >0.05. It means that we reject the null hypothesis Ho.
Table 4Tests of Between-Subject EffectsDependent Variable: Learning Motivation
Source Type III Sum of Squares df Mean Square F Sig. Partial Eta
SquaredCorrected Model 52.681a 33 1.596 2.298 .002 .535Intercept 324.824 1 324.824 467.590 .000 .876FinancialStress 52.681 33 1.596 2.298 .002 .535Error 45.849 66 .695Total 559.920 100Corrected Total 98.530 99
a. R Squared = .535 (Adjusted R Squared = .302)
ConclusionIt has become evidently clear that international students in Cavite, Philippines are moder-
ately experiencing financial stress. However, they are determined to have intrinsic motivation to pursue their study when it comes to learning motivation. They admit that there is a relationship between financial stress and learning motivation. This paper recommends that further research must be done to explain the intrinsic values that are motivating international students in Cavite, Philippines amidst their moderately financial stress.
ReferenceBritt, S. L., Canale, A., Fernatt, F., Stutz, K., & Tibbetts, R. (2015). Financial stress and finan-
cial counseling: Helping college students. Journal of Financial Counseling and Planning, 26(2), 172-186.
Brougham, R. R., Zail, C. M., Mendoza, C. M., & Miller, J. R. (2009). Stress, sex differences, and coping strategies among college students. Current psychology, 28(2), 85-97.
Epel, E. S., Crosswell, A. D., Mayer, S. E., Prather, A. A., Slavich, G. M., Puterman, E., & Mendes, W. B. (2018). More than a feeling: A unified view of stress measurement for population science. Frontiers in neuroendocrinology.
Ferreira, M., Cardoso, A. P., & Abrantes, J. L. (2011). Motivation and Relationship of the Student with the School as Factors Involved in the Perceived Learning. Procedia-Social and Be-havioral Sciences, 29, 1707-1714.
Fırat, M., Kılınç, H., & Yüzer, T. V. (2018). Level of intrinsic motivation of distance education students in e-learning environments. Journal of Computer Assisted Learning, 34(1), 63-70.

Volume 1 Issue 1 | July 2019
74 Fidēre: Journal of Business, Governance, and Information Technology
Fosnacht, K., & Dong, Y. (2013, November). Financial stress and its impact on first-year students’ college experience. In an-nual meeting of the Association for the Study of Higher Education, St. Louis.
Furnham, A. (2004). Education and culture shock. Psychologist, 17(1), 16
Gregory, R. W. (2009). Student motivation. A Master Teacher Programme, United States Military Academy, West Point, NY.
Hanratty, B., Holland, P., Jacoby, A., & White-head, M. (2007). Financial stress and strain associated with terminal can-cer—a review of the evidence. Pallia-tive Medicine, 21(7), 595-607.
Heckman, Stuart; Lim, HanNa; and Montal-to, Catherine (2014) “Factors Relat-ed to Financial Stress among College Students,” Journal of Financial erapy: Vol. 5: Iss. 1, Article 3. h p://dx.doi.org/10.4148/1944-9771.1063
Joo, S. H., Durband, D. B., & Grable, J. (2008). The academic impact of financial stress on college students. Journal of College Student Retention: Research, Theory & Practice, 10(3), 287-305.
Lim, H., Heckman, S., Montalto, C., & Let-kiewicz, J. (2014). Financial stress, self-efficacy, and financial help-seeking behavior of college students.
Lin, J. C. G., & Yi, J. K. (1997). Asian interna-tional students’ adjustment: Issues and program suggestions. College student journal.
Malakolunthu, S., & Selan, P. S. (2011). Ad-justment problems among international
students in Malaysian private higher ed-ucation institutions.
Misra, R., & Castillo, L. G. (2004). Academic stress among college students: Com-parison of American and international students. International Journal of Stress Management, 11(2), 132.
Northern, J., O’Brien, W. H., & Goetz, P. W. (2010). The development, evaluation, and validation of a financial stress scale for undergraduate students. Journal of College Student Development, 51(1), 79-92.
Rajapaksa, S., & Dundes, L. (2003). It’s a long way home: international student ad-justment to living in the United States. Journal of College Student Retention 4, (1), 15-28.
Reyes, M. L., & Yujuico, I. C. (2014). Psycho-logical distress among college youth as a function of family SES: The mediating effect of sense of poverty and the miti-gating role of family resources. Journal of Pacific Rim Psychology, 8, 95-104.
Trombitas, K. (2012). Financial stress: An ev-eryday reality for college students. In-ceptia.
Vagias, W. M. (2006). Likert-type scale re-sponse anchors. Clemson International Institute for Tourism & Research Devel-opment, Department of Parks, Recre-ation and Tourism Management. Clem-son University.
Wharton, B. I. (2007). First-year student fi-nancial behavior and academic success (Doctoral dissertation, The Ohio State University).

Volume 1 Issue 1 | July 2019
75Fidēre: Journal of Business, Governance, and Information Technology
Abstract
Presently, Thai higher education institutions are more aware of the continual reducing numbers of higher education admission of Thai students which is lower than the provided seats in universities. Hence, the students’ Public Re-
lations and Recruitment Strategies (PRRS) are considered to be the necessary strat-egies to solve this difficult situation especially in the new challenges of ASEAN opening community and the 21st century era. Therefore, “A study of university stu-dents’ PRRS for ASEAN opening community and the 21st century” was conduct-ed. The proposes of this research were to 1) study the important channels of PRRS and 2) provide the effective strategies of PRRS in this era. The survey research was conducted by using the seven main indicators as a tool of research to search the PRRS information on the websites of 27 Thai Autonomous Public Universities (TAPU). The data of each indicator was analyzed in to percentage and ordered them. The findings showed that mostly TAPUs provided the important channels of PRRS such as online admission application form, electronic posters, Facebook, call centers, radio, and youtube. Hence, it was recommended that the Memoran-dum of Understanding (MoU) strategy should be utilized for this era as well. Keywords: students’ recruitment, public relations, university students, reducing, 21st century
universiTy sTudenTs’ publiC relaTions and reCruiTMenT sTraTegies for asean opening CoMMuniTy and The 21sT CenTury
Udomtheerakhun, Phanommas Bamrungsin, Srisalab UpamaiFaculty of Education, Mahamakut Buddhist University,
Mahapajapati Buddhist College, Nakhon Ratchasima, [email protected]
The crisis of the continual reducing number of higher education students’ admission. It be-comes the main problem for higher education institutions in now a day. This situation has oc-curred in Thailand that the number of HIEs is more than the need of learners (Bangkok post public company limited , 2018).
There are several causes of this crisis in Thailand which are
1) Thailand is fully integrated into the Aging Society. The birth rate of the Thai popu-lation is very low and will continue to be lower than the mortality rate. The Thai population is
still 65 million people over the past 15 years, with older people and fewer births. The results clearly impacted the universities. In Thailand where the number of applicants for HEIS’ ad-mission and quality of the selection has de-creased obviously.
2) Thailand has more universities, at present, the combination of private universities, Rajabhat Institutions, Rajamangala Institutu-tions of technology, college of physical educa-tion, agricultural college Higher education in-stitutions with specific missions. There may be up to three hundred.
Volume 1 Issue 1 | July 2019
76 Fidēre: Journal of Business, Governance, and Information Technology
3) Each institution has a lot of competi-tion and offered many courses such as regular courses, evening programs, special and part-time programs.
4) The number of Thai students study-ing abroad from secondary school, bachelor or master degree is growing every year.
5) In addition, information technology has led to online education or distance educa-tion.
6) Students are more interested in vo-cational education than universities and it is a policy of the current government to promote students to study more vocational education. From the circumstances and causes, they effect to the number of university students and gradu-ates decreased.
Therefore, higher education institutes are very active and hurry to promote the high school students to study in their higher educa-tion institutions. Thus the various public rela-tions strategies are used to promote and recruit students. It has also encouraged more ASEAN students study in Thai HEIs in order to open and respond to the ASEAN community, as well as applying techniques and technologies to digital public relations public relations and recruitment strategies for the ASEAN community and the 1st century education. This crisis has had an impact to many HEIs including MBC for the several years. Hence, a study of university stu-dents’ public relations and recruitment strate-gies for ASEAN opening community and the 21st century is conducted to be the important guide to solute and improve the MBC students’ public relations and recruitment strategy. This research is a survey research.
The aim of the study was to study and promote public relations strategies for MBC and also the other higher education institutions. The results will be used as a guide to improv-ing the public relations strategy of the univer-sity. The study was a search of public relations information for students on the website of the
27 universities in the autonomous public HEIs which is the same type of MBU-MBC by using the indicator as a tool for searching information of this research.
Literature reviewThe meaning of public relations.
Suwannaboon (2018) provides the pub-lic relations means communicating opinions, facts, and facts to the people. Strengthening re-lationships and understanding between organi-zations, institutions and groups to people, goals and people involved as well as for cooperation. public relations can contribute to the good im-age, faith. Public relations can help to find and eliminate misunderstandings as well as help to clear the problem and to succeed in the opera-tion of the agency and the cooperation as well.
Chaisumrej (2006) summarizes the meaning of public relations for educational ser-vices of educational institutes. Communication is at the heart of the effort and is planned to promote mutual understanding from institution with target group .The public is expected to be candidates by influencing the minds of the tar-get group to recognize, trust and support their cooperation in pursuit of the objectives, institu-tion policy affect the decision to use educational services or tend to use the services of the future education. Institution must have a good attitude on the communicate and service of institution.
According to the definition of public re-lations, the researcher can conclude that public relations is the effective way of communication, share information, news, facts, to the people or target group. It enhances relationships and un-derstanding and cooperation between institu-tion and the people or target group as well as to solve problems of misunderstanding. And it’s a great way to build trust and acceptance of in-stitution. In today’s society, public relations is the key to a successful corporate strategy and reputation.

77University Students’ Public Relations and Reqruitment Strategies
for ASEAN Opening Community and the 21st Century
Fidēre: Journal of Business, Governance, and Information Technology Volume 1 Issue 1 | July 2019
Public Relations ProcessPublic relations is a two-way communi-
cation. The public relations process consists of four major steps: Chaisumrej (2006)
Defining the problem/fact finding of institutional public relations. To get the cor-rect and adequate information about the insti-tution, both in terms of knowledge, opinions, attitudes, and behavior as a result of the policy and operation of the institution.
Planning and programming. Know the problem, implement and communicate as planned and set out in the second step to achieve the objectives of institutional public re-lations.
Taking acting & communicating. This step implements and communicates as planned and defined in the second step to achieve the objectives of institutional public relations.
Evaluating the Program. Judging by the performance of the plan including evalua-tion of the effectiveness of planning and support plan by surveying results and opinions from the target.
Public Relations waysMahidol University (2018) provided the
idea of public relations as below:1) Make the publicity of news. The ba-
sic purpose of the news publicity aimed at the market is to raise brand awareness, promote a positive attitude towards the company and its brand. And influence customer buying the prod-uct behavior. News publicity may take on a variety of forms, such as news publicity about new product modifications, and other valuable news headlines.
2) Advertising. Advertising is to invite or induce the public to crave by using a prod-uct or service advertising as the one-way public. There will be no public hearings. People who watch or listen to advertising should consider the content of ads carefully, because advertising is usually only good news presenting.
3) Information service is a fact inform-ing in various matters. The benefit to the under-standing is not misunderstanding.
4) Propaganda is a one-way advertise-ment aimed at convincing ideas and motiva-tions. To agree with the advertiser or to antag-onize what they want by obscuring the facts or turning them into good ones or incriminate op-ponents for their benefit.
5) Psychology warfare is a way of caus-ing disruption, discomfort and suspicion. Dis-trust of one another, anger, anger, hatred, and fear are one act that diverts attention to change the mind, emotions, beliefs of the people.
6) Rumor is often spread out over word of mouth and often changes over time until the information or story is distorted or changed from hand to finger. Rumors often involve products, brands, companies, or other business goals. The rumors can be a major problem that public re-lations will face. Because rumors often spread quickly and often on negative story with the in-stitution. In dealing with the rumors that happen some people may think that the best solution. To let the rumors disappear over time. But in fact the passing is dangerous. For the company. Thus the best way is to get rid of those rumors as soon as possible.
7) Product and service promotion is a way for the company to support its products and services. To sell more products or services by the news or events to motivate a customer’s purchase or change a customer’s attitudes to-ward the company’s objectives, and to publish the product in various ways.
8) Persuasion is the style of persuading a customer to behave as desired by the company. The style of motivation must make the custom-er feel comfortable with the message or mes-sage that motivates the customer sincere. Thus incentives must be used to convince customers to agree based on the concept presented.
9) Motivation is similar to motivation. But this stimulus can be used to the customer

Volume 1 Issue 1 | July 2019
78 Fidēre: Journal of Business, Governance, and Information Technology
behaves as desired, but the motivator may have a better understanding of the story. There is no need for behavior. Therefore, it must be prompt-ed. While incentives may apply for the motiva-tors who do not know the story at all.
Techniques to formulate strategies for pro-active public relations.
Strategies in public relations (Suwan-perm, 2018) was recognized as the driving force behind successful corporate communication. By participating in all strategic decisions in the strategy. Critical success factors are also need-ed as a guide in determining concrete strategies. The author has gathered the following factors.
1) Differentiation to create a difference in the organization through things like product service personal Image. Public relations em-ployees are responsible for presenting positive information that strengths or advantages of the organization. To create a unique and distinctive publicity activity that recognizes what the orga-nization is describing or providing information to better understand the stakeholders.
2) IMC (Integrated Marketing Com-munication) is a combination of all marketing communication concepts to promote public re-lations, such as promotions mix and marketing mix, to integrate the media into the same direc-tion many groups are effective.
3) No Free Media is a public relations concept that reflects the reality of public rela-tions in the capitalist era or press releases will diminish. The organization, whether private or government, must understand that public rela-tions must be cost effective. Although some-times we may ask for free news. But in reality it is of good is nowhere it is okay nowhere and no free in the world.
4) Social marketing is the proactive public relations will also need to provide infor-mation that is relevant to solving social prob-lems. The use of social marketing concepts in proactive public relations will help to commu-
nicate and engage with people in the society. It helps to raise awareness and raise awareness for stakeholders in the other corner. Nowadays, the business sector is turning to business. Corporate Social Responsibility (CSR) is becoming more and more popular as well as environmental con-servation reforestation and educational assis-tance for the underprivileged.
5) Creativity is an important strategy in all sectors of corporate management. Especially aggressive publicity that is the gateway to the public with a variety of feelings. Creativity is a strategy that plays a critical role in solving the crisis. Therefore, the development of creativity in public relations should be initiated by brain-storming from the knowledge management platform and the involvement of stakeholders in the organization.
6) Marketing mind having a modern marketing concept in public relations. Although some organizations may be limited in manage-ment. The problem of corporate culture and organizational structure for example, a govern-ment agency that considers acting as a duty to perform but if we use more marketing perspec-tive it will bring new organizational direction and culture to proceed to the competition to sat-isfy all stakeholders of the organization.
7) High Technology is the use of mod-ern information technology in public relations. It can create an advantage to the organization. The use of data communication technology in the organization will be the introduction of in-formation from the information that has been made to choose the operating decisions, result-ing in organizations can reduce costs. Including reduce communication time, promote resource sharing.
8) Database to have a modern and flexi-ble database to run. It is another strategy that is very important in public relations work where the organization must have a collection center. And the information command to allow orga-nizations to retrieve information from the same

79University Students’ Public Relations and Reqruitment Strategies
for ASEAN Opening Community and the 21st Century
Fidēre: Journal of Business, Governance, and Information Technology Volume 1 Issue 1 | July 2019
source, accurate and fast. They can also be used for knowledge management or use the informa-tion to effectively direct the direction of corpo-rate communications on various agendas.
9) International PR is a public relations strategy. Today’s public and private organiza-tions are all members of the national and global population. Any activities of the organization will be monitored by the society. There are also laws, treaties or beliefs in each of the many cul-tural traditions. The need to focus on the inter-national principle that information must be pub-lished internationally. Whether it is language, content, images that need to reflect the reflec-tion of the global community, such as human rights, environment, religion, politics, etc.
10) Lobbying is a public relations strat-egy in a legal and ethical way. In terms of com-munication, it is explained that the lobbying is communication to create cooperation or reduce conflict by way of informal communication or using interpersonal communication to build a network in public relations. Cause the data link exchange of information it can also create part-nerships and reduce the conflict of stakeholders of the organization as well.
According to the crisis of the continual reducing number of higher education students’ admission. It becomes the main problem for higher education institutions in now a day. This situation has occurred in Thailand that the num-ber of HIEs is more than the need of learners. Thus the universities must consider to make the proactive PRRS.
The examples of a strategy for public rela-tions of higher education institutions.
Khon Kaen University (2018) had a strategy for public relations. Public Relations and Marketing have the main goal to dissemi-nate information, news of the stakeholders and the general public in the region both in and out-side the country. The results of public relations will be made public know the activities of the
university and students can get information to apply study with the university. The activities of the students include the recruitment of new students, provide scholarships, scholarships for young learners (inauguration day of the Gradu-ate School), and other under and graduate pro-grams related to graduate students. Faculty and interested graduate school has prepared tools for public relations, as appropriate for goals and activities by using the targeting approach is an important part of communication and public re-lations.
Ramkhamhaeng University (2018) Public relations, admissions and educational guidance it is one of the components of com-munication. Marketing is one of the important functions of an organization besides advertising that sales by salesman and promotion. The or-ganization may be in the form of a company, a shop, an association or an agency which are the part of social systems that are interrelated. The organization cannot live in society, or it can be difficult without public acceptance and under-standing as part of society. Therefore, the orga-nization needs to pay attention. Understanding and building good relationships with the public through various media. The purpose To give the public a good attitude, belief or perspective on the organization. This will result in smooth op-eration. In the long run of the organization
Mahidol University (2018) has imple-mented the project creating a public relations network Mahidol University for the campaign to open the student opportunity by the gradu-ate school. The collaboration with the faculty of collegiate institute, Mahidol University open various curriculums in the special program cov-ers the fields of science, social sciences, human-ities, liberal arts, languages, religions, music, environment, medicine, public health and tech-nology. It will be open to the general public to adapt to the full market. Including to gain more competitive education, increasing the number of students and the competition among educa-

Volume 1 Issue 1 | July 2019
80 Fidēre: Journal of Business, Governance, and Information Technology
tional institutions. As a result, each institution is motivated to create a strategy in various forms to reach the target and apply for admission to the institution. The institution prepares ready in a competitive situation. To promote the pro-active in public relations approach of graduate students to pursue graduate studies. The pur-pose is to promote.
1) To establish a network for public re-lations activities of graduate students to be of high quality and to undertake the development of graduate studies in a timely manner.
2) For proactive public relations activ-ities, the target group will be widely informed and widely spread cover all areas to increase the number of applicants.
3) To make members of the network participate, support, cooperate and seek new ways of public relations. To achieve efficiency and effectiveness and achieve the ultimate goal together.
4) To build trust and confidence in the image of Mahidol University. To be a leader in education.
5) To enhance learning and experience in public relations activities.
Valaya Alongkorn Rajabhat University (2018) arranged the strategies to enhance the ef-ficiency of the application through the informa-tion technology (E-Service) to increase student enrolment more aggressive. Offer scholarships, provide one-stop service, network development project between the university and the school network. Provide international cooperation pro-gram and cooperative education program. De-velopment of curricular and teaching potential as well as support the co-operation programs in foreign countries.
Sripatum University (2018) summarizes the public relations with many different types of special activities;
(1) Contest(2) Competition management
(3) Entertainment (4) Grand opening(5) Exhibition(6) Seminar(7) Social services or public event(8) Celebration (9) Family day(10) Employee award day (11) Promotional activities (12) The road show(13) Company visit
Sutheethorn, 1997 states that in public relations and popular advertising, the boundar-ies of the groups in the society are narrow and clear. The factors that may be called different variables to determine or frame the separation of people into groups more clearly, such as the demographic factors, such as gender, age, edu-cation level of the people to determine the dif-ferent people or psychology of attitude, moti-vation, personality needs, etc., is the separation for planning and strategies for public relations.
Related ResearchLekkaothod (2018) study the state of
the public relations operated by the Public Re-lations Group, Office of the Higher Education Commission (OHEC). The research findings were presented that the strategic public rela-tions process conducted by OHEC Public Re-lations Group comprises the following 4 steps namely Step 1 - a study on the state of OHEC public relations operation; Step 2 - formulation of OHEC public relations strategic plan; Step 3 - communication through a plan to utilize inter-nal and external media; and Step 4 - evaluation of public relations operation. 3. Recognition of the strategic public relations process - The ex-perts found that such process was greatly ap-propriate.
Somyoonsab (2018) studies the In-fluencing Promotional Strategies towards the Decision to study in Private University, Inter-

81University Students’ Public Relations and Reqruitment Strategies
for ASEAN Opening Community and the 21st Century
Fidēre: Journal of Business, Governance, and Information Technology Volume 1 Issue 1 | July 2019
national. Research findings were as follows: 1) Most of students focus on the promotional strategies which influence the decision to study in private university, international programs in Bangkok and metropolitan areas by overall are in a high level, and considering in each section, it shows that every factors have high levels es-pecially the image of the brand is the first prior-ity to choose to study in private university, in-ternational programs. Followed by the creation of the trust, brand differentiation, using media and using the celebrity testimonial consecutive-ly. The hypothesis test results found that 1) the difference of school types and study programs emphasize vary in image factor in deciding to study in different universities, international programs. 2) the influencing person in deciding of choosing international programs study vary, having use medias and the creation of credibil-ity emphasize vary in the decision to study in private university, international programs.
Julthab & Tansuwannon (2018) studies the proactive Public Relations Strategy of High-er Education Institutions in Southern Region. The results revealed that five main strategies were required to achieve the proactive public relations including 1) clear policies on proac-tive public relations, 2) variety of activities and methods of proactive public relations to achieve each goal and contribute to organizational cul-ture, 3) various and modern communication tools and channels, 4) creation of networks to coordinate outreach communication, and 5) ini-tiative techniques to promote different and dis-tinctive public relations. The findings also indi-cated six salient key success factors as follows: 1) a clear policy along with leaders’ practical vi-sions to put the policy into practice 2) availabil-ity of organizations and experienced personnel with particular expertise, 3) concerns on raising moraie and encouragement to personnel, 4) par-ticipations of leaders and staff, 5) diverse and modern communication channels, and 6) build-ing strong relationships with other mass media.
Wongwattana (2018) et al studied the image of Pibulsongkram Rajabhat University. The results showed that the level of people’s perception was 3.64 on average, with the high-est mean on public relations, university mission and the attributes of lectures, staffs and students, respectively. The study suggested that the uni-versity needed to boost up the following imag-es: administration, personnel attribute, graduate produce, research and academic service, art and culture conservation, and public relations.
In accordance with the meaning, con-cepts and relevant research of public relations, students recruitment and the crisis of the higher education in Thailand of the reducing number of students’ admission. It can be concluded that many universities in Thailand tend to find the way to cope and pass this difficult crisis, one effective means that mostly use is the improve the PRRS in the various ways and intensive ways.
Research ObjectivesThere were 1) study the important chan-
nels of PRRS and 2) provide the effective strat-egies of PRRS in this era patronage.
Research FrameworkThis research was a qualitative research
based on the idea that “the PRRS was an im-portant way to solve the problem of HEIs’ stu-dent’s number admission reducing and in order to be a PRR guide for the ASEAN community and the 21st century education.”
Scope of ResearchThere were 3 main scopes of the study
of public relations strategies for the admission of higher education institutions to the ASEAN community and education in the 21st century which were as follows.
1) Data scope; the research informa-tion were retrieved from the PEA HEIs’ web sites. Therefore, it was a scope for information
Volume 1 Issue 1 | July 2019
82 Fidēre: Journal of Business, Governance, and Information Technology
disclosure. The information was limited to be searched on the PEA HEIS’s web site only.
2) The scope of the content is the con-cept of public relations and students’ recruit-ments as well as the problem of the number of students decreased.
3) Time frame is the research and data search during March-May, 2018.
Terminology of research - Public relations means communicating
opinions, facts, and information to the public. It enhances relationships and understanding between agencies as well as to solve problems. And it’s a great way to build trust and accep-tance of organization.
- Strategy refers to the tools, methods, approaches that will enable an institution or or-ganization to achieve or achieve a defined goal.
- The Association of South East Asian Nations (ASEAN) refers to the regional organi-zations of Southeast Asia. The establishment of ASEAN is the first of its kind in Southeast Asia. This brings about the cooperation of political stability, economic, education and so on.
Methodology
A study of university students’ public relations and recruitment strategies for ASE-AN opening community and the 21st century was a survey research aimed at studying pub-lic relations strategies for higher education in-stitutions in the 21st century. The results of the study could be used as a guideline for improv-ing the PRRS of MBC. The study is a search for public relations information for students on the website of the 27 Thai autonomous public universities (TAPU) according to the indicators that have been made to search in each of the channels.
Population and sample
The population and sample were 27 au-tonomous public universities’ websites.
Research toolsThe instrument was the indicators. The
indicators were developed from the PRRS con-cepts and some relevant researches. Three ex-perts assessed the appropriateness of indicators by using IOC values. Objectives (IOC: Item Objective Congruence approach) each of which indicator was not less than 0.5. The details or indicators were as follows.
Indicators
1. Higher education institution (HEI) provides a unit to responsible for PRRS, such as the student affairs center, students’ information center and so on.
2. According to no.1, the HEI provides PRRS for Thai students only.
3. According to no.1, HEI PRRS for both Thai and foreign students.
4. The HEI has written a vision, infor-mation or strategy for admissions and student relations.
5. The channel for public relations of the institution.
5.1 University Website 5.2 Online Application 5.3. Electronic leaflets 5.4 Electronic posters 5.5 Public relations Facebook 5.6 Radio 5.7 Television 5.7 Call center 5.8 You Tube6. The outstanding strategies for PRRS7. New student’ preparing program,
such as pre-learning program, English intensive program and so on.
Data collectionThis survey research was conducted by
using the following data collection methods:1. Primary data were collected from the
sample by searching on the TAPUs’ web site. Data were collected from March to May 2018.

83University Students’ Public Relations and Reqruitment Strategies
for ASEAN Opening Community and the 21st Century
Fidēre: Journal of Business, Governance, and Information Technology Volume 1 Issue 1 | July 2019
2. Secondary data were collected from the theories, concepts, idea, news and related re-search researches and journals.
Data AnalysisThe data would be analyses into the percentage of each indicator and would be concluded
according to the objectives of research.
Results and DiscussionResults and analysis of data were as follows.-The results would be presented into the “found number (√) or not found (×) in the 27 HEIs’
websites according to the main 7 indicators as well as analyzed into the percentage.
Table 1Results of the websites searching of 27 TAPUs.
Indicators Foundnumber (%)
Not foundnumber (%)
Totalnumber (%)
1. Higher education institution provides a unit to responsible for PRRS, such as the student affairs center, students’ informa-tion center and so on.
27 (100%) 0 (0%) 27 (100%)
2. According to no.1, the HEI provides PRRS for Thai students only. 0 (0%) 27 (100%) 27 (100%)
3. According to no.1, HEI PRRS for both Thai and foreign students. 27 (100%) 0 (0%) 27 (100%)
4. The HEI has written a vision, infor-mation or strategy for admissions and student relations
25 (92.60) 2 (7.40%) 27 (100%)
5. The channel for PRRS of the institution. 20.75 (76.85) 6.25 (23.25) 27 (100%) 5.1 University website 27 (100%) 0 (0%) 27 (100%) 5.2 Online application 27 (100%) 0 (0%) 27 (100%) 5.3. Electronic leaflets 1 (3.70) 26 (96.30) 27 (100%) 5.4 Electronic posters 27 (100%) 0 (0%) 27 (100%) 5.5 Public relations on facebook 27 (100%) 0 (0%) 27 (100%) 5.6 Radio 21 (77.77) 6 (22.23) 27 (100%) 5.6 Television 17 (62.97) 10 (37.04) 27 (100%) 5.7 Call center 27 (100%) 0 (0%) 27 (100%) 5.8 Youtube 10 (37.04%) 17 (62.97) 27 (100%)6. The outstanding strategies for PRRS was a You Tube
You tube 10 (37.04%) 17 (62.97) 27 (100%)
7. New student’ preparing program, such as pre-learning program, English inten-sive program and so on.
25 (92.60%) 2 (7.40%) 27(100%)

Volume 1 Issue 1 | July 2019
84 Fidēre: Journal of Business, Governance, and Information Technology
The results could be presented into the figure as the followings.
Figure1. Percentage of each indicator.
In accordance with the table 1 and figure 1, could be described according this 100 percent of Higher education institution provides a unit to responsible for PRRS, such as the student affairs center, students’ information center and so on. 100 percent of admissions and publicity for Thai and foreign students. 96.60 percent of the TAPUs have written visions, information or strategies for admissions and student relations. 100 Percent that all TAPUs provide the PRR information on university websites, provide online application, Facebook, electronic poster and call center. And 77.7 percent of radio, 62.67 TV, You Tube 37.04, electronic brochures 3.70. 92.60 percent of New student’ preparing program, such as pre-learning program, English intensive program and so on. The outstanding PR could be a website design to be easy and convenient access and use You Tube to promote PRR and TAPUs, programs as well.
Conclusions and RecommendationsThe Conclusion Effective HEIs’ PRRS 1) There is a clear publicity center or organization for clearing student’s recruitment infor-mation at all universities as well as they provide the PRR vision, mission, and tactics of the PPR work clearly. 2) The university uses electronic media to promote the admission, such as an electronic recruitment application, provide the publicity on You Tubes to be interesting and to be up to date and easily access. 3) Provide a website design to attract candidates. The text, color and presentation are used as
85University Students’ Public Relations and Reqruitment Strategies
for ASEAN Opening Community and the 21st Century
Fidēre: Journal of Business, Governance, and Information Technology Volume 1 Issue 1 | July 2019
well as provide the special information, promo-tion for students to make decision of applying. The design is easy to access like search program of learning, online application form, informa-tion on the application or contact directly for those who are interested in further applying. 4) Every university has webpage in both Thai and English in order to provide both Thai and foreign students who want to study. 5) There are also other channels such as radio, television, You Tube and electronic leaf-lets, respectively. 6) There are some universities that make the proactive PRR at the schools by providinginformation, create a relationship and motivate students to select those programs and universi-ties for the further study. 7) After finishing the PRR, students are chosen by the universities, then all universities provide new student’ preparing program, such as pre-learning program, English intensive pro-gram and so on. The Conclusion Strategy for Public Relations for the ASEAN Communityand the 21st Century 1) HEIs should provide a clear public-ity center or organization of PRR as well as provide clear vision, mission, tactics of the of PRR. For example, provide the program for Thai and ASEAN students as well as could offer the scholarship for ASEAN students. Establish-ment of ASEAN community center or interna-tional student affairs or provide ASEAN food shop, learning/activities fund, interested works to enhance the skills as an extra-curricular pro-gram, provide accommodation for the ASEAN students. HEIs can create according their own abilities in order to promote and support ASE-AN students. 2) The Memorandum of Understanding (MoU) strategy should be utilized for this era in order to enhance and increase the number of students as well as can provide the cooperation
and exchange programs for both Thai and for-eign counties. 3) In the ASEAN community and the 21st century era, the technology should be fully utilized for the succeed PRR such as use elec-tronic media to promote the application, such as an electronic application form, You Tubes, radio, television, electronic leaflets to make it is interesting and to keep up to date information as well as to more available in this time. 4) The PRR can make directly at the ASEAN schools in the ASEAN region to get students to study in their own institution. 5) In addition, the ASEAN cultural ex-change program will be outstanding to promote the ASEAN students to study in Thai HEIs. 6) The project of preparing new students both Thai and foreign students is also very im-portant in order to enhance students the learn-ing, culture, language and etc. 7) HEIs should arrange alumni to sup-port and promote the institutions as well as to motivate the students to choose the institution to study. The recommendations of PRRS for MBC 1) The administrators, staff and staff of MBC should use the findings to improve the public relations strategies and system. 2) It should be planned to promote ag-gressively and use the aggressive recruitment. 3) To solve the problem of students’ number reducing, it is necessary to look at the holistic view, not only the public relations such as the program offered, education management, teaching and learning courses, activities that can respond effectively to the opening of the ASEAN community as well as education in the 21st century. This is to address the changing world situation and solve the current crisis. Especial-ly, MBC provide the MoU strategy which is the effective way to cope and challenge this crisis.

Volume 1 Issue 1 | July 2019
86 Fidēre: Journal of Business, Governance, and Information Technology
ReferencesBangkok post public company limited. (2018).
University of overflow and abandoned classroom, crisis of Thai higher educa-tion. Retrieved from h t t p s : / / w w w.posttoday.com/politic/report/427241.
Chaisumrej, R. (2006). Writing for public rela-tions. P. 2. Chulalongkorn University, Bangkok. Thailand
Julthab, S., Tansuwannon, C. (2018). Proactive Public Relations Strategy of Higher Ed-ucation Institutions in Southern Region. Retrieved from file:///C:/Users/Administrator.OGQ7038OOTS-RWQ4/Downloads/370-557-1- PB%20(1).pdf
Khon Kaen University. (2018). Public relation and marketing. Retrieved from https://gsbooks.gs.kku.ac.th/54/report2010/files/2_13.pdf.
Lekkaothod, J. (2018). A study of the process of strategic public relations for office of the higher education commission. Retrieved from http://www.thapra.lib.su.ac.th/the-sis/showthesis_th.asp?id=0000006526
Mahidol University. (2018). Meeting of the networking working group of public relations of the grauduate college of Mahidol university. Retrieved from ttp://www.grad.mahidolh.ac.th/th/news- events/press-network01.php.
Ramkhamhaeng University. (2018). Conclu-
sion of the exchange of learning on public relations applying and guiding education. Retrieved from http://www.chaiyaphum.ru.ac.th/images/document/attachment.pdf.
Somyoonsab, N. (2018). The influencing promotional strategies towards the decision to study in private univer-sity, international programs. Re-trieved from file:///C:/Users/Ad-ministrator.OGQ7038OOTSRWQ4/Downloads/112444- Article%20Text-288281-1-10-20180218%20(2).pdf
Sripatum University. (2018). Principles and strategies for public relations. Retrieved from http://www.stou.ac.th/offices/Oce/kmoce1/pr249561.pdf.
Sutheethorn, B. (1997). Target in public rela-tions, principles of advertising and Pub-lic relations. Teaching materials unit 13. Pp. 279-282. Sukhothai Thammathirat Open University. Nonthaburi. Thailand
Suwannaboon, S. (2018). The meaning of Pub-lic relations. Retrieved from h t t p : / /www.ipesp.ac.th/learning/thai/chap-ter7-5.html.
Suwanperm, C. (2018). The strategies for public relations skillful. Retrieved from https://www.posttoday.com/life/life/30152
Valaya Alongkorn Rajabhat University. (2018). Strategic plan for student recruit-ment. Retrieved from council.vru.ac.th/spa1/6_2557/vara%20 51/ Strategic plan for student recruitment %20.pdf.
Wongwattana, S., Lamnao, A., Phothihang, P., Prakrongjai, P. (2018). The Image of Pibulsongkram Rajabhat Universi-ty. Retrieved from https://www.kmutt.ac.th/jif/public_html/article_detail.php?ArticleID=177353

Volume 1 Issue 1 | July 2019
87Fidēre: Journal of Business, Governance, and Information Technology
Abstract
This paper investigated the professional competencies required of secretaries using Microsoft Office and compared them to the current secretarial class-room training in Akademi Sekretari Manajemen Indonesia Klabat. Specif-
ically, the study sought to determine competencies required of secretaries when using MS-Word, MS-Excel, MS-Power Points, MS-Access, and MS-Publish-er. Data were collected using survey questionnaire and interview. A comparative analysis between classroom trainings and actual office practices were analyzed using paired-sample t tests of 36 students and office professionals. The find-ings showed that office professionals’ ratings are higher than students’ ratings and the most important skills a professional secretary must acquire are the abil-ity to create document using MS Word (mean= 4.5625 & 4.4376), followed by Microsoft Power-points (mean= 4.2188 & 4.1146), Microsoft Outlook (mean= 4.0833 & 4.0313), Microsoft Excel (4.1094 & 3.7110) and Microsoft Access (mean= 3.7917 & 3.4688); however, the result also found no significant differ-ences between classroom trainings and office practices, except for the training in MS Power Point (p=0.037), MS Excel (p=0.01), and MS Access (p=0.03). Keywords: Secretarial competencies, Secretarial training, Microsoft office compe-tencies
MiCrosofT offiCe CoMpeTenCies required of seCreTaries
in posTModern auToMaTed offiCes: a CoMparaTive analysis
of ClassrooM and aCTual offiCe praCTiCesLenda Mambo
Akademi Sekretari Manajemen Indonesia Klabat, Manado, [email protected]
Over the 40-years of Microsoft existence, it has completely changed the way people run their business. It has altered the nature, meth-od, work environment, equipment as well as the skills and competencies of business profession-als. Softpedia, a website that provides software information and downloads which primarily covers Windows, Mac, Linux, games, drivers, mobile, web-scripts, and technology/science topics, reported that Microsoft Office is used by over a billion people worldwide (Softpedia, 2012).
Microsoft Office was first developed by Bill Gates in 1988. Initially the first version of Office contained only Microsoft Word, Micro-soft Excel, and Microsoft PowerPoint. Since then Office applications have been developed with additional shared features such as spell checker, data integration and visual basic for applications scripting language. Microsoft also positions Office as a development platform for line-of-business software under the Office Busi-ness Applications brand (TWCN Tech-news, 2015). The new innovation has completely

Volume 1 Issue 1 | July 2019
88 Fidēre: Journal of Business, Governance, and Information Technology
changed the way corporations run their offices and also challenged the skills and competencies of business professionals, including managers, accountants, auditors, lawyers, and office sec-retaries (Okoye 2016; Adam 2015; Achikele 2013).
This technology has transformed the way secretary processes their office documents from production, revision, reproduction, distri-bution as well as filing and storage (Okoye 2016; Sani 2015; Udo 2014; Halici, Yilmaz, & Kasi-moglu 2012). Microsoft Office has also revolu-tionized the traditional role of secretaries in the areas of producing documents, creating folders, filing and storage, preparing presentations, ac-cessing documents, publishing information and processing of mails (Omoniyi & Omoniyi 2015; Tunde, Abasino, Benjamin, & Muhibeedeen 2013; Onamade & Adedayo 2012).
Today, all business organizations have come to appreciate the role and importance of the secretary MS Office skills, as well as the need to providing other necessary skills, office machines and equipment for the efficacy of the secretarial functions (Ido & Abasienie 2015; Sani 2015; Adesina, Udoh, Ndomi, & Aliyu 2013).
The efficiency and effectiveness of the secretary in every business organization depends largely on the availability of office technologies as well as the skills and compe-tencies of the secretary to handle these office technologies. The current automated offices have required secretaries to improve their skills and competencies to be relevant and function-al in their office. Therefore, they must possess technological competencies, especially in using computer for administrative and communica-tion works (Omoniyi & Omoniyi 2015; Yakubu and Ugwu 2015).
The high rate of flux of information and communication technology also has made it ba-sically important for secretaries to acquire inno-vated skills in their field so as to keep abreast of
current skills and competencies. Emerging of-fice technologies have played an important role on the use of computer system, internet, data-base management, software packages, fax-ma-chines, electronic mail services, duplicating machines for quick and easy service delivery of secretarial functions (Okoye 2016; Okolocha & Osahon 2015; Adam 2015).
Being the pioneer in developing office software, Microsoft launches Microsoft Office in several versions targeted towards different end-users and computing environments. The original, and most widely used version, is the desktop version, available for PCs running the Windows and Mac operating systems. The most current desktop version is Office 2016 for Windows and MacOS, released on 9 July and 22 September 2015, respectively (Softpe-dia, 2016). More recently, Microsoft developed Office Mobile, which has free-to-use versions of Office applications for mobile devices. Mi-crosoft also produces and runs Office Online, a web-based version of core Office apps, which is included as part of a Microsoft account. Mic-rosoft also provides Office 365 working online and cloud storage to teachers and students for free (Microsoft, 2016).
Okoye (2016), Yakubu and Ugwu (2015), Buseni (2013) and Adesina, Udoh, Ndomi, and Aliyu (2013) also found in their study that modern technology skills re-quired of secretaries include the ability to use computer to create spreads with Microsoft Ex-cel, compose correspondences using Microsoft Words; manage data bases using Microsoft Ac-cess, create presentations with Microsoft Pow-erPoint, manage reports and documents using Microsoft Outlook.
The main purpose of this study was to determine the professional competencies re-quired of secretaries in an automated office us-ing Microsoft Office and compare them to the current secretarial training in ASMIK (Aka-demi Sekretari and Manajemen Indonesia, Kla-
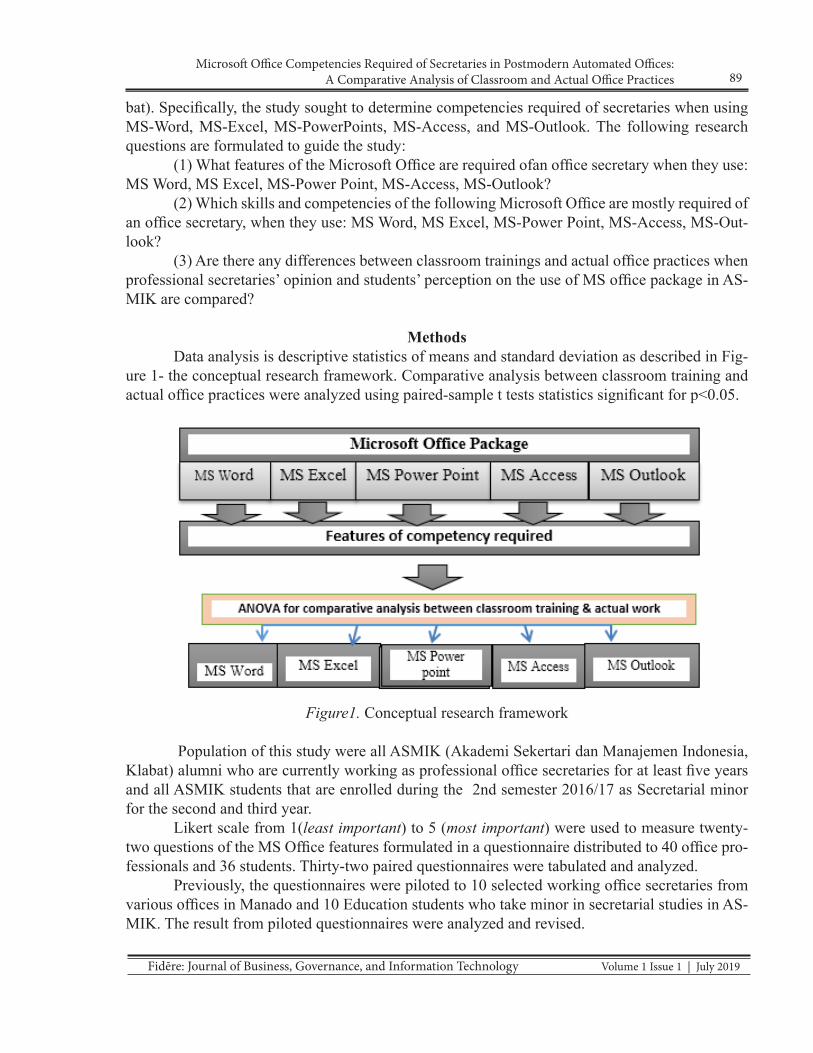
89Microsoft Office Competencies Required of Secretaries in Postmodern Automated Offices:
A Comparative Analysis of Classroom and Actual Office Practices
Fidēre: Journal of Business, Governance, and Information Technology Volume 1 Issue 1 | July 2019
bat). Specifically, the study sought to determine competencies required of secretaries when using MS-Word, MS-Excel, MS-PowerPoints, MS-Access, and MS-Outlook. The following research questions are formulated to guide the study:
(1) What features of the Microsoft Office are required ofan office secretary when they use: MS Word, MS Excel, MS-Power Point, MS-Access, MS-Outlook?
(2) Which skills and competencies of the following Microsoft Office are mostly required of an office secretary, when they use: MS Word, MS Excel, MS-Power Point, MS-Access, MS-Out-look?
(3) Are there any differences between classroom trainings and actual office practices when professional secretaries’ opinion and students’ perception on the use of MS office package in AS-MIK are compared?
MethodsData analysis is descriptive statistics of means and standard deviation as described in Fig-
ure 1- the conceptual research framework. Comparative analysis between classroom training and actual office practices were analyzed using paired-sample t tests statistics significant for p<0.05.
Figure1. Conceptual research framework
Population of this study were all ASMIK (Akademi Sekertari dan Manajemen Indonesia, Klabat) alumni who are currently working as professional office secretaries for at least five years and all ASMIK students that are enrolled during the 2nd semester 2016/17 as Secretarial minor for the second and third year.
Likert scale from 1(least important) to 5 (most important) were used to measure twenty- two questions of the MS Office features formulated in a questionnaire distributed to 40 office pro-fessionals and 36 students. Thirty-two paired questionnaires were tabulated and analyzed.
Previously, the questionnaires were piloted to 10 selected working office secretaries from various offices in Manado and 10 Education students who take minor in secretarial studies in AS-MIK. The result from piloted questionnaires were analyzed and revised.

Volume 1 Issue 1 | July 2019
90 Fidēre: Journal of Business, Governance, and Information Technology
The reliability and construct validity of these questionnaires were tested using Cronbach’s Alpha test with a coefficient of 0.924 as shown in Table 1.
Table 1Test for reliability
Reliability StatisticsCronbach's Alpha Cronbach's Alpha Based on
Standardized ItemsN of Items
.924 .919 64
Results and DiscussionsThis study aimed to find out professional competencies required of secretaries in an auto-
mated office using Microsoft Office, especially to determine competencies required of secretaries when using MS-Word, MS-Excel, MS-PowerPoints, MS-Access, and MS-Outlook.
The result showed that Microsoft Word is considered the most important Microsoft Of-fice Program by both practitioner and student respondents (mean= 4.5625 & 4.4376) followed by Microsoft PowerPoints (mean= 4.2188 & 4.1146), Microsoft Outlook (mean= 4.0833 & 4.0313), Microsoft Excel (4.1094 & 3.7110) and Microsoft Access (mean= 3.7917 & 3.4688).
However, as shown in Table 2, practitioners considered MS Word, MS PowerPoint, MS Outlook and MS Excel are very important, while classroom practices do not consider MS Excel is as important. MS Access is considered not so important by both respondents.
Table 2Descriptive mean and Standard deviation
Office practices Classroom practicesMean Std. Deviation Mean Std. Deviation
MS Word 4.5625 0.5660 4.4376 0.7400 MS Power Point 4.2188 0.7343 4.1146 1.0522 MS Outlook 4.0833 0.8939 4.0313 0.8925 MS Excel 4.1094 0.8886 3.7110 0.9152 MS Access 3.7917 0.8618 3.4688 0.8835
The practitioners also have less variation in the opinion compared to the students with stan-dard deviation (0.5660-0.8939) for practitioners and (0.7400-1.0522) for students.
Descriptive statistics in Table 3 shows that in actual office practices the following are the most important skills an office professional must acquire when using Microsoft Office: ability to create document using MS Word (mean= 4.8438), manage office project using MS outlook (mean=4.75), review/protect/track-changes document using MS word (mean=4.6875), create/man-age calendar using MS Outlook (mean= 4.6875), prepare worksheet/table/chart using MS Excel (mean=4.625), create/edit presentation using MS PowerPoint (mean=4.5938), create graphs and tables using MS Word (mean= 4.375), insert citation/references using MS word, (mean= 4.3438) insert photo/pictures/clip art using MS PowerPoint (mean=4.3125), and apply formula/function/formatting using MS Excel (mean=4.0938).

91Microsoft Office Competencies Required of Secretaries in Postmodern Automated Offices:
A Comparative Analysis of Classroom and Actual Office Practices
Fidēre: Journal of Business, Governance, and Information Technology Volume 1 Issue 1 | July 2019
Table 3Featured skills required of Microsoft Office
Office practices Classroom practices
Mean Standard Deviation Mean Standard
DeviationMS WordCreate document: format/edit 4.8438 0.653 4.7688 0.76134Citation/references 4.3438 0.3689 4.4063 0.71208Create graphs/tables 4.375 0.70711 4.2188 0.94132Review/protect/track-changes 4.6875 0.53506 4.6563 0.54532MS Power PointCreate/Edit presentation 4.5938 0.55992 4.3125 0.96512Insert photo/pictures/clip art 4.3125 0.6927 4.0938 1.14608Create animation/music/video 3.75 0.95038 3.9375 1.04534MS OutlookManage agenda & email 3.8125 1.0298 3.8125 0.99798Create and manage calendar 3.6875 1.0298 3.7813 1.00753Project management 4.75 0.62217 4.5 0.67202MS ExcelWorksheet with table/chart 4.625 0.70711 3.9688 0.82244Formula/function/formatting 4.0938 1.02735 3.6875 1.0298What if 3.8438 0.98732 3.625 1.00803V-Look-up/H-look-up 3.875 0.8328 3.5625 0.80071MS AccessDatabase & database objects 3.6875 0.93109 3.3125 0.93109Query database 3.8438 0.8466 3.375 0.90696Maintain data base 3.8438 0.8076 3.7188 0.81258
Further investigation also showed that both office practitioners and students agree that all four MS Word featured skills and one MS Outlook featured skill (Project Management) are very much applied in the office as well as in the classroom. However, classroom preparation is lacking two MS Excel skills compared to the actual office practice as shown in the differences of their means: 4.625 and 3.9688 (Worksheet with table/chart) and 4.0938 and 3.6875 (formula/function/ formatting).
There are seven featured skills rated not so important by both respondents: All three MS Access features (Database & database objects, Query database &Maintain data base), two MS Excel features (What if & V-Look-up/H-look-up) and two MS Outlook features (Manage agenda/email & Create/manage calendar).
To find out if there are significant differences between classroom trainings and office prac-tices, paired sample t test showed no significant differences, except for training in MS PowerPoint (p=0.037), requirement for skill in MS Word: creating/format/edit document (p=0.023) and create
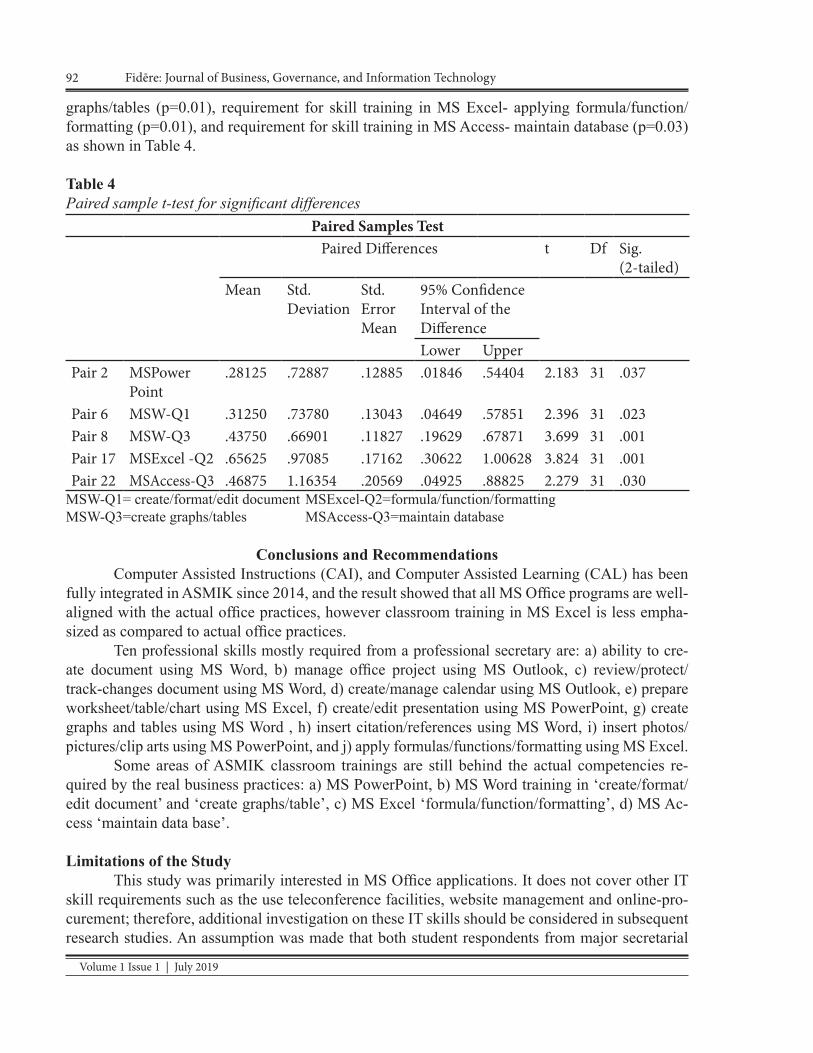
Volume 1 Issue 1 | July 2019
92 Fidēre: Journal of Business, Governance, and Information Technology
graphs/tables (p=0.01), requirement for skill training in MS Excel- applying formula/function/formatting (p=0.01), and requirement for skill training in MS Access- maintain database (p=0.03) as shown in Table 4. Table 4Paired sample t-test for significant differences
Paired Samples TestPaired Differences t Df Sig.
(2-tailed)Mean Std.
DeviationStd. Error Mean
95% Confidence Interval of the DifferenceLower Upper
Pair 2 MSPower Point
.28125 .72887 .12885 .01846 .54404 2.183 31 .037
Pair 6 MSW-Q1 .31250 .73780 .13043 .04649 .57851 2.396 31 .023Pair 8 MSW-Q3 .43750 .66901 .11827 .19629 .67871 3.699 31 .001Pair 17 MSExcel -Q2 .65625 .97085 .17162 .30622 1.00628 3.824 31 .001Pair 22 MSAccess-Q3 .46875 1.16354 .20569 .04925 .88825 2.279 31 .030
MSW-Q1= create/format/edit document MSExcel-Q2=formula/function/formattingMSW-Q3=create graphs/tables MSAccess-Q3=maintain database
Conclusions and RecommendationsComputer Assisted Instructions (CAI), and Computer Assisted Learning (CAL) has been
fully integrated in ASMIK since 2014, and the result showed that all MS Office programs are well-aligned with the actual office practices, however classroom training in MS Excel is less empha-sized as compared to actual office practices.
Ten professional skills mostly required from a professional secretary are: a) ability to cre-ate document using MS Word, b) manage office project using MS Outlook, c) review/protect/track-changes document using MS Word, d) create/manage calendar using MS Outlook, e) prepare worksheet/table/chart using MS Excel, f) create/edit presentation using MS PowerPoint, g) create graphs and tables using MS Word , h) insert citation/references using MS Word, i) insert photos/ pictures/clip arts using MS PowerPoint, and j) apply formulas/functions/formatting using MS Excel.
Some areas of ASMIK classroom trainings are still behind the actual competencies re-quired by the real business practices: a) MS PowerPoint, b) MS Word training in ‘create/format/ edit document’ and ‘create graphs/table’, c) MS Excel ‘formula/function/formatting’, d) MS Ac-cess ‘maintain data base’.
Limitations of the StudyThis study was primarily interested in MS Office applications. It does not cover other IT
skill requirements such as the use teleconference facilities, website management and online-pro-curement; therefore, additional investigation on these IT skills should be considered in subsequent research studies. An assumption was made that both student respondents from major secretarial
93Microsoft Office Competencies Required of Secretaries in Postmodern Automated Offices:
A Comparative Analysis of Classroom and Actual Office Practices
Fidēre: Journal of Business, Governance, and Information Technology Volume 1 Issue 1 | July 2019
department and those from other departments taking minor in Secretarial Studies are trained to achieve the same professional skills.
The study also presume that all student respondents have comprehensive understanding of the skill required eventhough they have not completed the course.
ReferencesAchilike, A. N. (2013). Real-life problem solv-
ing required from office managers in labor market. Mediteranean Journal of Social Science, 4(5), 169-175.
Adam, A. K. (2015). The efficacies of secretari-al profession by Ghana education ser-vice and higher education institutions. Journal of Education and Practice, 6(18), 81-113.
Adesina, T. J., Udoh, A., Ndomi, B., & Aliyu, M. (2013). Impact of information tech-nology skills on old and new generation secretarial teachers to utilize internet fro classroom delivery. European Journal for Sustainable and Development, 2(4), 105-116.
Buseni, J. (2013). Effects of information and communication technology on secretar-ies’ performance in contemporary orga-nizations. Information and Knowledge Management, 3(5), 87-93.
Halici, A., Yilmaz, B., & Kasimoglu, M. (2012). Employment prediction in secretarial profession. Journal of Management and Sustainability, 2(2), 187-196.
Ido, C., & Abasienie, S. B. (2015). Challenges in business education in achieving em-ployment efficiency. Journal of Quati-tative Education, 11(1), 1-7.
Microsoft. (2016, December 5). Microsoft cel-ebrates Computer Science education week with free tutorials and work-shop. Retrieved from Microsoft Office: https://news.microsoft.com/rss-catego-ry/in-the-news
Nwosu, E. N. (2012). Secretaries in motivating secretarial education students interest in emerging technologies. Business Edu-cation Journal, 8(2), 269 – 279.
Okolocha, C., & Osahon, M. (2015). Profes-sionalism in the secretarial profession. International Educative Research Foun-dation and Publisher, 3(11), 54-62.
Okoye, A. C. (2016). Professional competen-cies required of secretaries in modern automated offices. Journal of Manage-ment and Social Science, 1(1), 89-97.
Olayanju (2015). The challenges of new tech-nologies on secretarial profession. Asso-ciation of Business Educators of Nige-ria, Conference Proceedings, 2(1),
Omoniyi, E., & Omoniyi, S. (2015). An assess-ment of benefits and challenges of infor-mation and communication technology to office managers in the banking in-dustry. Journal of Internet Banking and Commerce, 20(1), 1-9.
Onamade, S., & Adedayo, T. (2012). Skill im-provement needs of secretaries trained in private institutions in South-West re-gion in Nigeria. Continental Journal of Educational Research, 5(1), 17-26.
Sani, A. (2015). Changing needs of business edu-cation students with specific reference to secretarial studies. Internationa Journal of Theory, Policy and Practice, 7(2), 61-70.

Volume 1 Issue 1 | July 2019
94 Fidēre: Journal of Business, Governance, and Information Technology
Saunders, M. N. K., Lewis, P., & Thornhill A. (2016). Research methods for business students, 7th edition. London: Pearson Education
Softpedia (2012, July 10) Retrieved Dec. 7, 2016 from news.softpedia.com › News › Microsoft, Security
Tunde, J. A., Abasino, U., Benjamin, N., & Muhibeedeen, A. (2013). Relationship between the utilization of information technology by secretarial teachers and the effectiveness of their lesson deliv-ery. International Journal of Vocational and Technical Education, 5(2), 13-20.
TWCN-Tech News (2015, April 10) Five ways Microsoft change the world in forty years. Retrieved Dec. 7, 2016 from http://news.thewindowsclub.com/ microsoft-changed-the-world-40-years-76667
Udo, M. P. (2014). Attitude of vocational Busi-ness Education students towards ac-quiring maximum vocational business skills and competencies. Asian Journal of Social Sciences and Humanities, 3(4), 113-123.

Volume 1 Issue 1 | July 2019
95Fidēre: Journal of Business, Governance, and Information Technology
Abstract
A resort is a full-service lodging facility that provides access or offers a range of amenities and recreation facilities to emphasize leisure experience. The patronage of leisure establishments depends solely on the type of season.
This study aimed to determine the coping strategies implemented by beach resorts in Nasugbu, Batangas. Descriptive-survey method was employed which involved twenty-one (21) beach resorts. Most of the beach resorts in Nasugbu, Batangas op-erated more than five (5) years, employed more than ten (10) employees, majority of beach resorts offer 11-15 rooms with 2-4 types of recreational facilities. Custom-er attrition was the most common problem encountered by the beach resorts during lean season. Study showed that beach resort management used price differential, reduced number of employees and multi-tasking and energy conservation was the most frequent used as their coping strategies. As to level of effectiveness of the cop-ing strategies used, loyalty programs and price differential for marketing strategies, for maintenance and other operating expenses strategies, energy conservation and reduce number of employees and multi-tasking for the human resource utilization strategies were extremely effective. Results implied that resort management should focus and maintain their coping strategies during lean season.Keywords: beach resorts, resort management, coping strategies, lean season, cus-tomer attrition
Coping sTraTegies during lean season
of seleCTed beaCh resorTs in nasugbu, baTangas
Edward Jonson Nioko, Sam Dela Cuesta Villamas,Marjorie Artajo De Vera, Juliet G. De Castro, Leila Bayot
Batangas State University
Resort Establishment is one of the most suc-cessful businesses. Man build resort because it is in demand and affordable for the people who want to take a vacation. Resort is one of the profitable businesses if the resort operation is manage well.
Resort is a place to spend holidays for relaxation and recreation so that one can give dynamism to their leisure time. Oxford dictio-nary defines resort as a place that is frequent-ed for holidays for recreation or for a specific purpose. One can enjoy sunbathing, experience best gastronomy, enjoy some resorts activities, past time, and being happy posing photos in so-
cial media. A resort can function as a confer-ence center, as a meeting center, as banquette, restaurant, and various other functions.
According to the new definition, a re-sort is a full service lodging facility that pro-vides access to or offers a range of amenities and recreation facilities to emphasize a leisure experience. Resorts serve as the primary pro-vider of the experience, often provide services for business and meetings, and are characteris-tically located in vacation oriented settings. If we go through the history of resort, it dates back to roman era where themselves multifunctional recreation activity and most popular.
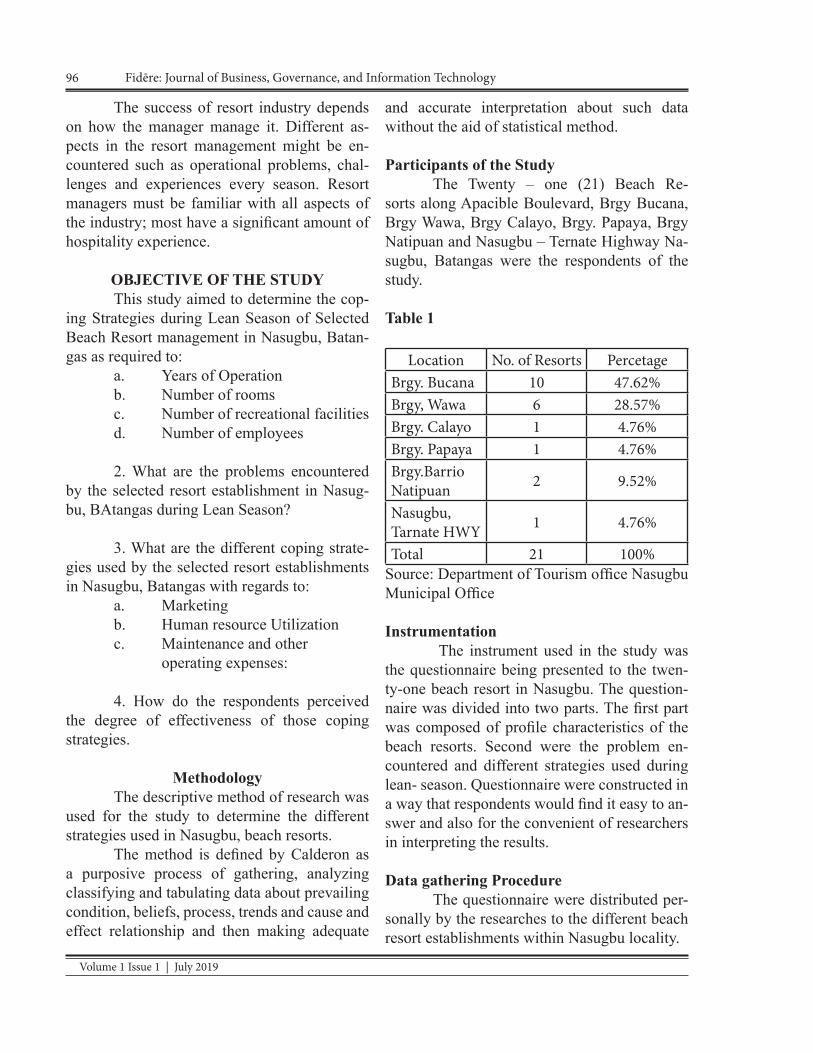
Volume 1 Issue 1 | July 2019
96 Fidēre: Journal of Business, Governance, and Information Technology
The success of resort industry depends on how the manager manage it. Different as-pects in the resort management might be en-countered such as operational problems, chal-lenges and experiences every season. Resort managers must be familiar with all aspects of the industry; most have a significant amount of hospitality experience.
OBJECTIVE OF THE STUDYThis study aimed to determine the cop-
ing Strategies during Lean Season of Selected Beach Resort management in Nasugbu, Batan-gas as required to:
a. Years of Operationb. Number of roomsc. Number of recreational facilitiesd. Number of employees
2. What are the problems encountered by the selected resort establishment in Nasug-bu, BAtangas during Lean Season?
3. What are the different coping strate-gies used by the selected resort establishments in Nasugbu, Batangas with regards to:
a. Marketingb. Human resource Utilizationc. Maintenance and other operating expenses:
4. How do the respondents perceived the degree of effectiveness of those coping strategies.
MethodologyThe descriptive method of research was
used for the study to determine the different strategies used in Nasugbu, beach resorts.
The method is defined by Calderon as a purposive process of gathering, analyzing classifying and tabulating data about prevailing condition, beliefs, process, trends and cause and effect relationship and then making adequate
and accurate interpretation about such data without the aid of statistical method.
Participants of the StudyThe Twenty – one (21) Beach Re-
sorts along Apacible Boulevard, Brgy Bucana, Brgy Wawa, Brgy Calayo, Brgy. Papaya, Brgy Natipuan and Nasugbu – Ternate Highway Na-sugbu, Batangas were the respondents of the study.
Table 1
Location No. of Resorts PercetageBrgy. Bucana 10 47.62%Brgy, Wawa 6 28.57%Brgy. Calayo 1 4.76%Brgy. Papaya 1 4.76%Brgy.Barrio Natipuan 2 9.52%
Nasugbu, Tarnate HWY 1 4.76%
Total 21 100%Source: Department of Tourism office Nasugbu Municipal Office
Instrumentation The instrument used in the study was the questionnaire being presented to the twen-ty-one beach resort in Nasugbu. The question-naire was divided into two parts. The first part was composed of profile characteristics of the beach resorts. Second were the problem en-countered and different strategies used during lean- season. Questionnaire were constructed in a way that respondents would find it easy to an-swer and also for the convenient of researchers in interpreting the results.
Data gathering ProcedureThe questionnaire were distributed per-
sonally by the researches to the different beach resort establishments within Nasugbu locality.

97Coping Strategies During Lean Season Of Selected Beach Resorts In Nasugbu, Batangas
Fidēre: Journal of Business, Governance, and Information Technology Volume 1 Issue 1 | July 2019
To retrieve the questionnaires, the fol-lowing ways were done: through personal fol-low-up, and through texts. The collected data were tallied, analyzed and interpreted.
Statistical Treatment of DataThe statistical tools that were used in the
treatment of data are as follow: Weighted points would be assigned for quantitative analysis and an equivalent rating was determined. The weighted mean was obtained by multiplying the scale value of the responses indicating it, and then dividing the total weighted points by the number of responses.
To be able to interpret the rating of re-spondents on the scale, the following range of weighted mean and their corresponding adjec-tives was observed.
Table 2
SCALE MEAN RANGE RATING
5 4.2 – 5.0 Extremely Effective
4 3.4 – 4.19 Very Effective3 2.6- 3.39 Effective
2 1.8 – 2.59 Slightly Effec-tive
1 1-1.79 Not Effective
Results and DiscussionThe study was an analysis of the differ-
ent strategies used by the select twenty-one (21) registered Beach Resorts in Nasugbu, Batangas during lean season.
The presentation analysis, and interpre-tation of data were shown based on chronolog-ical order of the specific questions in the first chapter.
1. Profile of the selected Beach Resorts during Lean Season in Nasugbu, Batangas
1.1 Years of operationTable 3Profile of the Selected Beach Resorts in Nasug-bu, Batangas as to Years of Operation
Years of Operation Frequency Percentage Rank
More than 5 years
19 90.48% 1
3-4 years 2 9.52% 2Total 21 100% -
Table 3 presents the percentage of the years of operation among Nasugbu Beach Re-sorts. It can be observed that majority of the beach resort operates for more than five (5) years. It implies that the beach resorts in Na-sugbu outperform the problems they encoun-tered with their business strategies. On the other hand, there are two (2) beach resorts established on the bracket of (3) to four (4) years. It means that many beach resorts owners believed that they can operate for a long time like the previ-ous beach resorts.
According to Kelly B. 2008, the devel-opment of exclusive resorts facilities offering more privacy to the visitors. The wealthy people wished for private resorts facilities and Swit-zerland’s resort industry realized the lucrative business prospects of this idea. One must also understand that It was an era when transporta-tion costs were very high and travel itself was a time-consuming and difficult exercise. There-fore, particularly the wealthy people preferred to go on a long vacation to make the most of their visit, and at the same time it achieved the best value for money to stay at a resort for lon-ger periods, usually ranging from a few weeks up to a few months.
1.2 Number of Rooms Table 4.2 shows the pro-file of the selected Beach Resorts in Nasug-bu, Batangas as to number of rooms.

Volume 1 Issue 1 | July 2019
98 Fidēre: Journal of Business, Governance, and Information Technology
Table 4Profile of the Selected Beach Resorts in Nasug-bu, Batangas as to number of rooms.
Number of Rooms Frequency Percentage Rank
5-10 4 19.05% 311-15 8 38.10% 116-20 0 0% 521-25 5 23.81% 225 and above rooms 3 14.29 4
Total 21 100%
Table 4 presents the percentage of the number of rooms among Nasugbu, Beach Re-sorts. It can be observed that majority of the rooms in Nasugbu Beach Resort are in the bracket of eleven (11) to fifteen (15) rooms. In the other hand only one (1) out of twenty-one Nasugbu Beach Resort is under the bracket of (1) to five rooms. Table 5Profile of the Selected Beach Resorts in Nasug-bu, Batangas as to the Number of Recreational Facilities Offered
No. of Recreational
FacilitiesFrequency Percentage Rank
1 6 28.57% 22-4 9 42.86% 15-7 1 4.76% 4.58-10 1 4.76% 4.5More than 10 4 19.05% 3Total 21 100%
Table 5 presents the percentage of the recreational facilities among Nasugbu Beach Resort. It can be observed that majority of the beach resorts’ have 2-4 recreational facilities. And only one (1) out of twenty one (21) Nasug-bu Beach Resort is under the bracket of five (5) to seven (7) and eight (8) to ten (10).
According to Bohrod, et al (2010), 40% 0f hospitality managers indicated they were ready to make a “recreation area” structural improvements with (20%) also specifying spa improvements (Bohrod, 2010). Because todays travelers expect much from their recreation.
The study states that the resort industry grew, multiple amenity offerings became the norm and customers became conditioned to ex-pect certain amenities as part of the resort ex-perience.
Table 6Profile of Selected Beach resorts in Nasugbu, Batangas as to number of Employees
No. ofEmployees
Frequency Percentage Rank
1 0 0%2-4 8 38.10% 1.55-7 4 19.05% 28-10 1 4.76% 3More than 10 8 38.10% 1.5Total 21 100%
Table 6 presents the percentage of the number of employees among Nasugbu Beach Resorts. As reflected eight (8) of twenty –one (21) beach resorts are under the bracket of 2-4 employees, four (4) of twenty one beach resorts are under the bracket of 5-7 employees, one of twenty- one (21) Nasugbu beach resort is un-der the bracket of 8- 10 employees and (8) of twenty one (21) are under the bracket of more than 10.
According to ISPA, from 1999 to 2010 the number of resorts employees has grown from 151,000 to 338,000 which seems like strong growth – but not when compared with 500% growth in the number of spas.
Successful resort are indeed investing in their staffs, and they are offsetting the added expense in part by adopting strategies that keep staff busy. Meanwhile, average service prices,
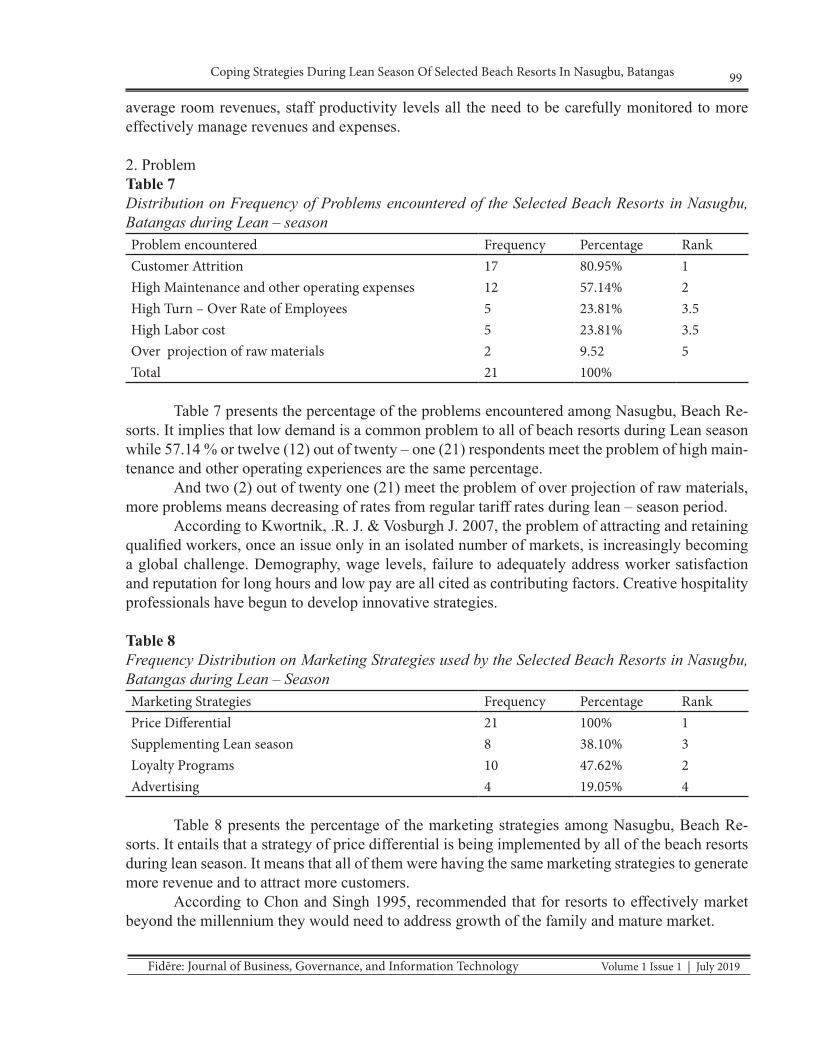
99Coping Strategies During Lean Season Of Selected Beach Resorts In Nasugbu, Batangas
Fidēre: Journal of Business, Governance, and Information Technology Volume 1 Issue 1 | July 2019
average room revenues, staff productivity levels all the need to be carefully monitored to more effectively manage revenues and expenses.
2. Problem Table 7Distribution on Frequency of Problems encountered of the Selected Beach Resorts in Nasugbu, Batangas during Lean – seasonProblem encountered Frequency Percentage RankCustomer Attrition 17 80.95% 1High Maintenance and other operating expenses 12 57.14% 2High Turn – Over Rate of Employees 5 23.81% 3.5High Labor cost 5 23.81% 3.5Over projection of raw materials 2 9.52 5Total 21 100%
Table 7 presents the percentage of the problems encountered among Nasugbu, Beach Re-sorts. It implies that low demand is a common problem to all of beach resorts during Lean season while 57.14 % or twelve (12) out of twenty – one (21) respondents meet the problem of high main-tenance and other operating experiences are the same percentage.
And two (2) out of twenty one (21) meet the problem of over projection of raw materials, more problems means decreasing of rates from regular tariff rates during lean – season period.
According to Kwortnik, .R. J. & Vosburgh J. 2007, the problem of attracting and retaining qualified workers, once an issue only in an isolated number of markets, is increasingly becoming a global challenge. Demography, wage levels, failure to adequately address worker satisfaction and reputation for long hours and low pay are all cited as contributing factors. Creative hospitality professionals have begun to develop innovative strategies.
Table 8Frequency Distribution on Marketing Strategies used by the Selected Beach Resorts in Nasugbu, Batangas during Lean – SeasonMarketing Strategies Frequency Percentage RankPrice Differential 21 100% 1Supplementing Lean season 8 38.10% 3Loyalty Programs 10 47.62% 2Advertising 4 19.05% 4
Table 8 presents the percentage of the marketing strategies among Nasugbu, Beach Re-sorts. It entails that a strategy of price differential is being implemented by all of the beach resorts during lean season. It means that all of them were having the same marketing strategies to generate more revenue and to attract more customers.
According to Chon and Singh 1995, recommended that for resorts to effectively market beyond the millennium they would need to address growth of the family and mature market.

Volume 1 Issue 1 | July 2019
100 Fidēre: Journal of Business, Governance, and Information Technology
Table 9Frequency Distribution on Human Resource Utilization Strategies Used by the Selected Beach Resorts in Nasugbu, BatangasHuman Resource Utilization Strategies Frequency Percentage RankReduce snumber of employees 15 71.43% 1.5Multi-Tasking 15 71.43% 1.5Job sharing 6 28.57% 3Broken Schedule of employees 4 19.05% 4Pay reduction 1 4.76% 5.5Reduce number of employees 1 4,76% 5.5
Table 9 presents the percentage of human resource utilization strategies among Nasugbu Beach Resorts. It brings about that strategies of reduce number of employees and multi – tasking is being applied by fifteen (15) out of twenty one (21) beach resorts during lean season, six (6) out of twenty one (21) respondents using job sharing, four (4) out of twenty one (21) respondents using broken schedules of employee’s and one (1) out of twenty one (21) Respondents using reduce number of employee benefits and pay reduction strategies.
Table 10Frequency Distribution on Maintenance and other Operating Expenses Strategies Usedby the selected beach resorts in Nasugbu, Batangas during lean SeasonMaintenance and other operating Expenses Frequency Percentage RankEnergy Conservation 21 100% 1Broken Schedule Operation 3 14.29% 3Regular monitoring of stocks inventory record 8 38.10% 2
Table 10 presents the percentage of the maintenance and other operating Expenses strat-egies among Nasugbu Beach Resorts. It conveys that using a strategies of energy conservation minimize the Maintenance and other Operating Expenses during lean-season.
Table 11Degree of effectiveness of the Strategies Used by the selected Beach Resorts in Nasugbu, Batangas during Lean – seasonMarketing Strategies Weighted Mean Vertical Interpretation RankLoyalty Programs 4.29 Extremely effective 1Price Differential 4.14 Extremely effective 2.5Supplementing Lean Season 4.14 Extremely effective 2.5Flyers, Coupons 2.43 Effective 4Advertisement on Television, Radio, newspaper, Tarpaulin
2 Slightly Effective 5
Average Mean 3.4 Very Effective -

101Coping Strategies During Lean Season Of Selected Beach Resorts In Nasugbu, Batangas
Fidēre: Journal of Business, Governance, and Information Technology Volume 1 Issue 1 | July 2019
Table 11 shows that based on the given result, the respondents evaluate the effectiveness of the given coping strategies as effective, slightly effective and extremely effective In this Interpre-tation, those coping strategies being implemented by the aforesaid beach resorts were found to be helpful and useful in carrying out the operation and management during lean-season.
Table 12Degree of Effectiveness of the Strategies Used by the Selected Beach Resortsin Nasugbu, Batangas during Lean-seasonMarketing Strategies Weighted Mean Vertical Interpretation RankLoyalty Programs 4.29 Extremely effective 1Price Differential 4.14 Extremely effective 2.5Supplementing Lean Season 4.14 Extremely effective 2.5Flyers, Coupons 2.43 Effective 4Advertisement on Television, Radio, newspaper, Tarpaulin
2 Slightly Effective 5
Average Mean 3.4 Very Effective -
Table 12 shows that based on the given result, the respondents evaluate the effectiveness of the given coping strategies as effective, very effective and extremely effective. In this interpre-tation, those coping strategies being implemented by the aforesaid beach resorts were found to helpful and useful in carrying out the operation and management of the establishment during lean season.
Table 13Maintenance and other operating expenses Weighted Mean Vertical Interpretation RankEnergy Conservation 4.90 Extremely Effective 1Broken schedule of operation 2.86 Effective 2Average Mean 3.88 Very Effective --
Table 13 shows that based on the given result, the respondents evaluate the effectiveness of the given coping strategies as effective and extremely effective. In this interpretation, those coping strategies being implemented by the aforesaid beach resorts were found to be helpful and useful in carrying out the operation and management of the establishment during lean – season. Table 14Summary table of Degree of effectiveness of the Strategies Used by the Selected Beach Resorts in Nasugbu, Batangas during Lean - SeasonStrategies Weighted Mean Verbal Interpretation RankMaintenance and other operating expenses 3.88 Very Effective 1Human Resource Utilization Strategies 3.65 Very Effective 2Marketing Strategies 3.4 Very Effective 3Composite Mean 3.64 Very Effective -

Volume 1 Issue 1 | July 2019
102 Fidēre: Journal of Business, Governance, and Information Technology
Table 14 shows that based on the given result, the respondents evaluates the effective-ness of the given coping strategies being im-plemented by the aforesaid beach resorts were found to be helpful and useful in carrying out operation and manage ment of the establish-ment during lean- season.
Riley ( 2007) has noted that resorts will need to promote a holistic experience, maintain marketing consistency, understand guest, ex-amine website efficiency, increase online mar-keting, maintain previous guest, and create a strong industry relationships to be successful.
ConclusionsBased on the findings of the study, the
following conclusion were drawn:1. Most of the beach resorts in Nasugbu,
Batangas operated for more than five ( 5) years majority of the beach resorts in Na-sugbu, Batangas offered 11-15 rooms with 2-4 recreational facilities and employed 2-4 and more than 10 employees.
2. The most common problem encounterd by the beach resort establishments was custom-er attrition.
3. In the Aspect of marketing strategies, price git the highest frequency as perceived by the beach resort. In the aspect of human resources utilization reduce number of em-ployees and multi- tasking got the highest frequency. Lastly, in the aspect of the main-tenance and other operating expenses, ener-gy conservation was the most frequent used by the beach resort establishments.
4. Loyalty programs, price differential and supplementing lean season were perceived as extremely effective for the marketing strategies; for human resource utilization strategies, reduce number of employees, job sharing and multi-tasking were perceived as extremely effective and for the maintenance and other operating expenses, human re-
source utilization strategies were perceived by the beach resort establishments are very effective.
RecommendationsFor the foregoing findings and conclu-
sions the following are recommended:1. The beach resort establishments in Nasug-
bu, Batangas should continually promote their establishments by strengthening other marketing strategies.
2. That the beach resort establishments should create their own association for sharing their different strategies for marketing ang human resource utilization.
3. That the Nasugbu beach resort establish-ments should participate in different activ-ities of Nasugbu, Tourism Office.
4. That the nasugbu beach resort 5. Establishments should prepare an effective
marketing plan to cope up with the lean sea-son.
ReferencesCabrera E.B (2007). Managerial Accounting
and Finance for Hospitality Operations: New York: McGraw- Hill/Irwin
Claravall, B.G (Ed) 2008 Travel and Tour oper-ation in the Philippines. Manila; Paul So and Partner.
Covens D. W. Piercy N.F (2000) Strategic Mar-keting: New Jersey: Pearson Education (Inc.)
Cruz, R.G (2000) Principles of Travel and Tourism ver.2 Quezon City: Tourism Research
Goeldner, C.R Ritchie, J.R (Eds.) (2009) Tour-ism: Principles, Practices, Philosophies. Canada: Pearson Education (Inc.)

103Coping Strategies During Lean Season Of Selected Beach Resorts In Nasugbu, Batangas
Fidēre: Journal of Business, Governance, and Information Technology Volume 1 Issue 1 | July 2019
John Wiley & Sons, Inc. Robbins, Stephen P. (2003). Beach Resort and Operartion Management 10th Edition. New Jersey: Pearson Education (Inc.)
Noel, Raymond A. 2008 Labor Training and Development of the resort York: Mc-Graw-Hill/Irwin.
Santos, B. (2010) Introduction to Hotel and Re-sort Management. Edsa South Triangle, Quezon City: C & E Publishing,INC.

Volume 1 Issue 1 | July 2019
104 Fidēre: Journal of Business, Governance, and Information Technology
Abstract
The ultimate goal of an investor is the maximization of profits and reduction of risks involved in stocks trading. In spite of the numerous literatures on the benefits of Cost-Averaging, there are papers challenging its effectiveness in
theory and in practice as it contradicts the principle of buying-low and selling-high. The study is aimed to develop a model that will guide the investors for a more prof-itable trade. It will attempt to modify the principle of buying at regular intervals into a more strategic determination of optimal buying positions. To be able to test the profitability of Dynamic Cost-Averaging (DCA) method, this study utilized empirical method of research. The research used the price data in the last ten years of ten (10) stocks representing various sectors. The buying and selling price of the stocks was recorded based on the signals given by technical indicators. Empirical evidence proves that DCA provides a substantial increase in profitability over CA. There is a significant increase in the profit ratio (by 33.71 percent) as evidenced by the result of t-test. A decision tree model was developed to standardize the method, and may serve as a guide for long term investments.Keywords: Profitability Analysis, Cost Averaging, Dynamic Cost Averaging, Stocks Trading, Position Trading
developMenT and evaluaTion of dynaMiC CosT-averaging
Model using relaTive sTrengTh index and sToChasTiCs
Erwin A. CaparasBatangas State University
Equities investors can be categorized based on their competence and availability of time to monitor price actions. They differ on their knowledge and skills of the use of fundamental and technical analysis. Fundamental analysis determines what shares of companies to buy (what to buy), while technical analysis deter-mines the optimum time to buy and sell (when to buy). The ultimate objective of an equities investor is the maximization of profits and re-duction of risks involved in stocks trading. They use various techniques to consistently earn through price appreciation and distribu-tion of dividends. The basic principle to earn in the stock market is to buy-low then sell-high,
whereas, a skilled trader also uses the principle of buy-high then sell-higher. However, one of the dilemma a trader faces, is how do an inves-tor determine if a stock price is already low for buying, and how do an investor determine if a stock price is already high to signal a sell order. Many beginner traders incur losses since they trade using emotions rather than a system, they buy when the price is already high due to crowd buying (greed), then they sell when the price is already low due to crowd selling (fear).
The most common strategy used by long term investors is the Cost-Averaging Method, it is the constant buying of shares at an equal value of investment of a stock on a regular interval. It

105Development and Evaluation of Dynamic Cost-Averaging
Model Using Relative Strength Index and Stochastics
Fidēre: Journal of Business, Governance, and Information Technology Volume 1 Issue 1 | July 2019
results to more shares purchased when the stock price is low, then fewer shares are purchased when the stock price is high. However, the lat-ter contradicts the principle of buying-low, it is in this premise that the proponent aims to deter-mine the optimum buying points that will yield more profits in the long run. In spite of the nu-merous literatures and studies on the advantages of the Cost-Averaging method, there are papers (Williams and Bacon, 2004; Thorly, 1994; and Greenhut, 2006) , challenging its effectiveness in theory and in practice. Greenhut (2006) crit-icised the principles of Cost-Averaging (CA) method comparing it to Lump-Sum (LS) in-vestment. The proponent examined the perfor-mance of stocks to test the impact of trends on Cost-Averaging and Lump-Sum. The research proved that CA will have a favorable return on the down-trend in contrast to the up-trend ben-efits of LS. In addition, Thorly (1994) explains the logical fallacy of utilizing average cost and average price as measure of performance. Wil-liams and Bacon (2004) criticized Dollar Cost Averaging on the basis of his empirical study on the use of Lump Sum method. However, one can argue that comparing Cost Averaging and Lump Sum Investing is like comparing two different things. CA is mostly used by individ-ual private investment retailers who are either risk averse or there is no large chunk of mon-ey as starting capital. CA has been the widely accepted strategies for wage earners who uses the stock market as a means of growing their savings. It is in this premise that the proponent looks for an alternative strategy to increase the profitability of a long term investment.
The study is aimed to develop a model that will guide the investors for a more profit-able trade. It will attempt to modify the prin-ciple of buying at regular intervals into a more strategic determination of optimal buying in-dicators. The study will use major and minor price-corrections of the Philippine Stock Ex-change Index as indicators.
This paper offers a modification of the Cost Averaging Method, it seeks to develop a trading model that will use the rudimentary principles of CA while seizing the opportunity of buying at low price levels and lock the profits by selling a portion of the portfolio. Specifical-ly it attempts to determine the stock companies that have good fundamentals in terms of price action performance; determine the technical in-dicators to be used in the method; conduct prof-itability analysis of stock positions; determine if there is a significant difference in the profit ratio of the stocks and; develop a trading model for reproducibility of results.
Peso-Cost Averaging (PCA) Method is widely recommended by financial advisers in the Philippines for newbie (beginner) investors to mitigate risks associated with price volatili-ty. IMoney Learning Centre (2015) presented the pros and cons of the use of PCA in equi-ties investment. Advantages include minimal capital requirements; investment can be done in less cost thus less risk involved; and downtrend movement in the market price gives an oppor-tunity to lower the average price of the stock. PCA method is advantageous if the investor don’t have large amount of funds available as starting capital. Increasing stock position can be done by buying shares at a constant amount of money at a regular interval. Drawbacks of the said method include the inability to respond to investment opportunities, wrong entry point only leads to averaging down the losses in the long term and will take a lot of time before it will recover, and lower steady returns.
Technical analysis determines trad-ing patterns as observed in mass psychology. As cited by Cam (2015), the primary tool for technical analysis is the chart. The chart is the compendium of real-life trading decisions of institutional investors and individual retailers. Technical analysis was built on the premise that crowds tend to reach in a similar fashion. Though not exactly the same, rather, in a man-

Volume 1 Issue 1 | July 2019
106 Fidēre: Journal of Business, Governance, and Information Technology
ner wherein a correlation can be made to predict future movement based on previous trends.
Price actions reflect everything about the market, it represent the unanimity of how the market value the stock, may it be an insti-tutional investor, speculators, retailers, insiders and gamblers. As explained by Elder (2014), technical analysis is a study of mass psychol-ogy, it is considered a science because many technicians uses scientific method in making an informed trading decision. They use prob-abilities and forecasting techniques based on technical indicators. It is also considered an art because technical analysts identify candlestick formations and patterns. They try to correlate patterns to market behavior, then trade when they recognize patterns go with their forecast.
Similary, Pesavento and Jouflas (2007) highlights the use of technical analysis in deter-mining moments of opportunity to profit in the markets. Every time a specific pattern is in for-mation, and is repeated with enough regularity, trading methods and strategies are developed and implemented with higher rate of success.
Technical analysis using charts to mon-itor price and price actions started a thousand years ago and was first renowned in Japan. That time, the price is used as gauge in determining supply and demand. Developments in the field and evolutionary process launched a technical revolution by great technical analysts such as Jesse Livermore, H.M. Gartley, W.D. Gann, Richard Wyckoff, Richard Schabacker, Ralph Elliott, Charles Dow, George Cole, and a host of others who dedicate their time and efforts to the art, science and skill in technical analysis. It is noteworthy to mention that much of their work was done by hand. There are no computers at that time to compute for moving averages and instantly set up charts at different timeframes with multitude of indicators and filters applied. They drew their charts by their own bare hands, noting their observations, tests and apply their theories and standardize as trading strategies.
They are considered great market observers, and today many great traders still do some chart work manually on a daily basis. Conversely, expert services are now available where daily or weekly chart sentiments of shortlisted stocks are provided for a fee.
During the years of Depression and World War II, there is a very limited available printed materials regarding technical analysis. The first financial news printed in newspapers, long before the Wall Street Journal, had begun about 10 years after the Civil War. Improve-ments and advancements in communications paved the way in easily gaining financial in-formation through ticker tape, teletype and telephone. The advent of internet and personal computers made available at home improved the access to financial information and spurred many technical analysis programs. Real-time data and charting software packages load-ed with every indicator and testing capability imaginable are now made available to both the individual private retailer and institutional in-vestors. For many years, financial community had doubted the accuracy of technical analysis and not worthy of consideration for seriously making money.
The basic component of technical anal-ysis is the chart. The chart captures all relevant data and displays it in a logical format. The chart is used to determine price movements over a period of time, it is also used as a gauge in determine the supply and demand, investor sentiment, and financial forecasts (Khan, 2010). A market that has traded in a very small price range for months with very little news emerged. Few people are interested in following it at all, until one day, trading volume suddenly doubles. The people who bought that day knew some-thing was going on. The market breaks out of its price range due to an increase in demand. Often, the good news that caused this breakout is re-leased to the public and the rally begins in ear-nest. Prices would jump from one equilibrium
107Development and Evaluation of Dynamic Cost-Averaging
Model Using Relative Strength Index and Stochastics
Fidēre: Journal of Business, Governance, and Information Technology Volume 1 Issue 1 | July 2019
level to the next in an instant. Technical analysis attempts to determine where the market is in the process of information dissemination to deter-mine if it is in the early, middle, or late stages of a trend.
Technicians uses the chart together with overlaid indicators to market momentum (how fast the market is moving), trade volume (how much power is behind the moves), and even the natural order of crowd behavior (sentiment). Technical analysis of a stock may include tech-nical treatment of fundamental data. Each price represents the consensus of value of all market participants at the moment of transaction. Ac-cording to Elder (2014), the closing price reflects the most important consensus of the market.
The relative strength index (RSI) was developed by J Welles Wilder, Jr. It is used as momentum indicator where it determines the velocity of price movements. In this mod-el, prices are generally considered to be elas-tic in that they can move only so far from a mean price before reacting or retracing. Rapid price advances result in overbought situations, and rapid price declines result in oversold sit-uations. The slope and values of the RSI are directly proportional to the velocity and mag-nitude of the price action and has proven use-ful in determining overbought and oversold levels. The core of the formula for RSI takes the last “n” periods and divides the gross pos-itive changes per period by the gross negative changes. This means that the more often pric-es move higher in that “n” period span and the greater those changes become, the higher the RSI value. By depending on both the number of up closes and the magnitude of those clos-es, RSI filters out normal volatility difference between markets while maintaining the signifi-cance of single large price moves. By reducing the number of periods in the calculation, RSI can be made more sensitive (faster). The RSI value itself ranges from 0 to 100, and support, resistance, and market trends can be found on
the RSI plot. Generally speaking, an RSI value above 75 indicates a possible overbought situa-tion, and a value below 25 indicates a possible oversold situation. This does not mean, howev-er, that a market will immediately reverse when either of these levels is reached. It is more likely that the market will pause to consolidate, result-ing in a more neutral RSI value. The RSI chart is most often used with a bar chart. Relatively high RSI (55–75) normally accompanies a pos-itive price trend and relatively low RSI (25–45) normally accompanies a negative price trend. Divergences between price action and the RSI plot could signal market reversals.
Both RSI and Stochastic work well in trading ranges, but give premature and danger-ous signals when prices begin to trend. RSI, based exclusively on closing prices, is less noisy than Stochastic. It calls for rallies when it rises above its lower reference line, it signals declines by sinking below its upper reference line. Com-paring both charts, a technician can see that the RSI signals emerge earlier. A very powerful sell signal is given by a bearish divergence of RSI. The stock may rally to a new high, while RSI couldn’t reach its upper reference line, pointing to that rally’s hidden weakness. The sharp break near the right edge pushes prices lower despite the RSI buy signal. To avoid getting hurt, an in-vestor must use protective stops because the last trade in a range can easily create a loss when a new trend begins. When the market closes higher, bulls make money and bears lose. When the market closes lower, bears make money and bulls lose. Traders pay more attention to clos-ing prices than to any other prices of the day. In the futures markets, money is transferred from losers’ to winners’ accounts at the end of each trading day. RSI shows whether bulls or bears are stronger at closing time—the crucial mon-ey-counting time in the market
The Stochastic indicator, developed by George Lane, can be a valuable tool for identi-fying near-term tops and bottoms to help in tim-
Volume 1 Issue 1 | July 2019
108 Fidēre: Journal of Business, Governance, and Information Technology
ing trades closer to local reversal points. It mea-sures the placement of a current price within a recent trading range under the theory that as a market rises, close prices tend to occur nearer to the high end of their recent range. When prices trend higher and closes begin to sag within the range, it signals internal market weakness.
Stochastics is one of a few indicators that uses two lines, known as the K and D lines (sometimes known as %K and %D). The D line is simply a smoothed version of the K, and the two of them are analyzed for both overbought and oversold situations just like RSI. Two lines give the added dimension of crossovers, which are similar to price crossovers of moving aver-ages. Stochastics are often smoothed a second time by renaming the D line to the “slow K” line and smoothing it again to create the “slow D.”
Each price is the consensus of value of all market participants at the moment of trans-action. Elder (2014), emphasizes that Daily closing prices are important because the settle-ment of trading accounts depends on them. The high of any period marks the maximum power of bulls during that time. The low of that peri-od shows the maximum power of bears during that time. Stochastic measures the capacity of bulls or bears to close the market near the up-per or lower edge of the recent range. When prices rally, markets tend to close near the high. If bulls can lift prices during the day but can’t close them near the top, Stochastic turns down. It shows that bulls are weaker than they appear and gives a sell signal. Daily closes tend to oc-cur near the lows in downtrends. When a bar closes near its high, it shows that bears can only push prices down during the day but cannot hold them down. An upturn of Stochastic shows that bears are weaker than they appear and flashes a buy signal.
MethodologyTo be able to test the profitability of
Dynamic Cost-Averaging (DCA) Method, this
study utilized empirical method of research. As stated by Wilson (2018), empirical meth-od of research allows the researcher to gath-er the data by direct observation of the tested hypotheses. Then the researcher will formally operationalize the observed results through the use of testable research problems. Empirical research is a more structured way of address-ing research problems and validate it through actual tests. A researcher must take great care to prevent from any bias, error of expectation and opinions focusing only on what can be supported empirically.
The research used the historical price data of ten (10) stocks representing various in-dustries, the said stocks were selected based on their price action performance in the previous years in order to compare the net earnings us-ing DCA Method set-up with the common CA Method. Purposive sampling was employed to determine the ten (10) stock companies that will be used in the investigation. In obtaining the data needed for the investigation, the buying and selling price of the stocks was noted based on the signals given by technical indicators in the chart. The study used the Relative Strength Index and Stochastics to determine the momen-tum of price actions, trail stops were also uti-lized to detect probable reversal on price trends.
The researcher devised an excel com-putation to determine the stock positions, profit ratio and profitability analysis of both methods. The study used paired t-test to determine if there is a significant difference on the profitability of CA and DCA methods.
Results and DiscussionStock Companies.
In order to determine which stock/com-pany to be used in the study, the proponent used the purposive sampling. The subject companies were identified using the price action perfor-mance since 2009. The usual process of deter-mining what company shares to buy is through

109Development and Evaluation of Dynamic Cost-Averaging
Model Using Relative Strength Index and Stochastics
Fidēre: Journal of Business, Governance, and Information Technology Volume 1 Issue 1 | July 2019
fundamental analysis, the reason thereof is to ensure that the price of stocks are not greatly affected by extreme volatility caused by stocks trading jockeys. However, it can only be deter-mined at the current time as it has different per-formance in the previous decade. The propo-nent picked one (1) stock/company from each sector, since the selection was based from price action performance from the last nine (9) years. Year 2009 was selected due to the trend reversal from the previous major market correction at-tributed from Asian financial crisis.
The stocks were shortlisted from funda-mentally sound stock companies and are iden-tified as Blue Chip Stocks, the study focused on the comparison of their performance data to determine which stock will represent the iden-tified sectors.
Table 1Performance Data of Selected Stock Companies
SECTOR STOCK PERCENT GAINS
Banks and Financials SECB 1,107Commercial andIndustrial
EEI 1,400
Conglomerates JGS 3,906Consumer JFC 614Gaming BEL 497Mining SCC 1,144Power MER 552Property MEG 617Telecoms GLO 141Exchange Traded Fund FMETF 150
The paper used the investment guide provided by Col Financial (2018) to its inves-tors. The investment guide contains all the nec-essary information to gauge the company’s fi-nancial performance in the previous years. The
price of each company from different sectors were backtracked from the Investagrams appli-cation. The profit ratio were computed using the price of the stock from the first trading day of Fiscal Year 2009 up to the last trading day of 2017.
Technical Indicators The study used various oscillators to
determine the momentum of the trend. An os-cillator ranges from 0 to 100, where zero is an indication of oversold trades and 100 is a signal of overbought trades. Thus, oscillators may be used in buy and sell decisions through cross-overs, Kuepper (2018) stated that crossover happens when there is an overlap of moving averages.
This study used Relative Strength Index (RSI) and Stochastics (STS) to determine buy-ing and selling points in the chart.
The RSI measures the speed and magni-tude of price movement. Cam (2015) suggested that the chart can be set to 30 and 70 levels for oversold and overbought signals. However, any trader may opt to use other levels based on its strategy and trading plan. The STS, just like the RSI is a momentum indicator, it uses the cur-rent closing price and compares it to previous highs and lows of a period. STS may be used for short-term reversals and RSI for mid to long term indicators of reversals. The default set-tings for STS is at 20 and 80 levels.
Based on series of trials in selected stocks, the study will use 25 and 75 levels for RSI and the default settings for STS. To be able to address the issues on false indications for an up trending market, the researcher also set up 45 and 55 levels for minor corrections and pull-backs.

Volume 1 Issue 1 | July 2019
110 Fidēre: Journal of Business, Governance, and Information Technology
Figure 1. Technical Analysis Using Relative Strength Index and Stochastics
Figure 1 shows a sample of technical analysis of JG Summit Holdings Inc using RSI and STS. It is noteworthy to mention that one of the limitations of RSI and STS is that it stays on the overbought level in an uptrend and also stays on the oversold level, thus, there is a need to use trail stops so as not to prematurely sell at a continuous uptrend rally and prematurely buy at a contin-uous downtrend rally. Trail stops safeguard an investor from price-whipsaw due primarily to the volatility of the stocks which may give false indications, it ensures optimum trading decisions.
Profitability Analysis. Since the investigation aimed to determine the profitability of the stock positions using
DCA method, the proponent looked for a bullish reversal from a major correction, the most recent is at the start of the Fiscal Year 2009. The study used investagrams for the interactive chart where leading and lagging indicators may be added and edited as an option. Since the strategy is geared towards long term investing, the chart will be setup at a weekly interval.
The first trading day of 2009 was used as the entry point for each setup, CA method started with a Php 10,000 initial investment followed by a constant addition of Php 1,000 every month. Buying point is every 6 months and ends on the last trading of 2017. Prices of each stocks are extracted from the historical data of Investagrams.
Figure 2. Historical Data of Prices Using Investagrams Application
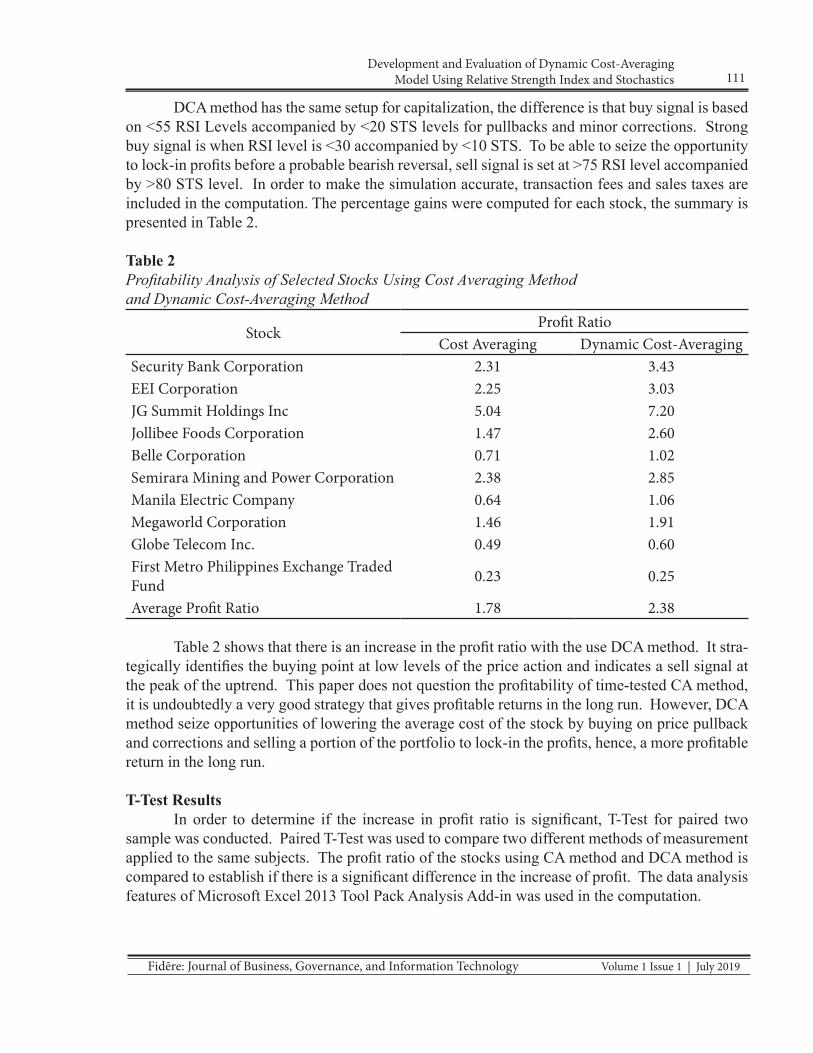
111Development and Evaluation of Dynamic Cost-Averaging
Model Using Relative Strength Index and Stochastics
Fidēre: Journal of Business, Governance, and Information Technology Volume 1 Issue 1 | July 2019
DCA method has the same setup for capitalization, the difference is that buy signal is based on <55 RSI Levels accompanied by <20 STS levels for pullbacks and minor corrections. Strong buy signal is when RSI level is <30 accompanied by <10 STS. To be able to seize the opportunity to lock-in profits before a probable bearish reversal, sell signal is set at >75 RSI level accompanied by >80 STS level. In order to make the simulation accurate, transaction fees and sales taxes are included in the computation. The percentage gains were computed for each stock, the summary is presented in Table 2.
Table 2Profitability Analysis of Selected Stocks Using Cost Averaging Methodand Dynamic Cost-Averaging Method
StockProfit Ratio
Cost Averaging Dynamic Cost-AveragingSecurity Bank Corporation 2.31 3.43EEI Corporation 2.25 3.03JG Summit Holdings Inc 5.04 7.20Jollibee Foods Corporation 1.47 2.60Belle Corporation 0.71 1.02Semirara Mining and Power Corporation 2.38 2.85Manila Electric Company 0.64 1.06Megaworld Corporation 1.46 1.91Globe Telecom Inc. 0.49 0.60First Metro Philippines Exchange Traded Fund 0.23 0.25
Average Profit Ratio 1.78 2.38
Table 2 shows that there is an increase in the profit ratio with the use DCA method. It stra-tegically identifies the buying point at low levels of the price action and indicates a sell signal at the peak of the uptrend. This paper does not question the profitability of time-tested CA method, it is undoubtedly a very good strategy that gives profitable returns in the long run. However, DCA method seize opportunities of lowering the average cost of the stock by buying on price pullback and corrections and selling a portion of the portfolio to lock-in the profits, hence, a more profitable return in the long run.
T-Test ResultsIn order to determine if the increase in profit ratio is significant, T-Test for paired two
sample was conducted. Paired T-Test was used to compare two different methods of measurement applied to the same subjects. The profit ratio of the stocks using CA method and DCA method is compared to establish if there is a significant difference in the increase of profit. The data analysis features of Microsoft Excel 2013 Tool Pack Analysis Add-in was used in the computation.

Volume 1 Issue 1 | July 2019
112 Fidēre: Journal of Business, Governance, and Information Technology
Table 3Performance Data of Selected Stock CompaniesSECTOR CA DCAMean 1.63 2.28Variance 2.21445 4.41905Observations 9 9Pearson Correlation 0.9912024Hypothesized Mean Difference 0df 8t Stat -2.966487P(T<=t) one-tail 0.0089836t Critical one-tail 1.859548P(T<=t) two-tail 0.0179673t Critical two-tail 2.3060041
Since TStat (2.96) is greater than TCrit (2.31), the null hypothesis is rejected and conclude with 95% confidence that the difference in profit ratio using CA method and DCA method is not solely due to chance. There is a significant increase in the profit ratio of stocks with the use of Dynamic Cost-Averaging Method.
Dynamic Cost-Averaging Model. In order to standardize the process of DCA method, a process decision tree model is de-
veloped. It was validated using ten (10) stocks from each sectors and was proven to increase the profitability as compared to CA method.
Figure 3. Decision Tree Model for Dynamic-Averaging
113Development and Evaluation of Dynamic Cost-Averaging
Model Using Relative Strength Index and Stochastics
Fidēre: Journal of Business, Governance, and Information Technology Volume 1 Issue 1 | July 2019
After a series of simulations using differ-ent setups, the proponent has finally determined the optimum conditions considering the price in-tervals, entry point, price action trend, RSI lev-els, STS levels, trail stops, volatility, pullbacks and corrections, percentage of shares for selling and percentage of buying power for trading.
The process starts with setting up of the chart to weekly interval. Investors can be cate-gorized based on its investment objectives, ev-ery category will require different chart interval as basis for trading decisions. A day trader will need minute to hourly to daily interval, while a swing and/or position trader uses daily and weekly chart, long term investors use weekly to monthly chart. By default, an investor us-ing Dynamic Cost-Averaging method may use the weekly chart. The entry point considered in the timeline is the first trading day of 2009, the most logical decision to enter into a trade for the first time is to look for bullish reversals from a major correction. Major corrections or market crash usually yields 30 to 50% decrease in peak price and is expected to give profitable results in the long run. The recent market crash was in 2008 due to Asian financial crisis, the end of the downtrend movement followed by a bullish reversal is an excellent entry point.
After entry, an investor will determine if the short term trend is bullish or bearish, bullish indicates an uptrend in price movement while bearish manifests a downtrend in price action. In a bullish trend, once the RSI level exceeded the 75 level, an investor will have to determine if the rally continues with a few pullbacks, then place a sell order once there is a trail stop. In a bearish trend, an investor has to look for a breach in 55 RSI level moving to 45 and ulti-mately below 25. If there is a breach in the said levels, an investor has to check the STS level if it breaches the 40 level. If a breach in RSI and STS level is confirmed, the investor may place a buy order on a trail stop. The process is re-peated every time there is a reversal in the trend.
Selling 70% of the shares is a strategy just in case the uptrend rally continues, while buying at 70% of the buying power is also a strategy just in case the downtrend rally continues.
Conclusions and RecommendationsThis paper pave an alternative method
of long-term investing. Dynamic Cost-Averag-ing method provides a different perspective in the use of Cost-Averaging method by seizing opportunities to buy during price pullbacks, mi-nor and major corrections, and lock-in the prof-its at the peak of an uptrend. The method will require a basic understanding of technical anal-ysis using Relative Strength Index and Stochas-tics as oscillator indicators. Based on empirical evidence, DCA provides a substantial increase in profitability as compared with CA method.
Dynamic Cost-Averaging method is applicable to individual private investment re-tailers wherein wage earners may use the stock market as a means of growing their savings in the long run. The use of trail stops is encour-aged to optimize the profitability of the trades. Future researchers may also explore the use of other trading indicators to increase further the profitability of the system.
ReferencesCam J. (2015) The Trading Code. Laguna: Lex
Media Digital Corporation.
Elder A. (2014). The New Trading for a Living. Canada: John Wiley and Sons Inc.
Imoney. (2015). Peso Cost Averaging: The Easy Way to Invest. Imoney Learning Center. Retrieved from https://www. imoney.ph/articles/peso-cost-averag-ing-easy-way-invest/
Khan M. (2010). Technical Analysis: Plain and Simple. New Jersey: Pearson Education Inc.

Volume 1 Issue 1 | July 2019
114 Fidēre: Journal of Business, Governance, and Information Technology
Kuepper J. (2018) Technical Analysis: Indica-tors and Oscillators. Investopedia. Re-trieved from https://www. investopedia. com/university/technical/techanaly-sis10.asp
Pesavento L. and Jouflas L. (2007). Trade What You See. Canada: John Wiley and Sons Inc.
Thorly S. (1994). The Fallacy of Dollar Cost Averaging. Financial Practice and Ed-ucation. 138-143.
Williams R. and Bacon P. (2004). Lump Sum Beats Dollar-Cost Averaging. Journal of Financial Planning, 92-95.
Wilson L. (2018) Empirical Research. Explor-able.com. Retrieved from. http:// www. Statisticshowto .com/ empirical-re-search/

Volume 1 Issue 1 | July 2019
115Fidēre: Journal of Business, Governance, and Information Technology
Abstract
One of the major expectations of the call center business is being able to gen-erate skilled personnel with expertise to provide solutions to the current business challenges through research that enables companies to respond to
the global demands. This expectation has raised a lot of pressure to the top mana-gerial team to outsource from abroad, and more emphasis is placed on the cost of processing the rightful personnel. The study sought to answer questions behind the reasons that makes call center business outsource, is there any difference between the outsourced and internal work results and the perceptions that align as far as im-proving the quality of services in line with the gap that exists together with impacts of outsourcing. Relying on phenomenological design in line with content, in this case study data were gathered though interview from 17 businesses call center top managerial levels in five different firms. Findings revealed, the risks of exposing the firm’s confidential financial data to the third party after being outsourced, the study further reveals that there are difficulties in synchronizing the deliverables and finally heights that huge costs that are attached to outsourcing. Recommendations are made to managers tackle more effectively the above issues heightened in this study that includes internal swiftness and expertise, filling up internal resources and focusing on core business process.Keywords: outsourcing, business process outsourcing, expert financial controller, service providers, call center business
ouTsourCing in aCCounTing and experT finanCial ConTrollers: eMpiriCal sTudy of The philippine Call CenTer business
Daniel Kyamuhangiire, Evely Garcia LintaoCollege of Business Adventist University of the Philiippines
Puting Kahoy, Silang, [email protected], [email protected]
Outsourcing is a typical form of strategic alli-ance, about “make or buy decisions.” Embleton and Wright (2008) define outsourcing as having an outside vendor provide services previously performed in-house, the transfer of “routine and repetitive tasks” to outside providers, and the paying of other organizations to provide that work. This means that outsourcing is about the strategic use of resources outside the organiza-tion to perform activities that otherwise would have been done by in-house personnel using in-house resources.
Whatever definition is employed, out-sourcing may be viewed as an arrangement in which one organization provides a service or services for another that chooses not to perform them in-house. For this research, the Embleton and Wright interpretation of outsourcing will be adopted.
Current literature on outsourcing iden-tifies differing viewpoints on what outsourcing covers. Some literature defines outsourcing as “hiring an outside company to handle all or part of an organizations data processing activities”

Volume 1 Issue 1 | July 2019
116 Fidēre: Journal of Business, Governance, and Information Technology
(Romney & Steinbart, 2006), while others sim-ply refer to outsourcing as “the assignment of an internal function to an outside vendor” (Ge-linas, Sutton & Hunton, 2005).
For this research, finance and account-ing outsourcing is defined as ‘the strategic use of an external third party organization to per-form all or part of an organization’s back of-fice functions within the organization’s envi-ronment.’ This definition has been determined from the contributions of literature on outsourc-ing and business process outsourcing and will be applied to the activity referred to as finance and accounting outsourcing (F&AO).
It is extensively claimed in the litera-ture that cost reduction is one of the main rea-sons tempting most small business to outsource their finance and accounting functions (Finan-cial Executive 2004). However, it seems that some other factors like “access to accountants with specialized skills” and “increased service levels” (Financial Executive, 2004) can also be put forward as an explanation of what influ-ences the decision to outsource the finance and accounting function. Most call center business owners want more than someone who simply fills in their tax forms and checks that financial reports are accurate. In truth, most small busi-ness owners want an advisor to take an active role in managing the business through rough years (Ray, 2007).
As the volume of outsourcing undertak-en by call center business escalates each year, the decision as to which activity to outsource becomes increasingly more difficult (Selim & Yiannakas , 2000), and as such, the decision to outsource any call center business activity should be considered very carefully due to the long lasting implications (Selim & Yiannakas 2000). Outsourcing evolved from activities nor-mally regarded as peripheral (such as cleaning, catering, and security), then expanded to in-clude critical areas such as payroll, accounts re-ceivable, and accounts payable (McIvor 2003).
This form of outsourcing is known as F&AO, or Finance and Accounting Outsourcing.
The incidence of outsourced accounting services is increasing, and many experts pre-dict a rapid growth in the outsourced account-ing market (Gildea 2005). Call center business managers are learning that outsourcing the fi-nance and accounting function is a sound busi-ness strategy (Jennings 2002).
Successful outsourcing of the finance and accounting function may provide ways for call center business to meet a diverse set of tac-tical and strategic objectives aimed at improv-ing decision-making activity while saving mon-ey and allowing the organization to focus on its core business activity (Jennings, 2002).
While great ideas and entrepreneurial skills are fundamental to a business start-up, good financial management is considered crit-ical to business survival (Gildea, 2005). The reason most small businesses fail is that they are not up to the challenges of effective finan-cial management and decision-making (Gildea 2005). This is where outsourcing the finance and accounting function becomes an alternative for call center business and service providers to consider in remaining competitive.
All organizations need relevant, time-ly, and accurate financial reports and analysis (Thiss, 2005). The needs are similar irrespec-tive of organizational size, but unlike larger organizations, a small business generally can-not afford to employ an in-house accountant. As such, outsourcing the internal accounting function can make sense for small business. It is generally regarded that the outsourcing of fi-nance and accounting functions by small busi-ness to organizations regarded as experts in the field, and can alleviate the burden of remaining abreast to frequent changes to tax codes and accounting regulations, as well as providing in-creased levels of information transparency, vis-ibility of controls, and clarity of accountability (Client Operations 2005). Turning to a qualified
117Outsourcing in Accounting and Expert Financial Controllers:
Empirical Study of the Philippine Call Center Business
Fidēre: Journal of Business, Governance, and Information Technology Volume 1 Issue 1 | July 2019
external outsourcing partner often becomes a logical step for small businesses struggling to find work strengths among their in-house per-sonnel (White, 2001).
In an age where the call center business focus is on core competencies, call center busi-nesses and service providers are increasingly outsourcing critical financial functions to ex-perts (Prahalad & Hamel 2000). Accounting is the core competency for many finance and ac-counting outsourcing providers, where they are experts in their fields.
Outsourcing is gaining popularity as a means of reducing financial and operational risks by making businesses easier to manage. As White (2001) points out, “improved risk man-agement has a direct correlation with improve-ments in financial performance and shareholder value,” and as continued pressure for improved financial performance increases, so do the lev-els of competency and demands for consistency in finance and accounting functions. “Outsourc-ing doesn’t work in every situation, but when it does, it is hard to argue with better financial reporting, decision making, and professional-ism as well as lower costs compared to in-house accounting” (Mulherin, 2006).
Statement of the ProblemThe aim of this study was to explore and
describe the outsourcing experiences among the call center businesses in the Philippines, and factors contributing to the arising of outsourc-ing instead of relying on the internal human re-sourcing and identifying the difference between the outsourced and the in-built internal employ-ees. Specifically, this study sought to answer the following questions: 1. What are the perceived decision factors
behind outsourcing practices? 2. What are the perceived differences be-
tween the outsourced internal account-ing functions among the call center firms?
3. What are the benefits of the outsourced accounting function to the call center or-ganizations?
Review of Related LiteratureThis chapter presents the review of liter-
ature and studies that are relevant to this study. This section focuses on finance and accounting outsourcing, a discipline- specific segment of the business process outsourcing industry. Key points in this section identified F&AO as being principally concerned with an organization’s back office activities. The activities outsourced may include all of the organization’s finance and accounting business processes. This section further identifies the needs of small business about finance and accounting activities, and the subsequent benefits of outsourcing these activi-ties to specialist service providers.
Accounting and Expert Financial Controllers Outsourcing
The roles of the small business owner are numerous and require extensive knowledge on all aspects of running a business. Organiza-tions regularly outsource the tasks they choose not to handle in-house, however small busi-nesses are not always so financially fortunate and are usually required to master certain tasks themselves or to hire a high salary employee to do so (Hirschman, 2000).
As the business environment continues to change rapidly and competition becomes more intense, small businesses are focusing more on their core competencies and outsourc-ing noncore activities and functions to external service providers (Kim & Won 2007). Business process outsourcing (BPO) is the outsourcing of business functions performed in-house by the white collar and clerical employees to achieve various benefits such as cost savings, better quality, and ability to focus on core competen-cies (Tutorial-Reports.com).

Volume 1 Issue 1 | July 2019
118 Fidēre: Journal of Business, Governance, and Information Technology
BPO involves outsourcing processes that are not core to an organization, but essential to the organization’s efficient operation (Tutori-al-Reports.com).
Further, Bagranoff, Simkin and Strand (2005) state “business process outsourcing is about specialization, allowing the organization to focus on core business processes.” BPO al-lows the organization to transfer complete re-sponsibility of specific non-core processes to the outsourcing service provider, who guar-antees certain service quality standards. BPO deals with an organization’s non-core processes and may include administrative support, docu-ment processes and finance and accounting out-sourcing.
Business process outsourcing has been increasingly used in today’s business practices (Zhu, Hsu & Lillie, 2001). Small businesses are searching for any strategy that can provide them with success. Outsourcing is one of these strategies that can lead to greater competitive-ness (Embleton & Wright, 2008). BPO typical-ly covers back-office financial operations like accounting, human resources, supply chain, and call center operations (Ephraim, 2005). Organizations are realizing that outsourcing al-lows them to focus on core competencies while leveraging BPO’s best-practices capabilities (Ephraim, 2005).
Call center business has outsourced so many activities in recent years; it was only a matter of time before the internal accounting function was to find itself next in the queue to receive the outsourcing treatment. Howev-er, while the decision to hand over to outside service providers support activities such as cleaning and security might be taken with some degree of ease (Selim & Yiannakas, 2000), the decision to outsource functions such as internal accounting should be taken with extreme cau-tion since such decisions could have long-last-ing implications.
As the amount of outsourcing undertak-en in a small business escalates year after year, decisions as to which activity or function to out-source inevitably become more difficult.
There can be no doubt that as long as outsourcing initiatives get closer to the orga-nization’s core and activities which are at the center of its future success, the risks involved will be greatly increased (Selim & Yiannakas, 2000).
Organizations outsource for various rea-sons; costly transactions, too much time spent on daily operations, the high cost of upgrading applications, lack of integrated processes, diffi-culty hiring or retraining process staff and lack of timely or accurate reports (Babcock, 2004).
Outsourcing has evolved from activi-ties normally regarded as peripheral, such as cleaning, catering, and security (McIvor, 2003) to include critical areas like payroll, accounts receivable and accounts payable. Due to the strategic importance of outsourcing (McIvor 2003), the decision to outsource is given more consideration by small businesses. Outlining his vision of the future, Drucker (2015) stated, “In another 10 to 15 years, organizations may be outsourcing all work that is “support” rather than revenue producing, and all activities that do not provide career opportunities into senior management. In many organizations majority of the people who work for them might be em-ployees of an outsourcing contractor.”
Outsourcing is not a new phenomenon. Small businesses have been outsourcing activi-ties and functions such as security, cleaning, and maintenance for decades. However, call center businesses are now outsourcing a whole range of activities or internal functions they would not have previously considered. Small businesses are increasingly rejecting the “we can do it all” mentality and are focusing solely on what they are best at and are outsourcing the rest.

119Outsourcing in Accounting and Expert Financial Controllers:
Empirical Study of the Philippine Call Center Business
Fidēre: Journal of Business, Governance, and Information Technology Volume 1 Issue 1 | July 2019
The specific arrangements of F&AO may differ between small businesses; however they usually entail the following functions of transfer from the client to the service provider which are: financial reporting, financial state-ment preparation, accounts payable process-ing, sales report processing, payroll processing, bank reconciliations, and cash balance report-ing (Laube & Roberts 2002). This transfer of functions means small business is no longer dependent on key accounting personnel to per-form internal accounting functions as the re-sponsibilities are turned over to the F&AO ser-vice provider. Outsourcing internal accounting functions means one less internal function that takes time and resources away from what deter-mines small business success (Laube & Roberts 2002), as clients gain access to better technol-ogy and expertise than they could afford to de-velop internally.
Call center business may regard out-sourcing of F&AO functions as “giving up control” of the vital business process; however, outsourcing internal accounting functions may be regarded as a way to gain control by man-aging the day-to-day operations of the business and paying someone else to report the numbers (Laube & Roberts 2002). More and more small businesses are recognizing the need to stay fo-cused on what they do best – their core compe-tency or process.
Outsourcing is a way of reducing finan-cial and operational risks by making them easi-er to manage (White 2001). With improved risk management correlating directly with improve-ments in financial performance and shareholder value, continued pressure for improved financial performance will increase, as will the levels of competency and consistency in finance and ac-counting functions (White 2001). “As call cen-ter businesses struggle to find work-strengths among their in-house personnel, turning to a qualified and external outsourcing partner often becomes a logical step” (White 2001).
In an age where the focus on core com-petency is the mantra (Prahalad & Hamel, 2013), call center businesses are increasingly outsourcing critical financial functions to ex-perts. Accounting is the core competency of many finance and accounting service providers who are experts in their field.
Cost reduction is one of the main rea-sons most small businesses outsource their fi-nance and accounting functions (Embleton & Wright, 2009). However, other factors such as increased flexibility, responsiveness, reduced risk, low cost, access to new business technolo-gy and reduced operating costs (Hosking 2004; Bengt 2005), can also influence the decision to outsource the finance and accounting function. Hosking (2004) identifies four key benefits of outsourcing: (1) Increased flexibility and re-sponsiveness for the business; (2) reduced risk; (3) lower cost access to new business technolo-gy; (4) and reduced operating costs.
Data processing tasks have long been a target for outsourcing (Bagranoff, Simkin & Strand 2005), with the outsourcing of account-ing functions such as accounts payable, accounts receivable, payroll, general ledger accounting, and financial reporting becoming more wide-spread. Finance and accounting business pro-cesses, including accounts payable, accounts re-ceivable, financial reporting, tax consulting and internal audit services are expected to be the most widely outsourced business process cate-gories in the near future (Financial Executive 2004). Spending on F&AO is estimated at $65 billion by 2006, a 12.3% five-year compound annual growth rate (Financial Executive 2004. p. 51). “Dunn & Bradstreet’s Global Barometer for outsourcing predicts F&AO will represent ten percent of the total worldwide market for outsourced services by 2005” (Financial Exec-utive 2004).
In a study of outsourcing, the Economist Intelligence Unit and Arthur Anderson found that 26 percent of organizations do outsource

Volume 1 Issue 1 | July 2019
120 Fidēre: Journal of Business, Governance, and Information Technology
some part of their finance and accounting func-tion, with 42 percent expected to outsource in the near future (Vollmers, 2000).
The data suggest a growing importance of F&AO, making it one of the fastest-growing sectors of the BPO industry. Thiss (2005) sug-gested that organizations need relevant, timely and accurate financial reports and analysis and that their needs are very similar, irrespective of the organization’s size. Unlike larger organiza-tions, small businesses generally cannot afford to employ an in-house accountant (Thiss 2005).
The Controller’s Report (2006) sug-gests many organizations have specialized de-partments to handle important operations, and that focusing on critical non-core functions like F&AO can distract business executives and detract from the organization’s ability to grow to its bottom-line. The report suggests this is where outsourcing the F&AO activities have found its niche. F&AO is about knowledge, skill, technology, and strategies to improve the organization’s ability to streamline its financial operations, and a holistic approach to F&AO can allow an organization to focus on its core business functions, leaving an expert resource to improve a key, non-core activity (The Con-troller’s Report, 2006).
Outsourcing doesn’t work in every sit-uation, but when it does, it is difficult to argue against better financial reporting, decision-mak-ing, and professionalism (as well as lower costs) when compared with in-house account-ing (Mulherin 2006). As Thiss (2005) suggests: “if you’re a small to mid-size business, chances are, you cannot afford to hire the breadth of ex-pertise you may require”; and that “with a few exceptions, outsourcing accounting can result in operating cost reductions and better strate-gic insight. No matter your size, your needs are constantly changing” (Thiss 2005).
By relying on external service providers for activities viewed as secondary to their core business, small business finds that they can si-
multaneously reduce their costs and at the same time maintain, or even improve, the quality of their output (Selim & Yiannakas, 2000).
Outsourcing the internal accounting function may be relatively new, but with these benefits, it is easy to see why it is here to stay (Mulherin, 2006). Organizations are embracing outsourcing internal accounting functions as they realize that they have certain limitations and that specialized service providers have the strengths of their limitations (Selim & Yianna-kas, 2000).
Outsourcing The effectiveness of outsourcing may
come in part from cost savings that outsourcing service providers can achieve with economies of scale. Furthermore, outsourcing fees can be fully tax deductible resulting in reduced federal income taxes (Bagranoff et al. 2005). Outsourc-ing for cost reasons can occur when provider’s costs are low enough that even with added over-head, profit and transaction costs, providers can still provide a service for a lower cost. Kremic, Tukel, and Rom (2006) state that specializations and economies of scale are mechanisms used to achieve these levels of efficiency, and cost sav-ings due to outsourcing can be quite significant. If an activity or function is to be outsourced for cost reasons, it assumed that the current in-house costs are considered higher than the ex-pected costs of outsourcing the activity or func-tion. Organizations outsource to reduce costs, therefore the higher the internal cost to perform the activity or function relative to the expected cost, the more likely the activity or function is to be outsourced (Kremic, Tukel & Rom 2006). Outsourcing enables organizations to stabilize their data processing operations, particularly with regards to fluctuating seasonal activity and personnel requirements, by paying outsourcing service providers fixed monthly fees for ser-vices provided based on the levels of activity (Bagranoff et al. 2005).

121Outsourcing in Accounting and Expert Financial Controllers:
Empirical Study of the Philippine Call Center Business
Fidēre: Journal of Business, Governance, and Information Technology Volume 1 Issue 1 | July 2019
Furthermore, Kremic, Tukel and Rom (2006) in their paper Outsourcing decision sup-port: a survey of benefits, risks, and decision factors identify a range of expected benefits including cost savings, reduced capital expen-diture, increased speed of service, greater flex-ibility, access to latest technology, access to skills and talent, staff augmentation, increased focus on core activities, legal compliance, and improved accountability and management.
Beaumont and Sohal (2004) suggest the criteria used to evaluate outsourcing decisions maybe multidimensional and intangible, and apart from being able to estimate cost savings, the organization should also consider the intan-gible impacts of freeing up management time and dependence upon the outsourcing service provider.
Additional to the benefits and risks of outsourcing, there are other factors such as strategy, cost, and function characteristics which may impact the outsourcing decision (Quinn 2009). Core competence may be seen as a strategic factor linked to the outsourcing deci-sion and as providing a competitive advantage to small businesses. It is widely recognized in the literature that identifying what a core func-tion is will have a bearing on whether or not to outsource it (Quinn 2009: Lankford & Parsa 2009: Prahalad & Hamel 2000).
Quinn (2009) suggests that ‘those ac-tivities—usually intellectually-based service activities—that the organization performs better than any other enterprise’ are core ac-tivities. That is, a function or activity that is core to the organization is less likely to be outsourced.
The ideas of core competence and its re-lationship to outsourcing have evolved from the work of Prahalad and Hamel (2013), who argue that the real sources of competitive advantage are to be found in management’s ability to con-solidate corporate-wide technologies and pro-duction skills into competencies that empower
individual businesses to adapt rapidly to chang-ing business opportunities.
Some issues are involved in the out-sourcing decision by organizations, with this, Lankford and Parsa (2014) suggest the follow-ing as key items for consideration:• Impact on the organization’s competitiveness• Identifying the services to be outsourced• The number of service providers to be used• Service provider reliability• Service provider service quality• The ability to return to in-house operations if
required.• Coordinating with the service provider and
evaluating performance.• Providing the latest/advanced technology and
expertise.
Many small businesses are increasingly involved in outsourcing due to changes in tech-nology, organizational structure, strategic plan-ning, and customer demands (Ray 2008). Small businesses have been both vendors and clients from this trend, as many small businesses pur-chase the expertise they lack, the expertise they cannot develop themselves, or can purchase at lower cost (Ray 2008).
Many businesses purchase payroll and accounting services from other small business-es (Gale Group 1998), while others purchase software and services from other small busi-nesses.
Conversely, many small businesses are vendors that provide specialized services. The advantages of outsourcing can be operational, strategic, or both (Lankford & Parsa, 2009). Where operational outsourcing may provide short term trouble avoidance, strategic out-sourcing may offer long term solutions in maxi-mizing opportunities as a long-term relationship may enable service providers to accomplish their strategic planning through co-ordinat-ing their efforts and the efforts of their clients (Hoffman & Kranhke, 2013). All too often, the

Volume 1 Issue 1 | July 2019
122 Fidēre: Journal of Business, Governance, and Information Technology
small business approaches outsourcing as a tac-tical or short-term solution.
Recently the main drivers for outsourc-ing appear to be shifting from cost to strategic issues such as core competence and flexibility (Lankford & Parsa, 2009). Outsourcing as a strategy may offer improved business perfor-mance on numerous dimensions (Prahalad & Hamel, 2015). The most often cited strategic reason for outsourcing is to allow small busi-ness to better focus on its core competencies (Quinn & Hilmer 2014).
Flexibility appears to be an important driver not just from a scale perspective but also regarding the scope of the product or service, as a small business needs to react quicker to customer requirements, and outsourcing is seen as a way to accomplish this (Kremic, Tukel & Rom, 2006).
The rapid growth of outsourcing sug-gests that small businesses expect benefits from outsourcing. Expected benefits of outsourcing as suggested by Kremic, Tukel, and Rom (2009) include realizing the same or better service at a lower overall cost, increased flexibility, access to latest technology, access to greater levels of expertise and the ability to re-focus scarce re-sources onto core functions.
Outsourcing is a rather recent strate-gy of call center business, where the complete costs are not always known. This poses a risk and while it is recognized that all the potential risks of outsourcing are not currently known, Kremic, Tukel and Rom (2006) suggest the fol-lowing as potential risks associated with out-sourcing: unrealized savings with a potential for increased costs, employee moral savings, over dependence on a supplier or service provider, lost corporate knowledge, and dissatisfied cus-tomers.
In today’s environment, outsourcing selected small business activities is becoming an integral part of the small business strate-gy. Activities considered as non-core to small
business such as payroll, human resources, and information systems are more frequently being outsourced to external service providers (Lank-ford & Parsa, 2009).
Theorists and practitioners alike, claim that outsourcing non-core competencies allow an organization to strategically focus on its pri-mary business and that while most areas where outsourcing occurs fit this non-core definition, a look at the activities less often outsourced leads to questions as to whether the move to outsourc-ing usually is driven by key competency focus. Areas such as investment analysis, financial re-porting, receivables management and financial information systems are hardly core competen-cies for most small businesses.
Some authors (including Quinn et al. 2014) emphasize the benefits of outsourcing in providing increased focus on a set of core ac-tivities and reduction in the functional scope of the organization, enabling the development of a more focused organization capable of increased responsiveness to market change. The comple-mentary use of outside resources can also pro-vide opportunities for enhanced leverage of the organization’s core resources.
A potential obstacle for service provid-ers is whether their client perceives outsourcing from a strategic or tactical perspective (Hoff-man & Kranhke n.d, 2009). If clients view outsourcing strategically, then benefits may be realized by the service provider. This is espe-cially true if the service provider and client can develop a strategic alliance allowing the service provider to plan, hire, train staff, and monitor quality; and thus provide a quality service to its client (Hoffman & Kranhke n.d, 2009).
MethodologyThis chapter briefly presents the meth-
ods and procedures used by the researcher in responding to the problem of the study. This includes the research design, population and sampling techniques, the instrumentation, data

123Outsourcing in Accounting and Expert Financial Controllers:
Empirical Study of the Philippine Call Center Business
Fidēre: Journal of Business, Governance, and Information Technology Volume 1 Issue 1 | July 2019
gathering procedure, and the statistical treat-ment of the data.
Research Design The study adopted a qualitative phe-
nomenological design. By utilizing this design, the researcher was able to explore the outsourc-ing of experts in the call centers; hence, having deeper understanding of the situations because qualitative research is used when little is known about the given phenomenon (Creswell, 2003; Hollyway & Wheel, 2010; Lapan, Quartoli & Reimer, 2012; Marshall & Ross, 1989). Patton (2005) explains that using qualitative research, the data is analyzed from direct fieldwork obser-vations, in-depth, open-ended interviews, and written documents. Qualitative researchers en-gage in naturalistic inquiry, studying real-world settings inductively to generate rich narrative descriptions, and constructing case studies. In this study, the researcher utilized qualitative re-search in the form of phenomenology as it fo-cused on outsourcing factors among call center businesses in the Philippines.
Selection of participants:Convenience sampling was used in se-
lecting the call center companies’ informants from a population of registered companies op-erating in the Philippines. Convenience sam-pling is when the researcher selects participants because they are willing and available to par-ticipate; furthermore, all have equal chances of participation. Relying on phenomenological design in line with content, data were gathered though interview from 17 businesses call center top managerial levels in five different firms.
Data Gathering Techniquesand Procedures
The researcher relied on a semi-struc-tured interview by utilizing open ended ques-tions to collect appropriate data relevant to the study. According to Patton (2002), probes and
open-ended questions yield in-depth responses about people’s experiences, perceptions, opin-ions, feelings, and knowledge. In this study, the researcher interviewed top financial, manage-rial leaders using open-ended questions to ex-plore the reasons behind outsourcing on finan-cial experts.
The researcher utilized two kinds of in-terviews which included the focused interview, where top managers were in groups and also in-dividual one-on-one interviews. Focused groups interview were conducted among the specific fi-nancial managers or team leaders while as indi-vidual interviews were conducted among those that felt comfortable being interviewed alone.
Pilot TestingCreswell(2012) states that pilot testing
is a procedure wherein the researcher makes changes in an instrument based on the feedback from a small number of participants who com-pleted and evaluated the instrument. It assisted the researcher in determining if there are flaws, limitations, or other weakness within the inter-view design and enabled to make necessary re-visions before the implementation of the study.
After validation of the instruments by experts, an interview that lasted 20minutes was conducted with one of the selected high ranking financial managers. The results indicated that the participant understood exactly the intentions of the study, referring to ease in answering with less difficulty; hence, there was no need for ad-justments.
Data Analysis In qualitative research, data analysis
consists of preparing and organizing the data, then reducing data into themes through a pro-cess of coding and condensing the codes, and finally representing the data in figures, tables, or discussions (Crabtree and Miller (1999). With-in this study, the transcribed one-on-one and focus group interview data were coded using

Volume 1 Issue 1 | July 2019
124 Fidēre: Journal of Business, Governance, and Information Technology
template approach. For research question No.1 the researcher also used thematic analysis in an-alyzing data gathered for Research Question 2 and 3. A theme captures something important about the data about the research questions and represents some level of patterned response or meaning within data set.
Thematic analysis is a qualitative ana-lytic method used for analyzing and reporting patterns or themes within data. It minimally or-ganizes and describes data in detail as well as interprets various aspects of the research topic (Braum, 2006).
According to Braun and Clarke (2006), there are six phases in conducting a thematic analysis. The first is becoming familiar with the data. The phase involves the researcher’s knowledge of the data collected as well as the initial analytic interests or thoughts. Moreover, the researcher read through the entire data set before actual data coding.
Ensuring Trustworthiness The researcher applied four strate-
gies suggested by Denzin and Lincoln (1994): credibility, transferability, dependability, and conformability. Krefiting (1991) considers credibility as the key strategy to ensure trust-worthiness. To avoid credibility of the data that was gathered, the researcher used triangulation, which refers to the use of multiple referents to conclude what constitutes truth. This method helped capture a more complete and conceptu-alized portrait of the cases that were studied.
Triangulation can be an important strat-egy for establishing rigor in qualitative work as opposing perspectives can bring an increased understanding of the data, and it is also a power-ful strategy than enhances quality research par-ticularly credibility(Creswell, 1998, 2003; Wa-terfield, 2004; Krefting, 1991; Li, 2004). There are five types of triangulation, namely; triangu-lation of data methods, triangulation methods, theoretical triangulation, triangulation of inves-
tigators, and environmental triangulation (Knafl & Breitmayer, 1989). To achieve validity and credibility of the data gathered in this study, the researcher used triangulation of data sources and environmental triangulation.
The researcher used environmental tri-angulation which involved the use of different settings and locations. The researcher collect-ed data in different regions in the Philippines. These included Makati, Quezon Global Village, and Nuvali. The researcher also used triangula-tion by data methods where data was collected by various means which include focus group in-terviews and individual interviews.
Transferability, according to Lincoln and Guba (1985), is the degree to which results of a given qualitative study can be transferred to a different setting if used with a different pop-ulation. This simply means that other readers can apply the findings to their own. To provide transferability, the researcher presented findings with detailed descriptions through deep analysis of the statements.
Thirdly, dependability is the stability of the findings over time and conformability to the internal coherence of the data about the find-ings, interpretations, and recommendations. It is the ability of the researcher to know where the data in a given study comes from, how it was collected, and how it was used (Denzin, 1994; Lincolin & Guba, 1985). The researcher ensured dependability through member checks where a trusted assistant and expert, i.e., the adviser, and methodologist examined the data transcription to ensure it was accurate.
Lastly, Shank (2006) states that con-formability deals with the details of the meth-odologies used; and it is achieved through an audit trial which addresses issues such as nature and type of raw data, how it was analyzed and how the categories and themes were formed. Moreover, conformability not only provides a clear picture of the methodology but also a clear map for other similar or related studies to be

125Outsourcing in Accounting and Expert Financial Controllers:
Empirical Study of the Philippine Call Center Business
Fidēre: Journal of Business, Governance, and Information Technology Volume 1 Issue 1 | July 2019
conducted. This study provided a detailed de-scription of the qualitative research design that was used. Through the data transcription, the researcher was able to adopt the thematic anal-ysis to formulate cluster themes and emergent themes from the findings of this study.
Ethical ConsiderationsPrior to the commencement of the pro-
posed study, research studies involving human participants require ethical approval. This is done to ensure that the right, dignity, and pri-vacy of the participants are protected and risks minimized (Denzin & Lincoln, 2005).
In this particular study, participants were assured that their participation or the in-formation they provided was not going to be used against them as confidentiality was con-sidered. The participants also had the right to voluntarily decide whether or not to participate in the study. The participant had all the chances of raising concerns or asks questions as well as to withdraw if necessary. The participants were enlightened on the researcher’s responsibilities, risks, and benefits that might occur. To protect the participant’s identity and maintained confi-dentiality, the researcher used pseudonyms in-stead of names.
After the participants have been ex-plained about the study, the researcher answered all their questions in relation to the research for clarity. The participants who wished to take part in the study were then required to sign an informed consent from prior to the commence-ment of the interview.
Results and Discussion This final chapter focuses on the themes
that emerged from the participants’ narrative of the outsourcing experience among the call cen-ters business. The findings of the reported study are discussed thematically and arranged by the participants’ reasons for outsourcing based on their experiences and other factors.
Accounting and ExpertFinancial Controllers
To answer the Research Question 1, “What are the perceived decision factors be-hind outsourcing practices?” Six cluster themes were formulated from the situation that finan-cial managers perceive the decisions behind outsourcing practices in their call center busi-nesses. These clusters were further merged into three emergent themes based on Embleton and Wright’s definition of outsourcing. Embleton and Wright (2008) define outsourcing as having an outside vendor provide services previously performed in-house, the transfer of “routine and repetitive tasks” to outside providers, and the paying of other organizations to provide that work. They further explained that outsourcing is about the strategic use of resources outside the small business in order to perform activi-ties that otherwise would have been done by in-house personnel using in-house resources.
Whatever definition is employed, out-sourcing may be viewed as an arrangement in which one organization provides a service or services for another that chooses not to perform them in-house. For this research, the Embleton and Wright interpretation of outsourcing will be adopted.
Outsourcing may be seen as a strategic or tactical initiative adopted by call center busi-ness to satisfy increasing demands of compet-itiveness and sustainability through increased cost savings and improved core activity focus. While outsourcing can often help control costs, simplify operations, and keep the call center business focused on its core competencies, it will not work unless it is properly implement-ed. It should be noted that outsourcing may fail due to inadequate requirements being defined by the client, lack of guidance in planning or managing the outsourcing arrangement, or be-cause of misconceptions between the client and service provider resulting in poor communica-tions.

Volume 1 Issue 1 | July 2019
126 Fidēre: Journal of Business, Governance, and Information Technology
Call Center Business has outsourced so many activities in recent years; it was only a matter of time before the internal accounting function was to find itself next in the queue to receive the outsourcing treatment. Howev-er, while the decision to hand over to outside service providers supports activities, such as cleaning and security, might be taken with some degree of ease (Selim & Yiannakas, 2000) the decision to outsource functions such as internal accounting should be taken with extreme cau-tion since such decisions could have long-last-ing implications.
“As the amount of outsourcing under-taken in a call center business escalates year after year, decisions as to which activity or function to outsource inevita-bly becomes more difficult Sw.”
Participant Sw has worked in call center business for 20 years and still feel and perceives outsourcing as a necessity in an organization which is generally accepted that not all tech-nocrats are available in a certain organization whereby they are always compelled to look out for experts from outside to offer services at an agreed amount of money or signed contract.
Participant PM, a financial manager at IBM who is in charge of the financial and ac-counting section, has worked for eight years in the same position and stated his understanding that “outsourcing and decision making do not always go along.” Similarly, AP also perceives outsourcing and decision making as a threat to the entire organization since the outsourced people, who are experts and are considered out-siders, might take off some confidential finan-cial information of a particular organization.
Participant D, a financial manager and administrator in E-Performax Contact Center Corp and subsidiaries, perceived outsourcing as a critical program that is a necessity to an organization, most especially to the growth and financial sustainability.
For me, I can say outsourcing is very important for the challenging situations most especially the firm is sinking into financial setbacks, and felt like a failure to consider an outsider might result into an organization being declared bank-rupt (D).
Participant P, a chief finance officer in Convergys Corporation, has worked for 12 years and is currently taking up another role outside finance and is also a manager, mentions that outsourcing is a great deal for an organiza-tion’s growth as it brings in a healthy competi-tion among the in house employees who get to learn new things while the outsourced experts are working out the projects. Performance is expected to technically get higher than expect-ed from the expatriates hired. Participant G, also mentions about the growth and stability of the organization because of the newly acquired skills through outsourcing.
Some authors (including Quinn et al. 2014) emphasize the benefits of outsourcing in providing increased focus on a set of core ac-tivities and reduction in the functional scope of the organization, enabling the development of a more focused organization capable of increased responsiveness to market change. The comple-mentary use of outside resources can also pro-vide opportunities for enhanced leverage of the organization’s core resources.
A potential obstacle for service provid-ers is whether their client perceives outsourcing from a strategic or tactical perspective (Hoff-man & Kranhke n.d). If clients view outsourc-ing strategically, then benefits may be realized by the service provider. This is especially true if the service provider and client can develop a strategic alliance allowing the service provid-er to plan, hire, train staff, and monitor quality; and thus provide a quality service to its client (Hoffman & Kranhke n.d, 2009).

127Outsourcing in Accounting and Expert Financial Controllers:
Empirical Study of the Philippine Call Center Business
Fidēre: Journal of Business, Governance, and Information Technology Volume 1 Issue 1 | July 2019
In addressing the issue of strategic out-sourcing Quinn and Hilmer (2014) emphasize the need for the organization to concentrate re-sources on a set of core competencies “where it can achieve definable pre-eminence and pro-vide unique values for customers … strategi-cally outsourcing other activities … including many traditionally considered aspects that are integral to the organization” (Quinn & Hilmer, 2000).If the client views outsourcing as a tac-tical initiative, the service provider is subject to that client’s fluctuating demands. Irregular or fluctuating demand may cause the service provider difficulty in satisfying the client’s de-mands, which may result in problems with turn-over, morale, poor service quality, costs and inefficiencies (Hoffman & Kranhke n.d). This, in turn, may decrease the small business’s prof-itability, sustainability, future competitiveness, and survival.
Outsourced Expatriates on Operations. This section presents themes extracted
from the impacts of outsourcing to the orga-nization whereby some firm’s functions gen-erate or activities that generate data or knowl-edge which the organizations may not be able to control over when it comes to outsourcing. The difference was answered through research Question 2. “What are the perceived differenc-es between the outsourced internal accounting functions among the call center firms?”
The ideas of core competence and its relationship to outsourcing have evolved from the work that is in-house built, Participant E a financial manager with AIG Business Process-ing Services in Makati head offices argues that the real sources of competitive advantage are to be found in management’s ability to consoli-date corporate-wide technology and production skills into competencies that empower individ-ual business to adapt rapidly to changing busi-ness opportunities.
Participant E, from CitiGroup Business Process solutions, identifies the lack of hu-man resources in the organizations “To access to people with specialized knowledge may be an issue, an activity or function is more like-ly to be outsourced if there is lack of internal human resources to perform. Impact on quali-ty is another strategy factor as the quality of an organization’s services establishes a reputation and can create demand. Quality of the services and its impact on the organization may be seen as a positive or negative factor influencing the outsourcing decision by the call center business organizations.
Participant J suggests that the advan-tages of outsourcing can be both operational or strategized. Similarly, participant I, an au-ditor in iTouchPoint Financial Technologies, Incorporated had this to say, while operation-al outsourcing may provide short term trouble avoidance, strategic outsourcing may offer long term solutions in maximizing opportunities as a long-term relationship may enable service providers to accomplish their strategic planning through co-ordinating their efforts and the ef-forts of their clients. She further notes that Flex-ibility appears to be an important driver not just from a scale perspective but also with regards to the scope of the product or service, as call cen-ters business need to react quicker to customer requirements and outsourcing is seen as a way to accomplish this.
Participant B, a financial controller in KGB Phils, Inc, and Subsidiary (formally IN-FONXX) expressed the advantages of outsourc-ing; Outsourcing is a rather recent strategy of the small business, where the complete costs are not always known. This poses a risk, yet it is recognized that all the potential risks of out-sourcing are not currently known. She further suggests that,
Outsourcing has potential risks associ-ated with outsourcing:- unrealized sav-ings with a potential for increased costs,

Volume 1 Issue 1 | July 2019
128 Fidēre: Journal of Business, Governance, and Information Technology
employee moral savings, over depen-dence on a supplier or service provider, lost corporate knowledge and dissatis-fied customers.
In today’s environment, outsourcing se-lected call center business activities are becom-ing an integral part of the small business strat-egy. Activities considered as non-core to small business such as payroll, human resources, and information systems are more frequently being outsourced to external service providers (Lank-ford & Parsa, 2009).
Theorists and practitioners alike, claim that outsourcing non-core competencies allow an organization to strategically focus on its primary business, while most areas where out-sourcing occurs fit this non-core definition, a look at the activities less often outsourced leads to questions as to whether the move to outsourc-ing usually is driven by key competency focus. Areas such as investment analysis, financial re-porting, receivables management, and financial information systems are hardly core competen-cies for most small businesses.
Outsourcing decisions and transactions are typically large and complex, strategically and operationally important, and involve signif-icant organizational strain (Mazzawi 2002).
As such, success in outsourcing is driv-en by the quality of the relationship between the service provider and the small business client, rather than the fine details of the outsourcing arrangement. Successful outsourcing by small business is dependent on trust. Aligned, mutu-ally beneficial outsourcing relationships deliver results and build-in the room to maneuver which allows both parties to ensure that the outsourc-ing arrangement remains appropriate to their circumstances and business imperatives. Out-sourcing is a hierarchical sequence of decisions (Beaumont & Sohal 2004), with the fundamen-tal decision as to whether or not to outsource a business process or activity.
Perceived Benefits of OutsourcingThis section presents the theme extract-
ed from lived experiences of top managers on issues concerning outsourcing, it only focused on the upsides of the outsourcing. Two major themes emerged.
Organizations outsource for various rea-sons; costly transactions, too much time spent on daily operations, the high cost of upgrading applications, lack of integrated processes, diffi-culty hiring or retraining process staff, and lack of timely or accurate reports. Research question 3 is, “What are the benefits of the outsourced accounting function to the call center organiza-tions?” which answers the reasons behind out-sourcing. Many situations lived experiences of being stuck at work with lots of projects have been brought up. Resources, in this case, are based on equipment and right skills needed to accomplish a certain project which is not only in accounting but also even in other various de-partments at large in the organization.
Participant S, a financial manager work-ing with Accenture, Inc Phils mentioned that outsourcing is not a new phenomenon. Small businesses have been outsourcing activities and functions such as security, cleaning, and main-tenance for decades. However, call center busi-nesses are now outsourcing a whole range of activities or internal functions they would not have previously considered. Small businesses are increasingly rejecting the “we can do it all” mentality and are focusing solely on what they are best at and are outsourcing the rest.
The specific arrangements of F&AO may differ between call center businesses, how-ever they usually entail the transfer from the cli-ent to the service provider the following func-tions; financial reporting, financial statement preparation, accounts payable processing, sales report processing, payroll processing, bank rec-onciliations and cash balance reporting.
Participant A, states how the organiza-tion benefits in critical areas like payroll, ac-

129Outsourcing in Accounting and Expert Financial Controllers:
Empirical Study of the Philippine Call Center Business
Fidēre: Journal of Business, Governance, and Information Technology Volume 1 Issue 1 | July 2019
counts receivable and accounts payable. Due to the strategic importance of outsourcing the de-cision to outsource is given more consideration by small businesses. Outlining his vision of the future, he further says;
“In another 10 to 15 years, organizations may be outsourcing all work that is “support” rather than revenue producing, and all activities that do not provide career opportunities into se-nior management. In many organizations, a ma-jority of the people who work for them might be employees of an outsourcing contractor.”
Call center business may regard out-sourcing of F&AO functions as “giving up control” of the vital business process, however outsourcing internal accounting functions may be regarded as a way to gain control by man-aging the day-to-day operations of the business and paying someone else to report the numbers (Laube & Roberts 2002). More and more small businesses are recognizing the need to stay fo-cused on what they do best – their core compe-tency or process.
Outsourcing is a way of reducing fi-nancial and operational risks by making them easier to manage (White 2001). With improved risk management correlating directly with im-provements in financial performance and share-holder value, continued pressure for improved financial performance will increase, as will the levels of competency and consistency in finance and accounting functions (White 2001). “As call centers businesses struggle to find work-strengths among their in-house personnel, turn-ing to a qualified, external outsourcing partner often become a logical step” (White 2001).
Cost reduction is one of the main rea-sons most small businesses outsource their fi-nance and accounting functions (Embleton & Wright, 1998). However, other factors such as increased flexibility, responsiveness, reduced risk, low cost, access to new business technolo-gy and reduced operating costs (Hosking 2004; Bengt 2005), can also influence the decision to
outsource the finance and accounting function. Hosking (2004) identifies four key benefits of outsourcing: Increased flexibility and respon-siveness for the business, reduced risk, lower cost access to new business technology, and re-duced operating costs.
In a study of outsourcing, the Economist Intelligence Unit and Arthur Anderson found that 26 per cent of organizations does outsource some part of their finance and accounting func-tion, with 42 per cent expected to outsource in the near future (Vollmers 2000).
The data suggest a growing importance of F&AO, making it one of the fastest-growing sectors of the BPO industry. Thiss (2005) sug-gested organizations need relevant, timely and accurate financial reports and analysis; which shows that their needs are very similar, irrespec-tive of the organization’s size. Unlike larger or-ganizations, small businesses generally cannot afford to employ an in-house accountant (Thiss 2005).
Outsourcing doesn’t work in every sit-uation, but when it does, it is difficult to argue against better financial reporting, decision-mak-ing, and professionalism (as well as lower costs) when compared with in-house account-ing (Mulherin 2006). As Thiss (2005) suggests: “if you’re a small to mid-size business chances are, you cannot afford to hire the breadth of ex-pertise you may require”; and that “with a few exceptions, outsourcing accounting can result in operating cost reductions and better strate-gic insight. No matter your size, your needs are constantly changing” (Thiss 2005).
By relying on external service providers for activities viewed as secondary to the core business, small businesses find that they can si-multaneously reduce their costs and at the same time maintain, or even improve, the quality of their output (Selim & Yiannakas, 2000).
Outsourcing the internal accounting function may be relatively new, but with these benefits, it is easy to see why it is here to stay
Volume 1 Issue 1 | July 2019
130 Fidēre: Journal of Business, Governance, and Information Technology
(Mulherin, 2006), organizations are embracing outsourcing internal accounting functions as they realize that they have certain limitations and that specialized service providers have the strengths of their limitations (Selim & Yianna-kas, 2000).
ConclusionsOutsourcing of accounting and finan-
cial experts to offshore locations causes some ripples in the company as serious hardships to in-house employees and their families is the result. However, if proper efforts are taken the call center company can ensure that the knowl-edge pool and highly talented employees are maintained in the company. The company also should keep in mind the economic aspects of ensuring cost reduction as a result of outsourc-ing operations.
When call center companies expand their operations, they need to ensure that they keep in mind the impact of strategic evaluation, relationship commitment, and contractual com-pleteness.
There are some issues which are cur-rently unknown about outsourcing. As the mag-nitude of outsourcing, the resultant benefits and effects are not identified very clearly. From what is known the researchers would like to conclude the research by identifying the following con-clusion:
Outsourcing of companies in call center industry in the Philippines could impact their fi-nancial, competitive performance.
Global economic integration as well as technology developments are bound to have an impact on actual jobs of people in the Philip-pines. This will cause issues concerning em-ployment relationships and may alter probable incentives for human capital accumulations.
Outsourcing has always been seen to be connected to the increase of Philippines em-ployment and investment rather than overall job loss. Many call center jobs are lost to other
countries around the globe. In general, never-theless, firms involved with offshore outsourc-ing are not shifting net jobs overseas and only are creating jobs both in the Philippines and other Asian countries around.
ReferencesAgarwal, R., Echambadi, R., Francom, A. M.,
and Sarkar, M. B. (2004). Knowledge transfer through inheritance: Spin-out generation, development, and surviv-al. Academy of Management Journal, 47:501-522
Amiti, M & Wei, S J (2006). “Should You Out-source Accounting and Finance?” The-Journal of Corporate Accounting & Fi-nance 17(6): 11.
Andrews Mazzawi (2002). “The virtual control-ler.” CA Magazine, October 1, 41–42. http://www.proquest.com.ezproxy.scu.edu.au/ (accessed June 15, 2017).
Barrar, P, Wood, D, Jones, J & Vedovato, M ( 2002). “The efficiency of accounting service provision.” Business Process Management Journal 8(3) 1463–7154): 195–217.
Beaumont & Sohal (2004). “Outsourcing mar-ket grows in popularity with compa-nies.” International AccountingBulletin, February, 14, 4. http://www.proquest.com.ezp roxy.scu.edu.au/ (accessed June 6, 2017)
Bernice, K & Meredith, GG (1997). “Relation-ships among owner/manager personal values, business strategies, and enter-prise performance.” Journal of Small Business Management 35(2): 37.
131Outsourcing in Accounting and Expert Financial Controllers:
Empirical Study of the Philippine Call Center Business
Fidēre: Journal of Business, Governance, and Information Technology Volume 1 Issue 1 | July 2019
Embleton and Wright (2008). “The outsourc-ing of the accounting function won a high-profile endorsement in October.” IOMA Financial Executive’s News, Jan-uary 1, 8–9. http://www.proquest.com. ezproxy.scu.edu.au/
Gelinas, Sutton & Hunton (2005). “Business Process Reengineering: Where Do Knowledge-based Systems Fit?” IEEE Expert, Vol. 8 No. 1, February.
Hoffman & Kranhke n.d, (2009). “Hackett Sur-vey Reveals Doubts About Outsourcing Finance and Accounting.” The Control-ler’s report(6):1
Jennings Samson (2002). “Outsourcing.” A to Z of Management Concepts and Models. London, GBR: Thorogood.
Kaplan, R.S., & Norton, D.P. (2006). The Bal-anced Scorecard: Translating Strategy into Action, Harvard Business School Press, Boston, MA. Retrieved from www.ncbi.nlm.nih.gov/pubmed/19765507
Kapler, J.K. (2007). The Theory of the firm, the theory of competition and the trans-national corporation, competition & change, Vol. 11(4), pp. 287-306. Re-trieved from www.http.competititon.fi-nancial/com.34/33-243.
Kastens, M.L. (2009). Long-range planning for your business: An Operating Manual, AMACOM, New York, NY. Retrieved from http://www.cnn.com/2012/04/ 30/world/asia/philippines-finances
Laube & Roberts (2002). “Outsourcing in Aus-tralia.” International Journal of Opera-tions & Production Management. 24(7): 688–700
McIvor Peterson, (2003). “Five outsourcing solutions for financial institutions.” Op-erations Management Report, February 1, 1–2. http://www.proquest.com.ez-proxy.scu.edu.au/ (accessed August 10, 2006).
Mulherin (2006). “Fear of service outsourcing: is it justified?” Economic Policy20(42): 308–347.Anderson, JR & Richard, NV
Osmond, V. (2011). Evaluation & auditing stan-
dards for internal control over financial. Retrieved from http://www.aicpa.org/Research/Standards/AuditAttest/Down-load ableDocuments/AT-00501.pdf
Padoa-Schioppa, T., (2002). Central banks and financial stability: exploring a land in between, paper presented at the second ECB central banking conference, Frank-furt am Main. Retrieved from http://papers.ssrn.com/sol3/papers.cfm? ab-stract_id=1143666
Pandey. M (2012). Financial management 7thed. New Delhi: Vikas Publishing House Pvt Ltd. India internal control integrated framework: Retrieved from http://www.aicp a.org/Research/Standards/AuditAt-test/DownloadableDocuments
Romney & Steinbart (2006). “Outsourcing market grows in popularity with com-panies.” International Accounting-Bulletin, February, 14, 4. http://www.proquest.com.ezproxy .scu.edu.au/ (ac-cessed May 6, 2017)
The Controller’s Report, (2006). “Quantifying Outsourcing Intangible Benefits.” A Glomark-Governan White Paper. Third EditionAikins, J

Volume 1 Issue 1 | July 2019
132 Fidēre: Journal of Business, Governance, and Information Technology
Selim & Yiannakas , (2000). “The outsourc-ing of the accounting function won a high-profile endorsement in October.” IOMA Financial Executive’s News 02(1): 8.
Volume 1 Issue 1 | July 2019
133Fidēre: Journal of Business, Governance, and Information Technology
Abstract
This study explored the relationship between vision, mission, policy, adminis-trative support, customer demand and organizational innovation in selected hospitals in the Philippines. A quantitative research study using descriptive
correlation design was done in targeting 300 respondents whereas 276 (92%) full-time workers that include regular and non-regular participated by answering and returning the survey questionnaires. The descriptive statistics findings showed that the vision, mission, and policy, are perceived by the respondents to be good. The level of administrative support in terms of supervision, training, and accountability is perceived to be high and customer demand in the hospitals is also perceived to be high by the respondents. The study also revealed that the level of organizational innovation in terms of marketing innovation, product innovation, and process inno-vation is high as perceived by the respondents. The statistical result also revealed that there is a positive correlation between vision, mission, policy, and overall orga-nizational innovation, vision (r = .418 (p-value = 0.000) mission (r = .352, p-value = 0.000) and policy (r = .44, p-value = 0.000). There is also a positive correlation between administrative support and overall organization. Customer demand also correlated positively with organizational innovation respectively. The hospitals un-der study are perceived with high innovation in their various departments.Keywords: vision, mission, policy, administrative support, customer demand, orga-nizational innovation
vision, Mission, poliCy, adMinisTraTive supporT, and CusToMer
deMand as prediCTors of organizaTional innovaTion
of seleCTed hospiTals in The philippinesMajeed Dramani Mahama, Lualhati Parulan Sausa
College of Business, Adventist University of the Philippines
Researchers from different disciplines and with different perspectives during the past half cen-tury have explored innovation (Birkinshaw, 2008). Innovation is important for companies to be competitive, to have a great influence on the development of the region and the country in which it resides (Santos-Rodrigues et al., 2011). Most of these studies have focused on technical innovations, while research on organizational innovations has been conducted to a lesser ex-tent (Birkinshaw, 2008). Organizational inno-vation is, in this case, defined as a new organi-zational method in a firm’s business practices, workplace organization, or external relations (OECD, 2010). Organizational innovations are
typically implemented in order to increase op-erational efficiency, employee satisfaction or a firm’s innovativeness.
Innovations in healthcare are related to product, process, or structure. Healthcare inno-vation can be defined as the introduction of a new concept, idea, service, process, or product aimed at improving treatment, diagnosis, edu-cation, outreach, prevention and research, and with the long term goals of improving quality, safety, outcomes, efficiency and costs (Varkey, et al 2008).
The Philippines is not excluded in the issue of global competitiveness, given its low ranking (66 out of 131 countries) in the world.

Volume 1 Issue 1 | July 2019
134 Fidēre: Journal of Business, Governance, and Information Technology
Economic Forum’s 2007-08 Global Econom-ic Report showed that this low ranking was attributed to lack of sophistication in produc-tion process in limited distribution channel and low capacity for innovation. It is, thus, evident that innovation is imperative to enable Philip-pine business organizations to cope better with global challenges (Ma, 2011) However, while organizational vision, mission, and policy, play a significant role in an organization, many or-ganizations only seem to apply them as they are expected of them and it is seen as common practice for a company to have a mission and vision statement. Approximately 89% of com-panies have a mission statement, yet only 23% of employees use the mission as the basis for their decisions and guidance (Jones & Goodrum 2010). Communication is very important from top management to rank and file. Many com-panies have inspiring vision statements which become lost because management is not com-municating or leading by example.
Furthermore, workplace policies are statements of principles and practices dealing with the ongoing management and administra-tion of the organization. Policies act as a guid-ing frame of reference for how the organization deals with everything from its day-to-day oper-ational problems or how to respond to require-ments to comply with legislation, regulation, and codes of practice. It is important that pol-icies are reasonable, that employees are aware and clearly understand what the policy is trying to achieve. Policies are a statement of purpose, which highlight broad guidelines on action to be taken to achieve that purpose (NSW, 2013).
Specialized support to achieve specific outcomes is a feature of range. Typically, this will involve accountability for a single func-tion, (e.g. ensuring data is properly maintained) or the operation of a work area (e.g. managing the day to day operation of administration). Ac-cording to NESTA (2010), demand is essential for the successful exploitation of ideas. Without
consumer uptake, innovations would not be vi-able. For back office process innovations, con-sumer needs may be less directly relevant, but ultimately even they can indirectly make goods and services more attractive, by reducing costs or response times. It is too easy to assume that consumer demand grows automatically, even if at times of economic growth this assumption goes unchallenged. Indeed in difficult economic times aggregate demand reduces in most sec-tors. Innovations may reduce because of this drop in demand, making it even more important to understand the role that the consumer plays in stimulating organizations to innovate.
Customer demand refers to what busi-nesses often call consumer voice, consumer wants, needs and preferences for goods and services. Demand refers to the desire or pref-erence to purchase an affordable product or service (as opposed to unconstrained prefer-ences or desires). Preferences may be obvious or hidden; demand can be private or public and can come from consumers, other businesses or government. Government demand to business can be either for its own use, or for collective consumption through public services such as education and healthcare. Consumer demand is influencing innovation within organizations. Research indicates that organizations are miss-ing out on such opportunities to involve users early in the innovation process to gain advanced insight from customers and maximize their competitive advantage (NESTA, 2010).
This research aimed to collaborate mis-sion, vision, policy administrative support, cus-tomer demand, and organizational innovation in selected hospitals in the Philippines and an-swered the following research questions:1. What is the respondents’ perception on the
following in the organization: vision mis-sion, and policy?
2. How do the respondents perceive the extent of administrative support in terms of super-vision, training, and accountability?

135Vision, Mission, Policy, Administrative Support, and Customer Demand as
Predictors of Organizational Innovation of Selected Hospitals in the Philippines
Fidēre: Journal of Business, Governance, and Information Technology Volume 1 Issue 1 | July 2019
3. How do the respondents perceive the extent of customer demand in terms of customer service, product, and value?
4. How do the respondents perceive the lev-el of organizational innovation in the orga-nization in terms of marketing innovation, process innovation, and product innovation?
5. Is there a significant relationship between vision, mission, policy, administrative sup-port, customer demand, and organizational innovation?
6. Which among the following variables sig-nificantly predict organizational innovation: vision, mission, policy, administrative sup-port, customer demand?
MethodologyThe descriptive- correlation design
was used in order to investigate and describe the possible relationship between vision, mis-sion, policy, administrative support, custom-er demand and organizational innovation. The population of the study comprised of fulltime workers in three selected hospitals in the Phil-ippines. The total number of full time workers in each of the selected hospitals was obtained from the employees’ database from the human resource departments. The total number of full time workers from the three 3 hospitals who participated in this study was 300.
The data gathering tool was divided into four parts. Part I required the respondents to provide their perception on vision, mission and policy of their hospitals. Part II consist-ed of questions designed to gather data about administrative support of the subject institution particularly looking into their administrative support. Part III consisted of questions designed to gather data about customer demand. Part IV was designed to gather data about the organi-zational innovation of the subject institutions particularly marketing innovation, product in-novation, and process innovation. The reliabil-ity of the questionnaire was tested among 100
respondents from a selected Adventist hospital for the pilot study and the reliability coefficient was .80. Data were analyzed using the mean, standard deviation, and regression analysis.
Results and DiscussionsPerception of Vision, Mission, Policy
The overall response on vision, mission, and policy is illustrated in Table 1. Based on the grand mean of 4.23 (SD = 0.54), the summary result indicated that the grand scale response is agree which is interpreted as good. This implies that overall, respondents perceived vision, mis-sion, and policy within the hospitals as good. The dimension with the highest mean score are vision (Mean = 4.25;SD = 0.61), mission (Mean = 4.22; SD = 0.61), and policy (Mean = 4.21; SD = 0.58) with the lowest mean scale response of agree and also interpreted as good.
Table 1Overall Perception of Vision, Mission, Policy No Item Mean SD Scale VI1 Vision 4.25 0.61 Agree Good2 Mission 4.22 0.61 Agree Good3 Policy 4.21 0.58 Agree GoodGrand mean and SD for Vision, Mission, Policy
4.23 0.54 Agree Good
Legend: 4.50-5.0 Strongly Agree (Very Good), 3.50-4.49 Agree (Good), 2.50-3.49 Somewhat Agree (Moderate), 1.50-2.49 Disagree (Poor), 1.00-1.49 Strongly Disagree (Very Poor)
The result implied that the perception of the respondents on vision, mission, and policy within the hospitals under study is good. This is in line with the body of literature and research supporting the relevance of mission and vision statements to organizations however far out-weighs the opposing view. According to Mari Anne and Tina (2012) rated mission statements second of all used tools particularly because they believe it is a useful ingredient in organiza-

Volume 1 Issue 1 | July 2019
136 Fidēre: Journal of Business, Governance, and Information Technology
tional integration which gets everyone focused on objectives and working together to pull in the same direction.
In the 2011 study Management Tools and Trends 2011, Bain and Company (2011) rated the mission and vision statement as num-ber three in the Top 10 Most Used Tools. This recognition has led to mission and vision being two of the most widely used yet grossly mis-understood business management tools. On the other hand policy statements indicate the specif-ic regulations, requirements, or modifications to organizational behavior that the policy is creat-ing. Policy statements are extremely diverse de-pending on the organization and intent, and may take almost any form (Irani & Noruzi, 2011).
Perception of Administrative SupportThe overall response on supervision,
training and accountability is illustrated on Ta-ble 2. Based on the grand mean of 3.97 (SD = 0.56), the summary result indicated that the grand scale response is agree which is interpret-ed as high. This means that the overall percep-tion of supervision, training and accountability within the hospitals is high. The dimensions with the highest mean score are supervision (Mean = 4.01;SD = 0.67), training (Mean = 3.97; SD = 0.63), and Accountability (Mean = 3.95, SD = 0.63) with the lowest means scale response of agree and also interpreted as high.
Table 2Overall Perception of Administrative Support No Item Mean SD Scale VI1 Supervision 4.01 0.67 Agree High 2 Training 3.97 0.63 Agree High 3 Accountability 3.95 0.63 Agree High Overall Supervision, Training, Account-ability
3.97 0.56 Agree High
Legend: 4.50-5.0 Strongly Agree (Very High), 3.50-4.49 Agree (High), 2.50-3.49 Somewhat Agree (Fair), 1.50-2.49 Disagree (Low), 1.00-1.49 Strong-ly Disagree (Very Low)
The overall response on administrative support is illustrated on Table 2. Based on the grand mean of 3.97 (SD = 0.56), the summa-ry result indicated that the grand scale response is agree which is interpreted as high. This im-plied that the overall administrative support of the hospitals is high. The dimensions with the highest mean scores are supervision and train-ing but with different mean scores. Supervision has a mean of 4. 01 (SD = 0.6), while training has 3.95 (SD = 0.63); accountability records the lowest mean score of 3.95 (SD = 0.63) with scale response agree and interpreted as high.
The results revealed that administrative support must improve. This result is supported by a studies done by Allen, Shore, and Griffeth (2013) and Miao (2011) which asserted that ac-cording to the norm of reciprocity, if employers offer a high level of support to their employees, employees are possibly to emotionally commit to their organizations with a low possibility of turnover and a high level of job performance. Previous empirical studies support that adminis-trative support was related to job performance. The study of Manyasi, Kibas, and Chep (2011) indicated that administrative supports positively affect improving employee’s performance.
Extent of Customer DemandOverall perception of the extent of cus-
tomer demand. The overall response on cus-tomer service, product and value is illustrated on Table 3. Based on the grand mean of 4.06 (SD = 0.48), the summary result indicated that the grand scale response is agree which is in-terpreted as high. This implied that the overall perception of customer service, product and value within the hospitals are high. The dimen-sions with the highest mean score are customer service (Mean = 4.24; SD= 0.55), followed by value (Mean = 4.08; SD = 0.52), and product (Mean = 3.86; SD = 0.75) with the lowest mean scale response of agree and also interpreted as good.

137Vision, Mission, Policy, Administrative Support, and Customer Demand as
Predictors of Organizational Innovation of Selected Hospitals in the Philippines
Fidēre: Journal of Business, Governance, and Information Technology Volume 1 Issue 1 | July 2019
Table 3Overall Perception of Customer Demand No Item Mean SD Scale VI
1 Customer service 4.24 0.55 Agree High
2 Value 4.08 0.52 Agree High 3 Product 3.86 0.75 Agree High Grand mean and SD of Customer service, Value and Product
4.06 0.48 Agree High
Legend: 4.50-5.0 Strongly Agree (Very High), 3.50-4.49 Agree (High), 2.50-3.49 Somewhat Agree (Fair), 1.50-2.49 Disagree (Low), 1.00-1.49 Strong-ly Disagree (Very Low)
The overall respondents’ perception of customer demand is illustrated in Table 3. Based on the grand mean of 4.06 (SD = 0.48), the summary result indicated that the grand scale response is agree which is interpreted as high. The dimensions with the highest mean scores are customer service and value (Mean = 4. 24; SD = 0.55) and (Mean = 4.08; SD = 0.48), respectively, while product records the lowest mean score of 3.86 (SD = 0.75) with scale re-sponse agree and interpreted as high. This im-plied that there is high customer demand ac-cording to the respondents in the hospitals.
This is supported by a recent research into sources of radical innovation which highlights the importance of customer demand-based factors alongside changes in technology. New opportuni-ties emerge because of trends and discontinuities in industry structures driven by changes, demog-raphy or attitudes, and because competitors rede-fine “market space”. In-depth understanding of customers’ demands, needs, wants, attitudes, and behaviors, enables leading companies to re-define buyer groups, focus on customer needs rather than wants, and re-define traditional market segments (Business Decisions Limited for the Enterprise Directorate General of The European, 2013).
According to a report by CGI (2014), to address the needs of customer demand, and
to start the transition of healthcare to a de-mand driven model, some of the world’s lead-ing hospitals are placing the patient firmly at the center of everything they do. For example, the Cleveland Clinic in Ohio has a clear mis-sion to improve the patient experience, and has a board-level Chief Experience Officer leading the Office of the Patient Experience.
Perception on OrganizationalInnovation
The overall response on organizational innovation namely market innovation, product innovation and process innovation is illustrated in Table 4. Based on the grand mean of 3.81 (SD = 0.61), the summary result indicated that the grand scale response is agree which is interpret-ed as high. This means that the overall percep-tion market innovation, product innovation, and process innovation within the hospitals are high.
Two of the dimensions with the high-est mean score are organizational innovation (Mean = 3.79; SD = 0.71); marketing innova-tion (Mean = 3.79; SD = 0.70) respectively, fol-lowed by product innovation (Mean = 3.87; SD = 0.63), process innovation (Mean = 3.78; SD = 0.65) with the lowest mean scale response of agree and is interpreted as high.
Table 4Overall Perception of Organizational Innova-tionNo Item Mean SD Scale VI
1 Productinnovation 3.87 0.70 Agree High
2 Marketing innovation 3.79 0.63 Agree High
3 Processinnovation 3.78 0.65 Agree High
Grand mean and SD of OI 3.81 0.61 Agree High
Legend: 4.50-5.0 Strongly Agree (Very High), 3.50-4.49 Agree (High), 2.50-3.49 Somewhat Agree (Fair), 1.50-2.49 Disagree (Low), 1.00-1.49 Strong-ly Disagree (Very Low)

Volume 1 Issue 1 | July 2019
138 Fidēre: Journal of Business, Governance, and Information Technology
This implied that the overall perception of respondents on organizational innovation is high with the scale of agree. It can be concluded that organizational innovation is high within the hospitals under study. This result was supported by Tidd, Bessant, and Pavitt (2006), stating that innovation contributes to achieving a competitive advantage in several aspects. The most import-ant characteristics of innovations include a strong relationship between market performance and new products. New products help maintain market shares and improve profitability.
Correlation of Vision, Mission, Policy and Organizational InnovationTable 5 presents the correlation of vision, mission, policy and organizational innovation.
A positive correlation was recorded between vision, mission, policy and overall organizational innovation (r = .418, r = .352, and r =.442 respectively, p-value = .000). This implies that vision and overall organizational innovation is significantly correlated. In addition, vision is positively correlated with each of the variables of organizational innovation, marketing innovation, and pro-cess innovation. This means that when organization has vision they tend to be innovative. This is also in line with a study by James (2013) revealing that organizations develop a mission statement for a number of reasons. According to King and Cleland (as cited by James, 2013), the mission statement provides a standard for allocating resources, facilitates the transition of objectives into a work structure, and specifies unanimous organizational purposes that are translated into objectives for standard performance. Strategic management literature has emphasized the mission statement because of its ability to direct organizations to effective organizational performance.
A survey by OECD (2010) showed that organization policies that shape the workplace are essential for determining how human capital translates into organizational innovation and productiv-ity. This further implied that when there is good vision, mission, and policy in an organization; inno-vation is higher or vice versa. The results are in line with McDonald (as cited by Christian & Mair, 2012), hypothesizing that “a clear, motivating mission and vision will help organizations identify and focus on the development or adoption of innovations that will support their mission and vision.” Evaluating the insights from their paper suggested that mission and vision clarity contributes to inno-vation. Finally, a survey by OECD (2010) showed that policies that shape the workplace are essential for determining how human capital translates into organizational innovation and productivity.
Table 5Correlation between Vision, Mission, Policy and Organizational Innovation VMP correlation Market in Product in Process in Overall inVision Pearson r Corr .397** .325** .385** .418**
Sig.(2-tailed) .000 .000 .000 .000Verbal inter Significant Significant Significant Significant
Mission Pearson r Corr .335* .252** .289** .352**Sig.(2-tailed) .000 .000 .000 .000Verbal inter Significant Significant Significant Significat
Policy Pearson r Corr .373** .362** .404** .442**Sig.(2-tailed) .000 .000 .000 .000Verbal inter Significant Significant Signicant Significant
*Significant at 0.05 level (2-tailed) **Significant at 0.01 level (2-tailed) S = Significant; NS = Not Significant

139Vision, Mission, Policy, Administrative Support, and Customer Demand as
Predictors of Organizational Innovation of Selected Hospitals in the Philippines
Fidēre: Journal of Business, Governance, and Information Technology Volume 1 Issue 1 | July 2019
Correlation of Administrative support and Organizational innovationCorrelation of administrative support in terms of supervision, training, and accountability and
organizational innovation is presented in Table 6. A positive correlation was computed between su-pervision, training, and accountability and organizational innovation (r = .499, r = .567, and r = 583; p-value = .000, respectively). This is an indication that if supervision, training, and accountability are high within the hospitals under study, it translates to high organizational innovation.
This is in line with aresearch by Cakar and Erturk (2010) which provided an empirical evidence of a positive relationship between supervisor and innovation capability when employees trust to supervisors is high, employees believe that the supervisors, and accordingly the organi-zation, will act for the benefit of employees, and that their supervisors and the organization will do the right and sound things for employees and the organization. If supervision exists, it would improve the willingness of an employee to accept greater responsibilities inherent in an empower-ment effort as well as improve the level of capability to innovate and be creative.
Table 6Correlation between Administrative Support and Organizational InnovationAdmin Supt Market inn Product inn Process inn Overall inn Overall inSupervision Pearson r .500** .443** .389** .499**
Sig.(2-tailed) .000 .000 .000 .000Verbal Inter Significant Significant Significant Significant
Training Pearson r .559** .482** .462** .567**Sig.(2-tailed) .000 .000 .000 .000Verbal Inter Significant Significant Significant Significant
Accountability Pearson r .599** .416** .465** .583**Sig.(2-tailed) .000 .000 .000 .000Verbal Inter Significant Significant Significant Significant
*Significant at 0.05 level (2-tailed) **Significant at 0.01 level (2-tailed) S = Significant; NS = Not Significant
This result implied that the better the administrative support, the higher the innovation in capabilities of the organization and this also leads to employee commitment and above all increase profitability. This is supported by Malikeh’s (2012) study which revealed that there is a positive relationship between administrative and organizational innovation. When employees feel support-ed, their outcomes towards organization are always positive which helps organization to achieve its goals.
This result is supported by Krishhan and Mary (2012) in their study which revealed that administrative support is positively related to a number of outcomes favorable to both the organi-zation and the individual, namely conscientiousness in carrying out conventional job responsibili-ties, organizational commitment, innovation and job satisfaction.
Therefore the level of support employees perceive of employers needs to be constantly reviewed to ensure favorable outcomes to the organization which ultimately leads to profitability. If individual perception about organizational support is not positives, the organization is not sup-portive, it would cause of developing negative attitude and behavior at workplace, e.g. work stress, low job performance, lower satisfaction, Rhoades, et al. (as cited by Malikeh, 2012).

Volume 1 Issue 1 | July 2019
140 Fidēre: Journal of Business, Governance, and Information Technology
Correlation of customer demand and organizational innovation Correlation of customer demand in terms customer service, product, value and organizational
innovation is presented in Table 7 which shows that there is a positive relationship between customer demand and overall organizational innovation (r = .493 for customer service, r = .563 for product, and r = .544 for value; p-value = .000). This implied that customer service and overall organization innovation are significantly related and it is an indicator that high customer service leads to organi-zational innovation. It is also positively correlated with other variables in organizational innovation.
Table 7Correlation Customer Demand and Organizational InnovationCustomerdemand
Market inn Product inn Process inn Overall inn Overall in
Customer service
Pearson r .478** .453** .419** .493**
Sig.(2-tailed) .000 .000 .000 .000Verbal Inter Significant Significant Significant Significant
Product Pearson r .528** .493** .517** .563**Sig.(2-tailed) .000 .000 .000 .000Verbal Inter Significant Significant Significant Significant
Value Pearson r .513** .466** .485** .544**Sig.(2-tailed) .000 .000 .000 .000Verbal Inter Significant Significant Significant Significant
*significant at 0.05 level (2-tailed) **significant at 0.01 level (2-tailed) s = significant; ns = Not Significant
This is in line with a research in India done by Asghar (2011) which revealed a positive cor-relation between customer service and organizational innovation. According to Goofin and Price (as cited by Asghar, 2011), customer service is importance because it ends in increasing product quality, gaining competitive advantage, gaining profitable opportunities, and as a result, increasing sales and income. Newby & McManus (as cited by Asghar 2011) mentioned that excellent quality of customer services is based upon not just the knowledge and skills of the individual but also upon the way that the organization as a whole, from top management downwards, pulls in the same di-rection and presents a clear, positive message to customers and trigger organizational innovation According to Bronwyn (201l), empirical survey evidence shows a positive relationship be-tween innovation and product, thus, finds an economically significant impact of product innova-tion on revenue productivity and a somewhat more ambiguous impact of process innovation. Polder (2009) stated, it is evidenced that “product and process innovation only lead to higher productivity when performed together with an organizational innovation.”This is in line with Nasution and Mavondo (2008) who suggested that innovative practices are fun-damental ability service which offer superior value to the customer. Their findings revealed that customer value associated with innovative product and innovative process. The following hypotheses were considered for the purpose of answering the research ques-tions: (1) There is no significant relationship between organizational vision, mission, policy, ad-ministrative support customer demand and organizational innovation is accepted; while (2) There are no variables that predict organizational innovation is rejected.

141Vision, Mission, Policy, Administrative Support, and Customer Demand as
Predictors of Organizational Innovation of Selected Hospitals in the Philippines
Fidēre: Journal of Business, Governance, and Information Technology Volume 1 Issue 1 | July 2019
Predictors of organizational innovationPredictors of organizational innovation in terms of marketing innovation. Table 8
present the variables which, when subjected to regressions analysis, appeared to significantly pre-dict organizational innovation. It further shows that the four independent variables accountability, product, customer service, and value significantly predict organizational innovation in terms of marketing innovation are (R = 0.0722, F = 73.792, p < 0.000) .The four variables that were entered the regression equation account for 52.1% of the total variance in marketing innovation.
The first variable accountability accounted for R2 change of 35.9% of the total variance which implies a proper accountability within the hospitals lead to marketing innovation; customer demand for product accounted for 13.4 % which implies that if there is high customer demand for product in the hospitals which leads to high marketing innovation within the hospitals.
Table 8Predictors of Organizational Innovation in terms of Marketing Innovation
Predictors R2 Change F Change p UC SC t pBeta Beta
Constant 1.128 0.217 5.186 0.000Accountability 0.359 153.307 0.000 0.673 0.599 12.382 0.000Product 0.134 72.013 0.000 0.36 0.383 8.486 0.000Service 0.021 11.971 0.000 0.218 0.17 3.46 0.001Value 0.007 4.154 0.000 0.158 0.116 2.038 0.043
R 0.722 R2 = 0.521F = 73.792 p < 0.001
Customer demand for customer service which also accounted for 2.1% of the total variance in marketing innovation is the third variable that entered the equation. The standardized coefficient beta is 0.17 (t = 3.46, p = .001) which implies that a good customer demand for service within the hospitals influence high level of marketing innovation.
Customer demand for value also accounts for 0.7% of the total variance of marketing in-novation. The standardized coefficient beta is 0.116 (t = 2.038, p = 0.043) implies that customer demand for value influence positively on marketing innovation. The regression model for market-ing innovation, is Marketing Innovation = 1.128 + 0.673 Accountability + 0.36 Product + 0.218 Customer Service + 0.158 Value.
The study of Richard (2006) supported this claim in his findings that revealed value, prod-uct, and service predict organizational innovation. This means that if values of the organization are in alignment with the aspirational values of employees, the result is high performance. There is a high level of staff engagement and a pursuit of excellence regarding the quality of products and services
Predictors of organizational innovation in terms of product innovationAs shown in Table 9, four independent variables product, customer service, accountabil-
ity, and policy significantly predicts organizational innovation in terms of product innovation are (R = 0.61, F = 41.29, p < 0.001). Together they account for, 37.9% of the variance in product in-novation. The first variable customer demand for product accounts for 24.3% of the total variance

Volume 1 Issue 1 | July 2019
142 Fidēre: Journal of Business, Governance, and Information Technology
in product innovation (F = 88.176, p < .001). The Standardized coefficient beta is 0.493 (t =9.390, p = .000) which implies that when demand for product in an organization is high and the organi-zation actively introduce new products in their respective organizations it enhance high innovation activity in the organization.
Table 9Predictors of Organizational Innovation in terms of Product innovation
Predictors R2 Change F Change p UC SC t pBeta Beta
Constant 2.261 0.175 12.916 0.000Product 0.243 88.176 0.000 0.418 0.493 9.390 0.000Service 0.098 40.393 0.000 0.38 0.329 6.356 0.000Accountability 0.027 11.77 0.001 0.193 0.191 3.431 0.001Policy 0.01 4.511 0.350 0.128 0.116 2.124 0.035
0.615 R2 = 0.379, F= 41.29 p < 0.001
Customer service accounted for 9.8% of the total variance in organizational innovation (F= 40.393, p <.000). The standardized coefficient beta is 0.329 (t =6.356, p = .000) which im-plies that organization sets a tone to influence product innovation if there is a good demand for customer service, this would lead to high level of product innovation in the organization
Accountability also account for 2.7% of the total variance in organizational innovation (F= 11.770, p<.000). The standardized coefficient beta is 0.191 (t =3.431, p = .001) which implies that if there is proper of accountability within the hospitals, it enhances high innovation in the organi-zation.
Policy also account of 1% of the total variance in product innovation (F= 4.511, p<.000). The standardized coefficient beta is 0.166 (t =2.124, p = .035) implies that a good policy standard within the hospitals leads to high level of product innovation. The Prediction Equation of product innovation, is Product Innovation = 2.261+ 0.418Product + 0.38Customer Service + 0.193Ac-countability + 0.128Policy. In Asghar’s (2011) study, the results indicate that customer service and product have been influential on organizational innovation.
Predictor of organizational innovation in terms of process. Table 10 shows four independent variables product, accountability, value, and policy
significantly predict organizational innovation in terms of process innovation are (R = 647, F= 48.666, p < 0.001). Together they account for 41.8% of the variance in process innovation
The first variable customer demand for product accounted for R2 change of 26.7% of the total variance in this implies when there is high customer demand, it leads to process innovation accountability (F = 46.112, P < .001). The standardized coefficient beta is .341 (t =-6.791, p = .000) which implies that when accountability is high within the hospital, it promotes high innova-tion in the hospital.

143Vision, Mission, Policy, Administrative Support, and Customer Demand as
Predictors of Organizational Innovation of Selected Hospitals in the Philippines
Fidēre: Journal of Business, Governance, and Information Technology Volume 1 Issue 1 | July 2019
Table 10 Predictors of Organizational Innovation in Terms of Process innovation
Predictors R2 Change F Change p UC SC t pBeta Beta
Constant 2.042 0.177 11.554 0.000Product 0.267 99.844 0.000 0.449 0.517 9.992 0.000Accountability 0.106 46.112 0.000 0.354 0.341 6.791 0.000Value 0.029 13.284 0.000 0.261 0.207 3.645 0.000Policy 0.016 7.383 0.007 0.164 0.146 2.717 0.007
0.647 R2 = 0.418, F = 48.666, p <0.001
Customer demand for value accounted for 2.9% is considered low of the total variance in process innovation (F = 7.383, p < .001). The standardized coefficient beta is 0.207 (t = 3.645, p = .000) which implies that a demand of customer value within the hospital leads to innovation.
Policy also accounts for 1.6% which is considered of the total variance of process innova-tion (F = 4.154, p <.001). The standardized coefficient beta is 0.146 (t = 2.717, p = 0.007) which implies that, good policy within the hospital encourage high level of innovation. The Prediction Equation of process innovation, is Process Innovation= 2.042+0.449Product+0.354Accountabili-ty+0.261Value+0.164Policy.
Bronwyn (2011) supports this findings in his study which shows a positive prediction be-tween innovation in firms and their productivity (i.e. both the level and its growth). Second, the positive relationship is primarily due to product innovation. The impact of process innovation is more variable, and often negative.
Conclusion Based on the findings of this study, it could be concluded that innovation was perceived to
be high among the three hospitals which significantly affected the overall organizational innovation of those hospitals under study. The respondents perceived the vision, mission, and policy of their respective hospital as good. The respondents also perceived customer demand, as high. Results also showed that administrative support was perceived to be high by respondents in the hospitals. The re-sults were also in line with the organizational innovation which states that for organizations to stay in business they must combine marketing innovation, product innovation, and process innovation for a stable organizational performance to be achieved. Further, organizations that support their employees achieve high organizational performance in order to stay relevant in the business world.
Indeed vision, mission, and policy are standard and critical elements of an organization. Most established companies develop organizational vision, mission, and policy which serve as foundational guides in the establishment of company objectives. Moreover, the result of this study revealed that a good mission, vision, and policy of an organization influence positively on the or-ganizational innovation.
ReferencesAllen, D. G., Shore, L. M., & Griffeth, R. W. (2013).The role of perceived organizational support
and supportive human resource practices in the turn over process.

Volume 1 Issue 1 | July 2019
144 Fidēre: Journal of Business, Governance, and Information Technology
Asghar, A. J. (2011) Study the effects of custom-er service and product quality on custom-er satisfaction and loyalty. International Journal of Humanities and Social Science, 1(7).
Bernstein, B., & Singh, P. (2006). An integrat-ed innovation process model based on practices of Australian biotechnology firms. Technovation, 26(5-6).
Birkinshaw, J., Hamel, G. & Mol, M. J. (2008). Management innovation. Academy of Management Review, 33(4), 825- 845.
Bronwyn, H. H. (2012). Innovation and produc-tivity. Retrieved from https://www.google.com.ph/search?rlz=1C1CHMO_tlPH-578PH578&noj=1&biw=1242&bi-h=602&q=Hal+%28201l%29+em-p i r i c a l + s u r v e y + e v i d e n c e + shows+a+positive+relationship+be-tween+innovation+and+product+find-s+an+economically+significant+im-pact+of+product+innovation+on+reve-nue+productivity+and+a+somewhat+more+.3...298971.302457.0.303616.1.1.0.0.0.0.0.0..0.0....0...1c.1.64.serp..1.0.0.VwujUpy-ceu0
Çakar, N. D., & Ertürk, A. (2010). Comparing innovation capability of small and me-dium-sized enterprises, examining the effects of organizational and empower-ment. Journal of Small Business Man-agement, 48(3), 325-559. http://dx.doi.org/10.1111/j.1540-627X.2010.00297.x
CGI. (2014). Healthcare challenges and trends: The patient at the heart of care. Re-trieved from https://www.cgi.com/sites/default/files/white-papers/cgi-health-challenges-white-paper.pdf
Christian S., & Mair, J (2012). What determines the capacity for continuous innovation in social sector organization…
Irani, F. N. E. H. A., & Noruzi M. R., (2011). What is policy? A brief study on policy and social policy; meanings and con-tents. Res Manageria, 29(1), 99–118. Re-trieved from http://dx.doi.org/10.1177 /014920630302900107 http://citeseerx.ist.psu.edu/viewdoc/download doi=10. 1.1.689.7707&rep=rep1&type=pdf
James, R. (2013). A comparative analysis of mission statement content and readabil-ity. Journal of Management Policy and Practice 14(6) 2013131.
Jones, T., Yongwei, S., & Goodrum, P. M. (2010). An investigation of corporate approaches to sustainability in the US engineering and construction industry. Construction Management & Econom-ics, 28(9), 971-983. doi:10.1080/01 44 6191003789465
Krishhan, J. & Mary, S. (2012). Perceived or-ganizational support an overview on its antecedents and consequences. Inter-national Journal of Multidisciplinary Research, 2(4), 2- 3. Retrieved from https://www.com.ph/?gfe_rd=cr&ei= LH8XV6WfB9DD9AW
Ma. R. M. H. (2011). Building a culture of in-novation in Philippine organizations: Implications for OD. Retrieved from https://www e.com.ph /?gfe_rd =cr&ei= 2bEhV9rYG4qR2AS6r7 LYBQ&gws_rd = ssl#q= Building +a+Culture+of+ Innovation+in+Philippine+Organiza-tions:+Implications +for+OD+

145Vision, Mission, Policy, Administrative Support, and Customer Demand as
Predictors of Organizational Innovation of Selected Hospitals in the Philippines
Fidēre: Journal of Business, Governance, and Information Technology Volume 1 Issue 1 | July 2019
Malikeh, B. (2012). Effect perceived organiza-tional support on employees’ attitudes toward work. Retrieved from https://wwwe.com.ph/?gfe _rd=cr&ei= LH8X V6W fB9DD9AWwv7vgCg&gws_rd=ssl#q=Malikeh+Beheshtifar+2012 Effect + perceived+organizational
Manyasi, J., Kibas, P. B., & Chep, K. R. (2011). Effects of organizational support for career development on employee per-formance: A case of Kenyan public uni-versities. Kabarak University First In-ternational Conference,1–17.
Mari Anne. D. and Tina P. (2012) Purpose, vision and mission: A clarification of fundamental concepts. Retrieved from https://www.google.com.ph/ ?gfe_rd= cr&ei= LH8XV6WfB9DD9 AWwv7vg-Cg&gws_rd =ssl#q= Mari+Anne +Daur a+and+Tina+Pers+
Miao, R. T. (2011). Job satisfaction, task perfor-mance and organizational citizenship be-havior in China. J. Behav. Appl. Manag., 12(2), 105–127. Retrieved from http://dx-.doi.org/10.1186/1472-6920-14-50 http:/citeseerx.is t.psu.edu/, viewdoc /down-load?doi=10.1.1.689.7707&rep=rep1&-type=pdf
Nasution, H.N. &Mavondo, F.T. (2008). Cus-tomer value in the hotel industry: What managers believe they deliver and what customer experience. International Journal of Hospitality Management, 27(1), 204-213.
NESTA (2010). Demand and innovation. How customer preferences shape the innova-tion process. New Evidence from Rep-resentative Panel. Applied Economics Quarterly, 57(2),
NSW Industrial Relations (2013). Retrieved from www.industrialrelations nsw .go v.au
OECD (2010). Innovation strategy. Retrieved from http://www.oecd.org/sti/453 26349.pdf
Polder, M.(2009) Productivity effects of innova-tion modes. Statistics Netherlands Dis-cussion Paper No. 09033, The Hague, Netherlands.
Richard, B. (2006). Building a values-driven organization: A whole-system approach to cultural transformation. Boston: But-terworth-Heinemann.
Santos-Rodrigues, H., Figueroa, P. & Jardon, C. (2011). The main intellectual capi-tal components that are relevant to the product, process and management firm innovativeness. International Journal of Transitions and Innovation Systems, 1, 271-301
Tidd, J., Bessant, J. & Pavitt, K. (2007). Řízení inovací – zavádění technologických, tržních a organizačních změn. Brno: Computer Press.
Varkey, P., A. Horne,& K.E. Bennet. (2008). Innovation in health care: A prier. Amer-ican Journal of Medical Quality, 23, 382-388.
Vic, (2006). Managing the day to day operation of a school office under th e direct ion of the principal or another senior manager. 2.6.1 of the Education and Training Re-form Act 2006 (Vic) or its successor.

Volume 1 Issue 1 | July 2019
146 Fidēre: Journal of Business, Governance, and Information Technology
Abstract
This paper investigated World Economic Forum report on the trend of Indone-sia competitiveness from 2008/09 to 2016/17 in order to find out factors that positively and negatively affect its long-term competitiveness sustainability.
In determining the country competitiveness, World Economic Forum developed a model called Global Competitiveness Index (GCI), which classified a country economy into three stages: factor-driven, efficiency-driven and innovation-driven. Given the complex nature of competitiveness, the index identifies twelve pillars of competitiveness reflecting the diverse and interrelated factors that have a bear-ing on long-term potential for sustained growth and prosperity. Data published by World Economic Forum from 2008/09 to 2016/17 were collected and analyzed in form of competitive scores and ranks. The result showed that in 2016, Indone-sia’s competitiveness ranks 41st among 138 countries with competitive status at efficiency driven economy, ranks 4th among ASEAN countries behind Singapore, Malaysia and Thailand. Corruption, inefficient government bureaucracy and inade-quate supply of infrastructure are three most problematic factors must be addressed to ensure Indonesia competitiveness regionally and globally.Keywords: Indonesia competitive analysis, Indonesia GCI index, World Economic Forum report
indonesia Through The lens of World eConoMiC foruM:global CoMpeTiTive index analysis 2008/09-2016/17
Stanley S. NangoyUniversitas Klabat
Indonesia’s economy has expanded strongly over recent decades, notwithstanding the sharp economic contraction that occurred during the 1997–1998 Asian financial crisis. This strong pace of growth has seen Indonesia become an increasingly important part of the global econ-omy. It is now the fourth largest economy in east Asia – after China, Japan and South Korea, the largest economy in Southeast Asia, and the 15th largest economy in the world on a purchas-ing power parity (PPP) basis (Elias & Noone, 2016). However, Indonesia is still struggling to contain a high level of corruption, ineffi-cient costs of doing business, and a relatively low level on the Human Development Index
(Damuri & Day, 2015; Tan & Amri, 2013). Its share of global output by 2016 was just about 2.5 percent though is expected to continue to rise over the years. Asian Development Bank (ADB) in 2016 predicted Indonesian GDP’s is trending higher for 2016 and 2017, and despite a decrease in its GDP’s growth as the Jokowi government started with economic reform in 2015, the 2016 inflation is only 3.5%, milder than projected earlier which is the lowest in 16 years (ADB, 2016).
With its rich natural resources, abundant labor supply, and growing domestic market, In-donesia had long been a favored destination for foreign direct investment in Southeast Asia, yet

147Indonesia through the Lens of World Economic Forum:
Global Competitive Index Analysis 2008/09-2016/17
Fidēre: Journal of Business, Governance, and Information Technology Volume 1 Issue 1 | July 2019
there has been overwhelming concern among observers why Indonesia has not attracted more foreign direct investment. In 2006, for example, Indonesia ranked fourth among recipients of foreign direct investment in Southeast Asia, sur-passed by Singapore, Thailand, and Malaysia. Only in 2010 did Indonesia move up to second in the region, and still with foreign direct in-vestment composing only 18% of total inflows for ASEAN 2014 (Lindbald, 2015).
Facing the 2017, the world faces a glob-al economic uncertainty following the Europe-an socio-political, economic and humanitarian crises, a divided US with controversial Trump political agenda, worsening regional safety and security in Korean peninsula and South China sea, the rising of fundamental radical Islamic terrorism and war on ISIS in Middle east/North-ern Africa. Internally, Indonesia under Jokowi government is also facing its own domestic challenges: slower economic growth and wider income inequality, conflict between econom-ic development and democratic reform, fight-ing on corruptions and the dominance of the elite political oligarchy parties, challenges by the Islamic fundamentalists on Pancasila and 1945 constitution as governing ideology to the world largest Muslim democracy, and fear of fragmented country (ethnic and religious fault lines, resistance to Javanese dominance) with a weak executive that could lead to the country break-up such as demand for separation from Aceh and Papua (Muhtadi, 2015; Damuri & Day, 2015; Rock, 2015; Yusuf & Sumner, 2015; WEF, 2016)).
Whether Indonesia will be able to main-tain its future growth, and how the dynamics of the country’s competitiveness cope to the dy-namics of global competitiveness is still a big question mark. Klaus Schwab (2016), the ex-ecutive chairman of World Economic Forum is optimistic and predict Indonesia has a bright future, although a number of challenges remain, which must be addressed in order to ensure that
Indonesia sustains the positive momentum for better competitiveness in the coming future. However, Warburton (2016), Muhtadi (2015), Damuri and Day (2015) and Mc Rae (2014) argue that though Jokowi offers a fast, simple agenda to improve infrastructures and public services, but he is weak and often takes a re-active approach in responding to the country problems as they arise and through whatever method seems most practical and convenient to the circumstances.
This paper investigated World Econom-ic Forum (WEF) reports on the trend of Indo-nesia competitiveness from 2008/09 to 2016/17 in order to find out factors that positively and negatively affect its long-term competitiveness sustainability. Competitiveness is defined as the set of institutions, policies, and factors that determine the level of productivity of a coun-try. Productivity, in turn, influences the level of prosperity that can be attained to sustain long-term competitiveness - a concept of sustainable competitiveness as development that meets the current generation needs without compromising the needs of future generations (Singh, Murty, Gupta, Dikshit, 2011; Bilbao-Osorio, Blanke, Campanella, Crotti, Drzeniek-Hanouz & Serin, WEF 2013).
In determining the country competi-tive-ness, WEF developed Global Competi-tiveness Index (GCI), a model that classified economies into three stages: factor-driven, efficiency-driven and innovation-driven. Giv-en the complex nature of competitiveness, the index identifies twelve pillars of competitive-ness reflecting the diverse and interrelated fac-tors that have a bearing on long-term potential for sustained growth and prosperity (Thore & Tarverdyan, 2016; Huggins, Izushi & Thomp-son, 2013; WEF, 2011). Specifically, the study investigated WEF report on the stages of In-donesia competitiveness during the period of 2008/09 to 2016/17, the ranks of Indonesia competitiveness as compared to both global and

Volume 1 Issue 1 | July 2019
148 Fidēre: Journal of Business, Governance, and Information Technology
the regional ASEAN countries for the period 2008/09 to 2016/17, and problems/ challenges must be addressed in order to ensure Indonesia competitiveness to sustain and develop
MethodologyThe presentation of this article is de-
scriptive in form of tables and a graph to an-alyze Indonesia economic competitiveness for the period 2008/09 to 2016/17, using the twelve factors of competitiveness developed by World Economic Forum as Global Competitive Index (GCI).
Data collection and statistical formulaData published by World Economic Fo-
rum from 2008/09 to 2016/17 in the form of competitive scores were collected and analyzed. The data prior to year 2008/09 were excluded because they were only made up of nine pillar indicators, while the competitive model used for this study requires twelve pillar indicators.
In calculation for GCI index WEF used the following formulas (WEF, 2016):
Qt-(t+1) = (Wt x Qt) + (Wt+1 x Qt+1)Wt= {(1-α) + Nt/[Nt + Nt+1]}/2Wt+1= {α+ [Nt+1/(Nt+Nt+1)]}/2Qt= the GCI score in year t Qt+1= the GCI score in year t+1Wt= the weight applied for year t Wt+1= the weight applied for year t N=the sample sizeThe score is in the Likert scale from 1(worst) to 7(best)
Competitiveness is defined as the set of institutions, policies, and factors that deter-mine the level of productivity of an economy, which in turn sets the level of prosperity that the country can achieve. In the initial, factor-driven stage, countries compete based on their factor endowments—primarily unskilled labor and natural resources—with their economies often based on commodities and/or basic manufac-
tured products. As countries progress to the efficiency-driven stage, their competitiveness becomes increasingly based upon well-func-tioning factor markets and efficient production processes and practices at the firm level, while in the most advanced, innovation-driven stage, countries are able to sustain higher wages and the associated standard of living only if their businesses can compete by offering new and unique products. These three competitive stag-es are built upon twelve pillars, which is called global competitive index (see Figure 1), reflect-ing the diverse and interrelated factors that have a bearing on long-term potential for sustained growth and prosperity (WEF, 2016). The twelve pillars of GCI are:
The 1st pillar: Institutions—The quali-ty of public and private institutions, including government efficiency, security levels, corpo-rate governance, and perceived fairness and transparency of public institutions; 2nd pillar: Infrastructure—The quality and extent of gen-eral and specific infrastructure, including roads, railroads, ports, air transport, electricity, and telephony; 3rd pillar: Macroeconomic environ-ment—The stability and soundness of the mac-roeconomic environment, including the govern-ment budget balance, public debt, inflation, the national savings rate, the interest rate spread, and the country credit rating; 4th pillar: Health and primary education—The general health lev-el of a country’s population and the quality of, and access to, basic education.
The 5th pillar: Higher education and training—The quality of, and access to, sec-ondary and university level education and the quality of on-the-job training; 6th pillar: Goods market efficiency—The extent of domestic and foreign competition in a given market and the quality of demand conditions; 7th pillar: Labor market efficiency—The flexibility of the labor market and the degree to which it ensures the efficient allocation and use of talent; 8th pillar: Financial market development—The extent to

149Indonesia through the Lens of World Economic Forum:
Global Competitive Index Analysis 2008/09-2016/17
Fidēre: Journal of Business, Governance, and Information Technology Volume 1 Issue 1 | July 2019
which the financial market ensures the availability and best allocation of capital; 9th pillar: Tech-nological readiness—The penetration of information and communication technology (ICT) and firms’ capacity to adopt and leverage technology to enhance their productivity; 10th pillar: Market size—The size of the domestic market as well as the export markets.
The 11th pillar: Business sophistication—At the firm level, the degree of sophistication of operations and company strategies and the presence and development of clusters; 12th pillar: Innovation—The national potential to generate endogenous innovation” (WEF, 2016).
Figure 1. The 12 pillars of competitiveness - source WEF 2016
Results and DiscussionsIndonesia competitiveness among ASEAN countries
As defined by the WEF (2016) there are two transition periods between the three stages of a country competitiveness development: the first stage is basic factor driven, then a transition period from factor driven to efficiency driven economy. The second stage is efficiency driven economy, followed by a transition period from efficiency to innovative driven economy, and the last stage is innovation driven economy.
As shown in table 1, Singapore has long been in the innovative stage, the 2nd best economy in the world since 2012/13, rank number 5 for 2008/09 and number 3 for 2009/10-2010/11. Singa-pore is the only ASEAN country enjoying the status of being well-developed country.
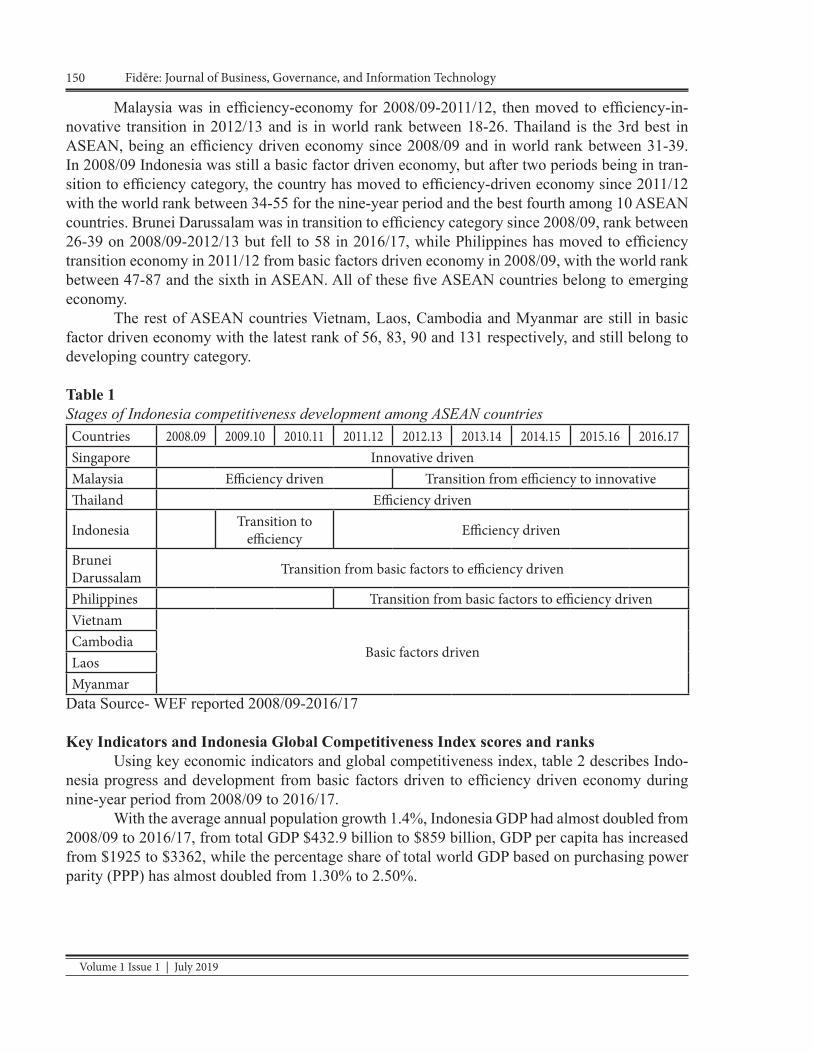
Volume 1 Issue 1 | July 2019
150 Fidēre: Journal of Business, Governance, and Information Technology
Malaysia was in efficiency-economy for 2008/09-2011/12, then moved to efficiency-in-novative transition in 2012/13 and is in world rank between 18-26. Thailand is the 3rd best in ASEAN, being an efficiency driven economy since 2008/09 and in world rank between 31-39. In 2008/09 Indonesia was still a basic factor driven economy, but after two periods being in tran-sition to efficiency category, the country has moved to efficiency-driven economy since 2011/12 with the world rank between 34-55 for the nine-year period and the best fourth among 10 ASEAN countries. Brunei Darussalam was in transition to efficiency category since 2008/09, rank between 26-39 on 2008/09-2012/13 but fell to 58 in 2016/17, while Philippines has moved to efficiency transition economy in 2011/12 from basic factors driven economy in 2008/09, with the world rank between 47-87 and the sixth in ASEAN. All of these five ASEAN countries belong to emerging economy.
The rest of ASEAN countries Vietnam, Laos, Cambodia and Myanmar are still in basic factor driven economy with the latest rank of 56, 83, 90 and 131 respectively, and still belong to developing country category.
Table 1Stages of Indonesia competitiveness development among ASEAN countriesCountries 2008.09 2009.10 2010.11 2011.12 2012.13 2013.14 2014.15 2015.16 2016.17Singapore Innovative drivenMalaysia Efficiency driven Transition from efficiency to innovativeThailand Efficiency driven
Indonesia Transition to efficiency Efficiency driven
Brunei Darussalam Transition from basic factors to efficiency driven
Philippines Transition from basic factors to efficiency drivenVietnam
Basic factors drivenCambodiaLaosMyanmar
Data Source- WEF reported 2008/09-2016/17 Key Indicators and Indonesia Global Competitiveness Index scores and ranks
Using key economic indicators and global competitiveness index, table 2 describes Indo-nesia progress and development from basic factors driven to efficiency driven economy during nine-year period from 2008/09 to 2016/17.
With the average annual population growth 1.4%, Indonesia GDP had almost doubled from 2008/09 to 2016/17, from total GDP $432.9 billion to $859 billion, GDP per capita has increased from $1925 to $3362, while the percentage share of total world GDP based on purchasing power parity (PPP) has almost doubled from 1.30% to 2.50%.
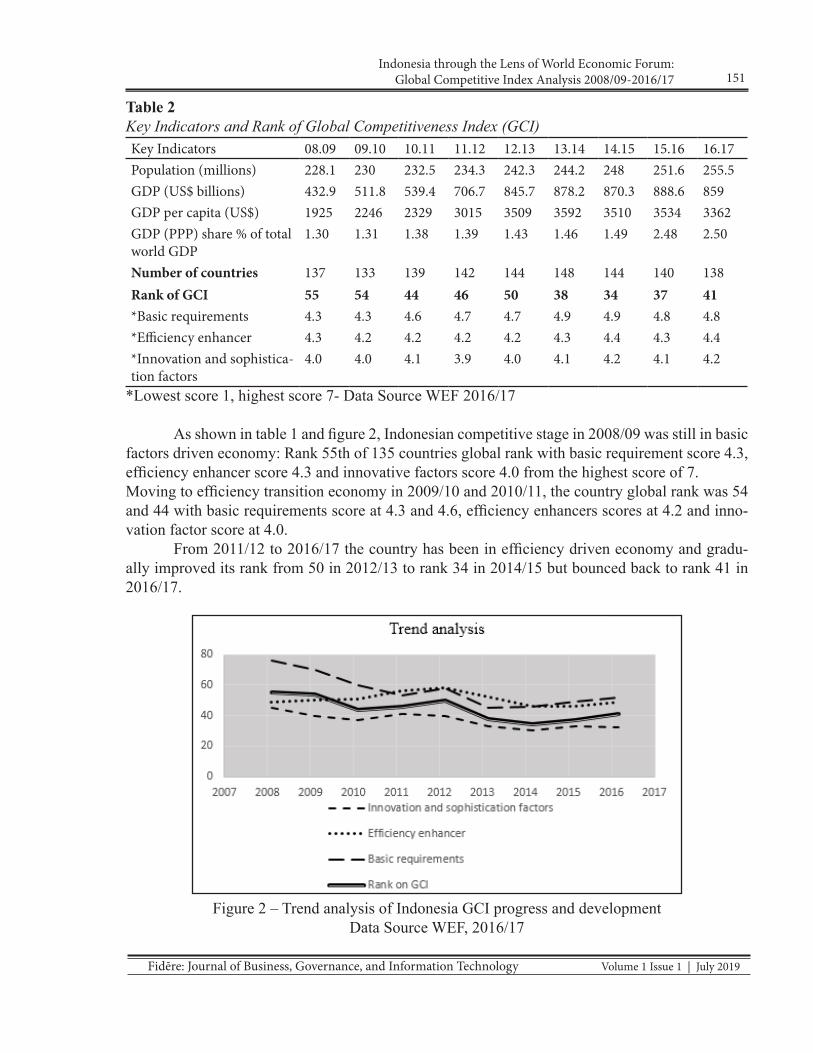
151Indonesia through the Lens of World Economic Forum:
Global Competitive Index Analysis 2008/09-2016/17
Fidēre: Journal of Business, Governance, and Information Technology Volume 1 Issue 1 | July 2019
Table 2Key Indicators and Rank of Global Competitiveness Index (GCI)Key Indicators 08.09 09.10 10.11 11.12 12.13 13.14 14.15 15.16 16.17Population (millions) 228.1 230 232.5 234.3 242.3 244.2 248 251.6 255.5GDP (US$ billions) 432.9 511.8 539.4 706.7 845.7 878.2 870.3 888.6 859GDP per capita (US$) 1925 2246 2329 3015 3509 3592 3510 3534 3362GDP (PPP) share % of total world GDP
1.30 1.31 1.38 1.39 1.43 1.46 1.49 2.48 2.50
Number of countries 137 133 139 142 144 148 144 140 138Rank of GCI 55 54 44 46 50 38 34 37 41*Basic requirements 4.3 4.3 4.6 4.7 4.7 4.9 4.9 4.8 4.8*Efficiency enhancer 4.3 4.2 4.2 4.2 4.2 4.3 4.4 4.3 4.4*Innovation and sophistica-tion factors
4.0 4.0 4.1 3.9 4.0 4.1 4.2 4.1 4.2
*Lowest score 1, highest score 7- Data Source WEF 2016/17
As shown in table 1 and figure 2, Indonesian competitive stage in 2008/09 was still in basic factors driven economy: Rank 55th of 135 countries global rank with basic requirement score 4.3, efficiency enhancer score 4.3 and innovative factors score 4.0 from the highest score of 7.Moving to efficiency transition economy in 2009/10 and 2010/11, the country global rank was 54 and 44 with basic requirements score at 4.3 and 4.6, efficiency enhancers scores at 4.2 and inno-vation factor score at 4.0.
From 2011/12 to 2016/17 the country has been in efficiency driven economy and gradu-ally improved its rank from 50 in 2012/13 to rank 34 in 2014/15 but bounced back to rank 41 in 2016/17.
Figure 2 – Trend analysis of Indonesia GCI progress and developmentData Source WEF, 2016/17
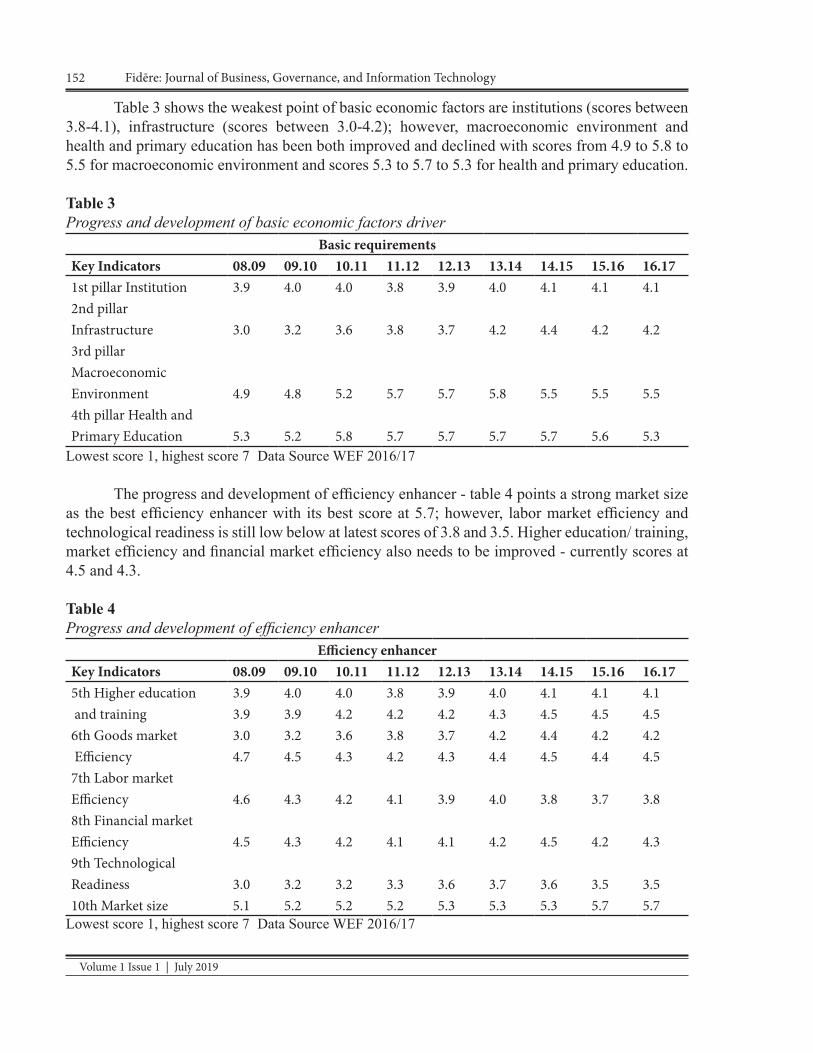
Volume 1 Issue 1 | July 2019
152 Fidēre: Journal of Business, Governance, and Information Technology
Table 3 shows the weakest point of basic economic factors are institutions (scores between 3.8-4.1), infrastructure (scores between 3.0-4.2); however, macroeconomic environment and health and primary education has been both improved and declined with scores from 4.9 to 5.8 to 5.5 for macroeconomic environment and scores 5.3 to 5.7 to 5.3 for health and primary education.
Table 3Progress and development of basic economic factors driver
Basic requirementsKey Indicators 08.09 09.10 10.11 11.12 12.13 13.14 14.15 15.16 16.171st pillar Institution 3.9 4.0 4.0 3.8 3.9 4.0 4.1 4.1 4.12nd pillar Infrastructure 3.0 3.2 3.6 3.8 3.7 4.2 4.4 4.2 4.23rd pillar Macroeconomic Environment 4.9 4.8 5.2 5.7 5.7 5.8 5.5 5.5 5.54th pillar Health andPrimary Education 5.3 5.2 5.8 5.7 5.7 5.7 5.7 5.6 5.3
Lowest score 1, highest score 7 Data Source WEF 2016/17
The progress and development of efficiency enhancer - table 4 points a strong market size as the best efficiency enhancer with its best score at 5.7; however, labor market efficiency and technological readiness is still low below at latest scores of 3.8 and 3.5. Higher education/ training, market efficiency and financial market efficiency also needs to be improved - currently scores at 4.5 and 4.3.
Table 4Progress and development of efficiency enhancer
Efficiency enhancerKey Indicators 08.09 09.10 10.11 11.12 12.13 13.14 14.15 15.16 16.175th Higher education 3.9 4.0 4.0 3.8 3.9 4.0 4.1 4.1 4.1 and training 3.9 3.9 4.2 4.2 4.2 4.3 4.5 4.5 4.56th Goods market 3.0 3.2 3.6 3.8 3.7 4.2 4.4 4.2 4.2 Efficiency 4.7 4.5 4.3 4.2 4.3 4.4 4.5 4.4 4.57th Labor market Efficiency 4.6 4.3 4.2 4.1 3.9 4.0 3.8 3.7 3.88th Financial market Efficiency 4.5 4.3 4.2 4.1 4.1 4.2 4.5 4.2 4.39th Technological Readiness 3.0 3.2 3.2 3.3 3.6 3.7 3.6 3.5 3.510th Market size 5.1 5.2 5.2 5.2 5.3 5.3 5.3 5.7 5.7
Lowest score 1, highest score 7 Data Source WEF 2016/17

153Indonesia through the Lens of World Economic Forum:
Global Competitive Index Analysis 2008/09-2016/17
Fidēre: Journal of Business, Governance, and Information Technology Volume 1 Issue 1 | July 2019
Innovation and business sophistication factors has not been in a good position since 2008/09 with latest scores at 4.3 and 4.0. business sophistication scores show a declining trend, while in-novation has gradually been improved for the last four years from score 3.6 to 4.0. However, compared to other economic drivers, innovation and business sophistication factor has the lowest score 4.2 among the three economic drivers with basic requirement and efficiency enhancer scores at 4.8 and 4.4 respectively, see also table 2.
Table 5Progress and development of Innovation and sophistication factors
Innovation and sophistication factorsKey Indicators 08.09 09.10 10.11 11.12 12.13 13.14 14.15 15.16 16.1711th Business 3.9 4.0 4.0 3.8 3.9 4.0 4.1 4.1 4.1 Sophistication 4.5 4.5 4.4 4.2 4.3 4.4 4.5 4.3 4.312th Innovation 3.4 3.6 3.7 3.6 3.6 3.8 3.9 3.9 4.0
Lowest score 1, highest score 7 Data Source WEF 2016/17
Problematic factors for doing business in Indonesia The information of most problematic factors for doing business is drawn from the 2016/17 World Economic Forum’s Executive Opinion Survey. From a list of 16 factors, respondents were asked to select the five most problematic and rank them from 1 (most problematic) to 5. The results were then tabulated and weighted according to the ranking assigned by respondents (WEF, 2016).Corruption, inefficient government bureaucracy and inadequate supply of infrastructure are three most problematic factors for doing business in Indonesia, accounted for 31.6%. However, two of these factors had shown a trend of improvement from 19.3% down to 9.8% for government bu-reaucracy and 16.4% to 9% for supply infrastructure, while corruption is still prevalent problem for doing business in Indonesia accounted for 19.3% in 2013/14, then down to 15.7% in 2014/15 but still accounted for 11.8% in 2016/17. As shown in table 6, other problematic factors for doing business in Indonesia are: access to financing, inflation, policy instability, inadequately educated workforce, tax rate and regulations – all combined accounted for 39.9%, and foreign currency regulations, government instability, poor work ethic, crime and theft, poor public health, labor regulation and insufficient capacity to innovate - all are accounted for 28.1%.

Volume 1 Issue 1 | July 2019
154 Fidēre: Journal of Business, Governance, and Information Technology
Table 6Problematic factors for doing business in IndonesiaProblematic factors for do-ing business (% out of total 100%)
08.09 09.10 10.11 11.12 12.13 13.14 14.15 15.16 16.17
Corruption 10.7 8.7 16 15.4 14.2 19.3 15.7 11.7 11.8Inefficient government bu-reaucracy
19.3 20.2 16.2 14.3 15.4 15 8.3 10.6 9.8
Inadequate supply of infra-structure
16.4 14.8 8.4 9.5 8.7 9.1 7.5 9.6 9
Access to financing 7.5 7.3 7.8 7.2 5.4 6.9 10.6 8.4 8.6Inflation 7.8 6.1 6.7 6.1 5.6 5.2 9.5 7.1 7.6Policy instability 5 9 6 7.4 5.4 5.7 6.9 8.7 6.5Inadequately educated work-force
4.4 4.7 5.4 6.3 4.1 4.2 4.1 2.7 6.3
Tax rates 1.3 1.9 2.7 4.2 3.3 5.2 5.3 8 6.1Tax regulations 6.7 6.8 5.6 6 5.1 2.6 2.9 6.7 4.8Foreign currency regulations 3.9 5.2 2.2 2.3 5.2 1.6 5.9 5 4.6Government instability/coups 3.7 3.6 6.4 6.1 5 4.9 5.2 4.9 4.1Poor work ethic in national labor force
3.5 3.7 4.9 6.2 7.2 5.7 5.3 6.2 4
Crime and theft 0.1 0.4 3.6 2.7 4.3 2.8 4.5 4.6 4Poor public health 0.1 0.5 2.7 2.5 2 3.5 2.3 1.3 4Restrictive labor regulations 9.7 7.1 5.3 3.6 6.8 6.3 4.9 2 3.7Insufficient capacity to innovate 2.3 2.1 1.3 2.5 3.7
Data Source WEF 2016/17
Indonesia’s GCI competitiveness ranks 41st among 138 countries in 2016/17 – under Jo-kowi government, drops seven places from its best rank 34 in 2014/15 – under Susilo Bambang Yudoyono (SBY) government (WEF, 2014/15; WEF 2016/17). Actually, Jokowi government’s main priority to improve Indonesia competitiveness is to reform Indonesian government bureau-cracy and business environment and to tackle corruption and inefficiency among government officials, members of DPR (the parliaments) as well as the members of MPR (the congress)- the main obstacle to the country’s competitive progress and development which he inherited from SBY government. Studies by Fukuoka and Djani (2016) and Kharisma and Jogiyanto (2016) conclude that Jokowi’s victory represented a triumph of a new democratic leader against tra-ditional oligarchic interests; however, Jokowi’s unique ‘bottom-up’ leadership style obscures important political dynamics that not only aided his ascendancy but also placed limits and has unfavorable impact on what he could achieve as a new president which also has put him in political limbo whether to go against or to adapt his grassroot aspiration to both political and business oligarchies.
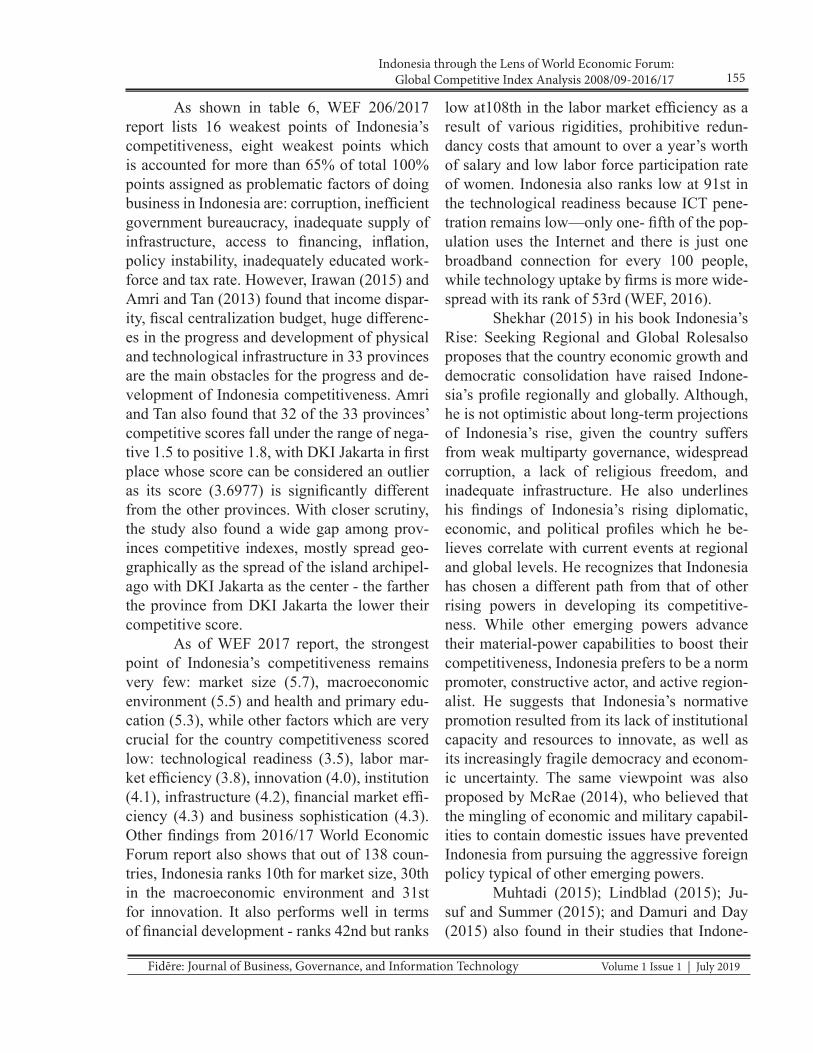
155Indonesia through the Lens of World Economic Forum:
Global Competitive Index Analysis 2008/09-2016/17
Fidēre: Journal of Business, Governance, and Information Technology Volume 1 Issue 1 | July 2019
As shown in table 6, WEF 206/2017 report lists 16 weakest points of Indonesia’s competitiveness, eight weakest points which is accounted for more than 65% of total 100% points assigned as problematic factors of doing business in Indonesia are: corruption, inefficient government bureaucracy, inadequate supply of infrastructure, access to financing, inflation, policy instability, inadequately educated work-force and tax rate. However, Irawan (2015) and Amri and Tan (2013) found that income dispar-ity, fiscal centralization budget, huge differenc-es in the progress and development of physical and technological infrastructure in 33 provinces are the main obstacles for the progress and de-velopment of Indonesia competitiveness. Amri and Tan also found that 32 of the 33 provinces’ competitive scores fall under the range of nega-tive 1.5 to positive 1.8, with DKI Jakarta in first place whose score can be considered an outlier as its score (3.6977) is significantly different from the other provinces. With closer scrutiny, the study also found a wide gap among prov-inces competitive indexes, mostly spread geo-graphically as the spread of the island archipel-ago with DKI Jakarta as the center - the farther the province from DKI Jakarta the lower their competitive score.
As of WEF 2017 report, the strongest point of Indonesia’s competitiveness remains very few: market size (5.7), macroeconomic environment (5.5) and health and primary edu-cation (5.3), while other factors which are very crucial for the country competitiveness scored low: technological readiness (3.5), labor mar-ket efficiency (3.8), innovation (4.0), institution (4.1), infrastructure (4.2), financial market effi-ciency (4.3) and business sophistication (4.3). Other findings from 2016/17 World Economic Forum report also shows that out of 138 coun-tries, Indonesia ranks 10th for market size, 30th in the macroeconomic environment and 31st for innovation. It also performs well in terms of financial development - ranks 42nd but ranks
low at108th in the labor market efficiency as a result of various rigidities, prohibitive redun-dancy costs that amount to over a year’s worth of salary and low labor force participation rate of women. Indonesia also ranks low at 91st in the technological readiness because ICT pene-tration remains low—only one- fifth of the pop-ulation uses the Internet and there is just one broadband connection for every 100 people, while technology uptake by firms is more wide-spread with its rank of 53rd (WEF, 2016).
Shekhar (2015) in his book Indonesia’s Rise: Seeking Regional and Global Rolesalso proposes that the country economic growth and democratic consolidation have raised Indone-sia’s profile regionally and globally. Although, he is not optimistic about long-term projections of Indonesia’s rise, given the country suffers from weak multiparty governance, widespread corruption, a lack of religious freedom, and inadequate infrastructure. He also underlines his findings of Indonesia’s rising diplomatic, economic, and political profiles which he be-lieves correlate with current events at regional and global levels. He recognizes that Indonesia has chosen a different path from that of other rising powers in developing its competitive-ness. While other emerging powers advance their material-power capabilities to boost their competitiveness, Indonesia prefers to be a norm promoter, constructive actor, and active region-alist. He suggests that Indonesia’s normative promotion resulted from its lack of institutional capacity and resources to innovate, as well as its increasingly fragile democracy and econom-ic uncertainty. The same viewpoint was also proposed by McRae (2014), who believed that the mingling of economic and military capabil-ities to contain domestic issues have prevented Indonesia from pursuing the aggressive foreign policy typical of other emerging powers.
Muhtadi (2015); Lindblad (2015); Ju-suf and Summer (2015); and Damuri and Day (2015) also found in their studies that Indone-

Volume 1 Issue 1 | July 2019
156 Fidēre: Journal of Business, Governance, and Information Technology
sia’s economy faces pressure on its external bal-ance and a continued slow economic growth as the world is facing global political, economic and social uncertainty. Domestically, the cur-rent government is caught between economic and democratic reform and oligarchic politic, while struggling to meet its commitments to the ASEAN Economic Community amid huge challenges to contain inequality of domestic growth, income disparity as well as the raise of Islamic fundamentalist and the fear of frag-mented country under ethnic and religious fault lines.
Although some may argue that the results of the Indonesia GCI competitiveness score and ranking does not describe ‘the real economic competitiveness of the huge diverse Indonesia’, somehow the study clearly described the coun-try’s competitiveness position among ASEAN neighborhood as well as for global and Asian Pacific region.
Conclusions and RecommendationsThe 2016/17 WEF report showed in the
CGI’s competitive status, Indonesia is at effi-ciency driven economy and still behind Singa-pore, Malaysia and Thailand, ranks 4th among ASEAN countries and ranks 41st among 138 countries. The current Jokowi administration has much to do to improve Indonesia’s perfor-mance and competitiveness. Competitiveness goes hand in hand with competition; competi-tion requires clean government and transpar-ency to work efficiently (Thore & Tarverdyan, 2016). The democratic reform which should be the mechanism for increasing good governance and bureaucratic reform that facilitates econom-ic development are still being hijacked by the Indonesia’s multiparty presidential system. A system controlled by a far-reaching party cartel which would make it difficult for any president to form a non-collusive administration and push through extensive reform (Danuri & Day, 2015; Muhtadi, 2015).
Some analysts, however believe the current president - Jokowi, though struggling during his first year in office, has successfully consolidated his leadership legitimacy by gain-ing support from the Golkar party, his former rival party. His latest economic deals made with Saudi Arabia during King Salman’s trip, though considered being relatively insignificant given the kingdom’s financial prowess, has given him huge support from conservative Islamic major-ity to consolidate the majority voice of country Muslim leaders behind him to fight domestic terrorism and promote religious tolerance and silent the radical Islam voice (Warburton, 2016; Gee, 2017; Wahyono, 2017).
Nevertheless, the world and Indonesians are waiting and expecting that Jokowi will be able to successfully balance his political move-ment between “pushing the economic/demo-cratic reformation agenda and clean govern-ment” and “gaining support from political party, avoiding the trap usual practices of trading cab-inet posts as reward for party oligarchs support or acting as the agent of those oligarchs” as he faces several sensitive political agenda such as: maintain Pancasila as the country ideology to unify the divided groups/parties polarized by ethnic/religious/income disparities, balancing government and foreign ownership in Papua Free Port Mining, tax redemption and conglom-erate properties/wealth in foreign accounts, control and safety of Indonesian maritime ter-ritory, and a clear direction for Indonesia trade, investment and foreign policy. These are crucial issues which must be resolved carefully and successfully, if not these will adversely affect his performance as pro democratic clean gov-ernment as well as the country economic com-petitiveness.
Therefore, one may conclude that it is still a long way for Indonesia to transform its current competitive status from level 3 efficien-cy-driven economy into level 4 transition to in-novative economy nor expect to see Indonesia
157Indonesia through the Lens of World Economic Forum:
Global Competitive Index Analysis 2008/09-2016/17
Fidēre: Journal of Business, Governance, and Information Technology Volume 1 Issue 1 | July 2019
competitiveness will reach the status of innova-tive economy in the near future.
Some limitations may be identified with this study such as the use of nine-year period of investigation of Indonesia competitive index from 2008/09 to 2016/17 instead of 10 years. This is due to the lack of index indicators used to measure competitiveness for the years prior to 2008/09 which comprises of nine indicators only, while the model of the study used twelve indicators. The actual report of World Econom-ic Forum (WEF) also measures the country competitiveness both in scores and ranks, but this study chooses to use the Likert scores to measure the country competitiveness instead of ranks, although in some discussions rank mea-surement is also included. The study adopts the final result of World Economic Forum calcu-lation of GCI index for each indicator, the de-tailed calculation of each measurement should be referred to WEF annual reports.
Furthermore, study should be done to in-vestigate Indonesia competitiveness using other reliable reports from World Bank, International Institute for Management Development (IMD), Asian Development Bank. Other supportive analysis may be developed to investigate Sin-gapore, Malaysia and Thailand competitiveness as a comparative evaluation for Indonesia com-petitive performance.
ReferencesAsian Development Bank (2016), Indonesia:
Economy. Retrieved from https://www.adb.org/ countries/indonesia/economy
Bilbao-Osorio, B., Blanke, J., Campanella, E., Crotti, R., Drzeniek-Hanouz, M., & Se-rin, C. (2013). Assessing the sustainable competitiveness of nations. The Glob-al Competitiveness Report 2013–2014, 436-459.
Burhanuddin, Muhtadi. (2015). Jokowi’s First Year: A weak president caught between reform and oligarchic politics, Bulletin of Indonesia Economic Studies, 51, 3, 349-368.
Damuri, Yose R. & Day, Creina (2015). Survey of recent developments, Bulletin of In-donesian Economic Studies, 51, 1, 3-27.
Elias, Stephen & Noone, Clare (2016). The growth and development of Indonesia. Reserve Bank of Australia. Retrieved from www.rba.gov.au/publications/ bul-letin/2011/dec/pdf/bu-1211-4.pdf
Fukuoka, Y., & Djani, L. (2016). Revisiting the rise of Jokowi: The triumph of reforma-si or an oligarchic adaptation of post-cli-entelist initiatives?. South East Asia Re-search, 24,2, 204-221.
Gee, J. (2017, January/February). Washington Report. Retrieved from Indonesia: At-tack the governor to attack the president?: https://www.wrmea.org/2017-janu-ary-february/indonesia-attack-a-gover-nor-to-attack-the-president.html
Huggins, R., Izushi, H., & Thompson, P. (2013). Regional competitiveness: the-ories and methodologies for empirical analysis. Journal of Centrum Cathedra: The Business and Economics Research Journal, 6,2, 155-172.
Irawan, Andi (2015). Regional income dispar-ities in Indonesia: Measurements, con-vergence process, and decentralization, Bulletin of Indonesian Economic Stud-ies, 51, 1, 148-149.
Volume 1 Issue 1 | July 2019
158 Fidēre: Journal of Business, Governance, and Information Technology
Kharisma, F., & Jogiyanto, J. (2016, May). Events Study: The Effect of Oil Price Changes in Jokowi’s Government to Share Price on Manufacturing Com-panies Listed in Indonesia Stock Ex-change. In ASEAN/Asian Academic Society International Conference Pro-ceeding Series.
Lindblad, J. T., (2015). Foreign direct invest-ment in Indonesia: Fifty years of dis-course, Bulletin of Indonesia Economic studies, 51, 2, 217-237.
McRae, Dave. (2014). More talk than walk: In-donesia as a foreign policy actor. Lowy Institute for International Policy.
Rock, Michael T. (2015). South-East Asia’s democratic development states and eco-nomic growth, Institutions and Econo-mies,7,1, 23-51.
Shekar, Vibhanshu (2015). Indonesia’s Rise: Seeking regional and global roles. New Delhi: Pentagon Press.
Singh, R.K., Murty, H. R., Gupta, S. K., Dik-shit, A. K. (2011), An overview of sus-tainability assessment methodology, Ecological Indicators, 5,2012, 281-299.
Tan, K. G., & Amri, M. (2013). Subnational competitiveness and national perfor-mance. Analysis Journal, 6, 2, 173-192.
Thore, S., & Tarverdyan, R. (2016). The sus-tainable competitiveness of nations. Technological Forecasting and Social Change, 106, 2, 108-114.
Wahyono, K. (2017, March 9). For Freeport just follow Indonesias wishes. Retrieved from The Jakarta Post: http://www.the-
jakartapost.com/academia/2017/03/09/for- f reepor t - jus t - fo l low-indone-sias-wishes.html
Wahyono, K. (2017, March 9). For Freeport, just follow Indonesia’s wishes. The Ja-karta Post, pp. 43-44.
Warburton, Eve (2016). Jokowi and the New Developmentalism. Bulletin of Indone-sia Economic Studies, 52, 3, 297-320.
World Economic Forum (2011). Sustaining the growth momentum, The Indonesia Competitiveness Report 2011. Geneva: World Economic Forum.
World Economic Forum (2016). The Global Competitiveness Report 2016/17. Gene-va: World Economic Forum.
Yusuf, A. A. & Summer, A. (2015). Growth, poverty, and inequality under Jokowi, Bulletin of Indonesia Economic Studies, 51,3, 323-348.
Volume 1 Issue 1 | July 2019
159Fidēre: Journal of Business, Governance, and Information Technology
Abstract
This research explained the factors which influence customers to purchase the HONDA motorcycles in Universitas Klabat 2017. The customer’s attitude toward price, taste, quality, after-sale price, prestige, and promotion influ-
ence the buying decision of the customers. The data were taken from the owners and the users of HONDA motorcycles in Universitas Klabat from January 2017 to July 2017. There were 150 questioners spread to customers and the data were analized by utilizing SPSS 16 to be analyzed by using Normality Test, Releability Test, and Validity Test in Likert Scale rating. The results of this research showed that there is no significant influence of price, taste, quality, after-sale price, pres-tige, and promotion on the buying decisions of the customers to purchase Honda Motorcycle in Universitas Klabat from January 2017 – July 2017. Interestingly for individual factor, the quality and promotion factors had positive significant influ-ence for buying decisions of the customers to buy Honda motorcycle in Universitas Klabat for the year 2017. The result showed that only 26.9% were positively influ-enced by the buying factor and the 73.1% are from the other factors that were not in the area of this research.Keywords: Price, taste, quality, after-sale price, prestige, promotion and buying decision
faCTors affeCTing ConsuMer behavior
in purChasing honda MoTorCyCleHartiny Pop Koapaha
Universitas Klabat Indonesia
In the era of globalization nowadays, there are many branded motorcycles offered to consum-ers, such as SUZUKI, YAMAHA, KAWASA-KI, HONDA, KTM and so forth. Each motorcy-cle manufacturer is trying to make its products superior to other brands. Therefore, good and proper marketing activities play an important role in supporting the business continuity and development of a company. In other words, the producers must be able to win the hearts of con-sumers and strive to satisfy its customers.
However, to understand consumer be-havior is certainly not easy because consumers
have different properties in accordance with the needs of each. In addition, consumers are also strongly influenced by external and inter-nal conditions, respectively. External factors include culture, sub-culture, social class, social group, reference group, and family. While inter-nal factors are factors that exist in the consumer itself (psychological) which includes: learning, personality, self-concept, and attitude (Supranto and Nandan, 2008).
Consumer behavior is also a study of how individuals, groups and organizations choose, buy, use goods and services, ideas or ex-

Volume 1 Issue 1 | July 2019
160 Fidēre: Journal of Business, Governance, and Information Technology
periences to satisfy their needs and wants (Kot-ler and Keller, 2008). In other words the deci-sion to buy is a learning process and purchasing decisions can be taken after the consumer learns and understands the needs of a good / service on themselves.
Therefore, producers have to understand the changes in behavior by trying to compen-sate, namely by influencing consumers in buy-ing products offered through periodic evalua-tions and research surveys. Research conducted by Handrijaningsih, Indira and Anisah (2013), which examines the factors that influence con-sumers in selecting motor brands HONDA, con-cluded that cultural, social, personal and psy-chological factors affect the selection of Honda products either partially or simultaneously.
Further research was conducted by In-drawati (2016) in CV. Hopefully, Jaya Sama-rinda states cultural, social, personal and psy-chological variables simultaneously have a significant effect on consumer decisions. While Wahyuni (2008), concluded that motivation fac-tors, perceptions and consumer attitudes influ-ence positively and significantly to the purchase decision of Honda motorcycle brand.
This study examines the variables that influence consumer behavior in the process of making purchasing decisions in accordance with the theory (Kotler and Keller, 2009) i.e. price, tastes, quality, resale price, prestige and promotion factors that can influence consumers in making decisions purchase.
Formulation of the problem. Based on the background of the proposed problem, this study formulated two research questions: (1) Are price, taste, quality, resale price, prestige, and promotion simultaneously affecting consumer behavior in buying HONDA motorcycles? (2)
Are price, taste, quality, resale price, prestige, and promotion paersial affect consumer behav-ior in buying motorcycle HONDA?
Significance of the StudyThis study is expected to be a consid-
eration and input for Honda companies, for ac-ademics, for consumers and for researchers in terms of: 1. Honda Company.This research can be useful for companies or their leaders in es-tablishing policies and marketing strategies for the development of their business. 2. Academ-ics. This study may contribute to the academics as an additional literature on factors that may influence purchasing decisions for motorcycles. 3. Consumer Honda motorcycle buyer. The results of this study can provide information to consumers on how to choose a motorcycle product. 4. Researchers. For the researchers, the results of this study can be a practical contribu-tion in conducting research methods on factors that affect consumers in buying a motorcycle.
The Theory Framework and Concep-tual Framework. This study uses the concept of consumer behavior, Kotler and Keller (2009) who argue that consumer behavior is the study of how consumers choose, buy, use goods, services, ideas, or experiences to satisfy their needs.
Factors of price, taste, quality, resale price, prestige and promotion are the main fac-tors chosen to influence consumers in making purchasing decisions. Figure 1 Concept frame-work describes the influence of price variables, tastes, quality, resale price, prestige and promo-tion of consumer purchase decisions.
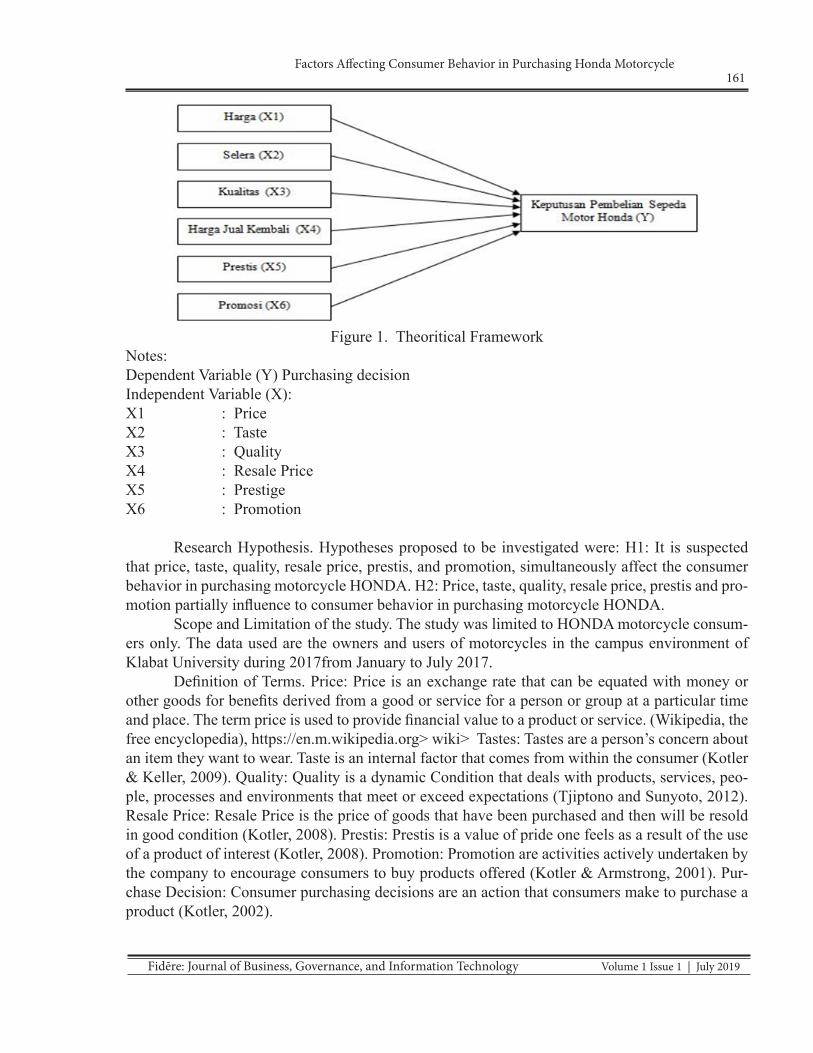
161Factors Affecting Consumer Behavior in Purchasing Honda Motorcycle
Fidēre: Journal of Business, Governance, and Information Technology Volume 1 Issue 1 | July 2019
Figure 1. Theoritical FrameworkNotes:Dependent Variable (Y) Purchasing decisionIndependent Variable (X):X1 : PriceX2 : TasteX3 : QualityX4 : Resale PriceX5 : PrestigeX6 : Promotion
Research Hypothesis. Hypotheses proposed to be investigated were: H1: It is suspected that price, taste, quality, resale price, prestis, and promotion, simultaneously affect the consumer behavior in purchasing motorcycle HONDA. H2: Price, taste, quality, resale price, prestis and pro-motion partially influence to consumer behavior in purchasing motorcycle HONDA.
Scope and Limitation of the study. The study was limited to HONDA motorcycle consum-ers only. The data used are the owners and users of motorcycles in the campus environment of Klabat University during 2017from January to July 2017.
Definition of Terms. Price: Price is an exchange rate that can be equated with money or other goods for benefits derived from a good or service for a person or group at a particular time and place. The term price is used to provide financial value to a product or service. (Wikipedia, the free encyclopedia), https://en.m.wikipedia.org> wiki> Tastes: Tastes are a person’s concern about an item they want to wear. Taste is an internal factor that comes from within the consumer (Kotler & Keller, 2009). Quality: Quality is a dynamic Condition that deals with products, services, peo-ple, processes and environments that meet or exceed expectations (Tjiptono and Sunyoto, 2012). Resale Price: Resale Price is the price of goods that have been purchased and then will be resold in good condition (Kotler, 2008). Prestis: Prestis is a value of pride one feels as a result of the use of a product of interest (Kotler, 2008). Promotion: Promotion are activities actively undertaken by the company to encourage consumers to buy products offered (Kotler & Armstrong, 2001). Pur-chase Decision: Consumer purchasing decisions are an action that consumers make to purchase a product (Kotler, 2002).

Volume 1 Issue 1 | July 2019
162 Fidēre: Journal of Business, Governance, and Information Technology
MethodologyResearch Design. This study is compar-
ative Causal research that is research with prob-lem characteristic of causation between two variables or more (Indriantoro, 2002). Compar-ative causal includes two or more groups and one independent variable as a research object between different subjects or times and then a causal relationship is found. This research was conducted in the campus of Klabat University (UNKLAB), Airmadidi, North Minahasa, North Sulawesi, Jl. Arnold Mononutu, Airmadidi, zip code 95371.
Population / Sample. The respondents were 150 users/owners of Honda motorcycles in Universitas Klabat campus in 2017. Those who use Honda motorcycles are considered qualified as respondents if the least for 20 consecutive days using Honda motorcycles as a means of transportation inside the campus of Klabat Uni-versity
Research Instruments. This study used primary data questionnaire which was adminis-tered to all users of Honda motorcycles in the University Campus Klabat. Data in the form of words, sentences distributed to consumers, and assessed by the form of numbers or qualitative data that was scored using Likert Scale.
Analysis Technique. Using the test of normality, reliability test and validity test by modifying the questionnaire from previous re-searchers followed by hypothesis test using multiple linear regression. Cooper and Schin-dler (2010) describes multiple linear regres-sion analysis showing the causal relationship between the variable X (independent variable) which is the cause and the variable Y (the de-pendent variable) is the result, and multiple lin-ear analysis is the method used to describe the effect of the variable free that affects the depen-dent variable. And multiple linear regression not only sees the interrelationships between variables but also measures the magnitude of the causality relationship.
The equality of doubled linear regres-sion model is as follows:
Y = α + b1X1 + b2X2 + b3X3 + b4X4 + b5X5 + b6X6 + e
Fungsi tersebut menerangkan hubungan antara variabel bebas ( X ) dan variabel tidak bebas ( Y ) dimana : Those function describes the relationship between independent variable (X) and dependent variable (Y) by which:
Y : Consumers behaviour α : Constantaβ1 s/d β6 : Coefficient regression of
each variableX1 : PriceX2 : TasteX3 : QualityX4 : Resale PriceX5 : PrestigeX6 : Promotion e : Errors factors.
Factors In Research InstrumentsPrice (X.1). Considering consumer re-
sponses regarding variable of HONDA motor-cycle prices compared with similar products. According to Kotler and Keller(2008), in this case given the question to the questionnaire as below: X1.1 Honda motorcycle prices afford-able to the public. X1.2 Price of Honda motor-cycles according to the quality X1.3 The price of each type of Honda motorcycle varies. X1.4. Honda motorcycle prices are cheaper than other brands. X1.5. Honda motorcycle prices include shipping costs
Taste (X.2). Taste is a description of HONDA motorcycle products that consumers want in providing pleasure and satisfaction. Consumer tastes usually depend on age, gender and social status (Anwar, 2011). And Julianda (2007) states that consumer tastes are internal factors that are based from within a person. Questions given to the questionnaire are as fol-lows: X2.1 Honda motorcycle is comfortably

163Factors Affecting Consumer Behavior in Purchasing Honda Motorcycle
Fidēre: Journal of Business, Governance, and Information Technology Volume 1 Issue 1 | July 2019
steered. X2.2 Honda motorcycles have good headlamps X2.3 Honda motorcycle lights have uniform illumination X2.4 Honda motorcycles have a large selection of colors. X2.5 The shape of Honda motorcycles is attractive.
Quality (X3). Kotler (2008) explains that product quality has a direct impact on prod-uct performance, how its durability, quality and product benefits. That is why given the fol-lowing questions to see consumer feedback on HONDA motorcycle quality. Questions given to the questionnaire are as follows: X3.1 Motorcy-cle Honda guaranteed quality, X3.2 Honda mo-torcycles have a high quality, X3.3 Motorcycle Honda fuel economy, X3.4 Honda motorcycle has a speed more class. X3.5 Honda motorcy-cles have superior engine technology.
Resale Price (X4). The resale price can be measured based on the consumer’s own treat-ment (Kotler and Keller, 2002). And to know the consumer response to the resale price and ease in marketing the products that have been used. Consumer valuation on the level of ease of marketing and acceptance from other con-sumers on the sale price of HONDA motorcycle after-use is measured by treatment.
Questions given to the questionnaire are as follows: X4.1 Honda motorcycle after-sales prices higher, X4.2 Honda motorcycle enthusi-asts used more than other brands.
Prestice (X5). As stated by Kotler (2008), the value of a product prestis is the val-ue of pride that is felt by a person resulting for the product used. The value of a person’s pride due to the use of a product is measured from the level of consumer pleasure. The questions given are as follows: X5.1 By riding a Honda motorcycle I am more confident, X5.2 Honda motorcycles have a choice of models that at-tract consumers, X5.3 Honda motorcycles have a sporty design, X5.4 Bike Honda motor has a design that follows the trend, X5.5 By riding a motorcycle H / onda raise the prestige of its us-ers
Promotion (X6). Private and Sukotjo (2002) mention that promotion is a flow of in-formation, one-way persuasion made to direct a person or organization to actions, that create exchanges in marketing. A form of marketing communication such as activities to disseminate information, influence, persuade consumers to buy HONDA motorcycles. As for the questions given are as follows: X6.1 Honda motorcycles carry out promotions in the newspaper media, X6.2 Granting discounts attract buyers, X6.3 Honda motorcycles held a rebate from the usual, X6.4 Honda motorcycles held an event -event to display its products, X6.5 Display banners in strategic places.
Buying Decision (Y). According to Kot-ler (2000), purchase decision is the attitude of a person to buy or use a product either in the form of goods or services that have been believed to satisfy themselves and the willingness to bear risks. In the end, consumers take the decision to buy the desired product after assessing the above variables that make consumers interested and want to have the product in fulfilling the wishes or needs. As for the questions given are as follows: Y1 There is a need for transportation from and out of the house, Y2 Want to have a collection of motorcycles, Y3 Many neighbors and friends who have Honda motorcycles, Y4 Honda motorbikes are economical, Y5 Bicycle purchase Honda motorcycles for investment
Normality test. Normality test is per-formed to determine whether the regression model, independent variable, dependent vari-able, or both have a normal distribution or not. To find out the first test was used One-Sample Kolmogorov-Smirnov Test for the first 50 sam-ples to be pilot test according to Santoso (2010) decision-making guidelines in the normality test ie, if Sig or significantly greater than 0.05 then the distribution is normality (symmetric). Meanwhile, according to Ghozali (2005), a good model is one that have a normal or near normal distribution of data.
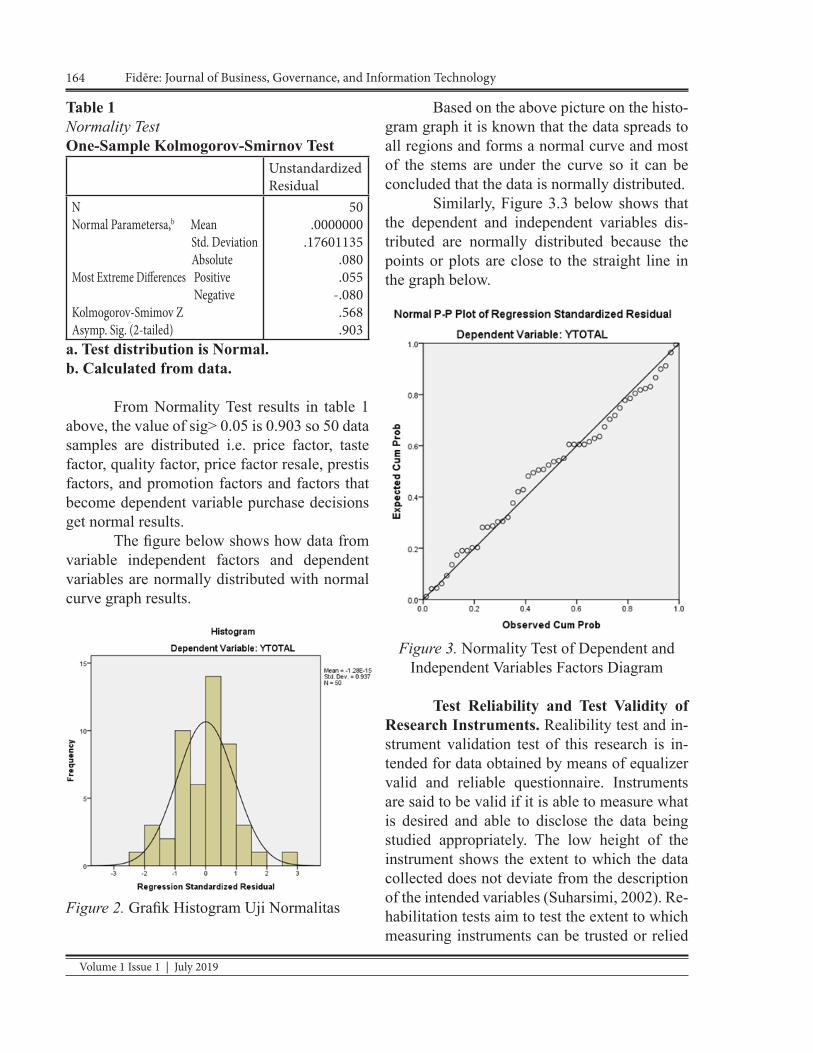
Volume 1 Issue 1 | July 2019
164 Fidēre: Journal of Business, Governance, and Information Technology
Table 1Normality TestOne-Sample Kolmogorov-Smirnov Test
Unstandardized Residual
NNormal Parametersa,b Mean Std. Deviation AbsoluteMost Extreme Differences Positive NegativeKolmogorov-Smimov ZAsymp. Sig. (2-tailed)
50.0000000
.17601135.080.055
-.080.568.903
a. Test distribution is Normal.b. Calculated from data.
From Normality Test results in table 1 above, the value of sig> 0.05 is 0.903 so 50 data samples are distributed i.e. price factor, taste factor, quality factor, price factor resale, prestis factors, and promotion factors and factors that become dependent variable purchase decisions get normal results.
The figure below shows how data from variable independent factors and dependent variables are normally distributed with normal curve graph results.
Figure 2. Grafik Histogram Uji Normalitas
Based on the above picture on the histo-gram graph it is known that the data spreads to all regions and forms a normal curve and most of the stems are under the curve so it can be concluded that the data is normally distributed.
Similarly, Figure 3.3 below shows that the dependent and independent variables dis-tributed are normally distributed because the points or plots are close to the straight line in the graph below.
Figure 3. Normality Test of Dependent and Independent Variables Factors Diagram
Test Reliability and Test Validity of Research Instruments. Realibility test and in-strument validation test of this research is in-tended for data obtained by means of equalizer valid and reliable questionnaire. Instruments are said to be valid if it is able to measure what is desired and able to disclose the data being studied appropriately. The low height of the instrument shows the extent to which the data collected does not deviate from the description of the intended variables (Suharsimi, 2002). Re-habilitation tests aim to test the extent to which measuring instruments can be trusted or relied
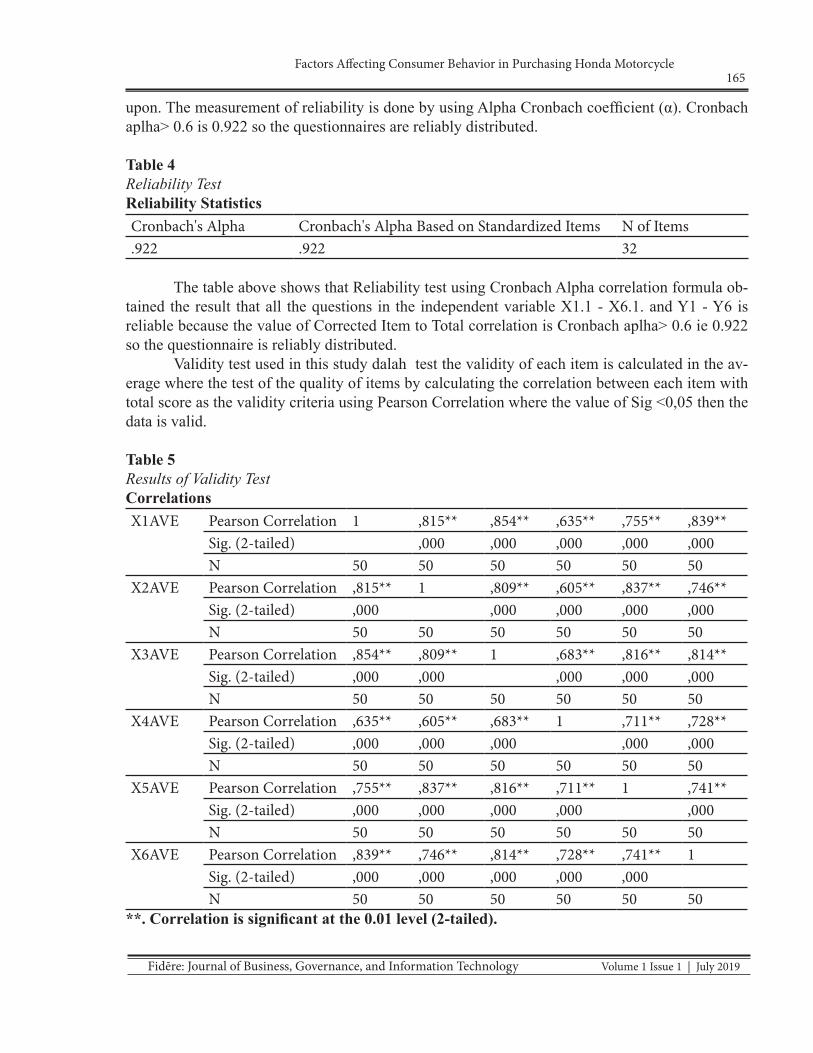
165Factors Affecting Consumer Behavior in Purchasing Honda Motorcycle
Fidēre: Journal of Business, Governance, and Information Technology Volume 1 Issue 1 | July 2019
upon. The measurement of reliability is done by using Alpha Cronbach coefficient (α). Cronbach aplha> 0.6 is 0.922 so the questionnaires are reliably distributed.
Table 4Reliability TestReliability StatisticsCronbach's Alpha Cronbach's Alpha Based on Standardized Items N of Items.922 .922 32
The table above shows that Reliability test using Cronbach Alpha correlation formula ob-tained the result that all the questions in the independent variable X1.1 - X6.1. and Y1 - Y6 is reliable because the value of Corrected Item to Total correlation is Cronbach aplha> 0.6 ie 0.922 so the questionnaire is reliably distributed.
Validity test used in this study dalah test the validity of each item is calculated in the av-erage where the test of the quality of items by calculating the correlation between each item with total score as the validity criteria using Pearson Correlation where the value of Sig <0,05 then the data is valid.
Table 5Results of Validity TestCorrelationsX1AVE Pearson Correlation 1 ,815** ,854** ,635** ,755** ,839**
Sig. (2-tailed) ,000 ,000 ,000 ,000 ,000N 50 50 50 50 50 50
X2AVE Pearson Correlation ,815** 1 ,809** ,605** ,837** ,746**Sig. (2-tailed) ,000 ,000 ,000 ,000 ,000N 50 50 50 50 50 50
X3AVE Pearson Correlation ,854** ,809** 1 ,683** ,816** ,814**Sig. (2-tailed) ,000 ,000 ,000 ,000 ,000N 50 50 50 50 50 50
X4AVE Pearson Correlation ,635** ,605** ,683** 1 ,711** ,728**Sig. (2-tailed) ,000 ,000 ,000 ,000 ,000N 50 50 50 50 50 50
X5AVE Pearson Correlation ,755** ,837** ,816** ,711** 1 ,741**Sig. (2-tailed) ,000 ,000 ,000 ,000 ,000N 50 50 50 50 50 50
X6AVE Pearson Correlation ,839** ,746** ,814** ,728** ,741** 1Sig. (2-tailed) ,000 ,000 ,000 ,000 ,000N 50 50 50 50 50 50
**. Correlation is significant at the 0.01 level (2-tailed).
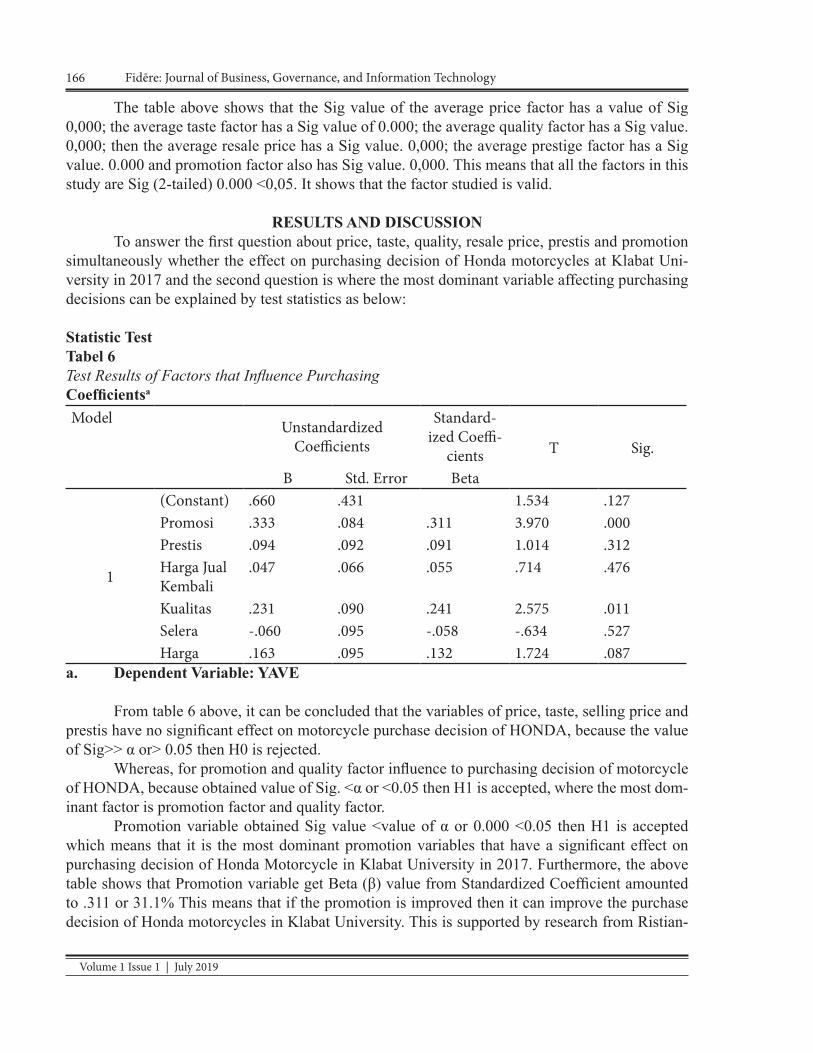
Volume 1 Issue 1 | July 2019
166 Fidēre: Journal of Business, Governance, and Information Technology
The table above shows that the Sig value of the average price factor has a value of Sig 0,000; the average taste factor has a Sig value of 0.000; the average quality factor has a Sig value. 0,000; then the average resale price has a Sig value. 0,000; the average prestige factor has a Sig value. 0.000 and promotion factor also has Sig value. 0,000. This means that all the factors in this study are Sig (2-tailed) 0.000 <0,05. It shows that the factor studied is valid.
RESULTS AND DISCUSSION To answer the first question about price, taste, quality, resale price, prestis and promotion simultaneously whether the effect on purchasing decision of Honda motorcycles at Klabat Uni-versity in 2017 and the second question is where the most dominant variable affecting purchasing decisions can be explained by test statistics as below:
Statistic TestTabel 6Test Results of Factors that Influence PurchasingCoefficientsa
Model UnstandardizedCoefficients
Standard-ized Coeffi-
cients T Sig.
B Std. Error Beta
1
(Constant) .660 .431 1.534 .127Promosi .333 .084 .311 3.970 .000Prestis .094 .092 .091 1.014 .312Harga Jual Kembali
.047 .066 .055 .714 .476
Kualitas .231 .090 .241 2.575 .011Selera -.060 .095 -.058 -.634 .527Harga .163 .095 .132 1.724 .087
a. Dependent Variable: YAVE
From table 6 above, it can be concluded that the variables of price, taste, selling price and prestis have no significant effect on motorcycle purchase decision of HONDA, because the value of Sig>> α or> 0.05 then H0 is rejected.
Whereas, for promotion and quality factor influence to purchasing decision of motorcycle of HONDA, because obtained value of Sig. <α or <0.05 then H1 is accepted, where the most dom-inant factor is promotion factor and quality factor.
Promotion variable obtained Sig value <value of α or 0.000 <0.05 then H1 is accepted which means that it is the most dominant promotion variables that have a significant effect on purchasing decision of Honda Motorcycle in Klabat University in 2017. Furthermore, the above table shows that Promotion variable get Beta (β) value from Standardized Coefficient amounted to .311 or 31.1% This means that if the promotion is improved then it can improve the purchase decision of Honda motorcycles in Klabat University. This is supported by research from Ristian-

167Factors Affecting Consumer Behavior in Purchasing Honda Motorcycle
Fidēre: Journal of Business, Governance, and Information Technology Volume 1 Issue 1 | July 2019
ingrum (2014) which showed that the most dominant promotion variable than other variables that affect the purchase of Honda motorcycle products at PT. Central Sakti Motor Wonogiri branch is the Promotion factor.
For the quality variable, the value of Sig. <Value of α or 0.011 <0.05 then H1 is accepted which means the variable of quality is the second dominant variable affecting the decision of pur-chasing HONDA motorcycle in Klabat University Year 2017. Quality variable get Beta value (β) of Standardized Coefficient of 0.241 or 24.1%. This means that if the quality of HONDA brand motorcycle products is better, it will improve consumer purchasing decisions towards HONDA bike in the campus of Klabat University. This claim is supported by the research conducted by Annafik and Raharjo (2012) which states that product quality has a significant effect on purchasing decision.
However, the result of promotion and quality variables has small effect because the coeffi-cient value for the promotion variable is only 31.1% and the quality variable is only 24.1%.
Table 7Model of Consumers Purchasing Decision TableANOVAa
Model Sum of Squares
Df Mean Square F Sig.
1Regression 12.350 6 2.058 10.158 .000b
Residual 28.977 143 .203Total 41.327 149
a. Dependent Variable: Y= Keputusan Membelib. Predictors: (Constant), Rata-rata: Harga, Selera, Kualitas, Harga jual Kembali, Prestis dan Promosi
F statistic test is used to test all independent variables; in this case price, taste, quality, re-sale price / after-sale, prestis and promotion together in influencing the dependent variable that is purchasing decision of Honda motorcycle, or to see the effect of independent variables collectively on the dependent variable. The Sig value obtained in the above table is 0.000 which means that p-value <0.05 means H1 is accepted. It can be concluded that the independent variables, which are: price, taste, quality, resale price, prestige and promotion significantly influence the purchase decision of Honda motor-cycles in the University of Klabat in 2017.
Table 8Model Summary Doubled Regression AnalysisModel Summaryb
Mode 1
R R Square
Adjust-ed R Square
Std. Error of the Estimate
Change Statistics Durbin WatsonR
Square Change
F Change
df1 df2 Sig. F Change
1 .547 .299 .269 .45015 .299 10.158 6 143 .000 2.177a. Predictors: (Constant), Harga rata-rata, Selera rat-rata, kualitas rata-rata, harga jual kembali rata-rata, prestis rata-rata dan promosi rata-ratab. Dependent Variable: Yrata-rata = Keputusan Membeli
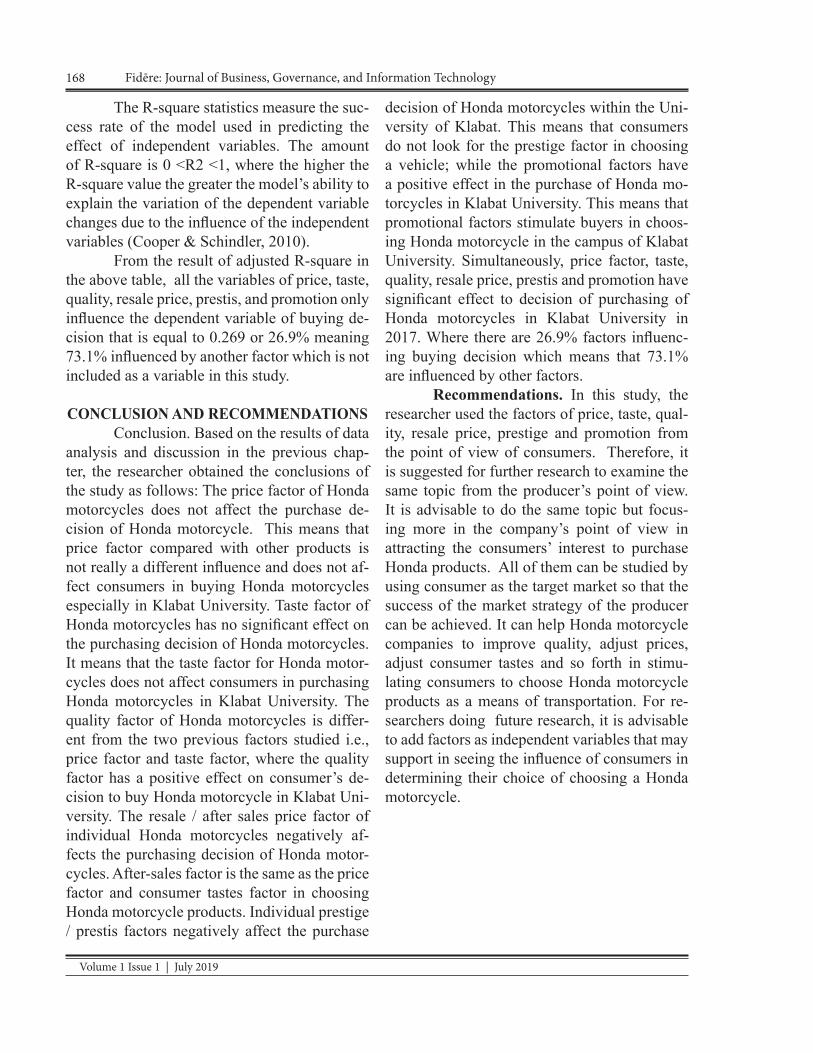
Volume 1 Issue 1 | July 2019
168 Fidēre: Journal of Business, Governance, and Information Technology
The R-square statistics measure the suc-cess rate of the model used in predicting the effect of independent variables. The amount of R-square is 0 <R2 <1, where the higher the R-square value the greater the model’s ability to explain the variation of the dependent variable changes due to the influence of the independent variables (Cooper & Schindler, 2010).
From the result of adjusted R-square in the above table, all the variables of price, taste, quality, resale price, prestis, and promotion only influence the dependent variable of buying de-cision that is equal to 0.269 or 26.9% meaning 73.1% influenced by another factor which is not included as a variable in this study.
CONCLUSION AND RECOMMENDATIONSConclusion. Based on the results of data
analysis and discussion in the previous chap-ter, the researcher obtained the conclusions of the study as follows: The price factor of Honda motorcycles does not affect the purchase de-cision of Honda motorcycle. This means that price factor compared with other products is not really a different influence and does not af-fect consumers in buying Honda motorcycles especially in Klabat University. Taste factor of Honda motorcycles has no significant effect on the purchasing decision of Honda motorcycles. It means that the taste factor for Honda motor-cycles does not affect consumers in purchasing Honda motorcycles in Klabat University. The quality factor of Honda motorcycles is differ-ent from the two previous factors studied i.e., price factor and taste factor, where the quality factor has a positive effect on consumer’s de-cision to buy Honda motorcycle in Klabat Uni-versity. The resale / after sales price factor of individual Honda motorcycles negatively af-fects the purchasing decision of Honda motor-cycles. After-sales factor is the same as the price factor and consumer tastes factor in choosing Honda motorcycle products. Individual prestige / prestis factors negatively affect the purchase
decision of Honda motorcycles within the Uni-versity of Klabat. This means that consumers do not look for the prestige factor in choosing a vehicle; while the promotional factors have a positive effect in the purchase of Honda mo-torcycles in Klabat University. This means that promotional factors stimulate buyers in choos-ing Honda motorcycle in the campus of Klabat University. Simultaneously, price factor, taste, quality, resale price, prestis and promotion have significant effect to decision of purchasing of Honda motorcycles in Klabat University in 2017. Where there are 26.9% factors influenc-ing buying decision which means that 73.1% are influenced by other factors.
Recommendations. In this study, the researcher used the factors of price, taste, qual-ity, resale price, prestige and promotion from the point of view of consumers. Therefore, it is suggested for further research to examine the same topic from the producer’s point of view. It is advisable to do the same topic but focus-ing more in the company’s point of view in attracting the consumers’ interest to purchase Honda products. All of them can be studied by using consumer as the target market so that the success of the market strategy of the producer can be achieved. It can help Honda motorcycle companies to improve quality, adjust prices, adjust consumer tastes and so forth in stimu-lating consumers to choose Honda motorcycle products as a means of transportation. For re-searchers doing future research, it is advisable to add factors as independent variables that may support in seeing the influence of consumers in determining their choice of choosing a Honda motorcycle.
169Factors Affecting Consumer Behavior in Purchasing Honda Motorcycle
Fidēre: Journal of Business, Governance, and Information Technology Volume 1 Issue 1 | July 2019
ReferencesAji Normawan Rosyid, Handoyo Djoko W,
Widayanto (2013), “Pengaruh Kualitas Produk, Citra Merek, Harga dan Iklan Terhadap Keputusan Pembelian Sepeda Motor Honda Revo,” Studi Kasus Pada Konsumen Sepeda Motor Honda Revo Astra Motor Kebumen, Diponegoro Journal Of Social and Politic. 1-8.
Annafik, A.F. dan M. Rahardjo (2012), “Anal-isis Pengaruh Kualitas Produk, Harga dan Daya Tarik Iklan Terhadap Niat Membeli Sepeda Motor Yamaha,” Stu-di Kasus Pada Konsumen Yamaha Ss Cabang Kedungmundu, Semarang. Journal Of Management. 1(2), 274-281.
Anwar, K. (2011), “Analisis Faktor – Faktor yang Mempengaruhi Niat Beli Kon-sumen Terhadap Sepeda Motor Mer-ek Honda Vario,” Studi Perilaku Kon-sumen Di Kota Lhokseumawe. Jurnal Studi Manajemen dan Organisasi 4(2), 91-100.
Arikunto, Suharsini. (2006). Prosedur Pene-litian Suatu Pendekatan Praktik. Edisi Revisi V. Jakarta: Rineka Cipta.
Arifin, S. Suharyono dan Wilopo (2010), “Pen-garuh Perceived Price dan Preceived Value Pada Produk Bundling Terhadap Niat Beli,” Survei Niat Beli Handphone Blackberry Indosat Pada Mahasiswa Jurusan Administrasi Bisnis Angkatan 2008/2009 dan 2009/2010. Jurnal Ilmu Administrasi Universitas Brawijaya, 3(2), 25-35.
Boone, L.E. & Kurtz, D.L. (2014), Principles of Marketing. Singapore: Cengage Learn-ing Asia Pte. Ltd.
Cahyasari, Arum. (2012), “Pengaruh Fak-tor-faktor Bauran Pemasaran Terhadap Keputusan Pembelian Ulang Sepada Motor Honda,” Studi Kasus Pada Sepe-da Motor Honda di Kecamatan Lawey-an Surakarta, Skripsi. Surakarta: Uni-versitas Sebelas Maret, Surakarta.
Cooper R.G., & Schneider, J. (2010), Winning at new products; creating value through innovation 4th, New York, NY: Basic Book, 408.
Dharmesta, B.S. dan Irawan (2001), Manaje-men Pemasaran Modern. Yogyakarta: Liberti.
Engel, et al. (1990), Perilaku Konsumen, Jilid I. Jakarta, Binarupa Akasara.
Fachrurozi Rifki (2014, “Faktor-Faktor Yang Mempengaruhi Keputusan Keputusan Pembelian Produk Kawasasi Ninja 250 CC Di Semarang,” Studi Kasus Pada PT. Sinar Gemala Sakti Semarang.
Fuad, Aan Nasrul, Arifin Zainul dan Yulianto Eddy (2013), “Pengaruh Bauran Pe-masaran Terhadap Keputusan Pembeli-an,” Survei Pada Pemilik Sepeda Mo-tor Honda Bear Karburator di AHASS Barokah Motor Kediri. Universitas Brawijaya Malang.
Ghozali, I. (2005). Aplikasi Analisis multivar-iate SPSS, Edisi I, Universitas Dipone-goro.
Handrijaningsih Lies, Indira Christera Kuswa-hyu, dan Anisah (2013), “Anilisis Fak-tor-Faktor Yang Mempengaruhi Kon-sumen Dalam Memilih Motor Merek Honda,” Studi Kasus Pada Mahasiswa Universtias Gunadarma Bandung.

Volume 1 Issue 1 | July 2019
170 Fidēre: Journal of Business, Governance, and Information Technology
Hansudoh. (2012), “Pengaruh Celebrity En-dorsement Terhadap Purchase Intention Melalui Perceived Value Pada Produk Top Coffee Di Surabaya,” Jurnal Strat-egy Bisnis dan Eksekusi, 2(2), 104 – 125.
Indrawati. (2016), “Variabel Perilaku Kon-sumen Yang Mempengaruhi Keputusan Pembelian Sepeda Motor Merek Hon-da Pada CV. Semoga Jaya Samarinda.” Jurnal Ilmu Administrasi Bisnis, 2016, 4(3), 743-757.
Julianda. (2007, “Faktor-Faktor Yang Mem-pengaruhi Keputusan Konsumen Dalam Pembelian Souvenir Aceh Di Kota Ban-da Aceh,”
Kadek Budi Ariyono, Made Ary Meitriana, dan Anjuman Zukhri. (2014), “Anali-sis Faktor-Faktor Yang Mempengaruhi Keputusan Pembelian Sepeda Motor Matic Honda Pada Dealer Astra Mo-tor Denpasar,” Universitas Pendidikan Ganesa, Jurusan Pendidikan Ekonomi, Singaraja, Indonesia.
Kamus Ekonomi, (2000)
Kompas.com. (2014). Sepeda Motor Bekas dengan Harga Jual Tinggi. Kompas Otomotif, Jakarta.
Kotler, Philip. (2002), Manajemen Pemasaran (terjemahan). Edisi Enam, Jilid
Pertama. Binarupa.
Kotler, Philip dan Kevin Lene Keller (2008), Manajemen Pemasaran. Edisi 13. In-donesia : PT.Gelora Aksara Pratama.
Kotler P, (2005). Manajemen Pemasaran: Analisis, Perencanaan Implementasi dan Kontrol, Alih bahasa oleh Hendra
Teguh, SE. Dan Ronny A Rusli, Se,Ak. Jilid I, Jakarta, PT. Prenhallindo.
Kotler, Philip dan Armstrong, Gary. (2008). Prinsip-Prinsip Pemasaran. (Alih baha-sa Bob Sabran). Jilid 1. Edisi keduabe-las. Erlangga, Jakarta. (Buku asli edisi 12).
Kotler, Philip dan Amstrong, Gary. (2009). Prinsip-Prinsip Pemasara., Jilid Edisi Kedelapan. Jakarta: Erlangga.
Kiswalini Annis dan I Ketut Nurcahya (2014), “Pengaruh Celebrity Endorser, Brand Image Dan Kepercayaan Konsumen Ter-hadap Keputusan Pembelian,” Fakul-tas Ekonomi dan Universitas Udayana (Unud). Bali – Indonesia.
Lamb, Hair dan McDaniel. (2001), Pemasaran (terjemahan). Edisi Bahasa Indonesia Jilid Pertama. Jakarta: Salemba.
Malau, Harman (2017), Manajemen Pemasa-ran, Teori dan Aplikasi Pemasaran Era Tradisional Sampai Era Modernisasi Global. Bandung: Alfabeta.
Mariyah. (2010), “Pengaruh Penggunaan Ce-lebrity Endorser Pada iklan Terhadap-Niat Beli Shampo Panten,” Jurnal Ma-najemen Universitas Gunadarma, 2(2), 24-34.
Monawaroh, Siti Rr. (2011), “Pengaruh Kual-itas Produk, Promosi dan Desain Terh-adap Keputusan Pembelian Kendaraan Bermotor Yamaha Mio Di Banjarbaru Kalimantan Selatan,” Jurnal Mana-jemen dan Akuntansi. Sekolah Tinggi Ilmu Ekonomi Indonesia, Banjarmasin Vol. 12 Nomor 2.
171Factors Affecting Consumer Behavior in Purchasing Honda Motorcycle
Fidēre: Journal of Business, Governance, and Information Technology Volume 1 Issue 1 | July 2019
Peter, Paul J. Dan Jerry C. Olson (1996). Cus-tomer Behavior and Marketing Strategy. Fourth Edition. Richard d. Irwin Inc. Terjemahan: Damos Sihombing. 1999. Jakarta. Erlangga.
Putra, N.E. (2011), “Analisis Pengaruh Suasa-na Toko (Store Atmosphere) dan Lo-kasi Terhadap Niat Beli Konsumen Di Wadezig Distro Kota Padang,” Skripsi Sarjana Jurusan Manajemen Fakultas Ekonomi Universitas Andalas.
Retnaningsih, D. (2009), “Analisis Pengaruh Mutu Produk dan Persepsi Harga Terha-dap Minat Beli,” Studi pada PT. StarOne Mitra Telekomunikasi, Tesis Pascasar-jana Jurusan Magister Manajemen Pada Fakultas Ekonomi Universtias Dipone-goro Semarang.
Ristianingrum, D.W. (2014), “Pengaruh Varia-bel Bauran Pemasaran (Marketing Mix) Terhadap Keputusan Pembelian Produk Sepeda Motor Honda Pada PT.Central Sakti Motor Cabang Wonogiri,” Fakul-tas Ekonomi Universitas Muhammadi-yah Surakarta.
Saidani B. Dan S. Arifin. (2012), ‘Pengaruh Kualitas Produk dan Kualitas Layanan Terhadap Keputusan Konsumen dan Niat Beli Pada Ranch Market,” Jurnal Riset Manajemen Sains Indonesia. 3(1), 1-22.
Setyorini, Winarti. (2012), “Pengaruh Bau-ran Pemasaran Terhadap Perilaku Kon-sumen Dalam Membeli Sepeda Motor Honda Beat Di Pangkalan Bu,”. Jurnal Spread Oktober 2012, Vol 2. Nomor 2. Pangkalan Bun: Universitas Antakusu-ma (Untama) Pangkalan Bun.
Sugiyono, (2011). Metode Penelitian Kuanti-tatif, Kualitatif, dan R & D. Bandung: Alfabeta.
Singgih, Santoso, (2010). Statistik Parametrik: Konsep dan Aplikasi dengan SPSS. Ja-karta: PT. Alex Media Komputindo.
Sumarwan, Ujang (2004). Perilaku Konsumen. Cetakan 2. Indonesia: Ghalia.
Supranto dan Nandan Limakrisna, (2007), Per-ilaku Konsumen dan Strategi Pemasa-ran Untuk Memenangkan Persaingan Bisnis. Jakarta: Mitra Wacana Media.
Stanton, William. (2001), Prinsip Pemasaran. Jakarta: Erlangga.
Swastha DH, Bayu dan Irawan. (2008), Mana-jemen Pemasaran Modern. Cetakan 13. Yogyakarta : Liberty.
Tjiptono, Fandy. (2008), Strategi Pemasaran. Edisi III. Yogyakarta: C.V Andi Offset.
Wahyuni, Dewi Urip, (2008), “Pengaruh Moti-vasi, Persepsi dan Sikap Konsumen Terhadap Keputusan Pembelian Sepe-da Motor Merek “Honda” di Kawasan Surabaya Barat,”. Jurnal Manajemen Kewirausahaan, Vol. 10(1), Maret 2008, 30-37.

Volume 1 Issue 1 | July 2019
172 Fidēre: Journal of Business, Governance, and Information Technology
Abstract
Frontline employees are people who work on the frontlines of a business op-eration, primarily in customer service roles. They are the first to interact with the customers and are expected to represent the face of the business.
However, some frontline employees are not behaving the way they are expected to behave. This study determined the customer satisfaction of the frontline employees of the student finance, records and admission office, cashier, and student services office of the university and compared the satisfaction rating about the services that is provided by frontline employees in the university according to their sex, age, and department. Likert-type survey questionnaires were administered to 100 students who were selected using convenience sampling. The customer satisfaction survey consisted of 20 descriptive questions using the scale strongly agree (4), agree (3), disagree (2), and strongly disagree (1). The respondents were given survey ques-tionnaires right after they were served by Frontline employees of the various de-partments of the university. Results from descriptive statistics revealed that the stu-dent customers were generally satisfied with the services of the frontline employees of the various departments in the university. The comparison of the satisfaction by sex and age are not significant (p > .05). Equally important in this study are the qualitative results which revealed positive and negative comments on the way the frontline employees handled queries and inquiries. Areas that need improvement were identified by the respondents. Similar studies on customer service satisfaction of frontline employees should be conducted regularly including other service de-partments in the university. Seminars can be conducted to improve and/or maintain customer satisfaction.Keywords: customer, service, satisfaction, frontline employees, university
CusToMer serviCe saTisfaCTion of fronTline eMployees
in a universiTy in CaviTe Marta B. Macalalad1, Jolly S. Balila2
1College of Business, 2Research Office,Adventist University of the Philippines
There has been an issue on how service workers or frontliners deal with their client. To ensure a satisfying service experience for customers, service organizations must address issues relat-ed to customers. Organizations must make ways to attract those customers whom the service de-sign is intended (Fisk, Grove, & John, 2014). There are situations experienced by the custom-ers like blank stares when they ask questions, pretending not to hear them.
According to Sommorville (2011), the success or failures of the service industry de-pend on customer satisfaction. It requires both the tangible and intangible aspects especially the expectation of the guest. The expectation usually refers to the prediction of what happens during the transaction exchange made by the guest.
The frontline employees are exposed to various service encounters which are significant in service delivery. They can make the organiza-

173Customer Service Satisfaction of Frontline Employees in a University in Cavite
Fidēre: Journal of Business, Governance, and Information Technology Volume 1 Issue 1 | July 2019
tion a loser or a winner. The customer perceives and rates the service quality of employees with whom they met during service encounter. Ser-vice encounter are classified into three types: (a) the remote encounter, (i.e., through brochures, advertisements, etc.) where one does not inter-act with company, (b) the indirect personal en-counter (i.e., through emails, telephones), and (c) the direct personal encounter (i.e., face-to-face interactions) in teaching, retailing, medical advice seeking, and others (Zeithaml, Gremler, Bitner, & Pandit, 2008). This study covers only the direct personnel encounter of the customer to the services of the frontline employees.
It is vitally important for this study to understand potential effects of sex, age, and other personal profile in the evaluation of ser-vice quality for the improvement of the orga-nization. Investigating such relationships is significant, because without sound evidence and guidelines, administrator may run the risk of making wrong decisions. Ignoring sex dif-ferences for example, may create problems if there are sex-based differences. A sex-sensitive approach may become even more problematic if there are no differences between male and fe-male customers (Karatepe, 2011).
This study determined the customer satisfaction of the frontline employees from students’ perspective. The frontline employees are working at the student finance, records and admission office, cashier, and student services office of the University. The customer satis-faction data were compared according to their gender and age.
Review of LiteratureCustomer Satisfaction
Customer satisfaction means how the customer perceives service delivery. It is a function of service relative to the customer ex-pectation. Customers have different views and expectations of a product or service. This means that customer may estimate what the service per-
formance will be or may think what the perfor-mance ought to be. If the service performance meets or exceeds customers’ expectation, the customers will be satisfied. The study conduct-ed by Kufuor and Doku (2017), which assessed the performance of frontline staff in the hotel industry, revealed that “quality services” is the highest ranking among other service dimen-sions which the hotel customers expect.
Ojo (2010) cited that customer satis-faction is the result of a cognitive and affective evaluation, where some comparison standard is compared to the actually perceived perfor-mance. He further explained that if the per-ceived performance is lesser than expected, cus-tomers will be dissatisfied. On the other hand, if the perceived performance exceeds expecta-tions, customers will be satisfied.
Differences on Customer Satisfaction by Respondent’s Profile
Differences of customer satisfaction in terms of sex. Customer satisfaction behaves differently at different situations and instances. Sex difference at a service encounter may lead to different customer service outcomes. As the male-to-male interaction and male-to-female interactions differ because people behave dif-ferently when they interact with the same sex and with the opposite sex, in a given particu-lar situation. If it is analyzed closely, it can be seen that some professions have become more sex-specific and if another sex plays that role, it is thought as an odd thing (Mansoora, 2017).
The study of Mokhlis (2012) using re-gression coefficients and R-square for each sex revealed that significant influences of service quality factors on customer satisfaction existed for each sex. The regression models for each of the sex groups were statistically significant. The five factors of service quality collectively explained a total of 48.1% variance on the cus-tomer satisfaction for males (R2 = 0.481). Fur-ther results revealed that the three dimensions
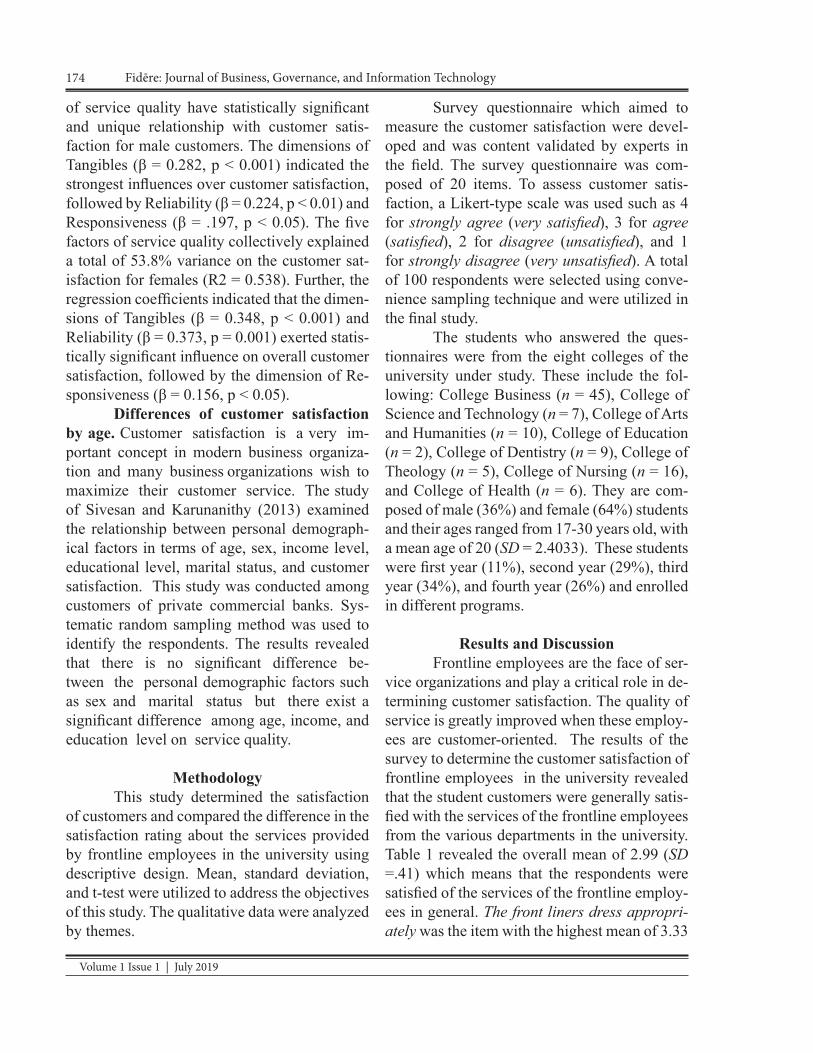
Volume 1 Issue 1 | July 2019
174 Fidēre: Journal of Business, Governance, and Information Technology
of service quality have statistically significant and unique relationship with customer satis-faction for male customers. The dimensions of Tangibles (β = 0.282, p < 0.001) indicated the strongest influences over customer satisfaction, followed by Reliability (β = 0.224, p < 0.01) and Responsiveness (β = .197, p < 0.05). The five factors of service quality collectively explained a total of 53.8% variance on the customer sat-isfaction for females (R2 = 0.538). Further, the regression coefficients indicated that the dimen-sions of Tangibles (β = 0.348, p < 0.001) and Reliability (β = 0.373, p = 0.001) exerted statis-tically significant influence on overall customer satisfaction, followed by the dimension of Re-sponsiveness (β = 0.156, p < 0.05).
Differences of customer satisfaction by age. Customer satisfaction is a very im-portant concept in modern business organiza-tion and many business organizations wish to maximize their customer service. The study of Sivesan and Karunanithy (2013) examined the relationship between personal demograph-ical factors in terms of age, sex, income level, educational level, marital status, and customer satisfaction. This study was conducted among customers of private commercial banks. Sys-tematic random sampling method was used to identify the respondents. The results revealed that there is no significant difference be-tween the personal demographic factors such as sex and marital status but there exist a significant difference among age, income, and education level on service quality.
MethodologyThis study determined the satisfaction
of customers and compared the difference in the satisfaction rating about the services provided by frontline employees in the university using descriptive design. Mean, standard deviation, and t-test were utilized to address the objectives of this study. The qualitative data were analyzed by themes.
Survey questionnaire which aimed to measure the customer satisfaction were devel-oped and was content validated by experts in the field. The survey questionnaire was com-posed of 20 items. To assess customer satis-faction, a Likert-type scale was used such as 4 for strongly agree (very satisfied), 3 for agree (satisfied), 2 for disagree (unsatisfied), and 1 for strongly disagree (very unsatisfied). A total of 100 respondents were selected using conve-nience sampling technique and were utilized in the final study.
The students who answered the ques-tionnaires were from the eight colleges of the university under study. These include the fol-lowing: College Business (n = 45), College of Science and Technology (n = 7), College of Arts and Humanities (n = 10), College of Education (n = 2), College of Dentistry (n = 9), College of Theology (n = 5), College of Nursing (n = 16), and College of Health (n = 6). They are com-posed of male (36%) and female (64%) students and their ages ranged from 17-30 years old, with a mean age of 20 (SD = 2.4033). These students were first year (11%), second year (29%), third year (34%), and fourth year (26%) and enrolled in different programs.
Results and DiscussionFrontline employees are the face of ser-
vice organizations and play a critical role in de-termining customer satisfaction. The quality of service is greatly improved when these employ-ees are customer-oriented. The results of the survey to determine the customer satisfaction of frontline employees in the university revealed that the student customers were generally satis-fied with the services of the frontline employees from the various departments in the university. Table 1 revealed the overall mean of 2.99 (SD =.41) which means that the respondents were satisfied of the services of the frontline employ-ees in general. The front liners dress appropri-ately was the item with the highest mean of 3.33
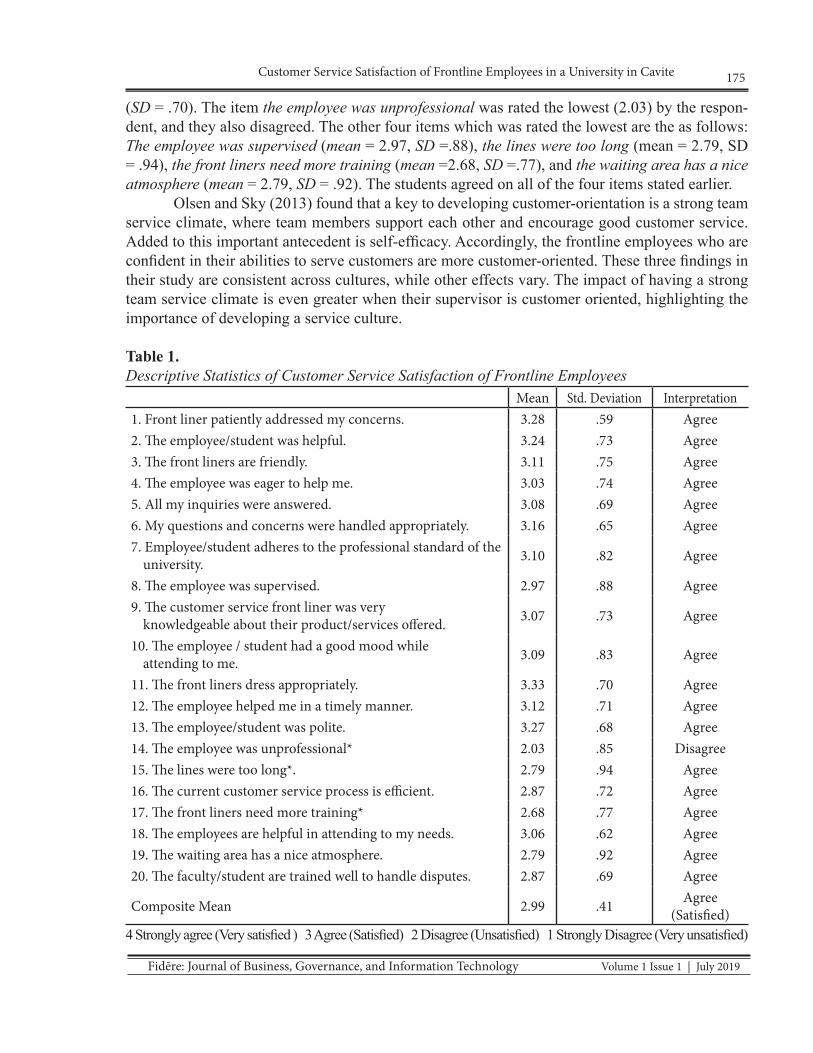
175Customer Service Satisfaction of Frontline Employees in a University in Cavite
Fidēre: Journal of Business, Governance, and Information Technology Volume 1 Issue 1 | July 2019
(SD = .70). The item the employee was unprofessional was rated the lowest (2.03) by the respon-dent, and they also disagreed. The other four items which was rated the lowest are the as follows: The employee was supervised (mean = 2.97, SD =.88), the lines were too long (mean = 2.79, SD = .94), the front liners need more training (mean =2.68, SD =.77), and the waiting area has a nice atmosphere (mean = 2.79, SD = .92). The students agreed on all of the four items stated earlier.
Olsen and Sky (2013) found that a key to developing customer-orientation is a strong team service climate, where team members support each other and encourage good customer service. Added to this important antecedent is self-efficacy. Accordingly, the frontline employees who are confident in their abilities to serve customers are more customer-oriented. These three findings in their study are consistent across cultures, while other effects vary. The impact of having a strong team service climate is even greater when their supervisor is customer oriented, highlighting the importance of developing a service culture.
Table 1.Descriptive Statistics of Customer Service Satisfaction of Frontline Employees
Mean Std. Deviation Interpretation1. Front liner patiently addressed my concerns. 3.28 .59 Agree2. The employee/student was helpful. 3.24 .73 Agree3. The front liners are friendly. 3.11 .75 Agree4. The employee was eager to help me. 3.03 .74 Agree5. All my inquiries were answered. 3.08 .69 Agree6. My questions and concerns were handled appropriately. 3.16 .65 Agree7. Employee/student adheres to the professional standard of the
university. 3.10 .82 Agree
8. The employee was supervised. 2.97 .88 Agree9. The customer service front liner was very
knowledgeable about their product/services offered. 3.07 .73 Agree
10. The employee / student had a good mood while attending to me. 3.09 .83 Agree
11. The front liners dress appropriately. 3.33 .70 Agree12. The employee helped me in a timely manner. 3.12 .71 Agree13. The employee/student was polite. 3.27 .68 Agree14. The employee was unprofessional* 2.03 .85 Disagree15. The lines were too long*. 2.79 .94 Agree16. The current customer service process is efficient. 2.87 .72 Agree17. The front liners need more training* 2.68 .77 Agree18. The employees are helpful in attending to my needs. 3.06 .62 Agree19. The waiting area has a nice atmosphere. 2.79 .92 Agree20. The faculty/student are trained well to handle disputes. 2.87 .69 Agree
Composite Mean 2.99 .41 Agree(Satisfied)
4 Strongly agree (Very satisfied ) 3 Agree (Satisfied) 2 Disagree (Unsatisfied) 1 Strongly Disagree (Very unsatisfied)

Volume 1 Issue 1 | July 2019
176 Fidēre: Journal of Business, Governance, and Information Technology
Comparison of Customer Satisfaction by Respondents’ Profile
To note the sex difference in the satisfac-tion about the services provided by frontline em-ployees of the various department of the univer-sity, t-test was performed. The mean satisfaction level of male is 2.92 (SD = .48) while 3.04 for fe-male (SD = .36). The comparison of the satisfac-tion by age and year in college are not significant (p > .05). The age of the respondents does not affect the customer satisfaction of the services of the frontline employees (r = -.026, p = .01). In the comparison of the customer satisfaction by year level, the result also revealed a non-signif-icant result {F (.459, 16.06), = .915, p = .437}.
In the study conducted by Mansoora (2017), the gender role of customers can play in the process of service encounter interactions on the customer satisfaction in the educational sec-tor. This result generally supports the hypothe-sis in the study of Mokhlis (2012) that gender affects service quality.
The current result in the comparison of customer satisfaction by age is not supported by the study of Sivesan and Karunanithy (2013). The results revealed that there is no significant difference between the personal demograph-ic factors such as sex and marital status but there exists a significant difference among age, income, and education level on service quality.
Challenges of the Front Line employees Equally important in this study was the
qualitative results in terms of positive and nega-tive comments on the way queries and inquiries were handled. Time management, behavioral challenges, and consistency/fairness in dealing with students were identified by the respondents as the areas which need improvement.
The frontline employees have different abilities and they perform the same service dif-ferently. Even the same employee might pro-vide varying levels of service from one time to another; sometimes it depends on the situation
they encountered. For this reason, it is difficult to ensure the consistency of behavior from ser-vice employees.
Time management in dealing with cus-tomers. Time management is one of the chal-lenges faced by front liners. They should re-spond quickly to the concerns of the customers.
Behavioral challenges. Positive attitude is an important asset of any service provider. One of the respondents commented that the frontline employees need to improve the way they treat their customers. They said, frontline employees should be more approachable. They should smile to their clients since according to this respondent, that “smile is the best they can give to their client”.
The attitudes of front liners differ in this study. The customers of the university also ex-perienced being treated well. They perceived that the employees in this university are gen-uinely friendly and kind. It was also observed that frontline employees are always ready to smile no matter how stressed out they were.
Consistency/fairness in dealing with customers. Other students perceived that some frontline employees were inconsistency in deal-ing with students’ request; other students are approved in their requests but others are not when they only have the same reasons. Further concern is that the frontline employees in the university prioritized local people as perceived by one respondent.
The challenges of frontline employees can be summarized in behavioral challenges. In the study conducted by Cagurangan (2017), it investigated the extent of the most pressing problems of employees. It revealed that work values are of the many challenges faced by the workforce and frontline employees are not an exemption to this.
ConclusionThe student customers were generally
satisfied with the services of the frontline em-

177Customer Service Satisfaction of Frontline Employees in a University in Cavite
Fidēre: Journal of Business, Governance, and Information Technology Volume 1 Issue 1 | July 2019
ployees from various departments in the uni-versity. The satisfaction level of these students was not affected regardless of sex, age, and year level. Equally important results of this study were the qualitative results which revealed that time management in dealing with customers, behavioral challenges, and consistency/fairness in dealing with customers were some challenges
Recommendations Areas that need improvement were
identified by the respondents:1. Similar studies on customer service satis-
faction of frontline employees be conduct-ed regularly including other service depart-ments in the university.
2. A seminar be conducted to improve and/or maintain customer satisfaction.
3. Service organizations need to develop a plan for managing their customer mix (customer mix refers to the array of people of differing ages, sexes, socio-economic backgrounds, knowledge or experience, ethnicity, and so on)
4. The university needs to develop policies and response plan for handling occasional situations (e.g., enrolment) that occur when serving various types of customers simulta-neously.
ReferencesCagurangan, G. (2017). Problems and challeng-
es encountered by in-premise restaurant managers of Tuguegarao City. Journal of Tourism & Hospitality, 6(5). DOI: 10.4172/2167-0269.1000305
Fisk, R.P., Grove, S.J., & John J. (2014). Ser-vices marketing: An interactive ap-proach (4th ed.). South-Western: Cen-gage Learning.
Karatepe, O.M. (2011, June). Service Quality, Customer Satisfaction and Loyalty: The Moderating Role of Gender. Journal
of Business Economics and Manage-ment 12(2):278-300 • June 2011 DOI: 10.3846/16111699.2011.573308
Kufuor, A.M. & Doku, V. (2017). Assess-ing frontline staff performance of service delivery in some selected ho-tels in Accra Metropolis, Internation-al Journal of Hospitality & Tourism Management, 1(1), 23-31. Retrieved from http://www.sciencepublishing-group.com/j/ijhtm doi: 10.11648/j.ijhtm.20170101.13
Mansoora, A. (2017). A Study on impact of gender differences on customer satisfac-tion, case of educational sphere. Journal of International Business Research and Marketing, 3(1), 14-18. DOI: 10.18775/jibrm.1849-8558.2015.31.3002
Mokhlis, S. (2012). The influence of service quality on satisfaction: A gender com-parison. Public Administration Re-search, 1(1), 103-112. doi:10.5539/par.v1n1p103
Olsen, E.M. & Astrid Sky, A. (2013). How can service organizations improve the customer orientation of frontline employees? A cross cultural study (Unpublished thesis). Norwegian School of Economics. Bergen. Re-trieved from https://pdfs.semantic-scholar.org/88b7/89568b600be315d-1360f4ac94606129dcb0f.pdf
Ojo, O. (2010). The relationship between ser-vice quality and customer satisfaction in the telecommunication industry: Ev-idence from Nigeria. BRAND Broad Re-search in Accounting, Negotiation, and Distribution, 1(1), 88-100.

Volume 1 Issue 1 | July 2019
178 Fidēre: Journal of Business, Governance, and Information Technology
Sivesan, S. & Karunanithy, M. (2013). Personal demographical factors and their influ-ence on customer satisfaction from cus-tomer perspective. European Journal of Business and Management, 5(20). Retrieved from https://pdfs.semantic-scholar.org/c9c9/efe45c811a12a18dc-fa7e18be43339aa9f60.
Sommorville, L. K. (2011). Hospitality employ-ee management. New Jersey: John Wi-ley and Sons.
Zeithaml, V. A., Bitner, M. J., Gremler, D. D., & Pandit, A. (2008). Services market-ing: Integrating customer focus across the firm. New Delhi: McGraw-Hill Pub-lishing.