Federal Register/Vol. 86, No. 145/Monday, August 2, 2021 ...
71
41540 Federal Register / Vol. 86, No. 145 / Monday, August 2, 2021 / Notices 1 See Figure 1 in Section IV, ‘‘Product Scope of the Investigation,’’ for the uranium products addressed by this report. 2 U.S. Department of Commerce. Bureau of Industry and Security. The Effect of Imports of Steel on the National Security (Washington, DC: 2018) (‘‘Steel Report’’) and U.S. Department of Commerce. Bureau of Industry and Security. The Effect of Imports of Aluminum on the National Security (Washington, DC: 2018) (‘‘Aluminum Report’’). https://www.bis.doc.gov/index.php/documents/ steel/2224-the-effect-of-imports-of-steel-on-the- national-security-with-redactions-20180111/file. DEPARTMENT OF COMMERCE Bureau of Industry and Security RIN 0694–XC078 Publication of a Report on the Effect of Imports of Uranium on the National Security: An Investigation Conducted Under Section 232 of the Trade Expansion Act of 1962, as Amended AGENCY: Bureau of Industry and Security, Commerce. ACTION: Publication of a report. SUMMARY: The Bureau of Industry and Security (BIS) in this notice is publishing a report that summarizes the findings of an investigation conducted by the U.S. Department of Commerce (the ‘‘Department’’) pursuant to Section 232 of the Trade Expansion Act of 1962, as amended (‘‘Section 232’’), into the effect of imports of uranium on the national security of the United States. This report was completed on April 14, 2019 and posted on the BIS website in July 2021. BIS has not published the appendices to the report in this notification of report findings, but they are available online at the BIS website, along with the rest of the report (see the ADDRESSES section). DATES: The report was completed on April 14, 2019. The report was posted on the BIS website in July 2021. ADDRESSES: The full report, including the appendices to the report, are available online at https://bis.doc.gov/ 232. FOR FURTHER INFORMATION CONTACT: For further information about this report contact Erika Maynard, Special Projects Manager, (202) 482–5572; and Leah Vidovich, Trade and Industry Analyst, (202) 482–1819. For more information about the Office of Technology Evaluation and the Section 232 Investigations, please visit: http:// www.bis.doc.gov/232. SUPPLEMENTARY INFORMATION: The Effect of Imports of Uranium on the National Security An Investigation Conducted Under Section 232 of the Trade Expansion Act of 1962, As Amended U.S. Department of Commerce Bureau of Industry and Security Office of Technology Evaluation April 14, 2019 Table of Contents I. Executive Summary II. Legal Framework A. Section 232 Requirements B. Discussion III. Investigation Process A. Initiation of Investigation B. Public Comments C. Site Visits and Information Gathering Activities D. Interagency Consultation E. Review of the Department of Commerce 1989 Section 232 Investigation on Uranium Imports IV. Product Scope of the Investigation V. Background on the U.S. Nuclear Industry A. Summary of the U.S. Uranium Fuel Cycle B. Summary of U.S. Nuclear Power Generation Industry VI. Global Uranium Market Conditions A. Summary of the Global Uranium Market B. Uranium Transactions: Book Transfers and Flag Swaps C. The Effect of the Fukushima Daiichi Incident on U.S. and Global Uranium Demand D. The Effect of State-Owned Enterprises on Global Uranium Supply VII. Findings A. Uranium Is Important to U.S. National Security 1. Uranium Is Needed for National Defense Systems 2. Uranium Is Required for Critical Infrastructure B. Imports of Uranium in Such Quantities as Are Presently Found Adversely Impact the Economic Welfare of the U.S. Uranium Industry 1. U.S. Utilities’ Reliance on Imports of Uranium in 1989 2. U.S. Utilities’ Reliance on Imports of Uranium Continue To Rise 3. High Import to Export Ratio 4. Uranium Prices 5. Declining Employment Trends 6. Loss of Domestic Long Term Contracts Due to Imported Uranium 7. Financial Distress 8. Research and Development Expenditures 9. Capital Expenditures C. Trade Actions: Anti-Dumping and Countervailing Duties D. Displacement of Domestic Uranium by Excessive Quantities of Imports Has the Serious Effect of Weakening Our Internal Economy 1. U.S. Production Is Well Below Demand and Utilization Rates Are Well Below Economically Viable Levels 2. Domestic Uranium Production Is Severely Weakened and Concentrated 3. Reduction of Uranium Production Facilities Limits Capacity Available E. Uranium Market Distortion by State- Owned Enterprises Is a Circumstance That Contributes to the Weakening of the Domestic Economy 1. Excess Russian, Kazakh, and Uzbek Production Adversely Affects Global Markets and Creates a Dangerous U.S. Dependence on Uranium From These Countries 2. The Increasing Presence of China in the Global Uranium Market Will Further Weaken U.S. and Other Market Uranium Producers 3. Increasing Global Excess Uranium Production Will Further Weaken the Internal Economy as U.S. Uranium Producers Will Face Increasing Import Competition VIII. Conclusion A. Determination B. Economic Impacts of 25 Percent U.S.- Origin Requirement C. Public Policy Proposals Appendices Appendix A: Section 232 Investigation Notification Letter to Secretary of Defense James Mattis, July 18, 2018 Appendix B: Federal Register Notices— Notice of Requests for Public Comments on Section 232 National Security Investigation of Imports of Uranium, July 25, 2018; Change in Comment Deadline for Section 232 National Security Investigation of Imports of Uranium, September 10, 2018 Appendix C: Summary of Public Comments Appendix D: Survey for Data Collection (Front-End Uranium Industry) Appendix E: Survey for Data Collection (Nuclear Electric Power Generation Industry) Appendix F: Uranium Product Specific Trade Flows Appendix G: Summary of Commerce Department 1989 Section 232 Uranium Investigation Appendix H: The National Security Aspect of U.S. Uranium Industry Regulation Appendix I: The Role of State Owned Enterprises in the Global Uranium Market Appendix J. U.S. Naval and Nuclear Weapons Uses of Uranium Appendix K: Glossary Prepared by Bureau of Industry and Security http://www.bis.doc.gov I. Executive Summary This report summarizes the findings of an investigation conducted by the U.S. Department of Commerce (the ‘‘Department’’) pursuant to Section 232 of the Trade Expansion Act of 1962, as amended (19 U.S.C. 1862 (‘‘Section 232’’)), into the effect of imports of uranium 1 on the national security of the United States. In conducting this investigation, the Secretary of Commerce (the ‘‘Secretary’’) noted the Department’s prior investigations under Section 232. This report incorporates the statutory analysis from the Department’s 2018 reports on the imports of steel and aluminum 2 with respect to applying the VerDate Sep<11>2014 21:46 Jul 30, 2021 Jkt 253001 PO 00000 Frm 00002 Fmt 4701 Sfmt 4703 E:\FR\FM\02AUN2.SGM 02AUN2 khammond on DSKJM1Z7X2PROD with NOTICES2
-
Upload
khangminh22 -
Category
Documents
-
view
1 -
download
0
Transcript of Federal Register/Vol. 86, No. 145/Monday, August 2, 2021 ...
41540 Federal Register / Vol. 86, No. 145 / Monday, August 2, 2021 / Notices
1 See Figure 1 in Section IV, ‘‘Product Scope of the Investigation,’’ for the uranium products addressed by this report.
2 U.S. Department of Commerce. Bureau of Industry and Security. The Effect of Imports of Steel on the National Security (Washington, DC: 2018) (‘‘Steel Report’’) and U.S. Department of Commerce. Bureau of Industry and Security. The Effect of Imports of Aluminum on the National Security (Washington, DC: 2018) (‘‘Aluminum Report’’).
https://www.bis.doc.gov/index.php/documents/ steel/2224-the-effect-of-imports-of-steel-on-the- national-security-with-redactions-20180111/file.
DEPARTMENT OF COMMERCE
Bureau of Industry and Security
RIN 0694–XC078
Publication of a Report on the Effect of Imports of Uranium on the National Security: An Investigation Conducted Under Section 232 of the Trade Expansion Act of 1962, as Amended
AGENCY: Bureau of Industry and Security, Commerce. ACTION: Publication of a report.
SUMMARY: The Bureau of Industry and Security (BIS) in this notice is publishing a report that summarizes the findings of an investigation conducted by the U.S. Department of Commerce (the ‘‘Department’’) pursuant to Section 232 of the Trade Expansion Act of 1962, as amended (‘‘Section 232’’), into the effect of imports of uranium on the national security of the United States. This report was completed on April 14, 2019 and posted on the BIS website in July 2021. BIS has not published the appendices to the report in this notification of report findings, but they are available online at the BIS website, along with the rest of the report (see the ADDRESSES section). DATES: The report was completed on April 14, 2019. The report was posted on the BIS website in July 2021. ADDRESSES: The full report, including the appendices to the report, are available online at https://bis.doc.gov/ 232. FOR FURTHER INFORMATION CONTACT: For further information about this report contact Erika Maynard, Special Projects Manager, (202) 482–5572; and Leah Vidovich, Trade and Industry Analyst, (202) 482–1819. For more information about the Office of Technology Evaluation and the Section 232 Investigations, please visit: http://www.bis.doc.gov/232. SUPPLEMENTARY INFORMATION:
The Effect of Imports of Uranium on the National Security
An Investigation Conducted Under Section 232 of the Trade Expansion Act of 1962, As Amended
U.S. Department of Commerce
Bureau of Industry and Security
Office of Technology Evaluation
April 14, 2019
Table of Contents
I. Executive Summary II. Legal Framework
A. Section 232 Requirements B. Discussion
III. Investigation Process A. Initiation of Investigation B. Public Comments C. Site Visits and Information Gathering
Activities D. Interagency Consultation E. Review of the Department of Commerce
1989 Section 232 Investigation on Uranium Imports
IV. Product Scope of the Investigation V. Background on the U.S. Nuclear Industry
A. Summary of the U.S. Uranium Fuel Cycle
B. Summary of U.S. Nuclear Power Generation Industry
VI. Global Uranium Market Conditions A. Summary of the Global Uranium Market B. Uranium Transactions: Book Transfers
and Flag Swaps C. The Effect of the Fukushima Daiichi
Incident on U.S. and Global Uranium Demand
D. The Effect of State-Owned Enterprises on Global Uranium Supply
VII. Findings A. Uranium Is Important to U.S. National
Security 1. Uranium Is Needed for National Defense
Systems 2. Uranium Is Required for Critical
Infrastructure B. Imports of Uranium in Such Quantities
as Are Presently Found Adversely Impact the Economic Welfare of the U.S. Uranium Industry
1. U.S. Utilities’ Reliance on Imports of Uranium in 1989
2. U.S. Utilities’ Reliance on Imports of Uranium Continue To Rise
3. High Import to Export Ratio 4. Uranium Prices 5. Declining Employment Trends 6. Loss of Domestic Long Term Contracts
Due to Imported Uranium 7. Financial Distress 8. Research and Development Expenditures 9. Capital Expenditures C. Trade Actions: Anti-Dumping and
Countervailing Duties D. Displacement of Domestic Uranium by
Excessive Quantities of Imports Has the Serious Effect of Weakening Our Internal Economy
1. U.S. Production Is Well Below Demand and Utilization Rates Are Well Below Economically Viable Levels
2. Domestic Uranium Production Is Severely Weakened and Concentrated
3. Reduction of Uranium Production Facilities Limits Capacity Available
E. Uranium Market Distortion by State- Owned Enterprises Is a Circumstance That Contributes to the Weakening of the Domestic Economy
1. Excess Russian, Kazakh, and Uzbek Production Adversely Affects Global Markets and Creates a Dangerous U.S. Dependence on Uranium From These Countries
2. The Increasing Presence of China in the Global Uranium Market Will Further Weaken U.S. and Other Market Uranium Producers
3. Increasing Global Excess Uranium Production Will Further Weaken the Internal Economy as U.S. Uranium
Producers Will Face Increasing Import Competition
VIII. Conclusion A. Determination B. Economic Impacts of 25 Percent U.S.-
Origin Requirement C. Public Policy Proposals
Appendices
Appendix A: Section 232 Investigation Notification Letter to Secretary of Defense James Mattis, July 18, 2018
Appendix B: Federal Register Notices— Notice of Requests for Public Comments on Section 232 National Security Investigation of Imports of Uranium, July 25, 2018; Change in Comment Deadline for Section 232 National Security Investigation of Imports of Uranium, September 10, 2018
Appendix C: Summary of Public Comments Appendix D: Survey for Data Collection
(Front-End Uranium Industry) Appendix E: Survey for Data Collection
(Nuclear Electric Power Generation Industry)
Appendix F: Uranium Product Specific Trade Flows
Appendix G: Summary of Commerce Department 1989 Section 232 Uranium Investigation
Appendix H: The National Security Aspect of U.S. Uranium Industry Regulation
Appendix I: The Role of State Owned Enterprises in the Global Uranium Market
Appendix J. U.S. Naval and Nuclear Weapons Uses of Uranium
Appendix K: Glossary
Prepared by Bureau of Industry and Security
http://www.bis.doc.gov
I. Executive Summary
This report summarizes the findings of an investigation conducted by the U.S. Department of Commerce (the ‘‘Department’’) pursuant to Section 232 of the Trade Expansion Act of 1962, as amended (19 U.S.C. 1862 (‘‘Section 232’’)), into the effect of imports of uranium 1 on the national security of the United States.
In conducting this investigation, the Secretary of Commerce (the ‘‘Secretary’’) noted the Department’s prior investigations under Section 232. This report incorporates the statutory analysis from the Department’s 2018 reports on the imports of steel and aluminum 2 with respect to applying the
VerDate Sep<11>2014 21:46 Jul 30, 2021 Jkt 253001 PO 00000 Frm 00002 Fmt 4701 Sfmt 4703 E:\FR\FM\02AUN2.SGM 02AUN2kham
mon
d on
DS
KJM
1Z7X
2PR
OD
with
NO
TIC
ES
2
41541 Federal Register / Vol. 86, No. 145 / Monday, August 2, 2021 / Notices
https://www.bis.doc.gov/index.php/documents/ aluminum/2223-the-effect-of-imports-of-aluminum- on-the-national-security-with-redactions-20180117/ file.
3 Steel Report at 13–14; Aluminum Report at 12– 13.
4 19 U.S.C. 1862(b)(3)(A). 5 Domestic uranium production refers to all stages
of the nuclear fuel cycle and their associated products, including uranium mining, uranium
milling, uranium conversion, uranium enrichment, and nuclear fuel fabrication. Uranium mining and milling produce uranium concentrate, uranium conversion produces uranium hexafluoride (UF6), uranium enrichment produces enriched uranium product (EUP), and nuclear fuel fabrication produces finished nuclear fuel assemblies.
6 U.S. White House. Office of the Press Secretary. Critical Infrastructure Security and Resilience. Presidential Policy Directive 21. (Washington, DC: 2013) https://obamawhitehouse.archives.gov/the- press-office/2013/02/12/presidential-policy- directive-critical-infrastructure-security-and-resil.
7 U.S. Department of Defense. Office of the Undersecretary of Defense for Acquisition, Technology, and Logistics. Report of the Defense Science Board Task Force on DoD Energy Strategy. (Washington, DC: 2008), 18. https://apps.dtic.mil/ dtic/tr/fulltext/u2/a477619.pdf.
8 For the purposes of this report, the front-end industry is defined as companies owning or operating uranium mines, uranium mills, uranium converters, uranium enrichers, and nuclear fuel fabricators.
9 Atomic Energy Act of 1946, as amended; Atomic Energy Act of 1954; 1964 Private Ownership of Special Nuclear Materials Act; The Energy Policy Act of 1992; The United States Enrichment Corporation Privatization Act of 1996.
10 U.S. Energy Information Administration, ‘‘Table S1a. Uranium purchased by owners and operators of U.S. civilian nuclear power reactors, 1994–2017’’, 2017 Uranium Marketing Annual Report (May 31, 2018), https://www.eia.gov/ uranium/marketing/pdf/umartableS1afigureS1.pdf.
11 U.S. Dept. of Commerce. Bureau of Export Administration; The Effect of Imports of Uranium on the National Security; 1989 (‘‘1989 Report’’) available at https://www.bis.doc.gov/index.php/ documents/section-232-investigations/88-uranium- 1989/file.
terms ‘‘national defense’’ and ‘‘national security’’ in a manner that is consistent with the statute and legislative intent.3
As required by the statute, the Secretary considered all factors set forth in Section 232(d). In particular, the Secretary examined the effect of imports on national security requirements, specifically:
i. Domestic production needed for projected national defense requirements;
ii. the capacity of domestic industries to meet such requirements;
iii. existing and anticipated availabilities of the human resources, products, raw materials, and other supplies and services essential to the national defense;
iv. the requirements of growth of such industries and such supplies and services including the investment, exploration, and development necessary to assure such growth; and
v. the importation of goods in terms of their quantities, availabilities, character, and use as those affect such industries; and the capacity of the United States to meet national security requirements.
The Secretary also recognized the close relation of the economic welfare of the United States to its national security. Factors that can compromise the nation’s economic welfare include, but are not limited to, the impact of ‘‘foreign competition on the economic welfare of individual domestic industries; and any substantial unemployment, decrease in revenues of government, loss of skills, or any other serious effects resulting from the displacement of any domestic products by excessive imports.’’ 19 U.S.C. 1862(d). In particular, this report assesses whether uranium is being imported ‘‘in such quantities’’ and ‘‘under such circumstances’’ as to ‘‘threaten to impair the national security.’’ 4
Findings
In conducting the investigation, the Secretary found:
A. Domestic Uranium Production Is Essential to U.S. National Security.5
1. Domestic uranium is required, based on U.S. policy and restrictions in
international agreements on the use of most imported uranium, to satisfy the U.S. Department of Defense (DoD) requirements for maintaining effective military capabilities, including nuclear fuel for the U.S. Navy’s fleet of 11 nuclear powered aircraft carriers and 70 nuclear powered submarines, source material for nuclear weapons, depleted uranium for ammunition, and other functions.
2. Uranium is also essential to maintaining U.S. critical infrastructure sectors, specifically the nation’s 98 reactors for nuclear power generation to support the Nation’s commercial power grid. Nuclear reactors supply 19 percent of U.S. electricity consumed in the U.S. and they support 15 of the 16 critical infrastructure sectors identified by the Department of Homeland Security (DHS).6 Maintaining a robust civilian nuclear power industry is essential to U.S. national security, including both national defense and critical infrastructure requirements. DoD installations in the U.S. rely on the commercial power grid for 99 percent of their electricity needs.7 The entire U.S. nuclear enterprise—weapons, naval propulsion, nonproliferation, enrichment, fuels services, and negotiations with international partners—depends on a robust U.S. civilian nuclear power industry.
3. Domestic uranium production and processing, referred to in this report as the ‘‘front-end’’ of the fuel cycle, depends on an economically viable, competitive U.S. commercial uranium industry.8 The distinct stages of the U.S. nuclear fuel cycle extract uranium from the ground and ultimately transform it into fuel suitable for civilian nuclear power. The same stages of the U.S. nuclear fuel cycle are needed to fulfill national defense requirements for
uranium used in naval nuclear fuel and tritium production in the future.
4. Since 1946, U.S. legislation governing the uranium production and nuclear power generation industries has consistently made explicit written reference to these industries’ national security functions.9
B. Imports in Such Quantities as Presently Found Adversely Affect the Economic Welfare of the U.S. Uranium Industry
1. In 2018, almost all uranium used for civilian U.S. nuclear electric power generation was imported, totaling approximately 94 percent of consumption. Between 2009 and 2018, U.S. nuclear electric power generators increased their reliance on imported uranium products from 85.8 percent to 93.3 percent of their annual requirements.10 In comparison, the Department’s 1989 Section 232 investigation into ‘‘The Effect of Imports of Uranium on the National Security’’ found that imported uranium satisfied just 51 percent of U.S. nuclear electric power generators’ requirements at that time. 11
2. Uranium is imported into the United States in eight forms, with the two largest categories being uranium concentrate and enriched uranium. Uranium concentrate is primarily imported from Australia, Canada, Kazakhstan, and Uzbekistan. Enriched uranium is primarily imported from Russia, the United Kingdom, Germany, France, and the Netherlands.
3. Between 2014 and 2018, an average of 52 percent of U.S. nuclear electric power generator requirements of uranium concentrate was provided by Australia and Canada, 25 percent from Kazakhstan and Uzbekistan, and the remainder from Namibia (8.4 percent), Niger (2.5 percent), South Africa (2.2 percent), Malawi (1.4 percent), China (0.3 percent), and Russia (0.2 percent). The Department notes that between 2014 and 2018, an average of 24.2 percent of the uranium concentrate provided by Australian and Canadian
VerDate Sep<11>2014 19:47 Jul 30, 2021 Jkt 253001 PO 00000 Frm 00003 Fmt 4701 Sfmt 4703 E:\FR\FM\02AUN2.SGM 02AUN2kham
mon
d on
DS
KJM
1Z7X
2PR
OD
with
NO
TIC
ES
2
41542 Federal Register / Vol. 86, No. 145 / Monday, August 2, 2021 / Notices
companies to U.S. nuclear power generators was originally sourced from Kazakhstan and Uzbekistan. In the same period, 20 percent of enrichment services purchased by U.S. utilities were from Russia. While a significant portion of imports come from Australia and Canada, the non-market practices of state-owned enterprises (SOEs) have similarly harmed the financial operations of uranium producers in these countries and threaten their continued ability to supply uranium mined in Australia or Canada to the U.S. market. China is also making steady strides to become a major supplier in the U.S. and global nuclear fuel market.
4. The entrance of China’s state- owned nuclear fuel companies as potential actors in the global nuclear fuel industry will further intensify pressure on market economy producers in Canada, Australia, Europe, and the U.S. By 2020, China could have enrichment capacity beyond their domestic needs. U.S. utilities have reported purchases of uranium concentrate and enrichment services from Chinese controlled companies in the 2014–2018 period. China provided two percent of U.S. utilities’ enrichment services contracts during this period, and is expected to supply even more in the coming years. Overall, the non- market business practices of Russia, Kazakhstan, Uzbekistan, and China’s uranium industries continue to erode U.S. uranium mining and processing capacity.
5. Import competition from state- owned uranium enterprises has caused a significant atrophy in U.S. uranium infrastructure to the point where production levels from front-end companies are no longer economically sustainable. Documented declines in employment and skilled workforce (front-end employment is down 47 percent since 2009), as well as idling and closures of mining (13 since 2009), milling (only one of five remaining U.S. mills is presently active), and uranium conversion operations (the last U.S. facility is idled), demonstrate the steep decline in U.S. production capacity. Additionally, loss of long-term contracts with nuclear utilities, minimal market share, falling marginal net income, and a tenuous financial outlook indicate a moribund U.S. uranium industry.
C. Displacement of Domestic Uranium by Excessive Quantities of Imports Has the Serious Effect of Weakening Our Internal Economy
1. U.S. nuclear electric power utilities and uranium suppliers face multiple challenges. Federal Energy Regulatory Commission (FERC) market rules do not
compensate nuclear power and other fuel-secure generation resources for their resilience value. In addition, subsidized renewable energy and lower natural gas prices are causing premature retirements of U.S. civilian nuclear power plants before the end of their useful lives. To cut costs and remain viable in distorted U.S. electricity markets, many nuclear power operators have ended long-term contracts with higher-priced U.S. uranium producers and turned to foreign SOEs for artificially low-priced uranium imports. The loss of long-term contracts, which provided the revenue stability needed to adequately support capital investment, research and development (R&D), and facility expansion, as well as to maintain workforce and production, has adversely impacted all elements of the U.S. uranium industry.
2. High dependence on uranium imports—averaging 93.3 percent of annual U.S. nuclear power utility consumption in 2018—has caused all elements of the U.S. uranium sector to shut down production capacity, struggle to maintain financial viability, reduce workforce, cut R&D, and slash capital expenditures. Excessive imports have dropped U.S. uranium mining production to some of the lowest levels seen since uranium mining began in the late 1940s.
3. Without a viable U.S. uranium industry, the United States cannot effectively respond to moderate or extended national security emergencies, or over the long-term meet the domestic uranium requirements of the U.S. Department of Defense. Moreover, U.S. nuclear electric power generators would not be able to operate at full capacity and would not be able to support critical infrastructure electric power needs if foreign nations, particularly Russia and other former Soviet states, chose to suspend or otherwise end uranium exports to the United States.
D. Uranium Market Distortion by State- Owned Enterprises Is a Circumstance That Contributes to the Weakening of the Domestic Economy
1. The 2011 Fukushima Daichii incident prompted the shutdown and/or idling of existing nuclear operators in Japan, Germany, and other countries. Additionally, many proposed nuclear reactors around the world, including in the United States, were cancelled. These actions decreased global demand for uranium, creating a supply glut and low uranium prices. This has severely affected the financial viability of U.S. uranium mining and milling in particular, as uranium imports have
reached over 94 percent of U.S. utility consumption.
2. The Fukushima incident caused similar declines in other elements of the U.S. front-end nuclear fuel business, including conversion, enrichment, and fuel fabrication companies. [TEXT REDACTED] As of 2018, the total domestic front-end uranium industry employs 4,958 workers, compared to 9,232 workers in 2009, a decline of 47 percent.
3. During this same period SOEs in Russia, Kazakhstan, and Uzbekistan undercut U.S. uranium producers with lower priced uranium. SOEs in China also injected additional quantities of uranium into the marketplace despite lower prices and a drop in overall demand. In contrast, U.S. producers significantly cut production, shut down capacity, and shrank workforce levels.
4. Market economy uranium producers such as Australia, Canada, South Africa, France, Germany, the Netherlands, and the United Kingdom have also been forced to curtail or suspend operations due to the excess production by SOE uranium producers that has depressed global uranium prices. SOE competition has displaced demand for Canadian and Australian product. Between 2016 and 2017, Canada cut back domestic production approximately 6.6 percent. Australia reduced output by 6.9 percent. In contrast, Russia and Kazakhstan decreased their production by only 5.1 and 2.9 percent, respectively; but China increased production by 16 percent. Uzbekistan made no production cuts.
5. U.S. nuclear electric power generators maintain only a limited amount of nuclear fuel materials in reserve to address potential supply disruptions. The U.S. Government maintains only a small stockpile of enriched uranium for utility use in the event of a fuel supply disruption. U.S. nuclear electric power generators are therefore vulnerable to sudden and extended disruptions in the nuclear fuel supply chain, especially product supplied through Russia and Kazakhstan.
Conclusion Based on these findings, the Secretary
of Commerce has concluded that the present quantities and circumstance of uranium imports are ‘‘weakening our internal economy’’ and ‘‘threaten to impair the national security’’ as defined in Section 232. An economically viable, secure supply of U.S.-sourced uranium is required for national defense needs. International obligations, including agreements with foreign partners under Section 123 of the Atomic Energy Act of
VerDate Sep<11>2014 19:47 Jul 30, 2021 Jkt 253001 PO 00000 Frm 00004 Fmt 4701 Sfmt 4703 E:\FR\FM\02AUN2.SGM 02AUN2kham
mon
d on
DS
KJM
1Z7X
2PR
OD
with
NO
TIC
ES
2
41543 Federal Register / Vol. 86, No. 145 / Monday, August 2, 2021 / Notices
12 U.S. White House Office. National Security Strategy of the United States of America. (Washington, DC: 2017), 2 https://www.whitehouse.gov/wp-content/uploads/2017/12/ NSS-Final-12-18-2017-0905-2.pdf.
1954, govern the use of most imported uranium and typically restrict it to peaceful, non-explosive uses. As a result, uranium used for military purposes must generally be domestically produced from mining through the fuel fabrication process. Furthermore, the predictable maintenance and support of U.S. critical infrastructure, especially the electric power grid, depends on a diverse supply of uranium, which includes U.S.-sourced uranium products and services.
The Secretary further recognizes that the U.S. uranium industry’s financial and production posture has significantly deteriorated since the Department’s 1989 Report. That investigation noted that U.S. nuclear power utilities imported 51.1 percent of their uranium requirements in 1987. By 2018, imports had increased to 93.3 percent of those utilities’ annual requirements. Based on comprehensive 2019 industry data provided by U.S. uranium producers and U.S. nuclear electric power utilities to the Department in response to a mandatory survey, U.S. utilities’ usage of U.S. mined uranium has dropped to nearly zero. [TEXT REDACTED] Based on the current and projected state of the U.S. uranium industry, the Department has concluded that the U.S. uranium industry is unable to satisfy existing or future national security needs or respond to a national security emergency requiring a large increase in domestic uranium production.
Absent immediate action, closures of the few remaining U.S. uranium mining, milling, and conversion facilities are anticipated within the next few years.
Further decreases in U.S. uranium production and capacity, including domestic fuel fabrication, will cause even higher levels of U.S. dependence on imports, especially from Russia, Kazakhstan, Uzbekistan, and China. Increased imports from SOEs in those countries, and in particular Russia and China, which the 2017 National Security Strategy noted present a direct challenge to U.S. influence, are detrimental to the national security.12 The high risk of loss of the remaining U.S. domestic uranium industry if the present excessive level of imports continue threatens to impair the national security as defined by Section 232.
The Secretary has determined that to remove the threat of impairment to national security, it is necessary to reduce imports of uranium to a level that enables U.S. uranium producers to return to an economically competitive and financially viable position. This will allow the industry to sustain production capacity, hire and maintain a skilled workforce, make needed capital expenditures, and perform necessary research and development activities. A modest reduction of uranium imports will allow for the revival of U.S. uranium mining and milling, the restart of the sole U.S. uranium converter, and a reduction in import challenges to fuel fabricators, while also recognizing the market and
pricing challenges confronting the U.S. nuclear power utilities.
Recommendation
Due to the threat to the national security, as defined in Section 232, from excessive uranium imports, the Secretary recommends that the President take immediate action by adjusting the level of these imports through the implementation of an import waiver to achieve a phased-in reduction of uranium imports. The reduction in imports of uranium should be sufficient to enable U.S. producers to recapture and sustain a market share of U.S. uranium consumption that will allow for financial viability, and would enable the maintenance of a skilled workforce and the production capacity and uranium output needed for national defense and critical infrastructure requirements. The reduction imposed should be sufficient to enable U.S. producers to eventually supply 25 percent of U.S. utilities’ uranium needs based on 2018 U.S. U308 concentrate annual consumption requirements.
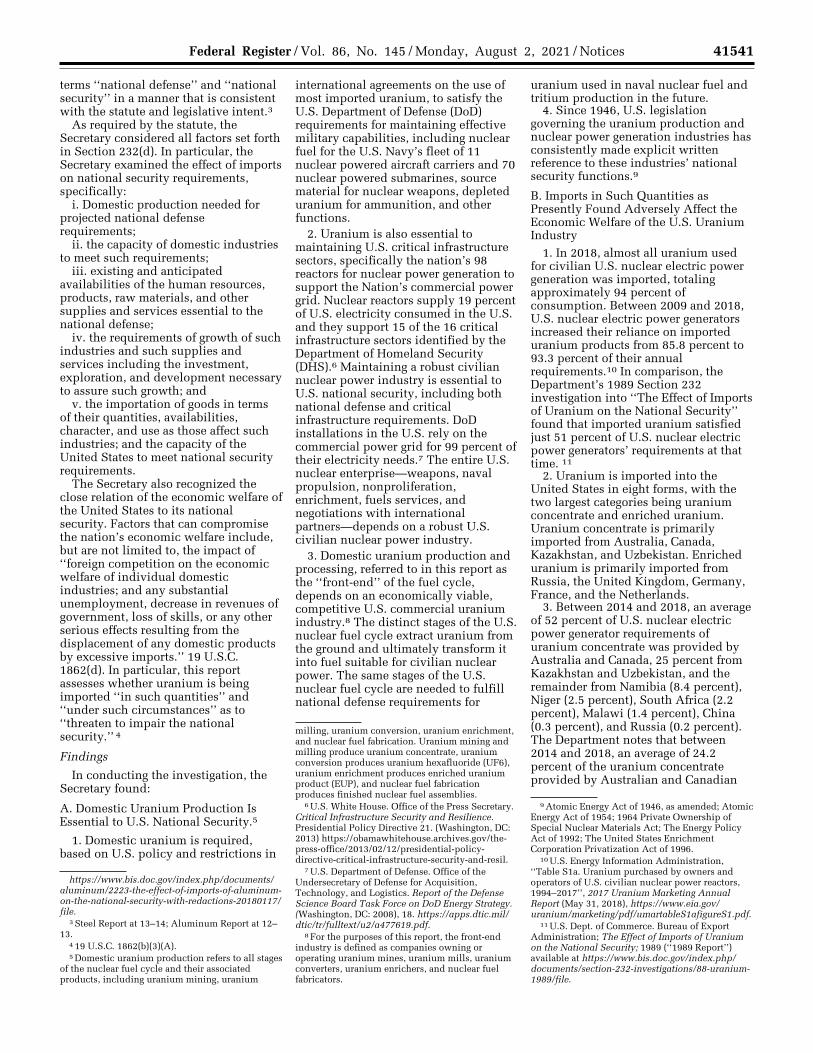
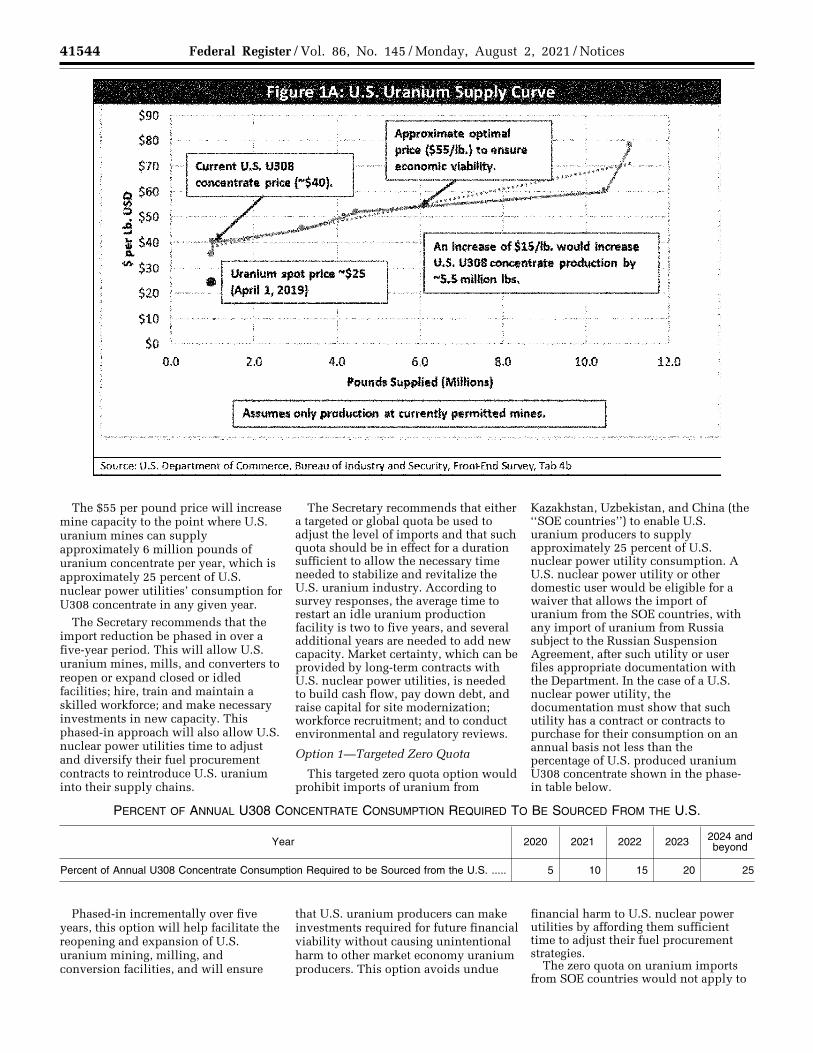
Based on the survey responses, the Department has determined that U.S. uranium producers require an amount equivalent to 25 percent of U.S. nuclear power utilities’ 2018 annual U308 concentrate consumption to ensure financial viability. Based on the Department’s analysis, if U.S.-mined uranium supplied 25 percent of U.S. nuclear power utilities’ annual U308 concentrate consumption, U.S. uranium prices will increase to approximately $55 per pound (see Figure 1A). The current spot price is low due to distortions from SOEs.
VerDate Sep<11>2014 19:47 Jul 30, 2021 Jkt 253001 PO 00000 Frm 00005 Fmt 4701 Sfmt 4703 E:\FR\FM\02AUN2.SGM 02AUN2kham
mon
d on
DS
KJM
1Z7X
2PR
OD
with
NO
TIC
ES
2
41544 Federal Register / Vol. 86, No. 145 / Monday, August 2, 2021 / Notices
The $55 per pound price will increase mine capacity to the point where U.S. uranium mines can supply approximately 6 million pounds of uranium concentrate per year, which is approximately 25 percent of U.S. nuclear power utilities’ consumption for U308 concentrate in any given year.
The Secretary recommends that the import reduction be phased in over a five-year period. This will allow U.S. uranium mines, mills, and converters to reopen or expand closed or idled facilities; hire, train and maintain a skilled workforce; and make necessary investments in new capacity. This phased-in approach will also allow U.S. nuclear power utilities time to adjust and diversify their fuel procurement contracts to reintroduce U.S. uranium into their supply chains.
The Secretary recommends that either a targeted or global quota be used to adjust the level of imports and that such quota should be in effect for a duration sufficient to allow the necessary time needed to stabilize and revitalize the U.S. uranium industry. According to survey responses, the average time to restart an idle uranium production facility is two to five years, and several additional years are needed to add new capacity. Market certainty, which can be provided by long-term contracts with U.S. nuclear power utilities, is needed to build cash flow, pay down debt, and raise capital for site modernization; workforce recruitment; and to conduct environmental and regulatory reviews.
Option 1—Targeted Zero Quota
This targeted zero quota option would prohibit imports of uranium from
Kazakhstan, Uzbekistan, and China (the ‘‘SOE countries’’) to enable U.S. uranium producers to supply approximately 25 percent of U.S. nuclear power utility consumption. A U.S. nuclear power utility or other domestic user would be eligible for a waiver that allows the import of uranium from the SOE countries, with any import of uranium from Russia subject to the Russian Suspension Agreement, after such utility or user files appropriate documentation with the Department. In the case of a U.S. nuclear power utility, the documentation must show that such utility has a contract or contracts to purchase for their consumption on an annual basis not less than the percentage of U.S. produced uranium U308 concentrate shown in the phase- in table below.
PERCENT OF ANNUAL U308 CONCENTRATE CONSUMPTION REQUIRED TO BE SOURCED FROM THE U.S.
Year 2020 2021 2022 2023 2024 and beyond
Percent of Annual U308 Concentrate Consumption Required to be Sourced from the U.S. ..... 5 10 15 20 25
Phased-in incrementally over five years, this option will help facilitate the reopening and expansion of U.S. uranium mining, milling, and conversion facilities, and will ensure
that U.S. uranium producers can make investments required for future financial viability without causing unintentional harm to other market economy uranium producers. This option avoids undue
financial harm to U.S. nuclear power utilities by affording them sufficient time to adjust their fuel procurement strategies.
The zero quota on uranium imports from SOE countries would not apply to
VerDate Sep<11>2014 19:47 Jul 30, 2021 Jkt 253001 PO 00000 Frm 00006 Fmt 4701 Sfmt 4703 E:\FR\FM\02AUN2.SGM 02AUN2 EN
02A
U21
.002
</G
PH
>
kham
mon
d on
DS
KJM
1Z7X
2PR
OD
with
NO
TIC
ES
2
$90
$80
$70
a $60 .,, ::, $50 :! l $4o
.. $30
$20
$10
$0
'""''"
,~,,
0.0
Figure lA: U.S. Uranium Supply Curve
Approximate optimal price ($55/lb.} to ensure I
CUmlnt U.S. U308 ..•.. ,,., ... economic viebility. ... 7 concentrate price ("'$40). .....
✓ . .... ~·· 'f" -······ J
./ - , .. ..-
... An 1nc;ra .. of $15/lb. would 1ncntM8
.... "'"'""""" U.S. U308 concentrate production by
• Uranium spot price "'$25 .. S.5 million lbs • (April 1, 2019)
2.0 4,0 6.0 8.0 10.0
Pounds Supplied (Millions)
I Anumes only production at currently permitted mines.
Source: U.S. Department of Commerce, Bureau of Industry and Security, Front;End SurveY, Tab 4b
, ...
,,,
12.0
41545 Federal Register / Vol. 86, No. 145 / Monday, August 2, 2021 / Notices
13 As of April 2019, EURATOM includes all 28 members of the European Union. The United Kingdom will cease to be a member of EURATOM
if and when it leaves the European Union. Should the United Kingdom cease to be a member of EURATOM, the same preferential treatment given
to EURATOM members will also be applied to the United Kingdom.
uranium imports from SOE countries for use by U.S. milling, conversion, enrichment, and fuel fabrication services that produce uranium products for export from the United States. A U.S. milling, conversion, enrichment, or fuel fabricator seeking to import uranium from an SOE country for use to produce uranium products for export would need to file appropriate documentation with the Department to obtain a waiver for the import of such uranium for export.
The Secretary believes that this option to impose a zero quota for imports of uranium from SOE countries, while continuing to allow unrestricted importation of uranium from Canada, Australia, and EURATOM 13 member countries based on their security and economic relationships with the United States, should address the threatened impairment of U.S. national security. This would be accomplished by promoting the economic revival of the U.S. uranium industry, so long as there is not significant transshipment or reprocessing of SOE country uranium through these unrestricted countries.
The Department will monitor these unrestricted imports to ensure there is not significant transshipment, reprocessing, or book transfers from SOE countries to unrestricted countries in an attempt to circumvent and undermine the U.S. uranium producers’ ability to provide 25 percent of U.S. annual U308 concentrate consumption. Many companies in unrestricted countries supply uranium sourced from SOE countries. Consequently, up to one-
third of the materials delivered to U.S. nuclear power utilities, at this time, is not sourced directly from the country of import.
Imports of uranium from Russia under a waiver would also be subjected to the Russian Suspension Agreement. This option assumes that such agreement will continue to be in effect over the relevant time period and would apply to any Russian uranium imports by U.S. nuclear power utilities, thus holding Russian uranium imports to their current level of approximately 20 percent of U.S. enrichment demand. In the event that the Russian Suspension Agreement is not extended and terminates, then the Secretary recommends that a quota on uranium imports under a waiver of Russian Uranium Products (as defined in the Russian Suspension Agreement) of up to 15 percent of U.S. enrichment demand be imposed. If adopted this quota would be administered by the Department in the same manner as the Russian Suspension Agreement is presently administered.
The adjustment of imports proposed under this option would be in addition to any applicable antidumping or countervailing duties collections.
To complement the proposed trade action, the Secretary recommends that the Federal Energy Regulatory Commission (FERC) should act promptly to ensure that regulated wholesale power market regulations adequately compensate nuclear and other fuel-secure generation resources. Specifically, FERC should determine whether current market rules, which
discriminate against secure nuclear fuel generation resources in favor of intermittent resources, such as natural gas, solar, and wind, result in unjust, unreasonable, and unduly discriminatory rates that distort energy markets, harm consumers, and undermine electric reliability. If so, FERC should consider taking appropriate action to ensure that rates are just and reasonable.
The Department of Commerce, in consultation with other appropriate departments and agencies, will monitor the status of the U.S. uranium industry and the effectiveness of this remedy and will make recommendations to the President regarding whether it should be modified, extended, or terminated.
Option 2—Global Zero Quota
This option would establish a zero quota on imports of uranium from all countries until specific conditions are met to enable U.S. producers to supply 25 percent of U.S. nuclear power utilities’ annual consumption of uranium U308 concentrate. A U.S. nuclear power utility or other domestic user would be eligible for a waiver to import uranium from any country after submitting appropriate documentation to the Department. In the case of a U.S. nuclear power utility, the documentation must show that such utility has a contract or contracts to purchase for their consumption on an annual basis not less than the percentage of U.S. produced uranium U308 concentrate shown in the phase- in table below.
PERCENT OF ANNUAL U308 CONCENTRATE CONSUMPTION REQUIRED TO BE SOURCED FROM THE U.S.
Year 2020 2021 2022 2023 2024 and beyond
Percent of Annual U308 Concentrate Consumption Required to be Sourced from the U.S. .................................................................................................................... 5 10 15 20 25
Phased-in incrementally over five years, this option will help facilitate the reopening and expansion of U.S. uranium mining, milling, and conversion facilities, and will ensure that U.S. uranium producers can make investments required for future financial viability. This option avoids undue financial harm to U.S. nuclear power utilities by affording them sufficient time to adjust their fuel procurement strategies.
The zero quota on uranium imports would not apply to uranium imports for
use by U.S. milling, conversion, enrichment, and fuel fabrication services that produce uranium products for export from the United States. A U.S. milling, conversion, enrichment, or fuel fabricator seeking to import uranium for use to produce uranium products for export would need to file appropriate documentation with the Department to obtain a waiver for the import of uranium.
The Department will provide adequate time for U.S. industry to receive a waiver prior to a zero quota
being implemented globally. Based on information received during the investigation, the Department believes that this option will not cause undue burdens.
The Secretary believes that this option to impose a zero quota for imports of uranium will address the threatened impairment of U.S. national security by promoting the economic revival of the U.S. uranium industry. This option also prevents the possibility of transshipment of SOE overproduction through third countries and avoids
VerDate Sep<11>2014 19:47 Jul 30, 2021 Jkt 253001 PO 00000 Frm 00007 Fmt 4701 Sfmt 4703 E:\FR\FM\02AUN2.SGM 02AUN2kham
mon
d on
DS
KJM
1Z7X
2PR
OD
with
NO
TIC
ES
2
41546 Federal Register / Vol. 86, No. 145 / Monday, August 2, 2021 / Notices
14 An investigation under Section 232 looks at excessive imports for their threat to the national security, rather than looking at unfair trade practices as in an antidumping investigation.
undue harm to U.S. enrichment and fuel fabrication export operations. These domestic export operations rely on an ability to access working uranium stock regardless of the specific mining origin of a given uranium-based material.
Tennessee Valley Authority (TVA) purchases of Canadian UO3 natural uranium diluent in its execution of the National Nuclear Security Administration’s current highly- enriched uranium (HEU) down-blending campaign would be excluded from the zero quota on imports of uranium. In addition, any transfer pursuant to a Mutual Defense Agreement that references special nuclear material would be excluded from the zero quota on imports of uranium.
Imports of uranium from Russia under a waiver would also be governed by the Russian Suspension Agreement. This option assumes that such agreement will continue to be in effect over the relevant time period and would apply to any Russian uranium imports by U.S. nuclear power utilities, thus holding Russian uranium imports to their current level of approximately 20 percent of U.S. enrichment demand. In the event that the Russian Suspension Agreement is not extended and terminates, then the Secretary recommends that a quota on uranium imports under a waiver of Russian Uranium Products (as defined in the Russian Suspension Agreement) of up to 15 percent of U.S. enrichment demand be imposed. If adopted, this quota would be administered by the Department in the same manner as the Russian Suspension Agreement is presently administered.
The adjustment of imports proposed under this option would be in addition to any applicable antidumping or countervailing duties collections.
To complement the proposed trade action, the Secretary recommends that the Federal Energy Regulatory Commission (FERC) should act promptly to ensure that regulated wholesale power market regulations adequately compensate nuclear and other fuel-secure generation resources. Specifically, FERC should determine whether current market rules, which discriminate against secure nuclear fuel generation resources in favor of intermittent resources, such as natural gas, solar, and wind, result in unjust, unreasonable, and unduly discriminatory rates that distort energy markets, harm consumers, and undermine electric reliability. If so, FERC should consider taking appropriate action to ensure that rates are just and reasonable.
The Department of Commerce, in consultation with other appropriate departments and agencies, will monitor the status of the U.S. uranium industry and the effectiveness of this remedy to determine if it should be modified, extended, or terminated.
Option 3—Alternative Action Should the President determine that
the threatened impairment of national security does not warrant immediate adjustment of uranium imports at this time but that alternative action should be taken to improve the condition of the U.S. uranium industry to enable the U.S. industry to supply 25 percent of U.S nuclear power utilities annual consumption of uranium U308 concentrate, the President could direct the Department of Defense (DOD) and the Department of Energy (DOE) to report to the President within 90 days on options for increasing the economic viability of the domestic uranium mining industry. The report should include, but not be limited to, recommendations for: (1) The elimination of regulatory constraints on domestic producers; (2) incentives for increasing investment; and (3) ways to work with likeminded allies to address unfair trade practices by SOE countries, including through trade remedy actions and the negotiation of new rules and best practices. The President could also direct the United States Trade Representative to enter into negotiations with the SOE countries to address the causes of excess uranium imports that threaten the national security.
To complement the proposed alternative action, the Secretary recommends that the Federal Energy Regulatory Commission (FERC) should act promptly to ensure that regulated wholesale power market regulations adequately compensate nuclear and other fuel-secure generation resources. Specifically, FERC should determine whether current market rules, which discriminate against secure nuclear fuel generation resources in favor of intermittent resources, such as natural gas, solar, and wind, result in unjust, unreasonable, and unduly discriminatory rates that distort energy markets, harm consumers, and undermine electric reliability. If so, FERC should consider taking appropriate action to ensure that rates are just and reasonable.
The Department of Commerce, in consultation with other appropriate departments and agencies, will monitor the status of the U.S. uranium industry and the effectiveness of this remedy and recommend to the President if any additional measures are needed.
Alternatively, the Secretary may initiate another investigation under Section 232.
The Secretary also makes public policy recommendations for additional measures that complement these three options.
II. Legal Framework
A. Section 232 Requirements
Section 232 provides the Secretary with the authority to conduct investigations to determine the effect on the national security of the United States of imports of any article. It authorizes the Secretary to conduct an investigation if requested by the head of any department or agency, upon application of an interested party, or upon his own motion. See 19 U.S.C. 1862(b)(1)(A).
Section 232 directs the Secretary to submit to the President a report with recommendations for ‘‘action or inaction under this section’’ and requires the Secretary to advise the President if any article ‘‘is being imported into the United States in such quantities or under such circumstances as to threaten to impair the national security.’’ See 19 U.S.C. 1862(b)(3)(A).
Section 232(d) directs the Secretary and the President to, in light of the requirements of national security and without excluding other relevant factors, give consideration to the domestic production needed for projected national defense requirements and the capacity of the United States to meet national security requirements. See 19 U.S.C. 1862(d).
Section 232(d) also directs the Secretary and the President to ‘‘recognize the close relation of the economic welfare of the Nation to our national security, and . . . take into consideration the impact of foreign competition on the economic welfare of individual domestic industries’’ by examining whether any substantial unemployment, decrease in revenues of government, loss of skills or investment, or other serious effects resulting from the displacement of any domestic products by excessive imports, or other factors, results in a ‘‘weakening of our internal economy’’ that may impair the national security.14 See 19 U.S.C. 1862(d).
Once an investigation has been initiated, Section 232 mandates that the Secretary provide notice to the Secretary of Defense that such an investigation has been initiated. Section 232 also
VerDate Sep<11>2014 19:47 Jul 30, 2021 Jkt 253001 PO 00000 Frm 00008 Fmt 4701 Sfmt 4703 E:\FR\FM\02AUN2.SGM 02AUN2kham
mon
d on
DS
KJM
1Z7X
2PR
OD
with
NO
TIC
ES
2
41547 Federal Register / Vol. 86, No. 145 / Monday, August 2, 2021 / Notices
15 Department regulations (i) set forth additional authority and specific procedures for such input from interested parties, see 15 CFR 705.7 and 705.8, and (ii) provide that the Secretary may vary or dispense with those procedures ‘‘in emergency situations, or when in the judgment of the Department, national security interests require it.’’ Id., 705.9.
16 Department of Commerce, Bureau of Export Administration; The Effects of Imports of Iron Ore and Semi-Finished Steel on the National Security; Oct. 2001 (‘‘2001 Iron and Steel Report’’) at 5.
17 Id. 18 Presidential Policy Directive 21; Critical
Infrastructure Security and Resilience; February 12, 2013 (‘‘PPD–21’’).
19 See Op. Cit. at 16.
20 The 2001 Iron and Steel Report used the phrase ‘‘fundamentally threaten to impair’’ when discussing how imports may threaten to impair national security. See 2001 Iron and Steel Report at 7 and 37. Because the term ‘‘fundamentally’’ is not included in the statutory text and could be perceived as establishing a higher threshold, the Secretary expressly does not use the qualifier in this report. The statutory threshold in Section 232(b)(3)(A) is unambiguously ‘‘threaten to impair’’ and the Secretary adopts that threshold without qualification. 19 U.S.C. 1862(b)(3)(A).
21 19 U.S.C. 1862(b)(3)(A). 22 See 19 U.S.C. 1862(d) (‘‘the Secretary and the
President shall, in light of the requirements of national security and without excluding other relevant factors . . .’’ and ‘‘serious effects resulting from the displacement of any domestic products by excessive imports shall be considered, without excluding other factors . . .’’).
23 This reading is supported by Congressional findings in other statutes. See, e.g., 15 U.S.C. 271(a)(1)(‘‘The future well-being of the United States economy depends on a strong manufacturing base . . . ’’) and 50 U.S.C. 4502(a)(‘‘Congress finds that—(1) the security of the United States is dependent on the ability of the domestic industrial base to supply materials and services . . . (2)(C) to provide for the protection and restoration of domestic critical infrastructure operations under emergency conditions . . . (3) . . . the national defense preparedness effort of the United States
Continued
requires the Secretary to do the following:
(1) ‘‘Consult with the Secretary of Defense regarding the methodological and policy questions raised in [the] investigation;’’
(2) ‘‘Seek information and advice from, and consult with, appropriate officers of the United States;’’ and
(3) ‘‘If it is appropriate and after reasonable notice, hold public hearings or otherwise afford interested parties an opportunity to present information and advice relevant to such investigation.’’ 15 See 19 U.S.C. 1862(b)(2)(A)(i)–(iii).
As detailed in the report, all of the requirements set forth above have been satisfied.
In conducting the investigation, Section 232 permits the Secretary to request that the Secretary of Defense provide an assessment of the defense requirements of the article that is the subject of the investigation. See 19 U.S.C. 1862(b)(2)(B).
Upon completion of a Section 232 investigation, the Secretary is required to submit a report to the President no later than 270 days after the date on which the investigation was initiated. See 19 U.S.C. 1862(b)(3)(A). The report must:
(1) Set forth ‘‘the findings of such investigation with respect to the effect of the importation of such article in such quantities or under such circumstances upon the national security;’’
(2) Set forth, ‘‘based on such findings, the recommendations of the Secretary for action or inaction under this section;’’ and
(3) ‘‘If the Secretary finds that such article is being imported into the United States in such quantities or under such circumstances as to threaten to impair the national security . . . so advise the President . . . See 19 U.S.C. 1862(b)(3)(A).
All unclassified and non-proprietary portions of the report submitted by the Secretary to the President must be published.
Within 90 days after receiving a report in which the Secretary finds that an article is being imported into the United States in such quantities or under such circumstances as to threaten to impair the national security, the President shall:
(1) ‘‘Determine whether the President concurs with the finding of the Secretary’’; and
(2) ‘‘If the President concurs, determine the nature and duration of the action that, in the judgment of the President, must be taken to adjust the imports of the article and its derivatives so that such imports will not threaten to impair the national security’’ (see 19 U.S.C. 1862(c)(1)(A)).
B. Discussion While Section 232 does not
specifically define ‘‘national security,’’ both Section 232, and the implementing regulations at 15 CFR part 705, contain non-exclusive lists of factors that the Secretary must consider in evaluating the effect of imports on the national security. Congress in Section 232 explicitly determined that ‘‘national security’’ includes, but is not limited to, ‘‘national defense’’ requirements. See 19 U.S.C. 1862(d)).
The Department in 2001 determined that ‘‘national defense’’ includes both defense of the United States directly and the ‘‘ability to project military capabilities globally.’’ 16 The Department also concluded in 2001 that, ‘‘In addition to the satisfaction of national defense requirements, the term ‘‘national security’’ can be interpreted more broadly to include the general security and welfare of certain industries, beyond those necessary to satisfy national defense requirements, which are critical to the minimum operations of the economy and government.’’ The Department called these ‘‘critical industries.’’ 17 This report once again uses these reasonable interpretations of ‘national defense’’ and ‘‘national security.’’ However, this report uses the more recent 16 critical infrastructure sectors identified in Presidential Policy Directive 21 18 instead of the 28 industry sectors used by the Bureau of Export Administration in the 2001 Report.19
Section 232 directs the Secretary to determine whether imports of any article are being made ‘‘in such quantities’’ or ‘‘under such circumstances’’ that those imports ‘‘threaten to impair the national security.’’ See 19 U.S.C. 1862(b)(3)(A). The statutory construction makes clear that either the quantities or the
circumstances, standing alone, may be sufficient to support an affirmative finding. They may also be considered together, particularly where the circumstances act to prolong or magnify the impact of the quantities being imported.
The statute does not define a threshold for when ‘‘such quantities’’ of imports are sufficient to threaten to impair the national security, nor does it define the ‘‘circumstances’’ that might qualify.
Likewise, the statute does not require a finding that the quantities or circumstances are impairing the national security. Instead, the threshold question under Section 232 is whether those quantities or circumstances ‘‘threaten to impair the national security.’’ See 19 U.S.C. 1862(b)(3)(A). This makes evident that Congress expected an affirmative finding under Section 232 before an actual impairment of the national security. 20
Section 232(d) contains a list of factors for the Secretary to consider in determining if imports ‘‘threaten to impair the national security’’21 of the United States, and this list is mirrored in the implementing regulations. See 19 U.S.C. 1862(d) and 15 CFR 705.4. Congress was careful to note twice in Section 232(d) that the list provided, while mandatory, is not exclusive.22 Congress’ illustrative list is focused on the ability of the United States to maintain the domestic capacity to provide the articles in question as needed to maintain the national security of the United States.23 Congress broke
VerDate Sep<11>2014 19:47 Jul 30, 2021 Jkt 253001 PO 00000 Frm 00009 Fmt 4701 Sfmt 4703 E:\FR\FM\02AUN2.SGM 02AUN2kham
mon
d on
DS
KJM
1Z7X
2PR
OD
with
NO
TIC
ES
2
41548 Federal Register / Vol. 86, No. 145 / Monday, August 2, 2021 / Notices
government requires—(C) the development of domestic productive capacity to meet—(ii) unique technological requirements . . . (7) much of the industrial capacity that is relied upon by the United States Government for military production and other national defense purposes is deeply and directly influenced by—(A) the overall competitiveness of the industrial economy of the United States; and (B) the ability of industries in the United States, in general, to produce internationally competitive products and operate profitably while maintaining adequate research and development to preserve competitiveness with respect to military and civilian production; and (8) the inability of industries in the United States, especially smaller subcontractors and suppliers, to provide vital parts and components and other materials would impair the ability to sustain the Armed Forces of the United States in combat for longer than a short period.’’).
24 Accord 50 U.S.C. 4502(a).
the list of factors into two equal parts using two separate sentences. The first sentence focuses directly on ‘‘national defense’’ requirements, thus making clear that ‘‘national defense’’ is a subset of the broader term ‘‘national security.’’ The second sentence focuses on the broader economy and expressly directs that the Secretary and the President ‘‘shall recognize the close relation of the economic welfare of the Nation to our national security.’’ 24 See 19 U.S.C. 1862(d).
In addition to ‘‘national defense’’ requirements, two of the factors listed in the second sentence of Section 232(d) are particularly relevant in this investigation. Both are directed at how ‘‘such quantities’’ of imports threaten to impair national security See 19 U.S.C. 1862(b)(3)(A). In administering Section 232, the Secretary and the President are required to ‘‘take into consideration the impact of foreign competition on the economic welfare of individual domestic industries’’ and any ‘‘serious effects resulting from the displacement of any domestic products by excessive imports’’ in ‘‘determining whether such weakening of our internal economy may impair the national security.’’ See 19 U.S.C. 1862(d).
Another factor, not on the list, that the Secretary found to be relevant is the presence of global excess supply of uranium. This excess supply results in uranium imports occurring ‘‘under such circumstances’’ that they threaten to impair the national security. See 19 U.S.C. 1862(b)(3)(A). The Secretary considers excess global uranium supply as a relevant circumstance because state-owned enterprises have maintained or increased uranium production, and reduced prices, notwithstanding declining market conditions. At the same time, market producers, including U.S. producers, have decreased production under these market conditions. This excess supply means that U.S. uranium producers, for
the foreseeable future, face increasing competition from state-owned uranium producers as well as foreign market- based competitors.
After careful examination of the facts in this investigation, the Secretary has concluded that excessive imports of uranium in the present circumstances are weakening our internal economy and threaten to impair the national security as defined in Section 232. Several important factors support this conclusion, including the global excess uranium supply due to non-market based production by state-owned enterprises, the resulting near total dependence of U.S. nuclear power production on uranium imports, and the impact that the loss of a domestic U.S. uranium production capacity and workforce would have on the nation’s ability to respond to potential national emergencies.
III. Investigation Process
A. Initiation of Investigation
On January 16, 2018, Energy Fuel Resources (US) Inc. and UR-Energy USA Inc. (hereafter ‘‘Petitioners’’) petitioned the Secretary to conduct an investigation under Section 232 of the Trade Expansion Act of 1962, as amended (19 U.S.C. 1862), to determine the effect of imports of uranium on the national security.
Upon receipt of the petition, the Department carefully reviewed the material facts outlined in the petition. Initial discussions were held with other bureaus within the Department of Commerce as well as with other interested parties at the Departments of Defense and Energy. Legal counsel at the Department also carefully reviewed the petition to ensure it met the requirements of the Section 232 statute and the implementing regulations. Subsequently, on July 18, 2018, the Department accepted the petition and initiated the investigation. Pursuant to Section 232(b)(1)(b), the Department notified the U.S. Department of Defense with a July 18, 2018 letter from Secretary Ross to the Secretary of Defense, James Mattis (see Appendix A).
On July 25, 2018, the Department published a Federal Register Notice (see Appendix B—Federal Register, Vol. 83, No. 143, 35,204–35,205) announcing the initiation of an investigation to determine the effect of imports of uranium on the national security. The notice also announced the opening of the public comment period.
B. Public Comments
On July 25, 2018, the Department invited interested parties to submit
written comments, opinions, data, information, or advice relevant to the criteria listed in Section 705.4 of the National Security Industrial Base Regulations (15 CFR 705.4) as they affect the requirements of national security, including the following:
(a) Quantity of the articles subject to the investigation and other circumstances related to the importation of such articles;
(b) Domestic production capacity needed for these articles to meet projected national defense requirements;
(c) The capacity of domestic industries to meet projected national defense requirements;
(d) Existing and anticipated availability of human resources, products, raw materials, production equipment, facilities, and other supplies and services essential to the national defense;
(e) Growth requirements of domestic industries needed to meet national defense requirements and the supplies and services including the investment, exploration and development necessary to assure such growth;
(f) The impact of foreign competition on the economic welfare of any domestic industry essential to our national security;
(g) The displacement of any domestic products causing substantial unemployment, decrease in the revenues of government, loss of investment or specialized skills and productive capacity, or other serious effects;
(h) Relevant factors that are causing or will cause a weakening of our national economy; and
(i) Any other relevant factors. The public comment period was
originally scheduled to end on September 10, 2018. Following requests from the general public, the Department extended the deadline from September 10 to September 25 (see Appendix B— Federal Register Vol. 83, No. 175, 45,595–45,596). The Department received 1,019 written submissions concerning this investigation. Representative samples were grouped together then 837 comments were posted on Regulations.gov for public review. Parties who submitted comments included firms representing all parts of the nuclear fuel cycle, representatives of U.S. federal, state and local governments, foreign governments, as well as other concerned organizations. All public comments were carefully reviewed and factored into the investigative process. The public comments of key stakeholders are summarized in Appendix C, along
VerDate Sep<11>2014 19:47 Jul 30, 2021 Jkt 253001 PO 00000 Frm 00010 Fmt 4701 Sfmt 4703 E:\FR\FM\02AUN2.SGM 02AUN2kham
mon
d on
DS
KJM
1Z7X
2PR
OD
with
NO
TIC
ES
2
41549 Federal Register / Vol. 86, No. 145 / Monday, August 2, 2021 / Notices
25 1989 Report, Letter Requesting 232 Investigation, also III–21.
26 1989 Report, III–2, III–25. 27 Ibid., V–4 to V–5.
with a link to the docket (BIS–2018– 0011) where all public comments can be viewed in full on Regulations.gov.
Due to the limited number of firms engaged in the U.S. uranium industry and in nuclear power generation, it was determined that a public hearing was not necessary in order to conduct a comprehensive investigation. In lieu of holding a public hearing on this investigation, the Department issued two separate mandatory surveys (see Appendix D and Appendix E) to participants in the U.S. front-end uranium industry and the U.S. nuclear power generation sector, which collected both qualitative and quantitative information. The front-end survey was sent to 34 companies engaged in uranium mining and milling, uranium concentrate production, uranium enrichment, and nuclear fuel fabrication. The nuclear power generation survey was sent to all 24 operators of U.S. nuclear power plants and covered 98 reactors.
The surveys provided an opportunity for organizations to disclose confidential and non-public information needed by the Department to conduct a thorough investigation. These mandatory surveys were conducted using statutory authority pursuant to Section 705 of the Defense Production Act of 1950, as amended (50 U.S.C. 4555), and collected detailed information concerning factors such as imports/exports, production, capacity utilization, employment, operating status, global competition, and financial information. The resulting aggregate data provided the Department with detailed industry information that was otherwise not publicly available and was needed to effectively conduct analysis for this investigation.
Responses to the Department’s surveys were required by law (50 U.S.C. 4555). Information furnished in the survey responses is deemed confidential and will not be published or disclosed except in accordance with Section 705 of the DPA. Section 705 of the DPA prohibits the publication or disclosure of this information unless the President determines that the withholding of such information is contrary to the interest of the national defense. Information will
not be shared with any non-government entity other than in aggregate form.
C. Site Visits and Information Gathering Activities
To obtain additional information on the U.S. uranium industry and the U.S. nuclear power generation sector, the Department conducted site visits to several uranium and nuclear power generation facilities:
1) Calvert Cliffs Nuclear Power Plant in Lusby, Maryland. This is a double reactor facility.
2) Three uranium mines: La Sal (Utah—Conventional Mine), Nichols Ranch (Wyoming—In Situ facility), and Lost Creek (Wyoming—In Situ facility).
(3) White Mesa Mill in Blanding, Utah. This facility is the only fully- licensed and operating conventional uranium mill in the U.S.
In order to gain insights into the U.S. uranium industry’s challenges, information gathering activities and meetings were held with representatives of domestic and international uranium producers, associations, power generators, foreign governments, and others interested parties.
D. Interagency Consultation
The Department consulted with the Department of Defense including the Office of Industrial Base, Defense Logistics Agency, and the Department of the Navy regarding methodological and policy questions that arose during the investigation.
The Department also consulted with other U.S. Government agencies with expertise and information regarding the uranium industry including the Department of Energy, the Energy Information Administration, the National Nuclear Security Administration, the International Trade Administration, the Department of State, the Office of the United States Trade Representative, the Nuclear Regulatory Commission, the U.S. Geological Survey, and the Federal Energy Regulatory Commission.
E. Review of the Department of Commerce 1989 Section 232 Investigation on Uranium Imports
The Department reviewed the previous Section 232 Investigation on
the Effect of Uranium Imports on National Security from September 1989. This investigation, requested by the Secretary of Energy, determined that U.S. utilities imported a significant share of their uranium requirements. In 1987, U.S. utilities imported approximately 51.1 percent of their requirements, and the investigation projected that this level would reach 70.8 percent by 1993.25 The 1989 investigation also found that U.S. uranium producers faced strong foreign competition, particularly from the Soviet Union. It further reported that employment in the domestic industry was steadily decreasing.26
[TEXT REDACTED]27 Consequently, the Secretary concluded that uranium was not being imported into the United States under such quantities or circumstances that threatened to impair the national security.
The Department took note of the methodologies and analytic approaches used to conduct the 1989 investigation and evaluated its findings and conclusion in light of the current state of the U.S. uranium industry. Further discussion of the September 1989 Section 232 Investigation is in Appendix G.
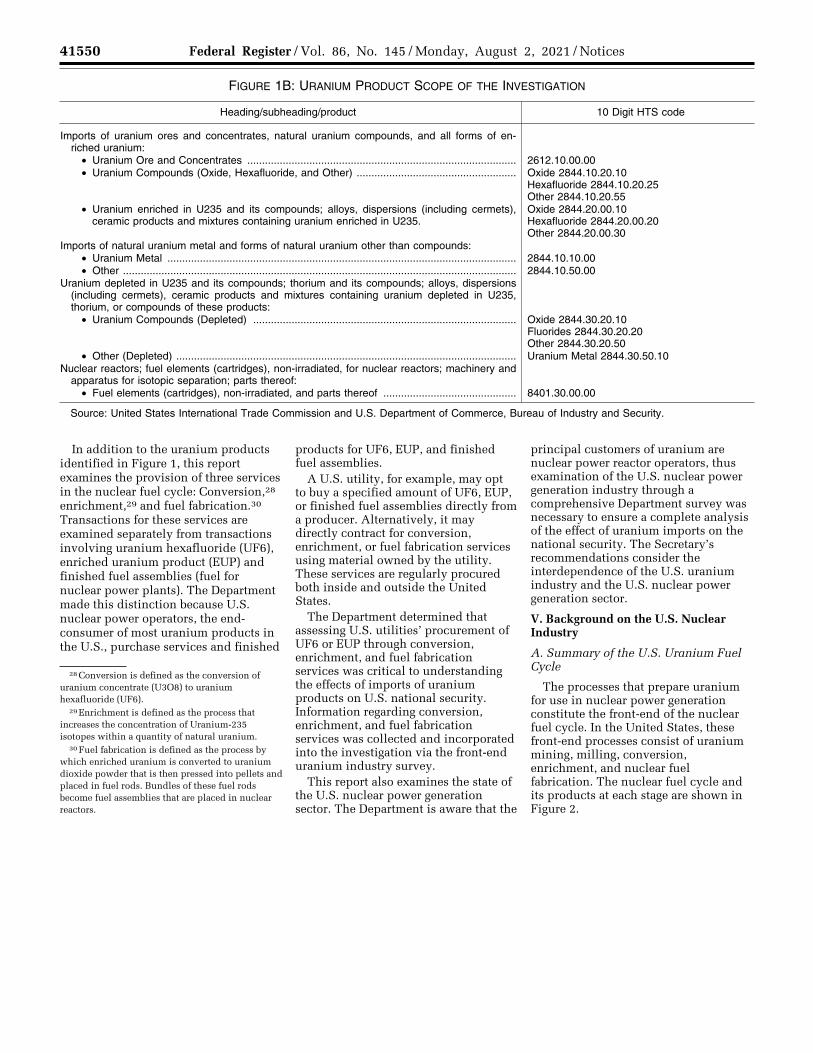
IV. Product Scope of the Investigation
The scope of this investigation defined uranium products at the Harmonized Tariff Schedule of the United States (HTS) 10-digit level. The eight product categories and related HTS codes covered by this report (see Figure 1B) are produced by U.S. uranium companies engaged in the nuclear fuel cycle, and are imported for use by U.S. nuclear power operators. Detailed information was collected in the Department’s survey responses from U.S. uranium producers and U.S. nuclear power operators regarding products covered by the HTS codes. These products are used in, or otherwise support, various national defense and critical infrastructure applications.
VerDate Sep<11>2014 19:47 Jul 30, 2021 Jkt 253001 PO 00000 Frm 00011 Fmt 4701 Sfmt 4703 E:\FR\FM\02AUN2.SGM 02AUN2kham
mon
d on
DS
KJM
1Z7X
2PR
OD
with
NO
TIC
ES
2
41550 Federal Register / Vol. 86, No. 145 / Monday, August 2, 2021 / Notices
28 Conversion is defined as the conversion of uranium concentrate (U3O8) to uranium hexafluoride (UF6).
29 Enrichment is defined as the process that increases the concentration of Uranium-235 isotopes within a quantity of natural uranium.
30 Fuel fabrication is defined as the process by which enriched uranium is converted to uranium dioxide powder that is then pressed into pellets and placed in fuel rods. Bundles of these fuel rods become fuel assemblies that are placed in nuclear reactors.
FIGURE 1B: URANIUM PRODUCT SCOPE OF THE INVESTIGATION
Heading/subheading/product 10 Digit HTS code
Imports of uranium ores and concentrates, natural uranium compounds, and all forms of en-riched uranium:
• Uranium Ore and Concentrates ........................................................................................... 2612.10.00.00 • Uranium Compounds (Oxide, Hexafluoride, and Other) ...................................................... Oxide 2844.10.20.10
Hexafluoride 2844.10.20.25 Other 2844.10.20.55
• Uranium enriched in U235 and its compounds; alloys, dispersions (including cermets), ceramic products and mixtures containing uranium enriched in U235.
Oxide 2844.20.00.10 Hexafluoride 2844.20.00.20 Other 2844.20.00.30
Imports of natural uranium metal and forms of natural uranium other than compounds: • Uranium Metal ...................................................................................................................... 2844.10.10.00 • Other ..................................................................................................................................... 2844.10.50.00
Uranium depleted in U235 and its compounds; thorium and its compounds; alloys, dispersions (including cermets), ceramic products and mixtures containing uranium depleted in U235, thorium, or compounds of these products:
• Uranium Compounds (Depleted) ......................................................................................... Oxide 2844.30.20.10 Fluorides 2844.30.20.20 Other 2844.30.20.50
• Other (Depleted) ................................................................................................................... Uranium Metal 2844.30.50.10 Nuclear reactors; fuel elements (cartridges), non-irradiated, for nuclear reactors; machinery and
apparatus for isotopic separation; parts thereof: • Fuel elements (cartridges), non-irradiated, and parts thereof ............................................. 8401.30.00.00
Source: United States International Trade Commission and U.S. Department of Commerce, Bureau of Industry and Security.
In addition to the uranium products identified in Figure 1, this report examines the provision of three services in the nuclear fuel cycle: Conversion,28 enrichment,29 and fuel fabrication.30 Transactions for these services are examined separately from transactions involving uranium hexafluoride (UF6), enriched uranium product (EUP) and finished fuel assemblies (fuel for nuclear power plants). The Department made this distinction because U.S. nuclear power operators, the end- consumer of most uranium products in the U.S., purchase services and finished
products for UF6, EUP, and finished fuel assemblies.
A U.S. utility, for example, may opt to buy a specified amount of UF6, EUP, or finished fuel assemblies directly from a producer. Alternatively, it may directly contract for conversion, enrichment, or fuel fabrication services using material owned by the utility. These services are regularly procured both inside and outside the United States.
The Department determined that assessing U.S. utilities’ procurement of UF6 or EUP through conversion, enrichment, and fuel fabrication services was critical to understanding the effects of imports of uranium products on U.S. national security. Information regarding conversion, enrichment, and fuel fabrication services was collected and incorporated into the investigation via the front-end uranium industry survey.
This report also examines the state of the U.S. nuclear power generation sector. The Department is aware that the
principal customers of uranium are nuclear power reactor operators, thus examination of the U.S. nuclear power generation industry through a comprehensive Department survey was necessary to ensure a complete analysis of the effect of uranium imports on the national security. The Secretary’s recommendations consider the interdependence of the U.S. uranium industry and the U.S. nuclear power generation sector.
V. Background on the U.S. Nuclear Industry
A. Summary of the U.S. Uranium Fuel Cycle
The processes that prepare uranium for use in nuclear power generation constitute the front-end of the nuclear fuel cycle. In the United States, these front-end processes consist of uranium mining, milling, conversion, enrichment, and nuclear fuel fabrication. The nuclear fuel cycle and its products at each stage are shown in Figure 2.
VerDate Sep<11>2014 19:47 Jul 30, 2021 Jkt 253001 PO 00000 Frm 00012 Fmt 4701 Sfmt 4703 E:\FR\FM\02AUN2.SGM 02AUN2kham
mon
d on
DS
KJM
1Z7X
2PR
OD
with
NO
TIC
ES
2
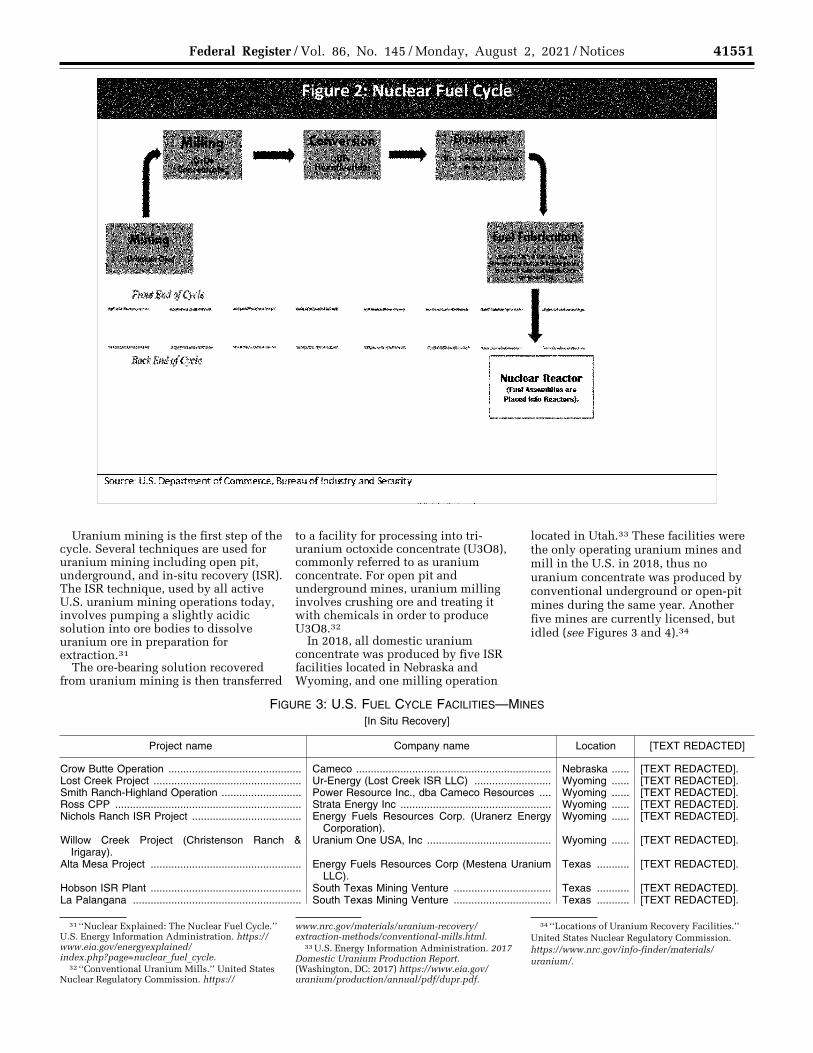
41551 Federal Register / Vol. 86, No. 145 / Monday, August 2, 2021 / Notices
31 ‘‘Nuclear Explained: The Nuclear Fuel Cycle.’’ U.S. Energy Information Administration. https://www.eia.gov/energyexplained/ index.php?page=nuclear_fuel_cycle.
32 ‘‘Conventional Uranium Mills.’’ United States Nuclear Regulatory Commission. https://
www.nrc.gov/materials/uranium-recovery/ extraction-methods/conventional-mills.html.
33 U.S. Energy Information Administration. 2017 Domestic Uranium Production Report. (Washington, DC: 2017) https://www.eia.gov/ uranium/production/annual/pdf/dupr.pdf.
34 ‘‘Locations of Uranium Recovery Facilities.’’ United States Nuclear Regulatory Commission. https://www.nrc.gov/info-finder/materials/ uranium/.
Uranium mining is the first step of the cycle. Several techniques are used for uranium mining including open pit, underground, and in-situ recovery (ISR). The ISR technique, used by all active U.S. uranium mining operations today, involves pumping a slightly acidic solution into ore bodies to dissolve uranium ore in preparation for extraction.31
The ore-bearing solution recovered from uranium mining is then transferred
to a facility for processing into tri- uranium octoxide concentrate (U3O8), commonly referred to as uranium concentrate. For open pit and underground mines, uranium milling involves crushing ore and treating it with chemicals in order to produce U3O8.32
In 2018, all domestic uranium concentrate was produced by five ISR facilities located in Nebraska and Wyoming, and one milling operation
located in Utah.33 These facilities were the only operating uranium mines and mill in the U.S. in 2018, thus no uranium concentrate was produced by conventional underground or open-pit mines during the same year. Another five mines are currently licensed, but idled (see Figures 3 and 4).34
FIGURE 3: U.S. FUEL CYCLE FACILITIES—MINES [In Situ Recovery]
Project name Company name Location [TEXT REDACTED]
Crow Butte Operation ............................................. Cameco .................................................................. Nebraska ...... [TEXT REDACTED]. Lost Creek Project .................................................. Ur-Energy (Lost Creek ISR LLC) .......................... Wyoming ...... [TEXT REDACTED]. Smith Ranch-Highland Operation ........................... Power Resource Inc., dba Cameco Resources .... Wyoming ...... [TEXT REDACTED]. Ross CPP ............................................................... Strata Energy Inc ................................................... Wyoming ...... [TEXT REDACTED]. Nichols Ranch ISR Project ..................................... Energy Fuels Resources Corp. (Uranerz Energy
Corporation).Wyoming ...... [TEXT REDACTED].
Willow Creek Project (Christenson Ranch & Irigaray).
Uranium One USA, Inc .......................................... Wyoming ...... [TEXT REDACTED].
Alta Mesa Project ................................................... Energy Fuels Resources Corp (Mestena Uranium LLC).
Texas ........... [TEXT REDACTED].
Hobson ISR Plant ................................................... South Texas Mining Venture ................................. Texas ........... [TEXT REDACTED]. La Palangana ......................................................... South Texas Mining Venture ................................. Texas ........... [TEXT REDACTED].
VerDate Sep<11>2014 19:47 Jul 30, 2021 Jkt 253001 PO 00000 Frm 00013 Fmt 4701 Sfmt 4703 E:\FR\FM\02AUN2.SGM 02AUN2 EN
02A
U21
.003
</G
PH
>
kham
mon
d on
DS
KJM
1Z7X
2PR
OD
with
NO
TIC
ES
2
Figure 2: Nuclear Fuel Cycle
.....
J t . 1& I . I I Ba&Ewlq/'Cyde
Source: U.S. Department of Commerce, Bureau of Industry and Security
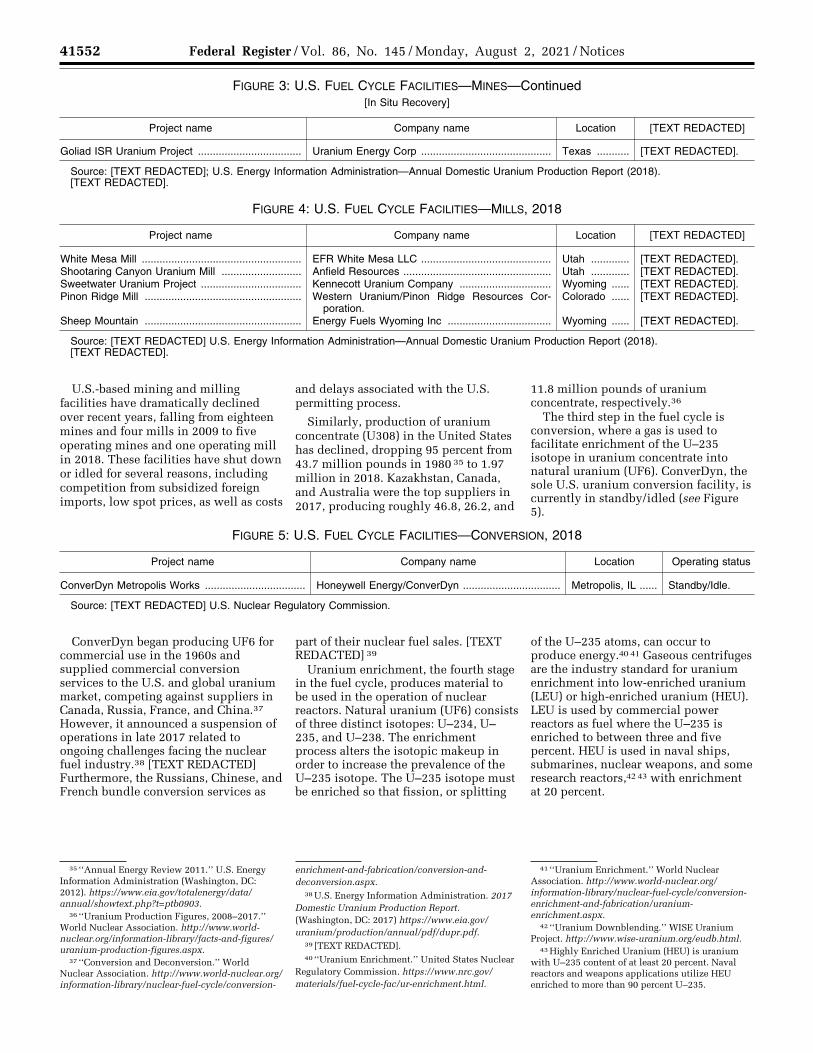
41552 Federal Register / Vol. 86, No. 145 / Monday, August 2, 2021 / Notices
35 ‘‘Annual Energy Review 2011.’’ U.S. Energy Information Administration (Washington, DC: 2012). https://www.eia.gov/totalenergy/data/ annual/showtext.php?t=ptb0903.
36 ‘‘Uranium Production Figures, 2008–2017.’’ World Nuclear Association. http://www.world- nuclear.org/information-library/facts-and-figures/ uranium-production-figures.aspx.
37 ‘‘Conversion and Deconversion.’’ World Nuclear Association. http://www.world-nuclear.org/ information-library/nuclear-fuel-cycle/conversion-
enrichment-and-fabrication/conversion-and- deconversion.aspx.
38 U.S. Energy Information Administration. 2017 Domestic Uranium Production Report. (Washington, DC: 2017) https://www.eia.gov/ uranium/production/annual/pdf/dupr.pdf.
39 [TEXT REDACTED]. 40 ‘‘Uranium Enrichment.’’ United States Nuclear
Regulatory Commission. https://www.nrc.gov/ materials/fuel-cycle-fac/ur-enrichment.html.
41 ‘‘Uranium Enrichment.’’ World Nuclear Association. http://www.world-nuclear.org/ information-library/nuclear-fuel-cycle/conversion- enrichment-and-fabrication/uranium- enrichment.aspx.
42 ‘‘Uranium Downblending.’’ WISE Uranium Project. http://www.wise-uranium.org/eudb.html.
43 Highly Enriched Uranium (HEU) is uranium with U–235 content of at least 20 percent. Naval reactors and weapons applications utilize HEU enriched to more than 90 percent U–235.
FIGURE 3: U.S. FUEL CYCLE FACILITIES—MINES—Continued [In Situ Recovery]
Project name Company name Location [TEXT REDACTED]
Goliad ISR Uranium Project ................................... Uranium Energy Corp ............................................ Texas ........... [TEXT REDACTED].
Source: [TEXT REDACTED]; U.S. Energy Information Administration—Annual Domestic Uranium Production Report (2018). [TEXT REDACTED].
FIGURE 4: U.S. FUEL CYCLE FACILITIES—MILLS, 2018
Project name Company name Location [TEXT REDACTED]
White Mesa Mill ...................................................... EFR White Mesa LLC ............................................ Utah ............. [TEXT REDACTED]. Shootaring Canyon Uranium Mill ........................... Anfield Resources .................................................. Utah ............. [TEXT REDACTED]. Sweetwater Uranium Project .................................. Kennecott Uranium Company ............................... Wyoming ...... [TEXT REDACTED]. Pinon Ridge Mill ..................................................... Western Uranium/Pinon Ridge Resources Cor-
poration.Colorado ...... [TEXT REDACTED].
Sheep Mountain ..................................................... Energy Fuels Wyoming Inc ................................... Wyoming ...... [TEXT REDACTED].
Source: [TEXT REDACTED] U.S. Energy Information Administration—Annual Domestic Uranium Production Report (2018). [TEXT REDACTED].
U.S.-based mining and milling facilities have dramatically declined over recent years, falling from eighteen mines and four mills in 2009 to five operating mines and one operating mill in 2018. These facilities have shut down or idled for several reasons, including competition from subsidized foreign imports, low spot prices, as well as costs
and delays associated with the U.S. permitting process.
Similarly, production of uranium concentrate (U308) in the United States has declined, dropping 95 percent from 43.7 million pounds in 1980 35 to 1.97 million in 2018. Kazakhstan, Canada, and Australia were the top suppliers in 2017, producing roughly 46.8, 26.2, and
11.8 million pounds of uranium concentrate, respectively.36
The third step in the fuel cycle is conversion, where a gas is used to facilitate enrichment of the U–235 isotope in uranium concentrate into natural uranium (UF6). ConverDyn, the sole U.S. uranium conversion facility, is currently in standby/idled (see Figure 5).
FIGURE 5: U.S. FUEL CYCLE FACILITIES—CONVERSION, 2018
Project name Company name Location Operating status
ConverDyn Metropolis Works .................................. Honeywell Energy/ConverDyn ................................. Metropolis, IL ...... Standby/Idle.
Source: [TEXT REDACTED] U.S. Nuclear Regulatory Commission.
ConverDyn began producing UF6 for commercial use in the 1960s and supplied commercial conversion services to the U.S. and global uranium market, competing against suppliers in Canada, Russia, France, and China.37 However, it announced a suspension of operations in late 2017 related to ongoing challenges facing the nuclear fuel industry.38 [TEXT REDACTED] Furthermore, the Russians, Chinese, and French bundle conversion services as
part of their nuclear fuel sales. [TEXT REDACTED] 39
Uranium enrichment, the fourth stage in the fuel cycle, produces material to be used in the operation of nuclear reactors. Natural uranium (UF6) consists of three distinct isotopes: U–234, U– 235, and U–238. The enrichment process alters the isotopic makeup in order to increase the prevalence of the U–235 isotope. The U–235 isotope must be enriched so that fission, or splitting
of the U–235 atoms, can occur to produce energy.40 41 Gaseous centrifuges are the industry standard for uranium enrichment into low-enriched uranium (LEU) or high-enriched uranium (HEU). LEU is used by commercial power reactors as fuel where the U–235 is enriched to between three and five percent. HEU is used in naval ships, submarines, nuclear weapons, and some research reactors,42 43 with enrichment at 20 percent.
VerDate Sep<11>2014 19:47 Jul 30, 2021 Jkt 253001 PO 00000 Frm 00014 Fmt 4701 Sfmt 4703 E:\FR\FM\02AUN2.SGM 02AUN2kham
mon
d on
DS
KJM
1Z7X
2PR
OD
with
NO
TIC
ES
2
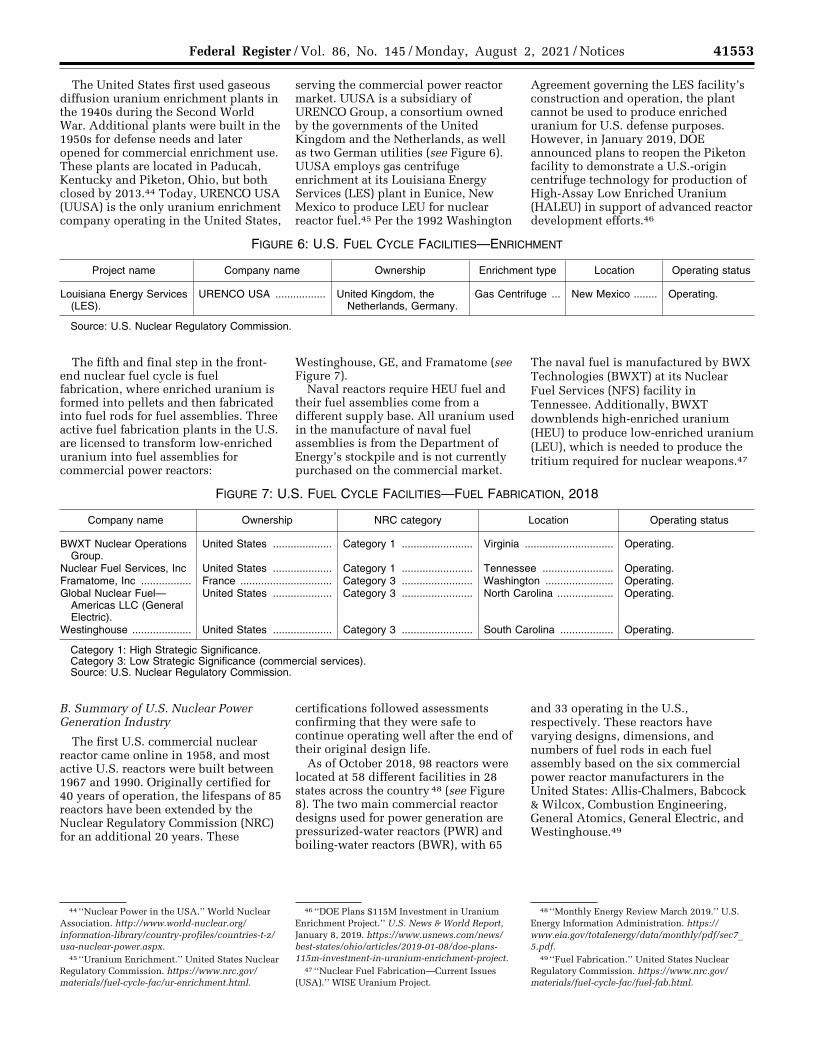
41553 Federal Register / Vol. 86, No. 145 / Monday, August 2, 2021 / Notices
44 ‘‘Nuclear Power in the USA.’’ World Nuclear Association. http://www.world-nuclear.org/ information-library/country-profiles/countries-t-z/ usa-nuclear-power.aspx.
45 ‘‘Uranium Enrichment.’’ United States Nuclear Regulatory Commission. https://www.nrc.gov/ materials/fuel-cycle-fac/ur-enrichment.html.
46 ‘‘DOE Plans $115M Investment in Uranium Enrichment Project.’’ U.S. News & World Report, January 8, 2019. https://www.usnews.com/news/ best-states/ohio/articles/2019-01-08/doe-plans- 115m-investment-in-uranium-enrichment-project.
47 ‘‘Nuclear Fuel Fabrication—Current Issues (USA).’’ WISE Uranium Project.
48 ‘‘Monthly Energy Review March 2019.’’ U.S. Energy Information Administration. https://www.eia.gov/totalenergy/data/monthly/pdf/sec7_5.pdf.
49 ‘‘Fuel Fabrication.’’ United States Nuclear Regulatory Commission. https://www.nrc.gov/ materials/fuel-cycle-fac/fuel-fab.html.
The United States first used gaseous diffusion uranium enrichment plants in the 1940s during the Second World War. Additional plants were built in the 1950s for defense needs and later opened for commercial enrichment use. These plants are located in Paducah, Kentucky and Piketon, Ohio, but both closed by 2013.44 Today, URENCO USA (UUSA) is the only uranium enrichment company operating in the United States,
serving the commercial power reactor market. UUSA is a subsidiary of URENCO Group, a consortium owned by the governments of the United Kingdom and the Netherlands, as well as two German utilities (see Figure 6). UUSA employs gas centrifuge enrichment at its Louisiana Energy Services (LES) plant in Eunice, New Mexico to produce LEU for nuclear reactor fuel.45 Per the 1992 Washington
Agreement governing the LES facility’s construction and operation, the plant cannot be used to produce enriched uranium for U.S. defense purposes. However, in January 2019, DOE announced plans to reopen the Piketon facility to demonstrate a U.S.-origin centrifuge technology for production of High-Assay Low Enriched Uranium (HALEU) in support of advanced reactor development efforts.46
FIGURE 6: U.S. FUEL CYCLE FACILITIES—ENRICHMENT
Project name Company name Ownership Enrichment type Location Operating status
Louisiana Energy Services (LES).
URENCO USA ................. United Kingdom, the Netherlands, Germany.
Gas Centrifuge ... New Mexico ........ Operating.
Source: U.S. Nuclear Regulatory Commission.
The fifth and final step in the front- end nuclear fuel cycle is fuel fabrication, where enriched uranium is formed into pellets and then fabricated into fuel rods for fuel assemblies. Three active fuel fabrication plants in the U.S. are licensed to transform low-enriched uranium into fuel assemblies for commercial power reactors:
Westinghouse, GE, and Framatome (see Figure 7).
Naval reactors require HEU fuel and their fuel assemblies come from a different supply base. All uranium used in the manufacture of naval fuel assemblies is from the Department of Energy’s stockpile and is not currently purchased on the commercial market.
The naval fuel is manufactured by BWX Technologies (BWXT) at its Nuclear Fuel Services (NFS) facility in Tennessee. Additionally, BWXT downblends high-enriched uranium (HEU) to produce low-enriched uranium (LEU), which is needed to produce the tritium required for nuclear weapons.47
FIGURE 7: U.S. FUEL CYCLE FACILITIES—FUEL FABRICATION, 2018
Company name Ownership NRC category Location Operating status
BWXT Nuclear Operations Group.
United States .................... Category 1 ........................ Virginia .............................. Operating.
Nuclear Fuel Services, Inc United States .................... Category 1 ........................ Tennessee ........................ Operating. Framatome, Inc ................. France ............................... Category 3 ........................ Washington ....................... Operating. Global Nuclear Fuel—
Americas LLC (General Electric).
United States .................... Category 3 ........................ North Carolina ................... Operating.
Westinghouse .................... United States .................... Category 3 ........................ South Carolina .................. Operating.
Category 1: High Strategic Significance. Category 3: Low Strategic Significance (commercial services). Source: U.S. Nuclear Regulatory Commission.
B. Summary of U.S. Nuclear Power Generation Industry
The first U.S. commercial nuclear reactor came online in 1958, and most active U.S. reactors were built between 1967 and 1990. Originally certified for 40 years of operation, the lifespans of 85 reactors have been extended by the Nuclear Regulatory Commission (NRC) for an additional 20 years. These
certifications followed assessments confirming that they were safe to continue operating well after the end of their original design life.
As of October 2018, 98 reactors were located at 58 different facilities in 28 states across the country 48 (see Figure 8). The two main commercial reactor designs used for power generation are pressurized-water reactors (PWR) and boiling-water reactors (BWR), with 65
and 33 operating in the U.S., respectively. These reactors have varying designs, dimensions, and numbers of fuel rods in each fuel assembly based on the six commercial power reactor manufacturers in the United States: Allis-Chalmers, Babcock & Wilcox, Combustion Engineering, General Atomics, General Electric, and Westinghouse.49
VerDate Sep<11>2014 19:47 Jul 30, 2021 Jkt 253001 PO 00000 Frm 00015 Fmt 4701 Sfmt 4703 E:\FR\FM\02AUN2.SGM 02AUN2kham
mon
d on
DS
KJM
1Z7X
2PR
OD
with
NO
TIC
ES
2
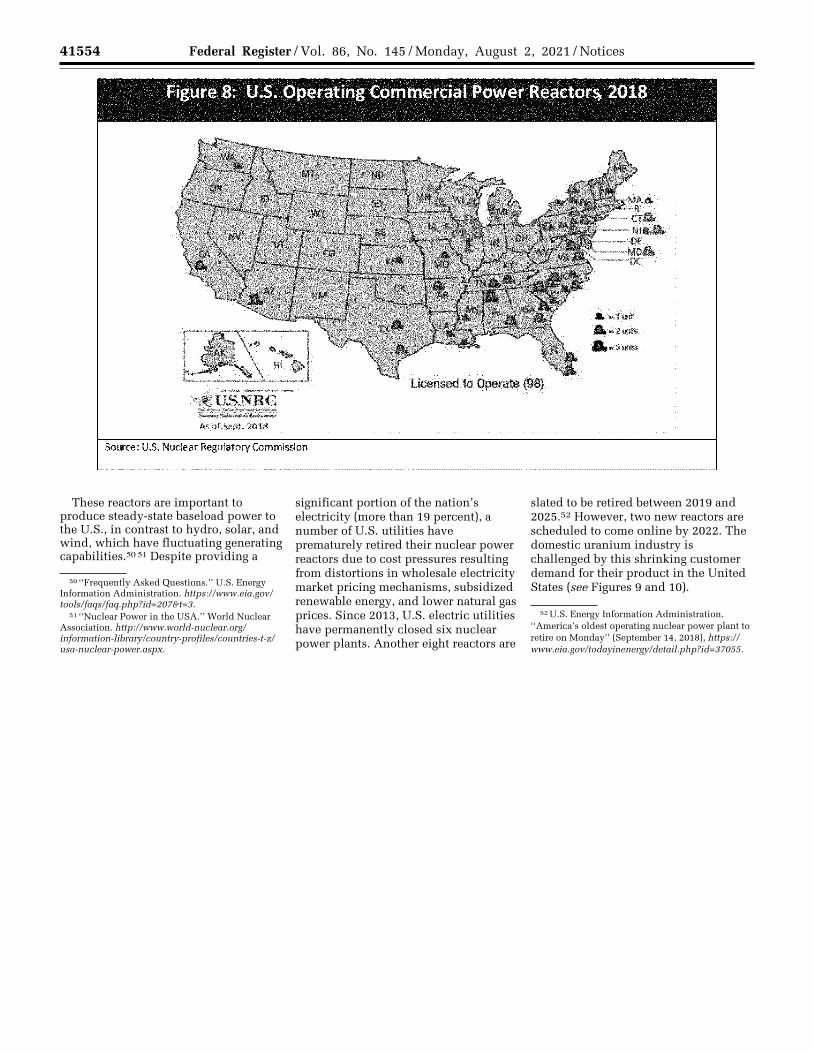
41554 Federal Register / Vol. 86, No. 145 / Monday, August 2, 2021 / Notices
50 ‘‘Frequently Asked Questions.’’ U.S. Energy Information Administration. https://www.eia.gov/ tools/faqs/faq.php?id=207&t=3.
51 ‘‘Nuclear Power in the USA.’’ World Nuclear Association. http://www.world-nuclear.org/ information-library/country-profiles/countries-t-z/ usa-nuclear-power.aspx.
52 U.S. Energy Information Administration. ‘‘America’s oldest operating nuclear power plant to retire on Monday’’ (September 14, 2018), https://www.eia.gov/todayinenergy/detail.php?id=37055.
These reactors are important to produce steady-state baseload power to the U.S., in contrast to hydro, solar, and wind, which have fluctuating generating capabilities.50 51 Despite providing a
significant portion of the nation’s electricity (more than 19 percent), a number of U.S. utilities have prematurely retired their nuclear power reactors due to cost pressures resulting from distortions in wholesale electricity market pricing mechanisms, subsidized renewable energy, and lower natural gas prices. Since 2013, U.S. electric utilities have permanently closed six nuclear power plants. Another eight reactors are
slated to be retired between 2019 and 2025.52 However, two new reactors are scheduled to come online by 2022. The domestic uranium industry is challenged by this shrinking customer demand for their product in the United States (see Figures 9 and 10).
VerDate Sep<11>2014 19:47 Jul 30, 2021 Jkt 253001 PO 00000 Frm 00016 Fmt 4701 Sfmt 4703 E:\FR\FM\02AUN2.SGM 02AUN2 EN
02A
U21
.004
</G
PH
>
kham
mon
d on
DS
KJM
1Z7X
2PR
OD
with
NO
TIC
ES
2
Figure 8: U.S. Operating Commercial Power Reactors, 2018
Source: U.S. Nuclear Regulatory Commission
&•lid
&-2!dl!I &=aid&
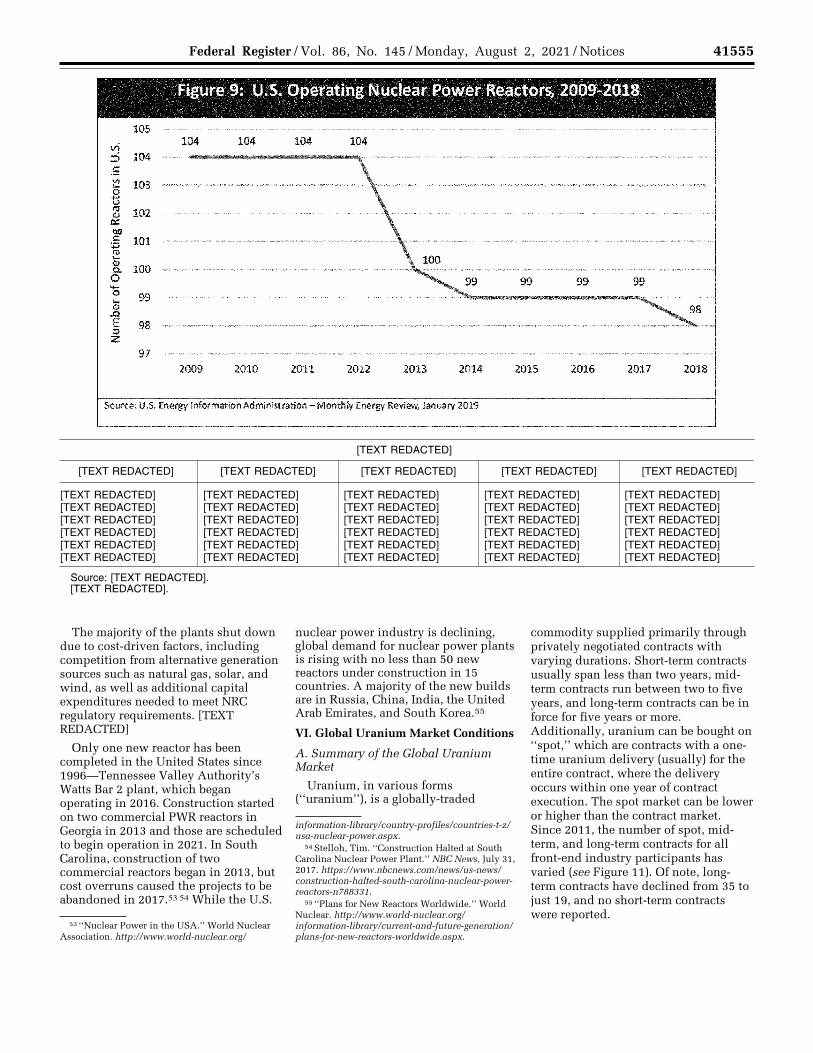
41555 Federal Register / Vol. 86, No. 145 / Monday, August 2, 2021 / Notices
53 ‘‘Nuclear Power in the USA.’’ World Nuclear Association. http://www.world-nuclear.org/
information-library/country-profiles/countries-t-z/ usa-nuclear-power.aspx.
54 Stelloh, Tim. ‘‘Construction Halted at South Carolina Nuclear Power Plant.’’ NBC News, July 31, 2017. https://www.nbcnews.com/news/us-news/ construction-halted-south-carolina-nuclear-power- reactors-n788331.
55 ‘‘Plans for New Reactors Worldwide.’’ World Nuclear. http://www.world-nuclear.org/ information-library/current-and-future-generation/ plans-for-new-reactors-worldwide.aspx.
[TEXT REDACTED]
[TEXT REDACTED] [TEXT REDACTED] [TEXT REDACTED] [TEXT REDACTED] [TEXT REDACTED]
[TEXT REDACTED] [TEXT REDACTED] [TEXT REDACTED] [TEXT REDACTED] [TEXT REDACTED] [TEXT REDACTED] [TEXT REDACTED] [TEXT REDACTED] [TEXT REDACTED] [TEXT REDACTED] [TEXT REDACTED] [TEXT REDACTED] [TEXT REDACTED] [TEXT REDACTED] [TEXT REDACTED] [TEXT REDACTED] [TEXT REDACTED] [TEXT REDACTED] [TEXT REDACTED] [TEXT REDACTED] [TEXT REDACTED] [TEXT REDACTED] [TEXT REDACTED] [TEXT REDACTED] [TEXT REDACTED] [TEXT REDACTED] [TEXT REDACTED] [TEXT REDACTED] [TEXT REDACTED] [TEXT REDACTED]
Source: [TEXT REDACTED]. [TEXT REDACTED].
The majority of the plants shut down due to cost-driven factors, including competition from alternative generation sources such as natural gas, solar, and wind, as well as additional capital expenditures needed to meet NRC regulatory requirements. [TEXT REDACTED]
Only one new reactor has been completed in the United States since 1996—Tennessee Valley Authority’s Watts Bar 2 plant, which began operating in 2016. Construction started on two commercial PWR reactors in Georgia in 2013 and those are scheduled to begin operation in 2021. In South Carolina, construction of two commercial reactors began in 2013, but cost overruns caused the projects to be abandoned in 2017.53 54 While the U.S.
nuclear power industry is declining, global demand for nuclear power plants is rising with no less than 50 new reactors under construction in 15 countries. A majority of the new builds are in Russia, China, India, the United Arab Emirates, and South Korea.55
VI. Global Uranium Market Conditions
A. Summary of the Global Uranium Market
Uranium, in various forms (‘‘uranium’’), is a globally-traded
commodity supplied primarily through privately negotiated contracts with varying durations. Short-term contracts usually span less than two years, mid- term contracts run between two to five years, and long-term contracts can be in force for five years or more. Additionally, uranium can be bought on ‘‘spot,’’ which are contracts with a one- time uranium delivery (usually) for the entire contract, where the delivery occurs within one year of contract execution. The spot market can be lower or higher than the contract market. Since 2011, the number of spot, mid- term, and long-term contracts for all front-end industry participants has varied (see Figure 11). Of note, long- term contracts have declined from 35 to just 19, and no short-term contracts were reported.
VerDate Sep<11>2014 19:47 Jul 30, 2021 Jkt 253001 PO 00000 Frm 00017 Fmt 4701 Sfmt 4703 E:\FR\FM\02AUN2.SGM 02AUN2 EN
02A
U21
.005
</G
PH
>
kham
mon
d on
DS
KJM
1Z7X
2PR
OD
with
NO
TIC
ES
2
105 vi :::> 104 .5 ~
j !' :;::: e & 0 0 ] e :::s z
103
102
101
100
99
97
Figure 9: U.S. Operating Nuclear Power Reactors, 2009-2018
104 104 104 104
2009 .2010 2011 2012 2013 2014 2015 2016 2017
source: U.S. Energy Information Administration-Monthly Energy Review, January 2019
2018
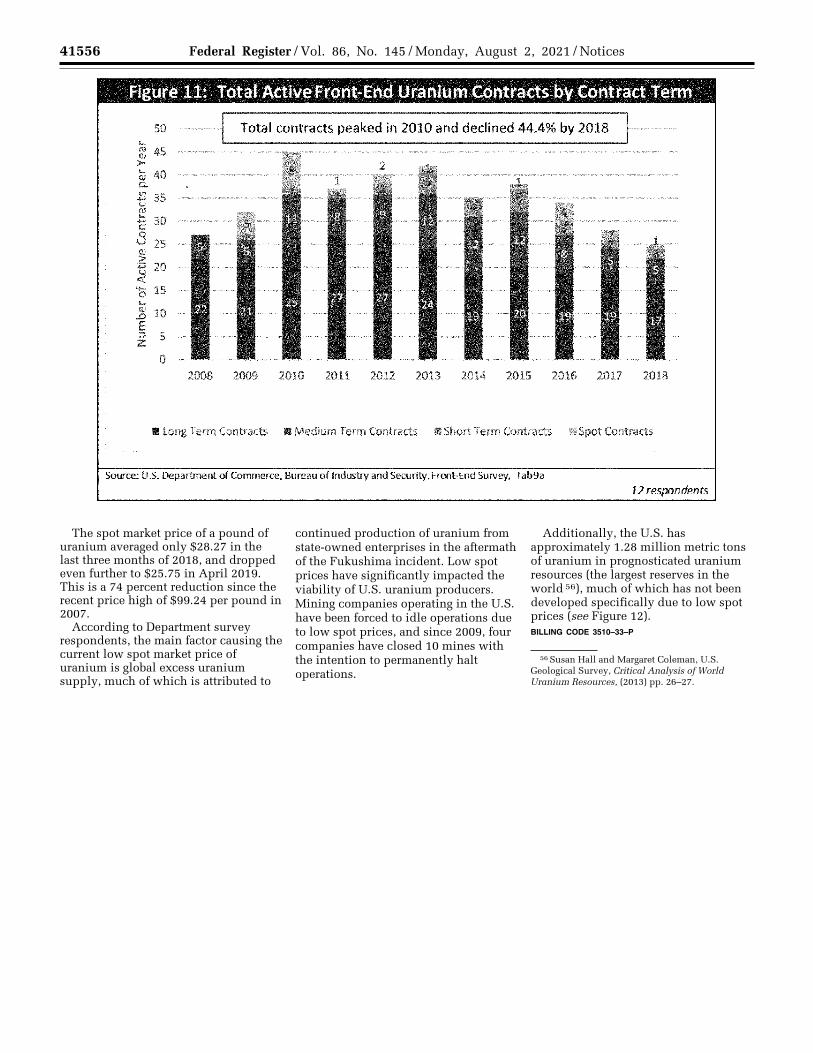
41556 Federal Register / Vol. 86, No. 145 / Monday, August 2, 2021 / Notices
56 Susan Hall and Margaret Coleman, U.S. Geological Survey, Critical Analysis of World Uranium Resources, (2013) pp. 26–27.
The spot market price of a pound of uranium averaged only $28.27 in the last three months of 2018, and dropped even further to $25.75 in April 2019. This is a 74 percent reduction since the recent price high of $99.24 per pound in 2007.
According to Department survey respondents, the main factor causing the current low spot market price of uranium is global excess uranium supply, much of which is attributed to
continued production of uranium from state-owned enterprises in the aftermath of the Fukushima incident. Low spot prices have significantly impacted the viability of U.S. uranium producers. Mining companies operating in the U.S. have been forced to idle operations due to low spot prices, and since 2009, four companies have closed 10 mines with the intention to permanently halt operations.
Additionally, the U.S. has approximately 1.28 million metric tons of uranium in prognosticated uranium resources (the largest reserves in the world 56), much of which has not been developed specifically due to low spot prices (see Figure 12). BILLING CODE 3510–33–P
VerDate Sep<11>2014 19:47 Jul 30, 2021 Jkt 253001 PO 00000 Frm 00018 Fmt 4701 Sfmt 4703 E:\FR\FM\02AUN2.SGM 02AUN2 EN
02A
U21
.006
</G
PH
>
kham
mon
d on
DS
KJM
1Z7X
2PR
OD
with
NO
TIC
ES
2
Figure 11: Total Active Front-End Uranium Contracts by Contract Term
50 ... m 4s ► t 40 C.
~ 35 J:; 30 C: 0 u 25 ~ ~ 20
15 15 ... Ji 10 E ;:I 5 z
0
Total contracts peaked in 2010 and declined 44.4% by 2018
2008 2009 2010 2011 2012 2013 2014 2015 2016 2017 2018
■ long Term Contracts ■ Medium Term Contracts s Short Term Contracts II Spot Contracts
Source: U.S. Department of Commerce, Bureau of lndll'itry and Security, Front-End Survey, Tab9a
12 respondents
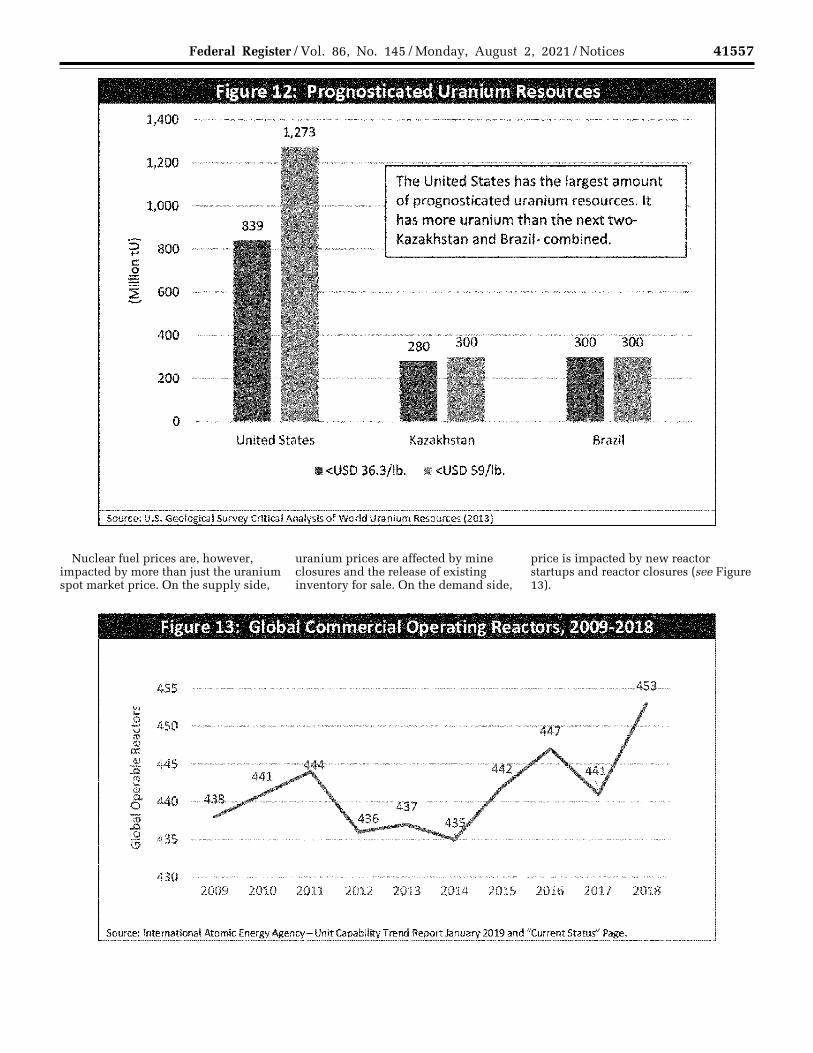
41557 Federal Register / Vol. 86, No. 145 / Monday, August 2, 2021 / Notices
Nuclear fuel prices are, however, impacted by more than just the uranium spot market price. On the supply side,
uranium prices are affected by mine closures and the release of existing inventory for sale. On the demand side,
price is impacted by new reactor startups and reactor closures (see Figure 13).
VerDate Sep<11>2014 19:47 Jul 30, 2021 Jkt 253001 PO 00000 Frm 00019 Fmt 4701 Sfmt 4725 E:\FR\FM\02AUN2.SGM 02AUN2 EN
02A
U21
.007
</G
PH
>E
N02
AU
21.0
08<
/GP
H>
kham
mon
d on
DS
KJM
1Z7X
2PR
OD
with
NO
TIC
ES
2
1,400
1,200
1,000
5' 800 .... C
-~ ~ 600
400
200
0
Figure 12: Prognosticated Uranium Resources -~ ,·--·--·---· --
1,273
United States
The United States has the largest amount of prognosticated uranium resources. It has more uranium than the next twoKazakhstan and Brazil- combined.
Kazakhstan Brazil
11 <USO 36.3/lb. 11 <USO 59/lb.
Source: U.S. Geologica I SUTvey Critical Analysis of World Uranium Resources (2013)
Figure 13: Global Commercial Operating Reactors, 2009-2018
455 ------·-·----- -- ----- ···••·········•··453
"' .... 0
450 ..., '-' m Qi 0::: (I} 445 ::0 m .... Q) Q. 440 0 iij .a .2 435 (.!)
430 2009 2010 2011 2012 2013 2014 2015 2016 2017 2018
Source: lnremational Atomic Energy Agency- Unit Capability Trend Report January 2019 and "Current Status" Page.
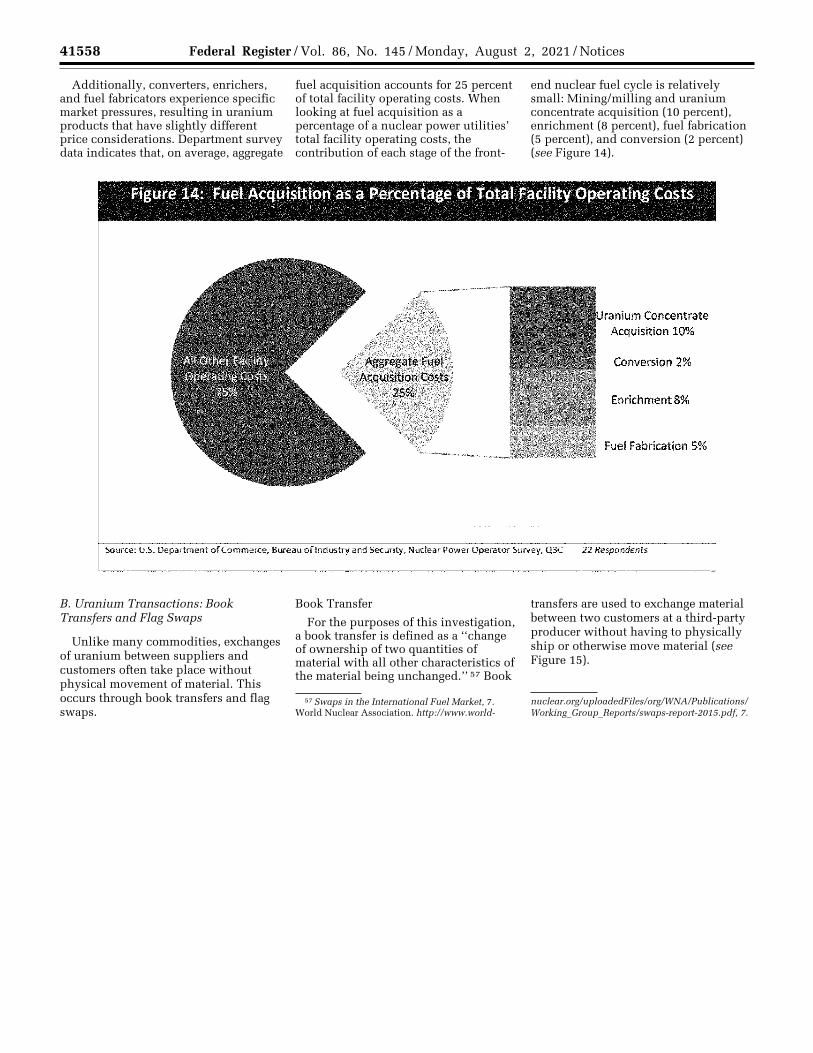
41558 Federal Register / Vol. 86, No. 145 / Monday, August 2, 2021 / Notices
57 Swaps in the International Fuel Market, 7. World Nuclear Association. http://www.world-
nuclear.org/uploadedFiles/org/WNA/Publications/ Working_Group_Reports/swaps-report-2015.pdf, 7.
Additionally, converters, enrichers, and fuel fabricators experience specific market pressures, resulting in uranium products that have slightly different price considerations. Department survey data indicates that, on average, aggregate
fuel acquisition accounts for 25 percent of total facility operating costs. When looking at fuel acquisition as a percentage of a nuclear power utilities’ total facility operating costs, the contribution of each stage of the front-
end nuclear fuel cycle is relatively small: Mining/milling and uranium concentrate acquisition (10 percent), enrichment (8 percent), fuel fabrication (5 percent), and conversion (2 percent) (see Figure 14).
B. Uranium Transactions: Book Transfers and Flag Swaps
Unlike many commodities, exchanges of uranium between suppliers and customers often take place without physical movement of material. This occurs through book transfers and flag swaps.
Book Transfer
For the purposes of this investigation, a book transfer is defined as a ‘‘change of ownership of two quantities of material with all other characteristics of the material being unchanged.’’ 57 Book
transfers are used to exchange material between two customers at a third-party producer without having to physically ship or otherwise move material (see Figure 15).
VerDate Sep<11>2014 19:47 Jul 30, 2021 Jkt 253001 PO 00000 Frm 00020 Fmt 4701 Sfmt 4703 E:\FR\FM\02AUN2.SGM 02AUN2 EN
02A
U21
.009
</G
PH
>
kham
mon
d on
DS
KJM
1Z7X
2PR
OD
with
NO
TIC
ES
2
Figure 14: Fuel Acquisition as a Percentage of Total Facility Operating Costs
ranium Concentrate Acquisition 10%
Conversion 2%
Enrichment 8%
Fuel Fabrication 5%
Source: U.S. Department of Commerce, Bureau oflndustry and Security, Nuclear Power Operator Survey, Q3C 22 Respondents
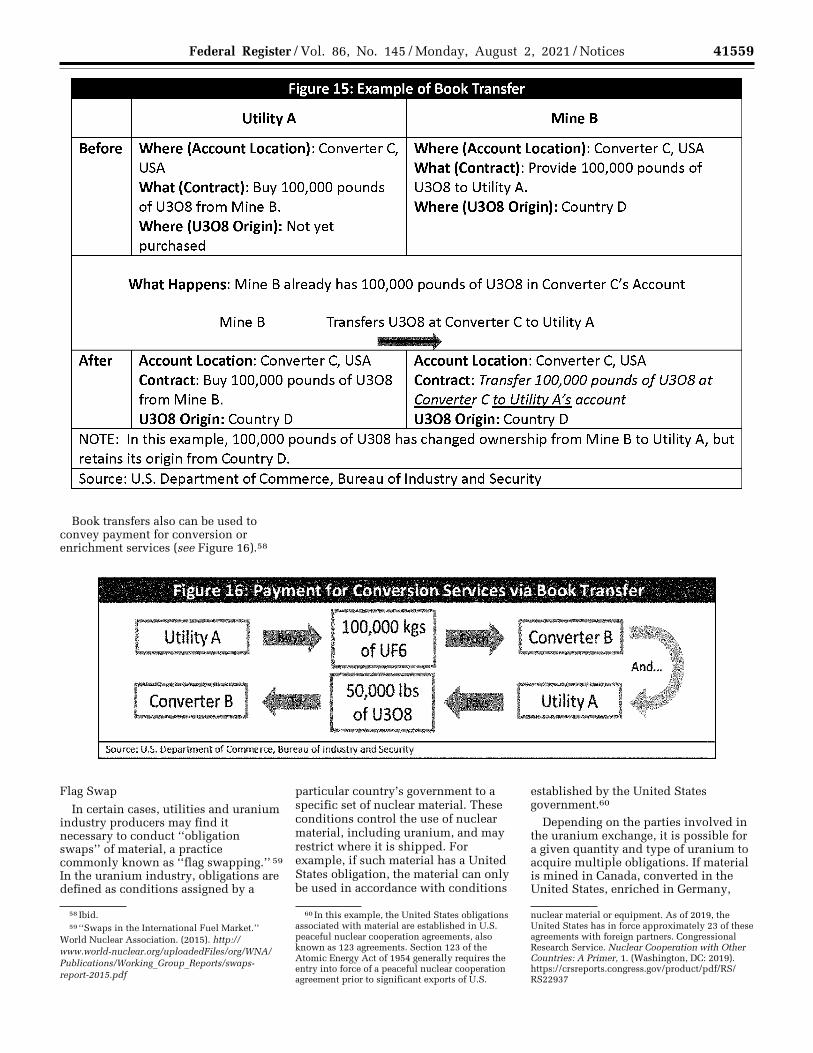
41559 Federal Register / Vol. 86, No. 145 / Monday, August 2, 2021 / Notices
58 Ibid. 59 ‘‘Swaps in the International Fuel Market.’’
World Nuclear Association. (2015). http://www.world-nuclear.org/uploadedFiles/org/WNA/ Publications/Working_Group_Reports/swaps- report-2015.pdf
60 In this example, the United States obligations associated with material are established in U.S. peaceful nuclear cooperation agreements, also known as 123 agreements. Section 123 of the Atomic Energy Act of 1954 generally requires the entry into force of a peaceful nuclear cooperation agreement prior to significant exports of U.S.
nuclear material or equipment. As of 2019, the United States has in force approximately 23 of these agreements with foreign partners. Congressional Research Service. Nuclear Cooperation with Other Countries: A Primer, 1. (Washington, DC: 2019). https://crsreports.congress.gov/product/pdf/RS/ RS22937
Book transfers also can be used to convey payment for conversion or enrichment services (see Figure 16).58
Flag Swap
In certain cases, utilities and uranium industry producers may find it necessary to conduct ‘‘obligation swaps’’ of material, a practice commonly known as ‘‘flag swapping.’’ 59 In the uranium industry, obligations are defined as conditions assigned by a
particular country’s government to a specific set of nuclear material. These conditions control the use of nuclear material, including uranium, and may restrict where it is shipped. For example, if such material has a United States obligation, the material can only be used in accordance with conditions
established by the United States government.60
Depending on the parties involved in the uranium exchange, it is possible for a given quantity and type of uranium to acquire multiple obligations. If material is mined in Canada, converted in the United States, enriched in Germany,
VerDate Sep<11>2014 19:47 Jul 30, 2021 Jkt 253001 PO 00000 Frm 00021 Fmt 4701 Sfmt 4703 E:\FR\FM\02AUN2.SGM 02AUN2 EN
02A
U21
.010
</G
PH
>E
N02
AU
21.0
11<
/GP
H>
kham
mon
d on
DS
KJM
1Z7X
2PR
OD
with
NO
TIC
ES
2
Figure 15: Example of Book Transfer
Utility A Mine B
Before Where (Account Location): Converter C, Where (Account Location): Converter C, USA USA What (Contract): Provide 100,000 pounds of What (Contract): Buy 100,000 pounds U3O8 to Utility A. of U3O8 from Mine B. Where (U3O8 Origin): Country D Where (U3O8 Origin): Not yet purchased
What Happens: Mine B already has 100,000 pounds of U3O8 in Converter C's Account
Mine B Transfers U3O8 at Converter C to Utility A ~
After Account Location: Converter C, USA Account Location: Converter C, USA Contract: Buy 100,000 pounds of U3O8 Contract: Transfer 100,000 pounds of U308 at from Mine B. Converter C to Utility A's account U3O8 Origin: Country D U3O8 Origin: Country D
NOTE: In this example, 100,000 pounds of U308 has changed ownership from Mine B to Utility A, but retains its origin from Country D.
Source: U.S. Department of Commerce, Bureau of Industry and Security
Figure 16: Payment for Conversion Services via Book Transfer
I Utility A , ..... 100,000 kgs .... J Converter B I ofUF6
I I ... 50,000 lbs ..., I Converters Utility A ofU308
Source: U.S. Department of Commerce, Bureau of Industry and Security
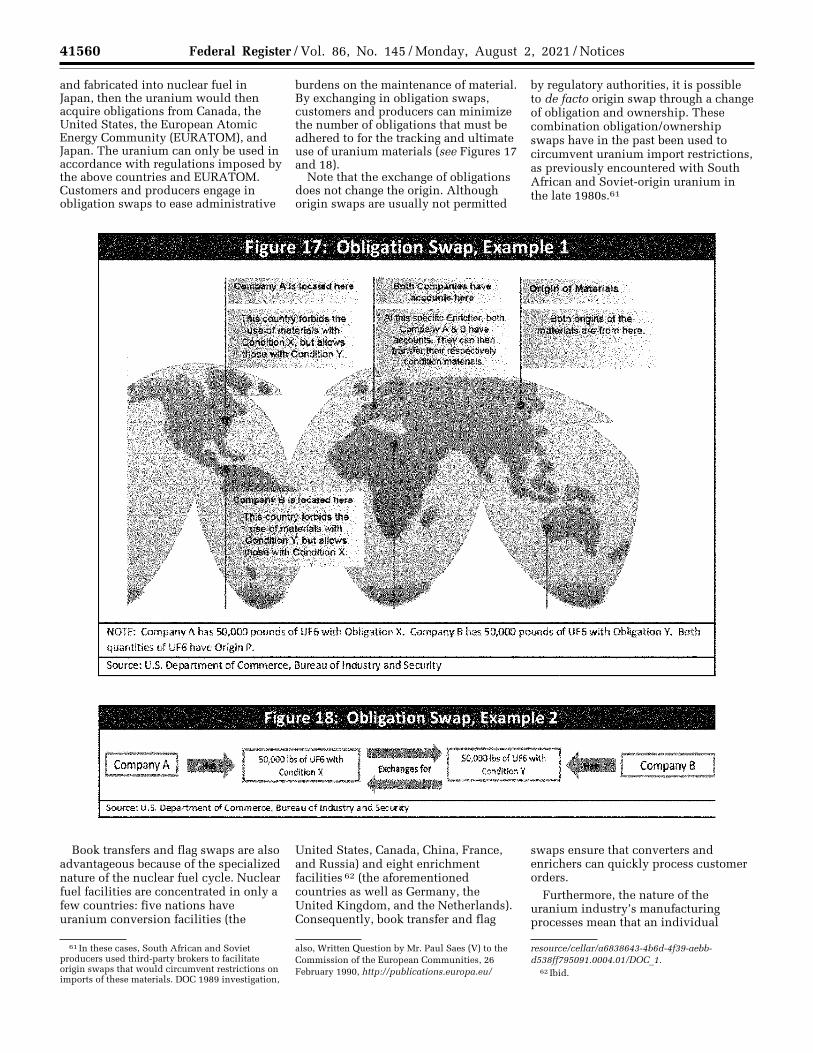
41560 Federal Register / Vol. 86, No. 145 / Monday, August 2, 2021 / Notices
61 In these cases, South African and Soviet producers used third-party brokers to facilitate origin swaps that would circumvent restrictions on imports of these materials. DOC 1989 investigation,
also, Written Question by Mr. Paul Saes (V) to the Commission of the European Communities, 26 February 1990, http://publications.europa.eu/
resource/cellar/a6838643-4b6d-4f39-aebb-d538ff795091.0004.01/DOC_1.
62 Ibid.
and fabricated into nuclear fuel in Japan, then the uranium would then acquire obligations from Canada, the United States, the European Atomic Energy Community (EURATOM), and Japan. The uranium can only be used in accordance with regulations imposed by the above countries and EURATOM. Customers and producers engage in obligation swaps to ease administrative
burdens on the maintenance of material. By exchanging in obligation swaps, customers and producers can minimize the number of obligations that must be adhered to for the tracking and ultimate use of uranium materials (see Figures 17 and 18).
Note that the exchange of obligations does not change the origin. Although origin swaps are usually not permitted
by regulatory authorities, it is possible to de facto origin swap through a change of obligation and ownership. These combination obligation/ownership swaps have in the past been used to circumvent uranium import restrictions, as previously encountered with South African and Soviet-origin uranium in the late 1980s.61
Book transfers and flag swaps are also advantageous because of the specialized nature of the nuclear fuel cycle. Nuclear fuel facilities are concentrated in only a few countries: five nations have uranium conversion facilities (the
United States, Canada, China, France, and Russia) and eight enrichment facilities 62 (the aforementioned countries as well as Germany, the United Kingdom, and the Netherlands). Consequently, book transfer and flag
swaps ensure that converters and enrichers can quickly process customer orders.
Furthermore, the nature of the uranium industry’s manufacturing processes mean that an individual
VerDate Sep<11>2014 19:47 Jul 30, 2021 Jkt 253001 PO 00000 Frm 00022 Fmt 4701 Sfmt 4703 E:\FR\FM\02AUN2.SGM 02AUN2 EN
02A
U21
.012
</G
PH
>E
N02
AU
21.0
13<
/GP
H>
kham
mon
d on
DS
KJM
1Z7X
2PR
OD
with
NO
TIC
ES
2
Figure 17: Obligation Swap, Example 1
NOTE; Company A has 50,000 pounds of UR:i with Obligation X. Company B has 50,000 pounds of UF6 with Obligation Y. Both
quantities of UR:i have Origin P.
Source: U.S. Department of Commerce, Bureau of Industry and Security
Figure 18: Obligation Swap, Example 2
I Company A , .... 50,000 lbs of UF6 with ConditionX -------..J Exchanges for
~ Source: U.S. Department of Commerce, Bureau of Industry and Security
50,000lbs of UF6 with ConditlonY -------~I CompanyB
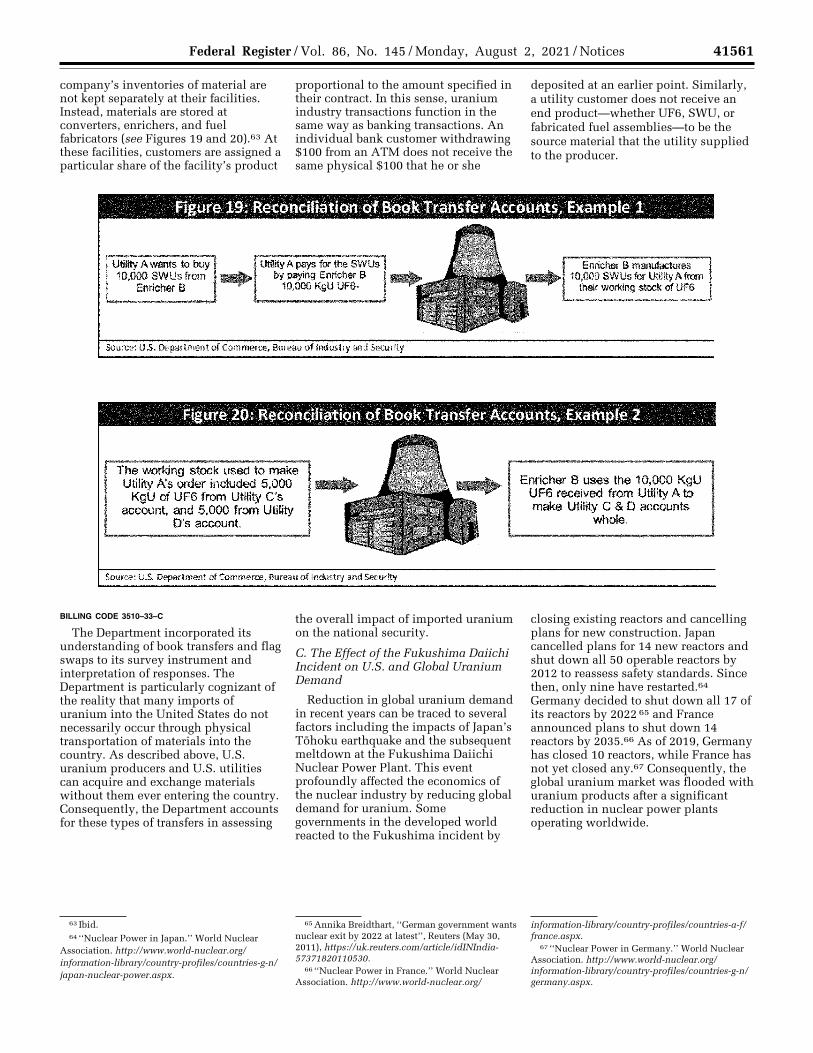
41561 Federal Register / Vol. 86, No. 145 / Monday, August 2, 2021 / Notices
63 Ibid. 64 ‘‘Nuclear Power in Japan.’’ World Nuclear
Association. http://www.world-nuclear.org/ information-library/country-profiles/countries-g-n/ japan-nuclear-power.aspx.
65 Annika Breidthart, ‘‘German government wants nuclear exit by 2022 at latest’’, Reuters (May 30, 2011), https://uk.reuters.com/article/idINIndia- 57371820110530.
66 ‘‘Nuclear Power in France.’’ World Nuclear Association. http://www.world-nuclear.org/
information-library/country-profiles/countries-a-f/ france.aspx.
67 ‘‘Nuclear Power in Germany.’’ World Nuclear Association. http://www.world-nuclear.org/ information-library/country-profiles/countries-g-n/ germany.aspx.
company’s inventories of material are not kept separately at their facilities. Instead, materials are stored at converters, enrichers, and fuel fabricators (see Figures 19 and 20).63 At these facilities, customers are assigned a particular share of the facility’s product
proportional to the amount specified in their contract. In this sense, uranium industry transactions function in the same way as banking transactions. An individual bank customer withdrawing $100 from an ATM does not receive the same physical $100 that he or she
deposited at an earlier point. Similarly, a utility customer does not receive an end product—whether UF6, SWU, or fabricated fuel assemblies—to be the source material that the utility supplied to the producer.
BILLING CODE 3510–33–C
The Department incorporated its understanding of book transfers and flag swaps to its survey instrument and interpretation of responses. The Department is particularly cognizant of the reality that many imports of uranium into the United States do not necessarily occur through physical transportation of materials into the country. As described above, U.S. uranium producers and U.S. utilities can acquire and exchange materials without them ever entering the country. Consequently, the Department accounts for these types of transfers in assessing
the overall impact of imported uranium on the national security.
C. The Effect of the Fukushima Daiichi Incident on U.S. and Global Uranium Demand
Reduction in global uranium demand in recent years can be traced to several factors including the impacts of Japan’s Tohoku earthquake and the subsequent meltdown at the Fukushima Daiichi Nuclear Power Plant. This event profoundly affected the economics of the nuclear industry by reducing global demand for uranium. Some governments in the developed world reacted to the Fukushima incident by
closing existing reactors and cancelling plans for new construction. Japan cancelled plans for 14 new reactors and shut down all 50 operable reactors by 2012 to reassess safety standards. Since then, only nine have restarted.64 Germany decided to shut down all 17 of its reactors by 2022 65 and France announced plans to shut down 14 reactors by 2035.66 As of 2019, Germany has closed 10 reactors, while France has not yet closed any.67 Consequently, the global uranium market was flooded with uranium products after a significant reduction in nuclear power plants operating worldwide.
VerDate Sep<11>2014 19:47 Jul 30, 2021 Jkt 253001 PO 00000 Frm 00023 Fmt 4701 Sfmt 4703 E:\FR\FM\02AUN2.SGM 02AUN2 EN
02A
U21
.014
</G
PH
>
kham
mon
d on
DS
KJM
1Z7X
2PR
OD
with
NO
TIC
ES
2
Figure 19: Reconciliation of Book Transfer Accounts, Example 1
Utifity A wants to buy Utility A pays for lhe SWUs 10,000 SWUsfrom ... by paying Enricher B
Enricher B 10,000 KgU UF6-
source: u .s. Oe-partment of Commerce, Bureau of Industry and Security
Enricher B manufactures 10,000 SWUs for Utility A from
their working stock of UF6
Figure 20: Reconciliation of Book Transfer Accounts, Example 2
The working stock used to make Utility Ns order included 5,000
KgU of UF6 from Utility C's account. and 5,000 from Utility
O's account.
Source: U.S. Department of Commerce, Bureau of Industry and Security
Enricher Buses the 10,000 KgU UF6 received from Utility A to make Utility C & D accounts
whole.
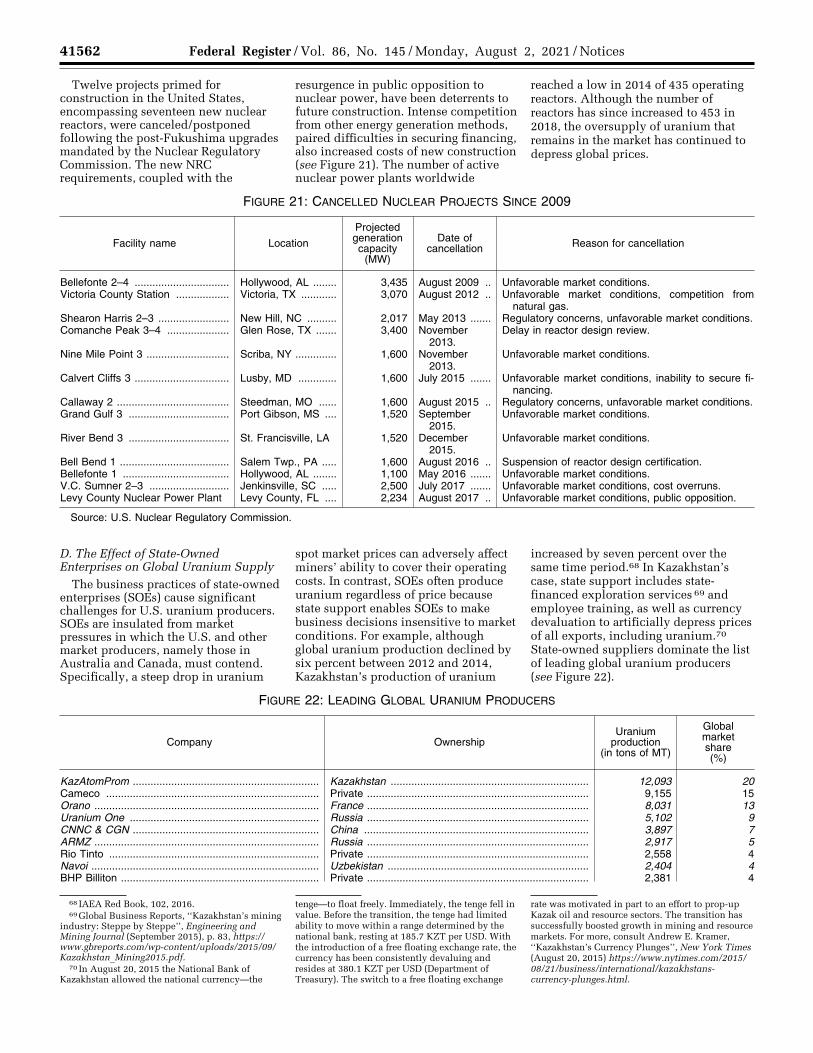
41562 Federal Register / Vol. 86, No. 145 / Monday, August 2, 2021 / Notices
68 IAEA Red Book, 102, 2016. 69 Global Business Reports, ‘‘Kazakhstan’s mining
industry: Steppe by Steppe’’, Engineering and Mining Journal (September 2015), p. 83, https://www.gbreports.com/wp-content/uploads/2015/09/ Kazakhstan_Mining2015.pdf.
70 In August 20, 2015 the National Bank of Kazakhstan allowed the national currency—the
tenge—to float freely. Immediately, the tenge fell in value. Before the transition, the tenge had limited ability to move within a range determined by the national bank, resting at 185.7 KZT per USD. With the introduction of a free floating exchange rate, the currency has been consistently devaluing and resides at 380.1 KZT per USD (Department of Treasury). The switch to a free floating exchange
rate was motivated in part to an effort to prop-up Kazak oil and resource sectors. The transition has successfully boosted growth in mining and resource markets. For more, consult Andrew E. Kramer, ‘‘Kazakhstan’s Currency Plunges’’, New York Times (August 20, 2015) https://www.nytimes.com/2015/ 08/21/business/international/kazakhstans- currency-plunges.html.
Twelve projects primed for construction in the United States, encompassing seventeen new nuclear reactors, were canceled/postponed following the post-Fukushima upgrades mandated by the Nuclear Regulatory Commission. The new NRC requirements, coupled with the
resurgence in public opposition to nuclear power, have been deterrents to future construction. Intense competition from other energy generation methods, paired difficulties in securing financing, also increased costs of new construction (see Figure 21). The number of active nuclear power plants worldwide
reached a low in 2014 of 435 operating reactors. Although the number of reactors has since increased to 453 in 2018, the oversupply of uranium that remains in the market has continued to depress global prices.
FIGURE 21: CANCELLED NUCLEAR PROJECTS SINCE 2009
Facility name Location
Projected generation capacity
(MW)
Date of cancellation Reason for cancellation
Bellefonte 2–4 ................................ Hollywood, AL ........ 3,435 August 2009 .. Unfavorable market conditions. Victoria County Station .................. Victoria, TX ............ 3,070 August 2012 .. Unfavorable market conditions, competition from
natural gas. Shearon Harris 2–3 ........................ New Hill, NC .......... 2,017 May 2013 ....... Regulatory concerns, unfavorable market conditions. Comanche Peak 3–4 ..................... Glen Rose, TX ....... 3,400 November
2013.Delay in reactor design review.
Nine Mile Point 3 ............................ Scriba, NY .............. 1,600 November 2013.
Unfavorable market conditions.
Calvert Cliffs 3 ................................ Lusby, MD ............. 1,600 July 2015 ....... Unfavorable market conditions, inability to secure fi-nancing.
Callaway 2 ...................................... Steedman, MO ...... 1,600 August 2015 .. Regulatory concerns, unfavorable market conditions. Grand Gulf 3 .................................. Port Gibson, MS .... 1,520 September
2015.Unfavorable market conditions.
River Bend 3 .................................. St. Francisville, LA 1,520 December 2015.
Unfavorable market conditions.
Bell Bend 1 ..................................... Salem Twp., PA ..... 1,600 August 2016 .. Suspension of reactor design certification. Bellefonte 1 .................................... Hollywood, AL ........ 1,100 May 2016 ....... Unfavorable market conditions. V.C. Sumner 2–3 ........................... Jenkinsville, SC ..... 2,500 July 2017 ....... Unfavorable market conditions, cost overruns. Levy County Nuclear Power Plant Levy County, FL .... 2,234 August 2017 .. Unfavorable market conditions, public opposition.
Source: U.S. Nuclear Regulatory Commission.
D. The Effect of State-Owned Enterprises on Global Uranium Supply
The business practices of state-owned enterprises (SOEs) cause significant challenges for U.S. uranium producers. SOEs are insulated from market pressures in which the U.S. and other market producers, namely those in Australia and Canada, must contend. Specifically, a steep drop in uranium
spot market prices can adversely affect miners’ ability to cover their operating costs. In contrast, SOEs often produce uranium regardless of price because state support enables SOEs to make business decisions insensitive to market conditions. For example, although global uranium production declined by six percent between 2012 and 2014, Kazakhstan’s production of uranium
increased by seven percent over the same time period.68 In Kazakhstan’s case, state support includes state- financed exploration services 69 and employee training, as well as currency devaluation to artificially depress prices of all exports, including uranium.70 State-owned suppliers dominate the list of leading global uranium producers (see Figure 22).
FIGURE 22: LEADING GLOBAL URANIUM PRODUCERS
Company Ownership Uranium
production (in tons of MT)
Global market share (%)
KazAtomProm ............................................................... Kazakhstan ................................................................... 12,093 20 Cameco ........................................................................ Private ........................................................................... 9,155 15 Orano ............................................................................ France ........................................................................... 8,031 13 Uranium One ................................................................ Russia ........................................................................... 5,102 9 CNNC & CGN ............................................................... China ............................................................................ 3,897 7 ARMZ ............................................................................ Russia ........................................................................... 2,917 5 Rio Tinto ....................................................................... Private ........................................................................... 2,558 4 Navoi ............................................................................. Uzbekistan .................................................................... 2,404 4 BHP Billiton ................................................................... Private ........................................................................... 2,381 4
VerDate Sep<11>2014 19:47 Jul 30, 2021 Jkt 253001 PO 00000 Frm 00024 Fmt 4701 Sfmt 4703 E:\FR\FM\02AUN2.SGM 02AUN2kham
mon
d on
DS
KJM
1Z7X
2PR
OD
with
NO
TIC
ES
2
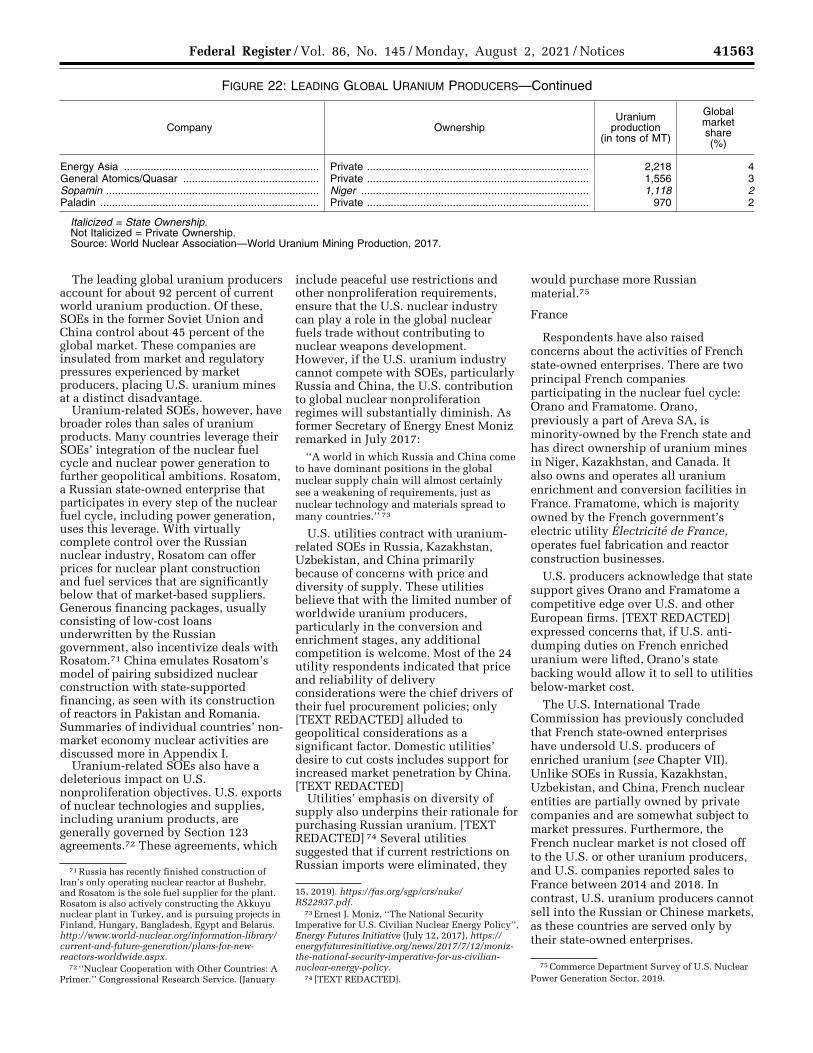
41563 Federal Register / Vol. 86, No. 145 / Monday, August 2, 2021 / Notices
71 Russia has recently finished construction of Iran’s only operating nuclear reactor at Bushehr, and Rosatom is the sole fuel supplier for the plant. Rosatom is also actively constructing the Akkuyu nuclear plant in Turkey, and is pursuing projects in Finland, Hungary, Bangladesh, Egypt and Belarus. http://www.world-nuclear.org/information-library/ current-and-future-generation/plans-for-new- reactors-worldwide.aspx.
72 ‘‘Nuclear Cooperation with Other Countries: A Primer.’’ Congressional Research Service. (January
15, 2019). https://fas.org/sgp/crs/nuke/ RS22937.pdf.
73 Ernest J. Moniz, ‘‘The National Security Imperative for U.S. Civilian Nuclear Energy Policy’’, Energy Futures Initiative (July 12, 2017), https://energyfuturesinitiative.org/news/2017/7/12/moniz- the-national-security-imperative-for-us-civilian- nuclear-energy-policy.
74 [TEXT REDACTED].
75 Commerce Department Survey of U.S. Nuclear Power Generation Sector, 2019.
FIGURE 22: LEADING GLOBAL URANIUM PRODUCERS—Continued
Company Ownership Uranium
production (in tons of MT)
Global market share (%)
Energy Asia .................................................................. Private ........................................................................... 2,218 4 General Atomics/Quasar .............................................. Private ........................................................................... 1,556 3 Sopamin ........................................................................ Niger ............................................................................. 1,118 2 Paladin .......................................................................... Private ........................................................................... 970 2
Italicized = State Ownership. Not Italicized = Private Ownership. Source: World Nuclear Association—World Uranium Mining Production, 2017.
The leading global uranium producers account for about 92 percent of current world uranium production. Of these, SOEs in the former Soviet Union and China control about 45 percent of the global market. These companies are insulated from market and regulatory pressures experienced by market producers, placing U.S. uranium mines at a distinct disadvantage.
Uranium-related SOEs, however, have broader roles than sales of uranium products. Many countries leverage their SOEs’ integration of the nuclear fuel cycle and nuclear power generation to further geopolitical ambitions. Rosatom, a Russian state-owned enterprise that participates in every step of the nuclear fuel cycle, including power generation, uses this leverage. With virtually complete control over the Russian nuclear industry, Rosatom can offer prices for nuclear plant construction and fuel services that are significantly below that of market-based suppliers. Generous financing packages, usually consisting of low-cost loans underwritten by the Russian government, also incentivize deals with Rosatom.71 China emulates Rosatom’s model of pairing subsidized nuclear construction with state-supported financing, as seen with its construction of reactors in Pakistan and Romania. Summaries of individual countries’ non- market economy nuclear activities are discussed more in Appendix I.
Uranium-related SOEs also have a deleterious impact on U.S. nonproliferation objectives. U.S. exports of nuclear technologies and supplies, including uranium products, are generally governed by Section 123 agreements.72 These agreements, which
include peaceful use restrictions and other nonproliferation requirements, ensure that the U.S. nuclear industry can play a role in the global nuclear fuels trade without contributing to nuclear weapons development. However, if the U.S. uranium industry cannot compete with SOEs, particularly Russia and China, the U.S. contribution to global nuclear nonproliferation regimes will substantially diminish. As former Secretary of Energy Enest Moniz remarked in July 2017:
‘‘A world in which Russia and China come to have dominant positions in the global nuclear supply chain will almost certainly see a weakening of requirements, just as nuclear technology and materials spread to many countries.’’ 73
U.S. utilities contract with uranium- related SOEs in Russia, Kazakhstan, Uzbekistan, and China primarily because of concerns with price and diversity of supply. These utilities believe that with the limited number of worldwide uranium producers, particularly in the conversion and enrichment stages, any additional competition is welcome. Most of the 24 utility respondents indicated that price and reliability of delivery considerations were the chief drivers of their fuel procurement policies; only [TEXT REDACTED] alluded to geopolitical considerations as a significant factor. Domestic utilities’ desire to cut costs includes support for increased market penetration by China. [TEXT REDACTED]
Utilities’ emphasis on diversity of supply also underpins their rationale for purchasing Russian uranium. [TEXT REDACTED] 74 Several utilities suggested that if current restrictions on Russian imports were eliminated, they
would purchase more Russian material.75
France
Respondents have also raised concerns about the activities of French state-owned enterprises. There are two principal French companies participating in the nuclear fuel cycle: Orano and Framatome. Orano, previously a part of Areva SA, is minority-owned by the French state and has direct ownership of uranium mines in Niger, Kazakhstan, and Canada. It also owns and operates all uranium enrichment and conversion facilities in France. Framatome, which is majority owned by the French government’s electric utility Electricite de France, operates fuel fabrication and reactor construction businesses.
U.S. producers acknowledge that state support gives Orano and Framatome a competitive edge over U.S. and other European firms. [TEXT REDACTED] expressed concerns that, if U.S. anti- dumping duties on French enriched uranium were lifted, Orano’s state backing would allow it to sell to utilities below-market cost.
The U.S. International Trade Commission has previously concluded that French state-owned enterprises have undersold U.S. producers of enriched uranium (see Chapter VII). Unlike SOEs in Russia, Kazakhstan, Uzbekistan, and China, French nuclear entities are partially owned by private companies and are somewhat subject to market pressures. Furthermore, the French nuclear market is not closed off to the U.S. or other uranium producers, and U.S. companies reported sales to France between 2014 and 2018. In contrast, U.S. uranium producers cannot sell into the Russian or Chinese markets, as these countries are served only by their state-owned enterprises.
VerDate Sep<11>2014 21:46 Jul 30, 2021 Jkt 253001 PO 00000 Frm 00025 Fmt 4701 Sfmt 4703 E:\FR\FM\02AUN2.SGM 02AUN2kham
mon
d on
DS
KJM
1Z7X
2PR
OD
with
NO
TIC
ES
2
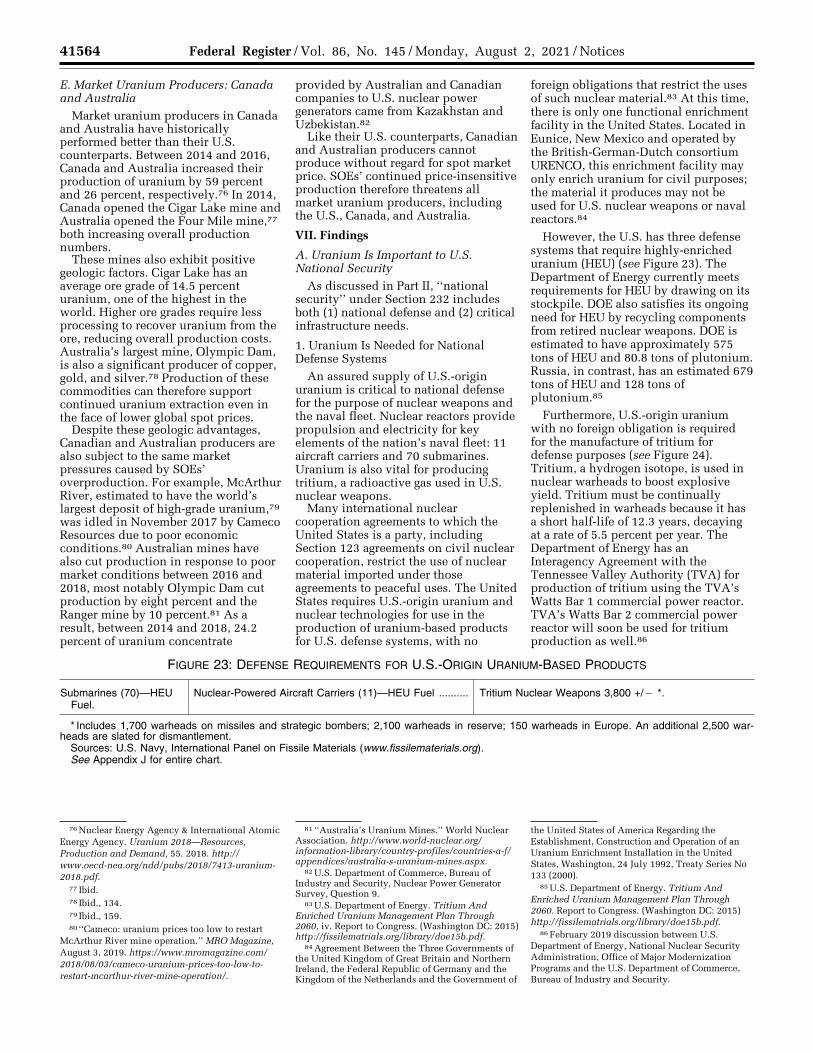
41564 Federal Register / Vol. 86, No. 145 / Monday, August 2, 2021 / Notices
76 Nuclear Energy Agency & International Atomic Energy Agency. Uranium 2018—Resources, Production and Demand, 55. 2018. http://www.oecd-nea.org/ndd/pubs/2018/7413-uranium- 2018.pdf.
77 Ibid. 78 Ibid., 134. 79 Ibid., 159. 80 ‘‘Cameco: uranium prices too low to restart
McArthur River mine operation.’’ MRO Magazine, August 3, 2019. https://www.mromagazine.com/ 2018/08/03/cameco-uranium-prices-too-low-to- restart-mcarthur-river-mine-operation/.
81 ‘‘Australia’s Uranium Mines.’’ World Nuclear Association. http://www.world-nuclear.org/ information-library/country-profiles/countries-a-f/ appendices/australia-s-uranium-mines.aspx.
82 U.S. Department of Commerce, Bureau of Industry and Security, Nuclear Power Generator Survey, Question 9.
83 U.S. Department of Energy. Tritium And Enriched Uranium Management Plan Through 2060, iv. Report to Congress. (Washington DC: 2015) http://fissilematrials.org/library/doe15b.pdf.
84 Agreement Between the Three Governments of the United Kingdom of Great Britain and Northern Ireland, the Federal Republic of Germany and the Kingdom of the Netherlands and the Government of
the United States of America Regarding the Establishment, Construction and Operation of an Uranium Enrichment Installation in the United States, Washington, 24 July 1992, Treaty Series No 133 (2000).
85 U.S. Department of Energy. Tritium And Enriched Uranium Management Plan Through 2060. Report to Congress. (Washington DC: 2015) http://fissilematrials.org/library/doe15b.pdf.
86 February 2019 discussion between U.S. Department of Energy, National Nuclear Security Administration, Office of Major Modernization Programs and the U.S. Department of Commerce, Bureau of Industry and Security.
E. Market Uranium Producers: Canada and Australia
Market uranium producers in Canada and Australia have historically performed better than their U.S. counterparts. Between 2014 and 2016, Canada and Australia increased their production of uranium by 59 percent and 26 percent, respectively.76 In 2014, Canada opened the Cigar Lake mine and Australia opened the Four Mile mine,77 both increasing overall production numbers.
These mines also exhibit positive geologic factors. Cigar Lake has an average ore grade of 14.5 percent uranium, one of the highest in the world. Higher ore grades require less processing to recover uranium from the ore, reducing overall production costs. Australia’s largest mine, Olympic Dam, is also a significant producer of copper, gold, and silver.78 Production of these commodities can therefore support continued uranium extraction even in the face of lower global spot prices.
Despite these geologic advantages, Canadian and Australian producers are also subject to the same market pressures caused by SOEs’ overproduction. For example, McArthur River, estimated to have the world’s largest deposit of high-grade uranium,79 was idled in November 2017 by Cameco Resources due to poor economic conditions.80 Australian mines have also cut production in response to poor market conditions between 2016 and 2018, most notably Olympic Dam cut production by eight percent and the Ranger mine by 10 percent.81 As a result, between 2014 and 2018, 24.2 percent of uranium concentrate
provided by Australian and Canadian companies to U.S. nuclear power generators came from Kazakhstan and Uzbekistan.82
Like their U.S. counterparts, Canadian and Australian producers cannot produce without regard for spot market price. SOEs’ continued price-insensitive production therefore threatens all market uranium producers, including the U.S., Canada, and Australia.
VII. Findings
A. Uranium Is Important to U.S. National Security
As discussed in Part II, ‘‘national security’’ under Section 232 includes both (1) national defense and (2) critical infrastructure needs.
1. Uranium Is Needed for National Defense Systems
An assured supply of U.S.-origin uranium is critical to national defense for the purpose of nuclear weapons and the naval fleet. Nuclear reactors provide propulsion and electricity for key elements of the nation’s naval fleet: 11 aircraft carriers and 70 submarines. Uranium is also vital for producing tritium, a radioactive gas used in U.S. nuclear weapons.
Many international nuclear cooperation agreements to which the United States is a party, including Section 123 agreements on civil nuclear cooperation, restrict the use of nuclear material imported under those agreements to peaceful uses. The United States requires U.S.-origin uranium and nuclear technologies for use in the production of uranium-based products for U.S. defense systems, with no
foreign obligations that restrict the uses of such nuclear material.83 At this time, there is only one functional enrichment facility in the United States. Located in Eunice, New Mexico and operated by the British-German-Dutch consortium URENCO, this enrichment facility may only enrich uranium for civil purposes; the material it produces may not be used for U.S. nuclear weapons or naval reactors.84
However, the U.S. has three defense systems that require highly-enriched uranium (HEU) (see Figure 23). The Department of Energy currently meets requirements for HEU by drawing on its stockpile. DOE also satisfies its ongoing need for HEU by recycling components from retired nuclear weapons. DOE is estimated to have approximately 575 tons of HEU and 80.8 tons of plutonium. Russia, in contrast, has an estimated 679 tons of HEU and 128 tons of plutonium.85
Furthermore, U.S.-origin uranium with no foreign obligation is required for the manufacture of tritium for defense purposes (see Figure 24). Tritium, a hydrogen isotope, is used in nuclear warheads to boost explosive yield. Tritium must be continually replenished in warheads because it has a short half-life of 12.3 years, decaying at a rate of 5.5 percent per year. The Department of Energy has an Interagency Agreement with the Tennessee Valley Authority (TVA) for production of tritium using the TVA’s Watts Bar 1 commercial power reactor. TVA’s Watts Bar 2 commercial power reactor will soon be used for tritium production as well.86
FIGURE 23: DEFENSE REQUIREMENTS FOR U.S.-ORIGIN URANIUM-BASED PRODUCTS
Submarines (70)—HEU Fuel.
Nuclear-Powered Aircraft Carriers (11)—HEU Fuel .......... Tritium Nuclear Weapons 3,800 +/¥ *.
* Includes 1,700 warheads on missiles and strategic bombers; 2,100 warheads in reserve; 150 warheads in Europe. An additional 2,500 war-heads are slated for dismantlement.
Sources: U.S. Navy, International Panel on Fissile Materials (www.fissilematerials.org). See Appendix J for entire chart.
VerDate Sep<11>2014 19:47 Jul 30, 2021 Jkt 253001 PO 00000 Frm 00026 Fmt 4701 Sfmt 4703 E:\FR\FM\02AUN2.SGM 02AUN2kham
mon
d on
DS
KJM
1Z7X
2PR
OD
with
NO
TIC
ES
2
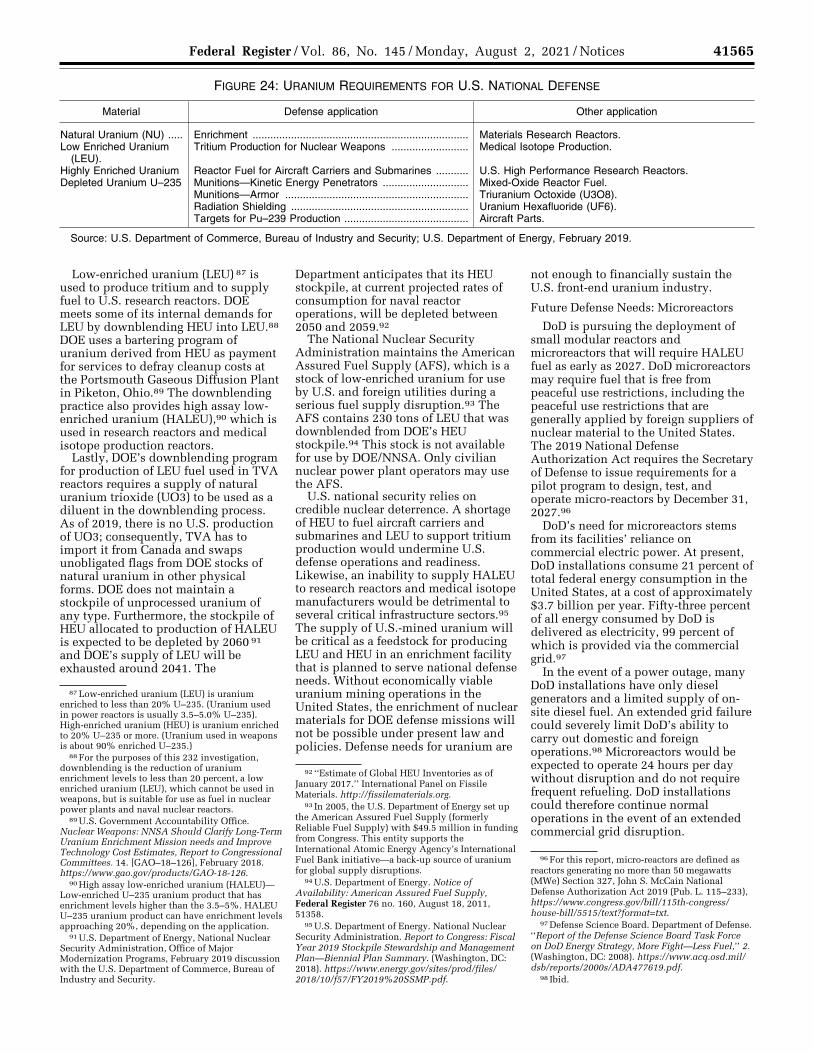
41565 Federal Register / Vol. 86, No. 145 / Monday, August 2, 2021 / Notices
87 Low-enriched uranium (LEU) is uranium enriched to less than 20% U–235. (Uranium used in power reactors is usually 3.5–5.0% U–235). High-enriched uranium (HEU) is uranium enriched to 20% U–235 or more. (Uranium used in weapons is about 90% enriched U–235.)
88 For the purposes of this 232 investigation, downblending is the reduction of uranium enrichment levels to less than 20 percent, a low enriched uranium (LEU), which cannot be used in weapons, but is suitable for use as fuel in nuclear power plants and naval nuclear reactors.
89 U.S. Government Accountability Office. Nuclear Weapons: NNSA Should Clarify Long-Term Uranium Enrichment Mission needs and Improve Technology Cost Estimates, Report to Congressional Committees. 14. [GAO–18–126], February 2018. https://www.gao.gov/products/GAO-18-126.
90 High assay low-enriched uranium (HALEU)— Low-enriched U–235 uranium product that has enrichment levels higher than the 3.5–5%. HALEU U–235 uranium product can have enrichment levels approaching 20%, depending on the application.
91 U.S. Department of Energy, National Nuclear Security Administration, Office of Major Modernization Programs, February 2019 discussion with the U.S. Department of Commerce, Bureau of Industry and Security.
92 ‘‘Estimate of Global HEU Inventories as of January 2017.’’ International Panel on Fissile Materials. http://fissilematerials.org.
93 In 2005, the U.S. Department of Energy set up the American Assured Fuel Supply (formerly Reliable Fuel Supply) with $49.5 million in funding from Congress. This entity supports the International Atomic Energy Agency’s International Fuel Bank initiative—a back-up source of uranium for global supply disruptions.
94 U.S. Department of Energy. Notice of Availability: American Assured Fuel Supply, Federal Register 76 no. 160, August 18, 2011, 51358.
95 U.S. Department of Energy. National Nuclear Security Administration. Report to Congress: Fiscal Year 2019 Stockpile Stewardship and Management Plan—Biennial Plan Summary. (Washington, DC: 2018). https://www.energy.gov/sites/prod/files/ 2018/10/f57/FY2019%20SSMP.pdf.
96 For this report, micro-reactors are defined as reactors generating no more than 50 megawatts (MWe) Section 327, John S. McCain National Defense Authorization Act 2019 (Pub. L. 115–233), https://www.congress.gov/bill/115th-congress/ house-bill/5515/text?format=txt.
97 Defense Science Board. Department of Defense. ‘‘Report of the Defense Science Board Task Force on DoD Energy Strategy, More Fight—Less Fuel,’’ 2. (Washington, DC: 2008). https://www.acq.osd.mil/ dsb/reports/2000s/ADA477619.pdf.
98 Ibid.
FIGURE 24: URANIUM REQUIREMENTS FOR U.S. NATIONAL DEFENSE
Material Defense application Other application
Natural Uranium (NU) ..... Enrichment ......................................................................... Materials Research Reactors. Low Enriched Uranium
(LEU).Tritium Production for Nuclear Weapons .......................... Medical Isotope Production.
Highly Enriched Uranium Reactor Fuel for Aircraft Carriers and Submarines ........... U.S. High Performance Research Reactors. Depleted Uranium U–235 Munitions—Kinetic Energy Penetrators ............................. Mixed-Oxide Reactor Fuel.
Munitions—Armor .............................................................. Triuranium Octoxide (U3O8). Radiation Shielding ............................................................ Uranium Hexafluoride (UF6). Targets for Pu–239 Production .......................................... Aircraft Parts.
Source: U.S. Department of Commerce, Bureau of Industry and Security; U.S. Department of Energy, February 2019.
Low-enriched uranium (LEU) 87 is used to produce tritium and to supply fuel to U.S. research reactors. DOE meets some of its internal demands for LEU by downblending HEU into LEU.88 DOE uses a bartering program of uranium derived from HEU as payment for services to defray cleanup costs at the Portsmouth Gaseous Diffusion Plant in Piketon, Ohio.89 The downblending practice also provides high assay low- enriched uranium (HALEU),90 which is used in research reactors and medical isotope production reactors.
Lastly, DOE’s downblending program for production of LEU fuel used in TVA reactors requires a supply of natural uranium trioxide (UO3) to be used as a diluent in the downblending process. As of 2019, there is no U.S. production of UO3; consequently, TVA has to import it from Canada and swaps unobligated flags from DOE stocks of natural uranium in other physical forms. DOE does not maintain a stockpile of unprocessed uranium of any type. Furthermore, the stockpile of HEU allocated to production of HALEU is expected to be depleted by 2060 91 and DOE’s supply of LEU will be exhausted around 2041. The
Department anticipates that its HEU stockpile, at current projected rates of consumption for naval reactor operations, will be depleted between 2050 and 2059.92
The National Nuclear Security Administration maintains the American Assured Fuel Supply (AFS), which is a stock of low-enriched uranium for use by U.S. and foreign utilities during a serious fuel supply disruption.93 The AFS contains 230 tons of LEU that was downblended from DOE’s HEU stockpile.94 This stock is not available for use by DOE/NNSA. Only civilian nuclear power plant operators may use the AFS.
U.S. national security relies on credible nuclear deterrence. A shortage of HEU to fuel aircraft carriers and submarines and LEU to support tritium production would undermine U.S. defense operations and readiness. Likewise, an inability to supply HALEU to research reactors and medical isotope manufacturers would be detrimental to several critical infrastructure sectors.95 The supply of U.S.-mined uranium will be critical as a feedstock for producing LEU and HEU in an enrichment facility that is planned to serve national defense needs. Without economically viable uranium mining operations in the United States, the enrichment of nuclear materials for DOE defense missions will not be possible under present law and policies. Defense needs for uranium are
not enough to financially sustain the U.S. front-end uranium industry.
Future Defense Needs: Microreactors
DoD is pursuing the deployment of small modular reactors and microreactors that will require HALEU fuel as early as 2027. DoD microreactors may require fuel that is free from peaceful use restrictions, including the peaceful use restrictions that are generally applied by foreign suppliers of nuclear material to the United States. The 2019 National Defense Authorization Act requires the Secretary of Defense to issue requirements for a pilot program to design, test, and operate micro-reactors by December 31, 2027.96
DoD’s need for microreactors stems from its facilities’ reliance on commercial electric power. At present, DoD installations consume 21 percent of total federal energy consumption in the United States, at a cost of approximately $3.7 billion per year. Fifty-three percent of all energy consumed by DoD is delivered as electricity, 99 percent of which is provided via the commercial grid.97
In the event of a power outage, many DoD installations have only diesel generators and a limited supply of on- site diesel fuel. An extended grid failure could severely limit DoD’s ability to carry out domestic and foreign operations.98 Microreactors would be expected to operate 24 hours per day without disruption and do not require frequent refueling. DoD installations could therefore continue normal operations in the event of an extended commercial grid disruption.
VerDate Sep<11>2014 19:47 Jul 30, 2021 Jkt 253001 PO 00000 Frm 00027 Fmt 4701 Sfmt 4703 E:\FR\FM\02AUN2.SGM 02AUN2kham
mon
d on
DS
KJM
1Z7X
2PR
OD
with
NO
TIC
ES
2
41566 Federal Register / Vol. 86, No. 145 / Monday, August 2, 2021 / Notices
99 Roadmap for the Deployment of Micro-Reactors for U.S. Department of Defense Domestic Installations.’’ Nuclear Energy Institute. October 4, 2018. https://www.nei.org/CorporateSite/media/ filefolder/resources/reports-and-briefs/Road-map- micro-reactors-department-defense-201810.pdf.
100 ‘‘Report to Congress on the Annual Long- Range Plan for Construction of Naval Vessels for Fiscal Year 2020.’’ Office of the Chief of Naval
Operations. March 2019. https://www.secnav.navy.mil/fmc/fmb/Documents/20pres/ PB20%2030-year%20Shipbuilding%20Plan%20Final.pdf.
101 S9G Nuclear Reactors: http://www.world- nuclear.org/information-library/non-power-nuclear- applications/transport/nuclear-powered-ships.aspx.
102 U.S. White House. Office of the Press Secretary. Critical Infrastructure Security and
Resilience. Presidential Policy Directive 21. (Washington, DC: 2013) https://obamawhitehouse.archives.gov/the-press-office/ 2013/02/12/presidential-policy-directive-critical- infrastructure-security-and-resil.
103 Ibid. 104 Ibid.
DoD aims to deploy microreactors in 2027, or shortly thereafter. This timeline assumes that there are no major technical hurdles to overcome. In addition, there are environmental and reactor siting reviews to address. Should microreactors become viable on a commercial scale, large-scale adoption of microreactors will require significant amounts of HALEU. DoD currently can only supply its HALEU needs through DOE’s downblending of highly-enriched uranium, the supply of which is limited.99 Future deployment of micro- reactors for defense purposes will increase national defense requirements for uranium and emphasizes the need for a viable U.S. commercial uranium industry.
A healthy U.S. commercial uranium industry is essential for defense needs. As DoD does not anticipate requiring newly-mined uranium for some years, it is impractical to suggest that a privately- owned mine could afford to operate on standby awaiting future DoD purchases. DoD analysts have noted that it ‘‘can be difficult to reconstitute a material capability if all expertise and market share is lost,’’ as most recently seen with U.S. rare earth mineral producers. U.S. uranium producers must be able to attract sufficient commercial (i.e. nuclear power generator) business in the present market to ensure their
availability for defense requirements in the future.
Future Defense Needs: Proposed Nuclear Submarine Production
The Department of the Navy recently submitted its Fiscal Year 2020 President’s Budget, recommending the construction of 55 new battle force ships over the next five years.100 Fourteen of these are nuclear-powered: Eleven Virginia-class submarines, two Columbia-class submarines, and one Gerald R. Ford-class aircraft carrier.
The Virginia-class and Columbia-class submarines both house reactors which contain enough fuel to last the life of the ship, roughly 33 and 40 years respectively, unlike previous models which required refueling and overhaul.101 The Ford-class aircraft carrier requires refueling, but at a significantly lower rate than the Nimitz- class aircraft carriers it will replace. DOE’s current projection of HEU stockpile consumption for naval reactors does not take into account the addition of these 14 new nuclear- powered vessels. If these vessels are built, the total naval demand for HEU fuel will increase beyond what NNSA has anticipated, thus accelerating the date by which the HEU stockpile will be depleted.
The Role of National Security in Nuclear Regulation
Since Congress passed the Atomic Energy Act in 1946, all legislation governing the nation’s uranium and nuclear power generation industries has been written with an emphasis on national security functions. As envisioned by Congress, regulation of the U.S. uranium and nuclear power generation industries is to be conducted in support of national security objectives. Consequently, Congress has empowered federal agencies to intervene in support of continued domestic U.S. uranium production capacity on several occasions. A brief history of this legislation can be found in Appendix H.
2. Uranium Is Required for Critical Infrastructure
Uranium is also required to satisfy requirements associated with the 16 critical infrastructure sectors identified by the U.S. Government in the 2013 Presidential Policy Directive 21 (PPD– 21) 102 (see Figure 25). Critical infrastructure, as defined by PPD–21, provides the ‘‘essential services that underpin American society’’ and ‘‘are vital to public confidence and the Nation’s safety, prosperity, and well- being.’’ 103
FIGURE 25: CRITICAL INFRASTRUCTURE SECTORS
Chemical Commercial facilities Communications
Critical Manufacturing ..................... Dams ...................................................................................................... Defense Industrial Base. Emergency Services ....................... Energy (Including Electric Power Grid) ................................................. Financial Services. Food and Agriculture ....................... Government Facilities ............................................................................ Healthcare and Public Health. Information Technology ................... Nuclear Reactors, Materials, and Waste ............................................... Transportation Systems. Water and Wastewater Systems .... ................................................................................................................
Source: PPD–21; Department of Homeland Security.
U.S. nuclear power generators are specifically included in the Nuclear Reactors, Materials, and Waste sector. Additionally, as U.S. nuclear power generators are integral to the nation’s commercial electric grid, they are also part of the Energy sector. PPD–21 specifically notes that the Energy sector supports all other sectors because of its ‘‘enabling function.’’ 104 Consequently, as all critical infrastructure sectors are dependent on reliable supplies of electricity, 19 percent of which is
provided by the nation’s 98 nuclear reactors. Thus, uranium is needed to support all U.S. critical infrastructure sectors.
Changing Electricity Generation Markets Affect U.S. Nuclear Generators
One of the primary challenges to the viability of the U.S. uranium industry is the closure of U.S. nuclear power plants. The front-end U.S. uranium industry relies on nuclear power plant operators for approximately 98 percent
of its business. Consequently, the uranium industry cannot survive without a healthy U.S. nuclear power generation sector. Between January 2013 and September 2018, U.S. utilities retired seven reactors at six nuclear power facilities—a loss of more than 5,000 megawatts (MW) of generation capacity. Another 12 reactors with a combined generation capacity of 11.7
VerDate Sep<11>2014 19:47 Jul 30, 2021 Jkt 253001 PO 00000 Frm 00028 Fmt 4701 Sfmt 4703 E:\FR\FM\02AUN2.SGM 02AUN2kham
mon
d on
DS
KJM
1Z7X
2PR
OD
with
NO
TIC
ES
2
41567 Federal Register / Vol. 86, No. 145 / Monday, August 2, 2021 / Notices
105 ‘‘America’s oldest operating nuclear power plant to retire on Monday.’’ U.S. Energy Information Administration. September 14, 2018. https://www.eia.gov/todayinenergy/detail.php?id=37055.
106 ‘‘Advancing Past ‘‘Baseload’’ to a Flexible Grid- How Grid Planners and Power Markets Are Better Defining System Needs to Achieve a Cost- Effective and Reliable Supply Mix,’’ 1. The Brattle Group. June 26, 2017. http://files.brattle.com/ system/publications/pdfs/000/005/456/original/ advancing_past_baseload_to_a_flexible_grid.pdf?1498246224.
107 Roughly defined, baseload generation capacity refers to generation capacity that can provide ‘‘relatively low-cost electricity production to meet around-the-clock electricity loads’’. Ibid., 5.
108 The Federal Energy Regulatory Commission (FERC or the Commission) has recognized that there are deficiencies in the way the regulated wholesale power markets price power (‘‘price formation,’’ i.e., energy, capacity, and ancillary services) and has developed an extensive record on price formation in the Commission-approved ISOs and RTOs.
109 ‘‘Ensuring Resilient and Efficient Electricity Generation: The Value of the current diverse US power supply portfolio.’’ IHS Markit. April 2018. [hereinafter IHS Ensuring Resilient and Effective Electricity Generation].
110 FERC acknowledges that that there are deficiencies in the way the regulated wholesale power markets price power (‘‘price formation,’’ i.e., energy, capacity, and ancillary services) and has
developed an extensive record on price formation in the Commission-approved ISOs and RTOs. FERC ‘‘Grid Resilience in Regional Transmission Organizations and Independent System Operators,’’ Docket No. AD18–7–000 (January 2018)
111 ‘‘Long Term Reliability Assessment,’’ 12. North American Reliability Electric Reliability Corporation. December 2018. https://www.nerc.com/pa/RAPA/ra/ Reliability%20Assessments%20DL/NERC_LTRA_2018_12202018.pdf.
112 In 1990, the compound annual growth rate in demand for both summer and winter exceeded 2%. Ibid.
gigawatts (GW) are scheduled to close within the next seven years.105
A majority of the current nuclear fleet was constructed in the 1970s and 1980s when large-scale bulk power generators, including nuclear plants, were considered the most cost-effective means of providing reliable electricity. Although these plants required significant capital expenditures for construction, low fuel and operating costs made them practical to operate on a near-constant basis.106 Energy planners particularly recognized that
large scale plants were well equipped to provide baseload generation capacity.107
However, lower-than-projected electrical consumption growth rates, combined with aggressive energy conservation efforts, prevented many utilities from operating the baseload nuclear power plants at optimal levels. Distorted electricity markets caused by current FERC-approved market rules and increased adoption of renewable energy resources, such as solar and wind, which are subsidized through Federal and state tax incentives, are
resulting in increased cost sensitivity within the nuclear power industry and premature retirements of nuclear power generation units.108
[TEXT REDACTED] In this decreased demand environment, wind generators were able to compete through the Production Tax Credit (PTC) that allows them to produce at negative cost. Nuclear generators, in contrast, generally do not receive similar subsidies.
[TEXT REDACTED]
[TEXT REDACTED] [TEXT REDACTED] [TEXT REDACTED]
[TEXT REDACTED] [TEXT REDACTED] [TEXT REDACTED] [TEXT REDACTED] [TEXT REDACTED] [TEXT REDACTED] [TEXT REDACTED] [TEXT REDACTED] [TEXT REDACTED] [TEXT REDACTED] [TEXT REDACTED] [TEXT REDACTED] [TEXT REDACTED] [TEXT REDACTED] [TEXT REDACTED] [TEXT REDACTED] [TEXT REDACTED] [TEXT REDACTED] [TEXT REDACTED] [TEXT REDACTED] [TEXT REDACTED] [TEXT REDACTED].
[TEXT REDACTED] [TEXT REDACTED]
In addition to renewables, the introduction of highly efficient turbine gas generators and the wide availability of low cost natural gas, has changed the competitive landscape. Ten survey respondents indicated that their nuclear facilities faced significant challenges to their viability from natural gas-fired generators. Under current wholesale electricity pricing mechanisms, natural gas-fired generators are able to sell their electricity to the grid at lower costs than nuclear operators. This is partially due to the intermittent nature of natural-gas fired generation; natural gas-fired generators can be activated and deactivated as needed, whereas nuclear power generators have less operational flexibility. Similarly, subsidized renewable sources, such as solar and wind, are intermittent operators (e.g., during daytime hours for solar, and favorable wind conditions for wind) and
can be sold at a lower cost than constantly-running nuclear generators.
These factors create a situation that substantially disadvantages nuclear power generators. A 2017 IHS Markit study observed that, ‘‘generating resources providing security of supply receive negative market-clearing prices because distorted market conditions drive rival subsidized suppliers to bid against each other to avoid the loss of output-based subsidy payments.’’ 109 FERC, recognizing challenges faced by nuclear and other baseload generators, opened a proceeding in January 2018 to examine the relationship between grid reliability and wholesale market rules.110 The proceeding will examine grid resilience pricing and consider how valuation deficiencies lead to premature retirements of fuel-secure generation, including nuclear. FERC, has not yet taken action to address the inequities of
the markets that threaten the resilience of the Nation’s electricity system.
Increased state energy efficiency standards and the predominance of the service sector in the economy, which does not consume as much energy as other sectors such as manufacturing, have slowed electricity demand growth. In 2017, the North American Electric Reliability Corporation (NERC) reported that the annual growth rate of peak demand reached record lows of 0.61 percent in summer and 0.59 percent in winter.111 Slower growth in electricity demand places increased economic pressures on large-scale generators, including nuclear power plants.112
The increased presence of natural gas- fired and renewable power plants in the nation’s electric generation grid does not obviate the need for nuclear power baseload generators. In fact, there is a continued role for nuclear power plants because they can provide a constant
VerDate Sep<11>2014 19:47 Jul 30, 2021 Jkt 253001 PO 00000 Frm 00029 Fmt 4701 Sfmt 4703 E:\FR\FM\02AUN2.SGM 02AUN2kham
mon
d on
DS
KJM
1Z7X
2PR
OD
with
NO
TIC
ES
2
41568 Federal Register / Vol. 86, No. 145 / Monday, August 2, 2021 / Notices
113 ‘‘Special Reliability Assessment: Potential Bulk Power System Impacts Due to Severe Disruptions on the Natural Gas System,’’ 10. North American Electric Reliability Corporation. November 2017. https://www.nerc.com/pa/RAPA/ ra/Reliability%20Assessments%20DL/NERC_SPOD_11142017_Final.pdf.
114 Ibid. 115 Blake Sobczak, Hannah Northey, and Peter
Behr, ‘‘Cyber raises threat against America’s energy backbone’’, E&E News (May 23, 2017), https://www.eenews.net/stories/1060054924/.
116 During extreme cold temperatures in January 2018, Distrigas of Massachusetts had to import liquefied natural gas from Russia to address a gas shortage in the region.
Chesto, Jon. ‘‘Russian LNG Is Unloaded in Everett; the Supplier (but Not Gas) Faces US Sanctions.’’ Boston Globe, January 30, 2018. https:// www.bostonglobe.com/business/2018/01/29/tanker- unloads-lng-everett-terminal-that-contains-russian- gas/rewj1wKjajaKtLp79irzTI/story.html.
117 1989 Report, I–2. 118 Id. III–10 and III–27. 119 Ibid., V–4 to V–5.
flow of electricity to the grid and do not require constant deliveries of fuel from external sources. Nuclear power plants can produce at near-full capacity when solar and wind generation facilities cannot produce electricity.
Similarly, natural gas plants are reliant on ‘‘just-in-time’’ deliveries of natural gas, and natural gas storage capacity in the U.S. is severely limited in many regions.113 A North American Electric Reliability Corporation (NERC) report noted that only 27 percent of U.S. natural gas-fired generation capacity installed since 1997 is capable of dual fuel usage, which uses alternative fuel such as diesel to maintain generation.114 Natural gas pipelines are also vulnerable to cyberattack, which can disable pipeline operations and cut off gas supply.115
In contrast, nuclear generators are not subject to similar potential disruptions or energy storage limitations since they have long refueling cycles between 18 and 24 months, and do not require constant fuel deliveries. These refueling operations are planned well in advance, allowing both plant and transmission system operators to make arrangements for alternative generation capacity. All survey respondents indicated that they could maintain normal generation operations even with a missed delivery of uranium concentrate, uranium hexafluoride, or enriched uranium. Respondents indicated that they
maintain sufficient inventory of the above products and have layered contracts with multiple suppliers. Any single missed delivery could therefore be addressed with existing inventory.
Respondents identified missed deliveries of fabricated fuel prior to a scheduled refueling as the greatest threat to continue operation. [TEXT REDACTED]
Based on the nature of the nuclear supply chain, nuclear power generators are comparatively more resilient than other power generation sources that require constant fuel deliveries. As presented in Chapter VII, U.S. nuclear power generators can use U.S.-sourced uranium to meet their power needs, potentially avoiding situations where U.S. utilities would be reliant on last- minute imports of natural gas or other materials to address shortfalls.116 Leveraging the unique operational characteristics of nuclear power generators and the unused capacity of the U.S. uranium industry can ensure greater grid reliability.
B. Imports of Uranium in Such Quantities as Are Presently Found Adversely Impact the Economic Welfare of the U.S. Uranium Industry
1. U.S. Utilities’ Reliance on Imports of Uranium in 1989
In September 1989, the Secretary completed a Section 232 investigation on the effect of uranium imports on the national security. The investigation,
requested by the Secretary of Energy, determined that U.S. utilities imported a significant share of their uranium requirements. At the time, imports of uranium concentrate accounted for roughly 51 percent of domestic utility demand.117 The 1989 investigation also found that U.S. uranium producers faced strong foreign competition, particularly from the Soviet Union. It further reported that employment in the industry was steadily decreasing.118
[TEXT REDACTED] 119 Consequently, the Secretary
concluded that uranium was not being imported into the United States under such quantities or circumstances that threatened to impair the national security. For more discussion of the 1989 Section 232 investigation, refer to Appendix G.
2. U.S. Utilities’ Reliance on Imports of Uranium Continue To Rise
U.S. utilities’ reliance on foreign suppliers to meet their uranium product and service requirements have continued to increase since the 1989 uranium 232 investigation. In 2018, U.S. nuclear utility operators relied on foreign suppliers for 93.3 percent of their uranium concentrate requirements, 85.5 percent of their uranium hexafluoride requirements, and 97.6 percent of their enriched uranium hexafluoride (UF6) requirements. As for uranium service requirements, U.S. nuclear utility operators relied on foreign suppliers for 42.3 percent of their conversion service requirements and 61.5 percent of their enrichment service requirements from 2014 to 2018 (see Figure 27). BILLING CODE 3510–33–P
VerDate Sep<11>2014 19:47 Jul 30, 2021 Jkt 253001 PO 00000 Frm 00030 Fmt 4701 Sfmt 4703 E:\FR\FM\02AUN2.SGM 02AUN2kham
mon
d on
DS
KJM
1Z7X
2PR
OD
with
NO
TIC
ES
2
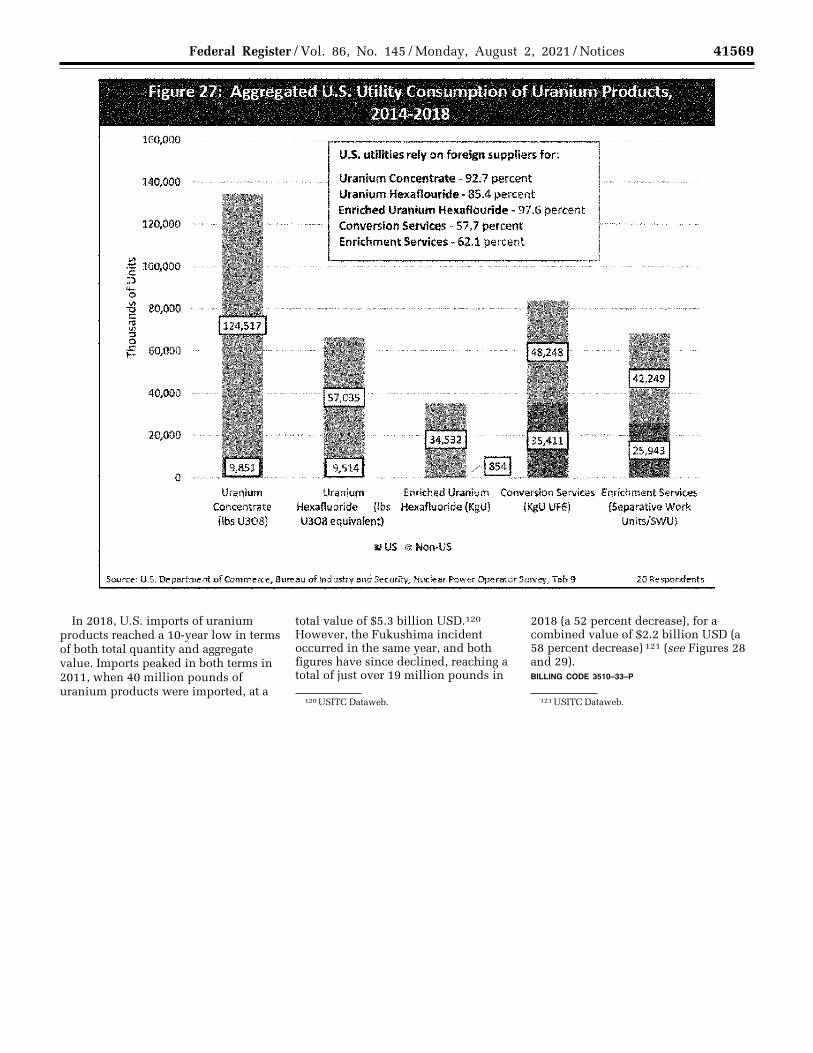
41569 Federal Register / Vol. 86, No. 145 / Monday, August 2, 2021 / Notices
120 USITC Dataweb. 121 USITC Dataweb.
In 2018, U.S. imports of uranium products reached a 10-year low in terms of both total quantity and aggregate value. Imports peaked in both terms in 2011, when 40 million pounds of uranium products were imported, at a
total value of $5.3 billion USD.120 However, the Fukushima incident occurred in the same year, and both figures have since declined, reaching a total of just over 19 million pounds in
2018 (a 52 percent decrease), for a combined value of $2.2 billion USD (a 58 percent decrease) 121 (see Figures 28 and 29). BILLING CODE 3510–33–P
VerDate Sep<11>2014 19:47 Jul 30, 2021 Jkt 253001 PO 00000 Frm 00031 Fmt 4701 Sfmt 4703 E:\FR\FM\02AUN2.SGM 02AUN2 EN
02A
U21
.015
</G
PH
>
kham
mon
d on
DS
KJM
1Z7X
2PR
OD
with
NO
TIC
ES
2
Figure 27: Aggregated U.S. Utility Consumption of Uranium Products1
2014-2018
160,000
140,000
120,000
~ 100,000 ::) .... 0 VI ~ 80,000 51 5 fE. 60,000
20,000
0 Uranium
Concentrate {lbsU308)
U.S. utilities rely on foreign suppliers for:
Uranium Concentrate- 92.7 percent Uranium Hexaflouride - 85.4 percent Enriched uranium Hexaflouride-97.6 percent Conversion Services - 57 .7 percent Enrichment Services• 62.1 percent
Uranium Enriched Uranium conversion services Enrichment Services Hexafluoride (lbs Hexafluoride {Kgll) (KgU UF6) {Separative Work U308 equivalent) Units/SWU)
• us ill Non-US
Sotm:e: U.S. Department of Commerce, Bureau of lndllStry and Serurll:y, Nuclear Power Operator Survey, Tab 9 20 Respondents
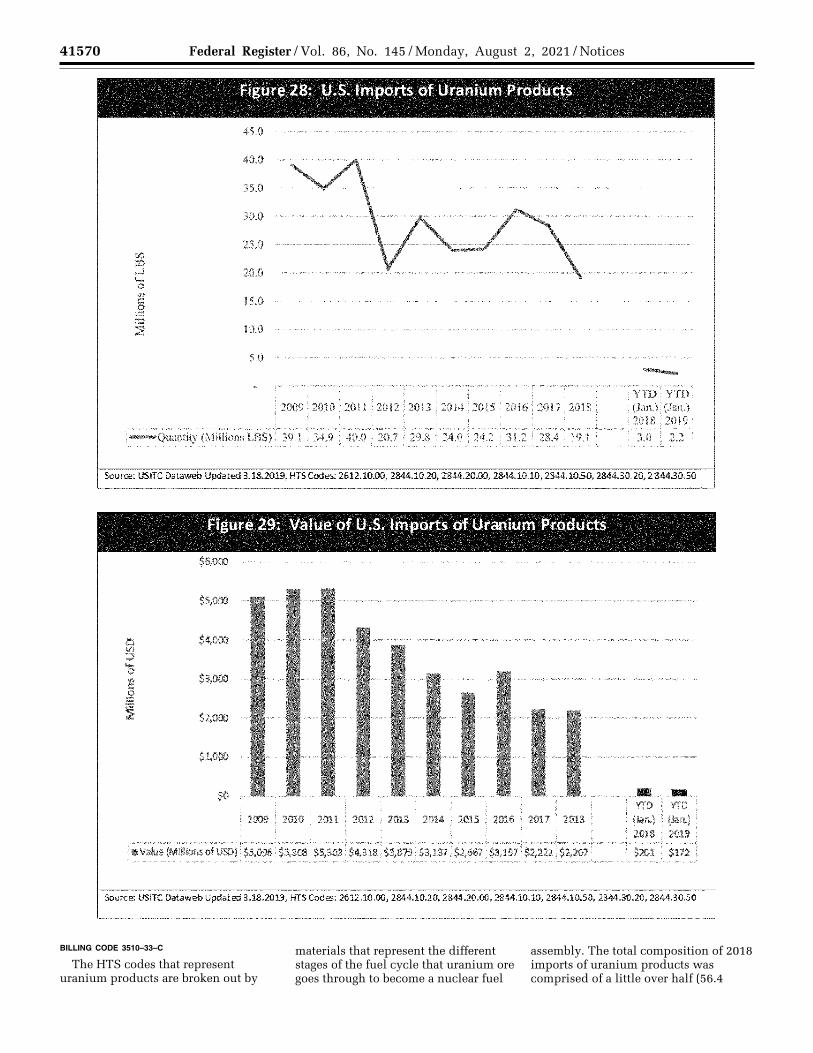
41570 Federal Register / Vol. 86, No. 145 / Monday, August 2, 2021 / Notices
BILLING CODE 3510–33–C
The HTS codes that represent uranium products are broken out by
materials that represent the different stages of the fuel cycle that uranium ore goes through to become a nuclear fuel
assembly. The total composition of 2018 imports of uranium products was comprised of a little over half (56.4
VerDate Sep<11>2014 19:47 Jul 30, 2021 Jkt 253001 PO 00000 Frm 00032 Fmt 4701 Sfmt 4703 E:\FR\FM\02AUN2.SGM 02AUN2 EN
02A
U21
.016
</G
PH
>
kham
mon
d on
DS
KJM
1Z7X
2PR
OD
with
NO
TIC
ES
2
Figure 28: U.S. Imports of Uranium Products
45.0
15.0
10.0
2009 20!0 201 l 2012 2013 2014 2015 2016 2017 2018
i--(Jua,~tity (Millions LBS) 39.1 34.9 40.0 20.7 29.8 24.0 24;2 31.2 28.4 19.l
--..
Source: US.ITC Dataweb Updated 3.18.2019, HTS Codes: 2612.10.00, 2844.10.20, 2844.20.00, 2844.10.10, 2844.1050, 2844.30.20, 284430.:50
Figure 29: Value of U.S. Imports of Uranium Products
$5,000 --
$4,000 ---
$3,000 ., ..
$2,000 ..
$1,000 . --r 1 : j -·--;-· -"~-- r i r 1 T YTO ; vro 1 l~l~l~l~!~l~l~!~1~1~1 ~aji~I
!■viti(M1l~sofU~~1$5,096t$~~08;~~·303l$4,3~:;-~3:879t~~-1~!$~~1~~19.7l~~22ls2,2~L.:.··"·j ;::--! ;;;J Source: USITC Dataweb Updated 3.18.2019, HTS Codes: 2612.10.00, 2844.10.20, 2844.20.00, 2844.10.10, 2844.10.50, 2844.30.20, 2844.30.50
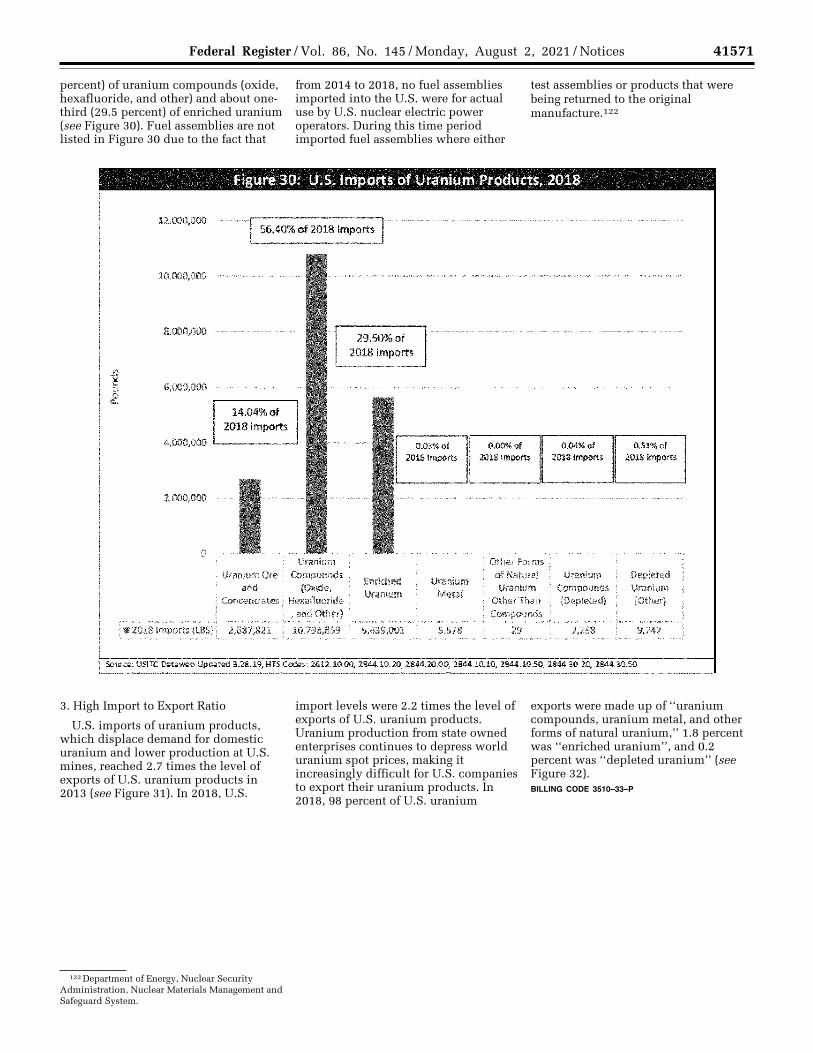
41571 Federal Register / Vol. 86, No. 145 / Monday, August 2, 2021 / Notices
122 Department of Energy, Nuclear Security Administration, Nuclear Materials Management and Safeguard System.
percent) of uranium compounds (oxide, hexafluoride, and other) and about one- third (29.5 percent) of enriched uranium (see Figure 30). Fuel assemblies are not listed in Figure 30 due to the fact that
from 2014 to 2018, no fuel assemblies imported into the U.S. were for actual use by U.S. nuclear electric power operators. During this time period imported fuel assemblies where either
test assemblies or products that were being returned to the original manufacture.122
3. High Import to Export Ratio
U.S. imports of uranium products, which displace demand for domestic uranium and lower production at U.S. mines, reached 2.7 times the level of exports of U.S. uranium products in 2013 (see Figure 31). In 2018, U.S.
import levels were 2.2 times the level of exports of U.S. uranium products. Uranium production from state owned enterprises continues to depress world uranium spot prices, making it increasingly difficult for U.S. companies to export their uranium products. In 2018, 98 percent of U.S. uranium
exports were made up of ‘‘uranium compounds, uranium metal, and other forms of natural uranium,’’ 1.8 percent was ‘‘enriched uranium’’, and 0.2 percent was ‘‘depleted uranium’’ (see Figure 32). BILLING CODE 3510–33–P
VerDate Sep<11>2014 19:47 Jul 30, 2021 Jkt 253001 PO 00000 Frm 00033 Fmt 4701 Sfmt 4703 E:\FR\FM\02AUN2.SGM 02AUN2 EN
02A
U21
.017
</G
PH
>
kham
mon
d on
DS
KJM
1Z7X
2PR
OD
with
NO
TIC
ES
2
Figure 30: U.S. Imports of Uranium Products, 2018
12,000,000
10,000,000
8,000,000 ------- 29.S0%of 2018 Imports
6,000,000
14.04%of 2018 Imports
O.O~of 2018 Imports
0,00% of 0.04% of 2018 !mpom 2018 lmp,rts
0,S1%of 2018 lqiorn
zooo,ooo -1 ·· 0 '. ' -~- ---,-.-----~-·., '
, 1 Uranium I Other Forms i i · ;_;_ Uranium Ore ) Compounds I of Natural l Uranium l Depleted l.
· Enriched Uranium ·, · • j and ; (Oxide, M-§to! Uranium i Compounds l Uranlu.m j · Uranium ~ .. · · 1 Concentrates I Hexafluoride 1 I Other Than J_ (Depleted) ( (Other) l , and Other) i Compounds '
r■Io1s·i;;;;,m,1.SS>l 2.sa1,a21 i 10,1gai;g J s:sii:001 1 s::sn i · 29 · l 1jsi ; 9,747 .... J > _., •• ,_.,., •• ,._,,_,,,___.,.,~>,,,-,_ :,•,, "c•~--~-,•-~~--• c-", -,•~•" •"•,•••••"--•,•••,ww~••••,s,s '"", •','" Y, -,l,,~~,•-•-•••,••, , :•• ,,,,, s,•••v~ , · J, '"'• .-,-.,,,,,_,,,,~,•, ""''"'~J.-,. .,, •" ,","" , • ,~,--.,-.,.:•,, __ _._ •"~•• ."" ."''••"'"""~""• , l~-.••--••-,•,. •, --. •'•~•,,-
Sooo:e: USIK Dataweb Updat.ed 3 . .28.19,HTSCode:s: 2612.10.00, 2844.10.2.Q.2844.20.00, 2844.10.10, 2844.1050, 2844.30.20, 2844 . .30.50
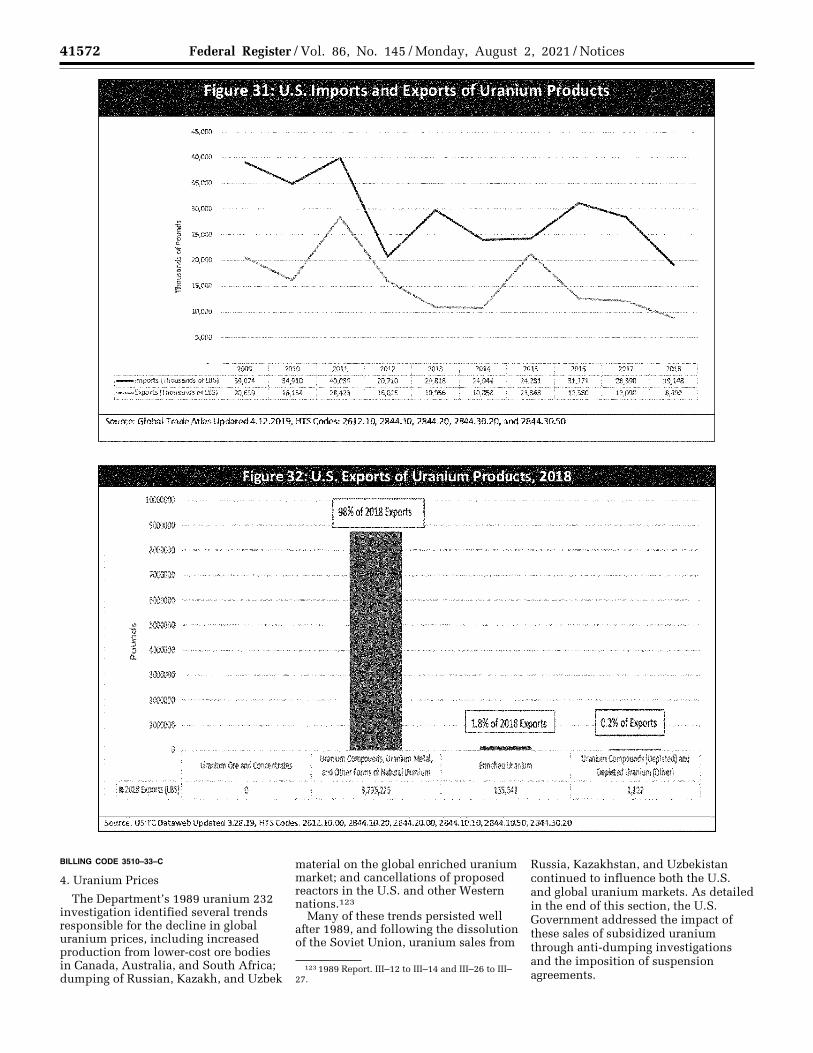
41572 Federal Register / Vol. 86, No. 145 / Monday, August 2, 2021 / Notices
123 1989 Report. III–12 to III–14 and III–26 to III– 27.
BILLING CODE 3510–33–C
4. Uranium Prices
The Department’s 1989 uranium 232 investigation identified several trends responsible for the decline in global uranium prices, including increased production from lower-cost ore bodies in Canada, Australia, and South Africa; dumping of Russian, Kazakh, and Uzbek
material on the global enriched uranium market; and cancellations of proposed reactors in the U.S. and other Western nations.123
Many of these trends persisted well after 1989, and following the dissolution of the Soviet Union, uranium sales from
Russia, Kazakhstan, and Uzbekistan continued to influence both the U.S. and global uranium markets. As detailed in the end of this section, the U.S. Government addressed the impact of these sales of subsidized uranium through anti-dumping investigations and the imposition of suspension agreements.
VerDate Sep<11>2014 19:47 Jul 30, 2021 Jkt 253001 PO 00000 Frm 00034 Fmt 4701 Sfmt 4703 E:\FR\FM\02AUN2.SGM 02AUN2 EN
02A
U21
.018
</G
PH
>
kham
mon
d on
DS
KJM
1Z7X
2PR
OD
with
NO
TIC
ES
2
Figure 31: U.S. Imports and Exports of Uranium Products
45,000
35,000
30,000
.; ~ 25,000 ...
11 .. 20,000 -g ~ ! 15,000
5,000
' 2009 ! 2010 2011 2012 ; 2013 ' 2014 . 2015 . 2016 , . . 2017 . . ' 2018 !
!-lmpms(lluJUSandsofl.BSJl 39,074 i _·34_,9_10_.,___402_0'..~~-;-,·---201.6_'.~~-----!,. ___ 291,,0 •• ~568 ',, :40,~58 i .2
2~•:',!---:,•:. i;;,.;;,.Eliports{Tl1<Jumndsofi.Bs): 20,659 1 16,134 ~-J . ,....., , • ,.. .. -
31,171 i _, 28,390 ___ __!, 19,148 ! 12,580 ! U,098 ' ... 8,892 ---- i
Source: Global Trade Atlas Update<l4.12.2019, HTSCodes: 2612.10. 2844.10, 2844.20, 2844.30.20, and 2844.30.50
Figure 32: U.S. Exports of Uranium Products, 2018
6000000 -••·••'•-·-,.s'<"''" ····e····•··· '"""''""''"''""''"""-·
~ .. so·. 5000000 ... _ .... ,,. ..... _,, ...
... 4000000 -•---.• ..... -· '""· ----·.- ·. '"'· ., . --
II ;·········--··--•-... ~--
Uranium Ore and~
Source; USITC 0ataweb Updated 3.28.19, HTS Codes: 2612.10.00, 2844.10.20, 2844.20.00. 2844.10.10, 2844.1050, 2844.30.20
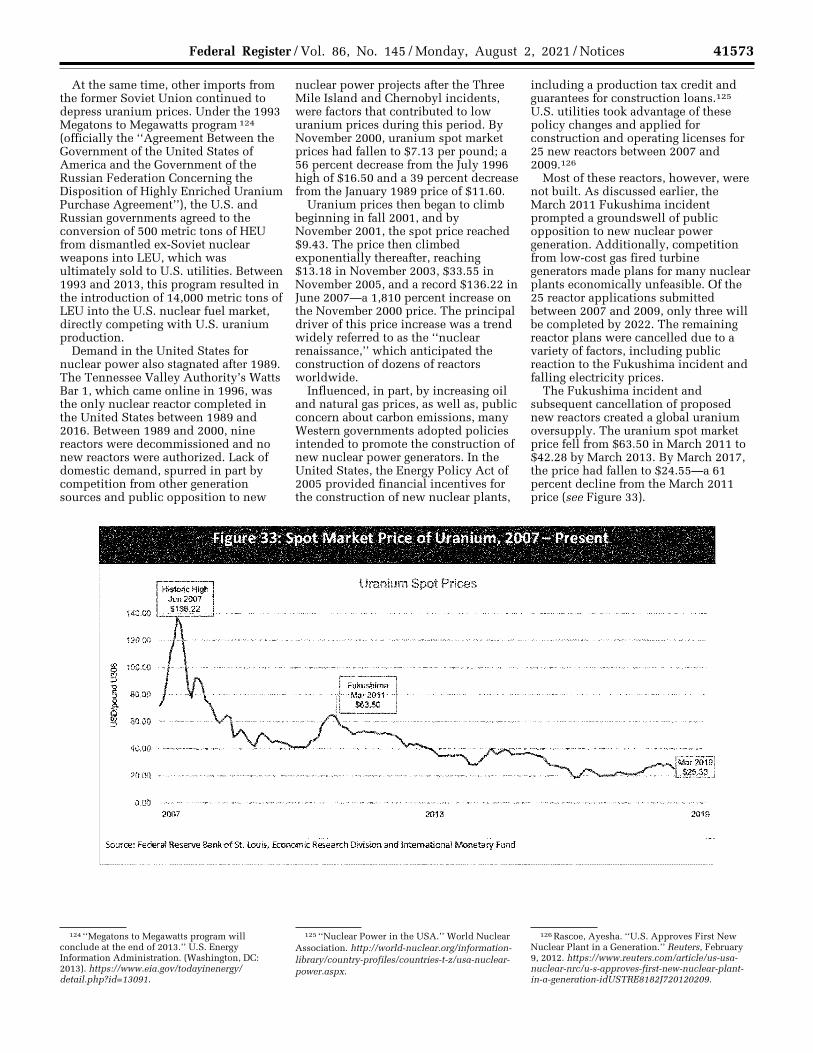
41573 Federal Register / Vol. 86, No. 145 / Monday, August 2, 2021 / Notices
124 ‘‘Megatons to Megawatts program will conclude at the end of 2013.’’ U.S. Energy Information Administration. (Washington, DC: 2013). https://www.eia.gov/todayinenergy/ detail.php?id=13091.
125 ‘‘Nuclear Power in the USA.’’ World Nuclear Association. http://world-nuclear.org/information- library/country-profiles/countries-t-z/usa-nuclear- power.aspx.
126 Rascoe, Ayesha. ‘‘U.S. Approves First New Nuclear Plant in a Generation.’’ Reuters, February 9, 2012. https://www.reuters.com/article/us-usa- nuclear-nrc/u-s-approves-first-new-nuclear-plant- in-a-generation-idUSTRE8182J720120209.
At the same time, other imports from the former Soviet Union continued to depress uranium prices. Under the 1993 Megatons to Megawatts program 124 (officially the ‘‘Agreement Between the Government of the United States of America and the Government of the Russian Federation Concerning the Disposition of Highly Enriched Uranium Purchase Agreement’’), the U.S. and Russian governments agreed to the conversion of 500 metric tons of HEU from dismantled ex-Soviet nuclear weapons into LEU, which was ultimately sold to U.S. utilities. Between 1993 and 2013, this program resulted in the introduction of 14,000 metric tons of LEU into the U.S. nuclear fuel market, directly competing with U.S. uranium production.
Demand in the United States for nuclear power also stagnated after 1989. The Tennessee Valley Authority’s Watts Bar 1, which came online in 1996, was the only nuclear reactor completed in the United States between 1989 and 2016. Between 1989 and 2000, nine reactors were decommissioned and no new reactors were authorized. Lack of domestic demand, spurred in part by competition from other generation sources and public opposition to new
nuclear power projects after the Three Mile Island and Chernobyl incidents, were factors that contributed to low uranium prices during this period. By November 2000, uranium spot market prices had fallen to $7.13 per pound; a 56 percent decrease from the July 1996 high of $16.50 and a 39 percent decrease from the January 1989 price of $11.60.
Uranium prices then began to climb beginning in fall 2001, and by November 2001, the spot price reached $9.43. The price then climbed exponentially thereafter, reaching $13.18 in November 2003, $33.55 in November 2005, and a record $136.22 in June 2007—a 1,810 percent increase on the November 2000 price. The principal driver of this price increase was a trend widely referred to as the ‘‘nuclear renaissance,’’ which anticipated the construction of dozens of reactors worldwide.
Influenced, in part, by increasing oil and natural gas prices, as well as, public concern about carbon emissions, many Western governments adopted policies intended to promote the construction of new nuclear power generators. In the United States, the Energy Policy Act of 2005 provided financial incentives for the construction of new nuclear plants,
including a production tax credit and guarantees for construction loans.125 U.S. utilities took advantage of these policy changes and applied for construction and operating licenses for 25 new reactors between 2007 and 2009.126
Most of these reactors, however, were not built. As discussed earlier, the March 2011 Fukushima incident prompted a groundswell of public opposition to new nuclear power generation. Additionally, competition from low-cost gas fired turbine generators made plans for many nuclear plants economically unfeasible. Of the 25 reactor applications submitted between 2007 and 2009, only three will be completed by 2022. The remaining reactor plans were cancelled due to a variety of factors, including public reaction to the Fukushima incident and falling electricity prices.
The Fukushima incident and subsequent cancellation of proposed new reactors created a global uranium oversupply. The uranium spot market price fell from $63.50 in March 2011 to $42.28 by March 2013. By March 2017, the price had fallen to $24.55—a 61 percent decline from the March 2011 price (see Figure 33).
VerDate Sep<11>2014 19:47 Jul 30, 2021 Jkt 253001 PO 00000 Frm 00035 Fmt 4701 Sfmt 4725 E:\FR\FM\02AUN2.SGM 02AUN2 EN
02A
U21
.019
</G
PH
>
kham
mon
d on
DS
KJM
1Z7X
2PR
OD
with
NO
TIC
ES
2
;
I ::::,
Hislorie High Jun2007
140.oo .u~~---
12(t00
100 .. 00
80.00
60.00
40.00
20.00
crno 2007
Figure 33: Spot Market Price of Uranium, 2007- Present
Uranium Spot Prices
2013
Source: Federal Reserve Bank of St. I.Duis, Economic Research Division and lntt;mational Monetary Fund
2019
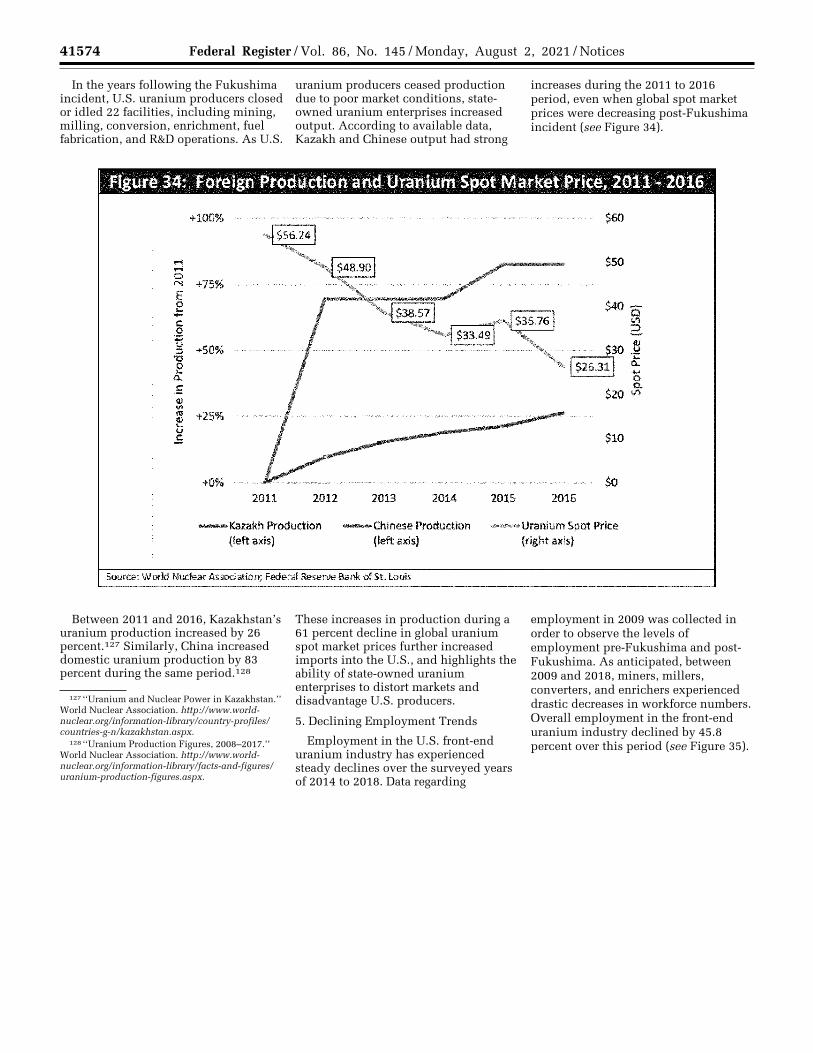
41574 Federal Register / Vol. 86, No. 145 / Monday, August 2, 2021 / Notices
127 ‘‘Uranium and Nuclear Power in Kazakhstan.’’ World Nuclear Association. http://www.world- nuclear.org/information-library/country-profiles/ countries-g-n/kazakhstan.aspx.
128 ‘‘Uranium Production Figures, 2008–2017.’’ World Nuclear Association. http://www.world- nuclear.org/information-library/facts-and-figures/ uranium-production-figures.aspx.
In the years following the Fukushima incident, U.S. uranium producers closed or idled 22 facilities, including mining, milling, conversion, enrichment, fuel fabrication, and R&D operations. As U.S.
uranium producers ceased production due to poor market conditions, state- owned uranium enterprises increased output. According to available data, Kazakh and Chinese output had strong
increases during the 2011 to 2016 period, even when global spot market prices were decreasing post-Fukushima incident (see Figure 34).
Between 2011 and 2016, Kazakhstan’s uranium production increased by 26 percent.127 Similarly, China increased domestic uranium production by 83 percent during the same period.128
These increases in production during a 61 percent decline in global uranium spot market prices further increased imports into the U.S., and highlights the ability of state-owned uranium enterprises to distort markets and disadvantage U.S. producers.
5. Declining Employment Trends
Employment in the U.S. front-end uranium industry has experienced steady declines over the surveyed years of 2014 to 2018. Data regarding
employment in 2009 was collected in order to observe the levels of employment pre-Fukushima and post- Fukushima. As anticipated, between 2009 and 2018, miners, millers, converters, and enrichers experienced drastic decreases in workforce numbers. Overall employment in the front-end uranium industry declined by 45.8 percent over this period (see Figure 35).
VerDate Sep<11>2014 19:47 Jul 30, 2021 Jkt 253001 PO 00000 Frm 00036 Fmt 4701 Sfmt 4703 E:\FR\FM\02AUN2.SGM 02AUN2 EN
02A
U21
.020
</G
PH
>
kham
mon
d on
DS
KJM
1Z7X
2PR
OD
with
NO
TIC
ES
2
I Figure 34: Foreign Production and Uranium Spot Market Price, 2011- 2016 I
.... .... 0 N
E 0 ... -C 0
~ ::J
'CJ 0 ... 0. C
GI '11 l'IJ GI ... u .E
+100% ", .. /
+75%
+$0%
+25%
+0% 2011 2012
-Kazakh Production (left axis)
2013 2014
-Chinese Production (left axis)
Source: World Nuclear Association; Federal Reserve Bank of St. Low
2015 2016
-uranium Spot Price {right axis)
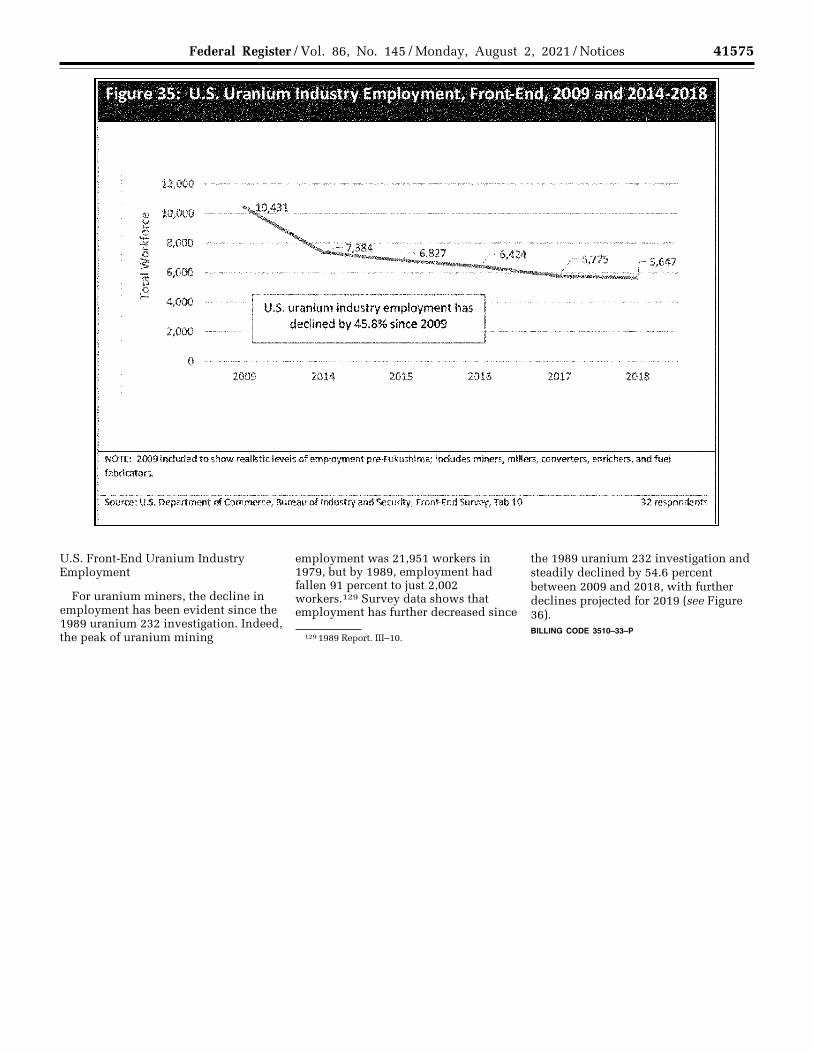
41575 Federal Register / Vol. 86, No. 145 / Monday, August 2, 2021 / Notices
129 1989 Report. III–10.
U.S. Front-End Uranium Industry Employment
For uranium miners, the decline in employment has been evident since the 1989 uranium 232 investigation. Indeed, the peak of uranium mining
employment was 21,951 workers in 1979, but by 1989, employment had fallen 91 percent to just 2,002 workers.129 Survey data shows that employment has further decreased since
the 1989 uranium 232 investigation and steadily declined by 54.6 percent between 2009 and 2018, with further declines projected for 2019 (see Figure 36). BILLING CODE 3510–33–P
VerDate Sep<11>2014 19:47 Jul 30, 2021 Jkt 253001 PO 00000 Frm 00037 Fmt 4701 Sfmt 4703 E:\FR\FM\02AUN2.SGM 02AUN2 EN
02A
U21
.021
</G
PH
>
kham
mon
d on
DS
KJM
1Z7X
2PR
OD
with
NO
TIC
ES
2
Figure 35: U.S. Uranium Industry Employment, Front-End, 2009 and 2014-2018
12,000
!!l 10,000 V ... .e
8,000 ;),I': ,_ 0
:?; 6,000 ,ii ..,,
{?. 4,000
2,000
0 2009
U.S. uranium industry employment has declined by 45.8% since 2009
2014 2015 2016
6,424 5,647
2017 2018
NOTE: 2009 included to show realistic levels of employment pre-Fukushima; indm:les miners, millers_, converters, emichers, and fuel
fabricators.
Source: U.S. Department of Commerce, Bureau of lndustiy and Security, Front-End Survey, Tab 10 32 respondents
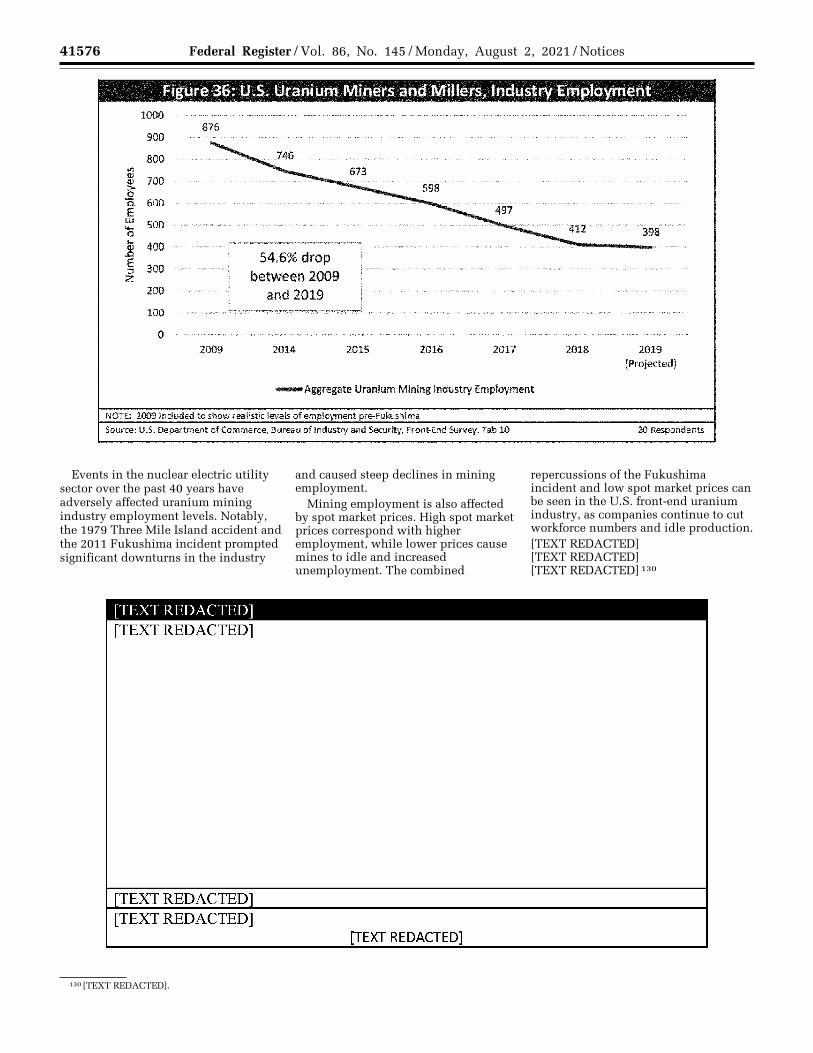
41576 Federal Register / Vol. 86, No. 145 / Monday, August 2, 2021 / Notices
130 [TEXT REDACTED].
Events in the nuclear electric utility sector over the past 40 years have adversely affected uranium mining industry employment levels. Notably, the 1979 Three Mile Island accident and the 2011 Fukushima incident prompted significant downturns in the industry
and caused steep declines in mining employment.
Mining employment is also affected by spot market prices. High spot market prices correspond with higher employment, while lower prices cause mines to idle and increased unemployment. The combined
repercussions of the Fukushima incident and low spot market prices can be seen in the U.S. front-end uranium industry, as companies continue to cut workforce numbers and idle production. [TEXT REDACTED] [TEXT REDACTED] [TEXT REDACTED] 130
VerDate Sep<11>2014 19:47 Jul 30, 2021 Jkt 253001 PO 00000 Frm 00038 Fmt 4701 Sfmt 4725 E:\FR\FM\02AUN2.SGM 02AUN2 EN
02A
U21
.022
</G
PH
>E
N02
AU
21.0
23<
/GP
H>
kham
mon
d on
DS
KJM
1Z7X
2PR
OD
with
NO
TIC
ES
2
Figure 36: U.S. Uranium Miners and Millers, Industry Employment
1000 876
900
800 VI (II
700 (II
~ 600 0. e
LI.I 500 .... 0 ... 400 (II
.Q E 300 :::, z
200
100
0 2009 2014 2015 2016 2017
-Aggregate Uranium Mining Industry Employment
NOTE: 2009 included to show realistic levels of employment pre-Fukushima
Source: U.S. Department of Commerce, Bureau of Industry and Security, FronHnd Survev, Tab 10
[TEXT REDACTED] [TEXT REDACTED]
fTEXT REDACTEDl [TEXT REDACTED]
[TEXT REDACTED]
2018 2019 (Projected)
20 Respondents
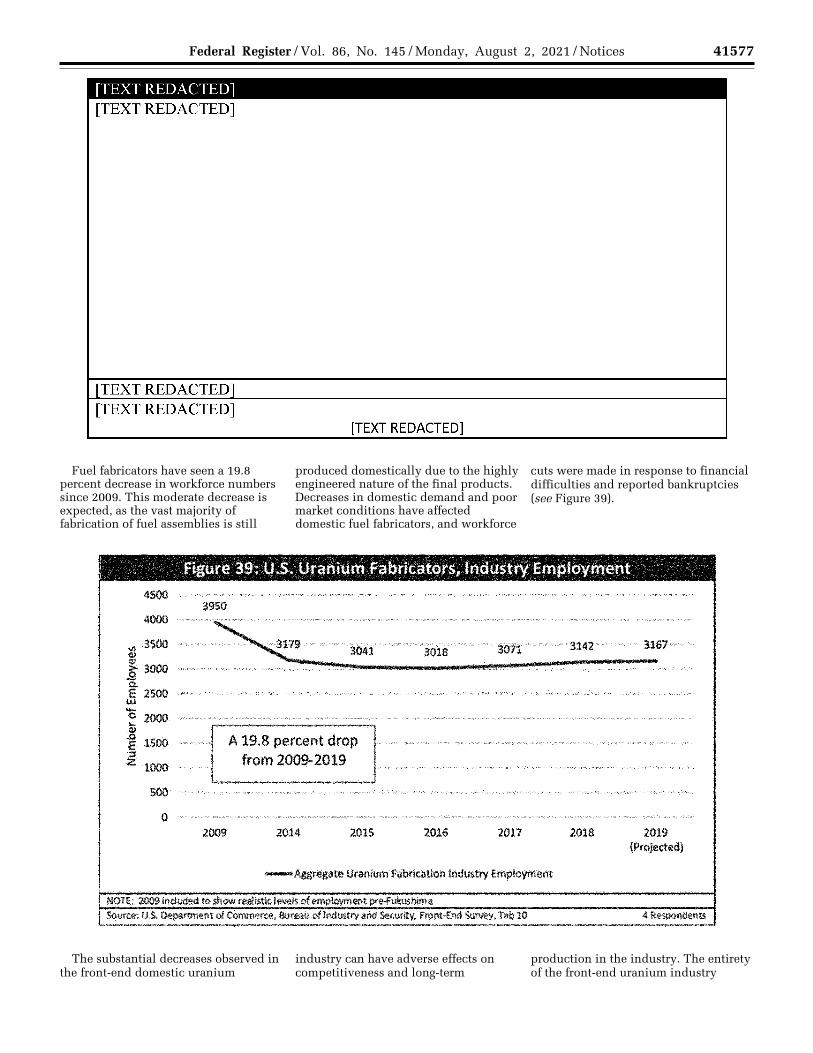
41577 Federal Register / Vol. 86, No. 145 / Monday, August 2, 2021 / Notices
Fuel fabricators have seen a 19.8 percent decrease in workforce numbers since 2009. This moderate decrease is expected, as the vast majority of fabrication of fuel assemblies is still
produced domestically due to the highly engineered nature of the final products. Decreases in domestic demand and poor market conditions have affected domestic fuel fabricators, and workforce
cuts were made in response to financial difficulties and reported bankruptcies (see Figure 39).
The substantial decreases observed in the front-end domestic uranium
industry can have adverse effects on competitiveness and long-term
production in the industry. The entirety of the front-end uranium industry
VerDate Sep<11>2014 19:47 Jul 30, 2021 Jkt 253001 PO 00000 Frm 00039 Fmt 4701 Sfmt 4703 E:\FR\FM\02AUN2.SGM 02AUN2 EN
02A
U21
.024
</G
PH
>E
N02
AU
21.0
25<
/GP
H>
kham
mon
d on
DS
KJM
1Z7X
2PR
OD
with
NO
TIC
ES
2
[TEXT REDACTED] [TEXT REDACTED]
rTEXT REDACTEDl [TEXT REDACTED]
[TEXT REDACTED]
' Figure 39: U.S. Uranium Fabricators, Industry Employment
4500 3950
.4000 . . . . . . . . . . . .. . . . .. . . .. . . . . . .. . ... . . . . . . . .. . .. .... · .. • • • •<>>• oc.. . r "·••·•
i 3500 ··• ·· •• ~,. • 3041 ·• · ''3018 · · I011" · • 9142· at&~ " ~ 3000 · "· ·' .,. .. , .. ,.,. ...... __ .,, .. · •·· ... ., ......... , ... " I l
-a. s 2soo I.U
'o 2000 ,,, .... c., .. ,:.,. ... _:_• ..... ,; .. : •• ·:::..:.·_···-·'·'-====:::=·;,::, .. ;;;;;.. ................................................. , ....... ,, .. ,., ..... ,., .. , ............ ,. ....... . t r-
t 1500 ::, z 1000
.. SOO
0 2009
A 19.8 percent drop from 2009-2019
2014 2015 2016
NOT£:. 2009 lnduded ft> show reallstfe levels of employment pre-Fukushima
2017
Source: u.s. Department of Comme~. Bureau oftndust,vand ~. Front-End SuMv, Tab 10
2018 2019 (Projected)
4Re~ts
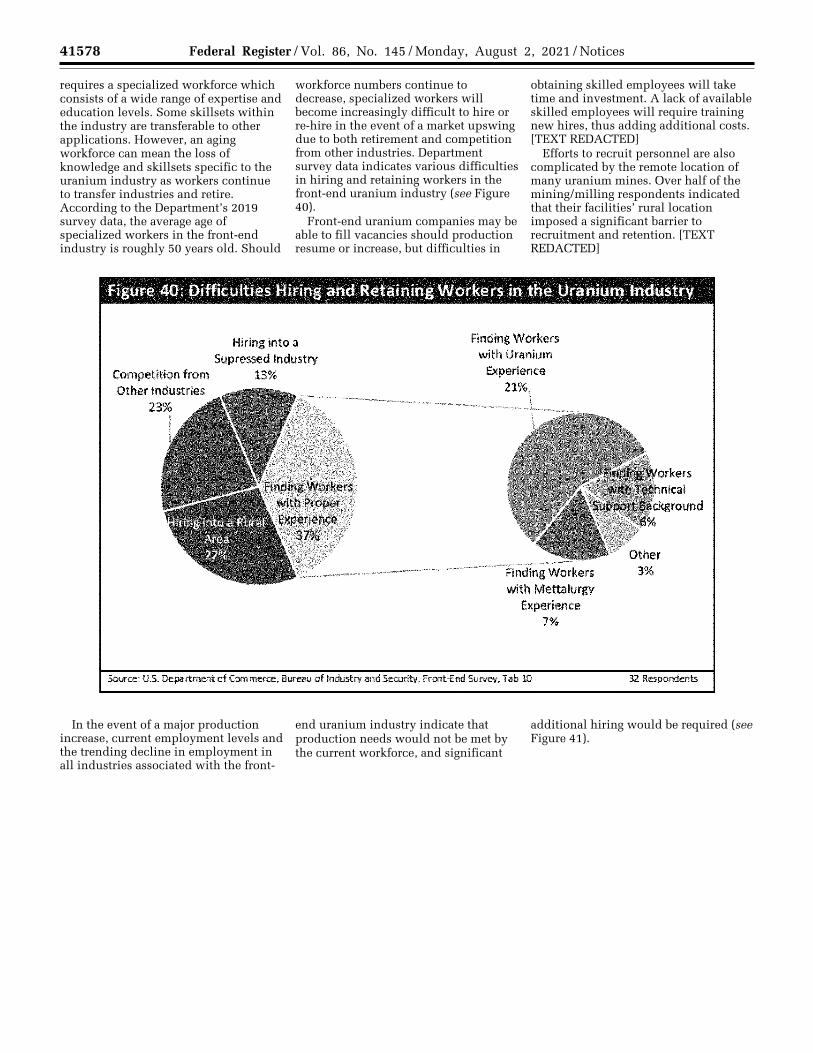
41578 Federal Register / Vol. 86, No. 145 / Monday, August 2, 2021 / Notices
requires a specialized workforce which consists of a wide range of expertise and education levels. Some skillsets within the industry are transferable to other applications. However, an aging workforce can mean the loss of knowledge and skillsets specific to the uranium industry as workers continue to transfer industries and retire. According to the Department’s 2019 survey data, the average age of specialized workers in the front-end industry is roughly 50 years old. Should
workforce numbers continue to decrease, specialized workers will become increasingly difficult to hire or re-hire in the event of a market upswing due to both retirement and competition from other industries. Department survey data indicates various difficulties in hiring and retaining workers in the front-end uranium industry (see Figure 40).
Front-end uranium companies may be able to fill vacancies should production resume or increase, but difficulties in
obtaining skilled employees will take time and investment. A lack of available skilled employees will require training new hires, thus adding additional costs. [TEXT REDACTED]
Efforts to recruit personnel are also complicated by the remote location of many uranium mines. Over half of the mining/milling respondents indicated that their facilities’ rural location imposed a significant barrier to recruitment and retention. [TEXT REDACTED]
In the event of a major production increase, current employment levels and the trending decline in employment in all industries associated with the front-
end uranium industry indicate that production needs would not be met by the current workforce, and significant
additional hiring would be required (see Figure 41).
VerDate Sep<11>2014 19:47 Jul 30, 2021 Jkt 253001 PO 00000 Frm 00040 Fmt 4701 Sfmt 4703 E:\FR\FM\02AUN2.SGM 02AUN2 EN
02A
U21
.026
</G
PH
>
kham
mon
d on
DS
KJM
1Z7X
2PR
OD
with
NO
TIC
ES
2
Figure 40: Difficulties Hiring and Retaining Workers in the Uranium Industry
Hiring into a Supressed Industry
Competition from 13%
Finding Workers with Uranium
Experience
Other Industries 23%
------~~dingWorkers with Mettalurgy
Experience 7%
Source: US. Department of Commen:e, Bureau of mdustfv and Serum.y, Front-End SuNey, Tab 10 32 Respondents
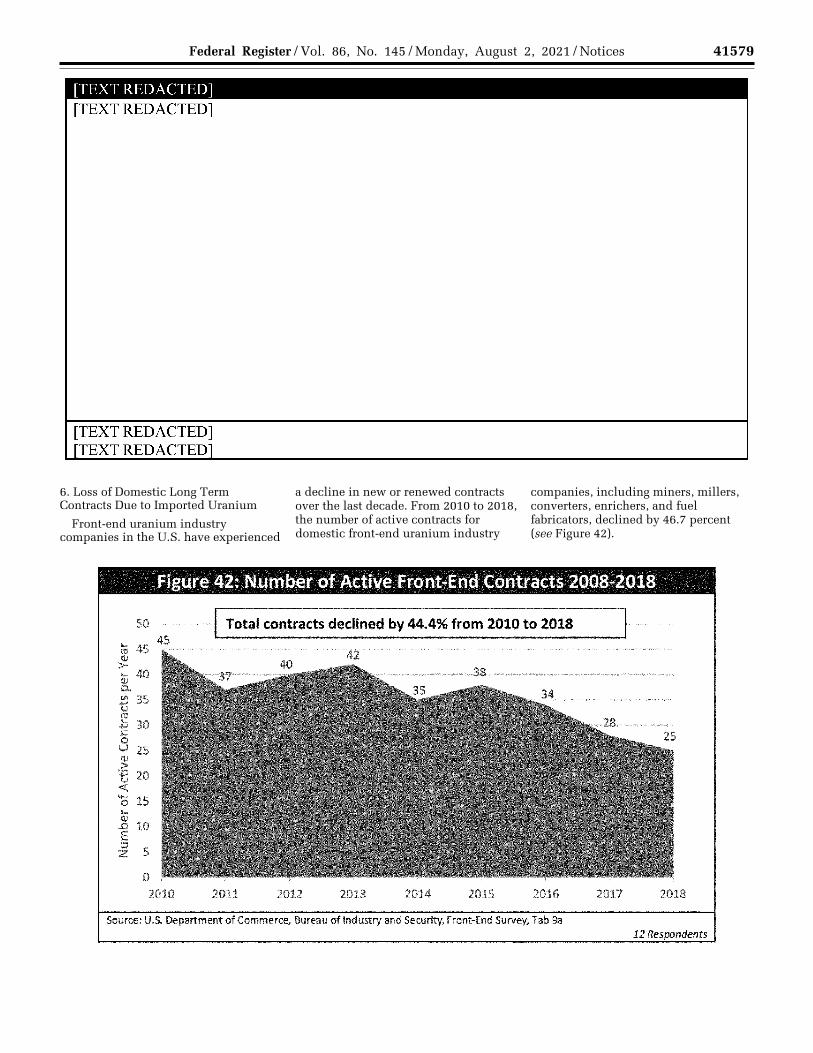
41579 Federal Register / Vol. 86, No. 145 / Monday, August 2, 2021 / Notices
6. Loss of Domestic Long Term Contracts Due to Imported Uranium
Front-end uranium industry companies in the U.S. have experienced
a decline in new or renewed contracts over the last decade. From 2010 to 2018, the number of active contracts for domestic front-end uranium industry
companies, including miners, millers, converters, enrichers, and fuel fabricators, declined by 46.7 percent (see Figure 42).
VerDate Sep<11>2014 19:47 Jul 30, 2021 Jkt 253001 PO 00000 Frm 00041 Fmt 4701 Sfmt 4725 E:\FR\FM\02AUN2.SGM 02AUN2 EN
02A
U21
.027
</G
PH
>E
N02
AU
21.0
28<
/GP
H>
kham
mon
d on
DS
KJM
1Z7X
2PR
OD
with
NO
TIC
ES
2
[TEXT RED t\CTED]
[TEXT REDACTED]
[TEXT REDACTED] fTEXT REDACTEDl
Figure 42: Number of Active Front-End Contracts 2008-2018
so ····--·-----•-•» Total contracts declined by 44.4% from 2010 to 2018 ~ 45 4.,...5 ____ ~----~.......-------~-------~~-~ _, 40 8. 111 35 ti ca J:; 30 C 0 u 25 ~ '£ 20 <C 'o 15 ... ~ 10 E ~ s
0 2010 2011 2012 2013 2014 2015 2016
Source: U.S. Department of Commerce, Bureau of Industry and Security, Front-End Survey; Tab 9a
2017 2018
12 Respondents
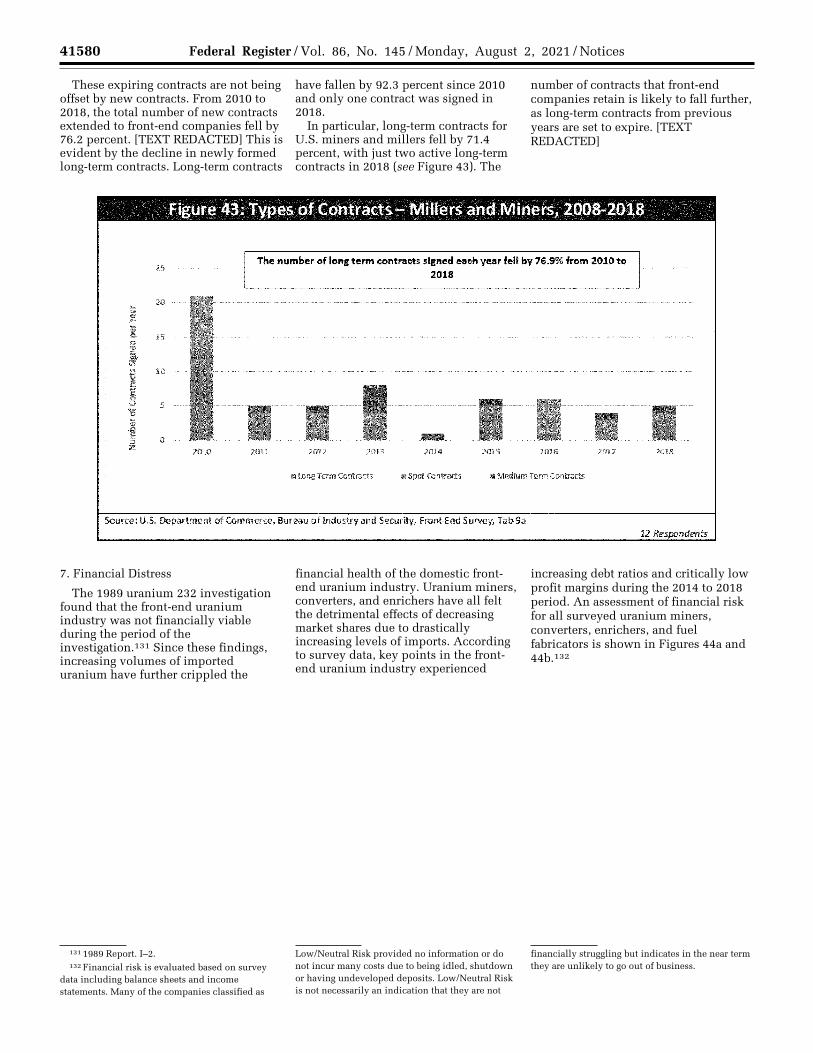
41580 Federal Register / Vol. 86, No. 145 / Monday, August 2, 2021 / Notices
131 1989 Report. I–2. 132 Financial risk is evaluated based on survey
data including balance sheets and income statements. Many of the companies classified as
Low/Neutral Risk provided no information or do not incur many costs due to being idled, shutdown or having undeveloped deposits. Low/Neutral Risk is not necessarily an indication that they are not
financially struggling but indicates in the near term they are unlikely to go out of business.
These expiring contracts are not being offset by new contracts. From 2010 to 2018, the total number of new contracts extended to front-end companies fell by 76.2 percent. [TEXT REDACTED] This is evident by the decline in newly formed long-term contracts. Long-term contracts
have fallen by 92.3 percent since 2010 and only one contract was signed in 2018.
In particular, long-term contracts for U.S. miners and millers fell by 71.4 percent, with just two active long-term contracts in 2018 (see Figure 43). The
number of contracts that front-end companies retain is likely to fall further, as long-term contracts from previous years are set to expire. [TEXT REDACTED]
7. Financial Distress
The 1989 uranium 232 investigation found that the front-end uranium industry was not financially viable during the period of the investigation.131 Since these findings, increasing volumes of imported uranium have further crippled the
financial health of the domestic front- end uranium industry. Uranium miners, converters, and enrichers have all felt the detrimental effects of decreasing market shares due to drastically increasing levels of imports. According to survey data, key points in the front- end uranium industry experienced
increasing debt ratios and critically low profit margins during the 2014 to 2018 period. An assessment of financial risk for all surveyed uranium miners, converters, enrichers, and fuel fabricators is shown in Figures 44a and 44b.132
VerDate Sep<11>2014 19:47 Jul 30, 2021 Jkt 253001 PO 00000 Frm 00042 Fmt 4701 Sfmt 4703 E:\FR\FM\02AUN2.SGM 02AUN2 EN
02A
U21
.029
</G
PH
>
kham
mon
d on
DS
KJM
1Z7X
2PR
OD
with
NO
TIC
ES
2
25
... "' i ... "' ... ... "' i ti 10
I 8 s '3 j E 0 ::> z
Figure 43: Types of Contracts- Millers and Miners, 2008-2018
2010
The number of lon1 term contracts siped each year fell by 76.9% from 2010 to 2018
2011 2012 2013 2014 2015 2016 2017
■ long Term COfltracts Ill Spot Q:mtrads ■ Medium Term Contracts
201&
Source: U.S. Department of Commerce, Bm-eau of Industry and Security, Front-End Survey, Tab 9a 12Res nil'
41581 Federal Register / Vol. 86, No. 145 / Monday, August 2, 2021 / Notices
133 1989 Report III–1 to III–2. 134 1989 Report. III–2.
[TEXT REDACTED] Uranium Miners
The financial health of uranium mining companies has deteriorated to even more unsustainable levels than at the time of the 1989 uranium 232 investigation.133 As a result of the consolidation and homogenization of the industry in the past 30 years, financial struggles during market downturns have been magnified. U.S. uranium mining companies continue to struggle to compete in a market with low spot market prices that do not cover production costs, increasing imports
from SOEs, and static/declining domestic demand. Should current market conditions continue, U.S. uranium miners will not be able to sustain operations for much longer.
The 1989 Uranium 232 Investigation found that a, ‘‘characteristic of the uranium mining industry is that few companies are exclusively dependent on the production and sale of the ore. Uranium production is usually a relatively small part or byproduct of other major activities of the firm.’’ 134 This is a material difference between the state of uranium mining during the 1989
uranium 232 investigation and the uranium mining industry today. According to Department survey data, a majority of the 20 companies in today’s domestic uranium mining industry depend exclusively on uranium mining for financial viability, and do not have the support of diverse business lines that would offset losses in their uranium mining activities.
The trend in industry debt ratios for the 2014 to 2018 period is worsening (see Figure 45). The increasing average and stable median for approximately half of the companies surveyed implies poor performance in managing debt. [TEXT REDACTED] The increase in debt
VerDate Sep<11>2014 21:46 Jul 30, 2021 Jkt 253001 PO 00000 Frm 00043 Fmt 4701 Sfmt 4703 E:\FR\FM\02AUN2.SGM 02AUN2 EN
02A
U21
.030
</G
PH
>
kham
mon
d on
DS
KJM
1Z7X
2PR
OD
with
NO
TIC
ES
2
[TEXT REDA.CTED]
[TEXT REDACTED]
[TEXT REDACTED] fTEXT REDACTEDl
[TEXT REDA.CTED]
[TEXT REDACTED]
[TEXT REDACTED] fTEXT REDACTEDl
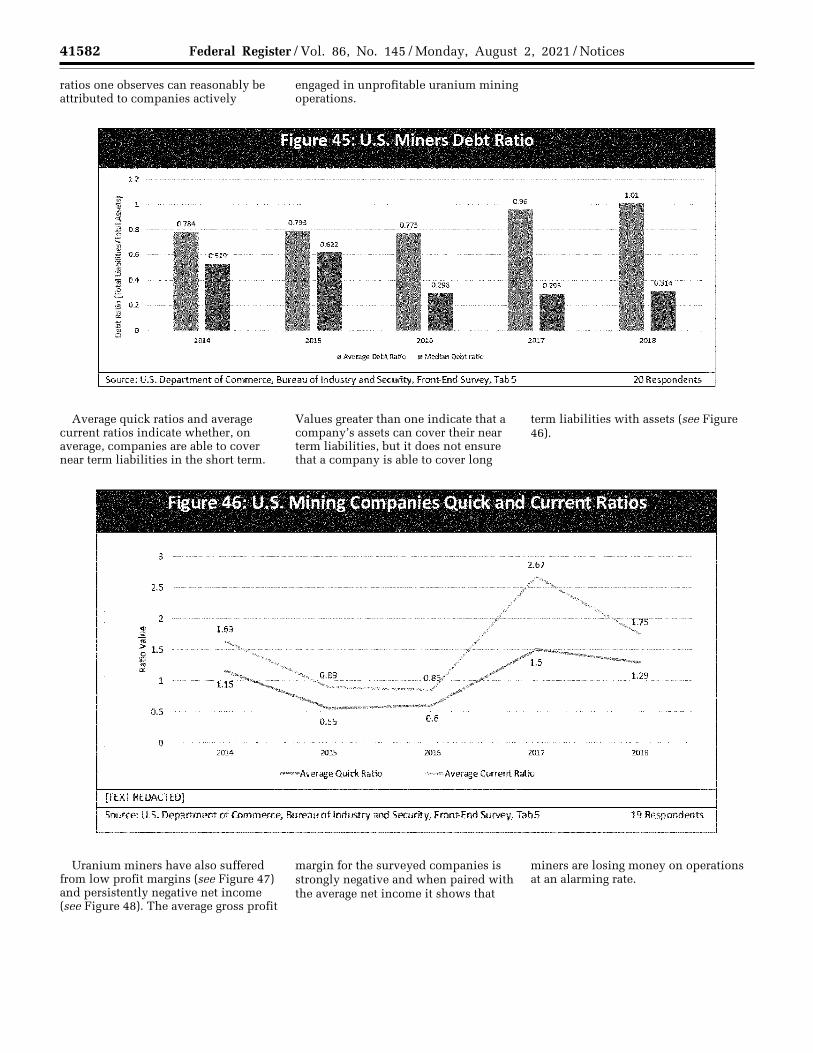
41582 Federal Register / Vol. 86, No. 145 / Monday, August 2, 2021 / Notices
ratios one observes can reasonably be attributed to companies actively
engaged in unprofitable uranium mining operations.
Average quick ratios and average current ratios indicate whether, on average, companies are able to cover near term liabilities in the short term.
Values greater than one indicate that a company’s assets can cover their near term liabilities, but it does not ensure that a company is able to cover long
term liabilities with assets (see Figure 46).
Uranium miners have also suffered from low profit margins (see Figure 47) and persistently negative net income (see Figure 48). The average gross profit
margin for the surveyed companies is strongly negative and when paired with the average net income it shows that
miners are losing money on operations at an alarming rate.
VerDate Sep<11>2014 19:47 Jul 30, 2021 Jkt 253001 PO 00000 Frm 00044 Fmt 4701 Sfmt 4703 E:\FR\FM\02AUN2.SGM 02AUN2 EN
02A
U21
.031
</G
PH
>E
N02
AU
21.0
32<
/GP
H>
kham
mon
d on
DS
KJM
1Z7X
2PR
OD
with
NO
TIC
ES
2
Figure 45: U.S. Miners Debt Ratio
f1----------- 1.01
< '! 0.8
~ 0.784 0.7!13
I o.6
:!!l ! 0.4
E. j 02
i Q
2014 2015 2016 2017 2018
■/We- O..btRallo ■ Median D<!btratlo
Source: U.S. Department of Commerce, Bureau of Industry and Security, Front-End Survey, Tab 5 20 Respondents
Figure 46: U.S. Mining Companies Quick and Current Ratios
3
2.5
2
1
0.5
0
ff EXT REDACTED}
2014
0.55
2015
-Average Quick Ratio
2.67
0.6
2016 2017
--Average Current Ratio
SOurc-e: U.S. Department of commerce, Bureau of l.ndustry and Security, Front-End Survey, Tabs
20111
19 Respondents
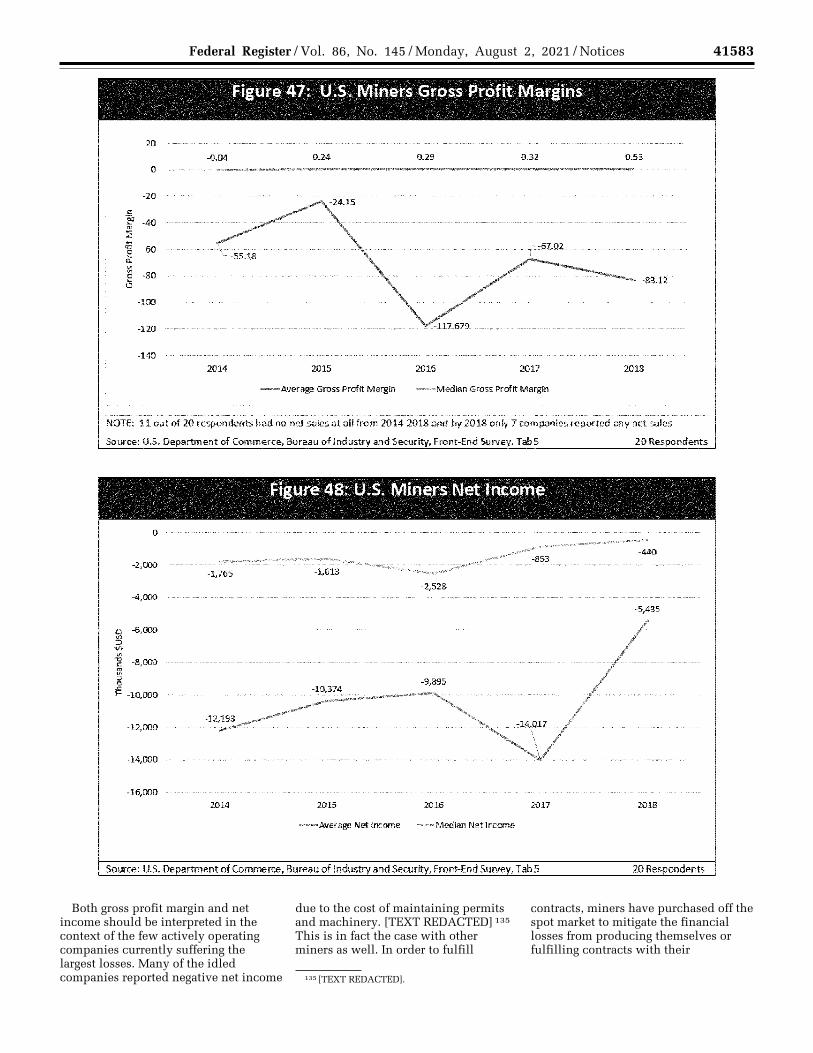
41583 Federal Register / Vol. 86, No. 145 / Monday, August 2, 2021 / Notices
135 [TEXT REDACTED].
Both gross profit margin and net income should be interpreted in the context of the few actively operating companies currently suffering the largest losses. Many of the idled companies reported negative net income
due to the cost of maintaining permits and machinery. [TEXT REDACTED] 135 This is in fact the case with other miners as well. In order to fulfill
contracts, miners have purchased off the spot market to mitigate the financial losses from producing themselves or fulfilling contracts with their
VerDate Sep<11>2014 19:47 Jul 30, 2021 Jkt 253001 PO 00000 Frm 00045 Fmt 4701 Sfmt 4703 E:\FR\FM\02AUN2.SGM 02AUN2 EN
02A
U21
.033
</G
PH
>E
N02
AU
21.0
34<
/GP
H>
kham
mon
d on
DS
KJM
1Z7X
2PR
OD
with
NO
TIC
ES
2
Figure 47: U.S. Miners Gross Profit Margins
20 -·-·····----····-·····---······ -
-0.04 0.24 0.29 0.32 0.53 0
-20
.5 1:1!' -40 .. ::i: ... e -60 ... i -80 I!)
. -83 .• 12 ..
-100
-120
-140 2014 2015 2016 2017 2018
-Average Gross Profit Margin -Median Gross Prafd: Margin
NOTE: 11 out of 20 respondents had .no net sales at all from 2014-2018 and by 2018 only 7 companies reported any net sales
Source: U.S. Department of Commerce, Bureau of Industry and Security, Front-End Survey, Tab5 20 Respondents
Figure 48: U.S. Miners Net Income
-440 -2,000
-1,766 -1,613
-2,528
-5,435
Q -'6,000 ~
~ <I).
i -8,000
j ;- -10,000
-12,000
-14,000
-16,000 2014 2015 2016 2017 2018
-Average Net Income -Median Net Income
Source: U.S. Department of Commerce, Bureau of Industry and Security, Front-End Survey, Tab 5 20 Respondents
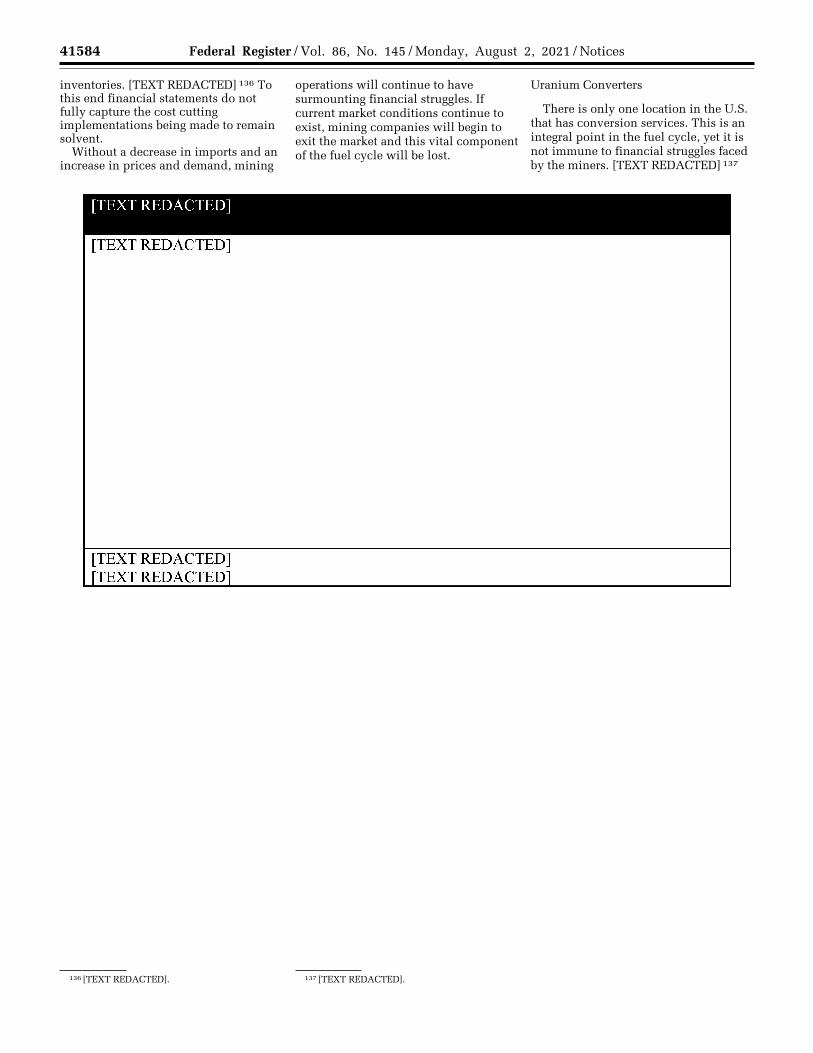
41584 Federal Register / Vol. 86, No. 145 / Monday, August 2, 2021 / Notices
136 [TEXT REDACTED]. 137 [TEXT REDACTED].
inventories. [TEXT REDACTED] 136 To this end financial statements do not fully capture the cost cutting implementations being made to remain solvent.
Without a decrease in imports and an increase in prices and demand, mining
operations will continue to have surmounting financial struggles. If current market conditions continue to exist, mining companies will begin to exit the market and this vital component of the fuel cycle will be lost.
Uranium Converters
There is only one location in the U.S. that has conversion services. This is an integral point in the fuel cycle, yet it is not immune to financial struggles faced by the miners. [TEXT REDACTED] 137
VerDate Sep<11>2014 19:47 Jul 30, 2021 Jkt 253001 PO 00000 Frm 00046 Fmt 4701 Sfmt 4725 E:\FR\FM\02AUN2.SGM 02AUN2 EN
02A
U21
.035
</G
PH
>
kham
mon
d on
DS
KJM
1Z7X
2PR
OD
with
NO
TIC
ES
2
[TEXT REDACTED]
[TEXT REDACTED]
[TEXT REDACTED] fTEXT REDACTEDl
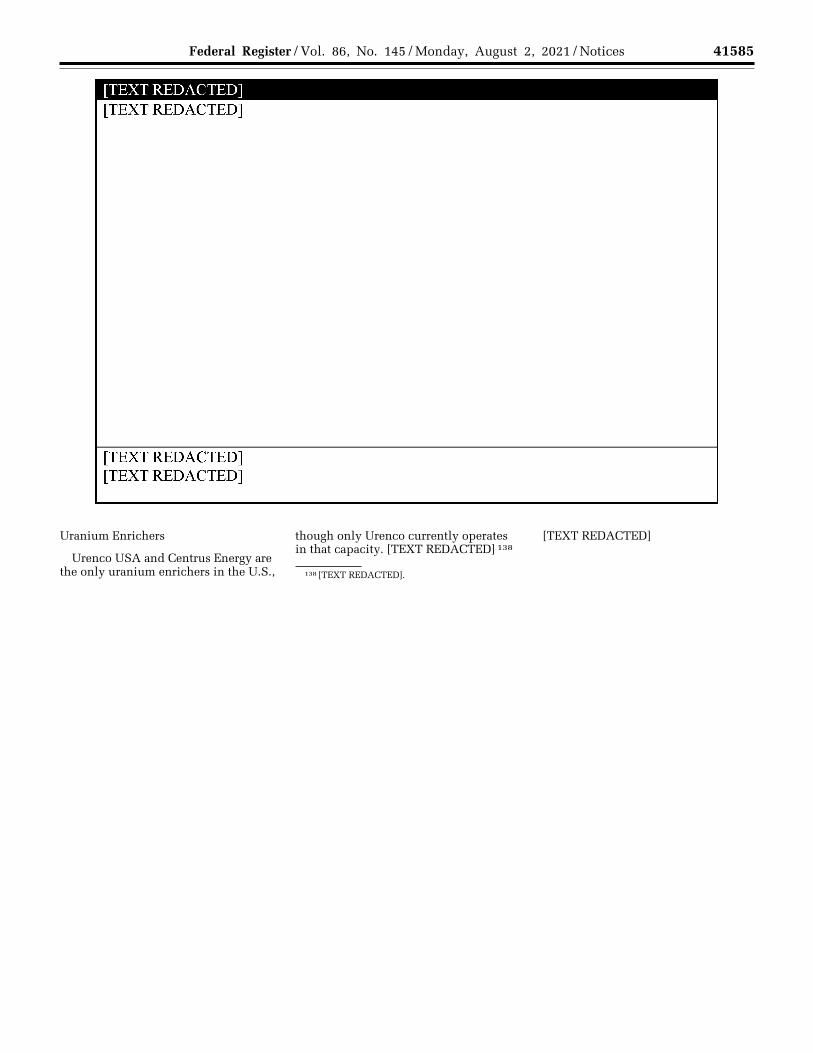
41585 Federal Register / Vol. 86, No. 145 / Monday, August 2, 2021 / Notices
138 [TEXT REDACTED].
Uranium Enrichers
Urenco USA and Centrus Energy are the only uranium enrichers in the U.S.,
though only Urenco currently operates in that capacity. [TEXT REDACTED] 138
[TEXT REDACTED]
VerDate Sep<11>2014 19:47 Jul 30, 2021 Jkt 253001 PO 00000 Frm 00047 Fmt 4701 Sfmt 4703 E:\FR\FM\02AUN2.SGM 02AUN2 EN
02A
U21
.036
</G
PH
>
kham
mon
d on
DS
KJM
1Z7X
2PR
OD
with
NO
TIC
ES
2
[TEXT REDACTED] [TEXT REDACTED]
[TEXT REDACTED] [TEXT REDACTED]
41586 Federal Register / Vol. 86, No. 145 / Monday, August 2, 2021 / Notices
VerDate Sep<11>2014 19:47 Jul 30, 2021 Jkt 253001 PO 00000 Frm 00048 Fmt 4701 Sfmt 4725 E:\FR\FM\02AUN2.SGM 02AUN2 EN
02A
U21
.037
</G
PH
>E
N02
AU
21.0
38<
/GP
H>
kham
mon
d on
DS
KJM
1Z7X
2PR
OD
with
NO
TIC
ES
2
[TEXT REDACTED] [TEXT REDACTED]
[TEXT REDACTED] rTEXT REDACTEDl
[TEXT RED AC TED]
[TEXT REDACTED]
[TEXT REDACTED] [TEXT REDACTED]
41587 Federal Register / Vol. 86, No. 145 / Monday, August 2, 2021 / Notices
Enrichment is a key part of the nuclear fuel cycle and these two companies represent the entire U.S. capability to commercially enrich nuclear material. Retaining their vital capabilities is necessary to preserve the
domestic fuel cycle, as their financial struggles are driven by the current state of the market.
Fuel Fabricators
The fuel fabricators are largely unaffected by financial struggles in other sectors of the industry. Debt ratios show that most cover the majority of their liabilities (see Figure 53).
[TEXT REDACTED]
[TEXT REDACTED] Over the longer term, the fuel fabricators are concerned
that Russia and Chinese SOEs will sell fabricated fuel directly to the nuclear
electric power operators, bypassing the need for U.S. domestic fuel fabricators.
VerDate Sep<11>2014 19:47 Jul 30, 2021 Jkt 253001 PO 00000 Frm 00049 Fmt 4701 Sfmt 4703 E:\FR\FM\02AUN2.SGM 02AUN2 EN
02A
U21
.039
</G
PH
>E
N02
AU
21.0
40<
/GP
H>
kham
mon
d on
DS
KJM
1Z7X
2PR
OD
with
NO
TIC
ES
2
[TEXT REDACTED] [TEXT REDACTED]
fTEXT REDACTEDl [TEXT REDACTED] fTEXT REDACTEDl
[TEXT REDACTED] [TEXT REDACTED]
fTEXT REDACTEDl [TEXT REDACTED]
fTEXT REDACTEDl
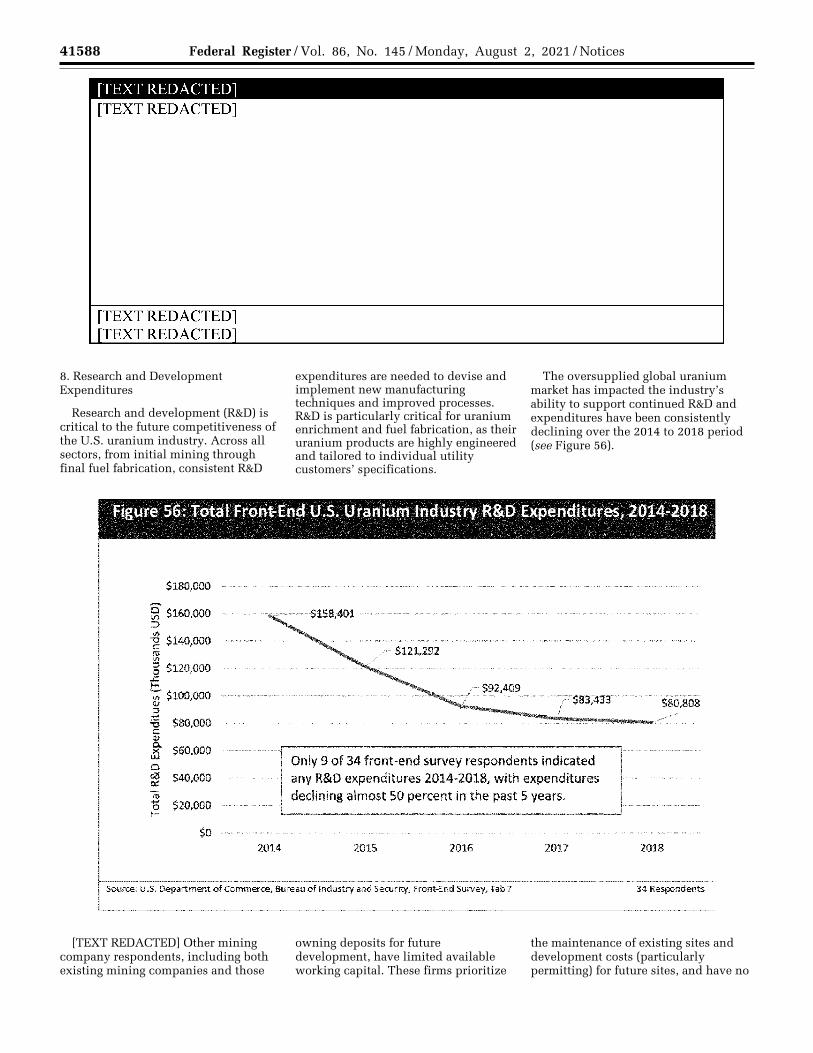
41588 Federal Register / Vol. 86, No. 145 / Monday, August 2, 2021 / Notices
8. Research and Development Expenditures
Research and development (R&D) is critical to the future competitiveness of the U.S. uranium industry. Across all sectors, from initial mining through final fuel fabrication, consistent R&D
expenditures are needed to devise and implement new manufacturing techniques and improved processes. R&D is particularly critical for uranium enrichment and fuel fabrication, as their uranium products are highly engineered and tailored to individual utility customers’ specifications.
The oversupplied global uranium market has impacted the industry’s ability to support continued R&D and expenditures have been consistently declining over the 2014 to 2018 period (see Figure 56).
[TEXT REDACTED] Other mining company respondents, including both existing mining companies and those
owning deposits for future development, have limited available working capital. These firms prioritize
the maintenance of existing sites and development costs (particularly permitting) for future sites, and have no
VerDate Sep<11>2014 19:47 Jul 30, 2021 Jkt 253001 PO 00000 Frm 00050 Fmt 4701 Sfmt 4703 E:\FR\FM\02AUN2.SGM 02AUN2 EN
02A
U21
.041
</G
PH
>E
N02
AU
21.0
42<
/GP
H>
kham
mon
d on
DS
KJM
1Z7X
2PR
OD
with
NO
TIC
ES
2
[TEXT REDACTED]
[TEXT REDACTED]
[TEXT REDACTED] fTEXT REDACTEDl
Figure 56: Total Front-End U.S. Uranium Industry R&D Expenditures, 2014-2018
$180,000
~ $160,000 :)
1 $140,000 IIJ "' S: $120,000 ~ ';;;' $100,000 GI ::,
:li $80,000
& ~ $60,000 0 t $40,000
! $20,000
Only 9 of 34 front-end survey respondents indicated any R&0 expenditures 2014-2018, with expenditures declining almost SO percent in the past 5 years.
$0 ' __ ,_ _________ _
2014 2015 2016 2017
Source: U .s. Department of Commerce, Bureau of Industry and Security, Fmnt-End Survey, Tab 7
$80,808 -
2018
34 Respondents
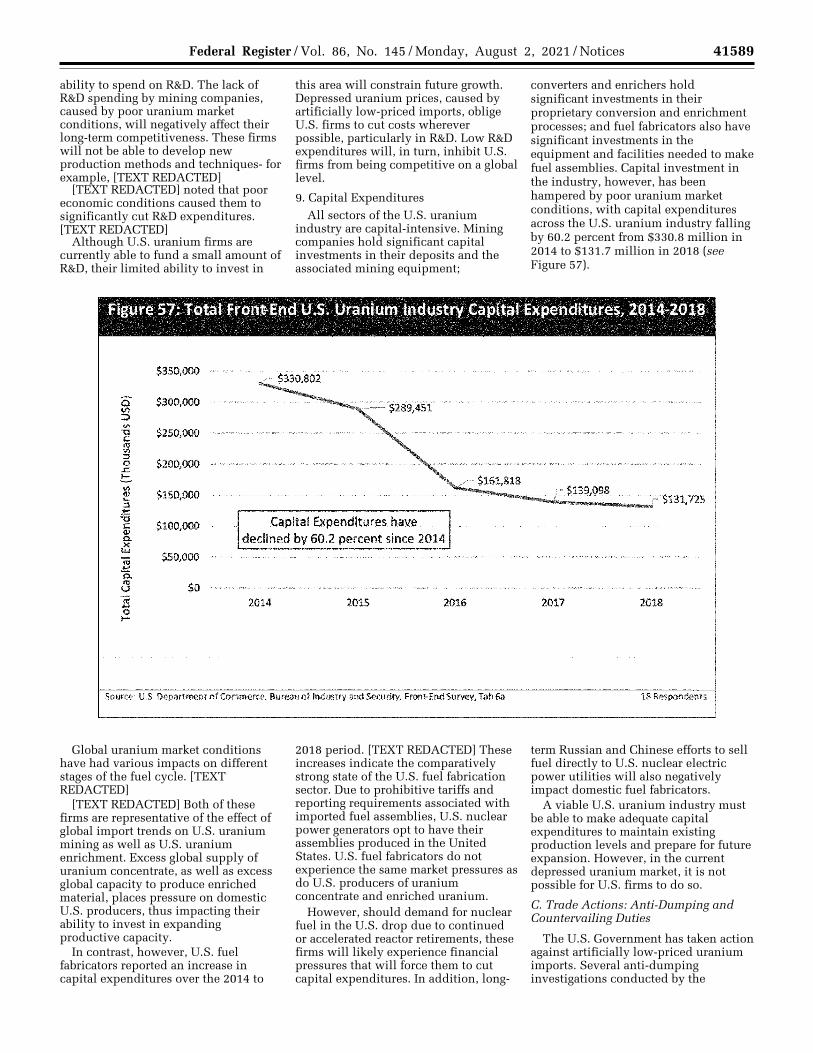
41589 Federal Register / Vol. 86, No. 145 / Monday, August 2, 2021 / Notices
ability to spend on R&D. The lack of R&D spending by mining companies, caused by poor uranium market conditions, will negatively affect their long-term competitiveness. These firms will not be able to develop new production methods and techniques- for example, [TEXT REDACTED]
[TEXT REDACTED] noted that poor economic conditions caused them to significantly cut R&D expenditures. [TEXT REDACTED]
Although U.S. uranium firms are currently able to fund a small amount of R&D, their limited ability to invest in
this area will constrain future growth. Depressed uranium prices, caused by artificially low-priced imports, oblige U.S. firms to cut costs wherever possible, particularly in R&D. Low R&D expenditures will, in turn, inhibit U.S. firms from being competitive on a global level.
9. Capital Expenditures All sectors of the U.S. uranium
industry are capital-intensive. Mining companies hold significant capital investments in their deposits and the associated mining equipment;
converters and enrichers hold significant investments in their proprietary conversion and enrichment processes; and fuel fabricators also have significant investments in the equipment and facilities needed to make fuel assemblies. Capital investment in the industry, however, has been hampered by poor uranium market conditions, with capital expenditures across the U.S. uranium industry falling by 60.2 percent from $330.8 million in 2014 to $131.7 million in 2018 (see Figure 57).
Global uranium market conditions have had various impacts on different stages of the fuel cycle. [TEXT REDACTED]
[TEXT REDACTED] Both of these firms are representative of the effect of global import trends on U.S. uranium mining as well as U.S. uranium enrichment. Excess global supply of uranium concentrate, as well as excess global capacity to produce enriched material, places pressure on domestic U.S. producers, thus impacting their ability to invest in expanding productive capacity.
In contrast, however, U.S. fuel fabricators reported an increase in capital expenditures over the 2014 to
2018 period. [TEXT REDACTED] These increases indicate the comparatively strong state of the U.S. fuel fabrication sector. Due to prohibitive tariffs and reporting requirements associated with imported fuel assemblies, U.S. nuclear power generators opt to have their assemblies produced in the United States. U.S. fuel fabricators do not experience the same market pressures as do U.S. producers of uranium concentrate and enriched uranium.
However, should demand for nuclear fuel in the U.S. drop due to continued or accelerated reactor retirements, these firms will likely experience financial pressures that will force them to cut capital expenditures. In addition, long-
term Russian and Chinese efforts to sell fuel directly to U.S. nuclear electric power utilities will also negatively impact domestic fuel fabricators.
A viable U.S. uranium industry must be able to make adequate capital expenditures to maintain existing production levels and prepare for future expansion. However, in the current depressed uranium market, it is not possible for U.S. firms to do so.
C. Trade Actions: Anti-Dumping and Countervailing Duties
The U.S. Government has taken action against artificially low-priced uranium imports. Several anti-dumping investigations conducted by the
VerDate Sep<11>2014 19:47 Jul 30, 2021 Jkt 253001 PO 00000 Frm 00051 Fmt 4701 Sfmt 4703 E:\FR\FM\02AUN2.SGM 02AUN2 EN
02A
U21
.043
</G
PH
>
kham
mon
d on
DS
KJM
1Z7X
2PR
OD
with
NO
TIC
ES
2
Figure 57: Total Front-End U.S. Uranium Industry Capital Expenditures, 2014-2018
$350,000
o $300,000 ::I "' ,:, C IIJ
"' ::I 0 .c t:. "' G) ,_ ;;i -'6 C G) 0. X w
iii ~ a. Ill V
5 0 I-
$250,000
$200,000
$150,000 --------- ·-··········--······
$100,000 - -· ........ Capital Expenditures_have. declined by 60.2 percent since 2014
$50,000
$0 2014 2015 2016
Source; U.S. Department of Commerce, Bureau of Industry and Security, Front-End Survey, Tab 6a
2017 2018
18 Respondents
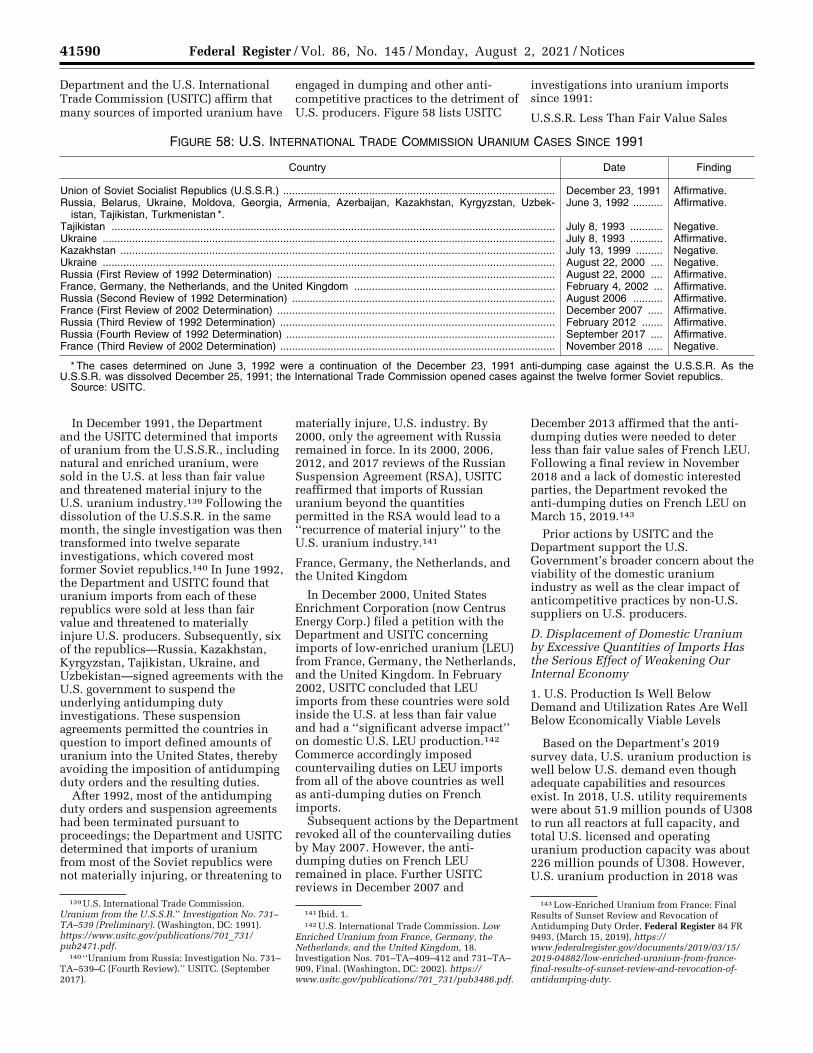
41590 Federal Register / Vol. 86, No. 145 / Monday, August 2, 2021 / Notices
139 U.S. International Trade Commission. Uranium from the U.S.S.R.’’ Investigation No. 731– TA–539 (Preliminary). (Washington, DC: 1991). https://www.usitc.gov/publications/701_731/ pub2471.pdf.
140 ‘‘Uranium from Russia: Investigation No. 731– TA–539–C (Fourth Review).’’ USITC. (September 2017).
141 Ibid. 1. 142 U.S. International Trade Commission. Low
Enriched Uranium from France, Germany, the Netherlands, and the United Kingdom, 18. Investigation Nos. 701–TA–409–412 and 731–TA– 909, Final. (Washington, DC: 2002). https://www.usitc.gov/publications/701_731/pub3486.pdf.
143 Low-Enriched Uranium from France: Final Results of Sunset Review and Revocation of Antidumping Duty Order, Federal Register 84 FR 9493, (March 15, 2019), https://www.federalregister.gov/documents/2019/03/15/ 2019-04882/low-enriched-uranium-from-france- final-results-of-sunset-review-and-revocation-of- antidumping-duty.
Department and the U.S. International Trade Commission (USITC) affirm that many sources of imported uranium have
engaged in dumping and other anti- competitive practices to the detriment of U.S. producers. Figure 58 lists USITC
investigations into uranium imports since 1991:
U.S.S.R. Less Than Fair Value Sales
FIGURE 58: U.S. INTERNATIONAL TRADE COMMISSION URANIUM CASES SINCE 1991
Country Date Finding
Union of Soviet Socialist Republics (U.S.S.R.) ............................................................................................ December 23, 1991 Affirmative. Russia, Belarus, Ukraine, Moldova, Georgia, Armenia, Azerbaijan, Kazakhstan, Kyrgyzstan, Uzbek-
istan, Tajikistan, Turkmenistan *.June 3, 1992 .......... Affirmative.
Tajikistan ...................................................................................................................................................... July 8, 1993 ........... Negative. Ukraine ......................................................................................................................................................... July 8, 1993 ........... Affirmative. Kazakhstan ................................................................................................................................................... July 13, 1999 ......... Negative. Ukraine ......................................................................................................................................................... August 22, 2000 .... Negative. Russia (First Review of 1992 Determination) .............................................................................................. August 22, 2000 .... Affirmative. France, Germany, the Netherlands, and the United Kingdom .................................................................... February 4, 2002 ... Affirmative. Russia (Second Review of 1992 Determination) ......................................................................................... August 2006 .......... Affirmative. France (First Review of 2002 Determination) .............................................................................................. December 2007 ..... Affirmative. Russia (Third Review of 1992 Determination) ............................................................................................. February 2012 ....... Affirmative. Russia (Fourth Review of 1992 Determination) ........................................................................................... September 2017 .... Affirmative. France (Third Review of 2002 Determination) ............................................................................................. November 2018 ..... Negative.
* The cases determined on June 3, 1992 were a continuation of the December 23, 1991 anti-dumping case against the U.S.S.R. As the U.S.S.R. was dissolved December 25, 1991; the International Trade Commission opened cases against the twelve former Soviet republics.
Source: USITC.
In December 1991, the Department and the USITC determined that imports of uranium from the U.S.S.R., including natural and enriched uranium, were sold in the U.S. at less than fair value and threatened material injury to the U.S. uranium industry.139 Following the dissolution of the U.S.S.R. in the same month, the single investigation was then transformed into twelve separate investigations, which covered most former Soviet republics.140 In June 1992, the Department and USITC found that uranium imports from each of these republics were sold at less than fair value and threatened to materially injure U.S. producers. Subsequently, six of the republics—Russia, Kazakhstan, Kyrgyzstan, Tajikistan, Ukraine, and Uzbekistan—signed agreements with the U.S. government to suspend the underlying antidumping duty investigations. These suspension agreements permitted the countries in question to import defined amounts of uranium into the United States, thereby avoiding the imposition of antidumping duty orders and the resulting duties.
After 1992, most of the antidumping duty orders and suspension agreements had been terminated pursuant to proceedings; the Department and USITC determined that imports of uranium from most of the Soviet republics were not materially injuring, or threatening to
materially injure, U.S. industry. By 2000, only the agreement with Russia remained in force. In its 2000, 2006, 2012, and 2017 reviews of the Russian Suspension Agreement (RSA), USITC reaffirmed that imports of Russian uranium beyond the quantities permitted in the RSA would lead to a ‘‘recurrence of material injury’’ to the U.S. uranium industry.141
France, Germany, the Netherlands, and the United Kingdom
In December 2000, United States Enrichment Corporation (now Centrus Energy Corp.) filed a petition with the Department and USITC concerning imports of low-enriched uranium (LEU) from France, Germany, the Netherlands, and the United Kingdom. In February 2002, USITC concluded that LEU imports from these countries were sold inside the U.S. at less than fair value and had a ‘‘significant adverse impact’’ on domestic U.S. LEU production.142 Commerce accordingly imposed countervailing duties on LEU imports from all of the above countries as well as anti-dumping duties on French imports.
Subsequent actions by the Department revoked all of the countervailing duties by May 2007. However, the anti- dumping duties on French LEU remained in place. Further USITC reviews in December 2007 and
December 2013 affirmed that the anti- dumping duties were needed to deter less than fair value sales of French LEU. Following a final review in November 2018 and a lack of domestic interested parties, the Department revoked the anti-dumping duties on French LEU on March 15, 2019.143
Prior actions by USITC and the Department support the U.S. Government’s broader concern about the viability of the domestic uranium industry as well as the clear impact of anticompetitive practices by non-U.S. suppliers on U.S. producers.
D. Displacement of Domestic Uranium by Excessive Quantities of Imports Has the Serious Effect of Weakening Our Internal Economy
1. U.S. Production Is Well Below Demand and Utilization Rates Are Well Below Economically Viable Levels
Based on the Department’s 2019 survey data, U.S. uranium production is well below U.S. demand even though adequate capabilities and resources exist. In 2018, U.S. utility requirements were about 51.9 million pounds of U308 to run all reactors at full capacity, and total U.S. licensed and operating uranium production capacity was about 226 million pounds of U308. However, U.S. uranium production in 2018 was
VerDate Sep<11>2014 19:47 Jul 30, 2021 Jkt 253001 PO 00000 Frm 00052 Fmt 4701 Sfmt 4703 E:\FR\FM\02AUN2.SGM 02AUN2kham
mon
d on
DS
KJM
1Z7X
2PR
OD
with
NO
TIC
ES
2
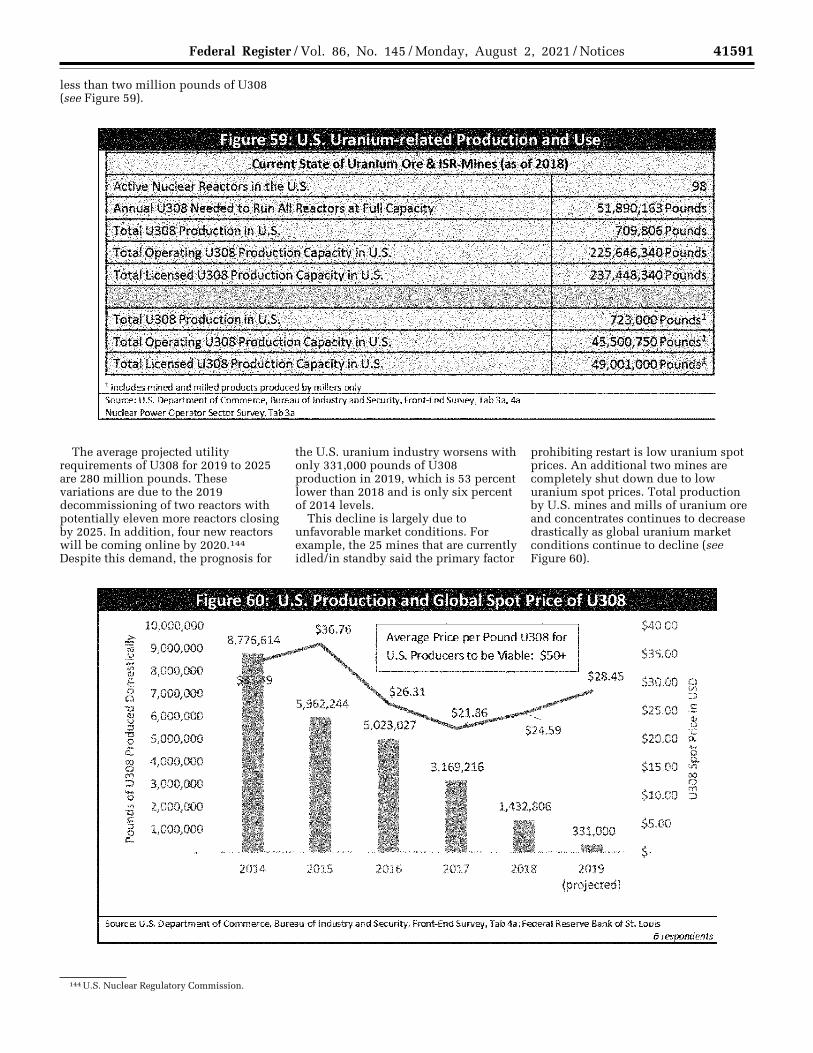
41591 Federal Register / Vol. 86, No. 145 / Monday, August 2, 2021 / Notices
144 U.S. Nuclear Regulatory Commission.
less than two million pounds of U308 (see Figure 59).
The average projected utility requirements of U308 for 2019 to 2025 are 280 million pounds. These variations are due to the 2019 decommissioning of two reactors with potentially eleven more reactors closing by 2025. In addition, four new reactors will be coming online by 2020.144 Despite this demand, the prognosis for
the U.S. uranium industry worsens with only 331,000 pounds of U308 production in 2019, which is 53 percent lower than 2018 and is only six percent of 2014 levels.
This decline is largely due to unfavorable market conditions. For example, the 25 mines that are currently idled/in standby said the primary factor
prohibiting restart is low uranium spot prices. An additional two mines are completely shut down due to low uranium spot prices. Total production by U.S. mines and mills of uranium ore and concentrates continues to decrease drastically as global uranium market conditions continue to decline (see Figure 60).
VerDate Sep<11>2014 19:47 Jul 30, 2021 Jkt 253001 PO 00000 Frm 00053 Fmt 4701 Sfmt 4725 E:\FR\FM\02AUN2.SGM 02AUN2 EN
02A
U21
.044
</G
PH
>E
N02
AU
21.0
45<
/GP
H>
kham
mon
d on
DS
KJM
1Z7X
2PR
OD
with
NO
TIC
ES
2
Source: U.S. Department of Commerce, Bureau of Industry and Security, Front-End Survey, Tab 3a, 4a
Nuclear Power O rator Sector SUrve , Tabla
Figure 60: U.S. Production and Global Spot Price of U308
10,000,000 $36.76 2: Average Price per Pound U308 for "iii 9,000,000
U.S.. Producers to be Viable: $50t IJ .:; VI 8,000,000 QJ E 8 7,000,000
5,962,244 "C
8 6,000,000 ::,
"e 5,000,000 Q..
00 4,000,000 0 rt') ::., 3,000,000 -0
"" 2,000,000 1,432,806 "C c:; ::, 1,000,000 331,000 0
Cl. .~'-'"""•~~••S-,.«•,so;,.,h .•... , .••• ,., .... _.lllllllll .... ,.,., ..
2014 2015 2016 2017 2018 2019 (projected)
$40.00
$35.00
$30.00 0 II') ::.,
$25.00 .5 QJ V
$20.00 ·c Q. .... 0
$15.00 0..
II')
~ $10.00
rt')
:>
$5.00
$-
Source: U.S. Department of Commerce, Bureau of Industry and Security, Front-End Survey, Tab4a; Federal Reserve Bank of St. Louis 6 respondents
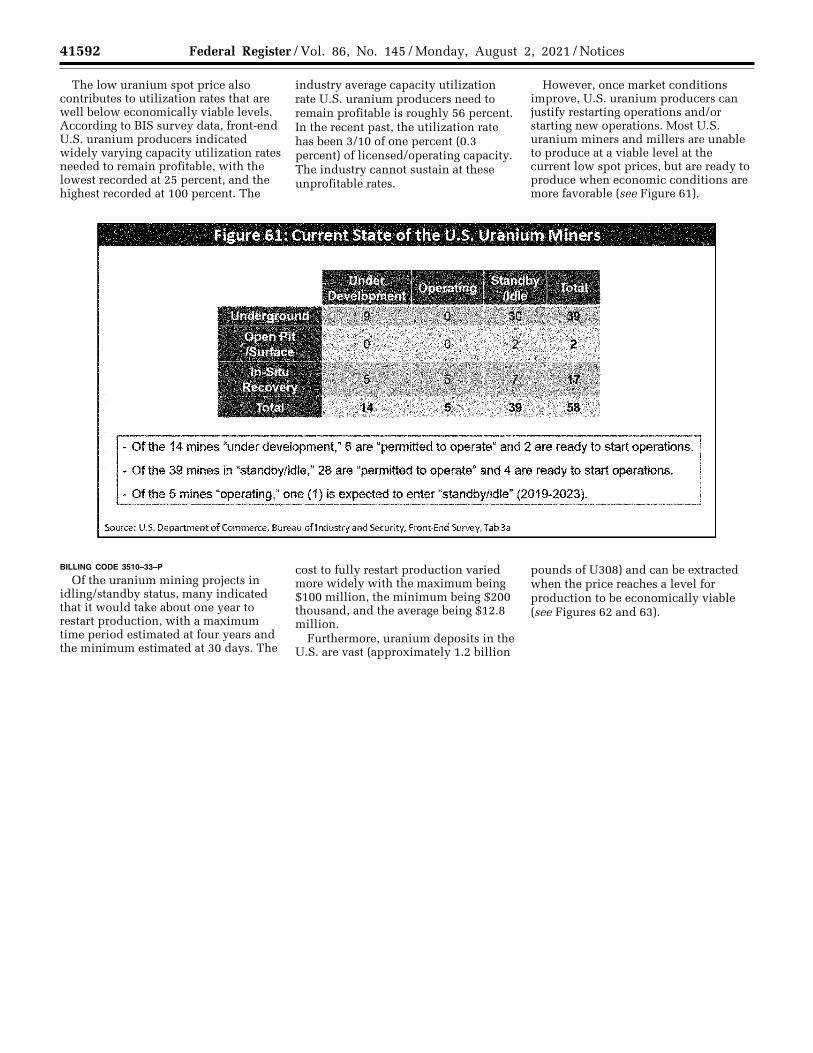
41592 Federal Register / Vol. 86, No. 145 / Monday, August 2, 2021 / Notices
The low uranium spot price also contributes to utilization rates that are well below economically viable levels. According to BIS survey data, front-end U.S. uranium producers indicated widely varying capacity utilization rates needed to remain profitable, with the lowest recorded at 25 percent, and the highest recorded at 100 percent. The
industry average capacity utilization rate U.S. uranium producers need to remain profitable is roughly 56 percent. In the recent past, the utilization rate has been 3/10 of one percent (0.3 percent) of licensed/operating capacity. The industry cannot sustain at these unprofitable rates.
However, once market conditions improve, U.S. uranium producers can justify restarting operations and/or starting new operations. Most U.S. uranium miners and millers are unable to produce at a viable level at the current low spot prices, but are ready to produce when economic conditions are more favorable (see Figure 61).
BILLING CODE 3510–33–P
Of the uranium mining projects in idling/standby status, many indicated that it would take about one year to restart production, with a maximum time period estimated at four years and the minimum estimated at 30 days. The
cost to fully restart production varied more widely with the maximum being $100 million, the minimum being $200 thousand, and the average being $12.8 million.
Furthermore, uranium deposits in the U.S. are vast (approximately 1.2 billion
pounds of U308) and can be extracted when the price reaches a level for production to be economically viable (see Figures 62 and 63).
VerDate Sep<11>2014 19:47 Jul 30, 2021 Jkt 253001 PO 00000 Frm 00054 Fmt 4701 Sfmt 4703 E:\FR\FM\02AUN2.SGM 02AUN2 EN
02A
U21
.046
</G
PH
>
kham
mon
d on
DS
KJM
1Z7X
2PR
OD
with
NO
TIC
ES
2
Figure 61: Current State of the U.S. Uranium Miners
- Of the 14 mines "under development,• 6 are "permitted to operate• and 2 are ready to start operations.
- Of the 39 mines in nstandby/idle." 28 are "permitted to operate" and 4 are ready to start operations.
- Of the 5 mines "operating," one (1) is expected to enter "standby/idle" (2019--2023).
Source: U.S. Department of Commerce, Bureau ofl ndustry and Security, Front-End Survev, Tab 3a
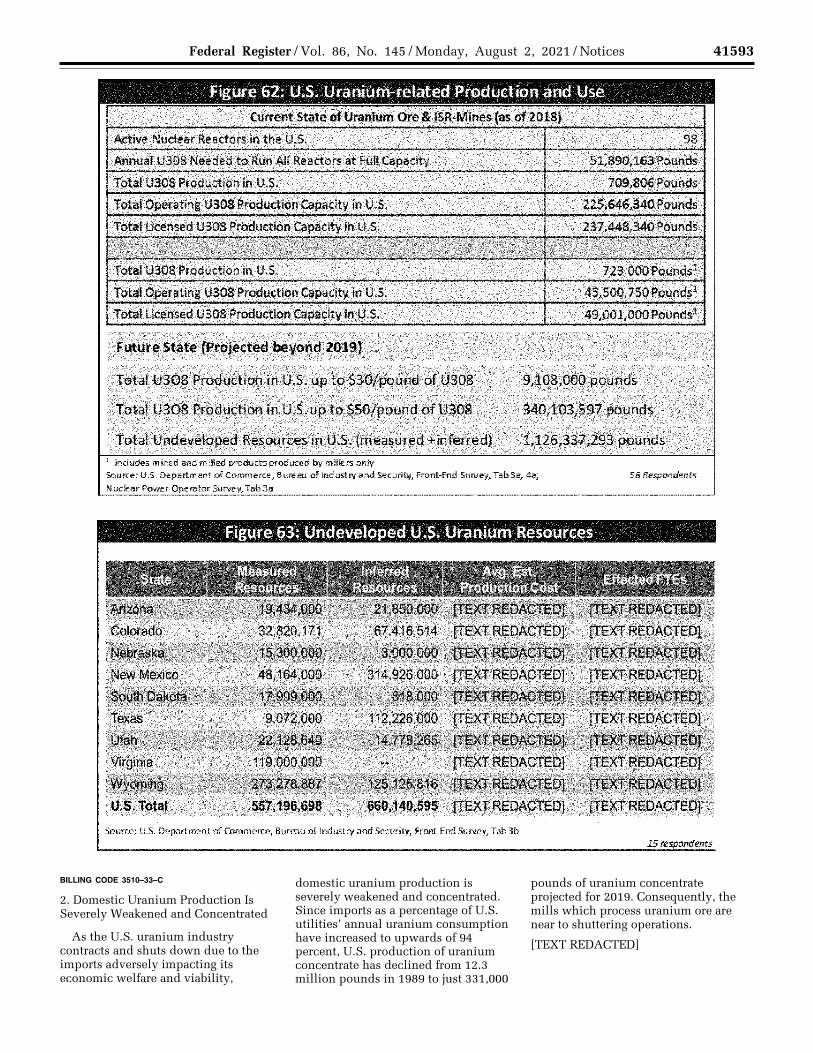
41593 Federal Register / Vol. 86, No. 145 / Monday, August 2, 2021 / Notices
BILLING CODE 3510–33–C
2. Domestic Uranium Production Is Severely Weakened and Concentrated
As the U.S. uranium industry contracts and shuts down due to the imports adversely impacting its economic welfare and viability,
domestic uranium production is severely weakened and concentrated. Since imports as a percentage of U.S. utilities’ annual uranium consumption have increased to upwards of 94 percent, U.S. production of uranium concentrate has declined from 12.3 million pounds in 1989 to just 331,000
pounds of uranium concentrate projected for 2019. Consequently, the mills which process uranium ore are near to shuttering operations.
[TEXT REDACTED]
VerDate Sep<11>2014 19:47 Jul 30, 2021 Jkt 253001 PO 00000 Frm 00055 Fmt 4701 Sfmt 4703 E:\FR\FM\02AUN2.SGM 02AUN2 EN
02A
U21
.047
</G
PH
>
kham
mon
d on
DS
KJM
1Z7X
2PR
OD
with
NO
TIC
ES
2
1 includes mined and milled products produced by miller.;; only So1rn:e: U.S. Department of Commen::e, Bureau of Industry and Security, front-End Survey, Tab3a, 4a; Nuclear Power Operator SUrvey, Tab3a
Figure 63: Undeveloped U.S. Uranium Resources
58 Respondents
State Measured Inferred Avg .. Est. ' Effected FTEs , Resources Resources Production Cost
source: U.S. Department of commerce, Bureau of Industry and security, Front-End Survey, Tab 3b 15 respondents
41594 Federal Register / Vol. 86, No. 145 / Monday, August 2, 2021 / Notices
3. Reduction of Uranium Production Facilities Limits Capacity Available for a National Emergency and Threatens To Impair National Security
Key factors in this investigation include growth requirements of domestic industries to meet national defense requirements; however, reduction of uranium production
facilities limits the capacity available in the event of a national emergency. The United States cannot be subject and should not be subject to foreign dependence in the face of potential uranium needs in an emergency scenario. The decline of the U.S. uranium production industry limits availability and puts the U.S. at risk, impairing national security. On the
miners side, sales and export data show that U.S. producers are selling more product than they are producing, indicating that contracts are being fulfilled with either inventory, spot market purchases, or other. U.S. mines have resorted to buying spot market uranium in order to fulfill contracts since it is cheaper than producing themselves.
The U.S. uranium industry’s low production levels force U.S. nuclear power generators into heavy
dependence on foreign uranium supplies. Of the 98 active U.S. nuclear reactors, only four have annual
requirements less than 331,000 pounds U3O8 per year, which is the total U.S.
VerDate Sep<11>2014 19:47 Jul 30, 2021 Jkt 253001 PO 00000 Frm 00056 Fmt 4701 Sfmt 4703 E:\FR\FM\02AUN2.SGM 02AUN2 EN
02A
U21
.048
</G
PH
>E
N02
AU
21.0
49<
/GP
H>
kham
mon
d on
DS
KJM
1Z7X
2PR
OD
with
NO
TIC
ES
2
[TEXT REDACTED]
[TEXT REDACTED]
[TEXT REDACTED] fTEXT REDACTEDl
[TEXT REDACTED] [TEXT REDACTED] [TEXT REDACTED [TEXT REDACTED TEXT REDACTED
[TEXT REDACTED] TEXT REDACTED
T ACTED] T
ACTED T
ACTED
T ACTED] T
ACTED T
ACTED
ACTED] T
ACTED] T
ACTED T
ACTED
41595 Federal Register / Vol. 86, No. 145 / Monday, August 2, 2021 / Notices
145 ‘‘World Uranium Mining Production.’’ World Nuclear Association. http://www.world-nuclear.org/
information-library/nuclear-fuel-cycle/mining-of- uranium/world-uranium-mining-production.aspx.
production expected for 2019 (see Figure 65).
Projected 2019 U.S. uranium production would be sufficient to fuel only one of these reactors. [TEXT REDACTED] Low U.S. production levels denote that a sudden loss of access to foreign uranium supplies has the potential to severely disrupt the nuclear power plants that provide almost one- fifth of the nation’s electricity.
[TEXT REDACTED] Therefore, a remedy to resolve the inhibiting factors to production must be implemented so that U.S. miners are once again reliable
suppliers of uranium, and with additional U.S. capability to convert and enrich the mined uranium, U.S. utilities are able to fulfill their need of domestic uranium for national security or national emergency use.
As previously discussed, the stockpile maintained by DOE is anticipated to satisfy needs for LEU and HEU through 2041 and 2060 respectively. However, U.S. nuclear electric power utilities only maintain enough inventory of uranium to fuel their reactors for an average of [TEXT REDACTED] (see Figure 66). The compounded effects of both minimal
inventory and minimal U.S. production highlights the national security threat imposed by U.S. nuclear electric utilities’ near complete dependence on imports of uranium to fuel their reactors. In the event of a supply disruption, U.S. utilities’ would be unable to supply the 19 percent of U.S. electricity consumption they usually provide after [TEXT REDACTED]. The continued loss in U.S. production capabilities ensures that a disruption in supply to the nation’s 98 reactors would be catastrophic to U.S. critical infrastructure.
E. Uranium Market Distortion by State- Owned Enterprises Is a Circumstance That Contributes to the Weakening of the Domestic Economy
1. Excess Russian, Kazakh, and Uzbek Production Adversely Affects Global Markets and Creates a Dangerous U.S. Dependence on Uranium From These Countries
Although global uranium production increased by 42 percent between 2008 and 2016, the subsequent supply glut following the Fukushima disaster and reactor retirements has begun to affect production.145 As the potential for new reactor construction increased, new mines came online to meet potential demand. In 2008, the world’s uranium mines produced enough uranium to fulfill 70 percent of existing world
demand. By 2016, global uranium production filled 98 percent of world demand.
However, the increasing pace of reactor retirements, cancellation of proposed new reactors, and excess supply caused by the shutdown of German and Japanese reactors all impacted the global uranium market. Accordingly, between 2016 and 2017, global uranium production dropped by 4.7 percent—remaining production could satisfy 93 percent of 2017 demand. As more reactors come online in certain regions, particularly in Asia, the Middle East, and Africa, global demand is expected to grow once more.
By 2025, the International Atomic Energy Agency estimates that global uranium demand could be as high as 68,920 metric tons—a 10 percent
increase on 2016 levels. However, current poor market conditions, exacerbated by artificially low-priced SOE producers, have forced many producers in the U.S. and other countries to idle production or close mines entirely. U.S. and other market producers may therefore not be present in the market to take advantage of higher future demand.
Thus, while U.S. production declined by 16 percent between 2016 and 2017, Russian and Kazakh production declined only by 5.1 and 2.9 percent respectively (see Figure 67). Uzbek production remained constant. Even Canada and Australia, which have historically produced more than the U.S., cut their production to a greater degree than did Russia, Kazakhstan, and Uzbekistan.
FIGURE 67: CHANGES IN URANIUM PRODUCTION, 2016–2017
Country 2016 Production
(metric tons uranium)
2017 Production (metric tons
uranium)
Change in production
(percentage)
United States ............................................................................................................. 1,125 940 ¥16.4 Canada ...................................................................................................................... 14,039 13,116 ¥6.55 Australia ..................................................................................................................... 6,315 5,882 ¥6.86 Russia ........................................................................................................................ 3,004 2,917 ¥2.89 Kazakhstan ................................................................................................................ 24,586 23,321 ¥5.14 Uzbekistan ................................................................................................................. 2404 2404 0 China .......................................................................................................................... 1616 1885 16.6
Source: World Nuclear Association, March 2019, 2018 data has not been released.
VerDate Sep<11>2014 19:47 Jul 30, 2021 Jkt 253001 PO 00000 Frm 00057 Fmt 4701 Sfmt 4703 E:\FR\FM\02AUN2.SGM 02AUN2 EN
02A
U21
.050
</G
PH
>
kham
mon
d on
DS
KJM
1Z7X
2PR
OD
with
NO
TIC
ES
2
TEXT REDACTED [TEXT REDACTED] [TEXT REDACTED]
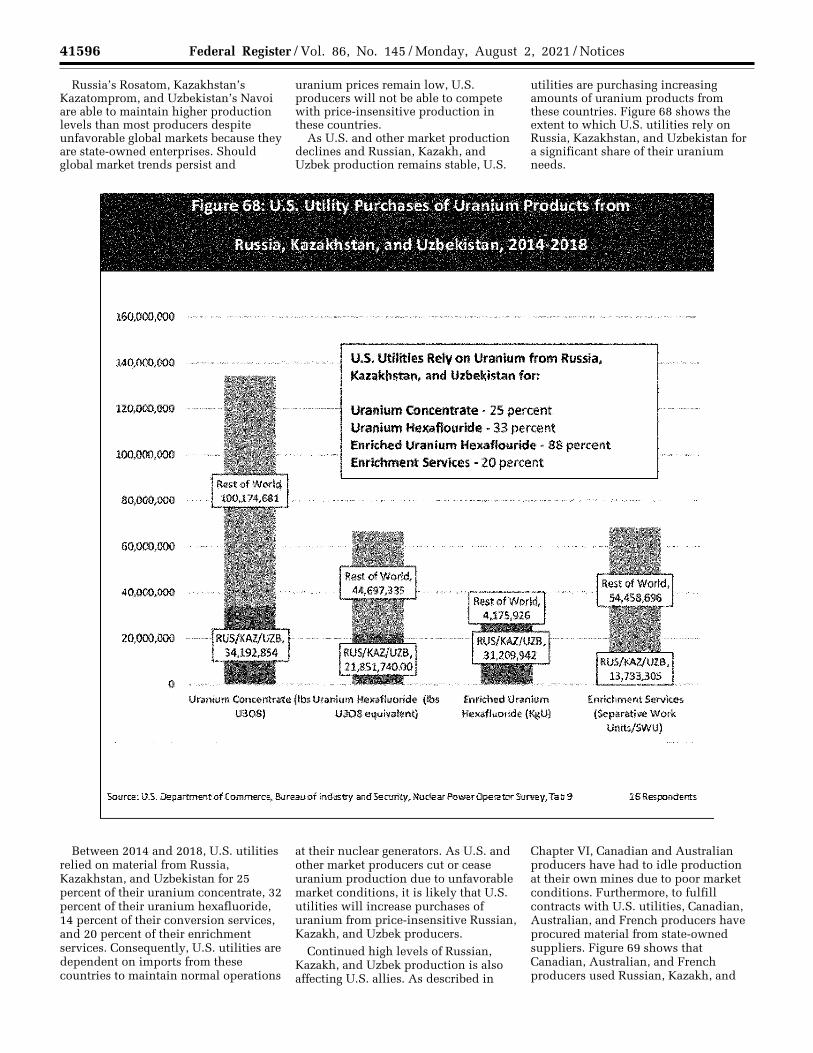
41596 Federal Register / Vol. 86, No. 145 / Monday, August 2, 2021 / Notices
Russia’s Rosatom, Kazakhstan’s Kazatomprom, and Uzbekistan’s Navoi are able to maintain higher production levels than most producers despite unfavorable global markets because they are state-owned enterprises. Should global market trends persist and
uranium prices remain low, U.S. producers will not be able to compete with price-insensitive production in these countries.
As U.S. and other market production declines and Russian, Kazakh, and Uzbek production remains stable, U.S.
utilities are purchasing increasing amounts of uranium products from these countries. Figure 68 shows the extent to which U.S. utilities rely on Russia, Kazakhstan, and Uzbekistan for a significant share of their uranium needs.
Between 2014 and 2018, U.S. utilities relied on material from Russia, Kazakhstan, and Uzbekistan for 25 percent of their uranium concentrate, 32 percent of their uranium hexafluoride, 14 percent of their conversion services, and 20 percent of their enrichment services. Consequently, U.S. utilities are dependent on imports from these countries to maintain normal operations
at their nuclear generators. As U.S. and other market producers cut or cease uranium production due to unfavorable market conditions, it is likely that U.S. utilities will increase purchases of uranium from price-insensitive Russian, Kazakh, and Uzbek producers.
Continued high levels of Russian, Kazakh, and Uzbek production is also affecting U.S. allies. As described in
Chapter VI, Canadian and Australian producers have had to idle production at their own mines due to poor market conditions. Furthermore, to fulfill contracts with U.S. utilities, Canadian, Australian, and French producers have procured material from state-owned suppliers. Figure 69 shows that Canadian, Australian, and French producers used Russian, Kazakh, and
VerDate Sep<11>2014 19:47 Jul 30, 2021 Jkt 253001 PO 00000 Frm 00058 Fmt 4701 Sfmt 4703 E:\FR\FM\02AUN2.SGM 02AUN2 EN
02A
U21
.051
</G
PH
>
kham
mon
d on
DS
KJM
1Z7X
2PR
OD
with
NO
TIC
ES
2
160,000,000
140,000,000
100,000,000
80,000,000
60,000,000
40,000,000
20,000,000
0
Figure 68: U.S. Utility Purchases of Uranium Products from
Russia, Kazakhstan, and Uzbekistan, 2014-2018
U.S. Utilities Rely on Uranium from Russia, Kazakhstan, and Uzbekistan for:
uranium Concentrate - 25 percent Uranium Hexaflourlde - 33 percent Enriched Uranium Hexaflouride ... 88 percent Enrichment Services - 20 percent
Uranium Concentrate (lbs Uranium Hexafluoride (lbs Enriched Uranium U308l uaos equivalent) Heqfiuoride (K,gU}
Enrithmen.t Services (Se~rative Work
Unlts/SWU)
Som-ce: US. .Oepanment of u:immerre, Bureau of tmruRy and Se1:U1ity, Nudeai- l"owerOperamr Stmrey, Tab !J 16 Hespomiel'IIS
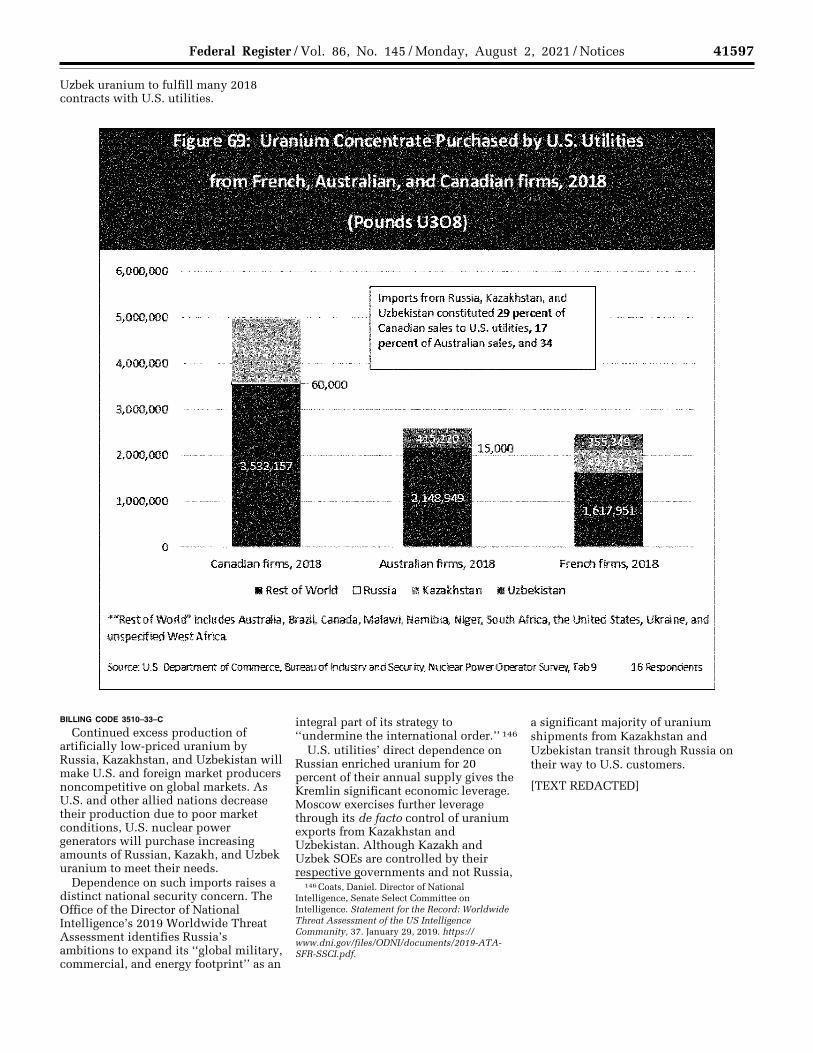
41597 Federal Register / Vol. 86, No. 145 / Monday, August 2, 2021 / Notices
146 Coats, Daniel. Director of National Intelligence, Senate Select Committee on Intelligence. Statement for the Record: Worldwide Threat Assessment of the US Intelligence Community, 37. January 29, 2019. https://www.dni.gov/files/ODNI/documents/2019-ATA- SFR-SSCI.pdf.
Uzbek uranium to fulfill many 2018 contracts with U.S. utilities.
BILLING CODE 3510–33–C
Continued excess production of artificially low-priced uranium by Russia, Kazakhstan, and Uzbekistan will make U.S. and foreign market producers noncompetitive on global markets. As U.S. and other allied nations decrease their production due to poor market conditions, U.S. nuclear power generators will purchase increasing amounts of Russian, Kazakh, and Uzbek uranium to meet their needs.
Dependence on such imports raises a distinct national security concern. The Office of the Director of National Intelligence’s 2019 Worldwide Threat Assessment identifies Russia’s ambitions to expand its ‘‘global military, commercial, and energy footprint’’ as an
integral part of its strategy to ‘‘undermine the international order.’’ 146
U.S. utilities’ direct dependence on Russian enriched uranium for 20 percent of their annual supply gives the Kremlin significant economic leverage. Moscow exercises further leverage through its de facto control of uranium exports from Kazakhstan and Uzbekistan. Although Kazakh and Uzbek SOEs are controlled by their respective governments and not Russia,
a significant majority of uranium shipments from Kazakhstan and Uzbekistan transit through Russia on their way to U.S. customers.
[TEXT REDACTED]
VerDate Sep<11>2014 19:47 Jul 30, 2021 Jkt 253001 PO 00000 Frm 00059 Fmt 4701 Sfmt 4703 E:\FR\FM\02AUN2.SGM 02AUN2 EN
02A
U21
.052
</G
PH
>
kham
mon
d on
DS
KJM
1Z7X
2PR
OD
with
NO
TIC
ES
2
6,000,000
5,000,000
4,000,000
3,000,000
2,000,000
1,000,000
0
Figure 69: Uranium Concentrate Purchased by U.S. Utilities
from French, Australian, and Canadian firms, 2018
(Pounds U308}
60,000
Canadian firms, 2018
Imports from Russia, ,Kazakhstan, and Uzbekistan constituted 29 pen:ent of Canadian sales to U.S. utilities~ 17 percent of Australian sales, and 34
15,000
Australian firms, 2018 French finns, 2018
■ Rest of Wor1d □ Russia II Kazakhstan ■ Uzbekistan
*"Rest of Wodd' indudes Australia, Brazil, canada, Malawi, Nammia, Niger, South Africa, the United states, Ukraine, and
unspecified West Africa
Source: U.S. Depatment d Conmerce,. Bureauof lmfuslry andSecU'ity, Nuclear PowerOJBator SUlvE!l Tab9 16 lespondents
41598 Federal Register / Vol. 86, No. 145 / Monday, August 2, 2021 / Notices
147 Since the Russian annexation of Crimea and intervention in eastern Ukraine in 2014, Russia has steadily built up its military assets in the Baltic Sea region. Russia therefore could close Baltic Sea shipping lanes with comparative ease. Oder, Tobias. ‘‘The Dimensions of Russian Sea Denial in the Baltic Sea.’’ Center for International Maritime Security, January 04, 2018. http://cimsec.org/ dimensions-russian-sea-denial-baltic-sea/35157.
148 ‘‘China’s Nuclear Fuel Cycle.’’ World Nuclear Association. http://www.world-nuclear.org/ information-library/country-profiles/countries-a-f/ china-nuclear-fuel-cycle.aspx.
149 Pascale Massot and Zhan-Ming Chen. ‘‘China and the Global Uranium Market: Prospects for Peaceful Coexistence.’’ The Scientific World Journal, 2013. https://www.hindawi.com/journals/ tswj/2013/672060/.
150 ‘‘China’s Nuclear Fuel Cycle.’’ World Nuclear Association. http://www.world-nuclear.org/ information-library/country-profiles/countries-a-f/ china-nuclear-fuel-cycle.aspx.
151 ‘‘Rio Tinto to sell Rossing stake.’’ World Nuclear News, November 26, 2018. http://www.world-nuclear-news.org/Articles/Rio-Tinto-to- sell-Rossing-stake.
152 Hui Zhang, ‘‘China’s Uranium Enrichment Capacity: Rapid Expansion to Meet Commercial Needs’’, (Cambridge: Harvard Kennedy School, 2015), 32.
153 Ibid., 34.
In the event of increased political or potential military tensions, Russia could choose to ban uranium exports to the United States; denying U.S. utilities a significant share of their enriched uranium. Russia further possesses the military means to deny U.S. and U.S.- aligned countries access to Kazakh and Uzbek uranium exported through Russian ports, principally on the Baltic Sea.147 In either of these circumstances, U.S. utilities would conceivably be denied a significant percentage of their uranium requirements and could face critical fuel shortages.
2. The Increasing Presence of China in the Global Uranium Market Will Further Weaken U.S. and Other Market Uranium Producers
Although China’s uranium industry has been developed primarily to serve the country’s growing fleet of nuclear reactors, China is increasing its involvement in the global nuclear fuel industry.148 China’s involvement in the global nuclear fuel industry is an outgrowth of its domestic uranium procurement strategy. As China has only limited domestic uranium reserves, it has also acquired interests in uranium deposits outside China. This ‘‘two markets, two resources’’ 149 policy has led Chinese firms to acquire significant shares of mines in Kazakhstan and Namibia, with prospective developments in Niger and Canada.150
China’s activity in Namibia is of particular interest.151 Namibia has two active uranium mines—Husab and Rossing. Chinese firms have a majority stake in Husab and purchased a majority stake in Rossing. However, the Rossing transaction is under review by the Namibia Competition Commission. A Chinese firm does have a 25 percent stake in the Langer Heinrich mine, but that mine was placed in care and maintenance in 2018 and thus cannot be characterized as active. These mines’ production costs exceed current global uranium prices, and so cannot support commercial production. However, cost recovery is seemingly not a concern for Chinese-state owned producers.
Between 2014 and 2018, U.S. utilities purchased approximately 347,781 pounds of uranium concentrate, 2.33 million pounds of U3O8 equivalent of conversion services, and 1.4 million separative work units (SWU) of enrichment services—enough to supply 16 average reactors per year—from Chinese producers. U.S. utilities also have contracts with Chinese producers for at least 130,000 SWU between 2019 and 2023, indicating an interest in continued relationships with Chinese producers. U.S. utilities have also contracted with CGN Global Uranium Ltd., the trading arm of Chinese SOE China General Nuclear, for certain uranium purchases. Between 2014 and 2018, U.S. utilities purchased 800,000 pounds of uranium concentrate from CGN Global.
As the bulk of China’s uranium concentrate production is consumed by domestic nuclear power generators, most Chinese exports of uranium will likely be in the form of enrichment services. Domestic Chinese enrichment capacity is increasing faster than domestic demand: By 2020, the country’s enrichment centrifuges will have a total capacity of 12 million SWU, compared to domestic demand of 9
million SWU.152 Chinese producers intend to use this excess capacity to increase the country’s presence in the nuclear fuels trade. A China National Nuclear Corporation (CNNC) executive remarked in 2013: ‘‘On the basis of securing its domestic supply [of SWU], CNNC will gradually expand its foreign markets and make China’s fuel industry internationally competitive.’’ 153 China’s increasing control of global uranium deposits and its excess enrichment capacity will allow it to further enter the nuclear fuels market and undermine U.S. and other market producers.
3. Increasing Global Excess Uranium Production Will Further Weaken the Internal Economy as U.S. Uranium Producers Will Face Increasing Import Competition
Continued high levels of production by state-owned enterprises in Russia, Kazakhstan, Uzbekistan, and China will place further financial pressure on U.S. uranium producers. U.S. uranium concentrate production, which declined by 94 percent between 2014 and 2018, will be non-existent in the near future as subsidized foreign production continues.
Foreign market producers are not immune from the effects of state-owned producers either. As described in Chapter VI, Canadian and Australian producers have had to idle production at their own mines due to poor market conditions. Furthermore, to fulfill contracts with U.S. utilities, Canadian, Australian, and French producers have procured material from state-owned suppliers.
VIII. Conclusion
A. Determination Based on these findings, the Secretary
of Commerce has concluded that the present quantities and circumstance of uranium imports are ‘‘weakening our internal economy’’ and ‘‘threaten to
VerDate Sep<11>2014 19:47 Jul 30, 2021 Jkt 253001 PO 00000 Frm 00060 Fmt 4701 Sfmt 4703 E:\FR\FM\02AUN2.SGM 02AUN2 EN
02A
U21
.053
</G
PH
>
kham
mon
d on
DS
KJM
1Z7X
2PR
OD
with
NO
TIC
ES
2
[TEXT RED/\CTED] [TEXT REDACTED]
[TEXT REDACTED] [TEXT REDACTED] fTEXT REDACTEDl
41599 Federal Register / Vol. 86, No. 145 / Monday, August 2, 2021 / Notices
154 U.S. White House Office. National Security Strategy of the United States of America. (Washington, DC: 2017), 2 https://www.whitehouse.gov/wp-content/uploads/2017/12/ NSS-Final-12-18-2017-0905-2.pdf.
impair the national security’’ as defined in Section 232. An economically viable and secure supply of U.S.-sourced uranium is required for national defense needs. International obligations, including agreements with foreign partners under Section 123 of the Atomic Energy Act of 1954, govern the use of most imported uranium and generally restrict it to peaceful, non- explosive uses. As a result, uranium used for military purposes must generally be domestically produced from mining through the fuel fabrication process. Furthermore, the predictable maintenance and support of U.S. critical infrastructure, especially the electric power grid, depends on a diverse supply of uranium, which includes U.S.-sourced uranium products and services.
The Secretary further recognizes that the U.S. uranium industry’s financial and production posture has significantly deteriorated since the Department’s 1989 Report. That investigation noted that U.S. nuclear power utilities imported 51.1 percent of their uranium requirements in 1987. By 2018, imports had increased to 93.3 percent of those utilities’ annual requirements. Based on comprehensive 2019 industry data provided by U.S. uranium producers and U.S. nuclear electric power utilities to the Department in response to a mandatory survey, U.S. utilities’ usage of U.S. mined uranium has dropped to nearly zero. [TEXT REDACTED] Based on the current and projected state of the U.S. uranium industry, the Department has concluded that the U.S. uranium industry is unable to satisfy existing or future national security needs or respond to a national security emergency requiring a significant
increase in domestic uranium production.
Absent immediate action, closures of the few remaining U.S. uranium mining, milling, and conversion facilities are anticipated within the next few years. Further decreases in U.S. uranium production and capacity, including domestic fuel fabrication, will cause even higher levels of U.S. dependence on imports, especially from Russia, Kazakhstan, Uzbekistan, and China. Increased imports from SOEs in those countries, and in particular Russia and China, which the 2017 National Security Strategy noted present a direct challenge to U.S. influence, are detrimental to the national security.154 The high risk of loss of the remaining U.S. domestic uranium industry, if the present excessive level of imports continue, threatens to impair the national security as defined by Section 232.
The Secretary has determined that to remove the threat of impairment to national security, it is necessary to reduce imports of uranium to a level that enables U.S. uranium producers to return to an economically competitive and financially viable position. This will allow the industry to sustain production capacity, hire and maintain a skilled workforce, make needed capital expenditures, and perform necessary research and development activities. A modest reduction of uranium imports will allow for the revival of U.S. uranium mining and milling, the restart of the sole U.S. uranium converter, and a reduction in
import challenges to fuel fabricators, while also recognizing the market and pricing challenges confronting the U.S. nuclear power utilities.
Recommendation
Due to the threat to the national security, as defined in Section 232, from excessive uranium imports, the Secretary recommends that the President take immediate action by adjusting the level of these imports through implementation of an import waiver to achieve a phased-in reduction of uranium imports. The reduction in imports of uranium should be sufficient to enable U.S. producers to recapture and sustain a market share of U.S. uranium consumption that will allow for financial viability, and enable the maintenance of a skilled workforce and the production capacity and uranium output needed for national defense and critical infrastructure requirements. The reduction imposed should be sufficient to enable U.S. producers to eventually supply 25 percent of U.S. utilities’ uranium needs based on 2018 U.S. U308 concentrate annual consumption requirements.
Based on the survey responses, the Department has determined that U.S. uranium producers require an amount equivalent to 25 percent of U.S. nuclear power utilities’ 2018 annual U308 concentrate consumption to ensure financial viability. Based on the Department’s analysis, if U.S.-mined uranium supplied 25 percent of U.S. nuclear power utilities’ annual U308 concentrate consumption, U.S. uranium prices will increase to approximately $55 per pound (see Figure 71). The current spot price is low due to distortions from SOEs.
VerDate Sep<11>2014 19:47 Jul 30, 2021 Jkt 253001 PO 00000 Frm 00061 Fmt 4701 Sfmt 4703 E:\FR\FM\02AUN2.SGM 02AUN2kham
mon
d on
DS
KJM
1Z7X
2PR
OD
with
NO
TIC
ES
2
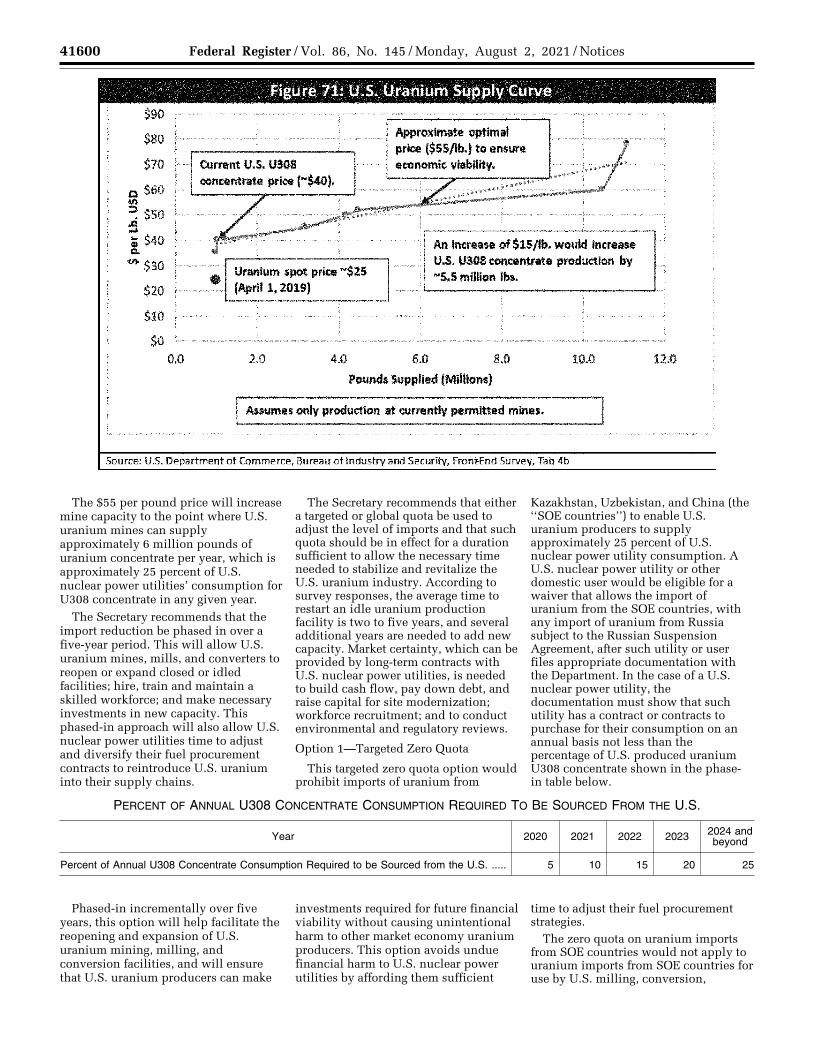
41600 Federal Register / Vol. 86, No. 145 / Monday, August 2, 2021 / Notices
The $55 per pound price will increase mine capacity to the point where U.S. uranium mines can supply approximately 6 million pounds of uranium concentrate per year, which is approximately 25 percent of U.S. nuclear power utilities’ consumption for U308 concentrate in any given year.
The Secretary recommends that the import reduction be phased in over a five-year period. This will allow U.S. uranium mines, mills, and converters to reopen or expand closed or idled facilities; hire, train and maintain a skilled workforce; and make necessary investments in new capacity. This phased-in approach will also allow U.S. nuclear power utilities time to adjust and diversify their fuel procurement contracts to reintroduce U.S. uranium into their supply chains.
The Secretary recommends that either a targeted or global quota be used to adjust the level of imports and that such quota should be in effect for a duration sufficient to allow the necessary time needed to stabilize and revitalize the U.S. uranium industry. According to survey responses, the average time to restart an idle uranium production facility is two to five years, and several additional years are needed to add new capacity. Market certainty, which can be provided by long-term contracts with U.S. nuclear power utilities, is needed to build cash flow, pay down debt, and raise capital for site modernization; workforce recruitment; and to conduct environmental and regulatory reviews.
Option 1—Targeted Zero Quota
This targeted zero quota option would prohibit imports of uranium from
Kazakhstan, Uzbekistan, and China (the ‘‘SOE countries’’) to enable U.S. uranium producers to supply approximately 25 percent of U.S. nuclear power utility consumption. A U.S. nuclear power utility or other domestic user would be eligible for a waiver that allows the import of uranium from the SOE countries, with any import of uranium from Russia subject to the Russian Suspension Agreement, after such utility or user files appropriate documentation with the Department. In the case of a U.S. nuclear power utility, the documentation must show that such utility has a contract or contracts to purchase for their consumption on an annual basis not less than the percentage of U.S. produced uranium U308 concentrate shown in the phase- in table below.
PERCENT OF ANNUAL U308 CONCENTRATE CONSUMPTION REQUIRED TO BE SOURCED FROM THE U.S.
Year 2020 2021 2022 2023 2024 and beyond
Percent of Annual U308 Concentrate Consumption Required to be Sourced from the U.S. ..... 5 10 15 20 25
Phased-in incrementally over five years, this option will help facilitate the reopening and expansion of U.S. uranium mining, milling, and conversion facilities, and will ensure that U.S. uranium producers can make
investments required for future financial viability without causing unintentional harm to other market economy uranium producers. This option avoids undue financial harm to U.S. nuclear power utilities by affording them sufficient
time to adjust their fuel procurement strategies.
The zero quota on uranium imports from SOE countries would not apply to uranium imports from SOE countries for use by U.S. milling, conversion,
VerDate Sep<11>2014 19:47 Jul 30, 2021 Jkt 253001 PO 00000 Frm 00062 Fmt 4701 Sfmt 4703 E:\FR\FM\02AUN2.SGM 02AUN2 EN
02A
U21
.054
</G
PH
>
kham
mon
d on
DS
KJM
1Z7X
2PR
OD
with
NO
TIC
ES
2
$90
$80
$70
a $60 en ~ $50 .a . .... ~ $40 C.
*$30
$20
$10
so 0.0
Figure 71: U.S. Uranium Supply Curve
Current u.s. usoa concentrate price {"'$40).
Approximate optimal price ($55/lb.) to ensure economic viability. ~~~~-----··
• Uranium spot price "'$25 (April 1, 2019)
An increase of $15/lb. would increase U.S. US08 concentrate production by "'5.5 million lbs.
2.0 4.0 6.0 8.0 10.0
Pounds supplied (Millions)
I Assumes only production at currently permitted mines.
Source: US. Department of Commerce, Bureau of Industry and Security, FrontEnd Survey, Tab 4b
12.0
41601 Federal Register / Vol. 86, No. 145 / Monday, August 2, 2021 / Notices
enrichment, and fuel fabrication services’ that produce uranium products for export from the United States. A U.S. milling, conversion, enrichment, or fuel fabricator seeking to import uranium from an SOE country for use to produce uranium products for export would need to file appropriate documentation with the Department to obtain a waiver for the import of such uranium for export.
The Secretary believes that this option to impose a zero quota for imports of uranium from SOE countries, while continuing to allow unrestricted importation of uranium from Canada, Australia, and EURATOM member countries based on their security and economic relationships with the United States, should address the threatened impairment of U.S. national security. This would be accomplished by promoting the economic revival of the U.S. uranium industry, so long as there is not significant transshipment or reprocessing of SOE country uranium through these unrestricted countries. The Department will monitor these unrestricted imports to ensure there is not significant transshipment, reprocessing, or book transfers from SOE countries to unrestricted countries in an attempt to circumvent and undermine the U.S. uranium producers’ ability to provide 25 percent of U.S. annual U308 concentrate consumption. Many companies in unrestricted countries supply uranium sourced from SOE countries. Consequently, up to one- third of the materials delivered to U.S. nuclear power utilities, at this time, are
not sourced directly from the country of import.
Imports of uranium from Russia under a waiver would also be subjected to the Russian Suspension Agreement. This option assumes that such agreement will continue to be in effect over the relevant time period and would apply to any Russian uranium imports by U.S. nuclear power utilities, thus holding Russian uranium imports to their current level of approximately 20 percent of U.S. enrichment demand. In the event that the Russian Suspension Agreement is not extended and terminates, then the Secretary recommends that a quota on uranium imports under a waiver of Russian Uranium Products (as defined in the Russian Suspension Agreement) of up to 15 percent of U.S. enrichment demand be imposed. If adopted this quota would be administered by the Department in the same manner as the Russian Suspension Agreement is presently administered.
The adjustment of imports proposed under this option would be in addition to any applicable antidumping or countervailing duties collections.
To complement the proposed trade action, the Secretary recommends that the Federal Energy Regulatory Commission (FERC) act promptly to ensure that regulated wholesale power market regulations adequately compensate nuclear and other fuel- secure generation resources. Specifically, FERC should determine whether current market rules, which discriminate against secure nuclear fuel
generation resources in favor of intermittent resources, such as natural gas, solar, and wind, result in unjust, unreasonable, and unduly discriminatory rates that distort energy markets, harm consumers, and undermine electric reliability. If so, FERC should consider taking appropriate action to ensure that rates are just and reasonable.
The Department of Commerce, in consultation with other appropriate departments and agencies, will monitor the status of the U.S. uranium industry and the effectiveness of this remedy and will make recommendations to the President regarding whether it should be modified, extended, or terminated.
Option 2—Global Zero Quota
This option would establish a zero quota on imports of uranium from all countries until specific conditions are met to enable U.S. producers to supply 25 percent of U.S. nuclear power utilities’ annual consumption of uranium U308 concentrate. A U.S. nuclear power utility or other domestic user would be eligible for a waiver to import uranium from any country after submitting appropriate documentation to the Department. In the case of a U.S. nuclear power utility, the documentation must show that such utility has a contract or contracts to purchase for their consumption on an annual basis not less than the percentage of U.S. produced uranium U308 concentrate shown in the phase- in table below.
PERCENT OF ANNUAL U308 CONCENTRATE CONSUMPTION REQUIRED TO BE SOURCED FROM THE U.S.
Year 2020 2021 2022 2023 2024 and beyond
Percent of Annual U308 Concentrate Consumption Required to be Sourced from the U.S. ..... 5 10 15 20 25
Phased-in incrementally over five years, this option will help facilitate the reopening and expansion of U.S. uranium mining, milling, and conversion facilities, and will ensure that U.S. uranium producers can make investments required for future financial viability. This option avoids undue financial harm to U.S. nuclear power utilities by affording them sufficient time to adjust their fuel procurement strategies.
The zero quota on uranium imports would not apply to uranium imports for use by U.S. milling, conversion, enrichment, and fuel fabrication services’ that produce uranium products for export from the United States. A U.S. milling, conversion, enrichment, or fuel
fabricator seeking to import uranium for use to produce uranium products for export would need to file appropriate documentation with the Department to obtain a waiver for the import of uranium for export.
The Department will provide adequate time for U.S. industry to receive a waiver prior to a zero quota being implemented globally. Based on information received during the investigation, the Department believes that this option will not cause undue burdens.
The Secretary believes that this option to impose a zero quota for imports of uranium will address the threatened impairment of U.S. national security by promoting the economic revival of the
U.S. uranium industry. This option also prevents the possibility of transshipment of SOE overproduction through third countries and avoids undue harm to U.S. enrichment and fuel fabrication export operations. These domestic export operations rely on an ability to access working uranium stock regardless of the specific mining origin of a given uranium-based material.
Tennessee Valley Authority (TVA) purchases of Canadian UO3 natural uranium diluent in its execution of the National Nuclear Security Administration’s current highly- enriched uranium (HEU) down-blending campaign would be excluded from the zero quota on imports of uranium. In addition, any transfer pursuant to a
VerDate Sep<11>2014 19:47 Jul 30, 2021 Jkt 253001 PO 00000 Frm 00063 Fmt 4701 Sfmt 4703 E:\FR\FM\02AUN2.SGM 02AUN2kham
mon
d on
DS
KJM
1Z7X
2PR
OD
with
NO
TIC
ES
2
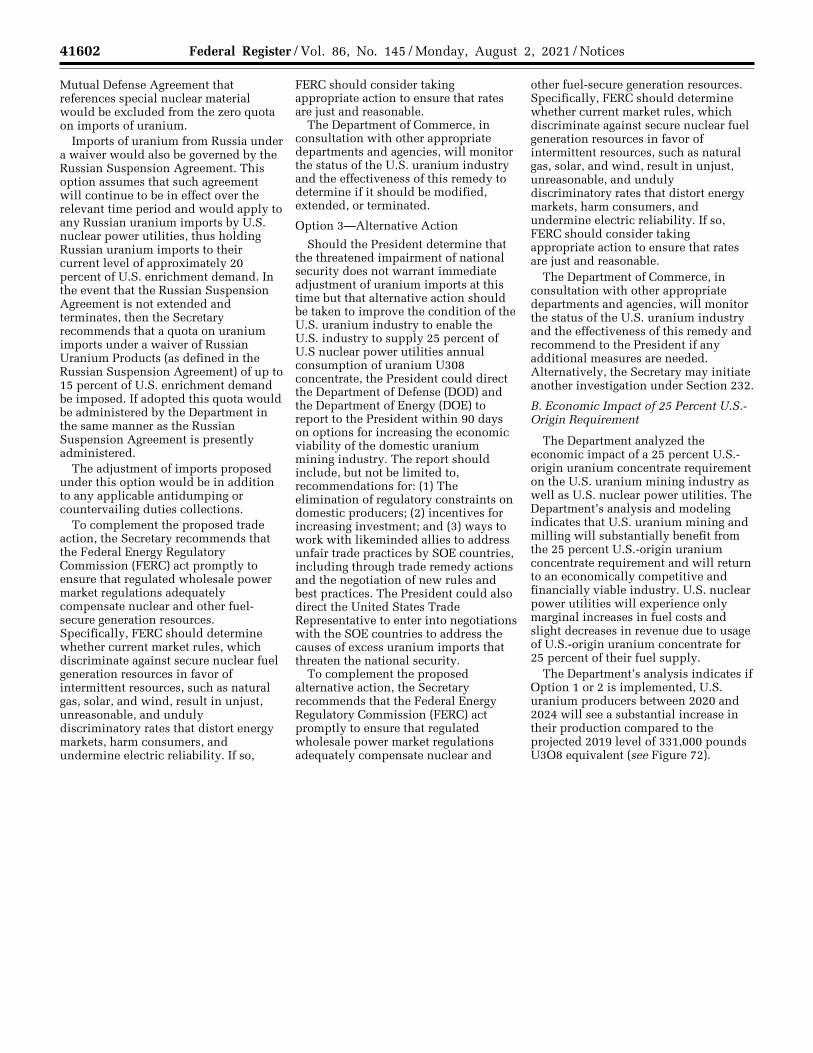
41602 Federal Register / Vol. 86, No. 145 / Monday, August 2, 2021 / Notices
Mutual Defense Agreement that references special nuclear material would be excluded from the zero quota on imports of uranium.
Imports of uranium from Russia under a waiver would also be governed by the Russian Suspension Agreement. This option assumes that such agreement will continue to be in effect over the relevant time period and would apply to any Russian uranium imports by U.S. nuclear power utilities, thus holding Russian uranium imports to their current level of approximately 20 percent of U.S. enrichment demand. In the event that the Russian Suspension Agreement is not extended and terminates, then the Secretary recommends that a quota on uranium imports under a waiver of Russian Uranium Products (as defined in the Russian Suspension Agreement) of up to 15 percent of U.S. enrichment demand be imposed. If adopted this quota would be administered by the Department in the same manner as the Russian Suspension Agreement is presently administered.
The adjustment of imports proposed under this option would be in addition to any applicable antidumping or countervailing duties collections.
To complement the proposed trade action, the Secretary recommends that the Federal Energy Regulatory Commission (FERC) act promptly to ensure that regulated wholesale power market regulations adequately compensate nuclear and other fuel- secure generation resources. Specifically, FERC should determine whether current market rules, which discriminate against secure nuclear fuel generation resources in favor of intermittent resources, such as natural gas, solar, and wind, result in unjust, unreasonable, and unduly discriminatory rates that distort energy markets, harm consumers, and undermine electric reliability. If so,
FERC should consider taking appropriate action to ensure that rates are just and reasonable.
The Department of Commerce, in consultation with other appropriate departments and agencies, will monitor the status of the U.S. uranium industry and the effectiveness of this remedy to determine if it should be modified, extended, or terminated.
Option 3—Alternative Action
Should the President determine that the threatened impairment of national security does not warrant immediate adjustment of uranium imports at this time but that alternative action should be taken to improve the condition of the U.S. uranium industry to enable the U.S. industry to supply 25 percent of U.S nuclear power utilities annual consumption of uranium U308 concentrate, the President could direct the Department of Defense (DOD) and the Department of Energy (DOE) to report to the President within 90 days on options for increasing the economic viability of the domestic uranium mining industry. The report should include, but not be limited to, recommendations for: (1) The elimination of regulatory constraints on domestic producers; (2) incentives for increasing investment; and (3) ways to work with likeminded allies to address unfair trade practices by SOE countries, including through trade remedy actions and the negotiation of new rules and best practices. The President could also direct the United States Trade Representative to enter into negotiations with the SOE countries to address the causes of excess uranium imports that threaten the national security.
To complement the proposed alternative action, the Secretary recommends that the Federal Energy Regulatory Commission (FERC) act promptly to ensure that regulated wholesale power market regulations adequately compensate nuclear and
other fuel-secure generation resources. Specifically, FERC should determine whether current market rules, which discriminate against secure nuclear fuel generation resources in favor of intermittent resources, such as natural gas, solar, and wind, result in unjust, unreasonable, and unduly discriminatory rates that distort energy markets, harm consumers, and undermine electric reliability. If so, FERC should consider taking appropriate action to ensure that rates are just and reasonable.
The Department of Commerce, in consultation with other appropriate departments and agencies, will monitor the status of the U.S. uranium industry and the effectiveness of this remedy and recommend to the President if any additional measures are needed. Alternatively, the Secretary may initiate another investigation under Section 232.
B. Economic Impact of 25 Percent U.S.- Origin Requirement
The Department analyzed the economic impact of a 25 percent U.S.- origin uranium concentrate requirement on the U.S. uranium mining industry as well as U.S. nuclear power utilities. The Department’s analysis and modeling indicates that U.S. uranium mining and milling will substantially benefit from the 25 percent U.S.-origin uranium concentrate requirement and will return to an economically competitive and financially viable industry. U.S. nuclear power utilities will experience only marginal increases in fuel costs and slight decreases in revenue due to usage of U.S.-origin uranium concentrate for 25 percent of their fuel supply.
The Department’s analysis indicates if Option 1 or 2 is implemented, U.S. uranium producers between 2020 and 2024 will see a substantial increase in their production compared to the projected 2019 level of 331,000 pounds U3O8 equivalent (see Figure 72).
VerDate Sep<11>2014 19:47 Jul 30, 2021 Jkt 253001 PO 00000 Frm 00064 Fmt 4701 Sfmt 4703 E:\FR\FM\02AUN2.SGM 02AUN2kham
mon
d on
DS
KJM
1Z7X
2PR
OD
with
NO
TIC
ES
2
41603 Federal Register / Vol. 86, No. 145 / Monday, August 2, 2021 / Notices
Over the five-year implementation, U.S. uranium concentrate producers, including mines and mills, will see prices rise to a level that will support sustained production of approximately
6 million pounds U3O8 equivalent per year, or 25 percent of U.S. concentrate requirements based on 2018 data.
[TEXT REDACTED] By acquiring more U.S.-origin uranium concentrate,
U.S. utilities will need to have at least some of that material converted domestically. [TEXT REDACTED] BILLING CODE 3510–33–P
VerDate Sep<11>2014 19:47 Jul 30, 2021 Jkt 253001 PO 00000 Frm 00065 Fmt 4701 Sfmt 4703 E:\FR\FM\02AUN2.SGM 02AUN2 EN
02A
U21
.055
</G
PH
>
kham
mon
d on
DS
KJM
1Z7X
2PR
OD
with
NO
TIC
ES
2
Figure 72. Projected U.S. Uranium Concentrate Production
and Per-Pound Price, 2020-2024
Price Per Pound Given Projected U.S. Demand
Source: U.S. Department of Commerce, Bureau of Industry and Security, Front-End Survey, Q4B
13 respondents
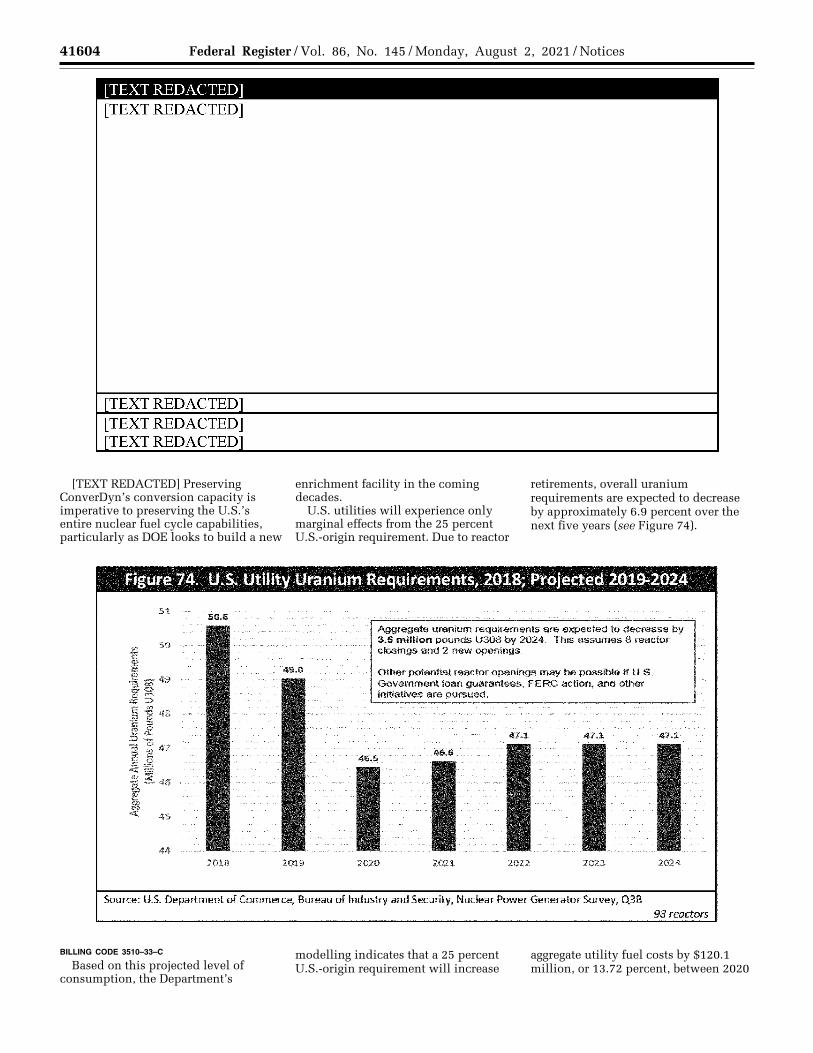
41604 Federal Register / Vol. 86, No. 145 / Monday, August 2, 2021 / Notices
[TEXT REDACTED] Preserving ConverDyn’s conversion capacity is imperative to preserving the U.S.’s entire nuclear fuel cycle capabilities, particularly as DOE looks to build a new
enrichment facility in the coming decades.
U.S. utilities will experience only marginal effects from the 25 percent U.S.-origin requirement. Due to reactor
retirements, overall uranium requirements are expected to decrease by approximately 6.9 percent over the next five years (see Figure 74).
BILLING CODE 3510–33–C
Based on this projected level of consumption, the Department’s
modelling indicates that a 25 percent U.S.-origin requirement will increase
aggregate utility fuel costs by $120.1 million, or 13.72 percent, between 2020
VerDate Sep<11>2014 19:47 Jul 30, 2021 Jkt 253001 PO 00000 Frm 00066 Fmt 4701 Sfmt 4703 E:\FR\FM\02AUN2.SGM 02AUN2 EN
02A
U21
.056
</G
PH
>E
N02
AU
21.0
57<
/GP
H>
kham
mon
d on
DS
KJM
1Z7X
2PR
OD
with
NO
TIC
ES
2
[TEXT REDACTED] [TEXT REDACTED]
[TEXT REDACTED] [TEXT REDACTED] rTEXT REDACTEDl
Figure 74. U.S. Utility Uranium Requirements, 2018; Projected 2019-2024
5l.
49.0
Aggregate uranium requirements are expected to decrease by 3.6 million pounds U308 by 2024. This assumes 8 reactor closings and 2 new openings.
Other potential reactor openings may ba possible if U.S. Government loan guarantees, FERC action, and other initiatives are pursued.
47,1 47.1
46.5 46,6
4'1,.1
Source: U.S. Department of Commerce, Bureau of Industry and Security, Nuclear Power Generator Survey, Q3B 98 reactors
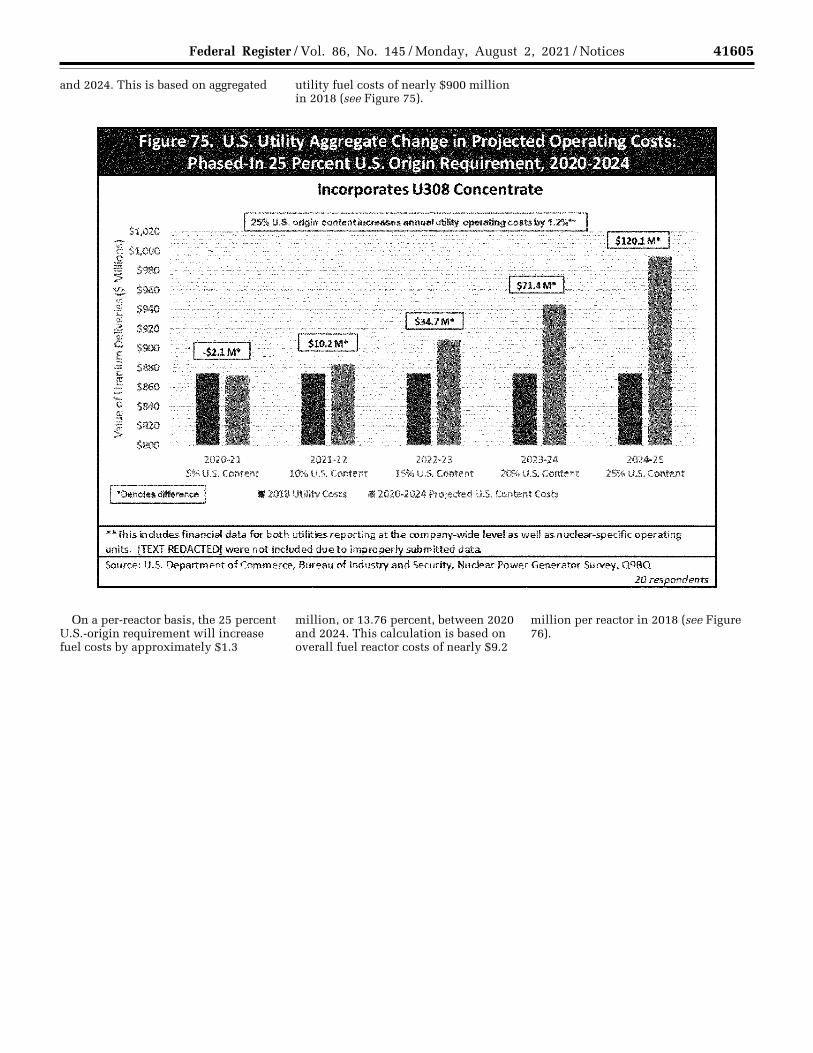
41605 Federal Register / Vol. 86, No. 145 / Monday, August 2, 2021 / Notices
and 2024. This is based on aggregated utility fuel costs of nearly $900 million in 2018 (see Figure 75).
On a per-reactor basis, the 25 percent U.S.-origin requirement will increase fuel costs by approximately $1.3
million, or 13.76 percent, between 2020 and 2024. This calculation is based on overall fuel reactor costs of nearly $9.2
million per reactor in 2018 (see Figure 76).
VerDate Sep<11>2014 19:47 Jul 30, 2021 Jkt 253001 PO 00000 Frm 00067 Fmt 4701 Sfmt 4703 E:\FR\FM\02AUN2.SGM 02AUN2 EN
02A
U21
.058
</G
PH
>
kham
mon
d on
DS
KJM
1Z7X
2PR
OD
with
NO
TIC
ES
2
Figure 75. U.S. Utility Aggregate Change in Projected Operating Costs: Phased-In 25 Percent U.S. Origin Requirement, 2020-2024
Incorporates U308 Concentrate
25% U.S. origin comentlncreaMsannuel utility operetlng costtl by 1.2'1!.•
, ... -··· . . ······~-- --..... -·····- ....... , ........ , ....... -·· ., . -·· ... , --- , ..... ,, .... -·.. .... . . ··- .............. , ..... ... .. ,,,_...._,,_,-.,~-,~._,,,,-.-...""' -.,-,-. .. ~-,,.,....,._,_ ,,_ ·•····"'"' ... ~~--""''-"~ --"~ ~ ---- .. •"¼.~~---- ► -~,--,.., ' -~-----,- , ., .. , ' --- ... , .. , '-····~ ... ················ ... . •······ .. . . .... I
.. , ,,,.;:·· , .. ,.,··••·•··••·•c•::·,., .• ·••·~.:::····::, .:.:,,.,.. •••··•··••:.··•··'·••.•·•··••·•••·•··•··•• L.'.·••·•••••·>·•:·•··••···•··••··· :i .... _$1 ___ _
,., ........•............. , , .....• ,.. _,
, ... , ... , ... -. '
____ ., .. ,-.,.,.. .,
·······" ' , ..... -...... ..,
_,,,,,,.,~"-'""" ~
,.......... .,
'""""""'''"'· "'
2020-21 2022·23 5% U.S. Content
2021,22 10% U.S. Content 15% U.S. Content
2023-24 20% U.S. Content
1 -oenotn difference 1 ■ 2018 Utility Costs ■ 2020-2024 Projected U.S. Content Costs
2024-25 25% U.S. Content
**This includes financial data for both utilities reporting at 1he. mmpany-wide level as well as nuclear-specificopNating units. EXT REDACTED] were not included due to imp.roper! submitted data Source: U.S. Department of Commerce, Bureau of Industry and Security, Nuclear Power Generator Survey, Q98Q
20 respondents
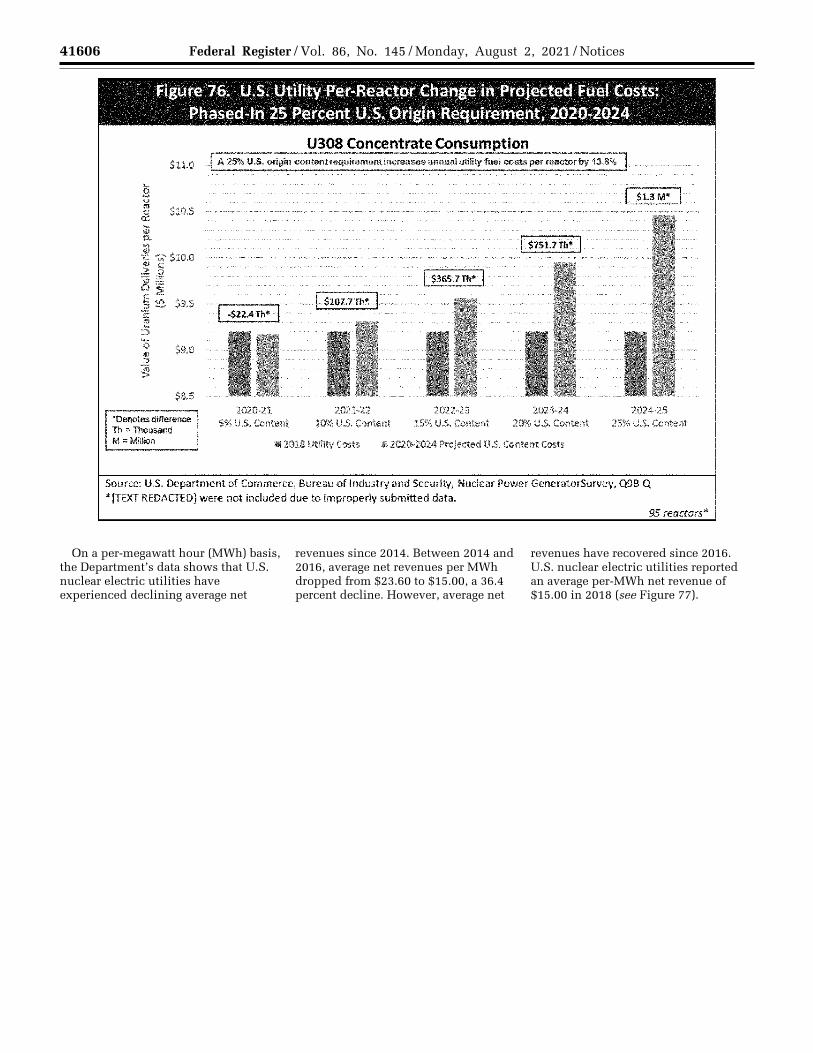
41606 Federal Register / Vol. 86, No. 145 / Monday, August 2, 2021 / Notices
On a per-megawatt hour (MWh) basis, the Department’s data shows that U.S. nuclear electric utilities have experienced declining average net
revenues since 2014. Between 2014 and 2016, average net revenues per MWh dropped from $23.60 to $15.00, a 36.4 percent decline. However, average net
revenues have recovered since 2016. U.S. nuclear electric utilities reported an average per-MWh net revenue of $15.00 in 2018 (see Figure 77).
VerDate Sep<11>2014 19:47 Jul 30, 2021 Jkt 253001 PO 00000 Frm 00068 Fmt 4701 Sfmt 4703 E:\FR\FM\02AUN2.SGM 02AUN2 EN
02A
U21
.059
</G
PH
>
kham
mon
d on
DS
KJM
1Z7X
2PR
OD
with
NO
TIC
ES
2
Figure 76. U.S. Utility Per-Reactor Change in Projected Fuel Costs: I
Phased-In 25 Percent U.S. Origin Requirement, 2020-2024 I
U308 Concentrate Consum tion $1l.O " A 25% u.s. ongm contentrequnmentin«Nsennnualutility twt c,osnperreactorby 13.8%
,_
~ &! $10.5
$9.,0
$8,S
•Denotes difference Th = Thousand M=Million
··············1·•··-.· -· .. ,.•.•·····~•··-· .,
,....._.__,...,,._..., "'
.•.. -...•.....•..••..•.•.•.....•••.••... ·•···
2020-21 2021-22 2022·23 2023-24 5% U.S. Content 10% U.S. Content 15% U.S. Content 20% U.S. Content
112018 Utility Costs • 2020-2024 Projected U.S. Content Costs
2024-25 25% U.S. Content
Source: U.S. Department of Commerce, Bureau of Industry and Security, Nuclear Power GeneratorSurvey, Q98-Q
*ITEXT REDACTED] were not included due to improperly submitted data.
95 reactors"'
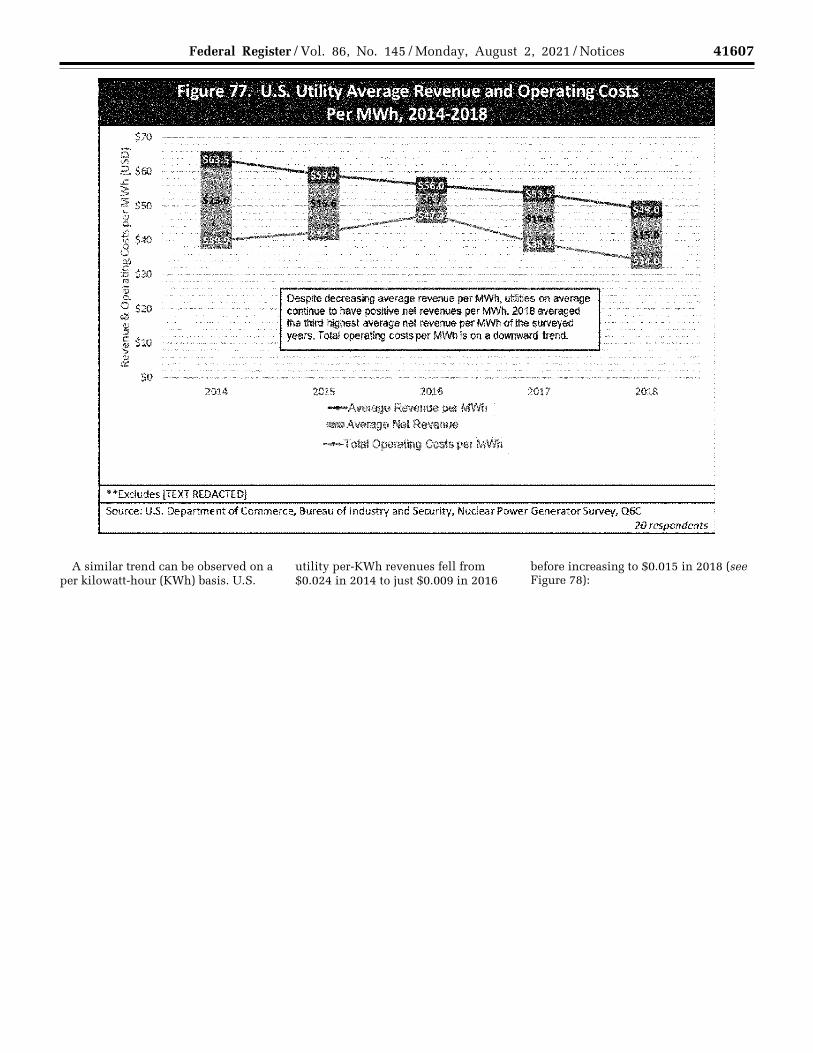
41607 Federal Register / Vol. 86, No. 145 / Monday, August 2, 2021 / Notices
A similar trend can be observed on a per kilowatt-hour (KWh) basis. U.S.
utility per-KWh revenues fell from $0.024 in 2014 to just $0.009 in 2016
before increasing to $0.015 in 2018 (see Figure 78):
VerDate Sep<11>2014 19:47 Jul 30, 2021 Jkt 253001 PO 00000 Frm 00069 Fmt 4701 Sfmt 4703 E:\FR\FM\02AUN2.SGM 02AUN2 EN
02A
U21
.060
</G
PH
>
kham
mon
d on
DS
KJM
1Z7X
2PR
OD
with
NO
TIC
ES
2
$70
Figure 77. U.S. Utility Average Revenue and Operating Costs Per MWh, 2014-2018
Despite decreasing average revenue per MWh, utilities on average continue to have positive net revenues per MWh. 2018 averaged the lhlrd highest average net revenue per MWh of the surveyed
.. . years. Total operating costs per MWh is on a downward trend.
so ................. ······~
2014 2015 2016 2017 2018 -Average Revenue per MWh -Average Net Revenue
-Total Operating Costs per MWh
*"'Excludes [TEXT REDACTED]
Source: US. Department of Commerce, Bureau of l ndustry and Security, Nuclear Power Generator Survey, Q6C 20respondents
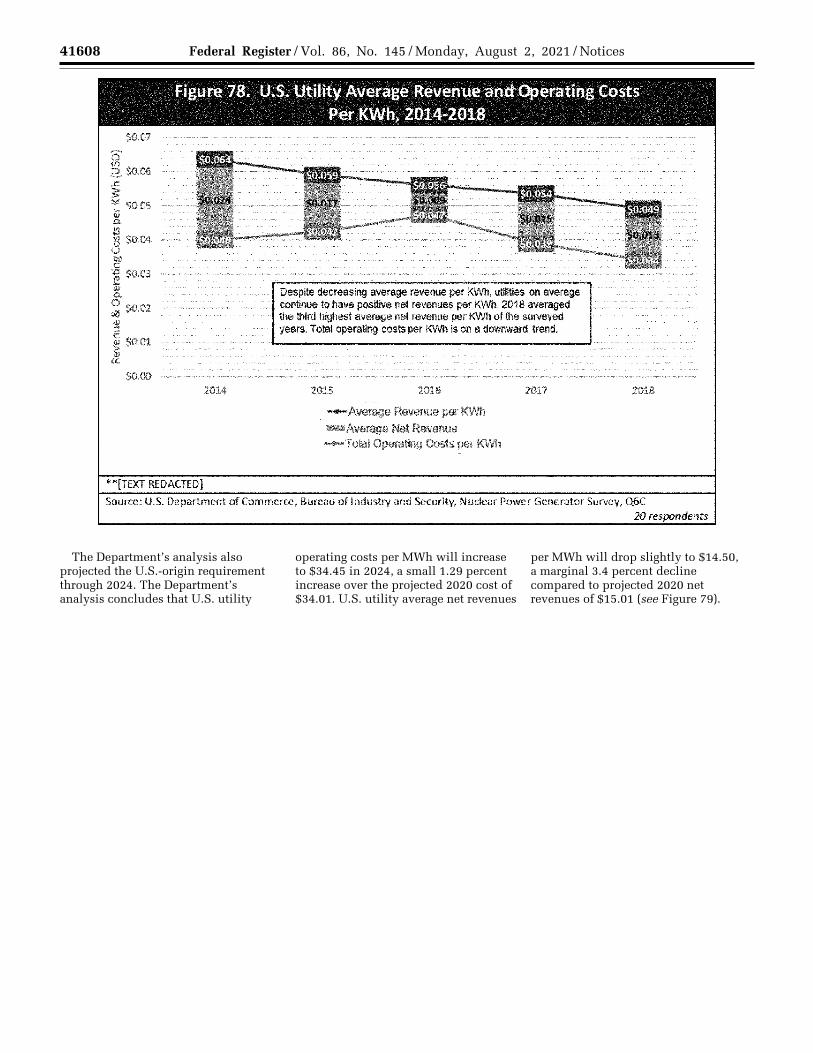
41608 Federal Register / Vol. 86, No. 145 / Monday, August 2, 2021 / Notices
The Department’s analysis also projected the U.S.-origin requirement through 2024. The Department’s analysis concludes that U.S. utility
operating costs per MWh will increase to $34.45 in 2024, a small 1.29 percent increase over the projected 2020 cost of $34.01. U.S. utility average net revenues
per MWh will drop slightly to $14.50, a marginal 3.4 percent decline compared to projected 2020 net revenues of $15.01 (see Figure 79).
VerDate Sep<11>2014 19:47 Jul 30, 2021 Jkt 253001 PO 00000 Frm 00070 Fmt 4701 Sfmt 4703 E:\FR\FM\02AUN2.SGM 02AUN2 EN
02A
U21
.061
</G
PH
>
kham
mon
d on
DS
KJM
1Z7X
2PR
OD
with
NO
TIC
ES
2
$0.07
Figure 78. U.S. Utility Average Revenue and Operating Costs Per KWh, 2014-2018
2014
Despite decreasing average revenue per KWh, Utilities on average continue to have posilive net revenues per KWh. 2018 averaged the tlird highest average net revenue per KWh of Ille surveyed years. Total operating costs per KWh is on a downward trend.
2015 2016
....,_Average Revenue per KWh .-Average Net Revenue -Total Operating Costs per KWh
2017 2018
**[TEXT REDACTED]
Source: U.S. Department of Commerce, Bureau of Industry and Security, Nuclear Power Generator Survey, Q6C 20 respondents
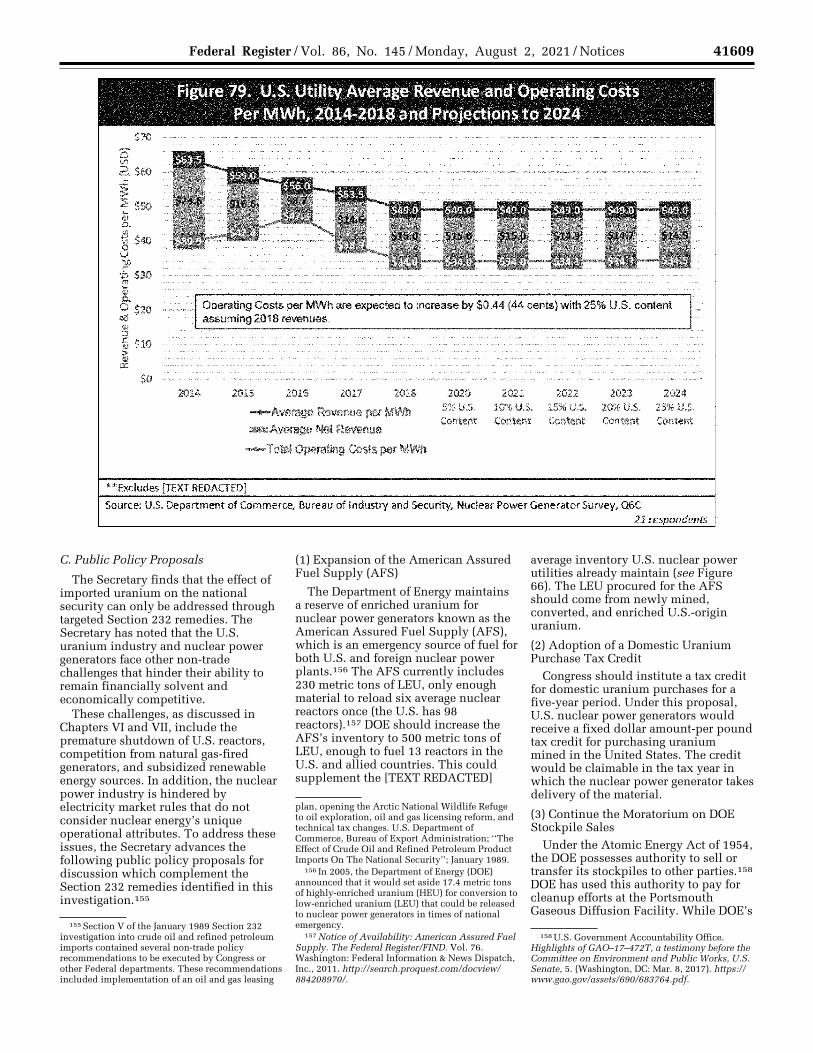
41609 Federal Register / Vol. 86, No. 145 / Monday, August 2, 2021 / Notices
155 Section V of the January 1989 Section 232 investigation into crude oil and refined petroleum imports contained several non-trade policy recommendations to be executed by Congress or other Federal departments. These recommendations included implementation of an oil and gas leasing
plan, opening the Arctic National Wildlife Refuge to oil exploration, oil and gas licensing reform, and technical tax changes. U.S. Department of Commerce, Bureau of Export Administration; ‘‘The Effect of Crude Oil and Refined Petroleum Product Imports On The National Security’’; January 1989.
156 In 2005, the Department of Energy (DOE) announced that it would set aside 17.4 metric tons of highly-enriched uranium (HEU) for conversion to low-enriched uranium (LEU) that could be released to nuclear power generators in times of national emergency.
157 Notice of Availability: American Assured Fuel Supply. The Federal Register/FIND. Vol. 76. Washington: Federal Information & News Dispatch, Inc., 2011. http://search.proquest.com/docview/ 884208970/.
158 U.S. Government Accountability Office. Highlights of GAO–17–472T, a testimony before the Committee on Environment and Public Works, U.S. Senate, 5. (Washington, DC: Mar. 8, 2017). https:// www.gao.gov/assets/690/683764.pdf.
C. Public Policy Proposals
The Secretary finds that the effect of imported uranium on the national security can only be addressed through targeted Section 232 remedies. The Secretary has noted that the U.S. uranium industry and nuclear power generators face other non-trade challenges that hinder their ability to remain financially solvent and economically competitive.
These challenges, as discussed in Chapters VI and VII, include the premature shutdown of U.S. reactors, competition from natural gas-fired generators, and subsidized renewable energy sources. In addition, the nuclear power industry is hindered by electricity market rules that do not consider nuclear energy’s unique operational attributes. To address these issues, the Secretary advances the following public policy proposals for discussion which complement the Section 232 remedies identified in this investigation.155
(1) Expansion of the American Assured Fuel Supply (AFS)
The Department of Energy maintains a reserve of enriched uranium for nuclear power generators known as the American Assured Fuel Supply (AFS), which is an emergency source of fuel for both U.S. and foreign nuclear power plants.156 The AFS currently includes 230 metric tons of LEU, only enough material to reload six average nuclear reactors once (the U.S. has 98 reactors).157 DOE should increase the AFS’s inventory to 500 metric tons of LEU, enough to fuel 13 reactors in the U.S. and allied countries. This could supplement the [TEXT REDACTED]
average inventory U.S. nuclear power utilities already maintain (see Figure 66). The LEU procured for the AFS should come from newly mined, converted, and enriched U.S.-origin uranium.
(2) Adoption of a Domestic Uranium Purchase Tax Credit
Congress should institute a tax credit for domestic uranium purchases for a five-year period. Under this proposal, U.S. nuclear power generators would receive a fixed dollar amount-per pound tax credit for purchasing uranium mined in the United States. The credit would be claimable in the tax year in which the nuclear power generator takes delivery of the material.
(3) Continue the Moratorium on DOE Stockpile Sales
Under the Atomic Energy Act of 1954, the DOE possesses authority to sell or transfer its stockpiles to other parties.158 DOE has used this authority to pay for cleanup efforts at the Portsmouth Gaseous Diffusion Facility. While DOE’s
VerDate Sep<11>2014 19:47 Jul 30, 2021 Jkt 253001 PO 00000 Frm 00071 Fmt 4701 Sfmt 4703 E:\FR\FM\02AUN2.SGM 02AUN2 EN
02A
U21
.062
</G
PH
>
kham
mon
d on
DS
KJM
1Z7X
2PR
OD
with
NO
TIC
ES
2
Figure 79. U.S. Utility Average Revenue and Operating Costs I
Per MWh, 2014-2018 and Projections to 2024 ]
2014 2015 2016 2017 2018 2020 2021 2022 2023 2024
-Average Revenue pa- MWh 5%U.S. 10%U.S. 15%U.S. 20%U.S. 25%U.S.
lllillllllllAvemge Net Revenue eontent Content Content Content content
-Total Operating Costs per MWh
"'"'Excludes [TEXT REDACTED]
Source: U.S. Department of Commerce, Bure.au of Industry .and Security, Nuclear Power Gener.at or Survey, Q6C 21 respondents
41610 Federal Register / Vol. 86, No. 145 / Monday, August 2, 2021 / Notices
determination process evaluates whether DOE transfers are having a material effect on the industry, respondents to the Department’s 2019 uranium survey have reported that DOE’s uranium transfer program has negatively impacted uranium producers’ business. Congress should block further transfers of DOE stockpile material.
(4) State Adoption of Zero Emissions Credits
Implement zero emissions credits (ZEC) to compensate nuclear power generators for the value of the zero- emissions electricity that they produce. ZECs will help nuclear generators fairly compete against renewable sources such as solar and wind, which are subsidized through the federal production tax credit (PTC) and similar state subsidies. ZECs, if adopted by more states, may halt some current U.S. reactor
retirements and solidify utility demand for U.S.-produced uranium.
(5) Mandate That Federal Departments and Agencies Use Nuclear Power
The Federal government can support U.S. nuclear power generation by requiring Federal departments and agencies to purchase an average of 20 percent of their power from nuclear power plants for a period of five years at a fixed price. This would provide predictable demand for nuclear power generators.
(6) Expand the Responsibilities of the Nuclear Materials Management and Safeguard Systems (NMMSS)
The 123 Agreements do not require tracking and reporting of ‘‘mining origin’’ data for nuclear material subject to peaceful use provisions. Furthermore, the domestic U.S. operators are not required to report origin data to NMMSS
for imports, exports, and other nuclear material inventory changes.
NMMSS, as the national U.S. system of nuclear material accounting, can add the capability to track mining origin data. However, this outcome required changes impacting NRC regulations, 123 Agreements, and industry practices.
The Secretary recommends that the NRC and NNSA work with the Departments of Commerce, Defense, Energy, Homeland Security, and Justice to examine potential options and mechanisms to enable the reporting of origin data to NMMSS, and to coordinate with NMMSS to identify actions necessary for changes to the system.
Matthew S. Borman, Deputy Assistant Secretary for Export Administration. [FR Doc. 2021–16113 Filed 7–30–21; 8:45 am]
BILLING CODE 3510–33–P
VerDate Sep<11>2014 19:47 Jul 30, 2021 Jkt 253001 PO 00000 Frm 00072 Fmt 4701 Sfmt 9990 E:\FR\FM\02AUN2.SGM 02AUN2kham
mon
d on
DS
KJM
1Z7X
2PR
OD
with
NO
TIC
ES
2