Farmers' Preferences for Management Options as Payment for ...
22
2015 International Food and Agribusiness Management Association (IFAMA). All rights reserved. 171 International Food and Agribusiness Management Review Volume 18 Issue 3, 2015 Farmers’ Preferences for Management Options as Payment for Environmental Services Scheme Lily Kisaka a and Ajuruchukwu Obi b a PhD. Candidate, Department of Agricultural Economics and Extension, University of Fort Hare, 1 King Williams Town Road, Private Bag X1314, Alice, Eastern Cape Province, South Africa b Professor, Department of Agricultural Economics and Extension, University of Fort Hare, 1 King Williams Town Road, Private Bag X1314, Alice, Eastern Cape Province, South Africa Abstract In developing countries opportunity exists for the application of policy instruments like Payment for Environmental Services (PES) to address the challenges of poverty and environmental degradation. Assessing the preferences of farmers for management scenarios provides an inroad into the application of this tool and should be considered by policy makers and practitioners. Using conjoint analysis this study found that farmers’ ranking of management scenarios is affected by the commitment period and land sizes exceeding 40% of their total land size and that their decision to participate was affected by gender, age, household size, awareness, land tenure and annual income. Keywords: payment for environmental services, farmers’ preferences, conjoint analysis, management scenarios Corresponding author: Tel: +27.40.602.2135 Email: A. Obi: [email protected] L. Kisaka: [email protected]
-
Upload
khangminh22 -
Category
Documents
-
view
3 -
download
0
Transcript of Farmers' Preferences for Management Options as Payment for ...
2015 International Food and Agribusiness Management Association (IFAMA). All rights reserved.
171
International Food and Agribusiness Management Review Volume 18 Issue 3, 2015
Farmers’ Preferences for Management Options as
Payment for Environmental Services Scheme
Lily Kisakaa and Ajuruchukwu Obib
a PhD. Candidate, Department of Agricultural Economics and Extension, University of Fort Hare, 1 King Williams Town Road, Private Bag X1314, Alice, Eastern Cape Province, South Africa
b Professor, Department of Agricultural Economics and Extension, University of Fort Hare,
1 King Williams Town Road, Private Bag X1314, Alice, Eastern Cape Province, South Africa
Abstract In developing countries opportunity exists for the application of policy instruments like Payment for Environmental Services (PES) to address the challenges of poverty and environmental degradation. Assessing the preferences of farmers for management scenarios provides an inroad into the application of this tool and should be considered by policy makers and practitioners. Using conjoint analysis this study found that farmers’ ranking of management scenarios is affected by the commitment period and land sizes exceeding 40% of their total land size and that their decision to participate was affected by gender, age, household size, awareness, land tenure and annual income.
Keywords: payment for environmental services, farmers’ preferences, conjoint analysis, management scenarios
Corresponding author: Tel: +27.40.602.2135
Email: A. Obi: [email protected] L. Kisaka: [email protected]
Kisaka and Obi Volume18 Issue 3, 2015
2015 International Food and Agribusiness Management Association (IFAMA). All rights reserved.
172
Introduction
Desertification, biodiversity loss, reduced forest cover, water scarcity, increased soil erosion, and climate change contribute to the complex environmental challenges the world faces today. These are complicated by their linkages to other global challenges, like fast growing population, increasing inequality and the global financial crises. Together these challenges leave an estimated one billion people in the world without enough food, water and other basic needs. Recognizing the gravity of these global challenges, the United Nations through its agencies United Nations Environment Program (UNEP 2008); the Food and Agricultural Organization (FAO 2011); and the International Fund for Agricultural Development (IFAD 2013), have endeavored to focus the World’s attention on the questions about how we manage natural resource production systems, what value we assign to them, how we distribute these resources, and how we conserve them for future generations. However, poverty has been identified as one of the obstacles to the conservation and sustainability agenda. The Millennium Ecosystem Assessment (2005) defines poverty as the pronounced deprivation of well-being, which often arises from a broken link between human well-being and environmental services. Further poverty is directly linked to food security, which refers to the supply and access to provisioning environmental services, such as food, fibers, water, wood and fuel (MA 2005). One of the greatest challenges to addressing the problem of food insecurity in Africa, is how best to formulate development strategies that integrate environmental resource conservation into food security goals.
These strategies need to reconcile the environmental debt of tomorrow with the food deficit of today, calling for a trade-off between food security and environmental quality. There is need therefore for affordable policy approaches that will meet these two goals simultaneously.
Since the release of the Millennium Ecosystem Assessment (MA 2005), ecosystems have become widely recognized as natural capital assets supporting and supplying services which are highly valuable to humans. Agricultural ecosystems are by far the largest managed ecosystems in the world (FAO 2007) and the largest sector of rural economies in Africa, engaging majority of the rural population (Nkonya et al. 2011). The productivity of smallholder agriculture and its contribution to poverty reduction and food security depend on the services provided by well-functioning ecosystems, and in turn, affect the condition of ecosystems (IFAD 2013). In the face of the current global challenges, the agricultural sector is expected to provide an ever-growing supply of ecosystem-based goods and services. About 80 percent of the anticipated increase in land-based agricultural production is expected to derive from increased input use and improved technology on existing agricultural land (FAO 2007). This in turn could exacerbate damage to land-based ecosystems through expansion into environmentally fragile areas, soil erosion, pressure on water supplies, rising nitrate levels in ground and surface water, salinization, and growing air and water pollution from livestock wastes. Farmers can provide a better mix of ecosystem services through changes in land-use and production systems, and in so doing expand the share of environmental services characterized by positive externalities.
There are some land use practices based on sustainable agricultural principles which produce multiple outputs and thus offer potential opportunity to achieving the two mutually exclusive objectives and minimize the tradeoffs (Ajayi et al. 2008). There is a consensus in the literature
Kisaka and Obi Volume18 Issue 3, 2015
2015 International Food and Agribusiness Management Association (IFAMA). All rights reserved.
173
that most of the practices are feasible and technically sound (Ajayi et al. 2008; Sileshi et al. 2008), but the level of uptake of the practices by farmers has been low particularly in low income regions of the world, or attained only a modest success in other regions (Antle and Diagana 2003; Mercer 2004).
Environmental services are public goods, a special class of externalities, that are non-excludable and non-rivalry, therefore there is generally very little incentive to preserve them. As a result, there are no direct market mechanisms to signal the scarcity or degradation of a service until it fails. A key question, therefore, concerns how society can motivate farmers to reduce negative side-effects while continuing to meet the increasing demand for agricultural produce.
Payment for environmental services (PES) has emerged as an important tool that can motivate farmers to provide environmental services through land use changes and adoption of best land management practices, and in so doing, ensure the productive basis of long-term food security for local communities. PES is premised on the concept that to maintain the flow of environmental goods and services for society, incentives are needed to induce local people to forego more disruptive land and resource use practices. It is defined as a voluntary transaction in which a well-defined environmental service (or land use likely to secure that service) is being bought by a minimum of one environmental services buyer from a minimum of one environmental services provider if and only if the provider continues to supply that service (Wunder 2005). Proponents of PES argue that compensating land user for ecosystem services would make markets consider such services in decision making processes, thereby increasing chances of arresting land degradation and other environmental problem such as erosion and floods (Pagiola et al. 2005).
The concept of PES is premised on a theoretical background that stems from neoclassical environmental economics (Pearce and Turner 1990; Perman et al.2003), where environmental dilapidation is attributed to the constant inability of markets to internalize environmental externalities, and to free-riding brought on by the public-good nature of ecosystem services. A Coasian solution to land use externalities has gained popularity and proposes to align private and social costs through conditional payments from those affected by the externality to the landholder (Engel et al. 2008). Hence, the PES philosophy argues for the internalization of environmental externalities through the creation of ES markets or quasi-markets. The explicit focus on positive externalities results in a shift from the ‘Polluter Pays Principle’ (PPP) to a ‘Beneficiary Pays Principle’ (BPP) (Pagiola et al.2002, Pearce et al. 2004) or ‘Provider Gets Principle’ (PGP) (Hubermann and Leipprand 2006). The land user is now seen not as a polluter, but as a service provider who is presented with an opportunity to add an environmental service to their production portfolio, either as a joint product of other goods or as a service that is independently generated (Heckens and Bastiaensen 2010). Watershed contexts are believed to tie in better with the Coasean upstream–downstream externalities framework, as they can capitalize on the production of straightforward externalities (water services) and the generation of relatively low transaction costs by adding environmental services payments to financing structures already established by local water utilities (Kosoy et al. 2007). This prompted research exploring the potential of local payments for watershed services and the prospects it offers for securing long-term ecosystem protection (Ortega-Pacheco et al. 2009; Porras et al. 2008; Southgate and Wunder 2009) and financing for improved agricultural productivity.
Kisaka and Obi Volume18 Issue 3, 2015
2015 International Food and Agribusiness Management Association (IFAMA). All rights reserved.
174
In developing countries opportunity exists for emerging markets in PES to help address the challenges of poverty and natural resource degradation. The study, whose findings are presented in this paper, was motivated by that opportunity and building on existing knowledge of PES, endeavored to understand how farmers can participate effectively in PES schemes to meet the intertwined goals of increased food production and reduced ecological footprint. The study was conducted in the western part of Kenya, in the Mt. Elgon ecosystem, one of the five water towers in the country. River Kuywa the watershed used in this study is one of the tributaries of the River Nzoia that drains into the Lake Victoria an important shared resource of the East African Community Partner States. To facilitate planning for sustainable land management, it is vital that there is an understanding of farmers’ preferences for the different attributes that make up the management options for intended PES Schemes. However, there is little information on farmers’ preferences as they relate to PES management options in Kenya and specifically in the Mt Elgon ecosystem. This study examined the preferred management options that farmers would be willing to adopt to support provision of environment services in a Payment for Environmental Services (PES) approach within the Mt. Elgon ecosystem, Kenya. Specifically the study:
i. determined combinations of attributes that comprise a suitable management scenario. ii. evaluated farmers preferences for these attributes with a view to select the best
combination of attributes to form the most preferred management option for a PES scheme.
iii. examined which factors affect the selection of attributes that constitute the management options.
The results of this study will directly inform the development of PES schemes and lay the foundation for negotiations with potential buyers of the environmental services, while also contributing to a broader understanding of investment in PES programs which continue to expand globally, by providing critical information to policy makers and development practitioners.
Environmental Services
In recent decades, the interdisciplinary field of ecosystem management focused on human-nature dependence has emerged and represents a major area of inquiry into understanding the current state of earth’s ecosystems and their ability to support human wellbeing (MA 2005). Natural or human- managed ecosystems provide positive environmental externalities, normally not taken into account in individual economic decisions (Pagiola et al. 2002a). This, economists such as Suhdev (2010), claim is the underlying cause for the observed degradation of ecosystems and the loss of biodiversity. The notion of environmental services was therefore, introduced and promoted as an alternative way of thinking about conserving biodiversity threatened by habitat destruction; one in which human well- being is considered more explicitly. In so doing environmental economists postulate that this would lead to economic valuation of ecosystems and their integration into decision making (Wunder et al.
2008; Stiglitz and Walsh 2002; Pagiolo 2005; Spangenberg and Settele 2010) providing a comprehensive and compelling economic case for conservation. According to Goldman et al. (2008), “Where traditional approaches focused on setting land aside by purchasing property
Kisaka and Obi Volume18 Issue 3, 2015
2015 International Food and Agribusiness Management Association (IFAMA). All rights reserved.
175
rights, ecosystem service approaches aim to engage a much wider range of places, people, policies and financial resources in conservation.” With this new environmental services approach has come new strategies and tools to support conservation efforts worldwide.
The term environmental services has been defined in a variety of ways by scholars. According to Kosoy et al. (2007) environmental services refers to the provision of positive environmental externalities. Spangenberg et al.(2010) defined environmental goods (such as food) and services (such as waste assimilation) as representing the benefits human population derive, directly or indirectly, from ecosystem functions. Daily (1997) noted that environmental services are the conditions and processes through which natural ecosystems, and the species that make them up, sustain and fulfil human life, while Boyd and Banzhaf (2007) define environmental services as “components of nature, directly enjoyed, consumed, or used to yield human well-being”. Rosegrant (2002) and Johnson and Baltodano (2004) also defined environmental services as “the conditions and processes through which ecosystems sustain and fulfil human life, including the provision of food and other goods”. This paper adopts the definition by the MEA (2005) which defined environmental services (ES) as benefits received from healthy ecosystems, satisfying human needs without neglecting other species requirements that are usually not internalized in economic decisions. A critical factor is the maintenance of adequate stocks of ecosystem resources to ensure an adequate flow of environmental services (Batabyal et al. 2003) and hence the need to understand ecological resilience. Human decisions lead to actions that have impacts on ecosystems, causing changes in ecosystem structure and function. These changes in turn lead to changes in the provision of environmental services, which have impacts on human welfare. A clear understanding of these links provides information that can lead to the reform of institutions and better decisions that ultimately improve the state of ecosystems and the services they provide to society.
The Millennium Ecosystem Assessment report (2005) classified environmental services into four categories; (i) provisioning services, which are the products obtained directly from the environment like food or water; (ii) regulating services, which are the benefits obtained from the regulation of environmental processes such as control of floods, erosion regulation, water purification and waste treatment; (iii) supporting services which are needed to maintain the functioning of other ecosystem processes, including nutrient cycling; soil creation; and photosynthesis; and (iv) Cultural services which are the non-material benefits that people obtain the environment such as aesthetic pleasure, recreational opportunities, and spiritual and cultural sustenance.
Payment for Environmental Services
Natural resources are the basis of subsistence in many rural communities and the livelihoods of developing country populations are directly dependent on healthy ecosystems. There is a recognized link between poverty alleviation and the benefits that people derive from ecosystem services. Payment for Environmental Services (PES) has been presented as contributing towards sustainable development—a positive incentive to combine nature conservation and livelihood development (Gross-Camp et al. 2012). The PES approach strives to attain both goals of economic gain and environmental nourishment. PES is a policy instrument that combines the transfer of monetary resources directly to farmers or other rural actors in exchange of a land-use
Kisaka and Obi Volume18 Issue 3, 2015
2015 International Food and Agribusiness Management Association (IFAMA). All rights reserved.
176
or management practice that increases or secures the provision of an environmental service. The most widely applied definition of PES given by Wunder (2005) refers to PES as “a voluntary transaction in which a well-defined environmental service (ES), or a land-use likely to secure that service, is being bought by at least one well defined ES buyer from a defined ES provider, if, and only if, the ES provider secures ES provision”. While there is no consensus on this definition of PES schemes, it introduces basic principles that differentiate PES schemes from other market-based policy instruments.
While the definition of Wunder (2005) is acknowledged and widely applied, it is increasingly considered to be too narrow in some aspects and thereby excluding PES-like incentive and effective rewarding schemes that do not adhere strictly to these principles (Sommerville et al. 2009; Swallow et al. 2007; Pagiola et al. 2005). Since 2005, efforts have been undertaken to refine and improve the concepts (Karousakis 2010; Swallow et al. 2007; Wunder et al. 2008; Sommerville et al. 2009). This has resulted in the development of a number of alternative and extended concepts such as: Markets for Ecosystem Services (MES) (Pagiola and Platais 2007), Compensation for Ecosystem Services (CES) (Van Noordwijk and Leimona 2010), International Payments for Environmental Services (IPES) (UNEP et al. 2006) or Compensation and Rewards for Ecosystem Services (CRES).
Compensation and Rewards for Ecosystem Services (CRES) are defined as negotiated and contractual agreements between ES stewards, ES beneficiaries and/or intermediaries aimed at maintaining, enhancing, reallocation or offsetting of damage to ES (Swallow et al. 2007).
Pagiola (2010) provided three reasons that make PES particularly attractive namely: i) it can be implemented as a development program that has the ability of generating its own finance; ii) it can be economically efficient, since efforts can be focused where benefits of conservation are highest and costs are lower; and iii) it can be more sustainable in the long-term, since it relies more on self- interested users than on external supporters such as governments, NGOs or donors. It follows from this that in a situation of high environmental concerns and limited financial resources, PES can generate additional alternative resources, allocate funds to environmentally friendly management practices and sustainable production patterns (WWF 2012). Payments for Environmental Services (PES) schemes require clear and enforceable rules and transaction mechanisms to foster trust and confidence among stakeholders (Robertson and Wunder 2005). Identification of farmers’ preferences for management options provides information to support the development of acceptable management contracts for PES schemes.
Methodology
Sampling Procedures
To generate the sampling frame GIS was used to delineate the watershed area for the Kuywa River and the sampling frame was the list of households living within the delineated watershed based on the Kenya National population Census 2009. Using catchment maps provided by the Lake Victoria North Water Resources Management Authority (LVNWRMA), overlaid on a GIS map with administrative boundaries; the researcher listed all sub-locations (smallest Administrative unit) that fell within the watershed. Using a random sampling technique, six sub-
Kisaka and Obi Volume18 Issue 3, 2015
2015 International Food and Agribusiness Management Association (IFAMA). All rights reserved.
177
locations were selected for inclusion in the study. Since the sub-locations vary in size and population, selection of sample households was based on a spatial sampling technique; systematic unaligned pattern (McCoy 2005). Accordingly for each sub-location random sampling points (RSP) were calculated in each cell using ArcGIS tools. This guaranteed a good spatial representation of the sample set. Each RSP represented a survey respondent. For each RSP the GIS coordinates were provided and used to identify the respondents on the ground. Some RSP fell at a spot with no household like churches or market places. To take care of this, some reserve RSP were generated to replace possible ineligible ones. The sample size was determined by the experimental design as outlined in the next section.
Experimental Design
To determine which management scenario would be ranked by the respondents, and therefore the experimental foundation for the design of the conjoint analysis, attributes and attribute levels were selected based on information collected from a review of literature, focus group discussions and key informant interviews. The study selected six attributes with various levels namely: (i) Land area to be committed (ii) Length of commitment period; (iii) Right to harvest products from committed land; (iv) Incentive Scheme; (v) Local scheme administering Agent; (vi) Required free labor contribution. The design of the hypothetical scenarios (Product) was then created by combinations of different attribute levels using a factorial design method on the selected attributes previously employed by Arifin et al. (2009). Of the six attributes, four attributes had three levels and two had four levels therefore (34*42) generated a total of 1,296 management scenarios. Based on a pre-test of the questionnaire, it was determined that each respondent could comfortably rank a maximum of 9 management scenarios, therefore the full set of scenarios could be handled by 144 respondents. The 1,296 management scenarios were divided among the 144 respondents in a manner that achieved a near orthogonal design using AlgDesign package from R statistical system (Wheeler 2008). The respondents were asked to rank the scenarios on a scale of 1-5 for each hypothetical scenario in terms of the likelihood that s/he would participate.
Model Specification
The study applied conjoint analysis to evaluate farmers’ preferences towards various unique hypothetical management scenarios that could be applied to a proposed Payment for Environmental Services (PES) scheme. A fundamental characteristic of this approach is that the utility derived from a product can be decomposed into part-worths1 relating to the different attributes of that product. To ensure accuracy and reliability of the results for the conjoint analysis, the data collected was analyzed using three models; (i) the traditional conjoint rating model; (ii) the Binary Logistic regression; and (iii) the ordered logit model. The traditional conjoint rating model was used to analyze rating data assuming intervals are equal. A binary logistic regression was used to assess the effect of the levels of the attributes on farmer’s preference to definitely undertake a specific scenario. While the Ordered logit model was used to analyze the rating data assuming intervals are not equal.
1 Part-worths
Kisaka and Obi Volume18 Issue 3, 2015
2015 International Food and Agribusiness Management Association (IFAMA). All rights reserved.
178
The statistical method primarily used in Traditional conjoint analysis is Ordinary Least Squares regression. The underlying assumption of this method is that the rating scale responses satisfy the numerical properties associated with interval scales i.e. that individuals can use rating scales to provide meaningful differences between scenario profiles and that the units of the rating scale represent equal differences. The landholders’ rating for each management scenario is assumed to be proxies for individual utility. And assuming (a) rating scale intervals are equal; (b) the individual’s utility function is strictly additive and linear in the model parameters; (c) The errors are distributed normally and independently with constant variance; the unobserved latent utility of individual n when he selects management scenario j will be expressed as:
(1) Unj = βo + β1Rnj +εnj
Where:
β are unobserved true parameters that linearly relate the observed ratings to the unobserved latent utility
R are the rating given by respondent n to management scenario j ε is an error term
The ratings provide information about the true utilities, and thus allow one to specify the rating data as a linear regression of attribute levels as follows:
(2) Rnj = αo + β1X1,1 + β2X1,2 + ... + βm-1X1,m-1 + ...+ βk(m-1)Xk(m-1) + εnj Where:
β’s are utility or preference estimates (part-worth) associated with each attribute level, and εnj is an error term that must satisfy the usual OLS assumptions of mean zero, constant variance and independence.
If the assumptions are satisfied, the estimated β’s can be interpreted as part-worth utilities, representing the conditional response means associated with each attribute level. A binary logit model was used to assess the effects of the levels of attributes on farmers’ preferences to definitely undertake a specific scenario among the different options presented during the conjoint experiment. For purposes of logit modeling a binary dependent variable Y is created; Where:
Y = 1 when the individual would definitely undertake a given scenario; and Y=0 otherwise.
In this approach only those individuals who said they would definitely undertake a given scenario were counted as participating. Further it is assumed that individual’s decisions to participate depend upon program attributes. The rational farmer will prefer to undertake the
Kisaka and Obi Volume18 Issue 3, 2015
2015 International Food and Agribusiness Management Association (IFAMA). All rights reserved.
179
ithmanagement scenario if the utility he expects to derive from i is greater than or equal to the utility he would expect to derive from other alternative contract scenarios. In other words:
Yi= 1 if Uni ≥ Unj , ∀j≠i and Yi = 0 if Uni ≤ Unj , ∀j≠i
It follows that the utility that farmer n derives from the observed attributes of the ith land management scenarios can be represented as:
(3) Vni = βiX1i + ....+ βkXki + αiHi +.....+ αRHR
X1i .... Xki are levels of the identified attributes H1 ..... Hs are respondent’s individual socio-economic characteristics Β1...... βk and α1 ...αs are unknown parameters
An ordered Logit model was used in the analysis of the respondents rating for alternative management scenarios. Suppose a rating scale of 1 – 5; it follows that the dependent variable is the rating between 1 (a respondent preferred that he would definitely not undertake) and; 5 (a respondent preferred that he would definitely undertake). The independent variables are the levels of the attributes and the specific characteristics of the respondents. We assume that any contract that the farmer rates with a higher number is preferred over any contract that he/she rates with a lower number. But unlike in the traditional conjoint model, we do not assume that the intervals between ratings are equal. The ratings are characterized as discrete and ordered, but not ordered by equal intervals and again assuming the error terms are distributed over the logistic function. It follows then that the utility that farmer n derives from the observed attributes of the ith land management scenarios can be represented as
(4) Vni =βiX1i + ....+ βkXki + αiHi +.....+ αRHR
Where:
X1i .... Xki are levels of the identified attributes H1 ..... Hs are respondent’s individual socio-economic characteristics
Β1...... βk and α1 ...αs are unknown parameters Though Vni , the indirect utility derived from a particular contract cannot be observed, the conjoint rating experiment provides information about farmer’s ratings of alternative scenarios. We observe the rating 1 through 5 where:
Rating = 1 ifVi ≤ µ1
Rating = 2 ifµ1 ≤ Vi ≤ µ2
Rating = 3 ifµ2 ≤ Vi ≤ µ3
Rating = 4 ifµ3 ≤ Vi ≤ µ4
Rating = 5 ifVi ≥ µ4and
Kisaka and Obi Volume18 Issue 3, 2015
2015 International Food and Agribusiness Management Association (IFAMA). All rights reserved.
180
µ1 .......µ4 are estimated cut off points The probability that the farmer will give a rating of j to the ith contract scenario is given as:
(5) Pr(Rating = j) = Pr[µj-1 < (β1X1j + ... βKXkj + α1jH1 +.... + αRJHR ) < µ4]
Results and Discussion Socio-Economic and Demographic Characteristics of Respondent
Of the 144 respondents, 42.1% were male and 57.9% were female. Demographic characteristics of respondents are said to affect their responses. An examination of these showed that the respondents ranged from age 18 years to 86 years, with an average age of 41 years. Respondents had an average household size of 6 persons and ranging from one person per household to 13 people per household. This indicates that in the study area majority of the people are middle aged and they have relatively large families compared to the county average of 5.31persons per household (KNBS 2010). Majority of the respondents had some years of formal education, with those with primary education making up 51% of the respondents and those with secondary education 37.2%; technical and university levels 1.4% and 4.8% respectively. Those with no formal schooling made up only 5.5% of the respondents. The main occupation and therefore main source of income for the respondents is farming comprising over 80% of the respondents. Income level has been predicted to affect farmer’s land use choices; Farmers in the study area have a mean income of approximately USD 149 per month. The average income from farming activities was approximately USD 102 per month and that from off-farm activities was approximately USD 46 per month. This is consistent with reports that the area suffers high unemployment (KNBS 2010) and the low farm income could indicate poor farming methods and/or poor soils, which are all indicators of land degradation. The low mean income indicates high level of poverty which, when converted to income per person per day, translates to less than a dollar a day at approximately USD 0.8 per person per day, based on the assumption of a 30-day month and household size of six.
Land is an important factor of production in rural economies and therefore land size, tenure and other variables affecting land are critical to any scheme. The study examined the land use characteristics of the respondents and found that they have an average land size of 3.4 acres ranging from land as small as 0.25 acres to a maximum of 24 acres. The respondents have lived on these farms for periods ranging from 1 year to 62 years with an average length of stay being approximately 17years. Land tenure is an important factor that has been found to affect the decision to participate in land management schemes (Kosoy 2007). The land tenure upstream differed among respondents with individual tenure accounting for 52.8%; family land 33.3%; community land 3.5% and squatters accounted for 10.4% of the respondents. These findings indicate that slightly over half of the participants have secure rights to the land they live on. This is expected to affect the decision they make to participate in the hypothetical scheme, since one need to be able to guarantee their ability to provide the environmental service to be able to participate in a PES scheme.
Kisaka and Obi Volume18 Issue 3, 2015
2015 International Food and Agribusiness Management Association (IFAMA). All rights reserved.
181
State of the Environment in the River Kuywa Watershed For PES to be viable there must be a valuable environmental service that is actually being degraded or whose degradation is imminent, and key stakeholders who perceive, or can be made aware of, both the value of the environmental service and the threat. It must also be possible for actions by defined individuals or groups to mitigate these threats or prevent degradation. The study examined the state of the environment within the study area and found that 82.8% of the respondents perceived the catchment as degraded while another 6.9% thought it was very degraded. Further, since the study area was in the River Kuywa catchment, the state of the water in the river was seen as an indicator for the state of the environment. In this regard the study found that 81.25% and 9.03% of the respondents reported that the quality of water in the river was poor and very poor respectively. On the other hand, 74.3% of the respondents said the quantity of water was reliable against those who felt it was unreliable of 25.7%. To find out which were the most prevalent environmental challenges in the watershed respondents were asked to rank environmental problems according to how severely they affect them, with 1 being the most prevalent problem and 6 the least prevalent. Respondents felt that poor water quality was their biggest environmental problem, followed by deforestation, wetland degradation, loss of biodiversity, poor agricultural yield and the problem of least concern was inadequate water. These challenges were blamed on increased human activities and the magnitude of these problems has led to increasing poverty and food insecurity among the communities, deteriorating environmental conditions and continued depletion of natural resources. The design and implementation of watershed PES scheme is premised on stakeholders recognizing the relationship between the condition of the ecosystem and its capacity to provide environmental services for instance suitable land use activities like agro-forestry practices, organic agriculture are expected to enhance provision of environmental services such as provision of clean water, increased ability of the soil to absorb water, vegetation filtration potential, water flow rates and weather buffering of the wetland and thus the water quality and flow seen as the most valuable of hydrological services. Recognizing this relationship establishes a basis for connecting the needs and wellbeing of downstream users of water to the actions of upstream land managers. This knowledge is expected to help influence upstream land use and management practices. Based on this the study sought to find out the level of awareness of the respondents, whether they were already carrying out environmental conservation activities, what kind of environmental activities the respondents are already carrying out, and if they are not practicing any conservation initiatives why they choose not to. Majority of the respondents, (89.4%) are aware that the activities farmers carry out on their farms upstream affects the quality and quantity of water received by downstream and urban users. However, only about 56 % are carrying out conservations activities on their farms. Despite the high awareness on environmental conservation within the watershed only 4% of the respondents had heard of trade in environmental services in any of its forms. The study results show that the respondents are aware of the interrelatedness of the upstream activities to the downstream benefits. However, this was not matched one-to-one with those who are implementing conservation measures to reduce their impact. The reasons given for not engaging in environmental conservation included a lack of awareness, inadequate labor, lack of money and too little land.
Kisaka and Obi Volume18 Issue 3, 2015
2015 International Food and Agribusiness Management Association (IFAMA). All rights reserved.
182
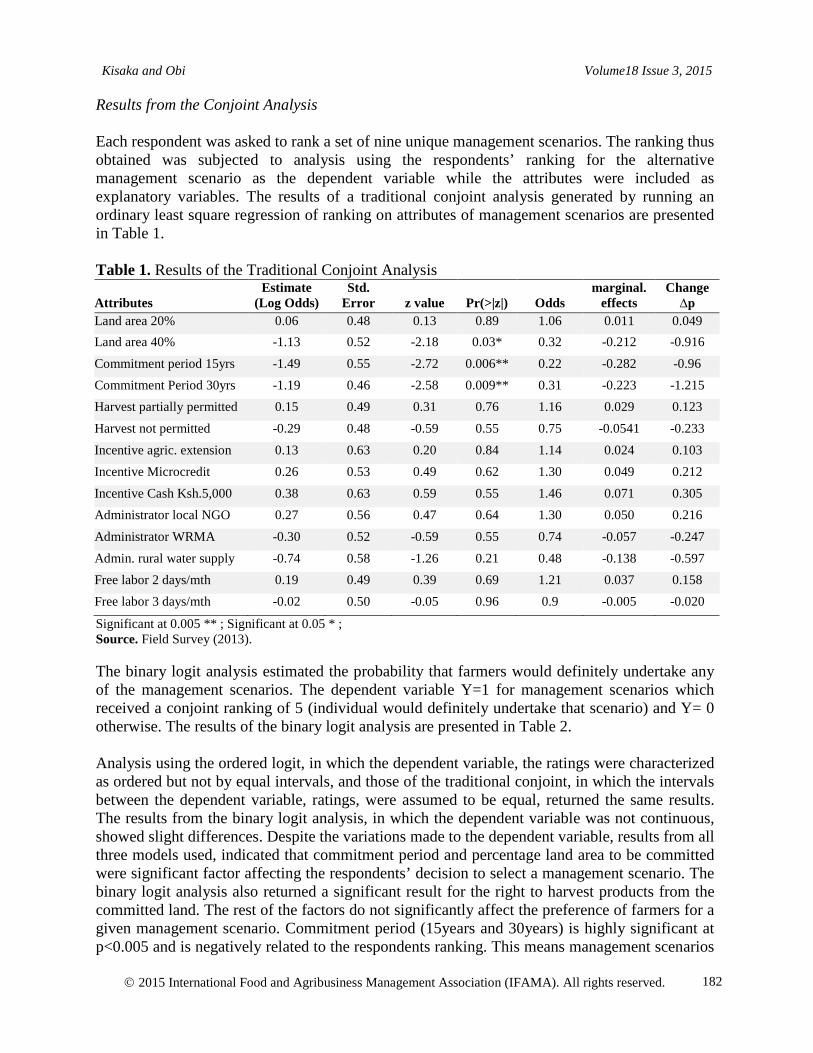
Results from the Conjoint Analysis Each respondent was asked to rank a set of nine unique management scenarios. The ranking thus obtained was subjected to analysis using the respondents’ ranking for the alternative management scenario as the dependent variable while the attributes were included as explanatory variables. The results of a traditional conjoint analysis generated by running an ordinary least square regression of ranking on attributes of management scenarios are presented in Table 1. Table 1. Results of the Traditional Conjoint Analysis Attributes
Estimate (Log Odds)
Std. Error
z value
Pr(>|z|)
Odds
marginal. effects
Change ∆p
Land area 20% 0.06 0.48 0.13 0.89 1.06 0.011 0.049 Land area 40% -1.13 0.52 -2.18 0.03* 0.32 -0.212 -0.916 Commitment period 15yrs -1.49 0.55 -2.72 0.006** 0.22 -0.282 -0.96 Commitment Period 30yrs -1.19 0.46 -2.58 0.009** 0.31 -0.223 -1.215 Harvest partially permitted 0.15 0.49 0.31 0.76 1.16 0.029 0.123 Harvest not permitted -0.29 0.48 -0.59 0.55 0.75 -0.0541 -0.233 Incentive agric. extension 0.13 0.63 0.20 0.84 1.14 0.024 0.103 Incentive Microcredit 0.26 0.53 0.49 0.62 1.30 0.049 0.212 Incentive Cash Ksh.5,000 0.38 0.63 0.59 0.55 1.46 0.071 0.305 Administrator local NGO 0.27 0.56 0.47 0.64 1.30 0.050 0.216 Administrator WRMA -0.30 0.52 -0.59 0.55 0.74 -0.057 -0.247 Admin. rural water supply -0.74 0.58 -1.26 0.21 0.48 -0.138 -0.597 Free labor 2 days/mth 0.19 0.49 0.39 0.69 1.21 0.037 0.158 Free labor 3 days/mth -0.02 0.50 -0.05 0.96 0.9 -0.005 -0.020
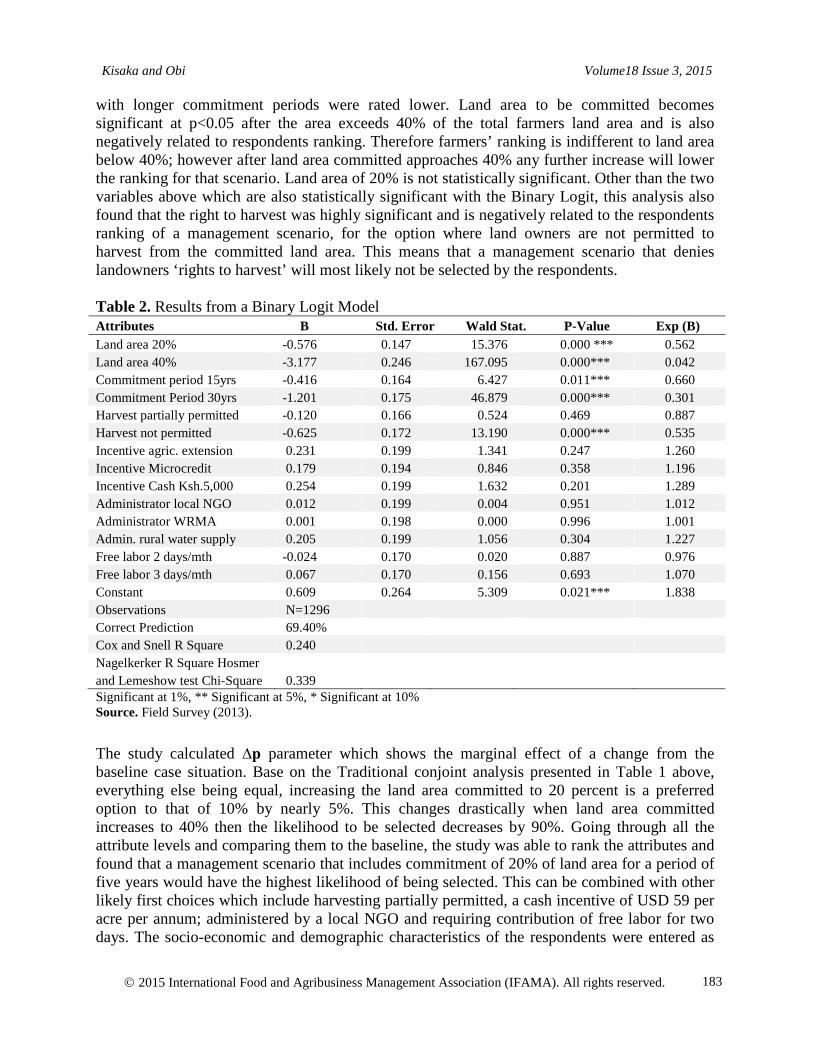
Significant at 0.005 ** ; Significant at 0.05 * ; Source. Field Survey (2013). The binary logit analysis estimated the probability that farmers would definitely undertake any of the management scenarios. The dependent variable Y=1 for management scenarios which received a conjoint ranking of 5 (individual would definitely undertake that scenario) and Y= 0 otherwise. The results of the binary logit analysis are presented in Table 2. Analysis using the ordered logit, in which the dependent variable, the ratings were characterized as ordered but not by equal intervals, and those of the traditional conjoint, in which the intervals between the dependent variable, ratings, were assumed to be equal, returned the same results. The results from the binary logit analysis, in which the dependent variable was not continuous, showed slight differences. Despite the variations made to the dependent variable, results from all three models used, indicated that commitment period and percentage land area to be committed were significant factor affecting the respondents’ decision to select a management scenario. The binary logit analysis also returned a significant result for the right to harvest products from the committed land. The rest of the factors do not significantly affect the preference of farmers for a given management scenario. Commitment period (15years and 30years) is highly significant at p<0.005 and is negatively related to the respondents ranking. This means management scenarios
Kisaka and Obi Volume18 Issue 3, 2015
2015 International Food and Agribusiness Management Association (IFAMA). All rights reserved.
183
with longer commitment periods were rated lower. Land area to be committed becomes significant at p<0.05 after the area exceeds 40% of the total farmers land area and is also negatively related to respondents ranking. Therefore farmers’ ranking is indifferent to land area below 40%; however after land area committed approaches 40% any further increase will lower the ranking for that scenario. Land area of 20% is not statistically significant. Other than the two variables above which are also statistically significant with the Binary Logit, this analysis also found that the right to harvest was highly significant and is negatively related to the respondents ranking of a management scenario, for the option where land owners are not permitted to harvest from the committed land area. This means that a management scenario that denies landowners ‘rights to harvest’ will most likely not be selected by the respondents. Table 2. Results from a Binary Logit Model Attributes B Std. Error Wald Stat. P-Value Exp (B) Land area 20% -0.576 0.147 15.376 0.000 *** 0.562 Land area 40% -3.177 0.246 167.095 0.000*** 0.042 Commitment period 15yrs -0.416 0.164 6.427 0.011*** 0.660 Commitment Period 30yrs -1.201 0.175 46.879 0.000*** 0.301 Harvest partially permitted -0.120 0.166 0.524 0.469 0.887 Harvest not permitted -0.625 0.172 13.190 0.000*** 0.535 Incentive agric. extension 0.231 0.199 1.341 0.247 1.260 Incentive Microcredit 0.179 0.194 0.846 0.358 1.196 Incentive Cash Ksh.5,000 0.254 0.199 1.632 0.201 1.289 Administrator local NGO 0.012 0.199 0.004 0.951 1.012 Administrator WRMA 0.001 0.198 0.000 0.996 1.001 Admin. rural water supply 0.205 0.199 1.056 0.304 1.227 Free labor 2 days/mth -0.024 0.170 0.020 0.887 0.976 Free labor 3 days/mth 0.067 0.170 0.156 0.693 1.070 Constant 0.609 0.264 5.309 0.021*** 1.838 Observations N=1296 Correct Prediction 69.40% Cox and Snell R Square 0.240 Nagelkerker R Square Hosmer and Lemeshow test Chi-Square
0.339
Significant at 1%, ** Significant at 5%, * Significant at 10% Source. Field Survey (2013).
The study calculated ∆p parameter which shows the marginal effect of a change from the baseline case situation. Base on the Traditional conjoint analysis presented in Table 1 above, everything else being equal, increasing the land area committed to 20 percent is a preferred option to that of 10% by nearly 5%. This changes drastically when land area committed increases to 40% then the likelihood to be selected decreases by 90%. Going through all the attribute levels and comparing them to the baseline, the study was able to rank the attributes and found that a management scenario that includes commitment of 20% of land area for a period of five years would have the highest likelihood of being selected. This can be combined with other likely first choices which include harvesting partially permitted, a cash incentive of USD 59 per acre per annum; administered by a local NGO and requiring contribution of free labor for two days. The socio-economic and demographic characteristics of the respondents were entered as
Kisaka and Obi Volume18 Issue 3, 2015
2015 International Food and Agribusiness Management Association (IFAMA). All rights reserved.
184
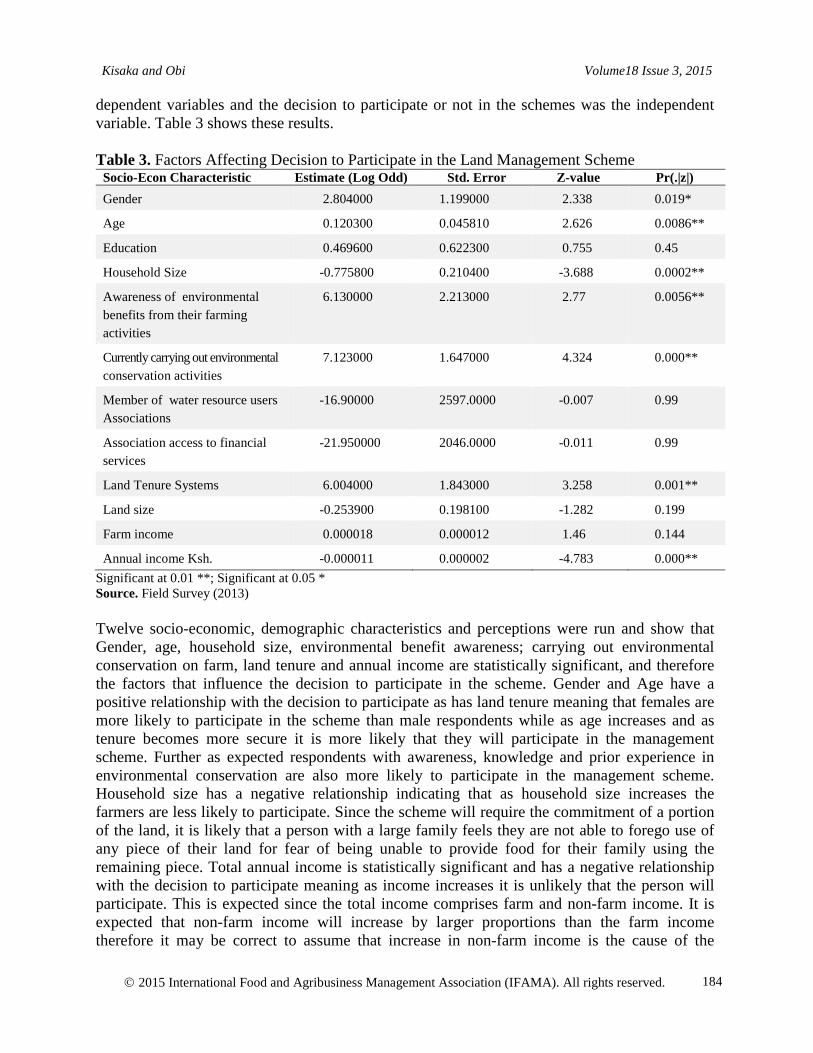
dependent variables and the decision to participate or not in the schemes was the independent variable. Table 3 shows these results. Table 3. Factors Affecting Decision to Participate in the Land Management Scheme
Socio-Econ Characteristic Estimate (Log Odd) Std. Error Z-value Pr(.|z|) Gender 2.804000 1.199000 2.338 0.019*
Age 0.120300 0.045810 2.626 0.0086**
Education 0.469600 0.622300 0.755 0.45
Household Size -0.775800 0.210400 -3.688 0.0002**
Awareness of environmental benefits from their farming activities
6.130000 2.213000 2.77 0.0056**
Currently carrying out environmental conservation activities
7.123000 1.647000 4.324 0.000**
Member of water resource users Associations
-16.90000 2597.0000 -0.007 0.99
Association access to financial services
-21.950000 2046.0000 -0.011 0.99
Land Tenure Systems 6.004000 1.843000 3.258 0.001**
Land size -0.253900 0.198100 -1.282 0.199
Farm income 0.000018 0.000012 1.46 0.144
Annual income Ksh. -0.000011 0.000002 -4.783 0.000** Significant at 0.01 **; Significant at 0.05 * Source. Field Survey (2013) Twelve socio-economic, demographic characteristics and perceptions were run and show that Gender, age, household size, environmental benefit awareness; carrying out environmental conservation on farm, land tenure and annual income are statistically significant, and therefore the factors that influence the decision to participate in the scheme. Gender and Age have a positive relationship with the decision to participate as has land tenure meaning that females are more likely to participate in the scheme than male respondents while as age increases and as tenure becomes more secure it is more likely that they will participate in the management scheme. Further as expected respondents with awareness, knowledge and prior experience in environmental conservation are also more likely to participate in the management scheme. Household size has a negative relationship indicating that as household size increases the farmers are less likely to participate. Since the scheme will require the commitment of a portion of the land, it is likely that a person with a large family feels they are not able to forego use of any piece of their land for fear of being unable to provide food for their family using the remaining piece. Total annual income is statistically significant and has a negative relationship with the decision to participate meaning as income increases it is unlikely that the person will participate. This is expected since the total income comprises farm and non-farm income. It is expected that non-farm income will increase by larger proportions than the farm income therefore it may be correct to assume that increase in non-farm income is the cause of the
Kisaka and Obi Volume18 Issue 3, 2015
2015 International Food and Agribusiness Management Association (IFAMA). All rights reserved.
185
negative sign. And increase in Non-farm income is usually associated with stay away from home since most jobs are in urban areas. The study found that level of education, and land size were not statistically significant and are therefore unlikely to affect the decision to participate in the management scheme. The insignificance of level of education is an unexpected result since previous studies show that education plays a significant role in environmental management programs in developing countries (Balana et al. 2008). This contrary finding could mean that the respondent have sufficient environmental awareness, knowledge and hands on experience. Another unexpected result was the insignificant and negative relationship of land size and the decision to participate. It had been anticipated that given the value attached to land and the generally small land size (average land size of 3.4 acres), the decision to participate would be related positively to land size. This finding could mean that with other appropriate measures in place, land size is not a major constraint in implementing improved land management practices. Conclusion and Recommendations Environmental services provided by watersheds are scarce due to destruction and unsustainable use of watershed resources. Land degradation, poor water quality and the associated stress on human populations continues to be a major challenge to policy makers as demand for water increases and the human population continues its exponential growth path. The sustainable development thinking highlighted the economic angle of the problem of environmental management and made interdependence central to the policy formulation process. This led to governance approaches that incorporate economic consideration into environmental management. Work therefore increased to making environmental goods and services marketable, through valuation and using this information to inform policymaking. It is from this that the concept of Payment for Environmental services grew. Payment for Environmental Services (PES) is an economic instrument designed to provide positive incentives to natural resource users that are expected to result in continued or improved provision of environmental services. In watershed land use decisions by farmers upstream affect the provision of water quality and quantity downstream providing a setting in which PES can be applied. PES has emerged as an important tool that can motivate farmers to provide environmental services through land use changes and adoption of best land management practices. It is premised on the concept that to maintain the flow of environmental goods and services for society, incentives are needed to induce local people to forego more disruptive land and resource use practices. It is also presented as a sustainable, economically efficient and self – financing development program that could go a long way to support the goals of increased production at farm level while reducing the ecological footprint. The study finds that information on the preferences of farmers to aspects of a possible management contract for a PES are a key to setting up a sustainable PES scheme. Using locally identified sets of management attributes and their levels and applying conjoint analysis, this study assessed farmers’ preferences for alternative management options for a PES scheme aimed at enhancing watershed service in River Kuywa catchment. This conjoint analysis study of farmers' preferences for the attributes of management scenarios for PES was analyzed using three methods that gave similar results indicating high confidence in the validity of the
Kisaka and Obi Volume18 Issue 3, 2015
2015 International Food and Agribusiness Management Association (IFAMA). All rights reserved.
186
results. The results indicate that in Mt Elgon Ecosystem and probably elsewhere in Kenya, conjoint analysis can be effective in eliciting farmers’ preferences over the attributes for management options for PES. The results found that the length of time the management intervention will commit the farmers land significantly affected their ranking of the management scenarios presented. Land size to be committed also significantly affected the ranking of the management scenario, but only after it reached land area of 40% and above of the total land area. This is an indication that farmers are willing to set aside a portion of their land for the conservation intervention. This leads the study to conclude that preparation of any management contract should take these two factors into consideration to encourage farmers to accept the contract. Based on the ranking of the farmers for the various management scenarios presented to them lead to the conclusion that a management contracts that includes commitment of 20% of land area for a period of five years, a cash incentive of USD 59 per acre per annum; administered by a local NGO and requiring contribution of free labor for two days would have the highest likelihood of being selected. It is therefore recommended that these attributes are incorporated in management contracts for a PES scheme for the Kuywa River watershed. The study found that gender, age, household size, awareness of upstream effect on downstream benefits; carrying out environmental conservation on farm, land tenure and annual income are the main factors that affected the decision of the farmer to participate in the scheme. These characteristics should therefore be taken into consideration when designing a PES scheme. PES implemented elsewhere in the world have been found to support both development and environmental goals, therefore developing countries faced with the problems of land degradation, food insecurity and water scarcity should consider the use of this policy instrument. Assessing the preferences of farmers for management options provides an inroad into the application of this tool and should be considered by policy makers and practitioners who intend to use PES. The findings of this study that land size did not significantly affect the farmers’ decision to participate in the scheme implies to policy makers and practitioners that environmental goals could be realized despite the size of the land held by the farmers. The practical value of the findings in this study have been demonstrated, however the study focused on only one aspect of an entire toolbox required for the design and implementation of a Payment for Environmental Services Scheme. Further research is recommended to fill the gap. Specifically for PES to meet the goal for reduced land degradation, research is needed to find out which agricultural practice could be promoted in such a scheme to ensure this is met alongside the goal of increased food production.
References Ajayi, O, F. Akinnifesi, J. Mullila-Mitti, J. Dewolf, P. Matakala and F. Kwesiga. 2008.
Adoption, profitability, impacts and scaling-up of agroforestry technologies in southern African countries, edited by D. Batish, R. Kohli, S. Jose and H. Singh, ‘Ecological basis of agroforestry’, Taylor and Francis Group, Boca Raton, Florida.
Kisaka and Obi Volume18 Issue 3, 2015
2015 International Food and Agribusiness Management Association (IFAMA). All rights reserved.
187
Alriksson, S., and T. Oberg. 2008. Conjoint analysis for environmental evaluation: a review of methods and applications. Environmental Science and Pollution Research 15 (3): 244-257.
Angelsen, A. 2010. Policies for reduced deforestation and their impact on agricultural
production. Proceedings of the National Academy of Sciences 107(46): 19639–19644. Arifin, B., B.M. Swallow, S. Suyanto, and R.D. Coe. 2009. A conjoint analysis of farmer
preferences for community forestry contracts in the Sumber Jaya Watershed, Indonesia. Ecological Economics 68(7): 2040-2050.
Batabyal, A.A., J.R. Kahn, and R.V. O’Neill. 2003. On the scarcity value of ecosystem services.
Journal of Environmental Economics and Management 46(2): 334–352, Balana, B., B. Muys, F. Nega, E. Tollens, J. Nyssen, J. Deckers, and E. Mathijs. 2008.
Household livelihood strategies and forest dependence in the highlands of Tigray, Northern Ethiopia. Agricultural Systems 98(2): 147–155.
Balana, B., B. Muys, F. Nega, E. Tollens, J. Nyssen, J. Deckers, and E. Mathijs. 2008. The
Economic Contribution of Forest Resource use to rural livelihoods in Tigray Northern Ethiopia. Forest Policy and Economics. 11(2): 109 – 117.
Boyd, J. and S. Banzhaf. 2007. What are ecosystem services? The need for standardized
environmental accounting units. Ecological Economics 63(2–3): 616–626. Cary J, and A. J. Roberts. 2011. The limitations of environmental management systems in
Australian agriculture. Environment Management. 92(3):878-85. Coase R. 1960. The problem of social cost. Journal of Law and Economics. 3: 1-44. Comprehensive Assessment of Water Management in Agriculture. 2007. Water for Food,
Water for Life: A Comprehensive Assessment of Water Management in Agriculture. London: Earthscan, and Colombo: International Water Management Institute.
Daily G. C, ed. 1997. Nature’s services: societal dependence on natural ecosystems. Island
Press, Washington, D.C., USA. Engel, S., S. Pagiola and S. Wunder. 2008. Designing payments for environmental services in
theory and practice: an overview of the issues. Ecological Economics 65:663-674. Food and Agriculture Organization of the United Nations. 2011. Payments for ecosystem
services and food security. Rome, Italy: The Food and Agriculture Organization of the United Nations.
Gómez-Baggethun, E. 2011. Economic valuation and the commodification of ecosystem
services. Progress in Physical Geography 35(5): 613-628.
Kisaka and Obi Volume18 Issue 3, 2015
2015 International Food and Agribusiness Management Association (IFAMA). All rights reserved.
188
Gross-Camp Nicole D., A. Martin, S. McGuire, B. Kebede and J. Munyarukaza. 2012. Payments for ecosystem services in an African protected area: exploring issues of legitimacy, fairness, equity and effectiveness. Oryx 46(1):24-33.
Hardin, G. 1968. The tragedy of the commons. Science 162(3859): 1243-8. Hubermann, D. and T. Leipprand. 2006. Developing International Payments for Ecosystem
Services: A Technical Discussion. Background Paper. UNEP-Economic and Trade Branch, Geneva.
International Fund for Agricultural Development. 2013. Smallholders, food security, and the
environment. Rome, Italy: International Fund for Agricultural Development. Jack B., C. Kousky and K. Sims. 2008. Designing payments for ecosystem services: lessons
from previous experience with incentive-based mechanisms. Proceedings of the National Academy of Science 105(28): 9465.
Johnson N., and M. E. Baltodano. 2004. The economics of community watershed management:
Some evidence from Nicaragua. Ecological Economics 49(1): 57 – 71. Johnson F.R., E. Lancsar and D. Marshall. 2013. Constructing experimental designs for
discrete-choice experiments: report of the ISPOR Conjoint Analysis Experimental Design Good Research Practices Task Force. Value Health 16(1):3–13.
Kenya National Bureau of Statistics. 2010. Kenya population and Housing Census Volume 1a:
Population distribution by administrative units. 217p. Kenya: Kenya National Bureau of Statistics, Nairobi (KNBS).
Kothari C. R. 2004. Research Methodology: Methods and Techniques. New Age International
Publishers. Kosoy, N., M. Martinez-Tuna, R. Muradian, and J. Martinez-Alier. 2007. Payments for
environmental services in watersheds: insights from a comparative study of three cases in Central America. Ecological Economics 61 (2-3): 446–455.
Marshall D, J.F.P. Bridges, and B. Hauber. 2010. Conjoint analysis applications in health—How
are studies being designed and reported? Patient 3(4):249–256. McCoy, R. M. 2005. Field Methods in Remote Sensing. The Guilford Press, New York.
Millennium Ecosystem Assessment. 2005. Ecosystems and Human Wellbeing: Synthesis. Island Press, Washington DC. 319.
Moon K, and C. Cocklin. 2011. A landholder-based approach to the design of private-land
conservation programs. Conservation Biology 25(3):493-503.
Kisaka and Obi Volume18 Issue 3, 2015
2015 International Food and Agribusiness Management Association (IFAMA). All rights reserved.
189
Nkonya E., F. Place, J. Pender, M. Mwanjololo, A. Okhimamhe, E. Kato, S. Crespo, J. Ndjeunga and S. Traore. 2011. Climate Risk management through Sustainable Land management in Sub-Saharan Africa. IFPRI Discussion paper 01126. Washington DC: International Food Policy Research Institute.
Ortega-Pacheco, D. V., F. Lupi, and M. D. Kaplowitz. 2009. Payment for Environmental
Services: Estimating demand within a Tropical Wetland. Journal of Natural Resources Policy Research 1(2): 189 – 202.
Ostrom, E. 1990. Governing the Commons: The evolution of Institutions for Collective Action.
Cambridge University Press, Cambridge. Pagiola, S., N Landell-Mills, and J. Bishop. 2002. Making market-based mechanisms work for
forests and people. In selling forest environmental services: Market-based mechanisms for conservation and development, edited by S. Pagiola, j. Bishop, and N. Landell-Mills, Earthscan, London. 261-289.
Pagiola S., A. Arcenas, and G. Platais. 2005. Can Payments for environmental services help
reduce poverty? An exploration of the issues and the evidence to date from Latin America. World Development 33(2): 237 - 253
Pagiola, S. and G. Platais. 2007. Payment for Environmental services: From theory to Practice.
World Bank, Washington. Pagiola, S. 2008. Payments for environmental services in Costa Rica. Ecological Economics
65 (4): 712-724. Pagiola S. 2010. Payment for Environmental Services in Saltillo. World Bank, Washington. Pearce D., C. Pearce and C. Palmer. 2004. Valuing the Environment in Developing Countries.
Case Studies. Edward Elgar, Cheltenham. Pearce D., a n d K . Turner K. 1990. Economics of Natural Resources and the Environment.
Harvester, New York/London. Perman, R., M. Yae, J. McGilvray, J. and M. Common. 2003. Natural Resource and
Environmental Economics, Third Edition. Porras, I., M. Grieg-Gran, and N. Neves. 2008. All that glitters. A review of payments for
watershed services in developing countries. Natural Resource Issues No. 11. International Institute for Environment and Development, London, UK.
Putten V.I., S.M. Jennings, J.J. Louviere, and L.B. Burgess. 2011. Tasmanian landowner
preferences for conservation incentive programs: a latent class approach. Journal of Environmental Management. 92(10):2647-56
Kisaka and Obi Volume18 Issue 3, 2015
2015 International Food and Agribusiness Management Association (IFAMA). All rights reserved.
190
Rafuse S. 2013. Payment for Watershed Ecosystem Services: Explaining Landowner willingness to Participate in Watershed conservation. University of Oregon, Oregon.
Reed Johnson F, E. Lancsar, D. Marshall, V. Kilambi, A. Mühlbacher, D.A. Regier, B.W.
Bresnahan, B. Kanninen, and J.F. Bridges. 2013. Constructing experimental designs for discrete-choice experiments: report of the ISPOR Conjoint Analysis Experimental Design Good Research Practices Task Force. Value Health. 16(1):3-13.
Robertson N., and S. Wunder. 2005. Fresh tracks in the Forest: Assessing incipient Payment for
Environmental Services initiatives in Bolivia. CIFOR, Bogor. Rosegrant, Mark W., C . Ximing, and Sarah A. Cline. 2002. World water and food to 2025:
Dealing with scarcity. IFPRI-2020 Vision/International Water Management Institute book. Washington, D.C. U.S.A.: International Food Policy Research Institute.
Sileshi, G, F. Akinnifesi, O. Ajayi and F. Place. 2008. ‘Meta-analysis of maize yield response to
woody and herbaceous legumes in sub-Saharan Africa’, Plant and Soil, 307:1–19. Sommerville, M. M., J. P.G. Jones, and E. J. Milner-Gulland. 2009. A revised conceptual
framework for payments for environmental services. Ecology and Society 14(2): 34. Sommerville, M., J.P.G. Jones, M. Rahajaharison, and E.J. Milner-Gulland. 2010b. The role
of fairness and benefit distribution in community-based payment for environmental services interventions: a case study from Menabe, Madagascar. Ecological Economics 69(6): 1262–1271.
Southgate, D., and S. Wunder. 2009. Paying for watershed services in Latin America: A review
of current initiatives. Journal of Sustainable Forestry 28 (3-5): 497 - 524 Spangenberg, J. H. and J. Settele. 2010. Precisely incorrect? Monetising the value of ecosystem
services, Ecological Complexity 7 (2010) 327–337 Swallow B, M. van Noordwijk, S. Dewi, D. Murdiyarso, D. White, J. Gockowski, G.
Hyman, S. Budidarsono, V. Robiglio, V. Meadu, A. Ekadinata, F. Agus, K. Hairiah, P.N. Mbile, D.J. Sonwa, and S. Weise. 2007. Opportunities for Avoided Deforestation with Sustainable Benefits. An Interim Report of the ASB Partnership for the Tropical Forest Margins, ASB Partnership for Tropical Forest Margins, Nairobi, Kenya.
United Nations Environment Program. 2012. Global Environment Outlook 5: Summary for
Africa. UNEP Van Hecken, G., and J. Bastiaensen. 2010. Payments for ecosystem services: justified or not?
A political view. Environment Science Policy 13 (8):785-792.
Kisaka and Obi Volume18 Issue 3, 2015
2015 International Food and Agribusiness Management Association (IFAMA). All rights reserved.
191
Van Heckens G., J. Bastiaensen, W.F. Vásquez. 2010. Institutional embeddedness of local willingness to pay for environmental services: Evidence from Matiguás, Nicaragua. Institute of Development Policy and Management (IOB), University of Antwerp, Discussion Paper 2010-04.
Van Hecken G., and J. Bastiaensen. 2011. The viability of local payment for watershed services:
empirical evidence from Matiguas, Nicaragua; Ecological Economics 74: 169 – 176. Van Noordwijk, M., and B. Leimona. 2010. Principles for fairness and efficiency in enhancing
environmental services in Asia: payments, compensation, or co-investment? Ecology and Society 15(4): 17.
Wheeler, B. 2008. The AlgDesign Package. Available from: http://cran.r-project.org/. Wunder, S. 2005. Payment for environmental services: Some nuts and bolts. Occasional Paper
No. 42. Bogor, CIFOR. Wunder S., S. Engel, S. Pagiola. 2008. Taking Stock: A comparative analysis of payment for
environmental services programs in developed and developing countries. Ecological Economics 65(4): 834 - 852
World Wildlife Fund. 2012. Living Planet Report 2010: Biodiversity, biocapacity and better
choices. Gland: World Wildlife Fund. Zhang, J., Z. Li, L. Zhu, F. Yang, and Q. Zhao. 2009. Advances of Research on Agricultural
Non- point Source pollution and it’s Control. Agro-environment and Development (Chinese) 26(3):1−5.

Kisaka and Obi Volume18 Issue 3, 2015
2015 International Food and Agribusiness Management Association (IFAMA). All rights reserved.
192