family environment and educational aspirations of secondary ...
126
FAMILY ENVIRONMENT AND EDUCATIONAL ASPIRATIONS OF SECONDARY AND HIGHER SECONDARY SCHOOL STUDENTS IN CHURACHANDPUR, MANIPUR Thesis submitted in fulfillment of the requirement for the degree of Master of philosophy in Social Work CANNY LALSANHIM Under the Supervision of Prof.C. Devendiran Professor & Head Department of Social Work School of Social Sciences Mizoram University Tanhril-796004 Aizawl, Mizoram 2018
-
Upload
khangminh22 -
Category
Documents
-
view
8 -
download
0
Transcript of family environment and educational aspirations of secondary ...

FAMILY ENVIRONMENT AND EDUCATIONAL ASPIRATIONSOF SECONDARY AND HIGHER SECONDARY SCHOOL
STUDENTS IN CHURACHANDPUR, MANIPUR
Thesis submitted in fulfillment of the requirement for the degree of Master ofphilosophy in Social Work
CANNY LALSANHIM
Under the Supervision of
Prof.C. Devendiran
Professor & Head
Department of Social Work
School of Social Sciences
Mizoram University
Tanhril-796004
Aizawl, Mizoram
2018

i
MIZORAM UNIVERSITY
DCECMBER, 2018
CERTIFICATE
This is to certify that the dissertation “Family Environment and Educational
Aspirations of Secondary And Higher Secondary School Students in Churachandpur,
Manipur” submitted by Canny Lalsanhim for the award of Master of Philosophy in Social
Work is carried out under my guidance and incorporates the student bonafide research and
this has not been submitted for award of any degree in this or any other university or
institution of learning.
Dated: (Prof. C. Devendiran)
Place: Aizawl, Mizoram Research Supervisor
Department of Social Work
Mizoram University
Aizawl
ii
MIZORAM UNIVERSITY
DECEMBER, 2018
DECLARATION
I, Canny Lalsanhim, hereby declare that the subject matter of this dissertation is the
record of work done by me, that the contents of this dissertation did not form bias of the
award of any previous degree to me or to the best of my knowledge, to anybody else; and that
the dissertation has not been submitted by me for any research degree in any other
University/ Institution.
This is being submitted to the Mizoram University for the degree of Master of
Philosophy in Social Work Department.
Dated: (CANNY LASANHIM)
Place: Aizawl, Mizoram Research Scholar
(Prof. C. DEVENDIRAN) (Prof. C. DEVENDIRAN)
Research Supervisor Head
Department of Social Work Department of Socia Work
Mizoram University Mizoram University
Aizawl-796004 Aizawl-796004

ii
iii
ACKNOWLEDGEMENT
Firstly, I would like to thank almighty God for his unconditional love,
manifold blessings and guidance to enable me to complete my research work.
It is a genuine pleasure to express my heartfelt gratitude to Prof. C.
Devendiran, Head of Department Social Work, my research Supervisor for giving me
the opportunity to learn and improve skills in research and for the continued guidance
and support throughout my research. I am truly grateful to Prof. KanagarajEaswaran
for his encouragement and support throughout the process of my research.
Also my gratitude to the principals of the two schools for granting me the
permission to collect data from their students, providing necessary information for my
research and their hospitality. I also thank all the people who availed themselves in
spite of their busy schedule by contributing the knowledge and generously of their
valuable time.
I would like to extend my gratitude to all the faculty and non-faculty members
of the Social Work Department for their endless support.
Last but not the least I am deeply grateful to my parents, Ms. Brenda, Ms.
JeenaLaishram, Mr. Mangboi, Mr. Steven, Mr. Emmanuel, Mr.Lalhmangaiha,
Mr.Lallawmzuala and Mr. Vanlalduata, without their prayers and support I would not
have been able to complete my research.
Dated: (CANNY LALSANHIM)
Place: Aizawl, Mizoram Research Scholar

iv
CONTENTS
Chapter Page No.
Certificate i
Declaration ii
Acknowledgement iii
Contents iv
List of tables v
List of figures vi
List of Abbreviation vii
I Introduction 1
II Review of Literature10
III Methodology27
IV Results And Discussions33
V Conclusion and Suggestions 94
Bibliographyx
Appendixxvi
Particulars of the candidate xxiii
Bio-data xxiv

v
LIST OF TABLES
TableNo.
Name Page No.
1 Profile of the respondents 33
2 Parental Characteristics of the respondents 37
3 Familial Characteristics of the respondents 41
4 Respondents Socio Economic Characteristics by Type of School 43
5 Descriptive statistics of Family Environment by Type of School ofthe Respondents
45
6 Respondents Level of Family Environment by Type of School 46
7 Correlates of Family Environment 48
8 Respondents Ambition by Type of School 50
9 Respondents Educational Aspirations by Type of School 52
10 Respondents Opinion on Everyone about Educational Aspiration byType of School
54
11 Respondents Educational Support by Type of School 57
12 Respondents Educational Support and Encouragement by Type ofSchool
59
13 Respondents Parental Raise their Children by Type of School 61
14 Respondents Satisfaction of Economic Status and Resources byType of School
63
15 Respondents Academic Achievement by Type of School 65
16 Correlates of Leisure time Activities 68
17 Respondents Co-curricular Activities by Type of School 70
18 Respondent Reasons to Pursue Higher Education by Type of School 73
19 Educational Aspiration by Family Environment 77

vi
LIST OF FIGURES
Figure No. Name Page No.
1 Map of Manipur viii
2 Map of Churachandpur ix
3 Member of Organization 72
4 Respondents Occupational Preferences 84
5 Daily Activity Schedule 89

vii
LIST OF ABBREVIATIONS
1. FES : Family Environment Scale
2. SES : Socio- Economic Status
3. SPSS : Statistical Package for Social Sciences
4. HSLC :High School Living Certificate
5. HSSLC :Higher Secondary School Living Certificate
6. SC :Scheduled Caste
7. ST :Scheduled Tribe
8. OBC :Other Backward Class
9. APL :Above Poverty Line
10. BPL :Below Poverty Line
11. AAY :Antyodaya Anna Yojana
12. UPSC :Union Public Service Commission
13. MPSC :Manipur Public Service Commission
14. SSC : Staff Selection Commission
15. CGL : Combine Graduate Level
16. TET : Teacher’s Eligibility Test
17. Ph.D : Doctoral Degree
18. M.Phil : Master of Philosophy
19. C.S.E : Civil Service Examination
20. I.E.S : Indian Economic Service Examination
21. I.A.S : Indian Administrative Service
22. I.F.S : Indian Foreign Service
23. I.R.S : Indian Revenue Service
24. L.L.B : Bachelor of Legislative Law
25. B.E : Bachelor of Engineering
26. B.Ed. : Bachelor of Education
27. B.Lib : Bachelor of Library Science
28. NSS : National Service Scheme
29. NCC : National Cadet Corps
30. H.E :Higher Education

1
CHAPTER- I
INTRODUCTIONThe present study is an attempt to understand the family environment and
educational aspirations of secondary and higher secondary school students in
Churachandpur, Manipur.
Background of the Study
Youth is an important intermediary phase of life between childhood and
adulthood which begins with the onset of puberty and until the individual is
psychologically and emotionally matured. It is the stage of life where many changes
and development take place. The young people even though they belong to the same
age group there are many differences among them and more or less they do not
represent a homogeneous group. The lives of the young people are shaped by
education and there are differences among young people depending on the time they
spent in educational settings, and the experience they have in schools, colleges and
universities. The young people having good and extended education have a better
career and employment opportunities than the ones who leave education at an early
year's.
Chapman, A, and Robinson (2009) discussed the way young people spent their
leisure and resources has been changed over time. They hold the view that the way
young people spent their leisure becomes a conflict between themselves and the state.
Young people are more confined to their room and spent their leisure time in pursuits
of indoor games such as computer games and mobile. There is a decline in the
pursuits of outdoor and physical fitness such as games and sports. The young people
are perceived as lazy wasting time doing nothing and unconstructively using their
leisure time.
Adolescence
Chaube, S.P (2002) stated that adolescence is a very important period of life
where changes take place rapidly. It is a stage of life where revolutionary changes
take place such as the individual's mental, social, moral, and spiritual. In his book as
given by Psychologists, adolescence starts at the age of 12or 13 years. The dawn of
adolescence is comparatively earlier in girls than in boys. Psychologists generally
agree that for Boys, Early Adolescence starts from 11 to 12 ½ or 13 years, Middle
Adolescence from 13 to 18 years and Late Adolescence from 18 to 21 years whereas

2
in the case of Girls, Early Adolescence from 10 to 11 years, Middle Adolescence from
12 to 15 years and Late Adolescence from 17 to 20 or 21 years.
Youth
The United Nations, for statistical purposes, defines ‘youth', as those persons
between the ages of 15-24 years. According to the National Youth Policy 2014 India,
Youth refers to that population between the ages of 15-29 years. The National Youth
Policy in India has highlighted 11 important priorities among which education is the
first. The rest of the remaining priorities which includes employment and skill
development, entrepreneurship, health, and healthy lifestyle, sports, promotion of
social values, community engagement, participation in politics and governance, youth
engagement, inclusion, and social justice have either direct or indirect implications on
the educational aspirations of youth in India. Therefore, the Youth policy in India
focuses among others in institutional areas where students engage in both formal and
informal process of learning and socialization. It becomes imperative for stakeholders
to base their strategies of Youth empowerment through primary agents of
socialization such as the family and secondary agents such as schools where students
engage themselves with a hope for the better tomorrow.
Family
Aufseeser et al. (2006) emphasize the importance of family in the lives of
children. It is from the family the children certain things and it is the place where the
first socialization of the child takes place. The child learns certain behaviours of the
parents and developed attitude from the family. The way the child is brought up in the
family have a positive and negative impact in the lives of the child. The parents are
the role model of the child and they are the ones who shape the life of the children
from birth till adulthood. The positive behaviour and support of the parents also
impact on the academic life of the children which enable them to attain higher self-
esteem and greater academic achievement. He also stated the importance of family
meal as it is the time parents and children communicates and discuss certain unwanted
and expected behaviours are discussed such as substance abuse, delinquency,
depressive symptoms, and suicide attempts, and with better grades and academic
performance.
Cook and Cook (2008) pointed out the importance of family in shaping the
child's personality. The infant child has certain needs, desires, and potentials and

3
looks upon his mother to facilitate his unmet needs. The child is interested in
exploring himself and the things around him. The mother is responsible to educate the
child and the needs of the child also vary as he matures.
Importance of Family Environment
Family environment is a primary socializing agent where the first socialization
of the child takes place. Family Environment is very important in the process of
upbringing children. It can be a strong source of support if there is a close
relationship, strong parenting skills, good communication, and modeling positive
behaviors. The family environment can also be a problematic environment when the
modeling behavior is negative such as if the behavior like smoking and heavy
drinking are present.
Prasad (2004) stated the importance of family in educating the child. The
family takes up the task of educating the child which may be in a positive or negative
way. The parents are the role model of the child and act as a strong source of support
by having a close relationship, strong parenting skills, good communication and
modeling positive behaviour. In spite of its positive modeling behaviour the family
environment can also be a problematic environment when the modeling behavior is
negative such as if the behavior like smoking and heavy drinking are present. In the
beginning, the child learns through imitation. The child then learns to communicate,
pick up things and respond to nature's call. In this stage of imitation, the child imitates
the mother as the mother is the first teacher of the child.
Family Environment bears healthy and high-quality characteristics affecting
the development of the child. It influences the child in many ways like the ego
concept, emotional and social development. Family environment is where the
foundation of emotional intelligence is first laid, helping the child grow up and
acquire information relating to life (Ozabaci, 2006). Further, he highlighted that the
family environment is the foundation of emotional intelligence. It is the family which
helps the child grow up and acquire information about life and how to face the
challenges of life. The family environment bears healthy and high-quality
characteristics affecting the development of the child. It influences the child in many
ways like the ego concept, emotional and social development.
Kashyap, L.D (1993) highlighted the superiority of parents upon their children
in India. Families do not place such a high value on independence and self-reliance.

4
The children look upon their parents in every decision they make. Parents demanded
obedience and submission and their authority is unquestioned. The parents hold the
belief that ‘parents know better' as the basis of all decision making. They took in
charge of all the decisions for their children, be it a selection of colleges, careers, jobs,
and marriages. The adolescent boys and girls have less autonomy in decision making
over their life.
Mahale, M. N (1987) stated that parents exercised a great control over their
children and gain a greater control over their daughters compared to that of their sons.
To some degree, it resulted in the frustrations of the daughters when they sensed
injustice and discrimination.
Devi (2005) stated the importance of the teacher in the education of the child.
The things taught in the school guide the students till they attain maturity. It helps
them to become a responsible person in the family, society and the nation at large. In
teaching the students the teachers must be careful with what they taught in the school
as inculcating the right knowledge will only make him become good members of the
society. They should instill in the minds of the young people national attitude,
substantive knowledge, methods of acquiring and accessing knowledge. Kurdek and
Sinclair (1988) in their study stated that there is a significant difference among
students by the type of family. Their study found that the students in two-parental
nuclear families attained better academic performance than the students brought up in
either in mother-custody or stepfather families.
Educational Aspirations
Prasad (2004) stated the importance of education in the functioning of society.
It is a process of leading out or bringing out what is already within. It can also be
viewed as the transmission of the values and accumulated knowledge of a society.
Education is essential for the development of society a society's development depends
on how well educated the people are, as they go hand in hand. It is very important for
the agencies imparting education like family, community and also important for
schools to have a clear and precise understanding on the development of education
since the very beginning up to the present day. This will provide a basic
understanding of the bases of the educational aims. It is very important to know the

5
background of education to understand well the present situation and to know the
steps to be followed.
Several quotations on Education as provided by Janardan Prasad and several
educationists in his book "Education And Society Concepts, Perspectives And
Suppositions" can be understood as, “Education is defined as a natural, harmonious,
and progressive development of man’s innate powers” – Pestalozi and also that,
“Education is defined as a process of development which consists of the passage of
human being from infancy to maturity, the process by which he adapts himself
gradually in various ways to his political, social, and spiritual environment”- T.
Raymont. Prasad also mentions the definition of education as defined by M.K Gandhi
as; "By education, I mean an all-round drawing out of the best in child and man,
body, mind, and spirit. Literary itself is no education”-M.K Gandhi
Unger D.G. et al., (2000) stated that it is the dream of every student to get high
grades and get admitted to the best schools and colleges and besides the dream of the
student alone the family and schools also expect high grades from the student and feel
proud when they get high grades than others. The parents and teachers are content
with the student when they compete within themselves and got high grades to their
expectation. The students are often pushed literally and emotionally to acquire the
height of what was expected. Sometimes when the student fails to achieve what was
expected it leaves the parents and teachers disappointed. The expectations of the
parents towards their ward are as high level as possible. The high expectations of the
parents create a lot of pressure on their wards, teachers, and schools. In the study, the
family was examined as mediators of the relationship between inter parental conflict
and the academic achievement of the students. It is seen that there is a significant
relationship between parents' supportive behaviors and adolescent adjustment. It is
suggested that the youth's perceptions of family cohesion and parent-school
involvement are important components of family support that may potentially mediate
the effects of inter parental conflict on academic adjustment
Biswas, N.B (2006) stated that education interacts and is inter-dependent with
a developmental process such as social structure, policies, and goals. Education has
brought change in the economy and facilitates development through the application of
scientific knowledge and skills. Scholars also agreed that education is a factor in
social change. Certain implications have hampered the education of the tribal people

6
in North Eastern region such as under-development, inaccessibility, isolation, low
population density and dispersed population, hilly and difficult terrain, low level of
urbanization, the high cost of livelihood and high infrastructure development cost and
insurgency movement in certain parts.
Razia, R & Ahmed, N (2017) stated that Emotional Intelligence is a positive
predictor of academic success of students. The academic achievement may be differed
by gender and socio-economic status. It is also found that female students have higher
academic achievement than the male students and it is further observed that students
with higher level of socio-economic income had meaningfully higher academic
average than the academic average of students with middle socio-economic income
and low socioeconomic income.
Chakrabarti, M (2005) stated the need and importance of women education as
the important key to improving health, nutrition, and education in the family and to
empowering women to participate in decision-making in the society is through
literacy of women. Education is a human right and an essential tool for achieving the
goals of equality, development, and peace. Educational access, attainment, and
qualification is a necessity if more women are to become agents of change. There
must be no discrimination between boys and girls s to bring equal relationships
between men and women.
Kalawati (1994) emphasize the importance of girl's education as they are the
future mother and giving the right kind of education for the mother is very important
as mothers are the source of proper physical, mental and moral development of their
children. A child learns from his mother certain things like food habits, social
manners, skills, values attitudes, and his environment. The education of the mother is
an essence because, in the upbringing and education of the child, an educated mother
can perform her role more efficiently. In spite of the importance of education of girls,
there are many obstacles. The girls at an early age started helping out their parents in
the household chores and none finds the need to send to school as they can learn from
their mothers. It is also considered that girl’s education as a wastage and hindrance to
her marriage as she demands more autonomy and may not surrender to others. The
parental apathy towards girls’ education is the main root cause behind her educational
backwardness.

7
Deshmukh, B, A (2004) discussed tribal education and its linkage with the
economy. The general backwardness of the tribal along with the isolation and
subsistence economy hampers the education of the tribal population. In spite of the
differences, isolation, problems and tribal attitude towards literacy and education due
to their subsistence the continuation of regular tribal training or educational
institutions in the tribal areas has hampered the educational development in the areas.
The children learn from the habitat, family and kin group which was an informal form
of learning and was dominant among the tribal. In this type of transmission of cultural
learning from one generation to another have three components-the post-figurative
culture, in which the children are educated by their parents, the con-figurative culture,
in which the children and parents learn from their kids and the figurative culture, in
which the adults learn from their children.
Sharma, K.R (1990) stated the problems confronting the tribal education.
Stagnation and drop out poor enrolment and low achievement is the factors affecting
the education of the tribal. There are several possible factors behind the poor impact
of educational efforts in the area of tribal education, may be the lack of sufficient
understanding of the tribal student. The tribal students lack regularity with low
attendance record and have a low level of educational aspirations.
Sharma, S.R (1991) stated that today’s educational system is facing a problem
due to its exclusive emphasis on theory alone. The educational system is theory
oriented lacking in practical form and the theory taught and the teaching remains to be
barren and partial. He suggested the need of integration of theoretical knowledge with
skills, attitudes, productive work, social responsibility and creativity and further stated
that education is always to be linked with the emerging problem of the world of work.
Statement of the problem
Today's society is witnessing the expanding and growing influence of
education. Education has touched and changed the lives of many people. Rich or poor,
every parent tries to send their children to the best schools to get an education, which
is a challenge and competition among parents. In the process of education,
educational aspirations are one universal trait. The educational aspirations of the
student may not all be the same and vary from one person to another. Some students
have high educational aspirations while some students have low educational
aspirations. The educational achievement also varies from one student to another and

8
there are also certain factors contributing to the student's educational aspirations.
Family environment is one of the most important factors in influencing the
educational aspirations of the student. It is the place where the first socialization of
the child takes place where the parents are the role model. The attitude and
personality are invariably influenced by the family environment. One can take a
decision about what he or she wants to become and what he or she wants to study to
achieve the dreams but there are many students who cannot take decisions. At this
point, the family plays a very significant role in helping the student to take the right
decision and shaping the attitudes and aspirations. The study attempts to understand
the youth educational aspirations and the significant relationship between family
environment and educational aspirations.
Objectives
The objectives of the present study are as follows:
1 To study the demographic profile of secondary and higher secondary school
students in Churachandpur.
2 To assess the Family Environment of secondary and higher secondary school
students in Churachandpur.
3 To assess the Educational Aspirations of secondary and higher secondary
school students in Churachandpur.
4 To find out the relationship between Family Environment and Educational
Aspirations among secondary and higher secondary school students of
Churachandpur.
Hypothesis
There is a relationship between Family Environment and Educational
Aspirations of secondary and higher secondary school students in Churachandpur,
Manipur.

9
Chapter Scheme
The present study is presented in the following chapter scheme:
Chapter I: Introduction
Chapter II: Review of Literature
Chapter III: Methodology
Chapter IV: Results and Discussions
Chapter V: Conclusion

10
CHAPTER- II
REVIEW OF LITERATUREReview of literature is essential and its help the researcher to understand the
theoretical background and findings of different scholars in various aspects. For any type
of scientific research work, theoretical knowledge is needed in order to understand the
concepts thoroughly. However, the secondary data is the only source, which helps the
researcher to get the information as well as to analyze the present situation of the problem
in the theoretical context. The purpose of the current review is to find out the research
gap for further research on educational aspirations of secondary and higher secondary
school students. The chapter presents the review of available literature on the subject
matter related to the present study.
Studies related to the importance of education
Dalal, A.K (1990) discussed the importance of family support among the Indians.
It is a feeling that a person is cared for and valued by other family members when one
can seek help on the family network in times of trouble. The support renders are in terms
of behavioral support such as emotional, instrumental as financial assistance. Besides the
behavioral support are the appraisal support such as affirmation and feedback and also
instrumental support such as money. Falling sick is one event which requires the support
of family. It is an event which not only affects the individual but disrupts the whole
functioning of the family. Family treatment and care are important for successful coping
with many diseases. The family members provide physical and emotional support to
facilitate the patient's recovery and return to normal routine.
Teachman, J.D and Paasch, K (1998) stated that family is an important agent in
the educational attainment of the children. Educational attainment can vary considerably
depending on the type of the family environment. Educational aspirations are the most
important variable having direct effects of family background such as parental education.
The family is the smallest unit of society which represents micro-social environments that
influence how children experience the larger social world. The way parents perceived
things and acted on certain circumstances will be reflected by the behavior of their
children. Families provide children with a larger social environment that affect how they
reviewed education. The economic position of a family influences the educational

11
aspirations of the young people. The low family income parents feel ill-equipped to
prepare their children for college, despite a strong desire to do so. With few economic
resources, even academically talented young people may perceive college as beyond their
reach and many, therefore scale downward their educational aspirations.
Kumar, B (2005) emphasize the importance of the home environment in shaping
students level of aspiration. The family acts as a source of stability and support in times
of trouble which determine the development of individuals. He laid stress to the need for
the parent's awareness of various positive and negative mechanisms that can be helpful in
enhancing the educational aspirations level of their children. To sustain high Educational
Aspirations of the student it becomes the foremost duty of parents to make every effort to
create a conducive and healthy atmosphere no matter the income or background of the
family. He also suggested the need and importance of the parent's awareness of various
positive and negative mechanisms that can be helpful in enhancing the educational
aspirations level of their children.
Prasad (2004) discussed the important role of the school in the educational
process. He stated that the word ‘school’ is a derivation of the Latin word ‘Schola' which
means leisure discussion, a philosophy, a place in which persons are instructed in any
species of learning, an educational establishment where higher learning is achieved
through instruction. It can be further perceived that a school is a place where youngsters
largely spend their time and get a formal education for life. It plays a pivotal role in
transforming the lives of the youngsters and a place where maximum socialization occurs
through the interaction of students with the teachers and their peer group further leading
to the development of value system. The school imparts education on diverse disciplines
like history, political science, economics, geography, mathematics, sciences, and visual
and plastic arts. It also inculcates cultural patterns, social values through various
functions.
Sharma, S.R (2006) discussed the responsibility of parents and teachers in the
education of the children. It is utmost important for teacher and parents to plan and bring
certain changes in the activities of the children as it will help to stimulate their goal. The
quality of learning which takes place in the classroom is a result of the kind of experience
which the pupils have with the teacher. The teacher is responsible for creating a healthy

12
learning environment to enhance the learning of the pupil. The harmony achieved
between child and adult goal depends considerably on the teacher's effort and initiative.
Children unquestionably work better with a teacher whom they like than with one whom
they dislike. The pupil learns and responds best both socially and emotionally to teachers
who deal constructively with them. The teacher is an expert in guiding human
relationships and developing skills of participation on social understandings and
imparting knowledge at the formal and at the informal community learning.
Singh & Singh (2014) examined the influence of SES of parents and home
environment on the study habits and academic achievement of students. The study was
conducted among 90 students studying in three primary and two private schools and were
randomly selected. The findings show that the mean scores of students belonging to
higher status families was observed higher with respect to the students belonging from
lower status families. The students of higher educational level differ from those of the
students with low or illiterate parents. The students with a good health condition perform
better in academic and achieve better than those with poor health. The study reveals that
the student belonging to higher income families tend to study the more costly courses in
comparison to those belonging from poor families. The study suggested that policies
should be made for the parents belonging to lower socio-economic status to enable their
children have equal educational opportunities in the educational institution.
Prasad (2004) stated that community vital role in the education of an individual.
Socialization largely helps the child learn about culture, society, and morals through
participation in several cultural functions. The term community is the derivation of the
Latin word ‘Komin' which means to unite. It has defined qualitative characteristics of
uniting such as common character and traditions. A community can be understood as a
body of those having common or equal rights or rank or distinguished based on
privileges. It is also a body of people organized for social unity, which are living in the
area or locality and have the same postulates political, monastic or social.
Pandey, V.C (2005) stated the positive impact of education on society and human
development. Girls being part of the weaker section, imparting education to the girls has
become a necessity to uplift them. Education of girls transforms the lives of girls and
women. It grants women to have greater control not only for themselves but also makes

13
decisions and influences their families. It can also prove that women's participation can
influence governments, families, communities, the economy and the provision of services
is a common good. It also leads to more equitable development, stronger, families, better
services, and better child health. It can also be said that when educated girls become
mothers they are much more likely to send their children to school, thereby passing on
and multiplying benefits both for themselves and society positively.
Khaute (2013) stated the importance of education in the life of the Mizo women.
It has changed their position in the family and society. It has brought them more or less in
the same par with the man enabling them to profess outside the four walls. Cieslik and
Simpson (2013) stated that the education of the western societies aims to enhance life
chances of individuals and bring in the people sense of competition for more knowledge
through the promotion of "equality of opportunity" and widening access to provision. Dr.
Ambedkar, the great Dalit leader and chief architect of the Indian Constitution had said
that “in the complex world man lives at his peril and he must find his way in it without
losing his freedom. There can, under these circumstances, be no freedom that is
worthwhile unless the mind is trained to use its freedom. Deprive a man of knowledge
and you will make him inevitably to a slave of those more fortunate than himself…
deprivation of knowledge is denied of power to use liberty for great ends. An ignorant
man may be free… but he cannot employ his freedom so as to give him assurance of
happiness" as cited in Bhatt, S (2011).
Raj and Raj (1998) conducted a study in the different colleges in Kerela. The total
sample of students from different colleges and schools constituted 2428 among whom
2197 were from colleges and 231 from schools. The sample for teachers is 495 and it is
confined to the private sector in Kerela education. It is concluded that employment in
schools and colleges has become nothing more than a means for earning one's livelihood.
The teacher-taught relationship has become essentially formal with little personal
involvement. The management of educational institutions is primarily concerned with the
maintenance of the status quo so that upper-class domination can be a safeguard. As a
result of this, the system of education has become fossilized and the upper and middle-
class sections alone are given opportunities at all levels of appointments and enrollments.
14
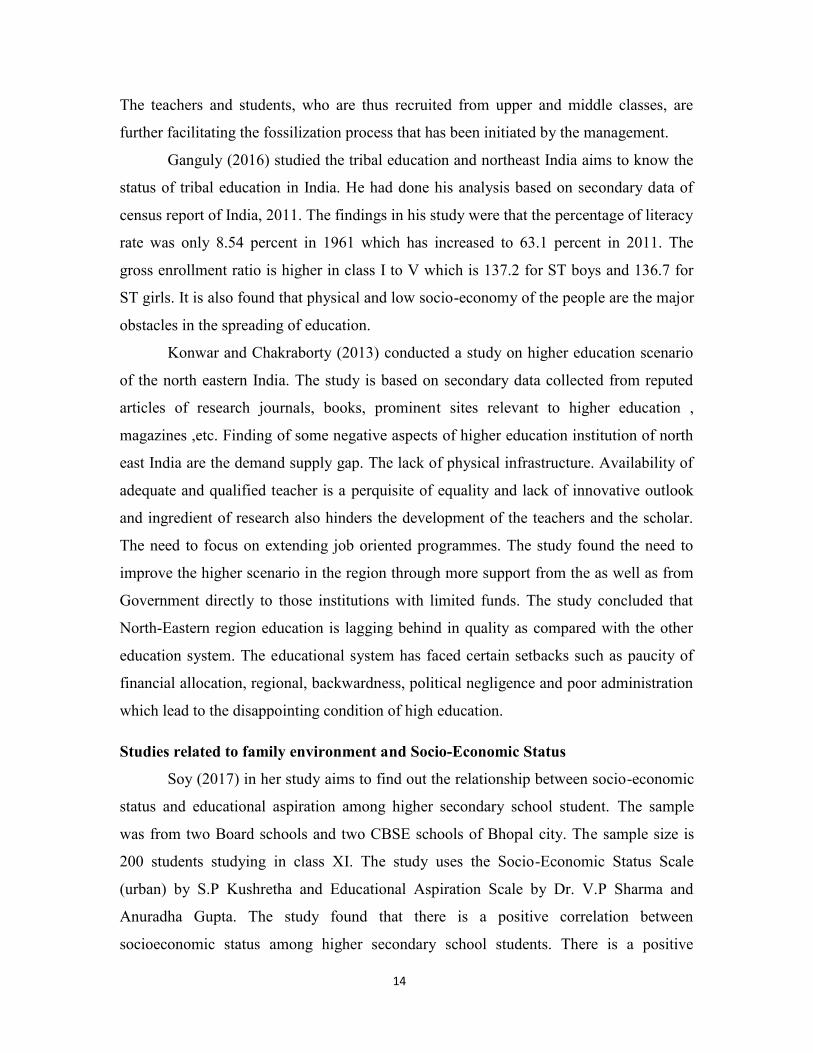
The teachers and students, who are thus recruited from upper and middle classes, are
further facilitating the fossilization process that has been initiated by the management.
Ganguly (2016) studied the tribal education and northeast India aims to know the
status of tribal education in India. He had done his analysis based on secondary data of
census report of India, 2011. The findings in his study were that the percentage of literacy
rate was only 8.54 percent in 1961 which has increased to 63.1 percent in 2011. The
gross enrollment ratio is higher in class I to V which is 137.2 for ST boys and 136.7 for
ST girls. It is also found that physical and low socio-economy of the people are the major
obstacles in the spreading of education.
Konwar and Chakraborty (2013) conducted a study on higher education scenario
of the north eastern India. The study is based on secondary data collected from reputed
articles of research journals, books, prominent sites relevant to higher education ,
magazines ,etc. Finding of some negative aspects of higher education institution of north
east India are the demand supply gap. The lack of physical infrastructure. Availability of
adequate and qualified teacher is a perquisite of equality and lack of innovative outlook
and ingredient of research also hinders the development of the teachers and the scholar.
The need to focus on extending job oriented programmes. The study found the need to
improve the higher scenario in the region through more support from the as well as from
Government directly to those institutions with limited funds. The study concluded that
North-Eastern region education is lagging behind in quality as compared with the other
education system. The educational system has faced certain setbacks such as paucity of
financial allocation, regional, backwardness, political negligence and poor administration
which lead to the disappointing condition of high education.
Studies related to family environment and Socio-Economic Status
Soy (2017) in her study aims to find out the relationship between socio-economic
status and educational aspiration among higher secondary school student. The sample
was from two Board schools and two CBSE schools of Bhopal city. The sample size is
200 students studying in class XI. The study uses the Socio-Economic Status Scale
(urban) by S.P Kushretha and Educational Aspiration Scale by Dr. V.P Sharma and
Anuradha Gupta. The study found that there is a positive correlation between
socioeconomic status among higher secondary school students. There is a positive

15
correlation between socio-economic status and educational aspiration among girls but a
negative correlation between socio-economic and educational aspirations among boys.
Pathak (2014) conducted a study among the college students and aim to study the
educational aspirations of the students. The total number of the sample is 100 out of
which 50 are male and another 50 are female. The sample is selected randomly. The tools
used were Educational Aspiration Scale by V.P Sharma and Anuradha Gupta and Deo
Mohan Achievement Scale by Deo Mohan (2002). The study reveals that there is a
significant difference in male and female and also locality of the students in relation to
their aspiration. The male has a higher level of aspirations than the female students. The
mean score for the male student is 36.40 and for female students 30.48. The student of
the urban area means the score is 36.16 and for students of rural area is 30.72. It shows
that students of urban area have higher aspiration than those of the rural area.
Rather and Sharma (2017) studied the grades and grading system in relation to
levels of aspiration. They used a descriptive survey research method. The sample size is
400 secondary school students of Aligarh district. The samples were selected through
stratified random sampling technique. The results show that there is no significant
relationship between the grades and level of aspiration of the students. It is also
concluded that there is a significant difference between male and female, rural and urban
secondary school students.
The background of the family of the respondents reveals the nature of their
socialization which in turn affects their personality. The influence, of the family, is
pervasive and determines various goals, aspirations, attitudes, and lifestyle of its
members (Singh, N.K, 1979, p.31). It has also been viewed that Economic status
significantly influences various aspects of life further stating that children from a higher
social class are more likely to aspire a high education and occupational goals than
children of lower social class origins (Singh, N.K,1979,p.34)
Yunus and Baba (2014) studied the effect of family environment on student’s
academic performance and adjustment problems in school. The study was conducted
among 168 students, out of which 77 are male students and 91 are female students
between the ages of 16-20 years of age. The study employed a survey design in two
standardized questionnaires were administered concurrently to all the participants. The

16
tools used were the Family Environment Scale (FES) and School Adjustment Scale
(SAS) developed by Ojiji and Tafida (2010). The result shows that family environment
has no effect on academic performance of the student and also there is no gender
difference in school adjustment and academic performance of the students but the family
environment has an effect on school adjustment. The findings suggested the need for
parents attention on their relationship with children while in school as it may affect them
negatively.
Malsawmtluanga and Fanai (2018) conducted a study to find out the relationship
between the home environment and academic achievement among secondary school
students of Champhai town. The study used simple random sampling method. The total
sample used was 210 students. The tools used for the study were Home Environment
Scale developed by Aaliyaakhtar and Dr. Shail Bala Saxena and the examination result
was used to find out the level of academic achievement. The study found that there was
no correlation between home environment and academic achievement among female
students and private school students and the negatively weak correlation was found
among government school students.
Kumar and Lal (2014) studied the academic achievement in relation to family
environment among adolescence. The study was conducted among 200 adolescence in
the age group of 15- 18 years and convenient random sampling technique was adopted.
The tools used were the Family Environment Scale by Moos (1974). The academic
achievement of the studies was gathered through self-constructed information sheets,
where the students have to enter the results of the two previous classes. The result shows
that the mean score for males on academic achievement is 65.39 and that of females is
66.87. The mean academic performance score of enriched family environment group is
higher than that of a low family environment group. It shows that children with the
enriched family environment are found to have better academic achievement than those
belonging to low family environment group.
Singh et.al (2015) conducted a study on the impact of home-environment of
educational aspiration among the intermediate school students. The study concluded that
there exists a significant relationship between home environment and educational
aspiration of intermediate school students.

17
Kumar and Phogat (2017) stated that there exists a significant difference in
overall educational aspirations in relation to the gender of the students where female
students have higher educational aspirations. Socio-Economic Status (SES) also have
influenced the educational aspirations of the adolescents. Parent's personal support for
adolescent educational aspirations is hampering by the low SES of parents. Lomax
(1985) stated that students who studied in private schools are more economically well off
and have a higher degree of academic orientation than that of their public school
counterparts. Makkar (2010) stated that female have significantly high educational
aspirations. The educational aspirations of the students coming from the urban area and
rural area differ where the students belonging to the urban area have higher educational
aspirations. The students who belong to the less privileged family needed to be treated
politely and psychologically to best achieve their educational aspirations. Bashir and
Kaur (2017) stated that there is a positivist’s significant relationship between educational
aspirations of secondary students with the school. The school plays an important role in
influencing the student’s attitude and the development of their aspirations.
In a study conducted by Ravi and Setia (2016) it was found that there is a
significant relationship between educational aspirations and family environment. The
family environment enables the child to be confident and adjust well and solve his
problems. Eijek and Graaf (1995) found that the size of the family, birth order and
spacing had a considerable influence on the educational attainment of children. The
larger the size of the family the parents need to invest more of the material resources
(financial) where it is distributed among the siblings. Many siblings result to diluters of
one another's resources then few widely spaced siblings. The first and the last born child
is likely to have more resources from their parents and get to spent more time with them.
In a similar study conducted by Glass et.al (1974) the achievement of children also
depends upon the birth order. The earlier born children have higher aspiration than the
later born children. The later born children spent more time under the supervision and
company of the earlier-born children while the earlier born children get the opportunity to
spend more time with the parents. The better educated parents encourage their children
and have higher aspirations.

18
Yadav and Pandey (2016) stated that the child's personality is invariably
influenced by the family environments that surround him. Heredity and environment play
an important role in shaping the personality of the child. The study reveals that a
significant relationship lies between the home environment and the educational
aspirations among students. The home plays an important role in shaping the behavior
attitudes and aspirations of the child. The type of family is it nuclear and joint family had
a differential influence upon the child's personality. The income of the parents bears a
significant relationship with student educational aspirations. Trusty (1998) stated the
higher the parent involvement behavior towards the adolescents, the higher the
aspirations of the adolescents. The adolescent perceived their parents more positively,
more controlling which result in higher educational expectations of the adolescents. In
the attainment of educational aspirations, the girls have higher educational aspirations
compared to their male counterparts.
Mc Donald et al., (2012) in their study of Wangaratta youth stated that parental
influence has a significant impact on the educational aspirations of the child. In the
school, the one who performs well is the one whose parents have strong education values,
and who permits their children to leave home to study have a high educational
qualification. There are also parents without skills who fail to help their children even
though they were disappointed with their child disengagement from education.
Marjoribanks (1986) stated persons having parents who expressed relatively weak
aspirations have low perception scores and they have comparatively low aspirations. The
adolescents with the highest parental and friends aspirations had the most positive
perceptions and strong aspirations and the lower parental and peer support for learning
had lower aspirations.
The young people feel good when they have someone to talk to about their future
Kintrea et al., (2011). Home and family life is a series of parental practices in which the
parents help the children in doing their homework and stay attuned with their emotions.
Where there is a good bonding between parent and children and there is an also high
educational aspiration of the child. The children behavior is control and modeled with
discipline and the parents inculcate learning, reading habits and aspirations. The family
has a significant influence on the educational life of the child (Barber et al., 2005).

19
Family environment plays a vital role in the educational life of the student.
Parents with greater educational aspirations participate more in school activities which
help their children to perform well. One of the best ways for parents to convey the
importance of education is to have high educational aspirations for their adolescent. The
parenting behavior to a certain degree helps the student perform better when there is more
of parental involvement. Parents also have to speak with their adolescent about the
expectations from them and ask about their adolescent educational and professional goals
(Hayes, 2011). Parental desire for their children is direct determinants of the child's
educational plans. The influence of peers increases with the intimacy of the friendship,
the influence of family structure and of the closeness of the adolescent to his mother. The
educational plans of the adolescent are in considerate agreement with both parents and
peers (Kandel and Lesser, 1969). Geckova et al. (2010) stated that the higher the
educational level of the parents and the social support of the father the higher the
educational aspirations of the students. Tafere 2015 conducted a study among children
living in the poor community. The findings showed that grade is very important in
influencing the aspirations as grade increases the aspirations of the students rise. The
qualitative result showed that students perceive education as a way out from their poor
living condition.
Yeboah et al.(2017) in their study on the parental aspirations and investments in
the educational achievements of African immigrant students that SES of the parents did
not play an important role in the educational achievement of the students as both parents
whether high or low find it important to invest in the education of their children. The
parents knew the importance of active participation in school activities such as parent-
teacher meeting and sports events for the development of their children's education. The
study was conducted among 205 parents using longitudinal immigrant student adaptation
questionnaire. The findings also suggest the importance of parents investment through
support and providing resources for their children’s academic success.
In a study conducted by Mohanraj and Latha (2005) on the perceived family
environment in relation to adjustment and academic achievement that family plays an
important role in home adjustment and academic achievement of students. The study also
found that home adjustment is influenced by the support and commitment renders by

20
members of the family. The study was conducted among 192 adolescents’ boys and girls.
Family environment Scale by Moos and Moos, Bell’s adjustment inventory and academic
records of the students were used to assess.
Studies related to aspirations
Yadav (2011) in his comparative study of the students try to find out the position
of the level of aspiration, anxiety and academic achievement of government and non-
government school students. The total was 400 school students using the descriptive
survey method of Research. The tools used were Saraswat self-concept questionnaire and
Gupta's level of aspiration scale. The result shows that the level of government school
students is found better than non-government school students have higher aspiration than
that of government boys. It is also found that government girls are better than
government boys and non-government girls. The non-government girls have a higher
level of an aspiration than the government boys. As a whole, the government school girls
have a higher level of aspiration.
Ahiya (2016) studied the self-efficacy among secondary school students in
relation to Educational Aspiration and Academic Achievements and aims to find out the
correlation between the educational aspirations and academic achievement scores of
school students. The research uses descriptive survey research design. The sample size is
210 students by random sampling. The tools used were Self-efficacy Scale (2014) by
Arun Kumar Singh and Shruti Narain and Educational Aspiration Scale (2015) by V.P
Sharma and Anuradha Gupta. The studies found that girl students in comparison to boy
students, had statistically significant higher educational aspirations and it is also found
that girls have high academic achievement than boys.
Rani and Setia (2016) in their study of the educational aspiration of +2 students in
relation to family environment of 150 students intended to find out the relationship
between educational aspiration and family environment. The students were randomly
selected. The findings show that there is a significant relationship between educational
aspirations and family environment of +2 students.
Saika (2015) study the level of educational aspirations of college students in
relation to gender and location. The study gives importance to study and find out the level
of aspirations of three districts of Assam Sibsagar, Jorhat and Golaghat. The total sample
21
of the study was 324 students representing the urban, semi-urban and rural areas from 27
colleges. The study uses a stratified random sampling method. The tools used in their
study were Information Schedule and Educational Aspiration Scale by V.P Sharma and
Anuradha Gupta of Raipur. The result shows that 10.5% of girls are more inspired than
9.88% boys. There is no significant difference in average on the levels of aspirations
between the boys and girls. There is a significant difference between the means of
educational aspirations of students in various colleges located in urban and rural areas as
well as in semi-urban and rural areas at 0.05 levels but there is no significant difference
found in between the means of students in urban and semi-urban area's colleges.
Jacob, M.J (2010) in his study on the parental expectations and aspirations for
their children’s attainment: An examination of the college-going mindset among parents
found that parents who have higher expectations and aspirations render more help and
support to their children’s educational needs and encourage their children to join college.
The study was conducted among 598 parents of students in the 8th and 9th grade.
Singh (2016) has made a comparative study backward caste boy and non-
backward caste boys students in relation to their intelligence. The study uses a systematic
technique under descriptive study with a sample size of 500 students. The tools used in
the study ere Mixed Group Test of Intelligence (verbal and non-verbal by PN Mehrotra)
and Educational Aspirations Scale by V.P Sharma and Anuradha Gupta. It is concluded
that backward caste boy students are more intelligent that non-backward caste boy
students but there is no significant difference between the backward caste and non-
backward caste boys students in terms of educational aspirations level.
Bora (2016) conducted a study among the secondary school students aim to assess
the Educational and Occupational aspiration of the secondary school students in relation
to the school environment. The study was conducted among 490 students through simple
random sampling technique. The findings showed that there is no significant difference
between Educational Aspiration of boys and girls. There is no significant difference
between Occupational Aspirations of boys and girls but both the category has an average
level of Occupational Aspirations. The study further concluded that there is a significant
relationship between the Educational Aspiration and School Environment.

22
Ali (2018) conducted his study among 450 students out of which 240 boys and
210 girls .The study asses the relationship between Educational Aspiration and Academic
Achievement of senior secondary school students. The studies concluded that there is a
significant relationship between Educational Aspiration and Academic Achievement.
Educational Aspiration has a positive effect on the academic achievement of students. It
is also concluded that students who belong to urban background differ in their academic
achievement with that of the student with a rural background.
Singh (2016) conducted a study among 500 students under the descriptive
method. The study focuses on the intelligence and educational aspiration level of
backward caste boys and backward caste girls. The tools used were mixed group test of
intelligence (verbal and non-verbal) by P.N Mehrotra and educational Aspiration Scale
(EAS) by VP Sharma and Anuradha Gupta. The results of the study indicate there is no
significant difference between backward boys and backward girls in regards to
educational aspiration level. The study reveals that backward boys are more intelligent
than backward class students.
Onabamiro et.al (2013) examined the Psycho-social factors predicting secondary
school students academic self-efficacy among 400 students in Lagos. The students were
selected randomly for the study. The study uses 18 questionnaires on the socio-
psychological factors to generate data for the study. The result shows that the study habit,
career aspiration, and parental involvement have a significant effect on academic self-
efficacy. Based on the findings it was recommended that the government and parents
should provide enabling environment for teaching and learning, the confidence in the
students should be boosted, parents and teachers should encourage students to aspire for
greater heights.
Kumar, N and Phogat, V (2017) examined the level of educational aspiration
among secondary school students. The total sample of the study was 85 students from
two private schools. The study uses simple random sampling and descriptive method. To
know the level of educational aspiration, Level of Educational Aspiration Test (LEAT)
developed and standardized by Yashmin Ghani Khan (2011) was used. The findings
show that boys and girls differ significantly on their family support aspect and overall
educational aspiration. The ‘t' – value is 8.46 which is higher than table value 1.98 at .05

23
level of significance is for overall educational aspirations between male and female
students, which is significant at level .01 level of significance. There is a significant
difference in overall educational aspirations in relation to the gender of the students
where female students have higher educational aspirations. The students view that efforts
and reality of aspired goals do not differ significantly. It is also suggested that the
findings serve helpful to stakeholders such as educationists, policy makers, teachers,
parents, etc.
Khattab (2015) examined the influence in student behavior by the different
combinations of aspirations, expectations and school achievement. The study uses the
Longitudinal Study of Young people in England (LSYPE) and selected university
students in the age group of 17-18 years. The result shows that students with either high
aspirations or high expectations have higher school achievements than those with both
low aspirations and low expectations. It is also found that complete alignment between
high aspirations, high expectations, and high achievement is the most important predictor
of future educational behavior among students.
Kaur (2012) studied the educational aspiration of adolescents in relation to their
intelligence. The study was conducted among 200 students of IX standard studying in
secondary schools out of which 100 were from government schools and another 100 from
public schools. The study uses the descriptive method of research and uses tools of
Educational Aspiration Scale by V.P Sharma and Anuradha Gupta, 1966 and Raven's
Standard Progressive Matrices (SPM) Raven's, 1983. The findings showed that there is
no significant difference in regards to educational aspirations between the government
and public schools and also there is no significant difference in educational aspiration in
respect to gender. It is found that significant differences exist in the educational
aspiration of adolescents with respect to the level of intelligence. The students with a
high level of intelligence have high educational aspiration than the students with low
level of intelligence.
Bashir and Kaur (2017) studied the educational aspiration of secondary school
students in relation to the school environment. It aims to find out the difference in
educational aspirations and school environment of secondary school students on the basis
of locality. The study was conducted among 400 students of Kashmir division. The study

24
uses a descriptive survey method of research where 200 students were selected from rural
areas and another 200 from the urban areas by using the simple random technique. It is
concluded that there is no significant difference between rural and urban secondary
school students in their educational aspiration. There is a significant difference between
rural and urban school students in their school environment. The findings revealed that
there is a positive significant relationship between educational aspirations of secondary
school students with the school environment.
Lenka and Kant (2016) use a descriptive survey method and inferential technique
for the investigation. The total sample was 200 selected among secondary school students
of both special and regular schools of four districts of Orissa state. The students were in
the age group of 12-18 years of age of which 100 were blind and another 100 were
partially sighted students. From the sample, 90were from the rural areas and 110 were
from the urban areas. The findings showed that the level of educational aspirations of the
visually challenged is low. The level of educational aspiration of partially vision children
is higher than the totally blind children. The level of educational aspiration is higher in
case of visually challenged children who are studying in regular schools than in special
schools and likewise, it is higher with visually challenged of urban and male than that of
visually challenged and female children.
Kumari (2015) conducted a study on the level of aspiration on the level of
aspiration on the academic performance of school students among 300 school students.
The study adopted stratified random sampling was adopted. The tools used were Personal
Data Questionnaire and self-actualization inventory made by Sharma K.N (1987). The
study concluded that home plays a significant role in shaping students' level of aspiration
no matter what the income level or background of the family is. The study suggested that
a comparative study must be conducted on the level of aspiration on the academic
performance of Tribal and Non-tribal school students and also a study in relation to
career aspiration and academic performance in school students.
Kakkar (2017) studied the academic achievement in relation to the home
environment of secondary school student among 160 students. The study used a
descriptive survey method and the random sampling method. The tools used were the
Home Environment Inventory (HEI) developed by DR. Karuna Shankar Misra’s and

25
Academic Achievement of senior school student on the basis of class X results. The
findings show that there is a positive relationship between home environment and
academic achievement of secondary school students. The study suggested that the school
environment, locality, peer group, and the physical environment and their impact on
academic achievement on students can also be studied.
Gupta and Bashir (2017) studied the level of parental encouragement, school
environment and educational aspiration of secondary school students and examine the
impact of parental encouragement and school environment on educational aspiration of
students. The study adopted the descriptive survey method and 400 students out of which
200 students were from urban and another 200 students from rural areas were selected for
the study. The sample was selected using a stratified random sampling technique. School
Environment Inventory standardized by Misra (2002), Level of Educational Aspiration
Test standardized by Khan (2011) and Parental Encouragement Scale developed and
standardized by Sharma (2010) were used. The findings show that there is a significant
positive relationship between school environment and parental encouragement with the
educational aspiration of the secondary school students. School environment and parental
encouragement is a significant predictor of educational aspiration of the secondary school
student’s magnitude of 15.1% of the variance.
Rodman and Voydanoff (1978) in their study on the educational aspirations for
their young children among 436 black students found that limited resources are one
reason the lower class find it difficult to rise in par with the middle class in regards to
educational and occupational aspirations. The findings call for the need of social policy
for the upward mobility of the lower class.
Pappattu and Vanitha (2017) conducted a study on the family environment and its
effect on academic achievement among secondary school students in science. The total
sample size was 300 students selected from 8 schools and normative survey method was
used. The study concluded that there exists no significant difference in the mean scores of
family environment factors of high school students for the sub-sample based on locale.
The score of the family environment factors of urban and rural (-0.285) is found to be
less than the table values (1.96 and 2.58) at 0.05 and 0.01 levels of significance. The
study found that there exists no significant difference in the mean scores of achievement
26
in science skills based on gender. It is also conducted that there exists no significant
difference in the mean score of achievement skills based on locale. The study as a whole
concluded that there doesn’t exist any relationship between family environment factors
and achievement in science skills among high school students.
Paliwal and Rathi (2016) in their study on the academic performance as a function
of level of aspiration and gender which is a comparative study among different streams of
education found that the level of aspiration failed to influence the academic performance
of students belonging to engineering and management but law student having a low level
of aspiration showed better academic performance than students with high level of
aspiration. There is a significant difference in academic performance as the girls perform
better than the boys in management and legal streams of education. The study was
conducted among 717 college students in the age group of 18-19 years and was randomly
selected. Level of aspiration measure developed by Dr. Mahesh Bhargavaand M.A Shah
and class XII board results were used to measure the level of aspiration and academic
performance.
The literature in this chapter has highlighted the various aspects of educational
aspirations in terms of the importance of education, family environment and socio-
economic status and educational aspirations. There are copious studies are found on
educational aspects and family environment at global and national levels. In the
northeast context few studies are found in adolescents and life skills studies and drug
habits related studies among the adolescents and youths. From the literature review it can
be seen that there is research gap, especially on educational aspirations and family
environment. There are few studies found in the context of northeast and Manipur.
Therefore, the present study tries to fill the research gaps.
In this light, the next chapter presents the methodology of the present study in
terms of settings, research design, sampling, and tools of data collection, data processing
and analysis of the study

27
CHAPTER III
METHODOLOGYThe earlier chapter presented a critical review of the literature and the major
research gaps therein. In this chapter, the setting of the present study and methodology
are presented, a description of the studying process and the interview techniques that
were used. This chapter has been divided into two major sections. The first section deals
with the profile of the study area and schools. The second section deals with the
methodological aspects of the present study such as pilot study, research design,
sampling, tools of data collection, sources of data, pretesting, analysis, operational
definition, and limitations.
The setting: Profile of the Study Area
The present study was conducted in two government higher secondary schools of
Churachandpur, Manipur. The two schools were selected based on the location, i.e core,
and periphery. Vungzagen Higher Secondary School is selected for the core and is
located in Mata. It is a co-educational institution with a school category of primary, upper
primary, secondary and higher secondary. The school was hill high school and was
established in the year 1957 and upgraded to higher secondary school in the year 2012.
The medium of instruction in the school is English. At present, the total number of staff is
37 and the total number of students is 410. The school representing periphery is Sagang
Higher Secondary School, in Sagang. It is a co-educational institution established in the
year 1970. The medium of instruction in the school is Manipuri. The school was
upgraded to Higher Secondary School in the year 2015.
The State Manipur
Manipur is one of the 28 states of India, situated on the country's northeast. The
state covers an area of 22,347 square kilometers with 2,721,756 inhabitants. The state is
bordered by Nagaland to the north, Mizoram to the south and Assam to the west; it also
borders Burma to the east. Imphal is the capital of Manipur and Meiteilon, the primary
official language of communication. English also becomes more popular and slowly gain
ground as a common language. Hindi is also used by immigrants from northern India.
The main occupation of the people is agriculture. The state has the quality of life in the
country with excellent physical infrastructure and it has 79.85% literacy level.

28
Churachandpur District
Churachandpur lies in the South - Western part of Manipur. It is bounded on the
North by Tamenglong, Imphal East, Senapati, Bishnupur and Thoubal Disctricts, south
by Mizoram and Myanmar (Burma), east by Chandel district and west by Assam state.
The total area of the district is 4,570 sq.km. Its literacy rate as per 2011 census is 82.75
percent.
Methodology
The methodological aspects of the present study such as pilot study, research
design, sampling, tools of data collection, sources of data, pretesting, analysis,
operational definition, and limitations are also discussed
Pilot study
In the initial stage of the pilot study, the researcher discussed the present study
with the school headmasters and principals of the selected Government and Private
schools in order to get permission to conduct the present study. The researcher also
explained the objectives and the scope of the present to the headmasters and principals
that the study is academic in nature. The pilot study ascertained the feasibility of carrying
out the present study with the student respondents in both Government and private
schools. They extended full cooperation in order to conduct the present study with the
selected schools of high and higher secondary students.
Research Design
The present study is cross-sectional in nature and descriptive in design. The
quantitative, qualitative and participatory methods were used. To obtain quantitative data
from the respondent’s questionnaire were collected. The case study was conducted to
collect qualitative data and Focus Group Discussion for students group, teachers and
parents. Daily activity schedule technique was used to know the utilization of time and
leisure among the students.
Sampling
The unit of the study is high school and higher secondary school student of
Churanchadpur. The respondents for the study were the high and higher secondary school
students who are studying in class IX, class X, class XI, and class XII formed the
population of the present study. Disproportionate stratified sampling was used to select a

29
sample from both the schools. Students 100 questionnaires were distributed among the
two schools out of which 89 valid questionnaires returned.The sample size consists of 89
respondents of both high and higher secondary school students in class IX, class X, class
XI and class XII in Churachandpur, Manipur.
Tools of Data Collection
The present study based on primary data collected from the selected schools. The
structured questionnaire was used to collect quantitative data from the respondents. The
questionnaire consisted of six parts. The first part was the profile of the respondents then
the family details. The second part is regarding the family environment in which the
family environmental scale was used by Moos and Moos. The family environmental scale
is widely used by the researcher to measure the dimensions of the family environment. In
the scale, there are 10 dimensions –Cohesion, Expressiveness, Conflict, Independence,
Achievement orientation, Intellectual –cultural orientation, Active recreational
orientation, Moral-religious emphasis, Organization, Control and out which 7 dimensions
are used by the researcher for the present study.
The third part of the questionnaire was regarding the ambition and support in
which Self-structured questionnaire was employed and a modified questionnaire was also
adopted from Educational aspiration scale by Gupta and Sharma (2001). Four lists of
questions were asked to the respondents regarding educational aspirations as a modified
form of the Educational Aspirations Scale such as Examination like to pass, Examination
consider to be the best, the highest examination you think will be able to pass after
complete of age 20, the examination you think best and would like to pass after age 20.
The first part of the questionnaire was the demographic profile and familial
characteristics of the respondents.
The next part of the questionnaire is about the educational aspirations,
educational support, and achievement for which the self-administered questionnaire was
used.
Source of Data
The source of data is one of the most significant segments, without which, it is
very difficult to gain knowledge of the present study. There were two sources of data
used by the researcher. They were primary and secondary sources. The primary data

30
was collected from the respondents of the selected both high and higher secondary school
students with the help of a structured questionnaire. In the qualitative method,
participatory methods were included in the case study, focus group discussion and daily
activity schedule. The secondary data was collected from books, journals, local
newspapers, magazines, websites, education departments and annual reports of the
schools.
Pretesting
The finalized tool was pretested with a higher secondary school in Chrachandpur
and five respondents from class high school and other five from higher secondary school
students and in order to find out the feasibility and adaptability of the tool. They felt that
the questionnaire was very clear because it was administered. The researcher modified
the questions as suggested by the student respondents based on the pre-testing of the tool
which helped her to focus the present study exactly on what the researcher wanted to
study based on the objectives.
Reliability of the tool
The administered scale namely Family Environment Scale developed by (Moos
and Moos 2009). It was tested for its reliability by conducting the statistical tests of
Cranach’s alpha and the Split- half. The values are .69 and .63. Since the alpha value is
more than .7 and split-half value is almost .6, the tool was found to be reliable and
accepted for further data collection. Further, the Educational aspiration tool is modified
and used for the research (Gupta and Sharma, 2001).
Data Collection
The Actual data collection was done by the researcher. The data were collected
from the selected high and higher secondary school during the month of August –
September 2018. The questionnaire was distributed to the selected respondents and the
data were collected within the stipulated month period.

31
Definition and Concepts
Family Environment is a socializing agent and plays an important role in the
education of the child. The family environmental is measured the dimensions of
cohesion, expressiveness, independence, achievement orientation, intellectual –cultural
orientation, active recreational orientation, and organization.
Aspiration is the desire to achieve something in the near future by a student.
Educational Aspiration is an educational goal of the student to achieve through
hard work and dedication based on the ambition, role model and the most important
examinations likely to pass in their educational career.
Data Analysis
The raw data are processed and analyzed with the help of a computer package
know as Statistical Package for Social Sciences (SPSS). The data were interpreted based
on the objectives of the present study. The data are analyzed in the form of descriptive
statistics and inferential statistics. The descriptive statistics mean and standard deviation,
proportions and percentages and Karl Pearson's coefficient of correlation was also
applied in the study. The inferential statistics parametric tests t-test was also used in the
present study for testing hypotheses.
Limitations
This present study is restricted to only high and higher secondary school going
student group.
Both high and higher secondary school students are is scattered throughout the
district and it was difficult to analyze the difference between the government and
private school in terms of the school characteristics.
The present study is focused to study only the district of Churachandpur so that it
cannot represent the entire school student’s family environment and educational
aspirations.
The present study conducted among the school students and it may not encompass
the whole Manipur.
In this chapter, an attempt has been made to present the empirical contexts of the
present study area. It also described the various facets of the methodology of the present
study in terms of research design, sampling procedure, sources of data, tools of data

32
collection, processing and analysis and limitation of the study. In the next chapter
Results and Discussion are described.
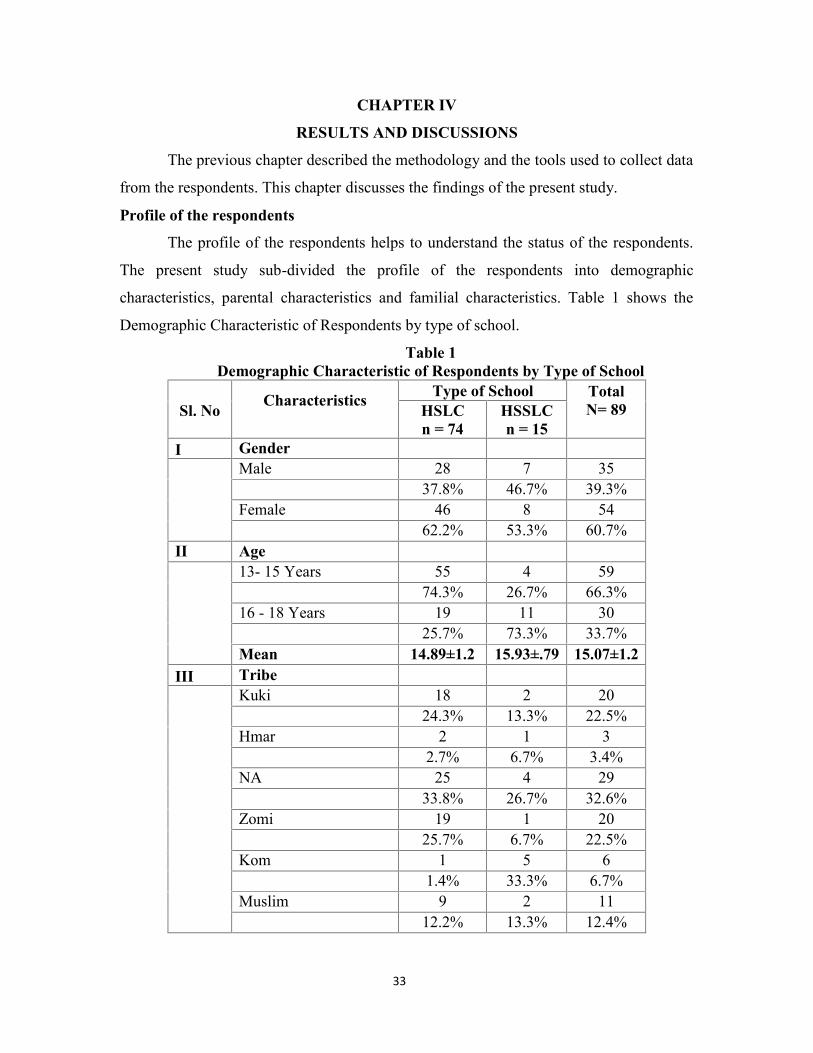
33
CHAPTER IV
RESULTS AND DISCUSSIONS
The previous chapter described the methodology and the tools used to collect data
from the respondents. This chapter discusses the findings of the present study.
Profile of the respondents
The profile of the respondents helps to understand the status of the respondents.
The present study sub-divided the profile of the respondents into demographic
characteristics, parental characteristics and familial characteristics. Table 1 shows the
Demographic Characteristic of Respondents by type of school.
Table 1Demographic Characteristic of Respondents by Type of School
Sl. No Characteristics Type of School TotalN= 89HSLC
n = 74HSSLCn = 15
I GenderMale 28 7 35
37.8% 46.7% 39.3%Female 46 8 54
62.2% 53.3% 60.7%II Age
13- 15 Years 55 4 5974.3% 26.7% 66.3%
16 - 18 Years 19 11 3025.7% 73.3% 33.7%
Mean 14.89±1.2 15.93±.79 15.07±1.2III Tribe
Kuki 18 2 2024.3% 13.3% 22.5%
Hmar 2 1 32.7% 6.7% 3.4%
NA 25 4 2933.8% 26.7% 32.6%
Zomi 19 1 2025.7% 6.7% 22.5%
Kom 1 5 61.4% 33.3% 6.7%
Muslim 9 2 1112.2% 13.3% 12.4%
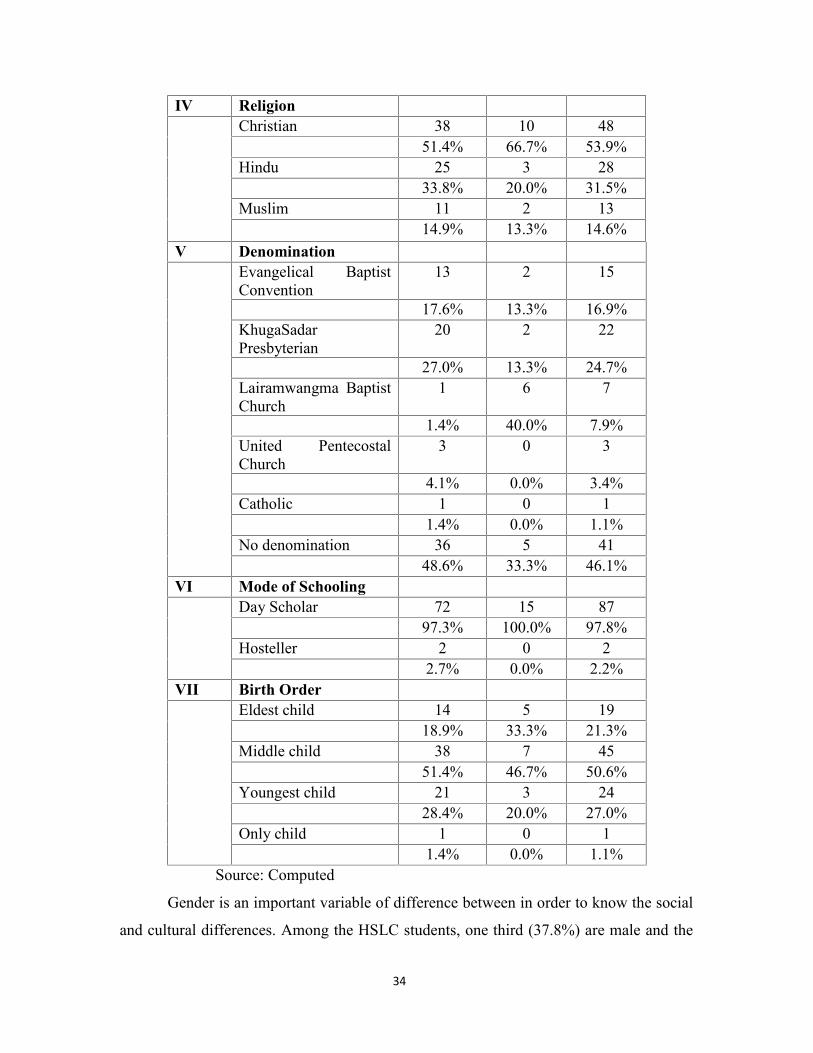
34
IV ReligionChristian 38 10 48
51.4% 66.7% 53.9%Hindu 25 3 28
33.8% 20.0% 31.5%Muslim 11 2 13
14.9% 13.3% 14.6%V Denomination
Evangelical BaptistConvention
13 2 15
17.6% 13.3% 16.9%KhugaSadarPresbyterian
20 2 22
27.0% 13.3% 24.7%Lairamwangma BaptistChurch
1 6 7
1.4% 40.0% 7.9%United PentecostalChurch
3 0 3
4.1% 0.0% 3.4%Catholic 1 0 1
1.4% 0.0% 1.1%No denomination 36 5 41
48.6% 33.3% 46.1%VI Mode of Schooling
Day Scholar 72 15 8797.3% 100.0% 97.8%
Hosteller 2 0 22.7% 0.0% 2.2%
VII Birth OrderEldest child 14 5 19
18.9% 33.3% 21.3%Middle child 38 7 45
51.4% 46.7% 50.6%Youngest child 21 3 24
28.4% 20.0% 27.0%Only child 1 0 1
1.4% 0.0% 1.1%Source: Computed
Gender is an important variable of difference between in order to know the social
and cultural differences. Among the HSLC students, one third (37.8%) are male and the
35
majority two third (62.2%) are female. Similarly, among HSSLC students, two fifths
(46.7%) are male and the majority two fourth(53.3%) are female. From both category of
the above table shows the majority two third (60.7%) of the respondents are female and
had higher percentages than male.
Age is a variable of defining an individual development in terms of years. The
present study has categorized the age into two groups viz 13-15 years and 16-18 years
age group. Among the HSLC students, three fourth (74.3%) are in the age group of 13-15
years and one fourth 25.7% are in the age group of 16-18 years of age. Similarly among
the HSSLC students, one fourth(26.7%) are in the age group of 13-15 years of age and
the remaining almost three fourth(73.3%) are in the age group of 16-18 years. From both
category of the above table, it is observed that the majority two third (66.3%) are in the
age group of 13-15 years. The mean age of the student was 15.07 with Standard
Deviation 1.2.
The tribe is a division in a society which gives an indication of numerous families
sharing same language or dialect, culture, social and economic characteristics. Among the
HSLC students one fourth (24.3%) belong to the tribe of Kuki, less than one-tenth (2.7%)
Hmar,one fourth (25.7%) Zomi, less than one-tenth (1.4%) Kom, one-tenth (12.2%)
Muslim and one third (33.8%) do not have tribe as they belong to Meitei community.
From both category of the above table, it is observed that the majority one third
(32.6%)are Meitei followed by Zomi, Kuki, Muslim, Kom and Hmar.
Religion is an institution of a belief and faith and particular system of worship.
Among the HSLC students, about half (51.4%) are Christian, one third (33.8%) Hindu
and more than one-tenth (14.9%) Muslim. Similarly among the HSSLC students (66.7%)
are Christian, one fifth (20.0%) Hindu and the remaining more than one-tenth (13.3%)
are Muslim. From both category of the above table, it is observed that more than half
(53.9%) belong to Christian.
A denomination is part of a religious group of Christian faith with slightly
different beliefs and doctrine. Among the HSLC students less than one fifth (17.6%)
belong to Evangelical Baptist Convention, one fourth (27.0%) belong to Khuga Sadar
Presbyterian, less than one-tenth (1.4%) belong to Lairamwangma Baptist Church, less
than one-tenth 4.1% belong to United Pentecostal Church, less than one-tenth (1.4%)

36
belong to Catholic and almost half (48.6%)does not belong to any denomination as they
are not Christian. Similarly among the HSSLC students one-tenth (13.3%) belong to
Evangelical Baptist Convention another one-tenth (13.3%) belong to Kuga Sadar
Presbyterian, two fifth (40%) belong to Lairamwangma Baptist Church, less than one-
tenth 1.1% belong to Catholic and one third (33.3%) does not belong to any
denomination as they are not Christian. From both category of the above table, it is
observed that majority two fifths (46.1%) does not belong to any denomination as they
are not Christian and then followed by KhugaSadar Presbyterian, Evangelical Baptist
Convention, Lairamwangma Baptist Church, United Pentecostal Church, and Catholic.
Mode of schooling gives a picture of the student daily routine and the present
residence of the students. The present study has categorized the student groups into day
scholar and hosteller. Among the HSLC students, vast majority (97.3%) are day scholar
and less than one-tenth (2.7%) are hosteller. Similarly, among HSSLC students, vast
majorities (97.8%) are day scholar and none of the HSSLC students is hosteller. From
both categories of the above table, it is observed that majority vast majority (97.8%) are
day scholar.
Birth order is the order of birth of a child in a family and has a profound effect on
the psychological and educational development of a child. Among the HSLC students,
one fifth (18.9%) is the eldest child, more than half (51.4%) is the middle child, more
than one fourth (28.4%) is the youngest child and less than one-tenth (1.4%) is the only
child. Similarly, among the HSSLC students, one third (33.3%) are the eldest child, two
fifths (46.7%) are the middle child, one fifth (20%) is the youngest child and none of the
HSSLC students is the only child. From both category of the above table, it is observed
that the majority more than half (50.6%) are the middle child followed by the youngest
child, eldest child and the only child.
Parental Characteristics of the Respondents
Parental Characteristics are an important variable to understand the respondents'
parents. Parental influence plays an important role in a child's social, emotional, mental
and educational development. Table 2 has included seven sub-parental characteristics viz
father's education, father's occupation, father's monthly income, mother's education,
mother's occupation, mother's monthly income, and family income.

37
Table 2Parental Profile of the Respondents
Sl.No. Characteristics
Type of School Total N =89HSLCn = 74
HSSLCn= 15
I Father's EducationIlliterate 26 6 32
35.1% 40.0% 36.0%Primary (I-V) 16 2 18
21.6% 13.3% 20.2%Middle (VI-VIII) 12 1 13
16.2% 6.7% 14.6%High (IX-X) 13 5 18
17.6% 33.3% 20.2%Higher (XI-XII) 7 1 8
9.5% 6.7% 9.0%II Father's occupation
Carpenter 2 0 22.7% 0.0% 2.2%
Cultivator 65 15 8087.8% 100.0% 89.9%
Daily Labour 4 0 45.4% 0.0% 4.5%
Driver 1 0 11.4% 0.0% 1.1%
Masion 1 0 11.4% 0.0% 1.1%
Teacher 1 0 11.4% 0.0% 1.1%
III Father's MonthlyIncomeRs. 1000 -5000 59 11 70
79.7% 73.3% 78.7%Rs. 5000 – 10000 15 4 19
20.3% 26.7% 21.3%Mean±SD 4479.73±1764.25 4960.00±2327.72 4560.67±1864.600

38
IV Mother's EducationIlliterate 38 10 48
51.4% 66.7% 53.9%Primary (I-V) 14 1 15
18.9% 6.7% 16.9%Middle (VI-VIII) 12 3 15
16.2% 20.0% 16.9%High (IX-X) 8 1 9
10.8% 6.7% 10.1%Higher (XI-XII) 2 0 2
2.7% 0.0% 2.2%V Mother's occupation
Cultivator 8 2 1010.8% 13.3% 11.2%
Daily Labour 1 0 11.4% 0.0% 1.1%
Housewife 42 7 4956.8% 46.7% 55.1%
Petty Business 7 3 109.5% 20.0% 11.2%
Shopkeeper 4 1 55.4% 6.7% 5.6%
Weaver 12 2 1416.2% 13.3% 15.7%
VI Mother's IncomeNo Income 42 7 49
56.8% 46.7% 55.1%Rs.500-2000 14 3 17
18.9% 20.0% 19.1%Rs.2000 – 3500 10 2 12
13.5% 13.3% 13.5%Rs. 3500 -5000 8 3 11
10.8% 20.0% 12.4%VII Family Monthly
IncomeRs. 1000-5000 41 5 46
55.4% 33.3% 51.7%Rs. 5000 – 10000 25 9 34
33.8% 60.0% 38.2%Rs. 10000 & Above 8 1 9
10.8% 6.7% 10.1%Source: Computed

39
Parent’s education is one of the most influential factors in the education of the
child. The children acquire and learn certain things from their parents. The way parents
brought up their child and their educational level has an impact on the education of the
child. The study divided the level of educational level of the parents into six levels viz
illiterate, primary, high and higher secondary level. Among the HSLC students, one third
(35.1%) of the respondents' fathers are illiterate, one fifth (21.6%) primary, less than one
fifth (16.2%) middle, less than one fifth (17.6%) high school level and less than one-tenth
(9.5%) higher secondary level. Similarly, among the HSSLC students, two fifths (40%)
of the respondents' fathers are illiterate, one-tenth (13.3%) primary, less than one-tenth
(6.7%) middle, one third (33.3%) high school and the remaining less than one-tenth
(6.7%) are higher secondary level. From both category of the above table, it is observed
that majority i.e one third (36.0%) respondents' fathers are illiterately followed by the
educational level of primary and high school with the same percentages then the middle
and higher secondary level.
Among the HSLC students, less than one-tenth (2.7%) of the respondent's father's
occupation is carpenter, more than three fourth (87.8%) cultivator, less than one-tenth
(5.4%) daily labour, less than one-tenth (1.4%) driver, less than one-tenth (1.4%)each
masion and teacher. Similarly, among the HSSLC students, all the respondent's fathers
education is a cultivator. From both category of the above table, it is observed that vast
majority (89.9%) respondents' fathers' occupation is cultivator followed by daily labor,
carpenter and driver, masion, a teacher with the same percentages.
Among the HSLC students majority, three fourth (79.7%) of the respondent's
father's income was Rs. 1000-5000 and one fifth (20.3%) income was Rs.5000-10,000.
Similarly among the HSSLC students, three fourth (73.3%) of the respondent's father's
income was Rs.1000-5000 and the remaining one fourth (26.7%) income was Rs.5000-
10,000. From both category of the above table, it is observed that the majority three
fourth (78.7%) of the respondent's father's income is Rs.1000-5000 per month. The mean
monthly income of the respondent’s father was 4560.67 with Standard Deviation
1864.600.

40
Among the HSLC students about half (51.4%) of the respondent's mother's are
illiterate, one fifth (18.9% )primary, less than one fifth (16.2%) middle, one-tenth
(10.8%) high school level and less than one-tenth (2.7%) higher secondary level.
Similarly, among the HSSLC students, two third (66.7%) of the respondents' mothers are
illiterate, less than one-tenth (6.7%) primary, one fifth (20%) middle, less than one-tenth
(6.7%) high and none of the respondent's mother's reach the higher secondary level. From
both categories of the above table, it is observed that majority i.e. more than half (53.9%)
respondents mother are illiterate followed by the educational level of primary and middle
with the same percentages then the high and higher secondary level.
Among the HSLC students one-tenth (10.8%) of the respondent's mother's
occupation was cultivator, (1.4%) daily labor, more than half (56.8%) housewife, one-
tenth (9.5%) petty business, (5.4%) shopkeeper and less than one fifth (16.2%), weaver.
Similarly among the HSSLC students less than one fifth (13.3%) cultivator, two fifths
(46.7%) housewife, one fifth (20%) petty business, less than one-tenth (6.7%) shopkeeper
and less than one fifth (13.3%) weaver. From both category of the above table it is
observed that majority i.e more than half (55.1%) respondents mother's occupation is
housewife followed by Weaver, cultivator and petty business sharing the same
percentages then the shopkeeper and daily labor.
Among the HSLC students, more than half (56.8%) of the respondents' mothers
have no income as they are housewife one fifth (18.9%) income was Rs 500-2000, less
than one fifth (13.5%) income was Rs.3500-5000. Similarly, among the HSSLC students
two fifths (46.7%) of the respondents' mothers have no income as they are a housewife,
one fifth (20%) income was Rs.500-2000, less than one fifth (13.3%) income was
Rs.2000-3500 and remaining one fifth (20%) income was Rs.3500-5000.From both
category of the above table, it is observed that more than half (55.1%)respondents
mother's did not have income as they are housewife followed by mothers with income of
Rs.500-2000 and mothers with income of Rs.2000-3500 and Rs.3500-5000.
Among the HSLC students more than half (55.4%) of the respondents family
income was Rs.1000-5000, one third (33.8%) respondents family income was Rs.5000-
10,000 and the remaining one-tenth (10.8%) family income was Rs.10,000 & Above.
Similarly, among the HSSLC students, one third (33.3%) of the respondents family

41
income was Rs.1000-5000, almost two-thirds (60%) respondents family income was
Rs.5000-10,000 and less than one-tenth (6.7%) family income was Rs.10,000 & Above.
From both category of the above table, it is observed that majority i.e. more than half
(51.7%) family income is Rs.1000-5000 followed by a family income of Rs.5000-10,000
and Rs.10, 000 & above.
Familial characteristics of the respondents
The familial characteristics are important determinants of the parenting, quality
and well-being of the family. Table 3 shows the familial characteristics of the
respondents by type of school. It is divided into namely size of family, type of family
and form of family.
Table 3Familial characteristics of the Respondents by Type of School
Sl.No. CharacteristicsType of School Total
N=89HSLCn=74
HSSLCn= 15
I Size of familySmall (1-3) 1 0 1
1.4% 0.0% 1.1%Medium (4-6) 36 7 43
48.6% 46.7% 48.3%Large (7>) 37 8 45
50.0% 53.3% 50.6%Mean Size
II Type of familyNuclear 60 13 73
81.1% 86.7% 82.0%Joint 14 2 16
18.9% 13.3% 18.0%III Form of family
Stable 61 9 7082.4% 60.0% 78.7%
Broken 4 1 55.4% 6.7% 5.6%
Reconstituted 4 1 55.4% 6.7% 5.6%
Single parent 5 4 96.8% 26.7% 10.1%
Source: Computed

42
Among the HSLC students one-tenth (14%) of the respondents belonged to small
family (1-3) members, two fifths (48.6%) belonged to medium family (4-6) members and
a half (50%) belonged to the large family having more than 7 members. Similarly, among
the HSSLC students, two fifths (46.7%) belonged to the medium family having 4-6
members and more than half (53.3%) belonged to a large family having more than 7
members. From both categories of the above table, it is observed that majority more than
half (50.6%) respondents belonged are having a large family of more than 7 members.
Among the HSLC students, more than three fourth (81.1%) belonged to the
nuclear family and less than one fifth (18.9%) belonged to the joint family.Similarly,
among the HSSLC students, more than three fourth (86.7%) belonged to the nuclear
family and less than one fifth (13.3%) belonged to the joint family. From both categories
of the above table, it is observed that the majority of more than three fourths (82%)
respondents belonged to the nuclear family.
Among the HSLC students more than three fourths (82.4%) belonged to a stable
family, less than one-tenth (5.4%) each belonged to a broken family and reconstituted
family. Similarly among the HSSLC students three-fifth (60%) belonged to the stable
family and less than one-tenth (6.7%) each belonged to the reconstituted family and
almost one third (26.7%) belonged to the single-parent family. From both category of the
above table, it is observed that the majority i.e. more than three fourths (78.7%) belonged
to a stable family.
Socio-Economic Characteristics by Type of School
Socio-Economic characteristic is an indicator of one's standing position in a
society. Table 4 shows the Respondents Socio-Economic Characteristics by type of
school. It is divided into viz type of house, ownership of a house, socio-economic status
and social status.

43
Table 4Respondents Socio-Economic Characteristics by Type of School
Sl. No. Characteristics Type of School TotalN=89HSLC
n = 74HSSLCn =15
I Type of housePucca 10 3 13
13.5% 20.0% 14.6%Semi-pucca 21 3 24
28.4% 20.0% 27.0%Kutcha 43 9 52
58.1% 60.0% 58.4%II Ownership of house
Owned 59 11 7079.7% 73.3% 78.7%
Rented 11 4 1514.9% 26.7% 16.9%
Quarter 4 0 45.4% 0.0% 4.5%
IIISocio-economicstatusAPL 9 1 10
12.2% 6.7% 11.2%BPL 55 10 65
74.3% 66.7% 73.0%AAY 1 2 3
1.4% 13.3% 3.4%No category 9 2 11
12.2% 13.3% 12.4%IV Social status
ST 37 8 4550.0% 53.3% 50.6%
SC 13 2 1517.6% 13.3% 16.9%
OBC 24 5 2932.4% 33.3% 32.6%
Source: Computed
Among the HSLC students one-tenth (13.5%) lived in a pucca house, one fourth
(28.4%) lived in semi-pucca house and almost two-thirds (58.1%) lived in the kutcha
house. Similarly, among the HSSLC students, one fifth (20%) each lived in a pucca and
semi-pucca house and three fifths (60%) lived in a kutcha house. From both categories of
44
the above table, it is observed that majority i.e. almost three-fifth (58.4%) lived in a
kutcha house.
Among the HSLC students more than three fourth (79.7%) owned their house,
less than one fifth (14.9%) lived in a rented house and less than one-tenth (5.4%) lived in
the quarter. Similarly among the HSSLC students, three fourth (73.3%) owned their
house, one fourth (26.7%) lived in a rented house. From both categories of the above
table, it is observed that majority i.e. three fourth (78.7%) owned their house.
Among the HSLC students about one-tenth (12.20%) belonged to Above Poverty
Line, three fourth (74.3%) belonged to Below Poverty Line, less than one-tenth (1.4%)
belonged to Antyodaya Anna Yojana and less than one fifth (12.2%) belong to No
Category group. Similarly, among the HSSLC students, less than one-tenth 6.7%
belonged to APL, two third (66.7%) belonged to BPL and one-tenth (13.3%) each
belonged to AAY and No category group. From both categories of the above table, it is
observed that majority i.e. three fourth(73%) belonged to BPL.
Among the HSLC students half (50%) belonged to Scheduled Tribe, almost one
fifth (17.6%) belonged to Scheduled Caste, one third (32.4%) belonged to Other
Backward Caste. Similarly among the HSSLC students about half (53.3%) belonged to
ST, less than one fifth (13.3%) belonged to SC and remaining one third (33.3%) belonged
to OBC. From both categories of the above table, it is observed that majority i.e. more
than half (50.6%) belonged to ST.
Descriptive statistics of Family Environment
Family environment is an important indicator as everything the child learns start
from the family. Table 5 shows the Descriptive statistics of Family Environment by type
of School. T is divided into viz cohesion, expressiveness, independence, achievement
orientation, intellectual-cultural orientation, active recreational orientation, and
organization.

45
Table 5Descriptive statistics of Family Environment by Type of School of the Respondents
Sl.No.
Family Environment
Type of School
Total N = 89HSLCn=74
HSSLCn = 15
Mean S.D Mean S.D Mean S.D1 Cohesion 6.30 1.36 5.80 1.20 6.21 1.342 Expressiveness 4.70 1.41 4.53 1.40 4.67 1.403 Independence 4.68 1.36 4.67 1.29 4.67 1.344 Achievement
Orientation5.27 1.30 5.73 1.10 5.35 1.28
5 Intellectual CulturalOrientation
4.84 1.63 4.67 1.29 4.81 1.57
6 Active RecreationalOrientation
4.70 1.51 5.00 1.41 4.75 1.49
7 Organisation 4.82 1.18 4.20 1.26 4.72 1.21
The above table depicts that among the respondents the highest mean score is cohesion
(6.21) in which the highest mean score (6.30). The second highest mean score is
Achievement orientation (5.35) in which the highest mean score is (5.73) among the
HSSLC students. The least mean score is found between two dimension expressiveness
and independence (4.67).
The data shows that the highest mean score among the FES is cohesion and is
high in HSLC whereas in the Achievement Orientation the highest mean score is among
the HSSLC students. It is clearly observed that the higher the standard the aspiration level
also rise up.
Level of Family Environment by Type of School
The level of the Family environment is an important indicator in the child's
educational and career development. Table 6 shows the respondents level of Family
Environment by type of school. It is divided into cohesion, expressiveness, independence,
achievement orientation, intellectual-cultural orientation, active recreational orientation
and organization, and family environment.

46
Table 6Respondents Level of Family Environment by Type of School
Sl. No. Family EnvironmentType of School Total
N = 89HSLCn = 74
HSSLCn = 15
I CohesionLow (1-3) 1 1 2
1.4% 6.7% 2.2%Moderate (3-6) 41 11 52
55.4% 73.3% 58.4%High (6-9) 32 3 35
43.2% 20.0% 39.3%II Expressiveness
Low (1-3) 14 3 1718.9% 20.0% 19.1%
Moderate (3-6) 52 11 6370.3% 73.3% 70.8%
High (6-9) 8 1 910.8% 6.7% 10 .1%
III IndependenceLow (1-3) 16 3 19
21.6% 20.0% 21.3%Moderate (3-6) 52 11 63
70.3% 73.3% 70.8%High (6-9) 6 1 7
8.1% 6.7% 7.9%IV Achievement
Low (1-3) 7 0 79.5% 0.0% 7.9%
Moderate (3-6) 53 11 6471.6% 73.3% 71.9%
High (6-9) 14 4 1818.9% 26.7% 20.2%
V Intellectual CulturalOrientiationLow (1-3) 16 3 19
21.6% 20.0% 21.3%Moderate (3-6) 45 11 56
60.8% 73.3% 62.9%High (6-9) 13 1 14
17.6% 6.7% 15.7%

47
Source: Computed
Cohesion refers to the support and bonding in the family and it has been classified
into three levels; low, moderate and high. Majority of the respondents i.e. more than half
(58.4%) 52 respondents have a moderate cohesion among the family.
Expressiveness refers to the freedom of the members of the family in expressing
their thoughts and feelings. From the above table, it is observed that majority i.e. almost
three fourth (70.8%) 63 respondents are moderate in their expressiveness.
Independence refers to the degree of freedom of the family members in doing
certain things. The above data shows that majority i.e. almost three fourth (70.8%)
respondents are moderate in Independence level.
Achievement refers to the encouragement and support among members to achieve
high. From the above table, it is observed that majority i.e. almost three fourth (71.9%)
respondents have a moderate level towards achievement among the family.
Intellectual-cultural orientation refers to the degree of participation of family
members in the society. The above table shows that majority i.e. almost two-thirds
VI Active RecreationalOrientationLow (1-3) 13 3 16
17.6% 20.0% 18.0%Moderate (3-6) 53 9 62
71.6% 60.0% 69.7%High (6-9) 8 3 11
10.8% 20.0% 12.4%VII Organisation
Low (1-3) 12 4 1616.2% 26.7% 18.0%
Moderate (3-6) 57 11 6877.0% 73.3% 76.4%
High (6-9) 5 0 56.8% 0.0% 5.6%
Family EnvironmentModerate (21-41) 67 15 82
90.5% 100.0% 92.1%High (41and above) 7 0 7
9.5% 0.0% 7.9%

48
(62.9%) respondents have a moderate level towards intellectual-cultural orientation
among the family.
Active recreational orientation refers to the time spent and recreate through
activities. The above table shows that two third (69.7%) have a moderate level towards
active recreational orientation.
Table 7 Correlates of Family Environment
Sl.No.
FamilyEnvironment
Coh
esio
n
Exp
ress
iven
ess
Inde
pend
ence
Ach
ieve
men
tO
rien
tatio
n
Inte
llect
ual
Cul
tura
lO
rien
tatio
nA
ctiv
eR
ecre
atio
nal
Ori
enta
tion
Org
anis
atio
n
Fam
ilyE
nvir
onm
ent
1 Cohesion 12 Expressiveness -.041 13 Independence .234* .021 14 Achievement
Orientation -.004 -.164 -.059 1
5 IntellectualCulturalOrientation
.202 .193 .196 -.125 1
6 ActiveRecreationalOrientation
.106 .069 .044 .277** -.015 1
7 Organisation .169 -.088 .110 .159 .180 .068 18 Family
Environment .518** .334** .483** .313** .549** .502** .467** 1
Source: Computed
*. Correlation is significant at the 0.05 level (2-tailed).
**. Correlation is significant at the 0.01 level (2-tailed).
Correlation is the standardized scale to find the relationship between two variables. In the
present table 7 shows the variables of the family environment have been given and seven
environment variables have been given with the overall family environment viz cohesion,
expressiveness, Independence, achievement orientation, intellectual cultural orientation,
active recreational orientation, organization, and family environment.

49
The above table shows that there is a positive correlation existing between
independence and cohesion of family environment at 0.05 level of significance (.234) and
between active recreational orientation achievement orientations at 0.01 level of
significance (.277). The family environment as a whole has a positive correlation with all
the variables at 0.01 level of significance: cohesion (.518), Expressiveness (.334),
independence (.483), achievement orientation (.313), intellectual cultural orientation
(.549), active recreational orientation (.502) and organization (.467) which indicates that
the respondents family is having a cohesive, expressive, independence, achievement
orientation, intellectual cultural organization, active recreational orientation, and an
organized family.
Respondents Ambition by Type of School
Ambition is something which an individual desires to become or achieve in the
future. The purpose here is to find out whether or not the respondents have ambition,
what is the ambition, whether or not the respondents have a role model and to know the
role model. Table 8 shows Respondents Ambition by Type of School.
From the table, it is found that among the HSLC students three fourth (78.4%)
have ambition and one fifth (21.6%) did not have ambition. Similarly, among the HSSLC
students, more than three fourth (86.7%) have ambition and less than one fifth (13.3%)
did not have ambition. From both categories of the above table, it is found that majority
of the students more than three fourths (79.8%) have ambition.
Among the students having ambition majority of the students one fifth (18.0%)
wanted to become doctor followed by army one-tenth (14.6%), civil service one-tenth
(13.5%), teacher one-tenth (12.4%), others one-tenth (10.1%), and less than one-tenth
(5.6%) each MPS and sport person.
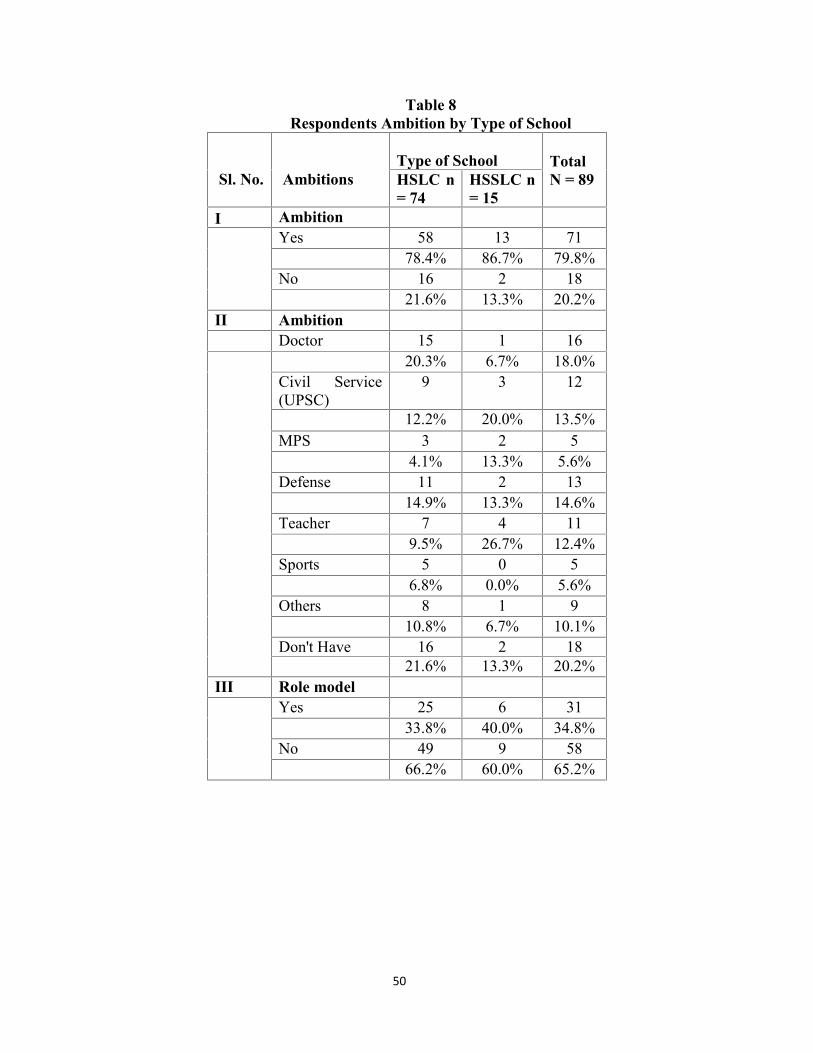
50
Table 8Respondents Ambition by Type of School
Sl. No. AmbitionsType of School Total
N = 89HSLC n= 74
HSSLC n= 15
I AmbitionYes 58 13 71
78.4% 86.7% 79.8%No 16 2 18
21.6% 13.3% 20.2%II Ambition
Doctor 15 1 1620.3% 6.7% 18.0%
Civil Service(UPSC)
9 3 12
12.2% 20.0% 13.5%MPS 3 2 5
4.1% 13.3% 5.6%Defense 11 2 13
14.9% 13.3% 14.6%Teacher 7 4 11
9.5% 26.7% 12.4%Sports 5 0 5
6.8% 0.0% 5.6%Others 8 1 9
10.8% 6.7% 10.1%Don't Have 16 2 18
21.6% 13.3% 20.2%III Role model
Yes 25 6 3133.8% 40.0% 34.8%
No 49 9 5866.2% 60.0% 65.2%

51
IV Ambition RoleModelNone 49 9 58
66.2% 60.0% 65.2%Others 2 1 3
2.7% 6.7% 3.4%Scientist 7 1 8
9.5% 6.7% 9.0%Teacher 1 1 2
1.4% 6.7% 2.2%Actor 7 1 8
9.5% 6.7% 9.0%Politician 1 0 1
1.4% 0.0% 1.1%FreedomFighter
1 1 2
1.4% 6.7% 2.2%Pastor 1 0 1
1.4% 0.0% 1.1%Singer 2 0 2
2.7% 0.0% 2.2%Doctor 3 1 4
4.1% 6.7% 4.5%Source Computer
A role model is a person whose behavior is admired and imitated by others. The
present study intended to know whether or not the students have a role model and who is
their role model. From the above table among the HSLC students, one third (33.8%) have
a role model and two third (66.2%) did not have a role model. Similarly, among the
HSSLC students, two fifths (40%) have a role model and three fifth (60%) did not have a
role model. From both categories of the above table, one third (34.8%) have a role model
and two third (65.2%) did not have a role model. The result indicates that the majority
two third (65.2%) did not have a role model.
Educational Aspirations by Type of School
Educational aspirations are an important indicator of the student's desire and level
for achievement in the academic. The present study intended to know the educational
aspirations of the student and included four educational aspirations indicator viz: the
examination the respondents like to pass, the examination which the respondents consider

52
to be the best, the highest examination the respondents consider to be able to pass after
complete age 20 and the examination the respondents consider best and would like to
pass after age 20.
Table 9Respondents Educational Aspirations by Type of School
Sl.No.
Educational AspirationsType of School Total
N =89HSLCn = 74
HSSLCn = 15
I Examination like to passHSLC 23 5 28
31.1% 33.3% 31.5%HSSLC 18 3 21
24.3% 20.0% 23.6%Bachelor Degree 5 1 6
6.8% 6.7% 6.7%Master Degree Exam 28 6 34
37.8% 40.0% 38.2%II Examination Consider being the best
Union Public Service Commission (UPSC) 25 6 3133.8% 40.0% 34.8%
Manipur Public Service Commission(MPSC)
26 3 29
35.1% 20.0% 32.6%Staff Selection Commission (SSC) 6 1 7
8.1% 6.7% 7.9%Teacher's Eligibility Test (TET) 17 5 22
23.0% 33.3% 24.7%III The Highest Examination think will be
able to pass after complete of 20 yearsPh.D. (Doctoral degree) 19 1 20
25.7% 6.7% 22.5%M.Phil (Master of Philosophy) 9 3 12
12.2% 20.0% 13.5%Master Degree 13 5 18
17.6% 33.3% 20.2%Bachelor Degree 20 5 25
27.0% 33.3% 28.1%Higher Secondary 13 1 14
17.6% 6.7% 15.7%

53
IV Best and like to pass after age 20Civil Service Examination (CSE) 35 8 43
47.3% 53.3% 48.3%Indian Economic Service Examination(IES)
10 3 13
13.5% 20.0% 14.6%Indian Statistical Service Examination 8 2 10
10.8% 13.3% 11.2%Indian Military Academy Exam 21 2 23
28.4% 13.3% 25.8%Source: Computed
From the above table among the HSLC students one third (31.1%) like to pass
HSLC, one fourth (24.3%) HSSLC, less than one-tenth (6.8%) Bachelor degree, one third
(37.8%) Master degree exam. Similarly, among the HSSLC students one third (33.3%)
like to pass HSLC students, one fifth (20%) HSSLC, less than (6.7%) Bachelor degree
and two fifth (40%) Master degree exam. From both category of the above table majority,
one third (34%) would like to pass Master degree exam.
Among the HSLC students, one third (33.8%) consider UPSC to be the best
examination, one third (35.1%) MPSC, less than one-tenth (8.1%) SSC, one fifth (23%)
TET exam. Similarly, among the HSSLC students, two fifths (40%) consider UPSC to be
the best examination, (20%) MPSC, less than one-tenth (6.7%) SSC and one third
(33.3%) TET exam. From both categories of the above table majority, one third (34.8%)
consider UPSC exam to be the best.
Among the HSLC students one fourth (25.7%) respondents consider Ph.D. to be
the highest examination that they will be able to pass after complete of age 20, one-tenth
(12.2%) M.Phil, one fifth (17.6%) Master degree, one fourth (27%) Bachelor degree and
one fifth (17.6%) Higher Secondary. Similarly among the HSSLC students less than one-
tenth (6.7%) respondents consider PhD to be the highest examination that they will be
able to pass after complete of age 20, one fifth (20%) M.Phil, one third (33.3%) each
Master degree and Bachelor degree and less than one-tenth (6.7%) Higher Secondary.
From both categories of the above table majority, one fourth (28.1%) respondents
consider Bachelor Degree to be the highest examination he thinks will be able to pass.
Among the HSLC students, two fifths (47.3%) consider Civil Service
Examination to be the best exam and like to pass after age 20, one-tenth (13.5%) Indian

54
Economic Service Examination, one-tenth (10.8%) Indian Statistical Service
Examination) and one fourth (28.4%) Indian Military Exam. Similarly among the
HSSLC more than half (53.3%) consider Civil Service Examination to be the best exam
and like to pass after age 20, one fifth (20%) Indian Economic Service Examination and
one-tenth (13.3%) each to Indian Statistical Service Examination and Indian Military
Academy Exam. From both categories of the above table majority more fifth (48.3%)
consider the Civil Service Examination to be the best exam and like to pass after age 20.
Opinion on Everyone about Educational Aspiration by Type of School
The present study aims to know the respondent's opinion and expectation that
everyone should pass. Table 10 shows Respondents Opinion on Everyone about
Educational Aspiration by Type of School.
Table 10Respondents Opinion on Everyone about Educational Aspiration by Type of School
Sl. No. OpinionType of School Total
N = 89HSLCn = 74
HSSLCn = 15
IExamination everyone should atpassingPrimary 5 0 5
6.8% 0.0% 5.6%Middle 3 0 3
4.1% 0.0% 3.4%HSLC 23 2 25
31.1% 13.3% 28.1%HSSLC 2 2 4
2.7% 13.3% 4.5%Bachelor 8 3 11
10.8% 20.0% 12.4%Master 33 8 41
44.6% 53.3% 46.1%

55
II Think you will certainly able topassSBI PO (Probationary Officer) 6 1 7
8.1% 6.7% 7.9%IBPS (Institute Bank PersonnelSelection)
8 0 8
10.8% 0.0% 9.0%Civil Service Examination (CSE) 26 5 31
35.1% 33.3% 34.8%Manipur Public ServiceCommission (MPSC)
24 6 30
32.4% 40.0% 33.7%Staff Selection Commission (SSC) 7 3 10
9.5% 20.0% 11.2%Combine Graduate Level (CGL) 3 0 3
4.1% 0.0% 3.4%III Think best and like to pass after
age 20Indian Administrative Service(IAS)
28 4 32
37.8% 26.7% 36.0%Indian Foreign Service (IFS) 11 3 14
14.9% 20.0% 15.7%Indian Police Service (IPS) 31 3 34
41.9% 20.0% 38.2%Indian Revenue Service (IRS) 4 5 9
5.4% 33.3% 10.1%
IVThink best and like to pass afterage 20Bachelor of Legislative Law(L.L.B)
7 5 12
9.5% 33.3% 13.5%Bachelor of Engineering (B.E) 19 1 20
25.7% 6.7% 22.5%Bachelor of Education (B.Ed.) 27 6 33
36.5% 40.0% 37.1%Bachelor of Library Science(B.Lib)
21 3 24
28.4% 20.0% 27.0%Source: Computed

56
Among HSLC students less than one-tenth (6.8%) opined that everyone should
pass the primary level, than one-tenth (4.1%) middle, one third (31.1%) HSLC, than one-
tenth (2.7%) HSSLC, (10.8%) Bachelor degree and two fifth (44.6%) Master degree.
Among the HSSLC students than one-tenth (13.3%) each opined that everyone should
pass HSLC and HSSLC, two fifths (20%) Bachelor degree and more than half (53.3%)
Master degree. From both categories of the above table majority, two fifths (46.1%)
opined that everyone should pass Master degree exam.
Among the HSLC students less than one-tenth (8.1%) think that they will
certainly be able to pass Bank PO (Probationary Officer), one-tenth (10.8%) IBPS
(Institute Bank Personal Selection), one third 35.1% Civil Service Examination (CSE),
one third (32.4%) Manipur Public Service Commission (MPSC), less than one-tenth
(9.5%) Staff Selection Commission (SSC) and less than one-tenth (4.1%) Combine
Graduate Level (CGL). Similarly, less than one-tenth (6.7%) think they will certainly be
able to pass Bank PO, one third (33.3%) CSE, two fifth (40%) MPSC and one fifth (20%)
SSC. From both categories of the above table majority, one third (34.8%) think that they
will certainly be able to pass the Civil Service Examination.
Among the HSLC students almost two-fifth one third (37.8%) consider Indian
Administrative Service (IAS) to be the best examination and like to pass after age 20, less
than one fifth (14.9%) Indian Foreign Service (IFS), two fifth (41.9%) Indian Police
Service (IPS), less than one-tenth (5.4%) Indian Revenue Service (IRS). Similarly one
fourth (26.7%) consider Indian Administrative Service (IAS), one fifth (20%) each Indian
Foreign Service(IFS) and Indian Police Service(IPS) and one third (33.3%) Indian
Revenue Service (IRS). From both categories of the above table, it is observed that the
majority almost two fifth (38.2%) consider Indian Police Service (IPS) to be the best
examination and like to pass after age 20.
Educational Support by Type of School
Educational support is an indicator of the facilities, resources to help the students
in his academic. The table 11Respondents Educational Support by Type of School. The
present study intended to know where the respondents look into in times of having a
problem with his studies, to which the respondents discuss his career, whether the parents
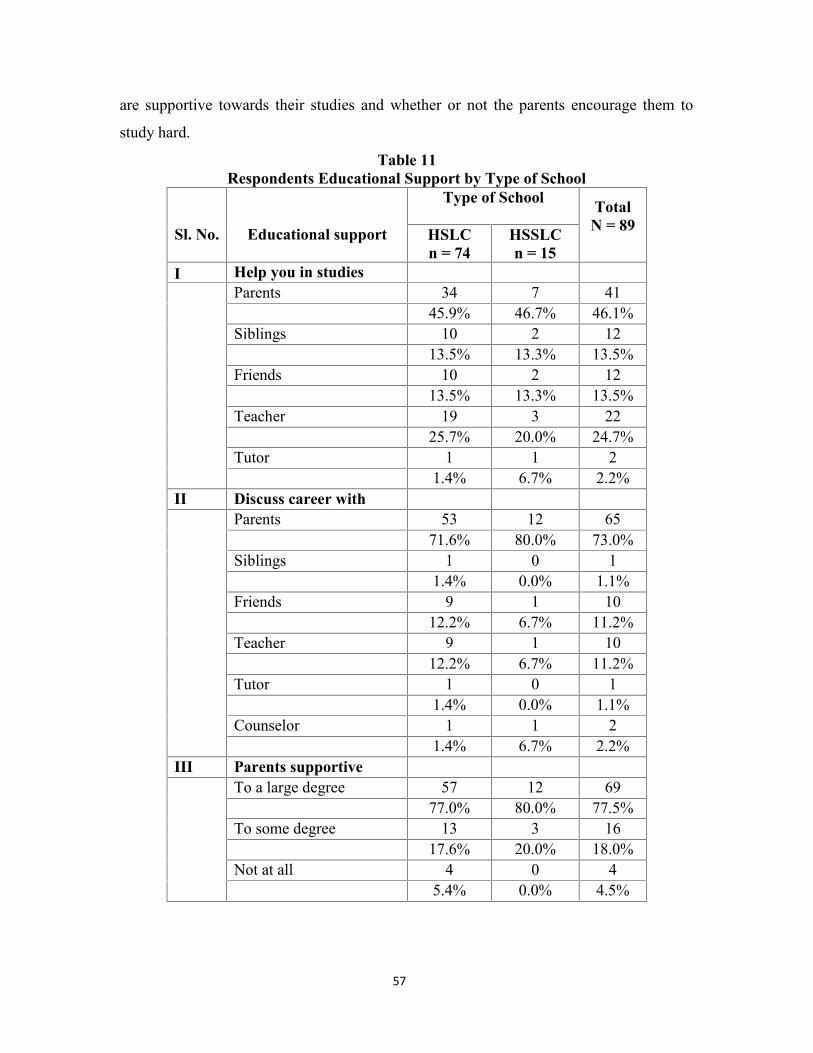
57
are supportive towards their studies and whether or not the parents encourage them to
study hard.
Table 11Respondents Educational Support by Type of School
Sl. No. Educational support
Type of School TotalN = 89HSLC
n = 74HSSLCn = 15
I Help you in studiesParents 34 7 41
45.9% 46.7% 46.1%Siblings 10 2 12
13.5% 13.3% 13.5%Friends 10 2 12
13.5% 13.3% 13.5%Teacher 19 3 22
25.7% 20.0% 24.7%Tutor 1 1 2
1.4% 6.7% 2.2%II Discuss career with
Parents 53 12 6571.6% 80.0% 73.0%
Siblings 1 0 11.4% 0.0% 1.1%
Friends 9 1 1012.2% 6.7% 11.2%
Teacher 9 1 1012.2% 6.7% 11.2%
Tutor 1 0 11.4% 0.0% 1.1%
Counselor 1 1 21.4% 6.7% 2.2%
III Parents supportiveTo a large degree 57 12 69
77.0% 80.0% 77.5%To some degree 13 3 16
17.6% 20.0% 18.0%Not at all 4 0 4
5.4% 0.0% 4.5%

58
IV Parents encourageYes 60 13 73
81.1% 86.7% 82.0%No 14 2 16
18.9% 13.3% 18.0%Source: Computed
Among the HSLC students more than two fifths (45.9%) seek help from their
parents when they have problems with their studies, almost one fifth (13.5%)each seek
help from siblings and friends, one fourth (25.7%) seek help from teacher and less than
one-tenth (1.4%) seek help from tutor. Similarly, among the HSSLC students, two fifth
(46.7%) seek help from their parents when they have problems with their studies, one-
tenth (13.3%) each sibling and friends, one fourth(20%) teacher and less than one-tenth
(6.7%)seek help from the tutor. From both categories of the above table, it is observed
that the majority (46.1%) seek help from parents when they have problems with their
studies.
Among the HSLC students almost three fourth (71.6%) used to discuss with their
parents regarding career, less than one tenth (1.4%) each sibling, tutor counselor, about
one tenth (12.2%) each friend and teacher. Similarly among the HSSLC students more
than three fourth (80%) used to discuss with their parents regarding career, less than one
tenth (6.7%) each friend, teacher, tutor, counselor. From both categories of the above
table, it is observed that the majority almost three fourth (70%) of the respondents discuss
with their parents regarding career.
Among the HSLC students three fourth (77%) of the respondents feel that their
parents are supportive of their education to a large degree, one fifth (17.6%) feel that
their parents are supportive of their education to some degree and less than one-tenth
(5.4%) feel that their parents are not at all supportive towards their education. From both
categories of the above table, it is concluded that the majority three fourth (77.5%) feel
that their parents are supportive towards their education to a large degree.
Among the HSLC students, more than three fourth (81.1%) feel that their parents
are encouraging towards their studies, one fifth (18.9%) feel that their parents are
encouraging towards their studies. Similarly more than three fourths (86.7%) feel that
their parents are encouraging towards their studies and one fifth (18%) feel that their

59
parents are not encouraging towards their studies. From both categories of the above
table, it is observed that the vast majority of more than three fourths (82%) feel that their
parents are encouraging towards their studies.
Educational Support and Encouragement by Type of SchoolTable 12
Respondents Parental Educational Support and Encouragement by Type of School
Sl.No.
Parental SupportType of School
TotalN = 89
HSLCn = 74
HSSLCn = 15
I Parental expectationHigh 33 10 43
44.6% 66.7% 48.3%Medium 39 5 44
52.7% 33.3% 49.4%Low 2 0 2
2.7% 0.0% 2.2%II Took care in sickness
Family 71 15 8695.9% 100.0% 96.6%
Friends 3 0 34.1% 0.0% 3.4%
II Parents controlStrongly agree 41 8 49
55.4% 53.3% 55.1%Agree 26 4 30
35.1% 26.7% 33.7%Disagree 2 3 5
2.7% 20.0% 5.6%Strongly disagree 5 0 5
6.8% 0.0% 5.6%III Selection of school
Myself 19 3 2225.7% 20.0% 24.7%
Parents 25 6 3133.8% 40.0% 34.8%
Friends 5 0 56.8% 0.0% 5.6%
Teachers 25 6 3133.8% 40.0% 34.8%

60
The study presents educational support and encouragement received by the
respondents as the level of support can make a difference in the academic achievement
and aspirations of the students. Table 12 shows Respondents Educational Support and
Encouragement by Type of School. It is sub-divided into parental expectation, took care
in times of sickness, parents control, selection of school.
Among the HSLC students two fifths (44.6%) of the respondents claim that their
parents held high-level expectation from them, more than half (52.7%) claim that their
parents held medium level of expectation from them, less than one-tenth (2.7%) claim
that their parents held low level of expectation from them. From both categories of the
above table, it is observed that the majority almost half (49.4%) of the parents held the
medium level of expectation from their children.
Among the HSLC students, the vast majority (95.9%) claim that their family took
care of them in times of sickness and less than one-tenth less than one-tenth (4.1%) claim
that their friends took care of them in times of sickness. Similarly, (100%) of the
respondents claim that their family took care of them in times of sickness. From both
categories of the above table, it is observed that the vast majority (96.6%) respondents
claim that their family took care of them in times of sickness.
Among the HSLC students more than half (55.4%) strongly agree that their
parents exercised great control in regards to their career, one third (35.1%) agree that
their parents exercised a great control in regards to their career, less than one-tenth
(2.7%) disagree that their parents exercised a great control in regards to their career and
less than one-tenth (6.8%) strongly disagree that their parents exercised a great control in
regards to their career. Similarly among the HSSLC students more than half (53.3%)
strongly agree that their parents exercised great control in regards to their career, one
fourth (26.7%) agree that their parents exercised a great control in regards to their career,
one fourth one fifth (20%) disagree that their parents exercised great control in regards to
their career. From both category of the above table majority more than half (55.1%)
strongly agree that their parents exercised a great control in regards to their career.

61
Parental Raise their Children by Type of School
The study also aims to see the different ways parents raise their children in
regards to their education. The study intended to know whether parents encourage
pursuing higher education, whether or not parents encourage them to do well in all
courses, whether or not parents pushed them to obtain a high degree and whether or not
parents pushed to choose a career of their choice.
Table 13Respondents Parental Raise their Children by Type of School
Sl.No. Ways parents Raise
Type of SchoolTotalN = 89HSLC
n =74HSSLCn = 15
I Pursue higherNot true at all 17 2 19
23.0% 13.3% 21.3%Somewhat true 8 6 14
10.8% 40.0% 15.7%Very true 47 6 53
63.5% 40.0% 59.6%Hold 2 1 3
2.7% 6.7% 3.4%II Do well in all course
Not true at all 0 1 10.0% 6.7% 1.1%
Somewhat true 12 4 1616.2% 26.7% 18.0%
Very true 61 10 7182.4% 66.7% 79.8%
Hold 1 0 11.4% 0.0% 1.1%
III Pushed me to obtainhighNot true at all 8 2 10
10.8% 13.3% 11.2%Somewhat true 7 5 12
9.5% 33.3% 13.5%Very true 58 8 66
78.4% 53.3% 74.2%Hold 1 0 1
1.4% 0.0% 1.1%

62
Among the HSLC students almost one fourth (23%) claim that it is very true that
their parents encouraged to pursue higher education, about one tenth(10.8%) claim that it
is only somewhat true, almost two third (63.5%) very true and less than one tenth (2.7%)
hold the view that their parents encouraged to pursue higher education. Similarly among
the HSSLC students less than one fifth (13.3%) claim that it is very true that their parents
encouraged to pursue higher education, two fifth (40%) each somewhat true and very true
and less than one tenth (6.7%) hold the view that their parents encouraged to pursue
higher education. From both categories of the above table, it is observed that the majority
three fifth (59.6%) claim that it is very true that their parents encouraged to pursue higher
education.
Among the HSLC students less than one fifth (16.2%) claim that it is somewhat
true that their parents encouraged them to do well in all courses, more than three
fourth(82.4%) very true, less than one tenth (1.4%) somewhat true and less than one tenth
(1.4%) hold. Similarly, among the HSSLC students less than one tenth (6.7%) claim that
it is somewhat true that their parents encouraged them to do well in all courses, one
fourth (26.7%) somewhat true, two third (66.7%) very true. From both categories of the
above table, it is observed that the majority (79.8%) claim that it is very true that their
parents encouraged them to do well in all courses.
Among the HSLC students one tenth (10.8%) claim that it is not true at all that
their parents pushed them to obtain the high degree, almost one tenth (9.5%) somewhat
true, more than three fourth (78.4%) very true, less than one tenth (1.4%) hold. Similarly
among the HSSLC students (13.3%) claim that it is not true at all that their parents
pushed them to obtain the high degree, one third (33.3%) somewhat true, about half
IVThe career of theirchoiceNot true at all 28 2 30
37.8% 13.3% 33.7%Somewhat true 5 4 9
6.8% 26.7% 10.1%Very true 40 9 49
54.1% 60.0% 55.1%Hold 1 0 1
1.4% 0.0% 1.1%

63
(53.3%) very true. From both categories of the above table, it is observed that the
majority (74.2%) claim that it is very true at all that their parents pushed them to obtain
the high degree.
Among the HSLC students more than one third (37.8%) claim that it is not true at
all that they took a career of their parents’ choice, less than one tenth (6.8%) somewhat
true, about half (54.1%) very true and less than one tenth (1.4%) hold. Similarly among
the HSLC students less than one fifth (13.3%) claim that it is not true at all that they took
a career of their parents’ choice, one fourth (26.7%) somewhat true, three fifth (60%)
very true. From both categories of the above table, it is observed that the majority i.e.
more than half (55.1%) claim that it is very true that they took the career of their parents’
choice.
Satisfaction of Economic Status and Resources by Type of School
The study aims to see the satisfaction level of the respondents in regards to their
economic status and the resources available in support of their education.
Table 14Respondents Satisfaction of Economic Status and Resources by Type of School
Sl. No. Satisfaction status Type of School TotalN = 89HSLC
n = 74HSSLCn = 15
I Satisfied with the economySatisfied 23 6 29
31.1% 40.0% 32.6%Somewhat satisfied 13 3 16
17.6% 20.0% 18.0%Little satisfied 25 6 31
33.8% 40.0% 34.8%Not at all satisfied 13 0 13
17.6% 0.0% 14.6%II Get resources
Very much 35 8 4347.3% 53.3% 48.3%
A moderate amount 16 6 2221.6% 40.0% 24.7%
A little 15 1 1620.3% 6.7% 18.0%
Not at all 8 0 810.8% 0.0% 9.0%

64
Among the HSLC students one third (31.1%) are satisfied with the economy and
resources of their family, one fifth (17.6%) somewhat satisfied, one third (33.8%) littlie
satisfied and one fifth (17.6%) not at all satisfied. Similarly, among the HSSLC students,
two fifth (40%) are satisfied with the economy and resources of their family, one fifth
(20%) somewhat satisfied and two fifth (40%) little satisfied. From both categories of the
above table, it is observed that the majority one third (34.8%) are little satisfied with the
economy and resources of their family.
Among the HSLC students two fifth (47.3%) claim that they get very much get all
the resources they needed in regards to their education, one fifth (21.6%) a moderate
amount, one fifth (20.3%) a little amount, one-tenth (10.8%) not at all. Similarly among
the HSSLC students more than half (53.3%) claim that they get very much all the
resources they needed in regards to their education, two fourth (40%) a moderate amount,
less than one-tenth (6.7%) a little amount. From both categories of the above table, it is
observed that the majority of two fifth (48.3%) claim that they get very much all the
resources they needed in regards to their education.
Academic Achievement by Type of School
Academic achievement is an indicator of the achievement by the student in terms
of educational goals. The study intended to know the regularity of students in attending
class, study hours and the respondent's knowledge on Career Guidance Programme.
Among the HSLC students almost three fourth (73%) attended class regularly,
almost one fifth (18.9%) fairly attended class, more than three fourth (81%) did not
attend class regularly. Similarly among the HSSLC students more than three fourth
(80%) attended class regularly, one fifth (20%) fairly attended class. From both
categories of the above table, it is observed that the majority almost three fourth (74.2%)
attended class regularly.
Among the HSLC students about one tenth (12.2%) study one hour daily, more
than one fifth (23.0%) study two hours daily, more than one fourth (28.4%) study three
hours daily, almost one fourth (24.3%) study four hours daily, one tenth (11.2%) study
five hours daily. Similarly among the HSSLC students about one fourth (26.7%) study
one hour daily, less than one tenth (6.7%) study two hours daily, more than one tenth
(13.3%) study three hours daily, almost one fourth (24.3%) study four hours daily, about
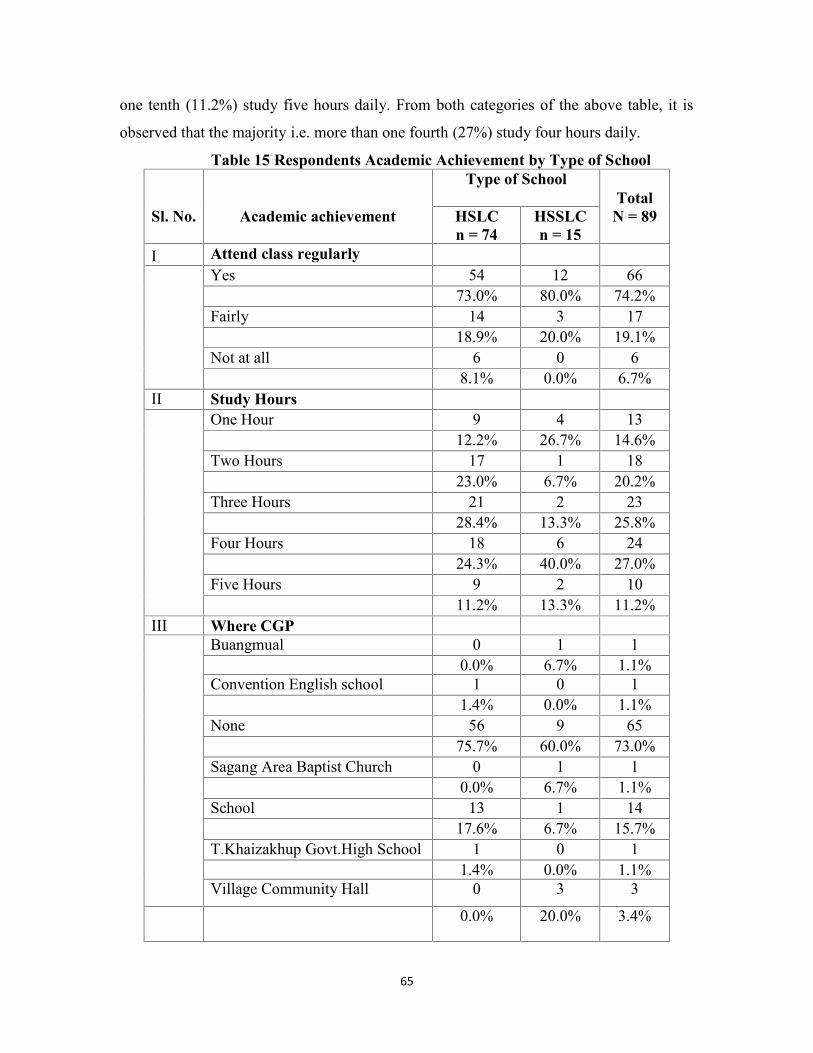
65
one tenth (11.2%) study five hours daily. From both categories of the above table, it is
observed that the majority i.e. more than one fourth (27%) study four hours daily.
Table 15 Respondents Academic Achievement by Type of School
Sl. No. Academic achievement
Type of SchoolTotal
N = 89HSLCn = 74
HSSLCn = 15
I Attend class regularlyYes 54 12 66
73.0% 80.0% 74.2%Fairly 14 3 17
18.9% 20.0% 19.1%Not at all 6 0 6
8.1% 0.0% 6.7%II Study Hours
One Hour 9 4 1312.2% 26.7% 14.6%
Two Hours 17 1 1823.0% 6.7% 20.2%
Three Hours 21 2 2328.4% 13.3% 25.8%
Four Hours 18 6 2424.3% 40.0% 27.0%
Five Hours 9 2 1011.2% 13.3% 11.2%
III Where CGPBuangmual 0 1 1
0.0% 6.7% 1.1%Convention English school 1 0 1
1.4% 0.0% 1.1%None 56 9 65
75.7% 60.0% 73.0%Sagang Area Baptist Church 0 1 1
0.0% 6.7% 1.1%School 13 1 14
17.6% 6.7% 15.7%T.Khaizakhup Govt.High School 1 0 1
1.4% 0.0% 1.1%Village Community Hall 0 3 3
0.0% 20.0% 3.4%

66
IV School Organize CGO prog.Always 9 3 12
12.2% 20.0% 13.5%Sometimes 32 6 38
43.2% 40.0% 42.7%Rarely 13 1 14
17.6% 6.7% 15.7%Never 20 5 25
27.0% 33.3% 28.1%V Necessary to organize
Yes 68 15 8391.9% 100.0% 93.3%
No 6 0 68.1% 0.0% 6.7%
Source: Computed
Among the HSLC students (1.4%) attended Career Guidance Programme at
Convention English School, more than three fourth(75.7%) did not attended any Career
Guidance Programme, one fifth (17.6%) attended Career Guidance Programme at School,
less than one-tenth (1.4%) attended Career Guidance Programme at T.Khaizakhup
Government High School, less than one-tenth (4.1%) attended a Career Guidance
Programme at Mata village Community Hall. Similarly among the HSSLC students less
than one-tenth (6.7%) attended the Career Guidance Programme at Buangmal, three
fifths (60%) did not attend any Career Guidance Programme, less than one-tenth less than
one-tenth (6.7%) each attended Career Guidance Programme at Sagang Area Baptist
Church and at School, one fifth (20%) attended the Career Guidance Programme at
Sagang village community Hall. From both category of the above table it is observed that
majority three fourth (73%) did not attend any Career Guidance Programme and among
who attended majority one fifth (15.7%) attended Career Guidance Programme at School.
Among the HSLC students one-tenth (12.2%) claim that their school always
organize Career Guidance Programme, two fifths (43.2%) claim that their school
sometimes organize Career Guidance Programme, one fifth (17.6%) claim that their
school rarely organize Career Guidance Programme, one fourth (27%) claim that their
school never organize Career Guidance Programme. Similarly among the HSSLC
students one fifth (20%) claim that their school always organize Career Guidance
Programme, two fifths (40%) claim that their school sometimes organize Career

67
Guidance Programme, less than one-tenth (6.7%) claim that their school rarely organize
Career Guidance Programme, one third (33.3%) claim that their school never organize
Career Guidance Programme. From both categories of the above table, it is observed that
the majority two fifths (42.7%) claim that their schools sometimes organize Career
Guidance Programme.
Among the HSLC students, the vast majority (91.9%) feel that it is necessary to
organize Career Guidance Programme and one-tenth (8.1%) feel that it is not necessary to
organize Career Guidance Programme. Similarly, among the HSSLC students (100%), all
the respondents feel that it is necessary to organize a career guidance programme. From
both categories of the above table, the vast majority (93.3%) feel that it is necessary to
organize a Career Guidance Programme.
Correlates of Leisure time Activities
The present study intended to find out the way the respondents spent their free
time and the activities they do in their free time. Correlation tries to find out the
relationship holds by the two variables. For the present study, eight leisure activities have
been given viz watching TV, games, and sports, reading books, visiting friends, listening
to music, talking on the phone, computer games and helping out parents.

68
Table 16Correlates of Leisure time Activities
Type
of
Scho
ol
Wat
chin
gTV
Gam
es a
ndSp
orts
Rea
ding
Boo
ks
Vis
iting
frie
nds
List
enin
gto
mus
ic
Talk
ing
onph
one
Com
pute
rga
mes
Hel
ping
out p
aren
ts
Type ofSchool
1
StudyHours
.012
WatchingTV
-.097 1
GamesandSports
-.046 .332** 1
ReadingBooks
-.129 .397** .319** 1
Visitingfriends
-.212* .346** .602** .253* 1
ListeningMusic
-.266* .220* .368** .107 .435** 1
Talking onPhone
-.283** .294** .234* .173 .282** .270* 1
Computergames
-.262* .099 .126 .008 .227* .220* .368** 1
Helpingoutparents
-.081 .452** .546** .545** .522** .278** .312** .027 1
*. Correlation is significant at the 0.05 level (2-tailed).
**. Correlation is significant at the 0.01 level (2-tailed).
There is a negative correlation by type of school with visiting friends (-.212),
listening music (-.266), and computer game at 0.05 level of significance (-.262) and
talking on the phone (-.283) at 0.01 level of significance. The negative correlation shows
that majority of the respondents spent most of their leisure time in visiting friends,
listening to music, talking on phone and computer games.
Watching TV is positively correlated with computer games (.332), reading books
(.397), visiting friends (.346), talking on the phone (.294) at 0.01level of significance and
listening music at 0.05 level of significance.

69
Games and sports have a positive correlation with reading books (.319), visiting
friends (.602), listening music (.368) at 0.01 level of significance and talking on the
phone (.234) at 0.05 level of significance.
Reading books have a positive correlation with visiting friends (.253) at 0.05 level
of significance.
Visiting friends have a positive correlation with listening music (.435), talking on
the phone (.282) at 0.01 level of significance and computer games (.227) at 0.05 level of
significance.
Listening to music has a positive correlation with talking on the phone (.270) and
computer game (.220) at 0.05 level of significance.
Talking on the phone has a positive correlation with computer games (.368) at
0.01 level of significance.
Co-curricular Activities by Type of School
Co-curricular activities are an indicator of the activities undertaken by the
students besides their studies. Table 17 shows the respondents co-curricular activities by
type of school. The study aims to find out the level of participation of the respondents in
different co-curricular activities held at schools such as debate and discussion, study
circle, music, dance, painting, football, and basketball.
Among the HSLC students, one fourth (27%) participated in debate and
discussion as part of the school co-curricular activities and more than half (54%) did not
participate in debate and discussion. Similarly among the HSSLC students more than
half(53.3%) participated in debate and discussion as part of the school co-curricular
activities and two fifths (46.7%) did not participate in debate and discussion. From both
categories of the above table, it is observed that the majority of more than three fourths
(68.5%) did not participate in debate and discussion.

70
Table 17
Respondents Co-curricular Activities by Type of School
Sl. No. Co-curricularactivities
Type of SchoolTotal
N = 89HSLCn=74
HSSLCn = 15
IDebate andDiscussionYes 20 8 28
27.0% 53.3% 31.5%No 54 7 61
73.0% 46.7% 68.5%II Study circle
Yes 21 5 2628.4% 33.3% 29.2%
No 53 10 6371.6% 66.7% 70.8%
III MusicYes 34 8 42
45.9% 53.3% 47.2%No 40 7 47
54.1% 46.7% 52.8%IV Dance
Yes 23 8 3131.1% 53.3% 34.8%
No 51 7 5868.9% 46.7% 65.2%
V PaintingYes 16 8 24
21.6% 53.3% 27.0%No 58 7 65
78.4% 46.7% 73.0%VI Yoga
Yes 8 4 1210.8% 26.7% 13.5%
No 66 11 7789.2% 73.3% 86.5%
VII FootballYes 48 10 58
64.9% 66.7% 65.2%No 26 5 31
35.1% 33.3% 34.8%VIII Basketball
Yes 8 4 1210.8% 26.7% 13.5%
No 66 11 7789.2% 73.3% 86.5%
Source: Computed

71
Among the HSLC students, one fourth (28.4%) have a study circle and three
fourth (71.6%) did not have a study circle. Similarly, among the HSSLC students, one
third (33.3%) have a study circle and two third (66.7%) did not have a study circle. From
both categories of the above table, it is observed that the majority almost three fourth
(70.8%) did not have a study circle.
Among the HSLC students, more than two fifth (45.9%) co-curricular activities
school was listening to music and playing different musical instruments and more than
half (54.1%) did not love music. Similarly, among the HSSLC students more than half
(53.3%) co-curricular activities were listening to music and playing different musical
instruments and two fifths (46.7%) did not entertain themselves with music. From both
categories of the above table majority, more than half (52.8) did not love music.
Among the HSLC students, one third (31.1%) co-curricular activities at school
was dance and two third (68.9%) did not participate in. Similarly, among the HSSLC
students more than half (53.3%), co-curricular activities were dance and two fifth
(46.7%)did not participate in dance. From both categories of the above table majority,
two third (65.2%) did not participate in dance.
Among the HSLC students, one-tenth (10.8%) practice yoga at school as part of
co-curricular activities and the vast majority (89.2%) did not practice any form of yoga.
Similarly, among the HSSLC students, one fourth (26.7%) practice yoga at school as part
of co-curricular activities and three fourth (73.3%)did not practice any form of yoga.
From both categories of the above table majority, more than three fourths (86.5%) did not
practice yoga as a part of co-curricular activities.
Among the HSLC students, more than three fourth (64.9%) played football as part
of the school co-curricular activities and one third (35.1%) did not play football.
Similarly, among the HSSLC students, two third (66.7%) played football as part of the
school co-curricular activities and two sixth (33.3%) did not play football. From both
categories of the above table, it is observed that the majority (65.2%) played football as
part of the school co-curricular activities.
Among the HSLC students one-tenth (10.8%) played basketball as part of the
school co-curricular activities, the vast majority (89.2%) did not play basketball.
Similarly among the HSSLC students one fourth (26.7%) played basketball as part of the

72
school co-curricular activities and three fourth three fourth (73.3%) did not play
basketball. From both categories of the above table, it is observed that the majority of
more than three fourths (86.5%) did not play basketball.
Figure 4 shows members of the organization, to which the respondents belong.
Figure 3Member of organization
Member of organization Frequency Percent ValidPercent
CumulativePercent
Indian Red CrossSociety 8 9.0 9.0 9.0
National ServiceScheme 32 36.0 36.0 44.9
National Cadet Corps 9 10.1 10.1 55.1None 40 44.9 44.9 100.0Total 89 100.0 100.0
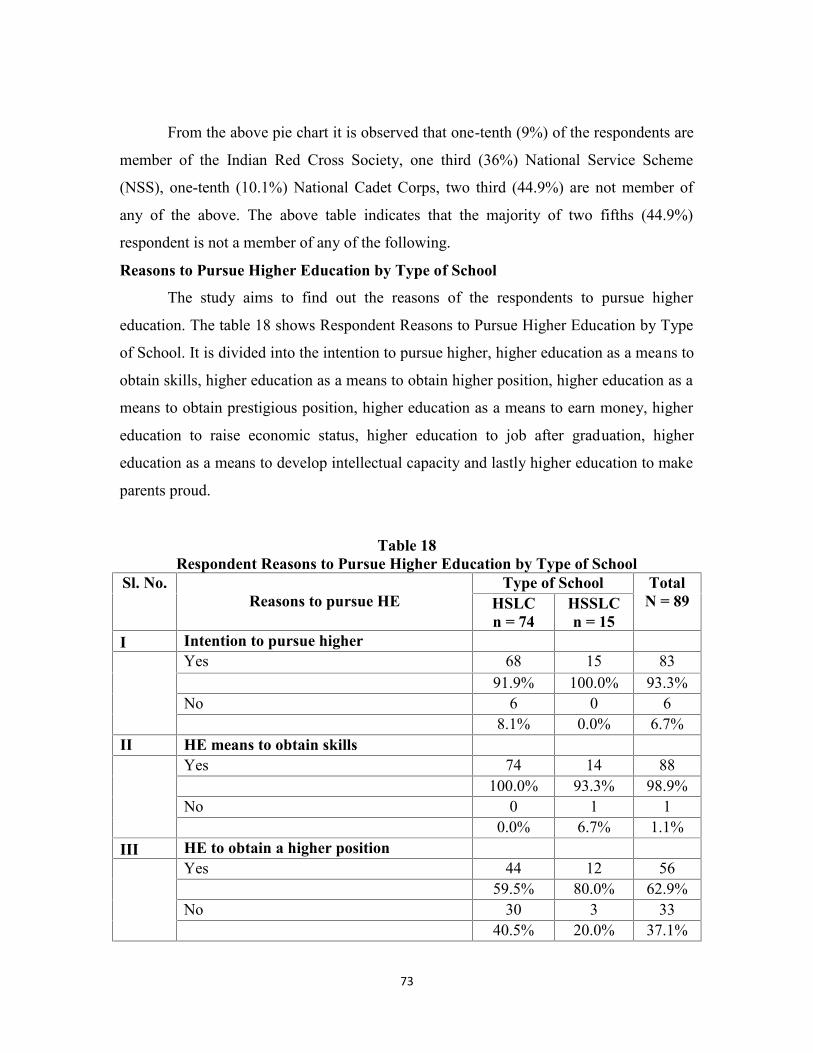
73
From the above pie chart it is observed that one-tenth (9%) of the respondents are
member of the Indian Red Cross Society, one third (36%) National Service Scheme
(NSS), one-tenth (10.1%) National Cadet Corps, two third (44.9%) are not member of
any of the above. The above table indicates that the majority of two fifths (44.9%)
respondent is not a member of any of the following.
Reasons to Pursue Higher Education by Type of School
The study aims to find out the reasons of the respondents to pursue higher
education. The table 18 shows Respondent Reasons to Pursue Higher Education by Type
of School. It is divided into the intention to pursue higher, higher education as a means to
obtain skills, higher education as a means to obtain higher position, higher education as a
means to obtain prestigious position, higher education as a means to earn money, higher
education to raise economic status, higher education to job after graduation, higher
education as a means to develop intellectual capacity and lastly higher education to make
parents proud.
Table 18Respondent Reasons to Pursue Higher Education by Type of School
Sl. No.Reasons to pursue HE
Type of School TotalN = 89HSLC
n = 74HSSLCn = 15
I Intention to pursue higherYes 68 15 83
91.9% 100.0% 93.3%No 6 0 6
8.1% 0.0% 6.7%II HE means to obtain skills
Yes 74 14 88100.0% 93.3% 98.9%
No 0 1 10.0% 6.7% 1.1%
III HE to obtain a higher positionYes 44 12 56
59.5% 80.0% 62.9%No 30 3 33
40.5% 20.0% 37.1%

74
IV HE obtains the prestigious positionYes 68 13 81
91.9% 86.7% 91.0%No 6 2 8
8.1% 13.3% 9.0%V HE to earn money
Yes 40 9 4954.1% 60.0% 55.1%
No 34 6 4045.9% 40.0% 44.9%
VI HE to raise socio-economic statusYes 45 10 55
60.8% 66.7% 61.8%No 29 5 34
39.2% 33.3% 38.2%VII HE job after graduation
Yes 48 12 6064.9% 80.0% 67.4%
No 26 3 2935.1% 20.0% 32.6%
VIIIEducation should help developintellectual capacityYes 66 15 81
89.2% 100.0% 91.0%No 8 0 8
10.8% 0.0% 9.0%IX Make parents proud
Yes 63 14 7785.1% 93.3% 86.5%
No 11 1 1214.9% 6.7% 13.5%
Source: Computed
Among the HSLC students, the vast majority (91.9%) have the intention to pursue
higher education and less than one-tenth (8.1%) did not have the intention to pursue
higher education. Similarly, among the HSSLC students (100%) of the respondents have
the intention to pursue higher education. From both categories of the above table, it is
observed that the vast majority (93.3%) have the intention to pursue higher education.
Among the HSLC students (100%) perceived higher education as a means to
obtain skills. Similarly, among the HSSLC students, the vast majority (93.3%) perceived

75
higher education as a means to obtain skills and less than one-tenth (6.7%) did not
perceive education as a means to obtain skills. From both categories of the above table, it
is observed that the vast majority (98.1%) perceived education as a means to obtain skills.
Among the HSLC students, three-fifths (59.5%) perceived higher education as a
means to obtain a higher position and two fifth (40.5%) did not perceive education as a
means to obtain higher education. Similarly among the HSSLC students, three fourth
(80%) perceived education as a means to obtain a higher position and one fifth (20%) did
not perceive education as a means to obtain higher education. From both categories of the
above table, it is observed that the majority two third (62.9%) perceived education as a
means to obtain a higher position.
Among the HSLC students, the vast majority (91.9%) perceived higher education
as a means to obtain prestigious position and less than one-tenth (8.1%) did not perceive
education as a means to obtain prestigious education. Similarly, among the HSSLC
students, more than three fourth (86.7%) perceived education as a means to obtain
prestigious position and one-tenth (13.3%) did not perceive education as a means to
obtain higher education. From both categories of the above table, it is observed that the
vast majority (91%) perceived education as a means to obtain a prestigious position.
Among the HSLC students, more than half (54.1%) perceived higher education as
a means to earn money and two fifths (45.9%) did not perceive education as a means to
earn money. Similarly, among the HSSLC students, three-fifths (60%) perceived
education as a means to earn money and two fifths (40%) did not perceive education as a
means to earn money. From both categories of the above table, it is observed that the
majority more than half (55.1%) perceived education as a means to earn money.
Among the HSLC students, three-fifths (60.8%) perceived higher education as a
means to raise the economic status and two fifths (39.2%) did not perceive education as a
means to raise economic status. Similarly, among the HSSLC students, two third (66.7%)
perceived education as a means to raise the economic status and one third (33.3%) did not
perceive education as a means to raise economic status. From both categories of the
above table, it is observed that the majority two third (61.8%) perceived education as a
means to raise economic status.
76
Among the HSLC students, two third(64.9%) perceived higher education as a
means to get a job after graduation and one third (35.1%) did not perceive education as a
means to get the job after graduation. Similarly, among the HSSLC students, more than
three fourths (80%) perceived education as a means to get the job after graduation and
one fifth (20%) did not perceive education as a means to get the job after graduation.
From both categories of the above table, it is observed that the majority two third (67.4%)
perceived education as a means to get the job after graduation.
Among the HSLC students, a vast majority (89.2%) believe that education will
help develop their intellectual capacity and one tenth (10.8%) does not believe education
to develop their intellectual capacity. Similarly among the HSSL students (100%)
believed that education will help develop their intellectual capacity. From both categories
of the above table, it is observed that the vast majority (91%) believed education will help
develop their intellectual capacity.
Among the HSLC students, more than three fourth (85.1%) believed that pursuing
higher education will make their parents proud and one-tenth (14.9%) did not believe that
higher education will make their parents proud. Similarly, among the HSSLC students, a
vast majority (93.3%) believed that pursuing higher education will make their parents
proud and one tenth(6.7%) did not believe that higher education will make their parents
proud. From both categories of the above table, it is observed that the majority of more
than three fourth (86.5%) believed that pursuing higher education will make their parents
proud.
Educational Aspiration by Family Environment
The table 19 shows the Educational Aspiration by Family Environment. It is sub-
divided into ambition, rolemodel, examination like to pass, consider best, best and like to
pass after age 20, think best and like to pass after age 20, examination everyone should at
passing, think able to pass after age 20, best and like to pass after age 20, think best and
like to pass after age 20,

77
Table19 Educational Aspiration by Family Environment
Sl. No.Educational Aspirations
FES
TotalLow (35<)n = 47
High (<35)n =42
I AmbitionYes 33 38 71
70.2% 90.5% 79.8%No 14 4 18
29.8% 9.5% 20.2%Chi-Square
Value dfAsymp. Sig. (2-
sided)5.645 1 .018
II Role modelYes 12 19 31
25.5% 45.2% 34.8%No 35 23 58
74.5% 54.8% 65.2%
Value dfAsymp. Sig. (2-
sided)3.794a 1 .051
III Examination like to passHSLC 15 13 28
31.9% 31.0% 31.5%HSSLC 14 7 21
29.8% 16.7% 23.6%Bachelor Degree 1 5 6
2.1% 11.9% 6.7%Master Degree Exam 17 17 34
36.2% 40.5% 38.2%IV Consider best
Union Public Service Commission(UPSC)
15 16 31
31.9% 38.1% 34.8%Manipur Public ServiceCommission (MPSC)
18 11 29
38.3% 26.2% 32.6%Staff Selection Commission (SSC) 0 7 7
0.0% 16.7% 7.9%Teacher's Eligibility Test (TET) 14 8 22
29.8% 19.0% 24.7%

78
Value dfAsymp. Sig. (2-
sided)Chi-Square 10.109a 3 .018
V Think able to pass after age 20Ph.D (Doctoral degree) 8 12 20
17.0% 28.6% 22.5%M.Phil (Master of Philosophy) 7 5 12
14.9% 11.9% 13.5%Master Degree 11 7 18
23.4% 16.7% 20.2%Bachelor Degree 13 12 25
27.7% 28.6% 28.1%Higher Secondary 8 6 14
17.0% 14.3% 15.7%VI Best and like to pass after age 20
Civil Service Examination (CSE) 21 22 4344.7% 52.4% 48.3%
Indian Economic ServiceExamination (IES)
6 7 13
12.8% 16.7% 14.6%Indian Statistical ServiceExamination
5 5 10
10.6% 11.9% 11.2%Indian Military Academy Exam 15 8 23
31.9% 19.0% 25.8%
VIIExamination everyone should atpassingPrimary 2 3 5
4.3% 7.1% 5.6%Elementary 2 1 3
4.3% 2.4% 3.4%HSLC 14 11 25
29.8% 26.2% 28.1%HSSLC 2 2 4
4.3% 4.8% 4.5%Bachelor 3 8 11
6.4% 19.0% 12.4%Master 24 17 41
51.1% 40.5% 46.1%

79
VIIIThink you will certainly able topassSBI PO (Probationary Officer) 3 4 7
6.4% 9.5% 7.9%IBPS (Institute Bank PersonalSelection)
4 4 8
8.5% 9.5% 9.0%Civil Service Examination (CSE) 14 17 31
29.8% 40.5% 34.8%Manipur Public ServiceCommission (MPSC)
20 10 30
42.6% 23.8% 33.7%Staff Selection Commission (SSC) 5 5 10
10.6% 11.9% 11.2%Combine Graduate Level (CGL) 1 2 3
2.1% 4.8% 3.4%
IXThink best and like to pass afterage 20Indian Administrative Service(IAS)
20 12 32
42.6% 28.6% 36.0%Indian Foreign Service (IFS) 6 8 14
12.8% 19.0% 15.7%Indian Police Service (IPS) 17 17 34
36.2% 40.5% 38.2%Indian Revenue Service (IRS) 4 5 9
8.5% 11.9% 10.1%
XThink best and like to pass afterage 20Bachelor of Legislative Law(L.L.B)
3 9 12
6.4% 21.4% 13.5%Bachelor of Engineering (B.E) 8 12 20
17.0% 28.6% 22.5%Bachelor of Education (B.Ed.) 21 12 33
44.7% 28.6% 37.1%Bachelor of Library Science(B.Lib)
15 9 24
31.9% 21.4% 27.0%Pearson Chi-Square
Value dfAsymp. Sig. (2-
sided)7.497a 3 .058

80
Table 19 shows the educational aspirations by family environment. Almost four
fifth (79.8%) of the respondents are having ambition while one fifth (20%) are without
any ambition. Among the respondents who have ambition, almost two third (70%) are
from low family environment while among those who do not have ambition only a few
percentage of (9.5%) less than one tenth are from high family environment.
In order to find out the relationship between the ambition and family environment
by applying chi-square test, an hypothesis has been formulated in such a way as:
H0: There is no relationship between ambition and family environment of the
respondents.
H1: There is a relationship between ambition and family environment of the respondents.
From the above table the chi-square value is significant at 0.018 (.000*) with 5.645
degrees of freedom 1. Hence the null hypothesis is rejected and the alternative hypothesis
is accepted. Therefore, we can conclude that there is a relationship between ambition and
family environment.
Regarding the role played by respondents in the family, almost two third (65.2%)
of the respondents does not play any role model. Among them More than half are from
high family environment and almost three fourth (74.5%) are from low family
environment. More than one third (79.8%) of the respondents played role model.
In order to find out the relationship between the ambition and family environment
by applying chi-square test, an hypothesis has been formulated in such a way as:
H0: There is no relationship between role model and family environment of the
respondents.
H1: There is a relationship between role model and family environment of the
respondents.
From the above table the chi-square value is significant at 0.051 (.000*) with
3.794 degrees of freedom 1. Hence the null hypothesis is rejected and the alternative
hypothesis is accepted. Therefore, we can conclude that there is a relationship between
role model and family environment.

81
Almost two fifth (38.2%) of the respondents liked to pass Master Degree in which
among them two fifth (40.5%) are from high family environment. Only a few percentage
of 6.7% liked to pass Bachelor Degree where only 2.1% of them are from low family
environment and 11.9 percent are from high family environment.
Towards the perception of respondents to be the best in examinations almost one
third (34.8%) of the respondents consider to be best in Union Public Service Commission
(UPSC). Among them more than three eight (38.1%) of them are from low family
environment and 31 percent are from high family environment. Almost one fourth
(24.7%) from the whole respondents consider to be best in passing Teacher's Eligibility
Test (TET). Among them more than one fourth (29.8%) of them are from low family
environment and more than one sixth (19%) are from high family environment.
Table 19 from the chi-square test shows that there is a positive significant
relationship between ambition and family environment (.018) at 0.01 level of significance
and with 1 degree of freedom.
From the above table 19 shows that there is a positive significant relationship
between role model and family environment (.051) at 0.01 level of significance and with
1 degree of freedom.
From the above table 19 shows that there is a positive relationship between the
examination consider to be best and family environment (.018) at 0.01 level of
significance and with 1 degree of freedom.
From the above table 19 shows that there is a positive relationship between the
examination think best and like to pass after age 20 and family environment (.058) at
0.01 level of significance and with 3 degrees of freedom.
In order to find out the relationship between the perception of respondents to be
the best in examinations and family environment by applying chi-square test, an
hypothesis has been formulated in such a way as:

82
H0: There is no relationship between perception of respondents to be the best in
examinations and family environment of the respondents.
H1: There is a relationship between perception of respondents to be the best in
examinations and family environment of the respondents.
From the above table the chi-square value is significant at 0.018 (.000*) with 3 degrees of
freedom. Hence the null hypothesis is rejected and the alternative hypothesis is accepted.
Therefore, we can conclude that there is a relationship between perception of respondents
to be the best in examinations and family environment.
More than one fourth (28.1%) of the respondents felt that the highest level of
examination they can pass after the age of twenty is Bachelor Degree. Among them more
than one fourth (28.6%) are from the high family environment. More than one eight
(13.5%) of the whole respondents felt that their highest level of examination they can
pass is M.Phil (Master of Philosophy) and almost one sixth (14.9%) among them are
from low environment family and 11.9 percent are from high family environment.
Almost half (48.3%) of the respondents think Civil Service Examination to be the
best and would like to pass after they complete the age of twenty. Among them more than
half (52.4%) are from high family environment and more than two fifth (44.7%) are from
low family environment. One ninth (11.2%) of the respondents think Indian Statistical
Service Examination to be the best and would like to pass after they complete the age of
twenty. Out of which about one tenth (10.6%) are from low family environment and
(11.9%) are from high family environment.
Almost half (46.1%) of the respondents think Master degree would be the best
examination which everyone should pass. Among them more than half (51.1%) are from
low family environment and (40.5%) are from high family environment. Among them
only (3%) think Elementary would be the best examination which everyone should pass.
Where less than one tenth (2.4%) are from high family environment and (4.3%) from low
family environment.
More than one third (34.8%) of the respondents thought that they would certainly
pass Civil Service Examination (CSE) in which among them two fifth (40.5%) are from
high family environment and more than one fourth (29.8%) are from low family

83
environment. Only a small amount of respondents with only less than one tenth (3.4%)
thought that they would certainly pass Combine Graduate Level (CGL) out of which less
than one tenth (2.1%) are from low family environment and (4.8%) are from high family
environment.
Almost two fifth (38.2%) of the respondents think Indian Police Service (IPS) to
be best and like to pass after the age of 20 years. Among them two fifth (40.5%) are from
high family environment and more than one third (36.2%) are from low family
environment. One tenth (10.1%) from the whole respondents think Indian Revenue
Service (IRS) to be best and like to pass after the age of 20 years, out of which more than
one tenth (11.9%) are from high family environment and 8.5% are from low family
environment.
More than one third (37.1%) think Bachelor of education B.Ed. to be the best and
like to pass after they complete the age of twenty. Among them more than one fifth
(21.4%) are from high family environment and almost one third (31.9%) are from low
family environment. More than one fifth (22.5%) of the respondents think Bachelor
Engineering (B.E) to be the best and like to pass after they complete the age of twenty.
Among them more than one fourth (28.6%) are from high family environment and 17%
are from low family environment.
In order to find out the relationship between the examination that respondents
think best and which they will like to pass after 20 years and family environment by
applying chi-square test, an hypothesis has been formulated in such a way as:
H0: There is no relationship between ambition and family environment of the
respondents.
H1: There is a relationship between ambition and family environment of the respondents.
From the above table the chi-square value is significant at 0.058 (.000*) with 3 degrees of
freedom. Hence the null hypothesis is rejected and the alternative hypothesis is accepted.
Therefore, we can conclude that there is a relationship between ambition and family
environment.

84
Respondents Occupational Preferences
Occupational preference is the type of work the individual prefer to do. Figure 5
shows the respondent's occupation preference. The occupational preferences are given viz
government service, the private sector, and non-governmental organization.
Figure 4Respondents Occupational Preferences
Sl.No. Occupational preference Frequency Percent1 Government service 71 79.82 Private Sector 9 10.13 Non- Governmental
Organization (NGO)9 10.1
Total 89 100.0
Source: Computed
From the above bar graph, it is observed that three fourth(79.8%) of the
respondent's occupational preferences is Government service, one tenth (10.1%) private
sector, and non-governmental organization. The above table indicates that the majority
three fourth (79.8%) of the respondent's occupational preference is government service.
In this chapter as a section one, an attempt has been made to discuss the results of
analysis of the quantitative data collected through questionnaire. The chapter was
devoted to discussing the socioeconomic characteristics, life skills assessment, social
well-being assessment, and relationships between the life skills and social wellbeing. In

85
the light of results and discussion of this chapter, the next section of the chapter is
devoted to discussing the qualitative aspects of the present study.
Qualitative Section
The second section presents the qualitative techniques and tools adopted of the
present study. The qualitative techniques are such as case study and focus group
discussion. Further, a daily activity schedule also portrayed in the chapter.
Case Studies
Case I:
Name: Ronald (Name changed)
Age: 16
Sex: Male
Mr. Ronald is an Arts student. He has four siblings, 2 brothers, and 1 sister. He is the
youngest child. He lives with his sister and brother-in-law. His mother passed away when
he was 10 years old and two years later his father also passed away. Ever since his
parents passed away he lived with his sisters’ family. He has one niece and two twin
nephews.
There are a lot of times that life has knocked him down and often he feels despair.
In the family aspect, he did not get the warmth and love like his friends living with their
parents and this made him more desperate. He expressed that the love of a sister and the
love of a mother is so different and mother’s love is unconditional and incomparable to
any others love. He did quite a number of tasks in the house including household chores
helping out his sister, who is now a mother of three children. In the educational aspect, he
witnesses failure a number of times. He fails his matric examination in his first attempt
and missed out his examination for his second attempt. At his third attempt, he got
through his matric in 2nd division. He went to Bangalore for pursuing his further studies
but due to financial problems, he came back home. He often feels that life is not fair. He
sometimes feels that all the unwanted things happen to him and find it hard to understand
life. He felt sorry for himself as many times he could not get all the resources he needed
for his studies. There are many a time he wanted to give up his education but he could not
do that because he knew education can help him to become a great person one day. He
always dreams to be a great teacher and strive hard towards attaining his goal.

86
Mr. Ronald uses multiple coping mechanisms in order to cope up with the
challenges he faced. One of the most useful coping mechanisms is listening to music and
singing. Listening to music and singing make him forget all his worriers and bound him
with happiness and for this reason, he often sings in events of his school and even in the
community. He also shares his burden with his close friends.
Case II:
Name: Emily (Name changed)
Age: 16
Sex: Female
Ms. Emily is a science student. She has one sibling, 1 brother and herself being
the younger one in the family. Currently, she stays with her grandparents and her uncle’s
family. Her family is joint and stable and there are 13 members in the family. Her father
is a Government servant and her mother is a housewife. Her parents stay away from the
family as her father has been posted in different places.
Ms. Emily hesitating to leave her school chooses to stay with her grandparents
instead of staying with her parents. In the family aspect, she faces a lot of problems as
sometimes there are role conflict issues. She has to do most of the household chores,
study and also helps out her grandmother in her garments shop. Staying without her
parents she often feels lonely and longing to stay with her parents. She often faces
financial problems and could not get enough materials for her studies. She feels that she
need to go for home tuition as she finds it hard to cope with the teaching in the class and
complained that the irregularity of the teachers pulls down her interest to a large degree.
She also feels sad that she could not go for home tuitions due to financial problem and no
encouragement from her family members to achieve high in education. Less interest has
been shown in her studies.
In order to cope with her problems, Emily listens to music as a source of comfort
to her loneliness. Emily complained that there are no friends to share her problems in her
locality. She seeks God and prays at times of trouble as she has no friends to share her
problems and her parents were not available most of the times.
87
Case: III
Name: Mawi (Name changed)
Age: 15
Sex: Female
Ms. Mawi is a 10th standard student. She has 3 siblings, 2 elder sisters and 1 elder
brother. She is the youngest child. Her family is nuclear and stable and resides in their
own house. Her father is a cultivator and her mother, a weaver.
Ms. Mawi faces lots of hardships in pursuance of her education. The biggest
challenges towards her education are financed. Her parents find it hard to meet all the
educational needs of their children. As a school going children there are many
educational and its related needs. Ms. Mawi also faces problems in regards to
transportation as the distance between her home and school is far. She feels disappointed
as her parents were unable to give all the materials she needed in her studies. She also
wanted to become a doctor but she is worried because to study doctor it needed a huge
capital and doubt whether her parents will be able to pay for her fees. She also faces a lot
of competition among her peers and also fears not to do well in the coming board exam.
She had a big fear not to reach the expectation of her parents
In order to cope with her problems, Ms. Mawishare her problems with her
siblings and often discuss and share their problems with each other. Ms. Mawihave a
great faith in God and believing that prayer and hard work is the key to success devote
most of her time in studying.
Case IV:
Name: Joshua (Name changed)
Age: 14
Sex: Male
Mr. Joshua is a 9th standard student. He has two siblings, 1 elder sister, and 1
younger brother. He is the second child and resides with his parents. His family is nuclear
and stable. They live in their owned house. Both his parents are literate, and his father is a
driver and his mother, a weaver.
Mr. Joshua faces lots of challenges in his life. In a family aspect, he faces lots of
financial problems due to the drunken behavior of his father. Though his father quit his

88
drinking a year ago it has already affected his health badly. His liver has been damaged
with intestinal and stomach ulcer. Due to his ill health, he could not work to support his
family instead he finds it difficult to pay off his medical bills. His mother is the only
breadwinner of the family and paying all the expenses only through weaving is a very
difficult task. Mr. Joshua often thought of dropping out of school and working as a daily
laborer. During holidays he used to work as a laborer in the construction work. Though
his aim in life is to become an army officer sometimes he doubts whether he could ever
be the person he dreamt of.
Mr. Joshua does a lot of exercises to make his body fit so that he can become an army
officer. He also plays football regularly in order to cope up with his stressful situation and
a healthy physique. Regular exercise gives him a fresh mind and happiness.
Findings:
From the case studies, it can be concluded that the student's main problem lies
with the family. The Socio-Economic Status greatly affected their educational life. Lack
of financial support and encouragement hampers the education of the student. It also
created fear and doubt in the minds of the student that they might not be able to achieve
their goal as a huge capital investment is needed. When it comes to resolving their
problems their faith plays a very important role by praying to God. Music is also another
important instrument which they resort to in times of facing hardships. Social support of
siblings and friends also plays a great role. Physical exercise is also another way to stay
away from their problems.
Participatory Rural Appraisal (Daily Activity Schedule)
Participants of the FGD listed their daily activity schedule which are present their
time utilization. It helps to understand how much time they invest their time especially
how much time they spend for studies and leisure.
No. of participants: 10
Date: 20/10/2018
Date: 3:30pm
Venue: Sagang Higher Secondary School playground

89
Figure 5Daily Activity Schedule
Sl. No. Activity Time1. Wake up 5:30-6:00a.m2. Wash up 6:00-6:30 am3. Studies 6:30-7:30a.m4. Breakfast 7:30-8:30a.m5. Left for school 8:30a.m6. Back from school 4:00p.m7. Studies 4:00-5:30p.m8. Leisure 5:30-6:00p.m9. Dinner 6:00-7:00p.m10. Studies 7:00-9:00p.m11. Sleep 9:00p.mSource: Participatory Rural Appraisal
Focused Group Discussion
A focused Group Discussion was conducted among teachers group, parents group,
and students group so that the researcher could gather in-depth information regarding the
role of parents, teachers, and students for students to aspire high and successful
education.
Teachers Group
The teachers are not satisfied with the educational system claiming that it has
really gone complex with competitiveness among the students but without much effort
and preparation. The internet culture has influenced the student’s life too much affecting
their studies. It also marks the transition from Montessori to digital class.
The teachers claim that there are many setbacks in the educational system. The
lack of infrastructure and facilities such as vocational training, games and sports, skill
development programme. The irregularity of school teachers which hamper the
development of the student and make them lose interests in their studies. The laziness of
the students to attend a class which results in too much dependence on bazar notes. There
is a lack of co-operation among teacher-parent-student relationship. Engagement of
untrained teachers affects the students as well as the institutions. The educational system
needed proper management and implementation of the curriculum.

90
The teachers opined that the Socio-Economic Status of the parents has a great
influence on the students' performance in the school. The educated family provided a
proper time schedule for studying. High drop out from the low economic students as they
need to help their parents in earning bread for the family. Home plays an important role
in the education of the students as it is an informal agency of education where the parent's
principles such as manner, self-esteem, economic support, etc., can bring a positive effect
to the child. Parents are the main supporter of the students and their participation is a
necessity for the successful learning of the students.
The teachers also agreed to the notion that they are the model of the students and
must set good examples to the students. They say that is responsible for imparting the
right knowledge to the students and must keep themselves well updated and informative.
The teacher's group find that Career Guidance is very important in a student's life.
Many of the students did not know the reason why they go to school. Career guidance
can help the student realize the importance of education It can help the students know the
career to pursue after they pass their secondary and higher secondary examination. It can
enlighten the students on the fact that every opportunity can be grasped.
Suggestions
The teacher's group suggested the following points so to enable fruitful learning
and high aspiration of the students. The following points are listed hereunder-
i. To improve the parent-teacher relationship and engage the parents to participate more
in school activities.
ii. The culture of home tuition should or by any means be put to an end.
iii. Enlightenment through career guidance and support from family would help best the
students in their career.
iv. The state government should provide a better educational facility.
Parents group
The parents group like the teacher's group are not satisfied with today's
educational system.. They say that there is no thirst for knowledge but the students strive
just to pass exams. Socio-political and economic issues hamper education. The changing
of the syllabus to suit the opinion, interest, and policy of the ruling party. The parents feel
that there is too much pressure on the students for jobs rather than self-reliant. They also

91
say that there is no transparency in the recruitment of teachers which is an unhealthy act
affecting the students and institutions.
The parent's view that the teachers are most responsible in educating the child as
the child spends most of their time school. They are responsible for creating the right
approach towards education among the students. They must develop the spirit of service,
moral, character and co-operation. They must be well experienced and enable to
understanding the interest of the students. The parent's group blames the government
teachers that they did not teach the students properly.
The parents also feel that they are responsible for the education of their child. It is
necessary that parents see to the needs of the students be it financially, emotionally and
physically participating in school activities.
The parent's group felt the need for Career Guidance for a student's life. They
admit that they don't know what will be best for their children and what courses will suit
the interest of their children. They believe that there will many programs and courses
which they are not aware of which will be helpful for their children's education and
career. They say that Career Guidance will motivate their children and help them to better
understand themselves and enable to right selection of career.
Suggestions
The teacher's group suggested the following points so to enable fruitful learning
and high aspiration of the students. The following points are listed here under-
1. Teachers and students should be serious in their teaching and learning. Teachers
should not teach only for the sake of salary and students also should not study simply for
the sake of good marks.
Students Group
The student's group opined that education has become a necessity and every child
has to go to school whether they are interested in going to school or not. The educational
system is failing the students in many ways. It is a classroom centered and focuses on
curriculum only.
The student says that the problem here with the educational system is that
students show more interest in mobile phones and the internet world more than their

92
studies. They say that a school is a boring place of learning as there are no curricular
activities and no proper teaching aids.
The students feel that parents are very important in the education of the child.
They say that if the parents evaluate their child's performance it will raise the interest and
seriousness of the children in their studies. Parents should learn to appreciate the ability
of their children as their appreciation is a source of encouragement to study harder.
Parents must also have an interest in the education of the children. They must understand
their needs and problems and supply materials need for their education.
The student group expects the teacher to be able to lecture so that student can
understand. It should be fun and not boring. They wanted the teacher to set good
examples for the students.
The student feels that Career Guidance help students to acquire skills and
knowledge to better understand themselves for their future. Many students don’t know
what subject to take and what exams to appear.
Suggestions
i. If Career Guidance programme is conducted by our school or by some
philanthropic organization.
ii. For better education system, proper training of teachers is required.
Findings:
From the above group discussions, it can be concluded that all the groups are not
satisfied with the existing educational system. The teacher's group are not happy due to
the parents for not co-operating well in school activities. The parent's group blames the
educational system for encouraging students to achieve good grades and not develop the
real love for knowledge and skills. The student's group claim that many students lost
interest in attending classes due to the irregularity of teachers. They look upon their
teachers and parents as their role models. All the groups felt the needs for more of
parental active participation in academic-related activities for more successful learning of
the students. They also viewed Career Guidance is very essential for the right selection of
a career in student's life.
In this section, an attempt has been made to discuss the qualitative data collected
through a case study, FGD and daily activity schedule. The chapter was devoted to
93
results and discussion of this chapter, the next chapter is devoted to the conclusion and
suggestion.

94
CHAPTER - V
CONCLUSIONS AND SUGGESTIONSThe present study intended to know the family environment and educational
aspirations of secondary and higher secondary school students. The previous chapter
introduced detailed literature, methods used and the findings of the study.
The first chapter introduced the background of the present study and discussed the
youth, adolescence, family environment, educational aspirations and the problems in the
field of education. The statement of the problem, objectives of the study, hypothesis, and
chapter scheme are presented in the first chapter.
The second chapter presented a review of the literature on the family environment
and educational aspirations. The studies were categorized broadly into, studies on the
importance of education, family environment, and Socio-Economic Status and
Aspirations.
The third chapter discussed the methods applied to the present study. The chapter
was broadly categorized into the profile of the study area: the state Manipur,
Churachandpur district, pilot study, research design, sampling, unit of study, tools of data
collection, sources of data, operational definition, analysis and report of case studies and
FGD and one daily activity schedule.
The study was conducted in two higher secondary schools of Churachandpur, Manipur
which were selected based on the location, i.e core, and periphery. The study was
descriptive in design and cross-sectional in nature. Mixed method approach was applied.
Stratified sampling technique was used to select a sample from the two schools and the
sample size was 89. Family Environmental Scale by Moos and Moos through a structured
questionnaire and self-administered questionnaire was employed and a modified
questionnaire from Educational Aspirations Scale by Gupta and Sharma was also used.
The data were analyzed and processed using Microsoft Excel and SPSS where
percentages, mean standard deviation, correlation, and chi-square test were done. The
sample drawn may not represent the whole population and hence in the future, a larger
sample may be taken for greater representation. The questionnaire was printed only in
English and needed an interpreter which makes it more complicated and many of the

95
respondents could not understand properly and therefore in the future research English
version and Meitei on version questionnaire may be employed to generate better results.
The fourth chapter presented the tables and the interpretation of the table. And the
present chapter presents the summarization of the previous chapters, the major findings
of the present study and suggestions.
Major Findings
The present chapter will highlight the major findings of the present study and
shall also include suggestions. The major findings of the present study are presented in
six sections based on the objectives of the study. The first section presents the
demographic profile of the respondents which include the parental characteristics,
familial characteristics, socio-economic characteristic of the respondents. The second
section presents the family environment of the respondents. The third section presents the
educational aspirations of the respondents. The fourth section presents the respondents'
reason to pursue higher education. The fifth section presents the educational support
received by the respondents. Lastly, the sixth section presents findings related to leisure
and co-curricular activities.
Demographic findings
Majority of the respondents were female and they belong to 13-15 years age
group. The mean age of the student was 15.07 with Standard Deviation 1.2. Majority of
the respondents are Meitei and speak Meiteilon. Majority of the respondents were
Christian and belong to the denomination of Khuga Sadar Presbyterian. Almost all the
respondents were day scholar. Majority of the respondents were the middle child and few
the only child of the family. Majority of the respondents’ fathers were illiterate and few
reach to the level of higher secondary. Majority of the respondent's fathers were
cultivator with a monthly income of Rs 1000-5000. The mean income of the respondents’
father was Rs.4560.67 with Standard Deviation 1864.600. Majority of the respondent's
mothers were illiterate and few reach to the level of higher secondary. Most of the
respondent's mothers were housewife and few were weaver with a monthly income of Rs
500-2000. It is found that majority of the respondents’ family monthly income is Rs
5000-10,000.
96
Majority of the respondents had a large family of more than 7 members. Majority
of the respondents belonged to the nuclear family and a stable form of family. Majority of
the respondents lived in their owned kutcha houses and belong to BPL family. Majority
of the respondents belonged to ST category.
Family environment
In the Family Environmental Scale, cohesion mean score is the highest and is high
in HSLC whereas in the Achievement Orientation which is the second highest mean
score is high among the HSSLC students than among the HSLC students. It is clearly
observed that the higher the standard the aspiration level also rise up. And Independence
have the lowest mean score.
There is a positive correlation existing between independence and cohesion of
family environment at 0.05 level of significance (.234) and between active recreational
orientation achievement orientations at 0.01 level of significance (.277). The family
environment as a whole has a positive correlation with all the variables at 0.01 level of
significance: cohesion (.518), Expressiveness (.334), independence (.483), achievement
orientation (.313), intellectual cultural orientation (.549), active recreational orientation
(.502) and organization (.467) which indicates that the respondents family is having a
cohesive, expressive, independence, achievement orientation, intellectual cultural
organization, active recreational orientation, and an organized family.
Educational Aspirations
Majority of the respondents have an ambition and among the students having
ambition majority of the respondents wanted to become a doctor. Majority of the students
did not have a role model.
Majority of the respondents would like to pass Master degree exam. Majority of
the respondents consider the UPSC exam to be the best. Majority respondents consider
Bachelor Degree to be the highest examination and think will be able to pass. Majority of
the respondents consider the Civil Service Examination to be the best exam and like to
pass after age 20. Majority of the respondents opined that everyone should pass Master
degree exam. Majority of the respondents think that they will certainly be able to pass the
Civil Service Examination. Majority of the respondents consider Indian Police Service

97
(IPS) to be the best examination and like to pass after age 20 and in regards to
professional courses majority of the respondents think Bachelor of Education (B.Ed.) to
be best and like to pass after age 20.
Reasons to pursue higher education
Majority of the respondents were encouraged by their parents to pursue higher
education and do well in all courses. Majority of the respondents’ parents pushed them to
obtain a high degree. Majority of the respondents took the career of their parents’ choice.
The similar findings were supported by the study done by (Kashyap, L.D (1993) and
Mahale, M. N (1987).
The vast majority of the respondents have the intention to pursue higher education
and the vast majority of the respondent's perceived education as a means to obtain skills.
The vast majority of the respondents perceived education as a means to obtain higher
position and the vast majority of the respondents perceived education as a means to
obtain prestigious position while more than half of the respondents perceived education
as a means to earn money and the majority of the respondents perceived education as a
means to raise economic status. Majority of the respondents perceived education as a
means to get a job after graduation and the vast majority of the respondents believed
education will help develop their intellectual capacity. Majority of the respondents
believed that pursuing higher education will make their parents proud.
Educational Support
Majority seek help from parents when they have problems with their studies.
Majority of the respondents discuss with their parents regarding career. The majority
feels that their parents are supportive towards their education to a large degree. Majority
of the respondents feel that their parents are encouraging towards their studies. Majority
of the parents held the medium level of expectation from their children. Majority of the
respondents claim that their family took care of them in times of sickness. Majority of the
respondents strongly agree that their parents exercised a great control in regards to their
career.
98
Majority of the respondents are little satisfied with the economy and resources of
their family. Majority of the respondents get very much all the resources they needed in
regards to their education.
Majority of the respondents attended class regularly. Majority of the respondents
study four hours daily. Majority of the respondents did not attend any Career Guidance
Programme and among who attended the majority of the respondents attended Career
Guidance Programme at School. Majority of the respondents claim that their schools
sometimes organize Career Guidance Programme. Majority of the respondents feels that
it is necessary to organize a Career Guidance Programme.
About half of the respondents were a member of Indian Red Cross Society,
National Service Scheme (NSS) and National Cadet Corps. After completion of their
studies, the majority of the respondents wanted to have a government job.
Leisure Activities and co-curricular activities
There is a negative correlation by type of school with visiting friends (-.212),
listening music (-.266), and computer game at 0.05 level of significance (-.262) and
talking on the phone (-.283) at 0.01 level of significance. The negative correlation shows
that majority of the respondents spent most of their leisure time in visiting friends,
listening to music, talking on phone and computer games.
Watching TV is positively correlated with computer games (.332), reading books
(.397), visiting friends (.346), talking on the phone (.294) at 0.01level of significance and
listening music at 0.05 level of significance. Games and sports have a positive correlation
with reading books (.319), visiting friends (.602), listening music (.368) at 0.01 level of
significance and talking on the phone (.234) at 0.05 level of significance. Reading books
have a positive correlation with visiting friends (.253) at 0.05 level of significance.
Visiting friends have a positive correlation with listening music (.435), talking on the
phone (.282) at 0.01 level of significance and computer games (.227) at 0.05 level of
significance. Listening to music have a positive correlation with talking on the phone
(.270) and computer game (.220) at 0.05 level of significance. Talking on the phone have
a positive correlation with computer games (.368) at 0.01 level of significance.
There is relationship between ambition and family environment and also there is
relationship between role model and family environment. The similar finding was found

99
in the study conducted by Ravi and Setia (2016). These findings show that there is good
family environment in the family. On the other hand there is a relationship between
perception of respondents to be the best in examinations and family environment of the
respondents
Majority of the respondents did not participate in debate and discussion. Majority
of the respondents did not have a study circle. Majority of the respondents did not love
music. Majority of the respondents did not participate in dance. Majority of the
respondents did not practice yoga as a part of co-curricular activities. Majority of the
respondents played football as part of the school co-curricular activities. Majority of the
respondents did not play basketball.
Conclusion
The present study attempted to understand the aspect of the family environment
and educational aspirations of the secondary and higher secondary school students, as
family environment plays a significant role in the academic life of the student and the
positive and negative influence can have a profound impact on the aspirations of the
students. At the secondary and higher secondary level students usually set the goal for
themselves so that they can attain through education by investing their time, labour and
rigorous study.
The findings of the present study indicate that the family environment is moderate
in the family with the dimension cohesion, expressiveness, independence, achievement
orientation, intellectual cultural orientation, active recreational orientation, and
organization. The present study clearly reveals that there is low parental education and is
seen that none of the parents reach graduation level. The students did not have a say in
the selection of their career and less independence is found among the students. The low
Socio-Economic status is one problem in the education of the students as the majority of
the students are not satisfied with the economy of the family and they could not get
enough resources for their education. The need for Career Guidance Programme is felt by
most of the students to enrich their educational aspirations. Further, most of the
respondents interested and considered the civil service examinations and public service
examinations are the best. Therefore, coaching classes could be conducted in the higher
secondary level for the sensitization of the government exams.

100
The present study enriches to the studies on the family environment and
educational aspirations among the secondary and higher secondary school students,
especially among the students in Churachapur, Manipur.
Suggestions
The present study aims to suggest measures based on the findings for the
betterment of the student and for policy making and intervention. The following
suggestions are presented as follows:
The need to raise the economy of the people as majority one-third of the
respondents is little satisfied with the economy of the family. By raising the
economy, the needs to the students will be met and get all the resources they
need in regards to education which will help them to raise their aspirations
and achievement.
The need to raise the education of the parents for better understanding of their
children’s career.
The need to educate parents about having high expectations from their
children a majority of the parents have moderate not high and also not low
expectation from their children and it is believed that the high expectation of
the parents will raise the aspiration level of the students.
The need to give achievement orientation to the HSLC students as they held
lower achievement orientation in comparison with the HSSLC students.
The need to give more independence to the students to pursue their own career
choice as more than half of the respondents take up a career of their parents’
choice which may lower the aspiration level of the students.
The need to improve teacher-student and parent relationship for more fruitful
learning and better career of the students.
The need to educate the students about the different professional courses.
The need for Career Guidance Programme as even a vast majority (93.3%)
felt the needs of organizing career guidance programme.
The need to improve infrastructure and e-learning facilities to raise the interest
and aspirations of the students.
The need for state government to provide a better educational facility.

101
There is a need to improve and enable the students to work hard more to
increase their study hours.
There is a need to create an awareness to use the leisure time activities in the
useful manner.
There is need to sensitize among the students about the link between ambition
and role model. Ambition and role model should be realistic and goal
oriented.
A healthy competitive spirit and skill orientated educational aspiration could
be promoted.
There is a need for school social worker to conduct training programme and
career guidance.
Social Work Implication
Social work is a new profession which is more than seven decades old in India. It
has its own philosophies and principles, knowledge and values, methods, skills and
techniques to be practiced or intervened to the individuals, groups and communities,
those who are encountered challenges in the society. Through this social work process,
the clients or the people to realize the problems encountered and work out the modalities
in such a way that the potentials and resources are utilized to remove the causes deals
with the symptoms and reduce the magnitude of the problem.
In the present study, social work methods like social case work and social group work
and community organization could used to educated students . The social worker can
play an important role in raising the educational aspirations of the students. As a trained
social worker in the present context can act as a counselor for the individual student
youth, family and the community at large.
Moreover, the ecological systems also disturbed at micro, mezzo and macro
levels. Microsystems related to the individual experiences, in the home environment,
living with his parents and siblings and the school environment living with teachers and
peers. Mezzo systems refer to the links amongst settings where the individual
participates. For example, the home school, workplaces are such settings and the quality
of the home environment may affect the individual's performance in the surroundings his
102
adjustment with peers. Macro systems denote to the general pattern of ideology and
organization of the different social and the sub-cultural institutions.
Group counseling can be given stressing the importance of aspirations at different
levels. Awareness among the parents, teachers and the wider community can be given
regarding the importance of the right choice of career. Career guidance programme must
be held at the school, community and other institution to provide adequate knowledge
and competition among the students. Further, a school social worker is also needed to
give counseling in terms of motivation and encouragement among the students in order to
improve their educational aspirations.
Recommendation for further research
There is a tremendous scope for further research to study extensively among the
Secondary and higher secondary school students of both government and private
institutions at large covering entire Manipur. Further a study could be conducted with
college students of whole northeast India. A separate Family environment scale could be
developed in the context of northeast India to find out the family environment and also a
separate educational aspirations scale could be developed to measure in the northeast
context since the family structure, dynamics and parenting patterns differ the rest of India
due to tribal characteristics and topography and socio cultural perspective. The present
study is useful to both government and private institutions, and Education department and
family welfare department.
Conclusion
School is an educational institution where the students spend most of their prime time
next to primary institution of family. Family plays pivotal role for upbringing of the
children wherein parents are the role models and guiding factor to achieve the
educational aspirations. The present study facilitated to understand the educational
aspirations of higher secondary school students and the family environment.
x
BIBILIOGRAPHY
Ahiya, A. (2016). A Study of Self-efficacy among Secondary School Students inrelation to educational aspiration and academic achievement.InternationalJournal of Education and Applied Sciences, 17 (3).
Ali, M,I. (2018). Study of educational aspiration and academic achievement of seniorsecondary school students in relation to gender and area. Zenith InternationalJournal of Multidisciplinary Research,8 (4).
Archer, L. &H.Yamashita. (2003). “Knowing their limits? identities, inequalities andinner city school leavers’ Post -16 aspirations.”Journal of Education Policy18(17),53-69.
Aufseeser,D.,Jekielek,S.,&Brown,B.(June 2006). The family environment andadolescent well-being: Exposure to positive and negative family influences.Child trends and the national adolescent health information center.Retrieved19th April 2018, from htpp:nahic.ucsf.edu/wp-content/uploads/2011/02/2006-Fam.Environmentbrief.pdf
Bashir,L. &Kaur,R.(2017).A study on interrelation of educational. An internationalEducation and Applied Social Science.8:269-275.Journal of Retrieved on 10th
April 2018 from ndpublisher.in/admin/issues/EQv8spli.pdfBiswas,N.B.(2006).Development of school education among the tribes of north-east
indiaInSymiemlieh et al.challenges of development in North-East India. NewDelhi: RegencyPublication.
Barber et al.,(2005).Parental support, psychological control and behavioral control:Assessing Relevance across time, culture, and method. Monograph of thesociety for Research in child development.70(4):1-47.
Bhatt, S. (2011).Dalits, Tribals and Human Rights.Adhaya publishers& publishers,New Delhi.
Bora, B,P. (2016). Educational and occupational aspiration in relation to schoolenvironment of the secondary school students of south Kamrup area ofAssam- a study.The International Journal of Indian Psychology, 4 (1).
Chakrabarti,M.(2005).Education in the 21stCentury.Delhi: KalpazPublications.Cieslik, M. & Simpson, D. (2013).Key concepts in Youth Studies.Sage Publications,
New Delhi.Chaube, S.P. (2002).Psychology of Adolescents in India.Concept publishing company,
New Delhi.Chapman,A., J. &Robinson . (2009) ‘Leisure activeness, place and identity’, in
A.Furlong (ed.), Handbook of Youth and Young Adulthood,Abingdon:Routledge
Cook,L.A., &Cook,E.F.(2008).A Sociological approach toeducation.SurjeetPublicationSingh,K.(Ed).(2014).Education for a globalsociety. Shipra Publications.

xi
Dash, B.N. (2005).Development of learner and teaching learning process. New Delhi:dominant publishers and distributors.
Dalal,A.K.(1990).Family Support and Coping with Chronic Diseases.The IndianJournal of Social Work, 1(2),167-176.
Devi, P. (2005). Teacher’s intervention in Social Change: Some issues in highereducation. In Gupta, R.K &Bist, H.K. (Eds.), Higher education challenges forthe future. New Delhi: AnamikaPublishers.
Desai,M.(1990).Family dynamics and development programmes: Curriculumplanning. The Indian Journal of Social Work, 4(1), 3-22.
Deshmukh,B.A.(2004).Tribal Education. New Delhi: Sonali Publications.Eijek, K.V &Graaf, P.M.(1995).The effects of family structure on the educational
attainment of siblings in Hungary-European Sociological Review.11(3):273-292.Retrieved on 12th April 2018 from http://www.jstor.org/stable/522756
Furlong, A., Cartmel, F., Biggart, A., Sweeting, H. and West, P. (2003).YouthTransitions: Patterns of Vulnerability and Process of Social Inclusion,Edinburgh: Scottish executive social research.
Ganguly, L. (2016). Tribal education and northeast india. International Journal ofScientific and Engineering Research, 7 (1).
Glass,D,Neulinger ,J.& Brim ,O.(1974).Birth order, Verbal intelligence, andeducational Aspirations.Childdevelopment.45(3): Retrieved on 10th April2018 from doi:102307/1127851
Geckova, A,M., Tavel, P, Dijik, J.P.,Abel, T. &Reijneveld.S. (2010). Factorsassociated witheducational aspirations among adolescents: Cues to counteractsocio-economic differences?.BMC Public Health. Retrieved fromhttps://doi.org/10.1186/1471-2458-10-154
Gupta, R.K, Bist, H.D. (Eds.). (2005). Higher education challenges for thefuture.AnamikaPublishers&Distributors,New Delhi.
Gupta, S. & Bashir, L. (2017). Educational aspiration of secondary school students:Influence ofschool environment and parental encouragement.InternationalJournal of Applied Business and Economic Research.15, Number 21 (Part 2).Retrieved from http: www.serialsjournals.com
Hartas.(2016).Young people’s educational aspirations:Psychological factors and theHome.Environment.Journal of Youth Studies.19(9), 1145-1163,DOI:10.1080/13676261.2016.1145634
Hayes,D.M.(2018).Predicting parental home and school involvement in high schoolAfrican American Adolescents.The High School Journal.99(4),154-166.Retrieved on 12nd April 2018 from http://www.jstor.org/stable/41236873
International Institute for Population Sciences, October 2006. Youth In India:Situation andNeeds.Retrievedfromhttps://www.popcouncil.org/uploads/pdfs/2010PGY_YouthInIndiaReport.pdf
Jacob, B. &Wilder, T. (2010).Educational expectations and attainment. Retrievedfromhttps://ssrn.com/abstract=1540987

xii
Jacob, M.J. (2010). Parental expectations and aspirations for the children’seducationalattainment: An examination of the college going mindset amongparents. (Doctoral Dissertation).Faculty of the Graduate School, Minnesota.Retrieved fromhttps://conservancy.umn.edu/bitstream/handle/11299/93924/1/Jacob_umn_0130E_10989.pdf
Kakkar, N. (2017). A study of academic achievement in relation to home environmentof secondary school students.3 (13).
Kandel, D.B., & Lesser, G.S. (1969).Parental and Peer Influence on Educational Plansof Adolescents. American Sociological Review 32(2), 213-223http://www.jstor.org/stable/2092178
Kashyap,L.D.(1993).Adolescent/Youth and family dynamics and developmentProgrammes.The Indian Journal of Social Work,4(1),93-107.
Kaur, J. (2013). Parent adolescent perception of family environment in defenceofficers’ families in India.International Journal of Advancements in Researchand Technology. 2(11) 39-55.
Kaur, P. (2012). Educational aspirations of adolescents in relation to their level ofIntelligence.International Multidisciplinary e-Journal, 1(7).
Kalawati.(1994).Educational Status of Rural Girls.New Delhi: Discovery publishinghouse.
Khattab, N. (2015).Students’ aspirations, expectations and school achievement: whatreally matters?.British Educational Research Journal.4 (5).
Khaute, G.K.(2013). Changing Status of Women through Education: A study withspecial reference to Mizo women.In Larinchhani, B &Sinha, H (Eds.).Womenin Mizo Society. New Delhi: Mittal Publications.
Kintrea, K., Clair, R.S., & Houston, M. (2011).The influence of parents, places andpoverty oneducation attitudes and aspirations. Retrieved fromhttp://www.researchgate.net/publication/277998...
Konwar, N. Chakraborty, S. (2013). Higher Education Scenario of North EasternIndia.IndianJournalofResearch.2(3).Retrievedfromhttps://www.researchgate.net/profile/Subhadeep_Chakraborty4/publication/274925552_Higher_Education_Scenario_of_the_NorthEastern_India/links/5805f90608ae0075d82b58cd.pdf
Kumari, B. (2015). Level of aspiration on academic performance of schoolsstudents.The International Journal of Indian Psychology.3(1). Retrieved fromhttp://oaji.net/articles/2015/1170-1443375976.pdf
Kumar,B.(2005).Level of aspiration on academic performance of social science. TheInternational Journal of Indian Psychology,3(1),75-79.
Kumar, R. &Lal, R. (2014). Study of academic achievement in relation to familyenvironmentamong adolescents. The International Journal of IndianPsychology.2 (1). Retrievedfromhttp://citeseerx.ist.psu.edu/viewdoc/download?doi=10.1.1.685.5455&rep=rep1&type=pdf

xiii
Kumar,N.,&Phoghat, V.(2017).Educational aspirations of secondary students inrelation to their gender.BhartiyamIternational Journal of Educational andResearch,6(4):85-94.Retrieved from gangainstituteofedu educationalaspiration of special needs.Students in Relation to some Factors.Globaljournals of Human Social Sciene,16(5).
Kurdek, A. & Sinclair, R.J. (1988). Relation of eight graders’ family structure,gender andfamily environment with academic performance and schoolbehaviour.Journal ofEducationalPsychology.80(1).9094.Retrievedfromhttp://www.viriya.net/jabref/relation_of_eighth_graders_family_structure_gender_and_family_environment_with_academic_performance_and_school_behavior.pdf
Lenka, S.K & Kant, R. (2016). A study of educational aspirations of special needs inrelation tosome factors. Global Journal of Human Social Science.16 (5).
Lomax,R.G.(1985).A structural model of public and private schools. The Journal ofExperimental Education,53(4),216-226.
MacBrayne,P.S.(1987).Educational and occupational aspirations of rural youth : Areview ofLiterature. Research in Rural Education, 4(3),135-141.
Mahale, M.N. (1987). The Adolescent: Their Family Situations andEducation,Delhi:MittalPublication.
Makkar,N.(2010).A study of Educational Aspirations and School Adjustment ofstudents in relation to Organizational climate.(Doctoral dissertation PunjabUniversity,Patiala)Retrieved on 12th April 2018 fromhttp://hdl.handle.net/10603/4471
Mc Donald et al. (2012).Aspirations and destinations of young people(UnpublishedDissertation School of Education and Arts University of Ballart)
Malsawmtluanga, H.T. &Fanai, L. (2018).A study on relationship between homeenvironment and academic achievement among secondary school students ofChamphai town, Mizoram.International Journal of Academic Research andDevelopment.3(2)Retrieved fromwww.academicsjournal.com/download/1588/3-1-487-907.pdf
Marjoribanks,K.(1986).Australian families and Adolescents’ Aspirations:A follow-upAnalysis.Journal of comparative family studies,17(3):333-348.Retrieved fromhttp://www.jstor.org/stable/41601492
Mohanraj, R. &Latha. (2005). Perceived family environment in relation to adjustmentandacademic achievement. Journal of the Indian Academy of AppliedPsychology, 31 (12),18-23. Retrieved fromhttp://medind.nic.in/jak/t05/i1/jakt05i1p18.pdf Ministry of Youth Affairs&Sports.(2014).National Youth Policy 2014.Retrieved fromwww.rgniyd.gov.in>scheme>nyp2014
Onabamiro, A.A., Omoruyi, A.A., Soyingbe, A.A.,&Rosiji, C.O. (2013). Psychosocial factors predicting secondary school students academic self- efficacy inlagos state, Nigeria. International Journal of Humanities & Social ScienceInvention, 2 (4).

xiv
Ozabaci,N.(2006). Emotional Intelligence and Family Environment.Available on http:journals.manas.edu.kg/…/vol08_Issue/6_2006/537-1425-1-PB.pdf-PDFfile
Pandey, V.C. (2005). Child Education. New Delhi: Isha Books.Paliwal, A. &Rathi, N. (2016).Academic performance as a function of level of
aspiration andgender- A comparative study amongst different streams ofeducation.The International of Indian Psychology.3(2). Retrieved fromoaji.net/articles/2016/1170-1461358505.pdf
Pappattu, J. &Vanitha, J. (2017).A study on family environment and its effect onacademicachievement in science among secondary schoolstudents.International Journal of Research.5 (6). Retrieved fromgranthaalayah.com/Articles/Vol5lss6/51_IJRG17_A06_418.pdf
Prakash,V.(1993).School Education in Rural India.MittalPublications.New Delhi.Paun,A.M,.(2004).Family environment types and their association with family
support satisfaction among African American women with breast cancer.Retrieved from etd.fcla.edu>UFE0005382>mirsupaun_a
Prasad, J. (2004). Education and society concepts, perspectives and suppositions.NewDelhi: Kanishka Publications
Rani, A. &Setia,V. (2016). Educational aspiration of +2 students in relation to familyEnvironment.Indian Journal of Applied Research, 6 (12).
Rani, M. &Latha. (2005). Perceived family environment in relation to adjustment andacademicachievement. Journal of the Indian Academy of AppliedPsychology.31 (1-2), 18-25. Retrieved frommedind.nic.in/jak/t05/i1/jakt05i1p18.pdf
Raj, G.R. & Raj, A. (1998).Sociology of formal Education Class of SectarianRelations, The Associated Publishers, Delhi.
Rather, S. A., & Sharma, K. (2017). Grages and grading system in relation to levels ofaspiration.University Grants Commission, New Delhi Recognized Journal, 5(6).
Ravi, A.&Setia,V.(2016). Educational aspiration of +2student in relation to familyenvironment. Indian journal of Applied Research,6(12):79-96.
Razia,R.&Ahmad,N.(2017).Emotional intelligence and socio-economic status as thedeterminants of Academic among adolescents.International Journal ofEducation and Psychological Research,6(2):137-142.
Richard,A.&Sherwood,J.R.(1989).A conceptual framework for the study ofAspirations.Research in rural development,6(2):61-66.
Rodman, H &Voydanoff, P. (1978).Social class and parrents’ range of aspirations fortheirchildren.Social problems.25 (3). 333-344. Retrieved fromhttps://www.jstor.org/stable/800069.
Sangeeta, &Pathak, N.(2014). A study of Level of Aspirations and AchievementMotivation ofCollegeStudents,2(4).Retrievedfromhttp://www.socialresearchfoundation.com/upoadresearchpapers/3/30/150413104351 english.pdf
Saika, I. (2015). A study on the level of educational aspiration of college students inrelation To Gender And Location, 4 (6).

xv
Singh, A. & Singh J.P. (2014).The influence of socio-economic status of parents andhome environment on the study habits and academic achievement ofstudents.International Research Journals.5 (9). 348-352. DOI:http:/dx.doi.org/10.14303/er.2014.202
Singh , D. (2016). A comparative study of backward caste boys and non-backwardcaste boys students in relation to their intelligence and educational aspiration.International Journal of Multidisciplinary Research and Modern Education, 2(1).
Sharma,K.R.(1990).Educational Lifestyle of Tribal Students. The Indian Journal ofSocial Work,1(3),457-472.
Sharma, S.R. (2006). Learning theory and educational process. New Delhi:Educational Publishers.
Soy, S. (2017).Relationship between socio-economic status and educational aspirationamong higher secondary school students.South-Asian Journal ofMultidisciplinary Studies, 4 (5).
Teachman, J.D., &Paasch,K.(1998)The family and educationalaspirations.JournalofMarriage and Family. 60(3), 74-714. Retrieved fromhttp://www.jstor.org/stable/353539
Trusty, J. (1998).Family influences on educational expectations of late adolescent.The of educational research.91(5):260-270.Journal Retrieved on 12th April2018 from http://www.jstor.org/stable/27542165
Unger,D.G et al.,(2000).The role of family support in inter-parental conflict andadolescent academic achievement.Journal of Child and familyStudies,9(2):191-202Retrieved from http://www.jstor.org/stable/20151604
Yadav, R &Pandey, S. (2016).To study the relationship between home environmentand Educational Aspirations of private Secondary School students of SehoreCity. Journal of Research and method in Education,6(5):45-45.Retrieved on12th April 2018 onwww.iosrjournals.org
Yadav, S.K. (2011). Self-concept, level of aspiration, anxiety and academicachievement of government and non-government school sdtudents-Acomparative study.Journal of educational and psychological research, 1 (1).
Yeboah, A.K, Linda, T, &Mununkum, R.A. (2017).Parental aspirations andinvestments in theeducational achievements of African immigrants.Retrievedfrom DOI: 105.1515/mlt-2016-0009.
Yunus, S, A., & Baba, S.L. (2014).Effect of family environment on student academicperformance and adjustment problems in school.Journal of Education andPractice.5 (19).

xvi
Appendix
FAMILY ENVIRONMENT AND EDUCATIONAL ASPIRATIONS OF SECONDARYAND HIGHER SECONDARY SCHOOL STUDENTS IN CHURACHANDPUR,
MANIPUR
Dear Respondent,I am Canny Lalsanhim, a research scholar pursuing M.Phil. in the Department of
Social Work, Mizoram University. I am conducting a research on the above topic for therequirement of the degree and I request you to kindly share your honest opinion on thefollowing given questionnaire. I hereby declare that the information will be kept confidentialand use for academic purpose only.
QUESTIONNAIREResearch Scholar, Research SupervisorMs.CannyLalsanhim, Prof.C.Devendiran,Deptt.of Social Work, Deptt. of Social Work,Mizoram University. Mizoram University.
I (Profile of the Respondent)
Sl.No.1 Name (Optional) :2 Age : ……………years3 Gender : 1.Male 2.Female4 Tribe : 1.Mizo 2.Kuki 3.Hmar
4.Meitei 5.Zomi 6.Others5 Sub-tribe :6 Religion : 1.Christian 2.Hindu 3.Muslim
4.Sikh 5.Others (Specify)7 If Christian, which Denomination :8 Standard/Class :9 Type of School
1.HSLC2.HSSLC
:1.Specify……………………………..2.Specify……………………………..
10 Whether Hosteller/ Day Scholar :11 Birth order : 1.Eldest child 2.Middle child
3.Youngest child 4.Only childII (Family Details)
Sl.No.1 Father’s Education :2 Father’s Occupation :3 Father’s Monthly Income : Rs………………………..per month4 Mother’s Education :5 Mother’s Occupation :6 Mother’s Monthly income : Rs………………………..per month

xvii
7 Size of the family (no. of familymembers)
:
8 Type of family : 1.Nuclear 2.Joint9 Form of family : 1.Stable 2.Broken
3.Reconstituted 4.Single parent10 Number of siblings11 Ownership of House : 1.Owned 2.Rented 3.Quarter12 Type of house : 1.Pucca 2.Semi-pucca3.Kutcha13 Socio-economic status : 1.APL 2.BPL 3.AAY 4.No Category14 Social Status : 1.ST 2.SC 3.OBC
III (Family environment)
Tick ( ) which is true or false in your opinion
Sl.No. Statement True False1 Family members really help and support one another2 Family members often keep their feelings to themselves3 We don’t do things on our own very often in our family4 We feel it is important to be best at whatever you do5 We often talk about political and social problems6 We spent most weekends and evenings at home7 Family members are rarely ordered around8 We often seem to be killing time at home9 We say anything we want to around at home10 In our family, we are strongly encouraged to be independent11 Getting ahead in life is very important in our life12 We rarely go to lectures , play or concerts13 Friends often come over for dinner or to visit14 There are very few rules to follow in our family15 We put a lot of energy into what we do at home16 It is hard to ‘blow off steam’ at home without upsetting somebody17 We think for ourselves in our family18 How much money a person makes is not very important to us19 Learning about new and different things is very important in our family20 Nobody in our family is active in sports and other games21 There is one family member who makes most of the decisions22 There is a feeling of togetherness in our family23 We tell each other about our personal problems24 We come and go as we want to in our family25 We believe in competition and may the best man win26 We are not that interested in cultural activities27 We often go to movies, sports events, camping, etc.28 There are set ways of doing things at home29 We rarely volunteer when something has to be done at home30 If we feel like doing something on the spur of the moment we often
pick up and go31 There is very little privacy in our family

xviii
32 We always strive to do things just a little better the next time33 We rarely have intellectual discussions34 Everybody in our family has a hobby or two35 There is a strong emphasis on following rules in our family36 Family members really back each other up37 Someone usually gets upset if you complain in our family38 Family members always rely on themselves when a problem comes up39 Family members rarely worry about job promotions , school grades,
etc.40 Someone in our family plays a musical instrument41 Family members are not very involved in recreational activities outside
work or school42 Everyone has an equal say in family decisions43 There is very little group spirit in our family44 Money and paying bills is openly talked about in our family45 Family members strongly encourage each other to stand up for their
rights46 In our family , we don’t try that hard to succeed47 Family members often go to the library48 Family members sometimes attend courses or take lessons for some
hobby or interest (outside of school)49 We can do whatever we want to in our family50 We really get along well with each other51 We are usually careful about what we say to each other52 It is hard to be by yourself without hurting someone’s feelings in our
household53 ’Work before play’ is the rule in our family54 Watching TV is more important than reading in our family55 Family members go out a lot56 Rules are pretty inflexible in our household57 There is plenty of time and attention for everyone in our family58 There are a lot of spontaneous discussions in our family59 We are not really encouraged to speak up for ourselves in our family60 Family members are often compared with others as to how well they
are doing at work or school61 Family members really like music, art and literature62 Our main form of entertainment is watching TV or listening to the
radio63 You can’t get away with much in our family
IV (Educational Aspirations)
1 Do you have ambition in your life? 1.Yes 2.No2 If yes, means what is your ambition specify3 Do you have any role model in your life? 1.Yes 2.No4 If yes, means, who is your role model

xix
Given below is a list of examinations. People passing these examinations are appreciated inthe society, though in different degrees. Some of these examinations are more valued whilesome are valued comparatively less. Keeping in mind the various factors that may influenceyour performance in the examination such as your capacity for working hard, social,economic and cultural conditions, your competence and memory etc., please give tick markto the appropriate option.
List 1: The examination that you will like to pass.
1.HSLC 2.HSSLC
3.Bachelor Degree Exam 4.Master Degree Exam
List-2:The examination that you consider to be the best.
1.Union Public Service Commission (UPSC) 2.Manipur Public Service Commission
3.Staff Selection Commission (SSC) 4.Teacher’s Eligibility Test (T.E.T)
List-3:The highest examination that you think that you will be able to pass after youcomplete the age of twenty.
1.Ph.D (Doctoral degree) 2.M.Phil.(Master of Philosophy) 3.Master degree
4.Bachelor degree 5.Higher Secondary 6.Upto High School
List-4:The examination that you think to be the best and which you will like to passafter you complete the age of twenty.
1.Civil Service Examination (CSE) 2.Indian Economic Service Examination (IES)
3.Indian Statistical Service Examination 4. Indian Military Academy Exam
List-5:The examination that you think to be the best and which everyone should atpassing.
1.Primary 2.Elementary 3.HSLC 4.HSSLC 5.Bachelor 6.Master
List-6:The highest examination that you think you will certainly be able to pass.
1.SBI PO(Probationary Officer) 2.IBPS (Institute Bank Personal Selection)
3. Civil Service Examination (CSE) 4. Manipur Public Service Commission
5. .Staff Selection Commission (SSC) 6.Combine Graduate Level (CGL)
List-7:The examination that you think to be the best and which you will like to passafter you complete the age of twenty.
1.IAS (Indian Administrative Service) 2.IFS (Indian Foreign Service)
3.IPS(Indian Police Service) 4.IRS (Indian Revenue Service)
List-8:The examination that you think to be the best and which you will like to passafter you complete the age of twenty.

xx
1.L.L.B.(Bachelor of Legislative Law) 2.B.E.(Bachelor of Engineering)
3.B.Ed.(Bachelor of Education) 4.B.Lib(Bachelor of Library Science)
V (Educational support)
1.When you have problem with your studies, whom do you usually seek help from?
1.Parents 2.Siblings 3.Friends 4.Teacher 5.Tutor
2.Whom do you discuss with regarding your career?
1.Parents 2.Siblings 3.Friends 4.Teacher 5.Tutor 6.Counselor
3. Is your parents supportive towards your studies?
1.To large degree 2.To some degree 3.Not at all
4.Did your parents encourage you to study hard?
1.Yes 2.No 3.Don’t know
5. What is your parental expectations towards your studies?
1.High 2.Medium 3.Low
6. Who took care of you in times of sickness
1.Family 2.Friends 3.Relatives 4.Neighbours
7. Do you think your parents exercised a great control over you in regards to your career?
1.Strongly Agree 2.Agree 3.Disagree 4.Strongly disagree
8.Who made the decision in the selection of your school?
1.Myself 2.Parents 3.Friends 4.Teachers
9.The following statements are descriptions of how parents raise their children. Mark theresponses which best describes your parents as they were most influential in your educationaldecisions.
S.No. Statement Not true atall
Somewhattrue
Verytrue
Hold
1. My parents encouraged meto pursue higher education.
2. My parents encouraged meto do well in all courses.
3. My parents pushed me toobtain a high degree.
4. My parents pushed me tochoose career of theirchoice.
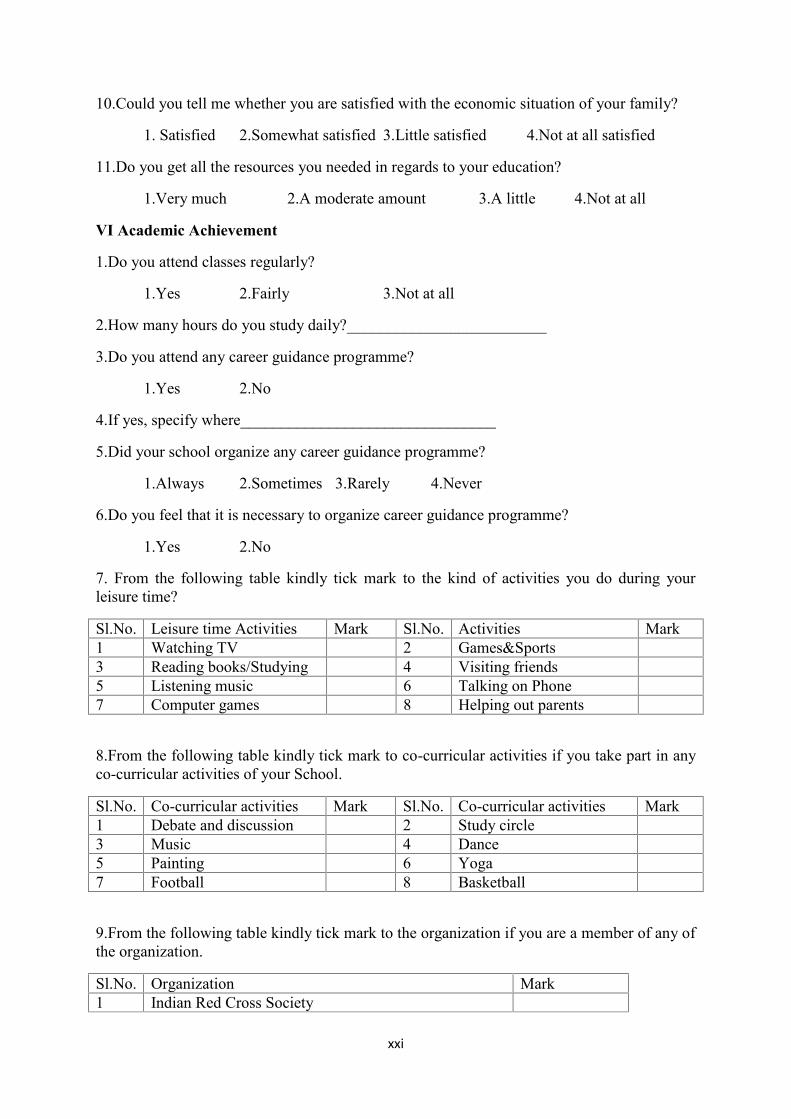
xxi
10.Could you tell me whether you are satisfied with the economic situation of your family?
1. Satisfied 2.Somewhat satisfied 3.Little satisfied 4.Not at all satisfied
11.Do you get all the resources you needed in regards to your education?
1.Very much 2.A moderate amount 3.A little 4.Not at all
VI Academic Achievement
1.Do you attend classes regularly?
1.Yes 2.Fairly 3.Not at all
2.How many hours do you study daily?_________________________
3.Do you attend any career guidance programme?
1.Yes 2.No
4.If yes, specify where________________________________
5.Did your school organize any career guidance programme?
1.Always 2.Sometimes 3.Rarely 4.Never
6.Do you feel that it is necessary to organize career guidance programme?
1.Yes 2.No
7. From the following table kindly tick mark to the kind of activities you do during yourleisure time?
Sl.No. Leisure time Activities Mark Sl.No. Activities Mark1 Watching TV 2 Games&Sports3 Reading books/Studying 4 Visiting friends5 Listening music 6 Talking on Phone7 Computer games 8 Helping out parents
8.From the following table kindly tick mark to co-curricular activities if you take part in anyco-curricular activities of your School.
Sl.No. Co-curricular activities Mark Sl.No. Co-curricular activities Mark1 Debate and discussion 2 Study circle3 Music 4 Dance5 Painting 6 Yoga7 Football 8 Basketball
9.From the following table kindly tick mark to the organization if you are a member of any ofthe organization.
Sl.No. Organization Mark1 Indian Red Cross Society

xxii
2 National Service Scheme (NSS)3 National Cadet Corps (NCC)
10.Do you have any intension to pursue higher education?
1.Yes 2.No
11.If yes, indicate the importance of each of the following statements regarding the reasonyou have
S.No Statement Yes No1. Higher education is a way for me to obtain advantaged skills in
order to support my career in the future.2. Higher education is a way to obtain a higher position in the work
environment.3. Higher education is a long way to obtain a prestigious profession
in society.4. Higher education is a way for me to get advantaged skills that
can help me to earn more money.5. Higher education is a way for me to raise my family’s socio
economic status.6. Higher education is a way for me to obtain a job after graduation.7. My education should help me develop intellectual capacity.8. To make my parents proud of me
12.After completing your studies, what is your occupational preference
1.Government service 2..Private Sector
3.Non-Governmental Organization (NGO) 3.Business
4.Agriculture and related works
13.How important do you think it is to have a good education to get ahead in life?
1.Essential 2.Very important3.Fairly important 4.Not very important5.Not important at all
14.Do you feel education is an important means for achieving economic security in life?
1.Very much 2.A moderate amount 3.A little 4.Not at all

xxii
PARTICULARS OF THE CANDIDATE
NAME OF THE CANDIDATE : Canny Lalsanhim
DEGREE :M.Phil
DEPARTMENT : Social Work
TITLE OF DESERTATION :Family Environment And Educational
Aspirations of Secondary And Higher
Secondary School Students in
Churachandpur, Manipur
DATE OF PAYMENT OF ADMISSION : 30th August, 2017
1. BOARD OF PROFESSIONAL STUDIES : 25th April, 2018
2. SCHOOL BOARD :3rd May, 2018
3. REGISTRATION NO. & DATE : MZU/M.Phil./485 of 03.05.2018
4. EXTENSION IF ANY :NA
(Prof. C. DEVENDIRAN)
Head
Department of Social Work
Mizoram University
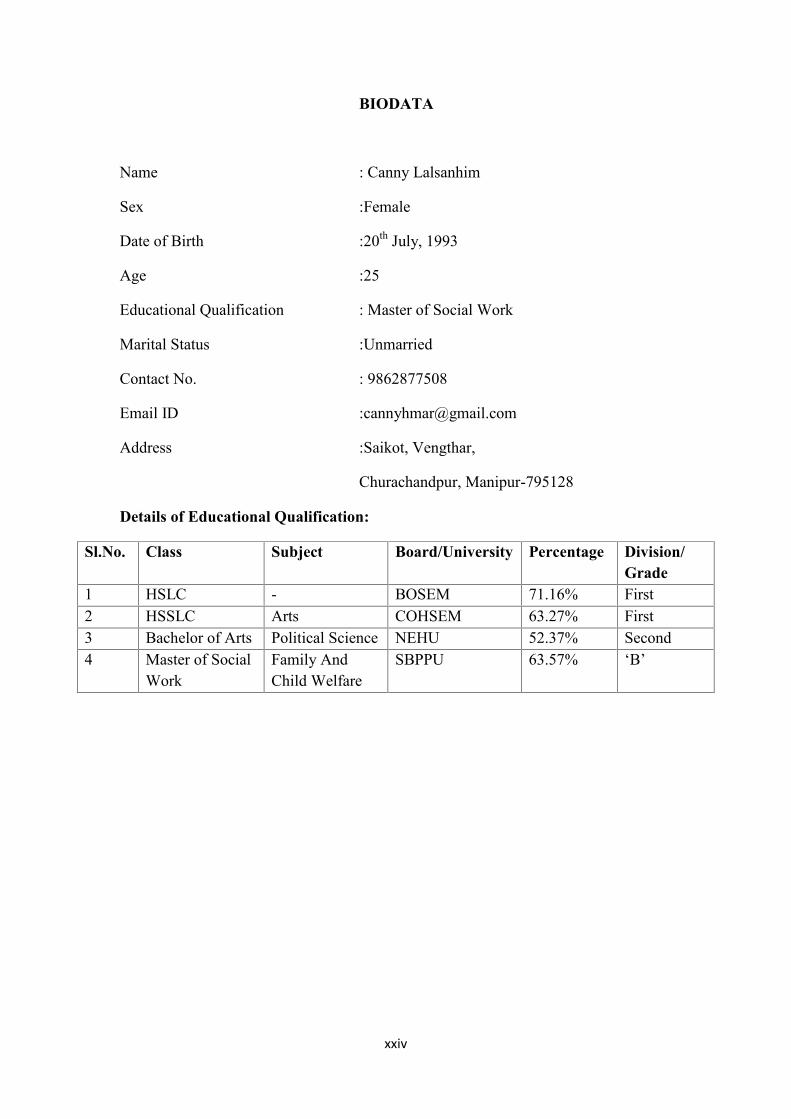
xxiv
BIODATA
Name : Canny Lalsanhim
Sex :Female
Date of Birth :20th July, 1993
Age :25
Educational Qualification : Master of Social Work
Marital Status :Unmarried
Contact No. : 9862877508
Email ID :[email protected]
Address :Saikot, Vengthar,
Churachandpur, Manipur-795128
Details of Educational Qualification:
Sl.No. Class Subject Board/University Percentage Division/Grade
1 HSLC - BOSEM 71.16% First2 HSSLC Arts COHSEM 63.27% First3 Bachelor of Arts Political Science NEHU 52.37% Second4 Master of Social
WorkFamily AndChild Welfare
SBPPU 63.57% ‘B’