Factors Influencing Schoolchildren's Responses to a Questionnaire in Wildlife Conservation Education
17
This article was downloaded by: [178.143.223.234] On: 29 January 2015, At: 08:35 Publisher: Routledge Informa Ltd Registered in England and Wales Registered Number: 1072954 Registered office: Mortimer House, 37-41 Mortimer Street, London W1T 3JH, UK Click for updates International Journal of Science Education Publication details, including instructions for authors and subscription information: http://www.tandfonline.com/loi/tsed20 Factors Influencing Schoolchildren's Responses to a Questionnaire in Wildlife Conservation Education Jean-Marie Ballouard ab , Stephen J. Mullin c , Rastko Ajtic d , José Carlos Brito e , El Hassan ElMouden f , Mehmet Erdogan g , Monica Feriche h , Juan M. Pleguezuelos h , Pavol Prokop ij , Aida Sánchez k , Xavier Santos e , Tahar Slimani f , Bogoljub Sterijovski l , Ljiljana Tomovic mn , Muhammet Uşak o , Marco Zuffi p & Xavier Bonnet a a Centre d'Etude Biologique de Chizé, UMR-7372, CNRS ULR, Villiers en Bois, France b SOPTOM-Centre de Recherche et de Conservation des Chéloniens, Gonfaron, France c Department of Biological Sciences, Eastern Illinois University, Charleston, IL, USA d Institute for Nature Conservation of Serbia, Belgrade, Serbia e CIBIO, Centro de Investigação em Biodiversidade e Recursos Genéticos da Universidade do Porto, Instituto de Ciências Agrárias de Vairão, Vairão, Portugal f Département de Biologie, Faculté des Sciences Semlalia, Marrakech, Morocco g Faculty of Education, Akdeniz University, Antalya, Turkey h Departamento de Biología Animal, Facultad de Ciencias, Universidad de Granada, Granada, Spain i Department of Biology, Faculty of Education, University of Trnava, Trnava, Slovakia j Institute of Zoology, Slovak Academy of Sciences, Bratislava, Slovakia k Departament de Biologia Animal, Universitat de Barcelona, Barcelona, Spain l Macedonian Ecological Society, Faculty of Natural Sciences, Skopje, Macedonia m Faculty of Biology, University of Belgrade, Belgrade, Serbia n Institute for Biological Research, “Sinisa Stankovic”, University of Belgrade, Belgrade, Serbia
-
Upload
independent -
Category
Documents
-
view
3 -
download
0
Transcript of Factors Influencing Schoolchildren's Responses to a Questionnaire in Wildlife Conservation Education

This article was downloaded by: [178.143.223.234]On: 29 January 2015, At: 08:35Publisher: RoutledgeInforma Ltd Registered in England and Wales Registered Number: 1072954 Registeredoffice: Mortimer House, 37-41 Mortimer Street, London W1T 3JH, UK
Click for updates
International Journal of ScienceEducationPublication details, including instructions for authors andsubscription information:http://www.tandfonline.com/loi/tsed20
Factors Influencing Schoolchildren'sResponses to a Questionnaire inWildlife Conservation EducationJean-Marie Ballouardab, Stephen J. Mullinc, Rastko Ajticd, JoséCarlos Britoe, El Hassan ElMoudenf, Mehmet Erdogang, MonicaFericheh, Juan M. Pleguezuelosh, Pavol Prokopij, Aida Sánchezk,Xavier Santose, Tahar Slimanif, Bogoljub Sterijovskil, LjiljanaTomovicmn, Muhammet Uşako, Marco Zuffip & Xavier Bonneta
a Centre d'Etude Biologique de Chizé, UMR-7372, CNRS ULR,Villiers en Bois, Franceb SOPTOM-Centre de Recherche et de Conservation desChéloniens, Gonfaron, Francec Department of Biological Sciences, Eastern Illinois University,Charleston, IL, USAd Institute for Nature Conservation of Serbia, Belgrade, Serbiae CIBIO, Centro de Investigação em Biodiversidade e RecursosGenéticos da Universidade do Porto, Instituto de Ciências Agráriasde Vairão, Vairão, Portugalf Département de Biologie, Faculté des Sciences Semlalia,Marrakech, Moroccog Faculty of Education, Akdeniz University, Antalya, Turkeyh Departamento de Biología Animal, Facultad de Ciencias,Universidad de Granada, Granada, Spaini Department of Biology, Faculty of Education, University ofTrnava, Trnava, Slovakiaj Institute of Zoology, Slovak Academy of Sciences, Bratislava,Slovakiak Departament de Biologia Animal, Universitat de Barcelona,Barcelona, Spainl Macedonian Ecological Society, Faculty of Natural Sciences,Skopje, Macedoniam Faculty of Biology, University of Belgrade, Belgrade, Serbian Institute for Biological Research, “Sinisa Stankovic”, Universityof Belgrade, Belgrade, Serbia

o Department of Elementary Education, Zirve University,Gaziantep, Turkeyp Museum Natural History and Territory, University of Pisa, Calci,ItalyPublished online: 27 Jan 2015.
To cite this article: Jean-Marie Ballouard, Stephen J. Mullin, Rastko Ajtic, José Carlos Brito,El Hassan ElMouden, Mehmet Erdogan, Monica Feriche, Juan M. Pleguezuelos, Pavol Prokop,Aida Sánchez, Xavier Santos, Tahar Slimani, Bogoljub Sterijovski, Ljiljana Tomovic, MuhammetUşak, Marco Zuffi & Xavier Bonnet (2015): Factors Influencing Schoolchildren's Responses to aQuestionnaire in Wildlife Conservation Education, International Journal of Science Education, DOI:10.1080/09500693.2014.993000
To link to this article: http://dx.doi.org/10.1080/09500693.2014.993000
PLEASE SCROLL DOWN FOR ARTICLE
Taylor & Francis makes every effort to ensure the accuracy of all the information (the“Content”) contained in the publications on our platform. However, Taylor & Francis,our agents, and our licensors make no representations or warranties whatsoever as tothe accuracy, completeness, or suitability for any purpose of the Content. Any opinionsand views expressed in this publication are the opinions and views of the authors,and are not the views of or endorsed by Taylor & Francis. The accuracy of the Contentshould not be relied upon and should be independently verified with primary sourcesof information. Taylor and Francis shall not be liable for any losses, actions, claims,proceedings, demands, costs, expenses, damages, and other liabilities whatsoever orhowsoever caused arising directly or indirectly in connection with, in relation to or arisingout of the use of the Content.
This article may be used for research, teaching, and private study purposes. Anysubstantial or systematic reproduction, redistribution, reselling, loan, sub-licensing,systematic supply, or distribution in any form to anyone is expressly forbidden. Terms &Conditions of access and use can be found at http://www.tandfonline.com/page/terms-and-conditions
Dow
nloa
ded
by [
178.
143.
223.
234]
at 0
8:35
29
Janu
ary
2015
Factors Influencing Schoolchildren’s
Responses to a Questionnaire in
Wildlife Conservation Education
Jean-Marie Ballouarda,b∗, Stephen J. Mullinc, Rastko Ajticd,Jose Carlos Britoe, El Hassan ElMoudenf, Mehmet Erdogang,Monica Fericheh, Juan M. Pleguezuelosh, Pavol Prokopi,j,Aida Sanchezk, Xavier Santose, Tahar Slimanif,Bogoljub Sterijovskil, Ljiljana Tomovicm,n,Muhammet Usako, Marco Zuffip
and Xavier Bonneta
aCentre d’Etude Biologique de Chize, UMR-7372, CNRS ULR, Villiers en Bois, France;bSOPTOM-Centre de Recherche et de Conservation des Cheloniens, Gonfaron, France;cDepartment of Biological Sciences, Eastern Illinois University, Charleston, IL, USA;dInstitute for Nature Conservation of Serbia, Belgrade, Serbia; eCIBIO, Centro de
Investigacao em Biodiversidade e Recursos Geneticos da Universidade do Porto, Instituto
de Ciencias Agrarias de Vairao, Vairao, Portugal; fDepartement de Biologie, Faculte des
Sciences Semlalia, Marrakech, Morocco; gFaculty of Education, Akdeniz University,
Antalya, Turkey; hDepartamento de Biologıa Animal, Facultad de Ciencias, Universidad
de Granada, Granada, Spain; iDepartment of Biology, Faculty of Education, University
of Trnava, Trnava, Slovakia; jInstitute of Zoology, Slovak Academy of Sciences,
Bratislava, Slovakia; kDepartament de Biologia Animal, Universitat de Barcelona,
Barcelona, Spain; lMacedonian Ecological Society, Faculty of Natural Sciences, Skopje,
Macedonia; mFaculty of Biology, University of Belgrade, Belgrade, Serbia; nInstitute for
Biological Research, “Sinisa Stankovic”, University of Belgrade, Belgrade, Serbia;oDepartment of Elementary Education, Zirve University, Gaziantep, Turkey; pMuseum
Natural History and Territory, University of Pisa, Calci, Italy
Questionnaires are important tools for assessing attitudes regarding conservation issues. However,
they are not easily comparable and their reliability has been insufficiently assessed. We examined
factors influencing responses to open- and closed-ended questions about animal conservation to
more than 600 schoolchildren (9 years old on average). We analysed the level of understanding,
International Journal of Science Education, 2015
http://dx.doi.org/10.1080/09500693.2014.993000
∗Corresponding author. SOPTOM-Centre de Recherche et de Conservation des Cheloniens,
83590 Gonfaron, France. Email: [email protected]
# 2015 Taylor & Francis
Dow
nloa
ded
by [
178.
143.
223.
234]
at 0
8:35
29
Janu
ary
2015

controllable (e.g. sample size) and less controllable factors (e.g. affectivity). Most children
responded appropriately to the questions, but subtle changes in the phrasing influenced the
answers. Affectivity towards endearing species and spontaneity also influenced the responses
whereas small sample sizes (�50 children) provided relatively stable patterns. Overall, we suggest
that standardization of questionnaires administered over large spatial and time scales is needed to
accurately assess children’s attitudes towards conservation issues.
Keywords: Affectivity; Environmental education; Iconic species; Sample size; Survey
methodology
Introduction
Environmental education is essential to improve the attitude of citizens towards con-
servation issues (Caro, Pelkey, & Grigrione, 1994; Van Weelie & Walls, 2002).
However, despite abundant media campaigns, public concerns about the biodiversity
crisis tend to lose momentum (Novacek, 2008). Furthermore, public knowledge con-
cerning biodiversity questions, or even about the term ‘biodiversity’ itself, is particu-
larly low (Pilgrim, Cullen, Smith, & Pretty, 2008; Robelia & Murphy, 2012). Thus,
specific education effort about biodiversity is needed to promote positive attitudes
and practical conservation efforts (Lindemann-Matthies, 2006).
The efficiency of educational programmes must be evaluated to select the most
appropriate approaches. Zoological exhibitions, media campaigns or animated films
with strong conservationist content are assumed to stimulate positive attitudes and
increase public’s commitment to conservation efforts. Yet, different studies revealed
that counter intuitively, portraying threatened species in popular media, animated
films or zoos can negatively affect public’s perception and attitude regarding biodiver-
sity (Schroepfer, Rosati, Chartrand, & Hare, 2011; Yong, Fam, & Lum, 2011).
Most assessments in environmental education are conducted using questionnaire
surveys. There is a wide range of possibilities to perform and to analyse questionnaires
and many factors (e.g. cultural and socio-economic) can influence the outcomes
(Fowler, 1995; Groves et al., 2009; White, Jennings, Renwick, & Barker, 2005).
Various types of questionnaires have been used: postal surveys, in person interviews,
telephone surveys and, to a lesser extent, individual questionnaires administered
during school time (Lindemann-Matthies, Junge, & Matthies, 2010), and there is a
proliferation of polls on the Internet (e.g. using searching keywords such as
‘opinion’, ‘poll’ and ‘biodiversity’). Thus, a plethora of surveys based on a wide
variety of methods is available.
This lack of standardization precludes comparative analyses; especially across
countries, socio-economic levels, age classes and over time (Groves et al., 2009;
Walsh-Daneshmandi & MacLachlan, 2006). Therefore, standard evaluations are
required (Robelia & Murphy, 2012). In this context, written questionnaires offer
several advantages. They provide rigorous qualitative and quantitative information
by employing standardized sets of questions whereas possible impact of the observer
on the respondents is minimized (Newing, Eagle, Puri, & Watson, 2011).
2 J.-M. Ballouard et al.
Dow
nloa
ded
by [
178.
143.
223.
234]
at 0
8:35
29
Janu
ary
2015

Furthermore, written questionnaires are well adapted to survey schoolchildren;
indeed, a teacher can manage tens of paper-questionnaires simultaneously, but
cannot interview more than one child at a time.
Nonetheless, the use of written questionnaires is subjected to methodological com-
plications (Groves et al., 2009; Tourangeau, Rips, & Rasinski, 2000). We examined 50
environmental education studies based on questionnaires (Table 1). In most cases,
assessment was fragmentary. For example, the influence of the sample size was not
taken into account (Table 1). However, this parameter is important regarding the
robustness of conclusions and to analyse the contribution of different variables.
Most studies were performed in a single country, rarely two, impeding cultural com-
parisons. Furthermore, a major source of variation – wording and selection of words
employed in the questionnaire – has not been examined (Groves et al., 2009). Thus, a
key assumption associated with the use of written questionnaires remains unverified:
do respondents understand the questions correctly and does their understanding cor-
respond to the intention of the person posing the questions (Fowler, 1995). Other
factors likely influence responses, such as social desirability (Richman, Kiesler, Waist-
band, & Drasgow, 1999), affectivity or spontaneity (Randler, Ilg, & Kern, 2005). The
influence of these factors is usually detected through qualitative interviews, but most
written questionnaires are not designed with that purpose in mind, limiting the possi-
bility to perform appropriate analyses. Overall, both controllable (formulation of the
questions and sample size) and other factors (impact of the media, cultural factors and
Table 1. Survey parameters in 50 studies based on survey questionnaires (1991–2009, annexe-1)
Parameters STO BES EPA
Number of studies 15 13 22
Mean number of countries surveyed 1.1 1.1 1.0
Mean sample size (range) 236 (72–1,933) 430 (40–2,000) 459 (10–4,000)
Expert reviews 6 6 8
Quality interviews 1 0 1
A posteriori analyses 1 2 1
Reliability test 1 4 6
Other effects (see text) 1 1 7
Test on sample size effect 0 0 0
Notes: The studies were classified into three main types: (1) STO: Single Taxon Oriented (i.e.
focusing on one species), (2) BES: Broad Environmental Survey and (3) EPA: Education
Programme Assessment. Mean sample size (range) corresponds to the number of people
questioned. Expert review: type and order of questions, alternative responses and instruction to
interviewers were examined by a committee; Quality interviews: comparative qualitative
questionnaire and cognitive interviewing were performed; A posteriori analyses: split ballot and
introspective tests used, consistency of the answers examined; Reliability tests: Cronbach coefficient
alpha and principal component analyses were used to assess the congruence of the answers; Other
effects: for example, impact of interviewer’s appearance, presence of other people, influence of a
particular event have been assessed; Test on the sample size effect were not assessed.
Questionnaire in Conservation Education 3
Dow
nloa
ded
by [
178.
143.
223.
234]
at 0
8:35
29
Janu
ary
2015

field experiences) were not included in the survey design (Ballantyne, Packer, &
Everett, 2005; Fowler, 1995).
Our study reports on a written questionnaire about conservation education admi-
nistered to French primary schoolchildren (9 years old on average). Targeting chil-
dren is important for conservation programmes (Rivas & Owens, 1999). Indeed,
children are more receptive than adults to educational actions. Our study is oriented
towards methodological issues rather than on the attitudes of the schoolchildren
towards biodiversity per se; however, these two components cannot be totally separ-
ated. We focused on one conservation issue of major importance for children: Which
animal species should be protected? Most analyses were based on open-ended items
that all revolve around variations of a central question: ‘List five animals that must be
protected in priority’. We assessed the following methodological questions:
(1) Did primary schoolchildren (9 years old on average) understand the questions?
(2) If yes, did minimal modification in the wording influence the response?
(3) Do analyses reveal the influence of spontaneity and/or affectivity factors?
(4) What sample strategy (sample size, number of classes or schools surveyed) was
appropriate?
Methods
Participants
The survey was conducted in France in 2007–2008, with 626 respondents complet-
ing different versions of a printed questionnaire. The mean age of the children was 9
(9.1 + 1.3 years [SD]). The schoolchildren were drawn from 15 schools situated in
the Central-West of France in rural (N ¼ 10 schools, N ¼ 477 schoolchildren) and
urban areas (N ¼ 5 schools, N ¼ 149 schoolchildren). The sex ratio was equilibrated
(girls 49% and boys 51%). All schools possess internet access, and probably all chil-
dren had also access to various media at home and/or through friend relationships.
Questionnaire
The questionnaire is consisting of open- and closed-ended items. From a total of 28
different questions, several items (i.e. a central question Q1 +Q 5 derived questions
Q2–Q6, details in the later text) were investigated in this study. The other items were
used for different purposes that are not presented here (cf. Ballouard, Brischoux, &
Bonnet, 2011, for example).
This study focuses on the answers to the central question ‘List five animals that must
be protected in priority’ (Q1). We assumed that the responses reflect those species that
children considered to be important. However, the question or at least the intention of
the observer might not have been clearly understood. For example, the children may
list the species only because they love them. Therefore, we assessed the level of under-
standing to a subset of 188 children (among the 626 tested). We posed the three
4 J.-M. Ballouard et al.
Dow
nloa
ded
by [
178.
143.
223.
234]
at 0
8:35
29
Janu
ary
2015

additional questions in a random order to limit possible influence of questions order in
the answers.
. ‘Why should the five animals listed be protected?’ (Q2)
. ‘What are the causes of the disappearance of the five animals listed?’ (Q3)
. ‘How can we protect the five animals listed?’ (Q4)
Although superficially similar, the questions were partly divergent. In Q2, for
example, the children might have included an affective factor by answering
‘because I love them’, something illogical to do in the response for Q3 because
loving animals is not supposed to cause their disappearance. We expected that the
answers to Q3 would contain more functional reasoning such as ‘poaching’ and
that the answers to Q4 would propose practical actions such as ‘building nests’.
The appropriateness of the answers provided an index of understanding.
We further explored the level of understanding with the whole sample of children
(N ¼ 626) by including subtle changes in the formulation of the central question
(Q1) in two additional ways:
. ‘List five animals that you want to protect in priority’ (Q5; N ¼ 189).
. ‘List five animals that should be saved in priority’ (Q6; N ¼ 123).
Overall, the central question Q1 was posed to 314 children and the slightly modi-
fied versions Q5 and Q6 (derived from Q1) to 312 children. We expected the
responses associated with each variation of the main question to be different. Ques-
tion 5 contains more affective element (i.e. the verb ‘want’ refers to personal wishes
compared to the terms ‘must be’), and consequently endearing species such as pets
should be more represented. Question 6 is quite similar to Q1, although the terms
‘should be saved’ contain more affective factor compared to the very formal ‘must be
protected’. Q1 corresponded to the formulation where duty factor is the most
prevalent.
Because we asked children to list five animals, it was possible to examine if the
responses were influenced by their position in the list. The first animal listed would
be more influenced by spontaneity than the next one, and more reflection by the
child would have been required to add animals to the list.
Sample Size
We evaluated the importance of sample size through a random sub-sampling on the
whole data set. We used a step-wise approach, starting with 100% of the data, and
removed randomly an increasing proportion of the sample each time before re-
running the analyses. This procedure was performed three times. For this analysis,
we used the most cited animals: mammals. To visualize the influence of various
sample sizes on the results, we plotted relevant practical subsamples represented
by different classes (N , 30 children) or schools (30 , N , 150); thereby provid-
ing elements reflecting the level of investigations performed under a practical
context.
Questionnaire in Conservation Education 5
Dow
nloa
ded
by [
178.
143.
223.
234]
at 0
8:35
29
Janu
ary
2015
Administration Procedures
All surveys were performed during class time by one evaluator (first author, briefly pre-
sented by the teachers to the schoolchildren) in 2008 and 2009. The questionnaire was
introduced as a survey and not an exam to limit the anxiety on the schoolchildren. The
evaluator explained to the schoolchildren that the main goal was to assess their percep-
tion and knowledge about biodiversity. Before giving the questionnaire individually to
the schoolchildren, the observer provided preliminary explanations about global pro-
blems regarding biodiversity but carefully avoided citing any precise example of threa-
tened group of animals, and did not cite particular species (e.g. the term ‘animal’ was
used, not ‘bear’). In other words, the observer restricted introductory explanations to
the notion that animals in general are threatened. The observer also reminded the chil-
dren that the term ‘animal’ includes organisms such as insects and worms – otherwise,
many children would have overlooked invertebrates (cf. Bell, 2010).
The children required 30 minutes on average to complete the questionnaire. Chil-
dren were allowed to require clarification. In most cases, individual response was pro-
vided (e.g. spelling a name), albeit frequent or general questions were explained to the
class.
Data Analysis
Open-ended questions generated open and diverse answers. Consequently, we
selected a limited number of categories to perform analyses. To classify the animal
species listed, we referred to popular taxonomy, irrespective to phylogeny (e.g.
giant panda, bear, or fish, where all considered at the same taxonomic level). For
several analyses, we allocated the animals listed into six broad categories:
mammals, birds, reptiles, amphibians, fishes and invertebrates. This popular classifi-
cation, although scientifically inaccurate, reflects the perception of biodiversity by
most people. We also distinguished pets (e.g. guinea pigs) from non-domestic
animals (livestock were not considered as pets; Serpell, 1989) and from exotic
animals (Ballouard et al., 2011).
To analyse the level of understanding, and affectivity factor, we classified the
responses to the other open questions (Q2, Q3 and Q4) into six categories:
(1) Null or out of focus answers: not related to animal conservation.
(2) Affectivity factor predominant: children clearly introduced an affective factor.
For instance using the phrase ‘because they are cute’.
(3) Patrimonial factor predominant: general interest for animal conservation was
revealed through sentences referring to broad patrimonial values, as in answers
containing a phrase such as ‘because animals are vanishing’.
(4) Direct threat: for instance, animals should be protected from hunting or poach-
ing, or phrases such as ‘people kill animals for their fur’.
(5) Indirect threat: for instance, climate change or habitat loss that can threaten
species.
(6) Other: some answers were not easily classified – for instance, ‘to help them’.
6 J.-M. Ballouard et al.
Dow
nloa
ded
by [
178.
143.
223.
234]
at 0
8:35
29
Janu
ary
2015

For the spontaneity factor assessment, we retained the most relevant (i.e. most cited)
type of animals: the pets. Indeed, children were likely more prone to love and protect,
and thus spontaneously select in the list, their pet compared to other animals. In prac-
tice, the pets were essentially mammals (e.g. cats). We expected a decrease in the mean
frequency of pets in the five consecutive responses of the list. Consequently, we per-
formed repeated measures ANOVA with the five consecutive responses as the repeated
variable and the type of question [Q1, Q5 and Q6] as the factor.
Many statistical tests were based on proportions (e.g. exotic versus local species)
using contingency table analysis. Pearson’s chi-square was used to test different pro-
portions in the type of answer to questions (a ¼ 0.05). We also used mean individual
children score (e.g. mean value of mammal species cited in the five animals listed by
each child) to perform analyses of variance. Statistics were performed with Statistica
7.1 software (wStatSoft Inc. 1984–2005). Some children did not complete the ques-
tionnaire question, thereby generating fluctuations in the sample sizes.
Results
Did Primary Schoolchildren Clearly Understand the Questions Proposed?
The three questions (Q2, Q3 and Q4) that aimed to assess the level of understanding of
the children generated different frequencies of the six categories of answers (Figure 1;
x2 ¼ 305.3, df ¼ 10, p , .01). Within each question, the frequency of the response
categories also differed (Figure 1; Q2: x2 ¼ 139.2, df ¼ 5, p , .01; Q3: x2 ¼ 351.8,
df ¼ 5, p , .01; and Q4: x2 ¼ 138.9, df ¼ 5, p , .01). Despite these variations, the
proportion of out-of-focus answers remained always low (Figure 1). The affective
factor was well represented in the questions where it was expected (Q2); in contrast,
that factor was almost totally absent when it would have been illogical to refer to it
(Q3 and Q4; Figure 1). Many answers to Q2 contained a patrimonial value, and to a
lesser extent an affectivity factor. In other words, the children logically considered
that it is necessary to protect animals not only because they are threatened, but also
because they love them. Almost no children, however, incorrectly proposed that the
cause of their disappearance is because they love them. Similarly, almost all children
correctly indicated a reduction in direct and indirect threats (e.g. poaching, pollution,
etc.) to better protect animals.
Did Subtle Modifications in the Wording Influence the Response?
The children responded differently to the subtle changes in the formulation of the
central question (Q1 versus Q5 or Q6) (Figure 2). For example, the proportion of
pets (x2 ¼ 4.847, df ¼ 2, p , .01) or of exotic animals (exotic animals are very
often cited, Authors 2011; x2 ¼ 34.1, df ¼ 2, p , .01) in the answers was influenced
by the verb used. For instance, the use of verbs ‘must’ versus ‘want’ generated differ-
ences in the proportion of answers containing an affective factor (i.e. proportion of
pets cited: x2 ¼ 68.8, df ¼ 1, p , .01; Figure 2). The meaning of the phrase ‘must
Questionnaire in Conservation Education 7
Dow
nloa
ded
by [
178.
143.
223.
234]
at 0
8:35
29
Janu
ary
2015

be protected’ was similar to ‘should be saved’, and the responses tended to converge.
Examining the effect of proportion of exotic versus local animals generated similar
trends: children proposed more exotic animal species when the question was formu-
lated in a more formal way (Q1) and a general interest of the wildlife became more
visible (Figure 2).
Figure 1. Numbers of responses (Y-axis) to three questions (Q1, Q2, Q3, respectively, panels a, b, c)
posed to schoolchildren about animal conservation. The X-axis indicates the main types of answers:
Null ¼ out of focus; Affectivity ¼ inclusion of affective factor; Patrimony ¼ answer with broad
patrimonial values; Direct threat ¼ direct causes for animal disappearance; Indirect threat ¼
indirect causes for animal disappearance; Others ¼ unclear answers (see text for details)
8 J.-M. Ballouard et al.
Dow
nloa
ded
by [
178.
143.
223.
234]
at 0
8:35
29
Janu
ary
2015

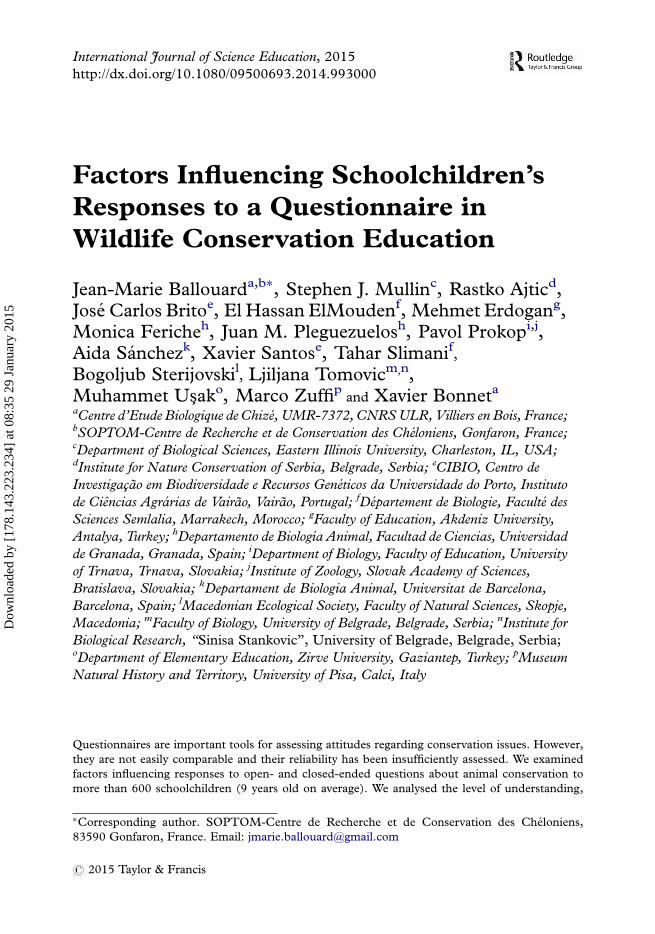
Did Spontaneity and Affectivity Factors Influence Primary Schoolchildren?
The frequency of pets in the responses decreased as the children added animals to the
list (repeated measures ANOVA; specific effect of the position of the animal listed [i.e.
time]: F4, 21 ¼ 6.7, p , .01 and F4, 21 ¼ 5.2, p , .01 for mammals and pets, respect-
ively; Figure 3). Furthermore, an influence of the type of question (Q1, Q5 and Q6)
on this trend was detected using pets in the analysis (Wilk’s l ¼ 0.94, F10, 10 ¼ 3.21, p
, .01; interaction F8, 212 ¼ 1.92, p ¼ .05).
What Sample Strategy was Appropriate to Discern Differences in Survey Responses?
Mean values of most subsamples were similar to the average values obtained through
the random sub-sampling procedure: the proportion of mammals did not deviate
markedly from the mean value calculated on the whole sample size (Figure 4). The
pattern of the average children’s response was relatively stable, even with small
sample sizes (i.e. N , 50). Focusing on classes or schools instead of using random
sampling, a few outliers were apparent (Figure 4). Such a class and the related
school benefited from environmental education programmes oriented towards local
fauna (mostly birds) during the previous months, and were associated with a decrease
in the prevalence of exotic fauna (exotic mammals mainly) and a concomitant increase
in the citation rate of wild local fauna.
Figure 2. Proportions (Y-axis) of responses to three modifications (underlined below) of the
formulation of the main question (X-axis), ‘List five animals that must be protected in priority’
(Q1), versus ‘ . . . you want to protect . . . ’ (Q5), or ‘ . . . should be saved . . . ’ (Q6). All the animals
listed by the children tested were pooled (total number of animals cited .3,000). Black bars and
left Y-axis correspond to the proportion of pets in the responses. Grey bars and right Y-axis
correspond to the proportion of exotic animals in the responses
Questionnaire in Conservation Education 9
Dow
nloa
ded
by [
178.
143.
223.
234]
at 0
8:35
29
Janu
ary
2015

Discussion
Our results provide both encouraging and cautious messages for the use of written ques-
tionnaires in monitoring conservation educationprogrammes as exposed in the later text.
Level of Understanding of the Primary Schoolchildren
The children provided accurate responses. They did not confuse the causes for animal
rarefaction and the reasons why they deserve protection. For example, expressions of
causality (e.g. poaching) dominated the responses when the questions were directed
towards the reasons why animals disappear, showing that the schoolchildren
responded in an appropriate manner. Other results indicate that the responses were
reliable: (1) the detection of the influence of subtle changes in the formulation of
the same question; (2) a low occurrence of out-of-focus answers and (3) the consist-
ency of the prevalence of large animals (especially exotic mammals) in the responses.
Thus, a major outcome is that using written questionnaires with schoolchildren is an
accurate and simple technique for monitoring important issues in conservation edu-
cation, at least in the tested age groups.
Influence of Subtle Wording Modifications in the Responses
We detected differences caused by subtle variations in the phrasing of an otherwise
identical question: the verb ‘want’ was more often associated with affective elements
Figure 3. Effect of the questions (Q1, Q5, Q6) on the changes in the frequency of pets cited (mean
proportion + SE) in the list of five successive responses provided by French children (N ¼ 444).
The X-axis provides the order of each of the successive answers proposed by the children to
elaborate a list of five animals
10 J.-M. Ballouard et al.
Dow
nloa
ded
by [
178.
143.
223.
234]
at 0
8:35
29
Janu
ary
2015

than the verb ‘must’ that involved more duty elements (Figure 2). The terms ‘must be
protected’ involve a duty factor whilst ‘you want to protect’ refers more to a personal
wish. Therefore, a larger proportion of familiar animals was expected, and actually
observed, in the answers to the question Q5 compared to the responses to Q1. Affec-
tivity was mostly apparent in the responses where it was logical to express, and other-
wise almost absent (Figure 1). The children correctly differentiated words that might
have otherwise been considered as secondary to the aim of the question. Thus, it is
important to take into account these effects to use questionnaires.
Influence of Spontaneity and Affectivity Factors
The influence of spontaneity was clearly revealed, notably when considering interaction
with spontaneity (Figure 3). When the order of the five animals listed was taken into
account, the prevalenceof petswas initially strong and decreasedmarkedly if the question
was formulated with the verb ‘want’, whilst the use of the verb ‘must’ prompted relatively
stable responses with a lower initial prevalence of pets (Figure 3). Thus, the weight of the
affective factor was better controlled when the question was phrased in a more neutral
way (e.g. Q1 versus Q5). This result echoes psychological studies that demonstrate the
importance of affective and emotional factors in children attitude and responses
(D’Argembeau & Van der Linden, 2004; Iozzi, 1989; Littledyke, 2008).
Figure 4. Influence of sample size on the mean (+SE) proportion of mammals cited. The dashed
grey line indicates a mean value for comparisons. Crosses indicate values obtained for classes (N ,
30) or schools (N . 30). Arrows show the class and the related school where field trips were
performed two months before the survey
Questionnaire in Conservation Education 11
Dow
nloa
ded
by [
178.
143.
223.
234]
at 0
8:35
29
Janu
ary
2015

The high ranks occupied by cats and dogs that are not endangered (ranking first and
second among all cited animals) were somewhat inappropriate at first glance. Previous
study showed that these often cited animals are also the most frequently observed in
the environment by schoolchildren (Patrick & Tunnicliffe, 2011). Children exhibit
clear preference for familiar species (Nates, Campos, & Lindemann-Matthies,
2010). This high frequency of not-endangered pets may reflect the fact that children
wanted to protect the animals they love the most (D’Argembeau & Van der Linden,
2004; Prokop, Prokop, & Tunnicliffe, 2008; Schlegel & Rupf, 2010). Yet, perhaps
young children actually considered pets to be threatened.
Influence of Sample Size
The stability of the outcome using a wide range of sample sizes suggested that large
sample sizes might not be compulsory. The predominance of a limited number of
iconic animals (i.e. exotic mammals) could explain such a result. Querying a large
number of schoolchildren is unnecessary to ascertain whether or not tigers are
often cited as animals that deserve priority protection. Considering more practical
units (class and school) produced different results and the outliers were those
classes that were involved in programmes oriented towards local fauna (Figure 4).
Hence, basing studies on few classes or schools (the level at which most conservation
education is conducted) remains tenuous.
Practical Consequences
One practical message is that the frequency of iconic animal species and pets in the
responses could be used as indicators (cursors), at least with children. Using a
simple cursor might be a useful monitoring and comparative tool (Schlegel & Rupf,
2010). The impact of programmes oriented to redress taxonomic bias, field trips or
different methods (handling animals versus watching them) could be assessed using
such a cursor. A possible increase in the rankings of local or non-popular organisms
relative to the dominant exotic and iconic animals before and after the education
action might reveal the effectiveness of the technique employed (Ballouard,
Provost, Barre, & Bonnet, 2012; Ballouard et al., 2013).
Standardized written questionnaires represent an option to monitor the impact of
environmental education over time, geographic areas and across studies. Neutral
phrasing should be preferred to limit the impact of affective factor (Robelia &
Murphy, 2012). Although questionnaires based on small sample sizes can provide
useful patterns, they should be administered over large spatial and time scales
rather than focusing on a single locality.
Limitations and Further Investigations
This study represents an early and limited examination of a rarely explored issue.
However, it may prompt further tests. This investigation was not designed to
12 J.-M. Ballouard et al.
Dow
nloa
ded
by [
178.
143.
223.
234]
at 0
8:35
29
Janu
ary
2015

provide deep insights about how the students understood the questionnaire.
Language was possibly a factor of bias, subtle changes in the wording might not
easily transgress cultural and language boundaries. Furthermore, a child might cite
an animal type because she/he is limited by her/his capacity to name animals
(Patrick & Tunnicliffe, 2011). Nonetheless, this study can serve as a baseline for
further research; improving the toolbox for conservation education is timely (Balm-
ford, Clegg, Coulson, & Taylor, 2002). For routine surveys, simple school standard
survey should be developed to better assess the efficiency of alternative methods
(internet searching versus handling wildlife during field trip; Ballouard et al., 2012;
Lindemann-Matthies, 2002; Zoldosova & Prokop, 2006).
Acknowledgements
We thank Dr M. Place for his help to set up the questionnaire, and the teachers and
children who kindly participated in this study. R. Cambag, F. Groumpf, B. Clothaire
and Wallaby Thaler were very helpful to photocopy questionnaires.
Disclosure statement
No potential conflict of interest was reported by the authors.
References
Ballantyne, R., Packer, J., & Everett. M. (2005). Measuring environmental education program
impact and learning in the field/using and action research cycle to develop a tool for use with
young students. Australian Journal of Environmental Education, 21, 23–38.
Ballouard, J.-M., Ajtic, R., Balint, H., Brito, J. C., Crnobrnja-Isailovic, J., Desmonts, D., . . .
Bonnet, X. (2013). Schoolchildren and one of the most unpopular animals: Are they ready
to protect snakes? Anthrozoos, 26, 93–109.
Ballouard, J.-M., Brischoux, F., & Bonnet, X. (2011). Children prioritize virtual exotic biodiversity
over local biodiversity. PLoS ONE, 6, e23152. doi:10.1371/journal.pone.0023152.
Ballouard, J.-M., Provost, G., Barre, D., & Bonnet, X. (2012). Influence of a field trip on the atti-
tude of schoolchildren toward unpopular organisms: An experience with snakes. Journal of Her-
petology, 46(3), 423–428.
Balmford, A., Clegg, L., Coulson, T., & Taylor, J. (2002). Why conservationists should heed
Pokemon. Science, 295, 2367.
Bell, B. (2010). When an animal is not an animal? Journal of Biological Education, 15, 213–218.
Caro, T., Pelkey, N., & Grigrione. M. (1994). Effect of conservation biology education on attitudes
toward nature. Conservation Biology, 8, 846–852.
D’Argembeau, A., & Van der Linden. M. (2004). Influence of affective meaning on memory for
contextual information. Emotion, 4, 173–188.
Fowler, F. (1995). Improving survey questions: Design and evaluation. Applied Social Research
Methods Series 38. London: Sage.
Groves, R. M., Fowler, F. J., Couper, M. P., Lepkowski, J. L., Singer, E., & Tourangeau, R. (2009).
Survey methodology. 2nd ed. New Jersey: Wiley.
Iozzi, L. A. (1989). What research says to the educator: Part two: Environmental education and the
affective domain. Journal of Environmental Education, 20, 6–13.
Questionnaire in Conservation Education 13
Dow
nloa
ded
by [
178.
143.
223.
234]
at 0
8:35
29
Janu
ary
2015

Lindemann-Matthies, P. (2002). The influence of an educational program on children’s perception
of biodiversity. Journal of Environmental Education, 33, 22–31.
Lindemann-Matthies, P. (2006). Investigating nature on the way to school: Responses to an edu-
cational program by teachers and their pupils. International Journal of Science Education, 28,
895–918.
Lindemann-Matthies, P., Junge, X., & Matthies, D. (2010). The influence of plant diversity on
people’s perception and aesthetic appreciation of grassland vegetation. Biological Conservation,
143, 195–202.
Littledyke, M. (2008). Science education for environmental awareness: Approaches to integrating
cognitive and affective domains. Environmental Education Research, 14, 1–17.
Nates, J., Campos, C., & Lindemann-Matthies, P. (2010). Students perception of plant and animal
species: A case study from rural Argentina. Applied Environmental Education & Communication,
9, 131–141.
Newing, H., Eagle, C., Puri, R., & Watson, C. (2011). Conducting research in conservation: Social
science methods and practice. London: Routledge.
Novacek, M. J. (2008). Engaging the public in biodiversity issues. Proceedings of the National
Academy of Sciences of the USA, 105, 11571–11578.
Patrick, P., & Tunnicliffe, S. D. (2011). What plants and animals Do early childhood and primary
Students’ name? Where Do they See them? Journal of Science Education and Technology, 20,
630–642.
Pilgrim, S. E., Cullen, L. C., Smith, D. J., & Pretty, J. (2008). Ecological knowledge is lost in weal-
thier communities and countries. Environmental Science & Technology, 42, 1004–1009.
Prokop, P., Prokop, M., & Tunnicliffe, S. D. (2008). Effects of keeping animals as pets on children’s
concepts of vertebrates and invertebrates. International Journal of Science Education, 30,
431–449.
Randler, C., Ilg, A., & Kern, J. (2005). Cognitive and emotional evaluation of an amphibian con-
servation program for elementary school students. Journal of Environmental Education, 37,
43–52.
Richman, W. L., Kiesler, S., Waistband, S., & Drasgow, F. (1999). A meta-analytic study of social
desirability distortion in computer-administered questionnaires, traditional questionnaires,
and interviews. Journal of Applied Psychology, 84, 754–775.
Rivas, J. A., & Owens, R. Y. (1999). Teaching conservation effectively: A lesson from life-history
strategies. Conservation Biology, 13, 453–454.
Robelia, B., & Murphy, T. (2012). What do people know about key environmental issues? A review
of environmental knowledge surveys. Environmental Education Research, 18, 299–321.
Schlegel, J., & Rupf, R. (2010). Attitudes towards potential flagship species in nature conservation:
A survey among students of different educational institutions. Journal for Nature Conservation,
18, 278–290.
Serpell, James A. (1989). Pet-keeping and animal domestication: A reappraisal. London: Unwin
Hyman.
Schroepfer, K. K., Rosati, A. G., Chartrand, T., & Hare, B. (2011). Use of “entertainment” chim-
panzees in commercials distorts public perception regarding their conservation status. PloS
ONE, 6(10), e26048.
Tourangeau, R., Rips, L. J., & Rasinski, K. (2000). The psychology of survey response. New York:
Cambridge University Press.
Van Weelie, D., & Wals, A. (2002). Making biodiversity meaningful through environmental edu-
cation. International Journal of Science Education, 24, 1143–1156.
Walsh-Daneshmandi, A., & MacLachlan, M. (2006). Toward effective evaluation of environ-
mental education: Validity of the children’s environmental attitudes and knowledge scale
using data from a sample of Irish adolescents. Journal of Environmental Education, 37,
13–23.
14 J.-M. Ballouard et al.
Dow
nloa
ded
by [
178.
143.
223.
234]
at 0
8:35
29
Janu
ary
2015
White, P. C. L., Jennings, N. V., Renwick, A. R., & Barker, N. H. L. (2005). Questionnaires in
ecology: A review of past use and recommendations for best practice. Journal of Applied
Ecology, 42, 421–430.
Yong, D. L., Fam, S. D., & Lum, S. (2011). Reel conservation: Can big screen animations save tro-
pical biodiversity? Tropical Conservation Science, 4(3), 244–253.
Zoldosova, K., & Prokop, P. (2006). Education in the field influences children’s ideas and interest
toward science. Journal of Science Education and Technology, 15, 304–313.
Questionnaire in Conservation Education 15
Dow
nloa
ded
by [
178.
143.
223.
234]
at 0
8:35
29
Janu
ary
2015