Quality of Work Life Factors for Mental Health Therapists Providing Neurofeedback
Upload
khangminh22Category
view
4download
0
i
FACTORS IMPACTING ON THE QUALITY OF WORK LIFE: A CASE STUDY OF UNIVERSITY “A”
Submitted in fulfillment of the requirements of the degree of
Masters of Technology: Public Management
In the Faculty of Public Management and Economics
at the Durban University of Technology
Mpho Kenneth Letooane
December 2013
APPROVED FOR FINAL SUBMISSION
Signature:_________________________ Date______________________
Supervisor: Dr. B.S. Ngcamu (B. Paed degree, LLM, M. Com & D.Tech)
Signature:_________________________ Date______________________
Co-Supervisor: Prof. Dorasamy (PhD)

ii
DECLARATION
I ………………………………………………………………declare that
(i) The research reported in this dissertation/thesis, except where otherwise
indicated, is my original research.
(ii) This thesis has not been submitted for any degree or examination at any
other university.
(iii) This thesis does not contain other persons’ data, pictures, graphs or other
information, unless specifically acknowledged as being sourced from other
persons.
(iv) This thesis does not contain other persons’ writing, unless specifically
acknowledged as being sourced from other researchers. Where other
written sources have been quoted, then:
a) their words have been re-written but the general information
attributed to them has been referenced:
b) where their exact words have been used, their writing has
been placed inside quotation marks, and referenced.
(v) This thesis does not contain text, graphics or tables copied and pasted
from the internet, unless specifically acknowledged, and the source being
detailed in the dissertation/thesis and in the references sections.
Signature:_________________________ Date______________________

iii
ABSTRACT
Poor quality of work life is a challenge in higher education institutions (HEIs) and it
impact negatively on performance, attraction and retention of quality staff. The
purpose of the research was to report on the factors that impact on the quality of
work life of employees at the University “A”. The findings from this investigation will
assist employees and management alike to understand factors that can improve
performance and assist University “A” to be an employer of choice to attract, develop
and retain suitably qualified employees.
The rationale for the study was to investigate and obtain a better understanding of
the quality of work life status in University “A”. Higher education institutions face a
serious challenge of retaining adequately qualified and competent staff due to
regular resignation and termination of employment contracts of employees. This has
resulted in a steady backlog of vacant positions and which has a detrimental effect
on the quality of teaching and learning. The deficit of staff leads to increased
teaching workloads and consequently impacts negatively on the quality of service
being offered including teaching and learning.
This study is grounded in both quantitative and qualitative research traditions
whereby a survey was conducted in the form of a structured questionnaire and in
depth-interviews to university employees. The structured questionnaire was
analysed using Statistical Packages for Social Scientists version 12 generating the
reliability coefficient Alpha of 0.898 indicating the high degree of acceptance and
consistent of the results. This study used the probability stratified random sampling
whereby 160 structured questionnaires were distributed to both academic and non-
academic employees with 142 returned successfully generating the response
percentage of 89%.
The findings of this research suggested that career advancement was one of the
main reasons that were identified to lead to poor quality of work life. Furthermore,
another primary concern was job insecurity, employees felt that their jobs are not
reliable and secure. It was also noted in the research outcomes that a high
proportion of the respondents were generally not well. The study findings suggest
that respondents were not involved in decisions that affect them in their area of work
and they feel that they are not given a lot of freedom to decide how to do their jobs.

iv
The research results indicated that the increase percentage of the respondents
disagreed that their employer provides adequate facilities and flexibility for
employees to adjust their work with their family time. It was evident from the
responses that even though some policies exist, employees were unaware of their
application and also the absence of performance management systems. Another
prominent finding from the study was that employee expressed that their health and
safety of their working conditions should be improved.
The findings and results will assist management and employees alike in the practical
implementation of quality of work life programmes with the aim of improving the
retention of current employees and attracting potential employees. This study will
contribute to the body of knowledge as published studies on the quality of work life is
scant in higher education institutions. There is minimal research that has been
conducted on the QoWL of employees in higher education institutions, and the
results from this research could be utilized by management and supervisors, in order
to minimize the potential factors that could negatively impact on the QoWL of
employees in HEIs.

v
Acknowledgement
Firstly I would like to thank the Almighty God for blessing me with people who assisted me with the project.
This dissertation would not have been possible without Dr. B.S. Ngcamu who has supervised me throughout the project and for his constant motivation.
I owe my deepest gratitude to Prof. N. Dorasamy for her great insight, constructive feedback and guidance throughout the project.
I would also like to thank Mr. Deepak Singh for data analysis, presentation and interpretation. I offer my gratitude to Ms. N. Mthembu, Ms. L. Sempe, Ms. U. April and all those who assisted assisted me in any respect during the project.
A sincere thank you to my parents, Mr. and Mrs. Letooane, family and friends for providing me with advice and support during the project.

vi
LIST OF KEY ABBREVIATIONS AND ACRONYMS
Compensation for Occupational Injuries and Diseases Act COIDA
Council of Higher Education CHE
Department of Public Service and Administration DPSA
Employee Assistace Programme EAP
Employment Equity Act EEA
European Union EU
Heads of Departments HOD
Higher Education Act HEA
Higher education institutions HEI
Higher Education Quality Committee HEQC
Institutional Research Ethics Committee IREC
International Labour Organisation ILO
Job Characteristics Model JCD
Klynveld Peat Marwick Goerdeler KPMG
KwaZulu-Natal KZN
Labour Relations Act LRA
National Economic Development and Labour Council NEDLAC
National Plan Higher Education NPHE
National Qualification Framework NFQ
New Public Management NPM
Occupational Health and Safety Act OHSA
Organisation for Economic Co-operation and Development OECD
Personal Development Plans PDPs
Post Traumatic Stress Disorder PTSD
Public Service Commission PSC
Quality of Work Life QoWL
Research Information System RIS
Sector Education and Training Authorities SETA
Service Quality SERVQUAL
Skills Development Act SDA
Skills Development Facilitators SDF

vii
South African Institute of Chartered Accountants SAICA
South African Qualifications Authority SAQA
The Basic Conditions of Employment Act BCEA
Total Quality Management TQM
United Kingdom UK
United Nations Development Programme UNDP
United States of America U.S.A
White Paper on Human Resource Management in
the Public Service
WPHRMPS
White Paper on Transformation of Higher Education WPTHE
White Paper on Transformation of Public Service WPTPS
White Paper on Transforming Public Service Delivery WPTPSD
Work Life Quality WRKLFQUAL
Work Related Quality of work life WRQoL
World Health Organization WHO

viii
TABLE OF CONTENTS Declaration ii
Abstract iii
Acknowledgements v
Key abbreviations and acronyms vi
Table of contents viii
List of tables xv
List of figures xvi
CHAPTER ONE: INTRODUCTION 1.1 Introduction 1
1.2 Background 2
1.3 Rationale 3
1.4 Problem statement 3
1.5 Aims and objectives of the study 4
1.6 Literature review 4
1.7 Research methodology 7
1.8 Scope of the study 8
1.9 Significance of the study 8
1.10 Potential outputs 8
1.11 Structure of the chapters 9
1.11.1 Chapter 1 – Introduction 9
1.11.2 Chapter 2 – International perspective 9
1.11.3 Chapter 3 - South African legislative framework and quality
of work life
1.11.4 Chapter 4 - Public management and quality of work life 10
1.11.5 Chapter 5 – Research methodology 10
1.11.6 Chapter 6 – Data presentation and analysis of results 10
1.11.7 Chapter 7 – Conclusion and recommendations 10
1.12 Conclusion 11

ix
CHAPTER TWO: INTERNATIONAL PERSPECTIVE ON THE QUALITY OF WORK LIFE
2.1 Introduction 12
2.2 Concepts relating to quality of work life 12
2.3.1 Job and career satisfaction 14
2.3.2 General wellbeing 16
2.3.2.1 Physical and physiological wellbeing 17
2.3.2.2 Psychological wellbeing 18
2.3.2.3 Emotional wellbeing 19
2.3.2.4 Intellectual and mental wellbeing 19
2.3.2.5 Social wellbeing 20
2.3.2.6 Ethical and moral wellbeing 21
2.3.2. Spiritual wellbeing 22
2.3.3 Stress at work 23
2.3.4 Control at work 25
2.3.5 Work conditions 26
2.3.6 Home work interface 27
2.4 Quality of work life in developed and developing countries 29
2.4.1 Developed countries 29
2.4.2 Developing countries 31
2.5 Trends between developing and developed countries. 32
2.6 Conclusion 34
CHAPTER THREE: SOUTH AFRICAN LEGISLATIVE FRAMEWORK AND QUALITY OF WORK LIFE
3.1 Introduction 35
3.2 Legislation 35
3.2.1 Basic Conditions of Employment Act 75 of 1997 36
3.2.2 Employment Equity Act 55 of 1998 37
3.2.3 Skills Development Act 97 of 1998 39
3.2.4 Occupational Health and Safety Act 85 of 1993 41
3.2.5 Compensation for Occupational Injuries and 42
Diseases Act 130 of 1993
3.2.6 Labour Relations Act 66 of 1995 43

x
3.3 Public and private sector perspective 45
3.4 Females and quality of work life 47
3.5 Performance management and quality of work life 48
3.6 Conclusion 50
CHAPTER FOUR: PUBLIC MANAGEMENT AND QUALITY OF WORK LIFE IN SOUTH AFRICA
4.1 Introduction 51
4.2 Institutional framework 51
4.2.1 Higher Education Act 101 of 197 52
4.2.2 The White Paper on Transformation of Higher Education 53
of South Africa (1997)
4.2.2.1 Higher education institutional framework 55
4.2.3 The White Paper on Human Resource Management in 56
the Public Service of (S. A. 1997)
4.3 Public administration and public management 56
4.4 New public management and quality of work life 59
4.5 Leadership 62 4.5.1 Transformational leadership 62
4.5.2 Transactional leadership 63
4.5.3 Laissez faire leadership 64
4.6 “Batho Pele” principles. 64
4.7 The key differences between King ii and King iii Reports 65
4.8 Public Human Resource Management Model 68
4.8.1 Representative of all the South Africans 71
4.8.2 Public servants as valuable resource 73
4.8.3 Service delivery 73
4.8.4 Accountability of public officials 75
4.8.4.1 Hierarchal accountability 75
4.8.4.2 Legal accountability 74
4.8.4.3 Political accountability 76
4.8.4.4 Professional accountability 76
4.8.5 Cultivate career development practices 76
4.8.6 Result orientated managerial responsibilities 78

xi
4.8.7 South African case study 79
4.9 Conclusion 82
CHAPTER FIVE – RESEARCH METHODOLOGY 5.1 Introduction 83
5.2 Study area 83
5.3 Research design 83
5.4 Research instrument 84
5.4.1 Other methods of determining quality of work life 85
5.5 Mixed methods 86
5.6 Case study 87
5.7 The study population 87
5.8 Sampling 88
5.8.1 Stratified random sampling 88
5.9 Sample size 89
5.10 Recruitment 89
5.11 Pre test 90
5.12 Primary and secondary data 90
5.13 Quantitative data collection 90
5.13.1 Close-ended questions 91
5.14 Qualitative data collection 91
5.14.1 Advantages and disadvantages of open-ended questions 93
5.14.3 Observation 93
5.14.4 Interviews 94
5.15 Triangulation 95
5.16 Reliability 95
5.17 Validity 96
5.18 Administration of questionnaire 96
5.19 Data analysis 96
5.20 Cross tabulation 97
5.21 Analysis of variance (ANOVA) 97
5.22 Parametric statistics 97
5.23 Non-parametric statistics 97
5.24 Descriptive statistics 97

xii
5.25 Inferential statistics 98
5.26 T-test 98
5.27 Chi-Square (x2) analysis 98
5.28 Measures of central tendency 98 5.28.1 Mean 98
5.28.2 Median 99
5.28.3 Mode 99
5.29 Measures of variance 99
5.29.1 Range 99
5.29.2 Variance 99
5.30 Hypothesis testing 99
5.31 Ethical considerations 99
5.32 Ethical clearance Institutional Research Ethics 100
Committee (IREC)
5.33 Informed consent 100
5.34 Consent to conduct research at the University “A” 100
5.35 Anonymity 100
5.36 Confidentiality 101
5.37 Data presentation 101
5.37.1 The graph 101
5.37.2 The histogram 101 5.37.3 Bar chart 101
5.38 Dissemination of the data 101
5.39 Data types 102
5.39.1 Nominal scale 102
5.39.2 Ordinal scale 102
5.40 Likert scale 102
5.41 Conclusion 102
CHAPTER SIX – DATA PRESENTATION AND ANALYSIS 6.1 Introduction 103
6.2 Reliability Statistics 103
6.3 Validity 104

xiii
6.4 Data presentation and discussion 104
6.4.1Biographical data 104
6.4.2.1 Job and career satisfaction 112
6.4.2.2 General well-being 115
6.4.2.3 Control at work 117
6.4.2.4 Home-work interface 119
6.4.2.5 Stress at work 122
6.4.2.6 Working conditions 124
6.5 Overall scores 126
6.6 Correlations 127
6.6.1 Job satisfaction and general wellbeing 127
6.6.2 Job satisfaction and control at work 128
6.6.3 Stress at work and job satisfaction 128
6.6.4 Stress at work and general wellbeing 128
6.6.5 Working conditions and Job satisfaction 128
6.6.6 General Wellbeing and control at work 128
6.6.7 Working conditions and general wellbeing 128
6.6.8 Control at work and home-work interface 129
6.6.9 Stress at work and control at work 129
6.6.10 Working conditions and stress at work 129
6.7 Hypothesis Testing 132
6.7.1 Chi square analysis 132
6.8 Qualitative Data Analysis 132 6.8.1 Availability of policies 132
6.8.2 Positive factors: QoWL satisfaction 133
6.8.3 Negative factors: QoWL satisfaction 134
6.8.4 Influence on performance management 134
6.10 Interviews 135
6.10.1 Policies 135
6.10.2 Positive factors: QoWL satisfaction 135
6.10.3 Negative factors: QoWL satisfaction 136
6.10.4 Performance 136
6.11 Observations 136
6.12 Conclusion 137

xiv
CHAPTER SEVEN – CONCLUSION AND RECOMMENDATIONS 7.1 Introduction 139
7.2 Conclusion 139
7.3 Recommendations 141
7.3.1 Job and career satisfaction 141
7.3.2 General Well-being 142
7.3.3 Control at work 144
7.3.4 Homework interface 144
7.3.5 Stress at Work 145
7.3.6 Working condition 146
7.3.7 Policies 147
7.3.8 Performance Management 148
7.3.9 Recommendations for future research 149
7.4 Conclusion 149

xv
LIST OF TABLES TABLE NUMBER DESCRIPTION PAGE 6.1 Cronbach’s Alpha scores 104
6.2 Composition of the sample 105
6.3 Race 108
6.4 Job and career satisfaction 112
6.5 General Wellbeing 115
6.6 Home work interface 119
6.7 Stress at work 122
6.8 Working conditions 124
6.9 Overall mean scores 126
6.10 Correlations 127
6.11 Results of the chi square test 130

xvi
LIST OF FIGURES FIGURE NUMBER DESCRIPTION PAGE 2.1 Dimensions of the quality of work life 14
4.1 Public human resource management model of QoWL
70
6.1 Age 107
6.2 Gender 108
6.3 Education levels 109
6.4 Length of service 110
6.5 Job type 111
6.6 Current job level 111
6.7 Control at work 117

xvii
REFERENCES 150
Annexture A: Structured questionnaire Annexture B: Semi-structured questionnaire
Annexure C: Letter of information and consent
Annexure D: Ethical Clearance letter

1
CHAPTER 1 INTRODUCTION
1.1 Introduction Quality of Work Life (QoWL) has been a cause for concern in recent years. This has
captured the attention of employees and employers, more so due to workplaces
competing for suitably qualified and competent employees. Employers have utilized
QoWL factors as a tool for attracting and retaining talented employees. Higher
education institutions have not been an exception to this growing phenomena.
Organisations need to seek ways of improving their employees QoWL through
healthy and safe working conditions; better conditions of service; and adequate and
fair compensation amongst other factors. Institutions of higher education in the public
sector in South Africa, which is the focal point of this study, have to adopt these in
order to survive in this competitive environment. Universities need to utilise their
autonomy to develop and maintain QoWL by offering a wide range of support
systems to address issues such as absenteeism, sick leave, and turnover to improve
performance (Nataranjan and Annamalai 2011: 46).
The research is in the field of public management and it intended to provide an
extensive understanding of the variables that affect and determine quality of work life
in the public sector, within the context of higher education institutions. The purpose
of the study was to investigate the factors impacting on the quality of work life of
employees at University “A”. The research project also intended to understand the
factors that affect the quality of work life of employees at University “A”, with the aim
of improving performance and working conditions of those employees. This can be
achieved by acting upon the concerns that are raised by employees and providing
feedback to enhance the workplace environment, where employees feel that they
are valued. The research findings assisted in mapping out a retention strategy for
the institution.
This chapter provides a background to the study, the problem statement, the
rationale of the study and also the main aim of the study which is to assess the
perception of Quality of Work Life (QoWL) amongst employees at University “A”,
together with the interrelated objectives.

2
1.2 Background
Quality of work life (QoWL) is a mutually beneficial relationship between work, home,
the individual and the organisation. There are individual needs such as
remuneration, security and wellness that the organisation needs to satisfy to keep
the individual happy and motivated (Bagtatos 2011: 1). It is also critical to keep
employees happy so that in turn they can be able to better serve the clients, increase
morale and performance.
A paradigm shift in higher education institutions came with additional challenges to
employees which included increased workload, high stress levels, inadequate
resources, and increased job related pressures. University “A” is no exception,
employees may have to cope with changes in organisational restructuring, staffing
and resources. These transitions could possibly lead to increased medical boarding
applications, higher cases of unofficial leave, a high number of resignations and an
unsatisfactory working environment that impacts on QoWL.
Further, with the restructuring of higher education in South Africa, there could be an
urgency to develop policies and procedures. Another challenge could be the need for
consistency in implementing, monitoring and evaluation of these policies and
procedures. University “A” may not have a progressive programme as part of
employees QoWL and consequently this might have affected employee job
satisfaction and led in employees seeking employment elsewhere. There is a need
for research in QoWL to determine how best the needs of employees can be met to
improve performance and retention. However, the needs of the institution and the
needs of the employees should be interrelated. With a focus on six dimensions of
QoWL job and career satisfaction; general wellbeing; home-work interface; stress at
work; control at work and working conditions the study sought to understand the
perceptions of staff at University “A” on QoWL.
An institution can only function effectively if it takes into consideration the needs of
its employees and there is an assumption that there is a strong positive relationship
between QoWL and organizational commitment of employees (Normala 2010: 77).

3
1.3 Rationale The issue of QoWL has become critical in the last 20 years, because of increasing
competitiveness in the business world and the demands of the family structure
(Bagtasos 2011: 01). According to May, Lau and Johnson (1999), institutions that
offer a better QoWL are more likely to gain an advantage in attracting and retaining
valuable employees. There is also an assumption that there is a strong positive
relationship between QoWL and organizational commitment of employees (Normala
2010: 75). There are more similarities than there are differences in terms of what the
employer and the employee expects, such as performing, developing and obtaining
organisational goals. To attract and retain quality staff, the employee must take
advantage of the gaps identified such as minimising work related stress and
decreasing monotonous work and upgrading the workplace facilities to continually
improve the QoWL.
There has been no previous study that has been conducted on QoWL at University
“A”. The outcomes of this research will help in learning about QoWL of University “A”
employees. The study intends to explore and obtain a better comprehension of the
QoWL status in University “A” so as to provide intervention strategies. The
investigator observed that the QoWL at University “A” might appear to be poor. The
findings from this investigation will assist employees and management alike to
understand factors that can improve performance and assist University “A” to be an
employer of choice to attract, develop and retain suitably qualified employees.
1.4 Problem statement University “A” may face a serious challenge of retaining adequately qualified and
competent staff due to regular resignations and termination of employment contracts
of employees. This has resulted in a steady backlog of vacant positions and which
has affected the quality of teaching and learning. The deficit of academic staff leads
to increased teaching workloads and consequently impacts negatively on the quality
of teaching and learning. One of the threats facing University “A” is the inability to
retain highly qualified staff. High workloads, inadequate support resources and an
unsafe working environment, affects efficiency and performance. The poor QoWL
can cause high stress levels, because of work related demands and it can have
detrimental effects on family life and the general wellbeing of employees.

4
Given the importance of job and career satisfaction, it is important to ensure a good
QoWL for employees. It is critical for the research to be conducted to enable
appropriate intervention to be implemented with a view of improving QoWL of
employees. The study will assist in identifying the dynamics of QoWL in the
institution that needs attention and is a cause for concern at University “A”. When
institutions fail to include QoWL issues when introducing systems for improving
productivity, they will experience mass movements of quality employees to better
institutions (Cascio 2006).
1.5 Aims and objectives of the study The aim of the study is to assess the factors impacting on the QoWL within
University “A”.
The objectives of this study are,to inter alia:
1. Investigate the impact of policies and procedures on the QoWL.
2. Determine the influence of QoWL on the general wellbeing of employees.
3. Investigate the level of job satisfaction amongst University “A” employees.
4. Investigate the perceived causes of stress at work.
5. Determine the impact of QoWL on performance.
6. Explore the potential influence senior managers can have on quality of work life
in the public sector.
1.6 Literature review QoWL is determined by employee satisfaction with a variety of needs through
resources, activities and outcomes stemming from participation in the workplace.
Hackman and Oldhams (1980 as cited in Muftah and Hanan 2011: 110) and Sirgy,
Efraty, Siegel and Lee (2001) concur in terms of basing their definitions of QoWL on
the ‘needs’ of employees, “QoWL is employee satisfaction with a variety of needs
through resources, activities, and outcomes stemming from participation in the
workplace”. The conventional workplace environment has evolved because of the
current pressing needs of the employees like lifestyle values and therefore these
needs should not be ignored in order to satisfy the QoWL (Chitakornkijsil 2009: 214).
Nadler and Lawler (1983) define QoWL as “ A way of thinking about people, work
and the organistion. Its distinctive elements are (1) a concern about the impact of

5
work on people as well as on organisational effectiveness, and (2) the idea of
participating in organisational problem solving and decision making”. Kiernan and
Knutson (1990) on the other hand define QoWL as “An individual’s interpretation of
his or her role in the workplace and the interaction of that role with the expectations
of others. The quality of one’s work life is individually determined, designed and
evaluated. A quality of work life means something different to each and every
individual and is likely to vary according to the individual’s age, career stage, and/or
position in the industry”.
Most studies of QoWL are perceptual, as Johnsrud (2002: 380) indicates that
whether the QoWL in a certain institution is good or bad, the facts are not as
important as perceptions held by employees. It is further assumed that perceptions
matter (Bagtasos 2011: 4). Employees can be surveyed to assess their QoWL and
factors that influence QoWL like job satisfaction, homework interface and stress at
work. The information that is obtained from the assessment will be used to improve
the QoWL of employees (Edwards et al. 2009: 208).
The objective of QoWL is to improve performance and improve the working
conditions of employees (Koruca, Stowasser, and Ozdemir 2011: 103). Modern
lifestyle makes it difficult for employees to cope with work related pressure and
balance demands at home, therefore job performance will be affected and
employees will opt for another job. From the literature reviewed it is clear that QoWL
is a dynamic phenomena that has various dimensions and it is also a perceptual
subject that is dependent on the researcher. QoWL includes factors such as
organisational psychology and development, employee behaviour patterns,
organisational culture, sub-culture and traditions, motivational factors, morale and
workplace facilities.
The relationship between work life and home life is an issue that is raising concerns,
both in the private and public sectors (Wentzel, Buys and Mostert 2009: 1). Previous
research indicates that attention should be paid to enhancing QoWL at universities,
as it appears to be poor (Edwards, Van Laar and Easton 2009: 218). Poor QoWL
factors such as emotional stress are caused by increased workload by administrative
work and aligning curriculums together with policy and procedures and lack of

6
organisational support indicated the most significant factor of burnout amongst
academic staff (Rothman, Barkhuizen and Tytherleigh 2008: 418).
A study that was conducted by Viljoen and Rothman (2009: 67) indicated that the
employee’s experience of a particular occupational stressor resulted in lower levels
of organisational and individual commitment and also higher levels of physical and
psychological ill health. According to Rothman et al. (2008: 418), academics in the
South African context have been exposed to stress that is associated with
transformation with mergers, high teaching and research demands, multicultural
student profile, and a majority of students are coming from a poor primary and
secondary education background. This change affects both academic and academic
support staff, which collectively contributes to the effective functioning of the
organisation (Barkhuizen and Rothmann 2008; Mostert, Rothmann, Mostert and Nell
2008; Rothmann and Essenko 2007 as cited in Viljoen and Rothman 2009:67).
The advantages that are related to QoWL are; reduced sickness absence; low
turnover; absenteeism; improve retention; productivity;recruitment; high morale and
work commitment (Fuller 2006; Worral and Cooper 2006 as cited in Edwards, Van
Laar, Easton and Kinman 2009: 208). A study by Mammen (2006: 475 ) on higher
education academics’ satisfaction with their terms of conditions of service and job
satisfaction in a historically disadvantaged institution (HDI) in South Africa found that
when academics are not happy with their conditions of service and job satisfaction,
they are more likely to move away from the institution, if they cannot see any
attempts to rectify the situation. The author (Mammen 2006: 475) witnessed his
colleagues leaving the institution and was convinced that high quality academics with
low satisfaction with their conditions of service or job satisfaction were being hired by
potential employers leaving behind the less qualified and experienced behind. A
study by Field and Buitendach (2011: 1) on a tertiary institution in KwaZulu-Natal
attempted to evaluate the link between, happiness, work engagement and
organisational commitment of support staff revealed a significant positive relationship
between wellbeing and organisational commitment.
QoWL offers a mutually beneficial relationship between work, home the individual
and the organisation. There are individual needs such as remuneration, security and

7
wellness that the organisation needs to satisfy to keep the individual happy and
motivated (Bagtatos 2011: 1). The benefits of QoWL are reduced sickness; low
turnover and absenteeism; improved retention; productivity; recruitment; high morale
and commitment (Fuller 2006; Worral and Cooper 2006 as cited in Edwards, Van
Laar, Easton and Kinman 2009: 208).
1.7 Research Methodology The study type was that of a case study method and it employed both qualitative and
quantitative approaches. A probability sampling technique in a form of stratified
random sampling was utilised to draw the sample of 160 from a total population of
530 employees. Data was collected through a structured questionnaire to the
sampled population as well as semi-structured interviews were conducted with
senior management. The nominal scale was used for the biographical profiles,
whilst, the Likert scale was used with a scale of 1-5 to all the dimensions of QoWL.
The tool that was used is a questionnaire adopted from the 23-item WRQoL scale
developed by Van Laar, Edwards and Easton (2007) to measure six factors of
QoWL. The questionnaire is available in the public domain for use by researchers.
All responses in the six sub-scales were recorded on a five point Likert-type scale
(1= strongly disagree; 2= disagree; 3= undecided; 4= agree; 5= strongly agree)
(Edwards et al. 2009: 209).
The data was analysed using Statistical Packages for Social Scientists (SPSS)
version 20 and the Cronbach’s coefficient alpha was utilised to test the reliability of
the questionnaire. Descriptive statistics were used to describe patterns and trends in
the data set. Inferential statistics in the form of the t-test were utilised to test the
research hypothesis. Analysis of variance (ANOVA) was used to test for significant
differences between two means. Qualitative data was analysed with the assistance
of a computer programme, N-Vivo which allowed the researcher to organise and
analyse open- ended questionnaires to assess the correlations that may exist in the
data. Data was presented in graphs, bar charts and tables for cross tabulations.

8
1.8 Scope of the study The study focused on the entire University “A” population. The research adopted a
case study type of survey research in which a sample from the target population was
utilised for the study. In total, a sample population of 142 full time staff was selected
from a population of 530, using a probability sampling methodology in the form of
stratified random sampling. The target population was divided into 3 strata which
were as follows: academic, academic support and administrative staff, this ensured
fair representation since the different strata differ significantly in their functionality. All
the groups and departments were included in the study. With a focus on QoWL
factors impacting on University “A” the study was designed to achieve the objectives
set out by the investigator. The delimitation of the study was that some respondents
were suspicions that the research findings were going to be used for other purposes
other than the one it was intended for.
1.9 The significance of the study The research findings will motivate interventions to be taken to improve the QoWL.
The findings will prompt more questions to be examined and might probe further
research to be conducted about QoWL. The findings of this study will possibly
influence human resource development policies that focus on improving the QoWL
of employees. Further, staff and students will be the main beneficiaries of the project
because they will meet required educational standards by retaining quality staff
members. The findings of the study will also help to enhance employee’s personal
and professional well-being. Institutions realize that a happy employee is a
productive employee and therefore, the working environment must be improved.
1.10 Potential outputs The study utilized the data gathered on employees’ perceptions on QoWL to gain a
better understanding of QoWL with a view of improving the QoWL at University A.
Furthermore, other potential outputs are as follows:
• To assist University “A” to attract, develop and retain quality employees by
understanding their QoWL to enable appropriate intervention to be
implemented.
• The research will give valuable information about the wellbeing of
University “A” employees. If the QoWL of higher institution's workforce is

9
improved then there is a potential that the delivery of education to students
will be more effective.
• The research will contribute to Journal publications and add to the
valuable body of knowledge on QoWL in South Africa within higher
education from a public management perspective.
• The study will be presented at conferences to enable the researcher to
share information with other professionals from different fields with similar
interests. The conferences will also enrich the researcher’s knowledge on
QoWL in the workplace and it also is beneficial in opening up networking
opportunities. Information will also be shared during the group discussion
sessions that form an intergrated part of the conference.
1.11 Structure of the chapters 1.11.1 Chapter 1 - Introduction
This chapter introduced the research topic and give a background, research problem
and rationale of the study. This chapter outlined the introduction, background of the
study, the problem statement, the rationale of the study and also the main aim of the
study which is to assess the perception of QoWL amongst University “A” employees
together with the interrelated objectives.
1.11.2 Chapter 2 - International perspective
This chapter provided a literature review of the published material from the primary,
secondary and tertiary source of information. Variations in the definition of QoWL by
different authors were compared. Quality of work life and its dimensions were
covered in this chapter. The various concepts that are related to QoWL were clarified
and the researcher contrasted QoWL in the developed and developing countries.
The aim of the literature review was to have a comprehensive understanding of the
dimensions of QoWL such as, job and career satisfaction; general wellbeing; the
working environment; work-home interface; control at work and stress at work.
1.11.3 Chapter 3 - South African legislative framework and quality of work life.
This chapter focused on the QoWL in the South African context. A comparison was
made between the private and public sector in South Africa. Chapter 3 also reviewed
legislation that is interrelated with the quality of work life like the Occupational Health

10
and Safety Act 85 of 1993 and Basic Conditions of Employment Act 67 of 1995 and
other relevant legislation.
1.11.4 Chapter 4 - Public management and quality of work life.
This chapter focused on a detailed review of the available literature on public
management and the QoWL to provide an extensive understanding of the variables
that affect and determine quality of work life in the public sector as well as the private
sector. This chapter also concentrated on the legislation that governs Higher
Education landscape in South Africa.
1.11.5 Chapter 5 - Research methodology
This chapter discussed the research design; research strategies; sampling methods;
data collection and analysis. The questionnaire was discussed in terms of its design,
reliability and validity. For the purpose of this study, a qualitative and quantitative
questionnaire was utilised to understand employee perceptions about the QoWL at
the university so that the researcher can comprehend how it affects the institution.
The questionnaire was discussed in terms of its design, reliability and validity.
1.11.6 Chapter 6 - Data presentation and analysis of results
This chapter discussed the data analysis and interpretation of the research findings.
The results were discussed in line with the research objectives. The collected data
were thoroughly studied; the sample population results were scrutinized and
discussed in line with the research aim and interrelated objectives. The research
findings were compared with those by other researchers to demonstrate any
significant trends.
1.11.7 Chapter 7 - Conclusion and recommendations
Conclusions drawn were based on the research findings and literature review.
Interventions on how to improve the quality of work life of employees were discussed
in this chapter. This chapter entailed a comprehensive strategic plan of how the
stakeholders can bring about meaningful change that will improve the QoWL of
University “A” employees.

11
1.12 Conclusion This study was undertaken to ascertain factors relating to QoWL in University “A” in
an effort to address the objectives that have been raised. This chapter focused on
the background to the research, the problem statement and an overview of the
research methods that were utilised. This investigation was designed and planned to
explore the factors that impact on the QoWL of University “A” employees and
understand how these factors operate in order to promote performance and retain
employees. Although QoWL has been widely researched and proven to cause high
turnover and reduce performance, it has not been properly researched in the South
African context. QoWL factors must be researched and dealt with no matter how
minor they might seem especially in higher education institutions to improve
performance and to retain suitably qualified and competent staff. Literature on the
international perspective of QoWL will be reviewed in Chapter 2.

12
CHAPTER TWO INTERNATIONAL PERSPECTIVE ON THE QUALITY OF WORK LIFE
2.1 Introduction There is anecdotal evidence from research that the quality of work life (QoWL)
amongst employees of institutions of higher education is poor. The drastic changes
in institutions of higher education such as an increase in student population, past
inequalities, lack of resources and facilities, quality and shortage of skills exposed
employees to increased workloads and unsatisfactory working conditions.
As a result, these changes have not only affected the work environment, but also the
home life environment. This chapter intends to look at the conceptual framework of
the quality of work life and how it has developed over the years. Since the quality of
work life as a concept is multifaceted with varying constructs, this chapter will
investigate the different dimensions of the QoWL such as job and career satisfaction,
control at work, stress at work, general wellbeing, the work environment and work-
home interface. Finally, the quality of work life is contrasted between developing and
developed countries to compare the differences in the global arena.
2.2 Concepts relating to quality of work life The International Labour Organisation (ILO) stated that there is not one commonly
accepted definition of QoWL (World Labour report, 1989: 193). Hackman and
Oldhams (1980 as cited in Muftah and Hanan 2011: 110) define QoWL as the by-
product of the relationship between the work environment and personal needs. In
line with Hackman and Oldham’s (1980) definition, Lawler (1982 as cited in
Rethinam and Ismail 2008: 59) defines QoWL in terms of work conditions and job
characteristics. Solmus (2000 as cited in Koruca, Stowasser, Ozdemir, Orhan and
Aydemir 2011: 102) states that QoWL can be described as the degree of covering
the important personal needs of workers’ lives in the organisation. Sirgy, Efraty,
Siegel and Lee (2001: 241) affirm that QoWL is determined by employee
satisfaction with a variety of needs through resources, activities and outcomes
stemming from participation in the workplace. Hackman and Oldhams (1980), Sirgy
et al. (2001) together with Solmus (2000) concur in terms of basing their definitions
of QoWL on the ‘needs’ of employees. Lau, Wong, Chan and Law (2001 as cited in

13
Rethinam and Ismail 2008: 59) defines QoWL as the favourable working
environment that supports and promotes satisfaction by providing employees with
rewards, job security and career growth opportunities. Supporting the view of
‘satisfaction’, Serey’s (2006: 8-9) definition relates to meaningful and satisfying work.
Schemerhorn, John, Hunt, James, Orsborne and James (1994: 56-57) suggests that
QoWL offers fair pay, a safe working environment, opportunities to learn and utilize
new skills, career progression, upholding individual rights and pride in the
organisation. Kiernan and Knutson (1990: 105) define QoWL as methods which
serve the individual’s needs and the organisational effectiveness.
QoWL can therefore be seen as a ‘partnership’ or a symbiotic relationship between
the organisation and the employees. Literature reviewed indicates that there are
many different interpretations of QoWL. There seems to be an agreement amongst
the different authors that QoWL covers employee’s needs, satisfying work
environment, and meeting certain goals of the organisation. The definition of QoWL
appears to be dependent on the perception, objectives, experience, point of view
and the circumstances of the individual or group. It can be suggested that QoWL is a
multi dynamic concept that has varying constructs and dimensions that can be
determined by the interests of the researcher.

14
Figure 2.1 Dimensions of the quality of work life
Source: VanLaar, Edwards and Easton. 2007. 325- 333.
It is critical to understand the dimensions of QoWL such as job and career
satisfaction; general wellbeing; stress at work; control at work; working conditions
and work-home interface in order to analyse them and establish measures to control
them. These dimensions play an important part in performance systems and to
increase the efficiency and effectiveness of the organisation.
2.3.1 Job and career satisfaction Job satisfaction can be described as the satisfaction that employees receive from the
internal and external factors of their career including pecuniary and non-pecuniary
needs such as fair remuneration, training, development opportunities, management
style and organisational culture (Chitakornkijsil 2009: 215). It is the feelings and
attitudes of how people perceive their work psychologically and it is a known fact that
job satisfaction results in qualitative and quantitative improvement in performance.
QUALITY OF WORK LIFE
General well-being
Job and career satisfaction
Stress at work
Control at work
Working conditions
Home-work interface

15
When people are satisfied with the job that they are performing they tend to be
motivated and are more interested in the job, which in turn gives them the
psychological satisfaction (Ganguly 2010: 210). In a study by Johnsrud and Rosser
1999 (as cited in Johnsrud 2002 : 390) that determined the university administrative
staff ‘s QoWL in relation to morale, identified nine work related aspects that define
the morale of the administrative staff as follows career support; working conditions;
discrimination; review/intervention; diversity; recognition for competence;
gender/race issues; intradepartment relations and external relations. Even the
satisfaction of academic employees is an important factor that must be assessed,
because quality higher education globally depends on the steady and supportive
academic work environment and on academic staff performance (Winter, Taylor and
Sarros 2000: 281).
Employees may believe that their job is satisfying, interesting, motivating and
stimulating, if there are cognitive aspects that represent their beliefs about the job or
job circumstances. By actively attending work regularly, working hard to stay
motivated and planning to remain in the organisation for a long period is an
indication of job satisfaction. Rethinam and Ismail (2008: 63) argue that job
satisfaction of individuals is different in importance and meaning, according to the
work circumstances. Competencies can be developed by the nature of the job that
one performs and if that job provides stimuli for skills development, motivation,
knowledge and opportunities for career or organisational development. Learning
opportunities and skills development have been proven to have a positive effect on
job and career satisfaction and less job stress which results in better QoWL
(Rethinam and Ismail 2008: 64). In-service training workshops as well as ‘personal
development plans’ (PDPs) at University “A” may assist employees to acquire new
skills that will advance their career. Furthermore, this could possibly enhance
University “A” staff with opportunities for career growth and advancement, job
enrichment as well as personal development.
Some employees feel satisfied about their career and job if they are able to
accomplish their set goals at work, when they are trained and developed, and are
given the opportunity to be able to utilize the newly acquired skills. Furthermore,
recognition and acknowledgement from the supervisor will make one feel satisfied

16
and appreciated at work (Li and Yeo 2011: 40).The authors state that employees
view their career development in the organisation as a way of improving their QoWL.
This includes opportunities to learn and training that will contribute towards
professional development; increased competency levels and expertise. Furthermore,
when employees enlarge and enrich their job through training and professional
development, they will attribute QoWL to a time period where they will see
themselves progressing as more valuable employees (Li and Yeo 2011: 42).
The institutions that give career developmental opportunities and support will reap
more benefits by ensuring that employees realize how to proactively manage their
own career (Coetzee, Bergh and Schreuder 2010: 2). Workers feel valued when they
can make use of their acquired skills and alternate from their normal duties and
avoid monotonous work. University “A”, as a public organisation may influence
employee retention if it focuses on employee development which might be
neglected.
University “A”’s retention strategy should include fringe benefits, while a good
remuneration package will satisfy employees, or a challenging work project will
provide career and job satisfaction. By paying employee salaries that are much lower
than what their counterparts are being offered might impact on high rates of
absenteeism, low productivity, industrial action and high attrition rates. Job
satisfaction and QoWL can be utilised to enhance the general wellbeing of
employees and the organisation as a whole.
2.3.2 General wellbeing According to the World Health Organization (2002: 2), health can be defined as ‘a
complete state of physical, mental and social wellbeing and not just the absence of
disease’. Wellbeing as part of QoWL refers to the physical and psychological factors
of an individual in any working environment. To Meyer and Botha (2000), wellness
refers to a state of being that must be reached for wellbeing to be experienced, and
this can be realised by through appropriate policies and legislation as they will be
discussed in the next chapters. In a study by Botha and Brand (2009: 1) that
assessed the wellness behaviour and health risk levels of managers in two South
African universities, the findings indicated that physical fitness, nutrition, medical

17
self-care and wellness behaviour levels were identified as weak among managers for
which urgent control measures were required. The purpose of a wellbeing
programme should be to improve the general wellness of employees and to promote
the good and healthy lifestyles of employees in University “A”.
While most empirical studies on the relationship between QoWL and employee
wellbeing have been conducted in developed countries, there is little research
carried out in developing countries (Rathi 2010: 59). Employee wellbeing will be
discussed under the following dimensions, physical and physiological; psychological
wellbeing; emotional; intellectual and mental; social; ethical; spiritual and
psychological wellbeing.
2.3.2.1 Physical and physiological wellbeing A study by Rothmann, Barkhuizen and Tytherleigh (2008: 417) investigated the link
between burnout; ill health; job demands and resource, and disproportional optimism
of academic staff in an institution of higher learning in South Africa. The findings
revealed that job demands and a lack of job resources led to burnout of academics,
which resulted in physical and psychological ill health. The findings also revealed
that a lack of teaching resources, increased academics’ levels of exhaustion and
cynism. Kinman, Jones and Kinman (2006: 15) reported on national studies that
were conducted in the United Kingdom (UK) which showed that psychological
distress amongst higher education employees exceeded those of many other
professional groups and the general population.
Each occupation has its physical and physiological requirements in order to perform
the task. Occupations in information technology and the office environment include
new stressors that are physically demanding called technostressors, these are
caused by daily frustrations of system crashes and computer viruses. Moreover, the
symptoms of technostressors are linked to physical and psychological conditions
such as backache, insomnia and low morale (Ismail and Rethinam 2008: 61).
According to Imail and Rethinam (2008: 61) technostressors involve the pressure of
mastering the information technology applications such as daily frustrations of
system crashes and computer viruses, which often lead to work intensification and
work related stress. Moreover, the symptoms of technostressors are linked to

18
physical and psychological conditions such as backache, insomnia and low morale
(Ismail and Rethinam 2008: 61).Further, there must also be a fit-match between the
individual and the required job. For example, one cannot expect a blind person to be
an electrician or a 40kg woman to carry a 60kg load. A study conducted by
Srivastava (2007: 347) concluded that a suitable working environment enhances the
physical and psychological health of employees.
2.3.2.2 Psychological wellbeing The psychological state of mind of an employee has a great impact on personal and
work life and is influenced by a satisfying job that is free from stress, monotony,
frustration and alienation (Al-Qutop and Hussein 2011: 198). A research study
amongst secretaries at the University of Botswana, identified 17 occupational
stressors that were associated with psycho-physiological wellbeing such as
insomnia, headache, fatigue, exhaustion and nervousness (Plattner and
Mberengwa 2010: 5). In a study conducted by Oliver, Jose and Brough (2006: 845-
846) on non-academic staff of a university, it was discovered that job satisfaction and
social support in the workplace enhanced employees’ psychological wellbeing. It is
critical to improve the QoWL to reduce the risk of physiological, psychological and
emotional stress. According to Sithole (2001: 80) university academic and academic
support employees experience increased rates of depression.
Michie and Williams study (2003: 3) showed that the key work aspect that are linked
with psychological ill health in staff were long working hours, work overload and
pressure, lack of control over work, lack of participation in decision making and
unclear management and work role. Stress factors such as poor working conditions
and heavy workloads were significantly and negatively associated with job
satisfaction and psychological strain. These had an effect on the wellbeing of
academic staff in a Nigerian university and in addition employees ought to be in a
good psychological state of mind to enable them to perform their duties effectively,
psychological is closely related to emotional wellbeing (Ladebo and Oloruntoba 2005
: 212).

19
2.3.2.3 Emotional wellbeing Smelzer and Bare (2004: 101) state that emotional wellbeing is the ability to
acknowledge, accept and express emotions appropriately, accept personal
limitations, and function comfortably and productively. The workplace is an emotional
place whereby varying emotions are expressed, such as pleasure, excitement, fear,
doubtfulness, respect, self-esteem, security, safety, courage, love, optimism
friendship and empathy. When employees are assisted to do their jobs better, the
institution benefits and the employees feel a sense of achievement and satisfaction
that boosts their self esteem and emotional wellbeing.
A study by Partridge (2012: 122) indicated the importance of meeting the emotional
wellbeing of staff in order to meet the emotional wellbeing needs of students and it is
imperative that staffs' needs are listened to. The study highlighted that staff needed
to feel contained, offered opportunities to offload, process, staff need to understand
their emotions and responses to manage them effectively and reflect and emotional
wellbeing must be promoted in the workplace.
According to Sinclair (2009), people who are emotionally well, are capable of
building supportive social networks, which increases their sense of belonging to the
organisation. In this regard, the supervisor and other co-workers should empathize
with each other and develop a friendly and supportive environment. Sharing the
same vision and goal creates a sense of belonging. Leadership that is appreciative,
effective, friendly and supportive can encourage open communication at work
through the establishment of social clubs, physical activities and other recreational
activities. Emotions play an important role in how people feel and express
themselves at work, University “A” as a public organisation must strive to create a
conducive working environment that enhances positive emotions and mental
wellbeing.
2.3.2.4 Intellectual and mental wellbeing To enhance responsible citizenship at organisational, community, national and
international level requires the continuous development of the intellectual capacity of
individuals far beyond job related training and development. Education should cover
skills, attitudes, expertise and knowledge that serve all the welfare spheres.

20
Underutilisation of skills leads to low self esteem, discouragement, feelings of failure
and a decrease in organisational commitment (Morrison, Cordery, Girardi and Payne
2005: 75). According to Goetzel, Ozminkowski, Sederer, and Mark (2002: 320),
depressed employees exert a significant cost burden for employers and there is
evidence that employee depression may have its greatest impact on productivity
losses such as increased absenteeism, high turnover, and suboptimal performance
at work.
According to Paton (2013: 16), most academics and academic support staff are
under excessive pressure of performance related scrutiny and expectations of
management and students and this level of stress is damaging to the mental and
physical health. Moreover, management is not doing enough to support their staff in
dealing with the work demands. University “A”‘s core business is teaching and
learning, it is therefore logical that it rewards and promotes a culture of investing in
its employees through education and therefore, it should offer opportunities for
education and development so that employees can be supported and empowered
through active participation and knowledge sharing. This can be achieved by
providing opportunities for paid leave for employees to attend seminars, workshops,
conferences where they can interact with their peers at different institutions who are
in the same field. This will benefit the employee the department, organisation and it
will also benefit the employees mentally and socially
2.3.2.5 Social wellbeing Human beings are social beings who have a need to socialise and interrelate with
other humans that they work with. The organisation should encourage and support
employees to develop caring relationships with colleagues and external stakeholders
that interact with the employees so that they can be accepted as being part of the
larger network (Al-Qutop and Harrim 2011: 200). According to Helliwell and Putman
(2004: 1437), people who have developed a wide network of close friends and
colleagues have a lower chance of experiencing depression, sadness, loneliness, a
low self esteem and problems with eating and sleeping.
In a study by Viswesvaran, Sanchez and Fisher (1999: 329), it appeared that social
support reduces the strains of stress, reduces the strength of the stress factors and it

21
alleviates the effects stressors on strains at work. For example, University “A” can
enhance the social wellbeing of employees by redesigning jobs according to the Job
Characteristics Model (JCD) which allows workers to interact with wider internal and
external stakeholders, build a team based organisational structures that enhance
social networks, and integrate structures that allow free flow of communication.
Reasonable and equitable workloads that will allow employees to engage in
recreational activities that accommodates families on and off the work premises.
Furthermore University ‘A’ must promote social responsibility engagement with the
surrounding historically disadvantaged communities, and employees at University
“A” must strive to be socially responsible which will encourage ethical behaviour.
2.3.2.6 Ethical and moral wellbeing Unethical behaviour tarnishes the image of the organisation, if the leadership and
employees in general do not aspire to reach high moral behaviour. A very crucial
challenge facing many organisations is unethical behaviour. Unethical behaviour is
manifested through maladministration, misconduct, nepotism, favouritism, corruption,
and bribing as well as financial manipulation especially by managers, violation of the
basic rights of people by discrimination and embezzlement (Al-Qutop and Harrim
2011: 200).
Any institution should enrich a strong ethics culture that emphasises integrity,
honesty, openness, truthfulness, accountability, transparency, equity, risk tolerance,
collaboration and the protection of basic human rights. Higher education institutions
must be run in an open and transparent manner whereby all transactions and
activities are accountable. University “A” must engage and implement a code of
conduct that clearly stipulates which behaviours are acceptable and which ones are
unacceptable in public management and workshop employees on the code of
conduct. Further, it is vital to institutionalise and implement policies, procedures,
committees and any other necessary measures to implement the ethics code of
conduct. The ethical survey that was carried out by (Klynveld Peat Marwick
Goerdeler) KPMG, the Public Service Commission and Transparency South Africa
revealed that the ethics training which organisations provide is too brief and it
excludes new appointees and managers (Malan and Smit 2001: 4; Nicolaides 2009:
49).

22
Public managers should set an example by being role models who openly
communicate ethical expectations, provide ethical training and openly reward good
ethical behaviour, penalize unethical behaviour, provide protective measures for
whistleblowers, whereby employees can discuss the ethical challenges without fear
(Robbins and Coulter 2005: 60). Respect for core human values like dignity, basic
human rights and good citizenship is good for QoWL within higher education
institutions (Robbins and Coulter 2005: 199). University professionals with
competencies, practical skills and public service values can make a significant
contribution to the lives of people they interact with.
Ethical wellness coincides with the “Batho Pele” principles which are integrated into
the White Paper for transforming Public Service Delivery in South Africa (1997: 15).
The “openness and transparency” of “Batho Pele” principle implores the public sector
institutions to be open and honest about all aspects of their work. Moreover, to curb
irregular spending; overspending; wasteful; and fruitless expenditure; there should
be accountability and responsibility if public resources are to be utilised effectively
and efficiently. Employees should always apply high ethical behaviour or conduct in
performing the organisational duties. University “A” must strive to train employees to
adhere to ethical behaviour.
2.3.2. Spiritual wellbeing Banks (1980 as cited in Kamya 2000: 232) define spiritual wellbeing in terms of the
four components (i) unifying force that integrates physical, emotional and social
dimensions of wellness, (ii) a source of meaning to life which serves as driving force
for personal achievement, (iii) a bond that brings individuals together to share
compassion and adhere to a set of principles and (iv) a source of individual
perception to acknowledge the supernatural and to experience pleasure. To
Marques (2008: 25), spirituality in the workplace is an experience enhances trust
amongst stakeholders, whereby it is developed by an individual and then leads to
the creation of a motivational culture encouraging improved performance and
organisational excellence.
Purdy and Dopey (2005: 97) concur that spiritual wellness is the common key factor
that determines the individual’s health and satisfaction within each dimension

23
(physical, emotional, intellectual, social and occupational). Constructing and
maintaining a spiritual organisation is a challenging task that requires consistent
changes in organisational structures, culture, leadership and training. According to
Mcdonough (2011: 2), spirituality wellness in QoWL is not necessarily related to any
religion, yet it affects how employees interrelate with each other everyday and this
has a significant influence on an employee’s happiness and wellbeing. Spirituality is
a critical component of QoWL and it must be incorporated in the employee wellness
programme. Developing a spiritual organisation requires a people focused
organisation that stimulates an organisational culture based on the following three
main factors: core values; organisational climate; and workplace attributes such as
job design.
The organisational structure can be redesigned to enrich spirituality. The general
wellbeing aspects of employees are not the only factors that should be taken into
consideration. Employee health must also be observed holistically to alleviate stress
at work.
2.3.3 Stress at work
There are many definitions of stress as it is perceived to be a subjective matter.
Chan, Lai, Ko and Boey (2000: 1420) define stress as the response to the perceived
relationship between a person and the work environment that threatens the
individual’s physically, psychologically and physiologically. Work pressure and work
stress increase physical sickness and psychological diseases. There is also clear
evidence that show that negative acts by superior and colleagues such as strict
monitoring, excessive criticism and withholding information constitute workplace
bullying (Lewis and Gunn 2007 as cited in Van Schalkwyk, Els and Rothmann 2011:
4). It is reported that there is a positive correlation between employees who have
been exposed to high stress levels for a period of over two years in a high strain
environment and high systolic blood pressure (Rethinam and Ismail 2008: 61). A
survey that was conducted in the United Kingdom based Association of University
Teachers (AUT) (2003 cited in Barkhuizen and Rothmann 2008: 323) indicated that
work home balance and excessive workload are amongst the most common
reported causes of stress amongst academics.

24
Work related stress and depression are other forms of stress that contribute to poor
health. Employees can develop various symptoms of stress that can negatively
affect job performance, health and the ability to cope with the environment. Research
indicates that in recent years in the United Kingdom, Canada, United States of
America, Australia, China and India, occupational caused stress is significantly
extensive in higher education (Kinman, Jones and Kinman 2006: 16). Distractions
and interruptions in a form of emails, telephone calls, visits by a colleagues cause
delays in the work to be performed and employee will require extra time to finish the
job. Mark, Gudith and Klocke (2008: 107) research suggested that employees
recompense for interruptions by performing their job more rapidly, but this comes at
a cost of employees experiencing more stress, heightened feeling of frustrations,
time pressure and effort. The employee who is interrupted will need more time and
perform under pressure to complete the task and this will add more stress to the
individual and therefore hinder QoWL.
A study by Gillespie, Walsh, Winefield, Dua and Stough (2001: 53) that focused on
understanding university staff’s experience of occupational stress, perceptions of the
sources, consequences and moderators of stress in 15 Australian universities,
revealed that both academic and general staff reported increased levels of stress
during the previous five years, however academic staff reported much higher levels
of stress than the general staff. There were five major causes of stress identified,
insufficient funding and resources, work overload, poor management practice, job
insecurity and inadequate recognition and reward. The majority of respondents
indicated that work-related stress was having a detrimental impact on their
professional and personal life. In addition, aspects of the work environment such as
support from colleagues and management, recognition for achievement, high
morale, flexible working patterns and personal coping mechanisms such as stress
management techniques, work/non-work balanve, tight role boundarie and lowering
of standards were reportrd to assist staff cope with stress. Another study of New
Zealand universities by Boyd and Wylie (1994) noted that high workloads and job-
related stress led to less time spent on research activities, publishing and
professional development, decreased teaching and research standards and
increasing interpersonal conflict amongst academic staff. Furthermore, it was also

25
reported that stress at work negatively impact on the physical and emotional health,
family relations and leisure activities of both academic and general staff.
It has been noted that South African managers are adversely affected by heart
disease because of increased workloads, lack of physical exercise and poor QoWL
(Nzimande 2008: 3). When employees feel that their needs are not met, they are
more likely to encounter stress at work which may lead to adverse health effects and
also affect performance at work, (Gallie 2005). A study conducted by Court and
Kinman (2008: 54) that included 9740 employees in U.K higher education intitutions
revealed that more than fifty percent of the participants indicated that they
experienced generally high or very high levels of stress, and almost one third
indicated that they experienced unacceptable levels of stress. High work demands
and increased workloads lead to longer working hours, and in turn causes workplace
stress, especially if employees have low control over their work.
2.3.4 Control at work A number of research studies with a focus on job components like job control have
indicated that the combination of low control at work and high demanding job
functions have an impact on health, wellbeing and on the QoWL. (Rethinam and
Ismail 2008: 62). Griffin, Fuhrer, Stansfeld and Marmot (2002: 783) indicated that
both men and women with low control at work or at home had a high risk of
developing anxiety and stress, but women in the in the lower or middle employment
grades who also reported low control at work or home were at most risk for
depression and anxiety. Paoli and Merlie (2000: 12) confirm that there has been a
sharp decline in the level of job control amongst some occupations.
Williams (2003 as cited in Plattner and Mberengwa 2010: 1) indicates that work
related stress was once viewed as present only in senior positions, is currently
acknowledged that it can be experienced at all levels of employment. In addition,
stress is much more prevalent in employees at lower levels of the workplace
organogram, where they have less control over their work processes. According to
Spector (1986: 1013-1014), employees who perceive reasonably high levels of
control at work are more satisfied, committed, involved and motivated, in addition
they experience less emotional and physical illness and are less absent at work.
26
With increased control, there is increased responsibility and usually an increased
workload. The locus of control at work has been shown to be an important variable
influencing behaviour at work by affecting various work related variables, including
job satisfaction, job performance, turnover and commitment (Oliver, Jose and
Brough, 2006: 835).
High job demands with limited low control reduce the ability and opportunity to
develop new skills and knowledge. This can reinforce negative attitudes such as
depression and anxiety which diminishes QoWL (Rethinam et al. 2008: 64). Kinman,
Jones and Kinman (2006: 15) indicated that the perception amongst higher
education employees is that the work demands have increased with a decrease in
job control and support. Furthermore, the majority of health and safety standards at
work are not met at United Kingdom universities. More emphasis should be placed
on controlling the work conditions to improve QoWL.
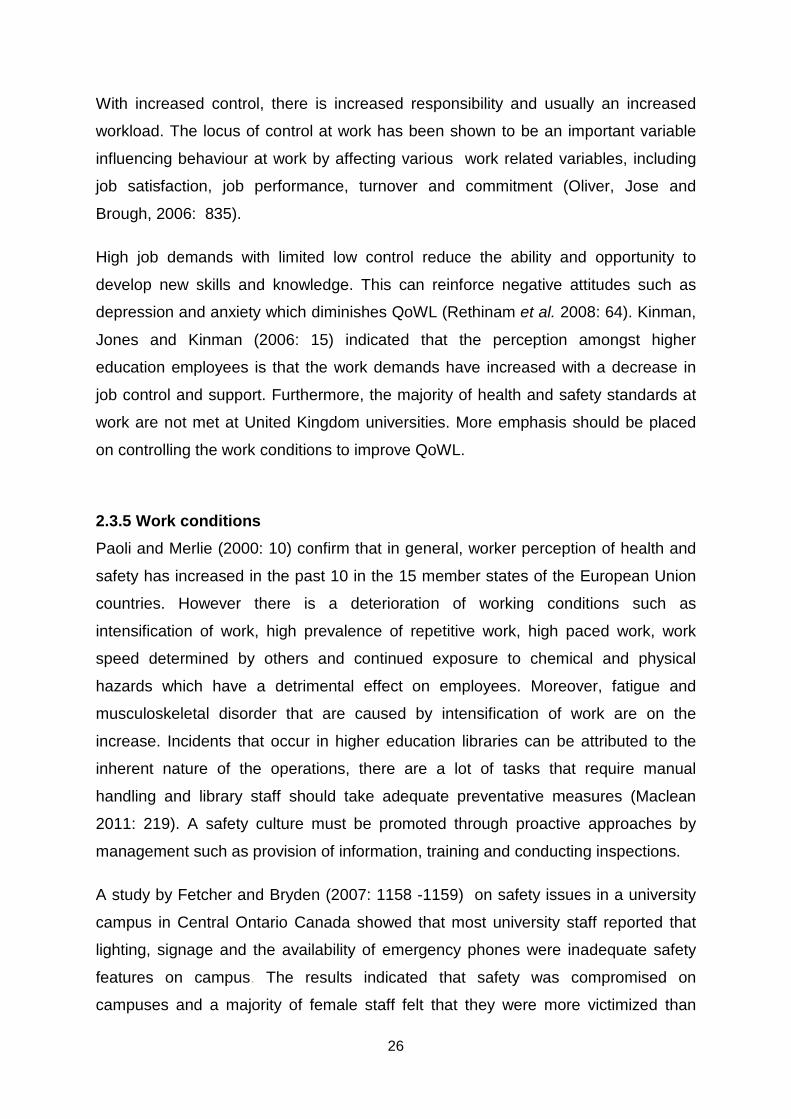
2.3.5 Work conditions Paoli and Merlie (2000: 10) confirm that in general, worker perception of health and
safety has increased in the past 10 in the 15 member states of the European Union
countries. However there is a deterioration of working conditions such as
intensification of work, high prevalence of repetitive work, high paced work, work
speed determined by others and continued exposure to chemical and physical
hazards which have a detrimental effect on employees. Moreover, fatigue and
musculoskeletal disorder that are caused by intensification of work are on the
increase. Incidents that occur in higher education libraries can be attributed to the
inherent nature of the operations, there are a lot of tasks that require manual
handling and library staff should take adequate preventative measures (Maclean
2011: 219). A safety culture must be promoted through proactive approaches by
management such as provision of information, training and conducting inspections.
A study by Fetcher and Bryden (2007: 1158 -1159) on safety issues in a university
campus in Central Ontario Canada showed that most university staff reported that
lighting, signage and the availability of emergency phones were inadequate safety
features on campus. The results indicated that safety was compromised on
campuses and a majority of female staff felt that they were more victimized than

27
others. Malone, Denny, Dalton and Addley (1997: 25-30) have identified the physical
aspects of work related noise, unfavourable thermal conditions and lighting in the
workplace as occupational stressors.
The United States of America (USA) government demonstrated its seriousness in
the enforcement of health and safety laws by increasing their budget for such
purposes by 14 million dollars (Neuman 2010). Perceived health risks that are
associated with the use of computers does not deter library based Nigerian
university staff from using information system due to their benefits compared to the
manual system (Uwaifo 2008: 68). Even though a wide range of health hazards were
identified in the libraries, the level of availability of ergonomic programmes to control
them was low.
Another study revealed that the majority of employees spend more than 95% of their
time indoors and the indoor air quality adversely affects their health comfort and
QoWL (Steenkamp 2002: 80). Employees feel a sense of achievement and change
when their workplace hazards are corrected and this leads to a feeling of
satisfaction. Poor working conditions like high noise levels, badly designed work
stations and long working hours can have a negative impact on employees at work
and at home.
2.3.6 Home work interface A major dimension of QoWL which critically affects the relationship between the
individual and the organisation is the interaction between work and home life.
Research studies on hours of work and health confirm that consistent long hours at
work results in physical and psychological ill-health. The latest technology of wireless
connection in the workplace has created virtual workplaces and borderless
organisations so that people can work anywhere without being restricted by the
physical working environment (Kreiner, Hollensbe and Mathew 2009: 704). The
authors furthermore state that the ‘workplace’ is no longer necessarily a physical
location, meaning that work can be done at anyplace at any time. Therefore,
employees can find themselves taking work home and spending long hours
performing work and subsequently compromising their personal lives. This creates
complexity in terms of the home work interface.

28
There is also an association between long hours and family disintegration as a study
by Elisa and Ellen (2001 as cited in Almuftah and Lafi 2011: 113) uncovered that
most employees indicated that their long working hours have negatively affected
their personal lives. Furthermore, the authors affirm that home-work imbalance has
implications for the organisation as well as for the individual. The more the workload
and commitment, the more the spillover of negative work outcomes in personal life.
The high demand at work and at home are more likely to be a cause of stress
because it permits spillover to family life and therefore disturbing the equilibrium
between work and home (Elisa and Ellen 200 as cited in Almuftah and Lafi 2011:
113). The opposite is also true, an increase in home responsibilities and
expectations will contribute to a negative spillover in the workplace. The author
further asserts that problems associated with family responsibility are additional
sources that may decrease the QoWL.
The spillover between work and home has critical consequences on the employees
QoWL, moreover work and personal related conflict can cause negative health
effects for employees, they may also decrease organisational commitment, job
satisfaction and increase burnout which will ultimately result in poor QoWL
(Rethinam et al. 2008: 65). A study that was conducted by Place and Jacob
(2001:102-103), confirmed that academic staff who spent a significant amount of
time with their family, were less likely to develop stress than the one who did not.
Quick, Henley and Quick (2004: 426) concur, as the home-work conflict increase, the
job satisfaction and life satisfaction of employees decrease, this leads to low levels
of general happiness and wellbeing and intensions by employees to leave their
current workplace. The home-work conflict is further exacerbated by the modern
competitive workplace environment, self imposed demands, workaholism, work
related travelling, alcohol consumption and sleep deprivation. Another factor in
home-work balance is the distance from home to work. The results from Spies
(2006: 133) study show that increasing commuting distance does not necessarily
cause decrease job satisfaction, however there are other factors that play a role
such as the mode of transport and the actual distance from home to work.

29
According to Dex (2004 cited in Downes and Koekemoer 2011: 2) work life balance
was identified as a key factor in the retention strategy of the 23 Best Companies to
Work for Survey in 2003. Furthermore, by lowering the level of spillover the
perceived stress and psychological stress can be reduced and contribute toward
striking a balance between work and home. The United Kingdom government
launched a work life campaign through the Department of Trade and Industry which
was endorsed by Prime Minister Tony Blair in March 2000. This was done in an
effort to encourage employers to introduce flexible working practices to enable
employees to achieve a better balance between work and home, and therefore
contributes to lower absenteeism and staff turnover and better productivity
(Arrowsmith 2000).
Organisations must come up with other employment practices to control the effects
of spillover without affecting career growth. Finding the correct equilibrium between
work and home should be the core interest of organisations who want employees to
perform at optimal levels, this is an emerging phenomenon in developed and
developing countries.
2.4 Quality of work life in developed and developing countries A comparative analysis will illustrate the quality of work life in the global arena
between developed and developing countries.
2.4.1 Developed countries The QoWL concept has been applied mainly in different parts of the industrialised
countries in Europe as well as Canada, United States of America (U.S.A), Japan and
Australia and it has led to more humanised workplaces and better performance of
the workforce (Wyatt and Wah 2001: 59). In Japan, the majority of managers
deliberately take less leave period to offer more time to their organisations. However,
the general workforce does not follow the same practice as they would rather use
their leave to spend time with family or for leisure purposes. Japanese managers
work hand in hand with their subordinates in order to make collective decisions, and
remuneration in Japan is linked with aging which is given by tenure as far as
permanent government employees and medium and large enterprises are concerned

30
(Chitakornkijsil 2009: 222). Various developed countries also have unique
challenges that relate to the specific circumstances.
For most developed countries like France, Great Britain and Germany, there is an
opportunity for employees to take time off work and go back to school to further their
studies (Chitakornkijsil 2009: 221). A study by Winter, Taylor and Sarros (2000: 279-
291) on the quality of academic work life within a comprehensive Australian
university, disclosed that most academics experienced low levels of feedback,
minimal opportunities to influence university decision making processes and role
overload. During the era of public sector transformation, academics reported high
levels of workloads, meeting deadlines under pressure, depleting resources,
stresses and demotivation. Furthermore, the merger of institutions with completely
dissimilar traditions created a new cultural identity and this was a mentally agonizing
experience for academics both personally and professionally and this lead
academics to feel demoralized and cynical.
Korucha, Stowasser, Ozdemir, Orhan and Aydemir (2011: 103) state that
occupational health and safety at work is evident in regulations and standards in
almost all the developed countries. Moreover, most developed nations have created
legislation that will make QoWL to be progressive such as the United States which
has safety laws, wages, pension laws, labour laws, but it still lacks laws that deal
with meaningfulness of job opportunities for the personal development of employees.
Developed nations that belong to the European Union and the World market are
pushing their developing countries producers to make the necessary legal
arrangements to improve QoWL (European Agency for Safety and Health at Work.
2008). Therefore the QoWL of these exporter companies has increased.
Employees in developed nations are at liberty to choose which shifts they want to
work and still enjoy the benefits of study and vocational leave. Developed nations
are more stringent in enforcing the health and safety and labour related legislation
than their developing countries counterparts.

31
2.4.2 Developing countries More attention has been given to developed countries in terms of QoWL and to a
lesser extent on developing countries. Except for Japan, Asian countries have
placed little emphasis on QoWL as compared to North America and Europe. Hence,
there are fewer organisations who are implementing QoWL programmes (Bagtatos
2011: 3) . There is also less published research material on QoWL in the Southeast
Asian region (Wyatt and Wah 2001: 60). In addition there is evidence that has been
presented by Normala (2010: 75), that research on QoWL amongst employees in
Malaysia, Indonesia and Asian countries is still very scant. Furthermore, Wyatt and
Wah’s (2001: 59) study examined perceptions of QoWL amongst Singapore
employees, and the findings supported the factors that impact on QoWL from various
parts of the world such as favourable working environment, personal growth and
autonomy, the nature of the job and stimulating opportunities.
There is a belief that the concept of QoWL is based on the corporations of the United
States of America and they propagate the idea to other parts of the world, including
the southeast region (Childs 2003). Developing countries like China are experiencing
drastic economic developments and are taking QoWL factors into consideration to
give them a global competitive advantage. In a study that was conducted in China by
Chan and Wyatta (2007: 511), it was discovered that there was a positive
relationship between satisfaction of the need to be recognised and appreciated and
how satisfied employees are with their lives at work. Moreover, in the same study
there was a negative association between the employee’s, family needs, economic
needs, self actualization and employees’ wellbeing in non-work life. The implication
is that employees with low self actualization were under pressure at work which
spilled over negatively in their non-work life general wellbeing. This study affirmed
that perceived higher QoWL is associated with organisational commitment.
A study by Tabassum, Rahman and Jahan (2012: 52-53) which evaluated the QoWL
of faculty members of universities in Bangladesh, provided the most positively and
negatively perceived QoWL factors by the faculty members of the universities. The
faculty members perceive the social relevance of QoWL and safe and healthy
working conditions as the most positive factors of QoWL and negatively perceived
factors were career growth and job security, adequate remuneration and the

32
opportunity to utilise and develop human capacities. The study concluded that from
the overall evaluation employee welfare, freedom of speech, management
consciousness about employee needs, fair and adequate compensation,
performance based incentives, university reputation and equal employment
opportunity can significantly affect faculty member’s QoWL.
According to a study by Mercedes and Caceres (2002: 381), which was conducted in
Argentina, Brazil and Chile, study leave was perceived as an important factor in
determining economic development for all three countries. Regarding work
outcomes, there was a decrease in placing a lot of effort to perform the work with
intensity and this had implications on job security which led to more costs in terms of
higher workloads from employees in all three developing countries. In all three
countries, the strongest correlation was between the level of education which is
associated with higher income and promotion. There is anecdotal evidence that
QoWL in the Nepalese workplace is deteriorating and this is seen by poor
performance and dissatisfaction amongst employees at work because of poor
implementation of labour laws (Adhikari, Hirasawa, Takakubo and Pandey 2012: 78).
Due to globalisation, developing countries cannot avoid labour issues in their
process of economic growth, as this is the period when employees are more aware
and take interest in their roles as consumers and producers. Developing countries
need to comply with the legal labour requirements to enable them to compete
globally.
2.5 Trends between developing and developed countries. The conditions in developing and developed countries are significantly different and
therefore the dimensions of QoWL that may be important in developed countries
may not be so in developing countries.
According to Tamini, Yazdany and Bojd (2011: 368), about 83% of the workforce in
developed countries such as the U.S.A. and Great Britain, work in a structured work
environment whereby the job is more functionally detailed and specific and usually
involves constant feedback to the supervisor. Conclusions from the European Union
(E.U.) wide research indicated that working time arrangements and flexible working

33
arrangement policies are of major interest amongst employees (Krings 2009: 9).
Employees show more interest and preference in regulating their work time
schedules because flexible working arrangements play a major role in balancing
work and family life. Developing countries such as Bangladesh, Malaysia, Thailand
and Sri Lanka are working long hours and there is a decline in working hours in
developed countries such as Great Britain, Germany and Netherlands with the least
working hours (Stephenson 2012). The author further adds that stringent labour laws
in developed countries, especially in Europe, have contributed toward reduced
working hours.
Research by Carlier, Llorente and Grau, (2012: 286), indicated that even though
developing Latin-American countries have organisations that support work-life
policies, those policies that are not well implemented because of a lack of
understanding of QoWL by managers and staff. Adhikari, Hirasawa, Takakubo and
Pandey (2012: 78) further affirm that dissatisfaction amongst employees in Nepal, a
developing country, are caused by poor implementation of labour laws. Labour laws
such the occupational health and safety regulations and standards are implemented
in almost all almost all developed nations. (Korucha, Stowasser, Ozdemir, Orhan
and Aydemir 2010: 103). It is clear from the aforementioned literature that developed
nations are more stringent in implementing labour laws that impact on QoWL than
their developing countries counterparts.
Another common factor amongst European Union countries is that females are faced
with the challenge of changing their work time pattern due to cultural and political
separation of work and family life by gender, which causes career dissatisfaction and
inequality amongst females (Krings 2009: 73). A study in an Arab developing country
by Sidani, Hakim and Zeina (2012: 1376), revealed that despite being educated,
females were underpaid and their upward career development seemed to be
significantly hampered. They furthermore more reported a higher work-family
conflict, low job satisfaction and had intentions to leave their organisation. Women
seem to face similar challenges of career dissatisfaction and work-family balance
irrespective of whether they are in developing or developed countries.

34
The concept of QoWL has been researched in many developed countries, evidently
due to globalisation, QoWL research is now spreading outside the developed nations
into developing countries (Akanji 2012: 248). This clearly shows that there is a
growing concern about QoWL both in developing and developed countries.
As much as there are differences between developed and developing countries,
there are also similarities that have been noted between such countries.
Globalisation is instrumental in bringing out QoWL in both groups of countries.
Developing countries must integrate QoWL factors into their employment practices to
compete with the developed countries for a market share. Developing countries must
ensure better implementation of the labour laws that impact on QoWL.
2.6 CONCLUSION From the literature reviewed, it can be concluded that QoWL is widely defined by
various authors (Hackman and Oldhams 1980; Lawler 1982; Solmus 2000; Sirgy,
Efraty, Siegel and Lee 2001; Lau, Wong, Chan and Law 2001; Kiernan and Knutson
1990). It is viewed as a dynamic concept that is informed by varying constructs such
as job satisfaction, productivity, adequate remuneration, fringe benefits, the work
environment, the employer and employee needs. It is clear incorporating QoWL
factors into the workplace presents various benefits and organisations need to take
advantage of these benefits.
From the aforementioned literature it can also be stated that there is a considerable
difference between developing and developed countries. Developed countries have
more progressive legislation, programmes and research relating to QoWL. QoWL is
a growing concern in developing countries because of the changes in the current
workplaces such as globalisation. The next chapter focuses on the QoWL in the
private and public sector in South Africa. Legislation that is interrelated with the
QoWL will also be reviewed.

35
CHAPTER THREE SOUTH AFRICAN LEGISLATIVE FRAMEWORK AND
QUALITY OF WORK LIFE
3.1 Introduction The radical political and socio-economic paradigm shift in South Africa brought about
new challenges in institutions of higher learning. These challenges exposed
employees in higher education to new demands such as rapidly growing needs in
tertiary education, quality standards, research outputs, technology transfer and
community engagements. Despite these growing needs, the needs of employees
that affect their quality of work life (QoWL) such as their conditions of service,
resources and the work environment are being overlooked. Currently, many South
African organisations are involved in a process of large-scale organisational change
and it is therefore the responsibility of organisations, particularly management to
ensure that employees who commit themselves fully to achieve the organisational
objectives also experience a high QoWL (Kortze 2005: 97).
This chapter focuses on the QoWL in the South African context. A comparison is be
made between the private and public sector in South Africa. Moreover, this chapter
will review legislative framework that underpins QoWL.
3.2 Legislation Verespej (1999: 37) states that inequalities that are created by workload, lack of
skills and global business pressures are now emerging in South Africa with
associated social problems. According to Sanichar (2004: 34-35), South Africa does
not have legislation that is responsible for putting into practice flexible working hours,
this may be due government prioritising issues that are perceived to be more critical
like employment equity, unemployment and minimum wages over flexible working
time. Flexible working patterns are particularly important to employees, because it
allows them to accommodate their personal and family commitments in order to
better balance work-life responsibilities.

36
3.2.1 Basic Conditions of Employment Act 75 of 1997 The Basic Conditions of Employment Act (BCEA) 75 of South Africa (S.A) (1997)
forms the employee’s employment contract. It regulates factors that are related to
the (QoWL) such as working time, leave and remuneration. Section (10) of the BCEA
75 of S.A. (1997: 9) stipulates that the employer must not allow employees to work
overtime, unless if it is by agreement with the employee. This is relevant to the stress
at work dimension which addresses the question of excessive workload that may
require employees to work extra hours, thereby compromising their QoWL.
According to the BCEA 75 of S.A. (1997: 13-16), public employees are entitled to
annual, sick, maternity, paternity and family responsibility leave to balance the home-
work interface dimension. Employees must utilize the leave options that they are
offered to promote and enhance a healthy work-life balance.
Section 7(d) of the BCEA 75 of S.A. (1997: 8) stipulates that the employers must
take into account the family responsibility of employees when regulating the working
time of each employee. The South African Employment Equity Act 55 of 1998: Code
of Good Practice on the integration of Employment Equity into Human Resource
Policies and Practices (1998: 24) resonates this by requiring the employer to make
reasonable provisions to accommodate pregnant women and parents of young
children, including health and safety adjustments and antenatal care leave.
Furthermore, it states that the employer must endeavour to provide an accessible,
supportive and flexible working environment for employees with family
responsibilities. This includes considering flexible working hours and offering
sufficient family responsibility leave for both parents (Dancaster and Cohen 2010:
41). The employer must consider employees with family responsibilities and offer
them flexible working arrangements that will assist them in enhancing their QoWL by
balancing work and family responsibilities.
Van Jaarsveld (2002: 418) argues that family responsibility leave is not adequate. It
is currently three days annually, especially considering the fact that it has to be used
in various circumstances such as funerals or sick child, to name a few. In addition,
this excludes a lot of employees in the private sector because to be eligible for this
leave, an employee has to work a minimum of days per week and therefore many
part-time workers in the private sector may forfeit this leave. University “A”

37
employees are also eligible for study leave which assists in taking time off to
enhance skills by furthering studies and advancing their careers.
3.2.2 Employment Equity Act 55 of 1998 The purpose of the Employment Equity Act 55 (EEA) of S.A. (1998: 5) is to make
provision for fair labour practices, redress the effect of discrimination so that the
South African public can be well represented in the workforce which is in line with the
International Labour Organisation (ILO) requirements. On the question of pregnant
women, section (6) of the EEA 55 of S.A. (1998: 7) states that no person shall be
dismissed or discriminated against on account of pregnancy. The South African
EEA 55 (1998) is responsible for transforming the designated groups that were
previously sidelined, but are now a significant component of the workforce that is
changing conventional family roles and adopting the white culture (Potgieter and
Barnard 2010: 1). The EEA 55 of S.A. (1998) had an impact on white employees
because to balance the discrepancies of the past there is a need to recruit more
black employees. According to Singh, Robinson and Williams-Green (1995: 401),
black female academics might face challenges such as confronting racism, sexism
and special challenges in promotion and tenure.
In a study on the effects of change and transformation at a South African University
by Mapesela and Hay (2006: 722), it was noted that academics had different
viewpoints regarding the implementation of the EEA 55 of S.A. (1998). The majority
of white academics were mostly uncomfortable with the fact that appointment and
promotions were going to be based on race and gender as opposed to subjective
academic merits and competencies. The authors further indicated that the black
academics felt that the implementation of the EEA 55 of S.A. (1998) was not meeting
their expectations.
The EEA 55 of S.A. (1998:7) also has to advance the mandate of affirmative action
whereby groups from previously disadvantaged backgrounds have to be
accommodated in order to enjoy equal opportunity and be equitably represented in
the workforce. According to Portnotoi (2003: 79), affirmative action in South Africa
means that suitably qualified people from designated groups must be well
represented in the public or private organisation. The EEA 55 of S.A. (1998) faces

38
certain challenges in the in the higher education institutions as Universities employ
employees with highly specialised skills both in academic, technical, and
administrative fields.
Higher education institutions (HEI) have to deal with the challenges of employment
equity, which are regulated by the EEA 55 of S.A. (1998). The EEA 55 of S.A.
(1998: 10-11) requires that higher education institutions as public organisations to
meet certain employment equity goals and develop employment equity plans and
committees. The process of developing employment equity plans and an
employment equity committee has already been initiated at University “A”. HEI
management is mandated to drive the process that will impact on the human
resources composition in terms of gender, race, and physical domination to balance
the demographics and comply with the requirements of the EEA 55 of S.A. (1998)
(Sebola and Khalo 2010: 203).
The equity and redress matters cannot be ignored and it is quite evident that equity
issues and targets must be achieved through institutional transformation and must
be reached because they are of national importance. The higher education working
environment must be conducive and allow every individual independent of gender a
fair chance to develop within the organisation. For example the EEA 55 of S.A.
(1998: 10-11), legislative point of view is that there are targets that have been set
and there is a strong case for placing deserving, competent and adequately qualified
women in key positions within institutions of higher education.
According to Portnotoi (2003: 82-84), the shortage of qualified and competent
employees from the previously disadvantaged groups has led to another
phenomenon called “poaching”. Designated group applicants are being attracted by
lucrative salaries and other employment benefits and this phenomenon of poaching
impacts on universities and the private sector. Moreover, the financial crisis that the
universities are undergoing makes it difficult for universities to attract and retain
quality employees. Universities require higher qualifications such as Masters
degress and Doctor of Philisophy degrees than most organisation in the private
sector, hence it is even more challenging to acquire suitably qualified candidates for

39
university positions. These issues make it detrimental to the implementation of the
EEA 55 of S.A. (1998).
The fact that the EEA 55 (1998: 7) of South Africa promotes the employment of
previously disadvantaged groups to redress gender and racial imbalances, it is more
likely that the blacks and female numbers will increase in universities. The
recruitments should not be done to increase the numbers only, but also to ensure
that the previously disadvantaged, especially black females are occupying key
positions in universities.
3.2.3 Skills Development Act 97 of 1998 The shortage of skilled and qualified employees in tertiary institutions is a major
challenge in the public sector. The purpose of the Skills Development Act (SDA) 97
of S.A. (1998: 2) is to provide an institutional framework to forge and implement
national, public and private sector workplace strategies to develop and improve the
skills of the South African workforce. These workplace strategies should be
integrated within the armpit of the National Qualification Framework (NFQ) in the
South African Qualifications Authority (SAQA) Act 58 of S.A. (1995) to provide
learnerships that lead to recognised occupational qualifications. Due to the NFQ, not
only are academics required to perform their normal academic duties, they are also
required to implement the newly developed curriculum which placed an increased
workload on them (Mapesela and Hay 2006: 722).
Grieves (2000: 8), upholds that the nature of knowledge can mostly be witnessed in
a technologically advanced environment, knowledge application is critical to the
operation of public organisations in dynamic environments that are service delivery
orientated, and universities are highly technological places. The SDA 97 of S.A.
(1998: 8-9), underpins the job and career dimension of QoWL which seeks to
understand if employees at University “A” are encouraged to develop new skills and
if they are satisfied with the training they receive to perform their jobs effectively.
To enable employees to perform their jobs effectively, they have to be trained and
this part and parcel of Total Quality Management (TQM). TQM training must be
implemented from the top management and cascaded down to be fully effective and

40
it must be in-cooperated into the organisational culture (Vermeulen and Crous 2000:
62). To improve QoWL there must be an integrated quality management and
organisational culture that must be instilled by top management to employees
through training because quality assurance issues cannot be ignored The SDA 97 of
S.A. (1998: 14) influences the health and wellness of employees in that it enhances
the development of employees who were previously lacked competencies by up-
skilling them and therefore reducing their stress levels when they perform their duties
(Sieberhagen, Rothmann and Pienaar 2009: 23).
Section 2(1) (a) of the SDA 97 of S.A. (1998: 8) further stipulates that its purpose is
to improve the quality of life of the South African workforce, their prospect of work,
labour mobility, competitiveness, improve productivity in the workplace and to
improve the delivery of social services. There are structures that have been
established to ensure that the SDA 97 of S.A. (1998: 14) achieves its objectives of
improving the skills of the South African workforce such as the Sector Education and
Training Authorities (SETAs), to provide for learnerships that lead to recognised
occupational qualification and the submission of workplace skills plans.
Skills Development Facilitators are critical in the implementation of the SDA 97 of
S.A. (1998) in the sense that they are responsible for assessing the skills needs of
the organisation and drawing up and properly administrating the skills plan. In an
interpretive research study on skills development in South African Higher Education
Institutions (HEI), Botha and Potgieter and (2009: 246) investigated the perceptions
of Skills Development Facilitators (SDF) in relation to the challenges experienced by
Higher Education Institutions (HEI) with the implementation of the SDA 97 of S.A.
(1998). The results indicated that all the SDFs viewed the SDA 97 of S.A. (1998) as
being primarily labour-orientated and informal learning through seminars and
conferences was perceived as the most relevant form of learning in HEI especially
by academic staff and this directly influences their career development and thus their
QoWL. Furthermore, the HEIs will face challenges implementing the SDA 97 of S.A.
(1998) because it is labour orientated and therefore academic staff will be excluded
because they are perceived as people who are well skilled with top academic
credentials.

41
Skills development initiatives by the SDA 97 of S.A. (1998) can be viewed as another
way of improving competencies and QoWL of employees in the private and public
sector. Lee (2002: 4) is of the opinion that the private and public organisations are
considering the SDA 97 of S.A. (1998) as just another system of taxation. Both
public and private sector employees can benefit from SDA 97 of S.A. (1998) if it is
implemented correctly because it places responsibility on the employer to develop
scarce and critical skills of employees, including education and training on health
and safety.
3.2.4 Occupational Health and Safety Act 85 of 1993 The health and safety of employees is very important in the employment contract
and employees are vulnerable. It is therefore justifiable for the government to
intervene statutorily by enforcing the Occupational Health and Safety Act (OHSA) 85
of S.A. (1993). Section (8) of the OHSA 85 of S.A. (1993: 13) imposes an obligation
on every employer to provide and maintain, as far as is reasonably practicable, a
safe working environment that is risk-free to the health of employees and this
obligation emanates from the Constitution of South Africa Act 108 of S.A. (1996),
which states that every person is entitled to a safe and healthy working environment.
Kruger’s (2012: 20) research aim was to investigate the perceptions and experiences
of health and safety representatives within an academic hospital with regards to the
OHSA 85 of 1993. The main finding was that the representatives perceived
supervisors as not being supportive enough when it came to health and safety, even
though executive management supported them by dealing with challenges identified
and attending health and safety committee meetings. According to Malczyk and
Tissima (2010:18) employee health and safety should be a priority for all employers
and employees.
According to the Industrial Health Unit (1999: 2) the OHSA 85 of S.A. (1993: 22-23)
is based on the principle that dangers in the workplace must be addressed by
communication and co-operation between the employee and the employer, both
parties must proactively identify and control hazards to make the work environment
safe. This clearly demonstrates how the employer employee relationship is crucial in
ensuring a safe workplace and therefore good QoWL. The OHSA 85 of S.A.

42
(1993:18) further places a duty on the employer to provide information and training
on the hazards that are associated with the work, this obligation can be fulfilled by
the SDA 97 of S.A. (1998). Health and safety education and training is vital because
it influences both management and workers’ behaviour.
Section (7) of the BCEA 75 of S.A. (1997: 8) necessitates employer to regulate the
working period of every employee and take into account the health and safety of
employees. This indicates how both the BCEA 75 of S.A. (1997) and the OHSA 85 of
S.A. (1993) interconnect to safeguard the health and safety of employees. The
inspectors are empowered to enter any premises that are occupied by the employer
for the purpose of assessing compliance with the OHSA 85 0f S.A. (1993) (Grogan
2005).
A conclusion can be made that the development of the OHSA 85 of S.A. (1993) is to
a large extent interrelated with QoWL aspects to the benefit of the employees. If an
employee sustains a serious injury or disease that is work related the Compensation
for Occupational Injuries and Diseases Act (COIDA) 130 of 1993 deals with the
aftermath of that incident.
3.2.5 Compensation for Occupational Injuries and Diseases Act 130 of 1993 Where the OHSA 85 of S.A. (1993) has failed to protect the employee and the
employee is injured, COIDA 130 of S.A. (1993) takes over. COIDA 130 of S.A.
(1993: 17) provides a system of no-fault compensation for employees who are
injured while in the line of duty or those who develop a work related disease. This
means that the employer is protected against all civil claims which may be instituted
against him/her in the event of an injury on duty, even if the employee was negligent.
COIDA 130 of S.A. (1993) makes it simple for employees because they do not have
to prove anything to claim compensation. Furthermore, section (56) of COIDA 130 of
S.A. (1993: 30-31) makes provision “increased compensation’ to be paid if it can be
proved that the employer was negligent.
The employee who is injured while on duty is entitled to benefits such as payment of
compensation in respect of temporary total disablement, permanent disability, and
death benefits to dependents. Furthermore reasonable medical expenses arising out

43
of the injury on duty are payable for periods of up to two years or longer if further
medical treatment will reduce the degree of disablement. COIDA of 130 S.A. (1993)
is influential to the health and wellbeing of employees in that it makes provision of
compensation for employees sustain work related injuries or diseases, Sieberhagen,
Rothmann and Pienaar (2009: 22).
According to Adams and Jeebhay (2002: 228), there is link between work and ill-
health and only a minority of employees are diagnosed, reported and have their
claims fully administered for compensation and this has implications for the QoWL
affected employees and their employment prospects. Work related stress in another
critical factor that affects the QoWL of employees, Guild, Ehrlich, Johnston, and
Ross (2001: 412) noted that an employee can claim for work related Post Traumatic
Stress Disorder (PTSD) under COIDA 130 of S.A. (1993) even thought it lays down
very strict requirements for claims relating to PTSD. According to Guilt et. al. (2001:
409) COIDA 130 of S.A. (1993) suffers from a number of challenges besetting the
occupational disease claims such as poor quality of completion of forms, insufficient
details are given and this results in long waiting periods between the submission and
acceptance or rejection of the claim.
The Industrial Health Unit concurs (1999: 8), that the system is exceedingly slow and
cumbersome because of its centralised nature, and sometimes medical practitioners
are reluctant to handle cases of occupational disease as they may not be reimbursed
if the claim is not accepted, this results in gross under reporting occupational
diseases. If there are any disputes regarding the compensation claim between the
employer and the employee the Labour Relations Act (LRA) 66 of S.A. (1995) can be
utilised to resolve the dispute.
3.2.6 Labour Relations Act 66 of 1995 Section (185: 145) of the LRA 66 of S.A. 1995 (1995) makes provision for every
employee not to be unfairly dismissed or subjected to unfair labour practices. Where
an employee claims that he/she has been unfairly dismissed on the basis of
misconduct or incapacity, the dispute will be referred to the Commission for
Conciliation, Mediation and Arbitration (CCMA) for conciliation, and if the dispute is
still unresolved it will then be referred for compulsory arbitration to the CCMA or

44
Bargain Council. If an employer terminates an employee’s fixed term contract before
the term expires, then that employer will probably be challenged as a repudiation
which constitutes unfair dismissal (Buthelezi v/s Municipal Demarcation Board 2004).
The aforementioned section of the LRA (185: 145) of S.A. (1995) clearly indicates
that this piece of legislation enhances the job security of employees and protects
them from unfair dismissal and treatment, and this is linked to the job satisfaction
dimension of the research questionnaire. Furthermore, section (187) of the LRA 66
of S.A. (1995: 146) prohibits the automatic unfair dismissal on the ground of
pregnancy, intended pregnancy or any other matter that is related to pregnancy. It
can be concluded that the LRA 66 of S.A. (1995) favours employees in that it makes
it difficult for an employee to be dismissed and the employer runs the risk of paying
heavy compensation if the dismissal is unfair because the employer did not follow
the right procedure in terms of the act. This legislation also addresses the issues of
unfair treatment by sexual harassment.
Section 203 of the LRA 66 of S.A. (1995: 168-169), protects an employee from being
sexually harassed by providing A Good Code of Practice on Handling of Sexual
harassment Cases in the Workplace by the National Economic Development and
Labour Council (NEDLAC). Wilken and Badenhorst (2003: 203) point out that most
institutions of higher learning in South Africa have sexual harassment policies in
place even though there is little evidence to prove their effectiveness. Furthermore
the authors state that it is not enough that the policy has been developed, it must be
clearly written, readily available and reviewed to ensure that it is effective. A study by
Joubert and Van Wyk (2010: 1) that represented 10 higher education institutions in
South Africa showed that despite the existence of sexual harassment policies, they
are not effective in dealing with sexual harassment and few academics received
training on the utilisation of the policy. Regular training on the contents of the sexual
harassment policies and reviewing the policy will assist in alleviating the challenge of
sexual harassment in HEI.
Another fundamental principle of the LRA 66 of S.A. (1995: 86-89) is the right to
freedom of association, particularly to form and join a union and exercise the right to
an industrial action for the purpose of remedying a grievance or dispute of mutual

45
interest subject to certain legal requirements. The LRA 66 of S.A. (1995) also
introduced a new concept of workplace forums, DuToit, Woolfrey, Murphy, Godfrey,
Boschman and Christie (1998: 45) noted that this represented a paradigm shift from
the conventional collective bargaining between employers and trade unions.
The workplace forums under section (79) of LRA 66 of S.A. (1995: 75) seeks to
enhance efficiency and worker participation in the decision making process in the
workplace. Msweli-Mbanga and Potwana (2006: 29) confirmed that if employees
have access to participate in work related matters, they are less likely to resist
change in the organisation. Employees must be involved in the decision making
processes to avoid resistance. The LRA 66 of S.A. (1995) therefore sets out a
platform for employees to voice out their opinions in terms of quality of work life
matters in the private and public sector.
3.3 Public and private sector perspective The relationship between work life and home life is an issue that is raising concern in
both the private and public sectors (Wentzel, Buys and Mostert 2009: 1). The past
Chairperson of the Council of Higher Education (CHE) raised an issue about the low
remuneration for Higher Education (HE) academic staff in South Africa, both in the
private and public HEI (Reddy 1998: 5). Therefore, the terms and conditions of
service for academic staff and their job satisfaction are likely to have an impact on
academic staff commitment to quality development, quality management and quality
assurance to improve service delivery (Reddy 1998: 6).
Kubler and Lennon (2007: iii) discovered in their academic staff salary survey that
the salaries of graduates in the private sector are much higher than salaries of
academics in all countries surveyed, more so in South African institutions where the
salaries are very distinct. Nieuwenhuizen’s (2009: 310) research aim was to identify
the reasons and practical solutions to the challenge of attracting and retaining
academic staff in HEI. The findings showed that there are major scarce skills in the
fields of management and business management, not only in HE but in public-and
private sector. The problem in HEIs is exacerbated by attempting to attract potential
employees at relatively low salaries as compared to the private-public sectors and
even compared to non academic managerial positions in universities.

46
Increased workload through administrative work and aligning curriculums together
with policy and procedures and lack of organisational support were indicated as the
most significant factor of burnout (Rothman et. al. 2008: 418). According to Pantit
and Pant (2010: 173), the QoWL aspects that affect job satisfaction in public
hospitals are, free working lunch, work related training, rented accommodation
provided by the institution and a proper health and safety policy. While for private
hospitals it is a free lunch, availability of rented family residence and on the job
training, this study discovered that the major difference between private and public
sector hospitals, was the provision of the health and safety policy in the private
sector hospitals but not in public hospitals.
While government aims at delivering services, the private sector focuses on making
a return on investments. For University “A” to survive, it depends on the business
approach of the organisation. To Dowling (2006: 6), private higher education in
South Africa is not homogeneous, there are two main types, firstly there are those
institutions that provide education for non-profit purposes and the other delivers high
quality education for profit whereby most of the funds are derived from students. In
addition, the main distinguishing factor between public and private HEI is that private
institutions are financially independent of the government. However, it is noteworthy
that not being government funded does not necessarily mean independent of the
state control and regulation. The policy framework requires private and public HEI to
achieve the same policy objectives.
According to Keefer and Khemani (2005: 470) people from disadvantaged
backgrounds rely on public service that is managed by higher education graduates,
these graduates offer service delivery that is predominantly from education, health
and welfare. Furthermore, the South African government and the public sector’s
objectives are on other issues such as unemployment, crime prevention, poverty
alleviation, social welfare HIV/AIDS. Therefore, the government and the private
sector are delaying to respond to transforming social and economic pressing issues
that adversely affect the South African employee and their families (Nzimande 2008:
3). Volkwein and Parmley (2000 as cited in Johnrud 2002: 390 ) found teamwork is
positively linked with satisfaction and interpersonal work stress is negatively related

47
to satisfaction that these predictors of satisfaction held among administrators in both
private and public institutions.
Work related obligations are just as important as non-work obligations and workers
must ensure that they manage their home life so that it does not adversely affect
their lives at work. Some companies in the private sector have already started with
work life balance programmes whereas implementation in the public sector is still
minimal (Apgar 2000). The government must lead by example in driving the QoWL
initiatives because there are common goals and challenges in the private and public
sectors concerning QoWL.
3.4 Females and quality of work life Most females in South Africa are still faced with the challenge of juggling work
demands and home responsibilities which include raising children. Due to the EEA
55 of S.A. (1998), between 1995 and 2005 there was a significant increase of
women entering the workplace, the majority of which were black women (Van der
Westhuizen, Goga and Oosthuizen 2007: 47-48). In addition the authors indicate that
black, young and poor women are still the most vulnerable group in the work force in
terms of remuneration and being discriminated. There seems to be no change in the
gender roles of women besides them entering the world of work, they are still
caretakers and primarily responsible for household responsibilities.
Female academics in particular, are likely to get fewer rewards and less recognition
for their work and to face numerous challenges in the highly dynamic kaleidoscope
of South African higher education (Bezuidenhout and Cilliers 2010: 1). To cite a
statement by Olsen, Maple and Stage (1995: 267) which might be relevant in the
South African context: “By and large enthusiasm for increasing the number of
women and minorities (blacks) on our campuses has outstripped our understanding
of the experience of these traditionally underrepresented groups in academe”. The
authors further stated that female academics derive a high level of intrinsic rewards
from their academic work and are in dire need for organisational support. The
University of Venda Business Plan 2005-2010 (2005: 41) displays striking disparities
in the ratio of male and female employees amongst different work categories,
whereby women are still under represented.

48
In a study by Schultz (2005: 768) about black female academics confirmed that the
job satisfaction of this group was linked to intrinsic aspects of their employment, such
as enjoyment of teaching, contact with students, serving the community and the
growth that teaching generated. In addition, their job satisfaction was enhanced by
having their own private offices and flexible working arrangements. The
dissatisfaction of this group was caused by intrinsic factors such as lack of
achievement in the research field, high workloads, lack of funding to attend
conferences, inadequate facilities, unfair remuneration, heavy administrative work
and meetings, job insecurity and a flawed promotion system. This group needs an
emotionally supportive environment, become better researchers, administrators and
academics.
A study by Barkhuizen and Rothman (2008: 332-333) showed that the academic
environment is still predominantly male dominated and there is a notion that female
academics may experience more stressors that their male counterparts because of
gender stereotypes and lack of role models. Furthermore, extended working hours in
an attempt to juggle work and home responsibilities might make female academics
to be more likely to be exposed to psychological health and wellbeing risk factors. In
addition Dancaster and Cohen (2010: 33), state that employers are reluctant to
promote flexible working hours.
Women academics are still facing various challenges in academic institutions such
as gender discrimination, promotions and unsatisfactory conditions of service and
home-work balance. HEI management can contribute substantially to improve the
performance and QoWL of this group.
3.5 Performance management and quality of work life The main aim of management is to achieve optimum performance of its employees.
This is possible if the people work in an integrated manner whereby they work as a
collective toward a common objective which is the University “A”s vision and mission.
Employees spend most of their time at work and therefore demands better quality of
life in the workplace and it is the very same people who ensure the performance of
the organization. The main purpose of public organizations is service delivery and
this can be achieved by integrating performance management and the QoWL

49
successfully. This highlights the need to focus on organizational culture, its norms,
traditions and behaviour patterns.
The current situation around South African companies is that this emerging culture
has different dimensions such as job satisfaction; job control; home-work interface;
general wellbeing; working conditions, depending on the service being offered. Some
companies in the private sector are in the process of transformation, with some in
the initial stages while others are still in denial (De Witt 2001)
Managers are under pressure to ensure that their subordinates attain high levels of
productivity. Higher education institutions are facing a challenge of addressing
performance management of academic staff (Mapesela and Strydom 2004 as cited
in Molefe 2010: 1-2). The authors furthermore state that the absence of a
performance management instrument leads to demotivation amongst employees, in
particular the high performers and those in need of development. A study by Molefe
(2010: 1) that called for an investigation on performance management dimensions
that can be utilised for evaluating the performance of academic staff, verified that
lectures’ performance can be measured on the basis of seven performance
dimensions. The study has a potential of capacitating the management of
universities in South Africa with a guideline for developing policy on performance
evaluation for lecturers.
To attain organisational goals, employees should be able to participate in the
decision making process and understand the relationship between the individual
goals and organisational business processes and the measurement must be linked
to a reward system (De Witt 2001). According to Mweemba and Malan (2009: 370),
a positive effect of performance management on QoWL requires a strong emphasis
on open communication and interrelations in the organisation. Performance
management driven organisation, There is a need to close the gap between
performance and improving the QoWL of their employees.

50
3.6 Conclusion The unique history and characteristics of South Africa such as the socioeconomic
and political transformation has affected employee’s experience of QoWL differently
in comparison to other countries. HEI operate under the same policy framework that
requires similar objectives therefore factors that impact on the QoWL both on the
private and public such as remuneration, scarce skills health and safety matters
should be managed to ensure good QoWL. Women, particularly black, were
traditionally marginalised, apart from the strides that the South African government
has made in terms of implementing the EEA 55 of S.A. (1998), this group is still
facing challenges in sexism, racism, occupation of higher positions, sexual
harassment and unsafe working conditions.
Besides the legislation that has been passed in labour and in higher education,
employees still struggle with QoWL challenges and therefore South Africa must
adopt more progressive QoWL legislation to be on par with developed countries.
There is very broad legislation that addresses QoWL in South Africa, but the main
challenge that remains is implementation and enforcement on the ground. The
benefits of the legislation can only be realised if organisations comply, monitor,
evaluate and enforce the legislation effectively. The next chapter will focus on public
management and the QoWL to provide a comprehensive understanding of the
dimensions that impact on QoWL in the public and private sector. Furthermore the
chapter will anlyse the legislation that influences higher education in S.A.

51
CHAPTER FOUR PUBLIC MANAGEMENT AND QUALITY OF WORK LIFE IN SOUTH AFRICA
4.1 Introduction The rapid transformation to access to Higher Education (HE) was faster than what
the government had expected. These changes were evident in the sector of HE, the
purpose of this chapter is to analyse these changes that are associated with public
human resource management. A systematic focus on public human resource
management is critical in the efficiency of public management in Higher Education
institutions (HEI) as they struggle with transitions and attracting and retaining quality
staff. For improvement in the public service working conditions, emphasis should be
placed on promoting a high quality of work life (QoWL). This chapter will provide a
detailed review of the available literature on public management, and the QoWL.
Furthermore this chapter will provide an extensive understanding of the variables
that affect and determine QoWL in the public sector as well as the private sector.
4.2 Institutional framework The state has the constitutional responsibility to specify the functions of organs of
state enshrine their duty to cooperate for the public good and to safeguard their
rights. The South African White Paper on Transformation of Public Service ( S.A.
WPTPS) of (1995) serves as a guideline in the implementation of new policies and
legislation that aim to transform the South African Public Service and it emanates
from the Constitution of the Republic of South Africa of 1996.The S.A. WPTTPS of
(1995) is based on the fundamentals of the constitution of transformation of service
delivery in a coherent and representative manner by competent human resources
who can meet the needs of the citizens. Furthermore, it promotes the human
resources development, transformation of the behaviour of public servants to
encourage accountability in order to enhance the efficiency and effectiveness of the
public service. The main motive of the constitution is to enhance the quality of life of
the South African citizens and that includes the quality of life of employees which is
enshrined by the South African Bill of Rights (1996).
The South African Bill of Rights (1996) is a binding piece of legislation to all state
organs and public management, plays a very important role in promoting these

52
constitutional rights in South Africa (S. A.). Institutionally, the role players in the state
in higher education are threefold, government and its bureaucracies: relevant
statutory bodies, institutions and individuals all of which are within the framework of
public accountability (Jonathan 2006: 33). Over and above providing social goods
and benefits to the society, higher education is viewed as a private good which
provides individuals: better employment possibilities, better salaries and benefits,
improved working conditions, improved health and quality of life, and greater
capacity to participate in a society that endeavours to build a democratic and just
social order Council of Higher education (CHE) (2004h: section 1.1.1).The higher
education must uphold these fundamental rights that are underpinned by QoWL
principles to integrate their employees jobs with their family life and assist employees
to cope with changes in the workplace.
4.2.1 Higher Education Act 101 of 197 One of the responsibilities of Higher Education Institutions is to respond to the
changes in the world of work. The Higher Education Act (HEA) 101 of S.A. (1997: 3)
states that universities must respond to the needs of the public that is served by the
institutions. The main aims of the HEA 101 of S.A. (1997: 1) is to regulate higher
education by providing for the establishment and composition and functions of the
Council on Higher Education (CHE), to provide for the establishment , governance
and funding of public higher education institutions and to provide for quality
assurance and quality promotion in higher education. The HEA 101 of S.A. (1997)
furthermore stipulates that Higher Education Institutions (HEIs) are autonomous and
liberal in their relationship with the Republic of South Africa, but they should do so
within the context of advancing national skills, scientific knowledge and public
accountability. During the transition to democracy the government forged a
cooperative framework of “conditional autonomy” of higher education institutions
(Hall and Hymes 2005: 206).
The responsibility of CHE is to standardise quality assurance and accreditations and
re-accreditations of academic programmes, institutional reviews and to advance the
objectives of the National Qualifications Framework (NQF) within the higher
education system. SAQA (South African Qualifications Authority) is the primary
institution that is mandated under the SAQA Act 58 of S. A. (1995: 3-4) and the new

53
NQF Bill of S.A to promote the development and implementation of the NQF, which
contributes to the full development of each learner and to the social and economic
development of the nation. The NFQ outlines the standards of integrating education
and training to recognise qualifications and acquired skills and therefore assuring
good QoWL through learning to advance the careers of employees. For the
purposes of quality assurance to register a new program up to 24 months and it must
undergo accreditation by the CHE, approved by the Department of Education,
included in the programme and qualification mix (PQM), registered by SAQA and
finally quality assured by the Higher Education Quality Committee (HEQC) (Du Prey
2009: 67). These demands by the (NFQ) places additional workload on employees in
the higher education public system which in turn affect their QoWL.
The HEA 101 of S.A. (1997) provided the legal framework for a single national
quality assurance body, therefore the HECQ was formed. The Higher Education
Quality Committee (HEQC) of the Council on Higher Education has been established
for quality assurance purposes in higher education and this adds more pressure on
the already overloaded institutions and employees further impinging on their QoWL.
The HECQ’s functions include the evaluation of HE academic programmes
according to HECQ’s programme accreditation criteria which stipulates the minimum
requirements for programme input, process, output, impact and review. The HECQ
utilizes a criteria audit to assess the institution’s policies, systems, strategies and
resources for quality management of the core functions of teaching and learning,
research and community engagement.
4.2.2 The White Paper on Transformation of Higher Education of South Africa (1997) The White Paper on Transformation of Higher Education (WPTHE) (S.A. 1997:10)
urges institutions of higher learning to re-evaluate their human resource strategies
and practices with the objective of developing competent and motivated employees
that are able to meet the expectations of stakeholders. In order to obtain this, these
organisations have to formulate a management model that will reinforce the desired
behaviour, embed core values and enhance high performance while simultaneously
reinforcing an ethos of scholarship that maintains creative learning as an integral
nature of these institutions. These transformative human resource strategies and

54
practices also potentially transformed how employees experience QoWL, and the
outcomes had an impact on performance this could be experienced by the learners.
Makgoba (1996: 183-184) stated that transformative conditions which affect the
experience of students and educators in institutions of higher learning to embrace
the notion of equal access, accountability, development and quality. What the author
suggests is that work must be transformed through accessibility, liability, and
productivity to give rise to QoWL. Under WPTHE (S.A. 1997), there is the National
Plan Higher Education (NPHE) which highlights five policy goals which are
fundamental to the transformation of higher education:
• High access to higher education regardless of race, gender age, creed, class
or disability that would result in competent graduates that can respond to the
country’s challenges.
• Enhance equity and rectify the past imbalances to ensure that all the
demographics of the country are well represented by staff and student profile.
• Diversification of the organisation and a variety of academic programmes to
address the nation socio-economic developments in the country.
• Form, develop and support high level research capacity that will solve the
needs of the communities.
• Construct new institutional and organisational integration amongst regional
institutions (NPHE 2001: 16-17).
Transformation can be seen as a way of improving QoWL in order to enhance higher
education quality. The aim of the WPTHE (S.A. 1997), is to urge institutions of
higher learning to re-examine and change their human resource practices with the
aim of developing competent and motivated employees that are able to meet the
organisational goals. These changes should enrich the work environment and they
allow the public policy to have a greater influence on the QoWL.

55
4.2.2.1 Higher education institutional framework
The transformation of HEI was accompanied by a new focus on the additional
workload of not just lecturing but also research output and community engagement
programmes.
According to Rothman et al. (2008: 418), academics in the South African context
have been exposed to transformation such as mergers which have led to higher
teaching and research demands; multicultural student profile; and a majority of
students are coming from a poor primary and secondary educational background.
Apart from the stress factors that are related to academic work elsewhere, South
African academics have to deal with the stress that is related to the drastic change in
higher education and the South African society at large as a result of political
transformation. This change affects both academic and academic support staff who
collectively contribute toward the effective functioning of the organisation
(Barkhuizen and Rothmann 2008; Mostert, Rothmann, Mostert and Nell 2008;
Rothmann and Essenko 2007 as cited in Viljoen and Rothmann 2009: 67).
Transformation in HEIs is reinforced by legislation and policies such as the White
Paper on Transformation of Higher Education (1997). A programme for
transformation of higher education is underpinned by the White Paper on Science
and Technology and National Research and Development Strategy to provide
strategic direction and to ensure that it is aligned with the needs of society (Du Prez
2009: 32). Moreover, as a result of being marginalised before 1994, a majority of
academic staff lacks the necessary skills, competencies and organisational support
for the research output required. To adapt to the major educational, social, political
and economic transformation challenges in South Africa, higher education
institutions (HEI) should be very conscious of the need to operate efficiently and
effectively.
Academic restructuring, strategic planning, revision of academic programmes,
quality assurance, TQM, capacity building and community engagements are
emerging issues in South African higher education institutions. Nonetheless,
employee satisfaction with their conditions of service as well as their job satisfaction
seems to be taken for granted. Satisfaction with the terms and conditions of service

56
and the job satisfaction they experience from their work is likely to affect their
commitment to the quality of service they render (Mammen 2006: 467). Higher
education institutions must be transformed to utilize the skills of both the male and
female and different races to benefit the society.
4.2.3 The White Paper on Human Resource Management in the Public Service of (S. A. 1997) The White Paper on Human Resource Management in the Public Service
(WPHRMPS) of S.A. (1997) states that the public human resource management is
the responsibility of only the human resource specialists, but the responsibility will be
shared amongst human resource specialists and all other public managers. This is
consistent with the “New Public Management” feature on public management that
managers are responsible for results and are responsible to manage (Hughes 2003:
58). The WPHRMPS (S.A. 2000) highlights the inadequacies and old-fashioned
practices of Human Resource Management in the public sector, describing its
components as being overly centralised and bureaucratic and it is not results
orientated. The human resource planning is weak, vacancies and promotions put too
much emphasis on academic qualifications and minimal emphasis on key
performance areas and performance management.
According to Horwitz, Browning, Jain and Steenkamp (2000 :1105), South Africa has
a progressive legislation to create a favourable organisational environment for
human resource management, nonetheless it will take some time to reverse the
effects of the past regime in “recreating structural inequalities in the acquisition of
education, work skills and access managerial, professional and occupational
positions’’.
4.3 Public administration and public management In the 1980s,’ the government and academics alike were not sure if the conventional
administrative system was an effective and efficient in managing the public sector as
compared to the system that was used in the private sector. This brought about a
new ways of running the government like a business to deliver service and this
brought about the birth of a new management approach (Hughes 2003: 48). In 1991
Christopher Hood (1991: 3-19) came up with the terminology “New Public

57
Management” (NPM) to classify the wide range of transformation that was taking
place in the United Kingdom. The “NPM” then became a phrase for a wide range of
programmes that were seeking to recognise public sector organisations to allow
public service providers to be competitive like their private sector counterparts.
“NPM” ideology was grouped into management in government and a new
institutional economy which accentuates the markets and competitiveness as a form
of giving freedom of choice, and many of the NPM approaches are borrowed from
the private sector (Basheka 53: 2012). To Hood (1996: 268) the “NPM” is the
apparent move away from what now is seen as a traditional progressive-era set of
doctrines of good administration emphasising the orderly hierarchies, depoliticised
beurocracies, elimination of duplication and decentralisation, towards what has been
described as the “NPM”.
The “NPN” was the answer to meet South Africa’s new administrative challenge. The
less bureaucratic and decentralised nature of the “NPM” allows a more coordinated
organisation of work with less hierarchal division of employees in which teamwork,
communication, decision making could be achieved more easily and in turn improve
the QoWL.
The New Public Management (NPM) is seen as a new system that promotes the
principles of decentralised, democratic and free-market orientated government as
opposed to the traditional public administration that was not democratic and free
market orientated and failed to improve the institutions, administration, organisations,
and structures (Vyas-Doorgapersad 2011: 239). Before 1994 the South African
public service was centralised by the Commission for Administration which had
considerable powers that encompassed the appointment of senior management,
disciplinary action , grading of posts, pension, leave days, promotion and evaluating
staff qualifications and requirements Department of Public Service and
Administration (DPSA 2008a: 2). After 1994 South Africa introduced a host of NPM-
influenced transitions that included decentralisation of powers to managers, financial
reforms, performance management and contract appointments (Cameron 2009:
937). The “NPM” seems to share the same characteristics as QoWL such
decentralisation of powers to managers to offer more control at work and
performance management.

58
To Mthembu (2001: 1), a drift from public administration to management is judicious
because South Africa like many other countries is not operating in a silo, and it is
therefore also affected by globalisation on public service. Mthembu further expands
that the public management model is a strategic way of meeting the challenges of
globalisation through professionalism, transparency and accountability to enhance
service-orientated public servants. Falconer (1997: 1-2) adds that those people
responsible for public service delivery should be proactive managers rather than
reactive administrators. Furthermore, the modern public manager should have
discretion in decision making within his or her particular area of responsibility as
opposed to the traditional public administrator, who operated in accordance with
established rules and regulations, and who implemented the policies of government
with little or no discretion and with no direct responsibility. The public manager is a
much more active individual, with decision making authority over, and responsibility
for, the public service he or she delivers services to.
Under the “NPM”, management lies at the core of public sector activity, and
professional managers are viewed as the key to improved public sector
performance. Hughes (2003: 58) view is that if one of the main features of public
management is that managers are responsible for attaining results, therefore the
political administrative relationship must transform from a master-servant interaction
because managers are not involved in policies and politics. This result in managers
finding themselves involved in politics, whereas the traditional public administration
was attempting to separate the two. The involvement of managers with politics has a
potential of influencing the decisions of managers in favour of certain employees,
this might cause division amongst colleagues and impact on their QoWL. Contract
appointments are not a new phenomenon in South Africa, as they were initially
introduced by P.W. Botha as part of the Public Sector Reform in the early 1980’s and
the post apartheid government also applied contract appointments even though they
did it in a more systematic way and most notably by linking it with performance
management and by decreasing the contract from five years to three for Heads of
Departments 1980’s (Milne 2005 as cited in Cameron 2009: 927). The
consequences of reducing the contract period are early departure of managers with
valuable skills and therefore the public service loses quality employees to
competitors. A study by Kompier, Ybema, Janssen and Taris (193: 2009) found that

59
a positive change in the employment contract was linked with a better psychological
health and a better QoWL, in addition a negative contract appointment was
associated with poor QoWL. Contract appointments show some similarity between
the old administration and the new management.
4.4 New public management and quality of work life
With the turbulent transition taking place in South Africa, there was a need for more
fundamental transformation from an apartheid bureaucracy era to a more democratic
public service which put people first (Fraser-Moleketi and Salojee 2008: 4). Service
delivery was centrally controlled by a top-down management, low productivity, low
morale and professional service ethos and poor work ethic , the South African public
service had to be representative of the demographic makeup of the people it was
serving in terms of race, gender and disability.
The White Paper on the Transformation of the Public Service (WPTPS) of S.A.
(1997) laid down the foundation for the national policy framework for the
transformation of the public service and most of its recommendations were in line
with ‘international best practice’ (Bardill 2000: 105). The objectives of the WPTPS
were further enshrined in the Constitution of S.A. (Ncholo 2000: 88), whereby its
values and principles for Public Administration along with the Bill of Rights clearly
committed the government to a broad developmental, redistributive and participative
manner. The Constitutional Court has interpreted these measures in a manner that
placed pressure and commitment on the government to improve the performance of
the public service (Levin 2004: 2). To Pillay, Subban and Qwabe (2008: 5), the NPM
is characterised by enhancing the management of human resources to provide
responsive services and restructure the management of training and development,
these are all principles of QoWL.
According to Hope and Chikulo (2000: 28), decentralisation can be seen as a system
whereby public goods and services are provided primarily through individuals and
market mechanisms that are regarded as having better knowledge of the local
conditions to improve responsiveness the quality of public services. Furthermore,
decentralisation is a way of bringing economic and political systems closer to the
local communities as a means of providing high quality services and goods that are

60
valued by citizens and therefore also a good QoWL. The South African Presidency
Report (2007: 101-102) states that one of the characteristics of the “NPM” is
performance management which includes rewards and incentives to improve
performance. The interrelation between the changes made by the “NPM” and the
experience of QoWL of employees were likely to have been influenced by
performance management.
Mafunisa and Paterson (2005: 539) argue that the “NPM” puts emphasis on the
following core aspects: a client/consumer focus, results driven process, and
accountability orientated approach, these work practices that are advantageous to
the organisation and employees and thus improve their QoWL. It promotes
decentralised organisational functions by means of various contracted out service
delivery mechanisms (eg: quasi markets) in which public and private service
providers compete for resources to do the work. When authority is decentralised,
QoWL is enhanced through participative management. Fraser-Moleketi (2006)
argues that “NPN” creates and exacerbates diversity problems more so, where
decentralisation makes the government powerless in protecting the disadvantaged.
According to Osborne and Gaebler (1993: 19) the “NPM” encourages governments
to promote competition between service providers and empower the citizens by
pushing control into the service providers and giving the customer more options.
Organisations can increase their competitive edge by attracting and retaining quality
staff through QoWL programmes.
The United Nations (2005: 28) stated that much of the influence of the NPM currently
may be said to have been adopted from the ongoing attention to it by organizations
such as the Organisation for Economic Co-operation and Development (OECD).
Furthermore, the OECD has emphasised that the transformation in economic, social,
political, technological and administrative environments have joined forces to probe
the paradigm shift in public administration and management systems. In addition
devolving human resource and management functions to managers is an important
component of both “NPM” and QoWL.
A study at Pretoria University by Madue (2007: 163) responded to the new policy on
the measurement of research output in relation to the “NPM” might assist other

61
Institutions of higher learning to manage and improve their research output. The
University of Pretoria is leading research output and that is made possible by the
utilisation of the Research Information System (RIS). The RIS coordinators are
primarily responsible for ensuring that the system is in place to comply with the
research requirements of the Department of Education’s policy on the measurement
of research output and manage the technical requirements of each submission.
Rabin, Hildreth and Miller (2007: 1070) affirm that technological advancement is the
driving force behind the “NPM”. In a discussion document Higher Education South
Africa (2005: 03) states that, the measurement of research and innovation output
should take into consideration quantity and quality. In this research the University is
harnessing the principles of the “NPM” to improve their performance on research
output by means of the (RIS), this is directly linked to QoWL aspects as employees
will derive more job satisfaction through utilisation of technology that increases their
performance.
According to Lane (2000) the “NPM” does not necessarily replace the old system but
rather adds a new approach to the public sector governance like contractualism.
Through contracts, the public sector managers act as agents for the definitive client
which is the public. Moreover, the “NPM” supports the notion that the government is
owned by the voters and it should therefore be customer orientated and public
management embodies the important belief that public sector organisations should
increasingly be subjected to rigorous measures of performance. This means that
these organisations must pay closer attention to their output. Performance
management seems to be a common characteristic between “NPM” and QoWL and
also as an indicator of organisational service delivery. Subjecting public managers to
performance evaluation introduces disciplinary mechanisms which compel public
sector bodies to focus on their specific responsibilities and carry out those tasks
efficiently and effectively. The author concludes that the public management school
of thought argues that, performance measurement also enables public sector bodies
to be held directly accountable for their activities. Under the regime of performance
measurement, public sector organisations should be committed to an ethos of
continuous improvement in levels and standards of service delivery, Falconer (1997:
3).

62
Furthermore the advantages of the “NPM” can be seen as decreasing the cost,
increasing efficiency and transparency. From the literature reviewed it is evident that
the “NPM” combines various public and private processes to improve service
delivery. Some authors view the “NPM” as a business minded form of managing the
public sector.
4.5 Leadership Leadership is critical to the survival of public sector organisations that operate within
dynamic environments. Due to the transformational changes and demands on higher
education institutions in South Africa, there is pressure on the duties and
responsibilities of academic leaders especially Heads of Departments (HODs) to
manage change, human resources, decision making, performance, control finances,
plan, organise.
Graetz (2000: 550-559) defines leadership as the mental and emotional involvement
of employees in a group situation whereby organisational decisions are concluded
and furthermore the author explicates the pros of leadership as that it enhances
productivity, reduce conflicts, lowers absenteeism and turnover, elevates employees
self esteem, encourages employee commitment to goals and allows for better flow of
communication. In addition the author states that for the organisation to be
competitive they must strike a balance between instrumental and an inspirational
leader. The different types of leadership styles are discussed underneath.
4.5.1 Transformational leadership Transformational leadership is a high order of leadership characterised by the
leader’s capability to the correct values, beliefs, shared vision for long term
implications.
• Individual consideration
The leader’s ability to see and treat individual employees as important assets
that contribute meaningfully in the workplace.
• Inspirational motivation

63
This refers to the ability of a leader to clearly formulate an attractive future of
the company by communication vision, mission, objectives and core values of
the organisation.
• Intellectual stimulation
Encourage employees to be innovative when developing ideas through
challenging situations.
• Idealised influence
The leader’s ability to charismatically influence followers that mimic the
leader’s behaviour (Sarros and Santora 2001: 385-387)
The United Nations Development Programme (UNDP) (2003: 21) stressed that the
public service needs a new breed of people who can apply transformational
leadership skills when dealing with extremely challenging circumstances.
Leaders in organisations must understand that the work environment is complex and
dynamic and they must be flexible according to the situation. Transformational
leadership seems to be employee orientated and takes into consideration the factors
that impact on employee QoWL such communication, motivation and viewing
employees as valuable assets that contribute meaningfully towards the performance
of the organisation
4.5.2 Transactional leadership As the name suggests, transactional leadership is based on an interchange of tasks
for rewards or penalties between the leader and subordinates. The leader will act in
a certain way depending on the outcomes of the task was given to the subordinate.
The transactional leader sets certain goals that must be reached by the
subordinates, of which they will either be rewarded of penalised according to their
performance (Mester, Visser, Roodt and Kellerman 2003: 73).
Transactional leaders remunerate favourable behaviour and penalise unacceptable
behaviour from their employees to attain their objectives. This type of leadership
directly influences QoWL as it is linked to the performance of subordinates.

64
4.5.3 Laissez faire leadership The laissez faire leader does not make any efforts to encourage, recognise and to
satisfy the needs of employees. This type of leadership avoids decision making,
does not reinforce positive behaviour or achievements with rewards and there is no
feedback provided furthermore there are minimal restrictions on employees (Mester
et al. 2003: 73).
Laissez faire leadership offers a lot of freedom on staff to manage their work
processes, the level of freedom that employees exercise on their work has an
influence on their QoWL and this type of leadership style offers employees authority
on how to do their job. This leadership style can also be viewed as being passive
because the leader is not actively involved in motivating employees.
Various leadership styles have different aspects that affect the QoWL such
performance, commitment, control at work, responsibility and job satisfaction which
are all linked to QoWL.
4.6 “Batho Pele” principles. The Batho Pele principles serve as a guideline for all government institutions on how
to render public services and they are stated in the White Paper on Transforming
Public Service Delivery (WPTPSD) of S.A. (1997: 5) that was introduced by the then
minister of Public Service and Administration, Zola Skweyiya in 1997. According to
the WPTPSD in S.A (1997: 15) the main aims of the Batho Pele principles are to
ensure that service delivery is more citizen friendly, and to ensure that the needs and
expectations of the members of the public are met in an effective and efficient
manner. Batho Pele is based on eight national principles that aim to develop and
progressively raise the standards of service delivery especially to those who were
previously disadvantaged.
• Public servants must consult citizens about the level and quality of the
services that the members of the public receive.
• Citizens must be made aware of the level of service they are expected to
receive.
• All citizens should have equal access to services which they are entitled to
receive.

65
• Citizens should be treated with courtesy and consideration.
• Citizens should be given full and accurate information regarding the service
they are entitled to receive.
• Public servants must conduct their business in a more transparent and open
manner.
• Should public servants fail to deliver the services as promised, an apology or
explanation should be given immediately and corrective action taken to rectify.
• Public service rendered to citizens must be economical and efficient to
provide good value for money.
Batho Pele principles contribute towards improved QoWL by urging public servants
to raise the service delivery standards, they cannot deliver service if they are corrupt
and have poor work ethic.To constantly improve service delivery, national and
provincial government departments will be required to layout their goals for service
provision and annual and five year targets for service delivery (WPTPSD of S.A.
1997: 11). Moreover, the Department of Public Service and administration will
therefore systematically monitor and evaluate the effectiveness of the Batho Pele
principles and submit regular reports to Parliament. Batho Pele principles are also
aligned with the QoWL ideals accountability, responsibility and performance. Public
service servants who transgress service delivery must be held accountable and
there must be consequences. Accountability and performance management
practices and arrangements must be implemented consistently to revive Batho Pele
principles.
4.7 The key differences between King ll and King lll Reports The King Committee on Corporate Governance was established in 1992 by the
Institute of Directors, to take into account the increasing global issue of corporate
governance in the South African context (Institute of Directors in Southern Africa
2002). The main objective of the King report 1994 was to uphold the highest levels of
corporate governance in South Africa. Furthermore King Report 1994 exceeded the
the financial and regulatory facets of corporate governance unlike its counterparts in
other countries, by prescribing an integrated approach to good governance in the
wider scope of encapsulating financial, social, ethical and environmental practices.
The King Committee in 1994 successfully constituted that companies can no longer

66
operate independently of the environment or the communities they exist within
(Institute of Directors in Southern Africa 2002).
The release of the King lll report signifies the progress that has been made since the
King ll report. The difference between King lll and King ll will be analysed. Even
though an inclusive approach was stressed in King ll, King lll expands in more detail
with the inclusion of governing stakeholder relationships whereby the Directors
should take the interests and expectations of the stakeholders into consideration
(Steyn 2009).
Naspers Group (2010) indicate that the directors must take a conscientious effort in
running the affairs of the organisation and furthermore those directors must be
competent and possess the skill and experience required to run the organisation.
The directors must demonstrate diligence and commitment towards the company
and they must be courageous in their decision making processes. Competency and
skill are important aspects of QoWL, and these are reflected under the job
satisfaction dimension. High competency and skills will enhance the success of an
organisation which depends on the decisions that are made by the leaders.
According to the Institute of Directors (2009) unlike the King l and King ll, King lll is
applicable to all entities, private, public, non-profit, quasi institutions like universities
of technology. Furthermore, one of the most critical contrasts between King lll and
King ii is that King ii predominately focus on reporting whereas the King lll puts more
emphasis on actually acting upon or doing rather than just simply reporting. It is
noteworthy that the other fundamental difference between the King ll and King lll is
that, sustainability was treated as a separate phenomena from governance and
strategy in King ll but, it is an integral part of governance, strategy and the company
as a whole in King lll. The issues of compliance with the laws, codes and standards
are both covered in the King ll and King lll report and legislation influences the QoWL
that employees experience as it was ealier discussed in chapter three. The King
code of corporate governance is not enforced through legislation, however most of
the key principles of King lll are encapsulated in the Public Finance Management Act
1 of S. A. (1999) and the Promotion of Access to Information Act. 2 of S.A (2000).

67
King ll and King lll reports require that the board of directors should have a working
understanding of the effects of the applicable legislation and standards. Curtin
(2009) states that in terms of the Companies Bill, stringent measures are placed on
performance of directors and they are likely to lose their assets, this makes company
directors to be more liable to legalities by shareholders, employees and the public. In
addition the King lll code states that Directors and officers will be crucial to the
financial wellbeing of the South African companies and their personal finances. The
King iii report on corporate governance in South Africa places emphasis on how the
company interacts with the community in which it operates.
Unlike King ll, King lll stipulates it very clear that as much as directors are expected
to act in the best interest of the organisation, they must take into consideration the
interests and needs of the various stakeholders in business and it even sets out
guidelines on how to do that (Esser 2009: 199). University “A” in this instance will
have a responsibility of fostering the socioeconomic advancement and community
engagements with historically disadvantaged communities. A research survey by the
Aspen Institute (2003) confirmed that organisations that are obligated to corporate
social responsibility can benefit both the organisation and the employees by
projecting a better public reputation, customer loyalty and more productive and
satisfied employees which in turn affect QoWL.
South African Institute of Chartered Accountants (SAICA) (2011) indicates that the
King lll code of governance requires the entities provide a more integrated reporting
system to give stakeholders wider picture about the strategy, social, environmental
performance alongside financial performance. These performance measures are
largely dependent on the QoWL and performance of their employees. Moreover, the
integrated reporting system will highlight the strengths and weaknesses’ of the
organisations’ operations, and how the organisation plans to address the
weaknesses and enhance the strengths.
Kings report on cooperate governance sets the necessary conditions for
accountability, ethical conduct, decision making and performance, all of these are
connected to QoWL. When management and employees cooperate in ensuring
organisational effectiveness and efficiency through accountability, reporting and high

68
competency levels, they are indeed also contributing towards a better QoWL. The
key aspects in King lll report circulate around responsibility, commitment, reporting,
accountability, sustainability and corporate citizenship. King lll gives more attention
on risk management than the King ll report in the sense that a more detailed
guidance is given on how to articulate and integrate the design, implementation and
monitoring of the risk management plan. The King lll report will no doubt assist South
African corperate world to be world class, even though this might take a couple of
years.
4.8 Public Human Resource Management Model The integrated Public Human Resource Model provides a model in the form of (see
figure 4.1), this model provides a framework that is inclusive of QoWL programmes
that can be used to operationalise the strategies that will enhance the current levels
of service delivery. The public sector can only be understood by means of a basic
model that can be used to explain the various components. Employees in the public
sector must conduct healthy and balanced lives to contribute meaningfully at work
and ensure efficient and effective service delivery. The model will make strides in
addressing the employee’s QoWL aspects in the public sector. The model will offer a
foundation for a synchronised way of attending to the QoWL needs of employees
such as the working environment, wellness, job satisfaction, home work interface,
control and stress at work.
The intention of the integrated model is to include other critical aspects in public
human resources. Human resource in the Public sector is important to corporate
governance to deliver effective and efficient service in an ethical manner. In the
absence of high standard public human resource management, organisations could
experience low staff morale, high unofficial leave, inappropriate recruitment and
selection, and high turnover. A strategic public human resource management is
critical to public management, particularly in organisations such as institutions of
higher learning that are still struggling with issues of transformation.
Public human resource management as a discipline is a component of management
that deals with all the aspects that are associated employees in the organisation
such as decisions, operations, strategies, practices, activities, methods and

69
procedures linked to employees. In addition it also refers to the dimensions
associated with people in their employment interactions with one another and the
interlinked dynamics, all of which are focused on assisting to ensure continuous
institutional success through “good match-fit’ relationships in unstable and ever
revolving conditions (Erasmus 2004: 4).
Section (3) of the White Paper on Human Resources Management in the Public
Sector of S.A. (1997: 9) recognises people as Public Service’s most valuable asset,
and therefore managing human resource effectively and strategically must be the
foundation of the broader transformation of the Public Service. The White Paper on
Human Resources Management in the Public Sector of S.A. (1997: 9) promotes the
transition from personnel management to human resource management. These
changes include a move from a centralised public human resource management
system the one that which is:
• Represents the South African workforce.
• Treats all public servants as a valuable resource.
• Service delivery focussed.
• Accountability of public officials.
• Assigns managerial responsibilities that are result orientated and economic.
• Promotes effectiveness and efficiency.
Quality of Work Life Programme
• Job and Career Satisfaction
• Employee Wellness
• Stress at Work
• Control at Work
• Working conditions
• Home –Work

70
Fig.4.1 Public human resource management model of QoWL
(Source: South Africa. 1997. White paper on transforming public service delivery
Pretoria: Goverment Printers)
Public Human Resource
Management Model
Representative
Service Delivery
Accountability Cultivate Career Development
Public Employee: Valuable resource
Quality of Work Life Programme
• Job andCareer Satisfaction
• EmployeeWellness
• Stress atWork
• Control atWork
• Workingconditions
• Home –Workinterface

71
4.8.1 Representative of all the South Africans South African workforce is highly diversified and this diversity must be reflected in
the work environment and they should redress the imbalances of the past not just
numerically but multi culturally as well. Section (10) of the WPHRMPS of S.A. (1997:
11) stipulates that a major human resource management goal is the development an
authentic culture of diversity which embraces employees from different cultural
backgrounds. The Public Service needs to affirm people regardless of race, gender
disability, rural background, single parents. The WPPSTE of S.A. (1997: 31) has
even set out targets and timeframes to meet representativeness in the public sector,
four years from implementation the legislation required that all government
departments must strive to be 50% black management, 30% of new recruits should
be women and in ten years 2% should consist of people with disabilities, in
accordance with the Affirmative Action.
The main aim is to ensure that all the groups of the society are represented and
performance is increased by maximizing the collective effort of all employees. To
Chang (1996), diversity pertains to more than just cultural differences, gender and
race but rather is inclusive of other variations such as religion and ethnicity.
Workplaces which are able to accommodate employees from diverse backgrounds
with various skills and expertise will reap the benefits of attracting and retaining their
employees and in turn enhance their QoWL through diversity.
May’s (2012: 1-8) research investigated the diverse dynamics operating between
students, lecturers and management at a historically black university, several
diversity dynamics emerged. The stakeholders in the various organisations are faced
with the fact that diversity dynamics are not only involved in their daily activities, but
also in other activities as well. They are not just spectators, but they are actively
involved in destructive and constructive behaviours and norms of diversity dynamics.
In conclusion there is a need for stakeholders at universities and other public
institutions to give diversity dynamics attention through internal work in order to
ensure meaningful work relationships. To have a good QoWL, the organisation must
cultivate a workplace environment that promotes good working relations amongst
employees from diverse background to ensure free communication and mitigate
stress at work.

72
Reichenberg (2001: 2) describes diversity management as looking through the
mindset of the organisation, the organisational climate and the various perspectives
that people bring to the organisation as an outcome of race, gender, disabilities,
workplace styles and other differences. To Tshikwatamba (2004: 603-604)
comprehending diversity in the workplace leads to employees acknowledging and
appreciating their own differences. Appreciation encourages the workforce to focus
on their similarities and differences in order increase their productivity.
According to Horwitz, Bowmaker-Falconer and Searll (1996: 140) the South African
society is diversified, and therefore the organisations are multicultural, to manage
such diversity requires skilful and extensive managerial competencies in
interpersonal skills and an understanding of both ethnic and corporate cultures. A
misunderstanding cultural and other subgroups differences can result in misinformed
assumptions, poor working relations, underperformance and discrimination.
Stereotypes enhance the “us and them” mentality which can contribute towards
underperformance and there fore poor QoWL. Individual change that is not coupled
with organisational change and systems to eradicate employment discrimination will
not have a lasting effect.
Pretorius, Cilliers and May (2012: 7), suggest that South African organisations
should approach diversity in a dynamic and experiential manner by using group
relations training and systems psychodynamic thinking instead of utilizing
instructional methodologies such as lectures and presentations . The participants
may be defensive and resistant, but the learning processes will include accepting
personal responsibility for their role and action with regards to diversity. The
researchers further state that the destructive trends around diversity dynamics which
manifest in organisations can only be addressed by re-owning projections to repair
the broken relationships and communication and attitude become stimulating
aspects on the road to healing and reconciliation.
On a personal level, diversity applies to the wellbeing of employees by appreciating
their diversified feelings, values, thoughts and beliefs and penetrate their home
environment for challenges impacting on their work environment. Furthermore
culturally, appreciation acknowledges that “our way and their way” may differ, but

73
none is superior to the other. At the organisational level appreciation brings unity
between the leader and the followers, and recognises the different viewpoints and
also accepts that the workforce can be unified in their diversity and view themselves
as valuable resources.
4.8.2 Public servants as valuable resource Public officials are sometimes regarded as assets in the public sector and this result
to feelings of demotivation, ineffectiveness and a lack of commitment. Employees
feel entrapped in the public management system if they are not offered the freedom
to be strategic thinkers. When employees are not valued and are excluded in the
decision making processes they are likely to develop negative feelings and feel
unimportant.
According to Tshikwatamba (2004: 596), Human resource management values
“Ubuntu”, humanity and therefore it views people as its most critical assets in the
public sector. The people are a common factor in the success or failure of an
organisation, independent of the size or the technology of the organisation. It is
therefore vital for organisations to attract, develop, retain and motivate appropriately
competent employees. Public organisations must realise that it is only through their
employees that they can be able to achieve their goals. It can be concluded that a
high QoWL can be linked employees that feel valued to ensure effective and efficient
service delivery.
4.8.3 Service delivery It is the responsibility of universities to provide quality customer service, in this case
the customers are the learners, employers and the society at large. Service that is
rendered to the customers must be satisfactory for clients to come back again,
institutions must offer an effective and efficient service. Delivering excellent service
that sustains customer satisfaction requires employees who experience a high
QoWL.
Nengwekhulu (2009: 352-353) describes the public service as an administrative
vehicle in which the government delivers various services to the public. Furthermore,
Universities’ goals are to produce academics and intellectuals, but there is still a

74
challenge of skills shortage and capacity of the public service to deliver services. It is
therefore, critical to identify whether poor performance in public service is attributed
to lack of skills to deliver services, this will assist in determining skills deficiency and
address them. Organisational performance can be optimised through QoWL
initiatives, such as in-service training.
According to Lienberg and Barnes (2004: 8), programmes that can enhance the
quality of service in the organisation the academic programmes, service delivery to
learners, service delivery to employees in the execution of their task are all factors
that contribute to the promotion of customer service and impact on the institution’s
competitiveness. QoWL practices will enable public officials to enhance service
delivery as it is one of the fundamentals of being world class, customer service and
organisational culture in the context of higher education environment can assist in
developing strategies that can meet the expectations set for higher education
institutions.
To Lienberg and Barnes (2004: 7), in academic institutions, quality is not limited to
the content of academic programmes, the quality and quantity of the research
articles published by the institution but it also encapsulates the level of service that
the customer receives. Herselbein, Goldsmith and Beckhard (1996: 35) bring forth
customer care and employee satisfaction by conceptualising “service-profit chain”: If
you want to keep customers happy, you need to ensure that the employees are
satisfied and the employment relationship is managed in such a way that is
conducive to enhance customer service. When employees enjoy a high QoWL, their
job satisfaction will increase and consequently raise service delivery.
Mafunisa and Maserumule (2004: 164) point out that governance was not a public
service term by origin but it was traced back from business, having a domain in
company law, which is referred to as corporate governance in business terms. Its
intention is to ensure that the organisation is strategically organised to render daily
operations profitably, otherwise if the governance is not well positioned to the
corporate strategy then it is very likely that the organisation will lose profit.

75
In higher education, learners are not just customers in the equation of customer care
or service, but they are also products of the organisation. Higher education
institutions have to retain their market share for survival, to ensure their success they
must focus on QoWL programmes to increase service delivery.
4.8.4 Accountability of public officials.
In principle, public accountability refers to public officials being responsible for their
actions and decisions which have a direct impact on the organisation and the society
at large. Public officials are required to be liable as to how public finances have been
utilized to the benefit of the society, the resources that are exhausted should be in
line with the national objectives. Mafunisa (2003: 11) maintains that the development
of adequate accountability exercises includes progressive ways of measuring to
what extent public servants are performing their duties. In addition public official
must establish clear goals and be accountable to meet those goals, performance
management standards must be established to meet service delivery and service
delivery is dependent on effective human resource management in the public sector. The public demands for the accountability places an additional workload on public
officials and therefore impacts on their QoWL.
Accountability has become the fundamental principle that informs operations in
which those who hold and exercise public authority can be held responsible for their
actions or lack of. Accountability is based on the control of abuse or misuse of public
authority, to provide assurance in respect of the use of public resources on
adherence to public service values and to promote learning in pursuit of continuous
improvement in public management (Aucoin and Heitzman 2000: 45). The principle
of accountability carries four main forms that are, hierarchical, legal, political and
professional.
4.8.4.1 Hierarchal accountability
This is based on the conventional public administration system whereby
accountability is based on the organisational organogram. Communication and
authority lines are based on internal control measures such as superior-sub-ordinate
relationships (Kakumba and Fourie 2007: 654). The employer-employee relationship

76
is an important determinant of QoWL as it affects communication, control at work,
decision making and teamwork.
4.8.4.2 Legal accountability
Legal accountability refers to being accountable to an external body such as the
department of labour or the auditor general usually through inspections and audits.
Performance is measured against legal compliance with a particular act or legislation
(Kakumba and Fourie 2007: 654).There are pieces of legislation that were discussed
in the previous chapter that support QoWL.
4.8.4.3 Political accountability
The political office bearer has political accountability over the public who voted for
them .Members of parliament and councillors have to account to the public they
represent for their actions (Napier 2007: 379). These civil servants a held liable by
the public if they fail to deliver services that should improve the quality of life.
4.8.4.4 Professional accountability
Under the armpit of professional accountability public servants are expected to use
their professional judgement to achieve goals in relation to input and output
(Kakumba and Fourie 2007: 656). Public servants are responsible to their clients and
for them to maximise their input out-put, QoWL factors will determine who is
accountable , responsible and capable of achieving the set organisational goals.
Accountability has become the foundation of the public sector, it forms the principles
that inform operations in which those who hold and exercise public authority can be
held answerable for their actions or lack of. Accountability is based on controlling the
abuse of public authority or power, provide assurance in respect of the use of public
resources and adherence to public value resources and finally promote learning in
pursuit of continuous improvement in public management (Aucoin and Heitzman
2000: 45).
4.8.5 Cultivate career development practices The policy framework governing the public human resources management is very
clear in that it states that the public service is accountable for placing the right
candidate in the correct post and that person has a career path that supports

77
competence and commitment. Public servants should be career orientated and they
should therefore be provided with opportunities for career growth and advancement
as well as personal development. When an organisation lacks career development
plans, then employees will look for external development opportunities as this
influences their QoWL in terms of career growth, consequently the organisation will
not be able to retain its employees.
Proper career planning can lead to higher pay, promotions, and job status, which can
be attributed to QoWL, as employees see themselves progressing in the workplace. Employees should be encouraged to have more control over their career
development and there should be no bottlenecks for applying for employment in
higher levels. Career advancement will be the responsibility of the organisation and
employees, who will determine the career path that he/she wants to follow taking into
consideration the career aspirations. Multi skilling will result in job enrichment and
therefore improved career and performance management whereby good
performance will be rewarded and poor performance will be managed.
Senge (1990: 140) states that a manager’s primary duties are not limited to planning,
organising, leading and controlling but also in creating a favourable environment for
employees to lead fulfilling lives at work in addition the employee will utilize the
knowledge gained to the employer’s advantage to develop their careers. Career
development was identified as one of the aspects that impact on job satisfaction and
QoWL (Pienaar and Bester 2009)
Career development usually includes a wide range of human resources programmes
that aim to assist employees to improve their performance, streamlining career
trajectory of employees with the organisational goals. In addition both the employee
and the institution stand to benefit from developing and managing careers. It is in the
best interest of public institutions to improve employees’ QoWL in order to retain
qualified, effective and efficient employees.
The institution should promote a favourable environment that encourages career
growth through career pathing, succession planning, counselling, or career change.
The Public Service Commission (PRC) (2008: 75-77) recommends that career

78
management in public service should be assessed annually by evaluating the
institution’s needs in line with specific skills needed. Where there are skills gaps
employees should be re-skilled and their competencies utilised to the advantage of
the individual and the organisation.
4.8.6 Result orientated managerial responsibilities Public managers ought to operate efficiently and avoid unnecessary duplication, and
make the best use of available resources in a sustainable and affordable way. Sukram and Hoskins (2012: 96) state that employees will only provide good service
if they receive good service from their managers, and they need to be valued and
their managers. Aspects such as job enrichment, accountability, the nature of the
job, decision making are all components of management role that can be utilised to
increase QoWL and job satisfaction amongst employees. The employee’s
performance should be measured based on the work plan, responsibilities,
objectives and the time frame. Public managers are required to be results orientated
and develop skills of objectives setting and measurement, financial management and
over and above this they should be skilled in managing people. Therefore, human
resources will not only be responsibility of human resource practitioners but that of
line managers as well. Human resource practitioners will still be instrumental in
providing professional advice and guidance to ensure that the organisation meets its
strategic objectives through competent staff and managers.
In Potgieter and Coetzee’s (2010: 1) research that aimed to determine the link
between the managerial competencies HODs of a higher education institution in
Gauteng, and the level of training required for their competencies. It was discovered
that there is a significant gap between managerial competencies of HODs and the
level of training required. In addition HODs need to be trained in management
competencies to better prepare them for their managerial responsibilities.
The WPTPS of S.A. (1995: 48-63) management is responsible for creating a
strategic framework and therefore it is crucial to empower and motivate managers at
all levels to be leaders, decision makers, communicators who are able to proactively
respond to the challenges of change, instead of being administrators of rigid rules.
The ability of managers and employees alike to voice out their opinions and make

79
changes in their area of work influences their QoWL, and this is encapsulated under
the control at work dimension of QoWL.
Performance management forms an integral part of human resource management
and development according to the WPHRMPS (S.A. 1997: 42) in the South African
public service. Cameron (2009: 910) states that performance management is a
critical part of the South African public service transformation, it has however been
“erratically and inconsistently applied”. The WPHRMPS (S.A. 1997: 42) in the public
service states that the success of public organisations in delivering its operational
and developmental objectives is dependent on the effectiveness and efficiency with
which employees perform their functions, therefore employees’ QoWL and
performance cannot be separated.
Mphehle (2012: 17), states that the public sector‘s purpose is not to make profit on
services rendered unlike the private sector, but the similarity lies with the
management of human resources that have to interact with customers daily to
deliver services. It is for this reason that institutions should have good recruitment
and retention strategies in place to ensure that the officials employed in
management positions offer high performance because they play a critical role in
realising the goals of the organisation. According to Manyaka and Sebola (2012:
299), management of employees’ performance is legislated and therefore public
organisations are given a mandate to manage and streamline the performance of
their employees. Furthermore performance management has been introduced
primarily to ensure that there is continuous improvement of employees’ performance
in public service. Perfomance is dependent on employees, and therefore to improve
performance employees’ QoWL must be improved.
4.8.7 South African case study Although teaching and research demands cut across in all other countries, the South
African context is compounded by democratic transformation and mergers of higher
education institutions. A study that was conducted by Schultz (2010: 1) at a merged
higher education institution that aimed to determine the human resource
competencies and to establish the satisfaction of academics, administrative staff and
management regarding human resource competencies. It was discovered that

80
business knowledge and human resource practices, personal skills and
management skills are critical human resource competencies in the higher learning
environment. In addition employees were not satisfied with Human Resource (HR)
competencies and this required urgent attention to close down the identified gaps.
HR departments must develop operational plans that are streamlined with the
organisations strategic plan to gain advantage over their competitors.
To cite a case study by Mammen (2006: 466) on higher education academics
satisfaction with their terms of conditions of service and job satisfaction at
historically disadvantaged institutions (HDI) in S.A., it was found that when
academics are not happy with their conditions of service and job satisfaction, they
are more likely to move away from the institution if they cannot see any attempts to
rectify the situation. The author witnessed his colleagues leaving the institution and
was convinced that high quality academics with low satisfaction with their conditions
of service or job satisfaction were being hired by potential employers, leaving behind
the less qualified and experienced.
A research study by Dockel, Basson and Coetzee (2006: 20) inverstigated
retention aspects that enhance organisational commitment of high technology
employees in a telecommunication organisation in Gauteng, South Africa. The most
pertinent issues that affected these employees were compensation, job
characteristics, supervisor support and work life policies. In a study by Johnsrud,
Heck and Rosser (2000) (as cited in Johnsrud 2002: 391) that analysed the
intentions of the middle level university administrative staff to leave revealed that
their intentions to leave were similar to those of faculty members, morale was the
common denominator that had a significant impact on both groups’ intention to
leave. The intention to leave is not kept in isolation by the individual employees, but
it is shared amongst other employees as it has an impact on administrative staff
QoWL.
A study by Field and Buitendach (2011: 1) in a tertiary institution in KwaZulu-Natal
(KZN) that attempted to evaluate the link between, happiness, work engagement and
organisational commitment of support staff revealed a significant positive relationship
between wellbeing and organisational commitment. It is therefore critical for

81
institutions of higher learning to take into consideration the level of happiness of their
employees to address the issue of retention. A study by Rothman and Viljoen (2009:
67) that aimed to investigate the relationship between the perceived organisational
stressors, the levels of commitment and ill health of staff in a South African university
of technology, revealed that job security and job control were the greatest stressors
in the institution. From the same study, the findings showed that a number of work
related stress factors correlate with the employee’s psychological ill health and
organisational commitment. Moreover, the research indicated that the employee’s
experience of a particular occupational stressor resulted in lower levels of
organisational and individual commitment and also higher levels of physical and
psychological ill health.
With reference to the aforementioned findings, academic staff in institutions of higher
learning in South Africa are more likely to develop burnout and ultimately ill health.
With regard to stress at work, a study by Rothmann, Jackson and Kruger (2003: 58)
in a local government municipality in South Africa revealed that, the main
contributing stress factors linked to job demands were lack of organisational support,
insufficient personnel to handle assignments, insufficient resources, performing
duties that are not in the job description and performing other people’s tasks. The
authors add that stressful job demands are related to the lack of organisational
support which includes inadequate salary, lack of opportunity for growth, lack of
motivation by employees and colleagues not performing their duties. The findings
further suggest that the effect of exhaustion on professional efficacy is mediated by
cynism, whereas the effect of job stress on professional efficacy is mediated by a
sense of coherence (Rothman et al. 2003: 52).
It can be argued that the experience of the employee with work related stress factors
can possibly erode how employees relate and associate themselves with the
organisation and its priorities as well as the desire to participate in organisational
activities and decision making (Chow 1994; Robbins 1998 as cited in Viljoen and
Rothmann 2009: 75).
Analysing the aforementioned literature in the South African context, it affirms that
university employees operate under stressful conditions that affect their QoWL. This

82
has significant implications as it negatively affects the commitment of employees to
the organisation.
4.9 Conclusion Taking into consideration the literature reviewed, employees’ in institutions of higher
education in South Africa are more susceptible to develop stress because of the
unique South African QoWL factors such as drastic transformation in higher
education. Considering the South African employment equity, which focuses on
transformation affects the QoWL of employees. The main challenge for the new
political dispensation government is to ensure that public service reaches the
citizens and public human resource upholds the culture of performance and
accountability.
For public servants to achieve a high level of service delivery and ensure that their
duties are properly discharged, it is of pivotal importance that they enjoy a high
quality of work life and this will in turn enable them to cope with the workplace
challenges that they will face. To assist public human resources to cope with the
changing public services, remedial activities need to be taken to improve QoWL in
the public sector. The Human Resource Management in the Public Service should
incorporate QoWL programme, this will encourage an interactive approach to
managing public human resources. The following chapter will focus on the research
findings, data analysis and discussion of the results in line with the research
objectives.

83
CHAPTER FIVE RESEARCH METHODOLOGY
5.1 Introduction This chapter focuses the research design, which involves research strategies,
sampling methods, data collection and analysis. For the purpose of this study, a
descriptive exploratory approach was utilised to understand factors that impact on
the quality of work life (QoWL) of employees at University “A” in order for the
researcher to comprehend how it affects the institution. The questionnaire was
discussed in terms of its design, reliability and validity.
5.2 Study area The purpose of the study is to investigate the factors impacting on the quality of work
life (QoWL) of employees at the University “A”. The research project also intended to
understand the factors that affect the QoWL of employees at University ”A” with the
aim of improving performance and working conditions of those employees. It is
envisaged that the results will provide valuable feedback to enhance the workplace
environment where employees feel that they are valued, and also assist in mapping
out a retention strategy for the institution.
5.3 Research design The study type that was adopted to achieve the objectives of the study was a case
study method and it employed both qualitative and quantitative approaches. A
probability sampling technique in a form of stratified random sampling was utilised to
draw the sample of 160 from a total population of 550 employees at the University
“A”. This is an ideal type because the probability of selecting the sample from one
group of employees is zero and all the groups are proportionally represented. This
type of sampling technique requires small numbers to get valid results (Welman,
Kruger and Mitchell, 2005: 62). Data was collected through a structured
questionnaire to the sampled population, observations as well as semi-structured
interviews were conducted personally with senior management. The nominal scale
was used for the biographical profiles, whilst, the Likert scale was used with a scale
of 1-5 for all the dimensions of QoWL. The tool that that was utilised was a
questionnaire adopted from the 23-item Work Related Quality of Life (WRQoL) scale
developed by Van Laar, Edwards and Easton (2007) to measure six factors of

84
QoWL. All responses in the six sub-scales were recorded on a five point Likert-type
scale (1= strongly disagree to 5= strongly agree) (Edwards et al. 2009: 209).
5.4 The research instrument The tool that was used was a questionnaire adopted from the 23-item WRQoL scale
developed by Van Laar et al. (2007) to measure six factors of QoWL. The
questionnaire was chosen because it was less costly and less complex. All
responses in the six sub-scales were recorded on a five point Likert-type scale (1=
strongly disagree to 5= strongly agree). The questionnaire had open-ended and
closed-ended questions to assess the level of QoWL within University “A”. The
WRQoL questionnaire addressed a wide range of factors that are work and non-work
related. The WRQoL scale that was developed by Van Laar et al. (2007) was utilised
in this study to measure the dimensions of the WRQoL questionnaire which include: Job and career satisfaction;
General wellbeing;
Home-work interface;
Stress at work;
Control at work and
Working conditions
The closed-ended and open ended questions measured the abovementioned
dimensions. The measuring tool is not industry specific and can be used in other
sectors as well. The measuring instrument is compact but still covers factors that
influence the QoWL. The benefits that are associated with the utilization of this
instrument include, reducing the time required to complete the survey. Moreover, the
concise and compact nature of the tool makes it more likely to contain fewer missing
responses and therefore increases the response rate because it is convenient and
easy to implement (Edwards, Van Laar and Easton 2009: 209). The tool assisted in
being more specific as to where interventions should be made, for example if high
stress levels are associated with a poor working environment then the institution will
look at more intense health and safety control measures . The sub-scales reliabilities
for each of the six WRQoL indicate that the six WRQoL sub-scales all have a good
internal consistency (Edwards et al. 2009: 212).

85
Kaushik and Tonk (2008 as cited in Van der Berg.and Martins 2013) have a different
view that QoWL is also determined by the interplay of personal (subjective) and
situational (objective) factors of rewards, the work experience and environment.
Satisfaction is therefore viewed as a determining psychological factor of QoWL
resulting from the difference between the situation that a person finds himself in,
compared to where he wishes to be in. The perceptions held by participants are
completely subjective and may misinterpret actual conditions of the situation. Trist and Wesley (2001) as cited in Martel and Dupuis ( 2006: 342) have argued that
the most reliable aspects of determining the impact of QoWL are objective
measurements like productivity, absenteesim and staff turnover. This view is
supported by studies that uncovered that QoWL is associated with organizational
commitment, autonomy, education, reduced work stress, fairness and years of work
experience. Sashkin and Lengermann (1984) as cited in Saklani (2004:112) have a view that
QoWL can be assessed with the assistance of scales that include items based on
QoWL, conditions which are made up of a set of indicators that reflect the current
status of working conditions and management policies and practices. This method
allows for the drafting of QoWL statements in a way that is descriptive of empirical
realities evoking recall and leaving little room for the influence of opinions and
affective reaction. Different groups of people from different backgrounds will view
QoWL in different context, depending on their experience and perceptions. 5.4.1 Other methods of determining the quality of work life Other methods employed to determine the QoWL are gap analysis tools which
benefit some studies. The basis of quality perceptions arises from where customers
compare their expectations as a point of reference against which quality can be
measured. Service quality (SERVQUAL) is an instrument that measures the gap
between the customer’s expectations and perception of service (Parasuraman,
Zeithaml and Berry 1988). This method asks the respondents to respond twice to the
same question, the first time is with regard to their quality expectation and secondly
about their experience. Items in the tool range on a 7 point Likert scale from strongly
disagree to strongly agree. The outcomes of the gaps between expectation and

86
perception range from -6 to +6, the range of scores representing the difference
between the highest expectation and the lowest perception. The significant
assumption is that the smaller the gap, the higher the quality of service (Kandasamy
and Sreekumar 2009: 29).
The Work Life quality (WRKLFQUAL) model was adopted from the SERVQUAL
model. By modifying the SERVQUAL to suit the work life situation as a service
rendered by the institution to the staff, an operational model called WRKLFQUAL
was conceptualized. The WRKLFQUAL model assesses the gap between
expectation and perception of various QoWL factors. Like the SERVQUAL, in the
WRKLFQUAL model the respondents are required to indicate their level of
expectation on each item of the QoWL dimension on a scale of 1 (very low
expectation) to 5 (very high expectation). The second part of the questionnaire
indicates the respondent’s perception of the QoWL on a scale of 1 (highly
dissatisfied) to 5 (highly satisfied). The quality of a particular work life factor (QDi)
depends on the difference between perception (Pij) and expectation (Eij) scores.
This type of tool is more suited for the service industry since it was adopted from
measuring service quality (Kandasamy and Sreekumar 2009: 63).
5.5 Mixed methods Qualitative research assists in understanding and interpreting correlations. It is
advisable to use quantitative analysis to make findings to be relevant for future
research. The research question may be less focussed on some individual behaviour
than on the behaviours of larger populations where quantitative research is utilised.
Qualitative research can then be added to explain the results and search for
particular reasons (Fischl, Breitenmoser and Füllemann 2011). Findings from
qualitative interviews can assist in identifying previously unrelated data in
quantitative research as well as explaining variables. Qualitative research can also
assist to validate the quantitative research findings; therefore the two methods
compensate each other. The integration of qualitative and quantitative research
methods has gained popularity, because research methodology has evolved and
mixed methods is another progressive step of using the strength of both qualitative
and quantitative methods (Creswell 2009: 203).

87
In mixed methods research, quantitative method is used to describe the investigated
phenomena and elaborate on a macro-level, whereas qualitative research provides
the necessary information to fully explain arguments (Kelle 2006: 309-310). All
methodologies have their particular weaknesses and strengths, and therefore by
combining the qualitative and quantitative methods in this study, it compensates for
their limitations (Johnson and Turner 2003: 299). By combining both qualitative and
quantitative research, a comprehensive understanding of the complex research
problem is provided, whereas one method would prove to be inadequate to address
the problem (Creswell 2009: 203). The use of qualitative and quantitative research
methods made the research findings to be more valid.
5.6 Case study A case study method may be employed to test a theory by following a falsification
rather than verification logic. Case studies can also be used to exemplify didactical
purposes and for strengthening a validated theory in an attempt to further test the
theory. Case studies are used in research if the knowledge gained is going to be
utilised to solve the investigated problem (Daniel 2007: 301).
According to O’Leary (2004: 116), the advantage and disadvantages of case studies
include:
• Case studies focus research efforts on one location, and therefore offer one
set of parameters for the study.
• By focussing on one site this can decrease travel, offer easy access and
make the case study more feasible.
• The case study was employed to describe and gain an in-depth
understanding of the factors that impact on the QoWL at University “A”.
• Strategically case studies build strong relationships with respondents through
the development of trust and rapport.
The case study method was utilised in this research in order to intensively
analyse the study group in the University “A” in real life context in relation to
QoWL and to understand the causal factors.

88
Disadvantages of case studies
• The researcher can be biased if involved emotionally with the research
participants.
• There are high and difficult demands to obtain permission to collect data, such
as meeting institutional research ethics committee demands.
5.7 The study population The research question is always associated with a particular group of the sampling
unit. This particular group that is composed of all the sampling units that are linked to
the research question which is the total number of eligible subjects which qualify to
be included in the study is called the study population (Maree 2007:147). The study
population was full time, permanent employees at University “A”.
5.8 Sampling In a research investigation since there could be a couple of hundred of research
elements, it would be cumbersome to collect data from all the research elements and
costly. Studying a representative sample instead of the whole population saved time,
money and effort (Cavana, Delahaye and Sekaran 2001: 254). The population is the
entire university community which was divided into 3 strata which are as follows:
academic (n=179), academic support (n=52) and administrative staff (n=298).
Academic staff consisted of lectures and senior lectures, administrative staff was
made up of employees from departments such as finance, student affairs, marketing,
human resources and maintenance and academic support consisted of librarians
and laboratory technicians. A stratified random sampling was obtained by taking a
30% sample from each stratum of the entire population. This ensured that the entire
population is sampled. In this research study the probability sampling method was
used.
5.8.1 Stratified random sampling In probability sampling, a random procedure is used to give elements a known
likelihood of being selected (Hair, Money, Samouel and Page 2007: 175. The
probability sampling method that was utilised was stratified random sampling. The

89
population was divided into 3 strata: academic, academic support and administrative
staff. Sample subjects were drawn randomly from each stratum proportionally
according to the sample ratio to ensure that each stratum is well represented in the
sample. This is an ideal type because the probability of selecting the sample from
one group of employees is zero and all the groups are represented. This type of
sampling technique requires small numbers to get valid results (Welman, Kruger and
Mitchell 2005: 62).
5.9 Sample size When determining the sample size, issues such as time and cost effectiveness must
be taken into consideration by the researcher. There are 3 factors that predominantly
determine sample size (Maree 2007:177).
• A type of statistical analysis.
• Accuracy of results.
• Characteristics of the population.
The more homogeneous the sample the lesser the sample size required because the
study units will not vary significantly in relation to the variables of interest to the
study. The more complex the method of statistical analysis the bigger the sample
size required. The degree of accuracy of the findings is directly proportional to the
sample size (Maree 2007: 178-179). The sample size that will be drawn from each
stratum was as follows:
Job types Population size Sampling size
Academic 179 55
Academic support 52 15
Administrative staff 298 90
5.10 Recruitment The subjects were recruited by sending a letter that explained the purpose of the
research. Each participant was offered sufficient time to read the letter and was
given the opportunity to clarify any questions. The participants signed the information
and consent letter only after they understood what the research entailed. The

90
inclusion criteria were full time, permanent employees at the University “A” and the
exclusion criteria were part-time employees and subcontractors at University “A”.
5.11 Pre test The research questionnaire was “test driven” by piloting it to a limited number of
participants who fit the inclusion criteria, but were not within the same stratified
random sample selected to check for any flaws, reliability and validity (Welman et al.,
2005: 148). It was used to identify if the participants understood what the question
requires, and to assess how the participants interpret and respond to the questions.
Some of the questions were not clear and the respondents did not fully understand
how to respond to the question and other questions were a repetition of others.
These questions were clarified and made to be more understandable and repetitive
questions were rectified.
5.12 Primary and secondary data Data already collected for some other purpose is called secondary data (Sounders,
Lewis and Thornhill 2007: 246). Secondary data sources that were utilised included
records from the Higher Education, journal articles, documents from the University
“A”. This secondary data was used in conjunction with other data sources such as
questionnaires and observations. New data that is collected particularly for the
current research purposes is called primary data. The primary data methods that
were employed to achieve the objectives of this research were a questionnaire with
open ended and close ended questions, observations and interviews. Secondary
data was compared and reviewed with the primary data collected to evaluate the
research findings.
5.13 Quantitative data collection Quantitative research measures objective data that are made up of numbers
(Welman et al. 2005: 8). All the responses in the six sub-scales were recorded on a
five –point Likert-type scale (1= strongly disagree to 5= strongly agree). The close-
ended questions were in a form of multiple choice and the respondent was asked to
choose the relevant option. The weakness of quantitative research is that, it may
overlook critical factors that explain important realities, complexities and phenomena,

91
which can be achieved by qualitative research (Peters, Abu-Saad, Vydelingum and
Murphy 2002: 1053).
5.13.1 Close-ended questions Close ended questions compel the respondents to select from a range of pre-set
questions that were coded (O’Leary 2004: 159). The advantages and disadvantages
of using closed-ended questions include the following (Terre Blanche, Durrheim and
Painter (2006: 132) and Kumar (2005: 135) :
Advantages of close-ended questions
• Quantitative research can inform us about people’s perception and one of the
main reasons of using quantitative data is that it allows us to make statistical
comparisons of different situations.
• Since responses in quantitative research have already been classified, it
assists the researcher in obtaining the intended information.
• The classified data also make it easy to analyse.
Disadvantages of close-ended questions:
• One of the major weaknesses of close-ended questions is that it lacks depth
and variety.
• It is simple to respond to, and therefore some respondents may respond to a
question without really applying their minds to it.
• It lacks information on the context of the situation, where the phenomenon
under research actually happens.
• The lack of control over the environment where the participants respond to the
questionnaire.
• Constricting the research findings to only those mentioned in the research
proposal because of the structured and close-ended questions.
5.14 Qualitative data collection Public administration research realizes how critical context is, and qualitative
research approaches contribute perspective and insight information on context that

92
quantitative research cannot offer. Qualitative research approaches also provide a
way of closing the gap and encouraging the possibility that public administration
research will address the research question in a relevant way, (Luton 2010: 10-13).
Peters, Abu-Saad, Vydelingum and Murphy (2002: 1053) allude that the advantages
of the qualitative research method are that the subjects are being researched in their
natural setting which assists in gaining a better comprehension of the participant’s
environment. Furthermore, this method takes into consideration the perspective of
the participants and it is more flexible, and presents more realistic information, views
and attitudes that cannot be gained by quantitative methods.
The qualitative data was collected by unstructured questions formulated around
open questions that were presented to the participants, which in this case was senior
management. Data was collected from October 2012 to February 2013, and this
included questionnaire administration of about 25 minutes with the respondent
(Appendix A). Data was also collected through participant observation and the
researcher recorded the observations in a diary. Triangulation data was collected
from more than one source such as closed-ended and open-ended questions and
observation. Qualitative data gathering offered the respondents the option to express
themselves without any constraints, which led to more variety of data. Consequently,
some respondents may be unable to express themselves and information may be
lost (Kumar 2005: 135). The questionnaires were distributed to the work areas of
respondents, this assisted in covering a high number of respondents and offered the
convenience of completing the questionnaire in their own time. The questionnaire
was collected in a box to ensure anonymity and confidentiality.
Administering the questionnaire allowed the researcher the opportunity to reply to
any questions or concerns that were raised by the respondents. The main limitation
was that the researcher had to be careful not to influence the participant’s responses
by expressing verbal or non-verbal communication or signalling approval or non-
approval.

93
5.14.1 Advantages and disadvantages of open-ended questions The other method that was utilised was presenting participants with open-ended
questions. These types of questions require the respondent to formulate responses
in their own words (O’Leary 2004: 159). Respondents expressed themselves freely
and provided their perceptions and opinions, even though they were restricted by the
space allocated. The advantages and disadvantages of open ended questions
according to Creswell (2009: 175) are as follows:
Advantages
• Open-ended questions provide an environment whereby the participants can
express themselves freely without limitations by the researcher.
• Multiple source of data such as observation and interviews may be used as
opposed to depending on a single data source and data is gathered by
communicating directly with the participant and observing behave within their
context.
Disadvantages • Information may be lost because the respondents cannot express themselves,
• The researcher is more likely to be biased in open ended questions.
• Data collected can only be analysed qualitatively.
5.14.2 Observation Observation is a method of research in which the investigator observes the study
participants with the aim of understanding their behaviour and culture. The
researcher is not allowed to communicate with the participants during the research,
because in may interfere with the normal work arrangements of the employees
(Jandagh and Matin 2010: 61). The researcher recorded information relating to
research observation in a field diary, to keep a record of the participant’s verbal and
nonverbal expressions and feelings. O’Leary (2004: 174-175) outlined the
observation process on how to access the participants as follows:
• Observe, and use all the senses to collect data. The researcher must listen,
gain trust and establish rapport with the participants.
• Record and review, by recording observations in a diary as they unfold. They
must be recorded systematically to make it easy to analyse.

94
• The observed data must be reviewed and any challenges that were
encountered must be noted. The recorded data should the triangulated with
other data types.
• Based on the reviewed data and the quality of data collected, the data should
be refined to the satisfaction of the researcher.
• Analysis, which includes exploring words and non-verbal forms of expressions
to analyse data.
Advantages of observation includes, information gained through observation is more
reliable and free from respondent bias (Cavana, Delahaye and Sekaran 2001: 261).
Disadvantages of observation include a very slow method of collecting data and
information gained is more likely to be prone to observation bias (Cavana, Delahaye
and Sekaran 2001: 260).
5.14.3 Interviews Firstly, the researcher set up an appointment with the senior managers at their
offices. The researcher then established a rapport by introduction and expressing
appreciation to the manager for making the time. The researcher introduced the
purpose of the study and also the importance of the involvement of senior
management. The informed consent was explained and confidentiality and
anonymity assured before the interview commenced. The senior manager was then
asked open-ended questions to respond to. The researcher took down notes during
the interview. According to Kumar (2005: 131) the advantages of the interview
include: Data collected can be supplemented with information gained from the
observations. It is a more relevant for studying complex situations because the
interviewer has the opportunity of clarifying any unclear questions. It is a preferred
method if the research aims to gain in-depth information about the phenomena. The
interview can be used widely with any type of participants such as the illiterate and
the very old.
Disadvantages of the interview as Kumar (2005: 131) state are as follows; It can be
time consuming and expensive particularly if respondents are dispersed over a large

95
area, but it is ideal if respondents are situated on one site such a university. The
quality of the information gathered is dependent on the level of the interaction
between the interviewee and the interviewer.
5.15 Triangulation Triangulation refers to an approach whereby more than one research method or data
collection technique is used to provide confirmation and completeness of data.
Triangulation is not merely integrating different types of data, but it also tries to
interrelate the two types of data so as to leave the validity of each type of information
intact. The use of triangulation provided the researcher with a more holistic and
contextual picture and uncovered the various dimensions of the phenomena under
study. With the use of triangulation, bias can be limited and validity encouraged
(Perone and Tucker 2003: 2). According to Linlof and Taylor (2011: 275),
triangulation is a reliable validation method, if it is accepted that its principle of
multiple sources, techniques can reach a consensus on a single version of reality.
Triangulation was ensured by compensating the quantitative data in the form of
structured questionnaires by qualitative methods such as interviews and
observations as these can give rich and insight information about QoWL. The
researcher employed these various data collection methodologies to triangulate and
gain a better understanding of the phenomena under investigation.
5.16 Reliability Gottschalk (1995) (as cited by Jandagh and Matin 2010: 66) outlines three factors
that can affect the reliability of data analysis:
• Stability refers to the consistency of coding the same data in the same way
over a period of time.
• Reproducibility refers to the tendency for a group of coders classifies
categories membership in the same way.
• Accuracy or the extent to which classified text corresponds statistically to a
norm or standard.

96
The reliability of the data was determined by the test-retest method that assessed
the consistency of the questionnaire undertaken with respondents who were not part
of the sample population (Golafshani 2003: 598-599).
5.17 Validity The research questionnaire was “test driven” by piloting it to a limited number of
respondents who were not part of the sample population to check for any flaws,
reliability and validity. It was used to identify if the participants understood what the
question required, also to assess how the participants interpreted and responded to
the questions. The questionnaire was validated by using triangulation to improve the
evaluation of the research findings and data was also validated by analysing similar
studies by other researchers (Golafshani 2003:600-603).
5.18 Administration of questionnaire Each participant was offered sufficient time to read the letter and be given the
opportunity to clarify any questions. The respondents were offered questionnaires
and the researcher declared that the responses are confidential. The purpose of the
questionnaire was communicated to the respondents. All complete questionnaires
were collected in a box.
5.19 Data analysis Data was analysed by using Statistical Packages for Social Scientists (SPSS)
version 20 and the Cronbach’s coefficient alpha was utilised to test the reliability of
the questionnaire. The questionnaire was validated by using triangulation to improve
the evaluation of the research findings (Golafshani 2003: 603). The independence of
the variables was determined by Chi-square tests (χ²) to observe the degree of the
frequency of data (Terre Blanche, Durhheim and Painter 2006: 207). Descriptive
statistic such as bivariate analysis and correlations were used to describe patterns
and trends in the data set (Welman, Kruger and Mitchell 2005: 231). Inferential
statistics in the form of the t-test were utilised to test the research hypothesis.
Analysis of variance (ANOVA) was used to test for significant differences between
two means. Qualitative data was analysed with the assistance of a computer
programme, N-Vivo (Welman, Kruger and Mitchell 2005: 224). N-Vivo allowed the
researcher to organise and clarify high amounts of data to assess the correlation that

97
may exist. Furthermore, the computer programme offered the researcher the option
to explore correlations more easily. However, it is ultimately the researcher had the
responsibility of interpreting and analysing the data in a meaningful manner.
5.19.1 Cross tabulation This is the frequency distribution of responses on two or more sets of variables or
the subcategories of both variables are analysed in relation to each other to
ascertain if a relationship exists between them. For example, a cross tabulation may
compare how control at work differs from academic versus academic support staff.
5.19.2 Analysis of variance (ANOVA) ANOVA is utilised to evaluate the statistical difference between the means of two or
more groups. The weakness of ANOVA test is that it only enables the researcher to
conclude that there are statistical differences between the group means, but it fails to
pinpoint where the differences are (Hair, Money, Samouel and Page 2007: 343-344).
5.19.3 Parametric statistics Parametric statistics are based on the assumption that the population sample follows
a normal distribution and information is collected on an interval ratio scale (Cavana,
Delahaye and Sekaran 2001: 402).
5.19.4 Non-parametric statistics Non-parametric statistics are used when the distribution of the population sample is
not normal, or it is skewed. They are used when data is collected on a nominal or
ordinal scale (Cavana, Delahaye and Sekaran 2001: 402).
5.19.5 Descriptive statistics Descriptive statistics refer to the basic summary and description of the data.
Descriptive statistics simply describe what the data highlights in a more manageable
form. Inferential statistics are used to make conclusions about the probability that the
observed differences between groups are dependent on some factors or it just
occurred by chance (Trochim 2006).

98
5.19.6 Inferential statistics Inferential statistics are utilised to make conclusions about the population, based on
the information collected from the sample (Terre Blanche, Durhheim and Painter
2006: 208). Inferential statistics are used for two main purposes, to test the
population parameter and to test hypothesis. Inferential statistics offer the researcher
the authority to draw the boundaries to quantify approximate scores. Inferential
statistics are used to test hypothesis, which is an informed assumption, about the
difference between two variables (Terre Blanche, Durhheim and Painter 2006: 209).
5.19.7 T-test The T-test is used to determine if the observed difference in averages of the two
groups is large enough to be associated with a change in a variable or if it transpired
by chance (Welman, Kruger and Mitchell 2005: 237).
5.19.8 Chi-Square (x2) analysis Chi-Square (x2) analysis is generally employed when the data can be separated into
various categories. Chi-Square analysis was used to make inferences between
categories such as academic and academic support to determine which staff prefer a
certain variable (Welman, Kruger and Mitchell 2005: 237). The Chi-square test was
used to determine if any of the responses was significantly selected more frequently
than other responses and to test the association between the type of employee
category and their response to each question.
5.19.9 Measures of central tendency
Measures of central tendency are the approximate central score in a distributed data
set. They are used as a single value that is more representative of the data collected
for a variable. There are three measures of central tendency, namely mean, median
and mode (Welman et al. 2005: 229-230).
5.19.9.1 Mean
The mean is the arithmetic average score of a set of data, it is obtained by adding all
the scores and dividing by the total sum.

99
5.19.9.2 Median
The median is the most central value in a data set if arranged from the lowest to the
highest.
5.19.9.3 Mode
This is the most commonly occurring value in a distribution data set.
5.19.20 Measures of variance Measures of variance indicate the degree to which values differ from the measures
of central tendency. There are two common measures of variance, which are the
range and the variance.
5.19.20.1 Range
The range is the difference between the highest and the lowest score on a variable.
5.19.20.2 Variance
The variance is an approximate measure of the average distance of each value from
the mean (Terre Blanche, Durhheim and Painter 2006: 198).
5.20 Hypothesis testing Another technique of inferring from a sample population is hypothesis testing. It
initially begins with the researcher, having a certain assumption or beliefs about the
constructs of some of the study variables in the population. These assumptions are
then tested for their credibility in relation to the information gathered from the sample
e.g. Hypothesis about a relationship between two variables. For every hypothesis
there is a null hypothesis (Maree 2007: 203).
5.21 Ethical considerations
The researcher ensured that the information provided by the respondents is kept
strictly anonymous and confidential. It is unethical to identify individual respondents
and therefore the researcher must ensure that after the data has been gathered, the
source must not be known (Kumar 2005: 214). Both the researcher and the
supervisors ensured that confidentiality was maintained throughout the research
process.

100
5.22 Ethical clearance Institutional Research Ethics Committee (IREC) Full ethical clearance was sought and granted by the Institutional Research Ethics
Committee. All ethical matters were identified and addressed effectively before any
data collection commenced. The study proposal was scrutinized by the Durban
University of Technology IREC to guarantee that the research study is conducted in
an ethical manner.
5.23 Informed consent A consent form is a key factor in achieving and satisfying ethical requirements. It is
unethical to collect data without the knowledge of the subjects and their willingness
and informed consent (Kumar 2005: 212). The participants of the study must be
informed of the key issues in a way that is understandable to them, and the
participants should not be under the impression that they are compelled to
participate and they should not be deceived into doing so. The consent letters were
also translated into Zulu, to offer the participants the opportunity to make a decision
to participate in the study in a language that they understand. The consent to
participate clearly outlined the aims of the study and what the collected data will be
used for. The participants were offered sufficient time to read the informed consent
and to make an informed decision to participate in the study.
3.24 Consent to conduct research at the University “A” An application to conduct the research at University “A” was submitted and the
research was presented to the University ethics committee which was the case
study. Furthermore, the research proposal was submitted to the University’s Ethics
Committee where the researcher is registered and it was approved.
5.25 Anonymity Anonymity is deeper than confidentiality in that it refers to safeguarding the
respondent’s identification from even the researcher. Information or data that is
gathered anonymously cannot be traced back to a particular respondent (O’ Leary
2004: 54). The research respondents remained unidentifiable and nameless during
the research process. Moreover, the researcher employed pseudonyms or codes to
avoid the research respondents from being identified (Henn, Weistein and Foard
2009: 94-95).

101
5.26 Confidentiality The study participants were assured of the confidentiality of their responses to the
questionnaire. Numbers were used to identify the questionnaires and not
indemnifying information such as names. Only the researcher and the supervisors
had access to the questionnaires. Confidentiality of the study participants was
maintained throughout the research process, even the name of the University was
not disclosed.
5.27 Data presentation Statistical data does not only need to be analysed, but also presented in a clear and
easily understood manner. The data was presented in graphs, bar charts and tables
for cross tabulations (Kumar 2005: 253).
5.27.1 The graph
The main aim of the graph is to present data in a way that is easy to understand and
interpret and attractive to look at. A graphical presentation is made up of two axis, a
horizontal (x) axis and a vertical (y) axis. The graph was drawn to the appropriate
scale.
5.27.2 The histogram
The histogram is constructed from a number of rectangles next to each other without
any space in between. The height of the rectangles is proportional to the frequencies
they represent (Kumar 2005: 254).
5.27.3 Bar chart
A bar chart is similar to the histogram, but there are spaces between rectangles to
indicate that the data is categorical. The bar diagram are used for variables on
nominal or ordinal scales and it is displayed on the y and x axis.
5.28 Dissemination of the data A copy of the dissertation will be made available at the Durban University of
Technology libraries. The research will also be published in a relevant national
journal.

102
5.29 Data types Data was obtained from various sources and it is captured on different scales. There
are four types of such scales, namely nominal and ordinal (Maree 2007: 147).
5.29.1 Nominal scale
In this type of scale the scores are differentiated from each other by different names
e.g. gender male or female (Maree 2007: 148).
5.29.2 Ordinal scale
Basically similar to nominal scale, but the categories are arranged in a meaningful
pattern. Ordinal scales include numeric data that has been grouped into classes .e.g.
levels of agreement with a question, agree, strongly disagree (Maree 2007: 148).
5.30 Likert scale The data scale that was utilized for quantitative data is the Likert scale. It is an
ordinal scale that included numeric data that has been grouped into classes.
Furthermore, the Likert scale is very convenient if one wants to measure a construct
e.g. level of agreement with a question, agree, and strongly agree (Maree 2007:
177).
5.31 Conclusion The chapter demonstrated how data was processed from the time it was collected,
coded, analysed and displayed. A comprehensive rationale of the use of mixed
methods of qualitative and quantitative research was made. The chapter provided a
detailed account of the research analysis and presentation methods. The following
chapter will focus on recommendations and interventions on how to improve the
QoWL of employees at University “A”.

103
CHAPTER 6 RESEARCH FINDINGS, DATA ANALYSIS AND INTERPRETATION
6.1 Introduction This chapter discusses the research findings from the quality of work life (QoWL)
research study that was conducted at University “A”. The data collected from the
quantitative responses was analysed with SPSS version 20.0 and N-VIVO version
N10 for qualitative data. The results presented the descriptive statistics in the form of
graphs, cross tabulations and other figures. Inferential techniques included the use
of chi square test values and Spearman correlation, interpreted using p – values and
correlation coefficients respectively.
The demographic data were collected to assess the variation in the distribution of
respondents by their age, gender, ethnic group, education qualifications, length of
service, job, type and job level. The second section discussesed the quantitative
data from the questionnaire survey, while the third section discussesed the open
ended questionnaires in the form of interviews. In the fourth section data obtained
through observations are analysed.
6.2 Reliability statistics
The two most important aspects of precision are reliability and validity. Reliability is
computed by taking several measurements on the same subjects. A reliability
coefficient of 0.70 or higher is considered as “acceptable”. The table below reflects
the Cronbach’s alpha score for all the items that constituted the various sections of
the questionnaire.

104
Table 6.1: Cronbach’s Alpha scores
Section Cronbach's Alpha
Job Satisfaction .896
General Wellbeing .772
Control at Work .795
Home Work Interface .581
Stress at Work .587
Working conditions .757
Overall .898
The overall reliability score (0.898) is greater than the suggested value (of 0.70).
This indicates a high degree of acceptable, consistent scoring for the different
categories of the ordinal variables for this research. All of the categories have high
acceptable values, except Home Work Interface (.581) and Stress at Work (.587)
which have values approximating 0.6. This was mainly due to the structure of the
questions that comprised these sections in terms of their direction or alignment.
6.3 Validity The research questionnaire was piloted to a limited number of 15 participants with
the respondents who were not part of the sample population to check for any flaws,
reliability and validity. It was used to identify if the participants comprehended what
the question required, also to assess how the participants interpreted and responded
to the questions. There were some duplicate questions that were rectified.
6.4 Data presentation and discussion The Figures and Tables below indicate the scoring patterns of the respondents for
the variables that constitute the different categories.This section investigates
responses of the opinion of the respondents on the quantitative questionnaire.
6.4.1 Biographical data Basic demographic data were collected to assess the variation in the distribution of
respondents by their age, gender, race, length of service, education level job type
and current job level.

105
6.4.2 Table 6.2 illustrates the biographical data of the sample The biographical data assisted in understanding how it relates to QoWL. This set of
data was assessed if it had any influence on the research findings. Factors that
impact on the quality of work life: A case study of a University “A”. Of the 142
respondents 55.8% were administrative, 21.8% academic support and 25.4% were
academic.
Table 6.2: Composition of the sample
Variable Frequency Percent
Age
20-25 6 4.2
26-34 50 35.2
35-44 34 23.9
45-54 27 19.0
55-64 24 16.9
65+ 1 0.9
Total 142 100
Gender
Male 61 43
Female 81 57
Total 142 100
Ethnic group
Black 121 85.2
Coloured 2 1.4
White 8 5.6
Indian 11 7.7
Total 142 100
Highest educational qualification
Below matric 12 8.5
Matric 6 4.2
Trade certificate 7 4.9
Advanced diploma 28 19.7
Degree 37 26.1

106
Postgraduate 52 36.6
Total 142 100
Length of service
Less than 1 year 10 7
1-3 52 36.6
4-6 19 13.4
7-11 15 10.6
12-15 22 15.5
20+ 24 16.9
Total 142 100
Job type
Academic 36 25.4
Academic support 31 21.8
Administration 75 52.8
Total 142 100
Job level
Semi skilled ( grade 11-
17)
63 44.4
Professionals/specialist
(grade 9&10)
13 19.1
Lectures (grade 7,8&9) 33 23.2
Junior management (7&8) 27 9.2
Middle management
(grade 5&6)
6 4.2
Total 142 100

107
Figure 6.1: Age
Figure 6.1 shows that, while 35.2% of respondents were between age 26-34, 23.9%
ranged between 35-44 years, 19% of respondents were between age 45-54, 6.9%
were between age 55-64, 4.2% of respondents were between the age of 20-25 and
finally 0.7% of respondents were 65 years and older. About 35.2% of respondents
were between the ages of 26-34 years old, which means they are they are more
likely to remain employed at university “A” and QoWL will have a great impact on
their career.
0.0
5.0
10.0
15.0
20.0
25.0
30.0
35.0
40.0
20 - 25 26 - 34 35 - 44 45 - 54 55 - 64 65+
4.2
35.2
23.9
19.0 16.9
.7
Perc
ent
Age (years)

108
Figure 6.2: Gender
Figure 6.2 demonstrates the gender distribution of respondents. There were (57%)
female and (43%) male respondents. The gender representation closely resembles
that of University “A” .
Table 6.3: Race
Frequency Percent
Black 121 85.2
Coloured 2 1.4
White 8 5.6
Indian 11 7.7
Total 142 100.0
Table 6.3 reflects that about 85.2% of respondents were Black, 7.7% were Indian,
5.6% of the respondents were White while 1.4% were Coloured. It is important to
differenciate gender and race groups in this study as they impact on QoWL as
indicated in a study by Rosser (2004: 304) that female faculty members tend to be
less satisfied with certain aspects of QoWL such as workload, benefits,
compensation and job security than their male counterparts. Furthermore ethnic
minorities were more likely to leave their career or their academic institution than
their majority faculty members. Aguirre (2000:4) affirms that an examination of the
43
57
Gender
Male
Female

109
academic workplace for women and minorities including ethnic minorities is
imperative when taking into consideration the fact that demographic predictors
suggest that the U.S.A workforce will be highly diverse in the 21st century, and the
two populations that will most likely determine diversity are women and minorities.
Figure 6.3: Education levels
The results in Figure 6.3 depict the education level of respondents as 36.6% have
postgraduate qualifications, 26.1% have obtained their degrees, 19.7% have
achieved advanced diploma education level, 8.5% of respondents have below matric
qualification, 4.9% have a trade certificate and 4.2% of the respondents reached
matric level and a majority of the respondents have a post matric qualification hence
the response are reliable since they are from educated sources. About 87.3% of the
sample had a qualification and the fact that most employees are in possession of a
qualification is consistent with the fact that this is an academic environment.
8.5 4.2
4.9
19.7
26.1
36.6 Below matric
Matric
Trade certificate
Advanced diploma
Degree
Post graduate

110
Figure 6.4: Length of service
The results in Figure 6.4 show that 36.6% have a service length of 1-3 years, 16.9%
have worked in the institution for 20 or more years, 15.5% of respondents have a 12-
15 length of service, 13.4% of respondents have worked for 4-6 years, 10.6% have
7-11 length of service while 7% of respondents have tenure of less than 1 year.
7.0
36.6
13.4 10.6
15.5 16.9
0.0
5.0
10.0
15.0
20.0
25.0
30.0
35.0
40.0
< 1 1 - 3 4 - 6 7 - 11 12 - 15 20+
Perc
ent
Length of service (years)

111
Figure 6.5: Job type
Figure 6.5 illustrates the job types of employees as 52.8% were administrative staff
25.4% academic, while 21.8% of respondents were from academic support. The
majority of respondents were administrative staff followed by academic and then
academic support, this is consistent with the total population ratio. The stratified
random sampling achieved its representativeness objective.
Figure 6.6: Current job level
According to Figure 6.6, 44.4% of respondents were semi-skilled, 23.2% of
respondents were lectures, 19% were professionals or specialists in their job type,
9.2% occupied junior management positions and 4.2% were from middle
management.
25.4
21.8
52.8
Academic
Academic support
Administration support
0.0 20.0 40.0 60.0
Middle management (grade 5&6)
Junior management (7&8)
Lecturer (grade 7,8&9)
Professional/specialist (grade9 &10)
Semi skilled ( grade 11-17)
4.2
9.2
23.2
19.0
44.4
Percent

112
6.4.2.1 Job and career satisfaction The relationship between job and career satisfaction and QoWL is very important,
because employees feel a sense of satisfaction if they recieve training at work, when
they are offered opportunities to use their skills and advance in their careers.
Table 6.4: Job and career satisfaction Disagree Undecided Agree
I have a clear set of goals and aims that enable me to do my job. 17.1 9.3 73.6
I have the opportunity to use my abilities and skills at work. 24.5 10.8 64.7
When I have done a good job it is acknowledged by my line manager. 31.9 20.3 47.8
I am satisfied with the career opportunities available to me here. 42.1 22.9 35.0
I am satisfied with the training I receive in order to perform my present
job. 50.4 18.0 31.7
I am encouraged to develop new skills. 37.9 23.6 38.6
I think that my job is reliable and secure. 35.2 24.6 40.1
I am growing as a professional in my current job 34.5 22.5 43.0
• Goals and aimsNotably 73.6% of the study participants agree that they have a clear set of
goals and aims that enable them to do their job, 17.1% disagree with this
statement and 9.3% were undecided. This certainty could be as a result of
clear job descriptions and end results of job processes. Michie and Williams
study (2003: 3) showed that the key work aspect that are linked with
psychological ill health were unclear management and work role.
• Use of abilities and skills at workA high majority of respondents 64.7% indicated that they agreed that they
have the opportunity to use their abilities and skills at work, 24.5% disagreed
with the statement and a further 10.8% were undecided on the question.
Schemerhorn, John, Hunt, James, Osborne and James (1994: 56-57)
suggests that QoWL offers employees opportunities to learn and utilize new
acquired skills. It was noteworthy that a high majority of respondents (64.7%),
indicated a positive perception by agreeing that they have the opportunity to
use their abilities and skills at work.

113
• Acknowledgement by line mangersAbout 47.8 % and 31.9 % respectively agreed or strongly disagreed with the
statement” “When I have done a good job it is acknowledged by my line
manager” and 20.3% were undecided. The satisfaction of employees is an
important factor that must be assessed, because the quality in higher
education globally depends on the steady and supportive academic work
environment and on academic staff performance (Winter, Taylor and Sarros
2000: 281; Oliver, Jose and Brough 2006: 845-846).
• Career opportunitiesAbout 42.1% of respondents disagreed that they are satisfied with the career
opportunities available while 35.0% agreed and a further 22.9% were
undecided. Career development was identified as one of the aspects that
impact on job satisfaction and QoWL (Pienaar and Bester 2009;
Schemerhorn, John, Hunt, James, Orsborne and James 1994: 56-57). It is
noteworthy that 42.1% of the respondents are not satisfied with the career
opportunities available for them. Coetzee, Bergh and Schreuder (2010: 2)
agree that institutions that give career development opportunities and support
to their employees will reap more benefits from their employees. Clearly the
respondents see career opportunities as a part of career development. This
could be attributed to unclear promotion policies for some departments.
• TrainingMore than half 50.4% of the respondents disagreed that they were satisfied
with the training they receive at work to perform their functions while 31.7%
agreed and 18% were neutral of undecided. The findings of the study indicate
that employees are not satisfied with the training they receive are confirmed
by Pantit and Pant (2010: 173) that work related training as one of the QoWL
issues that impact job satisfaction. Furthermore the results obtained from a
study by Schultz (2005: 768) identified intrinsic factors such lack of funding to
attend conferences as causes of job dissatisfaction amongst employees.
Potgieter and Coetzee’s (2010: 1) research affirm that there is a link between
the competencies and the level of training required for these competencies.

114
• Development of new skills A proportion of 38.6% agreed that they are encouraged to develop new skills,
however 37.9% disagreed with this statement and 23.6% were neutral. This
showed that the respondents' views were divided on the issue of being
encouraged to develop new skills as (37.9%) and (38.6%) respectively
disagreed or agreed on that question. According to Rethinam and Ismail
(2008: 64) learning opportunities and skills development have been proven to
have a positive effect on job and career satisfaction and less job stress which
results in better QoWL. Schemerhorn, John, Hunt, James, Orsborne and
James (1994: 56-57) also confirm that QoWL offers opportunities to learn and
utilize new skills and career progression.
• Job is reliable and secure It was noteworthy that 40.1% of respondents agreed that their job is not
reliable and secure, 35.2% disagreed and 24.6% were undecided. It was
interesting to note that (40.1%) of respondents agreed that their job is not
reliable and secure. Schultz (2005: 768) and Rothman and Viljoen (2009: 67)
confirm that job insecurity is a matter of concern in universities.
• Growth as professionals About 34.5% of the participants disagree that they are growing as
professionals in their current job while 43% agreed that they are growing as
professionals and 22.5% were undecided. Lau, Wong, Chan and Law (2001
as cited in Rethinam and Ismail 2008: 59) attest that QoWL that supports and
promotes job satisfaction by providing employees with career growth
opportunities. Tabassum, Rahman and Jahan (2012: 52-53) also identified
career growth as a one of the negatively perceived factors that affect QoWL at
a university.
According to the results, job satisfaction has a significant negative link with QoWL at
University “A”. It seems as if job satisfaction is not given the attention it requires to
improve QoWL in public institutions. In addition a study by Mammen (2006: 475 )

115
indicated that employees from a (HDI) are more likely to seek employment
elsewhere if they experience job dissatisfaction.
6.4.2.2 General wellbeing An organisation will find it difficult to meet its goals and objectives if the general
wellbeing of its workforce is not in a healthy state.
Table 6.5: General wellbeing Disagree Undecided Agree
I feel well at the present moment. 33.3 13.5 53.2
Recently I have been feeling unhappy and depressed. 46.7 19.0 34.3
I am satisfied with my life. 31.2 21.3 47.5
In most ways my life is closer to ideal. 34.5 36.0 29.5
Generally things work out well for me. 38.6 20.0 41.4
Recently I have been feeling reasonably happy all
things considered. 41.1 22.0 36.9
• Feeling wellAlmost 53.2% agreed that they are feeling well at the present moment, a third
of respondents 33.3% are not feeling well at the present moment, 13.5% are
undecided and. The findings are consistent with research findings by Botha
and Brand (2009: 1). The results obtained in the study are also confirmed by
Plattner and Mberengwa (2010: 5) study amongst secretaries at the University
of Botswana, identified 17 occupational stressors that were associated with
psycho-physiological wellbeing amongst university employees.
• Feeling unhappy and depressedAbout 46.7% of respondents disagreed with the statement, 34.3 % of
respondents agree that they were feeling unhappy and depressed, 19% were
undecided. These findings are verified by Sithole’s (2001: 80) research that
university academic and academic support employees experience increased
rates of depression. Furthermore, Viljoen and Rothman (2009: 67) indicated
that the employee’s experience of a particular occupational stressor resulted
in higher levels of physical and psychological ill health.

116
• Life satisfactionOnly 47.5% of respondents were satisfied with their life while 31.2% were not
satisfied with their life and 21.3% were undecided on the question. In a study
conducted by Oliver, Jose and Brough (2006: 845-846) on non-academic staff
of a university affirm this as it was discovered that job satisfaction and social
support in the workplace enhanced employees’ psychological well being.
• Life close to idealHigh percentages 36% of respondents are undecided on the question of “in
most ways my life is closer to ideal, a further 34.5% disagreed and 29.5%
agreed that their life is closer to ideal. High percentages, 36% of respondents
who were undecided on the question of “in most ways my life is closer to
ideal”, could be attributed to the fact that most employees do not know as to
how their life should ideally be. There is scant research to assess if
employees' lives are closer to ideal.
• Feeling reasonably happyFurthermore 41.1% disagreed with the statement “Recently I have been
feeling reasonably happy all things considered" further 36.9% agreed with the
statement and 22% were undecided. This is consistent with a study by Field
and Buitendach (2011) in a university that revealed a significant positive
relationship between well-being and organisational commitment.
• Things working out wellThe response to the question “Generally things work out well for me”, 41.4%
of respondents indicated that they agreed with the statement while 38.6%
disagreed and 20% were undecided. In a study conducted by (QoWL Limited
2007: 04 ) about the 56% of the respondents from this organisation strongly
agreed or agreed that they felt good or content in themselves which was
similar to the QoWL benchmark sample 56%. This indicates that University
“A” has a lower than average percentage of employees who are content in
themselves.

117
6.4.2.3 Control at work Control at work is an important variable of QoWL as it focuses on the degree of
freedom, responsibility and authority that employees have on their work
environment.
Figure 6.7: Control at work
• Voicing out opinionsThe findings reflected in figure 6.7 indicated that more than half 50.7% of
respondents disagreed that they are able to voice out their opinions and
influence changes in their area of work, a further 33.8% agreed and 15.5%
were neutral. Msweli-Mbanga and Potwana (2006: 29) confirmed that if
employees have access to participate in work related matters, they are less
likely to be resistant to change in the organisation. This result is also in
accordance with earlier research by Winter, Taylor and Sarros (2000: 279-
0.0 20.0 40.0 60.0
I have the necessary authority to do my job.
I am given a lot of freedom to decide how I do my job.
I have a lot of say about what happens in my job.
My job carries a lot responsibility, but I do not have much authority.
I am involved in decision that affects me in my own area of work.
I am able to voice out my opinions and influence changes in my area of work.
33.8
41.4
40.1
26.8
44.4
50.7
47.2
40.7
34.5
54.2
34.5
33.8
Percent
Agree
Undecided
Disagree

118
291) that most employees experience minimal opportunities to influence the
university decision making processes.
• Decision makingAccording to figure 6.7, 44.4% of respondents reported that they disagree that
they are involved in decisions that affect them in their area of work, 34.5% of
respondents disagreed with this statement while 21.1% remained undecided.
According to De Witt (2001) employees should be able to participate in the
decision making process in to attain organisational goals. In another research
by Michie and Williams (2003: 3), it was noticed that one of the key factors
that are associated with psychological ill health is lack of participation in
decision making processes. A conclusion can be made that involving
employees in desicion making is an important element of QoWL.
• Job responsibilityIn figure 6.7 shows a high proportion of 54.2% of the participants who agreed
that their job carries a lot of responsibility, but they do not have much
authority, about 26.8% disagreed followed by 19% were undecided. A number
of research studies with a focus on job components like job control have
affirmed that the combination of low control at work and high demanding job
functions have an impact on the QoWL. (Rethinam and Ismail 2008: 62).
Paton (2013: 16), is in agreement that most academics and academic support
staff are under excessive pressure to perform and meet expectations of
management and students and this has an effect on their wellbeing.
• Say about what happensFigure 6.7 shows that 40.1% of respondents disagreed with the statement “I
have a lot of say about what happens in my job”, a further 34.5% disagreed
and 25.4% were undecided on the sub dimension. According to Spector
(1986: 1013-1014) employees who perceive reasonably high levels of control
at work are more satisfied, committed involved and motivated.

119
• Freedom to decideFigure 6.7 above depicts that 41.4% disagreed that they are given a lot of
freedom to decide how to do their jobs while 40.7% agreed and 17.9% were
neutral. Griffin, Fuhrer, Stansfeld and Marmot (2002: 783) concur that
employees with low control at work or at home had a high risk of developing
anxiety and stress. Another research by Kinman, Jones and Kinman (2006:
15) amongst university employees revealed th similar resuts that indicated
that the work demands have increased with results. It appears that
respondents view control at work as a high contributing factor to QoWL
• Necessary authorityThe statement “I have the necessary authority to do my job” generated 47.2%
agreement responses from the study participants, 33.8% of the participants
disagreed with the statement while 19% remained neutral. Paoli and Merlie
(2000: 12) confirm that there has been a sharp decline in the level of job
control amongst some occupations.
6.4.2.4 Home work interface The relationship between work and home life can no longer be teated separately, as
what happens at home influences what happens at work, and vice versa.
Table 6.6: Home work interface Disagree Undecided Agree
My employer provides adequate facilities and flexibility for me to adjust
my work in with my family time. 46.0 20.4 33.6
My current working hours/patterns suit my personal circumstances. 25.7 17.1 57.1
My line manager actively promotes flexible working hours. 43.0 15.5 41.5
I often have to take work home to keep up with my job demands. 45.1 16.2 28.7
The job demands interfere with my family time. 52.9 14.3 32.9
I can keep a reasonable time between work and personal time. 23.4 19.1 57.4
I often worry about work even when I am at home. 32.1 16.4 51.4
I travel a long distance between work and home 46.5 11.3 42.3

120
• Work-home flexibilityTable 6.5 indicates that 46% of respondents disagreed that their employer
provides adequate facilities and flexibility for employees to adjust their work
with their family time, wherein 33.6% agreed with the statement and a further
20.4% were undecided. According to Arrowsmith (2000) flexible working
practices enable employees to obtain a better balance between work and
home. These results highlight the importance of flexible working patterns.
• Suitable working patternsThe findings as indicated in table 6.5 show a high percentage of 57.1% of
respondents who agreed that their current working hours/patterns suit their
personal circumstances, while 25.7% disagreed with the and 17.1% were
undecided on the statement. Quick, Henley and Quick (2004: 426) and
Barkhuizen and Rothman (2008: 332-333) agree that, as the home-work
conflict increase, the job satisfaction and life satisfaction of employees
decrease.
• Promotion of flexible hours by line managerAbout 43% of the respondents disagreed that their line manager actively
promotes flexible working hours, and 41.5% agreed with this statement while
15.5% were undecided. Dancaster and Cohen (2010: 33) and Hegewisch
and Gornick (2008) concur that employers are slow to respond to promote
flexible working hours. These results suggest that the University “A” needs to
reexamine their flexible working practices.
• Taking work homeTable 6.5 indicates that 45.1% of the respondents disagreed with the
statement “I often have to take work home to keep up with my job demands”,
28.7% agreed with the statement while 16.2% were undecided. The
Association of University Teachers (AUT) (2003 cited in Barkhuizen and
Rothmann 2008: 323) confirm that work home balance and excessive
workload are amongst the most common reported causes of stress amongst
academics.

121
• Job demands and family timeThe research findings as reflected on table 6.5 highlights that 52.9% of the
study participants disagreed that their job demands interfere with their family
time, a further 32.9% disagreed while 14.3% remained neutral. Employees
suffer detrimental effects in an attempt to juggle work and home demands
(Wentzel, Buys and Mostert 2009: 1; Barkhuizen and Rothman 2008: 332-
333). Elisa and Ellen (2001 as cited in Almuftah and Lafi 2011: 113)
presented evidence that there is an association between long hours and
family disintegration. The outcomes suggest that this is an area of concern
that needs improvement.
• Work and personal timeTable 6.5 results show that a high percentage of 57.4% of the study
participants agreed that they can keep a reasonable time between work and
personal time, 23.4% disagreed and 19.1% were undecided. Kreiner,
Hollensbe and Mathew (2009: 704) confirm that employees can find
themselves taking work home and spending long hours performing work and
subsequently compromising their personal lives.
• Worrying about workTable 6.5 illustrates that 51.4% of respondents reported that they worry about
work even when they are at home and 32.1% disagreed and 16.4% reported
undecided. Ellen et al. (2001) verify that high demand at work and at home
are more likely to be a cause of stress because it permits spillover to family
life and therefore destructing the equilibrium between work and home. There
was evidence that was presented by Place and Jacob (2001:102-103), that
confirmed that staff who spent a significant amount of time with their family,
were less likely to develop stress than the one who did not. These outcomes
imply that the employer must consider flexible working arrangements that will
assist in integrating employees' work and family responsibilities.

122
• Work and home travelThe findings as demonstrated in table 6.5 indicate the 46.5% of the study
participants disagreed that they travel long distances between work and
home, a further 42.3% agreed and 11.3% remained neutral. These research
findings are synonymous with Spies (2006: 133) study show that increasing
commuting distance does not necessarily cause decrease job satisfaction.
6.4.2.5 Stress at work Stress takes a toll on the performance of the organisation, therefore the organisation
must asses and address factors that give raise to stress in their workforce in order
for the organisation to function optimally.
Table 6.7 Stress at work Disagree Undecided Agree
I often feel under pressure at work. 32.9 20.0 47.1
I often feel excessive levels of stress at work. 34.8 22.7 42.6
The workload placed on me is more than I can handle. 52.1 13.6 34.3
There is friction or anger amongst colleagues. 41.4 18.6 40.0
I get help and support I need from colleagues. 22.0 19.1 58.9
I am often unable to find the information I need to perform my
job 50.0 17.9 32.1
I often perform my job without interruption 44.7 9.9 45.4
• Under pressureTable 6.6 depicts that a high percentage of 47.1% of respondents agreed that
they often feel under pressure at work, 32.9% disagree with the statement
and a further 20% remained undecided. Michie and Williams study (2003: 3)
showed that the key work aspect that is associated with stress in staff were
long working hours, work overload and working under pressure. A majority of
respondents 47.1% was of the opinion that they often feel under pressure at
work.
• Excessive levels of stressAbout 42.6% of respondents agreed that they often feel excessive levels of
stress at work, 34.8% disagreed and 22.7% were undecided. These findings

123
concur with Court and Kinman (2008: 54) that employees in higher education
experienced generally high or very high levels of stress. Notably 42.6% of
respondents agreed that they often feel excessive levels of stress at work.
• WorkloadTable 6.6 findings reflect that 52.1% of the study participants disagreed that
the workload placed on them is more that they can handle, 34.3% agreed and
13%.6% were neutral. Mapesela and Hay (2006: 722) affirm that academics
experience increased workload. Previous research by Rothman et. al. (2008:
418) confirm that increased workload through administrative work was
indicated as the most significant factor of burnout. The results suggest that
control measures to minimise the workload are needed.
• Friction amongst colleaguesTable 6.6 demonstrates that 40% of the study participants agreed that there is
friction or anger amongst colleagues, 41.4% disagreed and a further 18.6%
were undecided. Chan, Lai, Ko and Boey (2000: 1420) assert that the
response to the perceived relationship between employees and the work
environment that threatens the individual physically, psychologically and
physiologically leads to stress. Mcdonough (2011: 2) confirms that the
interrelations amongst employees have a significant influence on their
happiness and wellbeing. These findings mean that efforts should be placed
on improving interrelations amongst University “A” employees.
• Help and supportThe results as indicated in table 6.6 illustrate that a high percentage of 58.9%
agreed that they get help and support they need from colleagues, a further
22% disagreed with the statement and 19.1% remained undecided. According
to Helliwell and Putman (2004: 1437), people who get support from
colleagues have a low chance of experiencing depression, sadness,
loneliness and low self esteem. It was interesting to note that the results as
indicated that a high percentage of 58.9% agreed that they get help and
support they need from colleagues.

124
• Information Table 6.6 demonstrated that half 50% of respondents disagreed that they are
often unable to find the information they need to perform their job, 32.1%
agreed and 17.9% were undecided. There is clear evidence that show that
negative acts by superior and colleagues such as strict monitoring, excessive
criticism and withholding information constitute workplace bullying (Lewis and
Gunn 2007 as cited in Van Schalkwyk, Els and Rothmann 2011: 4).
• Interruptions Table 6.6 reported that 44.7% of the study participants disagreed that they
often perform their job without interruption, 45.4% agreed that they perform
their job without interruption and only 9.9% were undecided. Mark, Gudith and
Klocke’s (2008: 107) research suggested that employees recompense for
interruptions by performing their job more rapidly, but this comes at a cost of
employees experiencing more stress.
6.4.2.6 Working conditions Unsatisfactory working condition can compromise the health and safety of
employees, moreover all health and safety risks shold be identified, and controlled to
acceptable levels.
Table 6.8 Working conditions
Disagree Undecided Agree
My employer provides me with what I need to do my job effectively. 47.5 22.0 30.5
I work in a safe environment. 39.4 14.1 46.5
Employee health and safety is a high priority where I work. 46.5 25.4 28.2
The health and safety conditions are satisfactory. 46.1 21.3 32.6
At work employees and management work together to ensure the
safest possible working conditions. 47.2 28.9 23.9
Working conditions need to be improved 7.7 11.3 81
• Provision to perform The research results as indicated in Table 6.7 showed that 47.5% of
participants disagreed that the employer provided them with what they need
to do their job effectively, 30% agreed and 22% remained undecided. A study

125
by Rothmann, Barkhuizen and Tytherleigh (2008: 417) confirmed that job
demands and a lack of job resources led to burnout amongst employees.
Rothmann, Jackson and Kruger (2003: 58) also indicated insufficient
resources as one of the main contributing factors associated with work
demands.
• Safe environmentTable 6.7 illustrated that 46.5% agreed that they work in a safe environment,
39.4% disagreed that they work in a safe environment and 14.1% were
undecided. These findings are confirmed by Uwaifo (2008: 68) and Maclean
(2011: 219) that there are health and safety risks that are associated with
universities.
• Employee health and safetyThe results in Table 6.7 show that 46.5% of participants disagreed that
employee health and safety is a priority where they work, 28.2% agreed while
25.4% were undecided. According to Malczyk and Tissima (2010:18)
employee health and safety should be a priority for all employers. This is a
major concern for University “A” from a health and safety perspective.
• Healthy and safe conditionsThe research findings indicate that 46.1% of respondents disagreed that
health and safety conditions are satisfactory, 32.6% agreed while 21.3%
remain undecided. Fetcher and Bryden (2007: 1158-1159) affirm that health
and safety issues in university campuses were inadequate. These results are
in accordance to Paoli and Merlie (2000: 10) who also confirmed that even
though in general, worker perception of health and safety has increased, there
is a deterioration of working conditions
• Employee-management working togetherTable 6.7 shows that 47.2% of the study participants disagreed with the
statement “At work employees and management work together to ensure the
safest possible working conditions”, a high percentage of 28.9% were

126
undecided on this statement while 23.9% agreed. These findings are
supported by Kruger’s research (2012: 20) which revealed that management
is not supportive when it came to health and safety matters.These findings
suggest that improvements in health and safety, will largely depend on the
cooperation of management and employees.
• Improved working conditionsTable 6.7 shows that an overwhelming majority 81% of respondents agreed
that the working conditions need to be improved, 11.3% remained undecided
and only 7.7% disagreed. A research study by Court and Kinman (2008)
confirm that environmental health and safety management standards are not
met in higher education institutions. The study results imply that this is an
area of high concern that needs urgent improvement.
6.5 Overall scores
The overall mean scores for the various sections is given below.
Table 6.9 Overall mean scores
Mean Std. Deviation
Job Satisfaction 3.0985 .98403
General Wellbeing 2.9486 .85285
Control at Work 2.9153 .89761
Home Work Interface 2.9984 .68010
Stress at Work 3.0873 .80123
Working conditions 2.9716 .80942
The overall mean scores of approximately 3 imply that there were as many
respondents who agreed with statements as those who did not. The standard
deviations are low indicating clustering around the mean value.

127
6.6 Correlations Bivariate Spearman’s correlation was also performed on the ordinal data. The results
indicate the following patterns. Positive values indicate a directly proportional
relationship between the variables and a negative value indicates an inverse
relationship. All significant relationships are indicated by a * or ** in table 6.9.
Table 6.10 Correlations
Dimensions of the study Job Satisfaction
General Wellbeing
Control at Work
Home Work Interface
Stress at Work
Working conditions
Spe
arm
an's
rho
Job
Satisfaction
Correlation
Coefficient
1.000
Sig. (2-tailed)
N 142
General
Wellbeing
Correlation
Coefficient
.537** 1.000
Sig. (2-tailed) .000
N 142 142
Control at
Work
Correlation
Coefficient
.690** .504** 1.000
Sig. (2-tailed) .000 .000
N 142 142 142
Home Work
Interface
Correlation
Coefficient
.324** .380** 451** 1.000
Sig. (2-tailed) .000 .000 000
N 142 142 142 142
Stress at
Work
Correlation
Coefficient
-.214* -.292** .194* .024 .1.000
Sig. (2-tailed) .010 .000 021 .778
N 142 142 1`42 142 142
Working
conditions
Correlation
Coefficient
.491** .389** .449** .383** .189* 1.000
Sig. (2-tailed) .000 .000 .000 .000 024
N 142 142 142 142 142 142

128
6.6.1 Job satisfaction and general wellbeing There is a strong correlation between Job Satisfaction and General Wellbeing (r =
0.537). This implies that the more a person has job satisfaction; the better is his
wellbeing.
6.6.2 Job satisfaction and control at work There is also a strong correlation between Job Satisfaction and Control at Work (r=
0.690) which means the more employees have control over their work the better the
job satisfaction.
6.6.3 Stress at work and job satisfaction There was a negative correlation between Stress at Work and Job Satisfaction (r= -
0.214) meaning that the more stress an employee is the worse of is the job
satisfaction.
6.6.4 Stress at work and general wellbeing On the other hand, the negative correlation of (r= - 0.292) between Stress at Work
and General Wellbeing implies that the more stressed people are at work, the worse
off in terms of his wellbeing.
6.6.5 Working conditions and Job satisfaction There was a positive correlation between Working Conditions and Job Satisfaction
(r= 0.491). This implies that the better the Working Conditions the better the Job
Satisfaction.
6.6.6 General Wellbeing and control at work There was a strong correlation between the General Wellbeing and Control at Work
(r= 0.504), which signify that the more the control at work the better the general
wellbeing.
6.6.7 Working conditions and general wellbeing A positive relation between Working Conditions and General Wellbeing (r= 0.389),
which denotes that the poorer the working Conditions the poorer the General well
being.

129
6.6.8 Control at work and home-work interface A positive relation between Control at Work and Home Work Interface (r= 0.451)
depicts that the better the control at work the better the home work interface.
6.6.9 Stress at work and control at work A negative relationship between Stress at Work and Control at Work (r= -0.194). This
implies that the less the locus of control at works the more stresses the employee
will be.
6.6.10 Working conditions and stress at work A negative correlation between Working Conditions and Stress at Work (r= -1.89),
which suggests that the worse off the working conditions the more stressed will the
employees be.

130
Table 6.11 Results of the chi square test
Sub-dimensions of the study Age Gender Ethnic
group Education
Length of service
Job type
Current job level
I have a clear set of goals and aims
that enable me to do my job. 0.787 0.117 .649 0.292 0.256 .319 0.438
I have the opportunity to use my
abilities and skills at work. 0.602 0.108 .331 .014* .006* .408 0.347
When I have done a good job it is
acknowledged by my line manager. 0.309 .024* 030* .008* .003* .134 0.885
I am satisfied with the career
opportunities available to me here. 0.647 .009* .159 .042* .040* .090 0.082
I am satisfied with the training I
receive in order to perform my
present job.
0.844 .000* 032* .003* 0.973 .003* 0.175
I am encouraged to develop new
skills. 0.439 .031* .913 .001* .017* .518 0.431
I think that my job is reliable and
secure. 0.712 .015* .436 .002* 0.906 046* 0.184
I am growing as a professional in my
current job 0.276 .015* .401 .019* 0.701 .061 0.343
I feel well at the present moment. 0.679 .012* .371 .003* 0.462 .062 .010*
Recently I have been feeling unhappy
and depressed. 0.858 0.608 .700 0.414 0.323 .609 0.817
I am satisfied with my life. 0.590 0.098 .849 .000* 0.361 .194 .005*
In most ways my life is closer to ideal. 0.462 .004* 035* .001* 0.580 014* 0.073
Generally things work out well for me. 0.256 .005* .627 .000* 0.709 017* .001*
Recently I have been feeling
reasonably happy all things
considered.
0.347 0.061 .410 .003* 0.142 025* 0.089
I am able to voice out my opinions
and influence changes in my area of
work.
0.752 .002* .319 .006* 0.394 .226 0.806
I am involved in decisions that affects
me in my own area of work. 0.634 .008* .066 .001* 0.671 .123 .006*
My job carries a lot responsibility, but
I do not have much authority. 0.226 0.329 .319 0.061 0.677 .202 0.379
I have a lot of say about what
happens in my job. 0.421 0.126 .078 .005* 0.750 .068 .041*
I am given a lot of freedom to decide
how I do my job. 0.670 .047* .582 .001* 0.681 .115 0.189
I have the necessary authority to do
my job. 0.823 0.055 .668 0.196 0.801 037* 0.190

131
Sub-dimensions of the study Age Gender Ethni
c group
Education
Length of service
Job type
Current job level
My employer provides adequate facilities
and flexibility for me to adjust my work in
with my family time.
0.521 0.073 .158 0.099 0.417 .170 0.683
My current working hours/patterns suit my
personal circumstances. 0.377 0.165 .185 .006* 0.558 .077 0.188
My line manager actively promotes flexible
working hours. 0.668 0.181 .087 0.151 0.329 .163 0.604
I often have to take work home to keep up
with my job demands. 0.666 .010* .521 .023* 0.864 004* .006*
The job demands interfere with my family
time. 0.345 0.228 .506 0.728 0.947 021* 0.125
I can keep a reasonable time between
work and personal time. 0.510 0.283 .395 0.424 0.414 .718 0.389
I often worry about work even when I am
at home. 0.908 0.373 .469 0.494 0.660 .689 0.542
I travel a long distance between work and
home 0.657 0.512 .098 .044* 0.780 .456 0.380
I often feel under pressure at work. 0.290 0.136 .578 .018* 0.349 .074 0.784
I often feel excessive levels of stress at
work. 0.625 0.075 .923 0.281 0.066 .486 0.894
The workload placed on me is more than I
can handle. 0.102 0.142 .655 .006* 0.117 .607 0.706
There is friction or anger amongst
colleagues. 0.461 0.522 .305 0.719 0.949 .308 0.374
I get help and support I need from
colleagues. 0.546 0.099 208 0.430 0.850 .422 0.368
I am often unable to find the information I
need to perform my job 0.990 0.656 .683 0.327 0.672 .451 0.586
I often perform my job without interruption 0.626 0.325 .747 0.526 0.516 .844 0.571
My employer provides me with what I need
to do my job effectively. 0.719 .030* .386 .004* 0.574 .330 0.702
I work in a safe environment. 0.665 .030* .476 0.062 0.280 042* 0.165
Employee health and safety is a high
priority where I work. 0.065 0.117 .360 0.301 0.171 .331 0.299
The health and safety conditions are
satisfactory. 0.425 0.053 .314 .001* .009* 025* 0.101
At work employees and management work
together to ensure the safest possible
working conditions.
0.163 0.368 .249 0.123 0.235 .131 0.226
I feel that the current working conditions
need to be improved. 0.514 005* .681 0.496 0.862 .733 0.985

132
6.7 Hypothesis Testing The traditional approach to reporting a result requires a statement of statistical
significance. A p-value is generated from a test statistic. The Chi square test was
performed to determine whether there was a statistically significant relationship
between the variables A significant result is indicated with "p < 0.05". These values
are highlighted in yellow.
6.7.1 Chi square analysis The Chi square analysis will be used to make inferences between categories of data
to determine the relationship between various variables. The null hypothesis states
that there is no association between the two. The alternate hypothesis indicate that
there is an association.
The p-value between “Gender” and “When I have done a good job it is
acknowledged by my line manager” is 0.024 (which is less than the significance
value of 0.05). This means that there is a significant relationship between the
variables. That is, there was a difference in the way males and females felt in terms
of receiving an acknowledgment from their superiors.
6.8 Qualitative Data Analysis The qualitative data were collected by open ended questions that were presented to
the participants. Qualitative data offered the respondents the option to express
themselves without any constraints or limitations which enriched the data. The study
of QoWL used N-VIVO N10 for qualitative data analysis. N-Vivo allowed the
researcher to organise and analyse open- ended questionnaires to assess the
correlations that may exist in the data. Different themes in the form of nodes were
used to categorise and analyse the qualitative research findings.
6.8.1 Availability of policies Two nodes or themes relating to the knowledge of policies and procedures that are
related to the QoWL were divided into “Yes” and “No”. The node that represented
“Yes” has 7 references coded which equate to (86%) as compared to a low
percentage of (14%) coverage of the node that represented “No”. A high number of
employees (86%) who agreed that there are policies and procedures available,

133
moreover different respondents have raised similar concerns. The respondents
consistently indicated that available policies were not enforced and were
inconsistently implemented. Very few of the respondents who also concurred about
the availability of these policies procedures thus they recommended that
performance management policies to appraise and motivate staff are needed.
The disproportionately high percentage of the respondents who confirmed the
availability of policies with negative connotations on their usage. These findings are
consistent with the study conducted by (Rothman, Barkhuizen and Tytherleigh 2008:
418 ) that in universities policies and procedures are not applied consistently and are
not aligned to the curriculum, furthermore a study by Joubert and Van Wyk (2010: 1)
reflected that despite the existence of sexual harassment policies, they are
ineffective in dealing with sexual harassment and moreover a few academics
received training on the implementation of the policy.
6.8.2 Positive factors: QoWL satisfaction The researcher classified factors that positively affect respondents satisfaction of
QoWL into organisational; departmental and personal. The organisational level
(node) had 25 references with a total coverage of 19.7 (70%), followed by individual
at 25% and departmental 5%.
The extreme coverage 70% of organisational factors that impact positively on the
respondents’ satisfaction revolves around research incentives, study grants, network
and benchmarking. The individual level covered 25% reference nodes which
included subsidised food, good testimonial from students, accessibility to work and
collegiality are factors that were cited by the respondents. Very few, 5% positive
factors that have been attributed by the respondents (career days and teamwork).
The study revealed that employee compensation impacts positively on QoWL
satisfaction, and there seems to be a consensus between the research results on
and literature reviewed by Tebassum, Rahman and Jahan (2012: 52-53) adequate
and fair remuneration impact positively on the satisfaction of employees. Fair
compensation is not the only benefit that the university can utilise to retain and
attract employees. The university can develop and maintain QoWL by offering a

134
various of support to reduce absenteeism, sick leave, and turnover to improve
performance (Nataranjan and Annamalai 2011: 46).
6.8.3 Negative factors: QoWL satisfaction The nodes that relate to the negative factors that impact on QoWL were divided into
3 categories, namely; organisational, departmental and personal. Organisational
nodes covered (63%) of the factors at (26%) and finally personal (11%).
Organisational factors included poor organisational culture, disintegrated systems,
lack of communication, unsafe and unhygienic offices, poor facilities, poor
registration processes and remuneration. Departmental factors revolved around
unfair allocation of duties, work overload and division amongst departments.
Personal factors included silo mentality, time mentality, time management, taking
credit for other people’s job.
The negative factors that impact on QoWL that were raised by respondents are
similar to previous research by Michie and Williams study (2003: 3) showed that the
key negative factors that impact on QoWL satisfaction were , work overload and
pressure, lack of participation in decision making and unclear management and
work role . There is a need to clarify management work role to ensure that there is
no conflict in reporting between supervisor and subordinate. These results are
consistent with findings from a study by Court and Kinman (2008: 54) which revealed
that higher education institutions are not meeting environmental health and safety
management standards
6.8.4 Influence on performance management Employees were asked if QoWL affects their performance at work. This question
was divided into two nodes “Yes” and “No”. The node that represented “Yes” had 12
references coded which is equivalent to (99%) and the node that represented “No”
had only 1 reference code which equate to (1%). Employees who agreed that QoWL
affects performance management raised issues such as; set standards are not being
met, poor facilities, inadequate teaching and learning resources.
Different authors have cited performance based incentives (Tabassum et al. 2012:
52-53) as factors that significantly impact on QoWL of employees work-home

135
interface imbalance affects job performance (Koruca et al. 2011) excessive pressure
if performance is synonymous with the study research findings that set standards are
not met. However, Johnsrud (2002: 392) says performance seems to be less linked
to perceptions of QoWL and more to personal characteristics. The study results
confirm that there is a link between performance management and QoWL.
Performance management is about attaining organisational goals, for the
organisation to attain its objectives it largely depend on the QoWL of its employees.
The findings from this research will assist management to understand which aspects
hamper on the QoWL of employees and therefore on performance. Cascio (2006)
states that when organisations When institutions exclude QoWL issues when
introducing systems for improving performance, they will lose their employees to
better organisations.
6.9 Interviews The discussion of the data includes quotations from the interviews to support the
issues that were being raised.
6.9.1 Policies On the question of policies one staff member commented that: “Yes, there are
policies but departments do not follow these policies and the institutional code book” Most respondents reflected that there are policies in place however they are
inconsistently applied and implemented. Another employee concurred: “There are
policies that I know, but they are not enforced”. Even though policies are in place
and they could be accessed through the intranet, their implementation remains a
challenge.
6.9.2 Positive factors: QoWL satisfaction The following quote demonstrates that there are motivational facts that influence the
job satisfaction and QoWL of employees as one lecturer expressed: “I get motivated
by compliments from former students who are now employed, student progress until
graduation, especially students who excel such as a student who obtained 12
distinctions”. Another employee acknowledged: “This is a good institution with a lot of
potential”. These remarks indicate that employees are deriving job satisfaction from

136
the institution and they are aware that the institution has got a potential to grow and
develop in the future.
6.9.3 Negative factors: QoWL satisfaction Referring to some of the comments made by staff members below, it is apparent that there are a number of negative factors that impact on employees’ QoWL. A lecturer
raised a concern about the working environment: “Air conditioners are not working in
lecture halls and offices and therefore the working environment is not comfortable”.
Another employee shared this view when she said: The work process systems are
not integrated and there is a lack of communication between departments”.
Comments such as these confirm the overall responses of employees about the
negative factors that impact on their QoWL.
6.9.4 Performance Most respondents mentioned a lack of facilities as an aspect that could hamper their
performance at work. In answering this question one lecturer said: “There is a lack of
teaching and learning resources such as overhead projectors in the lecture halls and
we waste a lot of time trying to set up our personal laptops”. Another employee made
an interesting comment: “Performance is affected by slow IT systems and
employees who do not submit their work in time”. It is apparent fro these responses
that employees are experiencing challenges in performance.
6.10 Observations The researcher recorded information relating to research observation in a field diary,
to keep a record of the participant’s verbal and nonverbal expressions and feelings.
Various groups of employee were observed in the study to ensure representatively of
the University population. Employees generally felt dissatisfied about their
remuneration and an increase in compensation will have a positive effect on their
QoWL. This will enable employees to meet their needs, those of their families and
also to pay off debts. Other staff members felt that they are stuck in one place as
they do not see any prospects of growing within University “A”, and this affected both
their work commitment and their QoWL. Other employees were experiencing a lot of
stress from high work expectation but they were receiving minimal support in terms
of human resources, financial resources or facilities. There seems to be a lack of

137
feedback and information sharing as certain employees do not know certain aspect
that involve their work tasks, they feel they should be well informed. There is a need
for job security amongst employees, they fear to raise their grievances because they
feel that might jeopardise their employment.
Some employees were simply conforming and have stopped to make any attempts
to bring about changes because they felt that some of their concerns are being
ignored and they are of the opinion that their initiative are not being supported. Other
employees felt that there is pressure register a high quantity not quality of students
and this brings about more workload for employees. Some employees’ leave is not
approved besides having leave credit. Employees mistrust the workers
representative union because they feel that the union does not consult them before
making decisions that impact on their QoWL.
In spite of all the negative aspects that affect QoWL, the organisation has a potential
to be top class and there is a sense of unity amongst some members of the
organisation. There is some satisfaction with the benefits that employees receive
such as study grants, pension fund and medical aid because they feel they are better
than other organisations. There are infrastructural developments in progress within
the university, which indicate that management is aware of the facilities challenges
and is dealing with them. The management of the institution is aware of the high
turnover of employees and they have subsequently started to address this challenge
by drawing a retention strategy which will hopefully assist in retaining valuable staff
and thus improve their QoWL.
6.11 Conclusion This chapter presented, analysed and discussed the research results with reference
to the literature review. The aim of the study was to assess the perceived factors of
QoWL in the University “A”. The findings suggested that a majority of employees at
the University “A” were not satisfied with their career opportunities available for them
and they felt that their job is not reliable and secure. According to the responses of
employees, lack of facilities, health and safety issues, workload, communication,
remuneration, disintegrated systems seemed to be the key issues that impact on the
QoWL at the University “A”.

138
The key finding that have been discussed in this chapter indicate that there are
major challenges related to QoWL at University “A”. Chapter 7 will conclude the
study by discussing limitations and make recommendations and further research

139
CHAPTER SEVEN CONCLUSIONS AND RECOMMENDATIONS
7.1 Introduction It is important that of quality of work life (QoWL) should be analysed within in the
wider context of attracting, and retaining quality employees. Management must
understand the implications and benefits of QoWL before they can even start to
implement quality of work life programmes. The implementation of the
recommendations can make a significant contribution to alleviate QoWL and
retention challenges. The research was initiated by the research question and
objectives outlined in chapter one. Chapter two provided a literature review on the
dimensions QoWL and the contrast of QoWL between developing and developed
countries. Chapter three compared QoWL between the private and public sector in
South Africa, and reviewed legislation that is interrelated with QoWL. Chapter four
concentrated on the legislation that governs higher education landscape in South
Africa, public administration and QoWL. Chapter six focused on the research
findings, data analysis and results of the research.
In order to answer the research questions research was conducted by means of
open-ended, close-ended and observation methods. Information that included
biographical data of the population was collected and also the different dimensions
of QoWL. The primary aim was to determine which factors impacted on the QoWL of
employees in University “A” with the purpose of providing recommendations to
improve QoWL.
7.2 Conclusions Career progression was one of the main reasons that were identified to lead to poor
QoWL. The should be open communication and platform for upward advancement
of employees to ensure that they achieve career goals and professional
development. Employees must be promoted from within at university “A” and career
development must be underpinned by the QoWL programme. Another primary
concern of respondents was job insecurity, employees felt that their jobs are not
reliable and secure. Job insecurity is very stressful and employees cannot perform if
they are under stressful conditions. All the factors that threaten job security of

140
employees must be addressed. It was also noted in the research results that a high
proportion of the respondents were generally not well. Staff general wellbeing has
broad implications on the QoWL, such physiological health and psychological
wellbeing. University “A” should provide an employee assistance programme
services on-site, and there must be a continuous wellness programme initiatives that
are supported by senior management.
The study findings suggested that respondents are not involved in decisions that
affect them in their area of work. They felt that they are not given a lot of freedom to
decide how to do their jobs. It seems that involvement of employees in desicions is a
challenge in University “A”. There should be greater engagement of employees for
them to have a say in their areas of responsibility. Therefore there should be
effective communication, consultation and an interactive environment that will foster
collective desicion making between the employees, employee representatives and
management.
The research results indicated that most respondents disagreed that their employer
provides adequate facilities and flexibility for employees to adjust their work with their
family time. Flexible working time is particularly important to employees, because it
allows them to accommodate their personal and family commitments in their work
schedules to better balance work-life responsibilities. Flexible working patterns must
be actively promoted and intergrated in organisational business systems throughout
all the departments, without compromising perfomance. Employees must also
therefore utilize the leave options that they are offered to promote and enhance a
healthy work-life balance.
It was apparent from the responses that although some policies exist, employees are
unaware of their application. In cases whereby employees are not aware of the
existence or application of certain organisational policies, briefing sessions should be
conducted to inform them of such policicies. Policy briefing sessions should be held
with the aim of informing and convincing employees of the need to adopt a certain
policy to address any underlying challenges in the organisation. Employees might be
more likely to adopt policies if they have been briefed about them.

141
The absence of performance management systems was also noted an issue of
concern at University “A”. Management needs to establish concrete performance
indicators and outcomes for employees so that they aware of what is expected of
them. University “A” must set up a performance management system that is in line
with the vision, mission and objectives of the institution, the system should aim to
address under performance and reward excellent performance. Another prominent
finding from the study was that employees expressed that the health and safety of
their working conditions are not satisfactory and therefore should be improved.
Employees and management alike must be trained and be kept well informed about
their health and safety obligations with regards to health and safety. Emphasis
should be placed on conducting health and safety risk assessments, audits and
inspection with the aim of maintaining the workplace in a healthy and safe condition.
These findings provided proof that QoWL in University “A” is indeed poor, the views
and perceptions that employees hold provided important information that defines
how they perceive their QoWL.
7.3 Recommendations This chapter intended to offer recommendations for the institution with regard to
research findings as well as recommendations for future research.
7.3.1 Job and career satisfaction Notably a high majority of the study participants agreed that they have a clear set of
goals and aims that enable them to do their job. Furthermore, a high majority of
respondents, showed a positive perception towards having the opportunity to use
their abilities and skills at work. Only marginal number of respondents agreed that
when they have done a good job it is acknowledged by their line manager .The
findings of the study indicated that employees are not satisfied with the training they
receive. Job insecurity was one of the prominent concerns of respondents.
Employees felt that they are not growing as professionals in their current jobs.
Advancement in the career path was one of the main reasons that were identified to
lead to poor QoWL and subsequently may prompt employees to leave the
organisation, hence the following recommendations were proposed

142
• The institution must create a conducive environment with career opportunities
for growth, but it is ultimately the responsibility of employees to seize these
opportunities for personal development.
• Besides making sure that employees are able to perform in their current jobs,
they need to be offered opportunities for career advancement by acquiring
competencies that improve their ability to work in other areas or at other
levels.
• Employees need to be trained in management development, in order to
better prepare them for opportunities that may arise within the organisation in
the future. Moreover, increasing job rotation and exposure employees to a
wide range of job experiences.
• Recognising and rewarding individual or group efforts for accomplishing
objectives of a work project. Employees can be rewarded in various forms
such as paid leave, career progression opportunities and monetary incentives,
this will encourage employees to perform above the set performance
standards.
• The organisational culture must be acknowledged, and organisational culture
and traditional factors that hinder the development of employees must be
analysed and controlled. The organisation should build a culture that supports
career development across all levels.
• Workplace learning should be prioritised to promote career development and
employee related matters must be taken into consideration when developing
training programmes. After being trained, employees must be offered
opportunities to develop and use their acquired skills, in turn enrich jobs to
stimulate knowledge, skills and competencies.
• Further, by utilising team based, cross-border, cross-task and cross hierarchy
structures to rotate and integrate jobs by providing regular feedback on work
performance, employees can to enjoy higher levels of workplace training.
7.3.2 General wellbeing Respondents expressed that they experienced unhappiness and depression and
they seem not to be satisfied with their lives. The findings indicated that most
employees do not know as to how their life should ideally be. Furthermore, most

143
respondents disagreed that they recently have been feeling reasonably happy all
things considered. Respondents felt that generally things don’t work out well for them
and it was noted in the research results that a high proportion of the respondents
were generally not feeling well.
• Conducting a health survey that will take into cognizance high employee
participation and furthermore the outcomes of the survey should act as a
guide as to which wellness issues to focus on e.g. smoking, nutrition,
exercise.
• A dedicated and voluntary on-site Employee Assistance Programme (EAP)
service to all employees and this service should be extended to their
immediate family members who have psycho-social challenges. The EAP
programme should be incorporated with wellness coaching that will assist
employees and family members to achieve realistic lifestyle changing
objectives such as losing weight or changing an unfavourable behaviour.
• Educational preventative workshops should be conducted as way intervening
work related and personal stress factors. This will ensure that employees
have the necessary knowledge that will assist them to adopt healthy lifestyle
habits.
• Return on investment analysis must be conducted to assess if there are any
significant reduction in medical aid costs, decreased absenteeism, a healthy
workforce and other gains from the employee wellness programme.
• A wellness day event should be held to promote awareness of personal well-
being and employees will be encouraged to complete the health assessment
test such as blood sugar level, blood pressure, body mass index for early
detection and treatment of any health condition.
• Support from senior staff is critical to an efficacious wellness programme and
visible senior management involvement is one of the most important factors in
the success of the programme. Senior management should act as wellness
role models to assist in positioning the wellness programs as fundamental
components of the institution.
144
7.3.3 Control at work About half of respondents indicated that they are unable to voice out their opinions
and influence changes in their area of work. A high proportion of the participants
agreed that their job carries a lot of responsibility, but they do not have much
authority. Respondents felt that they are not given a lot of freedom to decide how to
do their jobs. The study findings suggested that respondent were not involved in
decisions that affect them in their area of work. Employees should be offered the
opportunity to exercise control over their work processes and decisions about the
way their duties are carried out by adding more decision making authority.
• Offering employees to work with other people from different departments and
offer them new challenges and therefore actively creating interactive
conditions that will allow collaborative learning.
• The supervisor must delegate certain duties to subordinates in a view of not
just offering more control over their tasks, but also encouraging personal
development through delegation. Effective delegation will give subordinates a
sense of empowerment and accountability while developing subordinates at
the same time.
• Ensure effective communication and consultation between management and
staff and especially where there are institutional or system changes,
furthermore employees should be involved in decisions that affect their
department or the entire university.
7.3.4 Home-work interface A considerable amount of the respondents disagreed that their line manager actively
promotes flexible working hours. Most of the study participants disagreed that their
job demands interfered with their family time. In contrast results showed that a high
percentage of the study participants agreed that they can keep a reasonable time
between work and personal time and their current working patterns suit their
personal circumstances. Respondents also reported that they worry about work even
when they are at home. The findings indicated that the study participants disagreed
that they travel long distances between work and home. The research results
indicated that most respondents disagreed that their employer provides adequate
facilities and flexibility for employees to adjust their work with their family time.

145
• Flexible working practices are important in balancing personal and
professional lives of staff and it will assist in placing the University “A” as a
preferred workplace. Flexible working arrangements must be incorporated into
the management systems to allow employees to deal with personal problems
when necessary.
• Compressed/flexible work week that offers employees to schedule their work
week according to their needs, this will enable employees to formulate their
working schedules to increase the time they spend with family.
• Employees should manage their working schedules and days to enable them
to manage work and personal commitments by utilising a dairy to ensure that
they achieve their set daily objectives.
• In some academic departments there are arrangements in place for staff to
work in flexible hours and therefore there must be a framework within which
more employees can exercise flexible working patterns taking into
consideration the nature of their work.
7.3.5 Stress at work Many respondents agreed that they often feel under pressure at work. In contrast
most study participants disagreed that the workload placed on them is more that they
can handle. Many study participants reflected that there is friction or anger amongst
colleagues. A number of respondents agreed that they get help and support they
need from colleagues. About half of the respondents disagreed that they are often
unable to find the information they need to perform their job. It also seems that study
participants often cannot perform their job without interruption. In this study
respondents highlighted stress at work as a challenge and therefore the following
control measures are proposed.
• The organisation must conduct risk assessments to identify stress factors,
evaluate and put control measures to minimise them, and supervisors should
be trained in order to identify symptoms of stress amongst their subordinates.
Furthermore, management, employee representatives and employees must
discuss pertinent issues that impact on employees at work.
• The university must offer counselling for employees who are affected by work
related or personal stress factors to ensure that they return to work at the

146
highest level of performance. The counselling service must be conveniently
accessed by the university staff and strict confidentiality must be maintained
at all times to increase participation.
• Employees should be proactive when dealing with interruptions, such as
limiting the number of people who come into the work area, checking emails
only at specific times and keeping the phone on silent while attending a high
demanding task. Making a to-do list to prioritise and plan work task in the
morning and schedule appointments to assist in avoiding interruptions at
work.
• Leave days must be monitored to ensure that employees take the leave days
that they are entitled to. Employees must be encouraged to take regular
breaks from work to relax in order to energize their minds and bodies.
• There must be regular review of common work stress factors such as conflict
amongst colleagues. All incidents physical or emotional abuse between
colleagues must be reported to the supervisor or human resource department
to be thoroughly investigated and all practical measures to be taken to control
the incidencents.
• Where the workload placed on employees is more that they can handle, then
the way the job is done must be redesigned in line with the employees'
competencies. Alternatively employing additional staff on contract basis to
assist in dealing with the workload.
7.3.6 Working conditions
Participants felt that the employer should provide them with what they need to do
their job effectively. Moreover, most respondents felt that employee health and
safety should be prioritised at work. Respondents furthermore expressed that
employees and management should work together to ensure the safest possible
working conditions. An overwhelming majority of respondents agreed that the
working conditions need to be improved. The research findings indicated that a
majority of respondents disagree that health and safety conditions are satisfactory
and the working conditions need to be improved and therefore the following
recommendations are offered.

147
• Employees and management must be kept well trained and informed about
their legal health and safety roles and responsibilities through workshops,
memos, emails and health and safety meetings.
• Developing a a health and safety framework that will ensure that the
organisation attains its health and safety aims of minimising risks. The
framework must include a health and safety policy that states managements s
commitment to provide healthy and safe working environment. Furthermore,
creating programmes that will ensure compliance with the applicable
legislation.
• All levels of management must be accountable and ensure that health and
safety is well managed in their designated work areas. Management and
employees must implement health and safety practices that will maintain the
workplace in a healthy and safe condition.
• Inspections and risk assessments must be carried out to identify any
potentially hazardous working conditions and put measures in place to control
such hazards.
• The workstations need to be redesigned to suit individuals needs to make it
more user friendly so and to increase comfort and efficiency. Improving the
existing facilities such as air conditioners and providing new infrastructure to
ensure compliance with the workplace health and safety legislation.
7.3.7 Policies It was apparent from the responses that although some policies exist employees
were unaware of their application.
• Fair and realistic strategic human resources policies and procedures should
be clearly drafted by management and staff to condone QoWL of employees.
These policies should include a commitment from management to continually
improve the QoWL of employees.
• Employees and management at all levels must be made aware of their
responsibilities with regards to QoWL related policies. There must be a clear
association between QoWL policies and institutional goals, the policies should
be consistent with the vision and mission of University “A”. There

148
organisational policies must be well aligned with organisational goals and
objectives
• In order to achieve a smooth implementation of a policy,there must be briefing
sessions for staff and awareness must be raised on QoWL matters for both
management and employees. Management must be consistent in the
implementation of the policies.
• Employee representatives must integrate their goals with the organisational
strategy in the interest of the organisation and its employees.
7.3.8 Performance management. The absence of performance management systems in place was identified as a
challenge. It is advised that the organisation develop innovative methods to
encourage their employees in their job satisfaction and promotion so as to have high
performance.
• The current situation whereby there are no performance management
systems in place should be evaluated by means of an initial review that will
provide a baseline of establishing performance management systems. These
systems should cover the expected outputs and staff development with the
aim of encouraging high performance.
• Where the employee’s performance is below average and prior efforts of
addressing performance have failed, then the employee’s performance must
be managed under unsatisfactory performance procedures.
• Setting out clear monthly, quarterly and annual performance expectations for
each employee and performance expectations must be specific, measurable,
achievable and with timeframes expressed as an outcome. This will enable
the institution to have a clear framework which they can measure their
performance.
• The supervisors must create formal and informal opportunities to offer
feedback to the employee’s performance and these must be linked to
performance based incentives which will improve productivity.

149
7.3.9 Recommendations for future research The research was undertaken to assist to identify factors that significantly impact on
the QoWL.
• Even though the research covered the critical aspects of QoWL, it could
however expand its scope to include remuneration factors and job content
and context factors.
• Furthermore the research can utilise focus group discussions as data
collection method and to better understand aspects of QoWL that impact on
employees
7.4 Conclusion University “A” must enhance the QoWL of its employees in turn to retain them and
obtain its strategic priorities. The University must construct and maintain QoWL
programmes. The proposed model will assist management to pay attention to those
aspects that significantly impact on QoWL. Support from senior staff is critical to an
efficacious QWL programme and visible senior management involvement is one of
the most important factors in the success of the process. Employees should be
nurtured and developed to establish long term relationships with them and develop
commitment from them. Synchronising communication and consultation between
management and employees by interacting at different levels of the institution will
assist in developing trust and confidence that will creating a harmonious working
environment with improve QoWL.

150
REFERENCES Adams, S. and Jeebhay, M. 2006. How to claim compensation for work-related
injuries or diseases. In Mash B, Blitz-Lindeque J eds. South African family
practice manual. 2nd
ed. Pretoria. Van Schaik.
Adhikari, D. R., Hirasawa, K., Takakubo, Y. and Pandey, D. L . 2012. Decent work
and work life quality in Nepal : an observation. Employee relations, 34(1): 61-
79.
Aguirre Jr, A. 2000. Women and minority faculty in the academic workplace:
Recruitment, retention, and academic culture. Higher Education Report,
Volume 27(6). Jossey-Bass Higher and Adult Education Series. Jossey-Bass,
350 Sansome St., San Francisco.
Akanji, B. 2012. Realities of work life balance in Nigeria : perceptions of role
conflict and coping beliefs. Business, management and education, 10(2):
248-263.
Almuftah, H. and Lafi, H. 2011. Impact of QWL on employee satisfaction case of oil
and gas industry in Qatar. Advances in management and applied economics,
1(2): 107-134.
Al-Qutop, M.Y. and Hussein, H. 2011. Quality of work life human well-being linkage:
integrated conceptual framework. International journal of business and
management, 6(8): 193-205.
Apgar, M. 2000. Harvard business review on work and life balance. USA: Harvard
Business School Publishing.
Arrowsmith, J. 2001. Flexible working hours, quality of working life, organization of
work, productivity, mental stress, statutory instrument, social dialogue, trade
union attitude, management attitude, United Kingdom (online). Available at:
http://www.eurofound.europa.eu/eiro/2001/02/ (Accesed 04 July 2012)
Aspen Institute. 2003. Where will they lead? MBA student’s attitudes about business
& society. Washington D.C. The Aspen Institute's Business and Society
Program (online). Available at: http://www.aspeninstitute.org/atf/cf/ (Accessed
21 February 2013)
Aucoin, P. and Heintzman, R. 2000. The dialectics of accountability for performance
in public management reform. International review of administrative
sciences, 66(1): 45-55.

151
Badenhorst, C.J. 2009. Occupational health and safety considerations for the
Bagtasos, M.R. 2011. Quality of work life: a review of literature. DLSU Business and
economics review, 20(2): 1-8.
Bardill, J. E. 2000. Towards a culture of good governance: the presidential review
commission and public service reform in South Africa. Public administration
and development, 103-118.
Barkhuizen, N. and Rothmann, S. 2008. Occupational stress of academic staff in
South African higher education institutions. South African journal of
psychology, 28(2): 321-336.
Basheka, B.C. 2012. The paradigms of public administration re-examined: a
reflection. Uganda management institute, 47(1): 25-67.
Bekke, H.A., Perry, J.L. and Toonen, T.A. (n.d.). Civil service systems in
comparative perspective. Bloomington: Indiana University Press, 268-287.
Bezuidenhout, A. and Cilliers, F.V.N. 2010. Burnout, work engagement and sense
of coherence in female academics in higher-education institutions in South
Africa. South African journal of industrial psychology, 36(1): 1-10.
Botha, L.S. and Potgieter, F.J. 2009. Understanding skills development in South
African higher education institutions. South African journal of higher
education, 23(2): 246-263.
Botha, P.A., and Brand, H. 2009. Development of a holistic wellness model for
managers in tertiary institutions. South African journal of human resource, 7
(1): 166-175.
Boyd, S., and Wylie, C. 1994. Workload and Stress in New Zealand Universities.
New Zealand Council for Educational Research and the Association of
University Staff of New Zealand. Wellington.
Brink, B., and De la Rey, C. 2001. Work–family interaction strain: coping strategies
used by successful women in the public, corporate and self-employed sectors
of the economy. South African journal of psychology, 31(4): 55−61.
Brotheridge, C. and Lee, R. 2008. The emotions of managing: an introduction to the
special issue. Journal of managerial psychology, 32(2): 108-17.
Buthelezi v/s. Municipal Demarcation Board. 2004. 25 Indus. L.J. Juta 2317.
Cameron, R.G. 2009. New public management reforms in the South African public
service: 1999-2009. Journal of public administration, 44 (4.1): 910–942.

152
Cardosa, M, and Fauziah, W.Y. 1994. Health consequences of VDT work in
Malaysia: some preliminary findings. In: Ng, C. and M.K. Anne (eds). Keying
into the future: the impact of computerisation on office workers. Women’s’
development collective and women’s studies unit, UPM Serdang, Malaysia :
Vinlin Press.
Carlier, S. I., Llorente, C. L., and Grau, M. G. 2012. Comparing work-life balance in
Spanish and Latin-American countries. European journal of training and
development, 36(2/3): 286-307.
Cascio, F. W. 2006. Managing human resources: productivity, quality of work life and
profits, 7th ed. San Francisco.
Cavana, R.Y., Delahaye, B.L. and Sekaran, U. 2001. Applied business research:
qualitative and quantitative methods. Wiley .
Chan K, and Wyatta,T.A. 2007. Quality of work life: a study of employees in
Shanghai, China, Asia. Pacific business review, 13(4): 501–517.
Chan, K.B., Lai, G., Ko, Y.C. and Boey, K.W. 2000. Work stress among six
professionals groups: the Singapore experience. Social science and
medicine, 50(10): 1415-1432.
Chang, R.C. 1996. Capitalizing on workplace diversity. United States of America:
Richard Chang Associates, Inc.
Childs, T. 2003. Is Work /Life balance a Global issue- or has the U.S Culture simply
exported the issue (online). Available at: http://www.workfamily.com/
(Accessed 15 December 2012).
Chitakornkijsil, P. 2009. Broad perspective and framework of quality of work life. The
International journal of organizational innovation, 3(2): 214-242.
Coetzee, M., Bergh, Z., and Schreuder, D. 2010. The influence of career orientations
on subjective work experiences. South African journal of human resource
management, 8(1): 1-13.
Council on Higher Education (CHE). 2004. South African higher education in `the
first decade of democracy. Pretoria: Council on Higher Education online.
Visited at: http://www.che.ac.za/media_and_publications/research/south-
african-higher-education-first-decade-democracy (Accessed 4 November
2012).
Court, S. and Kinman, G. 2008. Tackling stress in higher education. London : UCU
Publications.

153
Creswell, J.W. 2009. Research design, qualitative, quantitative and mixed methods
approaches, 3rd ed. SAGE.
Curtin, K. 2009. Changes to King iii and Companies Act (online). Available at:
http://www.hrfuture.net/governance/changes-to-king-iii-and-companies-
act.php (Accessed 21 February 2013).
Dancaster, L. and Cohen, T. 2010. Workers with family responsibilities: a
comparative analysis to advocate for the legal right to request flexible
working arrangements in South Africa. South African journal of labour
relations, 34(1): 31-45.
Daniel, D.F. 2007. Case study methodology, fundamentals and critical analysis.
cognitie, creier, comportment /cognition, brain, behaviour, 11(2): 299-317.
De Swaan, A., J. Manor, E. Øyen and E. P. Reis. 2000. Elite perceptions of the poor:
reflections for a comparative research project. Current sociology, 48(1): 43–
54.
De Witt, D. 2001. Management today (online). Available at:
http//www.managementtoday.co.za (Accesed 23 October 2012).
Department of Health: 2004. Ethics in Health Research: Principles, Structures and
Processes http://www.doh.gov.za/docs/factsheets/guidelines/ethnics/.
Department of Health. 2006.
Department of Public Service and Administration (DPSA). 2008. Summary Report to
the July 2008 Lekgotla: status regarding HR delegations from EAs to HoDs in
the public service. Pretoria: Department of Public Service and
Administration.
Dex, S. 2004. Flexible working arrangements in the UK : work life balance across the
life course conference, centre for research on families and relationships.
Edinburgh: Edinburgh University.
Dockel, A., Basson, J.S. and Coetzee, M. 2006. The effect of retention factors on
organisational commitment: an inverstigation of high technology employees .
South African journal of human resource management, 4 (2): 20-28.
Dowling, D. 2006. Convergent interests in South African public and private higher
education institutions: public and private good. The Journal of independent
teaching and learning, 1: 4-10.

154
Downes, C., and Koekemoer, E. 2011. Work–life balance policies: challenges and
benefits associated with implementing flexitime. South African journal of
human resource management, 9(1): 1-13.
Du Prez, R. 2009. The place and role of University of Technology in South Africa:
South African technology network.
Du Toit, D., Woolfrey, D., Murphy, J., Godfrey, S., Bosch, D. and Christie, S. 1998.
The Labour Relations Act of 1995. 2nd Ed. Durban: Butterworths.
Dublin, Rahim, Afzalur, M. 2007. Current Topics in Management. New Jersey:
Transaction and Publishers.
Edwards, J., Van Laar, D.L. and Easton, S. (2009). The Work-Related Quality of
Life(WRQoL) scale for higher education employees. Quality in higher
education, 15(3): 207-219.
employment of female workers in hard rock mines. The Southern African
Institute of mining and metallurgy hard rock safety conference, Johannesburg,
28-30 September 2009.
Erasmus, B., Swanepoel. B., Schenk, H., van der Westhuizen, E.J. and Wessels J.S.
2005. South African human resource management for the public sector.
Kenwyn: Juta.
Esser Irene-Marie, 2009, The Protection of stakeholder interests in terms of the
South African King III report on corporate governance: an improvement on
King II ?University of South Africa. South African mercantile law journal, 21:
188-201.
European Agency for Safety and Health at Work. 2008. The State of occupational
safety in the European Union, pilot study (online). Luxembourg: Office for
Official Publications of the European Communities. Available at:
http//www.agency.osha.eu.int/reports (Accessed 13 December 2012).
Falconer P. 1997. Public administration and the new public management : lessons
from the United Kingdom experience. Pg1-17.
Farmer, E. A. 2004. Faculty development for problem-based learning. European
journal of dental education, 8(2): 59-66.
Field, L.K. and Buitendach, J.H. 2011. Happiness, work engagement and
organisational commitment of support staff at a tertiary education institution in
South Africa. South African journal of industrial psychology, 37(1): 1-10.

155
Fischl, M., Breitenmoser, P. and Füllemann, M. 2011. How do qualitative and
quantitative researches differ? Doctoral Seminar: research methodology.
Fletcher, P.C. and Bryden, P. J. 2007. Preliminary examination of safety issues on a
university campus: personal safety practices, beliefs and attitudes of female
faculty and staff .College student journal, 41(4): 1149-1162.
Fraser-Moleketi, G. and Salojee, E. 2008. "South Africa's Public Service: Evolution
and Future Perspective." "New World, New Society, New
Administration(online). Department of Public Service and Administration,
Government of South Africa. Available
at:http//www.ipac.ca/2008/docs/presentation/2508PM-Anver- Saloojee.pdf
( Accesed 02 January 2013).
Fraser-Moleketi, G. 2001. Tackling diversity. United Nations Expert Group Meeting
on Managing Diversity in the Civil Service. New York.
Fraser-Moleketi. G. J. 2006. Public service reform in South Africa: an overview of
selected case studies from 1994-2004. Master of administration thesis,
University of Pretoria.
Fuller, G. 2006. Anti-stress scheme boosts health and morale of city of London
Police’, Personnel Today, 3(7): 207–19.
Gabriel, Y. and Griffins, D.S. 2003. Emotions, learning and organization. The
Learning organization, 9(5): 214-221.
Gallie, D. 2005. Work pressure in Europe 1996-2001: trends and determinants.
British journal of industrial relations, 43(3): 351-75.
Ganguly, R. 2010. Quality of work life and job satisfaction of a group of university
employees. Journal of management research, 209-216.
Gibson, J.L., Ivancevich, J.M., and Donnelly, J.H. 2000.Organizations: behaviour,
structure, processes. New York: McGraw-Hill.
Gillespie, N. A., Walsh, M., Winefield, A. H., Dua, J., and Stough, C. 2001.
Occupational stress in universities: staff perceptions of the causes,
consequences and moderators of stress. Work and stress, 15(1): 53-72.
Goetzel, R. Z., Ozminkowski, R. J., Sederer, L. I. and Mark, T. L. 2002. The business
case for quality mental health services: why employers should care about the
mental health and well-being of their employees. Journal of occupational and
environmental medicine, 44(4): 320-330.
Golafshani, N. 2003. Understanding reliability and validity in qualitative research.

156
Graetz, F. 2000. Strategic change leadership. Management decision, 38(8): 550-
562.
Grieves, J. 2000. Navigating change into the new millennium : themes and issues for
the learning organization. The Learning organization, 7(2): 54-74.
Griffin, J. M., Fuhrer, R., Stansfeld, S. A., and Marmot, M. 2002. The importance of
low control at work and home on depression and anxiety: do these effects
vary by gender and social class? Social science and medicine, 54(5): 783-
798.
Grogan, J. 2005. Workplace law. 8th ed. Cape Town: Juta.
Guild, R., Ehrlich, R.I., Johnston, J.R. and Ross, M. H. 2001. SIMRAC handbook of
occupational health and practice in the South African mining industry.
Johannesburg : SIMRAC.
Hackman, J.R. and G.R. and Oldham, 1980. Work redesign, M.A: Addison-
Wesley.
Hair, J.F., Money, A.H., Samouel, P and Page, M. 2007. Research methods for
business. John Wiley & Sons, West Sussex.
Hall, M. and Hymes, A. 2005. South African higher education in the first decade of
democracy : from cooperative governance to conditional autonomy. Studies in
higher education, 30(2): 199-212.
Hegewisch, A. and Gornick, J. C. 2008. Statutory routes to workplace flexibility in
cross national perspective. Institute for women’s policy research.
Helliwell, J.F. and Putman, R.D. 2004. The social context of wellbeing. The
royal society, 359 (1449): 1435-1446.
Henn, M., Weistein, M. and Foard, N. 2009. A critical introduction to social research.
2nd ed. Sage, London.
Heskett, J.L., Jones, T.O., Loveman, G.W.,Sasser, W.E. and Schlesinger, L.A.
1994. Putting the service-profit chain to work, Harvard Business Review,
March/April.
Heskett, J.L., Sasser, W.E., Jr and L.A., Schlesinger, 1997. The service profit chain.
New York : The Free Press.
Hesselbein, F., Goldsmith, R. and Beckhard, R. 1996. The Leader of the future: new
visions, strategies, and practices for the next era. San Francisco. CA: Jossey-
Bass.

157
Higher Education South Africa. 2005. Guidelines for the categorisation of research
innovation output at universities of technology (online). Pretoria. HESA
Available at: http: //www.research.up.ac.za/ (Accessed 21 January 2013)
Hood, C. 1991. A public management for all seasons? Public administration, 69(1):
3-19.
Hood, C. 1996. Exploring Variations in Public Management Reform of the 1980s.
Hope, K.R. and Chikulo, B.C. 2000. Decentralisation : the new public
management and the changing role of the public sector in Africa. Public
management, 2(1): 25-42.
Hope, K.R. and Chikulo, B.C. 2000. Decentralisation, the new public management
and the changing role of the public sector in Africa. Public Management, 2(1):
25-42.
Horwitz, F. M., Bowmaker-Falconer, A., and Searll, P. 1996. Human resource
development and managing diversity in South Africa. International Journal of
Manpower, 17(4/5):134-151.
Horwitz, F. M., Browning, J. H. and Steenkamp, A. J. 2002. Human resource
practices and discrimination in South Africa: overcoming the apartheid legacy.
The International journal of human resource management, 13(7): 1105-
1118.
Hughes, O.E. 2003. Public management and administration: an introduction.
Macmillan, New York.
Industrial Health Unit. 1999. Compensation for Occupational injuries and Diseases
Act 130 of 1993, (COIDA), lecture notes distributed in the Centre of
Occupational and environmental health, University of Kwa-Zulu Natal, 20
March 2004.
Institute of Directors in Southern Africa. 2002. Executive Summary of the King report
King committee on corporate governance (online). Available at:
www.ecgi.org/codes/documents/executive_summary.pdf (Accessed 20
January 2014).
Institute of Directors in Southern Africa. 2009. Kings Report on Corporate
Governance for South Africa (online). Available at:
http://www.library.up.ac.za/law/docs/king111report.pdf. (Accessed 5 July
2012).

158
Institute of Directors of Southern Africa. 2009. King Report on Corporate
Governance for South Africa (King III). Park Town. September
International Labour Office . 1989. World labour report. Oxford: Oxford
University Press.
Jandagh, G. and Matin, H.Z. 2010. Application of quantitative research in
management (why, when and how). Iranian journal of management studies,
3(3): 59-74.
Johnson, B. and Turner, L.A. 2003. Data collection strategies in mixed methods
research. In Tashakkori, A. and Teddlie, C., eds. Handbook of mixed methods
in social and behavioral sciences. Sage, 297-319.
Johnstrund, L.K. 2002. Measuring the quality of faculty and administrative workplace.
Jonathan, R. 2006. Academic freedom, institutional autonomy and public
accountability in higher education: a framework for the analysis of the 'state-
sector' relationship in a democratic South Africa. Council on Higher
Education.
Joubert, P., Van Wyk, C., and Rothmann S. 2011. The effectiveness of sexual
harassment policies and procedures at higher education institutions in South
Africa. South African journal of human resource management, 9(1): 1-10.
Kakumba, U. and Fourie D.J. 2007 Revitalising accountability in public management
reform : issues and challenges for developing countries, Journal of public
administration, 42(7): 650-663.
Kamya, H. A. 2000. Hardiness and spiritual well-being among social work students:
implications for social work education. Journal of social work education, 36(2):
23-240.
Kandasamy, I. and Sreekumar, A. 2009. WRKLFQUAL: a tool for measuring quality
of work life. Research and practice in human resource management, 17(1):
59-70.
Keefer, P. and Khemani, S. 2005. Democracy, public expenditures, and the poor:
conditions of service and their job satisfaction: a case study. South African
journal of higher education, 20(4): 466-477.
Kelle, U. 2006. Combining qualitative and quantitative methods in research practice:
purposes and advantages, Philipps-University Marburg. Qualitative research
in psychology, 3(4): 293-31.

159
Kiernan, W.E. and Knuson, K. 1990. ‘Quality of work life’, in Schallock, R.L. and
Begab, M.J. (eds.), Quality of life: perspectives and issues (American
Association of Mental Retardation, Washington DC).
Kinman, G., Jones, F. and Kinman, R. 2006. ‘The well-being of the UK academy,
1998–2004’. Quality in higher education, 12(1): 15-27.
Klynveld Peat Marwick Goerdeler (KPMG). 2001. Ethics survey (online). Visited at:
http://www.info.gov.za (Accessed 17 March 2013).
Kompier, M., Ybema, J. F., Janssen, J., & Taris, T. 2009. Employment contracts:
cross-sectional and longitudinal relations with quality of working life, health
and well-being. Journal of occupational health, 51(3), 193-203.
Kortze,T. 2005 . The nature and development of the construct quality of work life.
Acta academia, 37(2) 96-122.
Koruca, H.I., Stowasser, S., Ozdemir, G., Orhan, H. and Aydemir, E. 2011.
Evaluation of working life quality for a textile company in Turkey: a case study,
Gazi. University journal of science, 24(1): 101-112.
Kreiner, G. E., Hollensbe, E.C. and Sheep, M.L. 2009. Balancing borders and
bridges: negotiating the home work interface via boundary work tactics.
Academy of management journal, 52(4): 704-730.
Krings, B. J. 2009. Working time, gender and work-life balance. Katholieke
Universiteit Leuven, Hoger Instituut voor de Arbeid.
Kruger, W. H. 2012 Health and safety representatives' perceptions and experiences
in an academic hospital: appointment and relationships: original research.
Occupational health Southern Africa, 18 (4): 20-24.
Kubler, J. and Lennon, M.C. 2007. 2006-07 Academic staff salary survey.Policy
Research Unit Association of Commonwealth Universities. Association of
Commonwealth Universities May 2007.
Kumar, R. 2005. Research methodology: a step-by-step guide for beginners. London
Sage.
Ladebo, O and Oloruntoba, A. 2005. The effects of stressors, positive affectivity and
coping strategies on well-being among academic staff in a Nigerian
agricultural university. Acta academica, 37(3): 212-233.
Lane, J. E. 2000. New public management , New Fetter Lane. London : Routledge.

160
Lau, T., Y.H., Wong, K.F., Chan, and Law, M. 2001. Information technology and the
work environment-does it change the way people interact at work. Human
systems management, 20(3): 267-280.
Lawler, E. E.1982. “Strategies for Improving the Quality of Work Life”. American
psychologist, 37: 486-693.
Leadership model in practice. Leadership organisation development journal, 22(8):
383-393.
Lee, G. J. 2002. Reviewing the economics of the skills development levy: a political
non sequitur? South African journal of labour relations autumn, 26(1): 4-20.
Levin, R. 2004. Building a unified system of public administration. Speech delivered
at the 2nd public service conversation, Gordons Bay.
Lewis, S. 1997. “An International Perspective on Work-Family Issues”. In: S.
Parasuraman S. and. Greenhaus J.H. eds. Integrating work and family:
challenges and choices for a changing world. Westport, CN :Quorum Books.
Li, J. and Yeo, R.K. 2011. Working out the quality of work life: a career development
perspective with insights for human resource Management Human
resource management international digest, 19(3): 39-45.
Liebenberg, N. Barnes. 2004. Factors influencing customer service culture in higher
education environment. South African journal of human resource
management, 2(2): 7-16.
Lindlof, T.R. and Taylor, B.C. 2011. Qualitative communication research methods.
Sage.
Luton, L.S. 2010. Qualitative research approach for public administration, M.E
Sharpe Inc.
Maclean, D.B. 2011. Health and safety in the United Kingdom higher e ducation
libraries: a review of literature. New review of academic librarianship, 17:
209–221.
Madue, S.M. 2007. New public management and the implementation of policies on
the measurement of research output. Journal of public administration, 42(3):
163-178.
Mafunisa, M.J, and Paterson, A. 2005 December. The new public management an
public sector training in Africa. Journal of public administration, 4(1),
December 2005.

161
Mafunisa, M.J. 2003. Ethical governance. (A training manual for Public Servants
prepared for the University of Pretoria). Pretoria.
Mafunisa, M.J. and Maserumule, M.H. 2004. Cases in public administration and
management: a South African perspective. Heinemann.
Makgoba, M.W. 1996. Mokoko: The Makgoba affair: A reflection on transformation.
Florida: Vivlia.
Malan, F. and Smit, B. 2001. Ethics and leadership in business and politics.
Lansdowne : Juta.
Malczyk, A and Tissiman, C. 2010. Setting up your occupational health and safety
plan: human resources. Graphix. 9(8): 18.
Malone, J., Denny T., Dalton, P. and Addley, K. 1997. Stress at work. Part 1:
recognition, causes, outcomes and effects. 1-47.
Mammen, K.J. 2006. Higher education academics' satisfaction with their terms and
conditions of service and job satisfaction: a case study. South African journal
of higher education, 20(4): 466-477.
Manyaka, R.K. and Sebola, M.P. 2012. Impact of performance management on
service delivery in the South African public service. Journal of public
administration, 47(1): 299-310.
Mapesela, M. and Hay, D. 2006. The effects of change and transformation on
academic staff and job satisfaction: a case of a South African University.
South African journal higher education, 52(4): 711-747.
Maree, K. 2007. First steps in research. Van Schaik.
Mark, G., Gudith, D., and Klocke, U. 2008. The cost of interrupted work: more speed
and stress. In Proceedings of the SIGCHI conference on Human Factors in
Computing Systems: 107-110. 2008 November 08-12.
Marques, J. 2008. Spirituality at work: Internal growth with potential external
challenges. Journal for quality and participation, 31: 24-27.
Martel, J-P. and Dipius, G. 2006. Quality of work life: Theoretical and methodological
problems and presentation of a new model and measuring instrument. Social
indicators research, 77(2): 333-368.
May, B. E., Lau, R.S.M. and Johnson, S.K. 1999. A longitudinal study of quality of
work life and business performance. South Dakota business review, 58 (2):
275-308.

162
May, M.S. 2012. Diversity dynamics operating between students, lecturers and
management in a historically Black university: the lecturers’ perspective.
South African journal of industrial psychology, 38(2): 1-8
McDonough, M. E. 2011. Employee wellness plan, FBI Law enforcement bulletin,
80(12): 1-6.
Mercedes, M. and Caceres, J. 2002. More training, less security? training and the
quality of life at work in Argentina, Brazil and Chile. International labour
review, 141(4): 359-383.
Mester, C., Visser, D., Roodt, G. and Kellerman, R. 2003. Leadership style and its
relation to employee attitudes and behaviour. South Afican journal of industrial
psychology, 29 (2): 72-82.
Meyer, M. and Botha, E. 2000. Organizational development and transformation in
South Africa. Durban: Butterworth.
Michie, S., & Williams, S. 2003. Reducing work related psychological ill health and
sickness absence: a systematic literature review. Occupational and
environmental medicine, 60(1): 3-9.
Miller, K. 2005. Public sector reform governance in South Africa. Aldershot:
Ashgate.
Molefe, G.N. 2010. Performance measurement dimensions for lecturers at selected
universities: an international perspective. South Africa journal of human
resource management, 8(1): 1-13.
Morrison, D., Cordery, J., Girardi, A., and Payne, R. 2005. Job design, opportunities
for skills utilization, and intrinsic job satisfaction. European journal of work
and organizational psychology, 14(1): 59-79.
Mostert, F.F., Rothmann, S., Mostert, K. and Nell, K. 2008. Outcomes of
occupational stress in a higher education institution. South African business
review, 12(3): 102-127.
Mphehle, Z. 2012. Are service delivery protests justifiable in the democratic South
Africa? Journal of public administration, 47(1.1): 213-227.
Msweli-Mbanga, P. and Potwana, N. 2006. Modelling participation, resistance to
change and organisational citizenship behaviour: a South African case.
South African Journal of business management, 37(1): 21-29.
Mthembu, B. 2001. Speech on public service and administration budget vote,
national assembly. Cape Town.

163
Muftah, H. and Hanan Lafi, H. 2011. Impact of QWL on employee satisfaction case
of oil and gas industry in Qatar. Advances in management and applied economics,
1 (2): 107 -134.
Mweemba, R.S. and J. Malan, J. 2009. The impacts of performance measurement
on the equality of service delivery in Zambian public service. Journal of
contemporary management, 6: 361-374.
Nadler, D.A. and Lawler, E.E. 1983. Quality of work life: Perceptions and direction,
Organisational dynamics, 11(3): 20-30.
Napier, C.J. 2007. Accountability an assessment at the local government sphere.
Journal of public administration, 42(4): 376-390.
Naspers. 2010. Application of and approach to King III (online). Available at:
http://www.naspers.com.(Accessed 13 February 2013).
Nataranjan, P. and Annamalai, C. 2011. A Study of quality of work Life in
Pondicherry University Puducherry. Advances in management, 4(5): 46-51.
National Plan for Higher Education. 2001. Ministry of Education. Pretoria.
Ncholo, P. 2000. Reforming the public service in South Africa: a policy framework.
Public administration and development, 20: 87-102.
Nengwekhulu, R.H. 2009. Public service delivery challenges facing the South
African public service. Journal of public administration, 44(2): 341-363.
Neuman, M. 2010. Occupational health and safety (online). Available at:
http://ohsonline.com/blogs/ (Accessed 11September 2013).
Nicolaides, A. 2009. Business ethics in Africa. Journal of contemporary
management, 6: 490–501.
Nieuwenhuizen, C. 2009. Scarcity, requirements and remuneration of applicants with
management qualifications in the private-public and higher education sectors.
Journal of contemporary management, 6:310 – 324.
Normala, D. 2010. Investigating the relationship between quality of work life and
organisational commitment amongst Employees in Malaysian Firms.
International journal of business and management, 5(10): 75-82.
Nzimande, J. 2008. Investigation of worklife balance in organisations in Kwazulu –
Natal: comparison with the United Kingdom. Theses. University of KwaZulu-
Natal.
O’ Leary, Z. 2004. The essential guide to doing research. London: Sage.

164
Oliver, J.E., Jose, P.E. and Brough, P. 2006. Confirmatory, factor analysis of the
Work Locus of Control Scale. Educational and psychological measurement,
66(5): 835-851.
Olsen, D., Maple, S.A. and Stage, F.K. 1995. Women and minority faculty job
satisfaction. Journal of higher education, 66(3): 267-293.
Osborne, D. and Gaebler, T. 1993. Reinventing government: how the entrepreneurial
spirit is transforming the public sector. New York: Penguin.
Pantit, N. and Pant. R. 2010. Study of quality of work life of nurses and its impact on
their job satisfaction in selected private and government hospitals in Gujarat.
International journal of business research, 10(3): 172-178.
Paoli, P. and Merlie, D. 2000. Third European survey on working conditions.
European Foundation for the improvement of living and working conditions.
Parsons, P.G., and Slabbert, A.D. 2001. Performance management and academic
workload in higher education. South African journal for higher education,
15(3): 74–81.
Paton, N. 2013. Stressed out at university. Occupational health, 65(4): 16-18.
Patridge, K. 2012. Exploring pastoral staff’s experiences of their own emotional
wellbeing in a secondary school. Educational and child psychology. 29 (4):
121-132.
Perone, J. and Tucker, T. 2003. An exploration of triangulation of methodologies:
quantitave and qualitative methodology fusion in an investigation of
percetions of transit safety, Center for Urban Transportation Research at the
University of South Florida. Summary of Final Report, BC. 137-142.
Peters, M., Abu-Saad, H.H.,Vydelingum, V. and Murphy, M. 2002. Research into
headache: the contribution of qualitative methods, The Journal of head and
face pain, 42(10): 1051-1059.
Pienaar, C. and Bester, C. 2009. Addressing career obstacles within a changing
higher education work environment: perspectives of academics. South
African journal of psychology, 39(3): 376-385.
Pillay, P., Subban, M. and Qwabe, B. 2008. Talent management – “Putting the right
people in the right jobs”. Journal of public administration, 43(3): 308-323.
Place, N. and Jacob, S.J. 2001. Stress: professional development needs of
extension faculty. Journal of agricultural education. 42(1): 96-104.

165
Plattner, I.E., and Mberengwa, D.S. 2010. We are the forgotten ones: occupational
stress among university secretaries in Botswana. South African journal of
human resource management, 8(1): 1-8.
Police. Personnel today, 3(7): 207–19.
Portnoi, L.M. 2003. Implications of the employment equity act for the higher
education sector. South African journal of higher education, 17(2): 79-85.
Potgieter, I.L., and Coetzee, M. 2010. Management competencies in higher
education: perceived job importance in relation to level of training required.
South African journal of human resource management, 8(1): 1-10.
Potgieter, S.C.B. and Barnard, A. 2010. The construction of work–life balance: the
experience of black employees in a call-centre environment. South African
Journal of industrial psychology, 36(1): 1-8.
Pretorious, M. Cilliers, F.and May, M. 2012. The Robben island diversity experience.
An exploration of South African diversity dynamics. South African journal of
industrial psychology, 38(2): 1-8.
Public Service Commission. 2008. State of the Public Service Report 2008 (online)
Available at http:// www.psc.gov.za. (Accessed 13 February 2013). Purdy, M. And Dopey P. 2005. Holistic flow model of spiritual wellness. Counselling
and value 49(95).
Quick, J.D., Henley, A.B., and Quick, J.C. 2004. The balancing act – at work and at
home. Organizational dynamics, 33(4): 426-438.
Rabin, J., Hildreth, W.B., and Miller, G.J. 2007. Handbook of public administration.
3rd ed. Boca Raton : Taylor & Francis.
Rathi N. Relationship of quality of work life with employees’ psychological well-being,
International journal of business insights & transformation, Oct 2009-Mar
2010, 3(1): 52-60.
Reddy, J. 1998. Capacity-building for quality teaching and learning in further and
higher education. South African journal of higher education, 12(3): 5-6.
Reichenberg, N. E. 2001. Best practices in diversity management. Paper presented
at the United Nations expert group meeting on managing diversity in the civil
service. 3–4 May. New York.
Research in higher education, 43 (3): 379-396.

166
Rethinam, G. S. and Ismail, M. 2008. Constructs of quality of work life: a
perspective of information and technology professionals. European journal of
social sciences, 7(1): 58-70.
Robbins, S. and Coulter, M. 2005. Management, 8th int. ed., New Jersey: Pearson.
Rosser, V. J. 2004. Faculty members' intentions to leave: A national study on their
worklife and satisfaction. Research in higher education, 45(3): 285-309.
Rothmann, S. and Essenko, N. 2007. Burnout of support staff in a higher education
institution in the North West Province. South African journal of psychology,
37(1): 135-152.
Rothmann, S. Barkhuizen, N. and Tytherleigh, M.Y. 2008. Model of work-related ill
health of academic staff in a South African higher education institution, South
African journal of higher education, 22(2): 404-422.
Rothmann, S., Jackson, L.T.B. and Kruger, M.M. 2003. Burnout and job stress in a
local government : the moderating effects of sense of coherence. South
African journal of industrial psychology, 29(4): 52-60.
Saklani, D.R. 2004. Quality of work life in the Indian context : an empirical
investigation. Decision, 31(2): 102-136.
Sanicher, A. 2004. The strategic implications and management of considerations of
work life programmes. Journal of contemporary managements, 1:31-44.
Sarros, C. J. and Santora C. J. 2001. The transformation transactional leadership
model in practice. Leadership organisation development journal, 22(8): 383-
393.
satisfaction in the North-West Russian oil industry. Fennia 184(2): 133–
149.
Schemerhorn, John, Hunt, James, Orsborne and James. 1994. Managing
organisational behaviour, 5th ed. New York. Wiley.
Schultz, C.M. 2010. Human Resource competencies at a merged higher education
institution. South African journal of human resource management, 8(1): 1-8.
Schulze, S. 2005. The job satisfaction of black female academics. South African
journal of higher education, 19(4): 754-769.
Sebola, M. and Khalo, T. 2010. Implementation of the employment equity act: a case
study of University of Venda and of Pretoria. Journal of public administration,
45(1): 202-217.

167
Senge, P. M. 1990. The Fifth discipline: the art and practice of the learning
organization, London: Random House.
Serey, T.T. 2006. Choosing a robust quality of work life. Business forum, 27(2): 7-10.
Sidani, Yusuf M.; Al Hakim, Zeina T. 2012. Work–family conflicts and job attitudes
of single women: a developing country perspective. International journal of
human resource management, 23 (7): 1376-1393.
Sieberhagen, C., Rothmann, S., and Pienaar, J. 2009.Employee health and wellness
in South Africa: the role of legislation and management standards. South
African journal of human resource management, 7(1): 18- 26.
Sinclair, V. 2009. Experiencing career satisfaction and career success over the life
span (online). Available at: http://www.counselling-directory.org.uk. (Accessed
23 October 2012).
Singh, K., Robinson, A. and Williams-Green, J. 1995. Differences in perceptions of
African American women and men faculty and administrators. The Journal of
negro education, 64(4): 401-408.
Sireteau, N.A, Bedrule-Grigoruta, M.V., 2007. Perspective of knowledge
management. .Social sciece network.
Sirgy, M.J., Efraty, D., Siegel, P. and Dong-Jin, L. 2001. A new measure of quality of
work life (QWL) based on need satisfaction and spillover theories. Social
indicators research, 55(3): 241-302.
Sithole, S.L. 2001. The need for employee assistance programmes at South African
universities. South African journal of higher education,15(2): 80-85.
Smeltzer, S.C. and Bare, B.G. 2004. Brunner and Suddarth’s textbook of medical-
surgical nursing, 10th ed. Philadelphia: Lippincott Williams & Wilkins.
Sounders, M., Lewis, P. and Thornhill, A. 2007. Research methods for business
students 4th ed. Pearson.
South Africa .1995. South African Qualifications Authority Act 1995. (online)
Available at: http://www.info.gov.za/acts/1995/a58-95.pdf (Accessed 15
October 2012).
South Africa. 1995. Department of Public Service and Administration. White Paper
on Transformation of Public Service. Goverment Gazzete number: 15
November 1995 online. Available:
http://www.info.gov.za/whitepapers/1995/transformation.htm. (Accesed 06
October 2012).

168
South Africa. 1996. Constitution of the Republic of South Africa of 1996. Pretoria:
Government Printers.
South Africa. 1997. Department of Public Service and Administration. White paper
on public human resources. Goverment Gazzete number 15594: 03 Dec
(online). Available at: http://www.info.gov.za/whitepapers/1997/hrmwp.pdf.
(Accessed 14 October 2012).
South Africa. 1997. Higher Education Act 19 of 1997(online). Available at:
http://www.che.ac.za/documents/d000004/HigherEducationAct.pdf
(Accessed 2 February 2012).
South Africa. 1997. White paper on transforming public service delivery of S.A.
Goverment Gazzette number 18340: 18 December (online). Available
at:http://www.info.gov.za/whitepapers/1997/18340.pdf. (Accessed 08
November 2012).
South Africa. 1997. White paper on transforming public service delivery. Pretoria:
Goverment Printers.
South Africa. 1998. Employment Equity Act 55 of 1998: code of good practice on the
integration of employment equity into human resource policies and practices
(online). Available at: http://www.labour.gov.za (Accessed 12 January 2013).
South Africa. 2002. Basic Conditions of Employment Act 75 of 1997 (online).
Available at: http://www.labour.gov.za (Accessed 12 June 2012).
South Africa. 2002. Compensation for Occupational Diseases and Injuries Act 130
of 1993 (online). Available at: http://www.labour.gov.za ( Accessed 2 August
2012).
South Africa. 2002. Labour Relations Act no. 66 of 1995 (online). Available at:
http: (http://www.labour.gov.zaAccessed 2 June 2012).
South Africa. 2002. Skills Development Act 56 of 1997 (online). Available at:
http: http://www.labour.gov.za (Accessed 2 May 2012).
South Africa. 2004. Employment Equity Act 55 of 1998 (online). Available at:
http: http://www.labour.gov.za (Accessed 04 July 2012).
South Africa. 2009. Occupational Health and Safety Act 85 of 1993. Claremont: Juta.
South Africa. Department of higher education. 1997. White paper on transformation
of higher education (online). Available at: http://www.labour.gov.za (Accessed
15 December 2012).

169
South African Institute of Chartered Accountants .2011. An integrated report is a
new requirement for listed companies(online). Available at:
http://www.saica.co.za. (Accessed 18 February 2013).
South African Presidency. 2010. Annual report 2007(online). Available
at:http://www.thepresidency.gov.za (Accessed 12 January 2013).
Spector, P.E. 1986. Perceived control employees: a meta-analysis of studies
concerning autonomy and participation at work. Human relations, 39(11):
1005 -1016.
Spies, M. 2006. Distance between home and workplace as a factor for job
satisfaction in the North-West Russian oil industry. Fennia, 184(2): 133-149
Srivastava, A.K. 2007. Perceived work environment and employees’ health.
psychological studies, 52(4): 345-347.
Steenkamp, R. and Van Schoor, A. 2002. The quest for quality of work life: a total
quality management approach. Cape Town. Juta.
Stephenson, W. 23 May 2012. Who works the longest hours, BBC news (online)
Available at: http://www.bbc.co.uk/news/magazine-18144319 (Accessed 1
May 2013).
Steyn, B. 2009. Difference between King III and King II Reports on
Governance(online) Available at: http://www.prconversations.com (Accessed
19 February 2013).
Sukram, P. and Hoskins, R. 2012. Leading the way: the managerial skills of library
managers in South African university libraries. Innovation journal of
appropriate librarianship and information work in Southern Africa, 45: 94-119.
Tabassum, A., Rahman, T. and Jahan, K. 2012 . An Evaluation of the quality of
work life: a study of the faculty members of private universities in Bangladesh.
ABAC Journal, 32(3): 36-57.
Tamini, B. K., Yazdany, B. O., and Bojd, F. B. 2011. Quality of work life as a function
of organizational commitment and job burnout of Government and Private
Bank Employees in Zahedan city. The Social sciences, 6(5): 368-374.
Terre Blanche, M., Durrheim, K. and Painter, D. 2006. Research in practice, applied
methods for social science, 2nd ed. Cape Town: University of Cape Town
Press.
The Qualitative report, 8(4): 597-607.

170
Trochim, W.M.K. 2006. Research methods knowledge base, Available at:
http://www.socialresearchmethods.net/kb/statdesc.php, (Accesed 11 March
2013).
Tshikwatamba, N.E. 2004. Human resource management of diversity in the public
sector: addressing challenges of in equality an exclusions. Journal of public
administration, 39(4): 592-606.
Tshoose, I.C. 2011. Employer’s duty to provide a safe working environment: a
South African perspective. Journal of international commercial law and
technology, 6(3).
Tytherleigh, M. Y., Webb, C., Cooper, C. L. and Ricketts, C. 2005. Occupational
stress in UK higher education institutions: a comparative study of all staff
categories. Higher education research and development, 24(1): 41-61.
United Nations Development Programme. 2003. Leadership and social
transformation in the public sector: moving from challenges to solutions.
New York: Oxford University Press.
United Nations. 2005. Unlocking the human potential for public sector performance:
world public sector report. Department of social and economic affairs. New
York.
University of Venda. 2005. University of Venda Strategic Plan 2005-2010. Available
at: http://www.univen.ac.za (Accessed 04 February 2011).
Uwaifo, S. O. 2008. Nigerian library staff and their perceptions of health risks posed
by using computer-based systems in university libraries. Program: electronic
library and information systems, 42(1): 68-75.
Van den Broek, D. 2003. Selling human services: public sector rationalisation and
the call centre labour process. Australian bulletin of labour, 29 (3): 236-253.
Van der Berg, Y.and Martins, N. 2013. The relationship between organisational trust
and quality of work life. South African journal of human resource
management. Available at:
http://www.sajhrm.co.za/index.php/sajhrm/article/view/392/568. (Accessed:
18 March. 2013).
Van der Westhuizen, C., Goga, S., and Oosthuizen, M. 2007. Women in the South
African Labour Market, 1995-2005.

171
Van Der Zee, J. and Abu Saad, H.H. 2001. Quality of working life and workload in
home help services: a review of the literature and a proposal for a research
model. Scandinavian Journal of Caring Society, 15: 12-24.
Van Jaarsveld, M. 2002. Parental leave: for the sake of the children: A comparative
study. South African medical journal 783.
Van Schalkwyk, L., Els, C., and Rothmann, S. 2011. The moderating role of
perceived organisational support in the relationship between workplace
bullying and turnover intention across sectors in South Africa. South African
journal of human resource management, 9(1): 1-13.
VanLaar, D., Edwards, J. A. and Easton, S. 2007. The Work-related quality of life
scale for healthcare workers. Journal of advanced nursing, 60 (3) :325- 333.
Veeran, P. 2011. The impact of globalisation on human resource management
policies and procedures in the South African public service. Journal of public
management, 46(3).
Vermeulen, W. and Crous, M.J. 2000.Training and education for TQM in the
commercial banking industry of South Africa. Managing service quality, 10(I):
61-67.
Viljoen, J.P. and Rothmann, S. 2009. Occupational stress, ill health and
organisational commitment of employees at a university of technology. South
African journal of industrial psychology, 35(1): 67-77.
Viswesvaran, C., Sanchez, J. I., and Fisher, J. 1999. The role of social support in the
process of work stress: a meta-analysis. Journal of vocational behavior,
54(2): 314-334.
Vyas-Doorgapersad, S. 2011. Paradigm shift from new public administration to
new public management: theory and practice in Africa. The Journal for
transdisciplinary research.
Walker, M. and McLean, M. 2010. Making lives go better: university education and
'professional capabilities'. South African journal of higher education, 24(5):
847-869.
Welman, J.C. Kruger, S.J. and Mitchell, B. 2005. Research methdology 3rd ed. Cape
Town: Oxford University Press.
Wentzel, L., Buys, C. and Mostert, K. 2009. Work and personal life: which strategies
do secondary school educators use to deal with the interaction? South African
journal of human resources management, 7(1):1-9.

172
Wilken, E.C., and Badenhorst, J.W. 2003. A comparative analysis of sexual
harassment policies at selected higher education institutions in South Africa.
South african journal of higher education,17(2): 197-205.
Williams, N. 2003. Occupational stress. Practice nurse, 26 : 21–26.
Winefield, T., Boyd, C., Saebel, J. and Pignata, S. 2008. Update on national
university stress study. Australian universities review, 50(1): 20-29.
Winter, R., Taylor, T. and Sarros, J. 2000. Trouble at the mill: quality of academic
worklife issues within a comprehensive Australian University. Studies in
higher education, 25(3): 279-294.
World Health Organisation. 2005. Knowledge Management Strategy.
World Health Organization. 2002. Constitution of the world health organisation
(online).Available at:
http://whqlibdoc.whoint/hist/official_records/constitution.pdf. (Accesed 06
January 2012).
World Labour Report. 1989. International Labour Organisation.
Wyatt, T.A. and Wah, C.Y. 2001. Perceptions of quality of work life: a study of
Singaporean employees development. Research in human resource
management, 9(2): 59-76.

173

Annexure A Factors impacting on the quality of work life : A case study of
University “A”
Section A: Biographical Data
1. Age
20-25 01
26-34 02
35-44 03
45-54 04
55-64 05
65+ 06
2. Gender
Male 01
Female 02
3. Ethnic group
Black 01
Coloured 02
White 03
Indian 04
Asian 05
4. Highest education level reached
Below matric 01
Matric 02
Trade certificate 03
Advanced diploma 04
Degree 05
Post graduate 06

5. Length of service
Less than 1 year 01
1-3 02
4-6 03
7-11 04
12-15 05
20+ 06
6. Job type
Academic 01
Academic support 02
Administration support 03
7. Current job level
Senior management (grade 3&4) 01
Middle management (grade 5&6) 02
Junior management (7&8) 03
Lectures (grade 7,8&9) 04
Professional/specialist (grade9 &10) 05
Semi skilled ( grade 11-17) 06

Instructions: Please rate how strongly you agree or disagree with each of the
following statements by placing a tick (X) in the appropriate box.
1 = Strongly disagree
2 = Disagree
3 = Undecided
4 = Agree
5 = Strongly agree
Section B: Job Satisfaction
I have a clear set of goals and aims that enable me to do my job. 1 2 3 4 5
I have the opportunity to use my abilities and skills at work. 1 2 3 4 5
When I have done a good job it is acknowledged by my line manager. 1 2 3 4 5
I am satisfied with the career opportunities available to me here. 1 2 3 4 5
I am satisfied with the training I receive in order to perform my present
job.
1 2 3 4 5
I am encouraged to develop new skills. 1 2 3 4 5
I think that my job is reliable and secure. 1 2 3 4 5
I am growing as a professional in my current job 1 2 3 4 5
Section C: General Wellbeing
I feel well at the present moment. 1 2 3 4 5
Recently I have been feeling unhappy and depressed. 1 2 3 4 5
I am satisfied with my life. 1 2 3 4 5
In most ways my life is closer to ideal. 1 2 3 4 5
Generally things work out well for me. 1 2 3 4 5
Recently I have been feeling reasonably happy all things considered. 1 2 3 4 5
Section D: Control at Work
I am able to voice out my opinions and influence changes in my area of
work.
1 2 3 4 5
I am involved in decision that affects me in my own area of work. 1 2 3 4 5
My job carries a lot responsibility, but I do not have much responsibility. 1 2 3 4 5

I have a lot of say about what happens in my job. 1 2 3 4 5
I am given a lot of freedom to decide how I do my job. 1 2 3 4 5
I have the necessary authority to do my job. 1 2 3 4 5
Section E: Home Work Interface
My employer provides adequate facilities and flexibility for me to adjust
my work in with my family time.
1 2 3 4 5
My current working hours/patterns suit my personal circumstances. 1 2 3 4 5
My line manager actively promotes flexible working hours. 1 2 3 4 5
I often have to take work home to keep up with my job demands. 1 2 3 4 5
The job demands interfere with my family time. 1 2 3 4 5
I can keep a reasonable time between work and personal time. 1 2 3 4 5
I often worry about work even when I am at home. 1 2 3 4 5
Section F: Stress at Work
I often feel under pressure at work. 1 2 3 4 5
I often feel excessive levels of stress at work. 1 2 3 4 5
The workload placed on me is more than I can handle. 1 2 3 4 5
There is friction or anger amongst colleagues. 1 2 3 4 5
I get help and support I need from colleagues. 1 2 3 4 5
I am often unable to find the information I need to perform my job 1 2 3 4 5
I often perform my job without interruption 1 2 3 4 5
Section G: Working conditions
My employer provides me with what I need to do my job effectively. 1 2 3 4 5
I work in a safe environment. 1 2 3 4 5
Employee health and safety is a high priority where I work. 1 2 3 4 5
The health and safety conditions are satisfactory. 1 2 3 4 5
At work employees and management work together to ensure the
safest possible working conditions.
1 2 3 4 5
I feel that the current working conditions need to be improved. 1 2 3 4 5
Thank you!!

Annexure B: Factors impacting on the quality of work life: A case study of University “A”
In this questionnaire you will be asked your opinion on various aspects of quality of
work life. In each question you are presented with a statement to which you are
supposed to respond to.
Open ended questions
1. Do you know of any policies and procedures that are related to quality of work
life at University “A”?
............................................................................................................................
2. What factors do you think positively affect your satisfaction with your quality of
work life at University “A” ?
............................................................................................................................
3. What factors do you think negatively affect your satisfaction with your quality
of work life at University “A”?
............................................................................................................................
4. Do you think other employees or your satisfaction with the quality of work life
affects your performance at work?
............................................................................................................................
5. What will be your recommendation to management to improve the satisfaction
of employees with the quality of their work life?
............................................................................................................................
Thank You!!!

Annexure C: LETTER OF INFORMATION AND CONSENT
Title of the Research Study: Factors impacting on the quality of work life: A case
study of University “A”.
Principal Investigator/s/researcher: Mr. Mpho Kenneth Letooane, BTech:
Environmental Health
Post graduate diploma: Occupational health
Supervisor/s: Dr. B.S. NgcamuB.Paed degree, LLM, Mcom & DTech
Co-supervisor :Prof. Nirmarla Dorasamy, PhD
Brief Introduction and Purpose of the Study:
I am currently undertaking a research project as part of my studies towards a
Masters degree in Technology: Public Management at Durban University of
Technology. The study aims to assess the perceptions of employees on the Quality
of Work Life within University “A”.
The poor quality of work life can result from high stress levels because of work and
non-work related demands and it can have detrimental effects on family life and the
general wellbeing of employees. Quality of work life can be defined as the
relationship between the organisation and employee needs.The study will assist us
in gaining insight to the employee needs and determine how best these can be met
to improve performance and retention. As a University “A” employee we believe that
you can provide us with the critical information that is relevant to the study we are
undertaking.
Outline of the Procedures:
The researcher will set up an appointment with the senior manager at the manager’s
office. The researcher will then establish rapport by introduction and expressing
appreciation to the manager for making the time. of senior management. The senior
manager will then be asked open-ended questions to respond to. The researcher will
take down notes during the interview

The subjects will be recruited by being given a letter by the researcher that explains
the purpose of the research. Each participant will be offered sufficient time to read
the letter and be given the opportunity to clarify any questions. Only after the
participants have understood what the research entails can they sign the information
letter and a letter of consent. The researcher will introduce the purpose of the study
and also the importance of the involvement. The informed consent will be explained
and confidentiality and anonymity will be assured before the questionnaire/interview
commences.
The questionnaire/interview will take approximately 20 minutes. Participation is
voluntary participants are free to withdraw from the study at any time without giving
reasons, and without prejudice or any adverse consequences. The information you
give will only be used for research purposes and will be aggregated with other
responses and only the overall or average information will be used.
Risks or Discomforts to the Participant:
All the questionnaire and interview questions are based on the Quality of Work Life,
and therefore the questions asked are less likely to cause any harm.
Benefits:
The research will give valuable information about the quality of work life of University
“A” employees and will assist the researcher in Journal publications.
Reason/s why the Participant May Be Withdrawn from the Study:
You are completely free withdraw from the study should any question about Quality
of Work life cause any transitory discomfort. Participation is voluntary and you are
free to withdraw from the study at any time without giving reasons, and without
prejudice or any adverse consequence
Remuneration:
There are no rewards offered for participating in this study, nonetheless your time
and effort is highly appreciated.

Costs of the Study:
There are no costs related to participating in the study.
Confidentiality:
To ensure your confidentiality, your name will not be recorded on the questionnaire.
The researcher will code the questionnaires to ensure anonymity of the respondents
and that the questionnaires cannot be traced back to a particular respondent
Research-related Injury:
There are no anticipated research-related injury or adverse reaction.
Persons to Contact in the Event of Any Problems or Queries:
In the event of any problems or queries, please feel free to contact me or my
supervisor Dr B.S. Ngcamu, telephone: 031 260 2765 or [email protected] , or
Mr. Mpho Kenneth Letooane:, tel :031 907 7197 [email protected] or the
Institutional Research Ethics administrator on 031 373 2900. Complaints can be
reported to the DVC: TIP, Prof F. Otieno on 031 373 2382 or [email protected].
General:
Potential participants must be assured that participation is voluntary and the
approximate number of participants to be included should be disclosed. A copy of
the information letter should be issued to participants. The information letter and
consent form must be translated and provided in the primary spoken language of the
research population e.g. isiZulu.
CONSENT
Statement of Agreement to Participate in the Research Study:
I hereby confirm that I have been informed by the researcher, ____________ (Mpho
Kenneth Letooane), about the nature, conduct, benefits and risks of this study -
Research Ethics Clearance Number: ___________,

I have also received, read and understood the above written information (Participant
Letter of Information) regarding the study.
I am aware that the results of the study, including personal details regarding my sex,
age, date of birth, initials and diagnosis will be anonymously processed into a study
report.
In view of the requirements of research, I agree that the data collected during this
study can be processed in a computerised system by the researcher.
I may, at any stage, without prejudice, withdraw my consent and participation in the
study.
I have had sufficient opportunity to ask questions and (of my own free will) declare
myself prepared to participate in the study.
I understand that significant new findings developed during the course of this
research which may relate to my participation will be made available to me.
____________________ __________ ______ _______________
Full Name of Participant Date Time Signature / Right Thumbprint
I, Mpho Kenneth Letooane herewith confirm that the above participant has been fully
informed about the nature, conduct and risks of the above study.
_________________ __________ ___________________
Full Name of Researcher Date Signature
_________________ __________ ___________________
Full Name of Witness (If applicable) Date Signature
_________________ __________ ___________________
Full Name of Legal Guardian (If applicable) Date Signature

Please note the following:
Research details must be provided in a clear, simple and culturally appropriate
manner and prospective participants should be helped to arrive at an informed
decision by use of appropriate language (grade 10 level - use Flesch Reading Ease
Scores on Microsoft Word), selecting of a non-threatening environment for
interaction and the availability of peer counselling (Department of Health, 2004)
If the potential participant is unable to read/illiterate, then a right thumb print is
required and an impartial witness, who is literate and knows the participant e.g.
parent, sibling, friend, pastor, etc. should verify in writing, duly signed that informed
verbal consent was obtained (Department of Health, 2004).
If anyone makes a mistake completing this document e.g. wrong date or spelling
mistake a new document has to be completed. The incomplete original document
has to be kept in the participant file and not thrown away and copies thereof must be
issued to the participant.
Copyright © 2022 FDOKUMEN