
Facebook: a new era of marketing. - Stockholm School of ...
54
1 HANDELSHÖGSKOLAN I STOCKHOLM Institutionen för marknadsföring och strategi Kandidatuppsats Vårterminen 2010 Facebook: a new era of marketing. A quantitative study on the effectiveness of Facebook marketing There has been a vivid debate within the marketing community concerning what role social media has in influencing brand perceptions and consumer behaviour. The success of Facebook has not escaped the spotlight or the professionals’ attention, but there is a clear absence of quantitative research supporting the debate. Many brands have already entered the Facebook arena and due to the economic benefits of the platform, brands with a low marketing budget can be tempted to join the race. The purpose of this thesis is to, with a quantitative approach, determine whether Facebook is an effective marketing medium and if a creative communications approach is to prefer before a selling approach. An experiment was conducted where a sample of respondents were exposed to a selection of fictive fan pages on Facebook during one weeks time. Four sample-groups were exposed to different status updates, with different combinations of tonality (i.e. selling and creative) and frequency. The results showed that a selling approach is to prefer when communicating via Facebook news feeds to younger segments. This supports further research and debate on the subject due to the fact that recent research has proven that a creative tonality should, generally, have better effects on brand perceptions and key advertisement indicators. Authors: Johan Eriksson & Mattia Tosti Tutor: Jonas Colliander
-
Upload
khangminh22 -
Category
Documents
-
view
4 -
download
0
Transcript of Facebook: a new era of marketing. - Stockholm School of ...
1
HANDELSHÖGSKOLAN I STOCKHOLM Institutionen för marknadsföring och strategi Kandidatuppsats Vårterminen 2010
Facebook: a new era of marketing. A quantitative study on the effectiveness of Facebook marketing
There has been a vivid debate within the marketing community concerning what role social media has in influencing brand perceptions and consumer behaviour. The success of Facebook has not escaped the spotlight or the professionals’ attention, but there is a clear absence of quantitative research supporting the debate. Many brands have already entered the Facebook arena and due to the economic benefits of the platform, brands with a low marketing budget can be tempted to join the race. The purpose of this thesis is to, with a quantitative approach, determine whether Facebook is an effective marketing medium and if a creative communications approach is to prefer before a selling approach. An experiment was conducted where a sample of respondents were exposed to a selection of fictive fan pages on Facebook during one weeks time. Four sample-groups were exposed to different status updates, with different combinations of tonality (i.e. selling and creative) and frequency. The results showed that a selling approach is to prefer when communicating via Facebook news feeds to younger segments. This supports further research and debate on the subject due to the fact that recent research has proven that a creative tonality should, generally, have better effects on brand perceptions and key advertisement indicators.
Authors: Johan Eriksson & Mattia Tosti Tutor: Jonas Colliander

2
1. INTRODUCTION................................................................................................................................4
1.1. Background ...............................................................................................................................5
1.2. Problem area ............................................................................................................................5
1.3. Purpose.....................................................................................................................................5
1.4. Expected contribution to knowledge........................................................................................6
1.5. Boundaries................................................................................................................................6
1.6. Definitions.................................................................................................................................7
2. THEORY ............................................................................................................................................8
2.1. Facebook as a marketing platform ...........................................................................................8
2.2. Marketing signals......................................................................................................................9
2.2.1. The impact of creativity on marketing signals .................................................................10
2.2.2. An active Facebook fan page signals invested resources on consumers.........................12
2.2.3. An active Facebook fan page signals quality, leadership and smartness.........................13
2.2.4. An active Facebook fan page signals an innovative brand ..............................................14
2.2.5. An active Facebook fan page signals thoughtfulness ......................................................14
2.2.6. An active Facebook fan page signals trustworthiness .....................................................15
2.3. The effect of Facebook on key advertisement indicators.......................................................15
2.3.1. Brand attitude..................................................................................................................16
2.3.2. Purchasing intentions ......................................................................................................17
2.3.3. WOM intentions ..............................................................................................................18
3. METHOD ........................................................................................................................................19
3.1. Selection of the subject ..........................................................................................................19
3.2. Approach ................................................................................................................................19
3.3. Experiment Design..................................................................................................................20
3.3.1. Manipulation of independent variables ..........................................................................20
3.3.2. Respondents ....................................................................................................................20
3.4. Preparations ...........................................................................................................................21
3.4.1. Choice of brands ..............................................................................................................21
3.4.2. Test of status updates......................................................................................................22
3.5. Implementation of the study..................................................................................................22
3.5.1. Recruitment .....................................................................................................................22
3
3.5.2. The Experiment................................................................................................................23
3.5.3. Survey distribution...........................................................................................................23
3.5.4. Survey ..............................................................................................................................23
3.6. Reliability of the experiment ..................................................................................................25
3.6.1. Validity of the experiment ...............................................................................................25
3.6.2. Internal validity ................................................................................................................25
3.6.3. External validity ...............................................................................................................27
3.7. Reliability of the survey ..........................................................................................................28
3.7.1. Validity of the survey .......................................................................................................28
3.8. Analyzing tools........................................................................................................................29
4. RESULTS AND ANALYSIS........................................................................................................29
4.1. Facebook effects on marketing signals ...................................................................................30
4.2. Invested resources...................................................................................................................30
4.2.1. Leadership, Smartness And Quality .................................................................................31
4.2.2. Innovativeness .................................................................................................................32
4.2.3. Thoughtfulness ................................................................................................................34
4.2.4. Trustworthiness....................................................................................................................34
4.3. Key Advertisement Indicators ................................................................................................35
4.3.1. Brand Attitude .................................................................................................................35
4.3.2. Purchasing Intention ............................................................................................................36
4.3.3. Word-of-mouth Intentions ...................................................................................................36
4.4. Overall analysis .......................................................................................................................37
5. CRITICISM ......................................................................................................................................39
6. CONCLUSION .................................................................................................................................40
7. REFERENCES...................................................................................................................................41
8. APPENDIX.......................................................................................................................................51
8.1. Brands .....................................................................................................................................51
GLOWE SHAMPOO ........................................................................................................................51
SPARROW AIRLINES ......................................................................................................................51
COFFEBREAK..................................................................................................................................52
JUMP MOBILE OPERATOR.............................................................................................................52
8.2. Facebook group: Invitation to participate in the study ..........................................................53
8.3. Friend list (example) ...............................................................................................................54
4
1. INTRODUCTION “Facebook: More Popular Than Porn” was one of the first hits found on Google when
looking for the phrase “marketing on Facebook”. Bill Tancer – general manager of global
research at Hitwise – found that amongst 18 to 24 year olds, social media outranks Porn in
popularity (Time, 2007).
Over 400 million people are active on Facebook today, fifty percent of them use the platform
on any given day and for a total of 500 billion minutes per month. Each user is connected to
an average of 130 friends, which means that if a company induces one person to post
something about their brand they have the potential of reaching 130 more. There are 25
billion pieces of content shared each month (i.e. links, posts and photos) and over 160 million
objects to interact with (i.e. pages, groups and events) (Facebook web-page, press
information, 2010). These statistics speak for themselves, and one can understand why
companies around the world are drooling over the endless marketing possibilities presented
by the Facebook platform.
However, the attractiveness of Facebook as a marketing platform is not only to be understood
in terms of statistics. The way businesses promote their products and market their brands is
evolving, a change in which social media is playing a central role. We are all familiar with the
old interruption marketing technique, just think of the last time a salesman called and
interrupted your lunch. Consumers are evolving and learning how to screen disruptive
communication attempts, which is why this way of marketing is being replaced by the more
modern form of permission marketing (Godin, 1999; Blackwell et al 2001; Tuk et al 2005;
Friestad & Wright 1994). The advertiser is no longer the one who decides when, how and to
whom to communicate. Today it is the consumer who decides which company and what
information to take part of (Meadows-Klue 2007).
The younger consumers are the most proactive when it comes to this new way of screening
information. It is the younger segment that is the most active on social media and also the
hardest to reach in the increasing media buzz (Day 2002). In Sweden there are 3.5 million
registered users on Facebook, 1.8 million of whom under the age of twenty-eight. Facebook is
thus an attractive marketing channel to reach the younger consumers, and particularly
interesting for start-up companies that do not have an extensive marketing budget.
5
1.1. Background Last fall Sofia Kocken and Karin Skoghagen (2009) conducted a quantitative study showing
that Twitter enhances the perception of brand associations and traditional communication
effects, thus arguing that Twitter is an effective marketing tool. Communication professionals
have praised social media as the future marketing-channel and that thesis had sparked the idea
of performing a similar study, but applied on Facebook. Finding that no accurate research had
previously been conducted exploring Facebook as a marketing medium, and well aware of the
platform being the greatest worldwide, we believed to have found the subject for our thesis.
Moreover, being passionate about entrepreneurship, we believed that a practical guide
explaining how small businesses could build their brand at practically no cost at all would be
of great value for many.
1.2. Problem area Facebook is still a fairly young communications platform and there are not that many studies
concerning its effectiveness as a means of marketing. Also, there are very few guidelines
concerning what role fan pages should play in a business’ marketing strategy and how the
brand should communicate with consumers through such a medium. The absence of scientific
studies does not however reflect a lack of interest amongst advertisers and the number of
businesses starting their own fan page is constantly increasing.
Recently, there has also been a debate concerning the effectiveness of a creative approach
versus a selling approach to marketing (Kover and Goldberg, 1995; Sasser and Koslow,
2008). This debate has been supported fuelled by extensive research and according to several
studies a creative approach is to be preferred (Colliander, Erlandsson and Modig 2010).
However, these results have yet to be tested on the Facebook platform.
1.3. Purpose The main purpose of this study is to investigate whether start-up companies shall use a
Facebook fan page in order to enhance perceptions of brand associations and improve
traditional key advertisement indicators amongst consumers. The study will also determine
whether an advertiser shall adopt a creative approach rather than a strictly selling approach on
Facebook. We address this study to start-up companies targeting young consumers in the
“student segment”.
The secondary purposes of this thesis are to investigate whether:
6
i) The intensity of the communication (i.e. frequency of status updates) affects the
outcome;
ii) The business category as perceived by the consumers (i.e. its position in the
Rossiter & Percy Grid) affects the outcome.
1.4. Expected contribution to knowledge As mentioned above, Facebook is a fairly new communications channel and has not yet been
fully explored. The contribution of this study is thus to provide start-up companies with
guidance on whether Facebook shall be used for marketing purposes, and which approach is
appropriate when targeting the younger “student” segment. The study will hopefully also
contribute with some quantitative evidence to the debate concerning the effectiveness of a
creative versus a selling approach to advertisement. Moreover the impact of communication
intensity in a social media platform (i.e. the frequency of status updates) will be examined.
The thesis will hereby fill an important knowledge gap in the research field of marketing
through social media and hopefully be a good ground for further studies in the field.
1.5. Boundaries This paper will delimit its analysis to marketing through Facebook fan pages via news feed
updates. It is worth pointing out that Facebook offers many different alternatives to marketers
and that fan pages are one of many possible ways for a brand to market itself on Facebook. In
an effort to measure the effect of Facbook fan pages on key advertisement indicators, we have
chosen to look at brand attitude, buyer intention, and word-of-mouth intention. There are also
several different approaches to fan-page marketing, and within the boundaries of this thesis
we will only compare a creative and a selling approach.
Due to the fact that the study has been conducted from a start-up perspective, unknown brands
have been used. This creates the direct implication that the results of the experiment are only
directly applicable on upcoming brands. Moreover, the brands analyzed were business-to-
consumer oriented and the results are thereby not directly applicable on business-to-business
brands.
We have chosen to limit our research to the Swedish market and the study is therefore also
limited with regards to the data sample. We have investigated the effects on individuals
between 20-28 years old, making our results most suitable for brands with a similar target
audience.
7
1.6. Definitions Facebook: A global social platform with millions of members worldwide. Facebook works as
a social networking website enabling users to communicate and share information with
friends and brands from around the globe (Facebook web-site, 2010).
Fan page: A Facebook fan page is a public profile used by brands to share information with
other facebook users.
Fan: A fan is a Facebook user that has chosen to become a member of a brand’s Facebook
Fan Page.
Follow: By becoming a fan of a fan page the member is said to start following that fan page.
This implies that the member will be able to see the status updates (see below) made by the
fan page.
Status Update: A Facebook status update is a short message that users can upload on their
profile and that will be visible to other members within their network.
Like: Members might like a status update by clicking on a like-button below the update. The
like is public (i.e. each member within the network of the user that have liked the status
update will be able to see this).
News Feed: The Facebook news feed is a long list of status updates that each member has
visible on his/her profile. On the news feed a selection of status updates uploaded by users
within the users’ personal networks is shown.
Friend list: A friend list is a personalized news feed where the consumer himself chooses
which friends’ (i.e. members within the personal network) status updates to show.
Post: To post is the action of uploading a status update.
Key advertisement indicators: Indicators that measure the effect of advertisement on
consumers’ behaviour. We have chosen to analyze buyer intention, brand attitude and word-
of-mouth intention (this will be explained further down).
Creative approach: A creative approach is defined as a status update that is conceived as
divergent and relevant (Smith and Yang, 2004).
Selling approach: A selling approach is defined as a status update that focuses on getting a
product sold.
8
2. THEORY
2.1. Facebook as a marketing platform We are every day exposed to about 1,500 brand-related messages (Lucas & Dorrian, 2006)
and have developed what Blackwell (2001) calls selective attention, or advertising skepticism
if we are to use the words of Obermiller and Spangenberg (2005). The fact is that these
“mental barriers” are a necessary reaction of consumers to the increased advertising noise
(Dahlen & Edenius 2007; Friestad & Wright 1994) and that marketers must find new ways to
break through these barriers. It is, in other words, increasingly difficult for companies to stand
out and get consumers to pay attention to their company (Granlund and Grenros, 2007). In
this new marketing landscape advertisers must surprise consumers and adopt methods around
which mental barriers have not yet been developed (Dahlén & Edenius 2007). In this setting
unconventional advertising have proven to be very effective (Bach & Persson 2003, Nilsson
& Friberg 2006) and is increasing in popularity among advertisers.
Also, there is an increasing understanding that consumers do not want to be victims of
persuasion tactics (Blackwell et al 2001, Tuk et al 2005) but instead want to control their
relation with advertisers and brands. Having been exposed to so much advertising, consumers
have learned to recognize and recall any attempt of persuasion (Friestad & Wright 1994) and
that is why the old form of interruption marketing has been replaced by something new
(Godin, 1999). Instead of interrupting consumers and trying desperately to control consumer
perceptions, marketers are today looking for ways to engage consumers and interact with
them (Meadows-Klue 2007).
Much attention in recent years has been paid to issues concerning the practice of marketing
and advertising to young people (Lindstrom 2003). It is a sophisticated but cynical generation
(Bond and Kirshenbaum 1998) yet considered to be particularly important for marketers to
reach (Zollo 1995). The current generation of teenagers are depicted as the “me” generation
(Newall and Steele 2002) searching for personal satisfaction at the expense of more altruistic
motives. This results in consumers willing to consider engagement but very much on their
own terms (Day 2002) making it very hard for brands to interact with them.
In the midst of this development a young grad student started a community for his fellow
college friends – Facebook. The platform created by Mark Zuckerberg is yet highly
unexplored by the marketing research community and many questions on its marketing
effectiveness still remain unanswered. Advertising activities on Facebook are however
9
increasing, even if its effectiveness and its effects on brand perceptions are still uncertain.
This can be explained as Facebook offers brands the means to interact with consumers in a
communication that is no longer single-tracked. The advertiser can instead engage consumers
in a dialogue, a two-way communication that has been proven to be very effective (Kocken
and Skoghagen 2009). Furthermore it is the consumer that comes to the brand when
marketing via fan pages and news feeds, thus being very receptive. With this in mind we can
assume Facebook to be one perfect modern marketing platform.
2.2. Marketing signals As stated above it is becoming increasingly difficult for marketers to get their message
through due to the large amount of commercial information that consumers are constantly
exposed to (Blackwell et al. 2006; Speck and Elliott 1998). The endless amount of choices
that consumers face daily makes it is impossible for them to evaluate all the information by
themselves (Kirimani and Rao 2000) and brands are instead used as filters, helping consumers
decrease the number of choices and thus uncertainty (Hakansson and Wahlund 2006). In this
marketing climate having a strong brand is thus becoming a more prominent factor for
survival, as a strong brand will more likely be in the top of consumer’s mind once the
purchase decision is to be made (Hoeffler and Keller, 2003). The media adopted by the
advertiser carries specific signals about the brand, something that have been proven to play a
significant role in influencing brand perceptions and thereby developing the brand (Ambler
and Hollier 2004; Dahlén et al. 2008; Kirmani 1990; Kirmani and Rao 2000; Kirmani and
Wright, 1989). In other words it is often not what is said but rather the way it is said that
matters (Boyd, 2006), a statement that Kocken and Skohagen (2009) confirmed when
showing that Twitter did enhance brand perception and several key advertisement indicators.
Also Dahlén (2005) and Dahlén (2009) showed that the exact same ad had radically different
effects on the perception of brand associations, ad credibility and brand attitude if exposed on
a creative medium rather than on more traditional ones.
Many studies have shown online advertising to be far more effective than any other media
(Calisir, 2003; Ducoffe, 1996; Leong, Huang and Stanners, 1998, Dahlen, Rasch and
Rosengren, 2003, Gallagher, Fosters and Parsons, 2001), sometimes even indicating this to be
particularly true when targeting students (Bracket and Carr, 2001; Rosner, 1996). We are
however not aware of any study that explores the signal effects of brands being active on
Facebook and have observed a particular lack of studies focusing on start-up companies. We
aim at filling this gap and more specifically to determine how a creative versus a selling
10
approach on Facebook, as well as the level of engagement in terms of update-frequency,
influence the brand’s marketing signals. We will perform the experiment on a sample for the
younger consumers using unknown brands (i.e. start-up companies).
2.2.1. The impact of creativity on marketing signals “Creative ads are more effective in promoting brand attitudes (…) purchase intentions, ad
and brand WOM intentions” (Modig and Lethagen, 2008).
One judge from a Swedish advertising award show once defined creative advertising as that
which communicates in a “playful but relevant way” (Modig & Lethagen, 2008) while Leo
Burnett talks about “the art of establishing new and meaningful relationships between
previously unrelated things in a manner that is relevant, believable and in good taste, but
which somehow presents the product in a fresh new light” (El-Murad and West 2004).
When Kover, Goldberg, and James (1995) define creativity as pushing “the message into
viewers’ minds” they are fully in line with Parnes (1975) definition of creativity. He identifies
creativity with the notion of “aha (…) the fresh and relevant association of thoughts, facts,
and ideas, into a new configuration which pleases, which has meaning beyond the sum of the
parts, which provides a synergistic effect” (White and Smith 2001).
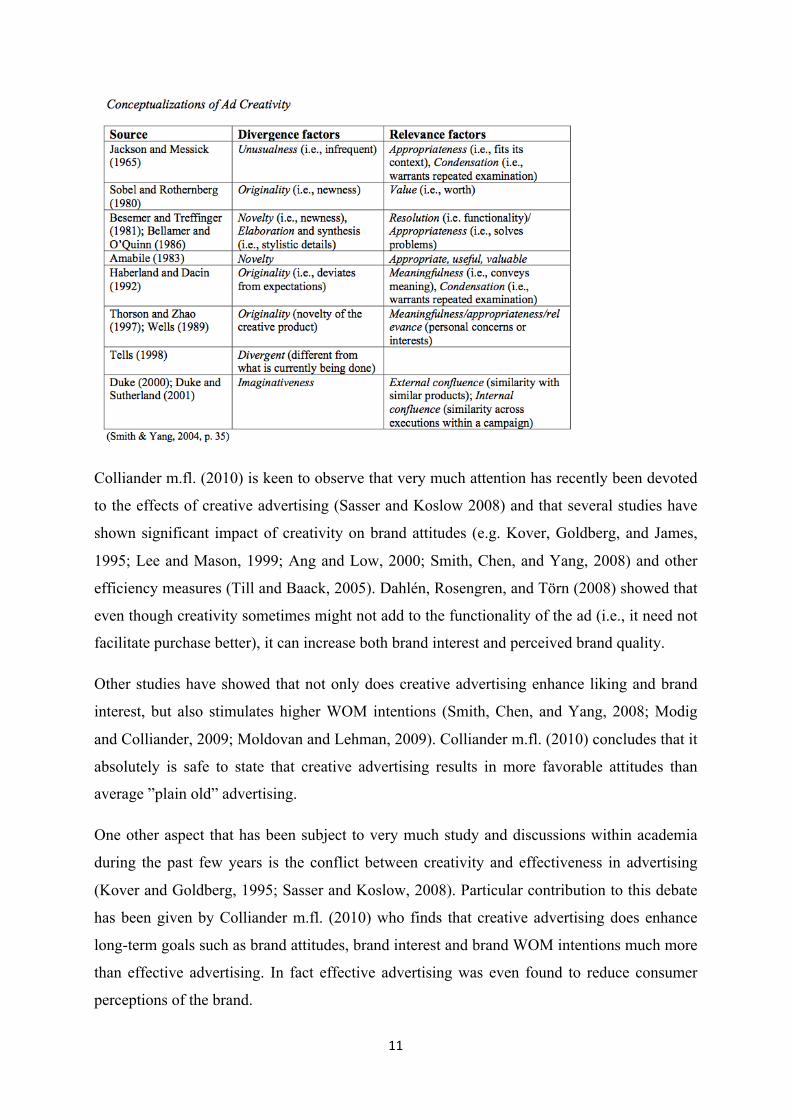
Most definitions suggest that creativity relies on the two central aspects of divergence and
relevance (Smith and Yang, 2004). Amabile (1996) argues for instance that a “product or
response will be judged creative to the extent that it is a novel and appropriate, useful, correct,
or valuable response to the task at hand”. In fact several definitions of creativity involve some
consideration about newness, divergence, unexpectedness and originality (Haberland and
Dacin 1992; Sternberg and Lubart 1993; Ang and Low 2000; El-Murad and West 2004, Smith
and Yang 2004, Tellis 1998) and many researches define divergence as the most important
aspect when judging a product’s level of creativity (Jackson and Messick 1967; White and
Smith 2001; Koslow, Sasser, and Riordan 2003). All definitions however suggest that
creativity must provide some value added (Ang and Low 2000) since the audience may
perceive ideas as simply bizarre if they are novel but carrying no apparent meaning
(Haberland and Dacin 1992; Ang and Low 2000). Weinberger and Spotts (1989) and Smith
and Yang (2004) propose even humor as a facet of creativity while Ang and Low (2001) add
the concept of positiveness, i.e. the emotional feeling of the ad content.
11
Colliander m.fl. (2010) is keen to observe that very much attention has recently been devoted
to the effects of creative advertising (Sasser and Koslow 2008) and that several studies have
shown significant impact of creativity on brand attitudes (e.g. Kover, Goldberg, and James,
1995; Lee and Mason, 1999; Ang and Low, 2000; Smith, Chen, and Yang, 2008) and other
efficiency measures (Till and Baack, 2005). Dahlén, Rosengren, and Törn (2008) showed that
even though creativity sometimes might not add to the functionality of the ad (i.e., it need not
facilitate purchase better), it can increase both brand interest and perceived brand quality.
Other studies have showed that not only does creative advertising enhance liking and brand
interest, but also stimulates higher WOM intentions (Smith, Chen, and Yang, 2008; Modig
and Colliander, 2009; Moldovan and Lehman, 2009). Colliander m.fl. (2010) concludes that it
absolutely is safe to state that creative advertising results in more favorable attitudes than
average ”plain old” advertising.
One other aspect that has been subject to very much study and discussions within academia
during the past few years is the conflict between creativity and effectiveness in advertising
(Kover and Goldberg, 1995; Sasser and Koslow, 2008). Particular contribution to this debate
has been given by Colliander m.fl. (2010) who finds that creative advertising does enhance
long-term goals such as brand attitudes, brand interest and brand WOM intentions much more
than effective advertising. In fact effective advertising was even found to reduce consumer
perceptions of the brand.
12
Despite the researches stated above, many researchers condemn the paucity of literature when
it comes to studying the impact of creativity on marketing effectiveness (Boyd, 2006;
Cunningham, Hall, & Young, 2006; El-murad & West, 2004; Plummer, 2004; Romeo,
Denham, & Neves, 2004; Sasser et al., 2007; Smith & Yang, 2004; Zinkhan, 1993) and
encourage to further research.
2.2.2. An active Facebook fan page signals invested resources on consumers Previous research has proven that investing heavily in advertisement has a positive influence
on brand perceptions. Milgrom and Roberts (1986) support the notion that when a brand
believes its product to be superior to the competition and thereby spends great sums of money
on promotion, it signals perceived superiority to consumers. This is because the risk
associated with advertising is much higher if the product marketed is weak (Kirmani 1990;
Kirmani and Wright, 1989) and the fact that much effort is put into marketing reveals great
confidence into the superiority of the product. It is not so much the claims made by the
advertiser that are important, but the willingness of spending an extravagant amount of money
on advertising (Davis and Kay, 1991). In their study Kocken and Skoghagen (2009) refer to
the handicap principle in order to explain this positive correlation between marketing
investments and brand signals. It is a theory first presented by Amber and Hollier (2004), who
argue that exactly as animals use wasteful characteristics to signal their exceptional biological
fitness, do brands use excesses in advertising to signal “brand fitness”. Just as female
peacocks are drawn to mates with the most spectacular tail feathers, to use the authors’ own
words, are consumers attracted to brands who lavishly invest in advertising because such
excesses signal a high-quality and successful brand. It is however worth to notice that if a
brand does not live up to the signal it is sending, other brands will soon take its place
(Hakansson and Wahlund 1996).
Also, there is strong evidence from social psychology that consumers can be expected to
appreciate creative ideas (Guilford, 1967) and that a creative approach easier captures
consumers’ attention – Parnes “aha” experience (1975). We can once again illustrate this
considering the handicap principle and, as an example, at a male Elk who proudly shows his
magnificent antlers when looking for a female partner. The female will choose the male that is
able to prove his dominance and leadership by creating the “aha” experience.
There is thus support for the theory that time and resources spent on advertising by a brand
are representative of its strength in the brand-jungle. We argue that Facebook is a highly
13
unconventional investment for a brand and many resources are needed in terms of time and
workforce. We therefore find it interesting to apply the above theory on Facebook-marketing.
We also argue that the effect will be more prominent with a creative approach or a more
frequent update-rate.
- H1 (a): Creative communication on the Facebook status-field signals invested
resources on consumers more than selling-oriented communication;
- H1 (b): Frequent creative communication on the Facebook status-field signals more
invested resources on consumers than less frequent creative communication;
- H1 (c): Frequent selling-oriented communication on the Facebook status-field signals
more invested resources on consumers than less frequent selling-oriented
communication
2.2.3. An active Facebook fan page signals quality, leadership and smartness Several previous studies have shown a positive correlation between perceived quality of a
product and the estimated effort of advertisement (Archibald, Haulman and Moody, 1983;
Milgrom and Roberts, 1986). This is something that can be explained through the previously
discussed handicap principle, being great advertising efforts a clear signal of “brand fitness”
and thus of product quality (Ambler and Hollier 2004). We have previously discussed that an
active fan page on Facebook will result in the consumer perceiving the brand to be investing
many resources. We can therefore argument that being active on Facebook will lead to higher
perceived quality.
There are findings indicating that unnecessarily creative advertising induces consumers to
think of the brand as smart (Dahlén, 2008). We have previously argued that Facebook can be
considered somewhat of an unconventional advertising medium. We find it therefore
legitimate to assume that a brand being active on Facebook will be perceived as a smart
brand. Also, previously cited findings have shown online advertising to be far more effective
than other media (Calisir, 2003; Ducoffe, 1996; Leong, Huang and Stanners, 1998, Dahlen,
Rasch and Rosengren, 2003, Gallagher, Fosters and Parsons, 2001). Facebook falls within the
“online media“ -category and we could thus argue that smart brands ought to use such an
effective media for marketing purposes.
- H2 (a): Creative communication on the Facebook status-field signals a leading and
smart brand of higher quality more than selling-oriented communication;
14
- H2 (b): Frequent creative communication on the Facebook status-field signals a
leading and smart brand of higher quality more than less frequent creative
communication;
- H2 (c): Frequent selling-oriented communication on the Facebook status-field signals
a leading and smart brand of higher quality more than less frequent selling-oriented
communication
2.2.4. An active Facebook fan page signals an innovative brand Facebook is a fairly new marketing platform that has yet to be exploited fully. Not many
brands have up till now used Facebook for commercial purposes and we find it intuitive to
assume that those that do will be seen as more innovative. We also believe that creative ads
will lead to higher perceived innovativeness, being creativity closely linked to innovativeness.
- H3 (a): Creative communication on the Facebook status-field signals an innovative
brand more than selling-oriented communication;
- H3 (b): Frequent creative communication on the Facebook status-field signals an
innovative brand more than less frequent creative communication;
- H3 (c): Frequent selling-oriented communication on the Facebook status-field signals
an innovative brand more than less frequent selling-oriented communication.
2.2.5. An active Facebook fan page signals thoughtfulness Such media that urges to interaction is much more effective than other media (Calisir, 2003;
Kocken and Skoghagen, 2009). By engaging in two-way communication the advertiser ads a
whole new dimension to its customer-focus, demonstrating respect and genuine interest in
what the consumer has to say. We find it reasonable to assume that brands active on Facebook
and thereby interacting with the consumer will signal thoughtfulness. Being a creative
approach far more interactive than a strictly selling approach, we also assume that creativity
in Facebook-advertising will result in greater signalled thoughtfulness.
- H4 (a): Creative communication on the Facebook status-field signals a thoughtful
brand more than selling-oriented communication;
- H4 (b): Frequent creative communication on the Facebook status-field signals a
thoughtful brand more than less frequent creative communication;
- H4 (c): Frequent selling-oriented communication on the Facebook status-field signals
a thoughtful brand more than less frequent selling-oriented communication
15
2.2.6. An active Facebook fan page signals trustworthiness Web in general is perceived to be the most reliable source to gather information, especially
according to the younger consumers (Calisir, 2003), which is why we argue that a brand that
is active on Facebook will be perceived as more trustworthy. We can also assume that a social
network such as Facebook is primarily seen as a place to interact with friends rather than as a
marketing platform. In such settings, brands that engage in a more creative and interactive
communication will very likely establish a close and friend-like relation to the consumer, and
thereby thought of as even more trustworthy. We thereby find it reasonable to think that a
creative approach on Facebook advertising will result in higher trustworthy-signals than a
more selling-oriented communication.
- H5 (a): Creative communication on the Facebook status-field signals a trustworthy
brand more than selling-oriented communication;
- H5 (b): Frequent creative communication on the Facebook status-field signals a
trustworthy brand more than less frequent creative communication;
- H5 (c): Frequent selling-oriented communication on the Facebook status-field signals
a trustworthy brand more than less frequent selling-oriented communication
2.3. The effect of Facebook on key advertisement indicators Research in the last few years has established a link between brand equity and financial
returns (Madden, Fehle, and Fournier, 2006). Advertising can thus contribute to future
revenue by enhancing brand equity (Rust, Lemon, and Zeithaml, 2004) and the purpose of this
study is to investigate whether Facebook can contribute in building brand equity. We will
thereby study the impact of Facebook on traditional key advertisement indicators.
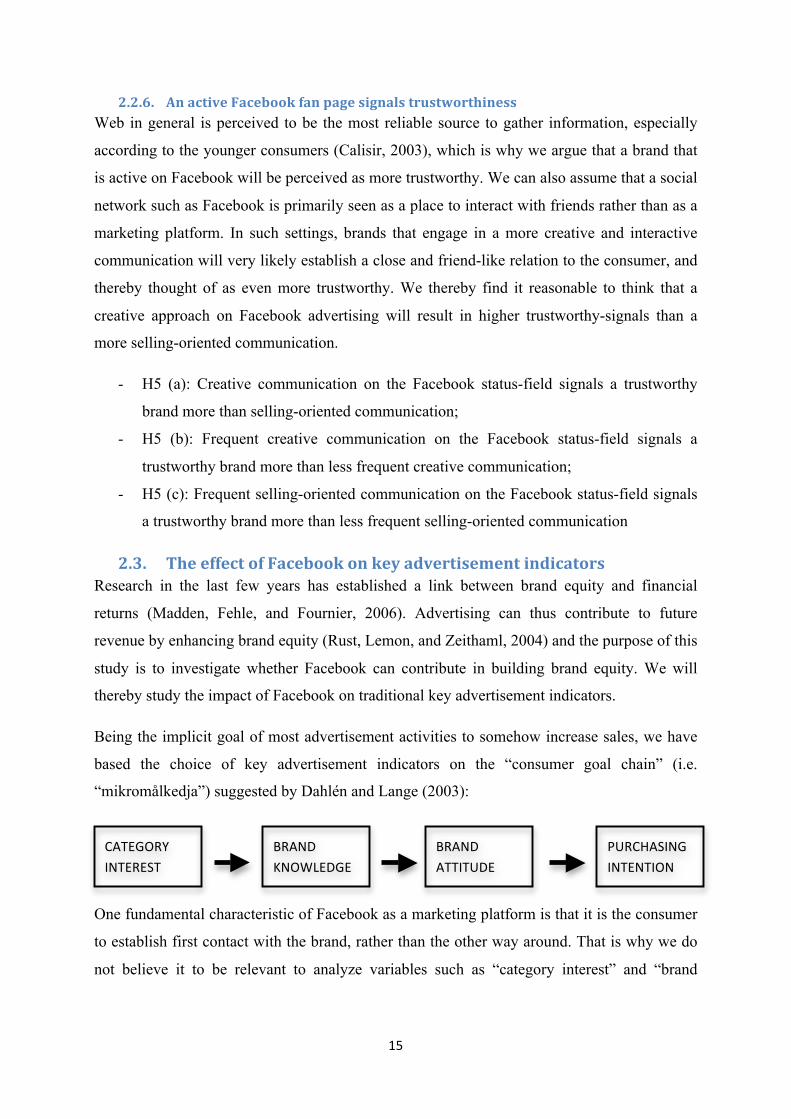
Being the implicit goal of most advertisement activities to somehow increase sales, we have
based the choice of key advertisement indicators on the “consumer goal chain” (i.e.
“mikromålkedja”) suggested by Dahlén and Lange (2003):
One fundamental characteristic of Facebook as a marketing platform is that it is the consumer
to establish first contact with the brand, rather than the other way around. That is why we do
not believe it to be relevant to analyze variables such as “category interest” and “brand
CATEGORY
INTEREST
PURCHASING
INTENTION
BRAND
KNOWLEDGE
BRAND
ATTITUDE
16
knowledge” since these can be assumed to be positive to start with. We will therefore focus
on studying the variables “brand attitude” and “purchasing intentions”.
One way of significantly increasing future revenue is by enhancing consumers’ interest in
promoting the brand (Machleit, Allen, and Madden, 1993) which is why we have also decided
to include word-of-mouth intentions (WOM) in our analysis.
2.3.1. Brand attitude Attitude has been defined as a person’s favourable or unfavourable evaluations and feelings
towards an object or idea (Kottler, 2007), brand attitude being the comprehensive approach
towards a brand Keller (1993). Holding a favorable attitude toward a good or service is one
major prerequisite for consumers to hold a favorable purchase or consumption intention
toward it (Blackwell, Miniard, and Engel 2005; Dahlén and Lange 2007). Brand attitude is
thus one of the most important aspects for a marketer to influence (Keller 1998).
Keller (1993) as well as Kocken and Skoghagen (2009) argue that positive brand associations
do lead to positive attitude towards the brand. If that is true we are prone to hypothesise that
by being active on Facebook, a brand will create positive associations thereby stimulating a
positive attitude amongst consumers.
Several studies have also tried to establish a link between advertisement creativity and brand
attitude (Kover, Goldberg, and James 1995; Lee and Mason 1999; Ang and Low 2000; Stone,
Besser, and Lewis 2000; Till and Back 2005; Ang, Lee, and Leong 2007). Kover, Goldberg,
and James (1995) found that ads classified as creative by consumers also produced the
strongest liking and purchase interest. It can be assumed to be fairly intuitive that the
unexpectedness and divergence do cause greater arousal and in the end more favorable
evaluations (Ang and Low 2000), and this is exactly what Colliander m.fl. (2010) found: more
creative ads generate considerably greater consumer ad and brand attitudes.
We find it thereby legitimate to assume that a more creative approach to Facebook will result
in greater positive associations, thus greater brand attitude, than a more traditional approach to
the medium.
We can therefore formulate the following hypothesis:
- H6 (a): Creative communication on the Facebook status-field has greater positive
effect on brand attitude than what a selling-oriented approach has.
17
- H6 (b): Frequent creative communication on the Facebook status-field has a
greater positive effect on brand attitude than what less frequent creative
communication has;
- H6 (c): Frequent selling-oriented communication on the Facebook status-field has
a greater positive effect on brand attitude than what less frequent selling-oriented
communication has.
2.3.2. Purchasing intentions Purchase is the ultimate goal of every advertiser (Dahlén and Lange, 2007) and the prevalent
theoretical model of predicting purchasing behaviour is to look at intentions (Warshaw 1980;
Söderlund 2001). Intentions have been defined as the “subjective judgments about how we
will behave in the future” (Blackwell, Miniard, and Engel 2005) and a number of studies have
demonstrated their explanatory effect on actual behavior (Juster 1964; Stapel 1968; Howard
and Sheth 1969; Granbois and Summers 1975). Even if other studies have pointed out some
limitations of the intention-behavior model (Belk 1985; Cote, McCullough, and Reilly 1985;
Notani 1998; Söderlund 2001; Till and Baack 2005; Söderlund and Öhman 2003), this is
generally regarded as the best method of predicting actual behavior (Dahlén and Lange 2003;
Jones and Sasser 1995).
If it is true that there is a positive relation between brand attitude and purchasing, as several
studies seem to evidence (Dahlén 2003; Notani 1998; Söderlund and Öhman 2003), and if
communicating through the Facebook status-field does increase brand attitude, as
hypothesized above, we can also assume that Facebook does have a positive influence on
purchasing intention.
Moreover it has been found that unexpected and relevant advertisement (i.e. creative
advertisement by definition) has the highest positive impact on purchase intentions (Ang and
Low, 2000).
We can thus formulate the following hypothesis:
- H7 (a): Creative communication on the Facebook status-field has greater positive
effect on purchasing intentions than what a selling-oriented approach has.
18
- H7 (b): Frequent creative communication on the Facebook status-field has a
greater positive effect on purchasing intentions than what less frequent creative
communication has;
- H7 (c): Frequent selling-oriented communication on the Facebook status-field has
a greater positive effect on purchasing intentions than what less frequent selling-
oriented communication has.
2.3.3. WOM intentions Word-of-mouth is about one person spreading information about a brand to its surroundings
(Dahlén och Lange 2003; Dichter 1966; Söderlund 1997). It is defined as “the informal
transmission of ideas, comments, opinions and information between two people” (Blackwell
et al. 2006). Many studies demonstrates that recommendations from peers often are crucial
when a consumer is to determine whether to make the purchase or not, and what brand to
chose (East et al. 2005; Dichter 1966; Gremler och Brown 1999; Söderlund 2001). The reason
why it is such a powerful media is because there are no commercial issues driving the
recommendations, which therefore are very trustworthy (Dichter 1966).
We believe that having a brand being active on Facebook might stimulate word-of-mouth
intentions among consumers. In a natural setting this can be justified because the consumer
has actively chosen to follow the brand and, being evidently interested in it, will be very
receptive. This however is not true in our experiment since the consumer has been given some
brands to follow and has thereby not made an active personal choice. One might however
argue that information spread through social media has a feel of being new and has almost the
nature of “inside information”. This could make the consumer feel special and involved,
thereby stimulating word-of-mouth intentions because of emotional reasons (Kocken and
Skoghagen 2009). Kocken and Skoghagen (2009) also refer to the concept of message
involvement (Dichter, 1966), meaning that being social media a new interesting medium it is
often in the spotlight, which might encourage consumers to talk about it.
Earlier studies have also shown that creative communication stimulates WOM intention much
more than less creative communication does (Modig and Lethagen 2008), something that
Colliander m.fl. (2010) explains as people naturally more inclined to talk about divergent or
humorous experiences. Moreover we can argue that if creative advertising does result in
greater ad attitude, as reasoned above, WOM intentions should be greater as well.
19
We can thereby formulate the following hypotheses:
- H8 (a): Creative communication on the Facebook status-field has greater positive
effect on WOM intentions than what a selling-oriented approach has.
- H8 (b): Frequent creative communication on the Facebook status-field has a
greater positive effect on WOM intentions than what less frequent creative
communication has;
- H8 (c): Frequent selling-oriented communication on the Facebook status-field has
a greater positive effect on WOM intentions than what less frequent selling-
oriented communication has.
3. METHOD
3.1. Selection of the subject There has been quite a buzz about social media lately, and of how it is giving the consumer
increasingly more power while rapidly changing the way marketing should be done. We
found ourselves very fascinated by this phenomenon, but were soon to realize that this
unconditioned belief in the power of social media lacked some very fundamental quantitative
research. We decided to fill this gap and found a great source of inspiration reading Kocken &
Skoghagen (2009). They had conducted quantitative research, analyzing whether Twitter was
a valid marketing platform and how it should be used. With the belief that there are many
similarities between Twitter and Facebook we decided to perform an analogous study on
Facebook.
We thereafter talked to M.Sc. Jonas Colliander and Professor Micael Dahlén – the tutors of
Kocken and Skoghagen (2009) – and had our thesis approved.
3.2. Approach We follow a deductive approach. The study is of causal character, being that the aim is to find
a correlation between the exposure of a brand on Facebook and certain effects on consumer
behaviour and perception of brand associations.
It is a quantitative study held in a real setting. By simulating a realistic environment we
believe to obtain more general results.
20
3.3. Experiment Design Respondents were given four specific brands (i.e. fan pages) to follow on Facebook during
one week and were thereafter asked to answer a survey.
We chose to follow this experiment design despite the difficulties attached with involving a
rather big test-group into a relatively time-consuming study. Our choice was greatly
influenced by the fact that Kocken & Skoghagen (2009) had used a similar design, which had
already been proved to be successful. Moreover we were hoping that by using a similar design
as Kocken & Skoghagen (2009), we would open up for an interesting comparison between
Facebook and Twitter as marketing channels.
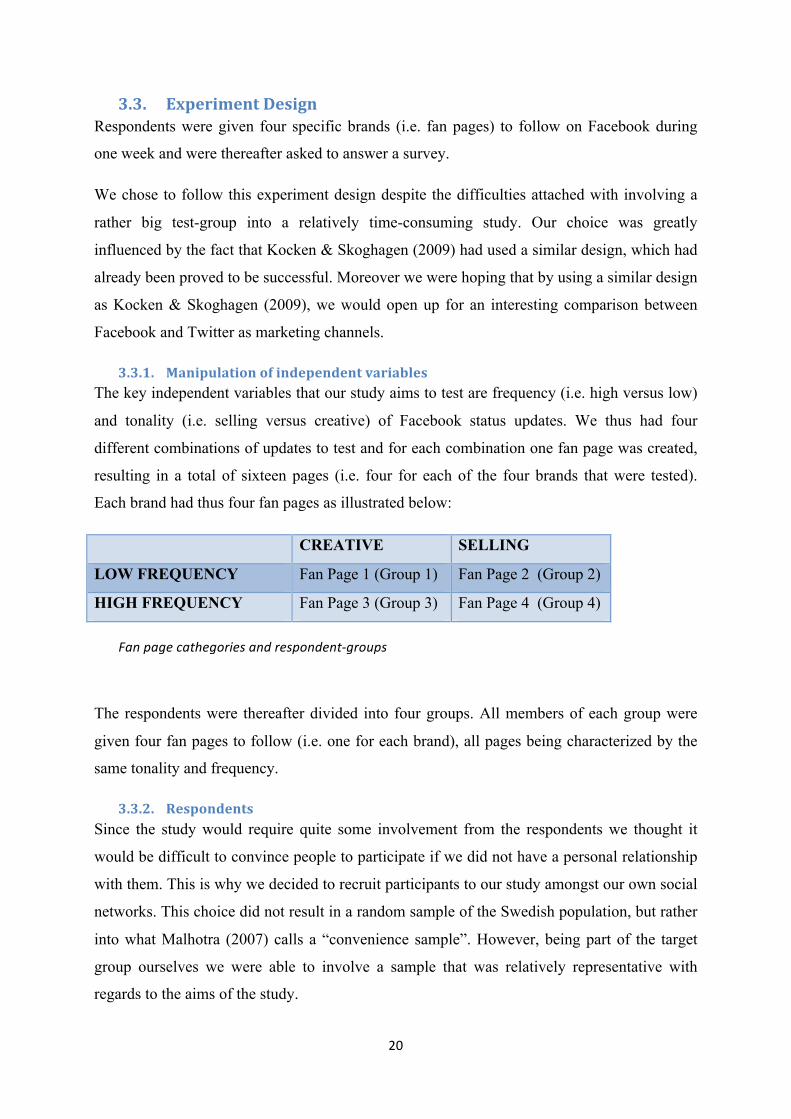
3.3.1. Manipulation of independent variables The key independent variables that our study aims to test are frequency (i.e. high versus low)
and tonality (i.e. selling versus creative) of Facebook status updates. We thus had four
different combinations of updates to test and for each combination one fan page was created,
resulting in a total of sixteen pages (i.e. four for each of the four brands that were tested).
Each brand had thus four fan pages as illustrated below:
CREATIVE SELLING
LOW FREQUENCY Fan Page 1 (Group 1) Fan Page 2 (Group 2)
HIGH FREQUENCY Fan Page 3 (Group 3) Fan Page 4 (Group 4)
The respondents were thereafter divided into four groups. All members of each group were
given four fan pages to follow (i.e. one for each brand), all pages being characterized by the
same tonality and frequency.
3.3.2. Respondents Since the study would require quite some involvement from the respondents we thought it
would be difficult to convince people to participate if we did not have a personal relationship
with them. This is why we decided to recruit participants to our study amongst our own social
networks. This choice did not result in a random sample of the Swedish population, but rather
into what Malhotra (2007) calls a “convenience sample”. However, being part of the target
group ourselves we were able to involve a sample that was relatively representative with
regards to the aims of the study.
Fan page cathegories and respondent-‐groups
21
We managed to gather a sample of 283 people interested in participating to our study. One
week before the start of the experiment we divided these members into four groups (see
above) and emailed the instructions asking to become fans with given fan pages. Even if
repeatedly reminded, quite some respondents did not do as they had been told, forcing us to
eliminate them from the study. At the beginning of the experiment we had therefore 202
respondents taking part of our test. The experiment lasted one week and we were very
accurate in making sure that all respondents followed the instructions properly. It was a
tedious process during which we were forced to eliminate some more people that did not do
what they had been told to, or did not do it on time. At the end of the experiment we had a
sample of 141 respondents divided in four groups with on average 53,25 members each. The
respondents were between 20 and 28 years of age (on average 22.5), of whom 52 percent
were women and 48 percent were men.
We also performed two side-tests involving respectively 31 and 43 respondents. These
respondents did not take part to the main experiment. (More information about the side-tests
follows below).
3.4. Preparations In order to get started with the experiment we begun by ideating four fictive brands, thus
ensuring that none of the respondents would be familiar with them, and creating all the
necessary fan pages. We also prepared all the status updates that would be posted during the
study.
3.4.1. Choice of brands1 We decided to perform our study on four different brands, thus minimizing the risk of
receiving biased results caused by brand-specific characteristics. In order to determine which
brands to include in the experiment we used the Rossiter & Percy- grid (Donovan, R. J. Percy,
L. & Rossiter, J. R., 1991), which identifies four ways a product/brand can be perceived by
the consumer. Our aim was to include four brands covering the entire grid and thereby hoping
to find more general results. Since the tools provided by Donovan & Percy & Rossiter (1991)
are not absolute but rather dependent on how the consumer perceives the product, we tested
several product categories on a sample of 31 respondents and had the following results:
• Shampoo: informational – low involvement (84 percent of the respondents);
• Coffee: transformational – low involvement (65 percent of the respondents);
1 Appendix med beskrivningen av varumärkena. Kanske en ”screenshot” av sidan.
22
• Mobile operator: informational – high involvement (97 percent of the respondents);
• Flight: transformational – high involvement (90 percent of the respondents).
We thereafter ideated four brands, one for each of the above categories. It is worth mentioning
that these respondents did not take part of the main experiment.
3.4.2. Test of status updates Before starting the experiment we prepared all the status updates that would be used during
the study. Forty-two updates were created for each brand, one half being creative and the
other half being selling. In order to make sure that the tonality (i.e. creative and selling) would
be perceived correctly we performed a test, asking a group of 43 respondents to answer the
following questions for each status update:
- Do you perceive this ad to be selling;
- Do you perceive this ad to be divergent (Smith and Yang, 2004);
We found that for each status update on average 95 percent of the respondents recognized the
right tonality, thus concluding that there was significant difference between the selling and the
creative ads. It is worth mentioning that the respondents involved in this test did not take part
to the main experiment or to the first side-test (i.e. Rossiter & Percy, see above).
3.5. Implementation of the study
3.5.1. Recruitment One great challenge was the recruitment of enough respondents. Our goal was to have a
minimum of 30 respondents per group (i.e. 120 respondents in total) in order to increase our
chances of obtaining significant results. We outperformed this goal by achieving a total of 141
respondents with an average of 35,25 respondents per group.
As already pointed out our study called for quite some involvement and time from the
respondents, which is why we had to create a strong incentive to participate. We therefore
contacted our social network via an invitation to a group on Facebook where we told about
our study and asked for their help. We urged visitors to join and promised to hold an event for
all the people who would contribute to our study. We were very active on this group, posting
videos and photos, and engaging visitors in several discussions. Our effort paid off and we
managed to create a viral spread. After a couple of days, 280 participants had shown interest
in participating.

23
3.5.2. The Experiment The respondents were divided into four groups. Each respondent was given four fan pages
(i.e. one for each brand) to follow and asked to create one friend list consisting of all fan
pages he/she had been assigned. The friend list was a necessary precaution in order to
simulate a news feed and make sure that all status updates we wanted the respondents to see
would be noticed. This was done because the traditional news feed function only posts a
selection of updates based on a rather complex logarithm that ranks the updates. The fact that
our fan pages were fictive would make our updates receive very low rankings and they would
thus not have been posted on the regular news feed.
In addition to the four “branded” fan pages, the respondents were given one more page named
“Test” to add to their friend list. Each respondent would visit her/his friend list once every day
for a week. In order for us to control that the instructions were being followed, he/she would
click on “like-button” on the “Test”-fan-page’s daily update. If someone did not follow the
instructions he/she would receive a reminder and eventually be eliminated from the study.
At the end of the study we had received 43 responses from group one, 32 responses from
group two, 30 responses from group three and 36 responses from group four.
3.5.3. Survey distribution Directly after the experiment was finished, a survey was distributed to all participants through
the Facebook-mail. The participants were given one week to answer the survey before they
were eliminated from the study. This was decided because we did not want too much time to
pass between the experiment and the survey as that could bias the study.
3.5.4. Survey The survey was created with the survey-tool provided by the Stockholm School of Economics
(www.qualtrics.com). All respondents were given the exact same survey, with questions
covering all the four brands examined. Most of the questions asked were standard-questions,
where respondents were asked to determine how well they agreed with some given assertions,
similar to those asked by Kocken and Skoghagen (2009). This was done with a “Lickerscale”
(Churchill and Peter 1984) ranging from 1 (“Do not agree”) to 7 (“Fully agree”). Moreover
some demographic questions were asked in order to confirm that the groups were
homogeneous.

24
The questions were then turned into indexes. In order to verify that the internal consistency
was high, only indexes where the Cronbachs alfa exceeded 0.7 were accepted (Söderlund,
2005). The following indexes were used in the analysis:
Resources: in order to measure how much resources the respondents felt that the brand
devoted, a index was created using a design already tested by Amber and Hollies (2004),
Dahlen et al. (2008) and Kocken & Skoghagen (2009). The following questions were used:
“The brand devotes time to their customers" and "the brand spends money on their
customers'. The Cronbach alpha was 0,896 (Glowe), 0,889 (Sparrow), 0,940 (Jump) and
0,947 (Coffebreak).
Quality, leadership and smartness: Respondents were asked to respond to the following
statements: "The brand maintains high quality on its products and services", "the brand is a
leader", "the brand is successful" and "the brand is smart". These were the same questions as
the ones used by Kocken&Skoghagen (2009) and designed with the consultancy of Professor
Micael Dahlén. The questions were made into an index with a Cronbach alpha of 0,935
(Glowe), 0,904 (Sparrow), 0,829 (Jump) and 0,869 (Coffebreak).
Innovative: in order to measure the innovativeness of the brands, respondents were asked to
consider whether the brand was perceived as: modern, new thinking (Granlund and Grenros
2007) and innovative. An index was created with a Cronbach alpha of 0,974 (Glowe), 0,953
(Sparrow), 0,952 (Jump) and 0,965 (Coffebreak).
Credibility: In order to measure the level of perceived credibility of the brands the
respondents were asked to evaluate the following statements: the brand is credible, persuasive
(McKenzie and Lutz 1989) and honest. An index was created with a Cronbach alpha of 0,949
(Glowe), 0,920 (Sparrow), 0,928 (Jump) and 0,962 (Coffebreak).
Caring: respondents were asked to answer the following questions: "The brand cares about
its customers" and "The brand is available to their customers", the same questions that were
also used by Kocken&Skoghagen (2009). An index was created with a Cronbach alpha of
0,943 (Glowe), 0,928 (Sparrow), 0,838 (Jump) and 0,922 (Coffebreak).
Brand Attitude: In order to measure the attitude towards the brands the respondents were
asked to consider the following statements: the brand is good, loving and positive (Brown and
Stayman 1992; MacKenzie, Lutz and Belcher 1986; Söderlund 2001). These were then used
25
to create an index with a Cronbach alpha of 0,967 (Glowe), 0,964 (Sparrow), 0,962 (Jump)
and 0,957 (Coffebreak).
Buying intention: In order to measure the respondents’ purchasing intention, the following
questions were asked: "I would like to purchase the products / services from the brand" and
"It is likely that I will be buying products / services from the brand". These questions had
already been used by Kocken & Skoghagen (2009) and were designed with the help of
(Söderlund and Öhman 2003). They successfully integrate intentions as wants and intentions
as expectations, thus increasing reliability. They were then transformed into an index with a
Cronbach alpha of 0,932 (Glowe), 0,969 (Sparrow), 0,962 (Jump) and 0,927 (Coffebreak).
WOM-intention: In order to measure the WOM-intention respondents were asked the
following questions: "I would like to recommend a product/ service from the brand"
(Intentions-as-want) and "It's likely that I would recommend a product/ service from the
brand" (Intentions-as-expectations). This was done after the design used by Kocken &
Skoghagen (2009) and recommended by Reicheld (2003). The questions showed a high
internal consistency and indexes were created, with a Cronbach alpha of 0,953 (Glowe), 0,929
(Sparrow), 0,963 (Jump) and 0,940 (Coffebreak).
3.6. Reliability of the experiment In order for the experiment to have a high degree of reliability its measurements must be
consistent. That consistency represents measures that are free from error (Peter 1979). The
experiment’s reliability is also dependent on its internal and external validity (Malhotra
2007):
3.6.1. Validity of the experiment With validity we refer to the observed score’s ability to reflect the true score of the feature it
is trying to measure, and nothing else (Churchill, 1979). One could also say that validity is the
degree to which the experiment measures what it is supposed to measure. If the validity of the
experiment is high then the independent variable will have a real impact on the dependent
variable.
3.6.2. Internal validity In order for the internal validity to be high and for the independent variable (Facebook
exposure via fan pages and news feeds) to have an effect on the dependent variables (brand
perception and key advertisement indicators), influences from external variables must be
26
minimized. Several precautions have been taken to ensure that the effect of external
influencers is minimized:
All respondents participated in the experiment during the same time period. This means that
any exposure to an external variable, that might have had an influence, would hopefully have
affected all respondents. By using students we can assume that the respondents are more
experienced in filling out questionnaires which could decrease the possibility of measurement
error (Churchill & Peter, 1984).
Being the brands that the respondents were exposed to purely fictive, the risk of having the
study infected by external variables was minimized. Such external variables include other
commercial, promotional or brand-building activities that a regular brand may have been
active in during the experiment period. Moreover, since the respondents had no preconceived
opinions of the brands all people in the experiment had the same stance towards the brands at
the beginning of the study. All results can therefore be attributed to the experiment.
On the fan pages there was a short description about the brand. All respondents were given
the exact same information and we were careful not to reveal our underlying purpose so as not
to bias the results.
We designed our scale so as there was a neutral alternative since a forced choice scale may
increase measurement error. This can happen when a respondent does not have a prominent
bias in a issue and is thus, with a forced scale, required to choose a side that is not coherent
with their true score. The fact that we used 7 items in our scale should also have increased the
reliability as more choices lead to more accurate results. We also chose to ask as simple
questions as we possibly could so as to increase transparency and reliability. (Churchill and
Peter 1984)
The respondents had to access their friend list once every day, during the experiment period,
and press the like-button so that we could control their participation. We accepted a margin of
error up to two days, before eliminating the respondent from the experiment. This ensured
that all respondents were exposed to the same updates in an equal amount of time.
Some aspects, however, impede for a complete internal validity. For instance we have not had
the possibility to monitor at what time during the day each respondent was on Facebook,
which might have implied that some did log in before one status update was made and did not
27
see it until the day after. We do not however believe that this has have had a negative effect
on the results of the study. If an update was not seen one day it would be seen the day after.
Also we did not have the possibility to control that all respondents actually logged into the
friend list, since our only way to control that they had been active was by having them
“liking” the status update of the “Test”-page. This control system had a basic flaw, being fully
possible for the respondents to simply visit the “Test”-page and “like” its update without
instead doing it by logging into the friend list. We are well aware of this problem and had first
designed an experiment meant to solve this by having all respondents “like” the updates of all
“branded” pages. This experiment design, however, revealed to have a much greater flaw:
once an update received a number of “likes” it soon began to rise in “ranking” and
respondents from other groups would have seen them on their news feed. This because most
of our respondents were part of the same network (i.e. were “friends”) having been selected
from the same environment. However, having been very clear with the instructions and since
“liking” in the wrong way required the exact same effort as doing it the way we asked for, we
believe that the majority of all respondents did visit the friend list when “liking” the “Test”-
page. How to eliminate this effect will be discussed in the future research suggestions.
We believe that the precautions we have taken outpace the flaws that have been defined and
guarantee a high level of internal validity.
3.6.3. External validity In order to ensure the external validity of the experiment some precautions have been taken.
We have for instance exposed the respondents to four brands that were perceived to have very
different characteristics. This way we believe to have increased the level of generalization of
the study and cautioned ourselves against brand specific characteristics. The fact that the
experiment was set in a natural environment (i.e. the respondents actually visited Facebook
once every day during one week time) contributes to ensure a high level of external validity.
Some flaws that might inhibit full external validity are that the experiment was not set on the
regular Facebook status feed, but that respondents instead were asked to create a friend list
where all the brands analyzed would be shown. This list was meant to emulate the regular
feed and was a necessary arrangement since the regular status feed only would show a
selection of feeds based on Facebook’s ranking system. The friend list was therefore
necessary in order to ensure that the respondents actually would see the status updates they
28
were supposed to. Never the less this might have increased the possibility of measurement
error.
One might also argue that since the respondents did not decide to follow the brands
themselves, a full degree of external validity was inhibited. This thought does hold for
established brands, since people that have decided to follow the brands themselves might have
a better attitude a be more receptive towards their messages compared to people that have not
chosen to follow the brands. This however only strengthens any positive results that are
retrieved from the study seeing as the respondents are less receptive and, in that case, still
show a positive result.
Another possible critic is that the activity asked from the respondents is quite demanding
which might imply that the chosen respondent-population is not entirely homogeneous. We
however believe that the positive aspects stated are far more relevant than the negative ones,
and that the external validity is high overall.
3.7. Reliability of the survey In order for the survey to have a high degree of reliability it shall, as mentioned above, give
the same results if it is to be answered on several occasions (Peter 1979). We controlled the
reliability of the survey by asking several separate questions that measured the same concept,
and then computed the correlation between the answers of these questions. We then followed
the recommendation of Söderlund (2005) and only accepted indexes with a Cronbachs Alfa
over 0,7.
3.7.1. Validity of the survey In order to secure high validity we adopted questions that had already been proven to be
effective. Also we assured to have a minimum of 30 respondents for every group, thus
increasing the chances of getting significant results (Churchill and Peter 1984).
Since questions regarding four brands were asked in the same survey one problem that
became evident was its length: studies show that the longer a survey is, the more the
respondents tend to get distracted (Söderlund, 2005). Also, the fact that we did not have the
possibility to monitor exactly when and where the respondents filled in the survey, might
inhibit its full validity since respondents could have been influenced by external factors while
answering.
29
However we believe that we have received reliable answers overall and that the survey shall
be considered as valid.
3.8. Analyzing tools To analyze the data collected from the surveys we used the statistical analysis program,
PASW Statistics 18 (formerly SPSS statistics). We used independent t-tests, reliability
analysis and tested the correlation between the variables. The descriptive function was also
used to retrieve tables where we could see overall mean effects. We have accepted a statistical
significance level of 10 percent when it comes to differences in brand perceptions and key
indicators between the groups.
4. RESULTS AND ANALYSIS
We will start by presenting some thoughts we believe to be important in order to fully
understand the following analysis.
The results have shown that the respondents did not perceive a significant difference between
the creative and selling approach, when the respondents were exposed to low-frequency news
feeds (this will be discussed further down).
The two groups that were exposed to a higher frequency of news feeds gave the selling
approach better average scores on the innovativeness index. The fact that innovativeness is
the index that closest represents a brands level of creativity, brings up the question on whether
the respondents have perceived the creative news feeds as creative. We have chosen to believe
that this is the case given the results from our initial tests of the news feeds (see paragraph
2.4.2.).
The different brands have also shown different tendencies and the results are not coherent for
all the four brand types. This brings us to the conclusion that the results cannot be
generalized. It also forces us to discard from drawing conclusions from the individual index
differences. Instead we will look at the all the significant differences and see whether there is
an overall tendency between the different groups, with regards to the effects of the different
approaches and frequencies. We will therefore first present the results at a detailed level and
then finish off with an analysis of the results taken as a whole.
30
4.1. Facebook effects on marketing signals
Even though we did not find a significant difference between the sales-oriented and the
creative approach, the results show a positive effect on all indexes after only one week of
having an active fan page. It is also worth reminding the reader that these are unknown and
newly started brands which means that the effect should be put in relationship to this fact. Due
to the fact that these are start-ups, we chose not to have a control group. Had such a group
existed we argue that the mean average would have been 1 on our scale of 1-7 (1 is the lowest
score) due to the fact that the control group never would have heard about the brands. When
we analyze the effect that Facebook has had on the different key indicators and indexes we
will compare the mean average after a week’s exposure to a mean average of 1. By looking at
the mean values in the appendix for the different indexes we can conclude that even though it
is only an increase of generally between 1-2 rating points, the mean average has been
positively affected by the Facebook fan page.
In the following paragraphs we will present the results of the different indexes and what
effects they have had. We have used independent samples t-tests to compare the means
between the four different groups. The results from the comparison between the groups that
were exposed to the sales-oriented and creative approach with a high-frequency will be
presented first. The results from when the same approach was compared but with different
frequencies will be presented after.
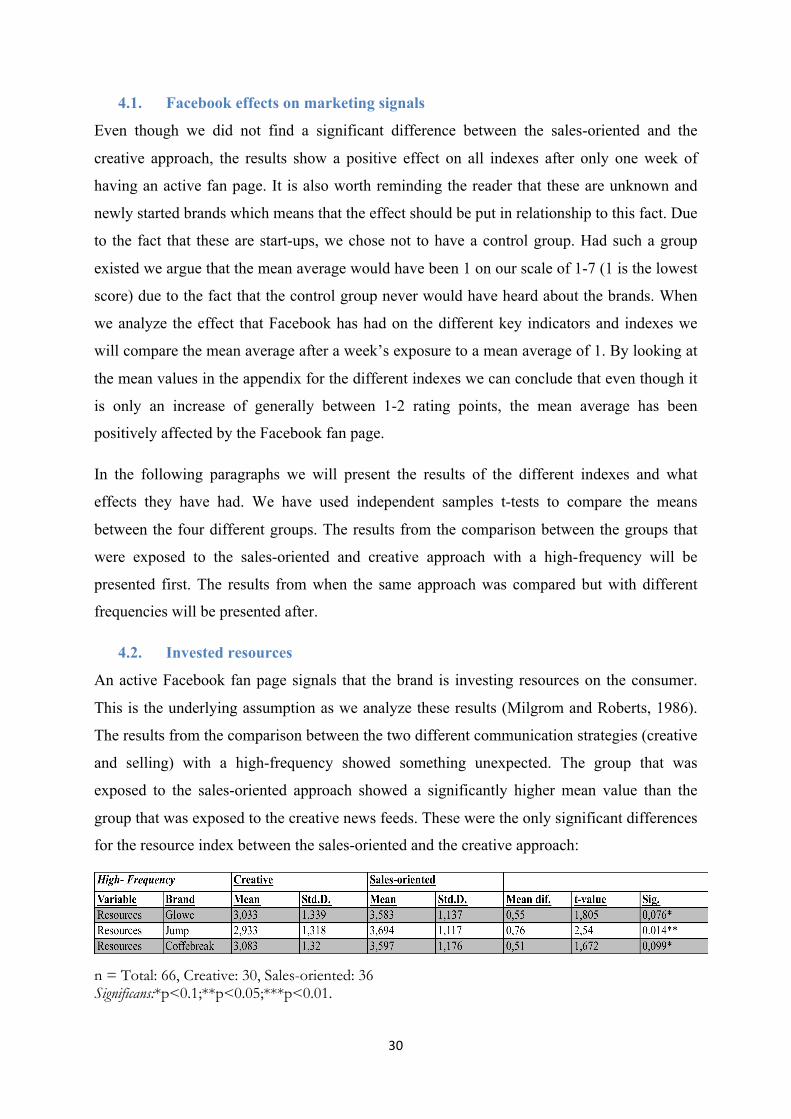
4.2. Invested resources
An active Facebook fan page signals that the brand is investing resources on the consumer.
This is the underlying assumption as we analyze these results (Milgrom and Roberts, 1986).
The results from the comparison between the two different communication strategies (creative
and selling) with a high-frequency showed something unexpected. The group that was
exposed to the sales-oriented approach showed a significantly higher mean value than the
group that was exposed to the creative news feeds. These were the only significant differences
for the resource index between the sales-oriented and the creative approach:
n = Total: 66, Creative: 30, Sales-oriented: 36 Significans:*p<0.1;**p<0.05;***p<0.01.

31
There was no significant difference between high- and low- frequency, neither for the sales-
oriented nor for the creative approach. The reasons for this will be discussed further down.
The results show that a creative approach does not affect the perceived resource investment
more than a sales-oriented approach. To the contrary the possibility of it being the selling
approach that is the most effective will be discussed later. This forces us to reject hypothesis
H1 (c). We are also forced to reject hypothesis H1 (d) and H1 (e).
- H1 (a): Creative communication on the Facebook status-field signals invested
resources on consumers more than selling-oriented communication; REJECTED
- H1 (b): Frequent creative communication on the Facebook status-field signals more
invested resources on consumers than less frequent creative communication;
REJECTED
- H1 (c): Frequent selling-oriented communication on the Facebook status-field signals
more invested resources on consumers than less frequent selling-oriented
communication REJECTED
4.2.1. Leadership, Smartness And Quality The underlying assumption in this paragraph is that an active Facebook fan page signals a
leading and smart brand with high-quality products (Archibald, Haulman and Moody, 1983;
Milgrom and Roberts, 1986). The results only showed one significant difference when a
comparison was done between the two groups that were exposed to different communication
approaches. This difference was only evident for the high-frequency exposure. The results
showed that respondents that were exposed to the sales-oriented communication strategy gave
Glowe Shampoo a higher score than the group that was exposed to creative feeds. This means
that the group that was exposed to the sales-oriented feeds perceived the brand to be more
leading, smart and have a higher quality.
n = Total: 66, Creative: 30, Sales-oriented: 36 Significans:*p<0.1;**p<0.05;***p<0.01.
A test of what effect different levels of frequency had on the creative approach with regards to
the quality, leadership and smartness (Q,L,S) index showed no significant difference. The
results did however show a significant difference between low- and high- frequency selling
approach. The group that was exposed to a higher frequency gave Sparrow Airlines a higher
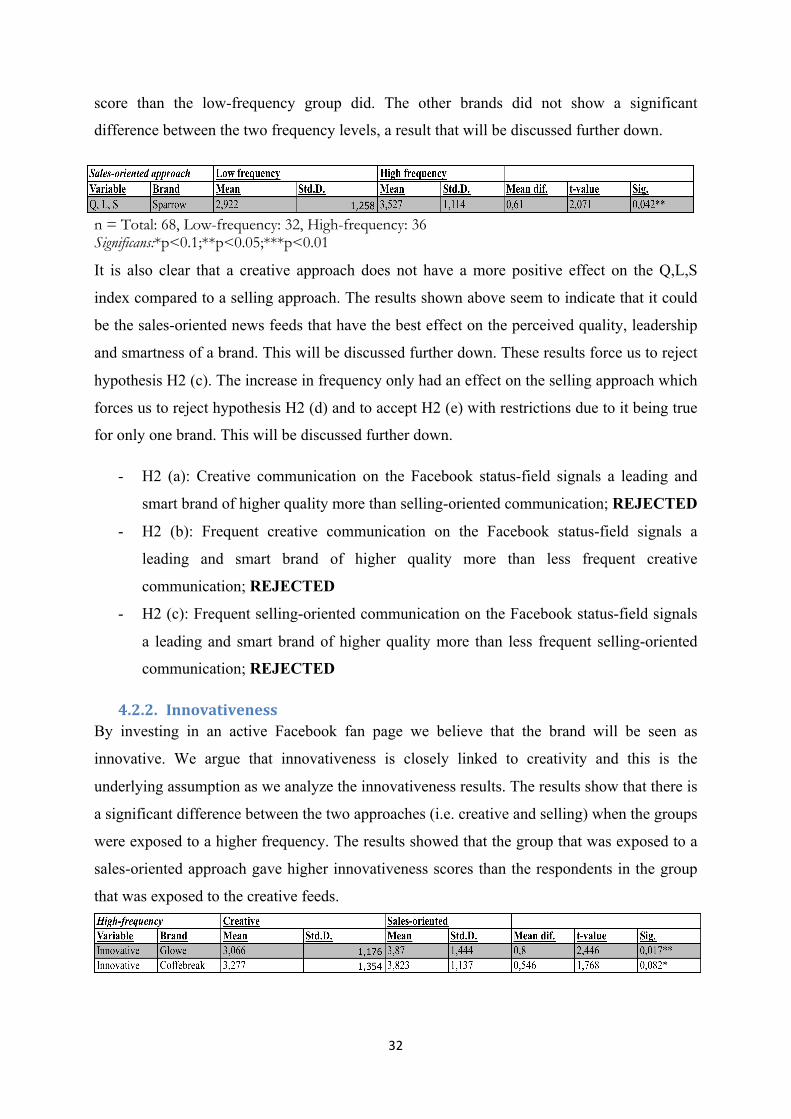
32
score than the low-frequency group did. The other brands did not show a significant
difference between the two frequency levels, a result that will be discussed further down.
n = Total: 68, Low-frequency: 32, High-frequency: 36 Significans:*p<0.1;**p<0.05;***p<0.01
It is also clear that a creative approach does not have a more positive effect on the Q,L,S
index compared to a selling approach. The results shown above seem to indicate that it could
be the sales-oriented news feeds that have the best effect on the perceived quality, leadership
and smartness of a brand. This will be discussed further down. These results force us to reject
hypothesis H2 (c). The increase in frequency only had an effect on the selling approach which
forces us to reject hypothesis H2 (d) and to accept H2 (e) with restrictions due to it being true
for only one brand. This will be discussed further down.
- H2 (a): Creative communication on the Facebook status-field signals a leading and
smart brand of higher quality more than selling-oriented communication; REJECTED
- H2 (b): Frequent creative communication on the Facebook status-field signals a
leading and smart brand of higher quality more than less frequent creative
communication; REJECTED
- H2 (c): Frequent selling-oriented communication on the Facebook status-field signals
a leading and smart brand of higher quality more than less frequent selling-oriented
communication; REJECTED
4.2.2. Innovativeness By investing in an active Facebook fan page we believe that the brand will be seen as
innovative. We argue that innovativeness is closely linked to creativity and this is the
underlying assumption as we analyze the innovativeness results. The results show that there is
a significant difference between the two approaches (i.e. creative and selling) when the groups
were exposed to a higher frequency. The results showed that the group that was exposed to a
sales-oriented approach gave higher innovativeness scores than the respondents in the group
that was exposed to the creative feeds.
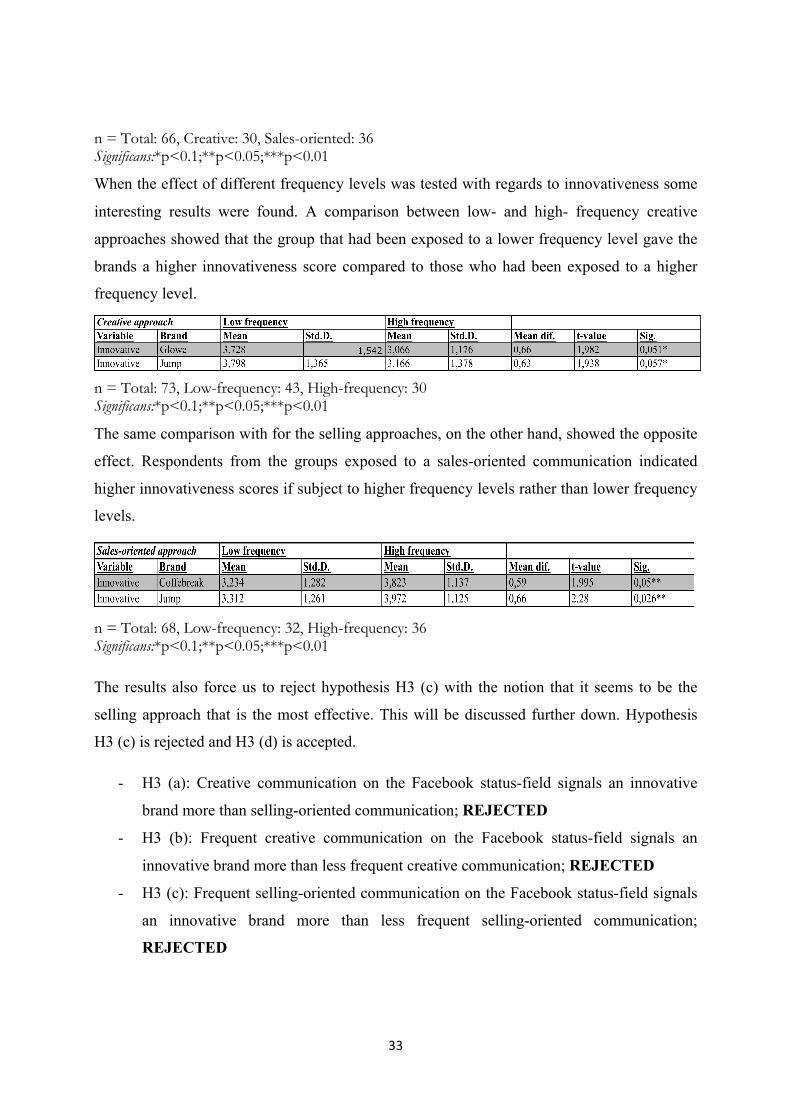
33
n = Total: 66, Creative: 30, Sales-oriented: 36 Significans:*p<0.1;**p<0.05;***p<0.01
When the effect of different frequency levels was tested with regards to innovativeness some
interesting results were found. A comparison between low- and high- frequency creative
approaches showed that the group that had been exposed to a lower frequency level gave the
brands a higher innovativeness score compared to those who had been exposed to a higher
frequency level.
n = Total: 73, Low-frequency: 43, High-frequency: 30 Significans:*p<0.1;**p<0.05;***p<0.01
The same comparison with for the selling approaches, on the other hand, showed the opposite
effect. Respondents from the groups exposed to a sales-oriented communication indicated
higher innovativeness scores if subject to higher frequency levels rather than lower frequency
levels.
n = Total: 68, Low-frequency: 32, High-frequency: 36 Significans:*p<0.1;**p<0.05;***p<0.01
The results also force us to reject hypothesis H3 (c) with the notion that it seems to be the
selling approach that is the most effective. This will be discussed further down. Hypothesis
H3 (c) is rejected and H3 (d) is accepted.
- H3 (a): Creative communication on the Facebook status-field signals an innovative
brand more than selling-oriented communication; REJECTED
- H3 (b): Frequent creative communication on the Facebook status-field signals an
innovative brand more than less frequent creative communication; REJECTED
- H3 (c): Frequent selling-oriented communication on the Facebook status-field signals
an innovative brand more than less frequent selling-oriented communication;
REJECTED
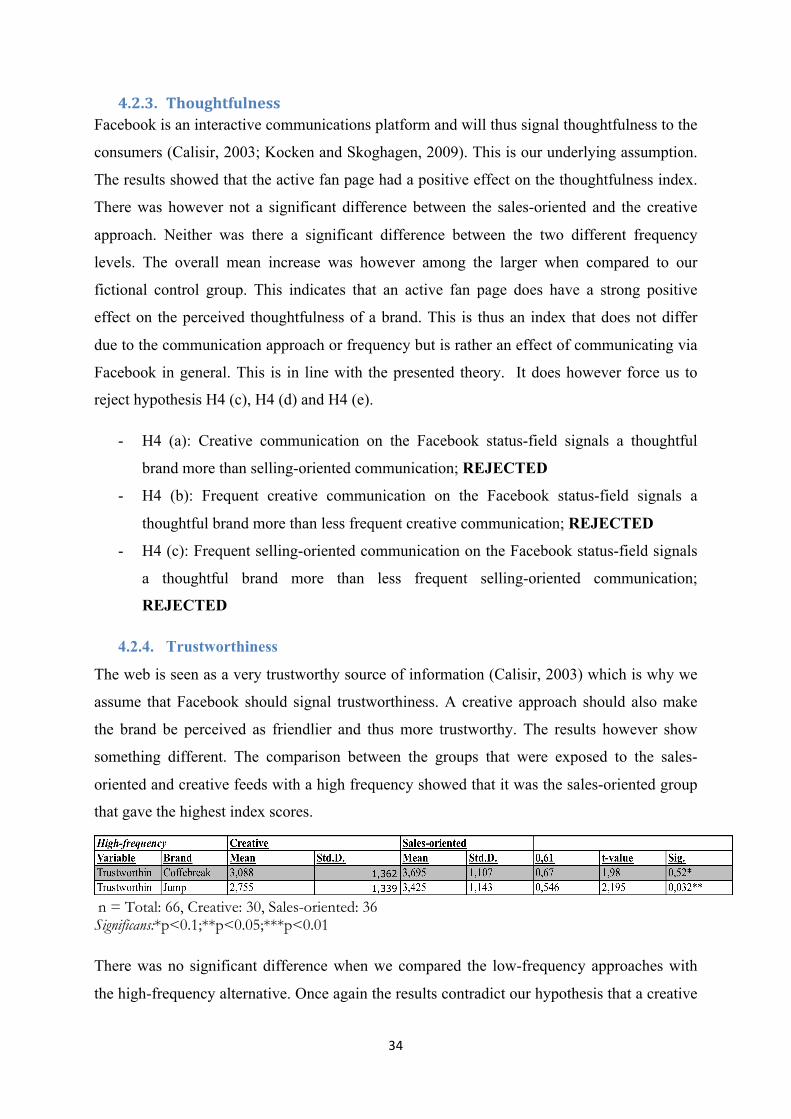
34
4.2.3. Thoughtfulness Facebook is an interactive communications platform and will thus signal thoughtfulness to the
consumers (Calisir, 2003; Kocken and Skoghagen, 2009). This is our underlying assumption.
The results showed that the active fan page had a positive effect on the thoughtfulness index.
There was however not a significant difference between the sales-oriented and the creative
approach. Neither was there a significant difference between the two different frequency
levels. The overall mean increase was however among the larger when compared to our
fictional control group. This indicates that an active fan page does have a strong positive
effect on the perceived thoughtfulness of a brand. This is thus an index that does not differ
due to the communication approach or frequency but is rather an effect of communicating via
Facebook in general. This is in line with the presented theory. It does however force us to
reject hypothesis H4 (c), H4 (d) and H4 (e).
- H4 (a): Creative communication on the Facebook status-field signals a thoughtful
brand more than selling-oriented communication; REJECTED
- H4 (b): Frequent creative communication on the Facebook status-field signals a
thoughtful brand more than less frequent creative communication; REJECTED
- H4 (c): Frequent selling-oriented communication on the Facebook status-field signals
a thoughtful brand more than less frequent selling-oriented communication;
REJECTED
4.2.4. Trustworthiness
The web is seen as a very trustworthy source of information (Calisir, 2003) which is why we
assume that Facebook should signal trustworthiness. A creative approach should also make
the brand be perceived as friendlier and thus more trustworthy. The results however show
something different. The comparison between the groups that were exposed to the sales-
oriented and creative feeds with a high frequency showed that it was the sales-oriented group
that gave the highest index scores.
n = Total: 66, Creative: 30, Sales-oriented: 36 Significans:*p<0.1;**p<0.05;***p<0.01
There was no significant difference when we compared the low-frequency approaches with
the high-frequency alternative. Once again the results contradict our hypothesis that a creative
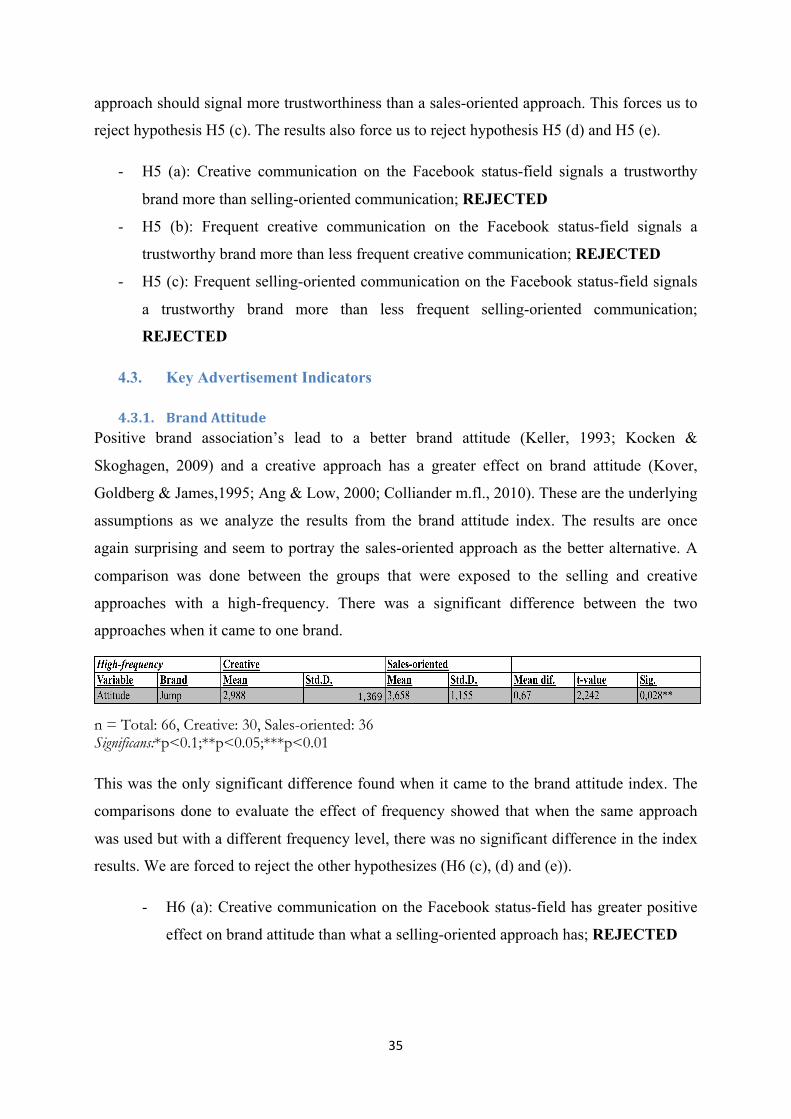
35
approach should signal more trustworthiness than a sales-oriented approach. This forces us to
reject hypothesis H5 (c). The results also force us to reject hypothesis H5 (d) and H5 (e).
- H5 (a): Creative communication on the Facebook status-field signals a trustworthy
brand more than selling-oriented communication; REJECTED
- H5 (b): Frequent creative communication on the Facebook status-field signals a
trustworthy brand more than less frequent creative communication; REJECTED
- H5 (c): Frequent selling-oriented communication on the Facebook status-field signals
a trustworthy brand more than less frequent selling-oriented communication;
REJECTED
4.3. Key Advertisement Indicators
4.3.1. Brand Attitude Positive brand association’s lead to a better brand attitude (Keller, 1993; Kocken &
Skoghagen, 2009) and a creative approach has a greater effect on brand attitude (Kover,
Goldberg & James,1995; Ang & Low, 2000; Colliander m.fl., 2010). These are the underlying
assumptions as we analyze the results from the brand attitude index. The results are once
again surprising and seem to portray the sales-oriented approach as the better alternative. A
comparison was done between the groups that were exposed to the selling and creative
approaches with a high-frequency. There was a significant difference between the two
approaches when it came to one brand.
n = Total: 66, Creative: 30, Sales-oriented: 36 Significans:*p<0.1;**p<0.05;***p<0.01
This was the only significant difference found when it came to the brand attitude index. The
comparisons done to evaluate the effect of frequency showed that when the same approach
was used but with a different frequency level, there was no significant difference in the index
results. We are forced to reject the other hypothesizes (H6 (c), (d) and (e)).
- H6 (a): Creative communication on the Facebook status-field has greater positive
effect on brand attitude than what a selling-oriented approach has; REJECTED
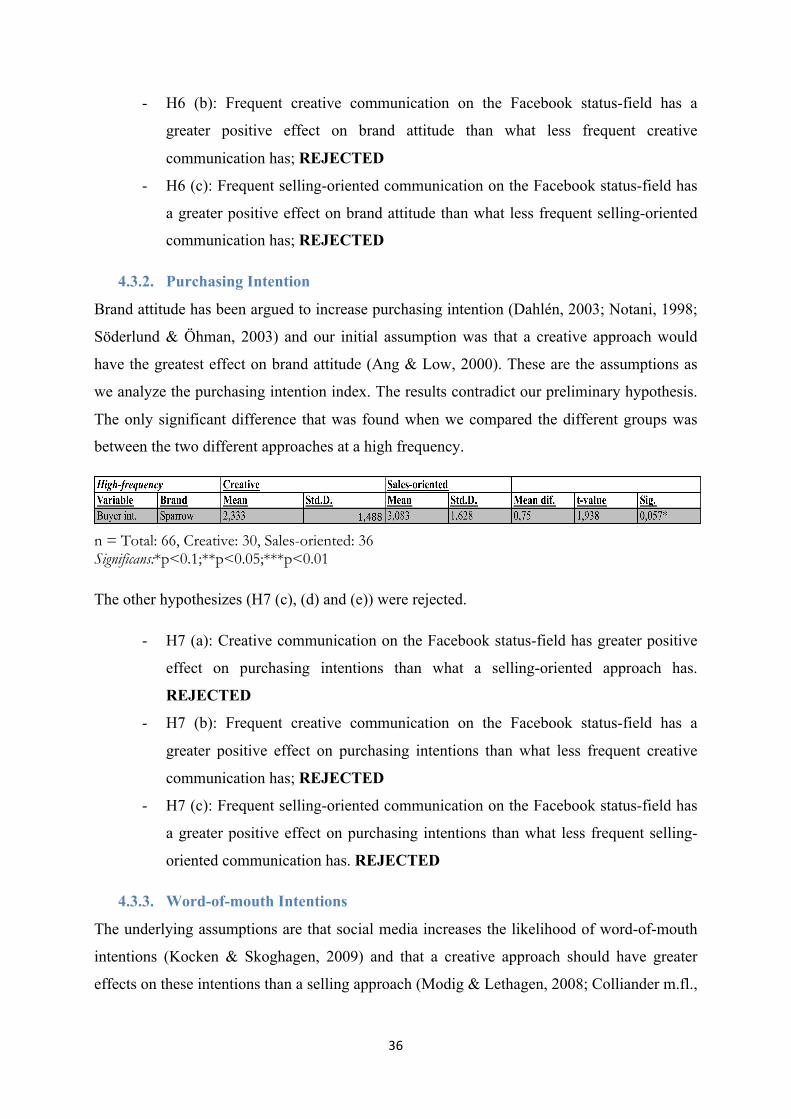
36
- H6 (b): Frequent creative communication on the Facebook status-field has a
greater positive effect on brand attitude than what less frequent creative
communication has; REJECTED
- H6 (c): Frequent selling-oriented communication on the Facebook status-field has
a greater positive effect on brand attitude than what less frequent selling-oriented
communication has; REJECTED
4.3.2. Purchasing Intention
Brand attitude has been argued to increase purchasing intention (Dahlén, 2003; Notani, 1998;
Söderlund & Öhman, 2003) and our initial assumption was that a creative approach would
have the greatest effect on brand attitude (Ang & Low, 2000). These are the assumptions as
we analyze the purchasing intention index. The results contradict our preliminary hypothesis.
The only significant difference that was found when we compared the different groups was
between the two different approaches at a high frequency.
n = Total: 66, Creative: 30, Sales-oriented: 36 Significans:*p<0.1;**p<0.05;***p<0.01
The other hypothesizes (H7 (c), (d) and (e)) were rejected.
- H7 (a): Creative communication on the Facebook status-field has greater positive
effect on purchasing intentions than what a selling-oriented approach has.
REJECTED
- H7 (b): Frequent creative communication on the Facebook status-field has a
greater positive effect on purchasing intentions than what less frequent creative
communication has; REJECTED
- H7 (c): Frequent selling-oriented communication on the Facebook status-field has
a greater positive effect on purchasing intentions than what less frequent selling-
oriented communication has. REJECTED
4.3.3. Word-of-mouth Intentions
The underlying assumptions are that social media increases the likelihood of word-of-mouth
intentions (Kocken & Skoghagen, 2009) and that a creative approach should have greater
effects on these intentions than a selling approach (Modig & Lethagen, 2008; Colliander m.fl.,

37
2010). The results showed that there was one significant difference between the high-
frequency sales-oriented and the creative approach.
n = Total: 66, Creative: 30, Sales-oriented: 36 Significans:*p<0.1;**p<0.05;***p<0.01
This contradicts our first thoughts once again and proves that a selling approach has a better
affect on word-of-mouth intentions than a creative approach. The results also force us to reject
H8 (c), H8 (d) and H8 (e).
- H8 (a): Creative communication on the Facebook status-field has greater positive
effect on WOM intentions than what a selling-oriented approach has; REJECTED
- H8 (b): Frequent creative communication on the Facebook status-field has a
greater positive effect on WOM intentions than what less frequent creative
communication has; REJECTED
- H8 (c): Frequent selling-oriented communication on the Facebook status-field has
a greater positive effect on WOM intentions than what less frequent selling-
oriented communication has. REJECTED
4.4. Overall analysis First we will analyze the observation that there are no significant differences in brand
perceptions or key advertisement indicators when comparing between groups that have been
exposed to less frequent updates, and a selling- or creative- approach. This can most likely be
explained due to the following circumstances; the study was conducted with unknown brands
and thus making the respondents need more time or, as the study showed, a higher frequency
(more information) in order to perceive a significant difference under such a short period of
time. Had the experiment-period been longer than one week, we might have had significant
results for the groups exposed to less frequent updates.
When we increased the update frequency we were able to distinguish significant results
between the creative and selling approach. To our surprise we found that there was a clear
bias indicating that the selling approach was the most effective. All significant differences
between the two different communication approaches, at a high frequency, indicated that the
selling approach had higher mean values. We believe that this result could have been affected
by our target audience. The student segment is a target group that is known for being
38
particularly price-sensitive and thus more receptive for a price-centred selling approach. We
also argue that earlier research comparing selling- and creative- marketing (Colliander m.fl.,
2010) did not look specifically at advertising on social media. The bias towards a selling
approach clearly diverges from previous studies. It could possibly be explained by the theory
that “the medium is the message”. Social media is already associated with playfulness and
creativity. By applying the theory that the medium is the message, we argue that, in such
context, a creative approach may be thought of as too fuzzy and unclear, distancing the
consumer from its actual core purpose, being a company. We argue that this will lead the
consumer into not perceiving the news feed sender not as a company but more as another
Facebook friend. This will affect the way a consumer remembers the creative ads while
answering the survey. Because the survey questions always had a brand name in the
formulation, the consumer will more likely remember the ads that came from the approach
that clearly showed that it was a brand sending the information. A selling approach increases
top-of-mind awareness. We argue that this is why a selling approach, being more serious and
“business-like”, is to be preferred when marketing on Facebook.
One other interesting observation that can be made when looking closer at the results is the
effect on the innovativeness index. Among the respondents exposed to creative
communication, innovativeness scored significantly higher amongst the group that was
exposed to the less frequent updates. The test groups that had been subject to selling-oriented
advertising perceived the brand to be much more innovative for the high frequency updates.
This could strengthen the previous assumption, indicating that too much creativity on an
already “creative medium” simply denotes fuzziness and a lack of seriousness.
The selling approach on the other hand has the ability to penetrate through the already fuzzy
and in many ways creative flow of information that a consumer is exposed to on Facebook.
The abrupt selling approach, that in a way differentiates itself from the other signals sent to
the consumer on Facebook, stands out and creates that “aha” feeling. The selling approach
catches the attention of the consumer better than creative approach whilst still being on a new
and innovative platform. When we apply the theory that the medium is the message we are
left with an approach that catches the consumer’s attention and is perceived as creative only
thanks to the medium.
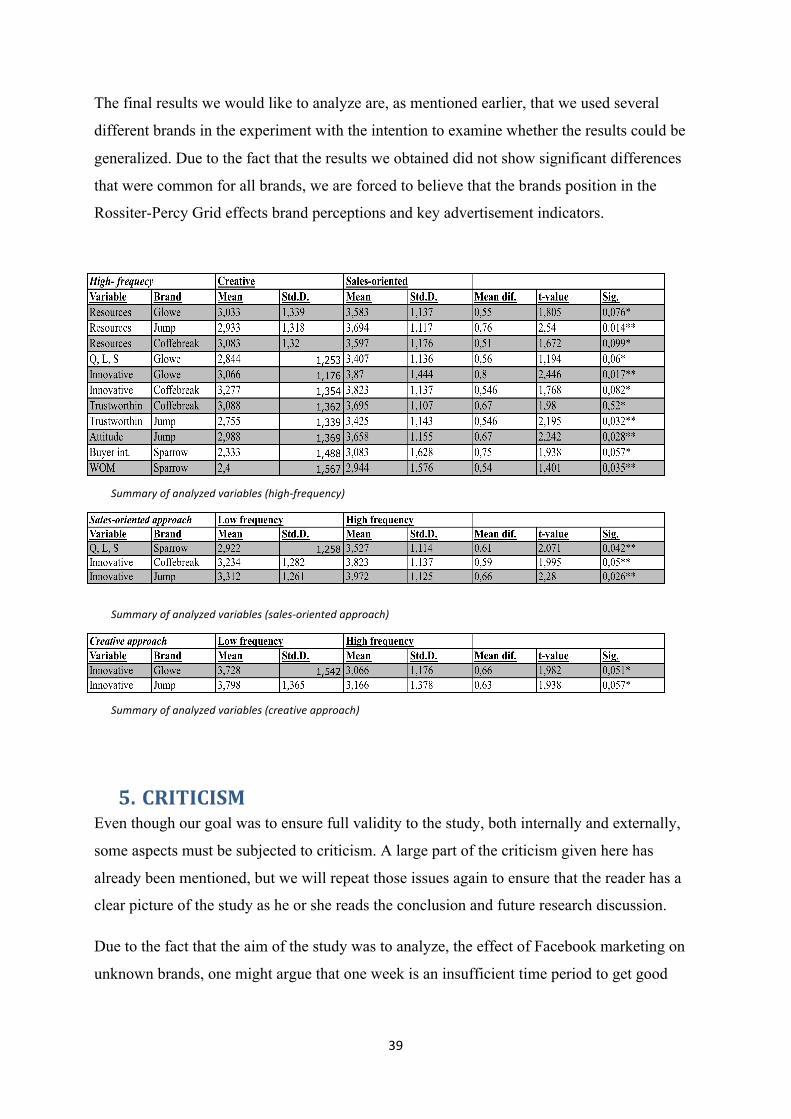
39
Summary of analyzed variables (high-‐frequency)
Summary of analyzed variables (sales-‐oriented approach)
Summary of analyzed variables (creative approach)
The final results we would like to analyze are, as mentioned earlier, that we used several
different brands in the experiment with the intention to examine whether the results could be
generalized. Due to the fact that the results we obtained did not show significant differences
that were common for all brands, we are forced to believe that the brands position in the
Rossiter-Percy Grid effects brand perceptions and key advertisement indicators.
5. CRITICISM Even though our goal was to ensure full validity to the study, both internally and externally,
some aspects must be subjected to criticism. A large part of the criticism given here has
already been mentioned, but we will repeat those issues again to ensure that the reader has a
clear picture of the study as he or she reads the conclusion and future research discussion.
Due to the fact that the aim of the study was to analyze, the effect of Facebook marketing on
unknown brands, one might argue that one week is an insufficient time period to get good
40
results. The respondents may simply have needed more time in order to get a significant
impression.
We are also aware of the fact that our sample has been selected within the same network (i.e.
mainly consisting of students from the Stockholm School of Economics) and that this may
have inhibited the reliability of the scores. The logarithm that determines which news feeds
that are seen on a fan’s own Facebook page, has made it impossible for us to control that the
respondents actually read all the updates.
The updates themselves deserve some criticism. We cannot guarantee that all the respondents
perceived the news feeds as creative or selling. Our initial test showed that this was the case,
but those subjected to that test were able to compare the different updates. They were in other
words not affected by the effect that the medium has on the message. The fact that the
definition of creative advertisement is very broad leaves a lot of space for subjective opinions.
One more issue that could have affected the survey scores was the length of our survey. This
resulted in a survey that took on average 5.57 minutes to complete which could have made the
answers towards the end unreliable.
The last factor that we would like to criticise is the effect of the brands position in the
Rossiter-Percy Grid. Due to the fact that a products position in the grid is highly subjective
and up to the individual consumer we cannot ensure that all of our respondents agreed with
our placement of the brands.
6. CONCLUSION The study has shown an unmistakeable tendency indicating that a selling approach is a more
effective strategy for start-up companies that want to communicate with students on
Facebook. This is most probably due to the fact that selling communication catches the
consumers attention more whilst still being seen as creative, thanks to the theory that the
medium is the message. The results confirm this by showing that a sales-oriented approach
leads to higher results with regards to both the brand perceptions and key advertisement
indicators.
41
7. REFERENCES Amabile, T. M. (1996) Creativity in context: Update to "The Social Psychology of Creativity".
Oxford: Westview;
Ambler, Tim & Hollier, E. Ann. (2004), “The Waste in Advertising Is the Part That Works”,
Journal of Advertising Research, Vol. 44, Issue 2, p. 375-389;
Ang, S. H. and Low, Y. M. (2000), “Exploring the Dimensions of Ad Creativ- ity”. Psychology
& Marketing, 17:10 (October), 835–854;
Ang, S. H., Lee, Y. H., and Leong, S. M. (2007), “The ad creativity cube: con- ceptualization
and initial validation”. Journal of the Academy of Marketing Science, 35, 220–232;
Archibald, Robert B., Clyde A. Haulman, Carlisle E.
Audience Measurement (WAM) Conference, Geneva, Switzerland;
Bach, L. & Persson, S. (2003) “Kreativa Medieval: Medievalets påverkan på konsumentens
uppfattning om reklamen & varumärket”, Examensuppsats, Handelshögskolan i Stockholm;
Belk, R. W. (1985), “Issues in the Intention-Behavior Discrepancy”. Research in Consumer
Behavior, 1, 1–34;
Blackwell, R. D., Miniard, P. W. and Engel, J. F. (2005), Consumer Behavior. 9th edition,
Orlando: Harcourt College Publishers;
Blackwell, R.D. Miniard, P.W. & Engel J.F. (2006), Consumer Behavior, 10th ed, Orlando,
USA: Harcourt College Publishers;
Blackwell, R.D., Miniard, P.W. & Engel J.F. (2001). Consumer Behavior, 9th ed., Orlando,
USA: Harcourt College Publishers;
Bond, J. and Kirshenbaum, R. (1998), Under the radar: talking to today's cynical consumers.
Canada: John Wiley and Sons;
Boyd, H. C. (2006). Persuasive talk: Is it what you say or how you say it? Journal of
Advertising Research, 46(1), 84-92;
42
Brackett, L.K., Carr, B.N. (2001), "Cyberspace advertising vs other media: consumer vs
mature student attitudes", Journal of Advertising Research, Vol. 41 pp.23-32;
campaigns. Journal of Advertising Research, 47(3), 237-256;
Churchill GA, 1979, A Paradigm for Developing Better Measures of Marketing Constructs,
Journal of Marketing Research, Vol. XVI, February, 64-73;
Churchill, G. Jr. Peter, P. (1984), “Research design effects on the reliability of rating scales: A
meta-analysis”, JMR, Journal of Marketing Research, Vol. 21, pg. 360-366
Colliander, J. Erlandsson, S. Modig, E. (2010), “Speed or Distance”, Manuscript, Stockholm
School of Economics;
Cote, J. A., McCullough, J., and Reilly, M. (1985), “Effect of Unexpected Situa- tions on
Behavior-Intention Differences: A Garbology Analysis”. Journal of Consumer Research, 12:2
(September), 188–194;
Cunningham, T., Hall, A. S., & Young, C. (2006). The advertising magnifier effect: An MTV
study. Journal of Advertising Research, 46(4), 369-380;
Dahlén M., Rosengren, S. & Törn, F. (2008), “Advertising Creativity Matters”, Journal of
Advertising Research, Vol. 48, Issue 3, p. 392-403
Dahlén, M. & Edenius, M. (2007), “When is Advertising Advertising? Comparing Responses
to Non-Traditional and Traditional Media”, Journal of Current Issues and Research in
Advertising, Vol. 29 No. 1, 33-42;
Dahlén, M. (2005), “The medium as a Contextual Cue: Effects of Creative Media Choice”,
Journal of Advertising, Vol 34, Issue 3, p. 89-98;
Dahlén, M. and Lange, F. (2003) Optimal Marknadskommunikation, Liber Ekonomi, Malmö;
Dahlén, M. Friberg, L. & Nilsson, E. (2009), “Long Live Creative Media Choice- The Medium
as a Persistent Brand Cue”, Journal of Advertising, Vol 38, Issue 2, p. 121-129;
43
8.
Dahlén, M. Rosengren, S. and Törn, F. “Advertising Creativity Matters”, Journal of
Advertising Research, Sep 2008, Vol 48, No. 3;
Dahlén, M., & Lange, F. (2003). Optimal marknadskommunikation. Malmö: Liber Ekonomi;
Dahlen, M., Rasch, A., & Rosengren, S. (2003). Love at first site? A study of website
advertising effectiveness. Journal of Advertising Research, 43(1), 25-33;
Day, J. (2002), "Those crazy kids". The Guardian, 11 February, 8-9;
Dichter, E. (1966), “How Word-of-Mouth Advertising Works”. Harvard Busi- ness Review,
(November/December), 147–166;
Donovan, R. J. Percy, L. & Rossiter, J. R., (1991), “A better advertising planning grid”, Journal of Advertising Research. Vol 31(5), Oct-Nov 1991, 11-21.
Ducoffe, R.H. (1996), "Advertising value and advertising on the Web", Journal of Advertising
Research, Vol. 36 pp.21-35.;
East, R., Hammond, K., Lomax, W. & Robinson, H. (2005), “What is the Effect of a
Recommendation?”, Marketing Review, Vol. 5, Issue 2, p. 145-157
El-Murad, J., and West, D. C. (2004) ”The Definition and Measurement of Creativity: What
Do We Know?”, Journal of Advertising Research, (June), 188–201;
El-Murad, J., and West, D. C. (2004) ”The Definition and Measurement of Creativity: What
Do We Know?”. Journal of Advertising Research, (June), 188–201;
Facebook web-page, press information, http://www.facebook.com/press/info.php?statistics , 15
May 2010
Facebook web-page, www.facebook.se , 15 May 2010
Fethi Calisir (2003), ” Web advertising vs other media: young consumers’ view”, Internet
Research: Electronic Networking Applications and Policy, Vol 13 nr 5;
Friestad, M. & Wright, P. (1994), “The Persuasion Knowledge Model: How People Cope With
Persuasion Attempts”, Journal of Consumer Research, 21:1, 1–31;
44
9.
Gallagher, K., Foster, K. D., & Parsons, J. (2001). The medium is not the message: Advertising
effectiveness and content evaluation in print and on the web. Journal of Advertising Research,
41(4), 57-70;
Godin, S. (1999), Permission Marketing: Turning Strangers Into Friends, and Friends into
Customers, Simon & Schuster, ISBN: 0684856360;
Granbois, D. H. and Summers, J. O. (1975), ”Primary and Secondary Validity of Consumer
Purchase Probabilities”. Journal of Consumer Research, 1:4 (Mars), 31–38;
Granlund, A. & Grenros, M. (2007), “Gerillareklam – Överraskande effektivt”,
Examensuppsats, Handelshögskolan i Stockholm;
Gremler D. D. and Brown S. W. (1999), “The loyalty ripple effect – Appreciat- ing the full
value of customers”. International Journal of Service Industry Management, 10:3, 271–291;
Guilford, J. P. (1967), “The Nature of Human Intelligence”, New York, USA: McGraw Hill;
Haberland, G. S. and Dacin, P. A. (1992), “The Development of a Measure to Assess Viewers’
Judgments of the Creativity of an Advertisement: A Pre- liminary Study”. Advances in
Consumer Research, 19, 817–825;
Hoeffler & Keller, (2003), “The marketing advantages of strong brands”, Journal of Brand
Management, Volume 10, Issue 6, pp. 421-445;
Howard, J. and Sheth, J. (1969), The Theory of Buyer Behavior, John Wiley & Sons, New
York;
Jackson, P. W. and Messick, S. (1965), “The Person, the Product, and the Response:
Conceptual Problems in the Assessment of Creativity”. Journal of Personality, 33, 309–329;
Jones, T. O. & Sasser, W. E. (1995), “Why Satisfied Customers Defect”, Harvard Business
Review, Vol. 73, Issue 6, p. 88-91;
Juster, F. (1964), Anticipations and Purchases: An Analysis of Concumer Behavior, Princeton
University Press, New Jersey;
Keller, K. L. (1993), “Conceptualizing, Measuring, and Managing Customer- Based Brand
45
Equity”. Journal of Marketing, 57:1 (January), 1–22;
Keller, K.L. (1998), “Strategic Brand Management: Building, Measuring, and Managing Brand
Equity”, Prentice-Hall International, Hemel Hempstead;
Kirmani (1990), The effects of perceived advertising costs on brand perceptions”, Journal of
consumer research, Vol 17, Issue 2, p. 160-171;
Kirmani, A. & Rao, A. (2000), “No Pain, No Gain: a critical review of the litterature of
signaling unobservable product quality”, Journal of marketing, Vol 64, Issue 2, p. 66;
Kirmani, A. & Wright, P. (1989), “Money Talks: Perceived Advertising Expense and Expected
Product Quality”, Journal of Consumer Research, Vol. 16, Issue 3, p. 344;
Kocken, S. & Skoghagen, C. (2009), “En ny sångfågel i marknadsföringsdjungeln”,
Examesuppsats, Handelshögskolan i Stockholm;
Koslow, S., Sasser, S. L., and Riordan, E. A. (2003), “What Is Creative to Whom and Why?:
Perceptions in Advertising Agencies”. Journal of Adver- tising Research, (March), 96–110;
Kotler, P., Armstrong, G., Saunders, J. and Wong, V. (2007) Principles of Mar- keting, 4th
European Edition, Prentice Hall;
Kover, A. J., Goldberg, S. M., and James, W. J. (1995), ”Creativity vs. Effec- tiveness?: An
Integrating Classification for Advertising”. Journal of Advertis- ing Research,
(November/December), 29–40;
Kover, A. J., Goldberg, S. M., and James, W. J. (1995), ”Creativity vs. Effec- tiveness?: An
Integrating Classification for Advertising”. Journal of Advertis- ing Research,
(November/December), 29–40;
Kover, A. J., Goldberg, S. M., and James, W. J. (1995), ”Creativity vs. Effectiveness?: An
Integrating Classification for Advertising”. Journal of Advertising Research,
(November/December), 29–40;
Lee, Y. H. and Mason, C. (1999), ”Responses to Information Incongruency in Advertising:
The Role of Expectancy, Relevancy, and Humor”. Journal of Consumer Research, 26
(September), 156–169;
Leong, E., Huang, X., Stanners, P-J. (1998), "Comparing the effectiveness of the Web site with
46
traditional media", Journal of Advertising Research, Vol. 38 pp.44-50;
Lindstrom, M. and Seybold, P.B. (2003), Brandchild: remarkable insights into the minds of
today's global kids and their relationships with brands. London: Kogan Page;
litical Economy,94 (August),796-821;
Lucas, G. & Dorrian, M. (2006), Guerrilla Advertising, London: Laurence King Publishing
Ltd;
Machleit, K. A., Allen, C. T., and Madden, T. J. (1993), ”The Mature Brand and Brand
Interest: An Alternative Consequence of Ad-Evoked Affect”. Journal of Marketing, 57:4
(October), 72–82;
Madden, T. J. Fehle, F. & Fournier, S. (2006), “Brands matter: An empirical demonstration of
the creation of shareholder value through branding”, Journal of the Academy of Marketing
Science, Vol. 34, Number 2/March, Pages 224-235;
Malhotra, N. K. (2007), “Marketing Research: An Applied Orientation”, 3rd edition, Artes
Graficas, Spain, NJ: Prentice-Hall.
Meadows-Klue (2007), “Falling in Love 2.0: Relationship marketing for the Facebook
generation”, Journal of Direct, Data and Digital Marketing Practice, Vol 9, Issue 3, p. 245-
250;
Milgrom, Paul, and John Roberts. “Price and Advertising Signals of Product Quality.” Jour-
nal of Political Economy 94, 4 (1986): 796–821;
Milgrom,PaulandJohnRoberts(1986), "Price and Advertising Signals of Product Quality," The
Journal of Po-
Modig, E. & Lethagen, H. (2008), “Unbundling Creativity”, Examensuppsats,
Handelshögskolan i Stockholm;
Modig, E. and Colliander, J. (2009), “Word of Mouth Effects of Creative Advertising”. In
Helfer J-P & Nicolas J-L (Eds.), Proceedings from the 38th EMAC Conference, Audencia
Nantes, France, 26-29 May.

47
Moldovan, S. and Lehman, D. R. (2009), “The Effect of Advertising on Word-of-Mouth”. In
Helfer J-P & Nicolas J-L (Eds.), Proceedings from the 38th EMAC Conference, Audencia
Nantes, France, 26-29 May;
Moody, Jr. (1983), "Quality, Price, Advertising, and PublishedQualityRatings," TheJournalof
Consumer Research,9 (March),347-356;
Newall, T. and Steele, L. (2002), "Snapshot 2001: strategies for the youth market". Advertising
and Marketing to Children, January-March, pp. 9-15;
Nilsson, E. & Friberg, L. (2006), ”Laga läckan – De verkliga effekterna av kreativa mediaval
på kort & lång sikt”, Examensuppsats, Handelshögskolan i Stockholm;
Notani, A. S. (1998), “Moderators of Perceived Behavioral Control’s Predic- tiveness in the
Theory of Planned Behavior: A Meta-Analysis”. Journal of Consumer Psychology, 7:3, 247–
271;
Obermiller, C. & Spangenberg E. R. (2005), ”Ad Scepticism”, Journal of Advertising, 34:3, 7–
17;
Park, W. C., Jaworski, B. J. & MacInnis, D. J. (1986), “Strategic Brand Concept-Image
Management”, Journal of Marketing, Vol. 50 (October), 135–145;
Parnes, S. J. (1975), “Aha!” in Perspectives in Creativity, Taylor, I. A. and Get- zels, J. W.,
Aldine, Chichago, 224–228;
Plummer, J. T. (2004). Editorial: To our readers and supporters from the new editor, Journal of
Advertising Research, 44(3), 223-224.
Reliability: A review of psychometric basics and recent marketing practices
Romeo, A., Denham, S., & Neves, J. (2004, June). How and why online advertising has been
getting better over time. Presented at the ARF/ESOMAR Worldwide
Rosner, H. (1996), "Trapping students in the Web", Brandweek, Vol. 15 No. April;
Rust, R. T. Lemon & K. Seithaml, V. A.(2004), ” Return on Marketing: Using Customer
Equity to Focus Marketing Strategy”, Journal of Marketing, Vol. 68/January, 109-127;
48
Sasser, S. L. and Koslow, S. (2008), “Desperately Seeking Advertising Creativity”. Journal of
Advertising, 37:4 (Winter), 5-19;
Sasser, S. L., Koslow, S., & Riordan, E. A. (2007). Creative and interactive media use by
agencies: Engaging an IMC media palette for implementing advertising
Scipione, Paul. “Too Much or Too Little? Public Perceptions of Advertising Expenditures.”
Journal of Advertising Research 37, 3 (1997): 49–58;
Smith, R. E. and Yang, X. (2004), ”Toward a general theory of creativity in ad- vertising:
Examining the role of divergence”. Marketing Theory, 4:31, 31–57;
Smith, R. E., Chen, J. and Yang, X. (2008), “The Impact of Advertising Creativity on the
Hierarchy of Effects”. Journal of Advertising, 37:4 (Winter), 47-61;
Speck, P. & Elliot, M.(1998), Consumer perception of advertising clutter and its impact across
various media”, Journal of Advertising Research, Vol. 38, Issue 1, p29-41;
Stapel, J. (1968), “Predictive Attitudes”, in Attitude Research on the Rocks, Adler, L. and
Crespi, I., American Marketing Association, Chichago;
Sternberg, R. J. and Lubart, T. I. (1993), “Investing in Creativity”. American Psychologist,
51:7, 677–688;
Stone, G. Besser, D., and Lewis, L. E. (2000), “Recall, Liking, and Creativity in TV
Commercials: A New Approach”. Journal of Advertising Research, (May/June), 7–18;
Söderlund, M. & Öhman, N. (2003), “Behavioral Intentions in Satisfaction Research
Revisited”, Journal of Consumer Satisfaction, Dissatisfaction, and Complaining Behavior,
Vol.16, p. 53-66;
Söderlund, M. (1997), Den nöjda kunden, Liber Ekonomi, Malmo;
Söderlund, M. (2001) Den lojala kunden, Liber Ekonomi, Malmö;
Söderlund, M. (2005), “Mätningar och Mått - i marknadsundersökarens värld”, Liber
Ekonomi, Malmö;
49
Tellis, G. J. (1998), Advertising and Sales Promotion Strategy, Addison Wesley, Reading MA;
50
Till, B. D. and Baack D. W. (2005), “Recall and Persuasion: Does Creative Ad- vertising
Matter?”. Journal of Advertising, 34:2 (Fall), 47–57;
Time web-page (2007), http://www.time.com/time/business/article/0,8599,1678586,00.html , 5
May 2010;
Tuk, M. A. Verlegh, P.W. J. Smidts, A. Wigboldus, D. H. J. (2005), “Activation of
Salesperson Stereotypes Affects Perceptions of Word-of-Mouth Referral”, Advances in
Consumer Research, 2005, Vol. 32 Issue 1, p256-25;
Warshaw, P. R. (1980), “Predicting Purchase and Other Behaviors from Gen- eral and
Contextually Specific Intentions”. Journal of Marketing Research, 17:1 (February), 26–33;
Weinberger ,M. G. and Spotts, H. E. (1989), “Humor in U.S. versus U.K. TV Commercials: A
Comparison”. Journal of Advertising, 18:2, 39–44;
White, A. and Smith, B. L. (2001), “Assessing Advertising Creativity Using the Creative
Product Semantic Scale”. Journal of Advertising Research, 41:6, 27– 34;
Zinkhan, J. M. (1993). Creativity in advertising. Journal of Advertising, 22(2), 1-3;
Zollo, P. (1995), "Talking to teens". American Demographics, November;

51
8. APPENDIX
8.1. Brands
GLOWE SHAMPOO Glowe är ett shampo för unga och medvetna. En produkt
för varje tillfälle, frisyr och personlighet, som ger håret
glans och volym. Glowe vill erbjuda alla kvalitetsprodukter
till ett billigt pris.
Visionen på Glowe är att du ska frigöra din inre skönhet –
vi vill nämligen inte att du någonsin ska sluta att tycka om
ditt hår. Att håret ser bra ut och känns bra är viktigt för
män och kvinnor i hela världen. Vår passion är att upptäcka nya, spännande produktlösningar
som hjälper dig att hitta och ta fram just din stil. Vi vill erbjuda dig det bästa tänkbara utbudet
av kvalitetsprodukter som fungerar i perfekt harmoni med dig och din livsstil.
SPARROW AIRLINES Sparrow Airways är flygbolaget som värnar om
världsmedborgaren. Vi på Sparrow Airways tycker att hela
världen ska vara tillgänglig. Att kunna flyga till Asien ska
inte behöva vara en tung belastning på kundernas ekonomi.
Vi ser det som en självklarhet att man landar på en central
ort och inte långt bort från resmålet. Vi är väl medvetna om
att resor från och till avlägsna flygplatser kost pengar och tar
tid. ”Time is money and we know it”. Vi är alternativet för dig som tycker att en resa inom
landet är lika naturligt som en weekend utomlands.
52
COFFEBREAK Coffeebreak är en ny typ av kaffe varumärke som ser kaffe
som ett måste i vardagen. Många konsumenter kan inte tänka
sig en vardag utan kaffe och liksom dessa konsumenter kan vi
på Coffeebreak inte vara utan kaffe. Vi menar att kaffe borde
vara billigt och fortfarande riktigt gott. Vi vill hjälpa
människor få njuta lite varje dag. Våra bönor är av väldigt fin
kvalité och vi arbetar hårt med att erbjuda miljövänligt kaffe.
Vi hoppas att våra barnbarn och deras barnbarn kommer att kunna njuta av kaffe i framtiden.
JUMP MOBILE OPERATOR Jump Mobile är en mobiloperatör på den svenska marknaden
som riktar sig till kostnadsmedvetna och
kommunikationsintensiva unga människor. Jump erbjuder
kontaktkorts- och abbonemangslösningar till superlåga
priser på bade samtal och sms-tjänster.
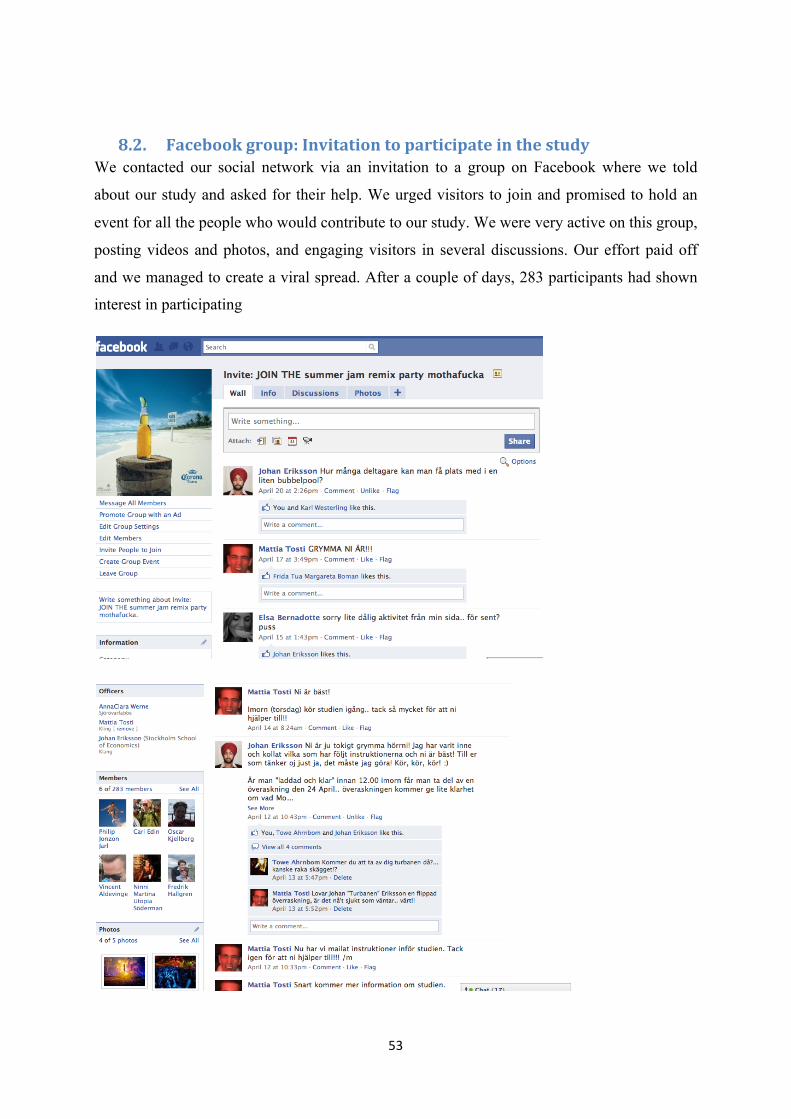
53
8.2. Facebook group: Invitation to participate in the study We contacted our social network via an invitation to a group on Facebook where we told
about our study and asked for their help. We urged visitors to join and promised to hold an
event for all the people who would contribute to our study. We were very active on this group,
posting videos and photos, and engaging visitors in several discussions. Our effort paid off
and we managed to create a viral spread. After a couple of days, 283 participants had shown
interest in participating
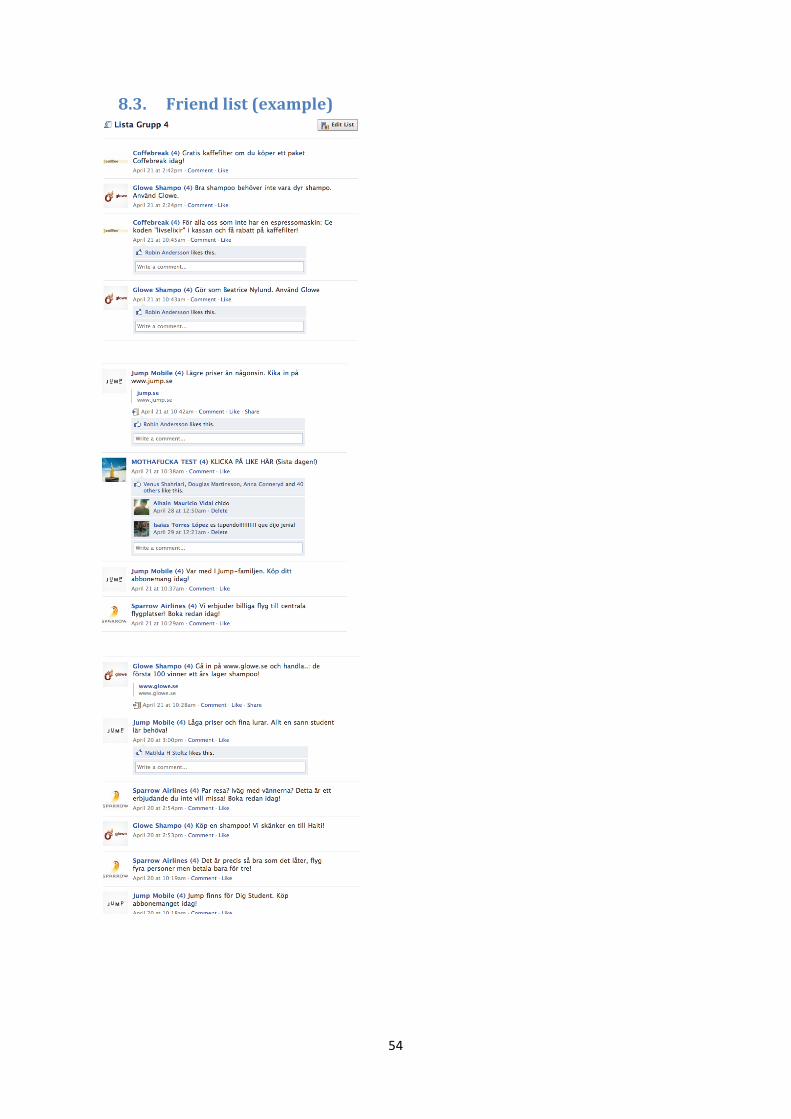
54
8.3. Friend list (example)