Exploitation of Social Networking Sites and Its Impacts on Students’ Academic Results: A Quest for...
29
Volume–IX, Issue–01, January-June, 2014 Exploitation of Social Networking Sites and Its Impacts on Students’ Academic Results: A Quest for Correlation or Misspecification in Bangladesh THAWHIDUL KABIR * SHIRIN AKTER ** ZANNATUL FERDUS *** Abstract Social networking sites have become the inevitable part of everyone’s life. Large numbers of students in Bangladesh spend a lion share of daily time by wandering through online social networking sites. So it is imperative to mention the effects of using social networking sites on the society. This study aims to analyse whether the use of social networking sites can influence students’ academic results or not. To get the desired answer, a random sample, constituted with 1182 university students from Dhaka Metropolitan City, Bangladesh, was drawn and surveyed with self-administered questionnaire. This study significantly found that, students achieved average results in last two semesters were inversely influenced by their hours of regular involvement in different social networking sites (SNSs), and also by the use of different mobile messaging applications (MMAs). Based on the finding, this study concludes that, students’ involvement in different SNSs and MMAs in terms of hours should be closely monitored to mitigate the aforesaid inverse effects. Keywords: Social Networking Sites, Mobile Messaging Applications, Academic Result, Frequency of Using Network. * Assistant Professor, Department of Management, Bangladesh University of Business & Technology. Email: [email protected] ** Lecturer, Department of Management, Bangladesh University of Business & Technology. Email: [email protected] *** Lecturer, Department of Management, Bangladesh University of Business & Technology. Email: [email protected]
Transcript of Exploitation of Social Networking Sites and Its Impacts on Students’ Academic Results: A Quest for...

Volume–IX, Issue–01, January-June, 2014
Exploitation of Social Networking Sites and Its
Impacts on Students’ Academic Results: A
Quest for Correlation or Misspecification in
Bangladesh
THAWHIDUL KABIR*
SHIRIN AKTER**
ZANNATUL FERDUS***
Abstract
Social networking sites have become the inevitable part of everyone’s life. Large
numbers of students in Bangladesh spend a lion share of daily time by
wandering through online social networking sites. So it is imperative to mention
the effects of using social networking sites on the society. This study aims to
analyse whether the use of social networking sites can influence students’
academic results or not. To get the desired answer, a random sample,
constituted with 1182 university students from Dhaka Metropolitan City,
Bangladesh, was drawn and surveyed with self-administered questionnaire. This
study significantly found that, students achieved average results in last two
semesters were inversely influenced by their hours of regular involvement in
different social networking sites (SNSs), and also by the use of different mobile
messaging applications (MMAs). Based on the finding, this study concludes that,
students’ involvement in different SNSs and MMAs in terms of hours should be
closely monitored to mitigate the aforesaid inverse effects.
Keywords: Social Networking Sites, Mobile Messaging Applications, Academic Result,
Frequency of Using Network.
* Assistant Professor, Department of Management, Bangladesh University of Business &
Technology. Email: [email protected] ** Lecturer, Department of Management, Bangladesh University of Business & Technology.
Email: [email protected] *** Lecturer, Department of Management, Bangladesh University of Business & Technology.
Email: [email protected]

Journal of Business and Technology (Dhaka)
24
1. INTRODUCTION
Internet was introduced in Bangladesh through an UUCP (Unix-to-Unix
copy) email connectivity in 1993 by Pradesta Ltd. (Rahman, 2002), and the
online Internet service activated in June 1996 when VSAT (Very Small Aperture
Terminal), a satellite communications system, was legalized by Bangladesh
Telegraph and Telephone Board
(BTTB).The Board gave VSAT permission to two Internet service providers-
Information Services Network (ISN) and Grameen Cybernet, to install VSAT
data circuits in the same year (Azam, 2007; Internet World Stats, 2004; and
Rahman, 2002). At that moment, the Internet penetration rate in Bangladesh was
as low as 0.2%, compared to Thailand 9.3%, Maldives 5.2%, Vietnam 4.2%,
India 1.7%, Pakistan 1.0%, and Sri Lanka 1.0% (Internet World Stats, 2004).
Later, Bangladesh has officially been connected with the world’s information
super highway, submarine optic fibre cable network on 21st May, 2006, which
has facilitated Bangladesh to get more faster access in Internet, and hence,
Bangladesh’s ICT position has been ranked at 6th among the seven SAARC
countries (Azam, 2007). Now, Bangladesh is treated as a growing ICT
(Information and Communication Technology) country in the world where the
rate of internet use is increasing day by day (Mahmud,2011) and, as
consequences, there has been much talk about the use of Internet in industry,
business, communication, education, research, and in every other sphere of life
(Internet World Stats, 2004).
2. LITERATURE REVIEW
Previous researchers have significantly addressed and documented different
aspects of internet use in Bangladesh. Rahman, (2002) has evaluated the internet
and its access; Lane (2006) has conducted a case study for the GSM association;
Roknuzzaman (2006) has conducted a survey on internet access in a large public
university; Alam, Kabir, and Elizabeth (2006) have looked at the implementation
and evaluation of e-learning; Islam and Selim (2006) have examined the current
status and prospects for e-learning in the promotion of distance education; Azam
(2007) has studied the internet adoption and its usage; Debnath and Mahmud
(2007) have scrutinized the E-commerce environment; Mohseni, Dowra and
Haghighat(2008) have investigated whether the use of internet is making people
socially isolated or not; Islam and Grönlund (2011) have studied the pros and

Kabir, Akter & Ferdus : Exploitation of Social Networking Sites & Students Results 25
cons of the digitalization process in Bangladesh, Islam and Ahamed (2011) have
evaluated customers’ attitude towards wireless internet; Mostofa (2011) has
scanned the access and use of internet among business students of a private
university of Bangladesh; Mahmud (2011) has checked up the private university
student’s attitudes towards internet; Akhter, Siddique and Masum (2011) have
analyzed the effect of social network on job satisfaction and employee
performance; Zaman and Chowdhury (2012) have analyzed the present status,
future prospects and challenges of technology driven banking; Alam (2013) have
investigated the future prospect of ‘3G’ network in Bangladesh; Rahaman, Ullah
and Shafayet (2013) have explored the factors that are influencing Facebook
privacy awareness of Bangladeshi undergraduate university students. But none of
them have investigated the impacts of the use of social networking sites on
Bangladeshi students’ academic results in any of their aforementioned studies
except, Asad, Mamun & Clement (2012) who have surveyed the effect of social
networking sites to the lifestyles of teachers and students; and Mafiz, Ismail, and
Bhuyan (2011) who have assessed the effects of socio-economic, demographic
and internet exposure factors on school performance among selected high school
students.
But yet in the context of Bangladesh, there has hardly been any study
which significantly has set forth the potential impacts of using of social
networking sites on students’ academic results in different college and university
settings. Hence, to plug this gap in the literature, this study primarily attempts to
identify whether the use of social networking sites by university students has any
tendency to influence their academic results or not in the context of Bangladesh.
In particular, importance of this issue is significantly connected to those streams
of research which identifies higher education as a key component to a country
remaining globally competitive and declining academic performance can have
long-term consequences for both, society and the individual, in terms of overall
quality of life (Down, 2009; Phusavat, Ketsarpong, Ooi, & Shyu, 2012).

Journal of Business and Technology (Dhaka)
26
TABLE 1
EFFECTS OF SOCIAL NETWORKING SITES
To Students To Teachers
Positive Effects Negative Effects Positive Effects Negative Effects
Sharing homework,
information,
resources or ideas
Failure to meet
study targets
Share information
and resources with
students
Devotes little
time to attend to
students class
related problems
Communicating to
teachers
Poor performance
(lower grades)
Learn how social
networking can be
incorporated into
teaching
Reduction in
face-to-face
human contact
due to SNS
General group
discussion and
exchanging ideas
Paying more
attention towards
SNS than utilizing
this time for their
studies
Creates student
groups to collaborate
on projects
Reducing the
time of doing
research to
improve on your
profession
Assignment
preparation and
argument
Missing classes
due to SNS
Increases teachers
availability to
students outside
school hours
Affects
profession
reputation and
career
Communication
among students and
their instructors,
following
announcements
about classes and
courses
Reduction in face
to face human
contact
Enables research
through the
exchange of
different materials
Causes stress and
affects your
health
Source: Asad, et al., 2012.
2.1 Social Networking Sites (SNSs)
Social networking sites, henceforward SNSs, specifically refer to those
Internet-based services that: promote online social interaction between two or
more persons within a bounded system for the purposes of friendship, meeting
other persons, and/or exchanging information; contains a functionality that lets
users create public or semi-public personal profile pages that contain information
of their own choosing; articulates a list of other users with whom they share a
connection, and thus serves as a mechanism to communicate with other users;
and contains mechanisms that allow users to search for other users according to
some specific criteria (Boyd, & Ellison, 2007, 2008; EU, 2009; Zwart, Lindsay,
Henderson, & Phillips, 2011).

Kabir, Akter & Ferdus : Exploitation of Social Networking Sites & Students Results 27
2.2 Global Consumption or Use of SNSs
Since 2000, overall internet use and the use of SNSs have grown
significantly (Pew, 2009). In terms of membership and daily usage, more recent
estimates show that Facebook has 1.19 billion monthly active users; LinkedIn
over 100 million members; Twitter having over 177 million tweets per day; and
YouTube having over 3 billion views each day (Chen, & Bryer, 2012). Amongst
these, the overwhelmingly more popular SNS is Facebook (Gonzalez, 2009)
which has, as of September 2013, 727 million daily active users on average and
there are approximately 874 million monthly active users who used Facebook
mobile products (https://newsroom.fb.com/Key-Facts). Additionally, in terms of
overall popularity regarding usage, one recent survey conducted by the Pew
Research Center found that Facebook is the most used (92%), followed by
MySpace (29%), then LinkedIn (18%), Twitter (13%), and other SNSs (10%)
(Hampton, Sessions-Goulet, Rainie, & Purcell, 2011). In terms of age,
approximately 61% of teens, aged between 12 and 17, utilize SNSs to send
messages to their friends on a regular basis (Lenhart, 2009). Besides, the use of
SNSs has been repeatedly found to be the highest among those between the ages
of 18 and 29 (Rainie, 2011) and the fastest growing segment utilizing SNSs since
2008 has been among those age 35 and older (Hampton et al., 2011, p. 8).
Furthermore, In terms of gender, it has been found that women more than men
tend to utilize SNSs to communicate and exchange information (Hampton et al.,
2011).
2.3 Rewards and Drawbacks of Using SNSs
In general, benefits typically associated with the use of SNSs have included:
encouraging greater social interaction via electronic mediums; providing greater
access to information and information sources; encouraging creativity among and
between individuals and groups; creating a sense of belonging among users of
common social media tools; providing more choices to promote engagement
among different individuals and groups; reducing barriers to group interaction
and communications such as distance and social/economic status; and increasing
the technological competency levels of frequent users of SNSs (Connolly, 2011;
Rosen, 2011; and Zwart, et al., 2011). Conversely, potential risks or drawbacks
identified with the use of SNSs include risks of psychological disorders and
health problems such as social isolation, anxiety, depression, time
mismanagement, poor eating habits, and lack of physical exercise; amplified

Journal of Business and Technology (Dhaka)
28
short attention spans and subverted higher-order reasoning skills such as
concentration, persistence, and analytical reasoning among frequent users of
SNSs; a tendency to overestimate one’s ability to multi-task and manage
projects; and technology being seen as a substitute for the analytical reasoning
process (Anderson, & Rainie, 2012; Brenner, 1997; Connolly, 2011; Kraut,
Patterson, Lundmark, Kiesler, Mukophadhyay, & Scherlis, 1998; Rosen, 2011;
Young, 1996; and Zwart, et al.,, 2011).
2.4 Impacts of Using SNSs on Students
Long since, there has also been considerable discussion regarding the
frequent use of different SNSs by students and the possible effect of its tools
(e.g., Facebook, MySpace, Twitter, Xanga, Friendster) on students’ academic
performance (Connolly, 2011; Hargittai & Hsieh, 2010; Karpinski & Duberstein,
20009). Regarding academic settings, Lenhart in 2009 and later, Anderson &
Rainie in 2012 have mentioned that use of internet has wide spread implications
particularly for the areas of education (e.g., the identification and use of
compatible teaching methods, the design and implementation of complimentary
curriculum decisions, and the design of non-classroom educational assignments);
communications (e.g., the identification of appropriate channels to exchange
educational information among individuals); and economics (e.g., the allocation
of public financial resources towards educational and social services activities,
and the creation of future business opportunities) (Anderson, & Rainie, 2012;
Chen, & Bryer, 2012). But widely divergent studies in the field of higher
education (e.g. Colleges and Universities) have engendered an assortment of
findings. Some researchers, studying the impact of SNSs on college students’
academic performance, found a negative effect; that is, higher usage typically
leading to lower academic performance as measured by grades (Canales,
Wilbanks, & Yeoman, 2009; Karpinski, & Duberstein, 2009; Rouis, Limayem, &
Salehi-Sangari, 2011; Stollak, Vandenberg, Burklund, & Weiss, 2011; Wang,
Chen, & Liang, 2011). At Alfred University, 50% of students interviewed after
dismissal for academic failure listed excessive Internet usage as a reason for their
problems (“On Line,” 1996). Furthermore, by asking students that why they did
not put more effort into academic work, Yazedjan et al. in 2008 have found
SNSs’ distraction as a regular explanation. Other researchers studying this same
issue found either no-to-little relationship between the use of SNSs and student
academic performance (Ahmed & Qazi, 2011; Hargittai & Hsieh, 2010; Kolek

Kabir, Akter & Ferdus : Exploitation of Social Networking Sites & Students Results 29
and Saunders, 2008), or actually an increase in student academic performance
(Junco, Heibergert, & Loken, 2011; Pasek, More, & Hargittai, 2009; Rizzuto,
LeDoux, & Hatala, 2009). Among these studies, Madge, et al. in 2009 found that
SNSs are mainly used to keep up with social aspects of college life and it is a part
of most students’ daily routine. Kubey, Lavin, & Barrows have found in their
study that recreational Internet use is strongly correlated with impaired academic
performance (Kubey, Lavin, & Barrows, 2001).
2.5 Use of SNSs in the Academic Sector of Bangladesh
By studying 137 Private university students, Mostafa (2011) has found in his
study that, 56.2 percent students used the internet for educational purposes, 15.3
percent for research purposes, 10.2 percent for communication purposes, 16.8
percent for entertainment purposes and remaining 1.5 percent indicated used it
for other purposes. Mostafa (2011) also has identified in his study that, most
(82.5%) of the students responded that internet can play a significant role in the
field of education. Mafiz, Ismail and Bhuyan (2011) have studied the impact of
socio-economic, demographic and internet exposure factors on school
performance among 10 grade students of Nilkhet High School and hence, they
have found that, overall 80.5% out of 87 students were exposed to internet, and
among these internet users, 79.3% had Facebook account. They also have found
that, majority of the students (50.6% out of 87) used internet for entertainment,
20.7% used internet for educational purposes (Mafiz, Ismail and Bhuyan, 2011).
Besides, Asad, et al. (2012), by studying 200 respondents comprised of 100
teachers and 100 students, have found in their study that, Facebook is used by
90% students and 82.1% teachers; 47% of students and 57.1% of teachers have
logged on in to these SNSs at least once in a day; 87% students and 96.4%
teachers have used their computers to access internet; 22% students have used
mobile phone and 36.9% teachers have used the same device for accessing it
In terms of different devices to access the internet and different places from
where the internet has been accessed, they have found 87% have used computers,
22% used their mobile phones and 2% used other devices; and majority (52%)
have accessed the internet from their hostels, 43% from computer laboratory, 8%
from their classes and 3% from the library respectively. Besides, in terms of the
duration of use, Asad, et al. (2012) have further reporter in their study that
majority (47%) of the students have indicated that they logged in once in a day,

Journal of Business and Technology (Dhaka)
30
36% spent 2-5times a day, 10% spent a couple of hours and only 7% were always
logged on (Asad, et al., 2012).
However, by utilizing non-parametric statistics (Chi square test), both of
these two aforesaid studies have significantly concluded that, (i) the school
performance measured by grade of the students was significantly related with the
work on internet (Mafiz, Ismail and Bhuyan, 2011), and (ii) students’ poor
performance (lower grades) is one of the negative effects of using SNSs (Asad, et
al., 2012).
2.6 Research Gap
Although the frequency of using different SNSs is well documented in the
literature (See Asad, et al., 2012; Chen, & Bryer, 2012; Gonzalez, 2009;
Hampton et al., 2011; Lenhart, 2009; Mafiz, Ismail and Bhuyan, 2011; Pew,
2009; Rainie, 2011), none of the aforesaid studies and other previous studies
have assessed the quantity of active SNSs that each student may have and its
association with that student’s academic results. Besides, impacts of both, the
quantity of installed mobile messaging applications and its frequency of use, on
students’ academic results have not been explored yet in Bangladesh. Similarly,
in terms of variance, comparative predictability of this two types of social
networking tools regarding the academic results of students have not been shown
in any research study. Hence, this study has tried to set forth the prospective
impacts of SNSs on the academic result of Bangladeshi university students,
especially undergraduate students, throughout following queries:
a) How many active social networking sites (SNSs) does each student have
and which one among these accounts is most frequently used by them?
b) How much time in any particular day is spent by the students in these
social networking accounts?
c) How many mobile messaging applications does each student have
installed in their mobile phones and which one among these installed
mobile messaging applications is most frequently used by the students?
d) How much time in any particular day is spent by the students in these
installed mobile messaging applications?
e) What is the average result of each student in last two semesters?
f) To what extent, the use of SNSs can predict each student’s achieved
average result?

Kabir, Akter & Ferdus : Exploitation of Social Networking Sites & Students Results 31
g) How much variance in each student’s achieved average result in last two
semesters can be explained by their use of SNSs and mobile messaging
applications?
h) Between these both habits, using SNSs and using mobile messaging
applications, which one is the best predictor of students achieved average
results in last two semesters?
i) If we control for the possible effect of some additional demographic
independent variable, are these both independent factors, Exploitation of
SNSs and Exploitation mobile messaging applications, still be able to
predict a significant amount of variance in the students’ achieved average
results in last two semesters?
3. METHODOLOGY OF THE STUDY
3.1 Research Design
Most appropriate type of research design for this study was causal research
because, as kind of conclusive research, it deals with the potential cause and
effect relationship among identified variables in any study.
3.2. Operationalization
3.2.1 Independent Variables
This study consists of two independent variables, namely- (i) Social
Networking Sites (SNSs) and (ii) Mobile Messaging Applications
(MMAs), and thus had looked for their quantity as well as frequency of
use.
3.2.1.1 Social Networking Sites (SNSs)
This study defined social networking sites as “technologies
that facilitate social interaction, make possible collaboration, and
enable deliberations across stakeholders” (Bryer & Zavattaro, 2011,
p. 327; Chen, & Bryer, 2012, p. 88). To assess the quantity of
registered active SNSs that each student may possibly have, a
checklist containing the name of 15 different but most popular SNSs
was developed (i.e. Facebook, Twitter, Tagged, MySpace, Pinterest,
Google Plus+, Meetup, Mylife, etc.). After that, all the responding

Journal of Business and Technology (Dhaka)
32
students were asked to ensure from the given list that whether or not
they are using one or more than one of those SNSs. Moreover, it had
been compassionately assumed in this study that, some students
might use some other similar sites which was not enlisted and thus,
they were asked to specify the name of those unlisted SNSs as well
as an additional ‘don’t have’ option was inserted for those students
who didn’t really have registered in any such types of SNSs yet.
Besides, students were asked to mention from the aforesaid check list
of SNSs that which one they used mostly along with their average
tenure of using it in any given day.
3.2.1.2 Mobile Messaging Applications (MMAs)
This study have defined ‘Mobile Messaging Applications’,
hereafter MMAs, as instant messaging technologies which are mobile
phone friendly in nature and which may utilize either online or offline
or both type of connectivity for pursuing social affiliation effectively
and efficiently. Thus, a check list, containing the names of 10 most
popular mobile messaging applications, was offered to the responding
students to confirm that how many of these applications they had
installed in their mobile phones. Additionally, students were also
inquired to specify if they used any other similar MMAs which were
not procured in that check list, as well as, an additional
‘Incompatibility’ clause was added for those students who either didn’t
have any mobile phone or the phone they have has an incompatibility
to install and use such types of mobile messaging application.
Afterward students were asked to mention which one among those
aforementioned MMAs they mostly use in conjunction with their
average tenure of using such applications in any given day. Also, the
numbers of registered active SNSs as well as the number of installed
mobile messaging application reported by individual respondents were
coded and then grouped into the following five (05) categories like
this:

Kabir, Akter & Ferdus : Exploitation of Social Networking Sites & Students Results 33
Code Used Defined Categories Range of Registered Active
Social Networking Accounts
0 Don’t / Can’t Use 0
1 Trivial Users 01 - 02
2 Slightly Heavy Users 03 - 04
3 Heavy Users 05 - 06
4 Overly Heavy Users 07 - 08
5 Unusually Heavy Users 9 and above
3.2.2 Dependent Variable:
Students’ achieved average results in last two semesters were the one and
only dependent variable of this study. To ease the generalization and
estimation of student, they were asked to mention their results of last two
semesters in the format of ‘Grade Point Average GPA)’. Next, individual
respondent’s reported results of last two semester were averaged simply by
calculating the sum total of those two results and then dividing that sum total
(Result of Semester One + Result of Semester Two) by the total numbers of
results (02) reported by each students. Subsequently, their achieved average
results in last two semesters was coded and then grouped into the following
six (06) categories,
Code Used Defined Categories Range of Achieved
Average Results
1 Weak Students Less than 1.49
2 Below Average Students 1.50 – 1.99
3 Above Below Average Students 2.00 – 2.49
4 Average Students 2.50 - 2.99
5 Above Average Students 3.00 – 3.49
6 Well-built Students 3.50 and Above
3.3 Data extraction and analysis
A random sample, constituted with 1250 Bangladeshi undergraduate students
from different universities of Dhaka Metro Politian City, surveyed with a self
administered structured questionnaire. The survey was conducted by the
researchers themselves in the period April to July, 2013. To test whether the
scales were reliable or not, the value of the Chronbach's alpha had been estimated
and evaluated against the recommended standard by DeVellis (2003) who

Journal of Business and Technology (Dhaka)
34
suggested that, ideally the Cronbach alpha coefficient of a scale should be above
(0.7). As the number of items in all the scales in this study, ‘Achieved average
results’, ‘Use of SNSs’ and ‘Use of Mobile Messaging Applications’, are much
less (below 10), the inter-item correlations of these scales are also evaluated and
reported according to the recommend optimal range of Briggs and Cheek (1986)i.
Besides, the ‘Bivariate’ correlation analysis was done by using ‘Pearson Product-
moment Correlation’ to explore the relationships between dependent and
independent variables, and the resulting relationships were interpreted according
to the standards suggested by Cohen (1988) where ‘r = .10 to .29 or r = -.10 to -
.29’ stands for ‘small’; ‘r = .30 to .49 or r = -.30 to -.49’ for ‘medium’ and ‘r= .50
to 1.0 or r = -.50 to -1.0’ for ‘large’ relationships. Decision of accepting or
rejecting the null hypotheses was taken on the basis of consequential
‘Significance’ value and ‘F’ value calculated by the analysis of variance
(ANOVA). After measuring the outliers, normality, and multi-colinearity, the
standard multiple regression and sequential multiple regression analysis were
conducted to find the answers of the remaining queries of this study.
4. ANALYSIS
4.1 Sample Demographics
After receiving the feedback, 68 fragmentary questionnaires were declined
and 1182 feedbacks were retained for further processing which engendered
94.56% response rate for this study. Among these 1182 respondents, 33.6% of
the total respondents were female and 66.4% were male. The average age of
those students were 21.40 years along with a standard deviation of 1.473,
Standard error of mean .043 and 2.169 years of variance. Both the median and
modal age were found to be 21 years which indicates a normal distribution. In
terms of academic tenure in a 4 years undergraduate program, most (46.4%) of
the students were from the 1st semester, 72.5% were in between 1st to 3rd year
and 325 (27.5%) respondents were found studying in the 4th year. And, as the
categories of students were pre-coded, most (53.6%) of the sampled students
were found to be the Well-built Students of their universities, followed by 35.4 %
were above average students, 10.2 % were average students and 1.2 % were weak
students to above the below average students (see APPENDIX 01.A, &
APPENDIX 01.B).
Kabir, Akter & Ferdus : Exploitation of Social Networking Sites & Students Results 35
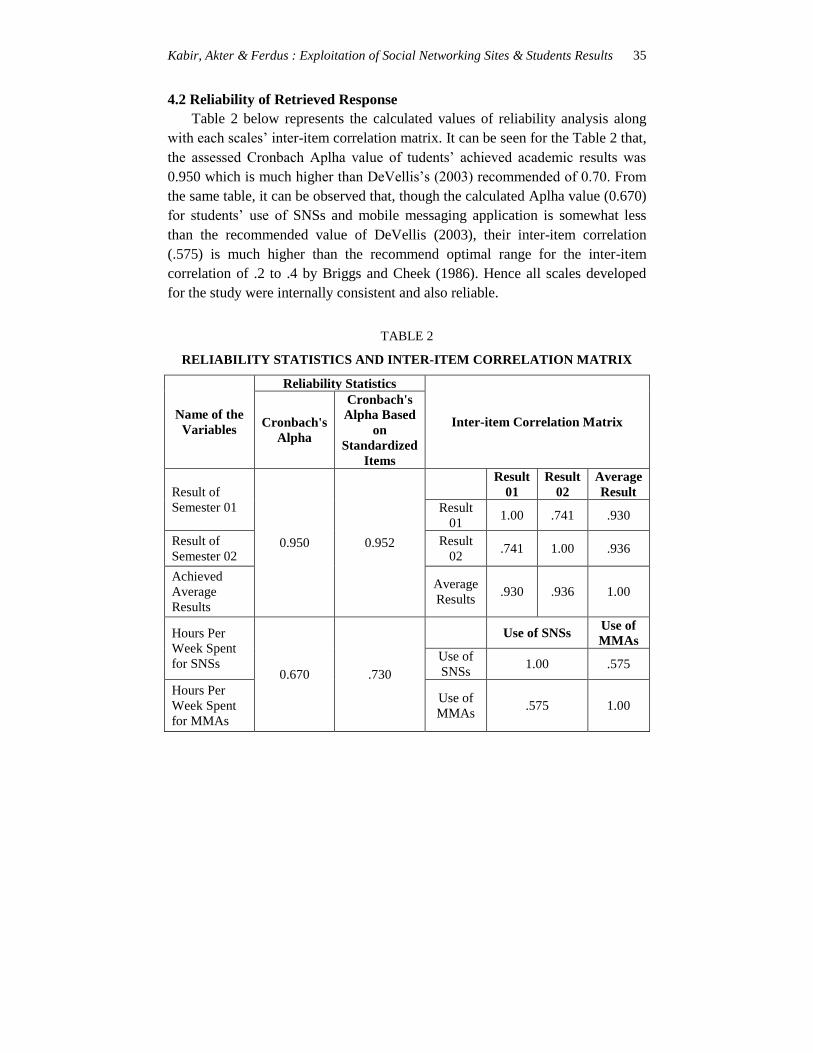
4.2 Reliability of Retrieved Response
Table 2 below represents the calculated values of reliability analysis along
with each scales’ inter-item correlation matrix. It can be seen for the Table 2 that,
the assessed Cronbach Aplha value of tudents’ achieved academic results was
0.950 which is much higher than DeVellis’s (2003) recommended of 0.70. From
the same table, it can be observed that, though the calculated Aplha value (0.670)
for students’ use of SNSs and mobile messaging application is somewhat less
than the recommended value of DeVellis (2003), their inter-item correlation
(.575) is much higher than the recommend optimal range for the inter-item
correlation of .2 to .4 by Briggs and Cheek (1986). Hence all scales developed
for the study were internally consistent and also reliable.
TABLE 2
RELIABILITY STATISTICS AND INTER-ITEM CORRELATION MATRIX
Name of the
Variables
Reliability Statistics
Inter-item Correlation Matrix Cronbach's
Alpha
Cronbach's
Alpha Based
on
Standardized
Items
Result of
Semester 01
0.950 0.952
Result
01
Result
02
Average
Result
Result
01 1.00 .741 .930
Result of
Semester 02
Result
02 .741 1.00 .936
Achieved
Average
Results
Average
Results .930 .936 1.00
Hours Per
Week Spent
for SNSs 0.670 .730
Use of SNSs Use of
MMAs
Use of
SNSs 1.00 .575
Hours Per
Week Spent
for MMAs
Use of
MMAs .575 1.00

Journal of Business and Technology (Dhaka)
36
4.3 The Quantity and Frequency of SNSs and MMAs Used by Bangladeshi
Students
In terms of registered active social networking accounts, this study had found
that out of 1182 students, 77.7 % were the ‘Trivial Users’ (having 01-02 active
accounts), 12.4 % were ‘Slightly Heavy Users’, 5.6% had agreed that they ‘Don’t
or Can’t Use’ such accounts and other categories had included the remaining
4.2% students. Moreover, Facebook were used by 88.5% students followed by
Twitter 2.2%, GooglePlus+ 1.2%, 6.3% did not have used any kind of SNSs and
the remaining social networking sites mentioned in the list were used by 1.8%
students (see APPENDIX 02.A, APPENDIX 03). Besides, by asking the
responding students (excluding those 66 (5.6%) respondents who were not using
any SNSs) to mention their average daily use in the form of hours per day, it was
found that, out of 1116 students, about 83.8% (990) were using SNSs for
maximum two and half hours (02.5 Hours) and only 10.7% students were using it
more than 02.5 hours (see APPENDIX 02.B). Furthermore, in terms of the
quantity of installed mobile messaging application, most of the student’s (42%)
had reported that their mobile phone have an incompatibility issue to install and
use it, followed by 31.7% were the ‘Trivial Users’ (installed 01-02 mobile
messaging applications), 12.8% were ‘Slightly Heavy Users’, 7.4% were ‘Heavy
Users’ and 6.1% were the other type of users. In terms of preferring mobile
messaging applications, it was found that, 13.71% students preferred eBuddy,
followed by 11% preffered NimBuzz, 6.85% MessageMe, 5% Viber and
WeChat, 4.91% Line, 4.48% TextNow, 4.06% whatsApp, 42% students’ mobile
phones were mismatched to use such applications and the remaining 3% students
had preferred either HeyTell or Snapchat or other MMAs (see APPENDIX 02.A
& APPENDIX 03). And by asking students (of course, excluding those 496
students who were facing incompatibility to install and use MMAs) to reveal
their average daily use of MMAs in terms of hours per day, this study found that,
out of 686 students, a total of 860 (57.5%) students was not using MMAs for
more than 04 hours and only a few (0.5%) students were using it more than 04
hours (see APPENDIX 02.B) in a day.
4.4 Relationship of Students’ Achieved Results with the Use of SNSs and
MMAs
Table 3 below shows the consequent coefficients of correlation analysis
between the independent and dependent variables of this study. Thus, it can be

Kabir, Akter & Ferdus : Exploitation of Social Networking Sites & Students Results 37
observed from resulting correlation coefficients shown in Table 03 that, two
independent variables, frequency of using SNSs (with r = -0.807) and frequency
of using MMAs (with r = -0.464), have strong and inverse relationship with the
dependent variable (students’ achieved academic results). This finding was
statistically significant because, in both cases, the identified P values were less
than 0.05 (α = < 0.05).
TABLE 3
CORRELATION COEFFICIENTS DEPICTED
Items Average Results Use of SNSs Use of MMAs
Average Results 1 -.807** -.464**
Use of SNSs -.807** 1 .515**
Use of MMAs -.464** .515** 1
**. Correlation is significant at the 0.01 level (1-tailed).
4.5 Assessment of Normality and Outliers
Normality was assessed by ‘Normal Probability Plot of Regression
Standardized Residuals’ which is illustrated by Figure 01 below. Here it can be
observed that points were positioned in a reasonably straight diagonal line from
bottom left to top right indicating no major deviation from normality.
FIGURE 01: Normal P-P Plot of Regression Standardized Residual
Moreover, Tabachnick and Fidell (1996) defined outliers as cases that have a
standard residual of more than 3.3 or less than -3.3. As shown in Figure 02
below, all the observed cases, except a few, were within this range.

Journal of Business and Technology (Dhaka)
38
FIGURE 02: Scatterplot
Thus, to inspect the number of outliers, Mahalanobis Distance was compared
against the recommended critical value which is shown in Table 4 below.
TABLE 4
RESIDUALS STATISTICS A
Minimum Maximum Mean Std.
Deviation N
Predicted Value 1.76 6.68 5.42 .597 1182
Std. Predicted Value -6.123 2.119 .000 1.000 1182
Standard Error of Predicted
Value .014 .083 .019 .007 1182
Adjusted Predicted Value 1.79 6.69 5.42 .597 1182
Residual -2.681 .270 .000 .397 1182
Std. Residual -6.749 .681 .000 .999 1182
Stud. Residual -6.765 .681 -.001 1.001 1182
Deleted Residual -2.694 .271 .000 .399 1182
Stud. Deleted Residual -6.897 .681 -.002 1.006 1182
Mahal. Distance .379 51.073 1.998 3.053 1182
Cook's Distance .000 .074 .002 .007 1182
Centered Leverage Value .000 .043 .002 .003 1182
TABLE 4 Cont.

Kabir, Akter & Ferdus : Exploitation of Social Networking Sites & Students Results 39
Minimum Maximum Mean Std.
Deviation N
Predicted Value 1.76 6.68 5.42 .597 1182
Std. Predicted Value -6.123 2.119 .000 1.000 1182
Standard Error of Predicted
Value .014 .083 .019 .007 1182
Adjusted Predicted Value 1.79 6.69 5.42 .597 1182
Residual -2.681 .270 .000 .397 1182
Std. Residual -6.749 .681 .000 .999 1182
Stud. Residual -6.765 .681 -.001 1.001 1182
Deleted Residual -2.694 .271 .000 .399 1182
Stud. Deleted Residual -6.897 .681 -.002 1.006 1182
Mahal. Distance .379 51.073 1.998 3.053 1182
Cook's Distance .000 .074 .002 .007 1182
Centered Leverage Value .000 .043 .002 .003 1182
a. Dependent Variable: Students’ Achieved Average Results
In this study, the critical values for evaluating Mahalanobis distance (see
Tabachnick and Fidell, 2007) was 13.82 because it had two independent
variables only. Table 04 above represents the results of residual statistics from
where, under the column headed ‘Maximum’, it can be observed that the
Mahalanobis Distance for this study was 51.073 which was much higher than the
critical value (13.82), and 13 specific cases with the largest Mahalanobis
Distance were responsible for this deviation. However, instead of removing those
13 cases, they were considered to be kept because the maximum value for Cook’s
Distance (see Table 04: Residual Statistics) of this study was .074, suggesting no
major problemii.
4.6 Multi-colinearity Test
To assess the degree of multi-colinearity, ‘Tolerance’ and ‘VIF’ (variation
inflation factor) were used (Stapelton, 1995) in this study. Table 05 represents the
outputs of ‘Collinearity Diagnostics’ which was actually performed as a part of
standard multiple regression analysis. Here the values given in the column
headed ‘Tolerance’ was calculated by the formula: 1-R2 for each variable.
Standardized Regression assumes that, if this value is very low (near 0), then
there is a possibility of multi-colinearity. From Table 05 below, it can be

Journal of Business and Technology (Dhaka)
40
observed that the tolerance values for the two independent factors were identical
and quite respectable (SNSs= .734, MMAs = .734) in this study, and the VIF
values for those two specific factors were 1.362. Hence, it was not only
confirmed that this study did not violated the assumption of multi-colinearity and
but also no problem of multi-colinearity appears to be present in the study.
TABLE 5
COEFFICIENTS OF STUDENTS’ ACHIEVED AVERAGE RESULTS
Model
Unstandardized
Coefficients
Standardized
Coefficients t Sig.
Collinearity
Statistics
B Std. Error Beta Tolerance VIF
1 (Constant) 6.681 .028 242.494 .000
Use of SNSs -.911 .022 -.795 -42.261 .000 .734 1.362
Use of MMAs -.041 .011 -.069 -3.668 .000 .734 1.362
4.7 Assessment of Null Hypotheses
Table 6 below represents the outcome of analysis of variance (ANOVA) as a
part of standard multiple regression analysis.
TABLE 6
ANALYSIS OF VARIANCE (ANOVA B)
Model Sum of Squares df Mean Square F Sig.
1 Regression 421.104 2 210.552 1332.608 .000a
Residual 186.104 1179 .158
Total 607.208 1181
a. Predictors: (Constant), Use of SNSs, Use of MMAs.
b. Dependent Variable: Students’ Achieved Average Results
In Table 6, mentioned above, the F value was derived from dividing the
Mean Square Model (210.552) by the Mean Square Residual (0.158), which was
equal to 1332.608. Consequently, the P value associated with this F value, shown
under the column headed ‘Sig.’, was less than 0.001. Thus P and F value depicted
in Table 06 above indicates that independent variables (SNSs and MMAs) of this
study reliably predicted the dependent variable (Student’s Achieved Average
Results) along with strong evidence against the null hypothesis.

Kabir, Akter & Ferdus : Exploitation of Social Networking Sites & Students Results 41
4.8 Evaluation of the Model
Standard Multiple Regression analysis was conducted to evaluate the model
used in this study. The column’s value in Table 7 under the heading ‘Adjusted R
Square’ indicates 69.3% (0.693 X 100) of variance in Student’s Achieved
Average Results.
TABLE 7
MODEL SUMMARY B
Model R R Square Adjusted R Square Std. Error of the Estimate
1 .833a .694 .693 .397
a. Predictors: (Constant), Use of SNSs, Use of MMAs.
b. Dependent Variable: Students’ Achieved Average Results
More precisely, the ‘Beta Value’ of independent factors under the column
‘Standardized Coefficients’ in Table 4 represents which of the factors included in
this model contributed to the prediction of dependent variable. The largest
standardized beta coefficient found in this study was -0.795 which stands for
‘Use of SNSs’. It represents that, when the variance explained by all other
variables in this model was controlled for, this variable (Use of SNSs) made the
most strongest and unique contribution to explain the dependent variable
(Students’ Achieved Average Results) significantly (Sig = .000). For further
query, ‘Sequential Multiple Regression’ analysis was conducted to understand
that, if we control the possible effect of ‘Gender’, ‘Age’, ‘Marital Status’,
‘Academic Year and Semester’ as additional independent factors, whether or
not, the main set of independent variables (Use of SNSs and MMAs) still be able
to predict a significant amount of variance in ‘Students’ Achieved Average
Results’. As demonstrated in Table 08 below, it can be realize that, after entering
the additional factors (Gender, Marital Status, Age, Academic Year and
Semester) into the ‘Block 1’, the overall model (Model 1) had explained 4.4%
variance in students’ achieved average results. Next, after entering all the
assumed independent factors together (Gender, Marital Status, Age, Academic
Year, Semester, Use of SNSs and MMAs) into the ‘Block 2’, engendered ‘Model
2’ as a whole had explained 69.8% variance. It means that, if the effects of
‘Gender’, ‘Age’, ‘Marital Status’, ‘Academic Year’ and ‘Semester’ were
statistically controlled for, ‘Use of Social networking sites (SNSs)’ and ‘Use of
Mobile Messaging Applications (MMAs)’ together can explain an additional
65% variance in ‘Students’ Achieved Average Results’ in the context of

Journal of Business and Technology (Dhaka)
42
Bangladesh significantly (see Table 08 where R Square Change = .650, F change
= 1264.909, p < .001).
TABLE 8
MODEL SUMMARY OF THE SEQUENTIAL MULTIPLE REGRESSION
Model R R
Square
Adjusted
R
Square
Std.
Error
of the
Estimate
Change Statistics
R Square
Change
F
Change df1 df2
Sig. F
Change
1 .219a .048 .044 .701 .048 11.856 5 1176 .000
2 .836b .698 .696 .395 .650 1264.909 2 1174 .000
a. Predictors: (Constant), Semester, Academic year, Gender, Marital Status, Age
b. Predictors: (Constant), Semester, Academic year, Gender, Marital Status, Age, Use of
MMAs, Use of SNSs.
c. Dependent Variable: Achieved Average Results
TABLE 9
COEFFICIENTSA OF FACTORS CONTRIBUTING IN MODEL 1 & MODEL 2
Model
Unstandardized
Coefficients
Standardized
Coefficients t Sig.
B Std. Error Beta
1
(Constant) 5.606 .359 15.611 .000
Respondents Gender .112 .045 .074 2.469 .014
Respondents Age -.014 .016 -.029 -.897 .370
Marital Status -.086 .062 -.041 -1.393 .164
Academic year .116 .022 .170 5.369 .000
Semester -.107 .028 -.111 -3.843 .000
2
(Constant) 6.878 .204 33.665 .000
Respondents Gender -.030 .026 -.020 -1.146 .252
Respondents Age -.007 .009 -.015 -.815 .416
Marital Status -.048 .035 -.022 -1.361 .174
Academic year .044 .012 .064 3.553 .000
Semester -.024 .016 -.025 -1.493 .136
Use of SNSs -.902 .022 -.787 -41.510 .000
Use of MMAs -.039 .011 -.067 -3.516 .000
Additionally, the ‘Beta Value’ of independent factors, shown under the
column ‘Standardized Coefficients’ in Table 09 above, represents which of the
factors included in the Model 2 had contributed to the prediction of dependent

Kabir, Akter & Ferdus : Exploitation of Social Networking Sites & Students Results 43
variable as well as the degree of their individual significance of unique
contribution. By scanning the ‘Sig. column’, it can be unfolded that, out of seven
independent factors, only three factors had contributed statistically (p value less
than .05). As said by the importance those were: Use of Social networking sites
(beta = - 0.787), Use of Mobile Messaging Application (beta = - 0.067), and
Academic Year (beta = 0.064).
5. CONCLUSIVE GENERALIZATION OF ANALYSES
In the context of Bangladesh, this study conclusively generalizes according
to the analyzed findings that, approximately 77% of Bangladeshi university
students do not use more than two social networking sites (SNSs); 83.8%
students have mentioned up to 2.5 hours per day as maximum tenure of using
SNSs; and Facebook is the most frequently preferred SNSs among the other
popular SNSs. In terms of using different mobile messaging applications
(MMAs), ‘eBuddy’ and ‘NimBuzz’ are found commonly used by Bangladeshi
Students and most of the students are using these messaging applications up to 04
hour in a day. As consequences, it has significantly been found in this study that,
university students’ academic results are inversely influenced by their use of
different social networking sites and mobile messaging application. That is, the
more a student gets involved in using such SNSs and MMAs, the more lower
grades might be achieved by them. It has been suggested based on the
aforementioned findings that, students use of SNSs and MMAs must be closely
monitored by their parents and teachers, and if possible, such use should be
controlled after a certain extent to lower the possible distractions engendering
from it and hence, uplifting their academic performance.
6. CONSTRAINTS OF THIS STUDY AND FUTURE RESEARCH
IMPLICATIONS
By scrutinizing the post works on how the social networking sites affects the
students, this study has attempted to merge the existing gap within the literature
in the context of Bangladesh and hence, has presented some statistically
significant information on it. But, caused by the time and funding constraints,
this study could not conduct any inter-sector and intra-sector analysis to validate
its findings and thus its replicability and generalizability, until now, are required
to be tested. Thus, it proposes to the further comprehensive research studies to
incorporate all of those excluded aspects.

Journal of Business and Technology (Dhaka)
44
APPENDIX 1.A
DEMOGRAPHIC CHARACTERISTICS OF SAMPLE
Demographic Factors Frequency Percent Cumulative
Percent
Gender
Male 785 66.4 66.4
Female 397 33.6 100.0
Total 1182 100.0
Age
17 2 .2 .2
18 14 1.2 1.4
19 92 7.8 9.1
20 218 18.4 27.6
21 329 27.8 55.5
22 245 20.7 76.2
23 185 15.7 91.9
24 75 6.3 98.2
25 20 1.7 99.9
26 1 .1 100.0
Total 1181 99.9
System 1 .1
1182 100.0
Year
1st Year 206 17.4 17.4
2nd Year 242 20.5 37.9
3rd Year 409 34.6 72.5
4th Year 325 27.5 100.0
Total 1182 100.0
Demographic Factors Frequency Percent Cumulative
Percent
Semester
1st Semester 549 46.4 46.4
2nd Semester 427 36.1 82.6
3rd Semester 206 17.4 100.0
Total 1182 100.0
APPENDIX 1.A Cont.

Kabir, Akter & Ferdus : Exploitation of Social Networking Sites & Students Results 45
Category of Students
Weak Students 1 .1 .1
Below Average Students 2 .2 .3
Above the Below Average
Students 6 .5 .8
Average Students 120 10.2 10.9
Above Average Students 419 35.4 46.4
Well-built Students 634 53.6 100.0
Total 1182 100.0
APPENDIX 1.B
DEMOGRAPHIC STATISTICS
Semester Respondents
Age Academic year
Mean 1.71 21.40 2.72
Std. Error of Mean .022 .043 .031
Median 2.00 21.00 3.00
Mode 1 21 3
Std. Deviation .745 1.473 1.049
Variance .555 2.169 1.100
Minimum 1 17 1
Maximum 3 26 4

Journal of Business and Technology (Dhaka)
46
APPENDIX 2.A
QUANTITY OF ACTIVE SOCIAL NETWORKING SITES (SNSS) AND
INSTALLED MOBILE MESSAGING APPLICATIONS (MMAS)
Quantity Students
Category
No. of Registered Active
SNSs
No. of Installed MMAs
Frequency Percent Cumulative
Percent Frequency Percent
Cumulative
Percent
0 Don’t / Can’t
Use 66 5.6 5.6 496 42.0 42.0
01 - 02 Trivial Users 919 77.7 83.3 375 31.7 73.7
03 - 04 Slightly Heavy
Users 147 12.4 95.8 151 12.8 86.5
05 -06 Heavy Users 45 3.8 99.6 88 7.4 93.9
07 - 08 Overly Heavy
Users 5 .4 100.0 50 4.2 98.1
09 and
Above
Unusually
Heavy Users 0 0
22 1.9 100
Total 1182 100.0 1182 100.0
APPENDIX 2.B
TENURE OF USING SOCIAL NETWORKING SITES (SNSS) AND
INSTALLED MOBILE MESSAGING APPLICATIONS (MMAS)
Use of Social Networking Sites (SNSs) Use of Mobile Messaging
Applications (MMAs)
Category of
Use Frequency Percent
Cumulative
Percent
Category of
Use Frequency Percent
Cumulative
Percent
Don't/Can't
Use 66 5.6 5.6
Can't Use 496 42.0 42.0
Up to 2.5
Hours 990 83.8 89.3
Up to 04
Hours 680 57.5 99.5
More than
2.5 Hours 126 10.7 100.0
More than
04 Hours 6 .5 100.0
Total 1182 100.0 Total 1182 100.0

Kabir, Akter & Ferdus : Exploitation of Social Networking Sites & Students Results 47
APPENDIX 3
FREQUENCY OF USING DIFFERENT SOCIAL NETWORKING SITES (SNSS)
AND
MOBILE MESSAGING APPLICATIONS (MMAS)
Frequency Percent Cumulative Percent
Different Social networking sites and their frequency of use
Facebook 1046 88.5 88.5
Twitter 26 2.2 90.7
Linkedin 4 .3 91.0
Pinterest 4 .3 91.4
MySpace 1 .1 91.5
GooglePlus+ 14 1.2 92.6
Tagged 1 .1 92.7
CafeMoM 7 .6 93.3
Ning 3 .3 93.6
Meetup 1 .1 93.7
myLife 1 .1 93.7
I don't have any such type of account 74 6.3 100.0
Total 1182 100.0
Different mobile massaging applications and their frequency of use
Line 58 4.91 4.9
whatsApp 48 4.06 9.0
Viber 60 5.0 14.0
MessageMe 81 6.85 20.9
eBuddy 162 13.71 34.6
HeyTell 14 1.19 35.8
TextNow 53 4.48 40.3
NimBuzz 130 11.0 51.3
WeChat 60 5.0 56.3
SNSpchat 2 .2 56.5
Others 18 1.52 58.0
My cell phone doesn’t support such
type of applications 496 42 100.0
Total 1182 100.0

Journal of Business and Technology (Dhaka)
48
REFERENCES
Ahmed, I. and Qazi, F. T. (June)‘A look out for academic impacts of social networking
sites (SNSs): A student based perspective’, African Journal of Business
Management, 5(12), 5022-5031.
Akhter, M. M. Siddique, M. N. and Masum, A. A (2011) ‘Analysis of Social Network and
its Effect on Job Satisfaction and Employee Performance’. ASA University
Review, 5(1), 195-207
Alam, M.J.B., Kabir, S.M.L and Elizabeth, H. (2006) ‘E-Learning in Bangladesh:
Implementation and Evaluation of a Pilot Project’, Retrieved from
http://www.codewitz.net/papers/MMT_77-82_e-Learning_in_Bangladesh.pdf,
Alam, M. S. (2013) ‘Future Prospect of 3G Network in Bangladesh’, National
Conference on Need Assessment of B.Sc. Engineering in CSE Program, February
20, 2013.
Anderson, J. Q. and Rainie, L. (2012) ‘Millennials will benefit and suffer due to their
hyperconnected lives’, Washington DC: Pew Research Center.
Anderson, K. (1999) ‘Internet use among college students: Should we be concerned?’,
Paper presented at the American Psychological Association, Boston, MA.
Asad, S., Mamun, M.A. and Clement, C.K. (2012) ‘The Effect of Social Networking Sites
to the Lifestyles of Teachers and Students in Higher Educational Institutions’,
International Journal of Basic and Applied Sciences, Vol. 1 Iss. 4, PP. 498-510.
Azam, M. S. (2007) ‘Internet Adoption and Usage in Bangladesh. Japanese Journal of
Administrative Science’ Volume20, No.1, 2007, pp. 43-54.
Barratt, W., Hendrickson, M., Stephens, A. and Torres, J. (2005) ‘Thefacebook.com:
Computer mediated social networking’, Student Affairs Online, 6(1), 1-5.
Boyd, D., & Ellison, N. (2007) ‘Social Network Sites: Definition, History and
Scholarship’, Journal of Computer-Mediated Communication, 13(1).
Brenner, V. (1997) ‘Psychology of computer use: XLVII. Parameters of Internet use,
abuse and addiction: The first 90 days of the Internet usage survey’, Psychological
Reports, 80, pp. 879-882.
Briggs, S.R. and Cheek, J.M. (1986) ‘The role of factor analysis in the development and
evaluation of personality scales’, Journal of Personality, 54, 106–48.
Bryer, T. and Zavattaro, S. (2011) ‘Social media and public administration: Theoretical
dimensions and introduction to symposium’, Administrative Theory & Praxis,
33(3), 327.
Canales, C., Wilbanks, B. and Yeoman, A. (2009) ‘Facebook Usage in Relation to
Personality and Academic Performance’, Modern Psychological Studies, Spring.
Chen, B. and Bryer, T. (2012)‘Investigating Instructional Strategies for Using Social
Media in Formal and Informal Learning’, The International Review of Research
in Open and Distance Learning,13(1), 87-104.
Connolly, M. (2011, October) ‘Benefits and Drawbacks of Social Media in Education’,
Retrieved from Wisconsin Center for Education Research:
http://www.wcer.wisc.edu/news/coverstories/2011/benefits_and_drawbacks.php
DeVellis, R.F. (2003) ‘Scale development: Theory and applications (2nd edn)’ Thousand
Oaks, California: Sage

Kabir, Akter & Ferdus : Exploitation of Social Networking Sites & Students Results 49
Debnath, N. C. and Mahmud, A. A. (2007) ‘The Environment of E-Commerce in
Bangladesh’, Daffodil International University Journal of Business and
Economics, 2(2).
Down, B. (2009) ‘Schooling, Productivity and the Enterprising Self: Beyond Market
Values’, Critical Studies in Education, 50(1).
EU. (2009) ‘ Safer Social Networking Principles for the EU’, European Commission.
Gonzalez, N. ‘CheckFacebook.com: Facebook marketing statistics, demographics,
reports, and news’, Retrieved from: http://www.checkfacebook.com, Accessed
December 8, 2013.
Hampton, K. N., Sessions-Goulet, L., Rainie, L., & Purcell, K. (2011) ‘Social networking
sites and our lives’, Washington, DC: Pew Research Center.
Hargittai, E., & Hsieh, Y. P. (2010, June) ‘Predictors and Consequences of Differentiated
Practices on Social Network Sites’, Information, Communication & Society, 13(4),
pp. 515-536.
Horn, S. (1998) ‘ Cyberville: Clicks, culture, and the creation of an online town’, New
York: Warner Books.
Internet World Stats: Usage and Population Statistics’ (2004), at
http://www.internetworldstats.com/, accessed 02 January 2014.
Junco, R., Heibergert, G. and Loken, E. (2011) ‘The effect of Twitter on college student
engagement and grades’, Journal of Computer Assisted Learning, 27, 119-132.
Karpinski, A. C., & Duberstein, A. (2009, April) ‘A Description of Facebook Use and
Academic Performance among Undergraduate and Graduate Students’, San
Diego, California: American Educational Research Association.
Katz, J., & Aspden, P. (1997) ‘A nation of strangers? Friendship patterns and community
involvement of Internet users’, Communications of The ACM, 40, pp. 81–86.
Kolek, E. A. and Saunders, D. (2008) ‘Online disclosure: An empirical examination of
undergraduate Facebook profiles’,NASPA Journal, 45(1), 1-25.
Kraut, R., Lundmark, V., Patterson, M., Kiesler, S. and Mukapadhyay, T. (1998)
‘Internet Paradox: A Social Technology that Reduces Social Involvement and
Psychological Well-being?’, American Psychologist, 53: 1017-1031.
Kraut, R., Patterson, M., Lundmark, V., Kiesler, S., Mukophadhyay,T., & Scherlis, W.
(1998) ‘Internet paradox: A social technology that reduces social involvement and
psychological well-being?’, American Psychologist, 53(9), pp. 1017–1031.
Kubey, R. W., Lavin, M. J. and Barrows, J. R. (2001)‘Internet use and collegiate
academic performance decrements: Early findings’, Journal of Communication,
51, 366-382.
Lane, Barney (2006), ‘The Economic and Social Benefits of Mobile Services in
Bangladesh: A case study for the GSM Association’. Retrieved from:
http://www.dirsi.net/english/files/Ovum%20Bangladesh%20Main%20report1f.pdf
Lenhart, A. (2009) ‘Teens and Social Media: An Overview’, New York: Pew Internet &
American Life Project.
Madge, C., Meek, J., Wellens, J. and Hooley, T. (2009) ‘Facebook, social integration
and informal learning at university: It is more for socializing and talking to

Journal of Business and Technology (Dhaka)
50
friends about work than for actually doing work’, Learning, Media, and
Technology, 34 (2), 141-155.
Mafiz, A. I., Ismail, I. and Bhuyan, M. A. H. (2011) ‘Effects of Socio-economic,
Demographic and Internet Exposure Factors on School Performance among
Selected Students of Nilkhet High School’, Bangladesh Journal of Nutrition, Vol.
24-25, PP. 107-120.
Mahmud, M. A. A. (2011) ‘Student’s Attitudes towards Internet: A study on Private
University of Bangladesh’, European Journal of Business and Management, Vol. 3
Issn. 2222-1905(paper), Issn 2222-2839 (online)
Mohseni, M., Dowra, B. and Haghighat, M.H.S. (2008), ‘Does the Internet Make People
Socially Isolated?’, A Social Network Approach, Bangladesh e-Journal of
Sociology, Volume 5 Number 1. January 2008.
McQuail, D. (2005) ‘McQuail’s Mass Communication Theory’, 5th edition, London:
Sage Publications.
Mostofa, Sk. M. (2011) ‘Internet Access and Use among Business Students of a Private
University of Bangladesh: A Survey’, Annals of Library and Information Studies,
58, 78-85.
On Line (1996), ‘Chronicle of Higher Education’, 42(33), A21.
Pallant, J. (2010), ‘SPSS Survival Manual: A step by step guide to data analysis using
SPSS (4th ed.)’, New York, NY: Open University Press.
Pasek, J., More, E. and Hargittai, E. (2009) ‘Facebook and academic performance:
Reconciling a media sensation with data’,First Monday, 14(5).
Pew. (2009) ‘Infographics. Retrieved 2012, from Pew Internet’,
http://pewinternet.org/Infographics/Generational-Differences-in-SNS.aspx.
Phusavat, K., Ketsarpong, S., Ooi, K.-B., & Shyu, S. (2012) ‘ Sustaining higer educatino
reforms: Knowledge and policy implications learned from Thailand’, International
Journal of Educational Management, 26(3), 284-301.
Rahaman, Arafatur, Ullah, G. M. Shafayet(2013), ‘Exploration Of Influencing Factors
That Effecting Facebook Privacy Awareness On Bangladeshi Undergraduate
University Student‘s’, International Journal Of Scientific & Technology Research
Volume 2, Issue 6, June 2013.
Rahman, Sayeedur (2002) ‘Internet in Bangladesh’, at http://www.e-
ela.com/computer/InternetBD_122202.html, accessed 21 November 2013.
Rainie, L. (2011, November) ‘The new education ecology’, Powerpoint presentation,
Orlando, Florida.
Rizzuto, T. E., LeDoux, J., and Hatala, J. P. (2009) ‘It's not just what you know, it's who
you know: Testing a model of the relative importance of social networks to
academic performance’, Social Psychology Education, 12, 175-189.
Roknuzzaman, M.(2006) ‘A survey of Internet access in a large public university in
Bangladesh’, International Journal of Education and Development using
Information and Communication Technology(IJEDICT), 2006, Vol. 2, Issue 3, pp.
86-105.
Rosen, L. (2011, August) ‘Poke Me: How Social Networks Can Both Help and Harm Our
Kids’, Washington, DC: American Psychological Association.

Kabir, Akter & Ferdus : Exploitation of Social Networking Sites & Students Results 51
Rouis, S., Limayem, M. and Salehi-Sangari, E. (2011) ‘Impact of Facebook Usage on
Students' Academic Achievement: Role of Self-Regulation and Trust,’ Journal of
Research in Educational Psychology, 9(3), 961-994.
Scherer, K. (1997) ‘College life online: Healthy and unhealthy Internet use’, Journal of
College Student Development, 38(6), 655–665.
Stollak, M. J., Vandenberg, A., Burklund, A. and Weiss, S. (2011) ‘Getting Social: The
Impact of Social Networking Usage on grades Among College Students’,
American Society of Business and Behavioral Sciences, 18(1), 859-865.
Tabachnick, R.G. and Fidell, L.S. (1996), ‘Using multivariate statistics (3rd edition)’,
New York: HarperCollins, Chapter 13.
Tofazzal, I. M., Abu S. M. S. (2006), ‘Current Status and Prospects for E-learning in the
Promotion of Distance Education in Bangladesh’, Turkish Online Journal of
Distance Education, 7(1). ISSN 1302-6488
Wang, Q., Chen, W. and Liang, Y. (2011) ‘The Effects of Social Media on College
Students. The Alan Shawn Feinstein Graduate School’, Providence: Johnson &
Wales University.
Yazedjian, A., Toews, M. and Sevin, T. (2008) ‘It’s a whole new world: a qualitative
exploration of college students’ definitions of and strategies for college students’,
Journal of College Student Development, 49 (2), 141-154.
Young, K. (1996) ‘Internet addiction: The emergence of a new clinical disorder,’
[Online], Available: http://www.pitt.edu/~ksy/apa.html.
Zaman, Farhana.Chowdhury, Priyabrata (2012), ‘Technology Driven Banking in
Bangladesh: Present Status, Future Prospects and Challenges’, BUP JOURNAL,
Volume 1, Issue 1. ISSN: 2219-4851.
Zwart, M. d., Lindsay, D., Henderson, M., & Phillips, M. (2011) ‘Teenagers, Legal Risks
and Social Networking Sites’, Victoria, Australia: Victoria Law Foundation.
i According to Pallant (2010i), “…Cronbach alpha values are, however, quite
sensitive to the number of items in the scale. With short scales (e.g. scales
with fewer than ten items) it is common to find quite low Cronbach values
(e.g. .5). In this case, it may be more appropriate to report the mean inter-item
correlation for the items. Briggs and Cheek (1986i) recommend an optimal
range for the inter-item correlation of .2 to .4. (Pallant, 2010)”. ii According to Tabachnick and Fidell (2007, P. 75) maximum value above 01
refers to a potential problem.