Explaining Total Factor Productivity at Firm Level in Italy: Does Location Matter?
Upload
independentCategory
view
5download
0
eScholarship provides open access, scholarly publishingservices to the University of California and delivers a dynamicresearch platform to scholars worldwide.
Institute of Governmental StudiesUC Berkeley
Title:Explaining Corporate Environmental Performance: How Does Regulation Matter?
Author:Kagan, Robert A., University of California, BerkeleyGunningham, Neil, Australian National UniversityThornton, Dorothy, University of California, Berkeley
Publication Date:09-22-2005
Publication Info:Institute of Governmental Studies, UC Berkeley
Permalink:http://escholarship.org/uc/item/7xd041hz
Explaining Corporate Environmental Performance:
How Does Regulation Matter?
Robert A. Kagan Neil GunninghamDorothy Thornton
How and to what extent does regulation matter in shaping corporatebehavior? How important is it compared to other incentives and mechanismsof social control, and how does it interact with those mechanisms? How mightwe explain variation in corporate responses to law and other externalpressures? This article addresses these questions through an study ofenvironmental performance in 14 pulp and paper manufacturing mills inAustralia, New Zealand, British Columbia, and the states of Washington andGeorgia in the United States. Over the last three decades, we find tighteningregulatory requirements and intensifying political pressures have broughtabout large improvements and considerable convergence in environmentalperformance by pulp manufacturers, most of which have gone ‘‘beyondcompliance’’ in several ways. But regulation does not account for remainingdifferences in environmental performance across facilities. Rather, ‘‘sociallicense’’ pressures (particularly from local communities and environmentalactivists) and corporate environmental management style prod some firmstoward better performance compliance than others. At the same time,economic pressures impose limits on ‘‘beyond performance’’ investments. Inproducing large gains in environmental performance, however, regulation stillmatters greatly, but less as a system of hierarchically imposed, uniformlyenforced rules than as a coordinative mechanism, routinely interacting withmarket pressures, local and national environmental activists, and the cultureof corporate management in generating environmental improvement whilenarrowing the spread between corporate leaders and laggards.
I. Introduction
In what ways and to what extent does regulation matter inshaping corporate behavior? How important is it compared to
Law & Society Review, Volume 37, Number 1 (2003)r 2003 by The Law and Society Association. All rights reserved.
51
The authors are grateful to scores of pulp mill managers, regulatory officials, industryconsultants, and environmental activistsFall of whom must remain anonymousFfor theircooperation and insight. David Sonnenfeld, Kathryn Harrison, Peter May, and anonymousreviewers all gave us valuable advice on earlier drafts. Biyi Abesina provided valuableresearch assistance. The Center for the Study of Law and Society, University of California,Berkeley, provided space, administrative assistance, and social support for the researchproject that led to this article, and the Smith Richardson Foundation funded our research.Please direct correspondence to Robert A. Kagan, Center for the Study of Law & Society,University of California, 2240 Piedmont Ave., Berkeley, CA 94720; tel: (510) 642-4038;email: [email protected].
other incentives and mechanisms of social control, and how does itinteract with those mechanisms? As all firms do not respond in thesame way to law or to other external pressures, how do weunderstand variation in corporate behavior?
In seeking to answer these questions, the sociolegal and policyliterature on regulatory administration traditionally has focused onexplaining corporate compliance and noncompliance with existinglegal requirements. The tacit assumption has been that legalcompliance by targeted groups is the key to meeting the objectivesof social regulation. Underlying that assumption is another: thatregulated business corporations take costly measures to improvetheir performance only when they believe that legal noncomplianceis likely to be detected and harshly penalized (Becker 1968;Stigler 1970; Miller & Anderson 1986; OECD 2000).1 From theviewpoint of traditional models of corporations as ‘‘amoralcalculators’’ (Kagan & Scholz 1984), why would a profit-maximiz-ing company want to do more than the law requires sincecompliance is itself often expensive and overcompliance evenmore so?
Yet it is becoming apparent that an increasing number ofcompanies now perform, to a greater or lesser extent, ‘‘beyondcompliance’’ with existing regulatory requirements. This suggeststhat the degree of variation in, and the motivations for, corporatebehavior may be much broader than many researchers haveimagined. This is of practical importance: some existing regulatorystrategies, in focusing on compliance, have failed to facilitate,reward, or encourage beyond-compliance behavior, or eveninadvertently discourage it,2 while other regulatory reformers,in contrast, have argued that government-mandated self-regula-tion is the key to progress.
There is no better illustration of the importance of studying‘‘overcompliance’’ as well as compliance than the arena of environ-mental regulation. For here there is considerable variation in howfirms respond to external pressures, including regulation, and in atleast some industries, considerable evidence of ‘‘beyond-compli-ance’’ behavior (Smart 1992; Hoffman 1997; Prakash 2000).Indeed, over the last decade, a new body of literature has evolved
1 Even in 2000, the OECD was still assuming that this was the case, see Reducing theRisk of Policy Failure: Challenges for Regulatory Compliance (OECD 2000). See the appendix tothis document for an excellent survey of the academic literature.
2 The two most common regulatory strategies are specification (technology) basedstandards and performance standards (which specify the outcomes to be achieved but nothow to achieve them). Both have a substantial limitation: they only require enterprises toachieve minimum standards and provide no incentives or encouragement to go beyondthose minima. They do not encourage continuous improvement or industry best practice.In contrast, many economic incentives do provide continuing incentives for improvement.
52 Explaining Corporate Environmental Performance
on the ‘‘greening of industry.’’3 At its heart lies the unresolvedquestion, ‘‘What are the determinants of greening?’’ Notwithstand-ing some valuable case studies (confined to environmental leaders)and some less illuminating survey evidence,4 adequate empiricalanswers have not been forthcoming (Fuchs & Mazmanian 1998).We still know little about why individual corporations behave theway they do in the environmental context, or why some companiesbut not others choose to move beyond compliance, or what socialpolicy tools are likely to prove most effective in achieving improvedcorporate environmental performance. For example, although it iswidely assumed that variations in regulation and regulatoryenforcement account for differences in environmental perfor-mance by regulated businesses, it is far from clear that this isindeed the case. It is equally plausible (at least in economicallyadvanced democracies) that differences among regulatory regimeshave narrowed sharply, and that local social pressures, marketincentives, and corporate environmental management are now thechief determinants of variations in firm-level environmentalperformance, and of beyond-compliance behavior in particular.
In this article, we seek to advance the empirical understandingof these questions by reporting the results of our study of 14 pulpand paper manufacturing mills in British Columbia, Canada;Australia; New Zealand; and the states of Washington and Georgiain the United States. We have used a combination of qualitative andquantitative data gathered in 1998–1999 to examine a number ofalternative explanations for variation in ‘‘environmental perfor-mance’’ across business corporations. We have particularly focusedon the role of (1) regulatory regimes; (2) economic variables (suchas firm-level economic incentives and resources); (3) political andsocial pressures; and (4) corporate environmental managementand attitudes. We address these questions: What explains both anarrowing in the gap between best and worst performers and thesubstantial variation that remains? To what extent, and how, dovarious external environmental drivers, such as regulation,market, or community pressures impact on corporate environ-mental performance? What is the relationship between managerialattitudes and environmental performance: to what extent does
3 The Greening of Industry conference and the journals Business Strategy andEnvironment, Greener Management International, and the Journal of Industrial Ecology are themain vehicles for this movement.
4 The survey methodology is weakened by relatively low response rates (which makesthe sample less representative), by the inability of researchers to probe general responsesfor concrete details and other supportive evidence, and by the noncomparability of therespondents’ different industrial and ecological contexts. The in-depth case studies of oneor a few firms are more reliable, but are weaker in explanatory power and external validity.The large majority are also highly selective, being ‘‘success stories’’ that provide insightsbut from which it would be very dangerous to generalize. Moreover, they are not capable ofexplaining variation between firmsFour key research challenge.
Kagan, Gunningham, & Thornton 53
‘‘management matter’’? And do different types of regulatoryregime achieve different environmental outcomes?
II. Research Methods
We focused on the pulp and paper industry for a number ofreasons. The manufacture of pulp is chemically intensive andhistorically a major source of serious air and water pollution.Consequently, pulp mills have been an important focus of environ-mental regulation all around the world. Because the industry isclosely scrutinized, we were able to examine the influence ofenvironmental advocacy organizations and local communities, aswell as regulatory agencies, on corporate environmental perfor-mance. Because pulp mills have been obliged to develop complexsystems of internal regulation and record keeping, we were able tostudy differences among firms in management styles and to obtainrelatively detailed data concerning their control technologies andemissions. The industry’s ubiquity enabled us to compare the impactof regulatory regimes on the same industrial processes in fournationsFCanada, Australia, New Zealand, and the United States. Toenable us to make meaningful comparisons between the environ-mental performance of different mills we selected mills with oneparticular production technology.
A. The Sample of Firms
We focused on one Canadian province (British Columbia) andtwo American states (Washington and Georgia) that each had anumber of comparable-technology pulp mills. In New Zealand andAustralia, the number of similar kinds of mills was very muchsmaller and we could not choose particular subnational jurisdic-tions. A total of 15 mills agreed to cooperate, but one of the latterclosed its doors, leaving us with 14.5 We promised all our
5 In selecting which mills in each jurisdiction to study, we chose not to select them atrandom because we wanted to be sure to include some firms that had a reputation foroutstanding environmental performance and some that did not. Through preliminarydiscussions with regulatory officials, industry association representatives, environmentalNGOs, and other informed sources, we identified facilities with a reputation for excellence.We chose three mills (one in each of BC, WA, GA) for their good reputation. The totalnumber of mills that met our study criteria (same technology) in each jurisdiction were:BC514, GA55, WA54, NZ5 2, and AUS51. We then chose all available mills in WA,NZ, and AUS. In BC we deliberately chose a mill that was operated by the same parentcorporation as two other mills already chosen, enabling us to compare the relative impactof corporate management and regulatory jurisdiction. We then chose two mills in BC thathad a reputation for being average or below average. In GA, two mills were excluded fordifficulty of access reasons. Thus, of the 14 facilities in our sample, eight were chosen onthe basis of their jurisdiction alone, three were chosen based on their reputation forexcellence, two on the basis of their reputation for being average or below average, andone because it was owned by the same company as two other mills in the study. The samplealso includes smaller independent operations as well as mills owned by large transnationalcorporations.
54 Explaining Corporate Environmental Performance

interviewees confidentiality in the write-up of information weobtained from them.
B. Qualitative Environmental Performance Data
At each facility, we conducted lengthy on-site, semi-structuredinterviews with environmental managers and, in most cases, millmanagers. Our discussions were designed to elicit informationabout each facility’s environmental management and pollutioncontrol history, control systems, challenges, approach to problems,and relations with regulators and environmental activists. Weprobed for specific examples, collecting detailed stories ofparticular environmental, regulatory, and economic problems,current or past, that illustrated the firm’s characteristic response tochallenges. In most cases, we also interviewed officials in corporateheadquarters, regulators, and environmental activists familiar withthe mills in question.6 We sought additional perspective on eachfacility through interviews with industry association officials,environmental consultants, financial analysts, corporate lawyers,other commercial third parties, and, on occasion, mill employees.
C. Quantifiable Environmental Performance Data
Because good environmental performance requires progresson many dimensions, measuring relative success, even within anindustry with comparable processes, is far from simple. In thisarticle, we focus on water pollution alone, partly because of theelusiveness of comparable measures for the many types andsources of air pollution in pulp mills, and partly because of theconsensus that certain contaminants in pulp mill wastewater, if notcontrolled, have especially serious impacts on aquatic ecosystemsand human health. We concentrated, therefore, on obtaining thefollowing measures of water pollution data, which pulp mills in allour jurisdictions are obligated to monitor and report.
1. Biological Oxygen Demand (BOD), the standard measure oforganic pollutant content of water, is a universally important
6 We interviewed HQ people at 7 out of the 14 facilities, regulators at 10 facilities, andactivists at 6 facilities. In a small minority of cases, where direct contact was not practicable,we conducted telephone interviews. In some cases, we conducted follow-up telephoneinterviews with mill personnel and relevant regulatory officials. In our interviews with pulpmill personnel, we asked, inter alia, (1) what environmental protection actions companypersonnel were proudest of and why they had taken them; (2) what actions they believedstill needed to be taken and why these actions had not yet been taken; (3) the extent towhich production and environmental management decisions were integrated; (4) how thecompany evaluated environmental performance; (5) what environmental technology wascurrently in use at the facility; (6) what their experience had been with environmentalregulators and inspectors and what their attitude toward regulation was; (7) what theirexperience had been in relations with host communities and environmental activistsconcerning environmental issues, and what their attitude toward such groups was.
Kagan, Gunningham, & Thornton 55
measure of effluent quality. We were able to obtain 1998 and/or1999 BOD data for 12 mills in the United States, Canada, andNew Zealand (but not in Australia).7
2. Total Suspended Solids (TSS), the standard measure of particulatecontent of water, is another universally important measure ofeffluent quality. We were able to obtain 1998 and/or 1999 TSSdata for 12 mills in the United States, Canada, and New Zealand(but not in Australia).
3. AOX measures the level of absorbable organic halides in mills’effluent waters standardized by production level. AOX is aproxy measure for dioxins and furans, a family of persistentchlorinated organic compounds that accumulate in the foodchain and have been associated with the poisoning of aquaticlife, ecosystem damage, and possible human health effects. Wewere able to obtain comparable 1998 and/or 1999 AOX data fornine mills in the United States, Canada, and New Zealand (butnot Australia).
In addition, for seven mills, we were able to obtain data on theincidence of accidental spills of chemicals used in the pulping andbleaching process. Such spills can result in toxic pollution andoverwhelm the mills’ wastewater-treatment systems, and they alsoare an indicator of the relative quality of the mills’ environmentalmanagement program.
D. Assessing Environmental Management Style
In discussions of emerging strategies of environmental regula-tion, considerable emphasis has been placed on corporateenvironmental management systems, conceived of as formalizedprocedures for making and implementing corporate environmen-tal policies, auditing results, and responding to shortcomings. Yet ithas not been clear that adopting formalized management plans,which can be instituted for primarily symbolic reasons, actuallyproduces improved environmental performance. Cary Coglianese(2001), for example, has argued that managerial attitudes andactionsFwhat he labels ‘‘commitment’’Fare the key variables inshaping corporate environmental performance. Our field research,accordingly, sought to identify ‘‘environmental management style’’at each of the mills and corporations in our sample. By manage-ment style, we refer to the combination of managerial attitudes andactions that mark the intensity and character of each management’s
7 The mill-level data on BOD, TSS, and AOX is not easily available to the public inaccessible form amenable to cross-mill comparison. Thus we were able to obtain some datafor all 14 mills, but not the same set of data for all mills. Time periods over which thereported emissions data was averaged (daily, monthly, or annual) often varied fromjurisdiction to jurisdiction, as did the time period for which various kinds of data wasavailable for different mills (e.g., 30 years, 10 years, 2 years, 1 year).
56 Explaining Corporate Environmental Performance
‘‘commitment’’ to meeting environmental responsibilities. We focuson both attitudes and implementing actions because we learnedthat that managerial attitudes toward environmental matters couldbest be inferred from managers’ accounts of the decisions andactions they had taken in response to particular regulatory orcommunity challenges.
Thus we based our assessment of each mill’s ‘‘environmentalmanagement style’’ on (1) managers’ ‘‘expressed attitudes’’ towardenvironmental problems, (2) managers’ actions and implementa-tion efforts to meet specific economic, regulatory, and communitychallenges, and (3) their explanations for those actions. We reliedon our interview data to score each firm8 on three relateddimensions of commitment to environmental values: (1) theintensity of managerial scanning for environmentally relevantinformation, including the search for ‘‘win-win’’ expendituresidentified as both environmentally good and economically desir-able for the firm; (2) the management’s degree of responsiveness toenvironmentally relevant information, including demands fromregulators, customers, neighbors, and environmental activists; and(3) the assiduousness with which the facility had institutionalizedimplementing routines to ensure high levels of environmentalconsciousness and control capacity (including activities such asself-auditing, employee training, and close integration of environ-mental and production-oriented training and decision making).We sought to increase the validity of our assessment of each firm onthese dimensions by coding the qualitative data separately so thatall three members of our research team agreed on the samecharacterization of the firm’s environmental management style.
We found it difficult, however, to agree on a single numericalscore for each mill because of the large number of activities withineach of the three categories and because we could not easily weightthe categories in terms of importance. However, we foundourselves in substantial agreement when we grouped the compa-nies more holistically in terms of ideal types, while still drawing onthe initially identified variables. We constructed five ideal types:Environmental Laggards, Reluctant Compliers, Committed Compliers,Environmental Strategists, and True Believers. Each successive man-agerial ‘‘type’’ displays incrementally greater commitment tocompliance (or ‘‘overcompliance’’) with regulatory requirements,scanning for environmental information and opportunities, respon-siveness to regulators and environmental activists, and development
8 We took care to develop our measures of mill environmental management beforewe analyzed the objective pollution data for each mill, and indeed before we had evenobtained the environmental performance data for some facilities. This separate assessmentwas designed to ensure that our knowledge of firm-level environmental performance didnot influence our assessment of the firms’ management style.
Kagan, Gunningham, & Thornton 57
of reliable implementing routines for their environmental policies.The Appendix contains a more extensive description of each type.
III. Findings
A. General Pattern: Compliance, Declining Pollution, NarrowingDifferences
Over the last few decades, the pulp and paper industry hasgradually reduced many important categories of environmentallyharmful emissions. For the industry as a whole, biological oxygendemand (BOD) in effluent per ton of pulp produced decreased 90%between 1959 and 1988, total suspended solids (TSS) decreased by80% between 1979 and 1988 (Armstrong et al. 1998:123), anddioxin decreased by 90% between 1992 and 1998.9 Canadian govern-ment data show that between 1990 and 1999, British Columbia’s 22pulp mills reduced BOD emissions (per ton of pulp produced) by91%, TSS emissions by 50%, and AOX emissions by 83%, and therehas been a considerable narrowing of differences betweenenvironmental ‘‘leaders and laggards’’ in levels of pollution.
Mill-level data from our sample facilities mimic that industry-wide trend, as indicated by Figure 1, which displays total BODemissions (as opposed to BOD per unit of pulp produced) for thetwo mills for which we obtained the longest time series data. In thelate 1990s, for which we have good comparative data, JF wasamong the worst environmental performers in our sample, whileTS was among the best; hence the trends for the other sampledmills probably have been quite similar.
In 1999, none of the mills we studied were regulatory laggardsin the sense of being ignorant of or systematic evaders of their‘‘regulatory licenses.’’ All the mills in our sample generally were incompliance with their regulatory permits, and indeed theiremissions of BOD and TSS generally were substantially lowerthan the levels required by their permits.10 The finding of general
9 In the United States, the American Forest and Paper Association (AF&PA) haswritten that new bleaching practices have achieved a 90% reduction in chlorinated organicdischarges since 1975 (AF&PA 2000:5). The volume of water consumed per unit of pulpproduction fell by 70% in the last 40 years (Armstrong et al. 1998:123). Total energyconsumed per ton of pulp produced fell 30% between 1972 and 1999 (AF&PA 2000:12)and sulfur dioxide emissions per ton of pulp produced fell 65% between 1980 and 1999(AF&PA 2000:6).
10 With respect to water pollution, for facilities in the United States and Canada, wewere able to compare each mill’s BOD and TSS discharges with the legal limits prescribedin their regulatory permits. In 1998–1999, these nine mills’ BOD emissions were muchlower than the permitted amount, ranging from 18–85% of their permit limits, with a meanof 38%. For TSS, the range was 14–66% of permit limits and the mean was 36%. Thecorrelation between permit limit and actual performance was 0.46 for BOD; 0.30 for TSS.No correlation for AOX is reported because U.S. permits do not prescribe numeric limitsfor AOX.
58 Explaining Corporate Environmental Performance

0
2000
0
4000
0
6000
0
8000
0
1000
00
1200
00
1400
00
1600
00
1966
1967
1968
1969
1970
1971
1972
1973
1974
1975
1976
1977
1978
1979
1980
1981
1982
1983
1984
1985
1986
1987
1988
1989
1990
1991
1992
1993
1994
1995
1996
1997
1998
1999
TS
An.
Av.
BO
DJF
An
Av
BO
D
Fig
ure
1.
An
nu
alav
erag
eB
OD
(lb
/day
)at
TS
and
JF.
Kagan, Gunningham, & Thornton 59
compliance is in keeping with findings of other recent studies ofthe pulp and paper industry.11
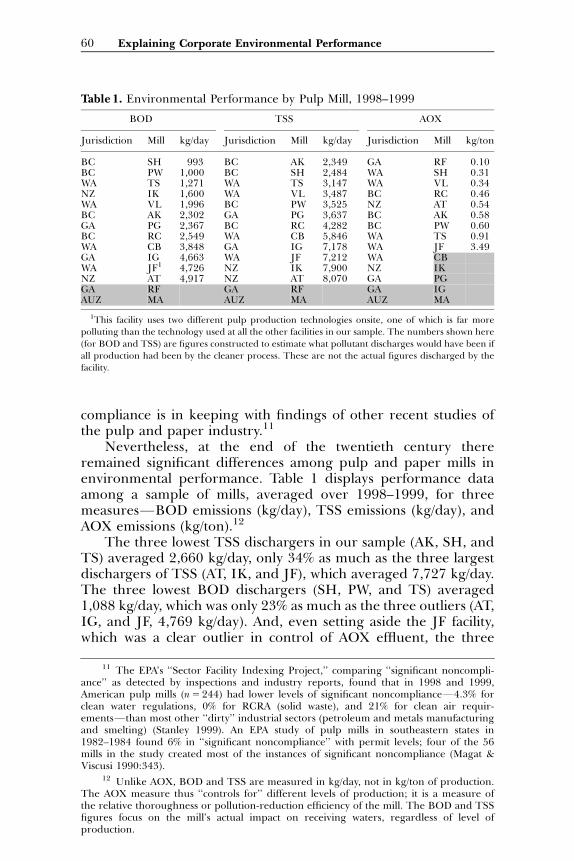
Nevertheless, at the end of the twentieth century thereremained significant differences among pulp and paper mills inenvironmental performance. Table 1 displays performance dataamong a sample of mills, averaged over 1998–1999, for threemeasuresFBOD emissions (kg/day), TSS emissions (kg/day), andAOX emissions (kg/ton).12
The three lowest TSS dischargers in our sample (AK, SH, andTS) averaged 2,660 kg/day, only 34% as much as the three largestdischargers of TSS (AT, IK, and JF), which averaged 7,727 kg/day.The three lowest BOD dischargers (SH, PW, and TS) averaged1,088 kg/day, which was only 23% as much as the three outliers (AT,IG, and JF, 4,769 kg/day). And, even setting aside the JF facility,which was a clear outlier in control of AOX effluent, the three
Table 1. Environmental Performance by Pulp Mill, 1998–1999
BOD TSS AOX
Jurisdiction Mill kg/day Jurisdiction Mill kg/day Jurisdiction Mill kg/ton
BC SH 993 BC AK 2,349 GA RF 0.10BC PW 1,000 BC SH 2,484 WA SH 0.31WA TS 1,271 WA TS 3,147 WA VL 0.34NZ IK 1,600 WA VL 3,487 BC RC 0.46WA VL 1,996 BC PW 3,525 NZ AT 0.54BC AK 2,302 GA PG 3,637 BC AK 0.58GA PG 2,367 BC RC 4,282 BC PW 0.60BC RC 2,549 WA CB 5,846 WA TS 0.91WA CB 3,848 GA IG 7,178 WA JF 3.49GA IG 4,663 WA JF 7,212 WA CBWA JF1 4,726 NZ IK 7,900 NZ IKNZ AT 4,917 NZ AT 8,070 GA PGGA RF GA RF GA IGAUZ MA AUZ MA AUZ MA
1This facility uses two different pulp production technologies onsite, one of which is far morepolluting than the technology used at all the other facilities in our sample. The numbers shown here
(for BOD and TSS) are figures constructed to estimate what pollutant discharges would have been ifall production had been by the cleaner process. These are not the actual figures discharged by thefacility.
11 The EPA’s ‘‘Sector Facility Indexing Project,’’ comparing ‘‘significant noncompli-ance’’ as detected by inspections and industry reports, found that in 1998 and 1999,American pulp mills (n5244) had lower levels of significant noncomplianceF4.3% forclean water regulations, 0% for RCRA (solid waste), and 21% for clean air requir-ementsFthan most other ‘‘dirty’’ industrial sectors (petroleum and metals manufacturingand smelting) (Stanley 1999). An EPA study of pulp mills in southeastern states in1982–1984 found 6% in ‘‘significant noncompliance’’ with permit levels; four of the 56mills in the study created most of the instances of significant noncompliance (Magat &Viscusi 1990:343).
12 Unlike AOX, BOD and TSS are measured in kg/day, not in kg/ton of production.The AOX measure thus ‘‘controls for’’ different levels of production; it is a measure ofthe relative thoroughness or pollution-reduction efficiency of the mill. The BOD and TSSfigures focus on the mill’s actual impact on receiving waters, regardless of level ofproduction.
60 Explaining Corporate Environmental Performance
lowest dischargers (RF, SH, and LV) pumped out only 36% as muchAOX per ton of pulp produced as the three worst performers onthat measure (TS, PW, and AK). The differences between leadersand laggards, it should be noted, is not because the ‘‘laggards’’ arelarger mills or have higher levels of production than the leaders.13
Although it is clear that reductions in these major pollutantshave had positive and meaningful effects on the environment, theremaining effluent, even from the best performing pulp mills,continues to have negative environmental impacts. Thus we are leftwith an important puzzle. Why have some pulp mills done a betterjob in reducing pollution than others? Let us begin by examiningthe influence of different regulatory regimes.
B. Regulatory Regimes and Facility-Level EnvironmentalPerformance
Underlying the tradition of ‘‘command and control’’ regula-tory laws, as well as much popular and academic writing aboutregulation, is a ‘‘deterrence model’’ of firm behavior, which holdsthat business firms abate environmental impacts only as required toby law and when they believe that noncompliance might bedetected and penalized. In this model, variation in environmentalperformance depends on the interaction of: (1) the stringency ofofficial environmental regulations; (2) the likelihood that violationswill be detected (by officials or complainants); and (3) the severityof sanctions for noncompliance, as applied. From that standpoint,one would expect the best-performing pulp mills to be in theregulatory jurisdictions that have the most prescriptive andstringent legal rules, the most fearsome sanctions, and the mostaggressive enforcement style. Other theories of regulation, how-ever, argue that a uniformly aggressive style of regulation is likelyto engender legalistic and political resistance, and that a morecooperative and flexible style of regulatory enforcement will
13 For the sample as a whole, production and environmental performance are notclosely correlated. In 1998/1999, the correlations between production and BOD, TSS, andAOX are 0.03, –0.12, and –0.19, respectively, none of which are statistically significant. Theefficacy of primary and secondary effluent treatment systems varies primarily not with thevolume of wastewater processed but with the capacity and efficiency of the systems andhow well they are maintained and operated. A larger mill may have to build a largercapacity system, but if well designed and operated, it should be able to reduce BOD andTSS to levels comparable to those at smaller mills that have good equipment and goodoperational control.
Nor, as best as we could tell, can intermill differences in effluents be explained bydifferences in types of raw materials, pulping technology, or type of paper produced, withJF as a partial exception. Although ‘‘age of facility’’ in principle might be another source ofvariation, it is difficult to establish an ‘‘age’’ for these facilities, most of which have beencontinuously added to, reconfigured, and remodeled over the years, often under thepressure of regulatory requirements.
MA treats and disposes of its effluent differently from the other mills in our sample,relying in large part on a public treatment works, and hence we dropped its statistics fromour data analysis.
Kagan, Gunningham, & Thornton 61
generate higher levels of compliance, at least if regulators have thecredible capacity to invoke strong legal sanctions against firms thatfail to cooperate (Bardach & Kagan 1982; Scholz 1984; Ayres& Braithwaite 1992; Gunningham & Grabowsky 1998).14 Whichevertheory is correct, however, one would expect a significant correlationbetween regulatory style and environmental performance.
Prior research strongly indicates that the United States tends toemploy a more prescriptive, deterrence-oriented style of regula-tion, whereas Canada, New Zealand, and Australia (like most othereconomically advanced democracies) generally employ a morecooperative, negotiated mode of enforcement.15 Comparingenforcement of environmental regulations for pulp and papermills in the United States and Canada, Kathryn Harrison (1995)concluded that the American regulations were enforced morelegalistically, with more frequent penalties,16 and that compliancewith BOD effluent standards was higher in the United States. Moreimpressionistic studies in Australia suggest that regulators thererely heavily on cooperation and persuasion, with an almostcomplete absence of the kind of coercive enforcement that oftenoccurs in the United States (Gunningham 1987; Grabosky &Braithwaite 1986; see also Sonnenfeld 1996b). Moreover, com-pared to pulp mills in Canada, Australia, and New Zealand, mills inthe United States are much more vulnerable to costly defense andpotentially punitive private class action lawsuits for nonpermitteddischarges that cause harm to fish, natural resources, or humanhealth.
Although the level of regulatory prescriptiveness andlegalism in American regulatory enforcement varies,17 manyenvironmental managers in the companies we visited reaffirmedthe conventional differences in regulatory style. For example,
14 Thus researchers have sometimes found that regulatory regimes in WesternEurope and Japan, which are less legalistic and less punishment oriented than theircounterparts in the United States, have achieved equal or better results (Verweij 2000;Scruggs 1999; Kagan & Axelrad 2000; Wokutch & Vansandt 2000; Kelman 1981).
15 Detailed case studies of a variety of regimes of social regulation, from coal minesafety (Braithwaite 1985), workplace safety (Kelman 1981; Wilson 1985; Wokutch 1992),and nursing home quality of care (Braithwaite 1993) to various kinds of environmentalregulation (Aoki & Cioffi 2000; Aoki, Kagan, & Axelrad 2000; Dwyer, Brooks, & Marco2000; Axelrad 2000) affirm that compared to the other national regimes in each study(which include Australia, Sweden, France, Japan, the Netherlands, Germany, and GreatBritain), the comparable American regulatory rules are far more detailed and are enforcedmore legalistically, resulting in more frequent and much larger regulatory sanctions.American rules generally require regulated enterprises to engage in more detailed recordkeeping, reporting, and proof of compliance.
16 In the period January 1, 1975 to July 1, 1985, the U.S. EPA brought 64 legal actionsin the pulp and paper industry, resulting in fines that varied from $1,500 to $750,000, withan average of $89,437 (Magat & Viscusi 1990:339).
17 The permits for pulp mills in the State of Washington that we obtained reflect agreat deal of tailoring to particular firms’ technical and economic situations.
62 Explaining Corporate Environmental Performance

corporate officials at a corporation with mills in both Canada andthe United States contrasted the ‘‘enforcement frenzy’’ in theUnited States with the partnering approach regulatory officialstook in Canada, where ‘‘We can stay focused on the end result andthe regulators work with us on a compliance schedule. Often theimportant thing is keeping an eye on the goal. In the US they wantthe standard and they want compliance today.’’ Within the UnitedStates, some mill officials described U.S. EPA as more legalistic thanstate environmental enforcement officials18 and some Americanstates, such as Georgia (where three mills in our sample arelocated), have long had the reputation of adopting a less legalisticapproach to enforcement than some other states, such as Washington.
Nevertheless, our comparative data, dating from 1998–1999,found no consistent difference among regulatory jurisdictions inthe environmental performance of ‘‘their’’ pulp mills, as shown byFigure 2. On none of the three measures (BOD, TSS, and AOX) dothe facilities cluster tightly by regulatory jurisdiction, except forAOX emissions for mills in British Columbia, where regulations callfor radical reductions in AOX by the end of 2002. Even so, two ofthe four BC pulp mills in our sample were slightly above the overallmedian in AOX emissions. Similarly, while two mills in BC had thelowest BOD and TSS emissions, two other BC mills were closer tothe median, and one of those was slightly above it. Notwithstandingthe supposedly greater deterrent threat of the American approachto regulation, the mills in the United States in 1998–1999 were aslikely to be in the bottom half as in the top half of the environmentalperformance league. Moreover, the American mills in Washington(considered by some a politically ‘‘greener’’ state) did not dosignificantly better on average than those in Georgia. Indeed,variations among mills within each state were as large as differencesacross jurisdictions. More formally, when we compare the averageemissions for each jurisdiction, there is no statistically significantdifference across jurisdictions for BOD or AOX, and only BritishColumbia and New Zealand differed significantly on TSS.19
Similarly, we failed to detect any significant statistical relation-ship between regulatory jurisdiction and the extent to which pulp
18 One company official in the United States told us: ‘‘There is a contrast between thestate and federal agencies. Suppose, for example, we release chlorine every Tuesday. Thestate would see it and ask ‘‘What’s going on?’’ By the third time we did it, they would writeus an order and say we won’t go away until you solve the problem. That is, they wouldinsist we reduce the pollution and limit the risk. In contrast, the federal EPA would allowthe excursion to continue until it was so serious it enabled them to impose a large penalty.They would then come in and want a million-dollar fine.’’
19 For BOD, single-factor ANOVA, F50.913, p5 0.476. For AOX, single-factorANOVA, F5 0.338, p5 0.843. For TSS, a single-factor ANOVA found that not alljurisdiction averages were the same (F54.199, p50.046), and a multiple comparisons test(Tukey) found only British Columbia and New Zealand were significantly different(q5 –4.971; q crit at 0.05 is 4.529).
Kagan, Gunningham, & Thornton 63
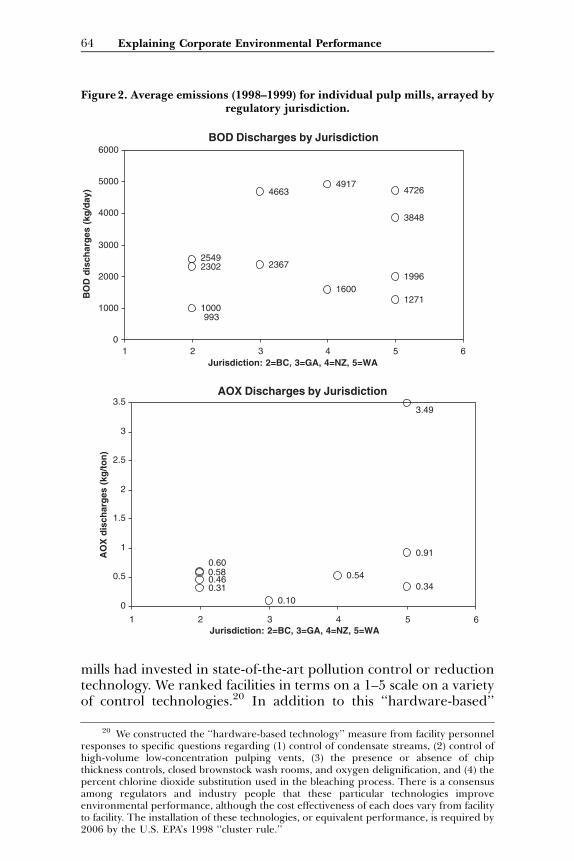
mills had invested in state-of-the-art pollution control or reductiontechnology. We ranked facilities in terms on a 1–5 scale on a varietyof control technologies.20 In addition to this ‘‘hardware-based’’
BOD Discharges by Jurisdiction
23022549
1000
4663
2367
4917
1600
4726
3848
1996
1271
993
0
1000
2000
3000
4000
5000
6000
1 2 3 4Jurisdiction: 2=BC, 3=GA, 4=NZ, 5=WA
BO
D d
isch
arg
es (
kg/d
ay)
AOX Discharges by Jurisdiction
0.460.31
0.10
0.540.34
0.91
3.49
0.580.60
0
0.5
1
1.5
2
2.5
3
3.5
1 2 3 4 5Jurisdiction: 2=BC, 3=GA, 4=NZ, 5=WA
AO
X d
isch
arg
es (
kg/t
on
)
5 6
6
Figure 2. Average emissions (1998–1999) for individual pulp mills, arrayed byregulatory jurisdiction.
20 We constructed the ‘‘hardware-based technology’’ measure from facility personnelresponses to specific questions regarding (1) control of condensate streams, (2) control ofhigh-volume low-concentration pulping vents, (3) the presence or absence of chipthickness controls, closed brownstock wash rooms, and oxygen delignification, and (4) thepercent chlorine dioxide substitution used in the bleaching process. There is a consensusamong regulators and industry people that these particular technologies improveenvironmental performance, although the cost effectiveness of each does vary from facilityto facility. The installation of these technologies, or equivalent performance, is required by2006 by the U.S. EPA’s 1998 ‘‘cluster rule.’’
64 Explaining Corporate Environmental Performance
technology measure, we asked environmental managers to ranktheir own facility’s control technologies from 1 to 5 (with 5 beingthe best available).21 We found that regulatory regime does notpredict technological sophistication; each jurisdiction has mills thatare both above and below average on both hardware-based andsubjective control technology measures.
The loose fit between regulatory jurisdiction and mill-levelenvironmental performance in our data does not mean thatdifferences among regulatory regimes do not matter at all. Asnoted above, BC’s regulation requiring elimination of AOXemissions by the end of 2002Fa requirement more stringentand more imminent than the U.S. cluster ruleFhelps explain thetighter clustering in AOX among Canadian mills. Similarly, U.S.regulations compelled pulp mills to install secondary wastewater-treatment facilities in the 1970s; but neither Canada nor BritishColumbia required secondary treatment for mills discharging intocoastal waters until the 1990s. Thus, in 1998–1999, the time of themeasures in Figure 2, Canadian coastal mills such as PW, SH, andRC had much newer (hence closer to ‘‘state of the art’’) secondarytreatment facilities than most American mills, and hence lowerBOD and TSS emissions, on average.
Nevertheless, the overall weakness of the correlation betweenregulatory jurisdiction and firm-level environmental performancesuggests (1) that at least by the mid-1990s, there was considerableconvergence in the substantive pollution control standards in allour jurisdictions, and (2) within all the jurisdictions in this study,there is considerable variability in regulatory requirements,because (as indicated by Table 1) regulators tailor facility-levelpermits and informal orders to individual mills’ inputs, technolo-gies, surrounding environmental exigencies, and investment cycles(e.g., delaying stricter permit requirements for old facilities until ascheduled upgrade of its production processes). In no jurisdictiondo regulations and regulators make all facilities march exactlytogether, as in close order drill; rather, like cowboys during a long,slow cattle drive, they prod a group of individuals in the samegeneral direction. Differences in the details of regulatory permitsmay help explain some of the remaining differences in environ-mental performance between those at the front and at the back ofthe herd. But the correlation between mill-level regulatory permitlimits and actual performance is only 0.46 for BOD, 0.30 for TSS,and those correlations did not reach statistical significance (based
21 To construct the ‘‘subjective measure’’ of water technology, we asked managers ateach mill to rate their own facility’s water-treatment system and water-process-controltechnologies as world class (which we scored as 5), the best currently available (4), betterthan average (3), average (2), or out of date (1).
Kagan, Gunningham, & Thornton 65
on nine facilities in Canada and the United States). Hence it is morelikely that other factors, associated with the firms’ economicsituations, community pressures, and environmental managementstyles, are equally if not more important.
C. Economic Variables and Environmental Performance
Logically, firms that are more profitable and have greaterfinancial depth should be able to sustain better environmentalrecords than firms in the same industry that are pinched for profitsand financially strained. Larger firms tend to be better environ-mental performers than smaller firms, partly because of theirgreater visibility and reputational concerns, partly because theyhave more resources to spare for specialized environmentalengineering and management. For the most part, we could getfinancial data for only the corporations that own the individualmills, not for each pulp mill itself. Many of the parent corporationsare vertically integrated, operating not only pulp mills (the subjectof our research) but a variety of different kinds of paper mills and/or forestry divisions. We reasoned that although individual millsare expected to be financially independent to a considerableextent, they generally enjoy some degree of access to corporatefinancial resources for major capital investments. Moreover, sincethe mills’ environmental failings might be attributed by the marketor by regulators to the parent corporation, corporate-level resourcespresumably can be made available to deal with subpar environ-mental performance at the company’s pulp mills if corporateofficials desire or feel compelled to do so. Thus we tested theproposition that mills owned by larger corporations, and those withlarger current profits and rising stock prices, would have betterenvironmental improvements than those owned by corporationswith lower sales, smaller (or negative) earnings, and declining shareprices.
Our data provides some support for this proposition, providedthat one assumes that it takes time for a corporation to translateeconomic good times into good environmental performance. First,we divided the mills in our sample into three categoriesFsmaller,larger, and hugeFbased on the average annual sales of theircorporate parents during the 1998–1999 period. We foundno significant statistical relationship when we calculated average1998–1999 BOD, TSS, and AOX emissions for each corporate sizecategory. The same was true when we compared (1) corporate netincome and (2) change in corporate stock price (up or down) with(3) their mills’ environmental performance. Mills whose corporateparent was presumably experiencing milder economic constraintsin 1998–1999 did not have lower BOD, TSS, or AOX levelsthan mills whose corporate parents were doing less well in that
66 Explaining Corporate Environmental Performance
period.22 Nor did we find a significant correlation between 1998–1999 corporate economic indicators and the relative 1998–1999ranking of each pulp mill’s environmental control technology(using either ‘‘objective’’ or ‘‘subjective’’ technology measures).
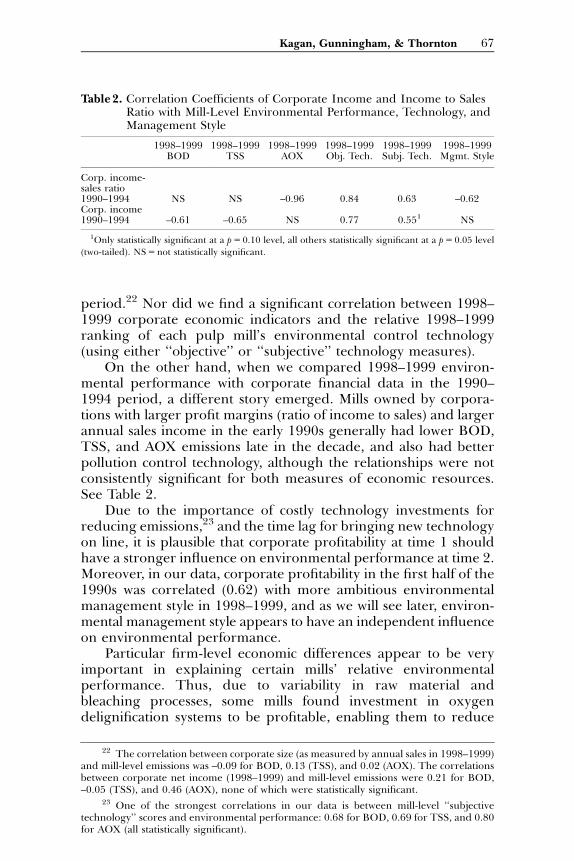
On the other hand, when we compared 1998–1999 environ-mental performance with corporate financial data in the 1990–1994 period, a different story emerged. Mills owned by corpora-tions with larger profit margins (ratio of income to sales) and largerannual sales income in the early 1990s generally had lower BOD,TSS, and AOX emissions late in the decade, and also had betterpollution control technology, although the relationships were notconsistently significant for both measures of economic resources.See Table 2.
Due to the importance of costly technology investments forreducing emissions,23 and the time lag for bringing new technologyon line, it is plausible that corporate profitability at time 1 shouldhave a stronger influence on environmental performance at time 2.Moreover, in our data, corporate profitability in the first half of the1990s was correlated (0.62) with more ambitious environmentalmanagement style in 1998–1999, and as we will see later, environ-mental management style appears to have an independent influenceon environmental performance.
Particular firm-level economic differences appear to be veryimportant in explaining certain mills’ relative environmentalperformance. Thus, due to variability in raw material andbleaching processes, some mills found investment in oxygendelignification systems to be profitable, enabling them to reduce
Table 2. Correlation Coefficients of Corporate Income and Income to SalesRatio with Mill-Level Environmental Performance, Technology, andManagement Style
1998–1999 1998–1999 1998–1999 1998–1999 1998–1999 1998–1999BOD TSS AOX Obj. Tech. Subj. Tech. Mgmt. Style
Corp. income-sales ratio1990–1994 NS NS –0.96 0.84 0.63 –0.62Corp. income1990–1994 –0.61 –0.65 NS 0.77 0.551 NS
1Only statistically significant at a p5 0.10 level, all others statistically significant at a p5 0.05 level
(two-tailed). NS5not statistically significant.
22 The correlation between corporate size (as measured by annual sales in 1998–1999)and mill-level emissions was –0.09 for BOD, 0.13 (TSS), and 0.02 (AOX). The correlationsbetween corporate net income (1998–1999) and mill-level emissions were 0.21 for BOD,–0.05 (TSS), and 0.46 (AOX), none of which were statistically significant.
23 One of the strongest correlations in our data is between mill-level ‘‘subjectivetechnology’’ scores and environmental performance: 0.68 for BOD, 0.69 for TSS, and 0.80for AOX (all statistically significant).
Kagan, Gunningham, & Thornton 67
emissions of AOX, on average, somewhat more than mills thatconcluded that oxygen delignification would not be cost effective.24
On the other hand, economic concerns constrain environmentalmanagers in all firms when they push for nonincrementalimprovements. At least partly because of overcapacity in the worldmarket for pulp and the weakness of customer demand forunbleached or totally chlorine-free paper, none of the mills in oursample had leapt far ahead of the others by abandoning pulpbleaching or by running a totally chlorine free (TCF) operation.One mill (SH) that tried TCF lost too much money and retreated.25
No companies in our sample had done the innovative engineeringor made the very costly investments that would be necessary tooperate a completely ‘‘closed loop’’ mill, with no discharges tosurrounding waterways.26
D. Social Pressures
A growing body of literature focuses on the role of socialpressures (or their absence) in shaping firm behavior vis-a-visregulatory values. In some communities, environmental advocacyorganizations, neighborhood groups, and local governments haveintensified legal pressures by lodging complaints with regulatoryagencies and courts (Morag-Levine 1994; Sabatier & Mazmanian1983; see also Sonnenfeld 1996a, 1998a, 1998b). Environmentalactivists can intensify economic pressures by generating adversepublicity about polluting firms and organizing consumer boycotts.Mobilized communities also can have a direct political effect,
24 Oxygen delignification is an extension of the pulping process that reduces the useof bleaching chemicals (Norberg-Bohm & Rossi 1998:233). Some analyses have suggestedthat oxygen delignification is cost effective for mills that use softwood pulp, but not forusers of hardwood (Norberg-Bohm & Rossi 1998:236).
If we set aside the data for JF, a ‘‘reluctant complier’’ and an outlier on severalemissions measures, 1998–1999 AOX figures averaged 0.76 per ton for facilities withoutoxygen delignification, twice the 0.39 average for facilities with oxygen delignification.
25 In the late 1980s and early 1990s, the mill we label SH invested $1 billion in newfacilities and achieved TCF operations in the early 1990s, But paper made from its TCFpulp was cream colored, not bright white, and it was costlier, both of which limiteddemand. Mounting losses forced SH to operate at a level that entailed some use ofelemental chlorine (although in 1998–1999 it still had the third lowest level of AOX in oursample, as well as being a leader in control of BOD and TSS). Managers at other facilitieswe visited regard SH’s ‘‘leap ahead’’ into TCF as a failed experiment, not to be emulated.For an account of a similar technological ‘‘leap ahead’’ that was not emulated, see Norbert-Bohm & Rossi (1998).
26 Even if pulp mills faced weak economic constraints, they might refrain frominvesting in closed loop or TCF production on grounds that the expenditures involvedwould outweigh the presumed environmental benefits. We take no position on this issue,not having discovered any serious cost-benefit analysis addressing it. Industry personnelhave argued that few if any economic benefits would flow from going beyondenvironmental chlorine-free (ECF) operations to TCF production processes, and there issome argument that adverse effects on aquatic life from current pulp mill effluent does notstem from the minimal amounts of dioxin remaining in their wastewater, but rather fromother organic material in the effluent.
68 Explaining Corporate Environmental Performance
inducing firms to improve environmental performance beyond thedictates of current law in hopes of forestalling tighter governmentalregulation, or in hopes of preserving the local goodwill thatfacilitates smooth relations with local government and employees.
Virtually every pulp mill we visited reported significantenvironmental pressures from their host communities, whichcould hardly fail to notice the unpleasant odors and plumes ofsteam emitted by these facilities. With a constantly diversifyingeconomy and a more mobile workforce, many mills that were oncethe only major employer in an isolated ‘‘company town’’ now aresurrounded by more informed and more sophisticated commu-nities in which they are not necessarily the dominant employer.Many mill managers spoke to us of having to meet the terms notonly of their regulatory license but of their ‘‘social license.’’ As amill manager told us, ‘‘We have to continuously convince the publicwe have a right to exist.’’ Social concerns about pulp effluent wereintensified by a highly visible, worldwide campaign led by Green-peace in the late 1980s and early 1990s that emphasized the threatsto aquatic life and human health from the dioxin-laden effluentgenerated by the use of chlorine as a pulp bleaching agent(Sonnenfeld 2002). In 1999, managers at one mill told us that thesanctions it feared most for breaching regulations were not legalbut informal sanctions imposed by the public and the media,and hence it was motivated less by avoiding regulatory violationsper se as ‘‘anything that could give you a bad name.’’27
We could not generate quantifiable measures of the degree ofsocial pressure on each mill, that is, of the relative ‘‘stringency’’ ofthe terms of each firm’s social license. Activists demanded differentthings from different mills, and mills employed different ways ofresponding to, and hence reshaping, those demands. Thus wecannot compute a quantitative relationship between social licensepressures and firm-level environmental performance.
A qualitative analysis, however, suggests that variations in socialpressures have significant effects on firms’ relative environmentalperformance. Consider again the contrast between TS and JF, asshown in Figures 1 and 2 and in Table 1. TS is among the leaders incontrol of BOD, and does reasonably well in controlling AOX,while JF is one of the comparative laggards. Yet both mills are inthe same American jurisdiction, subject to the same federal andstate laws, the same federal and state regulatory agencies, andhence presumably similar regulatory license requirements. While
27 For example, mill managers were particularly anxious to keep their mill fromgetting bad marks on the ‘‘Environmental Score Card’’ that British Columbia regulatorsperiodically published (outlining environmental performance indicators for particularfacilities, along with major infringements of regulations). Indeed, the managers said that‘‘public pressure is more demanding than regulatory agencies y agencies are moreforgiving.’’
Kagan, Gunningham, & Thornton 69
we do not have financial data for TS, part of a privately heldcorporation, it is a smaller corporation than JF, with less financialdepth; in the latter half of the 1990s, JF had a better profit marginthan most of the corporations in our sample for which public datawas available. The two mills do differ significantly, however, in theimmediacy and intensity of the community pressures theyexperience concerning environmental performance.
TS is located on the waterfront in a fairly large city, once heavilydependent on trade in forest products but now with a much morediversified economic base. TS’s blue-collar and largely industrialneighborhood has changed; the TS mill is very visible to the white-collar workforce in nearby downtown office buildings and tocommuters on a main roadway. The city is home to severalenvironmental groups that pay close attention to TS’s operations.When TS purchased its mill in the early 1980s from a companynotorious for its lack of concern for the local environment while‘‘shipping the profits back East,’’ the new owners found they facedan uphill battle in winning the trust of local activists and a localpopulation who no longer wanted or needed a pulp mill on theirdoorstep. Yet the mill felt it needed to gain the community’s trust.TS’s environmental manager told us, ‘‘I see most of the [environ-mental] groups 2–3 times a month. Most important of all, what wesay is what we do y I need their trust as much as they need ours.As soon as we violate it, all bets are off.’’
TS’s sensitivity to community pressure has at times prodded itto ‘‘beyond-compliance’’ measures. The company invited activiststo all its permit negotiations with the regulators and it claims tohave based its environmental priorities, at least in part, on thosevoiced by community activists. TS’s sense of vulnerability tocommunity action is conveyed by this account by its environmentalmanager.
We had a major spill when the effluent line to the bay ruptured.This was treated effluent but it kept gushing so we had to closethe mill. There was lots of foam and it was unsightly. Everyonewas going to see this big white foaming bubble floating in the bayso we got a spill recovery company and put a boom around it. Wesampled the water and phoned the regulators and the commu-nity y When we have a violation I call y the agency first, thenthe NGOsF‘‘this is what happened, this is the environmentaldamage.’’
JF, in contrast, is the primary employer in a small companytown, miles from the nearest large city. It experiences some localpressures from owners of high-priced vacation homes whoseriverside view encompasses the plumes from JF’s pulp mill andsome pressures from the government. After a chlorine release fromthe facility required a partial evacuation of JF’s neighbors, the mill
70 Explaining Corporate Environmental Performance
was obliged to install chlorine monitors both inside the mill and atthe local fire department. Nevertheless, with its more isolatedlocation, JF is not exposed to regular inquiries from local orregional environmental NGOs. JF managers do not voice the samesense of vulnerability to local pressures that TS’s managers do.They have not come close to establishing the same level ofcommunication or dialogue with NGOs or regulatory officials thatTS’s managers mention repeatedly. And unlike TS, they do notrefer to voluntary ‘‘beyond-compliance’’ measures they have takento win the trust of NGOs and regulators. Thus JF’s less demanding‘‘social license’’ appears to be a very important reason for thedisparate environmental performance of the two mills.28
In several cases, customers’ demands wedded environmentalconcerns with economic pressure, helping to explain certainperformance differentials among the pulp mills in our sample.RF is the leader in our sample in eliminating AOX emissions, farexceeding the performance of the other American mills,which aresubject to the same general standard for AOX in the EPA ‘‘clusterrule.’’ The company’s decision to improve AOX performance wasmade in 1989 due to European customer concerns regardingdioxin in the diapers it produced. RF ‘‘Felt it’s not good business tobe in the middle of the [dioxin] controversy.’’29
In 1998–1999, SH’s environmental performance was excellentin all three effluent measures. A combination of environmentalactivism and consumer concerns a decade earlier helps explainwhy. In 1987, air pollution from SH was publicly criticized by newsmedia, local environmental organizations, and local citizens(Cashore & Vertinsky 2000:14). In November 1988, dioxins werediscovered in shellfish near SH’s pulp mill in British Columbia. Inhighly dramatic public demonstrations, environmental activiststargeted SH’s parent company, a forestry company, and SH itself.The corporate CEO announced in 1988 that the firm wouldrebuild SH’s facility, creating an environmentally friendly modernmill, and in April 1989 announced a new, wide-ranging environ-mental policy (Cashore & Vertinsky 2000:15). At the same time,environmental activists had been generating political pressures inBritish Columbia. In May 1989, the provincial environmentalministry announced tighter BOD and TSS limits, increased fines
28 Mills PW and IG provide a similar story. Both faced strong economic pressures toimprove profits and cash reserves, but managers at PW were conscious of their mill’svisibility to middle-class motorists on a nearby highway and recalled dramatic demonstra-tions at their mill and at their parent corporation by environmental activists. IG, notlocated near a major population center, had not experienced such social license pressures.PW had decidedly better environmental performance than IG according to all ourmeasures.
29 More generally, Sonnenfeld (2002:17) observes that companies that are producersof ‘‘personal’’ consumer paper products (tissue paper, sanitary products) are most sensitiveto reputational concerns.
Kagan, Gunningham, & Thornton 71

for violations, and in 1991 it demanded complete elimination ofAOX discharge by December 31, 2002. Greenpeace kept up thepressure in the early 1990s; it organized a consumer boycott ofchlorine-bleached paper in Germany, generating demands fromsome SH customers for chlorine-free paper. SH announced that itwould ‘‘lead the way’’ in alternative bleaching processes andbecame the first company in North America to complete a full-scalemill trial of completely chlorine-free bleached softwood kraftmarket pulp (Cashore & Vertinsky 2000:16–17, 26; Raizada1998; Walsh 1992). American pulp mills, on the other hand,generally are not export oriented and hence are more insulatedfrom European demands for ECF and effluent-free paper(Norbert-Bohm & Rossi 1998:230). With the exception of RF, withits special customer concerns, the American mills in our sample hadbelow-average records in AOX reduction in 1998–1999.30
As noted above, however, managers at different mills re-sponded to social pressures in different ways. In some cases, ourinterviewees claimed that dramatic demonstrations against them byGreenpeace operated as a ‘‘wake-up call’’ that changed theircorporation’s attitudes toward its environmental responsibilities.31
But it took a change in management before TS, despite its salienceto the local community, adopted an open and receptive stancetoward local activists. Mill AT, located in New Zealand, respondedto Greenpeace’s campaign against it by seeking court injunctions torestrain individual group members and engaging in its own mediacampaign to counter Greenpeace’s arguments. As AT’s environ-mental manager described it: ‘‘We decided to take the battle toGreenpeace, and our PR guy enjoyed the scrap. We decided we canwin this war. We can visit the schools before they do, and buildrelationships with indigenous groups. It comes down to individualsand over time, to trust.’’ In summary, the company does notacknowledge any change in its behavior as resulting from theGreenpeace campaign and prefers simply to ‘‘tough it out.’’ (Notethat in 1998–1999, AT had the weakest record in our sample forcontrol of BOD and TSS emissions, although it was in the middle ofthe pack with respect to reduction of AOX emissions.)
30 At the same time, European demand for TCF paper, at least in the late 1990s, wasnot so strong as to enable producers to charge a premium for TCF pulp. Hence even millslike SH, with the ability to operate TCF, felt economic pressures to back off fromeliminating all AOX, as long as regulations allowed them do to do so.
31 For example, one major corporation, the parent company of mill PG, was subject toa direct action campaign by Greenpeace in the early 1990s. Activists scaled the corporateheadquarters building and draped banners over it (‘‘Take the Poison out of Paper!’’), all ofwhich became headline news. Corporate officials described how this event influencedsenior decisionmakers and precipitated a major rethinking of its approach to environ-mental issues, including a large expansion of environmental initiatives and staff. As one putit, ‘‘It was the start of a wake upFwe have to do more than crank the mills.’’
72 Explaining Corporate Environmental Performance
E. Environmental Management Style and EnvironmentalPerformance
AT’s response suggests that the influence of social pressures onenvironmental performance depends on an ‘‘intervening varia-ble’’Fmanagerial attitudes. Our interviews, too, convinced us thatfirm-level ‘‘environmental management style’’ affects how firmsrespond to pressures from regulatory regimes and economicconstraints. As noted earlier, we classified each mill’s environmentalmanagement style on a scale extending from EnvironmentalLaggard through Reluctant Complier, Committed Complier,Environmental Strategist, to True Believer.32 We then correlatedenvironmental management style with environmental perfor-mance.
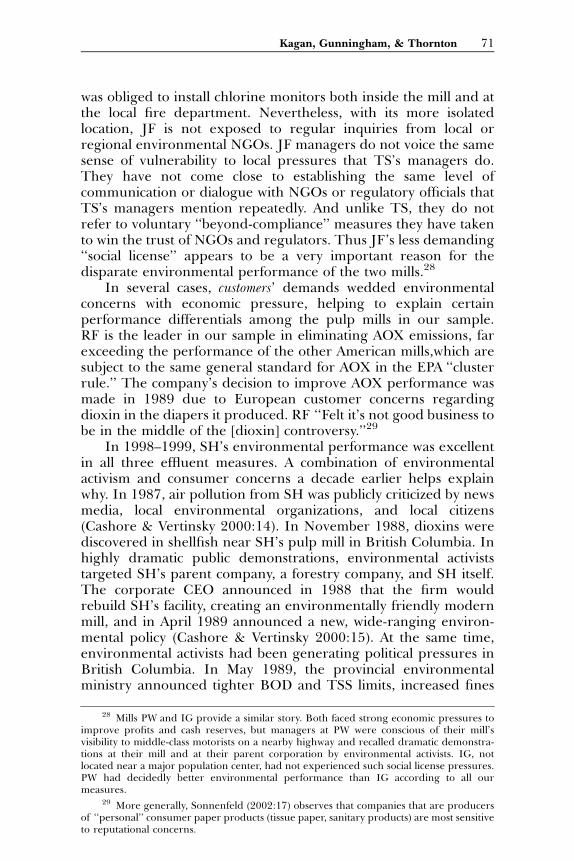
The results are striking. As shown by Table 3, average BODemissions for True Believers were substantially lower than those forEnvironmental Strategists, whose emissions were substantiallylower than the average for Committed Compliers, whose emissionswere substantially lower than the average for Reluctant Compliers.The same relationship emerges, albeit somewhat less dramatically,with respect to control of AOX and TSS (except that theEnvironmental Strategists did better than True Believers, onaverage, in controlling TSS). The correlation between environ-mental management style and environmental performance was0.76 for BOD, 0.66 for TSS, and 0.57 for AOX. Thus in a cross-sectional analysis in 1998–1999, environmental management stylewas a much more powerful predictor of mill-level environmentalperformance than regulatory regime or corporate size and earnings.
One reason that environmental management style is associatedwith better environmental performance is that True Believers andEnvironmental Strategists tend to invest in better pollution controltechnology. The correlation between management style and the
Table 3. Management Style and Average Environmental Performance in1998–1999
Management Style
EnvironmentalPerformance
True Believer EnvironmentalStrategist
CommittedComplier
ReluctantComplier
BOD (kg/day) 1,288 2,304 3,607 4,726TSS (kg/day) 4,510 3,439 6,155 7,212AOX (kg/ton) 0.44 0.46 0.57
32 In the actual scoring, we placed some firms on the borderline between two idealtypes. Thus the actual scoring went from 1–7, just as the insertion of A– or C1 in anacademic grading system expands the number of possible scores. For a more completedescription of the ideal types of environmental management, see the Appendix.
Kagan, Gunningham, & Thornton 73
‘‘subjective technology’’ measure (based on managers’ self-evalua-tion) is 0.67; with the ‘‘objective technology’’ measure (see note 19),it is 0.53. Higher-ranked ‘‘subjective technology,’’ in turn, iscorrelated with control of BOD (0.68), TSS (0.69), and AOX(0.8).33
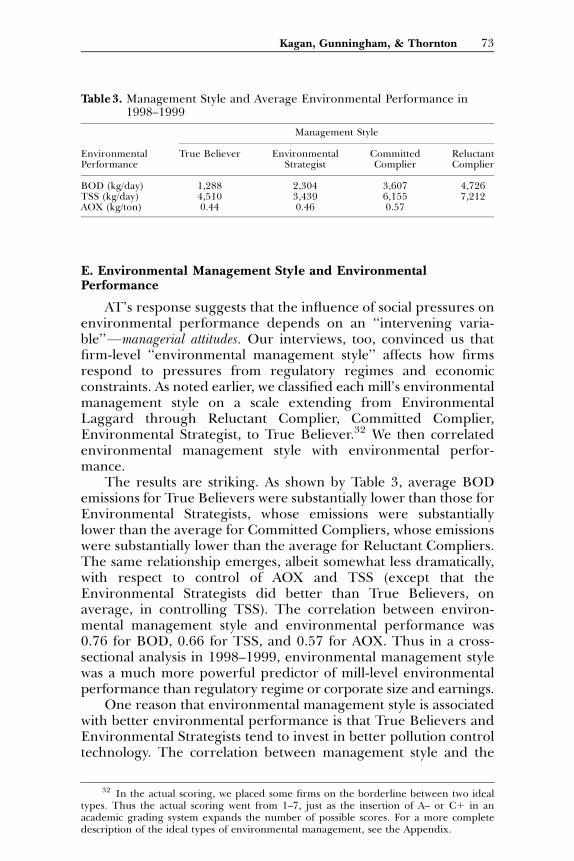
But better technology is far from the only reason for betterenvironmental performance by Environmental Strategists andTrue Believers. Much of their edge, our interviews suggest, stemsmore active ‘‘scanning’’ for ‘‘win-win’’ measures (which improveenvironmental performance and cut costs)34 and from a dedicatedapproach to day-to-day environmental management (what we havecalled ‘‘implementation’’). Table 4 shows the relationship betweenmill environmental management style and the annual averageincidence of chemical spills in 1998 and 1999 for seven U.S. mills.Two measures of spills are used: the first column shows theaverage number of all chemical spills reported to regulatoryofficials by each facility each year, the second the annual averageof all ‘‘large spills.’’35 Strikingly, the True Believers had perfectrecords, exceeding that of Environmental Strategists (whobested Committed Compliers on the first measure, but not thesecond).
Environmental Strategists and, especially, True Believers alsodo a better job of building ‘‘reputational capital’’ with regulatorsand with environmental activists (in local communities and
Table 4. Management Style and Control of Chemical Spills, 1998–1999
Management Style
True Believer EnvironmentalStrategist
CommittedComplier
ReluctantComplier
All spills 0 1.5 3.5 3Large spills 0 0.5 0.5 0
NOTE: Numbers are average number of spills per facility per year. Big spills are those measuring
more than 100 units, regardless of the unit of measure, because more hazardous materials tend to bemeasured in smaller units. Data available only for the seven U.S. facilities.
33 The ‘‘objective technology’’ correlations with environmental performance aresomewhat lower, we speculate, because those measures are based on a narrower range oftechnologies than the ‘‘subjective technology’’ measures, and are focused on a particularemissions.
34 One environmental manager noted that ‘‘last year environmental mistakes cost us$2.8 million.’’ The costs he referred to were not fines or legal damage awards, but lossesfrom plant closures and extra production expenses engendered by the effort to clean up ormitigate the discharges. This money spent on mistakes could exemplify a ‘‘win-win’’measure.
35 Larger spills are those that measured more than 100 units, whatever the units ofmeasure, because more dangerous chemicals tend to be measured in smaller units.However, all petroleum product spills were measured in gallons.
74 Explaining Corporate Environmental Performance
nationally), which appears to pay off in attaining more flexibilityin regulatory permits.36
At the same time, environmental management style operateswithin important economic constraints. It is far from omnipotent inshaping environmental performance, and may well be shaped inpart by the firm’s economic situation. Two mills in our sample thatwere struggling economically through the 1990s nevertheless wereTrue Believers in terms of environmental management style, andhad good or excellent environmental performance scores. Never-theless, we found that corporations that had larger sales and profitmargins in the first half the 1990s were more likely to beEnvironmental Strategists in 1998–1999, while less profitable firmswere more likely to be Committed Compliers. The quality ofpollution control technology, too, is strongly correlated witheconomic performance, and it was the mills whose corporateparents did well financially in the 1990–1994 period that had thebetter environmental performance, on average, in 1998–1999.Finally, regulatory action and social pressures were the principaltriggers for those expensive investments in pollution controltechnology, as visible ecological impacts and the environmentalactivism based on the dioxin scare in the late 1980s and early 1990sled to more stringent regulatory standards for AOX (and inCanada, for BOD and TSS).
We are left, therefore, with a complex, multivariate explanationfor interfirm differences in environmental performance. Oursample is too small, unfortunately, to enable us to perform amultivariate regression analysis.
IV. Discussion
What explains the convergence in corporate environmentalperformance that our data reveals, and what explains theremaining variation? To what extent, and how, do various externalenvironmental pressures, such as regulation, market, or commu-nity pressures, impact corporate environmental performance,particularly the extent to which firms go ‘‘beyond compliance’’?
36 For example, to control dioxin emissions, both JF and TS were required by stateregulators to develop a control program. But while the permit given TS (a True Believerwith good relations with the regulatory agency) required it simply to submit a detailedengineering report within 18 months, JF (an obvious Reluctant Complier) was required bythe same agency to (1) submit a preliminary report within six months, (2) submit a finalscope-of-work document within eight months for agency review and approval, and (3)submit an engineering report for review and approval within 10 months. According to itsown mill-level environmental manager, RC (a cross between a Reluctant Complier andEnvironmental Strategist) had ‘‘done a horrible job on PR,’’ which had ‘‘put them in a holewith the community.’’ One result was enormous community resistance to issuance of apermit for a new landfill for RC’s solid waste. Consequently, RC faced paying substantialsums to ship its waste to an off-site landfill.
Kagan, Gunningham, & Thornton 75
To what extent does ‘‘management matter’’? And do differentmodes of regulation achieve different environmental out-comes?
No simple answers to these questions emerge from our data.Corporate environmental behavior and motivation are extremelycomplex. They involve the interaction of numerous variables,difficult to measure. It is harder still to assign an appropriateweight to each variable, or to perform a reliable quantitativemultivariate regression analysis, particularly with a sample of 14firms.37 Nevertheless, our interview and statistical data do generatea considerable number of insights for theories of regulation andcorporate environmental behavior, relevant not just to theparticular industry sector we studied, but also for other highlyregulated, heavily scrutinized, and mature industry sectors, andperhaps for other sectors as well.
A. Toward an Interactive Model of Corporate EnvironmentalBehavior
Both our quantitative and qualitative analyses leave usconvinced that theories of corporate environmental behavior thatfocus on a single variableFwhether legal, economic, or attitudinalFare almost always doomed to be incomplete and inadequate.Corporate environmental behavior appears to be shaped by twosets of interactions, first among ‘‘external variables’’Flegal, econom-ic, and social/political (see Sections B and C below)Fthe secondbetween corporate managerial attitudes and each of the externalfactors (see Section D below).
Notwithstanding substantial convergence in environmentalperformance, and at levels that often go beyond regulatoryrequirements, some pulp mills still do a much better job thanothers in curbing pollution. To explain that kind of interfirmvariation, much of the literature on business strategy andenvironment has pointed to external ‘‘drivers’’ of behavior, suchas the firm’s economic circumstances and opportunities for profitthrough environmental activism, or the degree of political andsocial pressure for environmental improvements that the firmfaces. However, we found it more useful to think of the variousexternal pressures (as indeed industry itself increasingly thinks ofthem) as terms or conditions of a multifaceted ‘‘license to operate.’’In contrast with the concept of unidirectional drivers, the concept
37 Our qualitative interviews, which revealed the complex interaction of oftencompany-specific factors that shaped environmental performance, leave us with littleconfidence that a small sample quantitative analysis would result in definitive or strikingfindings, particularly based on the difficult to assemble and inevitably rough quantitativeindicators we were able to construct.
76 Explaining Corporate Environmental Performance
of a license captures the complexity of the relationship between theregulated enterprise and key stakeholders, and it accords with animportant reality we observed: the relationship between thelicensors and licensees is interactive, not unidirectional, and manyof the terms of the license are open to interpretation, negotiation,and company-initiated amendment.
Traditionally, the notion of a business’s ‘‘license to operate’’referred only to the company’s legal obligations. For example, inorder to operate legally, a pulp mill manufacturer had to obtain aland-use and a construction permit before building a new facility, ithad to introduce particular pollution control technology, and onceoperating the facility, it had to maintain certain process andperformance standards (for example, concerning hazardous wastedisposal and workplace safety). Together, these regulatory obliga-tions and permits might be referred to as a facility’s legal orregulatory license. Today, however, the concept of ‘‘license tooperate’’ must include ‘‘economic reality’’ requirements such as theneed to maximize shareholder return on investment (or at least toprovide a reasonable rate of return). Of course, the terms of thiseconomic licenseFwhat is an adequate rate of return on investmentor level of profitabilityFare not written down in detail like aregulatory permit. Moreover, they may vary over time, ‘‘tighten-ing’’ and ‘‘loosening’’ with market conditions and each firm’seconomic performance.
In addition, the ‘‘license to operate’’ concept has beenextended to include the demands of social actors. Neighbors maycomplain about odor, local and international environmental groupsmay demand the use of less hazardous bleaching chemicals, andboth groups may threaten a variety of informal sanctions ifindustry fails to respond. An extremely serious violation ofcommunity expectationsFsuch as a death-dealing explosion in amill or a chlorine leak that results in severe threats to human healthor severe ecological damageFcan trigger political demands toclose the plant down.
The regulatory, economic, and social licenses are monitoredand enforced by a variety of stakeholders, who commonly seekleverage via the other licenses as well. Environmental groups notonly enforce the terms of the social license directly (e.g., throughshaming and adverse publicity) but also seek to influence the termsof the economic license (e.g., generating consumer boycotts ofenvironmentally damaging products) and of the regulatory license(e.g., through citizen suits or political pressure for regulatoryinitiatives). Thus the interaction of the different types of licenseoften exceeds the effect of each acting alone. The terms of somelegal license provisions extend the reach and impact of the sociallicense by directly empowering social activists or by giving themaccess to information that they can use to pressure target
Kagan, Gunningham, & Thornton 77
enterprises.38 Conversely, a company that fails to respond appro-priately to social license obligations risks a tightening of its theregulatory license, as frustrated community activists turn for helpto politicians and regulators.39
The terms of each strand of the ‘‘license to operate,’’ however,often are far from clear. Different corporate managers, we learned,may interpret similar regulatory, economic, or social demandsdifferently. Moreover, skillful corporate officials not infrequentlycan reshape some license terms by providing information to andnegotiating with regulators or environmental activists, by engagingin community outreach and education, and/or by scanning fortechnologies and procedures that simultaneously cut costs andimprove the firm’s environmental performance.
B. Understanding Convergence
Over time, there has been growing convergence across thecountries and the firms we studied in the terms of each strand ofthe ‘‘license to operate.’’ Firms with operations in more than onejurisdiction did not regard their regulatory license as beingmaterially different in different jurisdictions. Although they didrefer to interjurisdictional differences of enforcement styleand philosophy, they also observed that when the regulatorylicense ratcheted more tightly in one jurisdiction, other jurisdic-tions commonly followed that lead.40 Similarly, while many millsreported that they had experienced far less social pressure in an
38 The potency of the social license can be increased, we observed, when the legalregime grants rights of standing to sue either a company or a regulatory agency, requiresbroader public access to facility-level permits and emissions reports, requires companies toconsult with local communities, and allows activists to participate in the decision-makingprocess for permits. In addition to criminal sanctions and administrative notices (and in theUnited States, civil penalties) companies that breach their legal obligations are alsovulnerable to either individual or class actions from citizens injured as a result of thefacility’s illegal activities. In the case of local residents, they can oppose, by both legal andpolitical means, any expansion of the facility, thereby slowing or halting its economicgrowth.
39 As one senior corporate official pointed out, ‘‘local communities have the abilitythrough the political process to create the regulations that allow you to do business y weoperate under a license from the public in every place we do business so we have to besensitive to public concerns.’’
40 Regulatory regimes do not evolve in isolation. On the contrary, jurisdictionscommonly model their legislation on that of other jurisdictions. Indeed, Braithwaite andDrahos (2000:291), in their study of global business regulation, found that ‘‘in all thecountries we visited for this research, substantial parts of national environment protectionlaws were modeled from other nation’s laws.’’ And Harrison (2002), in a comparison ofenvironmental standards setting in the United States, Canada, and Sweden, notes that‘‘There has been considerable convergence in both regulatory standards and industryperformance.’’ Of course, there is often a time lag between when one jurisdiction adopts aparticular regulatory solution and it is taken up elsewhere, but in a industry like pulp andpaperFwith a high environmental profile, plus relatively standard processes ofproduction and environmental technologiesFit is hardly surprising that substantialintergovernmental modeling takes place.
78 Explaining Corporate Environmental Performance
earlier era, all now experienced some such pressure, andcommunities tended to act as de facto regulators, thereby furtherdiluting the importance of different enforcement styles. As one millmanager put it, ‘‘the implications of failing to meet the regulationsare too great from a public or market point of view, so we are moredemanding on ourselves than the regulators are.’’ Finally, anincreasingly global and competitive world pulp market hasdiminished variability in the economic licenses of pulp mills.Institutional investors and financial analysts today are likely tojudge all firms by common criteria.
Just as importantly, environmental demands among thedifferent types of license have converged. Both regulatory andsocial licenses have demanded tighter controls on emissions.Moreover, economic and financial markets today are moreprepared to look skeptically at firms that get adverse publicity fordramatic regulatory penalties or serious environmental accidents.Thus in our sample we did not find a single true Laggard, and onlyone full-blown Reluctant Complier. Simultaneously, however, aglobal-competition-driven economic license has in all jurisdictionsconstrained how far firms can go in a ‘‘green’’ direction. Thuswhen SH, as noted earlier, made a more far-reaching environ-mental investment in totally chlorine-free (TCF) technology thanits industry peers, it ended up losing money, and the firms in oursample converged on the goal of substantially ECF operation. Thenet result of accommodating to the demands of the three differenttypes of license is that a firm can neither afford to drop too low, noraim too high: hence the considerable convergence in performancerevealed by the statistics.
That convergence, however, has drifted toward better controlof effluent in the pulp industry. The primary engine of thatmovement, we believe, has been periodic ‘‘tightenings’’ of govern-mental regulatory licenses. The law on the books (and in each mill’spermit) is a benchmark for enforcers of both the social andeconomic license. Exposure of substantial legal noncompliance istaken by both community activists and professional investors as ajustification for skepticism about the environmental good faith orthe competence of mill managers. And that, of course, strengthensthe capacity of regulatory license requirements to overcomeeconomic license restraints. The largest reductions in pulp milldischarge to water of harmful pollutants have stemmed frominvestments in expensive control technologies, particularly sec-ondary wastewater-treatment facilities and the substitution ofchlorine dioxide for elemental chlorine as a bleaching agent (whichoften required construction of a chlorine dioxide plant). Economiclicense constraints often affected the timing of those installations, asfirms often successfully argued that they should coincide withperiodic rebuilding or updating of primary production equipment.
Kagan, Gunningham, & Thornton 79
But sooner or later, the regulatory license has trumped economicdemands, partially through the implicit promise that all competi-tors would be obliged to make the same investment. And indeed,one of the most striking findings in our research has been theextent to which major investments in control technology have beenmade in response to pending or anticipated regulatory rules.41
C. Understanding Variation
Notwithstanding substantial convergence in the terms of thevarious license requirements, significant variation between thelicenses of different mills helped explain some of the differences intheir environmental performance. With respect to the regulatorylicense, for example, we found that British Columbia’s lag behindthe United States in requiring secondary wastewater treatment inmills at the edge of coastal waters resulted in better BOD control bythose BC mills in 1998–1999, on average, because their treatmentfacilities were newer and closer to ‘‘state of the art.’’ Similarly, BC’smore imminent and more stringent regulatory deadline forelimination of AOX discharges helps explain why BC mills, onaverage, had lower AOX emissions in 1998–1999 than theAmerican mills in our sample.
Other interfirm differences in environmental performancecould be attributed directly to the terms of their particular economiclicense. A mill whose products (diapers) and customers (WesternEuropeans) were particularly environmentally sensitive had thelowest AOX discharges.42 Some firms operating under seriouseconomic license limits, such as those who were ‘‘cash-strapped,’’told us this constrained their capacity to put in place appropriateenvironmental technology. Conversely, mills whose corporateparents had larger sales and higher profit margins in the first halfof the 1990s, a period of intense social and regulatory pressuresregarding chlorine, tended to have better technologies and betterenvironmental performance at the end of that decade.
Different social license demands often appeared to be particu-larly powerful in influencing differences in environmental out-
41 Not only did regulation account for significant technological change, but it wasregarded as an inevitably ‘‘tightening noose.’’ A number of managers viewed regulation asparamount in bringing about long-term environmental improvements. Some cited thepersonal responsibilities of senior officers or managers, who, in most jurisdictions, are alsoliable to penalties as individuals. Others were influenced by their vulnerability to eitherindividual or class actions from citizens injured as a result of the mill’s activities. Many wereconcerned with the informal punishments that might accompany breach of regulations, notleast, negative publicity and shaming. And of course some were influenced by all thesefactors.
42 On the other hand, another company (CB) that made paper food containers didnot have as good environmental performance as RF, the mill that was sensitive to the paperdiaper market. CB was only at 60% chlorine substitution and did not have oxygendelignification; its management thought this was sufficient to prevent health problems.
80 Explaining Corporate Environmental Performance

comes. For example, the gap between the emissions of JF and TS,described earlier, was very much what one would have anticipated,given JF’s more remote, small-town location and TS’s location nearthe heart of a changing, more economically diversified city withlively environmental activists.43 In a number of cases, our interviewdata suggested that a painful well-publicized encounter with amajor environmental group produced a sea-change in thecorporate approach to the environment.
D. Management Matters
Although firm behavior seemed clearly linked to the terms ofits license to operate, we found a number of instances, describedearlier, which could not be satisfactorily explained in these terms.Managers at different mills responded to social pressures indifferent ways. Corporate economic resources, as measured bysales and profitability, did not account for all the variance in mill-level environmental performance. And as noted, there usually wassubstantial variability in emissions by mills in the same regulatoryjurisdiction. Accordingly, we hypothesized that the perceptions andattitudes of mill and corporate management, and their interpreta-tion of their license terms, acted as an important filter throughwhich information about the external licenses is sifted and guidedtheir responsiveness to conflicting external pressures.
As described earlier, we found that there was indeed astatistically significant relationship between management styleand environmental outcomes.44 Firms that we classified as Commit-ted Compliers on the basis of our qualitative interview data hadbetter control of their effluents, on average, than ReluctantCompliers, but the Committed Compliers did not do as well, onaverage, as the Environmental Strategists, who were in turnoutperformed on most measures by the True Believers. Inaddition, if we compare the average and maximum BOD andTSS discharges of Environmental Strategists and True Believers(PG, VL, and TS) to that of Committed and Reluctant Compliers(IG, CB, JF) from 1990 through 1999, we find that all the formergroup show improvement in all parameters, and that thisimprovement is unambiguous and obvious in all but two (out of12) cases. Among the latter group, only three cases (out of 12) of
43 Almost all our respondents acknowledged that a ‘‘mill in the boondocks’’ with aneconomically dependent local community could be anticipated to have a very relaxed sociallicense compared to one located near (or visible to) a middle-class and environmentallyconscious community that no longer depended upon it for its economic well-being.
44 The correlation between management style and BOD, TSS, and AOX was 0.76,0.55, and 0.66, respectively. The BOD and AOX correlations are significant at a p level of0.05, while the TSS figure is significant at a p level of 0.10.
Kagan, Gunningham, & Thornton 81
improvement occur, and in no case is the improvement obvious orunambiguous.
Yet firms still are constrained by the terms of their licenses. Afirm that pushes the boundaries of its licenses too far will bepunished: by regulators (if there is serious breach of the terms of apermit), by markets (if behavior goes beyond what is perceived byinvestors and analysts as economically rational), and by commu-nities or NGOs (if its behavior goes far beyond what is perceived associally acceptable). But since the limits on those licenses areunclear, and some of their terms are ambiguous, there isconsiderable scope for different environmental management tointerpret them in different ways.
Although we are convinced both by our statistical and fieldworkdata that ‘‘management matters,’’ our methodology did not enableus to explain precisely why firms approximated one ideal type oranother. As a working model, we assume this will be the outcome ofinteraction between external factors (e.g., the license require-ments), internal factors (e.g., corporate culture), and mediatingfactors (e.g., available corporate financial resources). Certainly,there was much to suggest that firms with different culturesbehaved very differently. We were struck, for example, by thebehavior of one ‘‘corporate raider’’ that operated two mills in oursample. In each case, its attitude to the local community wasconfrontationist in circumstances in which many other mills hadgone to very substantial lengths to appease and establish trust withcommunity groups. This attitude clearly came directly from thehead office. The environmental manager at one of those mills(whose community liaison efforts had not received corporatesupport) summed it up as follows: ‘‘we’ve done a horrible job onPR in the last decade. There is a huge trust chasm with the localcommunity y it’s part of the corporate philosophy, to come in andtake what you can get.’’ But to more fully tease out why differentenvironmental management cultures arise, it would take a far moredetailed and intensive study of a number of firms, including notjust leaders (as a few studies have done)45 but also laggards (whoare apt to refuse access to social scientists).
V. Conclusion
At the outset of this article we asked ‘‘In what ways, and to whatextent, does regulation matter in shaping corporate behavior?’’Our research on environmental regulation in the pulp and paperindustry demonstrates that regulation matters a great deal.Regulation has been directly responsible for the large reductions
45 Prakash (2000); Hoffman (1997).
82 Explaining Corporate Environmental Performance
in pulp mill pollution that stem from capital investments in verycostly pollution control technologies. Less directly, regulatory rules(and corporate compliance or noncompliance with them) serve as abenchmark for groups other than regulatory officials who evaluateand influence corporate behaviorFfinancial analysts, environ-mental advocacy groups, politicians, and corporate environmentalmanagers.
Yet governmental regulation, as conventionally viewed, doesnot fully explain two clear and important findings. First, the pulpmills we studied did not merely comply with regulation butoperated ‘‘beyond compliance’’ in significant ways, for example, byreducing water pollution to levels well below the limits required bythe companies’ regulatory permits. Second, notwithstandingsubstantial convergence over time, the pulp mills differedsignificantly in the extent to which they had gone beyond legalcompliance. That variation did not correlate closely with thedemands of the firms’ regulatory licenses. Nor did the purportedgreater prescriptiveness and deterrence threat of U.S. environ-mental regulation make pulp mills in the United States betterenvironmental performers, on average, than those in Canada,Australia, or New Zealand. More broadly, there was more variationwithin than across regulatory jurisdictions.
Rather than regulation, social license pressures and the characterof corporate environmental management appear to be the mostpowerful factors that prod some firms further beyond compliancethan others. Conversely, in a highly competitive commodity marketsuch as pulp manufacturing, economic pressures limit how far eventhe most environmentally committed firm can leap ahead of itscompetitors, at least in making nonincremental environmentalgains through costly new technologies that are not clearly likely topay for themselves in financial terms. Although the EnvironmentalStrategists and True Believers in our sample were able to makesteady incremental progress through ‘‘win-win’’ measures such asbetter employee training and dedicated maintenance regimes, wefound little evidence of a rich supply of major ‘‘win-win’’investments that environmentally committed corporate managerscould make, and hence little evidence that simply exhortingmanagers toward ‘‘environmental excellence’’ could substitute forregulation in overcoming tough economic constraints. Manage-ment does matter, but to paraphrase Marx, while companies maketheir own history, they do so in circumstances not of their ownchoosing.
If the pulp industry is any guide, governments pay attention toeconomic constraints facing the industry as well. They rarelymandate the use of such costly new environmental technologies inthe absence of the demonstrated economic viability of thetechnology or major public pressure, as in the case of the dramatic
Kagan, Gunningham, & Thornton 83
reaction to the discovery of dioxins in pulp mill effluent. Far frominflicting a technology-forcing, one-size-fits-all set of regulatoryrequirements on all regulated firms, as critics of regulation oftensuggest, a close examination of the permits of pulp mills reflects agovernmental propensity, in all jurisdictions we studied, to tailorrequirements to the technological and economic constraints ofparticular regulated entities.
One lesson of this study, therefore, is that governmentregulation might be viewed less as a system of hierarchicallyimposed, uniformly enforced rules than as a coordinativemechanism, routinely interacting with other sources of pressurefor socially responsible corporate behavior such as markets, localand national environmental activists, and the culture of corporatemanagement. If regulation is less important than environmentalmanagement and social pressures in inspiring ‘‘beyond-compli-ance’’ corporate activity, a competent regulatory system spursprogress by reassuring corporate environmental leaders that theirless-committed competitors also will be compelled to spend themoney to achieve environmental outcomes that the leaders havedemonstrated are technologically and economically feasible. More-over, in the programs we studied, regulators issued permits thatrequired firms to file their own plans for analyzing and reducingdesignated emissions or environmental hazards; after review andperhaps renegotiation by regulators, the company plan became abinding regulatory obligation. By ‘‘delegating the details,’’ regu-lated entities were prodded to undertake periodic, if notcontinuous, efforts to keep up with or advance the state of the artin environmental protection.
References
AF&PA (2000) Progress Report: Environmental, Health and Safety Principles VerificationProgram. Washington, DC: AF&PA.
Aoki, Kazumasu, & John Cioffi (2000) ‘‘Poles Apart: Industrial Waste ManagementRegulation and Enforcement in the United States and Japan,’’ in Robert A. Kagan& Lee Axelrad, eds., Regulatory Encounters: Multinational Corporations and AmericanAdversarial Legalism. Berkeley, CA: Univ. of California Press.
Aoki, Kazumasu, Robert A. Kagan, & Lee Axelrad (2000) ‘‘Industrial Effluent Control inthe United States and Japan,’’ in Robert A. Kagan & Lee Axelrad, eds., RegulatoryEncounters: Multinational Corporations and American Adversarial Legalism. Berkeley,CA: Univ. of California Press.
Armstrong, Douglas A., Keith A. Bentley, Sergio F. Galeano, Robert J. Olszewski, Gail A.Smith, & Jonathan R. Smith (1998) ‘‘The Pulp and Paper Industry,’’ in Deanna J.Richards & Greg Pearson, eds., The Ecology and Industry: Sectors and Linkages.Washington, DC: National Academy of Engineering, National Academy Press.
Axelrad, Lee (2000) ‘‘Investigation and Remediation of Contaminated ManufacturingSites in the United States, the United Kingdom, and the Netherlands,’’ in Robert A.Kagan & Lee Axelrad, eds., Regulatory Encounters: Multinational Corporations andAmerican Adversarial Legalism. Berkeley, CA: Univ. of California Press.
84 Explaining Corporate Environmental Performance
Ayres, Ian, & John Braithwaite (1992) Responsive Regulation. New York: Oxford Univ.Press.
Bardach, Eugene, & Robert A. Kagan (1982) Going by the Book: The Problem of RegulatoryUnreasonableness. A Twentieth Century Fund Study. Philadelphia, PA: Temple Univ.Press.
Becker, Gary (1968) ‘‘Crime and Punishment: An Economic Approach,’’ 76 J. of PoliticalEconomy 169.
Braithwaite, John (1985) To Punish or Persuade: Enforcement of Coal Mine Safety. Albany,NY: SUNY Press.
FFF (1993) ‘‘The Nursing Home Industry,’’ in Michael Tonry & Albert J. Reiss Jr.,eds., Beyond the Law: Crime in Complex Organizations. Chicago, IL: Univ. of ChicagoPress.
Braithwaite, John, & Peter Drahos (2000) Global Business Regulation. Cambridge/NewYork: Cambridge Univ. Press.
Cashore, Benjamin, & Ilan Vertinsky (2000) ‘‘Policy Networks and Firm Behaviours:Governance Systems and Firm Responses to External Demands for SustainableForest Management,’’ 33 Policy Sciences 1–20.
Coglianese, Cary (2001) ‘‘Policies to Promote Systematic Environmental Management,’’in Cary Coglianese & Jennifer Nash eds., Regulating from the Inside: Can Environ-mental Management Systems Achieve Policy Goals? Washington, DC: Resources for theFuture.
Dwyer, John, Richard Brooks, & Alan Marco (2000) ‘‘The Air Pollution Permit Processfor U.S. and German Automobile Assembly Plants,’’ in Robert A. Kagan & LeeAxelrad, eds., Regulatory Encounters: Multinational Corporations and AmericanAdversarial Legalism. Berkeley, CA: Univ. of California Press.
Fuchs, D. A., & D. A. Mazmanian (1998) ‘‘The Greening of Industry: Needs of theField,’’ 7 Business Strategy and the Environment 193–203.
Grabosky, Peter, & John Braithwaite (1986) Of Manners Gentle: Enforcement Strategies ofAustralian Business Regulatory Agencies. Melbourne: Oxford Univ. Press.
Gunningham, Neil (1987) ‘‘Negotiated Non-Compliance: A Case Study of RegulatoryFailure,’’ 9 Law & Policy Q. 69–87.
Gunningham, Neil, & Peter Grabowsky (1998) Smart Regulation: Designing EnvironmentalPolicy. Oxford: Clarendon Press.
Harrison, Kathryn (1995) ‘‘Is Cooperation the Answer? Canadian EnvironmentalEnforcement in Comparative Context,’’ 14 J. Policy Analysis & Management 221–24.
FFF (2002) ‘‘Ideas and Environmental Standard-Setting: A Comparative Study ofRegulation of the Pulp and Paper Industry,’’ 15(1) GovernanceFAn International J.of Policy & Administration 65–96.
Hoffman, Andrew (1997) From Heresy to Dogma: An Institutional History of CorporateEnvironmentalism. San Francisco, CA: New Lexington Press.
Kagan, Robert A., & Lee Axelrad (2000) Regulatory Encounters: Multinational Corporationsand Adversarial Legalism. Berkeley, CA: Univ. of California Press.
Kagan, Robert, & John Scholz (1984) ‘‘The Criminology of the Corporation andRegulatory Enforcement Styles,’’ in Keith Hawkins & John Thomas, eds., EnforcingRegulation. Boston, MA: Kluwer-Nijhoff.
Kelman, Steven (1981) Regulating America, Regulating Sweden: A Comparative Study ofOccupational Safety and Health Policy. Cambridge, MA: MIT Press.
Magat, Wesley, & W. Kip Viscusi (1990) ‘‘Effectiveness of the EPA’s RegulatoryEnforcement: The Case of Industrial Effluent Standards,’’ 33 J. Law & Economics331–60.
Miller, J. L., & A. B. Anderson (1986) ‘‘Updating the Deterrence Doctrine,’’ 77 J. ofCriminal Law and Criminology 418.
Morag-Levine, Noga (1994) ‘‘Between Choice and Sacrifice: Constructions of Commu-nity Consent in Reactive Air Pollution Regulation,’’ 28 Law & Society Rev. 1035–77.
Kagan, Gunningham, & Thornton 85
Norbert-Bohm, Vicki, & Mark Rossi (1998) ‘‘The Power of Incrementalism: Environ-mental Regulation and Technological Change in Pulp and Paper Bleaching in theUS,’’ 10 Technology Analysis & Strategic Management 225–41.
OECD (2000) Reducing the Risk of Policy Failure: Challenges for Regulatory Compliance,Working Paper Vol. III, No 77. Paris: OECD.
Prakash, Asseem (2000) Greening the Firm: The Politics of Corporate Environmentalism.Cambridge, UK: Cambridge Univ. Press.
Raizada, R. (1998) Corporate Responses to Government and Environmental Group ActionsDesigned to Protect the Environment. Ph.D. dissertation, University of BritishColumbia.
Sabatier, Paul, & Daniel Mazmanian (1983) Can Regulation Work? The Implementation of the1972 California Coastline Initiative. New York: Plenum.
Scholz, John T. (1984) ‘‘Cooperation, Deterrence and the Ecology of RegulatoryEnforcement,’’ 18 Law & Society Rev. 601.
Scruggs, Lyle A. (1999) ‘‘Institutions and Environmental Performance in SeventeenWestern Democracies,’’ 29 British J. Political Science 1–31.
Smart, B., ed. (1992) Beyond Compliance: A New Industry View of the Environment.Washington DC: World Resources Institute.
Sonnenfeld, David A. (1996a) ‘‘Greening the Tiger? Social Movements’ Influence onAdoption of Environmental Technologies in the Pulp and Paper Industries ofAustralia, Indonesia, and Thailand,’’ Unpublished Ph.D. thesis, Department ofSociology, University of California, Santa Cruz.
FFF (1996b) ‘‘The Ghost of Wesley Vale: Environmentalists’ Influence on Innovationin Australia’s Pulp and Paper Industry,’’ 1(4) Competition and Change 379–401.
FFF (1998a) ‘‘From Brown to Green? Late Industrialization, Social Conflict, andAdoption of Environmental Technologies in Thailand’s Pulp and Paper Industry,’’11(1) Organization & Environment 59–87.
FFF (1998b) ‘‘Social Movements, Environment, and Technology in Indonesia’s Pulpand Paper Industry,’’ 39(1) Asia Pacific Viewpoint 95–110.
FFF (2002) ‘‘Social Movements and Ecological Modernization: The Transformation ofPulp and Paper Manufacturing,’’ 33(1) Development and Change 1–27.
Stanley, Elaine (1999) ‘‘Available Environmental Data for Deterrence Research,’’presentation by EPA Office of Compliance at Forum on Deterrence of Environ-mental Violations and Environmental Crimes, National Institute of Justice.Washington, DC.
Stigler, George (1970) ‘‘The Optimum Enforcement of Laws,’’ 78 J. of Political Economy526.
Verweij, Marco (2000) ‘‘Why is the River Rhine Cleaner than the Great Lakes (DespiteLooser Regulation),’’ 34 Law & Society Rev. 1007.
Walsh, Mary Williams (1992) ‘‘Canadian Mill’s Quandary: Can It Make Money onPollution-Free Paper?,’’ Los Angeles Times, March 8, D-3.
Wilson, Graham (1985) The Politics of Safety and Health. Oxford: Clarendon Press.Wokutch, Richard E. (1992) Worker Protection, Japanese Style: Occupational Safety and Health
in the Auto Industry. Ithaca, NY: ILR Press.Wokutch, Richard E., & Craig V. Vansandt (2000) ‘‘National Styles of Worker Protection
in the United States and Japan: The Case of the Automotive Industry,’’ 22 Law &Policy Q. 369–84.
Appendix: Company Environmental Management:Five Ideal Types
1. Environmental Laggards. Management in these firms do notcommit to consistent achievement of regulatory standards as anessential business goal or constraint. They have a negative
86 Explaining Corporate Environmental Performance
attitude toward many regulatory requirements and comply onlyto avoid costly enforcement actions. They do not scan foropportunities for environmental innovation, are slow to createspecialized environmental management positions or proce-dures, and when they do so, those personnel and proceduresare not closely integrated with production. Laggards do notseek to develop cooperative, open relationships with regulatoryagencies or with local communities on environmental issues.
2. Reluctant Compliers. In contrast with Environmental Laggards,Reluctant Compliers, as a matter of firm or facility policy, seek tomeet the minimum standards prescribed by legislation andpermits, and they are more willing to establish environmentalpositions and procedures to keep up with regulatory require-ments. However, they are not committed to invariant or ‘‘full’’compliance; they are willing to countenance ‘‘short cuts’’ oroccasional permit exceedances, unless monitored closely andpushed hard by regulatory enforcement officials, and areinclined to interpret their permit obligations narrowly. Theyresemble Environmental Laggards in feeling no moral impera-tive to comply and in their disinclination to scan broadly for‘‘win-win’’ environmental investments, for they tend not to seeeconomic or social benefits in compliance. They also resembleEnvironmental Laggards in their disinclination to develop openand cooperative relationships with regulators or local commu-nity environmental activists.
3. Committed Compliers. Committed Compliers take their regulatoryresponsibilities seriously. They strive to maintain complianceeven when there are opportunities for avoidance. They usuallyseek to build in a ‘‘margin of safety,’’ setting equipment anddesigning processes so that even an unanticipated emission doesnot put them in breach of their overall license requirements.They are more cooperative in dealing with regulators in thesense that they seek to demonstrate their reliability in complyingwith regulatory and permit requirements. Nevertheless, theyare predominantly reactive in their dealing with environmentalissues; their environmental agenda is set almost entirely byreference to current and imminent legal requirements. They doseek out ‘‘win-win’’ opportunities in a narrow and traditionalaccounting sense, but invest only in environmental measuresthat can be demonstrated, ex ante, to produce a profit in areasonably short time. They may respond to pressures fromlocal communities or other external stakeholders such ascustomers, but they do so predominantly by reference to theterms of the legal license, believing compliance to be thefundamental indicator by which their environmental perfor-mance will be judged. Environmental spending is still regardedpredominantly as a cost without compensating economic
Kagan, Gunningham, & Thornton 87
benefits, although its benefit to the environment is generallyacknowledged.
4. Environmental Strategists. Compared to Committed Compliers,Environmental Strategists have a broader, more future-orientedconception of their environmental objectives, which they see asmore closely linked to their business goals. As a matter of long-term ‘‘business sense,’’ they believe it is desirable to fully meetcurrent and anticipated regulatory requirements with a marginof safety. They often seek to ‘‘overcomply’’ with existing permitrequirements in order to maintain a reputation as a goodenvironmental citizen with regulators, environmental activists,neighbors, customers, and financial markets. They also actstrategically and proactively in their relationship with regula-tors, seeking to build a positive reputation for honesty andreliability where they believe that will generate long-termeconomic benefits. However, they strive to reshape regulation(at its formulation stage) so as to minimize its economic impacton them, and to provide greater flexibility.
Environmental Strategists believe that in a range of circum-stances, environmental improvements can lead to improvedeconomic performance. Hence they establish highly profes-sional environmental management departments that activelyscan for and seek out ‘‘win-win’’ opportunities. They placeemphasis on the integration of economic and environmentalperformance, establishing sophisticated internal control andauditing systems. They are willing to make substantial environ-mental investments that cannot be justified, ex ante, as directlyprofit enhancing, but that can be viewed qualitatively, and in thelong term, as adding to the economic health of the corporation.For similar strategic reason, Environmental Strategists, ascompared to the Committed Compliers, often accommodateto community demands, taking environmental measures that gowell beyond legal compliance. However, Environmental Strate-gists also take initiatives designed to shape community attitudes,educating local interest groups, and governmental officialsabout the firm’s environmental policies and the constraints itfaces. Information is also carefully managed, for fear that thismight be misinterpreted, misunderstood, and/or used againstthem by environmental groups or their competitors. For thisreason they have only very limited transparency, at least ascompared to True Believers.
5. True Believers. Like other firms, True Believers have to makedecisions that ensure that they remain economically viable.Nevertheless, they approach those decisions with a distinctiveattitude toward their environmental responsibilities, explainingtheir decisions on environmental issues not purely in pragmaticterms (the ‘‘business case’’) but also in terms of principle, as ‘‘the
88 Explaining Corporate Environmental Performance
right thing to do.’’ They see a reputation for environmentalexcellence as an important key to business success, as do manyEnvironmental Strategists. They therefore adopt many of thesame strategies of such Environmental Strategists, but make thatgoal more central to their corporate identity. They have anextremely broad perception of what constitutes win-winopportunities. This makes them more inclined to defineinvestment in ‘‘beyond-compliance’’ environmental measuresas ‘‘good business decisions’’ even if the numerical payoff cannotbe calculated ex ante. True Believers constantly scan for suchopportunities, both internally and externally, and are preparedto invest in them both for the short and the long term. Becausethey believe that establishing trust with local communities isessential, they are more inclined than Environmental Strategiststo accept the need to be fully transparent. Accordingly, theydisclose whatever information the community requests abouttheir environmental impacts and they are even more inclinedthan Environmental Strategists to go ‘‘beyond compliance’’ inremedying environmental impacts that disturb their neighbors.
Kagan, Gunningham, & Thornton 89
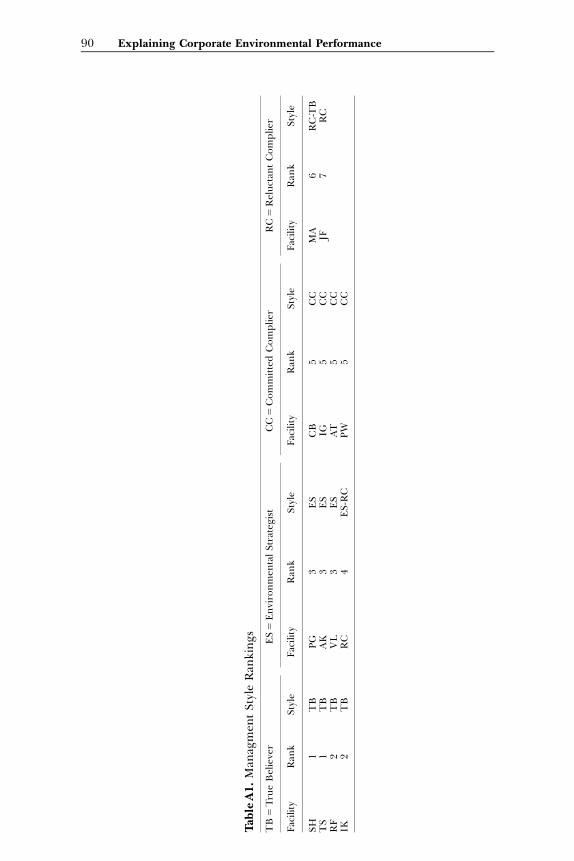
Tab
leA
1.
Man
agm
ent
Sty
leR
ank
ing
s
TB5
Tru
eB
elie
ver
ES5
En
viro
nm
enta
lS
trat
egis
tC
C5
Co
mm
itte
dC
om
plier
RC5
Rel
uct
ant
Co
mp
lier
Fac
ilit
yR
ank
Sty
leF
acilit
yR
ank
Sty
leF
acilit
yR
ank
Sty
leF
acilit
yR
ank
Sty
le
SH
1T
BP
G3
ES
CB
5C
CM
A6
RC
-TB
TS
1T
BA
K3
ES
IG5
CC
JF7
RC
RF
2T
BV
L3
ES
AT
5C
CIK
2T
BR
C4
ES
-RC
PW
5C
C
90 Explaining Corporate Environmental Performance
Copyright © 2022 FDOKUMEN