Experimental and numerical analysis of seat belt bunching ...
37
HAL Id: hal-00573076 https://hal.archives-ouvertes.fr/hal-00573076 Submitted on 3 Mar 2011 HAL is a multi-disciplinary open access archive for the deposit and dissemination of sci- entific research documents, whether they are pub- lished or not. The documents may come from teaching and research institutions in France or abroad, or from public or private research centers. L’archive ouverte pluridisciplinaire HAL, est destinée au dépôt et à la diffusion de documents scientifiques de niveau recherche, publiés ou non, émanant des établissements d’enseignement et de recherche français ou étrangers, des laboratoires publics ou privés. Experimental and numerical analysis of seat belt bunching phenomena David Dubois, Harald Zellmer, Eric Markiewicz To cite this version: David Dubois, Harald Zellmer, Eric Markiewicz. Experimental and numerical analysis of seat belt bunching phenomena. International Journal of Impact Engineering, Elsevier, 2009, 36 (6), pp.763. 10.1016/j.ijimpeng.2008.11.006. hal-00573076
-
Upload
khangminh22 -
Category
Documents
-
view
5 -
download
0
Transcript of Experimental and numerical analysis of seat belt bunching ...
HAL Id: hal-00573076https://hal.archives-ouvertes.fr/hal-00573076
Submitted on 3 Mar 2011
HAL is a multi-disciplinary open accessarchive for the deposit and dissemination of sci-entific research documents, whether they are pub-lished or not. The documents may come fromteaching and research institutions in France orabroad, or from public or private research centers.
L’archive ouverte pluridisciplinaire HAL, estdestinée au dépôt et à la diffusion de documentsscientifiques de niveau recherche, publiés ou non,émanant des établissements d’enseignement et derecherche français ou étrangers, des laboratoirespublics ou privés.
Experimental and numerical analysis of seat beltbunching phenomena
David Dubois, Harald Zellmer, Eric Markiewicz
To cite this version:David Dubois, Harald Zellmer, Eric Markiewicz. Experimental and numerical analysis of seat beltbunching phenomena. International Journal of Impact Engineering, Elsevier, 2009, 36 (6), pp.763.�10.1016/j.ijimpeng.2008.11.006�. �hal-00573076�
Please cite this article as: Dubois D, Zellmer H, Markiewicz E. Experimental and numerical analysis of seat belt bunching phenomena, International Journal of Impact Engineering (2008), doi: 10.1016/j.ijimpeng.2008.11.006
This is a PDF file of an unedited manuscript that has been accepted for publication. As a service to our customers we are providing this early version of the manuscript. The manuscript will undergo copyediting, typesetting, and review of the resulting proof before it is published in its final form. Please note that during the production process errors may be discovered which could affect the content, and all legal disclaimers that apply to the journal pertain.
Accepted Manuscript
Title: Experimental and numerical analysis of seat belt bunching phenomena
Authors: David Dubois, Harald Zellmer, Eric Markiewicz
PII: S0734-743X(08)00309-6DOI: 10.1016/j.ijimpeng.2008.11.006Reference: IE 1720
To appear in: International Journal of Impact Engineering
Received Date: 6 May 2008Revised Date: 6 November 2008Accepted Date: 10 November 2008
TPIRCSUNAM DETPECCA
ARTICLE IN PRESS
Experimental and numerical analysis of seat belt bunching phenomena
David Duboisa, Harald Zellmerb, Eric Markiewiczc
aAutoliv France, Avenue de l’Europe, 76220 Gournay en Bray, France
b Autoliv Germany, Otto-Hahn-Strasse 4, P O Box 109, D-25333 Elmshorn, Germany
c University of Valenciennes, Laboratory of Industrial and Human Automation Control,
Mechanical Engineering and Computer Science LAMIH UMR CNRS 8530, Le Mont
Houy, Jonas 2, 59313 Valenciennes, Cedex 9, France
Abstract
In current cars, loops are commonly used to redirect the webbing which reels out
from the retractor to the passenger’s shoulder. Some types of pillar loops, also called D-
rings, lead to a non-systematic instability. The webbing, which should scroll without
hindrance through the D-ring, laterally shifts, bunches and produces the overturning of
the ring.
In this paper, this so-called seat belt bunching phenomenon is parsed during a first
step with sled test campaigns data. The results of designs of experiments are analysed
and discussed.
To expertise this instability issue, an innovative fixture is exploited during a
second step to reproduce the phenomenon in a fully controlled manner for dynamic and
quasi-static loadings. To assess these sub-system tests, a Digital Images Correlation
system is employed to evaluate the strain distribution of seat belt webbing during the
bunching phase. Based on these local measurements, a correlation of a Finite Element
model of seat belt bunching is achieved using a new shell element for webbing fabric,
before proposing an explanation of the phenomenon.
Keywords: Seat Belt; Bunching; Finite Element; Correlation
TPIRCSUNAM DETPECCA
ARTICLE IN PRESS
1. Introduction
Automotive manufacturers and suppliers commonly conduct crash tests in order to
assess the performance of safety systems on new vehicles. Crash scenarios are
reproduced using dynamic tests. For instance, the EuroNCAP protocol; a 64 km/h
frontal impact in a 40% offset deformable barrier is used to simulate a car to car impact.
An assessment protocol is then applied to achieve a rating for each body region. The
head acceleration, the chest deflection, the femurs loading, compression / extension /
flexion of the neck are measured on crash test dummies and a star rating is given. The
safest cars obtain a 5 star performance.
During the vehicle deceleration, the dummies are subjected to the collision forces
and in the case of a frontal impact, they move forward. To prevent severe contacts
between the passenger and the car interior (dashboard, steering wheel), a three-point
seat belt restrains the passenger’s motion. In parallel, the driver and the passenger
airbags reduce the acceleration peak applied to the occupant and distribute the restraint
loads on the upper part of the body. To take benefit of their coupled actions, these
restraint systems are developed in interaction. Nevertheless, although an airbag has a
spectacular action during a collision, the belt, part of the passive restraint system, is the
only protection against the ejection of the passenger away from his vehicle.
A safety belt webbing is a fabric material using polyester threads woven on
Jacquard weaving looms. The webbing of a width of 48 mm of the belt restraint system
has to resist to dynamic loads up to 14kN. Depending on the type of vehicle, about 3.5m
of webbing are used in the seat belt. The interactions between the warp and weft threads
of the fabric control the behaviour of the seat belt during the crash event.
Seat belt systems are usually combined with a load limiter retractor and also pre-
tensionner integrated in the retractor, fixed at the buckle or at the lower part of the B
TPIRCSUNAM DETPECCA
ARTICLE IN PRESS
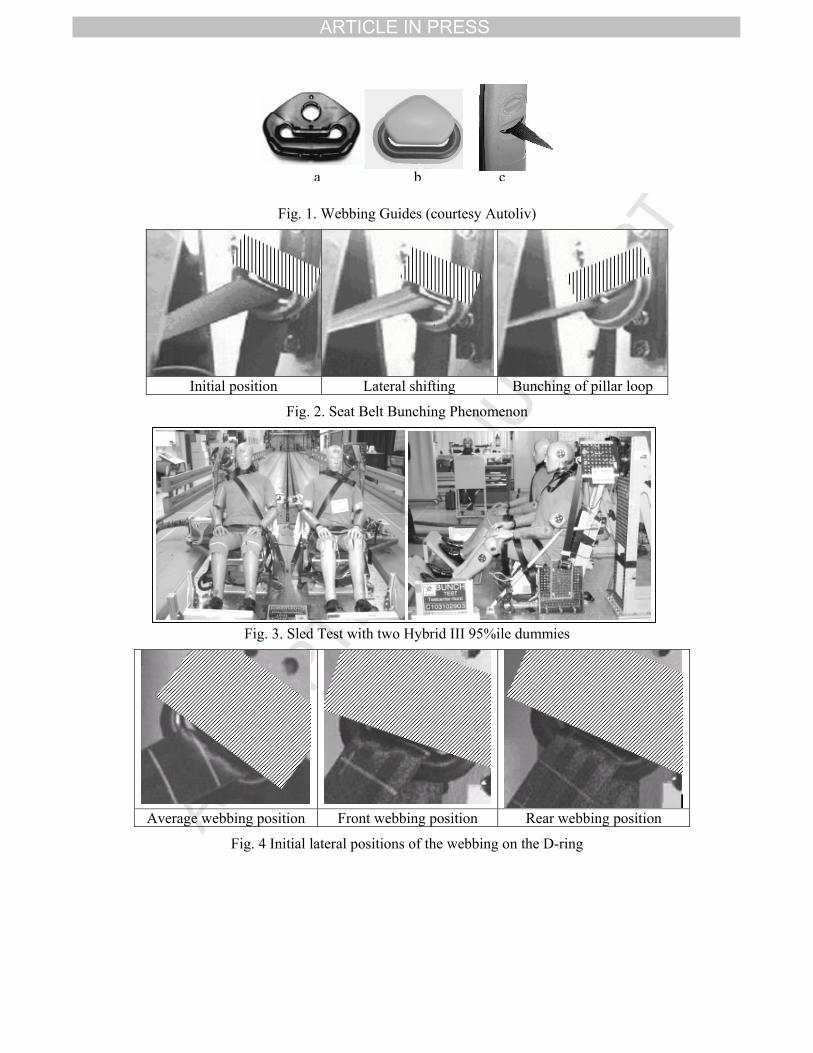
pillar (the pillar on which the rear doors are fixed). A D-ring is used on the upper part of
this pillar in order to redirect the seat belt, which reels out from the retractor to the
passenger shoulder. It is designed to adapt its angular position according to the
passenger’s motion. Numerous different kinds of D-rings (also called webbing guides)
are used in current vehicles: most of them are made of a metal insert on which polymer
part in nylon or in acetyl is moulded (see Fig. 1.a). In some cases, the ring frame and the
guidance surface are made of one piece of metal (see Fig. 1.b). In the latest vehicles, the
complete webbing guide assemblies are integrated into the trim panel, and only the
diagonal belt portion appears (see Fig. 1.c).
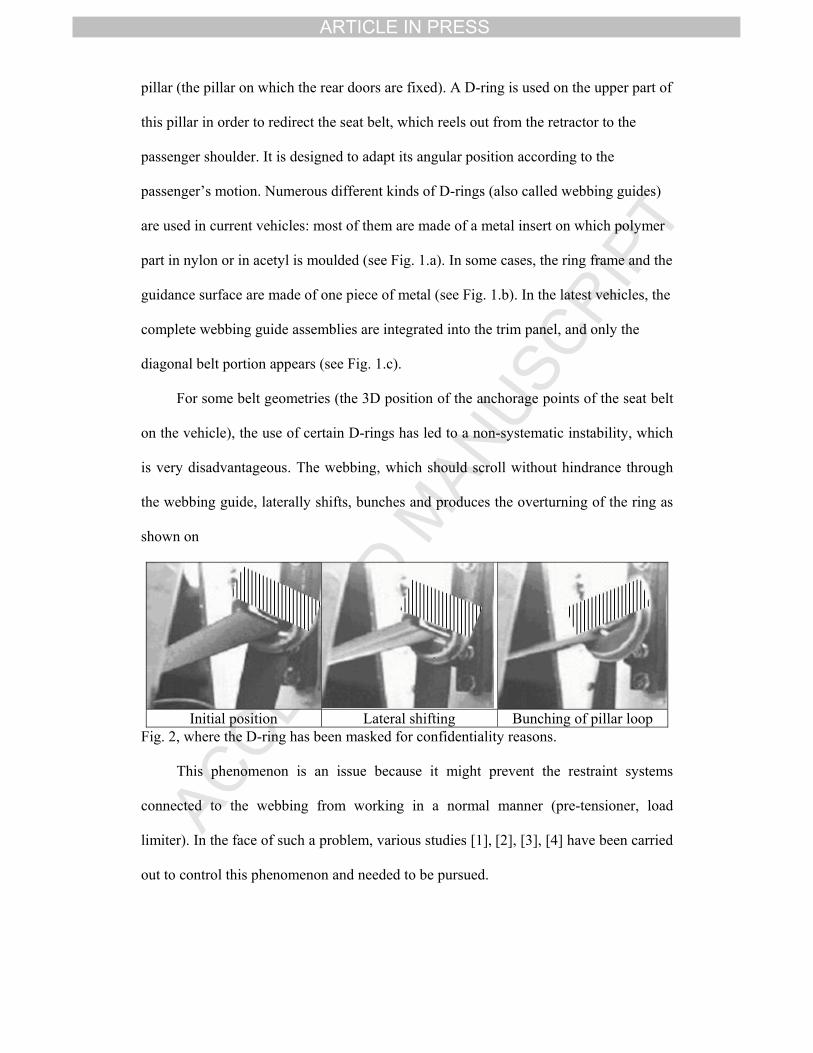
For some belt geometries (the 3D position of the anchorage points of the seat belt
on the vehicle), the use of certain D-rings has led to a non-systematic instability, which
is very disadvantageous. The webbing, which should scroll without hindrance through
the webbing guide, laterally shifts, bunches and produces the overturning of the ring as
shown on
Initial position Lateral shifting Bunching of pillar loop
Fig. 2, where the D-ring has been masked for confidentiality reasons.
This phenomenon is an issue because it might prevent the restraint systems
connected to the webbing from working in a normal manner (pre-tensioner, load
limiter). In the face of such a problem, various studies [1], [2], [3], [4] have been carried
out to control this phenomenon and needed to be pursued.
TPIRCSUNAM DETPECCA
ARTICLE IN PRESS
2. Analysis of the phenomenon based on sled tests
To develop restraint systems, numerical simulations are conducted and to confirm
the airbag and the seat belt performances, dynamic sled tests are performed.
A sled is a mechanical welded assembly developed to simulate the car interior.
The anchorage points of the seat belt are positioned in accordance with the car project
specifications. The dashboard geometry is reproduced using foams and seat prototypes
are used.
The bunching phenomenon was occasionally observed during these non-
destructive sled tests. Previous studies [1] shown that during this type of tests, the
plastic deformations of the crash frame are not reproduced and the corresponding
absorbed energy is transferred to the webbing (no deformation of the B pillar on which
the D-ring is fixed, no deformation of the car floor on which the seat is fixed, no
dynamic pitch of the car body). The load applied to the seat belt webbing (measured
locally by specific load cells) is thus often higher than the load measured during the
corresponding complete vehicle crash tests. Sled tests are known to overload the
webbing and to maximise the seat belt bunching likelihood.
To expertise belt behaviours, frontal sled tests campaigns were performed. Based
on this experimental approach, designs of experiments have permitted to point out that
one of the major factors which influence the phenomenon is the seat belt geometry [1].
Several risky seat belt geometries have been then defined but no generic assessment has
been developed to explain the seat belt bunching phenomenon.
To pursue the research, a critical analysis of the design of experiments results was
proposed. It appears that two consecutive and supposed identical tests may result in two
different local behaviours of the ring (bunching for the first one and no bunching for the
second one). For instance, sled tests performed with two seats on the same platform
(and thus the same pulse, the same dummies, the same belt geometries) gave different
TPIRCSUNAM DETPECCA
ARTICLE IN PRESS
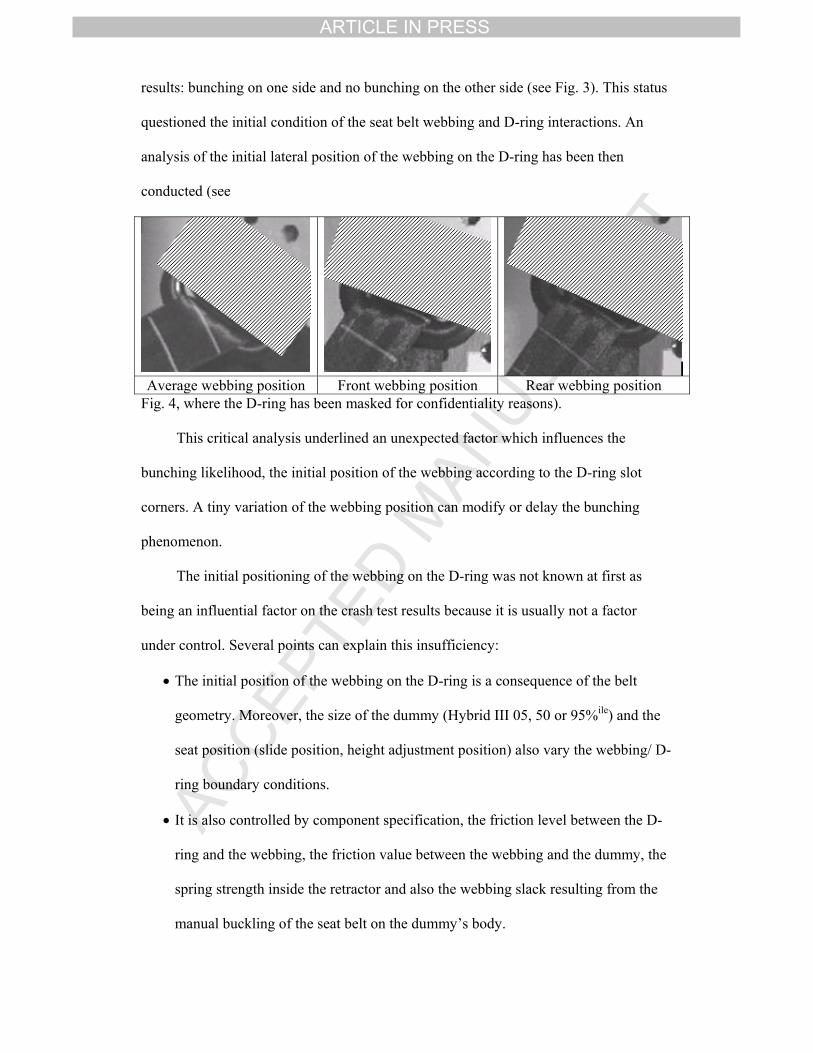
results: bunching on one side and no bunching on the other side (see Fig. 3). This status
questioned the initial condition of the seat belt webbing and D-ring interactions. An
analysis of the initial lateral position of the webbing on the D-ring has been then
conducted (see
Average webbing position Front webbing position Rear webbing position
Fig. 4, where the D-ring has been masked for confidentiality reasons).
This critical analysis underlined an unexpected factor which influences the
bunching likelihood, the initial position of the webbing according to the D-ring slot
corners. A tiny variation of the webbing position can modify or delay the bunching
phenomenon.
The initial positioning of the webbing on the D-ring was not known at first as
being an influential factor on the crash test results because it is usually not a factor
under control. Several points can explain this insufficiency:
• The initial position of the webbing on the D-ring is a consequence of the belt
geometry. Moreover, the size of the dummy (Hybrid III 05, 50 or 95%ile) and the
seat position (slide position, height adjustment position) also vary the webbing/ D-
ring boundary conditions.
• It is also controlled by component specification, the friction level between the D-
ring and the webbing, the friction value between the webbing and the dummy, the
spring strength inside the retractor and also the webbing slack resulting from the
manual buckling of the seat belt on the dummy’s body.
TPIRCSUNAM DETPECCA
ARTICLE IN PRESS
• The dynamic ring technology has also an influence on the webbing positioning on
the D-ring. In a case of a direct crash test (sled decelerated using deformable
bumpers), the initial webbing position is often modified by the tiny sways of the
dummy during the acceleration phase. These perturbations can potentially be
reduced by the use on an inversed crash sled (sled accelerated using hydraulic
valves), but as the seat belt bunching phenomenon is an instability problem, small
variations of the sled pulse can also interfere on the webbing behaviour.
The critical analysis of the results of designs of experiments shows that
experimental studies based on sled tests are helpful to investigate the phenomenon but
do not lead to a final solution to the instability of D-rings. They enable to list several
important influential factors and to show tendencies. Detailed analysis proved that sled
dynamic tests are not adapted to the study of the webbing/D-ring interactions, because
this test method provokes local dispersions which have an effect on the final result of
the experiments.
Numerous sled tests would be necessary to evaluate the trends according to the
initial position of the webbing on the D-ring, but the high cost of these sled tests does
not enable to pursue in that way.
3. Analysis of the phenomenon based on global sub-system tests
To complete the analysis of the seat belt bunching phenomenon, a global sub-
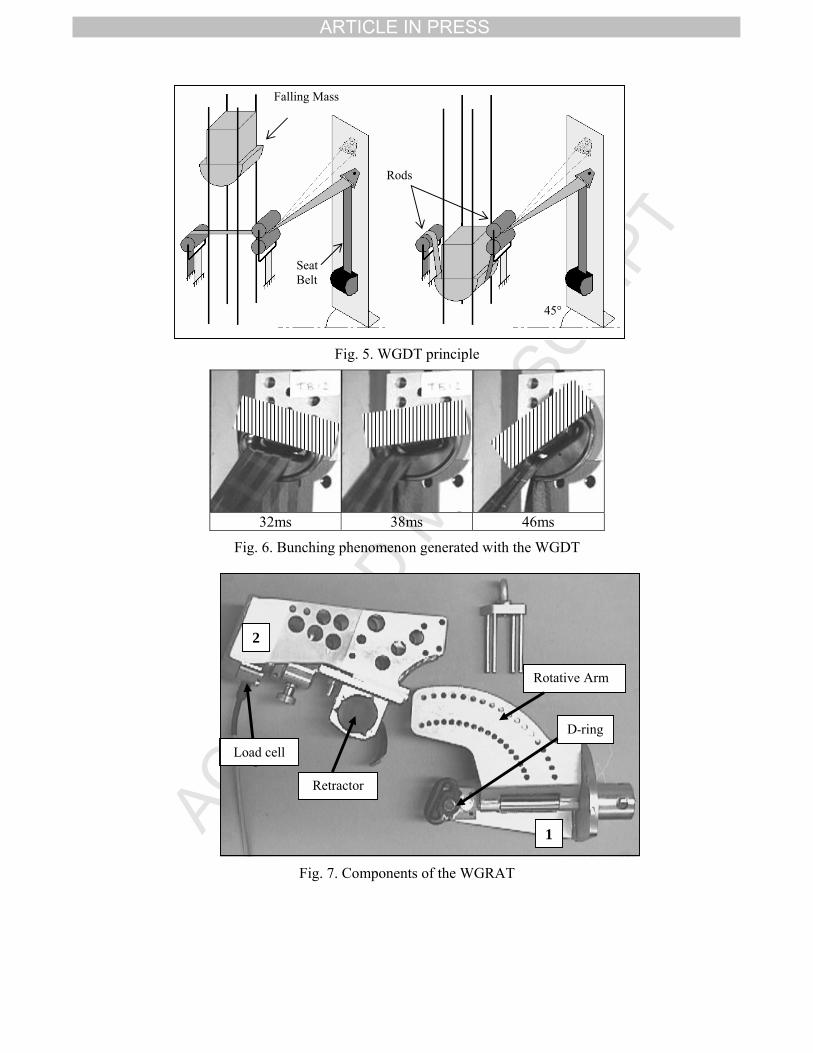
system test, called Webbing Guide Drop Test (WGDT) has been used [5]. The principle
of this bench is: a half cylinder drop weight, fixed to the sled of a drop test, impacts a
horizontal webbing portion between a set of rods (see Fig. 5). The horizontal webbing
portion is then pulled and the shoulder belt reels out. The D-ring is screwed on a vertical
column. Its column is oriented at 45° to facilitate the shoulder belt orientation. The total
energy applied to the system is controlled by the mass and the speed of the impactor.
TPIRCSUNAM DETPECCA
ARTICLE IN PRESS
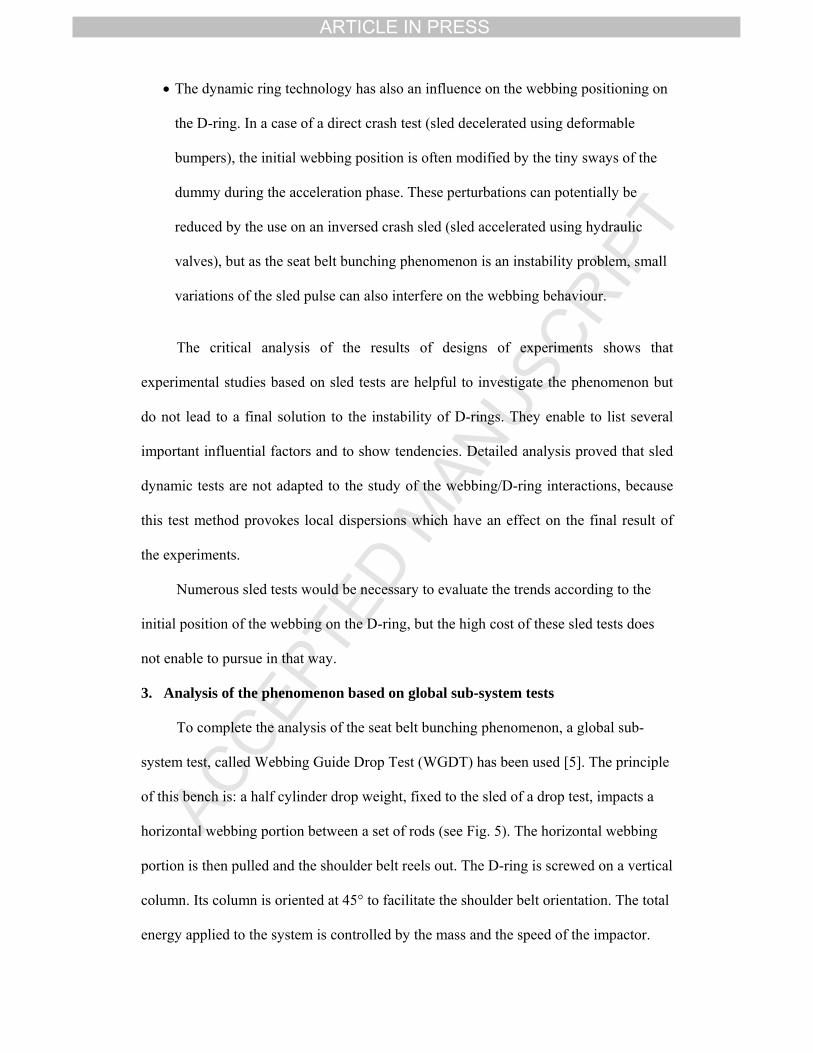
Experimental campaigns showed that the WGDT is a consistent method to test D-
ring in dynamic loading conditions. With this device, the D-ring’s instability can be
easily reproduced (see
32ms 38ms 46ms
Fig. 6) with loading levels and scrolling speeds equivalent to those observed during R16
sled tests [6]. The advantage of this test method compared to sled test is that results are
completely repeatable and the cost per experiment is low compared to dynamic sled
tests.
The use of the WGDT to investigate the seat belt bunching phenomenon enables
to complete the global understanding of the webbing behaviour. It confirms that the
initial position of the webbing influences the global stability of the ring. Nevertheless to
assess and to solve the ring’s instability; a local analysis of the webbing has been
investigated.
4. Analysis of the phenomenon based on local sub-system tests
Based on sled test results and the WGDT results, the need of a local sub system
test has emerged [7].
4.1. Sub-System Test
To reduce the variance of designs of experiment based on sled test and to focus
the study on the behaviour of D-rings, a sub-system test method has been used. Thus, an
innovative experimental bench was developed by Autoliv North Germany [8], [9].
TPIRCSUNAM DETPECCA
ARTICLE IN PRESS
4.2. Experimental set-up
This innovative experimental bench called WGRAT (Webbing Guide Rotative
Arm Test), consists in two main parts (see Fig. 7) fixed on a quasi-static tensile test
machine:
• Part 1: a support structure with a rotating arm on which the D-ring is fixed.
• Part 2: a fixture on which the retractor and a load cell are mounted.
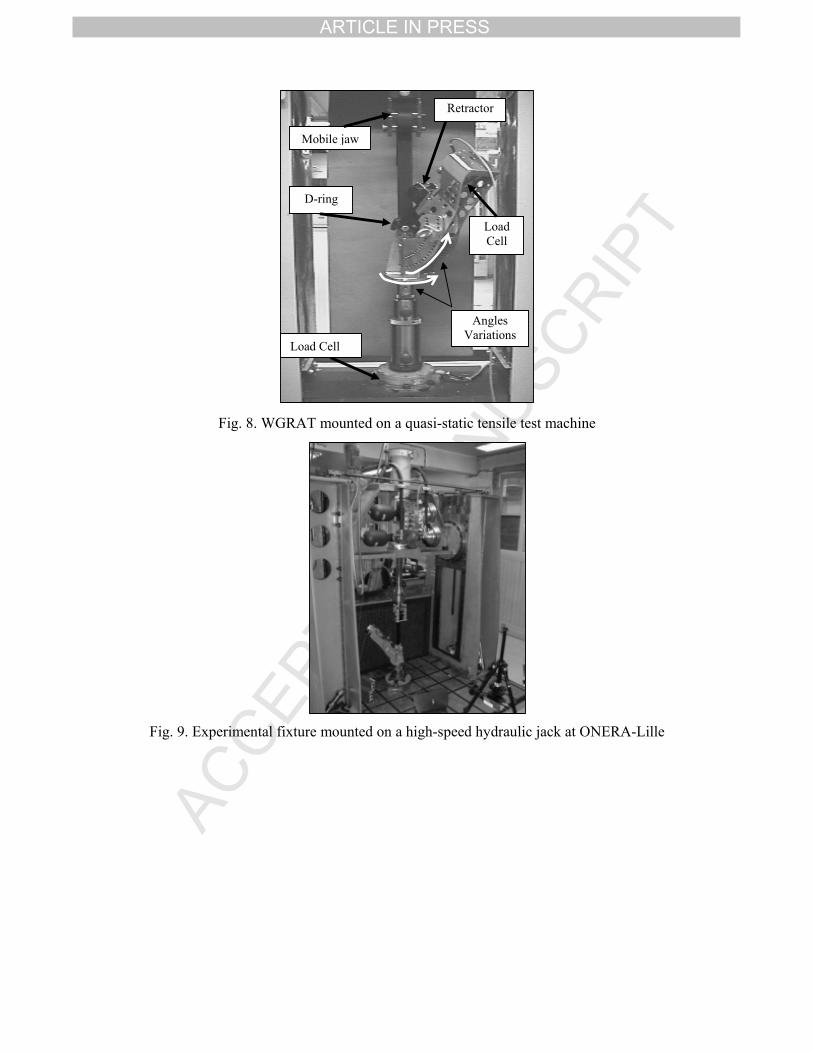
This mechanism has a multi-angle rotative arm, which allows to reproduce all the
belt orientations seen in an automotive vehicle. It is usually fixed to the lower jaw of a
tensile test machine. For each test, a retractor is mounted on the device, the D-ring is
fixed on its axle and the webbing is set through the ring. Then, the free end of the
webbing is fixed to the upper jaw of the tensile test machine. The experimental fixture
(see Fig. 8) enables to load the D-ring in similar loading conditions to a sled test.
The use of two devices of angle variation allows re-creating the seat belt curvature
through the D-ring. Compared to a real car set up, the loading conditions are varied as
following:
• The position of the retractor and the position of the loading webbing end are
reversed.
• The loading direction is constant (during a sled test, the dummy is moving
forward and the loading direction is varying).
• The speed of loading is limited by the pulling device specification (it can reach up
to several meters per second during a sled test).
• No deceleration pulse is applied to the D-ring and to the webbing.
5. Experimental analysis based on WGRAT
The local assessment on the seat belt bunching phenomena based on experimental
tests has been pursed in two steps:
TPIRCSUNAM DETPECCA
ARTICLE IN PRESS
• For dynamic loadings, using an hydraulic jack and a high speed video camera.
• For quasi-static loadings, using a tensile test machine and a Digital Images
Correlation for strain distribution measurement.
5.1. Dynamic WGRAT Test Set Up
The WGRAT device was adapted to dynamic loadings to obtain the same outlet
speed of the webbing through the webbing guide than the speed measured during
dynamic sled tests (see Fig. 9).
Thus, the fixture was mounted on a high-speed hydraulic jack at ONERA Lab.
Center of Lille (The French Aerospace Lab.). The frame is made of two vertical
columns fixed on ground (2.5 x 2.5 m²). This ground is fixed to a 40 tons seismic mass
suspended and damped. The columns are connected by a horizontal crosspiece to two
degrees of freedom, on the middle of which the hydraulic jack is mounted.
Its loading capacity is 50kN in dynamic. Its maximal speed is close to 10m/s. The
cylinder travel exceeds 250mm. Its guidance is obtained by hydrostatic bearings and
allows radial loadings.
5.2. Dynamic WGRAT Test Result
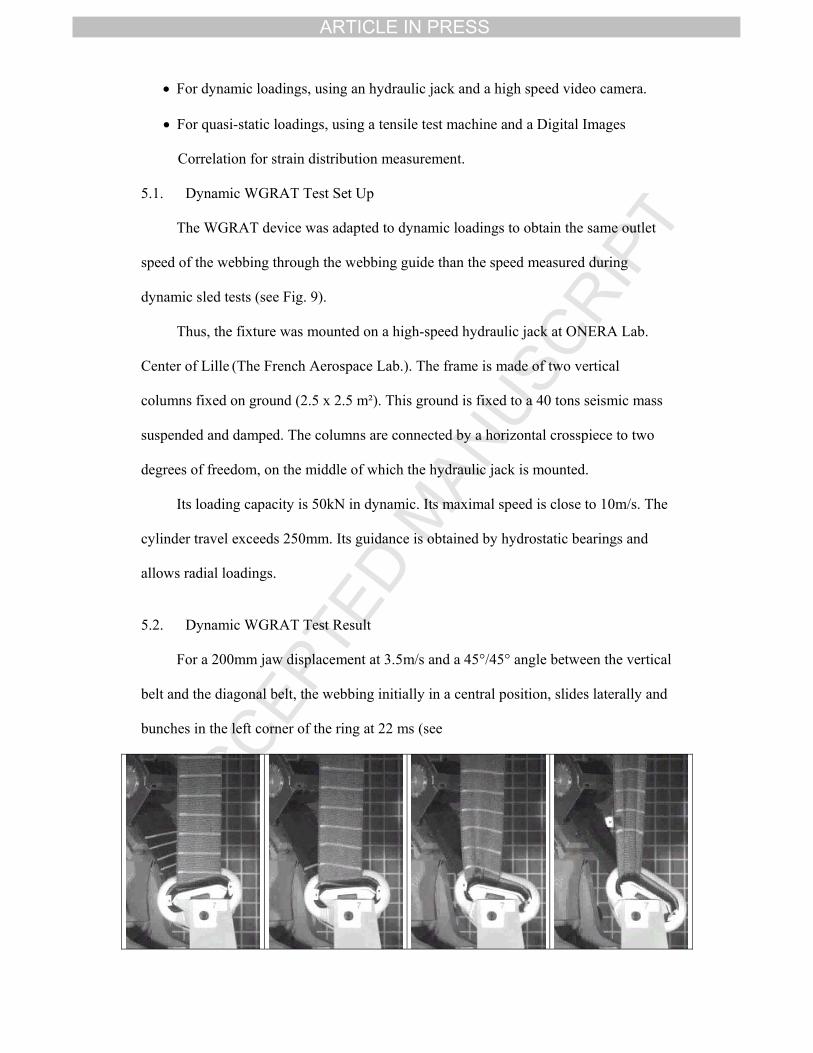
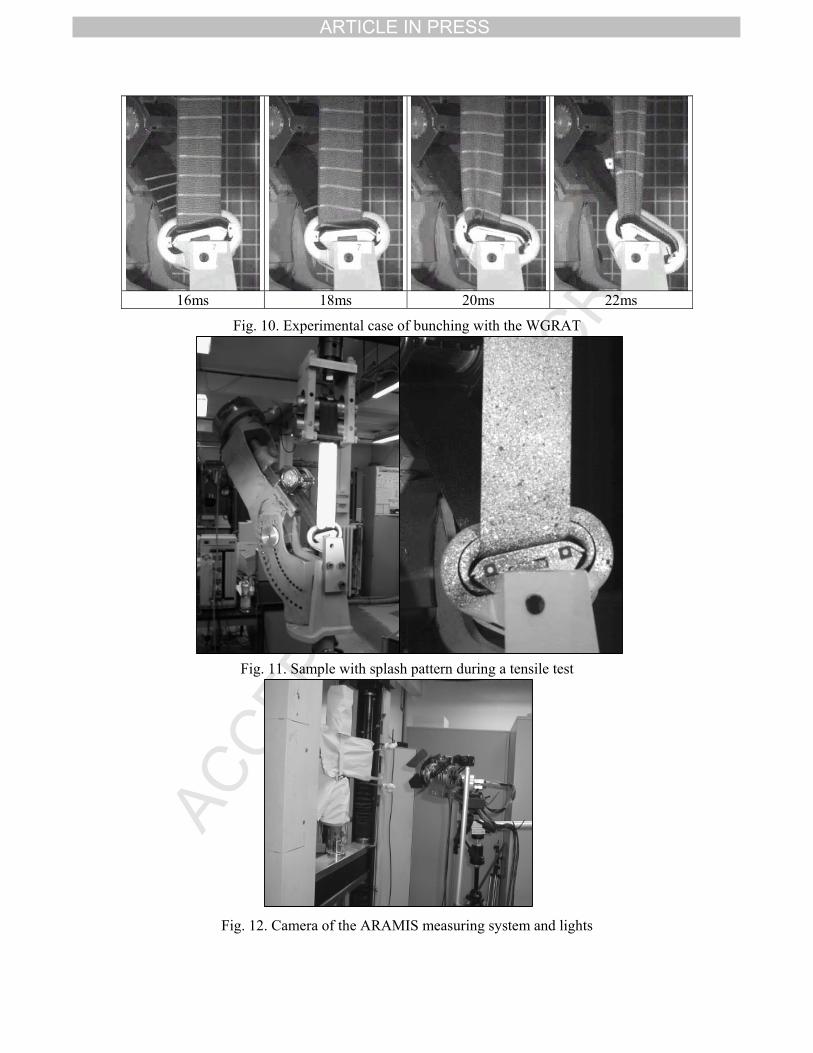
For a 200mm jaw displacement at 3.5m/s and a 45°/45° angle between the vertical
belt and the diagonal belt, the webbing initially in a central position, slides laterally and
bunches in the left corner of the ring at 22 ms (see
TPIRCSUNAM DETPECCA
ARTICLE IN PRESS
16ms 18ms 20ms 22ms Fig. 10).
These dynamic tests enable to visualize the deformation of the vertical belt
portion. Initially flat, the webbing deforms and several weaves appear on the surface
close to the ring. In parallel, the analyses of horizontal lines drawn on the belt show
discontinue local perturbations which grow until bunching.
5.3. Quasi-static WGRAT test set up
During a second step, the WGRAT device has been used for quasi-static loadings
to evaluate the strain distribution through the webbing (see Fig. 11). To complete the
assessment of the seat belt bunching phenomena, an analysis of the strain distribution
through the webbing during the instability issue has been investigated.
In order to study the strain field distribution over the seat belt webbing during the
bunching phenomena, tensile tests, performed on an INSTRONTM tensile test machine,
were undertaken and post-analysed by ''GOM/ARAMISTM'' Digital Images Correlation
system [10].
To enable the strain measurement, the specimens needed to be prepared. For this
purpose, a very thin layer of white flexible silicon was spread on the surface of the
vertical portion of webbing. A black colour spray was next applied to obtain an irregular
contrast pattern results.
During these quasi-static tests, the following set up was used:
• Retractor without load limiter (to reduce the reel out distance of the webbing
through D-ring and to focus the analysis area).
• 45°/45° belt geometry.
• The webbing was positioned in the middle of the D-ring.
• The loading speed was fixed at 100 mm/min.
• The camera frame was fixed to one frame per second.
TPIRCSUNAM DETPECCA
ARTICLE IN PRESS
• A 1240*1240 pixels resolution digital video camera was used.
The sample was installed in the tensile testing machine and the ARAMIS system
was calibrated and positioned in front of the sample (see Fig. 12). During the tensile
tests, a camera recorded the 2D displacements of the splash pattern. During the same
time, the displacement of the jaw, the tensile load and the retractor load were recorded.
A Digital Images Correlation of the movie pictures was performed to measure the
longitudinal and transversal strain distributions. This method has enabled to
quantitatively capture the development of an unbalanced strain field of the webbing
before and during the bunching phenomenon.
5.4. Quasi-static WGRAT Test Results
Three repeatable tensile tests were performed. During these tests, left bunching
phenomena occurred. The two main directions of the strain tensor were calculated and
they showed different behaviours. The measurement field, size about 10 x 4 cm² was
located in the center of the specimen where the largest deformation was expected.
Finally, the deformation behaviour in the whole measuring area was observed in real-
time until bunching.
By eliminating the jaw movement of the specimen, the local deformation of the
specimen surface can be made visible. By a mathematical derivation of these images,
the strains were determined and displayed as a whole field distribution (isolines of equal
strains). The distribution epsilon X and epsilon Y was calculated and graphically shown
by plotting strain curves variation exported in a specific ASCII-format. Thus, the
behaviour of the sample during the test shall be evaluated and displayed graphically.
5.4.1. Transversal strain
TPIRCSUNAM DETPECCA
ARTICLE IN PRESS
The analysis of the deformation of the seat belt webbing (in the weft direction)
shows a homogenous and a close to zero strain distribution of the webbing before the
bunching phenomena. As soon as the webbing begins to bunch, the out of plane
deformation of the samples disturbs the measurement.
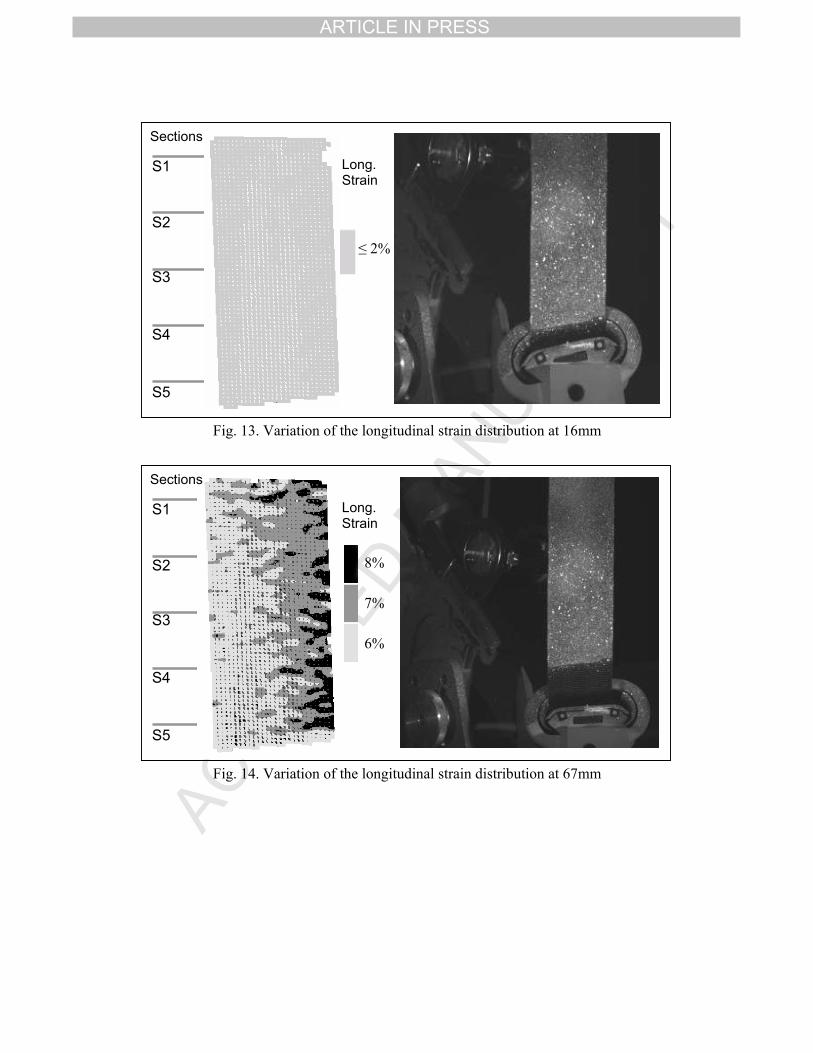
5.4.2. Longitudinal strain
The analysis of the longitudinal strain of webbing shows that its behaviour varies
in several stages:
From 0 to 34mm, a homogenous distribution of the longitudinal strain can be seen on
the webbing sample (see Fig. 13).
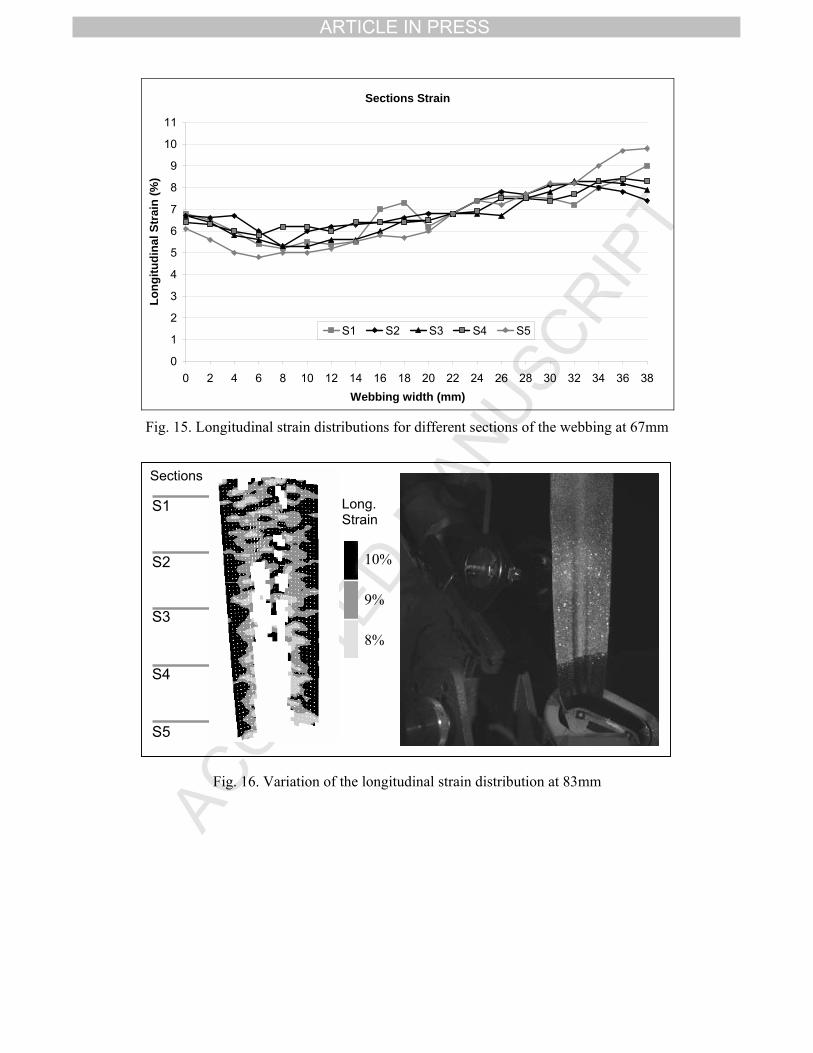
• At 34mm, a dissymmetry of the longitudinal strain appears and this dissymmetry
increases from 34 to 67mm. At that stage, the difference between the strain
values calculated on the right edge and the ones calculated on the left edge of the
webbing sample reaches 30%. (see Fig. 14).
This phenomenon was computed along several sections of the webbing (see
sections 1 to 5, Fig. 14). An increasing difference reaching more than 2% of
longitudinal strain value (a variation of 30% between each edge, see Fig. 15)
was measured between the two edges of the webbing before the overturning of
the D-ring.
• At 68mm, the bunching phenomenon begins, and 15mm later the bunching
phenomenon is completely achieved (see Fig. 16).
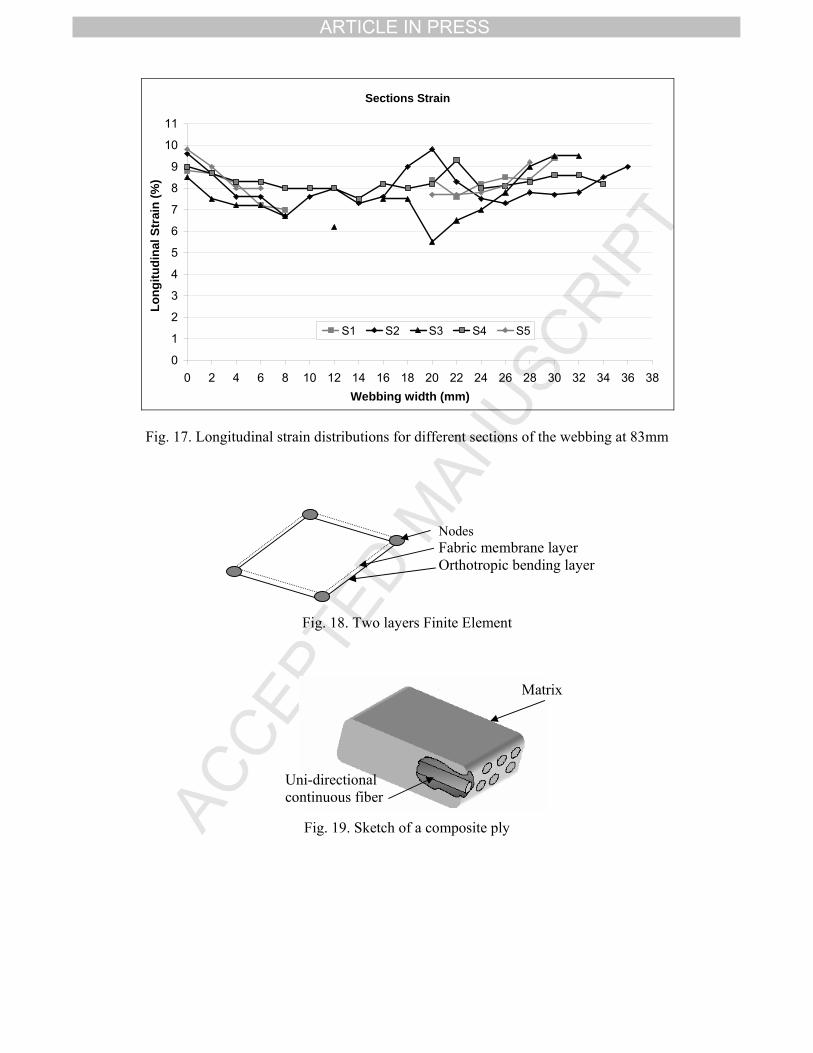
• After bunching, at 83mm, the out of plane deformation of the sample disturbs the
measurement in the center of the specimen but the edges deformation can be
assessed. For each edge, the longitudinal strain reaches the same average value:
9% (see Fig. 17).
TPIRCSUNAM DETPECCA
ARTICLE IN PRESS
Judging from the results obtained by the Digital Image Correlation method, the
phenomenology of the seat belt bunching phenomenon can be discussed:
At the beginning of the test, the belt is uniformly loaded, thus the system is in
equilibrium. A disequilibrium appears, the longitudinal strain distribution becomes
inhomogeneous along the width of the webbing. That unbalanced strain distribution
grows up to reach a 30% variation between each edge of the webbing and leads to the
instability of the system by the overturning of the D-ring. The system has reached a new
stable state with a symmetric strain distribution.
At that stage, the dissymmetry of the strain distribution and the D-ring rotation
appear to be synchronized. To complete the results obtained with the Digital Image
Correlation method and to pursue the assessment of the bunching phenomena, a FE
numerical model of D-ring / seat belt interactions has been developed. The use of this
numerical tool aims at organizing into hierarchy the factors influencing on the stability
of D-rings.
6. Numerical analysis based on WGRAT tests
To complete the experimental analysis of the seat belt bunching phenomena based
on the WGRAT dynamic and quasi-static test results, a numerical analysis is proposed.
A specific FE model of seat belt webbing is developed. Based on the numerical
innovation, the experimental tests described in the previous chapter are modelled.
6.1. FE model – new shell finite element model for webbing
To improve the finite element model of seat belt webbing fabric, an innovative
shell finite element is developed using Pam-CrashTM packages [11]. This shell element
takes into account the low but effective bending stiffness of the seat belt webbing by the
use of a plate bending element with a decoupled and orthotropic bending stiffness.
According to the results of tests on seat belt webbing, a method to simulate its
TPIRCSUNAM DETPECCA
ARTICLE IN PRESS
behaviour was studied. To evaluate its stability, it is applied to realistic belt geometries
and loadings.
The global behaviour of seat belt webbings corresponds to the behaviour of a
fabric. Fabrics are usually modelled with membrane elements, which do not take the
bending stiffness into account. This method has proved to be satisfactory for the
simulation of thin fabrics, such as fabrics used for airbags, but cannot be extrapolated to
the case of seat belt webbing because the bending stiffness cannot be neglected during
the bunching phenomenon.
Thus a new simulation method was used to model the behaviour of seat belt
webbings. It consists in the superposition of two layers of shell finite elements (see Fig.
18.). The two layers are defined with the same nodes and the density of each layer
corresponds to half the density of seat belt webbings.
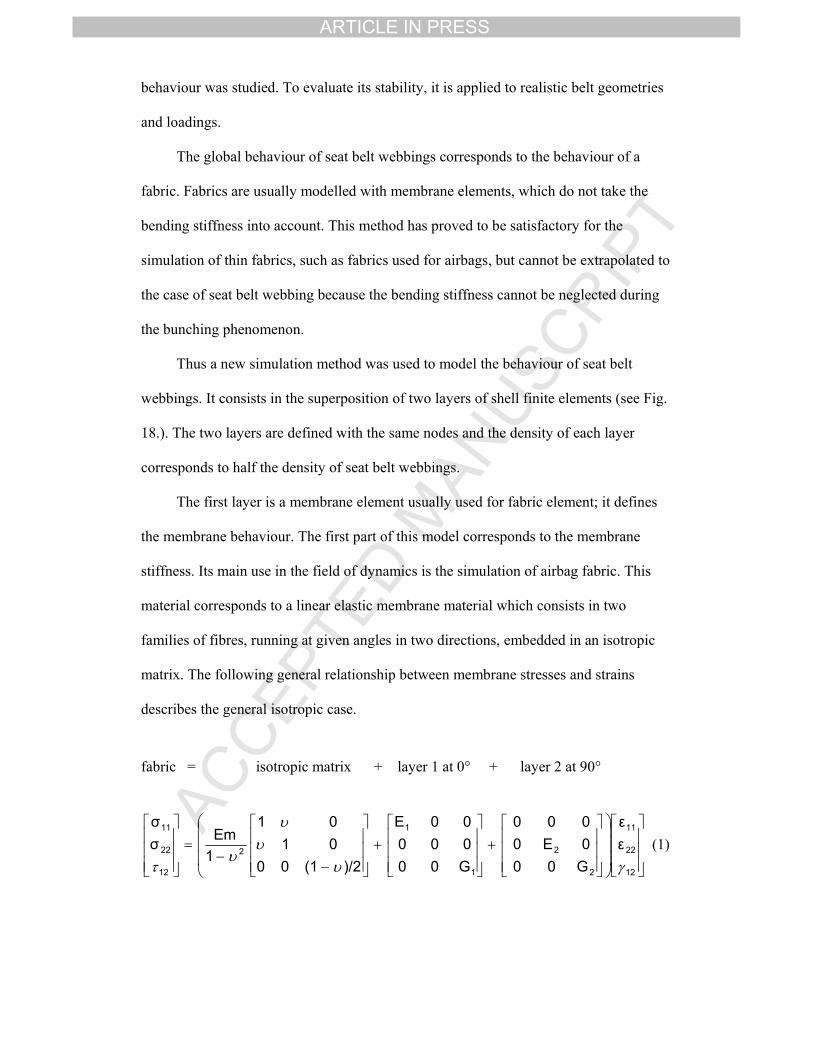
The first layer is a membrane element usually used for fabric element; it defines
the membrane behaviour. The first part of this model corresponds to the membrane
stiffness. Its main use in the field of dynamics is the simulation of airbag fabric. This
material corresponds to a linear elastic membrane material which consists in two
families of fibres, running at given angles in two directions, embedded in an isotropic
matrix. The following general relationship between membrane stresses and strains
describes the general isotropic case.
fabric = isotropic matrix + layer 1 at 0° + layer 2 at 90°
⎥⎥⎥
⎦
⎤
⎢⎢⎢
⎣
⎡
⎟⎟⎟
⎠
⎞
⎜⎜⎜
⎝
⎛
⎥⎥⎥
⎦
⎤
⎢⎢⎢
⎣
⎡+
⎥⎥⎥
⎦
⎤
⎢⎢⎢
⎣
⎡+
⎥⎥⎥
⎦
⎤
⎢⎢⎢
⎣
⎡
−−
=⎥⎥⎥
⎦
⎤
⎢⎢⎢
⎣
⎡
12
22
11
2
2
1
1
2
12
22
11
εε
G000E0000
G0000000E
)/2(1000101
1Emσ
σ
γυυ
υ
υτ
(1)
TPIRCSUNAM DETPECCA
ARTICLE IN PRESS
Where Em is the Young’s Modulus of the isotropic matrix, E1 and E2 are Young’s
tension/compression moduli of the threads, G1 and G2 are shear moduli and ν is the
Poisson’s coefficient.
This element is formulated in a total Lagrangian approach, in which the Green-
Lagrange strains (εGL =1/2 (L2 – L02) / L0
2) and the second Piola-Kirchhoff stresses are
used (σPK = (L/L0) E εGL). This element is completely integrated by four Gaussian points.
The second part of the model corresponds to a bending plate stiffness based on a
Mindlin shell element [12]. That plate bending element [11] is usually used in the field
of non-linear dynamic loadings to simulate the behaviour of composite ply made of two
components, the fibres and a matrix.
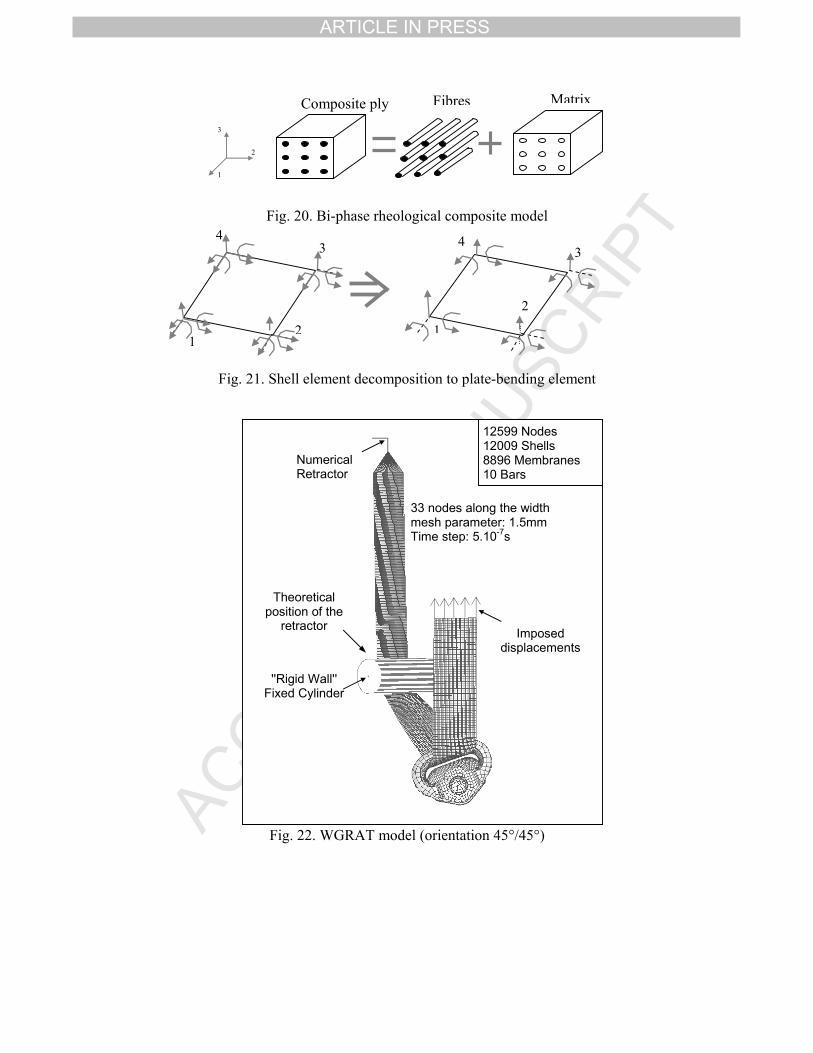
Then, the behaviour of uni-directional continuous fibres reinforced composites is
modelled with this shell using the superposition of plies composed of two phases: a uni-
directional fibres phase and an orthotropic matrix phase (see Fig. 19). The original
aspect of this numerical model is the distinction of these two phases.
Each phase of each ply is defined independently in tension and in compression.
For each ply, the stiffness is calculated by superposing the effects of the orthotropic
elastic matrix (matrix minus fibres) and of the one-dimensional elastic fibres (see Fig.
20).
Within the context of the seat belt webbing, only the matrix phase has been used
(no fibres phase has been used). To transform it into a bending plate stiffness, this shell
element was degenerated by removing from the code the calculated membranes forces
transmitted to the nodes (see Fig. 21).
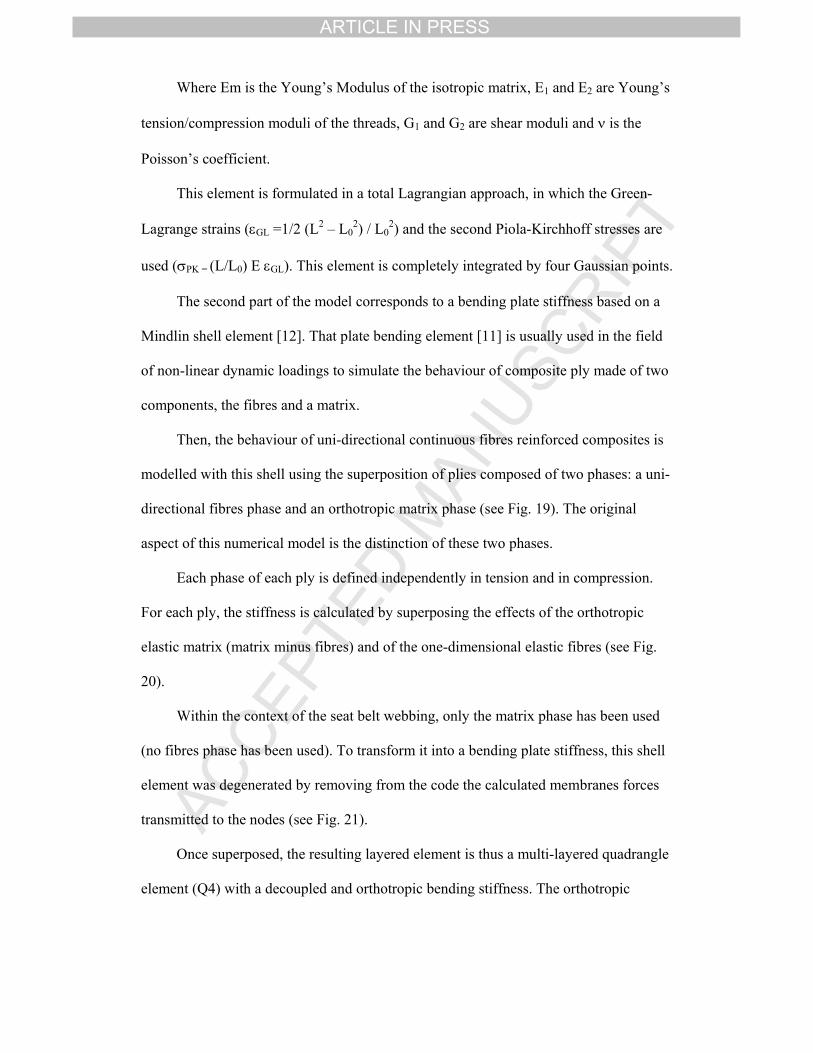
Once superposed, the resulting layered element is thus a multi-layered quadrangle
element (Q4) with a decoupled and orthotropic bending stiffness. The orthotropic
TPIRCSUNAM DETPECCA
ARTICLE IN PRESS
material phase is defined with the following strain-stress relation (expressed in the
directions of orthotropy).
⎥⎥⎥⎥⎥⎥
⎦
⎤
⎢⎢⎢⎢⎢⎢
⎣
⎡
⎥⎥⎥⎥⎥⎥
⎦
⎤
⎢⎢⎢⎢⎢⎢
⎣
⎡
=
⎥⎥⎥⎥⎥⎥
⎦
⎤
⎢⎢⎢⎢⎢⎢
⎣
⎡
23
13
12
22
11
23
13
12
222212
112111
23
13
12
22
11
εε
G00000G00000G00000CC000CC
σσ
γγγ
υυ
τττ (2)
With 2112
1111 1
ECυυ ⋅−
= 2112
2222 1
ECυυ ⋅−
= and 22
21
11
12
EEυυ
=
Where: E11 the Young’s modulus in direction 1
E22 the Young’s modulus in direction 2
G12 the in-plane shear modulus
G13, G23 the transversal shear moduli
νn,m the Poisson’s ratio in n,m directions
This plate-bending element (12 d.o.f.) defines two different bending stiffnesses, in
the warp and in the weft directions, independently of the membrane stiffness.
The parameters of the stiffness matrix were identified with rheological tests
performed on seat belt webbing fabric [13]. Several experimental tests were undertaken:
- Picture frame tests to measure the real in plane shear modulus
- Cantilever tests to evaluate the bending stiffness
- Tensile tests for Young's modulus and the Poisson's ratio
This new shell finite element was used to simulate the behaviour of seat belt
webbing and to investigate the webbing kinematics observed experimentally.
6.2. Numerical model of Dynamic WGRAT test
A numerical model has been achieved to reproduce the seat belt bunching cases
which had been experimentally obtained. Special care has been devoted to model the
tribology of the phenomenon in a most correct way.
TPIRCSUNAM DETPECCA
ARTICLE IN PRESS
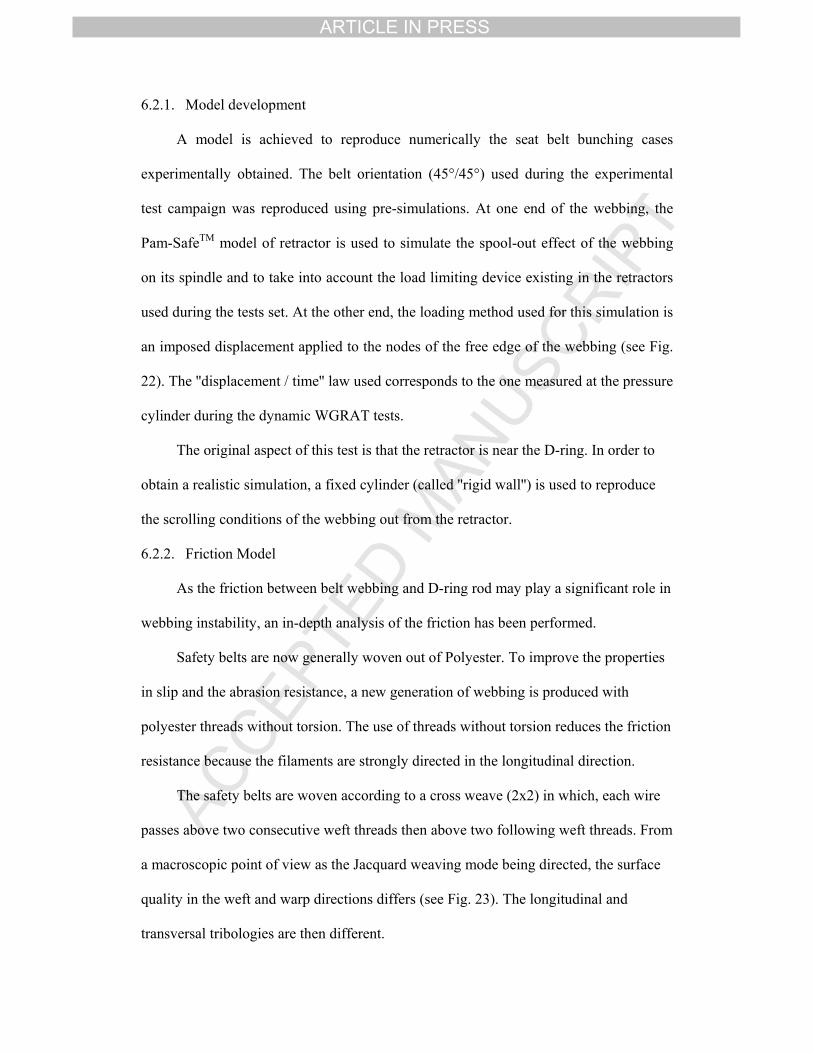
6.2.1. Model development A model is achieved to reproduce numerically the seat belt bunching cases
experimentally obtained. The belt orientation (45°/45°) used during the experimental
test campaign was reproduced using pre-simulations. At one end of the webbing, the
Pam-SafeTM model of retractor is used to simulate the spool-out effect of the webbing
on its spindle and to take into account the load limiting device existing in the retractors
used during the tests set. At the other end, the loading method used for this simulation is
an imposed displacement applied to the nodes of the free edge of the webbing (see Fig.
22). The ''displacement / time'' law used corresponds to the one measured at the pressure
cylinder during the dynamic WGRAT tests.
The original aspect of this test is that the retractor is near the D-ring. In order to
obtain a realistic simulation, a fixed cylinder (called ''rigid wall'') is used to reproduce
the scrolling conditions of the webbing out from the retractor.
6.2.2. Friction Model As the friction between belt webbing and D-ring rod may play a significant role in
webbing instability, an in-depth analysis of the friction has been performed.
Safety belts are now generally woven out of Polyester. To improve the properties
in slip and the abrasion resistance, a new generation of webbing is produced with
polyester threads without torsion. The use of threads without torsion reduces the friction
resistance because the filaments are strongly directed in the longitudinal direction.
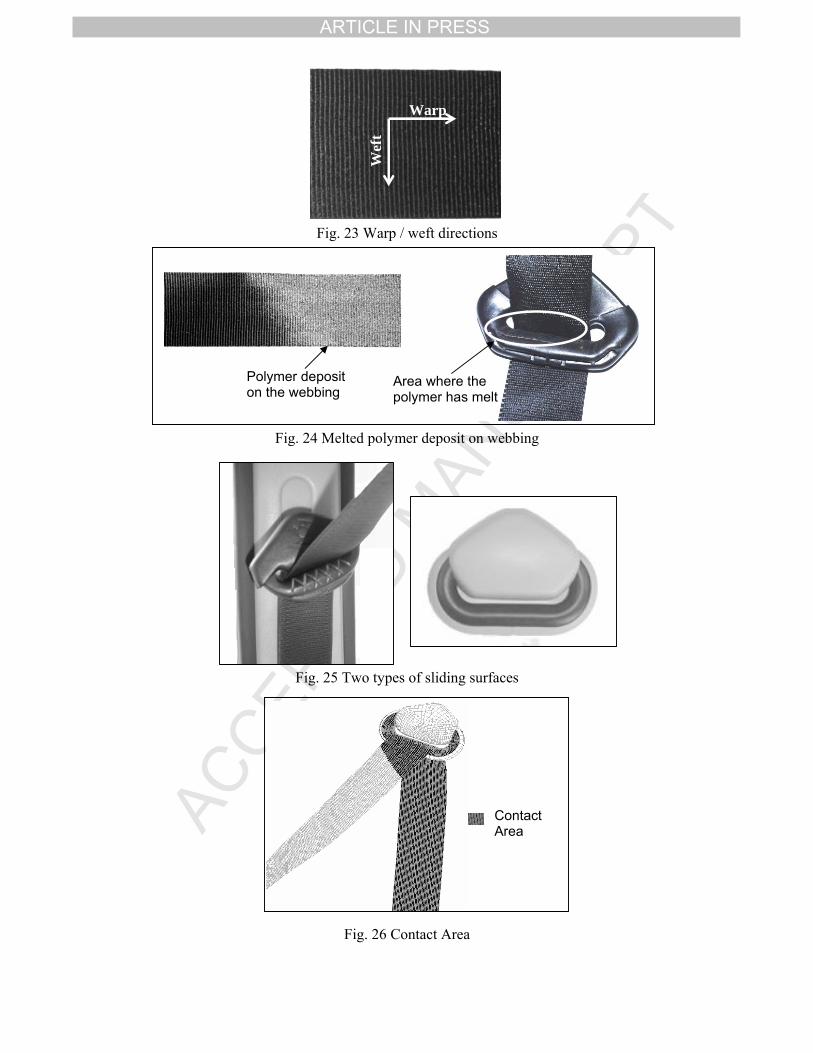
The safety belts are woven according to a cross weave (2x2) in which, each wire
passes above two consecutive weft threads then above two following weft threads. From
a macroscopic point of view as the Jacquard weaving mode being directed, the surface
quality in the weft and warp directions differs (see Fig. 23). The longitudinal and
transversal tribologies are then different.
TPIRCSUNAM DETPECCA
ARTICLE IN PRESS
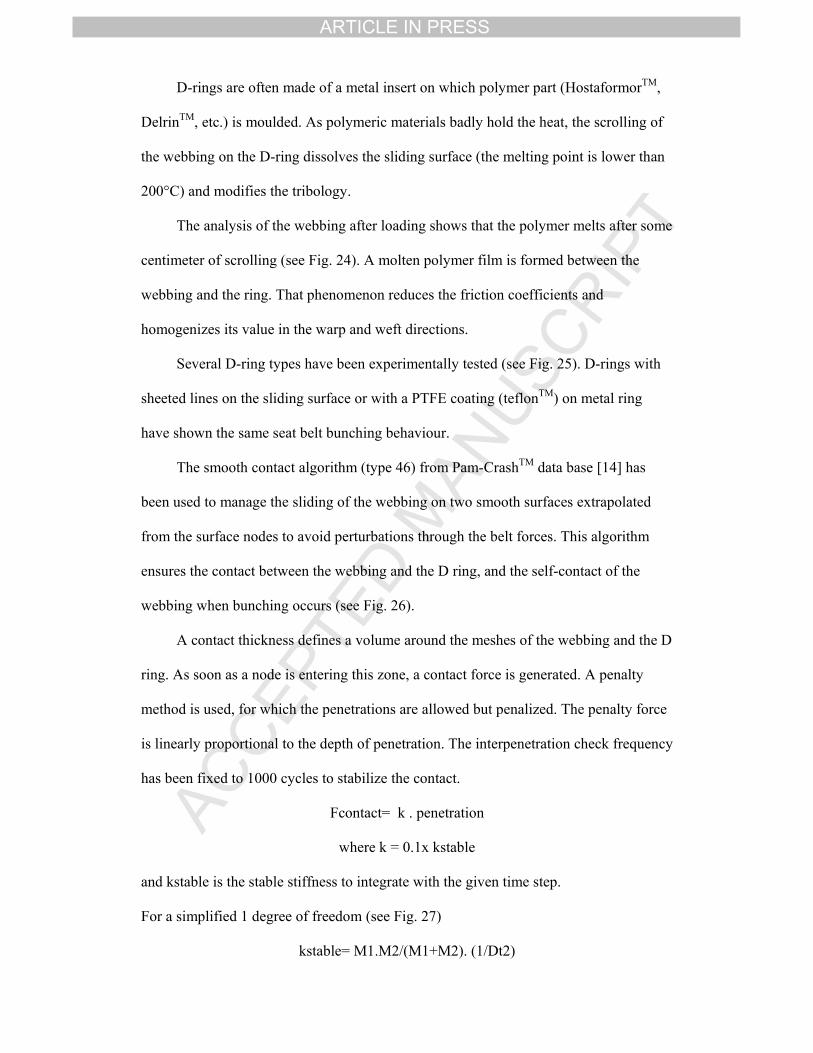
D-rings are often made of a metal insert on which polymer part (HostaformorTM,
DelrinTM, etc.) is moulded. As polymeric materials badly hold the heat, the scrolling of
the webbing on the D-ring dissolves the sliding surface (the melting point is lower than
200°C) and modifies the tribology.
The analysis of the webbing after loading shows that the polymer melts after some
centimeter of scrolling (see Fig. 24). A molten polymer film is formed between the
webbing and the ring. That phenomenon reduces the friction coefficients and
homogenizes its value in the warp and weft directions.
Several D-ring types have been experimentally tested (see Fig. 25). D-rings with
sheeted lines on the sliding surface or with a PTFE coating (teflonTM) on metal ring
have shown the same seat belt bunching behaviour.
The smooth contact algorithm (type 46) from Pam-CrashTM data base [14] has
been used to manage the sliding of the webbing on two smooth surfaces extrapolated
from the surface nodes to avoid perturbations through the belt forces. This algorithm
ensures the contact between the webbing and the D ring, and the self-contact of the
webbing when bunching occurs (see Fig. 26).
A contact thickness defines a volume around the meshes of the webbing and the D
ring. As soon as a node is entering this zone, a contact force is generated. A penalty
method is used, for which the penetrations are allowed but penalized. The penalty force
is linearly proportional to the depth of penetration. The interpenetration check frequency
has been fixed to 1000 cycles to stabilize the contact.
Fcontact= k . penetration
where k = 0.1x kstable
and kstable is the stable stiffness to integrate with the given time step.
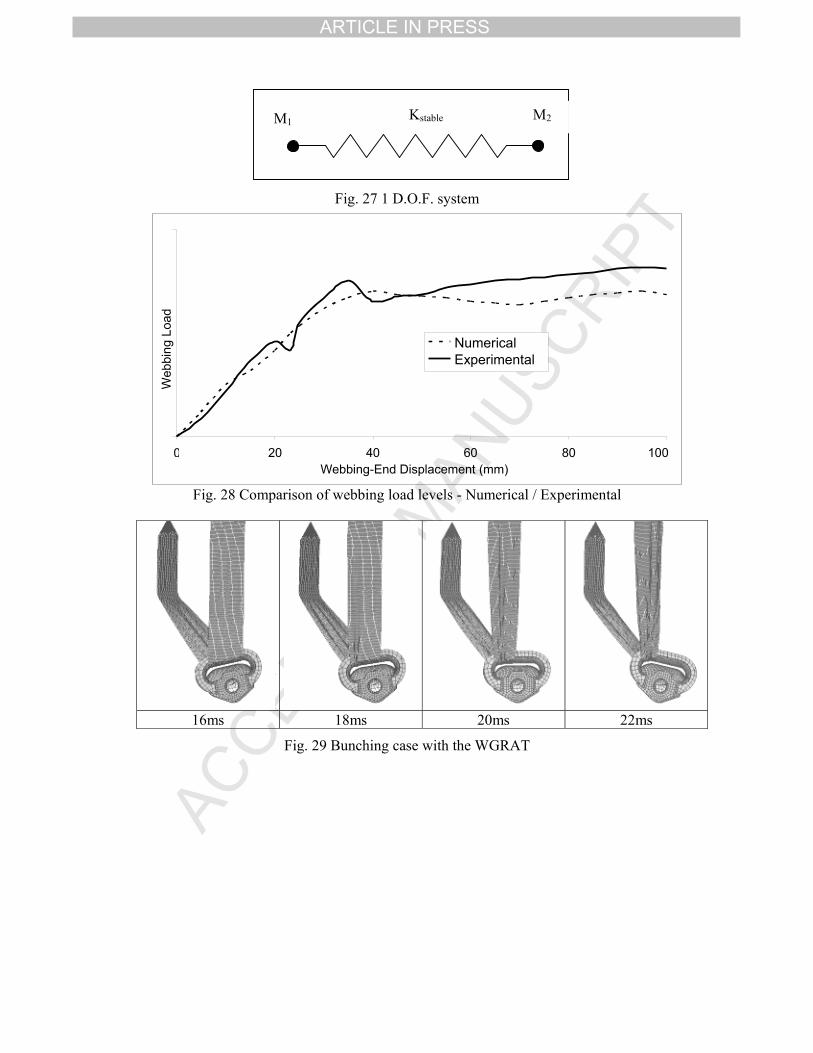
For a simplified 1 degree of freedom (see Fig. 27)
kstable= M1.M2/(M1+M2). (1/Dt2)
TPIRCSUNAM DETPECCA
ARTICLE IN PRESS
To model the friction, several friction models have been alternatively tested.
Isotropic Standard Coulomb Friction, orthotropic, pressure and/or velocity dependent
friction models have been numerically evaluated.
Due to the molten polymer film between the webbing and the D-ring, a
homogenized isotropic friction has been first chosen.
Pressure and velocity dependent friction models haven’t proved significant
improvement in the correlation process. As the modeled kinematics is an energetic and
quick process, the melted state of the polymer is rapidly established and the dynamic
friction value remains low during the whole loading.
Starting from the academic value of PTFE friction coefficient [15] equals to a
0.05, a parametric study has been performed to analyze the effect of the friction value
variation (between 0.0 and 0.1) on the global kinematics of bunching. In that range, the
overturning of the rings was equivalent. Preliminary results of a design of experiment,
in which geometrical and physical parameters were varied, have also confirmed its low
influence.
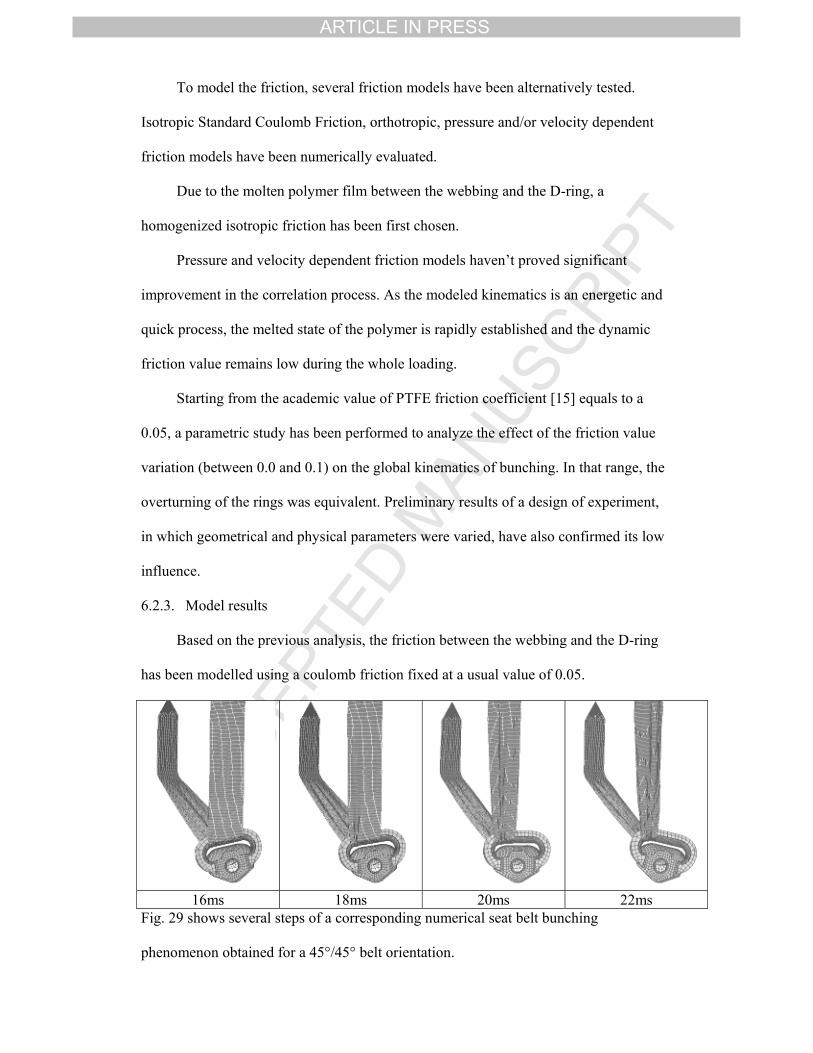
6.2.3. Model results Based on the previous analysis, the friction between the webbing and the D-ring
has been modelled using a coulomb friction fixed at a usual value of 0.05.
16ms 18ms 20ms 22ms
Fig. 29 shows several steps of a corresponding numerical seat belt bunching
phenomenon obtained for a 45°/45° belt orientation.
TPIRCSUNAM DETPECCA
ARTICLE IN PRESS
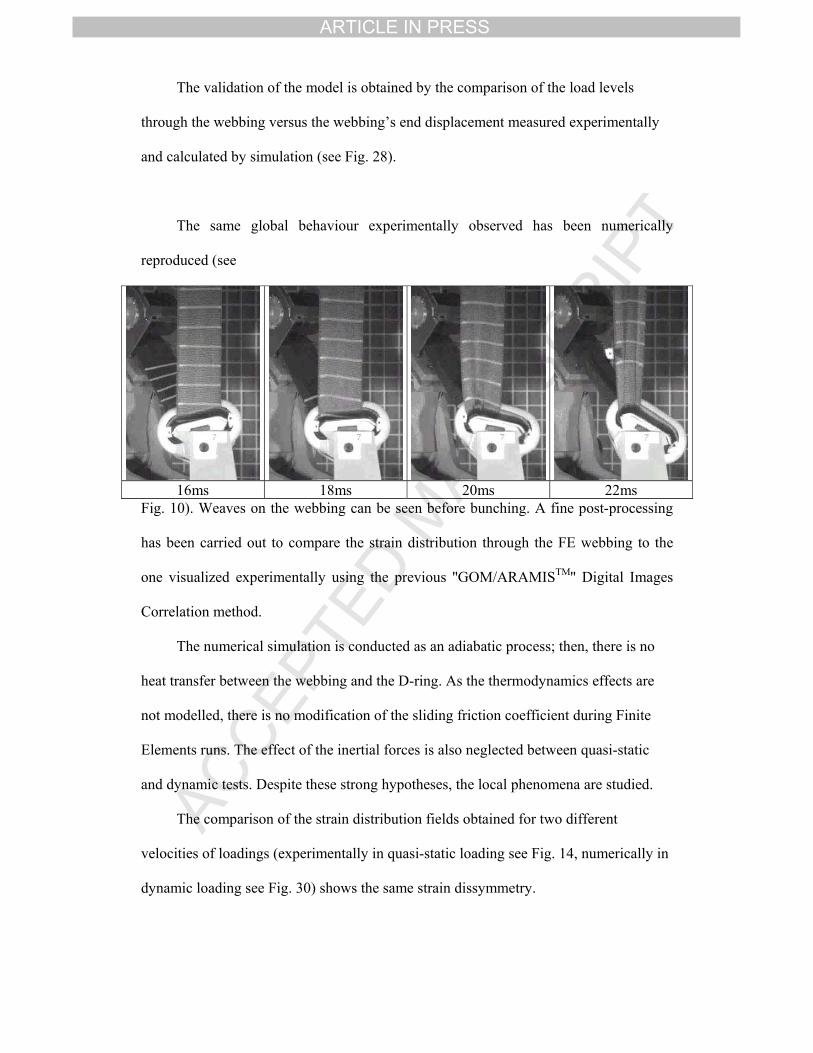
The validation of the model is obtained by the comparison of the load levels
through the webbing versus the webbing’s end displacement measured experimentally
and calculated by simulation (see Fig. 28).
The same global behaviour experimentally observed has been numerically
reproduced (see
16ms 18ms 20ms 22ms
Fig. 10). Weaves on the webbing can be seen before bunching. A fine post-processing
has been carried out to compare the strain distribution through the FE webbing to the
one visualized experimentally using the previous ''GOM/ARAMISTM'' Digital Images
Correlation method.
The numerical simulation is conducted as an adiabatic process; then, there is no
heat transfer between the webbing and the D-ring. As the thermodynamics effects are
not modelled, there is no modification of the sliding friction coefficient during Finite
Elements runs. The effect of the inertial forces is also neglected between quasi-static
and dynamic tests. Despite these strong hypotheses, the local phenomena are studied.
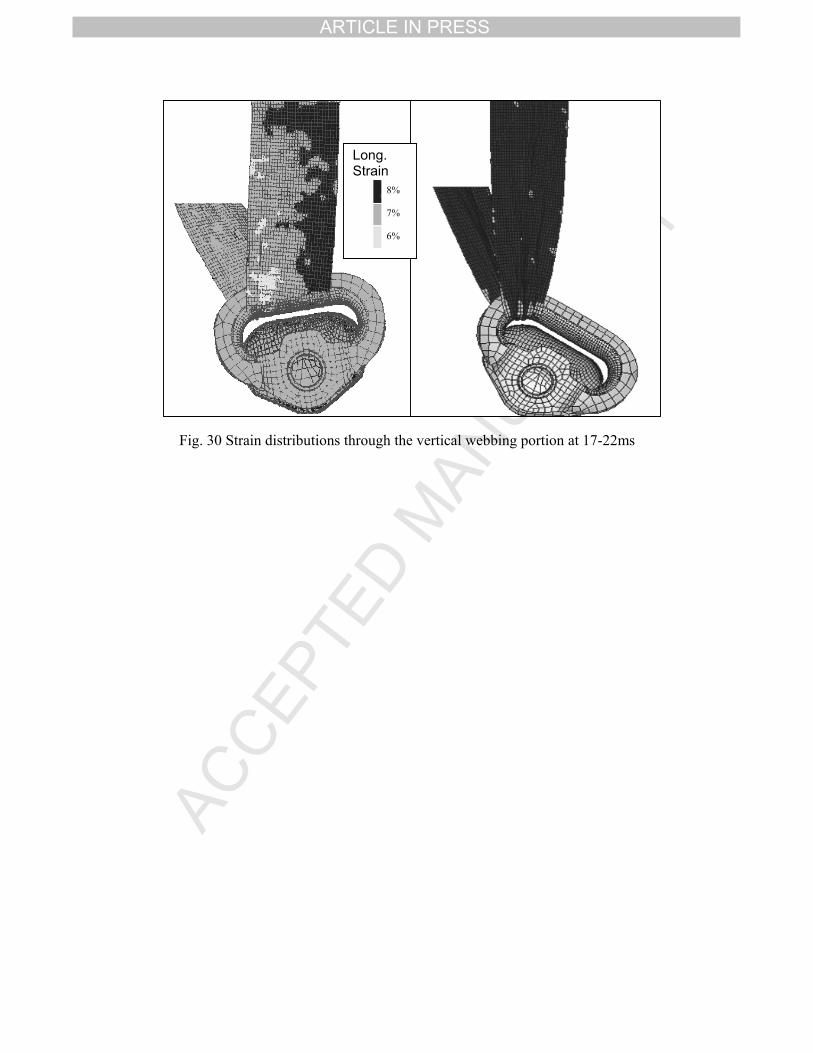
The comparison of the strain distribution fields obtained for two different
velocities of loadings (experimentally in quasi-static loading see Fig. 14, numerically in
dynamic loading see Fig. 30) shows the same strain dissymmetry.
TPIRCSUNAM DETPECCA
ARTICLE IN PRESS
Thus, the results of FE model show that the strain distribution is equivalent to the
experimental measurement. At 17ms, the range of strain deformation between the two
edges of the webbing extends from 6 to 8% (a variation of about 30%) and the iso-strain
areas are localized in the same zones. At 22ms, after belt bunching, the overturning of
the D-ring interrupts the disequilibrium. A new homogenous distribution of longitudinal
strains (about 9%) can be observed on the vertical belt portion.
A design of experiment will be performed based on this correlated numerical
model. That numerical study will take into account:
• The friction coefficient between the webbing and the D-ring.
• The bending stiffness of the webbing.
• The behaviour of the revolute joint of the loop.
The aim of this analysis will be an improvement of the stability of the D-ring.
Numerical simulation data enable to complete experimental tests results and to
assess the chronology of the phenomena. Up to the round off load value of 4kN, the
webbing/D-ring couple is stable. The webbing reels out normally and the angular D-ring
position is constant. Beyond that load level, the diagonal portion of the webbing shifts
laterally on its guide. That shifting causes a dissymmetry of the D-ring loading which
generates an angular rotation. That rotation imbalances the strain distribution of the
webbing. In order to reduce this perturbation, the webbing’s shifting grows. The two
phenomena become coupled and quicken until the complete overturning of the ring.
7. Conclusion
The objective of this study was to assess the Seat Belt Bunching Phenomenon
and to develop a numerical model of the instability issue. In this paper, the webbing / D-
ring behaviour is first investigated using several experiments. An analysis of dynamic
TPIRCSUNAM DETPECCA
ARTICLE IN PRESS
sled tests results is proposed. Innovative global and local sub-system tests are developed
and are used to investigate the overturning of the ring.
An efficient Finite Element model for seat belt webbing is developed using an
original two layers shell quadrangle. The first layer is a membrane element usually used
for fabric element. The second layer corresponds to a degenerated bending plate
stiffness. Once superposed, the resulting layered element is a multi-layered quadrangle
element with a decoupled and orthotropic bending stiffness.
FE models of the sub-system tests are developed using the layered shell element.
The correlation of these finite element models is proved to be good. A fine post
processing of the local subsystem test results is used to assess the behaviour of seat belt
webbing. The internal strain distribution of the webbing measured by Digital Image
Correlation is very well reproduced by the FE model and a numerical bunching
phenomenon has been detected for an equivalent loading.
Based on experimental and numerical data, an assessment of the phenomenon is
proposed. To complete this research study, further investigations are planned. This
validated model will be used for a numerical Design of Experiment in order to analyze
the stability of the D-ring and to fully control the bunching phenomenon.
Acknowledgements
The authors would like to thank Jacky Fabis from ONERA Lab Centre of Lille for
his valuable contribution during the WGRAT tests.
References
TPIRCSUNAM DETPECCA
ARTICLE IN PRESS
[1] D. Dubois, Master of Research, Simulation Project, Autoliv UK, Valenciennes
University, LAMIH UMR 8530, Laboratory of Industrial and Human Automation
Control, Mechanical Engineering and Computer Science, 2000.
[2] Pedrazzi, Elsäßer and Schaub, TRW Occupant Restraint Systems Gmbh & Co, KG,
Alfdorf, Simulation of belt movement in the D-ring during a crash CAD-FEM, User’s
meeting Internationale FEM-Technologietage Graf-Zeppelin-Haus, Friedrichshafen,
2000.
[3] Pedrazzi, Elsäßer and Schaub, TRW Occupant Restraint Systems Gmbh & Co, KG,
Alfdorf, Aspects of Seat belt Material Simulation, Third European LS-DYNA
Conference, Dynalis, Paris, 2001.
[4] D. Dubois, F.E. Analysis of Seat Belt Behaviour Under Dynamic loading, ICD2003,
Int. Crashworthiness and Design Congress, Lille, 2003.
[5] D. Dubois, H. Cord, E. Markiewicz, Innovative test method for seat belt D-ring,
International Journal of Vehicle Safety, Vol.2, Nos. 1/2, 2007, p.87-102.
[6] UNECE agreement, Addendum 15 Regulation 16, Safety-belts and restraint systems
for occupants of power-driven vehicles, 1995.
[7] D. Dubois, Prevention and Prediction of the Seat Belt Bunching Phenomena, PhD
Thesis, University of Valenciennes, France, 2004.
[8] P. Markvardsén, Expermentelle Untersuchung des Verhaltens von
Sicherheitsgurtumlenkern in Frontalcrashverlauf, Autoliv North Germany, Internal
report, 1999.
[9] P. Markvardsén, Untersuchung einer neuentwickelten Prüfvorrichtung zur
Simulation von Sicherheitsgurtumlenkern unter Lastbedingungen, Autoliv North
Germany, Internal report, 2001.
[10] Aramis, version 4.6.5, Fundamentals Principles, chapter 2, 2001, p.7-20.
TPIRCSUNAM DETPECCA
ARTICLE IN PRESS
[11] Pam-Crash/SafeTM, Solver Notes Manual, V2007, Shell/Membrane Materials,
2007, p. 253-348.
[12] Mindlin R.D, Influence of Rotary Inertia and Shear on Flexural Motions of
Isotropic, J.Applied Mechanics18, 1951, p.31-38.
[13] D. Dubois, P. Gross, A. Trameçon, E. Markiewicz, F.E. analysis of seat belt
bunching phenomena, International Journal of Crashworthiness, ISSN: 1358-8265 Vol.
11, Nos 6, 2006, p. 519-528.
[14] Pam-Crash/SafeTM, Solver Notes Manual, V2007, Shell/Membrane Materials,
2007, p. 562.
[15] Gieck, Formulaire technique, ISBN : 3-920-379-24-1,1997, p. Z7.
TPIRCSUNAM DETPECCA
ARTICLE IN PRESS
Fig. 1. Webbing Guides (courtesy Autoliv)
Initial position Lateral shifting Bunching of pillar loop
Fig. 2. Seat Belt Bunching Phenomenon
Fig. 3. Sled Test with two Hybrid III 95%ile dummies
Average webbing position Front webbing position Rear webbing position
Fig. 4 Initial lateral positions of the webbing on the D-ring
a b c
TPIRCSUNAM DETPECCA
ARTICLE IN PRESS
Fig. 5. WGDT principle
32ms 38ms 46ms
Fig. 6. Bunching phenomenon generated with the WGDT
Fig. 7. Components of the WGRAT
Falling Mass
Rods
Seat Belt
45°
1
Load cell
Retractor
D-ring
Rotative Arm
2
TPIRCSUNAM DETPECCA
ARTICLE IN PRESS
Fig. 8. WGRAT mounted on a quasi-static tensile test machine
Fig. 9. Experimental fixture mounted on a high-speed hydraulic jack at ONERA-Lille
D-ring
Retractor
Mobile jaw
Load Cell
Load Cell
Angles Variations
TPIRCSUNAM DETPECCA
ARTICLE IN PRESS
16ms 18ms 20ms 22ms
Fig. 10. Experimental case of bunching with the WGRAT
Fig. 11. Sample with splash pattern during a tensile test
Fig. 12. Camera of the ARAMIS measuring system and lights
TPIRCSUNAM DETPECCA
ARTICLE IN PRESS
Fig. 13. Variation of the longitudinal strain distribution at 16mm
Fig. 14. Variation of the longitudinal strain distribution at 67mm
≤ 2%
S1 S2 S3 S4 S5
Long. Strain
Sections
8% 7% 6%
S1 S2 S3 S4 S5
Long. Strain
Sections
TPIRCSUNAM DETPECCA
ARTICLE IN PRESS
Sections Strain
0
1
2
3
4
5
6
7
8
9
10
11
0 2 4 6 8 10 12 14 16 18 20 22 24 26 28 30 32 34 36 38Webbing width (mm)
Long
itudi
nal S
trai
n (%
)
S1 S2 S3 S4 S5
Fig. 15. Longitudinal strain distributions for different sections of the webbing at 67mm
Fig. 16. Variation of the longitudinal strain distribution at 83mm
10% 9% 8%
S1 S2 S3 S4 S5
Long. Strain
Sections
TPIRCSUNAM DETPECCA
ARTICLE IN PRESS
Sections Strain
0
1
2
3
4
5
6
7
8
9
10
11
0 2 4 6 8 10 12 14 16 18 20 22 24 26 28 30 32 34 36 38Webbing width (mm)
Long
itudi
nal S
trai
n (%
) .
S1 S2 S3 S4 S5
Fig. 17. Longitudinal strain distributions for different sections of the webbing at 83mm
Fig. 18. Two layers Finite Element
Fig. 19. Sketch of a composite ply
Nodes Fabric membrane layer Orthotropic bending layer
Uni-directional continuous fiber
Matrix
TPIRCSUNAM DETPECCA
ARTICLE IN PRESS
Fig. 20. Bi-phase rheological composite model
Fig. 21. Shell element decomposition to plate-bending element
Fig. 22. WGRAT model (orientation 45°/45°)
3
2
1
4
3
21
4
Numerical Retractor
''Rigid Wall'' Fixed Cylinder
Imposed displacements
12599 Nodes 12009 Shells 8896 Membranes 10 Bars
33 nodes along the width mesh parameter: 1.5mm Time step: 5.10-7s
Theoretical position of the
retractor
1
2
3
Composite ply Fibres Matrix
TPIRCSUNAM DETPECCA
ARTICLE IN PRESS
Fig. 23 Warp / weft directions
Fig. 24 Melted polymer deposit on webbing
Fig. 25 Two types of sliding surfaces
Fig. 26 Contact Area
Warp
Wef
t Area where the polymer has melt
Polymer deposit on the webbing
Contact Area
TPIRCSUNAM DETPECCA
ARTICLE IN PRESS
Fig. 27 1 D.O.F. system
Fig. 28 Comparison of webbing load levels - Numerical / Experimental
16ms 18ms 20ms 22ms
Fig. 29 Bunching case with the WGRAT
0
1
2
3
4
5
6
0 20 40 60 80 100 Webbing-End Displacement (mm)
W
ebbi
ng L
oad)
NumericalExperimental
M1 M2 Kstable
TPIRCSUNAM DETPECCA
ARTICLE IN PRESS
Fig. 30 Strain distributions through the vertical webbing portion at 17-22ms
Long. Strain
8% 7% 6%