Experimental analysis of the molecular theory of rubber elasticity
10
Experimental Analysis of the Molecular Theory of Rubber Elasticity J. SANJUAN and M. A. LLORENTE,* Departamento de Quimica Fisica, Universidud a Distancia (UNED),28040 Madrid, Spain Synopsis Stress-strain and birefringence-strain experiments, on polybutadiene and poly(methyl-3,3,3,trii- fluoropropyl siloxane) elastomeric networks of various degrees of crosslinking have been carried out in order to evaluate the recent molecular theory of rubber elasticity of Erman and Flory, which is based on the idea of constraints imposed by entangled network chains on crosslink fluctuations. Previously published results on polyoxypropylene and poly(dimethylsi1oxane) net- works have also been analyzed. In general, the theory describes the elastic behavior of all these systems satisfactorily. Stress-strain and birefringence data can be interpreted using the same set of parameters. The most important theoretical parameter I(, which is a measure of the severity of constraints, varies with the elastic modulus as predicted by theory. However, the relationship is not a universal one, as was originally suggested. INTRODUCTION The molecular theory of rubber elasticity recently developed by Flory and Er~nanl-~ is based on the idea of constraints imposed by entangled network chains on crosslink fluctuations. These constraints are considered to be re- sponsible for the departure of the elastic response from the phantom limit. Thus, for uniaxial extension, the modulus or “reduced stress” is given by where f is the elastic force a t equilibrium, A* is the cross-sectional area of the unstretched sample, a is the elogation ratio a = L/L,, [ fpg] is the reduced stress for the corresponding phantom network, and fc and fph are the contributions to the force from the constraints on fluctuations of junctions and from the equivalent phantom network, respectively. The ratio fdfph is given by the theory as a function of two parameters, K, which is a measure of the severity of the constraints, and 5, which is related to the degree of nonaffineness in the relaxation of those constraints with strain. The parameter K is the most important one and should be related to the degree of inter- penetration of the network. Thus, it has been suggested that K should be given by 2- *To whom correspondence should be addressed. Journal of Polymer Science: Part B: Polymer Physics, Vol. 26, 235-244 (1988) a 1988 John Wiley & Sons, Inc. CCC 0098-1273/88/020235-10$04.00
-
Upload
independent -
Category
Documents
-
view
6 -
download
0
Transcript of Experimental analysis of the molecular theory of rubber elasticity
Experimental Analysis of the Molecular Theory of Rubber Elasticity
J. SANJUAN and M. A. LLORENTE,* Departamento de Quimica Fisica, Universidud a Distancia (UNED), 28040 Madrid, Spain
Synopsis
Stress-strain and birefringence-strain experiments, on polybutadiene and poly(methyl-3,3,3,trii- fluoropropyl siloxane) elastomeric networks of various degrees of crosslinking have been carried out in order to evaluate the recent molecular theory of rubber elasticity of Erman and Flory, which is based on the idea of constraints imposed by entangled network chains on crosslink fluctuations. Previously published results on polyoxypropylene and poly(dimethylsi1oxane) net- works have also been analyzed. In general, the theory describes the elastic behavior of all these systems satisfactorily. Stress-strain and birefringence data can be interpreted using the same set of parameters. The most important theoretical parameter I(, which is a measure of the severity of constraints, varies with the elastic modulus as predicted by theory. However, the relationship is not a universal one, as was originally suggested.
INTRODUCTION The molecular theory of rubber elasticity recently developed by Flory and
E r ~ n a n l - ~ is based on the idea of constraints imposed by entangled network chains on crosslink fluctuations. These constraints are considered to be re- sponsible for the departure of the elastic response from the phantom limit. Thus, for uniaxial extension, the modulus or “reduced stress” is given by
where f is the elastic force a t equilibrium, A* is the cross-sectional area of the unstretched sample, a is the elogation ratio a = L/L, , [ fpg] is the reduced stress for the corresponding phantom network, and fc and fph are the contributions to the force from the constraints on fluctuations of junctions and from the equivalent phantom network, respectively. The ratio f d f p h is given by the theory as a function of two parameters, K , which is a measure of the severity of the constraints, and 5, which is related to the degree of nonaffineness in the relaxation of those constraints with strain. The parameter K is the most important one and should be related to the degree of inter- penetration of the network. Thus, it has been suggested that K should be given by 2-
*To whom correspondence should be addressed.
Journal of Polymer Science: Part B: Polymer Physics, Vol. 26, 235-244 (1988) a 1988 John Wiley & Sons, Inc. CCC 0098-1273/88/020235-10$04.00

236 SANJUAN AND LLORENTE
where I is a constant, NA is Avogadro's number, p, is the density, is the unperturbed, mean-square molecular dimension of the chain, and F(+) is given by
where + is the functionality of the junctions. In a similar way, the theory can also describe the strain-birefringence of
elastomeric networks. For uniaxial deformation, a reduced birefringence, anal- ogous to the reduced stress, may be defined by4
where [An,,] is the reduced birefringence of the phantom network, and the ratio AnC/hnph has the same meaning as fc/f,,h and is given by similar functions of a, K , and [.
The molecular theory outlined above has been able to describe satisfactorily most of the features of the elasticity of elastomeric network^,^?^ but there are
.still some aspects that need to be clarified and supported by more experi- mental evidence. In this work we have carried out stress-strain and birefrin- gence-strain experiments on polybutadiene (PBD) and poly(methyl-3,3,3,tri- fluoropropyl siloxane) (PMFPS) elastomeric networks of different degrees of crosslinking. The results were interpreted according to the theory.
Previously published results on polyoxypropylene and poly(dimethy1 silox- ane) networks of different functionalities have been analyzed. In particular, this investigation addresses the validity of eq. (3), in which the parameter K is proportional to [ f p z ] - ' / 2 , and to the suggestion that the constant I should be a universal parameter with a value close to 0.5.'
EXPERIMENTAL
The polybutadiene used was a commercial sample (Solprene@ 255 poly- butadiene) supplied by Phillips Petroleum Company. This polymer was a cis-trans copolymer having 47% trans, 43% cis, and 10% vinyl group^.^ PMFPS was obtained from Dow Corning Co. It was also a commercial sample continuing 0.5% methyl-vinyl units to facilitate crosslinking. The polymers were purified by precipitation, from benzene for PBD and ethylacetate for PMFPS, using methanol and toluene as precipitants, respectively. Densities of the polymers were taken as 0.896 g/cm3 for PBD7 and 1.288 g/cm3 for PMFPS.8
Elastomer networks were prepared in the usual manner using dicumyl peroxide (DCP) as the crosslinking agent. The amounts of peroxide and the cure times were varied in order to get networks with different degrees of crosslinking. Once the networks were obtained they were swollen to extract soluble material. The characteristics of networks thus prepared are listed in Table I.
Stress-strain isotherms and birefringence measurements were carried out on strips cut from the networks sheets using standard techniques.' The appara- tus used is described else~here.~ Measurements for PBD were carried out at

EXPERIMENTAL ANALYSIS OF RUBBER ELASTICITY 237
TABLE I Characterization of Networks
Network DCP(%) Sol. fraction(%)
PBD-1 PBD-2
PBD-4 PBD-5
PBD-3
PBD-6 PBD-7 PMFPS-1 PMFPS-2 PMFPS-3 PMFPS-4
0.12 0.06 0.365 0.19 0.08 0.02 0.005 3.0 0.54 0.24 0.06
3.4 1.3 3.0
19.3 13.0 20.0 3.6 5.1 8.8
30.0
-
40°C to prevent strain-induced crystallization that may occur in this polymer.' For PMFPS the temperature was 25OC, and only stress-strain measurements were performed.
RESULTS AND DISCUSSION
Polybutadiene
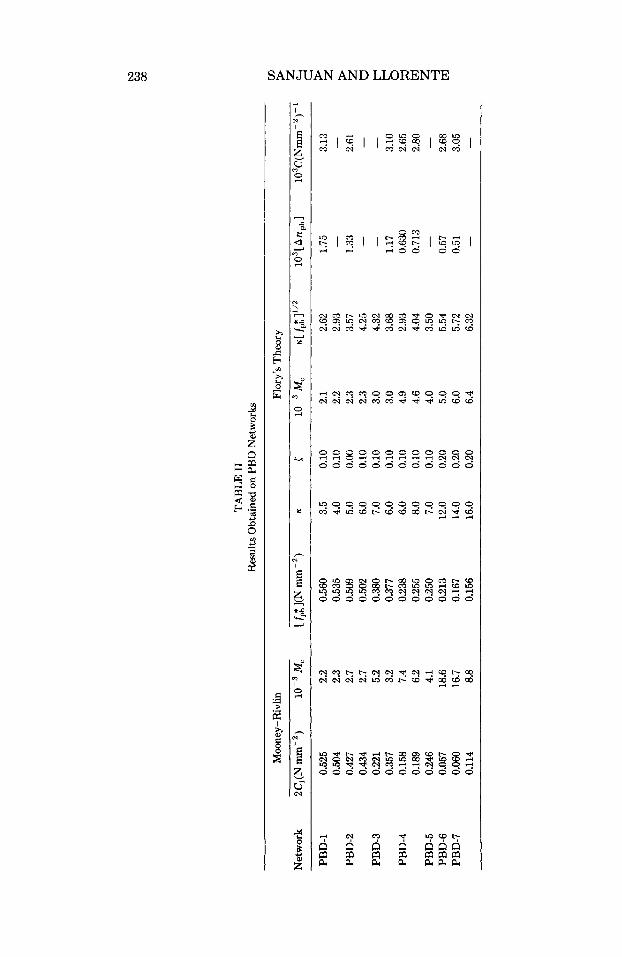
Figure 1 shows representative stress-strain results obtained on PBD net- works. The lines drawn through the points are theoretical curves [eq. (l)] obtained with the molecular parameters listed in Table 11. The parameter K
'E E t
on 0.2 0.4 0.6 0.0 1 .o oc-'
Fig. 1. Representative stress-strain isotherms for PBD networks. Curves are for eq. (l), with the molecular parameters given in Table 11.
TA
BL
E I1
R
esul
ts O
btai
ned
on P
BD
Net
wor
ks
Moo
ney-
Riv
lin
Flor
y’s T
heor
y
Net
wor
k 2C
,(N
M,
[ fp*
h](N
mm
-’)
K 3
M,
K[
fp*]”
’ lo
3 [ A n p
h ]
103C
(Nm
m ~ ‘
)-I
~~ PB
D-1
PBD
-2
PBD
-3
PBD
-4
PBD
-5
PBD
-6
PBD
-7
0.52
5 0.
504
0.42
7 0.
434
0.22
1 0.
357
0.15
8 0.
189
0.24
6 0.
057
0.06
0 0.
114
2.2
2.3
2.7
2.7 5.2
3.2
7.4
6.2
4.1
18.6
16
.7
8.8
0.56
0 0.
535
0.50
9 0.
502
0.38
0 0.
377
0.23
8 0.
255
0.25
0 0.
213
0.16
7 0.
156
3.5
0.10
4.
0 0.
10
5.0
0.00
6.
0 0.
10
7 .O
0.10
6.
0 0.
10
6.0
0.10
8.
0 0.
10
7.0
0.10
12
.0
0.20
14
.0
0.20
16
.0
0.20
2.1
2.2
2.3
2.3
3.0
3.0
4.9
4.6
4.0 5.0
6.0
6.4
2.62
2.
93
3.57
4.
25
4.32
3.68
2.
93
4.04
3.5
0 5.
54
5.72
6.
32
1.75
1.33
-
-
-
1.17
0.
630
0.71
3
0.57
0.
51
-
3.13
2.61
-
-
3.10
2.65
2.
80
2.68
3.
05
-
3.0
I ~
- 8 - 2.0
m 2
1.0
I I I I 1 - i
0 0.2 0 .A 0.6 0.8
oc-' Fig. 2. Birefringence results for PBD networks (see legend to Fig. 1).
increases with decreasing crosslink density, as the theory predicts,2 whereas the values of 1 different from zero indicate that the networks are heteroge- nous. From the value of the modulus extrapolated to a-l + 1 (phantom limit) we can obtain the molecular weight between crosslink, assuming perfect tetrafunctional networks, by means of the equation1°-13
where u2c is the volume fraction of polymer incorporated into the network structure during crosslinking. For comparison, we have also included the values obtained from the constant 2C, of the linear Mooney-Rivlin extra- p01ation.l~ As we can see in several cases, both values are quite different, indicating that the Mooney-Rivlin formula may introduce a large error in determining the crosslinking density under certain circumstances and must, therefore, be used with care.
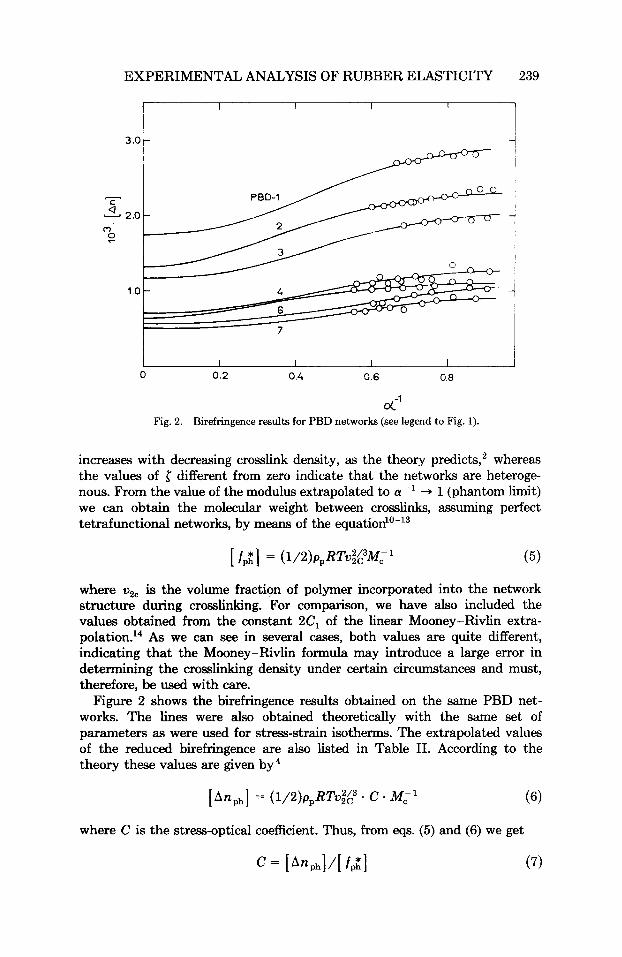
Figure 2 shows the birefringence results obtained on the same PBD net- works. The lines were also obtained theoretically with the same set of parameters as were used for stress-strain isotherms. The extrapolated values of the reduced birefringence are also listed in Table 11. According to the theory these values are given by4
where C is the stress-optical coefficient. Thus, from eqs. (5) and (6) we get
240 SANJUAN AND LLORENTE
Values of the stress-optical parameter obtained from eq. (7) are given in the last column of Table 11. The average value is 103C = 2.86 f 0.22 (N m r ~ - ~ ) - ' , somewhat lower than earlier published data,7 which gave 103C = 3.35 (N m-')-'. However the agreement can be considered satisfactory since this last value was obtained a t low deformation, whereas the former one corre- sponds to data extrapolated to infinite deformation.
According to eq. (2), the product K [ f p 2 ] ' / 2 should remain constant. Values of this quantity are given in Table 11. Although there is some scatter in the values, owing to the uncertities involved in K and the long extrapolation required to obtain [ fp2], no trend can be observed in the data, and an averaged value of K [ fpz]1/2 = 4.1 & 1.2 (N mm-2)1/2 is obtained.
From this value the constant I can be calculated from eq. (2). The required molecular dimension has been taken as ( r 2 ) , / M = 8.80 X lo-'* m2 mol kg-'. This figure was obtained using the approximate value for the characteristic ratio,16 C, = 5.4 and molecular parameters given in Ref. 5. In this way a value of I = 0.54 k 0.14 was obtained for this polymer.
Poly(methyl-3,3,3-trifluoropropyl siloxane)
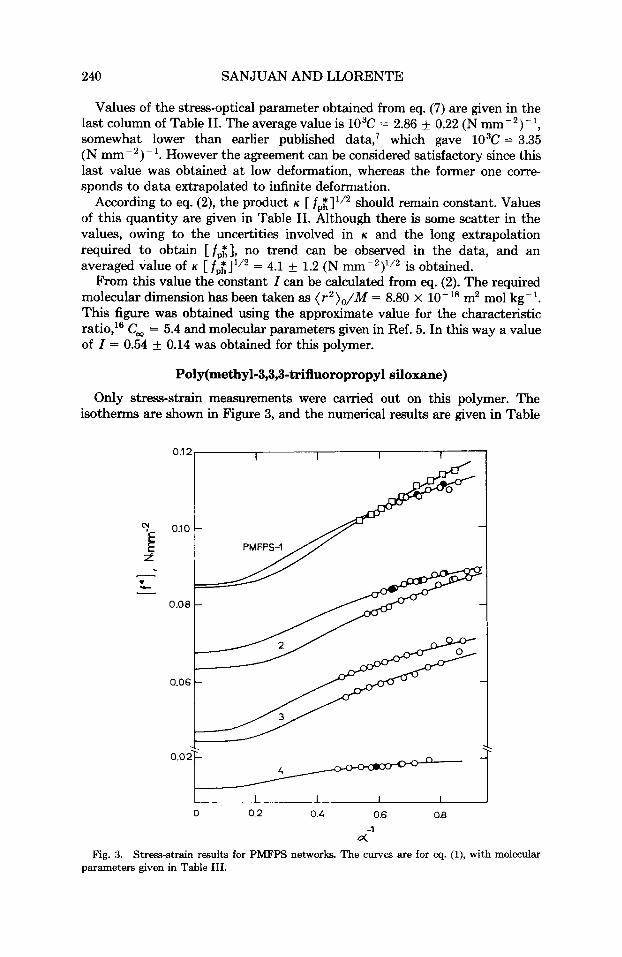
Only stress-strain measurements were carried out on this polymer. The isotherms are shown in Figure 3, and the numerical results are given in Table
0.1 2
I O j O 2 -
* u- - 0.08
0.06
0.04
0 0.2 0.4 0.6 0.8 -1
G(
Fig. 3. Stress-strain results for PMFPS networks. The curves are for eq. (l), with molecular parameters given in Table 111.

EXPERIMENTAL ANALYSIS OF RUBBER ELASTICITY 241
TABLE111 Results Obtained on PMFPS Networks
Mooney-Rivlin Flory's Theory
Network 2C, (N mn-') 10-3Mc [/$,I (N m-*) I( [ 10-3Mc K [ fp*]1'2
PMFPS-1 0.0892 17.5 0.0850 3.0 0.00 18.3 0.88 0.0842 18.5 0.0845 4.0 0.05 18.4 1.16
PMFPS-2 0.0724 21.3 0.0675 3.0 0.00 22.8 0.78 0.0601 25.6 0.0635 4.0 0.05 24.3 1.01
PMFPS-3 0.0495 30.3 0.0467 6.0 0.00 32.1 1.30 0.0413 36.3 0.0445 6.0 0.025 33.7 1.27
PMFPS-4 0.0137 92.0 0.0118 10.0 0.00 107.0 1.09
111. In this case differences of extrapolated values from the Mooney-Rivlin relation and from Flory's theory are lower than for PBD. Also the parameter { is close to zero, indicating that the relaxation of the domains of constraint is nearly affine in this polymer.
As can be seen in the last column of Table I11 the product K [ f p : ] ' / 2 is approximately constant, indicating the validity of eq. (2). The average value for this quantity is K [ f p 8 ] ' / 2 = 1.07 0.18 (N mm-2)1/2. The molecular dimensions of this polymer have been measured in solution,16 and the value
N
' E E i 0.20 c
I I I I I 0 0.2 0.4 0.6 0.8 1.0
ci' Fig. 4. Stress-strain data on PDMS multifunctional networks fitted according to the theory
using molecular parameters listed in Table IV.

242 SANJUAN AND LLORENTE
TABLE IV Calculations for PDMS Networks
Functionality [ fpfi 1 (N m-2) K 3 F(@)[ fpfi1-1'2
3 4 6
11 37
0.135 6.0 0.00 1.048 0.184 5.0 0.00 0.825 0.240 4.0 0.00 0.555 0.292 2.0 0.00 0.303 0.236 0.5 0.00 0.109
( r 2 ) o / M = 4.20 x m2 mol kg-' has been reported. With this value the proportionality constant in eq. (2) is I = 0.25 k 0.04, which is rather low.
The dimensions given above for this polymer have been obtained from viscosity measurements using an experimental value for the universal parame- ter Q, = 1.50 X lo2' mol-'. If the most common value of Q, = 2.1 X lo2' mol-' is used, the constant I becomes 0.36 k 0.06.
Calculations on Multifunctional PDMS Networks
We have applied the theory to previously published results on PDMS networks of different functionalities.12 The fitted curves are shown in Figure 4, and the numerical parameters are given in Table IV. Except for the trifunctional network, for which some deviation can be observed a t high extension, a good fit of the data can be achieved. The parameter 5 was set equal to zero since these samples were model networks, and the parameter K is found to decrease with increasing functionality.
According to eq. (2), K should be proportional to F(+)[ f :]-'I2 for this set of networks. In Figure 5 a plot of K against F(@)[ fp$]-52 gives a straight line, indicating that this theoretical prediction is fulfilled. The line drawn in this figure was obtained by least-squares analysis, and according to eq. (2), the
I I 1
K 1
0 05 1.0
Fig. 5. F( + )[ 12 1-
Theoretical parameter I( obtained from PDMS data shown in Figure 4 as a function of [see eq. @)I.

EXPERIMENTAL ANALYSIS OF RUBBER ELASTICITY 243
TABLE V Values Obtained for the Constant I
Polymer Z
PBD PMFPS
PDMS POP'
0.54 & 0.14 0.25 k 0.04" 0.36 f O M b 0.48 k 0.05
0.24
"With Q = 1.5 X 10" mol-I. bWith @ = 2.1 x loz1 mol-'. 'Reference 18.
slope is given by
and the numerical value obtained is slope = (5.81 f 0.55) lo3 (N mm-2 1 'I/'. From this figure and the following data for PDMS5'": ( r 2 ) o / M = 5.67 X 10-'8(m2 mol kg-'), pp = 0.970 g/cm3, and the value of the constant I can be calculated by means of eq. (8). The resulting value is I = 0.48 f 0.05 for this system, in very good agreement with previously reported values for PDMS.2
CONCLUSION
In general the theory describes correctly the elastic behavior of the systems considered here. The same set of parameters can fit the stress-strain and birefringence data, and the dependence on the functionality of junctions is also predicted satisfactorily. Moreover, the effect of the degree of crosslinking on the parameter K indicated by eq. (2) is confirmed. As has been mentioned in the introduction, Erman and Flory2 originally
suggested that the constant I could be a universal parameter independent of the polymer system under consideration, with a numerical value close to 0.5, although these authors also indicated that the data were too few for conclu- sions, and more systems should be investigated. In Table V we have gathered the average values of I, including recently reported18 values for poly- oxypropylene (POP). These data suggest that I is not a universal constant but depends on the system. This same conclusion was reported by Brotzman and Mark using a large variety of systems measured at different degrees of ~welling.~ However, I is a constant for each polymer.
References 1 . P. J. Flory and B. Eman, Macromolecules, 15, 800 (1982). 2. B. Eman and P. J. Flory, Macromolecules, 15, 806 (1982). 3. B. Eman and P. J. Flory, Macromolecules, 16, 1601 (1983). 4. B. Eman and P. J. Flory, Macromolecules, 16, 1607 (1983). 5. R. W. Brotzman and J. E. Mark, Macromolecules, 19, 667 (1986). 6. B. Eman, Br. Polym. J., 17, 140 (1985). 7. J. E. Mark and M. A. Llorente, Polym. J. (Tokyo), 13, 543, (1981).
244 SANJUAN AND LLORENTE
8. M. R. G6mez Anton and A. Horta, to be published. 9. M. A. Llorente, I. Femhdez de Rerola, and E. Saiz, Macromolecules, 18, 2663 (1985). 10. P. J. Flory, Proc. R. SOC. London, Ser. A, 361, 351 (1976). 11. P. J. Flory, J . Chm. Phys., 66, 5720 (1977). 12. M. A. Llorente and J. E. Mark, Macromolecules, 13, 681 (1980). 13. P. J. Flory, Br. Polym. J., 17, 96 (1985). 14. M. Mooney, J . Appl. Phys., 19, 434 (1948); R. S. Rivlin, Philos. Trans. R. SOC. London,
15. P. J. Flory, Statistical Mechanics of Chain Molec&, Interscience, New York, 1969. 16. R. R. Buch, H. M. Klimisch, and 0. K. Johannson, J. Polym. Sci., PartA-2,7,563 (1969). 17. J. E. Mark and J. L. Sullivan, J. Chm. Phys., 66, 1006 (1977). 18. A. L. Andrady and M. A. Llorente, J. Polym. Sci. Polym. Phys. Ed. 25, 195 (1987).
Ser. A, 241, 379 (1948).
Received January 28, 1987 Accepted June 17, 1987