executive summary city of fort worth, texas economic ...
492
AUSTIN SEATTLE DECEMBER 2017 EXECUTIVE SUMMARY CITY OF FORT WORTH, TEXAS ECONOMIC DEVELOPMENT STRATEGIC PLAN
-
Upload
khangminh22 -
Category
Documents
-
view
1 -
download
0
Transcript of executive summary city of fort worth, texas economic ...

AUSTIN � SEATTLEDECEMBER 2017
EXECUTIVE SUMMARY
CITY OF FORT WORTH, TEXASECONOMIC DEVELOPMENT STRATEGIC PLAN
CITY OF FORT WORTH, TEXAS ECONOMIC DEVELOPMENT STRATEGIC PLAN
EXECUTIVE SUMMARY PAGE | I
ACKNOWLEDGEMENTS TIP would like to thank the following individuals and organizations for their participation in this planning process:
CITY OF FORT WORTH MAYOR AND CITY COUNCIL Betsy Price, Mayor
Carlos Flores, District 2 (current)
Sal Espino, District 2 (former)
Brian Byrd, District 3 (current)
W.B. “Zim” Zimmerman, District 3 (former)
Cary Moon, District 4
Gyna Bivens, District 5
Jungus Jordan, District 6
Dennis Shingleton, District 7
Kelly Allen Gray, District 8
Ann Zadeh, District 9
CITY OF FORT WORTH STAFF David Cooke, City Manager
Jay Chapa, Assistant City Manager
Robert Sturns, Director, Economic Development
Brenda Hicks-Sorensen, CEcD, Assistant Director, Economic Development
PROJECT STEERING COMMITTEE Lisa McMillan, Tarrant County Administrator’s Office
Darlene Boudreaux, Tech Fort Worth
Brandom Gengelbach, Fort Worth Chamber of Commerce
Stacy Marshall, Southeast Fort Worth, Inc.
Andy Taft, Downtown Fort Worth, Inc.
Paul Paine, Near Southside, Inc.
Cintya Segoviano, Fort Worth Hispanic Chamber of Commerce
Devoyd “Dee” Jennings, Fort Worth Metropolitan Black Chamber of Commerce
David Walters, CBRE
Nina Petty, Tarrant County College District
Bob Jameson, Fort Worth Convention & Visitors Bureau
Janet Black, BNSF Railway Company
Marie A. Holliday, DMD, Sundance Square Dentist
Robert Folzenlogen, Hillwood Properties
Don Boren, Don Boren and Company Inc.
JJ Cawelti, Bell Helicopter-Textron, Inc.
Kevin Davies, Hulen Mall
Matt Robinson, Walton Development and Management, Inc.
Judy McDonald, Workforce Solutions of Tarrant County

CITY OF FORT WORTH, TEXAS ECONOMIC DEVELOPMENT STRATEGIC PLAN
EXECUTIVE SUMMARY PAGE | II
PROJECT LEADERSHIP TEAM Paul Ballard, Fort Worth Transportation Authority
Mike Berry, Hillwood Properties
Jay Chapa, Assistant City Manager
John Terrell, DFW International Airport
Victor Boschini, Texas Christian University
Michael Branum, NAS Fort Worth Joint Reserve Base
Dr. Kent Paredes Scribner, Fort Worth ISD
Eugene V. Giovannini, Tarrant County College District
J.D. Granger, Trinity River Vision Authority
Johnny Campbell, Sundance Square
Lillie Biggins, Texas Health Harris Methodist Fort Worth
PROJECT CONSULTING TEAM
TIP STRATEGIES, INC. is a privately held economic development consulting firm with offices in Austin and Seattle. TIP is committed to providing quality solutions for public and private sector clients. Established in 1995, the firm's primary focus is economic development strategic planning.
Project Team: Jon Roberts, Managing Principal John Karras, Senior Consultant Alex Cooke, Senior Consultant Karen Beard, Analyst Meredith Eberle, Project Support
FREGONESE ASSOCIATES is a Portland-based urban planning firm with expertise in citywide comprehensive planning as well as scenario planning and modeling in specific areas (such as downtowns and urban corridors). Established in 1997, the firm’s work has been instrumental in the development and adoption of growth policies and land use plans in large cities and metro areas across the US and internationally.
Project Team: John Fregonese, President Nadine Appenbrink, Project Manager Julia Reisemann, GIS Analyst
JLL is a member of the Fortune 500 and is a global professional services and investment management firm specializing in real estate. JLL’s industry-leading research group delivers commercial real estate analysis and insights that drive value in real estate decisions and support successful strategies.
Project Team: Jubal Smith, Executive Vice President Todd Burnette, Managing Director
ISAAC BARCHAS led the Austin Technology Incubator for 10 years, starting in 2006. Over that time, he has overseen the incubation of more than 200 companies. He is responsible for ATI's strategic direction and evolving the ATI economic model. Isaac remains active in the technology and venture capital communities in Austin and across the US and has been published in the Washington Post, Wall Street Journal, Chicago Tribune, and Austin American Statesman.

CITY OF FORT WORTH, TEXAS ECONOMIC DEVELOPMENT STRATEGIC PLAN
EXECUTIVE SUMMARY PAGE | III
CONTENTS ABOUT THIS WORK ................................................................................................................................. 1 EXECUTIVE SUMMARY .............................................................................................................................. 3
PHASE 1: COMPETITIVENESS AS CONTEXT ............................................................................................ 3 PHASE 2: OPPORTUNITY FOR TALENT AND INDUSTRY ............................................................................. 4 PHASE 3: FROM ANALYSIS TO STRATEGY ............................................................................................... 6 STRATEGIC PLAN OVERVIEW ................................................................................................................. 7

CITY OF FORT WORTH, TEXAS ECONOMIC DEVELOPMENT STRATEGIC PLAN
EXECUTIVE SUMMARY PAGE | 1
ABOUT THIS WORK CHALLENGE. Over the last several decades, Fort Worth has been one of the fastest-growing large cities in the US. The challenge for economic development, however, is not just whether the community can continue to add people and jobs. As with all growing cities, the question becomes what kind of development the City wants—and what it will take to ensure that development is sustainable. In short, how does Fort Worth “up its game” to compete regionally as well as globally?
There are two existing models in Fort Worth that demonstrate the effectiveness of long-term, strategic thinking. A lesson can be learned from Hillwood’s business development strategy for the Alliance district. A long-term vision, a thoughtful approach to real estate development, investments in strategic transportation assets, and a holistic view that includes amenities and housing are the factors that have established Alliance as a national model of successful business development. Similarly, Sundance Square has undertaken long-term planning efforts that have transformed the city. Thanks to the rejuvenation of downtown, Fort Worth now has a true center of gravity that functions as the city’s premier entertainment, dining, shopping, and residential district. Yet, despite the success of Alliance and Sundance Square, these two models stand as outliers in Fort Worth, almost as if they are separate from the community. The City, the Fort Worth Chamber, and other partners have not embraced the need for a narrowly focused economic development program that aggressively pursues the most promising opportunities. Without a focused business development effort, Fort Worth has fallen behind its competition. The city’s growth in recent years has largely been defined by expansion of single-family residential development driven by employment growth in other cities.
The threats facing the city may not always be apparent but they are very real. Recent business relocations, an increase in population not matched by an increase in wages, an out-of-balance tax base, and persistent difficulties in attracting skilled and educated young people—these issues risk engulfing Fort Worth. These challenges put Fort Worth in an increasingly weak position towards the City of Dallas and aggressive suburbs throughout the metro area. Of course, these concerns represent a snapshot in time. Conditions will change. Some of the trends we have identified are themselves subject to changes at the national level. That is part of the challenge as well: establishing a strategic framework flexible enough to respond to changing conditions while moving the community toward a more prosperous future.
RESPONSE. To address this challenge, the City of Fort Worth chose to devise its first ever economic development strategic plan. Working with TIP Strategies (an economic development consulting with offices in Austin and Seattle) and their partners (Fregonese Associates, JLL, and Isaac Barchas), the City of Fort Worth has engaged the business community and local stakeholders to create a strategic framework to guide the City’s economic development activities. During the project’s “Discovery Phase,” the TIP consulting team met with more than 300 community, business, and academic leaders through roundtable discussions, employer interviews, and other meetings with key stakeholders. Input was also received during community workshops held in each of the six target areas (specific neighborhoods studied for their redevelopment potential) and through an online community survey that received nearly 1,300 unique responses. The project Steering Committee and Leadership Team provided their expertise over the course of five meetings, which contributed immensely to the strategic plan.

CITY OF FORT WORTH, TEXAS ECONOMIC DEVELOPMENT STRATEGIC PLAN
EXECUTIVE SUMMARY PAGE | 2
RESULTS. The economic development strategic plan that emerged has very specific outcomes:
1. High-wage job growth.
2. A more sustainable tax base, driven less by residential property valuation and more by commercial and industrial investment.
3. An economy that capitalizes on high-growth businesses and the creative individuals who fuel them.
4. A commitment to “quality of place” throughout the community.
These outcomes are tangible and measurable. In the case of the first two (wage growth and tax burden), data are readily available and can be easily tracked over time. The third outcome (attracting high-growth industries) can be measured using employment data in target industry classifications. The fourth outcome (quality of place) is less easily measured, but there are many ways in which the vitality of neighborhoods can be assessed indirectly. These include rising home values, new business startups, reduction of blighted areas, and the emergence of walkable corridors with a mixture of residential and commercial developments and related amenities.
The plan is ambitious by design and is structured around a bold vision. That vision was articulated in the City’s initial call for a strategic plan, and, in various forms, was reiterated in stakeholder discussions. The vision seeks to capitalize on the city’s many advantages and its dramatic growth.
CITY OF FORT WORTH, TEXAS ECONOMIC DEVELOPMENT STRATEGIC PLAN
EXECUTIVE SUMMARY PAGE | 3
EXECUTIVE SUMMARY What is the significance of Fort Worth emerging as one of the most populous US cities? It means the city has an opportunity—even a responsibility—to capitalize on its growing size, influence, and economic potential. The goals and initiatives in this plan are an ambitious response to that new reality.
The plan is a roadmap for the city’s economic development program. Just as important, it must be viewed as a call to action. The time has come for Fort Worth to embrace its status as a major US city and compete on the national and international stage.
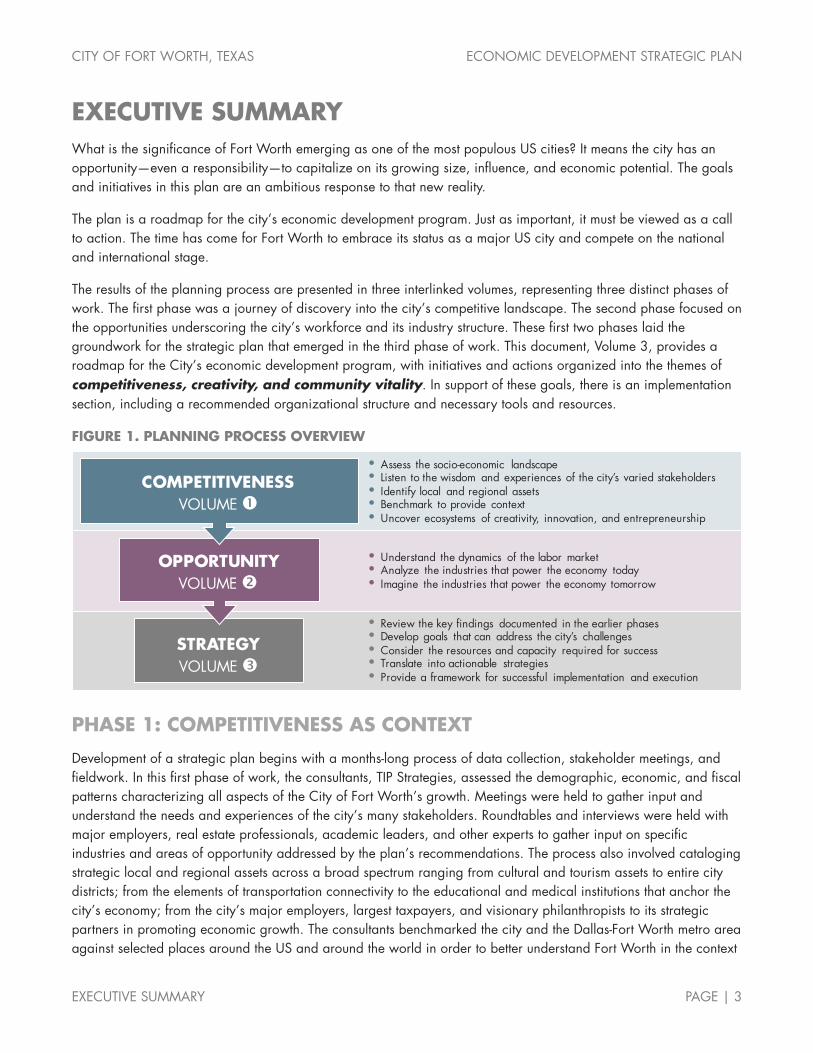
The results of the planning process are presented in three interlinked volumes, representing three distinct phases of work. The first phase was a journey of discovery into the city’s competitive landscape. The second phase focused on the opportunities underscoring the city’s workforce and its industry structure. These first two phases laid the groundwork for the strategic plan that emerged in the third phase of work. This document, Volume 3, provides a roadmap for the City’s economic development program, with initiatives and actions organized into the themes of competitiveness, creativity, and community vitality. In support of these goals, there is an implementation section, including a recommended organizational structure and necessary tools and resources.
FIGURE 1. PLANNING PROCESS OVERVIEW
PHASE 1: COMPETITIVENESS AS CONTEXT
Development of a strategic plan begins with a months-long process of data collection, stakeholder meetings, and fieldwork. In this first phase of work, the consultants, TIP Strategies, assessed the demographic, economic, and fiscal patterns characterizing all aspects of the City of Fort Worth’s growth. Meetings were held to gather input and understand the needs and experiences of the city’s many stakeholders. Roundtables and interviews were held with major employers, real estate professionals, academic leaders, and other experts to gather input on specific industries and areas of opportunity addressed by the plan’s recommendations. The process also involved cataloging strategic local and regional assets across a broad spectrum ranging from cultural and tourism assets to entire city districts; from the elements of transportation connectivity to the educational and medical institutions that anchor the city’s economy; from the city’s major employers, largest taxpayers, and visionary philanthropists to its strategic partners in promoting economic growth. The consultants benchmarked the city and the Dallas-Fort Worth metro area against selected places around the US and around the world in order to better understand Fort Worth in the context
• Review the key findings documented in the earlier phases• Develop goals that can address the city’s challenges• Consider the resources and capacity required for success• Translate into actionable strategies• Provide a framework for successful implementation and execution
• Assess the socio-economic landscape • Listen to the wisdom and experiences of the city’s varied stakeholders• Identify local and regional assets• Benchmark to provide context• Uncover ecosystems of creativity, innovation, and entrepreneurship
STRATEGYVOLUME
• Understand the dynamics of the labor market• Analyze the industries that power the economy today • Imagine the industries that power the economy tomorrow
OPPORTUNITYVOLUME
COMPETITIVENESSVOLUME

CITY OF FORT WORTH, TEXAS ECONOMIC DEVELOPMENT STRATEGIC PLAN
EXECUTIVE SUMMARY PAGE | 4
of its peers. Experts were brought in to analyze the city’s build-out potential (Fregonese), to map out the city’s entrepreneurial ecosystems (Isaac Barchas), and to evaluate the city from a corporate site selection perspective (JLL).
After months of investigation, the first volume in this three-volume series was rolled out. Volume 1 included an unabridged reference appendix with the entire scope of the research undertaken. Most importantly, Volume 1 summarizes the consulting team’s findings from this phase of work. These findings highlight specific issues affecting the city’s competitive position and, as such, form important underpinnings of the economic development strategic plan in the final phase of work. The findings from Phase 1 shown below are supplemented by a technical report with guidance on marketing, program areas, and site selection, which was delivered to City staff separately.
VOLUME ❶ COMPETITIVENESS THEME FINDINGS
Implications of Land Use
The City has a vast reserve of land (vacant properties & redevelopment sites) that can drive economic growth
In the absence of a focused business development effort, residential uses dominate the tax base
Regional job growth draws Fort Worth residents outside the city for work
Current trends imply that Fort Worth’s jobs-housing balance is slowly eroding
Districts as Drivers
Fort Worth has districts at different stages of their life cycle, which can serve as drivers for economic development
Harnessing the potential of the urban core (Downtown & surrounding districts) will be critical to the city’s future
External Visibility
Fort Worth has relatively low external visibility among large US cities
Fort Worth has a unique asset to leverage for enhancing the city’s external visibility…It’s Not “Dallas International Airport” It’s DFW
Fort Worth is a visitor destination with untapped potential
Economic Development
Economic development is a shared responsibility among local entities
Fort Worth’s partners must expand and add to current baseline economic development activities
New initiatives are required to take Fort Worth to the next level
A proactive economic development effort is required to counteract misperceptions of the city and to increase investment
Fort Worth lags many benchmark communities—both within the region and outside the state—in terms of resource levels allocated to economic development
Fort Worth's favorable factors for corporate site location should inform the City’s target marketing messages, both nationally and internationally
Favorable perceptions of the city among commercial real estate brokers should be emphasized in marketing efforts
Economic development marketing efforts lack consistent messaging as well as global perspective
PHASE 2: OPPORTUNITY FOR TALENT AND INDUSTRY
While the first phase of work was far-ranging in the scope of material it covered, the second phase was more focused on specific areas of opportunity. Phase 2 concentrated on a thorough review of the city’s industrial and occupational drivers. The consultants sought to understand the dynamics of the city’s labor market, to analyze the industries that power the current economy, and to imagine the possibilities embodied in Fort Worth’s industries of tomorrow. This work was largely data-driven but also involved extensive fieldwork. Roundtable discussions and interviews were held with
CITY OF FORT WORTH, TEXAS ECONOMIC DEVELOPMENT STRATEGIC PLAN
EXECUTIVE SUMMARY PAGE | 5
industry leaders in the fields of healthcare, aviation/aerospace, startups and technology, higher education and workforce, infrastructure, logistics and transportation, and manufacturing.
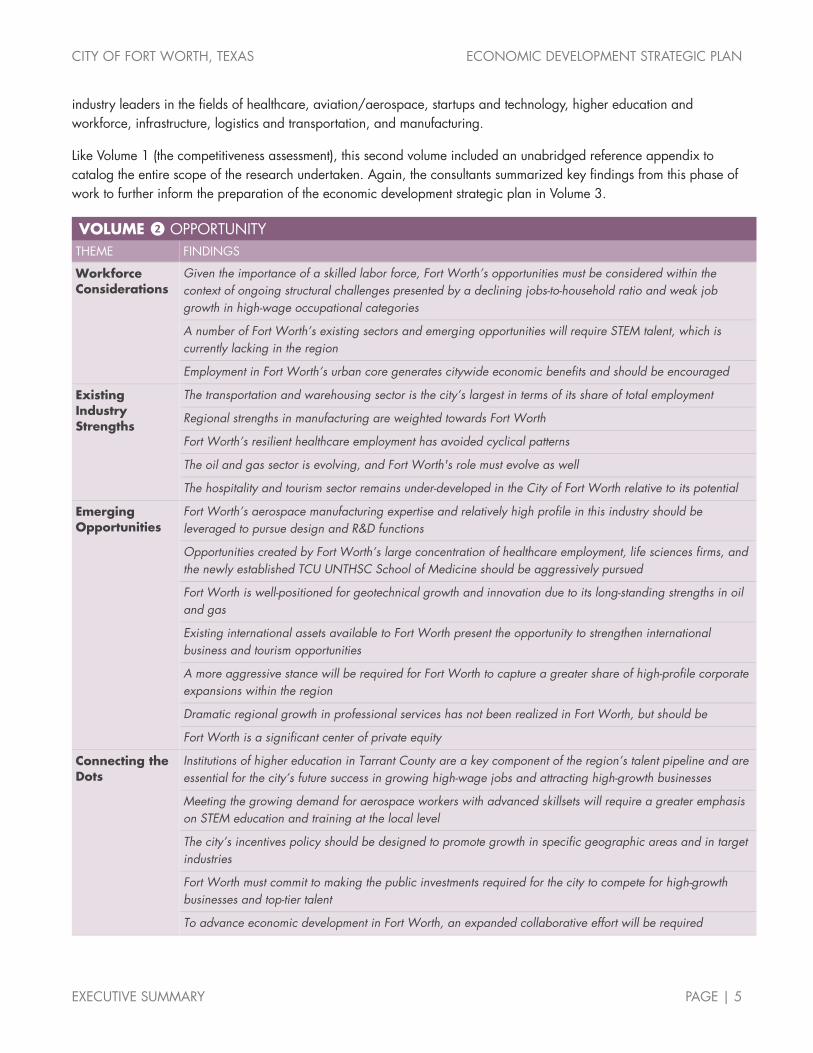
Like Volume 1 (the competitiveness assessment), this second volume included an unabridged reference appendix to catalog the entire scope of the research undertaken. Again, the consultants summarized key findings from this phase of work to further inform the preparation of the economic development strategic plan in Volume 3.
VOLUME ❷ OPPORTUNITY THEME FINDINGS
Workforce Considerations
Given the importance of a skilled labor force, Fort Worth’s opportunities must be considered within the context of ongoing structural challenges presented by a declining jobs-to-household ratio and weak job growth in high-wage occupational categories
A number of Fort Worth’s existing sectors and emerging opportunities will require STEM talent, which is currently lacking in the region
Employment in Fort Worth’s urban core generates citywide economic benefits and should be encouraged
Existing Industry Strengths
The transportation and warehousing sector is the city’s largest in terms of its share of total employment
Regional strengths in manufacturing are weighted towards Fort Worth
Fort Worth’s resilient healthcare employment has avoided cyclical patterns
The oil and gas sector is evolving, and Fort Worth's role must evolve as well
The hospitality and tourism sector remains under-developed in the City of Fort Worth relative to its potential
Emerging Opportunities
Fort Worth’s aerospace manufacturing expertise and relatively high profile in this industry should be leveraged to pursue design and R&D functions
Opportunities created by Fort Worth’s large concentration of healthcare employment, life sciences firms, and the newly established TCU UNTHSC School of Medicine should be aggressively pursued
Fort Worth is well-positioned for geotechnical growth and innovation due to its long-standing strengths in oil and gas
Existing international assets available to Fort Worth present the opportunity to strengthen international business and tourism opportunities
A more aggressive stance will be required for Fort Worth to capture a greater share of high-profile corporate expansions within the region
Dramatic regional growth in professional services has not been realized in Fort Worth, but should be
Fort Worth is a significant center of private equity
Connecting the Dots
Institutions of higher education in Tarrant County are a key component of the region’s talent pipeline and are essential for the city’s future success in growing high-wage jobs and attracting high-growth businesses
Meeting the growing demand for aerospace workers with advanced skillsets will require a greater emphasis on STEM education and training at the local level
The city’s incentives policy should be designed to promote growth in specific geographic areas and in target industries
Fort Worth must commit to making the public investments required for the city to compete for high-growth businesses and top-tier talent
To advance economic development in Fort Worth, an expanded collaborative effort will be required
CITY OF FORT WORTH, TEXAS ECONOMIC DEVELOPMENT STRATEGIC PLAN
EXECUTIVE SUMMARY PAGE | 6
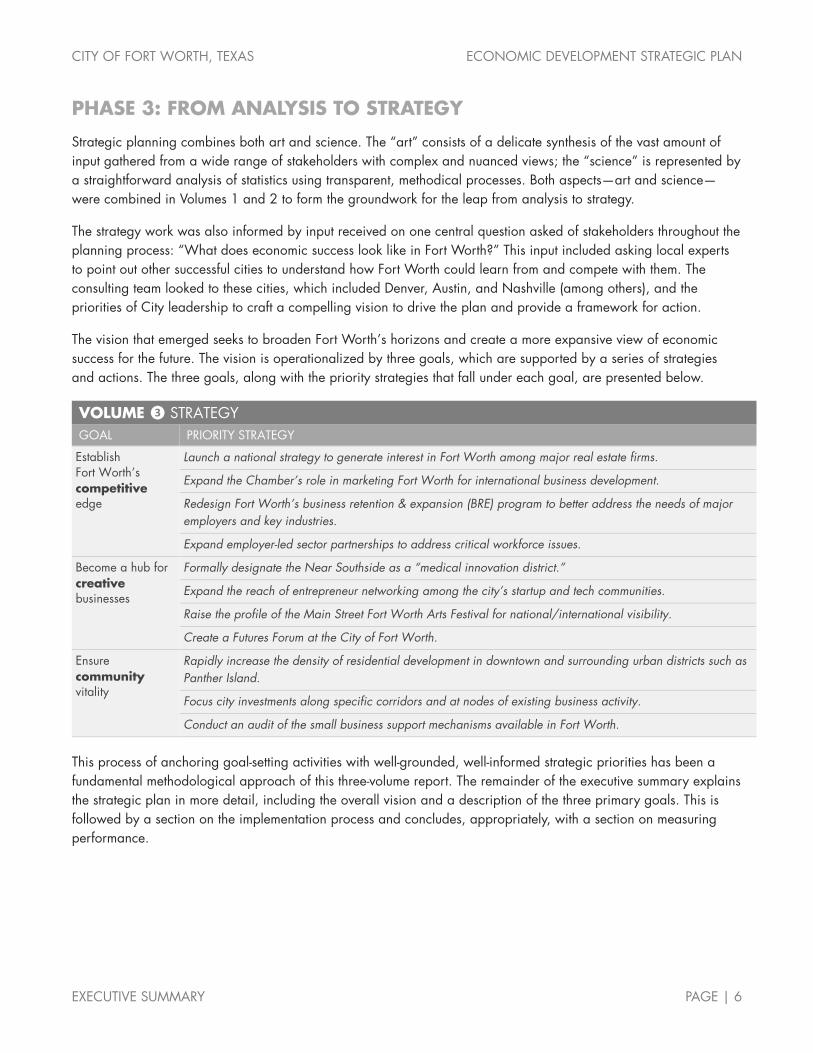
PHASE 3: FROM ANALYSIS TO STRATEGY
Strategic planning combines both art and science. The “art” consists of a delicate synthesis of the vast amount of input gathered from a wide range of stakeholders with complex and nuanced views; the “science” is represented by a straightforward analysis of statistics using transparent, methodical processes. Both aspects—art and science—were combined in Volumes 1 and 2 to form the groundwork for the leap from analysis to strategy.
The strategy work was also informed by input received on one central question asked of stakeholders throughout the planning process: “What does economic success look like in Fort Worth?” This input included asking local experts to point out other successful cities to understand how Fort Worth could learn from and compete with them. The consulting team looked to these cities, which included Denver, Austin, and Nashville (among others), and the priorities of City leadership to craft a compelling vision to drive the plan and provide a framework for action.
The vision that emerged seeks to broaden Fort Worth’s horizons and create a more expansive view of economic success for the future. The vision is operationalized by three goals, which are supported by a series of strategies and actions. The three goals, along with the priority strategies that fall under each goal, are presented below.
VOLUME ❸ STRATEGY GOAL PRIORITY STRATEGY
Establish Fort Worth’s competitive edge
Launch a national strategy to generate interest in Fort Worth among major real estate firms.
Expand the Chamber’s role in marketing Fort Worth for international business development.
Redesign Fort Worth’s business retention & expansion (BRE) program to better address the needs of major employers and key industries.
Expand employer-led sector partnerships to address critical workforce issues.
Become a hub for creative businesses
Formally designate the Near Southside as a “medical innovation district.”
Expand the reach of entrepreneur networking among the city’s startup and tech communities.
Raise the profile of the Main Street Fort Worth Arts Festival for national/international visibility.
Create a Futures Forum at the City of Fort Worth.
Ensure community vitality
Rapidly increase the density of residential development in downtown and surrounding urban districts such as Panther Island.
Focus city investments along specific corridors and at nodes of existing business activity.
Conduct an audit of the small business support mechanisms available in Fort Worth.
This process of anchoring goal-setting activities with well-grounded, well-informed strategic priorities has been a fundamental methodological approach of this three-volume report. The remainder of the executive summary explains the strategic plan in more detail, including the overall vision and a description of the three primary goals. This is followed by a section on the implementation process and concludes, appropriately, with a section on measuring performance.
CITY OF FORT WORTH, TEXAS ECONOMIC DEVELOPMENT STRATEGIC PLAN
EXECUTIVE SUMMARY PAGE | 7
STRATEGIC PLAN OVERVIEW
The plan is structured around a bold vision. That vision was articulated in the City’s initial call for a strategic plan, and, in various forms, was reiterated in stakeholder discussions. It seeks to capitalize on the city’s many advantages and its dramatic growth. Based on annual population growth trends since the last census, Fort Worth is on track to become the nation’s 12th largest city by 2019, a significant leap from its 2016 ranking as the 16th largest. This track would leap frog major US cities including San Francisco, Columbus, and Indianapolis.
The steady stream of new residents, coupled with the city’s vast tracts of available land and numerous assets, calls for an ambitious response. Findings from the planning process suggest the time has come for Fort Worth to use its growing influence to compete more fully on the national and international stage. Committing to a longer-term vision (not just short-term success) means embracing a holistic notion of what economic development can accomplish. A clear, concise vision provides strategic direction and serves as a touchstone for future decisions, especially those that impact community investments and re-allocation of resources. This focus is reflected in the vision statement that emerged from the planning process.
VISION To compete successfully on the national and international stage for creative, high-growth businesses and the talented individuals who fuel them.
Supporting the vision are three goals. These goals address competitiveness, creativity, and community vitality. They form the core of the plan’s recommendations. They reflect the guidance received by the City and stakeholders and were informed by data analysis and benchmarking against other communities facing similar challenges. Within each goal are specific initiatives that the City–and the community at large–can undertake to realize the vision. Some of the initiatives represent “baseline economic development,” that is, the activities every city must commit to for economic growth. Others are intended to be transformative–strategies that will have a more dramatic impact on the future of the community as a whole. An implementation matrix is provided for directing the work of the City and its partners. In addition, the plan includes a discussion of tools and resources to support implementation.
The approach taken in this plan has been especially mindful of the fact that economic development is never a strictly City-driven activity. It is, first and foremost, a community challenge.
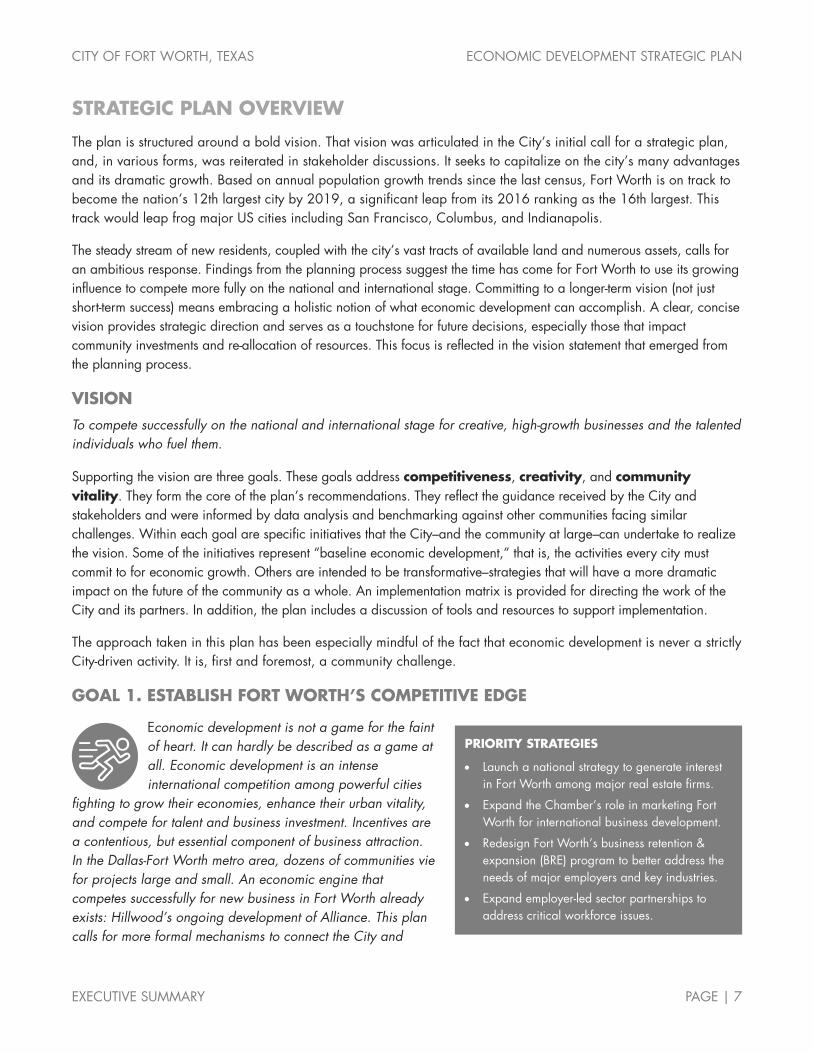
GOAL 1. ESTABLISH FORT WORTH’S COMPETITIVE EDGE
Economic development is not a game for the faint of heart. It can hardly be described as a game at all. Economic development is an intense international competition among powerful cities
fighting to grow their economies, enhance their urban vitality, and compete for talent and business investment. Incentives are a contentious, but essential component of business attraction. In the Dallas-Fort Worth metro area, dozens of communities vie for projects large and small. An economic engine that competes successfully for new business in Fort Worth already exists: Hillwood’s ongoing development of Alliance. This plan calls for more formal mechanisms to connect the City and
PRIORITY STRATEGIES
• Launch a national strategy to generate interest in Fort Worth among major real estate firms.
• Expand the Chamber’s role in marketing Fort Worth for international business development.
• Redesign Fort Worth’s business retention & expansion (BRE) program to better address the needs of major employers and key industries.
• Expand employer-led sector partnerships to address critical workforce issues.

CITY OF FORT WORTH, TEXAS ECONOMIC DEVELOPMENT STRATEGIC PLAN
EXECUTIVE SUMMARY PAGE | 8
Hillwood, but the Alliance template for business development is a model that should be emulated by the City, the Chamber, and other partners focused on stimulating economic growth in Fort Worth. With the exception of Alliance, the reality is that Fort Worth has not been an effective player in the region. The question is not whether Fort Worth can continue to grow absent a more aggressive posture; it can. The real question is whether high-profile recruitment opportunities, those that generate enormous press and attract both investment and high-paying jobs, will by-pass Fort Worth. Unless the community makes a whole-hearted commitment to competing for projects, growth will be driven more by residential development and lower-wage employment. The success of this plan is predicated on a more dynamic approach to business attraction and retention.
THE INITIATIVES
1.1. Brand & Image. Elevate the profile of Fort Worth at the regional, national, and international levels.
1.2. Marketing & Target Industry Recruitment. Attract new investments and businesses into the community, focusing on target industries that align with Fort Worth’s assets.
1.3. Business Retention & Expansion (BRE). Improve the competitiveness of existing businesses and help them remain and grow in the community.
1.4. Workforce & Industry Partnerships. Expand collaboration between employers and training providers to address the needs of local industries and build a pipeline of talent to fuel future business growth.
OVERVIEW OF PRIORITY STRATEGIES
INITIATIVE: BRAND & IMAGE
PRIORITY STRATEGY: Launch a national strategy to generate interest in Fort Worth among major real estate firms.
Challenge While public-sector investments such as transportation networks and water/wastewater systems are necessary to set the stage for economic development, the private sector is responsible for the vast majority of the built environment in US cities. This is especially true in the Dallas-Fort Worth metro area, where the real estate development and brokerage community drives a high level of business expansion and recruitment activity. Compared with Dallas and its northern suburbs, Fort Worth is an afterthought among regional and national real estate professionals. Current and recent construction of office space exacerbates this problem, with more than half of all ongoing class A office space under construction in a narrow corridor stretching from downtown Dallas, up through Plano, and into Frisco. In light of their importance to the process, building relationships with brokers and developers should be a major focus of the City’s marketing and recruitment efforts.
Response As a starting point for stronger ties to the real estate community, the City should create a Fort Worth Real Estate Working Group (in partnership with the Real Estate Council of Greater Fort Worth). This group should provide guidance on strategies for hosting a national conference of real estate brokers and developers, a major real estate competition focused on a specific project in Fort Worth, and other events (such as CoreNet Global and the annual meeting of the Urban Land Institute). In addition, the City and Chamber should launch a real estate-focused foreign direct investment (FDI) strategy to build awareness of Fort Worth among global real estate investors.

CITY OF FORT WORTH, TEXAS ECONOMIC DEVELOPMENT STRATEGIC PLAN
EXECUTIVE SUMMARY PAGE | 9
Results With an abundant supply of land, few natural barriers, and a pro-growth mindset, the Dallas Fort-Worth area has been able to thrive on its aggressive real estate opportunities. The economic development community, especially in Texas, has long recognized that unless something “happens on the ground,” the benefits are usually ephemeral. If Fort Worth can raise its profile among regional and national real estate professionals, it will realize the benefits of these relationships in the form of “on the ground” opportunities.
INITIATIVE: MARKETING & TARGET INDUSTRY RECRUITMENT
PRIORITY STRATEGY: Expand the chamber’s role in marketing Fort Worth for international business development.
Challenge Fort Worth has largely ignored one of the most promising business development opportunities: capturing international business development and foreign direct investment (FDI). The prospect of increased FDI in the US is a strong argument for Fort Worth establishing a strategy to capitalize on this opportunity. In recent years, the only major players in the Dallas-Fort Worth metro area that have invested significantly in recruiting international businesses are DFW International Airport and the Dallas Regional Chamber. As such, a large share of the region’s FDI projects have landed in the City of Dallas and North Dallas suburbs near the airport such as Plano and Irving.
Response This requires two separate approaches: 1) regional partnerships with DFW International Airport and the Dallas Regional Chamber; and 2) a stand-alone effort led by the Fort Worth Chamber, with support of local international companies, to promote the city for foreign-based investment.
Results A focused international recruitment program will generate a new wave of investments, business expansions, and employment growth in Fort Worth from multinational corporations and foreign-based firms. A corollary benefit to this strategy is enhanced business opportunities for existing Fort Worth companies seeking to sell products and services abroad.
INITIATIVE: BUSINESS RETENTION & EXPANSION (BRE)
PRIORITY STRATEGY: Redesign Fort Worth’s business retention & expansion (BRE) program to better address the needs of major employers and key industries.
Challenge The June 2017 announcement of XTO Energy’s relocation of 1,600 jobs from Fort Worth to the new Exxon campus in The Woodlands (just outside Houston) illustrates the need for a strong, proactive business retention and expansion (BRE) program. As soon as the firm was acquired by Exxon, the alarm bells should have been rung about the firm’s potential to vacate Fort Worth. Similar concerns need to be taken seriously in light of Williamson Dickie’s recent acquisition by VF Corporation. These examples illustrate the need for the City’s economic development program to strengthen its understanding of the requirements of local businesses.
Response The City and Chamber must establish a set of filtering mechanisms to identify target companies as part of the BRE program. This should be structured around a tiered approach that prioritizes companies that are at risk of downsizing/relocating, have significant growth potential, and fall within the city’s target industries. Relationships must be cultivated not only with local business leaders, but also with executive leadership (e.g., CEOs, CFOs, global real estate directors) of Fort Worth’s major employers whose HQs are located elsewhere. Beyond the companies themselves, connections must also be made with relevant professional service providers that offer a different understanding of the company’s needs and challenges, such as accounting firms, legal firms, marketing/PR firms, and commercial real estate professionals. The program should coordinate BRE efforts among organizations to fully leverage available resources and relationships and to exchange vital information. Focus should be on the Chamber and City relationships (including the Mayor’s office), but should also extend to the local business relationships maintained by the Fort Worth Hispanic Chamber (FWHC) and the Fort Worth Metropolitan Black Chamber (FWMBC).
CITY OF FORT WORTH, TEXAS ECONOMIC DEVELOPMENT STRATEGIC PLAN
EXECUTIVE SUMMARY PAGE | 10
Results A solid BRE program is, arguably, more important than a recruitment program. Not only does BRE offer similar potential for job creation (through the “expansion” part of the title), it also creates a climate that is more supportive of business growth generally. Stated another way, it is difficult to recruit a new company if existing businesses are not thriving, especially if they have a negative attitude about the local business climate. In addition to creating a supportive business climate, a robust BRE program must also help mitigate risks and vulnerabilities facing existing employers.
PRIORITY: WORKFORCE & INDUSTRY PARTNERSHIPS
PRIORITY STRATEGY: Expand employer-led sector partnerships to address critical workforce issues.
Challenge Access to a skilled workforce consistently ranks at or near the top of the list of site selection factors ranked in Area Development’s Annual Survey of Corporate Executives. The Dallas-Fort Worth metro area consistently attracts new business expansion projects that create thousands of new jobs on a monthly basis. Some of these new jobs will be filled by workers moving into the area from outside of the region and state, but the majority will be filled by local talent. This places the burden on communities in the region to develop a pipeline of talent to support the area’s rapidly expanding economy.
Response Fort Worth’s most prominent workforce and industry partnership is the regional DFW Aerospace Consortium. The community needs to increase its commitment to the consortium’s programs and promote a greater emphasis on design, R&D, and technology-related skills. Fort Worth should also play an active role in other regional workforce & industry partnerships, such as the North Texas Supply Chain Council and similar efforts focused on technology, healthcare, and infrastructure.
Results Ensuring a pipeline of workers to support the needs of current and future employers requires workforce development initiatives built on successful partnerships between major employers, workforce development organizations, educational institutions, economic development groups, and community organizations. Re-affirming and expanding Fort Worth’s role as a leader in building this pipeline of talent will help position the community for future employment growth.

CITY OF FORT WORTH, TEXAS ECONOMIC DEVELOPMENT STRATEGIC PLAN
EXECUTIVE SUMMARY PAGE | 11
GOAL 2: BECOME A HUB FOR CREATIVE BUSINESSES
Being recognized as a hub of creative energy is the hallmark of successful cities. Fort Worth already has many of the ingredients needed to become a major hub for creative businesses.
Entrepreneurship is one important element of this energy, but is not the only one. Innovation districts, collaboration between higher education and existing industry, and dynamic talent clusters are all part of what makes for a creative community. Fort Worth already benefits from a strong cluster of higher education, industry, and talent: the Near Southside medical district. Formally establishing this area as a “medical innovation district,” with new incentives and investments, can fuel citywide economic growth. New and expanded linkages between Fort Worth’s arts community and businesses (including technology firms) can help raise the city’s profile as a leading center for creative people and businesses. Lastly, the City itself can take a more forward-looking stance that encourages innovation through its own programs and investments.
THE INITIATIVES
2.1. Near Southside Medical Innovation District. Enhance and expand the Near Southside’s role as a medical innovation district and position it to become the most livable medical district in the US.
2.2. Entrepreneurship. Build on the dynamic environment that embraces and fuels high-growth business in Fort Worth. Ensure that expanding startups see the city as hospitable to their continuing growth.
2.3. Broader Promotion of the Arts. Expand the connection between the arts community and tech entrepreneurs as well as established businesses.
2.4. Establish a “Futures Forum” at the City. Create a formal working group, led by the mayor, that addresses city issues from a “futures perspective.” Implicit in this initiative is the recognition that major public investments, from transportation to water to energy, can be a significant stimulus for economic development.
OVERVIEW OF PRIORITY STRATEGIES
INITIATIVE: NEAR SOUTHSIDE MEDICAL INNOVATION DISTRICT
PRIORITY STRATEGY: Formally designate the Near Southside as a “medical innovation district.”
Challenge Fort Worth already has the Dallas-Fort Worth metro area’s single largest concentration of medical jobs. While not widely recognized within the region, this distinction belongs to the Near Southside medical district. As a result, the recently developed TCU-UNTHSC School of Medicine is opening a new set of opportunities for innovation. The district benefits from proximity to downtown and growing urban vitality along the Magnolia Avenue corridor and South Main Street. These elements—concentrated employment, proximity to medical research, and connections to dynamic neighborhoods and amenities—constitute many of the ingredients necessary to establish a formal “medical innovation district” that can fuel citywide growth.
PRIORITY STRATEGIES
• Formally designate the Near Southside as a “medical innovation district.”
• Expand the reach of entrepreneur networking among the city’s startup and tech communities.
• Raise the profile of the Main Street Fort Worth Arts Festival for national/international visibility.
• Create a Futures Forum at the City of Fort Worth.
CITY OF FORT WORTH, TEXAS ECONOMIC DEVELOPMENT STRATEGIC PLAN
EXECUTIVE SUMMARY PAGE | 12
Response A formal “medical innovation district” designation would start with additional public investments to enhance walkability and pedestrian connectivity, as well as support broadband that creates extended connectivity across all devices, both wired and wireless. It would also involve the creation of incentives for talent recruitment (e.g., a nationally recognized life sciences researcher) that would advance the district and attract additional research staff. Establishing the district formally will also provide opportunities to generate national attention about the district and to invite outside organizations to evaluate the area and uncover strategies for accelerating its development.
Results Public investments, incentives, and awareness of the Near Southside as a medical innovation district will help the area expand its existing medical assets and increase its appeal as a vibrant urban district.
INITIATIVE: ENTREPRENEURSHIP
PRIORITY STRATEGY: Expand the reach of entrepreneur networking among the city’s startup and tech communities.
Challenge Entrepreneurial companies have specific needs for talent, real estate, and capital. The undercurrent for all of these needs is the network of people involved in supporting the growth of entrepreneurial companies. Communities with a highly engaged, connected, and collaborative startup scene have a built-in advantage in the global competition for high-growth business development. Fort Worth has all of the building blocks needed to support a higher level of entrepreneurship: TECH Fort Worth and other strong support organizations, talented entrepreneurs and workers in the city and metro area, innovative companies and higher education institutions in the area, and a growing menu of real estate options suitable for tech firms and startups (including WeWork and other co-working spaces and an expanding supply of attractive office spaces in downtown and the Near Southside). What Fort Worth and the entire metro area lack is a robust networking environment for local entrepreneurs and tech workers. In fact, the only city in Texas that does this well is Austin.
Response Elevate the role of TECH Fort Worth as a connector/convener to address the need for better and more frequent networking opportunities aimed at entrepreneurs, young professionals, and tech workers. This should involve new events such as reverse-pitch competitions to engage major corporations and other organizations in Fort Worth with needs for innovation. It should also involve specific tactics to enhance entrepreneur networking in Fort Worth, such as an online calendar of networking events hosted by TECH Fort Worth. Lastly, stronger connections must be established between Fort Worth’s startup/tech community and local and regional higher education institutions.
Results A stronger, more connected set of networking channels for entrepreneurs, investors, and tech workers in Fort Worth will help existing startups and tech firms. Just as important, this will help the city become a hub of entrepreneurial activity, positioning it to attract entrepreneurs and high-growth companies from across the metro area, state, and nation.
INITIATIVE: BROADER PROMOTION OF THE ARTS
PRIORITY STRATEGY: Raise the profile of the Main Street Fort Worth Arts Festival for national/international visibility.
Challenge Fort Worth’s reputation as a center of the arts is well-established. The Kimbell and the Amon Carter Museums are destinations on national and international levels. However, the city doesn’t have any arts events that rise to the same level of prominence. The most recent economic impact study of the Main Street Fort Worth Arts Festival indicates that 92 percent of the estimated 283,000 festival attendees reside within 50 miles of downtown Fort Worth. Only 8 percent (19,000) are visitors from outside the area. Contrast that with the SXSW festival, which draws 22 percent of its 204,000 registrants from outside the US. And among US registrants, only 25 percent are from the South Central US (Texas, Oklahoma, Arkansas, and Louisiana). The Main Street Fort Worth Arts Festival needs to emulate SXSW and other hallmark events so that when attendees visit Fort Worth they feel “what you’re experiencing here can’t be experienced anywhere else.”

CITY OF FORT WORTH, TEXAS ECONOMIC DEVELOPMENT STRATEGIC PLAN
EXECUTIVE SUMMARY PAGE | 13
Response The City should work with Downtown Fort Worth Inc., the Arts Council of Fort Worth, and other partners to raise the profile of the Main Street Fort Worth Arts Festival to make it an event with national and international visibility. The festival should be re-envisioned to explore the linkage between graphic arts and software gaming.
Results An expanded Main Street Fort Worth Arts Festival can do for Fort Worth what SXSW Interactive did for Austin. The Interactive portion of SXSW (separate from the music festival) is now one of the premier tech conferences in the world and has helped solidify Austin’s position as a global tech hub. Elevating the Main Street Fort Worth Arts Festival to incorporate tech-related elements that draw an international audience can serve as a vehicle for the attraction of artists, graphic designers, and related creative individuals to Fort Worth.
INITIATIVE: ESTABLISH A "FUTURES FORUM" AT THE CITY
PRIORITY STRATEGY: Create a futures forum at the City of Fort Worth.
Challenge Private sector firms, by necessity, are focused on the immediate and near-term demands of the marketplace. Municipal governments are better positioned for long-term strategic thinking than almost any other type of organization. Unfortunately, most cities are bogged down by election cycles and a day-to-day “putting out fires” approach to their operations. This challenge exists in small and large cities across the US, Fort Worth included. New mechanisms are required to leverage the City’s inherent need for long-range planning, including City purchasing around major investments (from transportation to water to energy), which can itself be a stimulus for economic development.
Response The City should create a Futures Forum as an internal city leadership group that also seeks guidance from outside experts around specific topics. Other cities have created similar internal leadership groups. Fort Collins, Colorado, created its Futures Committee to assist City Council members in their decision-making process. They meet monthly with a goal “to position the City in the distant future (30 plus years) for achievable successes, integrating community desires with known fiscal, social, and environmental data.”
Results This recommendation has two dimensions. First, to engage elected officials in the recognition that “disruption” as a force in business also applies to the public sector. Second, to address specific purchasing opportunities that will advance technology solutions for Fort Worth. Taken together, these two dimensions will help the community move closer toward its long-range objectives.

CITY OF FORT WORTH, TEXAS ECONOMIC DEVELOPMENT STRATEGIC PLAN
EXECUTIVE SUMMARY PAGE | 14
GOAL 3: ENSURE COMMUNITY VITALITY
Quality of place is an essential component of a successful economic development strategy. The strength of neighborhoods, of connectivity among different districts of the city, and of urban
amenities is what makes cities attractive to talented individuals and to dynamic businesses. With the Trinity River Project, the Arts District, and extensive trails and parks, Fort Worth is well on its way to realizing this goal. Downtown Fort Worth has improved dramatically in recent years, serving as the city’s most concentrated center of employment and entertainment. However, the city’s urban core has not benefited from the ongoing waves of corporate expansion and relocation projects captured by other cities in the region (Dallas, Plano, Irving) and other downtowns across the US (Boston, Denver, Chicago). Fort Worth can turn the tide and become a leading destination for corporate expansions and high-wage employment growth. And downtown—including surrounding urban districts such as Panther Island—should play a central role in this strategy. This will require new incentives and coordinated programs to rapidly accelerate development in the city’s urban core, starting with a much greater density of residential development, but also including new hotels, an expanded higher education presence, and new office construction. Employment growth and business investment in the downtown will generate citywide benefits, but the plan also calls for a more targeted approach to encourage economic development in Fort Worth’s neighborhoods and commercial corridors. Lastly, a major re-organization is required in the way the City of Fort Worth provides services to support the growth of independent, locally-owned small businesses, including minority-owned firms.
THE INITIATIVES
3.1. Downtown Fort Worth. Accelerate downtown Fort Worth’s emergence as the premier mixed-use business district in Texas.
3.2. Neighborhood Alignment. Align neighborhood assets (people, businesses, and real estate) to benefit from and support citywide economic growth.
3.3. Small Business Support. Restructure small business assistance based on a communitywide audit.
OVERVIEW OF PRIORITY STRATEGIES
INITIATIVE: DOWNTOWN FORT WORTH
PRIORITY STRATEGY: Rapidly increase the density of residential development in downtown and surrounding urban districts such as Panther Island.
Challenge High-density residential development is the “secret” ingredient for the success of downtown Austin, Denver, and Seattle as dynamic mixed-use business districts. Each of these cities made a commitment to a downtown housing strategy first and is now reaping the benefits in the form of commercial office development and the expansion of tech firms and other professional jobs in their urban cores. Fort Worth is beginning to see these benefits, thanks to its commitment to urban residential development in recent years. However, the City needs a much more aggressive program to accelerate the growth of housing in downtown, Panther Island, the Near Southside, and surrounding urban districts.
PRIORITY STRATEGIES
• Rapidly increase the density of residential development in downtown and surrounding urban districts such as Panther Island.
• Focus City investments along specific corridors and at nodes of existing business activity.
• Conduct an audit of the small business support mechanisms available in Fort Worth.
CITY OF FORT WORTH, TEXAS ECONOMIC DEVELOPMENT STRATEGIC PLAN
EXECUTIVE SUMMARY PAGE | 15
Response Encouraging an increased pace of housing construction in the urban core will require a mix of bold targets for new development, new and expanded incentive programs that reward developers for investing in taller/denser residential structures, and creative approaches (such as shared parking facilities and reuse of outdated office buildings for residential purposes) to reduce barriers to new housing construction.
Results A more aggressive agenda for rapidly expanding the base of residents living in and around downtown Fort Worth will generate much more than new housing in the urban core. With thousands of new residents moving into downtown, Panther Island, the Near Southside, and other close-in districts over the next several years, other target audiences will take note. A rapidly expanding urban population base is the key to unlocking the city’s potential for attracting new commercial office development, corporate HQs, professional services firms, and tech companies.
INITIATIVE: NEIGHBORHOOD ALIGNMENT
PRIORITY STRATEGY: Focus City investments along specific corridors and at nodes of existing business activity.
Challenge Economic development does not guarantee prosperity for all. Even in the nation’s most successful and diversified metropolitan economies, specific geographies and segments of the population are often left behind. Fort Worth is no exception. Segments of the city’s population in specific neighborhoods and corridors have struggled to achieve prosperity, even while the city as a whole has experienced widespread growth. The City can and should play a lead role in catalyzing development in under-served neighborhoods and for under-served residents.
Response Public investments in economic development must be made only when they can reasonably be expected to generate economic benefits. The City must play a lead role as a strategic investor to catalyze development in neighborhoods and corridors targeted for urban revitalization. Just as important, the City is responsible for preventing the proliferation of land uses and activities that might diminish the economic potential of a target area, such as large public sector or nonprofit developments (e.g., community centers, churches, homeless services centers) and land-intensive, auto-centric development (e.g., gas stations, automotive repair shops, car washes, storage unit complexes).
Results Outcomes for challenged neighborhoods receiving targeted investments include ancillary development, tax base growth, and job creation.
INITIATIVE: SMALL BUSINESS SUPPORT
PRIORITY STRATEGY: Conduct an audit of the small business support mechanisms available in Fort Worth.
Challenge Dynamic local economies are often defined by a strong base of independent, locally-owned, small businesses. Distinctive retailers, restaurants, and coffee shops help otherwise sterile corridors build unique identities. They also provide opportunities for minority-owned business development. Independent, locally-owned firms also recirculate a higher share of their revenue in the local economy, compared to national chain businesses. Additionally, these businesses help attract tech companies and often become magnets for young people, even beyond the city limits. Magnolia Avenue in the Near Southside is a perfect example of this trend, and Race Street is following the same trajectory. An emphasis on independent small businesses also recognizes that there is a distinction between entrepreneurial companies and small businesses. Both types of firms are important to the city’s economy, but their support systems differ substantially.
Response Much of what is being done by the Fort Worth Business Assistance Center (BAC) fits into the category of entrepreneurial company support, which is the core mission of TECH Fort Worth. To sharply distinguish between entrepreneurial and small business support, the way the City of Fort Worth provides services will need to be reorganized. An audit is the logical starting point for addressing the way in which small businesses—distinct from entrepreneurial companies—are supported by the City and its partners.
Results Clear delineation of the support functions available to support small businesses in Fort Worth will help the BAC and other partners provide more effective and efficient services to grow the base of local firms.

CITY OF FORT WORTH, TEXAS ECONOMIC DEVELOPMENT STRATEGIC PLAN
EXECUTIVE SUMMARY PAGE | 16
4. TOOLS & RESOURCES
Goals 1, 2, and 3 describe what is necessary for Fort Worth’s overall economic success, regardless of what resources may be drawn upon. The Tools & Resources section addresses the organizational changes required and investments in new tools and resources needed to support the City’s economic development program.
THE INITIATIVES
4.1. Economic Development Bond Package. Identify how the citywide bond package makes investments in livability, Smart City infrastructure, and business development. Elevate projects that impact economic development goals.
4.2. Citywide Incentive Program. Create new incentive tools to encourage business growth within target industries and to facilitate development and redevelopment in designated districts.
4.3. Organizational Alignment. Clarify the roles and responsibilities of Fort Worth’s economic development partners; build a shared framework for decision making and ongoing collaboration.
IMPLEMENTATION
Effective implementation of the plan rests primarily with collaboration between the City of Fort Worth Economic Development Department and the Fort Worth Chamber of Commerce. New investments from the City and the Chamber will be required to move this plan from concept to action, including a significant increase in staffing to carry out the primary economic development
functions outlined. These primary functions include: marketing and target industry recruitment, high-growth startups and tech company recruitment, business retention and expansion (BRE), research, and urban redevelopment.
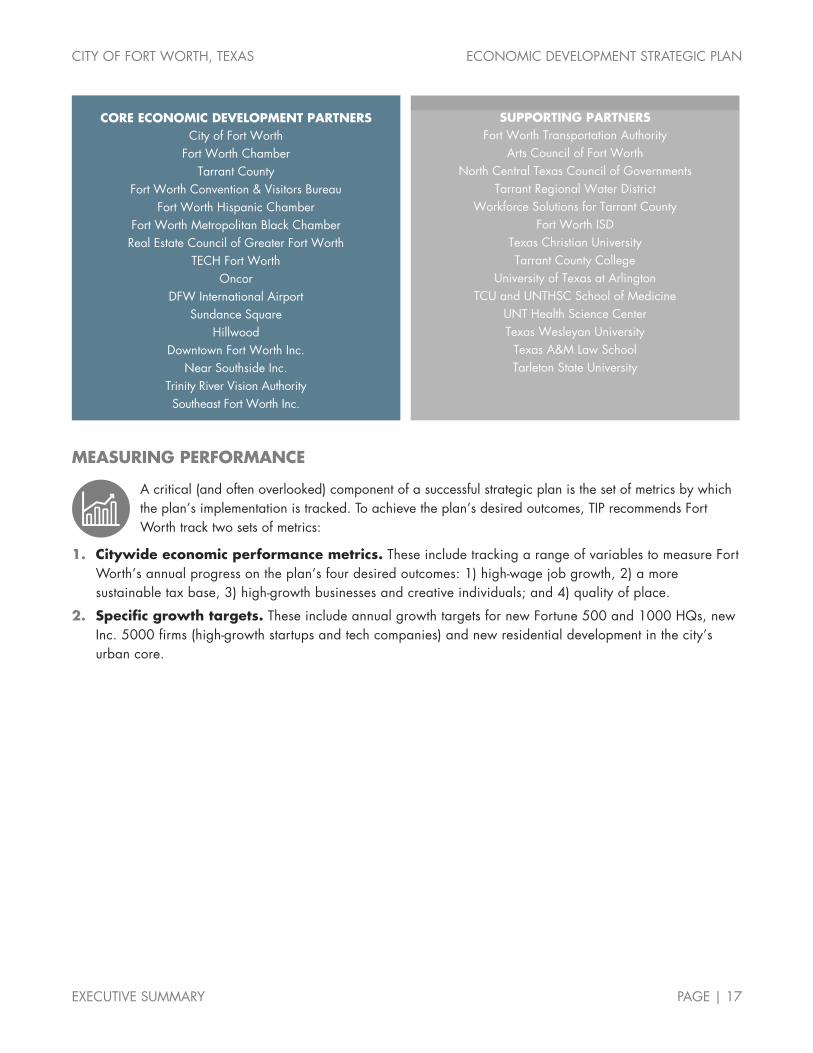
The City/Chamber partnership is not responsible for every activity outlined in this plan, but it acts as a lever to create large changes through targeted investments and initiatives. Other City departments, and a variety of local and regional partners, also play critical roles in growing and strengthening the Fort Worth economy. Based on an extensive organizational gap analysis, the consulting team identified the 30 organizations (listed below) that have the strongest impact on economic development in Fort Worth. These organizations have been split into two categories: those with economic development as a core part of their mission and those that play critical supporting roles.
CITY OF FORT WORTH, TEXAS ECONOMIC DEVELOPMENT STRATEGIC PLAN
EXECUTIVE SUMMARY PAGE | 17
MEASURING PERFORMANCE
A critical (and often overlooked) component of a successful strategic plan is the set of metrics by which the plan’s implementation is tracked. To achieve the plan’s desired outcomes, TIP recommends Fort Worth track two sets of metrics:
1. Citywide economic performance metrics. These include tracking a range of variables to measure Fort Worth’s annual progress on the plan’s four desired outcomes: 1) high-wage job growth, 2) a more sustainable tax base, 3) high-growth businesses and creative individuals; and 4) quality of place.
2. Specific growth targets. These include annual growth targets for new Fortune 500 and 1000 HQs, new Inc. 5000 firms (high-growth startups and tech companies) and new residential development in the city’s urban core.
CORE ECONOMIC DEVELOPMENT PARTNERS City of Fort Worth
Fort Worth Chamber Tarrant County
Fort Worth Convention & Visitors Bureau Fort Worth Hispanic Chamber
Fort Worth Metropolitan Black Chamber Real Estate Council of Greater Fort Worth
TECH Fort Worth Oncor
DFW International Airport Sundance Square
Hillwood Downtown Fort Worth Inc.
Near Southside Inc. Trinity River Vision Authority Southeast Fort Worth Inc.
SUPPORTING PARTNERS Fort Worth Transportation Authority
Arts Council of Fort Worth North Central Texas Council of Governments
Tarrant Regional Water District Workforce Solutions for Tarrant County
Fort Worth ISD Texas Christian University Tarrant County College
University of Texas at Arlington TCU and UNTHSC School of Medicine
UNT Health Science Center Texas Wesleyan University
Texas A&M Law School Tarleton State University
AUSTIN � SEATTLEDECEMBER 2017
VOLUME 1: COMPETITIVENESS
CITY OF FORT WORTH, TEXASECONOMIC DEVELOPMENT STRATEGIC PLAN
CITY OF FORT WORTH ECONOMIC DEVELOPMENT STRATEGIC PLAN
VOLUME 1: COMPETITIVENESS PAGE | I
ACKNOWLEDGEMENTS TIP would like to thank the following individuals and organizations for their participation in this planning process:
CITY OF FORT WORTH MAYOR AND CITY COUNCIL Betsy Price, Mayor
Carlos Flores, District 2 (current)
Sal Espino, District 2 (former)
Brian Byrd, District 3
W.B. ‘Zim’ Zimmerman, District 3 (former)
Cary Moon, District 4
Gyna Bivens, District 5
Jungus Jordan, District 6
Dennis Shingleton, District 7
Kelly Allen Gray, District 8
Ann Zadeh, District 9
CITY OF FORT WORTH STAFF David Cooke, City Manager
Jay Chapa, Assistant City Manager
Robert Sturns, Director, Economic Development
Brenda Hicks-Sorensen, CEcD, Assistant Director, Economic Development
PROJECT STEERING COMMITTEE Lisa McMillan, Tarrant County Administrator’s Office
Darlene Boudreaux, Tech Fort Worth
Brandom Gengelbach, Fort Worth Chamber of Commerce
Stacy Marshall, Southeast Fort Worth, Inc.
Andy Taft, Downtown Fort Worth, Inc.
Paul Paine, Near Southside, Inc.
Cintya Segoviano, Fort Worth Hispanic Chamber of Commerce
Devoyd “Dee” Jennings, Fort Worth Metropolitan Black Chamber of Commerce
David Walters, CBRE
Nina Petty, Tarrant County College District
Mitch Whitten, Fort Worth Convention & Visitors Bureau
Janet Black, BNSF Railway Company
Marie A. Holliday, DMD, Sundance Square Dentist
Robert Folzenlogen, Hillwood Properties
Don Boren, Don Boren and Company Inc.
JJ Cawelti, Bell Helicopter-Textron, Inc.
Kevin Davies, Hulen Mall
Matt Robinson, Walton Development and Management, Inc.
Judy McDonald, Workforce Solutions of Tarrant County

CITY OF FORT WORTH ECONOMIC DEVELOPMENT STRATEGIC PLAN
VOLUME 1: COMPETITIVENESS PAGE | II
PROJECT LEADERSHIP TEAM Paul Ballard, Fort Worth Transportation Authority
Mike Berry, Hillwood Properties
Jay Chapa, Assistant City Manager
John Terrell, DFW International Airport
Victor Boschini, Texas Christian University
Michael Branum, NAS Fort Worth Joint Reserve Base
Dr. Kent Paredes Scribner, Fort Worth ISD
Eugene V. Giovannini, Tarrant County College District
J.D. Granger, Trinity River Vision Authority
Johnny Campbell, Sundance Square
Lillie Biggins, Texas Health Harris Methodist Fort Worth
PROJECT CONSULTING TEAM
TIP STRATEGIES, INC. is a privately held economic development consulting firm with offices in Austin and Seattle. TIP is committed to providing quality solutions for public and private sector clients. Established in 1995, the firm's primary focus is economic development strategic planning.
Project Team: Jon Roberts, Managing Principal John Karras, Senior Consultant Alex Cooke, Senior Consultant Karen Beard, Analyst Meredith Eberle, Project Support
FREGONESE ASSOCIATES is a Portland-based urban planning firm with expertise in citywide comprehensive planning as well as scenario planning and modeling in specific areas (such as downtowns and urban corridors). Established in 1997, the firm’s work has been instrumental in the development and adoption of growth policies and land use plans in large cities and metro areas across the US and internationally.
Project Team: John Fregonese, President Nadine Appenbrink, Project Manager Julia Reisemann, GIS Analyst
JLL is a member of the Fortune 500 and is a global professional services and investment management firm specializing in real estate. JLL’s industry-leading research group delivers commercial real estate analysis and insights that drive value in real estate decisions and support successful strategies.
Project Team: Jubal Smith, Executive Vice President Todd Burnette, Managing Director
ISAAC BARCHAS led the Austin Technology Incubator for 10 years, starting in 2006. Over that time, he has overseen the incubation of more than 200 companies. He is responsible for ATI's strategic direction and evolving the ATI economic model. Isaac remains active in the technology and venture capital communities in Austin and across the US and has been published in the Washington Post, Wall Street Journal, Chicago Tribune, and Austin American Statesman.
CITY OF FORT WORTH ECONOMIC DEVELOPMENT STRATEGIC PLAN
VOLUME 1: COMPETITIVENESS PAGE | III
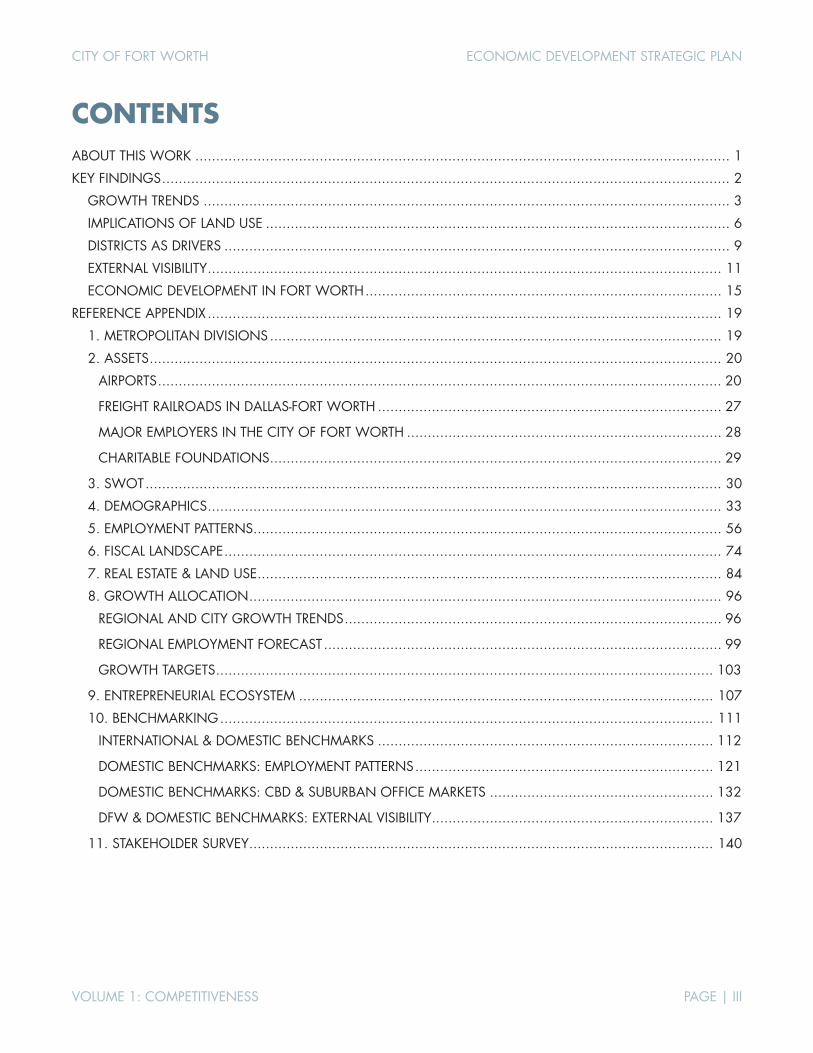
CONTENTS ABOUT THIS WORK ................................................................................................................................. 1 KEY FINDINGS ......................................................................................................................................... 2
GROWTH TRENDS ............................................................................................................................... 3 IMPLICATIONS OF LAND USE ................................................................................................................ 6 DISTRICTS AS DRIVERS .......................................................................................................................... 9 EXTERNAL VISIBILITY ............................................................................................................................ 11 ECONOMIC DEVELOPMENT IN FORT WORTH ...................................................................................... 15
REFERENCE APPENDIX ............................................................................................................................ 19 1. METROPOLITAN DIVISIONS ............................................................................................................. 19 2. ASSETS .......................................................................................................................................... 20
AIRPORTS ........................................................................................................................................ 20
FREIGHT RAILROADS IN DALLAS-FORT WORTH ................................................................................... 27
MAJOR EMPLOYERS IN THE CITY OF FORT WORTH ............................................................................ 28
CHARITABLE FOUNDATIONS ............................................................................................................. 29
3. SWOT ........................................................................................................................................... 30 4. DEMOGRAPHICS ............................................................................................................................ 33 5. EMPLOYMENT PATTERNS ................................................................................................................. 56 6. FISCAL LANDSCAPE ........................................................................................................................ 74 7. REAL ESTATE & LAND USE ................................................................................................................ 84 8. GROWTH ALLOCATION .................................................................................................................. 96
REGIONAL AND CITY GROWTH TRENDS ........................................................................................... 96
REGIONAL EMPLOYMENT FORECAST ................................................................................................ 99
GROWTH TARGETS ........................................................................................................................ 103
9. ENTREPRENEURIAL ECOSYSTEM .................................................................................................... 107 10. BENCHMARKING ....................................................................................................................... 111
INTERNATIONAL & DOMESTIC BENCHMARKS ................................................................................. 112
DOMESTIC BENCHMARKS: EMPLOYMENT PATTERNS ........................................................................ 121
DOMESTIC BENCHMARKS: CBD & SUBURBAN OFFICE MARKETS ...................................................... 132
DFW & DOMESTIC BENCHMARKS: EXTERNAL VISIBILITY .................................................................... 137
11. STAKEHOLDER SURVEY ................................................................................................................ 140
CITY OF FORT WORTH ECONOMIC DEVELOPMENT STRATEGIC PLAN
VOLUME 1: COMPETITIVENESS PAGE | 1
ABOUT THIS WORK Over the last several decades, Fort Worth has been one of the fastest-growing large cities in the US. Fort Worth has a unique identity and brand that combines its rich cultural heritage with an economy driven by industry-leading employers like Lockheed Martin and American Airlines. The City has made strategic investments in districts from Sundance Square to Alliance, resulting in numerous waves of private sector investment and employment growth. However, all this has been achieved without a comprehensive, citywide approach for economic development. There is no question that Fort Worth is primed for greater economic prosperity. The challenge is not about growth in a general sense, it is about guiding growth that creates the highest overall benefit to the city. To accomplish this, future development will need to be channeled into specific districts, into generating higher income levels and capital investment, strengthening the local tax base, and supporting a more attractive environment for companies and skilled workers.
In response to these challenges, Fort Worth is embarking on its first economic development strategic plan, aimed at enhancing the city's status in the region and nation over the next five years and beyond. Working with TIP Strategies (an economic development consulting firm with office in Austin and Seattle) and their partners (Fregonese Associates, JLL, and Isaac Barchas), the City of Fort Worth has engaged the business community and local stakeholders to create a strategic framework to guide the City’s economic development activities.
Volume 1 of the Economic Development Strategic Plan focuses on Fort Worth’s economic competitiveness. To provide a foundation for the planning process, TIP conducted an assessment of relevant trends and characteristics that influence Fort Worth’s economic potential. This document includes targeted analyses of the city’s demographics, employment patterns, land use and real estate conditions, fiscal landscape, entrepreneurial ecosystem, and other qualitative and quantitative factors impacting Fort Worth’s competitiveness.
To reach a deeper understanding of the current state of the area economy, data are shown for the city of Fort Worth, Tarrant County, the Fort Worth Metropolitan Division (MD), the Dallas-Fort Worth metropolitan area, the state of Texas, and the US. A review of strengths, weaknesses, opportunities, and threats identified during the planning process (a SWOT analysis) is also presented. Additionally, we compared Fort Worth to a group of 13 competitor cities in the Dallas-Fort Worth metro area (each city with a population above 100,000) on several factors. Lastly, we compared Fort Worth to a group of 16 peer/benchmark cities (8 domestic and 8 international) to provide a broader context for evaluating the city’s relative economic strengths. This work serves as the basis for the identification of strategies in subsequent phases of this planning process.
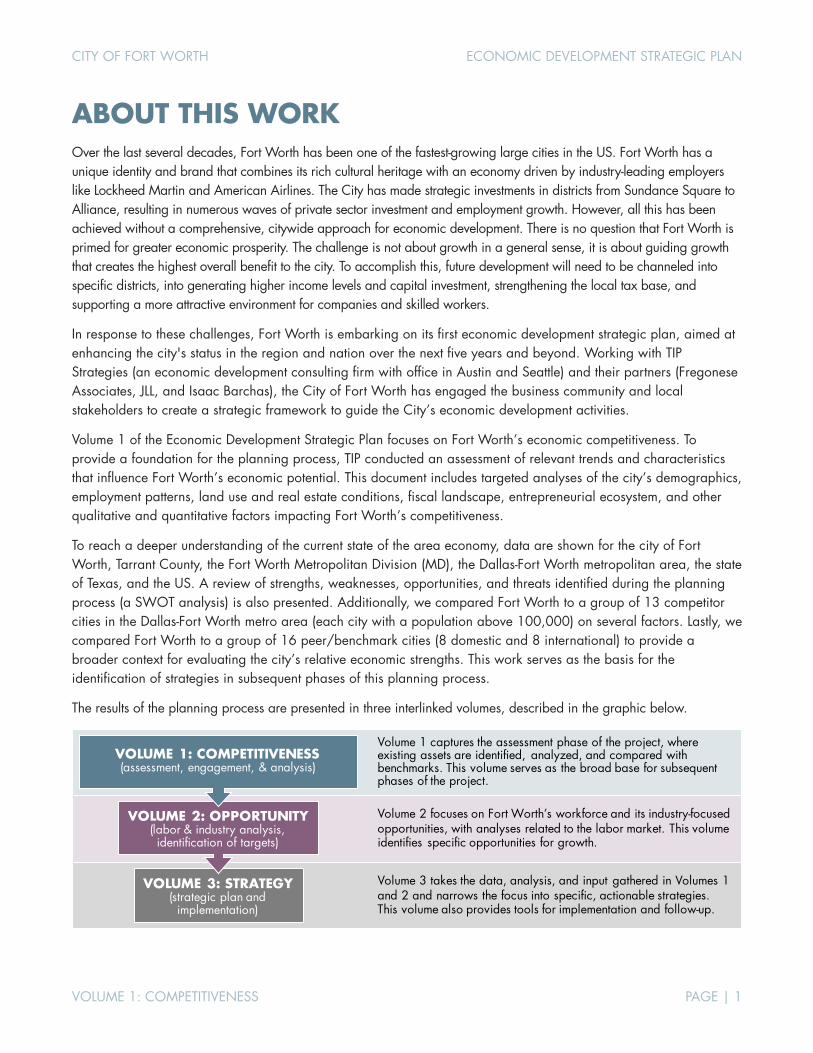
The results of the planning process are presented in three interlinked volumes, described in the graphic below.
Volume 3 takes the data, analysis, and input gathered in Volumes 1 and 2 and narrows the focus into specific, actionable strategies. This volume also provides tools for implementation and follow-up.
Volume 1 captures the assessment phase of the project, where existing assets are identified, analyzed, and compared with benchmarks. This volume serves as the broad base for subsequent phases of the project.
VOLUME 3: STRATEGY(strategic plan and
implementation)
Volume 2 focuses on Fort Worth’s workforce and its industry-focused opportunities, with analyses related to the labor market. This volume identifies specific opportunities for growth.
VOLUME 2: OPPORTUNITY(labor & industry analysis, identification of targets)
VOLUME 1: COMPETITIVENESS(assessment, engagement, & analysis)
CITY OF FORT WORTH ECONOMIC DEVELOPMENT STRATEGIC PLAN
VOLUME 1: COMPETITIVENESS PAGE | 2
KEY FINDINGS Arguably, Fort Worth has more development potential than any US city, with a land area of 340+ square miles encompassing a vibrant urban core (Sundance Square, Near Southside, and surrounding districts) and a dynamic suburban growth area (Alliance). The purpose of this strategic planning process is to guide Fort Worth on a path to becoming one of America’s most livable cities and to help position the city to compete regionally, nationally, and internationally.
Most cities approach economic competitiveness from a reactionary stance, addressing weaknesses and avoiding threats. Fort Worth’s success would be minimal with such a limited approach. The city is starting from a position of advantage, with numerous pre-existing strengths. Thus, our assessment of Fort Worth’s economic competitiveness is viewed through the lens of distinct strengths and untapped opportunities.
It begins with an examination of the city’s assets and competitive advantages, which include:
Fort Worth had the fastest growing population among the 20 largest US cities from 2000 to 2016.
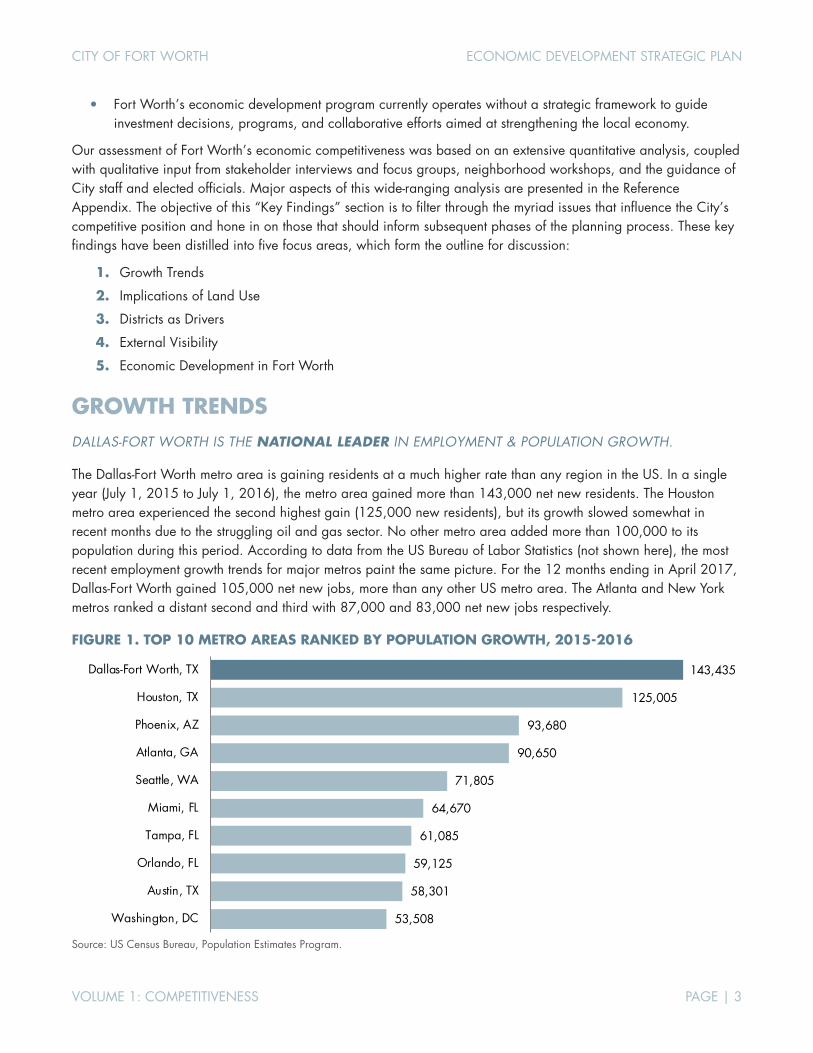
The Dallas-Fort Worth metro area leads the country in employment and population growth.
Fort Worth offers more vacant land available for development than any other city in the Dallas-Fort Worth metro area, in addition to major districts with capacity for development/redevelopment. These districts range from established areas like Downtown and Alliance to emerging districts like Panther Island.
Fort Worth’s transportation infrastructure reflects the city’s history as a continental crossroads, evolving from stagecoaches to cattle drives, railroads to highways, and eventually to air-travel. Alliance and DFW International Airport continue this evolution in the 21st century, providing national and global connectivity.
Fort Worth’s economy is driven by diverse industry clusters including transportation & logistics (air, rail, trucking, and warehousing/distribution); aerospace manufacturing (including services, design, and R&D); life sciences (healthcare & medical products/services); oil & gas; and tourism.
In addition to its impressive roster of corporations and major employers, Fort Worth benefits from a strong group of economic development partners (e.g., the City’s Economic Development Department and the Fort Worth Chamber); anchor institutions (e.g., Texas Christian University (TCU), Tarrant County College (TCC), Texas Wesleyan University (TWU), and medical institutions); and philanthropic foundations.
Beyond the city’s existing advantages, untapped opportunities abound.
Residential development and population growth in Fort Worth has been robust, but employment growth in the city has lagged the rest of the Dallas-Fort Worth metro area—especially in high-wage professional jobs.
Many recent high-profile corporate relocation projects in the metro area have landed outside Fort Worth’s city limits (e.g., Toyota in Plano and Charles Schwab in Westlake).
The influx of tech firms and IT workers has also largely bypassed Fort Worth in favor of locations in Dallas, Richardson, Plano, and Irving. Yet, the metro area lacks a strong geographic cluster of tech/startup activity, leaving the door open for development of one or more tech/innovation districts in Fort Worth.
Relative to other large US cities, Fort Worth struggles with external visibility and name recognition, especially in comparison to Dallas.
Despite a unique blend of visitor destinations (Sundance Square, the Stockyards, and the Cultural District), Fort Worth underperforms surrounding cities in terms of hotel revenues, indicating unmet demand.
CITY OF FORT WORTH ECONOMIC DEVELOPMENT STRATEGIC PLAN
VOLUME 1: COMPETITIVENESS PAGE | 3
Fort Worth’s economic development program currently operates without a strategic framework to guide investment decisions, programs, and collaborative efforts aimed at strengthening the local economy.
Our assessment of Fort Worth’s economic competitiveness was based on an extensive quantitative analysis, coupled with qualitative input from stakeholder interviews and focus groups, neighborhood workshops, and the guidance of City staff and elected officials. Major aspects of this wide-ranging analysis are presented in the Reference Appendix. The objective of this “Key Findings” section is to filter through the myriad issues that influence the City’s competitive position and hone in on those that should inform subsequent phases of the planning process. These key findings have been distilled into five focus areas, which form the outline for discussion:
1. Growth Trends
2. Implications of Land Use
3. Districts as Drivers
4. External Visibility
5. Economic Development in Fort Worth
GROWTH TRENDS DALLAS-FORT WORTH IS THE NATIONAL LEADER IN EMPLOYMENT & POPULATION GROWTH.
The Dallas-Fort Worth metro area is gaining residents at a much higher rate than any region in the US. In a single year (July 1, 2015 to July 1, 2016), the metro area gained more than 143,000 net new residents. The Houston metro area experienced the second highest gain (125,000 new residents), but its growth slowed somewhat in recent months due to the struggling oil and gas sector. No other metro area added more than 100,000 to its population during this period. According to data from the US Bureau of Labor Statistics (not shown here), the most recent employment growth trends for major metros paint the same picture. For the 12 months ending in April 2017, Dallas-Fort Worth gained 105,000 net new jobs, more than any other US metro area. The Atlanta and New York metros ranked a distant second and third with 87,000 and 83,000 net new jobs respectively.
FIGURE 1. TOP 10 METRO AREAS RANKED BY POPULATION GROWTH, 2015-2016
Source: US Census Bureau, Population Estimates Program.
53,508
58,301
59,125
61,085
64,670
71,805
90,650
93,680
125,005
143,435
Washington, DC
Austin, TX
Orlando, FL
Tampa, FL
Miami, FL
Seattle, WA
Atlanta, GA
Phoenix, AZ
Houston, TX
Dallas-Fort Worth, TX

CITY OF FORT WORTH ECONOMIC DEVELOPMENT STRATEGIC PLAN
VOLUME 1: COMPETITIVENESS PAGE | 4
FORT WORTH IS THE FASTEST GROWING, AMONG THE 20 LARGEST US CITIES.
Since 2000, Fort Worth‘s residential base has grown faster than any other big city. This is due, in large part, to the city’s unique geography. Within Fort Worth’s municipal boundaries lie a range of districts spanning the entire urban-to-suburban transect. Some of the city’s population growth has taken place in the downtown and surrounding urban districts, but the lion’s share of growth in Fort Worth occurred “outside the loop” (Loop IH-820). This dynamic is shared with the other fastest-growing cities. Charlotte has numerous suburban growth centers along Loop IH-485, Austin has The Domain, San Antonio has Stone Oak, and Jacksonville has a diversity of suburban districts within its city limits. By comparison, Denver and Seattle are the two fastest-growing cities where nearly all growth has been urban in nature. Since 2010, Denver and Seattle actually grew at a slightly higher pace than Fort Worth (16 percent vs. 15 percent), indicating that growth in major cities does not have to rely on suburban centers.
FIGURE 2. NET POPULATION CHANGE IN 20 LARGEST US CITIES, 2000-2016
Source: US Census Bureau, Population Estimates Program.
DALLAS-FORT WORTH IS A TALENT MAGNET, DRAWING NEW RESIDENTS FROM ACROSS THE US.
Not only is the Dallas-Fort Worth metro area growing rapidly, it is attracting numerous residents from other major metros. From 2010 to 2014, on a net basis (including inflow and outflow), Dallas-Fort Worth attracted more than 12,000 new residents from Chicago, nearly 11,000 new residents from New York, and over 9,000 new residents from Los Angeles. The only metro areas “winning the talent competition” against the Dallas-Fort Worth metro area are in Texas: Austin (net gain of 8,000 residents from Dallas-Fort Worth) and Houston (5,000 net migrants from Dallas-Fort Worth). Within the region, Tarrant County has gained many net new residents (more than 9,000 from 2010 to 2015) from Dallas County.
-7%
3%
7%
8%
9%
11%
12%
15%
15%
18%
21%
21%
22%
25%
25%
30%
39%
44%
56%
60%
Chicago, IL
Philadelphia, PA
New York, NY
Los Angeles, CA
Indianapolis, IN
Dallas, TX
San Francisco, CA
San Jose, CA
San Diego, CA
Houston, TX
Columbus, OH
El Paso, TX
Phoenix, AZ
Denver, CO
Seattle, WA
San Antonio, TX
Jacksonville, FL
Austin, TX
Charlotte, NC
Fort Worth, TX
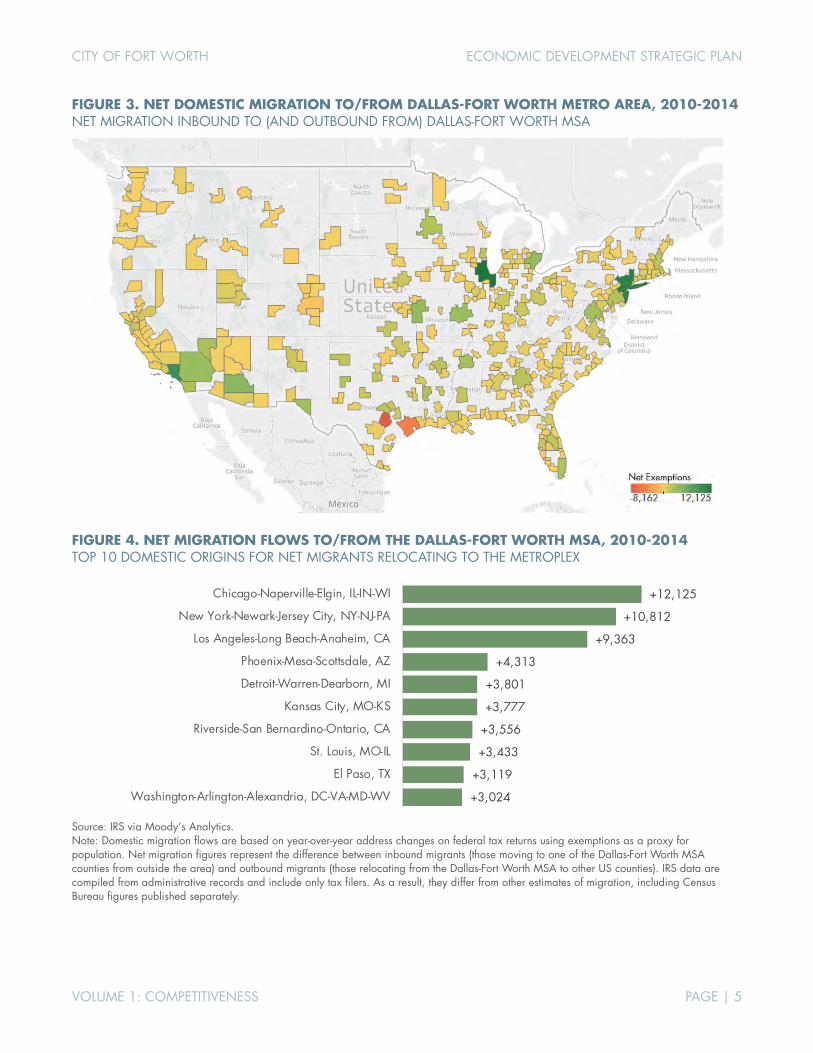
CITY OF FORT WORTH ECONOMIC DEVELOPMENT STRATEGIC PLAN
VOLUME 1: COMPETITIVENESS PAGE | 5
FIGURE 3. NET DOMESTIC MIGRATION TO/FROM DALLAS-FORT WORTH METRO AREA, 2010-2014 NET MIGRATION INBOUND TO (AND OUTBOUND FROM) DALLAS-FORT WORTH MSA
FIGURE 4. NET MIGRATION FLOWS TO/FROM THE DALLAS-FORT WORTH MSA, 2010-2014 TOP 10 DOMESTIC ORIGINS FOR NET MIGRANTS RELOCATING TO THE METROPLEX
Source: IRS via Moody’s Analytics. Note: Domestic migration flows are based on year-over-year address changes on federal tax returns using exemptions as a proxy for population. Net migration figures represent the difference between inbound migrants (those moving to one of the Dallas-Fort Worth MSA counties from outside the area) and outbound migrants (those relocating from the Dallas-Fort Worth MSA to other US counties). IRS data are compiled from administrative records and include only tax filers. As a result, they differ from other estimates of migration, including Census Bureau figures published separately.
+12,125
+10,812
+9,363
+4,313
+3,801
+3,777
+3,556
+3,433
+3,119
+3,024
Chicago-Naperville-Elgin, IL-IN-WI
New York-Newark-Jersey City, NY-NJ-PA
Los Angeles-Long Beach-Anaheim, CA
Phoenix-Mesa-Scottsdale, AZ
Detroit-Warren-Dearborn, MI
Kansas City, MO-KS
Riverside-San Bernardino-Ontario, CA
St. Louis, MO-IL
El Paso, TX
Washington-Arlington-Alexandria, DC-VA-MD-WV
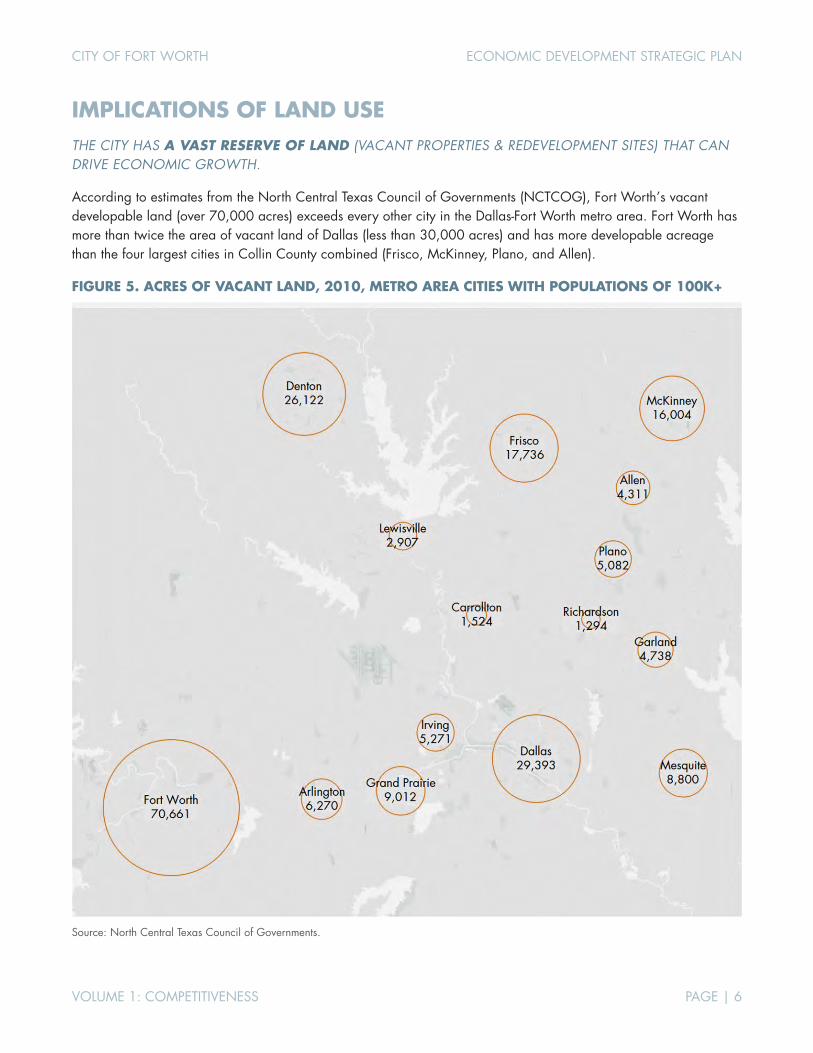
CITY OF FORT WORTH ECONOMIC DEVELOPMENT STRATEGIC PLAN
VOLUME 1: COMPETITIVENESS PAGE | 6
IMPLICATIONS OF LAND USE THE CITY HAS A VAST RESERVE OF LAND (VACANT PROPERTIES & REDEVELOPMENT SITES) THAT CAN DRIVE ECONOMIC GROWTH.
According to estimates from the North Central Texas Council of Governments (NCTCOG), Fort Worth’s vacant developable land (over 70,000 acres) exceeds every other city in the Dallas-Fort Worth metro area. Fort Worth has more than twice the area of vacant land of Dallas (less than 30,000 acres) and has more developable acreage than the four largest cities in Collin County combined (Frisco, McKinney, Plano, and Allen).
FIGURE 5. ACRES OF VACANT LAND, 2010, METRO AREA CITIES WITH POPULATIONS OF 100K+
Source: North Central Texas Council of Governments.

CITY OF FORT WORTH ECONOMIC DEVELOPMENT STRATEGIC PLAN
VOLUME 1: COMPETITIVENESS PAGE | 7
IN THE ABSENCE OF A FOCUSED BUSINESS DEVELOPMENT EFFORT, RESIDENTIAL USES DOMINATE THE TAX BASE.
From 2010 to 2016, Fort Worth gained nearly 13,000 net new single-family housing units. No other city in the metro area gained more than 10,000. At the same time, Dallas experienced a net loss of 572 single-family units, while gaining more than 20,000 net new multi-family units. By contrast, Fort Worth only gained about 7,000 multi-family units in this period.
When you combine these trends with the much higher level of employment growth in the Dallas side of the metro area—especially high-wage professional jobs—Fort Worth appears to be on its way to becoming a suburb of Dallas County. The fiscal challenges of growth driven by single-family residential development are illustrated below. A healthy tax base for a large central city must rely on high levels of business investment and employment growth. A center-city tax base dominated by residential uses is not sustainable for Fort Worth.
FIGURE 6. AVERAGE PROPERTY TAX REVENUE PER FORT WORTH RESIDENT LONG-TERM TRENDS IN PROPERTY TAX RATES AND PER-CAPITA REVENUES
Source: City of Fort Worth, Comprehensive Annual Financial Report, FY 2016, pp. 197, 202-203. Note: Rates applied per $100 of assessed valuation.
$0
$100
$200
$300
$400
$500
$600
$0.80
$0.82
$0.84
$0.86
$0.88
$0.90
$0.92
$0.94
$0.96
1997
1998
1999
2000
2001
2002
2003
2004
2005
2006
2007
2008
2009
2010
2011
2012
2013
2014
2015
2016
City of Fort Worth property tax revenues per resident (right scale)City of Fort Worth property tax rate (left scale)
pre-recession trend
post-recession trend
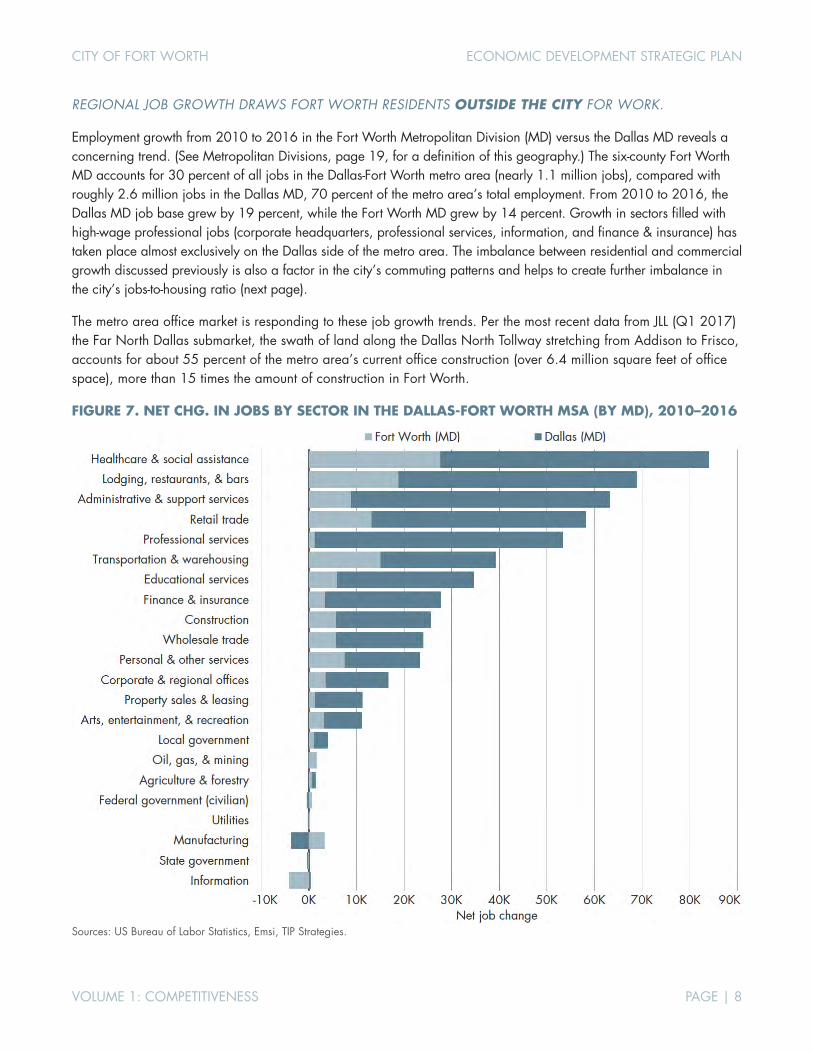
CITY OF FORT WORTH ECONOMIC DEVELOPMENT STRATEGIC PLAN
VOLUME 1: COMPETITIVENESS PAGE | 8
REGIONAL JOB GROWTH DRAWS FORT WORTH RESIDENTS OUTSIDE THE CITY FOR WORK.
Employment growth from 2010 to 2016 in the Fort Worth Metropolitan Division (MD) versus the Dallas MD reveals a concerning trend. (See Metropolitan Divisions, page 19, for a definition of this geography.) The six-county Fort Worth MD accounts for 30 percent of all jobs in the Dallas-Fort Worth metro area (nearly 1.1 million jobs), compared with roughly 2.6 million jobs in the Dallas MD, 70 percent of the metro area’s total employment. From 2010 to 2016, the Dallas MD job base grew by 19 percent, while the Fort Worth MD grew by 14 percent. Growth in sectors filled with high-wage professional jobs (corporate headquarters, professional services, information, and finance & insurance) has taken place almost exclusively on the Dallas side of the metro area. The imbalance between residential and commercial growth discussed previously is also a factor in the city’s commuting patterns and helps to create further imbalance in the city’s jobs-to-housing ratio (next page).
The metro area office market is responding to these job growth trends. Per the most recent data from JLL (Q1 2017) the Far North Dallas submarket, the swath of land along the Dallas North Tollway stretching from Addison to Frisco, accounts for about 55 percent of the metro area’s current office construction (over 6.4 million square feet of office space), more than 15 times the amount of construction in Fort Worth.
FIGURE 7. NET CHG. IN JOBS BY SECTOR IN THE DALLAS-FORT WORTH MSA (BY MD), 2010–2016
Sources: US Bureau of Labor Statistics, Emsi, TIP Strategies.
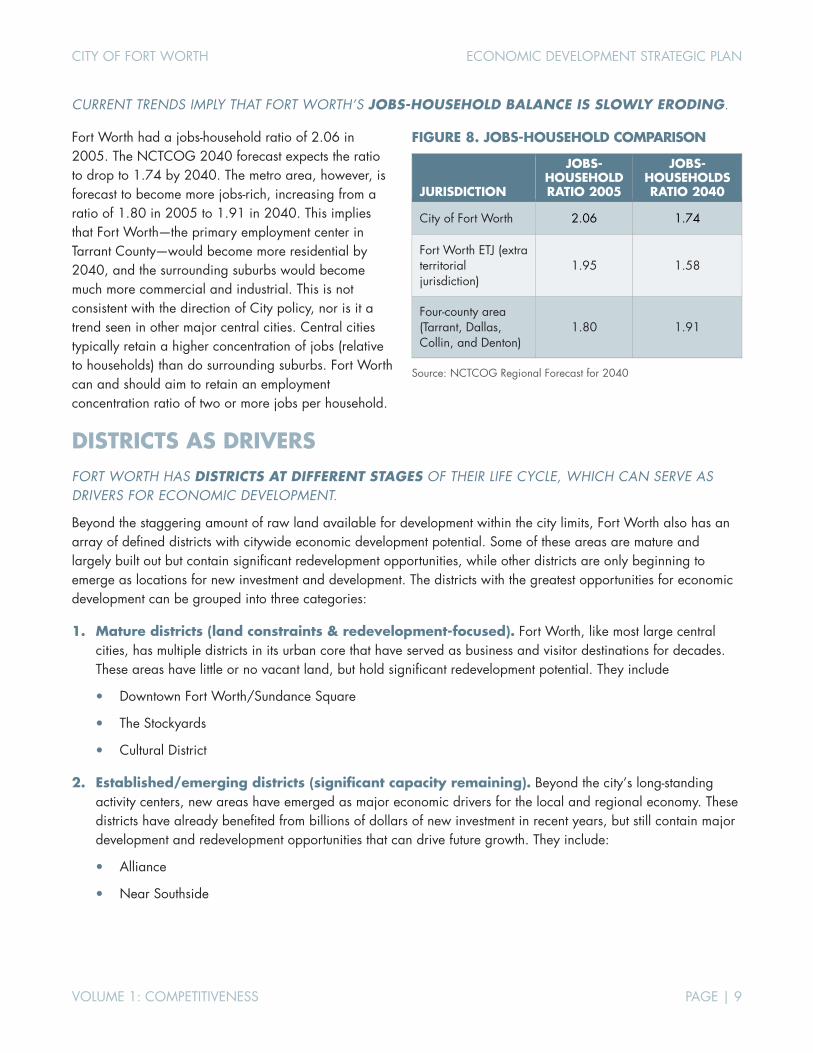
CITY OF FORT WORTH ECONOMIC DEVELOPMENT STRATEGIC PLAN
VOLUME 1: COMPETITIVENESS PAGE | 9
CURRENT TRENDS IMPLY THAT FORT WORTH’S JOBS-HOUSEHOLD BALANCE IS SLOWLY ERODING.
Fort Worth had a jobs-household ratio of 2.06 in 2005. The NCTCOG 2040 forecast expects the ratio to drop to 1.74 by 2040. The metro area, however, is forecast to become more jobs-rich, increasing from a ratio of 1.80 in 2005 to 1.91 in 2040. This implies that Fort Worth―the primary employment center in Tarrant County―would become more residential by 2040, and the surrounding suburbs would become much more commercial and industrial. This is not consistent with the direction of City policy, nor is it a trend seen in other major central cities. Central cities typically retain a higher concentration of jobs (relative to households) than do surrounding suburbs. Fort Worth can and should aim to retain an employment concentration ratio of two or more jobs per household.
DISTRICTS AS DRIVERS FORT WORTH HAS DISTRICTS AT DIFFERENT STAGES OF THEIR LIFE CYCLE, WHICH CAN SERVE AS DRIVERS FOR ECONOMIC DEVELOPMENT.
Beyond the staggering amount of raw land available for development within the city limits, Fort Worth also has an array of defined districts with citywide economic development potential. Some of these areas are mature and largely built out but contain significant redevelopment opportunities, while other districts are only beginning to emerge as locations for new investment and development. The districts with the greatest opportunities for economic development can be grouped into three categories:
1. Mature districts (land constraints & redevelopment-focused). Fort Worth, like most large central cities, has multiple districts in its urban core that have served as business and visitor destinations for decades. These areas have little or no vacant land, but hold significant redevelopment potential. They include
Downtown Fort Worth/Sundance Square
The Stockyards
Cultural District
2. Established/emerging districts (significant capacity remaining). Beyond the city’s long-standing activity centers, new areas have emerged as major economic drivers for the local and regional economy. These districts have already benefited from billions of dollars of new investment in recent years, but still contain major development and redevelopment opportunities that can drive future growth. They include:
Alliance
Near Southside
FIGURE 8. JOBS-HOUSEHOLD COMPARISON
JURISDICTION
JOBS-HOUSEHOLD RATIO 2005
JOBS- HOUSEHOLDS RATIO 2040
City of Fort Worth 2.06 1.74
Fort Worth ETJ (extra territorial jurisdiction)
1.95 1.58
Four-county area (Tarrant, Dallas, Collin, and Denton)
1.80 1.91
Source: NCTCOG Regional Forecast for 2040

CITY OF FORT WORTH ECONOMIC DEVELOPMENT STRATEGIC PLAN
VOLUME 1: COMPETITIVENESS PAGE | 10
3. Long-term plays (15- to 25-year build-out). New districts are taking shape that will provide substantial development opportunities over the next quarter century. These areas will initially be dominated by residential development, but over time, will provide the city with new locations for business growth. They include:
Panther Island
Walsh Ranch
Chisholm Trail Parkway
In addition to the primary districts that drive citywide economic development, a second tier of six target areas has been identified. These areas were evaluated as part of the planning process for their capacity to support new commercial and residential development. This analysis, led by Fregonese Associates and published separately, includes mapping of land uses, the identification of vacant properties and potential redevelopment opportunities, and the establishment of target employment levels. This work formed the basis for a discussion of strategies for economic development in the target areas and similarly positioned neighborhoods and corridors citywide, which are incorporated in Volume 3.
The six target areas are:
Evans & Rosedale
Stop Six
West Camp Bowie
Altamesa & McCart
Near Northside
East Lancaster
HARNESSING THE POTENTIAL OF THE URBAN CORE (DOWNTOWN & SURROUNDING DISTRICTS) WILL BE CRITICAL TO THE CITY’S FUTURE.
Each of the three major groupings of districts described in the previous page—mature, established/emerging, and long-term plays—includes at least one district located within Fort Worth’s urban core. Downtown Fort Worth is the largest single employment center in Tarrant County. The Near Southside medical district is the largest single healthcare employment cluster in all North Texas. The Panther Island development is on its way toward becoming one of the densest urban neighborhoods in Texas. The Stockyards and Cultural District help preserve the city’s unique heritage, while supporting a vibrant tourism sector.
The emphasis on Fort Worth’s urban core as a specific focus area for this plan does not take away from development in Alliance, CentrePort, or other locations outside of the urban core. These areas add value to the local economy. But the city’s urban core is what makes Fort Worth unique and differentiates the city from its competition. Arlington has its stadium/entertainment district. Frisco has its “Five Billion Dollar Mile.” But only Dallas and Fort Worth have large central business districts surrounded by other authentic urban districts/corridors. Moreover, Fort Worth’s downtown and its surrounding urban districts—including the close-in target areas that have struggled to develop (Evans & Rosedale, Near Northside, and East Lancaster—are where public resources can and should play the biggest role in facilitating economic development. According to recent data from Esri (Figure 9), urban residential growth is accelerating in the city’s urban core. The 2016 Downtown Fort Worth, Inc. annual report confirms these trends.

CITY OF FORT WORTH ECONOMIC DEVELOPMENT STRATEGIC PLAN
VOLUME 1: COMPETITIVENESS PAGE | 11
FIGURE 9. POPULATION GROWTH TRENDS IN FORT WORTH’S URBAN CORE, 2000–2016
Geography 2000 Pop. 2010 Pop. 2016 Pop. 2000-2010
Annual % Chg. 2010-2016
Annual % Chg. CBD 1-Mile 7,113 6,584 8,254 -0.7% +4.2%
CBD 2-Mile 25,751 24,476 27,562 -0.5% +2.1%
CBD 4-Mile 160,648 159,489 168,655 -0.1% +1.0%
City of Fort Worth 545,993 744,973 854,113 +3.6% +2.4%
Sources: urbanSCALE.com, Esri Community Analyst, TIP Strategies.
EXTERNAL VISIBILITY FORT WORTH HAS RELATIVELY LOW EXTERNAL VISIBILITY AMONG LARGE US CITIES.
Beyond traditional economic and demographic data sources, nontraditional data can often reveal new insights into the dynamics of cities and metro areas. One such data source, Sporcle, illustrates the challenges facing Fort Worth in terms of its external visibility and image. Sporcle is an online provider of quizzes, trivia, and other brain teasers. In 2016, Carl Bialik (former lead writer for FiveThirtyEight, now data science editor with Yelp) analyzed the results of a Sporcle quiz that asked participants to name the 100 most populous US cities in under 12 minutes. Based on a sample of about 500,000 people, Fort Worth is one of the least identifiable big cities in the US. Relative to population size, fewer people could identify Fort Worth than they could any of the other eight US cities selected as benchmarks for this study.
The title of the FiveThirtyEight article—San Jose Is the Most Forgettable Major American City—is a harsh attention-grabbing headline, but it raises an important issue about San Jose. Despite being the nation’s 10th most populous city and the center of Silicon Valley, it lives under the shadow of San Francisco. This should sound all too familiar to people in Fort Worth. The city often struggles to step out of Dallas’s shadow. Dallas is the nation’s 9th largest city, but was assumed as the 4th most populated city in the Sporcle quiz. This happens to align with the population rank of the Dallas-Fort Worth MSA as the 4th largest in the US, but has apparently become associated with the city of Dallas alone, possibly due to greater name recognition. Fort Worth, on the other hand, is the 16th largest city, but ranked 45th in the quiz. Among the benchmark
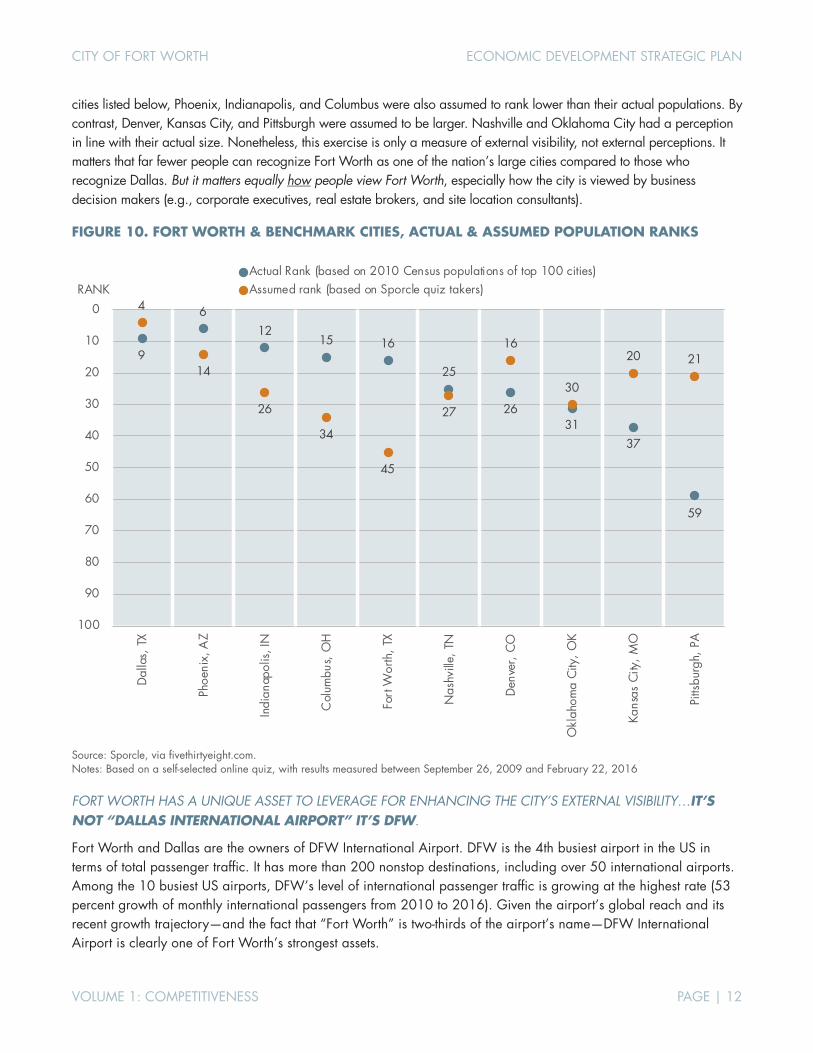
CITY OF FORT WORTH ECONOMIC DEVELOPMENT STRATEGIC PLAN
VOLUME 1: COMPETITIVENESS PAGE | 12
cities listed below, Phoenix, Indianapolis, and Columbus were also assumed to rank lower than their actual populations. By contrast, Denver, Kansas City, and Pittsburgh were assumed to be larger. Nashville and Oklahoma City had a perception in line with their actual size. Nonetheless, this exercise is only a measure of external visibility, not external perceptions. It matters that far fewer people can recognize Fort Worth as one of the nation’s large cities compared to those who recognize Dallas. But it matters equally how people view Fort Worth, especially how the city is viewed by business decision makers (e.g., corporate executives, real estate brokers, and site location consultants).
FIGURE 10. FORT WORTH & BENCHMARK CITIES, ACTUAL & ASSUMED POPULATION RANKS
Source: Sporcle, via fivethirtyeight.com. Notes: Based on a self-selected online quiz, with results measured between September 26, 2009 and February 22, 2016
FORT WORTH HAS A UNIQUE ASSET TO LEVERAGE FOR ENHANCING THE CITY’S EXTERNAL VISIBILITY…IT’S NOT “DALLAS INTERNATIONAL AIRPORT” IT’S DFW.
Fort Worth and Dallas are the owners of DFW International Airport. DFW is the 4th busiest airport in the US in terms of total passenger traffic. It has more than 200 nonstop destinations, including over 50 international airports. Among the 10 busiest US airports, DFW’s level of international passenger traffic is growing at the highest rate (53 percent growth of monthly international passengers from 2010 to 2016). Given the airport’s global reach and its recent growth trajectory—and the fact that “Fort Worth” is two-thirds of the airport’s name—DFW International Airport is clearly one of Fort Worth’s strongest assets.
9
612
15 16
25
2631
37
59
4
14
26
34
45
27
16
30
20 21
0
10
20
30
40
50
60
70
80
90
100
Dal
las,
TX
Phoe
nix,
AZ
Indi
anap
olis
, IN
Col
umbu
s, O
H
Fort
Wor
th,
TX
Nas
hvill
e, T
N
Den
ver,
CO
Okl
ahom
a C
ity,
OK
Kans
as C
ity,
MO
Pitts
burg
h, P
A
RANKActual Rank (based on 2010 Census populations of top 100 cities)Assumed rank (based on Sporcle quiz takers)
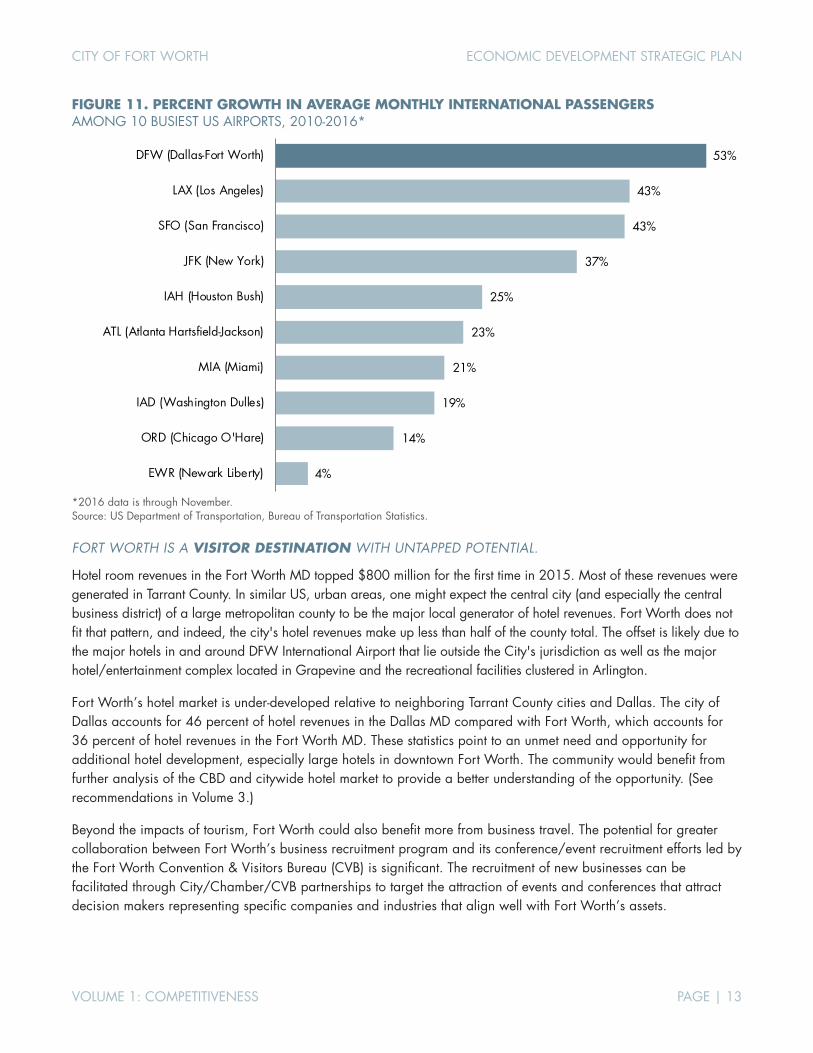
CITY OF FORT WORTH ECONOMIC DEVELOPMENT STRATEGIC PLAN
VOLUME 1: COMPETITIVENESS PAGE | 13
FIGURE 11. PERCENT GROWTH IN AVERAGE MONTHLY INTERNATIONAL PASSENGERS AMONG 10 BUSIEST US AIRPORTS, 2010-2016*
*2016 data is through November. Source: US Department of Transportation, Bureau of Transportation Statistics.
FORT WORTH IS A VISITOR DESTINATION WITH UNTAPPED POTENTIAL.
Hotel room revenues in the Fort Worth MD topped $800 million for the first time in 2015. Most of these revenues were generated in Tarrant County. In similar US, urban areas, one might expect the central city (and especially the central business district) of a large metropolitan county to be the major local generator of hotel revenues. Fort Worth does not fit that pattern, and indeed, the city's hotel revenues make up less than half of the county total. The offset is likely due to the major hotels in and around DFW International Airport that lie outside the City's jurisdiction as well as the major hotel/entertainment complex located in Grapevine and the recreational facilities clustered in Arlington.
Fort Worth’s hotel market is under-developed relative to neighboring Tarrant County cities and Dallas. The city of Dallas accounts for 46 percent of hotel revenues in the Dallas MD compared with Fort Worth, which accounts for 36 percent of hotel revenues in the Fort Worth MD. These statistics point to an unmet need and opportunity for additional hotel development, especially large hotels in downtown Fort Worth. The community would benefit from further analysis of the CBD and citywide hotel market to provide a better understanding of the opportunity. (See recommendations in Volume 3.)
Beyond the impacts of tourism, Fort Worth could also benefit more from business travel. The potential for greater collaboration between Fort Worth’s business recruitment program and its conference/event recruitment efforts led by the Fort Worth Convention & Visitors Bureau (CVB) is significant. The recruitment of new businesses can be facilitated through City/Chamber/CVB partnerships to target the attraction of events and conferences that attract decision makers representing specific companies and industries that align well with Fort Worth’s assets.
4%
14%
19%
21%
23%
25%
37%
43%
43%
53%
EWR (Newark Liberty)
ORD (Chicago O'Hare)
IAD (Washington Dulles)
MIA (Miami)
ATL (Atlanta Hartsfield-Jackson)
IAH (Houston Bush)
JFK (New York)
SFO (San Francisco)
LAX (Los Angeles)
DFW (Dallas-Fort Worth)
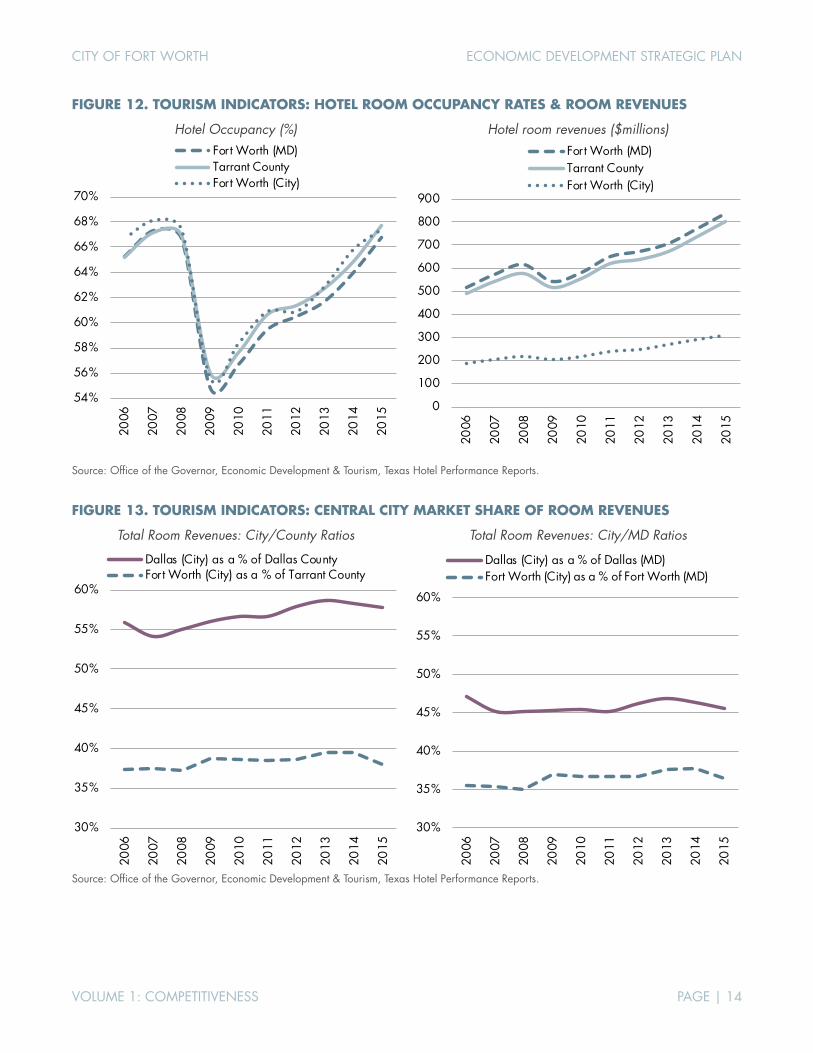
CITY OF FORT WORTH ECONOMIC DEVELOPMENT STRATEGIC PLAN
VOLUME 1: COMPETITIVENESS PAGE | 14
FIGURE 12. TOURISM INDICATORS: HOTEL ROOM OCCUPANCY RATES & ROOM REVENUES
Hotel Occupancy (%)
Hotel room revenues ($millions)
Source: Office of the Governor, Economic Development & Tourism, Texas Hotel Performance Reports.
FIGURE 13. TOURISM INDICATORS: CENTRAL CITY MARKET SHARE OF ROOM REVENUES
Total Room Revenues: City/County Ratios
Total Room Revenues: City/MD Ratios
Source: Office of the Governor, Economic Development & Tourism, Texas Hotel Performance Reports.
54%
56%
58%
60%
62%
64%
66%
68%
70%
2006
2007
2008
2009
2010
2011
2012
2013
2014
2015
Fort Worth (MD)Tarrant CountyFort Worth (City)
0
100
200
300
400
500
600
700
800
900
2006
2007
2008
2009
2010
2011
2012
2013
2014
2015
Fort Worth (MD)Tarrant CountyFort Worth (City)
30%
35%
40%
45%
50%
55%
60%
2006
2007
2008
2009
2010
2011
2012
2013
2014
2015
Dallas (City) as a % of Dallas CountyFort Worth (City) as a % of Tarrant County
30%
35%
40%
45%
50%
55%
60%
2006
2007
2008
2009
2010
2011
2012
2013
2014
2015
Dallas (City) as a % of Dallas (MD)Fort Worth (City) as a % of Fort Worth (MD)

CITY OF FORT WORTH ECONOMIC DEVELOPMENT STRATEGIC PLAN
VOLUME 1: COMPETITIVENESS PAGE | 15
ECONOMIC DEVELOPMENT IN FORT WORTH ECONOMIC DEVELOPMENT IS A SHARED RESPONSIBILITY AMONG LOCAL ENTITIES.
Economic development is not the sole jurisdiction of the City of Fort Worth Economic Development Department. The Fort Worth Chamber of Commerce, other City departments, and a variety of local and regional partners play critical roles in growing and strengthening the Fort Worth economy. Continued, increased collaboration among these partners (highlighted in the diagram below) is a necessary outcome of this strategic plan. The existing assets available for economic development in Fort Worth far outweigh the assets available in most communities. The graphic below shows the range of physical, financial, and organizational assets existing in Fort Worth. This is not intended to be an exhaustive listing of every asset related to economic development in Fort Worth, but instead, is meant to inform the planning process including strategy development and recommendations for organizational structure and alignment.
ATTRACTIONS Amon Carter Museum
Botanic Garden Casa Mañana
Kimbell Art Museum Stockyards
Sundance Square Trinity Park
Will Rogers Memorial Ctr.
CONNECTIVITY Alliance Airport
BNSF DFW Airport
I-20 / I-30 / I-35 Union Pacific
TEXRail Tower 55
TRE Commuter Rail Trinity Trails
PARTNERS Cultural District Alliance
DFW International Airport Downtown Fort Worth, Inc. East Fort Worth Bus Assoc.
East Fort Worth Inc. Fort Worth Chamber
Fort Worth Convention & Visitors Bureau Fort Worth Film
Commission Fort Worth Hispanic
Chamber Fort Worth Metropolitan
Black Chamber Fort Worth Transportation
Authority Hillwood NCTCOG
Near Southside, Inc. Southeast Fort Worth, Inc.
Real Estate Council of Greater Fort Worth Regional Hispanic
Contractors Association Sundance Square
Tarrant County Tarrant Regional Water
District Tech Fort Worth
Trinity River Vision Authority Workforce Solutions
DISTRICTS Cultural District
Downtown Camp Bowie
Medical District Near Southside
River District Stockyards West 7th
CORPORATE TAX BASE Alcon Labs
AMR/American Airlines Bell Helicopter Chesapeake
Sundance Square TU Electric
XTO Energy Wal-Mart
RESIDENTS Children Families
Millennials Seniors Students
INSTITUTIONS Baylor Scott & White All
Saints
Cook Children’s
FWISD
JPS
Southwestern Baptist Theological Seminary
Tarleton State University
TCC
TCU
TCU & UNTHSC Medical School
Texas A&M Law School
Texas Health Harris
Texas Wesleyan University
UNT Health Sciences Center
UT Southwestern/Moncrief Cancer Institute
UTA-Fort Worth
PHILANTHROPISTS Burnett Foundation
Amon Carter Foundation Kimbell Art Foundation Rainwater Foundation
Sid W. Richardson Foundation & other Bass
family foundations
MAJOR EMPLOYERS AMR/American
City of Fort Worth Cook Children’s Fort Worth ISD
JPS Health Network Lockheed Martin NAS Joint Base
Tarrant County College

CITY OF FORT WORTH ECONOMIC DEVELOPMENT STRATEGIC PLAN
VOLUME 1: COMPETITIVENESS PAGE | 16
A new strategic framework for economic development in Fort Worth will require the community’s efforts to be focused on two primary areas: 1) baseline economic development activities; and 2) new and highly tactical initiatives.
FORT WORTH’S PARTNERS MUST EXPAND AND ADD TO CURRENT BASELINE ECONOMIC DEVELOPMENT ACTIVITIES.
Baseline economic development activities include efforts that all communities need to compete successfully for businesses, investment, jobs, and skilled workers. Fort Worth is already tackling most of these activities with varying levels of success. To advance the City’s economic development program to the next level, new and/or expanded efforts will be required. These include (at a minimum):
Business retention & expansion (BRE). The US Small Business Administration estimates that roughly 60 percent of new jobs in a community are created through the expansion of existing businesses. Fort Worth’s existing employers and industries form the foundation of the local economy. The City and its partners must continue and expand their BRE programs to facilitate the ongoing success of local employers.
Target industries. Fort Worth’s economy is defined by strong existing industry clusters with additional growth potential. These include established sectors such as transportation & warehousing, manufacturing, healthcare, oil & gas, and tourism. These also include emerging sectors with high-growth potential in Fort Worth like corporate & regional headquarters, professional services (legal, IT, marketing), international business, aerospace manufacturing & design, and transportation innovation. These industries (and other potential growth sectors) are explored in detail in Volume 2: Industry & Occupation. The identification of target industries is a good starting point, but the list of industries being targeted matters far less than what a community does to actually “target” an industry. Strategies encompass marketing and recruitment initiatives, incentives, and policies to support growth, and talent and workforce initiatives.
Marketing. A successful marketing program requires highly tailored messaging aimed at target industries. Generic marketing and promotional efforts aimed at convincing people that Fort Worth is a “great place to live, work, and play” will not be sufficient to differentiate the city for business recruitment.
Incentives. The Dallas-Fort Worth metro area is an intensely competitive environment and Fort Worth needs a strong set of incentives to be a successful player in the regional competition for jobs and investment. The City’s existing incentive policies and programs have been evaluated holistically to ensure that Fort Worth is leveraging its public resources through a citywide framework to channel and focus growth in specific geographic areas and in target industries.
Workforce & industry partnerships. Per Area Development’s “30th Annual Survey of Corporate Executives (Q1 2016),” access to a skilled workforce ranked first among 36 site selection factors. Ensuring a sufficient pipeline of workers to support the needs of current and future employers will require a combination of targeted recruitment efforts and workforce development initiatives. In Fort Worth, this will involve the continuation of existing partnerships like the DFW Aerospace Consortium as well as new business and workforce collaborations.
Organizational alignment. Fort Worth has an abundance of strong partner organizations working at different levels to improve the city’s economy. These partners need a shared context for decision making, resource allocation, and collaborative implementation of strategies and actions.
CITY OF FORT WORTH ECONOMIC DEVELOPMENT STRATEGIC PLAN
VOLUME 1: COMPETITIVENESS PAGE | 17
NEW INITIATIVES ARE REQUIRED TO TAKE FORT WORTH TO THE NEXT LEVEL.
New and highly tactical initiatives include creative strategies unique to Fort Worth, designed to leverage specific assets and opportunities. Initiatives that have been considered include:
New collaboration between Alliance & downtown. Fort Worth has something no other city in the metro area can claim: a vibrant downtown district and a dynamic suburban growth center. Downtown Fort Worth and Alliance play distinct economic roles and offer distinct advantages for doing business. Downtown offers prime office space, urban residential options, nightlife, a high concentration of hotels, and a walkable environment connecting these uses and amenities. Alliance is the perfect location for land-intensive operations with a need for transportation access (highway, rail, and air) as well as high-speed broadband internet within a secure corporate environment.
While Downtown and Alliance rarely compete, they could more formally align their interests to mutual benefit. A large distribution or data center would not consider locating downtown. Likewise, a corporate headquarters in a downtown office tower is unlikely to locate in a far-away greenfield site. Fort Worth’s advantage is that it has many companies in both locations that could expand. Downtown-based firms could open facilities (e.g., a data center) in Alliance. And companies operating in Alliance could open offices (e.g., a software development center) in Downtown.
This new collaboration should start with a formal memorandum of understanding (MOU) between Hillwood and Sundance Square to support business attraction and expansion in Fort Worth (with Near Southside, Inc. and Downtown Fort Worth, Inc. as potential partners). The recent announcement by Hillwood, of its plans to establish its primary regional office for the Hillwood Energy division and a satellite office for the Hillwood Properties and Hillwood Urban divisions in a 9,000-square foot space in Sundance Square, supports this recommendation.
Medical district/real estate task force. Fort Worth already has the single largest concentration of medical jobs in North Texas: the Near Southside medical district. The recently developed TCU-UNTHSC medical school will open up a new set of opportunities for innovation and business growth tied to the healthcare sector. The district benefits from proximity to downtown and growing urban vitality along the Magnolia Avenue corridor and South Main Street. These elements are many of the ingredients necessary to establish a medical innovation district, specifically one that can fuel economic growth citywide.
A group of leaders from the public sector, the healthcare industry, and the real estate community will be identified and convened as a Medical District Task Force. The group will be charged with laying the foundation for new investments and policies to accelerate economic growth in this district.
The creation of an “innovation district” is a potentially transformative project that will be evaluated by this task force. The role of innovation districts and their economic development potential has been documented and understood in detail thanks to the Anne T. and Robert M. Bass Initiative on Innovation and Placemaking. The Bass Initiative is a collaboration between the Brookings Institution and Project for Public Spaces to catalyze new cross-disciplinary approaches to economic development that integrate the benefits of vibrant public spaces, innovative urban economies, and inclusive growth.
Specialized innovation centers (geo-tech & transportation). The ability of highly specialized innovation centers, or “centers of excellence,” to spur economic development is well-documented. SEMATECH, the non-profit research consortium focused on semiconductor innovation, played a foundational role in the 1980s in establishing Austin’s early competitive advantages. The presence of the organization is credited as a major factor in the city’s

CITY OF FORT WORTH ECONOMIC DEVELOPMENT STRATEGIC PLAN
VOLUME 1: COMPETITIVENESS PAGE | 18
emergence as one of the leading technology centers in the US. The Water Council in Milwaukee is another example of a highly-targeted innovation center focused on economic development.
Successful innovation centers rely on partnerships between higher education institutions and businesses, leveraging unique regional assets to support the advancement of research or training within a specific industry or focus area. They often serve as magnets for industry expertise and are dedicated to the success of companies within a region. Fort Worth and the surrounding metro area has a high level of industry expertise and research depth in at least two areas worth exploring as potential innovation centers: 1) geo-tech/oil & gas; and 2) transportation & logistics. These opportunities for specialized innovation centers are under evaluation as part of the planning process.
Re-thinking the citywide tax increment financing (TIF) district strategy. Fort Worth currently manages 12 TIF districts throughout the city. These districts exist to finance public improvements that generate economic development benefits for the district and for the city as a whole. Some districts have performed well, while others have seen limited success. Regardless of their individual performance, the TIF districts have operated in a “silo” environment without a broader citywide framework dictating how they fit into the overall economic development program and how they interact with each other.
An economic development bond package. Cities can support economic development through a variety of tools, many of which have been alluded to above. Beyond these programs and initiatives, the adoption of a major public bond package is among the most significant steps the City could take to advance its economic development efforts. Fort Worth does not benefit from the Type A and Type B economic development corporation status available to many of the metro area’s suburban cities. Resources dedicated to economic development in cities such as Frisco and McKinney number in the tens of millions of dollars. An economic development bond package in Fort Worth is one solution to the intense regional competition for business development.
An economic development bond package would include new investments in public infrastructure, amenities, and projects that enhance the city’s appeal among talent and businesses. Such a package would need to be carefully crafted to ensure broad support among residents and employers. It would also need to be fiscally sound, generating near- and long-term economic benefits for the city.
Fortunately, Fort Worth can learn from the experiences of other cities that have made similar investments. The Oklahoma City MAPS (Metropolitan Area Projects) bond program, now in its third iteration, is one of the most successful examples in the US. The MAPS investments are credited with raising the profile of Oklahoma City from a previously struggling economy to a dynamic city that has become a magnet for talent and business development. A similar bond package in Fort Worth must be considered as part of this planning process.

CITY OF FORT WORTH ECONOMIC DEVELOPMENT STRATEGIC PLAN
VOLUME 1: COMPETITIVENESS PAGE | 19
REFERENCE APPENDIX 1. METROPOLITAN DIVISIONS The Dallas–Fort Worth–Arlington, TX Metropolitan Statistical Area (Dallas-Fort Worth metro area) includes two metropolitan divisions (MDs): the Fort Worth-Arlington, TX Metropolitan Division (Fort Worth MD) and the Dallas-Plano-Irving, TX Metropolitan Division (Dallas MD). To better illustrate Fort Worth’s performance within the larger metropolitan area, a number of the analyses conducted as part of this work use this geographic concept.
Source: TIP Strategies (map); Office of Management and Budget, OMB Bulletin No. 15-01 (metropolitan division definitions)
ABOUT METROPOLITAN DIVISIONS Metropolitan divisions are smaller groupings of counties or equivalent entities defined within a metropolitan statistical area containing a single core with a population of at least 2.5 million. Not all metropolitan statistical areas with a single core population of this size will contain metropolitan divisions. A metropolitan division consists of one or more main/secondary counties that represent an employment center, plus adjacent counties associated with the main/secondary county or counties through commuting ties.
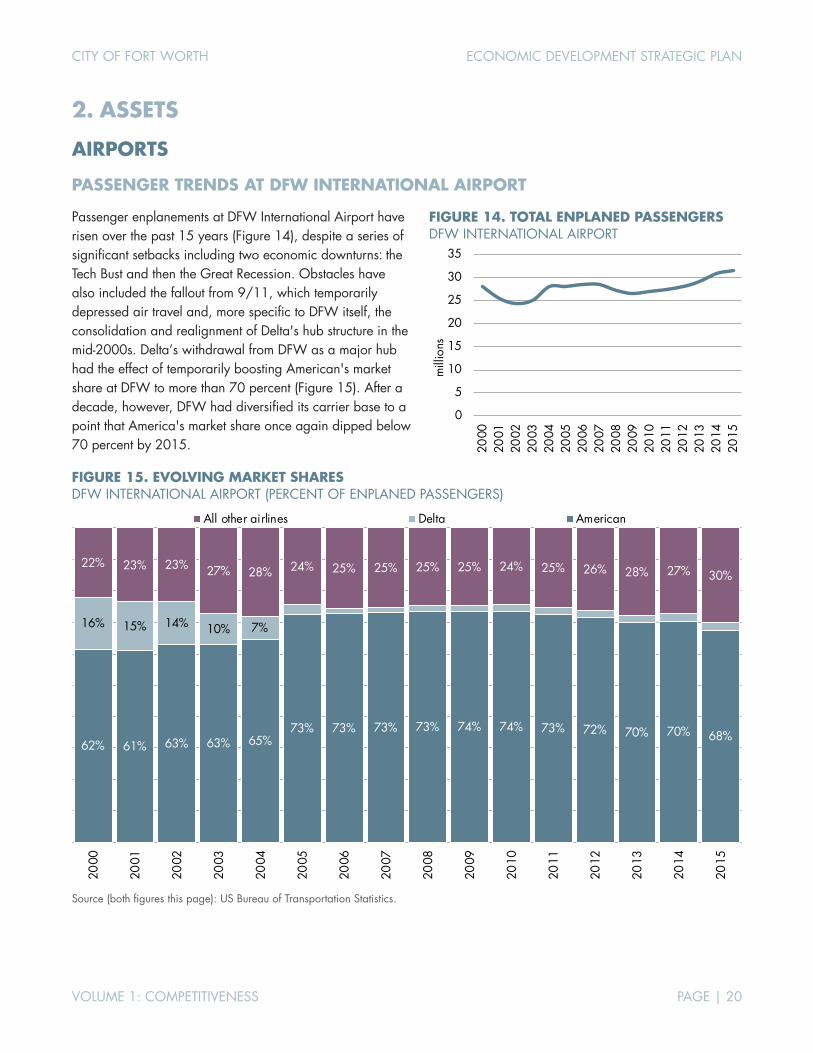
CITY OF FORT WORTH ECONOMIC DEVELOPMENT STRATEGIC PLAN
VOLUME 1: COMPETITIVENESS PAGE | 20
2. ASSETS
AIRPORTS
PASSENGER TRENDS AT DFW INTERNATIONAL AIRPORT
Passenger enplanements at DFW International Airport have risen over the past 15 years (Figure 14), despite a series of significant setbacks including two economic downturns: the Tech Bust and then the Great Recession. Obstacles have also included the fallout from 9/11, which temporarily depressed air travel and, more specific to DFW itself, the consolidation and realignment of Delta's hub structure in the mid-2000s. Delta’s withdrawal from DFW as a major hub had the effect of temporarily boosting American's market share at DFW to more than 70 percent (Figure 15). After a decade, however, DFW had diversified its carrier base to a point that America's market share once again dipped below 70 percent by 2015.
FIGURE 15. EVOLVING MARKET SHARES DFW INTERNATIONAL AIRPORT (PERCENT OF ENPLANED PASSENGERS)
Source (both figures this page): US Bureau of Transportation Statistics.
62% 61% 63% 63% 65%73% 73% 73% 73% 74% 74% 73% 72% 70% 70% 68%
16% 15% 14% 10% 7%
22% 23% 23% 27% 28% 24% 25% 25% 25% 25% 24% 25% 26% 28% 27% 30%
2000
2001
2002
2003
2004
2005
2006
2007
2008
2009
2010
2011
2012
2013
2014
2015
All other airlines Delta American
FIGURE 14. TOTAL ENPLANED PASSENGERS DFW INTERNATIONAL AIRPORT
0
5
10
15
20
25
30
35
2000
2001
2002
2003
2004
2005
2006
2007
2008
2009
2010
2011
2012
2013
2014
2015
mill
ions
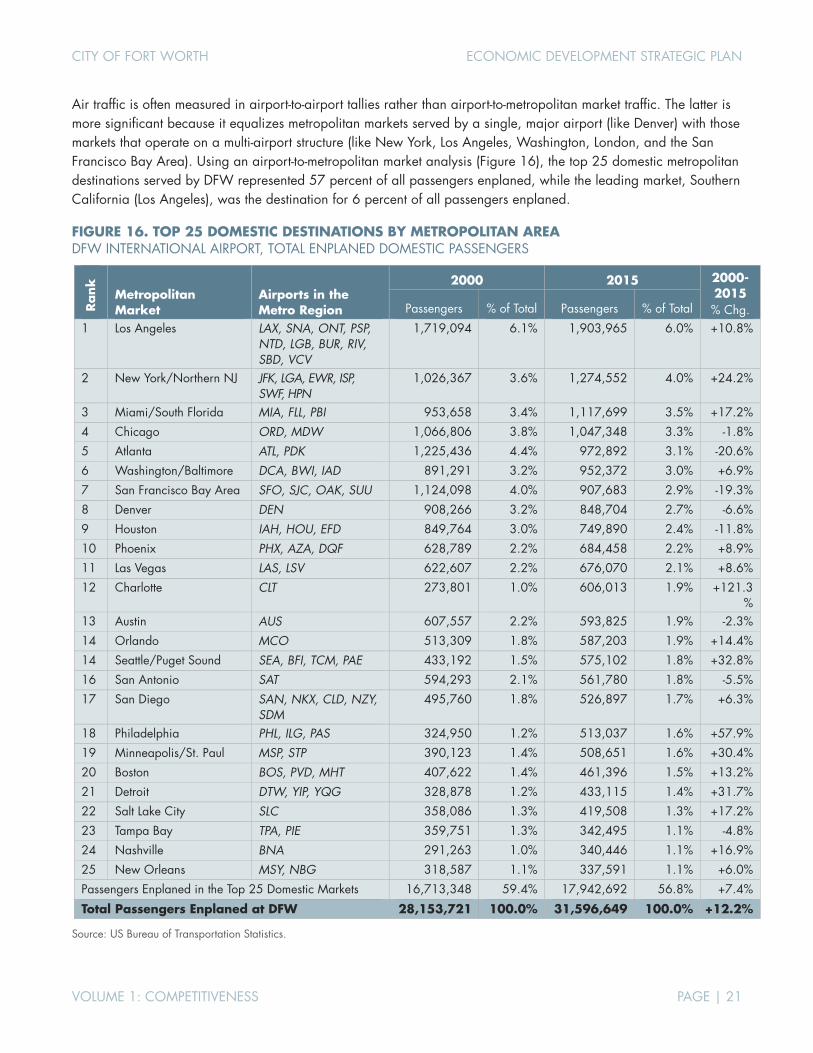
CITY OF FORT WORTH ECONOMIC DEVELOPMENT STRATEGIC PLAN
VOLUME 1: COMPETITIVENESS PAGE | 21
Air traffic is often measured in airport-to-airport tallies rather than airport-to-metropolitan market traffic. The latter is more significant because it equalizes metropolitan markets served by a single, major airport (like Denver) with those markets that operate on a multi-airport structure (like New York, Los Angeles, Washington, London, and the San Francisco Bay Area). Using an airport-to-metropolitan market analysis (Figure 16), the top 25 domestic metropolitan destinations served by DFW represented 57 percent of all passengers enplaned, while the leading market, Southern California (Los Angeles), was the destination for 6 percent of all passengers enplaned.
FIGURE 16. TOP 25 DOMESTIC DESTINATIONS BY METROPOLITAN AREA DFW INTERNATIONAL AIRPORT, TOTAL ENPLANED DOMESTIC PASSENGERS
Rank
Metropolitan Market
Airports in the Metro Region
2000 2015 2000-2015 % Chg. Passengers % of Total Passengers % of Total
1 Los Angeles LAX, SNA, ONT, PSP, NTD, LGB, BUR, RIV, SBD, VCV
1,719,094 6.1% 1,903,965 6.0% +10.8%
2 New York/Northern NJ JFK, LGA, EWR, ISP, SWF, HPN
1,026,367 3.6% 1,274,552 4.0% +24.2%
3 Miami/South Florida MIA, FLL, PBI 953,658 3.4% 1,117,699 3.5% +17.2%
4 Chicago ORD, MDW 1,066,806 3.8% 1,047,348 3.3% -1.8%
5 Atlanta ATL, PDK 1,225,436 4.4% 972,892 3.1% -20.6%
6 Washington/Baltimore DCA, BWI, IAD 891,291 3.2% 952,372 3.0% +6.9%
7 San Francisco Bay Area SFO, SJC, OAK, SUU 1,124,098 4.0% 907,683 2.9% -19.3%
8 Denver DEN 908,266 3.2% 848,704 2.7% -6.6%
9 Houston IAH, HOU, EFD 849,764 3.0% 749,890 2.4% -11.8%
10 Phoenix PHX, AZA, DQF 628,789 2.2% 684,458 2.2% +8.9%
11 Las Vegas LAS, LSV 622,607 2.2% 676,070 2.1% +8.6%
12 Charlotte CLT 273,801 1.0% 606,013 1.9% +121.3%
13 Austin AUS 607,557 2.2% 593,825 1.9% -2.3%
14 Orlando MCO 513,309 1.8% 587,203 1.9% +14.4%
14 Seattle/Puget Sound SEA, BFI, TCM, PAE 433,192 1.5% 575,102 1.8% +32.8%
16 San Antonio SAT 594,293 2.1% 561,780 1.8% -5.5%
17 San Diego SAN, NKX, CLD, NZY, SDM
495,760 1.8% 526,897 1.7% +6.3%
18 Philadelphia PHL, ILG, PAS 324,950 1.2% 513,037 1.6% +57.9%
19 Minneapolis/St. Paul MSP, STP 390,123 1.4% 508,651 1.6% +30.4%
20 Boston BOS, PVD, MHT 407,622 1.4% 461,396 1.5% +13.2%
21 Detroit DTW, YIP, YQG 328,878 1.2% 433,115 1.4% +31.7%
22 Salt Lake City SLC 358,086 1.3% 419,508 1.3% +17.2%
23 Tampa Bay TPA, PIE 359,751 1.3% 342,495 1.1% -4.8%
24 Nashville BNA 291,263 1.0% 340,446 1.1% +16.9%
25 New Orleans MSY, NBG 318,587 1.1% 337,591 1.1% +6.0%
Passengers Enplaned in the Top 25 Domestic Markets 16,713,348 59.4% 17,942,692 56.8% +7.4%
Total Passengers Enplaned at DFW 28,153,721 100.0% 31,596,649 100.0% +12.2%
Source: US Bureau of Transportation Statistics.

CITY OF FORT WORTH ECONOMIC DEVELOPMENT STRATEGIC PLAN
VOLUME 1: COMPETITIVENESS PAGE | 22
The 25 leading international metropolitan destinations served by DFW represented nearly 10 percent of all passengers enplaned in 2015 (Figure 17), up from just over 7 percent in 2000. New nonstop destinations to Dubai, Hong Kong, Sydney, Doha, and Shanghai ranked among DFW’s top 25 international markets in 2015, even though these were unserved nonstop markets just 15 years earlier.
FIGURE 17. TOP 25 INTERNATIONAL DESTINATIONS BY METROPOLITAN AREA DFW INTERNATIONAL AIRPORT, TOTAL ENPLANED INTERNATIONAL PASSENGERS
Rank
Metropolitan Market
Airports in the Metro Region
2000 2015 2000-2015 % Chg. Passengers % of Total Passengers % of Total
1 Cancun, Mexico CUN 252,842 0.9% 367,571 1.2% +45.4%
2 London, UK LHR, LGW, STN 217,964 0.8% 315,222 1.0% +44.6%
3 Mexico City, Mexico MEX 285,202 1.0% 262,050 0.8% -8.1%
4 Toronto, Canada YYZ 142,626 0.5% 151,571 0.5% +6.3%
5 Tokyo, Japan NRT, HND, OKO 108,290 0.4% 147,707 0.5% +36.4%
6 Los Cabos, Mexico SJD 58,006 0.2% 145,559 0.5% +150.9%
7 Monterrey, Mexico MTY 124,065 0.4% 126,768 0.4% +2.2%
8 Frankfurt, Germany FRA, HHN 135,068 0.5% 124,786 0.4% -7.6%
9 Seoul, South Korea ICN, SEL 20,898 0.1% 114,570 0.4% +448.2%
10 Dubai, UAE DXB 0 0.0% 114,264 0.4% —
11 Vancouver, Canada YVR 142,383 0.5% 109,747 0.3% -22.9%
12 Puerto Vallarta, Mexico PVR 50,252 0.2% 99,489 0.3% +98.0%
13 Guadalajara, Mexico GDL 94,141 0.3% 96,122 0.3% +2.1%
14 Hong Kong, HK HKG 0 0.0% 90,090 0.3% —
14 Sydney, Australia SYD 0 0.0% 87,445 0.3% —
16 Doha, Qatar DOH 0 0.0% 85,321 0.3% —
17 Sao Paulo, Brazil GRU, VCP 60,735 0.2% 82,171 0.3% +35.3%
18 Calgary, Canada YYC 92,829 0.3% 72,560 0.2% -21.8%
19 Paris, France CDG, ORY 56,897 0.2% 67,337 0.2% +18.3%
20 Madrid, Spain MAD, TOJ 3,335 0.0% 64,044 0.2% +1820.4%
21 Santiago, Chile SCL 44,010 0.2% 63,292 0.2% +43.8%
22 Leon/Guanajuato, Mexico
BJX 49,850 0.2% 61,659 0.2% +23.7%
23 Shanghai, China PVG 0 0.0% 61,225 0.2% —
24 Buenos Aires, Argentina EZE 11,273 0.0% 61,203 0.2% +442.9%
25 Cozumel, Mexico CZM 44,442 0.2% 55,438 0.2% +24.7%
Passengers Enplaned in the Top 25 International Markets 1,995,108 7.1% 3,027,211 9.6% +51.7%
Total Passengers Enplaned at DFW 28,153,721 100.0% 31,596,649 100.0% +12.2%
Source: US Bureau of Transportation Statistics.
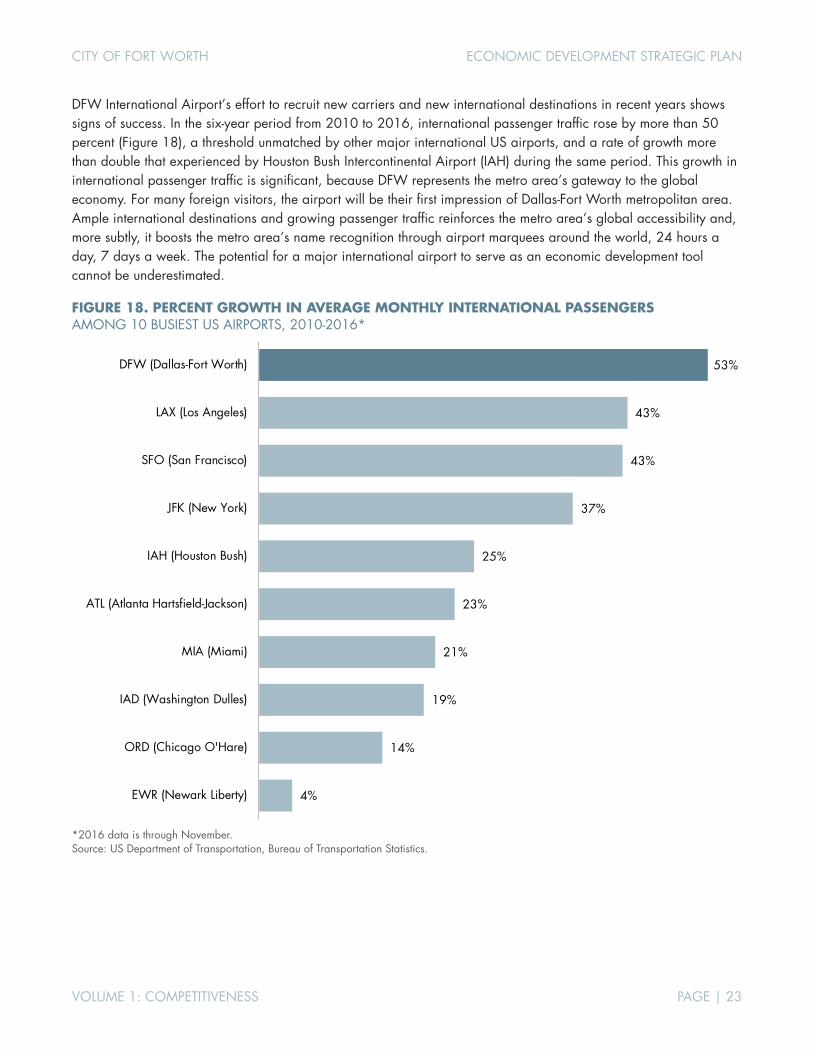
CITY OF FORT WORTH ECONOMIC DEVELOPMENT STRATEGIC PLAN
VOLUME 1: COMPETITIVENESS PAGE | 23
DFW International Airport’s effort to recruit new carriers and new international destinations in recent years shows signs of success. In the six-year period from 2010 to 2016, international passenger traffic rose by more than 50 percent (Figure 18), a threshold unmatched by other major international US airports, and a rate of growth more than double that experienced by Houston Bush Intercontinental Airport (IAH) during the same period. This growth in international passenger traffic is significant, because DFW represents the metro area’s gateway to the global economy. For many foreign visitors, the airport will be their first impression of Dallas-Fort Worth metropolitan area. Ample international destinations and growing passenger traffic reinforces the metro area’s global accessibility and, more subtly, it boosts the metro area’s name recognition through airport marquees around the world, 24 hours a day, 7 days a week. The potential for a major international airport to serve as an economic development tool cannot be underestimated.
FIGURE 18. PERCENT GROWTH IN AVERAGE MONTHLY INTERNATIONAL PASSENGERS AMONG 10 BUSIEST US AIRPORTS, 2010-2016*
*2016 data is through November. Source: US Department of Transportation, Bureau of Transportation Statistics.
4%
14%
19%
21%
23%
25%
37%
43%
43%
53%
EWR (Newark Liberty)
ORD (Chicago O'Hare)
IAD (Washington Dulles)
MIA (Miami)
ATL (Atlanta Hartsfield-Jackson)
IAH (Houston Bush)
JFK (New York)
SFO (San Francisco)
LAX (Los Angeles)
DFW (Dallas-Fort Worth)
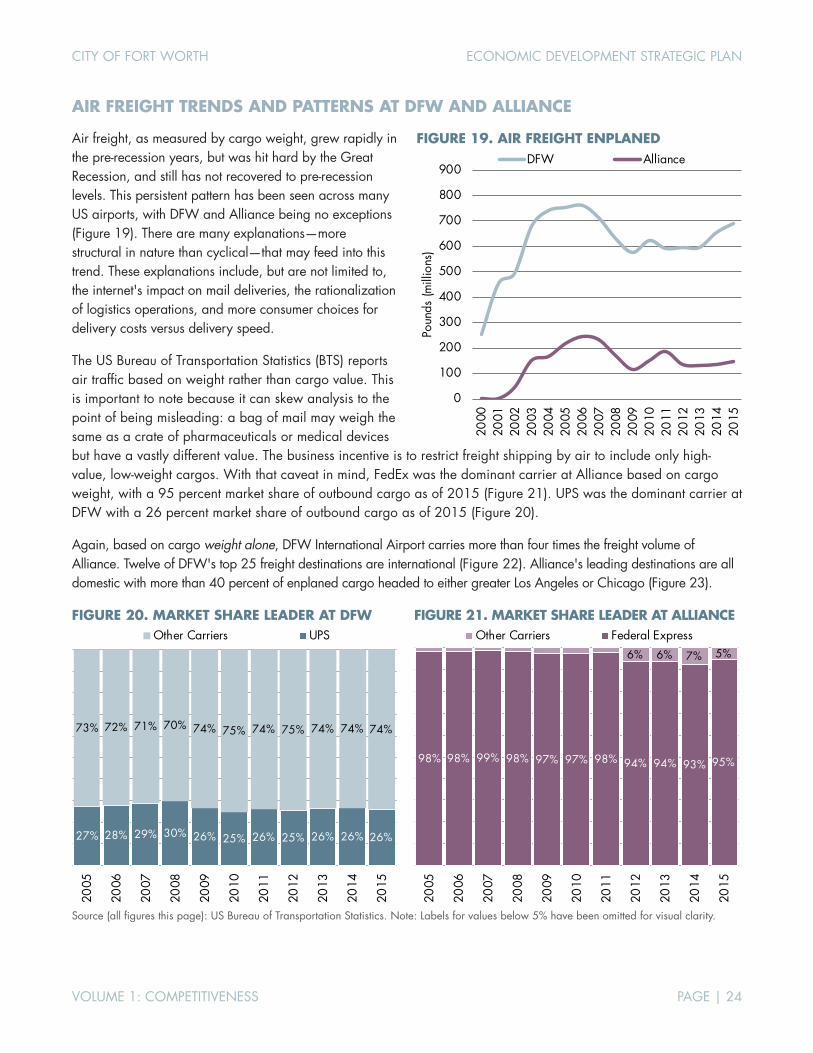
CITY OF FORT WORTH ECONOMIC DEVELOPMENT STRATEGIC PLAN
VOLUME 1: COMPETITIVENESS PAGE | 24
AIR FREIGHT TRENDS AND PATTERNS AT DFW AND ALLIANCE
Air freight, as measured by cargo weight, grew rapidly in the pre-recession years, but was hit hard by the Great Recession, and still has not recovered to pre-recession levels. This persistent pattern has been seen across many US airports, with DFW and Alliance being no exceptions (Figure 19). There are many explanations—more structural in nature than cyclical—that may feed into this trend. These explanations include, but are not limited to, the internet's impact on mail deliveries, the rationalization of logistics operations, and more consumer choices for delivery costs versus delivery speed.
The US Bureau of Transportation Statistics (BTS) reports air traffic based on weight rather than cargo value. This is important to note because it can skew analysis to the point of being misleading: a bag of mail may weigh the same as a crate of pharmaceuticals or medical devices but have a vastly different value. The business incentive is to restrict freight shipping by air to include only high-value, low-weight cargos. With that caveat in mind, FedEx was the dominant carrier at Alliance based on cargo weight, with a 95 percent market share of outbound cargo as of 2015 (Figure 21). UPS was the dominant carrier at DFW with a 26 percent market share of outbound cargo as of 2015 (Figure 20).
Again, based on cargo weight alone, DFW International Airport carries more than four times the freight volume of Alliance. Twelve of DFW's top 25 freight destinations are international (Figure 22). Alliance's leading destinations are all domestic with more than 40 percent of enplaned cargo headed to either greater Los Angeles or Chicago (Figure 23).
FIGURE 20. MARKET SHARE LEADER AT DFW
FIGURE 21. MARKET SHARE LEADER AT ALLIANCE
Source (all figures this page): US Bureau of Transportation Statistics. Note: Labels for values below 5% have been omitted for visual clarity.
27% 28% 29% 30% 26% 25% 26% 25% 26% 26% 26%
73% 72% 71% 70% 74% 75% 74% 75% 74% 74% 74%
2005
2006
2007
2008
2009
2010
2011
2012
2013
2014
2015
Other Carriers UPS
98% 98% 99% 98% 97% 97% 98% 94% 94% 93% 95%
6% 6% 7% 5%
2005
2006
2007
2008
2009
2010
2011
2012
2013
2014
2015
Other Carriers Federal Express
FIGURE 19. AIR FREIGHT ENPLANED
0
100
200
300
400
500
600
700
800
900
2000
2001
2002
2003
2004
2005
2006
2007
2008
2009
2010
2011
2012
2013
2014
2015
Poun
ds (m
illio
ns)
DFW Alliance
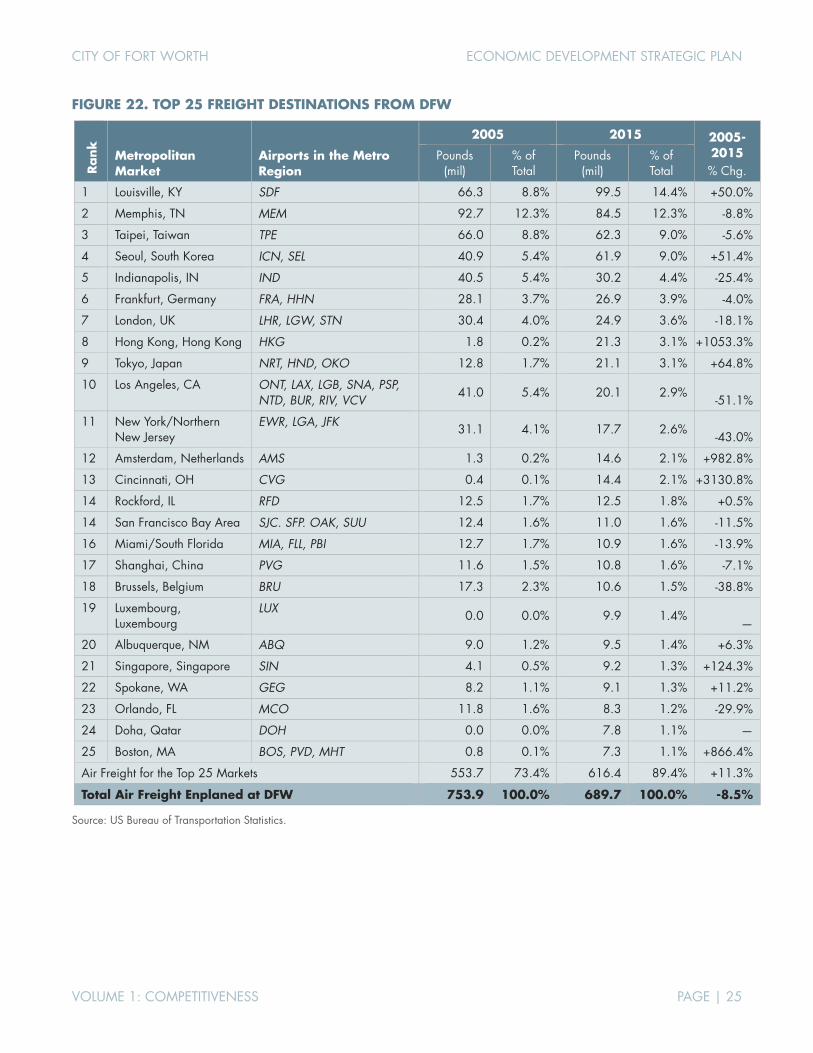
CITY OF FORT WORTH ECONOMIC DEVELOPMENT STRATEGIC PLAN
VOLUME 1: COMPETITIVENESS PAGE | 25
FIGURE 22. TOP 25 FREIGHT DESTINATIONS FROM DFW Rank
Metropolitan Market
Airports in the Metro Region
2005 2015 2005-2015 % Chg.
Pounds (mil)
% of Total
Pounds (mil)
% of Total
1 Louisville, KY SDF 66.3 8.8% 99.5 14.4% +50.0%
2 Memphis, TN MEM 92.7 12.3% 84.5 12.3% -8.8%
3 Taipei, Taiwan TPE 66.0 8.8% 62.3 9.0% -5.6%
4 Seoul, South Korea ICN, SEL 40.9 5.4% 61.9 9.0% +51.4%
5 Indianapolis, IN IND 40.5 5.4% 30.2 4.4% -25.4%
6 Frankfurt, Germany FRA, HHN 28.1 3.7% 26.9 3.9% -4.0%
7 London, UK LHR, LGW, STN 30.4 4.0% 24.9 3.6% -18.1%
8 Hong Kong, Hong Kong HKG 1.8 0.2% 21.3 3.1% +1053.3%
9 Tokyo, Japan NRT, HND, OKO 12.8 1.7% 21.1 3.1% +64.8%
10 Los Angeles, CA ONT, LAX, LGB, SNA, PSP, NTD, BUR, RIV, VCV
41.0 5.4% 20.1 2.9% -51.1%
11 New York/Northern New Jersey
EWR, LGA, JFK 31.1 4.1% 17.7 2.6% -43.0%
12 Amsterdam, Netherlands AMS 1.3 0.2% 14.6 2.1% +982.8%
13 Cincinnati, OH CVG 0.4 0.1% 14.4 2.1% +3130.8%
14 Rockford, IL RFD 12.5 1.7% 12.5 1.8% +0.5%
14 San Francisco Bay Area SJC. SFP. OAK, SUU 12.4 1.6% 11.0 1.6% -11.5%
16 Miami/South Florida MIA, FLL, PBI 12.7 1.7% 10.9 1.6% -13.9%
17 Shanghai, China PVG 11.6 1.5% 10.8 1.6% -7.1%
18 Brussels, Belgium BRU 17.3 2.3% 10.6 1.5% -38.8%
19 Luxembourg, Luxembourg
LUX 0.0 0.0% 9.9 1.4% —
20 Albuquerque, NM ABQ 9.0 1.2% 9.5 1.4% +6.3%
21 Singapore, Singapore SIN 4.1 0.5% 9.2 1.3% +124.3%
22 Spokane, WA GEG 8.2 1.1% 9.1 1.3% +11.2%
23 Orlando, FL MCO 11.8 1.6% 8.3 1.2% -29.9%
24 Doha, Qatar DOH 0.0 0.0% 7.8 1.1% —
25 Boston, MA BOS, PVD, MHT 0.8 0.1% 7.3 1.1% +866.4%
Air Freight for the Top 25 Markets 553.7 73.4% 616.4 89.4% +11.3%
Total Air Freight Enplaned at DFW 753.9 100.0% 689.7 100.0% -8.5%
Source: US Bureau of Transportation Statistics.
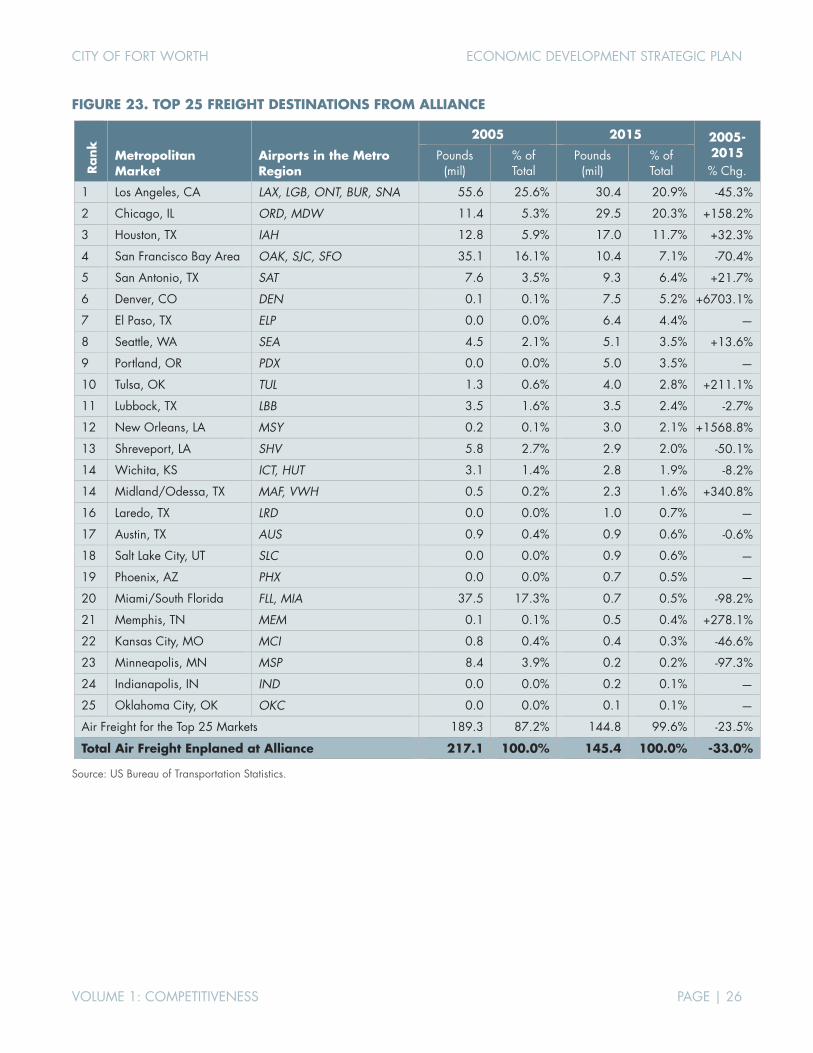
CITY OF FORT WORTH ECONOMIC DEVELOPMENT STRATEGIC PLAN
VOLUME 1: COMPETITIVENESS PAGE | 26
FIGURE 23. TOP 25 FREIGHT DESTINATIONS FROM ALLIANCE Rank
Metropolitan Market
Airports in the Metro Region
2005 2015 2005-2015 % Chg.
Pounds (mil)
% of Total
Pounds (mil)
% of Total
1 Los Angeles, CA LAX, LGB, ONT, BUR, SNA 55.6 25.6% 30.4 20.9% -45.3%
2 Chicago, IL ORD, MDW 11.4 5.3% 29.5 20.3% +158.2%
3 Houston, TX IAH 12.8 5.9% 17.0 11.7% +32.3%
4 San Francisco Bay Area OAK, SJC, SFO 35.1 16.1% 10.4 7.1% -70.4%
5 San Antonio, TX SAT 7.6 3.5% 9.3 6.4% +21.7%
6 Denver, CO DEN 0.1 0.1% 7.5 5.2% +6703.1%
7 El Paso, TX ELP 0.0 0.0% 6.4 4.4% —
8 Seattle, WA SEA 4.5 2.1% 5.1 3.5% +13.6%
9 Portland, OR PDX 0.0 0.0% 5.0 3.5% —
10 Tulsa, OK TUL 1.3 0.6% 4.0 2.8% +211.1%
11 Lubbock, TX LBB 3.5 1.6% 3.5 2.4% -2.7%
12 New Orleans, LA MSY 0.2 0.1% 3.0 2.1% +1568.8%
13 Shreveport, LA SHV 5.8 2.7% 2.9 2.0% -50.1%
14 Wichita, KS ICT, HUT 3.1 1.4% 2.8 1.9% -8.2%
14 Midland/Odessa, TX MAF, VWH 0.5 0.2% 2.3 1.6% +340.8%
16 Laredo, TX LRD 0.0 0.0% 1.0 0.7% —
17 Austin, TX AUS 0.9 0.4% 0.9 0.6% -0.6%
18 Salt Lake City, UT SLC 0.0 0.0% 0.9 0.6% —
19 Phoenix, AZ PHX 0.0 0.0% 0.7 0.5% —
20 Miami/South Florida FLL, MIA 37.5 17.3% 0.7 0.5% -98.2%
21 Memphis, TN MEM 0.1 0.1% 0.5 0.4% +278.1%
22 Kansas City, MO MCI 0.8 0.4% 0.4 0.3% -46.6%
23 Minneapolis, MN MSP 8.4 3.9% 0.2 0.2% -97.3%
24 Indianapolis, IN IND 0.0 0.0% 0.2 0.1% —
25 Oklahoma City, OK OKC 0.0 0.0% 0.1 0.1% —
Air Freight for the Top 25 Markets 189.3 87.2% 144.8 99.6% -23.5%
Total Air Freight Enplaned at Alliance 217.1 100.0% 145.4 100.0% -33.0%
Source: US Bureau of Transportation Statistics.
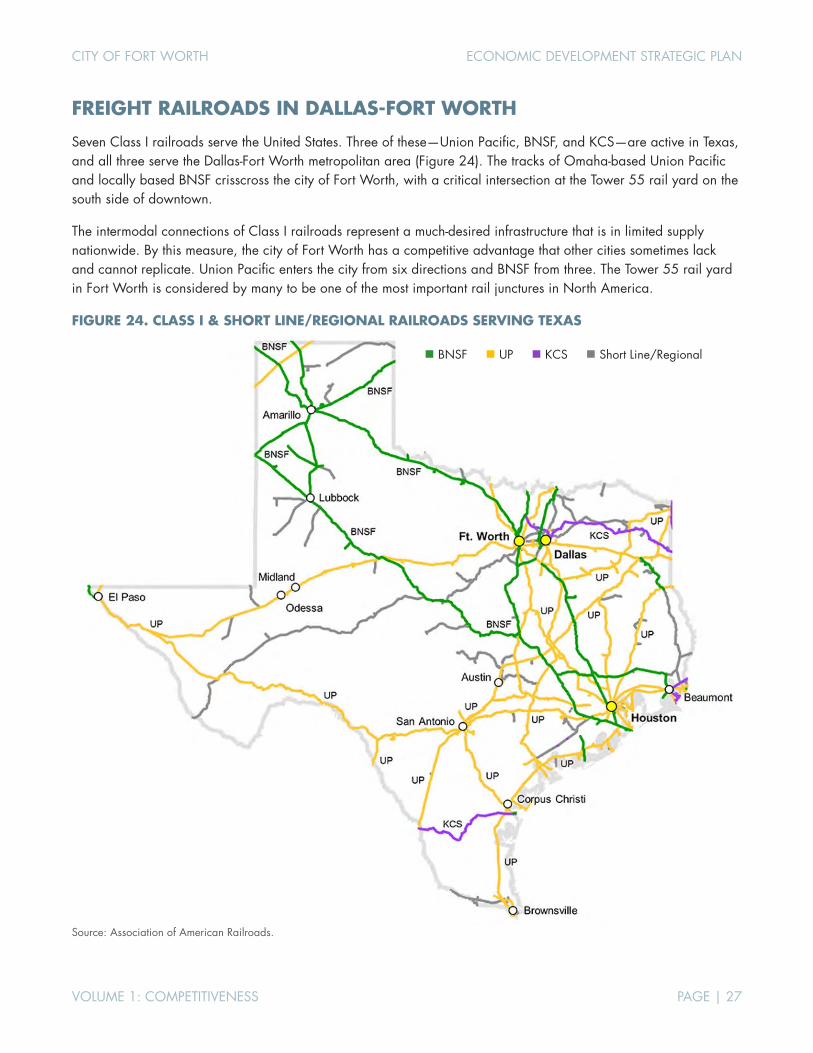
CITY OF FORT WORTH ECONOMIC DEVELOPMENT STRATEGIC PLAN
VOLUME 1: COMPETITIVENESS PAGE | 27
FREIGHT RAILROADS IN DALLAS-FORT WORTH
Seven Class I railroads serve the United States. Three of these—Union Pacific, BNSF, and KCS—are active in Texas, and all three serve the Dallas-Fort Worth metropolitan area (Figure 24). The tracks of Omaha-based Union Pacific and locally based BNSF crisscross the city of Fort Worth, with a critical intersection at the Tower 55 rail yard on the south side of downtown.
The intermodal connections of Class I railroads represent a much-desired infrastructure that is in limited supply nationwide. By this measure, the city of Fort Worth has a competitive advantage that other cities sometimes lack and cannot replicate. Union Pacific enters the city from six directions and BNSF from three. The Tower 55 rail yard in Fort Worth is considered by many to be one of the most important rail junctures in North America.
FIGURE 24. CLASS I & SHORT LINE/REGIONAL RAILROADS SERVING TEXAS
Source: Association of American Railroads.
BNSF UP KCS Short Line/Regional
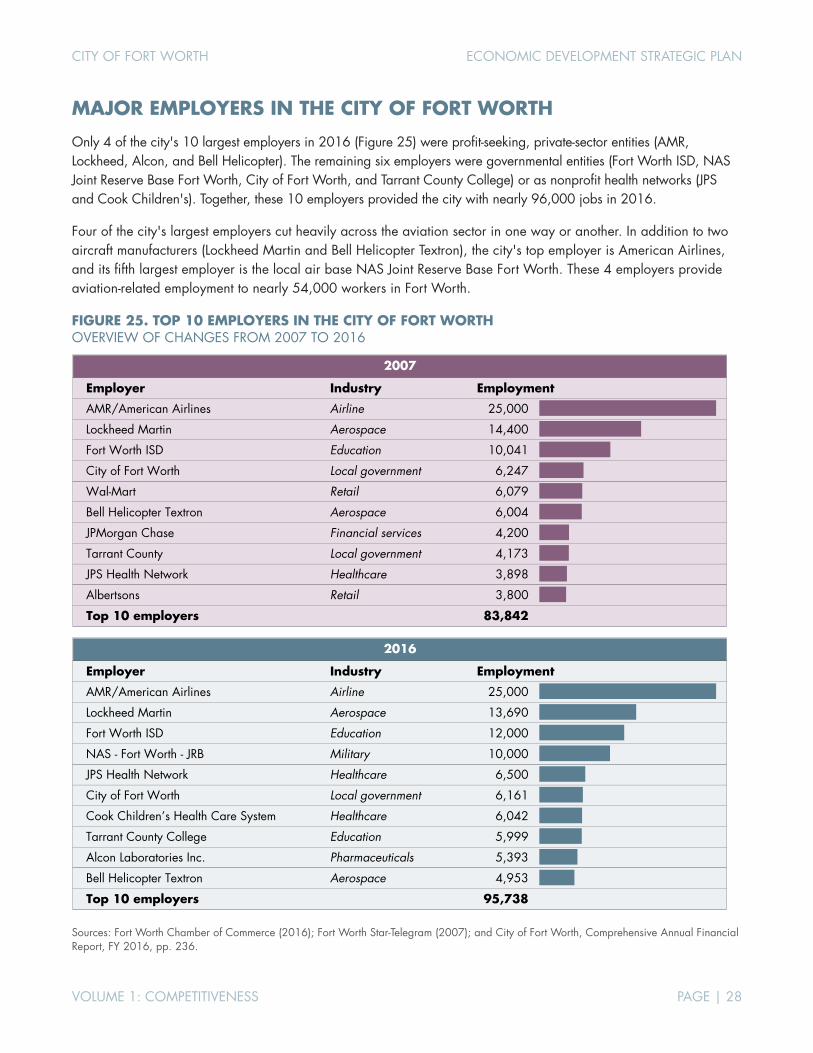
CITY OF FORT WORTH ECONOMIC DEVELOPMENT STRATEGIC PLAN
VOLUME 1: COMPETITIVENESS PAGE | 28
MAJOR EMPLOYERS IN THE CITY OF FORT WORTH
Only 4 of the city's 10 largest employers in 2016 (Figure 25) were profit-seeking, private-sector entities (AMR, Lockheed, Alcon, and Bell Helicopter). The remaining six employers were governmental entities (Fort Worth ISD, NAS Joint Reserve Base Fort Worth, City of Fort Worth, and Tarrant County College) or as nonprofit health networks (JPS and Cook Children's). Together, these 10 employers provided the city with nearly 96,000 jobs in 2016.
Four of the city's largest employers cut heavily across the aviation sector in one way or another. In addition to two aircraft manufacturers (Lockheed Martin and Bell Helicopter Textron), the city's top employer is American Airlines, and its fifth largest employer is the local air base NAS Joint Reserve Base Fort Worth. These 4 employers provide aviation-related employment to nearly 54,000 workers in Fort Worth.
FIGURE 25. TOP 10 EMPLOYERS IN THE CITY OF FORT WORTH OVERVIEW OF CHANGES FROM 2007 TO 2016
Sources: Fort Worth Chamber of Commerce (2016); Fort Worth Star-Telegram (2007); and City of Fort Worth, Comprehensive Annual Financial Report, FY 2016, pp. 236.
Employer Industry Employment
AMR/American Airlines Airline 25,000
Lockheed Martin Aerospace 14,400
Fort Worth ISD Education 10,041
City of Fort Worth Local government 6,247
Wal-Mart Retail 6,079
Bell Helicopter Textron Aerospace 6,004
JPMorgan Chase Financial services 4,200
Tarrant County Local government 4,173
JPS Health Network Healthcare 3,898
Albertsons Retail 3,800
Top 10 employers 83,842
2007
Employer Industry Employment
AMR/American Airlines Airline 25,000
Lockheed Martin Aerospace 13,690
Fort Worth ISD Education 12,000
NAS - Fort Worth - JRB Military 10,000
JPS Health Network Healthcare 6,500
City of Fort Worth Local government 6,161
Cook Children’s Health Care System Healthcare 6,042
Tarrant County College Education 5,999
Alcon Laboratories Inc. Pharmaceuticals 5,393
Bell Helicopter Textron Aerospace 4,953
Top 10 employers 95,738
2016
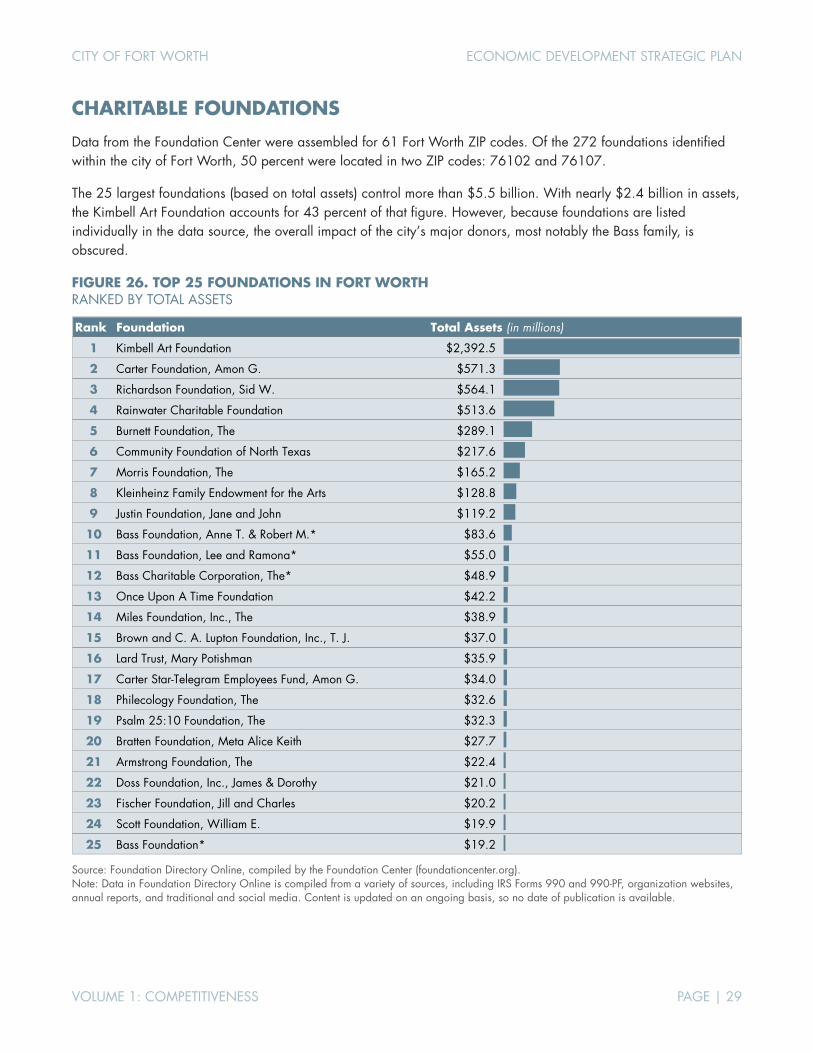
CITY OF FORT WORTH ECONOMIC DEVELOPMENT STRATEGIC PLAN
VOLUME 1: COMPETITIVENESS PAGE | 29
CHARITABLE FOUNDATIONS
Data from the Foundation Center were assembled for 61 Fort Worth ZIP codes. Of the 272 foundations identified within the city of Fort Worth, 50 percent were located in two ZIP codes: 76102 and 76107.
The 25 largest foundations (based on total assets) control more than $5.5 billion. With nearly $2.4 billion in assets, the Kimbell Art Foundation accounts for 43 percent of that figure. However, because foundations are listed individually in the data source, the overall impact of the city’s major donors, most notably the Bass family, is obscured.
FIGURE 26. TOP 25 FOUNDATIONS IN FORT WORTH RANKED BY TOTAL ASSETS
Source: Foundation Directory Online, compiled by the Foundation Center (foundationcenter.org). Note: Data in Foundation Directory Online is compiled from a variety of sources, including IRS Forms 990 and 990-PF, organization websites, annual reports, and traditional and social media. Content is updated on an ongoing basis, so no date of publication is available.
Rank Foundation
1 Kimbell Art Foundation $2,392.5
2 Carter Foundation, Amon G. $571.3
3 Richardson Foundation, Sid W. $564.1
4 Rainwater Charitable Foundation $513.6
5 Burnett Foundation, The $289.1
6 Community Foundation of North Texas $217.6
7 Morris Foundation, The $165.2
8 Kleinheinz Family Endowment for the Arts $128.8
9 Justin Foundation, Jane and John $119.2
10 Bass Foundation, Anne T. & Robert M.* $83.6
11 Bass Foundation, Lee and Ramona* $55.0
12 Bass Charitable Corporation, The* $48.9
13 Once Upon A Time Foundation $42.2
14 Miles Foundation, Inc., The $38.9
15 Brown and C. A. Lupton Foundation, Inc., T. J. $37.0
16 Lard Trust, Mary Potishman $35.9
17 Carter Star-Telegram Employees Fund, Amon G. $34.0
18 Philecology Foundation, The $32.6
19 Psalm 25:10 Foundation, The $32.3
20 Bratten Foundation, Meta Alice Keith $27.7
21 Armstrong Foundation, The $22.4
22 Doss Foundation, Inc., James & Dorothy $21.0
23 Fischer Foundation, Jill and Charles $20.2
24 Scott Foundation, William E. $19.9
25 Bass Foundation* $19.2
Total Assets (in millions)
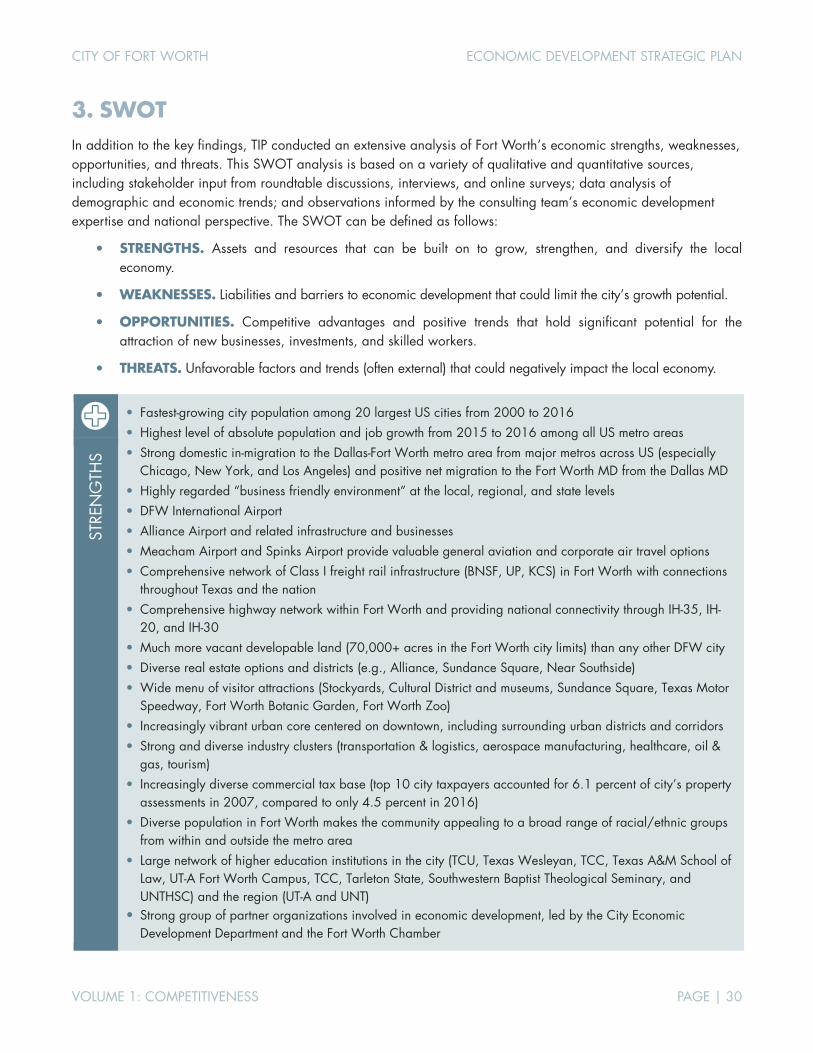
CITY OF FORT WORTH ECONOMIC DEVELOPMENT STRATEGIC PLAN
VOLUME 1: COMPETITIVENESS PAGE | 30
3. SWOT In addition to the key findings, TIP conducted an extensive analysis of Fort Worth’s economic strengths, weaknesses, opportunities, and threats. This SWOT analysis is based on a variety of qualitative and quantitative sources, including stakeholder input from roundtable discussions, interviews, and online surveys; data analysis of demographic and economic trends; and observations informed by the consulting team’s economic development expertise and national perspective. The SWOT can be defined as follows:
STRENGTHS. Assets and resources that can be built on to grow, strengthen, and diversify the local economy.
WEAKNESSES. Liabilities and barriers to economic development that could limit the city’s growth potential.
OPPORTUNITIES. Competitive advantages and positive trends that hold significant potential for the attraction of new businesses, investments, and skilled workers.
THREATS. Unfavorable factors and trends (often external) that could negatively impact the local economy.
• Fastest-growing city population among 20 largest US cities from 2000 to 2016 • Highest level of absolute population and job growth from 2015 to 2016 among all US metro areas • Strong domestic in-migration to the Dallas-Fort Worth metro area from major metros across US (especially
Chicago, New York, and Los Angeles) and positive net migration to the Fort Worth MD from the Dallas MD • Highly regarded “business friendly environment” at the local, regional, and state levels • DFW International Airport • Alliance Airport and related infrastructure and businesses • Meacham Airport and Spinks Airport provide valuable general aviation and corporate air travel options • Comprehensive network of Class I freight rail infrastructure (BNSF, UP, KCS) in Fort Worth with connections
throughout Texas and the nation • Comprehensive highway network within Fort Worth and providing national connectivity through IH-35, IH-
20, and IH-30 • Much more vacant developable land (70,000+ acres in the Fort Worth city limits) than any other DFW city • Diverse real estate options and districts (e.g., Alliance, Sundance Square, Near Southside) • Wide menu of visitor attractions (Stockyards, Cultural District and museums, Sundance Square, Texas Motor
Speedway, Fort Worth Botanic Garden, Fort Worth Zoo) • Increasingly vibrant urban core centered on downtown, including surrounding urban districts and corridors • Strong and diverse industry clusters (transportation & logistics, aerospace manufacturing, healthcare, oil &
gas, tourism) • Increasingly diverse commercial tax base (top 10 city taxpayers accounted for 6.1 percent of city’s property
assessments in 2007, compared to only 4.5 percent in 2016) • Diverse population in Fort Worth makes the community appealing to a broad range of racial/ethnic groups
from within and outside the metro area • Large network of higher education institutions in the city (TCU, Texas Wesleyan, TCC, Texas A&M School of
Law, UT-A Fort Worth Campus, TCC, Tarleton State, Southwestern Baptist Theological Seminary, and UNTHSC) and the region (UT-A and UNT)
• Strong group of partner organizations involved in economic development, led by the City Economic Development Department and the Fort Worth Chamber
STRE
NG
THS
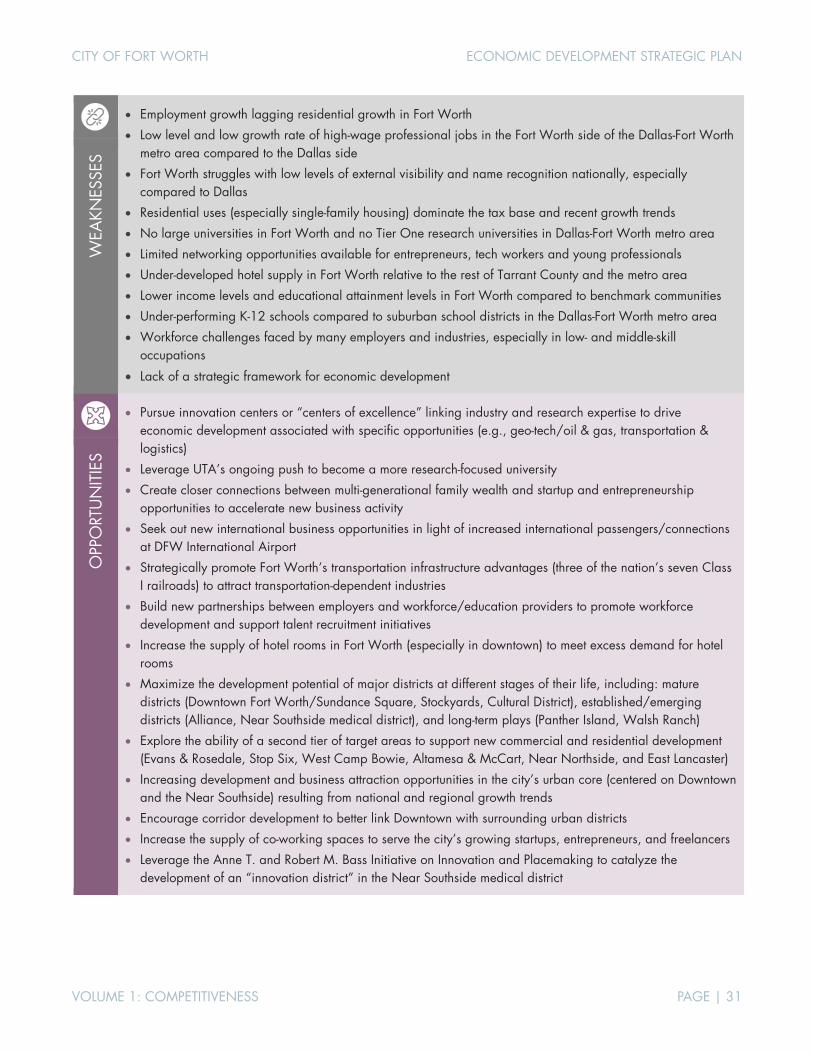
CITY OF FORT WORTH ECONOMIC DEVELOPMENT STRATEGIC PLAN
VOLUME 1: COMPETITIVENESS PAGE | 31
• Employment growth lagging residential growth in Fort Worth
• Low level and low growth rate of high-wage professional jobs in the Fort Worth side of the Dallas-Fort Worth metro area compared to the Dallas side
• Fort Worth struggles with low levels of external visibility and name recognition nationally, especially compared to Dallas
• Residential uses (especially single-family housing) dominate the tax base and recent growth trends
• No large universities in Fort Worth and no Tier One research universities in Dallas-Fort Worth metro area
• Limited networking opportunities available for entrepreneurs, tech workers and young professionals
• Under-developed hotel supply in Fort Worth relative to the rest of Tarrant County and the metro area
• Lower income levels and educational attainment levels in Fort Worth compared to benchmark communities
• Under-performing K-12 schools compared to suburban school districts in the Dallas-Fort Worth metro area
• Workforce challenges faced by many employers and industries, especially in low- and middle-skill occupations
• Lack of a strategic framework for economic development
WEA
KNES
SES
• Pursue innovation centers or “centers of excellence” linking industry and research expertise to drive
economic development associated with specific opportunities (e.g., geo-tech/oil & gas, transportation & logistics)
• Leverage UTA’s ongoing push to become a more research-focused university
• Create closer connections between multi-generational family wealth and startup and entrepreneurship opportunities to accelerate new business activity
• Seek out new international business opportunities in light of increased international passengers/connections at DFW International Airport
• Strategically promote Fort Worth’s transportation infrastructure advantages (three of the nation’s seven Class I railroads) to attract transportation-dependent industries
• Build new partnerships between employers and workforce/education providers to promote workforce development and support talent recruitment initiatives
• Increase the supply of hotel rooms in Fort Worth (especially in downtown) to meet excess demand for hotel rooms
• Maximize the development potential of major districts at different stages of their life, including: mature districts (Downtown Fort Worth/Sundance Square, Stockyards, Cultural District), established/emerging districts (Alliance, Near Southside medical district), and long-term plays (Panther Island, Walsh Ranch)
• Explore the ability of a second tier of target areas to support new commercial and residential development (Evans & Rosedale, Stop Six, West Camp Bowie, Altamesa & McCart, Near Northside, and East Lancaster)
• Increasing development and business attraction opportunities in the city’s urban core (centered on Downtown and the Near Southside) resulting from national and regional growth trends
• Encourage corridor development to better link Downtown with surrounding urban districts
• Increase the supply of co-working spaces to serve the city’s growing startups, entrepreneurs, and freelancers
• Leverage the Anne T. and Robert M. Bass Initiative on Innovation and Placemaking to catalyze the development of an “innovation district” in the Near Southside medical district
OPP
ORT
UN
ITIE
S
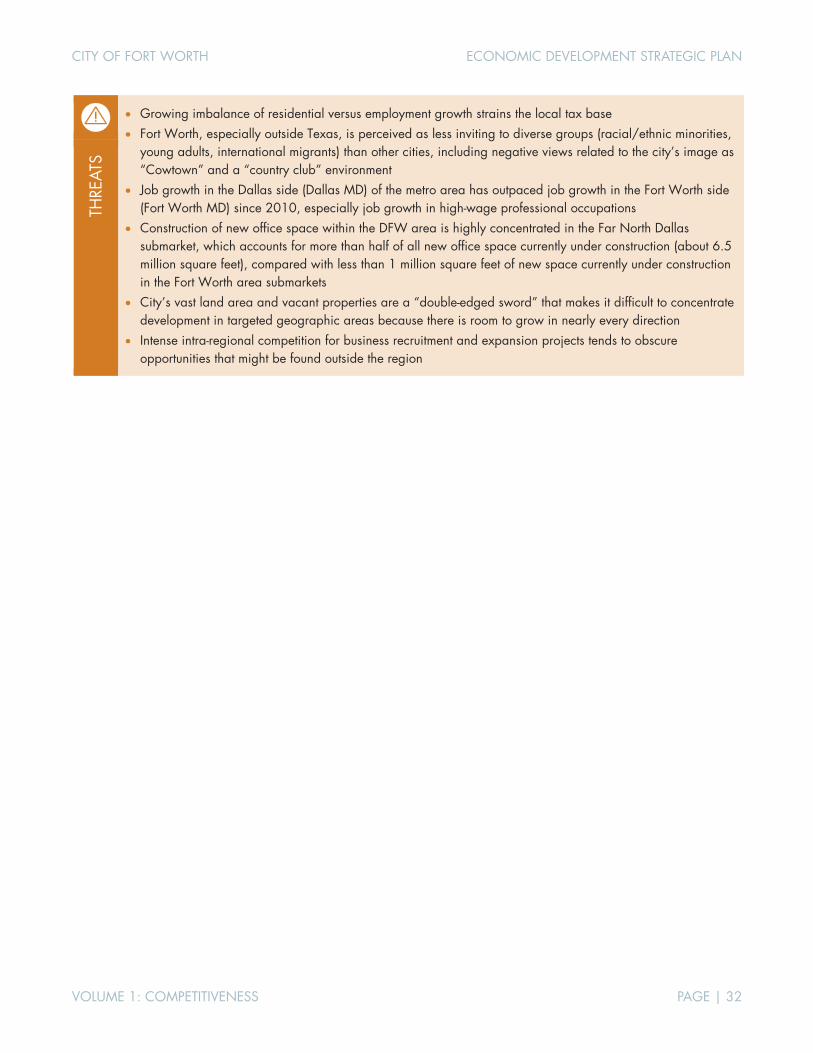
CITY OF FORT WORTH ECONOMIC DEVELOPMENT STRATEGIC PLAN
VOLUME 1: COMPETITIVENESS PAGE | 32
• Growing imbalance of residential versus employment growth strains the local tax base • Fort Worth, especially outside Texas, is perceived as less inviting to diverse groups (racial/ethnic minorities,
young adults, international migrants) than other cities, including negative views related to the city’s image as “Cowtown” and a “country club” environment
• Job growth in the Dallas side (Dallas MD) of the metro area has outpaced job growth in the Fort Worth side (Fort Worth MD) since 2010, especially job growth in high-wage professional occupations
• Construction of new office space within the DFW area is highly concentrated in the Far North Dallas submarket, which accounts for more than half of all new office space currently under construction (about 6.5 million square feet), compared with less than 1 million square feet of new space currently under construction in the Fort Worth area submarkets
• City’s vast land area and vacant properties are a “double-edged sword” that makes it difficult to concentrate development in targeted geographic areas because there is room to grow in nearly every direction
• Intense intra-regional competition for business recruitment and expansion projects tends to obscure opportunities that might be found outside the region
THRE
ATS
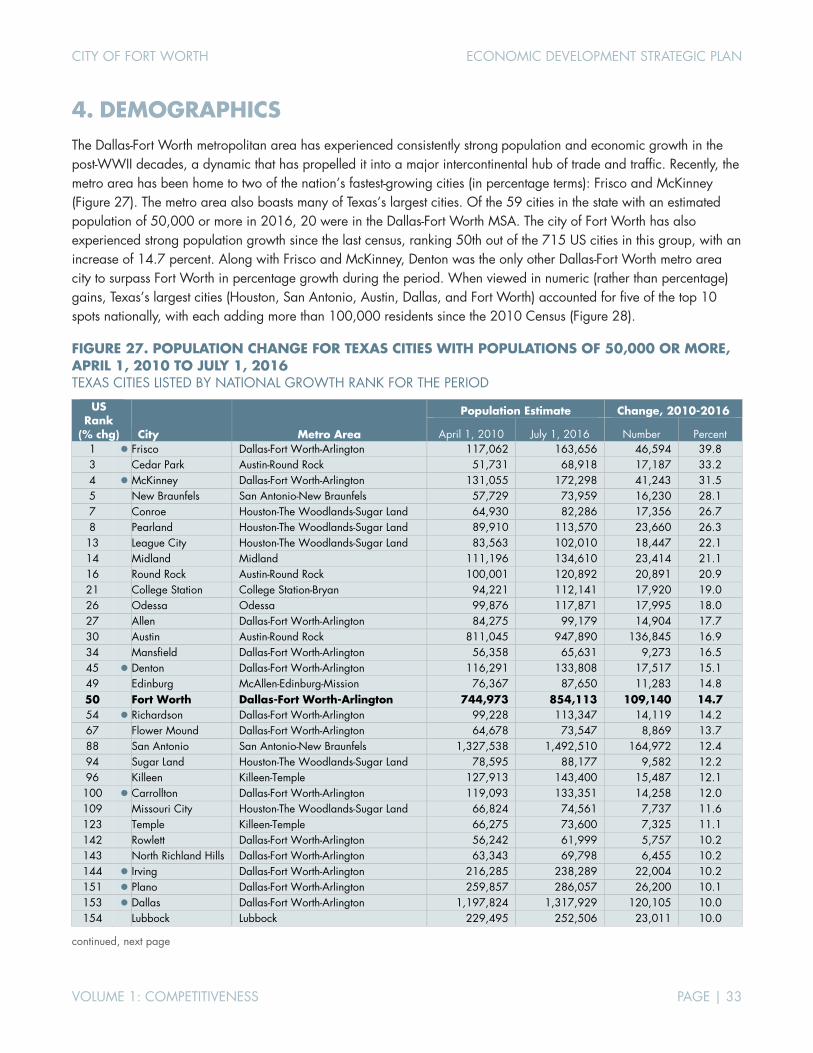
CITY OF FORT WORTH ECONOMIC DEVELOPMENT STRATEGIC PLAN
VOLUME 1: COMPETITIVENESS PAGE | 33
4. DEMOGRAPHICS The Dallas-Fort Worth metropolitan area has experienced consistently strong population and economic growth in the post-WWII decades, a dynamic that has propelled it into a major intercontinental hub of trade and traffic. Recently, the metro area has been home to two of the nation’s fastest-growing cities (in percentage terms): Frisco and McKinney (Figure 27). The metro area also boasts many of Texas’s largest cities. Of the 59 cities in the state with an estimated population of 50,000 or more in 2016, 20 were in the Dallas-Fort Worth MSA. The city of Fort Worth has also experienced strong population growth since the last census, ranking 50th out of the 715 US cities in this group, with an increase of 14.7 percent. Along with Frisco and McKinney, Denton was the only other Dallas-Fort Worth metro area city to surpass Fort Worth in percentage growth during the period. When viewed in numeric (rather than percentage) gains, Texas’s largest cities (Houston, San Antonio, Austin, Dallas, and Fort Worth) accounted for five of the top 10 spots nationally, with each adding more than 100,000 residents since the 2010 Census (Figure 28).
FIGURE 27. POPULATION CHANGE FOR TEXAS CITIES WITH POPULATIONS OF 50,000 OR MORE, APRIL 1, 2010 TO JULY 1, 2016 TEXAS CITIES LISTED BY NATIONAL GROWTH RANK FOR THE PERIOD
US Rank
(% chg) City Metro Area
Population Estimate Change, 2010-2016
April 1, 2010 July 1, 2016 Number Percent 1 Frisco Dallas-Fort Worth-Arlington 117,062 163,656 46,594 39.8 3
Cedar Park Austin-Round Rock 51,731 68,918 17,187 33.2
4 McKinney Dallas-Fort Worth-Arlington 131,055 172,298 41,243 31.5 5 New Braunfels San Antonio-New Braunfels 57,729 73,959 16,230 28.1 7 Conroe Houston-The Woodlands-Sugar Land 64,930 82,286 17,356 26.7 8 Pearland Houston-The Woodlands-Sugar Land 89,910 113,570 23,660 26.3
13 League City Houston-The Woodlands-Sugar Land 83,563 102,010 18,447 22.1 14 Midland Midland 111,196 134,610 23,414 21.1 16 Round Rock Austin-Round Rock 100,001 120,892 20,891 20.9 21 College Station College Station-Bryan 94,221 112,141 17,920 19.0 26 Odessa Odessa 99,876 117,871 17,995 18.0 27 Allen Dallas-Fort Worth-Arlington 84,275 99,179 14,904 17.7 30 Austin Austin-Round Rock 811,045 947,890 136,845 16.9 34 Mansfield Dallas-Fort Worth-Arlington 56,358 65,631 9,273 16.5 45 Denton Dallas-Fort Worth-Arlington 116,291 133,808 17,517 15.1 49
Edinburg McAllen-Edinburg-Mission 76,367 87,650 11,283 14.8
50 Fort Worth Dallas-Fort Worth-Arlington 744,973 854,113 109,140 14.7 54 Richardson Dallas-Fort Worth-Arlington 99,228 113,347 14,119 14.2 67 Flower Mound Dallas-Fort Worth-Arlington 64,678 73,547 8,869 13.7 88 San Antonio San Antonio-New Braunfels 1,327,538 1,492,510 164,972 12.4 94 Sugar Land Houston-The Woodlands-Sugar Land 78,595 88,177 9,582 12.2 96 Killeen Killeen-Temple 127,913 143,400 15,487 12.1 100 Carrollton Dallas-Fort Worth-Arlington 119,093 133,351 14,258 12.0 109 Missouri City Houston-The Woodlands-Sugar Land 66,824 74,561 7,737 11.6 123 Temple Killeen-Temple 66,275 73,600 7,325 11.1 142 Rowlett Dallas-Fort Worth-Arlington 56,242 61,999 5,757 10.2 143 North Richland Hills Dallas-Fort Worth-Arlington 63,343 69,798 6,455 10.2 144 Irving Dallas-Fort Worth-Arlington 216,285 238,289 22,004 10.2 151 Plano Dallas-Fort Worth-Arlington 259,857 286,057 26,200 10.1 153 Dallas Dallas-Fort Worth-Arlington 1,197,824 1,317,929 120,105 10.0 154 Lubbock Lubbock 229,495 252,506 23,011 10.0
continued, next page

CITY OF FORT WORTH ECONOMIC DEVELOPMENT STRATEGIC PLAN
VOLUME 1: COMPETITIVENESS PAGE | 34
FIGURE 27. POPULATION CHANGE FOR TEXAS CITIES WITH POPULATIONS OF 50,000 OR MORE, APRIL 1, 2010 TO JULY 1, 2016 TEXAS CITIES LISTED BY NATIONAL GROWTH RANK FOR THE PERIOD
US Rank
(% chg) City Metro Area Population Estimate Change, 2010-2016 160 Pharr McAllen-Edinburg-Mission 70,467 77,320 6,853 9.7 161 Lewisville Dallas-Fort Worth-Arlington 95,387 104,659 9,272 9.7 162 Houston Houston-The Woodlands-Sugar Land 2,100,277 2,303,482 203,205 9.7 175 Bryan College Station-Bryan 76,227 83,260 7,033 9.2 181 McAllen McAllen-Edinburg-Mission 130,463 142,212 11,749 9.0 186 Laredo Laredo 236,057 257,156 21,099 8.9 201 Grand Prairie Dallas-Fort Worth-Arlington 175,484 190,682 15,198 8.7 221 Tyler Tyler 96,887 104,798 7,911 8.2 226 Victoria Victoria 62,614 67,670 5,056 8.1 228 San Angelo San Angelo 93,227 100,702 7,475 8.0 241 Waco Waco 124,810 134,432 9,622 7.7 247 Mission McAllen-Edinburg-Mission 77,667 83,563 5,896 7.6 252 Arlington Dallas-Fort Worth-Arlington 365,399 392,772 27,373 7.5 281 Euless Dallas-Fort Worth-Arlington 51,280 54,769 3,489 6.8 287 Corpus Christi Corpus Christi 305,269 325,733 20,464 6.7 314 Baytown Houston-The Woodlands-Sugar Land 71,709 75,992 4,283 6.0 333 El Paso El Paso 648,054 683,080 35,026 5.4 360 Brownsville Brownsville-Harlingen 175,030 183,823 8,793 5.0 382 Amarillo Amarillo 190,666 199,582 8,916 4.7 419 Abilene Abilene 117,463 122,225 4,762 4.1 441 Garland Dallas-Fort Worth-Arlington 226,861 234,943 8,082 3.6 472 Mesquite Dallas-Fort Worth-Arlington 139,518 143,736 4,218 3.0 492 Pasadena Houston-The Woodlands-Sugar Land 149,285 153,351 4,066 2.7 526 Longview Longview 80,425 82,055 1,630 2.0 531 Port Arthur Beaumont-Port Arthur 54,376 55,427 1,051 1.9 581 Harlingen Brownsville-Harlingen 64,908 65,539 631 1.0 585 Beaumont Beaumont-Port Arthur 117,265 118,299 1,034 0.9 627 Wichita Falls Wichita Falls 104,724 104,724 — —
Indicates DFW peer community. Sources: US Census Bureau, Population Division; TIP Strategies.
FIGURE 28. US CITIES WITH THE LARGEST NUMERIC POPULATION CHANGE, APRIL 1, 2010 TO JULY 1, 2016 CITIES RANKED BY NUMERIC CHANGE
US Rank (# chg) City
Population Estimate Change, 2010-2016 April 1, 2010 July 1, 2016 Number Percent
1 New York, New York 8,174,962 8,537,673 362,711 4.4 2 Houston, Texas 2,100,277 2,303,482 203,205 9.7 3 Los Angeles, California 3,792,584 3,976,322 183,738 4.8 4 Phoenix, Arizona 1,447,624 1,615,017 167,393 11.6 5 San Antonio, Texas 1,327,538 1,492,510 164,972 12.4 6 Austin, Texas 811,045 947,890 136,845 16.9 7 Dallas, Texas 1,197,824 1,317,929 120,105 10.0
8 Fort Worth, Texas 744,973 854,113 109,140 14.7 9 Charlotte, North Carolina 735,612 842,051 106,439 14.5 10 San Diego, California 1,301,722 1,406,630 104,908 8.1
Sources: US Census Bureau, Population Division; TIP Strategies.

CITY OF FORT WORTH ECONOMIC DEVELOPMENT STRATEGIC PLAN
VOLUME 1: COMPETITIVENESS PAGE | 35
The age structure of the US population has changed over recent decades, with a “bubble” of baby boomers passing through various age cohorts and now entering retirement. Those same dramatic patterns are less apparent in Tarrant County’s age structure. Rapid growth within the county has kept the local age cohort structure relatively stable, though hints of the national patterns can be seen in Figure 29.
According to estimates by Moody’s Analytics, the senior share of the county’s population (age 65 or older) will begin to creep up as the baby boomers gradually pass the age 65 threshold. Children of school age (as a share of the county’s total population) peaked in the 1970s and declined until 1985, but this share has held relative steady since then and is not expected to shift dramatically, per Moody’s. From a workforce perspective, those in the middle cohorts (age 20-64) are not projected to present any major shocks to the county’s working age population. Again, the national patterns may pose challenges for some parts of the US, but in Tarrant County these changes appear relatively minor, at least in percentage terms.
FIGURE 29. AGE STRUCTURE OF TARRANT COUNTY POPULATION, 1970 TO 2030
Sources: Moody’s Analytics; US Census Bureau; TIP Strategies.
0%
10%
20%
30%
40%
50%
60%
70%
80%
90%
100%
1970
1975
1980
1985
1990
1995
2000
2005
2010
2015
2020
2025
2030
% o
f tot
al p
opul
atio
n
Seniors (% 65+)
Experienced WorkingAge (% 35-64)
Younger Working Age(% 20-34)
School Age (% 5-19)
Preschool (% under 5)
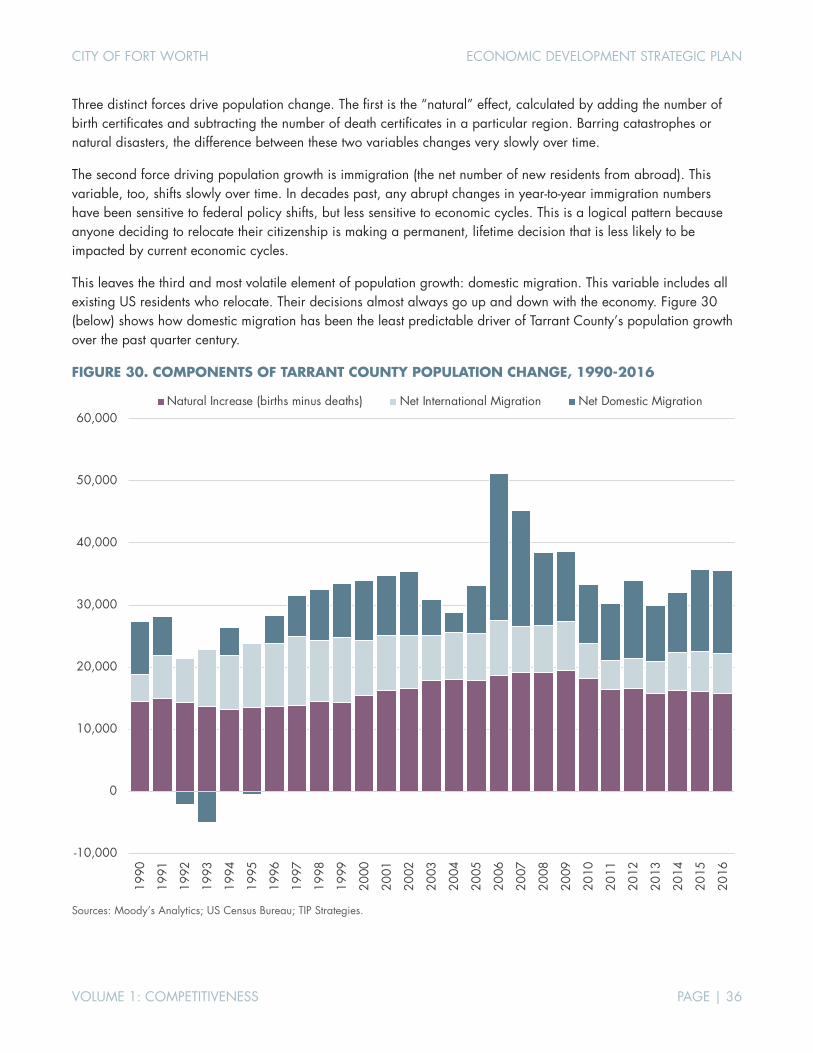
CITY OF FORT WORTH ECONOMIC DEVELOPMENT STRATEGIC PLAN
VOLUME 1: COMPETITIVENESS PAGE | 36
Three distinct forces drive population change. The first is the “natural” effect, calculated by adding the number of birth certificates and subtracting the number of death certificates in a particular region. Barring catastrophes or natural disasters, the difference between these two variables changes very slowly over time.
The second force driving population growth is immigration (the net number of new residents from abroad). This variable, too, shifts slowly over time. In decades past, any abrupt changes in year-to-year immigration numbers have been sensitive to federal policy shifts, but less sensitive to economic cycles. This is a logical pattern because anyone deciding to relocate their citizenship is making a permanent, lifetime decision that is less likely to be impacted by current economic cycles.
This leaves the third and most volatile element of population growth: domestic migration. This variable includes all existing US residents who relocate. Their decisions almost always go up and down with the economy. Figure 30 (below) shows how domestic migration has been the least predictable driver of Tarrant County’s population growth over the past quarter century.
FIGURE 30. COMPONENTS OF TARRANT COUNTY POPULATION CHANGE, 1990-2016
Sources: Moody’s Analytics; US Census Bureau; TIP Strategies.
-10,000
0
10,000
20,000
30,000
40,000
50,000
60,000
1990
1991
1992
1993
1994
1995
1996
1997
1998
1999
2000
2001
2002
2003
2004
2005
2006
2007
2008
2009
2010
2011
2012
2013
2014
2015
2016
Natural Increase (births minus deaths) Net International Migration Net Domestic Migration

CITY OF FORT WORTH ECONOMIC DEVELOPMENT STRATEGIC PLAN
VOLUME 1: COMPETITIVENESS PAGE | 37
This point about the volatility of domestic migration opens the door for further investigation. If the Dallas-Fort Worth metro area has been expanding with the demographic dynamism shown in Figures 27-30, then it is clearly attracting domestic migrants. But from where? The map below (Figure 31), which illustrates the five-year post-recession period of 2010–2014, may offer some surprises. It reveals that five US metropolitan areas had a substantial impact on the region’s growth. (See further details in Figures 32-36.) The net inbound domestic migration was by far the highest from metropolitan Chicago, New York, and Los Angeles. As the map shows, most US metropolitan areas lost residents to Dallas-Fort Worth, though in smaller numbers than these three MSAs did. The biggest surprise below may be that Dallas-Fort Worth was losing residents to a handful of areas, and two MSAs in particular. On a net basis, the Dallas-Fort Worth MSA lost residents to metropolitan Austin and Houston during the same five-year period. To be sure, the net flows with Houston have tipped back and forth over time, and 2010–2014 was a boom period for the energy industry, something that has historically worked in Houston’s favor. Austin’s pattern differs; it has persisted more consistently over economic cycles.
FIGURE 31. NET DOMESTIC MIGRATION TO/FROM DALLAS-FORT WORTH MSA, 2010 TO 2014 NET MIGRATION INBOUND TO (AND OUTBOUND FROM) DALLAS-FORT WORTH MSA
Source: IRS via Moody’s Analytics. Note: Domestic migration flows are based on year-over-year address changes on federal tax returns using exemptions as a proxy for population. Net migration figures represent the difference between inbound migrants (those moving to one of the Dallas-Fort Worth MSA counties from outside the area) and outbound migrants (those relocating from the Dallas-Fort Worth MSA to other US counties). IRS data are compiled from administrative records and include only tax filers. As a result, they differ from other estimates of migration, including Census Bureau figures published separately.
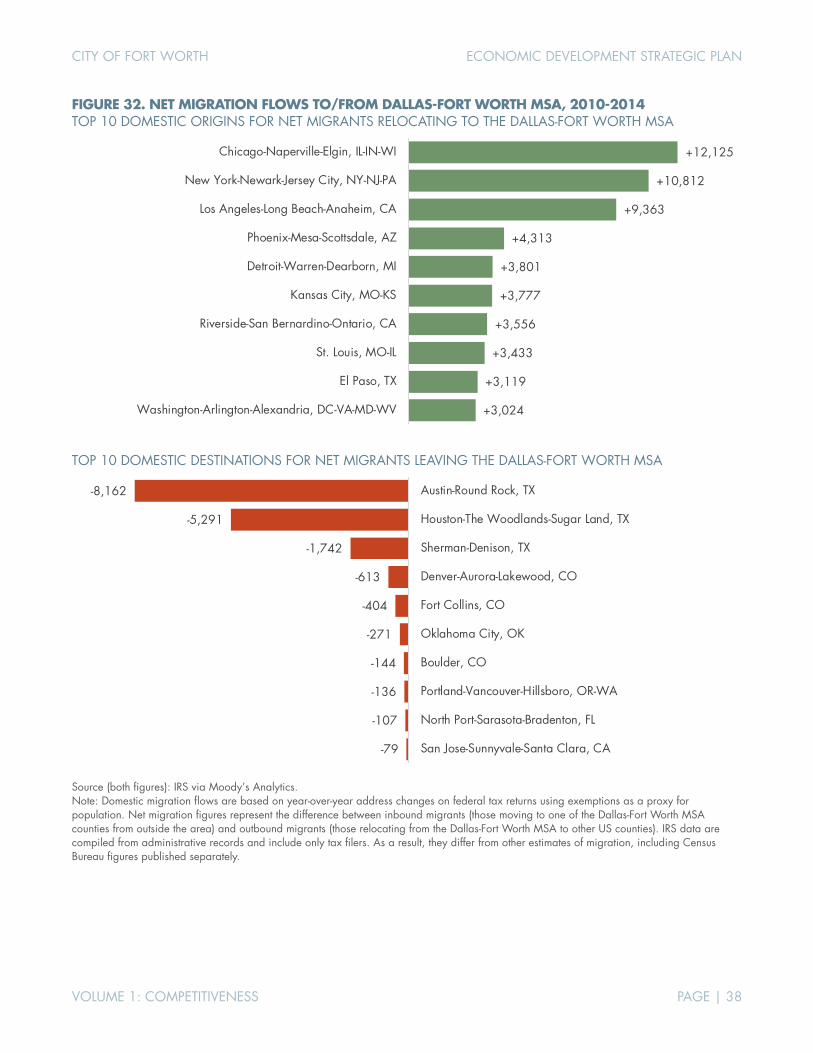
CITY OF FORT WORTH ECONOMIC DEVELOPMENT STRATEGIC PLAN
VOLUME 1: COMPETITIVENESS PAGE | 38
FIGURE 32. NET MIGRATION FLOWS TO/FROM DALLAS-FORT WORTH MSA, 2010-2014 TOP 10 DOMESTIC ORIGINS FOR NET MIGRANTS RELOCATING TO THE DALLAS-FORT WORTH MSA
TOP 10 DOMESTIC DESTINATIONS FOR NET MIGRANTS LEAVING THE DALLAS-FORT WORTH MSA
Source (both figures): IRS via Moody’s Analytics. Note: Domestic migration flows are based on year-over-year address changes on federal tax returns using exemptions as a proxy for population. Net migration figures represent the difference between inbound migrants (those moving to one of the Dallas-Fort Worth MSA counties from outside the area) and outbound migrants (those relocating from the Dallas-Fort Worth MSA to other US counties). IRS data are compiled from administrative records and include only tax filers. As a result, they differ from other estimates of migration, including Census Bureau figures published separately.
+12,125
+10,812
+9,363
+4,313
+3,801
+3,777
+3,556
+3,433
+3,119
+3,024
Chicago-Naperville-Elgin, IL-IN-WI
New York-Newark-Jersey City, NY-NJ-PA
Los Angeles-Long Beach-Anaheim, CA
Phoenix-Mesa-Scottsdale, AZ
Detroit-Warren-Dearborn, MI
Kansas City, MO-KS
Riverside-San Bernardino-Ontario, CA
St. Louis, MO-IL
El Paso, TX
Washington-Arlington-Alexandria, DC-VA-MD-WV
-8,162
-5,291
-1,742
-613
-404
-271
-144
-136
-107
-79
Austin-Round Rock, TX
Houston-The Woodlands-Sugar Land, TX
Sherman-Denison, TX
Denver-Aurora-Lakewood, CO
Fort Collins, CO
Oklahoma City, OK
Boulder, CO
Portland-Vancouver-Hillsboro, OR-WA
North Port-Sarasota-Bradenton, FL
San Jose-Sunnyvale-Santa Clara, CA
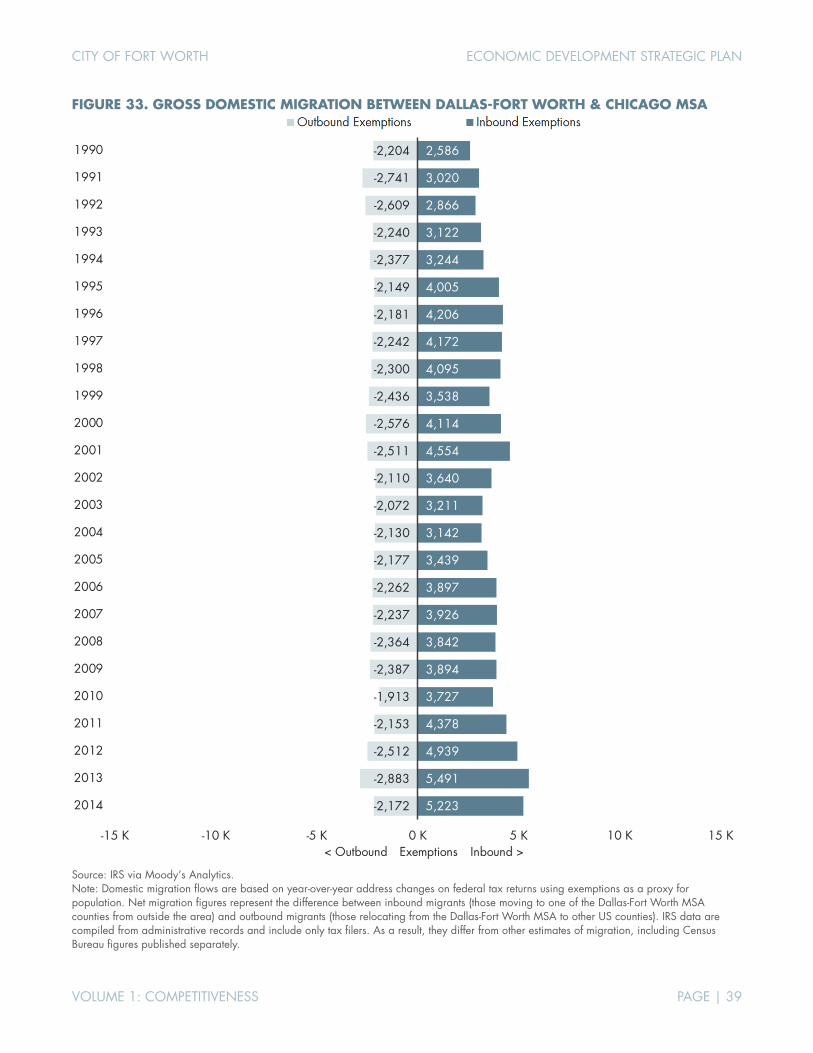
CITY OF FORT WORTH ECONOMIC DEVELOPMENT STRATEGIC PLAN
VOLUME 1: COMPETITIVENESS PAGE | 39
FIGURE 33. GROSS DOMESTIC MIGRATION BETWEEN DALLAS-FORT WORTH & CHICAGO MSA
Source: IRS via Moody’s Analytics. Note: Domestic migration flows are based on year-over-year address changes on federal tax returns using exemptions as a proxy for population. Net migration figures represent the difference between inbound migrants (those moving to one of the Dallas-Fort Worth MSA counties from outside the area) and outbound migrants (those relocating from the Dallas-Fort Worth MSA to other US counties). IRS data are compiled from administrative records and include only tax filers. As a result, they differ from other estimates of migration, including Census Bureau figures published separately.
2,586
3,020
2,866
3,122
3,244
4,005
4,206
4,172
4,095
3,538
4,114
4,554
3,640
3,211
3,142
3,439
3,897
3,926
3,842
3,894
3,727
4,378
4,939
5,491
5,223
-2,204
-2,741
-2,609
-2,240
-2,377
-2,149
-2,181
-2,242
-2,300
-2,436
-2,576
-2,511
-2,110
-2,072
-2,130
-2,177
-2,262
-2,237
-2,364
-2,387
-1,913
-2,153
-2,512
-2,883
-2,172
-15 K -10 K -5 K 0 K 5 K 10 K 15 K
1990
1991
1992
1993
1994
1995
1996
1997
1998
1999
2000
2001
2002
2003
2004
2005
2006
2007
2008
2009
2010
2011
2012
2013
2014
Inbound >< Outbound Exemptions
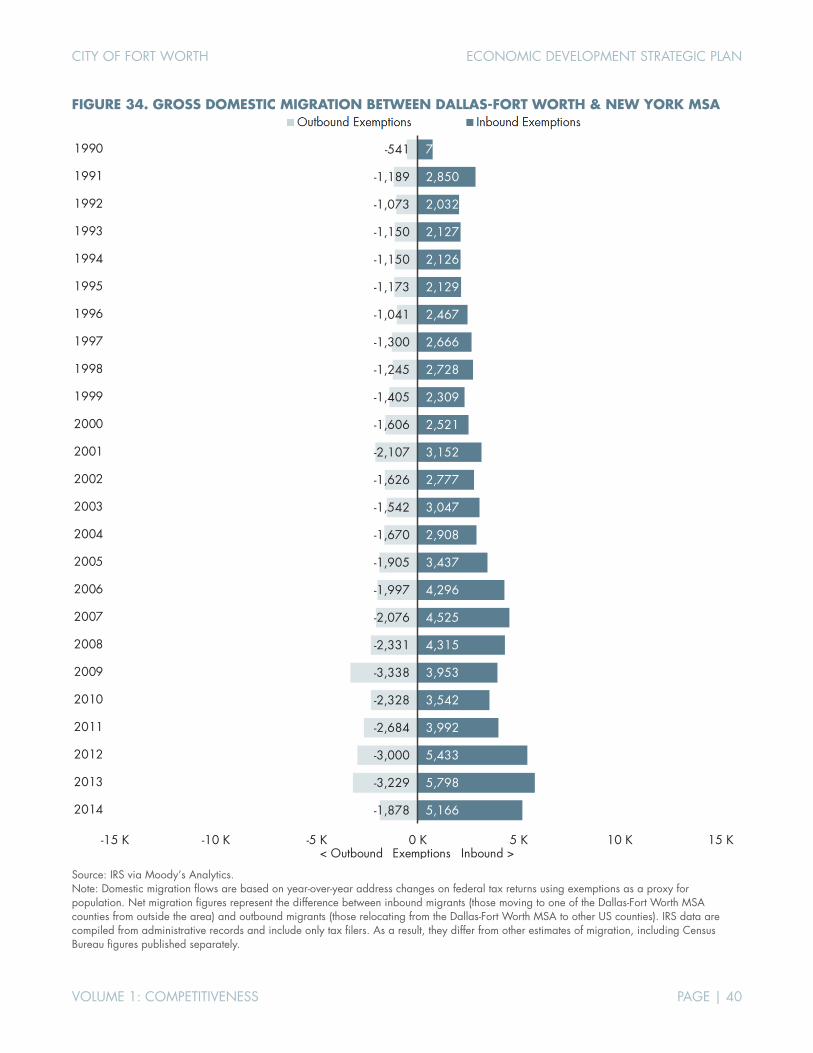
CITY OF FORT WORTH ECONOMIC DEVELOPMENT STRATEGIC PLAN
VOLUME 1: COMPETITIVENESS PAGE | 40
FIGURE 34. GROSS DOMESTIC MIGRATION BETWEEN DALLAS-FORT WORTH & NEW YORK MSA
Source: IRS via Moody’s Analytics. Note: Domestic migration flows are based on year-over-year address changes on federal tax returns using exemptions as a proxy for population. Net migration figures represent the difference between inbound migrants (those moving to one of the Dallas-Fort Worth MSA counties from outside the area) and outbound migrants (those relocating from the Dallas-Fort Worth MSA to other US counties). IRS data are compiled from administrative records and include only tax filers. As a result, they differ from other estimates of migration, including Census Bureau figures published separately.
729
2,850
2,032
2,127
2,126
2,129
2,467
2,666
2,728
2,309
2,521
3,152
2,777
3,047
2,908
3,437
4,296
4,525
4,315
3,953
3,542
3,992
5,433
5,798
5,166
-541
-1,189
-1,073
-1,150
-1,150
-1,173
-1,041
-1,300
-1,245
-1,405
-1,606
-2,107
-1,626
-1,542
-1,670
-1,905
-1,997
-2,076
-2,331
-3,338
-2,328
-2,684
-3,000
-3,229
-1,878
-15 K -10 K -5 K 0 K 5 K 10 K 15 K
1990
1991
1992
1993
1994
1995
1996
1997
1998
1999
2000
2001
2002
2003
2004
2005
2006
2007
2008
2009
2010
2011
2012
2013
2014
Inbound >< Outbound Exemptions
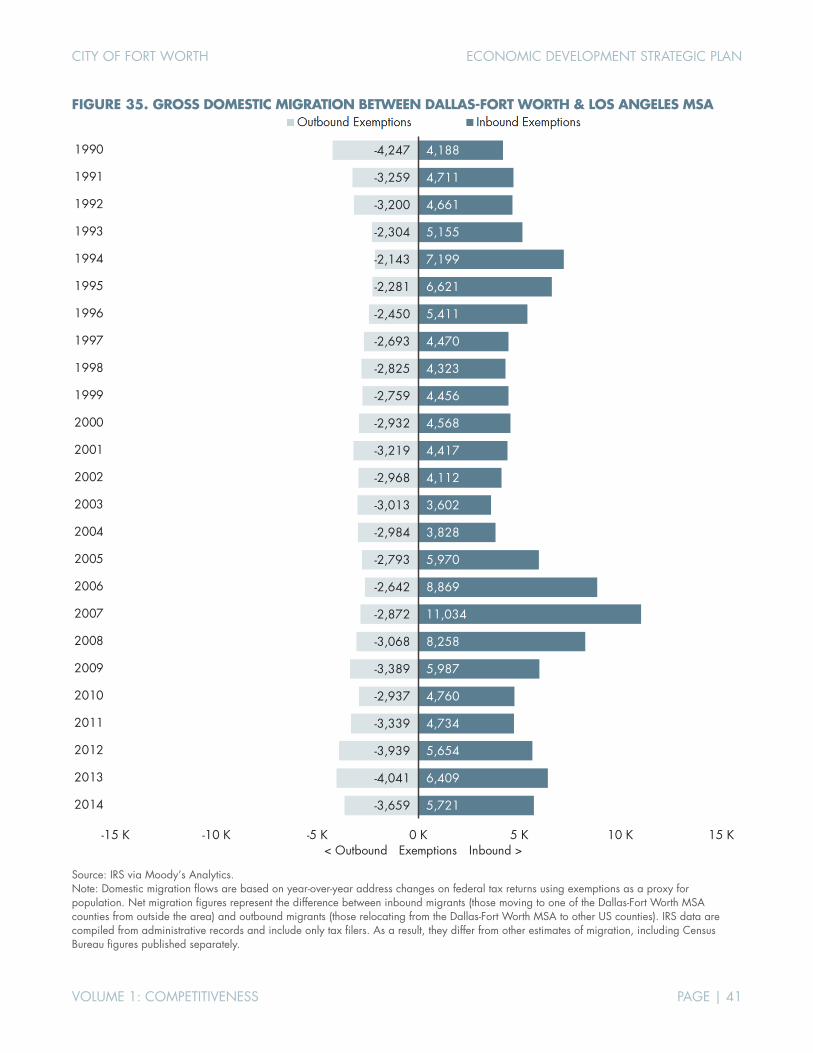
CITY OF FORT WORTH ECONOMIC DEVELOPMENT STRATEGIC PLAN
VOLUME 1: COMPETITIVENESS PAGE | 41
FIGURE 35. GROSS DOMESTIC MIGRATION BETWEEN DALLAS-FORT WORTH & LOS ANGELES MSA
Source: IRS via Moody’s Analytics. Note: Domestic migration flows are based on year-over-year address changes on federal tax returns using exemptions as a proxy for population. Net migration figures represent the difference between inbound migrants (those moving to one of the Dallas-Fort Worth MSA counties from outside the area) and outbound migrants (those relocating from the Dallas-Fort Worth MSA to other US counties). IRS data are compiled from administrative records and include only tax filers. As a result, they differ from other estimates of migration, including Census Bureau figures published separately.
4,188
4,711
4,661
5,155
7,199
6,621
5,411
4,470
4,323
4,456
4,568
4,417
4,112
3,602
3,828
5,970
8,869
11,034
8,258
5,987
4,760
4,734
5,654
6,409
5,721
-4,247
-3,259
-3,200
-2,304
-2,143
-2,281
-2,450
-2,693
-2,825
-2,759
-2,932
-3,219
-2,968
-3,013
-2,984
-2,793
-2,642
-2,872
-3,068
-3,389
-2,937
-3,339
-3,939
-4,041
-3,659
-15 K -10 K -5 K 0 K 5 K 10 K 15 K
1990
1991
1992
1993
1994
1995
1996
1997
1998
1999
2000
2001
2002
2003
2004
2005
2006
2007
2008
2009
2010
2011
2012
2013
2014
Inbound >< Outbound Exemptions
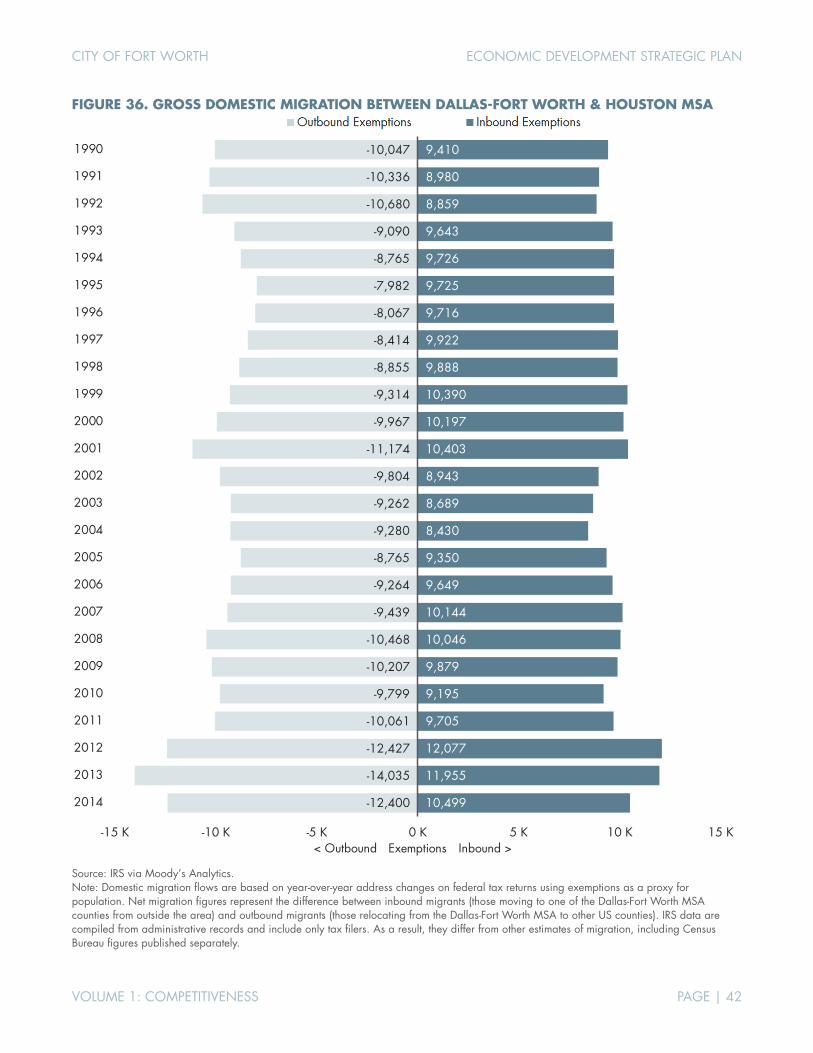
CITY OF FORT WORTH ECONOMIC DEVELOPMENT STRATEGIC PLAN
VOLUME 1: COMPETITIVENESS PAGE | 42
FIGURE 36. GROSS DOMESTIC MIGRATION BETWEEN DALLAS-FORT WORTH & HOUSTON MSA
Source: IRS via Moody’s Analytics. Note: Domestic migration flows are based on year-over-year address changes on federal tax returns using exemptions as a proxy for population. Net migration figures represent the difference between inbound migrants (those moving to one of the Dallas-Fort Worth MSA counties from outside the area) and outbound migrants (those relocating from the Dallas-Fort Worth MSA to other US counties). IRS data are compiled from administrative records and include only tax filers. As a result, they differ from other estimates of migration, including Census Bureau figures published separately.
9,410
8,980
8,859
9,643
9,726
9,725
9,716
9,922
9,888
10,390
10,197
10,403
8,943
8,689
8,430
9,350
9,649
10,144
10,046
9,879
9,195
9,705
12,077
11,955
10,499
-10,047
-10,336
-10,680
-9,090
-8,765
-7,982
-8,067
-8,414
-8,855
-9,314
-9,967
-11,174
-9,804
-9,262
-9,280
-8,765
-9,264
-9,439
-10,468
-10,207
-9,799
-10,061
-12,427
-14,035
-12,400
-15 K -10 K -5 K 0 K 5 K 10 K 15 K
1990
1991
1992
1993
1994
1995
1996
1997
1998
1999
2000
2001
2002
2003
2004
2005
2006
2007
2008
2009
2010
2011
2012
2013
2014
Inbound >< Outbound Exemptions
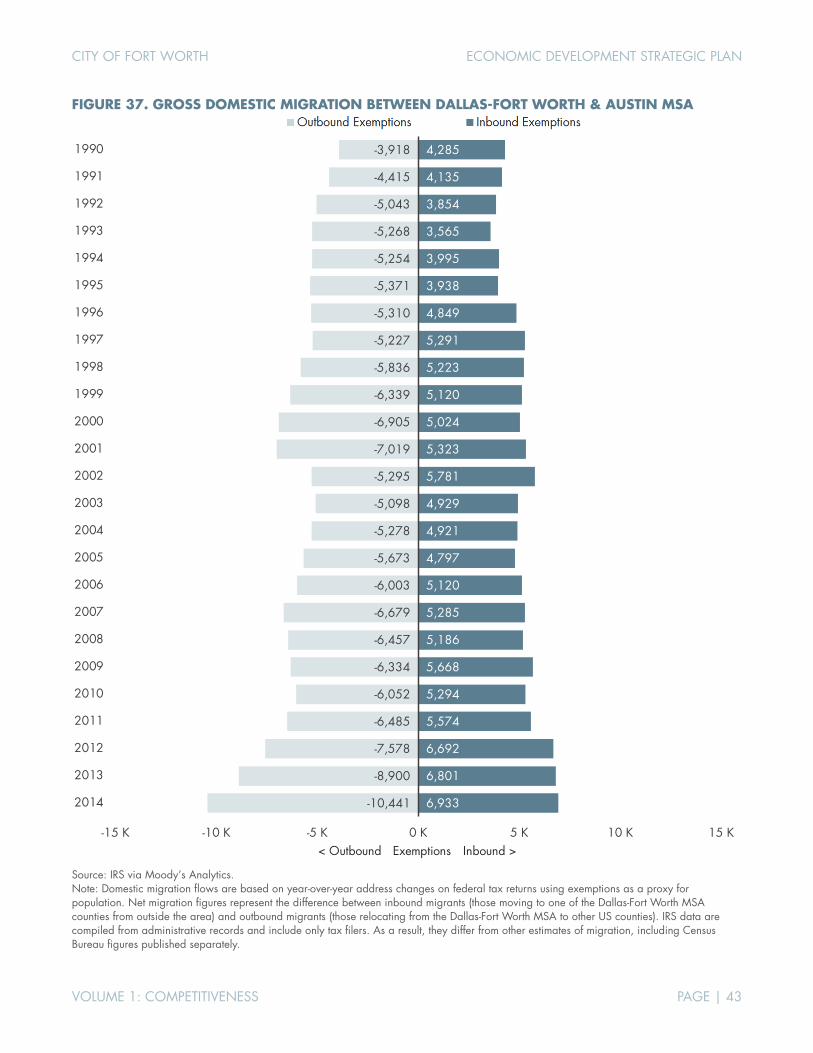
CITY OF FORT WORTH ECONOMIC DEVELOPMENT STRATEGIC PLAN
VOLUME 1: COMPETITIVENESS PAGE | 43
FIGURE 37. GROSS DOMESTIC MIGRATION BETWEEN DALLAS-FORT WORTH & AUSTIN MSA
Source: IRS via Moody’s Analytics. Note: Domestic migration flows are based on year-over-year address changes on federal tax returns using exemptions as a proxy for population. Net migration figures represent the difference between inbound migrants (those moving to one of the Dallas-Fort Worth MSA counties from outside the area) and outbound migrants (those relocating from the Dallas-Fort Worth MSA to other US counties). IRS data are compiled from administrative records and include only tax filers. As a result, they differ from other estimates of migration, including Census Bureau figures published separately.
4,285
4,135
3,854
3,565
3,995
3,938
4,849
5,291
5,223
5,120
5,024
5,323
5,781
4,929
4,921
4,797
5,120
5,285
5,186
5,668
5,294
5,574
6,692
6,801
6,933
-3,918
-4,415
-5,043
-5,268
-5,254
-5,371
-5,310
-5,227
-5,836
-6,339
-6,905
-7,019
-5,295
-5,098
-5,278
-5,673
-6,003
-6,679
-6,457
-6,334
-6,052
-6,485
-7,578
-8,900
-10,441
-15 K -10 K -5 K 0 K 5 K 10 K 15 K
1990
1991
1992
1993
1994
1995
1996
1997
1998
1999
2000
2001
2002
2003
2004
2005
2006
2007
2008
2009
2010
2011
2012
2013
2014
Inbound >< Outbound Exemptions

CITY OF FORT WORTH ECONOMIC DEVELOPMENT STRATEGIC PLAN
VOLUME 1: COMPETITIVENESS PAGE | 44
While Figures 31-37 show metropolitan migration patterns for the Dallas-Fort Worth MSA overall, Figures 38-46 show the same patterns within the Fort Worth MD. The MD patterns are similar but with a few subtle differences. Chicago remains the prime source of net inbound migration for the Fort Worth MD as it does for the larger MSA, but the Dallas MD alone (not shown on the map) edges in just ahead of Los Angeles and New York as the second leading source of net migration in the 2010-2014 period. Atlanta does not appear among the 10 leading sources of inbound migration to the Dallas-Fort Worth MSA as a whole, yet it checks in among the top five sources of new residents for the Fort Worth MD. Similar to the MSA as a whole, Austin and Houston were the main locations where Fort Worth residents were most likely to relocate (on a net basis). Net outbound migration to San Antonio and Oklahoma City from the MD outpaced the MSA totals overall, though the net losses to these locations were relatively small during the 2010-2014 period.
FIGURE 38. NET DOMESTIC MIGRATION TO/FROM THE FORT WORTH MD BY MSA*, 2010-2014 NET MIGRATION INBOUND TO (AND OUTBOUND FROM) FORT WORTH MD
*Only MSA boundaries are highlighted. The Dallas MD is not shown. Source: IRS via Moody’s Analytics. Note: Domestic migration flows are based on year-over-year address changes on federal tax returns using exemptions as a proxy for population. Net migration figures represent the difference between inbound migrants (those moving to one of the Fort Worth-Arlington MD counties from outside the area) and outbound migrants (those relocating from the Fort Worth-Arlington MD to other US counties). IRS data are compiled from administrative records and include only tax filers. As a result, they differ from other estimates of migration, including Census Bureau figures published separately.
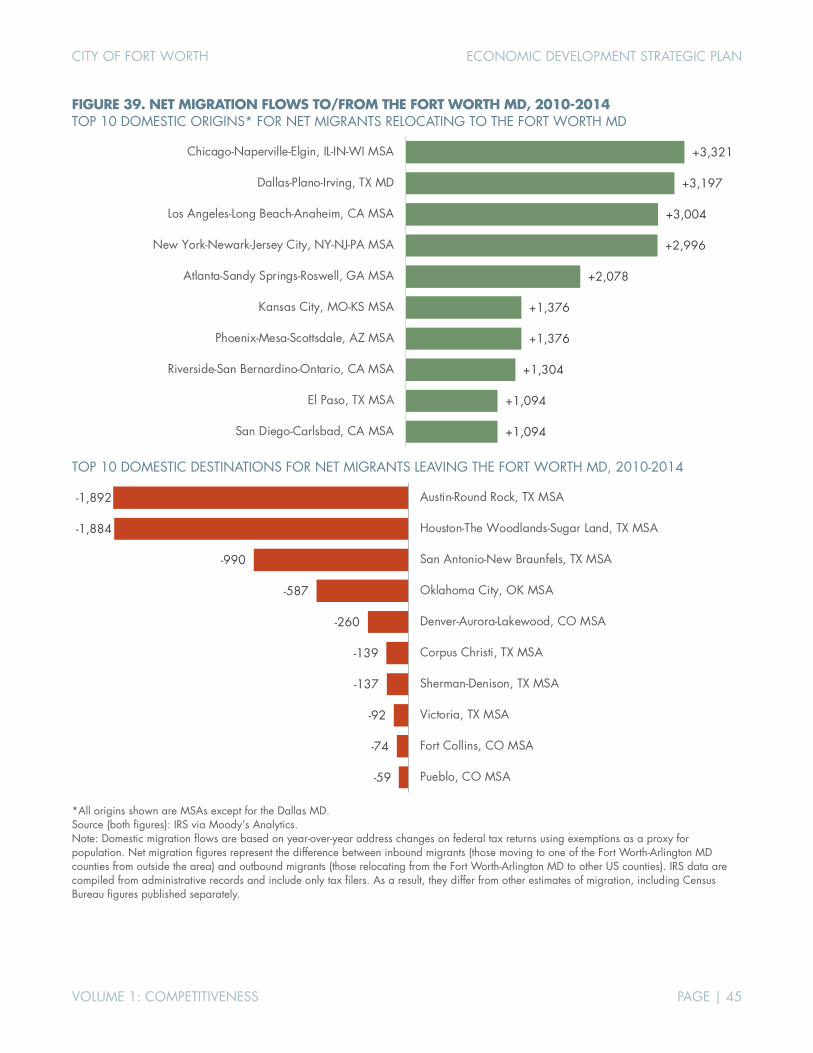
CITY OF FORT WORTH ECONOMIC DEVELOPMENT STRATEGIC PLAN
VOLUME 1: COMPETITIVENESS PAGE | 45
FIGURE 39. NET MIGRATION FLOWS TO/FROM THE FORT WORTH MD, 2010-2014 TOP 10 DOMESTIC ORIGINS* FOR NET MIGRANTS RELOCATING TO THE FORT WORTH MD
TOP 10 DOMESTIC DESTINATIONS FOR NET MIGRANTS LEAVING THE FORT WORTH MD, 2010-2014
*All origins shown are MSAs except for the Dallas MD. Source (both figures): IRS via Moody’s Analytics. Note: Domestic migration flows are based on year-over-year address changes on federal tax returns using exemptions as a proxy for population. Net migration figures represent the difference between inbound migrants (those moving to one of the Fort Worth-Arlington MD counties from outside the area) and outbound migrants (those relocating from the Fort Worth-Arlington MD to other US counties). IRS data are compiled from administrative records and include only tax filers. As a result, they differ from other estimates of migration, including Census Bureau figures published separately.
+1,094
+1,094
+1,304
+1,376
+1,376
+2,078
+2,996
+3,004
+3,197
+3,321
San Diego-Carlsbad, CA MSA
El Paso, TX MSA
Riverside-San Bernardino-Ontario, CA MSA
Phoenix-Mesa-Scottsdale, AZ MSA
Kansas City, MO-KS MSA
Atlanta-Sandy Springs-Roswell, GA MSA
New York-Newark-Jersey City, NY-NJ-PA MSA
Los Angeles-Long Beach-Anaheim, CA MSA
Dallas-Plano-Irving, TX MD
Chicago-Naperville-Elgin, IL-IN-WI MSA
-59
-74
-92
-137
-139
-260
-587
-990
-1,884
-1,892
Pueblo, CO MSA
Fort Collins, CO MSA
Victoria, TX MSA
Sherman-Denison, TX MSA
Corpus Christi, TX MSA
Denver-Aurora-Lakewood, CO MSA
Oklahoma City, OK MSA
San Antonio-New Braunfels, TX MSA
Houston-The Woodlands-Sugar Land, TX MSA
Austin-Round Rock, TX MSA
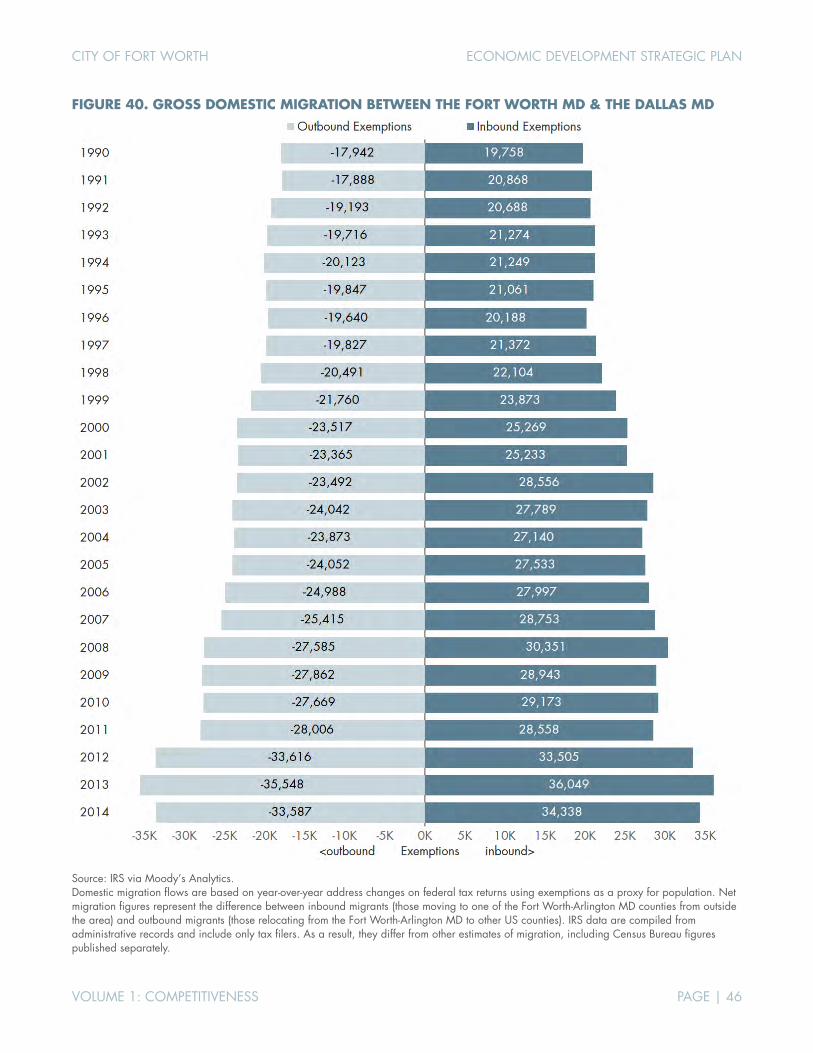
CITY OF FORT WORTH ECONOMIC DEVELOPMENT STRATEGIC PLAN
VOLUME 1: COMPETITIVENESS PAGE | 46
FIGURE 40. GROSS DOMESTIC MIGRATION BETWEEN THE FORT WORTH MD & THE DALLAS MD
Source: IRS via Moody’s Analytics. Domestic migration flows are based on year-over-year address changes on federal tax returns using exemptions as a proxy for population. Net migration figures represent the difference between inbound migrants (those moving to one of the Fort Worth-Arlington MD counties from outside the area) and outbound migrants (those relocating from the Fort Worth-Arlington MD to other US counties). IRS data are compiled from administrative records and include only tax filers. As a result, they differ from other estimates of migration, including Census Bureau figures published separately.
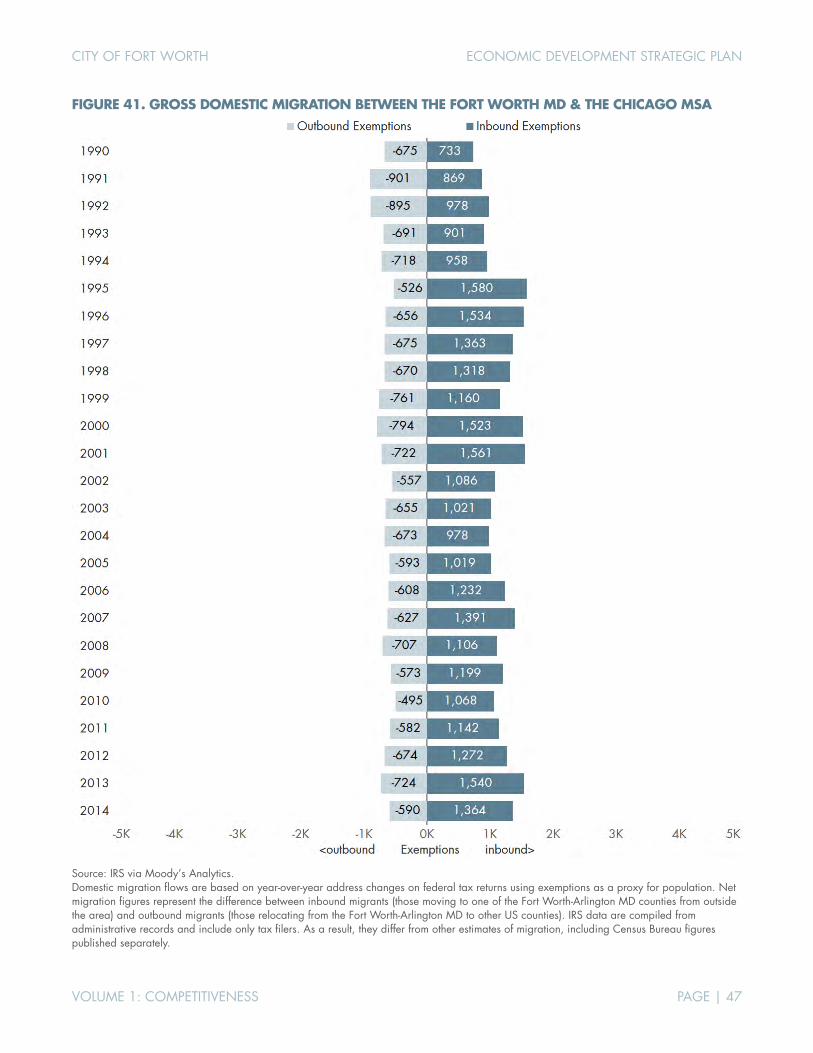
CITY OF FORT WORTH ECONOMIC DEVELOPMENT STRATEGIC PLAN
VOLUME 1: COMPETITIVENESS PAGE | 47
FIGURE 41. GROSS DOMESTIC MIGRATION BETWEEN THE FORT WORTH MD & THE CHICAGO MSA
Source: IRS via Moody’s Analytics. Domestic migration flows are based on year-over-year address changes on federal tax returns using exemptions as a proxy for population. Net migration figures represent the difference between inbound migrants (those moving to one of the Fort Worth-Arlington MD counties from outside the area) and outbound migrants (those relocating from the Fort Worth-Arlington MD to other US counties). IRS data are compiled from administrative records and include only tax filers. As a result, they differ from other estimates of migration, including Census Bureau figures published separately.
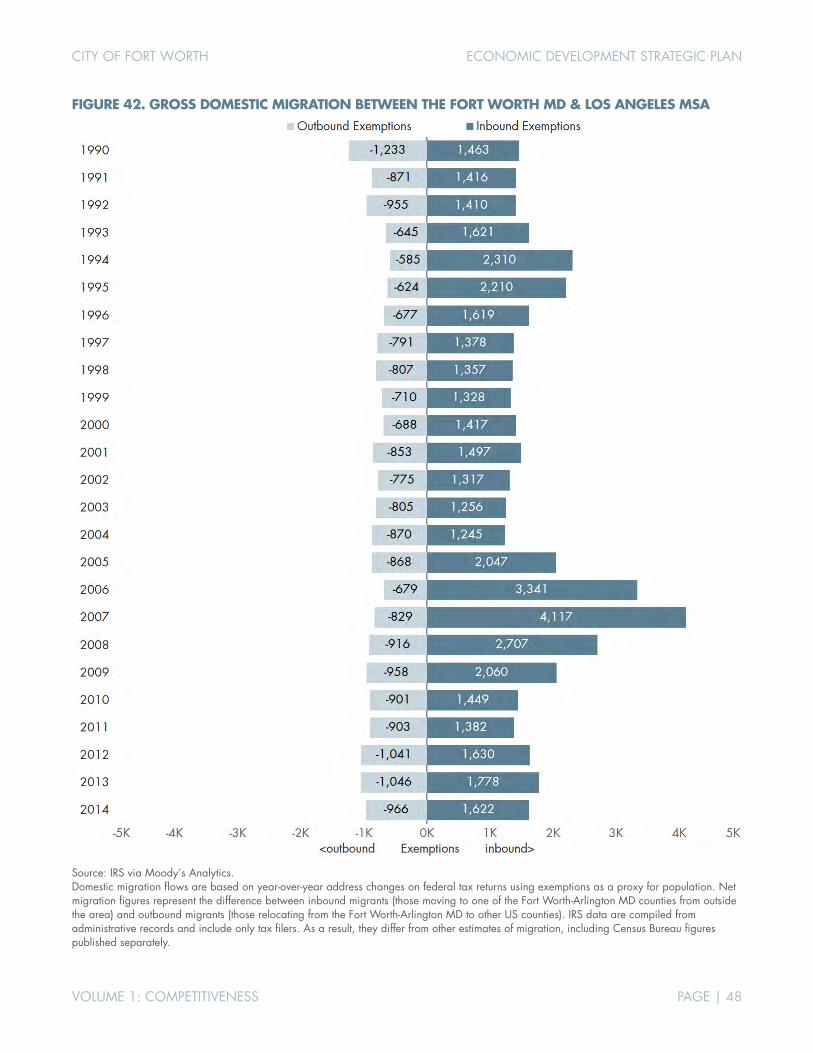
CITY OF FORT WORTH ECONOMIC DEVELOPMENT STRATEGIC PLAN
VOLUME 1: COMPETITIVENESS PAGE | 48
FIGURE 42. GROSS DOMESTIC MIGRATION BETWEEN THE FORT WORTH MD & LOS ANGELES MSA
Source: IRS via Moody’s Analytics. Domestic migration flows are based on year-over-year address changes on federal tax returns using exemptions as a proxy for population. Net migration figures represent the difference between inbound migrants (those moving to one of the Fort Worth-Arlington MD counties from outside the area) and outbound migrants (those relocating from the Fort Worth-Arlington MD to other US counties). IRS data are compiled from administrative records and include only tax filers. As a result, they differ from other estimates of migration, including Census Bureau figures published separately.

CITY OF FORT WORTH ECONOMIC DEVELOPMENT STRATEGIC PLAN
VOLUME 1: COMPETITIVENESS PAGE | 49
FIGURE 43. GROSS DOMESTIC MIGRATION BETWEEN HE FORT WORTH MD & THE NEW YORK MSA
Source: IRS via Moody’s Analytics. Domestic migration flows are based on year-over-year address changes on federal tax returns using exemptions as a proxy for population. Net migration figures represent the difference between inbound migrants (those moving to one of the Fort Worth-Arlington MD counties from outside the area) and outbound migrants (those relocating from the Fort Worth-Arlington MD to other US counties). IRS data are compiled from administrative records and include only tax filers. As a result, they differ from other estimates of migration, including Census Bureau figures published separately.

CITY OF FORT WORTH ECONOMIC DEVELOPMENT STRATEGIC PLAN
VOLUME 1: COMPETITIVENESS PAGE | 50
FIGURE 44. GROSS DOMESTIC MIGRATION BETWEEN THE FORT WORTH MD & THE ATLANTA MSA
Source: IRS via Moody’s Analytics. Domestic migration flows are based on year-over-year address changes on federal tax returns using exemptions as a proxy for population. Net migration figures represent the difference between inbound migrants (those moving to one of the Fort Worth-Arlington MD counties from outside the area) and outbound migrants (those relocating from the Fort Worth-Arlington MD to other US counties). IRS data are compiled from administrative records and include only tax filers. As a result, they differ from other estimates of migration, including Census Bureau figures published separately.

CITY OF FORT WORTH ECONOMIC DEVELOPMENT STRATEGIC PLAN
VOLUME 1: COMPETITIVENESS PAGE | 51
FIGURE 45. GROSS DOMESTIC MIGRATION BETWEEN THE FORT WORTH MD & THE HOUSTON MSA
Source: IRS via Moody’s Analytics. Domestic migration flows are based on year-over-year address changes on federal tax returns using exemptions as a proxy for population. Net migration figures represent the difference between inbound migrants (those moving to one of the Fort Worth-Arlington MD counties from outside the area) and outbound migrants (those relocating from the Fort Worth-Arlington MD to other US counties). IRS data are compiled from administrative records and include only tax filers. As a result, they differ from other estimates of migration, including Census Bureau figures published separately.
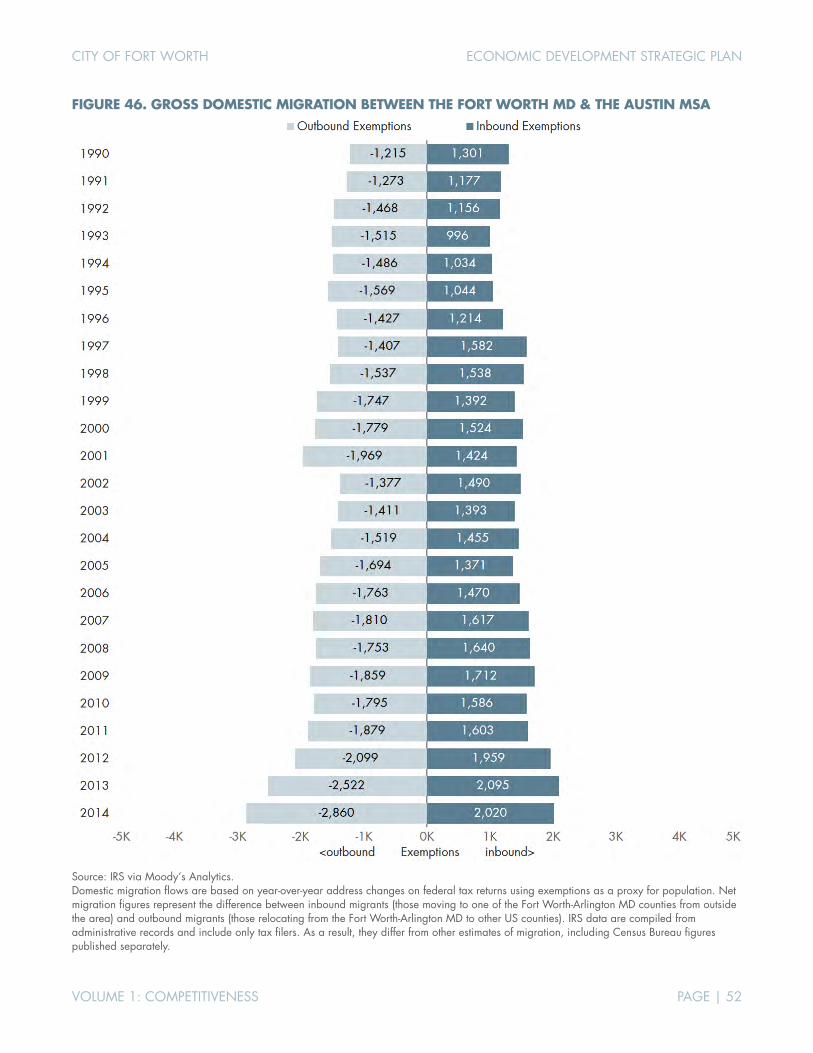
CITY OF FORT WORTH ECONOMIC DEVELOPMENT STRATEGIC PLAN
VOLUME 1: COMPETITIVENESS PAGE | 52
FIGURE 46. GROSS DOMESTIC MIGRATION BETWEEN THE FORT WORTH MD & THE AUSTIN MSA
Source: IRS via Moody’s Analytics. Domestic migration flows are based on year-over-year address changes on federal tax returns using exemptions as a proxy for population. Net migration figures represent the difference between inbound migrants (those moving to one of the Fort Worth-Arlington MD counties from outside the area) and outbound migrants (those relocating from the Fort Worth-Arlington MD to other US counties). IRS data are compiled from administrative records and include only tax filers. As a result, they differ from other estimates of migration, including Census Bureau figures published separately.
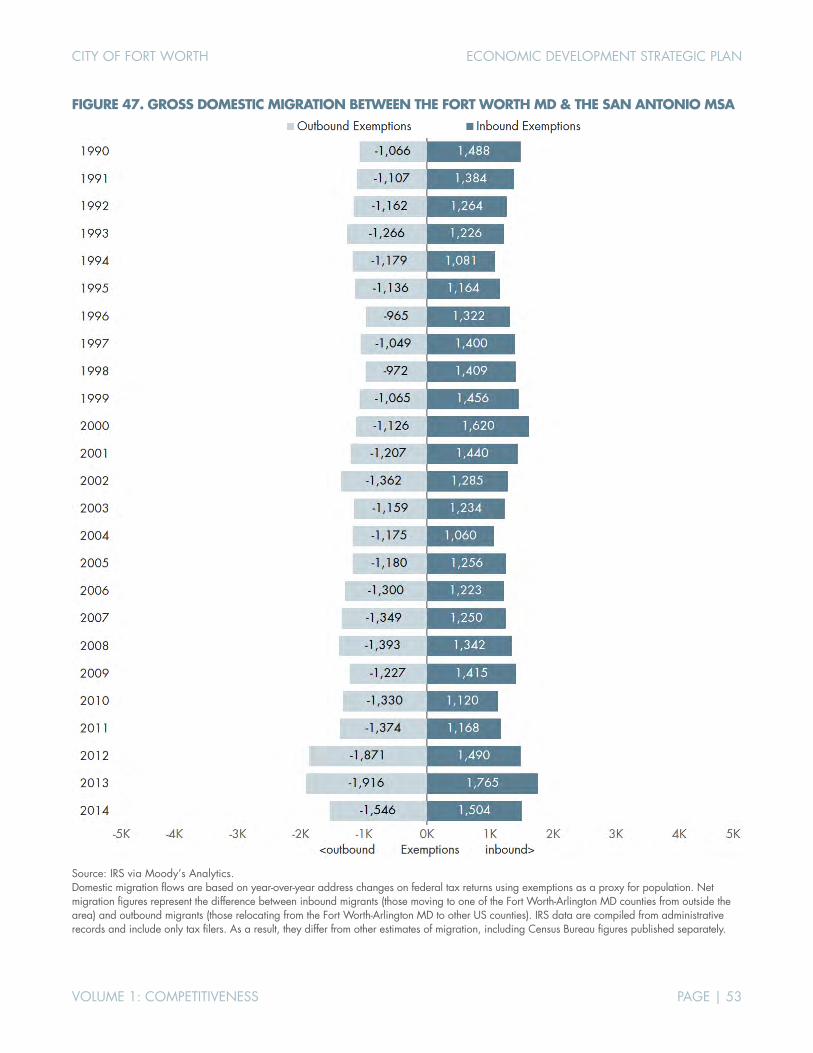
CITY OF FORT WORTH ECONOMIC DEVELOPMENT STRATEGIC PLAN
VOLUME 1: COMPETITIVENESS PAGE | 53
FIGURE 47. GROSS DOMESTIC MIGRATION BETWEEN THE FORT WORTH MD & THE SAN ANTONIO MSA
Source: IRS via Moody’s Analytics. Domestic migration flows are based on year-over-year address changes on federal tax returns using exemptions as a proxy for population. Net migration figures represent the difference between inbound migrants (those moving to one of the Fort Worth-Arlington MD counties from outside the area) and outbound migrants (those relocating from the Fort Worth-Arlington MD to other US counties). IRS data are compiled from administrative records and include only tax filers. As a result, they differ from other estimates of migration, including Census Bureau figures published separately.

CITY OF FORT WORTH ECONOMIC DEVELOPMENT STRATEGIC PLAN
VOLUME 1: COMPETITIVENESS PAGE | 54
FIGURE 48. SELECTED CHARACTERISTICS, 2015 COMPARISON OF FORT WORTH (CITY) TO SELECTED GEOGRAPHIES
Fort Worth
(city) Tarrant County
Fort Worth-Arlington Metro Div.
Dallas-Plano-Irving Metro
Div.
Dallas-Ft. Worth-Arl.
MSA Texas USA AGE
Share of the total population
Under 20 years 30.9% 29.6% 29.2% 29.1% 29.1% 29.2% 25.7%
20 to 64 years 59.8% 60.0% 59.4% 60.8% 60.3% 59.2% 59.5%
65 years and over 9.2% 10.5% 11.4% 10.2% 10.5% 11.7% 14.9%
Median age (in years) 32.6 34.3 35.1 34.5 34.7 34.4 37.8
RACE/ETHNICITY
Share of the total population
White, not Hispanic or Latino 39.9% 48.5% 53.7% 44.7% 47.7% 42.9% 61.5%
Hispanic or Latino, all races 35.4% 28.2% 26.2% 29.6% 28.4% 38.9% 17.6%
Black/African American 18.5% 15.6% 13.3% 16.1% 15.2% 11.7% 12.3%
American Indian/Alaska Native 0.2% 0.3% 0.3% 0.3% 0.3% 0.2% 0.6%
Asian 4.1% 5.2% 4.4% 7.3% 6.3% 4.5% 5.3%
Hawaiian/Pacific Islander 0.0% 0.2% 0.2% 0.0% 0.1% 0.1% 0.2%
Some other race 0.1% 0.1% 0.1% 0.1% 0.1% 0.1% 0.2%
Two or more 1.8% 2.0% 1.9% 1.9% 1.9% 1.6% 2.3%
FOREIGN-BORN
As share of total population 17.1% 15.9% 14.0% 20.3% 18.2% 17.0% 13.5%
Year of entry (% of foreign-born)
Entered after 2010 12.9% 15.1% 14.7% 16.6% 16.1% 16.3% 15.6%
Entered before 2010 87.1% 84.9% 85.3% 83.4% 83.9% 83.7% 84.4%
LANGUAGE SPOKEN AT HOME
English only 66.3% 71.7% 74.4% 66.3% 69.0% 64.6% 78.5%
Language other than English 33.7% 28.3% 25.6% 33.7% 31.0% 35.4% 21.5%
Speaks English less than “very well” 14.4% 12.3% 11.0% 15.6% 14.1% 14.3% 8.6%
RESIDENCE 1 YEAR AGO
Share of population 1 year and over
Same house 82.6% 82.7% 83.6% 83.9% 83.8% 83.9% 85.3%
Different house, same county 12.0% 10.8% 9.9% 9.1% 9.4% 9.3% 8.5%
Different county, same state 2.8% 3.3% 3.5% 4.0% 3.9% 4.0% 3.2%
Different state 2.0% 2.3% 2.2% 2.2% 2.2% 2.0% 2.4%
Outside US 0.6% 0.9% 0.8% 0.8% 0.8% 0.8% 0.7%
HOUSING UNITS
Share of occupied units
Owner-occupied 56.3% 60.0% 62.4% 57.7% 59.3% 61.1% 63.0%
Renter-occupied 43.7% 40.0% 37.6% 42.3% 40.7% 38.9% 37.0%
Median value, owner-occupied units $136,700 $153,200 $153,700 $189,000 $172,500 $152,000 $194,500
continued, next page

CITY OF FORT WORTH ECONOMIC DEVELOPMENT STRATEGIC PLAN
VOLUME 1: COMPETITIVENESS PAGE | 55
FIGURE 48. SELECTED CHARACTERISTICS, 2015 (CONTINUED) COMPARISON OF FORT WORTH (CITY) TO SELECTED GEOGRAPHIES
Fort Worth
(city) Tarrant County
Fort Worth-Arlington Metro Div.
Dallas-Plano-Irving Metro
Div.
Dallas-Ft. Worth-Arl.
MSA Texas USA SCHOOL ENROLLMENT
Pop. 3 yrs. and over enrolled in school
Nursery school, preschool 6.4% 6.2% 6.0% 6.2% 6.1% 6.0% 6.0%
Kindergarten 5.7% 5.4% 5.2% 6.0% 5.7% 5.6% 5.0%
Elementary school (grades 1-8) 44.6% 43.4% 44.1% 44.3% 44.2% 43.4% 40.3%
High school (grades 9-12) 20.5% 21.0% 21.3% 20.9% 21.1% 21.1% 20.9%
College or graduate school 22.8% 24.1% 23.4% 22.6% 22.9% 24.0% 27.8%
EDUCATIONAL ATTAINMENT
Population 25 years and over
Less than 9th grade 10.0% 7.1% 6.9% 8.3% 7.8% 8.9% 5.5%
9th to 12th grade, no diploma 9.1% 7.5% 7.8% 7.7% 7.7% 8.7% 7.3%
High school graduate/equivalent 26.0% 24.1% 25.2% 21.2% 22.6% 25.3% 27.6%
Some college, no degree 21.3% 23.3% 23.8% 20.9% 21.9% 21.8% 20.7%
Associate's degree 6.3% 7.2% 7.1% 6.3% 6.6% 6.9% 8.2%
Bachelor's degree 18.8% 21.0% 20.0% 23.2% 22.1% 18.7% 19.0%
Graduate or professional degree 8.6% 9.8% 9.3% 12.3% 11.3% 9.7% 11.6%
% high school graduate or higher 80.9% 85.4% 85.4% 84.0% 84.4% 82.4% 87.1%
% bachelor's degree or higher 27.3% 30.8% 29.3% 35.5% 33.4% 28.4% 30.6%
INCOME AND BENEFITS (IN 2015 INFLATION-ADJUSTED DOLLARS)
Total households
Less than $10,000 6.6% 5.2% 5.2% 5.3% 5.2% 6.6% 6.9%
$10,000 to $14,999 4.8% 3.6% 3.5% 3.7% 3.6% 4.7% 5.0%
$15,000 to $24,999 10.4% 9.3% 9.4% 8.8% 9.0% 10.3% 10.2%
$25,000 to $34,999 10.3% 10.2% 10.0% 9.0% 9.4% 10.1% 9.8%
$35,000 to $49,999 12.7% 12.6% 12.7% 13.3% 13.1% 13.5% 13.2%
$50,000 to $74,999 19.5% 19.6% 19.6% 17.9% 18.5% 18.0% 17.8%
$75,000 to $99,999 13.4% 13.0% 12.8% 12.5% 12.6% 12.0% 12.2%
$100,000 to $149,999 12.6% 14.1% 14.5% 14.8% 14.7% 13.5% 13.6%
$150,000 to $199,999 5.3% 5.9% 5.8% 7.1% 6.6% 5.4% 5.5%
$200,000 or more 4.4% 6.7% 6.5% 7.5% 7.1% 6.0% 5.8%
Median household income (dollars) $55,888 $60,737 $60,756 $62,142 $61,644 $55,653 $55,775
% WITH INCOME BELOW POVERTY LEVEL, PAST 12 MONTHS
All people
Under 18 years 22.5% 18.7% 18.5% 19.5% 19.2% 23.0% 20.7%
18 to 64 years 14.3% 11.7% 11.4% 11.9% 11.7% 13.8% 13.9%
65 years and over 10.3% 7.2% 6.9% 9.0% 8.2% 10.3% 9.0%
Source: US Census Bureau, 2015 American Community Survey 1-Year Estimates.
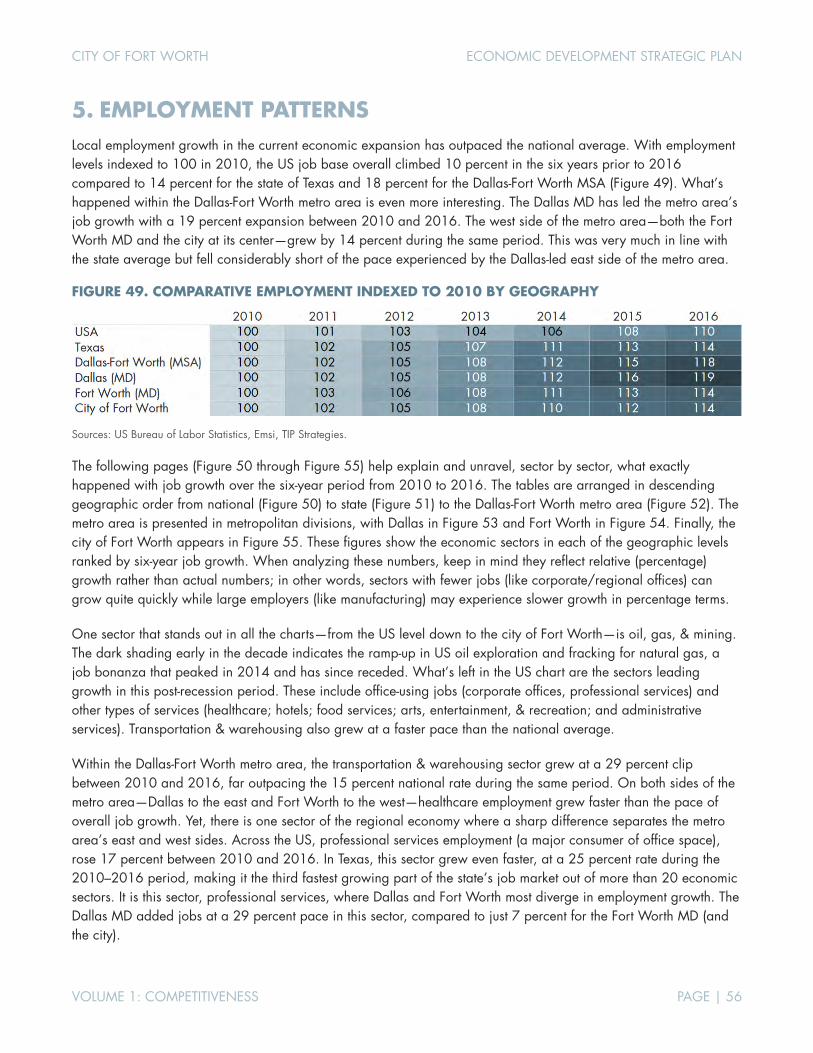
CITY OF FORT WORTH ECONOMIC DEVELOPMENT STRATEGIC PLAN
VOLUME 1: COMPETITIVENESS PAGE | 56
5. EMPLOYMENT PATTERNS Local employment growth in the current economic expansion has outpaced the national average. With employment levels indexed to 100 in 2010, the US job base overall climbed 10 percent in the six years prior to 2016 compared to 14 percent for the state of Texas and 18 percent for the Dallas-Fort Worth MSA (Figure 49). What’s happened within the Dallas-Fort Worth metro area is even more interesting. The Dallas MD has led the metro area’s job growth with a 19 percent expansion between 2010 and 2016. The west side of the metro area—both the Fort Worth MD and the city at its center—grew by 14 percent during the same period. This was very much in line with the state average but fell considerably short of the pace experienced by the Dallas-led east side of the metro area.
FIGURE 49. COMPARATIVE EMPLOYMENT INDEXED TO 2010 BY GEOGRAPHY
Sources: US Bureau of Labor Statistics, Emsi, TIP Strategies.
The following pages (Figure 50 through Figure 55) help explain and unravel, sector by sector, what exactly happened with job growth over the six-year period from 2010 to 2016. The tables are arranged in descending geographic order from national (Figure 50) to state (Figure 51) to the Dallas-Fort Worth metro area (Figure 52). The metro area is presented in metropolitan divisions, with Dallas in Figure 53 and Fort Worth in Figure 54. Finally, the city of Fort Worth appears in Figure 55. These figures show the economic sectors in each of the geographic levels ranked by six-year job growth. When analyzing these numbers, keep in mind they reflect relative (percentage) growth rather than actual numbers; in other words, sectors with fewer jobs (like corporate/regional offices) can grow quite quickly while large employers (like manufacturing) may experience slower growth in percentage terms.
One sector that stands out in all the charts—from the US level down to the city of Fort Worth—is oil, gas, & mining. The dark shading early in the decade indicates the ramp-up in US oil exploration and fracking for natural gas, a job bonanza that peaked in 2014 and has since receded. What’s left in the US chart are the sectors leading growth in this post-recession period. These include office-using jobs (corporate offices, professional services) and other types of services (healthcare; hotels; food services; arts, entertainment, & recreation; and administrative services). Transportation & warehousing also grew at a faster pace than the national average.
Within the Dallas-Fort Worth metro area, the transportation & warehousing sector grew at a 29 percent clip between 2010 and 2016, far outpacing the 15 percent national rate during the same period. On both sides of the metro area—Dallas to the east and Fort Worth to the west—healthcare employment grew faster than the pace of overall job growth. Yet, there is one sector of the regional economy where a sharp difference separates the metro area’s east and west sides. Across the US, professional services employment (a major consumer of office space), rose 17 percent between 2010 and 2016. In Texas, this sector grew even faster, at a 25 percent rate during the 2010–2016 period, making it the third fastest growing part of the state’s job market out of more than 20 economic sectors. It is this sector, professional services, where Dallas and Fort Worth most diverge in employment growth. The Dallas MD added jobs at a 29 percent pace in this sector, compared to just 7 percent for the Fort Worth MD (and the city).
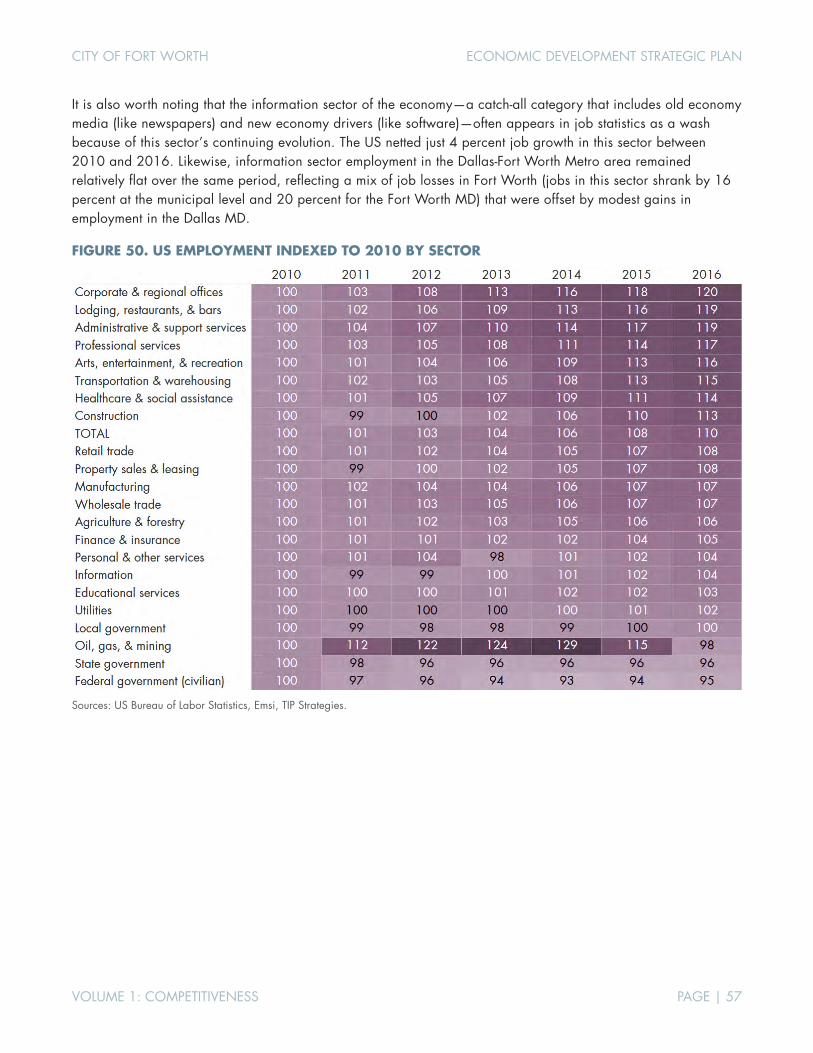
CITY OF FORT WORTH ECONOMIC DEVELOPMENT STRATEGIC PLAN
VOLUME 1: COMPETITIVENESS PAGE | 57
It is also worth noting that the information sector of the economy—a catch-all category that includes old economy media (like newspapers) and new economy drivers (like software)—often appears in job statistics as a wash because of this sector’s continuing evolution. The US netted just 4 percent job growth in this sector between 2010 and 2016. Likewise, information sector employment in the Dallas-Fort Worth Metro area remained relatively flat over the same period, reflecting a mix of job losses in Fort Worth (jobs in this sector shrank by 16 percent at the municipal level and 20 percent for the Fort Worth MD) that were offset by modest gains in employment in the Dallas MD.
FIGURE 50. US EMPLOYMENT INDEXED TO 2010 BY SECTOR
Sources: US Bureau of Labor Statistics, Emsi, TIP Strategies.
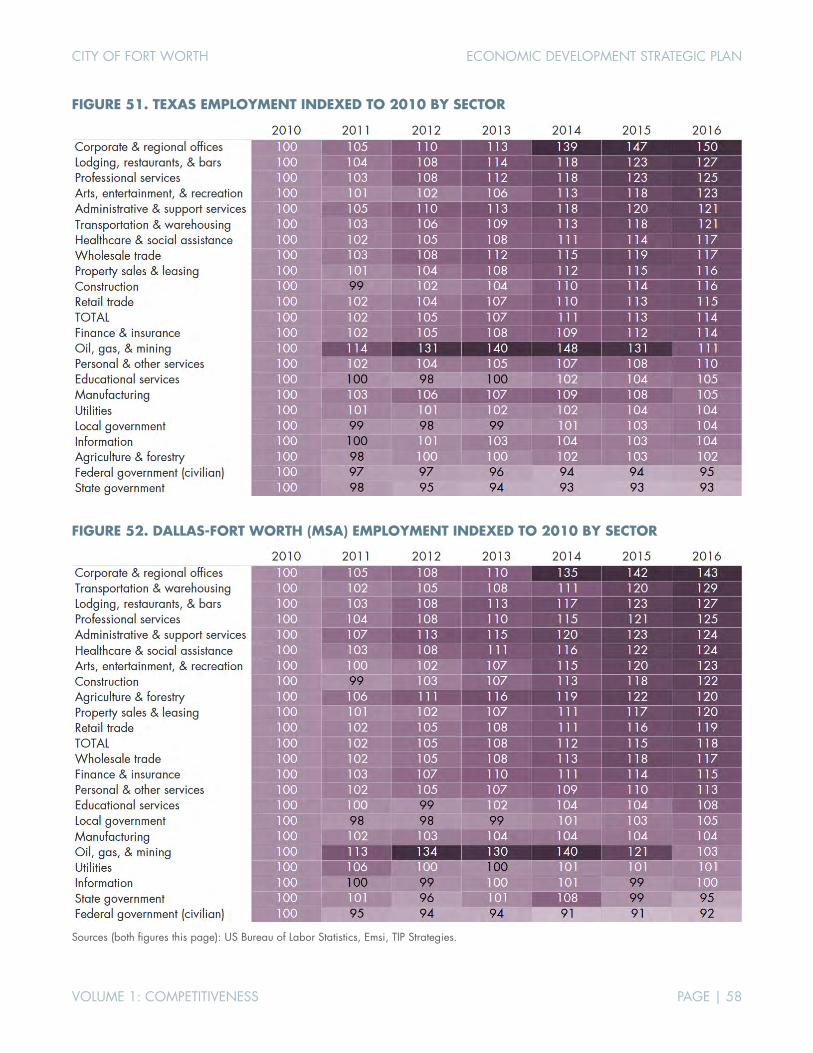
CITY OF FORT WORTH ECONOMIC DEVELOPMENT STRATEGIC PLAN
VOLUME 1: COMPETITIVENESS PAGE | 58
FIGURE 51. TEXAS EMPLOYMENT INDEXED TO 2010 BY SECTOR
FIGURE 52. DALLAS-FORT WORTH (MSA) EMPLOYMENT INDEXED TO 2010 BY SECTOR
Sources (both figures this page): US Bureau of Labor Statistics, Emsi, TIP Strategies.
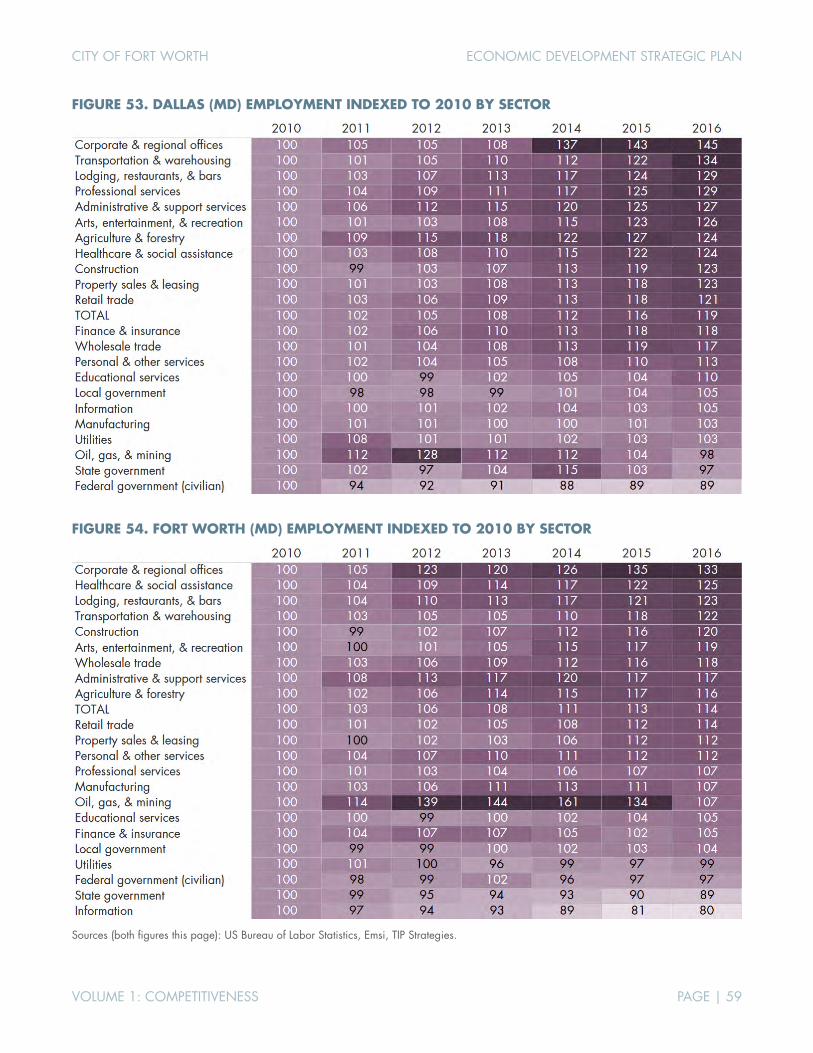
CITY OF FORT WORTH ECONOMIC DEVELOPMENT STRATEGIC PLAN
VOLUME 1: COMPETITIVENESS PAGE | 59
FIGURE 53. DALLAS (MD) EMPLOYMENT INDEXED TO 2010 BY SECTOR
FIGURE 54. FORT WORTH (MD) EMPLOYMENT INDEXED TO 2010 BY SECTOR
Sources (both figures this page): US Bureau of Labor Statistics, Emsi, TIP Strategies.

CITY OF FORT WORTH ECONOMIC DEVELOPMENT STRATEGIC PLAN
VOLUME 1: COMPETITIVENESS PAGE | 60
FIGURE 55. FORT WORTH (CITY) EMPLOYMENT INDEXED TO 2010 BY SECTOR
Sources: US Bureau of Labor Statistics, Emsi, TIP Strategies.
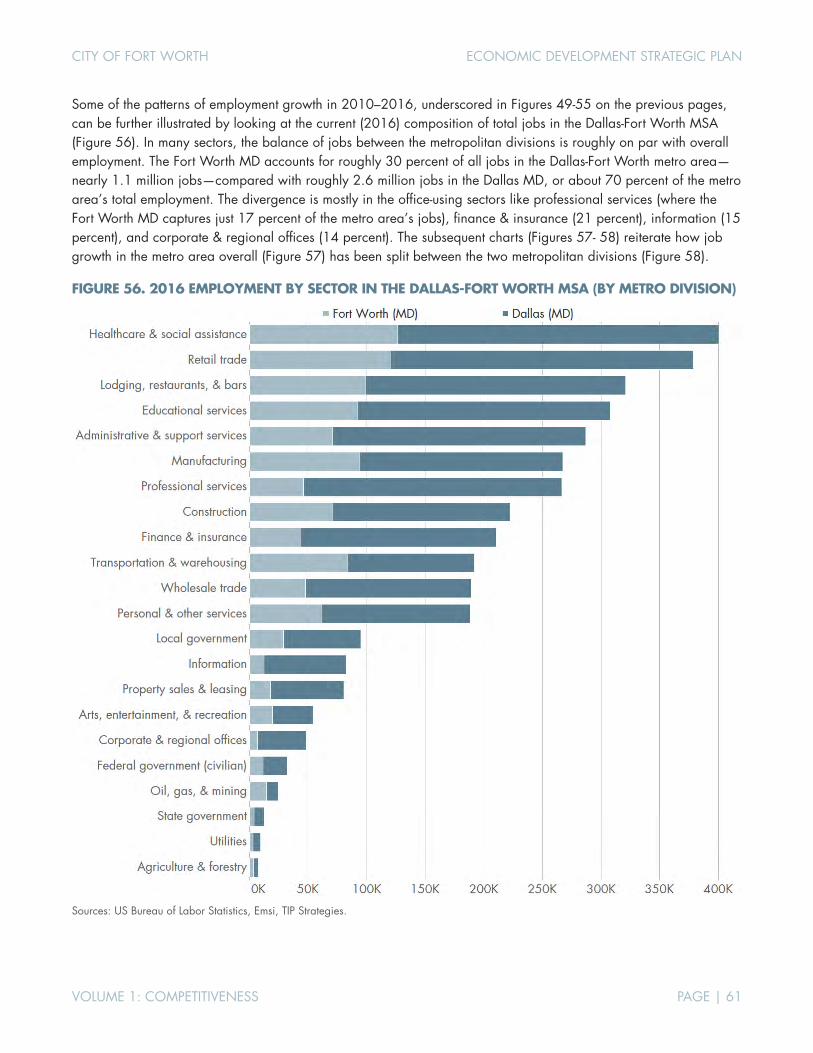
CITY OF FORT WORTH ECONOMIC DEVELOPMENT STRATEGIC PLAN
VOLUME 1: COMPETITIVENESS PAGE | 61
Some of the patterns of employment growth in 2010–2016, underscored in Figures 49-55 on the previous pages, can be further illustrated by looking at the current (2016) composition of total jobs in the Dallas-Fort Worth MSA (Figure 56). In many sectors, the balance of jobs between the metropolitan divisions is roughly on par with overall employment. The Fort Worth MD accounts for roughly 30 percent of all jobs in the Dallas-Fort Worth metro area—nearly 1.1 million jobs—compared with roughly 2.6 million jobs in the Dallas MD, or about 70 percent of the metro area’s total employment. The divergence is mostly in the office-using sectors like professional services (where the Fort Worth MD captures just 17 percent of the metro area’s jobs), finance & insurance (21 percent), information (15 percent), and corporate & regional offices (14 percent). The subsequent charts (Figures 57- 58) reiterate how job growth in the metro area overall (Figure 57) has been split between the two metropolitan divisions (Figure 58).
FIGURE 56. 2016 EMPLOYMENT BY SECTOR IN THE DALLAS-FORT WORTH MSA (BY METRO DIVISION)
Sources: US Bureau of Labor Statistics, Emsi, TIP Strategies.
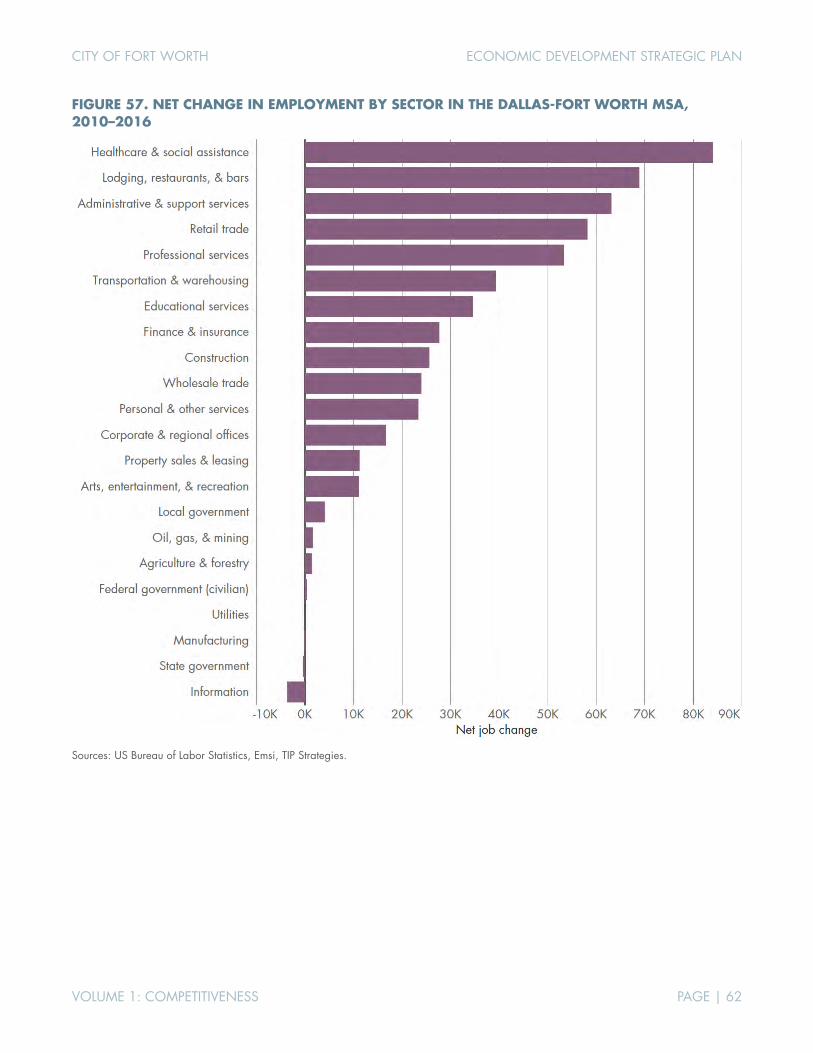
CITY OF FORT WORTH ECONOMIC DEVELOPMENT STRATEGIC PLAN
VOLUME 1: COMPETITIVENESS PAGE | 62
FIGURE 57. NET CHANGE IN EMPLOYMENT BY SECTOR IN THE DALLAS-FORT WORTH MSA, 2010–2016
Sources: US Bureau of Labor Statistics, Emsi, TIP Strategies.
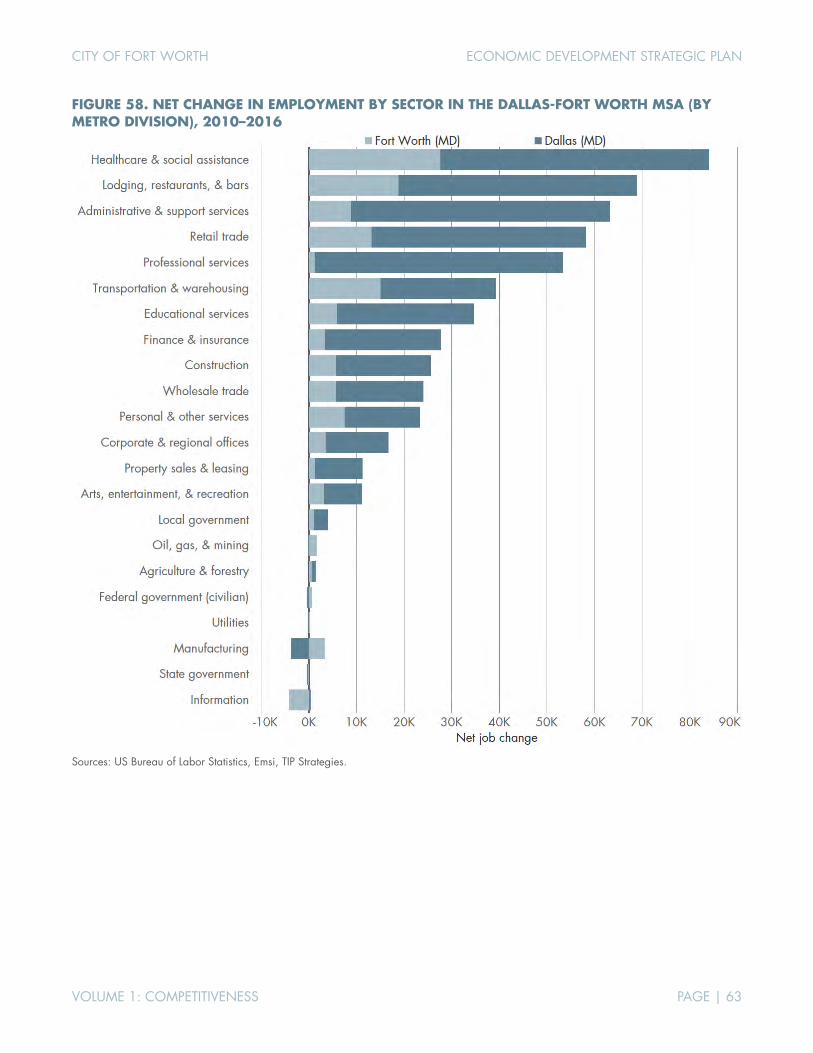
CITY OF FORT WORTH ECONOMIC DEVELOPMENT STRATEGIC PLAN
VOLUME 1: COMPETITIVENESS PAGE | 63
FIGURE 58. NET CHANGE IN EMPLOYMENT BY SECTOR IN THE DALLAS-FORT WORTH MSA (BY METRO DIVISION), 2010–2016
Sources: US Bureau of Labor Statistics, Emsi, TIP Strategies.
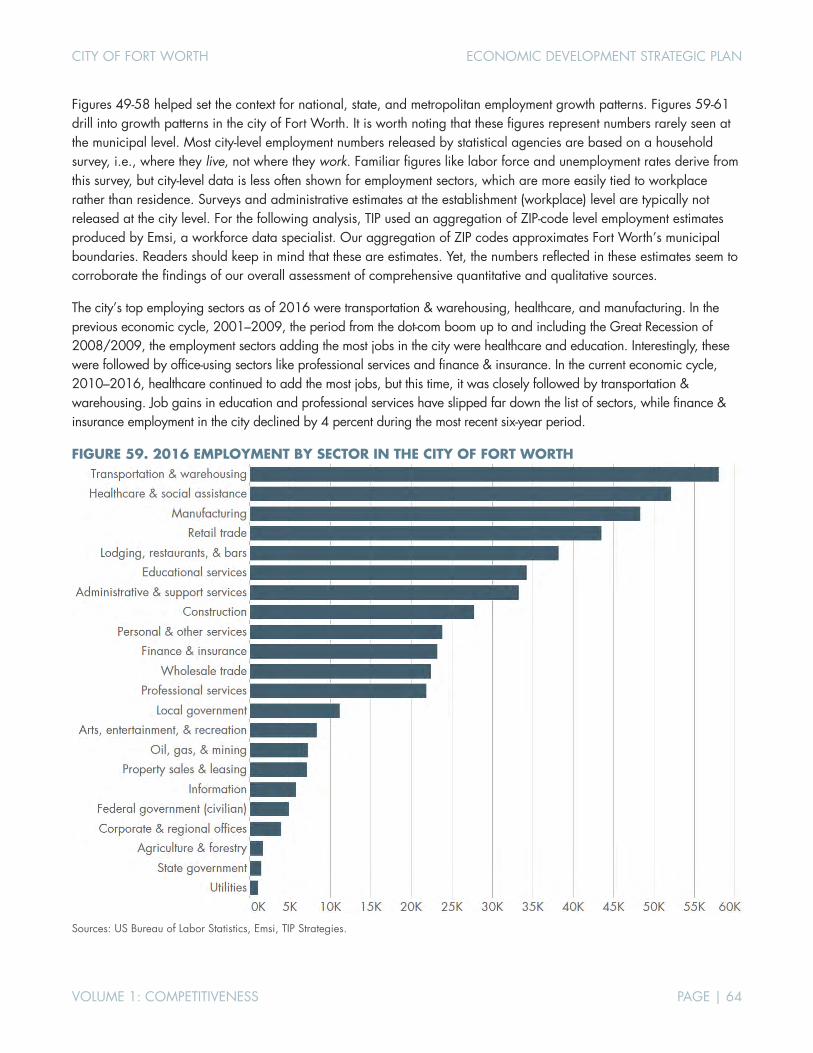
CITY OF FORT WORTH ECONOMIC DEVELOPMENT STRATEGIC PLAN
VOLUME 1: COMPETITIVENESS PAGE | 64
Figures 49-58 helped set the context for national, state, and metropolitan employment growth patterns. Figures 59-61 drill into growth patterns in the city of Fort Worth. It is worth noting that these figures represent numbers rarely seen at the municipal level. Most city-level employment numbers released by statistical agencies are based on a household survey, i.e., where they live, not where they work. Familiar figures like labor force and unemployment rates derive from this survey, but city-level data is less often shown for employment sectors, which are more easily tied to workplace rather than residence. Surveys and administrative estimates at the establishment (workplace) level are typically not released at the city level. For the following analysis, TIP used an aggregation of ZIP-code level employment estimates produced by Emsi, a workforce data specialist. Our aggregation of ZIP codes approximates Fort Worth’s municipal boundaries. Readers should keep in mind that these are estimates. Yet, the numbers reflected in these estimates seem to corroborate the findings of our overall assessment of comprehensive quantitative and qualitative sources.
The city’s top employing sectors as of 2016 were transportation & warehousing, healthcare, and manufacturing. In the previous economic cycle, 2001–2009, the period from the dot-com boom up to and including the Great Recession of 2008/2009, the employment sectors adding the most jobs in the city were healthcare and education. Interestingly, these were followed by office-using sectors like professional services and finance & insurance. In the current economic cycle, 2010–2016, healthcare continued to add the most jobs, but this time, it was closely followed by transportation & warehousing. Job gains in education and professional services have slipped far down the list of sectors, while finance & insurance employment in the city declined by 4 percent during the most recent six-year period.
FIGURE 59. 2016 EMPLOYMENT BY SECTOR IN THE CITY OF FORT WORTH
Sources: US Bureau of Labor Statistics, Emsi, TIP Strategies.

CITY OF FORT WORTH ECONOMIC DEVELOPMENT STRATEGIC PLAN
VOLUME 1: COMPETITIVENESS PAGE | 65
FIGURE 60. NET CHANGE IN CITY OF FORT WORTH EMPLOYMENT BY SECTOR, 2001-2009
Sources: US Bureau of Labor Statistics, Emsi, TIP Strategies.
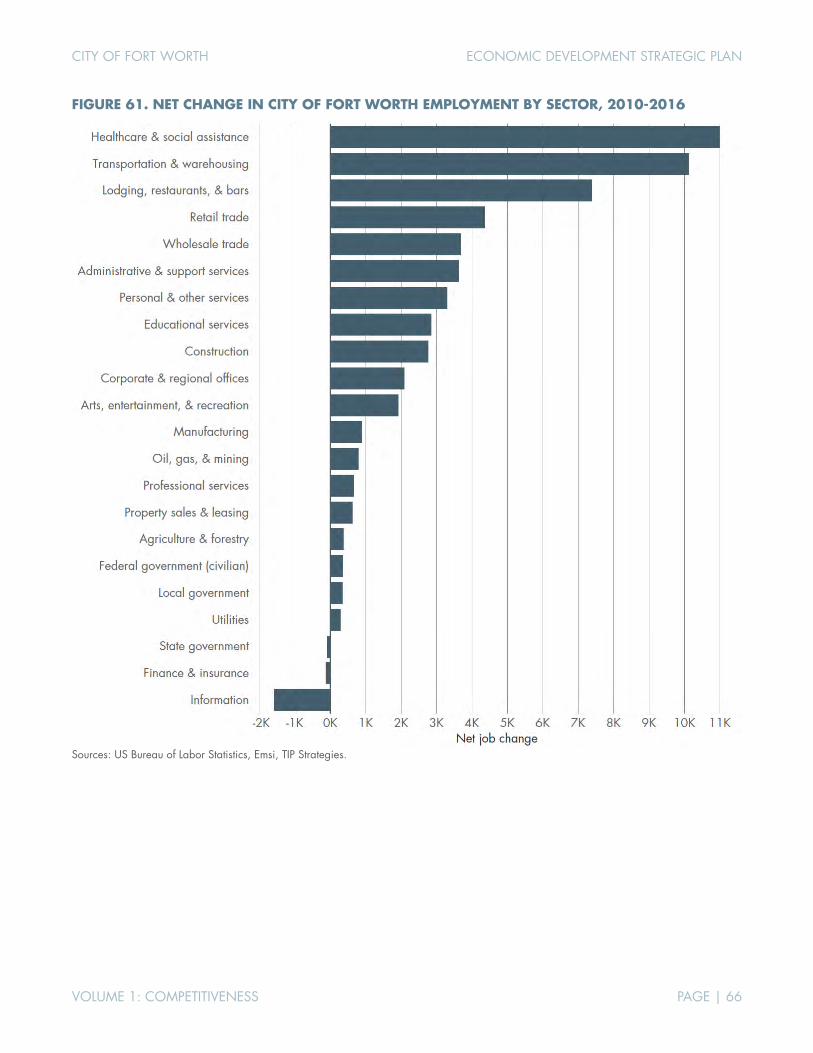
CITY OF FORT WORTH ECONOMIC DEVELOPMENT STRATEGIC PLAN
VOLUME 1: COMPETITIVENESS PAGE | 66
FIGURE 61. NET CHANGE IN CITY OF FORT WORTH EMPLOYMENT BY SECTOR, 2010-2016
Sources: US Bureau of Labor Statistics, Emsi, TIP Strategies.
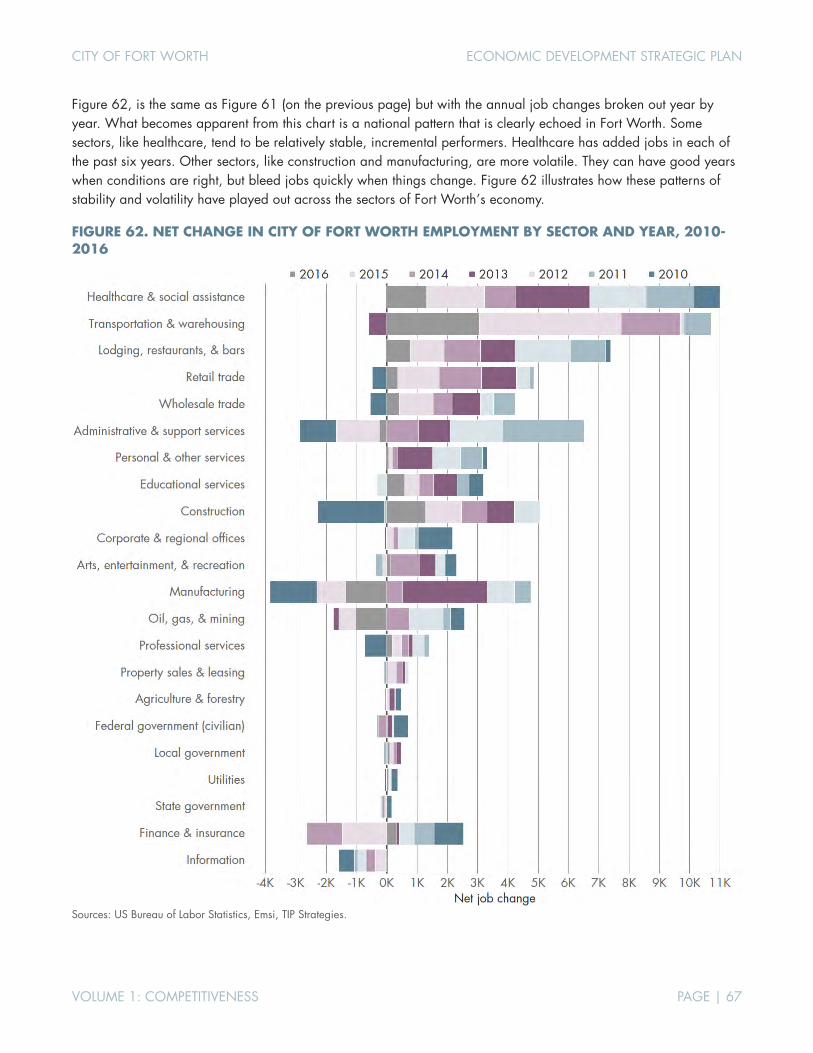
CITY OF FORT WORTH ECONOMIC DEVELOPMENT STRATEGIC PLAN
VOLUME 1: COMPETITIVENESS PAGE | 67
Figure 62, is the same as Figure 61 (on the previous page) but with the annual job changes broken out year by year. What becomes apparent from this chart is a national pattern that is clearly echoed in Fort Worth. Some sectors, like healthcare, tend to be relatively stable, incremental performers. Healthcare has added jobs in each of the past six years. Other sectors, like construction and manufacturing, are more volatile. They can have good years when conditions are right, but bleed jobs quickly when things change. Figure 62 illustrates how these patterns of stability and volatility have played out across the sectors of Fort Worth’s economy.
FIGURE 62. NET CHANGE IN CITY OF FORT WORTH EMPLOYMENT BY SECTOR AND YEAR, 2010-2016
Sources: US Bureau of Labor Statistics, Emsi, TIP Strategies.
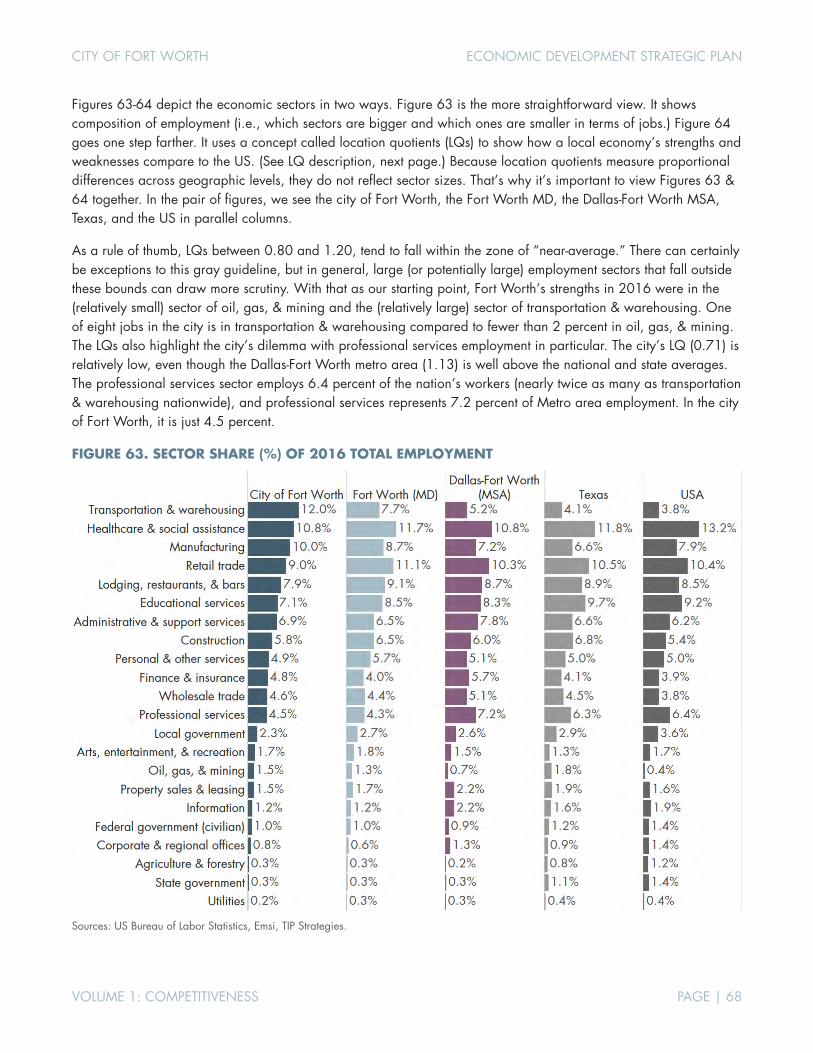
CITY OF FORT WORTH ECONOMIC DEVELOPMENT STRATEGIC PLAN
VOLUME 1: COMPETITIVENESS PAGE | 68
Figures 63-64 depict the economic sectors in two ways. Figure 63 is the more straightforward view. It shows composition of employment (i.e., which sectors are bigger and which ones are smaller in terms of jobs.) Figure 64 goes one step farther. It uses a concept called location quotients (LQs) to show how a local economy’s strengths and weaknesses compare to the US. (See LQ description, next page.) Because location quotients measure proportional differences across geographic levels, they do not reflect sector sizes. That’s why it’s important to view Figures 63 & 64 together. In the pair of figures, we see the city of Fort Worth, the Fort Worth MD, the Dallas-Fort Worth MSA, Texas, and the US in parallel columns.
As a rule of thumb, LQs between 0.80 and 1.20, tend to fall within the zone of “near-average.” There can certainly be exceptions to this gray guideline, but in general, large (or potentially large) employment sectors that fall outside these bounds can draw more scrutiny. With that as our starting point, Fort Worth’s strengths in 2016 were in the (relatively small) sector of oil, gas, & mining and the (relatively large) sector of transportation & warehousing. One of eight jobs in the city is in transportation & warehousing compared to fewer than 2 percent in oil, gas, & mining. The LQs also highlight the city’s dilemma with professional services employment in particular. The city’s LQ (0.71) is relatively low, even though the Dallas-Fort Worth metro area (1.13) is well above the national and state averages. The professional services sector employs 6.4 percent of the nation’s workers (nearly twice as many as transportation & warehousing nationwide), and professional services represents 7.2 percent of Metro area employment. In the city of Fort Worth, it is just 4.5 percent.
FIGURE 63. SECTOR SHARE (%) OF 2016 TOTAL EMPLOYMENT
Sources: US Bureau of Labor Statistics, Emsi, TIP Strategies.

CITY OF FORT WORTH ECONOMIC DEVELOPMENT STRATEGIC PLAN
VOLUME 1: COMPETITIVENESS PAGE | 69
FIGURE 64. 2016 COMPARATIVE LOCATION QUOTIENTS (LQs) BY SECTOR
Sources: US Bureau of Labor Statistics, Emsi, TIP Strategies.
ABOUT LOCATION QUOTIENTS (LQS) Location quotient analysis is a statistical technique used to suggest areas of relative advantage based on a region’s employment base. LQs are calculated as an industry’s share of total local employment divided by the same industry’s share of employment at the national level:
(local employment in industry/ total local employment -all industries)
(national employment in industry/ total national employment-all industries)
If the local industry and national industry are perfectly proportional, the LQ will be 1.00. LQs greater than 1.25 are presumed to indicate a comparative advantage; those below 0.75 suggest areas of weakness but also point to opportunities for expansion or attraction.
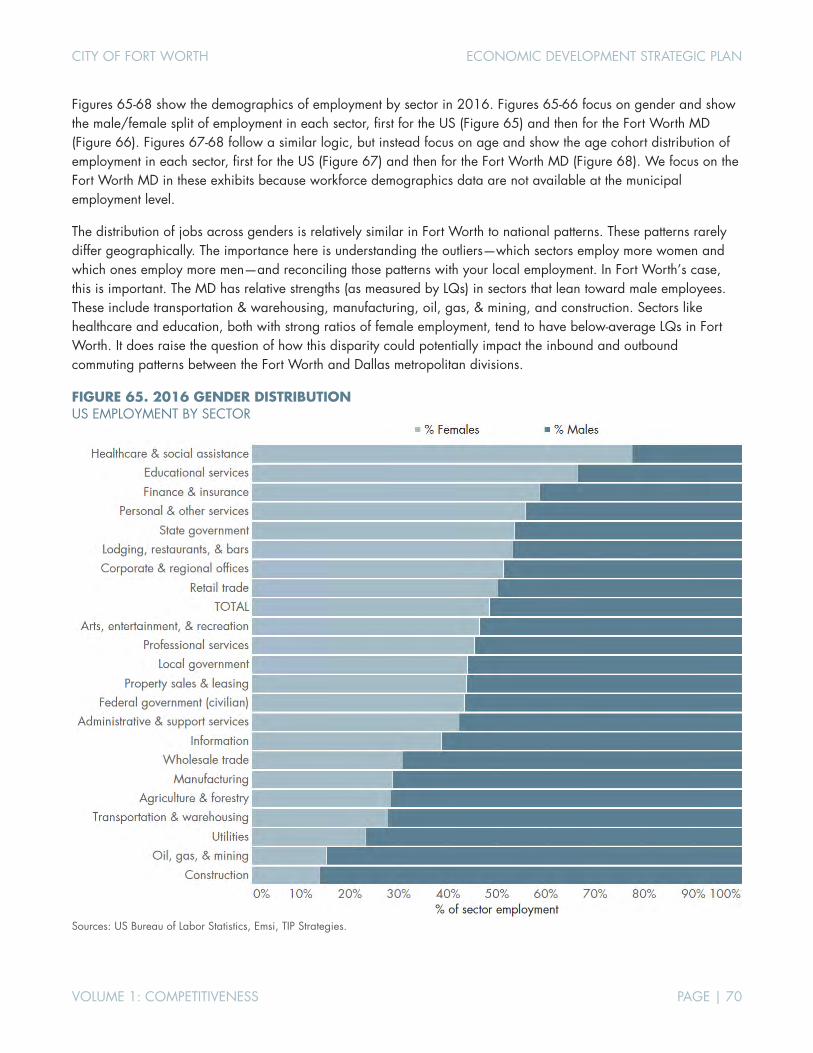
CITY OF FORT WORTH ECONOMIC DEVELOPMENT STRATEGIC PLAN
VOLUME 1: COMPETITIVENESS PAGE | 70
Figures 65-68 show the demographics of employment by sector in 2016. Figures 65-66 focus on gender and show the male/female split of employment in each sector, first for the US (Figure 65) and then for the Fort Worth MD (Figure 66). Figures 67-68 follow a similar logic, but instead focus on age and show the age cohort distribution of employment in each sector, first for the US (Figure 67) and then for the Fort Worth MD (Figure 68). We focus on the Fort Worth MD in these exhibits because workforce demographics data are not available at the municipal employment level.
The distribution of jobs across genders is relatively similar in Fort Worth to national patterns. These patterns rarely differ geographically. The importance here is understanding the outliers—which sectors employ more women and which ones employ more men—and reconciling those patterns with your local employment. In Fort Worth’s case, this is important. The MD has relative strengths (as measured by LQs) in sectors that lean toward male employees. These include transportation & warehousing, manufacturing, oil, gas, & mining, and construction. Sectors like healthcare and education, both with strong ratios of female employment, tend to have below-average LQs in Fort Worth. It does raise the question of how this disparity could potentially impact the inbound and outbound commuting patterns between the Fort Worth and Dallas metropolitan divisions.
FIGURE 65. 2016 GENDER DISTRIBUTION US EMPLOYMENT BY SECTOR
Sources: US Bureau of Labor Statistics, Emsi, TIP Strategies.
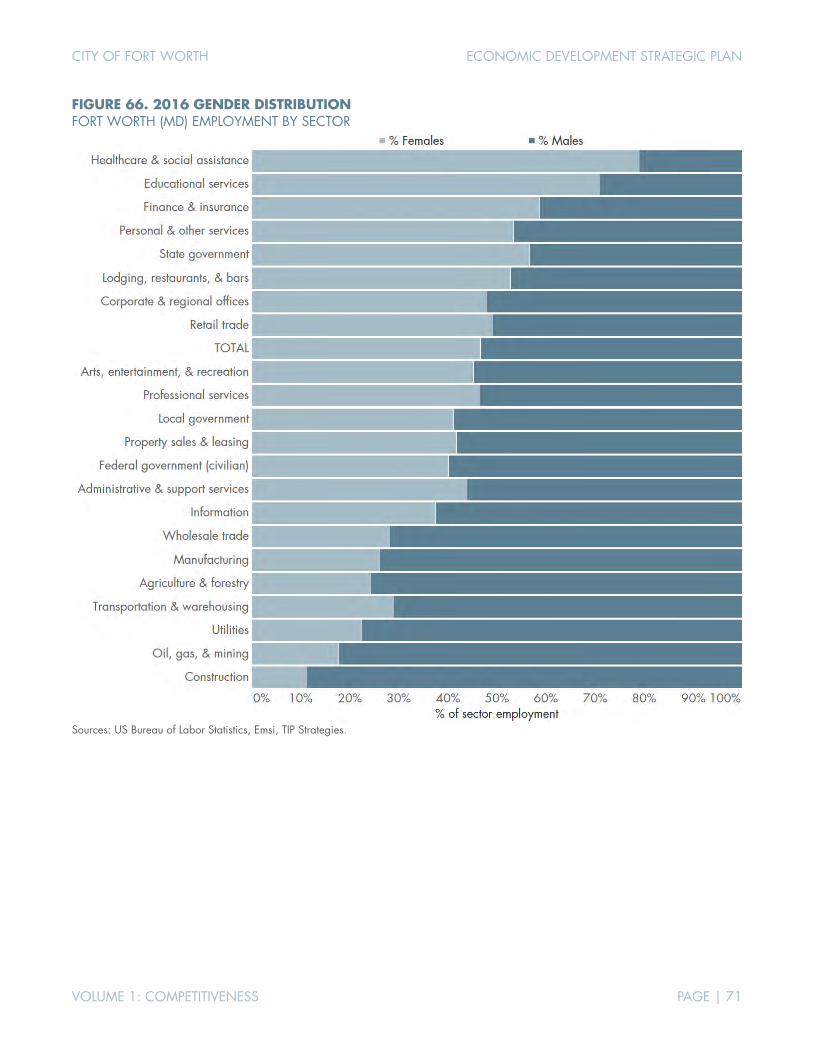
CITY OF FORT WORTH ECONOMIC DEVELOPMENT STRATEGIC PLAN
VOLUME 1: COMPETITIVENESS PAGE | 71
FIGURE 66. 2016 GENDER DISTRIBUTION FORT WORTH (MD) EMPLOYMENT BY SECTOR
Sources: US Bureau of Labor Statistics, Emsi, TIP Strategies.
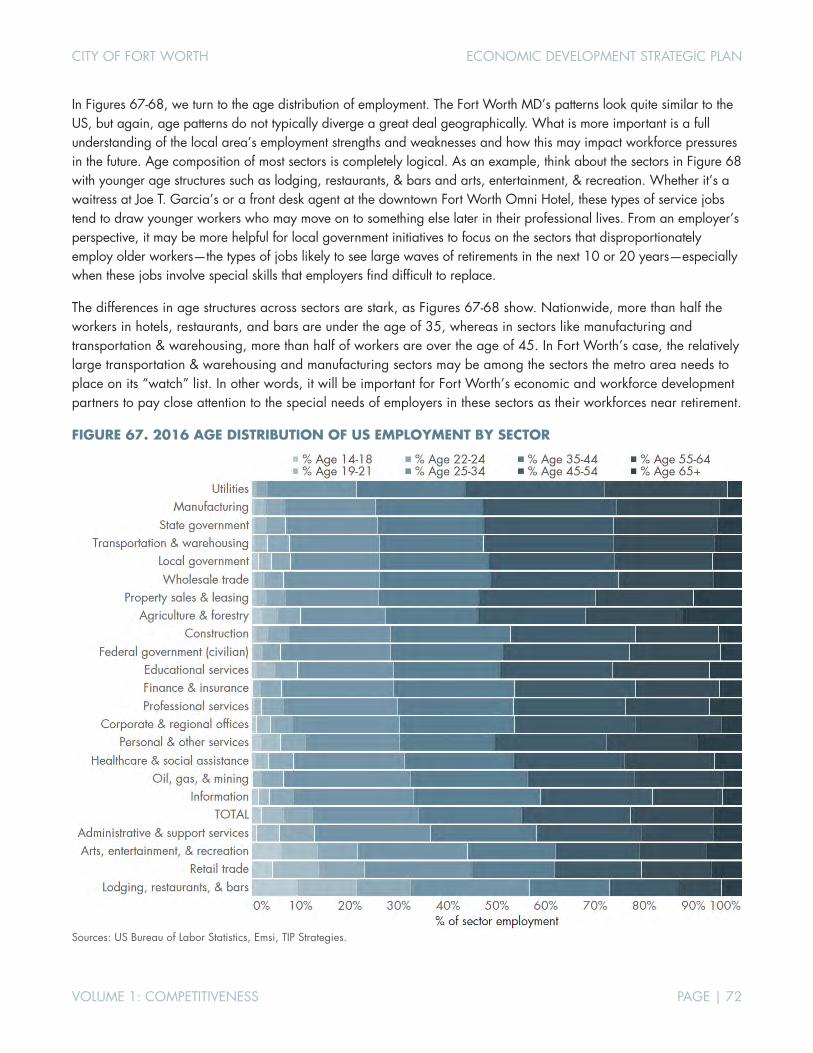
CITY OF FORT WORTH ECONOMIC DEVELOPMENT STRATEGIC PLAN
VOLUME 1: COMPETITIVENESS PAGE | 72
In Figures 67-68, we turn to the age distribution of employment. The Fort Worth MD’s patterns look quite similar to the US, but again, age patterns do not typically diverge a great deal geographically. What is more important is a full understanding of the local area’s employment strengths and weaknesses and how this may impact workforce pressures in the future. Age composition of most sectors is completely logical. As an example, think about the sectors in Figure 68 with younger age structures such as lodging, restaurants, & bars and arts, entertainment, & recreation. Whether it’s a waitress at Joe T. Garcia’s or a front desk agent at the downtown Fort Worth Omni Hotel, these types of service jobs tend to draw younger workers who may move on to something else later in their professional lives. From an employer’s perspective, it may be more helpful for local government initiatives to focus on the sectors that disproportionately employ older workers—the types of jobs likely to see large waves of retirements in the next 10 or 20 years—especially when these jobs involve special skills that employers find difficult to replace.
The differences in age structures across sectors are stark, as Figures 67-68 show. Nationwide, more than half the workers in hotels, restaurants, and bars are under the age of 35, whereas in sectors like manufacturing and transportation & warehousing, more than half of workers are over the age of 45. In Fort Worth’s case, the relatively large transportation & warehousing and manufacturing sectors may be among the sectors the metro area needs to place on its “watch” list. In other words, it will be important for Fort Worth’s economic and workforce development partners to pay close attention to the special needs of employers in these sectors as their workforces near retirement.
FIGURE 67. 2016 AGE DISTRIBUTION OF US EMPLOYMENT BY SECTOR
Sources: US Bureau of Labor Statistics, Emsi, TIP Strategies.
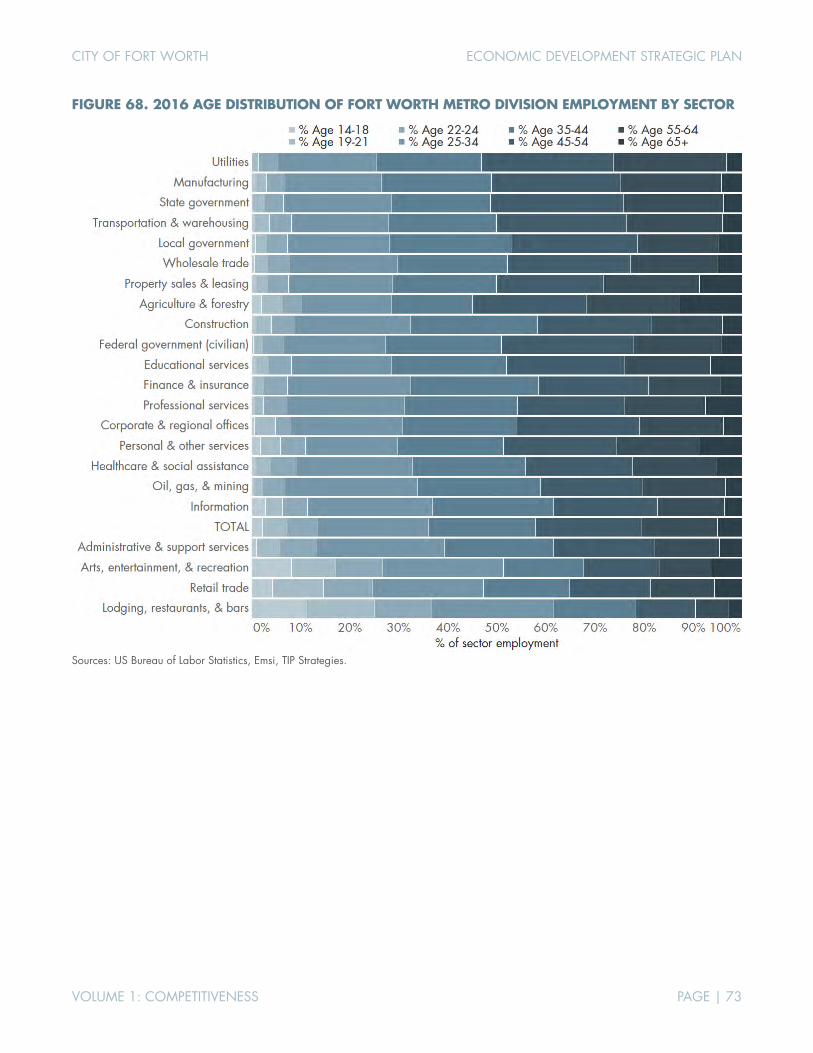
CITY OF FORT WORTH ECONOMIC DEVELOPMENT STRATEGIC PLAN
VOLUME 1: COMPETITIVENESS PAGE | 73
FIGURE 68. 2016 AGE DISTRIBUTION OF FORT WORTH METRO DIVISION EMPLOYMENT BY SECTOR
Sources: US Bureau of Labor Statistics, Emsi, TIP Strategies.

CITY OF FORT WORTH ECONOMIC DEVELOPMENT STRATEGIC PLAN
VOLUME 1: COMPETITIVENESS PAGE | 74
6. FISCAL LANDSCAPE Each of the city of Fort Worth’s top five sources of revenue has grown significantly over the past decade in absolute levels, but so has the city’s population. In percentage terms, general property taxes and other local taxes (including sales and use taxes) have consistently accounted for about two-thirds of municipal revenues. The 10-year landscape of municipal revenues, at a cursory level, raises no red flags or immediate concerns about revenue problems.
FIGURE 69. TOP 5 REVENUE SOURCES FOR THE CITY OF FORT WORTH BALANCE AT FISCAL YEAR END
PERCENT OF TOTAL AT FISCAL YEAR END
Source: City of Fort Worth, Comprehensive Annual Financial Report, FY 2016, pp. 190-191.
$0
$100
$200
$300
$400
$500
$600
$700
$800
$900
2007 2008 2009 2010 2011 2012 2013 2014 2015 2016
US$
mill
ions
Charges for Services
Franchise Fees
Intergovernmental
Other Local Taxes
General Property Tax
43% 45%
25% 25%
8% 8%5%3%4%
0%
10%
20%
30%
40%
50%
60%
70%
80%
90%
100%
2007 2008 2009 2010 2011 2012 2013 2014 2015 2016
% o
f Tot
al
Charges for Services
Franchise Fees
Intergovernmental
Other Local Taxes
General Property Tax

CITY OF FORT WORTH ECONOMIC DEVELOPMENT STRATEGIC PLAN
VOLUME 1: COMPETITIVENESS PAGE | 75
Similar to taxing jurisdictions across Texas, the total property tax rate (composed of taxes paid by the city, county, school district, and special districts) is driven primarily by its largest component—the school district. This holds true in Fort Worth. In the past 10 years, the city’s rate has changed only once but the ISD’s rate has changed four times, with a clear impact on annual property tax totals (Figure 70).
FIGURE 70. ALLOCATION OF THE LOCAL PROPERTY TAX IN RECENT YEARS TAX RATES OF MAJOR OVERLAPPING JURISDICTIONS
Sources: Tarrant County Appraisal District; City of Fort Worth, Comprehensive Annual Financial Report, FY 2016, p.195. Note: Rates applied per $100 of assessed valuation.
$1.514
$1.190
$1.257
$1.322
$1.322
$1.322
$1.322
$1.322
$1.322
$1.352
$0.860
$0.855
$0.855
$0.855
$0.855
$0.855
$0.855
$0.855
$0.855
$0.855
$0.272
$0.267
$0.264
$0.264
$0.264
$0.264
$0.264
$0.264
$0.264
$0.264
$0.235
$0.230
$0.228
$0.228
$0.228
$0.228
$0.228
$0.228
$0.228
$0.228
$0.139
$0.139
$0.138
$0.138
$0.149
$0.149
$0.149
$0.150
$0.150
$0.150
$0.00 $0.50 $1.00 $1.50 $2.00 $2.50 $3.00
2007
2008
2009
2010
2011
2012
2013
2014
2015
2016
Fort Worth ISD City of Fort Worth Tarrant County Hospital District Junior College District
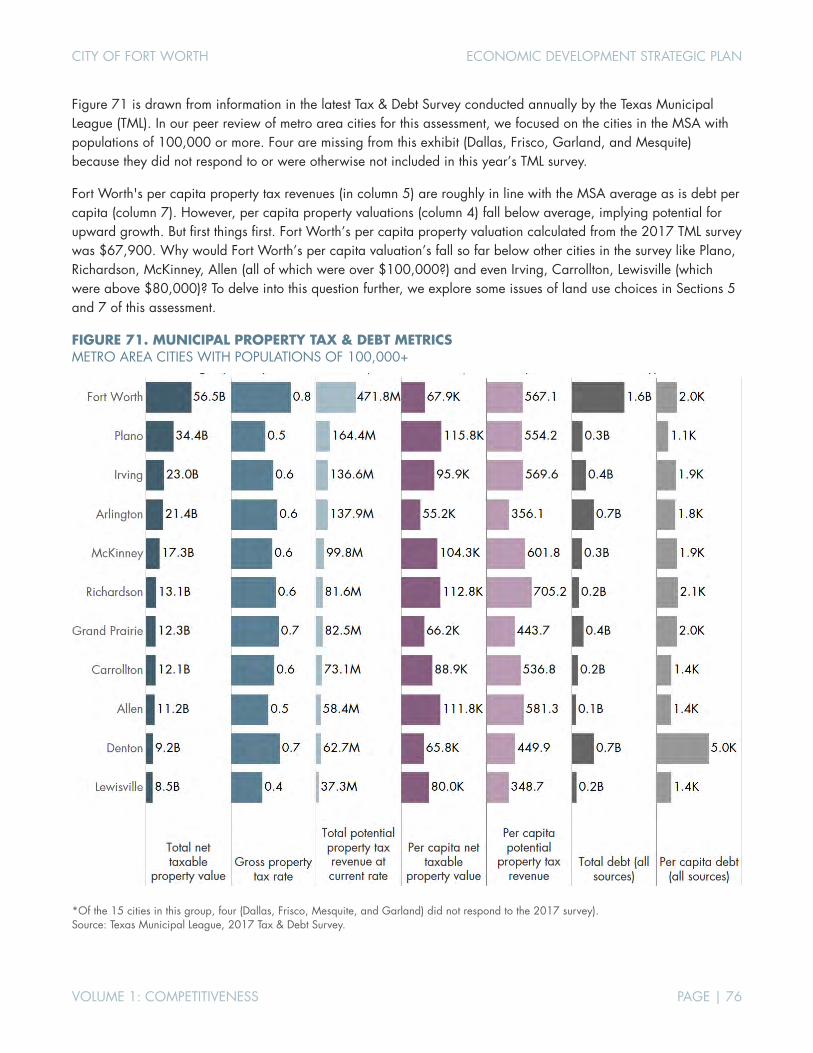
CITY OF FORT WORTH ECONOMIC DEVELOPMENT STRATEGIC PLAN
VOLUME 1: COMPETITIVENESS PAGE | 76
Figure 71 is drawn from information in the latest Tax & Debt Survey conducted annually by the Texas Municipal League (TML). In our peer review of metro area cities for this assessment, we focused on the cities in the MSA with populations of 100,000 or more. Four are missing from this exhibit (Dallas, Frisco, Garland, and Mesquite) because they did not respond to or were otherwise not included in this year’s TML survey.
Fort Worth's per capita property tax revenues (in column 5) are roughly in line with the MSA average as is debt per capita (column 7). However, per capita property valuations (column 4) fall below average, implying potential for upward growth. But first things first. Fort Worth’s per capita property valuation calculated from the 2017 TML survey was $67,900. Why would Fort Worth’s per capita valuation’s fall so far below other cities in the survey like Plano, Richardson, McKinney, Allen (all of which were over $100,000?) and even Irving, Carrollton, Lewisville (which were above $80,000)? To delve into this question further, we explore some issues of land use choices in Sections 5 and 7 of this assessment.
FIGURE 71. MUNICIPAL PROPERTY TAX & DEBT METRICS METRO AREA CITIES WITH POPULATIONS OF 100,000+
*Of the 15 cities in this group, four (Dallas, Frisco, Mesquite, and Garland) did not respond to the 2017 survey). Source: Texas Municipal League, 2017 Tax & Debt Survey.

CITY OF FORT WORTH ECONOMIC DEVELOPMENT STRATEGIC PLAN
VOLUME 1: COMPETITIVENESS PAGE | 77
The city's property tax rate fell precipitously in the late 1990s and early 2000s, but has since leveled off and maintained a relatively low, stable rate. A closer look at the city's property taxes shows that per-capita revenues generated from property were rising precipitously in the decade preceding the Great Recession. Property tax revenues in the post-recession years have been higher in per-capita terms than in the pre-recession years, but the average annual pace of growth is much smaller than in the pre-recession years. This is worth noting, since population growth in the pre-recession years was actually faster than in the following years. The city averaged just below 20,000 new residents per year between 1997 and 2008, raising the denominator in the per-capita revenue equation at a rapid pace. In the years since 2008, the average annual population growth has eased to just over 16,000 per year, still a steady stream of new residents, but with slightly less pressure on the denominator.
The implication is that the numerator (total property tax revenues) was growing at a slower pace from 2009 forward. This is not surprising given the realignment of housing values nationwide in the post-recession years. US cities that relied heavily on property taxes for revenues and were heavily zoned for single-family land uses were inevitably exposed to unexpected pressure on their revenues.
FIGURE 72. AVERAGE PROPERTY TAX REVENUE PER FORT WORTH RESIDENT LONG-TERM TRENDS IN PROPERTY TAX RATES AND PER-CAPITA REVENUES
Source: City of Fort Worth, Comprehensive Annual Financial Report, FY 2016, pp. 197, 202-203. Note: Rates applied per $100 of assessed valuation.
$0
$100
$200
$300
$400
$500
$600
$0.80
$0.82
$0.84
$0.86
$0.88
$0.90
$0.92
$0.94
$0.96
1997
1998
1999
2000
2001
2002
2003
2004
2005
2006
2007
2008
2009
2010
2011
2012
2013
2014
2015
2016
City of Fort Worth property tax revenues per resident (right scale)City of Fort Worth property tax rate (left scale)
pre-recession trend
post-recession trend
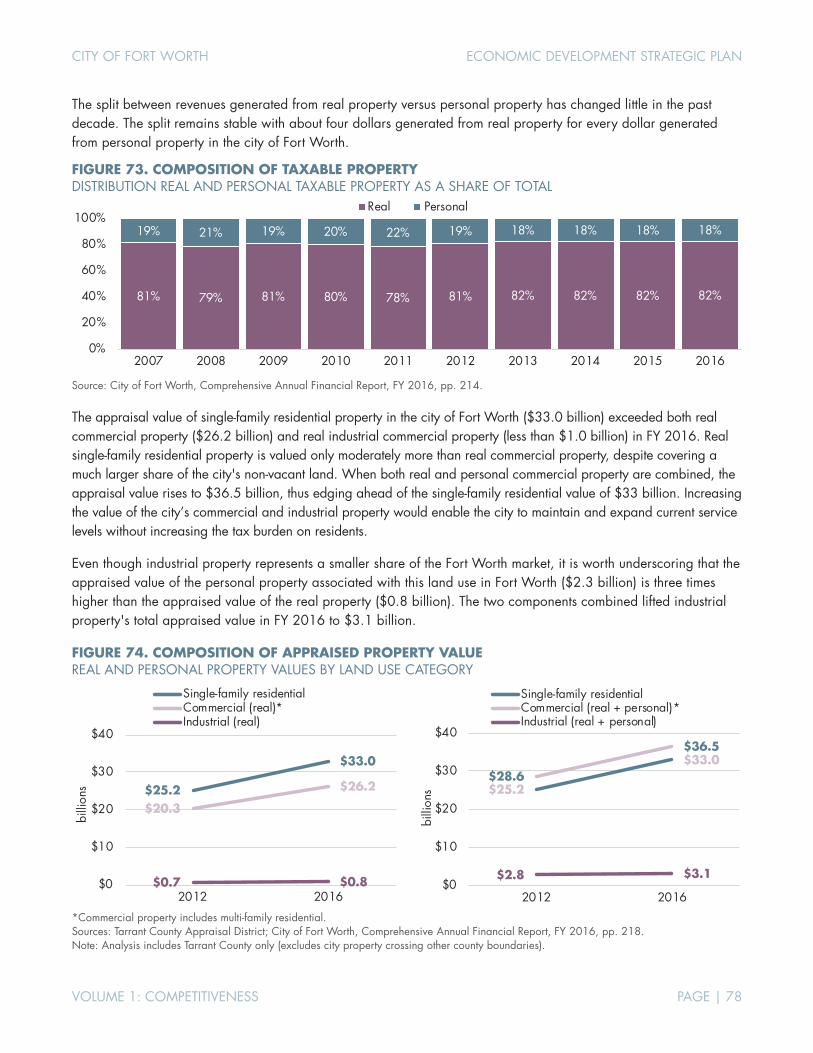
CITY OF FORT WORTH ECONOMIC DEVELOPMENT STRATEGIC PLAN
VOLUME 1: COMPETITIVENESS PAGE | 78
The split between revenues generated from real property versus personal property has changed little in the past decade. The split remains stable with about four dollars generated from real property for every dollar generated from personal property in the city of Fort Worth.
FIGURE 73. COMPOSITION OF TAXABLE PROPERTY DISTRIBUTION REAL AND PERSONAL TAXABLE PROPERTY AS A SHARE OF TOTAL
Source: City of Fort Worth, Comprehensive Annual Financial Report, FY 2016, pp. 214.
The appraisal value of single-family residential property in the city of Fort Worth ($33.0 billion) exceeded both real commercial property ($26.2 billion) and real industrial commercial property (less than $1.0 billion) in FY 2016. Real single-family residential property is valued only moderately more than real commercial property, despite covering a much larger share of the city's non-vacant land. When both real and personal commercial property are combined, the appraisal value rises to $36.5 billion, thus edging ahead of the single-family residential value of $33 billion. Increasing the value of the city’s commercial and industrial property would enable the city to maintain and expand current service levels without increasing the tax burden on residents.
Even though industrial property represents a smaller share of the Fort Worth market, it is worth underscoring that the appraised value of the personal property associated with this land use in Fort Worth ($2.3 billion) is three times higher than the appraised value of the real property ($0.8 billion). The two components combined lifted industrial property's total appraised value in FY 2016 to $3.1 billion.
FIGURE 74. COMPOSITION OF APPRAISED PROPERTY VALUE REAL AND PERSONAL PROPERTY VALUES BY LAND USE CATEGORY
*Commercial property includes multi-family residential. Sources: Tarrant County Appraisal District; City of Fort Worth, Comprehensive Annual Financial Report, FY 2016, pp. 218. Note: Analysis includes Tarrant County only (excludes city property crossing other county boundaries).
81% 79% 81% 80% 78% 81% 82% 82% 82% 82%
19% 21% 19% 20% 22% 19% 18% 18% 18% 18%
0%
20%
40%
60%
80%
100%
2007 2008 2009 2010 2011 2012 2013 2014 2015 2016
Real Personal
$25.2
$33.0
$20.3
$26.2
$0.7 $0.8$0
$10
$20
$30
$40
2012 2016
billi
ons
Single-family residentialCommercial (real)*Industrial (real)
$25.2
$33.0$28.6
$36.5
$2.8 $3.1$0
$10
$20
$30
$40
2012 2016
billi
ons
Single-family residentialCommercial (real + personal)*Industrial (real + personal)
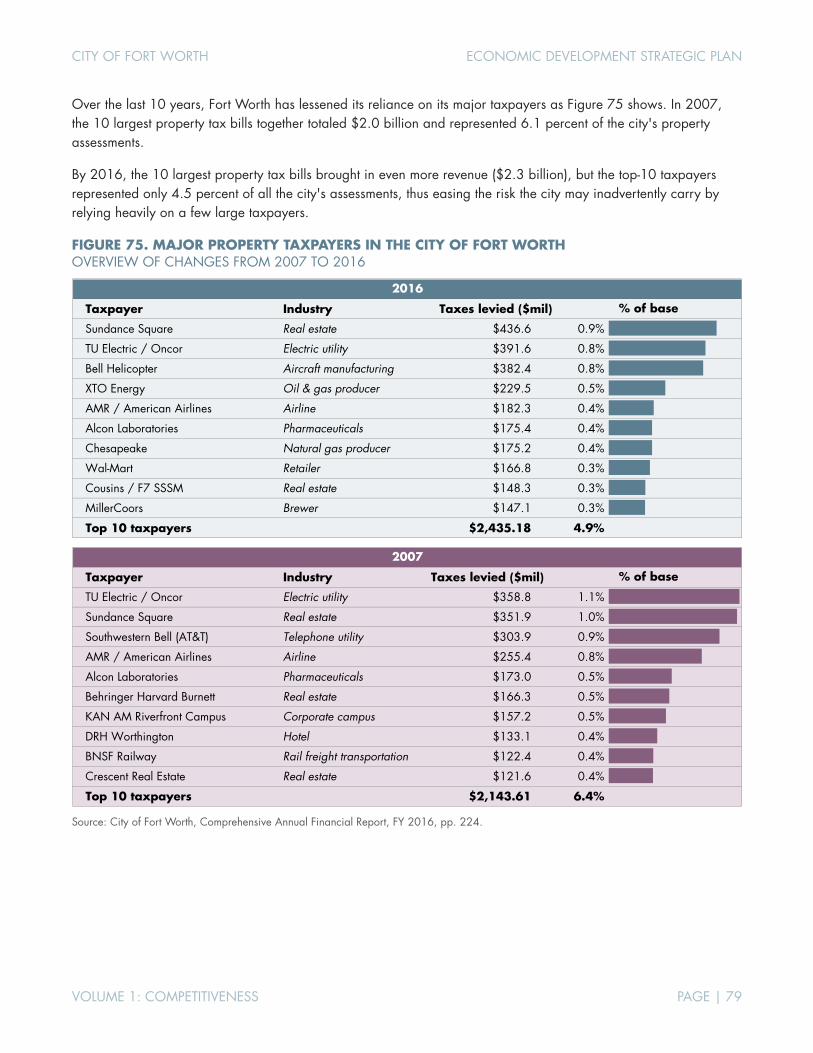
CITY OF FORT WORTH ECONOMIC DEVELOPMENT STRATEGIC PLAN
VOLUME 1: COMPETITIVENESS PAGE | 79
Over the last 10 years, Fort Worth has lessened its reliance on its major taxpayers as Figure 75 shows. In 2007, the 10 largest property tax bills together totaled $2.0 billion and represented 6.1 percent of the city's property assessments.
By 2016, the 10 largest property tax bills brought in even more revenue ($2.3 billion), but the top-10 taxpayers represented only 4.5 percent of all the city's assessments, thus easing the risk the city may inadvertently carry by relying heavily on a few large taxpayers.
FIGURE 75. MAJOR PROPERTY TAXPAYERS IN THE CITY OF FORT WORTH OVERVIEW OF CHANGES FROM 2007 TO 2016
Source: City of Fort Worth, Comprehensive Annual Financial Report, FY 2016, pp. 224.
Taxpayer Industry Taxes levied ($mil)
Sundance Square Real estate $436.6 0.9%
TU Electric / Oncor Electric utility $391.6 0.8%
Bell Helicopter Aircraft manufacturing $382.4 0.8%
XTO Energy Oil & gas producer $229.5 0.5%
AMR / American Airlines Airline $182.3 0.4%
Alcon Laboratories Pharmaceuticals $175.4 0.4%
Chesapeake Natural gas producer $175.2 0.4%
Wal-Mart Retailer $166.8 0.3%
Cousins / F7 SSSM Real estate $148.3 0.3%
MillerCoors Brewer $147.1 0.3%
Top 10 taxpayers $2,435.18 4.9%
% of base
2016
Taxpayer Industry Taxes levied ($mil)
TU Electric / Oncor Electric utility $358.8 1.1%
Sundance Square Real estate $351.9 1.0%
Southwestern Bell (AT&T) Telephone utility $303.9 0.9%
AMR / American Airlines Airline $255.4 0.8%
Alcon Laboratories Pharmaceuticals $173.0 0.5%
Behringer Harvard Burnett Real estate $166.3 0.5%
KAN AM Riverfront Campus Corporate campus $157.2 0.5%
DRH Worthington Hotel $133.1 0.4%
BNSF Railway Rail freight transportation $122.4 0.4%
Crescent Real Estate Real estate $121.6 0.4%
Top 10 taxpayers $2,143.61 6.4%
% of base
2007
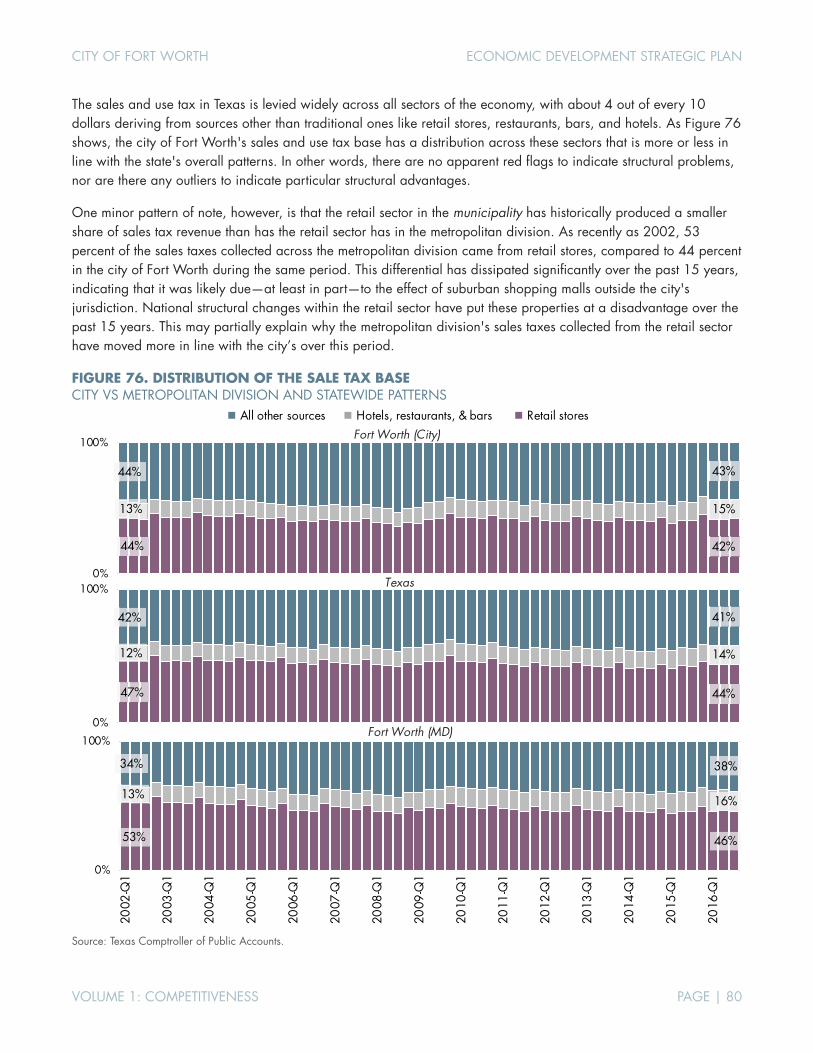
CITY OF FORT WORTH ECONOMIC DEVELOPMENT STRATEGIC PLAN
VOLUME 1: COMPETITIVENESS PAGE | 80
The sales and use tax in Texas is levied widely across all sectors of the economy, with about 4 out of every 10 dollars deriving from sources other than traditional ones like retail stores, restaurants, bars, and hotels. As Figure 76 shows, the city of Fort Worth's sales and use tax base has a distribution across these sectors that is more or less in line with the state's overall patterns. In other words, there are no apparent red flags to indicate structural problems, nor are there any outliers to indicate particular structural advantages.
One minor pattern of note, however, is that the retail sector in the municipality has historically produced a smaller share of sales tax revenue than has the retail sector has in the metropolitan division. As recently as 2002, 53 percent of the sales taxes collected across the metropolitan division came from retail stores, compared to 44 percent in the city of Fort Worth during the same period. This differential has dissipated significantly over the past 15 years, indicating that it was likely due—at least in part—to the effect of suburban shopping malls outside the city's jurisdiction. National structural changes within the retail sector have put these properties at a disadvantage over the past 15 years. This may partially explain why the metropolitan division's sales taxes collected from the retail sector have moved more in line with the city’s over this period.
FIGURE 76. DISTRIBUTION OF THE SALE TAX BASE CITY VS METROPOLITAN DIVISION AND STATEWIDE PATTERNS
Source: Texas Comptroller of Public Accounts.
44% 42%
13% 15%
44% 43%
0%
100%Fort Worth (City)
53% 46%
13% 16%
34% 38%
0%
100%
2002
-Q1
2003
-Q1
2004
-Q1
2005
-Q1
2006
-Q1
2007
-Q1
2008
-Q1
2009
-Q1
2010
-Q1
2011
-Q1
2012
-Q1
2013
-Q1
2014
-Q1
2015
-Q1
2016
-Q1
Fort Worth (MD)
47% 44%
12% 14%
42% 41%
0%
100% Texas
All other sources Hotels, restaurants, & bars Retail stores

CITY OF FORT WORTH ECONOMIC DEVELOPMENT STRATEGIC PLAN
VOLUME 1: COMPETITIVENESS PAGE | 81
The city sales and use tax collections, as shown in Figure 77, have risen and fallen in line with the state's overall economic cycle. It is not uncommon for individual cities or counties to show more volatility than the state overall. This is due largely to geographic size, as the state's larger jurisdiction inevitably has a smoothing effect on the many cities and counties included in the state average. Given this effect, one might reasonably expect more volatility in the city of Fort Worth's sales tax cycle because it covers a smaller jurisdiction compared to the state. Yet the city's and the metropolitan division's year-over-year changes in collections have largely mirrored state patterns in recent years. Again, no apparent red flags in the headline data.
FIGURE 77. GROWTH OF THE FORT WORTH SALES TAX BASE PERCENT CHANGE FROM THE SAME QUARTER A YEAR EARLIER
Source: Texas Comptroller of Public Accounts.
-22%
-20%
-18%
-16%
-14%
-12%
-10%
-8%
-6%
-4%
-2%
0%
2%
4%
6%
8%
10%
12%
14%
16%
18%
2003
-Q1
2003
-Q3
2004
-Q1
2004
-Q3
2005
-Q1
2005
-Q3
2006
-Q1
2006
-Q3
2007
-Q1
2007
-Q3
2008
-Q1
2008
-Q3
2009
-Q1
2009
-Q3
2010
-Q1
2010
-Q3
2011
-Q1
2011
-Q3
2012
-Q1
2012
-Q3
2013
-Q1
2013
-Q3
2014
-Q1
2014
-Q3
2015
-Q1
2015
-Q3
2016
-Q1
2016
-Q3
Texas Fort Worth (City) Fort Worth (MD)
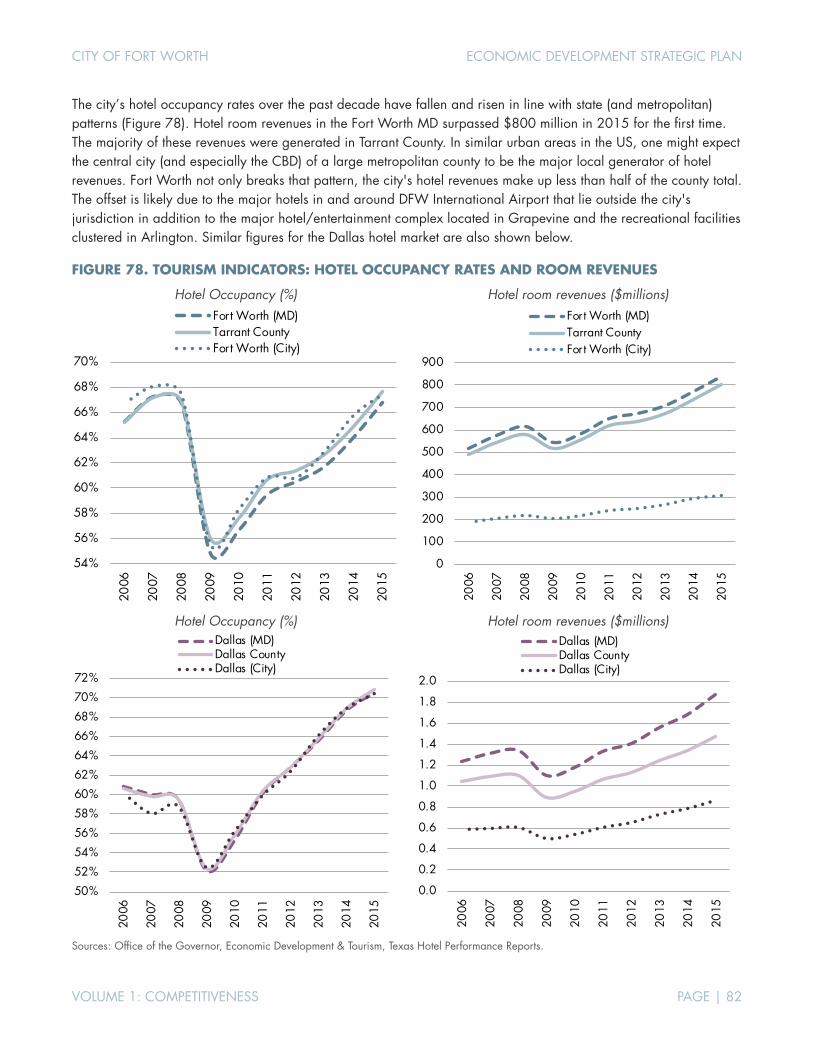
CITY OF FORT WORTH ECONOMIC DEVELOPMENT STRATEGIC PLAN
VOLUME 1: COMPETITIVENESS PAGE | 82
The city’s hotel occupancy rates over the past decade have fallen and risen in line with state (and metropolitan) patterns (Figure 78). Hotel room revenues in the Fort Worth MD surpassed $800 million in 2015 for the first time. The majority of these revenues were generated in Tarrant County. In similar urban areas in the US, one might expect the central city (and especially the CBD) of a large metropolitan county to be the major local generator of hotel revenues. Fort Worth not only breaks that pattern, the city's hotel revenues make up less than half of the county total. The offset is likely due to the major hotels in and around DFW International Airport that lie outside the city's jurisdiction in addition to the major hotel/entertainment complex located in Grapevine and the recreational facilities clustered in Arlington. Similar figures for the Dallas hotel market are also shown below.
FIGURE 78. TOURISM INDICATORS: HOTEL OCCUPANCY RATES AND ROOM REVENUES
Hotel Occupancy (%)
Hotel room revenues ($millions)
Hotel Occupancy (%)
Hotel room revenues ($millions)
Sources: Office of the Governor, Economic Development & Tourism, Texas Hotel Performance Reports.
54%
56%
58%
60%
62%
64%
66%
68%
70%
2006
2007
2008
2009
2010
2011
2012
2013
2014
2015
Fort Worth (MD)Tarrant CountyFort Worth (City)
0
100
200
300
400
500
600
700
800
900
2006
2007
2008
2009
2010
2011
2012
2013
2014
2015
Fort Worth (MD)Tarrant CountyFort Worth (City)
50%
52%
54%
56%
58%
60%
62%
64%
66%
68%
70%
72%
2006
2007
2008
2009
2010
2011
2012
2013
2014
2015
Dallas (MD)Dallas CountyDallas (City)
0.0
0.2
0.4
0.6
0.8
1.0
1.2
1.4
1.6
1.8
2.0
2006
2007
2008
2009
2010
2011
2012
2013
2014
2015
Dallas (MD)Dallas CountyDallas (City)
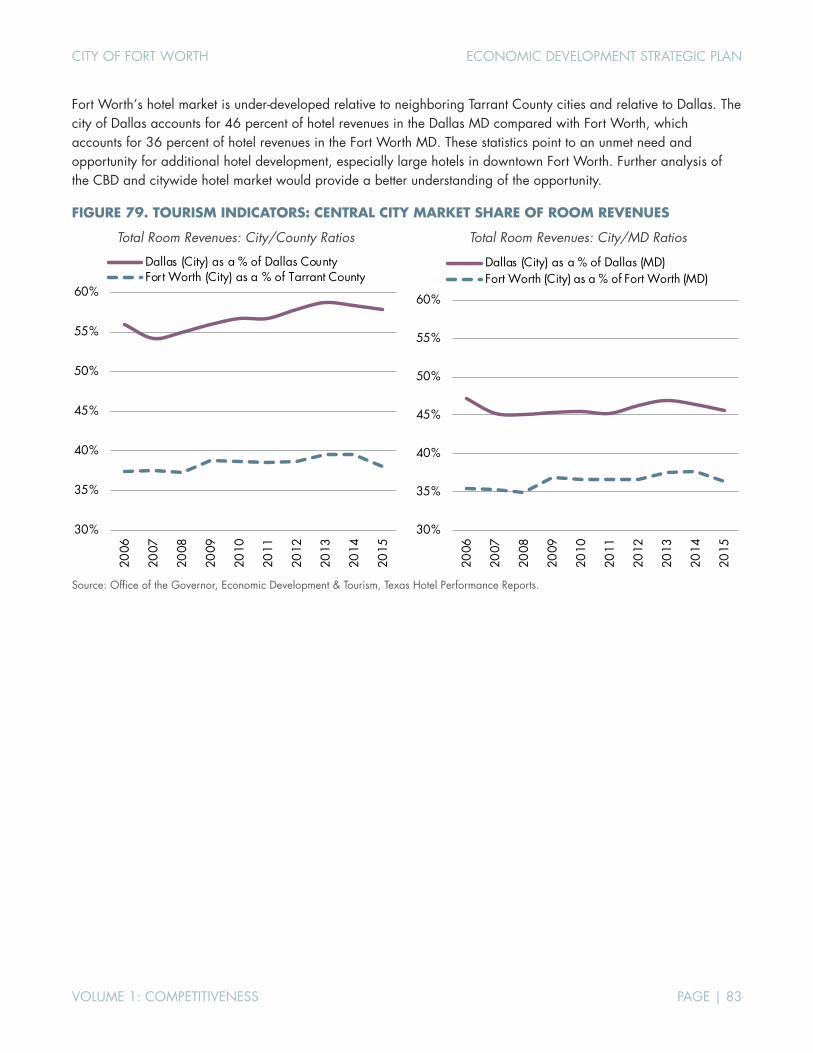
CITY OF FORT WORTH ECONOMIC DEVELOPMENT STRATEGIC PLAN
VOLUME 1: COMPETITIVENESS PAGE | 83
Fort Worth’s hotel market is under-developed relative to neighboring Tarrant County cities and relative to Dallas. The city of Dallas accounts for 46 percent of hotel revenues in the Dallas MD compared with Fort Worth, which accounts for 36 percent of hotel revenues in the Fort Worth MD. These statistics point to an unmet need and opportunity for additional hotel development, especially large hotels in downtown Fort Worth. Further analysis of the CBD and citywide hotel market would provide a better understanding of the opportunity.
FIGURE 79. TOURISM INDICATORS: CENTRAL CITY MARKET SHARE OF ROOM REVENUES
Total Room Revenues: City/County Ratios
Total Room Revenues: City/MD Ratios
Source: Office of the Governor, Economic Development & Tourism, Texas Hotel Performance Reports.
30%
35%
40%
45%
50%
55%
60%
2006
2007
2008
2009
2010
2011
2012
2013
2014
2015
Dallas (City) as a % of Dallas CountyFort Worth (City) as a % of Tarrant County
30%
35%
40%
45%
50%
55%
60%
2006
2007
2008
2009
2010
2011
2012
2013
2014
2015
Dallas (City) as a % of Dallas (MD)Fort Worth (City) as a % of Fort Worth (MD)
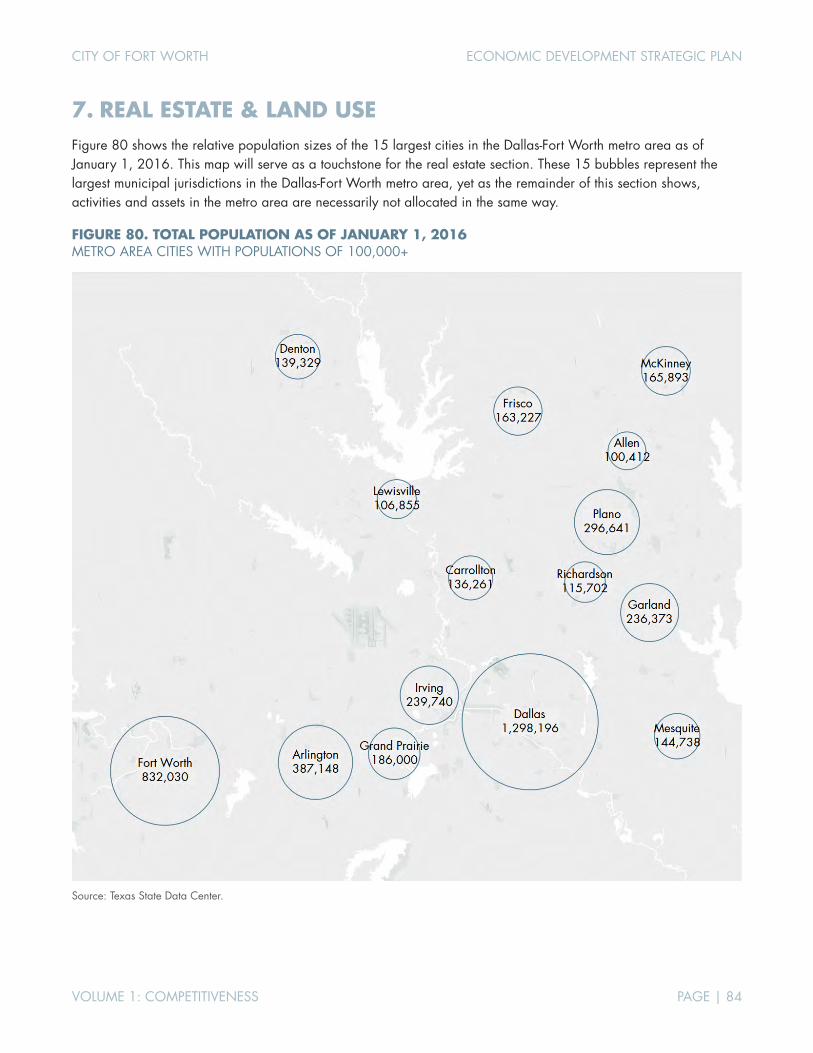
CITY OF FORT WORTH ECONOMIC DEVELOPMENT STRATEGIC PLAN
VOLUME 1: COMPETITIVENESS PAGE | 84
7. REAL ESTATE & LAND USE Figure 80 shows the relative population sizes of the 15 largest cities in the Dallas-Fort Worth metro area as of January 1, 2016. This map will serve as a touchstone for the real estate section. These 15 bubbles represent the largest municipal jurisdictions in the Dallas-Fort Worth metro area, yet as the remainder of this section shows, activities and assets in the metro area are necessarily not allocated in the same way.
FIGURE 80. TOTAL POPULATION AS OF JANUARY 1, 2016 METRO AREA CITIES WITH POPULATIONS OF 100,000+
Source: Texas State Data Center.
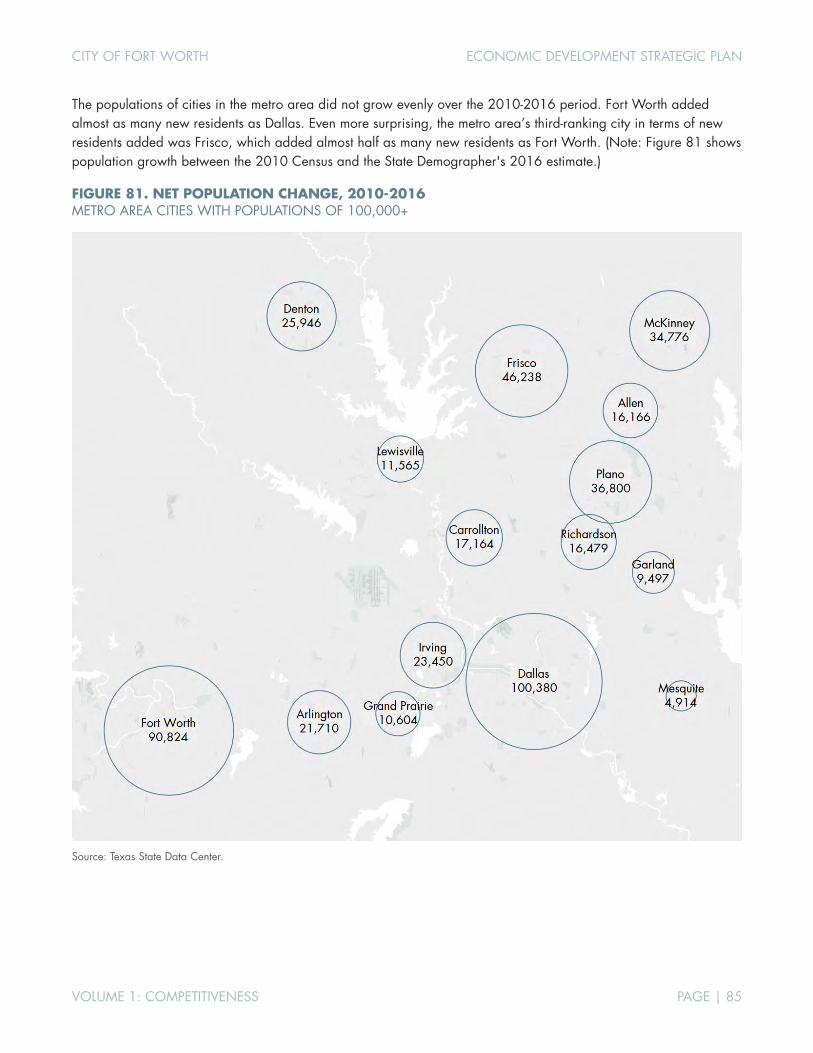
CITY OF FORT WORTH ECONOMIC DEVELOPMENT STRATEGIC PLAN
VOLUME 1: COMPETITIVENESS PAGE | 85
The populations of cities in the metro area did not grow evenly over the 2010-2016 period. Fort Worth added almost as many new residents as Dallas. Even more surprising, the metro area’s third-ranking city in terms of new residents added was Frisco, which added almost half as many new residents as Fort Worth. (Note: Figure 81 shows population growth between the 2010 Census and the State Demographer's 2016 estimate.)
FIGURE 81. NET POPULATION CHANGE, 2010-2016 METRO AREA CITIES WITH POPULATIONS OF 100,000+
Source: Texas State Data Center.
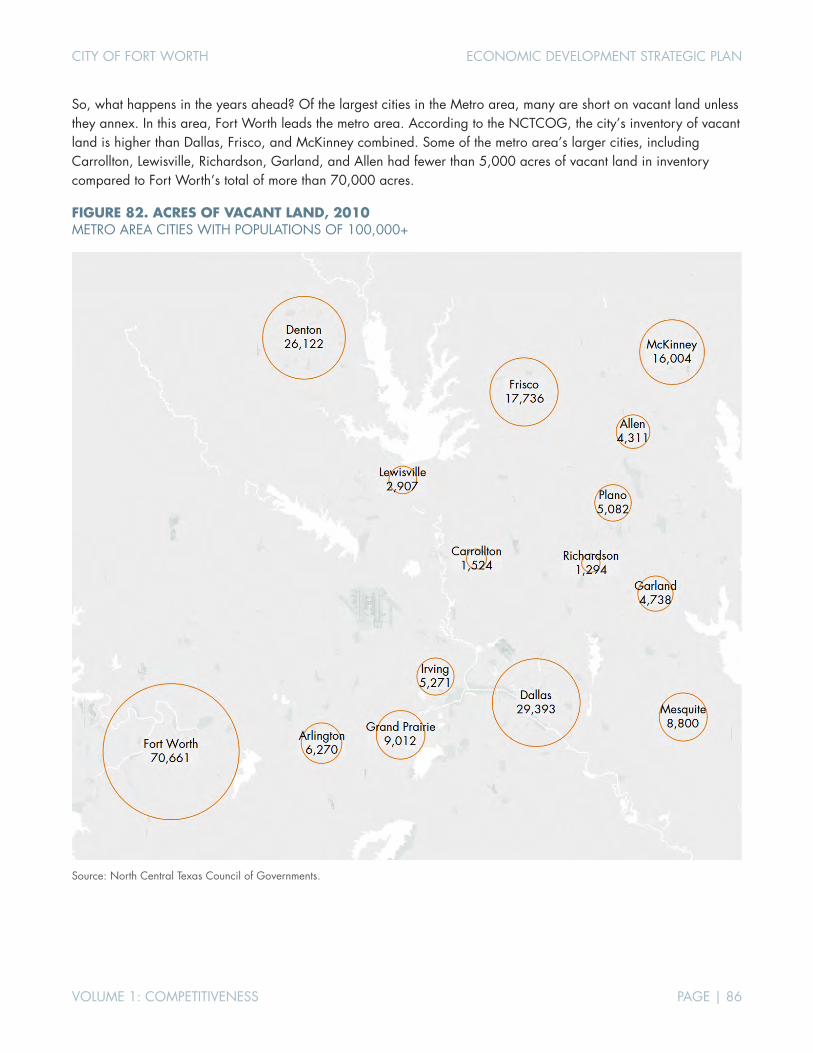
CITY OF FORT WORTH ECONOMIC DEVELOPMENT STRATEGIC PLAN
VOLUME 1: COMPETITIVENESS PAGE | 86
So, what happens in the years ahead? Of the largest cities in the Metro area, many are short on vacant land unless they annex. In this area, Fort Worth leads the metro area. According to the NCTCOG, the city’s inventory of vacant land is higher than Dallas, Frisco, and McKinney combined. Some of the metro area’s larger cities, including Carrollton, Lewisville, Richardson, Garland, and Allen had fewer than 5,000 acres of vacant land in inventory compared to Fort Worth’s total of more than 70,000 acres.
FIGURE 82. ACRES OF VACANT LAND, 2010 METRO AREA CITIES WITH POPULATIONS OF 100,000+
Source: North Central Texas Council of Governments.
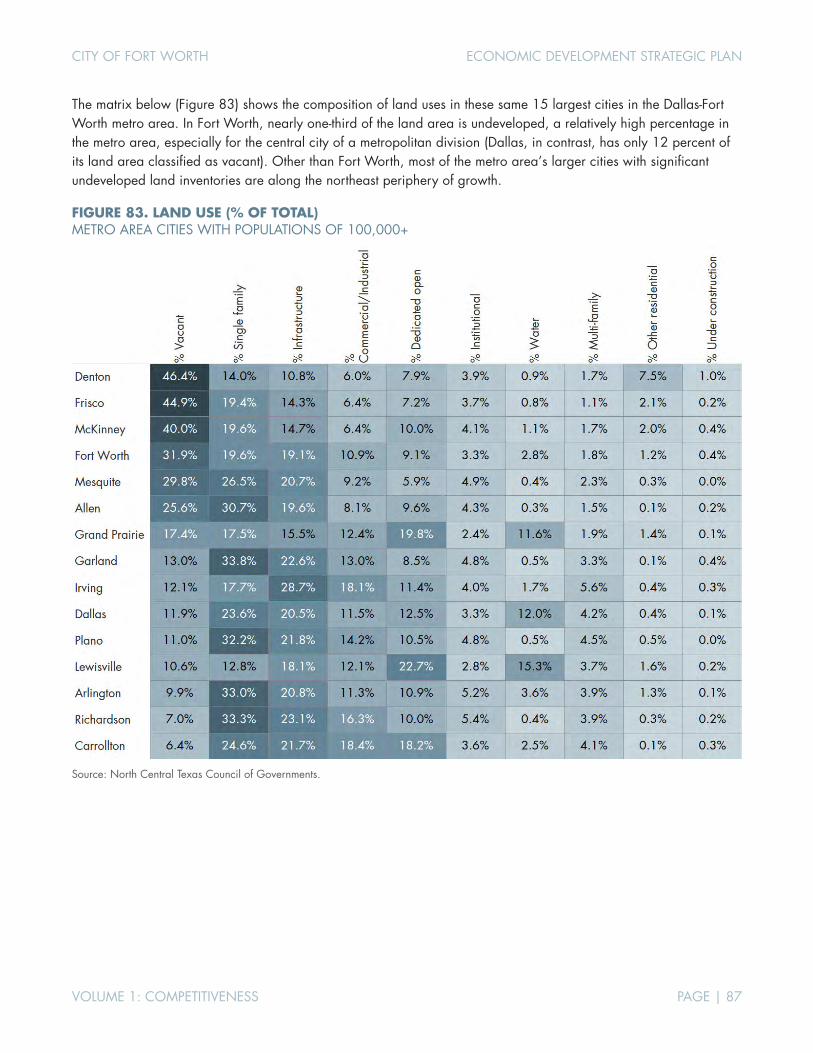
CITY OF FORT WORTH ECONOMIC DEVELOPMENT STRATEGIC PLAN
VOLUME 1: COMPETITIVENESS PAGE | 87
The matrix below (Figure 83) shows the composition of land uses in these same 15 largest cities in the Dallas-Fort Worth metro area. In Fort Worth, nearly one-third of the land area is undeveloped, a relatively high percentage in the metro area, especially for the central city of a metropolitan division (Dallas, in contrast, has only 12 percent of its land area classified as vacant). Other than Fort Worth, most of the metro area’s larger cities with significant undeveloped land inventories are along the northeast periphery of growth.
FIGURE 83. LAND USE (% OF TOTAL) METRO AREA CITIES WITH POPULATIONS OF 100,000+
Source: North Central Texas Council of Governments.

CITY OF FORT WORTH ECONOMIC DEVELOPMENT STRATEGIC PLAN
VOLUME 1: COMPETITIVENESS PAGE | 88
The housing mix in Fort Worth differs significantly from the city of Dallas, which approached a 1:1 ratio of single-family and multi-family units in 2016. Fort Worth's ratio is closer to 3:1.
FIGURE 84. SINGLE- & MULTI-FAMILY HOUSING STOCK AS OF JANUARY 1, 2016 METRO AREA CITIES WITH POPULATIONS OF 100,000+
Housing units, multi family (2016) Housing units, single family (2016)
Source: North Central Texas Council of Governments.
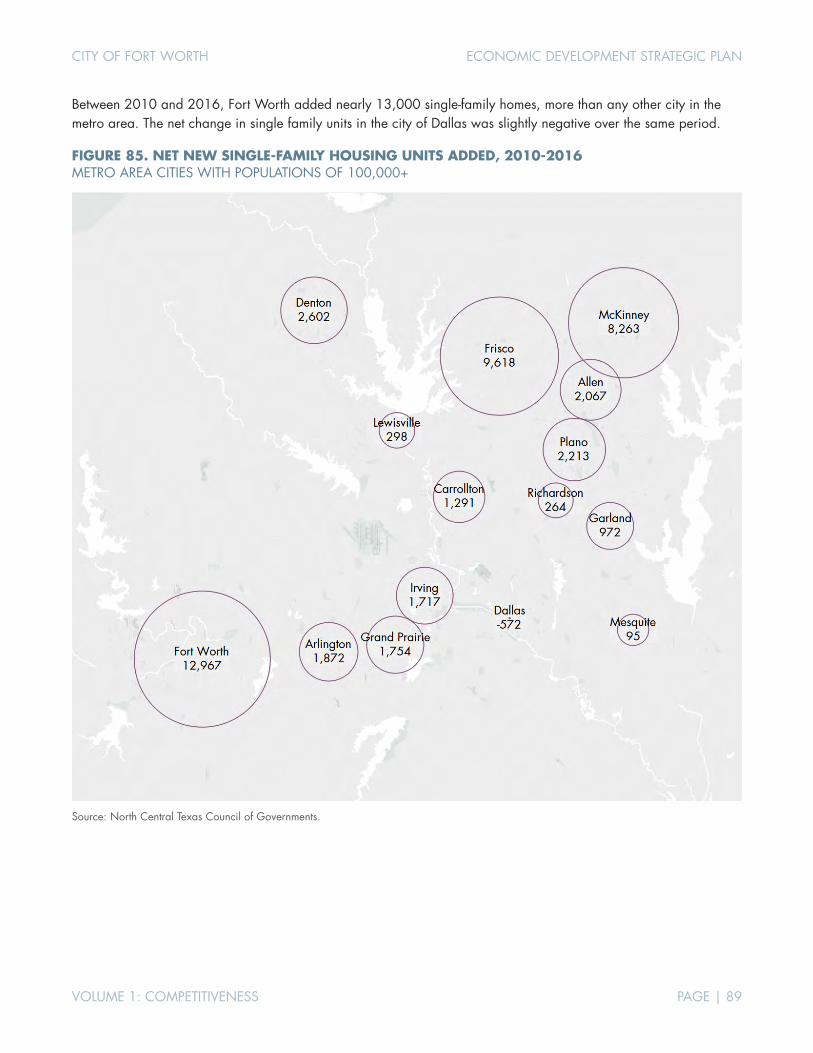
CITY OF FORT WORTH ECONOMIC DEVELOPMENT STRATEGIC PLAN
VOLUME 1: COMPETITIVENESS PAGE | 89
Between 2010 and 2016, Fort Worth added nearly 13,000 single-family homes, more than any other city in the metro area. The net change in single family units in the city of Dallas was slightly negative over the same period.
FIGURE 85. NET NEW SINGLE-FAMILY HOUSING UNITS ADDED, 2010-2016 METRO AREA CITIES WITH POPULATIONS OF 100,000+
Source: North Central Texas Council of Governments.
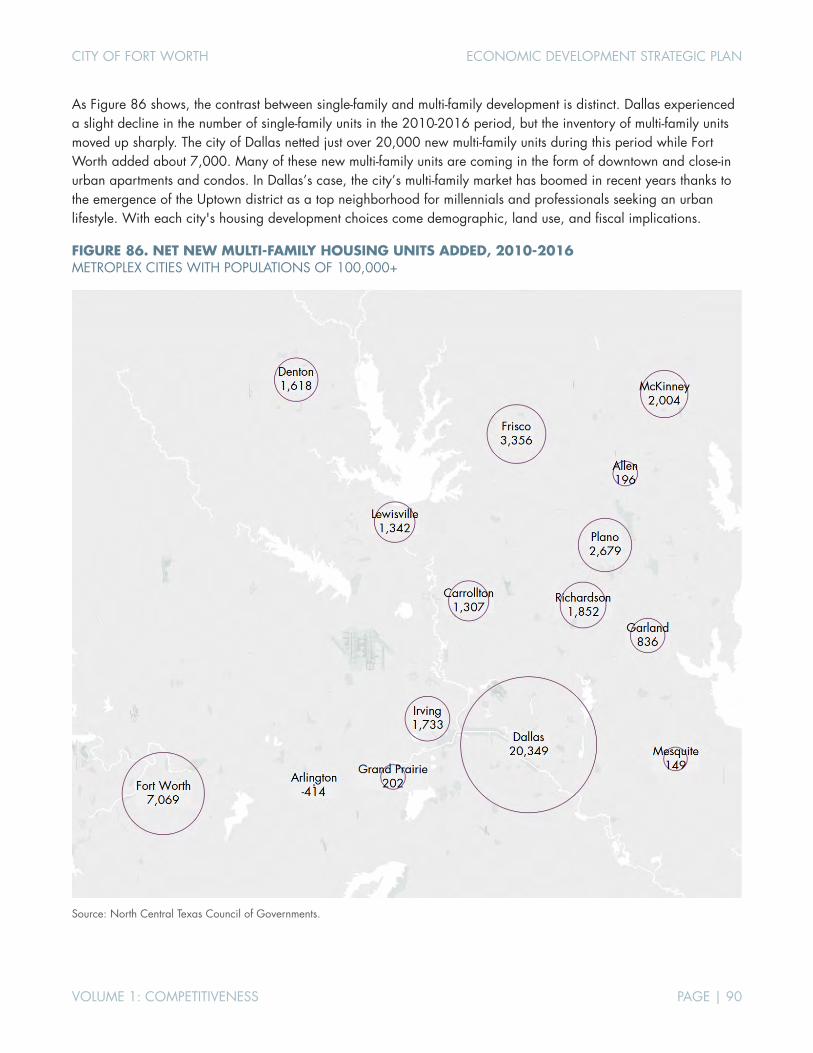
CITY OF FORT WORTH ECONOMIC DEVELOPMENT STRATEGIC PLAN
VOLUME 1: COMPETITIVENESS PAGE | 90
As Figure 86 shows, the contrast between single-family and multi-family development is distinct. Dallas experienced a slight decline in the number of single-family units in the 2010-2016 period, but the inventory of multi-family units moved up sharply. The city of Dallas netted just over 20,000 new multi-family units during this period while Fort Worth added about 7,000. Many of these new multi-family units are coming in the form of downtown and close-in urban apartments and condos. In Dallas’s case, the city’s multi-family market has boomed in recent years thanks to the emergence of the Uptown district as a top neighborhood for millennials and professionals seeking an urban lifestyle. With each city's housing development choices come demographic, land use, and fiscal implications.
FIGURE 86. NET NEW MULTI-FAMILY HOUSING UNITS ADDED, 2010-2016 METROPLEX CITIES WITH POPULATIONS OF 100,000+
Source: North Central Texas Council of Governments.

CITY OF FORT WORTH ECONOMIC DEVELOPMENT STRATEGIC PLAN
VOLUME 1: COMPETITIVENESS PAGE | 91
Section 5 of this report highlighted Fort Worth’s employment patterns of recent years. Of the most significant trends documented in this section related to the divergence of office-using employment growth between the metropolitan statistical divisions of Dallas and Fort Worth. To be sure, these trends were backward looking, meaning they underscored events that had already unfolded and did not reflect the future.
Contrast these recent trends with Figure 87, below, which provides a snapshot of the present (Q1 2017) and indirectly, the near-future. Figure 87 underscores Fort Worth’s ability to compete regionally for office-using jobs. Office space under construction in the Dallas-Fort Worth metro area tells us where the capacity to add new jobs will be located in the months and years ahead. As of the end of the first quarter of 2017, more than 6.4 million square feet of office space was under construction in the Far North Dallas submarket, a narrowly contained area that extends from the north side of the LBJ Freeway (in Dallas) up to and beyond the Sam Rayburn Tollway (in Frisco) and includes the north/south corridors along the Dallas North Tollway and Preston Road. Compare this to Fort Worth, where the underway total for office space was under 500,000 square feet for the same period. This included 280,000 square feet underway downtown and about 108,000 square feet combined in the North and South Fort Worth submarkets. Using the general rule-of-thumb of 200 square feet of leased space per office worker, the Far North Dallas submarket is adding enough capacity to support more than 32,000 new office jobs, compared to new capacity underway in all of Fort Worth’s combined submarkets, which would support fewer than 2,000 new office workers.
FIGURE 87. DFW OFFICE MARKET OVERVIEW BY SUBMARKET, 2017 Q1
Sources: CoStar, JLL.
SubmarketUnder
Constr. (SF) Inventory (SF)Construction
Rate Vacancy Rate (%)
Asking Rent ($)
Far North Dallas 6,443,100 57,743,297 11.2% 13.5% $27.55Uptown/Turtle Creek 1,295,323 14,664,921 8.8% 10.5% $37.46
Las Colinas 987,395 39,587,092 2.5% 13.4% $24.09Mid-Cities 892,627 40,406,416 2.2% 12.4% $21.71
Richardson/Plano 812,701 40,835,578 2.0% 15.0% $24.20Dallas CBD 353,637 33,581,393 1.1% 22.5% $25.67East Dallas 293,921 13,763,001 2.1% 10.6% $23.44
Ft Worth CBD 280,489 11,806,524 2.4% 10.3% $25.05Preston Center 183,589 5,885,416 3.1% 8.4% $36.24
Lewisville/Denton 167,104 12,977,935 1.3% 7.5% $22.16Stemmons Freeway 72,630 14,945,132 0.5% 23.3% $15.78
South Ft Worth 66,236 19,742,816 0.3% 8.0% $23.09North Fort Worth 42,003 6,551,118 0.6% 6.2% $20.62Southwest Dallas 6,300 7,231,323 0.1% 7.8% $17.28
Central Expressway 0 15,154,527 0.0% 10.1% $26.88LBJ Freeway 0 22,594,714 0.0% 22.3% $22.00
Northeast Ft Worth 0 5,400,765 0.0% 34.1% $19.18Dallas/Fort Worth Total 11,897,055 362,873,968 3.3% 14.3% $24.52
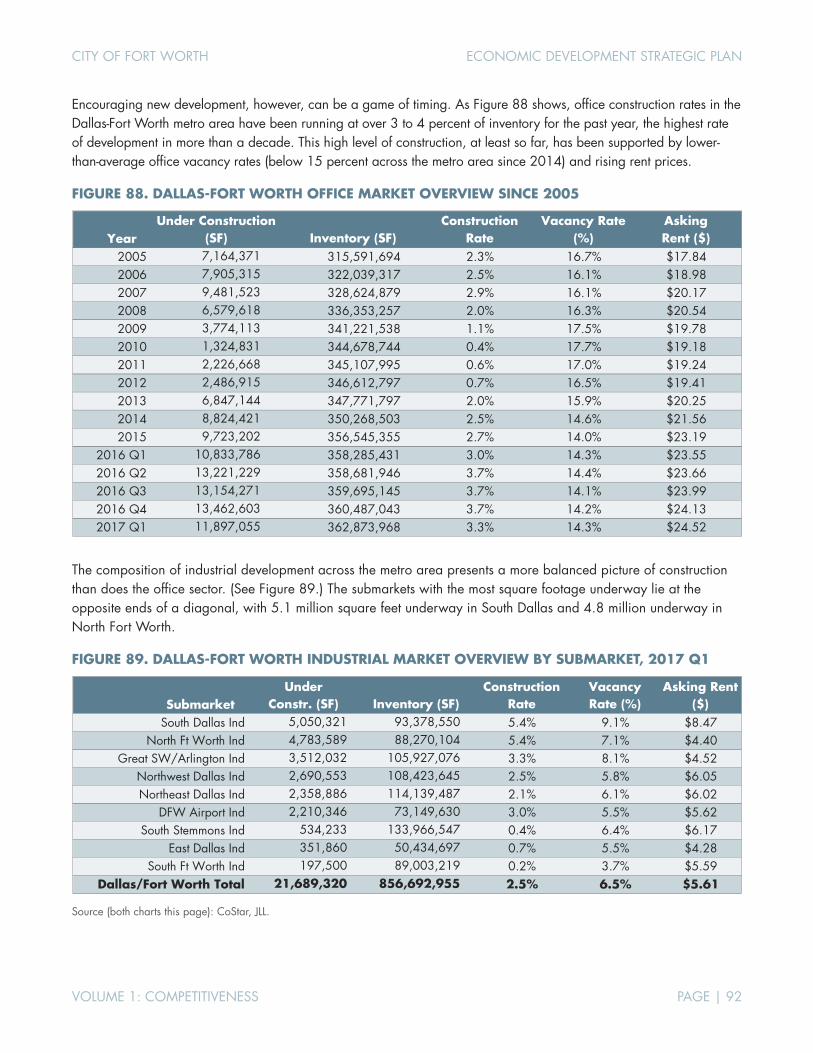
CITY OF FORT WORTH ECONOMIC DEVELOPMENT STRATEGIC PLAN
VOLUME 1: COMPETITIVENESS PAGE | 92
Encouraging new development, however, can be a game of timing. As Figure 88 shows, office construction rates in the Dallas-Fort Worth metro area have been running at over 3 to 4 percent of inventory for the past year, the highest rate of development in more than a decade. This high level of construction, at least so far, has been supported by lower-than-average office vacancy rates (below 15 percent across the metro area since 2014) and rising rent prices.
FIGURE 88. DALLAS-FORT WORTH OFFICE MARKET OVERVIEW SINCE 2005
The composition of industrial development across the metro area presents a more balanced picture of construction than does the office sector. (See Figure 89.) The submarkets with the most square footage underway lie at the opposite ends of a diagonal, with 5.1 million square feet underway in South Dallas and 4.8 million underway in North Fort Worth.
FIGURE 89. DALLAS-FORT WORTH INDUSTRIAL MARKET OVERVIEW BY SUBMARKET, 2017 Q1
Source (both charts this page): CoStar, JLL.
YearUnder Construction
(SF) Inventory (SF)Construction
Rate Vacancy Rate
(%)Asking Rent ($)
2005 7,164,371 315,591,694 2.3% 16.7% $17.842006 7,905,315 322,039,317 2.5% 16.1% $18.982007 9,481,523 328,624,879 2.9% 16.1% $20.172008 6,579,618 336,353,257 2.0% 16.3% $20.542009 3,774,113 341,221,538 1.1% 17.5% $19.782010 1,324,831 344,678,744 0.4% 17.7% $19.182011 2,226,668 345,107,995 0.6% 17.0% $19.242012 2,486,915 346,612,797 0.7% 16.5% $19.412013 6,847,144 347,771,797 2.0% 15.9% $20.252014 8,824,421 350,268,503 2.5% 14.6% $21.562015 9,723,202 356,545,355 2.7% 14.0% $23.19
2016 Q1 10,833,786 358,285,431 3.0% 14.3% $23.552016 Q2 13,221,229 358,681,946 3.7% 14.4% $23.662016 Q3 13,154,271 359,695,145 3.7% 14.1% $23.992016 Q4 13,462,603 360,487,043 3.7% 14.2% $24.132017 Q1 11,897,055 362,873,968 3.3% 14.3% $24.52
SubmarketUnder
Constr. (SF) Inventory (SF)Construction
RateVacancy Rate (%)
Asking Rent ($)
South Dallas Ind 5,050,321 93,378,550 5.4% 9.1% $8.47North Ft Worth Ind 4,783,589 88,270,104 5.4% 7.1% $4.40
Great SW/Arlington Ind 3,512,032 105,927,076 3.3% 8.1% $4.52Northwest Dallas Ind 2,690,553 108,423,645 2.5% 5.8% $6.05Northeast Dallas Ind 2,358,886 114,139,487 2.1% 6.1% $6.02
DFW Airport Ind 2,210,346 73,149,630 3.0% 5.5% $5.62South Stemmons Ind 534,233 133,966,547 0.4% 6.4% $6.17
East Dallas Ind 351,860 50,434,697 0.7% 5.5% $4.28South Ft Worth Ind 197,500 89,003,219 0.2% 3.7% $5.59
Dallas/Fort Worth Total 21,689,320 856,692,955 2.5% 6.5% $5.61
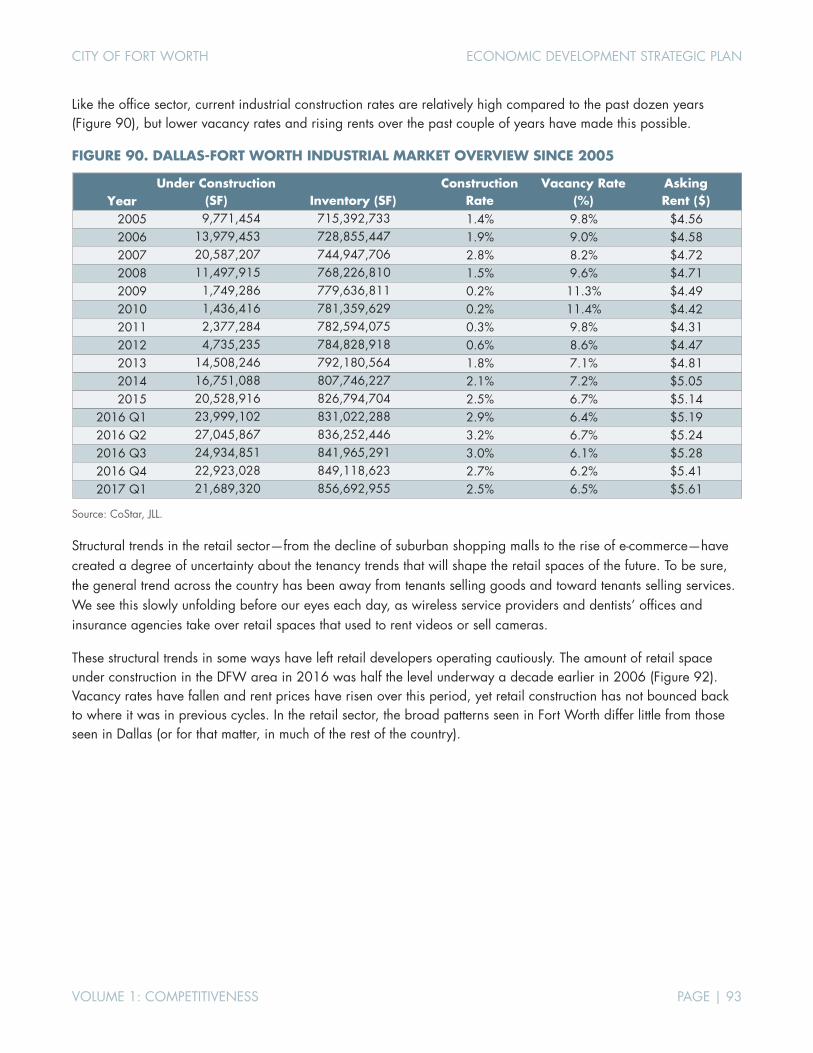
CITY OF FORT WORTH ECONOMIC DEVELOPMENT STRATEGIC PLAN
VOLUME 1: COMPETITIVENESS PAGE | 93
Like the office sector, current industrial construction rates are relatively high compared to the past dozen years (Figure 90), but lower vacancy rates and rising rents over the past couple of years have made this possible.
FIGURE 90. DALLAS-FORT WORTH INDUSTRIAL MARKET OVERVIEW SINCE 2005
Source: CoStar, JLL.
Structural trends in the retail sector—from the decline of suburban shopping malls to the rise of e-commerce—have created a degree of uncertainty about the tenancy trends that will shape the retail spaces of the future. To be sure, the general trend across the country has been away from tenants selling goods and toward tenants selling services. We see this slowly unfolding before our eyes each day, as wireless service providers and dentists’ offices and insurance agencies take over retail spaces that used to rent videos or sell cameras.
These structural trends in some ways have left retail developers operating cautiously. The amount of retail space under construction in the DFW area in 2016 was half the level underway a decade earlier in 2006 (Figure 92). Vacancy rates have fallen and rent prices have risen over this period, yet retail construction has not bounced back to where it was in previous cycles. In the retail sector, the broad patterns seen in Fort Worth differ little from those seen in Dallas (or for that matter, in much of the rest of the country).
YearUnder Construction
(SF) Inventory (SF)Construction
RateVacancy Rate
(%)Asking Rent ($)
2005 9,771,454 715,392,733 1.4% 9.8% $4.562006 13,979,453 728,855,447 1.9% 9.0% $4.582007 20,587,207 744,947,706 2.8% 8.2% $4.722008 11,497,915 768,226,810 1.5% 9.6% $4.712009 1,749,286 779,636,811 0.2% 11.3% $4.492010 1,436,416 781,359,629 0.2% 11.4% $4.422011 2,377,284 782,594,075 0.3% 9.8% $4.312012 4,735,235 784,828,918 0.6% 8.6% $4.472013 14,508,246 792,180,564 1.8% 7.1% $4.812014 16,751,088 807,746,227 2.1% 7.2% $5.052015 20,528,916 826,794,704 2.5% 6.7% $5.14
2016 Q1 23,999,102 831,022,288 2.9% 6.4% $5.192016 Q2 27,045,867 836,252,446 3.2% 6.7% $5.242016 Q3 24,934,851 841,965,291 3.0% 6.1% $5.282016 Q4 22,923,028 849,118,623 2.7% 6.2% $5.412017 Q1 21,689,320 856,692,955 2.5% 6.5% $5.61
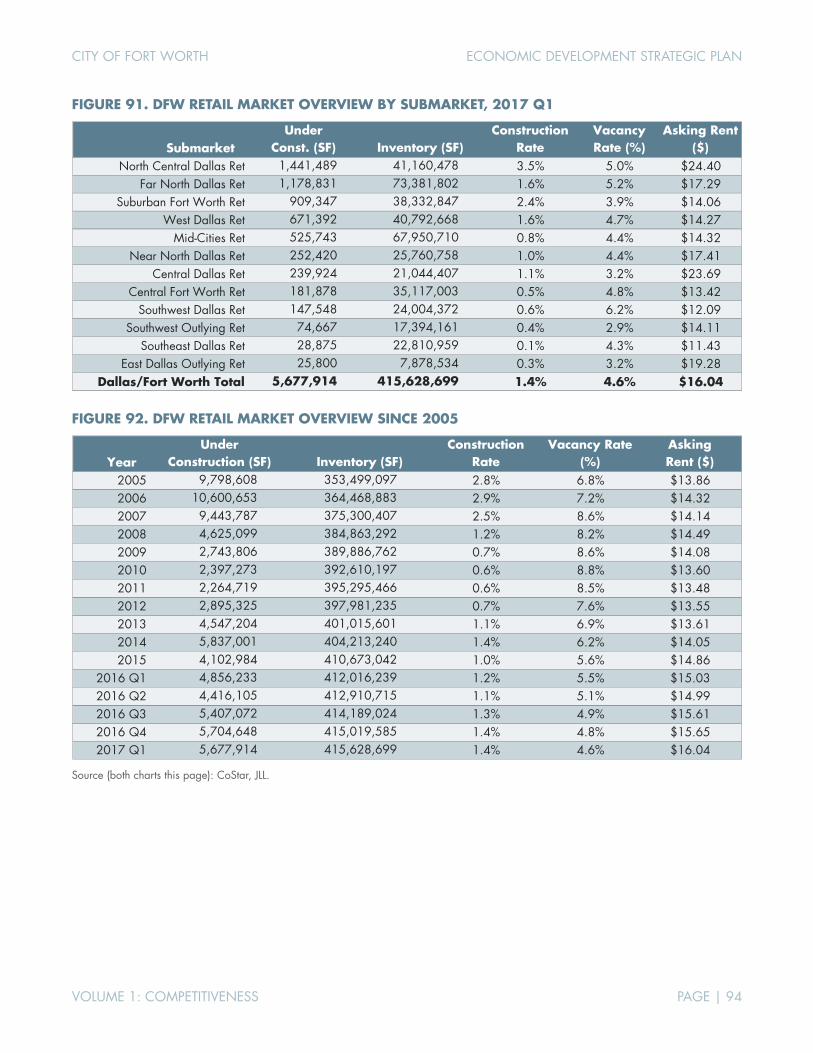
CITY OF FORT WORTH ECONOMIC DEVELOPMENT STRATEGIC PLAN
VOLUME 1: COMPETITIVENESS PAGE | 94
FIGURE 91. DFW RETAIL MARKET OVERVIEW BY SUBMARKET, 2017 Q1
FIGURE 92. DFW RETAIL MARKET OVERVIEW SINCE 2005
Source (both charts this page): CoStar, JLL.
SubmarketUnder
Const. (SF) Inventory (SF)Construction
RateVacancy Rate (%)
Asking Rent ($)
North Central Dallas Ret 1,441,489 41,160,478 3.5% 5.0% $24.40Far North Dallas Ret 1,178,831 73,381,802 1.6% 5.2% $17.29
Suburban Fort Worth Ret 909,347 38,332,847 2.4% 3.9% $14.06West Dallas Ret 671,392 40,792,668 1.6% 4.7% $14.27
Mid-Cities Ret 525,743 67,950,710 0.8% 4.4% $14.32Near North Dallas Ret 252,420 25,760,758 1.0% 4.4% $17.41
Central Dallas Ret 239,924 21,044,407 1.1% 3.2% $23.69Central Fort Worth Ret 181,878 35,117,003 0.5% 4.8% $13.42
Southwest Dallas Ret 147,548 24,004,372 0.6% 6.2% $12.09Southwest Outlying Ret 74,667 17,394,161 0.4% 2.9% $14.11
Southeast Dallas Ret 28,875 22,810,959 0.1% 4.3% $11.43East Dallas Outlying Ret 25,800 7,878,534 0.3% 3.2% $19.28
Dallas/Fort Worth Total 5,677,914 415,628,699 1.4% 4.6% $16.04
YearUnder
Construction (SF) Inventory (SF)Construction
RateVacancy Rate
(%)Asking Rent ($)
2005 9,798,608 353,499,097 2.8% 6.8% $13.862006 10,600,653 364,468,883 2.9% 7.2% $14.322007 9,443,787 375,300,407 2.5% 8.6% $14.142008 4,625,099 384,863,292 1.2% 8.2% $14.492009 2,743,806 389,886,762 0.7% 8.6% $14.082010 2,397,273 392,610,197 0.6% 8.8% $13.602011 2,264,719 395,295,466 0.6% 8.5% $13.482012 2,895,325 397,981,235 0.7% 7.6% $13.552013 4,547,204 401,015,601 1.1% 6.9% $13.612014 5,837,001 404,213,240 1.4% 6.2% $14.052015 4,102,984 410,673,042 1.0% 5.6% $14.86
2016 Q1 4,856,233 412,016,239 1.2% 5.5% $15.032016 Q2 4,416,105 412,910,715 1.1% 5.1% $14.992016 Q3 5,407,072 414,189,024 1.3% 4.9% $15.612016 Q4 5,704,648 415,019,585 1.4% 4.8% $15.652017 Q1 5,677,914 415,628,699 1.4% 4.6% $16.04
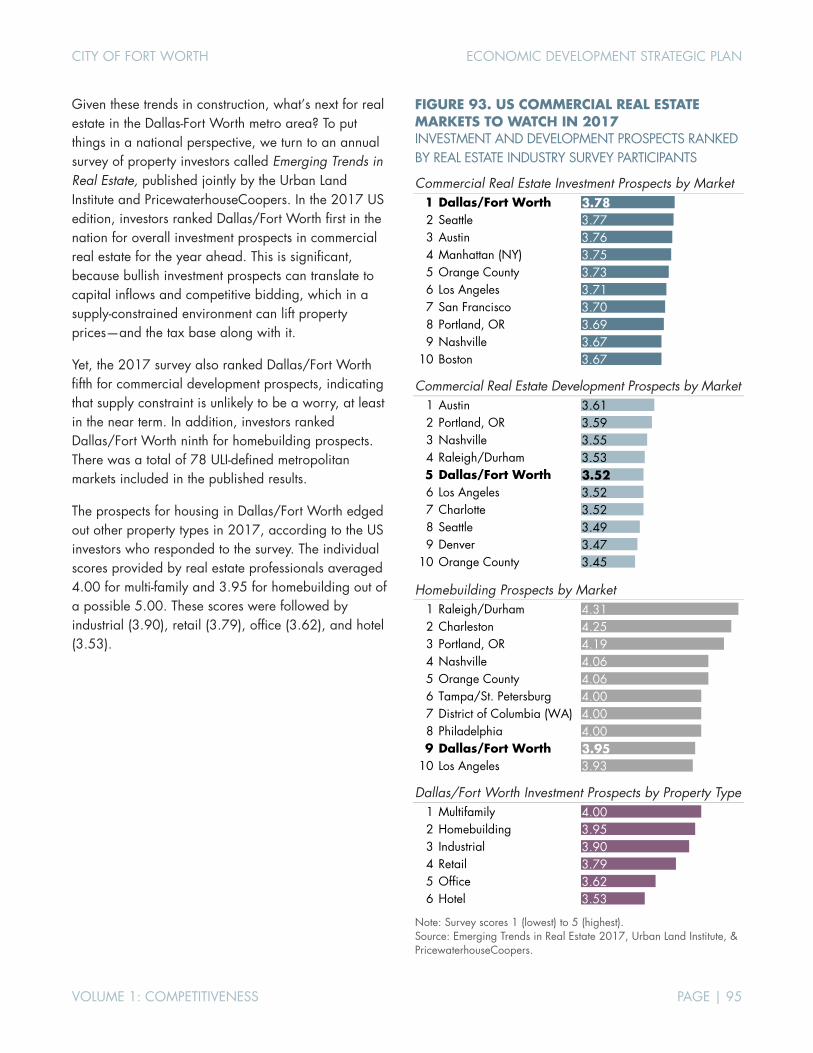
CITY OF FORT WORTH ECONOMIC DEVELOPMENT STRATEGIC PLAN
VOLUME 1: COMPETITIVENESS PAGE | 95
Given these trends in construction, what’s next for real estate in the Dallas-Fort Worth metro area? To put things in a national perspective, we turn to an annual survey of property investors called Emerging Trends in Real Estate, published jointly by the Urban Land Institute and PricewaterhouseCoopers. In the 2017 US edition, investors ranked Dallas/Fort Worth first in the nation for overall investment prospects in commercial real estate for the year ahead. This is significant, because bullish investment prospects can translate to capital inflows and competitive bidding, which in a supply-constrained environment can lift property prices—and the tax base along with it.
Yet, the 2017 survey also ranked Dallas/Fort Worth fifth for commercial development prospects, indicating that supply constraint is unlikely to be a worry, at least in the near term. In addition, investors ranked Dallas/Fort Worth ninth for homebuilding prospects. There was a total of 78 ULI-defined metropolitan markets included in the published results.
The prospects for housing in Dallas/Fort Worth edged out other property types in 2017, according to the US investors who responded to the survey. The individual scores provided by real estate professionals averaged 4.00 for multi-family and 3.95 for homebuilding out of a possible 5.00. These scores were followed by industrial (3.90), retail (3.79), office (3.62), and hotel (3.53).
FIGURE 93. US COMMERCIAL REAL ESTATE MARKETS TO WATCH IN 2017 INVESTMENT AND DEVELOPMENT PROSPECTS RANKED BY REAL ESTATE INDUSTRY SURVEY PARTICIPANTS
Commercial Real Estate Investment Prospects by Market
Commercial Real Estate Development Prospects by Market
Homebuilding Prospects by Market
Dallas/Fort Worth Investment Prospects by Property Type
Note: Survey scores 1 (lowest) to 5 (highest). Source: Emerging Trends in Real Estate 2017, Urban Land Institute, & PricewaterhouseCoopers.
1 Dallas/Fort Worth 3.782 Seattle 3.773 Austin 3.764 Manhattan (NY) 3.755 Orange County 3.736 Los Angeles 3.717 San Francisco 3.708 Portland, OR 3.699 Nashville 3.67
10 Boston 3.67
1 Austin 3.612 Portland, OR 3.593 Nashville 3.554 Raleigh/Durham 3.535 Dallas/Fort Worth 3.526 Los Angeles 3.527 Charlotte 3.528 Seattle 3.499 Denver 3.47
10 Orange County 3.45
1 Raleigh/Durham 4.312 Charleston 4.253 Portland, OR 4.194 Nashville 4.065 Orange County 4.066 Tampa/St. Petersburg 4.007 District of Columbia (WA) 4.008 Philadelphia 4.009 Dallas/Fort Worth 3.95
10 Los Angeles 3.93
1 Multifamily 4.002 Homebuilding 3.953 Industrial 3.904 Retail 3.795 Office 3.626 Hotel 3.53
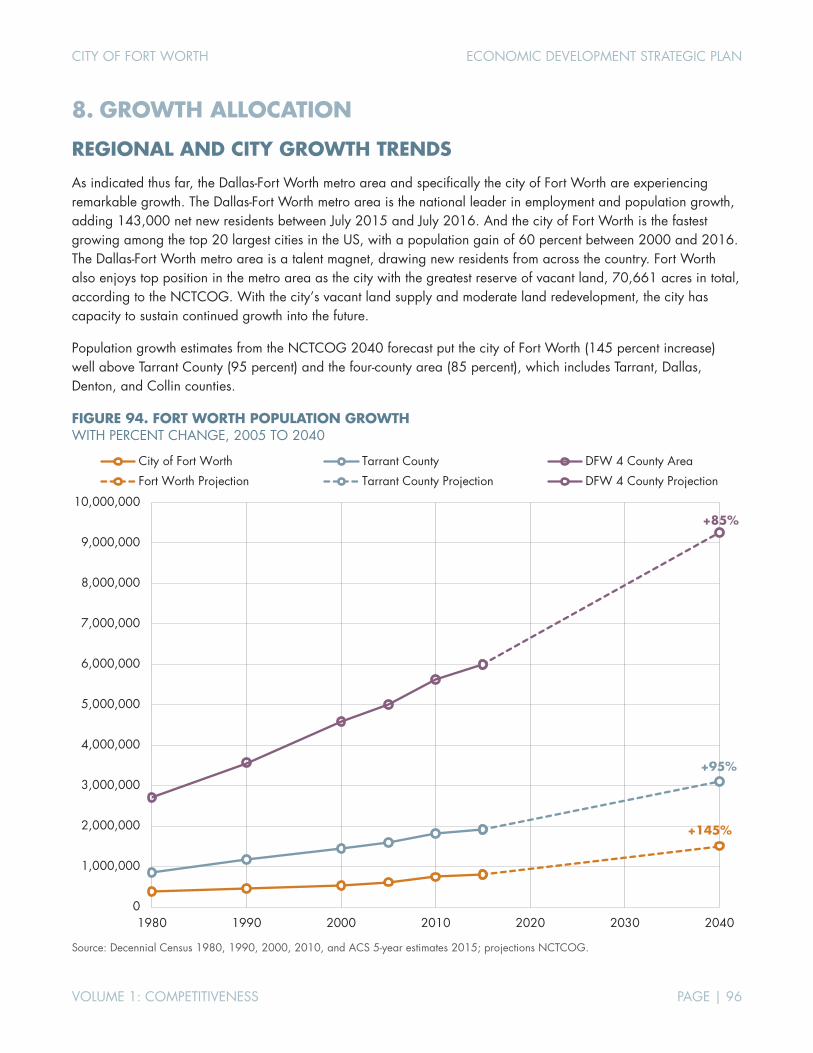
CITY OF FORT WORTH ECONOMIC DEVELOPMENT STRATEGIC PLAN
VOLUME 1: COMPETITIVENESS PAGE | 96
8. GROWTH ALLOCATION
REGIONAL AND CITY GROWTH TRENDS
As indicated thus far, the Dallas-Fort Worth metro area and specifically the city of Fort Worth are experiencing remarkable growth. The Dallas-Fort Worth metro area is the national leader in employment and population growth, adding 143,000 net new residents between July 2015 and July 2016. And the city of Fort Worth is the fastest growing among the top 20 largest cities in the US, with a population gain of 60 percent between 2000 and 2016. The Dallas-Fort Worth metro area is a talent magnet, drawing new residents from across the country. Fort Worth also enjoys top position in the metro area as the city with the greatest reserve of vacant land, 70,661 acres in total, according to the NCTCOG. With the city’s vacant land supply and moderate land redevelopment, the city has capacity to sustain continued growth into the future.
Population growth estimates from the NCTCOG 2040 forecast put the city of Fort Worth (145 percent increase) well above Tarrant County (95 percent) and the four-county area (85 percent), which includes Tarrant, Dallas, Denton, and Collin counties.
FIGURE 94. FORT WORTH POPULATION GROWTH WITH PERCENT CHANGE, 2005 TO 2040
Source: Decennial Census 1980, 1990, 2000, 2010, and ACS 5-year estimates 2015; projections NCTCOG.
0
1,000,000
2,000,000
3,000,000
4,000,000
5,000,000
6,000,000
7,000,000
8,000,000
9,000,000
10,000,000
1980 1990 2000 2010 2020 2030 2040
City of Fort Worth Tarrant County DFW 4 County Area
Fort Worth Projection Tarrant County Projection DFW 4 County Projection
+145%
+95%
+85%
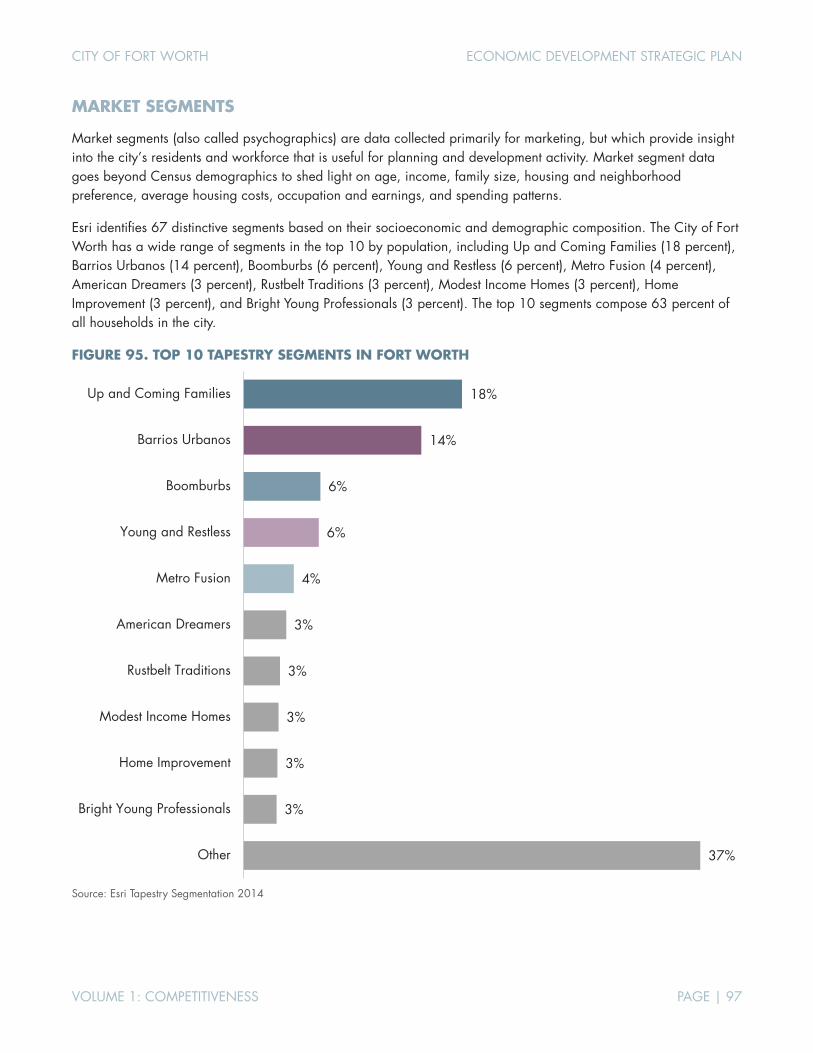
CITY OF FORT WORTH ECONOMIC DEVELOPMENT STRATEGIC PLAN
VOLUME 1: COMPETITIVENESS PAGE | 97
MARKET SEGMENTS
Market segments (also called psychographics) are data collected primarily for marketing, but which provide insight into the city’s residents and workforce that is useful for planning and development activity. Market segment data goes beyond Census demographics to shed light on age, income, family size, housing and neighborhood preference, average housing costs, occupation and earnings, and spending patterns.
Esri identifies 67 distinctive segments based on their socioeconomic and demographic composition. The City of Fort Worth has a wide range of segments in the top 10 by population, including Up and Coming Families (18 percent), Barrios Urbanos (14 percent), Boomburbs (6 percent), Young and Restless (6 percent), Metro Fusion (4 percent), American Dreamers (3 percent), Rustbelt Traditions (3 percent), Modest Income Homes (3 percent), Home Improvement (3 percent), and Bright Young Professionals (3 percent). The top 10 segments compose 63 percent of all households in the city.
FIGURE 95. TOP 10 TAPESTRY SEGMENTS IN FORT WORTH
Source: Esri Tapestry Segmentation 2014
18%
14%
6%
6%
4%
3%
3%
3%
3%
3%
37%
Up and Coming Families
Barrios Urbanos
Boomburbs
Young and Restless
Metro Fusion
American Dreamers
Rustbelt Traditions
Modest Income Homes
Home Improvement
Bright Young Professionals
Other
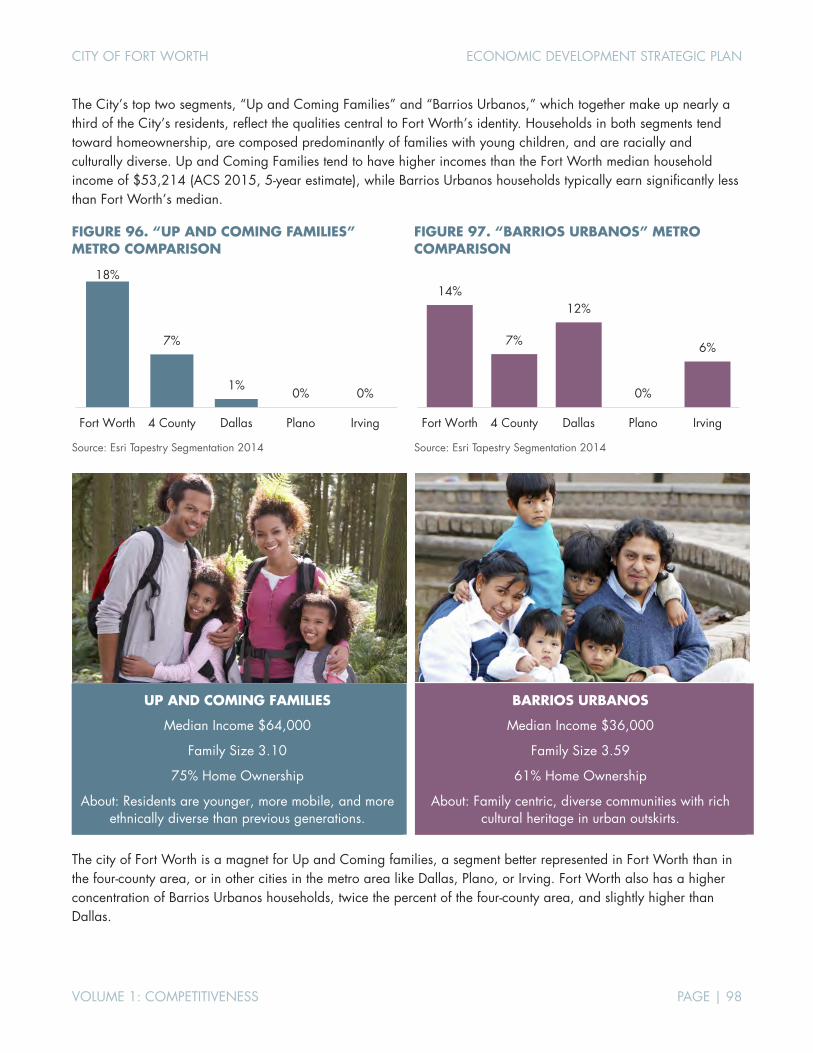
CITY OF FORT WORTH ECONOMIC DEVELOPMENT STRATEGIC PLAN
VOLUME 1: COMPETITIVENESS PAGE | 98
The City’s top two segments, “Up and Coming Families” and “Barrios Urbanos,” which together make up nearly a third of the City’s residents, reflect the qualities central to Fort Worth’s identity. Households in both segments tend toward homeownership, are composed predominantly of families with young children, and are racially and culturally diverse. Up and Coming Families tend to have higher incomes than the Fort Worth median household income of $53,214 (ACS 2015, 5-year estimate), while Barrios Urbanos households typically earn significantly less than Fort Worth’s median.
FIGURE 96. “UP AND COMING FAMILIES” METRO COMPARISON
Source: Esri Tapestry Segmentation 2014
FIGURE 97. “BARRIOS URBANOS” METRO COMPARISON
Source: Esri Tapestry Segmentation 2014
UP AND COMING FAMILIES
Median Income $64,000
Family Size 3.10
75% Home Ownership
About: Residents are younger, more mobile, and more ethnically diverse than previous generations.
BARRIOS URBANOS
Median Income $36,000
Family Size 3.59
61% Home Ownership
About: Family centric, diverse communities with rich cultural heritage in urban outskirts.
The city of Fort Worth is a magnet for Up and Coming families, a segment better represented in Fort Worth than in the four-county area, or in other cities in the metro area like Dallas, Plano, or Irving. Fort Worth also has a higher concentration of Barrios Urbanos households, twice the percent of the four-county area, and slightly higher than Dallas.
18%
7%
1%0% 0%
Fort Worth 4 County Dallas Plano Irving
14%
7%
12%
0%
6%
Fort Worth 4 County Dallas Plano Irving
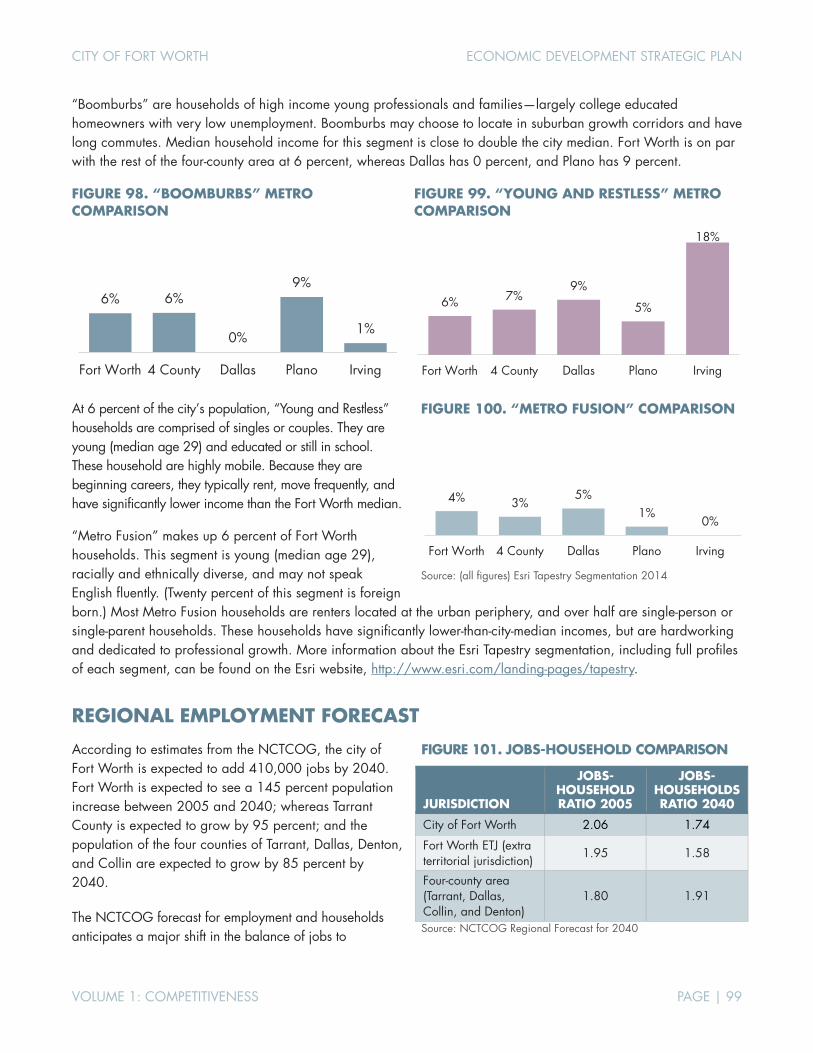
CITY OF FORT WORTH ECONOMIC DEVELOPMENT STRATEGIC PLAN
VOLUME 1: COMPETITIVENESS PAGE | 99
“Boomburbs” are households of high income young professionals and families—largely college educated homeowners with very low unemployment. Boomburbs may choose to locate in suburban growth corridors and have long commutes. Median household income for this segment is close to double the city median. Fort Worth is on par with the rest of the four-county area at 6 percent, whereas Dallas has 0 percent, and Plano has 9 percent.
FIGURE 98. “BOOMBURBS” METRO COMPARISON
FIGURE 99. “YOUNG AND RESTLESS” METRO COMPARISON
At 6 percent of the city’s population, “Young and Restless” households are comprised of singles or couples. They are young (median age 29) and educated or still in school. These household are highly mobile. Because they are beginning careers, they typically rent, move frequently, and have significantly lower income than the Fort Worth median.
“Metro Fusion” makes up 6 percent of Fort Worth households. This segment is young (median age 29), racially and ethnically diverse, and may not speak English fluently. (Twenty percent of this segment is foreign born.) Most Metro Fusion households are renters located at the urban periphery, and over half are single-person or single-parent households. These households have significantly lower-than-city-median incomes, but are hardworking and dedicated to professional growth. More information about the Esri Tapestry segmentation, including full profiles of each segment, can be found on the Esri website, http://www.esri.com/landing-pages/tapestry.
REGIONAL EMPLOYMENT FORECAST
According to estimates from the NCTCOG, the city of Fort Worth is expected to add 410,000 jobs by 2040. Fort Worth is expected to see a 145 percent population increase between 2005 and 2040; whereas Tarrant County is expected to grow by 95 percent; and the population of the four counties of Tarrant, Dallas, Denton, and Collin are expected to grow by 85 percent by 2040.
The NCTCOG forecast for employment and households anticipates a major shift in the balance of jobs to
6% 6%
0%
9%
1%
Fort Worth 4 County Dallas Plano Irving
6% 7%9%
5%
18%
Fort Worth 4 County Dallas Plano Irving
FIGURE 100. “METRO FUSION” COMPARISON
Source: (all figures) Esri Tapestry Segmentation 2014
FIGURE 101. JOBS-HOUSEHOLD COMPARISON
JURISDICTION
JOBS-HOUSEHOLD RATIO 2005
JOBS- HOUSEHOLDS RATIO 2040
City of Fort Worth 2.06 1.74
Fort Worth ETJ (extra territorial jurisdiction)
1.95 1.58
Four-county area (Tarrant, Dallas, Collin, and Denton)
1.80 1.91
Source: NCTCOG Regional Forecast for 2040
4% 3%5%
1%0%
Fort Worth 4 County Dallas Plano Irving
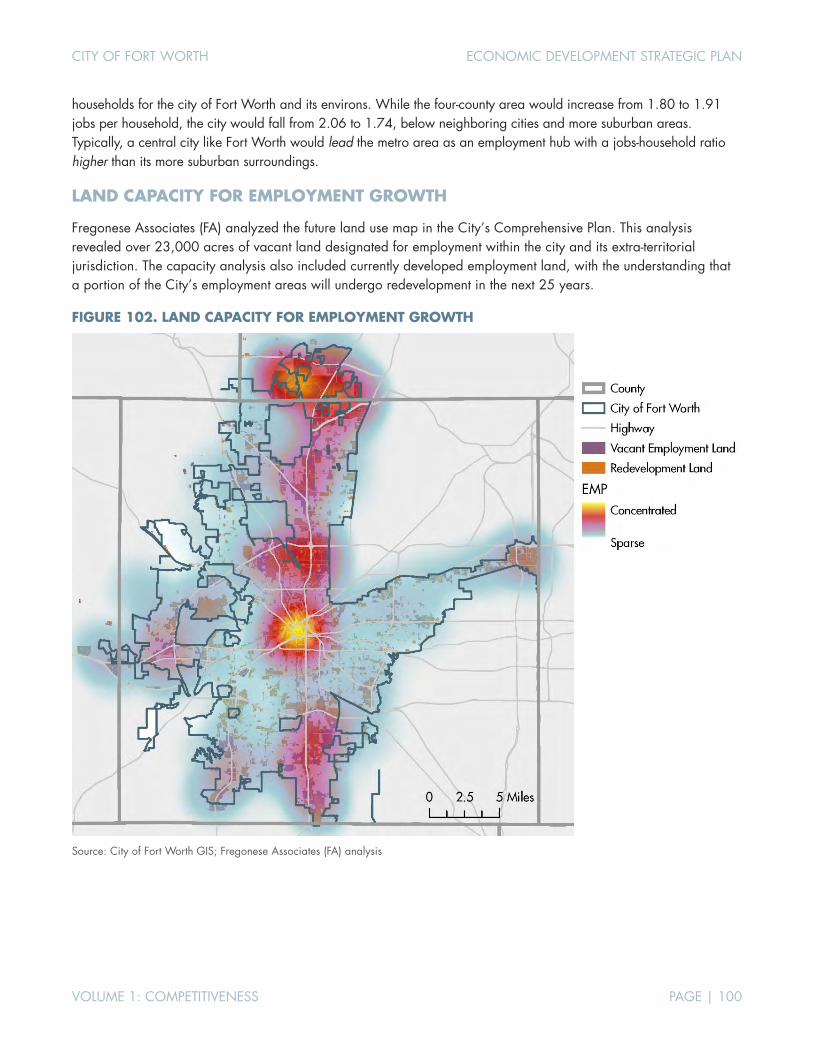
CITY OF FORT WORTH ECONOMIC DEVELOPMENT STRATEGIC PLAN
VOLUME 1: COMPETITIVENESS PAGE | 100
households for the city of Fort Worth and its environs. While the four-county area would increase from 1.80 to 1.91 jobs per household, the city would fall from 2.06 to 1.74, below neighboring cities and more suburban areas. Typically, a central city like Fort Worth would lead the metro area as an employment hub with a jobs-household ratio higher than its more suburban surroundings.
LAND CAPACITY FOR EMPLOYMENT GROWTH
Fregonese Associates (FA) analyzed the future land use map in the City’s Comprehensive Plan. This analysis revealed over 23,000 acres of vacant land designated for employment within the city and its extra-territorial jurisdiction. The capacity analysis also included currently developed employment land, with the understanding that a portion of the City’s employment areas will undergo redevelopment in the next 25 years.
FIGURE 102. LAND CAPACITY FOR EMPLOYMENT GROWTH
Source: City of Fort Worth GIS; Fregonese Associates (FA) analysis
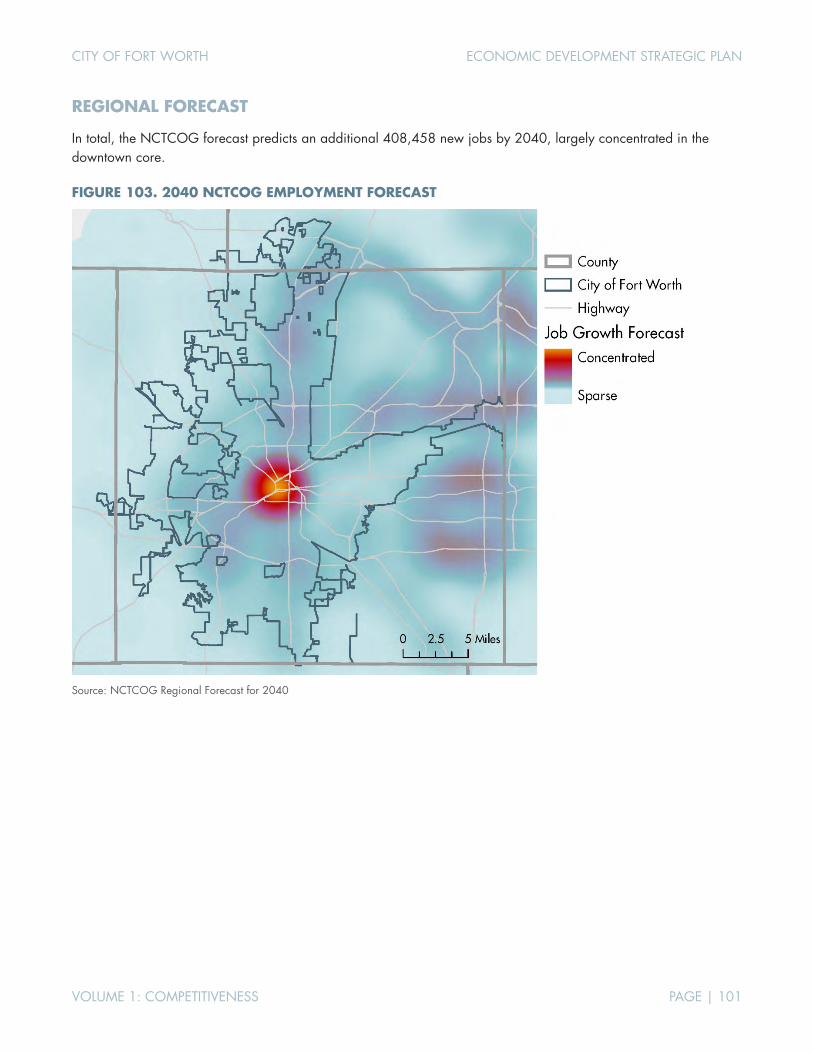
CITY OF FORT WORTH ECONOMIC DEVELOPMENT STRATEGIC PLAN
VOLUME 1: COMPETITIVENESS PAGE | 101
REGIONAL FORECAST
In total, the NCTCOG forecast predicts an additional 408,458 new jobs by 2040, largely concentrated in the downtown core.
FIGURE 103. 2040 NCTCOG EMPLOYMENT FORECAST
Source: NCTCOG Regional Forecast for 2040

CITY OF FORT WORTH ECONOMIC DEVELOPMENT STRATEGIC PLAN
VOLUME 1: COMPETITIVENESS PAGE | 102
FORECAST VERSUS CAPACITY
Fregonese Associates used its proprietary Envision Tomorrow planning tool, which allows scenario modeling and fiscal impact evaluation on a site-by-site or district-by-district basis, to provide a clear understanding of Fort Worth’s most promising options for new development, redevelopment, and job growth over the next 5 to 10 years. Based on this analysis, the city’s employment capacity was compared with the NCTCOG employment forecast. The map below clearly shows a mismatch between vacant land capacity designated by the City’s Comprehensive Plan as future employment land, and the 2040 regional growth forecast. The forecast for downtown job growth outstrips the current capacity of vacant land. This can be explained, at least to a degree. Downtown areas often experience higher rates of redevelopment than other parts of a city. But the NCTCOG forecast does not account for available employment land in other parts of the city, as shown in the blue areas where capacity exceeds the forecast expectations.
FIGURE 104. COMPARISON OF FORECAST TO CAPACITY
Source: Fregonese Associates (FA) scenario analysis
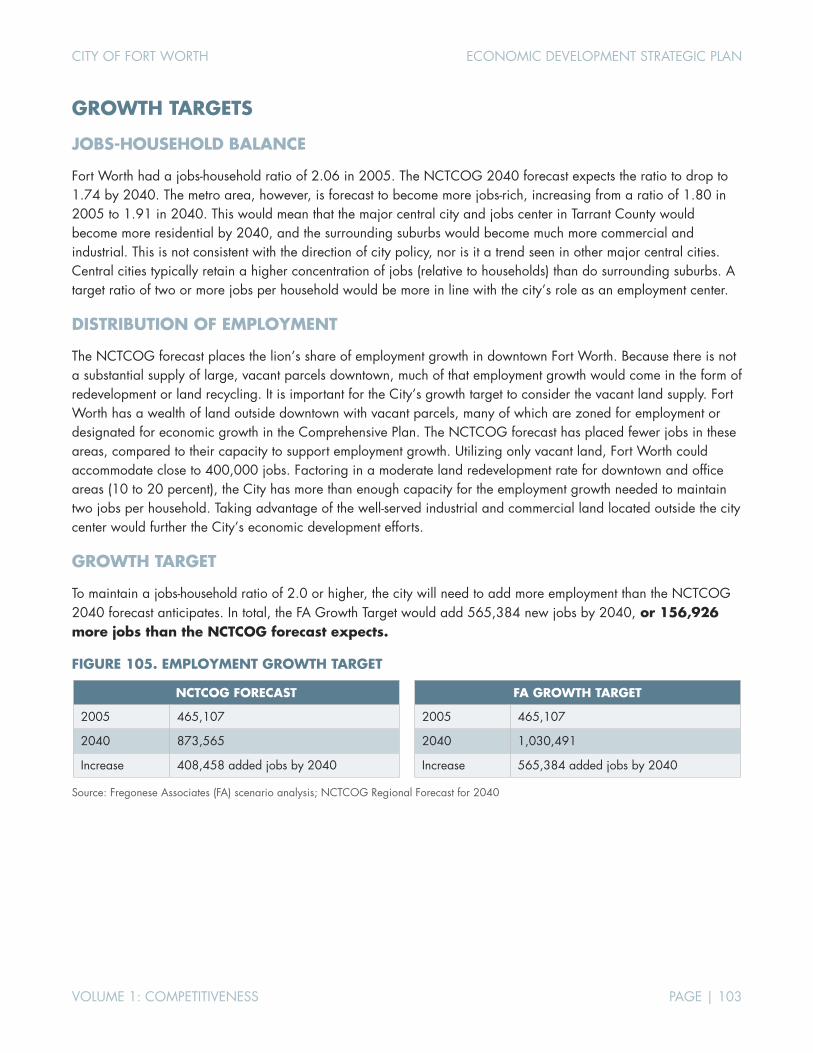
CITY OF FORT WORTH ECONOMIC DEVELOPMENT STRATEGIC PLAN
VOLUME 1: COMPETITIVENESS PAGE | 103
GROWTH TARGETS
JOBS-HOUSEHOLD BALANCE
Fort Worth had a jobs-household ratio of 2.06 in 2005. The NCTCOG 2040 forecast expects the ratio to drop to 1.74 by 2040. The metro area, however, is forecast to become more jobs-rich, increasing from a ratio of 1.80 in 2005 to 1.91 in 2040. This would mean that the major central city and jobs center in Tarrant County would become more residential by 2040, and the surrounding suburbs would become much more commercial and industrial. This is not consistent with the direction of city policy, nor is it a trend seen in other major central cities. Central cities typically retain a higher concentration of jobs (relative to households) than do surrounding suburbs. A target ratio of two or more jobs per household would be more in line with the city’s role as an employment center.
DISTRIBUTION OF EMPLOYMENT
The NCTCOG forecast places the lion’s share of employment growth in downtown Fort Worth. Because there is not a substantial supply of large, vacant parcels downtown, much of that employment growth would come in the form of redevelopment or land recycling. It is important for the City’s growth target to consider the vacant land supply. Fort Worth has a wealth of land outside downtown with vacant parcels, many of which are zoned for employment or designated for economic growth in the Comprehensive Plan. The NCTCOG forecast has placed fewer jobs in these areas, compared to their capacity to support employment growth. Utilizing only vacant land, Fort Worth could accommodate close to 400,000 jobs. Factoring in a moderate land redevelopment rate for downtown and office areas (10 to 20 percent), the City has more than enough capacity for the employment growth needed to maintain two jobs per household. Taking advantage of the well-served industrial and commercial land located outside the city center would further the City’s economic development efforts.
GROWTH TARGET
To maintain a jobs-household ratio of 2.0 or higher, the city will need to add more employment than the NCTCOG 2040 forecast anticipates. In total, the FA Growth Target would add 565,384 new jobs by 2040, or 156,926 more jobs than the NCTCOG forecast expects.
FIGURE 105. EMPLOYMENT GROWTH TARGET
NCTCOG FORECAST FA GROWTH TARGET
2005 465,107 2005 465,107
2040 873,565 2040 1,030,491
Increase 408,458 added jobs by 2040 Increase 565,384 added jobs by 2040
Source: Fregonese Associates (FA) scenario analysis; NCTCOG Regional Forecast for 2040

CITY OF FORT WORTH ECONOMIC DEVELOPMENT STRATEGIC PLAN
VOLUME 1: COMPETITIVENESS PAGE | 104
The map below shows the geographic distribution of new employment growth under the FA Growth Target for 2040. Similar to the NCTCOG forecast, much of the new growth will be concentrated in downtown Fort Worth. In contrast to the NCTCOG forecast, there will also be significant growth in other areas of the city, including a wide corridor extending north from downtown, connecting to the Fort Worth Alliance Airport; south along I-35W and the Chisholm Trail Parkway; and west to the Naval Air Station Joint Reserve Base.
The FA Growth Target assumes that, in addition to vacant land development, there will be a moderate level of redevelopment on employment land. The growth scenario allows for employment infill of 10 percent to 20 percent in concentrated employment areas (such as downtown), and citywide 6 percent.
FIGURE 106. FORT WORTH EMPLOYMENT GROWTH TARGET FOR 2040
Source: Fregonese Associates (FA) scenario analysis

CITY OF FORT WORTH ECONOMIC DEVELOPMENT STRATEGIC PLAN
VOLUME 1: COMPETITIVENESS PAGE | 105
FIGURE 107. FORT WORTH EMPLOYMENT GROWTH COMPARISON
Source: Fregonese Associates (FA) scenario analysis; NCTCOG Regional Forecast for 2040
GROWTH TARGETS BY SUB AREA
To better understand and visualize the growth forecast in areas across the city, Fregonese Associates created 10 sub areas based on traffic survey zones (TSZs). The following tables and associated map show where the Growth Target allocates additional employment beyond the NCTCOG forecast. All sub areas maintain or increase employment compared to the regional forecast.
FIGURE 108. GROWTH TARGETS BY SUB AREA
SUB AREAS
NCTCOG BASE 2005
(TOTAL)
NCTCOG FORECAST
2040 (TOTAL)
NCTCOG FORECAST
2045 (TOTAL)
FORECAST INCREASE
2005-2040 (INCREMENT)
FA GROWTH TARGET
2005-2040 (INCREMENT)
COG VS FA COMPARED
(DIFFERENCE)
BUILDABLE VACANT
LAND (ACRES)
Downtown-Near East 121,829 239,866 246,121 118,037 118,037 No change 705
East 40,704 59,757 61,978 19,053 21,613 +2,560 1,030
Inner West 40,797 66,930 68,973 26,133 26,133 No change 288
Near North 82,389 177,071 185,448 94,682 114,272 +19,590 7,206
North-Alliance 13,398 40,801 43,766 27,403 95,490 +68,087 5,000
Northwest 30,191 40,496 41,568 10,305 15,260 +4,955 792
South 33,512 66,681 69,907 33,169 59,295 +26,126 3,351
Southeast 42,544 69,510 72,446 26,966 26,966 No change 1,329
Southwest-Chisholm Trail 55,390 101,910 105,793 46,520 46,520 No change 2,169
West-Base & Lockheed 4,353 10,543 11,999 6,190 23,607 +17,417 1,572
Total 465,107 873,565 907,999 408,458 547,193 138,735 23,442
Source: Fregonese Associates (FA) scenario analysis; NCTCOG Regional Forecast for 2040
465,107 483,298 873,565
1,030,491
0
200,000
400,000
600,000
800,000
1,000,000
1,200,000
2005 2010 2015 2020 2025 2030 2035 2040
NCTCOG Forecast Growth Target
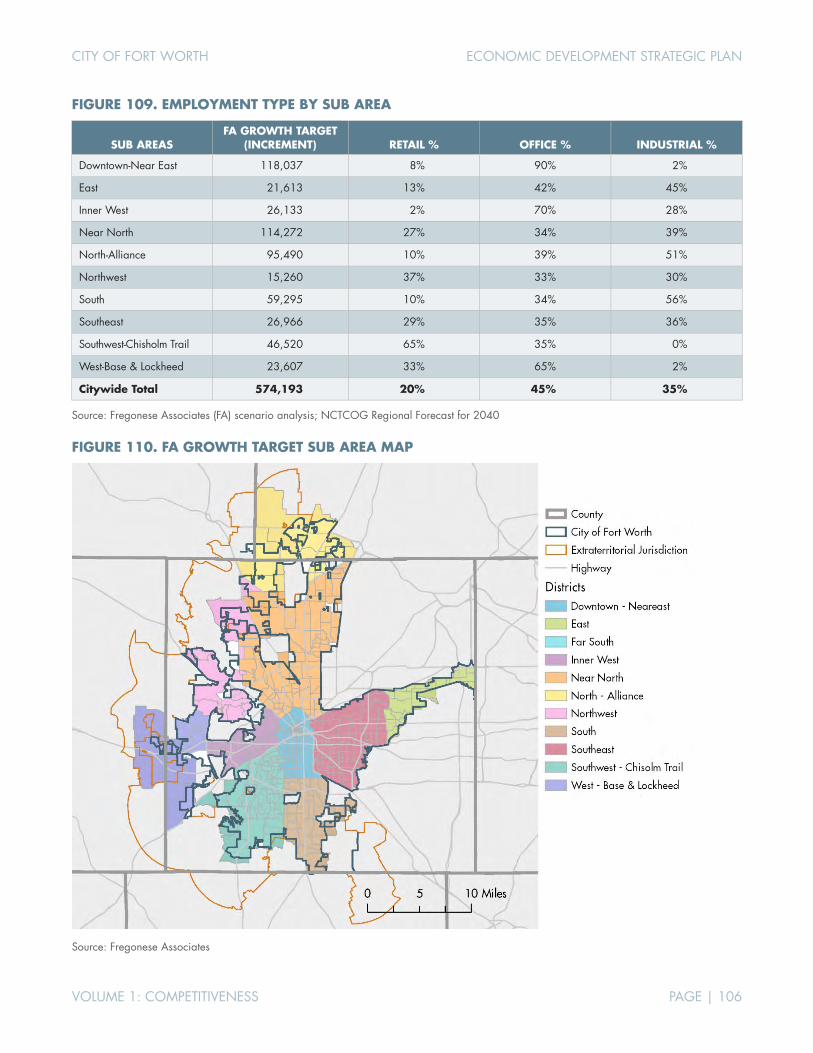
CITY OF FORT WORTH ECONOMIC DEVELOPMENT STRATEGIC PLAN
VOLUME 1: COMPETITIVENESS PAGE | 106
FIGURE 109. EMPLOYMENT TYPE BY SUB AREA
SUB AREAS FA GROWTH TARGET
(INCREMENT) RETAIL % OFFICE % INDUSTRIAL %
Downtown-Near East 118,037 8% 90% 2%
East 21,613 13% 42% 45%
Inner West 26,133 2% 70% 28%
Near North 114,272 27% 34% 39%
North-Alliance 95,490 10% 39% 51%
Northwest 15,260 37% 33% 30%
South 59,295 10% 34% 56%
Southeast 26,966 29% 35% 36%
Southwest-Chisholm Trail 46,520 65% 35% 0%
West-Base & Lockheed 23,607 33% 65% 2%
Citywide Total 574,193 20% 45% 35%
Source: Fregonese Associates (FA) scenario analysis; NCTCOG Regional Forecast for 2040
FIGURE 110. FA GROWTH TARGET SUB AREA MAP
Source: Fregonese Associates
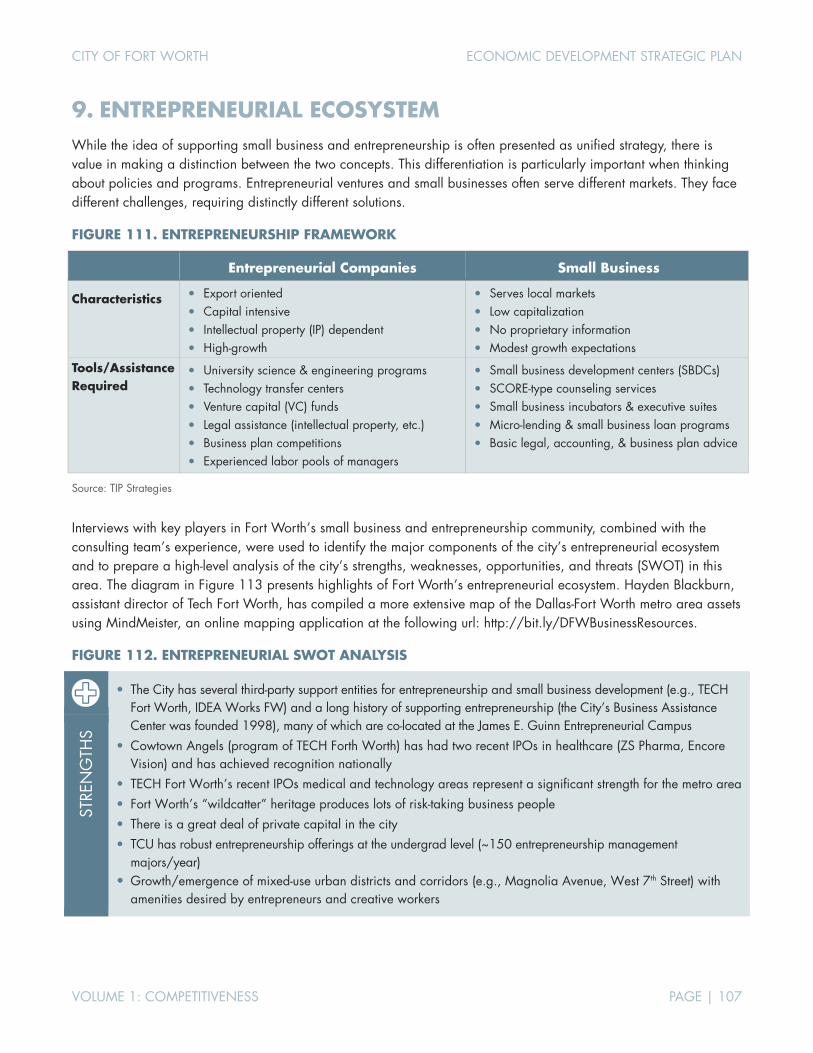
CITY OF FORT WORTH ECONOMIC DEVELOPMENT STRATEGIC PLAN
VOLUME 1: COMPETITIVENESS PAGE | 107
9. ENTREPRENEURIAL ECOSYSTEM While the idea of supporting small business and entrepreneurship is often presented as unified strategy, there is value in making a distinction between the two concepts. This differentiation is particularly important when thinking about policies and programs. Entrepreneurial ventures and small businesses often serve different markets. They face different challenges, requiring distinctly different solutions.
FIGURE 111. ENTREPRENEURSHIP FRAMEWORK
Entrepreneurial Companies Small Business
Characteristics Export oriented Capital intensive Intellectual property (IP) dependent High-growth
Serves local markets Low capitalization No proprietary information Modest growth expectations
Tools/Assistance Required
University science & engineering programs Technology transfer centers Venture capital (VC) funds Legal assistance (intellectual property, etc.) Business plan competitions Experienced labor pools of managers
Small business development centers (SBDCs) SCORE-type counseling services Small business incubators & executive suites Micro-lending & small business loan programs Basic legal, accounting, & business plan advice
Source: TIP Strategies
Interviews with key players in Fort Worth’s small business and entrepreneurship community, combined with the consulting team’s experience, were used to identify the major components of the city’s entrepreneurial ecosystem and to prepare a high-level analysis of the city’s strengths, weaknesses, opportunities, and threats (SWOT) in this area. The diagram in Figure 113 presents highlights of Fort Worth’s entrepreneurial ecosystem. Hayden Blackburn, assistant director of Tech Fort Worth, has compiled a more extensive map of the Dallas-Fort Worth metro area assets using MindMeister, an online mapping application at the following url: http://bit.ly/DFWBusinessResources.
FIGURE 112. ENTREPRENEURIAL SWOT ANALYSIS
• The City has several third-party support entities for entrepreneurship and small business development (e.g., TECH
Fort Worth, IDEA Works FW) and a long history of supporting entrepreneurship (the City’s Business Assistance Center was founded 1998), many of which are co-located at the James E. Guinn Entrepreneurial Campus
• Cowtown Angels (program of TECH Forth Worth) has had two recent IPOs in healthcare (ZS Pharma, Encore Vision) and has achieved recognition nationally
• TECH Fort Worth’s recent IPOs medical and technology areas represent a significant strength for the metro area • Fort Worth’s “wildcatter” heritage produces lots of risk-taking business people • There is a great deal of private capital in the city • TCU has robust entrepreneurship offerings at the undergrad level (~150 entrepreneurship management
majors/year) • Growth/emergence of mixed-use urban districts and corridors (e.g., Magnolia Avenue, West 7th Street) with
amenities desired by entrepreneurs and creative workers
STRE
NG
THS

CITY OF FORT WORTH ECONOMIC DEVELOPMENT STRATEGIC PLAN
VOLUME 1: COMPETITIVENESS PAGE | 108
• Despite the city’s high level of private capital, the families and individuals that control this wealth are not well-
connected with investment opportunities, particularly in technology • City engagement with entrepreneur support organizations (ESOs), including the BAC, is not “mediated by metrics” • Lack of internal coordination between City/Chamber business recruitment program and local ESOs’ efforts to support
growth of startups and smaller tech-focused operations (including small tech operations for larger companies) • Lack of strategic process or coordinated marketing across entrepreneur support community • Region’s coworking space is concentrated in Dallas and northern suburbs • Fort Worth has gaps in capital access, particularly in seed and Series A funding • Lack of large successful technology companies means there’s a lack of “natural acquirers” that will reinvest in
tech startups in the city. This also means there are fewer mentors • A shortage of technical talent, including developers, coders, etc., and difficulty retaining local graduates (e.g.,
UT-Dallas) limits growth in Fort Worth
WEA
KNES
SES
• Connecting private risk capital with investment opportunities to boost access to capital for Fort Worth entrepreneurs • Leveraging the abundant “old money” in the city to create a Fort Worth-based venture capital (VC) fund to
serve as an investment vehicle for high-net worth individuals (similar to Iconiq Capital in San Francisco which is funded by Facebook CEO Mark Zuckerberg, Facebook COO Sheryl Sandberg, Napster founder Sean Parker, and Twitter/ Square CEO Jack Dorsey)
• Adopting rigorous metrics to measure impact of city dollars (e.g., City of Austin–ATI model) • Expanding coworking space (several currently in the works) to provide physical space and centers of gravity for
the entrepreneurial community • Offering software training bootcamps to increase availability of this training in Fort Worth • Identifying an organization that can play a “convener” role to better coordinate the ecosystem • Encouraging a higher level of seed capital (e.g., reverse pitch events to support entrepreneurship) • Better connecting UTARI (UT-Arlington Research Institute) to businesses and entrepreneurs in Fort Worth • Leveraging Fort Worth’s large corporate employers (e.g., American Airlines, BNSF, Lockheed Martin, Bell
Helicopter, Alcon Laboratories) to pursue a higher level of spin-outs and technology commercialization • Creating and formalizing an “innovation district” in the Near Southside medical district with new and
expanded incentives, programs, and policies to fuel entrepreneurship and the growth of innovative companies • Capitalizing on the lack of a single geographic concentration of technology firms, startups, and entrepreneurs
(similar to the Route 128 corridor in Boston) to make a specific district within Fort Worth the metro area’s “go to” spot for entrepreneurship and innovation
• Pursuing other sectors that represent significant opportunity to diversify emerging industry base (oil and gas, aerospace (manufacturing and design), and transportation/logistics)
OPP
ORT
UN
ITIE
S
• The lack of a major research university (with more than $500 million in annual academic R&D investments) in the
Dallas-Fort Worth metro area limits potential for university-related entrepreneurship and technology commercialization. • Relatively under-developed VC funding network in Texas, and especially in the Dallas-Fort Worth metro area (roughly
half of VC funding in Texas is in the Austin metro area), limits the potential for high-growth firms and tech startups. • Leadership transition at IDEA Works FW means the organization may be unsettled for a period. This could
affect pipeline. • Uncertainty surrounding regulatory reforms (including tax reforms) may affect deal flow in the short term.
THRE
ATS

CITY OF FORT WORTH ECONOMIC DEVELOPMENT STRATEGIC PLAN
VOLUME 1: COMPETITIVENESS PAGE | 109
FIGURE 113. FORT WORTH ENTREPRENEURIAL ECOSYSTEM
EVENTS/COMPETITIONS • FW Business Plan Competition • Impact Awards • Value & Ventures Competition • Kernel • Chamber Small Business of the
Year • Entrepreneur Summit • Entrepreneurs of Excellence • 1 Million Cups FW • Startup Weekend • Open Coffee Club • Tech Nest
UNIVERSITIES • Texas Christian University • University of Texas–Arlington • Texas Wesleyan University • Tarrant County College • Tarleton • Texas A&M Law
MEDIA • Star-Telegram • Dallas Innovates • Launch DFW • Fort Worth Business Press • Fort Worth Business CEO
Magazine • FW Inc. • Fort Worth Magazine
FORT WORTH ENTREPRENEURIAL
ECOSYSTEM
GOVERNMENT • City of Fort Worth (Economic
Development, Procurement) • Fort Worth Library • Texas Workforce Commission • North Richland Hills (The Maker
Spot)
CAPITAL • Cowtown Angels (A,S) • People Fund (P) • Satori Capital (A) • LKCM/Luther King Capital Mgmt.
(S) • Lift Fund (P) • Bios Partners (S) • Grow Co (S,P) • Alliance Lending • William Mann CDC (P) • TPG Capital
ENTREPRENEUR SUPPORT ORGS INCUBATORS: • TECH Fort Worth • IDEA Works FW
COWORKING • CoLab Workspace • Ensemble • The Backlot • Craftwork Coffee Co • Common Desk Co-Working • Coming soon: Criterion Coworking,
WeWork, GF17, Connex
SEED ACCELERATORS: • [none]
EDUCATION/TECHNICAL ASSIST.: • Fort Worth Business Assist. Center • Tarrant SBDC • SCORE • The Alternative Board • Entrepreneurs’ Org. (EO) Fort Worth • Biz Owners Ed
OTHER: • Elixir Kitchen Space (commercial
kitchen) • Shop Small Fort Worth
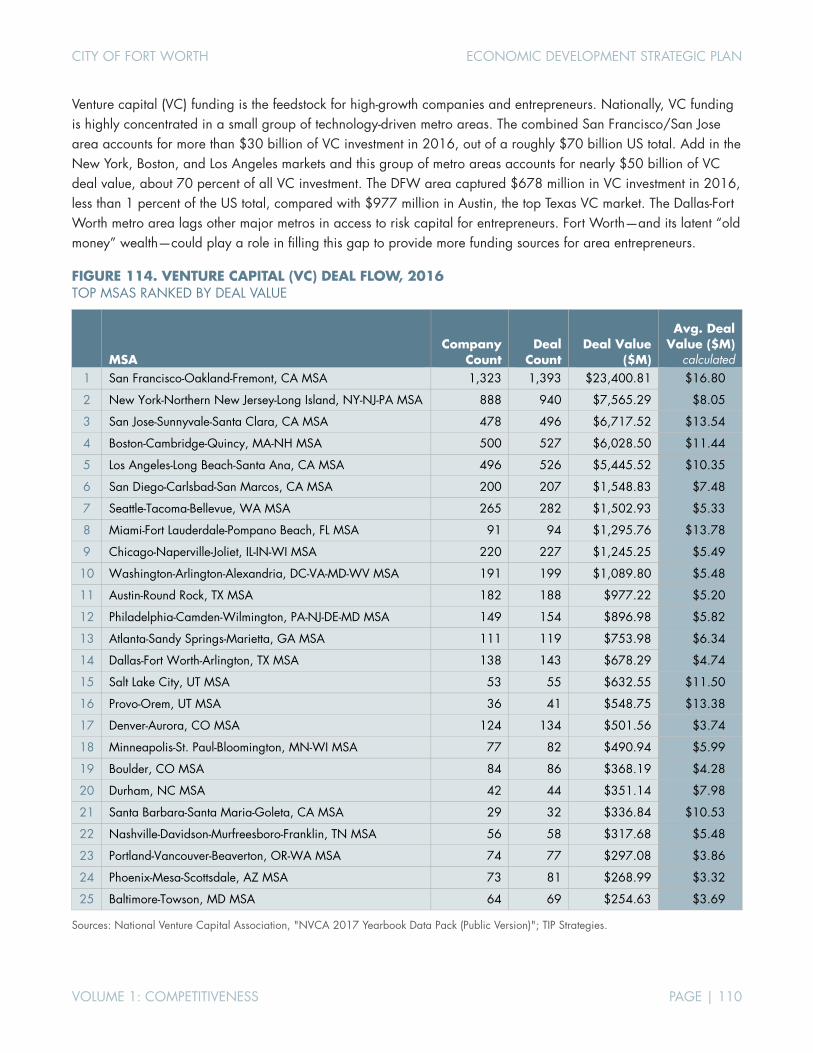
CITY OF FORT WORTH ECONOMIC DEVELOPMENT STRATEGIC PLAN
VOLUME 1: COMPETITIVENESS PAGE | 110
Venture capital (VC) funding is the feedstock for high-growth companies and entrepreneurs. Nationally, VC funding is highly concentrated in a small group of technology-driven metro areas. The combined San Francisco/San Jose area accounts for more than $30 billion of VC investment in 2016, out of a roughly $70 billion US total. Add in the New York, Boston, and Los Angeles markets and this group of metro areas accounts for nearly $50 billion of VC deal value, about 70 percent of all VC investment. The DFW area captured $678 million in VC investment in 2016, less than 1 percent of the US total, compared with $977 million in Austin, the top Texas VC market. The Dallas-Fort Worth metro area lags other major metros in access to risk capital for entrepreneurs. Fort Worth—and its latent “old money” wealth—could play a role in filling this gap to provide more funding sources for area entrepreneurs.
FIGURE 114. VENTURE CAPITAL (VC) DEAL FLOW, 2016 TOP MSAS RANKED BY DEAL VALUE
MSA
Company Count
Deal Count
Deal Value ($M)
Avg. Deal Value ($M)
calculated 1 San Francisco-Oakland-Fremont, CA MSA 1,323 1,393 $23,400.81 $16.80
2 New York-Northern New Jersey-Long Island, NY-NJ-PA MSA 888 940 $7,565.29 $8.05
3 San Jose-Sunnyvale-Santa Clara, CA MSA 478 496 $6,717.52 $13.54
4 Boston-Cambridge-Quincy, MA-NH MSA 500 527 $6,028.50 $11.44
5 Los Angeles-Long Beach-Santa Ana, CA MSA 496 526 $5,445.52 $10.35
6 San Diego-Carlsbad-San Marcos, CA MSA 200 207 $1,548.83 $7.48
7 Seattle-Tacoma-Bellevue, WA MSA 265 282 $1,502.93 $5.33
8 Miami-Fort Lauderdale-Pompano Beach, FL MSA 91 94 $1,295.76 $13.78
9 Chicago-Naperville-Joliet, IL-IN-WI MSA 220 227 $1,245.25 $5.49
10 Washington-Arlington-Alexandria, DC-VA-MD-WV MSA 191 199 $1,089.80 $5.48
11 Austin-Round Rock, TX MSA 182 188 $977.22 $5.20
12 Philadelphia-Camden-Wilmington, PA-NJ-DE-MD MSA 149 154 $896.98 $5.82
13 Atlanta-Sandy Springs-Marietta, GA MSA 111 119 $753.98 $6.34
14 Dallas-Fort Worth-Arlington, TX MSA 138 143 $678.29 $4.74
15 Salt Lake City, UT MSA 53 55 $632.55 $11.50
16 Provo-Orem, UT MSA 36 41 $548.75 $13.38
17 Denver-Aurora, CO MSA 124 134 $501.56 $3.74
18 Minneapolis-St. Paul-Bloomington, MN-WI MSA 77 82 $490.94 $5.99
19 Boulder, CO MSA 84 86 $368.19 $4.28
20 Durham, NC MSA 42 44 $351.14 $7.98
21 Santa Barbara-Santa Maria-Goleta, CA MSA 29 32 $336.84 $10.53
22 Nashville-Davidson-Murfreesboro-Franklin, TN MSA 56 58 $317.68 $5.48
23 Portland-Vancouver-Beaverton, OR-WA MSA 74 77 $297.08 $3.86
24 Phoenix-Mesa-Scottsdale, AZ MSA 73 81 $268.99 $3.32
25 Baltimore-Towson, MD MSA 64 69 $254.63 $3.69
Sources: National Venture Capital Association, "NVCA 2017 Yearbook Data Pack (Public Version)"; TIP Strategies.
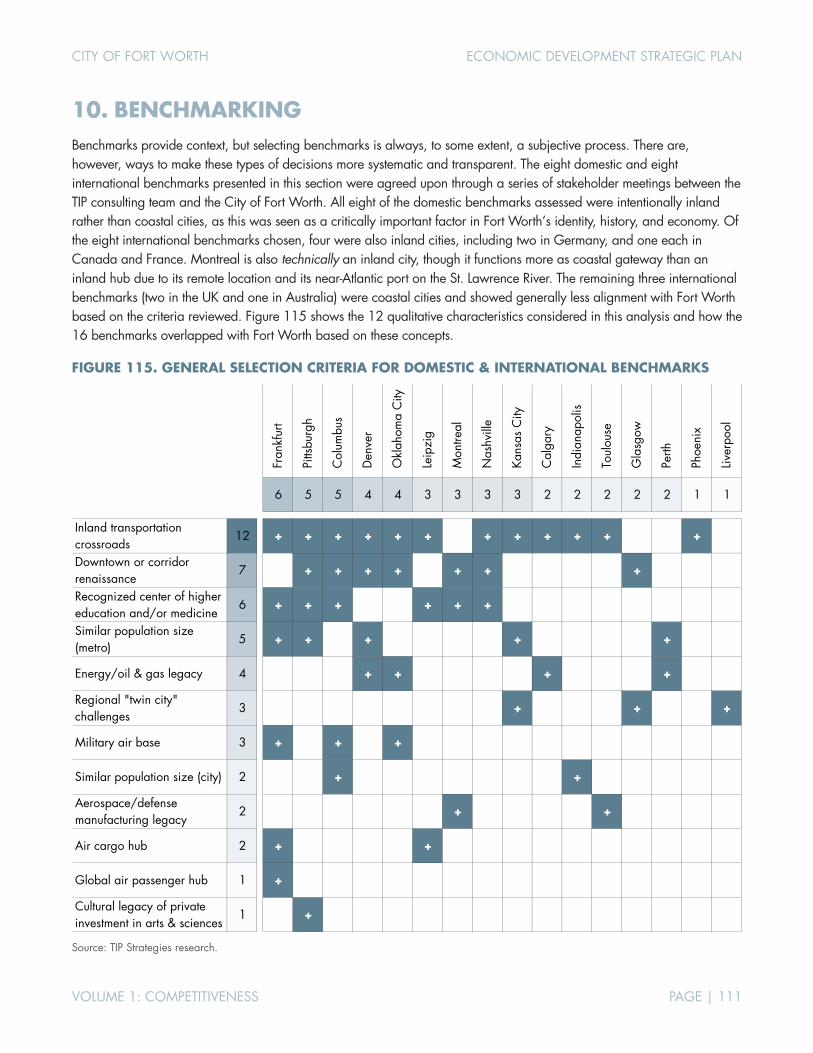
CITY OF FORT WORTH ECONOMIC DEVELOPMENT STRATEGIC PLAN
VOLUME 1: COMPETITIVENESS PAGE | 111
10. BENCHMARKING Benchmarks provide context, but selecting benchmarks is always, to some extent, a subjective process. There are, however, ways to make these types of decisions more systematic and transparent. The eight domestic and eight international benchmarks presented in this section were agreed upon through a series of stakeholder meetings between the TIP consulting team and the City of Fort Worth. All eight of the domestic benchmarks assessed were intentionally inland rather than coastal cities, as this was seen as a critically important factor in Fort Worth’s identity, history, and economy. Of the eight international benchmarks chosen, four were also inland cities, including two in Germany, and one each in Canada and France. Montreal is also technically an inland city, though it functions more as coastal gateway than an inland hub due to its remote location and its near-Atlantic port on the St. Lawrence River. The remaining three international benchmarks (two in the UK and one in Australia) were coastal cities and showed generally less alignment with Fort Worth based on the criteria reviewed. Figure 115 shows the 12 qualitative characteristics considered in this analysis and how the 16 benchmarks overlapped with Fort Worth based on these concepts.
FIGURE 115. GENERAL SELECTION CRITERIA FOR DOMESTIC & INTERNATIONAL BENCHMARKS
Source: TIP Strategies research.
Fran
kfur
t
Pitts
burg
h
Col
umbu
s
Den
ver
Okl
ahom
a C
ity
Leip
zig
Mon
treal
Nas
hvill
e
Kans
as C
ity
Cal
gary
Indi
anap
olis
Toul
ouse
Gla
sgow
Perth
Phoe
nix
Liver
pool
6 5 5 4 4 3 3 3 3 2 2 2 2 2 1 1
Inland transportation crossroads
12 + + + + + + + + + + + +
Downtown or corridor renaissance
7 + + + + + + +
Recognized center of higher education and/or medicine
6 + + + + + +
Similar population size (metro)
5 + + + + +
Energy/oil & gas legacy 4 + + + +
Regional "twin city" challenges
3 + + +
Military air base 3 + + +
Similar population size (city) 2 + +
Aerospace/defense manufacturing legacy
2 + +
Air cargo hub 2 + +
Global air passenger hub 1 +
Cultural legacy of private investment in arts & sciences
1 +
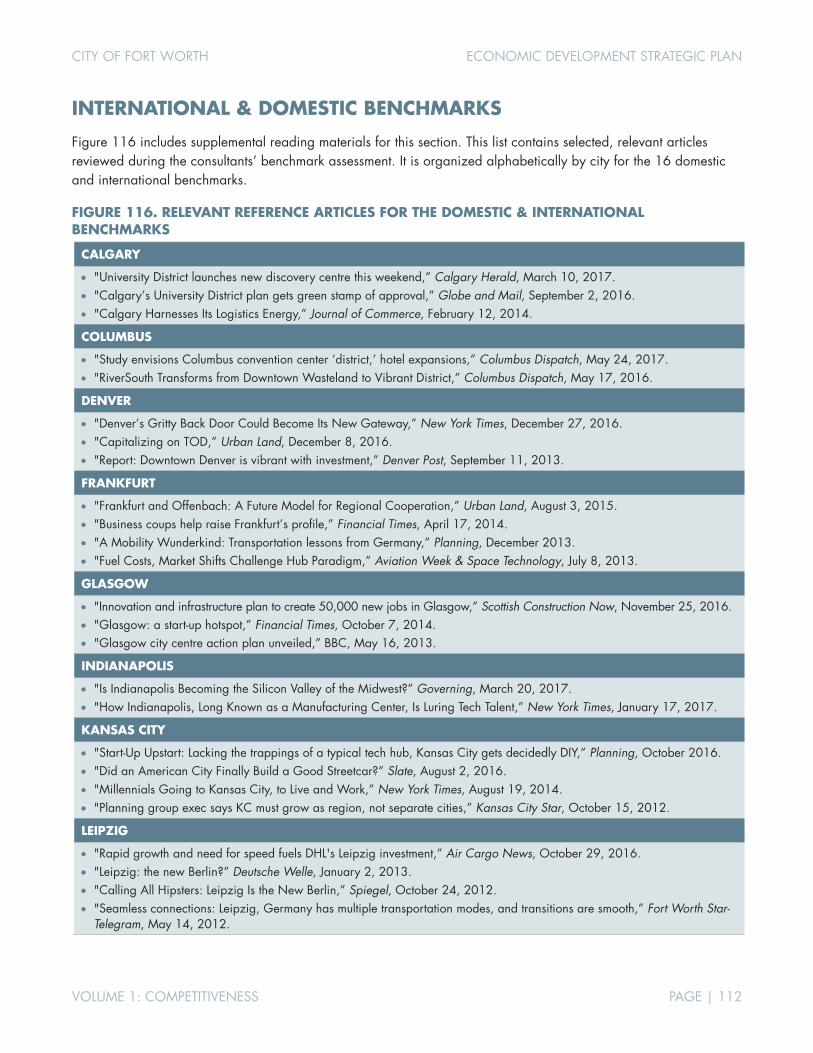
CITY OF FORT WORTH ECONOMIC DEVELOPMENT STRATEGIC PLAN
VOLUME 1: COMPETITIVENESS PAGE | 112
INTERNATIONAL & DOMESTIC BENCHMARKS
Figure 116 includes supplemental reading materials for this section. This list contains selected, relevant articles reviewed during the consultants’ benchmark assessment. It is organized alphabetically by city for the 16 domestic and international benchmarks.
FIGURE 116. RELEVANT REFERENCE ARTICLES FOR THE DOMESTIC & INTERNATIONAL BENCHMARKS
CALGARY
• "University District launches new discovery centre this weekend,” Calgary Herald, March 10, 2017. • "Calgary’s University District plan gets green stamp of approval,” Globe and Mail, September 2, 2016. • "Calgary Harnesses Its Logistics Energy,” Journal of Commerce, February 12, 2014.
COLUMBUS
• "Study envisions Columbus convention center ‘district,’ hotel expansions,” Columbus Dispatch, May 24, 2017. • "RiverSouth Transforms from Downtown Wasteland to Vibrant District,” Columbus Dispatch, May 17, 2016.
DENVER
• "Denver’s Gritty Back Door Could Become Its New Gateway,” New York Times, December 27, 2016. • "Capitalizing on TOD,” Urban Land, December 8, 2016. • "Report: Downtown Denver is vibrant with investment,” Denver Post, September 11, 2013.
FRANKFURT
• "Frankfurt and Offenbach: A Future Model for Regional Cooperation,” Urban Land, August 3, 2015. • "Business coups help raise Frankfurt’s profile,” Financial Times, April 17, 2014. • "A Mobility Wunderkind: Transportation lessons from Germany,” Planning, December 2013. • "Fuel Costs, Market Shifts Challenge Hub Paradigm,” Aviation Week & Space Technology, July 8, 2013.
GLASGOW
• "Innovation and infrastructure plan to create 50,000 new jobs in Glasgow,” Scottish Construction Now, November 25, 2016. • "Glasgow: a start-up hotspot,” Financial Times, October 7, 2014. • "Glasgow city centre action plan unveiled,” BBC, May 16, 2013.
INDIANAPOLIS
• "Is Indianapolis Becoming the Silicon Valley of the Midwest?” Governing, March 20, 2017. • "How Indianapolis, Long Known as a Manufacturing Center, Is Luring Tech Talent,” New York Times, January 17, 2017.
KANSAS CITY
• "Start-Up Upstart: Lacking the trappings of a typical tech hub, Kansas City gets decidedly DIY,” Planning, October 2016. • "Did an American City Finally Build a Good Streetcar?” Slate, August 2, 2016. • "Millennials Going to Kansas City, to Live and Work,” New York Times, August 19, 2014. • "Planning group exec says KC must grow as region, not separate cities,” Kansas City Star, October 15, 2012.
LEIPZIG
• "Rapid growth and need for speed fuels DHL's Leipzig investment,” Air Cargo News, October 29, 2016. • "Leipzig: the new Berlin?” Deutsche Welle, January 2, 2013. • "Calling All Hipsters: Leipzig Is the New Berlin,” Spiegel, October 24, 2012. • "Seamless connections: Leipzig, Germany has multiple transportation modes, and transitions are smooth,” Fort Worth Star-
Telegram, May 14, 2012.
CITY OF FORT WORTH ECONOMIC DEVELOPMENT STRATEGIC PLAN
VOLUME 1: COMPETITIVENESS PAGE | 113
LIVERPOOL
• "Shaking Off Downturn, Liverpool Has Big Plans,” New York Times, December 19, 2013. • "Liverpool steams ahead with development plan,” Financial Times, March 11, 2012.
MONTREAL
• "Montreal sees its future in smart sensors, artificial intelligence,” Computerworld, February 6, 2017. • "How does innovation come to life at McGill?” McGill Reporter, June 8, 2016. • "CSX to build $100-million terminal in Quebec,” Globe & Mail, January 25, 2013. • "Urban planners were saviours of our city,” Montreal Gazette, September 22, 2012.
NASHVILLE
• "NashvilleNext, Nashville-Davidson County,” Planning, April 2016. • "City Living Comes to Downtown Nashville,” Wall Street Journal, November 6, 2014. • "Nashville’s Latest Big Hit Could Be the City Itself,” New York Times, January 8, 2013.
OKLAHOMA CITY
• "Positioned for growth: Advancing the Oklahoma City innovation district,” Brookings Institution, April 18, 2017. • "How Oklahoma City Avoided Economic Pitfalls,” National Public Radio, January 19, 2012. • "Oklahoma City reaps positive effects of economic development,” The Oklahoman, January 1, 2012. • "A 180° Turnaround,” Planning, May 2011.
PERTH
• "City summit to revive Perth CBD dead zones,” West Australian, April 1, 2017. • "The changing face of Perth - modern and booming,” The Australian, May 18, 2013.
PHOENIX
• "Phoenix Focuses on Rebuilding Downtown, Wooing Silicon Valley,” New York Times, June 18, 2016. • "Phoenix Rises Again,” Planning, January 2016. • "Growing bioscience hub in Valley deserves support,” Arizona Republic, August 6, 2012. • "Raising Phoenix,” Urban Land, April 12, 2011.
PITTSBURGH
• "Coming-out party for Mellon Square,” Pittsburgh Post-Gazette, May 27, 2014. • "A Vision for the Rivers,” Pittsburgh Magazine, April 14, 2014. • "Bill Peduto wants to make Pittsburgh's Smithfield Street a 'grand boulevard',” Pittsburgh Post-Gazette, October 20, 2013. • "Pittsburgh’s Three Rivers, Now a Public Attraction,” New York Times, January 22, 2013. • "Upheaval and losses hurt, but Downtown Pittsburgh emerged from economic turmoil renewed,” Pittsburgh Post-Gazette,
December 30, 2012.
TOULOUSE
• "Toulouse to be EADS ‘centre of gravity’,” Financial Times, February 10, 2012. • "Aerospace: Valley where the businesses grow wings,” Financial Times, October 3, 2007.
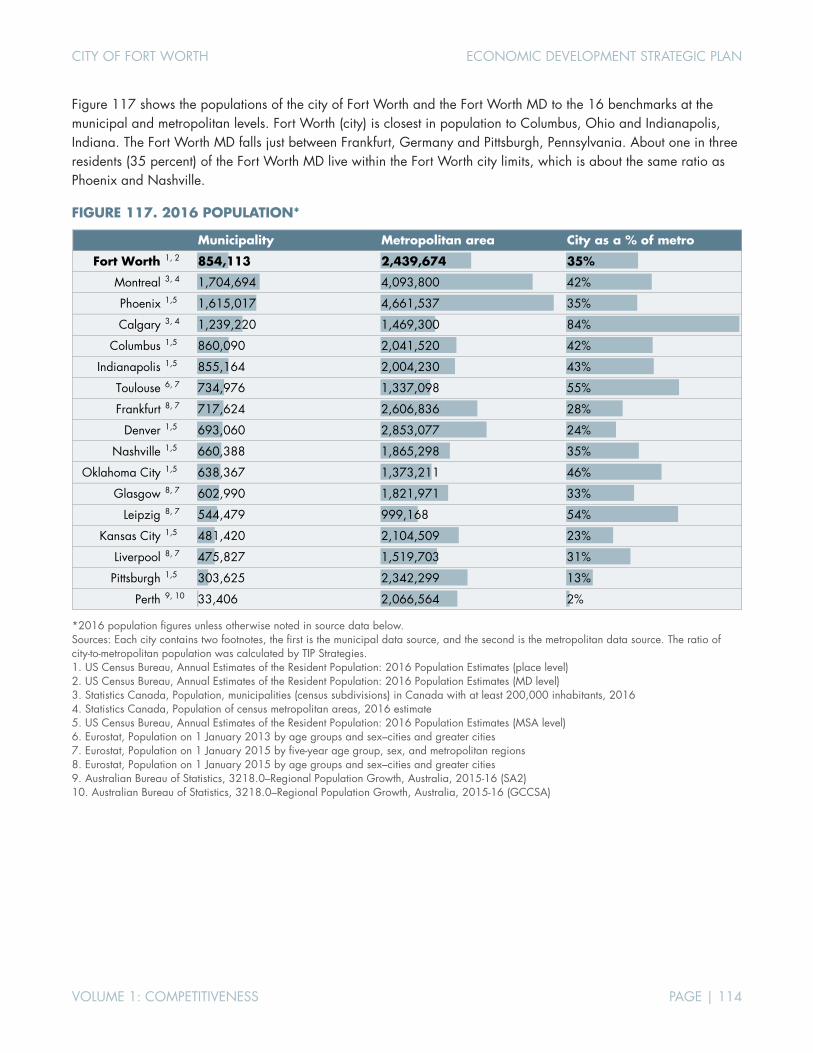
CITY OF FORT WORTH ECONOMIC DEVELOPMENT STRATEGIC PLAN
VOLUME 1: COMPETITIVENESS PAGE | 114
Figure 117 shows the populations of the city of Fort Worth and the Fort Worth MD to the 16 benchmarks at the municipal and metropolitan levels. Fort Worth (city) is closest in population to Columbus, Ohio and Indianapolis, Indiana. The Fort Worth MD falls just between Frankfurt, Germany and Pittsburgh, Pennsylvania. About one in three residents (35 percent) of the Fort Worth MD live within the Fort Worth city limits, which is about the same ratio as Phoenix and Nashville.
FIGURE 117. 2016 POPULATION*
*2016 population figures unless otherwise noted in source data below. Sources: Each city contains two footnotes, the first is the municipal data source, and the second is the metropolitan data source. The ratio of city-to-metropolitan population was calculated by TIP Strategies. 1. US Census Bureau, Annual Estimates of the Resident Population: 2016 Population Estimates (place level) 2. US Census Bureau, Annual Estimates of the Resident Population: 2016 Population Estimates (MD level) 3. Statistics Canada, Population, municipalities (census subdivisions) in Canada with at least 200,000 inhabitants, 2016 4. Statistics Canada, Population of census metropolitan areas, 2016 estimate 5. US Census Bureau, Annual Estimates of the Resident Population: 2016 Population Estimates (MSA level) 6. Eurostat, Population on 1 January 2013 by age groups and sex–cities and greater cities 7. Eurostat, Population on 1 January 2015 by five-year age group, sex, and metropolitan regions 8. Eurostat, Population on 1 January 2015 by age groups and sex–cities and greater cities 9. Australian Bureau of Statistics, 3218.0–Regional Population Growth, Australia, 2015-16 (SA2) 10. Australian Bureau of Statistics, 3218.0–Regional Population Growth, Australia, 2015-16 (GCCSA)
Municipality Metropolitan area City as a % of metro
Fort Worth 1, 2 854,113 2,439,674 35%
Montreal 3, 4 1,704,694 4,093,800 42%
Phoenix 1,5 1,615,017 4,661,537 35%
Calgary 3, 4 1,239,220 1,469,300 84%
Columbus 1,5 860,090 2,041,520 42%
Indianapolis 1,5 855,164 2,004,230 43%
Toulouse 6, 7 734,976 1,337,098 55%
Frankfurt 8, 7 717,624 2,606,836 28%
Denver 1,5 693,060 2,853,077 24%
Nashville 1,5 660,388 1,865,298 35%
Oklahoma City 1,5 638,367 1,373,211 46%
Glasgow 8, 7 602,990 1,821,971 33%
Leipzig 8, 7 544,479 999,168 54%
Kansas City 1,5 481,420 2,104,509 23%
Liverpool 8, 7 475,827 1,519,703 31%
Pittsburgh 1,5 303,625 2,342,299 13%
Perth 9, 10 33,406 2,066,564 2%
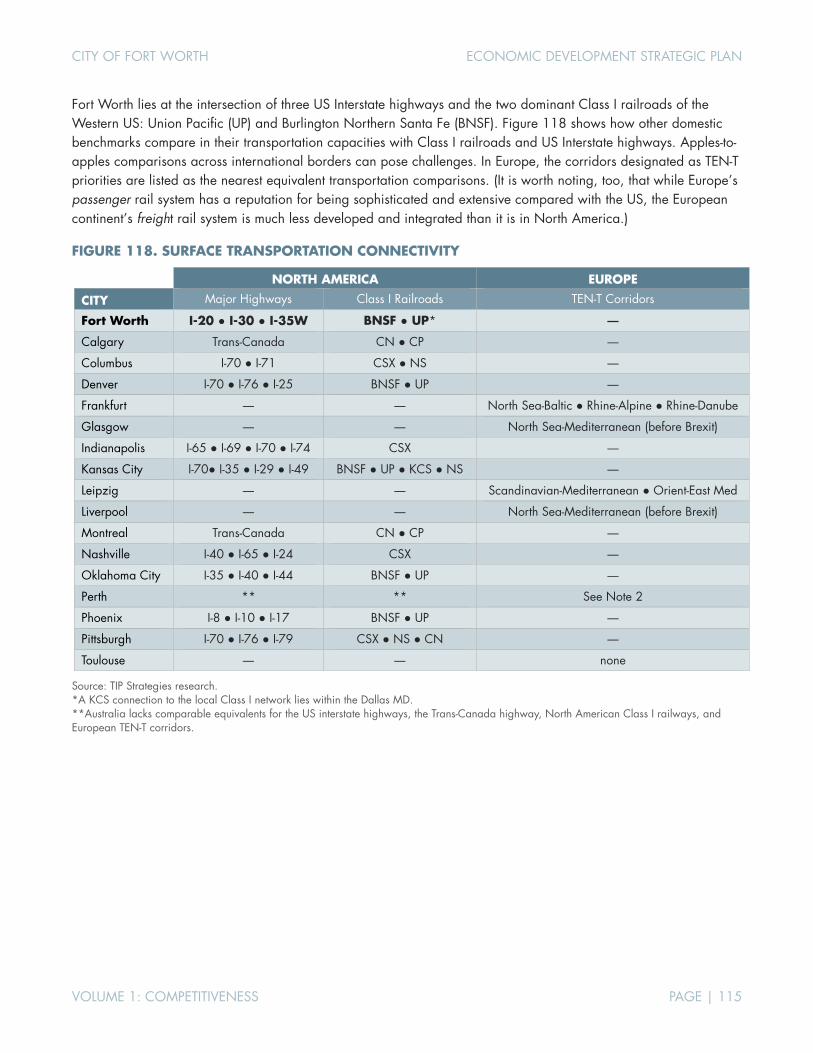
CITY OF FORT WORTH ECONOMIC DEVELOPMENT STRATEGIC PLAN
VOLUME 1: COMPETITIVENESS PAGE | 115
Fort Worth lies at the intersection of three US Interstate highways and the two dominant Class I railroads of the Western US: Union Pacific (UP) and Burlington Northern Santa Fe (BNSF). Figure 118 shows how other domestic benchmarks compare in their transportation capacities with Class I railroads and US Interstate highways. Apples-to-apples comparisons across international borders can pose challenges. In Europe, the corridors designated as TEN-T priorities are listed as the nearest equivalent transportation comparisons. (It is worth noting, too, that while Europe’s passenger rail system has a reputation for being sophisticated and extensive compared with the US, the European continent’s freight rail system is much less developed and integrated than it is in North America.)
FIGURE 118. SURFACE TRANSPORTATION CONNECTIVITY
NORTH AMERICA EUROPE
CITY Major Highways Class I Railroads TEN-T Corridors
Fort Worth I-20 ● I-30 ● I-35W BNSF ● UP* ―
Calgary Trans-Canada CN ● CP ―
Columbus I-70 ● I-71 CSX ● NS ―
Denver I-70 ● I-76 ● I-25 BNSF ● UP ―
Frankfurt ― ― North Sea-Baltic ● Rhine-Alpine ● Rhine-Danube
Glasgow ― ― North Sea-Mediterranean (before Brexit)
Indianapolis I-65 ● I-69 ● I-70 ● I-74 CSX ―
Kansas City I-70● I-35 ● I-29 ● I-49 BNSF ● UP ● KCS ● NS ―
Leipzig ― ― Scandinavian-Mediterranean ● Orient-East Med
Liverpool ― ― North Sea-Mediterranean (before Brexit)
Montreal Trans-Canada CN ● CP ―
Nashville I-40 ● I-65 ● I-24 CSX ―
Oklahoma City I-35 ● I-40 ● I-44 BNSF ● UP ―
Perth ** ** See Note 2
Phoenix I-8 ● I-10 ● I-17 BNSF ● UP ―
Pittsburgh I-70 ● I-76 ● I-79 CSX ● NS ● CN ―
Toulouse ― ― none
Source: TIP Strategies research. *A KCS connection to the local Class I network lies within the Dallas MD. **Australia lacks comparable equivalents for the US interstate highways, the Trans-Canada highway, North American Class I railways, and European TEN-T corridors.
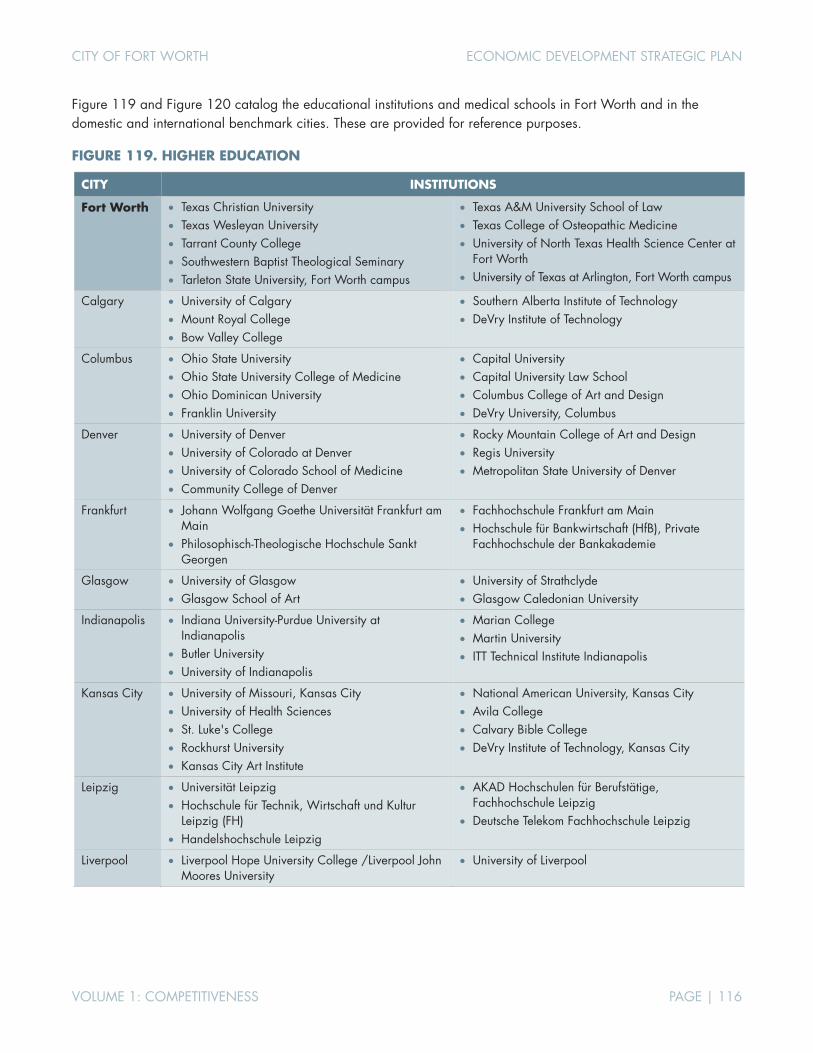
CITY OF FORT WORTH ECONOMIC DEVELOPMENT STRATEGIC PLAN
VOLUME 1: COMPETITIVENESS PAGE | 116
Figure 119 and Figure 120 catalog the educational institutions and medical schools in Fort Worth and in the domestic and international benchmark cities. These are provided for reference purposes.
FIGURE 119. HIGHER EDUCATION
CITY INSTITUTIONS
Fort Worth • Texas Christian University • Texas Wesleyan University • Tarrant County College • Southwestern Baptist Theological Seminary • Tarleton State University, Fort Worth campus
• Texas A&M University School of Law • Texas College of Osteopathic Medicine • University of North Texas Health Science Center at
Fort Worth • University of Texas at Arlington, Fort Worth campus
Calgary • University of Calgary • Mount Royal College • Bow Valley College
• Southern Alberta Institute of Technology • DeVry Institute of Technology
Columbus • Ohio State University • Ohio State University College of Medicine • Ohio Dominican University • Franklin University
• Capital University • Capital University Law School • Columbus College of Art and Design • DeVry University, Columbus
Denver • University of Denver • University of Colorado at Denver • University of Colorado School of Medicine • Community College of Denver
• Rocky Mountain College of Art and Design • Regis University • Metropolitan State University of Denver
Frankfurt • Johann Wolfgang Goethe Universität Frankfurt am Main
• Philosophisch-Theologische Hochschule Sankt Georgen
• Fachhochschule Frankfurt am Main • Hochschule für Bankwirtschaft (HfB), Private
Fachhochschule der Bankakademie
Glasgow • University of Glasgow • Glasgow School of Art
• University of Strathclyde • Glasgow Caledonian University
Indianapolis • Indiana University-Purdue University at Indianapolis
• Butler University • University of Indianapolis
• Marian College • Martin University • ITT Technical Institute Indianapolis
Kansas City • University of Missouri, Kansas City • University of Health Sciences • St. Luke's College • Rockhurst University • Kansas City Art Institute
• National American University, Kansas City • Avila College • Calvary Bible College • DeVry Institute of Technology, Kansas City
Leipzig • Universität Leipzig • Hochschule für Technik, Wirtschaft und Kultur
Leipzig (FH) • Handelshochschule Leipzig
• AKAD Hochschulen für Berufstätige, Fachhochschule Leipzig
• Deutsche Telekom Fachhochschule Leipzig
Liverpool • Liverpool Hope University College /Liverpool John Moores University
• University of Liverpool
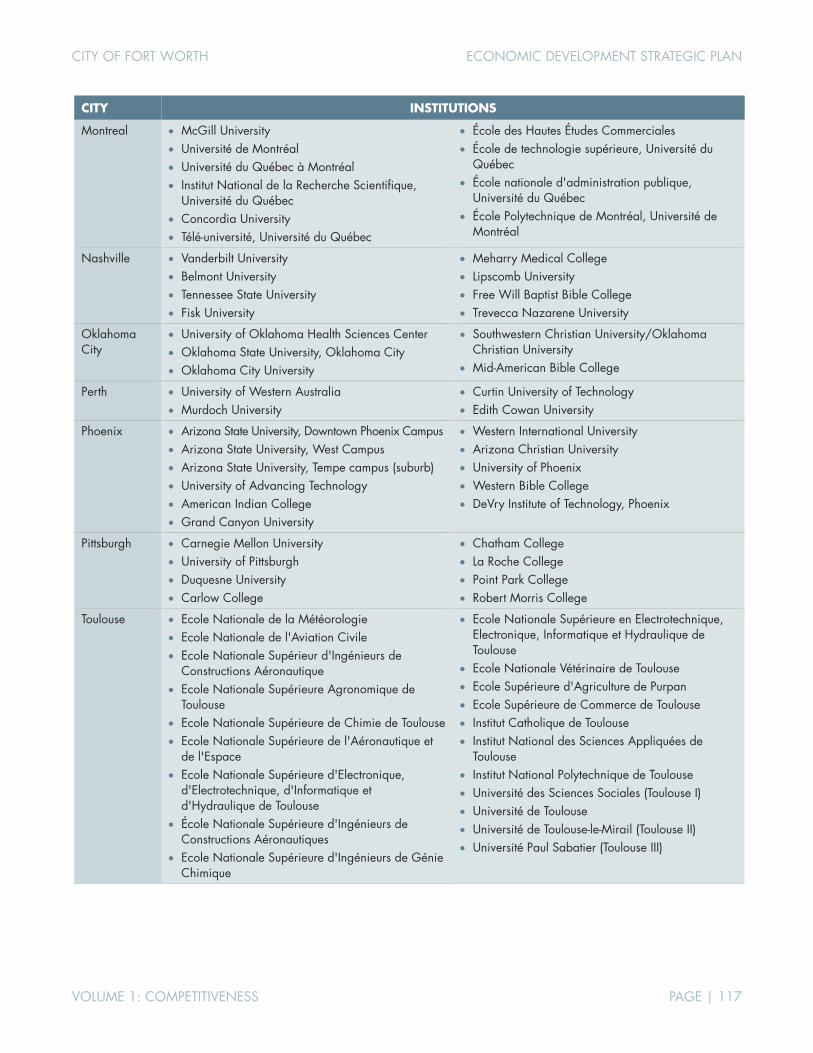
CITY OF FORT WORTH ECONOMIC DEVELOPMENT STRATEGIC PLAN
VOLUME 1: COMPETITIVENESS PAGE | 117
CITY INSTITUTIONS
Montreal • McGill University • Université de Montréal • Université du Québec à Montréal • Institut National de la Recherche Scientifique,
Université du Québec • Concordia University • Télé-université, Université du Québec
• École des Hautes Études Commerciales • École de technologie supérieure, Université du
Québec • École nationale d'administration publique,
Université du Québec • École Polytechnique de Montréal, Université de
Montréal
Nashville • Vanderbilt University • Belmont University • Tennessee State University • Fisk University
• Meharry Medical College • Lipscomb University • Free Will Baptist Bible College • Trevecca Nazarene University
Oklahoma City
• University of Oklahoma Health Sciences Center • Oklahoma State University, Oklahoma City • Oklahoma City University
• Southwestern Christian University/Oklahoma Christian University
• Mid-American Bible College
Perth • University of Western Australia • Murdoch University
• Curtin University of Technology • Edith Cowan University
Phoenix • Arizona State University, Downtown Phoenix Campus • Arizona State University, West Campus • Arizona State University, Tempe campus (suburb) • University of Advancing Technology • American Indian College • Grand Canyon University
• Western International University • Arizona Christian University • University of Phoenix • Western Bible College • DeVry Institute of Technology, Phoenix
Pittsburgh • Carnegie Mellon University • University of Pittsburgh • Duquesne University • Carlow College
• Chatham College • La Roche College • Point Park College • Robert Morris College
Toulouse • Ecole Nationale de la Météorologie • Ecole Nationale de l'Aviation Civile • Ecole Nationale Supérieur d'Ingénieurs de
Constructions Aéronautique • Ecole Nationale Supérieure Agronomique de
Toulouse • Ecole Nationale Supérieure de Chimie de Toulouse • Ecole Nationale Supérieure de l'Aéronautique et
de l'Espace • Ecole Nationale Supérieure d'Electronique,
d'Electrotechnique, d'Informatique et d'Hydraulique de Toulouse
• École Nationale Supérieure d'Ingénieurs de Constructions Aéronautiques
• Ecole Nationale Supérieure d'Ingénieurs de Génie Chimique
• Ecole Nationale Supérieure en Electrotechnique, Electronique, Informatique et Hydraulique de Toulouse
• Ecole Nationale Vétérinaire de Toulouse • Ecole Supérieure d'Agriculture de Purpan • Ecole Supérieure de Commerce de Toulouse • Institut Catholique de Toulouse • Institut National des Sciences Appliquées de
Toulouse • Institut National Polytechnique de Toulouse • Université des Sciences Sociales (Toulouse I) • Université de Toulouse • Université de Toulouse-le-Mirail (Toulouse II) • Université Paul Sabatier (Toulouse III)

CITY OF FORT WORTH ECONOMIC DEVELOPMENT STRATEGIC PLAN
VOLUME 1: COMPETITIVENESS PAGE | 118
FIGURE 120. MEDICAL SCHOOLS
CITY INSTITUTIONS
Fort Worth • University of North Texas Health Science Center
• Texas College of Osteopathic Medicine
• TCU and UNTHSC School of Medicine
Calgary • Cumming School of Medicine, University of Calgary
Columbus • Ohio State University College of Medicine
Denver • University of Colorado School of Medicine (Aurora, suburb)
Frankfurt • Goethe-Universität Frankfurt am Main Fachbereich Medizin
Glasgow • University of Glasgow School of Medicine
Indianapolis • Indiana University School of Medicine
• Marian University College of Osteopathic Medicine
Kansas City • Kansas City University of Medicine & Biosciences College of Osteopathic Medicine (Missouri)
• University of Missouri Kansas City School of Medicine (Missouri)
• University of Kansas School of Medicine (Kansas)
Leipzig • Universität Leipzig Medizinische Fakultät
Liverpool • University of Liverpool Faculty of Health and Life Sciences
Montreal • McGill University Faculty of Medicine
• Université de Montréal Faculté de Médecine
Nashville • Vanderbilt University School of Medicine
• Meharry Medical College School of Medicine
Oklahoma City • University of Oklahoma College of Medicine
Perth • University of Western Australia Faculty of Medicine, Dentistry, and Health Sciences
Phoenix • University of Arizona College of Medicine Phoenix
Pittsburgh • University of Pittsburgh School of Medicine
Toulouse • Faculté de Médecine Toulouse-Purpan
• Faculté de Médecine Toulouse-Rangueil

CITY OF FORT WORTH ECONOMIC DEVELOPMENT STRATEGIC PLAN
VOLUME 1: COMPETITIVENESS PAGE | 119
Figures 121-122 attempt to assemble a comparative overview of the office and industrial markets in Fort Worth and the benchmark metropolitan areas as of 2017 Q1. While it was impossible to reconstruct a cross-city dataset of perfect comparability, particularly for cities outside the US, the figures below come relatively close to full comparison, especially for office properties (where there were fewer gaps than in the industrial sector).
FIGURE 121. OFFICE REAL ESTATE AS OF 2017 Q1*
*Figures are from 2107 Q1 unless elsewhere noted Sources: 1. JLL 2. Cushman Wakefield 3. JLL (as of 2016 Q4) 4. BNP Paribas
City Inventory (msf)Under Construction (msf)
ConstructionRate (%) Vacancy (%)
Fort Worth 1 41.7 1.1 2.6% 16.6%
Frankfurt 1 125.5 3.7 2.9% 9.0%
Denver 1 109.0 4.1 3.8% 14.2%
Montreal 1 97.0 1.3 1.3% 13.0%
Phoenix 1 86.0 1.3 1.5% 19.9%
Calgary 1 68.4 3.1 4.5% 20.2%
Pittsburgh 1 50.4 0.4 0.8% 16.3%
Kansas City 2 50.0 0.3 0.0 17.0%
Toulouse 3 46.7 ― ― 5.2%
Leipzig 4 40.3 0.3 0.8% 8.9%
Nashville 1 35.2 2.4 6.8% 8.1%
Indianapolis 1 32.3 0.5 1.4% 17.3%
Columbus 1 28.8 1.0 3.6% 12.7%
Oklahoma City 2 21.6 0.9 4.1% 13.4%
Glasgow 1 16.0 0.0 0.0% 8.3%
Liverpool 1 ― ― ― ―
Perth 1 ― ― ― ―

CITY OF FORT WORTH ECONOMIC DEVELOPMENT STRATEGIC PLAN
VOLUME 1: COMPETITIVENESS PAGE | 120
FIGURE 122. INDUSTRIAL REAL ESTATE AS OF 2017 Q1
Sources: 1. JLL (Note: Fort Worth (metro) is defined as the aggregation North Fort Worth, South Fort Worth, and GSW/Arlington submarkets included in JLL's Dallas industrial market report) 2. JLL 3. JLL; Observatoire Toulousain d'Immobilier d'Entreprise (Otie) 4. JLL (includes all Northwest England but limited to modern buildings of 100,000 SF or larger) 5. JLL (includes all of Scotland but limited to modern buildings of 100,000 SF or larger)
City Inventory (msf)Under Construction (msf)
Construction Rate (%) Vacancy (%)
Fort Worth 1 207.0 10.0 4.8% 6.0%
Phoenix 2 262.3 3.8 1.5% 8.8%
Columbus 2 225.4 2.6 1.2% 5.3%
Indianapolis 2 213.5 5.1 2.4% 6.7%
Denver 2 201.8 4.8 2.4% 4.4%
Nashville 2 200.9 4.5 2.2% 4.0%
Pittsburgh 2 138.4 0.1 0.1% 8.3%
Toulouse 3 74.3 3.7 5.0% 3.0%
Liverpool 4 34.6 0.0 0.0% 3.0%
Glasgow 5 7.9 0.0 0.0% 3.0%
Kansas City 1 ― 5.5 ― 5.3%
Perth 1 ― 0.5 ― ―
Calgary 1 ― ― ― ―
Frankfurt 1 ― ― ― ―
Leipzig 1 ― ― ― ―
Montreal 1 ― ― ― ―
Oklahoma City 1 ― ― ― ―
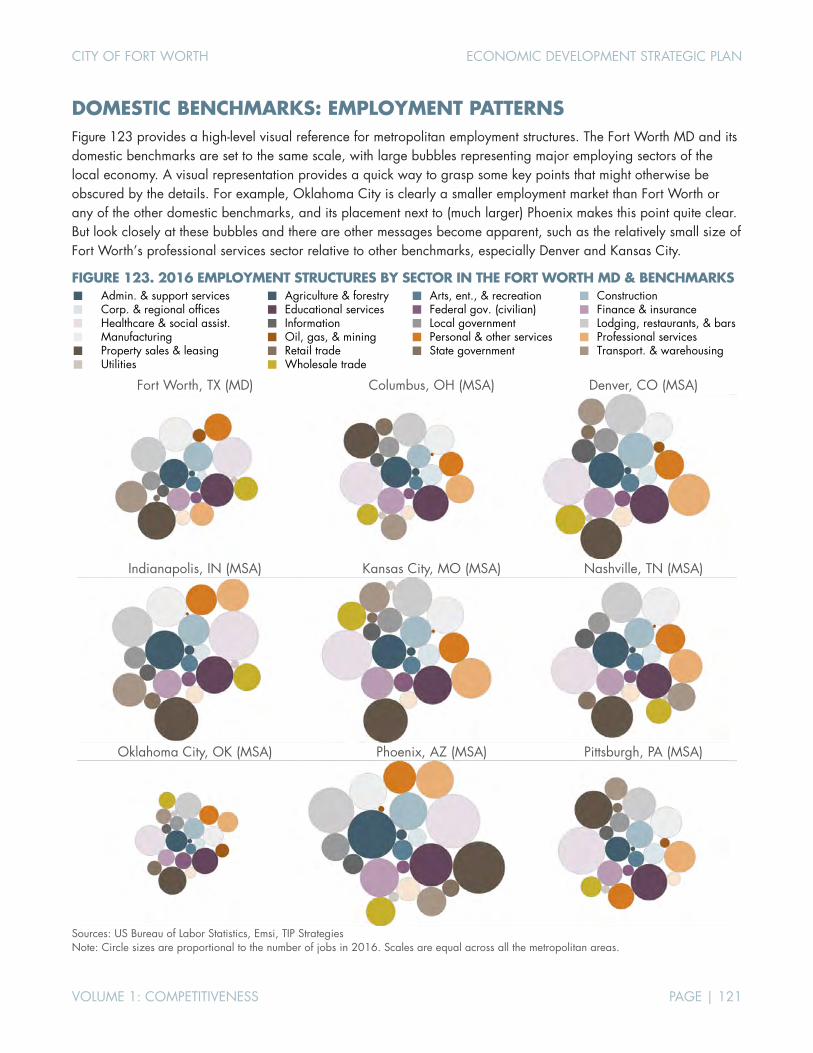
CITY OF FORT WORTH ECONOMIC DEVELOPMENT STRATEGIC PLAN
VOLUME 1: COMPETITIVENESS PAGE | 121
DOMESTIC BENCHMARKS: EMPLOYMENT PATTERNS Figure 123 provides a high-level visual reference for metropolitan employment structures. The Fort Worth MD and its domestic benchmarks are set to the same scale, with large bubbles representing major employing sectors of the local economy. A visual representation provides a quick way to grasp some key points that might otherwise be obscured by the details. For example, Oklahoma City is clearly a smaller employment market than Fort Worth or any of the other domestic benchmarks, and its placement next to (much larger) Phoenix makes this point quite clear. But look closely at these bubbles and there are other messages become apparent, such as the relatively small size of Fort Worth’s professional services sector relative to other benchmarks, especially Denver and Kansas City.
FIGURE 123. 2016 EMPLOYMENT STRUCTURES BY SECTOR IN THE FORT WORTH MD & BENCHMARKS Admin. & support services Agriculture & forestry Arts, ent., & recreation Construction Corp. & regional offices Educational services Federal gov. (civilian) Finance & insurance Healthcare & social assist. Information Local government Lodging, restaurants, & bars Manufacturing Oil, gas, & mining Personal & other services Professional services Property sales & leasing Retail trade State government Transport. & warehousing Utilities Wholesale trade
Fort Worth, TX (MD) Columbus, OH (MSA) Denver, CO (MSA)
Indianapolis, IN (MSA) Kansas City, MO (MSA) Nashville, TN (MSA)
Oklahoma City, OK (MSA) Phoenix, AZ (MSA) Pittsburgh, PA (MSA)
Sources: US Bureau of Labor Statistics, Emsi, TIP Strategies Note: Circle sizes are proportional to the number of jobs in 2016. Scales are equal across all the metropolitan areas.
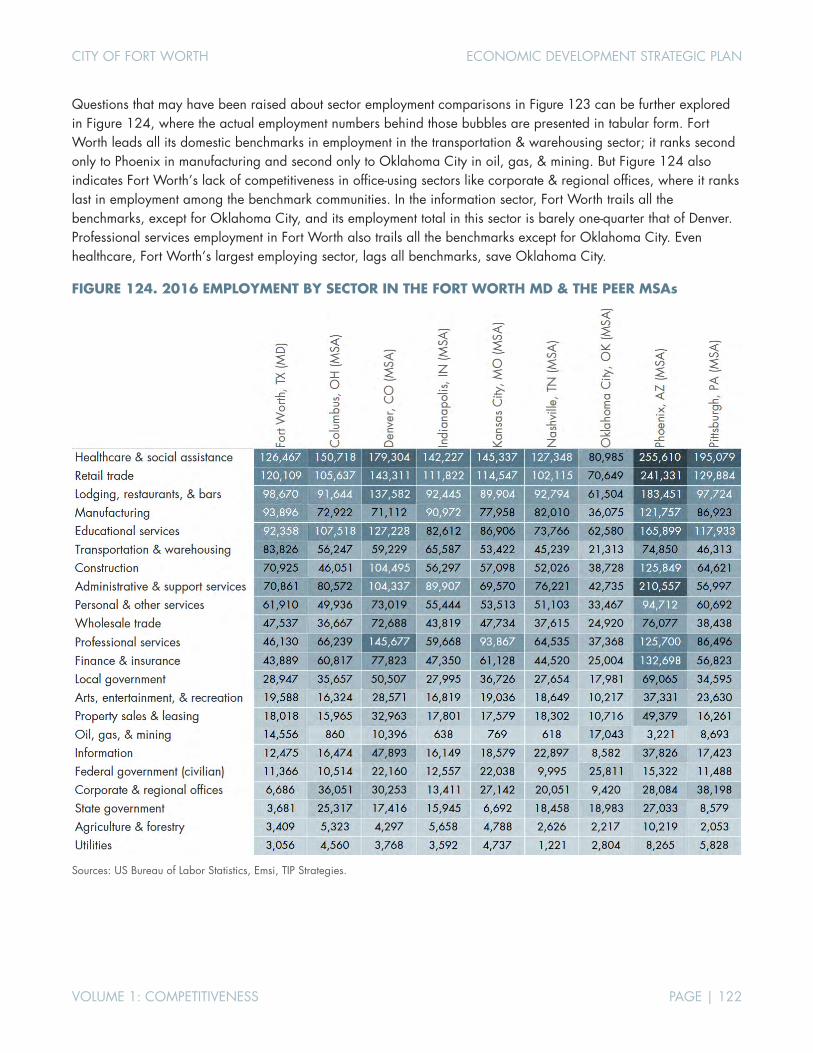
CITY OF FORT WORTH ECONOMIC DEVELOPMENT STRATEGIC PLAN
VOLUME 1: COMPETITIVENESS PAGE | 122
Questions that may have been raised about sector employment comparisons in Figure 123 can be further explored in Figure 124, where the actual employment numbers behind those bubbles are presented in tabular form. Fort Worth leads all its domestic benchmarks in employment in the transportation & warehousing sector; it ranks second only to Phoenix in manufacturing and second only to Oklahoma City in oil, gas, & mining. But Figure 124 also indicates Fort Worth’s lack of competitiveness in office-using sectors like corporate & regional offices, where it ranks last in employment among the benchmark communities. In the information sector, Fort Worth trails all the benchmarks, except for Oklahoma City, and its employment total in this sector is barely one-quarter that of Denver. Professional services employment in Fort Worth also trails all the benchmarks except for Oklahoma City. Even healthcare, Fort Worth’s largest employing sector, lags all benchmarks, save Oklahoma City.
FIGURE 124. 2016 EMPLOYMENT BY SECTOR IN THE FORT WORTH MD & THE PEER MSAs
Sources: US Bureau of Labor Statistics, Emsi, TIP Strategies.
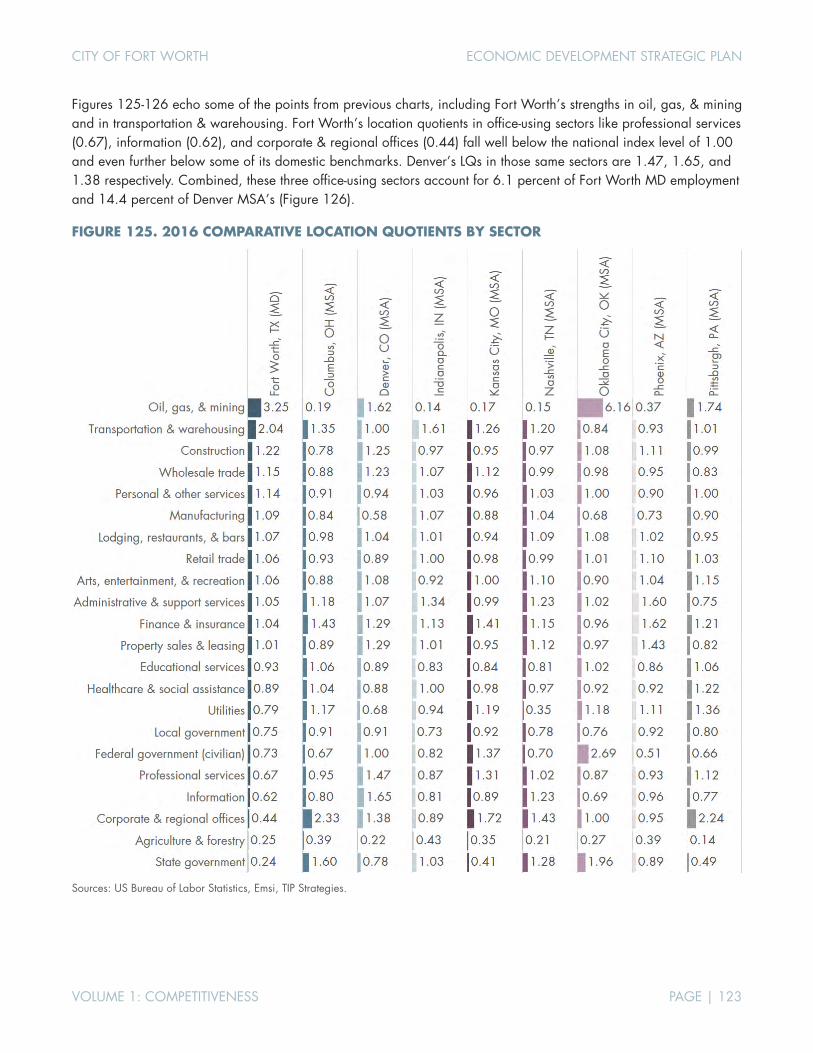
CITY OF FORT WORTH ECONOMIC DEVELOPMENT STRATEGIC PLAN
VOLUME 1: COMPETITIVENESS PAGE | 123
Figures 125-126 echo some of the points from previous charts, including Fort Worth’s strengths in oil, gas, & mining and in transportation & warehousing. Fort Worth’s location quotients in office-using sectors like professional services (0.67), information (0.62), and corporate & regional offices (0.44) fall well below the national index level of 1.00 and even further below some of its domestic benchmarks. Denver’s LQs in those same sectors are 1.47, 1.65, and 1.38 respectively. Combined, these three office-using sectors account for 6.1 percent of Fort Worth MD employment and 14.4 percent of Denver MSA’s (Figure 126).
FIGURE 125. 2016 COMPARATIVE LOCATION QUOTIENTS BY SECTOR
Sources: US Bureau of Labor Statistics, Emsi, TIP Strategies.
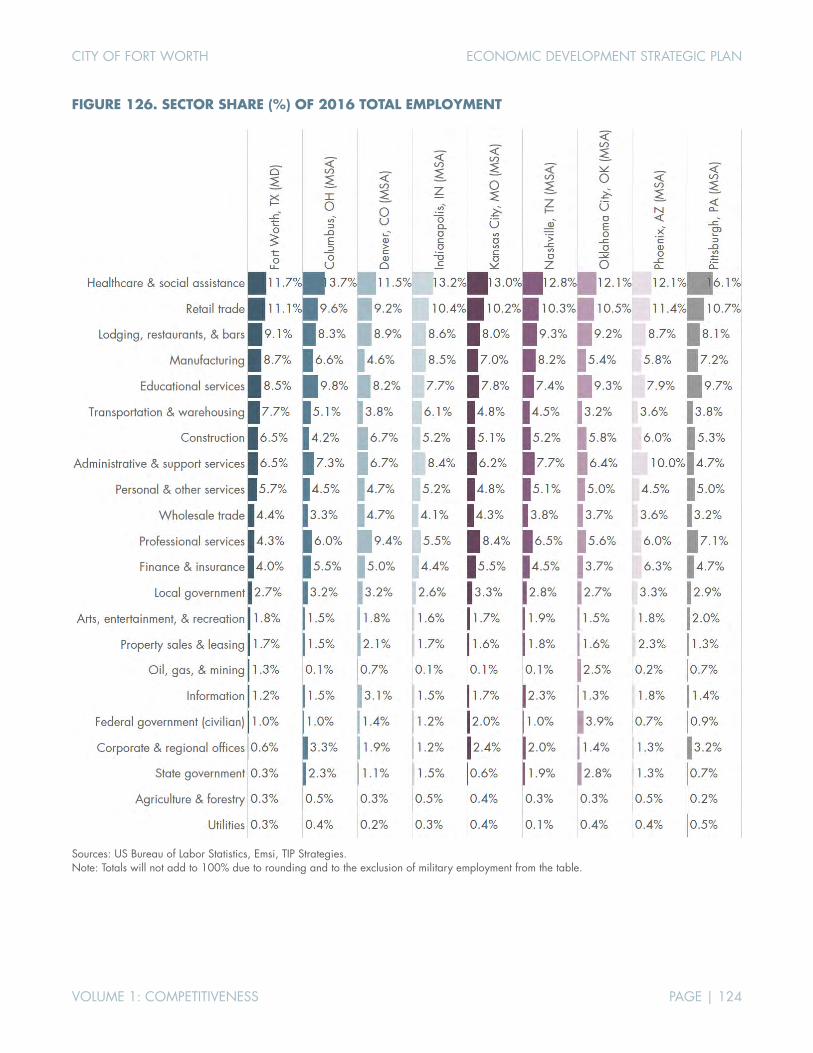
CITY OF FORT WORTH ECONOMIC DEVELOPMENT STRATEGIC PLAN
VOLUME 1: COMPETITIVENESS PAGE | 124
FIGURE 126. SECTOR SHARE (%) OF 2016 TOTAL EMPLOYMENT
Sources: US Bureau of Labor Statistics, Emsi, TIP Strategies. Note: Totals will not add to 100% due to rounding and to the exclusion of military employment from the table.

CITY OF FORT WORTH ECONOMIC DEVELOPMENT STRATEGIC PLAN
VOLUME 1: COMPETITIVENESS PAGE | 125
The structural differences highlighted between metropolitan Fort Worth and Denver were amplified during the 2010-2016 period as Fort Worth added 15,000 jobs in transportation & warehousing, compared to Denver’s 6,000 (Figure 127). Yet during this same period, Denver added 30,000 new professional services jobs compared to the roughly 1,000-job net gain in this sector in Fort Worth. Figures 127-128 show the same data, with the first exhibit providing ready visual cues for the most significant net employment changes and the second exhibit providing more specifics.
FIGURE 127. NET CHANGE IN EMPLOYMENT BY SECTOR, 2010-2016 IN THE FORT WORTH MD & THE PEER MSAs
Sources: US Bureau of Labor Statistics, Emsi, TIP Strategies.

CITY OF FORT WORTH ECONOMIC DEVELOPMENT STRATEGIC PLAN
VOLUME 1: COMPETITIVENESS PAGE | 126
FIGURE 128. NET CHANGE IN EMPLOYMENT BY SECTOR, 2010-2016 IN THE FORT WORTH MD & THE PEER MSAs
Sources: US Bureau of Labor Statistics, Emsi, TIP Strategies.
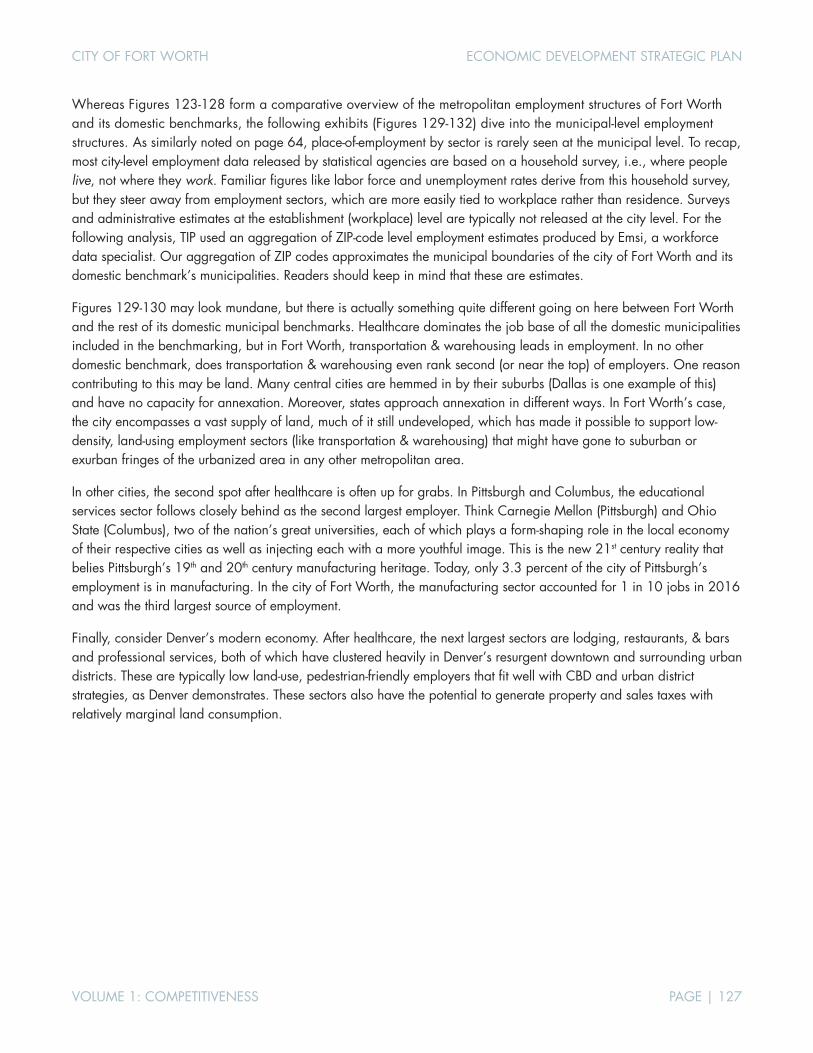
CITY OF FORT WORTH ECONOMIC DEVELOPMENT STRATEGIC PLAN
VOLUME 1: COMPETITIVENESS PAGE | 127
Whereas Figures 123-128 form a comparative overview of the metropolitan employment structures of Fort Worth and its domestic benchmarks, the following exhibits (Figures 129-132) dive into the municipal-level employment structures. As similarly noted on page 64, place-of-employment by sector is rarely seen at the municipal level. To recap, most city-level employment data released by statistical agencies are based on a household survey, i.e., where people live, not where they work. Familiar figures like labor force and unemployment rates derive from this household survey, but they steer away from employment sectors, which are more easily tied to workplace rather than residence. Surveys and administrative estimates at the establishment (workplace) level are typically not released at the city level. For the following analysis, TIP used an aggregation of ZIP-code level employment estimates produced by Emsi, a workforce data specialist. Our aggregation of ZIP codes approximates the municipal boundaries of the city of Fort Worth and its domestic benchmark’s municipalities. Readers should keep in mind that these are estimates.
Figures 129-130 may look mundane, but there is actually something quite different going on here between Fort Worth and the rest of its domestic municipal benchmarks. Healthcare dominates the job base of all the domestic municipalities included in the benchmarking, but in Fort Worth, transportation & warehousing leads in employment. In no other domestic benchmark, does transportation & warehousing even rank second (or near the top) of employers. One reason contributing to this may be land. Many central cities are hemmed in by their suburbs (Dallas is one example of this) and have no capacity for annexation. Moreover, states approach annexation in different ways. In Fort Worth’s case, the city encompasses a vast supply of land, much of it still undeveloped, which has made it possible to support low-density, land-using employment sectors (like transportation & warehousing) that might have gone to suburban or exurban fringes of the urbanized area in any other metropolitan area.
In other cities, the second spot after healthcare is often up for grabs. In Pittsburgh and Columbus, the educational services sector follows closely behind as the second largest employer. Think Carnegie Mellon (Pittsburgh) and Ohio State (Columbus), two of the nation’s great universities, each of which plays a form-shaping role in the local economy of their respective cities as well as injecting each with a more youthful image. This is the new 21st century reality that belies Pittsburgh’s 19th and 20th century manufacturing heritage. Today, only 3.3 percent of the city of Pittsburgh’s employment is in manufacturing. In the city of Fort Worth, the manufacturing sector accounted for 1 in 10 jobs in 2016 and was the third largest source of employment.
Finally, consider Denver’s modern economy. After healthcare, the next largest sectors are lodging, restaurants, & bars and professional services, both of which have clustered heavily in Denver’s resurgent downtown and surrounding urban districts. These are typically low land-use, pedestrian-friendly employers that fit well with CBD and urban district strategies, as Denver demonstrates. These sectors also have the potential to generate property and sales taxes with relatively marginal land consumption.

CITY OF FORT WORTH ECONOMIC DEVELOPMENT STRATEGIC PLAN
VOLUME 1: COMPETITIVENESS PAGE | 128
FIGURE 129. SECTOR SHARE (%) OF 2016 TOTAL EMPLOYMENT FOR THE CITY OF FORT WORTH & DOMESTIC MUNICIPAL BENCHMARKS
Sources: US Bureau of Labor Statistics, Emsi, TIP Strategies.
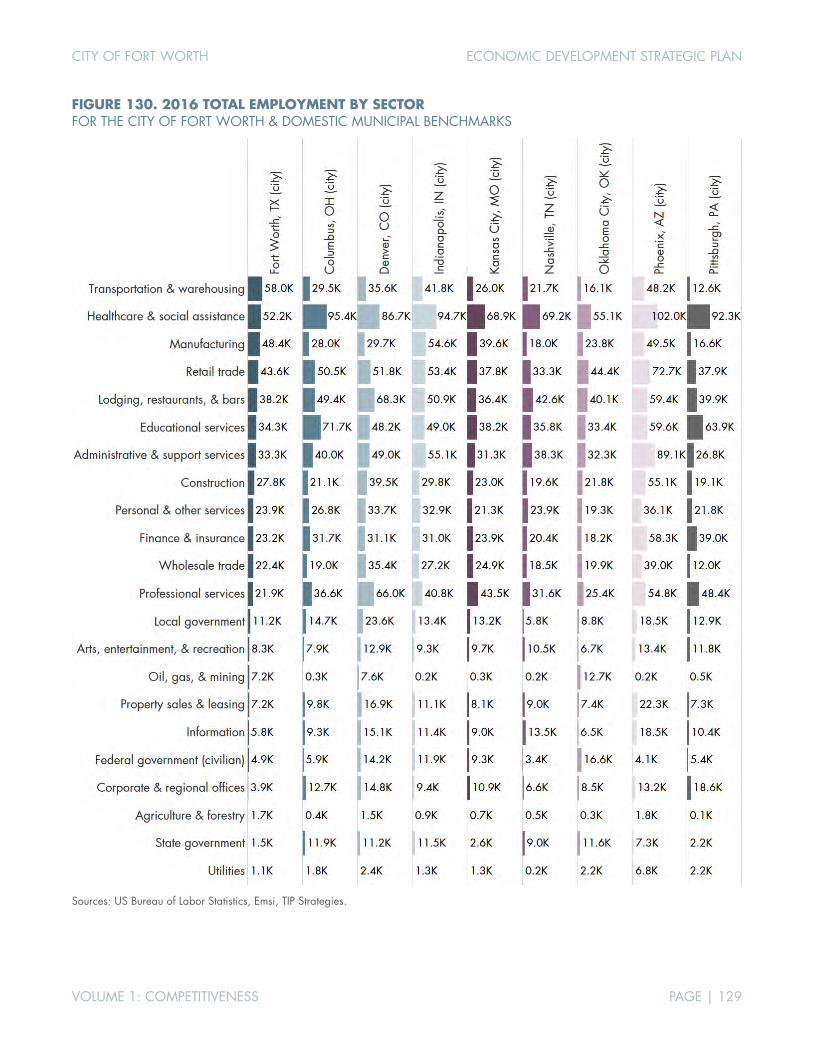
CITY OF FORT WORTH ECONOMIC DEVELOPMENT STRATEGIC PLAN
VOLUME 1: COMPETITIVENESS PAGE | 129
FIGURE 130. 2016 TOTAL EMPLOYMENT BY SECTOR FOR THE CITY OF FORT WORTH & DOMESTIC MUNICIPAL BENCHMARKS
Sources: US Bureau of Labor Statistics, Emsi, TIP Strategies.
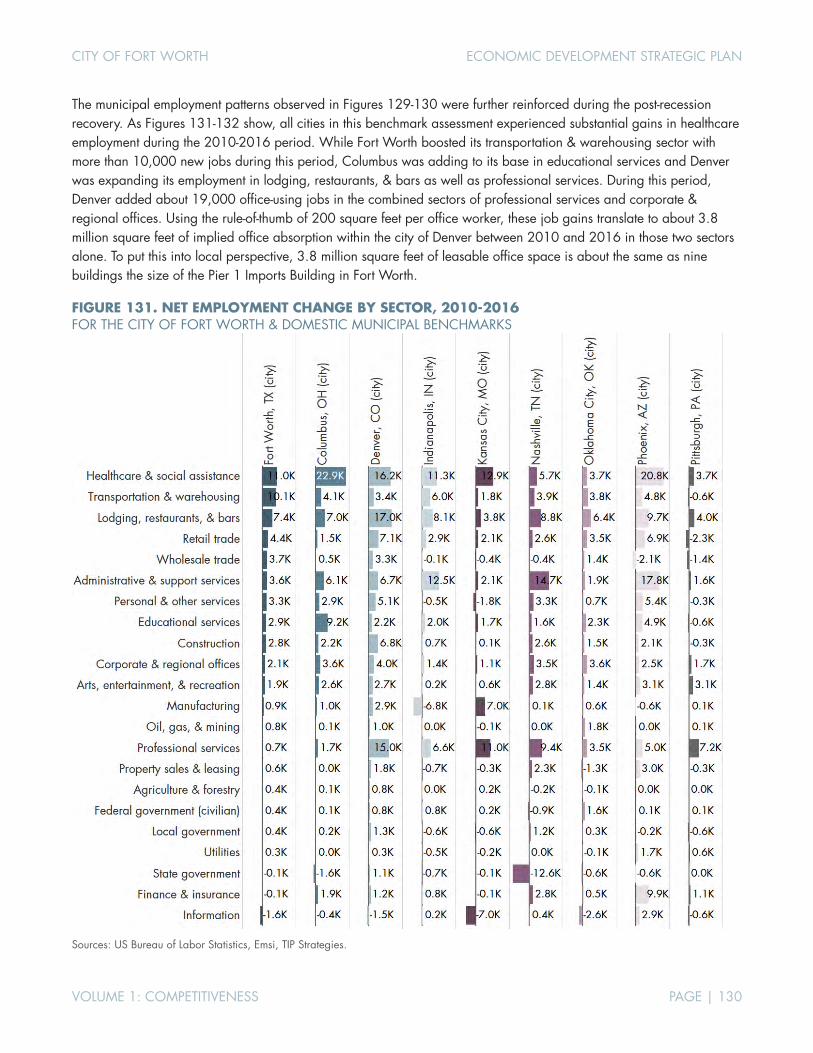
CITY OF FORT WORTH ECONOMIC DEVELOPMENT STRATEGIC PLAN
VOLUME 1: COMPETITIVENESS PAGE | 130
The municipal employment patterns observed in Figures 129-130 were further reinforced during the post-recession recovery. As Figures 131-132 show, all cities in this benchmark assessment experienced substantial gains in healthcare employment during the 2010-2016 period. While Fort Worth boosted its transportation & warehousing sector with more than 10,000 new jobs during this period, Columbus was adding to its base in educational services and Denver was expanding its employment in lodging, restaurants, & bars as well as professional services. During this period, Denver added about 19,000 office-using jobs in the combined sectors of professional services and corporate & regional offices. Using the rule-of-thumb of 200 square feet per office worker, these job gains translate to about 3.8 million square feet of implied office absorption within the city of Denver between 2010 and 2016 in those two sectors alone. To put this into local perspective, 3.8 million square feet of leasable office space is about the same as nine buildings the size of the Pier 1 Imports Building in Fort Worth.
FIGURE 131. NET EMPLOYMENT CHANGE BY SECTOR, 2010-2016 FOR THE CITY OF FORT WORTH & DOMESTIC MUNICIPAL BENCHMARKS
Sources: US Bureau of Labor Statistics, Emsi, TIP Strategies.
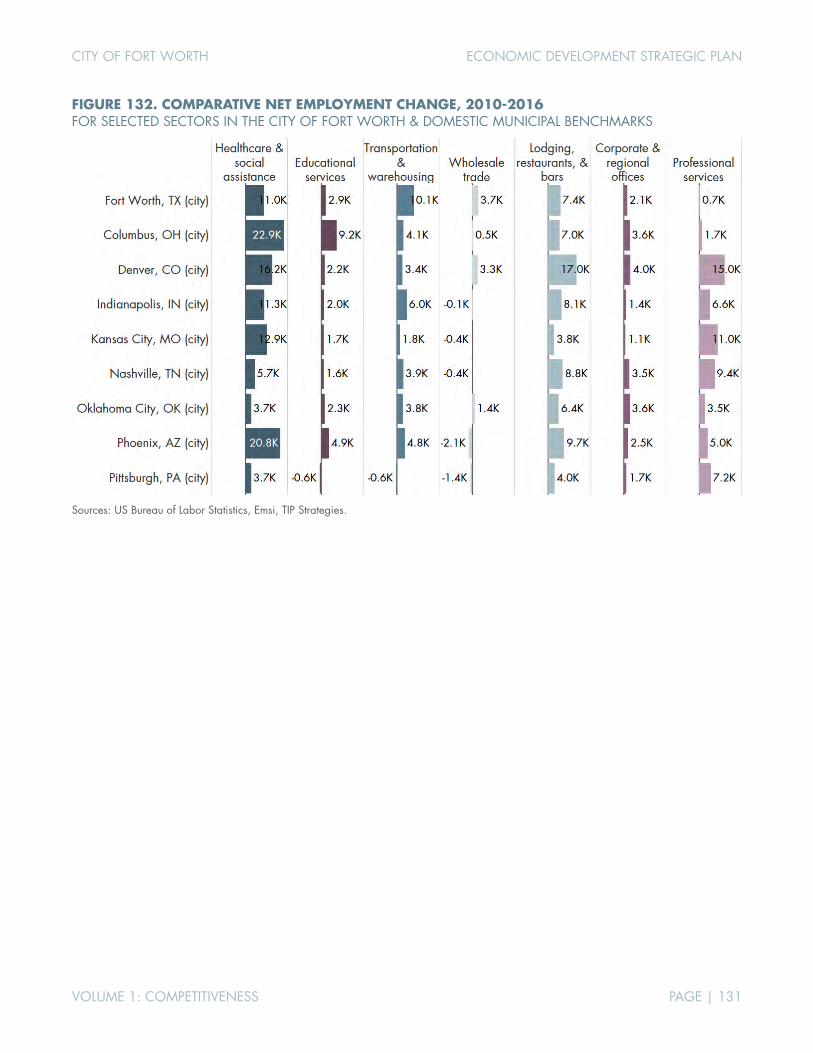
CITY OF FORT WORTH ECONOMIC DEVELOPMENT STRATEGIC PLAN
VOLUME 1: COMPETITIVENESS PAGE | 131
FIGURE 132. COMPARATIVE NET EMPLOYMENT CHANGE, 2010-2016 FOR SELECTED SECTORS IN THE CITY OF FORT WORTH & DOMESTIC MUNICIPAL BENCHMARKS
Sources: US Bureau of Labor Statistics, Emsi, TIP Strategies.
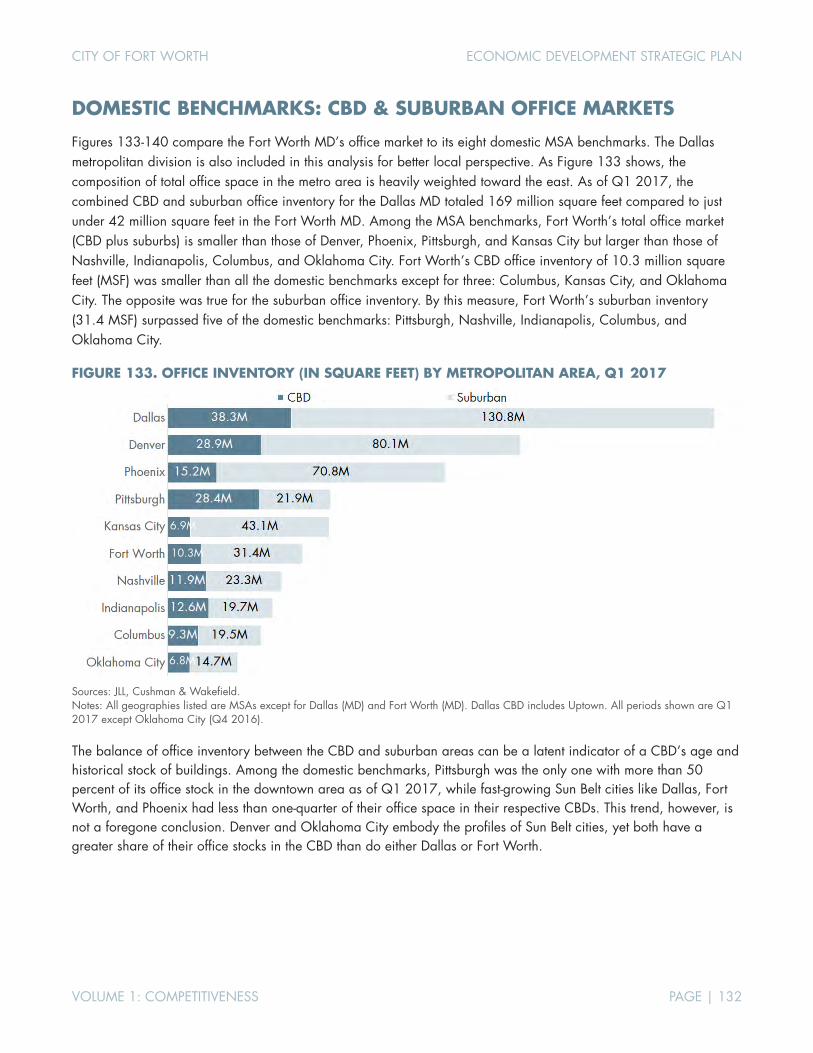
CITY OF FORT WORTH ECONOMIC DEVELOPMENT STRATEGIC PLAN
VOLUME 1: COMPETITIVENESS PAGE | 132
DOMESTIC BENCHMARKS: CBD & SUBURBAN OFFICE MARKETS
Figures 133-140 compare the Fort Worth MD’s office market to its eight domestic MSA benchmarks. The Dallas metropolitan division is also included in this analysis for better local perspective. As Figure 133 shows, the composition of total office space in the metro area is heavily weighted toward the east. As of Q1 2017, the combined CBD and suburban office inventory for the Dallas MD totaled 169 million square feet compared to just under 42 million square feet in the Fort Worth MD. Among the MSA benchmarks, Fort Worth’s total office market (CBD plus suburbs) is smaller than those of Denver, Phoenix, Pittsburgh, and Kansas City but larger than those of Nashville, Indianapolis, Columbus, and Oklahoma City. Fort Worth’s CBD office inventory of 10.3 million square feet (MSF) was smaller than all the domestic benchmarks except for three: Columbus, Kansas City, and Oklahoma City. The opposite was true for the suburban office inventory. By this measure, Fort Worth’s suburban inventory (31.4 MSF) surpassed five of the domestic benchmarks: Pittsburgh, Nashville, Indianapolis, Columbus, and Oklahoma City.
FIGURE 133. OFFICE INVENTORY (IN SQUARE FEET) BY METROPOLITAN AREA, Q1 2017
Sources: JLL, Cushman & Wakefield. Notes: All geographies listed are MSAs except for Dallas (MD) and Fort Worth (MD). Dallas CBD includes Uptown. All periods shown are Q1 2017 except Oklahoma City (Q4 2016).
The balance of office inventory between the CBD and suburban areas can be a latent indicator of a CBD’s age and historical stock of buildings. Among the domestic benchmarks, Pittsburgh was the only one with more than 50 percent of its office stock in the downtown area as of Q1 2017, while fast-growing Sun Belt cities like Dallas, Fort Worth, and Phoenix had less than one-quarter of their office space in their respective CBDs. This trend, however, is not a foregone conclusion. Denver and Oklahoma City embody the profiles of Sun Belt cities, yet both have a greater share of their office stocks in the CBD than do either Dallas or Fort Worth.
6.9M
10.3M
6.8M
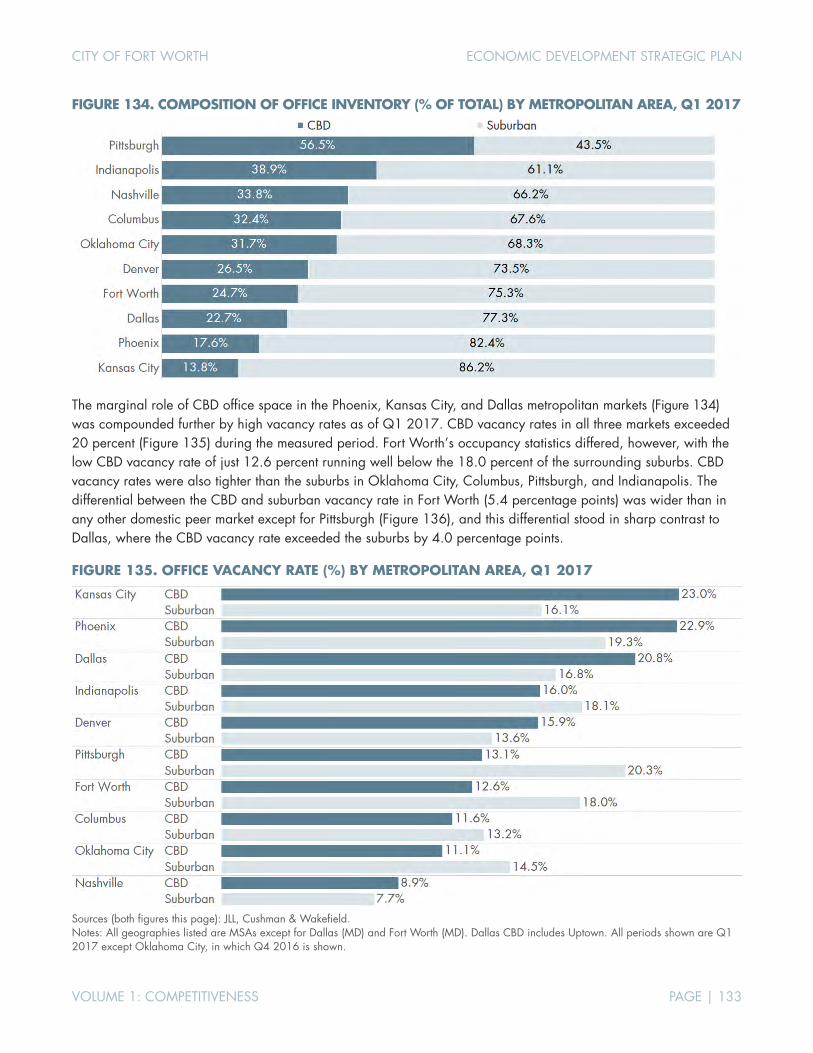
CITY OF FORT WORTH ECONOMIC DEVELOPMENT STRATEGIC PLAN
VOLUME 1: COMPETITIVENESS PAGE | 133
FIGURE 134. COMPOSITION OF OFFICE INVENTORY (% OF TOTAL) BY METROPOLITAN AREA, Q1 2017
The marginal role of CBD office space in the Phoenix, Kansas City, and Dallas metropolitan markets (Figure 134) was compounded further by high vacancy rates as of Q1 2017. CBD vacancy rates in all three markets exceeded 20 percent (Figure 135) during the measured period. Fort Worth’s occupancy statistics differed, however, with the low CBD vacancy rate of just 12.6 percent running well below the 18.0 percent of the surrounding suburbs. CBD vacancy rates were also tighter than the suburbs in Oklahoma City, Columbus, Pittsburgh, and Indianapolis. The differential between the CBD and suburban vacancy rate in Fort Worth (5.4 percentage points) was wider than in any other domestic peer market except for Pittsburgh (Figure 136), and this differential stood in sharp contrast to Dallas, where the CBD vacancy rate exceeded the suburbs by 4.0 percentage points.
FIGURE 135. OFFICE VACANCY RATE (%) BY METROPOLITAN AREA, Q1 2017
Sources (both figures this page): JLL, Cushman & Wakefield. Notes: All geographies listed are MSAs except for Dallas (MD) and Fort Worth (MD). Dallas CBD includes Uptown. All periods shown are Q1 2017 except Oklahoma City, in which Q4 2016 is shown.
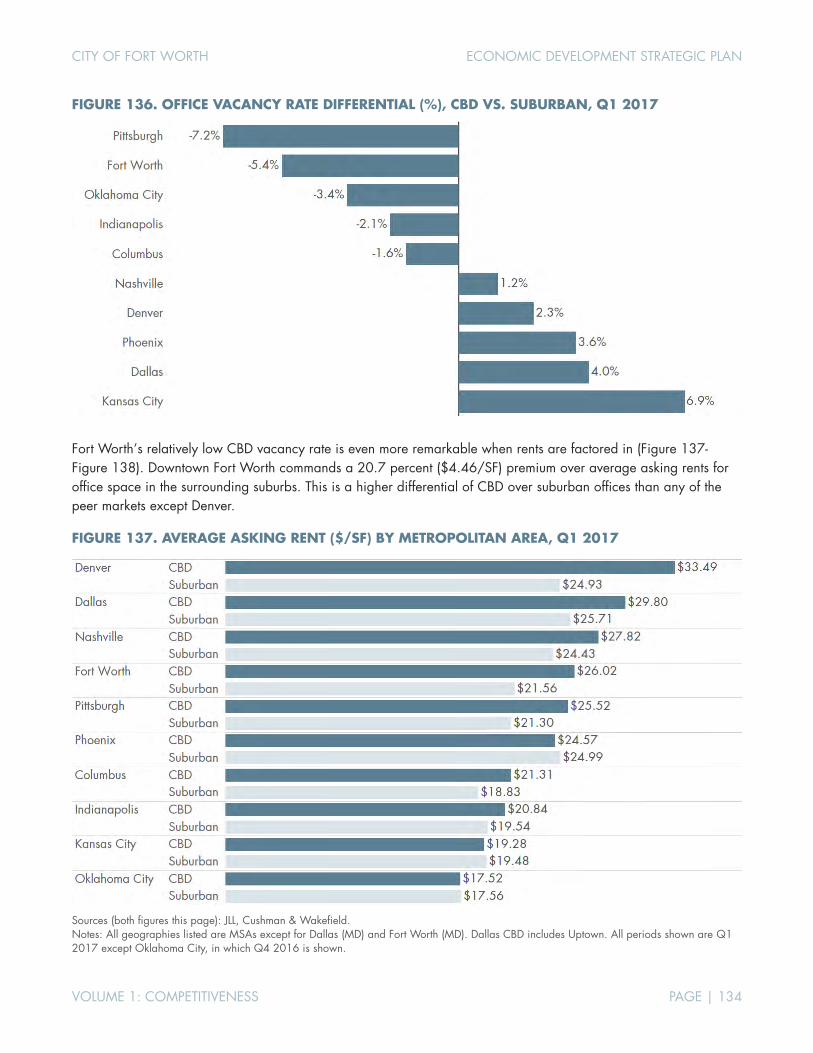
CITY OF FORT WORTH ECONOMIC DEVELOPMENT STRATEGIC PLAN
VOLUME 1: COMPETITIVENESS PAGE | 134
FIGURE 136. OFFICE VACANCY RATE DIFFERENTIAL (%), CBD VS. SUBURBAN, Q1 2017
Fort Worth’s relatively low CBD vacancy rate is even more remarkable when rents are factored in (Figure 137-Figure 138). Downtown Fort Worth commands a 20.7 percent ($4.46/SF) premium over average asking rents for office space in the surrounding suburbs. This is a higher differential of CBD over suburban offices than any of the peer markets except Denver.
FIGURE 137. AVERAGE ASKING RENT ($/SF) BY METROPOLITAN AREA, Q1 2017
Sources (both figures this page): JLL, Cushman & Wakefield. Notes: All geographies listed are MSAs except for Dallas (MD) and Fort Worth (MD). Dallas CBD includes Uptown. All periods shown are Q1 2017 except Oklahoma City, in which Q4 2016 is shown.

CITY OF FORT WORTH ECONOMIC DEVELOPMENT STRATEGIC PLAN
VOLUME 1: COMPETITIVENESS PAGE | 135
FIGURE 138. OFFICE RENT PREMIUM ($/SF), CBD VS. SUBURBAN, Q1 2017
CBD Premium ($/SF) CBD Premium (% +/- Suburban)
If vacancy rates and rents offer clues to near-term local and regional office demand, then the amount of office construction underway can foreshadow changes to supply and availability (Figure 139). In the Dallas-Fort Worth metro area, one might assume that the low vacancy rate in the Fort Worth CBD would spur more construction, especially since the limited availability of space in the CBD supports a high rent differential over the suburbs. What is happening on the ground may offer some surprises. As of Q1 2017, the Dallas-Fort Worth metro area had 10.7 MSF of construction underway, according to JLL, but the composition was lopsided with 9.6 MSF in the Dallas MD and just 1.1 MSF in the Fort Worth MD. And of the small pipeline of construction underway in Fort Worth, nearly three-quarters of the balance (73.7 percent) was underway outside of the CBD (Figure 140). The numbers in this section derive entirely from JLL’s analysis of the Q1 2017 office market, but these statistics differ only slightly from CoStar’s office analysis of the same period presented earlier in Figure 87. In both cases, the lopsided composition of office construction between Dallas and Fort Worth was unmistakable.
FIGURE 139. OFFICE SPACE UNDER CONSTRUCTION (IN SQUARE FEET) BY METRO AREA, Q1 2017
Sources (both figures this page): JLL, Cushman & Wakefield. Notes: All geographies listed are MSAs except for Dallas (MD) and Fort Worth (MD). Dallas CBD includes Uptown. All periods shown are Q1 2017 except Oklahoma City, in which Q4 2016 is shown.

CITY OF FORT WORTH ECONOMIC DEVELOPMENT STRATEGIC PLAN
VOLUME 1: COMPETITIVENESS PAGE | 136
FIGURE 140. COMPOSITION OF OFFICE SPACE UNDER CONSTRUCTION (% OF TOTAL) BY METROPOLITAN AREA, Q1 2017
Sources: JLL, Cushman & Wakefield. Notes: All geographies listed are MSAs except for Dallas (MD) and Fort Worth (MD). Dallas CBD includes Uptown. All periods shown are Q1 2017 except Oklahoma City, in which Q4 2016 is shown.
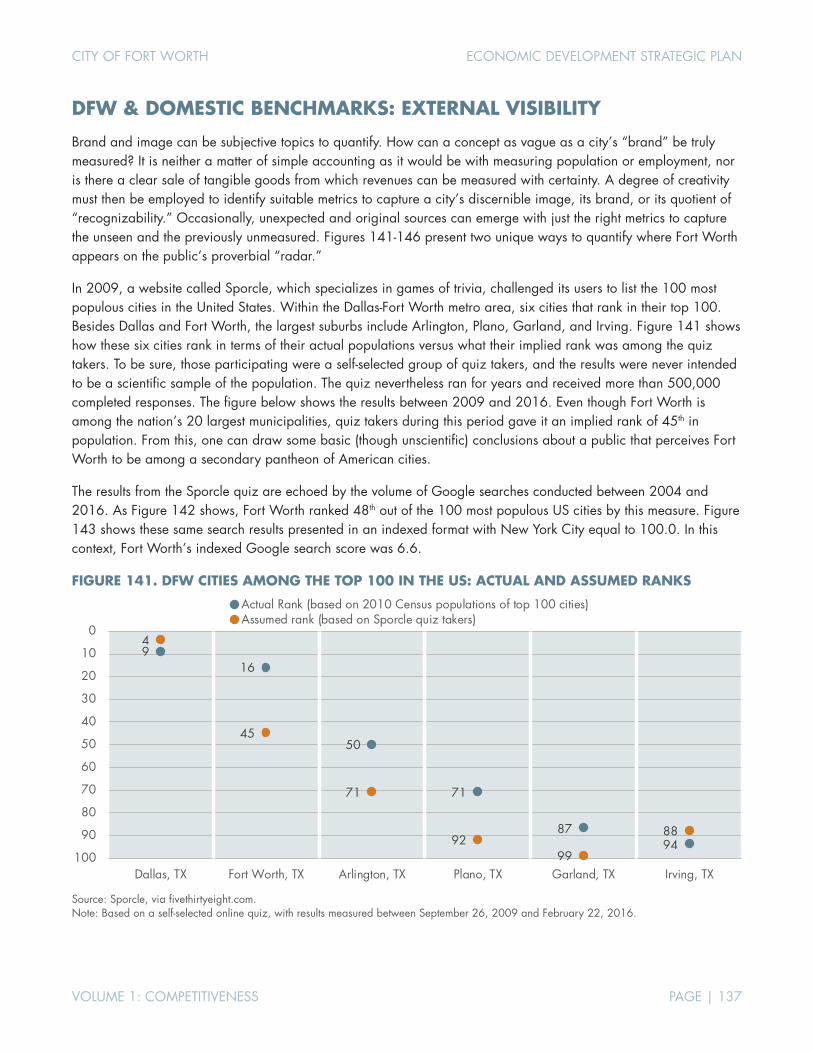
CITY OF FORT WORTH ECONOMIC DEVELOPMENT STRATEGIC PLAN
VOLUME 1: COMPETITIVENESS PAGE | 137
DFW & DOMESTIC BENCHMARKS: EXTERNAL VISIBILITY
Brand and image can be subjective topics to quantify. How can a concept as vague as a city’s “brand” be truly measured? It is neither a matter of simple accounting as it would be with measuring population or employment, nor is there a clear sale of tangible goods from which revenues can be measured with certainty. A degree of creativity must then be employed to identify suitable metrics to capture a city’s discernible image, its brand, or its quotient of “recognizability.” Occasionally, unexpected and original sources can emerge with just the right metrics to capture the unseen and the previously unmeasured. Figures 141-146 present two unique ways to quantify where Fort Worth appears on the public’s proverbial “radar.”
In 2009, a website called Sporcle, which specializes in games of trivia, challenged its users to list the 100 most populous cities in the United States. Within the Dallas-Fort Worth metro area, six cities that rank in their top 100. Besides Dallas and Fort Worth, the largest suburbs include Arlington, Plano, Garland, and Irving. Figure 141 shows how these six cities rank in terms of their actual populations versus what their implied rank was among the quiz takers. To be sure, those participating were a self-selected group of quiz takers, and the results were never intended to be a scientific sample of the population. The quiz nevertheless ran for years and received more than 500,000 completed responses. The figure below shows the results between 2009 and 2016. Even though Fort Worth is among the nation’s 20 largest municipalities, quiz takers during this period gave it an implied rank of 45th in population. From this, one can draw some basic (though unscientific) conclusions about a public that perceives Fort Worth to be among a secondary pantheon of American cities.
The results from the Sporcle quiz are echoed by the volume of Google searches conducted between 2004 and 2016. As Figure 142 shows, Fort Worth ranked 48th out of the 100 most populous US cities by this measure. Figure 143 shows these same search results presented in an indexed format with New York City equal to 100.0. In this context, Fort Worth’s indexed Google search score was 6.6.
FIGURE 141. DFW CITIES AMONG THE TOP 100 IN THE US: ACTUAL AND ASSUMED RANKS
Source: Sporcle, via fivethirtyeight.com. Note: Based on a self-selected online quiz, with results measured between September 26, 2009 and February 22, 2016.
916
50
71
8794
4
45
71
9299
88
0
10
20
30
40
50
60
70
80
90
100Dallas, TX Fort Worth, TX Arlington, TX Plano, TX Garland, TX Irving, TX
Actual Rank (based on 2010 Census populations of top 100 cities)Assumed rank (based on Sporcle quiz takers)
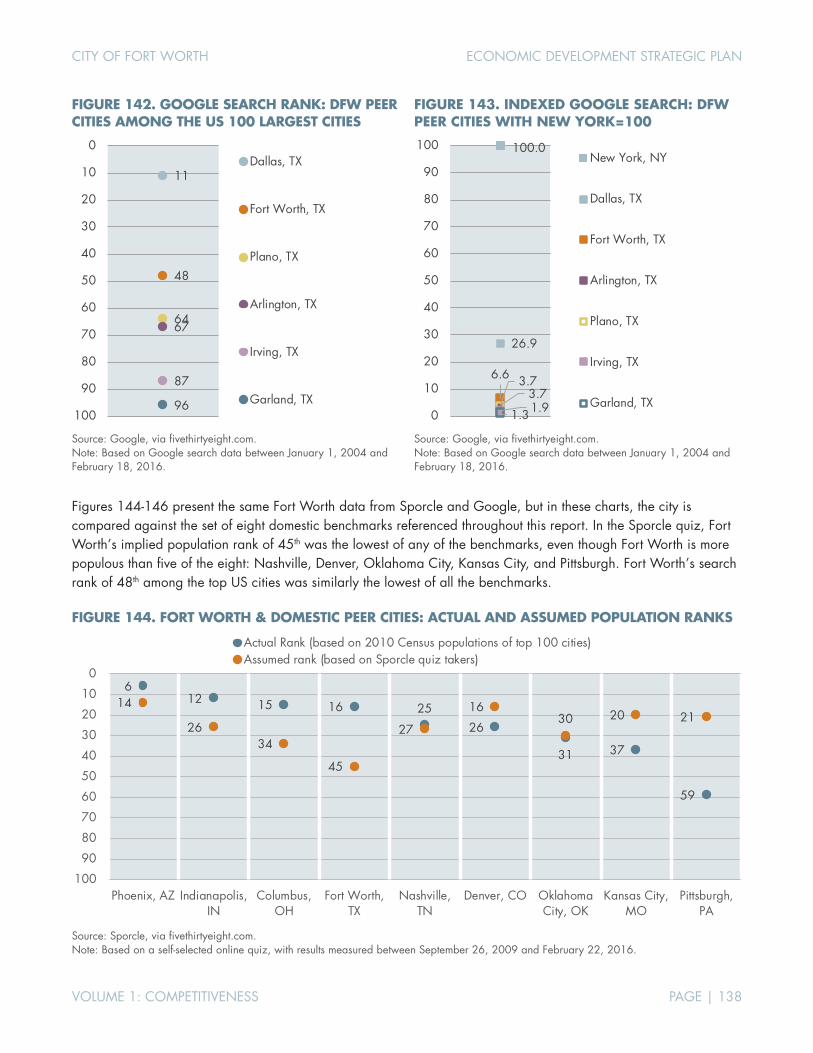
CITY OF FORT WORTH ECONOMIC DEVELOPMENT STRATEGIC PLAN
VOLUME 1: COMPETITIVENESS PAGE | 138
FIGURE 142. GOOGLE SEARCH RANK: DFW PEER CITIES AMONG THE US 100 LARGEST CITIES
Source: Google, via fivethirtyeight.com. Note: Based on Google search data between January 1, 2004 and February 18, 2016.
FIGURE 143. INDEXED GOOGLE SEARCH: DFW PEER CITIES WITH NEW YORK=100
Source: Google, via fivethirtyeight.com. Note: Based on Google search data between January 1, 2004 and February 18, 2016.
Figures 144-146 present the same Fort Worth data from Sporcle and Google, but in these charts, the city is compared against the set of eight domestic benchmarks referenced throughout this report. In the Sporcle quiz, Fort Worth’s implied population rank of 45th was the lowest of any of the benchmarks, even though Fort Worth is more populous than five of the eight: Nashville, Denver, Oklahoma City, Kansas City, and Pittsburgh. Fort Worth’s search rank of 48th among the top US cities was similarly the lowest of all the benchmarks.
FIGURE 144. FORT WORTH & DOMESTIC PEER CITIES: ACTUAL AND ASSUMED POPULATION RANKS
Source: Sporcle, via fivethirtyeight.com. Note: Based on a self-selected online quiz, with results measured between September 26, 2009 and February 22, 2016.
11
48
6467
87
96
0
10
20
30
40
50
60
70
80
90
100
Dallas, TX
Fort Worth, TX
Plano, TX
Arlington, TX
Irving, TX
Garland, TX
100.0
26.9
6.6 3.73.71.91.30
10
20
30
40
50
60
70
80
90
100New York, NY
Dallas, TX
Fort Worth, TX
Arlington, TX
Plano, TX
Irving, TX
Garland, TX
612 15 16 25
26
31 37
59
14
2634
45
27
1630 20 21
0
10
20
30
40
50
60
70
80
90
100Phoenix, AZ Indianapolis,
INColumbus,
OHFort Worth,
TXNashville,
TNDenver, CO Oklahoma
City, OKKansas City,
MOPittsburgh,
PA
Actual Rank (based on 2010 Census populations of top 100 cities)Assumed rank (based on Sporcle quiz takers)
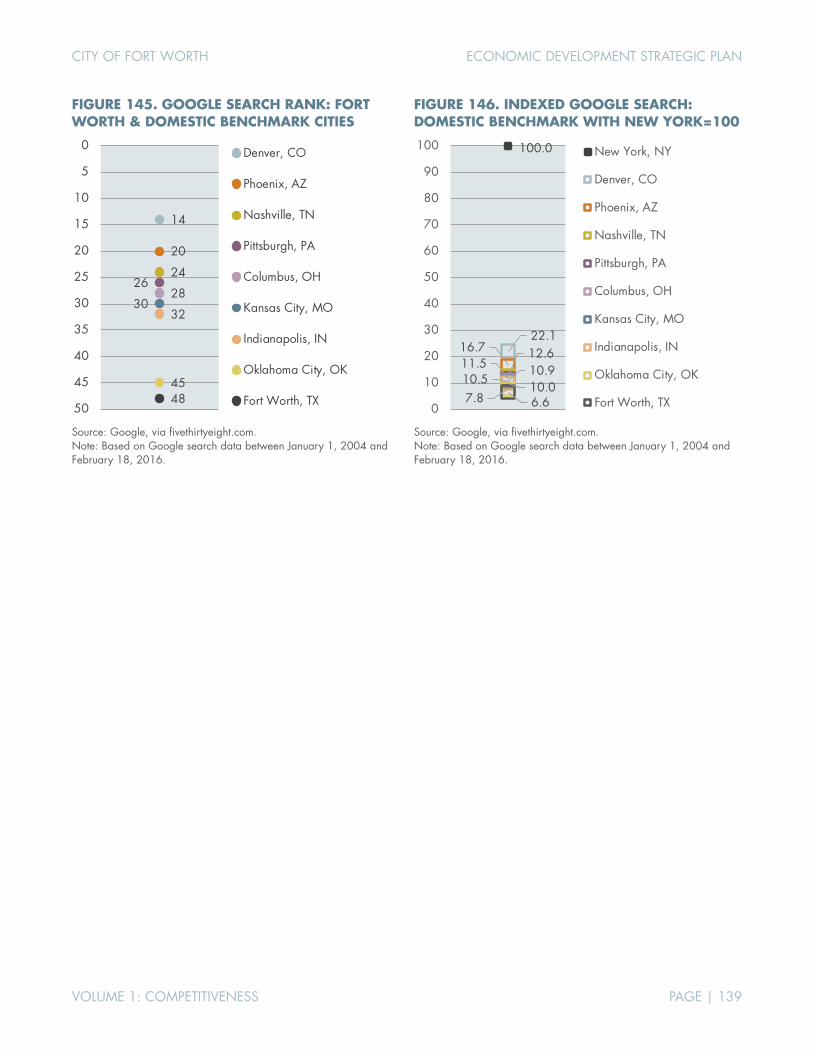
CITY OF FORT WORTH ECONOMIC DEVELOPMENT STRATEGIC PLAN
VOLUME 1: COMPETITIVENESS PAGE | 139
FIGURE 145. GOOGLE SEARCH RANK: FORT WORTH & DOMESTIC BENCHMARK CITIES
Source: Google, via fivethirtyeight.com. Note: Based on Google search data between January 1, 2004 and February 18, 2016.
FIGURE 146. INDEXED GOOGLE SEARCH: DOMESTIC BENCHMARK WITH NEW YORK=100
Source: Google, via fivethirtyeight.com. Note: Based on Google search data between January 1, 2004 and February 18, 2016.
14
20
2426
2830
32
4548
0
5
10
15
20
25
30
35
40
45
50
Denver, CO
Phoenix, AZ
Nashville, TN
Pittsburgh, PA
Columbus, OH
Kansas City, MO
Indianapolis, IN
Oklahoma City, OK
Fort Worth, TX
100.0
22.116.7 12.611.5 10.910.5
10.07.8 6.60
10
20
30
40
50
60
70
80
90
100 New York, NY
Denver, CO
Phoenix, AZ
Nashville, TN
Pittsburgh, PA
Columbus, OH
Kansas City, MO
Indianapolis, IN
Oklahoma City, OK
Fort Worth, TX

CITY OF FORT WORTH ECONOMIC DEVELOPMENT STRATEGIC PLAN
VOLUME 1: COMPETITIVENESS PAGE | 140
11. STAKEHOLDER SURVEY To better understand Fort Worth’s opportunities and challenges, an online survey was conducted as part of the strategic planning process. The survey was designed to solicit views of both residents and employers. This section focuses on aspects related to living in Fort Worth. Questions relating to hiring, training, and retraining workers will be presented as part of Volume 2 of the study, which will look at the metro area’s occupational structure and the alignment of the workforce with Fort Worth’s target industries.
The survey was posted on the website created for the planning process (http://fortworthtexas.gov/edplan/) and was available over a roughly 5-week period (April 29, 2017 through May 27, 2017). It was promoted by the City of Fort Worth Communications & Public Engagement Office and was highlighted in a Fort Worth Star-Telegram article about the planning process (“Fort Worth plan to dig deep on how to make the city more competitive,” May 19, 2017). A total of 1,273 responses were received.
As might be expected, given the focus of the survey, the majority of survey respondents (85 percent) were Fort Worth residents. Responses received from residents of other cities were almost exclusively from Tarrant County communities; just 4 percent of responses came from counties other than Tarrant. Respondents were also likely to have lived in the community for an extended period, with more than two out of five (44 percent) having resided in Fort Worth for 20 years or more.
FIGURE 147. RESPONDENT PROFILE: PLACE OF RESIDENCE
COUNTY TOP 10 CITIES TOP 10 ZIP CODES
# OF RESPONDENTS
% OF TOTAL
Fort Worth 1,087 85% Benbrook 23 2% North Richland Hills 15 1% Arlington 10 1% Burleson 10 1% Haslet 8 1% Keller 8 1% Bedford 6 <1% Haltom City 6 <1% Southlake 6 <1%
# OF RESPONDENTS
% OF TOTAL
76107 131 10% 76109 97 8% 76116 82 6% 76110 76 6% 76133 72 6% 76102 71 6% 76244 55 4% 76132 52 4% 76112 45 4% 76104 40 3%
NUMBER OF YEARS RESIDING IN FORT WORTH AREA
Source: Online survey of area residents conducted by TIP Strategies, April-May 2017.
Tarrant96%
Other4%
8.0%
13.1%
15.1%
19.4%
44.4%
0-2 years
2-5 years
5-10 years
10-20 years
20+ years

CITY OF FORT WORTH ECONOMIC DEVELOPMENT STRATEGIC PLAN
VOLUME 1: COMPETITIVENESS PAGE | 141
A large share of survey respondents was below the age of 40, with 45 percent having been born since 1980. Respondents also had high levels of education; 95 percent indicated at least some college experience. Nearly three-quarters (72 percent) of those who provided their attainment levels had a four-year degree or higher. Respondents also reported relatively high income levels, with more than one-quarter (27 percent) having household incomes above $150,000.
FIGURE 148. RESPONDENT PROFILE: DEMOGRAPHICS & INCOME
GENDER BIRTH YEAR
EDUCATIONAL ATTAINMENT HOUSEHOLD SIZE
INDIVIDUAL INCOME HOUSEHOLD INCOME
Source: Online survey of area residents conducted by TIP Strategies, April-May 2017.
Female54%
Male46%
6%
10%
18%
20%
33%
12%
Before 1950
1950 to 1959
1960 to 1969
1970 to 1979
1980 to 1989
1990 or later
4.0%
14.1%8.6%
39.7%33.0%
0.6%
Hig
h sc
hool
/GED
Som
e co
llege
2-yr
/ass
ocia
te's
4-ye
ar/b
ache
lor's
Gra
duat
e de
gree
Oth
er
19.6%
38.2%18.6%
15.4%
8.1%
1 person
2 people
3 people
4 people
5 or more
9.3%
9.3%
15.0%
26.5%
19.3%
12.7%
4.8%
3.1%
Less than $20k
$20k-$35k
$35k-$50k
$50k-$75k
$75k-$100k
$100k-$150k
$150k-$200k
More than $200k
1.3%
4.9%
8.2%
16.8%
16.1%
25.4%
14.9%
12.3%
Less than $20k
$20k-$35k
$35k-$50k
$50k-$75k
$75k-$100k
$100k-$150k
$150k-$200k
More than $200k
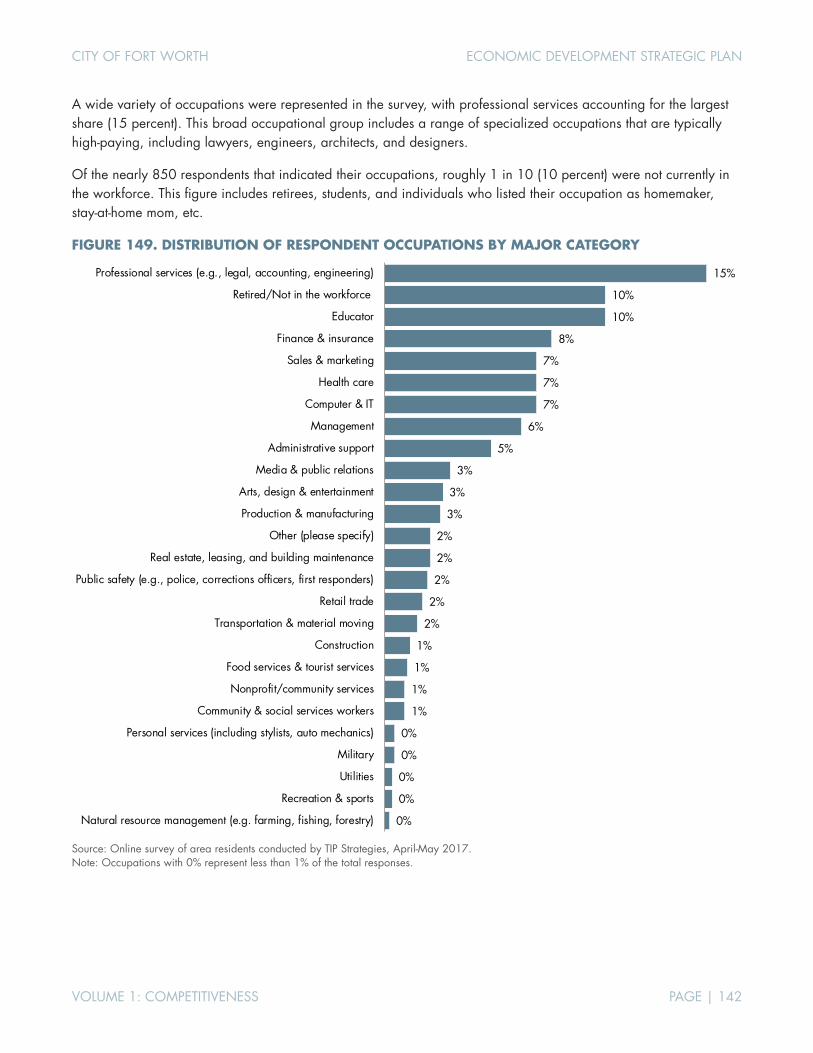
CITY OF FORT WORTH ECONOMIC DEVELOPMENT STRATEGIC PLAN
VOLUME 1: COMPETITIVENESS PAGE | 142
A wide variety of occupations were represented in the survey, with professional services accounting for the largest share (15 percent). This broad occupational group includes a range of specialized occupations that are typically high-paying, including lawyers, engineers, architects, and designers.
Of the nearly 850 respondents that indicated their occupations, roughly 1 in 10 (10 percent) were not currently in the workforce. This figure includes retirees, students, and individuals who listed their occupation as homemaker, stay-at-home mom, etc.
FIGURE 149. DISTRIBUTION OF RESPONDENT OCCUPATIONS BY MAJOR CATEGORY
Source: Online survey of area residents conducted by TIP Strategies, April-May 2017. Note: Occupations with 0% represent less than 1% of the total responses.
0%
0%
0%
0%
0%
1%
1%
1%
1%
2%
2%
2%
2%
2%
3%
3%
3%
5%
6%
7%
7%
7%
8%
10%
10%
15%
Natural resource management (e.g. farming, fishing, forestry)
Recreation & sports
Utilities
Military
Personal services (including stylists, auto mechanics)
Community & social services workers
Nonprofit/community services
Food services & tourist services
Construction
Transportation & material moving
Retail trade
Public safety (e.g., police, corrections officers, first responders)
Real estate, leasing, and building maintenance
Other (please specify)
Production & manufacturing
Arts, design & entertainment
Media & public relations
Administrative support
Management
Computer & IT
Health care
Sales & marketing
Finance & insurance
Educator
Retired/Not in the workforce
Professional services (e.g., legal, accounting, engineering)
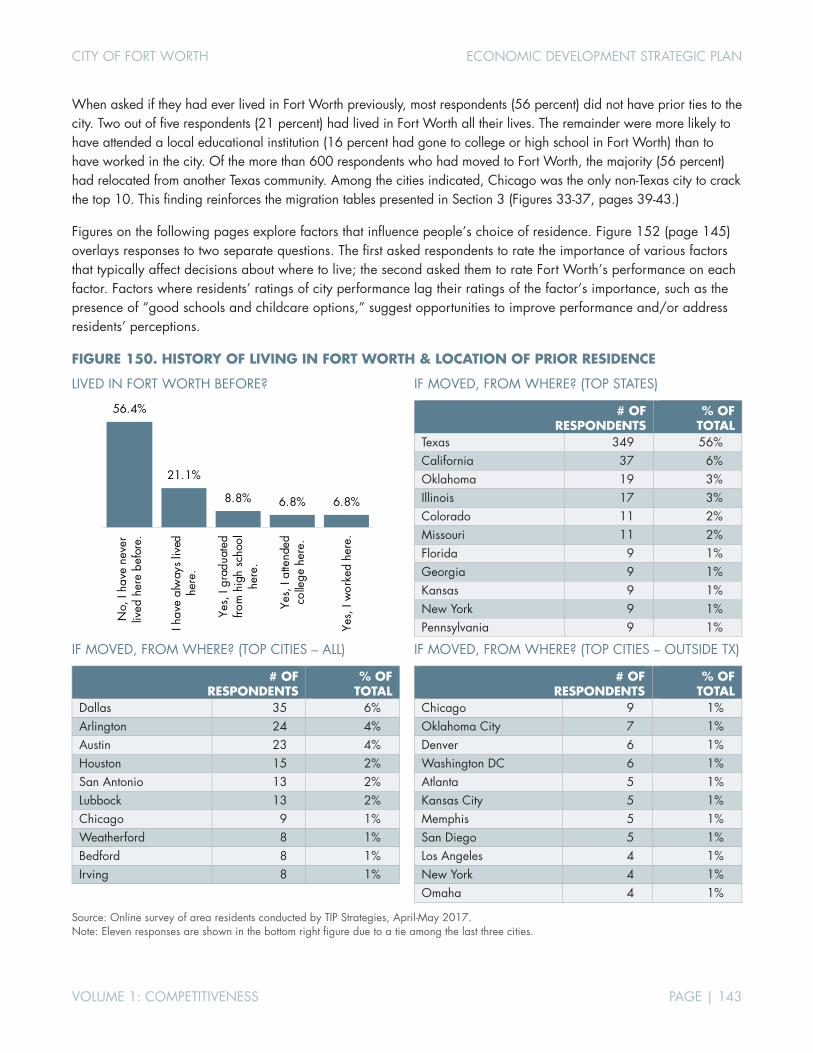
CITY OF FORT WORTH ECONOMIC DEVELOPMENT STRATEGIC PLAN
VOLUME 1: COMPETITIVENESS PAGE | 143
When asked if they had ever lived in Fort Worth previously, most respondents (56 percent) did not have prior ties to the city. Two out of five respondents (21 percent) had lived in Fort Worth all their lives. The remainder were more likely to have attended a local educational institution (16 percent had gone to college or high school in Fort Worth) than to have worked in the city. Of the more than 600 respondents who had moved to Fort Worth, the majority (56 percent) had relocated from another Texas community. Among the cities indicated, Chicago was the only non-Texas city to crack the top 10. This finding reinforces the migration tables presented in Section 3 (Figures 33-37, pages 39-43.)
Figures on the following pages explore factors that influence people’s choice of residence. Figure 152 (page 145) overlays responses to two separate questions. The first asked respondents to rate the importance of various factors that typically affect decisions about where to live; the second asked them to rate Fort Worth’s performance on each factor. Factors where residents’ ratings of city performance lag their ratings of the factor’s importance, such as the presence of “good schools and childcare options,” suggest opportunities to improve performance and/or address residents’ perceptions.
FIGURE 150. HISTORY OF LIVING IN FORT WORTH & LOCATION OF PRIOR RESIDENCE
LIVED IN FORT WORTH BEFORE? IF MOVED, FROM WHERE? (TOP STATES)
# OF RESPONDENTS
% OF TOTAL
Texas 349 56% California 37 6% Oklahoma 19 3% Illinois 17 3% Colorado 11 2% Missouri 11 2% Florida 9 1% Georgia 9 1% Kansas 9 1% New York 9 1% Pennsylvania 9 1%
IF MOVED, FROM WHERE? (TOP CITIES – ALL) IF MOVED, FROM WHERE? (TOP CITIES – OUTSIDE TX)
# OF RESPONDENTS
% OF TOTAL
Dallas 35 6% Arlington 24 4% Austin 23 4% Houston 15 2% San Antonio 13 2% Lubbock 13 2% Chicago 9 1% Weatherford 8 1% Bedford 8 1% Irving 8 1%
# OF RESPONDENTS
% OF TOTAL
Chicago 9 1% Oklahoma City 7 1% Denver 6 1% Washington DC 6 1% Atlanta 5 1% Kansas City 5 1% Memphis 5 1% San Diego 5 1% Los Angeles 4 1% New York 4 1% Omaha 4 1%
Source: Online survey of area residents conducted by TIP Strategies, April-May 2017. Note: Eleven responses are shown in the bottom right figure due to a tie among the last three cities.
56.4%
21.1%
8.8% 6.8% 6.8%
No,
I ha
ve n
ever
lived
her
e be
fore
.
I hav
e al
way
s liv
edhe
re.
Yes,
I gr
adua
ted
from
hig
h sc
hool
here
.
Yes,
I at
tend
edco
llege
her
e.
Yes,
I w
orke
d he
re.
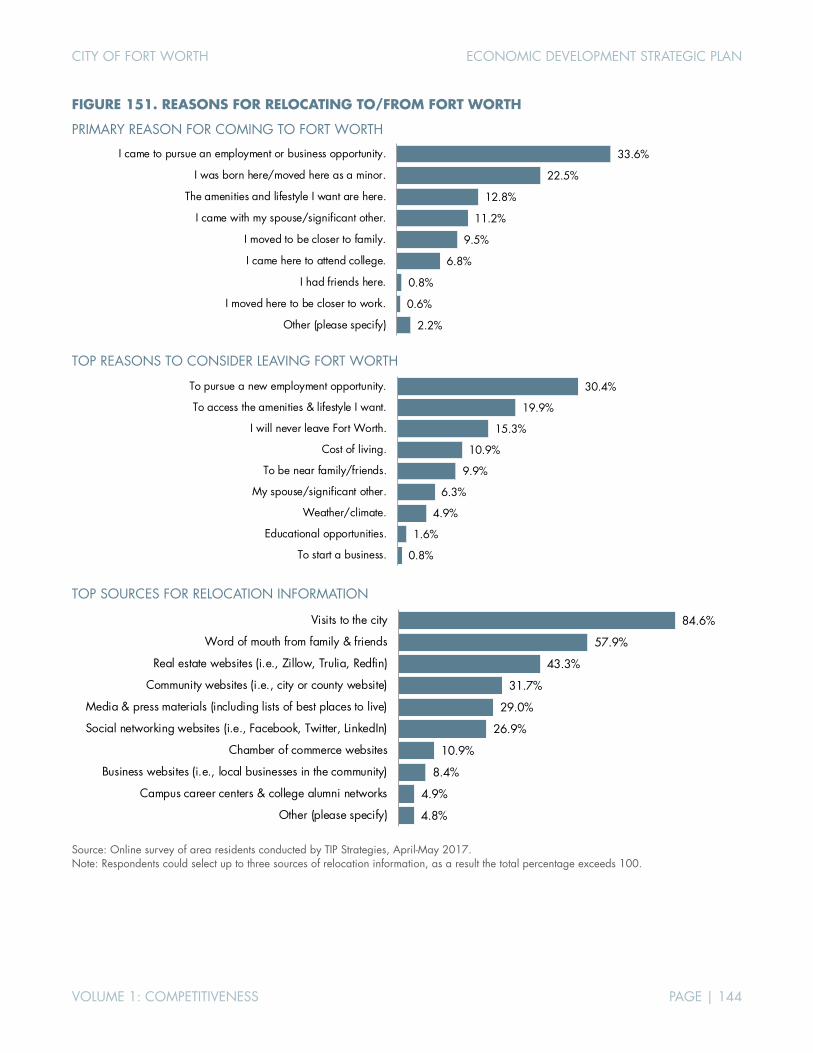
CITY OF FORT WORTH ECONOMIC DEVELOPMENT STRATEGIC PLAN
VOLUME 1: COMPETITIVENESS PAGE | 144
FIGURE 151. REASONS FOR RELOCATING TO/FROM FORT WORTH
PRIMARY REASON FOR COMING TO FORT WORTH
TOP REASONS TO CONSIDER LEAVING FORT WORTH
TOP SOURCES FOR RELOCATION INFORMATION
Source: Online survey of area residents conducted by TIP Strategies, April-May 2017. Note: Respondents could select up to three sources of relocation information, as a result the total percentage exceeds 100.
33.6%
22.5%
12.8%
11.2%
9.5%
6.8%
0.8%
0.6%
2.2%
I came to pursue an employment or business opportunity.
I was born here/moved here as a minor.
The amenities and lifestyle I want are here.
I came with my spouse/significant other.
I moved to be closer to family.
I came here to attend college.
I had friends here.
I moved here to be closer to work.
Other (please specify)
0.8%
1.6%
4.9%
6.3%
9.9%
10.9%
15.3%
19.9%
30.4%
To start a business.
Educational opportunities.
Weather/climate.
My spouse/significant other.
To be near family/friends.
Cost of living.
I will never leave Fort Worth.
To access the amenities & lifestyle I want.
To pursue a new employment opportunity.
4.8%
4.9%
8.4%
10.9%
26.9%
29.0%
31.7%
43.3%
57.9%
84.6%
Other (please specify)
Campus career centers & college alumni networks
Business websites (i.e., local businesses in the community)
Chamber of commerce websites
Social networking websites (i.e., Facebook, Twitter, LinkedIn)
Media & press materials (including lists of best places to live)
Community websites (i.e., city or county website)
Real estate websites (i.e., Zillow, Trulia, Redfin)
Word of mouth from family & friends
Visits to the city
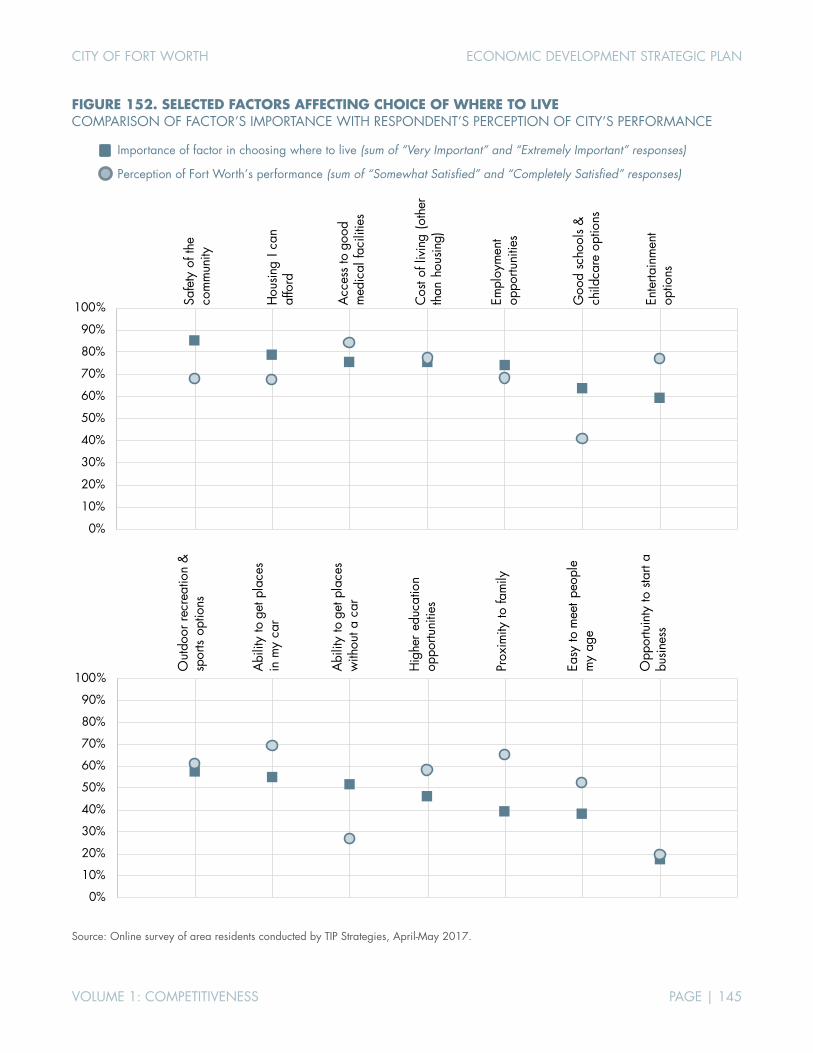
CITY OF FORT WORTH ECONOMIC DEVELOPMENT STRATEGIC PLAN
VOLUME 1: COMPETITIVENESS PAGE | 145
FIGURE 152. SELECTED FACTORS AFFECTING CHOICE OF WHERE TO LIVE COMPARISON OF FACTOR’S IMPORTANCE WITH RESPONDENT’S PERCEPTION OF CITY’S PERFORMANCE
Importance of factor in choosing where to live (sum of “Very Important” and “Extremely Important” responses)
Perception of Fort Worth’s performance (sum of “Somewhat Satisfied” and “Completely Satisfied” responses)
Source: Online survey of area residents conducted by TIP Strategies, April-May 2017.
0%
10%
20%
30%
40%
50%
60%
70%
80%
90%
100% Safe
tyof
the
com
mun
ity
Hou
sing
I can
af
ford
Acc
ess
to g
ood
med
ical
faci
litie
s
Cos
t of l
ivin
g (o
ther
th
an h
ousin
g)
Empl
oym
ent
oppo
rtuni
ties
Goo
d sc
hool
s &
ch
ildca
re o
ptio
ns
Ente
rtain
men
t op
tions
0%
10%
20%
30%
40%
50%
60%
70%
80%
90%
100%
Out
door
recr
eatio
n &
sp
orts
optio
ns
Abi
lity
to g
et p
lace
s in
my
car
Abi
lity
to g
et p
lace
s w
ithou
t a c
ar
Hig
her
educ
atio
n op
portu
nitie
s
Prox
imity
to fa
mily
Easy
to m
eet p
eopl
e m
yag
e
Opp
ortu
inty
to s
tart
a bu
sines
s
AUSTIN � SEATTLEDECEMBER 2017
VOLUME 2: OPPORTUNITY
CITY OF FORT WORTH, TEXASECONOMIC DEVELOPMENT STRATEGIC PLAN
CITY OF FORT WORTH, TEXAS ECONOMIC DEVELOPMENT STRATEGIC PLAN
VOLUME 2: OPPORTUNITY PAGE | I
ACKNOWLEDGEMENTS TIP would like to thank the following individuals and organizations for their participation in this planning process:
CITY OF FORT WORTH MAYOR AND CITY COUNCIL Betsy Price, Mayor
Carlos Flores, District 2 (current)
Sal Espino, District 2 (former)
Brian Byrd, District 3
W.B. ‘Zim’ Zimmerman, District 3 (former)
Cary Moon, District 4
Gyna Bivens, District 5
Jungus Jordan, District 6
Dennis Shingleton, District 7
Kelly Allen Gray, District 8
Ann Zadeh, District 9
CITY OF FORT WORTH STAFF David Cooke, City Manager
Jay Chapa, Assistant City Manager
Robert Sturns, Director, Economic Development
Brenda Hicks-Sorensen, CEcD, Assistant Director, Economic Development
PROJECT STEERING COMMITTEE Lisa McMillan, Tarrant County Administrator’s Office
Darlene Boudreaux, Tech Fort Worth
Brandom Gengelbach, Fort Worth Chamber of Commerce
Stacy Marshall, Southeast Fort Worth, Inc.
Andy Taft, Downtown Fort Worth, Inc.
Paul Paine, Near Southside, Inc.
Cintya Segoviano, Fort Worth Hispanic Chamber of Commerce
Devoyd “Dee” Jennings, Fort Worth Metropolitan Black Chamber of Commerce
David Walters, CBRE
Nina Petty, Tarrant County College District
Mitch Whitten, Fort Worth Convention & Visitors Bureau
Janet Black, BNSF Railway Company
Marie A. Holliday, DMD, Sundance Square Dentist
Robert Folzenlogen, Hillwood Properties
Don Boren, Don Boren and Company Inc.
JJ Cawelti, Bell Helicopter-Textron, Inc.
Kevin Davies, Hulen Mall
Matt Robinson, Walton Development and Management, Inc.
Judy McDonald, Workforce Solutions of Tarrant County

CITY OF FORT WORTH, TEXAS ECONOMIC DEVELOPMENT STRATEGIC PLAN
VOLUME 2: OPPORTUNITY PAGE | II
PROJECT LEADERSHIP TEAM Paul Ballard, Fort Worth Transportation Authority
Mike Berry, Hillwood Properties
Jay Chapa, Assistant City Manager
John Terrell, DFW International Airport
Victor Boschini, Texas Christian University
Michael Branum, NAS Joint Reserve Base Fort Worth
Dr. Kent Paredes Scribner, Fort Worth ISD
Eugene V. Giovannini, Tarrant County College District
J.D. Granger, Trinity River Vision Authority
Johnny Campbell, Sundance Square
Lillie Biggins, Texas Health Harris Methodist Fort Worth
PROJECT CONSULTING TEAM
TIP STRATEGIES, INC. is a privately held economic development consulting firm with offices in Austin and Seattle. TIP is committed to providing quality solutions for public and private sector clients. Established in 1995, the firm's primary focus is economic development strategic planning.
Project Team: Jon Roberts, Managing Principal John Karras, Senior Consultant Alex Cooke, Senior Consultant Karen Beard, Analyst Meredith Eberle, Project Support
FREGONESE ASSOCIATES is a Portland-based urban planning firm with expertise in citywide comprehensive planning as well as scenario planning and modeling in specific areas (such as downtowns and urban corridors). Established in 1997, the firm’s work has been instrumental in the development and adoption of growth policies and land use plans in large cities and metro areas across the US and internationally.
Project Team: John Fregonese, President Nadine Appenbrink, Project Manager Julia Reisemann, GIS Analyst
JLL is a member of the Fortune 500 and is a global professional services and investment management firm specializing in real estate. JLL’s industry-leading research group delivers commercial real estate analysis and insights that drive value in real estate decisions and support successful strategies.
Project Team: Jubal Smith, Executive Vice President Todd Burnette, Managing Director
ISAAC BARCHAS led the Austin Technology Incubator for 10 years, starting in 2006. Over that time, he has overseen the incubation of more than 200 companies. He is responsible for ATI's strategic direction and evolving the ATI economic model. Isaac remains active in the technology and venture capital communities in Austin and across the US and has been published in the Washington Post, Wall Street Journal, Chicago Tribune, and Austin American Statesman.

CITY OF FORT WORTH, TEXAS ECONOMIC DEVELOPMENT STRATEGIC PLAN
VOLUME 2: OPPORTUNITY PAGE | III
CONTENTS ABOUT THIS WORK ................................................................................................................................. 1 KEY FINDINGS ......................................................................................................................................... 2
WORKFORCE CONSIDERATIONS .......................................................................................................... 2 EXISTING INDUSTRY STRENGTHS ........................................................................................................... 4 EMERGING OPPORTUNITIES ................................................................................................................. 6 CONNECTING THE DOTS ................................................................................................................... 11
REFERENCE APPENDIX ............................................................................................................................ 14 1. METROPOLITAN DIVISIONS ............................................................................................................. 14 2. REGIONAL LABOR STUDY ............................................................................................................... 15
LABOR MARKET OVERVIEW .............................................................................................................. 15 COMMUTING PATTERNS .................................................................................................................. 26 OCCUPATIONAL ANALYSIS............................................................................................................... 33 POSTSECONDARY COMPLETIONS .................................................................................................... 59
3. EMPLOYMENT NODE DISTRICTS ...................................................................................................... 64 4. EMPLOYER SURVEY ......................................................................................................................... 85 5. TARGET INDUSTRY ANALYSIS........................................................................................................... 94
ESTABLISHED SECTORS ..................................................................................................................... 95 EMERGING OPPORTUNITIES ........................................................................................................... 135
CITY OF FORT WORTH, TEXAS ECONOMIC DEVELOPMENT STRATEGIC PLAN
VOLUME 2: OPPORTUNITY PAGE | 1
ABOUT THIS WORK Over the last several decades, Fort Worth has been one of the fastest-growing large cities in the US. Fort Worth has a unique identity and brand that combines its rich cultural heritage with an economy driven by industry-leading employers like Lockheed Martin and American Airlines. The City has made strategic investments in districts from Sundance Square to Alliance, resulting in numerous waves of private sector investment and employment growth. However, all this has been achieved without a comprehensive, citywide approach for economic development. There is no question that Fort Worth is primed for greater economic prosperity. The challenge is not about growth in a general sense, it is about guiding growth that creates the highest overall benefit to the city. To accomplish this, future development will need to be channeled into specific districts, into generating higher income levels and capital investment, strengthening the local tax base, and supporting a more attractive environment for companies and skilled workers.
In response to these challenges, Fort Worth is embarking on its first economic development strategic plan, aimed at enhancing the city's status in the region and nation over the next five years and beyond. Working with TIP Strategies (an economic development consulting firm with offices in Austin and Seattle) and their partners (Fregonese Associates, JLL, and Isaac Barchas), the City of Fort Worth has engaged the business community and local stakeholders to create a strategic framework to guide the City’s economic development activities.
Volume 2 of the Economic Development Strategic Plan focuses on Fort Worth’s workforce and its industry-focused opportunities. The first major section of this document provides a detailed analysis of the area labor market, commuting patterns, workforce demographics, occupational characteristics, and postsecondary completions. In addition to the data, we analyzed the results of an online stakeholder survey, which provides qualitative insights about the area workforce from more than 300 local employers (including business owners and managers in the public and private sectors). This document also examines Fort Worth’s opportunities for growth in two areas:
1. Established industries. Fort Worth has several long-standing industries that play a central role in the local economy (in terms of employment, visibility, and/or cultural heritage). These include: transportation and warehousing, manufacturing, healthcare, oil and gas, and tourism.
2. Emerging opportunities. These include new focus areas within Fort Worth’s established industries and sectors which haven’t fully matured locally. They include: aerospace manufacturing and design, transportation innovation, life sciences delivery and innovation, geotechnical engineering, international business, corporate and regional headquarters, professional services, and financial services.
The results of the planning process are presented in three interlinked volumes, described in the graphic below.
Volume 3 takes the data, analysis, and input gathered in Volumes 1 and 2 and narrows the focus into specific, actionable strategies. This volume also provides tools for implementation and follow-up.
Volume 1 captures the assessment phase of the project, where existing assets are identified, analyzed, and compared with benchmarks. This volume serves as the broad base for subsequent phases of the project.
VOLUME 3: STRATEGY(strategic plan and
implementation)
Volume 2 focuses on Fort Worth’s workforce and its industry-focused opportunities, with analyses related to the labor market. This volume identifies specific opportunities for growth.
VOLUME 2: OPPORTUNITY(labor & industry analysis, identification of targets)
VOLUME 1: COMPETITIVENESS(assessment, engagement, & analysis)

CITY OF FORT WORTH, TEXAS ECONOMIC DEVELOPMENT STRATEGIC PLAN
VOLUME 2: OPPORTUNITY PAGE | 2
KEY FINDINGS Over the last decade, economic development professionals have seen talent and workforce become integral parts of their work plans. This change in focus reflects the increasing emphasis placed on labor availability in site selection decisions and the growing awareness of the connection between talent and economic vitality. As a result, economic development success no longer rests solely on the availability of well-prepared sites, but rather, it extends to creating a climate that fosters innovation and a quality of place that will support the recruitment of both businesses and talent. Documenting the skills of the regional workforce, understanding existing industry strengths, and exploring emerging opportunities provides the foundation for this comprehensive approach.
WORKFORCE CONSIDERATIONS GIVEN THE IMPORTANCE OF A SKILLED LABOR FORCE, FORT WORTH’S OPPORTUNITIES MUST BE CONSIDERED WITHIN THE CONTEXT OF ONGOING STRUCTURAL CHALLENGES.
A skilled labor force is the source of modern economic strength. Thus, structural challenges impacting the workforce must be addressed as part of an economic development strategy, including changes to city policy, where applicable. Our analysis shows that Fort Worth faces two key challenges that must be considered.
First, while Fort Worth has experienced strong growth in its civilian labor force (CLF) over the past decade, job growth has not kept pace. Among the Dallas-Fort Worth metro area peer communities, Fort Worth has seen one of the largest CLF increases relative to 2007 levels, outpaced only by McKinney and Frisco. Among the US cities benchmarked for this work, Fort Worth’s 27 percent increase topped the list. Strong growth in the labor force can lead to a corresponding increase in the unemployment rate as new workers are absorbed into the labor pool, especially if employment growth does not keep pace. This lag in job growth relative to population has been the case in Fort Worth during the past decade. Estimates of employment and households prepared by the North Central Texas Council of Governments (NCTCOG) suggest the city’s jobs-to-household ratio will erode further in the coming decades, dipping to 1.74 by 2040. At the same time, neighboring cities and more suburban areas are projected to see slight increases in this measure. Typically, a central city like Fort Worth would lead the region as an employment hub with a jobs-to-household ratio higher than its more suburban surroundings.
Second, Fort Worth residents are increasingly dependent on jobs located in other cities. Between 2005 and 2014, the number of residents commuting to jobs outside the city grew by 50 percent. By contrast, the share of workers commuting into Fort Worth increased by just 22 percent during the same period. Only one-third of the city’s workforce (34 percent) resided in the city limits in 2014. This finding reflects Fort Worth’s rapid population increase (and corresponding growth in the CLF), above-average levels of residential development, and lagging employment growth relative to the eastern side of the metro area. In addition to the fiscal and land use implications discussed in Volume 1, the threat of Fort Worth’s continued “suburbanization” within the metro area extends to increased demand for government services (education, emergency services), overburdened infrastructure (transportation, parks, utilities), and the potential for greater economic and social disparity. A focused business development effort is required to balance the city’s tax base and create economic opportunity for residents within the city.
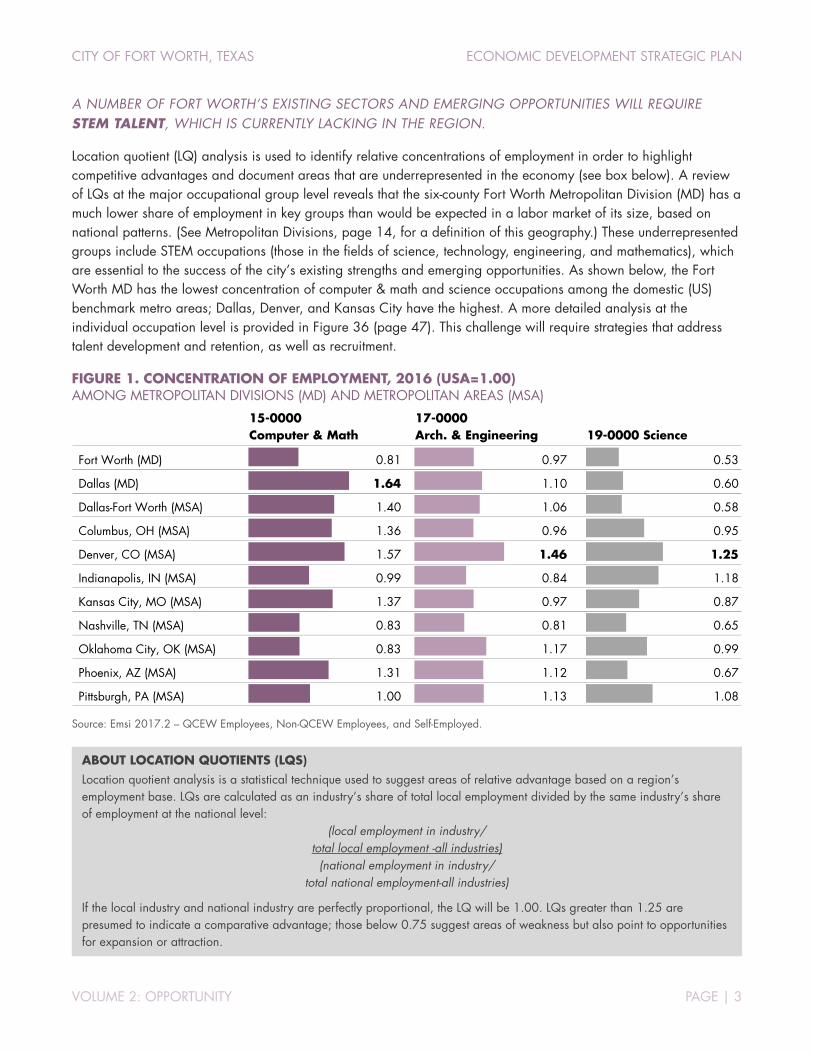
CITY OF FORT WORTH, TEXAS ECONOMIC DEVELOPMENT STRATEGIC PLAN
VOLUME 2: OPPORTUNITY PAGE | 3
A NUMBER OF FORT WORTH’S EXISTING SECTORS AND EMERGING OPPORTUNITIES WILL REQUIRE STEM TALENT, WHICH IS CURRENTLY LACKING IN THE REGION.
Location quotient (LQ) analysis is used to identify relative concentrations of employment in order to highlight competitive advantages and document areas that are underrepresented in the economy (see box below). A review of LQs at the major occupational group level reveals that the six-county Fort Worth Metropolitan Division (MD) has a much lower share of employment in key groups than would be expected in a labor market of its size, based on national patterns. (See Metropolitan Divisions, page 14, for a definition of this geography.) These underrepresented groups include STEM occupations (those in the fields of science, technology, engineering, and mathematics), which are essential to the success of the city’s existing strengths and emerging opportunities. As shown below, the Fort Worth MD has the lowest concentration of computer & math and science occupations among the domestic (US) benchmark metro areas; Dallas, Denver, and Kansas City have the highest. A more detailed analysis at the individual occupation level is provided in Figure 36 (page 47). This challenge will require strategies that address talent development and retention, as well as recruitment.
FIGURE 1. CONCENTRATION OF EMPLOYMENT, 2016 (USA=1.00) AMONG METROPOLITAN DIVISIONS (MD) AND METROPOLITAN AREAS (MSA)
Source: Emsi 2017.2 – QCEW Employees, Non-QCEW Employees, and Self-Employed.
15-0000 Computer & Math
17-0000 Arch. & Engineering 19-0000 Science
Fort Worth (MD) 0.81 0.97 0.53
Dallas (MD) 1.64 1.10 0.60
Dallas-Fort Worth (MSA) 1.40 1.06 0.58
Columbus, OH (MSA) 1.36 0.96 0.95
Denver, CO (MSA) 1.57 1.46 1.25
Indianapolis, IN (MSA) 0.99 0.84 1.18
Kansas City, MO (MSA) 1.37 0.97 0.87
Nashville, TN (MSA) 0.83 0.81 0.65
Oklahoma City, OK (MSA) 0.83 1.17 0.99
Phoenix, AZ (MSA) 1.31 1.12 0.67
Pittsburgh, PA (MSA) 1.00 1.13 1.08
ABOUT LOCATION QUOTIENTS (LQS) Location quotient analysis is a statistical technique used to suggest areas of relative advantage based on a region’s employment base. LQs are calculated as an industry’s share of total local employment divided by the same industry’s share of employment at the national level:
(local employment in industry/ total local employment -all industries) (national employment in industry/
total national employment-all industries)
If the local industry and national industry are perfectly proportional, the LQ will be 1.00. LQs greater than 1.25 are presumed to indicate a comparative advantage; those below 0.75 suggest areas of weakness but also point to opportunities for expansion or attraction.

CITY OF FORT WORTH, TEXAS ECONOMIC DEVELOPMENT STRATEGIC PLAN
VOLUME 2: OPPORTUNITY PAGE | 4
EMPLOYMENT IN FORT WORTH’S URBAN CORE GENERATES CITYWIDE ECONOMIC BENEFITS AND SHOULD BE ENCOURAGED.
As highlighted in Volume 1, Fort Worth’s existing and emerging districts have the potential to serve as drivers of the City’s economic development efforts. This potential extends to their role as employment-generating nodes. While Volume 1 emphasizes the need to capitalize on the city’s substantial volume of vacant land, there is an argument to be made for maximizing the central city’s employment potential. Combined, the five major districts analyzed in this report accounted for 35 percent of the city’s total employment as of 2016, but represented 41 percent of citywide employment growth from 2010 to 2016. Looking forward, the NCTCOG forecast predicts the majority of the city’s employment growth through 2040 will occur in the central city, further demonstrating the urban core’s importance to Fort Worth’s job base.
Of the five districts analyzed, four are located in Fort Worth’s urban core: Downtown, Near Southside, Cultural District, and Stockyards. Although these employment nodes draw in workers from a broad area, they provide an important source of jobs for the local labor force. Each of these nodes has a laborshed with at least one-third of workers residing in Fort Worth and roughly two-thirds of workers residing within Tarrant County By contrast, the fifth employment node, Alliance, primarily draws workers from outside the area. Just 15 percent of Alliance workers live in Fort Worth and 40 percent of the Alliance workforce resides in Tarrant County.
Among the most significant benefits of focusing on employment districts is the ability to help improve Fort Worth’s jobs-to-household ratio. The deterioration seen in this important metric in recent years is cause for concern as imbalances typically strain transportation networks, leading to longer commute times, air quality issues, and inequalities in access to employment among residents. A focus on encouraging employment-generating uses would also lead to additional commercial and industrial development, which would help address current imbalances in the city’s tax base. The urban core districts and Alliance provide complementary opportunities for addressing both issues.
EXISTING INDUSTRY STRENGTHS The rationale for identifying target industries is to orient the community toward high-growth sectors that can provide a new wave of business growth and investment. The foundation for target industry identification begins with an understanding of the current economic base. As highlighted in Volume 1, Fort Worth has several established sectors that currently dominate the local economic landscape. Building on these existing strengths and connecting them with future opportunities is at the core of a successful targeting initiative.
THE TRANSPORTATION & WAREHOUSING SECTOR IS THE CITY’S LARGEST IN TERMS OF ITS SHARE OF TOTAL EMPLOYMENT.
The transportation & warehousing sector is a significant source of employment and one of the city’s fastest growing. In 2016, one in every eight jobs in the city was in the transportation & warehousing sector. Between 2010 and 2016, the sector was second only to healthcare in terms of employment growth. The dominance of the transportation & warehousing sector—which includes the transport of passengers and freight using a variety of modes (e.g., truck, transit, rail, air)—reflects Fort Worth’s history as a crossroads. The city’s transportation assets include a network of interstate highways (I-20, I-30, and I-35), access to two Class I railroads (BNSF and UP), and two airports providing global connectivity (Alliance and DFW International Airport).
Fort Worth’s strengths in this sector are also reflected in its occupational structure, with nearly 11 percent of the city’s employment base in material moving jobs. This figure is significantly above the share that would be expected
CITY OF FORT WORTH, TEXAS ECONOMIC DEVELOPMENT STRATEGIC PLAN
VOLUME 2: OPPORTUNITY PAGE | 5
for a labor force of the same size based on national patterns, as evidenced by Fort Worth’s location quotient (LQ) of 1.61 for the occupational group. The city’s long history as a transportation hub, its dense network of transportation infrastructure, and human capital assets create a solid foundation for capitalizing on recent innovations in the industry, as outlined in the Emerging Opportunities section.
REGIONAL STRENGTHS IN MANUFACTURING ARE WEIGHTED TOWARDS FORT WORTH.
Since 2010, manufacturing employment growth in the Dallas-Fort Worth metro area has taken place almost exclusively in the Fort Worth MD. Both the city and the Fort Worth MD have strong concentrations of employment in the sector relative to the national average, with LQs of 1.26 and 1.09 respectively. The manufacturing industries in the MD with the largest employment are aircraft, automotive, and pharmaceuticals. In Fort Worth, the employment in these industries is driven by Lockheed Martin and Bell Helicopter (for aircraft manufacturing) and Novartis’s Alcon subsidiary (for pharmaceuticals). General Motors is the primary driver of the MD’s automotive manufacturing employment in Arlington.
Like the transportation & warehousing sector, the city’s manufacturing strengths are reflected in its occupational structure, with production workers accounting for just over 7 percent of the city’s total job base. This sector’s LQ of 1.22, indicates employment levels above national averages. However, as the sector becomes increasingly dependent on the development and adoption of new technologies, the ability to attract and retain a pipeline of skilled talent will become the major determinant in the health of the region’s manufacturing base. Fort Worth’s relative lack of workers in STEM-related occupations threatens to inhibit growth in this sector in the future.
FORT WORTH’S RESILIENT HEALTHCARE EMPLOYMENT HAS AVOIDED CYCLICAL PATTERNS.
Among the five highlighted clusters of existing industry strength in Fort Worth, healthcare is the only employment sector in the city that consistently added net new jobs each year from 2010 through 2016. This lack of employment cyclicality, during a period of national economic turbulence, reflects an inherent strength of the healthcare sector as a relatively stable economic base for the city.
Employment in healthcare occupations in the Dallas-Fort Worth MSA between 2010 and 2016 was explosive, leaping 24 percent over the period and tying the MSA with Atlanta for the fastest healthcare growth among the nation’s large metros. With its high concentration of medical institutions in the Near Southside, the city of Fort Worth can (and should) play a leading role as the center of gravity for the MSA’s healthcare sector.
THE OIL & GAS SECTOR IS EVOLVING, AND FORT WORTH’S ROLE MUST EVOLVE AS WELL
Fort Worth’s economy has long been shaped by the volatility of the oil & gas sector. The sector has traditionally been―and will continue to be―pro-cyclical in its national and local employment patterns. Nationally, employment in the sector grew by 34 percent from 2010 to 2014. Growth in the Fort Worth MD nearly doubled that pace (62 percent) during the same period, only to shed nearly all those jobs from 2014 to 2016. Future regional job growth is projected to happen mostly in the Fort Worth MD. While it comprises a relatively small share of total employment in the Fort Worth MD, it is highly concentrated in the area relative to national employment patterns as evidenced by the sector’s LQ of 3.37.
Historic trends indicate that downturns in this sector usher in job consolidation, of which Houston has often been the beneficiary over the sector’s regional outposts like Fort Worth, Denver, New Orleans, Tulsa, and Midland. Denver, in particular, provides some guidance in how a major metropolitan area can redirect its growth toward other sectors (communications and technology have been important drivers for Denver in recent decades). Meanwhile, in
CITY OF FORT WORTH, TEXAS ECONOMIC DEVELOPMENT STRATEGIC PLAN
VOLUME 2: OPPORTUNITY PAGE | 6
the greater Denver region, a more broadly defined “energy sector” has been active in the development of alternatives and renewables. As the data and trends in this report show, Fort Worth, too, may find that its best opportunities in the oil & gas sector are in selected niches where it can compete effectively. Options for this are discussed more in the “Emerging Opportunities” section of this volume.
THE HOSPITALITY & TOURISM SECTOR REMAINS UNDER-DEVELOPED IN THE CITY OF FORT WORTH RELATIVE TO ITS POTENTIAL
Fort Worth is home to an enviable array of tourism assets, including a globally connected airport, world-class museums, and a top-ranked zoo. Despite these and other strengths, a key finding presented in Volume 1 was that the City has not fully tapped into Fort Worth’s potential as a visitor destination. The report, which was focused on competitiveness, concluded that “Despite a unique blend of visitor destinations (Sundance Square, the Stockyards, and the Cultural District), Fort Worth underperforms surrounding cities in terms of hotel revenues, indicating unmet demand.” Moreover, the report encouraged greater collaboration with the Fort Worth Convention & Visitors Bureau (CVB) and the Fort Worth Chamber of Commerce toward their mutually shared goals.
Those opportunities identified in the first volume are further underscored by the research in Volume 2. While the Dallas-Fort Worth MSA as a whole enjoyed post-recession employment gains of more than 7,300 jobs in the hospitality & tourism sector through 2016, the city of Fort Worth saw a marginal net decline in total jobs in this sector. This trend correlates, to some extent, with the findings in Volume 1, which showed the city’s comparatively lagging growth in hotel room revenues. Strategies relating to the city of Fort Worth’s image, branding, and commitment to key districts―including the downtown district―can be tied to a reinvigoration of the city’s hospitality & tourism sector.
EMERGING OPPORTUNITIES Growth can and should take place within the city’s established sectors. But a narrow focus on existing industries is not enough. In order to position the city for a higher level of economic prosperity, we have identified eight emerging opportunities with significant potential for new business creation, expansion, and relocation. Fort Worth’s emerging opportunities for new investment and job growth are outlined below.
AEROSPACE MANUFACTURING & DESIGN: FORT WORTH’S AEROSPACE MANUFACTURING EXPERTISE AND RELATIVELY HIGH PROFILE IN THIS INDUSTRY SHOULD BE LEVERAGED TO PURSUE DESIGN AND R&D FUNCTIONS.
Fort Worth is one of the leading aerospace manufacturing centers in North America, a position that has become even stronger over the past quarter-century as Los Angeles’s strength has eroded due to industry consolidation and the migration of headquarters to be closer to the Pentagon. Numerous aerospace manufacturers operate in the Dallas-Fort Worth metro area, but the lion’s share of employment resides in Fort Worth. Between Lockheed Martin Aeronautics’ facility located at NAS Joint Reserve Base Fort Worth (where the F-35 and F-16 are manufactured) and Bell Helicopter Textron, there are nearly 20,000 workers in Fort Worth. Other companies, like Elbit Systems of America, play an important role in this sector as well. The industry’s extensive local presence means that Fort Worth has a specialized labor pool of skilled aerospace talent, an unusual asset in the US. The LQs within the Fort Worth MD are particularly noteworthy in several aerospace and aviation occupations: aerospace engineering & operations technicians (3.07), aerospace engineers (3.06), and mechanical engineering technicians (1.84).

CITY OF FORT WORTH, TEXAS ECONOMIC DEVELOPMENT STRATEGIC PLAN
VOLUME 2: OPPORTUNITY PAGE | 7
The convergence of unmanned air systems (UAS), drones, and in-demand electric vertical-takeoff-and-landing (e-VTOL) has the potential to create new technology and employment opportunities in the region. Uber has announced plans to team up with Fort Worth and other cities to launch in-demand e-VTOL air-taxi service in 2020. Bell Helicopter is part of the team Uber has assembled to develop the technology and infrastructure. Uber is also partnering with Hillwood to launch its UberAIR service and develop vertiports. One such vertiport is planned for downtown Fort Worth. Alliance Airport has been mentioned as a potential site for manufacturing and training center support for UberAIR.
Technological innovations in the aerospace industry are affecting the occupations and skills required by employers, especially original equipment manufacturers (OEM) such as Lockheed Martin and Bell Helicopter. The traditional emphasis on “drill and fill” assembly workers dominating the production floor is shifting. New technologies and products like fly-by-wire flight controls and unmanned systems are increasing the demand for IT specialists (e.g., software developers and computer engineers). Likewise, the growing use of composites and utilization of additive manufacturing (3D printing) and robotics is also driving demand for production workers with advanced technical skillsets. Other occupations and positions projected to grow in the coming years include logistics and supply chain management positions and repair and maintenance technicians (especially for composite materials).
These trends in the aerospace industry affect several of Fort Worth’s largest employers. Working with these employers to address their specialized skill requirements, amid a rapidly changing technological environment, should be a priority for the City. Meeting the growing demand for aerospace workers with advanced skillsets will require a greater emphasis on STEM education and training at the local level. A ready-to-go replacement workforce of younger, more diverse workers with modern technological skills will benefit Fort Worth from an employer retention standpoint, and it will also empower the workforce with skills adaptable to the more entrepreneurial climate that is evolving within this sector.
TRANSPORTATION INNOVATION. DRAMATIC TECHNOLOGICAL ADVANCES OCCURRING IN THE TRANSPORTATION INDUSTRY PRESENT A BUSINESS DEVELOPMENT OPPORTUNITY FOR THE CITY.
Dramatic technological advances have the potential to transform the transportation industry. Disruptive developments, such as the pursuit of autonomous vehicles, the integration of drones into economic activities, and the move towards transportation as a service (e.g., ride-sharing models) are prominent examples. Cities around the world are making themselves labs for things like autonomous vehicle testing and are experimenting with investments in “smart city” technologies for seemingly mundane things like sensory-controlled traffic signals, parking meters with real-time market pricing, and GPS-enabled resident feedback loops for reporting potholes, fallen branches, graffiti, etc.
Home to some of the nation’s leading transportation companies―BNSF, American Airlines, Lockheed Martin, Bell Helicopter Textron, and Epic Helicopters―Fort Worth has ample local opportunities for “partnering” with companies who need a municipal platform for testing new innovations. Local assets also include the Federal Aviation Administration’s Southwest US regional office, the Erma C. Johnson Hadley Northwest Center of Excellence for Aviation, Transportation & Logistics at Tarrant County College (TCC), and transportation-focused educational programs at nearby schools, including the University of Texas at Arlington (UTA) and the University of North Texas (UNT).
CITY OF FORT WORTH, TEXAS ECONOMIC DEVELOPMENT STRATEGIC PLAN
VOLUME 2: OPPORTUNITY PAGE | 8
LIFE SCIENCES DELIVERY & INNOVATION. OPPORTUNITIES CREATED BY FORT WORTH’S LARGE CONCENTRATION OF HEALTHCARE EMPLOYMENT, LIFE SCIENCES FIRMS, AND NEWLY ESTABLISHED TCU-UNTHSC SCHOOL OF MEDICINE SHOULD BE AGGRESSIVELY PURSUED.
The presence of life sciences firms, such as Alcon Laboratories, Galderma, and Encore Vision, coupled with the recently developed TCU-UNTHSC School of Medicine and the city’s large concentration of medical jobs, presents a significant opportunity. The creation of a formal “innovation district” in the Near Southside medical district, with new and expanded incentives, programs, and policies, will provide a mechanism to link healthcare delivery functions with life sciences innovations, products, and devices. By facilitating partnerships between medical providers, educational institutions, and life sciences firms, a medical innovation district can foster entrepreneurship, accelerate the growth of innovative companies, and fuel citywide growth.
Medical innovation districts also have the potential to act as magnets for talent. As a result, these districts tend to favor locations with dense activity in a mixed-use environment. The mixed-use environment surrounding Fort Worth's medical district represents a major advantage and opportunity for the city versus other districts in the state and beyond.
GEOTECHNICAL ENGINEERING. FORT WORTH IS WELL-POSITIONED FOR GROWTH AND INNOVATION IN THIS FIELD DUE TO ITS LONG-STANDING STRENGTHS IN OIL AND GAS.
Applications for geotechnical engineering range from the military to extractive industries (like oil & gas) to public infrastructure projects. Fort Worth’s ties to geotechnical engineering have traditionally been via the oil & gas sector. Yet, while Fort Worth is considered more of an oil & gas center than the rest of the metro area, the firms operating in the traditional production side of the industry employ barely more than 7,000 workers in the city, or about 1.5 percent of the municipal job base. During the field work and research for this report, however, an epiphany occurred. As part of this planning process, a group of 40 commercial real estate professionals (brokers and site selectors) completed an online questionnaire about their perceptions of Fort Worth. When asked the question, “Which of the following industries do you associate with Fort Worth,” oil & gas ranked second among 12 industries listed (tied with real estate & construction), with 68 percent of respondents associating it with the city.
Indeed, specific occupational strengths exist locally in geotechnical engineering. The Fort Worth MD has high LQs in several geotechnical engineering occupations: petroleum engineers (2.13), geological & petroleum technicians (1.89), mining & geological engineers (1.75), geoscientists (1.44), nuclear engineers (1.38), and surveying & mapping technicians (1.38). These are all occupations that are as likely to be employed in oilfield services and consulting as in core oil & gas production. Fort Worth’s workforce strengths in geotechnical engineering position the community to serve as a hub for development of new technologies in related sectors.
In a postscript to this analysis, XTO Energy’s June 2017 announcement—late in the strategic planning process for this 3-volume study—of a pending relocation of 1,600 jobs from Fort Worth to the new Exxon campus in the Houston suburbs has sparked a robust dialogue about the future of the city’s oil & gas sector. The loss of such a major local player presents obstacles to this opportunity, though there is reason for hope that some of XTO’s local talent may be retained and redeployed: XTO’s founder and former CEO, for example, has already launched a new venture in downtown Fort Worth.
CITY OF FORT WORTH, TEXAS ECONOMIC DEVELOPMENT STRATEGIC PLAN
VOLUME 2: OPPORTUNITY PAGE | 9
INTERNATIONAL BUSINESS. THE GLOBAL NAME RECOGNITION AND EXISTING INTERNATIONAL ASSETS AVAILABLE TO FORT WORTH PRESENT THE OPPORTUNITY TO STRENGTHEN INTERNATIONAL BUSINESS AND TOURISM OPPORTUNITIES.
The opportunities for capitalizing on global trade, investment, and tourism are not evenly distributed. Cross-border connectivity must, by necessity, rely on limited gateways of entry. Chinese goods typically enter the US by containership via the San Pedro port complex in Los Angeles/Long Beach. Similarly, international visitors to North America―investors, business executives, tourists―typically arrive by air through a limited number of entry points. Few cities have international passenger airports, and those that do often offer limited options for travelers.
Fort Worth is one of the few cities with the potential to emerge onto the global stage at a rapid pace over the next 5 to 10 years. This global emergence must be done in concert with DFW International Airport’s rise as a more significant global transport hub. The extensive and increasing array of international destinations offered by DFW is a unique regional asset that few locations in the US can match. It is the basis―the starting point―for crafting an international business strategy.
Beyond the airport, an international strategy must also leverage the entire metro area’s growing base of foreign-owned corporations and US companies operating in the global marketplace. Fort Worth’s large and increasing population of foreign talent is another key advantage for the growth of international business. As with many of the opportunities identified in this report, the city’s success will also hinge on raising the profile of Fort Worth nationally and internationally and creating a quality of place that builds on the city’s unique districts and authentic culture. These and other recommendations are outlined in the strategic plan (Volume 3).
CORPORATE & REGIONAL HEADQUARTERS (HQs). A MORE AGGRESSIVE STANCE WILL BE REQUIRED FOR FORT WORTH TO CAPTURE ITS FAIR SHARE OF THESE HIGH-PROFILE PROJECTS.
The competitiveness assessment (the first volume of this 3-volume strategic planning process) identified several untapped opportunities in Fort Worth. Three of the key findings are worth reiterating. First, residential development and population growth in Fort Worth has been robust, but employment growth in the city has lagged the rest of the Dallas-Fort Worth metro area—especially in high-wage professional jobs. Second, many recent high-profile corporate relocation projects in the metro area have landed outside Fort Worth’s city limits (e.g., Toyota in Plano and Charles Schwab in Westlake). And third, the influx of tech firms and IT workers has also largely bypassed Fort Worth in favor of scattered locations in Dallas, Richardson, Plano, and Irving.
Fort Worth must take advantage of the metro area’s established position as one of America’s leading corporate HQ destinations. The city can ensure that it captures its fair share of corporate and regional HQ relocation projects by better marketing its advantages. For starters, Fort Worth is a city―not a suburb―in an era when cities are becoming more desirable corporate locations than suburban office parks. Established urban districts within Fort Worth provide the precise amenities most desired by corporate office tenants. Further, Fort Worth offers faster access to both DFW International Airport and Alliance Airport. Fort Worth essentially shares a metropolitan labor pool with its metro area competitors, offering equal access to the same large, rapidly expanding workforce that corporate employers are seeking. TCU Neeley Business School’s nationally ranked entrepreneurship undergraduate program sweetens the deal even more with its stream of creative young graduates.
CITY OF FORT WORTH, TEXAS ECONOMIC DEVELOPMENT STRATEGIC PLAN
VOLUME 2: OPPORTUNITY PAGE | 10
PROFESSIONAL SERVICES. THE DRAMATIC REGIONAL GROWTH IN THIS SECTOR HAS NOT BEEN REALIZED IN FORT WORTH, BUT SHOULD BE.
As documented in Volume 1, professional services employment is highly concentrated in the Dallas MD compared to the Fort Worth MD. Recent growth trends are even more troubling for Fort Worth. While the Dallas MD experienced rapid growth of professional services employment in the post-recession period, the Fort Worth MD essentially saw no change in its professional services job base. A similar story holds true for high-growth startups.
The Dallas-Fort Worth metro area’s professional service sector is projected to add nearly 42,000 jobs over the next five years. If the recent post-recession trends persist, where will those jobs go? Without an adequate supply of office space (especially newer, Class A buildings) to support them, the answer will not be Fort Worth. Using the rule-of-thumb of 200 square feet per worker, the five-year job projection translates to about 8.4 million square feet of office space absorption by the professional services sector alone, excluding all other types of office-using industries. Where within the metro area this speculative office space is built will be an important determinant of where the job growth can feasibly be absorbed.
Fort Worth can begin to make a viable case for new office space by showcasing, for developers, the city’s potential internal demand drivers including its major employers who rely on the professional services of lawyers, accountants, engineers, consultants, etc., who could just as easily be located on the western side of the metropolitan area, namely Fort Worth. Startup activity is another demand argument, especially when considering the potential that the TCU Neeley Business School’s nationally ranked entrepreneurship undergraduate program could feasibly generate.
FINANCIAL SERVICES. LEVERAGE FORT WORTH’S ROLE AS A SIGNIFICANT CENTER OF PRIVATE EQUITY.
The broadly defined financial services sector includes, among other things, a vast array of bank branches, insurance agents, and personal financial advisors. These are the sector’s traditional “retail” interfaces ―the place where consumer transactions have long taken place. However, the sector is currently facing significant disruption. This shifting landscape offers multiple opportunities for the city of Fort Worth to become a larger player in the financial services sector.
One of the primary opportunities results from the continued decentralization of corporate functions like data processing and storage, accounting, procurement, customer services, and human resources. Faced with high real estate and labor costs in traditional financial centers, firms continue to look for lower cost options for these back-office activities. In addition, increasing demands for IT investments are likely to prompt the need for additional space outside of traditional financial markets. Along with the migration of corporate functions, interactions with customers are also increasingly migrating to a new venue, the internet. This trend has opened the door for both outsourcing and direct competition and has created a new market for security services that goes well beyond the armored vehicles and safe deposit boxes of yesterday.
Meanwhile, pensions and endowments, which have traditionally taken a back seat to more well-known elements of the financial services sector, have stepped forward to become more vocal front-seat actors in the allocation of investment capital. Pensions and endowments have led industry efforts to screen investments based on environmental, social, and corporate governance (ESG) standards. And private equity firms have emerged to play a vital, high-profile economic role in restructuring under-performing firms and industries.
The landscape of the financial services sector is rapidly changing and can no longer be viewed simply in terms of regional banks and insurance companies. The presence of large pools of investment capital (including major private
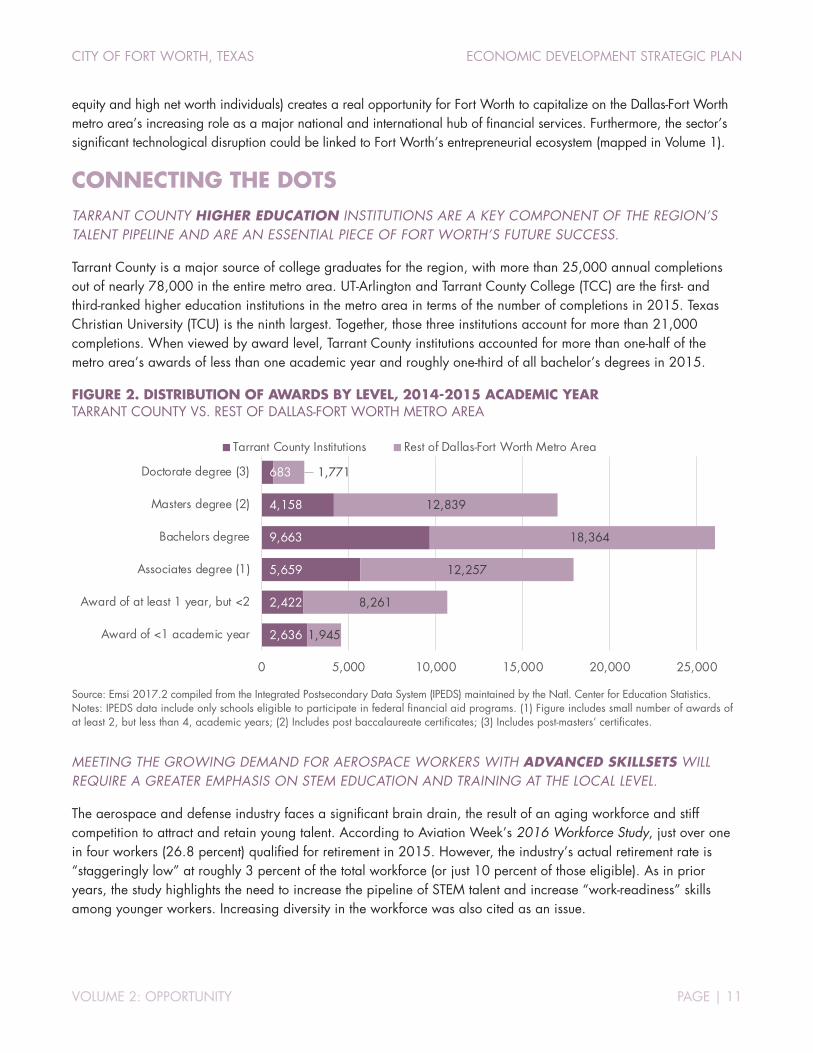
CITY OF FORT WORTH, TEXAS ECONOMIC DEVELOPMENT STRATEGIC PLAN
VOLUME 2: OPPORTUNITY PAGE | 11
equity and high net worth individuals) creates a real opportunity for Fort Worth to capitalize on the Dallas-Fort Worth metro area’s increasing role as a major national and international hub of financial services. Furthermore, the sector’s significant technological disruption could be linked to Fort Worth’s entrepreneurial ecosystem (mapped in Volume 1).
CONNECTING THE DOTS TARRANT COUNTY HIGHER EDUCATION INSTITUTIONS ARE A KEY COMPONENT OF THE REGION’S TALENT PIPELINE AND ARE AN ESSENTIAL PIECE OF FORT WORTH’S FUTURE SUCCESS.
Tarrant County is a major source of college graduates for the region, with more than 25,000 annual completions out of nearly 78,000 in the entire metro area. UT-Arlington and Tarrant County College (TCC) are the first- and third-ranked higher education institutions in the metro area in terms of the number of completions in 2015. Texas Christian University (TCU) is the ninth largest. Together, those three institutions account for more than 21,000 completions. When viewed by award level, Tarrant County institutions accounted for more than one-half of the metro area’s awards of less than one academic year and roughly one-third of all bachelor’s degrees in 2015.
FIGURE 2. DISTRIBUTION OF AWARDS BY LEVEL, 2014-2015 ACADEMIC YEAR TARRANT COUNTY VS. REST OF DALLAS-FORT WORTH METRO AREA
Source: Emsi 2017.2 compiled from the Integrated Postsecondary Data System (IPEDS) maintained by the Natl. Center for Education Statistics. Notes: IPEDS data include only schools eligible to participate in federal financial aid programs. (1) Figure includes small number of awards of at least 2, but less than 4, academic years; (2) Includes post baccalaureate certificates; (3) Includes post-masters’ certificates.
MEETING THE GROWING DEMAND FOR AEROSPACE WORKERS WITH ADVANCED SKILLSETS WILL REQUIRE A GREATER EMPHASIS ON STEM EDUCATION AND TRAINING AT THE LOCAL LEVEL.
The aerospace and defense industry faces a significant brain drain, the result of an aging workforce and stiff competition to attract and retain young talent. According to Aviation Week’s 2016 Workforce Study, just over one in four workers (26.8 percent) qualified for retirement in 2015. However, the industry’s actual retirement rate is “staggeringly low” at roughly 3 percent of the total workforce (or just 10 percent of those eligible). As in prior years, the study highlights the need to increase the pipeline of STEM talent and increase “work-readiness” skills among younger workers. Increasing diversity in the workforce was also cited as an issue.
2,636
2,422
5,659
9,663
4,158
683
1,945
8,261
12,257
18,364
12,839
1,771
0 5,000 10,000 15,000 20,000 25,000
Award of <1 academic year
Award of at least 1 year, but <2
Associates degree (1)
Bachelors degree
Masters degree (2)
Doctorate degree (3)
Tarrant County Institutions Rest of Dallas-Fort Worth Metro Area
CITY OF FORT WORTH, TEXAS ECONOMIC DEVELOPMENT STRATEGIC PLAN
VOLUME 2: OPPORTUNITY PAGE | 12
These issues are echoed in the forthcoming North Texas Aerospace and Aviation Talent Pipeline Study. Per the (unpublished) study, regional aerospace employers are concerned about a coming wave of retirements, especially among workers in key occupations. To fill many of the critical positions, employers must do a better job of attracting women and other under-represented populations.
Air transportation companies in the Dallas-Fort Worth metro area are also facing talent pipeline challenges. Similar to aerospace manufacturers, air transportation employers report difficulty in identifying and attracting IT specialists and software developers. In addition, there is a concern about meeting the future demand for pilot positions. Airlines report a significant portion of their pilots are approaching the mandatory retirement age of 65. American Airlines is also in the process of transitioning newer aircraft into its fleet, which will require hiring additional commercial pilots with training and experience in operating the new aircraft.
In order to meet the talent pipeline needs of regional aerospace and air transportation employers, the North Texas Aerospace and Aviation Talent Pipeline Study recommends the development of a demand-driven career pathways system to connect residents to jobs in the aerospace and aviation industries. This is especially true for building a long-term supply (within the existing K-12 population) to meet many of the critical skills needs, especially in advanced manufacturing, information technology, and systems engineering.
THE CITY’S INCENTIVES POLICY SHOULD BE DESIGNED TO PROMOTE GROWTH IN SPECIFIC GEOGRAPHIC AREAS AND IN TARGET INDUSTRIES.
The intensely competitive environment in the Dallas-Fort Worth metro area requires a bold response. For Fort Worth to compete for high-profile investments, the city’s existing incentives policy will need to be re-evaluated. A competitive incentives policy should provide a citywide framework that directs resources to specific areas, industries, and skill levels in accordance with specific shared goals. Geographic priorities should include incentives for the Near Southside that encourage and support the formation of a medical innovation district in the area and policies to support residential development in downtown Fort Worth. Examples include incentivizing needed infrastructure, such as broadband, and streetscape improvements that enhance walkability and connectivity. In terms of industry, the focus should be on supporting the region’s existing industry strengths, while helping encouraging growth and innovation around the emerging opportunities. Examples of skills-driven incentives could include the recruitment of life science researchers, top-level clinicians, and related scientists to support the medical innovation district. Regardless of the incentives chosen, the policy should be transparent and consistent and should include a mechanism for measuring performance.
FORT WORTH MUST COMMIT TO MAKING THE PUBLIC INVESTMENTS REQUIRED TO TAKE THE CITY TO THE NEXT LEVEL
A bolder economic development strategy for the city will require a strong commitment to make needed public investments. At the core of this commitment, are investments in livability, “Smart City” infrastructure, and projects that support the City’s business development goals. A carefully crafted economic development bond package, like the Oklahoma City Metropolitan Area Projects (MAPS) bond program, can provide the mechanism. The MAPS program, which is now in its third iteration, has helped transform the city through investments that have revitalized downtown and provided new and upgraded facilities.
CITY OF FORT WORTH, TEXAS ECONOMIC DEVELOPMENT STRATEGIC PLAN
VOLUME 2: OPPORTUNITY PAGE | 13
TO ADVANCE ECONOMIC DEVELOPMENT TO THE NEXT LEVEL IN FORT WORTH, AN EXPANDED, COLLABORATIVE EFFORT WILL BE REQUIRED.
Fort Worth has the potential to become a world-class city. Its assets are enviable: location in a fast-growing dynamic metropolitan area; a multi-modal transportation network, including one of the world’s top airports; internationally known museums; a strong manufacturing sector that includes large multinational corporations. What has been missing are clear objectives and a collaborative, aggressive approach to meet them. The strategies outlined in Volume 3 provide a game plan for establishing Fort Worth’s “competitive edge.” They focus on addressing the city’s branding and marketing challenges, implementing a more focused approach to business development, and creating partnerships with workforce and industry to ensure the availability of talent. In addition to these goals, a “next-level” economic development strategy must encourage innovation and creativity, build an environment that is attractive to talented individuals and dynamic businesses, and maintain a forward-looking organizational structure. Carrying out these goals will require a collaborative effort that is built on a clear understanding of roles and desired outcomes.

CITY OF FORT WORTH, TEXAS ECONOMIC DEVELOPMENT STRATEGIC PLAN
VOLUME 2: OPPORTUNITY PAGE | 14
REFERENCE APPENDIX 1. METROPOLITAN DIVISIONS The Dallas–Fort Worth–Arlington, TX Metropolitan Statistical Area (Dallas-Fort Worth metro area) includes two metropolitan divisions (MDs): the Fort Worth-Arlington, TX Metropolitan Division (Fort Worth MD) and the Dallas-Plano-Irving, TX Metropolitan Division (Dallas MD). To better illustrate Fort Worth’s performance within the larger metropolitan area, a number of the analyses conducted as part of this work use this geographic concept.
Sources: TIP Strategies (map); Office of Management and Budget, OMB Bulletin No. 15-01 (metropolitan division definitions).
ABOUT METROPOLITAN DIVISIONS Metropolitan divisions are smaller groupings of counties or equivalent entities defined within a metropolitan statistical area containing a single core with a population of at least 2.5 million. Not all metropolitan statistical areas with a single core population of this size will contain metropolitan divisions. A metropolitan division consists of one or more main/secondary counties that represent an employment center, plus adjacent counties associated with the main/secondary county or counties through commuting ties.
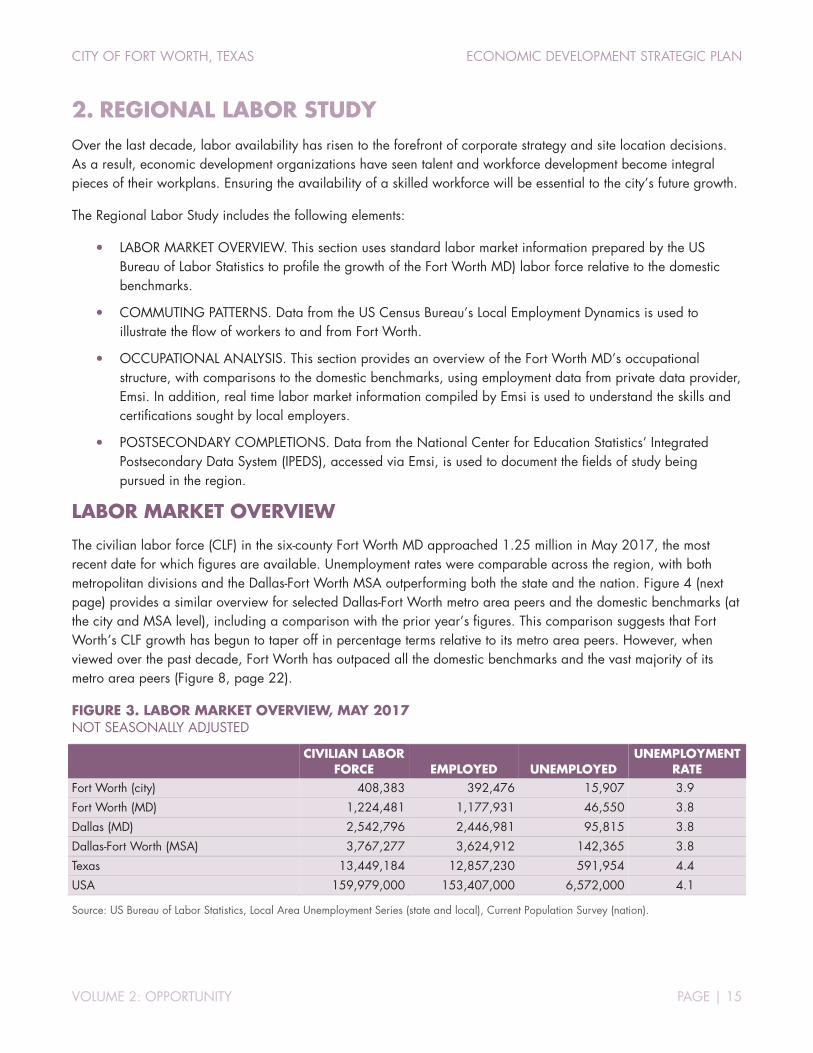
CITY OF FORT WORTH, TEXAS ECONOMIC DEVELOPMENT STRATEGIC PLAN
VOLUME 2: OPPORTUNITY PAGE | 15
2. REGIONAL LABOR STUDY Over the last decade, labor availability has risen to the forefront of corporate strategy and site location decisions. As a result, economic development organizations have seen talent and workforce development become integral pieces of their workplans. Ensuring the availability of a skilled workforce will be essential to the city’s future growth.
The Regional Labor Study includes the following elements:
LABOR MARKET OVERVIEW. This section uses standard labor market information prepared by the US Bureau of Labor Statistics to profile the growth of the Fort Worth MD) labor force relative to the domestic benchmarks.
COMMUTING PATTERNS. Data from the US Census Bureau’s Local Employment Dynamics is used to illustrate the flow of workers to and from Fort Worth.
OCCUPATIONAL ANALYSIS. This section provides an overview of the Fort Worth MD’s occupational structure, with comparisons to the domestic benchmarks, using employment data from private data provider, Emsi. In addition, real time labor market information compiled by Emsi is used to understand the skills and certifications sought by local employers.
POSTSECONDARY COMPLETIONS. Data from the National Center for Education Statistics’ Integrated Postsecondary Data System (IPEDS), accessed via Emsi, is used to document the fields of study being pursued in the region.
LABOR MARKET OVERVIEW
The civilian labor force (CLF) in the six-county Fort Worth MD approached 1.25 million in May 2017, the most recent date for which figures are available. Unemployment rates were comparable across the region, with both metropolitan divisions and the Dallas-Fort Worth MSA outperforming both the state and the nation. Figure 4 (next page) provides a similar overview for selected Dallas-Fort Worth metro area peers and the domestic benchmarks (at the city and MSA level), including a comparison with the prior year’s figures. This comparison suggests that Fort Worth’s CLF growth has begun to taper off in percentage terms relative to its metro area peers. However, when viewed over the past decade, Fort Worth has outpaced all the domestic benchmarks and the vast majority of its metro area peers (Figure 8, page 22).
FIGURE 3. LABOR MARKET OVERVIEW, MAY 2017 NOT SEASONALLY ADJUSTED
CIVILIAN LABOR
FORCE EMPLOYED UNEMPLOYED UNEMPLOYMENT
RATE Fort Worth (city) 408,383 392,476 15,907 3.9
Fort Worth (MD) 1,224,481 1,177,931 46,550 3.8
Dallas (MD) 2,542,796 2,446,981 95,815 3.8
Dallas-Fort Worth (MSA) 3,767,277 3,624,912 142,365 3.8
Texas 13,449,184 12,857,230 591,954 4.4
USA 159,979,000 153,407,000 6,572,000 4.1
Source: US Bureau of Labor Statistics, Local Area Unemployment Series (state and local), Current Population Survey (nation).

CITY OF FORT WORTH, TEXAS ECONOMIC DEVELOPMENT STRATEGIC PLAN
VOLUME 2: OPPORTUNITY PAGE | 16
FIGURE 4. LABOR MARKET OVERVIEW (WITH CHANGE FROM PRIOR 12 MONTHS), MAY 2017 NOT SEASONALLY ADJUSTED Unemployment rate change from prior year: increased decreased remained the same
DALLAS-FORT WORTH METRO AREA COMMUNITIES
STATES & US
continued, next page
Numeric Percentage
Frisco 87,417 +2,973 +3.5% 3.5 Dallas 677,502 +22,288 +3.4% 4.0 Lewisville 65,022 +2,135 +3.4% 3.4 Plano 163,499 +5,342 +3.4% 3.6 McKinney 88,092 +2,836 +3.3% 3.6 Irving 131,973 +4,223 +3.3% 3.6 Mesquite 77,988 +2,485 +3.3% 4.0 Carrollton 80,930 +2,561 +3.3% 3.4 Richardson 61,980 +1,961 +3.3% 3.5 Denton 72,670 +2,216 +3.1% 3.2 Garland 125,537 +3,684 +3.0% 3.7 Grand Prairie 98,197 +2,698 +2.8% 3.9 Arlington 208,189 +5,162 +2.5% 3.8 Fort Worth 408,383 +9,113 +2.3% 3.9
CIVILIAN LABOR FORCE UNEMPLOYMENT RATE
Current (May 2017)
Chg. from prior year Current (May 2017)
Chg. from prior year
Numeric Percentage
Colorado 2,959,849 +87,968 +3.1% 2.4 Arizona 3,300,420 +79,618 +2.5% 5.0 Texas 13,449,184 +203,665 +1.5% 4.4 Tennessee 3,152,400 +32,857 +1.1% 2.9 Ohio 5,771,461 +57,554 +1.0% 4.6 USA 159,979,000 +1,179,000 +0.7% 4.1 Pennsylvania 6,476,898 -8,079 -0.1% 5.2 Indiana 3,335,278 -7,045 -0.2% 2.8 Oklahoma 1,813,338 -9,081 -0.5% 4.6 Missouri 3,059,676 -59,968 -1.9% 4.1
CIVILIAN LABOR FORCE
Chg. from prior year
UNEMPLOYMENT RATE
Current (May 2017)
Current (May 2017)
Chg. from prior year

CITY OF FORT WORTH, TEXAS ECONOMIC DEVELOPMENT STRATEGIC PLAN
VOLUME 2: OPPORTUNITY PAGE | 17
FIGURE 4. LABOR MARKET OVERVIEW (WITH CHANGE FROM PRIOR 12 MONTHS), MAY 2017 (CONTINUED) NOT SEASONALLY ADJUSTED Unemployment rate change from prior year: increased decreased remained the same
DOMESTIC BENCHMARKS (CITIES)
DOMESTIC BENCHMARKS (MSAs)
Source: US Bureau of Labor Statistics, Local Area Unemployment Statistics.
Numeric Percentage
Dallas 677,502 +22,288 +3.4% 4.0 Nashville-Davidson, TN (consolidated city) 386,850 +12,069 +3.2% 2.1 Denver, CO (county/city) 394,501 +12,251 +3.2% 2.3 Phoenix, AZ (city) 794,044 +23,051 +3.0% 4.5 Fort Worth (city) 408,383 +9,113 +2.3% 3.9 Columbus, OH (city) 457,621 +7,742 +1.7% 3.8 Oklahoma City, OK (city) 312,180 +3,160 +1.0% 4.2 Indianapolis, IN (consolidated city) 444,230 +1,495 +0.3% 3.0 Kansas City, KS (city) 69,142 -217 -0.3% 4.9 Pittsburgh, PA (city) 157,921 -612 -0.4% 5.5 Kansas City, MO (city) 258,199 -1,943 -0.7% 4.4
CIVILIAN LABOR FORCE UNEMPLOYMENT RATE
Current (May 2017)
Chg. from prior year Current (May 2017)
Chg. from prior year
Numeric Percentage
Dallas, TX (MD) 2,542,796 +81,282 +3.3% 3.8 Denver, CO (MSA) 1,582,607 +49,087 +3.2% 2.3 Nashville, TN (MSA) 996,148 +29,980 +3.1% 2.3 Phoenix, AZ (MSA) 2,284,967 +66,969 +3.0% 4.3 Dallas-Fort Worth, TX (MSA) 3,767,277 +108,421 +3.0% 3.8 Fort Worth, TX (MD) 1,224,481 +27,139 +2.3% 3.8 Columbus, OH (MSA) 1,064,850 +17,147 +1.6% 3.7 Oklahoma City, OK (MSA) 666,848 +3,994 +0.6% 4.1 Indianapolis-Carmel-Anderson, IN MSA 1,042,307 +4,986 +0.5% 2.7 Kansas City, MO (MSA) 1,119,029 -5,850 -0.5% 3.9 Pittsburgh, PA (MSA) 1,212,778 -8,698 -0.7% 5.3
CIVILIAN LABOR FORCE UNEMPLOYMENT RATE
Current (May 2017)
Chg. from prior year Current (May 2017)
Chg. from prior year
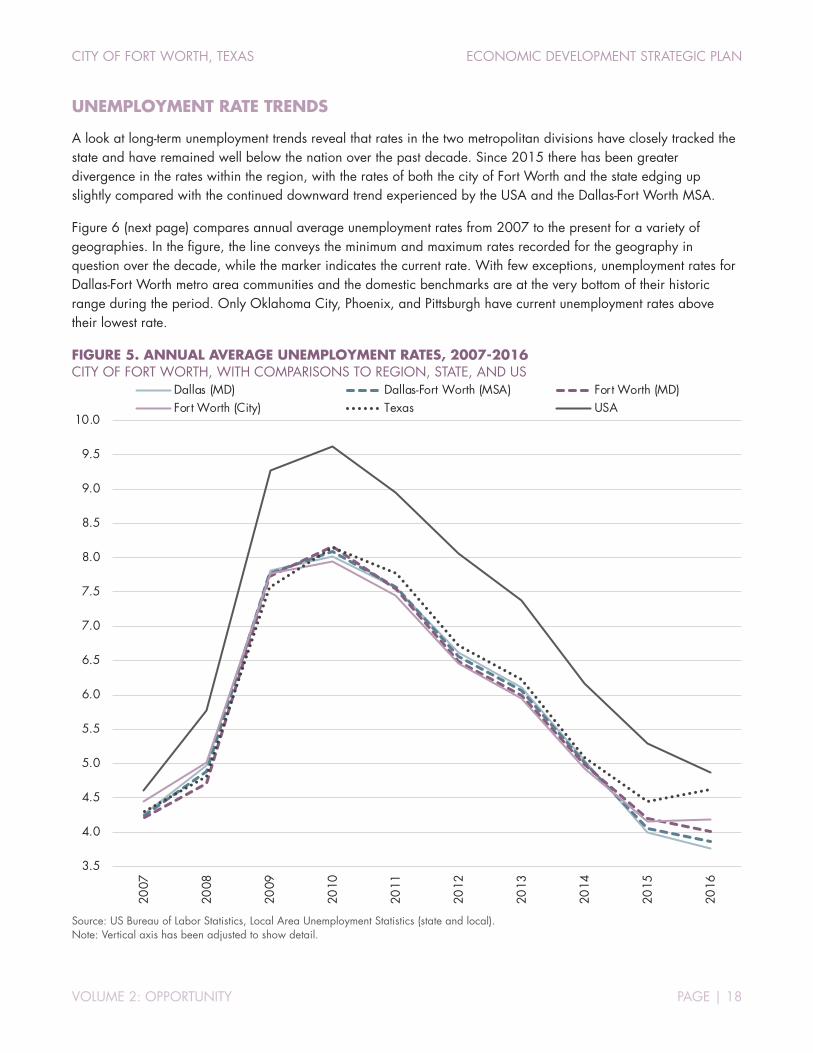
CITY OF FORT WORTH, TEXAS ECONOMIC DEVELOPMENT STRATEGIC PLAN
VOLUME 2: OPPORTUNITY PAGE | 18
UNEMPLOYMENT RATE TRENDS
A look at long-term unemployment trends reveal that rates in the two metropolitan divisions have closely tracked the state and have remained well below the nation over the past decade. Since 2015 there has been greater divergence in the rates within the region, with the rates of both the city of Fort Worth and the state edging up slightly compared with the continued downward trend experienced by the USA and the Dallas-Fort Worth MSA.
Figure 6 (next page) compares annual average unemployment rates from 2007 to the present for a variety of geographies. In the figure, the line conveys the minimum and maximum rates recorded for the geography in question over the decade, while the marker indicates the current rate. With few exceptions, unemployment rates for Dallas-Fort Worth metro area communities and the domestic benchmarks are at the very bottom of their historic range during the period. Only Oklahoma City, Phoenix, and Pittsburgh have current unemployment rates above their lowest rate.
FIGURE 5. ANNUAL AVERAGE UNEMPLOYMENT RATES, 2007-2016 CITY OF FORT WORTH, WITH COMPARISONS TO REGION, STATE, AND US
Source: US Bureau of Labor Statistics, Local Area Unemployment Statistics (state and local). Note: Vertical axis has been adjusted to show detail.
3.5
4.0
4.5
5.0
5.5
6.0
6.5
7.0
7.5
8.0
8.5
9.0
9.5
10.0
2007
2008
2009
2010
2011
2012
2013
2014
2015
2016
Dallas (MD) Dallas-Fort Worth (MSA) Fort Worth (MD)Fort Worth (City) Texas USA

CITY OF FORT WORTH, TEXAS ECONOMIC DEVELOPMENT STRATEGIC PLAN
VOLUME 2: OPPORTUNITY PAGE | 19
FIGURE 6. UNEMPLOYMENT RATE TRENDS, 2007 TO PRESENT LINE SHOWS HISTORIC RANGE (NOT SEASONALLY ADJUSTED); POINT SHOWS RATE AS OF MAY 2017
*Figures are for consolidated cities Source: US Bureau of Labor Statistics, Local Area Unemployment Statistics (state and local).
0.0
2.0
4.0
6.0
8.0
10.0
12.0
14.0D
OM
ESTI
C P
EERS
(MSA
s)
Den
ver,
CO
(MSA
)
Nas
hvill
e, T
N (
MSA
)
Indi
anap
olis
, IN
(MSA
)
Col
umbu
s, O
H (M
SA)
Dal
las-
Fort
Wor
th, T
X (M
SA)
Dal
las,
TX
(MD
)
Fort
Wor
th,
TX (M
D)
Kans
as C
ity,
MO
(MSA
)
Okl
ahom
a C
ity,
OK
(MSA
)
Phoe
nix,
AZ
(MSA
)
Pitts
burg
h, P
A (M
SA)
DO
MES
TIC
PEE
RS (S
TATE
S)
Col
orad
o
Indi
ana
Tenn
esse
e
Mis
sour
i
Texa
s
Ohi
o
Okl
ahom
a
Ari
zona
Penn
sylv
ania
0.0
2.0
4.0
6.0
8.0
10.0
12.0
14.0
DFW
CO
MM
UN
ITIE
S
Den
ton
Car
rollt
on
Lew
isvi
lle
Fris
co
Rich
ards
on
Irvin
g
McK
inne
y
Plan
o
Gar
land
Arli
ngto
n
Fort
Wor
th
Gra
nd P
rairi
e
Dal
las
Mes
quite
DO
MES
TIC
PEE
RS (C
ITIE
S)
Nas
hvill
e-D
avid
son,
TN
*
Den
ver,
CO
*
Indi
anap
olis
, IN
*
Col
umbu
s, O
H
Okl
ahom
a C
ity,
OK
Kans
as C
ity,
MO
Phoe
nix,
AZ
Kans
as C
ity,
KS
Pitts
burg
h, P
A
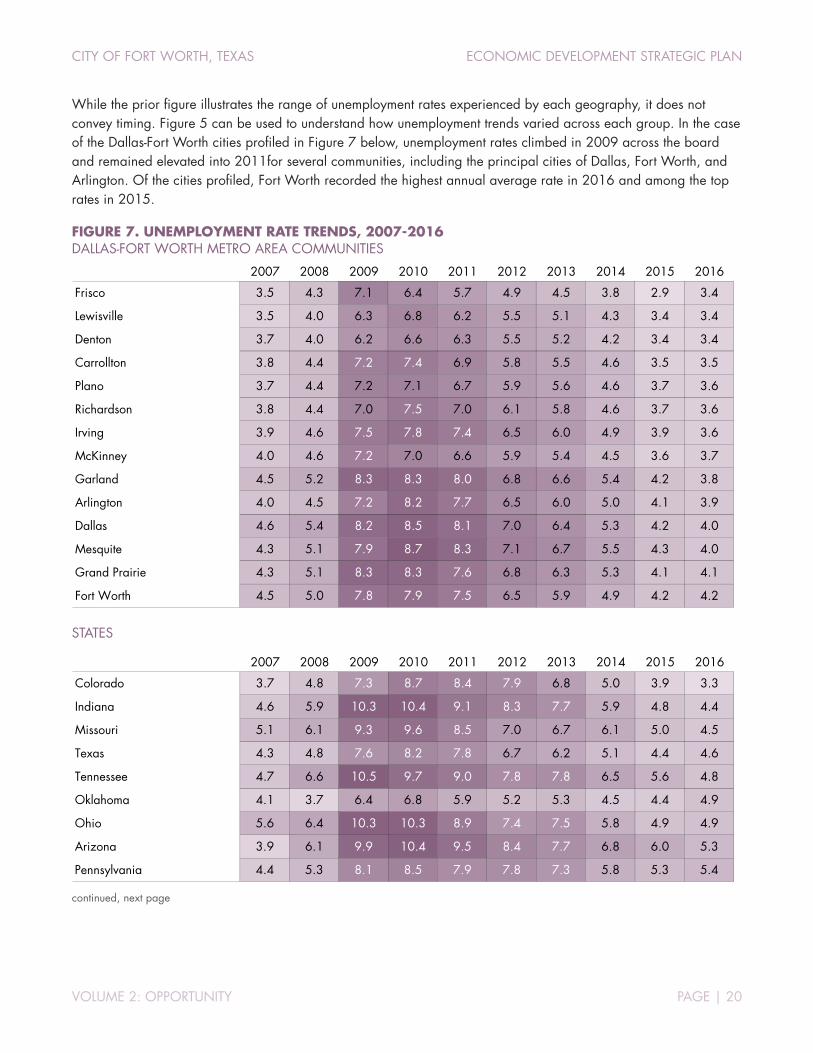
CITY OF FORT WORTH, TEXAS ECONOMIC DEVELOPMENT STRATEGIC PLAN
VOLUME 2: OPPORTUNITY PAGE | 20
While the prior figure illustrates the range of unemployment rates experienced by each geography, it does not convey timing. Figure 5 can be used to understand how unemployment trends varied across each group. In the case of the Dallas-Fort Worth cities profiled in Figure 7 below, unemployment rates climbed in 2009 across the board and remained elevated into 2011for several communities, including the principal cities of Dallas, Fort Worth, and Arlington. Of the cities profiled, Fort Worth recorded the highest annual average rate in 2016 and among the top rates in 2015.
FIGURE 7. UNEMPLOYMENT RATE TRENDS, 2007-2016 DALLAS-FORT WORTH METRO AREA COMMUNITIES
STATES
continued, next page
2007 2008 2009 2010 2011 2012 2013 2014 2015 2016
Frisco 3.5 4.3 7.1 6.4 5.7 4.9 4.5 3.8 2.9 3.4
Lewisville 3.5 4.0 6.3 6.8 6.2 5.5 5.1 4.3 3.4 3.4
Denton 3.7 4.0 6.2 6.6 6.3 5.5 5.2 4.2 3.4 3.4
Carrollton 3.8 4.4 7.2 7.4 6.9 5.8 5.5 4.6 3.5 3.5
Plano 3.7 4.4 7.2 7.1 6.7 5.9 5.6 4.6 3.7 3.6
Richardson 3.8 4.4 7.0 7.5 7.0 6.1 5.8 4.6 3.7 3.6
Irving 3.9 4.6 7.5 7.8 7.4 6.5 6.0 4.9 3.9 3.6
McKinney 4.0 4.6 7.2 7.0 6.6 5.9 5.4 4.5 3.6 3.7
Garland 4.5 5.2 8.3 8.3 8.0 6.8 6.6 5.4 4.2 3.8
Arlington 4.0 4.5 7.2 8.2 7.7 6.5 6.0 5.0 4.1 3.9
Dallas 4.6 5.4 8.2 8.5 8.1 7.0 6.4 5.3 4.2 4.0
Mesquite 4.3 5.1 7.9 8.7 8.3 7.1 6.7 5.5 4.3 4.0
Grand Prairie 4.3 5.1 8.3 8.3 7.6 6.8 6.3 5.3 4.1 4.1
Fort Worth 4.5 5.0 7.8 7.9 7.5 6.5 5.9 4.9 4.2 4.2
2007 2008 2009 2010 2011 2012 2013 2014 2015 2016
Colorado 3.7 4.8 7.3 8.7 8.4 7.9 6.8 5.0 3.9 3.3
Indiana 4.6 5.9 10.3 10.4 9.1 8.3 7.7 5.9 4.8 4.4
Missouri 5.1 6.1 9.3 9.6 8.5 7.0 6.7 6.1 5.0 4.5
Texas 4.3 4.8 7.6 8.2 7.8 6.7 6.2 5.1 4.4 4.6
Tennessee 4.7 6.6 10.5 9.7 9.0 7.8 7.8 6.5 5.6 4.8
Oklahoma 4.1 3.7 6.4 6.8 5.9 5.2 5.3 4.5 4.4 4.9
Ohio 5.6 6.4 10.3 10.3 8.9 7.4 7.5 5.8 4.9 4.9
Arizona 3.9 6.1 9.9 10.4 9.5 8.4 7.7 6.8 6.0 5.3
Pennsylvania 4.4 5.3 8.1 8.5 7.9 7.8 7.3 5.8 5.3 5.4
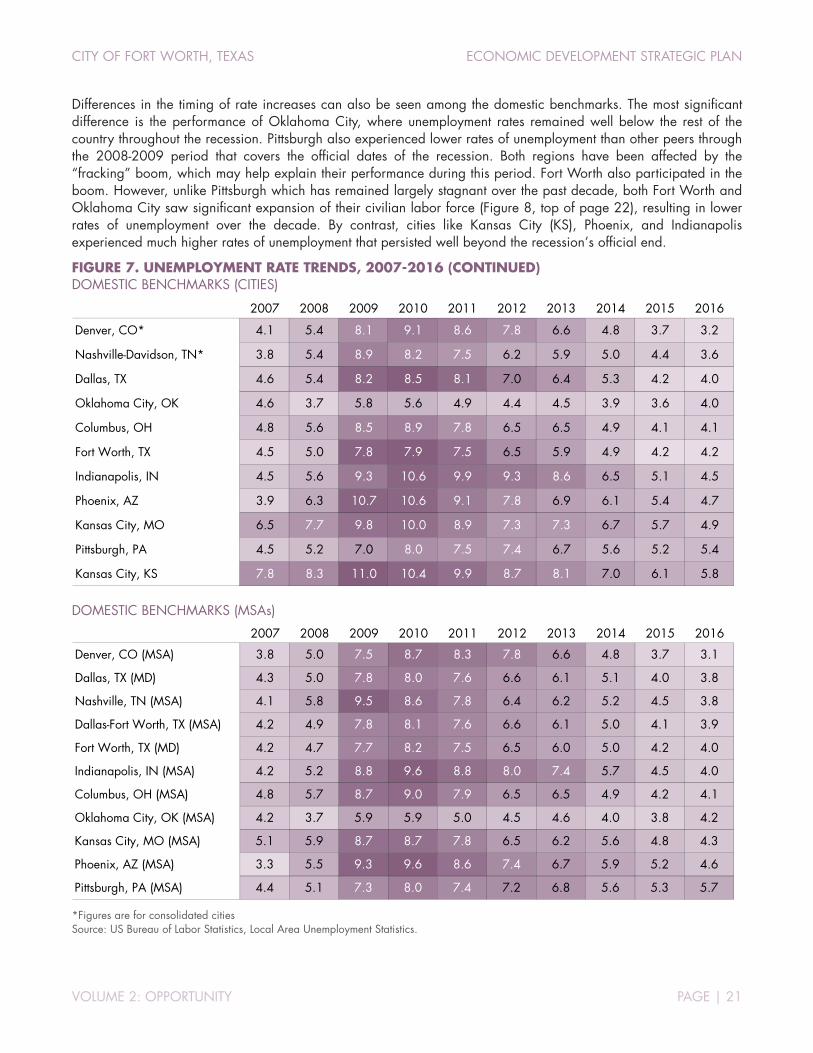
CITY OF FORT WORTH, TEXAS ECONOMIC DEVELOPMENT STRATEGIC PLAN
VOLUME 2: OPPORTUNITY PAGE | 21
Differences in the timing of rate increases can also be seen among the domestic benchmarks. The most significant difference is the performance of Oklahoma City, where unemployment rates remained well below the rest of the country throughout the recession. Pittsburgh also experienced lower rates of unemployment than other peers through the 2008-2009 period that covers the official dates of the recession. Both regions have been affected by the “fracking” boom, which may help explain their performance during this period. Fort Worth also participated in the boom. However, unlike Pittsburgh which has remained largely stagnant over the past decade, both Fort Worth and Oklahoma City saw significant expansion of their civilian labor force (Figure 8, top of page 22), resulting in lower rates of unemployment over the decade. By contrast, cities like Kansas City (KS), Phoenix, and Indianapolis experienced much higher rates of unemployment that persisted well beyond the recession’s official end.
FIGURE 7. UNEMPLOYMENT RATE TRENDS, 2007-2016 (CONTINUED) DOMESTIC BENCHMARKS (CITIES)
DOMESTIC BENCHMARKS (MSAs)
*Figures are for consolidated cities Source: US Bureau of Labor Statistics, Local Area Unemployment Statistics.
2007 2008 2009 2010 2011 2012 2013 2014 2015 2016
Denver, CO* 4.1 5.4 8.1 9.1 8.6 7.8 6.6 4.8 3.7 3.2
Nashville-Davidson, TN* 3.8 5.4 8.9 8.2 7.5 6.2 5.9 5.0 4.4 3.6
Dallas, TX 4.6 5.4 8.2 8.5 8.1 7.0 6.4 5.3 4.2 4.0
Oklahoma City, OK 4.6 3.7 5.8 5.6 4.9 4.4 4.5 3.9 3.6 4.0
Columbus, OH 4.8 5.6 8.5 8.9 7.8 6.5 6.5 4.9 4.1 4.1
Fort Worth, TX 4.5 5.0 7.8 7.9 7.5 6.5 5.9 4.9 4.2 4.2
Indianapolis, IN 4.5 5.6 9.3 10.6 9.9 9.3 8.6 6.5 5.1 4.5
Phoenix, AZ 3.9 6.3 10.7 10.6 9.1 7.8 6.9 6.1 5.4 4.7
Kansas City, MO 6.5 7.7 9.8 10.0 8.9 7.3 7.3 6.7 5.7 4.9
Pittsburgh, PA 4.5 5.2 7.0 8.0 7.5 7.4 6.7 5.6 5.2 5.4
Kansas City, KS 7.8 8.3 11.0 10.4 9.9 8.7 8.1 7.0 6.1 5.8
2007 2008 2009 2010 2011 2012 2013 2014 2015 2016
Denver, CO (MSA) 3.8 5.0 7.5 8.7 8.3 7.8 6.6 4.8 3.7 3.1
Dallas, TX (MD) 4.3 5.0 7.8 8.0 7.6 6.6 6.1 5.1 4.0 3.8
Nashville, TN (MSA) 4.1 5.8 9.5 8.6 7.8 6.4 6.2 5.2 4.5 3.8
Dallas-Fort Worth, TX (MSA) 4.2 4.9 7.8 8.1 7.6 6.6 6.1 5.0 4.1 3.9
Fort Worth, TX (MD) 4.2 4.7 7.7 8.2 7.5 6.5 6.0 5.0 4.2 4.0
Indianapolis, IN (MSA) 4.2 5.2 8.8 9.6 8.8 8.0 7.4 5.7 4.5 4.0
Columbus, OH (MSA) 4.8 5.7 8.7 9.0 7.9 6.5 6.5 4.9 4.2 4.1
Oklahoma City, OK (MSA) 4.2 3.7 5.9 5.9 5.0 4.5 4.6 4.0 3.8 4.2
Kansas City, MO (MSA) 5.1 5.9 8.7 8.7 7.8 6.5 6.2 5.6 4.8 4.3
Phoenix, AZ (MSA) 3.3 5.5 9.3 9.6 8.6 7.4 6.7 5.9 5.2 4.6
Pittsburgh, PA (MSA) 4.4 5.1 7.3 8.0 7.4 7.2 6.8 5.6 5.3 5.7

CITY OF FORT WORTH, TEXAS ECONOMIC DEVELOPMENT STRATEGIC PLAN
VOLUME 2: OPPORTUNITY PAGE | 22
CIVILIAN LABOR FORCE TRENDS
One consideration that is often overlooked when analyzing unemployment rates is the growth in the civilian labor force. Strong growth in the labor force, particularly in a relatively short period, can lead to a corresponding increase in the unemployment rate as new workers are absorbed into the labor pool. Given the dramatic population growth experienced in parts of the Dallas-Fort Worth metro area, it is no surprise that many communities have experienced similar rates of increase in their labor force. Fort Worth has seen one of the largest increases (relative to 2007 levels), outpaced only by McKinney and Frisco among the communities profiled. By contrast, the size of Arlington’s labor force has remained largely unchanged for a decade.
FIGURE 8. CIVILIAN LABOR FORCE TRENDS, 2007-2016 DALLAS-FORT WORTH METRO AREA COMMUNITIES
STATES
continued, next page
2007 2008 2009 2010 2011 2012 2013 2014 2015 2016
Frisco 100.0 107.1 112.0 131.8 137.6 142.0 151.4 160.5 170.4 178.0
McKinney 100.0 103.0 106.8 119.5 124.1 128.1 133.2 140.1 145.1 151.1
Fort Worth 100.0 102.6 105.5 113.6 117.4 119.7 122.1 123.7 124.6 127.4
Grand Prairie 100.0 101.2 102.1 117.2 119.3 120.6 121.9 122.6 122.7 126.8
Irving 100.0 100.6 101.2 107.8 109.4 111.2 112.8 114.1 115.7 120.0
Garland 100.0 99.7 100.0 108.2 109.7 110.2 111.0 110.8 110.8 114.8
Denton 100.0 101.2 101.7 97.1 99.9 102.0 103.6 107.6 109.8 114.3
Carrollton 100.0 100.5 101.8 100.1 102.6 104.0 105.3 106.5 109.8 114.2
Richardson 100.0 100.9 101.2 99.7 101.8 102.9 104.0 107.6 109.4 113.6
Dallas 100.0 100.1 100.1 102.4 104.0 104.9 106.2 107.6 108.6 112.8
Mesquite 100.0 100.0 99.5 107.4 108.5 108.8 109.0 109.1 108.8 112.7
Plano 100.0 100.9 101.6 100.3 102.6 103.7 104.9 106.1 107.7 111.9
Lewisville 100.0 101.8 103.3 98.5 100.1 101.6 103.3 105.0 105.8 110.2
Arlington 100.0 100.4 101.3 96.4 98.7 99.9 100.8 100.7 99.9 101.9
2007 2008 2009 2010 2011 2012 2013 2014 2015 2016
Texas 100.0 102.0 104.2 107.1 109.4 110.8 112.6 113.8 114.1 116.2
Colorado 100.0 101.9 102.2 102.2 102.7 103.5 104.2 105.5 106.3 108.5
Arizona 100.0 102.3 103.1 101.8 100.1 99.8 100.1 102.0 104.3 106.7
Oklahoma 100.0 101.2 102.2 102.4 102.7 104.5 104.6 103.9 106.2 105.9
Indiana 100.0 100.8 99.6 99.0 99.2 98.8 99.5 100.6 102.0 103.7
Missouri 100.0 99.8 100.5 100.7 100.4 99.7 99.6 100.8 102.0 102.5
Tennessee 100.0 99.7 99.6 100.9 102.0 101.2 100.3 99.2 100.2 102.3
Pennsylvania 100.0 101.7 100.9 100.6 100.8 101.9 101.6 100.9 101.3 102.0
Ohio 100.0 99.6 98.6 97.6 96.3 95.2 95.4 95.1 95.0 95.4

CITY OF FORT WORTH, TEXAS ECONOMIC DEVELOPMENT STRATEGIC PLAN
VOLUME 2: OPPORTUNITY PAGE | 23
FIGURE 8. CIVILIAN LABOR FORCE TRENDS, 2007-2016 (CONTINUED) DOMESTIC BENCHMARKS (CITIES)
DOMESTIC BENCHMARKS (MSAs)
*Figures are for consolidated cities Source: US Bureau of Labor Statistics, Local Area Unemployment Statistics.
2007 2008 2009 2010 2011 2012 2013 2014 2015 2016
Fort Worth, TX 100.0 102.6 105.5 113.6 117.4 119.7 122.1 123.7 124.6 127.4
Oklahoma City, OK 100.0 100.3 100.8 114.3 115.5 118.3 119.6 119.5 122.3 122.5
Denver, CO* 100.0 102.7 103.0 110.4 111.9 113.6 115.6 117.5 119.6 122.1
Nashville-Davidson, TN* 100.0 99.5 99.3 105.2 107.6 108.6 109.0 109.6 112.0 115.9
Dallas, TX 100.0 100.1 100.1 102.4 104.0 104.9 106.2 107.6 108.6 112.8
Kansas City, MO 100.0 99.8 99.2 105.6 105.1 104.8 104.5 106.5 109.0 110.4
Columbus, OH 100.0 100.4 100.5 101.3 101.4 101.8 103.5 104.7 106.0 107.5
Kansas City, KS 100.0 99.6 98.8 104.0 103.4 103.1 103.5 104.7 105.1 105.5
Indianapolis, IN* 100.0 100.6 99.3 98.4 99.1 99.6 100.8 101.6 102.8 105.2
Pittsburgh city, PA 100.0 101.5 101.0 102.9 103.8 105.3 104.5 103.8 103.6 103.7
Phoenix, AZ 100.0 101.6 101.9 94.8 92.9 92.7 93.2 95.1 97.7 100.5
2007 2008 2009 2010 2011 2012 2013 2014 2015 2016
Pittsburgh, PA (MSA) 100.0 101.7 101.3 99.4 100.2 101.6 101.2 100.3 100.4 100.8
Columbus, OH (MSA) 100.0 100.5 100.4 101.4 101.3 101.4 102.7 103.7 104.7 106.1
Indianapolis, IN (MSA) 100.0 101.5 100.7 99.4 100.2 100.8 102.3 103.8 105.9 108.5
Phoenix, AZ (MSA) 100.0 101.8 101.8 100.8 99.4 99.4 100.1 102.7 105.8 108.8
Kansas City, MO (MSA) 100.0 100.0 101.0 105.4 105.2 105.2 105.3 107.2 108.8 109.9
Denver, CO (MSA) 100.0 102.5 102.5 104.7 105.3 106.6 108.1 109.8 111.1 113.4
Fort Worth, TX (MD) 100.0 101.6 103.5 105.8 108.5 110.1 111.9 112.6 112.5 114.8
Nashville, TN (MSA) 100.0 100.6 101.0 105.2 107.4 107.9 108.6 109.7 112.6 116.5
Dallas-Fort Worth, TX (MSA) 100.0 101.3 102.6 106.2 108.6 110.1 111.9 113.6 114.9 118.6
Oklahoma City, OK (MSA) 100.0 100.8 101.6 111.2 112.4 115.1 116.2 115.8 118.6 118.8
Dallas-Plano-IrvingMD 100.0 101.1 102.1 106.5 108.7 110.1 112.0 114.1 116.2 120.5
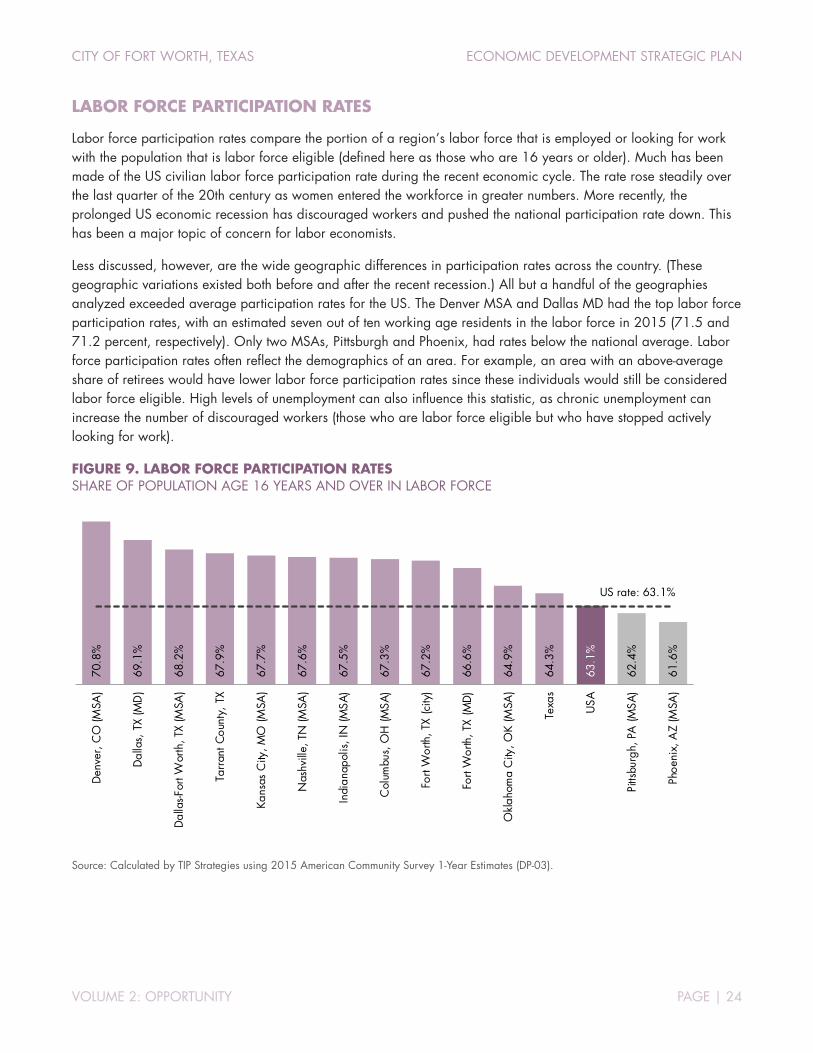
CITY OF FORT WORTH, TEXAS ECONOMIC DEVELOPMENT STRATEGIC PLAN
VOLUME 2: OPPORTUNITY PAGE | 24
LABOR FORCE PARTICIPATION RATES
Labor force participation rates compare the portion of a region’s labor force that is employed or looking for work with the population that is labor force eligible (defined here as those who are 16 years or older). Much has been made of the US civilian labor force participation rate during the recent economic cycle. The rate rose steadily over the last quarter of the 20th century as women entered the workforce in greater numbers. More recently, the prolonged US economic recession has discouraged workers and pushed the national participation rate down. This has been a major topic of concern for labor economists.
Less discussed, however, are the wide geographic differences in participation rates across the country. (These geographic variations existed both before and after the recent recession.) All but a handful of the geographies analyzed exceeded average participation rates for the US. The Denver MSA and Dallas MD had the top labor force participation rates, with an estimated seven out of ten working age residents in the labor force in 2015 (71.5 and 71.2 percent, respectively). Only two MSAs, Pittsburgh and Phoenix, had rates below the national average. Labor force participation rates often reflect the demographics of an area. For example, an area with an above-average share of retirees would have lower labor force participation rates since these individuals would still be considered labor force eligible. High levels of unemployment can also influence this statistic, as chronic unemployment can increase the number of discouraged workers (those who are labor force eligible but who have stopped actively looking for work).
FIGURE 9. LABOR FORCE PARTICIPATION RATES SHARE OF POPULATION AGE 16 YEARS AND OVER IN LABOR FORCE
Source: Calculated by TIP Strategies using 2015 American Community Survey 1-Year Estimates (DP-03).
61.6
%
62.4
%
63.1
%
64.3
%
64.9
%
66.6
%
67.2
%
67.3
%
67.5
%
67.6
%
67.7
%
67.9
%
68.2
%
69.1
%
70.8
%
US rate: 63.1%
Phoe
nix,
AZ
(MSA
)
Pitts
burg
h, P
A (M
SA)
USA
Texa
s
Okl
ahom
a C
ity, O
K (M
SA)
Fort
Wor
th, T
X (M
D)
Fort
Wor
th, T
X (c
ity)
Col
umbu
s, O
H (M
SA)
Indi
anap
olis
, IN
(MSA
)
Nas
hvill
e, T
N (M
SA)
Kans
as C
ity, M
O (M
SA)
Tarr
ant C
ount
y, T
X
Dal
las-F
ort W
orth
, TX
(MSA
)
Dal
las,
TX
(MD
)
Den
ver,
CO
(MSA
)

CITY OF FORT WORTH, TEXAS ECONOMIC DEVELOPMENT STRATEGIC PLAN
VOLUME 2: OPPORTUNITY PAGE | 25
EDUCATIONAL ATTAINMENT
Educational attainment refers to the highest level of education completed for the adult population 25 years of age or older. This statistic is an indicator of workforce skills. Often the percent of the population with a bachelor’s degree or higher is used as a proxy for the general education level of a population and the availability of highly skilled workers. In the US, roughly 3 out of 10 adult residents (30.6 percent) have a bachelor’s degree or higher.
The percent of the population with a bachelor’s degree or higher in the Fort Worth MD (29.3 percent) lags that of the US as well as most of the benchmark MSAs. Only the Oklahoma City MSA has a lower level of educational attainment than the Fort Worth MD. Among the benchmark MSAs, Denver has the highest share of individuals over the age of 25 with a bachelor’s degree or higher. Almost 42 percent of the adult population over 25 in Denver has a bachelor’s degree or higher.
At the other end of the educational attainment spectrum, the city of Fort Worth has the lowest level of attainment among the areas analyzed. In addition to lagging the benchmarks on the share of residents with a four-year degree or higher (27.4 percent), a significantly larger share of the city’s adult residents has a high school diploma or less as their highest level of attainment. Denver has the lowest share of population with a high school diploma or less.
FIGURE 10. EDUCATIONAL ATTAINMENT LEVELS (WITH COMPARISONS TO BENCHMARK MSAS) POPULATION AGE 25 YEARS AND OVER, RANKED BY SHARE WITH BACHELOR’S OR HIGHER, 2015
Source: 2015 American Community Survey 1-Year Estimates (DP-03).
9.5%
8.8%
16.0%
9.2%
11.0%
15.5%
11.2%
7.0%
12.8%
13.5%
14.7%
11.9%
17.6%
19.1%
20.1%
26.3%
21.2%
28.4%
27.9%
22.6%
28.5%
34.0%
27.6%
23.6%
25.2%
27.8%
25.3%
26.0%
21.0%
21.4%
20.9%
19.8%
20.6%
21.9%
19.9%
16.1%
20.7%
25.1%
23.8%
24.1%
21.8%
21.3%
7.5%
7.7%
6.3%
7.6%
6.8%
6.6%
7.6%
9.9%
8.2%
8.4%
7.1%
6.8%
6.9%
6.3%
26.6%
22.9%
23.2%
22.7%
21.6%
22.1%
21.7%
20.0%
19.0%
18.9%
20.0%
18.7%
18.7%
18.8%
15.3%
12.9%
12.3%
12.4%
12.1%
11.3%
11.2%
12.9%
11.6%
10.5%
9.3%
10.6%
9.7%
8.6%
0% 10% 20% 30% 40% 50% 60% 70% 80% 90% 100%
Denver, CO (MSA)
Kansas City, MO-KS (MSA)
Dallas, TX (MD)
Columbus, OH (MSA)
Nashville, TN (MSA)
Dallas-Fort Worth (MSA)
Indianapolis, IN (MSA)
Pittsburgh, PA (MSA)
United States
Phoenix, AZ (MSA)
Fort Worth, TX (MD)
Oklahoma City, OK (MSA)
Texas
Fort Worth (city)
Less than high school High school/GEDSome college, no degree Associate's degreeBachelor's degree Graduate or professional degree

CITY OF FORT WORTH, TEXAS ECONOMIC DEVELOPMENT STRATEGIC PLAN
VOLUME 2: OPPORTUNITY PAGE | 26
COMMUTING PATTERNS
In 2014, roughly two-thirds (66 percent) of people who worked in Fort Worth lived outside the city. This figure has risen steadily over the past decade. Over the same period, the number of outbound commuters has risen more sharply. In 2005, slightly more than one-half of employed residents (53 percent) commuted to work outside the city. By 2014, nearly 62 percent of the city’s residents held jobs in cities other than Fort Worth. During the same period, there was only modest growth in the number of residents who lived and worked in the city. In 2014, just over 118,000 workers met this criterion, an increase of roughly 5,600 jobholders.
FIGURE 11. INFLOW/OUTFLOW FOR CITY OF FORT WORTH, 2014 FLOW OF WORKERS TO/FROM THE CITY
Source: US Census Bureau, Local Employment Dynamics. Notes: Overlay arrows are for illustrative purposes and do not indicate directionality of worker flow between home and employment locations.
FIGURE 12. COMMUTING FLOWS, 2005 TO 2014
Source: US Census Bureau, Local Employment Dynamics.
118,005 Live and work
in thecity of Fort
Worth
227,165
Commute to jobs in the city of Fort Worth from outside
Of the 345,170 workers that held jobs in the city of Fort Worth in 2014, 66 percent lived outside the city.
191,892
Live in the city of Fort Worth and commute to
jobs outside
Of the 309,897 residents employed in 2014, 62 percent commuted to jobs outside the city.
0
50,000
100,000
150,000
200,000
250,000
2005
2006
2007
2008
2009
2010
2011
2012
2013
2014
Num
ber
of jo
b ho
lder
s
OUTBOUND (Commute from the city of Fort Worth to jobs outside)INBOUND (Commute into the city of Fort Worth from outside)LIVE & WORK (Live & work in the city of Fort Worth)

CITY OF FORT WORTH, TEXAS ECONOMIC DEVELOPMENT STRATEGIC PLAN
VOLUME 2: OPPORTUNITY PAGE | 27
Of the more than 227,000 inbound commuters, Arlington represents the largest source of labor at the city level, sending roughly 24,500 workers to Fort Worth in 2014 and accounting for 7 percent of the total workforce. However, the city draws from a wide area. After Fort Worth and Arlington, the remaining eight cities combined represented less than 15 percent of the total. For the city’s outbound workers, Dallas was the top employment destination, capturing roughly 24,500 of the city’s employed residents, followed by Arlington and Irving. When viewed on a net flow basis (Figure 14), Fort Worth gains workers from each of the top 10 laborshed cities except Dallas and Irving.
FIGURE 13. TOP 10 COMMUTING DESTINATIONS, 2014: CITIES FORT WORTH LABORSHED (WHERE WORKERS LIVE) & COMMUTE SHED (WHERE EMPLOYED RESIDENTS WORK)
Source: US Census Bureau, Local Employment Dynamics.
FIGURE 14. TOP 10 SOURCES OF WORKERS, 2014 CITIES WHERE CITY OF FORT WORTH WORKERS LIVE, WITH NET FLOW
Source: US Census Bureau, Local Employment Dynamics.
Where the city of Fort Worth workers liveCity (Place) Count Share
1 Fort Worth city, TX 118,005 34.2%2 Arlington city, TX 24,463 7.1%3 Dallas city, TX 13,007 3.8%4 Grand Prairie city, TX 6,763 2.0%5 North Richland Hills city, TX 6,530 1.9%6 Haltom City city, TX 5,436 1.6%7 Burleson city, TX 5,414 1.6%8 Benbrook city, TX 4,681 1.4%9 Mansfield city, TX 4,536 1.3%10 Irving city, TX 4,471 1.3%
All Other Locations 151,864 44.0%Total 345,170 100.0%
Where employed city of Fort Worth residents workCity (Place) Count Share
1 Fort Worth city, TX 118,005 38.1%2 Dallas city, TX 24,477 7.9%3 Arlington city, TX 18,986 6.1%4 Irving city, TX 12,825 4.1%5 Grapevine city, TX 7,486 2.4%6 White Settlement city, TX 6,921 2.2%7 Grand Prairie city, TX 5,625 1.8%8 Houston city, TX 4,924 1.6%9 Haltom City city, TX 4,631 1.5%10 Plano city, TX 4,156 1.3%
All Other Locations 101,861 32.9%Total 309,897 100.0%
People who WORK in city of Fort Worth and live in this city
People who LIVE in city of Fort Worth and work in this city Net flow
1 Arlington city, TX 24,463 18,986 +5,477
2 Dallas city, TX 13,007 24,477 -11,470
3 Grand Prairie city, TX 6,763 5,625 +1,138
4 North Richland Hills city, TX 6,530 3,951 +2,579
5 Haltom City city, TX 5,436 4,631 +805
6 Burleson city, TX 5,414 2,196 +3,218
7 Benbrook city, TX 4,681 1,655 +3,026
8 Mansfield city, TX 4,536 2,428 +2,108
9 Irving city, TX 4,471 12,825 -8,354
10 Euless city, TX 3,610 1,855 +1,755

CITY OF FORT WORTH, TEXAS ECONOMIC DEVELOPMENT STRATEGIC PLAN
VOLUME 2: OPPORTUNITY PAGE | 28
A look at flows by county shows that Tarrant County communities comprise the majority of Fort Worth’s labor pool, accounting for nearly 62 percent of jobholders in 2014. The remaining counties in the Fort Worth MD that fall in the top 10 (Johnson, Parker, Wise, and Hood) account for roughly 9 percent of the city’s jobholders. Tarrant County is also the largest employment destination for Fort Worth residents, with more than 196,000 residents holding jobs in the county in 2014. When the roughly 118,000 workers who live and work in the city of Fort Worth are subtracted (Figure 14, prior page), approximately 78,000 Fort Worth residents worked in other Tarrant County communities in 2014. Dallas County is the next largest employment destination, receiving more than 53,000 workers, or 17 percent of employed Fort Worth residents. When viewed on a net flow basis, Dallas County receives more than 22,000 workers above the number it sends to Tarrant County.
FIGURE 15. TOP 10 COMMUTING DESTINATIONS, 2014: COUNTIES FORT WORTH LABORSHED (WHERE WORKERS LIVE) & COMMUTE SHED (WHERE EMPLOYED RESIDENTS WORK)
Source: US Census Bureau, Local Employment Dynamics.
FIGURE 16. TOP 10 SOURCES OF WORKERS, 2014 COUNTIES WHERE CITY OF FORT WORTH WORKERS LIVE, WITH NET FLOW
Source: US Census Bureau, Local Employment Dynamics.
Where the city of Fort Worth workers liveCounty Count Share
1 Tarrant County, TX 213,302 61.8%2 Dallas County, TX 30,876 8.9%3 Denton County, TX 15,787 4.6%4 Johnson County, TX 13,545 3.9%5 Parker County, TX 11,529 3.3%6 Collin County, TX 7,476 2.2%7 Harris County, TX 4,137 1.2%8 Wise County, TX 3,026 0.9%9 Hood County, TX 2,752 0.8%10 Ellis County, TX 2,697 0.8%
All Other Locations 40,043 11.6%Total 345,170 100.0%
Where employed city of Fort Worth residents workCounty Count Share
1 Tarrant County, TX 196,379 63.4%2 Dallas County, TX 53,192 17.2%3 Denton County, TX 11,136 3.6%4 Collin County, TX 7,516 2.4%5 Harris County, TX 6,196 2.0%6 Johnson County, TX 3,823 1.2%7 Travis County, TX 3,493 1.1%8 Parker County, TX 3,139 1.0%9 Bexar County, TX 1,642 0.5%10 Wise County, TX 1,428 0.5%
All Other Locations 21,953 7.1%Total 309,897 100.0%
People who WORK in the city of Fort Worth and live in this county
People who LIVE in the city of Fort Worth and work in this county Net flow
1 Tarrant County, TX 213,302 196,379 +16,923
2 Dallas County, TX 30,876 53,192 -22,316
3 Denton County, TX 15,787 11,136 +4,651
4 Johnson County, TX 13,545 3,823 +9,722
5 Parker County, TX 11,529 3,139 +8,390
6 Collin County, TX 7,476 7,516 -40
7 Harris County, TX 4,137 6,196 -2,059
8 Wise County, TX 3,026 1,428 +1,598
9 Hood County, TX 2,752 721 +2,031
10 Ellis County, TX 2,697 1,035 +1,662

CITY OF FORT WORTH, TEXAS ECONOMIC DEVELOPMENT STRATEGIC PLAN
VOLUME 2: OPPORTUNITY PAGE | 29
Like most areas of the country, workers in Fort Worth are driving longer distances between work and home. Between 2004 and 2014, the share of workers employed in the city of Fort Worth who commuted distances of greater than 50 miles more than doubled, increasing from 6 percent of the city’s workforce to 13 percent. During the same period, the share of workers commuting less than 10 miles decreased sharply, dropping from 48 percent in 2004 to 39 percent in 2014. This pattern was also seen among the city’s employed residents.
FIGURE 17. DISTANCE TRAVELED, 2004 VS. 2014 SHARE OF JOBHOLDERS
PEOPLE WHO WORK IN the city of Fort Worth
EMPLOYED PEOPLE WHO LIVE IN the city of Fort Worth
Source: US Census Bureau, Local Employment Dynamics.
FIGURE 18. DIRECTION TRAVELED DURING COMMUTE, 2014 SHARE OF JOBHOLDERS
PEOPLE WHO WORK IN the city of Fort Worth
Source (both charts): US Census Bureau, Local Employment Dynamics.
EMPLOYED PEOPLE WHO LIVE IN the city of Fort Worth
48%
33%
12%6%
39%34%
14% 13%
Less than 10miles
10 to 24miles
25 to 50miles
Greater than50 miles
2004 201451%
27%
16%
6%
42%
32%
16%10%
Less than 10miles
10 to 24miles
25 to 50miles
Greater than50 miles
2004 2014
North9%
Northeast15%
East17%
Southeast13%
South17%
Southwest10%
West10%
Northwest9%
North11%
Northeast21%
East27%
Southeast13%
South11%
Southwest5%
West6%
Northwest6%

CITY OF FORT WORTH, TEXAS ECONOMIC DEVELOPMENT STRATEGIC PLAN
VOLUME 2: OPPORTUNITY PAGE | 30
A look at age, earnings, and broad industry by type of commuting flow reveals only modest differences. Employed residents who commute out of the city were slightly more likely to be younger and to earn less than those who worked in Fort Worth. A higher percentage of internal jobholders (those who lived and worked in Fort Worth) were more likely to be employed in service industries than in goods-producing or trades, transportation, and utilities.
FIGURE 19. SELECT JOBHOLDER CHARACTERISTICS, 2014 SHARE OF WORKERS BY TYPE OF COMMUTING FLOW (INTERNAL, OUTBOUND, INBOUND)
AGE
EARNINGS
INDUSTRY CLASS
Source (all figures this page): US Census Bureau, Local Employment Dynamics
22.5%
24.9%
21.4%
56.7%
57.5%
57.4%
20.8%
17.5%
21.2%
0% 25% 50% 75% 100%
Internal jobholders
Outbound commuters
Inbound commuters
29 years or younger 30 to 54 years 55 years or older
17.2%
19.8%
15.8%
39.3%
35.1%
32.9%
43.5%
45.1%
51.3%
0% 25% 50% 75% 100%
Internal jobholders
Outbound commuters
Inbound commuters
$1,250 per month or less $1,251 to $3,333 per month More than $3,333 per month
16.7%
18.1%
19.1%
18.3%
24.8%
24.7%
65.0%
57.1%
56.2%
0% 25% 50% 75% 100%
Internal jobholders
Outbound commuters
Inbound commuters
Goods-producing Trade, transportation, and utilities All other services
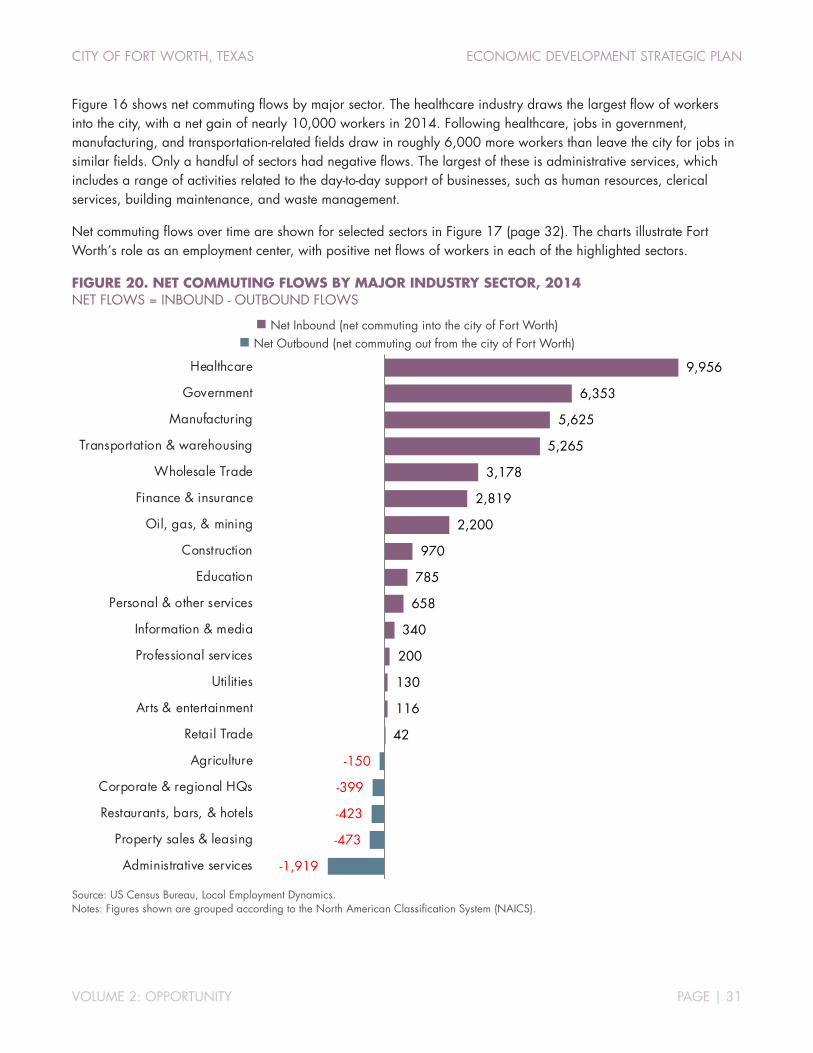
CITY OF FORT WORTH, TEXAS ECONOMIC DEVELOPMENT STRATEGIC PLAN
VOLUME 2: OPPORTUNITY PAGE | 31
Figure 16 shows net commuting flows by major sector. The healthcare industry draws the largest flow of workers into the city, with a net gain of nearly 10,000 workers in 2014. Following healthcare, jobs in government, manufacturing, and transportation-related fields draw in roughly 6,000 more workers than leave the city for jobs in similar fields. Only a handful of sectors had negative flows. The largest of these is administrative services, which includes a range of activities related to the day-to-day support of businesses, such as human resources, clerical services, building maintenance, and waste management.
Net commuting flows over time are shown for selected sectors in Figure 17 (page 32). The charts illustrate Fort Worth’s role as an employment center, with positive net flows of workers in each of the highlighted sectors.
FIGURE 20. NET COMMUTING FLOWS BY MAJOR INDUSTRY SECTOR, 2014 NET FLOWS = INBOUND - OUTBOUND FLOWS
Net Inbound (net commuting into the city of Fort Worth) Net Outbound (net commuting out from the city of Fort Worth)
Source: US Census Bureau, Local Employment Dynamics. Notes: Figures shown are grouped according to the North American Classification System (NAICS).
-1,919
-473
-423
-399
-150
42
116
130
200
340
658
785
970
2,200
2,819
3,178
5,265
5,625
6,353
9,956
Administrative services
Property sales & leasing
Restaurants, bars, & hotels
Corporate & regional HQs
Agriculture
Retail Trade
Arts & entertainment
Utilities
Professional services
Information & media
Personal & other services
Education
Construction
Oil, gas, & mining
Finance & insurance
Wholesale Trade
Transportation & warehousing
Manufacturing
Government
Healthcare
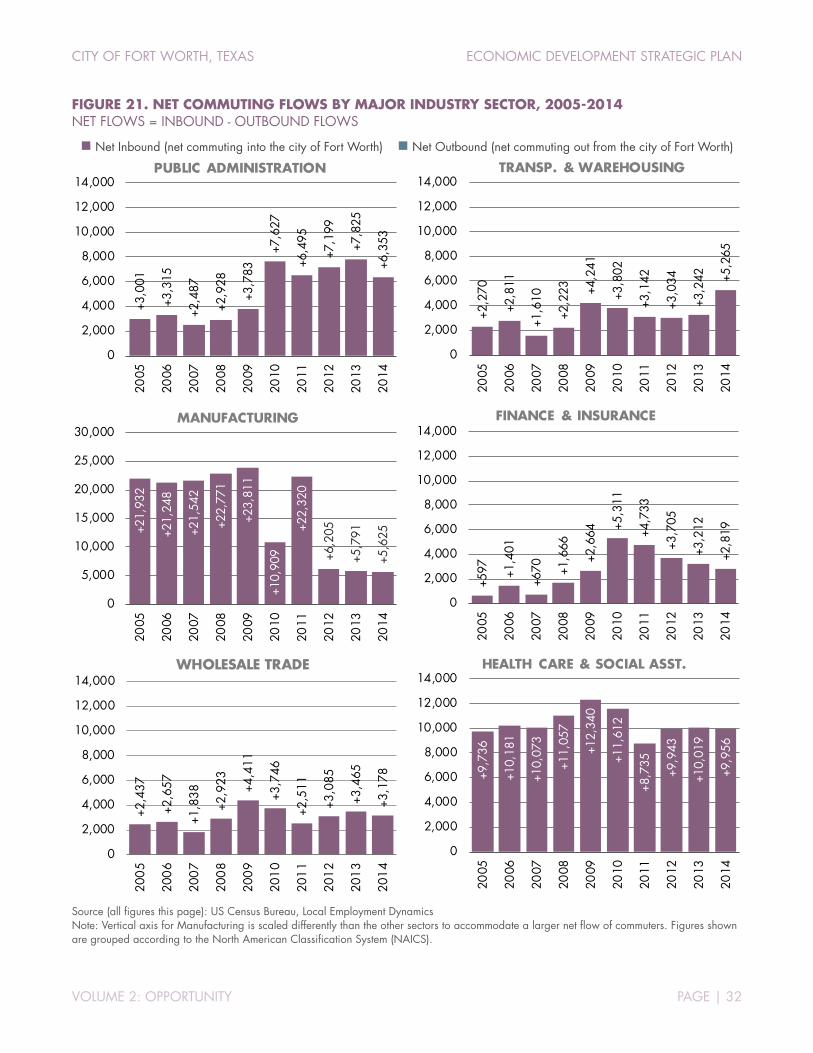
CITY OF FORT WORTH, TEXAS ECONOMIC DEVELOPMENT STRATEGIC PLAN
VOLUME 2: OPPORTUNITY PAGE | 32
FIGURE 21. NET COMMUTING FLOWS BY MAJOR INDUSTRY SECTOR, 2005-2014 NET FLOWS = INBOUND - OUTBOUND FLOWS
Net Inbound (net commuting into the city of Fort Worth) Net Outbound (net commuting out from the city of Fort Worth)
Source (all figures this page): US Census Bureau, Local Employment Dynamics Note: Vertical axis for Manufacturing is scaled differently than the other sectors to accommodate a larger net flow of commuters. Figures shown are grouped according to the North American Classification System (NAICS).
+3,0
01
+3,3
15
+2,4
87
+2,9
28
+3,7
83
+7,6
27
+6,4
95
+7,1
99
+7,8
25
+6,3
53
0
2,000
4,000
6,000
8,000
10,000
12,000
14,000
2005
2006
2007
2008
2009
2010
2011
2012
2013
2014
PUBLIC ADMINISTRATION
+21,
932
+21,
248
+21,
542
+22,
771
+23,
811
+10,
909
+22,
320
+6,2
05
+5,7
91
+5,6
25
0
5,000
10,000
15,000
20,000
25,000
30,000
2005
2006
2007
2008
2009
2010
2011
2012
2013
2014
MANUFACTURING
+2,4
37
+2,6
57
+1,8
38
+2,9
23 +4,4
11
+3,7
46
+2,5
11
+3,0
85
+3,4
65
+3,1
78
0
2,000
4,000
6,000
8,000
10,000
12,000
14,000
200
5
200
6
200
7
200
8
200
9
201
0
201
1
201
2
201
3
201
4
WHOLESALE TRADE
+2,2
70
+2,8
11
+1,6
10
+2,2
23 +4,2
41
+3,8
02
+3,1
42
+3,0
34
+3,2
42 +5,2
65
0
2,000
4,000
6,000
8,000
10,000
12,000
14,000
2005
2006
2007
2008
2009
2010
2011
2012
2013
2014
TRANSP. & WAREHOUSING
+597 +1
,401
+670 +1
,666
+2,6
64 +5,3
11
+4,7
33
+3,7
05
+3,2
12
+2,8
19
0
2,000
4,000
6,000
8,000
10,000
12,000
14,000
2005
2006
2007
2008
2009
2010
2011
2012
2013
2014
FINANCE & INSURANCE
+9,7
36
+10,
181
+10,
073
+11,
057
+12,
340
+11,
612
+8,7
35
+9,9
43
+10,
019
+9,9
56
0
2,000
4,000
6,000
8,000
10,000
12,000
14,000
2005
2006
2007
2008
2009
2010
2011
2012
2013
2014
HEALTH CARE & SOCIAL ASST.
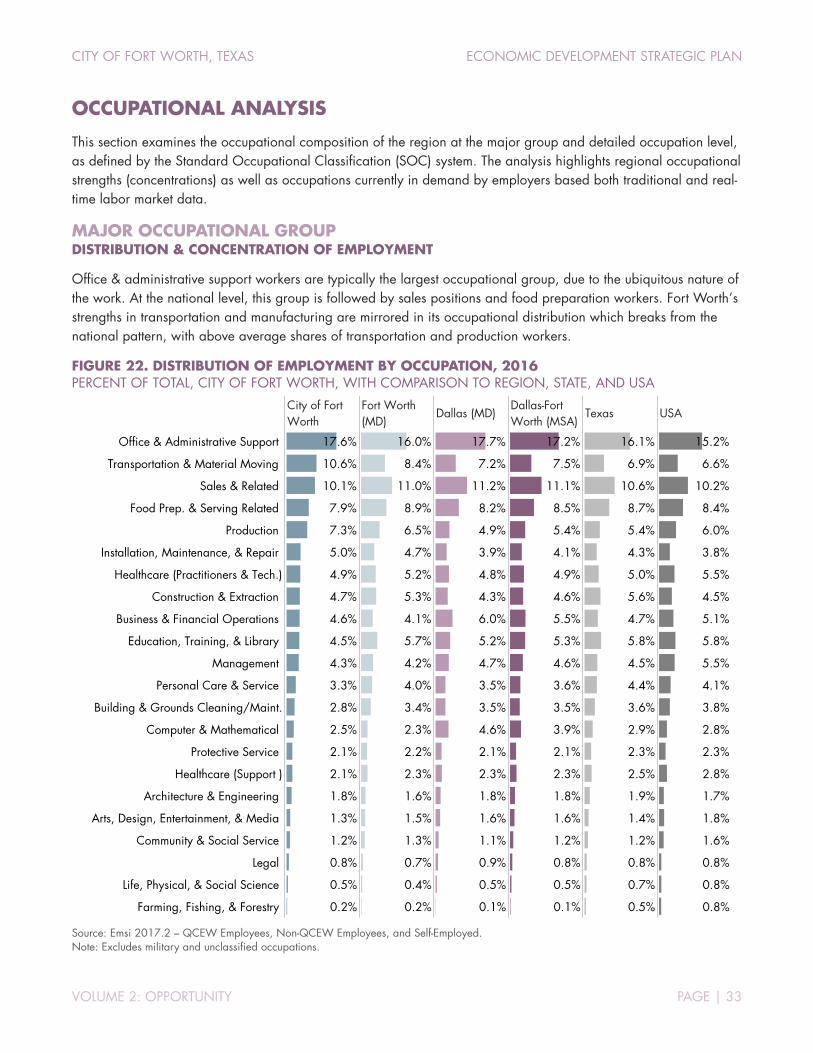
CITY OF FORT WORTH, TEXAS ECONOMIC DEVELOPMENT STRATEGIC PLAN
VOLUME 2: OPPORTUNITY PAGE | 33
OCCUPATIONAL ANALYSIS
This section examines the occupational composition of the region at the major group and detailed occupation level, as defined by the Standard Occupational Classification (SOC) system. The analysis highlights regional occupational strengths (concentrations) as well as occupations currently in demand by employers based both traditional and real-time labor market data.
MAJOR OCCUPATIONAL GROUP DISTRIBUTION & CONCENTRATION OF EMPLOYMENT
Office & administrative support workers are typically the largest occupational group, due to the ubiquitous nature of the work. At the national level, this group is followed by sales positions and food preparation workers. Fort Worth’s strengths in transportation and manufacturing are mirrored in its occupational distribution which breaks from the national pattern, with above average shares of transportation and production workers.
FIGURE 22. DISTRIBUTION OF EMPLOYMENT BY OCCUPATION, 2016 PERCENT OF TOTAL, CITY OF FORT WORTH, WITH COMPARISON TO REGION, STATE, AND USA
Source: Emsi 2017.2 – QCEW Employees, Non-QCEW Employees, and Self-Employed. Note: Excludes military and unclassified occupations.
City of Fort Worth
Fort Worth (MD)
Dallas (MD)Dallas-Fort Worth (MSA)
Texas USA
Office & Administrative Support 17.6% 16.0% 17.7% 17.2% 16.1% 15.2%
Transportation & Material Moving 10.6% 8.4% 7.2% 7.5% 6.9% 6.6%
Sales & Related 10.1% 11.0% 11.2% 11.1% 10.6% 10.2%
Food Prep. & Serving Related 7.9% 8.9% 8.2% 8.5% 8.7% 8.4%
Production 7.3% 6.5% 4.9% 5.4% 5.4% 6.0%
Installation, Maintenance, & Repair 5.0% 4.7% 3.9% 4.1% 4.3% 3.8%
Healthcare (Practitioners & Tech.) 4.9% 5.2% 4.8% 4.9% 5.0% 5.5%
Construction & Extraction 4.7% 5.3% 4.3% 4.6% 5.6% 4.5%
Business & Financial Operations 4.6% 4.1% 6.0% 5.5% 4.7% 5.1%
Education, Training, & Library 4.5% 5.7% 5.2% 5.3% 5.8% 5.8%
Management 4.3% 4.2% 4.7% 4.6% 4.5% 5.5%
Personal Care & Service 3.3% 4.0% 3.5% 3.6% 4.4% 4.1%
Building & Grounds Cleaning/Maint. 2.8% 3.4% 3.5% 3.5% 3.6% 3.8%
Computer & Mathematical 2.5% 2.3% 4.6% 3.9% 2.9% 2.8%
Protective Service 2.1% 2.2% 2.1% 2.1% 2.3% 2.3%
Healthcare (Support ) 2.1% 2.3% 2.3% 2.3% 2.5% 2.8%
Architecture & Engineering 1.8% 1.6% 1.8% 1.8% 1.9% 1.7%
Arts, Design, Entertainment, & Media 1.3% 1.5% 1.6% 1.6% 1.4% 1.8%
Community & Social Service 1.2% 1.3% 1.1% 1.2% 1.2% 1.6%
Legal 0.8% 0.7% 0.9% 0.8% 0.8% 0.8%
Life, Physical, & Social Science 0.5% 0.4% 0.5% 0.5% 0.7% 0.8%
Farming, Fishing, & Forestry 0.2% 0.2% 0.1% 0.1% 0.5% 0.8%

CITY OF FORT WORTH, TEXAS ECONOMIC DEVELOPMENT STRATEGIC PLAN
VOLUME 2: OPPORTUNITY PAGE | 34
A look at location quotients (LQs) can suggest areas where a region possesses a competitive advantage relative to other parts of the country (see box page 3). At the major group level, concentrations are less likely because of the wide range of individual occupations encompassed. For this reason, concentrations even slightly above the national level can be noteworthy, calling for the use of a slightly lower threshold when highlighting areas of potential advantage.
As in the prior figure, Fort Worth’s strengths in transportation and manufacturing can be seen in the above-average concentration of employment in these areas. The city’s LQ of 1.61 far exceeds that of the region, indicating a specialization in these skills above what would be expected for a similarly sized region based on national patterns. These strengths are obscured at the metropolitan area level, illustrating the benefit of a city-level review of the data. The analysis also highlights a potential weakness for the city in terms of computer & mathematical operations. This important occupational group is lacking in the region based on its below average LQ (0.91).
FIGURE 23. CONCENTRATION OF EMPLOYMENT, 2016 (USA=1.00) CITY OF FORT WORTH, WITH COMPARISON TO REGION, STATE, AND USA
Source: Emsi 2017.2 – QCEW Employees, Non-QCEW Employees, and Self-Employed. Note: Excludes military and unclassified occupations.
City of Fort Worth
Fort Worth (MD)
Dallas (MD)Dallas-Fort Worth (MSA)
Texas USA
Transportation & Material Moving 1.61 1.28 1.09 1.15 1.03 1.00
Installation, Maintenance, & Repair 1.30 1.23 1.03 1.09 1.12 1.00
Production 1.22 1.10 0.82 0.90 0.90 1.00
Office & Administrative Support 1.17 1.06 1.17 1.14 1.06 1.00
Architecture & Engineering 1.07 0.97 1.10 1.06 1.11 1.00
Construction & Extraction 1.05 1.19 0.97 1.03 1.25 1.00
Sales & Related 0.99 1.08 1.10 1.10 1.04 1.00
Legal 0.96 0.82 1.08 1.00 0.92 1.00
Food Prep. & Serving Related 0.94 1.07 0.99 1.01 1.03 1.00
Protective Service 0.93 0.96 0.95 0.95 1.03 1.00
Business & Financial Operations 0.92 0.82 1.20 1.09 0.93 1.00
Computer & Mathematical 0.91 0.81 1.64 1.40 1.03 1.00
Healthcare (Practitioners & Tech.) 0.89 0.95 0.88 0.90 0.92 1.00
Personal Care & Service 0.80 0.97 0.86 0.89 1.07 1.00
Management 0.79 0.78 0.86 0.83 0.82 1.00
Education, Training, & Library 0.79 1.00 0.90 0.93 1.01 1.00
Building & Grounds Cleaning/Maint. 0.74 0.90 0.92 0.91 0.95 1.00
Healthcare (Support ) 0.74 0.83 0.81 0.82 0.90 1.00
Arts, Design, Entertainment, & Media 0.72 0.81 0.91 0.88 0.79 1.00
Community & Social Service 0.72 0.80 0.67 0.71 0.74 1.00
Life, Physical, & Social Science 0.59 0.53 0.60 0.58 0.85 1.00
Farming, Fishing, & Forestry 0.26 0.26 0.16 0.19 0.65 1.00

CITY OF FORT WORTH, TEXAS ECONOMIC DEVELOPMENT STRATEGIC PLAN
VOLUME 2: OPPORTUNITY PAGE | 35
The following figures present employment distribution (share of total employment) and concentration (location quotients) for the domestic benchmarks. Comparisons are primarily made at the MSA level in this section as it is the most appropriate level for understanding the dynamics of a regional labor force. Along with the eight peer metro areas, figures are included for both metropolitan divisions (Fort Worth and Dallas) and for the Dallas-Fort Worth MSA to facilitate comparison. Darker shading indicates a larger share of the occupation (Figure 24) or a higher concentration of the occupation (Figure 25) relative to the other benchmark communities.
FIGURE 24. DISTRIBUTION OF EMPLOYMENT BY OCCUPATION, 2016: DOMESTIC BENCHMARKS (MSAs)
Source: Emsi 2017.2 – QCEW Employees, Non-QCEW Employees, and Self-Employed. Note: Excludes military and unclassified occupations. Formatting rules are applied by row (rather than to the entire chart) to show the relative distribution of the occupational group across the peer regions. Darker shading indicates a higher share of the occupation.
For
t Wor
th (M
D)
Dal
las
(MD
)
Dal
las-F
ort W
orth
(MSA
)
Col
umbu
s, O
H (M
SA)
Den
ver,
CO
(MSA
)
Indi
anap
olis
, IN
(MSA
)
Kan
sas
City
, MO
(MSA
)
Nas
hvill
e, T
N (M
SA)
Okl
ahom
a C
ity, O
K (M
SA)
Pho
enix
, AZ
(MSA
)
Pitt
sbur
gh, P
A (M
SA)
11-0000 Mgmt. 4.2% 4.7% 4.6% 5.2% 5.1% 5.7% 5.8% 6.8% 6.3% 5.5% 4.2%
13-0000 Bus. & Fin. 4.1% 6.0% 5.5% 6.2% 7.8% 5.4% 5.9% 4.8% 5.0% 5.7% 5.0%
15-0000 Computer & Math 2.3% 4.6% 3.9% 3.8% 4.4% 2.8% 3.8% 2.3% 2.3% 3.6% 2.8%
17-0000 Arch. & Eng. 1.6% 1.8% 1.8% 1.6% 2.4% 1.4% 1.6% 1.3% 2.0% 1.9% 1.9%
19-0000 Science 0.4% 0.5% 0.5% 0.8% 1.0% 1.0% 0.7% 0.5% 0.8% 0.5% 0.9%
21-0000 Social Svc. 1.3% 1.1% 1.2% 1.6% 1.4% 1.5% 1.6% 1.4% 2.1% 1.6% 2.0%
23-0000 Legal 0.7% 0.9% 0.8% 0.8% 1.1% 0.8% 0.9% 0.8% 1.2% 0.8% 0.9%
25-0000 Education 5.7% 5.2% 5.3% 5.5% 5.2% 4.2% 5.2% 4.8% 5.1% 4.7% 5.6%
27-0000 Arts & Ent. 1.5% 1.6% 1.6% 1.8% 2.0% 1.6% 1.9% 2.5% 1.5% 1.7% 1.4%
29-0000 Health (Tech.) 5.2% 4.8% 4.9% 5.9% 5.1% 6.4% 5.8% 6.1% 6.2% 5.1% 6.9%
31-0000 Health (Support) 2.3% 2.3% 2.3% 3.5% 2.5% 2.3% 2.4% 2.5% 2.7% 2.5% 3.2%
33-0000 Protective Svc. 2.2% 2.1% 2.1% 2.1% 1.9% 2.2% 2.1% 2.1% 2.1% 2.5% 2.0%
35-0000 Food Workers 8.9% 8.2% 8.5% 8.4% 8.3% 8.7% 8.3% 8.7% 9.2% 8.7% 8.5%
37-0000 Gen. Maint. 3.4% 3.5% 3.5% 3.6% 3.6% 3.6% 3.1% 3.2% 3.5% 3.6% 3.4%
39-0000 Personal Care 4.0% 3.5% 3.6% 3.1% 4.1% 3.5% 3.9% 3.1% 3.3% 4.1% 4.5%
41-0000 Sales & Related 11.0% 11.2% 11.1% 9.0% 11.0% 10.1% 10.2% 9.8% 10.0% 11.5% 10.2%
43-0000 Office & Admin. 16.0% 17.7% 17.2% 16.9% 14.5% 14.6% 16.5% 16.3% 15.7% 17.0% 16.6%
45-0000 Ag & Forestry 0.2% 0.1% 0.1% 0.2% 0.2% 0.3% 0.2% 0.2% 0.2% 0.4% 0.1%
47-0000 Construct./Mining 5.3% 4.3% 4.6% 3.5% 5.3% 4.1% 4.2% 3.8% 5.7% 4.7% 4.9%
49-0000 Install & Repair 4.7% 3.9% 4.1% 3.5% 3.7% 4.0% 3.7% 4.2% 4.3% 3.8% 3.9%
51-0000 Production 6.5% 4.9% 5.4% 5.5% 3.5% 6.6% 5.5% 7.1% 4.7% 4.1% 5.1%
53-0000 Transportation 8.4% 7.2% 7.5% 7.6% 5.8% 9.2% 6.6% 7.8% 6.1% 6.0% 6.0%
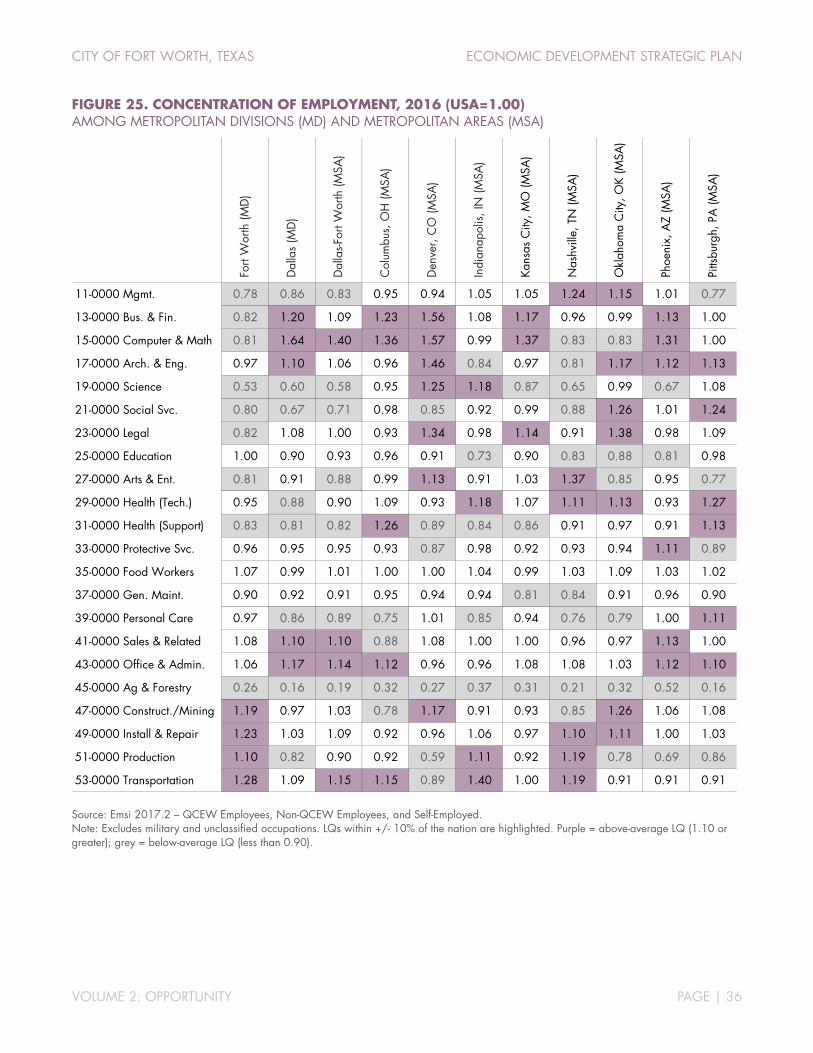
CITY OF FORT WORTH, TEXAS ECONOMIC DEVELOPMENT STRATEGIC PLAN
VOLUME 2: OPPORTUNITY PAGE | 36
FIGURE 25. CONCENTRATION OF EMPLOYMENT, 2016 (USA=1.00) AMONG METROPOLITAN DIVISIONS (MD) AND METROPOLITAN AREAS (MSA)
Source: Emsi 2017.2 – QCEW Employees, Non-QCEW Employees, and Self-Employed. Note: Excludes military and unclassified occupations. LQs within +/- 10% of the nation are highlighted. Purple = above-average LQ (1.10 or greater); grey = below-average LQ (less than 0.90).
For
t Wor
th (M
D)
Dal
las
(MD
)
Dal
las-F
ort W
orth
(MSA
)
Col
umbu
s, O
H (M
SA)
Den
ver,
CO
(MSA
)
Indi
anap
olis
, IN
(MSA
)
Kan
sas
City
, MO
(MSA
)
Nas
hvill
e, T
N (M
SA)
Okl
ahom
a C
ity, O
K (M
SA)
Pho
enix
, AZ
(MSA
)
Pitt
sbur
gh, P
A (M
SA)
11-0000 Mgmt. 0.78 0.86 0.83 0.95 0.94 1.05 1.05 1.24 1.15 1.01 0.77
13-0000 Bus. & Fin. 0.82 1.20 1.09 1.23 1.56 1.08 1.17 0.96 0.99 1.13 1.00
15-0000 Computer & Math 0.81 1.64 1.40 1.36 1.57 0.99 1.37 0.83 0.83 1.31 1.00
17-0000 Arch. & Eng. 0.97 1.10 1.06 0.96 1.46 0.84 0.97 0.81 1.17 1.12 1.13
19-0000 Science 0.53 0.60 0.58 0.95 1.25 1.18 0.87 0.65 0.99 0.67 1.08
21-0000 Social Svc. 0.80 0.67 0.71 0.98 0.85 0.92 0.99 0.88 1.26 1.01 1.24
23-0000 Legal 0.82 1.08 1.00 0.93 1.34 0.98 1.14 0.91 1.38 0.98 1.09
25-0000 Education 1.00 0.90 0.93 0.96 0.91 0.73 0.90 0.83 0.88 0.81 0.98
27-0000 Arts & Ent. 0.81 0.91 0.88 0.99 1.13 0.91 1.03 1.37 0.85 0.95 0.77
29-0000 Health (Tech.) 0.95 0.88 0.90 1.09 0.93 1.18 1.07 1.11 1.13 0.93 1.27
31-0000 Health (Support) 0.83 0.81 0.82 1.26 0.89 0.84 0.86 0.91 0.97 0.91 1.13
33-0000 Protective Svc. 0.96 0.95 0.95 0.93 0.87 0.98 0.92 0.93 0.94 1.11 0.89
35-0000 Food Workers 1.07 0.99 1.01 1.00 1.00 1.04 0.99 1.03 1.09 1.03 1.02
37-0000 Gen. Maint. 0.90 0.92 0.91 0.95 0.94 0.94 0.81 0.84 0.91 0.96 0.90
39-0000 Personal Care 0.97 0.86 0.89 0.75 1.01 0.85 0.94 0.76 0.79 1.00 1.11
41-0000 Sales & Related 1.08 1.10 1.10 0.88 1.08 1.00 1.00 0.96 0.97 1.13 1.00
43-0000 Office & Admin. 1.06 1.17 1.14 1.12 0.96 0.96 1.08 1.08 1.03 1.12 1.10
45-0000 Ag & Forestry 0.26 0.16 0.19 0.32 0.27 0.37 0.31 0.21 0.32 0.52 0.16
47-0000 Construct./Mining 1.19 0.97 1.03 0.78 1.17 0.91 0.93 0.85 1.26 1.06 1.08
49-0000 Install & Repair 1.23 1.03 1.09 0.92 0.96 1.06 0.97 1.10 1.11 1.00 1.03
51-0000 Production 1.10 0.82 0.90 0.92 0.59 1.11 0.92 1.19 0.78 0.69 0.86
53-0000 Transportation 1.28 1.09 1.15 1.15 0.89 1.40 1.00 1.19 0.91 0.91 0.91
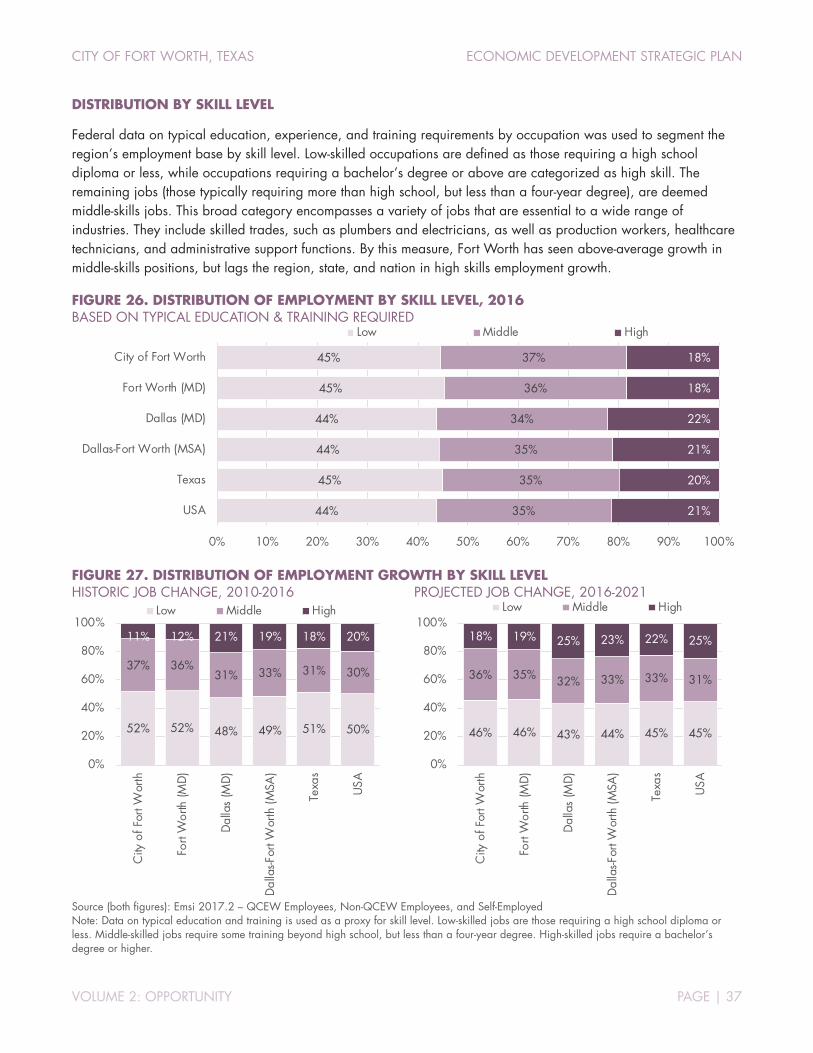
CITY OF FORT WORTH, TEXAS ECONOMIC DEVELOPMENT STRATEGIC PLAN
VOLUME 2: OPPORTUNITY PAGE | 37
DISTRIBUTION BY SKILL LEVEL
Federal data on typical education, experience, and training requirements by occupation was used to segment the region’s employment base by skill level. Low-skilled occupations are defined as those requiring a high school diploma or less, while occupations requiring a bachelor’s degree or above are categorized as high skill. The remaining jobs (those typically requiring more than high school, but less than a four-year degree), are deemed middle-skills jobs. This broad category encompasses a variety of jobs that are essential to a wide range of industries. They include skilled trades, such as plumbers and electricians, as well as production workers, healthcare technicians, and administrative support functions. By this measure, Fort Worth has seen above-average growth in middle-skills positions, but lags the region, state, and nation in high skills employment growth.
FIGURE 26. DISTRIBUTION OF EMPLOYMENT BY SKILL LEVEL, 2016 BASED ON TYPICAL EDUCATION & TRAINING REQUIRED
FIGURE 27. DISTRIBUTION OF EMPLOYMENT GROWTH BY SKILL LEVEL HISTORIC JOB CHANGE, 2010-2016 PROJECTED JOB CHANGE, 2016-2021
Source (both figures): Emsi 2017.2 – QCEW Employees, Non-QCEW Employees, and Self-Employed Note: Data on typical education and training is used as a proxy for skill level. Low-skilled jobs are those requiring a high school diploma or less. Middle-skilled jobs require some training beyond high school, but less than a four-year degree. High-skilled jobs require a bachelor’s degree or higher.
45%
45%
44%
44%
45%
44%
37%
36%
34%
35%
35%
35%
18%
18%
22%
21%
20%
21%
0% 10% 20% 30% 40% 50% 60% 70% 80% 90% 100%
City of Fort Worth
Fort Worth (MD)
Dallas (MD)
Dallas-Fort Worth (MSA)
Texas
USA
Low Middle High
52% 52% 48% 49% 51% 50%
37% 36%31% 33% 31% 30%
11% 12% 21% 19% 18% 20%
0%
20%
40%
60%
80%
100%
City
of F
ort W
orth
Fort
Wor
th (M
D)
Dal
las
(MD
)
Dal
las-F
ort W
orth
(MSA
)
Texa
s
USA
Low Middle High
46% 46% 43% 44% 45% 45%
36% 35% 32% 33% 33% 31%
18% 19% 25% 23% 22% 25%
0%
20%
40%
60%
80%
100%
City
of F
ort W
orth
Fort
Wor
th (M
D)
Dal
las
(MD
)
Dal
las-F
ort W
orth
(MSA
)
Texa
s
USA
Low Middle High
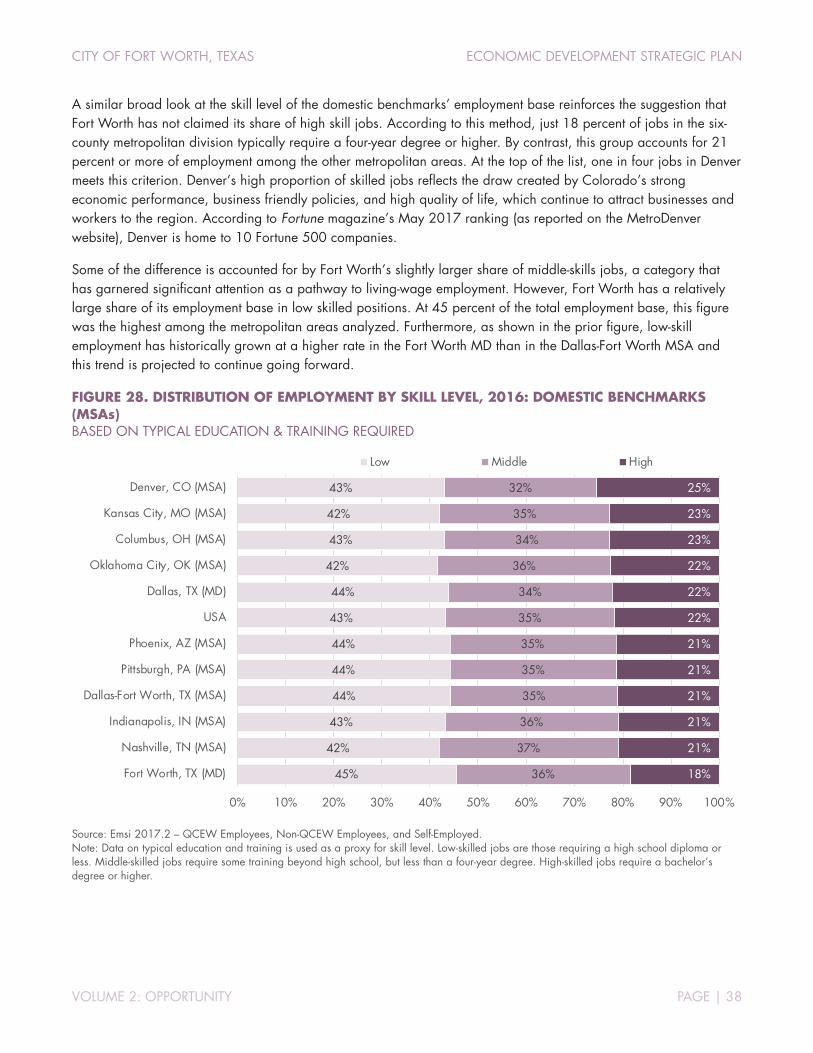
CITY OF FORT WORTH, TEXAS ECONOMIC DEVELOPMENT STRATEGIC PLAN
VOLUME 2: OPPORTUNITY PAGE | 38
A similar broad look at the skill level of the domestic benchmarks’ employment base reinforces the suggestion that Fort Worth has not claimed its share of high skill jobs. According to this method, just 18 percent of jobs in the six-county metropolitan division typically require a four-year degree or higher. By contrast, this group accounts for 21 percent or more of employment among the other metropolitan areas. At the top of the list, one in four jobs in Denver meets this criterion. Denver’s high proportion of skilled jobs reflects the draw created by Colorado’s strong economic performance, business friendly policies, and high quality of life, which continue to attract businesses and workers to the region. According to Fortune magazine’s May 2017 ranking (as reported on the MetroDenver website), Denver is home to 10 Fortune 500 companies.
Some of the difference is accounted for by Fort Worth’s slightly larger share of middle-skills jobs, a category that has garnered significant attention as a pathway to living-wage employment. However, Fort Worth has a relatively large share of its employment base in low skilled positions. At 45 percent of the total employment base, this figure was the highest among the metropolitan areas analyzed. Furthermore, as shown in the prior figure, low-skill employment has historically grown at a higher rate in the Fort Worth MD than in the Dallas-Fort Worth MSA and this trend is projected to continue going forward.
FIGURE 28. DISTRIBUTION OF EMPLOYMENT BY SKILL LEVEL, 2016: DOMESTIC BENCHMARKS (MSAs) BASED ON TYPICAL EDUCATION & TRAINING REQUIRED
Source: Emsi 2017.2 – QCEW Employees, Non-QCEW Employees, and Self-Employed. Note: Data on typical education and training is used as a proxy for skill level. Low-skilled jobs are those requiring a high school diploma or less. Middle-skilled jobs require some training beyond high school, but less than a four-year degree. High-skilled jobs require a bachelor’s degree or higher.
43%
42%
43%
42%
44%
43%
44%
44%
44%
43%
42%
45%
32%
35%
34%
36%
34%
35%
35%
35%
35%
36%
37%
36%
25%
23%
23%
22%
22%
22%
21%
21%
21%
21%
21%
18%
0% 10% 20% 30% 40% 50% 60% 70% 80% 90% 100%
Denver, CO (MSA)
Kansas City, MO (MSA)
Columbus, OH (MSA)
Oklahoma City, OK (MSA)
Dallas, TX (MD)
USA
Phoenix, AZ (MSA)
Pittsburgh, PA (MSA)
Dallas-Fort Worth, TX (MSA)
Indianapolis, IN (MSA)
Nashville, TN (MSA)
Fort Worth, TX (MD)
Low Middle High
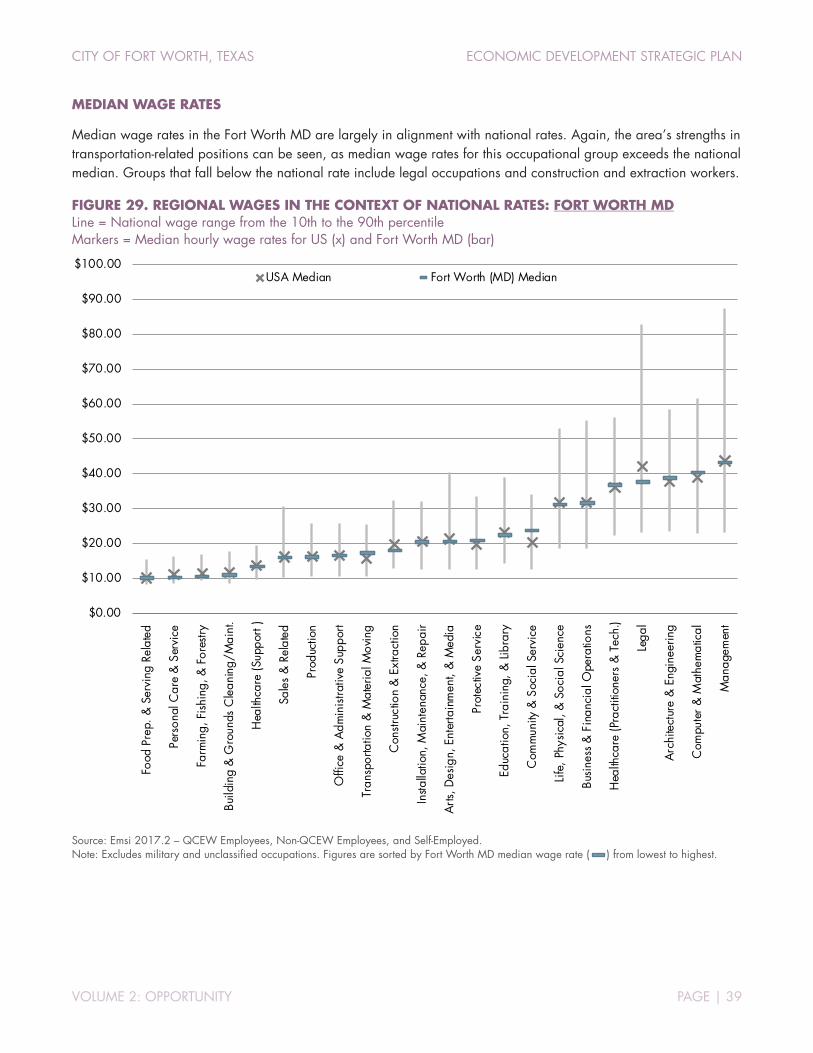
CITY OF FORT WORTH, TEXAS ECONOMIC DEVELOPMENT STRATEGIC PLAN
VOLUME 2: OPPORTUNITY PAGE | 39
MEDIAN WAGE RATES
Median wage rates in the Fort Worth MD are largely in alignment with national rates. Again, the area’s strengths in transportation-related positions can be seen, as median wage rates for this occupational group exceeds the national median. Groups that fall below the national rate include legal occupations and construction and extraction workers.
FIGURE 29. REGIONAL WAGES IN THE CONTEXT OF NATIONAL RATES: FORT WORTH MD Line = National wage range from the 10th to the 90th percentile Markers = Median hourly wage rates for US (x) and Fort Worth MD (bar)
Source: Emsi 2017.2 – QCEW Employees, Non-QCEW Employees, and Self-Employed. Note: Excludes military and unclassified occupations. Figures are sorted by Fort Worth MD median wage rate ( ) from lowest to highest.
$0.00
$10.00
$20.00
$30.00
$40.00
$50.00
$60.00
$70.00
$80.00
$90.00
$100.00
Food
Pre
p. &
Ser
ving
Rel
ated
Pers
onal
Car
e &
Ser
vice
Farm
ing,
Fis
hing
, & F
ores
try
Build
ing
& G
roun
ds C
lean
ing/
Mai
nt.
Hea
lthca
re (S
uppo
rt )
Sale
s &
Rel
ated
Prod
uctio
n
Offi
ce &
Adm
inis
trativ
e Su
ppor
t
Tran
spor
tatio
n &
Mat
eria
l Mov
ing
Con
stru
ctio
n &
Ext
ract
ion
Insta
llatio
n, M
aint
enan
ce, &
Rep
air
Arts
, Des
ign,
Ent
erta
inm
ent,
& M
edia
Prot
ectiv
e Se
rvic
e
Educ
atio
n, T
rain
ing,
& L
ibra
ry
Com
mun
ity &
Soc
ial S
ervi
ce
Life
, Ph
ysic
al, &
Soc
ial S
cien
ce
Busi
ness
& F
inan
cial
Ope
ratio
ns
Hea
lthca
re (P
ract
ition
ers
& T
ech.
)
Lega
l
Arc
hite
ctur
e &
Eng
inee
ring
Com
pute
r &
Mat
hem
atic
al
Man
agem
ent
USA Median Fort Worth (MD) Median
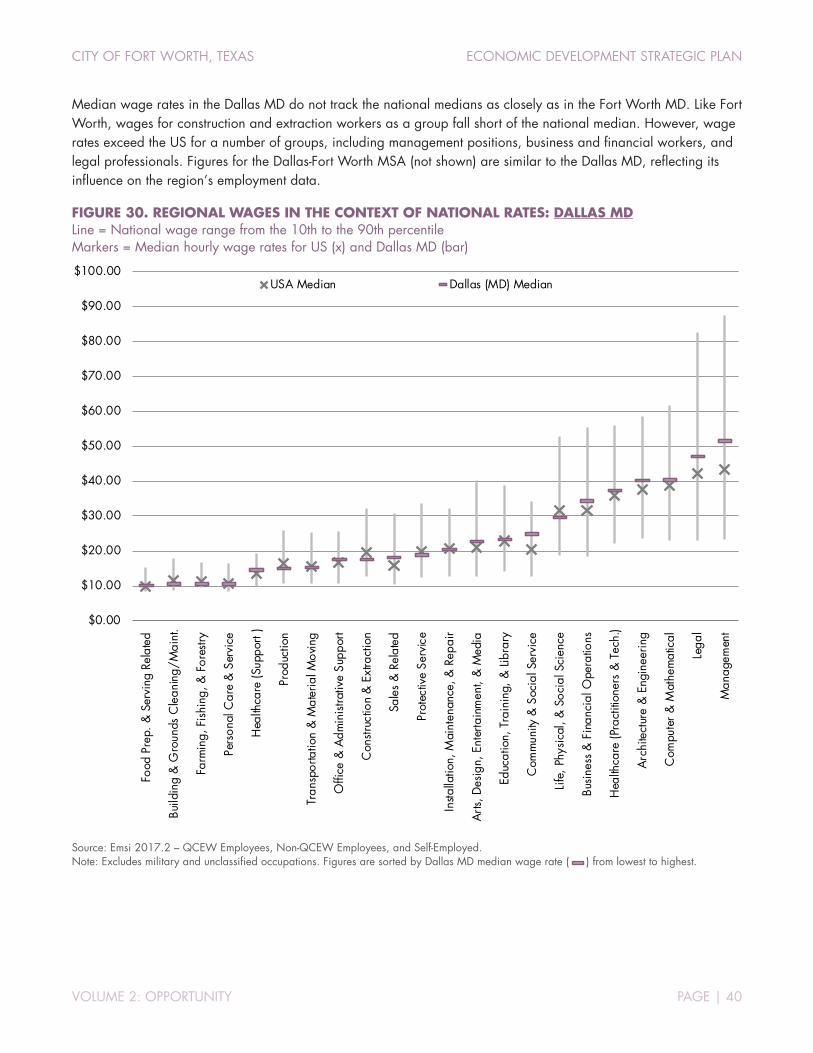
CITY OF FORT WORTH, TEXAS ECONOMIC DEVELOPMENT STRATEGIC PLAN
VOLUME 2: OPPORTUNITY PAGE | 40
Median wage rates in the Dallas MD do not track the national medians as closely as in the Fort Worth MD. Like Fort Worth, wages for construction and extraction workers as a group fall short of the national median. However, wage rates exceed the US for a number of groups, including management positions, business and financial workers, and legal professionals. Figures for the Dallas-Fort Worth MSA (not shown) are similar to the Dallas MD, reflecting its influence on the region’s employment data.
FIGURE 30. REGIONAL WAGES IN THE CONTEXT OF NATIONAL RATES: DALLAS MD Line = National wage range from the 10th to the 90th percentile Markers = Median hourly wage rates for US (x) and Dallas MD (bar)
Source: Emsi 2017.2 – QCEW Employees, Non-QCEW Employees, and Self-Employed. Note: Excludes military and unclassified occupations. Figures are sorted by Dallas MD median wage rate ( ) from lowest to highest.
$0.00
$10.00
$20.00
$30.00
$40.00
$50.00
$60.00
$70.00
$80.00
$90.00
$100.00
Food
Pre
p. &
Ser
ving
Rel
ated
Build
ing
& G
roun
ds C
lean
ing/
Mai
nt.
Farm
ing,
Fis
hing
, & F
ores
try
Pers
onal
Car
e &
Ser
vice
Hea
lthca
re (S
uppo
rt )
Prod
uctio
n
Tran
spor
tatio
n &
Mat
eria
l Mov
ing
Offi
ce &
Adm
inis
trativ
e Su
ppor
t
Con
stru
ctio
n &
Ext
ract
ion
Sale
s &
Rel
ated
Prot
ectiv
e Se
rvic
e
Insta
llatio
n, M
aint
enan
ce, &
Rep
air
Arts
, Des
ign,
Ent
erta
inm
ent,
& M
edia
Educ
atio
n, T
rain
ing,
& L
ibra
ry
Com
mun
ity &
Soc
ial S
ervi
ce
Life
, Ph
ysic
al, &
Soc
ial S
cien
ce
Busi
ness
& F
inan
cial
Ope
ratio
ns
Hea
lthca
re (P
ract
ition
ers
& T
ech.
)
Arc
hite
ctur
e &
Eng
inee
ring
Com
pute
r &
Mat
hem
atic
al
Lega
l
Man
agem
ent
USA Median Dallas (MD) Median

CITY OF FORT WORTH, TEXAS ECONOMIC DEVELOPMENT STRATEGIC PLAN
VOLUME 2: OPPORTUNITY PAGE | 41
Unlike the prior charts which compared wage rates in one metropolitan division against the national median, Figure 31 compares the median wage rate in the Fort Worth MD against the Dallas MD. The national context is still shown via the bar marking the US wage range from the 10th and 90th percentile. This view highlights some sharp differences in wage rates between the east and west sides of the metro area, most notably in median wage rates for management and legal occupations.
FIGURE 31. REGIONAL WAGES IN THE CONTEXT OF NATIONAL RATES: FORT WORTH MD COMPARED TO DALLAS MD Line = National wage range from the 10th to the 90th percentile Markers = Median hourly wage rates for Fort Worth MD (bar) and Dallas MD (x)
Source: Emsi 2017.2 – QCEW Employees, Non-QCEW Employees, and Self-Employed. Note: Excludes military and unclassified occupations. Figures are sorted by Fort Worth MD median wage rate ( ) from lowest to highest.
$0.00
$10.00
$20.00
$30.00
$40.00
$50.00
$60.00
$70.00
$80.00
$90.00
$100.00
Food
Pre
p. &
Ser
ving
Rel
ated
Pers
onal
Car
e &
Ser
vice
Farm
ing,
Fis
hing
, & F
ores
try
Build
ing
& G
roun
ds C
lean
ing/
Mai
nt.
Hea
lthca
re (S
uppo
rt )
Sale
s &
Rel
ated
Prod
uctio
n
Offi
ce &
Adm
inis
trativ
e Su
ppor
t
Tran
spor
tatio
n &
Mat
eria
l Mov
ing
Con
stru
ctio
n &
Ext
ract
ion
Insta
llatio
n, M
aint
enan
ce, &
Rep
air
Arts
, Des
ign,
Ent
erta
inm
ent,
& M
edia
Prot
ectiv
e Se
rvic
e
Educ
atio
n, T
rain
ing,
& L
ibra
ry
Com
mun
ity &
Soc
ial S
ervi
ce
Life
, Ph
ysic
al, &
Soc
ial S
cien
ce
Busi
ness
& F
inan
cial
Ope
ratio
ns
Hea
lthca
re (P
ract
ition
ers
& T
ech.
)
Lega
l
Arc
hite
ctur
e &
Eng
inee
ring
Com
pute
r &
Mat
hem
atic
al
Man
agem
ent
Dallas (MD) Median Fort Worth (MD) Median

CITY OF FORT WORTH, TEXAS ECONOMIC DEVELOPMENT STRATEGIC PLAN
VOLUME 2: OPPORTUNITY PAGE | 42
Figure 32 provides a comparison of median hourly wage rates by major occupational group for the domestic benchmarks. The data highlight some stark contrasts among the MSAs. One of the more obvious takeaways is the relatively high wage rates found in the Denver MSA across virtually every occupational group.
FIGURE 32. COMPARISON OF MEDIAN HOURLY WAGE RATES ACROSS DOMESTIC BENCHMARKS (MSAS) BY MAJOR OCCUPATIONAL GROUP
Source: Emsi 2017.2 – QCEW Employees, Non-QCEW Employees, and Self-Employed. Note: Excludes military and unclassified occupations. Formatting rules are applied by row (rather than to the entire chart) to show relative wage rates across the peer regions. Darker shading indicates higher median wage rates.
For
t Wor
th (M
D)
Dal
las
(MD
)
Dal
las-F
ort W
orth
(MSA
)
Col
umbu
s, O
H (M
SA)
Den
ver,
CO
(MSA
)
Indi
anap
olis
, IN
(MSA
)
Kan
sas
City
, MO
(MSA
)
Nas
hvill
e, T
N (M
SA)
Okl
ahom
a C
ity, O
K (M
SA)
Pho
enix
, AZ
(MSA
)
Pitt
sbur
gh, P
A (M
SA)
11-0000 Mgmt. $43.04 $51.48 $49.14 $43.44 $51.38 $39.66 $43.34 $37.79 $37.17 $41.50 $47.02
13-0000 Bus. & Fin. $31.32 $34.30 $33.63 $30.56 $33.88 $29.06 $30.81 $28.82 $28.34 $28.88 $30.23
15-0000 Computer & Math $40.09 $40.20 $40.18 $37.67 $42.68 $33.22 $37.04 $33.38 $30.23 $37.48 $33.28
17-0000 Arch. & Eng. $38.61 $39.95 $39.58 $34.25 $40.35 $34.32 $34.79 $32.95 $36.37 $36.76 $35.15
19-0000 Science $31.04 $29.55 $29.96 $27.86 $34.20 $27.30 $30.43 $26.25 $28.20 $28.52 $29.28
21-0000 Social Svc. $23.50 $24.72 $24.31 $19.70 $22.07 $21.32 $19.73 $19.29 $18.10 $19.15 $18.04
23-0000 Legal $37.53 $46.99 $44.70 $37.23 $44.22 $39.44 $37.97 $41.38 $34.44 $40.07 $42.86
25-0000 Education $22.28 $23.14 $22.86 $25.48 $23.75 $21.00 $19.63 $21.02 $18.86 $20.17 $24.12
27-0000 Arts & Ent. $20.44 $22.60 $22.02 $20.37 $20.85 $19.19 $21.44 $20.60 $20.10 $18.18 $20.46
29-0000 Health (Tech.) $36.63 $37.40 $37.16 $35.39 $38.23 $36.46 $34.86 $33.27 $31.57 $37.36 $33.36
31-0000 Health (Support) $13.38 $14.57 $14.22 $12.37 $15.39 $13.66 $13.42 $13.25 $13.23 $14.19 $13.82
33-0000 Protective Svc. $20.68 $18.78 $19.34 $22.57 $21.38 $17.17 $19.03 $15.77 $21.10 $19.89 $17.86
35-0000 Food Workers $9.87 $10.15 $10.06 $10.21 $10.29 $9.74 $9.77 $9.73 $9.44 $10.00 $9.96
37-0000 Gen. Maint. $10.84 $10.40 $10.53 $11.34 $11.77 $10.92 $11.65 $11.25 $10.48 $11.17 $11.95
39-0000 Personal Care $10.19 $10.52 $10.42 $10.59 $11.32 $10.46 $10.58 $11.03 $10.52 $10.97 $10.96
41-0000 Sales & Related $15.81 $18.19 $17.50 $15.84 $18.56 $16.67 $16.65 $15.76 $14.55 $15.50 $16.54
43-0000 Office & Admin. $16.52 $17.38 $17.14 $16.45 $18.28 $16.40 $16.85 $16.43 $15.77 $16.50 $16.32
45-0000 Ag & Forestry $10.28 $10.48 $10.40 $13.64 $12.70 $12.01 $12.98 $11.97 $11.72 $10.55 $11.60
47-0000 Construct./Mining $17.86 $17.52 $17.64 $19.82 $20.12 $21.93 $22.14 $17.50 $19.01 $18.69 $21.77
49-0000 Install & Repair $20.18 $20.40 $20.32 $21.04 $22.67 $21.09 $20.34 $20.58 $20.33 $20.01 $20.34
51-0000 Production $16.06 $15.07 $15.43 $17.28 $16.51 $15.49 $18.13 $16.80 $15.94 $15.89 $18.05
53-0000 Transportation $17.16 $15.15 $15.82 $14.19 $18.43 $14.98 $16.07 $15.06 $15.36 $16.05 $15.95
ALL GROUPS $20.02 $22.02 $21.42 $20.97 $23.64 $20.17 $21.16 $19.75 $19.40 $20.35 $20.69
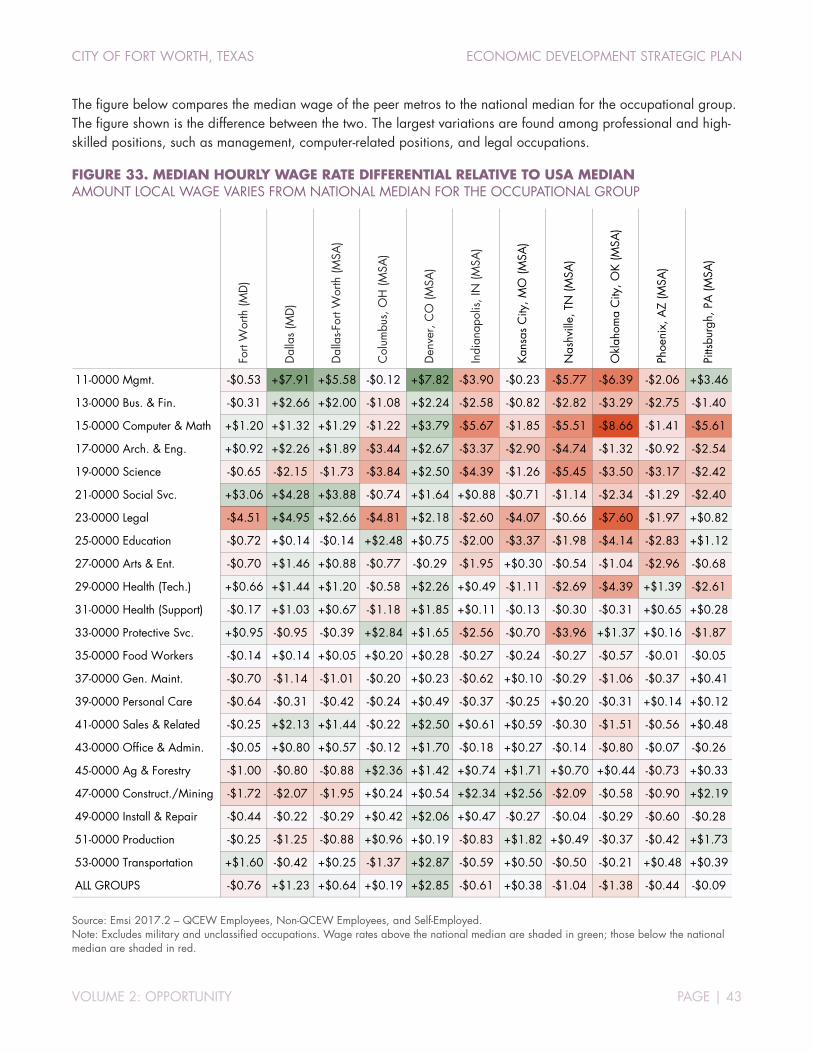
CITY OF FORT WORTH, TEXAS ECONOMIC DEVELOPMENT STRATEGIC PLAN
VOLUME 2: OPPORTUNITY PAGE | 43
The figure below compares the median wage of the peer metros to the national median for the occupational group. The figure shown is the difference between the two. The largest variations are found among professional and high-skilled positions, such as management, computer-related positions, and legal occupations.
FIGURE 33. MEDIAN HOURLY WAGE RATE DIFFERENTIAL RELATIVE TO USA MEDIAN AMOUNT LOCAL WAGE VARIES FROM NATIONAL MEDIAN FOR THE OCCUPATIONAL GROUP
Source: Emsi 2017.2 – QCEW Employees, Non-QCEW Employees, and Self-Employed. Note: Excludes military and unclassified occupations. Wage rates above the national median are shaded in green; those below the national median are shaded in red.
For
t Wor
th (M
D)
Dal
las
(MD
)
Dal
las-F
ort W
orth
(MSA
)
Col
umbu
s, O
H (M
SA)
Den
ver,
CO
(MSA
)
Indi
anap
olis
, IN
(MSA
)
Kan
sas
City
, MO
(MSA
)
Nas
hvill
e, T
N (M
SA)
Okl
ahom
a C
ity, O
K (M
SA)
Pho
enix
, AZ
(MSA
)
Pitt
sbur
gh, P
A (M
SA)
11-0000 Mgmt. -$0.53 +$7.91 +$5.58 -$0.12 +$7.82 -$3.90 -$0.23 -$5.77 -$6.39 -$2.06 +$3.46
13-0000 Bus. & Fin. -$0.31 +$2.66 +$2.00 -$1.08 +$2.24 -$2.58 -$0.82 -$2.82 -$3.29 -$2.75 -$1.40
15-0000 Computer & Math +$1.20 +$1.32 +$1.29 -$1.22 +$3.79 -$5.67 -$1.85 -$5.51 -$8.66 -$1.41 -$5.61
17-0000 Arch. & Eng. +$0.92 +$2.26 +$1.89 -$3.44 +$2.67 -$3.37 -$2.90 -$4.74 -$1.32 -$0.92 -$2.54
19-0000 Science -$0.65 -$2.15 -$1.73 -$3.84 +$2.50 -$4.39 -$1.26 -$5.45 -$3.50 -$3.17 -$2.42
21-0000 Social Svc. +$3.06 +$4.28 +$3.88 -$0.74 +$1.64 +$0.88 -$0.71 -$1.14 -$2.34 -$1.29 -$2.40
23-0000 Legal -$4.51 +$4.95 +$2.66 -$4.81 +$2.18 -$2.60 -$4.07 -$0.66 -$7.60 -$1.97 +$0.82
25-0000 Education -$0.72 +$0.14 -$0.14 +$2.48 +$0.75 -$2.00 -$3.37 -$1.98 -$4.14 -$2.83 +$1.12
27-0000 Arts & Ent. -$0.70 +$1.46 +$0.88 -$0.77 -$0.29 -$1.95 +$0.30 -$0.54 -$1.04 -$2.96 -$0.68
29-0000 Health (Tech.) +$0.66 +$1.44 +$1.20 -$0.58 +$2.26 +$0.49 -$1.11 -$2.69 -$4.39 +$1.39 -$2.61
31-0000 Health (Support) -$0.17 +$1.03 +$0.67 -$1.18 +$1.85 +$0.11 -$0.13 -$0.30 -$0.31 +$0.65 +$0.28
33-0000 Protective Svc. +$0.95 -$0.95 -$0.39 +$2.84 +$1.65 -$2.56 -$0.70 -$3.96 +$1.37 +$0.16 -$1.87
35-0000 Food Workers -$0.14 +$0.14 +$0.05 +$0.20 +$0.28 -$0.27 -$0.24 -$0.27 -$0.57 -$0.01 -$0.05
37-0000 Gen. Maint. -$0.70 -$1.14 -$1.01 -$0.20 +$0.23 -$0.62 +$0.10 -$0.29 -$1.06 -$0.37 +$0.41
39-0000 Personal Care -$0.64 -$0.31 -$0.42 -$0.24 +$0.49 -$0.37 -$0.25 +$0.20 -$0.31 +$0.14 +$0.12
41-0000 Sales & Related -$0.25 +$2.13 +$1.44 -$0.22 +$2.50 +$0.61 +$0.59 -$0.30 -$1.51 -$0.56 +$0.48
43-0000 Office & Admin. -$0.05 +$0.80 +$0.57 -$0.12 +$1.70 -$0.18 +$0.27 -$0.14 -$0.80 -$0.07 -$0.26
45-0000 Ag & Forestry -$1.00 -$0.80 -$0.88 +$2.36 +$1.42 +$0.74 +$1.71 +$0.70 +$0.44 -$0.73 +$0.33
47-0000 Construct./Mining -$1.72 -$2.07 -$1.95 +$0.24 +$0.54 +$2.34 +$2.56 -$2.09 -$0.58 -$0.90 +$2.19
49-0000 Install & Repair -$0.44 -$0.22 -$0.29 +$0.42 +$2.06 +$0.47 -$0.27 -$0.04 -$0.29 -$0.60 -$0.28
51-0000 Production -$0.25 -$1.25 -$0.88 +$0.96 +$0.19 -$0.83 +$1.82 +$0.49 -$0.37 -$0.42 +$1.73
53-0000 Transportation +$1.60 -$0.42 +$0.25 -$1.37 +$2.87 -$0.59 +$0.50 -$0.50 -$0.21 +$0.48 +$0.39
ALL GROUPS -$0.76 +$1.23 +$0.64 +$0.19 +$2.85 -$0.61 +$0.38 -$1.04 -$1.38 -$0.44 -$0.09

CITY OF FORT WORTH, TEXAS ECONOMIC DEVELOPMENT STRATEGIC PLAN
VOLUME 2: OPPORTUNITY PAGE | 44
REGIONAL PRICE PARITIES
Regional Price Parities (RPPs), produced by the US Bureau of Economic Analysis, provide a quick measure of the differences in prices of goods and services (including rent) across states and metropolitan areas for a given year. RPPs are expressed as a percentage of the overall national price level, which is equal to 100.0. Data are not provided for the metropolitan divisions, so comparisons are made to the Dallas-Fort Worth metro area.
Using this metric, the metro area’s cost of living is consistent with the national average. Of the three components that comprise the measure, the Dallas-Fort Worth metro area compares most favorably on the cost of goods, ranking fourth among the benchmark MSAs, with an RPP of 97.8. The Dallas-Fort Worth metro area compares least favorably to the other MSAs on the cost of services (excluding rent), although costs on this component are only slightly above the national norm.
Among the domestic benchmarks, Denver is the only MSA that has a combined score above the national average. Denver’s 106.0 RPP is driven by much higher rents, which are roughly 22 percent above the US average. At the other end of the spectrum, rents in the Pittsburgh MSA are well below the US average (more than 20 percent lower, as evidenced by an RPP of 78.8). Oklahoma City was the lowest cost MSA among the benchmarks, with an RPP on all items of 92.1, meaning overall cost of living in the Oklahoma City metro area is roughly 8 percent lower than the national average.
FIGURE 34. REGIONAL PRICE PARITIES, 2015 SORTED BY “ALL ITEMS,” US = 100.0
GOODS SERVICES: OTHER SERVICES: RENTS ALL ITEMS
Denver, CO (MSA) 1 101.5 2 101.1 1 122.4 1 106.0
Dallas-Fort Worth, TX (MSA) 4 97.8 1 101.8 2 101.6 2 100.0
Phoenix, AZ (MSA) 2 98.1 4 96.4 3 96.7 3 97.2
Pittsburgh, PA (MSA) 2 98.1 3 99.0 9 78.8 4 94.7
Nashville, TN (MSA) 8 97.1 6 94.0 4 87.9 5 93.9
Kansas City, MO-KS (MSA) 9 96.4 5 96.3 6 83.2 6 93.7
Indianapolis, IN (MSA) 5 97.6 8 93.7 6 83.2 7 93.1
Columbus, OH (MSA) 6 97.4 9 93.5 5 83.6 7 93.1
Oklahoma City, OK (MSA) 7 97.2 6 94.0 8 79.4 9 92.1
Source: US Bureau of Economic Analysis. Note: RPPs are not produced for metropolitan divisions.

CITY OF FORT WORTH, TEXAS ECONOMIC DEVELOPMENT STRATEGIC PLAN
VOLUME 2: OPPORTUNITY PAGE | 45
DETAILED OCCUPATIONS
The prior figures gave an overview of the regional workforce at the major occupational group level. The remainder of this section presents data on individual occupations. This section uses both traditional and real-time labor market information (LMI) to identify occupations in demand by area employers. Findings from a survey of area residents and business owners also informs this analysis. Relevant survey results are presented in Section 4.
EMPLOYMENT CONCENTRATIONS
A look at LQs again illustrates the dominance of transportation-related occupations in the Fort Worth MD. Of the top 10 occupations shown in Figure 35, eight are related to transportation, including positions associated with the movement of passengers and freight and those associated with aerospace manufacturing. Wage rates in the most specialized occupations (those with the highest LQs) tend to be higher than national medians for the occupation, but are largely in keeping with regional wage rates.
Given their importance to a number of Fort Worth’s major industries, Figure 36 (page 47) shows the relative concentration of employment by individual occupations within categories most closely associated with STEM fields: 15-0000 Computer & Mathematical Occupations, 17-0000 Architecture & Engineering Occupations, and 19-0000 Life, Physical, & Social Science Occupations. Comparisons are provided to the domestic peer MSAs.
This analysis suggests that many of these critical occupations are seriously underrepresented in the Fort Worth MD. Among computer-related occupations, only the Fort Worth MD and the Nashville MSA lag the US and the other peer metro areas on every position. Fort Worth performs better with regard to engineering talent, with concentrations of some engineers twice the levels that would be expected in a labor market of similar size based on national patterns. A lack of scientific employment suggests challenges for the growth of some targets, most notably, life sciences.
FIGURE 35. REGIONAL OCCUPATIONAL STRENGTHS, RANKED BY 2016 LOCATION QUOTIENT LOCATION QUOTIENTS OF 1.25 OR MORE, WITH COMPARISON TO MSA
SOC DESCRIPTION
FORT WORTH MD DALLAS-FORT WORTH MSA
RELATIVE WAGES
LQ 2016 Jobs
Median Hourly Wage LQ
2016 Jobs
Median Hourly Wage M
SA
USA
43-5011 Cargo & Freight Agents 7.50 4,311 $21.81 2.79 5,453 $21.53 1.01 1.08
53-2031 Flight Attendants 5.33 4,147 $26.86 2.30 6,090 $27.81 0.97 1.25
43-4181 Reservation/Ticket Agents & Travel Clerks 5.20 5,292 $21.47 2.48 8,604 $18.53 1.16 1.27
49-3011 Aircraft Mechanics & Service Technicians 4.82 4,347 $27.20 2.51 7,695 $29.21 0.93 0.97
47-5071 Roustabouts, Oil & Gas 4.20 1,533 $16.64 1.47 1,830 $17.07 0.97 0.95
47-5013 Service Unit Operators, Oil, Gas, & Mining 3.96 1,203 $24.04 2.00 2,064 $23.42 1.03 1.11
53-2011 Airline Pilots, Copilots, & Flight Engineers 3.92 2,365 $69.36 2.41 4,945 $72.38 0.96 1.23
51-2011 Aircraft Systems Assemblers 3.87 1,129 $22.36 1.62 1,608 $21.68 1.03 0.95
33-9093 Transportation Security Screeners 3.40 1,103 $18.60 1.26 1,393 $18.57 1.00 0.98
17-2011 Aerospace Engineers 3.06 1,455 $58.11 1.75 2,833 $51.23 1.13 1.12
23-2093 Title Examiners, Abstractors, & Searchers 2.40 1,033 $25.69 2.00 2,922 $24.60 1.04 1.20
continued, next page

CITY OF FORT WORTH, TEXAS ECONOMIC DEVELOPMENT STRATEGIC PLAN
VOLUME 2: OPPORTUNITY PAGE | 46
FIGURE 35. REGIONAL OCCUPATIONAL STRENGTHS, RANKED BY 2016 LOCATION QUOTIENT (CONTINUED)
SOC DESCRIPTION
FORT WORTH MD DALLAS-FORT WORTH MSA
RELATIVE WAGES
LQ 2016 Jobs
Median Hourly Wage LQ
2016 Jobs
Median Hourly Wage M
SA
USA
43-6013 Medical Secretaries 1.93 7,395 $15.58 1.97 25,740 $15.47 1.01 0.98
43-5061 Production, Planning, & Expediting Clerks 1.64 3,676 $21.24 1.39 10,670 $21.98 0.97 0.96
47-2081 Drywall & Ceiling Tile Installers 1.57 1,308 $15.83 1.47 4,161 $15.96 0.99 0.90
21-2011 Clergy 1.55 2,901 $21.69 1.23 7,849 $22.15 0.98 1.04
21-2021 Directors, Religious Activities & Education 1.54 1,488 $34.50 1.26 4,143 $35.91 0.96 1.85
29-1021 Dentists, General 1.48 1,355 $84.24 1.30 4,048 $88.66 0.95 1.14
17-2199 Engineers, All Other 1.46 1,453 $46.94 0.85 2,862 $46.59 1.01 1.04
43-5032 Dispatchers, (Except Police, Fire, Ambulance) 1.45 2,081 $18.27 1.17 5,739 $17.63 1.04 1.02
53-1031 First-Line Supvsr., Transp. & Material-Movers 1.44 2,094 $25.53 1.38 6,832 $26.17 0.98 0.95
47-2051 Cement Masons & Concrete Finishers 1.44 1,777 $16.31 1.29 5,423 $15.34 1.06 0.91
53-3032 Heavy & Tractor-Trailer Truck Drivers 1.42 18,692 $18.12 1.22 55,001 $18.43 0.98 0.94
43-4131 Loan Interviewers & Clerks 1.41 2,169 $19.08 2.23 11,680 $20.50 0.93 1.05
51-4121 Welders, Cutters, Solderers, & Brazers 1.41 3,895 $17.53 1.14 10,774 $17.34 1.01 0.96
25-2011 Teachers, Preschool (Except Special Ed.) 1.38 4,476 $24.33 1.01 11,095 $18.59 1.31 1.79
47-1011 First-Line Supvsr., Constr. Trades & Extraction 1.36 5,856 $28.71 1.21 17,756 $28.05 1.02 1.04
11-9021 Construction Managers 1.36 3,432 $31.03 1.22 10,442 $33.33 0.93 0.93
29-2041 Emergency Medical Techs. & Paramedics 1.36 2,248 $16.87 0.89 5,038 $17.95 0.94 1.10
25-2031 Teachers, Secondary (Exc. Special Ed. & CTE) 1.36 8,995 $27.08 1.15 26,076 $26.60 1.02 0.99
43-3011 Bill & Account Collectors 1.35 3,028 $16.41 1.39 10,662 $17.70 0.93 0.99
11-3071 Transp., Storage, & Distribution Mgrs. 1.34 1,094 $43.46 1.22 3,397 $45.60 0.95 1.05
49-9099 Install./Maint./Repair Workers, All Other 1.33 1,727 $15.73 0.90 3,989 $16.43 0.96 0.91
41-1012 First-Line Supvsr., Non-Retail Sales Workers 1.32 3,310 $27.14 1.48 12,606 $29.34 0.93 0.93
51-5112 Printing Press Operators 1.31 1,592 $17.17 1.03 4,241 $18.00 0.95 1.02
51-9061 Inspectors, Testers, Sorters, & Weighers 1.31 4,683 $18.92 1.06 12,954 $17.83 1.06 1.08
53-1021 Supvsr., Helpers/Material Movers, Hand 1.30 1,641 $22.89 1.14 4,940 $22.84 1.00 1.01
49-2022 Telecom. Equip. Install./Repair, Exc. Line 1.28 1,996 $21.79 1.69 9,024 $22.22 0.98 0.83
41-3099 Sales Reps., Services, All Other 1.27 8,541 $23.46 1.52 34,796 $25.28 0.93 0.95
51-4011 CNC Machine Operators, Metal/Plastic 1.26 1,266 $19.27 0.90 3,061 $18.09 1.07 1.08
49-3031 Bus/Truck Mechanics & Diesel Engine Spec. 1.26 2,339 $20.57 1.04 6,611 $21.31 0.97 0.98
29-1126 Respiratory Therapists 1.26 1,072 $28.27 1.08 3,144 $28.38 1.00 1.02
Source: Emsi 2017.2 – QCEW Employees, Non-QCEW Employees, and Self-Employed. Note: Excludes military and unclassified occupations. The relative wages column compares the median hourly wage for the occupation in the Fort Worth MD against the wage rate for the occupation in the Dallas-Fort Worth MSA (MSA = 1.00) and the USA (USA = 1.00). Wage rates more than 10% higher (greater than 1.10) are shaded purple; those that are more than 10% lower (less than 0.90) are highlighted in grey.
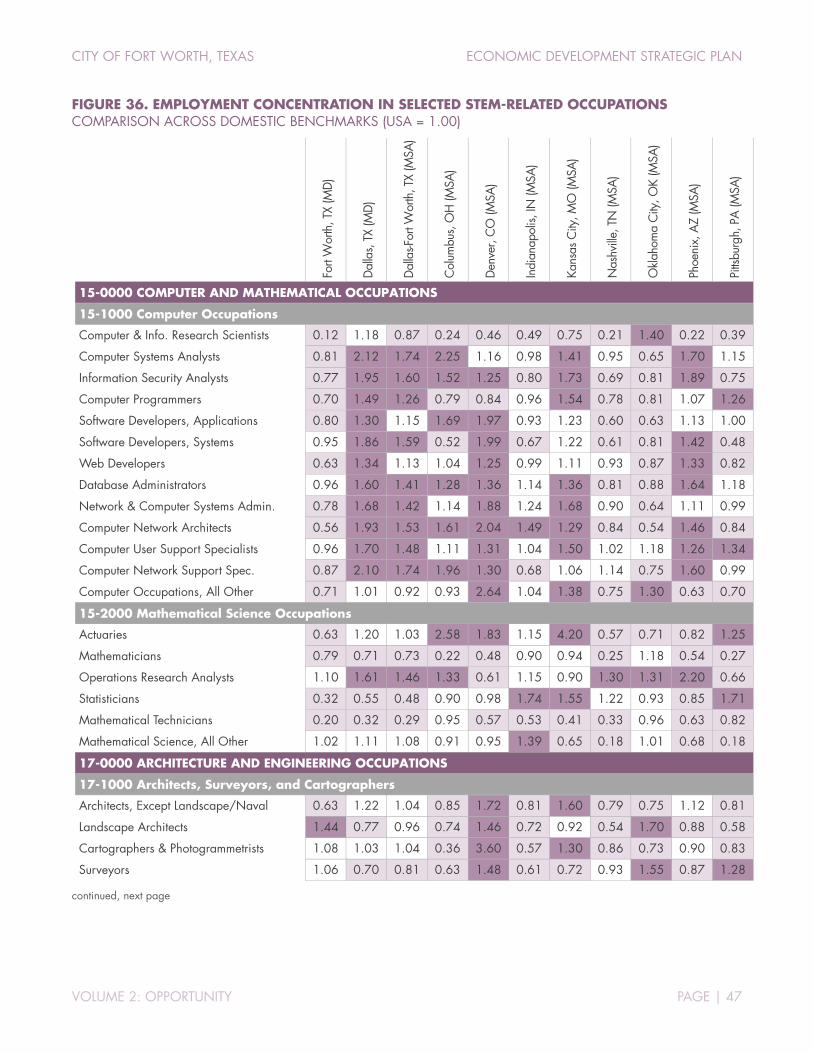
CITY OF FORT WORTH, TEXAS ECONOMIC DEVELOPMENT STRATEGIC PLAN
VOLUME 2: OPPORTUNITY PAGE | 47
FIGURE 36. EMPLOYMENT CONCENTRATION IN SELECTED STEM-RELATED OCCUPATIONS COMPARISON ACROSS DOMESTIC BENCHMARKS (USA = 1.00)
For
t Wor
th, T
X (M
D)
Dal
las,
TX
(MD
)
Dal
las-F
ort W
orth
, TX
(MSA
)
Col
umbu
s, O
H (M
SA)
Den
ver,
CO
(MSA
)
Indi
anap
olis,
IN (M
SA)
Kan
sas
City
, MO
(MSA
)
Nas
hville
, TN
(MSA
)
Okla
hom
a C
ity, O
K (M
SA)
Pho
enix
, AZ
(MSA
)
Pitt
sbur
gh, P
A (M
SA)
15-0000 COMPUTER AND MATHEMATICAL OCCUPATIONS
15-1000 Computer Occupations
Computer & Info. Research Scientists 0.12 1.18 0.87 0.24 0.46 0.49 0.75 0.21 1.40 0.22 0.39
Computer Systems Analysts 0.81 2.12 1.74 2.25 1.16 0.98 1.41 0.95 0.65 1.70 1.15
Information Security Analysts 0.77 1.95 1.60 1.52 1.25 0.80 1.73 0.69 0.81 1.89 0.75
Computer Programmers 0.70 1.49 1.26 0.79 0.84 0.96 1.54 0.78 0.81 1.07 1.26
Software Developers, Applications 0.80 1.30 1.15 1.69 1.97 0.93 1.23 0.60 0.63 1.13 1.00
Software Developers, Systems 0.95 1.86 1.59 0.52 1.99 0.67 1.22 0.61 0.81 1.42 0.48
Web Developers 0.63 1.34 1.13 1.04 1.25 0.99 1.11 0.93 0.87 1.33 0.82
Database Administrators 0.96 1.60 1.41 1.28 1.36 1.14 1.36 0.81 0.88 1.64 1.18
Network & Computer Systems Admin. 0.78 1.68 1.42 1.14 1.88 1.24 1.68 0.90 0.64 1.11 0.99
Computer Network Architects 0.56 1.93 1.53 1.61 2.04 1.49 1.29 0.84 0.54 1.46 0.84
Computer User Support Specialists 0.96 1.70 1.48 1.11 1.31 1.04 1.50 1.02 1.18 1.26 1.34
Computer Network Support Spec. 0.87 2.10 1.74 1.96 1.30 0.68 1.06 1.14 0.75 1.60 0.99
Computer Occupations, All Other 0.71 1.01 0.92 0.93 2.64 1.04 1.38 0.75 1.30 0.63 0.70
15-2000 Mathematical Science Occupations
Actuaries 0.63 1.20 1.03 2.58 1.83 1.15 4.20 0.57 0.71 0.82 1.25
Mathematicians 0.79 0.71 0.73 0.22 0.48 0.90 0.94 0.25 1.18 0.54 0.27
Operations Research Analysts 1.10 1.61 1.46 1.33 0.61 1.15 0.90 1.30 1.31 2.20 0.66
Statisticians 0.32 0.55 0.48 0.90 0.98 1.74 1.55 1.22 0.93 0.85 1.71
Mathematical Technicians 0.20 0.32 0.29 0.95 0.57 0.53 0.41 0.33 0.96 0.63 0.82
Mathematical Science, All Other 1.02 1.11 1.08 0.91 0.95 1.39 0.65 0.18 1.01 0.68 0.18
17-0000 ARCHITECTURE AND ENGINEERING OCCUPATIONS
17-1000 Architects, Surveyors, and Cartographers
Architects, Except Landscape/Naval 0.63 1.22 1.04 0.85 1.72 0.81 1.60 0.79 0.75 1.12 0.81
Landscape Architects 1.44 0.77 0.96 0.74 1.46 0.72 0.92 0.54 1.70 0.88 0.58
Cartographers & Photogrammetrists 1.08 1.03 1.04 0.36 3.60 0.57 1.30 0.86 0.73 0.90 0.83
Surveyors 1.06 0.70 0.81 0.63 1.48 0.61 0.72 0.93 1.55 0.87 1.28
continued, next page

CITY OF FORT WORTH, TEXAS ECONOMIC DEVELOPMENT STRATEGIC PLAN
VOLUME 2: OPPORTUNITY PAGE | 48
FIGURE 36. EMPLOYMENT CONCENTRATION IN SELECTED STEM-RELATED OCCUPATIONS (CONTINUED)
For
t Wor
th, T
X (M
D)
Dal
las,
TX
(MD
)
Dal
las-F
ort W
orth
, TX
(MSA
)
Col
umbu
s, O
H (M
SA)
Den
ver,
CO
(MSA
)
Indi
anap
olis,
IN (M
SA)
Kan
sas
City
, MO
(MSA
)
Nas
hville
, TN
(MSA
)
Okla
hom
a C
ity, O
K (M
SA)
Pho
enix
, AZ
(MSA
)
Pitt
sbur
gh, P
A (M
SA)
17-2000 Engineers
Aerospace Engineers 3.06 1.20 1.75 0.78 1.88 0.19 0.61 0.10 1.70 0.86 0.34
Agricultural Engineers 1.06 0.25 0.49 2.12 1.17 1.53 1.82 0.55 0.54 0.69 0.45
Biomedical Engineers 0.23 0.38 0.34 0.74 1.09 2.95 0.31 0.26 0.94 1.11 1.17
Chemical Engineers 0.30 0.90 0.73 0.42 1.14 1.45 0.70 0.26 0.49 0.33 1.41
Civil Engineers 0.65 0.85 0.79 0.91 1.84 0.73 0.94 1.00 0.72 1.08 1.49
Computer Hardware Engineers 0.28 1.58 1.20 0.15 2.47 0.38 0.39 0.52 0.27 1.45 0.48
Electrical Engineers 0.74 1.09 0.98 0.82 1.25 0.82 1.62 0.45 0.63 1.23 1.22
Electronics Eng., Except Computer 1.15 2.22 1.91 0.71 2.63 0.56 0.89 0.80 2.17 1.60 0.55
Environmental Engineers 0.59 0.83 0.76 0.40 3.00 0.77 0.95 0.75 0.79 0.68 1.91
Health & Safety Eng., Except Mines 0.64 0.81 0.77 0.43 1.11 0.70 0.91 1.16 2.15 0.88 1.10
Industrial Engineers 0.86 0.94 0.91 1.02 0.67 1.06 0.73 1.43 0.66 1.12 1.02
Marine Engineers & Naval Architects 0.74 0.14 0.31 0.17 0.92 0.47 0.40 0.20 0.39 0.32 0.35
Materials Engineers 0.75 1.51 1.29 1.07 1.47 1.01 0.34 0.52 0.73 1.19 1.52
Mechanical Engineers 0.76 0.82 0.80 2.03 1.42 1.52 1.12 0.49 0.62 0.70 1.25
Mining & Geological Eng., Incl. Mines 1.75 0.71 1.01 0.44 5.21 0.48 0.56 0.84 8.58 1.51 2.90
Nuclear Engineers 1.38 0.16 0.52 0.51 0.96 0.46 0.55 0.58 0.43 0.49 5.65
Petroleum Engineers 2.13 2.43 2.34 0.28 3.92 0.22 0.21 0.07 8.78 0.14 1.60
Engineers, All Other 1.46 0.59 0.85 0.94 0.73 0.95 0.70 0.80 1.12 0.72 0.74
17-3000 Drafters, Engineering Technicians, and Mapping Technicians
Architectural & Civil Drafters 0.94 1.25 1.16 1.30 1.45 0.53 1.14 1.00 0.89 1.11 1.46
Electrical & Electronics Drafters 0.67 1.57 1.31 0.46 1.60 0.81 1.40 1.20 0.82 1.78 1.01
Mechanical Drafters 0.84 0.83 0.83 0.66 0.90 0.96 1.01 0.76 1.38 0.59 1.57
Drafters, All Other 0.98 1.09 1.06 1.78 1.47 0.99 0.82 0.70 0.77 1.77 1.00
Aerospace Eng. & Operations Techs. 3.07 0.57 1.31 0.47 1.10 0.33 0.68 0.13 0.38 3.06 0.20
Civil Engineering Technicians 1.35 0.89 1.03 0.99 0.83 0.61 1.68 0.87 1.04 0.98 1.08
Electrical/Electronics Eng. Technicians 0.67 1.85 1.50 0.43 0.81 0.60 1.07 0.71 1.22 1.40 1.06
Electro-Mechanical Technicians 1.06 2.06 1.76 0.45 0.53 0.76 0.60 0.88 4.95 1.73 1.51
Environmental Engineering Techs. 0.26 0.69 0.56 0.58 2.55 0.94 0.88 3.38 1.55 0.38 2.06
continued, next page
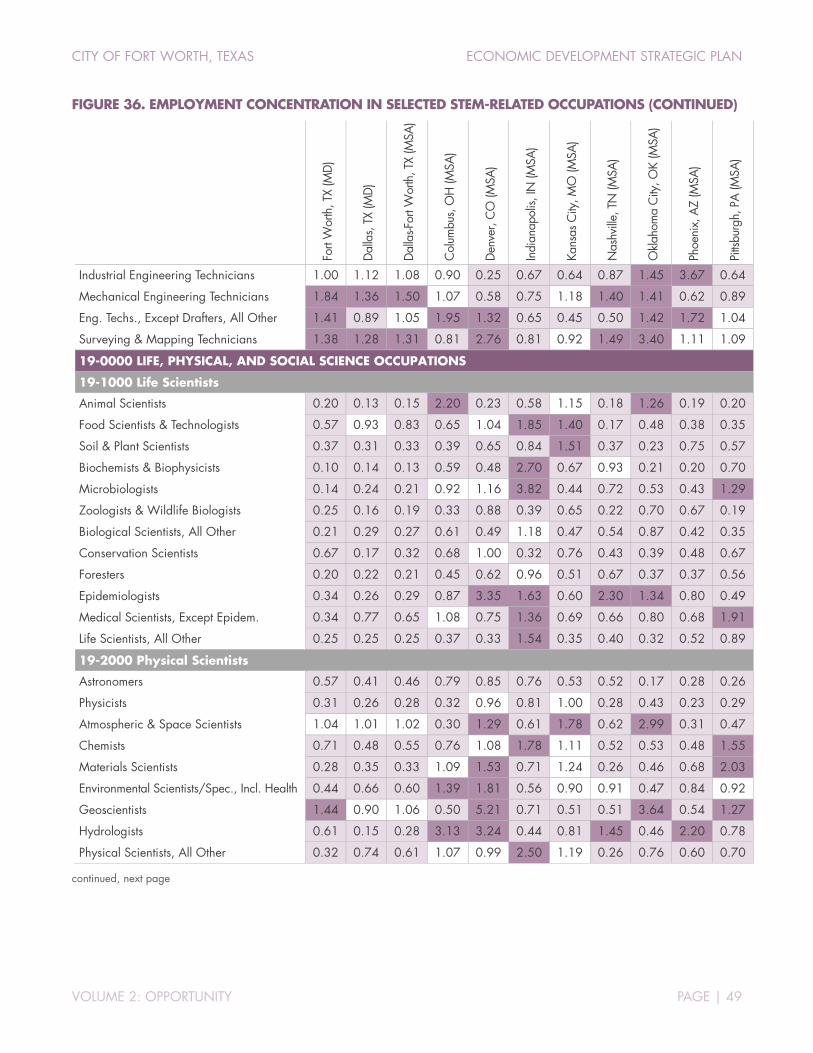
CITY OF FORT WORTH, TEXAS ECONOMIC DEVELOPMENT STRATEGIC PLAN
VOLUME 2: OPPORTUNITY PAGE | 49
FIGURE 36. EMPLOYMENT CONCENTRATION IN SELECTED STEM-RELATED OCCUPATIONS (CONTINUED)
For
t Wor
th, T
X (M
D)
Dal
las,
TX
(MD
)
Dal
las-F
ort W
orth
, TX
(MSA
)
Col
umbu
s, O
H (M
SA)
Den
ver,
CO
(MSA
)
Indi
anap
olis,
IN (M
SA)
Kan
sas
City
, MO
(MSA
)
Nas
hville
, TN
(MSA
)
Okla
hom
a C
ity, O
K (M
SA)
Pho
enix
, AZ
(MSA
)
Pitt
sbur
gh, P
A (M
SA)
Industrial Engineering Technicians 1.00 1.12 1.08 0.90 0.25 0.67 0.64 0.87 1.45 3.67 0.64
Mechanical Engineering Technicians 1.84 1.36 1.50 1.07 0.58 0.75 1.18 1.40 1.41 0.62 0.89
Eng. Techs., Except Drafters, All Other 1.41 0.89 1.05 1.95 1.32 0.65 0.45 0.50 1.42 1.72 1.04
Surveying & Mapping Technicians 1.38 1.28 1.31 0.81 2.76 0.81 0.92 1.49 3.40 1.11 1.09
19-0000 LIFE, PHYSICAL, AND SOCIAL SCIENCE OCCUPATIONS
19-1000 Life Scientists
Animal Scientists 0.20 0.13 0.15 2.20 0.23 0.58 1.15 0.18 1.26 0.19 0.20
Food Scientists & Technologists 0.57 0.93 0.83 0.65 1.04 1.85 1.40 0.17 0.48 0.38 0.35
Soil & Plant Scientists 0.37 0.31 0.33 0.39 0.65 0.84 1.51 0.37 0.23 0.75 0.57
Biochemists & Biophysicists 0.10 0.14 0.13 0.59 0.48 2.70 0.67 0.93 0.21 0.20 0.70
Microbiologists 0.14 0.24 0.21 0.92 1.16 3.82 0.44 0.72 0.53 0.43 1.29
Zoologists & Wildlife Biologists 0.25 0.16 0.19 0.33 0.88 0.39 0.65 0.22 0.70 0.67 0.19
Biological Scientists, All Other 0.21 0.29 0.27 0.61 0.49 1.18 0.47 0.54 0.87 0.42 0.35
Conservation Scientists 0.67 0.17 0.32 0.68 1.00 0.32 0.76 0.43 0.39 0.48 0.67
Foresters 0.20 0.22 0.21 0.45 0.62 0.96 0.51 0.67 0.37 0.37 0.56
Epidemiologists 0.34 0.26 0.29 0.87 3.35 1.63 0.60 2.30 1.34 0.80 0.49
Medical Scientists, Except Epidem. 0.34 0.77 0.65 1.08 0.75 1.36 0.69 0.66 0.80 0.68 1.91
Life Scientists, All Other 0.25 0.25 0.25 0.37 0.33 1.54 0.35 0.40 0.32 0.52 0.89
19-2000 Physical Scientists
Astronomers 0.57 0.41 0.46 0.79 0.85 0.76 0.53 0.52 0.17 0.28 0.26
Physicists 0.31 0.26 0.28 0.32 0.96 0.81 1.00 0.28 0.43 0.23 0.29
Atmospheric & Space Scientists 1.04 1.01 1.02 0.30 1.29 0.61 1.78 0.62 2.99 0.31 0.47
Chemists 0.71 0.48 0.55 0.76 1.08 1.78 1.11 0.52 0.53 0.48 1.55
Materials Scientists 0.28 0.35 0.33 1.09 1.53 0.71 1.24 0.26 0.46 0.68 2.03
Environmental Scientists/Spec., Incl. Health 0.44 0.66 0.60 1.39 1.81 0.56 0.90 0.91 0.47 0.84 0.92
Geoscientists 1.44 0.90 1.06 0.50 5.21 0.71 0.51 0.51 3.64 0.54 1.27
Hydrologists 0.61 0.15 0.28 3.13 3.24 0.44 0.81 1.45 0.46 2.20 0.78
Physical Scientists, All Other 0.32 0.74 0.61 1.07 0.99 2.50 1.19 0.26 0.76 0.60 0.70
continued, next page
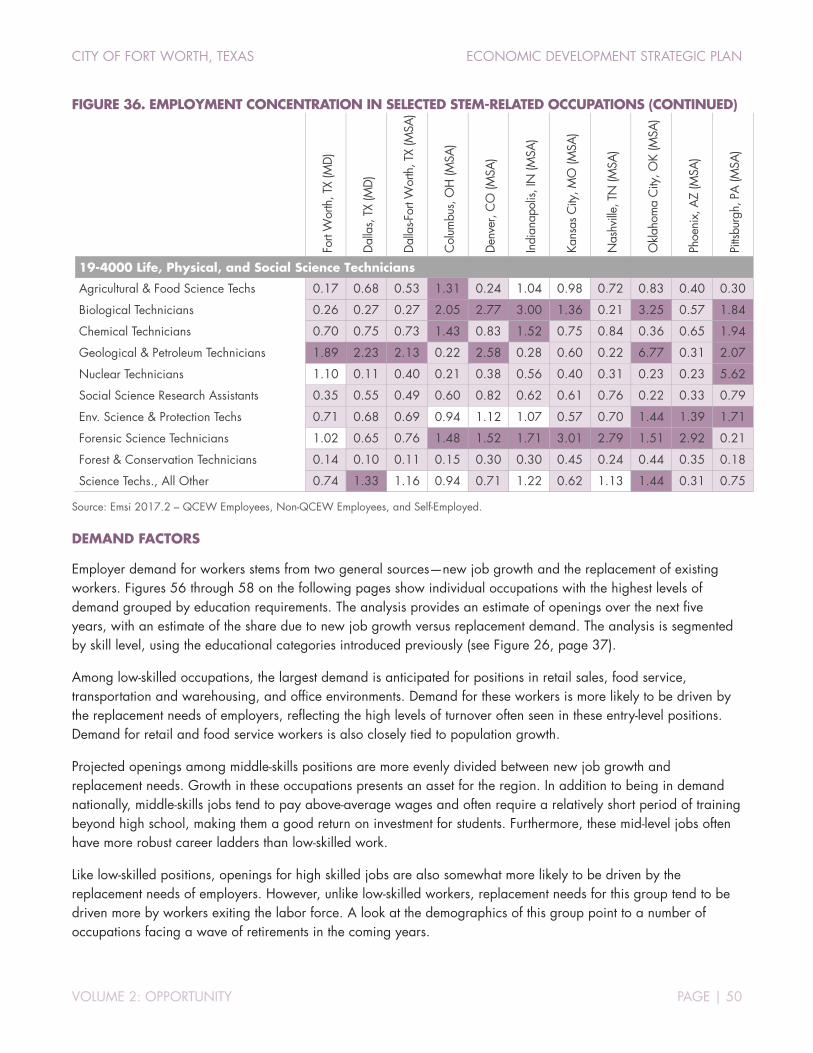
CITY OF FORT WORTH, TEXAS ECONOMIC DEVELOPMENT STRATEGIC PLAN
VOLUME 2: OPPORTUNITY PAGE | 50
FIGURE 36. EMPLOYMENT CONCENTRATION IN SELECTED STEM-RELATED OCCUPATIONS (CONTINUED)
For
t Wor
th, T
X (M
D)
Dal
las,
TX
(MD
)
Dal
las-F
ort W
orth
, TX
(MSA
)
Col
umbu
s, O
H (M
SA)
Den
ver,
CO
(MSA
)
Indi
anap
olis,
IN (M
SA)
Kan
sas
City
, MO
(MSA
)
Nas
hville
, TN
(MSA
)
Okla
hom
a C
ity, O
K (M
SA)
Pho
enix
, AZ
(MSA
)
Pitt
sbur
gh, P
A (M
SA)
19-4000 Life, Physical, and Social Science Technicians
Agricultural & Food Science Techs 0.17 0.68 0.53 1.31 0.24 1.04 0.98 0.72 0.83 0.40 0.30
Biological Technicians 0.26 0.27 0.27 2.05 2.77 3.00 1.36 0.21 3.25 0.57 1.84
Chemical Technicians 0.70 0.75 0.73 1.43 0.83 1.52 0.75 0.84 0.36 0.65 1.94
Geological & Petroleum Technicians 1.89 2.23 2.13 0.22 2.58 0.28 0.60 0.22 6.77 0.31 2.07
Nuclear Technicians 1.10 0.11 0.40 0.21 0.38 0.56 0.40 0.31 0.23 0.23 5.62
Social Science Research Assistants 0.35 0.55 0.49 0.60 0.82 0.62 0.61 0.76 0.22 0.33 0.79
Env. Science & Protection Techs 0.71 0.68 0.69 0.94 1.12 1.07 0.57 0.70 1.44 1.39 1.71
Forensic Science Technicians 1.02 0.65 0.76 1.48 1.52 1.71 3.01 2.79 1.51 2.92 0.21
Forest & Conservation Technicians 0.14 0.10 0.11 0.15 0.30 0.30 0.45 0.24 0.44 0.35 0.18
Science Techs., All Other 0.74 1.33 1.16 0.94 0.71 1.22 0.62 1.13 1.44 0.31 0.75
Source: Emsi 2017.2 – QCEW Employees, Non-QCEW Employees, and Self-Employed.
DEMAND FACTORS
Employer demand for workers stems from two general sources—new job growth and the replacement of existing workers. Figures 56 through 58 on the following pages show individual occupations with the highest levels of demand grouped by education requirements. The analysis provides an estimate of openings over the next five years, with an estimate of the share due to new job growth versus replacement demand. The analysis is segmented by skill level, using the educational categories introduced previously (see Figure 26, page 37).
Among low-skilled occupations, the largest demand is anticipated for positions in retail sales, food service, transportation and warehousing, and office environments. Demand for these workers is more likely to be driven by the replacement needs of employers, reflecting the high levels of turnover often seen in these entry-level positions. Demand for retail and food service workers is also closely tied to population growth.
Projected openings among middle-skills positions are more evenly divided between new job growth and replacement needs. Growth in these occupations presents an asset for the region. In addition to being in demand nationally, middle-skills jobs tend to pay above-average wages and often require a relatively short period of training beyond high school, making them a good return on investment for students. Furthermore, these mid-level jobs often have more robust career ladders than low-skilled work.
Like low-skilled positions, openings for high skilled jobs are also somewhat more likely to be driven by the replacement needs of employers. However, unlike low-skilled workers, replacement needs for this group tend to be driven more by workers exiting the labor force. A look at the demographics of this group point to a number of occupations facing a wave of retirements in the coming years.
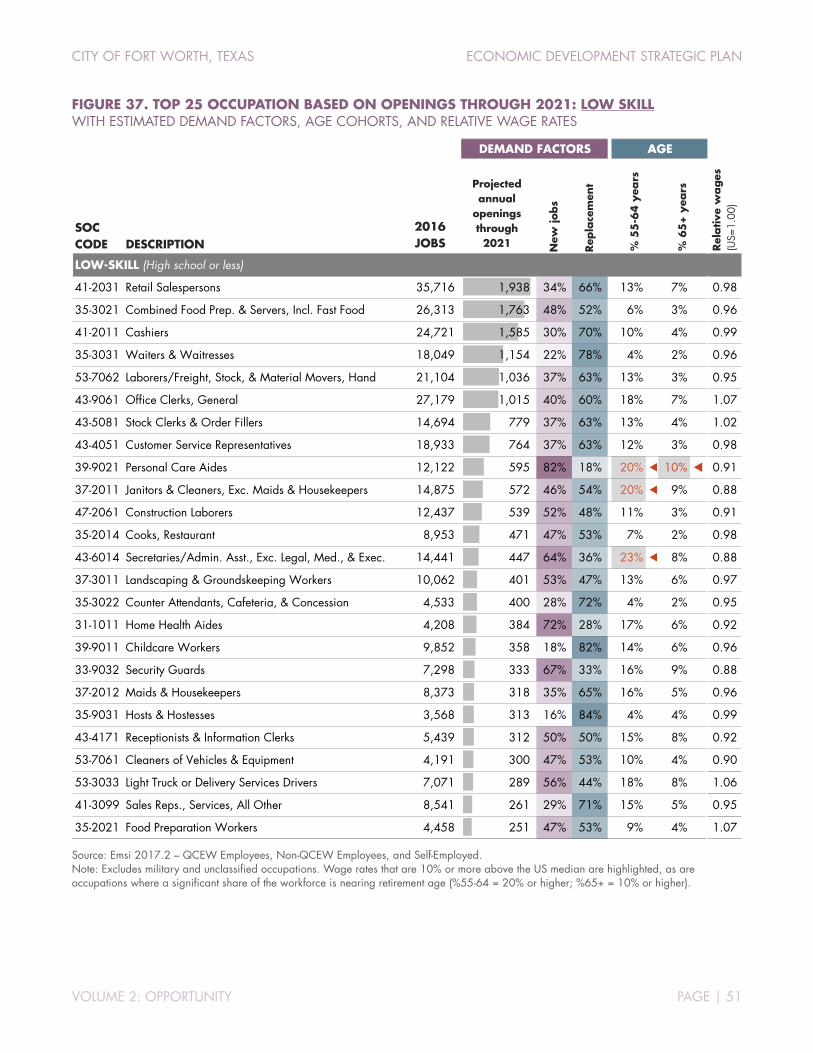
CITY OF FORT WORTH, TEXAS ECONOMIC DEVELOPMENT STRATEGIC PLAN
VOLUME 2: OPPORTUNITY PAGE | 51
FIGURE 37. TOP 25 OCCUPATION BASED ON OPENINGS THROUGH 2021: LOW SKILL WITH ESTIMATED DEMAND FACTORS, AGE COHORTS, AND RELATIVE WAGE RATES
Source: Emsi 2017.2 – QCEW Employees, Non-QCEW Employees, and Self-Employed. Note: Excludes military and unclassified occupations. Wage rates that are 10% or more above the US median are highlighted, as are occupations where a significant share of the workforce is nearing retirement age (%55-64 = 20% or higher; %65+ = 10% or higher).
2016 JOBS
Projected annual
openings through 2021 N
ew jo
bs
Rep
lace
men
t
LOW-SKILL (High school or less)
41-2031 Retail Salespersons 35,716 1,938 34% 66% 13% 7% 0.98
35-3021 Combined Food Prep. & Servers, Incl. Fast Food 26,313 1,763 48% 52% 6% 3% 0.96
41-2011 Cashiers 24,721 1,585 30% 70% 10% 4% 0.99
35-3031 Waiters & Waitresses 18,049 1,154 22% 78% 4% 2% 0.96
53-7062 Laborers/Freight, Stock, & Material Movers, Hand 21,104 1,036 37% 63% 13% 3% 0.95
43-9061 Office Clerks, General 27,179 1,015 40% 60% 18% 7% 1.07
43-5081 Stock Clerks & Order Fillers 14,694 779 37% 63% 13% 4% 1.02
43-4051 Customer Service Representatives 18,933 764 37% 63% 12% 3% 0.98
39-9021 Personal Care Aides 12,122 595 82% 18% 20% 10% 0.91
37-2011 Janitors & Cleaners, Exc. Maids & Housekeepers 14,875 572 46% 54% 20% 9% 0.88
47-2061 Construction Laborers 12,437 539 52% 48% 11% 3% 0.91
35-2014 Cooks, Restaurant 8,953 471 47% 53% 7% 2% 0.98
43-6014 Secretaries/Admin. Asst., Exc. Legal, Med., & Exec. 14,441 447 64% 36% 23% 8% 0.88
37-3011 Landscaping & Groundskeeping Workers 10,062 401 53% 47% 13% 6% 0.97
35-3022 Counter Attendants, Cafeteria, & Concession 4,533 400 28% 72% 4% 2% 0.95
31-1011 Home Health Aides 4,208 384 72% 28% 17% 6% 0.92
39-9011 Childcare Workers 9,852 358 18% 82% 14% 6% 0.96
33-9032 Security Guards 7,298 333 67% 33% 16% 9% 0.88
37-2012 Maids & Housekeepers 8,373 318 35% 65% 16% 5% 0.96
35-9031 Hosts & Hostesses 3,568 313 16% 84% 4% 4% 0.99
43-4171 Receptionists & Information Clerks 5,439 312 50% 50% 15% 8% 0.92
53-7061 Cleaners of Vehicles & Equipment 4,191 300 47% 53% 10% 4% 0.90
53-3033 Light Truck or Delivery Services Drivers 7,071 289 56% 44% 18% 8% 1.06
41-3099 Sales Reps., Services, All Other 8,541 261 29% 71% 15% 5% 0.95
35-2021 Food Preparation Workers 4,458 251 47% 53% 9% 4% 1.07
Rel
ative
wa
ges
(U
S=1.
00)
SOC CODE DESCRIPTION
DEMAND FACTORS AGE
% 5
5-6
4 y
ears
% 6
5+
yea
rs
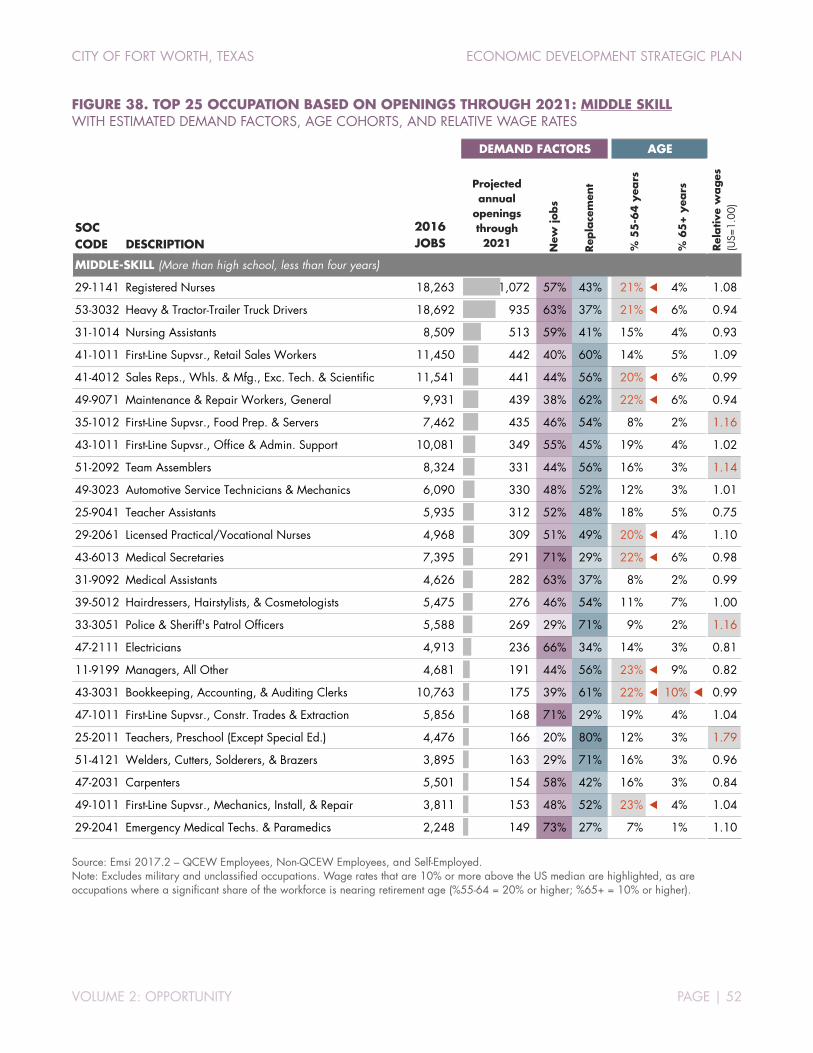
CITY OF FORT WORTH, TEXAS ECONOMIC DEVELOPMENT STRATEGIC PLAN
VOLUME 2: OPPORTUNITY PAGE | 52
FIGURE 38. TOP 25 OCCUPATION BASED ON OPENINGS THROUGH 2021: MIDDLE SKILL WITH ESTIMATED DEMAND FACTORS, AGE COHORTS, AND RELATIVE WAGE RATES
Source: Emsi 2017.2 – QCEW Employees, Non-QCEW Employees, and Self-Employed. Note: Excludes military and unclassified occupations. Wage rates that are 10% or more above the US median are highlighted, as are occupations where a significant share of the workforce is nearing retirement age (%55-64 = 20% or higher; %65+ = 10% or higher).
2016 JOBS
Projected annual
openings through 2021 N
ew jo
bs
Rep
lace
men
t
MIDDLE-SKILL (More than high school, less than four years)
29-1141 Registered Nurses 18,263 1,072 57% 43% 21% 4% 1.08
53-3032 Heavy & Tractor-Trailer Truck Drivers 18,692 935 63% 37% 21% 6% 0.94
31-1014 Nursing Assistants 8,509 513 59% 41% 15% 4% 0.93
41-1011 First-Line Supvsr., Retail Sales Workers 11,450 442 40% 60% 14% 5% 1.09
41-4012 Sales Reps., Whls. & Mfg., Exc. Tech. & Scientific 11,541 441 44% 56% 20% 6% 0.99
49-9071 Maintenance & Repair Workers, General 9,931 439 38% 62% 22% 6% 0.94
35-1012 First-Line Supvsr., Food Prep. & Servers 7,462 435 46% 54% 8% 2% 1.16
43-1011 First-Line Supvsr., Office & Admin. Support 10,081 349 55% 45% 19% 4% 1.02
51-2092 Team Assemblers 8,324 331 44% 56% 16% 3% 1.14
49-3023 Automotive Service Technicians & Mechanics 6,090 330 48% 52% 12% 3% 1.01
25-9041 Teacher Assistants 5,935 312 52% 48% 18% 5% 0.75
29-2061 Licensed Practical/Vocational Nurses 4,968 309 51% 49% 20% 4% 1.10
43-6013 Medical Secretaries 7,395 291 71% 29% 22% 6% 0.98
31-9092 Medical Assistants 4,626 282 63% 37% 8% 2% 0.99
39-5012 Hairdressers, Hairstylists, & Cosmetologists 5,475 276 46% 54% 11% 7% 1.00
33-3051 Police & Sheriff's Patrol Officers 5,588 269 29% 71% 9% 2% 1.16
47-2111 Electricians 4,913 236 66% 34% 14% 3% 0.81
11-9199 Managers, All Other 4,681 191 44% 56% 23% 9% 0.82
43-3031 Bookkeeping, Accounting, & Auditing Clerks 10,763 175 39% 61% 22% 10% 0.99
47-1011 First-Line Supvsr., Constr. Trades & Extraction 5,856 168 71% 29% 19% 4% 1.04
25-2011 Teachers, Preschool (Except Special Ed.) 4,476 166 20% 80% 12% 3% 1.79
51-4121 Welders, Cutters, Solderers, & Brazers 3,895 163 29% 71% 16% 3% 0.96
47-2031 Carpenters 5,501 154 58% 42% 16% 3% 0.84
49-1011 First-Line Supvsr., Mechanics, Install, & Repair 3,811 153 48% 52% 23% 4% 1.04
29-2041 Emergency Medical Techs. & Paramedics 2,248 149 73% 27% 7% 1% 1.10
Rel
ative
wa
ges
(U
S=1.
00)
SOC CODE DESCRIPTION
DEMAND FACTORS AGE
% 5
5-6
4 y
ears
% 6
5+
yea
rs
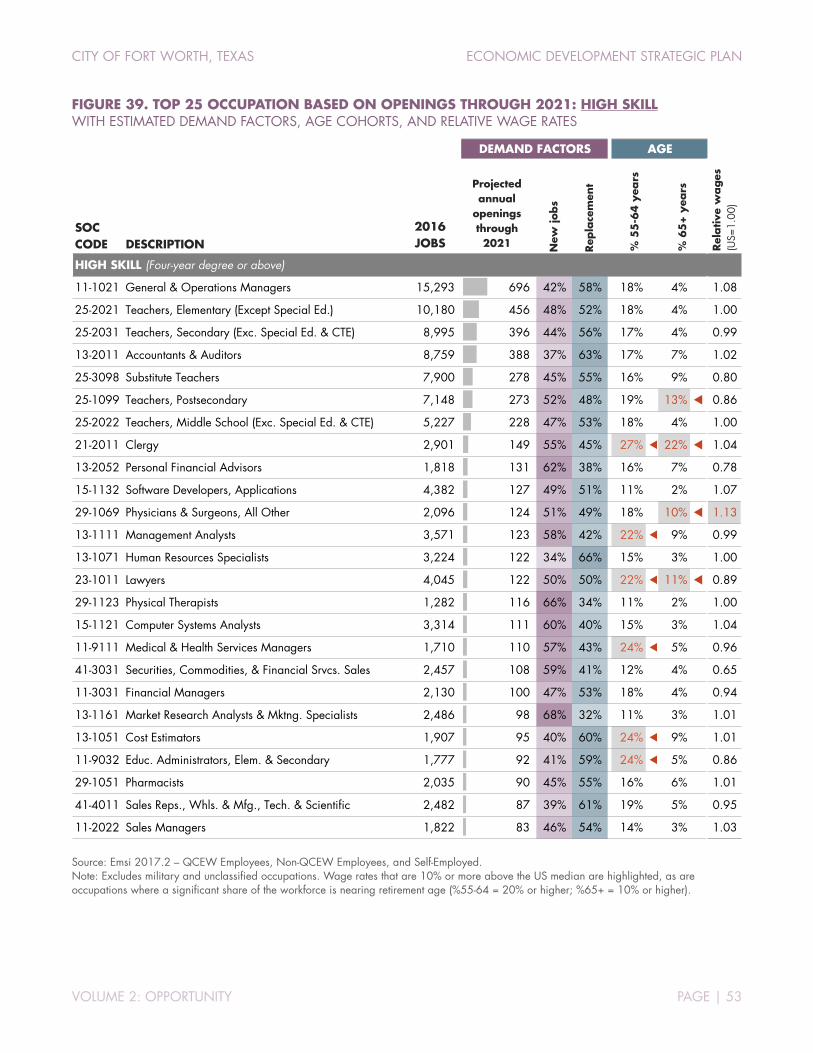
CITY OF FORT WORTH, TEXAS ECONOMIC DEVELOPMENT STRATEGIC PLAN
VOLUME 2: OPPORTUNITY PAGE | 53
FIGURE 39. TOP 25 OCCUPATION BASED ON OPENINGS THROUGH 2021: HIGH SKILL WITH ESTIMATED DEMAND FACTORS, AGE COHORTS, AND RELATIVE WAGE RATES
Source: Emsi 2017.2 – QCEW Employees, Non-QCEW Employees, and Self-Employed. Note: Excludes military and unclassified occupations. Wage rates that are 10% or more above the US median are highlighted, as are occupations where a significant share of the workforce is nearing retirement age (%55-64 = 20% or higher; %65+ = 10% or higher).
2016 JOBS
Projected annual
openings through 2021 N
ew jo
bs
Rep
lace
men
t
HIGH SKILL (Four-year degree or above)
11-1021 General & Operations Managers 15,293 696 42% 58% 18% 4% 1.08
25-2021 Teachers, Elementary (Except Special Ed.) 10,180 456 48% 52% 18% 4% 1.00
25-2031 Teachers, Secondary (Exc. Special Ed. & CTE) 8,995 396 44% 56% 17% 4% 0.99
13-2011 Accountants & Auditors 8,759 388 37% 63% 17% 7% 1.02
25-3098 Substitute Teachers 7,900 278 45% 55% 16% 9% 0.80
25-1099 Teachers, Postsecondary 7,148 273 52% 48% 19% 13% 0.86
25-2022 Teachers, Middle School (Exc. Special Ed. & CTE) 5,227 228 47% 53% 18% 4% 1.00
21-2011 Clergy 2,901 149 55% 45% 27% 22% 1.04
13-2052 Personal Financial Advisors 1,818 131 62% 38% 16% 7% 0.78
15-1132 Software Developers, Applications 4,382 127 49% 51% 11% 2% 1.07
29-1069 Physicians & Surgeons, All Other 2,096 124 51% 49% 18% 10% 1.13
13-1111 Management Analysts 3,571 123 58% 42% 22% 9% 0.99
13-1071 Human Resources Specialists 3,224 122 34% 66% 15% 3% 1.00
23-1011 Lawyers 4,045 122 50% 50% 22% 11% 0.89
29-1123 Physical Therapists 1,282 116 66% 34% 11% 2% 1.00
15-1121 Computer Systems Analysts 3,314 111 60% 40% 15% 3% 1.04
11-9111 Medical & Health Services Managers 1,710 110 57% 43% 24% 5% 0.96
41-3031 Securities, Commodities, & Financial Srvcs. Sales 2,457 108 59% 41% 12% 4% 0.65
11-3031 Financial Managers 2,130 100 47% 53% 18% 4% 0.94
13-1161 Market Research Analysts & Mktng. Specialists 2,486 98 68% 32% 11% 3% 1.01
13-1051 Cost Estimators 1,907 95 40% 60% 24% 9% 1.01
11-9032 Educ. Administrators, Elem. & Secondary 1,777 92 41% 59% 24% 5% 0.86
29-1051 Pharmacists 2,035 90 45% 55% 16% 6% 1.01
41-4011 Sales Reps., Whls. & Mfg., Tech. & Scientific 2,482 87 39% 61% 19% 5% 0.95
11-2022 Sales Managers 1,822 83 46% 54% 14% 3% 1.03
Rel
ative
wa
ges
(U
S=1.
00)
SOC CODE DESCRIPTION
DEMAND FACTORS AGE
% 5
5-6
4 y
ears
% 6
5+
yea
rs

CITY OF FORT WORTH, TEXAS ECONOMIC DEVELOPMENT STRATEGIC PLAN
VOLUME 2: OPPORTUNITY PAGE | 54
REAL-TIME LABOR MARKET INFORMATION
While traditional LMI remains the best source of data for understanding long-term trends and strategic decision-making, real-time data gleaned from online job postings provides a useful tool for understanding the needs of regional employers. Despite some limitations, most notably the underrepresentation of some occupations (production and skilled trades) and the overrepresentation of others (healthcare and IT), real-time LMI still offers timely insights regarding specific skills and certifications local employers are seeking. In addition, it can highlight occupations that are hard-to-fill in real time, something traditional sources of LMI cannot do.
Our analysis of job postings compiled by Emsi aligns with many of the findings from the data analysis presented previously. A look at job postings by occupation over the past six months in Figure 41 (page 55) reveals strong demand for truck drivers and nurses. In addition, the real-time data point to strong demand for a variety of retail positions (as demonstrated in the analysis of estimated openings presented in Figure 37, page 51). These three occupations also top the list of job postings nationally. In the case of truck drivers and nurses, high demand reflects long-standing shortages driven in part by an aging workforce. Demand for retail sales personnel is tied to economic cycles and population growth. Noteworthy among the most requested occupations is the number of IT positions, which accounted for five of the top 25 spots during the period analyzed. As previously stated, Fort Worth lags the region in these key skills.
A look at companies posting positions over the last six months (Figure 42, page 56) is also a direct reflection of the region’s established industries, along with some emerging sectors. Nearing the top of the list are transportation innovation companies, Uber and Lyft. And while the top 25 companies are dominated by retail firms, this list also includes employers in other sectors, such as healthcare (HCA Holdings, Texas Health Resources, Baylor Scott & White Health, and others), aerospace (Lockheed Martin), and transportation and logistics (CRST International, Celadon Group, and C.R. England)
Figure 43 and Figure 44 (pages 57-58) show the top certifications and hard skills culled from regional job postings. As with other data presented in this section, the region’s key sectors are reflected in the specific job requirements sought by regional employers. Commercial driver’s license tops the list of desired certifications. Healthcare-related qualifications are common among both the requested skills and certifications.
FIGURE 40. JOB POSTING ANALYTICS LAST SIX MONTHS
FORT
WORTH (MD)
DALLAS- FORT WORTH
(MSA) Unique postings 318,743 1,159,490 Total postings 2,242,977 7,853,439
DISTRIBUTION OF UNIQUE POSTS BY COUNTY
Source: Emsi based on job postings by regional employers December 2016 through May 2017.
Dallas County47%
Tarrant County24%
Collin County14%
Denton County
8%
Remaining counties
7%
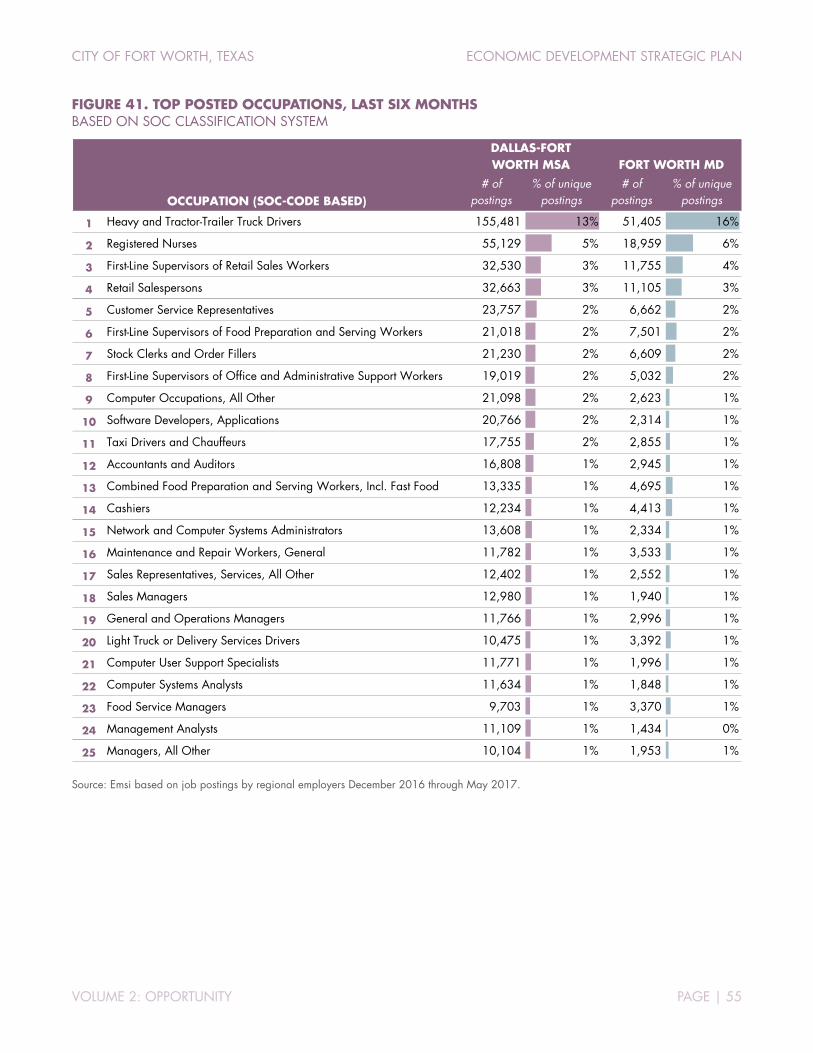
CITY OF FORT WORTH, TEXAS ECONOMIC DEVELOPMENT STRATEGIC PLAN
VOLUME 2: OPPORTUNITY PAGE | 55
FIGURE 41. TOP POSTED OCCUPATIONS, LAST SIX MONTHS BASED ON SOC CLASSIFICATION SYSTEM
Source: Emsi based on job postings by regional employers December 2016 through May 2017.
# of postings
% of unique postings
# of postings
% of unique postings
1 Heavy and Tractor-Trailer Truck Drivers 155,481 13% 51,405 16%
2 Registered Nurses 55,129 5% 18,959 6%
3 First-Line Supervisors of Retail Sales Workers 32,530 3% 11,755 4%
4 Retail Salespersons 32,663 3% 11,105 3%
5 Customer Service Representatives 23,757 2% 6,662 2%
6 First-Line Supervisors of Food Preparation and Serving Workers 21,018 2% 7,501 2%
7 Stock Clerks and Order Fillers 21,230 2% 6,609 2%
8 First-Line Supervisors of Office and Administrative Support Workers 19,019 2% 5,032 2%
9 Computer Occupations, All Other 21,098 2% 2,623 1%
10 Software Developers, Applications 20,766 2% 2,314 1%
11 Taxi Drivers and Chauffeurs 17,755 2% 2,855 1%
12 Accountants and Auditors 16,808 1% 2,945 1%
13 Combined Food Preparation and Serving Workers, Incl. Fast Food 13,335 1% 4,695 1%
14 Cashiers 12,234 1% 4,413 1%
15 Network and Computer Systems Administrators 13,608 1% 2,334 1%
16 Maintenance and Repair Workers, General 11,782 1% 3,533 1%
17 Sales Representatives, Services, All Other 12,402 1% 2,552 1%
18 Sales Managers 12,980 1% 1,940 1%
19 General and Operations Managers 11,766 1% 2,996 1%
20 Light Truck or Delivery Services Drivers 10,475 1% 3,392 1%
21 Computer User Support Specialists 11,771 1% 1,996 1%
22 Computer Systems Analysts 11,634 1% 1,848 1%
23 Food Service Managers 9,703 1% 3,370 1%
24 Management Analysts 11,109 1% 1,434 0%
25 Managers, All Other 10,104 1% 1,953 1%
DALLAS-FORT WORTH MSA FORT WORTH MD
OCCUPATION (SOC-CODE BASED)
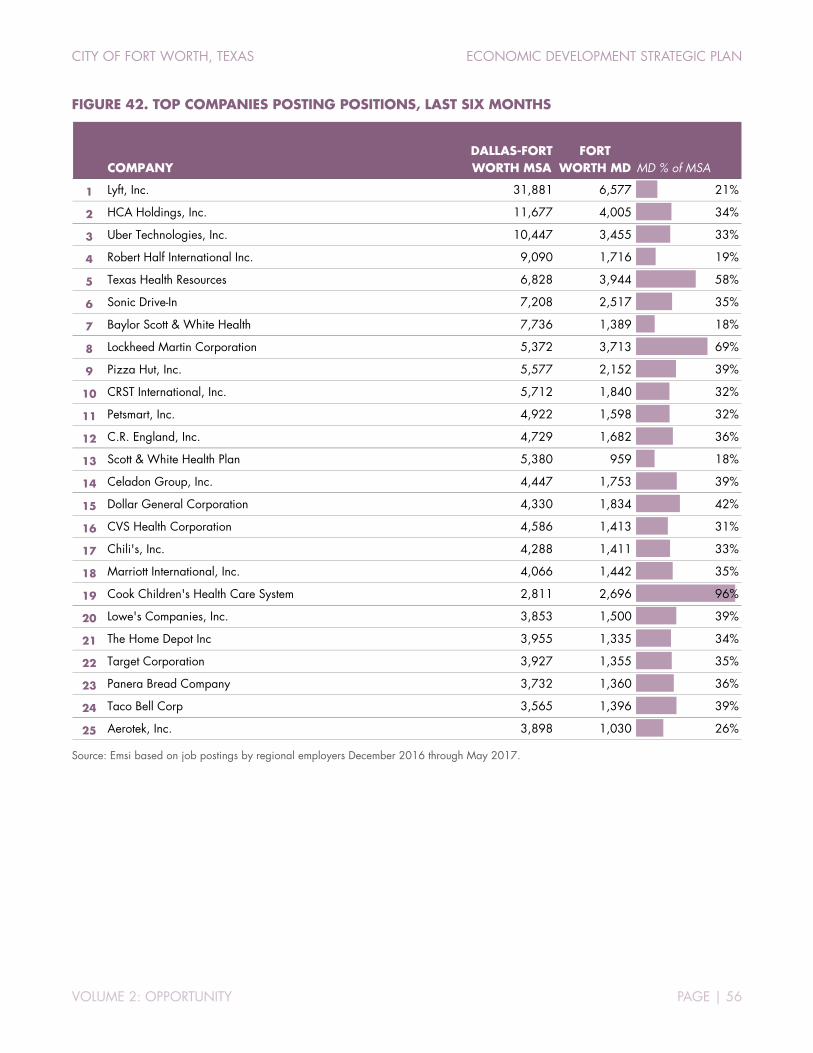
CITY OF FORT WORTH, TEXAS ECONOMIC DEVELOPMENT STRATEGIC PLAN
VOLUME 2: OPPORTUNITY PAGE | 56
FIGURE 42. TOP COMPANIES POSTING POSITIONS, LAST SIX MONTHS
Source: Emsi based on job postings by regional employers December 2016 through May 2017.
COMPANYDALLAS-FORT WORTH MSA
FORT WORTH MD MD % of MSA
1 Lyft, Inc. 31,881 6,577 21%
2 HCA Holdings, Inc. 11,677 4,005 34%
3 Uber Technologies, Inc. 10,447 3,455 33%
4 Robert Half International Inc. 9,090 1,716 19%
5 Texas Health Resources 6,828 3,944 58%
6 Sonic Drive-In 7,208 2,517 35%
7 Baylor Scott & White Health 7,736 1,389 18%
8 Lockheed Martin Corporation 5,372 3,713 69%
9 Pizza Hut, Inc. 5,577 2,152 39%
10 CRST International, Inc. 5,712 1,840 32%
11 Petsmart, Inc. 4,922 1,598 32%
12 C.R. England, Inc. 4,729 1,682 36%
13 Scott & White Health Plan 5,380 959 18%
14 Celadon Group, Inc. 4,447 1,753 39%
15 Dollar General Corporation 4,330 1,834 42%
16 CVS Health Corporation 4,586 1,413 31%
17 Chili's, Inc. 4,288 1,411 33%
18 Marriott International, Inc. 4,066 1,442 35%
19 Cook Children's Health Care System 2,811 2,696 96%
20 Lowe's Companies, Inc. 3,853 1,500 39%
21 The Home Depot Inc 3,955 1,335 34%
22 Target Corporation 3,927 1,355 35%
23 Panera Bread Company 3,732 1,360 36%
24 Taco Bell Corp 3,565 1,396 39%
25 Aerotek, Inc. 3,898 1,030 26%

CITY OF FORT WORTH, TEXAS ECONOMIC DEVELOPMENT STRATEGIC PLAN
VOLUME 2: OPPORTUNITY PAGE | 57
FIGURE 43. TOP CERTIFICATIONS REQUESTED BY EMPLOYERS, LAST SIX MONTHS SHADING SHOWS RELATIVE FREQUENCY OF SKILL AMONG TOTAL POSTINGS IN EACH GEOGRAPHIC AREA
Source: Emsi based on job postings by regional employers December 2016 through May 2017. Note: Shading shows relative number of postings in the region requesting listed certification. Darkest shading represents items mentioned on 90 percent of postings where certifications were specified; grey-shaded cells reflect certifications that appeared less than 10 percent of the time.
CERTIFICATIONS Dal
las-F
ort
Wor
th M
SA
Fort
Wor
th
MD
1 Commercial Driver's License (CDL)
2 Registered Nurse
3 Licensed Vocational Nurses
4 Master of Business Administration (MBA)
5 Nurse Practitioner
6 Licensed Practical Nurse
7 Board Certified [unspecified]
8 Certified Nursing Assistant
9 Certified Public Accountant
10 American Registry of Radiologic Technologists (ARRT) Certified
11 Certified Information Systems Security Professional
12 Patient Care Technician
13 Certified Information Security Manager
14 Certified Medical Assistant
15 ANCC Certified
16 Licensed Master Social Worker
17 Series 7 General Securities Representative License (Stockbroker)
18 Licensed Clinical Social Worker (LCSW)
19 Cisco Certified Network Associate
20 Transportation Worker Identification Credential (TWIC) Card
21 Cisco Certified Network Professional
22 Certified Benefits Professional
23 Certified Emergency Nurse (CEN)
24 Family Nursing Practitioner
25 Radiologic Technologist
26 Critical Care Registered Nurse (CCRN)
27 Medical Technologist
28 Advanced Life Support
29 Advanced Practice Registered Nurse
30 Licensed Professional Counselor (LPC)
31 CompTIA A+ Certification
32 Radiation Oncologist
33 Certified Financial Planner
34 Microsoft Certified Systems Engineer
35 Registered Health Information Technician

CITY OF FORT WORTH, TEXAS ECONOMIC DEVELOPMENT STRATEGIC PLAN
VOLUME 2: OPPORTUNITY PAGE | 58
FIGURE 44. TOP HARD & SOFT SKILLS REQUESTED BY EMPLOYERS, LAST SIX MONTHS SHADING SHOWS RELATIVE FREQUENCY OF SKILL AMONG TOTAL POSTINGS IN EACH GEOGRAPHIC AREA
Source: Emsi based on job postings by regional employers December 2016 through May 2017. Note: Shading shows relative number of postings in the region requesting listed skill. Darkest shading represents items mentioned on 90 percent of postings where skills were specified; grey-shaded cells reflect skills that appeared less than 10 percent of the time.
HARD SKILLS Dal
las-F
ort
Wor
th M
SA
Fort
Wor
th
MD
1 Management
2 Sales
3 Training
4 Customer Service
5 Communications
6 Recruitment
7 Retailing
8 Operations
9 Insurance
10 Finance
11 Health Care
12 Administration
13 Marketing
14 Information Security
15 Maintenance
16 Driving
17 Innovation
18 Restaurant Operation
19 Problem Solving
20 Testing
21 Merchandising
22 Appointment Scheduling
23 Analysis
24 Reports
25 Selling Techniques
26 Nursing
27 Lifting
28 Cleaning
29 Engineering
30 Presentations
31 Cargos
32 Life Insurance
33 Written Communication
34 Staffing
35 Hospitalization
SOFT SKILLS Dal
las-F
ort
Wor
th M
SA
Fort
Wor
th
MD
1 Scheduling (Project Management)
2 Leadership
3 Learning
4 Coordinating
5 Listening
6 Cleanliness
7 Ethics
8 Creativity
9 Critical Thinking
10 Telephone Skills
11 Career Development
12 Team Building
13 Depth Perception
14 Literacy
15 Mental Health
16 Cooperation
17 Persuasive Communication
18 Team Leading
19 Listening Skills
20 Leadership Development
21 Reliability
22 Active Listening
23 Speech
24 Creative Problem-Solving
25 Assertiveness
26 Conversation
27 Public Speaking
28 Tenacity
29 Perception
30 Persistence
31 Creative Thinking
32 Team Management
33 Imagination
34 Humility
35 Fine Motor Skills
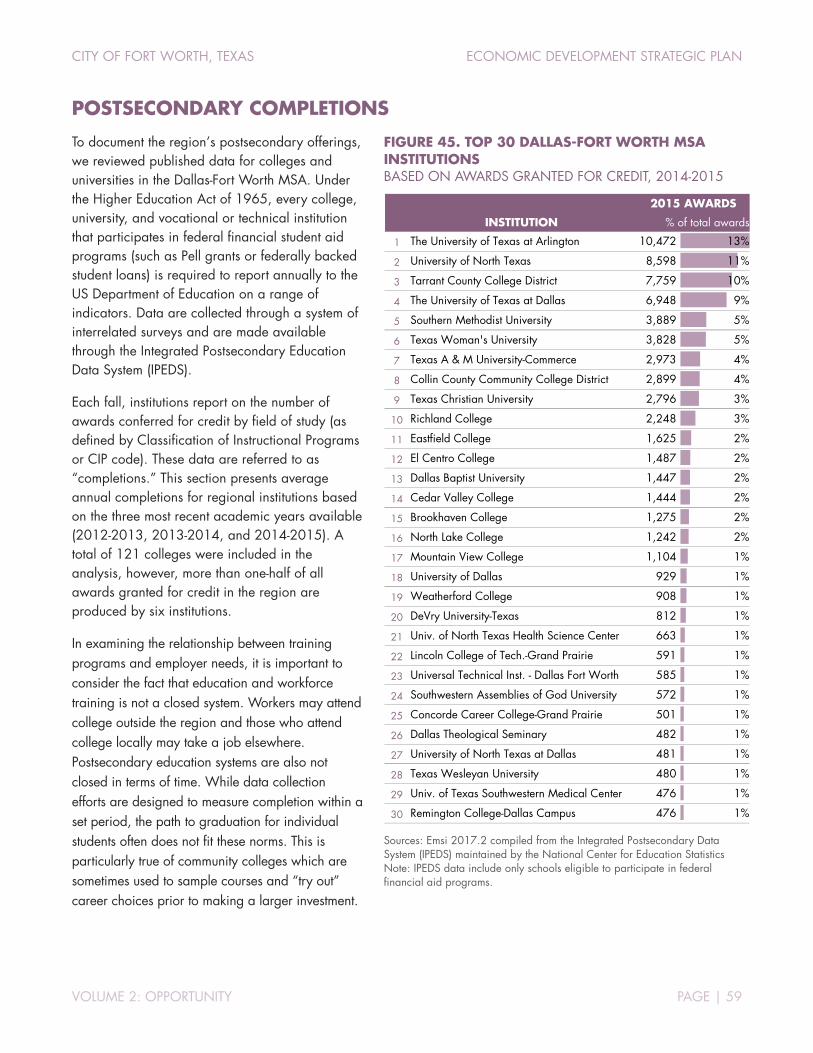
CITY OF FORT WORTH, TEXAS ECONOMIC DEVELOPMENT STRATEGIC PLAN
VOLUME 2: OPPORTUNITY PAGE | 59
POSTSECONDARY COMPLETIONS
To document the region’s postsecondary offerings, we reviewed published data for colleges and universities in the Dallas-Fort Worth MSA. Under the Higher Education Act of 1965, every college, university, and vocational or technical institution that participates in federal financial student aid programs (such as Pell grants or federally backed student loans) is required to report annually to the US Department of Education on a range of indicators. Data are collected through a system of interrelated surveys and are made available through the Integrated Postsecondary Education Data System (IPEDS).
Each fall, institutions report on the number of awards conferred for credit by field of study (as defined by Classification of Instructional Programs or CIP code). These data are referred to as “completions.” This section presents average annual completions for regional institutions based on the three most recent academic years available (2012-2013, 2013-2014, and 2014-2015). A total of 121 colleges were included in the analysis, however, more than one-half of all awards granted for credit in the region are produced by six institutions.
In examining the relationship between training programs and employer needs, it is important to consider the fact that education and workforce training is not a closed system. Workers may attend college outside the region and those who attend college locally may take a job elsewhere. Postsecondary education systems are also not closed in terms of time. While data collection efforts are designed to measure completion within a set period, the path to graduation for individual students often does not fit these norms. This is particularly true of community colleges which are sometimes used to sample courses and “try out” career choices prior to making a larger investment.
FIGURE 45. TOP 30 DALLAS-FORT WORTH MSA INSTITUTIONS BASED ON AWARDS GRANTED FOR CREDIT, 2014-2015
Sources: Emsi 2017.2 compiled from the Integrated Postsecondary Data System (IPEDS) maintained by the National Center for Education Statistics Note: IPEDS data include only schools eligible to participate in federal financial aid programs.
1 The University of Texas at Arlington 10,472 13%
2 University of North Texas 8,598 11%
3 Tarrant County College District 7,759 10%
4 The University of Texas at Dallas 6,948 9%
5 Southern Methodist University 3,889 5%
6 Texas Woman's University 3,828 5%
7 Texas A & M University-Commerce 2,973 4%
8 Collin County Community College District 2,899 4%
9 Texas Christian University 2,796 3%
10 Richland College 2,248 3%
11 Eastfield College 1,625 2%
12 El Centro College 1,487 2%
13 Dallas Baptist University 1,447 2%
14 Cedar Valley College 1,444 2%
15 Brookhaven College 1,275 2%
16 North Lake College 1,242 2%
17 Mountain View College 1,104 1%
18 University of Dallas 929 1%
19 Weatherford College 908 1%
20 DeVry University-Texas 812 1%
21 Univ. of North Texas Health Science Center 663 1%
22 Lincoln College of Tech.-Grand Prairie 591 1%
23 Universal Technical Inst. - Dallas Fort Worth 585 1%
24 Southwestern Assemblies of God University 572 1%
25 Concorde Career College-Grand Prairie 501 1%
26 Dallas Theological Seminary 482 1%
27 University of North Texas at Dallas 481 1%
28 Texas Wesleyan University 480 1%
29 Univ. of Texas Southwestern Medical Center 476 1%
30 Remington College-Dallas Campus 476 1%
2015 AWARDS
INSTITUTION % of total awards

CITY OF FORT WORTH, TEXAS ECONOMIC DEVELOPMENT STRATEGIC PLAN
VOLUME 2: OPPORTUNITY PAGE | 60
In terms of field of study (CIP Code), healthcare-related degrees top the list, accounting for nearly one in five completions in the region on average (Figure 47, page 61). Together with degrees in business-related fields and general studies, the top three fields of study represent slightly more than half of for-credit awards.
Figure 46 breaks out healthcare degrees awarded for credit by institutions in the Fort Worth MD during the 2014-2015 academic year. UT-Arlington was the largest provider of degrees in this area, accounting for more than 3,100 of the roughly 6,800 degrees awarded by Fort Worth MD institutions. Bachelor’s degrees were the most frequently awarded level, accounting for 46 percent of the total. Taken together, institutions in the Fort Worth MD awarded nearly 2,000 awards of less than two years.
Figure 48 (page 62) presents completions data by detailed CIP-Code. At this level of detail, general studies degrees emerge as the most commonly awarded degree accounting for 1 in 10 awards. Within healthcare, nursing degrees are most common, with nearly 4,000 awards granted in 2015.
FIGURE 46. HEALTH PROFESSIONS AND RELATED PROGRAMS (CIP 51): FORT WORTH MD AWARDS GRANTED FOR CREDIT BY INSTITUTIONS AND LEVEL, 2015
INSTITUTION
AWARD LEVEL
TOTAL
Award of < 1
academic year
Award of at least 1, but < 2 years
Associate degree
Bachelor’s degree
Master’s (1)
Doctorate (2)
Health Professions and Related Programs (CIP 51) The University of Texas at Arlington
2,750 334 89 3,173 Tarrant County College District 342 58 392
792 UNT Health Science Center
173 269 442 Texas Christian University
307 53 58 418 Weatherford College 11 67 225
303 Everest College-Fort Worth South
263 14
277 Brightwood College-Arlington
224
224 College of Health Care Profs.-Ft. Worth 49 125 13
187 Everest College-Arlington
181
181 Brightwood College-Fort Worth
176
176 Remington College-Fort Worth Campus 94 82
176 Texas Wesleyan University
6 104 22 132 Remaining Fort Worth MD institutions 224 26 36 44 0 0 330 TOTAL (CIP 51) 720 1,202 680 3,107 664 438 6,811
Sources: Emsi 2017.2 compiled from the Integrated Postsecondary Data System (IPEDS) maintained by the National Center for Education Statistics. Notes: IPEDS data include only schools eligible to participate in federal financial aid programs. (1) Figure includes small number of awards of at least 2, but less than 4, academic years; (2) Includes post baccalaureate certificates; (3) Includes post-masters’ certificates.

CITY OF FORT WORTH, TEXAS ECONOMIC DEVELOPMENT STRATEGIC PLAN
VOLUME 2: OPPORTUNITY PAGE | 61
FIGURE 47. AWARDS BY DALLAS-FORT WORTH MSA INSTITUTIONS, BY BROAD FIELD OF STUDY THREE-YEAR AVERAGE OF DEGREES & AWARDS GRANTED FOR CREDIT, BY 2-DIGIT CIP CODE
Sources: Emsi 2017.2 compiled from the Integrated Postsecondary Data System (IPEDS) maintained by the National Center for Education Statistics. Note: IPEDS data include only schools eligible to participate in federal financial aid programs.
51.0000 Health Professions And Related Programs 14,384 18.5%
52.0000 Business, Management, Marketing, And Related Support Services 14,223 18.3%
24.0000 Liberal Arts And Sciences, General Studies And Humanities 11,677 15.0%
12.0000 Personal And Culinary Services 3,214 4.1%
11.0000 Computer And Information Sciences And Support Services 2,922 3.8%
13.0000 Education 2,914 3.7%
30.0000 Multi/interdisciplinary Studies 2,867 3.7%
50.0000 Visual And Performing Arts 2,552 3.3%
14.0000 Engineering 2,156 2.8%
26.0000 Biological And Biomedical Sciences 1,901 2.4%
45.0000 Social Sciences 1,874 2.4%
42.0000 Psychology 1,823 2.3%
47.0000 Mechanic And Repair Technologies/Technicians 1,807 2.3%
43.0000 Homeland Security, Law Enforcement, Firefighting And Related 1,730 2.2%
09.0000 Communication, Journalism, And Related Programs 1,447 1.9%
39.0000 Theology And Religious Vocations 1,336 1.7%
44.0000 Public Administration And Social Service Professions 1,067 1.4%
15.0000 Engineering Technologies And Engineering-related Fields 1,039 1.3%
31.0000 Parks, Recreation, Leisure, And Fitness Studies 976 1.3%
22.0000 Legal Professions And Studies 822 1.1%
23.0000 English Language And Literature/letters 754 1.0%
16.0000 Foreign Languages, Literatures, And Linguistics 574 0.7%
25.0000 Library Science 537 0.7%
54.0000 History 527 0.7%
40.0000 Physical Sciences 442 0.6%
19.0000 Family And Consumer Sciences/Human Sciences 417 0.5%
27.0000 Mathematics And Statistics 414 0.5%
48.0000 Precision Production 344 0.4%
10.0000 Communications Technologies/Technicians And Support Services 282 0.4%
04.0000 Architecture And Related Services 177 0.2%
38.0000 Philosophy And Religious Studies 144 0.2%
01.0000 Agriculture, Agriculture Operations, And Related Sciences 118 0.2%
49.0000 Transportation And Materials Moving 104 0.1%
46.0000 Construction Trades 96 0.1%
03.0000 Natural Resources And Conservation 80 0.1%
05.0000 Area, Ethnic, Cultural, Gender, And Group Studies 28 0.0%
TOTAL, ALL FIELDS OF STUDY (3-YEAR AVERAGE) 77,777 100.0%
3-YEAR AVERAGECIP CODE PROGRAM Awards granted (with % of total & trend)
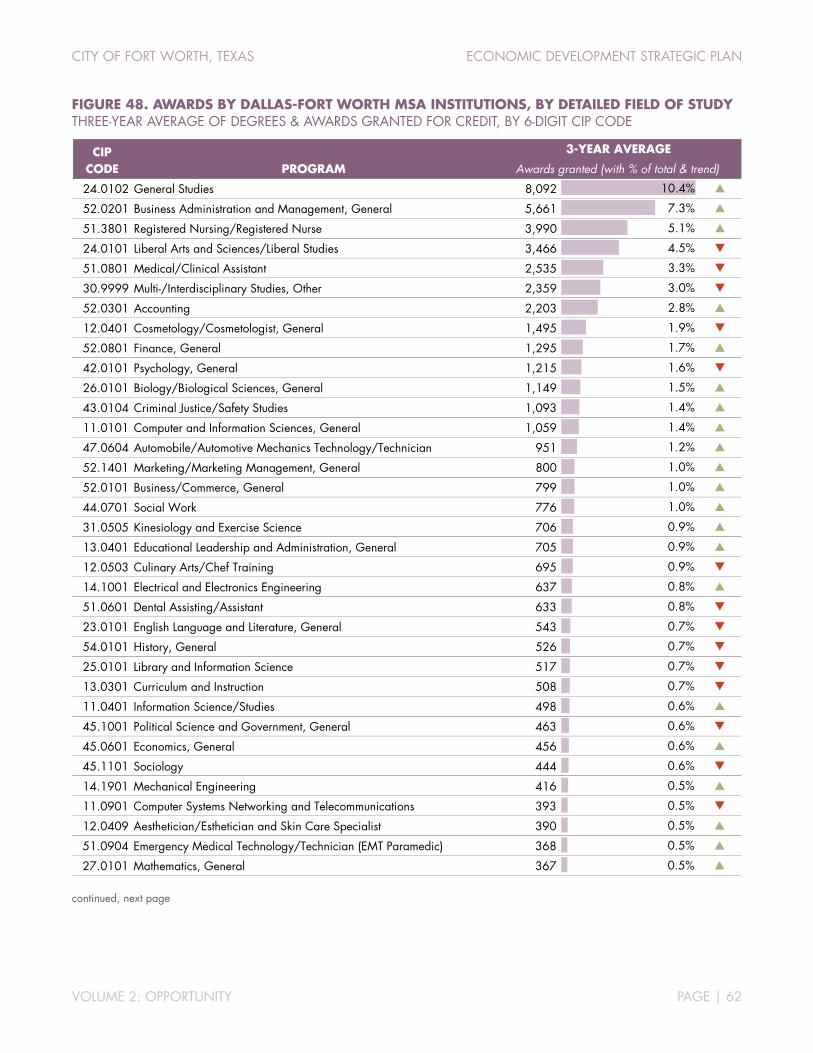
CITY OF FORT WORTH, TEXAS ECONOMIC DEVELOPMENT STRATEGIC PLAN
VOLUME 2: OPPORTUNITY PAGE | 62
FIGURE 48. AWARDS BY DALLAS-FORT WORTH MSA INSTITUTIONS, BY DETAILED FIELD OF STUDY THREE-YEAR AVERAGE OF DEGREES & AWARDS GRANTED FOR CREDIT, BY 6-DIGIT CIP CODE
continued, next page
24.0102 General Studies 8,092 10.4%
52.0201 Business Administration and Management, General 5,661 7.3%
51.3801 Registered Nursing/Registered Nurse 3,990 5.1%
24.0101 Liberal Arts and Sciences/Liberal Studies 3,466 4.5%
51.0801 Medical/Clinical Assistant 2,535 3.3%
30.9999 Multi-/Interdisciplinary Studies, Other 2,359 3.0%
52.0301 Accounting 2,203 2.8%
12.0401 Cosmetology/Cosmetologist, General 1,495 1.9%
52.0801 Finance, General 1,295 1.7%
42.0101 Psychology, General 1,215 1.6%
26.0101 Biology/Biological Sciences, General 1,149 1.5%
43.0104 Criminal Justice/Safety Studies 1,093 1.4%
11.0101 Computer and Information Sciences, General 1,059 1.4%
47.0604 Automobile/Automotive Mechanics Technology/Technician 951 1.2%
52.1401 Marketing/Marketing Management, General 800 1.0%
52.0101 Business/Commerce, General 799 1.0%
44.0701 Social Work 776 1.0%
31.0505 Kinesiology and Exercise Science 706 0.9%
13.0401 Educational Leadership and Administration, General 705 0.9%
12.0503 Culinary Arts/Chef Training 695 0.9%
14.1001 Electrical and Electronics Engineering 637 0.8%
51.0601 Dental Assisting/Assistant 633 0.8%
23.0101 English Language and Literature, General 543 0.7%
54.0101 History, General 526 0.7%
25.0101 Library and Information Science 517 0.7%
13.0301 Curriculum and Instruction 508 0.7%
11.0401 Information Science/Studies 498 0.6%
45.1001 Political Science and Government, General 463 0.6%
45.0601 Economics, General 456 0.6%
45.1101 Sociology 444 0.6%
14.1901 Mechanical Engineering 416 0.5%
11.0901 Computer Systems Networking and Telecommunications 393 0.5%
12.0409 Aesthetician/Esthetician and Skin Care Specialist 390 0.5%
51.0904 Emergency Medical Technology/Technician (EMT Paramedic) 368 0.5%
27.0101 Mathematics, General 367 0.5%
CIP CODE PROGRAM
3-YEAR AVERAGE
Awards granted (with % of total & trend)

CITY OF FORT WORTH, TEXAS ECONOMIC DEVELOPMENT STRATEGIC PLAN
VOLUME 2: OPPORTUNITY PAGE | 63
FIGURE 48. AWARDS BY DALLAS-FORT WORTH MSA INSTITUTIONS, BY DETAILED FIELD OF STUDY (CONTINUED)
Sources: Emsi 2017.2 compiled from the Integrated Postsecondary Data System (IPEDS) maintained by the National Center for Education Statistics. Note: IPEDS data include only schools eligible to participate in federal financial aid programs.
22.0302 Legal Assistant/Paralegal 357 0.5%
51.3805 Family Practice Nurse/Nursing 355 0.5%
51.3999 Practical Nursing, Vocational Nursing and Nursing Assistants, Other 351 0.5%
50.0702 Fine/Studio Arts, General 342 0.4%
52.1201 Management Information Systems, General 316 0.4%
52.0299 Business Administration, Management and Operations, Other 313 0.4%
22.0101 Law 309 0.4%
09.0401 Journalism 307 0.4%
09.0701 Radio and Television 306 0.4%
42.2803 Counseling Psychology 306 0.4%
39.0201 Bible/Biblical Studies 303 0.4%
39.0602 Divinity/Ministry 300 0.4%
48.0508 Welding Technology/Welder 296 0.4%
52.1501 Real Estate 291 0.4%
15.0303 Electrical, Electronic and Communications Engineering Technology/Tech 275 0.4%
13.1210 Early Childhood Education and Teaching 274 0.4%
52.0901 Hospitality Administration/Management, General 272 0.4%
50.0901 Music, General 264 0.3%
52.0203 Logistics, Materials, and Supply Chain Management 260 0.3%
16.0905 Spanish Language and Literature 258 0.3%
51.0701 Health/Health Care Administration/Management 254 0.3%
15.0501 Heating, Ventilation, Air Conditioning and Refrigeration Engineering Te 247 0.3%
51.0716 Medical Administrative/Executive Assistant and Medical Secretary 241 0.3%
50.0903 Music Performance, General 237 0.3%
26.0102 Biomedical Sciences, General 237 0.3%
39.0401 Religious Education 230 0.3%
51.1201 Medicine 228 0.3%
51.0713 Medical Insurance Coding Specialist/Coder 225 0.3%
13.1101 Counselor Education/School Counseling and Guidance Services 221 0.3%
51.0710 Medical Office Assistant/Specialist 220 0.3%
52.0803 Banking and Financial Support Services 220 0.3%
51.0808 Veterinary/Animal Health Technology/Technician and Veterinary Assista 217 0.3%
52.1902 Fashion Merchandising 215 0.3%
51.3501 Massage Therapy/Therapeutic Massage 214 0.3%
09.0101 Speech Communication and Rhetoric 211 0.3%
51.0805 Pharmacy Technician/Assistant 210 0.3%
51.1901 Osteopathic Medicine/Osteopathy 200 0.3%
CIP CODE PROGRAM
3-YEAR AVERAGE
Awards granted (with % of total & trend)
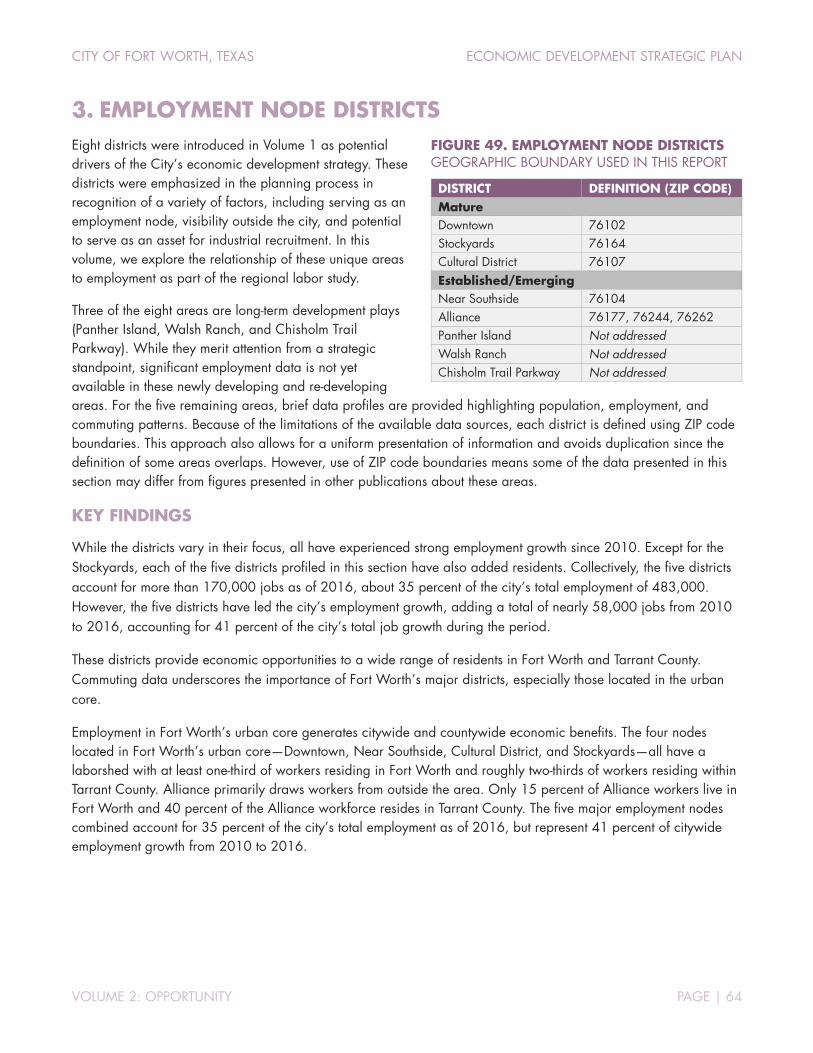
CITY OF FORT WORTH, TEXAS ECONOMIC DEVELOPMENT STRATEGIC PLAN
VOLUME 2: OPPORTUNITY PAGE | 64
3. EMPLOYMENT NODE DISTRICTS Eight districts were introduced in Volume 1 as potential drivers of the City’s economic development strategy. These districts were emphasized in the planning process in recognition of a variety of factors, including serving as an employment node, visibility outside the city, and potential to serve as an asset for industrial recruitment. In this volume, we explore the relationship of these unique areas to employment as part of the regional labor study.
Three of the eight areas are long-term development plays (Panther Island, Walsh Ranch, and Chisholm Trail Parkway). While they merit attention from a strategic standpoint, significant employment data is not yet available in these newly developing and re-developing areas. For the five remaining areas, brief data profiles are provided highlighting population, employment, and commuting patterns. Because of the limitations of the available data sources, each district is defined using ZIP code boundaries. This approach also allows for a uniform presentation of information and avoids duplication since the definition of some areas overlaps. However, use of ZIP code boundaries means some of the data presented in this section may differ from figures presented in other publications about these areas.
KEY FINDINGS
While the districts vary in their focus, all have experienced strong employment growth since 2010. Except for the Stockyards, each of the five districts profiled in this section have also added residents. Collectively, the five districts account for more than 170,000 jobs as of 2016, about 35 percent of the city’s total employment of 483,000. However, the five districts have led the city’s employment growth, adding a total of nearly 58,000 jobs from 2010 to 2016, accounting for 41 percent of the city’s total job growth during the period.
These districts provide economic opportunities to a wide range of residents in Fort Worth and Tarrant County. Commuting data underscores the importance of Fort Worth’s major districts, especially those located in the urban core.
Employment in Fort Worth’s urban core generates citywide and countywide economic benefits. The four nodes located in Fort Worth’s urban core—Downtown, Near Southside, Cultural District, and Stockyards—all have a laborshed with at least one-third of workers residing in Fort Worth and roughly two-thirds of workers residing within Tarrant County. Alliance primarily draws workers from outside the area. Only 15 percent of Alliance workers live in Fort Worth and 40 percent of the Alliance workforce resides in Tarrant County. The five major employment nodes combined account for 35 percent of the city’s total employment as of 2016, but represent 41 percent of citywide employment growth from 2010 to 2016.
FIGURE 49. EMPLOYMENT NODE DISTRICTS GEOGRAPHIC BOUNDARY USED IN THIS REPORT
DISTRICT DEFINITION (ZIP CODE) Mature Downtown 76102 Stockyards 76164 Cultural District 76107 Established/Emerging Near Southside 76104 Alliance 76177, 76244, 76262 Panther Island Not addressed Walsh Ranch Not addressed Chisholm Trail Parkway Not addressed

CITY OF FORT WORTH, TEXAS ECONOMIC DEVELOPMENT STRATEGIC PLAN
VOLUME 2: OPPORTUNITY PAGE | 65
DOWNTOWN (ZIP CODE 76102)
FIGURE 50. DISTRICT SNAPSHOT, 2016
INDICATOR VALUE
Population, 2016 8,576
Change since 2010 (#) +465
Change since 2010 (%) +6%
Age, 2016 (% of total population)
Less than 25 years old 27.4%
25 to 64 years 62.6%
65 years and older 10.1%
Jobs, 2016 45,454
Change since 2010 (#) +4,395
Change since 2010 (%) +11%
FIGURE 51. EMPLOYMENT BY MAJOR SECTOR, 2010 TO 2016
Source: Emsi 2017.2 – QCEW Employees, Non-QCEW Employees, and Self-Employed. Note: The figures shown may not align with other published data for this district due to differences in the data source, timeframe, and/or geographic definition.
NAICS Description2010Jobs
2016Jobs
Change2010-2016
2016 Location Quotient
Avg. Earnings Per Job
52 Finance & insurance 5,360 5,873 +513 3.33 $101,55790 Government (all branches) 5,032 5,589 +557 0.80 $58,01421 Mining (incl. oil & gas) 4,595 4,366 -229 23.24 $132,86354 Professional services 3,668 4,026 +358 1.39 $88,00772 Lodging, restaurants, & bars 3,230 3,593 +363 0.93 $24,69556 Administrative & support services 2,940 3,515 +575 1.24 $48,22948 Transportation & warehousing 2,719 3,320 +601 2.14 $42,63462 Healthcare & social assistance 2,126 2,756 +630 0.48 $54,04723 Construction 1,351 1,786 +435 0.73 $66,11951 Information 2,296 1,677 -619 1.98 $88,84242 Wholesale trade 1,205 1,484 +279 0.86 $62,34381 Personal & other services 1,307 1,393 +86 0.64 $34,94855 Corporate & regional offices 1,040 1,284 +244 2.01 $102,19931 Manufacturing 1,000 1,130 +130 0.31 $67,99971 Arts, entertainment, & recreation 840 1,110 +270 1.44 $21,88453 Property sales & leasing 843 908 +65 1.22 $53,36344 Retail trade 663 655 -8 0.14 $38,09722 Utilities 341 439 +98 2.72 $187,10861 Educational services (private) 262 286 +24 0.25 $59,78111 Agriculture & forestry 232 250 +18 0.44 $30,32099 Unclassified Industry <10 15 0.18 $35,850
TOTAL 41,059 45,454 +4,395 $70,953
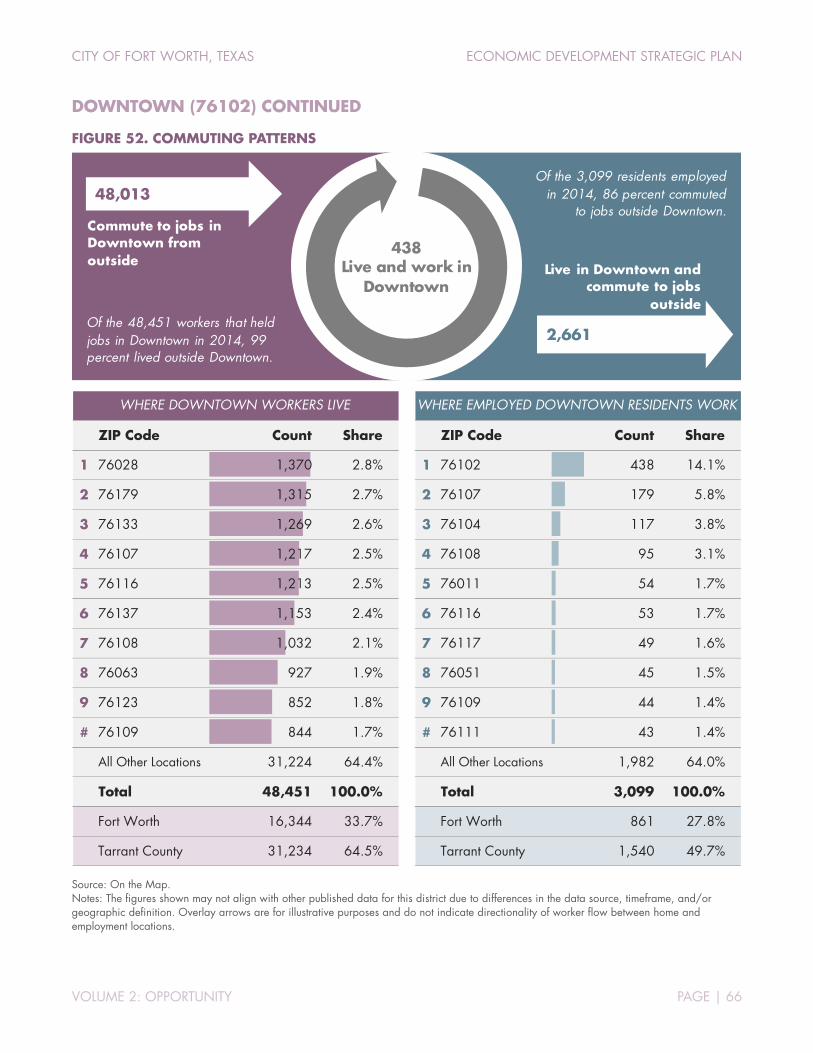
CITY OF FORT WORTH, TEXAS ECONOMIC DEVELOPMENT STRATEGIC PLAN
VOLUME 2: OPPORTUNITY PAGE | 66
DOWNTOWN (76102) CONTINUED
FIGURE 52. COMMUTING PATTERNS
Source: On the Map. Notes: The figures shown may not align with other published data for this district due to differences in the data source, timeframe, and/or geographic definition. Overlay arrows are for illustrative purposes and do not indicate directionality of worker flow between home and employment locations.
48,013
Commute to jobs in Downtown from outside
Of the 48,451 workers that held jobs in Downtown in 2014, 99 percent lived outside Downtown.
2,661
Live in Downtown and commute to jobs
outside
Of the 3,099 residents employed in 2014, 86 percent commuted
to jobs outside Downtown.
438 Live and work in
Downtown
ZIP Code Count Share
1 76028 1,370 2.8%
2 76179 1,315 2.7%
3 76133 1,269 2.6%
4 76107 1,217 2.5%
5 76116 1,213 2.5%
6 76137 1,153 2.4%
7 76108 1,032 2.1%
8 76063 927 1.9%
9 76123 852 1.8%
# 76109 844 1.7%
All Other Locations 31,224 64.4%
Total 48,451 100.0%
Fort Worth 16,344 33.7%
Tarrant County 31,234 64.5%
WHERE DOWNTOWN WORKERS LIVE
ZIP Code Count Share
1 76102 438 14.1%
2 76107 179 5.8%
3 76104 117 3.8%
4 76108 95 3.1%
5 76011 54 1.7%
6 76116 53 1.7%
7 76117 49 1.6%
8 76051 45 1.5%
9 76109 44 1.4%
# 76111 43 1.4%
All Other Locations 1,982 64.0%
Total 3,099 100.0%
Fort Worth 861 27.8%
Tarrant County 1,540 49.7%
WHERE EMPLOYED DOWNTOWN RESIDENTS WORK

CITY OF FORT WORTH, TEXAS ECONOMIC DEVELOPMENT STRATEGIC PLAN
VOLUME 2: OPPORTUNITY PAGE | 67
DOWNTOWN (76102) CONTINUED
FIGURE 53. WHERE DOWNTOWN WORKERS LIVE TOP 10 ZIP CODES
Source: On the Map.

CITY OF FORT WORTH, TEXAS ECONOMIC DEVELOPMENT STRATEGIC PLAN
VOLUME 2: OPPORTUNITY PAGE | 68
DOWNTOWN (76102) CONTINUED
FIGURE 54. NET COMMUTING FLOWS BY MAJOR INDUSTRY SECTOR NET FLOWS = INBOUND - OUTBOUND FLOWS
Net Inbound (net commuting into Downtown) Net Outbound (net commuting out from Downtown)
Source: On the Map. Notes: The figures shown may not align with other published data for this district due to differences in the data source, timeframe, and/or geographic definition. Overlay arrows are for illustrative purposes and do not indicate directionality of worker flow between home and employment locations.
+131
+327
+470
+547
+638
+879
+925
+1,032
+1,342
+1,500
+1,601
+1,808
+2,043
+2,409
+2,537
+3,279
+3,623
+4,363
+5,495
+10,403
Agriculture
Utilities
Property sales & leasing
Manufacturing
Arts & entertainment
Retail Trade
Personal & other services
Corporate & regional HQs
Information & media
Construction
Wholesale Trade
Healthcare
Transportation & warehousing
Administrative services
Restaurants, bars, & hotels
Education
Oil, gas, & mining
Professional services
Finance & insurance
Government

CITY OF FORT WORTH, TEXAS ECONOMIC DEVELOPMENT STRATEGIC PLAN
VOLUME 2: OPPORTUNITY PAGE | 69
NEAR SOUTHSIDE (ZIP CODE 76104)
FIGURE 55. DISTRICT SNAPSHOT, 2016
INDICATOR VALUE
Population, 2016 20,753
Change since 2010 (#) +1,735
Change since 2010 (%) +9%
Age, 2016 (% of total population)
Less than 25 years old 37.8%
25 to 64 years 49.8%
65 years and older 12.5%
Jobs, 2016 28,771
Change since 2010 (#) +4,484
Change since 2010 (%) +18%
FIGURE 56. EMPLOYMENT BY MAJOR SECTOR, 2010 TO 2016
Source: Emsi 2017.2 – QCEW Employees, Non-QCEW Employees, and Self-Employed. Note: The figures shown may not align with other published data for this district due to differences in the data source, timeframe, and/or geographic definition.
NAICS Description2010Jobs
2016Jobs
Change2010-2016
2016 Location Quotient
Avg. Earnings Per Job
62 Healthcare & social assistance 15,113 18,202 +3,089 5.05 $78,71690 Government (all branches) 1,923 2,293 +370 0.52 $86,04131 Manufacturing 1,342 1,338 -4 0.59 $72,07872 Lodging, restaurants, & bars 1,128 1,326 +198 0.54 $24,36256 Administrative & support services 760 985 +225 0.55 $45,22744 Retail trade 747 852 +105 0.28 $45,48054 Professional services 601 682 +81 0.37 $82,79581 Personal & other services 581 613 +32 0.44 $36,50223 Construction 477 581 +104 0.38 $60,15142 Wholesale trade 521 531 +10 0.48 $70,81355 Corporate & regional offices 366 514 +148 1.27 $104,93453 Property sales & leasing 236 260 +24 0.55 $53,57748 Transportation & warehousing 129 221 +92 0.22 $58,43452 Finance & insurance 157 152 -5 0.14 $88,05961 Educational services (private) 74 88 +14 0.12 $32,61771 Arts, entertainment, & recreation 45 51 +6 0.10 $25,70751 Information 61 49 -12 0.09 $76,01721 Mining (incl. oil & gas) 14 19 +5 0.16 $91,54411 Agriculture & forestry <10 <10 — — —22 Utilities <10 <10 — — —99 Unclassified <10 12 — — —
TOTAL 24,287 28,771 +4,484 $72,919
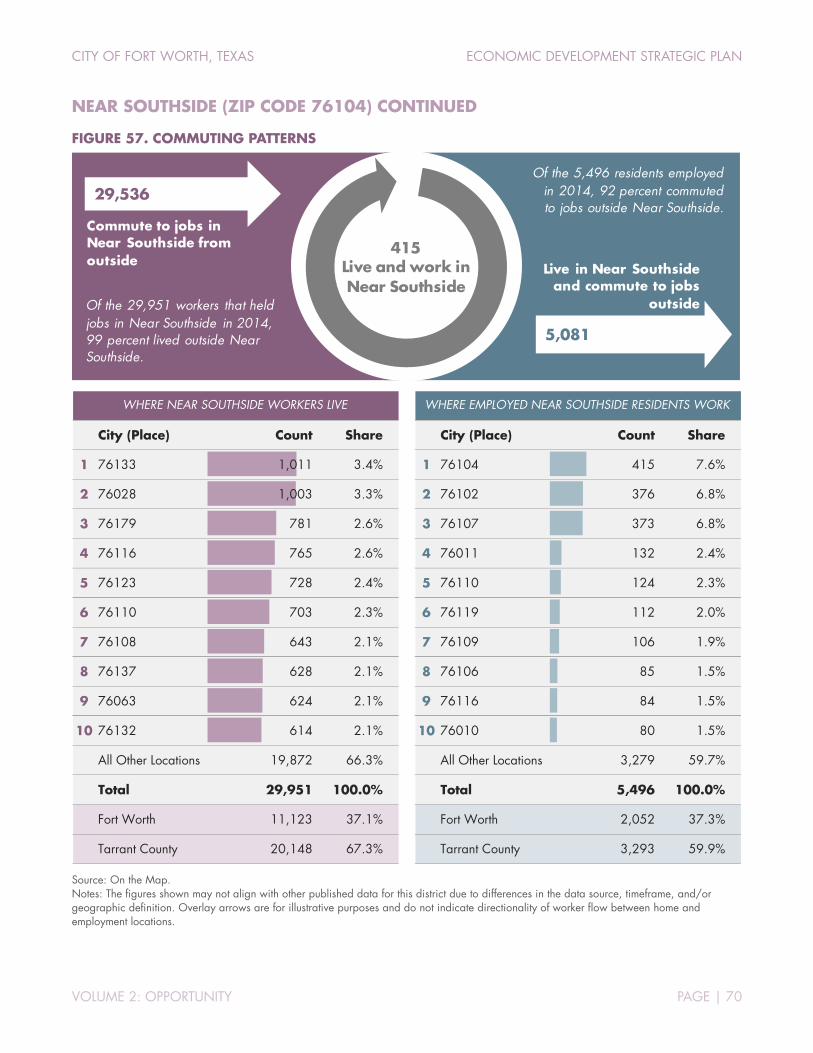
CITY OF FORT WORTH, TEXAS ECONOMIC DEVELOPMENT STRATEGIC PLAN
VOLUME 2: OPPORTUNITY PAGE | 70
NEAR SOUTHSIDE (ZIP CODE 76104) CONTINUED
FIGURE 57. COMMUTING PATTERNS
Source: On the Map. Notes: The figures shown may not align with other published data for this district due to differences in the data source, timeframe, and/or geographic definition. Overlay arrows are for illustrative purposes and do not indicate directionality of worker flow between home and employment locations.
29,536
Commute to jobs in Near Southside from outside
Of the 29,951 workers that held jobs in Near Southside in 2014, 99 percent lived outside Near Southside.
5,081
Live in Near Southside and commute to jobs
outside
Of the 5,496 residents employed in 2014, 92 percent commuted to jobs outside Near Southside.
415 Live and work in Near Southside
City (Place) Count Share
1 76133 1,011 3.4%
2 76028 1,003 3.3%
3 76179 781 2.6%
4 76116 765 2.6%
5 76123 728 2.4%
6 76110 703 2.3%
7 76108 643 2.1%
8 76137 628 2.1%
9 76063 624 2.1%
10 76132 614 2.1%
All Other Locations 19,872 66.3%
Total 29,951 100.0%
Fort Worth 11,123 37.1%
Tarrant County 20,148 67.3%
WHERE NEAR SOUTHSIDE WORKERS LIVE
City (Place) Count Share
1 76104 415 7.6%
2 76102 376 6.8%
3 76107 373 6.8%
4 76011 132 2.4%
5 76110 124 2.3%
6 76119 112 2.0%
7 76109 106 1.9%
8 76106 85 1.5%
9 76116 84 1.5%
10 76010 80 1.5%
All Other Locations 3,279 59.7%
Total 5,496 100.0%
Fort Worth 2,052 37.3%
Tarrant County 3,293 59.9%
WHERE EMPLOYED NEAR SOUTHSIDE RESIDENTS WORK

CITY OF FORT WORTH, TEXAS ECONOMIC DEVELOPMENT STRATEGIC PLAN
VOLUME 2: OPPORTUNITY PAGE | 71
NEAR SOUTHSIDE (ZIP CODE 76104) CONTINUED
FIGURE 58. WHERE NEAR SOUTHSIDE WORKERS LIVE TOP 10 ZIP CODES
Source: On the Map.
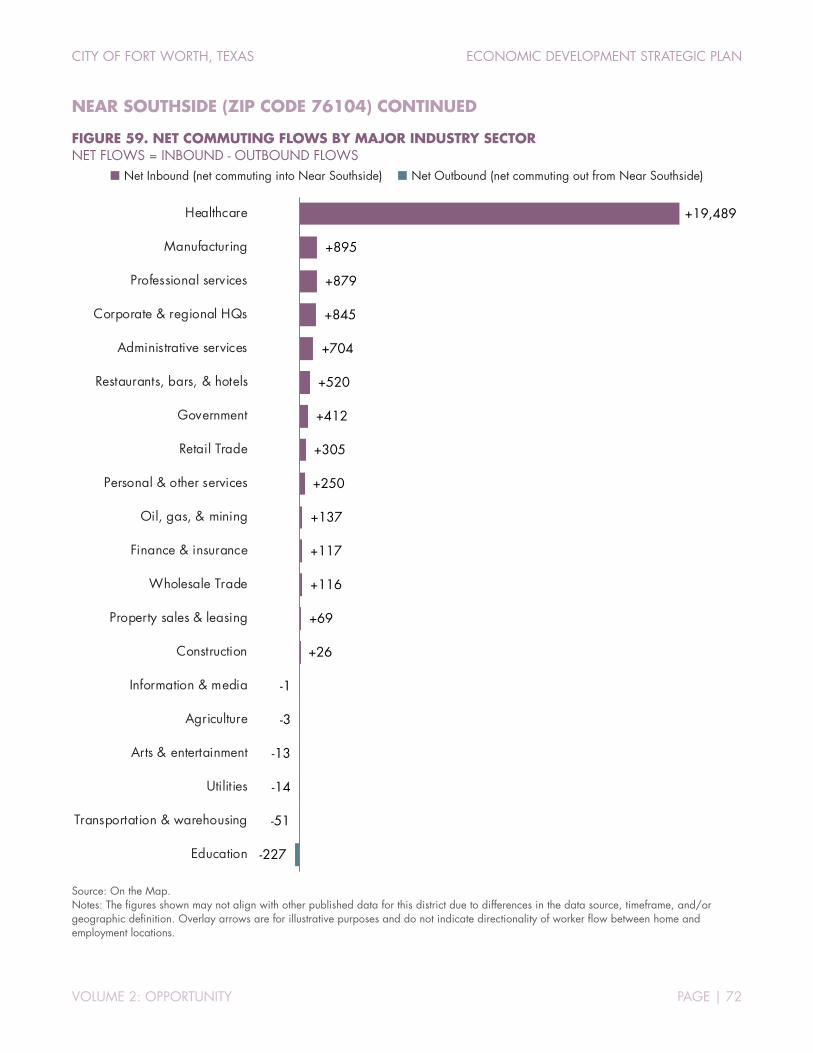
CITY OF FORT WORTH, TEXAS ECONOMIC DEVELOPMENT STRATEGIC PLAN
VOLUME 2: OPPORTUNITY PAGE | 72
NEAR SOUTHSIDE (ZIP CODE 76104) CONTINUED
FIGURE 59. NET COMMUTING FLOWS BY MAJOR INDUSTRY SECTOR NET FLOWS = INBOUND - OUTBOUND FLOWS
Net Inbound (net commuting into Near Southside) Net Outbound (net commuting out from Near Southside)
Source: On the Map. Notes: The figures shown may not align with other published data for this district due to differences in the data source, timeframe, and/or geographic definition. Overlay arrows are for illustrative purposes and do not indicate directionality of worker flow between home and employment locations.
-227
-51
-14
-13
-3
-1
+26
+69
+116
+117
+137
+250
+305
+412
+520
+704
+845
+879
+895
+19,489
Education
Transportation & warehousing
Utilities
Arts & entertainment
Agriculture
Information & media
Construction
Property sales & leasing
Wholesale Trade
Finance & insurance
Oil, gas, & mining
Personal & other services
Retail Trade
Government
Restaurants, bars, & hotels
Administrative services
Corporate & regional HQs
Professional services
Manufacturing
Healthcare
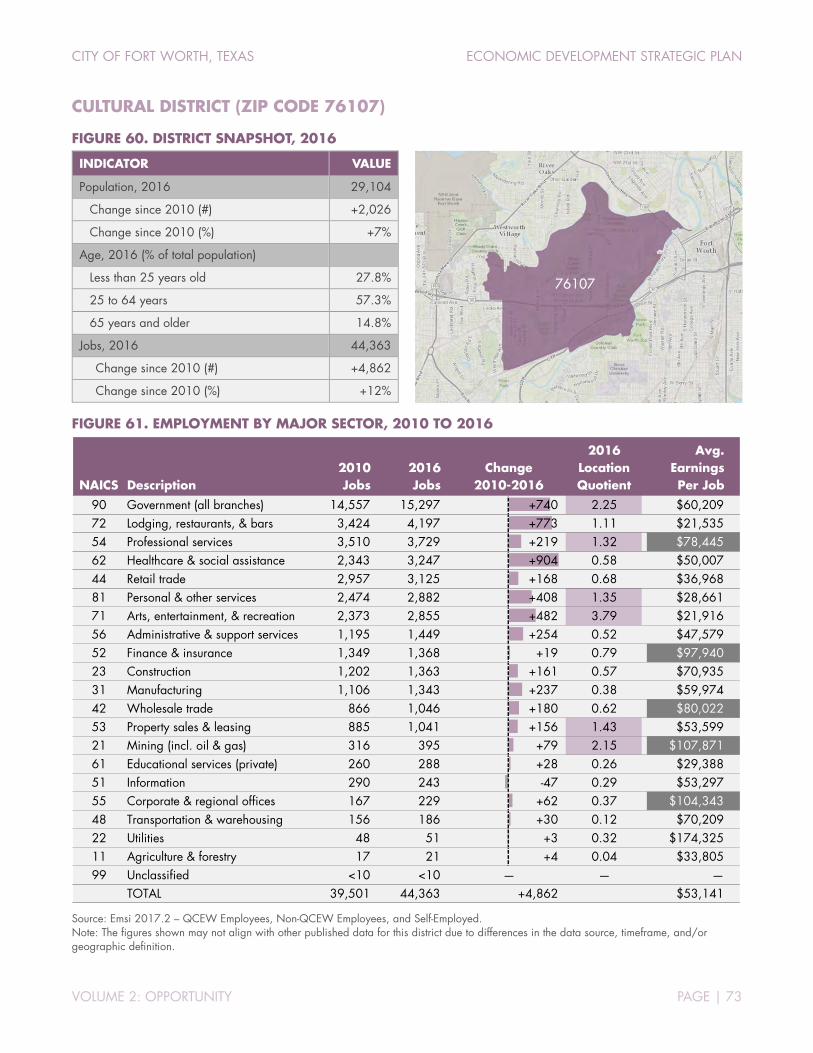
CITY OF FORT WORTH, TEXAS ECONOMIC DEVELOPMENT STRATEGIC PLAN
VOLUME 2: OPPORTUNITY PAGE | 73
CULTURAL DISTRICT (ZIP CODE 76107)
FIGURE 60. DISTRICT SNAPSHOT, 2016
INDICATOR VALUE
Population, 2016 29,104
Change since 2010 (#) +2,026
Change since 2010 (%) +7%
Age, 2016 (% of total population)
Less than 25 years old 27.8%
25 to 64 years 57.3%
65 years and older 14.8%
Jobs, 2016 44,363
Change since 2010 (#) +4,862
Change since 2010 (%) +12%
FIGURE 61. EMPLOYMENT BY MAJOR SECTOR, 2010 TO 2016
Source: Emsi 2017.2 – QCEW Employees, Non-QCEW Employees, and Self-Employed. Note: The figures shown may not align with other published data for this district due to differences in the data source, timeframe, and/or geographic definition.
NAICS Description2010Jobs
2016Jobs
Change2010-2016
2016 Location Quotient
Avg. Earnings Per Job
90 Government (all branches) 14,557 15,297 +740 2.25 $60,20972 Lodging, restaurants, & bars 3,424 4,197 +773 1.11 $21,53554 Professional services 3,510 3,729 +219 1.32 $78,44562 Healthcare & social assistance 2,343 3,247 +904 0.58 $50,00744 Retail trade 2,957 3,125 +168 0.68 $36,96881 Personal & other services 2,474 2,882 +408 1.35 $28,66171 Arts, entertainment, & recreation 2,373 2,855 +482 3.79 $21,91656 Administrative & support services 1,195 1,449 +254 0.52 $47,57952 Finance & insurance 1,349 1,368 +19 0.79 $97,94023 Construction 1,202 1,363 +161 0.57 $70,93531 Manufacturing 1,106 1,343 +237 0.38 $59,97442 Wholesale trade 866 1,046 +180 0.62 $80,02253 Property sales & leasing 885 1,041 +156 1.43 $53,59921 Mining (incl. oil & gas) 316 395 +79 2.15 $107,87161 Educational services (private) 260 288 +28 0.26 $29,38851 Information 290 243 -47 0.29 $53,29755 Corporate & regional offices 167 229 +62 0.37 $104,34348 Transportation & warehousing 156 186 +30 0.12 $70,20922 Utilities 48 51 +3 0.32 $174,32511 Agriculture & forestry 17 21 +4 0.04 $33,80599 Unclassified <10 <10 — — —
TOTAL 39,501 44,363 +4,862 $53,141
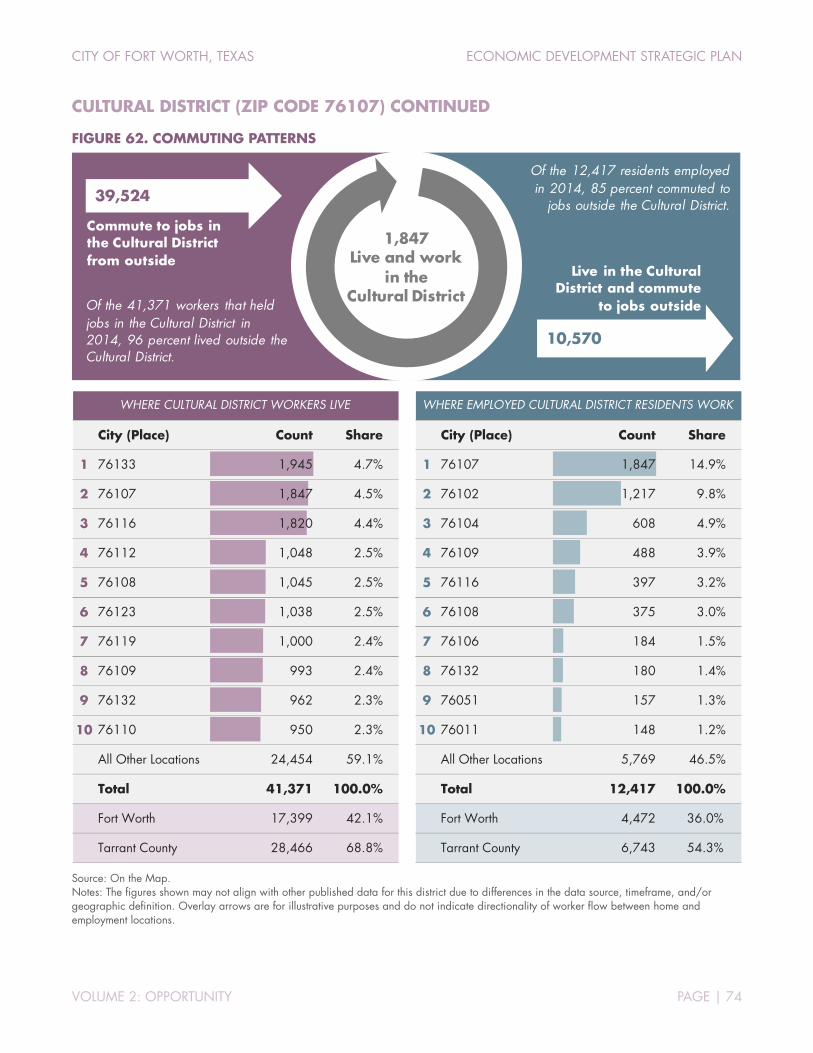
CITY OF FORT WORTH, TEXAS ECONOMIC DEVELOPMENT STRATEGIC PLAN
VOLUME 2: OPPORTUNITY PAGE | 74
CULTURAL DISTRICT (ZIP CODE 76107) CONTINUED
FIGURE 62. COMMUTING PATTERNS
Source: On the Map. Notes: The figures shown may not align with other published data for this district due to differences in the data source, timeframe, and/or geographic definition. Overlay arrows are for illustrative purposes and do not indicate directionality of worker flow between home and employment locations.
39,524
Commute to jobs in the Cultural District from outside
Of the 41,371 workers that held jobs in the Cultural District in 2014, 96 percent lived outside the Cultural District.
10,570
Live in the Cultural District and commute
to jobs outside
Of the 12,417 residents employed in 2014, 85 percent commuted to
jobs outside the Cultural District.
1,847 Live and work
in the Cultural District
City (Place) Count Share
1 76133 1,945 4.7%
2 76107 1,847 4.5%
3 76116 1,820 4.4%
4 76112 1,048 2.5%
5 76108 1,045 2.5%
6 76123 1,038 2.5%
7 76119 1,000 2.4%
8 76109 993 2.4%
9 76132 962 2.3%
10 76110 950 2.3%
All Other Locations 24,454 59.1%
Total 41,371 100.0%
Fort Worth 17,399 42.1%
Tarrant County 28,466 68.8%
WHERE CULTURAL DISTRICT WORKERS LIVE
City (Place) Count Share
1 76107 1,847 14.9%
2 76102 1,217 9.8%
3 76104 608 4.9%
4 76109 488 3.9%
5 76116 397 3.2%
6 76108 375 3.0%
7 76106 184 1.5%
8 76132 180 1.4%
9 76051 157 1.3%
10 76011 148 1.2%
All Other Locations 5,769 46.5%
Total 12,417 100.0%
Fort Worth 4,472 36.0%
Tarrant County 6,743 54.3%
WHERE EMPLOYED CULTURAL DISTRICT RESIDENTS WORK
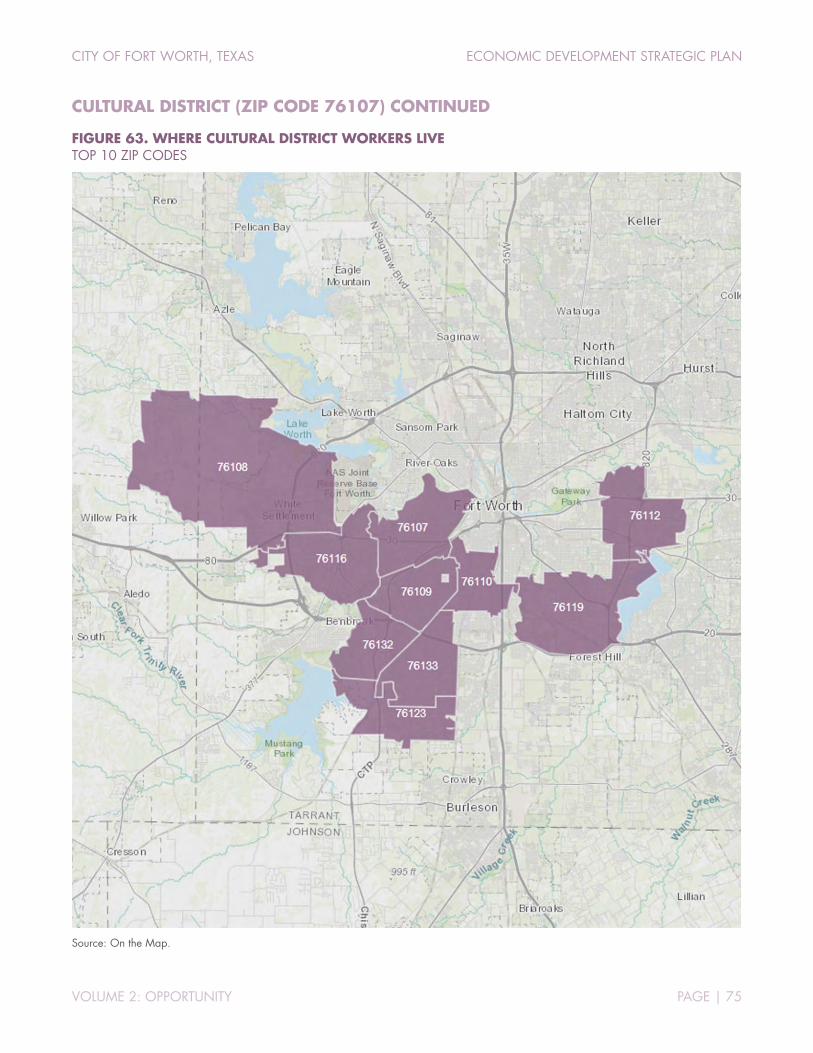
CITY OF FORT WORTH, TEXAS ECONOMIC DEVELOPMENT STRATEGIC PLAN
VOLUME 2: OPPORTUNITY PAGE | 75
CULTURAL DISTRICT (ZIP CODE 76107) CONTINUED
FIGURE 63. WHERE CULTURAL DISTRICT WORKERS LIVE TOP 10 ZIP CODES
Source: On the Map.
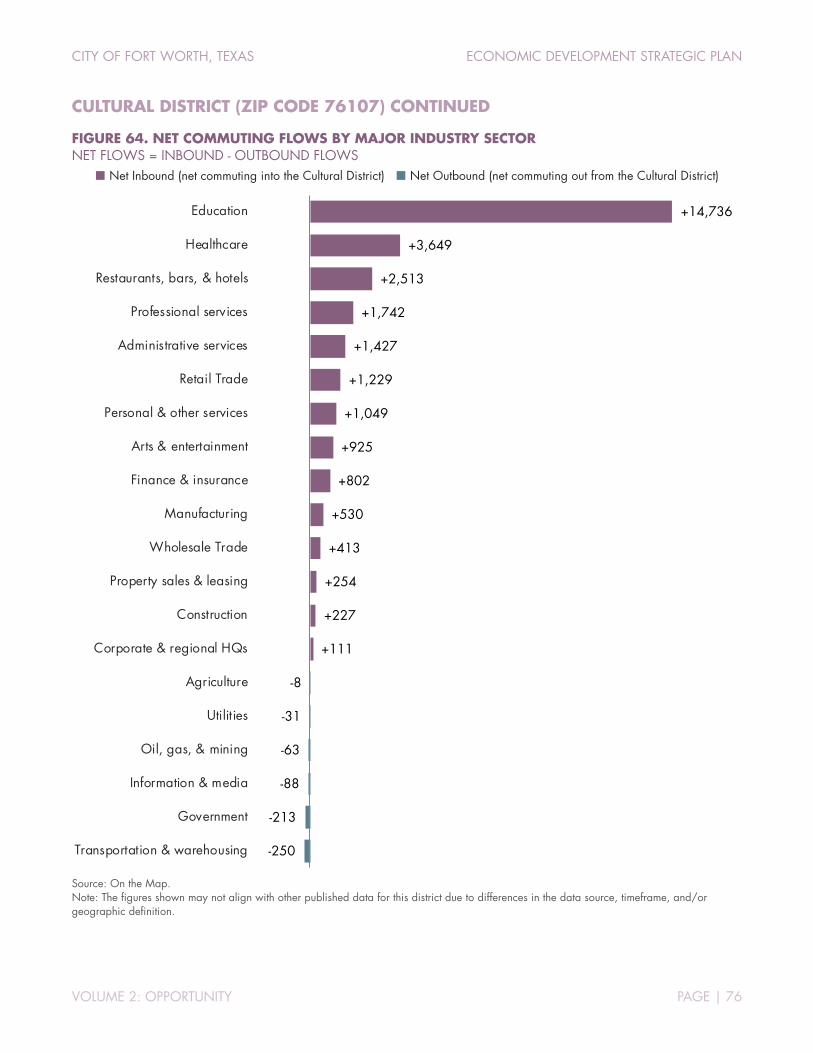
CITY OF FORT WORTH, TEXAS ECONOMIC DEVELOPMENT STRATEGIC PLAN
VOLUME 2: OPPORTUNITY PAGE | 76
CULTURAL DISTRICT (ZIP CODE 76107) CONTINUED
FIGURE 64. NET COMMUTING FLOWS BY MAJOR INDUSTRY SECTOR NET FLOWS = INBOUND - OUTBOUND FLOWS
Net Inbound (net commuting into the Cultural District) Net Outbound (net commuting out from the Cultural District)
Source: On the Map. Note: The figures shown may not align with other published data for this district due to differences in the data source, timeframe, and/or geographic definition.
-250
-213
-88
-63
-31
-8
+111
+227
+254
+413
+530
+802
+925
+1,049
+1,229
+1,427
+1,742
+2,513
+3,649
+14,736
Transportation & warehousing
Government
Information & media
Oil, gas, & mining
Utilities
Agriculture
Corporate & regional HQs
Construction
Property sales & leasing
Wholesale Trade
Manufacturing
Finance & insurance
Arts & entertainment
Personal & other services
Retail Trade
Administrative services
Professional services
Restaurants, bars, & hotels
Healthcare
Education
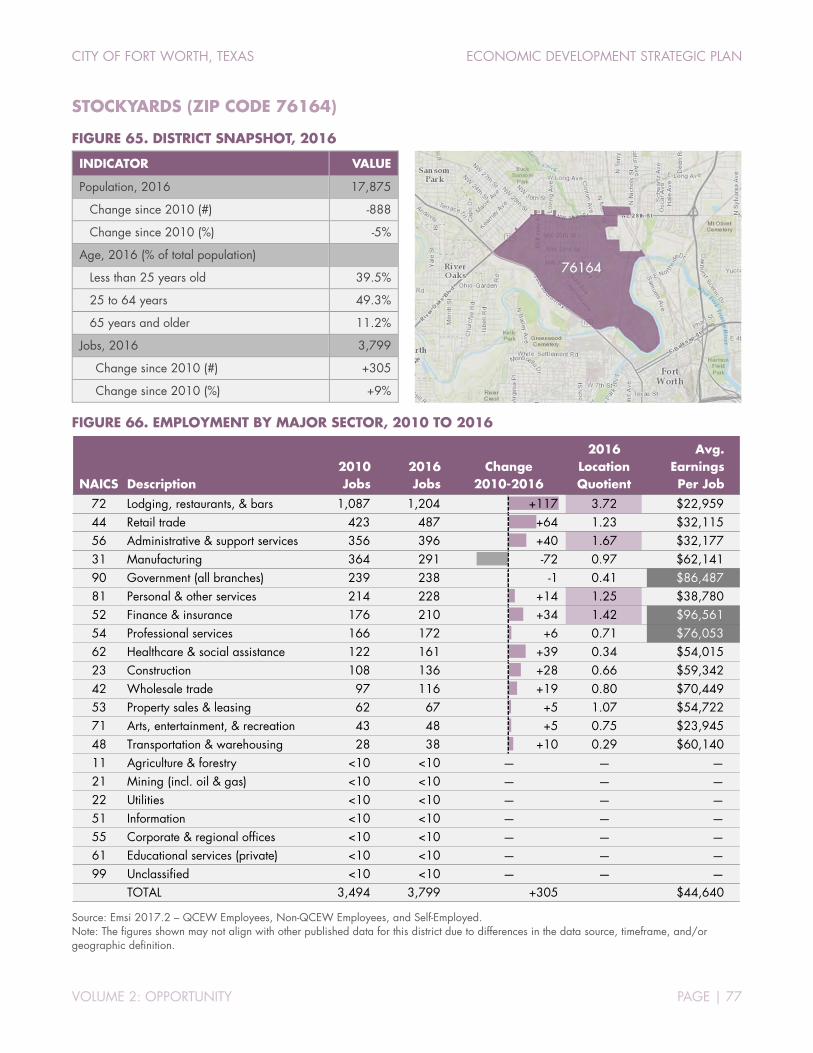
CITY OF FORT WORTH, TEXAS ECONOMIC DEVELOPMENT STRATEGIC PLAN
VOLUME 2: OPPORTUNITY PAGE | 77
STOCKYARDS (ZIP CODE 76164)
FIGURE 65. DISTRICT SNAPSHOT, 2016
INDICATOR VALUE
Population, 2016 17,875
Change since 2010 (#) -888
Change since 2010 (%) -5%
Age, 2016 (% of total population)
Less than 25 years old 39.5%
25 to 64 years 49.3%
65 years and older 11.2%
Jobs, 2016 3,799
Change since 2010 (#) +305
Change since 2010 (%) +9%
FIGURE 66. EMPLOYMENT BY MAJOR SECTOR, 2010 TO 2016
Source: Emsi 2017.2 – QCEW Employees, Non-QCEW Employees, and Self-Employed. Note: The figures shown may not align with other published data for this district due to differences in the data source, timeframe, and/or geographic definition.
NAICS Description2010Jobs
2016Jobs
Change2010-2016
2016 Location Quotient
Avg. Earnings Per Job
72 Lodging, restaurants, & bars 1,087 1,204 +117 3.72 $22,95944 Retail trade 423 487 +64 1.23 $32,11556 Administrative & support services 356 396 +40 1.67 $32,17731 Manufacturing 364 291 -72 0.97 $62,14190 Government (all branches) 239 238 -1 0.41 $86,48781 Personal & other services 214 228 +14 1.25 $38,78052 Finance & insurance 176 210 +34 1.42 $96,56154 Professional services 166 172 +6 0.71 $76,05362 Healthcare & social assistance 122 161 +39 0.34 $54,01523 Construction 108 136 +28 0.66 $59,34242 Wholesale trade 97 116 +19 0.80 $70,44953 Property sales & leasing 62 67 +5 1.07 $54,72271 Arts, entertainment, & recreation 43 48 +5 0.75 $23,94548 Transportation & warehousing 28 38 +10 0.29 $60,14011 Agriculture & forestry <10 <10 — — —21 Mining (incl. oil & gas) <10 <10 — — —22 Utilities <10 <10 — — —51 Information <10 <10 — — —55 Corporate & regional offices <10 <10 — — —61 Educational services (private) <10 <10 — — —99 Unclassified <10 <10 — — —
TOTAL 3,494 3,799 +305 $44,640

CITY OF FORT WORTH, TEXAS ECONOMIC DEVELOPMENT STRATEGIC PLAN
VOLUME 2: OPPORTUNITY PAGE | 78
STOCKYARDS (ZIP CODE 76164) CONTINUED
FIGURE 67. COMMUTING PATTERNS
Source: On the Map. Notes: The figures shown may not align with other published data for this district due to differences in the data source, timeframe, and/or geographic definition. Overlay arrows are for illustrative purposes and do not indicate directionality of worker flow between home and employment locations.
5,189
Commute to jobs in the Stockyards from outside
Of the 5,425 workers that held jobs in the Stockyards in 2014, 96 percent lived outside the Stockyards.
5,325
Live in the Stockyards and commute to jobs
outside
Of the 5,561 residents employed in 2014, 96 percent
commuted to jobs outsidethe Stockyards.
236 Live and work
in the Stockyards
City (Place) Count Share
1 76106 306 5.6%
2 76164 236 4.4%
3 76114 148 2.7%
4 76179 137 2.5%
5 76107 133 2.5%
6 76110 127 2.3%
7 76112 127 2.3%
8 76116 123 2.3%
9 76133 122 2.2%
# 76137 116 2.1%
All Other Locations 3,850 71.0%
Total 5,425 100.0%
Fort Worth 2,093 38.6%
Tarrant County 3,541 65.3%
WHERE STOCKYARDS WORKERS LIVE
City (Place) Count Share
1 76107 457 8.2%
2 76102 348 6.3%
3 76106 277 5.0%
4 76164 236 4.2%
5 76104 152 2.7%
6 76117 141 2.5%
7 76111 137 2.5%
8 76137 111 2.0%
9 76179 109 2.0%
# 76011 98 1.8%
All Other Locations 3,113 56.0%
Total 5,561 100.0%
Fort Worth 2,351 42.3%
Tarrant County 3,516 63.2%
WHERE EMPLOYED STOCKYARDS RESIDENTS WORK
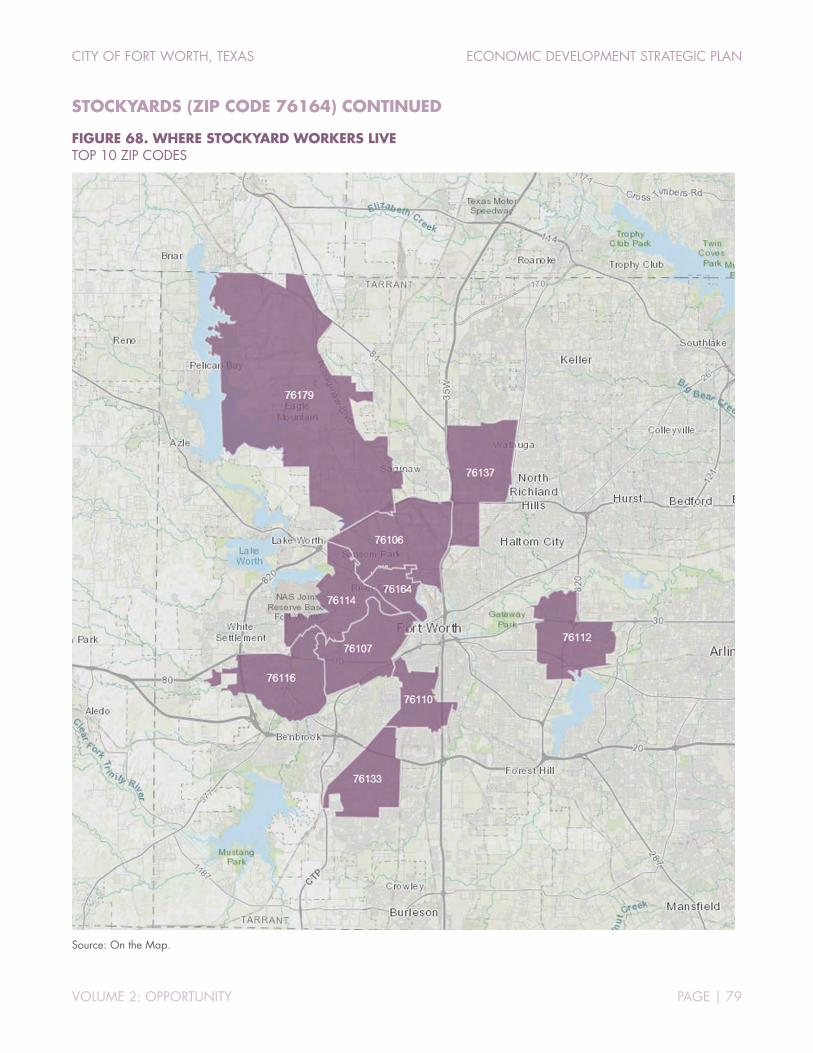
CITY OF FORT WORTH, TEXAS ECONOMIC DEVELOPMENT STRATEGIC PLAN
VOLUME 2: OPPORTUNITY PAGE | 79
STOCKYARDS (ZIP CODE 76164) CONTINUED
FIGURE 68. WHERE STOCKYARD WORKERS LIVE TOP 10 ZIP CODES
Source: On the Map.
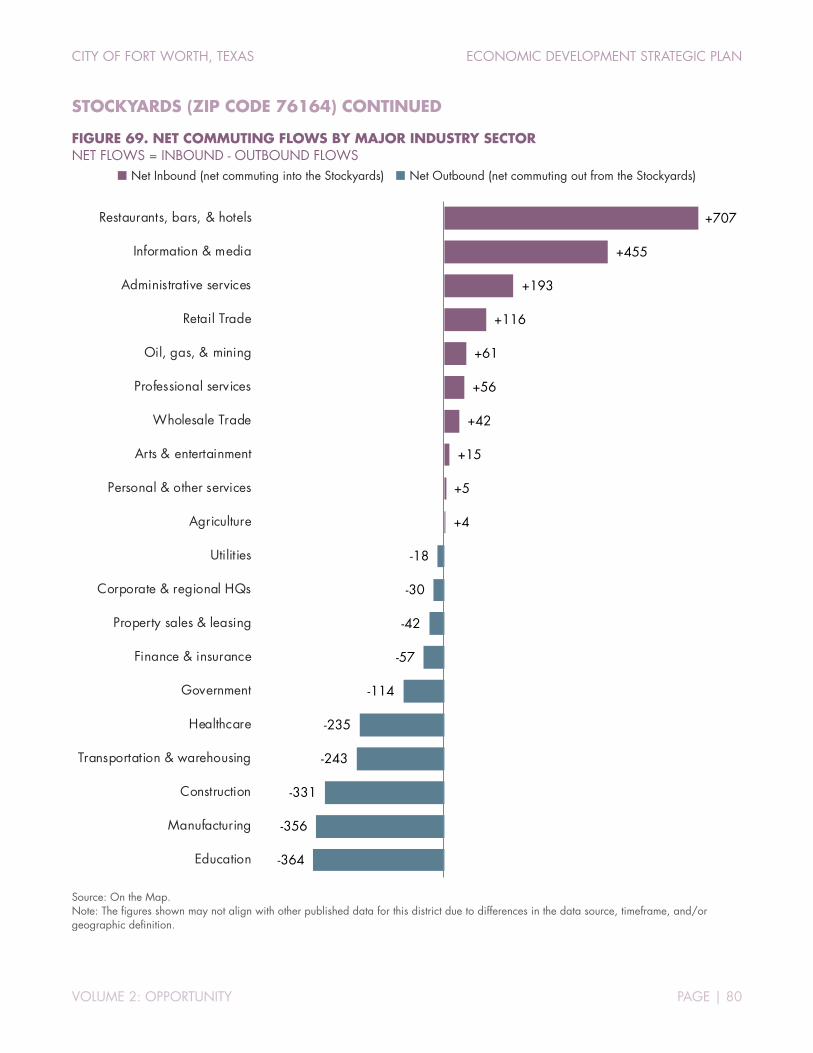
CITY OF FORT WORTH, TEXAS ECONOMIC DEVELOPMENT STRATEGIC PLAN
VOLUME 2: OPPORTUNITY PAGE | 80
STOCKYARDS (ZIP CODE 76164) CONTINUED
FIGURE 69. NET COMMUTING FLOWS BY MAJOR INDUSTRY SECTOR NET FLOWS = INBOUND - OUTBOUND FLOWS
Net Inbound (net commuting into the Stockyards) Net Outbound (net commuting out from the Stockyards)
Source: On the Map. Note: The figures shown may not align with other published data for this district due to differences in the data source, timeframe, and/or geographic definition.
-364
-356
-331
-243
-235
-114
-57
-42
-30
-18
+4
+5
+15
+42
+56
+61
+116
+193
+455
+707
Education
Manufacturing
Construction
Transportation & warehousing
Healthcare
Government
Finance & insurance
Property sales & leasing
Corporate & regional HQs
Utilities
Agriculture
Personal & other services
Arts & entertainment
Wholesale Trade
Professional services
Oil, gas, & mining
Retail Trade
Administrative services
Information & media
Restaurants, bars, & hotels

CITY OF FORT WORTH, TEXAS ECONOMIC DEVELOPMENT STRATEGIC PLAN
VOLUME 2: OPPORTUNITY PAGE | 81
ALLIANCE (ZIP CODES 76177, 76244, & 76262)
FIGURE 70. DISTRICT SNAPSHOT, 2016 INDICATOR VALUE
Population, 2016 111,289
Change since 2010 (#) +30,327
Change since 2010 (%) +37%
Age, 2016 (% of total population)
Less than 25 years old 39.8%
25 to 64 years 54.1%
65 years and older 6.0%
Jobs, 2016 47,914
Change since 2010 (#) +9,661
Change since 2010 (%) +25%
FIGURE 71. EMPLOYMENT BY MAJOR SECTOR, 2010 TO 2016
Source: Emsi 2017.2 – QCEW Employees, Non-QCEW Employees, and Self-Employed. Note: The figures shown may not align with other published data for this district due to differences in the data source, timeframe, and/or geographic definition.
NAICS Description2010Jobs
2016Jobs
Change2010-2016
2016 Location Quotient
Avg. Earnings Per Job
48 Transportation & warehousing 6,536 9,394 +2,859 5.74 $51,85556 Administrative & support services 4,432 5,471 +1,039 1.83 $41,08352 Finance & insurance 2,278 3,314 +1,036 1.78 $95,50972 Lodging, restaurants, & bars 2,791 3,787 +996 0.93 $20,90323 Construction 3,137 3,928 +790 1.52 $63,04742 Wholesale trade 1,869 2,600 +731 1.43 $79,99944 Retail trade 3,598 4,183 +585 0.84 $34,35731 Manufacturing 1,962 2,394 +432 0.63 $69,78862 Healthcare & social assistance 1,761 2,134 +373 0.36 $59,84854 Professional services 2,152 2,418 +266 0.79 $81,42781 Personal & other services 1,687 1,904 +217 0.83 $29,17155 Corporate & regional offices 332 549 +217 0.81 $96,01353 Property sales & leasing 695 876 +181 1.11 $50,82971 Arts, entertainment, & recreation 655 749 +94 0.92 $22,88890 Government (all branches) 3,004 3,032 +28 0.41 $83,84121 Mining (incl. oil & gas) 37 43 +6 0.22 $104,49011 Agriculture & forestry 13 15 +2 0.03 $27,31922 Utilities 19 12 -7 0.07 $132,82451 Information 880 815 -66 0.91 $90,24061 Educational services (private) 397 270 -127 0.22 $34,93399 Unclassified 18 26 +8 0.30 $53,279
TOTAL 38,253 47,914 +9,661 $56,634
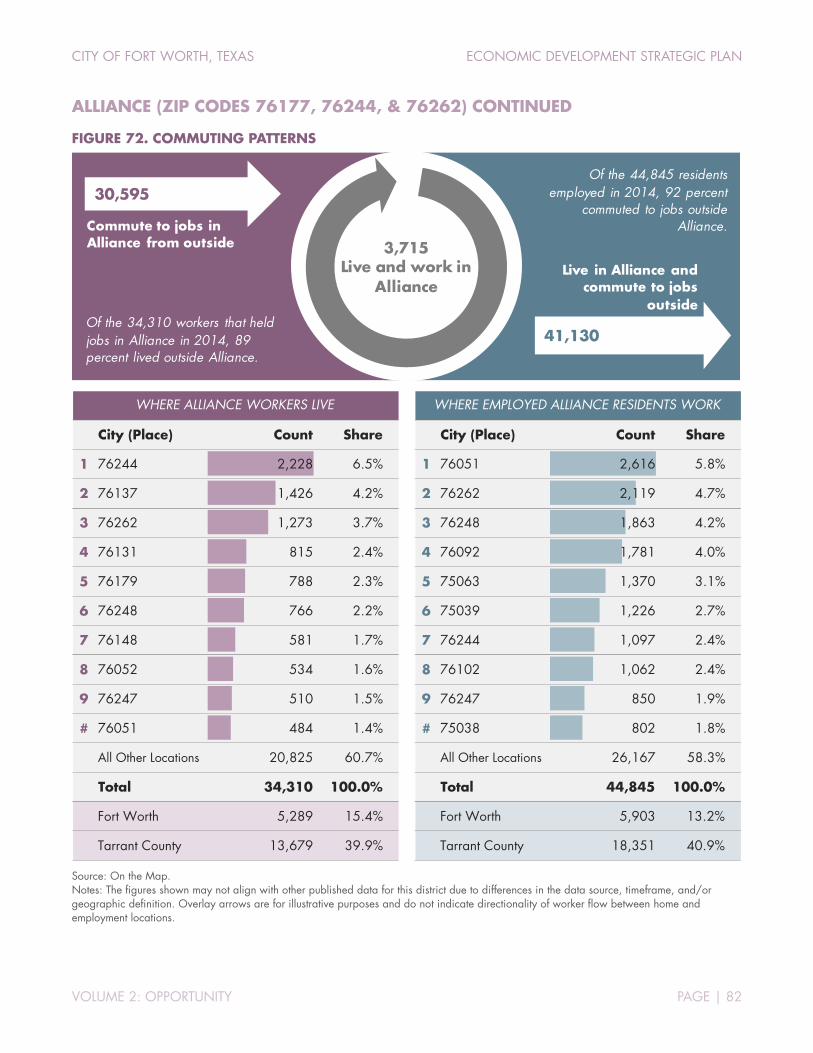
CITY OF FORT WORTH, TEXAS ECONOMIC DEVELOPMENT STRATEGIC PLAN
VOLUME 2: OPPORTUNITY PAGE | 82
ALLIANCE (ZIP CODES 76177, 76244, & 76262) CONTINUED
FIGURE 72. COMMUTING PATTERNS
Source: On the Map. Notes: The figures shown may not align with other published data for this district due to differences in the data source, timeframe, and/or geographic definition. Overlay arrows are for illustrative purposes and do not indicate directionality of worker flow between home and employment locations.
30,595
Commute to jobs in Alliance from outside
Of the 34,310 workers that held jobs in Alliance in 2014, 89 percent lived outside Alliance.
41,130
Live in Alliance and commute to jobs
outside
Of the 44,845 residents employed in 2014, 92 percent
commuted to jobs outside Alliance.
3,715 Live and work in
Alliance
City (Place) Count Share
1 76244 2,228 6.5%
2 76137 1,426 4.2%
3 76262 1,273 3.7%
4 76131 815 2.4%
5 76179 788 2.3%
6 76248 766 2.2%
7 76148 581 1.7%
8 76052 534 1.6%
9 76247 510 1.5%
# 76051 484 1.4%
All Other Locations 20,825 60.7%
Total 34,310 100.0%
Fort Worth 5,289 15.4%
Tarrant County 13,679 39.9%
WHERE ALLIANCE WORKERS LIVE
City (Place) Count Share
1 76051 2,616 5.8%
2 76262 2,119 4.7%
3 76248 1,863 4.2%
4 76092 1,781 4.0%
5 75063 1,370 3.1%
6 75039 1,226 2.7%
7 76244 1,097 2.4%
8 76102 1,062 2.4%
9 76247 850 1.9%
# 75038 802 1.8%
All Other Locations 26,167 58.3%
Total 44,845 100.0%
Fort Worth 5,903 13.2%
Tarrant County 18,351 40.9%
WHERE EMPLOYED ALLIANCE RESIDENTS WORK

CITY OF FORT WORTH, TEXAS ECONOMIC DEVELOPMENT STRATEGIC PLAN
VOLUME 2: OPPORTUNITY PAGE | 83
ALLIANCE (ZIP CODES 76177, 76244, & 76262) CONTINUED
FIGURE 73. WHERE ALLIANCE WORKERS LIVE TOP 10 ZIP CODES
Source: On the Map.
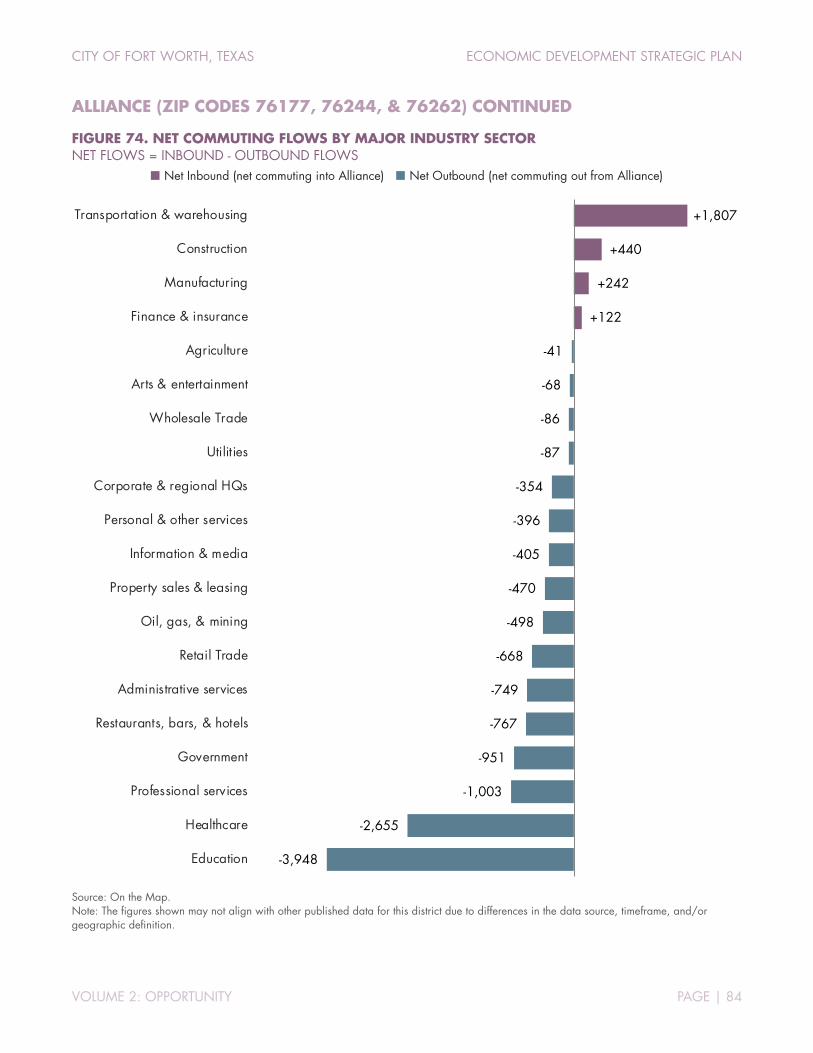
CITY OF FORT WORTH, TEXAS ECONOMIC DEVELOPMENT STRATEGIC PLAN
VOLUME 2: OPPORTUNITY PAGE | 84
ALLIANCE (ZIP CODES 76177, 76244, & 76262) CONTINUED
FIGURE 74. NET COMMUTING FLOWS BY MAJOR INDUSTRY SECTOR NET FLOWS = INBOUND - OUTBOUND FLOWS
Net Inbound (net commuting into Alliance) Net Outbound (net commuting out from Alliance)
Source: On the Map. Note: The figures shown may not align with other published data for this district due to differences in the data source, timeframe, and/or geographic definition.
-3,948
-2,655
-1,003
-951
-767
-749
-668
-498
-470
-405
-396
-354
-87
-86
-68
-41
+122
+242
+440
+1,807
Education
Healthcare
Professional services
Government
Restaurants, bars, & hotels
Administrative services
Retail Trade
Oil, gas, & mining
Property sales & leasing
Information & media
Personal & other services
Corporate & regional HQs
Utilities
Wholesale Trade
Arts & entertainment
Agriculture
Finance & insurance
Manufacturing
Construction
Transportation & warehousing
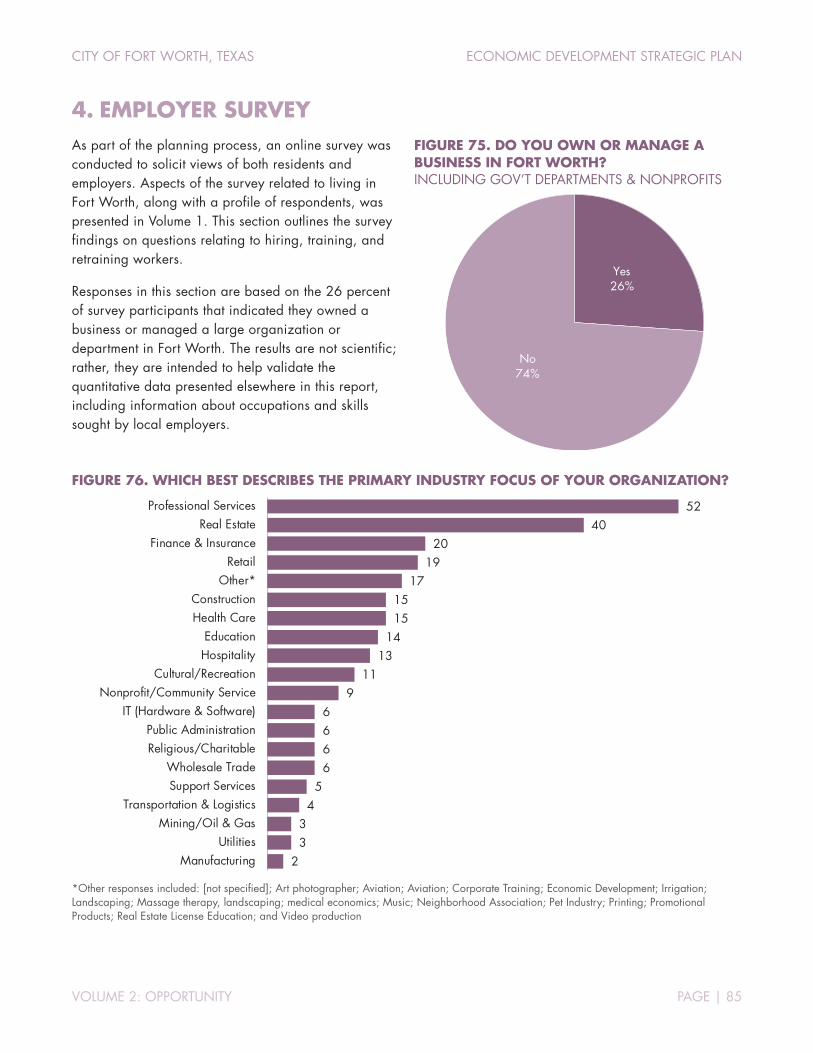
CITY OF FORT WORTH, TEXAS ECONOMIC DEVELOPMENT STRATEGIC PLAN
VOLUME 2: OPPORTUNITY PAGE | 85
4. EMPLOYER SURVEY As part of the planning process, an online survey was conducted to solicit views of both residents and employers. Aspects of the survey related to living in Fort Worth, along with a profile of respondents, was presented in Volume 1. This section outlines the survey findings on questions relating to hiring, training, and retraining workers.
Responses in this section are based on the 26 percent of survey participants that indicated they owned a business or managed a large organization or department in Fort Worth. The results are not scientific; rather, they are intended to help validate the quantitative data presented elsewhere in this report, including information about occupations and skills sought by local employers.
FIGURE 75. DO YOU OWN OR MANAGE A BUSINESS IN FORT WORTH? INCLUDING GOV’T DEPARTMENTS & NONPROFITS
FIGURE 76. WHICH BEST DESCRIBES THE PRIMARY INDUSTRY FOCUS OF YOUR ORGANIZATION?
*Other responses included: [not specified]; Art photographer; Aviation; Aviation; Corporate Training; Economic Development; Irrigation; Landscaping; Massage therapy, landscaping; medical economics; Music; Neighborhood Association; Pet Industry; Printing; Promotional Products; Real Estate License Education; and Video production
Yes26%
No74%
5240
2019
171515
1413
119
6666
54
33
2
Professional ServicesReal Estate
Finance & InsuranceRetail
Other*ConstructionHealth Care
EducationHospitality
Cultural/RecreationNonprofit/Community Service
IT (Hardware & Software)Public AdministrationReligious/Charitable
Wholesale TradeSupport Services
Transportation & LogisticsMining/Oil & Gas
UtilitiesManufacturing
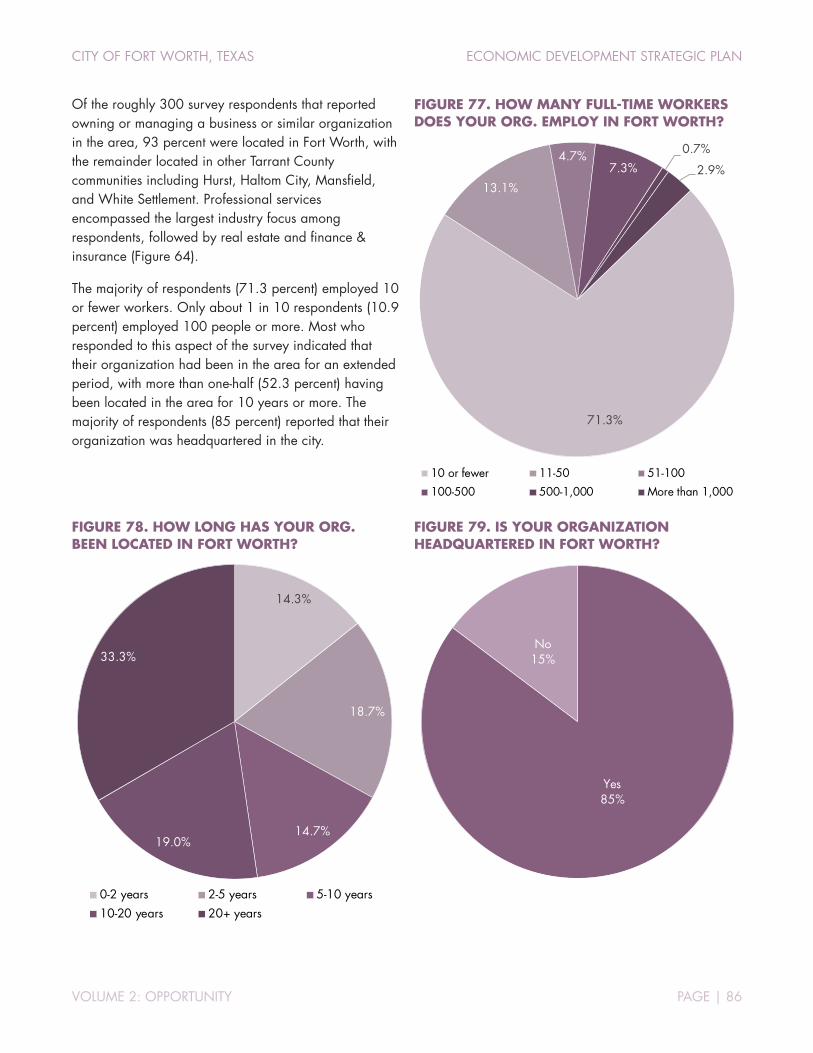
CITY OF FORT WORTH, TEXAS ECONOMIC DEVELOPMENT STRATEGIC PLAN
VOLUME 2: OPPORTUNITY PAGE | 86
Of the roughly 300 survey respondents that reported owning or managing a business or similar organization in the area, 93 percent were located in Fort Worth, with the remainder located in other Tarrant County communities including Hurst, Haltom City, Mansfield, and White Settlement. Professional services encompassed the largest industry focus among respondents, followed by real estate and finance & insurance (Figure 64).
The majority of respondents (71.3 percent) employed 10 or fewer workers. Only about 1 in 10 respondents (10.9 percent) employed 100 people or more. Most who responded to this aspect of the survey indicated that their organization had been in the area for an extended period, with more than one-half (52.3 percent) having been located in the area for 10 years or more. The majority of respondents (85 percent) reported that their organization was headquartered in the city.
FIGURE 77. HOW MANY FULL-TIME WORKERS DOES YOUR ORG. EMPLOY IN FORT WORTH?
FIGURE 78. HOW LONG HAS YOUR ORG. BEEN LOCATED IN FORT WORTH?
FIGURE 79. IS YOUR ORGANIZATION HEADQUARTERED IN FORT WORTH?
71.3%
13.1%
4.7%7.3%
0.7%
2.9%
10 or fewer 11-50 51-100
100-500 500-1,000 More than 1,000
14.3%
18.7%
14.7%19.0%
33.3%
0-2 years 2-5 years 5-10 years10-20 years 20+ years
Yes85%
No15%

CITY OF FORT WORTH, TEXAS ECONOMIC DEVELOPMENT STRATEGIC PLAN
VOLUME 2: OPPORTUNITY PAGE | 87
Management positions were the most commonly reported position, a reflection of the large number of small firms that responded to the survey. Unskilled labor was the least common category, which is not surprising given the mix of respondents, which included a large number of organizations in industries such as professional services, real estate, and finance & insurance (Figure 76, page 85)
At least one-third of respondents are planning to look towards international markets in the next two years. Of the choices offered, one-third of respondents are planning to sell to markets outside the US and/or work with suppliers and partners located outside of the country during this period. One in five (21 percent) are considering opening or acquiring facilities in foreign markets.
FIGURE 80. APPROXIMATELY WHAT PERCENTAGE OF YOUR WORKFORCE IS EMPLOYED IN THE FOLLOWING CATEGORIES?
FIGURE 81. OVER THE NEXT TWO YEARS, DOES YOUR COMPANY HAVE INTERNATIONAL EXPANSION PLANS? (CHECK ALL THAT APPLY)
Note: Percentages do not sum to 100 percent as respondents were permitted to select multiple categories.
16%
26%
29%
33%
57%
67%
35%
15%
39%
26%
12%
13%
18%
9%
16%
12%
6%
5%
8%
12%
9%
9%
8%
6%
5%
10%
6%
17%
27%
4%
14%
9%
7%
0% 20% 40% 60% 80% 100%
Management
Professional/Technical
Clerical/Administrative
Sales/Marketing
Skilled Labor
Unskilled/Laborers
None Less than 10% 10 to 24% 24% to 49% 50 to 74% 75% or more Morecommon
Lesscommon
We plan to sell more products/services outside the US
We plan to work with more suppliers and service providers located outside the US
We plan to recruit foreign workers for jobs located in the US
We plan to open new facilities and/or acquire facilities outside the US
We plan to hire more employees based outside the US
33.3%
33.3%
30.3%
21.2%
12.1%

CITY OF FORT WORTH, TEXAS ECONOMIC DEVELOPMENT STRATEGIC PLAN
VOLUME 2: OPPORTUNITY PAGE | 88
When asked about future hiring plans, 58 percent of respondents indicated they planned to add workers over the next two years. Collectively, these planned hires would amount to more than 2,000 additional workers. The majority of planned hires (39 percent) are expected to be in professional or technical positions, with a similar percentage split relatively evenly among skilled labor, clerical, management, and unskilled jobs.
In addition to being the most commonly expected area for hiring, professional positions are also among the hardest to find, with roughly one in four respondents (26 percent) indicating that vacancies take four months or more to fill. By contrast, 85 percent of unskilled positions are filled in a matter of weeks.
A summary of hard-to-find occupations (Figure 85) and skills needs (Figure 86) are provided on page 89.
FIGURE 82. OVER THE NEXT TWO YEARS, DO YOU PLAN TO HIRE ADDITIONAL EMPLOYEES IN FORT WORTH?
FIGURE 83. DISTRIBUTION OF HIRING PLANS BY MAJOR CATEGORY AMONG THOSE PLANNING TO HIRE
FIGURE 84. APPROXIMATELY HOW LONG DOES IT TYPICALLY TAKE TO FILL A VACANCY FOR EACH OF THE FOLLOWING CLASSIFICATIONS OF WORKERS?
Yes58%No
19%
Not sure23%
39%
13%
12%
12%
11%
7%
6%
Professional/Technical
Skilled Labor
Clerical/Administrative
Management
Unskilled/Laborer
Sales/Marketing
Other
24%
40%
51%
68%
76%
84%
50%
46%
43%
24%
22%
16%
26%
14%
6%
8%
0% 20% 40% 60% 80% 100%
Professional/Technical
Clerical/Administrative
Management
Sales/Marketing
Skilled Labor
Unskilled/Laborer
Less than 1 month 1 to 3 months 4 months or more Hardestto fill
Easiest to fill
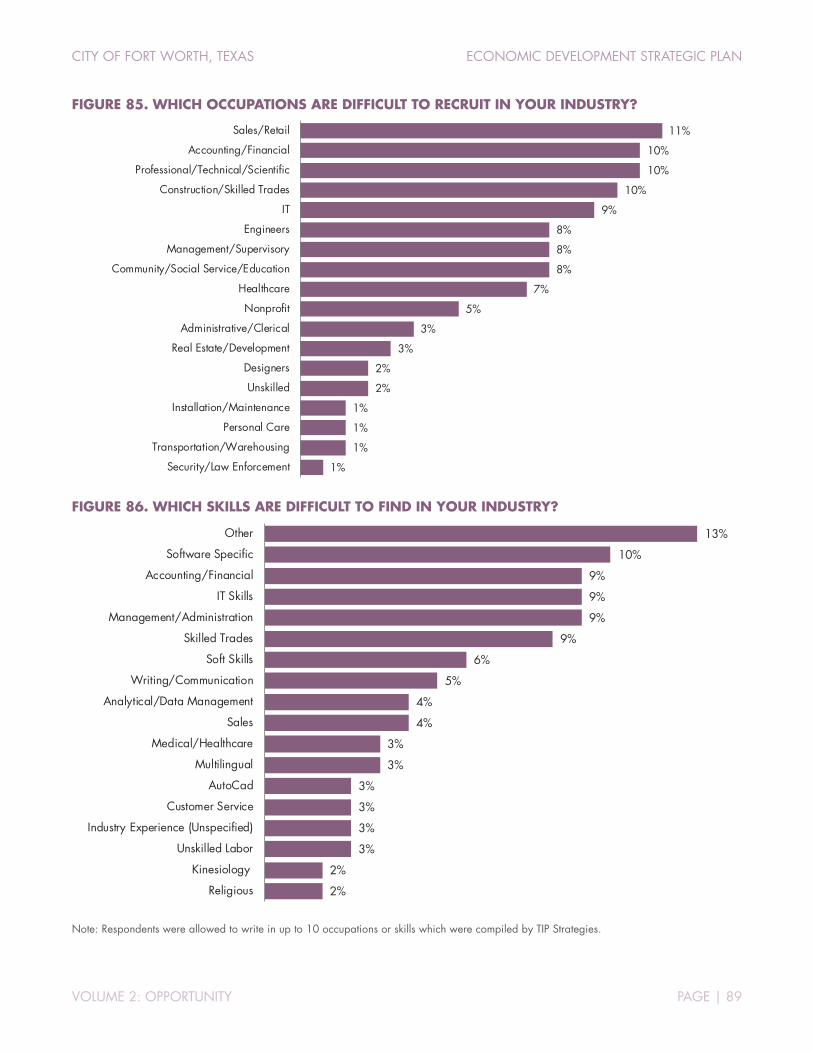
CITY OF FORT WORTH, TEXAS ECONOMIC DEVELOPMENT STRATEGIC PLAN
VOLUME 2: OPPORTUNITY PAGE | 89
FIGURE 85. WHICH OCCUPATIONS ARE DIFFICULT TO RECRUIT IN YOUR INDUSTRY?
FIGURE 86. WHICH SKILLS ARE DIFFICULT TO FIND IN YOUR INDUSTRY?
Note: Respondents were allowed to write in up to 10 occupations or skills which were compiled by TIP Strategies.
11%
10%
10%
10%
9%
8%
8%
8%
7%
5%
3%
3%
2%
2%
1%
1%
1%
1%
Sales/Retail
Accounting/Financial
Professional/Technical/Scientific
Construction/Skilled Trades
IT
Engineers
Management/Supervisory
Community/Social Service/Education
Healthcare
Nonprofit
Administrative/Clerical
Real Estate/Development
Designers
Unskilled
Installation/Maintenance
Personal Care
Transportation/Warehousing
Security/Law Enforcement
13%
10%
9%
9%
9%
9%
6%
5%
4%
4%
3%
3%
3%
3%
3%
3%
2%
2%
Other
Software Specific
Accounting/Financial
IT Skills
Management/Administration
Skilled Trades
Soft Skills
Writing/Communication
Analytical/Data Management
Sales
Medical/Healthcare
Multilingual
AutoCad
Customer Service
Industry Experience (Unspecified)
Unskilled Labor
Kinesiology
Religious
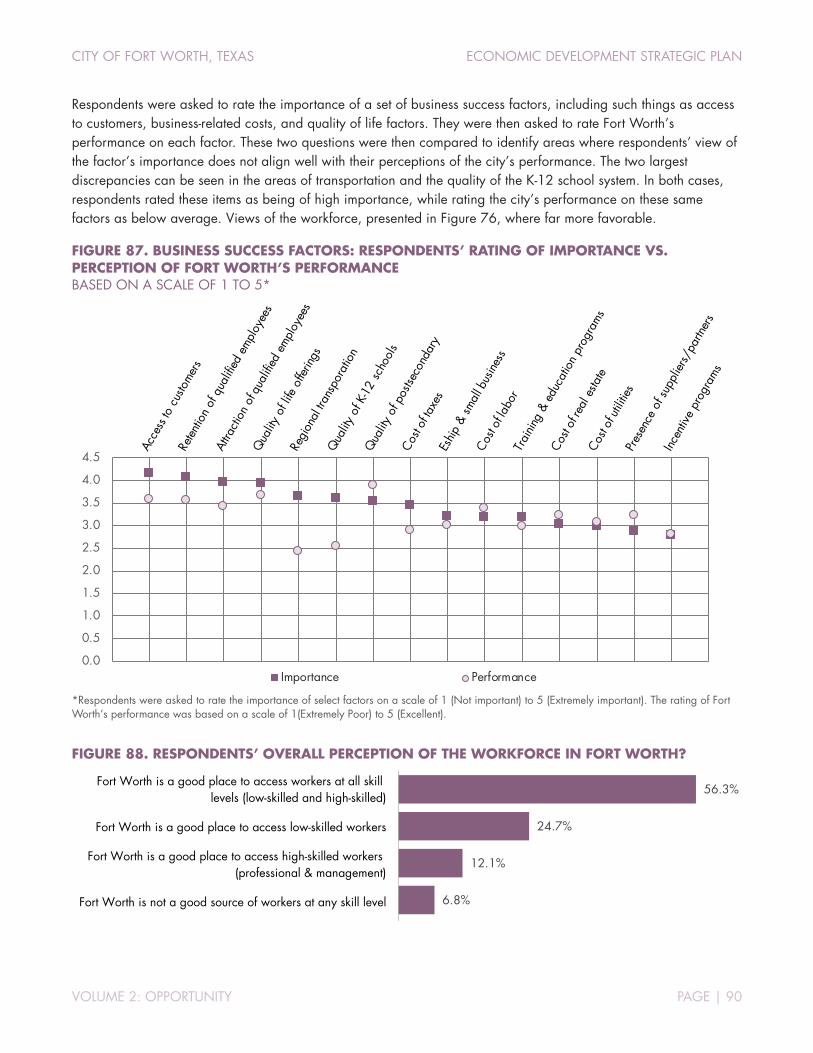
CITY OF FORT WORTH, TEXAS ECONOMIC DEVELOPMENT STRATEGIC PLAN
VOLUME 2: OPPORTUNITY PAGE | 90
Respondents were asked to rate the importance of a set of business success factors, including such things as access to customers, business-related costs, and quality of life factors. They were then asked to rate Fort Worth’s performance on each factor. These two questions were then compared to identify areas where respondents’ view of the factor’s importance does not align well with their perceptions of the city’s performance. The two largest discrepancies can be seen in the areas of transportation and the quality of the K-12 school system. In both cases, respondents rated these items as being of high importance, while rating the city’s performance on these same factors as below average. Views of the workforce, presented in Figure 76, where far more favorable.
FIGURE 87. BUSINESS SUCCESS FACTORS: RESPONDENTS’ RATING OF IMPORTANCE VS. PERCEPTION OF FORT WORTH’S PERFORMANCE BASED ON A SCALE OF 1 TO 5*
*Respondents were asked to rate the importance of select factors on a scale of 1 (Not important) to 5 (Extremely important). The rating of Fort Worth’s performance was based on a scale of 1(Extremely Poor) to 5 (Excellent).
FIGURE 88. RESPONDENTS’ OVERALL PERCEPTION OF THE WORKFORCE IN FORT WORTH?
0.0
0.5
1.0
1.5
2.0
2.5
3.0
3.5
4.0
4.5
Importance Performance
Fort Worth is a good place to access workers at all skill levels (low-skilled and high-skilled)
Fort Worth is a good place to access low-skilled workers
Fort Worth is a good place to access high-skilled workers (professional & management)
Fort Worth is not a good source of workers at any skill level
56.3%
24.7%
12.1%
6.8%
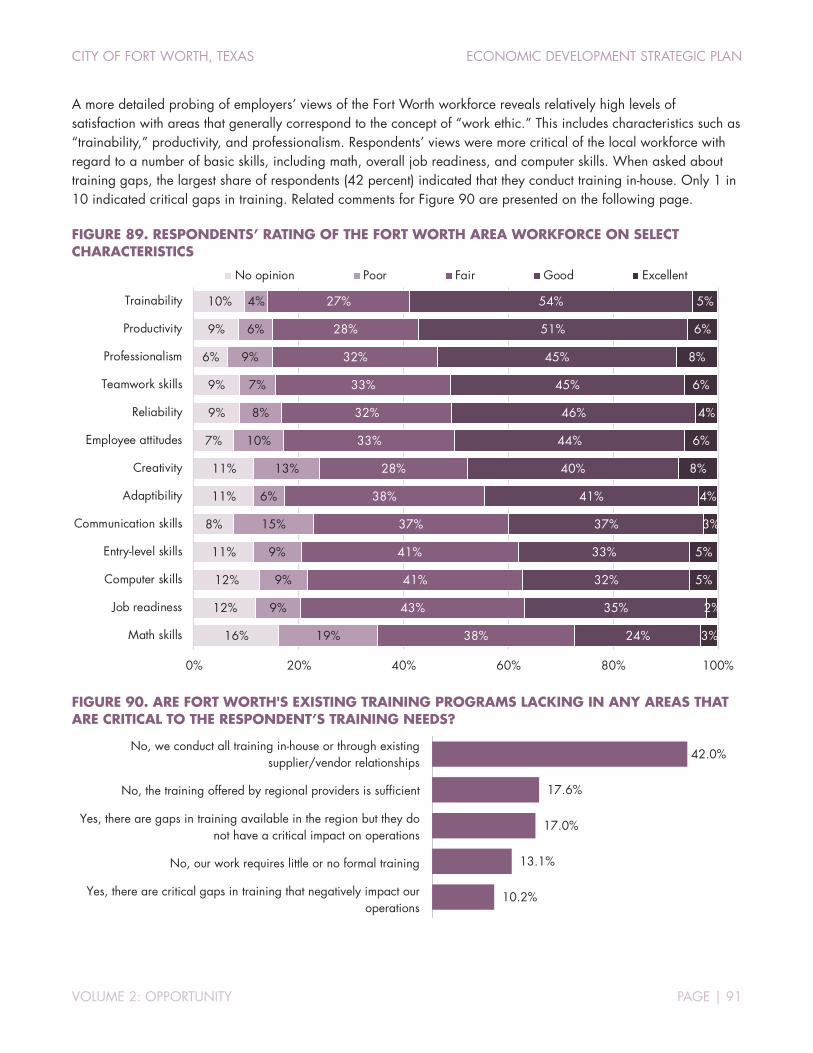
CITY OF FORT WORTH, TEXAS ECONOMIC DEVELOPMENT STRATEGIC PLAN
VOLUME 2: OPPORTUNITY PAGE | 91
A more detailed probing of employers’ views of the Fort Worth workforce reveals relatively high levels of satisfaction with areas that generally correspond to the concept of “work ethic.” This includes characteristics such as “trainability,” productivity, and professionalism. Respondents’ views were more critical of the local workforce with regard to a number of basic skills, including math, overall job readiness, and computer skills. When asked about training gaps, the largest share of respondents (42 percent) indicated that they conduct training in-house. Only 1 in 10 indicated critical gaps in training. Related comments for Figure 90 are presented on the following page.
FIGURE 89. RESPONDENTS’ RATING OF THE FORT WORTH AREA WORKFORCE ON SELECT CHARACTERISTICS
FIGURE 90. ARE FORT WORTH'S EXISTING TRAINING PROGRAMS LACKING IN ANY AREAS THAT ARE CRITICAL TO THE RESPONDENT’S TRAINING NEEDS?
10%
9%
6%
9%
9%
7%
11%
11%
8%
11%
12%
12%
16%
4%
6%
9%
7%
8%
10%
13%
6%
15%
9%
9%
9%
19%
27%
28%
32%
33%
32%
33%
28%
38%
37%
41%
41%
43%
38%
54%
51%
45%
45%
46%
44%
40%
41%
37%
33%
32%
35%
24%
5%
6%
8%
6%
4%
6%
8%
4%
3%
5%
5%
2%
3%
0% 20% 40% 60% 80% 100%
Trainability
Productivity
Professionalism
Teamwork skills
Reliability
Employee attitudes
Creativity
Adaptibility
Communication skills
Entry-level skills
Computer skills
Job readiness
Math skills
No opinion Poor Fair Good Excellent
No, we conduct all training in-house or through existing supplier/vendor relationships
No, the training offered by regional providers is sufficient
Yes, there are gaps in training available in the region but they do not have a critical impact on operations
No, our work requires little or no formal training
Yes, there are critical gaps in training that negatively impact our operations
42.0%
17.6%
17.0%
13.1%
10.2%

CITY OF FORT WORTH, TEXAS ECONOMIC DEVELOPMENT STRATEGIC PLAN
VOLUME 2: OPPORTUNITY PAGE | 92
FIGURE 90. ARE FORT WORTH'S EXISTING TRAINING PROGRAMS LACKING IN ANY AREAS THAT ARE CRITICAL TO THE RESPONDENT’S TRAINING NEEDS? (CONTINUED) OPEN-ENDED RESPONSES REQUESTED IF RESPONDENT ANSWERED “YES.”
Respondents were asked to describe the specific training needed and which organization they think would be best suited to providing it.
Commercial Diver training is going to be limited to coastal areas in most cases. Emergency rescue, potable water tank maintenance, marina operations, dredging, etc.
These questions are very subjective based on the age of the employee we hire. The new and younger employees usually do not have a good work ethic and do not show up on time or care about the product of their work.
All video production training and continuing education courses tend to be in Dallas.
Training is not an issue. All personnel must have 15 years’ experience.
Computer skills related to maintenance functions.
Tarrant County College has the structure and the staff to handle.
Business skills and training for small businesses is hard to find
TCC, FWISD
High school graduates with poor verbal and written communication skills.
We have training programs but we need a more strategic emphasis on getting people into these programs incorporating all education and workforce partners.
Productive and creative multilingual scientific efficiency and speediness
There need to be more technical training programs that aren't necessarily professional but are skilled
I need more paralegal options and the educational programs for that skill is very limited in this area.
TCU is great, but there are no large public institutions here for a 4-year degree and so our young adults leave.
There is a great medical school here, but no residency opportunities and so those students and their families have to leave.
Critical thinking is a gap we have identified in both educated and undereducated workforce. This is an overall detriment as creativity is critical to progress. All community stakeholders, including educational institutions, are best suited to provide a more creativity supported environment. Schools should look into increasing case study type of assignments, students generally provide minimal value in their work when they cannot think critically. Critical thinkers have beat university graduates in our organization and have been successful.
Real experience in the medical field that can allow an employee to start work with minimal training and no re-teaching of basic skills that should have been learned in school or externship.
I am not sure it is or should be the City’s job to do anything other than demand a first-rate educational system, K-12. The private sector can do what it needs to do. Public employees need a rigorous orientation and acknowledge who they work for- the taxpayer! We do NOT work for them!
Creativity, writing and general understanding of how things work, physics and basic math.

CITY OF FORT WORTH, TEXAS ECONOMIC DEVELOPMENT STRATEGIC PLAN
VOLUME 2: OPPORTUNITY PAGE | 93
For us, the employee training is primarily career experience. Few firms in investment management in FW makes it likely we’ll have to hire from out of town. We're happy to do that but is more labor and time intensive.
A local architecture school is needed. UTA isn't enough.
Local colleges and universities do NOT teach hands-on skills necessary for my company. The skill sets lacking for interior designers include the ability to measure and accurately complete drapery work orders and the lack of visualization ability. Even the trade schools such as the Art Institute are NOT teaching the rendering software that is generally used by both the design and the construction industry, such as Google SketchUp or Chief Architect. Somehow the institutions just do not communicate with the business community about THEIR needs.
Working with Workforce Solutions and other organizations to realize the visions of skillsets that will be needed in the future. Technology will change all industries and it is coming faster than what people think. We need to get ahead of the curve to ensure a quality workforce.
Tax and accounting for entrepreneurs - TX Wes or TCC
1 training class in our industry costs $8,000 per employee - that's impossible for a small business to keep up with... it'd be ideal for each employee to have 5 of these classes each.... that's $800,000 every 3 years.
Licensed irrigation repair can be a valid skilled trade with great potential for future growth and value. Technical retraining programs through TWC targeting veterans with applicable skills would be ideal.
Note: Minor corrections were made to spelling and capitalization to improve readability.
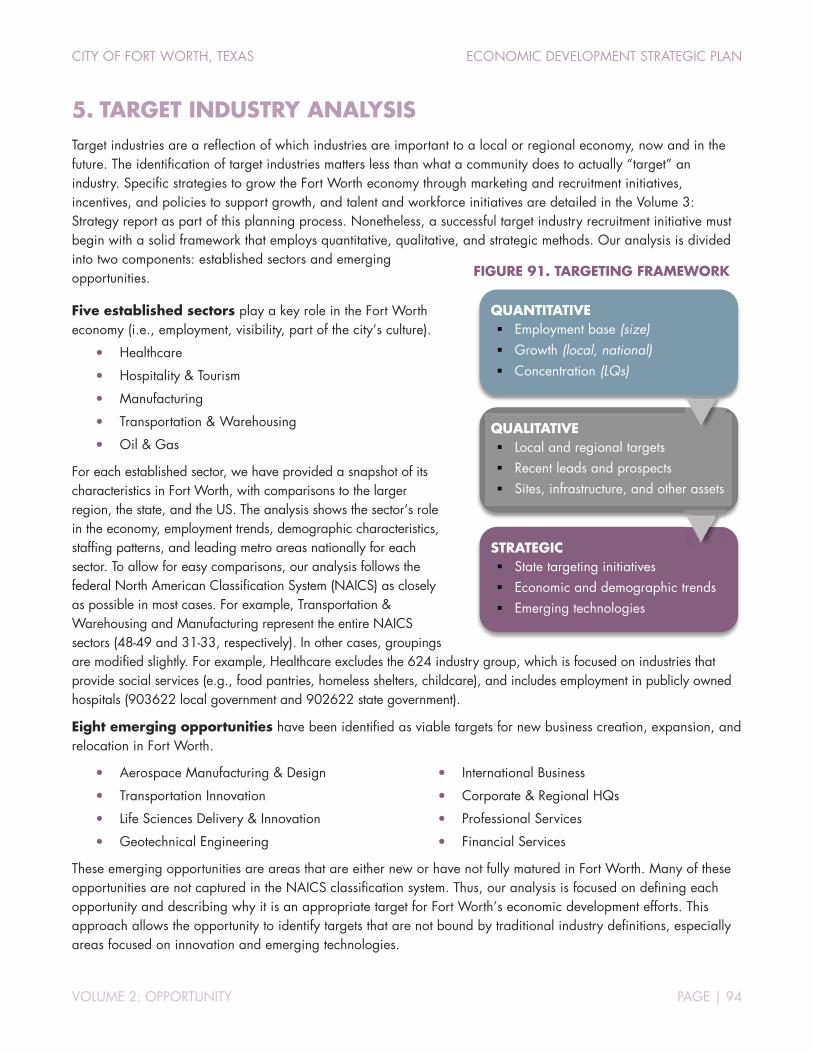
CITY OF FORT WORTH, TEXAS ECONOMIC DEVELOPMENT STRATEGIC PLAN
VOLUME 2: OPPORTUNITY PAGE | 94
5. TARGET INDUSTRY ANALYSIS Target industries are a reflection of which industries are important to a local or regional economy, now and in the future. The identification of target industries matters less than what a community does to actually “target” an industry. Specific strategies to grow the Fort Worth economy through marketing and recruitment initiatives, incentives, and policies to support growth, and talent and workforce initiatives are detailed in the Volume 3: Strategy report as part of this planning process. Nonetheless, a successful target industry recruitment initiative must begin with a solid framework that employs quantitative, qualitative, and strategic methods. Our analysis is divided into two components: established sectors and emerging opportunities.
Five established sectors play a key role in the Fort Worth economy (i.e., employment, visibility, part of the city’s culture).
Healthcare
Hospitality & Tourism
Manufacturing
Transportation & Warehousing
Oil & Gas
For each established sector, we have provided a snapshot of its characteristics in Fort Worth, with comparisons to the larger region, the state, and the US. The analysis shows the sector’s role in the economy, employment trends, demographic characteristics, staffing patterns, and leading metro areas nationally for each sector. To allow for easy comparisons, our analysis follows the federal North American Classification System (NAICS) as closely as possible in most cases. For example, Transportation & Warehousing and Manufacturing represent the entire NAICS sectors (48-49 and 31-33, respectively). In other cases, groupings are modified slightly. For example, Healthcare excludes the 624 industry group, which is focused on industries that provide social services (e.g., food pantries, homeless shelters, childcare), and includes employment in publicly owned hospitals (903622 local government and 902622 state government).
Eight emerging opportunities have been identified as viable targets for new business creation, expansion, and relocation in Fort Worth.
Aerospace Manufacturing & Design
Transportation Innovation
Life Sciences Delivery & Innovation
Geotechnical Engineering
International Business
Corporate & Regional HQs
Professional Services
Financial Services
These emerging opportunities are areas that are either new or have not fully matured in Fort Worth. Many of these opportunities are not captured in the NAICS classification system. Thus, our analysis is focused on defining each opportunity and describing why it is an appropriate target for Fort Worth’s economic development efforts. This approach allows the opportunity to identify targets that are not bound by traditional industry definitions, especially areas focused on innovation and emerging technologies.
FIGURE 91. TARGETING FRAMEWORK
QUANTITATIVE Employment base (size) Growth (local, national) Concentration (LQs)
QUALITATIVE Local and regional targets Recent leads and prospects Sites, infrastructure, and other assets
STRATEGIC State targeting initiatives Economic and demographic trends Emerging technologies

CITY OF FORT WORTH, TEXAS ECONOMIC DEVELOPMENT STRATEGIC PLAN
VOLUME 2: OPPORTUNITY PAGE | 95
ESTABLISHED SECTORS
This section provides a snapshot of employment in the established sectors. Information is provided for the city of Fort Worth throughout, with comparison to other relevant geographies (including the Dallas-Fort Worth metropolitan area, the state, and the US). The one exception is the “Industry Detail” section, which is presented for a single geography: the Fort Worth MD. This geography level was used to give a fuller view of regional strengths within the established sectors and to account for the way employment was distributed in Tarrant County by the data provider (Emsi).
DISTRIBUTION & CONCENTRATION
The five established sectors profiled in this section comprise a significant share of total employment across all geographies. However, they comprise a distinctly large share of jobs in located within the city of Fort Worth. As a group, the established sectors account for one-third of employment in Fort Worth (33.5 percent), compared with less than one-quarter of the job base at the regional (Dallas-Fort Worth MSA), state, or national level.
FIGURE 92. 2016 EMPLOYMENT LEVEL IN ESTABLISHED SECTORS BY GEOGRAPHY
CITY OF FORT
WORTH
FORT WORTH
(MD) DALLAS
(MD)
DALLAS- FORT WORTH
(MSA) TEXAS USA
TOTAL 483,517 1,084,691 2,610,528 3,695,088 13,189,982 157,926,564
Rest of economy 321,372 772,362 2,046,006 2,818,358 10,047,964 119,540,721
Transportation & warehousing 56,473 79,751 99,215 178,958 485,760 5,343,262
Manufacturing 48,350 93,896 173,485 267,283 867,686 12,525,242
Healthcare 44,506 107,571 240,071 347,642 1,329,396 16,658,807
Oil & gas 7,181 13,990 11,001 24,988 258,871 603,843
Hospitality & tourism 5,635 17,121 40,750 57,859 200,305 3,254,689
Sources: US Bureau of Labor Statistics, Emsi, TIP Strategies.
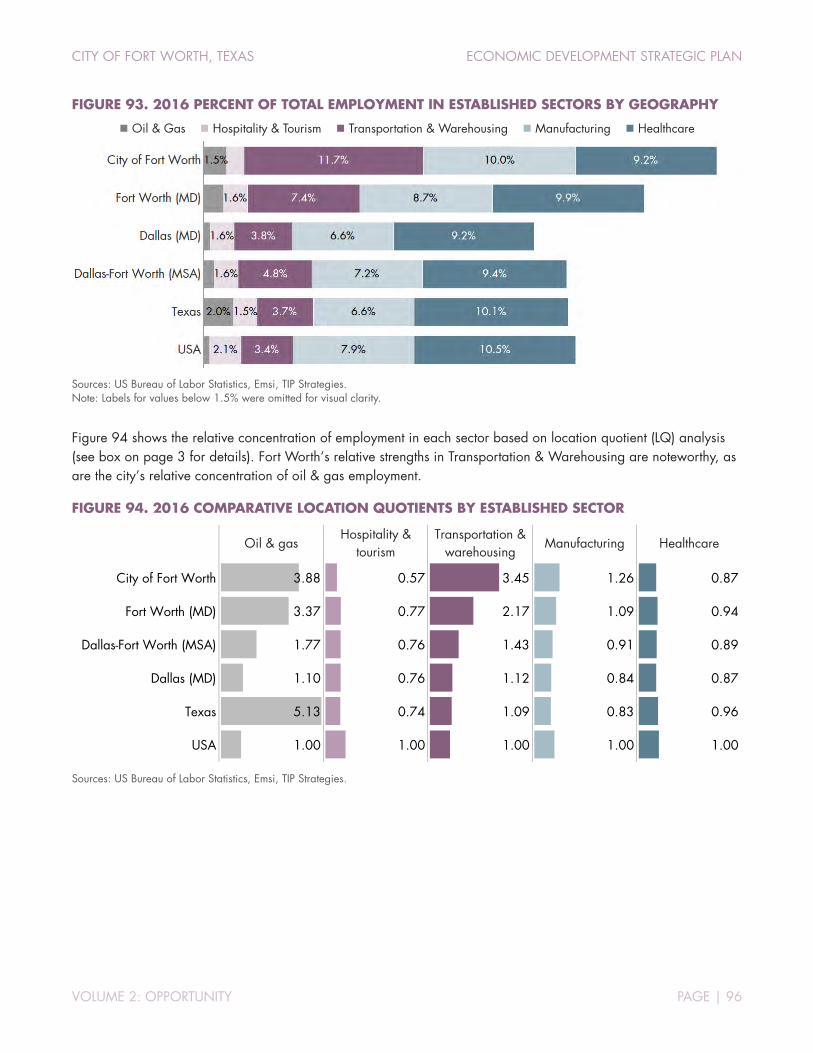
CITY OF FORT WORTH, TEXAS ECONOMIC DEVELOPMENT STRATEGIC PLAN
VOLUME 2: OPPORTUNITY PAGE | 96
FIGURE 93. 2016 PERCENT OF TOTAL EMPLOYMENT IN ESTABLISHED SECTORS BY GEOGRAPHY
Oil & Gas Hospitality & Tourism Transportation & Warehousing Manufacturing Healthcare
Sources: US Bureau of Labor Statistics, Emsi, TIP Strategies. Note: Labels for values below 1.5% were omitted for visual clarity.
Figure 94 shows the relative concentration of employment in each sector based on location quotient (LQ) analysis (see box on page 3 for details). Fort Worth’s relative strengths in Transportation & Warehousing are noteworthy, as are the city’s relative concentration of oil & gas employment.
FIGURE 94. 2016 COMPARATIVE LOCATION QUOTIENTS BY ESTABLISHED SECTOR
Sources: US Bureau of Labor Statistics, Emsi, TIP Strategies.
Oil & gasHospitality &
tourismTransportation &
warehousingManufacturing Healthcare
City of Fort Worth 3.88 0.57 3.45 1.26 0.87
Fort Worth (MD) 3.37 0.77 2.17 1.09 0.94
Dallas-Fort Worth (MSA) 1.77 0.76 1.43 0.91 0.89
Dallas (MD) 1.10 0.76 1.12 0.84 0.87
Texas 5.13 0.74 1.09 0.83 0.96
USA 1.00 1.00 1.00 1.00 1.00
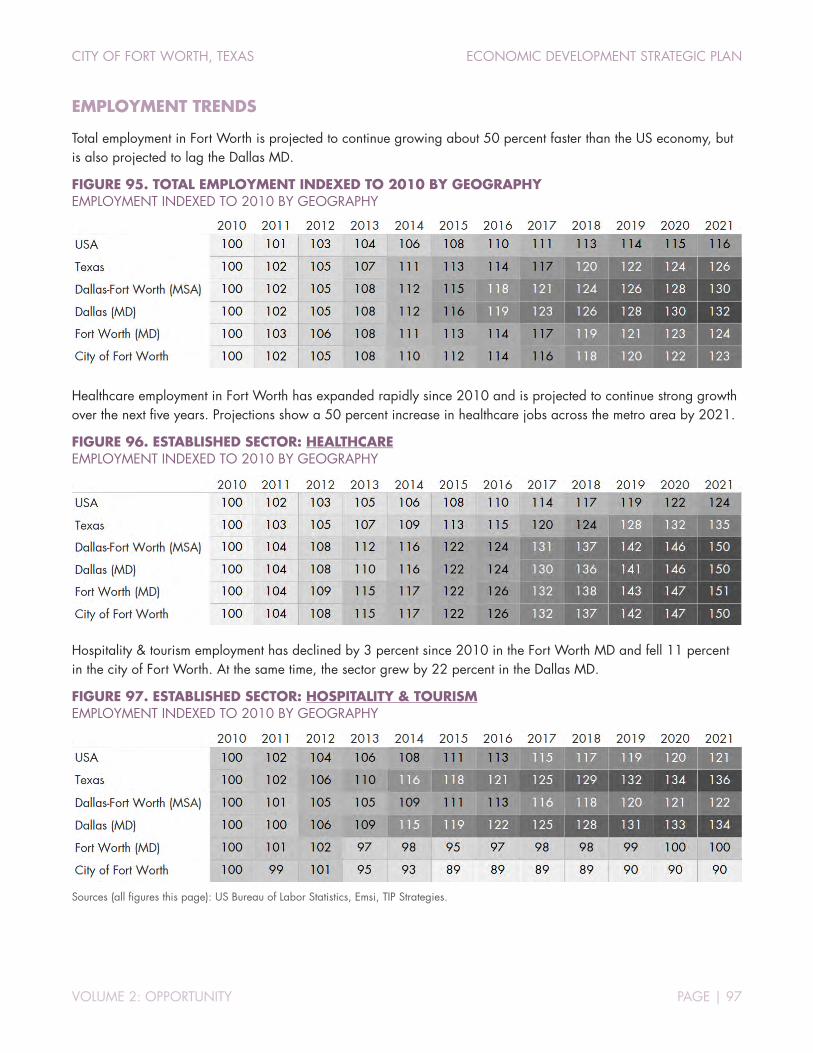
CITY OF FORT WORTH, TEXAS ECONOMIC DEVELOPMENT STRATEGIC PLAN
VOLUME 2: OPPORTUNITY PAGE | 97
EMPLOYMENT TRENDS
Total employment in Fort Worth is projected to continue growing about 50 percent faster than the US economy, but is also projected to lag the Dallas MD.
FIGURE 95. TOTAL EMPLOYMENT INDEXED TO 2010 BY GEOGRAPHY EMPLOYMENT INDEXED TO 2010 BY GEOGRAPHY
Healthcare employment in Fort Worth has expanded rapidly since 2010 and is projected to continue strong growth over the next five years. Projections show a 50 percent increase in healthcare jobs across the metro area by 2021.
FIGURE 96. ESTABLISHED SECTOR: HEALTHCARE EMPLOYMENT INDEXED TO 2010 BY GEOGRAPHY
Hospitality & tourism employment has declined by 3 percent since 2010 in the Fort Worth MD and fell 11 percent in the city of Fort Worth. At the same time, the sector grew by 22 percent in the Dallas MD.
FIGURE 97. ESTABLISHED SECTOR: HOSPITALITY & TOURISM EMPLOYMENT INDEXED TO 2010 BY GEOGRAPHY
Sources (all figures this page): US Bureau of Labor Statistics, Emsi, TIP Strategies.

CITY OF FORT WORTH, TEXAS ECONOMIC DEVELOPMENT STRATEGIC PLAN
VOLUME 2: OPPORTUNITY PAGE | 98
Manufacturing employment growth in the Dallas-Fort Worth metro area has taken place almost exclusively in the Fort Worth MD since 2010. Regional strengths in manufacturing are weighted toward Fort Worth.
FIGURE 98. ESTABLISHED SECTOR: MANUFACTURING EMPLOYMENT INDEXED TO 2010 BY GEOGRAPHY
Oil & gas is among the most volatile segments of the US economy. The sector grew by 34 percent nationally from 2010 to 2014 and nearly doubled that pace (62 percent) in the Fort Worth MD, only to shed nearly all those jobs from 2014 to 2016. Future regional job growth is projected to happen mostly in the Fort Worth MD.
FIGURE 99. ESTABLISHED TARGET SECTOR: OIL & GAS EMPLOYMENT INDEXED TO 2010 BY GEOGRAPHY
Transportation & warehousing employment has grown rapidly across all geographies since 2010. The Dallas MD experienced more steady growth in the sector than the Fort Worth MD, but the pace of job growth in Fort Worth accelerated rapidly from 2013 through 2016.
FIGURE 100. ESTABLISHED SECTOR: TRANSPORTATION & WAREHOUSING EMPLOYMENT INDEXED TO 2010 BY GEOGRAPHY
Sources (all figures this page): US Bureau of Labor Statistics, Emsi, TIP Strategies.
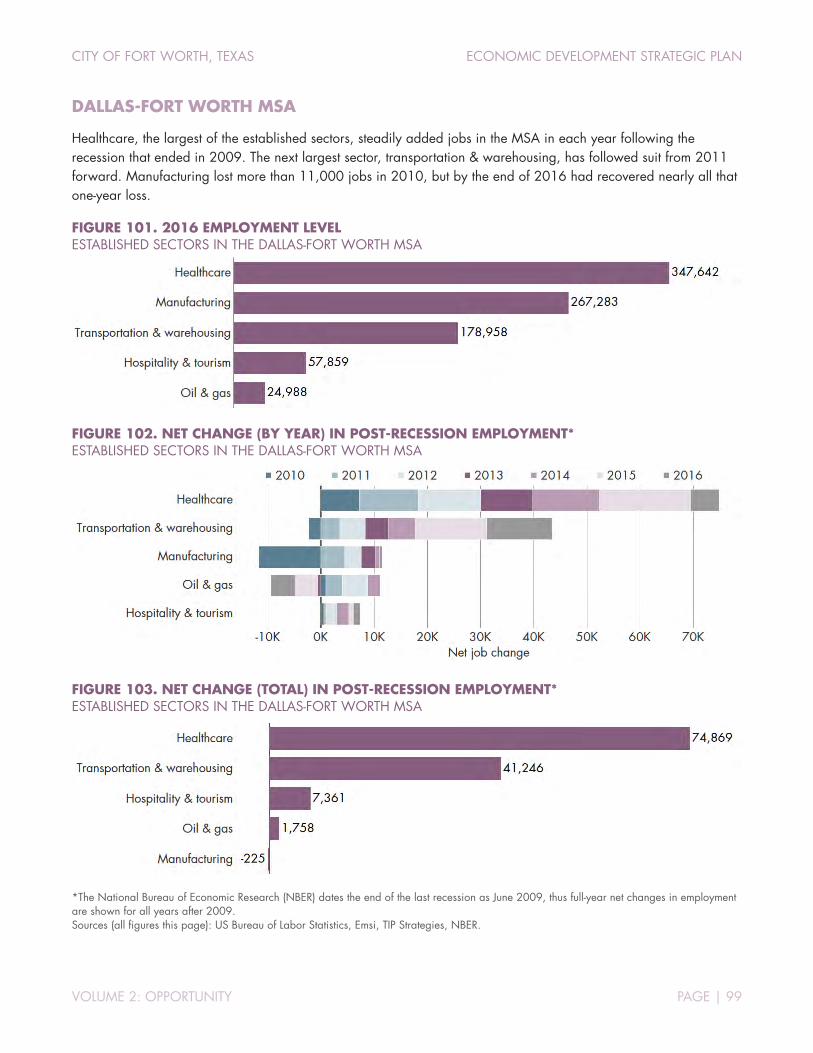
CITY OF FORT WORTH, TEXAS ECONOMIC DEVELOPMENT STRATEGIC PLAN
VOLUME 2: OPPORTUNITY PAGE | 99
DALLAS-FORT WORTH MSA
Healthcare, the largest of the established sectors, steadily added jobs in the MSA in each year following the recession that ended in 2009. The next largest sector, transportation & warehousing, has followed suit from 2011 forward. Manufacturing lost more than 11,000 jobs in 2010, but by the end of 2016 had recovered nearly all that one-year loss.
FIGURE 101. 2016 EMPLOYMENT LEVEL ESTABLISHED SECTORS IN THE DALLAS-FORT WORTH MSA
FIGURE 102. NET CHANGE (BY YEAR) IN POST-RECESSION EMPLOYMENT* ESTABLISHED SECTORS IN THE DALLAS-FORT WORTH MSA
FIGURE 103. NET CHANGE (TOTAL) IN POST-RECESSION EMPLOYMENT* ESTABLISHED SECTORS IN THE DALLAS-FORT WORTH MSA
*The National Bureau of Economic Research (NBER) dates the end of the last recession as June 2009, thus full-year net changes in employment are shown for all years after 2009. Sources (all figures this page): US Bureau of Labor Statistics, Emsi, TIP Strategies, NBER.

CITY OF FORT WORTH, TEXAS ECONOMIC DEVELOPMENT STRATEGIC PLAN
VOLUME 2: OPPORTUNITY PAGE | 100
FORT WORTH MD
Manufacturing ranks more prominently among the established sectors in the Fort Worth MD than in the MSA overall. Through the seven full years since the recession, however, manufacturing, oil & gas, and hospitality & tourism have shown more volatility from year to year than have the steadier growth sectors (healthcare and transportation & warehousing).
FIGURE 104. 2016 EMPLOYMENT LEVEL ESTABLISHED SECTORS IN THE FORT WORTH (MD)
FIGURE 105. NET CHANGE (BY YEAR) IN POST-RECESSION EMPLOYMENT* ESTABLISHED SECTORS IN THE FORT WORTH (MD)
FIGURE 106. NET CHANGE (TOTAL) IN POST-RECESSION EMPLOYMENT* ESTABLISHED SECTORS IN THE FORT WORTH (MD)
*The NBER dates the end of the last recession as June 2009, thus full-year net changes in employment are shown for all years after 2009. Sources (all figures this page): US Bureau of Labor Statistics, Emsi, TIP Strategies, NBER.
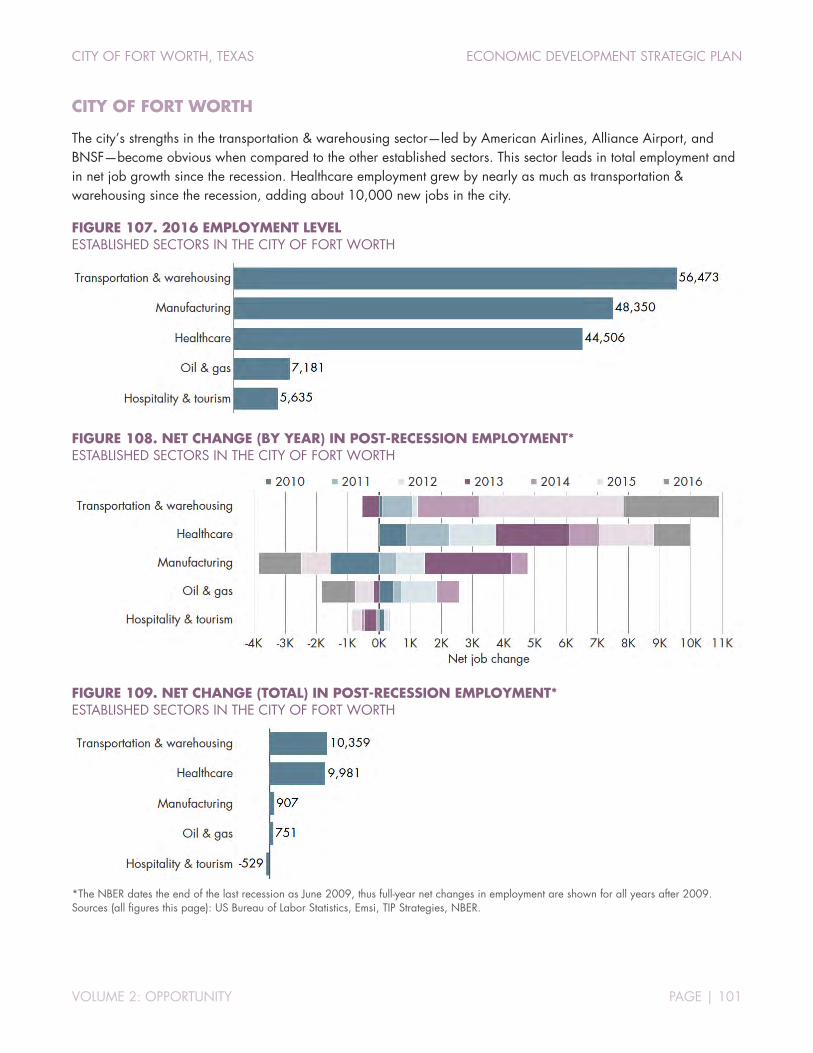
CITY OF FORT WORTH, TEXAS ECONOMIC DEVELOPMENT STRATEGIC PLAN
VOLUME 2: OPPORTUNITY PAGE | 101
CITY OF FORT WORTH
The city’s strengths in the transportation & warehousing sector—led by American Airlines, Alliance Airport, and BNSF—become obvious when compared to the other established sectors. This sector leads in total employment and in net job growth since the recession. Healthcare employment grew by nearly as much as transportation & warehousing since the recession, adding about 10,000 new jobs in the city.
FIGURE 107. 2016 EMPLOYMENT LEVEL ESTABLISHED SECTORS IN THE CITY OF FORT WORTH
FIGURE 108. NET CHANGE (BY YEAR) IN POST-RECESSION EMPLOYMENT* ESTABLISHED SECTORS IN THE CITY OF FORT WORTH
FIGURE 109. NET CHANGE (TOTAL) IN POST-RECESSION EMPLOYMENT* ESTABLISHED SECTORS IN THE CITY OF FORT WORTH
*The NBER dates the end of the last recession as June 2009, thus full-year net changes in employment are shown for all years after 2009. Sources (all figures this page): US Bureau of Labor Statistics, Emsi, TIP Strategies, NBER.

CITY OF FORT WORTH, TEXAS ECONOMIC DEVELOPMENT STRATEGIC PLAN
VOLUME 2: OPPORTUNITY PAGE | 102
DEMOGRAPHIC CHARACTERISTICS
The US economy has a nearly identical share of male and female workers, but major differences exist across sectors. The healthcare sector is dominated by females, who represent 77 percent of all workers. Oil & gas is highly dependent on male workers, who account for 81 percent of all employees.1 Transportation & warehousing and manufacturing are also heavily skewed toward male employment with females representing less than 30 percent of workers for both sectors. Hospitality & tourism employment is relatively balanced between genders.
FIGURE 110. 2016 GENDER DISTRIBUTION OF EMPLOYMENT BY SECTOR: US
Sources: US Bureau of Labor Statistics, Emsi, TIP Strategies.
The Fort Worth MD has a slightly larger share of its workforce that is male than does the US economy, but the gender distribution of employment within the established sectors closely mirrors national patterns.
FIGURE 111. 2016 GENDER DISTRIBUTION OF EMPLOYMENT BY SECTOR: FORT WORTH (MD)
Sources: US Bureau of Labor Statistics, Emsi, TIP Strategies.
1 This skewing of gender balance in oil & gas employment has not gone unnoticed by the industry. See, for example: World Petroleum Council and Boston Consulting Group, Untapped Reserves: Promoting Gender Balance in Oil and Gas, July 12, 2017. [www.bcg.com/publications/2017/energy-environment-people-organization-untapped-reserves.aspx]
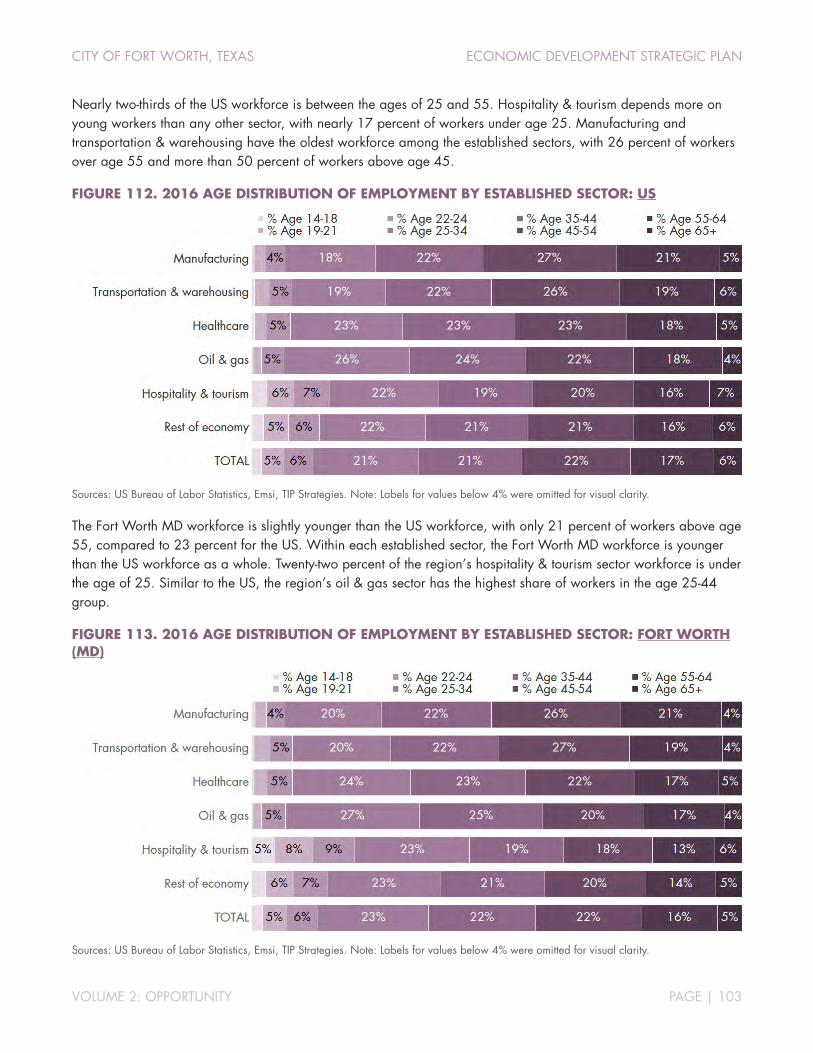
CITY OF FORT WORTH, TEXAS ECONOMIC DEVELOPMENT STRATEGIC PLAN
VOLUME 2: OPPORTUNITY PAGE | 103
Nearly two-thirds of the US workforce is between the ages of 25 and 55. Hospitality & tourism depends more on young workers than any other sector, with nearly 17 percent of workers under age 25. Manufacturing and transportation & warehousing have the oldest workforce among the established sectors, with 26 percent of workers over age 55 and more than 50 percent of workers above age 45.
FIGURE 112. 2016 AGE DISTRIBUTION OF EMPLOYMENT BY ESTABLISHED SECTOR: US
Sources: US Bureau of Labor Statistics, Emsi, TIP Strategies. Note: Labels for values below 4% were omitted for visual clarity.
The Fort Worth MD workforce is slightly younger than the US workforce, with only 21 percent of workers above age 55, compared to 23 percent for the US. Within each established sector, the Fort Worth MD workforce is younger than the US workforce as a whole. Twenty-two percent of the region’s hospitality & tourism sector workforce is under the age of 25. Similar to the US, the region’s oil & gas sector has the highest share of workers in the age 25-44 group.
FIGURE 113. 2016 AGE DISTRIBUTION OF EMPLOYMENT BY ESTABLISHED SECTOR: FORT WORTH (MD)
Sources: US Bureau of Labor Statistics, Emsi, TIP Strategies. Note: Labels for values below 4% were omitted for visual clarity.
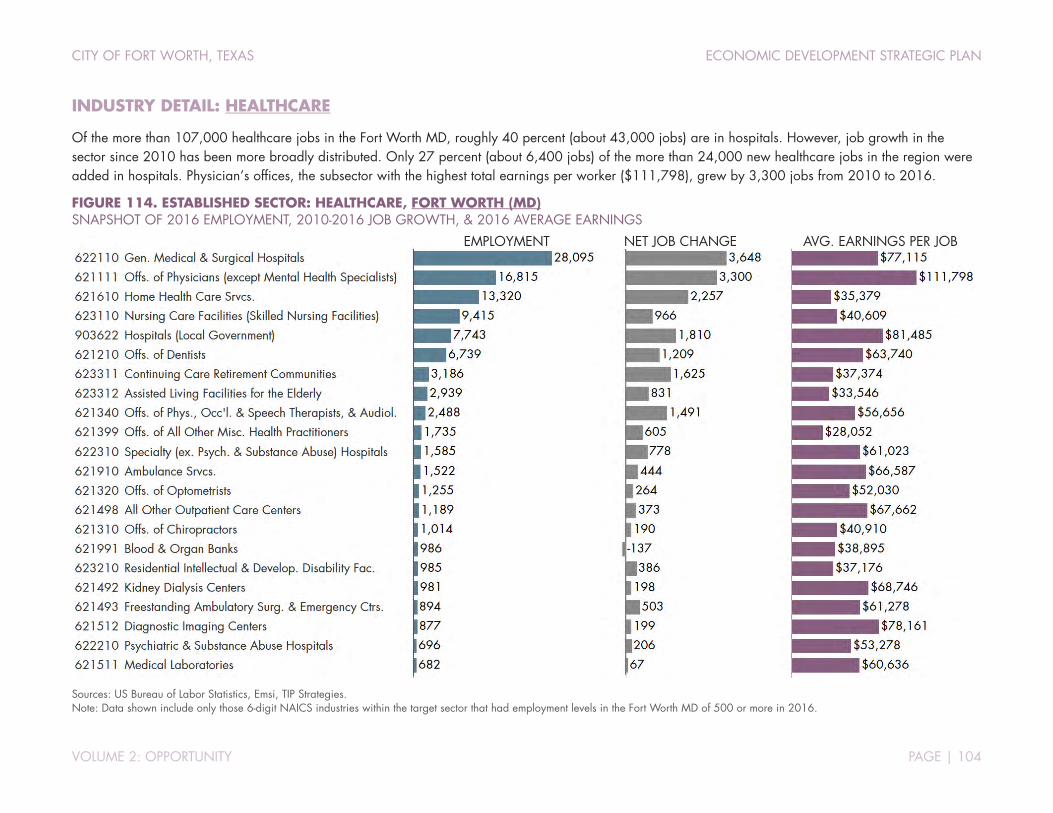
CITY OF FORT WORTH, TEXAS ECONOMIC DEVELOPMENT STRATEGIC PLAN
VOLUME 2: OPPORTUNITY PAGE | 104
INDUSTRY DETAIL: HEALTHCARE
Of the more than 107,000 healthcare jobs in the Fort Worth MD, roughly 40 percent (about 43,000 jobs) are in hospitals. However, job growth in the sector since 2010 has been more broadly distributed. Only 27 percent (about 6,400 jobs) of the more than 24,000 new healthcare jobs in the region were added in hospitals. Physician’s offices, the subsector with the highest total earnings per worker ($111,798), grew by 3,300 jobs from 2010 to 2016.
FIGURE 114. ESTABLISHED SECTOR: HEALTHCARE, FORT WORTH (MD) SNAPSHOT OF 2016 EMPLOYMENT, 2010-2016 JOB GROWTH, & 2016 AVERAGE EARNINGS
Sources: US Bureau of Labor Statistics, Emsi, TIP Strategies. Note: Data shown include only those 6-digit NAICS industries within the target sector that had employment levels in the Fort Worth MD of 500 or more in 2016.
EMPLOYMENT NET JOB CHANGE AVG. EARNINGS PER JOB
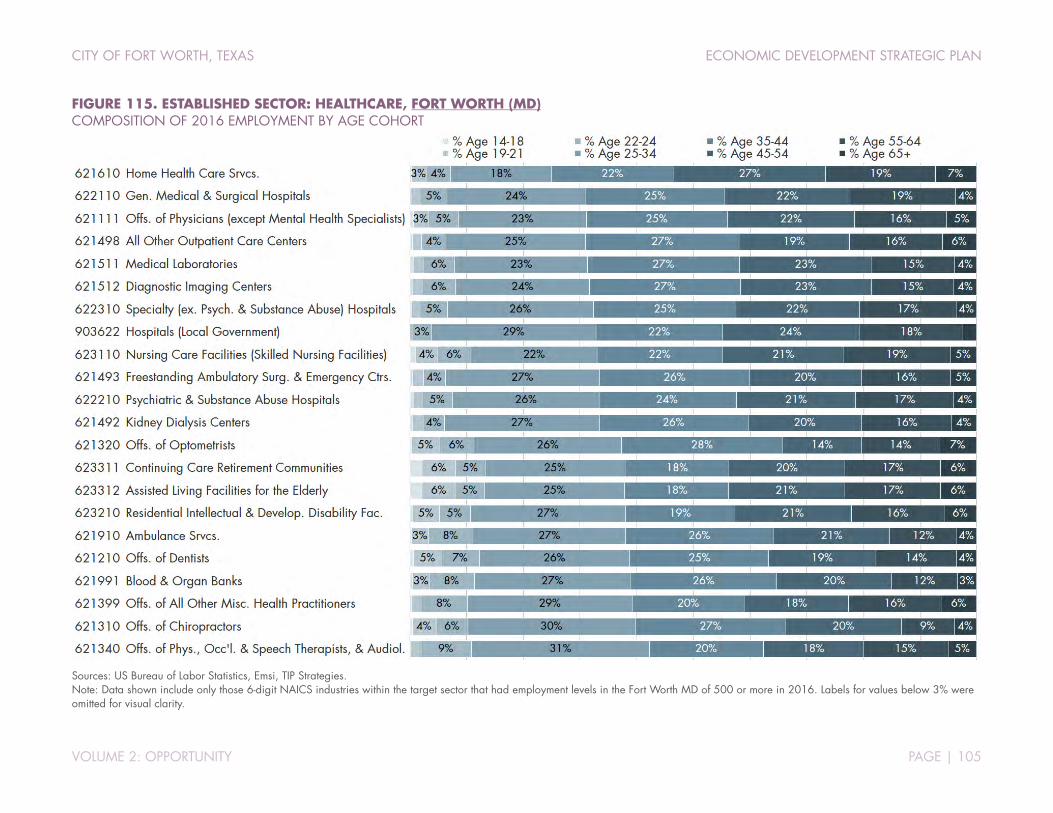
CITY OF FORT WORTH, TEXAS ECONOMIC DEVELOPMENT STRATEGIC PLAN
VOLUME 2: OPPORTUNITY PAGE | 105
FIGURE 115. ESTABLISHED SECTOR: HEALTHCARE, FORT WORTH (MD) COMPOSITION OF 2016 EMPLOYMENT BY AGE COHORT
Sources: US Bureau of Labor Statistics, Emsi, TIP Strategies. Note: Data shown include only those 6-digit NAICS industries within the target sector that had employment levels in the Fort Worth MD of 500 or more in 2016. Labels for values below 3% were omitted for visual clarity.
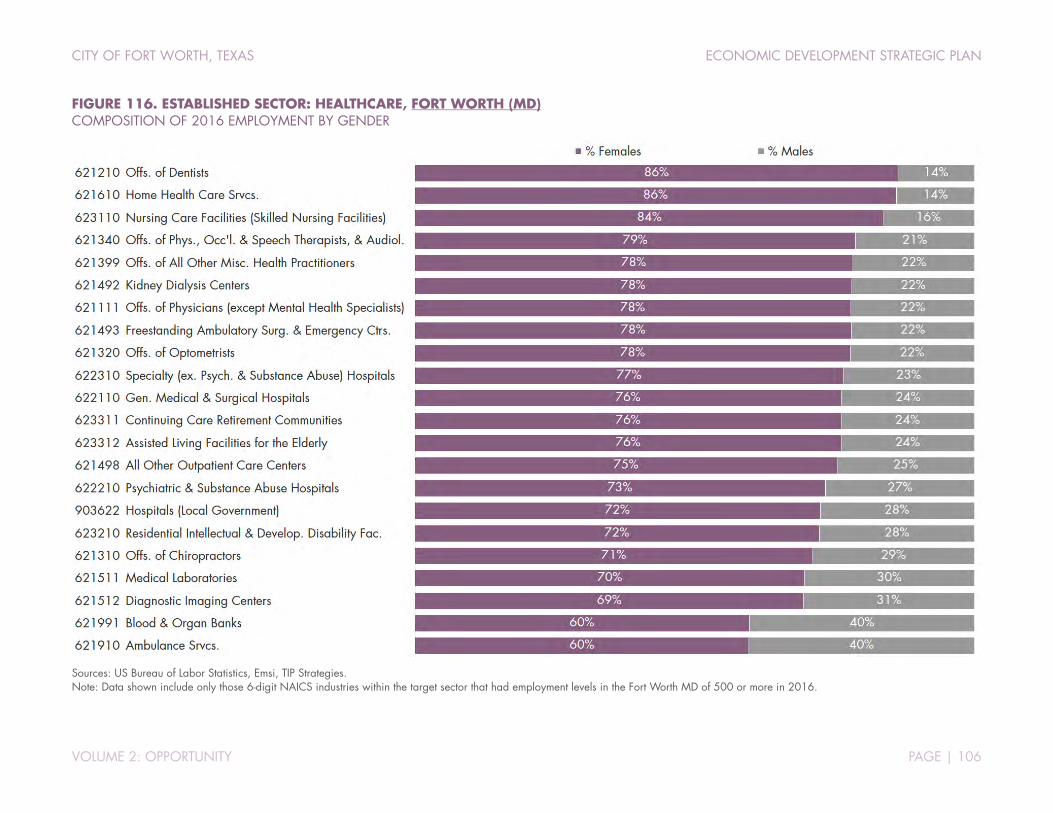
CITY OF FORT WORTH, TEXAS ECONOMIC DEVELOPMENT STRATEGIC PLAN
VOLUME 2: OPPORTUNITY PAGE | 106
FIGURE 116. ESTABLISHED SECTOR: HEALTHCARE, FORT WORTH (MD) COMPOSITION OF 2016 EMPLOYMENT BY GENDER
Sources: US Bureau of Labor Statistics, Emsi, TIP Strategies. Note: Data shown include only those 6-digit NAICS industries within the target sector that had employment levels in the Fort Worth MD of 500 or more in 2016.

CITY OF FORT WORTH, TEXAS ECONOMIC DEVELOPMENT STRATEGIC PLAN
VOLUME 2: OPPORTUNITY PAGE | 107
INDUSTRY DETAIL: HOSPITALITY & TOURISM
Hotels & motels account for roughly half of the 17,000 total jobs in hospitality & tourism in the Fort Worth MD, but the industry experienced a decline of more than 500 jobs from 2010 to 2016. Amusement & theme parks and other amusement & recreation industries gained 800 jobs during the same period.
FIGURE 117. ESTABLISHED SECTOR: HOSPITALITY & TOURISM, FORT WORTH (MD) SNAPSHOT OF 2016 EMPLOYMENT, 2010-2016 JOB GROWTH, & 2016 AVERAGE EARNINGS
Sources: US Bureau of Labor Statistics, Emsi, TIP Strategies. Note: Data shown include only those 6-digit NAICS industries within the target sector that had employment levels in the Fort Worth MD of 500 or more in 2016.
FIGURE 118. ESTABLISHED SECTOR: HOSPITALITY & TOURISM, FORT WORTH (MD) COMPOSITION OF 2016 EMPLOYMENT BY AGE COHORT
Sources: US Bureau of Labor Statistics, Emsi, TIP Strategies. Note: Data shown include only those 6-digit NAICS industries within the target sector that had employment levels in the Fort Worth MD of 500 or more in 2016. Labels for values below 3% were omitted for visual clarity.
EMPLOYMENT NET JOB CHANGE AVG. EARNINGS PER JOB

CITY OF FORT WORTH, TEXAS ECONOMIC DEVELOPMENT STRATEGIC PLAN
VOLUME 2: OPPORTUNITY PAGE | 108
FIGURE 119. ESTABLISHED SECTOR: HOSPITALITY & TOURISM, FORT WORTH (MD) COMPOSITION OF 2016 EMPLOYMENT BY GENDER
Sources: US Bureau of Labor Statistics, Emsi, TIP Strategies. Note: Data shown include only those 6-digit NAICS industries within the target sector that had employment levels in the Fort Worth MD of 500 or more in 2016.
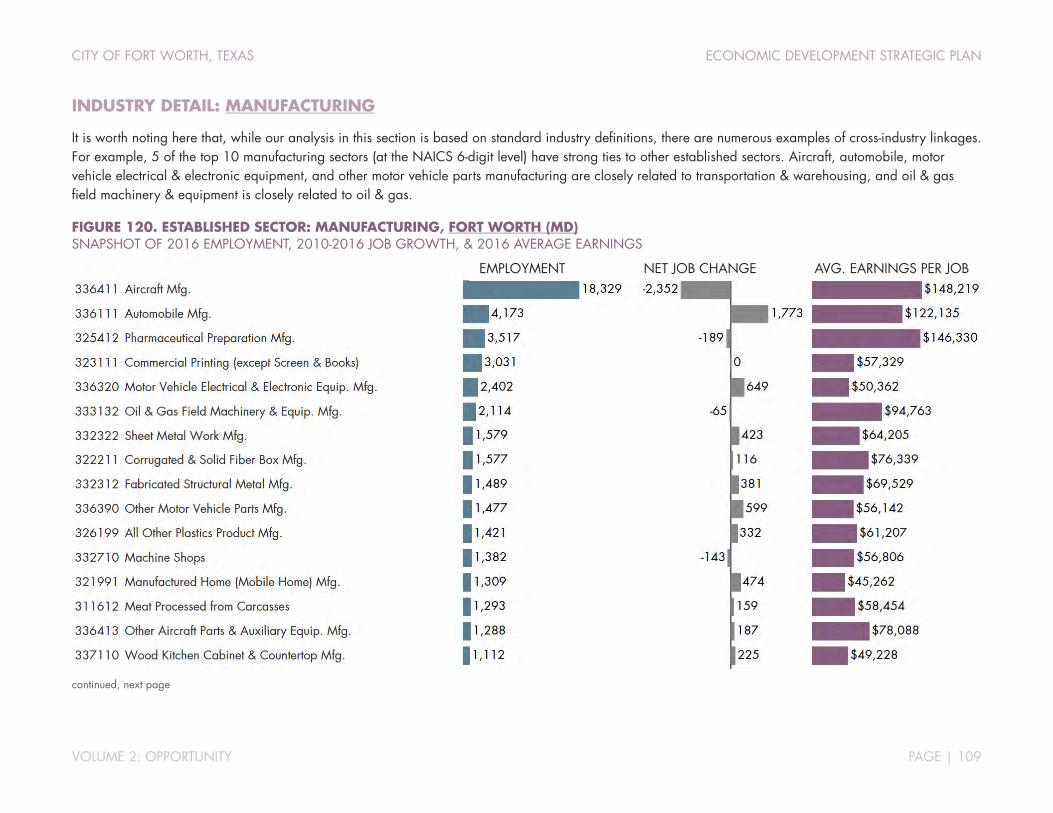
CITY OF FORT WORTH, TEXAS ECONOMIC DEVELOPMENT STRATEGIC PLAN
VOLUME 2: OPPORTUNITY PAGE | 109
INDUSTRY DETAIL: MANUFACTURING
It is worth noting here that, while our analysis in this section is based on standard industry definitions, there are numerous examples of cross-industry linkages. For example, 5 of the top 10 manufacturing sectors (at the NAICS 6-digit level) have strong ties to other established sectors. Aircraft, automobile, motor vehicle electrical & electronic equipment, and other motor vehicle parts manufacturing are closely related to transportation & warehousing, and oil & gas field machinery & equipment is closely related to oil & gas.
FIGURE 120. ESTABLISHED SECTOR: MANUFACTURING, FORT WORTH (MD) SNAPSHOT OF 2016 EMPLOYMENT, 2010-2016 JOB GROWTH, & 2016 AVERAGE EARNINGS
continued, next page
EMPLOYMENT NET JOB CHANGE AVG. EARNINGS PER JOB
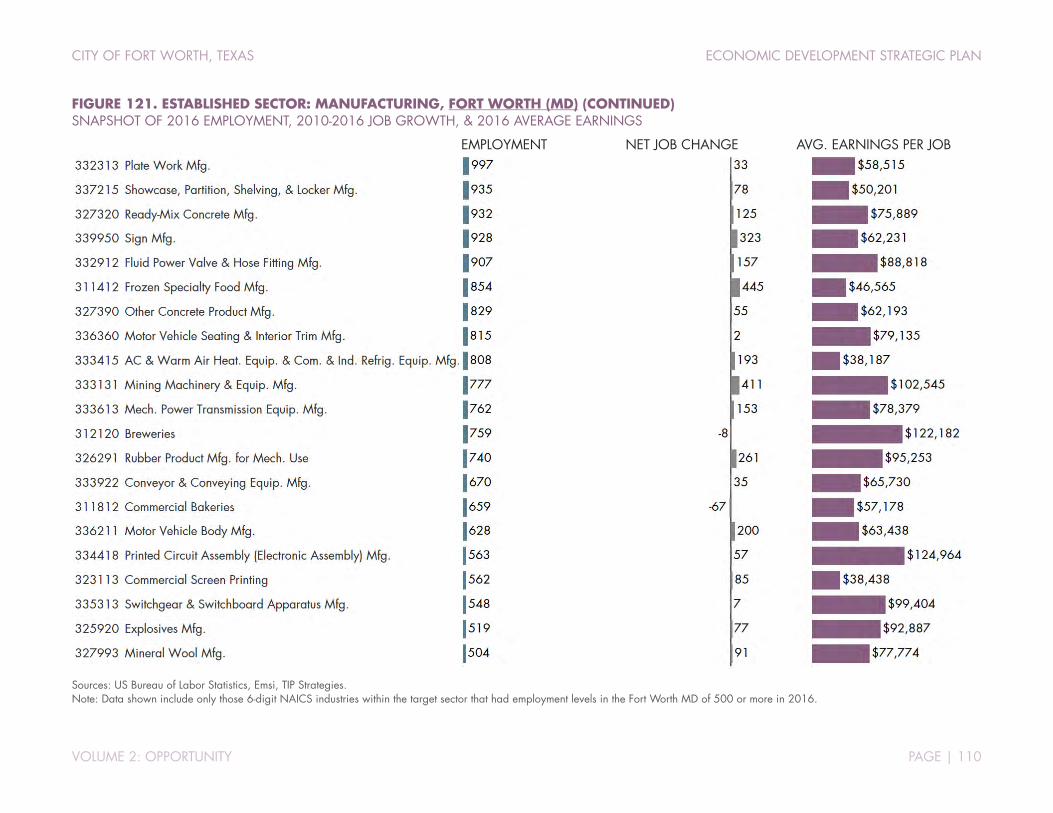
CITY OF FORT WORTH, TEXAS ECONOMIC DEVELOPMENT STRATEGIC PLAN
VOLUME 2: OPPORTUNITY PAGE | 110
FIGURE 121. ESTABLISHED SECTOR: MANUFACTURING, FORT WORTH (MD) (CONTINUED) SNAPSHOT OF 2016 EMPLOYMENT, 2010-2016 JOB GROWTH, & 2016 AVERAGE EARNINGS
Sources: US Bureau of Labor Statistics, Emsi, TIP Strategies. Note: Data shown include only those 6-digit NAICS industries within the target sector that had employment levels in the Fort Worth MD of 500 or more in 2016.
EMPLOYMENT NET JOB CHANGE AVG. EARNINGS PER JOB
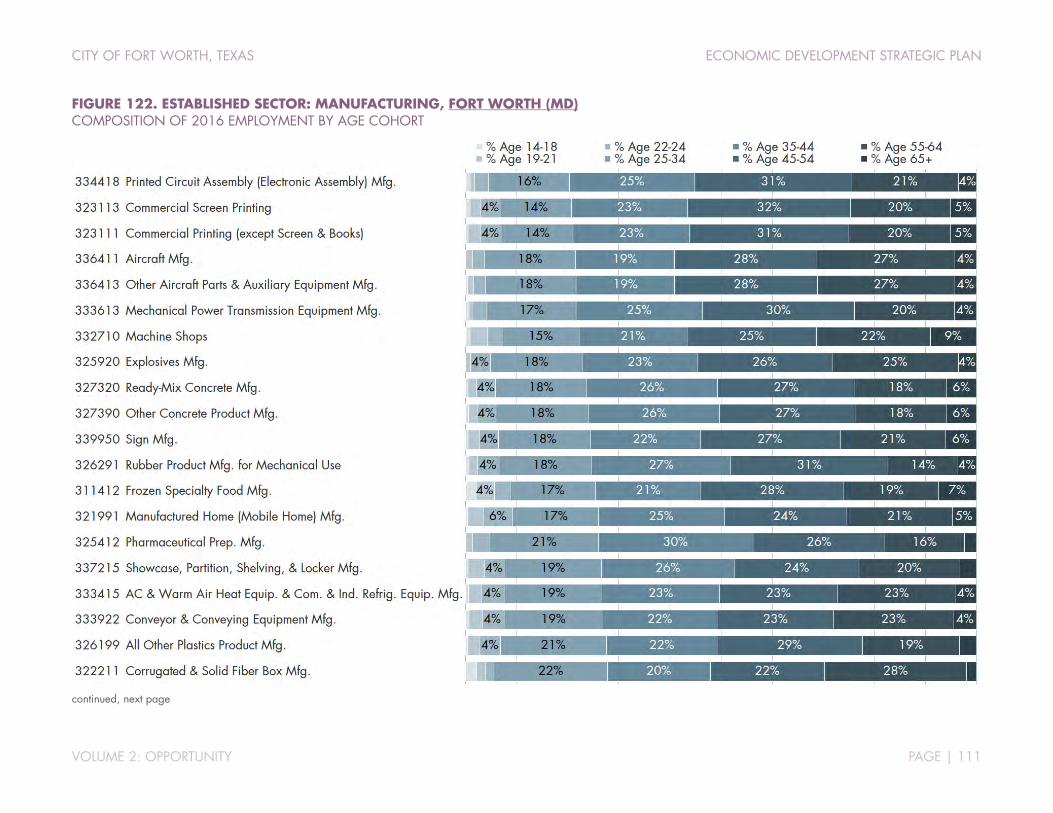
CITY OF FORT WORTH, TEXAS ECONOMIC DEVELOPMENT STRATEGIC PLAN
VOLUME 2: OPPORTUNITY PAGE | 111
FIGURE 122. ESTABLISHED SECTOR: MANUFACTURING, FORT WORTH (MD) COMPOSITION OF 2016 EMPLOYMENT BY AGE COHORT
continued, next page
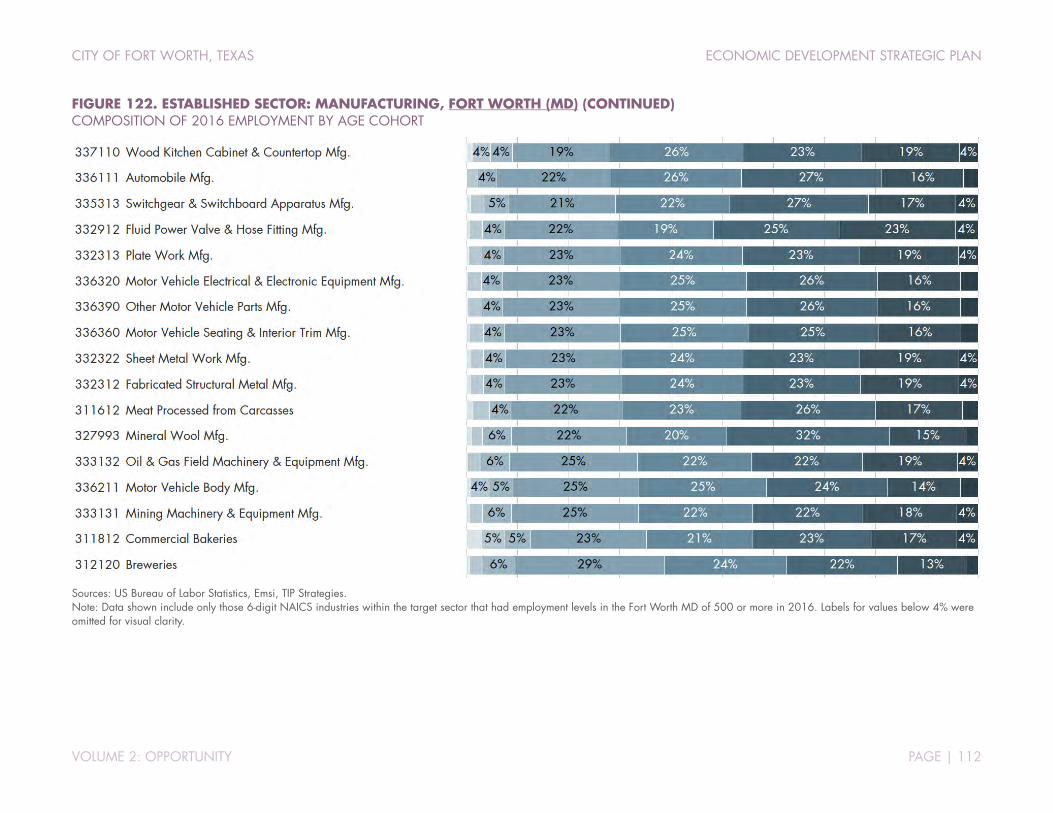
CITY OF FORT WORTH, TEXAS ECONOMIC DEVELOPMENT STRATEGIC PLAN
VOLUME 2: OPPORTUNITY PAGE | 112
FIGURE 122. ESTABLISHED SECTOR: MANUFACTURING, FORT WORTH (MD) (CONTINUED) COMPOSITION OF 2016 EMPLOYMENT BY AGE COHORT
Sources: US Bureau of Labor Statistics, Emsi, TIP Strategies. Note: Data shown include only those 6-digit NAICS industries within the target sector that had employment levels in the Fort Worth MD of 500 or more in 2016. Labels for values below 4% were omitted for visual clarity.
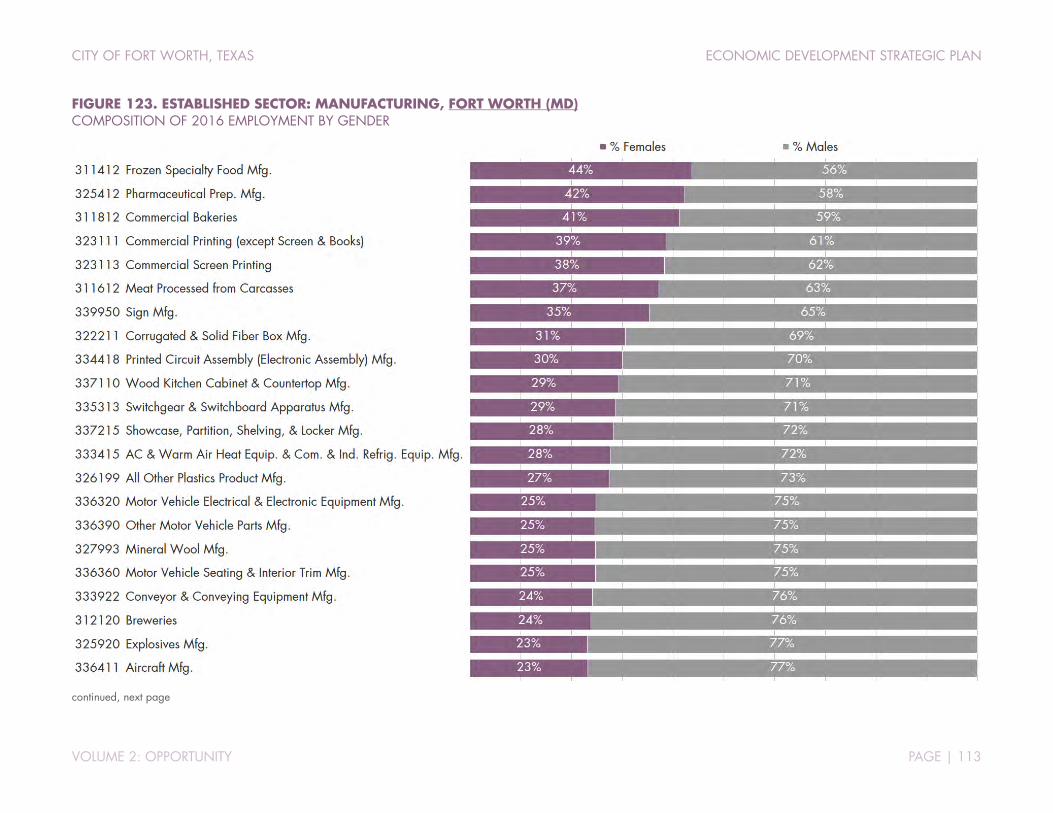
CITY OF FORT WORTH, TEXAS ECONOMIC DEVELOPMENT STRATEGIC PLAN
VOLUME 2: OPPORTUNITY PAGE | 113
FIGURE 123. ESTABLISHED SECTOR: MANUFACTURING, FORT WORTH (MD) COMPOSITION OF 2016 EMPLOYMENT BY GENDER
continued, next page
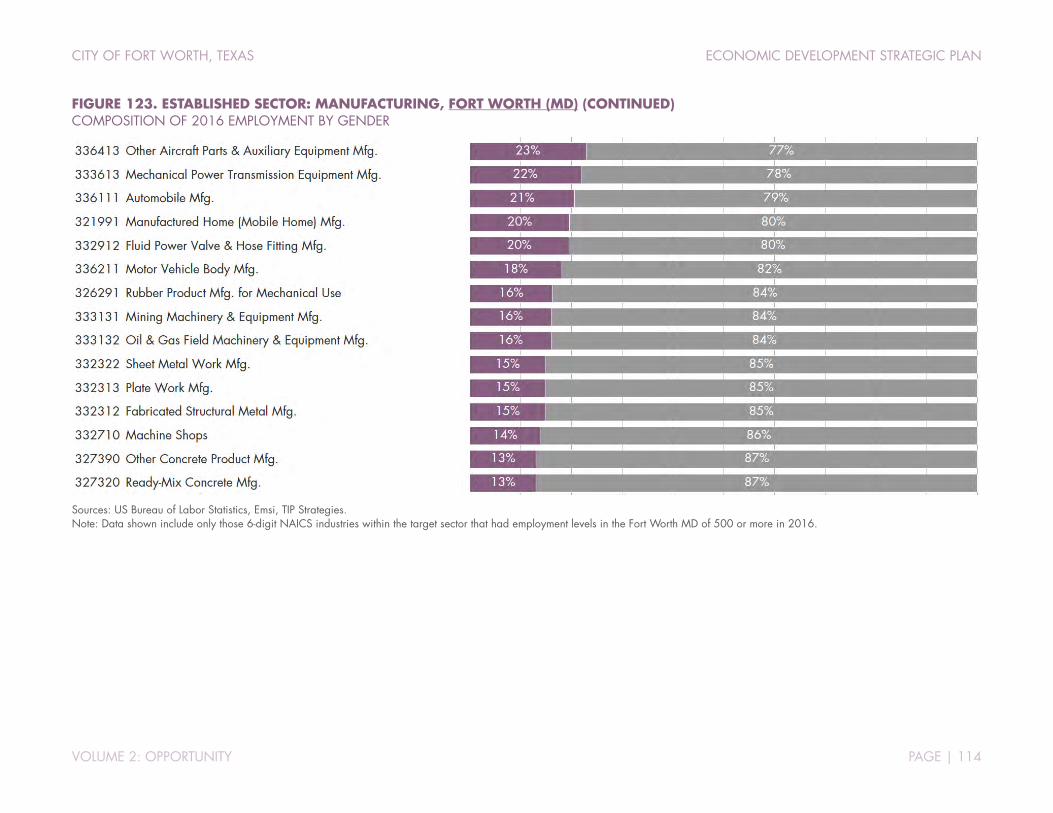
CITY OF FORT WORTH, TEXAS ECONOMIC DEVELOPMENT STRATEGIC PLAN
VOLUME 2: OPPORTUNITY PAGE | 114
FIGURE 123. ESTABLISHED SECTOR: MANUFACTURING, FORT WORTH (MD) (CONTINUED) COMPOSITION OF 2016 EMPLOYMENT BY GENDER
Sources: US Bureau of Labor Statistics, Emsi, TIP Strategies. Note: Data shown include only those 6-digit NAICS industries within the target sector that had employment levels in the Fort Worth MD of 500 or more in 2016.
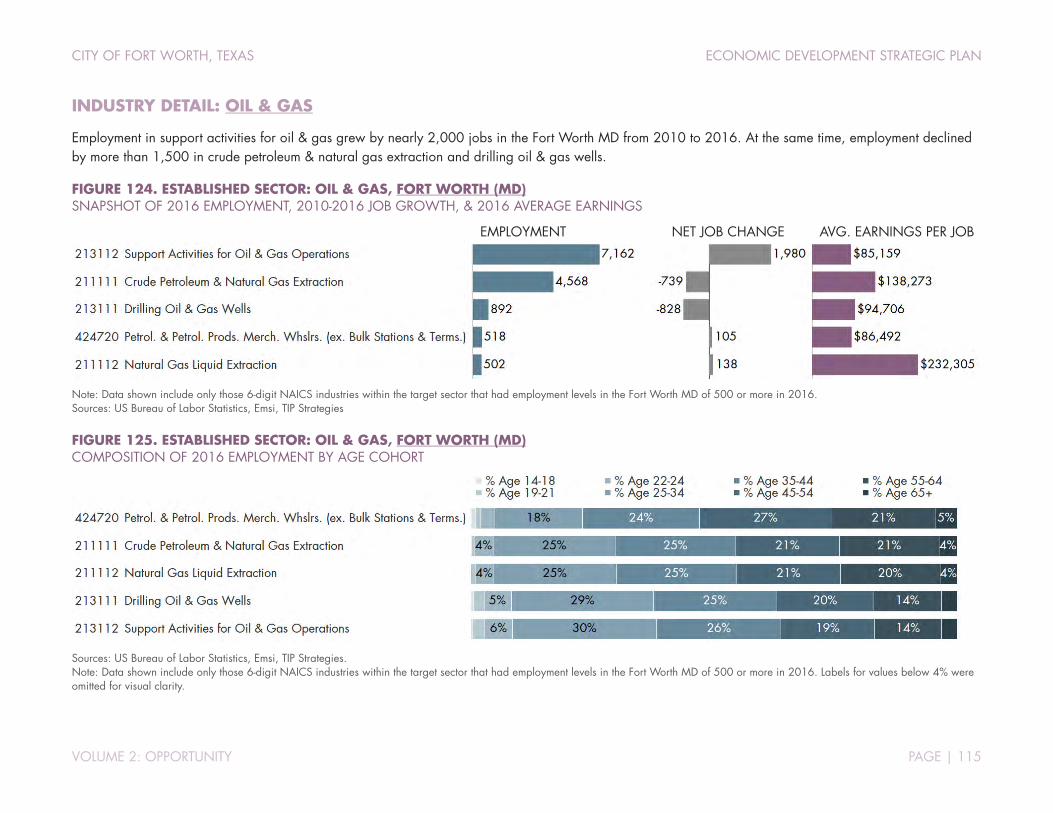
CITY OF FORT WORTH, TEXAS ECONOMIC DEVELOPMENT STRATEGIC PLAN
VOLUME 2: OPPORTUNITY PAGE | 115
INDUSTRY DETAIL: OIL & GAS
Employment in support activities for oil & gas grew by nearly 2,000 jobs in the Fort Worth MD from 2010 to 2016. At the same time, employment declined by more than 1,500 in crude petroleum & natural gas extraction and drilling oil & gas wells.
FIGURE 124. ESTABLISHED SECTOR: OIL & GAS, FORT WORTH (MD) SNAPSHOT OF 2016 EMPLOYMENT, 2010-2016 JOB GROWTH, & 2016 AVERAGE EARNINGS
Note: Data shown include only those 6-digit NAICS industries within the target sector that had employment levels in the Fort Worth MD of 500 or more in 2016. Sources: US Bureau of Labor Statistics, Emsi, TIP Strategies
FIGURE 125. ESTABLISHED SECTOR: OIL & GAS, FORT WORTH (MD) COMPOSITION OF 2016 EMPLOYMENT BY AGE COHORT
Sources: US Bureau of Labor Statistics, Emsi, TIP Strategies. Note: Data shown include only those 6-digit NAICS industries within the target sector that had employment levels in the Fort Worth MD of 500 or more in 2016. Labels for values below 4% were omitted for visual clarity.
EMPLOYMENT NET JOB CHANGE AVG. EARNINGS PER JOB
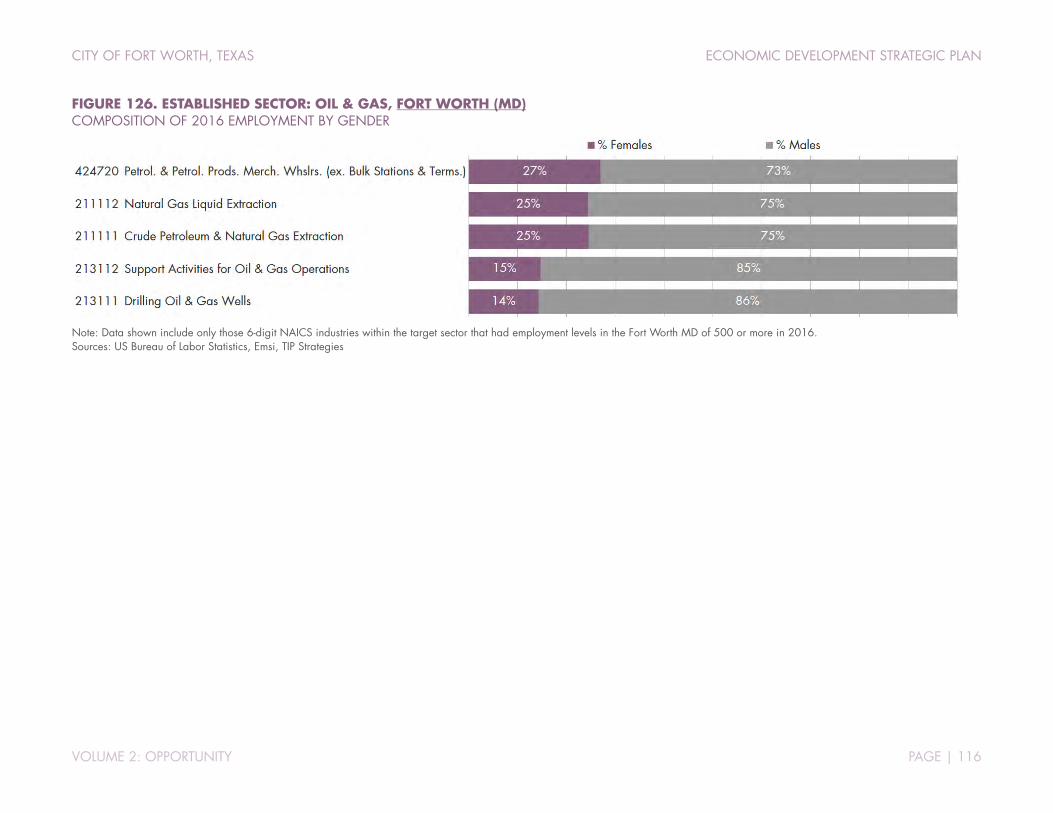
CITY OF FORT WORTH, TEXAS ECONOMIC DEVELOPMENT STRATEGIC PLAN
VOLUME 2: OPPORTUNITY PAGE | 116
FIGURE 126. ESTABLISHED SECTOR: OIL & GAS, FORT WORTH (MD) COMPOSITION OF 2016 EMPLOYMENT BY GENDER
Note: Data shown include only those 6-digit NAICS industries within the target sector that had employment levels in the Fort Worth MD of 500 or more in 2016. Sources: US Bureau of Labor Statistics, Emsi, TIP Strategies

CITY OF FORT WORTH, TEXAS ECONOMIC DEVELOPMENT STRATEGIC PLAN
VOLUME 2: OPPORTUNITY PAGE | 117
INDUSTRY DETAIL: TRANSPORTATION & WAREHOUSING
Scheduled passenger air transportation is the largest source of employment in the Fort Worth MD’s transportation & warehousing sector (accounting for 30 percent of the sector’s 80,000 total jobs), but it only represented 6 percent of job growth in the sector from 2010 to 2016. Three other subsectors—general warehousing & storage, long-distance general freight trucking, and local general freight trucking—gained a total of 8,000 new jobs, representing more than 50 percent of total job growth in the sector.
FIGURE 127. ESTABLISHED SECTOR: TRANSPORTATION & WAREHOUSING, FORT WORTH (MD) SNAPSHOT OF 2016 EMPLOYMENT, 2010-2016 JOB GROWTH, & 2016 AVERAGE EARNINGS
Sources: US Bureau of Labor Statistics, Emsi, TIP Strategies. Note: Data shown include only those 6-digit NAICS industries within the target sector that had employment levels in the Fort Worth MD of 500 or more in 2016.
EMPLOYMENT NET JOB CHANGE AVG. EARNINGS PER JOB
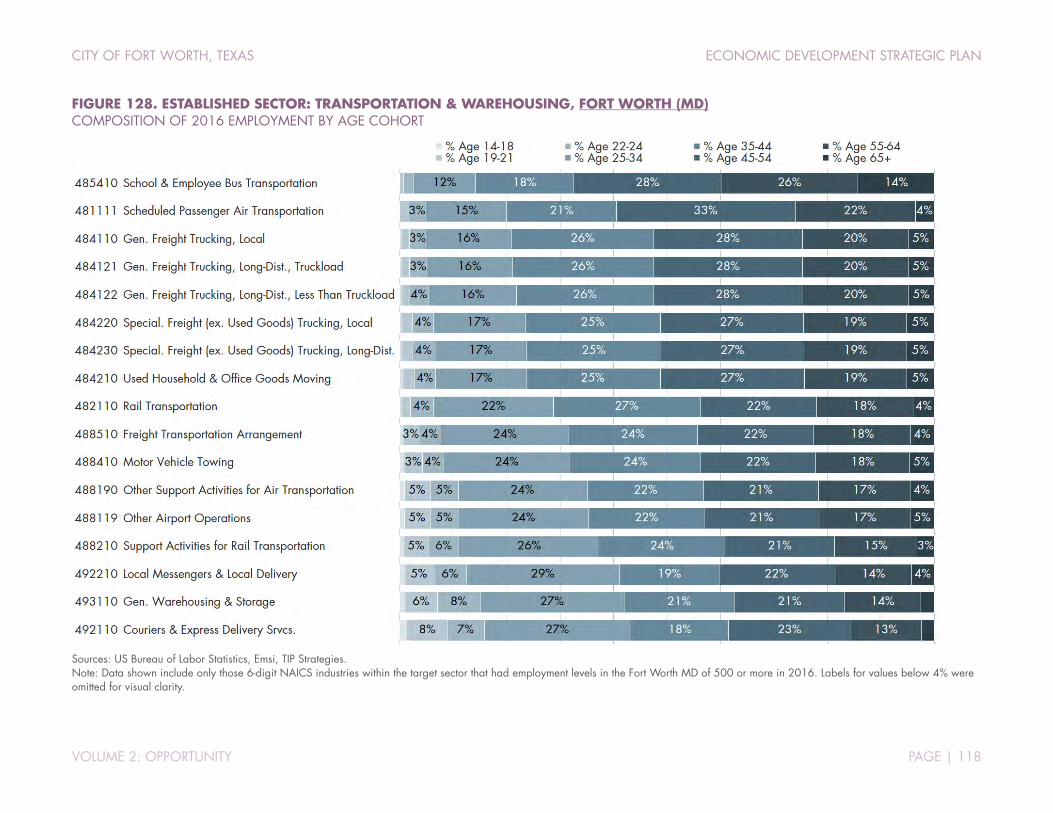
CITY OF FORT WORTH, TEXAS ECONOMIC DEVELOPMENT STRATEGIC PLAN
VOLUME 2: OPPORTUNITY PAGE | 118
FIGURE 128. ESTABLISHED SECTOR: TRANSPORTATION & WAREHOUSING, FORT WORTH (MD) COMPOSITION OF 2016 EMPLOYMENT BY AGE COHORT
Sources: US Bureau of Labor Statistics, Emsi, TIP Strategies. Note: Data shown include only those 6-digit NAICS industries within the target sector that had employment levels in the Fort Worth MD of 500 or more in 2016. Labels for values below 4% were omitted for visual clarity.

CITY OF FORT WORTH, TEXAS ECONOMIC DEVELOPMENT STRATEGIC PLAN
VOLUME 2: OPPORTUNITY PAGE | 119
FIGURE 129. ESTABLISHED SECTOR: TRANSPORTATION & WAREHOUSING, FORT WORTH (MD) COMPOSITION OF 2016 EMPLOYMENT BY GENDER
Sources: US Bureau of Labor Statistics, Emsi, TIP Strategies. Note: Data shown include only those 6-digit NAICS industries within the target sector that had employment levels in the Fort Worth MD of 500 or more in 2016.

CITY OF FORT WORTH, TEXAS ECONOMIC DEVELOPMENT STRATEGIC PLAN
VOLUME 2: OPPORTUNITY PAGE | 120
STAFFING PATTERNS
One aspect that is frequently overlooked is the alignment of target sectors with the available workforce. Using national staffing patterns, we identified key occupations for each sector based on shares of total employment. The following tables provide a snap shot of each occupation, including the share it represents of employment in the sector and the number of awards conferred for credit in related fields of study by regional institutions in 2015.
FIGURE 130. LEADING OCCUPATIONS: HEALTHCARE, FORT WORTH (MD)
continued, next page
SOC Code Description
Share of Industry
Employment JobsLQ
(US= 1.00)
Median Hourly
Earnings29-1141 Registered Nurses 14.9% 18,263 0.93 $34.98 1.08
31-1014 Nursing Assistants 7.8% 8,509 0.84 $11.54 0.93
39-9021 Personal Care Aides 4.3% 12,122 0.92 $9.14 0.91
31-1011 Home Health Aides 4.1% 4,208 0.63 $9.72 0.92
29-2061 Licensed Practical/Vocational Nurses 3.6% 4,968 0.98 $22.75 1.10
31-9092 Medical Assistants 3.5% 4,626 1.08 $14.67 0.99
43-6013 Medical Secretaries 3.1% 7,395 1.93 $15.58 0.98
43-4171 Receptionists & Information Clerks 2.7% 5,439 0.75 $12.15 0.92
43-9061 Office Clerks, General 1.9% 27,179 1.19 $15.20 1.07
31-9091 Dental Assistants 1.9% 2,035 0.88 $17.38 0.98
29-1069 Physicians & Surgeons, All Other 1.8% 2,096 0.85 $100.16 1.13
11-9111 Medical & Health Services Managers 1.6% 1,710 0.74 $43.10 0.96
37-2012 Maids & Housekeepers 1.5% 8,373 0.81 $9.46 0.96
43-6014 Secretaries/Admin. Asst., Exc. Legal, Med., & Exec 1.3% 14,441 0.77 $14.29 0.88
43-3021 Billing & Posting Clerks 1.2% 3,586 1.00 $16.56 0.98
29-1123 Physical Therapists 1.2% 1,282 0.82 $40.05 1.00
29-2021 Dental Hygienists 1.2% 1,226 0.86 $36.79 1.05
43-1011 First-Line Supvsr., Office & Admin. Support 1.2% 10,081 0.98 $25.86 1.02
29-2034 Radiologic Technologists 1.2% 1,197 0.86 $29.85 1.09
29-2041 Emergency Medical Techs. & Paramedics 1.0% 2,248 1.36 $16.87 1.10
29-2011 Medical & Clinical Laboratory Technologists 0.9% 1,170 1.01 $28.44 0.98
29-2071 Medical Records & Health Info. Technicians 0.9% 1,245 0.90 $18.21 1.02
29-2012 Medical & Clinical Laboratory Technicians 0.8% 1,033 0.92 $17.09 0.91
35-3041 Food Servers, Nonrestaurant 0.8% 1,101 0.61 $8.81 0.90
29-1171 Nurse Practitioners 0.8% 1,000 1.00 $49.72 1.05
Relative to US
(US=1.00)

CITY OF FORT WORTH, TEXAS ECONOMIC DEVELOPMENT STRATEGIC PLAN
VOLUME 2: OPPORTUNITY PAGE | 121
FIGURE 130. LEADING OCCUPATIONS: HEALTHCARE, FORT WORTH (MD) (CONTINUED)
Source: Emsi 2017.2 – QCEW Employees, Non-QCEW Employees, and Self-Employed. Notes: Median wages that exceed the regional median of $20.02 per hour are highlighted. LQs above 1.25 are highlighted. Markers indicate occupations where median wage rates exceed () or lag () the nation by 10 percent or more.
Fort Worth MD
Dallas-Fort Worth MSA
29-1141 Registered Nurses 18,263 1,072 3,563 5,258 $34.98
31-1014 Nursing Assistants 8,509 513 1 214 $11.54
39-9021 Personal Care Aides 12,122 595 0 21 $9.14
31-1011 Home Health Aides 4,208 384 1 71 $9.72
29-2061 Licensed Practical/Vocational Nurses 4,968 309 38 171 $22.75
31-9092 Medical Assistants 4,626 282 911 2,936 $14.67
43-6013 Medical Secretaries 7,395 291 88 455 $15.58
43-4171 Receptionists & Information Clerks 5,439 312 0 39 $12.15
43-9061 Office Clerks, General 27,179 1,015 0 2 $15.20
31-9091 Dental Assistants 2,035 135 205 644 $17.38
29-1069 Physicians & Surgeons, All Other 2,096 124 223 535 $100.16
11-9111 Medical & Health Services Managers 1,710 110 351 593 $43.10
37-2012 Maids & Housekeepers 8,373 318 0 0 $9.46
43-6014 Secretaries/Admin. Asst., Exc. Legal, Med., & Exec 14,441 447 15 63 $14.29
43-3021 Billing & Posting Clerks 3,586 179 113 127 $16.56
29-1123 Physical Therapists 1,282 116 41 269 $40.05
29-2021 Dental Hygienists 1,226 71 22 219 $36.79
43-1011 First-Line Supvsr., Office & Admin. Support 10,081 349 0 30 $25.86
29-2034 Radiologic Technologists 1,197 58 86 305 $29.85
29-2041 Emergency Medical Techs. & Paramedics 2,248 149 168 449 $16.87
29-2011 Medical & Clinical Laboratory Technologists 1,170 62 8 90 $28.44
29-2071 Medical Records & Health Info. Technicians 1,245 71 209 481 $18.21
29-2012 Medical & Clinical Laboratory Technicians 1,033 58 1 87 $17.09
35-3041 Food Servers, Nonrestaurant 1,101 71 0 0 $8.81
29-1171 Nurse Practitioners 1,000 75 226 450 $49.72
SOC Code Description
Proj. Annual
Openings (thru 2021)
Completions, 2015
Jobs
Median Hourly Wage
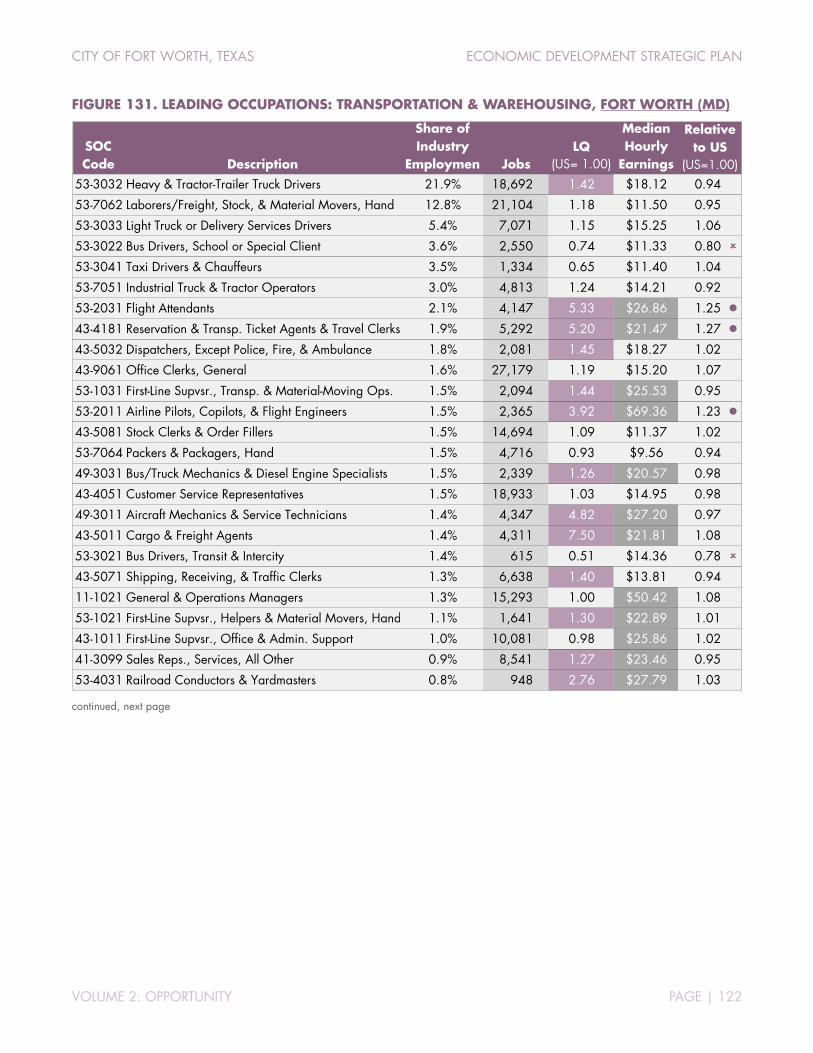
CITY OF FORT WORTH, TEXAS ECONOMIC DEVELOPMENT STRATEGIC PLAN
VOLUME 2: OPPORTUNITY PAGE | 122
FIGURE 131. LEADING OCCUPATIONS: TRANSPORTATION & WAREHOUSING, FORT WORTH (MD)
continued, next page
SOC Code Description
Share of Industry
Employmen JobsLQ
(US= 1.00)
Median Hourly
Earnings53-3032 Heavy & Tractor-Trailer Truck Drivers 21.9% 18,692 1.42 $18.12 0.94
53-7062 Laborers/Freight, Stock, & Material Movers, Hand 12.8% 21,104 1.18 $11.50 0.95
53-3033 Light Truck or Delivery Services Drivers 5.4% 7,071 1.15 $15.25 1.06
53-3022 Bus Drivers, School or Special Client 3.6% 2,550 0.74 $11.33 0.80
53-3041 Taxi Drivers & Chauffeurs 3.5% 1,334 0.65 $11.40 1.04
53-7051 Industrial Truck & Tractor Operators 3.0% 4,813 1.24 $14.21 0.92
53-2031 Flight Attendants 2.1% 4,147 5.33 $26.86 1.25
43-4181 Reservation & Transp. Ticket Agents & Travel Clerks 1.9% 5,292 5.20 $21.47 1.27
43-5032 Dispatchers, Except Police, Fire, & Ambulance 1.8% 2,081 1.45 $18.27 1.02
43-9061 Office Clerks, General 1.6% 27,179 1.19 $15.20 1.07
53-1031 First-Line Supvsr., Transp. & Material-Moving Ops. 1.5% 2,094 1.44 $25.53 0.95
53-2011 Airline Pilots, Copilots, & Flight Engineers 1.5% 2,365 3.92 $69.36 1.23
43-5081 Stock Clerks & Order Fillers 1.5% 14,694 1.09 $11.37 1.02
53-7064 Packers & Packagers, Hand 1.5% 4,716 0.93 $9.56 0.94
49-3031 Bus/Truck Mechanics & Diesel Engine Specialists 1.5% 2,339 1.26 $20.57 0.98
43-4051 Customer Service Representatives 1.5% 18,933 1.03 $14.95 0.98
49-3011 Aircraft Mechanics & Service Technicians 1.4% 4,347 4.82 $27.20 0.97
43-5011 Cargo & Freight Agents 1.4% 4,311 7.50 $21.81 1.08
53-3021 Bus Drivers, Transit & Intercity 1.4% 615 0.51 $14.36 0.78
43-5071 Shipping, Receiving, & Traffic Clerks 1.3% 6,638 1.40 $13.81 0.94
11-1021 General & Operations Managers 1.3% 15,293 1.00 $50.42 1.08
53-1021 First-Line Supvsr., Helpers & Material Movers, Hand 1.1% 1,641 1.30 $22.89 1.01
43-1011 First-Line Supvsr., Office & Admin. Support 1.0% 10,081 0.98 $25.86 1.02
41-3099 Sales Reps., Services, All Other 0.9% 8,541 1.27 $23.46 0.95
53-4031 Railroad Conductors & Yardmasters 0.8% 948 2.76 $27.79 1.03
Relative to US
(US=1.00)
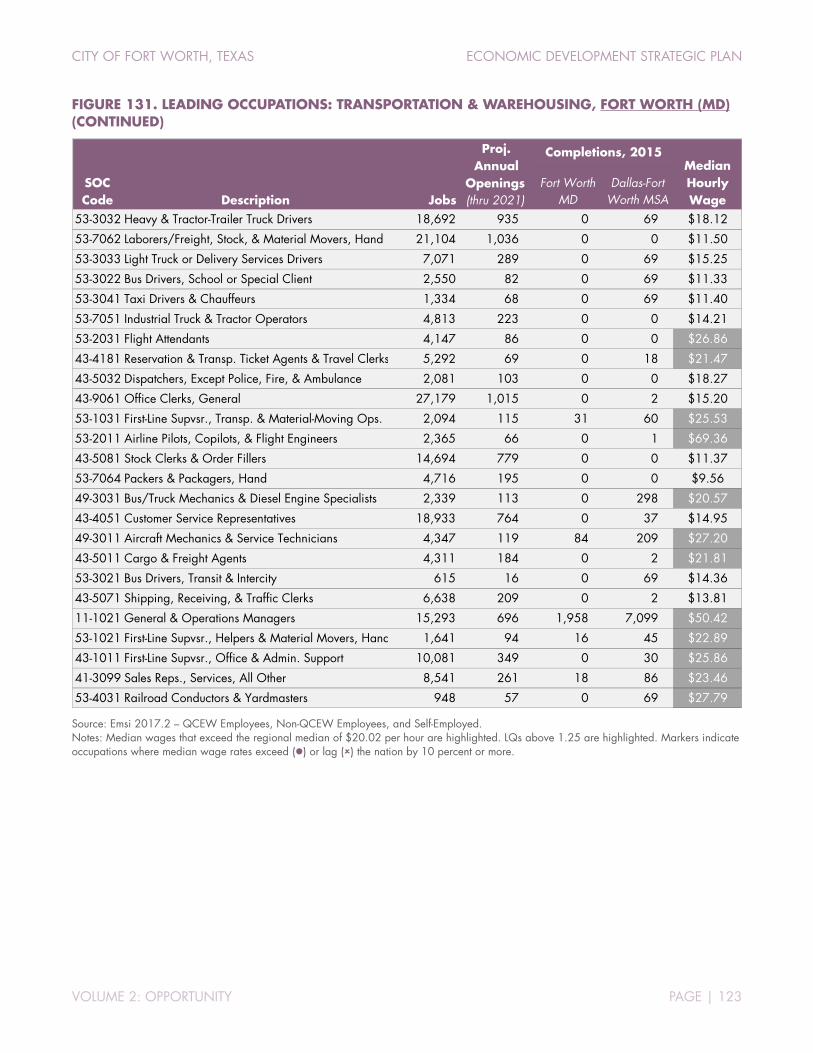
CITY OF FORT WORTH, TEXAS ECONOMIC DEVELOPMENT STRATEGIC PLAN
VOLUME 2: OPPORTUNITY PAGE | 123
FIGURE 131. LEADING OCCUPATIONS: TRANSPORTATION & WAREHOUSING, FORT WORTH (MD) (CONTINUED)
Source: Emsi 2017.2 – QCEW Employees, Non-QCEW Employees, and Self-Employed. Notes: Median wages that exceed the regional median of $20.02 per hour are highlighted. LQs above 1.25 are highlighted. Markers indicate occupations where median wage rates exceed () or lag () the nation by 10 percent or more.
Fort Worth MD
Dallas-Fort Worth MSA
53-3032 Heavy & Tractor-Trailer Truck Drivers 18,692 935 0 69 $18.12
53-7062 Laborers/Freight, Stock, & Material Movers, Hand 21,104 1,036 0 0 $11.50
53-3033 Light Truck or Delivery Services Drivers 7,071 289 0 69 $15.25
53-3022 Bus Drivers, School or Special Client 2,550 82 0 69 $11.33
53-3041 Taxi Drivers & Chauffeurs 1,334 68 0 69 $11.40
53-7051 Industrial Truck & Tractor Operators 4,813 223 0 0 $14.21
53-2031 Flight Attendants 4,147 86 0 0 $26.86
43-4181 Reservation & Transp. Ticket Agents & Travel Clerks 5,292 69 0 18 $21.47
43-5032 Dispatchers, Except Police, Fire, & Ambulance 2,081 103 0 0 $18.27
43-9061 Office Clerks, General 27,179 1,015 0 2 $15.20
53-1031 First-Line Supvsr., Transp. & Material-Moving Ops. 2,094 115 31 60 $25.53
53-2011 Airline Pilots, Copilots, & Flight Engineers 2,365 66 0 1 $69.36
43-5081 Stock Clerks & Order Fillers 14,694 779 0 0 $11.37
53-7064 Packers & Packagers, Hand 4,716 195 0 0 $9.56
49-3031 Bus/Truck Mechanics & Diesel Engine Specialists 2,339 113 0 298 $20.57
43-4051 Customer Service Representatives 18,933 764 0 37 $14.95
49-3011 Aircraft Mechanics & Service Technicians 4,347 119 84 209 $27.20
43-5011 Cargo & Freight Agents 4,311 184 0 2 $21.81
53-3021 Bus Drivers, Transit & Intercity 615 16 0 69 $14.36
43-5071 Shipping, Receiving, & Traffic Clerks 6,638 209 0 2 $13.81
11-1021 General & Operations Managers 15,293 696 1,958 7,099 $50.42
53-1021 First-Line Supvsr., Helpers & Material Movers, Hand 1,641 94 16 45 $22.89
43-1011 First-Line Supvsr., Office & Admin. Support 10,081 349 0 30 $25.86
41-3099 Sales Reps., Services, All Other 8,541 261 18 86 $23.46
53-4031 Railroad Conductors & Yardmasters 948 57 0 69 $27.79
SOC Code Description
Proj. Annual
Openings (thru 2021)
Completions, 2015
Jobs
Median Hourly Wage
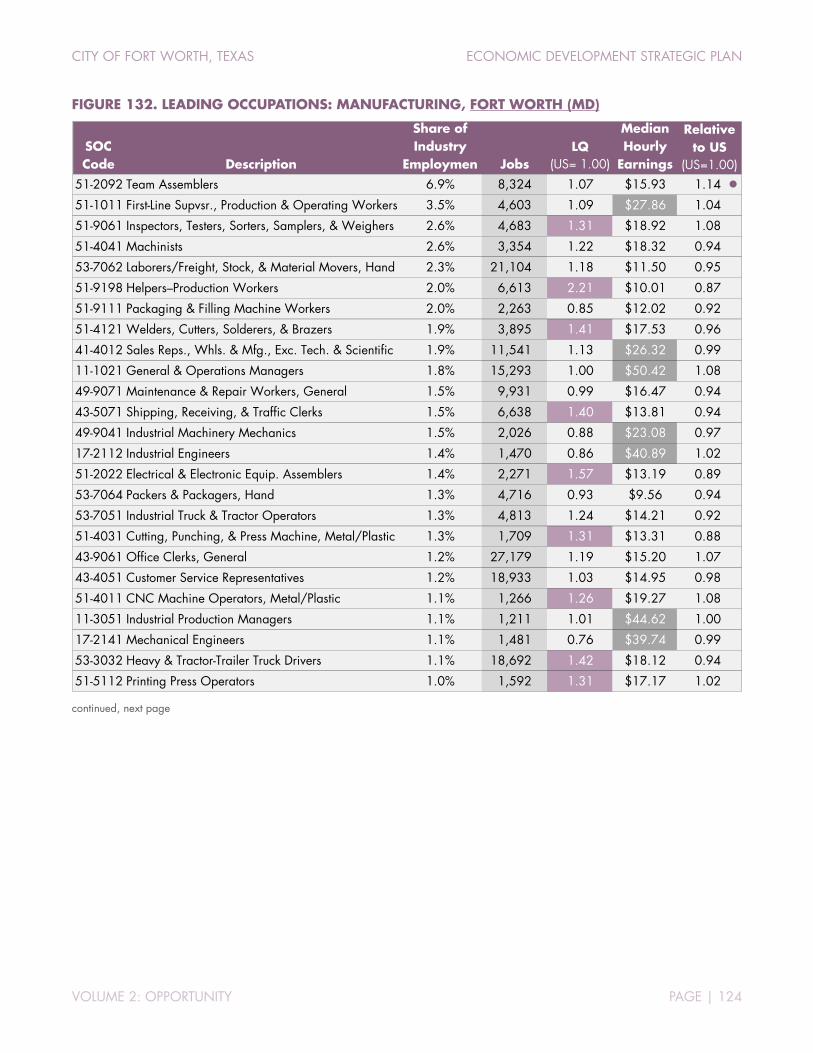
CITY OF FORT WORTH, TEXAS ECONOMIC DEVELOPMENT STRATEGIC PLAN
VOLUME 2: OPPORTUNITY PAGE | 124
FIGURE 132. LEADING OCCUPATIONS: MANUFACTURING, FORT WORTH (MD)
continued, next page
SOC Code Description
Share of Industry
Employmen JobsLQ
(US= 1.00)
Median Hourly
Earnings51-2092 Team Assemblers 6.9% 8,324 1.07 $15.93 1.14
51-1011 First-Line Supvsr., Production & Operating Workers 3.5% 4,603 1.09 $27.86 1.04
51-9061 Inspectors, Testers, Sorters, Samplers, & Weighers 2.6% 4,683 1.31 $18.92 1.08
51-4041 Machinists 2.6% 3,354 1.22 $18.32 0.94
53-7062 Laborers/Freight, Stock, & Material Movers, Hand 2.3% 21,104 1.18 $11.50 0.95
51-9198 Helpers–Production Workers 2.0% 6,613 2.21 $10.01 0.87
51-9111 Packaging & Filling Machine Workers 2.0% 2,263 0.85 $12.02 0.92
51-4121 Welders, Cutters, Solderers, & Brazers 1.9% 3,895 1.41 $17.53 0.96
41-4012 Sales Reps., Whls. & Mfg., Exc. Tech. & Scientific 1.9% 11,541 1.13 $26.32 0.99
11-1021 General & Operations Managers 1.8% 15,293 1.00 $50.42 1.08
49-9071 Maintenance & Repair Workers, General 1.5% 9,931 0.99 $16.47 0.94
43-5071 Shipping, Receiving, & Traffic Clerks 1.5% 6,638 1.40 $13.81 0.94
49-9041 Industrial Machinery Mechanics 1.5% 2,026 0.88 $23.08 0.97
17-2112 Industrial Engineers 1.4% 1,470 0.86 $40.89 1.02
51-2022 Electrical & Electronic Equip. Assemblers 1.4% 2,271 1.57 $13.19 0.89
53-7064 Packers & Packagers, Hand 1.3% 4,716 0.93 $9.56 0.94
53-7051 Industrial Truck & Tractor Operators 1.3% 4,813 1.24 $14.21 0.92
51-4031 Cutting, Punching, & Press Machine, Metal/Plastic 1.3% 1,709 1.31 $13.31 0.88
43-9061 Office Clerks, General 1.2% 27,179 1.19 $15.20 1.07
43-4051 Customer Service Representatives 1.2% 18,933 1.03 $14.95 0.98
51-4011 CNC Machine Operators, Metal/Plastic 1.1% 1,266 1.26 $19.27 1.08
11-3051 Industrial Production Managers 1.1% 1,211 1.01 $44.62 1.00
17-2141 Mechanical Engineers 1.1% 1,481 0.76 $39.74 0.99
53-3032 Heavy & Tractor-Trailer Truck Drivers 1.1% 18,692 1.42 $18.12 0.94
51-5112 Printing Press Operators 1.0% 1,592 1.31 $17.17 1.02
Relative to US
(US=1.00)

CITY OF FORT WORTH, TEXAS ECONOMIC DEVELOPMENT STRATEGIC PLAN
VOLUME 2: OPPORTUNITY PAGE | 125
FIGURE 132. LEADING OCCUPATIONS: MANUFACTURING, FORT WORTH (MD) (CONTINUED)
Source: Emsi 2017.2 – QCEW Employees, Non-QCEW Employees, and Self-Employed. Notes: Median wages that exceed the regional median of $20.02 per hour are highlighted. LQs above 1.25 are highlighted. Markers indicate occupations where median wage rates exceed () or lag () the nation by 10 percent or more.
Fort Worth MD
Dallas-Fort Worth MSA
51-2092 Team Assemblers 8,324 331 0 0 $15.93
51-1011 First-Line Supvsr., Production & Operating Workers 4,603 109 16 45 $27.86
51-9061 Inspectors, Testers, Sorters, Samplers, & Weighers 4,683 142 0 0 $18.92
51-4041 Machinists 3,354 131 0 0 $18.32
53-7062 Laborers/Freight, Stock, & Material Movers, Hand 21,104 1,036 0 0 $11.50
51-9198 Helpers–Production Workers 6,613 232 0 0 $10.01
51-9111 Packaging & Filling Machine Workers 2,263 101 0 0 $12.02
51-4121 Welders, Cutters, Solderers, & Brazers 3,895 163 55 396 $17.53
41-4012 Sales Reps., Whls. & Mfg., Exc. Tech. & Scientific 11,541 441 61 441 $26.32
11-1021 General & Operations Managers 15,293 696 1,958 7,099 $50.42
49-9071 Maintenance & Repair Workers, General 9,931 439 0 0 $16.47
43-5071 Shipping, Receiving, & Traffic Clerks 6,638 209 0 2 $13.81
49-9041 Industrial Machinery Mechanics 2,026 122 0 0 $23.08
17-2112 Industrial Engineers 1,470 55 112 121 $40.89
51-2022 Electrical & Electronic Equip. Assemblers 2,271 34 0 0 $13.19
53-7064 Packers & Packagers, Hand 4,716 195 0 0 $9.56
53-7051 Industrial Truck & Tractor Operators 4,813 223 0 0 $14.21
51-4031 Cutting, Punching, & Press Machine, Metal/Plastic 1,709 25 0 0 $13.31
43-9061 Office Clerks, General 27,179 1,015 0 2 $15.20
43-4051 Customer Service Representatives 18,933 764 0 37 $14.95
51-4011 CNC Machine Operators, Metal/Plastic 1,266 55 0 103 $19.27
11-3051 Industrial Production Managers 1,211 43 1,863 6,591 $44.62
17-2141 Mechanical Engineers 1,481 61 195 507 $39.74
53-3032 Heavy & Tractor-Trailer Truck Drivers 18,692 935 0 69 $18.12
51-5112 Printing Press Operators 1,592 24 0 0 $17.17
Median Hourly Wage
SOC Code Description
Completions, 2015Proj. Annual
Openings (thru 2021)Jobs
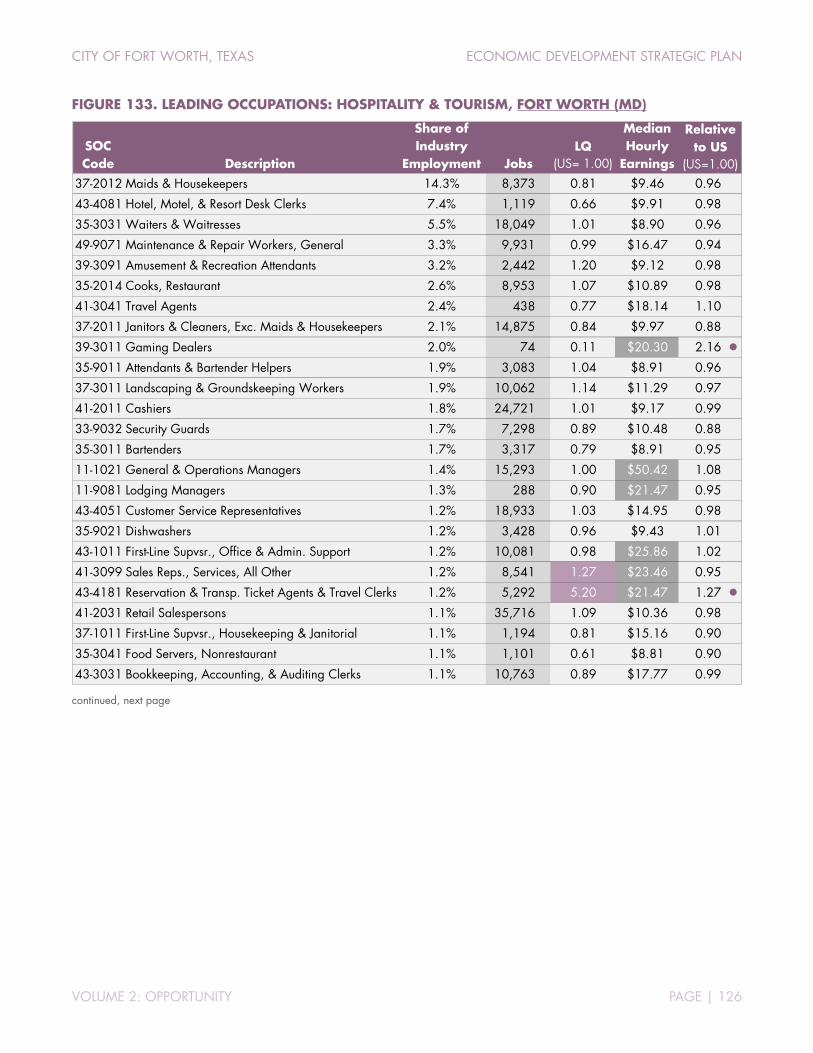
CITY OF FORT WORTH, TEXAS ECONOMIC DEVELOPMENT STRATEGIC PLAN
VOLUME 2: OPPORTUNITY PAGE | 126
FIGURE 133. LEADING OCCUPATIONS: HOSPITALITY & TOURISM, FORT WORTH (MD)
continued, next page
SOC Code Description
Share of Industry
Employment JobsLQ
(US= 1.00)
Median Hourly
Earnings37-2012 Maids & Housekeepers 14.3% 8,373 0.81 $9.46 0.96
43-4081 Hotel, Motel, & Resort Desk Clerks 7.4% 1,119 0.66 $9.91 0.98
35-3031 Waiters & Waitresses 5.5% 18,049 1.01 $8.90 0.96
49-9071 Maintenance & Repair Workers, General 3.3% 9,931 0.99 $16.47 0.94
39-3091 Amusement & Recreation Attendants 3.2% 2,442 1.20 $9.12 0.98
35-2014 Cooks, Restaurant 2.6% 8,953 1.07 $10.89 0.98
41-3041 Travel Agents 2.4% 438 0.77 $18.14 1.10
37-2011 Janitors & Cleaners, Exc. Maids & Housekeepers 2.1% 14,875 0.84 $9.97 0.88
39-3011 Gaming Dealers 2.0% 74 0.11 $20.30 2.16
35-9011 Attendants & Bartender Helpers 1.9% 3,083 1.04 $8.91 0.96
37-3011 Landscaping & Groundskeeping Workers 1.9% 10,062 1.14 $11.29 0.97
41-2011 Cashiers 1.8% 24,721 1.01 $9.17 0.99
33-9032 Security Guards 1.7% 7,298 0.89 $10.48 0.88
35-3011 Bartenders 1.7% 3,317 0.79 $8.91 0.95
11-1021 General & Operations Managers 1.4% 15,293 1.00 $50.42 1.08
11-9081 Lodging Managers 1.3% 288 0.90 $21.47 0.95
43-4051 Customer Service Representatives 1.2% 18,933 1.03 $14.95 0.98
35-9021 Dishwashers 1.2% 3,428 0.96 $9.43 1.01
43-1011 First-Line Supvsr., Office & Admin. Support 1.2% 10,081 0.98 $25.86 1.02
41-3099 Sales Reps., Services, All Other 1.2% 8,541 1.27 $23.46 0.95
43-4181 Reservation & Transp. Ticket Agents & Travel Clerks 1.2% 5,292 5.20 $21.47 1.27
41-2031 Retail Salespersons 1.1% 35,716 1.09 $10.36 0.98
37-1011 First-Line Supvsr., Housekeeping & Janitorial 1.1% 1,194 0.81 $15.16 0.90
35-3041 Food Servers, Nonrestaurant 1.1% 1,101 0.61 $8.81 0.90
43-3031 Bookkeeping, Accounting, & Auditing Clerks 1.1% 10,763 0.89 $17.77 0.99
Relative to US
(US=1.00)
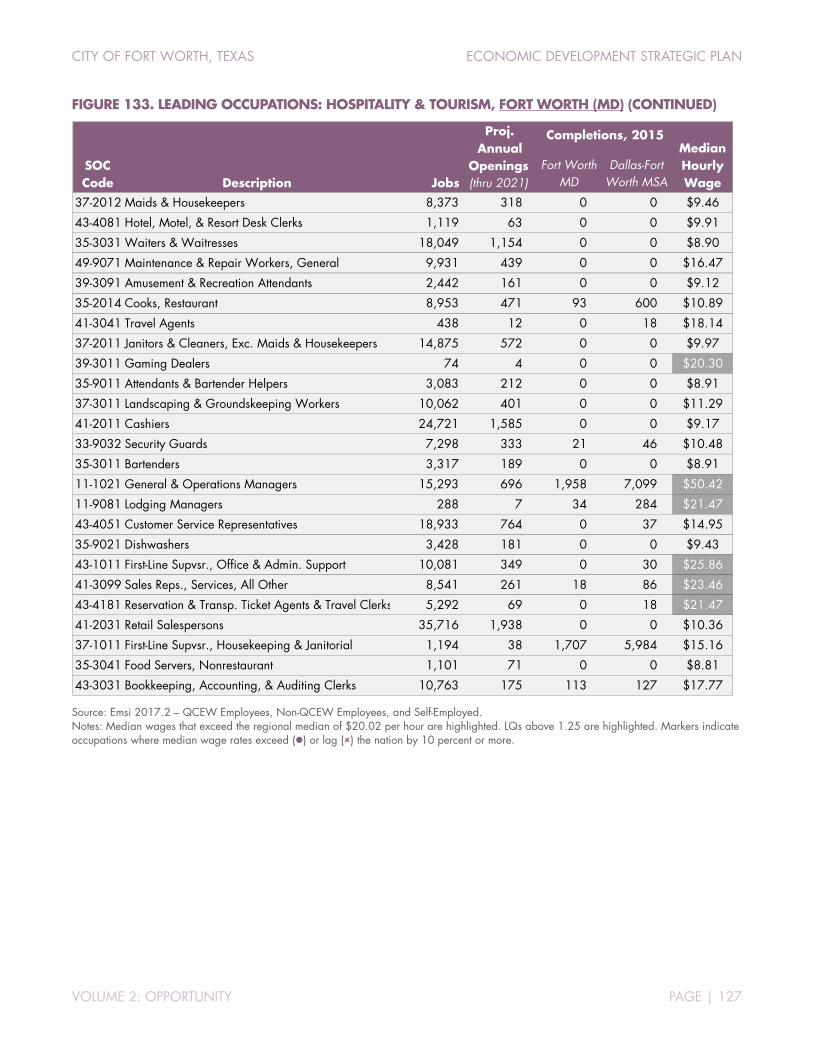
CITY OF FORT WORTH, TEXAS ECONOMIC DEVELOPMENT STRATEGIC PLAN
VOLUME 2: OPPORTUNITY PAGE | 127
FIGURE 133. LEADING OCCUPATIONS: HOSPITALITY & TOURISM, FORT WORTH (MD) (CONTINUED)
Source: Emsi 2017.2 – QCEW Employees, Non-QCEW Employees, and Self-Employed. Notes: Median wages that exceed the regional median of $20.02 per hour are highlighted. LQs above 1.25 are highlighted. Markers indicate occupations where median wage rates exceed () or lag () the nation by 10 percent or more.
Fort Worth MD
Dallas-Fort Worth MSA
37-2012 Maids & Housekeepers 8,373 318 0 0 $9.46
43-4081 Hotel, Motel, & Resort Desk Clerks 1,119 63 0 0 $9.91
35-3031 Waiters & Waitresses 18,049 1,154 0 0 $8.90
49-9071 Maintenance & Repair Workers, General 9,931 439 0 0 $16.47
39-3091 Amusement & Recreation Attendants 2,442 161 0 0 $9.12
35-2014 Cooks, Restaurant 8,953 471 93 600 $10.89
41-3041 Travel Agents 438 12 0 18 $18.14
37-2011 Janitors & Cleaners, Exc. Maids & Housekeepers 14,875 572 0 0 $9.97
39-3011 Gaming Dealers 74 4 0 0 $20.30
35-9011 Attendants & Bartender Helpers 3,083 212 0 0 $8.91
37-3011 Landscaping & Groundskeeping Workers 10,062 401 0 0 $11.29
41-2011 Cashiers 24,721 1,585 0 0 $9.17
33-9032 Security Guards 7,298 333 21 46 $10.48
35-3011 Bartenders 3,317 189 0 0 $8.91
11-1021 General & Operations Managers 15,293 696 1,958 7,099 $50.42
11-9081 Lodging Managers 288 7 34 284 $21.47
43-4051 Customer Service Representatives 18,933 764 0 37 $14.95
35-9021 Dishwashers 3,428 181 0 0 $9.43
43-1011 First-Line Supvsr., Office & Admin. Support 10,081 349 0 30 $25.86
41-3099 Sales Reps., Services, All Other 8,541 261 18 86 $23.46
43-4181 Reservation & Transp. Ticket Agents & Travel Clerks 5,292 69 0 18 $21.47
41-2031 Retail Salespersons 35,716 1,938 0 0 $10.36
37-1011 First-Line Supvsr., Housekeeping & Janitorial 1,194 38 1,707 5,984 $15.16
35-3041 Food Servers, Nonrestaurant 1,101 71 0 0 $8.81
43-3031 Bookkeeping, Accounting, & Auditing Clerks 10,763 175 113 127 $17.77
SOC Code Description
Proj. Annual
Openings (thru 2021)
Completions, 2015
Jobs
Median Hourly Wage
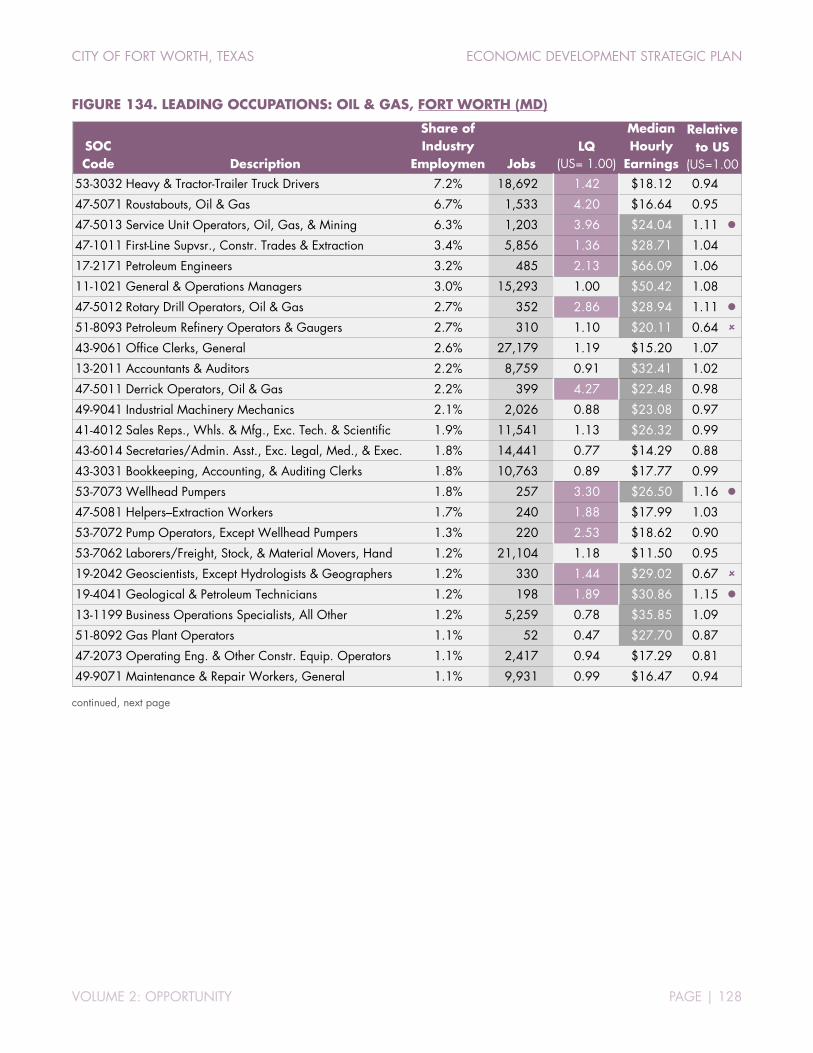
CITY OF FORT WORTH, TEXAS ECONOMIC DEVELOPMENT STRATEGIC PLAN
VOLUME 2: OPPORTUNITY PAGE | 128
FIGURE 134. LEADING OCCUPATIONS: OIL & GAS, FORT WORTH (MD)
continued, next page
SOC Code Description
Share of Industry
Employmen JobsLQ
(US= 1.00)
Median Hourly
Earnings53-3032 Heavy & Tractor-Trailer Truck Drivers 7.2% 18,692 1.42 $18.12 0.94
47-5071 Roustabouts, Oil & Gas 6.7% 1,533 4.20 $16.64 0.95
47-5013 Service Unit Operators, Oil, Gas, & Mining 6.3% 1,203 3.96 $24.04 1.11
47-1011 First-Line Supvsr., Constr. Trades & Extraction 3.4% 5,856 1.36 $28.71 1.04
17-2171 Petroleum Engineers 3.2% 485 2.13 $66.09 1.06
11-1021 General & Operations Managers 3.0% 15,293 1.00 $50.42 1.08
47-5012 Rotary Drill Operators, Oil & Gas 2.7% 352 2.86 $28.94 1.11
51-8093 Petroleum Refinery Operators & Gaugers 2.7% 310 1.10 $20.11 0.64
43-9061 Office Clerks, General 2.6% 27,179 1.19 $15.20 1.07
13-2011 Accountants & Auditors 2.2% 8,759 0.91 $32.41 1.02
47-5011 Derrick Operators, Oil & Gas 2.2% 399 4.27 $22.48 0.98
49-9041 Industrial Machinery Mechanics 2.1% 2,026 0.88 $23.08 0.97
41-4012 Sales Reps., Whls. & Mfg., Exc. Tech. & Scientific 1.9% 11,541 1.13 $26.32 0.99
43-6014 Secretaries/Admin. Asst., Exc. Legal, Med., & Exec. 1.8% 14,441 0.77 $14.29 0.88
43-3031 Bookkeeping, Accounting, & Auditing Clerks 1.8% 10,763 0.89 $17.77 0.99
53-7073 Wellhead Pumpers 1.8% 257 3.30 $26.50 1.16
47-5081 Helpers–Extraction Workers 1.7% 240 1.88 $17.99 1.03
53-7072 Pump Operators, Except Wellhead Pumpers 1.3% 220 2.53 $18.62 0.90
53-7062 Laborers/Freight, Stock, & Material Movers, Hand 1.2% 21,104 1.18 $11.50 0.95
19-2042 Geoscientists, Except Hydrologists & Geographers 1.2% 330 1.44 $29.02 0.67
19-4041 Geological & Petroleum Technicians 1.2% 198 1.89 $30.86 1.15
13-1199 Business Operations Specialists, All Other 1.2% 5,259 0.78 $35.85 1.09
51-8092 Gas Plant Operators 1.1% 52 0.47 $27.70 0.87
47-2073 Operating Eng. & Other Constr. Equip. Operators 1.1% 2,417 0.94 $17.29 0.81
49-9071 Maintenance & Repair Workers, General 1.1% 9,931 0.99 $16.47 0.94
Relative to US
(US=1.00
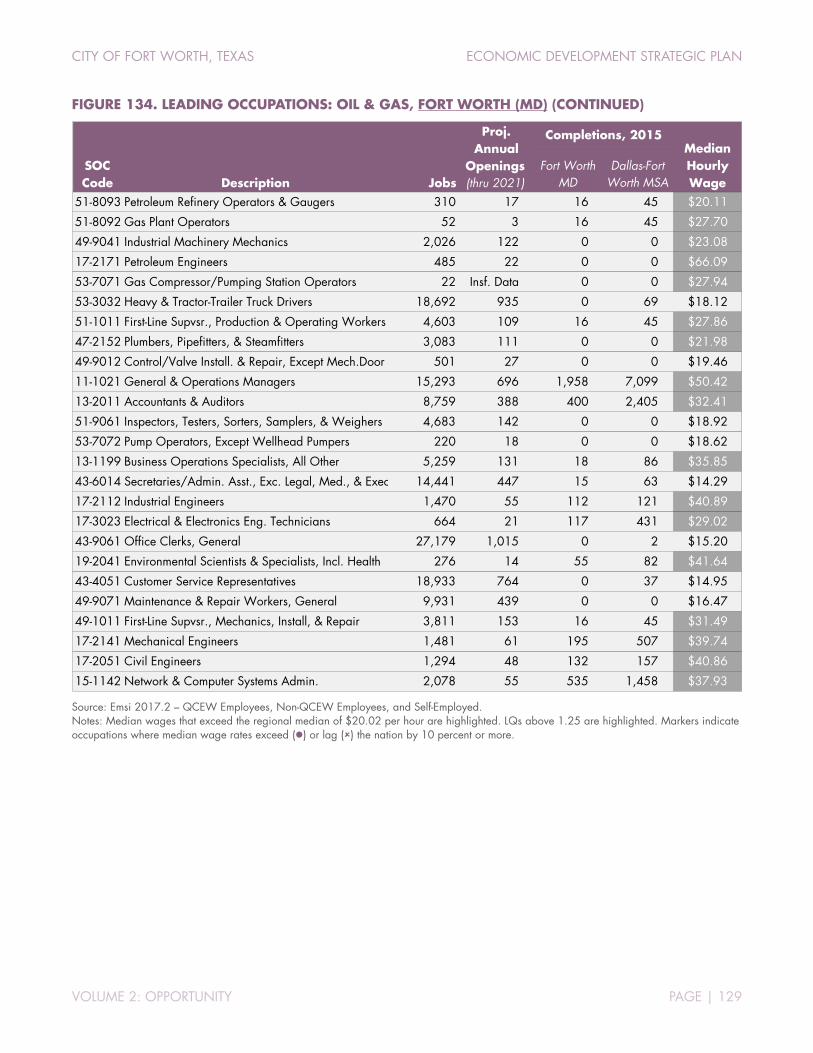
CITY OF FORT WORTH, TEXAS ECONOMIC DEVELOPMENT STRATEGIC PLAN
VOLUME 2: OPPORTUNITY PAGE | 129
FIGURE 134. LEADING OCCUPATIONS: OIL & GAS, FORT WORTH (MD) (CONTINUED)
Source: Emsi 2017.2 – QCEW Employees, Non-QCEW Employees, and Self-Employed. Notes: Median wages that exceed the regional median of $20.02 per hour are highlighted. LQs above 1.25 are highlighted. Markers indicate occupations where median wage rates exceed () or lag () the nation by 10 percent or more.
Fort Worth MD
Dallas-Fort Worth MSA
51-8093 Petroleum Refinery Operators & Gaugers 310 17 16 45 $20.11
51-8092 Gas Plant Operators 52 3 16 45 $27.70
49-9041 Industrial Machinery Mechanics 2,026 122 0 0 $23.08
17-2171 Petroleum Engineers 485 22 0 0 $66.09
53-7071 Gas Compressor/Pumping Station Operators 22 Insf. Data 0 0 $27.94
53-3032 Heavy & Tractor-Trailer Truck Drivers 18,692 935 0 69 $18.12
51-1011 First-Line Supvsr., Production & Operating Workers 4,603 109 16 45 $27.86
47-2152 Plumbers, Pipefitters, & Steamfitters 3,083 111 0 0 $21.98
49-9012 Control/Valve Install. & Repair, Except Mech.Door 501 27 0 0 $19.46
11-1021 General & Operations Managers 15,293 696 1,958 7,099 $50.42
13-2011 Accountants & Auditors 8,759 388 400 2,405 $32.41
51-9061 Inspectors, Testers, Sorters, Samplers, & Weighers 4,683 142 0 0 $18.92
53-7072 Pump Operators, Except Wellhead Pumpers 220 18 0 0 $18.62
13-1199 Business Operations Specialists, All Other 5,259 131 18 86 $35.85
43-6014 Secretaries/Admin. Asst., Exc. Legal, Med., & Exec 14,441 447 15 63 $14.29
17-2112 Industrial Engineers 1,470 55 112 121 $40.89
17-3023 Electrical & Electronics Eng. Technicians 664 21 117 431 $29.02
43-9061 Office Clerks, General 27,179 1,015 0 2 $15.20
19-2041 Environmental Scientists & Specialists, Incl. Health 276 14 55 82 $41.64
43-4051 Customer Service Representatives 18,933 764 0 37 $14.95
49-9071 Maintenance & Repair Workers, General 9,931 439 0 0 $16.47
49-1011 First-Line Supvsr., Mechanics, Install, & Repair 3,811 153 16 45 $31.49
17-2141 Mechanical Engineers 1,481 61 195 507 $39.74
17-2051 Civil Engineers 1,294 48 132 157 $40.86
15-1142 Network & Computer Systems Admin. 2,078 55 535 1,458 $37.93
SOC Code Description
Proj. Annual
Openings (thru 2021)
Completions, 2015
Jobs
Median Hourly Wage
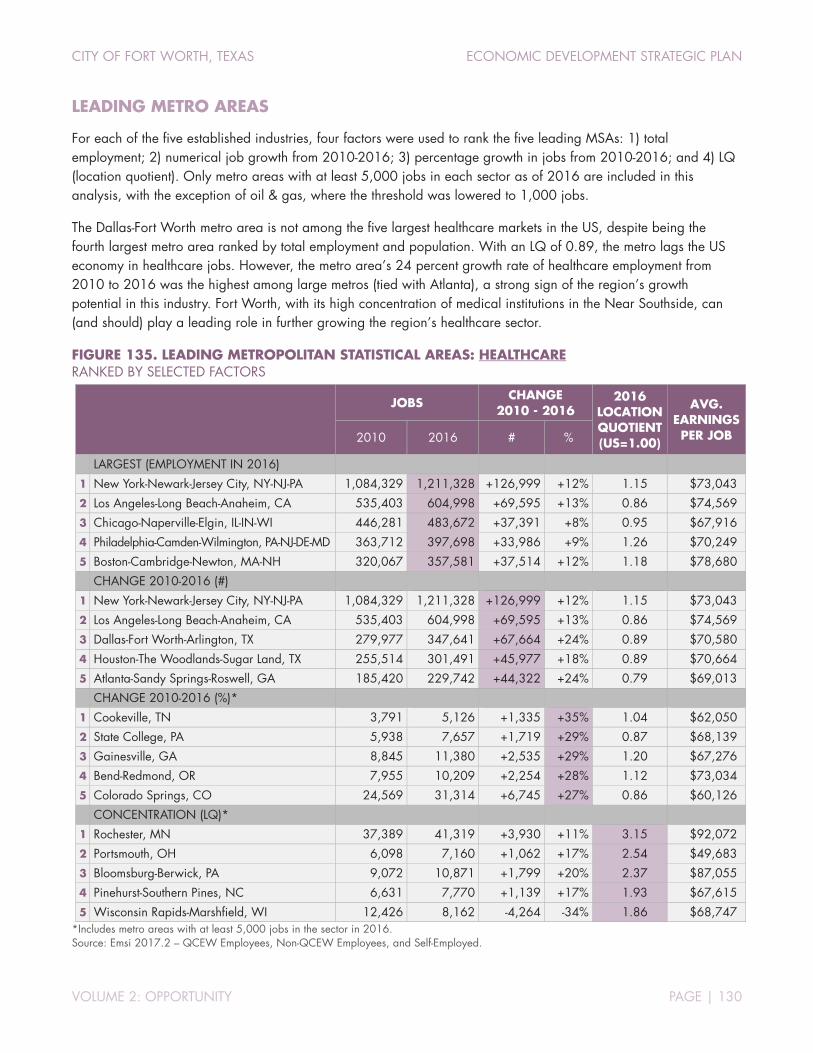
CITY OF FORT WORTH, TEXAS ECONOMIC DEVELOPMENT STRATEGIC PLAN
VOLUME 2: OPPORTUNITY PAGE | 130
LEADING METRO AREAS
For each of the five established industries, four factors were used to rank the five leading MSAs: 1) total employment; 2) numerical job growth from 2010-2016; 3) percentage growth in jobs from 2010-2016; and 4) LQ (location quotient). Only metro areas with at least 5,000 jobs in each sector as of 2016 are included in this analysis, with the exception of oil & gas, where the threshold was lowered to 1,000 jobs.
The Dallas-Fort Worth metro area is not among the five largest healthcare markets in the US, despite being the fourth largest metro area ranked by total employment and population. With an LQ of 0.89, the metro lags the US economy in healthcare jobs. However, the metro area’s 24 percent growth rate of healthcare employment from 2010 to 2016 was the highest among large metros (tied with Atlanta), a strong sign of the region’s growth potential in this industry. Fort Worth, with its high concentration of medical institutions in the Near Southside, can (and should) play a leading role in further growing the region’s healthcare sector.
FIGURE 135. LEADING METROPOLITAN STATISTICAL AREAS: HEALTHCARE RANKED BY SELECTED FACTORS
JOBS
CHANGE 2010 - 2016
2016 LOCATION QUOTIENT (US=1.00)
AVG. EARNINGS PER JOB 2010 2016 # %
LARGEST (EMPLOYMENT IN 2016) 1 New York-Newark-Jersey City, NY-NJ-PA 1,084,329 1,211,328 +126,999 +12% 1.15 $73,043 2 Los Angeles-Long Beach-Anaheim, CA 535,403 604,998 +69,595 +13% 0.86 $74,569 3 Chicago-Naperville-Elgin, IL-IN-WI 446,281 483,672 +37,391 +8% 0.95 $67,916 4 Philadelphia-Camden-Wilmington, PA-NJ-DE-MD 363,712 397,698 +33,986 +9% 1.26 $70,249 5 Boston-Cambridge-Newton, MA-NH 320,067 357,581 +37,514 +12% 1.18 $78,680
CHANGE 2010-2016 (#)
1 New York-Newark-Jersey City, NY-NJ-PA 1,084,329 1,211,328 +126,999 +12% 1.15 $73,043 2 Los Angeles-Long Beach-Anaheim, CA 535,403 604,998 +69,595 +13% 0.86 $74,569 3 Dallas-Fort Worth-Arlington, TX 279,977 347,641 +67,664 +24% 0.89 $70,580 4 Houston-The Woodlands-Sugar Land, TX 255,514 301,491 +45,977 +18% 0.89 $70,664 5 Atlanta-Sandy Springs-Roswell, GA 185,420 229,742 +44,322 +24% 0.79 $69,013
CHANGE 2010-2016 (%)*
1 Cookeville, TN 3,791 5,126 +1,335 +35% 1.04 $62,050 2 State College, PA 5,938 7,657 +1,719 +29% 0.87 $68,139 3 Gainesville, GA 8,845 11,380 +2,535 +29% 1.20 $67,276 4 Bend-Redmond, OR 7,955 10,209 +2,254 +28% 1.12 $73,034 5 Colorado Springs, CO 24,569 31,314 +6,745 +27% 0.86 $60,126
CONCENTRATION (LQ)*
1 Rochester, MN 37,389 41,319 +3,930 +11% 3.15 $92,072 2 Portsmouth, OH 6,098 7,160 +1,062 +17% 2.54 $49,683 3 Bloomsburg-Berwick, PA 9,072 10,871 +1,799 +20% 2.37 $87,055 4 Pinehurst-Southern Pines, NC 6,631 7,770 +1,139 +17% 1.93 $67,615 5 Wisconsin Rapids-Marshfield, WI 12,426 8,162 -4,264 -34% 1.86 $68,747
*Includes metro areas with at least 5,000 jobs in the sector in 2016. Source: Emsi 2017.2 – QCEW Employees, Non-QCEW Employees, and Self-Employed.

CITY OF FORT WORTH, TEXAS ECONOMIC DEVELOPMENT STRATEGIC PLAN
VOLUME 2: OPPORTUNITY PAGE | 131
The Dallas-Fort Worth metro area leads the nation in transportation & warehousing employment growth, adding more than 43,000 jobs from 2010-2016. Historically, large coastal cities dominated the transportation & distribution industry. That dynamic is changing as inland transport hubs continue to grow. Among the top five metros ranked by numerical job change in transportation & warehousing from 2010-2016, the two inland locations—Dallas-Fort Worth and Riverside—experienced growth rates that far outpaced the three coastal metros. When ranked by percentage, the top five metros were all inland locations.
Most importantly, transportation & warehousing is highly concentrated in Fort Worth. The city has a much higher concentration of jobs in the industry compared to the rest of the metro area. The city benefits from major assets (Alliance, DFW International Airport, Meacham, and Spinks Airports) and from large employers (American Airlines, BNSF). Fort Worth is well-positioned to attract additional investment and innovation from transportation firms.
FIGURE 136. LEADING METROPOLITAN STATISTICAL AREAS: TRANSPORTATION & WAREHOUSING RANKED BY SELECTED FACTORS
JOBS
CHANGE 2010 - 2016
2016 LOCATION QUOTIENT (US=1.00)
AVG. EARNINGS PER JOB 2010 2016 # %
LARGEST (EMPLOYMENT IN 2016) 1 New York-Newark-Jersey City, NY-NJ-PA 323,016 365,376 +42,360 +13% 1.07 $63,608 2 Chicago-Naperville-Elgin, IL-IN-WI 184,615 223,347 +38,732 +21% 1.36 $66,101 3 Los Angeles-Long Beach-Anaheim, CA 176,240 209,933 +33,693 +19% 0.92 $66,717 4 Dallas-Fort Worth-Arlington, TX 135,946 179,509 +43,563 +32% 1.42 $69,750 5 Atlanta-Sandy Springs-Roswell, GA 116,627 140,857 +24,230 +21% 1.50 $78,378
CHANGE 2010-2016 (#) 1 Dallas-Fort Worth-Arlington, TX 135,946 179,509 +43,563 +32% 1.42 $69,750 2 New York-Newark-Jersey City, NY-NJ-PA 323,016 365,376 +42,360 +13% 1.07 $63,608 3 Chicago-Naperville-Elgin, IL-IN-WI 184,615 223,347 +38,732 +21% 1.36 $66,101 4 Riverside-San Bernardino-Ontario, CA 66,644 105,196 +38,552 +58% 1.93 $51,634 5 Los Angeles-Long Beach-Anaheim, CA 176,240 209,933 +33,693 +19% 0.92 $66,717
CHANGE 2010-2016 (%)*
1 Trenton, NJ 4,793 9,715 +4,922 +103% 1.09 $48,469 2 Spartanburg, SC 4,578 8,248 +3,670 +80% 1.59 $50,662 3 Hagerstown-Martinsburg, MD-WV 4,221 7,507 +3,286 +78% 2.03 $42,931 4 Columbia, SC 7,019 12,356 +5,337 +76% 0.87 $44,778 5 Allentown-Bethlehem-Easton, PA-NJ 14,479 24,322 +9,843 +68% 1.87 $54,739
CONCENTRATION (LQ)*
1 Laredo, TX 12,143 16,003 +3,860 +32% 4.25 $45,664 2 Houma-Thibodaux, LA 10,515 10,874 +359 +3% 3.30 $94,427 3 Chambersburg-Waynesboro, PA 4,926 6,604 +1,678 +34% 2.98 $51,480 4 Pottsville, PA 5,210 5,499 +289 +6% 2.96 $47,248 5 Memphis, TN-MS-AR 62,733 68,369 +5,636 +9% 2.95 $70,730
*Includes metro areas with at least 5,000 jobs in the sector in 2016. Source: Emsi 2017.2 – QCEW Employees, Non-QCEW Employees, and Self-Employed.
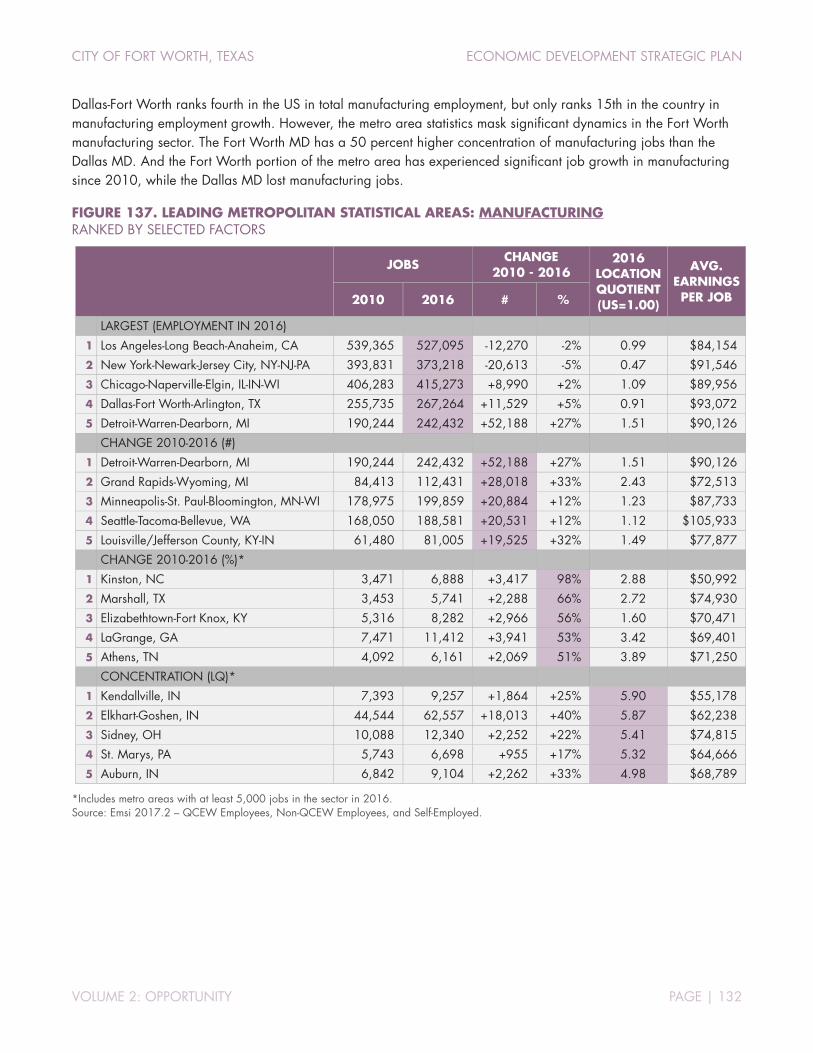
CITY OF FORT WORTH, TEXAS ECONOMIC DEVELOPMENT STRATEGIC PLAN
VOLUME 2: OPPORTUNITY PAGE | 132
Dallas-Fort Worth ranks fourth in the US in total manufacturing employment, but only ranks 15th in the country in manufacturing employment growth. However, the metro area statistics mask significant dynamics in the Fort Worth manufacturing sector. The Fort Worth MD has a 50 percent higher concentration of manufacturing jobs than the Dallas MD. And the Fort Worth portion of the metro area has experienced significant job growth in manufacturing since 2010, while the Dallas MD lost manufacturing jobs.
FIGURE 137. LEADING METROPOLITAN STATISTICAL AREAS: MANUFACTURING RANKED BY SELECTED FACTORS
JOBS
CHANGE 2010 - 2016
2016 LOCATION QUOTIENT (US=1.00)
AVG. EARNINGS PER JOB 2010 2016 # %
LARGEST (EMPLOYMENT IN 2016) 1 Los Angeles-Long Beach-Anaheim, CA 539,365 527,095 -12,270 -2% 0.99 $84,154 2 New York-Newark-Jersey City, NY-NJ-PA 393,831 373,218 -20,613 -5% 0.47 $91,546 3 Chicago-Naperville-Elgin, IL-IN-WI 406,283 415,273 +8,990 +2% 1.09 $89,956 4 Dallas-Fort Worth-Arlington, TX 255,735 267,264 +11,529 +5% 0.91 $93,072 5 Detroit-Warren-Dearborn, MI 190,244 242,432 +52,188 +27% 1.51 $90,126
CHANGE 2010-2016 (#) 1 Detroit-Warren-Dearborn, MI 190,244 242,432 +52,188 +27% 1.51 $90,126 2 Grand Rapids-Wyoming, MI 84,413 112,431 +28,018 +33% 2.43 $72,513 3 Minneapolis-St. Paul-Bloomington, MN-WI 178,975 199,859 +20,884 +12% 1.23 $87,733 4 Seattle-Tacoma-Bellevue, WA 168,050 188,581 +20,531 +12% 1.12 $105,933 5 Louisville/Jefferson County, KY-IN 61,480 81,005 +19,525 +32% 1.49 $77,877
CHANGE 2010-2016 (%)* 1 Kinston, NC 3,471 6,888 +3,417 98% 2.88 $50,992 2 Marshall, TX 3,453 5,741 +2,288 66% 2.72 $74,930 3 Elizabethtown-Fort Knox, KY 5,316 8,282 +2,966 56% 1.60 $70,471 4 LaGrange, GA 7,471 11,412 +3,941 53% 3.42 $69,401 5 Athens, TN 4,092 6,161 +2,069 51% 3.89 $71,250
CONCENTRATION (LQ)* 1 Kendallville, IN 7,393 9,257 +1,864 +25% 5.90 $55,178 2 Elkhart-Goshen, IN 44,544 62,557 +18,013 +40% 5.87 $62,238 3 Sidney, OH 10,088 12,340 +2,252 +22% 5.41 $74,815 4 St. Marys, PA 5,743 6,698 +955 +17% 5.32 $64,666 5 Auburn, IN 6,842 9,104 +2,262 +33% 4.98 $68,789
*Includes metro areas with at least 5,000 jobs in the sector in 2016. Source: Emsi 2017.2 – QCEW Employees, Non-QCEW Employees, and Self-Employed.
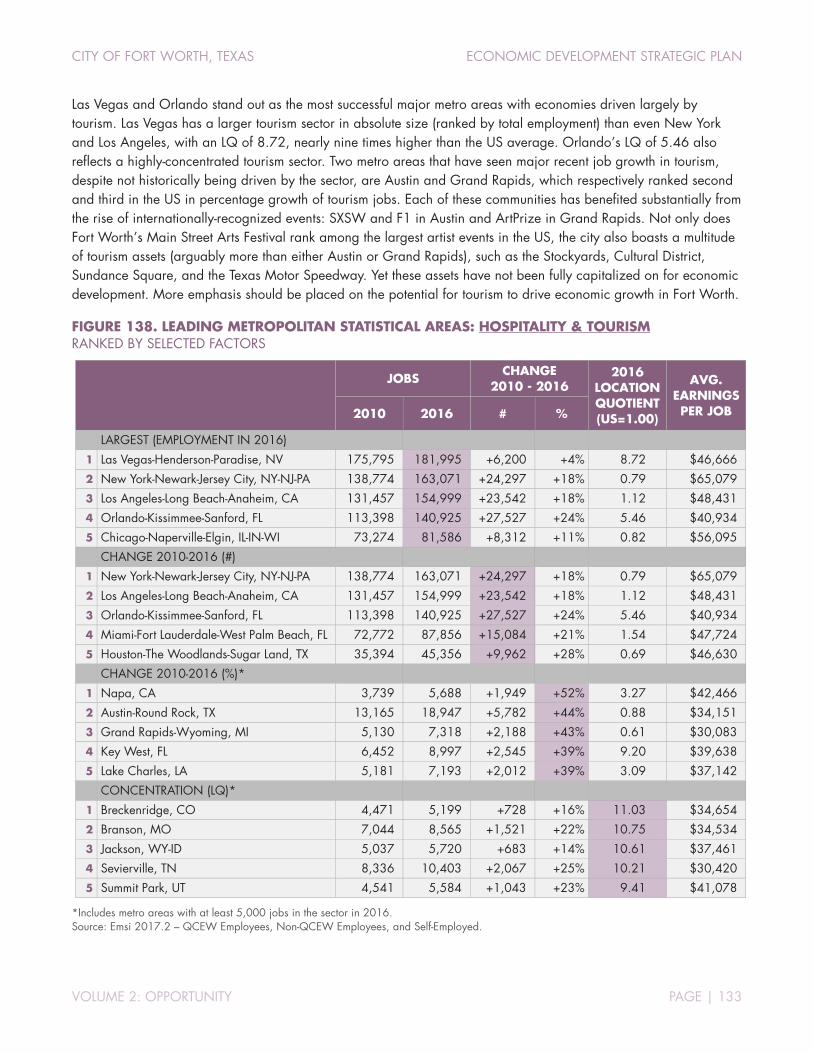
CITY OF FORT WORTH, TEXAS ECONOMIC DEVELOPMENT STRATEGIC PLAN
VOLUME 2: OPPORTUNITY PAGE | 133
Las Vegas and Orlando stand out as the most successful major metro areas with economies driven largely by tourism. Las Vegas has a larger tourism sector in absolute size (ranked by total employment) than even New York and Los Angeles, with an LQ of 8.72, nearly nine times higher than the US average. Orlando’s LQ of 5.46 also reflects a highly-concentrated tourism sector. Two metro areas that have seen major recent job growth in tourism, despite not historically being driven by the sector, are Austin and Grand Rapids, which respectively ranked second and third in the US in percentage growth of tourism jobs. Each of these communities has benefited substantially from the rise of internationally-recognized events: SXSW and F1 in Austin and ArtPrize in Grand Rapids. Not only does Fort Worth’s Main Street Arts Festival rank among the largest artist events in the US, the city also boasts a multitude of tourism assets (arguably more than either Austin or Grand Rapids), such as the Stockyards, Cultural District, Sundance Square, and the Texas Motor Speedway. Yet these assets have not been fully capitalized on for economic development. More emphasis should be placed on the potential for tourism to drive economic growth in Fort Worth.
FIGURE 138. LEADING METROPOLITAN STATISTICAL AREAS: HOSPITALITY & TOURISM RANKED BY SELECTED FACTORS
JOBS
CHANGE 2010 - 2016
2016 LOCATION QUOTIENT (US=1.00)
AVG. EARNINGS PER JOB 2010 2016 # %
LARGEST (EMPLOYMENT IN 2016) 1 Las Vegas-Henderson-Paradise, NV 175,795 181,995 +6,200 +4% 8.72 $46,666 2 New York-Newark-Jersey City, NY-NJ-PA 138,774 163,071 +24,297 +18% 0.79 $65,079 3 Los Angeles-Long Beach-Anaheim, CA 131,457 154,999 +23,542 +18% 1.12 $48,431 4 Orlando-Kissimmee-Sanford, FL 113,398 140,925 +27,527 +24% 5.46 $40,934 5 Chicago-Naperville-Elgin, IL-IN-WI 73,274 81,586 +8,312 +11% 0.82 $56,095
CHANGE 2010-2016 (#)
1 New York-Newark-Jersey City, NY-NJ-PA 138,774 163,071 +24,297 +18% 0.79 $65,079 2 Los Angeles-Long Beach-Anaheim, CA 131,457 154,999 +23,542 +18% 1.12 $48,431 3 Orlando-Kissimmee-Sanford, FL 113,398 140,925 +27,527 +24% 5.46 $40,934 4 Miami-Fort Lauderdale-West Palm Beach, FL 72,772 87,856 +15,084 +21% 1.54 $47,724 5 Houston-The Woodlands-Sugar Land, TX 35,394 45,356 +9,962 +28% 0.69 $46,630
CHANGE 2010-2016 (%)*
1 Napa, CA 3,739 5,688 +1,949 +52% 3.27 $42,466 2 Austin-Round Rock, TX 13,165 18,947 +5,782 +44% 0.88 $34,151 3 Grand Rapids-Wyoming, MI 5,130 7,318 +2,188 +43% 0.61 $30,083 4 Key West, FL 6,452 8,997 +2,545 +39% 9.20 $39,638 5 Lake Charles, LA 5,181 7,193 +2,012 +39% 3.09 $37,142
CONCENTRATION (LQ)*
1 Breckenridge, CO 4,471 5,199 +728 +16% 11.03 $34,654 2 Branson, MO 7,044 8,565 +1,521 +22% 10.75 $34,534 3 Jackson, WY-ID 5,037 5,720 +683 +14% 10.61 $37,461 4 Sevierville, TN 8,336 10,403 +2,067 +25% 10.21 $30,420 5 Summit Park, UT 4,541 5,584 +1,043 +23% 9.41 $41,078
*Includes metro areas with at least 5,000 jobs in the sector in 2016. Source: Emsi 2017.2 – QCEW Employees, Non-QCEW Employees, and Self-Employed.
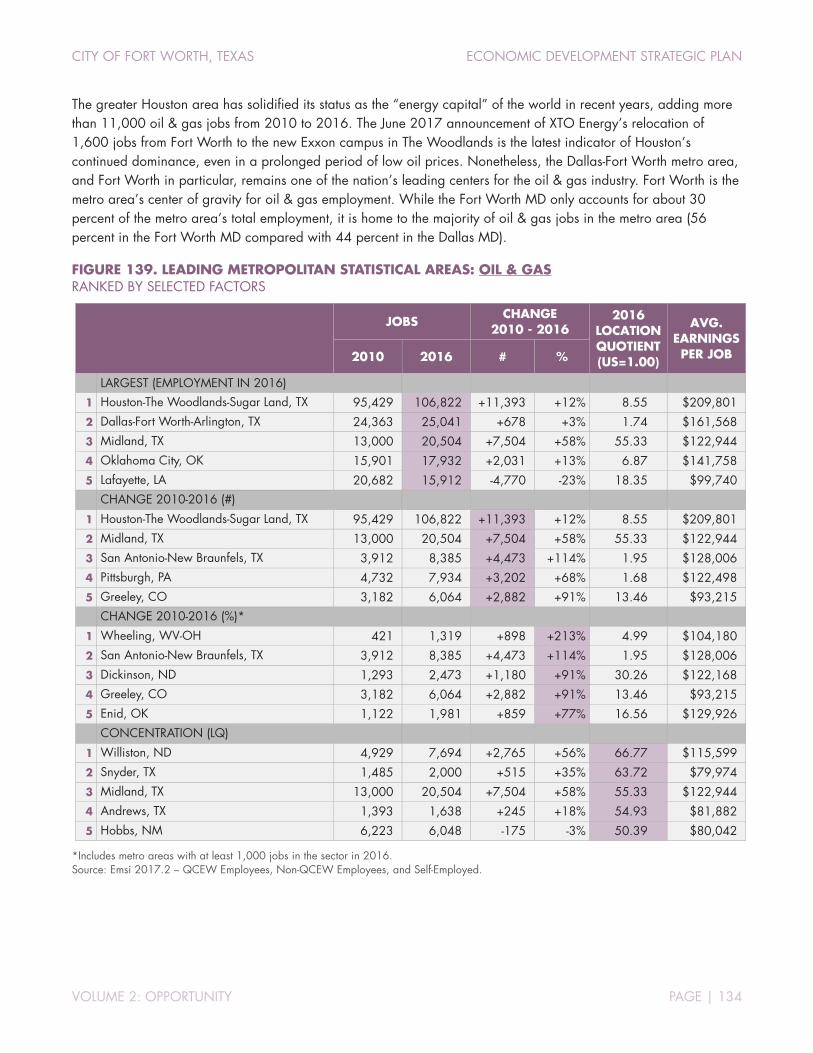
CITY OF FORT WORTH, TEXAS ECONOMIC DEVELOPMENT STRATEGIC PLAN
VOLUME 2: OPPORTUNITY PAGE | 134
The greater Houston area has solidified its status as the “energy capital” of the world in recent years, adding more than 11,000 oil & gas jobs from 2010 to 2016. The June 2017 announcement of XTO Energy’s relocation of 1,600 jobs from Fort Worth to the new Exxon campus in The Woodlands is the latest indicator of Houston’s continued dominance, even in a prolonged period of low oil prices. Nonetheless, the Dallas-Fort Worth metro area, and Fort Worth in particular, remains one of the nation’s leading centers for the oil & gas industry. Fort Worth is the metro area’s center of gravity for oil & gas employment. While the Fort Worth MD only accounts for about 30 percent of the metro area’s total employment, it is home to the majority of oil & gas jobs in the metro area (56 percent in the Fort Worth MD compared with 44 percent in the Dallas MD).
FIGURE 139. LEADING METROPOLITAN STATISTICAL AREAS: OIL & GAS RANKED BY SELECTED FACTORS
JOBS
CHANGE 2010 - 2016
2016 LOCATION QUOTIENT (US=1.00)
AVG. EARNINGS PER JOB 2010 2016 # %
LARGEST (EMPLOYMENT IN 2016) 1 Houston-The Woodlands-Sugar Land, TX 95,429 106,822 +11,393 +12% 8.55 $209,801 2 Dallas-Fort Worth-Arlington, TX 24,363 25,041 +678 +3% 1.74 $161,568 3 Midland, TX 13,000 20,504 +7,504 +58% 55.33 $122,944 4 Oklahoma City, OK 15,901 17,932 +2,031 +13% 6.87 $141,758 5 Lafayette, LA 20,682 15,912 -4,770 -23% 18.35 $99,740
CHANGE 2010-2016 (#)
1 Houston-The Woodlands-Sugar Land, TX 95,429 106,822 +11,393 +12% 8.55 $209,801 2 Midland, TX 13,000 20,504 +7,504 +58% 55.33 $122,944 3 San Antonio-New Braunfels, TX 3,912 8,385 +4,473 +114% 1.95 $128,006 4 Pittsburgh, PA 4,732 7,934 +3,202 +68% 1.68 $122,498 5 Greeley, CO 3,182 6,064 +2,882 +91% 13.46 $93,215
CHANGE 2010-2016 (%)*
1 Wheeling, WV-OH 421 1,319 +898 +213% 4.99 $104,180 2 San Antonio-New Braunfels, TX 3,912 8,385 +4,473 +114% 1.95 $128,006 3 Dickinson, ND 1,293 2,473 +1,180 +91% 30.26 $122,168 4 Greeley, CO 3,182 6,064 +2,882 +91% 13.46 $93,215 5 Enid, OK 1,122 1,981 +859 +77% 16.56 $129,926
CONCENTRATION (LQ)
1 Williston, ND 4,929 7,694 +2,765 +56% 66.77 $115,599 2 Snyder, TX 1,485 2,000 +515 +35% 63.72 $79,974 3 Midland, TX 13,000 20,504 +7,504 +58% 55.33 $122,944 4 Andrews, TX 1,393 1,638 +245 +18% 54.93 $81,882 5 Hobbs, NM 6,223 6,048 -175 -3% 50.39 $80,042
*Includes metro areas with at least 1,000 jobs in the sector in 2016. Source: Emsi 2017.2 – QCEW Employees, Non-QCEW Employees, and Self-Employed.
CITY OF FORT WORTH, TEXAS ECONOMIC DEVELOPMENT STRATEGIC PLAN
VOLUME 2: OPPORTUNITY PAGE | 135
EMERGING OPPORTUNITIES
This section provides a combination of qualitative and quantitative information describing opportunities for new investment and job growth in Fort Worth within specific industries and market segments. For each emerging opportunity, there is a summary of the market opportunities (regional/national trends and strategic considerations impacting future growth in the industry) and Fort Worth’s advantage (local assets and strengths that position the city for growth). Following each summary is a longer discussion of the opportunities for business recruitment and investment within the sector.
AEROSPACE MANUFACTURING & DESIGN
Aerospace manufacturing (NAICS 3364) includes establishments that manufacture complete aircraft, missiles, or space vehicles, and/or associated parts and equipment.
MARKET OPPORTUNITIES FORT WORTH’S ADVANTAGES
• Commercial & military aircraft markets show strong near- and mid-term demands for new vehicles
• The F-35 development program has solidified and is generating increasing interest from international partners
• Lockheed Martin plans to add over 1,000 employees over the next couple of years
• Bell Helicopter Textron is a strong contender to win the US Army’s Future Vertical Lift program
• Attracting additional aerospace suppliers and air service companies to Alliance Airport
• US DoD is emphasizing disruptive “third-offset” technologies such as robotics and automation, miniaturization, big data, artificial intelligence, and advanced manufacturing into its R&D and procurement programs
• Major investments in space exploration (e.g., Jeff Bezos’s Blue Origin, Elon Musk’s SpaceX) leading to future demand for design & production of commercial space vehicles
• Texas is home to development and test sites of multiple commercial space firms, including Boeing, SpaceX, Blue Origin, ULA, and XCOR
• Strong base of employment, including globally recognized firms such as Lockheed Martin, Bell Helicopter Textron, and Elbit Systems.
• The Dallas-Fort Worth metro area is one of the most highly concentrated regions of aircraft and aircraft parts production in the US
• The percentage of the workforce employed in aircraft manufacturing in the Dallas-Fort Worth metro area is nearly five times the national average
• A High concentration of key occupations (Aerospace Engineers, Aircraft Systems Assemblers, Aircraft Mechanics & Service Technicians, Avionics Technicians)
• More than 50 percent of Lockheed Martin’s global workforce is located in Fort Worth
• The Dallas-Fort Worth metro area is home to the headquarters of two international airlines
• Multi-modal transportation network (Interstate highways, international air service, Class I rail access
• NAS Joint Reserve Base Fort Worth
• TCC Erma C. Johnson Hadley Northwest Center of Excellence for Aviation, Transportation, and Logistics
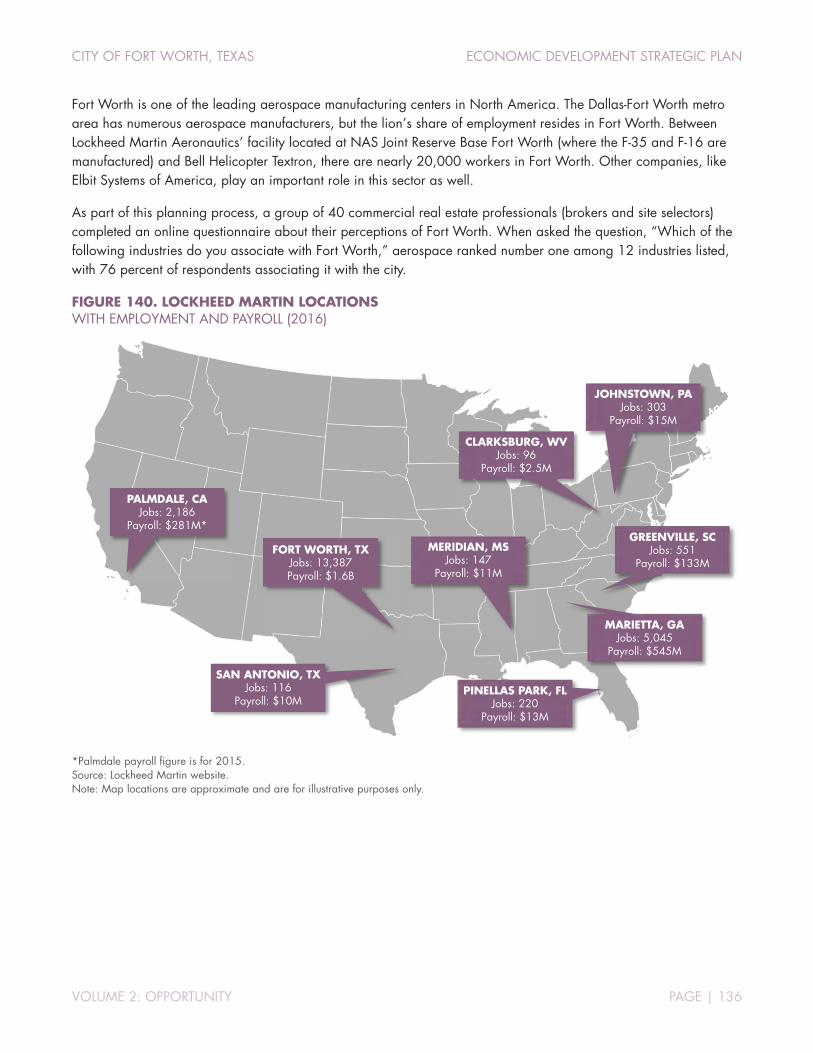
CITY OF FORT WORTH, TEXAS ECONOMIC DEVELOPMENT STRATEGIC PLAN
VOLUME 2: OPPORTUNITY PAGE | 136
Fort Worth is one of the leading aerospace manufacturing centers in North America. The Dallas-Fort Worth metro area has numerous aerospace manufacturers, but the lion’s share of employment resides in Fort Worth. Between Lockheed Martin Aeronautics’ facility located at NAS Joint Reserve Base Fort Worth (where the F-35 and F-16 are manufactured) and Bell Helicopter Textron, there are nearly 20,000 workers in Fort Worth. Other companies, like Elbit Systems of America, play an important role in this sector as well.
As part of this planning process, a group of 40 commercial real estate professionals (brokers and site selectors) completed an online questionnaire about their perceptions of Fort Worth. When asked the question, “Which of the following industries do you associate with Fort Worth,” aerospace ranked number one among 12 industries listed, with 76 percent of respondents associating it with the city.
FIGURE 140. LOCKHEED MARTIN LOCATIONS WITH EMPLOYMENT AND PAYROLL (2016)
*Palmdale payroll figure is for 2015. Source: Lockheed Martin website. Note: Map locations are approximate and are for illustrative purposes only.
PALMDALE, CA Jobs: 2,186
Payroll: $281M*
FORT WORTH, TX Jobs: 13,387 Payroll: $1.6B
SAN ANTONIO, TX Jobs: 116
Payroll: $10M
MERIDIAN, MS Jobs: 147
Payroll: $11M
MARIETTA, GA Jobs: 5,045
Payroll: $545M
PINELLAS PARK, FL Jobs: 220
Payroll: $13M
CLARKSBURG, WV Jobs: 96
Payroll: $2.5M
GREENVILLE, SC Jobs: 551
Payroll: $133M
JOHNSTOWN, PA Jobs: 303
Payroll: $15M

CITY OF FORT WORTH, TEXAS ECONOMIC DEVELOPMENT STRATEGIC PLAN
VOLUME 2: OPPORTUNITY PAGE | 137
The commercial aviation industry has experienced record growth in recent years due to demand for fleet replacement, passenger growth in emerging markets, and the introduction of new products and manufacturers to the market. Per the most recent data available from the Aerospace Industries Association (AIA), sales of aerospace products started to rebound in 2015 after stalling out at the end of the last decade. Over the past decade, aircraft manufacturing has made up an increasingly larger share of all aerospace sales, rising from 51 percent of the total in 2004 to an estimated 56 percent in 2015, per AIA’s analysis (Figure 141).
However, when aircraft sales are considered by type (civilian versus military) there are substantial differences in performance during the same time (Figure 142). Civilian (commercial) aircraft sales reached record highs in 2014 and 2015, doubling from 2004. By contrast, military-related sales declined after climbing to just over $60 billion (constant 2009 dollars) as the US entered the recession.
Major factors affecting the global outlook for the aerospace manufacturing & design sector include:
CONTINUED HIGH LEVELS OF DEMAND FOR AIRCRAFT: The global aerospace industry saw a decline in profits and revenues in 2015 for the first time in five years, due in large part to the impact of the strong US dollar and restructuring charges taken by two major companies (Bombardier and UTC). Despite the declines, prospects for commercial aircraft remain strong, driven by the replacement of aging fleet in established markets, new passenger growth in emerging markets (driving fleet expansion), and increasing fuel efficiency standards in North America and Europe.
Net orders for Boeing and Airbus flattened slightly in 2015, dropping below 2,000 aircraft for the first time in four years. However, the firms continue to have record-breaking backlogs, calculated at 12,626 units as of December 31, 2015. At current production rates, PricewaterhouseCoopers (PwC) estimates the backlog of orders is sufficient to keep manufacturers busy for the next nine years.
The long-term reauthorization of the US Export-Import Bank (Ex-Im) through 2019 was good news for domestic producers, who often rely on the bank to supplement traditional funding sources. The program is opposed by US
FIGURE 141. AEROSPACE SALES BY PRODUCT GROUP
FIGURE 142. AIRCRAFT SALES BY TYPE
Sources: Aerospace Industries Association, 2014 Year-End Review and Forecast (based on company reports; The Budget of the United States Government, National Aeronautics and Space Administration, US Department of Commerce, and Department of Defense); TIP Strategies. Note: Government purchases reflected as appropriated funding. (P = preliminary, E = estimate)
$83.03
$130.38
$0
$50
$100
$150
$200
$250
2004
2005
2006
2007
2008
2009
2010
2011
2012
2013
2014
(P)
2015
(E)
Con
stan
t 200
9 do
llars
(in
billi
ons)
RelatedProducts &Services
Space
Missiles
Aircraft(Civilian &Military)
$0
$10
$20
$30
$40
$50
$60
$70
$80
$9020
04
2005
2006
2007
2008
2009
2010
2011
2012
2013
2014
(P)
2015
(E)
Con
stan
t 200
9 do
llars
(in
bilio
ns)
Civilian Military
CITY OF FORT WORTH, TEXAS ECONOMIC DEVELOPMENT STRATEGIC PLAN
VOLUME 2: OPPORTUNITY PAGE | 138
carriers who view the program as a subsidy provided to foreign firms purchasing US aircraft, an option not available to domestic airlines.
The future is dimmer for defense contractors. Although passage of the Bipartisan Budget Act of 2015 extends relief from the full impacts of sequestration through 2017, uncertainty about the federal budget continues. However, PwC cites “rapidly changing US defense priorities” (including global threats from ISIS, the Russia-Ukraine conflict, and growing modernization of the militaries of North Korea and China) as a force that is likely to help drive compromise in future budget deals.
DEPARTMENT OF DEFENSE PRIORITIES: In addition to continued uncertainty over global military spending, the sector has experienced a shift towards vendors that “aren’t part of the core defense industry,” according to PwC’s review of trends affecting aerospace and defense in 2016. The analysis highlights the unusual position traditional defense contractors find themselves in, stating that the “combination of unexpected competitive pressures and a more frugal customer base is a one-two punch that the defense industry has never quite faced before.”
This shift towards technology-oriented vendors can be seen in the Defense Innovation Initiative announced in November 2014 by former Secretary of Defense, Chuck Hagel. This initiative is commonly referred to as the “third-offset strategy,” because it marks the third evolution of DoD’s thinking on how the US can maintain strategic advantage over potential adversaries into the future. Priority areas outlined in the Defense Innovation Initiative are designed to accelerate innovation and emphasize the application of breakthrough technologies. These priority areas include the following:
Robotics & Autonomous Systems: unmanned machines that assess situations and make decisions on their own
Miniaturization: making components of weapons systems smaller, including warheads, sensors, and electronics
Big Data: utilizing commercial techniques for analyzing large volumes of intelligence data
Advanced Manufacturing: using technologies such as 3-D printing that allow for ongoing, rapid changes for the testing of new technologies and the customization of existing technologies
ROBOTICS AND AUTONOMOUS SYSTEMS: The convergence of unmanned air systems (UAS), drones, and in-demand electric vertical-takeoff-and-landing (e-VTOL) has the potential to create new technology and employment opportunities in the region. UBER has announced a plan to launch in-demand e-VTOL air-taxi service in Dallas in 2020. Bell Helicopter is part of the team Uber has assembled to develop the technology and infrastructure. Uber is also partnering with the City of Dallas and Hillwood to launch its UberAIR service and develop vertiports. One such vertiport is planned for downtown Fort Worth. Alliance Airport has been mentioned as a potential site for manufacturing and training center support for UberAIR.
A growing number of systems are being designed to operate autonomously, including aerial, ground, and underwater vehicles. Interest in unmanned aerial vehicles (UAVs) for civilian use and among foreign militaries is expected to help push the market to $93 billion in sales over the next decade, per the Teal Group. The group’s 2015 study estimates that military uses will account for nearly three-quarters (72 percent) of the market, with consumer and civil uses capturing 23 percent and 5 percent, respectively. Though a much smaller market, growth in unmanned underwater vehicles (UUVs) is also expected to climb, driven primarily by DoD investments. Increasingly sophisticated sensors will be an important element to the growth of both aerial and underwater systems. Likewise, artificial intelligence (AI) also plays a key role in autonomous systems by allowing machines to place feedback generated by the sensors into context and learn to respond.
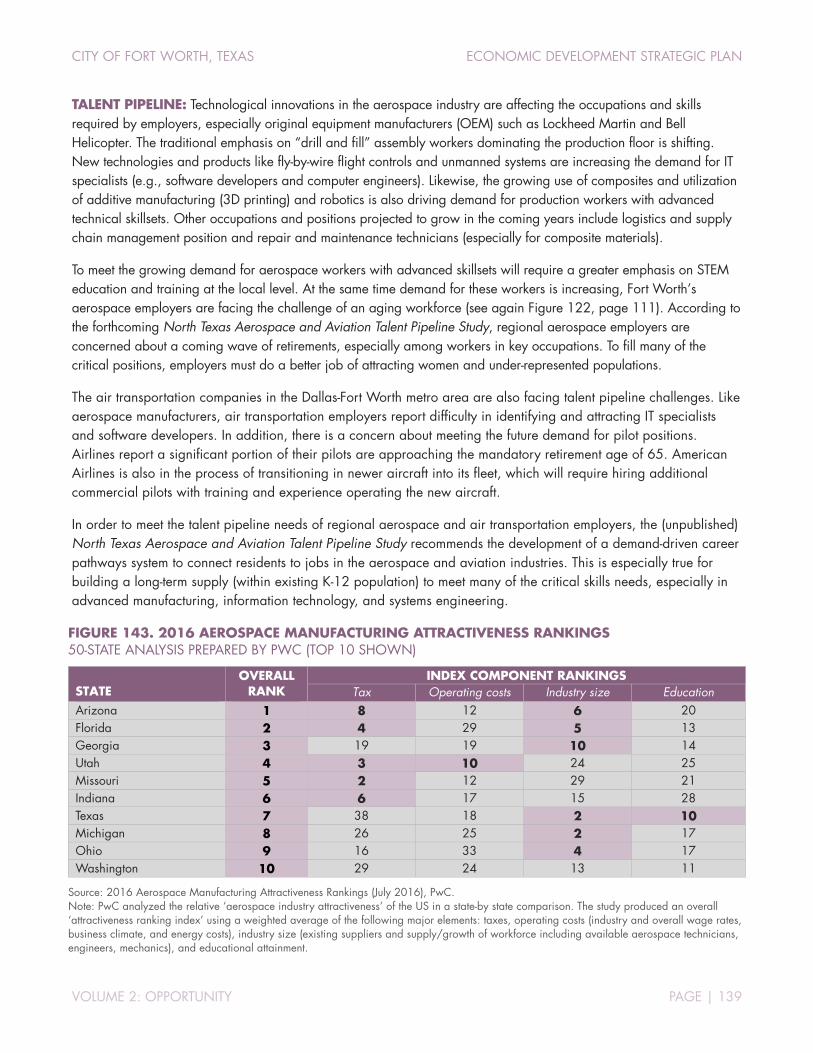
CITY OF FORT WORTH, TEXAS ECONOMIC DEVELOPMENT STRATEGIC PLAN
VOLUME 2: OPPORTUNITY PAGE | 139
TALENT PIPELINE: Technological innovations in the aerospace industry are affecting the occupations and skills required by employers, especially original equipment manufacturers (OEM) such as Lockheed Martin and Bell Helicopter. The traditional emphasis on “drill and fill” assembly workers dominating the production floor is shifting. New technologies and products like fly-by-wire flight controls and unmanned systems are increasing the demand for IT specialists (e.g., software developers and computer engineers). Likewise, the growing use of composites and utilization of additive manufacturing (3D printing) and robotics is also driving demand for production workers with advanced technical skillsets. Other occupations and positions projected to grow in the coming years include logistics and supply chain management position and repair and maintenance technicians (especially for composite materials).
To meet the growing demand for aerospace workers with advanced skillsets will require a greater emphasis on STEM education and training at the local level. At the same time demand for these workers is increasing, Fort Worth’s aerospace employers are facing the challenge of an aging workforce (see again Figure 122, page 111). According to the forthcoming North Texas Aerospace and Aviation Talent Pipeline Study, regional aerospace employers are concerned about a coming wave of retirements, especially among workers in key occupations. To fill many of the critical positions, employers must do a better job of attracting women and under-represented populations.
The air transportation companies in the Dallas-Fort Worth metro area are also facing talent pipeline challenges. Like aerospace manufacturers, air transportation employers report difficulty in identifying and attracting IT specialists and software developers. In addition, there is a concern about meeting the future demand for pilot positions. Airlines report a significant portion of their pilots are approaching the mandatory retirement age of 65. American Airlines is also in the process of transitioning in newer aircraft into its fleet, which will require hiring additional commercial pilots with training and experience operating the new aircraft.
In order to meet the talent pipeline needs of regional aerospace and air transportation employers, the (unpublished) North Texas Aerospace and Aviation Talent Pipeline Study recommends the development of a demand-driven career pathways system to connect residents to jobs in the aerospace and aviation industries. This is especially true for building a long-term supply (within existing K-12 population) to meet many of the critical skills needs, especially in advanced manufacturing, information technology, and systems engineering.
FIGURE 143. 2016 AEROSPACE MANUFACTURING ATTRACTIVENESS RANKINGS 50-STATE ANALYSIS PREPARED BY PWC (TOP 10 SHOWN)
STATE OVERALL
RANK INDEX COMPONENT RANKINGS
Tax Operating costs Industry size Education Arizona 1 8 12 6 20 Florida 2 4 29 5 13 Georgia 3 19 19 10 14 Utah 4 3 10 24 25 Missouri 5 2 12 29 21 Indiana 6 6 17 15 28 Texas 7 38 18 2 10 Michigan 8 26 25 2 17 Ohio 9 16 33 4 17 Washington 10 29 24 13 11
Source: 2016 Aerospace Manufacturing Attractiveness Rankings (July 2016), PwC. Note: PwC analyzed the relative ‘aerospace industry attractiveness’ of the US in a state-by state comparison. The study produced an overall ‘attractiveness ranking index’ using a weighted average of the following major elements: taxes, operating costs (industry and overall wage rates, business climate, and energy costs), industry size (existing suppliers and supply/growth of workforce including available aerospace technicians, engineers, mechanics), and educational attainment.

CITY OF FORT WORTH, TEXAS ECONOMIC DEVELOPMENT STRATEGIC PLAN
VOLUME 2: OPPORTUNITY PAGE | 140
FIGURE 144. INDUSTRY INTELLIGENCE & NETWORKING, AEROSPACE MANUFACTURING & DESIGN
AEROSPACE MANUFACTURING & DESIGN TRADE ASSOCIATIONS
Aerospace Industries Association www.aia-aerospace.org/
Aerospace Components Manufacturers www.aerospacecomponents.org
National Aeronautic Association www.naa.aero/
Aviation Distributors and Manufacturers Association (ADMA) www.members.adma.org/adma
General Aviation Manufacturers Association www.gama.aero/
American Institute of Aeronautics and Astronautics (AIAA) www.aerospacecomponents.org
Aircraft Electronics Association (AEA) www.aea.net
Aviation Suppliers Association www.aviationsuppliers.org/
Aviation Technician Education Council (ATEC) www.atec-amt.org/
Experimental Aircraft Association (EAA) www.eaa.org/eaa
IEEE Aerospace and Electronic Systems Society www.ieee-aess.org
Association for Unmanned Vehicle Systems International www.auvsi.org
Chinese Society of Aeronautics and Astronautics (CSAA) www.csaa.org.cn/a/english/ABOUT_US/CSAA_Profile
AeroSpace and Defence Industries Association of Europe (ASD) www.asd-europe.org
Royal Aeronautical Society www.aerosociety.com
Air and Space Academy (AAE) www.academie-air-espace.com/newIndex_test.php
RELEVANT CONFERENCES/EVENTS
AEA Central Connect Conference
26-27 October 2017 Kansas City, MO www.aea.net/connect/Central
Aero India
TBD 2018 Bengaluru, Karnataka, IN www.aeroindia.in/Default.aspx
Aerospace Manufacturing Conference
TBD May 2018 TBD www.speednews.com/aerospace-manufacturing-conference
ADMA 2017 Annual Conference
5-9 November 2017 La Quinta, CA www.members.adma.org/adma/ADMA/
AIAA SPACE and Astronautics Forum and Exposition
12-14 September 2017 Orlando, FL www.aiaa-space.org
ATEC Annual Conference
17-20 March 2018 Washington, DC www.atec-amt.org/annual-conference.html
China International Aviation & Aerospace Exhibition
6-11 November 2018 Zhuhai, Guangdong, CN www.airshow.com.cn/en
Dubai Airshow
12-16 November 2017 Jebel Ali, UAE www.dubaiairshow.aero
CITY OF FORT WORTH, TEXAS ECONOMIC DEVELOPMENT STRATEGIC PLAN
VOLUME 2: OPPORTUNITY PAGE | 141
AEROSPACE MANUFACTURING & DESIGN EAA Airventure Oshkosh
23-28 July 2018 Oshkosh, WI www.eaa.org/en/airventure
Farnborough Airshow
16-22 July 2018 Farnborough, UK www.farnboroughairshow.com
International IEEE Aerospace Conference
3-10 March 2018 Big Sky, MT www.aeroconf.org
Paris Airshow
17-23 June 2019 Paris, FR www.siae.fr/en
Singapore Airshow
6-11 February 2018 Singapore, MY www.singaporeairshow.com/trade
TRADE PUBLICATIONS
AIAA Journal www.arc.aiaa.org/loi/aiaaj
Avionics News www.aea.net/avionicsnews
Aerospace America www.aerospaceamerica.aiaa.org
Aerospace Testing International Magazine www.aerospacetestinginternational.com/
Aerospace Manufacturing Magazine www.aero-mag.com/
Aviation International News www.ainonline.com
International Journal of Aviation, Aeronautics, and Aerospace (IJAAA) www.commons.erau.edu/ijaaa

CITY OF FORT WORTH, TEXAS ECONOMIC DEVELOPMENT STRATEGIC PLAN
VOLUME 2: OPPORTUNITY PAGE | 142
TRANSPORTATION INNOVATION
This opportunity recognizes the dramatic technological advances that have occurred within the transportation industry, including the many disruptive technologies, like autonomous vehicles, and the move towards transportation as a service (e.g., ride-sharing models, such as Uber).
MARKET OPPORTUNITIES FORT WORTH’S ADVANTAGES
• The transportation industry is undergoing massive disruption and rapid change, leading to new business models and growth sectors
• The biggest changes include development of autonomous vehicles (e.g., passenger cars, trucks, helicopters), ride-sharing, car-sharing, bike-sharing, e-bikes
• Focus areas are autonomous vehicle testing, Smart City investments (e.g., traffic signals), transit system innovation, logistics & distribution
• Projected job growth in the Dallas-Fort Worth metro area is 11 percent over the next five years in transportation & warehousing
• Dallas-Fort Worth is the largest and fastest-growing inland transportation hub for goods movement
• Industry-leading companies (BNSF, American Airlines, Lockheed Martin, Bell Helicopter Textron, Epic Helicopters)
• Highly concentrated Transportation & warehousing sector (LQ of 3.16 in the city of Fort Worth and 2.04 in the Fort Worth MD)
• Three Class I rail lines (BNSF, UP, KCS)
• Interstate Highway access (IH-35W, IH-20, IH-30)
• Airport access (DFW International Airport, Alliance Airport, Meacham & Spinks Airports)
• Federal Aviation Administration (FAA) Southwest US regional HQ
• TCC Erma C. Johnson Hadley Northwest Center of Excellence for Aviation, Transportation & Logistics
• Regional higher education expertise in transportation (UNT Logistics, UT-A)
Few cities have as many strategic advantages as Fort Worth for attracting investment in transportation innovation. The city’s economic roots can be traced to investments and new innovations in transportation, starting with stagecoaches and cattle drives, then transitioning to railroads and highways, and eventually air travel. Fort Worth’s infrastructure assets (e.g., DFW International Airport, Alliance Airport) and its business leadership (e.g., American Airlines, BNSF, Lockheed Martin, Bell Helicopter Textron, Epic Helicopters) position the city to become a test bed for the evaluation and deployment of new transportation solutions.
The opportunities for business growth tied to transportation innovation have increased dramatically in recent years. The world’s most valuable startup, Uber Technologies (valued at $60 billion as of this writing) and other ride-sharing companies are a case in point. Major tech firms ranging from Google to Apple are aggressively investing in autonomous vehicle technology. These innovations are not limited to passenger vehicles, nor are they limited to the design and production of transportation equipment. The goods movement sector will soon depend on autonomous trucks, drones, and other new technologies. “Smart City” infrastructure investments by the public sector are creating new opportunities for innovation. The shift towards transportation as a service will lead to changes in vehicle ownership models that promise to disrupt entire industries. Auto insurance will take on different dimensions when fewer people own their own vehicles. New opportunities will arise for real estate development and construction thanks to significantly decreased parking requirements.
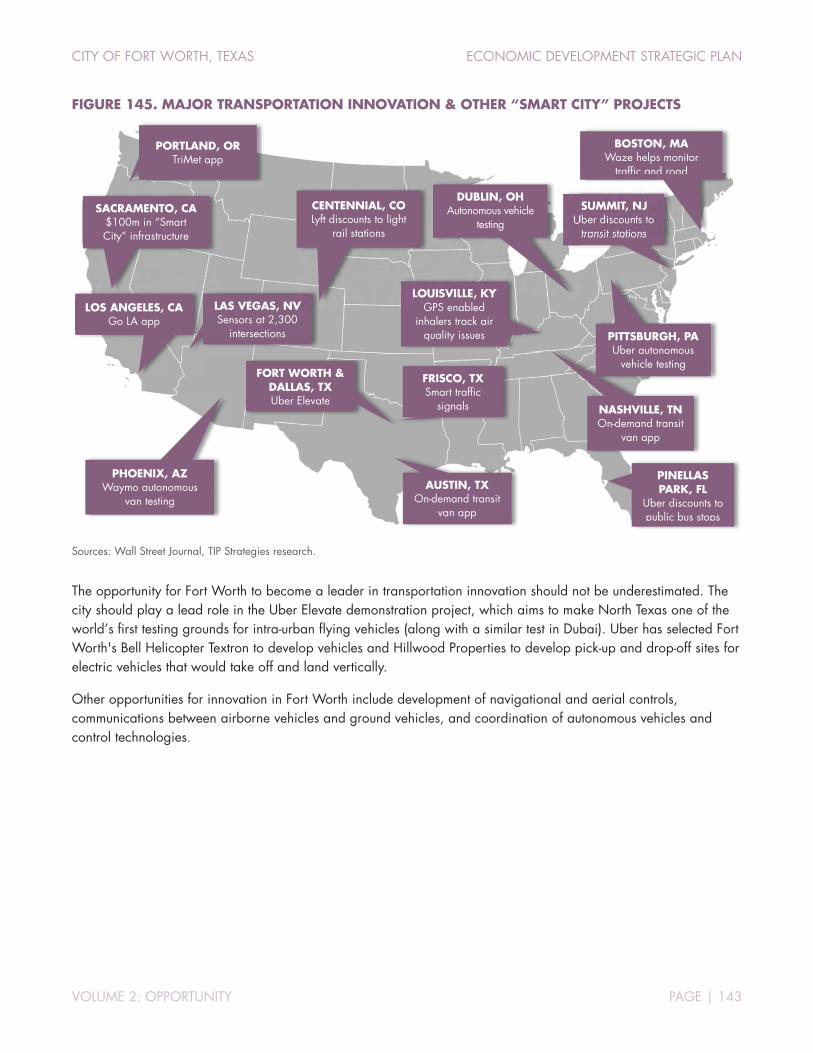
CITY OF FORT WORTH, TEXAS ECONOMIC DEVELOPMENT STRATEGIC PLAN
VOLUME 2: OPPORTUNITY PAGE | 143
FIGURE 145. MAJOR TRANSPORTATION INNOVATION & OTHER “SMART CITY” PROJECTS
Sources: Wall Street Journal, TIP Strategies research.
The opportunity for Fort Worth to become a leader in transportation innovation should not be underestimated. The city should play a lead role in the Uber Elevate demonstration project, which aims to make North Texas one of the world’s first testing grounds for intra-urban flying vehicles (along with a similar test in Dubai). Uber has selected Fort Worth's Bell Helicopter Textron to develop vehicles and Hillwood Properties to develop pick-up and drop-off sites for electric vehicles that would take off and land vertically.
Other opportunities for innovation in Fort Worth include development of navigational and aerial controls, communications between airborne vehicles and ground vehicles, and coordination of autonomous vehicles and control technologies.
FORT WORTH & DALLAS, TX Uber Elevate
FRISCO, TX Smart traffic
signals NASHVILLE, TN On-demand transit
van app
PITTSBURGH, PA Uber autonomous
vehicle testing
AUSTIN, TX On-demand transit
van app
LOS ANGELES, CA Go LA app
PHOENIX, AZ Waymo autonomous
van testing
PORTLAND, OR TriMet app
SUMMIT, NJ Uber discounts to
transit stations
PINELLAS PARK, FL
Uber discounts to public bus stops
LAS VEGAS, NV Sensors at 2,300
intersections
SACRAMENTO, CA $100m in “Smart City” infrastructure
LOUISVILLE, KY GPS enabled
inhalers track air quality issues
BOSTON, MA Waze helps monitor
traffic and road
DUBLIN, OH Autonomous vehicle
testing
CENTENNIAL, CO Lyft discounts to light
rail stations

CITY OF FORT WORTH, TEXAS ECONOMIC DEVELOPMENT STRATEGIC PLAN
VOLUME 2: OPPORTUNITY PAGE | 144
FIGURE 146. INDUSTRY INTELLIGENCE & NETWORKING, TRANSPORTATION INNOVATION
TRANSPORTATION INNOVATION
TRADE ASSOCIATIONS
International Warehouse Logistics Association (IWLA) www.iwla.com
National Association of Wholesaler-Distributors (NAW) www.naw.org
American Trucking Associations (ATA) www.trucking.org
Intermodal Association of North America (IANA) www.intermodal.org
Commercial Vehicle Training Association (CVTA) www.cvta.org
Truckload Carriers Association (TCA) www.truckload.org
Association for Unmanned Vehicle Systems International (AUVSI) www.auvsi.org
Smart Cities Council www.smartcitiescouncil.com
Living Cities www.livingcities.org
Transportation Research Board www.trb.org
RELEVANT CONFERENCES/EVENTS
CCJ Symposium 2017
22-24 May 2017 Asheville, NC www.ccjsymposium.com
2017 WorkForce Builders Conference
12-14 June 2017 Riverside, MO www.truckload.org/WFBCON-HOME
The Great American Trucking Show
24-26 August 2017 Dallas, TX www.truckshow.com
National Truck Driver Appreciation Week
10-16 September 2017 US www.trucking.org/Appreciation_Week.aspx
TXTA Annual Conference
03-05 August 2017 Austin, TX www.texastrucking.com/TXTA/Events/Annual_Conference
AV18 | Autonomous Vehicles Silicon Valley
26-28 Feb 2018 Silicon Valley, CA www.autonomousvehicles.iqpc.com/
TCA’s 80th Annual Convention
25-28 March 2018 Kissimmee, FL www.truckload.org/TCA17
Smart Cities Connect Conference and Expo - Placing Cities First
26-29 March 2018 Kansas City, MO www.smartcitiesconnect.com/
TRADE PUBLICATIONS
3PL Americas www.www.iwla.com/library/publications/
FleetOwner Magazine www.fleetowner.com
Truckers News www.truckersnews.com
Heavy Duty Trucking www.truckinginfo.com/magazine
Commercial Carrier Journal www.ccjdigital.com
Truckload Authority www.truckload.org/TLA

CITY OF FORT WORTH, TEXAS ECONOMIC DEVELOPMENT STRATEGIC PLAN
VOLUME 2: OPPORTUNITY PAGE | 145
LIFE SCIENCES DELIVERY & INNOVATION
This opportunity focuses on the linkage between healthcare delivery functions and the products, devices, and innovations in the life sciences field. In Fort Worth, an opportunity exists to bring innovation into the delivery of healthcare with partnerships between medical providers in the Near Southside medical district, life sciences firms (e.g., Alcon Laboratories, Galderma, Encore Vision), and educational institutions (e.g., TCU-UNTHSC medical school).
MARKET OPPORTUNITIES FORT WORTH’S ADVANTAGE
• Ongoing growth trends in medical districts as magnets for talent, innovation, and business growth favor locations with a density of activity in a mixed-use environment, similar to Near Southside
• Projected healthcare job growth in the Dallas-Fort Worth metro area of 20 percent over the next five years
• Demand for innovation in “downstream” portion of life sciences & healthcare field (the delivery systems as opposed to the medical products & devices)
• Demand for more physician residency programs in Fort Worth and in the region
• Potential for clinics & small medical offices in neighborhoods with unmet demand
• Largest medical employment concentration in North Texas (Near Southside)
• Relatively low LQs for healthcare in City of Fort Worth (0.82) and Fort Worth MD (0.89) indicate significant local unmet demand for healthcare
• TECH Fort Worth has a track record of success in facilitating growth of life sciences startups (Encore Vision most recently)
• Major life sciences firms operating in Fort Worth (e.g., Alcon Laboratories, Galderma, Smith & Nephew)
• New TCU-UNTHSC medical school
The distinction between life sciences delivery (healthcare) and life sciences products, devices, and innovation is an important one. Genuine life sciences clusters are few in number. In the US, there are clear strongholds in the Washington/Baltimore corridor, Boston, and the Bay Area, with significant pockets of activity in other regions including Raleigh-Durham, San Diego, Seattle, and the DC metro area.
FIGURE 147. US LIFE SCIENCES CLUSTER RANKINGS TOP US LIFE SCIENCES MARKETS, RANKED BY JLL’S WEIGHTED CLUSTER INDEX*, 2016
RANK CLUSTER WEIGHTED SCORE
RANK CLUSTER WEIGHTED SCORE
1 Greater Boston 87.5 9 Westchester County (NY) 41.2
2 San Francisco Bay Area 75.2 10 New Jersey 40.8
3 Raleigh-Durham 60.7 11 New York City 34.7
4 San Diego 58.3 12 Minneapolis 34.5
5 Seattle-Bellevue 56.3 13 Denver 34.5
6 Maryland Suburbs/DC Metro 53.2 14 Chicago 30.7
7 Philadelphia 49.4 15 Central & Southern Florida 30.6
8 Los Angeles/Orange County 44.7 16 Long Island (NY) 30.0
Sources: JLL Research, Life Sciences Outlook 2016. Note: Weighted cluster index scores are based on the following weights: employment concentration (20%), employment growth (10%), establishment concentration (10%), venture capital funding (15%), National Institutes of Health funding (15%), market occupancy rate (10%), average asking rent (10%), and rentable lab supply (10%).
CITY OF FORT WORTH, TEXAS ECONOMIC DEVELOPMENT STRATEGIC PLAN
VOLUME 2: OPPORTUNITY PAGE | 146
Research from JLL indicates life sciences real estate vacancy rates remain exceptionally low in top clusters like Boston and the Bay Area, while asking rents continue to rise. Meanwhile, secondary markets like Denver are seeing an uptick in leasing activity, and as vacancy rates slide, these clusters are quickly becoming supply-constrained as well. Firms are adapting their operating strategies to remain competitive by responding to four key industry themes:
1. Tight markets drive new real estate solutions.
2. Prioritizing talent is critical to growth.
3. Strategic hunt for revenue growth.
4. Influx of new sources of capital.
Life sciences operates somewhat “under the radar” in Fort Worth. Part of this is due to the attention within Texas garnered by the Texas Medical Center in Houston, and to a lesser extent the South Texas Medical Center in San Antonio, and now the emerging medical innovation district in Austin (centered on the new UT/Dell Medical School). Nonetheless, Fort Worth has numerous enviable assets in the life sciences delivery field.
Alcon Laboratories operates a major production facility in Fort Worth. The recent acquisition of the Fort Worth startup Encore Vision by Novartis (announced at $465 million) was one of the largest startup acquisitions in Texas over the last several years. Encore Vision was founded in 2007 by Bill Burns, a former Alcon executive, and received funding from the Cowtown Angels investor group, part of TECH Fort Worth. The startup developed an eyedrop treatment for presbyopia. The local successes of Alcon and Encore Vision demonstrate that ophthalmology is a worthwhile focus area for business expansion, creation, and recruitment efforts in Fort Worth.
Beyond ophthalmology and related life sciences firms, the much bigger opportunity for business growth in Fort Worth is within life sciences delivery. The Near Southside medical district is a major regional center of gravity for the delivery side of life sciences. The new TCU-UNTHSC medical school adds another dimension to the potential for innovation and business growth related to healthcare delivery in Fort Worth. An important focus area for the community should be to create a favorable environment for the deployment of clinical trials.
Clinical trials in the field of life sciences delivery include research studies that explore whether a medical strategy, treatment, or device is safe and effective for humans. These studies also may show which medical approaches work best for certain illnesses or groups of people. The earlier “upstream” part of the process begins with basic R&D that typically starts in laboratory settings where scientists first develop and test new concepts. Clinical trials are part of the “downstream” innovation in the area of life sciences, since they typically take place with patient groups in partnership with healthcare institutions. Fort Worth’s asset base lends itself to innovation in the downstream delivery side of life sciences.

CITY OF FORT WORTH, TEXAS ECONOMIC DEVELOPMENT STRATEGIC PLAN
VOLUME 2: OPPORTUNITY PAGE | 147
FIGURE 148. INDUSTRY INTELLIGENCE & NETWORKING, LIFE SCIENCES DELIVERY & INNOVATION
LIFE SCIENCES DELIVERY & INNOVATION
TRADE ASSOCIATIONS
International Society for Pharmaceutical Engineering (ISPE) www.ispe.org/
Pharmaceutical Research and Manufacturers of America (PhRMA) www.phrma.org
American Health Care Association www.ahcancal.org
American Medical Association www.ama-assn.org
Texas Health Care Association www.txhca.org
Texas Healthcare & Bioscience Institute www.thbi.com
The Association for Research in Vision and Ophthalmology (ARVO) www.arvo.org
American Association of Ophthalmic Oncologists and Pathologists (AAOOP) www.aaoop.org
Women in Ophthalmology www.wioonline.org
RELEVANT CONFERENCES/EVENTS
7th Annual Digital Marketing for Medical Devices
01-03 August 2017 Minneapolis, MN exlevents.com/digital-marketing-medical-devices
Women in Ophthalmology Summer Symposium 2017
10-13 August 2017 San Diego, CA www.wioonline.org/register
Stanford Medicine X 2017 Conference
15-17 September 2017 Stanford, CA www.medicinex.stanford.edu
2017 AAOOP Annual Meeting
10 November 2017 New Orleans, LA www.aaoop.org/annual-meetings/2017-aaoop-annual-meeting
American Academy of Ophthalmology Annual Meeting 2017
11-14 November 2017 New Orleans, LA www.aao.org/annual-meeting
36th Annual J.P. Morgan Healthcare Conference
08-11 January 2018 San Francisco, CA medtechengine.com/event/j-p-morgan-annual-healthcare-conference-2017
BIO International Convention
04-07 June 2018 Boston, MA www.convention.bio.org/2018/
TRADE PUBLICATIONS
Ophthalmology www.aaojournal.org/
The American Journal of Medicine www.amjmed.com
The American Journal of Medicine www.amjmed.com
Hospitals & Health Networks www.hhnmag.com
Pharmaceutical Engineering www.pharmaceuticalengineering.org
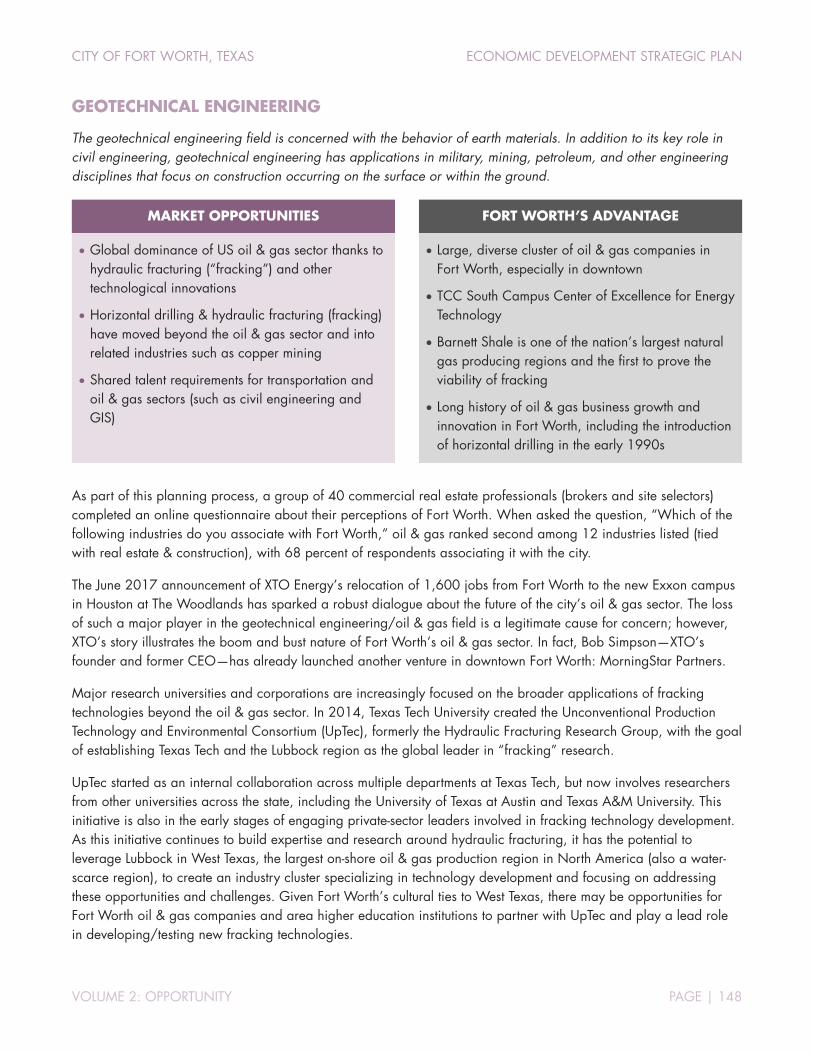
CITY OF FORT WORTH, TEXAS ECONOMIC DEVELOPMENT STRATEGIC PLAN
VOLUME 2: OPPORTUNITY PAGE | 148
GEOTECHNICAL ENGINEERING
The geotechnical engineering field is concerned with the behavior of earth materials. In addition to its key role in civil engineering, geotechnical engineering has applications in military, mining, petroleum, and other engineering disciplines that focus on construction occurring on the surface or within the ground.
MARKET OPPORTUNITIES FORT WORTH’S ADVANTAGE
• Global dominance of US oil & gas sector thanks to hydraulic fracturing (“fracking”) and other technological innovations
• Horizontal drilling & hydraulic fracturing (fracking) have moved beyond the oil & gas sector and into related industries such as copper mining
• Shared talent requirements for transportation and oil & gas sectors (such as civil engineering and GIS)
• Large, diverse cluster of oil & gas companies in Fort Worth, especially in downtown
• TCC South Campus Center of Excellence for Energy Technology
• Barnett Shale is one of the nation’s largest natural gas producing regions and the first to prove the viability of fracking
• Long history of oil & gas business growth and innovation in Fort Worth, including the introduction of horizontal drilling in the early 1990s
As part of this planning process, a group of 40 commercial real estate professionals (brokers and site selectors) completed an online questionnaire about their perceptions of Fort Worth. When asked the question, “Which of the following industries do you associate with Fort Worth,” oil & gas ranked second among 12 industries listed (tied with real estate & construction), with 68 percent of respondents associating it with the city.
The June 2017 announcement of XTO Energy’s relocation of 1,600 jobs from Fort Worth to the new Exxon campus in Houston at The Woodlands has sparked a robust dialogue about the future of the city’s oil & gas sector. The loss of such a major player in the geotechnical engineering/oil & gas field is a legitimate cause for concern; however, XTO’s story illustrates the boom and bust nature of Fort Worth’s oil & gas sector. In fact, Bob Simpson—XTO’s founder and former CEO—has already launched another venture in downtown Fort Worth: MorningStar Partners.
Major research universities and corporations are increasingly focused on the broader applications of fracking technologies beyond the oil & gas sector. In 2014, Texas Tech University created the Unconventional Production Technology and Environmental Consortium (UpTec), formerly the Hydraulic Fracturing Research Group, with the goal of establishing Texas Tech and the Lubbock region as the global leader in “fracking” research.
UpTec started as an internal collaboration across multiple departments at Texas Tech, but now involves researchers from other universities across the state, including the University of Texas at Austin and Texas A&M University. This initiative is also in the early stages of engaging private-sector leaders involved in fracking technology development. As this initiative continues to build expertise and research around hydraulic fracturing, it has the potential to leverage Lubbock in West Texas, the largest on-shore oil & gas production region in North America (also a water-scarce region), to create an industry cluster specializing in technology development and focusing on addressing these opportunities and challenges. Given Fort Worth’s cultural ties to West Texas, there may be opportunities for Fort Worth oil & gas companies and area higher education institutions to partner with UpTec and play a lead role in developing/testing new fracking technologies.
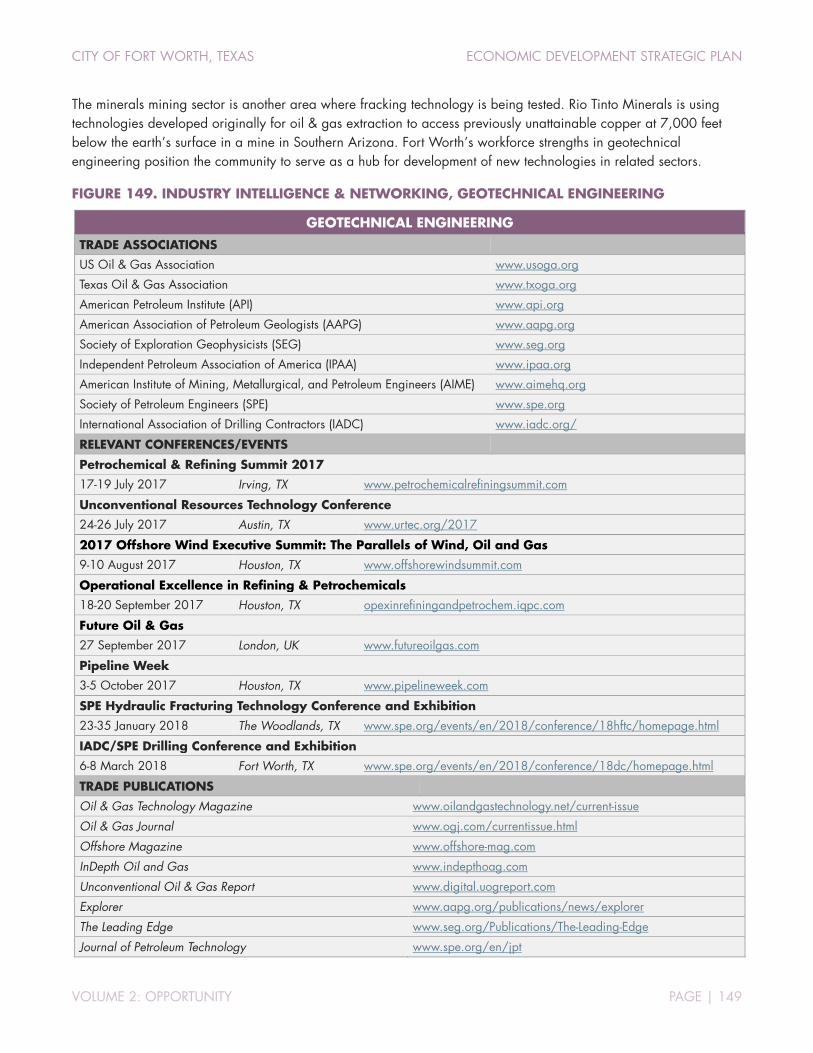
CITY OF FORT WORTH, TEXAS ECONOMIC DEVELOPMENT STRATEGIC PLAN
VOLUME 2: OPPORTUNITY PAGE | 149
The minerals mining sector is another area where fracking technology is being tested. Rio Tinto Minerals is using technologies developed originally for oil & gas extraction to access previously unattainable copper at 7,000 feet below the earth’s surface in a mine in Southern Arizona. Fort Worth’s workforce strengths in geotechnical engineering position the community to serve as a hub for development of new technologies in related sectors.
FIGURE 149. INDUSTRY INTELLIGENCE & NETWORKING, GEOTECHNICAL ENGINEERING
GEOTECHNICAL ENGINEERING
TRADE ASSOCIATIONS
US Oil & Gas Association www.usoga.org
Texas Oil & Gas Association www.txoga.org
American Petroleum Institute (API) www.api.org
American Association of Petroleum Geologists (AAPG) www.aapg.org
Society of Exploration Geophysicists (SEG) www.seg.org
Independent Petroleum Association of America (IPAA) www.ipaa.org
American Institute of Mining, Metallurgical, and Petroleum Engineers (AIME) www.aimehq.org
Society of Petroleum Engineers (SPE) www.spe.org
International Association of Drilling Contractors (IADC) www.iadc.org/
RELEVANT CONFERENCES/EVENTS
Petrochemical & Refining Summit 2017
17-19 July 2017 Irving, TX www.petrochemicalrefiningsummit.com
Unconventional Resources Technology Conference
24-26 July 2017 Austin, TX www.urtec.org/2017
2017 Offshore Wind Executive Summit: The Parallels of Wind, Oil and Gas
9-10 August 2017 Houston, TX www.offshorewindsummit.com
Operational Excellence in Refining & Petrochemicals
18-20 September 2017 Houston, TX opexinrefiningandpetrochem.iqpc.com
Future Oil & Gas
27 September 2017 London, UK www.futureoilgas.com
Pipeline Week
3-5 October 2017 Houston, TX www.pipelineweek.com
SPE Hydraulic Fracturing Technology Conference and Exhibition
23-35 January 2018 The Woodlands, TX www.spe.org/events/en/2018/conference/18hftc/homepage.html
IADC/SPE Drilling Conference and Exhibition
6-8 March 2018 Fort Worth, TX www.spe.org/events/en/2018/conference/18dc/homepage.html
TRADE PUBLICATIONS
Oil & Gas Technology Magazine www.oilandgastechnology.net/current-issue
Oil & Gas Journal www.ogj.com/currentissue.html
Offshore Magazine www.offshore-mag.com
InDepth Oil and Gas www.indepthoag.com
Unconventional Oil & Gas Report www.digital.uogreport.com
Explorer www.aapg.org/publications/news/explorer
The Leading Edge www.seg.org/Publications/The-Leading-Edge
Journal of Petroleum Technology www.spe.org/en/jpt
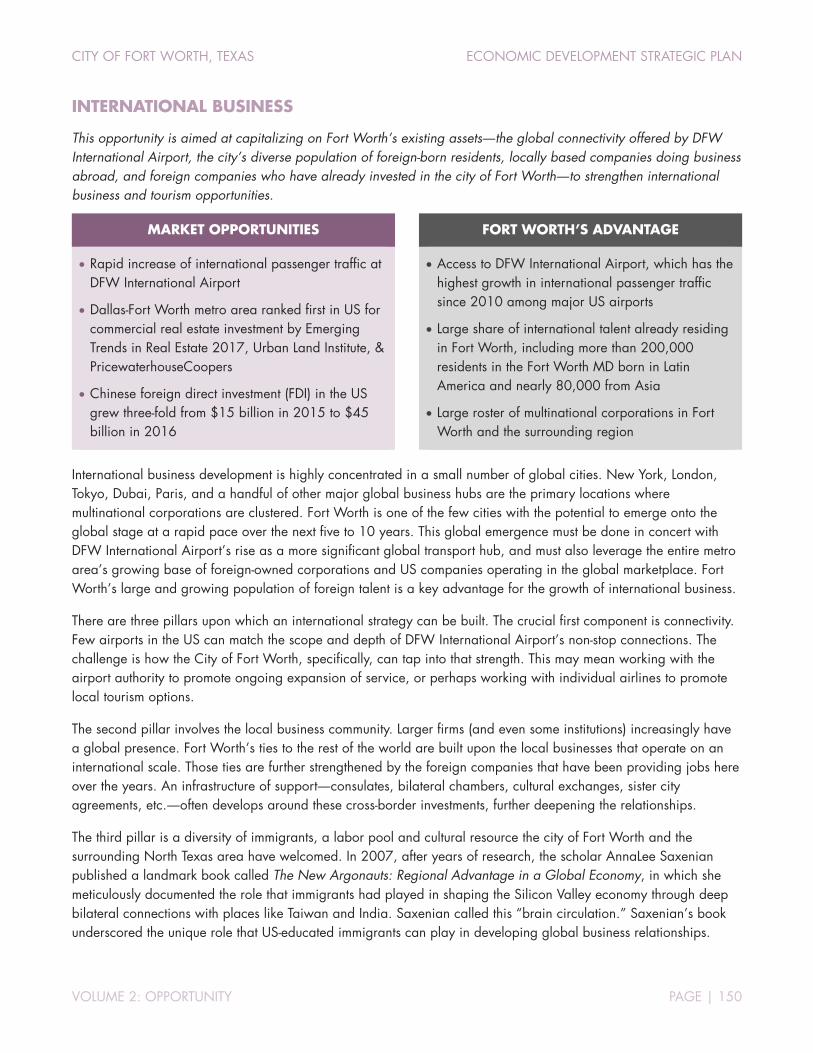
CITY OF FORT WORTH, TEXAS ECONOMIC DEVELOPMENT STRATEGIC PLAN
VOLUME 2: OPPORTUNITY PAGE | 150
INTERNATIONAL BUSINESS
This opportunity is aimed at capitalizing on Fort Worth’s existing assets―the global connectivity offered by DFW International Airport, the city’s diverse population of foreign-born residents, locally based companies doing business abroad, and foreign companies who have already invested in the city of Fort Worth―to strengthen international business and tourism opportunities.
MARKET OPPORTUNITIES FORT WORTH’S ADVANTAGE
• Rapid increase of international passenger traffic at DFW International Airport
• Dallas-Fort Worth metro area ranked first in US for commercial real estate investment by Emerging Trends in Real Estate 2017, Urban Land Institute, & PricewaterhouseCoopers
• Chinese foreign direct investment (FDI) in the US grew three-fold from $15 billion in 2015 to $45 billion in 2016
• Access to DFW International Airport, which has the highest growth in international passenger traffic since 2010 among major US airports
• Large share of international talent already residing in Fort Worth, including more than 200,000 residents in the Fort Worth MD born in Latin America and nearly 80,000 from Asia
• Large roster of multinational corporations in Fort Worth and the surrounding region
International business development is highly concentrated in a small number of global cities. New York, London, Tokyo, Dubai, Paris, and a handful of other major global business hubs are the primary locations where multinational corporations are clustered. Fort Worth is one of the few cities with the potential to emerge onto the global stage at a rapid pace over the next five to 10 years. This global emergence must be done in concert with DFW International Airport’s rise as a more significant global transport hub, and must also leverage the entire metro area’s growing base of foreign-owned corporations and US companies operating in the global marketplace. Fort Worth’s large and growing population of foreign talent is a key advantage for the growth of international business.
There are three pillars upon which an international strategy can be built. The crucial first component is connectivity. Few airports in the US can match the scope and depth of DFW International Airport’s non-stop connections. The challenge is how the City of Fort Worth, specifically, can tap into that strength. This may mean working with the airport authority to promote ongoing expansion of service, or perhaps working with individual airlines to promote local tourism options.
The second pillar involves the local business community. Larger firms (and even some institutions) increasingly have a global presence. Fort Worth’s ties to the rest of the world are built upon the local businesses that operate on an international scale. Those ties are further strengthened by the foreign companies that have been providing jobs here over the years. An infrastructure of support―consulates, bilateral chambers, cultural exchanges, sister city agreements, etc.―often develops around these cross-border investments, further deepening the relationships.
The third pillar is a diversity of immigrants, a labor pool and cultural resource the city of Fort Worth and the surrounding North Texas area have welcomed. In 2007, after years of research, the scholar AnnaLee Saxenian published a landmark book called The New Argonauts: Regional Advantage in a Global Economy, in which she meticulously documented the role that immigrants had played in shaping the Silicon Valley economy through deep bilateral connections with places like Taiwan and India. Saxenian called this “brain circulation.” Saxenian’s book underscored the unique role that US-educated immigrants can play in developing global business relationships.

CITY OF FORT WORTH, TEXAS ECONOMIC DEVELOPMENT STRATEGIC PLAN
VOLUME 2: OPPORTUNITY PAGE | 151
FIGURE 150. ESTIMATES OF FOREIGN-BORN POPULATION IN FORT WORTH MD & PEER MSAs RANKED BY FOREIGN-BORN POPULATION AS SHARE OF TOTAL
RANK BY FOREIGN-BORN SHARE OF TOTAL POP. IN
2015
FOREIGN-BORN POP. % BY WORLD REGION OF BIRTH*
# % OF TOTAL POP.
EUROPE ASIA AFRICA LATIN AMERICA
1 Dallas, TX (MD) 957,615 20.3% 3.8% 27.7% 6.5% 60.6%
2 Phoenix, AZ (MSA) 653,566 14.3% 9.1% 22.5% 3.3% 60.3%
3 Fort Worth, TX (MD) 336,394 14.0% 4.7% 23.4% 9.4% 60.2% 4 Denver, CO (MSA) 346,024 12.3% 11.8% 24.8% 7.2% 53.5%
5 Nashville, TN (MSA) 149,637 8.2% 8.7% 29.9% 16.0% 41.5%
6 Oklahoma City, OK (MSA) 111,787 8.2% 3.9% 30.1% 5.8% 58.6%
7 Columbus, OH (MSA) 155,968 7.7% 10.8% 40.8% 25.7% 20.5%
8 Kansas City, MO (MSA) 135,036 6.5% 9.1% 32.6% 9.4% 46.4%
9 Indianapolis, IN (MSA) 123,730 6.2% 7.1% 34.0% 11.1% 44.8%
10 Pittsburgh, PA (MSA) 92,670 3.9% 28.1% 45.4% 9.8% 13.0%
Source: 2011-2015 American Community Survey 5-year estimates. Note: Excludes Oceania and Northern America regions which together account for less than three percent of total US foreign-born population.
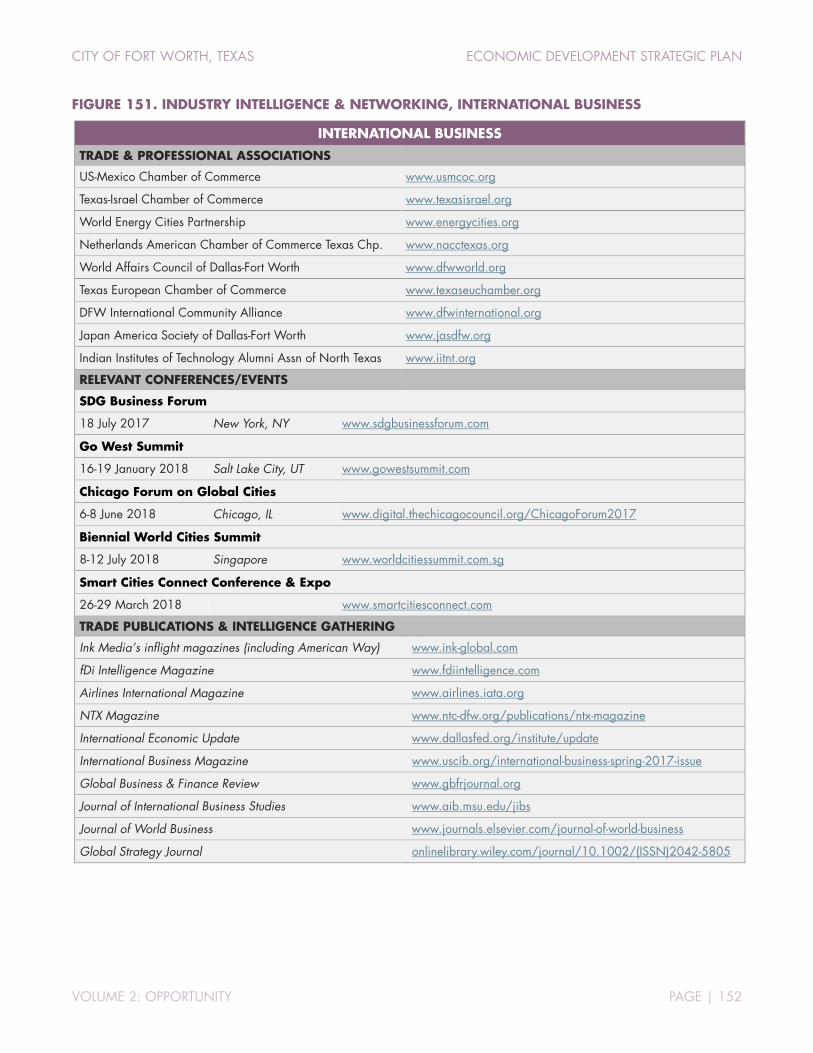
CITY OF FORT WORTH, TEXAS ECONOMIC DEVELOPMENT STRATEGIC PLAN
VOLUME 2: OPPORTUNITY PAGE | 152
FIGURE 151. INDUSTRY INTELLIGENCE & NETWORKING, INTERNATIONAL BUSINESS
INTERNATIONAL BUSINESS
TRADE & PROFESSIONAL ASSOCIATIONS
US-Mexico Chamber of Commerce www.usmcoc.org
Texas-Israel Chamber of Commerce www.texasisrael.org
World Energy Cities Partnership www.energycities.org
Netherlands American Chamber of Commerce Texas Chp. www.nacctexas.org
World Affairs Council of Dallas-Fort Worth www.dfwworld.org
Texas European Chamber of Commerce www.texaseuchamber.org
DFW International Community Alliance www.dfwinternational.org
Japan America Society of Dallas-Fort Worth www.jasdfw.org
Indian Institutes of Technology Alumni Assn of North Texas www.iitnt.org
RELEVANT CONFERENCES/EVENTS
SDG Business Forum
18 July 2017 New York, NY www.sdgbusinessforum.com
Go West Summit
16-19 January 2018 Salt Lake City, UT www.gowestsummit.com
Chicago Forum on Global Cities
6-8 June 2018 Chicago, IL www.digital.thechicagocouncil.org/ChicagoForum2017
Biennial World Cities Summit
8-12 July 2018 Singapore www.worldcitiessummit.com.sg
Smart Cities Connect Conference & Expo
26-29 March 2018 www.smartcitiesconnect.com
TRADE PUBLICATIONS & INTELLIGENCE GATHERING
Ink Media’s inflight magazines (including American Way) www.ink-global.com
fDi Intelligence Magazine www.fdiintelligence.com
Airlines International Magazine www.airlines.iata.org
NTX Magazine www.ntc-dfw.org/publications/ntx-magazine
International Economic Update www.dallasfed.org/institute/update
International Business Magazine www.uscib.org/international-business-spring-2017-issue
Global Business & Finance Review www.gbfrjournal.org
Journal of International Business Studies www.aib.msu.edu/jibs
Journal of World Business www.journals.elsevier.com/journal-of-world-business
Global Strategy Journal onlinelibrary.wiley.com/journal/10.1002/(ISSN)2042-5805

CITY OF FORT WORTH, TEXAS ECONOMIC DEVELOPMENT STRATEGIC PLAN
VOLUME 2: OPPORTUNITY PAGE | 153
CORPORATE & REGIONAL HEADQUARTERS (HQs)
Corporate headquarters are primarily engaged in administering, overseeing, and managing the activities of other business units within a company or enterprise. These private-sector establishments typically achieve economies of scale by performing a strategic or organizational planning and decision-making role across the company. Regional headquarters generally provide some type of concentrated function for an organization and typically locate in an area to take advantage of a customer base, proximity to government agencies, or access to talent.
MARKET OPPORTUNITIES FORT WORTH’S ADVANTAGE
• High level of ongoing corporate relocation & expansion activity
• Corporate and regional HQ location decisions favor sites with access to a large, growing talent base
• Increasing desire among major corporations for urban locations with amenity-rich environments
• Projected job growth in the Dallas-Fort Worth metro area of 22 percent over the next five years
• Focus on: transportation, manufacturing, oil & gas
• Access to DFW International Airport and Alliance Airport
• Access to a large, rapidly expanding workforce with diverse skill sets in demand by HQ operations
• Established districts within Fort Worth with amenities desired by corporate office tenants
• TCU Neeley Business School’s nationally ranked entrepreneurship undergraduate program
• Desirable downtown with amenities to attract HQs
While corporate HQs are classified under a single code in the NAICS system (55), corporate and regional HQ operations occur across all industry clusters. In essence, corporate HQs are not really an industry, but they are a legitimate target for business recruitment. The Dallas-Fort Worth metro area is one of the leading corporate centers in America with 22 Fortune 500 HQs and a total of 42 Fortune 1000 HQs. However, Fort Worth has not benefited from the region’s status as a corporate hub. The city only claims one Fortune 500 HQ (American Airlines) and one additional Fortune 1000 HQ (Pier 1 Imports). Recruitment of corporate and regional HQ operations into Fort Worth, especially into the urban core, must be a key focus area of the city’s economic development program.
FIGURE 152. CITIES IN DALLAS-FORT WORTH MSA BY NUMBER OF FORTUNE 1000 HQs, 2017
Source: Fortune Magazine.
1
1
1
1
1
1
2
2
6
9
17
Arlington
Coppell
Denton
Grapevine
McKinney
Southlake
Fort Worth
Richardson
Plano
Irving
Dallas
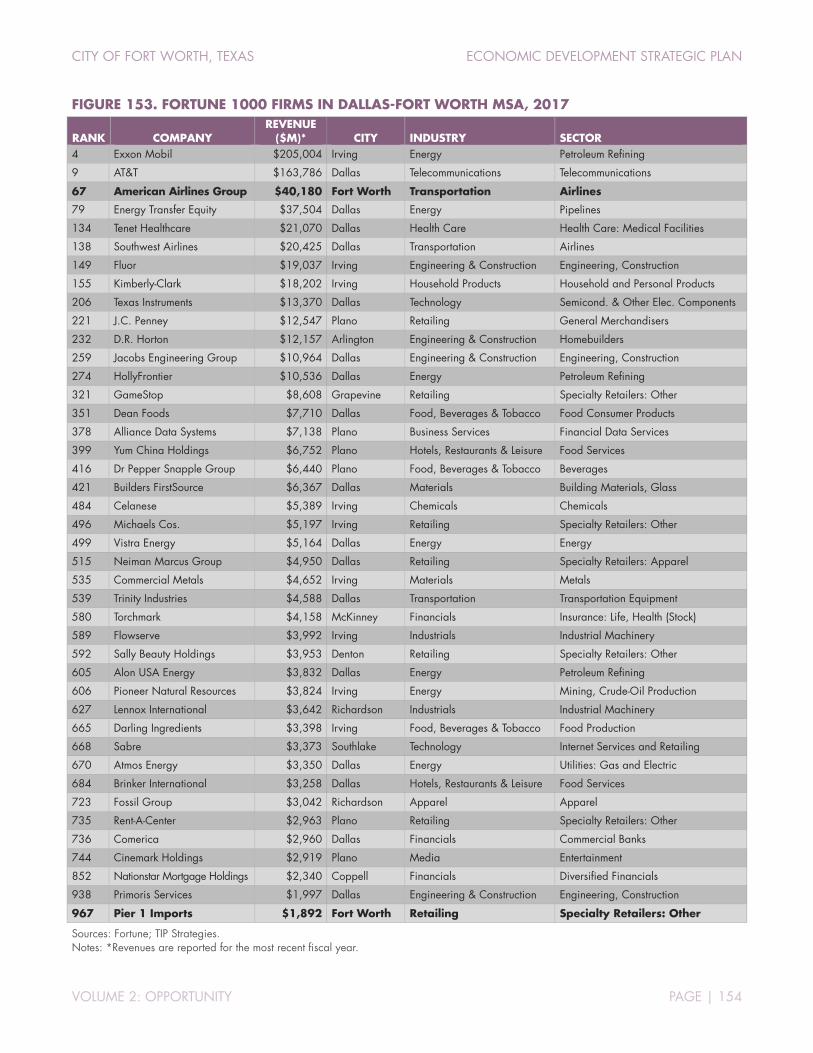
CITY OF FORT WORTH, TEXAS ECONOMIC DEVELOPMENT STRATEGIC PLAN
VOLUME 2: OPPORTUNITY PAGE | 154
FIGURE 153. FORTUNE 1000 FIRMS IN DALLAS-FORT WORTH MSA, 2017
RANK COMPANY REVENUE
($M)* CITY INDUSTRY SECTOR 4 Exxon Mobil $205,004 Irving Energy Petroleum Refining
9 AT&T $163,786 Dallas Telecommunications Telecommunications
67 American Airlines Group $40,180 Fort Worth Transportation Airlines
79 Energy Transfer Equity $37,504 Dallas Energy Pipelines
134 Tenet Healthcare $21,070 Dallas Health Care Health Care: Medical Facilities
138 Southwest Airlines $20,425 Dallas Transportation Airlines
149 Fluor $19,037 Irving Engineering & Construction Engineering, Construction
155 Kimberly-Clark $18,202 Irving Household Products Household and Personal Products
206 Texas Instruments $13,370 Dallas Technology Semicond. & Other Elec. Components
221 J.C. Penney $12,547 Plano Retailing General Merchandisers
232 D.R. Horton $12,157 Arlington Engineering & Construction Homebuilders
259 Jacobs Engineering Group $10,964 Dallas Engineering & Construction Engineering, Construction
274 HollyFrontier $10,536 Dallas Energy Petroleum Refining
321 GameStop $8,608 Grapevine Retailing Specialty Retailers: Other
351 Dean Foods $7,710 Dallas Food, Beverages & Tobacco Food Consumer Products
378 Alliance Data Systems $7,138 Plano Business Services Financial Data Services
399 Yum China Holdings $6,752 Plano Hotels, Restaurants & Leisure Food Services
416 Dr Pepper Snapple Group $6,440 Plano Food, Beverages & Tobacco Beverages
421 Builders FirstSource $6,367 Dallas Materials Building Materials, Glass
484 Celanese $5,389 Irving Chemicals Chemicals
496 Michaels Cos. $5,197 Irving Retailing Specialty Retailers: Other
499 Vistra Energy $5,164 Dallas Energy Energy
515 Neiman Marcus Group $4,950 Dallas Retailing Specialty Retailers: Apparel
535 Commercial Metals $4,652 Irving Materials Metals
539 Trinity Industries $4,588 Dallas Transportation Transportation Equipment
580 Torchmark $4,158 McKinney Financials Insurance: Life, Health (Stock)
589 Flowserve $3,992 Irving Industrials Industrial Machinery
592 Sally Beauty Holdings $3,953 Denton Retailing Specialty Retailers: Other
605 Alon USA Energy $3,832 Dallas Energy Petroleum Refining
606 Pioneer Natural Resources $3,824 Irving Energy Mining, Crude-Oil Production
627 Lennox International $3,642 Richardson Industrials Industrial Machinery
665 Darling Ingredients $3,398 Irving Food, Beverages & Tobacco Food Production
668 Sabre $3,373 Southlake Technology Internet Services and Retailing
670 Atmos Energy $3,350 Dallas Energy Utilities: Gas and Electric
684 Brinker International $3,258 Dallas Hotels, Restaurants & Leisure Food Services
723 Fossil Group $3,042 Richardson Apparel Apparel
735 Rent-A-Center $2,963 Plano Retailing Specialty Retailers: Other
736 Comerica $2,960 Dallas Financials Commercial Banks
744 Cinemark Holdings $2,919 Plano Media Entertainment
852 Nationstar Mortgage Holdings $2,340 Coppell Financials Diversified Financials
938 Primoris Services $1,997 Dallas Engineering & Construction Engineering, Construction
967 Pier 1 Imports $1,892 Fort Worth Retailing Specialty Retailers: Other
Sources: Fortune; TIP Strategies. Notes: *Revenues are reported for the most recent fiscal year.
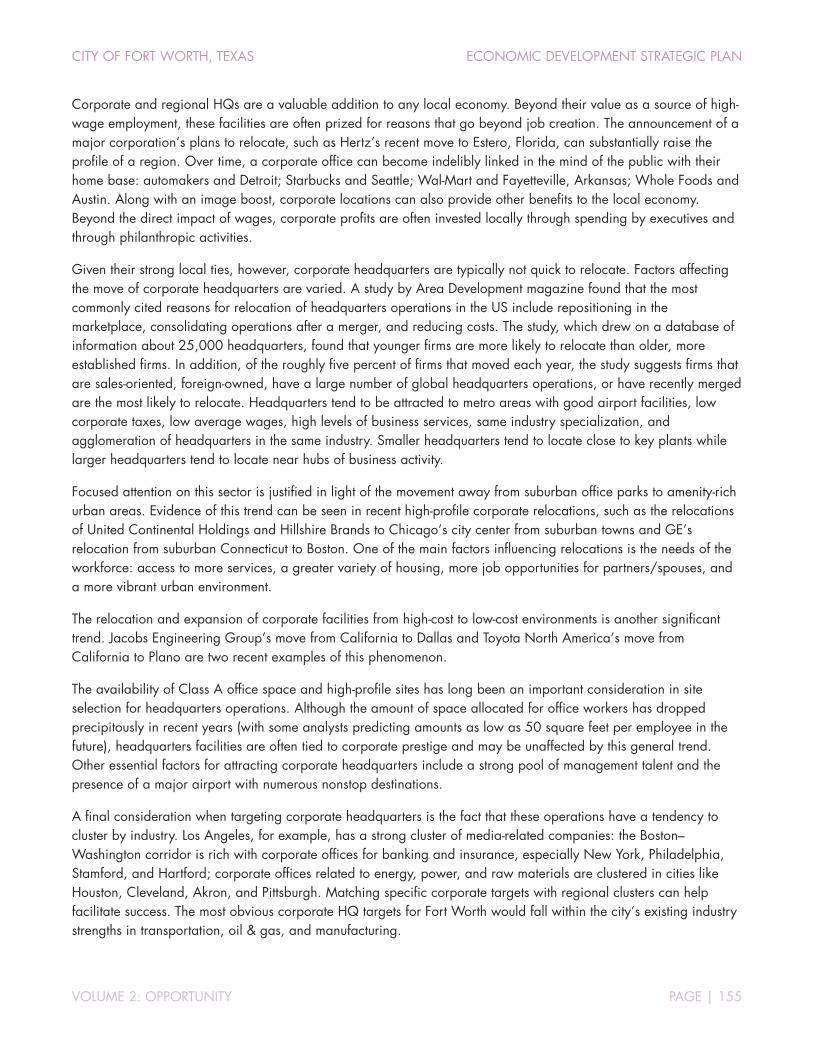
CITY OF FORT WORTH, TEXAS ECONOMIC DEVELOPMENT STRATEGIC PLAN
VOLUME 2: OPPORTUNITY PAGE | 155
Corporate and regional HQs are a valuable addition to any local economy. Beyond their value as a source of high-wage employment, these facilities are often prized for reasons that go beyond job creation. The announcement of a major corporation’s plans to relocate, such as Hertz’s recent move to Estero, Florida, can substantially raise the profile of a region. Over time, a corporate office can become indelibly linked in the mind of the public with their home base: automakers and Detroit; Starbucks and Seattle; Wal-Mart and Fayetteville, Arkansas; Whole Foods and Austin. Along with an image boost, corporate locations can also provide other benefits to the local economy. Beyond the direct impact of wages, corporate profits are often invested locally through spending by executives and through philanthropic activities.
Given their strong local ties, however, corporate headquarters are typically not quick to relocate. Factors affecting the move of corporate headquarters are varied. A study by Area Development magazine found that the most commonly cited reasons for relocation of headquarters operations in the US include repositioning in the marketplace, consolidating operations after a merger, and reducing costs. The study, which drew on a database of information about 25,000 headquarters, found that younger firms are more likely to relocate than older, more established firms. In addition, of the roughly five percent of firms that moved each year, the study suggests firms that are sales-oriented, foreign-owned, have a large number of global headquarters operations, or have recently merged are the most likely to relocate. Headquarters tend to be attracted to metro areas with good airport facilities, low corporate taxes, low average wages, high levels of business services, same industry specialization, and agglomeration of headquarters in the same industry. Smaller headquarters tend to locate close to key plants while larger headquarters tend to locate near hubs of business activity.
Focused attention on this sector is justified in light of the movement away from suburban office parks to amenity-rich urban areas. Evidence of this trend can be seen in recent high-profile corporate relocations, such as the relocations of United Continental Holdings and Hillshire Brands to Chicago’s city center from suburban towns and GE’s relocation from suburban Connecticut to Boston. One of the main factors influencing relocations is the needs of the workforce: access to more services, a greater variety of housing, more job opportunities for partners/spouses, and a more vibrant urban environment.
The relocation and expansion of corporate facilities from high-cost to low-cost environments is another significant trend. Jacobs Engineering Group’s move from California to Dallas and Toyota North America’s move from California to Plano are two recent examples of this phenomenon.
The availability of Class A office space and high-profile sites has long been an important consideration in site selection for headquarters operations. Although the amount of space allocated for office workers has dropped precipitously in recent years (with some analysts predicting amounts as low as 50 square feet per employee in the future), headquarters facilities are often tied to corporate prestige and may be unaffected by this general trend. Other essential factors for attracting corporate headquarters include a strong pool of management talent and the presence of a major airport with numerous nonstop destinations.
A final consideration when targeting corporate headquarters is the fact that these operations have a tendency to cluster by industry. Los Angeles, for example, has a strong cluster of media-related companies: the Boston–Washington corridor is rich with corporate offices for banking and insurance, especially New York, Philadelphia, Stamford, and Hartford; corporate offices related to energy, power, and raw materials are clustered in cities like Houston, Cleveland, Akron, and Pittsburgh. Matching specific corporate targets with regional clusters can help facilitate success. The most obvious corporate HQ targets for Fort Worth would fall within the city’s existing industry strengths in transportation, oil & gas, and manufacturing.
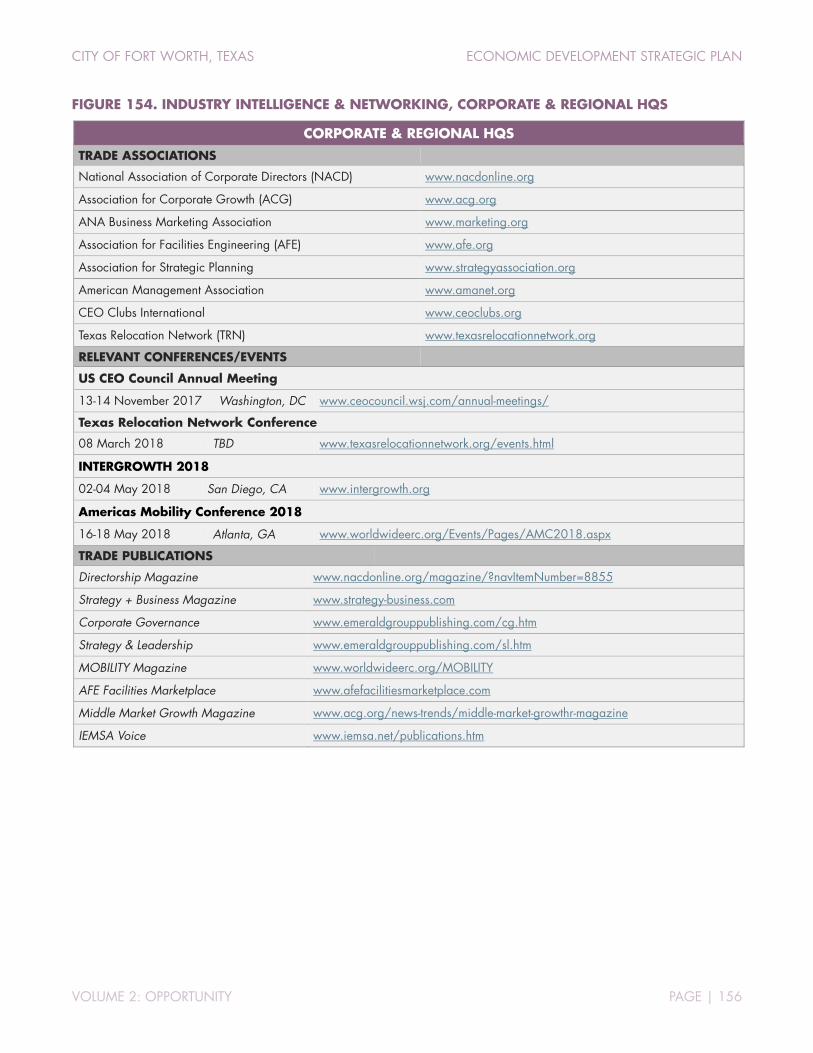
CITY OF FORT WORTH, TEXAS ECONOMIC DEVELOPMENT STRATEGIC PLAN
VOLUME 2: OPPORTUNITY PAGE | 156
FIGURE 154. INDUSTRY INTELLIGENCE & NETWORKING, CORPORATE & REGIONAL HQS
CORPORATE & REGIONAL HQS
TRADE ASSOCIATIONS
National Association of Corporate Directors (NACD) www.nacdonline.org
Association for Corporate Growth (ACG) www.acg.org
ANA Business Marketing Association www.marketing.org
Association for Facilities Engineering (AFE) www.afe.org
Association for Strategic Planning www.strategyassociation.org
American Management Association www.amanet.org
CEO Clubs International www.ceoclubs.org
Texas Relocation Network (TRN) www.texasrelocationnetwork.org
RELEVANT CONFERENCES/EVENTS
US CEO Council Annual Meeting
13-14 November 2017 Washington, DC www.ceocouncil.wsj.com/annual-meetings/
Texas Relocation Network Conference
08 March 2018 TBD www.texasrelocationnetwork.org/events.html
INTERGROWTH 2018
02-04 May 2018 San Diego, CA www.intergrowth.org
Americas Mobility Conference 2018
16-18 May 2018 Atlanta, GA www.worldwideerc.org/Events/Pages/AMC2018.aspx
TRADE PUBLICATIONS
Directorship Magazine www.nacdonline.org/magazine/?navItemNumber=8855
Strategy + Business Magazine www.strategy-business.com
Corporate Governance www.emeraldgrouppublishing.com/cg.htm
Strategy & Leadership www.emeraldgrouppublishing.com/sl.htm
MOBILITY Magazine www.worldwideerc.org/MOBILITY
AFE Facilities Marketplace www.afefacilitiesmarketplace.com
Middle Market Growth Magazine www.acg.org/news-trends/middle-market-growthr-magazine
IEMSA Voice www.iemsa.net/publications.htm
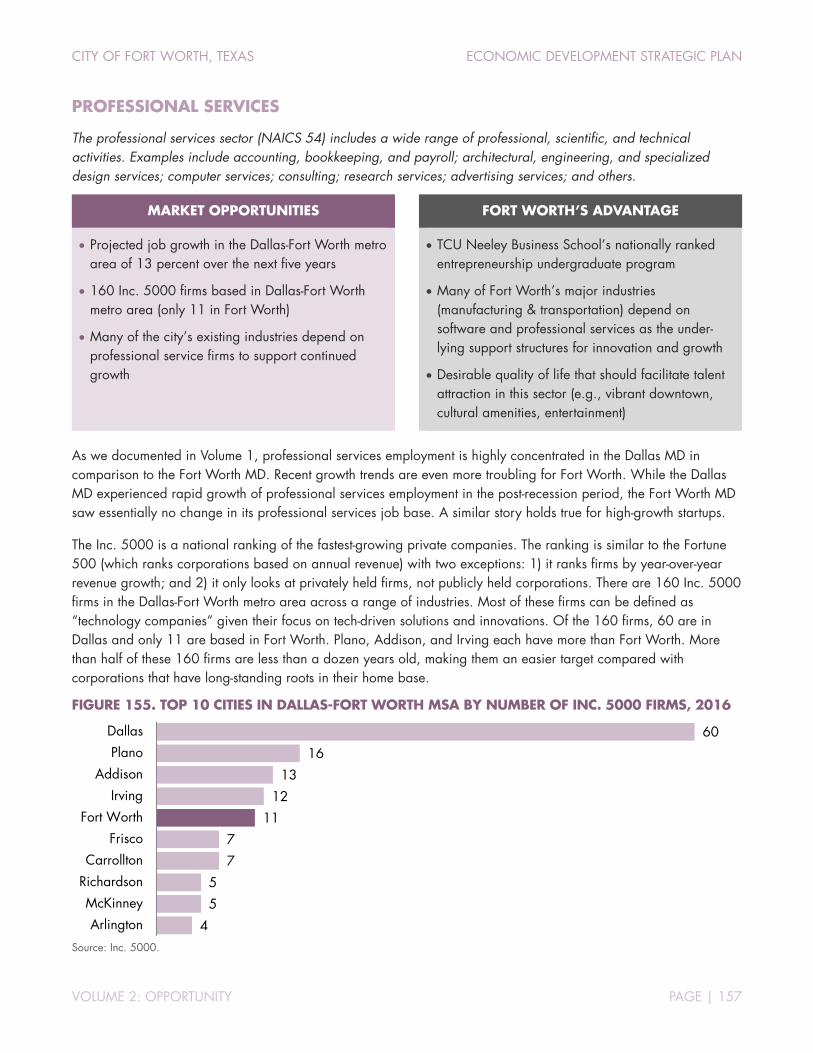
CITY OF FORT WORTH, TEXAS ECONOMIC DEVELOPMENT STRATEGIC PLAN
VOLUME 2: OPPORTUNITY PAGE | 157
PROFESSIONAL SERVICES
The professional services sector (NAICS 54) includes a wide range of professional, scientific, and technical activities. Examples include accounting, bookkeeping, and payroll; architectural, engineering, and specialized design services; computer services; consulting; research services; advertising services; and others.
MARKET OPPORTUNITIES FORT WORTH’S ADVANTAGE
• Projected job growth in the Dallas-Fort Worth metro area of 13 percent over the next five years
• 160 Inc. 5000 firms based in Dallas-Fort Worth metro area (only 11 in Fort Worth)
• Many of the city’s existing industries depend on professional service firms to support continued growth
• TCU Neeley Business School’s nationally ranked entrepreneurship undergraduate program
• Many of Fort Worth’s major industries (manufacturing & transportation) depend on software and professional services as the under-lying support structures for innovation and growth
• Desirable quality of life that should facilitate talent attraction in this sector (e.g., vibrant downtown, cultural amenities, entertainment)
As we documented in Volume 1, professional services employment is highly concentrated in the Dallas MD in comparison to the Fort Worth MD. Recent growth trends are even more troubling for Fort Worth. While the Dallas MD experienced rapid growth of professional services employment in the post-recession period, the Fort Worth MD saw essentially no change in its professional services job base. A similar story holds true for high-growth startups.
The Inc. 5000 is a national ranking of the fastest-growing private companies. The ranking is similar to the Fortune 500 (which ranks corporations based on annual revenue) with two exceptions: 1) it ranks firms by year-over-year revenue growth; and 2) it only looks at privately held firms, not publicly held corporations. There are 160 Inc. 5000 firms in the Dallas-Fort Worth metro area across a range of industries. Most of these firms can be defined as “technology companies” given their focus on tech-driven solutions and innovations. Of the 160 firms, 60 are in Dallas and only 11 are based in Fort Worth. Plano, Addison, and Irving each have more than Fort Worth. More than half of these 160 firms are less than a dozen years old, making them an easier target compared with corporations that have long-standing roots in their home base.
FIGURE 155. TOP 10 CITIES IN DALLAS-FORT WORTH MSA BY NUMBER OF INC. 5000 FIRMS, 2016
Source: Inc. 5000.
4
5
5
7
7
11
12
13
16
60
Arlington
McKinney
Richardson
Carrollton
Frisco
Fort Worth
Irving
Addison
Plano
Dallas

CITY OF FORT WORTH, TEXAS ECONOMIC DEVELOPMENT STRATEGIC PLAN
VOLUME 2: OPPORTUNITY PAGE | 158
FIGURE 156. INC. 5000 FIRMS IN DALLAS-FORT WORTH MSA, 2016
RANK COMPANY
3-YR. REVENUE GROWTH
2015 REVENUE
($M) INDUSTRY CITY YEAR
FOUNDED JOBS 14 S2 Capital 9646% $28.8 Real Estate Addison 2012 175* 40 JM Bullion 5907% $661.3 Financial Services Dallas 2011 37 138 Netvious 2537% $4.0 IT Services Grand Prairie 2012 5 154 CPSG Partners 2346% $43.4 IT Services Dallas 2009 225 177 Alliance Family of Companies 2073% $28.0 Health Irving 2006 184 210 Fire Line Services 1859% $15.0 Construction Fort Worth 1992 47 242 Primal Health 1612% $11.5 Health Allen 2012 25 244 Fathom Realty 1604% $29.6 Real Estate McKinney 2009 20 255 freshbenies 1555% $5.7 Health McKinney 2009 11 363 J.W. Logistics 1055% $107.8 Logistics & Transportation Frisco 2011 174 406 Koupon Media 948% $2.2 Retail Addison 2011 38 411 OrderMyGear 941% $4.6 Business Products & Svcs. Dallas 2007 32 422 NextAfter 914% $2.5 Advertising & Marketing Frisco 2009 6 450 Revere Capital 849% $22.6 Financial Services Dallas 2009 18 501 Akorbi 758% $23.3 Business Products & Svcs. Plano 2003 750 548 Saxony Partners 708% $8.4 IT Services Dallas 2011 46 577 Sports Marketing Monterrey 677% $2.6 Advertising & Marketing Dallas 2010 6 578 TruEnergy 676% $5.7 Energy Dallas 2011 85 596 Tachyon Technologies 656% $6.6 IT Services Irving 2011 82 677 WorldVentures 581% $567.4 Travel & Hospitality Plano 2005 538 720 Metre22 545% $2.7 Business Products & Svcs. Dallas 2011 8 733 mortgage financial services 540% $7.1 Financial Services Southlake 2001 140 747 King George 534% $4.0 Government Services Fort Worth 2011 110 778 EnTouch Controls 514% $3.6 Energy Richardson 2009 30 789 Salt and Light Energy Equipment 508% $11.9 Energy Dallas 2012 52 833 PEG Bandwidth 477% $76.1 Telecommunications The Colony 2009 127 841 Landmark Roofing 473% $3.8 Construction Bedford 2010 12 847 Daseke 468% $678.8 Logistics & Transportation Addison 2008 3000 886 Nerium International 450% $515.7 Consumer Products & Svcs. Addison 2011 460 989 Corvette Mods 405% $6.0 Retail Fort Worth 2010 15 1018 Pinnacle Group 389% $1,161.5 IT Services Dallas 1996 1936 1036 See Agency 382% $2.5 Business Products & Svcs. Dallas 2009 12 1040 Simpli.fi 379% $51.5 Advertising & Marketing Fort Worth 2010 175* 1078 ValuD Consulting 359% $6.8 IT Services Addison 2009 130 1115 Armor 347% $48.6 Security Richardson 2009 246 1137 Shop The BOSS 340% $5.7 Retail Dallas 2008 12 1158 Cyber Group 336% $11.5 Engineering Dallas 1998 51 1177 Alldaybot 330% $2.2 IT Services Plano 2010 25 1180 5 329% $8.6 Energy Irving 2011 37* 1183 Tasacom Technologies 329% $5.0 IT Services Dallas 2007 32 1213 OneSource Virtual 321% $95.9 Business Products & Svcs. Irving 2008 750 1257 HomeVestors of America 308% $48.3 Real Estate Dallas 1996 31 1266 Commercial Fleet Financing 306% $6.6 Financial Services Carrollton 1995 30 1267 Poo~Pourri 306% $33.1 Consumer Products & Svcs. Addison 2007 48 1271 Knightvest Capital 304% $15.8 Real Estate Dallas 2009 320 1283 MyStartupCFO 301% $4.2 Business Products & Svcs. Plano 2008 39
continued, next page
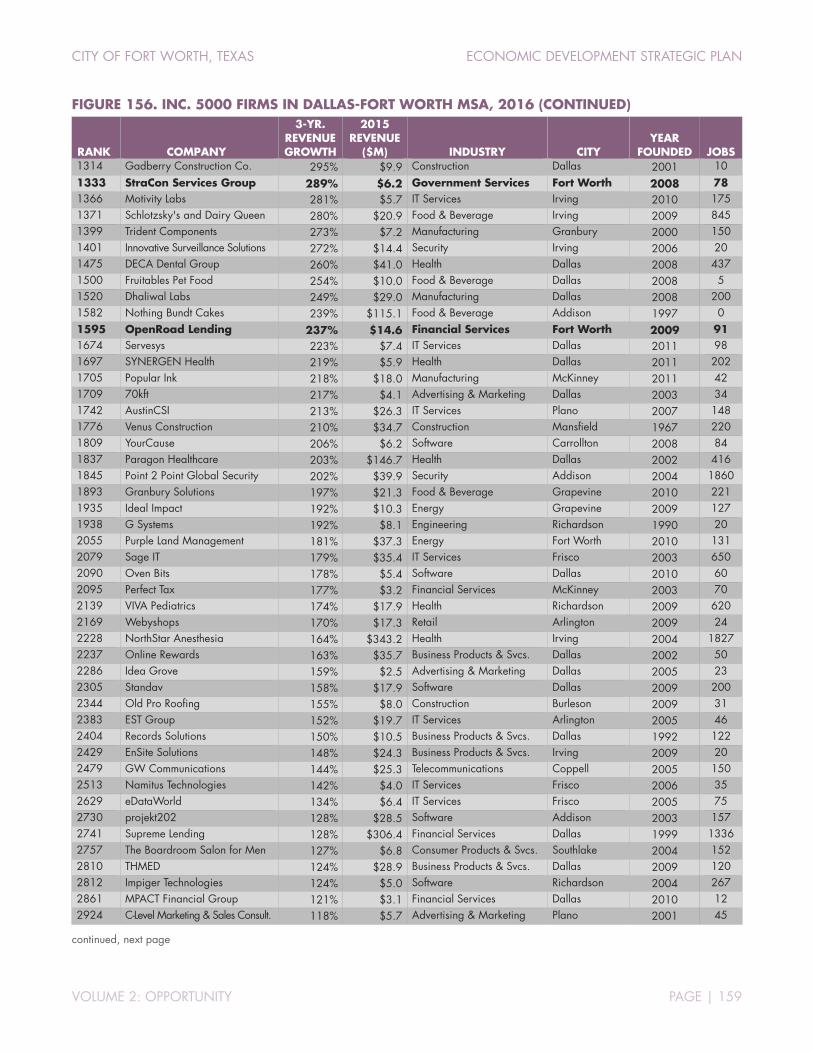
CITY OF FORT WORTH, TEXAS ECONOMIC DEVELOPMENT STRATEGIC PLAN
VOLUME 2: OPPORTUNITY PAGE | 159
FIGURE 156. INC. 5000 FIRMS IN DALLAS-FORT WORTH MSA, 2016 (CONTINUED)
RANK COMPANY
3-YR. REVENUE GROWTH
2015 REVENUE
($M) INDUSTRY CITY YEAR
FOUNDED JOBS 1314 Gadberry Construction Co. 295% $9.9 Construction Dallas 2001 10 1333 StraCon Services Group 289% $6.2 Government Services Fort Worth 2008 78 1366 Motivity Labs 281% $5.7 IT Services Irving 2010 175 1371 Schlotzsky's and Dairy Queen 280% $20.9 Food & Beverage Irving 2009 845 1399 Trident Components 273% $7.2 Manufacturing Granbury 2000 150 1401 Innovative Surveillance Solutions 272% $14.4 Security Irving 2006 20 1475 DECA Dental Group 260% $41.0 Health Dallas 2008 437 1500 Fruitables Pet Food 254% $10.0 Food & Beverage Dallas 2008 5 1520 Dhaliwal Labs 249% $29.0 Manufacturing Dallas 2008 200 1582 Nothing Bundt Cakes 239% $115.1 Food & Beverage Addison 1997 0 1595 OpenRoad Lending 237% $14.6 Financial Services Fort Worth 2009 91 1674 Servesys 223% $7.4 IT Services Dallas 2011 98 1697 SYNERGEN Health 219% $5.9 Health Dallas 2011 202 1705 Popular Ink 218% $18.0 Manufacturing McKinney 2011 42 1709 70kft 217% $4.1 Advertising & Marketing Dallas 2003 34 1742 AustinCSI 213% $26.3 IT Services Plano 2007 148 1776 Venus Construction 210% $34.7 Construction Mansfield 1967 220 1809 YourCause 206% $6.2 Software Carrollton 2008 84 1837 Paragon Healthcare 203% $146.7 Health Dallas 2002 416 1845 Point 2 Point Global Security 202% $39.9 Security Addison 2004 1860 1893 Granbury Solutions 197% $21.3 Food & Beverage Grapevine 2010 221 1935 Ideal Impact 192% $10.3 Energy Grapevine 2009 127 1938 G Systems 192% $8.1 Engineering Richardson 1990 20 2055 Purple Land Management 181% $37.3 Energy Fort Worth 2010 131 2079 Sage IT 179% $35.4 IT Services Frisco 2003 650 2090 Oven Bits 178% $5.4 Software Dallas 2010 60 2095 Perfect Tax 177% $3.2 Financial Services McKinney 2003 70 2139 VIVA Pediatrics 174% $17.9 Health Richardson 2009 620 2169 Webyshops 170% $17.3 Retail Arlington 2009 24 2228 NorthStar Anesthesia 164% $343.2 Health Irving 2004 1827 2237 Online Rewards 163% $35.7 Business Products & Svcs. Dallas 2002 50 2286 Idea Grove 159% $2.5 Advertising & Marketing Dallas 2005 23 2305 Standav 158% $17.9 Software Dallas 2009 200 2344 Old Pro Roofing 155% $8.0 Construction Burleson 2009 31 2383 EST Group 152% $19.7 IT Services Arlington 2005 46 2404 Records Solutions 150% $10.5 Business Products & Svcs. Dallas 1992 122 2429 EnSite Solutions 148% $24.3 Business Products & Svcs. Irving 2009 20 2479 GW Communications 144% $25.3 Telecommunications Coppell 2005 150 2513 Namitus Technologies 142% $4.0 IT Services Frisco 2006 35 2629 eDataWorld 134% $6.4 IT Services Frisco 2005 75 2730 projekt202 128% $28.5 Software Addison 2003 157 2741 Supreme Lending 128% $306.4 Financial Services Dallas 1999 1336 2757 The Boardroom Salon for Men 127% $6.8 Consumer Products & Svcs. Southlake 2004 152 2810 THMED 124% $28.9 Business Products & Svcs. Dallas 2009 120 2812 Impiger Technologies 124% $5.0 Software Richardson 2004 267 2861 MPACT Financial Group 121% $3.1 Financial Services Dallas 2010 12 2924 C-Level Marketing & Sales Consult. 118% $5.7 Advertising & Marketing Plano 2001 45
continued, next page

CITY OF FORT WORTH, TEXAS ECONOMIC DEVELOPMENT STRATEGIC PLAN
VOLUME 2: OPPORTUNITY PAGE | 160
FIGURE 156. INC. 5000 FIRMS IN DALLAS-FORT WORTH MSA, 2016 (CONTINUED)
RANK COMPANY
3-YR. REVENUE GROWTH
2015 REVENUE
($M) INDUSTRY CITY YEAR
FOUNDED JOBS 2926 Studio Movie Grill 117% $161.3 Food & Beverage Dallas 2000 5000 3007 Faulkner Design Group 114% $17.8 Business Products & Svcs. Dallas 1992 65 3030 Solutions by Text 113% $2.7 Telecommunications Dallas 1995 22 3060 Garland Heart Mgmt. Group 111% $2.2 Business Products & Svcs. Plano 2003 17 3099 Adaptive Medical Partners 110% $3.0 Health Irving 2010 12 3105 SRS Distribution 110% $1,411.0 Consumer Products & Svcs. McKinney 2008 2137 3162 ExamSoft Worldwide 106% $15.5 Education Dallas 1998 100 3172 Architectural Fabrication 106% $5.9 Construction Fort Worth 1997 31 3206 Service Nation 104% $10.3 Business Products & Svcs. Flower Mound 2002 25 3219 UR Holdings 104% $96.4 Construction Carrollton 2001 161 3278 Capital Title of Texas 101% $60.5 Real Estate Plano 1987 454 3295 Anserteam Workforce Solutions 101% $30.8 Human Resources Dallas 2004 8 3310 HumCap 100% $3.8 Human Resources Plano 2002 23 3349 Nat’l Assoc. of Expert Advisors 98% $6.4 Real Estate Frisco 2006 36 3441 c2mtech 94% $12.1 Telecommunications Carrollton 1994 50 3496 GTN Technical Staffing 91% $33.0 Human Resources Dallas 2000 115 3508 Homecare Homebase 90% $108.0 Health Dallas 2002 373 3520 W&M Environmental Group 90% $9.1 Environmental Services Plano 1995 45 3521 ZeOmega 90% $32.2 IT Services Plano 2001 477 3552 Staff One HR 89% $252.5 Human Resources Dallas 1988 44 3586 Switchplace 87% $27.5 Travel & Hospitality Dallas 1998 27 3597 Credera 87% $47.3 IT Services Addison 1999 222 3650 Infolob Solutions 85% $22.5 IT Services Irving 2009 2000 3807 A1 Security Cameras 80% $5.0 Security Addison 2007 9 3816 C1S Group 79% $11.9 Engineering Dallas 2009 25 3825 Goldfish Medical Staffing 79% $20.4 Health Plano 2007 40 3909 Point of Rental Software 76% $9.7 Software Grand Prairie 1982 50 3925 KWA Construction 75% $71.7 Construction Addison 2004 46 3934 Improving 75% $42.5 IT Services Addison 2007 175* 3942 Viva Railings 75% $8.5 Construction Carrollton 2008 36 4101 Oceans Healthcare 69% $77.7 Health Plano 2004 1277 4154 Ivie & Associates 67% $460.5 Advertising & Marketing Flower Mound 1993 622 4156 Silver Bullet Construction 67% $3.3 Construction Arlington 2010 17 4165 HealthMark Group 67% $2.7 Health Dallas 2006 22 4215 Vertical Nerve 65% $3.6 Advertising & Marketing Dallas 2009 35 4244 Masergy Communications 64% $254.3 IT Services Plano 2001 392 4246 RPC 64% $15.3 Human Resources Dallas 2002 23 4278 Maxim Management Group 63% $13.7 Health Frisco 1997 222 4287 Sundance Healthcare 63% $24.6 Health Fort Worth 2010 474 4321 M&S Technologies 62% $44.3 IT Services Dallas 2004 39 4337 Berrett Pest Control 61% $6.5 Consumer Products & Svcs. Garland 1999 45 4379 interRel Consulting 60% $13.5 Business Products & Svcs. Arlington 1997 64 4428 MedicOne Medical Response 58% $12.2 Health Farmers Branch 1999 215 4444 ZAK Products 58% $30.6 Business Products & Svcs. Dallas 2003 19 4452 Viverae 58% $37.1 Health Dallas 2003 737 4458 Pariveda Solutions 57% $83.6 IT Services Dallas 2003 456 4464 Parkway Construction 57% $210.1 Construction Lewisville 1981 165
continued, next page
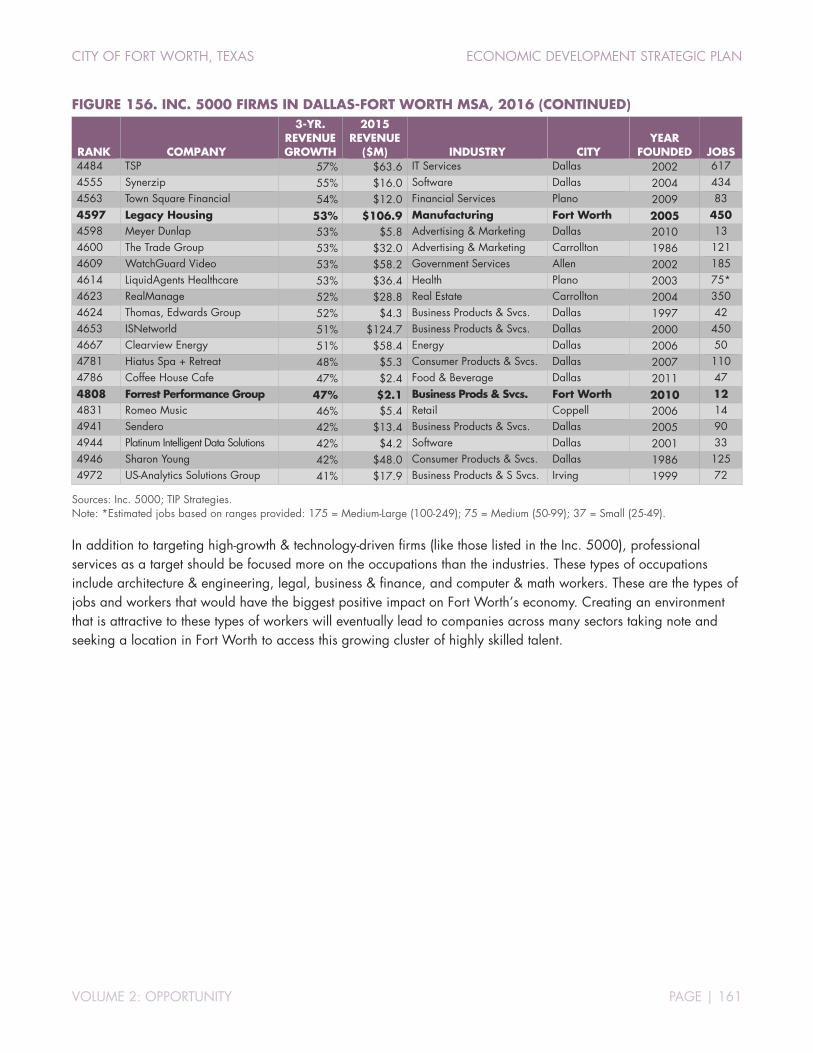
CITY OF FORT WORTH, TEXAS ECONOMIC DEVELOPMENT STRATEGIC PLAN
VOLUME 2: OPPORTUNITY PAGE | 161
FIGURE 156. INC. 5000 FIRMS IN DALLAS-FORT WORTH MSA, 2016 (CONTINUED)
RANK COMPANY
3-YR. REVENUE GROWTH
2015 REVENUE
($M) INDUSTRY CITY YEAR
FOUNDED JOBS 4484 TSP 57% $63.6 IT Services Dallas 2002 617 4555 Synerzip 55% $16.0 Software Dallas 2004 434 4563 Town Square Financial 54% $12.0 Financial Services Plano 2009 83 4597 Legacy Housing 53% $106.9 Manufacturing Fort Worth 2005 450 4598 Meyer Dunlap 53% $5.8 Advertising & Marketing Dallas 2010 13 4600 The Trade Group 53% $32.0 Advertising & Marketing Carrollton 1986 121 4609 WatchGuard Video 53% $58.2 Government Services Allen 2002 185 4614 LiquidAgents Healthcare 53% $36.4 Health Plano 2003 75* 4623 RealManage 52% $28.8 Real Estate Carrollton 2004 350 4624 Thomas, Edwards Group 52% $4.3 Business Products & Svcs. Dallas 1997 42 4653 ISNetworld 51% $124.7 Business Products & Svcs. Dallas 2000 450 4667 Clearview Energy 51% $58.4 Energy Dallas 2006 50 4781 Hiatus Spa + Retreat 48% $5.3 Consumer Products & Svcs. Dallas 2007 110 4786 Coffee House Cafe 47% $2.4 Food & Beverage Dallas 2011 47 4808 Forrest Performance Group 47% $2.1 Business Prods & Svcs. Fort Worth 2010 12 4831 Romeo Music 46% $5.4 Retail Coppell 2006 14 4941 Sendero 42% $13.4 Business Products & Svcs. Dallas 2005 90 4944 Platinum Intelligent Data Solutions 42% $4.2 Software Dallas 2001 33 4946 Sharon Young 42% $48.0 Consumer Products & Svcs. Dallas 1986 125 4972 US-Analytics Solutions Group 41% $17.9 Business Products & S Svcs. Irving 1999 72
Sources: Inc. 5000; TIP Strategies. Note: *Estimated jobs based on ranges provided: 175 = Medium-Large (100-249); 75 = Medium (50-99); 37 = Small (25-49).
In addition to targeting high-growth & technology-driven firms (like those listed in the Inc. 5000), professional services as a target should be focused more on the occupations than the industries. These types of occupations include architecture & engineering, legal, business & finance, and computer & math workers. These are the types of jobs and workers that would have the biggest positive impact on Fort Worth’s economy. Creating an environment that is attractive to these types of workers will eventually lead to companies across many sectors taking note and seeking a location in Fort Worth to access this growing cluster of highly skilled talent.
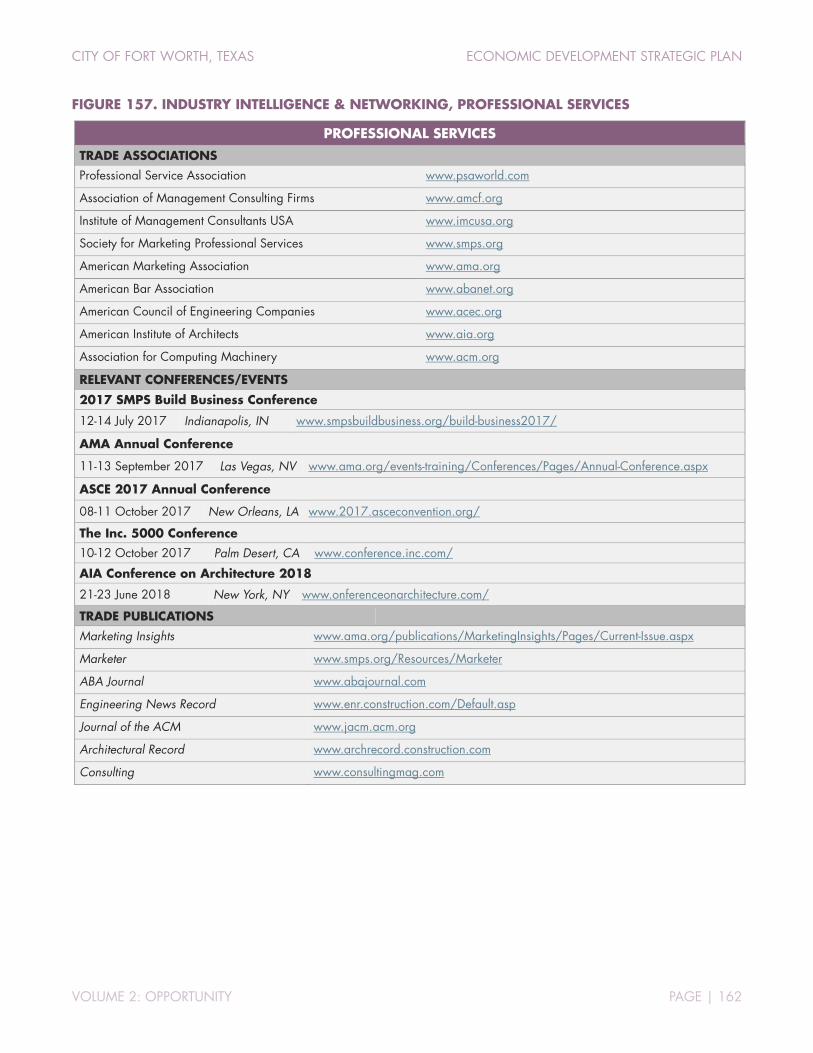
CITY OF FORT WORTH, TEXAS ECONOMIC DEVELOPMENT STRATEGIC PLAN
VOLUME 2: OPPORTUNITY PAGE | 162
FIGURE 157. INDUSTRY INTELLIGENCE & NETWORKING, PROFESSIONAL SERVICES
PROFESSIONAL SERVICES
TRADE ASSOCIATIONS
Professional Service Association www.psaworld.com
Association of Management Consulting Firms www.amcf.org
Institute of Management Consultants USA www.imcusa.org
Society for Marketing Professional Services www.smps.org
American Marketing Association www.ama.org
American Bar Association www.abanet.org
American Council of Engineering Companies www.acec.org
American Institute of Architects www.aia.org
Association for Computing Machinery www.acm.org
RELEVANT CONFERENCES/EVENTS
2017 SMPS Build Business Conference
12-14 July 2017 Indianapolis, IN www.smpsbuildbusiness.org/build-business2017/
AMA Annual Conference
11-13 September 2017 Las Vegas, NV www.ama.org/events-training/Conferences/Pages/Annual-Conference.aspx
ASCE 2017 Annual Conference
08-11 October 2017 New Orleans, LA www.2017.asceconvention.org/
The Inc. 5000 Conference
10-12 October 2017 Palm Desert, CA www.conference.inc.com/
AIA Conference on Architecture 2018
21-23 June 2018 New York, NY www.onferenceonarchitecture.com/
TRADE PUBLICATIONS
Marketing Insights www.ama.org/publications/MarketingInsights/Pages/Current-Issue.aspx
Marketer www.smps.org/Resources/Marketer
ABA Journal www.abajournal.com
Engineering News Record www.enr.construction.com/Default.asp
Journal of the ACM www.jacm.acm.org
Architectural Record www.archrecord.construction.com
Consulting www.consultingmag.com

CITY OF FORT WORTH, TEXAS ECONOMIC DEVELOPMENT STRATEGIC PLAN
VOLUME 2: OPPORTUNITY PAGE | 163
FINANCIAL SERVICES
In the past, a city like Fort Worth that lacked a traditional regional banking infrastructure might have faced daunting odds if aiming to raise its profile in financial services. Today, the shifting landscape offers multiple opportunities for the City of Fort Worth to become a larger player in the financial services sector. The challenge is to match the market opportunities and the local assets.
MARKET OPPORTUNITIES FORT WORTH’S ADVANTAGE
• Projected job growth in the Dallas-Fort Worth metro area of 10 percent over the next five years in the finance & insurance industry
• Recent high-profile expansions of financial services companies in the metro area are indicative of this sector’s growth potential (e.g., TD Ameritrade, Schwab, JP Morgan Chase, USAA, Liberty Mutual)
• Financial services firms tend to set up their satellite operations near available labor pools and adequate airline connectivity.
• TCU Neeley Business School’s nationally ranked entrepreneurship undergraduate program
• The presence of large pools of investment capital (including major private equity and high net worth individuals).
• Multiple generations of successful financial services and private equity firms and their spin-offs
• Supportive ecosystem for the industry that is competitive, different, and well-removed from other centers for the industry across the US
The financial services sector is broadly defined as NAICS 52, a category that includes, among other things, the vast array of bank branches, insurance agents, and personal financial advisors we see tucked away in strip malls and storefronts that line our daily commutes. These are the traditional “retail” interfaces of the financial services sector―the place where consumer transactions have long taken place. But the financial services sector as we thought we knew it is now in the throes of change. As this section describes, corporate functions continue to decentralize away from headquarter offices.
Moreover, the traditional interactions with customers are migrating to a new venue, the internet, a trend that has opened the door for both outsourcing and direct competition and has created a new market for security services that goes well beyond the armored vehicles and safe deposit boxes of yesterday.
Meanwhile, the financial services sector’s erstwhile back-seat players―pensions and endowments ― have stepped forward to become more vocal front-seat actors in the allocation of investment capital. Pensions and endowments have led industry efforts to screen investments based on environmental, social, and corporate governance (ESG) standards. And private equity firms have emerged to play a vital, high-profile economic role in restructuring under-performing firms and industries.
CONTINUED DECENTRALIZATION OF OPERATIONS: Financial services companies continue to spin various functional departments out of traditional financial centers where real estate and labor costs are high. The list of these functional areas―often including data processing and storage, accounting, procurement, customer services, and human resources―is likely to continue expanding. According to Deloitte, top priorities for IT investments by financial services include cloud-based platforms, robotic process automation, and cognitive technologies. In addition to meeting new demand, many of the sector’s largest players are expected to be facing the replacement of aging core systems (Perspectives: Banking and Securities Outlook 2017, Deloitte).

CITY OF FORT WORTH, TEXAS ECONOMIC DEVELOPMENT STRATEGIC PLAN
VOLUME 2: OPPORTUNITY PAGE | 164
When developing regional centers for functional operations, financial services firms tend to locate in urban areas where labor markets are ample, housing costs are affordable for employees, and the availability of non-stop air service to and from the corporate headquarters is dense. Dallas-Fort Worth’s size, its labor market, and its air service capacity fit this profile to a tee. The decentralization of financial services operations is already being captured by other communities in the Dallas-Fort Worth metro area that are in the Fort Worth orbit. Many of the major recent finance and insurance business expansion projects in the region have taken place outside Fort Worth: JP Morgan Chase and USAA in Plano, Fidelity and Charles Schwab in Westlake, and TD Ameritrade in Southlake. Why not Fort Worth, too?
GROWING COMPETITION FROM FINTECH FIRMS: New technologies are emerging in financial services as startups proliferate. Can local the entrepreneurship ecosystem in Fort Worth hitch onto this fast-moving train? PwC identifies the rapid development of financial technology firms—fintech—as a trend the sector can no longer afford to ignore. The term encompasses a growing number of startups offering financial services such as online lending, retail-payment services, and investment advising. In its brief on the topic, the consulting firm cites figures by CB Insights which place industry funding at $11.2 billion in the first three quarters of 2015, nearly double the funding received by fintech companies in all of 2014. CB Insights has been among the firms raising awareness of the increasing role that fintech firms have begun to play in traditional banking. As CB Insights’ map of the fintech revolution shows below, this is not a marginal trend. Moreover, these startups are not necessarily linked with traditional global banking centers like New York and London, or even regional financial centers like Charlotte or Dallas. How this industry evolves geographically remains an open question.
FIGURE 158. HOW FINTECH CAN “UNBUNDLE” THE FUNCTIONS OF TRADITIONAL BANKING
Sources: CB Insights, Disrupting Banking: The Fintech Startups That Are Unbundling Wells Fargo, Citi and Bank of America, Nov. 18, 2015.
CITY OF FORT WORTH, TEXAS ECONOMIC DEVELOPMENT STRATEGIC PLAN
VOLUME 2: OPPORTUNITY PAGE | 165
INCREASED SECURITY DEMANDS: A crucial (and still evolving) component of fintech is cybersecurity. Financial firms are expected to pursue digital strategies more aggressively, as a response to the rise of fintech and a reflection of the rapid growth in the number of digital payment options including wearable technologies (such as smart watches and internet-connected devices), commonly referred to as the “Internet of Things.” The growing number of these technologies is expected to continue to ratchet up the sector’s cybersecurity needs. Existing technologies like biometrics and encryption are likely to be the near-term response to securing payment transactions. According to Deloitte’s 2017 banking outlook, interest in creating “faster, seamless, and secure digital payments” will be a top focus. It is also important to keep in mind that “economic clusters” may be as likely to evolve around technologies (like cybersecurity, for example) as they are around traditional industries (like financial services). For example, the media outlet Xconomy reported in April 2016 that more than 60 cybersecurity firms were operating within an hour’s drive of Boston’s financial district.2
THE ROLE OF PRIVATE EQUITY: The person on the street has likely heard of private equity, but may not know exactly what it means. No surprise there, as private equity offices—unlike banks and insurance firms—employ few workers and fill only a tiny fraction of the office space in the US. Though few in number, the influence and power of private equity firms is considerable because they manage massive capital investments steered toward struggling companies and industries. Large institutions like endowments and pensions often “outsource” a portion of their investments to private equity firms allowing them to place large, long-term investments in raising the profitability of underperforming companies or industries. Once an acquisition is completed, a private equity firm will then send in a cadre of turnaround experts (often MBAs) who work with management to reboot the company. This is a much different type of work than hedge funds, which make risky, short-term investments hoping for hefty quick wins. Private equity is also different from venture capital where investments are smaller and spread across numerous startup and early stage companies, many of which are likely to fail.
Most people have heard the names of the leading US-based private equity firms like Blackstone, KKR, and Apollo and would not be surprised to learn that these firms call New York City home. But occasionally a twist of history means that a major player grows up in an unexpected location. The Carlyle Group in Washington, DC is one example of this. Fort Worth, too, counts itself in this elite group, thanks in large part to TPG Capital (formerly Texas Pacific Group), which consistently ranks as one of the world’s largest private equity firms. Being the hometown of a major global player in private equity carries two unique advantages from an economic development perspective. The first is regenerative potential. TPG itself was founded by financial managers with ties to the Bass family, and Fort Worth would be a logical home for any future spin-offs or breakaways from the talented group of Fort Worth managers TPG has assembled. This is how talent clusters grow. Along with TPG, the city is home to several other private equity firms, including Crescent Real Estate, Luther King Capital Management, and Crestline Investors, Inc.
The second advantage is image. While private equity will never be an extensive job provider for the city like Lockheed or American Airlines, TPG Capital does support a relatively small number of highly trained, highly skilled financial professionals. The underlying advantage for Fort Worth is that TPG is known in investment circles worldwide. But is this global recognition of TPG Capital interchangeable with the city of Fort Worth in the same way that the Dell company name is with the city of Austin? A key challenge for Fort Worth is how to benefit from TPG Capital’s global reputation and scope.
2 Xconomy, “Boston Cybersecurity Map Shows Deep, Diverse Local Sector,” April 20, 2016. [http://www.xconomy.com/boston/2016/04/20/boston-cybersecurity-map-shows-deep-diverse-local-sector/]
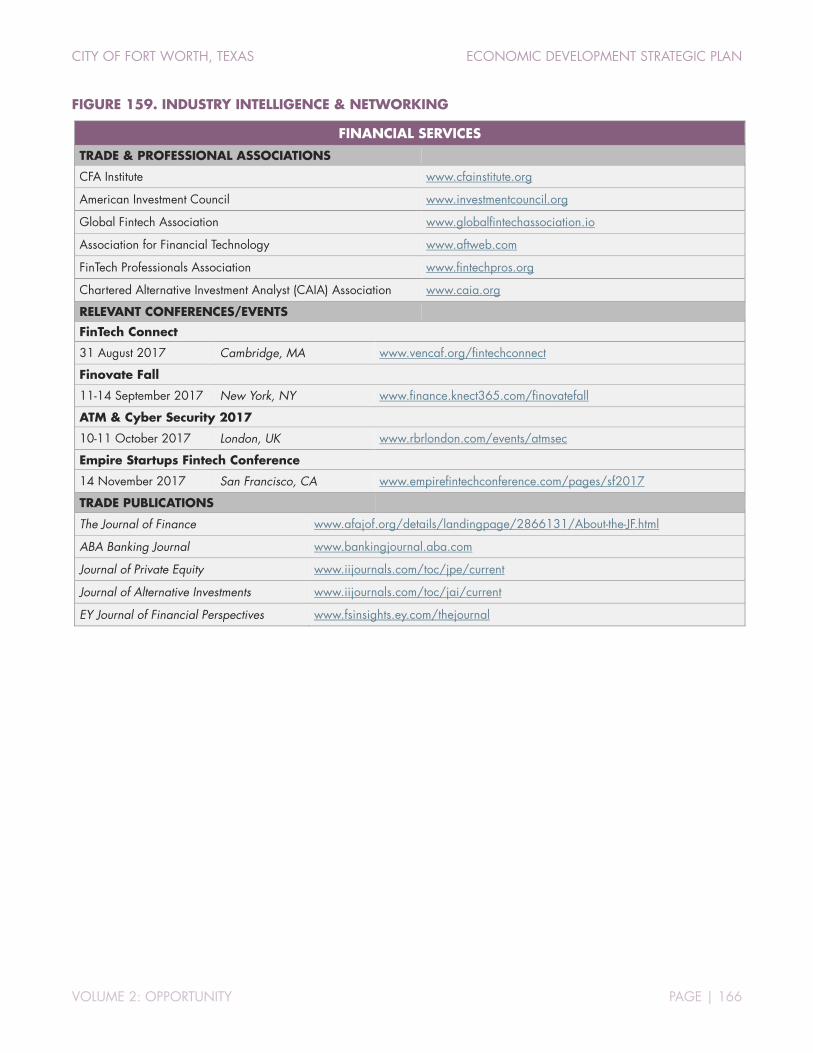
CITY OF FORT WORTH, TEXAS ECONOMIC DEVELOPMENT STRATEGIC PLAN
VOLUME 2: OPPORTUNITY PAGE | 166
FIGURE 159. INDUSTRY INTELLIGENCE & NETWORKING
FINANCIAL SERVICES
TRADE & PROFESSIONAL ASSOCIATIONS
CFA Institute www.cfainstitute.org
American Investment Council www.investmentcouncil.org
Global Fintech Association www.globalfintechassociation.io
Association for Financial Technology www.aftweb.com
FinTech Professionals Association www.fintechpros.org
Chartered Alternative Investment Analyst (CAIA) Association www.caia.org
RELEVANT CONFERENCES/EVENTS
FinTech Connect
31 August 2017 Cambridge, MA www.vencaf.org/fintechconnect
Finovate Fall
11-14 September 2017 New York, NY www.finance.knect365.com/finovatefall
ATM & Cyber Security 2017
10-11 October 2017 London, UK www.rbrlondon.com/events/atmsec
Empire Startups Fintech Conference
14 November 2017 San Francisco, CA www.empirefintechconference.com/pages/sf2017
TRADE PUBLICATIONS
The Journal of Finance www.afajof.org/details/landingpage/2866131/About-the-JF.html
ABA Banking Journal www.bankingjournal.aba.com
Journal of Private Equity www.iijournals.com/toc/jpe/current
Journal of Alternative Investments www.iijournals.com/toc/jai/current
EY Journal of Financial Perspectives www.fsinsights.ey.com/thejournal
AUSTIN � SEATTLEDECEMBER 2017
VOLUME 3: STRATEGY
CITY OF FORT WORTH, TEXASECONOMIC DEVELOPMENT STRATEGIC PLAN

CITY OF FORT WORTH, TEXAS ECONOMIC DEVELOPMENT STRATEGIC PLAN
VOLUME 3: STRATEGY PAGE | I
ACKNOWLEDGEMENTS TIP would like to thank the following individuals and organizations for their participation in this planning process:
CITY OF FORT WORTH MAYOR AND CITY COUNCIL Betsy Price, Mayor
Carlos Flores, District 2 (current)
Sal Espino, District 2 (former)
Brian Byrd, District 3 (current)
W.B. “Zim” Zimmerman, District 3 (former)
Cary Moon, District 4
Gyna Bivens, District 5
Jungus Jordan, District 6
Dennis Shingleton, District 7
Kelly Allen Gray, District 8
Ann Zadeh, District 9
CITY OF FORT WORTH STAFF David Cooke, City Manager
Jay Chapa, Assistant City Manager
Robert Sturns, Director, Economic Development
Brenda Hicks-Sorensen, CEcD, Assistant Director, Economic Development
PROJECT STEERING COMMITTEE Lisa McMillan, Tarrant County Administrator’s Office
Darlene Boudreaux, Tech Fort Worth
Brandom Gengelbach, Fort Worth Chamber of Commerce
Stacy Marshall, Southeast Fort Worth, Inc.
Andy Taft, Downtown Fort Worth, Inc.
Paul Paine, Near Southside, Inc.
Cintya Segoviano, Fort Worth Hispanic Chamber of Commerce
Devoyd “Dee” Jennings, Fort Worth Metropolitan Black Chamber of Commerce
David Walters, CBRE
Nina Petty, Tarrant County College District
Bob Jameson, Fort Worth Convention & Visitors Bureau
Janet Black, BNSF Railway Company
Marie A. Holliday, DMD, Sundance Square Dentist
Robert Folzenlogen, Hillwood Properties
Don Boren, Don Boren and Company Inc.
JJ Cawelti, Bell Helicopter-Textron, Inc.
Kevin Davies, Hulen Mall
Matt Robinson, Walton Development and Management, Inc.
Judy McDonald, Workforce Solutions of Tarrant County
CITY OF FORT WORTH, TEXAS ECONOMIC DEVELOPMENT STRATEGIC PLAN
VOLUME 3: STRATEGY PAGE | II
PROJECT LEADERSHIP TEAM Paul Ballard, Fort Worth Transportation Authority
Mike Berry, Hillwood Properties
Jay Chapa, Assistant City Manager
John Terrell, DFW International Airport
Victor Boschini, Texas Christian University
Michael Branum, NAS Fort Worth Joint Reserve Base
Dr. Kent Paredes Scribner, Fort Worth ISD
Eugene V. Giovannini, Tarrant County College District
J.D. Granger, Trinity River Vision Authority
Johnny Campbell, Sundance Square
Lillie Biggins, Texas Health Harris Methodist Fort Worth
PROJECT CONSULTING TEAM
TIP STRATEGIES, INC. is a privately held economic development consulting firm with offices in Austin and Seattle. TIP is committed to providing quality solutions for public and private sector clients. Established in 1995, the firm's primary focus is economic development strategic planning.
Project Team: Jon Roberts, Managing Principal John Karras, Senior Consultant Alex Cooke, Senior Consultant Karen Beard, Analyst Meredith Eberle, Project Support
FREGONESE ASSOCIATES is a Portland-based urban planning firm with expertise in citywide comprehensive planning as well as scenario planning and modeling in specific areas (such as downtowns and urban corridors). Established in 1997, the firm’s work has been instrumental in the development and adoption of growth policies and land use plans in large cities and metro areas across the US and internationally.
Project Team: John Fregonese, President Nadine Appenbrink, Project Manager Julia Reisemann, GIS Analyst
JLL is a member of the Fortune 500 and is a global professional services and investment management firm specializing in real estate. JLL’s industry-leading research group delivers commercial real estate analysis and insights that drive value in real estate decisions and support successful strategies.
Project Team: Jubal Smith, Executive Vice President Todd Burnette, Managing Director
ISAAC BARCHAS led the Austin Technology Incubator for 10 years, starting in 2006. Over that time, he has overseen the incubation of more than 200 companies. He is responsible for ATI's strategic direction and evolving the ATI economic model. Isaac remains active in the technology and venture capital communities in Austin and across the US and has been published in the Washington Post, Wall Street Journal, Chicago Tribune, and Austin American Statesman.
CITY OF FORT WORTH, TEXAS ECONOMIC DEVELOPMENT STRATEGIC PLAN
VOLUME 3: STRATEGY PAGE | III
CONTENTS ABOUT THIS WORK ................................................................................................................................. 1 EXECUTIVE SUMMARY .............................................................................................................................. 3
PHASE 1: COMPETITIVENESS AS CONTEXT ............................................................................................ 3 PHASE 2: OPPORTUNITY FOR TALENT AND INDUSTRY ............................................................................. 4 PHASE 3: FROM ANALYSIS TO STRATEGY ............................................................................................... 6 STRATEGIC PLAN OVERVIEW ................................................................................................................. 7
STRATEGIC PLAN .................................................................................................................................... 18 GOAL 1. ESTABLISH FORT WORTH’S COMPETITIVE EDGE ...................................................................... 18 GOAL 2. BECOME A HUB FOR CREATIVE BUSINESSES .......................................................................... 30 GOAL 3. ENSURE COMMUNITY VITALITY.............................................................................................. 36 4. TOOLS & RESOURCES..................................................................................................................... 53
IMPLEMENTATION MATRIX ...................................................................................................................... 59 PERFORMANCE METRICS ........................................................................................................................ 61
1. CITYWIDE ECONOMIC PERFORMANCE OUTCOMES: ....................................................................... 61 2. SPECIFIC GROWTH TARGETS: ......................................................................................................... 62
BEST PRACTICES INVENTORY .................................................................................................................. 63
CITY OF FORT WORTH, TEXAS ECONOMIC DEVELOPMENT STRATEGIC PLAN
VOLUME 3: STRATEGY PAGE | 1
ABOUT THIS WORK CHALLENGE. Over the last several decades, Fort Worth has been one of the fastest-growing large cities in the US. The challenge for economic development, however, is not just whether the community can continue to add people and jobs. As with all growing cities, the question becomes what kind of development the City wants—and what it will take to ensure that development is sustainable. In short, how does Fort Worth “up its game” to compete regionally as well as globally?
There are two existing models in Fort Worth that demonstrate the effectiveness of long-term, strategic thinking. A lesson can be learned from Hillwood’s business development strategy for the Alliance district. A long-term vision, a thoughtful approach to real estate development, investments in strategic transportation assets, and a holistic view that includes amenities and housing are the factors that have established Alliance as a national model of successful business development. Similarly, Sundance Square has undertaken long-term planning efforts that have transformed the city. Thanks to the rejuvenation of downtown, Fort Worth now has a true center of gravity that functions as the city’s premier entertainment, dining, shopping, and residential district. Yet, despite the success of Alliance and Sundance Square, these two models stand as outliers in Fort Worth, almost as if they are separate from the community. The City, the Fort Worth Chamber, and other partners have not embraced the need for a narrowly focused economic development program that aggressively pursues the most promising opportunities. Without a focused business development effort, Fort Worth has fallen behind its competition. The city’s growth in recent years has largely been defined by expansion of single-family residential development driven by employment growth in other cities.
The threats facing the city may not always be apparent but they are very real. Recent business relocations, an increase in population not matched by an increase in wages, an out-of-balance tax base, and persistent difficulties in attracting skilled and educated young people—these issues risk engulfing Fort Worth. These challenges put Fort Worth in an increasingly weak position towards the City of Dallas and aggressive suburbs throughout the metro area. Of course, these concerns represent a snapshot in time. Conditions will change. Some of the trends we have identified are themselves subject to changes at the national level. That is part of the challenge as well: establishing a strategic framework flexible enough to respond to changing conditions while moving the community toward a more prosperous future.
RESPONSE. To address this challenge, the City of Fort Worth chose to devise its first ever economic development strategic plan. Working with TIP Strategies (an economic development consulting with offices in Austin and Seattle) and their partners (Fregonese Associates, JLL, and Isaac Barchas), the City of Fort Worth has engaged the business community and local stakeholders to create a strategic framework to guide the City’s economic development activities. During the project’s “Discovery Phase,” the TIP consulting team met with more than 300 community, business, and academic leaders through roundtable discussions, employer interviews, and other meetings with key stakeholders. Input was also received during community workshops held in each of the six target areas (specific neighborhoods studied for their redevelopment potential) and through an online community survey that received nearly 1,300 unique responses. The project Steering Committee and Leadership Team provided their expertise over the course of five meetings, which contributed immensely to the strategic plan.
CITY OF FORT WORTH, TEXAS ECONOMIC DEVELOPMENT STRATEGIC PLAN
VOLUME 3: STRATEGY PAGE | 2
RESULTS. The economic development strategic plan that emerged has very specific outcomes:
1. High-wage job growth.
2. A more sustainable tax base, driven less by residential property valuation and more by commercial and industrial investment.
3. An economy that capitalizes on high-growth businesses and the creative individuals who fuel them.
4. A commitment to “quality of place” throughout the community.
These outcomes are tangible and measurable. In the case of the first two (wage growth and tax burden), data are readily available and can be easily tracked over time. The third outcome (attracting high-growth industries) can be measured using employment data in target industry classifications. The fourth outcome (quality of place) is less easily measured, but there are many ways in which the vitality of neighborhoods can be assessed indirectly. These include rising home values, new business startups, reduction of blighted areas, and the emergence of walkable corridors with a mixture of residential and commercial developments and related amenities.
The plan is ambitious by design and is structured around a bold vision. That vision was articulated in the City’s initial call for a strategic plan, and, in various forms, was reiterated in stakeholder discussions. The vision seeks to capitalize on the city’s many advantages and its dramatic growth.

CITY OF FORT WORTH, TEXAS ECONOMIC DEVELOPMENT STRATEGIC PLAN
VOLUME 3: STRATEGY PAGE | 3
EXECUTIVE SUMMARY What is the significance of Fort Worth emerging as one of the most populous US cities? It means the city has an opportunity—even a responsibility—to capitalize on its growing size, influence, and economic potential. The goals and initiatives in this plan are an ambitious response to that new reality.
The plan is a roadmap for the city’s economic development program. Just as important, it must be viewed as a call to action. The time has come for Fort Worth to embrace its status as a major US city and compete on the national and international stage.
The results of the planning process are presented in three interlinked volumes, representing three distinct phases of work. The first phase was a journey of discovery into the city’s competitive landscape. The second phase focused on the opportunities underscoring the city’s workforce and its industry structure. These first two phases laid the groundwork for the strategic plan that emerged in the third phase of work. This document, Volume 3, provides a roadmap for the City’s economic development program, with initiatives and actions organized into the themes of competitiveness, creativity, and community vitality. In support of these goals, there is an implementation section, including a recommended organizational structure and necessary tools and resources.
FIGURE 1. PLANNING PROCESS OVERVIEW
PHASE 1: COMPETITIVENESS AS CONTEXT
Development of a strategic plan begins with a months-long process of data collection, stakeholder meetings, and fieldwork. In this first phase of work, the consultants, TIP Strategies, assessed the demographic, economic, and fiscal patterns characterizing all aspects of the City of Fort Worth’s growth. Meetings were held to gather input and understand the needs and experiences of the city’s many stakeholders. Roundtables and interviews were held with major employers, real estate professionals, academic leaders, and other experts to gather input on specific industries and areas of opportunity addressed by the plan’s recommendations. The process also involved cataloging strategic local and regional assets across a broad spectrum ranging from cultural and tourism assets to entire city districts; from the elements of transportation connectivity to the educational and medical institutions that anchor the city’s economy; from the city’s major employers, largest taxpayers, and visionary philanthropists to its strategic partners in promoting economic growth. The consultants benchmarked the city and the Dallas-Fort Worth metro area against selected places around the US and around the world in order to better understand Fort Worth in the context
• Review the key findings documented in the earlier phases• Develop goals that can address the city’s challenges• Consider the resources and capacity required for success• Translate into actionable strategies• Provide a framework for successful implementation and execution
• Assess the socio-economic landscape • Listen to the wisdom and experiences of the city’s varied stakeholders• Identify local and regional assets• Benchmark to provide context• Uncover ecosystems of creativity, innovation, and entrepreneurship
STRATEGYVOLUME
• Understand the dynamics of the labor market• Analyze the industries that power the economy today • Imagine the industries that power the economy tomorrow
OPPORTUNITYVOLUME
COMPETITIVENESSVOLUME
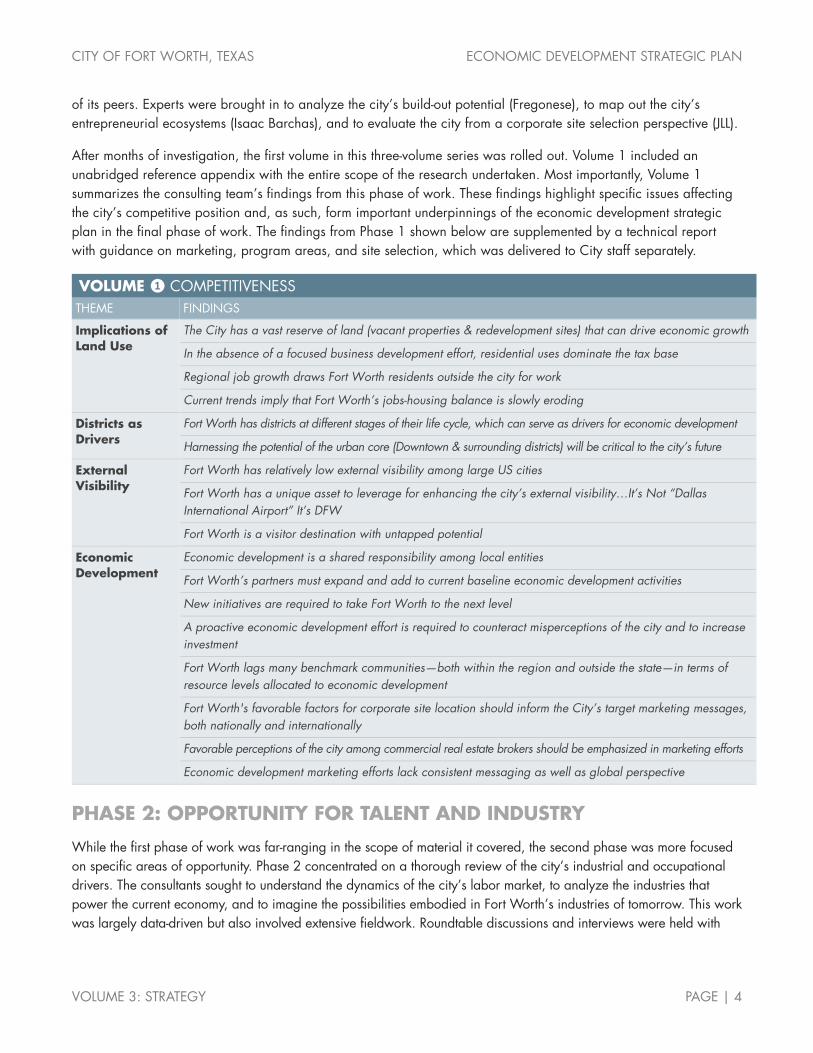
CITY OF FORT WORTH, TEXAS ECONOMIC DEVELOPMENT STRATEGIC PLAN
VOLUME 3: STRATEGY PAGE | 4
of its peers. Experts were brought in to analyze the city’s build-out potential (Fregonese), to map out the city’s entrepreneurial ecosystems (Isaac Barchas), and to evaluate the city from a corporate site selection perspective (JLL).
After months of investigation, the first volume in this three-volume series was rolled out. Volume 1 included an unabridged reference appendix with the entire scope of the research undertaken. Most importantly, Volume 1 summarizes the consulting team’s findings from this phase of work. These findings highlight specific issues affecting the city’s competitive position and, as such, form important underpinnings of the economic development strategic plan in the final phase of work. The findings from Phase 1 shown below are supplemented by a technical report with guidance on marketing, program areas, and site selection, which was delivered to City staff separately.
VOLUME ❶ COMPETITIVENESS THEME FINDINGS
Implications of Land Use
The City has a vast reserve of land (vacant properties & redevelopment sites) that can drive economic growth
In the absence of a focused business development effort, residential uses dominate the tax base
Regional job growth draws Fort Worth residents outside the city for work
Current trends imply that Fort Worth’s jobs-housing balance is slowly eroding
Districts as Drivers
Fort Worth has districts at different stages of their life cycle, which can serve as drivers for economic development
Harnessing the potential of the urban core (Downtown & surrounding districts) will be critical to the city’s future
External Visibility
Fort Worth has relatively low external visibility among large US cities
Fort Worth has a unique asset to leverage for enhancing the city’s external visibility…It’s Not “Dallas International Airport” It’s DFW
Fort Worth is a visitor destination with untapped potential
Economic Development
Economic development is a shared responsibility among local entities
Fort Worth’s partners must expand and add to current baseline economic development activities
New initiatives are required to take Fort Worth to the next level
A proactive economic development effort is required to counteract misperceptions of the city and to increase investment
Fort Worth lags many benchmark communities—both within the region and outside the state—in terms of resource levels allocated to economic development
Fort Worth's favorable factors for corporate site location should inform the City’s target marketing messages, both nationally and internationally
Favorable perceptions of the city among commercial real estate brokers should be emphasized in marketing efforts
Economic development marketing efforts lack consistent messaging as well as global perspective
PHASE 2: OPPORTUNITY FOR TALENT AND INDUSTRY
While the first phase of work was far-ranging in the scope of material it covered, the second phase was more focused on specific areas of opportunity. Phase 2 concentrated on a thorough review of the city’s industrial and occupational drivers. The consultants sought to understand the dynamics of the city’s labor market, to analyze the industries that power the current economy, and to imagine the possibilities embodied in Fort Worth’s industries of tomorrow. This work was largely data-driven but also involved extensive fieldwork. Roundtable discussions and interviews were held with

CITY OF FORT WORTH, TEXAS ECONOMIC DEVELOPMENT STRATEGIC PLAN
VOLUME 3: STRATEGY PAGE | 5
industry leaders in the fields of healthcare, aviation/aerospace, startups and technology, higher education and workforce, infrastructure, logistics and transportation, and manufacturing.
Like Volume 1 (the competitiveness assessment), this second volume included an unabridged reference appendix to catalog the entire scope of the research undertaken. Again, the consultants summarized key findings from this phase of work to further inform the preparation of the economic development strategic plan in Volume 3.
VOLUME ❷ OPPORTUNITY THEME FINDINGS
Workforce Considerations
Given the importance of a skilled labor force, Fort Worth’s opportunities must be considered within the context of ongoing structural challenges presented by a declining jobs-to-household ratio and weak job growth in high-wage occupational categories
A number of Fort Worth’s existing sectors and emerging opportunities will require STEM talent, which is currently lacking in the region
Employment in Fort Worth’s urban core generates citywide economic benefits and should be encouraged
Existing Industry Strengths
The transportation and warehousing sector is the city’s largest in terms of its share of total employment
Regional strengths in manufacturing are weighted towards Fort Worth
Fort Worth’s resilient healthcare employment has avoided cyclical patterns
The oil and gas sector is evolving, and Fort Worth's role must evolve as well
The hospitality and tourism sector remains under-developed in the City of Fort Worth relative to its potential
Emerging Opportunities
Fort Worth’s aerospace manufacturing expertise and relatively high profile in this industry should be leveraged to pursue design and R&D functions
Opportunities created by Fort Worth’s large concentration of healthcare employment, life sciences firms, and the newly established TCU UNTHSC School of Medicine should be aggressively pursued
Fort Worth is well-positioned for geotechnical growth and innovation due to its long-standing strengths in oil and gas
Existing international assets available to Fort Worth present the opportunity to strengthen international business and tourism opportunities
A more aggressive stance will be required for Fort Worth to capture a greater share of high-profile corporate expansions within the region
Dramatic regional growth in professional services has not been realized in Fort Worth, but should be
Fort Worth is a significant center of private equity
Connecting the Dots
Institutions of higher education in Tarrant County are a key component of the region’s talent pipeline and are essential for the city’s future success in growing high-wage jobs and attracting high-growth businesses
Meeting the growing demand for aerospace workers with advanced skillsets will require a greater emphasis on STEM education and training at the local level
The city’s incentives policy should be designed to promote growth in specific geographic areas and in target industries
Fort Worth must commit to making the public investments required for the city to compete for high-growth businesses and top-tier talent
To advance economic development in Fort Worth, an expanded collaborative effort will be required
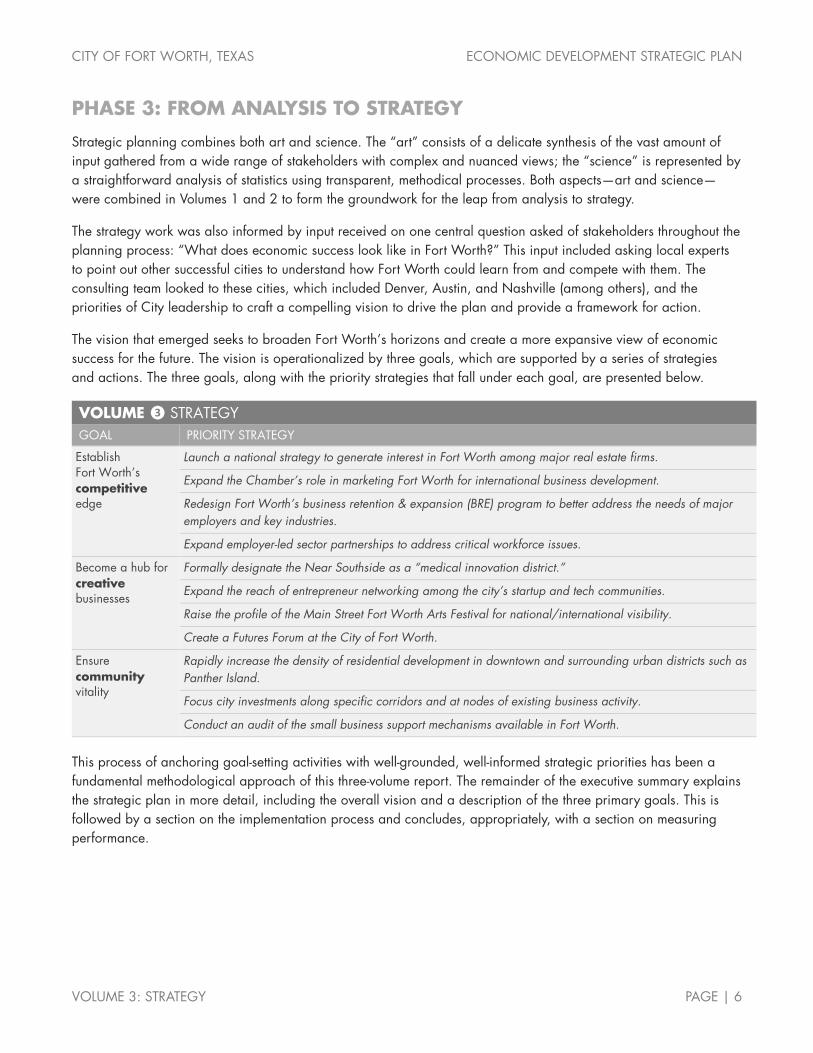
CITY OF FORT WORTH, TEXAS ECONOMIC DEVELOPMENT STRATEGIC PLAN
VOLUME 3: STRATEGY PAGE | 6
PHASE 3: FROM ANALYSIS TO STRATEGY
Strategic planning combines both art and science. The “art” consists of a delicate synthesis of the vast amount of input gathered from a wide range of stakeholders with complex and nuanced views; the “science” is represented by a straightforward analysis of statistics using transparent, methodical processes. Both aspects—art and science—were combined in Volumes 1 and 2 to form the groundwork for the leap from analysis to strategy.
The strategy work was also informed by input received on one central question asked of stakeholders throughout the planning process: “What does economic success look like in Fort Worth?” This input included asking local experts to point out other successful cities to understand how Fort Worth could learn from and compete with them. The consulting team looked to these cities, which included Denver, Austin, and Nashville (among others), and the priorities of City leadership to craft a compelling vision to drive the plan and provide a framework for action.
The vision that emerged seeks to broaden Fort Worth’s horizons and create a more expansive view of economic success for the future. The vision is operationalized by three goals, which are supported by a series of strategies and actions. The three goals, along with the priority strategies that fall under each goal, are presented below.
VOLUME ❸ STRATEGY GOAL PRIORITY STRATEGY
Establish Fort Worth’s competitive edge
Launch a national strategy to generate interest in Fort Worth among major real estate firms.
Expand the Chamber’s role in marketing Fort Worth for international business development.
Redesign Fort Worth’s business retention & expansion (BRE) program to better address the needs of major employers and key industries.
Expand employer-led sector partnerships to address critical workforce issues.
Become a hub for creative businesses
Formally designate the Near Southside as a “medical innovation district.”
Expand the reach of entrepreneur networking among the city’s startup and tech communities.
Raise the profile of the Main Street Fort Worth Arts Festival for national/international visibility.
Create a Futures Forum at the City of Fort Worth.
Ensure community vitality
Rapidly increase the density of residential development in downtown and surrounding urban districts such as Panther Island.
Focus city investments along specific corridors and at nodes of existing business activity.
Conduct an audit of the small business support mechanisms available in Fort Worth.
This process of anchoring goal-setting activities with well-grounded, well-informed strategic priorities has been a fundamental methodological approach of this three-volume report. The remainder of the executive summary explains the strategic plan in more detail, including the overall vision and a description of the three primary goals. This is followed by a section on the implementation process and concludes, appropriately, with a section on measuring performance.

CITY OF FORT WORTH, TEXAS ECONOMIC DEVELOPMENT STRATEGIC PLAN
VOLUME 3: STRATEGY PAGE | 7
STRATEGIC PLAN OVERVIEW
The plan is structured around a bold vision. That vision was articulated in the City’s initial call for a strategic plan, and, in various forms, was reiterated in stakeholder discussions. It seeks to capitalize on the city’s many advantages and its dramatic growth. Based on annual population growth trends since the last census, Fort Worth is on track to become the nation’s 12th largest city by 2019, a significant leap from its 2016 ranking as the 16th largest. This track would leap frog major US cities including San Francisco, Columbus, and Indianapolis.
The steady stream of new residents, coupled with the city’s vast tracts of available land and numerous assets, calls for an ambitious response. Findings from the planning process suggest the time has come for Fort Worth to use its growing influence to compete more fully on the national and international stage. Committing to a longer-term vision (not just short-term success) means embracing a holistic notion of what economic development can accomplish. A clear, concise vision provides strategic direction and serves as a touchstone for future decisions, especially those that impact community investments and re-allocation of resources. This focus is reflected in the vision statement that emerged from the planning process.
VISION To compete successfully on the national and international stage for creative, high-growth businesses and the talented individuals who fuel them.
Supporting the vision are three goals. These goals address competitiveness, creativity, and community vitality. They form the core of the plan’s recommendations. They reflect the guidance received by the City and stakeholders and were informed by data analysis and benchmarking against other communities facing similar challenges. Within each goal are specific initiatives that the City–and the community at large–can undertake to realize the vision. Some of the initiatives represent “baseline economic development,” that is, the activities every city must commit to for economic growth. Others are intended to be transformative–strategies that will have a more dramatic impact on the future of the community as a whole. An implementation matrix is provided for directing the work of the City and its partners. In addition, the plan includes a discussion of tools and resources to support implementation.
The approach taken in this plan has been especially mindful of the fact that economic development is never a strictly City-driven activity. It is, first and foremost, a community challenge.
GOAL 1. ESTABLISH FORT WORTH’S COMPETITIVE EDGE
Economic development is not a game for the faint of heart. It can hardly be described as a game at all. Economic development is an intense international competition among powerful cities
fighting to grow their economies, enhance their urban vitality, and compete for talent and business investment. Incentives are a contentious, but essential component of business attraction. In the Dallas-Fort Worth metro area, dozens of communities vie for projects large and small. An economic engine that competes successfully for new business in Fort Worth already exists: Hillwood’s ongoing development of Alliance. This plan calls for more formal mechanisms to connect the City and
PRIORITY STRATEGIES
• Launch a national strategy to generate interest in Fort Worth among major real estate firms.
• Expand the Chamber’s role in marketing Fort Worth for international business development.
• Redesign Fort Worth’s business retention & expansion (BRE) program to better address the needs of major employers and key industries.
• Expand employer-led sector partnerships to address critical workforce issues.
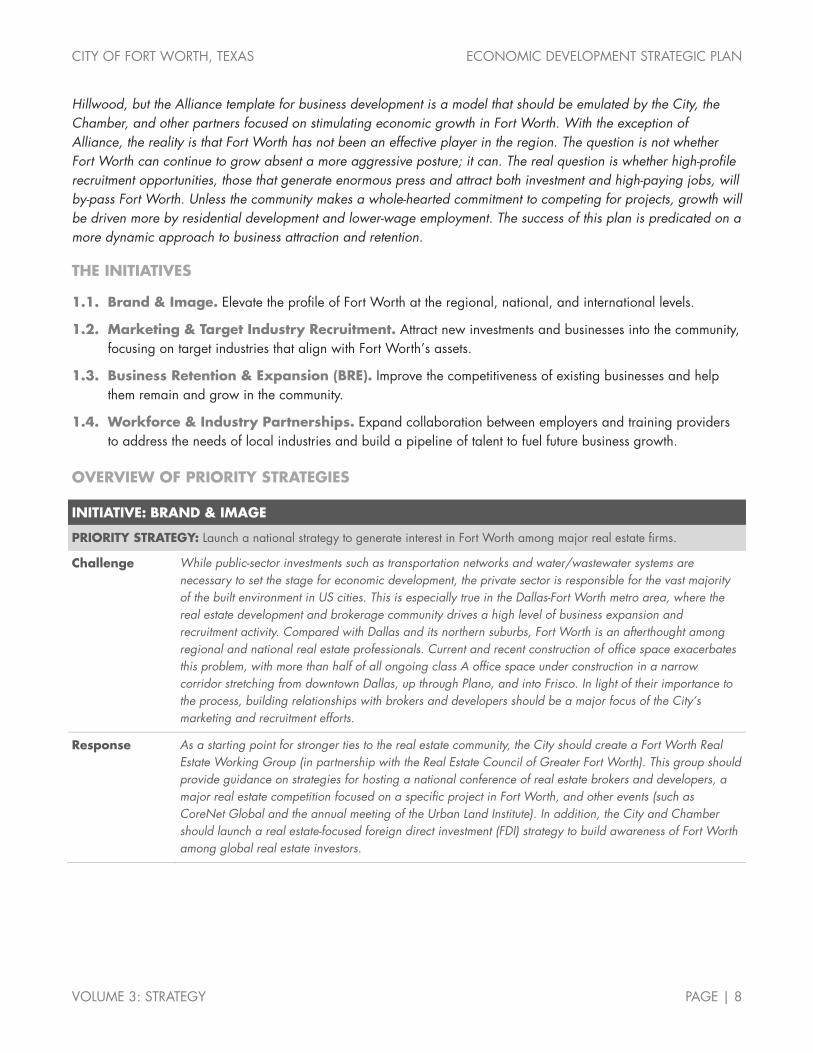
CITY OF FORT WORTH, TEXAS ECONOMIC DEVELOPMENT STRATEGIC PLAN
VOLUME 3: STRATEGY PAGE | 8
Hillwood, but the Alliance template for business development is a model that should be emulated by the City, the Chamber, and other partners focused on stimulating economic growth in Fort Worth. With the exception of Alliance, the reality is that Fort Worth has not been an effective player in the region. The question is not whether Fort Worth can continue to grow absent a more aggressive posture; it can. The real question is whether high-profile recruitment opportunities, those that generate enormous press and attract both investment and high-paying jobs, will by-pass Fort Worth. Unless the community makes a whole-hearted commitment to competing for projects, growth will be driven more by residential development and lower-wage employment. The success of this plan is predicated on a more dynamic approach to business attraction and retention.
THE INITIATIVES
1.1. Brand & Image. Elevate the profile of Fort Worth at the regional, national, and international levels.
1.2. Marketing & Target Industry Recruitment. Attract new investments and businesses into the community, focusing on target industries that align with Fort Worth’s assets.
1.3. Business Retention & Expansion (BRE). Improve the competitiveness of existing businesses and help them remain and grow in the community.
1.4. Workforce & Industry Partnerships. Expand collaboration between employers and training providers to address the needs of local industries and build a pipeline of talent to fuel future business growth.
OVERVIEW OF PRIORITY STRATEGIES
INITIATIVE: BRAND & IMAGE
PRIORITY STRATEGY: Launch a national strategy to generate interest in Fort Worth among major real estate firms.
Challenge While public-sector investments such as transportation networks and water/wastewater systems are necessary to set the stage for economic development, the private sector is responsible for the vast majority of the built environment in US cities. This is especially true in the Dallas-Fort Worth metro area, where the real estate development and brokerage community drives a high level of business expansion and recruitment activity. Compared with Dallas and its northern suburbs, Fort Worth is an afterthought among regional and national real estate professionals. Current and recent construction of office space exacerbates this problem, with more than half of all ongoing class A office space under construction in a narrow corridor stretching from downtown Dallas, up through Plano, and into Frisco. In light of their importance to the process, building relationships with brokers and developers should be a major focus of the City’s marketing and recruitment efforts.
Response As a starting point for stronger ties to the real estate community, the City should create a Fort Worth Real Estate Working Group (in partnership with the Real Estate Council of Greater Fort Worth). This group should provide guidance on strategies for hosting a national conference of real estate brokers and developers, a major real estate competition focused on a specific project in Fort Worth, and other events (such as CoreNet Global and the annual meeting of the Urban Land Institute). In addition, the City and Chamber should launch a real estate-focused foreign direct investment (FDI) strategy to build awareness of Fort Worth among global real estate investors.
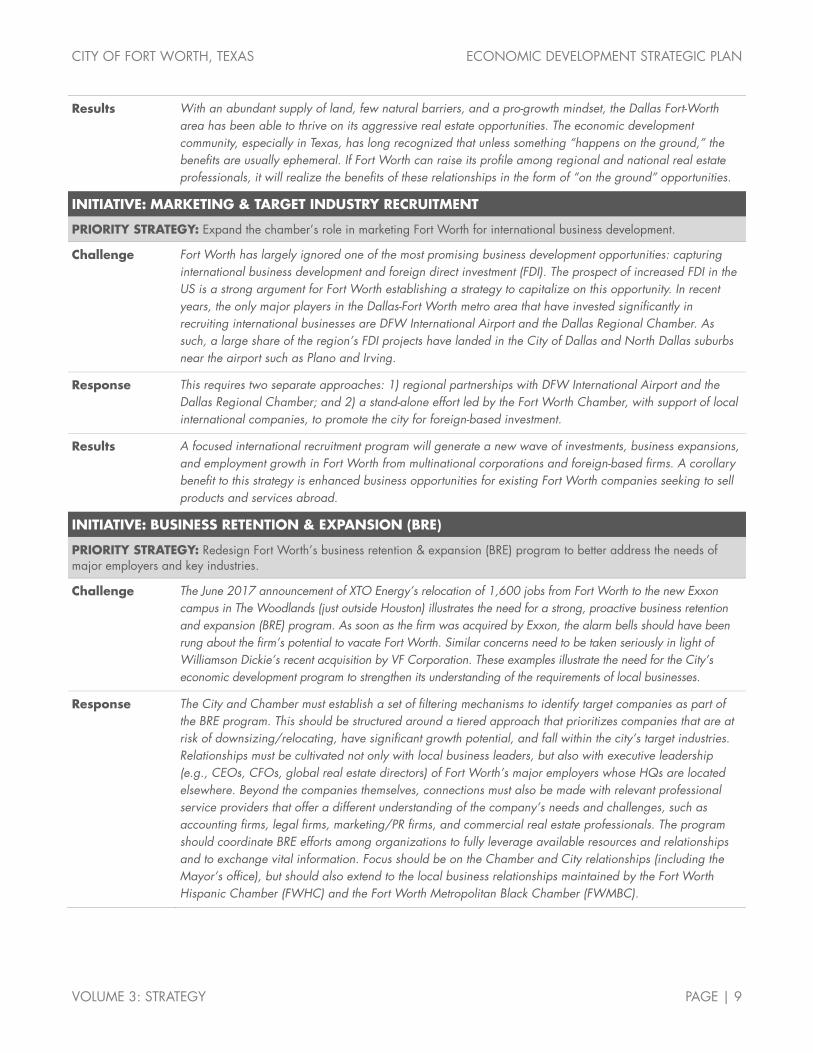
CITY OF FORT WORTH, TEXAS ECONOMIC DEVELOPMENT STRATEGIC PLAN
VOLUME 3: STRATEGY PAGE | 9
Results With an abundant supply of land, few natural barriers, and a pro-growth mindset, the Dallas Fort-Worth area has been able to thrive on its aggressive real estate opportunities. The economic development community, especially in Texas, has long recognized that unless something “happens on the ground,” the benefits are usually ephemeral. If Fort Worth can raise its profile among regional and national real estate professionals, it will realize the benefits of these relationships in the form of “on the ground” opportunities.
INITIATIVE: MARKETING & TARGET INDUSTRY RECRUITMENT
PRIORITY STRATEGY: Expand the chamber’s role in marketing Fort Worth for international business development.
Challenge Fort Worth has largely ignored one of the most promising business development opportunities: capturing international business development and foreign direct investment (FDI). The prospect of increased FDI in the US is a strong argument for Fort Worth establishing a strategy to capitalize on this opportunity. In recent years, the only major players in the Dallas-Fort Worth metro area that have invested significantly in recruiting international businesses are DFW International Airport and the Dallas Regional Chamber. As such, a large share of the region’s FDI projects have landed in the City of Dallas and North Dallas suburbs near the airport such as Plano and Irving.
Response This requires two separate approaches: 1) regional partnerships with DFW International Airport and the Dallas Regional Chamber; and 2) a stand-alone effort led by the Fort Worth Chamber, with support of local international companies, to promote the city for foreign-based investment.
Results A focused international recruitment program will generate a new wave of investments, business expansions, and employment growth in Fort Worth from multinational corporations and foreign-based firms. A corollary benefit to this strategy is enhanced business opportunities for existing Fort Worth companies seeking to sell products and services abroad.
INITIATIVE: BUSINESS RETENTION & EXPANSION (BRE)
PRIORITY STRATEGY: Redesign Fort Worth’s business retention & expansion (BRE) program to better address the needs of major employers and key industries.
Challenge The June 2017 announcement of XTO Energy’s relocation of 1,600 jobs from Fort Worth to the new Exxon campus in The Woodlands (just outside Houston) illustrates the need for a strong, proactive business retention and expansion (BRE) program. As soon as the firm was acquired by Exxon, the alarm bells should have been rung about the firm’s potential to vacate Fort Worth. Similar concerns need to be taken seriously in light of Williamson Dickie’s recent acquisition by VF Corporation. These examples illustrate the need for the City’s economic development program to strengthen its understanding of the requirements of local businesses.
Response The City and Chamber must establish a set of filtering mechanisms to identify target companies as part of the BRE program. This should be structured around a tiered approach that prioritizes companies that are at risk of downsizing/relocating, have significant growth potential, and fall within the city’s target industries. Relationships must be cultivated not only with local business leaders, but also with executive leadership (e.g., CEOs, CFOs, global real estate directors) of Fort Worth’s major employers whose HQs are located elsewhere. Beyond the companies themselves, connections must also be made with relevant professional service providers that offer a different understanding of the company’s needs and challenges, such as accounting firms, legal firms, marketing/PR firms, and commercial real estate professionals. The program should coordinate BRE efforts among organizations to fully leverage available resources and relationships and to exchange vital information. Focus should be on the Chamber and City relationships (including the Mayor’s office), but should also extend to the local business relationships maintained by the Fort Worth Hispanic Chamber (FWHC) and the Fort Worth Metropolitan Black Chamber (FWMBC).

CITY OF FORT WORTH, TEXAS ECONOMIC DEVELOPMENT STRATEGIC PLAN
VOLUME 3: STRATEGY PAGE | 10
Results A solid BRE program is, arguably, more important than a recruitment program. Not only does BRE offer similar potential for job creation (through the “expansion” part of the title), it also creates a climate that is more supportive of business growth generally. Stated another way, it is difficult to recruit a new company if existing businesses are not thriving, especially if they have a negative attitude about the local business climate. In addition to creating a supportive business climate, a robust BRE program must also help mitigate risks and vulnerabilities facing existing employers.
PRIORITY: WORKFORCE & INDUSTRY PARTNERSHIPS
PRIORITY STRATEGY: Expand employer-led sector partnerships to address critical workforce issues.
Challenge Access to a skilled workforce consistently ranks at or near the top of the list of site selection factors ranked in Area Development’s Annual Survey of Corporate Executives. The Dallas-Fort Worth metro area consistently attracts new business expansion projects that create thousands of new jobs on a monthly basis. Some of these new jobs will be filled by workers moving into the area from outside of the region and state, but the majority will be filled by local talent. This places the burden on communities in the region to develop a pipeline of talent to support the area’s rapidly expanding economy.
Response Fort Worth’s most prominent workforce and industry partnership is the regional DFW Aerospace Consortium. The community needs to increase its commitment to the consortium’s programs and promote a greater emphasis on design, R&D, and technology-related skills. Fort Worth should also play an active role in other regional workforce & industry partnerships, such as the North Texas Supply Chain Council and similar efforts focused on technology, healthcare, and infrastructure.
Results Ensuring a pipeline of workers to support the needs of current and future employers requires workforce development initiatives built on successful partnerships between major employers, workforce development organizations, educational institutions, economic development groups, and community organizations. Re-affirming and expanding Fort Worth’s role as a leader in building this pipeline of talent will help position the community for future employment growth.
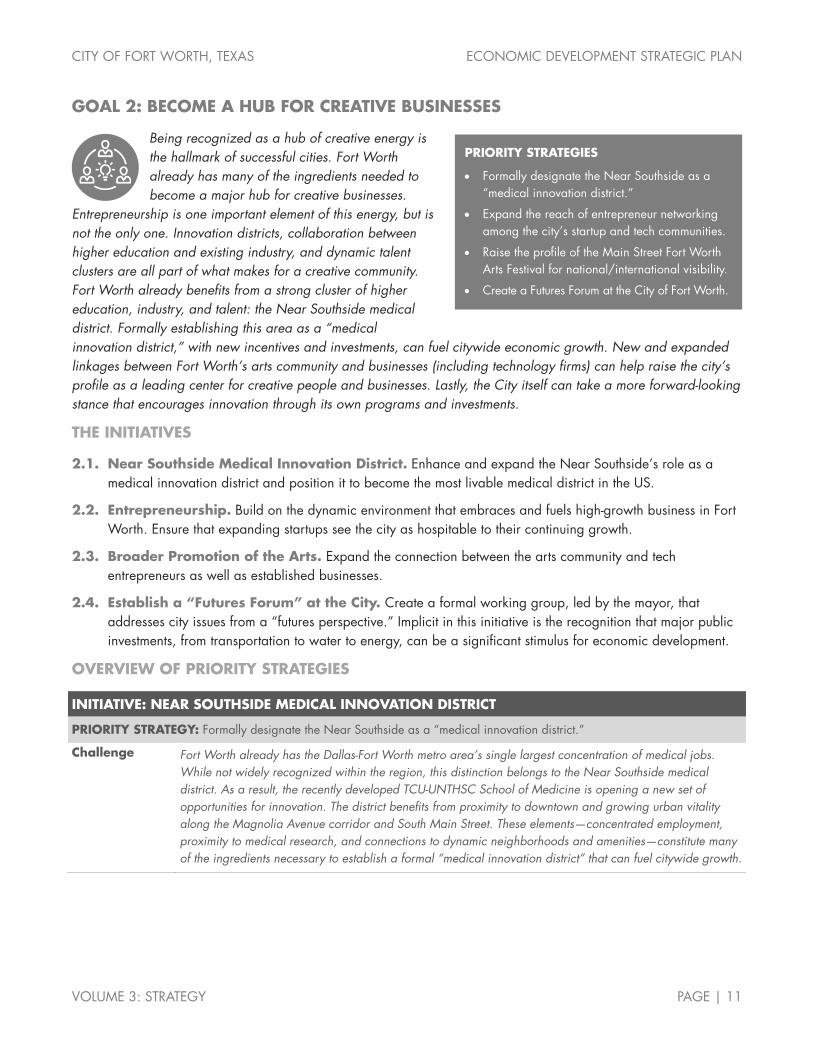
CITY OF FORT WORTH, TEXAS ECONOMIC DEVELOPMENT STRATEGIC PLAN
VOLUME 3: STRATEGY PAGE | 11
GOAL 2: BECOME A HUB FOR CREATIVE BUSINESSES
Being recognized as a hub of creative energy is the hallmark of successful cities. Fort Worth already has many of the ingredients needed to become a major hub for creative businesses.
Entrepreneurship is one important element of this energy, but is not the only one. Innovation districts, collaboration between higher education and existing industry, and dynamic talent clusters are all part of what makes for a creative community. Fort Worth already benefits from a strong cluster of higher education, industry, and talent: the Near Southside medical district. Formally establishing this area as a “medical innovation district,” with new incentives and investments, can fuel citywide economic growth. New and expanded linkages between Fort Worth’s arts community and businesses (including technology firms) can help raise the city’s profile as a leading center for creative people and businesses. Lastly, the City itself can take a more forward-looking stance that encourages innovation through its own programs and investments.
THE INITIATIVES
2.1. Near Southside Medical Innovation District. Enhance and expand the Near Southside’s role as a medical innovation district and position it to become the most livable medical district in the US.
2.2. Entrepreneurship. Build on the dynamic environment that embraces and fuels high-growth business in Fort Worth. Ensure that expanding startups see the city as hospitable to their continuing growth.
2.3. Broader Promotion of the Arts. Expand the connection between the arts community and tech entrepreneurs as well as established businesses.
2.4. Establish a “Futures Forum” at the City. Create a formal working group, led by the mayor, that addresses city issues from a “futures perspective.” Implicit in this initiative is the recognition that major public investments, from transportation to water to energy, can be a significant stimulus for economic development.
OVERVIEW OF PRIORITY STRATEGIES
INITIATIVE: NEAR SOUTHSIDE MEDICAL INNOVATION DISTRICT
PRIORITY STRATEGY: Formally designate the Near Southside as a “medical innovation district.”
Challenge Fort Worth already has the Dallas-Fort Worth metro area’s single largest concentration of medical jobs. While not widely recognized within the region, this distinction belongs to the Near Southside medical district. As a result, the recently developed TCU-UNTHSC School of Medicine is opening a new set of opportunities for innovation. The district benefits from proximity to downtown and growing urban vitality along the Magnolia Avenue corridor and South Main Street. These elements—concentrated employment, proximity to medical research, and connections to dynamic neighborhoods and amenities—constitute many of the ingredients necessary to establish a formal “medical innovation district” that can fuel citywide growth.
PRIORITY STRATEGIES
• Formally designate the Near Southside as a “medical innovation district.”
• Expand the reach of entrepreneur networking among the city’s startup and tech communities.
• Raise the profile of the Main Street Fort Worth Arts Festival for national/international visibility.
• Create a Futures Forum at the City of Fort Worth.

CITY OF FORT WORTH, TEXAS ECONOMIC DEVELOPMENT STRATEGIC PLAN
VOLUME 3: STRATEGY PAGE | 12
Response A formal “medical innovation district” designation would start with additional public investments to enhance walkability and pedestrian connectivity, as well as support broadband that creates extended connectivity across all devices, both wired and wireless. It would also involve the creation of incentives for talent recruitment (e.g., a nationally recognized life sciences researcher) that would advance the district and attract additional research staff. Establishing the district formally will also provide opportunities to generate national attention about the district and to invite outside organizations to evaluate the area and uncover strategies for accelerating its development.
Results Public investments, incentives, and awareness of the Near Southside as a medical innovation district will help the area expand its existing medical assets and increase its appeal as a vibrant urban district.
INITIATIVE: ENTREPRENEURSHIP
PRIORITY STRATEGY: Expand the reach of entrepreneur networking among the city’s startup and tech communities.
Challenge Entrepreneurial companies have specific needs for talent, real estate, and capital. The undercurrent for all of these needs is the network of people involved in supporting the growth of entrepreneurial companies. Communities with a highly engaged, connected, and collaborative startup scene have a built-in advantage in the global competition for high-growth business development. Fort Worth has all of the building blocks needed to support a higher level of entrepreneurship: TECH Fort Worth and other strong support organizations, talented entrepreneurs and workers in the city and metro area, innovative companies and higher education institutions in the area, and a growing menu of real estate options suitable for tech firms and startups (including WeWork and other co-working spaces and an expanding supply of attractive office spaces in downtown and the Near Southside). What Fort Worth and the entire metro area lack is a robust networking environment for local entrepreneurs and tech workers. In fact, the only city in Texas that does this well is Austin.
Response Elevate the role of TECH Fort Worth as a connector/convener to address the need for better and more frequent networking opportunities aimed at entrepreneurs, young professionals, and tech workers. This should involve new events such as reverse-pitch competitions to engage major corporations and other organizations in Fort Worth with needs for innovation. It should also involve specific tactics to enhance entrepreneur networking in Fort Worth, such as an online calendar of networking events hosted by TECH Fort Worth. Lastly, stronger connections must be established between Fort Worth’s startup/tech community and local and regional higher education institutions.
Results A stronger, more connected set of networking channels for entrepreneurs, investors, and tech workers in Fort Worth will help existing startups and tech firms. Just as important, this will help the city become a hub of entrepreneurial activity, positioning it to attract entrepreneurs and high-growth companies from across the metro area, state, and nation.
INITIATIVE: BROADER PROMOTION OF THE ARTS
PRIORITY STRATEGY: Raise the profile of the Main Street Fort Worth Arts Festival for national/international visibility.
Challenge Fort Worth’s reputation as a center of the arts is well-established. The Kimbell and the Amon Carter Museums are destinations on national and international levels. However, the city doesn’t have any arts events that rise to the same level of prominence. The most recent economic impact study of the Main Street Fort Worth Arts Festival indicates that 92 percent of the estimated 283,000 festival attendees reside within 50 miles of downtown Fort Worth. Only 8 percent (19,000) are visitors from outside the area. Contrast that with the SXSW festival, which draws 22 percent of its 204,000 registrants from outside the US. And among US registrants, only 25 percent are from the South Central US (Texas, Oklahoma, Arkansas, and Louisiana). The Main Street Fort Worth Arts Festival needs to emulate SXSW and other hallmark events so that when attendees visit Fort Worth they feel “what you’re experiencing here can’t be experienced anywhere else.”
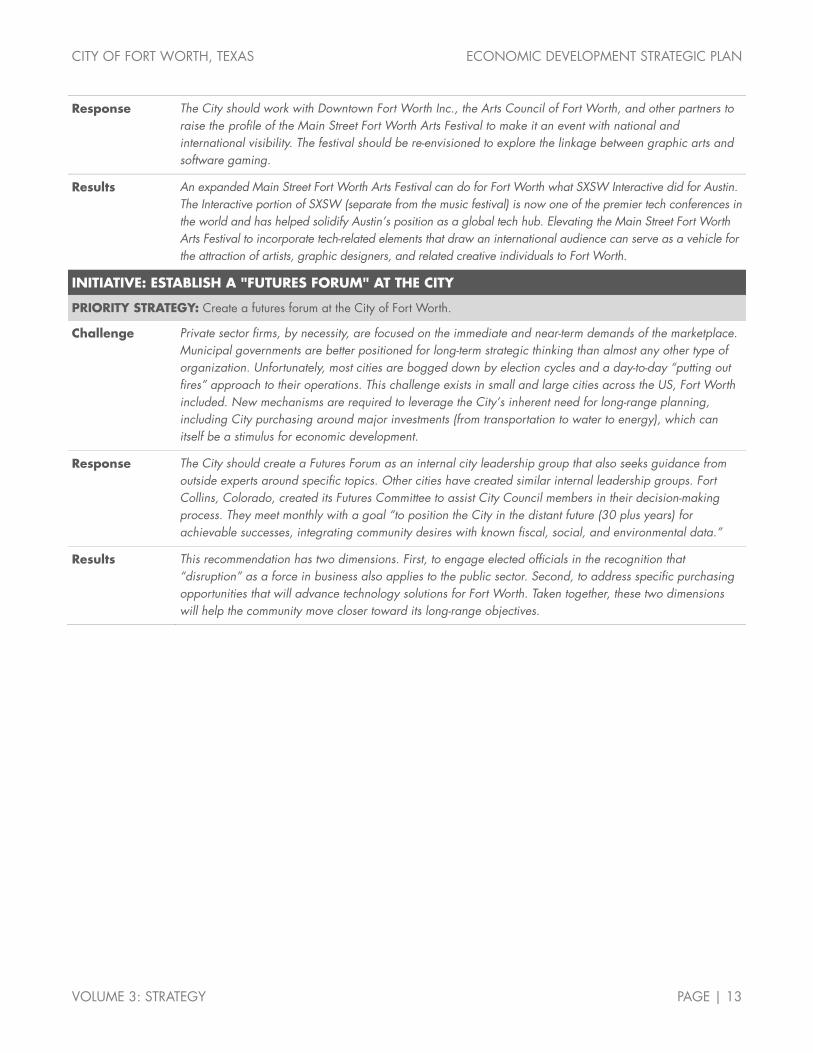
CITY OF FORT WORTH, TEXAS ECONOMIC DEVELOPMENT STRATEGIC PLAN
VOLUME 3: STRATEGY PAGE | 13
Response The City should work with Downtown Fort Worth Inc., the Arts Council of Fort Worth, and other partners to raise the profile of the Main Street Fort Worth Arts Festival to make it an event with national and international visibility. The festival should be re-envisioned to explore the linkage between graphic arts and software gaming.
Results An expanded Main Street Fort Worth Arts Festival can do for Fort Worth what SXSW Interactive did for Austin. The Interactive portion of SXSW (separate from the music festival) is now one of the premier tech conferences in the world and has helped solidify Austin’s position as a global tech hub. Elevating the Main Street Fort Worth Arts Festival to incorporate tech-related elements that draw an international audience can serve as a vehicle for the attraction of artists, graphic designers, and related creative individuals to Fort Worth.
INITIATIVE: ESTABLISH A "FUTURES FORUM" AT THE CITY
PRIORITY STRATEGY: Create a futures forum at the City of Fort Worth.
Challenge Private sector firms, by necessity, are focused on the immediate and near-term demands of the marketplace. Municipal governments are better positioned for long-term strategic thinking than almost any other type of organization. Unfortunately, most cities are bogged down by election cycles and a day-to-day “putting out fires” approach to their operations. This challenge exists in small and large cities across the US, Fort Worth included. New mechanisms are required to leverage the City’s inherent need for long-range planning, including City purchasing around major investments (from transportation to water to energy), which can itself be a stimulus for economic development.
Response The City should create a Futures Forum as an internal city leadership group that also seeks guidance from outside experts around specific topics. Other cities have created similar internal leadership groups. Fort Collins, Colorado, created its Futures Committee to assist City Council members in their decision-making process. They meet monthly with a goal “to position the City in the distant future (30 plus years) for achievable successes, integrating community desires with known fiscal, social, and environmental data.”
Results This recommendation has two dimensions. First, to engage elected officials in the recognition that “disruption” as a force in business also applies to the public sector. Second, to address specific purchasing opportunities that will advance technology solutions for Fort Worth. Taken together, these two dimensions will help the community move closer toward its long-range objectives.

CITY OF FORT WORTH, TEXAS ECONOMIC DEVELOPMENT STRATEGIC PLAN
VOLUME 3: STRATEGY PAGE | 14
GOAL 3: ENSURE COMMUNITY VITALITY
Quality of place is an essential component of a successful economic development strategy. The strength of neighborhoods, of connectivity among different districts of the city, and of urban amenities
is what makes cities attractive to talented individuals and to dynamic businesses. With the Trinity River Project, the Arts District, and extensive trails and parks, Fort Worth is well on its way to realizing this goal. Downtown Fort Worth has improved dramatically in recent years, serving as the city’s most concentrated center of employment and entertainment. However, the city’s urban core has not benefited from the ongoing waves of corporate expansion and relocation projects captured by other cities in the region (Dallas, Plano, Irving) and other downtowns across the US (Boston, Denver, Chicago). Fort Worth can turn the tide and become a leading destination for corporate expansions and high-wage employment growth. And downtown—including surrounding urban districts such as Panther Island—should play a central role in this strategy. This will require new incentives and coordinated programs to rapidly accelerate development in the city’s urban core, starting with a much greater density of residential development, but also including new hotels, an expanded higher education presence, and new office construction. Employment growth and business investment in the downtown will generate citywide benefits, but the plan also calls for a more targeted approach to encourage economic development in Fort Worth’s neighborhoods and commercial corridors. Lastly, a major re-organization is required in the way the City of Fort Worth provides services to support the growth of independent, locally-owned small businesses, including minority-owned firms.
THE INITIATIVES
3.1. Downtown Fort Worth. Accelerate downtown Fort Worth’s emergence as the premier mixed-use business district in Texas.
3.2. Neighborhood Alignment. Align neighborhood assets (people, businesses, and real estate) to benefit from and support citywide economic growth.
3.3. Small Business Support. Restructure small business assistance based on a communitywide audit.
OVERVIEW OF PRIORITY STRATEGIES
INITIATIVE: DOWNTOWN FORT WORTH
PRIORITY STRATEGY: Rapidly increase the density of residential development in downtown and surrounding urban districts such as Panther Island.
Challenge High-density residential development is the “secret” ingredient for the success of downtown Austin, Denver, and Seattle as dynamic mixed-use business districts. Each of these cities made a commitment to a downtown housing strategy first and is now reaping the benefits in the form of commercial office development and the expansion of tech firms and other professional jobs in their urban cores. Fort Worth is beginning to see these benefits, thanks to its commitment to urban residential development in recent years. However, the City needs a much more aggressive program to accelerate the growth of housing in downtown, Panther Island, the Near Southside, and surrounding urban districts.
PRIORITY STRATEGIES
• Rapidly increase the density of residential development in downtown and surrounding urban districts such as Panther Island.
• Focus City investments along specific corridors and at nodes of existing business activity.
• Conduct an audit of the small business support mechanisms available in Fort Worth.

CITY OF FORT WORTH, TEXAS ECONOMIC DEVELOPMENT STRATEGIC PLAN
VOLUME 3: STRATEGY PAGE | 15
Response Encouraging an increased pace of housing construction in the urban core will require a mix of bold targets for new development, new and expanded incentive programs that reward developers for investing in taller/denser residential structures, and creative approaches (such as shared parking facilities and reuse of outdated office buildings for residential purposes) to reduce barriers to new housing construction.
Results A more aggressive agenda for rapidly expanding the base of residents living in and around downtown Fort Worth will generate much more than new housing in the urban core. With thousands of new residents moving into downtown, Panther Island, the Near Southside, and other close-in districts over the next several years, other target audiences will take note. A rapidly expanding urban population base is the key to unlocking the city’s potential for attracting new commercial office development, corporate HQs, professional services firms, and tech companies.
INITIATIVE: NEIGHBORHOOD ALIGNMENT
PRIORITY STRATEGY: Focus City investments along specific corridors and at nodes of existing business activity.
Challenge Economic development does not guarantee prosperity for all. Even in the nation’s most successful and diversified metropolitan economies, specific geographies and segments of the population are often left behind. Fort Worth is no exception. Segments of the city’s population in specific neighborhoods and corridors have struggled to achieve prosperity, even while the city as a whole has experienced widespread growth. The City can and should play a lead role in catalyzing development in under-served neighborhoods and for under-served residents.
Response Public investments in economic development must be made only when they can reasonably be expected to generate economic benefits. The City must play a lead role as a strategic investor to catalyze development in neighborhoods and corridors targeted for urban revitalization. Just as important, the City is responsible for preventing the proliferation of land uses and activities that might diminish the economic potential of a target area, such as large public sector or nonprofit developments (e.g., community centers, churches, homeless services centers) and land-intensive, auto-centric development (e.g., gas stations, automotive repair shops, car washes, storage unit complexes).
Results Outcomes for challenged neighborhoods receiving targeted investments include ancillary development, tax base growth, and job creation.
INITIATIVE: SMALL BUSINESS SUPPORT
PRIORITY STRATEGY: Conduct an audit of the small business support mechanisms available in Fort Worth.
Challenge Dynamic local economies are often defined by a strong base of independent, locally-owned, small businesses. Distinctive retailers, restaurants, and coffee shops help otherwise sterile corridors build unique identities. They also provide opportunities for minority-owned business development. Independent, locally-owned firms also recirculate a higher share of their revenue in the local economy, compared to national chain businesses. Additionally, these businesses help attract tech companies and often become magnets for young people, even beyond the city limits. Magnolia Avenue in the Near Southside is a perfect example of this trend, and Race Street is following the same trajectory. An emphasis on independent small businesses also recognizes that there is a distinction between entrepreneurial companies and small businesses. Both types of firms are important to the city’s economy, but their support systems differ substantially.
Response Much of what is being done by the Fort Worth Business Assistance Center (BAC) fits into the category of entrepreneurial company support, which is the core mission of TECH Fort Worth. To sharply distinguish between entrepreneurial and small business support, the way the City of Fort Worth provides services will need to be reorganized. An audit is the logical starting point for addressing the way in which small businesses—distinct from entrepreneurial companies—are supported by the City and its partners.
Results Clear delineation of the support functions available to support small businesses in Fort Worth will help the BAC and other partners provide more effective and efficient services to grow the base of local firms.
CITY OF FORT WORTH, TEXAS ECONOMIC DEVELOPMENT STRATEGIC PLAN
VOLUME 3: STRATEGY PAGE | 16
4. TOOLS & RESOURCES
Goals 1, 2, and 3 describe what is necessary for Fort Worth’s overall economic success, regardless of what resources may be drawn upon. The Tools & Resources section addresses the organizational changes required and investments in new tools and resources needed to support the City’s economic development program.
THE INITIATIVES
4.1. Economic Development Bond Package. Identify how the citywide bond package makes investments in livability, Smart City infrastructure, and business development. Elevate projects that impact economic development goals.
4.2. Citywide Incentive Program. Create new incentive tools to encourage business growth within target industries and to facilitate development and redevelopment in designated districts.
4.3. Organizational Alignment. Clarify the roles and responsibilities of Fort Worth’s economic development partners; build a shared framework for decision making and ongoing collaboration.
IMPLEMENTATION
Effective implementation of the plan rests primarily with collaboration between the City of Fort Worth Economic Development Department and the Fort Worth Chamber of Commerce. New investments from the City and the Chamber will be required to move this plan from concept to action, including a significant increase in staffing to carry out the primary economic development functions outlined. These
primary functions include: marketing and target industry recruitment, high-growth startups and tech company recruitment, business retention and expansion (BRE), research, and urban redevelopment.
The City/Chamber partnership is not responsible for every activity outlined in this plan, but it acts as a lever to create large changes through targeted investments and initiatives. Other City departments, and a variety of local and regional partners, also play critical roles in growing and strengthening the Fort Worth economy. Based on an extensive organizational gap analysis, the consulting team identified the 30 organizations (listed below) that have the strongest impact on economic development in Fort Worth. These organizations have been split into two categories: those with economic development as a core part of their mission and those that play critical supporting roles.
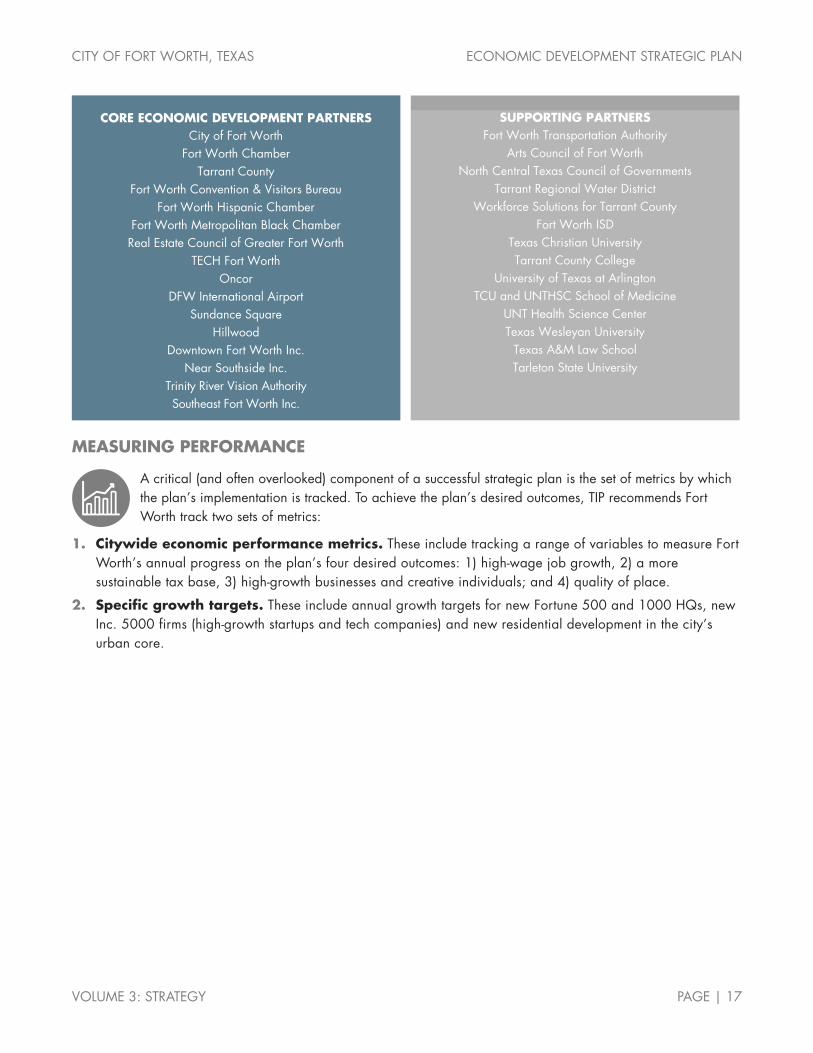
CITY OF FORT WORTH, TEXAS ECONOMIC DEVELOPMENT STRATEGIC PLAN
VOLUME 3: STRATEGY PAGE | 17
MEASURING PERFORMANCE
A critical (and often overlooked) component of a successful strategic plan is the set of metrics by which the plan’s implementation is tracked. To achieve the plan’s desired outcomes, TIP recommends Fort Worth track two sets of metrics:
1. Citywide economic performance metrics. These include tracking a range of variables to measure Fort Worth’s annual progress on the plan’s four desired outcomes: 1) high-wage job growth, 2) a more sustainable tax base, 3) high-growth businesses and creative individuals; and 4) quality of place.
2. Specific growth targets. These include annual growth targets for new Fortune 500 and 1000 HQs, new Inc. 5000 firms (high-growth startups and tech companies) and new residential development in the city’s urban core.
CORE ECONOMIC DEVELOPMENT PARTNERS City of Fort Worth
Fort Worth Chamber Tarrant County
Fort Worth Convention & Visitors Bureau Fort Worth Hispanic Chamber
Fort Worth Metropolitan Black Chamber Real Estate Council of Greater Fort Worth
TECH Fort Worth Oncor
DFW International Airport Sundance Square
Hillwood Downtown Fort Worth Inc.
Near Southside Inc. Trinity River Vision Authority Southeast Fort Worth Inc.
SUPPORTING PARTNERS Fort Worth Transportation Authority
Arts Council of Fort Worth North Central Texas Council of Governments
Tarrant Regional Water District Workforce Solutions for Tarrant County
Fort Worth ISD Texas Christian University Tarrant County College
University of Texas at Arlington TCU and UNTHSC School of Medicine
UNT Health Science Center Texas Wesleyan University
Texas A&M Law School Tarleton State University

CITY OF FORT WORTH, TEXAS ECONOMIC DEVELOPMENT STRATEGIC PLAN
VOLUME 3: STRATEGY PAGE | 18
STRATEGIC PLAN
GOAL 1. ESTABLISH FORT WORTH’S COMPETITIVE EDGE
Economic development is not a game for the faint of heart. It can hardly be described as a game at all. Economic development is an intense international competition among powerful cities fighting to grow their economies, enhance their urban vitality, and compete for talent and business investment. Incentives are a contentious, but essential component of business attraction. In the Dallas-Fort Worth metro area, dozens of communities vie for projects large and small. And the reality is that the City of Fort Worth has not been an effective player in the region. The question is not whether Fort Worth can continue to grow absent a more aggressive posture; it can. The real question is whether high-profile recruitment opportunities, ones that generate enormous press and attract both investment and high-paying jobs, will by-pass Fort Worth. Unless the community makes a whole-hearted commitment to competing for projects, growth will be driven more by residential development and lower-wage employment. The success of this plan is predicated on a more dynamic approach to business attraction and retention.
INITIATIVE 1.1. BRAND & IMAGE Engage the real estate community to elevate the profile of Fort Worth at the regional, national, and international levels.
A typical response to the need for economic development marketing is community branding and the taglines that go with it. Based on insights from JLL and knowledge of the Dallas-Fort Worth metro area, this approach is not likely to result in new business development opportunities. More success can be realized through engagement with the real estate community including developers, commercial brokers, and major landowners. We know this generates results. Alliance and Sundance Square are evidence of nationally successful business attraction through a real estate-driven strategy.
Brand marketing is often generic and unfocused. Giving a city a name or tag line does not ensure measurable benefits outside of tourism—and sometimes not even there. The challenge in Fort Worth is not whether Cowtown is a negative brand or if Cowboys and Culture is “sticky.” The real challenge is whether the city’s target industries—and the talented individuals that drive those sectors—find Fort Worth hospitable to their needs. In other words, it is less about tag lines and overarching image and more about capitalizing on specific opportunities. Austin may be known as “The Live Music Capital of the World,” and Chicago is “The Windy City,” but neither tag line matters much to the startups and major corporations that choose to relocate to those communities.
With an abundant supply of land, few natural barriers, and a pro-growth mindset, the Dallas Fort-Worth area has been able to thrive on its aggressive real estate opportunities. The economic development community, especially in Texas, has long recognized that unless something “happens on the ground,” the benefits are usually ephemeral. We can talk about higher education, research, and technology, but without development: land, buildings, and infrastructure, we aren’t really talking economic development at all. While somewhat overstated, the point is valid. It recognizes that even the most tech-dependent projects must ultimately generate taxes and give people a place to work if the community is to realize any benefit.
While public-sector investments such as transportation networks and water/wastewater systems are necessary to set the stage for economic development, the private sector is responsible for the vast majority of the built environment in US cities. This is especially true in the Dallas-Fort Worth metro area, where the real estate development and brokerage community drives such a high level of business expansion and recruitment activity.
CITY OF FORT WORTH, TEXAS ECONOMIC DEVELOPMENT STRATEGIC PLAN
VOLUME 3: STRATEGY PAGE | 19
In light of their importance to the process, building relationships with brokers and developers should be a major focus of the City’s marketing and recruitment efforts. The following strategies address how Fort Worth engages with this critical audience.
1.1.1. Create a Fort Worth Real Estate Working Group (in partnership with the Real Estate Council of Greater Fort Worth). The working group will provide the community’s economic development partners with closer, more direct lines of communication to the most important business decision-makers in the local and regional marketplace. This group can become the “eyes and ears” of Fort Worth’s economic development partners. Relying on these professionals, will yield a thorough understanding of the dynamics of the local and regional real estate market.
1.1.2. Launch a national strategy for generating attention and interest for Fort Worth among major real estate development and commercial brokerage firms.
1.1.2.1. Host a national conference of real estate brokers and developers.
1.1.2.2. Hold a major real estate competition focused on a specific project in Fort Worth, similar to the Commercial Real Estate Development Association (NAIOP) University Challenge.
1.1.2.3. Host a CoreNet Global event in Fort Worth.
1.1.2.4. Host the annual meeting of the Urban Land Institute (ULI) in Fort Worth.
1.1.3. Launch a real estate-focused foreign direct investment (FDI) strategy to build awareness of Fort Worth among global real estate investors.
1.1.3.1. Leverage Hillwood, Sundance Square, and DFW International Airport’s connections with international investors and business executives to build this strategy.
1.1.3.2. Host a symposium focused on real estate capital markets, bringing in major institutional real estate investment firms and capital management firms from across the world.
1.1.4. Engage local chapters of real estate organizations, such as ULI or NAIOP, to host a design competition featuring a location in Fort Worth. This strategy would showcase the potential of Fort Worth and place the city in the forefront of the minds of those who influence the site selection process for company relocation, expansion, and investment.
1.1.4.1. Work with the Real Estate Council of Greater Fort Worth to continue events like the Panther Den urban design competition (an event that engages young and emerging professionals in the area real estate industry) and to create new events that put a spotlight on Fort Worth as a location for commercial real estate development.
1.1.4.2. Competitors would form interdisciplinary teams with members from a variety of fields, such as architecture, planning, and real estate, and would propose ideas that are set within real-life constraints.
1.1.4.3. Members of the real estate community in the Dallas-Fort Worth metro area could get involved by helping to select a site, judge the competition, or host professional development events in association with the competition.
1.1.5. Work closely with Fort Worth ISD, TCC, Tarrant County, and other public-sector entities in the community to identify underutilized properties and position them for public-private redevelopment.

CITY OF FORT WORTH, TEXAS ECONOMIC DEVELOPMENT STRATEGIC PLAN
VOLUME 3: STRATEGY PAGE | 20
1.1.5.1. Fort Worth ISD is currently evaluating its portfolio of non-academic properties (including its headquarters office near the West Seventh Street district) for potential redevelopment partnerships.
1.1.5.2. Work with the ISD to ensure that the economic development potential of these properties is prioritized as part of any sale or redevelopment plans.
1.1.6. Identify and pursue Fort Worth expansion of regional trade associations, professional groups, and other special interest groups that are currently based in Dallas, but are meant to serve the entire metro area.
1.1.6.1. Start by inviting Dallas-based regional associations to host meetings in Fort Worth.
1.1.6.2. Encourage the creation of Fort Worth chapters of regional associations to serve Tarrant County and surrounding areas.
INITIATIVE 1.2. MARKETING & TARGET INDUSTRY RECRUITMENT Attract new investments and businesses into the community, focusing on target industries that align with Fort Worth’s assets.
In Volume 2: Opportunity, we outlined the established sectors that drive Fort Worth’s economy. We also identified a group of eight emerging opportunities that respond to the community’s unique assets and its position within the regional and global marketplace. We recommend Fort Worth focus its marketing and target industry recruitment efforts on companies in the following target industries and areas of emerging opportunity:
Aerospace Manufacturing & Design
Transportation Innovation
Life Sciences Delivery & Innovation
Geotechnical Engineering
International Business
Corporate & Regional HQs
Professional Services
Financial Services
A successful marketing program requires highly-targeted messaging aimed at specific audiences. Generic marketing and promotional efforts, aimed at convincing corporate executives and other business decision-makers that Fort Worth is a “great place to live, work, and play,” will not be sufficient to differentiate the city for business recruitment. In addition to using customized messaging, the community’s business recruitment efforts will benefit from a set of bold and creative tactics aimed at generating leads from new sources (both within the metro area and from national and international markets).
Fort Worth has been remiss in capturing international business development. The likelihood of increased foreign direct investment into the US, argues strongly that Fort Worth needs a strategy to capitalize on this opportunity. This requires two separate approaches: 1) regional partnerships with DFW International Airport and the Dallas Regional Chamber; and 2) a stand-alone effort led by the Fort Worth Chamber, with support of local international companies, to promote the city for foreign-based investment.
1.2.1. Design marketing materials around Fort Worth’s target industries. For the life sciences delivery (and clinical trials) opportunity, create a one-pager promoting “The Fort Worth clinical environment” and attend 2-3 major conferences (e.g., Bio, JP Morgan Chase Healthcare Conference) to promote the city as a destination for clinical trials. Create other industry-specific marketing and promotional materials along the same lines.
Best Practices: Craft Breweries & Supply Chain in Asheville (page 63), Water Technology in Milwaukee (page 63), and Animal Health Corridor in Kansas City (page 64).

CITY OF FORT WORTH, TEXAS ECONOMIC DEVELOPMENT STRATEGIC PLAN
VOLUME 3: STRATEGY PAGE | 21
1.2.2. Enhance the Fort Worth economic development program’s online presence to communicate desired messages to target audiences.
1.2.2.1. Create a new City of Fort Worth Economic Development Department website. Redesign the site so that it features two simple categories:
the City’s specific functions related to economic development (e.g., incentive programs, economic development initiatives, staff directory) and;
a prominent redirect link to the Fort Worth Chamber’s economic development website, clearly defining the Chamber’s site as the community’s primary online portal for economic development prospects, site location consultants, commercial real estate brokers, and other business decision-makers.
1.2.2.2. Add new features and information onto the Chamber’s economic development website.
Focus on building out relevant details highlighting what makes the city competitive for the growth of target industries and emerging opportunities. Pull out key findings for specific industries from the “Fort Worth’s Advantage” section for each emerging opportunity in Volume 2.
Present in-depth profiles and descriptions of local and regional workforce strengths.
Include testimonials from area business executives who endorse Fort Worth as a great place to do business. Extend this beyond the city limits into surrounding Tarrant County communities where business owners and managers can speak about the Fort Worth area’s positive workforce and business climate attributes.
1.2.2.3. Coordinate regularly with partners to maintain consistent messages and marketing themes.
1.2.2.4. Actively manage other online sources with city information, such as Fort Worth’s Wikipedia page, to ensure they depict an accurate and positive image of the city as a business location.
This is an important, but often overlooked, facet of economic development marketing since many prospective business executives and relocating workers use Wikipedia and other online sources as their starting point for researching a community before they make a visit in person.
This is an ideal ongoing task for local college student interns working under the supervision of City and/or Chamber economic development professionals.
1.2.3. Adopt creative and highly targeted marketing tactics.
1.2.3.1. Launch new initiatives to partner with DFW International Airport to market Fort Worth as a business and talent destination.
Use the DFW International Airport Wi-Fi Boingo network as a recruitment tool.
Design a 30-second video showcasing Fort Worth in order to access free public Wi-Fi. The target audience for this includes international business owners, corporate executives, tech workers, and other professionals.
1.2.3.2. Launch a quarterly direct mail campaign to real estate brokers and/or "A" leads that contains a locally made product that ties in with their industry or a relevant community asset.

CITY OF FORT WORTH, TEXAS ECONOMIC DEVELOPMENT STRATEGIC PLAN
VOLUME 3: STRATEGY PAGE | 22
Examples include: a model of a Bell helicopter, AA plane, or BNSF train; a pair of high-end Justin boots; a case of Mrs. Renfro's hot sauce; a Rahr & Sons craft beer six-pack; or a bottle of TX Whiskey or Bourbon from Firestone & Robertson Distilling Co.
Enclosed marketing collateral should tell the story of how the featured company found success in Fort Worth and how other companies can achieve similar results. Use these messages to tell a compelling story about why Fort Worth is a good business location.
Ensure that these messages not only tell the story about the specific company’s success, but also emphasize how Fort Worth has played a central role in the company’s growth.
1.2.3.3. Generate leads for economic development prospects from non-traditional sources.
One example of a useful technology tool for discovering leads is Google Alerts.
Obtain lease expiration data in competing cities within and outside of Texas. Send recruitment marketing materials to companies headquartered in these markets that fall within Fort Worth’s target industries, as well as whose leases are expiring within 24 months.
1.2.4. Capitalize on one of the most fertile business recruitment environments in America: the Dallas-Fort Worth metro area.
1.2.4.1. Take a more aggressive stance toward the recruitment of high-profile corporate and regional HQs.
Fort Worth must take advantage of the metro area’s established position as one of America’s leading corporate HQ destinations.
The city can ensure that it captures its fair share of corporate and regional HQ relocation projects by better marketing its advantages. For starters, Fort Worth is a city―not a suburb―in an era when cities are becoming more desirable corporate locations than suburban office parks. Established urban districts within Fort Worth provide the precise amenities most desired by corporate office tenants. Further, Fort Worth offers easy access to both DFW International Airport and Alliance Airport. Fort Worth essentially shares a labor pool with its metro area competitors, offering equal access to the same large, rapidly expanding workforce that corporate employers are seeking. TCU Neeley Business School’s nationally ranked entrepreneurship undergraduate program sweetens the deal even more with its stream of creative young graduates.
1.2.4.2. Position Fort Worth as a desirable landing spot for emerging companies in the region.
Start with the 160 Inc. 5000 companies based in the metro area as the primary target list.
Target additional firms such as successful startups in the region’s business incubators/accelerators that are on the cusp of outgrowing their existing space and could be positioned for expansion/relocation into Fort Worth.
Treat these companies as BRE target companies (i.e., build relationships with the company leadership as well as their networks of service providers).
This includes tracking venture capital (VC) firms in the region that have recently funded high-growth, innovative businesses.
1.2.4.3. Create a detailed package of promotional materials aimed at Fort Worth commercial real estate brokers, describing the attractive environment in Fort Worth for business relocation.
CITY OF FORT WORTH, TEXAS ECONOMIC DEVELOPMENT STRATEGIC PLAN
VOLUME 3: STRATEGY PAGE | 23
Use the material to teach local brokers about the top selling points of Fort Worth compared with the rest of the metro area.
Promote these materials and educational tactics equally among local Fort Worth area brokers and Dallas brokers to provide both groups with information needed to communicate a consistent and desirable image of Fort Worth as a business relocation/expansion destination.
1.2.4.4. Promote Fort Worth as the metro area’s young, up-and-coming location for high-growth startups, tech firms, and young talent.
Use the Manhattan (“corporate/boring”) vs. Brooklyn (“hip/cool”) model to inform this strategy.
1.2.5. Work through existing Fort Worth companies to recruit new expansion projects.
1.2.5.1. Target out-of-market HQs of companies with a major Fort Worth presence.
1.2.5.2. Partner with Fort Worth’s major employers to pursue supply-chain businesses. Start with industries that already have an existing cluster of suppliers and service providers (aerospace, transportation, oil & gas).
1.2.5.3. Focus on HQ relocations of major corporations within industries that already have a strong Fort Worth presence such as manufacturing and transportation.
1.2.6. Business recruitment efforts should be location-specific. While the Chamber and the City represent the entire Fort Worth community (not just a particular geographic area), the community’s recruitment efforts should favor locations where business investment and job growth provide the biggest citywide economic benefits. This means an explicit focus on business investment and job growth in the urban core (downtown and the surrounding neighborhoods and business districts).
1.2.6.1. Chamber marketing materials should promote and highlight Fort Worth’s urban core (downtown, Near Southside, Cultural District, the East Side, and surrounding urban districts).
1.2.7. Support Alliance’s business recruitment strategy. Elevate the role of City support when projects have strong spillover impacts for the city as a whole. Alliance’s contribution to the economic health of Fort Worth cannot be overstated. New Alliance business opportunities in the form of data centers, warehousing and distribution, and logistics have elevated the profile of the community on an international scale.
1.2.7.1. Extend incentives for business recruitment projects in Alliance, while encouraging economic benefits to the city as a whole. These benefits should take the form of high-wage jobs and additional business investments in other parts of the city. [See the recommended changes in the City’s tax abatement policy and in strategies related to downtown.]
1.2.8. Establish stronger linkages between Fort Worth’s tourism and event promotion efforts and its business recruitment activities.
1.2.8.1. Work closely with the Fort Worth Convention & Visitor’s Bureau (CVB) to create strategies for targeted conferences and events that bring in business executives within the city’s target industries.
Create a set of coordination protocols for sharing advance lists of attendees and/or sponsors for events and conferences that fit within the city’s target industries.
CITY OF FORT WORTH, TEXAS ECONOMIC DEVELOPMENT STRATEGIC PLAN
VOLUME 3: STRATEGY PAGE | 24
1.2.8.2. Put in place venue-specific strategies for leveraging Fort Worth’s major event spaces for target industry recruitment. Work with the CVB to identify and pursue events/conferences that bring business decision-makers into Fort Worth within the city’s target industries.
Start with the city’s newest venue, the Dickies Arena (scheduled to open in 2019), since its novelty will allow for more event scheduling opportunities.
Work with the CVB to put in place strategies for events that focus on the Fort Worth Convention Center.
Beyond the CVB, partner with other organizations that own and operate large event spaces to pursue events that align with the city’s target industries. These would include TCU, TCC, TWU, Alliance, and others.
Utilize the “industry intelligence & networking” sections for each of the eight emerging opportunities listed in Volume 2 as a list of potential events to bring to Fort Worth.
1.2.8.3. Encourage regional collaboration between the Fort Worth CVB, the Arlington CVB, the Irving CVB, the Dallas CVB, and other tourism promotion groups in the metro area aimed at targeting high-profile international events and conferences that would raise the profile of the entire Dallas-Fort Worth metro area. The region-wide effort to land the Super Bowl is a good example of this sort of collaboration for major event that benefit the entire metro area.
1.2.9. Establish the Chamber as taking the lead role in marketing Fort Worth and the entire Dallas-Fort Worth metro area as part of international business development efforts.
1.2.9.1. Build a robust understanding of the city’s current foreign-owned firms, major foreign direct investments (over time and in recent years), and domestic companies with a global footprint.
1.2.9.2. Continue working closely with the Chamber, DFW International Airport, the Dallas Regional Chamber, and the City of Dallas to promote the entire region as a hub for foreign direct investment and expansion/relocation of multinational corporations.
As part of these partnerships, focus on promoting the regional assets (Sundance Square, Alliance) and industries (aerospace, manufacturing, transportation) unique to Fort Worth.
1.2.9.3. Expand relationships with Fort Worth-based corporations that have an existing international presence, including foreign-owned companies and domestic firms looking to expand their footprint in the global marketplace.
Take existing multinational firms with a Fort Worth presence on global business development missions.
Lead international trade missions (inbound and outbound) to open up new opportunities for trade and investment for Fort Worth area businesses. Serve as a lead partner to facilitate the development of international business relationships for other Tarrant County cities (e.g., Arlington, Grapevine, Southlake).
1.2.9.4. Strengthen Fort Worth’s appeal for international talent and businesses by broadening local foreign language training programs, expanding the presence and activities of international chambers of commerce in Fort Worth, and developing stronger import/export assistance programs.

CITY OF FORT WORTH, TEXAS ECONOMIC DEVELOPMENT STRATEGIC PLAN
VOLUME 3: STRATEGY PAGE | 25
INITIATIVE 1.3. BUSINESS RETENTION & EXPANSION (BRE) Improve the competitiveness of existing businesses and help them remain and grow in the community.
The US Small Business Administration estimates that roughly 60 percent of new jobs in a community are created through the expansion of existing businesses. While this figure is often debated, there is little question that Fort Worth’s existing employers and industries form the foundation of the local economy. The City and its partners must expand their business retention and expansion (BRE) programs to facilitate the ongoing success of local employers.
A solid BRE program is, arguably, more important than a recruitment program. Not only does BRE offer similar potential for job creation (through the “expansion” part of the title), it also creates a climate that is more supportive of business growth generally. Stated another way, it is difficult to recruit a new company if existing businesses are not thriving, especially if they have a negative attitude about the local business climate. In addition to creating a supportive business climate, a robust BRE program must also help mitigate risks and vulnerabilities facing existing employers. This includes identifying businesses that are at risk of downsizing or relocation, such as those that have been recently acquired by other companies. The June 2017 announcement of XTO Energy’s relocation of 1,600 jobs from Fort Worth to the new Exxon campus in The Woodlands (just outside Houston) illustrates the need for a strong, proactive BRE program. As soon as the firm was acquired by Exxon, the alarm bells should have been rung about the firm’s potential to vacate Fort Worth.
There is a clear need for the City’s economic development program to start with a strong understanding of the needs of local businesses. But this need for understanding does not apply only to the downside risks associated with the potential loss of local businesses and jobs. It applies equally to the upside “risks.” Cultivating close relationships with the community’s existing employers can provide inside knowledge that could lead to growth from other sources, such as the recruitment of suppliers and service providers. Lastly, Fort Worth must make every effort to extend the same support (including incentives) to its existing employers as it does to prospects. Over time, a focus on existing business growth has the potential to generate more economic benefits than strategies aimed at bringing in new companies from outside the area.
1.3.1. Redesign Fort Worth’s BRE program to better address the needs of major employers and key industries.
Best Practice: Business Retention & Expansion in Grants Pass, Oregon (page 64)
1.3.1.1. Establish a set of filtering mechanisms to identify target companies as part of the BRE program. This should include the following tiered approach:
Identify companies at risk of relocating or downsizing (i.e., because of a recent merger/acquisition event).
Identify companies with the potential for a major expansion.
Build an understanding of the major employers within each of the city’s target industries and emerging opportunities.
Work intensively to understand companies targeted for BRE site visits through various sources (beyond relationships with key leadership at each target company). This includes relevant professional service providers with a different understanding of the company’s
CITY OF FORT WORTH, TEXAS ECONOMIC DEVELOPMENT STRATEGIC PLAN
VOLUME 3: STRATEGY PAGE | 26
needs and challenges, such as: accounting firms, legal firms, marketing/PR firms, and commercial real estate professionals.
Based on the filtered list of target BRE companies, apply a dedicated set of staff members to engage with those companies and cultivate deep relationships.
As part of the BRE program, cultivate relationships with executive leadership (e.g., CEOs, CFOs, global real estate directors) of Fort Worth’s major employers whose HQs are located elsewhere.
Employers on this list would include firms like Amazon (Seattle), Lockheed Martin (Bethesda, MD), GE (Boston), Williamson Dickie (future parent company HQ, VF Corporation, in Greensboro, NC) and a range of other large firms based outside of Fort Worth.
1.3.1.2. Coordinate BRE efforts between organizations to fully leverage available resources and relationships and to exchange vital information. This should focus on the Chamber and City relationships (including the Mayor’s office), but should also extend to the local business relationships maintained by the Fort Worth Hispanic Chamber (FWHC) and the Fort Worth Metropolitan Black Chamber (FWMBC).
1.3.2. Use Customer Relations Management (CRM) software between the City and the Chamber to better monitor business issues and concerns.
1.3.2.1. The City and Chamber should use a CRM to track all leads and prospects, including compliance of companies receiving incentives.
1.3.2.2. Explore shared use of technology tools and programs for managing BRE visits and other aspects of Fort Worth’s economic development program.
1.3.3. Protect industrial areas from encroachment. Through zoning, work with CFW Planning Department to ensure major current and future employment nodes and districts are protected from incompatible development and land uses.
1.3.3.1. Start with protection efforts aimed directly at maintaining the appropriate land use and zoning regulations in and around the city’s three airports (Alliance, Meacham, Spinks) and Naval Air Station Joint Reserve Base (NAS-JRB) Fort Worth.
1.3.3.2. Ensure protection for other significant industrial districts with concentrations of manufacturing, transportation, and warehousing businesses that generate heavy truck traffic.
1.3.3.3. Work with the real estate community to preserve strategically located sites within emerging employment/business districts (i.e. Chisholm Trail Parkway, Walsh Ranch) to allow and encourage future development of high-value, high density employment nodes.
INITIATIVE 1.4. WORKFORCE & INDUSTRY PARTNERSHIPS Expand collaboration between employers and training providers to address the needs of local industries and build a pipeline of talent to fuel future business growth.
Access to a skilled workforce consistently ranks at or near the top of the list of site selection factors ranked in Area Development’s Annual Survey of Corporate Executives. Ensuring a pipeline of workers to support the needs of current and future employers will require a combination of targeted recruitment efforts and workforce development
CITY OF FORT WORTH, TEXAS ECONOMIC DEVELOPMENT STRATEGIC PLAN
VOLUME 3: STRATEGY PAGE | 27
initiatives. Successful partnerships engage major employers with education, workforce development, economic development, and community organizations to address priority issues within a target industry.
Fort Worth and the Dallas-Fort Worth metro area as a whole already benefits from established industry partnerships addressing the aerospace manufacturing sector through the DFW Aerospace Consortium, a program of the DFW Regional Workforce Leadership Council. Similar partnerships exist for technology, healthcare, infrastructure, and logistics. Fort Worth participates in the logistics partnership, but must also be engaged in regional partnerships for other sectors. Beyond these regional efforts, Fort Worth should also expand local workforce and industry partnerships focused on the city’s own target industries and emerging opportunities.
In addition to the programs aimed at developing the local and regional workforce, Fort Worth needs to continue attracting talent from outside the region. Fortunately, Fort Worth has proven its ability to attract talent from other large metro areas across the country, as evidenced by positive net migration flows from markets like Chicago, New York, Los Angeles, Atlanta, Phoenix, and others. These existing pipelines of talent should be further capitalized on to support the growth of Fort Worth’s existing and emerging industries.
Marketing initiatives designed to recruit businesses are most successful when they are customized for specific audiences. The same is true about marketing messages for the attraction of talent. The city would benefit from a highly-targeted talent recruitment program. This must include specific messages geared toward two distinct groups: 1) professionals already residing in the Dallas-Fort Worth metro area; and 2) skilled workers moving into the region from outside of Texas. In the eyes of both groups, Fort Worth needs to become a top-choice destination for the upper echelon of talent.
1.4.1. Expand existing employer-led sector partnerships and create new efforts focused on Fort Worth’s target industries to address critical workforce issues facing employers.
Best Practices: NC Manufacturing Institute (page 65) and Alamo Colleges Aerospace Academy (page 65)
1.4.1.1. Increase Fort Worth’s commitment to the DFW Aerospace Consortium’s existing programs and promote a greater emphasis on design, R&D, and technology-related skills.
1.4.1.2. Reactivate the North Texas Supply Chain Council and play a leadership role in moving the partnership toward addressing the major innovations and disruptions facing the transportation & logistics sector over the next three to five years.
1.4.1.3. Actively engage in the other regional industry/workforce partnerships convened by the DFW Regional Workforce Leadership Council: technology, healthcare, and infrastructure.
1.4.2. Launch a new talent initiative [FIND IT. FORT WORTH.] to support employers in their talent recruitment efforts.
Best Practices: Washington State STARS (page 66), Chattanooga GeekMove (page 66),and Make It. MSP. (page 66)
1.4.2.1. Focus the messaging and promotional materials on specific industries, occupations, and employer needs. Also, structure messages to convey Fort Worth’s newest and most exciting amenities for talent attraction.
CITY OF FORT WORTH, TEXAS ECONOMIC DEVELOPMENT STRATEGIC PLAN
VOLUME 3: STRATEGY PAGE | 28
Highlight new and recently improved amenities such as the Trinity River trails, restaurants like the Woodshed Smokehouse, the Sundance Square Plaza, and emerging “hip” corridors like Magnolia Avenue and Race Street.
Also, highlight soon-to-arrive amenities like Panther Island and the Dickies Arena.
Ensure that all messaging is tailored to specific industry, business, and workforce audiences. This should not be a generic “come one, come all” talent campaign.
1.4.2.2. Create a talent portal to provide targeted information about employment opportunities, networking events/groups, and information to assist professionals relocating from outside of the region.
1.4.2.3. Work with regional higher education institutions to attract talent from outside the area.
TCU has 1,189 current students from California (nearly 12 percent of the University’s total enrollment). The University has a strong track record of attracting talent from California.
This existing pipeline should be explored for ways the community can capitalize on this relationship to recruit professional workers for specific occupational needs. For example, in addition to student recruitment, efforts to promote Fort Worth as a potential relocation destination for TCU parents (and potentially their businesses) could lead to a bigger and stronger talent pipeline from California to Fort Worth.
1.4.2.4. Take the FIND IT. FORT WORTH. initiative on the road to provide opportunities for employers to conduct joint marketing efforts aimed at specific pools of talent.
Travel to SXSW (and other major events where key segments of talent congregate) to promote local employers.
Visit major metro areas with a high concentration of workers in Fort Worth’s in-demand occupations to market the area as a top relocation destination. Focus on markets where a recent layoff, corporate merger, or other event has occurred that freed up workers in those competing cities.
Focus on recruiting occupations that serve numerous industries in the local economy. Software/IT talent is one example of an underlying support structure for the growth of practically all industries in Fort Worth (manufacturing, transportation, healthcare, oil & gas). Target specific hard-to-recruit occupations in demand from local employers, such as aerospace engineers, computer systems analysts, software developers, and other critical STEM (science, technology, engineering, and math) occupations.
1.4.3. Engage a broader cross-section of Fort Worth’s population in workforce development initiatives.
1.4.3.1. Encourage more of Fort Worth’s existing population to enter the workforce.
Partner with local nonprofits to make channels of reentry more attractive for residents who have been out of the workforce (e.g., stay-at-home moms, caretakers, retirees, and ex-offenders).
1.4.3.2. Work with young professionals, minority groups, and other underrepresented population groups to better connect them to existing professional development and networking opportunities.

CITY OF FORT WORTH, TEXAS ECONOMIC DEVELOPMENT STRATEGIC PLAN
VOLUME 3: STRATEGY PAGE | 29
Partner with SteerFW, the Fort Worth Hispanic Chamber of Commerce, the Fort Worth Metropolitan Black Chamber of Commerce, and other relevant groups to expand networking opportunities for existing residents.
1.4.3.3. Address significant barriers to entry and re-entry into the workforce through strategies like providing child care through traditional and non-traditional approaches.
Encourage major employers, Workforce Solutions, TCC, FWISD, and other partners to develop collaborative childcare models where multiple employers jointly fund and support a childcare facility.
Organize a social innovation challenge around childcare and other issues that prevent people from entering the workforce (such as transportation, housing, or criminal records). Invite teams to submit ideas for addressing the challenges through social enterprise. Hold a pitch competition for these ideas, judged by a panel of experts, to choose winners with implementable ideas that could help address workforce barriers. Award grants to winners to help accelerate their ideas to market. Connect these teams with incubator space and other entrepreneurial support resources.
1.4.4. Expand partnerships between Tarrant County Workforce Solutions, K-12 schools, TCC, adult education providers, and other institutions to strengthen the skills of Fort Worth’s emerging workforce.
1.4.4.1. Support the workforce development efforts of the Tarrant County consortium of career and technical education (CTE) directors from ISDs across the county.
1.4.4.2. Work with Fort Worth ISD and other area K-12 educational institutions to incorporate more entrepreneurship and business-related coursework (such as Junior Achievement) into their academic programs.
1.4.4.3. Encourage Fort Worth ISD and other area K-12 educational institutions to expand their STEM-focused programs at all grade levels. This should include new curriculum and training to match the future workforce needs of target industries.
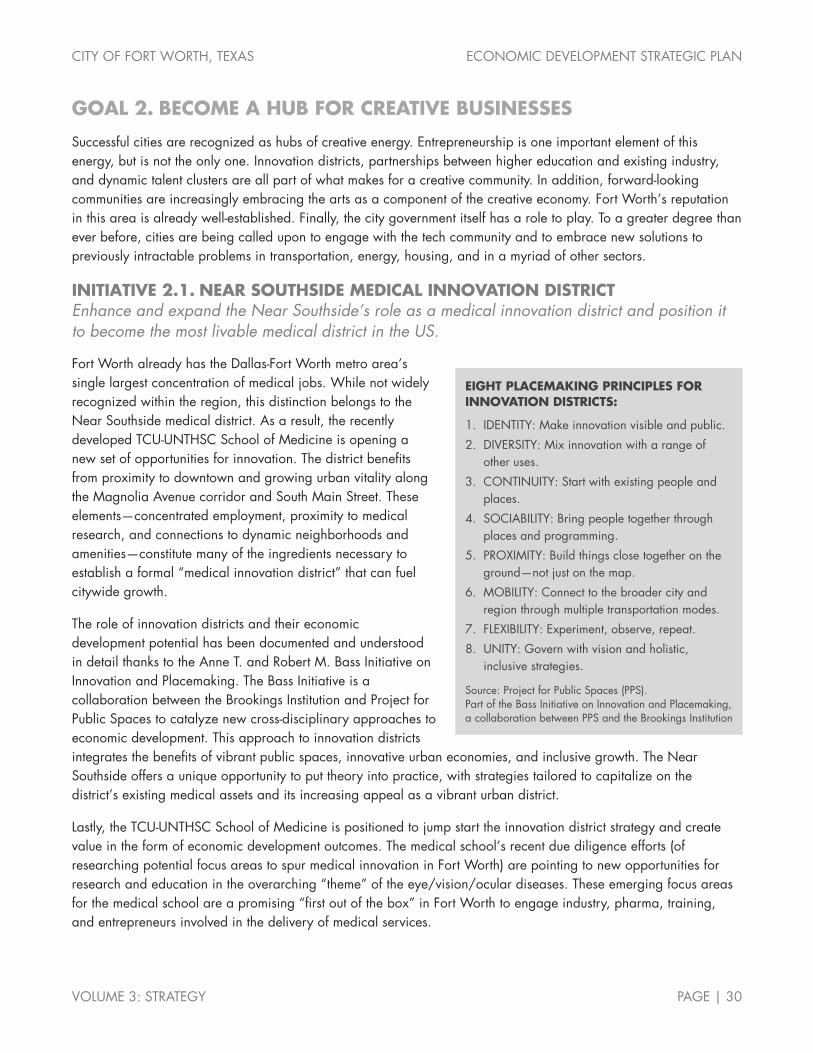
CITY OF FORT WORTH, TEXAS ECONOMIC DEVELOPMENT STRATEGIC PLAN
VOLUME 3: STRATEGY PAGE | 30
GOAL 2. BECOME A HUB FOR CREATIVE BUSINESSES
Successful cities are recognized as hubs of creative energy. Entrepreneurship is one important element of this energy, but is not the only one. Innovation districts, partnerships between higher education and existing industry, and dynamic talent clusters are all part of what makes for a creative community. In addition, forward-looking communities are increasingly embracing the arts as a component of the creative economy. Fort Worth’s reputation in this area is already well-established. Finally, the city government itself has a role to play. To a greater degree than ever before, cities are being called upon to engage with the tech community and to embrace new solutions to previously intractable problems in transportation, energy, housing, and in a myriad of other sectors.
INITIATIVE 2.1. NEAR SOUTHSIDE MEDICAL INNOVATION DISTRICT Enhance and expand the Near Southside’s role as a medical innovation district and position it to become the most livable medical district in the US.
Fort Worth already has the Dallas-Fort Worth metro area’s single largest concentration of medical jobs. While not widely recognized within the region, this distinction belongs to the Near Southside medical district. As a result, the recently developed TCU-UNTHSC School of Medicine is opening a new set of opportunities for innovation. The district benefits from proximity to downtown and growing urban vitality along the Magnolia Avenue corridor and South Main Street. These elements—concentrated employment, proximity to medical research, and connections to dynamic neighborhoods and amenities—constitute many of the ingredients necessary to establish a formal “medical innovation district” that can fuel citywide growth.
The role of innovation districts and their economic development potential has been documented and understood in detail thanks to the Anne T. and Robert M. Bass Initiative on Innovation and Placemaking. The Bass Initiative is a collaboration between the Brookings Institution and Project for Public Spaces to catalyze new cross-disciplinary approaches to economic development. This approach to innovation districts integrates the benefits of vibrant public spaces, innovative urban economies, and inclusive growth. The Near Southside offers a unique opportunity to put theory into practice, with strategies tailored to capitalize on the district’s existing medical assets and its increasing appeal as a vibrant urban district.
Lastly, the TCU-UNTHSC School of Medicine is positioned to jump start the innovation district strategy and create value in the form of economic development outcomes. The medical school’s recent due diligence efforts (of researching potential focus areas to spur medical innovation in Fort Worth) are pointing to new opportunities for research and education in the overarching “theme” of the eye/vision/ocular diseases. These emerging focus areas for the medical school are a promising “first out of the box” in Fort Worth to engage industry, pharma, training, and entrepreneurs involved in the delivery of medical services.
EIGHT PLACEMAKING PRINCIPLES FOR INNOVATION DISTRICTS:
1. IDENTITY: Make innovation visible and public.
2. DIVERSITY: Mix innovation with a range of other uses.
3. CONTINUITY: Start with existing people and places.
4. SOCIABILITY: Bring people together through places and programming.
5. PROXIMITY: Build things close together on the ground—not just on the map.
6. MOBILITY: Connect to the broader city and region through multiple transportation modes.
7. FLEXIBILITY: Experiment, observe, repeat.
8. UNITY: Govern with vision and holistic, inclusive strategies.
Source: Project for Public Spaces (PPS). Part of the Bass Initiative on Innovation and Placemaking, a collaboration between PPS and the Brookings Institution

CITY OF FORT WORTH, TEXAS ECONOMIC DEVELOPMENT STRATEGIC PLAN
VOLUME 3: STRATEGY PAGE | 31
2.1.1. Formally designate the Near Southside as a “medical innovation district.”
2.1.1.1. Formalize additional public investments that enhance walkability and pedestrian connectivity. Include support for broadband that creates a sense of extended connectivity across all devices, both wired and wireless.
2.1.1.2. Create incentives for talent recruitment (e.g., a nationally recognized life sciences researcher) that would advance the district and attract additional research staff.
Extend these incentives to include the recruitment of elite clinicians and clinician scientists, advancing quality of healthcare to an exemplary level and in focused areas to become a regional/national destination for care.
Structure the incentives similar to the Washington STARS program (referenced in Initiative 1.4 as a best practice example of talent recruitment).
2.1.1.3. Invite the Brookings Institution and the Project for Public Spaces (PPS) to evaluate the Near Southside as part of their Bass Initiative on Innovation and Placemaking. Use this to generate national attention about the district and to uncover strategies for accelerating its development.
Best Practices: OKC Innovation District (page 67), Allentown Innovation District (page 67), and Austin Med-Tech Innovation District (page 67).
2.1.2. Invest additional resources into the Near Southside, committing to further enhancements.
2.1.2.1. Continue encouraging the growth of urban residential developments in the district.
2.1.2.2. Avoid national chains or big-box retailers; instead promote the district as a hub for local, unique small businesses.
2.1.2.3. Position Magnolia Avenue as both “hip and authentic” – an urban corridor that attracts new investment (akin to South Congress Avenue in Austin).
2.1.3. Establish a task force to coordinate future public, private, and nonprofit investments associated with the new TCU-UNTHSC School of Medicine and other medical facilities in the Near Southside to support the district’s development as a hub for medical innovation.
2.1.3.1. Research the possibility of using the location near JPS Health to house new state-of-the-art facilities for the TCU-UNTHSC School of Medicine. Evaluate other real estate options within the center of the Near Southside for this purpose.
2.1.3.2. Include innovation, medical talent, and business attraction in the discussions about how to coordinate investments.
2.1.3.3. The task force should include CEO-level leadership from the following organizations:
TCU-UNTHSC School of Medicine, TECH Fort Worth, Near Southside Inc., Downtown Fort Worth Inc., TCU, TCC, other medical institutions, the Fort Worth Life Sciences Coalition, and other relevant groups.
2.1.4. Create a citywide Internal Review Board (IRB) through a collaboration of medical institutions in Fort Worth. This could be a major competitive advantage that allows Fort Worth to attract a high level of investment from medical device/pharmaceutical companies seeking a location for clinical trials. Discussions in this
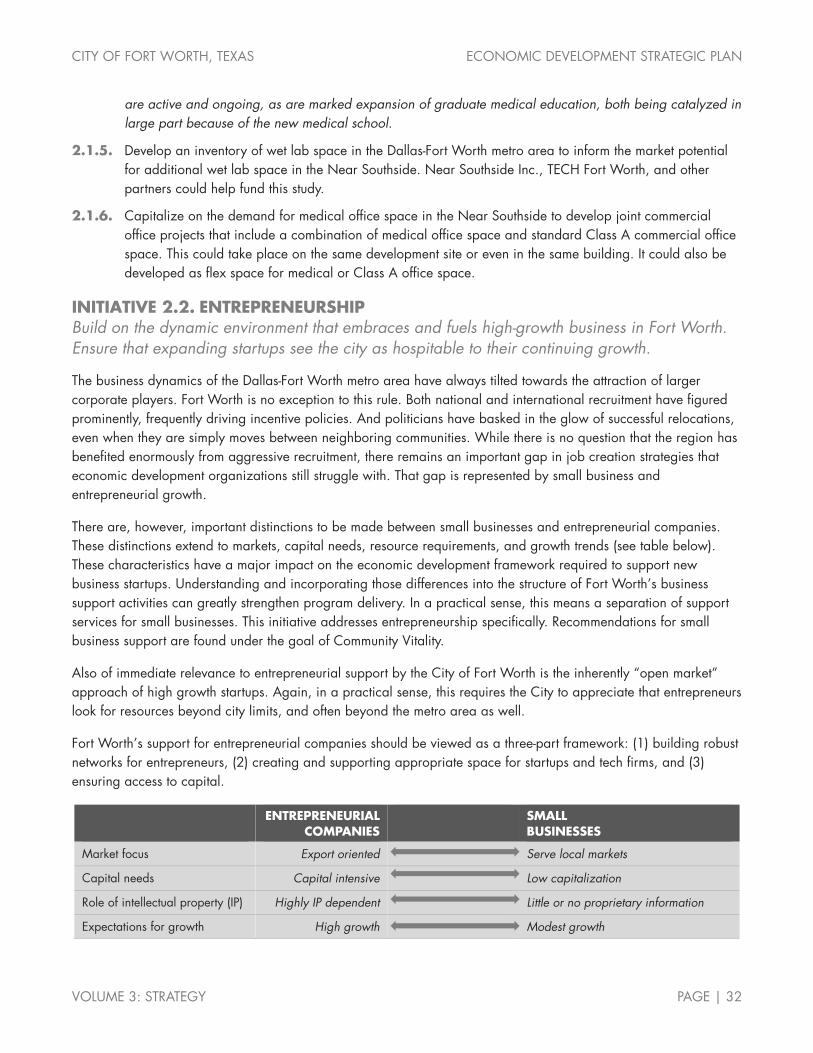
CITY OF FORT WORTH, TEXAS ECONOMIC DEVELOPMENT STRATEGIC PLAN
VOLUME 3: STRATEGY PAGE | 32
are active and ongoing, as are marked expansion of graduate medical education, both being catalyzed in large part because of the new medical school.
2.1.5. Develop an inventory of wet lab space in the Dallas-Fort Worth metro area to inform the market potential for additional wet lab space in the Near Southside. Near Southside Inc., TECH Fort Worth, and other partners could help fund this study.
2.1.6. Capitalize on the demand for medical office space in the Near Southside to develop joint commercial office projects that include a combination of medical office space and standard Class A commercial office space. This could take place on the same development site or even in the same building. It could also be developed as flex space for medical or Class A office space.
INITIATIVE 2.2. ENTREPRENEURSHIP Build on the dynamic environment that embraces and fuels high-growth business in Fort Worth. Ensure that expanding startups see the city as hospitable to their continuing growth.
The business dynamics of the Dallas-Fort Worth metro area have always tilted towards the attraction of larger corporate players. Fort Worth is no exception to this rule. Both national and international recruitment have figured prominently, frequently driving incentive policies. And politicians have basked in the glow of successful relocations, even when they are simply moves between neighboring communities. While there is no question that the region has benefited enormously from aggressive recruitment, there remains an important gap in job creation strategies that economic development organizations still struggle with. That gap is represented by small business and entrepreneurial growth.
There are, however, important distinctions to be made between small businesses and entrepreneurial companies. These distinctions extend to markets, capital needs, resource requirements, and growth trends (see table below). These characteristics have a major impact on the economic development framework required to support new business startups. Understanding and incorporating those differences into the structure of Fort Worth’s business support activities can greatly strengthen program delivery. In a practical sense, this means a separation of support services for small businesses. This initiative addresses entrepreneurship specifically. Recommendations for small business support are found under the goal of Community Vitality.
Also of immediate relevance to entrepreneurial support by the City of Fort Worth is the inherently “open market” approach of high growth startups. Again, in a practical sense, this requires the City to appreciate that entrepreneurs look for resources beyond city limits, and often beyond the metro area as well.
Fort Worth’s support for entrepreneurial companies should be viewed as a three-part framework: (1) building robust networks for entrepreneurs, (2) creating and supporting appropriate space for startups and tech firms, and (3) ensuring access to capital.
ENTREPRENEURIAL
COMPANIES SMALL
BUSINESSES
Market focus Export oriented Serve local markets
Capital needs Capital intensive Low capitalization
Role of intellectual property (IP) Highly IP dependent Little or no proprietary information
Expectations for growth High growth Modest growth
CITY OF FORT WORTH, TEXAS ECONOMIC DEVELOPMENT STRATEGIC PLAN
VOLUME 3: STRATEGY PAGE | 33
2.2.1. Expand the reach of local entrepreneur networking events and create new opportunities for face-to-face connection among the city’s startup and tech communities.
Best Practices: Capitol Factory in Austin (page 69), Venture Asheville (page 69), and Emerging Prairie (page 69)
2.2.1.1. Elevate the role of TECH Fort Worth as a connector/convener to address the need for better and more frequent networking opportunities aimed at entrepreneurs, young professionals, and tech workers.
Work with local chapters of the Entrepreneurs’ Organization (EO), One Million Cups, and other networking programs to promote more frequent and stronger connections for Fort Worth entrepreneurs.
2.2.1.2. Design reverse-pitch competitions to engage major corporations and other organizations in Fort Worth with needs for innovation. See Initiative 2.5 Futures Forum.
2.2.1.3. Pursue specific tactics to enhance entrepreneur networking in Fort Worth, such as an online calendar of networking events, hosted by TECH Fort Worth.
2.2.1.4. Build stronger connections between Fort Worth’s startup/tech community and local and regional higher education institutions.
Start with TCU and UTA, in addition to TCC, TWU, and Tarleton.
Next, pursue further connections with UNT, UTD, and SMU.
2.2.2. Expand access to capital in Fort Worth for high-growth companies.
Best practices: Iconiq Capital in Silicon Valley (page 70)
2.2.2.1. Further leverage the city’s high net-worth individuals to create a venture capital fund in Fort Worth.
2.2.2.2. Engage the city’s private equity and family wealth management/investment offices to explore the potential for developing a larger industry cluster and/or focus area for wealth management.
2.2.2.3. Continue supporting the success of Cowtown Angels.
2.2.3. Provide the real estate space desired by tech firms and creative workers.
2.2.3.1. Expand the co-working space options available in Fort Worth.
2.2.3.2. Market Fort Worth’s urban core to national players (e.g., WeWork).
2.2.3.3. Reinvigorate the over 600,000 square feet T&P Warehouse building on the south end of downtown as a bold new co-working space. Position it as a hub for regional, domestic, and international co-working companies.
2.2.3.4. In addition to providing office space demanded by tech firms, work with the real estate community to create additional flex space for high-growth firms with a need for small-scale manufacturing and warehouse space.
Identify opportunities to create new transitional real estate space to serve high-growth small manufacturing firms (e.g., medical technology products and device makers). This should involve space that does not require long-term leases.
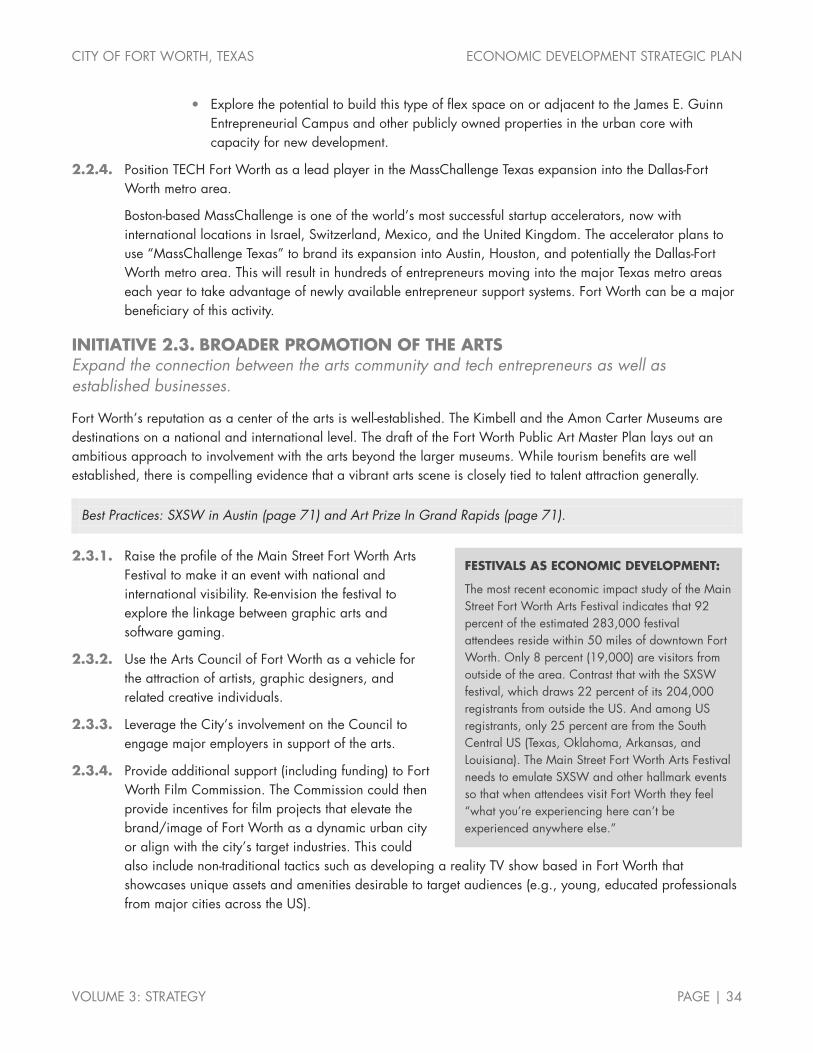
CITY OF FORT WORTH, TEXAS ECONOMIC DEVELOPMENT STRATEGIC PLAN
VOLUME 3: STRATEGY PAGE | 34
Explore the potential to build this type of flex space on or adjacent to the James E. Guinn Entrepreneurial Campus and other publicly owned properties in the urban core with capacity for new development.
2.2.4. Position TECH Fort Worth as a lead player in the MassChallenge Texas expansion into the Dallas-Fort Worth metro area.
Boston-based MassChallenge is one of the world’s most successful startup accelerators, now with international locations in Israel, Switzerland, Mexico, and the United Kingdom. The accelerator plans to use “MassChallenge Texas” to brand its expansion into Austin, Houston, and potentially the Dallas-Fort Worth metro area. This will result in hundreds of entrepreneurs moving into the major Texas metro areas each year to take advantage of newly available entrepreneur support systems. Fort Worth can be a major beneficiary of this activity.
INITIATIVE 2.3. BROADER PROMOTION OF THE ARTS Expand the connection between the arts community and tech entrepreneurs as well as established businesses.
Fort Worth’s reputation as a center of the arts is well-established. The Kimbell and the Amon Carter Museums are destinations on a national and international level. The draft of the Fort Worth Public Art Master Plan lays out an ambitious approach to involvement with the arts beyond the larger museums. While tourism benefits are well established, there is compelling evidence that a vibrant arts scene is closely tied to talent attraction generally.
Best Practices: SXSW in Austin (page 71) and Art Prize In Grand Rapids (page 71).
2.3.1. Raise the profile of the Main Street Fort Worth Arts Festival to make it an event with national and international visibility. Re-envision the festival to explore the linkage between graphic arts and software gaming.
2.3.2. Use the Arts Council of Fort Worth as a vehicle for the attraction of artists, graphic designers, and related creative individuals.
2.3.3. Leverage the City’s involvement on the Council to engage major employers in support of the arts.
2.3.4. Provide additional support (including funding) to Fort Worth Film Commission. The Commission could then provide incentives for film projects that elevate the brand/image of Fort Worth as a dynamic urban city or align with the city’s target industries. This could also include non-traditional tactics such as developing a reality TV show based in Fort Worth that showcases unique assets and amenities desirable to target audiences (e.g., young, educated professionals from major cities across the US).
FESTIVALS AS ECONOMIC DEVELOPMENT:
The most recent economic impact study of the Main Street Fort Worth Arts Festival indicates that 92 percent of the estimated 283,000 festival attendees reside within 50 miles of downtown Fort Worth. Only 8 percent (19,000) are visitors from outside of the area. Contrast that with the SXSW festival, which draws 22 percent of its 204,000 registrants from outside the US. And among US registrants, only 25 percent are from the South Central US (Texas, Oklahoma, Arkansas, and Louisiana). The Main Street Fort Worth Arts Festival needs to emulate SXSW and other hallmark events so that when attendees visit Fort Worth they feel “what you’re experiencing here can’t be experienced anywhere else.”

CITY OF FORT WORTH, TEXAS ECONOMIC DEVELOPMENT STRATEGIC PLAN
VOLUME 3: STRATEGY PAGE | 35
INITIATIVE 2.4. ESTABLISH A “FUTURES FORUM” AT THE CITY Create a formal working group, led by the mayor, that addresses city issues from a “futures perspective.”
Implicit in this initiative is the recognition that city purchasing around major investments (from transportation to water to energy) can itself be a stimulus for economic development. The Futures Forum is an internal city leadership group which also seeks guidance from outside experts around specific topics. This recommendation has two dimensions. First, to engage elected officials in the recognition that “disruption” as a force in business also applies to the public sector. And second, to address specific purchasing opportunities that advance technology solutions for Fort Worth.
Other cities have created similar internal leadership groups. Fort Collins, Colorado created its Futures Committee to assist City Councilmembers in their decision-making process. They meet monthly with a goal “to position the City in the distant future (30 plus years) for achievable successes, integrating community desires with known fiscal, social and environmental data.”
2.4.1. Create a Futures Forum for the City of Fort Worth, modeled on Fort Collins.
2.4.2. Use the Futures Forum to address purchasing options. Identify major capital expenditures anticipated by the City and invite tech companies to offer non-traditional solutions.
2.4.3. Draw upon the City Initiatives for Technology, Innovation, and Entrepreneurship (CITIE) as a resource to inform the city’s long-range investment decisions (www.citie.org). The CITIE framework sets out the policy levers city governments can use to support innovation and entrepreneurship.

CITY OF FORT WORTH, TEXAS ECONOMIC DEVELOPMENT STRATEGIC PLAN
VOLUME 3: STRATEGY PAGE | 36
GOAL 3. ENSURE COMMUNITY VITALITY
Quality of place is an essential component of a successful economic development strategy. The strength of neighborhoods, of connectivity among different districts of the city, and of urban amenities are what make cities attractive to talented individuals and to dynamic businesses. With ongoing Trinity River enhancements (including Panther Island), the Cultural District, and extensive trails and parks, Fort Worth is well on its way to realizing this goal.
INITIATIVE 3.1. DOWNTOWN FORT WORTH Accelerate downtown Fort Worth’s emergence as the premier mixed-use business district in Texas.
Fort Worth’s abundance of vacant land is a double-edged sword. A city with room to grow in every direction has the luxury of being able to grow its employment base, its population, and its tax base by simply developing new greenfield sites on the outskirts of its municipal boundaries. However, this approach leads to issues associated with urban sprawl, such as traffic congestion and rising infrastructure costs. To offset this, Fort Worth can further promote downtown as the centerpiece of the City’s economic development strategy.
Downtown Fort Worth is arguably the most walkable downtown district in the State of Texas. Sundance Square, with its small 250-foot blocks, more closely resembles Portland, Oregon, (famous for its pedestrian-friendly urban center) than it does the other big Texas cities, like Dallas, Houston, Austin, and San Antonio. In recent years, Sundance Square has leveraged this built-in advantage of fine-grained urbanism to become a vibrant entertainment district with a rapidly-expanding residential base. The next step for downtown is to become the destination of choice for businesses including corporate HQs, professional service firms, and tech companies.
The emphasis on Fort Worth’s urban core as a specific focus area for this plan does not take away from development in Alliance, CentrePort, or other locations outside of the urban core. These areas clearly add value to the local economy. But the city’s urban core is what makes Fort Worth unique and differentiates it from the competition. Arlington has its stadium/entertainment district. Frisco has its “Five Billion Dollar Mile.” But only Dallas and Fort Worth have a large central business district surrounded by other authentic urban districts and corridors.
The ultimate goal for downtown Fort Worth is to expand its role as the city’s primary business district through the growth of existing businesses and the recruitment of new corporate & regional HQs, tech firms, and professional service employment. Paradoxically, the most effective strategy to achieve that goal is to accelerate residential development in and around downtown Fort Worth. This is the “secret” ingredient for the success of downtown Austin, Denver, and Seattle as dynamic mixed-use business districts. Each of those cities made a commitment to a downtown housing strategy first and is now reaping the benefits in the form of commercial office development and the expansion of tech firms and other professional jobs in their urban cores. Fort Worth is beginning to see these benefits thanks to its commitment to urban residential development in recent years.
In late 2015, Smart Growth America issued a report titled, “Why American Companies Are Moving Downtown.” In partnership with Cushman & Wakefield and the Center for Real Estate & Urban Analysis at George Washington University, the report analyzed nearly 500 companies that relocated or expanded to walkable downtowns between 2010 and 2015. One of the report’s major findings was that the companies’ new locations were far more walkable than their prior setting. Fort Worth, with its walkable downtown and growing menu of urban amenities, is well-positioned to become the leading mixed-use business district in Texas, competing directly with Dallas’s Uptown district and downtown Austin, both of which have emerged a dynamic mixed-use business locations.

CITY OF FORT WORTH, TEXAS ECONOMIC DEVELOPMENT STRATEGIC PLAN
VOLUME 3: STRATEGY PAGE | 37
3.1.1. Rapidly increase the density of residential development in downtown Fort Worth and surrounding urban districts.
Best Practice: Austin, Seattle, and Denver (page 70)
3.1.1.1. Set specific targets for new housing units in the urban core.
Add 1,000 net new units per year in the CBD 1-mile radius (the core downtown area).
Add 2,000 net new units per year in the CBD 2-mile radius (includes downtown plus the Near Southside, Panther Island, and the Cultural District).
Add 4,000 net new units per year in the CBD 4-mile radius (includes all of Fort Worth’s inner-city districts, from TCU to the Stockyards, and from Race Street to Texas Wesleyan University).
3.1.1.2. Create incentives to encourage high-density residential development in downtown and surrounding districts (e.g., Panther Island, Near Southside). These incentives should address:
New high-rise residential and re-purposing of existing buildings that are currently underutilized.
Instead of density bonuses (allowing developers to increase density in return for something desired by the City), incentivize greater density. In other words, make density itself a desired outcome, rewarded through new incentives.
Redevelopment of surface parking lots.
Reduce necessary parking (and costs) for new developments through use of shared parking agreements, similar to how the Frost Tower is approaching its parking program. Leverage the downtown TIF’s investment in shared parking spaces as a tool to incentivize new developments (e.g., Class A office space, hotels, high-rise residential) that could benefit from additional parking in a shared setting. Expand the use of this tool over time as new projects develop in the downtown to create a larger pool of potential parking spaces for shared use.
3.1.2. Encourage higher education expansions in downtown Fort Worth through the continued growth of existing downtown institutions (TCC, UTA, and Texas A&M Law School).
DOWNTOWN + ALLIANCE PARTNERSHIP:
Fort Worth has something no other city in the metro area can claim: a vibrant downtown district and a dynamic suburban growth center. Downtown Fort Worth and Alliance play distinct economic roles and offer distinct advantages for doing business. Downtown offers prime office space, urban residential options, nightlife, a high concentration of hotels, and a walkable environment connecting these uses and amenities. Alliance is the perfect location for land-intensive operations requiring transportation access (highway, rail, and air) as well as high-speed broadband internet within a secure corporate environment. Downtown and Alliance rarely compete. In fact, their distinct value propositions represent mutual benefits. A large distribution or data center would not consider locating downtown. Likewise, a corporate headquarters in a downtown office tower is unlikely to locate in a far-away greenfield site. Fort Worth’s advantage lies in the large number of companies in both locations that could expand. Downtown-based firms could open facilities (e.g., a data center) in Alliance. And companies operating in Alliance could open offices (e.g., a software development center) in downtown.

CITY OF FORT WORTH, TEXAS ECONOMIC DEVELOPMENT STRATEGIC PLAN
VOLUME 3: STRATEGY PAGE | 38
3.1.2.1. Encourage other Fort Worth and regional higher education institutions to establish a downtown presence. This would include TCU, TWU, Tarleton State University, and even the University of North Texas.
Best Practice: ASU in Phoenix, UCF in Orlando, and UW in Tacoma (page 70)
3.1.3. Facilitate collaboration between Fort Worth’s two major anchor districts: downtown and Alliance.
3.1.3.1. Focus on enhancing business partnerships among firms within both districts.
3.1.3.2. Encourage greater collaboration between the lead-generation and business development activities in the two zones. Focus on partnerships between Alliance and Sundance Square on major prospect visits (e.g., Facebook) as well as international business missions (inbound and outbound).
3.1.3.3. Explore the creation of City incentive programs to facilitate greater collaboration and new business investment in the two areas.
3.1.3.4. Promote downtown as a location for specific functions related to Alliance firms (e.g., a downtown design center for IKEA).
3.1.4. Identify specific locations for downtown business attraction and future redevelopment.
3.1.4.1. Focus on the following specific sites and types of sites:
TCC’s Radio Shack campus.
The six downtown XTO properties.
The T&P Warehouse building and adjacent properties along the CBD portion of the Lancaster Avenue corridor.
Surface parking lots, including those owned by churches and other nonprofit entities (some of these could be developed through long-term ground leases whereby the nonprofit organization retains ownership of the land).
Underutilized and well-positioned government-owned properties (i.e., Tarrant County’s strategically located properties in the CBD).
3.1.4.2. Work with downtown landowners to understand site potential for business attraction.
3.1.5. Encourage business expansion and relocation from within Fort Worth to the downtown area.
3.1.5.1. Create a pilot project to encourage tech workers to relocate to downtown Fort Worth from other office locations in the city.
Encourage a pilot group of the city’s major employers (10-20) to set up a shared co-working space for a small portion of their workforce (10-20 workers initially for each employer).
Use this as a networking and talent retention strategy for the technology workers already employed by local businesses.
Depending on the success of the pilot, expand the initiative to include more employers and organizations that can help create an environment favorable to innovation and creativity.

CITY OF FORT WORTH, TEXAS ECONOMIC DEVELOPMENT STRATEGIC PLAN
VOLUME 3: STRATEGY PAGE | 39
Ensure area higher education institutions (TCU, UTA, TWU, and TCC) play a role in this project).
3.1.6. Promote downtown Fort Worth and surrounding urban districts as a test bed for “smart city” projects and forward-looking civic innovation. [See City “Futures Forum” strategy.]
3.1.6.1. Launch a Request for Expressions of Interest (RFEI) marketed to leading transportation innovation firms to begin positioning downtown Fort Worth as the first “driverless” downtown district in the US.
3.1.6.2. Partner with innovative Fort Worth and regional companies to explore ways to test and deploy new technologies in the downtown district. This should include local telecom providers (e.g., AT&T, Verizon) and energy providers (e.g., Oncor, CoServe).
3.1.6.3. Promote the use of PoE (Power over Ethernet) technology developed in partnership with Cisco Systems for the downtown Marriott Autograph Collection hotel (developed by Sinclair Holdings LLC) as a pioneering approach toward optimizing building operations such as interior and exterior lighting and other building systems.
Use this as a model to attract attention from other “smart building” technology providers and developers interested in redeveloping existing buildings and/or creating new downtown spaces with cutting-edge technologies.
3.1.7. Encourage high-density, mixed-use corridor development to strengthen the linkages between downtown Fort Worth and surrounding urban districts.
3.1.7.1. Make key infrastructure investments to enhance the transportation connections (including pedestrian and bike modes) between Sundance Square and the following areas: the Cultural District, Near Southside, the 41-acre Butler Place housing redevelopment project just east of downtown, and Panther Island.
3.1.7.2. Evaluate and revise zoning and land use regulations to allow and encourage dense mixed-use development (office, hotel, retail/restaurant, and residential) along key corridors radiating out from downtown Fort Worth.
3.1.8. Expand the use of “tactical urbanism” methods for activating empty spaces and underutilized properties in downtown and surrounding parts of the urban core.
3.1.8.1. Host alley fairs, PARK(ing) Day events (temporarily turning an on-street parking spot into a public space), and other events to raise the profile of downtown as the city’s center of gravity. Focus on lesser-known or underutilized areas of downtown to build a stronger sense of awareness around the possibilities for new development or business growth in distinct sub-districts within downtown.
THE “TACTICAL URBANISM” MOVEMENT:
The emerging “tactical urbanism” movement favors quick and cheap actions that create nearly instantaneous positive results. This new approach—led by groups such as the Project for Public Spaces and the Better Block Project—is helping to re-energize hundreds of downtowns and urban corridors in small and large cities across the US.
CITY OF FORT WORTH, TEXAS ECONOMIC DEVELOPMENT STRATEGIC PLAN
VOLUME 3: STRATEGY PAGE | 40
3.1.8.2. Bring in the Project for Public Spaces, the Better Block Project, and other groups with experience implementing tactical urbanism projects for a forum/event to showcase and discuss opportunities for enhancing downtown Fort Worth’s urban appeal through creative tactics.
3.1.9. Work closely with the Trinity River Vision Authority to position Panther Island as one of the premier urban mixed-use residential districts in the US.
3.1.9.1. Encourage rapid growth of high-density residential development in Panther Island.
Work with the Trinity River Vision Authority and the real estate community to accelerate permitting, development, and construction of new urban residential buildings in Panther Island.
As new residential buildings come online (with the first apartment buildings planned for construction in 2018), promote these and major infrastructure investments (the bridges scheduled to be opened by 2019) as evidence to dispel misperceptions about the Panther Island development as “off in the distant future”.
3.1.9.2. Over time, as the district’s population base grows, pursue business development within the district.
3.1.9.3. Support the addition of amenities, including retail and restaurant space, as the residential base within the district grows large enough to generate its own demand for commercial development.
3.1.9.4. Preserve key sites within Panther Island for future corporate HQ locations. Begin working in the near future (in 2018 and 2019) to create business plans for specific sites in Panther Island that would be ideal for future commercial office development.
3.1.10. Leverage Fort Worth’s downtown tourism assets for broader economic growth.
3.1.10.1. Expand the downtown hotel base to generate a higher level of activity, investment, and business development potential. Based on the goals of this plan, set specific targets for new hotel rooms in the urban core.
Add 500 net new hotel rooms per year in the CBD 1-mile radius (the core downtown area).
Add 1,000 net new hotel rooms per year in the CBD 4-mile radius (includes all of Fort Worth’s inner-city districts, from TCU to the Stockyards, and from Race Street to Texas Wesleyan University).
3.1.10.2. Commission a CBD and citywide hotel market study to provide a detailed understanding of the market opportunities for additional hotel development. Draw upon findings from the 2014 Hunden Strategic Partners’ hotel and convention center feasibility study. If the market study indicates stronger levels of demand than the specific numbers of additional hotel rooms in the urban core laid out above, increase those targets to respond to market demand.
3.1.10.3. Encourage the development of new boutique hotels in the city’s urban core to enhance the appeal of downtown and surrounding districts. Boutique hotels play an important role in community vitality and revitalization of urban districts. Examples of successful boutique hotel projects include the Ashton Hotel in Fort Worth, Hotel San Jose in Austin’s South Congress Avenue corridor, and The Padre Hotel in downtown Bakersfield, California.

CITY OF FORT WORTH, TEXAS ECONOMIC DEVELOPMENT STRATEGIC PLAN
VOLUME 3: STRATEGY PAGE | 41
INITIATIVE 3.2. NEIGHBORHOOD ALIGNMENT Align neighborhood assets (people, businesses, and real estate) to benefit from and support citywide economic growth.
The success of regional and citywide economies does not guarantee prosperity for all. Even in the nation’s most successful and diversified metropolitan economies, specific geographies and segments of the population are often left behind. Fort Worth is no exception. Segments of the city’s population in specific neighborhoods and corridors have struggled to achieve prosperity, even while the city as a whole has experienced widespread growth. The City can and should play a lead role in catalyzing development in under-served neighborhoods and for under-served residents. There are a number of promising national models for aligning assets to improve economic opportunity.
Minneapolis-Saint Paul is one of the most diverse economic regions in the US with enviable business clusters and a well-educated workforce defined by high income levels. However, the neighborhoods of North Minneapolis and Eastside Saint Paul have not benefited from regional economic success. Poverty levels and unemployment levels in those two neighborhoods have consistently remained several times above the regional average. New programs and partnerships are currently underway to address these challenges, including a Center Cities Competitiveness Initiative funded by the McKnight Foundation and implemented by Greater MSP (the regional economic development organization) in collaboration with other regional partners.
Denver is also a nationally recognized economic success story, with a dynamic city and metro economy that has served as a magnet for technology companies and young, educated workers. Despite Denver’s success, there are still significant disparities among the city’s neighborhoods. Life expectancies are a decade lower in the city’s most economically disadvantaged neighborhoods (West Colfax and Valverde) compared with desirable areas such as Stapleton and Washington Park. Recent public-private investments in the city’s market-challenged areas, led by the Denver Urban Renewal Authority, have begun to turn those areas around, including the recruitment of an Alamo Drafthouse Cinema as part a mixed-use development along West Colfax Avenue.
It is worth noting here that this plan is not intended to serve as a solution for every challenge in Fort Worth (e.g., public health, poverty, educational disparities). Public investments in economic development must be made only when they can reasonably be expected to generate economic benefits. Desired outcomes include ancillary development, tax base growth, and job creation.
3.2.1. Focus City investments along specific corridors and at nodes of existing business activity.
3.2.1.1. Apply an internal due-diligence process in advance of any major City-led investments intended to revitalize specific neighborhoods. Move forward with public investments only when the following criteria are addressed:
Ancillary or accelerated development generated by the investment;
Tax base growth; or
Employment growth, especially jobs for under-served populations within the neighborhoods.
3.2.1.2. Investments that enhance the economic potential of a target area (such as an Urban Village) include:
Broadband internet investments in under-served portions of the city.
Streetscape improvements that enhance a corridor’s appeal for pedestrians and cyclists.
CITY OF FORT WORTH, TEXAS ECONOMIC DEVELOPMENT STRATEGIC PLAN
VOLUME 3: STRATEGY PAGE | 42
Storefront/façade improvements for buildings along a commercial street.
3.2.1.3. For areas of the city targeted for urban revitalization, prevent the growth of land uses and activities that would make the area a less desirable location for business investment and job growth. Examples of land uses and activities that might diminish the economic potential of a target area include:
Large public sector or nonprofit developments (e.g., community centers, churches, homeless services centers).
Land-intensive, auto-centric development (e.g., gas stations, automotive repair shops, car washes, storage unit complexes).
3.2.2. Encourage substantial new housing investment and development in the city’s under-served neighborhoods.
3.2.2.1. Provide developer incentives for the creation of new high-quality housing stock on vacant properties. These should include a range of housing types and price points such as single-family homes, townhomes, high-quality multi-family properties, and mixed-use developments with residential units on upper floors and retail/office space on ground floors.
3.2.2.2. Work with the FWHC and the FWMBC and other partners (such as TWU and TCC) to launch a proactive marketing initiative that dispels the misperceptions and exaggerations about challenged neighborhoods in Fort Worth, especially on the East Side.
Highlight the area’s unique positive attributes: historic housing stock, scenic views, short commutes to major employment centers, access to recreational opportunities (e.g., Trinity River, Lake Arlington).
3.2.3. Use City-owned land and other publicly owned properties (such as FWISD and TCC properties) as a redevelopment tool to encourage investment in specific neighborhoods.
3.2.3.1. Pursue public/private development offerings through an RFEI (Request for Expressions of Interest) process that gauges demand and tests ideas from area developers for potential redevelopment of specific sites such as Fort Worth ISD’s properties near Farrington Field and the ISD’s headquarters site near the Cultural District.
3.2.4. Address transportation needs to better integrate neighborhoods with major employment nodes.
3.2.4.1. Encourage collaboration between transportation providers, major employers, and other partners to enhance transportation options that connect residents with employment opportunities.
Use commuting data for the city’s major employment nodes (included in Volume 2) to engage in discussions with The T and major employers to explore options for new bus routes, on-demand transit services, and other solutions to connect workers with jobs.
3.2.4.2. Consider City takeover of TXDOT roads to facilitate re-design, “complete streets” re-configurations, and take other measures to make major arterial corridors more attractive for redevelopment as mixed-use commercial corridors.
3.2.5. Engage local foundations to target specific geographies for economic development. Nonprofit grantmaking foundations play a critical role in supporting economic development initiatives in many communities across the US. Fort Worth is fortunate to have a large pool of well-capitalized foundations,

CITY OF FORT WORTH, TEXAS ECONOMIC DEVELOPMENT STRATEGIC PLAN
VOLUME 3: STRATEGY PAGE | 43
some of which already target their funds for economic development programs (e.g., the Anne T. and Robert M. Bass Initiative on Innovation and Placemaking).
Best Practice: MSP Center Cities Initiative (page 71)
3.2.5.1. Host a “Neighborhood Vitality” forum inviting Fort Worth-based foundations and national foundations to discuss options for how philanthropic groups engage in economic development and community development initiatives. Invite representatives from the McKnight Foundation in Minneapolis, the van Beuren Charitable Foundation in Newport, Rhode Island, and other foundations with a track record of investing in local economic development.
3.2.5.2. Leverage higher education assets to provide research, expertise, and other technical assistance.
3.2.5.3. Involve UTA’s urban planning master’s and PhD programs and the UTA Institute of Urban Studies. Involve TCU’s MBA and undergraduate entrepreneurship programs and its Center for Urban Studies. Involve Texas Wesleyan’s business programs. Involve TCC as well.
3.2.6. Continue to partner with anchor institutions such as Texas Wesleyan University to spark new investment and development in challenged neighborhoods and corridors with potential for additional commercial and residential development.
3.2.6.1. Work with Texas Wesleyan University to encourage new private sector investment on and adjacent to their campus.
This could include new housing, retail/restaurant spaces, office space, and sports/entertainment facilities (such as a potential new multi-use soccer field for joint use between Texas Wesleyan and the Fort Worth Vaqueros NPSL team).
INITIATIVE 3.3. SMALL BUSINESS SUPPORT Restructure small business assistance based on a communitywide audit.
Dynamic local economies are often defined by a strong base of independent, locally-owned small businesses. Distinctive retailers, restaurants, and coffee shops help otherwise sterile corridors build unique identities. These increasingly vital districts also provide opportunities for minority-owned business development. Independent, locally-owned firms also re-circulate a higher share of their revenue in the local economy as compared to national chain businesses. Finally, these businesses help attract tech companies and often become a magnet for young people, even beyond the city limits. Magnolia Avenue in the Near Southside is a perfect example of this trend. And Race Street is following the same trajectory.
This emphasis on independent small businesses highlights the distinction between entrepreneurial companies and small businesses established in Initiative 2.2. Both types of firms are important to the city’s economy, but their support systems differ substantially. Much of what is being done by the Fort Worth Business Assistance Center (BAC) fits into the category of entrepreneurial company support, which is the core mission of TECH Fort Worth. By sharply distinguishing between entrepreneurial and small business support, a major re-organization is required in the way the City of Fort Worth provides services. An audit is the logical starting point for addressing the way in which small businesses—as distinct from entrepreneurial companies—are supported by the City and its partners.
3.3.1. Conduct an audit of the small business support mechanisms available in Fort Worth.

CITY OF FORT WORTH, TEXAS ECONOMIC DEVELOPMENT STRATEGIC PLAN
VOLUME 3: STRATEGY PAGE | 44
3.3.1.1. Evaluate how small businesses access the resources and support they need.
3.3.1.2. Assess the ability of Fort Worth’s small business support providers to serve the needs of local businesses.
These would include the City, the Tarrant SBDC, the BAC, the Chamber, the FWHC, the FWMBC, the DFW Hispanic Contractors Association, churches, nonprofit organizations, foundations, and financial institutions.
Evaluate key functions for small businesses, including: business planning and marketing, financial support, real estate space, technology needs, and workforce.
3.3.1.3. The audit should consider the advantages of moving the City’s Office of Business Diversity into the Purchasing Department.
3.3.1.4. The audit should also evaluate how the FWHC and the FWMBC can further support small business development throughout the city’s neighborhoods.
3.3.2. Re-focus the role of the BAC to serve as the primary connector/convener to address the need for support mechanisms aimed at small business startups, minority owned firms, and locally-serving businesses.
3.3.3. Leverage churches and other under-utilized buildings as shared space for co-working, small business development, workforce training, networking, and other purposes that support economic and workforce development within the city’s neighborhoods.
3.3.4. Showcase the success of La Gran Plaza, an under-appreciated minority-business success story and quality-of-life asset in Fort Worth.
3.3.4.1. Use this as a model for other development projects in under-served neighborhoods in the city. Cultivate relationships with minority-focused real estate developers and investors with a track record of creating projects that provide retail and services to under-served populations in urban markets.
3.3.5. Establish a citywide revolving loan fund to provide “gap” financing for small business expansions, startups, and relocations.
3.3.5.1. To assist in capitalizing the fund, the City should pursue grants from the Economic Development Administration (EDA), the Department of Housing and Urban Development (HUD), and Community Development Block Grant (CDBG) program funds.
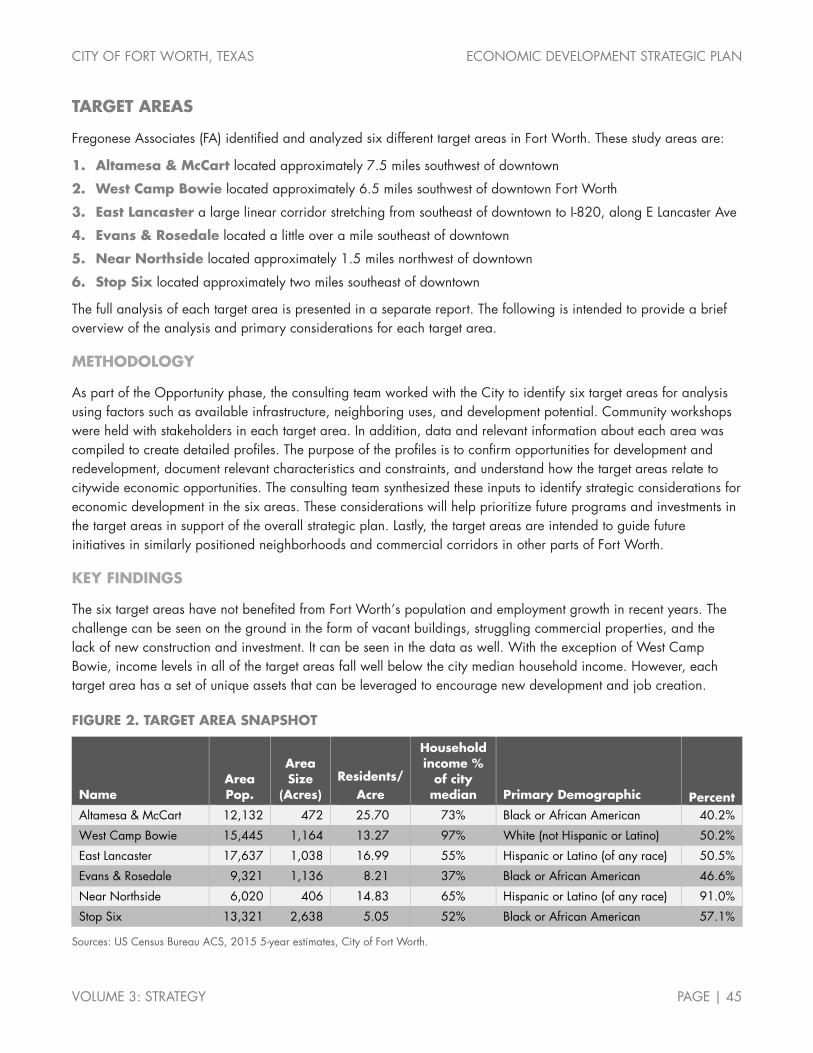
CITY OF FORT WORTH, TEXAS ECONOMIC DEVELOPMENT STRATEGIC PLAN
VOLUME 3: STRATEGY PAGE | 45
TARGET AREAS
Fregonese Associates (FA) identified and analyzed six different target areas in Fort Worth. These study areas are:
1. Altamesa & McCart located approximately 7.5 miles southwest of downtown
2. West Camp Bowie located approximately 6.5 miles southwest of downtown Fort Worth
3. East Lancaster a large linear corridor stretching from southeast of downtown to I-820, along E Lancaster Ave
4. Evans & Rosedale located a little over a mile southeast of downtown
5. Near Northside located approximately 1.5 miles northwest of downtown
6. Stop Six located approximately two miles southeast of downtown
The full analysis of each target area is presented in a separate report. The following is intended to provide a brief overview of the analysis and primary considerations for each target area.
METHODOLOGY
As part of the Opportunity phase, the consulting team worked with the City to identify six target areas for analysis using factors such as available infrastructure, neighboring uses, and development potential. Community workshops were held with stakeholders in each target area. In addition, data and relevant information about each area was compiled to create detailed profiles. The purpose of the profiles is to confirm opportunities for development and redevelopment, document relevant characteristics and constraints, and understand how the target areas relate to citywide economic opportunities. The consulting team synthesized these inputs to identify strategic considerations for economic development in the six areas. These considerations will help prioritize future programs and investments in the target areas in support of the overall strategic plan. Lastly, the target areas are intended to guide future initiatives in similarly positioned neighborhoods and commercial corridors in other parts of Fort Worth.
KEY FINDINGS
The six target areas have not benefited from Fort Worth’s population and employment growth in recent years. The challenge can be seen on the ground in the form of vacant buildings, struggling commercial properties, and the lack of new construction and investment. It can be seen in the data as well. With the exception of West Camp Bowie, income levels in all of the target areas fall well below the city median household income. However, each target area has a set of unique assets that can be leveraged to encourage new development and job creation.
FIGURE 2. TARGET AREA SNAPSHOT
Name Area Pop.
Area Size
(Acres) Residents/
Acre
Household income %
of city median Primary Demographic Percent
Altamesa & McCart 12,132 472 25.70 73% Black or African American 40.2%
West Camp Bowie 15,445 1,164 13.27 97% White (not Hispanic or Latino) 50.2%
East Lancaster 17,637 1,038 16.99 55% Hispanic or Latino (of any race) 50.5%
Evans & Rosedale 9,321 1,136 8.21 37% Black or African American 46.6%
Near Northside 6,020 406 14.83 65% Hispanic or Latino (of any race) 91.0%
Stop Six 13,321 2,638 5.05 52% Black or African American 57.1%
Sources: US Census Bureau ACS, 2015 5-year estimates, City of Fort Worth.

CITY OF FORT WORTH, TEXAS ECONOMIC DEVELOPMENT STRATEGIC PLAN
VOLUME 3: STRATEGY PAGE | 46
FIGURE 3. GEOGRAPHIC OVERVIEW OF TARGET AREAS, 2015
Evans & Rosedale
East Lancaster
Stop Six
West Camp Bowie
Near Northside
Altamesa & McCart
183
287
199
183
287
121
287 BUS
BUS
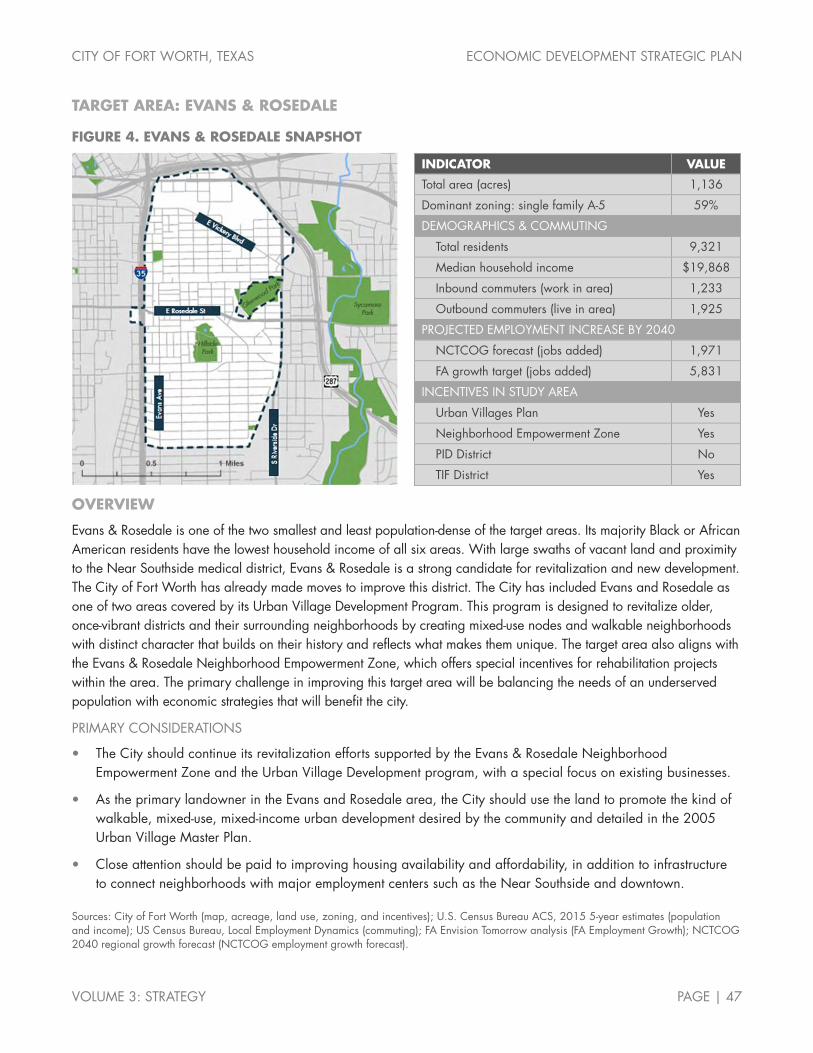
CITY OF FORT WORTH, TEXAS ECONOMIC DEVELOPMENT STRATEGIC PLAN
VOLUME 3: STRATEGY PAGE | 47
TARGET AREA: EVANS & ROSEDALE
FIGURE 4. EVANS & ROSEDALE SNAPSHOT
INDICATOR VALUE
Total area (acres) 1,136
Dominant zoning: single family A-5 59%
DEMOGRAPHICS & COMMUTING
Total residents 9,321
Median household income $19,868
Inbound commuters (work in area) 1,233
Outbound commuters (live in area) 1,925
PROJECTED EMPLOYMENT INCREASE BY 2040
NCTCOG forecast (jobs added) 1,971
FA growth target (jobs added) 5,831
INCENTIVES IN STUDY AREA
Urban Villages Plan Yes
Neighborhood Empowerment Zone Yes
PID District No
TIF District Yes
OVERVIEW
Evans & Rosedale is one of the two smallest and least population-dense of the target areas. Its majority Black or African American residents have the lowest household income of all six areas. With large swaths of vacant land and proximity to the Near Southside medical district, Evans & Rosedale is a strong candidate for revitalization and new development. The City of Fort Worth has already made moves to improve this district. The City has included Evans and Rosedale as one of two areas covered by its Urban Village Development Program. This program is designed to revitalize older, once-vibrant districts and their surrounding neighborhoods by creating mixed-use nodes and walkable neighborhoods with distinct character that builds on their history and reflects what makes them unique. The target area also aligns with the Evans & Rosedale Neighborhood Empowerment Zone, which offers special incentives for rehabilitation projects within the area. The primary challenge in improving this target area will be balancing the needs of an underserved population with economic strategies that will benefit the city.
PRIMARY CONSIDERATIONS
The City should continue its revitalization efforts supported by the Evans & Rosedale Neighborhood Empowerment Zone and the Urban Village Development program, with a special focus on existing businesses.
As the primary landowner in the Evans and Rosedale area, the City should use the land to promote the kind of walkable, mixed-use, mixed-income urban development desired by the community and detailed in the 2005 Urban Village Master Plan.
Close attention should be paid to improving housing availability and affordability, in addition to infrastructure to connect neighborhoods with major employment centers such as the Near Southside and downtown.
Sources: City of Fort Worth (map, acreage, land use, zoning, and incentives); U.S. Census Bureau ACS, 2015 5-year estimates (population and income); US Census Bureau, Local Employment Dynamics (commuting); FA Envision Tomorrow analysis (FA Employment Growth); NCTCOG 2040 regional growth forecast (NCTCOG employment growth forecast).
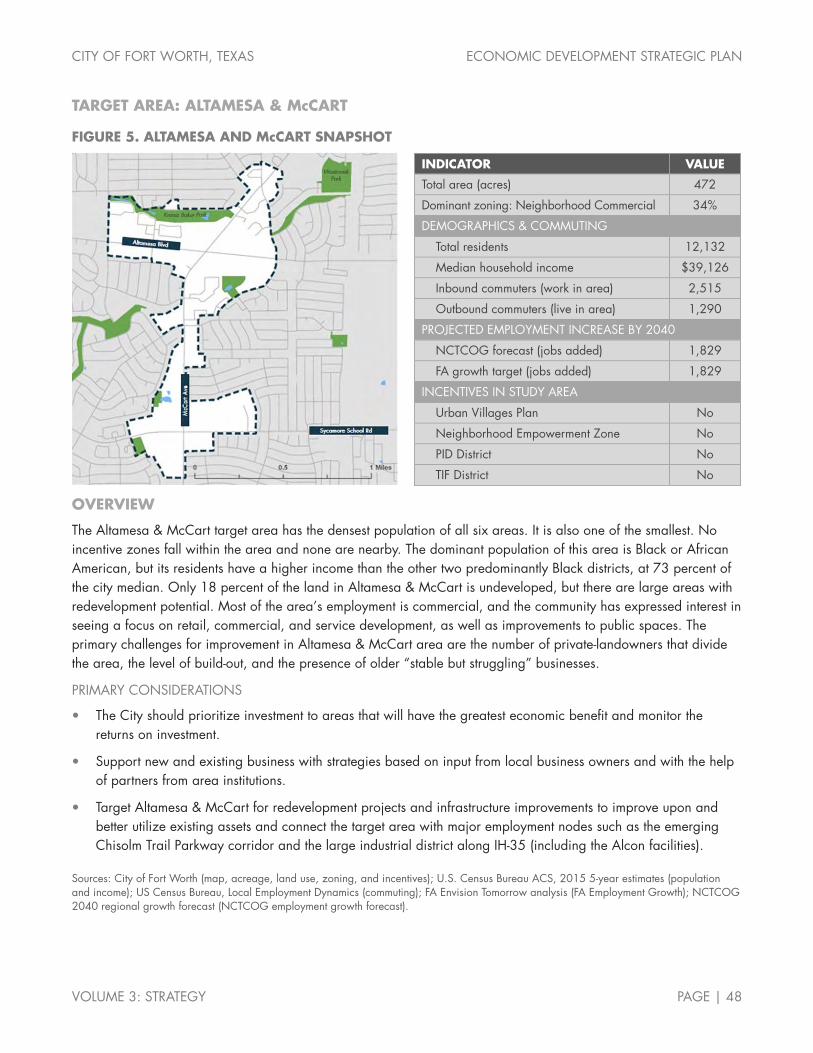
CITY OF FORT WORTH, TEXAS ECONOMIC DEVELOPMENT STRATEGIC PLAN
VOLUME 3: STRATEGY PAGE | 48
TARGET AREA: ALTAMESA & McCART
FIGURE 5. ALTAMESA AND McCART SNAPSHOT
INDICATOR VALUE
Total area (acres) 472
Dominant zoning: Neighborhood Commercial 34%
DEMOGRAPHICS & COMMUTING
Total residents 12,132
Median household income $39,126
Inbound commuters (work in area) 2,515
Outbound commuters (live in area) 1,290
PROJECTED EMPLOYMENT INCREASE BY 2040
NCTCOG forecast (jobs added) 1,829
FA growth target (jobs added) 1,829
INCENTIVES IN STUDY AREA
Urban Villages Plan No
Neighborhood Empowerment Zone No
PID District No
TIF District No
OVERVIEW
The Altamesa & McCart target area has the densest population of all six areas. It is also one of the smallest. No incentive zones fall within the area and none are nearby. The dominant population of this area is Black or African American, but its residents have a higher income than the other two predominantly Black districts, at 73 percent of the city median. Only 18 percent of the land in Altamesa & McCart is undeveloped, but there are large areas with redevelopment potential. Most of the area’s employment is commercial, and the community has expressed interest in seeing a focus on retail, commercial, and service development, as well as improvements to public spaces. The primary challenges for improvement in Altamesa & McCart area are the number of private-landowners that divide the area, the level of build-out, and the presence of older “stable but struggling” businesses.
PRIMARY CONSIDERATIONS
The City should prioritize investment to areas that will have the greatest economic benefit and monitor the returns on investment.
Support new and existing business with strategies based on input from local business owners and with the help of partners from area institutions.
Target Altamesa & McCart for redevelopment projects and infrastructure improvements to improve upon and better utilize existing assets and connect the target area with major employment nodes such as the emerging Chisolm Trail Parkway corridor and the large industrial district along IH-35 (including the Alcon facilities).
Sources: City of Fort Worth (map, acreage, land use, zoning, and incentives); U.S. Census Bureau ACS, 2015 5-year estimates (population and income); US Census Bureau, Local Employment Dynamics (commuting); FA Envision Tomorrow analysis (FA Employment Growth); NCTCOG 2040 regional growth forecast (NCTCOG employment growth forecast).
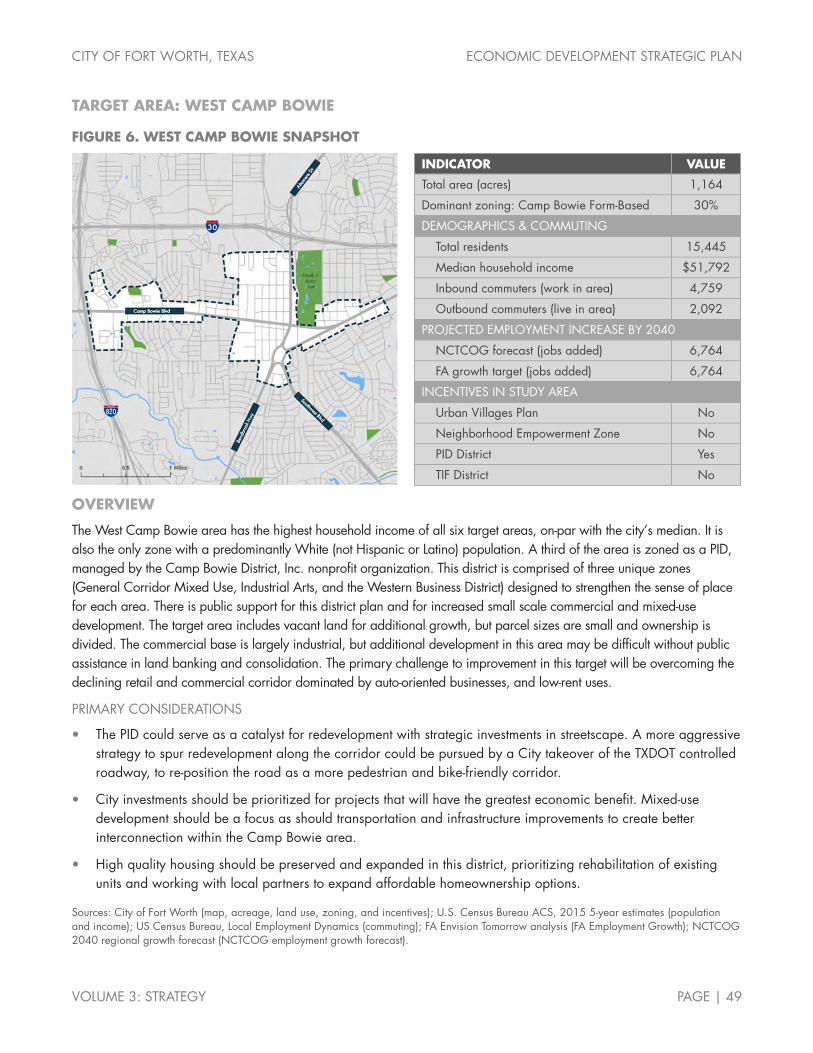
CITY OF FORT WORTH, TEXAS ECONOMIC DEVELOPMENT STRATEGIC PLAN
VOLUME 3: STRATEGY PAGE | 49
TARGET AREA: WEST CAMP BOWIE
FIGURE 6. WEST CAMP BOWIE SNAPSHOT
INDICATOR VALUE
Total area (acres) 1,164
Dominant zoning: Camp Bowie Form-Based 30%
DEMOGRAPHICS & COMMUTING
Total residents 15,445
Median household income $51,792
Inbound commuters (work in area) 4,759
Outbound commuters (live in area) 2,092
PROJECTED EMPLOYMENT INCREASE BY 2040
NCTCOG forecast (jobs added) 6,764
FA growth target (jobs added) 6,764
INCENTIVES IN STUDY AREA
Urban Villages Plan No
Neighborhood Empowerment Zone No
PID District Yes
TIF District No
OVERVIEW
The West Camp Bowie area has the highest household income of all six target areas, on-par with the city’s median. It is also the only zone with a predominantly White (not Hispanic or Latino) population. A third of the area is zoned as a PID, managed by the Camp Bowie District, Inc. nonprofit organization. This district is comprised of three unique zones (General Corridor Mixed Use, Industrial Arts, and the Western Business District) designed to strengthen the sense of place for each area. There is public support for this district plan and for increased small scale commercial and mixed-use development. The target area includes vacant land for additional growth, but parcel sizes are small and ownership is divided. The commercial base is largely industrial, but additional development in this area may be difficult without public assistance in land banking and consolidation. The primary challenge to improvement in this target will be overcoming the declining retail and commercial corridor dominated by auto-oriented businesses, and low-rent uses.
PRIMARY CONSIDERATIONS
The PID could serve as a catalyst for redevelopment with strategic investments in streetscape. A more aggressive strategy to spur redevelopment along the corridor could be pursued by a City takeover of the TXDOT controlled roadway, to re-position the road as a more pedestrian and bike-friendly corridor.
City investments should be prioritized for projects that will have the greatest economic benefit. Mixed-use development should be a focus as should transportation and infrastructure improvements to create better interconnection within the Camp Bowie area.
High quality housing should be preserved and expanded in this district, prioritizing rehabilitation of existing units and working with local partners to expand affordable homeownership options.
Sources: City of Fort Worth (map, acreage, land use, zoning, and incentives); U.S. Census Bureau ACS, 2015 5-year estimates (population and income); US Census Bureau, Local Employment Dynamics (commuting); FA Envision Tomorrow analysis (FA Employment Growth); NCTCOG 2040 regional growth forecast (NCTCOG employment growth forecast).

CITY OF FORT WORTH, TEXAS ECONOMIC DEVELOPMENT STRATEGIC PLAN
VOLUME 3: STRATEGY PAGE | 50
TARGET AREA: EAST LANCASTER
FIGURE 7. EAST LANCASTER SNAPSHOT
INDICATOR VALUE
Total area (acres) 1,038
Dominant zoning district: Single Family A-5 31%
DEMOGRAPHICS & COMMUTING
Total residents 17,637
Median household income $29,331
Inbound commuters (work in area) 2,513
Outbound commuters (live in area) 1,386
PROJECTED EMPLOYMENT INCREASE BY 2040
NCTCOG forecast (jobs added) 3,048
FA growth target (jobs added) 6,708
INCENTIVES IN STUDY AREA
Urban Villages Plan Yes
Neighborhood Empowerment Zone Yes
PID District No
TIF District No
OVERVIEW
East Lancaster is a primarily residential area dominated by Hispanic or Latino residents who earn just over half of the city median household income. East Lancaster has the most incentive zones that overlap the target area’s boundaries. Three NEZ zones are present within the target area: Evans and Rosedale NEZ, Evans and Rosedale NEZ, and Historic Handley NEZ. The target area also includes parts of two Urban Villages: Oakland Corners and Near East Side. It also borders three Tax Increment Financing (TIF) Districts, but does is not directly within a TIF district. However, the area faces more challenges than any other target, except for Stop Six. Several challenges to improvement exist for this target. Significant new business investment and employment growth within the area is not likely within the next 5 to10 years. Additionally, the unique geography of area (long and narrow), encompasses such diverse territory that it could be treated as three distinct zones. A concentration of homeless services in two-thirds of the area also presents a challenge, not only for current businesses, but for the attraction of new business.
PRIMARY CONSIDERATIONS
Prioritize public investments where the improvements will have the greatest economic benefit, and focus on supporting new and existing business utilizing the help of local partners and incentives zones.
Target East Lancaster for mixed-use projects, taking advantage of the Urban Villages in the area, and utilizing up-zoning where needed. Focus on nodes with existing businesses (e.g., Beech Street and Oakland Blvd).
Address transportation infrastructure and housing issues. East Lancaster should be better connected to major employment nodes and educational and training opportunities. Efforts should also focus on ways to create higher-density, more affordable housing for area residents.
Sources: City of Fort Worth (map, acreage, land use, zoning, and incentives); U.S. Census Bureau ACS, 2015 5-year estimates (population and income); US Census Bureau, Local Employment Dynamics (commuting); FA Envision Tomorrow analysis (FA Employment Growth); NCTCOG 2040 regional growth forecast (NCTCOG employment growth forecast).

CITY OF FORT WORTH, TEXAS ECONOMIC DEVELOPMENT STRATEGIC PLAN
VOLUME 3: STRATEGY PAGE | 51
TARGET AREA: NEAR NORTHSIDE
FIGURE 8. NEAR NORTHSIDE SNAPSHOT
INDICATOR VALUE
Total area (acres) 406
Dominant zoning district: Single Family A-5 47%
DEMOGRAPHICS & COMMUTING
Total residents 6,020
Median household income $34,794
Inbound commuters (work in area) 1,193
Outbound commuters (live in area) 861
PROJECTED EMPLOYMENT INCREASE BY 2040
NCTCOG forecast (jobs added) 2,457
FA growth target (jobs added) 2,486
INCENTIVES IN STUDY AREA
Urban Villages Plan Yes
Neighborhood Empowerment Zone Yes
PID District No
TIF District Yes
OVERVIEW
The Near Northside target area is the smallest and the least diverse of all the six targets, with a population that is 91 percent Hispanic or Latino. Residents in the area fare better than the other predominantly Hispanic or Latino area, East Lancaster, with median household incomes at 65 percent of the city’s median. The Near Northside is dominated by residential and industrial zones. The area has strong potential for increased development activity due to its proximity to downtown, Panther Island, and the Stockyards. However, despite the activity surrounding it, the Near Northside has seen little improvement within the area over the last several years. The main challenge for improvement within this target will be overcoming the perceived parking issues in business districts and adequately leveraging growth occurring in neighboring districts.
PRIMARY CONSIDERATIONS
The city should focus public investments where it can have the most impact and support new and existing business. Leverage the Historic Marine Urban Village to help small local businesses with storefront upgrades.
Transportation infrastructure needs to be addressed. Improvements in this area should include better connection to employment and education opportunities and address the parking problems unique to the Near Northside. Capitalize on the area’s proximity to Panther Island as it enters its first wave of major residential development.
Priorities should also include the creation of higher-density, more affordable housing for area residents. Housing near employment centers and transportation corridors is needed. The area also includes many existing residential areas that are underutilized and could be redeveloped with the help of the FWHFC and other partners.
Sources: City of Fort Worth (map, acreage, land use, zoning, and incentives); U.S. Census Bureau ACS, 2015 5-year estimates (population and income); US Census Bureau, Local Employment Dynamics (commuting); FA Envision Tomorrow analysis (FA Employment Growth); NCTCOG 2040 regional growth forecast (NCTCOG employment growth forecast).

CITY OF FORT WORTH, TEXAS ECONOMIC DEVELOPMENT STRATEGIC PLAN
VOLUME 3: STRATEGY PAGE | 52
TARGET AREA: STOP SIX
FIGURE 9. STOP SIX SNAPSHOT
INDICATOR VALUE
Total area (acres) 2,638
Dominant zoning district: single family A-5 55%
DEMOGRAPHICS & COMMUTING
Total residents 13,321
Median household income $27,772
Inbound commuters (work in area) 1,552
Outbound commuters (live in area) 4,844
PROJECTED EMPLOYMENT INCREASE BY 2040
NCTCOG forecast (jobs added) 3,575
FA growth target (jobs added) 3,575
INCENTIVES IN STUDY AREA
Urban Villages Plan Yes
Neighborhood Empowerment Zone Yes
PID District No
TIF District No
OVERVIEW
Stop Six, along with East Lancaster, is one of the most challenged of all the target areas. Its primarily Black and Latino residents earn just above half of the city median income. The City has already made strides toward improving this target area. Stop Six is included in a unique program designed to improve the health of a community’s residents, the Blue Zones Program, which has shown progress in the area. The area is also fully covered by the Stop Six Empowerment Zone, which offers incentives for redevelopment. Part of Stop Six is also covered by the Berry/Stalcup Urban Village. In March 2017, Fort Worth announced an investment of $2.56 million dollars into beautification, code enforcement, public improvements, and maintenance of Stop Six as the first Neighborhood Improvement Strategy target area. The area has several major barriers to economic development including some of the city’s highest pockets of poverty, crime, and vacant housing stock. Stop Six also does not benefit from proximity to downtown and the city’s thriving urban core in the same way as other target areas such as Evans & Rosedale, the Near Northside, and the western segment of East Lancaster.
PRIMARY CONSIDERATIONS
Housing investment and reinvestment are the most important strategies for this area to raise the level of appeal to existing and future residents as well as businesses.
Strategic City investments should be focused along corridors and nodes of existing activity. New and existing business should be supported, and mixed-use projects should be targeted for the area.
Transportation and infrastructure also needs to be addressed, with a focus on connecting key locations within Stop Six to employment centers in surrounding cities and educational and training opportunities.
Sources: City of Fort Worth (map, acreage, land use, zoning, and incentives); U.S. Census Bureau ACS, 2015 5-year estimates (population and income); US Census Bureau, Local Employment Dynamics (commuting); FA Envision Tomorrow analysis (FA Employment Growth); NCTCOG 2040 regional growth forecast (NCTCOG employment growth forecast).
CITY OF FORT WORTH, TEXAS ECONOMIC DEVELOPMENT STRATEGIC PLAN
VOLUME 3: STRATEGY PAGE | 53
4. TOOLS & RESOURCES
Goals 1, 2, and 3 describe what is necessary for Fort Worth’s overall economic success, regardless of what resources may be drawn upon. The Tools & Resources section addresses the organizational changes required and investments in new tools and resources needed to support the City’s economic development program.
4.1. ECONOMIC DEVELOPMENT BOND PACKAGE Identify how the citywide bond package makes investments in livability, Smart City infrastructure, and business development. Elevate projects that impact economic development goals.
Fort Worth will experience wide-ranging benefits from implementation of the strategies outlined in this plan. Beyond these programs and initiatives, the adoption of a major public bond package is among the most significant steps the City could take to advance its economic development efforts. Fort Worth does not benefit from the Type A and Type B economic development corporation status available to many of the metro area’s suburban cities. Resources dedicated to economic development in cities such as Frisco and McKinney number in the tens of millions of dollars. An economic development bond package in Fort Worth is one solution to the intense regional competition for business development. But this goes beyond resources. It represents an opportunity to regain ground against other cities in the metro area through the deployment of targeted investments over a short (three to five-year) timeframe.
An economic development bond package would include new investments in public infrastructure, amenities, and projects that enhance the city’s appeal to skilled workers and businesses alike. Such a package would need to be carefully crafted to ensure broad support among residents and employers. It would also need to be fiscally sound, generating near- and long-term economic benefits for the city.
Fortunately, Fort Worth can learn from the experiences of other cities that have made similar investments. The Oklahoma City MAPS (Metropolitan Area Projects) bond program, now in its third iteration, is one of the most successful examples in the country. The MAPS investments are credited with raising the profile of Oklahoma City from a previously struggling economy to a dynamic city that has become a magnet for talent and business development. A similar bond package in Fort Worth should be considered as part of this plan.
4.1.1. Focus the largest share of bond resources on livability investments.
Best Practices: Oklahoma City MAPS (page 71), 2017 Dallas Capital Bond (page 72), and El Paso Quality of Life Bond (page 72).
4.1.1.1. Invest in new trails improvements along Trinity River; connections to Lake Worth and Airfield Falls, Panther Island, Gateway Park in East Fort Worth, Lake Arlington; and other pedestrian and bike amenities.
4.1.1.2. Create a range of new family- and kid-centric amenities ranging from splash pads and playscapes to rock-climbing walls and science/discovery museums.
4.1.1.3. Invest in the enhancement of existing parks, ballfields, streetscapes, and other public amenities.
4.1.2. Focus the second-largest share of bond resources on “Smart City” infrastructure investments.
Best Practices: Frisco Traffic Light Technology (page 72), Waymo Autonomous Vehicles in Phoenix (page 73), and Sacramento/Verizon Partnership (page 73).
CITY OF FORT WORTH, TEXAS ECONOMIC DEVELOPMENT STRATEGIC PLAN
VOLUME 3: STRATEGY PAGE | 54
4.1.2.1. Create a fully connected traffic signal network (like the Frisco model) to enable the city’s signals to communicate with autonomous vehicles. [see “driverless downtown” strategy]. This should be done as an initial pilot project focused on a specific district such as downtown, the Near Southside, or the East Side.
4.1.2.2. Invest in communications technology infrastructure, in partnership with private sector service providers, in locations where tech firms and entrepreneurs are most concentrated. This should include high-speed broadband internet (similar to Google Fiber and Chattanooga’s Gig fiber). This could also include investments in 5G mobile technology and other emerging technologies that will have profound impacts on business and personal communication.
4.1.3. Focus the third-largest share of bond resources on business development investments.
4.1.3.1. Allocate funding for infrastructure, real estate space, and other enabling investments to accelerate private sector investment in the Near Southside Medical Innovation District.
4.1.3.2. Designate funding for infrastructure and real estate space to support the target industry recruitment efforts described in this plan.
4.1.3.3. Provide funding for specific redevelopment projects with citywide economic benefits.
This could include several of the identified downtown redevelopment sites or other strategic projects.
4.1.3.4. Include funding for new convention center/event space in downtown Fort Worth.
Ensure that new meeting space is designed in a way that makes it flexible and adaptive to the rapidly changing demands of the meeting/events industry.
New spaces should include a greater emphasis on arts, public spaces, and linking meeting space to surrounding amenities and destinations (e.g., restaurants, bars, hotels).
4.1.4. Form an economic development bond package working group to build out the details under the three major categories for a major public bond package: 1) livability; 2) Smart City investments; and 3) business development. This group should be led and driven by the City Council.
4.2. CITYWIDE INCENTIVE PROGRAM Create new incentive tools to encourage business growth within target industries and to facilitate development and redevelopment in designated districts.
The Dallas-Fort Worth metro area is an intensely competitive environment. Moreover, the level of national and international competition among cities of Fort Worth’s size is fierce. To be a successful player in the regional and global competition for jobs and investment, Fort Worth needs a strong set of incentives. However, having a robust incentive program is not the objective per se. Incentives are tools in the service of specific goals.
The plan’s vision is worth repeating here: To compete successfully on the national and international stage for creative, high-growth businesses and the talented individuals who fuel them. The vision answers the question of where Fort Worth is heading, but it leads to another question: what resources will be required to make progress toward the vision? Here is where the application of the City’s incentive program takes on greater focus. The City’s incentives must be structured and applied in a way that moves the community closer to its desired result.
CITY OF FORT WORTH, TEXAS ECONOMIC DEVELOPMENT STRATEGIC PLAN
VOLUME 3: STRATEGY PAGE | 55
This plan describes specific actions for achieving goals aimed at strengthening and growing the local economy. Many of the plan’s initiatives can be achieved without changes to the City’s incentive program. Some initiatives, however, require a more strategic and aggressive use of public incentive dollars. Several initiatives will rely on a transformed City incentive program, such as Marketing & Target Industry Recruitment, Downtown Fort Worth, and the Near Southside Medical Innovation District.
4.2.1. Establish an economic development fund similar to those of Plano and Richardson (through property taxes), and seek creative uses for natural resource extraction revenues.
Best Practices: Plano Property Tax Economic Development Fund (page 73), Arlington Tomorrow Foundation Gas Wells Fund (page 73)
4.2.1.1. Allocate a small portion of the city’s property tax for an economic development incentive fund.
4.2.1.2. Explore the potential to create another source of funds for economic development using gas-well revenue from Barnett Shale activity within the municipal boundaries of Fort Worth. Use the financial structure of the Arlington Tomorrow Foundation as an example of diverting gas well revenue.
4.2.2. Revise the City tax abatement policy to ensure that future abatements help advance the goals of this plan. Minimize or reduce requirements that make Fort Worth less competitive in comparison with other cities in the metro area.
4.2.2.1. For every tax abatement and other standard incentive awarded to businesses investment and expansion in Fort Worth, establish a requirement for the business to make an effort to establish an “upstream” (high-value input, technology, R&D) function in Fort Worth’s urban core.
For IKEA, this could be a design center.
For Facebook’s data center, this could be a user experience (UX) research center.
For Amazon, this could be a driverless store downtown.
4.2.2.2. Establish clear and simple guidelines for the use of City tax abatements. For a project to qualify for tax abatements, it should meet one or more of the following criteria:
Growth of business activity, employment, and investment in one of the city’s identified target industries and emerging opportunities. Incentives should not be denied to a specific company based purely on standard thresholds. For instance, if a given firm only employs 25 people and is seeking to occupy existing office space (i.e., no capital investment), but that firm is one of the leading technology providers within one of Fort Worth’s target industries, and is projected to grow at a rapid pace, consideration should be given for incentive use.
Creation of high-wage jobs.
Capital investment.
Revitalization with likelihood of ancillary development in a key employment node or target area of the city.
Retention or expansion of an existing major employer.
Anchor business expansion project with potential to generate additional spinoff and supplier/service provider activity.

CITY OF FORT WORTH, TEXAS ECONOMIC DEVELOPMENT STRATEGIC PLAN
VOLUME 3: STRATEGY PAGE | 56
4.2.3. Create a new incentive program for specific corporate relocations and expansions occupying existing space.
4.2.3.1. This program should be targeted at technology firms, other professional service firms, and corporate/regional HQs that are not making substantial capital investments.
4.2.4. Establish incentive guidelines for public investments that are not typically considered incentives, but function as indirect incentives. This would include infrastructure extensions (roads, water/wastewater, electric, and other utilities) necessary for a new facility.
4.3. ORGANIZATIONAL ALIGNMENT Clarify the roles and responsibilities of Fort Worth’s economic development partners; build a shared framework for decision-making and ongoing collaboration.
New investments from the City and the Chamber will be required to move this plan from concept to action. The success of models like Opportunity Austin is well documented. Under this approach, the Greater Austin Chamber of Commerce is responsible for marketing and recruitment, while the City of Austin focuses on incentives. The City provides funds for the Chamber, which are tied to clearly defined performance metrics. Fort Worth’s economic program should move toward this model, but with even stronger collaboration between the City and the Chamber.
While communication between the City and the Chamber has been very good, the significant increase in the marketing capacity of the Chamber requires a more formal collaboration. The Chamber should commit to sharing economic development prospects likely to require City participation in the form of incentives, infrastructure, development review processes, or other City-led assistance.
In a sense, the City/Chamber partnership is no different than a private sector business development model, in which a sales funnel converts a suspect into a prospect, and a prospect into a customer. In the private sector model, sales teams communicate internally with other staff during the sales process to ensure that external communications (messages delivered to the prospect) accurately reflect the company’s qualifications and commitments. Adopting a similar approach to the “reactive” side of Fort Worth’s economic development program, responding to prospects,
GUIDELINES FOR EFFECTIVE AND RESPONSIBLE INCENTIVE USE
• Incentives should be aligned with the city’s economic development goals.
• Upfront data and analysis can reduce risk and improve outcomes.
Due diligence that includes background research on applicants and business case analyses for projects seeking major discretionary incentives helps communities make sound decisions.
Evaluating project attributes relative to economic development goals and quantifying the fiscal and economic impacts of proposed investments enables economic development organizations to determine if projects can generate net benefits for the community.
In-depth analysis can help explain and build support for decisions.
• Define performance requirements and monitor compliance with performance agreements to assess whether project milestones are being reached.
• Be prepared to report on who is receiving incentives, how much is being spent, and the results of that spending.
• Establish policies to protect the community in the event of non-performance.
• Regularly (every three to five years) evaluate the city’s portfolio of incentives to determine which programs are most helpful in achieving economic development goals.
Source: www.smartincentives.org.

CITY OF FORT WORTH, TEXAS ECONOMIC DEVELOPMENT STRATEGIC PLAN
VOLUME 3: STRATEGY PAGE | 57
will be the most effective approach for ensuring a strong partnership between the City and the Chamber. We recommend that a formal meeting be held every two weeks during which the Chamber reviews prospects with the City. This review should consider timeframes, necessary staffing, and expected involvement required of the City.
Beyond a need for better communications, this plan advocates for a dramatic increase in staff capacity for economic development to take the community to the next level of economic success. Effective implementation of the plan rests primarily with collaboration between the City of Fort Worth Economic Development Department and the Fort Worth Chamber of Commerce. Other City departments and a variety of local and regional partners also play critical roles in growing and strengthening the Fort Worth economy. The City/Chamber partnership is not responsible for every activity outlined in this plan, but it acts as a lever to create large changes through targeted investments and initiatives.
Below we have outlined the minimum estimated staffing levels necessary to carry out the primary economic development functions outlined in this plan. In total, the plan calls for 11 new Chamber positions and 3 new City positions.
MARKETING & TARGET INDUSTRY RECRUITMENT:
While a dedicated staff person for each target industry would be beneficial, this plan recommends accepting the Chamber’s planned four-person team focused on target industry recruitment. The Chamber will meet with the City every two weeks to discuss prospects and coordinate responses that require City involvement.
HIGH-GROWTH STARTUPS & TECH COMPANY RECRUITMENT:
Beyond target industry recruitment, Fort Worth needs dedicated staff to grow the city’s local base of startups and tech companies. This should be a three-person team focused on developing a deep understanding of the local (Fort Worth) and regional (Dallas-Fort Worth metro area) startup scene and high-growth tech companies in the market. Two of these positions should reside in the Chamber and the City’s support should take the form of investment in TECH Fort Worth.
BUSINESS RETENTION & EXPANSION (BRE):
Fort Worth’s economic development program needs three full-time BRE staff members. Each should have a specific list of targeted business visits per year. These staff members should be housed in the Chamber. However, all business recruitment staff should also conduct a minimum number of BRE visits (five to ten per year) to maintain a strong understanding of the needs of local businesses. The BRE staff should coordinate regularly with City staff on matters involving permitting and development review, incentive programs, and other City-directed functions impacting local businesses.
RESEARCH:
Fort Worth’s economic development program needs a strong research team to support the various initiatives outlined in the plan. At a minimum, three staff positions will be needed for this function, with two housed in the Chamber and one housed in the City. The Chamber research team should focus on developing a robust knowledge base of local industries, employers, and talent, along with competitive information on target industries nationally and within competitor metro areas. The City research team should focus on maintaining a deep understanding of all aspects of the local and regional real estate market (commercial office, industrial, retail, hotels, and residential), redevelopment projects, incentive programs (utilization and performance), and the local tax base (commercial property tax, sales tax, and hotel revenues). The two research teams should function almost as a single unit, with strong crossover between areas of expertise and focus areas. In other words, City and Chamber research teams

CITY OF FORT WORTH, TEXAS ECONOMIC DEVELOPMENT STRATEGIC PLAN
VOLUME 3: STRATEGY PAGE | 58
should have their own distinct areas of focus, but should be completely conversant and knowledgeable in all research areas. The research team must include strong GIS capabilities.
URBAN REDEVELOPMENT:
Fort Worth needs a dedicated group of professionals focused on urban redevelopment projects. This team would require two staff members, both of which should be housed in the City. The team’s focus should be on awareness of the local development and redevelopment opportunities in the urban core. This necessitates an understanding of the businesses that have been successful, as well as those that have struggled, and knowing the major property owners and real estate developers active in the market. In addition, this team would assist in evaluating the collective impact of the City’s TIF districts and how they contribute to the community’s overall economic development program.
4.3.1. Commit to a City/Chamber relationship as the core of Fort Worth’s economic development program, based on the minimum staffing requirements outlined above, to implement the core economic development functions of this plan.
Best Practices: Opportunity Austin (page 74) and Greater Nashville Chamber of Commerce (page 74)
4.3.2. Restructure the City Economic Development Department so that its mission is driven by the goals outlined in this plan. This may include shifting funds and organizational structures in a new way, such as:
4.3.2.1. Reposition City funding toward more resources for TECH Fort Worth.
This could enable TECH Fort Worth to become the primary convening organization to support networking for local entrepreneurs, tech workers, and creative workers.
This could also position TECH Fort Worth to drive business growth and creation within the city’s target industries and emerging opportunities.
4.3.3. Invest in data subscriptions and analysis tools to support the research and marketing functions of Fort Worth’s economic development program.
4.3.3.1. Provide the research team with subscriptions to national data providers with demographic, economic, and workforce data (e.g., Emsi Developer Deluxe, Esri Community Analyst).
4.3.3.2. Use analysis, mapping, and data visualization tools to enhance research, marketing, and responses to RFPs from economic development prospects. These include: Esri’s desktop Geographic Information Systems (GIS) software for mapping, Tableau Desktop for data visualization, and GIS Planning’s online ZoomProspector tool for databases targeted at site selectors and corporate real estate professionals.
4.3.4. Pursue strategic regional collaboration that benefits Fort Worth’s economic development potential.
4.3.4.1. Work closely with NCTCOG to put Fort Worth’s growth targets and projections into future plans, models, and federal transportation funding programs.
4.3.4.2. Seek out logical areas where it would be beneficial to work in concert with the Dallas Regional Chamber (such as international business recruitment) and/or other local economic development organizations.
4.3.4.3. Encourage collaboration between the Fort Worth CVB and other regional CVBs (e.g., Arlington, Irving, Dallas) to promote large-scale events and conferences would benefit the entire region.
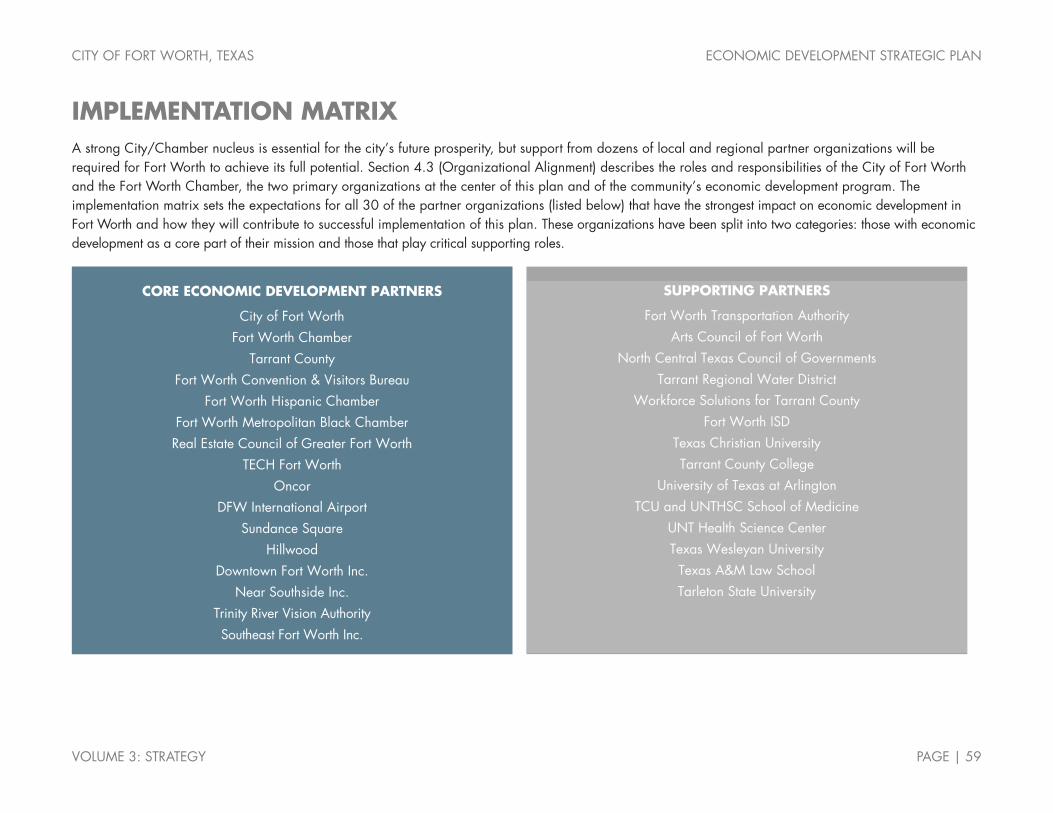
CITY OF FORT WORTH, TEXAS ECONOMIC DEVELOPMENT STRATEGIC PLAN
VOLUME 3: STRATEGY PAGE | 59
IMPLEMENTATION MATRIX A strong City/Chamber nucleus is essential for the city’s future prosperity, but support from dozens of local and regional partner organizations will be required for Fort Worth to achieve its full potential. Section 4.3 (Organizational Alignment) describes the roles and responsibilities of the City of Fort Worth and the Fort Worth Chamber, the two primary organizations at the center of this plan and of the community’s economic development program. The implementation matrix sets the expectations for all 30 of the partner organizations (listed below) that have the strongest impact on economic development in Fort Worth and how they will contribute to successful implementation of this plan. These organizations have been split into two categories: those with economic development as a core part of their mission and those that play critical supporting roles.
CORE ECONOMIC DEVELOPMENT PARTNERS
City of Fort Worth Fort Worth Chamber
Tarrant County Fort Worth Convention & Visitors Bureau
Fort Worth Hispanic Chamber Fort Worth Metropolitan Black Chamber Real Estate Council of Greater Fort Worth
TECH Fort Worth Oncor
DFW International Airport Sundance Square
Hillwood Downtown Fort Worth Inc.
Near Southside Inc. Trinity River Vision Authority Southeast Fort Worth Inc.
SUPPORTING PARTNERS
Fort Worth Transportation Authority Arts Council of Fort Worth
North Central Texas Council of Governments Tarrant Regional Water District
Workforce Solutions for Tarrant County Fort Worth ISD
Texas Christian University Tarrant County College
University of Texas at Arlington TCU and UNTHSC School of Medicine
UNT Health Science Center Texas Wesleyan University
Texas A&M Law School Tarleton State University

CITY OF FORT WORTH, TEXAS ECONOMIC DEVELOPMENT STRATEGIC PLAN
VOLUME 3: STRATEGY PAGE | 60
A sample of the implementation matrix is provided below. A complete implementation matrix, combining all the strategies and actions, is provided as an editable Excel document separate from this report. The implementation matrix provides a graphic representation of when the actions should realistically be implemented and the most appropriate organizations to carry them out.
Responsible Partners Ongoing
Year 1 Years 2-3 Years 4-5 GOAL 1. ESTABLISH FORT WORTH'S COMPETITIVE EDGE. (suggested lead in bold) (2018) (2019-2020) (2021-2022) Initiative 1.1. Brand & Image. Elevate the profile of Fort Worth at the regional, national, and international levels. 1.1.1 Create a Fort Worth Real Estate Working Group. CFW, REC, Chamber, Sundance,
Hillwood, area real estate brokers and developers
1.1.2. Launch a national strategy for generating attention and interest for Fort Worth among major real estate development and commercial brokerage firms. 1.1.2.1. Host a national conference of real estate brokers and developers.
CFW, REC, Chamber, Sundance, Hillwood, area real estate brokers and developers
1.1.2.2. Hold a major real estate competition focused on a specific project in Fort Worth, similar to the Commercial Real Estate Development Association (NAIOP) University Challenge.
CFW, REC, Chamber, Sundance, Hillwood, area real estate brokers and developers
1.1.2.3. Host a CoreNet Global event in Fort Worth. CFW, REC, Chamber, CVB, Sundance, Hillwood, area real estate brokers and developers
1.1.2.4. Host the annual meeting of the Urban Land Institute (ULI) in Fort Worth.
CFW, REC, Chamber, CVB, Sundance, Hillwood, area real estate brokers and developers
1.1.3. Launch a real estate-focused foreign direct investment (FDI) strategy to build awareness of Fort Worth among global real estate investors. 1.1.3.1. Leverage Hillwood, Sundance Square, and DFW International Airport’s connections with international investors and business executives to build this strategy.
CFW, REC, DFW, Chamber, Sundance, Hillwood, area real estate brokers and developers
1.1.3.2. Host a symposium focused on real estate capital markets, bringing in major institutional real estate investment firms and capital management firms from across the world.
CFW, REC, DFW, Chamber, CVB, Sundance, Hillwood, area real estate brokers and developers, area private equity firms
1.1.4. Engage local chapters of real estate organizations, such as ULI or NAIOP, to host a design competition featuring a location in Fort Worth. 1.1.4.1. Work with the Real Estate Council of Greater Fort Worth to continue events like the Panther Den urban design competition (an event that engages young and emerging professionals in the area real estate industry) and to create new events that put a spotlight on Fort Worth as a location for commercial real estate development.
REC, CFW, Chamber, area real estate brokers and developers
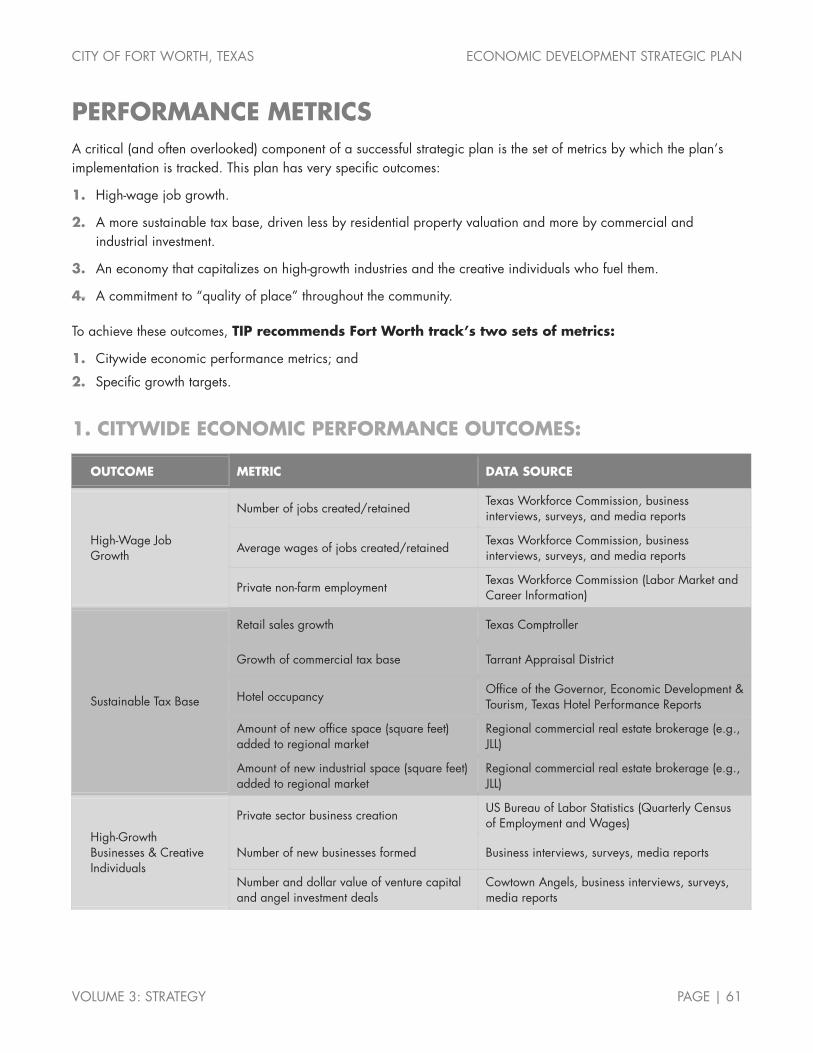
CITY OF FORT WORTH, TEXAS ECONOMIC DEVELOPMENT STRATEGIC PLAN
VOLUME 3: STRATEGY PAGE | 61
PERFORMANCE METRICS A critical (and often overlooked) component of a successful strategic plan is the set of metrics by which the plan’s implementation is tracked. This plan has very specific outcomes:
1. High-wage job growth.
2. A more sustainable tax base, driven less by residential property valuation and more by commercial and industrial investment.
3. An economy that capitalizes on high-growth industries and the creative individuals who fuel them.
4. A commitment to “quality of place” throughout the community.
To achieve these outcomes, TIP recommends Fort Worth track’s two sets of metrics:
1. Citywide economic performance metrics; and
2. Specific growth targets.
1. CITYWIDE ECONOMIC PERFORMANCE OUTCOMES:
OUTCOME METRIC DATA SOURCE
High-Wage Job Growth
Number of jobs created/retained Texas Workforce Commission, business interviews, surveys, and media reports
Average wages of jobs created/retained Texas Workforce Commission, business interviews, surveys, and media reports
Private non-farm employment Texas Workforce Commission (Labor Market and Career Information)
Sustainable Tax Base
Retail sales growth Texas Comptroller
Growth of commercial tax base Tarrant Appraisal District
Hotel occupancy Office of the Governor, Economic Development & Tourism, Texas Hotel Performance Reports
Amount of new office space (square feet) added to regional market
Regional commercial real estate brokerage (e.g., JLL)
Amount of new industrial space (square feet) added to regional market
Regional commercial real estate brokerage (e.g., JLL)
High-Growth Businesses & Creative Individuals
Private sector business creation US Bureau of Labor Statistics (Quarterly Census of Employment and Wages)
Number of new businesses formed Business interviews, surveys, media reports
Number and dollar value of venture capital and angel investment deals
Cowtown Angels, business interviews, surveys, media reports

CITY OF FORT WORTH, TEXAS ECONOMIC DEVELOPMENT STRATEGIC PLAN
VOLUME 3: STRATEGY PAGE | 62
OUTCOME METRIC DATA SOURCE
High-Growth Businesses & Creative Individuals
SBIR/awards US Small Business Administration
Utility patent grants US Patent & Trademark Office
Growth of academic R&D investments National Science Foundation, UTA, TCU
Growth of private capital investment Business interviews, surveys, and media reports
Population age 25+ with a bachelor’s degree or higher
US Census Bureau—American Community Survey (1-year estimates)
Percent of the population age 20-34 US Census Bureau—American Community Survey (1-year estimates)
Number of enrolled college and university students
UTA, TCU, TWU, TCC, Tarleton
Annual unemployment rate Texas Workforce Commission (Labor Market and Career Information)
Graduation rates of area high schools FWISD and other area ISDs
Quality of Place
Share of workers working from home US Census Bureau—American Community Survey (1-year estimates)
Median home sales prices National Association of Realtors
Median monthly rental rates of apartments Regional commercial real estate brokerage (e.g., JLL)
2. SPECIFIC GROWTH TARGETS:
SPECIFIC TARGET STARTING POINT (2017)
ANNUAL GROWTH TARGET (2018-2022)
FINISH LINE (2022) DATA SOURCE
Fortune 1000 HQs 2 (American Airlines & Pier 1 Imports)
Add 1 Fortune 1000 HQ each year
7 Fortune 1000 HQs
Fortune
Inc. 5000 firms 11 Add 5 Inc. 5000 firms each year
36 Inc. 5000 firms
Inc. 5000
Residential development in CBD-1-mile radius
4,095 housing units Add 1,000 net new housing units per year
9,095 housing units
Esri Community Analyst, Downtown Fort Worth Inc.
Residential development in CBD-2-mile radius
14,541 housing units Add 2,000 net new housing units per year
24,541 housing units
Esri Community Analyst, Downtown Fort Worth Inc.
Residential development in CBD-4-mile radius
66,709 housing units Add 4,000 net new housing units per year
82,709 housing units
Esri Community Analyst, Downtown Fort Worth Inc.
CITY OF FORT WORTH, TEXAS ECONOMIC DEVELOPMENT STRATEGIC PLAN
VOLUME 3: STRATEGY PAGE | 63
BEST PRACTICES INVENTORY Best practice examples are organized in response to specific strategies. They appear in the order in which they are listed in the plan.
TARGET INDUSTRY MARKETING
CRAFT BREWERIES & SUPPLY CHAIN IN ASHEVILLE
The Asheville Brewers Alliance was created to promote breweries in Asheville and the surrounding Western North Carolina region. The Alliance supports the region’s craft beer industry through networking, promotion and marketing efforts, knowledge exchange, and events. The Alliance is a major supporter of Asheville Beer Week, an annual event including tastings, dinners, beer education, and other beer-related activities. Beer Week culminates in the annual Beer City Festival, Asheville’s premier downtown craft beer festival that brings together local and regional breweries for a day of beer and live music. The Alliance is expanding its reach in 2016 through its first annual AVL Beer Expo, which will showcase all elements of craft beer production—from raw ingredients to brewing to packaging and distribution—while providing tastings of beers from across Western North Carolina.
The Alliance and its members have successfully facilitated the growth of Asheville’s craft brewing industry, along with assistance from key partners such as the Asheville-Buncombe County Economic Development Coalition. In just the last two years, several major brewery expansion projects have been announced in the region. Burial Beer Company will add 17 new jobs and $1.8 million of new capital investment. Hi-Wire Brewing has announced 15 new jobs and $1.62 million of new capital investment. Wicked Weed Brewing is adding 82 new jobs and $5 million in new capital investment with its expansion project. The most significant announcement is from Fort-Collins, Colorado-based New Belgium Brewing Company (the nation’s third-largest craft brewer), which is adding 154 new jobs and $140 million of new capital investment in a state-of-the-art brewery in Asheville’s historic River Arts District.
WATER TECHNOLOGY IN MILWAUKEE
The Water Council grew out of a regional economic development initiative, an industry cluster analysis, which revealed the depth and potential growth of the water technology cluster. The possibility to transform Milwaukee’s economy through this cluster brought people together. The initiative was driven by the private sector, higher education, two nonprofits, the Greater Milwaukee Committee, and the Spirit of Milwaukee. Through research, loaned executives, and extensive collaboration, the Water Council was formed as a nonprofit in 2009. It is focused on five outcomes:
Increasing research in water technology;
Commercializing water technology research;
Promoting water entrepreneurship;
Increasing access to capital; and
Developing a workforce skilled in water.
The Water Council generates revenues through membership dues, its annual summit, and grants from local foundations, the state, and other entities. Through its higher education partners, the Council also benefits from research grants. The Council holds member meetings on a quarterly basis, featuring speakers and offering networking opportunities.
CITY OF FORT WORTH, TEXAS ECONOMIC DEVELOPMENT STRATEGIC PLAN
VOLUME 3: STRATEGY PAGE | 64
In 2009, the Water Council was inducted into the UN Global Compact Cities Programme, an initiative to help City leaders find solutions to urban issues within local capacity. In July 2013, the Global Water Center opened its doors with 100,000 square feet of offices, meeting spaces, labs, and an auditorium to accelerate research and development, business formation, and triple helix collaboration to promote growth in the water technology sector. The Water Center is home to entrepreneurs, researchers, and business services and serves as a convening point for the industry. The state government played a key role, through a $50 million investment to create the School of Freshwater Sciences (the only graduate program of its kind in the country), housed at the University of Wisconsin-Milwaukee. The Water Center and the School of Freshwater Sciences serve as two anchors of the Water Technology District, an area just south of downtown Milwaukee that has become the epicenter for the region’s water cluster, thanks to more than $220 million of new public and private investment from 2010 to 2014. The region’s water cluster now includes over 200 companies that employ more than 35,000 people.
ANIMAL HEALTH CORRIDOR IN KANSAS CITY
The Greater Kansas City Region (from Manhattan, KS to Columbia, MO) accounts for nearly 32 percent of total sales in the $19 billion global animal health market. The KC Animal Health Corridor is an initiative housed within the Kansas City Area Development Council (KCADC) with the goal of promoting the Greater Kansas City region as the premier location nationally and globally for companies in the animal health industry. The lead organizations that have guided the creation and operation of the KC Animal Health Corridor are the KCADC, the Greater Kansas City Chamber of Commerce, and the Kansas City Area Life Sciences Institute, as well as an Advisory Board made up of local leaders.
KC Animal Health Corridor has successfully brought together all the region’s major animal health stakeholders and it functions as the industry’s unified marketing and advocacy organization. It is engaged in multiple regional marketing activities aimed at increasing national awareness of the region’s animal science assets and opportunities and improving communications and collaborative opportunities by providing greater connectivity amongst the region’s animal science stakeholders. The initiative’s 2013-2015 Strategic Priorities included:
Engagement of animal health industry with the Corridor;
Public policy development efforts; and
Workforce development.
Through these strategic priorities, the KC Animal Health Corridor aims to promote interaction and innovation within the animal health industry and to market the Corridor’s assets, initiatives, and successes to allow the region to be known worldwide as the center of the animal health industry. These priorities also focus the organization’s efforts on leveraging the opportunities created by the new National Bio and Agro-Defense Facility (NBAF) and on developing strategies to attract and retain a workforce skilled in key competencies meeting the needs of Corridor companies and entities.
BUSINESS RETENTION & EXPANSION
BUSINESS RETENTION & EXPANSION IN GRANTS PASS, OREGON
In 1998, the City of Grants Pass, Oregon, in partnership with the Grants Pass/Josephine County Chamber of Commerce, launched its award-winning Business Retention and Expansion (BRE) Program to improve the local business climate. The program focuses on keeping local firms in business and in the community, increasing their competitiveness, and helping them grow and expand.
A cornerstone of the award-winning program is a comprehensive survey of Josephine County businesses, conducted every three years, most recently in 2014. Traded-sector firms are invited to complete a professionally developed
CITY OF FORT WORTH, TEXAS ECONOMIC DEVELOPMENT STRATEGIC PLAN
VOLUME 3: STRATEGY PAGE | 65
standard survey instrument. The business is then interviewed by a pair of volunteers who use the survey responses to probe about specific issues. In total, between 50 and 60 volunteers participate in the program, with the goal of conducting face-to-face interviews with every traded-sector business in the county. Grants Pass’ reliance on community leaders as volunteers differentiates its BRE effort from many others. City ED staff has found that this approach fosters solid relationships with local businesses and is extremely cost-effective.
Findings from the survey are used to celebrate successes (an important, yet often overlooked, aspect of BRE programs) and to identify “red flag” issues. These issues are then incorporated into the program of work of relevant organizations in the county. The survey findings are invaluable to local BRE efforts, as they paint a clear picture of how City and Chamber staff can assist the local business community. In the two years between surveys, for example, the chamber provides workshops and other educational forums to address needs identified through the survey. The program has been credited with improving relationships between the public sector and the local business community and has led to other results, including a new industrial park to accommodate some of the quickly expanding businesses identified in the original 1999 effort.
Objectives of Grants Pass’ BRE program include:
1. To demonstrate to local businesses that the community appreciates their contributions to the local economy.
2. To help existing businesses solve problems.
3. To assist businesses in using programs aimed at helping them become more competitive.
4. To anticipate future local business issues and trends and develop strategies to address these.
5. To build community capacity to sustain growth and development.
6. To specifically identify those businesses poised to expand that need assistance to grow.
7. To develop collaborative relationships for participating in comprehensive long-range retention and expansion activities.
8. To identify opportunities to attract support businesses.
INDUSTRY-SPECIFIC WORKFORCE PROGRAMS
NC MANUFACTURING INSTITUTE
The NC Manufacturing Institute was created out of meetings between chambers of commerce and economic development authorities in Rowan and Cabarrus counties along with the Centralina Workforce Development Board and Rowan-Cabarrus Community College. The Institute was created in direct response to employer needs. This program solves talent recruitment problems and skills mismatches between job seekers and available positions. Through training, job-matching, and branding, the NC Manufacturing Institute creates future workers while at the same time marketing the manufacturing sector to job seekers, students, and schools. The most prominent program of the institute is the Certified Production Technician program, which teaches sought-after skills desired by local manufacturers.
ALAMO COLLEGES AEROSPACE ACADEMY
The Greater San Antonio Chamber estimates that the aerospace industry provides almost $4 billion in economic impact. With over 9,400 workers, this industry pays out $479 million annually to aerospace workers. To capitalize on this high-paying industry, Alamo Area Academies, a nonprofit, partners with Alamo Colleges, San Antonio high
CITY OF FORT WORTH, TEXAS ECONOMIC DEVELOPMENT STRATEGIC PLAN
VOLUME 3: STRATEGY PAGE | 66
schools, and the aerospace industry to provide tailored workforce training for the aerospace industry. The program teaches industry-specific skills to create a pipeline of qualified workers to replace the aging workforce in the aerospace industry. Alamo Area Academies sets target enrollment levels based on employment projection information provided by industry employers. High school students can earn up to 30 college credits in a two-year dual-enrollment structure, which can be used towards any postsecondary degree. The program is provided at no cost—thanks to industry tuition reimbursement and scholarships—and includes a paid summer internship.
TALENT RECRUITMENT
WASHINGTON STATE STARS
The STARS program in Washington state is aimed at recruiting entrepreneurial researchers to Washington with the desire to generate research products with commercial applications. Founded in 2007, the program is guided by the Washington Economic Development Commission and an Innovation Advisory Committee and is administered by the Higher Education Coordinating Board. Like traditional research models, the STARS program integrates technological advances and leverages federal and private-sector R&D funding. The STARS program differs in that all research efforts are guided by relationships with area businesses and market demand, as well. By engaging with business partnerships, networks, and investors, entrepreneurship remains the focus of the program. STARS funds were leveraged to create Entrepreneurs-In-Residence programs at the University of Washington and at Washington State University. Thus far, these programs have spurred the commercialization of biomedical devices, clean technology, software development, and biotechnology products. As of 2010, the program called for the recruitment of 10 more entrepreneurs in 10 years.
CHATTANOOGA GEEKMOVE
Chattanooga, Tennessee has carried out several strategies to live up to its nickname, Gig City. Chattanooga is positioning itself as an alternate destination to Silicon Valley for high-tech companies and talent due to the citywide gigabit-per-second fiber internet network. In addition, the high-speed internet, another strategy included GeekMove, a short-lived incentive program implemented in 2011 to assist computer developers in relocating to Chattanooga. In 2016, a video campaign was launched, highlighting the city’s affordable cost of living and attractive amenities in a catchy, quirky manner. Costing only $15,000, the videos have received 127,000 views in one year. The videos have captured more than just views: they are even being used a case study in an economic development class at Cornell University due to all the buzz they have created.
MAKE IT. MSP.
Make It. MSP is Greater MSP’s talent initiative that was developed and launched in 2015. The makeitmsp.org website serves as the platform for the initiative, providing information for individuals considering moving to the MSP region. The initiative is focused on three target talent groups: newcomers, professionals of color, and tech talent. To heighten its impact, Make It. MSP recruited more than 100 “Makers” to its “Makers Hub” network, in which community-minded individuals and organizations collaborate around four specific areas:
Radical Welcomers: dedicated to personally welcome newcomers to MSP
Career Acceleration: working to help more than 3,000 local professionals advance their career
Leaders of Color: supporting leadership development opportunities showcasing rising leaders of color in the region
Get Involved. MS: connecting civic engagement opportunities with residents to help get them more deeply involved in the community
CITY OF FORT WORTH, TEXAS ECONOMIC DEVELOPMENT STRATEGIC PLAN
VOLUME 3: STRATEGY PAGE | 67
INNOVATION DISTRICTS & MEDICAL DISTRICTS
OKC INNOVATION DISTRICT
Oklahoma’s innovation district encompasses 1.3 square miles and accounts for approximately 18,000 jobs and 77 percent of National Institutes of Health (NIH) funding in the state. The district leverages the preexisting medical district with new investments in the energy sector to create collaborations that cut across sectors. Prompted by the location of a GE global research center specializing in oil and gas inside the medical district in 2013, the previous medical district became a health-energy district. The Brookings Institute was hired with Project for Public Spaces’ Anne T. and Robert M. Bass Initiative on Innovation and Placemaking to create a growth strategy for the district. Focused on using innovation in research to position Oklahoma City as a premier destination for healthcare and oil and gas, area businesses quickly found common ground. The Brookings Institute identified four areas where these sectors have similar functions: big data analytics, sensors, imaging, and robotics. In 2017, GE sponsored a symposium on imaging technologies that was attended by scientists in healthcare, oil and gas, and aerospace. Today, Oklahoma City is working to create more opportunities for tech companies and startups to engage with the district.
The physical design of the innovation district also needed reimagining. Located near downtown, the district still suffered from suburban, auto-oriented design and restrictions on mixed land uses. However, walkable, mixed-use areas with attractive common spaces have been identified as one strategy to enhance the connections and innovation between sectors. As a result, the district is investing in activating public spaces through less capital-intensive means such as food hubs, music festivals, and health fairs. The future vision for the district includes more density, more multimodal access, increased programming, and more connections with surrounding neighborhoods.
ALLENTOWN INNOVATION DISTRICT
Downtown Allentown, Pennsylvania is emerging as a dynamic mixed-use district thanks to a unique state-funded incentive program (Neighborhood Improvement Zone) and a visionary real estate development firm. The downtown-focused innovation district has produced a wide range of new real estate products including new Class A office buildings, urban housing, entertainment venues, and the relocation of 500 IT workers from the region's hospital network. The economic impact of the innovation district includes more than one billion dollars in public and private sector investment, more than 4,000 new downtown workers in less than two years, and more than one million square feet of fully leased mixed-use space.
AUSTIN MED-TECH INNOVATION DISTRICT
The University of Texas at Austin, state legislators, and local voters collaborated with Seton Healthcare Family and Central Health to create the new Dell Medical School and teaching hospital in downtown Austin. Construction started in 2014. Local business and community leaders are positioning the new campus and surrounding properties as an innovation district focused on medical technologies. The district, located between the University of Texas campus and the downtown commercial core, will be a major economic driver over the next decade. BioAustin, the trade group representing local life sciences companies, predicts that a fully built-out innovation district could grow Austin’s life sciences economy to more than 200 businesses from the current 140 and could also help existing startups grow into major players or targets for acquisitions.
An October 2015 article by Evie Nagy of Fast Company Magazine profiled the new medical school and its potential to transform the healthcare industry through innovation. Nagy stated that “the new med school at the University of
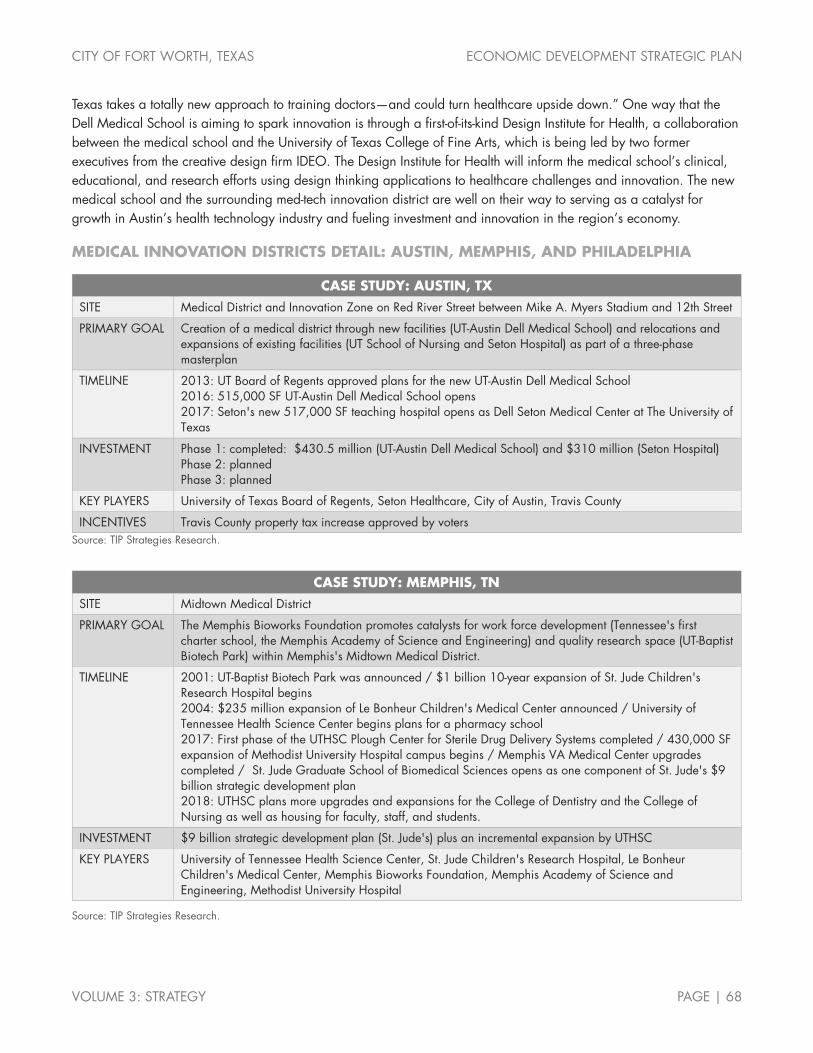
CITY OF FORT WORTH, TEXAS ECONOMIC DEVELOPMENT STRATEGIC PLAN
VOLUME 3: STRATEGY PAGE | 68
Texas takes a totally new approach to training doctors—and could turn healthcare upside down.” One way that the Dell Medical School is aiming to spark innovation is through a first-of-its-kind Design Institute for Health, a collaboration between the medical school and the University of Texas College of Fine Arts, which is being led by two former executives from the creative design firm IDEO. The Design Institute for Health will inform the medical school’s clinical, educational, and research efforts using design thinking applications to healthcare challenges and innovation. The new medical school and the surrounding med-tech innovation district are well on their way to serving as a catalyst for growth in Austin’s health technology industry and fueling investment and innovation in the region’s economy.
MEDICAL INNOVATION DISTRICTS DETAIL: AUSTIN, MEMPHIS, AND PHILADELPHIA
CASE STUDY: AUSTIN, TX SITE Medical District and Innovation Zone on Red River Street between Mike A. Myers Stadium and 12th Street
PRIMARY GOAL Creation of a medical district through new facilities (UT-Austin Dell Medical School) and relocations and expansions of existing facilities (UT School of Nursing and Seton Hospital) as part of a three-phase masterplan
TIMELINE 2013: UT Board of Regents approved plans for the new UT-Austin Dell Medical School 2016: 515,000 SF UT-Austin Dell Medical School opens 2017: Seton's new 517,000 SF teaching hospital opens as Dell Seton Medical Center at The University of Texas
INVESTMENT Phase 1: completed: $430.5 million (UT-Austin Dell Medical School) and $310 million (Seton Hospital) Phase 2: planned Phase 3: planned
KEY PLAYERS University of Texas Board of Regents, Seton Healthcare, City of Austin, Travis County
INCENTIVES Travis County property tax increase approved by voters Source: TIP Strategies Research.
CASE STUDY: MEMPHIS, TN SITE Midtown Medical District
PRIMARY GOAL The Memphis Bioworks Foundation promotes catalysts for work force development (Tennessee's first charter school, the Memphis Academy of Science and Engineering) and quality research space (UT-Baptist Biotech Park) within Memphis's Midtown Medical District.
TIMELINE 2001: UT-Baptist Biotech Park was announced / $1 billion 10-year expansion of St. Jude Children's Research Hospital begins 2004: $235 million expansion of Le Bonheur Children's Medical Center announced / University of Tennessee Health Science Center begins plans for a pharmacy school 2017: First phase of the UTHSC Plough Center for Sterile Drug Delivery Systems completed / 430,000 SF expansion of Methodist University Hospital campus begins / Memphis VA Medical Center upgrades completed / St. Jude Graduate School of Biomedical Sciences opens as one component of St. Jude's $9 billion strategic development plan 2018: UTHSC plans more upgrades and expansions for the College of Dentistry and the College of Nursing as well as housing for faculty, staff, and students.
INVESTMENT $9 billion strategic development plan (St. Jude's) plus an incremental expansion by UTHSC
KEY PLAYERS University of Tennessee Health Science Center, St. Jude Children's Research Hospital, Le Bonheur Children's Medical Center, Memphis Bioworks Foundation, Memphis Academy of Science and Engineering, Methodist University Hospital
Source: TIP Strategies Research.
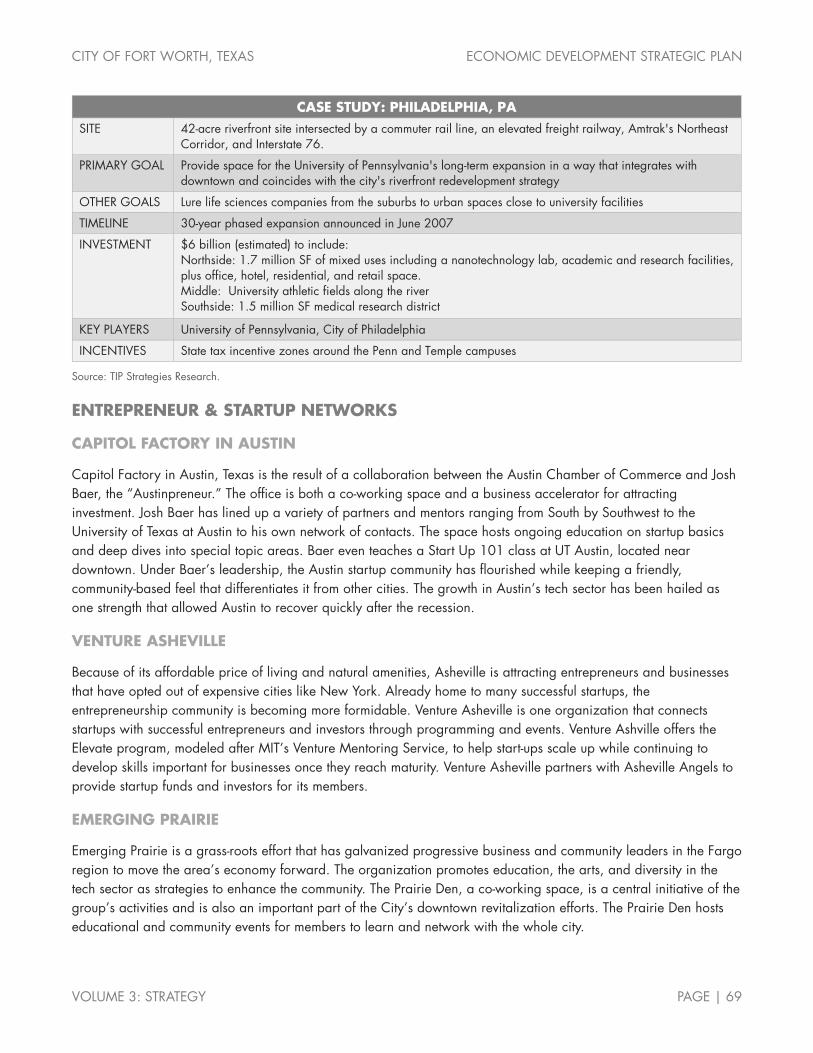
CITY OF FORT WORTH, TEXAS ECONOMIC DEVELOPMENT STRATEGIC PLAN
VOLUME 3: STRATEGY PAGE | 69
CASE STUDY: PHILADELPHIA, PA SITE 42-acre riverfront site intersected by a commuter rail line, an elevated freight railway, Amtrak's Northeast
Corridor, and Interstate 76.
PRIMARY GOAL Provide space for the University of Pennsylvania's long-term expansion in a way that integrates with downtown and coincides with the city's riverfront redevelopment strategy
OTHER GOALS Lure life sciences companies from the suburbs to urban spaces close to university facilities
TIMELINE 30-year phased expansion announced in June 2007
INVESTMENT $6 billion (estimated) to include: Northside: 1.7 million SF of mixed uses including a nanotechnology lab, academic and research facilities, plus office, hotel, residential, and retail space. Middle: University athletic fields along the river Southside: 1.5 million SF medical research district
KEY PLAYERS University of Pennsylvania, City of Philadelphia
INCENTIVES State tax incentive zones around the Penn and Temple campuses
Source: TIP Strategies Research.
ENTREPRENEUR & STARTUP NETWORKS
CAPITOL FACTORY IN AUSTIN
Capitol Factory in Austin, Texas is the result of a collaboration between the Austin Chamber of Commerce and Josh Baer, the “Austinpreneur.” The office is both a co-working space and a business accelerator for attracting investment. Josh Baer has lined up a variety of partners and mentors ranging from South by Southwest to the University of Texas at Austin to his own network of contacts. The space hosts ongoing education on startup basics and deep dives into special topic areas. Baer even teaches a Start Up 101 class at UT Austin, located near downtown. Under Baer’s leadership, the Austin startup community has flourished while keeping a friendly, community-based feel that differentiates it from other cities. The growth in Austin’s tech sector has been hailed as one strength that allowed Austin to recover quickly after the recession.
VENTURE ASHEVILLE
Because of its affordable price of living and natural amenities, Asheville is attracting entrepreneurs and businesses that have opted out of expensive cities like New York. Already home to many successful startups, the entrepreneurship community is becoming more formidable. Venture Asheville is one organization that connects startups with successful entrepreneurs and investors through programming and events. Venture Ashville offers the Elevate program, modeled after MIT’s Venture Mentoring Service, to help start-ups scale up while continuing to develop skills important for businesses once they reach maturity. Venture Asheville partners with Asheville Angels to provide startup funds and investors for its members.
EMERGING PRAIRIE
Emerging Prairie is a grass-roots effort that has galvanized progressive business and community leaders in the Fargo region to move the area’s economy forward. The organization promotes education, the arts, and diversity in the tech sector as strategies to enhance the community. The Prairie Den, a co-working space, is a central initiative of the group’s activities and is also an important part of the City’s downtown revitalization efforts. The Prairie Den hosts educational and community events for members to learn and network with the whole city.
CITY OF FORT WORTH, TEXAS ECONOMIC DEVELOPMENT STRATEGIC PLAN
VOLUME 3: STRATEGY PAGE | 70
VENTURE CAPITAL & LEVERAGING HIGH NET WORTH INDIVIDUALS
ICONIQ CAPITAL IN SILICON VALLEY
Iconiq Capital manages around $9 billion in client funds and serves tech giants such as Mark Zuckerberg, Sheryl Sandberg, Jack Dorsey, and Reid Hoffman. This firm is known for brokering deals between high net-worth individuals and young startup entrepreneurs or even between high-profile clients. Known for friendly business relationships, Iconiq provides a network and access to capital more than it provides operational support. This casual dynamic works well in Silicon Valley, promoting innovation and business deals through personal connections.
DOWNTOWNS AS A MIXED-USE BUSINESS DISTRICT
AUSTIN, SEATTLE, AND DENVER
Revitalization efforts to turn downtowns into connected, mixed-use business districts create huge returns on investment. Thriving downtowns include jobs, housing, entertainment, restaurants, shopping, and recreational opportunities. A mix of uses ensures that there is activity throughout the day and that people do not have to leave the district for the services they want. Furthermore, a mix of amenities in a compact, urban setting provides more opportunities for walking, biking, or utilizing public transit, which contributes to the health of a city. Austin, Denver, and Seattle are examples of cities that have nurtured a mix of uses to create a high quality of living in their downtowns. Each of these cities made a commitment to expand the residential base of their downtown, and has experienced the benefits of private investment by companies that prioritize quality of life for their employees. In early 2015, Google committed to occupy 200,000 square feet of a 500,000 square feet office tower in downtown Austin. In Seattle, Amazon continues to develop its urban corporate HQ campus that will house 55,000 employees (one building was completed in 2015). In Denver, the Lower Downtown District (LoDo), which houses Union Station, is home to the corporate HQs of Chipotle and DaVita.
HIGHER EDUCATION EXPANSION INTO A DOWNTOWN
ASU IN PHOENIX, UCF IN ORLANDO, AND UW IN TACOMA
Many universities are adding downtown campuses for a variety of reasons. Downtown locations are appealing to working adults looking to add night classes to their already busy schedules. Locating educational opportunities near employment centers helps students save time and money on commuting. Additionally, it provides access to a new segment of students who might not have considered going back to school without the convenience of a downtown location. For certain programs, like public policy or urban planning, there are benefits to co-locating near city centers for students looking to find internships and jobs. For some cities, like Phoenix and Orlando, downtown university campuses add a vibrancy to downtowns that previously functioned only as job centers, often attracting more investment than without the university’s presence. Phoenix has leveraged ASU’s investment of $225 million and today, the downtown is seeing a resurgence in jobs and residents. The University of Washington-Tacoma’s downtown campus was actually an early mover in this sense, locating downtown in the 1990s. Three decades later, the Tacoma’s executive of community and economic development said, “The university has served as the nucleus of the revitalization of downtown.” Today, Tacoma has a renovated warehouse district, a burgeoning restaurant movement, and a beautiful waterfront.
CITY OF FORT WORTH, TEXAS ECONOMIC DEVELOPMENT STRATEGIC PLAN
VOLUME 3: STRATEGY PAGE | 71
FESTIVALS & EVENTS WITH GLOBAL REACH
SXSW IN AUSTIN
South by Southwest (SXSW), the Austin festival known for music, film, and technology, has also had the effect of promoting international economic development. Notably, the City of Austin benefits from the influx of companies and visitors during the weeks of the festival, but cities and countries from around the world are viewing the festival as way to bolster their own economies. Cities and countries are banking on the SXSW brand to propel their own names into the minds of SXSW-goers and hopefully generate tourism, talent recruitment, and business development back home. Given that SXSW is a magnet for talent in music, film, and tech, countries and cities host extravagant events to differentiate themselves among the many vendors. Efforts including The Great Britain House, Casa Mexico, ChooseATL, and WeDC all centered attracting new talent and investment through rebranding.
ART PRIZE IN GRAND RAPIDS
Art Prize is a 19-day international art competition in Grand Rapids, Michigan, where artists of any medium can enter to win over $200,000. In 2016, 1,453 works of art were displayed from artists originating from 40 states and 44 countries. Two votes take place: a public vote and a vote by art experts. Art is displayed throughout the downtown in shops and restaurants, attracting those attendees interested in picking the next winner. This event attracts over 400,000 visitors and has enhanced the image of Grand Rapids around the world. Today, Art Prize is the most attended art event in the world.
NEIGHBORHOOD ALIGNMENT
MSP CENTER CITIES INITIATIVE
The Center Cities Competitive Initiative is a strategy proposed by TIP to bring economic opportunities to areas that have not benefited from the overall economic success of Minneapolis-St. Paul (MSP). Areas such as North and Northeast Minneapolis and Saint Paul’s East Side and Midway in inner city MSP continued to languish even as the greater MSP thrived. The initiative calls for focused resources to these locations by a dedicated staff person with the following goals: capitalize on the unique brand of each location, grow jobs with effective BRE efforts targeting economic sectors of opportunity, increase inventory of shovel-ready sites, and close more deals to increase job creation and capital investment. The dedicated staff person will have an in-depth knowledge of these areas with which to better facilitate these goals within the broader business and real-estate community.
BOND PACKAGES FOR ECONOMIC DEVELOPMENT
OKLAHOMA CITY MAPS
The Greater Oklahoma City Chamber of Commerce proposed the MAPS (Metropolitan Area Projects) program, which would be funded by a temporary one-cent sales tax. The tax was designed to raise enough money to fund nine specific capital improvement projects without incurring any additional debt. Initially levied for five years, the tax was extended for one six-month period. It raised $310 million (and generated an additional $52 million in income). Over an 11-year period, MAPS completely paid for all the projects, which included new and upgraded sports, recreation, entertainment, cultural, and convention facilities. Proposed MAPS projects were reviewed by an 11-member Citizens Advisory Board. Eight citizen sub-committees were appointed to provide additional input to the Advisory Board. MAPS began on December 14, 1993, when voters narrowly approved the dedicated sales tax.
CITY OF FORT WORTH, TEXAS ECONOMIC DEVELOPMENT STRATEGIC PLAN
VOLUME 3: STRATEGY PAGE | 72
The sales tax expired on July 1, 1999, and the MAPS board was dissolved on June 22, 2004, when the final project, the Ronald J. Norick Downtown Library, was completed.
In the 20 years since the original MAPS program began, Oklahoma City has seen significant economic and quality-of-life impacts. The city’s 2014 economic forecast showed that nearly $5 billion in revenue had been realized, a considerable return on the original investment. The increasing level of urban vitality in the city’s downtown is a testament to the program’s success. Further evidence of success can also be found in two subsequent MAPS programs. MAPS for Kids raised $514 million through a $180 million bond and taxes levied after the original MAPS tax expired. This money was used for repairs at OKC district schools and in 23 other suburban school districts. The latest MAPS program, MAPS 3, was approved by voters in 2009, by the same narrow margin (54 percent) as the original program. This new one-cent sales tax took effect in April 2010 and will end in December 2017. MAPS 3 focuses on eight projects designed to improve the quality of life for OKC residents. These will include a new downtown convention center, new senior health and wellness centers, and improvements to the Oklahoma River and State Fairgrounds and parks and trails throughout the city.
2017 DALLAS CAPITAL BOND
The 2017 Capital Bond Program has been approved for $1 billion and the city is planning to vote on the program on November 7, 2017. However, the city estimated over $10 billion in capital needs. A public engagement process consisting of 32 meetings and 90 volunteer task force members was utilized to prioritize needs. One 15-member Citizens Bond Task Force and five 15-member subcommittees are assisting in identifying projects in five proposed areas. The five areas include: Street, Parks and Trails, Economic Development and Housing, Flood Protection and Storm Drainage, and Critical Facilities. Economic Development includes target project sites and areas eligible for street, utility, and other infrastructure improvements as it relates to economic and business development. Housing infrastructure improvements will include street, alley, and drainage infrastructure for low- to moderate-income housing. As of May 18, 2017, around 6.8 percent of the entire bond program will be devoted to Economic Development and Housing. Amounts of $50 million and $60 million were proposed at the last Citizens Bond Task Force meeting.
EL PASO QUALITY OF LIFE BOND
The El Paso Quality of Life Bond Program was approved in 2011 by 72 percent of voters and authorized the use of $473 million over 12 years. A key aspect of the 2012 bond program is the Neighborhood Improvement Program (NIP) which targets resources to El Paso neighborhoods. Every year, $100,000 is allocated to each city council district and neighborhood associations are engaged to identify priorities. Other projects include parks, zoos, libraries, downtown enhancements, and museums. El Paso has a dedicated webpage to this bond program which tracks gives project updates and records completed projects by district and an interactive map viewing tool shows where the projects are located.
SMART CITY INVESTMENTS & INNOVATIVE PARTNERSHIPS
FRISCO TRAFFIC LIGHT TECHNOLOGY
In 2017, Frisco, Texas became the second city in the country to connect its traffic signal network with vehicles. Within Frisco, 115 intersections went live on the street network. In response to the technology, certain manufacturers, such as Audi, have started including real-time information on the dashboard of vehicles that tells drivers how much time until a traffic signal will change (also known as “time to green”). This technology can assist
CITY OF FORT WORTH, TEXAS ECONOMIC DEVELOPMENT STRATEGIC PLAN
VOLUME 3: STRATEGY PAGE | 73
driver decision-making, calculate alternate routes, or time a trip to coincide with more green lights. Overall, as more vehicles become connected, this technology could improve traffic cohesion in a city and even save fuel for drivers. In the future, Frisco will also adopt adaptive signal control which will allow traffic signalization to accommodate changing traffic patterns in real time.
WAYMO AUTONOMOUS VEHICLES IN PHOENIX
Waymo, the commercial arm of Google’s self-driving car research, expanded its pilot program across Phoenix, Arizona in 2017 to allow residents to use automated minivans for everyday transportation needs. This program represents Waymo’s first large-scale public test and will include hundreds of residents. Like Uber’s program, the service will be free and will still include a Waymo driver who can take control of the vehicle, if needed. In contrast to Uber’s program, this service will not be a ride-hailing service, but instead will focus on signing users up who want to truly integrate the autonomous vehicles into their daily routines and provide feedback to Waymo.
SACRAMENTO/VERIZON PARTNERSHIP
In June 2017, the city of Sacramento, California entered a public-private partnership with Verizon to develop smart city infrastructure. Verizon’s investment of more than $100 million will provide traffic signal control software to improve traffic flow and reduce the number of traffic injuries and deaths. Other improvements will be aimed at light rail and bus services to decrease congestion and reduce greenhouse gas emissions. 5G internet will be implemented and wi-fi will be installed in 27 public parks and in information kiosks across the city. The partnership extends further than technological advancements—Verizon is also creating internships at technology companies to promote STEM careers for local students. Overall, these types of improvements increase access to technology for Sacramento residents and create a higher quality of life due to efficiency and safety gains.
INCENTIVE PROGRAMS
PLANO PROPERTY TAX ECONOMIC DEVELOPMENT FUND
The City of Plano Economic Development Incentive Program is used specifically for projects and programs to attract or retain major businesses and employers within the city of Plano. Funds for this program are generated by a 2.0 cent portion of the city’s 48.86 cents per $100 valuation of the city’s ad valorem tax rate. This dedicated tax for economic development was established in 2006. The Economic Development Incentive Fund transfer dedicated solely for economic development program incentives was estimated at $8.1 million for fiscal year 2014-2015.
ARLINGTON TOMORROW FOUNDATION GAS WELLS FUND
The Arlington Tomorrow Foundation was created in 2007 by the Arlington City Council with an initial installment of $26 million originating from natural gas revenues. Today, the public endowment has grown and pays out an average of $1.4 million dollars in grants every year. Since 2007, $18 million has been given in 352 grants to charities in the Arlington community. The Foundation focuses on neighborhoods, nature, and programming which enhances the quality of life of the city.

CITY OF FORT WORTH, TEXAS ECONOMIC DEVELOPMENT STRATEGIC PLAN
VOLUME 3: STRATEGY PAGE | 74
ORGANIZATIONAL MODELS
OPPORTUNITY AUSTIN
The Opportunity Austin capital campaign—a partnership of the City of Austin and the Austin Chamber of Commerce—is a successful approach to regional economic development. Opportunity Austin was launched by the Austin Chamber of Commerce in 2004 as a five-year economic development initiative aimed at fostering job-creating investment in the five-county Austin metro area. This regional strategy aimed to create 72,000 jobs and increase payroll by $2.9 billion across the region. To implement the strategy, the business community committed to invest $14.4 million. From 2004 through the end of 2012, an estimated 190,900 new jobs were added to Austin's regional economy. Regional payroll increased by $9.9 billion during this period, along with increases in per capita income and average annual wages. In December 2012, Opportunity Austin 3.0 was launched, with a set of new initiatives focused on improving the region’s economy, talent, and place. Top priorities included boosting economic diversification to strengthen the economy, deepening the talent pool through development and attraction, and keeping the Greater Austin region attractive to entrepreneurs, business leaders and site selectors through expanded advocacy on issues such as a comprehensive regional transportation system and regional collaboration.
GREATER NASHVILLE CHAMBER OF COMMERCE
The Greater Nashville Chamber of Commerce serves the greater Nashville area which includes 10 counties, 1.9 million people, and over 40,000 businesses. The Chamber includes five Area Advisory Councils to provide more localized input. The Chamber had a budget of $7.6 million in FY2016 to which the City of Nashville contributes annually (around $350,000 planned for 2018). The Nashville Chamber works with the Nashville Mayor’s Office of Economic and Community Development on business attraction and expansion activities, but also focuses on workforce development and quality of place and livability for the region. The Chamber has increasingly focused on quality-of-life issues, such as affordability, public education, and transportation, as talent recruitment strategies. As of 2016, the Chamber was leading the effort in creating the Middle Tennessee Regional Workforce Alliance, a partnership between local workforce boards, the Tennessee Board of Regents, community colleges, and colleges of applied technology to improve the education-to-employment pipeline. The Chamber provides education and programming for local small businesses, and provides funding for The Entrepreneur Center, a one stop shop for startup support and investor funding. Finally, the Chamber hosts several research initiatives ranging from workforce studies, annual education report cards, annual transportation scorecards, and other regional statistics for the greater Nashville area.
AUSTIN � SEATTLEDECEMBER 2017
TECHNICAL REPORT: GUIDANCE ON MARKETING, PROGRAM AREAS, & SITE SELECTION
CITY OF FORT WORTH, TEXASECONOMIC DEVELOPMENT STRATEGIC PLAN

CITY OF FORT WORTH ECONOMIC DEVELOPMENT STRATEGIC PLAN
TECHNICAL REPORT: GUIDANCE ON MARKETING, PROGRAM AREAS & SITE SELECTION PAGE | I
ACKNOWLEDGEMENTS TIP would like to thank the following individuals and organizations for their participation in this planning process:
CITY OF FORT WORTH MAYOR AND CITY COUNCIL Betsy Price, Mayor
Carlos Flores, District 2 (current)
Sal Espino, District 2 (former)
Brian Byrd, District 3
W.B. ‘Zim’ Zimmerman, District 3 (former)
Cary Moon, District 4
Gyna Bivens, District 5
Jungus Jordan, District 6
Dennis Shingleton, District 7
Kelly Allen Gray, District 8
Ann Zadeh, District 9
CITY OF FORT WORTH STAFF David Cooke, City Manager
Jay Chapa, Assistant City Manager
Robert Sturns, Director, Economic Development
Brenda Hicks-Sorensen, CEcD, Assistant Director, Economic Development
PROJECT STEERING COMMITTEE Lisa McMillan, Tarrant County Administrator’s Office
Darlene Boudreaux, Tech Fort Worth
Brandom Gengelbach, Fort Worth Chamber of Commerce
Stacy Marshall, Southeast Fort Worth, Inc.
Andy Taft, Downtown Fort Worth, Inc.
Paul Paine, Near Southside, Inc.
Cintya Segoviano, Fort Worth Hispanic Chamber of Commerce
Devoyd “Dee” Jennings, Fort Worth Metropolitan Black Chamber of Commerce
David Walters, CBRE
Nina Petty, Tarrant County College District
Mitch Whitten, Fort Worth Convention & Visitors Bureau
Janet Black, BNSF Railway Company
Marie A. Holliday, DMD, Sundance Square Dentist
Robert Folzenlogen, Hillwood Properties
Don Boren, Don Boren and Company Inc.
JJ Cawelti, Bell Helicopter-Textron, Inc.
Kevin Davies, Hulen Mall
Matt Robinson, Walton Development and Management, Inc.
Judy McDonald, Workforce Solutions of Tarrant County
CITY OF FORT WORTH ECONOMIC DEVELOPMENT STRATEGIC PLAN
TECHNICAL REPORT: GUIDANCE ON MARKETING, PROGRAM AREAS & SITE SELECTION PAGE | II
PROJECT LEADERSHIP TEAM Paul Ballard, Fort Worth Transportation Authority
Mike Berry, Hillwood Properties
Jay Chapa, Assistant City Manager
John Terrell, DFW International Airport
Victor Boschini, Texas Christian University
Michael Branum, NAS Fort Worth Joint Reserve Base
Dr. Kent Paredes Scribner, Fort Worth ISD
Eugene V. Giovannini, Tarrant County College District
J.D. Granger, Trinity River Vision Authority
Johnny Campbell, Sundance Square
Lillie Biggins, Texas Health Harris Methodist Fort Worth
PROJECT CONSULTING TEAM
TIP STRATEGIES, INC. is a privately held economic development consulting firm with offices in Austin and Seattle. TIP is committed to providing quality solutions for public and private sector clients. Established in 1995, the firm's primary focus is economic development strategic planning.
Project Team: Jon Roberts, Managing Principal John Karras, Senior Consultant Alex Cooke, Senior Consultant Karen Beard, Analyst Meredith Eberle, Project Support
FREGONESE ASSOCIATES is a Portland-based urban planning firm with expertise in citywide comprehensive planning as well as scenario planning and modeling in specific areas (such as downtowns and urban corridors). Established in 1997, the firm’s work has been instrumental in the development and adoption of growth policies and land use plans in large cities and metro areas across the US and internationally.
Project Team: John Fregonese, President Nadine Appenbrink, Project Manager Julia Reisemann, GIS Analyst
JLL is a member of the Fortune 500 and is a global professional services and investment management firm specializing in real estate. JLL’s industry-leading research group delivers commercial real estate analysis and insights that drive value in real estate decisions and support successful strategies.
Project Team: Jubal Smith, Executive Vice President Todd Burnette, Managing Director
ISAAC BARCHAS led the Austin Technology Incubator for 10 years, starting in 2006. Over that time, he has overseen the incubation of more than 200 companies. He is responsible for ATI's strategic direction and evolving the ATI economic model. Isaac remains active in the technology and venture capital communities in Austin and across the US and has been published in the Washington Post, Wall Street Journal, Chicago Tribune, and Austin American Statesman.
CITY OF FORT WORTH ECONOMIC DEVELOPMENT STRATEGIC PLAN
TECHNICAL REPORT: GUIDANCE ON MARKETING, PROGRAM AREAS & SITE SELECTION PAGE | III
CONTENTS ABOUT THIS WORK ................................................................................................................................. 1 KEY FINDINGS ......................................................................................................................................... 3 ATTACHMENT A. PERCEPTION SURVEY ...................................................................................................... 6
CONNECTION TO FORT WORTH .......................................................................................................... 6 GENERAL PERCEPTIONS ....................................................................................................................... 7 PERCEPTIONS OF ASSETS ..................................................................................................................... 9 FORT WORTH SITE SELECTION EXPERIENCE ......................................................................................... 11 PERCEPTIONS OF BUSINESS CLIMATE .................................................................................................. 13
ATTACHMENT B. MARKETING REVIEW ..................................................................................................... 18 INTRODUCTION ................................................................................................................................. 18 METHODOLOGY ................................................................................................................................ 18 REVIEW OF THEMES & MESSAGES ...................................................................................................... 19 STRATEGIC CONSIDERATIONS ............................................................................................................ 22 ECONOMIC DEVELOPMENT WEBSITE COMPARISON............................................................................ 23
ATTACHMENT C. ORGANIZATION GAP ANALYSIS .................................................................................... 35 ATTACHMENT D. ORGANIZATIONAL REVIEW ........................................................................................... 37
STAFFING COMPARISONS .................................................................................................................. 37 ORGANIZATION FUNCTIONS ............................................................................................................. 39 INCENTIVES ....................................................................................................................................... 41 STRATEGIC PLAN DOCUMENTS ........................................................................................................... 44
ATTACHMENT E. SITE SELECTION FACTORS .............................................................................................. 45 AREA DEVELOPMENT TOP 10 FACTORS ............................................................................................... 45 DALLAS-FORT WORTH METRO AREA COMPARISONS ............................................................................ 57
CITY OF FORT WORTH ECONOMIC DEVELOPMENT STRATEGIC PLAN
TECHNICAL REPORT: GUIDANCE ON MARKETING, PROGRAM AREAS & SITE SELECTION PAGE | 1
ABOUT THIS WORK Over the last several decades, Fort Worth has been one of the fastest-growing large cities in the US. Fort Worth has a unique identity and brand that combines its rich cultural heritage with an economy driven by industry-leading employers like Lockheed Martin and American Airlines. The City has made strategic investments in districts from Sundance Square to Alliance, resulting in numerous waves of private sector investment and employment growth. However, all this has been achieved without a comprehensive, citywide approach for economic development. There is no question that Fort Worth is primed for greater economic prosperity. The challenge is not about growth in a general sense, it is about guiding growth that creates the highest overall benefit to the city. To accomplish this, future development will need to be channeled into specific districts, into generating higher income levels and capital investment, strengthening the local tax base, and supporting a more attractive environment for companies and skilled workers.
In response to these challenges, Fort Worth is embarking on its first economic development strategic plan, aimed at enhancing the city's status in the region and nation over the next five years and beyond. Working with TIP Strategies (an economic development consulting firm with office in Austin and Seattle) and their partners (Fregonese Associates, JLL, and Isaac Barchas), the City of Fort Worth has engaged the business community and local stakeholders to create a strategic framework to guide the City’s economic development activities.
This Technical Report was prepared as part of the strategic planning process to offer qualitative insights on Fort Worth’s economic development program. This report presents findings based on perceptions of area real estate brokers and developers, marketing messages and themes from Fort Worth’s economic development partners, and comparisons of Fort Worth’s economic development program vis-à-vis metro area competitor cities and US benchmarks. It also includes a review of how the city stacks up in light of major site selection factors for corporate expansions and relocations. These findings provide a foundation of knowledge that informed the other deliverables produced during the engagement (Volume 1: Competitiveness; Volume 2: Opportunity; and Volume 3: Strategy) and are also intended to provide guidance on internal resource allocation decisions for the City’s economic development program.
Five separate analyses incorporated into this summary are presented as attachments:
A. Perception Survey. As part of the planning process, TIP surveyed a targeted group of commercial real estate brokers and developers. Respondents were primarily located in Fort Worth, however, many of those completing the survey were based in other cities in the Dallas-Fort Worth metro area. Questions were focused on views of Fort Worth’s business climate, its appeal as a location for business expansion and relocation projects, and perceptions about the City’s key cultural and industry assets.
B. Marketing Review. This analysis looks at the marketing themes promulgated by the City of Fort Worth and other partner organizations. We also compared Fort Worth’s two primary economic development websites (the City of Fort Worth Economic Development Department and the Fort Worth Chamber of Commerce) against the metro area competitor cities and the US benchmark cities.
C. Organization Gap Analysis. This matrix visualizes the core functions and support functions for the 31 partner organizations that have the strongest impact on economic development in Fort Worth. This gap analysis informs the implementation matrix, which assigns specific organizations responsible for carrying out each strategy and action in the plan.
CITY OF FORT WORTH ECONOMIC DEVELOPMENT STRATEGIC PLAN
TECHNICAL REPORT: GUIDANCE ON MARKETING, PROGRAM AREAS & SITE SELECTION PAGE | 2
D. Organizational Review. This matrix offers a comparison of the resources dedicated to economic development in Fort Worth compared with metro area competitor cities and US benchmarks. We reviewed factors including staff size (total and by function), operating budgets, and major economic development incentive funds.
E. Site Selection Factors. To understand Fort Worth’s appeal as a business location, this document compares Fort Worth and Texas with the domestic benchmarks using major site selection factors typically considered by corporations. To supplement these state and metro-area level factors, we analyzed how Fort Worth stacks up within the Dallas-Fort Worth market according to more localized criteria including school district rankings, City incentive programs, and available real estate products. In addition, we used information from confidential discussions with JLL and City of Fort Worth staff concerning several recent economic development prospects. These conversations inform the key findings below, but more importantly, have also been used to inform strategy development for Volume 3.

CITY OF FORT WORTH ECONOMIC DEVELOPMENT STRATEGIC PLAN
TECHNICAL REPORT: GUIDANCE ON MARKETING, PROGRAM AREAS & SITE SELECTION PAGE | 3
KEY FINDINGS A number of key findings emerged from this work. The information presented below combines the results of multiple analyses with insights gained from an extensive stakeholder engagement process and the direct experience of the consulting team in working with prospects. The outcome points to areas where improvements are needed in Fort Worth’s site selection process and related marketing and positioning efforts. Where applicable, recommendations for addressing identified issues have been incorporated into the strategic plan (Volume 3).
Fort Worth is losing prospects to other metro area cities. A proactive economic development effort is required to counteract negative perceptions of the city and to increase investment.
Fort Worth currently competes for the same prospects that are choosing to locate in Dallas, Plano, Frisco, Irving, Allen, and McKinney. While most of these prospects could locate in Fort Worth, too many ultimately decide against making an investment in the city. In some cases, a perceived weakness is the deciding factor; perceptions of the quality of Fort Worth ISD and a lack of an effective transportation system were referenced in both the stakeholder survey presented in Volumes 1 and 2 and in the broker perception survey presented in Attachment A. Addressing these perceived weaknesses will be essential to the city’s future economic vitality.
However, the planning process suggests the lack of a proactive economic development response is an equally significant factor affecting the City’s ability to capture its share of the region’s growth. The Dallas-Fort Worth metro area is a highly competitive region. Dallas has a strong City economic development department and the Dallas Regional Chamber is very aggressive. There is no counterpart to this partnership in Fort Worth. The City is also faced with competition from dozens of Dallas-Fort Worth metro area sales tax corporations. In particular, the Type A economic development corporations in Frisco, Allen, and McKinney are extremely effective.
Defining and formalizing roles and responsibilities among the City’s economic development partners will help maximize resources and ensure a more consistent and professional site selection experience for prospects.
A critical element of an effective economic development program is a clear delineation of roles and responsibilities. In addition to increasing efficiency, a well-defined process for dealing with prospects can help eliminate confusion, ensure that information requests receive a timely and consistent response, and present a more favorable view of the city. This process should be formalized and the correct path should be evident from every potential entry point, including partner websites.
The organization gap analysis presented in Attachment C demonstrates the diverse set of partner organizations working to grow and strengthen the Fort Worth economy. A close look at the functional areas (both traditional and non-traditional) reveals areas of overlap where several organizations provide similar services and under-served areas. For instance, none of the core economic development partners are currently engaged in significant talent attraction. Currently, only the higher education institutions can claim that role.
The Fort Worth Chamber should expand its role as Fort Worth’s leading organization focused on target industry recruitment, including international business development. The Chamber needs to be a player regionally and globally. The City’s role should focus on incentives, redevelopment, and development assistance. However, the division of roles and responsibilities is not intended to put each partner in a separate silo. In fact, Volume 3 calls for shared responsibilities between the City and the Chamber for many critical functions (e.g., business retention & expansion and target industry recruitment). The key point is that the roles of each partner must be well understood and delineated.
CITY OF FORT WORTH ECONOMIC DEVELOPMENT STRATEGIC PLAN
TECHNICAL REPORT: GUIDANCE ON MARKETING, PROGRAM AREAS & SITE SELECTION PAGE | 4
Fort Worth lags many benchmark communities—both within the region and outside the state—in terms of resource levels allocated to economic development.
The organizational review presented in Attachment D illustrates that the City of Fort Worth has among the lowest staffing levels of economic development personnel compared with the US benchmark cities. The analysis also reveals that funding and staff resources for economic development in Fort Worth falls short of most competitor cities in the Dallas-Fort Worth market, in terms of both operations and incentives. Accordingly, the City should start by streamlining and enhancing the necessary “reactive” part of economic development: responding to prospects. This step should be followed by significant new investments in the “proactive” side of economic development: generating leads and cultivating relationships that lead to new business development opportunities.
Fort Worth lacks specific incentive programs that have been effective in other communities in the region.
In addition to being better resourced, many of Fort Worth’s metro area competitor communities have more robust incentive offerings. For example, Plano’s property tax-funded economic development incentive program has been very effective. The program is credited with playing a key role in luring Toyota and JP Morgan Chase into the community, which together are expected to result in 10,000 new jobs.
An important focus of the City’s economic development strategy must be increasing Fort Worth’s competitiveness within the region by introducing new and expanded incentive programs. Consideration should be given to providing incentives for companies that lease office space. This strategy would help the community attract more professional service companies (including tech firms) that would not otherwise qualify for existing tax abatement incentives, because their expansion does not include significant capital investment.
From a corporate site location standpoint, Fort Worth compares favorably against several of the peer metro areas. These factors should inform the City’s target marketing messages nationally and internationally.
The review of site selection factors presented in Attachment E offers a strong business case for the city and the Fort Worth MD based on the major factors typically considered in corporate site location decisions. Furthermore, it suggests Fort Worth is a competitive location for business expansion and relocation projects compared with the domestic peer metro areas. Fort Worth fared particularly well on measures related to labor availability and costs. In addition, the city’s large supply of land presents a significant advantage.
However, despite the positive comparison at the state-vs-state and metro-vs-metro levels, Fort Worth does not capture its fair share of projects. Focused messaging promoting these attributes could help raise the city’s profile outside the state and offer a mechanism for leapfrogging some of the competitive challenges regionally. National and international success could, in turn, help address negative perceptions in the region. This does not mean Fort Worth should ignore the disadvantages it has relative to metro area peers, such as the Type A and B sales tax incentive funds (e.g., Frisco, McKinney) and property tax incentive funds (Plano and Richardson). Instead, Fort Worth’s asset base and its favorable site selection factors suggest that marketing should focus on attracting investment and business expansion from national and international companies, rather than concentrating on differentiating the city from other regional players.
The city fares well among brokers on some points relative to its Dallas-Fort Worth metro area competitors according to the perception survey (Attachment A). These points should be emphasized in regional marketing efforts.
Among a range of 17 site selection factors, Fort Worth was rated most highly on cost of living and quality of life. Fort Worth is also perceived as having a relatively strong business climate among the surrounding competitor cities,
CITY OF FORT WORTH ECONOMIC DEVELOPMENT STRATEGIC PLAN
TECHNICAL REPORT: GUIDANCE ON MARKETING, PROGRAM AREAS & SITE SELECTION PAGE | 5
with two thirds of survey respondents giving the city a favorable rating in this area. However, Plano and Frisco stand out as having the highest regarded business climates. And other aspects of the survey suggest that Fort Worth’s development process is viewed unfavorably. Within the Dallas-Fort Worth market, Fort Worth is among the least competitive locations of those rated in terms of key local factors such as K-12 school performance, labor access, and commercial office space availability. Fort Worth also received relatively low marks on the presence of research universities, however, this factor was viewed as the least important among those analyzed.
One area of emphasis that could be explored is raising awareness of Fort Worth’s impressive base of industry. For example, Plano and Irving are known for their large corporate and professional facilities. Actively reinforcing such associations can support efforts to attract additional investment of this type. The industries most closely associated with Fort Worth in the perception survey were: aerospace, oil & gas, and real estate & construction. In addition, a concerted effort to connect the city more closely with other sectors could be productive. The industries least associated with Fort Worth were: software/IT, finance & insurance, professional services, and corporate HQs. Marketing and target industry recruitment efforts should be focused on the city’s established sectors and emerging opportunities detailed in Volume 2. Strategies should simultaneously strengthen the image already associated with the city (a location for industry), while also creating awareness of new sectors for which the city isn’t currently recognized.
The marketing review revealed a lack of consistent messaging related to economic development and little or no internationally focused business development marketing.
Fort Worth lacks a unified economic development message. Each partner organization sends a different message about living and doing business in Fort Worth through their marketing channels. While use of a longhorn is relatively consistent across organizations (and may represent a potential unifying theme), the presence of multiple messages can water down perceptions of an area. Current messaging also does little to convey the city’s competitive advantages and, in some cases, relies on variations of the overexposed “great place to live, work, and play” theme. We recommend that the City be more intentional in developing language that clearly communicates the benefits of a Fort Worth location to businesses and talent. Engaging in a more strategic manner with the regional and national real estate community is also critical.
The analysis also reveals that Fort Worth’s target industry marketing and recruitment are relatively weak. While the Chamber does highlight the city’s primary industries in marketing materials, these materials lack the depth required for a successful target industry recruitment program. Depth refers to more detailed information on the local and regional advantages within each industry (e.g., highlighting specific employers, key occupations, training programs) as well as focusing on specific segments and opportunities within a broader industry. Good examples of target industry marketing messages from the benchmark cities include the Animal Health Corridor in Kansas City and the Metro Denver EDC’s industry profiles. The emerging opportunities described in Volume 2: Opportunity provide a good starting point to build out a more focused set of marketing materials for Fort Worth’s target industry recruitment efforts.
International business development is nearly nonexistent within Fort Worth. Even a basic item such as listing the major foreign-owned firms and recent FDI projects in Fort Worth is lacking from existing marketing materials. Currently, the Dallas Regional Chamber, DFW International Airport, and Alliance are the only entities in the region focused on international business in a significant way. Raising the profile of Fort Worth as a global business center is a significant opportunity that needs to be addressed. Among the benchmark cities, Nashville and Pittsburgh provide examples of more robust international business development efforts.
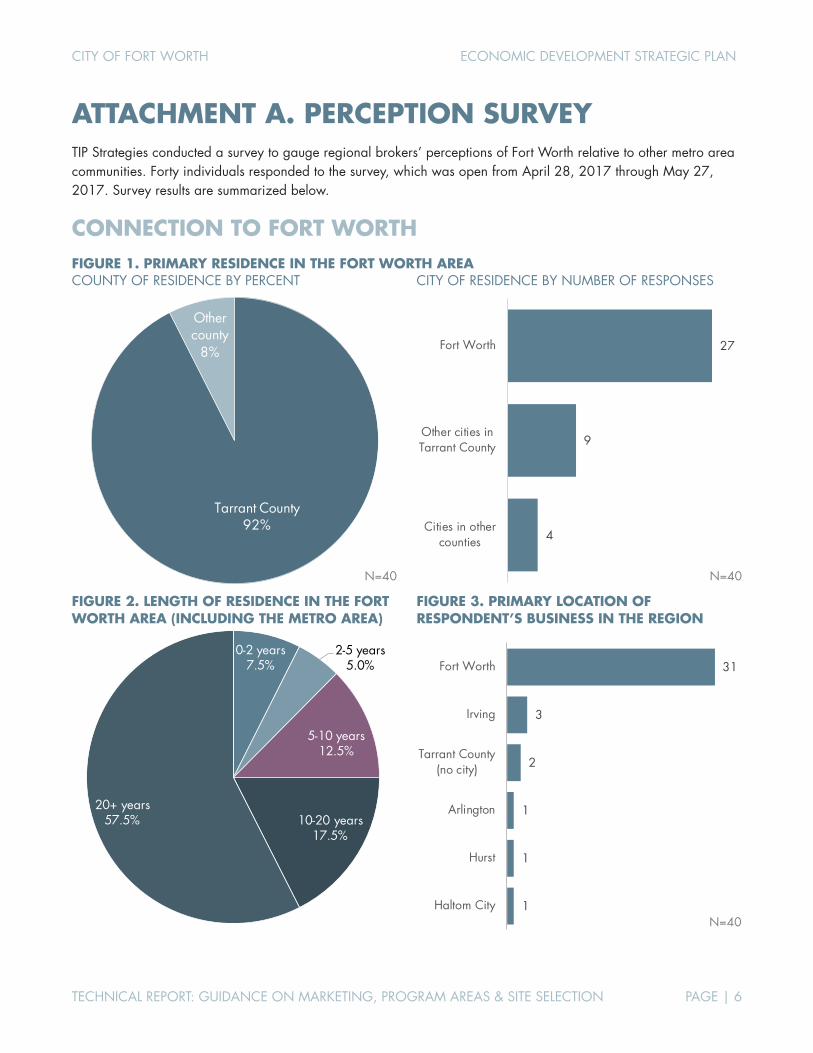
CITY OF FORT WORTH ECONOMIC DEVELOPMENT STRATEGIC PLAN
TECHNICAL REPORT: GUIDANCE ON MARKETING, PROGRAM AREAS & SITE SELECTION PAGE | 6
ATTACHMENT A. PERCEPTION SURVEY TIP Strategies conducted a survey to gauge regional brokers’ perceptions of Fort Worth relative to other metro area communities. Forty individuals responded to the survey, which was open from April 28, 2017 through May 27, 2017. Survey results are summarized below.
CONNECTION TO FORT WORTH FIGURE 1. PRIMARY RESIDENCE IN THE FORT WORTH AREA COUNTY OF RESIDENCE BY PERCENT
CITY OF RESIDENCE BY NUMBER OF RESPONSES
FIGURE 2. LENGTH OF RESIDENCE IN THE FORT WORTH AREA (INCLUDING THE METRO AREA)
FIGURE 3. PRIMARY LOCATION OF RESPONDENT’S BUSINESS IN THE REGION
Tarrant County92%
Other county
8%
N=40
27
9
4
Fort Worth
Other cities inTarrant County
Cities in othercounties
N=40
0-2 years7.5%
2-5 years5.0%
5-10 years12.5%
10-20 years17.5%
20+ years57.5%
31
3
2
1
1
1
Fort Worth
Irving
Tarrant County(no city)
Arlington
Hurst
Haltom CityN=40
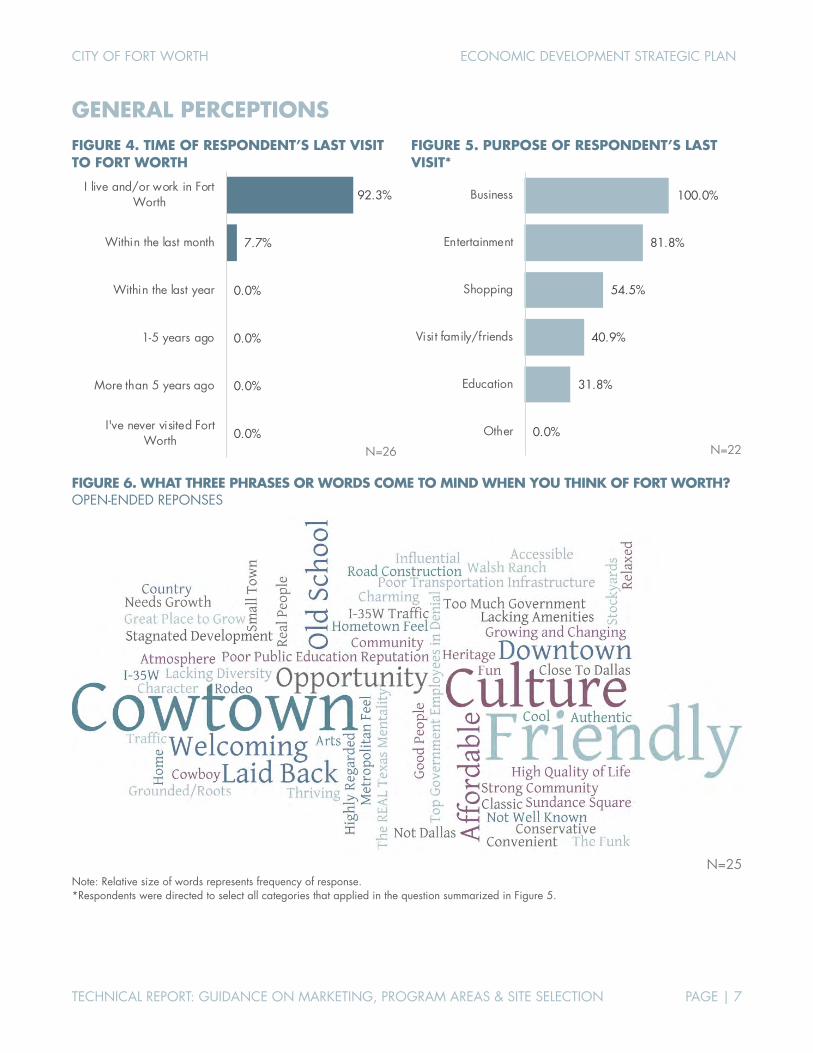
CITY OF FORT WORTH ECONOMIC DEVELOPMENT STRATEGIC PLAN
TECHNICAL REPORT: GUIDANCE ON MARKETING, PROGRAM AREAS & SITE SELECTION PAGE | 7
GENERAL PERCEPTIONS FIGURE 4. TIME OF RESPONDENT’S LAST VISIT TO FORT WORTH
FIGURE 5. PURPOSE OF RESPONDENT’S LAST VISIT*
FIGURE 6. WHAT THREE PHRASES OR WORDS COME TO MIND WHEN YOU THINK OF FORT WORTH? OPEN-ENDED REPONSES
N=25
Note: Relative size of words represents frequency of response. *Respondents were directed to select all categories that applied in the question summarized in Figure 5.
92.3%
7.7%
0.0%
0.0%
0.0%
0.0%
I live and/or work in FortWorth
Within the last month
Within the last year
1-5 years ago
More than 5 years ago
I've never visited FortWorth
N=26
100.0%
81.8%
54.5%
40.9%
31.8%
0.0%
Business
Entertainment
Shopping
Visit family/friends
Education
OtherN=22

CITY OF FORT WORTH ECONOMIC DEVELOPMENT STRATEGIC PLAN
TECHNICAL REPORT: GUIDANCE ON MARKETING, PROGRAM AREAS & SITE SELECTION PAGE | 8
FIGURE 7. INDICATE WHETHER THE FOLLOWING STATEMENTS ARE TRUE OR FALSE.
FIGURE 8. WHAT IS THE MOST RECENT NEWS YOU CAN RECALL ABOUT FORT WORTH—WHETHER FROM A BUSINESS OR A LIFESTYLE PERSPECTIVE? OPEN-ENDED RESPONSES (N=18)
500K lease at Mercantile Center Creation of Medical School collaboration between UNTHSC and TCU. Facebook expansion Facebook, general electric, high taxes Growth down the Chisholm Trail Pkwy corridor Multiple shootings/stabbings (appearance of HIGH crime rate) New AA headquarters Police issues with the community, expanding the freeways and Top Golf Related to development on and around South Main Street. Something related to Lockheed Martin Southside Redevelopment in progress. Stockyards redevelopment The F-35 Fighter contract with Lockheed, and the Squadron’s training at the NAS JRB. How many military
fighter programs can be manufactured and taxied out to a runway, to be met by a fighter pilot who gets into the new F-35's and flies it off to commence his training? ... Answer: Nowhere else I know of.
Top 4 home sales/prices Top ten fastest growing city in the US Trying to position the city for the next business cycle. Upcoming bond package Note: Minor corrections were made to spelling and capitalization to improve readability. Minor edits were also made to protect anonymity.
Reality
Fort Worth's total population is greater than 750,000. TRUE
Fort Worth is home to more Fortune 500 HQs than any other city in the DFW metro area.
FALSE
The total land area within Fort Worth's city limits is approximately the same (within 5%) as the City of Dallas.
TRUE
There is more vacant, developable land in Fort Worth than any other city in the DFW metro area.
TRUE
Fort Worth has the largest medical district (as measured by total employment) in the DFW metro area.
TRUE
Among the 20 largest US cities, Fort Worth has the fastest growing population since 2000.
TRUE
Fort Worth is the largest US city without a major league sports team (NFL, NBA, MLB, NHL).
FALSE
Repondent Perceptions
92%
13%
54%
96%
58%
87%
67%
8%
87%
46%
4%
42%
13%
33%
True False N=24
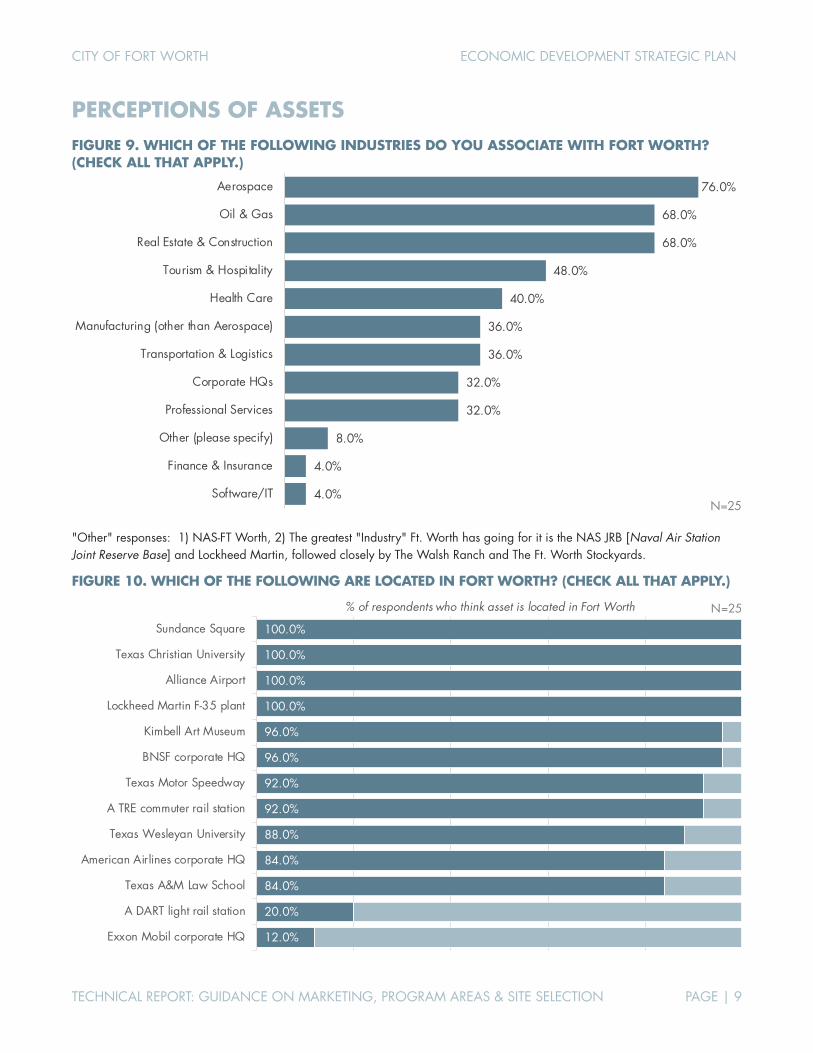
CITY OF FORT WORTH ECONOMIC DEVELOPMENT STRATEGIC PLAN
TECHNICAL REPORT: GUIDANCE ON MARKETING, PROGRAM AREAS & SITE SELECTION PAGE | 9
PERCEPTIONS OF ASSETS
FIGURE 9. WHICH OF THE FOLLOWING INDUSTRIES DO YOU ASSOCIATE WITH FORT WORTH? (CHECK ALL THAT APPLY.)
"Other" responses: 1) NAS-FT Worth, 2) The greatest "Industry" Ft. Worth has going for it is the NAS JRB [Naval Air Station Joint Reserve Base] and Lockheed Martin, followed closely by The Walsh Ranch and The Ft. Worth Stockyards.
FIGURE 10. WHICH OF THE FOLLOWING ARE LOCATED IN FORT WORTH? (CHECK ALL THAT APPLY.)
76.0%
68.0%
68.0%
48.0%
40.0%
36.0%
36.0%
32.0%
32.0%
8.0%
4.0%
4.0%
Aerospace
Oil & Gas
Real Estate & Construction
Tourism & Hospitality
Health Care
Manufacturing (other than Aerospace)
Transportation & Logistics
Corporate HQs
Professional Services
Other (please specify)
Finance & Insurance
Software/ITN=25
100.0%
100.0%
100.0%
100.0%
96.0%
96.0%
92.0%
92.0%
88.0%
84.0%
84.0%
20.0%
12.0%
Sundance Square
Texas Christian University
Alliance Airport
Lockheed Martin F-35 plant
Kimbell Art Museum
BNSF corporate HQ
Texas Motor Speedway
A TRE commuter rail station
Texas Wesleyan University
American Airlines corporate HQ
Texas A&M Law School
A DART light rail station
Exxon Mobil corporate HQ
% of respondents who think asset is located in Fort Worth N=25

CITY OF FORT WORTH ECONOMIC DEVELOPMENT STRATEGIC PLAN
TECHNICAL REPORT: GUIDANCE ON MARKETING, PROGRAM AREAS & SITE SELECTION PAGE | 10
FIGURE 11. INDICATE UP TO THREE ITEMS YOU CONSIDER STRENGTHS AND UP TO THREE ITEMS YOU CONSIDER WEAKNESSES OF THE CITY OPEN-ENDED RESPONSES (N=25)
The most commonly cited strengths were the city’s culture and its pro-development business climate. Commonly cited weaknesses were public school quality, local government red tape, and quality of transportation infrastructure.
STRENGTHS WEAKNESSES Cultural District, Sundance Square, Magnolia/South Main development
Lack of attention to development and promotion of East FW; over-development of W 7th area w/o sufficient traffic and parking development; I-30 to I-35N interchange and I-35 traffic in general
Cooperative/can do attitude/culture. Increasing younger population. Unique amenities/attractions
School quality; Economic/educational disparity; A little insular
Culture, fun and friendly atmosphere, great use of outdoor space
Cleanliness and attractiveness of public roads, traffic, code compliance of residential properties
1) The REAL Texas mentality!!! 2) Incredible downtown vibe
Opportunity if Ft Worth keeps the Ft Worth atmosphere and creates a model to keep and attract businesses
Locals with money willing to invest in Fort Worth Transportation Room for growth, Family environment, needs better education system
Slow growth, not enough entertainment, needs more affordable condos/town-homes
Culture, personality, atmosphere Difficult to work with the City, expensive to do business in, flexibility of the city
Culture, Cultural Amenities, Economic Opportunity Public Education, property tax burden, city responsiveness Cowtown culture, conservatism among city council leaders, chamber promotes a good business climate, local higher education opportunities
High tax rate, bureaucracy at city hall, slow city approvals for development projects, Mobility - inadequate arterial street infrastructure, new development pays for old neighborhood problems
Population growth, DFW airport, honest Traffic, taxes, close to Dallas Business climate, can do attitude, reputation FWISD schools, red tape in city government Smaller town feel/pace, lots of job prospects Not welcoming to meaningful diversity or people without resources Arts, culture, community Overspend tax base, fees for everything, staff is obstructionist to
normal simple development More laid back than Dallas; better quality of life City staff, subdivision regulations, development process Good quality of life, great colleges, great climate Older City; not as newly developed Available developable land High crime, traffic, lack of downtown residential opportunities
Healthy corporate community, excellent cultural resources, excellent higher ed institutions
Red Tape at City Hall
Arts/ Culture, Size, infrastructure, shopping/ entertainment Poor transportation esp. no mass transit, outdated, inadequate city development approval infrastructure
Culture, History, Generations Schools, local government (planning and zoning, specifically), sprawl, ability to attract younger workforce (it's all Dallas)
Atmosphere, positive renown Close minded, Behind the times, Misunderstanding of livability/mobility for Millennials & Gen X
Population Growth with new jobs being created High quality jobs for highly educated recent college grads Friendly, diverse, affordable Despite the best Mayor in America, Ft. Worth's Bureaucracy at City Hall
is the major reason I don't develop there - Life's too Short Cultural district, stockyards, opportunity Over regulated, bureaucratic development department Open to new ideas, try new things Infrastructure, ease of access to shopping and restaurants, traffic
Note: Minor corrections were made to spelling and capitalization to improve readability.
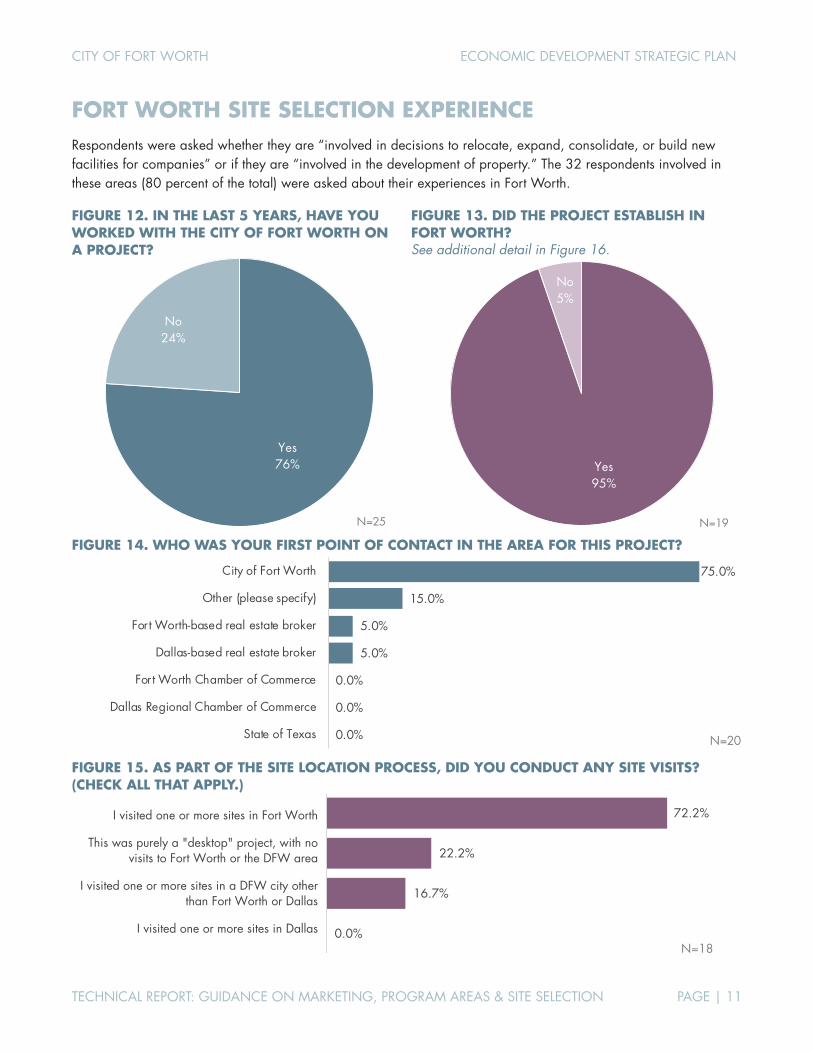
CITY OF FORT WORTH ECONOMIC DEVELOPMENT STRATEGIC PLAN
TECHNICAL REPORT: GUIDANCE ON MARKETING, PROGRAM AREAS & SITE SELECTION PAGE | 11
FORT WORTH SITE SELECTION EXPERIENCE Respondents were asked whether they are “involved in decisions to relocate, expand, consolidate, or build new facilities for companies” or if they are “involved in the development of property.” The 32 respondents involved in these areas (80 percent of the total) were asked about their experiences in Fort Worth.
FIGURE 12. IN THE LAST 5 YEARS, HAVE YOU WORKED WITH THE CITY OF FORT WORTH ON A PROJECT?
FIGURE 13. DID THE PROJECT ESTABLISH IN FORT WORTH? See additional detail in Figure 16.
FIGURE 14. WHO WAS YOUR FIRST POINT OF CONTACT IN THE AREA FOR THIS PROJECT?
FIGURE 15. AS PART OF THE SITE LOCATION PROCESS, DID YOU CONDUCT ANY SITE VISITS? (CHECK ALL THAT APPLY.)
Yes76%
No24%
N=25
Yes95%
No5%
N=19
75.0%
15.0%
5.0%
5.0%
0.0%
0.0%
0.0%
City of Fort Worth
Other (please specify)
Fort Worth-based real estate broker
Dallas-based real estate broker
Fort Worth Chamber of Commerce
Dallas Regional Chamber of Commerce
State of Texas N=20
72.2%
22.2%
16.7%
0.0%
I visited one or more sites in Fort Worth
This was purely a "desktop" project, with no visits to Fort Worth or the DFW area
I visited one or more sites in a DFW city other than Fort Worth or Dallas
I visited one or more sites in Dallas
N=18
I visited one or more sites in Fort Worth
This was purely a "desktop" project, with no visits to Fort Worth or the DFW area
I visited one or more sites in a DFW city other than Fort Worth or Dallas
I visited one or more sites in Dallas
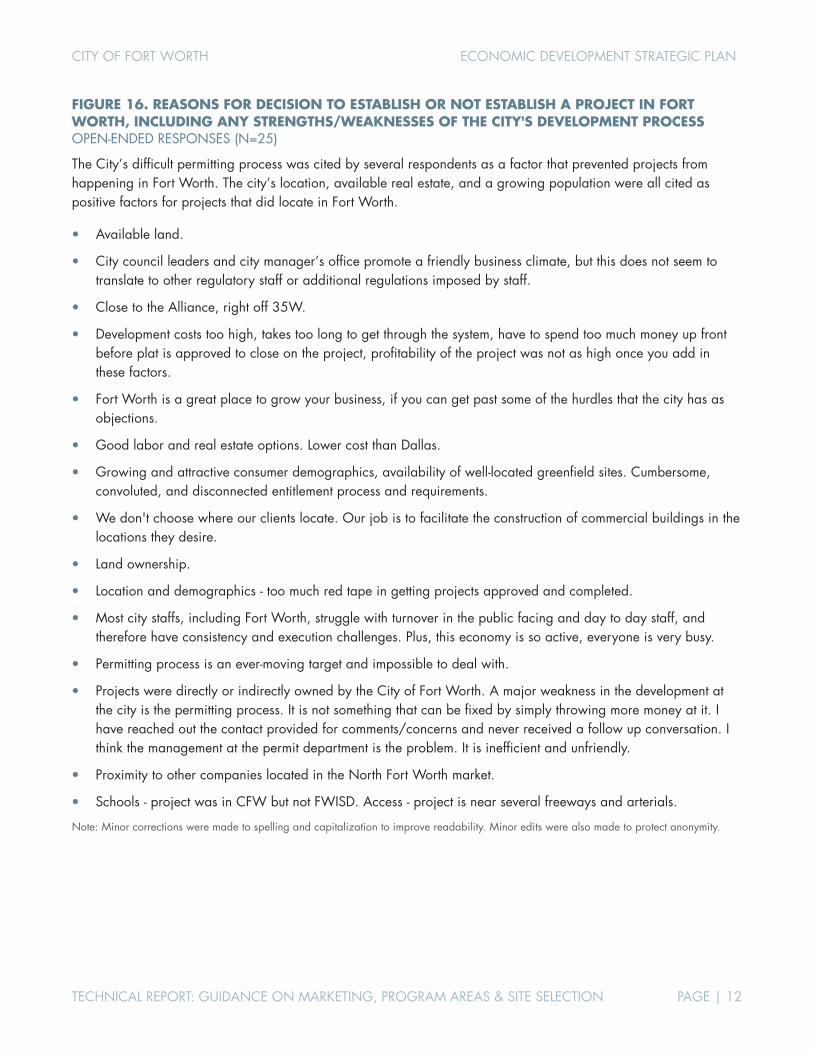
CITY OF FORT WORTH ECONOMIC DEVELOPMENT STRATEGIC PLAN
TECHNICAL REPORT: GUIDANCE ON MARKETING, PROGRAM AREAS & SITE SELECTION PAGE | 12
FIGURE 16. REASONS FOR DECISION TO ESTABLISH OR NOT ESTABLISH A PROJECT IN FORT WORTH, INCLUDING ANY STRENGTHS/WEAKNESSES OF THE CITY'S DEVELOPMENT PROCESS OPEN-ENDED RESPONSES (N=25)
The City’s difficult permitting process was cited by several respondents as a factor that prevented projects from happening in Fort Worth. The city’s location, available real estate, and a growing population were all cited as positive factors for projects that did locate in Fort Worth.
Available land.
City council leaders and city manager’s office promote a friendly business climate, but this does not seem to translate to other regulatory staff or additional regulations imposed by staff.
Close to the Alliance, right off 35W.
Development costs too high, takes too long to get through the system, have to spend too much money up front before plat is approved to close on the project, profitability of the project was not as high once you add in these factors.
Fort Worth is a great place to grow your business, if you can get past some of the hurdles that the city has as objections.
Good labor and real estate options. Lower cost than Dallas.
Growing and attractive consumer demographics, availability of well-located greenfield sites. Cumbersome, convoluted, and disconnected entitlement process and requirements.
We don't choose where our clients locate. Our job is to facilitate the construction of commercial buildings in the locations they desire.
Land ownership.
Location and demographics - too much red tape in getting projects approved and completed.
Most city staffs, including Fort Worth, struggle with turnover in the public facing and day to day staff, and therefore have consistency and execution challenges. Plus, this economy is so active, everyone is very busy.
Permitting process is an ever-moving target and impossible to deal with.
Projects were directly or indirectly owned by the City of Fort Worth. A major weakness in the development at the city is the permitting process. It is not something that can be fixed by simply throwing more money at it. I have reached out the contact provided for comments/concerns and never received a follow up conversation. I think the management at the permit department is the problem. It is inefficient and unfriendly.
Proximity to other companies located in the North Fort Worth market.
Schools - project was in CFW but not FWISD. Access - project is near several freeways and arterials.
Note: Minor corrections were made to spelling and capitalization to improve readability. Minor edits were also made to protect anonymity.
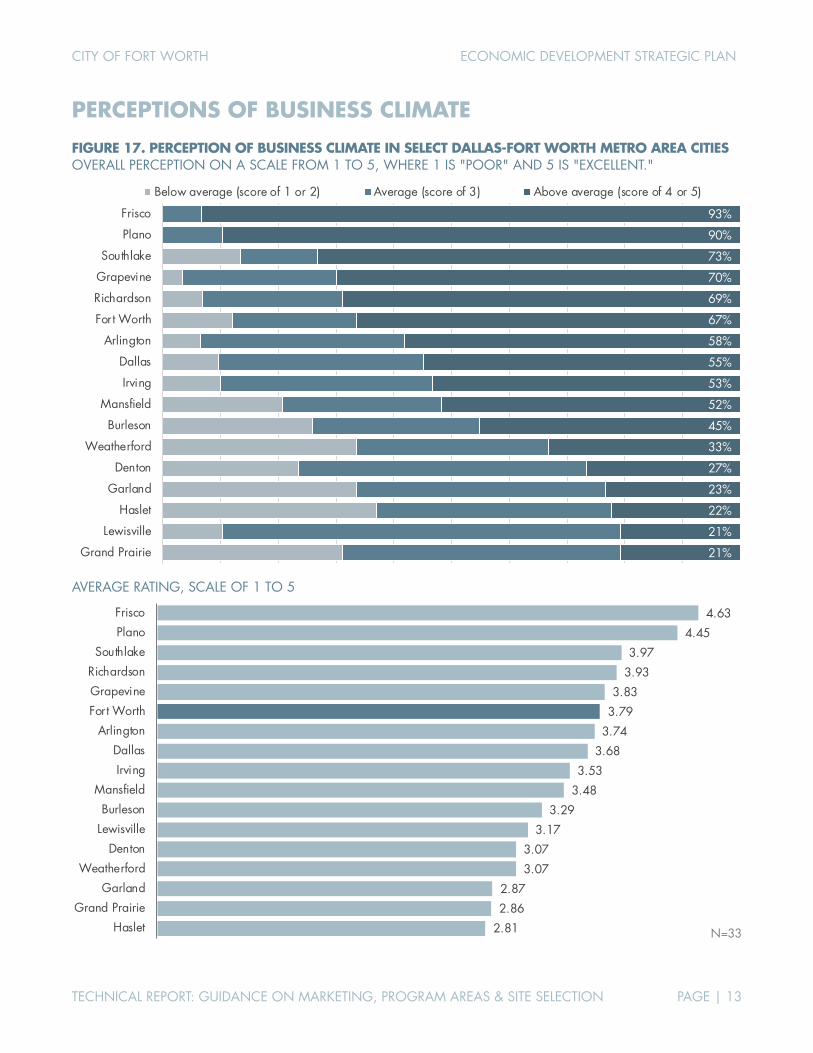
CITY OF FORT WORTH ECONOMIC DEVELOPMENT STRATEGIC PLAN
TECHNICAL REPORT: GUIDANCE ON MARKETING, PROGRAM AREAS & SITE SELECTION PAGE | 13
PERCEPTIONS OF BUSINESS CLIMATE
FIGURE 17. PERCEPTION OF BUSINESS CLIMATE IN SELECT DALLAS-FORT WORTH METRO AREA CITIES OVERALL PERCEPTION ON A SCALE FROM 1 TO 5, WHERE 1 IS "POOR" AND 5 IS "EXCELLENT."
AVERAGE RATING, SCALE OF 1 TO 5
93%
90%
73%
70%
69%
67%
58%
55%
53%
52%
45%
33%
27%
23%
22%
21%
21%
Frisco
Plano
Southlake
Grapevine
Richardson
Fort Worth
Arlington
Dallas
Irving
Mansfield
Burleson
Weatherford
Denton
Garland
Haslet
Lewisville
Grand Prairie
Below average (score of 1 or 2) Average (score of 3) Above average (score of 4 or 5)
4.63
4.45
3.97
3.93
3.83
3.79
3.74
3.68
3.53
3.48
3.29
3.17
3.07
3.07
2.87
2.86
2.81
Frisco
Plano
Southlake
Richardson
Grapevine
Fort Worth
Arlington
Dallas
Irving
Mansfield
Burleson
Lewisville
Denton
Weatherford
Garland
Grand Prairie
Haslet N=33

CITY OF FORT WORTH ECONOMIC DEVELOPMENT STRATEGIC PLAN
TECHNICAL REPORT: GUIDANCE ON MARKETING, PROGRAM AREAS & SITE SELECTION PAGE | 14
FIGURE 18. LIKELIHOOD OF RESPONDENT’S CLIENTS CONSIDERING THE FOLLOWING CITIES FOR FUTURE INVESTMENT PROJECTS RATED ON A SCALE FROM 1 TO 5, WHERE 1 IS "NOT AT ALL LIKELY" AND 5 IS "VERY LIKELY."
AVERAGE RATING, SCALE OF 1 TO 5
12%
7%
15%
16%
23%
15%
23%
18%
27%
33%
37%
37%
42%
52%
50%
50%
35%
8%
17%
15%
16%
19%
27%
31%
39%
31%
30%
37%
41%
42%
33%
36%
38%
54%
81%
77%
70%
68%
58%
58%
46%
43%
42%
37%
26%
22%
15%
15%
14%
13%
12%
Frisco
Fort Worth
Dallas
Plano
Grapevine
Southlake
Richardson
Arlington
Irving
Mansfield
Denton
Burleson
Grand Prairie
Garland
Weatherford
Haslet
Lewisville
Less Likely (score of 1 or 2) Average (score of 3) More Likely (score of 4 or 5)
4.194.03
3.813.80
3.693.46
3.363.31
3.192.96
2.782.70
2.622.58
2.462.41
2.38
FriscoFort Worth
DallasPlano
SouthlakeGrapevine
ArlingtonRichardson
IrvingMansfieldBurlesonDenton
LewisvilleGrand PrairieWeatherford
GarlandHaslet N=30
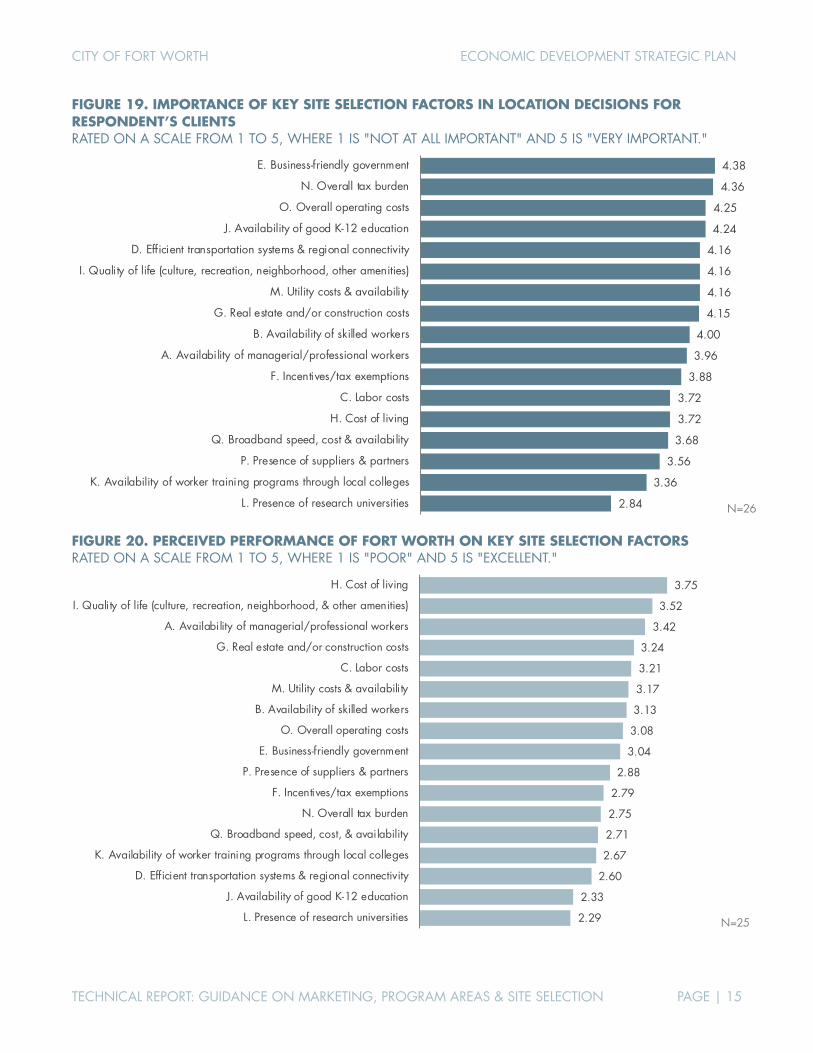
CITY OF FORT WORTH ECONOMIC DEVELOPMENT STRATEGIC PLAN
TECHNICAL REPORT: GUIDANCE ON MARKETING, PROGRAM AREAS & SITE SELECTION PAGE | 15
FIGURE 19. IMPORTANCE OF KEY SITE SELECTION FACTORS IN LOCATION DECISIONS FOR RESPONDENT’S CLIENTS RATED ON A SCALE FROM 1 TO 5, WHERE 1 IS "NOT AT ALL IMPORTANT" AND 5 IS "VERY IMPORTANT."
FIGURE 20. PERCEIVED PERFORMANCE OF FORT WORTH ON KEY SITE SELECTION FACTORS RATED ON A SCALE FROM 1 TO 5, WHERE 1 IS "POOR" AND 5 IS "EXCELLENT."
4.38
4.36
4.25
4.24
4.16
4.16
4.16
4.15
4.00
3.96
3.88
3.72
3.72
3.68
3.56
3.36
2.84
E. Business-friendly government
N. Overall tax burden
O. Overall operating costs
J. Availability of good K-12 education
D. Efficient transportation systems & regional connectivity
I. Quality of life (culture, recreation, neighborhood, other amenities)
M. Utility costs & availability
G. Real estate and/or construction costs
B. Availability of skilled workers
A. Availability of managerial/professional workers
F. Incentives/tax exemptions
C. Labor costs
H. Cost of living
Q. Broadband speed, cost & availability
P. Presence of suppliers & partners
K. Availability of worker training programs through local colleges
L. Presence of research universities N=26
3.75
3.52
3.42
3.24
3.21
3.17
3.13
3.08
3.04
2.88
2.79
2.75
2.71
2.67
2.60
2.33
2.29
H. Cost of living
I. Quality of life (culture, recreation, neighborhood, & other amenities)
A. Availability of managerial/professional workers
G. Real estate and/or construction costs
C. Labor costs
M. Utility costs & availability
B. Availability of skilled workers
O. Overall operating costs
E. Business-friendly government
P. Presence of suppliers & partners
F. Incentives/tax exemptions
N. Overall tax burden
Q. Broadband speed, cost, & availability
K. Availability of worker training programs through local colleges
D. Efficient transportation systems & regional connectivity
J. Availability of good K-12 education
L. Presence of research universities N=25

CITY OF FORT WORTH ECONOMIC DEVELOPMENT STRATEGIC PLAN
TECHNICAL REPORT: GUIDANCE ON MARKETING, PROGRAM AREAS & SITE SELECTION PAGE | 16
FIGURE 21. COMPARISON OF IMPORTANCE OF SITE SELECTION FACTORS [FIGURE 19] WITH VIEWS OF THE CITY’S PERFORMANCE [FIGURE 20]
N=24 to 26
Note: Respondents were asked to rate the importance of site selection factors on a scale of 1 (Not at all important) to 5 (Very important). The rating of Fort Worth’s performance was based on a scale of 1 (Poor) to 5 (Excellent).
FIGURE 22. WHAT IS THE MOST IMPORTANT THING THE CITY OF FORT WORTH CAN DO TO EFFECTIVELY MARKET THE CITY TO EXECUTIVES THAT YOU WORK WITH? OPEN-ENDED RESPONSE (N=20)
Be consistent on the branding and marketing - message and frequency. And not just magazine ads and emails and videos. Make an effort for “non-traditional” channels - a viral campaign, a reality show based here, culture/arts push.
Clearly enunciate the desirable income, age, and education demographics of the current population and of those migrating into the area.
Combine the local highway and rail agencies; create & execute a plan to finally make a REAL master plan in the Dallas-Fort Worth metro area. FT Worth is not just competing with Dallas. Look at Houston; at least on the highway front (not rail) a plan for the area's highway system. They are building loops 4 and 5 around Houston and Dallas-Fort Worth does not have a REAL loop around either city or both. All of the highways in this area
CITY OF FORT WORTH ECONOMIC DEVELOPMENT STRATEGIC PLAN
TECHNICAL REPORT: GUIDANCE ON MARKETING, PROGRAM AREAS & SITE SELECTION PAGE | 17
rely on other highways to complete the transportation avenues in this metro area. On the Rail front, which DART has done a much better job than TRE, on connecting the Cities together. The people are coming to North Texas; the government entities need to realize that because they are 20 years behind in their thinking.
Ease of movement in the downtown and surrounding areas.
Emphasize the city is highly sophisticated while also retaining cowboy/down home charm. Make it more friendly to outside businesses by encouraging more diversity.
Fort Worth has to be more business friendly and not make it so hard to get a development started.
Have a bigger economic development effort.
Improve public transportation.
Lower taxes more competitive incentives.
Promote availability of local universities/grads. Stress available land, defocus from the "hot" areas and promote the whole city.
Promote quality of life.
Pull your head out of the sand and get out of the CBD. Spend some time in the outer suburbs and surrounding communities (including Uptown in Dallas) and understand why so many millennials and Gen X'ers want to live in these areas and spend so much time and money.
Reduce the staff and adopt the position that everything does not fit in a box and there are exceptions to every ordinance.
Shake up the bureaucracy that currently exists at city hall... It is very similar to the problems that existed in Ft. Worth back in the 70's, when Ft. Worth had a great mayor and city leaders, but was issuing just over 100 building permits a year, and Ft. Worth's work force was moving into neighboring cities. Then City Manager, formed an over-site committee, that included the three largest developers in town. When the Ft. Worth Water Department and Park Department were dragging out permits ... They had the opportunity to explain their delays to the City Manager. As a result of that 1st. Development Policy Review Committee, developers were better able to design and build large-scale projects in the city. While the Development Policy Review Committee still exists ... it is bureaucratically archaic at best. Too many chiefs from the city & not enough strong check-writers from the development community.
Streamlined development process.
Tax Incentives.
The fact that FW has many prominent locals that give much money to the city. Basses, Fortsons, Williamsons, Moncriefs etc.
Top notch education system.
Try to improve FWISD.
Work on mobility! Need alternative modes of mass transportation that do NOT include a bus.
Note: Minor corrections were made to spelling and capitalization to improve readability. Minor edits were also made to protect anonymity.
CITY OF FORT WORTH ECONOMIC DEVELOPMENT STRATEGIC PLAN
TECHNICAL REPORT: GUIDANCE ON MARKETING, PROGRAM AREAS & SITE SELECTION PAGE | 18
ATTACHMENT B. MARKETING REVIEW INTRODUCTION Increased globalization and rapid technology growth have made the economic development marketing field more dynamic than ever. The rise of the digital age has given economic development professionals access to an expanded arsenal of tools to reach target audiences while broadening and equalizing the playing field. This evolution has given way to heightened competition among cities, regions, and states. Today’s economic developers must be more thoughtful about the ways they employ these tools, the messages they send, and the methods by which they position their community in relation to their peers. Effective marketing for economic development must embrace technology tools (e.g., dynamic and informative websites, targeted social media campaigns) to reach target audiences.
This section provides a review of the current economic development marketing and promotional communications of the City of Fort Worth (City), Fort Worth Chamber (Chamber), and partner organizations. This assessment is based on an evaluation and comparison of the organizations’ overarching themes and messages found in their electronic marketing tools and various collateral material. The objective of this analysis is to gauge what changes, if any, should be enacted to Fort Worth’s economic development marketing strategy to better engage decision-makers in target industries.
METHODOLOGY In marketing, perceptions are reality. They drive emotional connection and decision-making. While perceptions are formed by a variety of factors, the themes and messages contained in marketing communications can play an important role in how decision-makers view a community.
The consulting team developed three criteria below to evaluate the City, Chamber, and partner organizations’ marketing themes and messages:
A. Uniqueness: Do they communicate Fort Worth’s one-of-a-kind attributes, image, and identity – and set it apart from the competition?
B. Consistency: Are they consistent among all media and points-of-contact with the audience? Do the messages align with those of other economic development-related organizations in the Fort Worth area?
C. Engagement: Do they attract, intrigue, and/or educate the intended audience? Do they compel a response?
In the context of this analysis, themes refer to central or dominant ideas that are conveyed by an organization’s marketing communications, and messages refer to the more specific and unified set of communications that are crafted to help reveal these bigger ideas.

CITY OF FORT WORTH ECONOMIC DEVELOPMENT STRATEGIC PLAN
TECHNICAL REPORT: GUIDANCE ON MARKETING, PROGRAM AREAS & SITE SELECTION PAGE | 19
REVIEW OF THEMES & MESSAGES Below is the list of organizations and a review of their respective marketing themes and messages:
CITY OF FORT WORTH
The longhorn logo communicates the unique Fort Worth and Texas culture. There is no tagline or positioning statement. The website seems to act as more of a portal to incentive programs and links to partner organizations than a hub of economic development information. Marketing themes and messages are minimal, the ones that were gleaned are somewhat cliché and overused (e.g. see second and third bullet under messages). The City should develop more descriptive language to briefly introduce the City department and promote the unique assets and advantages of doing business in Fort Worth.
Themes: Authentic Fort Worth/Texas (longhorn logo); all elements that make a great city are offered in Fort Worth (video); governmental (a page on the City’s website vs. a stand-alone website or landing page); a gateway to incentive programs and partner organizations.
Messages:
“What makes a city great?” (video)
“…large talented labor pool, low cost of living, high quality of life, a business-friendly environment and strong infrastructure — all with easy access to national and international markets.”
“If you are already part of our city, Fort Worth appreciates your investment in our community and we are here to help you grow and prosper.”
FORT WORTH CHAMBER OF COMMERCE
The star logo is unique to Texas (Lone Star State). The homepage slides present several strong messages (see below) but there is no overarching tagline or unifying positioning statement to tie them together. The website seems to act as the clearinghouse of economic development information for the community. It is well-organized and very functional. The mission statement contains wording that is used in many communities (“live, work and do business”). The brochure headline is cliché and overused (i.e. “Open for Business”). The website and collateral could do a better job of promoting international business development, given the proximity to DFW.
Themes: Fort Worth is the epitome of success; all elements that make a great city are offered in Fort Worth (video).
Messages:
“The Future is Here”
“What Makes a city great?”
“No. 1 in Texas: Fort Worth is Tops in Texas and Ranked No. 4 in the US for Job Growth”
“Logistically Speaking: Fort Worth Transportation Assets Attract Investment”
“Fort Worth: The Texas Success Story Begins Here”
“…making Fort Worth an excellent place in which to live, work and do business.”
“Fort Worth is Open for Business” (brochure)
CITY OF FORT WORTH ECONOMIC DEVELOPMENT STRATEGIC PLAN
TECHNICAL REPORT: GUIDANCE ON MARKETING, PROGRAM AREAS & SITE SELECTION PAGE | 20
FORT WORTH CONVENTION & VISITORS BUREAU (CVB)
The longhorn logo was used here as well, although a slightly different version. Although the font size is small, there is a tagline below the logo that is static on all pages. The marketing themes and messages related to economic development are minimal. It is not clear at first glance what organization this website is representing.
Themes: Cowboys and culture; western heritage; Texas.
Messages:
“City of Cowboys and Culture”
“Where the West Begins”
“…a destination redefined”
“…one of the premier travel destinations in the nation.”
FORT WORTH HISPANIC CHAMBER OF COMMERCE
The longhorn logo was used here as well, although a slightly different version. Marketing themes and messages are minimal, the ones that were gleaned are cliché and overused (e.g. “fostering a vibrant economic environment”).
Themes: Member-driven.
Messages:
“Fostering a vibrant economic environment for members, individuals and the greater Fort Worth area”
“…a dynamic and progressive source for the ongoing development and promotion of our members’ economic growth.”
FORT WORTH METROPOLITAN BLACK CHAMBER OF COMMERCE
Marketing themes and messages are minimal, the ones that stood out were cliché and overused (e.g. “…make Fort Worth a better place to work and raise a family.”)
Themes: Member-driven.
Messages:
"To make Fort Worth a better place to work and raise a family."
“…promote, assist and enhance economic and business development for its members and to create wealth in the communities it serves.”
“Our Business is to Strengthen Your Business”
“…paving a new economic and business landscape in Fort Worth and Tarrant County...”
DOWNTOWN FORT WORTH, INC.
The homepage slides present several strong images and messages (see below) but there is no overarching tagline or unifying positioning statement to tie them together.
Themes: A welcome mat to downtown Fort Worth; downtown is a destination and the hub of everything Fort Worth has to offer.
Messages:
“We're glad you're here.”
“Welcome to Downtown.”
CITY OF FORT WORTH ECONOMIC DEVELOPMENT STRATEGIC PLAN
TECHNICAL REPORT: GUIDANCE ON MARKETING, PROGRAM AREAS & SITE SELECTION PAGE | 21
“Discover Downtown Fort Worth”
“The Texas You Want”
“A City on the Rise”
“Full of History. Full of Life.”
“Always Looking Forward”
“Live Downtown”
NEAR SOUTHSIDE, INC.
Marketing themes and messages are minimal.
Themes: Neighborhood development.
Messages:
“Meet us in the Near Southside.”
“…transforming the district and attracting new residents and businesses.”
“…renowned restaurants and historic landmarks attract visitors from throughout the region.”
“…promote the redevelopment of Fort Worth’s Near Southside as a vibrant, urban, mixed-use neighborhood.”
SOUTHEAST FORT WORTH, INC.
Marketing messages are variations on the generic "great place to live, work, and play" theme often seen in place-based marketing materials. Incentive programs are also highlighted (mostly city-wide programs).
Themes: Neighborhood development.
Messages:
“The Greatest Side of the Greatest City.”
“…to become a great place to live, learn, work, play, invest, do business, and shop.”
ALLIANCETEXAS
The homepage slides present several strong images and messages (see below) but there is no overarching tagline or unifying positioning statement to tie them together. Homepage does a good job of target industry marketing and has some references to international business development.
Themes: Fort Worth’s unique business assets and advantages; business development.
Messages:
“International reach in the heart of Texas”
“A World of Possibilities”
“20 Minutes from DFW Airport”
“As versatile as your business needs”
“One first class intermodal yard”
“A World of Possibilities”
“Best-in-Class Retailers”
“Distinctive and master-planned”
CITY OF FORT WORTH ECONOMIC DEVELOPMENT STRATEGIC PLAN
TECHNICAL REPORT: GUIDANCE ON MARKETING, PROGRAM AREAS & SITE SELECTION PAGE | 22
SUNDANCE SQUARE
The homepage animation is strong but there is no overarching tagline or unifying positioning statement.
Themes: Downtown is the destination for shopping, dining, and entertainment; Fort Worth has the best downtown in Texas.
Messages:
“Welcome.”
“Spend the day in Sundance Square”
“Your Favorite Downtown in Texas”
“…one of the finest entertainment and shopping districts in the Southwest.”
STRATEGIC CONSIDERATIONS Given the reviews above, the consulting team developed a set of considerations to strengthen Fort Worth’s economic development marketing strategy. They are based on the three criteria used to evaluate the marketing themes and messages.
UNIQUENESS Differentiation is more important than ever, especially considering there are roughly 90,000 local governmental units in the US, many of which are seeking to attract attention from the same relatively small group of industry decision-makers. Clichéd and generic phrases are no longer sufficient for economic developers to market their communities.
Fort Worth offers a wealth of unique assets and advantages to companies seeking a destination for business and investment; however, these unique attributes are not being communicated clearly and consistently across organizations. Fort Worth organizations engaged in economic development should be more intentional about developing language that communicates the distinct benefits of living and doing business in Fort Worth. Most importantly, the city’s assets as they relate to target industries must be placed front and center in the community’s marketing materials.
CONSISTENCY There is no unified economic development message among partner organizations. Each organization sends a different message about living and doing business in Fort Worth through their marketing channels. The City and Chamber should convene a working group to develop a united messaging strategy for economic development. Consideration should also be given to creating an economic development graphic that each partner uses on all marketing material according to specified standards to help visually tie the organizations together. The City, CVB, and Hispanic Chamber make consistent use of a longhorn in their logo, and a version of this might be considered.
ENGAGEMENT The City and Chamber should do a better job of engaging target industry decision-makers in their marketing communications. Marketing aimed at recruitment is very weak. Highly targeted recruitment materials such as Kansas City’s Animal Health Corridor or Asheville’s craft beer marketing are two good examples of an economic development marketing effort that speaks to specific industries and audiences. Consideration should also be given to providing a description of each organization’s role in the economic development process, especially in terms of prospecting and site selection. The videos do a great job of engaging the audience outside of typical messaging.
CITY OF FORT WORTH ECONOMIC DEVELOPMENT STRATEGIC PLAN
TECHNICAL REPORT: GUIDANCE ON MARKETING, PROGRAM AREAS & SITE SELECTION PAGE | 23
ECONOMIC DEVELOPMENT WEBSITE COMPARISON Websites, specifically, play an essential role in the success of economic development organizations. Just like in retail and service industries, the Internet is proving to be a preference for “buyers” of all types of products and should not be overlooked by economic development organizations. A website is often the first point of contact for individuals and businesses looking for economic development support or considering relocating. First impressions are important and the look and feel of a website can either attract a viewer or deter them. What also must be taken into consideration is the attention span of the viewer. How quickly can they find the information they are looking for and does the website stand out against the static of the Internet? Good website design is a balancing act, and should be thoroughly developed as a tool for converting viewers into clients.
Attractive design and a user-friendly interface are the primary factors stimulating a visitor’s interest in an organization’s site. However, if quantity and quality of content are lacking, no number of bells, whistles, or fancy graphics will make for a rewarding user experience. Ensuring a site isn’t just modern and attractive, but offers quality content in an engaging, user-friendly way is essential.
TIP’s marketing and design team reviewed the major economic development websites of Fort Worth, its metro area peers, and its domestic benchmarks. The purpose of this review was to provide a snapshot of the effectiveness of each website, through design and content, in engaging and assisting visitors interested in each community from a business development perspective.
The websites of Fort Worth’s economic development organizations varied in effectiveness, as did all the metro area and domestic competitors’ sites. Based on the criteria used for the review (see table next page), the Chamber’s site was more successful than the City’s.
METHODOLOGY
The website review was divided into two categories: Dallas-Fort Worth metro area competitor organizations and domestic (US) benchmark organizations. For each category, a matrix shows the performance of the organizations’ websites based on select factors. Brief write-ups follow the matrices and provide additional details on any notable elements that could not be communicated in the matrix.
For the matrix, search rankings were based on order of results returned from a Google search using the term "[City] [State] Economic Development." Results appearing with the Google "Ad" designation were excluded, since their positions were the result of paid advertising and not search popularity. If multiple sub-pages of a site appeared consecutively in top search positions, this was noted, as it can help explain lower rankings of other local economic development organizations' sites.
Scores were assigned using a “stoplight” scale to indicate the level of performance on each criterion.
Site features quality content in this category, in a well-designed way.
Site offers this content, but could use improvement in quality, design, or organization of content.
Site purports to offer this content, but design is significantly flawed or content is severely lacking.
Content is not offered, or it was poorly located and could not be found in a reasonable amount of time.
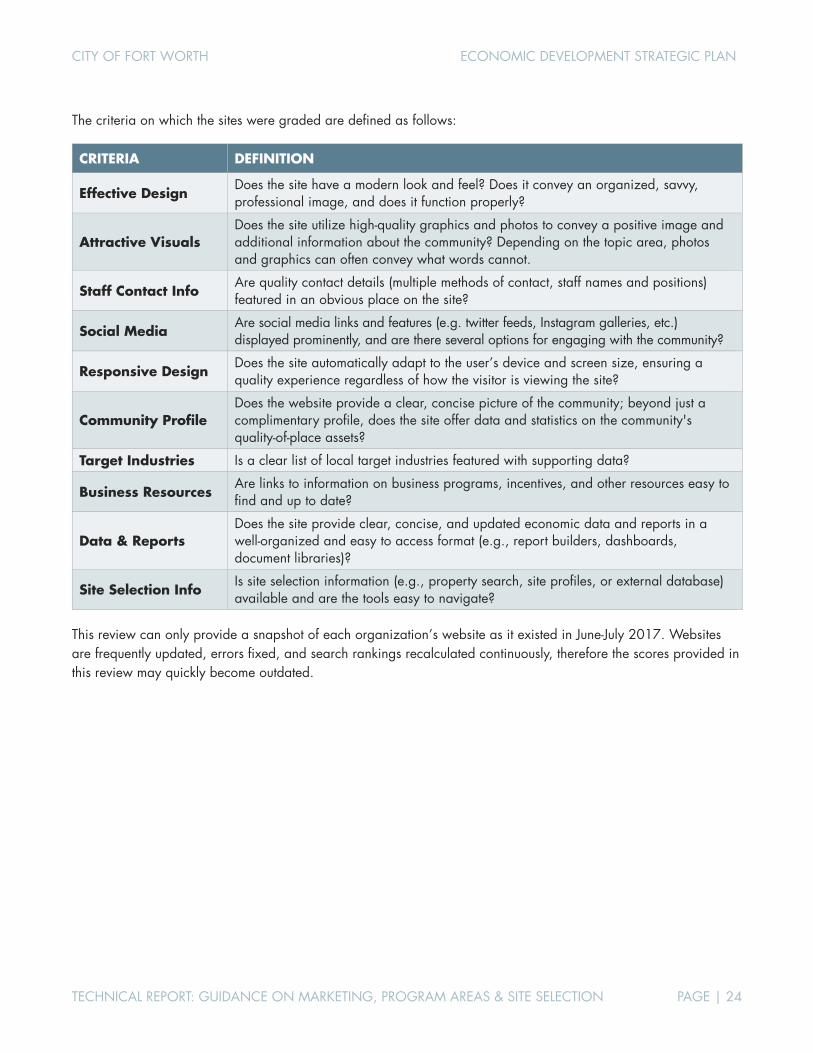
CITY OF FORT WORTH ECONOMIC DEVELOPMENT STRATEGIC PLAN
TECHNICAL REPORT: GUIDANCE ON MARKETING, PROGRAM AREAS & SITE SELECTION PAGE | 24
The criteria on which the sites were graded are defined as follows:
CRITERIA DEFINITION
Effective Design Does the site have a modern look and feel? Does it convey an organized, savvy, professional image, and does it function properly?
Attractive Visuals Does the site utilize high-quality graphics and photos to convey a positive image and additional information about the community? Depending on the topic area, photos and graphics can often convey what words cannot.
Staff Contact Info Are quality contact details (multiple methods of contact, staff names and positions) featured in an obvious place on the site?
Social Media Are social media links and features (e.g. twitter feeds, Instagram galleries, etc.) displayed prominently, and are there several options for engaging with the community?
Responsive Design Does the site automatically adapt to the user’s device and screen size, ensuring a quality experience regardless of how the visitor is viewing the site?
Community Profile Does the website provide a clear, concise picture of the community; beyond just a complimentary profile, does the site offer data and statistics on the community's quality-of-place assets?
Target Industries Is a clear list of local target industries featured with supporting data?
Business Resources Are links to information on business programs, incentives, and other resources easy to find and up to date?
Data & Reports Does the site provide clear, concise, and updated economic data and reports in a well-organized and easy to access format (e.g., report builders, dashboards, document libraries)?
Site Selection Info Is site selection information (e.g., property search, site profiles, or external database) available and are the tools easy to navigate?
This review can only provide a snapshot of each organization’s website as it existed in June-July 2017. Websites are frequently updated, errors fixed, and search rankings recalculated continuously, therefore the scores provided in this review may quickly become outdated.

CITY OF FORT WORTH ECONOMIC DEVELOPMENT STRATEGIC PLAN
TECHNICAL REPORT: GUIDANCE ON MARKETING, PROGRAM AREAS & SITE SELECTION PAGE | 25
METRO AREA COMPETITOR ORGANIZATION WEBSITES
METRO AREA COMPETITOR GRADING MATRIX
ORGANIZATION NAME SEA
RCH
RA
NK
ING
MO
DER
N D
ESIG
N
ATT
RA
CTI
VE
VIS
UA
LS
STA
FF C
ON
TACT
INFO
SOCIA
L M
EDIA
RES
PO
NSI
VE
DES
IGN
CO
MM
UN
ITY
PRO
FILE
TARG
ET IN
DU
STRIE
S
BU
SIN
ESS
RES
OU
RCES
DA
TA &
REP
ORTS
SITE
SEL
ECTI
ON
IN
FO
City of Arlington 1
City of Carrollton 1
City of Dallas Office of Economic Development 1
Dallas Regional Chamber 6
Denton Economic Development Partnership 1
City of Denton 2
Fort Worth Chamber (Economic Development Site) 2-3
Fort Worth Chamber 2-3*
City of Fort Worth 1
Frisco Economic Development Corporation 1
Garland Economic Development Partnership 1
Grand Prairie Texas 1
Irving-Las Colinas Chamber of Commerce 1
Irving, Texas 4
Lewisville, Texas Economic Development Corp. 1
McKinney Economic Development Corporation 1
Mesquite Texas 1
Plano Economic Development 1
Richardson Economic Development Partnership 1
*The Fort Worth Chamber main site did not appear as a result during the web search, but since it is the host for the Chamber ED site, the ranking is essentially the same as the ED site.

CITY OF FORT WORTH ECONOMIC DEVELOPMENT STRATEGIC PLAN
TECHNICAL REPORT: GUIDANCE ON MARKETING, PROGRAM AREAS & SITE SELECTION PAGE | 26
METRO AREA COMPETITOR SITE OVERVIEW
ARLINGTON, TX
City of Arlington
www.arlington-tx.gov/business
The City of Arlington’s site has a good cross section of data and information, although some data requires several clicks to locate. Economic data could be made available in a better format. Some links to key areas of data were broken (like workforce and top-10 employers). Site selection information was very thorough. The site is well organized overall, although visually distracting. Some images and graphics were low quality, and parts of the site are beginning to look dated.
CARROLLTON, TX
City of Carrollton
www.cityofcarrollton.com/departments/departments-a-f/economic-development
The City of Carrollton’s site offerings are limited, which is not ideal, since the City appears to be the only economic development entity in the area. Some reports are available as downloadable PDFs, but information is limited. Also, the site selection tools, while available, are rudimentary. Overall, the site feels dated and is not clearly organized. The impression is that the City is primarily focused on retail and transit-oriented development.
DALLAS, TX
City of Dallas Office of Economic Development
www.dallasecodev.org
The City of Dallas has a glossy site that clearly communicates that the City is interested in business. Site is very data heavy. Links to data in a variety of categories are prominently displayed (and described) on the homepage. Links to additional resources are offered, as well as an interactive tool to pinpoint data for a specific location. Advertised methods of contact were a generic contact form and general phone number. The user is required to dig to find specific departmental contacts. However, the option to sign up for an account to customize the user experience makes Dallas Economic Development seem slightly more personal.
Dallas Regional Chamber
www.dallaschamber.org
The Dallas Regional Chamber’s site is visually interesting, although the navigation takes a moment to get used to. It takes several clicks to get to the main economic development resources, but once you reach them, they are well organized. All the data is contained within extremely well-designed reports in PDF format. The look of the reports is consistent and incorporates a mix of interesting, quality visuals. The data is in-depth and in most cases up-to-date as of the current year. Print publications are even available for order. While the initial advertised method of contact is a generic form, just a few clicks takes you to a robust staff directory that showcases their numerous councils and task forces. Absent was any type of site selection resource (other than reports) showcasing the locations of available real-estate.

CITY OF FORT WORTH ECONOMIC DEVELOPMENT STRATEGIC PLAN
TECHNICAL REPORT: GUIDANCE ON MARKETING, PROGRAM AREAS & SITE SELECTION PAGE | 27
DENTON, TX
Denton Economic Development Partnership
www.dentonedp.com
The Denton Economic Development Partnership’s home page is beautiful, with simple, flattering visuals. A report builder and site selection information are featured prominently on the home page. Unfortunately, there are formatting/display issues with some of the reports that make them incongruously unprofessional looking. Also, the level of data provided is not particularly deep. Business resources and incentives are obvious, and the Denton Economic Development Partnership makes clear the industries they are interested in attracting. Direct staff contacts can be reached in one click.
City of Denton
www.cityofdenton.com/business/economic-development
The City of Denton’s site is mostly a brief overview of City policy and incentives. It provides little information, instead deferring to the Denton Economic Development Partnership site. However, the City’s site is modern and fun-looking. Some of the available incentives reports are well designed, others are not. The Denton Economic Development Partnership refers to the City's website for local culture information, and the City does a good job of portraying a quirky upbeat image with plenty of resources for residents and visitors.
FORT WORTH, TX
Fort Worth Chamber (Economic Development Site)
www.fortworthecodev.com
The Fort Worth Chamber economic development site is extremely well organized and user friendly. Links to all important topics are immediately accessible from the homepage, and it is possible to access a thorough overview of Fort Worth's community and business climate through tabbed navigation that doesn't require you to leave the homepage. There were a few fonts that did not display properly in some browsers, and a few navigation and display glitches occurred. Since most of the data is embedded within the site, a report builder would be a welcome feature.
Fort Worth Chamber
www.fortworthchamber.com
The Fort Worth Chamber’s site is primarily focused on business members, tourism, and residents. Most of the economic resources are housed in the economic development specific division of the site. The general Chamber site utilizes the same template as the Chamber ED site and, therefore, suffers from the same technical issues. The Chamber’s main site did not appear as a result during the web search, but since it is the host for the Chamber ED site, the ranking is essentially the same as the ED site.
City of Fort Worth
www.fortworthtexas.gov/ecodev/
The City of Fort Worth’s site seems primarily focused on existing and small businesses. The immediate pop-up requesting email subscription is a little frustrating. The design looks dated, and there is a jarring lack of consistency in layout, graphics, fonts, and navigation among pages and content. The illustrated header uses up valuable real-estate that could be better used to showcase actual images of the community. Some of the linked PDF reports do not display properly and are unreadable.
CITY OF FORT WORTH ECONOMIC DEVELOPMENT STRATEGIC PLAN
TECHNICAL REPORT: GUIDANCE ON MARKETING, PROGRAM AREAS & SITE SELECTION PAGE | 28
FRISCO, TX
Frisco Economic Development Corporation
www.friscoedc.com
The Frisco EDC’s site is extremely bold, with crisp saturated visuals, video, and a scrolling header touting impressive rankings. The site is organized in a simple way, requiring only one to two clicks to reach most information. While economic and business climate data is on the light side, the Frisco EDC offers powerful site selection tools. The business resource offerings are extensive, including LaunchPad City, a multi-faceted incubator/co-working center. The Frisco site is one of the most visually consistent sites of all the metro area competitor organizations reviewed.
GARLAND, TX
Garland Economic Development Partnership
www.garlandedp.com
The Garland Economic Development Partnership has a simple site that covers the basics. Visually, it conveys little about Garland as a community, opting for illustrations over community photos. This anonymity is compounded by the lack of social media links. A fair amount of data is offered, but it is mostly embedded within the site. No report builder is available and downloadable documents are limited. Besides a simple property search, few interactive tools are offered on the site. While generic contact information is obvious, it took a bit of digging to find staff contacts.
GRAND PRAIRIE, TX
Grand Prairie
www.gptx.org/businesses/economic-development
The City of Grand Prairie’s site is not very visually engaging. Resources are just a long list of links. However, the site is well organized and staff contact info is clearly listed in the right-hand column. A fair amount of data and information is available, but no report builder or advanced site selection tools are featured. The site links additional resources which are more heavily involved in economic development.
IRVING, TX
Irving-Las Colinas Chamber of Commerce
www.irvingchamber.com/edc
The Irving-Las Colinas Chamber of Commerce’s site is very plain, visually, making it slightly dated and less professional looking than peer sites. The amount of data available is minimal, and no report building function exists. The site does a good job of offering site selection information through a property search and detailed profiles of current projects.
City of Irving
www.cityofirving.org/1324/Economic-Development
The City of Irving’s site isn't notably more robust than the Irving chamber. It features attractive visuals and video, but they don't display consistently across browsers. Staff contact info is featured on almost every page with a link to the staff directory. The City site links back to the chamber frequently, which makes one wonder why the City and chamber haven’t combined resources in a more formal way, since they each offer only a piece of the economic picture. The City offers some data reports, but they are mostly demographic.
CITY OF FORT WORTH ECONOMIC DEVELOPMENT STRATEGIC PLAN
TECHNICAL REPORT: GUIDANCE ON MARKETING, PROGRAM AREAS & SITE SELECTION PAGE | 29
LEWISVILLE, TX
Lewisville Economic Development Corporation
www.ecodevlewisville.com
The City of Lewisville’s site is well-designed, with prominent links to economic development information on the front page. The homepage map identifying Lewisville's proximity to other major metros is a nice touch. Scrolling quotes from owners of local business adds a personal touch missing from many other sites. However, social media links and a staff directory were either nonexistent or buried, detracting from the personal feel. The community profile report is well designed and offers a great overview of the cultural and business climate of Lewisville. Additional information is featured in the "profile" section of the site, which can be added to a report builder.
MCKINNEY, TX
McKinney Economic Development Corporation
www.mckinneyedc.com
The McKinney EDC’s site is attractive with interesting infographics. Unfortunately, images fail to load in some browsers, and navigation is a little glitchy. Robust site selection tools utilizing Esri mapping technology are easily accessible. The site features attractive, downloadable community profile reports, however there aren't many additional reports to choose from, and links were broken to several.
MESQUITE, TX
Mesquite Texas
www.cityofmesquite.com/1446/Economic-Development
The City of Mesquite’s site is very basic with few modern elements. Very few visuals are related to the community. The site's economic development offerings cover the basics but little else. Most reports and data are buried under multiple levels of subpages and then only offered as links to PDFs. The site is not organized with efficiency in mind. Also, several of the mapping resources are Flash based, which can be problematic on certain devices and browsers.
PLANO, TX
Plano Economic Development
www.planotexas.org
Although not the most visually stunning, Plano Economic Development’s site does contain a lot of information and is clearly targeting business, with links to areas of major interest boldly displayed on the homepage. There are many reports available throughout the site and in the document library, but there is no report builder or other interactive function that would make them easier to sift through.
RICHARDSON, TX
Richardson Economic Development Partnership
www.telecomcorridor.com
Richardson Economic Development Partnership’s site looks a little dated, but is otherwise effective and well organized. Quick access to a plethora of data and information through a single click from the homepage. The site prominently features a report builder, but it isn't user friendly.
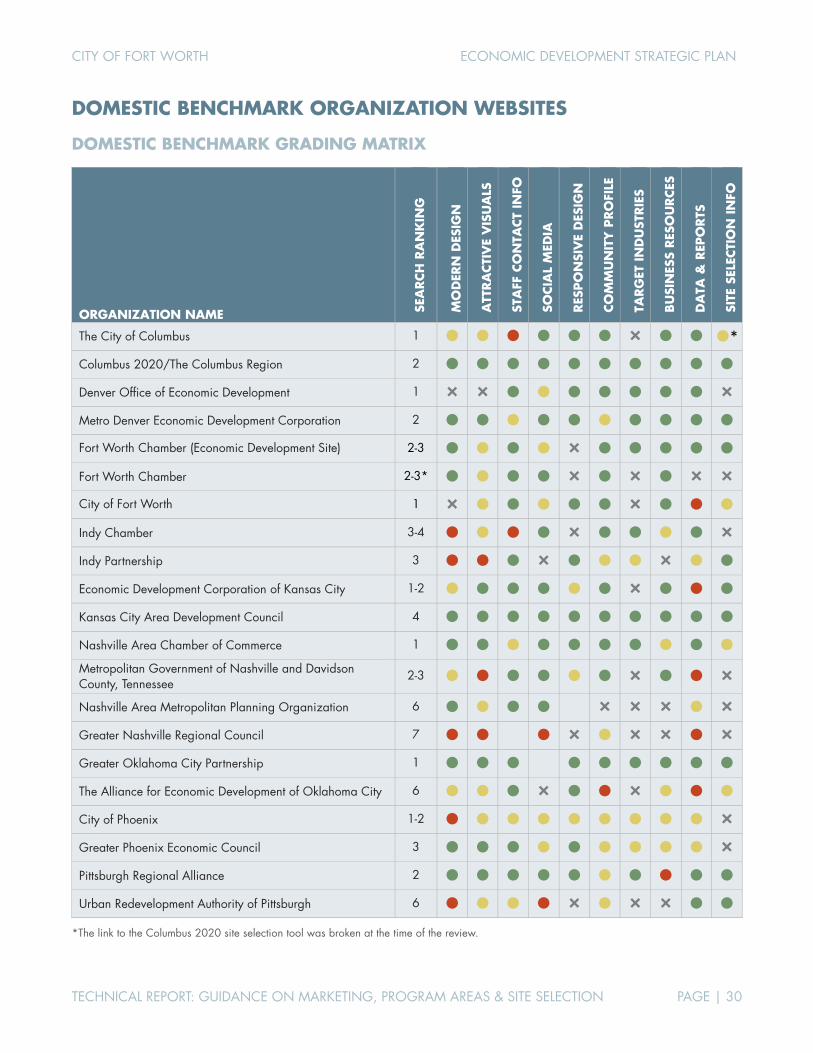
CITY OF FORT WORTH ECONOMIC DEVELOPMENT STRATEGIC PLAN
TECHNICAL REPORT: GUIDANCE ON MARKETING, PROGRAM AREAS & SITE SELECTION PAGE | 30
DOMESTIC BENCHMARK ORGANIZATION WEBSITES
DOMESTIC BENCHMARK GRADING MATRIX
ORGANIZATION NAME SEA
RCH
RA
NK
ING
MO
DER
N D
ESIG
N
ATT
RA
CTI
VE
VIS
UA
LS
STA
FF C
ON
TACT
INFO
SOCIA
L M
EDIA
RES
PO
NSI
VE
DES
IGN
CO
MM
UN
ITY
PRO
FILE
TARG
ET IN
DU
STRIE
S
BU
SIN
ESS
RES
OU
RCES
DA
TA &
REP
ORTS
SITE
SEL
ECTI
ON
IN
FO
The City of Columbus 1 *
Columbus 2020/The Columbus Region 2
Denver Office of Economic Development 1
Metro Denver Economic Development Corporation 2
Fort Worth Chamber (Economic Development Site) 2-3
Fort Worth Chamber 2-3*
City of Fort Worth 1
Indy Chamber 3-4
Indy Partnership 3
Economic Development Corporation of Kansas City 1-2
Kansas City Area Development Council 4
Nashville Area Chamber of Commerce 1
Metropolitan Government of Nashville and Davidson County, Tennessee
2-3
Nashville Area Metropolitan Planning Organization 6
Greater Nashville Regional Council 7
Greater Oklahoma City Partnership 1
The Alliance for Economic Development of Oklahoma City 6
City of Phoenix 1-2
Greater Phoenix Economic Council 3
Pittsburgh Regional Alliance 2
Urban Redevelopment Authority of Pittsburgh 6
*The link to the Columbus 2020 site selection tool was broken at the time of the review.
CITY OF FORT WORTH ECONOMIC DEVELOPMENT STRATEGIC PLAN
TECHNICAL REPORT: GUIDANCE ON MARKETING, PROGRAM AREAS & SITE SELECTION PAGE | 31
DOMESTIC BENCHMARK SITE OVERVIEW
COLUMBUS, OH
The City of Columbus (Economic Development)
www.columbus.gov/development/Economic-Development/
The City of Columbus’ site is well organized with detailed city-level information and clear organization. It coordinates well with the regional Columbus 2020 site visually. The City’s site also utilizes links well, directing users to additional resources available through Columbus 2020. Strangely, the Economic Development page doesn't list a specific staff contact or even a generic email, just a phone number and address. The link to the Columbus 2020 site selection tool was broken at the time of the review.
Columbus 2020/The Columbus Region
www.columbusregion.com
Columbus 2020 has an attractive, user friendly site that is consistent visually from the web design to the available reports and dashboards. The left-hand navigation is a unique design element, and enables easy-to use menus, allowing the visitor to find most sections directly from the homepage. All pages feature at least a contact email and phone number, while many feature an actual staff contact member with a photo. The inclusion of a "How can we help" button at the top of each page, adds to the welcoming character of this organization. A wealth of regional data and reports are available and accessible in well-designed formats. Like many sites that feature a vast quantity of information, having an interactive tool or report builder would be nice, instead of having to download and view multiple PDFs. One of the few flaws is the lack of clarity in branding. The organization's name is unclear and could lead to confusion. "The Columbus Region" and "Columbus 2020" are used interchangeably. The Columbus 2020 name is more reminiscent of a community visioning or long-range urban planning effort than of an economic development organization.
DENVER, CO
Denver Office of Economic Development
www.denvergov.org/content/denvergov/en/denver-office-of-economic-development.html
The Denver Office of Economic Development’s site contains a large quantity of data; however, the site is not well designed visually or well organized. It contains many poor-quality graphics and elements are oddly placed, often seeming out of context in their locations. Too many sub levels require a lot of clicking around to find necessary info. This site is more focused on providing resources than data or reporting.
Metro Denver Economic Development Corporation
www.metrodenver.org
The Metro Denver Economic Development Corporation’s site has a simple layout that uses the space efficiently. Even the scrolling header images provide facts and links in addition to offering attractive imagery of the community. The "Data Central" section is an extremely well-organized repository of information. This site is decidedly business and industry oriented and lacks the warmth of a community-oriented site. It could benefit from having contact info more easily accessible.
CITY OF FORT WORTH ECONOMIC DEVELOPMENT STRATEGIC PLAN
TECHNICAL REPORT: GUIDANCE ON MARKETING, PROGRAM AREAS & SITE SELECTION PAGE | 32
INDIANAPOLIS, IN
Indy Chamber
www.indychamber.com/economic-development
While the Indy Chamber's site is fairly current in design, it contained broken links and items that would not display on some browsers. Also, many of the graphics appear to be low resolution. The site offers a large quantity of reports, but they are only available as PDF, and often require several clicks to locate. A report builder would be helpful considering the amount of information offered and the navigation required to find it. The site is heavily focused on the region’s target industries and offers more than the usual amount of data for them. The Economic Briefings (dashboard-type reports) provide a great overview of the local economy, and are updated monthly. Site selection information doesn't appear to be included nor does a staff directory.
Indy Partnership
www.indypartnership.com
The design choices of the Indy Partnership's site are poor. The visitor is greeted with a giant rotating slideshow of visually inconsistent imagery that fills the entire screen except for a small menu header at the top, wasting valuable screen real estate. The images don't offer captions or titles, so it is unclear what many of them are intended to represent. There is also no visual cue that the visitor should scroll down to view additional content. The bottom of the home page does contain staff contact information as well as some text-heavy profile information about the region (which is hidden in a collapsed section you must expand). The rest of the site content is slow loading and oversized. Most of the data offerings are lists of PDF links or links to content on the Indy Chamber site. The Partnership site does offer a decent site selection tool, but navigating it is difficult on some browsers.
KANSAS CITY, MO
Economic Development Corporation of Kansas City
www.edckc.com
The Economic Development Corporation of Kansas City’s site is attractive and well organized. Unfortunately, some elements, especially on the homepage, do not display well in some browsers. The site is consistent in navigation and layout and offers a good mix of photos and infographics. Links to external resources (local employers, educational & training resources, etc.) are plentiful. Powerful site selection tools are included. The site's weakest area is economic data, which appeared extremely limited, with only a few charts and a little text embedded in the site. The Corporations’ development teams are unique, as is the large list of entrepreneurship resources.
KANSAS CITY, KS
Kansas City Area Development Council
www.thinkkc.com
The Kansas City Area Development Council’s site is both attractive and succeeds in offering a through mix of in-depth information in an attractive, user-friendly way. The blend of high-quality graphics, interactive elements (maps), and video (including a video library) is engaging. The top menu navigation is thorough, allowing the visitor to find sub-pages quickly. Sub-sections are well organized and staff contacts for each department are included toward the bottom of each page. A tidy, user friendly report builder is a welcome addition to the large quantity of information provided on the site. Information about local industries is well supported with data, which is available for download in Excel format. A robust site selection tool is also offered.
CITY OF FORT WORTH ECONOMIC DEVELOPMENT STRATEGIC PLAN
TECHNICAL REPORT: GUIDANCE ON MARKETING, PROGRAM AREAS & SITE SELECTION PAGE | 33
NASHVILLE, TN
Nashville Area Chamber of Commerce
www.nashvillechamber.com/economic-development
The Nashville Area Chamber of Commerce’s site is glossy with many well-designed reports available. The graphic elements of the site are questionably huge, and users must click through several links to reach information. Once found, the reports offered are high quality, especially the visually compelling "Economic Development Guide." A report builder is available to capture data and maps for local industries, and from community profiles. An Esri site property search applet is included, but the user is prompted to contact a staff member for information beyond that. Information on taxes, incentives, and business resources is limited, prompting the user to contact staff for more information.
Metropolitan Government of Nashville and Davidson County, Tennessee
www.nashville.gov/Mayors-Office/Economic-and-Community-Development.aspx
The economic development sub-section of the City site is limited. Almost no visuals are included, and all information is embedded in a text heavy format. Staff contacts are prominent, but almost nothing is offered in the way of data. The site does offer contact information and links to many business resources.
Nashville Area Metropolitan Planning Organization
www.nashvillempo.org/growth/economic_and_market.aspx
Although the Nashville Area MPO’s site is primarily focused on regional transportation planning, it does offer up a fair amount of economic data and in-depth resources with projections of where development is headed in the region. The site is well-organized, but visually unassuming. Unfortunately, some of the maps, graphs and tables featured are quite small, and lack options to enlarge the view. However, the Regional planning section offers a wealth of reports that offer an in-depth picture of the region’s future in terms of transportation, land-use, urban design, and other areas of infrastructure development.
Greater Nashville Regional Council
www.gnrc.org/agencies-programs/ecd
This Greater Nashville Regional Council’s site is badly in need of an update. It is visually unappealing and navigation is difficult due to a glitchy menu, and unclear categorization. The pages are text heavy, and all useful data is buried in PDF reports on the Publications page. The condition and organization of the site require a significant time investment for a user to locate desired data.
OKLAHOMA CITY, OK
Greater Oklahoma City Partnership
www.greateroklahomacity.com
The Great Oklahoma City Partnership's website uses a common layout, but does so in an attractive, effective way. The navigation is clear, and all sections offer interesting (and often interactive) graphics and a decent amount of information. Several interactive tools are offered, including a GIS-based site selection search and a 'Local Business Intelligence "SizeUp" Tool' which "provides expert regional analysis on advertising strategies, demographics data and business and industry information." Although the Partnership serves a large area, community profiles with contact information, data, and reports are provided for every geography.
CITY OF FORT WORTH ECONOMIC DEVELOPMENT STRATEGIC PLAN
TECHNICAL REPORT: GUIDANCE ON MARKETING, PROGRAM AREAS & SITE SELECTION PAGE | 34
The Alliance for Economic Development of Oklahoma City
www.theallianceokc.org
The Alliance for Economic Development of Oklahoma City’s site features a bright unique design; however, it could benefit from utilizing consistently high-quality imagery. Only a small amount of data and information is offered directly on the site, instead it serves as more of a jumping-off point to reach other local organizations and resources.
PHOENIX, AZ
City of Phoenix
www.phoenix.gov/econdev
Phoenix’s site is messy and visually distracting. The huge video that automatically plays on arrival is jarring and off-putting. The site's navigation is frustrating. Links to important economic information are relegated to a short menu on the right-hand side. After navigating to a link, the menu disappears, forcing you to hit the back button and view the auto-play video again. Data offerings appear limited at first, and the few charts and graphics embedded in the site are frequently distorted and grainy. There is a "Reports and Maps" section with a fair selection of PDF reports, but the page was difficult to find and it could easily be missed (buried under a link accessible only through a tiny "menu" icon in the top right of the header).
Greater Phoenix Economic Council
www.gpec.org
The Great Phoenix Economic Council has a modern site with large attractive graphics but poor organization. At first, the Council's site appears more visually compelling than informational. All sections provide extremely brief overviews of industries, communities, resources, etc. The entire site seems intended to entice the user to contact the Council directly. Several data intensive reports and a Greater Phoenix Overview brochure are available as a PDFs, but they aren't located in an intuitive place. Instead, they are accessible in a subsection of the "About us" section or in easily overlooked links in the graphic headers.
PITTSBURGH, PA
Pittsburgh Regional Alliance
www.pittsburghregion.org/why/
The Pittsburgh Regional Alliance has an elegantly designed site that covers all the bases. Notably, it offers several interactive tools. These include a report builder with a wide array of data and PittsburghProspector.com, a stand-alone site dedicated to site selection and business and demographic report building. Community profile information is included as a link to a separate "ImaginePittsburgh" site, "a one-of-its-kind portal" that appears to offer quality-of-place information as well as job resources. Other than limited international listings, business resources weren't clearly identified on the site.
Urban Redevelopment Authority of Pittsburgh
www.ura.org/
The Urban Redevelopment Authority is a slightly different development entity than the others reviewed in this section. Nevertheless, they seem distinctly tied to economic development in Pittsburgh. Their site is dated-looking and visually disorganized. Dividing the site into resources specifically for residents, business owners, and developers was helpful. The development site data is well organized, although the quantity of individual PDFs is overwhelming. Some pages are text heavy, while others have little information. The site could benefit greatly from an update and a better method for accessing development data.

CITY OF FORT WORTH ECONOMIC DEVELOPMENT STRATEGIC PLAN
TECHNICAL REPORT: GUIDANCE ON MARKETING, PROGRAM AREAS & SITE SELECTION PAGE | 35
ATTACHMENT C. ORGANIZATION GAP ANALYSIS A strong City/Chamber nucleus is essential for the city’s future prosperity, but support from dozens of local and regional partner organizations will be required for Fort Worth to achieve its full potential. We conducted an organizational gap analysis that visualizes the core functions and support functions for the 31 partner organizations (listed below) that have the strongest impact on economic development in Fort Worth. These organizations have been split into two categories: those with economic development as a core part of their mission and those that play critical supporting roles. This gap analysis informs the implementation matrix, which assigns specific organizations responsible for carrying out each strategy and action in the plan.
The matrix on the following page lists the functional areas where each partner organization currently dedicates staff and resources. We have broken the functional areas into traditional economic development functions and non-traditional functions.
CORE ECONOMIC DEVELOPMENT PARTNERS
City of Fort Worth Fort Worth Chamber
Tarrant County Fort Worth Convention & Visitors Bureau
Fort Worth Hispanic Chamber Fort Worth Metropolitan Black Chamber Real Estate Council of Greater Fort Worth
TECH Fort Worth Fort Worth Business Assistance Center
Oncor DFW International Airport
Sundance Square Hillwood
Downtown Fort Worth Inc. Near Southside Inc.
Trinity River Vision Authority Southeast Fort Worth Inc.
SUPPORTING PARTNERS
Fort Worth Transportation Authority Arts Council of Fort Worth
North Central Texas Council of Governments Tarrant Regional Water District
Workforce Solutions for Tarrant County Fort Worth ISD
Texas Christian University Tarrant County College
University of Texas at Arlington TCU and UNTHSC School of Medicine
UNT Health Science Center Texas Wesleyan University
Texas A&M Law School Tarleton State University
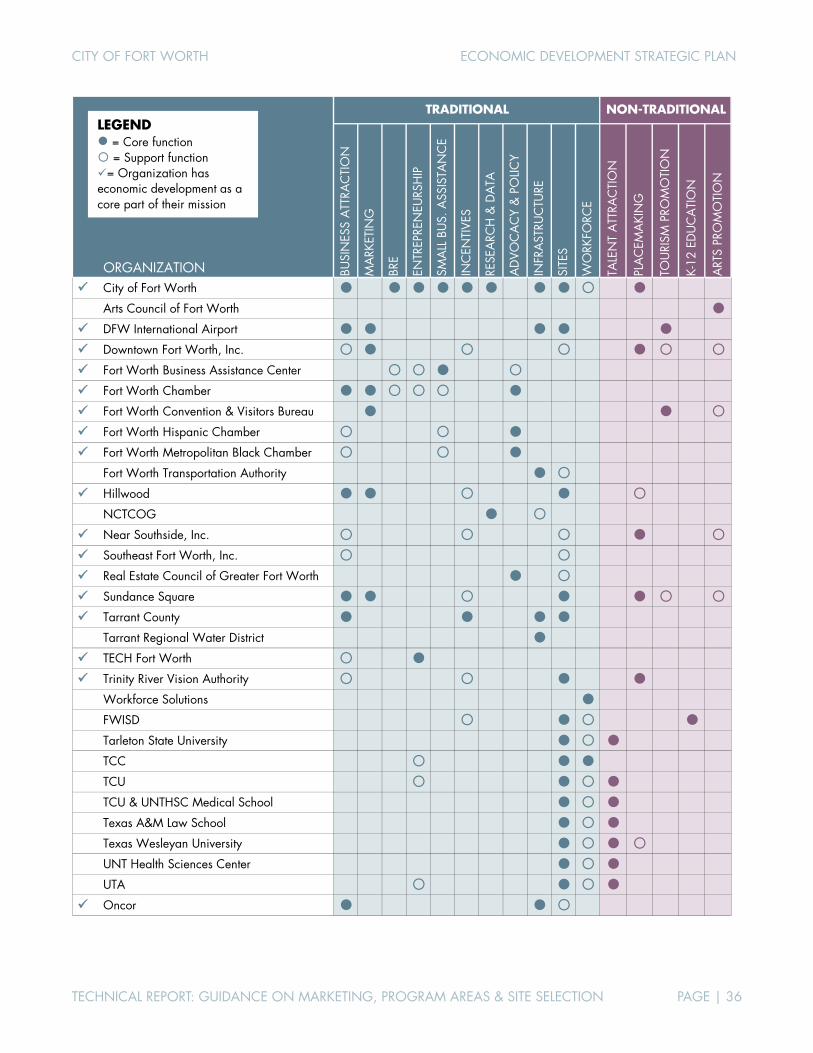
CITY OF FORT WORTH ECONOMIC DEVELOPMENT STRATEGIC PLAN
TECHNICAL REPORT: GUIDANCE ON MARKETING, PROGRAM AREAS & SITE SELECTION PAGE | 36
ORGANIZATION BUSI
NES
S A
TTRA
CTI
ON
MA
RKET
ING
BRE
ENTR
EPRE
NEU
RSH
IP
SMA
LL B
US.
ASS
ISTA
NC
E
INC
ENTI
VES
RESE
ARC
H &
DA
TA
AD
VOC
AC
Y &
PO
LICY
INFR
AST
RUC
TURE
SITE
S
WO
RKFO
RCE
TALE
NT
ATT
RAC
TIO
N
PLA
CEM
AKI
NG
TOU
RISM
PRO
MO
TIO
N
K-12
ED
UC
ATI
ON
ART
S PR
OM
OTI
ON
City of Fort Worth Arts Council of Fort Worth
DFW International Airport Downtown Fort Worth, Inc. Fort Worth Business Assistance Center Fort Worth Chamber Fort Worth Convention & Visitors Bureau Fort Worth Hispanic Chamber Fort Worth Metropolitan Black Chamber
Fort Worth Transportation Authority Hillwood
NCTCOG Near Southside, Inc. Southeast Fort Worth, Inc. Real Estate Council of Greater Fort Worth Sundance Square Tarrant County
Tarrant Regional Water District TECH Fort Worth Trinity River Vision Authority
Workforce Solutions FWISD Tarleton State University TCC TCU TCU & UNTHSC Medical School Texas A&M Law School Texas Wesleyan University UNT Health Sciences Center UTA
Oncor
TRADITIONAL NON-TRADITIONALLEGEND = Core function = Support function= Organization has economic development as a core part of their mission

CITY OF FORT WORTH ECONOMIC DEVELOPMENT STRATEGIC PLAN
TECHNICAL REPORT: GUIDANCE ON MARKETING, PROGRAM AREAS & SITE SELECTION PAGE | 37
ATTACHMENT D. ORGANIZATIONAL REVIEW To help understand Fort Worth’s position relative to its competitors, we reviewed the profiles and functions of the previously identified Dallas-Fort Worth metro area competitor and domestic benchmark economic development organizations. Information on staffing (including staffing relative to each community’s population), functional focus areas, and incentives are provided in brief profiles below. Following the profiles are matrices comparing the services each organization provides and highlighting which are major functions (if identifiable). The final section of this attachment provides a list of the organizations’ strategic plan documents available online. The information provided in this section was based on public documents available through organization and city websites. Although we attempted to provide as thorough a review as possible, some information is not available or easily accessible.
STAFFING COMPARISONS
METRO AREA COMPETITOR ORGANIZATIONS
Based on available data, economic development staffing levels in Fort Worth and Dallas fall short of those found among much smaller metro area communities. According to this analysis, the Frisco EDC had the highest relative staffing levels, with 8.6 staff members per 100,000 population served. By contrast, the City of Fort Worth’s staff-to-population ratio of 1.7 ranks near the bottom third. However, it should be noted that the City’s 14.5 staff include functions such as MWBE that are typically not included as part of a city economic development department in most communities. The Fort Worth Chamber’s ratio of 3.2 is almost double the City’s.
Source: TIP research.
ORGANIZATION STAFF POPULATION STAFF PER 100K POP.
Frisco Economic Development Corporation 14.0 163,656 8.6
Irving-Las Colinas Chamber of Commerce 15.0 238,289 6.3
Denton Economic Development Partnership 8.0 133,808 6.0
City of Denton 6.8 133,808 5.0
Lewisville Area Chamber of Commerce 5.0 104,659 4.8
Lewisville, Texas Economic Development Corporation 4.0 104,659 3.8
Fort Worth Chamber 27.0 854,113 3.2
McKinney Economic Development Corporation 5.0 172,298 2.9
Richardson Economic Development Partnership 3.0 113,347 2.6
Grand Prairie Economic Development 5.0 190,682 2.6
Garland Economic Development Partnership 6.0 234,943 2.6
Irving, Texas 6.0 238,289 2.5
Plano Economic Development 5.0 286,057 1.7
City of Fort Worth 14.5 854,113 1.7
City of Carrollton 2.0 133,351 1.5
Mesquite Texas 2.0 143,736 1.4
Dallas Regional Chamber 53.0 4,793,649 1.1
City of Arlington- Economic Development Department 4.0 392,772 1.0
City of Dallas Office of Economic Development 10.0 1,317,929 0.8
McKinney Community Development Corporation 1.0 172,298 0.6
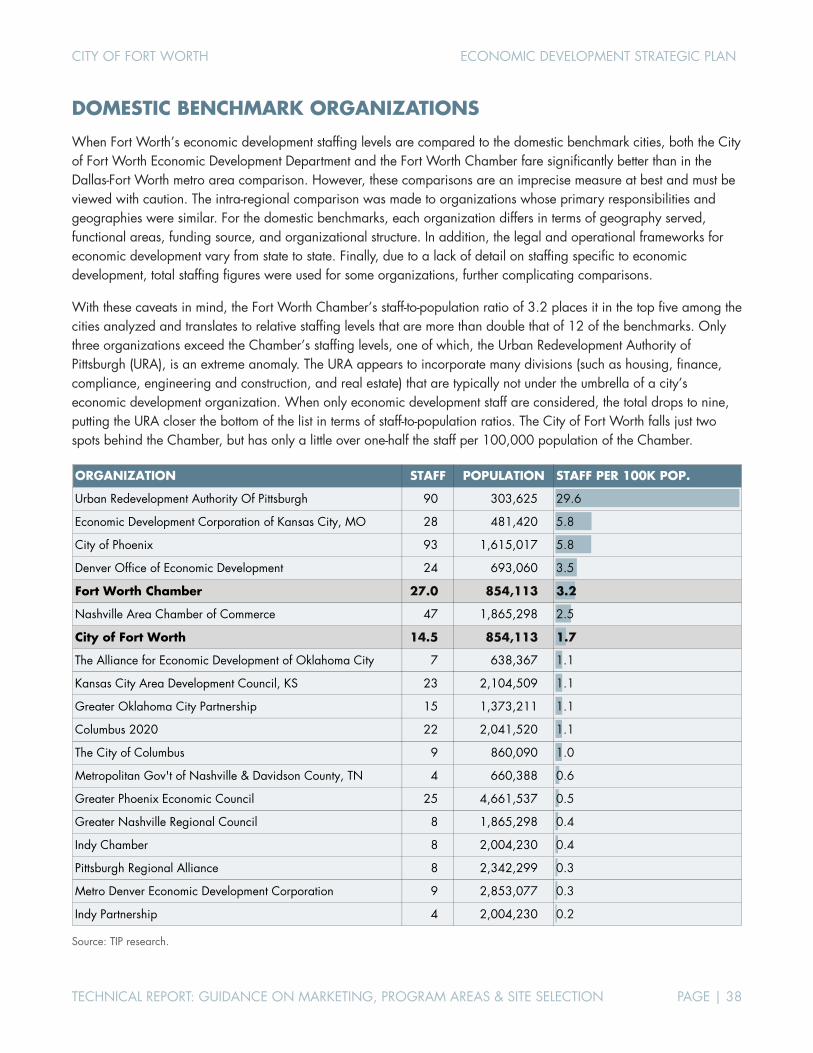
CITY OF FORT WORTH ECONOMIC DEVELOPMENT STRATEGIC PLAN
TECHNICAL REPORT: GUIDANCE ON MARKETING, PROGRAM AREAS & SITE SELECTION PAGE | 38
DOMESTIC BENCHMARK ORGANIZATIONS
When Fort Worth’s economic development staffing levels are compared to the domestic benchmark cities, both the City of Fort Worth Economic Development Department and the Fort Worth Chamber fare significantly better than in the Dallas-Fort Worth metro area comparison. However, these comparisons are an imprecise measure at best and must be viewed with caution. The intra-regional comparison was made to organizations whose primary responsibilities and geographies were similar. For the domestic benchmarks, each organization differs in terms of geography served, functional areas, funding source, and organizational structure. In addition, the legal and operational frameworks for economic development vary from state to state. Finally, due to a lack of detail on staffing specific to economic development, total staffing figures were used for some organizations, further complicating comparisons.
With these caveats in mind, the Fort Worth Chamber’s staff-to-population ratio of 3.2 places it in the top five among the cities analyzed and translates to relative staffing levels that are more than double that of 12 of the benchmarks. Only three organizations exceed the Chamber’s staffing levels, one of which, the Urban Redevelopment Authority of Pittsburgh (URA), is an extreme anomaly. The URA appears to incorporate many divisions (such as housing, finance, compliance, engineering and construction, and real estate) that are typically not under the umbrella of a city’s economic development organization. When only economic development staff are considered, the total drops to nine, putting the URA closer the bottom of the list in terms of staff-to-population ratios. The City of Fort Worth falls just two spots behind the Chamber, but has only a little over one-half the staff per 100,000 population of the Chamber.
Source: TIP research.
ORGANIZATION STAFF POPULATION STAFF PER 100K POP.
Urban Redevelopment Authority Of Pittsburgh 90 303,625 29.6
Economic Development Corporation of Kansas City, MO 28 481,420 5.8
City of Phoenix 93 1,615,017 5.8
Denver Office of Economic Development 24 693,060 3.5
Fort Worth Chamber 27.0 854,113 3.2
Nashville Area Chamber of Commerce 47 1,865,298 2.5
City of Fort Worth 14.5 854,113 1.7
The Alliance for Economic Development of Oklahoma City 7 638,367 1.1
Kansas City Area Development Council, KS 23 2,104,509 1.1
Greater Oklahoma City Partnership 15 1,373,211 1.1
Columbus 2020 22 2,041,520 1.1
The City of Columbus 9 860,090 1.0
Metropolitan Gov't of Nashville & Davidson County, TN 4 660,388 0.6
Greater Phoenix Economic Council 25 4,661,537 0.5
Greater Nashville Regional Council 8 1,865,298 0.4
Indy Chamber 8 2,004,230 0.4
Pittsburgh Regional Alliance 8 2,342,299 0.3
Metro Denver Economic Development Corporation 9 2,853,077 0.3
Indy Partnership 4 2,004,230 0.2
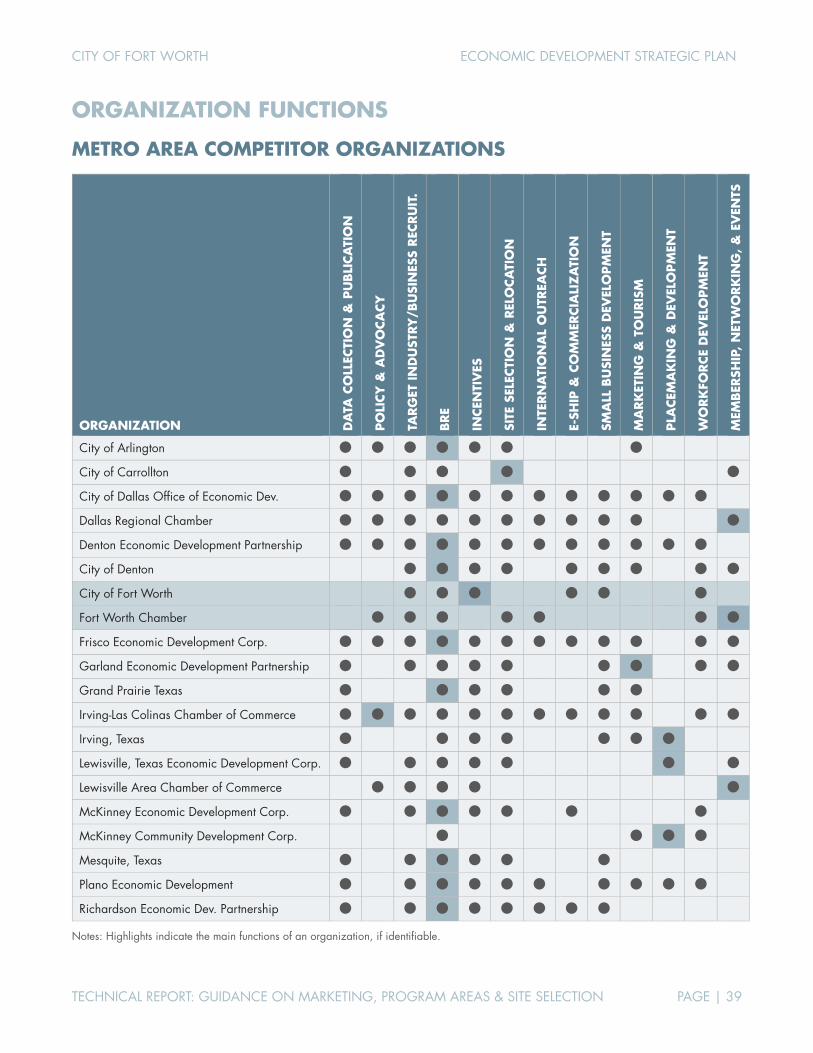
CITY OF FORT WORTH ECONOMIC DEVELOPMENT STRATEGIC PLAN
TECHNICAL REPORT: GUIDANCE ON MARKETING, PROGRAM AREAS & SITE SELECTION PAGE | 39
ORGANIZATION FUNCTIONS
METRO AREA COMPETITOR ORGANIZATIONS
ORGANIZATION DA
TA C
OLL
ECTI
ON
& P
UBLI
CA
TIO
N
PO
LICY
& A
DV
OCA
CY
TARG
ET IN
DU
STRY
/BU
SIN
ESS
REC
RU
IT.
BRE
INCEN
TIV
ES
SITE
SEL
ECTI
ON
& R
ELO
CA
TIO
N
INTE
RN
ATI
ON
AL
OU
TREA
CH
E-SH
IP &
CO
MM
ERCIA
LIZ
ATI
ON
SMA
LL B
USI
NES
S D
EVEL
OPM
ENT
MA
RK
ETIN
G &
TO
URIS
M
PLA
CEM
AK
ING
& D
EVEL
OPM
ENT
WO
RK
FORCE
DEV
ELO
PM
ENT
MEM
BER
SHIP
, N
ETW
ORK
ING
, &
EV
ENTS
City of Arlington
City of Carrollton
City of Dallas Office of Economic Dev.
Dallas Regional Chamber
Denton Economic Development Partnership
City of Denton
City of Fort Worth
Fort Worth Chamber
Frisco Economic Development Corp.
Garland Economic Development Partnership
Grand Prairie Texas
Irving-Las Colinas Chamber of Commerce
Irving, Texas
Lewisville, Texas Economic Development Corp.
Lewisville Area Chamber of Commerce
McKinney Economic Development Corp.
McKinney Community Development Corp.
Mesquite, Texas
Plano Economic Development
Richardson Economic Dev. Partnership
Notes: Highlights indicate the main functions of an organization, if identifiable.

CITY OF FORT WORTH ECONOMIC DEVELOPMENT STRATEGIC PLAN
TECHNICAL REPORT: GUIDANCE ON MARKETING, PROGRAM AREAS & SITE SELECTION PAGE | 40
DOMESTIC BENCHMARK ORGANIZATIONS
ORGANIZATION DA
TA C
OLL
ECTI
ON
& P
UBLI
CA
TIO
N
PO
LICY
& A
DV
OCA
CY
TARG
ET IN
DU
STRY
/BU
SIN
ESS
REC
RU
IT.
BRE
INCEN
TIV
ES
SITE
SEL
ECTI
ON
/DEV
. &
REL
OCA
TIO
N
INTE
RN
ATI
ON
AL
OU
TREA
CH
E-SH
IP &
CO
MM
ERCIA
LIZ
ATI
ON
SMA
LL B
USI
NES
S D
EVEL
OPM
ENT
MA
RK
ETIN
G &
TO
URIS
M
PLA
CEM
AK
ING
& D
EVEL
OPM
ENT
WO
RK
FORCE
DEV
ELO
PM
ENT
MEM
BER
SHIP
, N
ETW
ORK
ING
, &
EV
ENTS
The City of Columbus
Columbus 2020
Denver Office of Economic Development
Metro Denver Economic Development Corp.
City of Fort Worth
Fort Worth Chamber
Indy Chamber
Indy Partnership
Kansas City Area Development Council, KS
Economic Dev. Corp. of Kansas City, MO
Nashville Area Chamber of Commerce
Metropolitan Government of Nashville and Davidson County, Tennessee
Nashville Area Metropolitan Planning Org.
Greater Nashville Regional Council
Greater Oklahoma City Partnership
The Alliance for Economic Development of Oklahoma City
City of Phoenix
Greater Phoenix Economic Council
Pittsburgh Regional Alliance
Urban Redevelopment Authority of Pittsburgh
Notes: Highlights indicate the main functions of an organization, if identifiable.
CITY OF FORT WORTH ECONOMIC DEVELOPMENT STRATEGIC PLAN
TECHNICAL REPORT: GUIDANCE ON MARKETING, PROGRAM AREAS & SITE SELECTION PAGE | 41
INCENTIVES
METRO AREA COMPETITOR ORGANIZATIONS CITY OF ARLINGTON- ECONOMIC DEVELOPMENT DEPARTMENT
www.arlington-tx.gov/business/incentives/
CITY OF CARROLLTON
www.cityofcarrollton.com/business/carrollton-development/incentives/active-economic-incentive-agreements
www.cityofcarrollton.com/departments/departments-a-f/economic-development/incentives
CITY OF DALLAS OFFICE OF ECONOMIC DEVELOPMENT
www.dallasecodev.org/Faq.aspx?QID=106
www.dallasecodev.org/263/Public-Private-Partnership-Program
DALLAS REGIONAL CHAMBER
Unavailable
DENTON ECONOMIC DEVELOPMENT PARTNERSHIP
www.dentonedp.com/available-incentives
CITY OF DENTON
www.cityofdenton.imag-dev.com/CoD/media/City-of-Denton/Business/Economic%20Development/Denton-Incentives-brochure.pdf
CITY OF FORT WORTH
www.fortworthtexas.gov/ecodev
FORT WORTH CHAMBER
www.fortworthecodev.com/fort-worth-overview/incentives
FRISCO ECONOMIC DEVELOPMENT CORPORATION
www.friscoedc.com/incentives
GARLAND ECONOMIC DEVELOPMENT PARTNERSHIP
www.garlandedp.com/real-estate-development/incent.html
GRAND PRAIRIE ECONOMIC DEVELOPMENT
www.gptx.org/businesses/economic-development/incentives-policy
IRVING-LAS COLINAS CHAMBER OF COMMERCE
www.irvingchamber.com/connect/grow-your-business/incentives/
IRVING, TEXAS
www.cityofirving.org/876/Economic-Incentives
LEWISVILLE, TEXAS ECONOMIC DEVELOPMENT CORPORATION
www.ecodevlewisville.com/incentives

CITY OF FORT WORTH ECONOMIC DEVELOPMENT STRATEGIC PLAN
TECHNICAL REPORT: GUIDANCE ON MARKETING, PROGRAM AREAS & SITE SELECTION PAGE | 42
LEWISVILLE AREA CHAMBER OF COMMERCE
Unavailable
MCKINNEY ECONOMIC DEVELOPMENT CORPORATION
www.mckinneyedc.com/100/Incentives
MCKINNEY COMMUNITY DEVELOPMENT CORPORATION
Unavailable
MESQUITE TEXAS
www.cityofmesquite.com/1633/Incentive-Policy-and-Application
PLANO ECONOMIC DEVELOPMENT
www.planotexas.org/224/Incentives www.planotexas.org/DocumentCenter/Home/View/752
RICHARDSON ECONOMIC DEVELOPMENT PARTNERSHIP
www.telecomcorridor.com/site-selection/incentives-1
DOMESTIC BENCHMARK ORGANIZATIONS
THE CITY OF COLUMBUS
Small Business Funding: www.columbus.gov/development/economic-development/Small-Business/ Downtown Business Incentives: www.columbus.gov/development/economic-development/Downtown-Business-Incentives
COLUMBUS 2020
www.columbusregion.com/doing-business/operating-costs/incentives
DENVER OFFICE OF ECONOMIC DEVELOPMENT
www.denvergov.org/content/denvergov/en/denver-office-of-economic-development/build-your-business/incentives.html
METRO DENVER ECONOMIC DEVELOPMENT CORPORATION
www.metrodenver.org/do-business/incentives
INDY CHAMBER
www.indychamber.com/economic-development/why-indianapolis/incentives
INDY PARTNERSHIP
www.indychamber.com/index.php/download_file/view/1606/468/
KANSAS CITY AREA DEVELOPMENT COUNCIL (KANSAS)
www.thinkkc.com/business/taxes-incentives
ECONOMIC DEVELOPMENT CORPORATION OF KANSAS CITY (MISSOURI)
www.edckc.com/category/incentives-and-loans

CITY OF FORT WORTH ECONOMIC DEVELOPMENT STRATEGIC PLAN
TECHNICAL REPORT: GUIDANCE ON MARKETING, PROGRAM AREAS & SITE SELECTION PAGE | 43
NASHVILLE AREA CHAMBER OF COMMERCE
www.nashvillechamber.com/economic-development/relocate-or-expand/taxes-incentives
METROPOLITAN GOVERNMENT OF NASHVILLE AND DAVIDSON COUNTY, TENNESSEE
www.nashville.gov/Mayors-Office/Economic-and-Community-Development/Incentives.aspx
GREATER NASHVILLE REGIONAL COUNCIL
Tax Incentives: www.tn.gov/transparenttn/topic/openecd-tax-incentives
Film Incentives: www.tn.gov/transparenttn/topic/openecd-film-incentives
GREATER OKLAHOMA CITY PARTNERSHIP
www.greateroklahomacity.com/subdoingbusiness/incentives/
THE ALLIANCE FOR ECONOMIC DEVELOPMENT OF OKLAHOMA CITY
www.theallianceokc.org/economic-tools
CITY OF PHOENIX
www.phoenix.gov/econdev/Incentives
GREATER PHOENIX ECONOMIC COUNCIL
www.gpec.org/operating-costs-incentives
PITTSBURGH REGIONAL ALLIANCE
www.pittsburghregion.org/wp-content/uploads/2016/08/LocalEconomicDevelopmentPrograms.pdf
URBAN REDEVELOPMENT AUTHORITY OF PITTSBURGH
www.ura.org/business_owners/business_owners.php
CITY OF FORT WORTH ECONOMIC DEVELOPMENT STRATEGIC PLAN
TECHNICAL REPORT: GUIDANCE ON MARKETING, PROGRAM AREAS & SITE SELECTION PAGE | 44
STRATEGIC PLAN DOCUMENTS
METRO AREA COMPETITOR ORGANIZATIONS
CITY OF DALLAS OFFICE OF ECONOMIC DEVELOPMENT GrowSouth: www.dallasgrowsouth.com/category/growsouthplan/
IRVING-LAS COLINAS CHAMBER OF COMMERCE 2015-2018 Strategic Initiatives & KPIS: www.issuu.com/irvingchamber/docs/chamberbooklet2015spreadnobleed
IRVING, TEXAS Irving Economic Development Strategic Plan (2017-2022): www.cityofirving.org/2656/Economic-Development-Strategic-Plan
LEWISVILLE, TEXAS ECONOMIC DEVELOPMENT CORPORATION Lewisville 2025: www.cityoflewisville.com/?navid=1170
Lewisville 2025 Annual Report 2017: www.cityoflewisville.com/home/showdocument?id=10496
DOMESTIC BENCHMARK ORGANIZATIONS
COLUMBUS 2020 Columbus 2020 Strategy: www.columbusregion.com/columbus-2020/strategy CEDS 2014 Update: www.go.columbusregion.com/CEDS-2014
DENVER OFFICE OF ECONOMIC DEVELOPMENT JumpStart 2017- 2017: www.denvergov.org/content/dam/denvergov/Portals/690/Reports%20and%20Studies/ OED%20JumpStart%202017-web.pdf
METRO DENVER ECONOMIC DEVELOPMENT CORPORATION Toward a More Competitive Colorado, 12th Edition (2016): www.metrodenver.org/research-reports/toward-a-more-competitive-colorado/# Industry Cluster Study (2016): www.metrodenver.org/research-reports/industry-cluster-study/#
All Research & Reports: www.metrodenver.org/research-reports
INDY CHAMBER Plan 2020: www.indychamber.com/economic-development/major-initiatives/plan-2020/
Accelerate Indy: www.indychamber.com/index.php/download_file/2841/490/"
NASHVILLE AREA CHAMBER OF COMMERCE Strengthening the Middle Tennessee Region 2020: Building a Vital Workforce to Sustain Economic Growth and Opportunity (2015): s3.amazonaws.com/nashvillechamber.com/Talent/2015-workforce-study-full.pdf
Partnership 2020 Lead the Way brochure: s3.amazonaws.com/nashvillechamber.com/Economic-Development/P2020-LEAD-the-Way-Brochure-2016.pdf
NASHVILLE AREA METROPOLITAN PLANNING ORGANIZATION 2012-2017 Comprehensive Economic Development Strategy (2016 Update): www.gnrc.org/wp-content/uploads/2011/12/GNRC_CEDS_2016.pdf

CITY OF FORT WORTH ECONOMIC DEVELOPMENT STRATEGIC PLAN
TECHNICAL REPORT: GUIDANCE ON MARKETING, PROGRAM AREAS & SITE SELECTION PAGE | 45
ATTACHMENT E. SITE SELECTION FACTORS Findings from Area Development Magazine’s Annual Survey of Corporate Executives help to illustrate how a corporate decision-maker might initially assess site location decisions based on readily available data. This section uses the top 10 factors, based on rankings in the 2016 survey, as the framework for understanding the region’s competitive position. Since many of the factors are applicable only at the state or metropolitan area level, the focus of this analysis is on the domestic peer MSAs. This section closes with a review of factors that help to differentiate communities within the region, including school district rankings and labor availability.
AREA DEVELOPMENT TOP 10 FACTORS Figure 23 shows the top 10 site selection factors as ranked by Area Development’s 2016 Annual Survey of Corporate Executives, along with a look at how these factors have changed over a 25-year period. Comparisons across years are complicated by several factors, including the fluctuating composition of the survey respondents, revisions to individual questions, and methodological changes. However, a review of long-term trends illustrates the long-standing role these factors have played in site selection decisions.
FIGURE 23. TOP 10 SITE SELECTION FACTORS (RANKED BY SCORE IN 2016) WITH COMPARISONS TO SELECTED YEARS
2016 2015 2010 2000 1990
Rank Value Rank Value Rank Value Rank Value Rank Value
Highway accessibility 1 94.4 2 88.0 1 97.3 1 95.9 1 92.3
Availability of skilled labor 2 89.8 1 92.9 7 85.9 3 87.7 6 87.1
Labor costs 3 89.6 6 80.8 2 91.0 2 91.6 2 92.1
Occupancy or construction costs 4 86.0 4 85.4 4 89.8 6 83.0 4 88.5
State and local incentives 5 84.0 9 75.8 5 89.3 5 83.6 3 88.7
Corporate tax rate 6 82.3 7 78.8 6 86.3 4 84.7 N/A N/A
Tax exemptions 7 79.7 11 74.7 3 90.9 7 81.6 7 85.8
Energy availability and costs 8 78.5 10 75.3 9 82.1 10 77.7 5 88.1
Proximity to major markets 9 78.1 8 76.3 17 66.4 12 76.8 14 74.9
Quality of life* 10 76.4 3 87.6 19 62.1 18 58.8 17 70.6
Source: Area Development magazine, Annual Survey of Corporate Executives. Note: All figures are percentages and are the total of “very important” and “important” ratings. *Quality of life rating for surveys prior to 2015 is the average of rating of nine quality of life factors (climate, housing availability, housing costs, healthcare facilities, ratings of public schools, cultural opportunities, recreational opportunities, colleges and universities in the area, and low crime rate). N/A indicates that data are not available due to changes and additions to the survey.
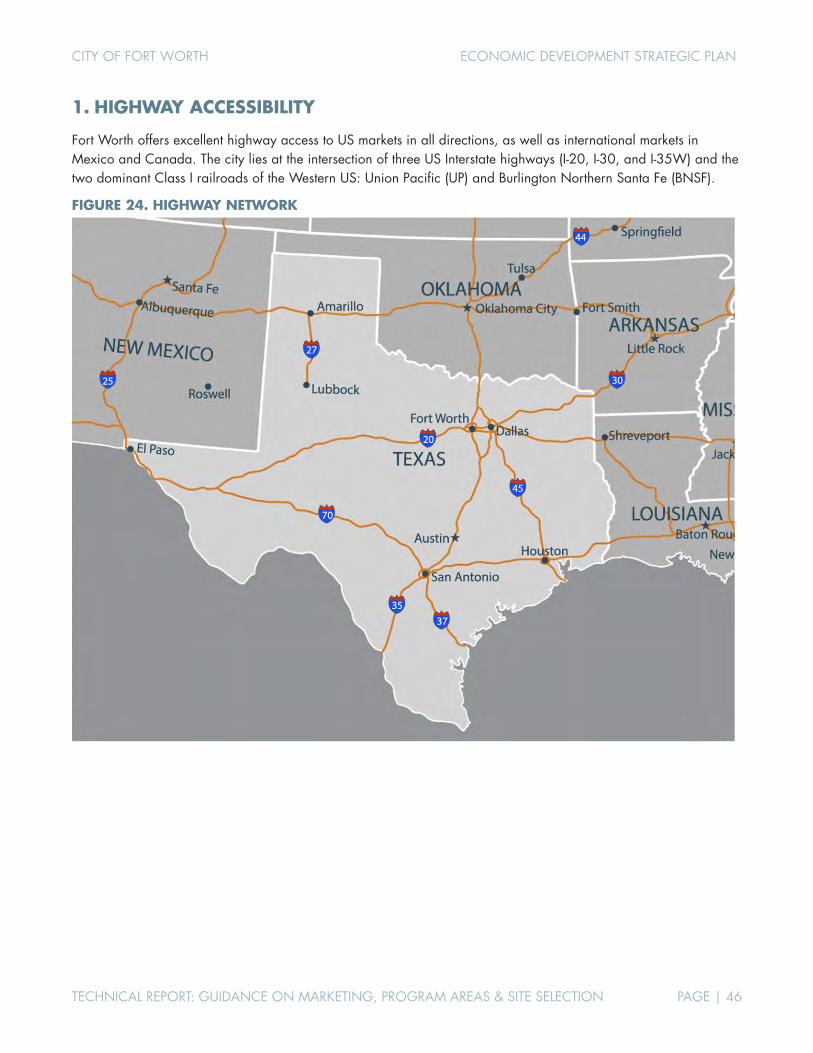
CITY OF FORT WORTH ECONOMIC DEVELOPMENT STRATEGIC PLAN
TECHNICAL REPORT: GUIDANCE ON MARKETING, PROGRAM AREAS & SITE SELECTION PAGE | 46
1. HIGHWAY ACCESSIBILITY
Fort Worth offers excellent highway access to US markets in all directions, as well as international markets in Mexico and Canada. The city lies at the intersection of three US Interstate highways (I-20, I-30, and I-35W) and the two dominant Class I railroads of the Western US: Union Pacific (UP) and Burlington Northern Santa Fe (BNSF).
FIGURE 24. HIGHWAY NETWORK
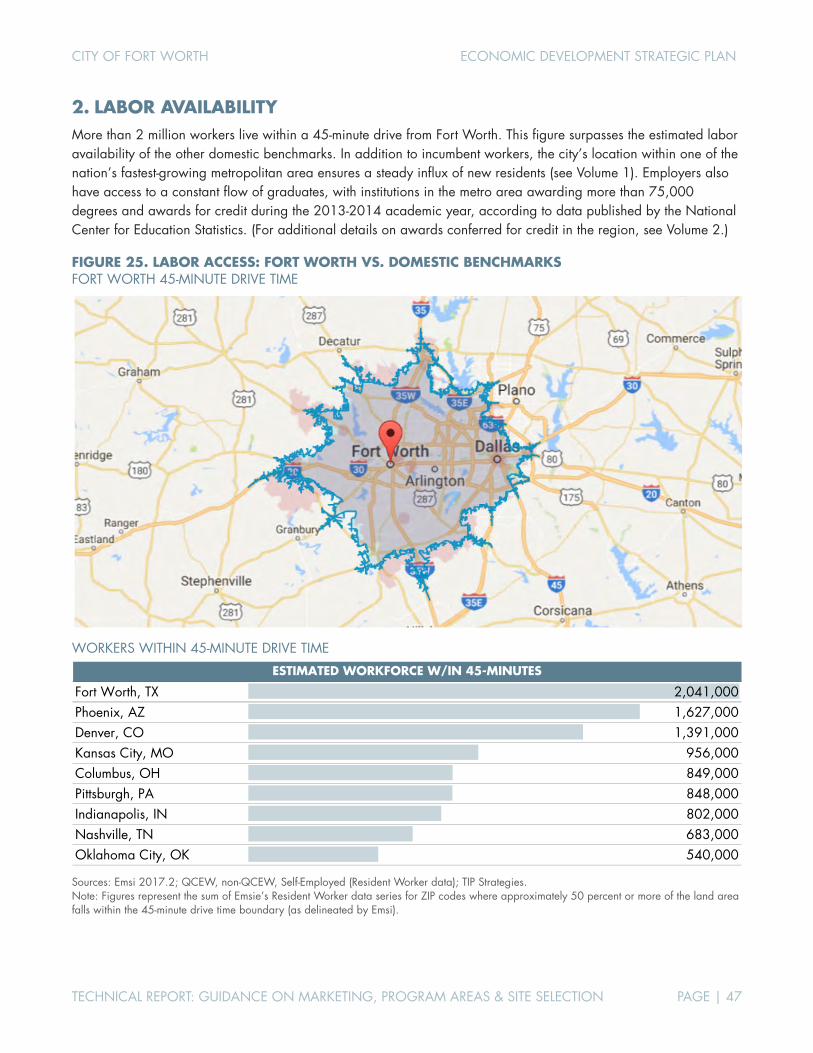
CITY OF FORT WORTH ECONOMIC DEVELOPMENT STRATEGIC PLAN
TECHNICAL REPORT: GUIDANCE ON MARKETING, PROGRAM AREAS & SITE SELECTION PAGE | 47
2. LABOR AVAILABILITY More than 2 million workers live within a 45-minute drive from Fort Worth. This figure surpasses the estimated labor availability of the other domestic benchmarks. In addition to incumbent workers, the city’s location within one of the nation’s fastest-growing metropolitan area ensures a steady influx of new residents (see Volume 1). Employers also have access to a constant flow of graduates, with institutions in the metro area awarding more than 75,000 degrees and awards for credit during the 2013-2014 academic year, according to data published by the National Center for Education Statistics. (For additional details on awards conferred for credit in the region, see Volume 2.)
FIGURE 25. LABOR ACCESS: FORT WORTH VS. DOMESTIC BENCHMARKS FORT WORTH 45-MINUTE DRIVE TIME
WORKERS WITHIN 45-MINUTE DRIVE TIME
Sources: Emsi 2017.2; QCEW, non-QCEW, Self-Employed (Resident Worker data); TIP Strategies. Note: Figures represent the sum of Emsie’s Resident Worker data series for ZIP codes where approximately 50 percent or more of the land area falls within the 45-minute drive time boundary (as delineated by Emsi).
Fort Worth, TX 2,041,000Phoenix, AZ 1,627,000Denver, CO 1,391,000Kansas City, MO 956,000Columbus, OH 849,000Pittsburgh, PA 848,000Indianapolis, IN 802,000Nashville, TN 683,000Oklahoma City, OK 540,000
ESTIMATED WORKFORCE W/IN 45-MINUTES

CITY OF FORT WORTH ECONOMIC DEVELOPMENT STRATEGIC PLAN
TECHNICAL REPORT: GUIDANCE ON MARKETING, PROGRAM AREAS & SITE SELECTION PAGE | 48
3. LABOR COSTS
As part of its most recent Cost of Doing Business Index, Moody’s Analytics compared unit labor costs in 401 metropolitan areas as one component of the overall index. Moody’s labor cost index calculates labor compensation per dollar of output for selected industries in each metropolitan area. Labor compensation is measured as wages and salaries per employee, while output is calculated as gross product per employee. These industry-specific labor costs are then compared with costs for the same industries nationally to construct the index. Because it accounts for labor productivity, the resulting unit labor cost index is a more accurate measure of labor costs than compensation alone, according to the Moody’s analysis.
Index values compare a metro area’s costs to US averages. An index value of 100 is the same as the US as a whole. Values below 100 represent lower cost metro areas, while values above 100 indicate higher cost metro areas. The rank compares each of the 401 metro areas to each other in terms of costs represented by the index values overall and for each component. New York ranks first in the US as the costliest metro area overall and Jacksonville, North Carolina ranks 401 as the least costly metro area. Fort Worth ranks as a relatively low-cost place for doing business compared with the domestic benchmarks. Only Oklahoma City and Nashville provide minor cost savings compared with Fort Worth.
FIGURE 26. MOODY’S COST OF DOING BUSINESS INDEX, JUNE 2016 RELATIVE BUSINESS COST ESTIMATES FOR THE PERIOD FROM 2012 TO 2014
METRO AREA
COST OF DOING
BUSINESS
INDEX COMPONENTS
Unit Labor Cost Energy Cost State & Local Tax Office Rent Index Value Rank Index
Value Rank Index Value Rank Index
Value Rank Index Value Rank
Fort Worth TX 88 204 93 264 107 130 65 368 70 165
Indianapolis IN 88 205 96 236 102 158 96 116 62 247
Columbus OH 95 101 99 189 112 110 95 120 75 108
Dallas TX 93 129 100 166 107 130 64 372 77 95
Nashville TN 82 317 100 147 93 248 66 355 51 360
Pittsburgh PA 96 85 100 145 128 65 93 132 73 128
Oklahoma City OK 86 254 105 82 75 383 64 371 62 248
Phoenix AZ 96 90 106 69 107 125 78 281 76 101
Denver CO 96 87 113 16 96 224 63 384 78 90
Kansas City MO 93 132 114 12 91 262 77 284 62 252
Sources: Moody's Analytics, "U.S. Cost of Doing Business: An Update," Regional Financial Review, June 2017. Note: The lowest cost ranking (highest number) is bolded for the overall index and for each component.

CITY OF FORT WORTH ECONOMIC DEVELOPMENT STRATEGIC PLAN
TECHNICAL REPORT: GUIDANCE ON MARKETING, PROGRAM AREAS & SITE SELECTION PAGE | 49
4. CONSTRUCTION COSTS
Per Craftsman’s 2017 National Construction Estimator, Fort Worth construction costs are only slightly higher than the national average. Fort Worth’s adjustment factor of +1 percent is among the lowest of the benchmark metro areas. By contrast, construction costs are significantly above the US average in Dallas. With a local adjustment factor of +6 percent, Dallas has the highest construction costs of the benchmark metro areas. Columbus and Oklahoma City have the lowest costs among the metro areas analyzed, with construction costs averaging 7 percent and 3 percent below national averages, respectively.
FIGURE 27. CONSTRUCTION COST COMPARISON, 2017 ESTIMATED LOCAL ADJUSTMENT FACTOR RELATIVE TO AVERAGE CONSTRUCTION COSTS NATIONALLY
Source: Craftsman 2017 National Construction Cost Estimator. Notes: Figures represent the weighted average of factors for labor, material, and equipment.
-7%
-3%
+1%
+2%
+3%
+4%
+5%
+6%
+6%
+6%
+8%
Columbus
Oklahoma City
Fort Worth
Nashville
Phoenix
Indianapolis
Kansas City (KS)
Kansas City (MO)
Pittsburgh
Dallas
Denver
BELOW US AVERAGE
ABOVE US AVERAGE
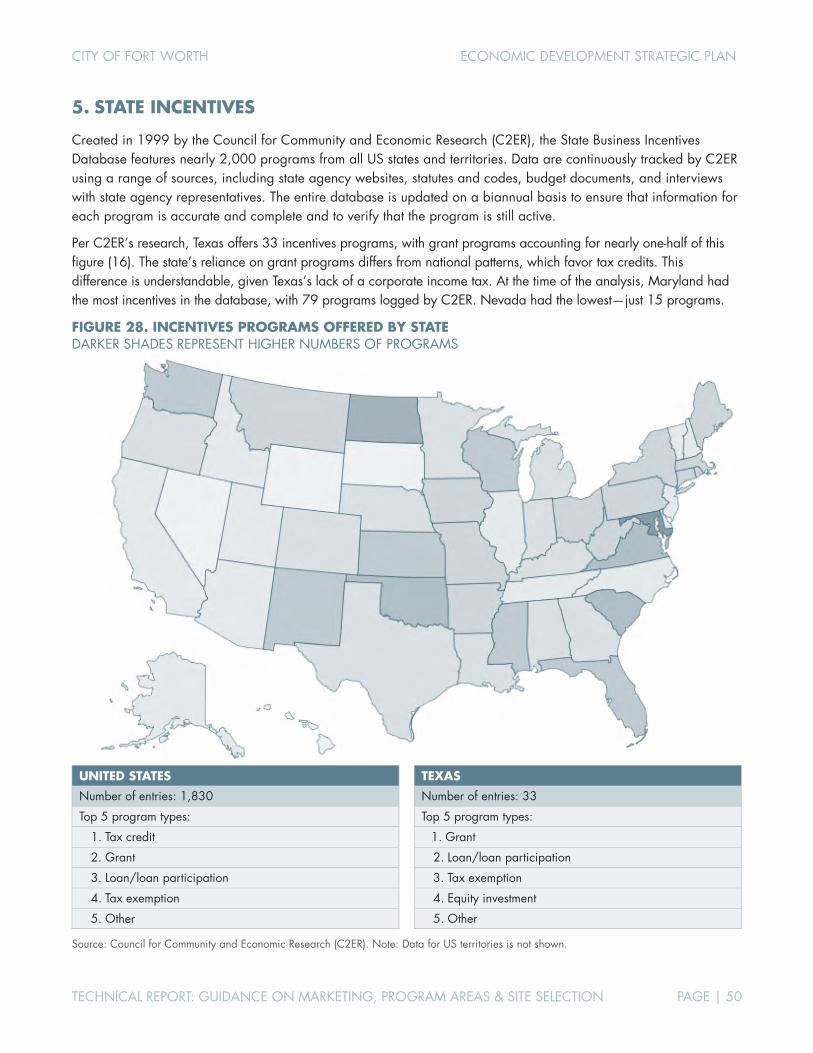
CITY OF FORT WORTH ECONOMIC DEVELOPMENT STRATEGIC PLAN
TECHNICAL REPORT: GUIDANCE ON MARKETING, PROGRAM AREAS & SITE SELECTION PAGE | 50
5. STATE INCENTIVES
Created in 1999 by the Council for Community and Economic Research (C2ER), the State Business Incentives Database features nearly 2,000 programs from all US states and territories. Data are continuously tracked by C2ER using a range of sources, including state agency websites, statutes and codes, budget documents, and interviews with state agency representatives. The entire database is updated on a biannual basis to ensure that information for each program is accurate and complete and to verify that the program is still active.
Per C2ER’s research, Texas offers 33 incentives programs, with grant programs accounting for nearly one-half of this figure (16). The state’s reliance on grant programs differs from national patterns, which favor tax credits. This difference is understandable, given Texas’s lack of a corporate income tax. At the time of the analysis, Maryland had the most incentives in the database, with 79 programs logged by C2ER. Nevada had the lowest—just 15 programs.
FIGURE 28. INCENTIVES PROGRAMS OFFERED BY STATE DARKER SHADES REPRESENT HIGHER NUMBERS OF PROGRAMS
UNITED STATES
Number of entries: 1,830
Top 5 program types:
1. Tax credit
2. Grant
3. Loan/loan participation
4. Tax exemption
5. Other
TEXAS
Number of entries: 33
Top 5 program types:
1. Grant
2. Loan/loan participation
3. Tax exemption
4. Equity investment
5. Other
Source: Council for Community and Economic Research (C2ER). Note: Data for US territories is not shown.

CITY OF FORT WORTH ECONOMIC DEVELOPMENT STRATEGIC PLAN
TECHNICAL REPORT: GUIDANCE ON MARKETING, PROGRAM AREAS & SITE SELECTION PAGE | 51
6. CORPORATE TAX RATE
According to the latest analysis of corporate income tax rates prepared by the Tax Foundation, top statutory corporate tax rates for 2017 range from a low of 3 percent in North Carolina to a high of 12 percent in Iowa. Texas is one of four states that impose gross receipts taxes instead of corporate income taxes; the others are Nevada, Ohio, and Washington. The Tax Foundation analysis reports that gross receipts taxes are perceived to be more economically harmful than corporate income taxes, however, the two types of tax are not directly comparable.
The Moody’s Cost of Doing Business Index presented in Figure 26 (page 48) includes a component that estimates relative tax burden. By this measure, state and local taxes in Fort Worth are among the lowest of the 401 metropolitan areas analyzed. Indianapolis firms face the highest estimated tax burden based on Moody’s analysis, with a ranking of 116 on the state and local tax component of the overall index.
FIGURE 29. TOP STATE MARGINAL CORPORATE INCOME TAX RATES IN 2017
Source: Tax Foundation, State Corporate Income Tax Rates and Brackets for 2017. Note (*): Nevada, Ohio, Texas, and Washington do not have corporate income taxes but do have gross receipts taxes with rates not strictly comparable to corporate income tax rates. Arkansas has a “benefit recapture,” by which corporations with more than $100,000 of taxable income pay a flat tax of 6.5% on all income, not just on amounts above the benefit threshold. Connecticut’s rate includes a 20% surtax, which effectively increases the rate from 7.5% to 9%. Surtax is required by businesses with at least $100 million in annual gross income. Illinois’ rate includes two separate corporate income taxes, one at a 5.25% rate and one at a 2.5% rate. Indiana’s tax rate will decrease to 6.0% on July 1, 2017.
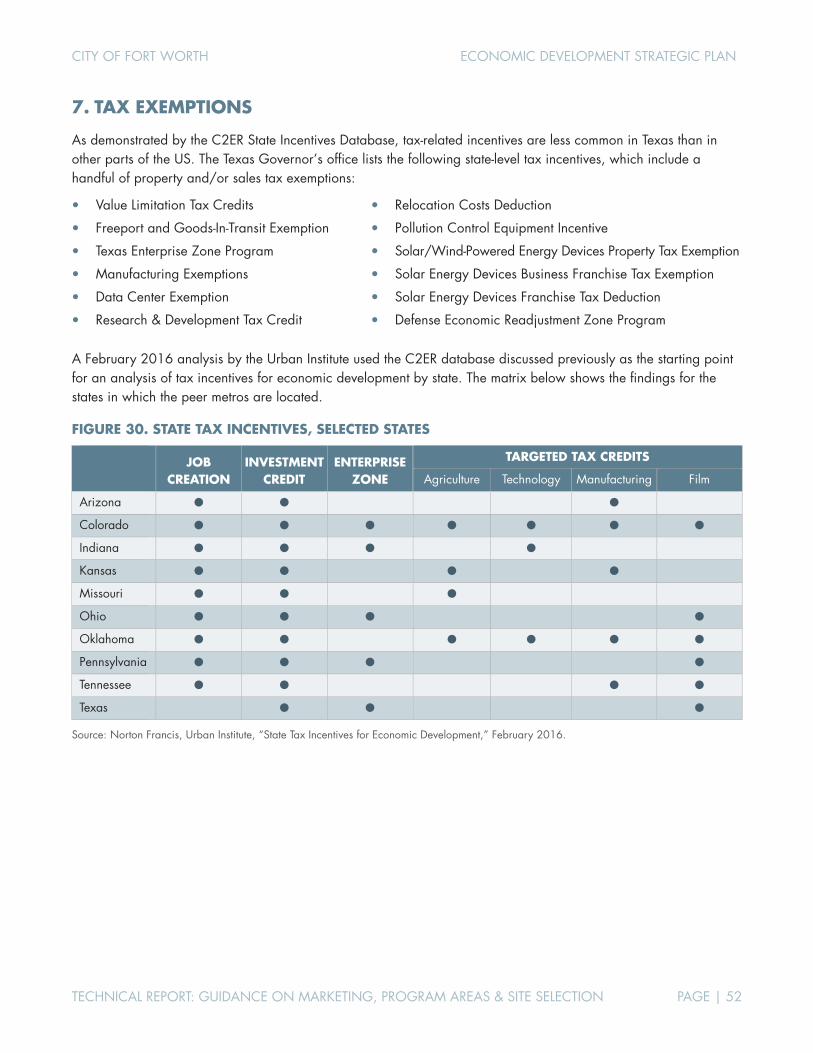
CITY OF FORT WORTH ECONOMIC DEVELOPMENT STRATEGIC PLAN
TECHNICAL REPORT: GUIDANCE ON MARKETING, PROGRAM AREAS & SITE SELECTION PAGE | 52
7. TAX EXEMPTIONS
As demonstrated by the C2ER State Incentives Database, tax-related incentives are less common in Texas than in other parts of the US. The Texas Governor’s office lists the following state-level tax incentives, which include a handful of property and/or sales tax exemptions:
Value Limitation Tax Credits
Freeport and Goods-In-Transit Exemption
Texas Enterprise Zone Program
Manufacturing Exemptions
Data Center Exemption
Research & Development Tax Credit
Relocation Costs Deduction
Pollution Control Equipment Incentive
Solar/Wind-Powered Energy Devices Property Tax Exemption
Solar Energy Devices Business Franchise Tax Exemption
Solar Energy Devices Franchise Tax Deduction
Defense Economic Readjustment Zone Program
A February 2016 analysis by the Urban Institute used the C2ER database discussed previously as the starting point for an analysis of tax incentives for economic development by state. The matrix below shows the findings for the states in which the peer metros are located.
FIGURE 30. STATE TAX INCENTIVES, SELECTED STATES
JOB CREATION
INVESTMENT CREDIT
ENTERPRISE ZONE
TARGETED TAX CREDITS
Agriculture Technology Manufacturing Film
Arizona
Colorado
Indiana
Kansas
Missouri
Ohio
Oklahoma
Pennsylvania
Tennessee
Texas
Source: Norton Francis, Urban Institute, “State Tax Incentives for Economic Development,” February 2016.
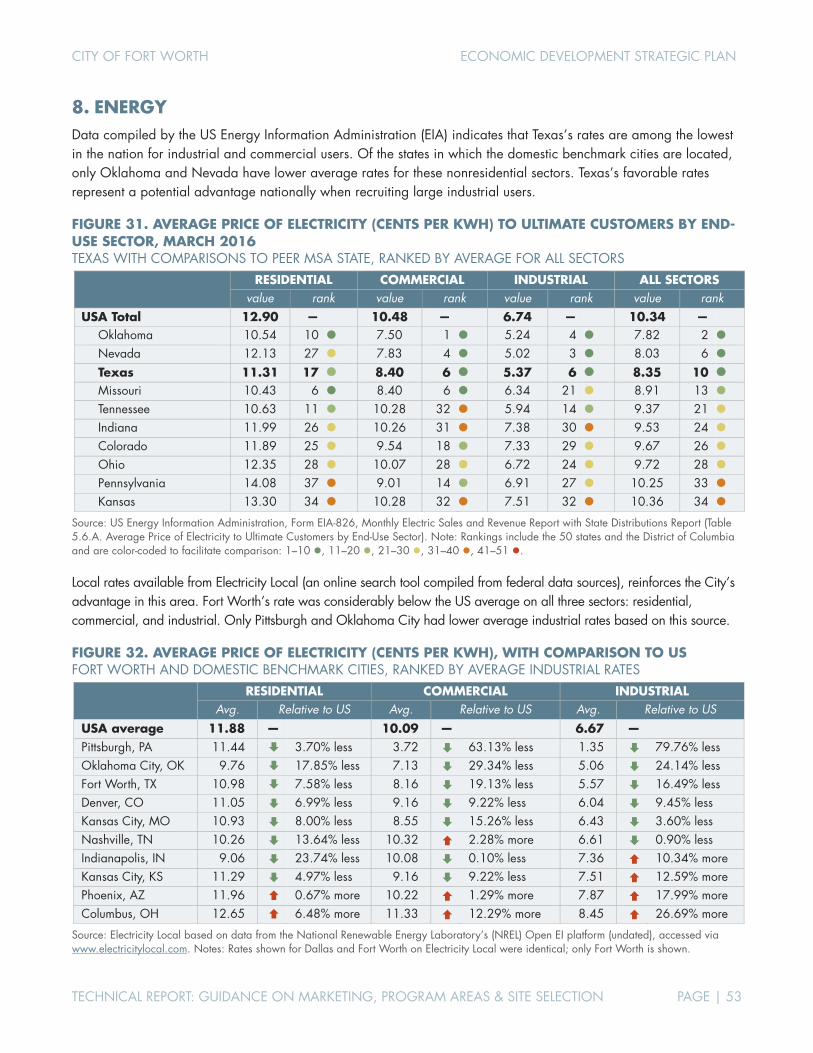
CITY OF FORT WORTH ECONOMIC DEVELOPMENT STRATEGIC PLAN
TECHNICAL REPORT: GUIDANCE ON MARKETING, PROGRAM AREAS & SITE SELECTION PAGE | 53
8. ENERGY Data compiled by the US Energy Information Administration (EIA) indicates that Texas’s rates are among the lowest in the nation for industrial and commercial users. Of the states in which the domestic benchmark cities are located, only Oklahoma and Nevada have lower average rates for these nonresidential sectors. Texas’s favorable rates represent a potential advantage nationally when recruiting large industrial users.
FIGURE 31. AVERAGE PRICE OF ELECTRICITY (CENTS PER KWH) TO ULTIMATE CUSTOMERS BY END-USE SECTOR, MARCH 2016 TEXAS WITH COMPARISONS TO PEER MSA STATE, RANKED BY AVERAGE FOR ALL SECTORS
RESIDENTIAL COMMERCIAL INDUSTRIAL ALL SECTORS
value rank value rank value rank value rank USA Total 12.90 — 10.48 — 6.74 — 10.34 —
Oklahoma 10.54 10 7.50 1 5.24 4 7.82 2 Nevada 12.13 27 7.83 4 5.02 3 8.03 6 Texas 11.31 17 8.40 6 5.37 6 8.35 10 Missouri 10.43 6 8.40 6 6.34 21 8.91 13 Tennessee 10.63 11 10.28 32 5.94 14 9.37 21 Indiana 11.99 26 10.26 31 7.38 30 9.53 24 Colorado 11.89 25 9.54 18 7.33 29 9.67 26 Ohio 12.35 28 10.07 28 6.72 24 9.72 28 Pennsylvania 14.08 37 9.01 14 6.91 27 10.25 33 Kansas 13.30 34 10.28 32 7.51 32 10.36 34
Source: US Energy Information Administration, Form EIA-826, Monthly Electric Sales and Revenue Report with State Distributions Report (Table 5.6.A. Average Price of Electricity to Ultimate Customers by End-Use Sector). Note: Rankings include the 50 states and the District of Columbia and are color-coded to facilitate comparison: 1–10 , 11–20 , 21–30 , 31–40 , 41–51 .
Local rates available from Electricity Local (an online search tool compiled from federal data sources), reinforces the City’s advantage in this area. Fort Worth’s rate was considerably below the US average on all three sectors: residential, commercial, and industrial. Only Pittsburgh and Oklahoma City had lower average industrial rates based on this source.
FIGURE 32. AVERAGE PRICE OF ELECTRICITY (CENTS PER KWH), WITH COMPARISON TO US FORT WORTH AND DOMESTIC BENCHMARK CITIES, RANKED BY AVERAGE INDUSTRIAL RATES
RESIDENTIAL COMMERCIAL INDUSTRIAL
Avg. Relative to US Avg. Relative to US Avg. Relative to US USA average 11.88 — 10.09 —
6.67 —
Pittsburgh, PA 11.44 3.70% less 3.72 63.13% less 1.35 79.76% less Oklahoma City, OK 9.76 17.85% less 7.13 29.34% less 5.06 24.14% less Fort Worth, TX 10.98 7.58% less 8.16 19.13% less 5.57 16.49% less Denver, CO 11.05 6.99% less 9.16 9.22% less 6.04 9.45% less Kansas City, MO 10.93 8.00% less 8.55 15.26% less 6.43 3.60% less Nashville, TN 10.26 13.64% less 10.32 2.28% more 6.61 0.90% less Indianapolis, IN 9.06 23.74% less 10.08 0.10% less 7.36 10.34% more Kansas City, KS 11.29 4.97% less 9.16 9.22% less 7.51 12.59% more Phoenix, AZ 11.96 0.67% more 10.22 1.29% more 7.87 17.99% more Columbus, OH 12.65 6.48% more 11.33 12.29% more 8.45 26.69% more
Source: Electricity Local based on data from the National Renewable Energy Laboratory’s (NREL) Open EI platform (undated), accessed via www.electricitylocal.com. Notes: Rates shown for Dallas and Fort Worth on Electricity Local were identical; only Fort Worth is shown.
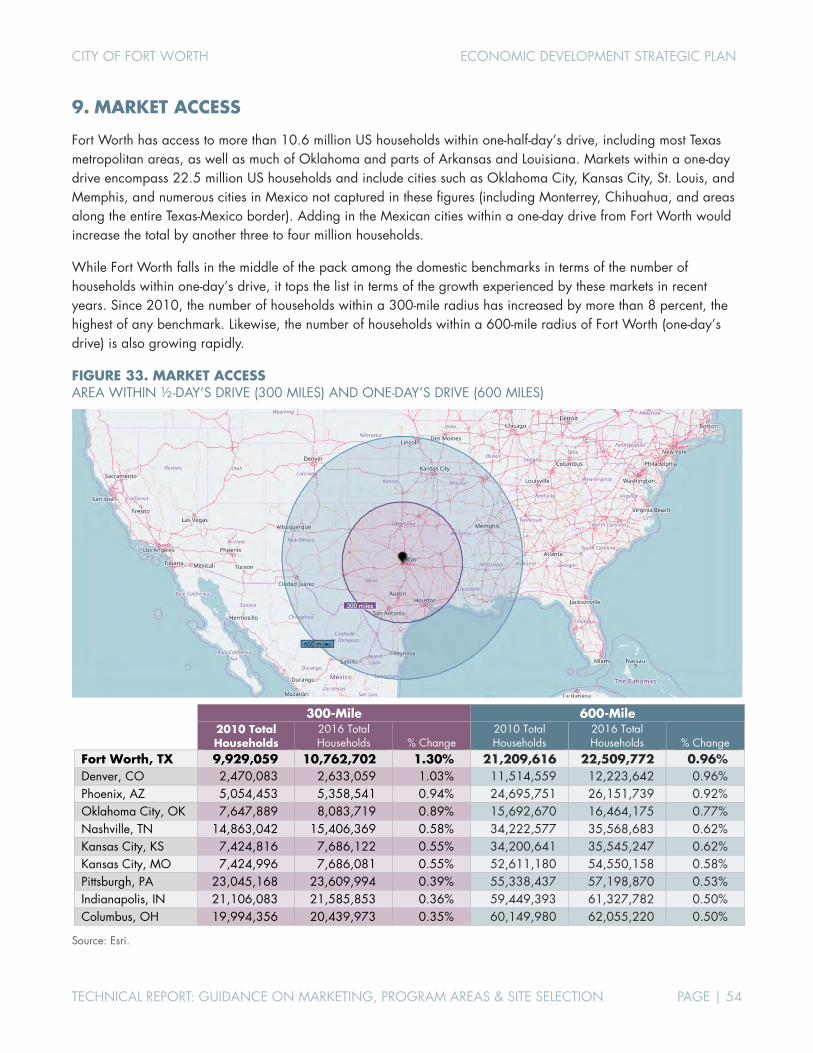
CITY OF FORT WORTH ECONOMIC DEVELOPMENT STRATEGIC PLAN
TECHNICAL REPORT: GUIDANCE ON MARKETING, PROGRAM AREAS & SITE SELECTION PAGE | 54
9. MARKET ACCESS
Fort Worth has access to more than 10.6 million US households within one-half-day’s drive, including most Texas metropolitan areas, as well as much of Oklahoma and parts of Arkansas and Louisiana. Markets within a one-day drive encompass 22.5 million US households and include cities such as Oklahoma City, Kansas City, St. Louis, and Memphis, and numerous cities in Mexico not captured in these figures (including Monterrey, Chihuahua, and areas along the entire Texas-Mexico border). Adding in the Mexican cities within a one-day drive from Fort Worth would increase the total by another three to four million households.
While Fort Worth falls in the middle of the pack among the domestic benchmarks in terms of the number of households within one-day’s drive, it tops the list in terms of the growth experienced by these markets in recent years. Since 2010, the number of households within a 300-mile radius has increased by more than 8 percent, the highest of any benchmark. Likewise, the number of households within a 600-mile radius of Fort Worth (one-day’s drive) is also growing rapidly.
FIGURE 33. MARKET ACCESS AREA WITHIN ½-DAY’S DRIVE (300 MILES) AND ONE-DAY’S DRIVE (600 MILES)
300-Mile 600-Mile
2010 Total Households
2016 Total Households % Change
2010 Total Households
2016 Total Households % Change
Fort Worth, TX 9,929,059 10,762,702 1.30% 21,209,616 22,509,772 0.96% Denver, CO 2,470,083 2,633,059 1.03% 11,514,559 12,223,642 0.96% Phoenix, AZ 5,054,453 5,358,541 0.94% 24,695,751 26,151,739 0.92% Oklahoma City, OK 7,647,889 8,083,719 0.89% 15,692,670 16,464,175 0.77% Nashville, TN 14,863,042 15,406,369 0.58% 34,222,577 35,568,683 0.62% Kansas City, KS 7,424,816 7,686,122 0.55% 34,200,641 35,545,247 0.62% Kansas City, MO 7,424,996 7,686,081 0.55% 52,611,180 54,550,158 0.58% Pittsburgh, PA 23,045,168 23,609,994 0.39% 55,338,437 57,198,870 0.53% Indianapolis, IN 21,106,083 21,585,853 0.36% 59,449,393 61,327,782 0.50% Columbus, OH 19,994,356 20,439,973 0.35% 60,149,980 62,055,220 0.50%
Source: Esri.
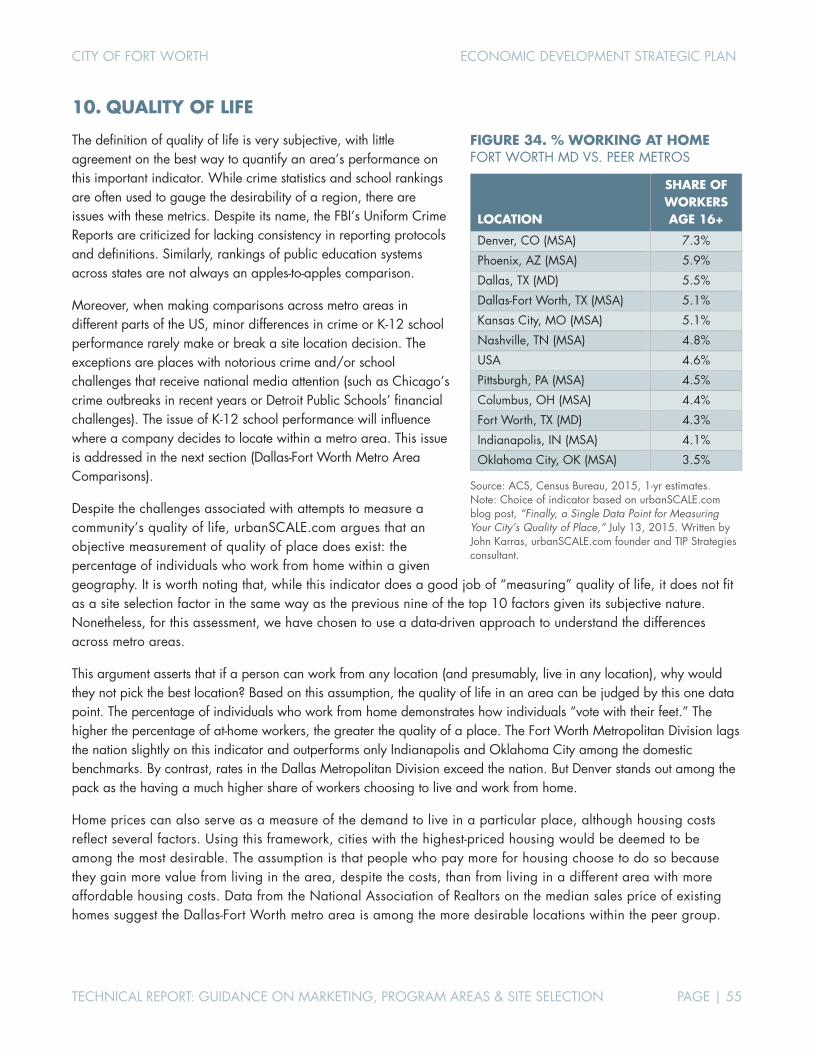
CITY OF FORT WORTH ECONOMIC DEVELOPMENT STRATEGIC PLAN
TECHNICAL REPORT: GUIDANCE ON MARKETING, PROGRAM AREAS & SITE SELECTION PAGE | 55
10. QUALITY OF LIFE
The definition of quality of life is very subjective, with little agreement on the best way to quantify an area’s performance on this important indicator. While crime statistics and school rankings are often used to gauge the desirability of a region, there are issues with these metrics. Despite its name, the FBI’s Uniform Crime Reports are criticized for lacking consistency in reporting protocols and definitions. Similarly, rankings of public education systems across states are not always an apples-to-apples comparison.
Moreover, when making comparisons across metro areas in different parts of the US, minor differences in crime or K-12 school performance rarely make or break a site location decision. The exceptions are places with notorious crime and/or school challenges that receive national media attention (such as Chicago’s crime outbreaks in recent years or Detroit Public Schools’ financial challenges). The issue of K-12 school performance will influence where a company decides to locate within a metro area. This issue is addressed in the next section (Dallas-Fort Worth Metro Area Comparisons).
Despite the challenges associated with attempts to measure a community’s quality of life, urbanSCALE.com argues that an objective measurement of quality of place does exist: the percentage of individuals who work from home within a given geography. It is worth noting that, while this indicator does a good job of “measuring” quality of life, it does not fit as a site selection factor in the same way as the previous nine of the top 10 factors given its subjective nature. Nonetheless, for this assessment, we have chosen to use a data-driven approach to understand the differences across metro areas.
This argument asserts that if a person can work from any location (and presumably, live in any location), why would they not pick the best location? Based on this assumption, the quality of life in an area can be judged by this one data point. The percentage of individuals who work from home demonstrates how individuals “vote with their feet.” The higher the percentage of at-home workers, the greater the quality of a place. The Fort Worth Metropolitan Division lags the nation slightly on this indicator and outperforms only Indianapolis and Oklahoma City among the domestic benchmarks. By contrast, rates in the Dallas Metropolitan Division exceed the nation. But Denver stands out among the pack as the having a much higher share of workers choosing to live and work from home.
Home prices can also serve as a measure of the demand to live in a particular place, although housing costs reflect several factors. Using this framework, cities with the highest-priced housing would be deemed to be among the most desirable. The assumption is that people who pay more for housing choose to do so because they gain more value from living in the area, despite the costs, than from living in a different area with more affordable housing costs. Data from the National Association of Realtors on the median sales price of existing homes suggest the Dallas-Fort Worth metro area is among the more desirable locations within the peer group.
FIGURE 34. % WORKING AT HOME FORT WORTH MD VS. PEER METROS
LOCATION
SHARE OF WORKERS AGE 16+
Denver, CO (MSA) 7.3%
Phoenix, AZ (MSA) 5.9%
Dallas, TX (MD) 5.5%
Dallas-Fort Worth, TX (MSA) 5.1%
Kansas City, MO (MSA) 5.1%
Nashville, TN (MSA) 4.8%
USA 4.6%
Pittsburgh, PA (MSA) 4.5%
Columbus, OH (MSA) 4.4%
Fort Worth, TX (MD) 4.3%
Indianapolis, IN (MSA) 4.1%
Oklahoma City, OK (MSA) 3.5%
Source: ACS, Census Bureau, 2015, 1-yr estimates. Note: Choice of indicator based on urbanSCALE.com blog post, “Finally, a Single Data Point for Measuring Your City’s Quality of Place,” July 13, 2015. Written by John Karras, urbanSCALE.com founder and TIP Strategies consultant.

CITY OF FORT WORTH ECONOMIC DEVELOPMENT STRATEGIC PLAN
TECHNICAL REPORT: GUIDANCE ON MARKETING, PROGRAM AREAS & SITE SELECTION PAGE | 56
Based on this measure, Denver is the clear “quality of life” winner, with median home sales prices that are 65 percent higher than the second-ranked market (Phoenix).
FIGURE 35. MEDIAN SALES PRICE OF EXISTING SINGLE-FAMILY HOMES (IN THOUSANDS) DALLAS-FORT WORTH MSA COMPARED TO DOMESTIC BENCHMARKS (RANKED BY 2017.I PRICES)
METROPOLITAN AREA
ANNUAL QUARTERLY
(Not Seasonally Adjusted) %Chg. Q1-Q1 2014 2015 2016 r 2016.I 2016.II 2016.III 2016.IV r 2017.I p
Denver, CO $310.2 $353.6 $384.3 $369.0 $394.4 $386.8 $381.6 $396.1 7.3%
Phoenix, AZ $198.5 $216.4 $232.7 $223.1 $234.7 $235.3 $235.6 $237.9 6.6%
Dallas-Fort Worth, TX $188.3 $207.2 $227.1 $210.1 $232.2 $230.5 $230.6 $236.5 12.6%
Nashville, TN $183.0 $204.2 $224.5 $204.7 $227.0 $230.0 $231.4 $232.2 13.4%
Kansas City, MO-KS $158.8 $170.4 $181.3 $163.3 $188.6 $188.0 $179.2 $179.0 9.6%
Columbus, OH $156.3 $164.7 $175.5 $160.7 $181.7 $181.6 $171.3 $170.7 6.2%
Indianapolis, IN $144.6 $153.2 $159.8 $146.9 $164.3 $164.1 $159.5 $159.2 8.4%
Oklahoma City, OK $150.3 $149.6 $150.8 $141.0 $154.9 $154.8 $152.3 $144.8 2.7%
Source: National Association of REALTORS® p = preliminary; r = revised. Note: Metropolitan statistical areas (MSA) as defined by the US Office of Management and Budget though in some areas an exact match is not possible from the available data. MSAs include the named central city and surrounding areas and may not match local reporting due to differences in specification. Data were not available for Pittsburgh.

CITY OF FORT WORTH ECONOMIC DEVELOPMENT STRATEGIC PLAN
TECHNICAL REPORT: GUIDANCE ON MARKETING, PROGRAM AREAS & SITE SELECTION PAGE | 57
DALLAS-FORT WORTH METRO AREA COMPARISONS National corporate expansion and relocation decisions begin with a comparison of states and metro areas to identify a “short list” of viable regions where an investment makes the most sense. For example, a corporation seeking to relocate its HQ from California to avoid high taxes does not begin by comparing Fort Worth to Plano. The decision maker would start by comparing Texas to Arizona and Phoenix to Dallas-Fort Worth. Once the Dallas-Fort Worth metro area has been identified as the preferred location, or has been selected as one of a few preferred locations, local comparisons of cities and specific sites can take place. In light of these realities, many of the top site selection factors identified in the Area Development survey are applicable only at the state or metro area level. Others, like highway access, can only be fully evaluated within the context of a specific site. As such, they tell us little about Fort Worth’s competitive position in the Dallas-Fort Worth metro area. This section provides a comparison of Fort Worth with the regional competitors on several factors that influence investment decisions within a larger region. One critical factor not reviewed below is the availability of incentives. This issue is addressed in the organizational review in Attachment C.
SCHOOL RANKINGS Although perceptions of school quality are not typically a critical factor in choosing between regions, they can have a tremendous bearing on corporate investment decisions within a region. This is particularly true for companies or industries for which the recruitment and retention of workers is paramount. In these site location decisions, close attention is paid to the performance of the primary K-12 school district serving a community. A worker relocating his or her family from Chicago to accept a new job in Fort Worth is more likely to look first at Fort Worth ISD as an indicator of the city’s school quality than Eagle Mountain-Saginaw ISD. The same can be said of Dallas, Irving, and other cities served by multiple districts. For this reason, the primary school district serving each of the competitor communities is used for comparative purposes. While there is no general agreement on the best measure, standardized test scores are used in the analysis as they provide a common data point for evaluating relative performance across districts and communities. Fort Worth ISD has the lowest performance among the competitor cities, followed by Irving and Dallas. Frisco ISD is the highest performing district, followed by Plano and McKinney.
FIGURE 36. SCHOOL RANKINGS: PRIMARY DISTRICT IN EACH FORT WORTH COMPETITOR CITY INCLUDES DISTRICTS FOR WHICH STANDARDIZED SCORES WERE REPORTED
DISTRICTS GRADES CITY
SCHOOLDIGGER RANK/RATINGS 2016 Score
2016 Rank 2016 Rating
2015 Rank
Change 2015-16
Frisco ISD PK, K-12 Frisco 0.873 50 37 +13 Plano ISD PK, K-12 Plano 0.795 116 99 +17 McKinney ISD PK, K-12 McKinney 0.688 250 245 +5 Richardson ISD PK, K-12 Richardson 0.613 348 413 +65 Denton ISD PK, K-12 Denton 0.608 360 436 +76 Carrollton-Farmers Branch ISD PK, K-12 Carrollton 0.564 419 351 +68 Grand Prairie ISD PK, K-12 Grand Prairie 0.462 555 626 +71 Garland ISD PK, K-12 Garland 0.451 568 555 +13 Mesquite ISD PK, K-12 Mesquite 0.406 626 545 +81 Arlington ISD PK, K-12 Arlington 0.392 639 691 +52 Dallas ISD PK, K-12 Dallas 0.333 715 755 +40 Irving ISD PK, K-12 Irving 0.285 768 753 +15 Fort Worth ISD PK, K-12 Fort Worth 0.263 782 780 +2
Source: Compiled by TIP Strategies via Schooldigger.com (last updated October 6, 2016). Notes: Schooldigger calculates school rankings based on test scores released by the Texas Education Agency (TEA). Districts for which standardized test scores were not reported by TEA are excluded. Stars are assigned based on the distribution of school districts in the state: 5 stars= 90th percentile, 4 stars = 70th to 90th percentile, 3 stars = 50th to 70th percentile, 2 stars = 30th to 50th percentile, 1 star = 10th to 30th percentile, no stars = 10th percentile and below.

CITY OF FORT WORTH ECONOMIC DEVELOPMENT STRATEGIC PLAN
TECHNICAL REPORT: GUIDANCE ON MARKETING, PROGRAM AREAS & SITE SELECTION PAGE | 58
FIGURE 37. COMPLETE SCHOOL RANKINGS: ALL SCHOOL DISTRICTS IN FORT WORTH COMPETITOR CITIES INCLUDES DISTRICTS FOR WHICH STANDARDIZED SCORES WERE REPORTED
DISTRICTS GRADES CITY
SCHOOLDIGGER RANK/RATINGS 2016 Score
2016 Rank
2016 Rating
2015 Rank
Change 2015-16
Highland Park ISD PK, K-12 Dallas 0.990 2 2 +0
Fort Worth Academy of Fine Arts 3-12 Fort Worth 0.961 9 8 -1
Leadership Prep School K-7 Frisco 0.933 16 12 -4
Frisco ISD PK, K-12 Frisco 0.873 50 37 -13
Arlington Classics Academy K-8 Arlington 0.801 110 75 -35
Plano ISD PK, K-12 Plano 0.795 116 99 -17
Keller ISD PK, KG-12 Keller 0.727 197 194 -3
Uplift Education - North Hills Prep. K-12 Dallas 0.717 208 196 -12
St Anthony School K-8 Dallas 0.706 225 260 +35
Texas School of The Arts K-8 Fort Worth 0.705 227 242 +15
McKinney ISD PK, K-12 McKinney 0.688 250 245 -5
Northwest ISD PK, KG-12 Justin 0.683 256 244 -12
Hurst-Euless-Bedford ISD PK, KG-12 Bedford 0.682 259 193 -66
White Settlement ISD PK, KG-12 White
Settlement 0.618 339
404 +65
Richardson ISD PK, K-12 Richardson 0.613 348 413 +65
Denton ISD PK, K-12 Denton 0.608 360 436 +76
Chapel Hill Academy PK, K-5 Fort Worth 0.606 363 583 +220
Inspired Vision Academy PK, K-11 Dallas 0.566 418 504 +86
Carrollton-Farmers Branch ISD PK, K-12 Carrollton 0.564 419 351 -68
Eagle Mt-Saginaw ISD PK, K-12 Fort Worth 0.554 431 501 +70
Texas College Preparatory Academies PK, K-12 Lewisville 0.544 448 398 -50
Manara Academy K-8 Irving 0.543 450 247 -203
East Fort Worth Montessori Academy PK, K-5 Fort Worth 0.477 539 824 +285
Nova Academy (Southeast) K-8 Dallas 0.465 553 612 +59
Grand Prairie ISD PK, K-12 Grand Prairie 0.462 555 626 +71
International Leadership of Texas (ILT) K-11 Richardson 0.458 560 589 +29
Garland ISD PK, K-12 Garland 0.451 568 555 -13
Cityscape Schools PK, K-5 Dallas 0.422 604 924 +320
Mesquite ISD PK, K-12 Mesquite 0.406 626 545 -81
Arlington ISD PK, K-12 Arlington 0.392 639 691 +52
Everman ISD PK, KG-12 Everman 0.374 664 741 +77
Crowley ISD PK, KG-12 Crowley 0.333 714 730 +16
Dallas ISD PK, K-12 Dallas 0.333 715 755 +40
Premier High Schools 6-12 Lewisville 0.313 739 739 +0
Trinity Basin Preparatory PK, K-8 Dallas 0.297 760 839 +79
continued, next page
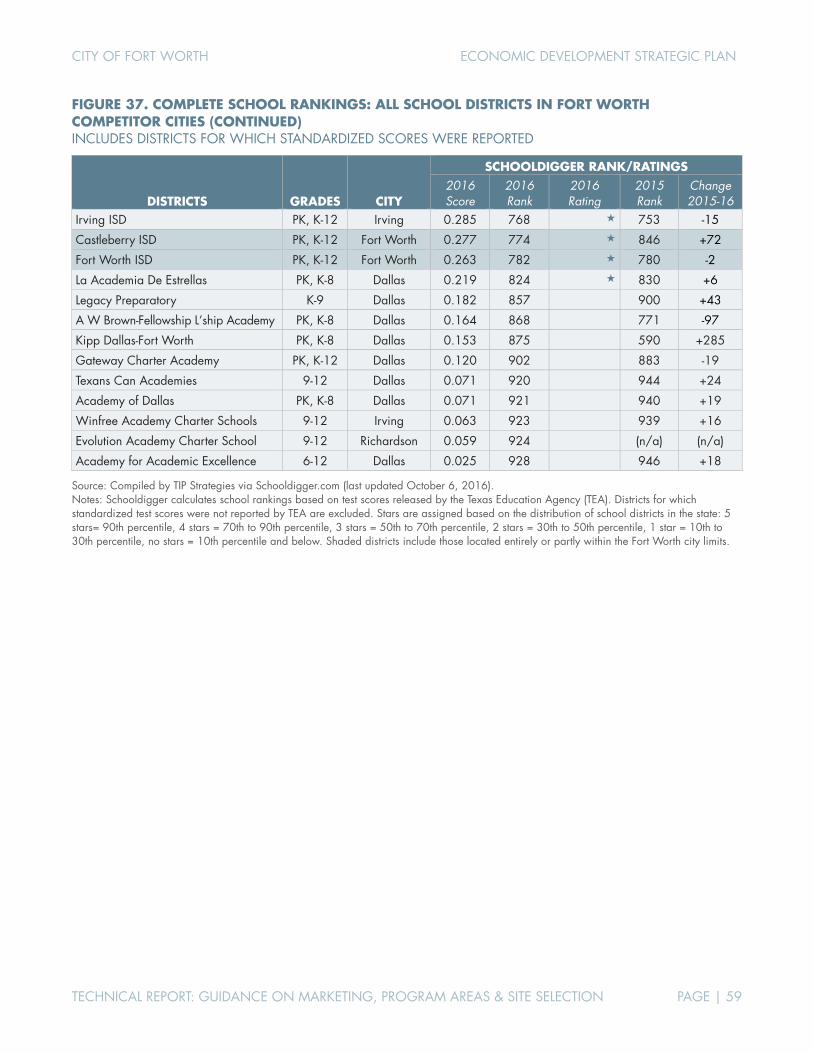
CITY OF FORT WORTH ECONOMIC DEVELOPMENT STRATEGIC PLAN
TECHNICAL REPORT: GUIDANCE ON MARKETING, PROGRAM AREAS & SITE SELECTION PAGE | 59
FIGURE 37. COMPLETE SCHOOL RANKINGS: ALL SCHOOL DISTRICTS IN FORT WORTH COMPETITOR CITIES (CONTINUED) INCLUDES DISTRICTS FOR WHICH STANDARDIZED SCORES WERE REPORTED
DISTRICTS GRADES CITY
SCHOOLDIGGER RANK/RATINGS 2016 Score
2016 Rank
2016 Rating
2015 Rank
Change 2015-16
Irving ISD PK, K-12 Irving 0.285 768 753 -15
Castleberry ISD PK, K-12 Fort Worth 0.277 774 846 +72
Fort Worth ISD PK, K-12 Fort Worth 0.263 782 780 -2
La Academia De Estrellas PK, K-8 Dallas 0.219 824 830 +6
Legacy Preparatory K-9 Dallas 0.182 857 900 +43
A W Brown-Fellowship L’ship Academy PK, K-8 Dallas 0.164 868 771 -97
Kipp Dallas-Fort Worth PK, K-8 Dallas 0.153 875 590 +285
Gateway Charter Academy PK, K-12 Dallas 0.120 902 883 -19
Texans Can Academies 9-12 Dallas 0.071 920 944 +24
Academy of Dallas PK, K-8 Dallas 0.071 921 940 +19
Winfree Academy Charter Schools 9-12 Irving 0.063 923 939 +16
Evolution Academy Charter School 9-12 Richardson 0.059 924 (n/a) (n/a)
Academy for Academic Excellence 6-12 Dallas 0.025 928 946 +18
Source: Compiled by TIP Strategies via Schooldigger.com (last updated October 6, 2016). Notes: Schooldigger calculates school rankings based on test scores released by the Texas Education Agency (TEA). Districts for which standardized test scores were not reported by TEA are excluded. Stars are assigned based on the distribution of school districts in the state: 5 stars= 90th percentile, 4 stars = 70th to 90th percentile, 3 stars = 50th to 70th percentile, 2 stars = 30th to 50th percentile, 1 star = 10th to 30th percentile, no stars = 10th percentile and below. Shaded districts include those located entirely or partly within the Fort Worth city limits.
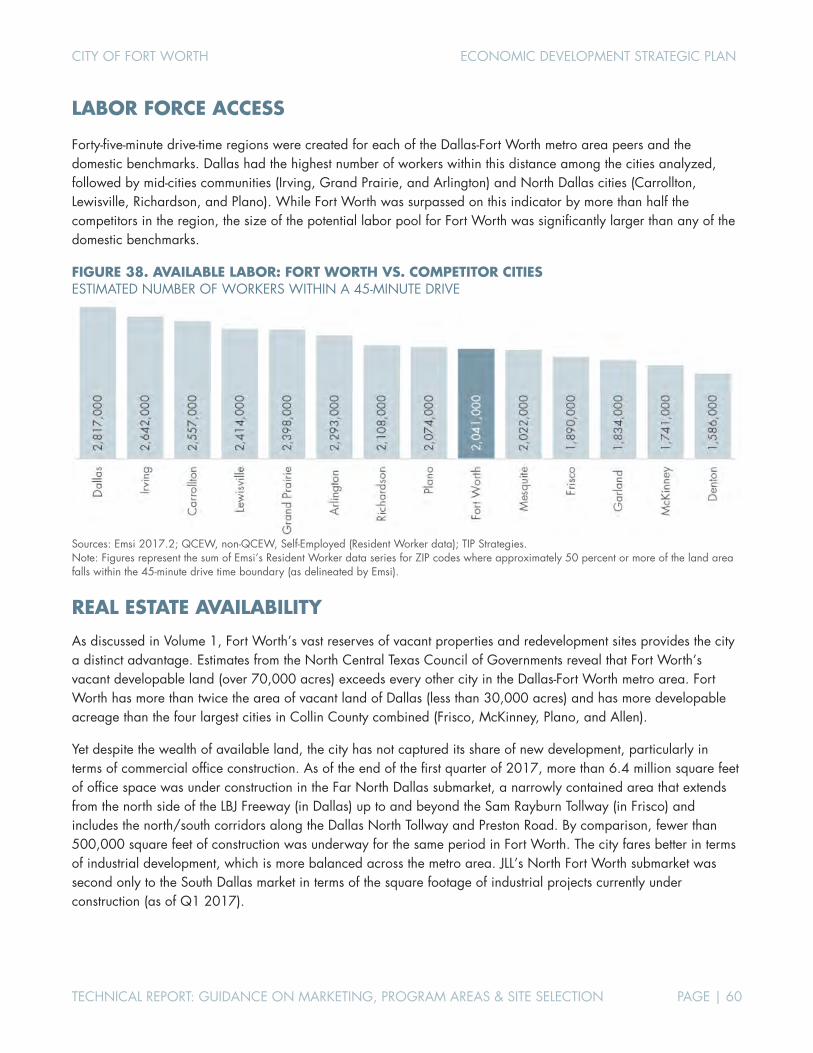
CITY OF FORT WORTH ECONOMIC DEVELOPMENT STRATEGIC PLAN
TECHNICAL REPORT: GUIDANCE ON MARKETING, PROGRAM AREAS & SITE SELECTION PAGE | 60
LABOR FORCE ACCESS
Forty-five-minute drive-time regions were created for each of the Dallas-Fort Worth metro area peers and the domestic benchmarks. Dallas had the highest number of workers within this distance among the cities analyzed, followed by mid-cities communities (Irving, Grand Prairie, and Arlington) and North Dallas cities (Carrollton, Lewisville, Richardson, and Plano). While Fort Worth was surpassed on this indicator by more than half the competitors in the region, the size of the potential labor pool for Fort Worth was significantly larger than any of the domestic benchmarks.
FIGURE 38. AVAILABLE LABOR: FORT WORTH VS. COMPETITOR CITIES ESTIMATED NUMBER OF WORKERS WITHIN A 45-MINUTE DRIVE
Sources: Emsi 2017.2; QCEW, non-QCEW, Self-Employed (Resident Worker data); TIP Strategies. Note: Figures represent the sum of Emsi’s Resident Worker data series for ZIP codes where approximately 50 percent or more of the land area falls within the 45-minute drive time boundary (as delineated by Emsi).
REAL ESTATE AVAILABILITY
As discussed in Volume 1, Fort Worth’s vast reserves of vacant properties and redevelopment sites provides the city a distinct advantage. Estimates from the North Central Texas Council of Governments reveal that Fort Worth’s vacant developable land (over 70,000 acres) exceeds every other city in the Dallas-Fort Worth metro area. Fort Worth has more than twice the area of vacant land of Dallas (less than 30,000 acres) and has more developable acreage than the four largest cities in Collin County combined (Frisco, McKinney, Plano, and Allen).
Yet despite the wealth of available land, the city has not captured its share of new development, particularly in terms of commercial office construction. As of the end of the first quarter of 2017, more than 6.4 million square feet of office space was under construction in the Far North Dallas submarket, a narrowly contained area that extends from the north side of the LBJ Freeway (in Dallas) up to and beyond the Sam Rayburn Tollway (in Frisco) and includes the north/south corridors along the Dallas North Tollway and Preston Road. By comparison, fewer than 500,000 square feet of construction was underway for the same period in Fort Worth. The city fares better in terms of industrial development, which is more balanced across the metro area. JLL’s North Fort Worth submarket was second only to the South Dallas market in terms of the square footage of industrial projects currently under construction (as of Q1 2017).

CITY OF FORT WORTH ECONOMIC DEVELOPMENT STRATEGIC PLAN
TECHNICAL REPORT: GUIDANCE ON MARKETING, PROGRAM AREAS & SITE SELECTION PAGE | 61
FIGURE 39. LAND USE (PERCENT OF TOTAL) DALLAS-FORT WORTH METRO AREA CITIES WITH POPULATIONS OF 100,000+
Source: North Central Texas Council of Governments.

CITY OF FORT WORTH ECONOMIC DEVELOPMENT STRATEGIC PLAN
TECHNICAL REPORT: GUIDANCE ON MARKETING, PROGRAM AREAS & SITE SELECTION PAGE | 62
FIGURE 40. DALLAS-FORT WORTH OFFICE MARKET OVERVIEW BY SUBMARKET, 2017 Q1
Submarket Under
Constr. (SF) Inventory (SF) Construction
Rate Vacancy Rate (%)
Asking Rent ($)
Far North Dallas 6,443,100 57,743,297 11.2% 13.5% $27.55
Uptown/Turtle Creek 1,295,323 14,664,921 8.8% 10.5% $37.46
Las Colinas 987,395 39,587,092 2.5% 13.4% $24.09
Mid-Cities 892,627 40,406,416 2.2% 12.4% $21.71
Richardson/Plano 812,701 40,835,578 2.0% 15.0% $24.20
Dallas CBD 353,637 33,581,393 1.1% 22.5% $25.67
East Dallas 293,921 13,763,001 2.1% 10.6% $23.44
Ft Worth CBD 280,489 11,806,524 2.4% 10.3% $25.05
Preston Center 183,589 5,885,416 3.1% 8.4% $36.24
Lewisville/Denton 167,104 12,977,935 1.3% 7.5% $22.16
Stemmons Freeway 72,630 14,945,132 0.5% 23.3% $15.78
South Ft Worth 66,236 19,742,816 0.3% 8.0% $23.09
North Fort Worth 42,003 6,551,118 0.6% 6.2% $20.62
Southwest Dallas 6,300 7,231,323 0.1% 7.8% $17.28
Central Expressway 0 15,154,527 0.0% 10.1% $26.88
LBJ Freeway 0 22,594,714 0.0% 22.3% $22.00
Northeast Ft Worth 0 5,400,765 0.0% 34.1% $19.18
Dallas/Fort Worth Total 11,897,055 362,873,968 3.3% 14.3% $24.52
FIGURE 41. DALLAS-FORT WORTH INDUSTRIAL MARKET OVERVIEW BY SUBMARKET, 2017 Q1
Submarket Under
Constr. (SF) Inventory (SF) Construction
Rate Vacancy Rate (%)
Asking Rent ($)
South Dallas Ind 5,050,321 93,378,550 5.4% 9.1% $8.47
North Ft Worth Ind 4,783,589 88,270,104 5.4% 7.1% $4.40
Great SW/Arlington Ind 3,512,032 105,927,076 3.3% 8.1% $4.52
Northwest Dallas Ind 2,690,553 108,423,645 2.5% 5.8% $6.05
Northeast Dallas Ind 2,358,886 114,139,487 2.1% 6.1% $6.02
DFW Airport Ind 2,210,346 73,149,630 3.0% 5.5% $5.62
South Stemmons Ind 534,233 133,966,547 0.4% 6.4% $6.17
East Dallas Ind 351,860 50,434,697 0.7% 5.5% $4.28
South Ft Worth Ind 197,500 89,003,219 0.2% 3.7% $5.59
Dallas/Fort Worth Total 21,689,320 856,692,955 2.5% 6.5% $5.61
Sources (both charts this page): CoStar, JLL.
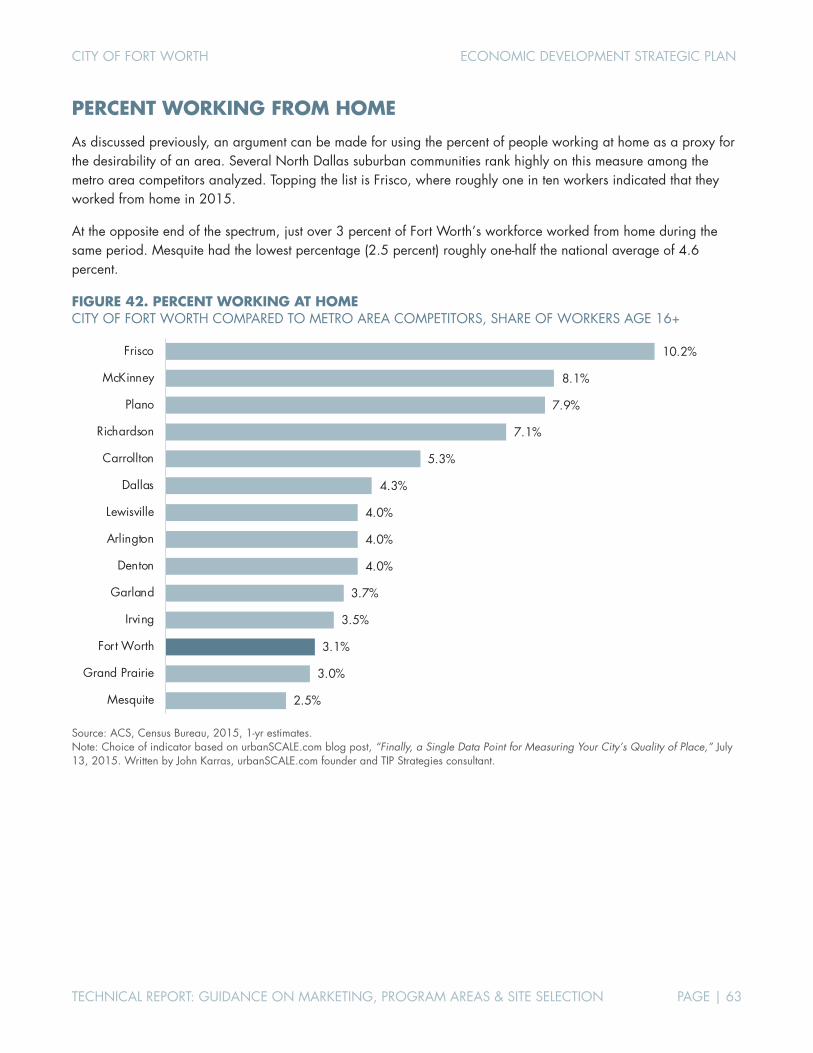
CITY OF FORT WORTH ECONOMIC DEVELOPMENT STRATEGIC PLAN
TECHNICAL REPORT: GUIDANCE ON MARKETING, PROGRAM AREAS & SITE SELECTION PAGE | 63
PERCENT WORKING FROM HOME
As discussed previously, an argument can be made for using the percent of people working at home as a proxy for the desirability of an area. Several North Dallas suburban communities rank highly on this measure among the metro area competitors analyzed. Topping the list is Frisco, where roughly one in ten workers indicated that they worked from home in 2015.
At the opposite end of the spectrum, just over 3 percent of Fort Worth’s workforce worked from home during the same period. Mesquite had the lowest percentage (2.5 percent) roughly one-half the national average of 4.6 percent.
FIGURE 42. PERCENT WORKING AT HOME CITY OF FORT WORTH COMPARED TO METRO AREA COMPETITORS, SHARE OF WORKERS AGE 16+
Source: ACS, Census Bureau, 2015, 1-yr estimates. Note: Choice of indicator based on urbanSCALE.com blog post, “Finally, a Single Data Point for Measuring Your City’s Quality of Place,” July 13, 2015. Written by John Karras, urbanSCALE.com founder and TIP Strategies consultant.
10.2%
8.1%
7.9%
7.1%
5.3%
4.3%
4.0%
4.0%
4.0%
3.7%
3.5%
3.1%
3.0%
2.5%
Frisco
McKinney
Plano
Richardson
Carrollton
Dallas
Lewisville
Arlington
Denton
Garland
Irving
Fort Worth
Grand Prairie
Mesquite
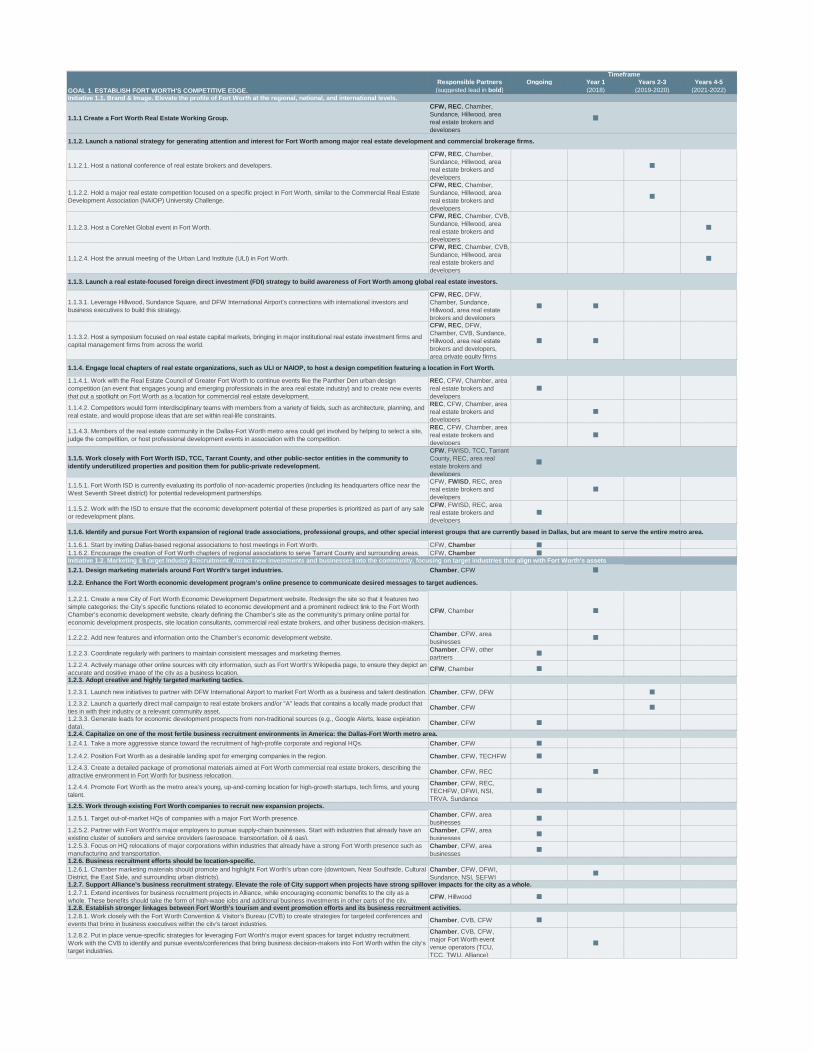
Responsible Partners Ongoing Year 1 Years 2-3 Years 4-5GOAL 1. ESTABLISH FORT WORTH'S COMPETITIVE EDGE. (suggested lead in bold) (2018) (2019-2020) (2021-2022)
1.1.1 Create a Fort Worth Real Estate Working Group.
CFW, REC, Chamber, Sundance, Hillwood, area real estate brokers and developers
1.1.2.1. Host a national conference of real estate brokers and developers.
CFW, REC, Chamber, Sundance, Hillwood, area real estate brokers and developers
1.1.2.2. Hold a major real estate competition focused on a specific project in Fort Worth, similar to the Commercial Real Estate Development Association (NAIOP) University Challenge.
CFW, REC, Chamber, Sundance, Hillwood, area real estate brokers and developers
1.1.2.3. Host a CoreNet Global event in Fort Worth.
CFW, REC, Chamber, CVB, Sundance, Hillwood, area real estate brokers and developers
1.1.2.4. Host the annual meeting of the Urban Land Institute (ULI) in Fort Worth.
CFW, REC, Chamber, CVB, Sundance, Hillwood, area real estate brokers and developers
1.1.3.1. Leverage Hillwood, Sundance Square, and DFW International Airport’s connections with international investors and business executives to build this strategy.
CFW, REC, DFW, Chamber, Sundance, Hillwood, area real estate brokers and developers
1.1.3.2. Host a symposium focused on real estate capital markets, bringing in major institutional real estate investment firms and capital management firms from across the world.
CFW, REC, DFW, Chamber, CVB, Sundance, Hillwood, area real estate brokers and developers, area private equity firms
1.1.4.1. Work with the Real Estate Council of Greater Fort Worth to continue events like the Panther Den urban design competition (an event that engages young and emerging professionals in the area real estate industry) and to create new events that put a spotlight on Fort Worth as a location for commercial real estate development.
REC, CFW, Chamber, area real estate brokers and developers
1.1.4.2. Competitors would form interdisciplinary teams with members from a variety of fields, such as architecture, planning, and real estate, and would propose ideas that are set within real-life constraints.
REC, CFW, Chamber, area real estate brokers and developers
1.1.4.3. Members of the real estate community in the Dallas-Fort Worth metro area could get involved by helping to select a site, judge the competition, or host professional development events in association with the competition.
REC, CFW, Chamber, area real estate brokers and developers
1.1.5. Work closely with Fort Worth ISD, TCC, Tarrant County, and other public-sector entities in the community to identify underutilized properties and position them for public-private redevelopment.
CFW, FWISD, TCC, Tarrant County, REC, area real estate brokers and developers
1.1.5.1. Fort Worth ISD is currently evaluating its portfolio of non-academic properties (including its headquarters office near the West Seventh Street district) for potential redevelopment partnerships.
CFW, FWISD, REC, area real estate brokers and developers
1.1.5.2. Work with the ISD to ensure that the economic development potential of these properties is prioritized as part of any sale or redevelopment plans.
CFW, FWISD, REC, area real estate brokers and developers
1.1.6.1. Start by inviting Dallas-based regional associations to host meetings in Fort Worth. CFW, Chamber 1.1.6.2. Encourage the creation of Fort Worth chapters of regional associations to serve Tarrant County and surrounding areas. CFW, Chamber
1.2.1. Design marketing materials around Fort Worth’s target industries. Chamber, CFW
1.2.2.1. Create a new City of Fort Worth Economic Development Department website. Redesign the site so that it features two simple categories: the City’s specific functions related to economic development and a prominent redirect link to the Fort Worth Chamber’s economic development website, clearly defining the Chamber’s site as the community’s primary online portal for economic development prospects, site location consultants, commercial real estate brokers, and other business decision-makers.
CFW, Chamber
1.2.2.2. Add new features and information onto the Chamber’s economic development website. Chamber, CFW, area businesses
1.2.2.3. Coordinate regularly with partners to maintain consistent messages and marketing themes. Chamber, CFW, other partners
1.2.2.4. Actively manage other online sources with city information, such as Fort Worth’s Wikipedia page, to ensure they depict an accurate and positive image of the city as a business location. CFW, Chamber
1.2.3.1. Launch new initiatives to partner with DFW International Airport to market Fort Worth as a business and talent destination. Chamber, CFW, DFW 1.2.3.2. Launch a quarterly direct mail campaign to real estate brokers and/or "A" leads that contains a locally made product that ties in with their industry or a relevant community asset. Chamber, CFW 1.2.3.3. Generate leads for economic development prospects from non-traditional sources (e.g., Google Alerts, lease expiration data). Chamber, CFW
1.2.4.1. Take a more aggressive stance toward the recruitment of high-profile corporate and regional HQs. Chamber, CFW
1.2.4.2. Position Fort Worth as a desirable landing spot for emerging companies in the region. Chamber, CFW, TECHFW 1.2.4.3. Create a detailed package of promotional materials aimed at Fort Worth commercial real estate brokers, describing the attractive environment in Fort Worth for business relocation. Chamber, CFW, REC
1.2.4.4. Promote Fort Worth as the metro area’s young, up-and-coming location for high-growth startups, tech firms, and young talent.
Chamber, CFW, REC, TECHFW, DFWI, NSI, TRVA, Sundance
1.2.5.1. Target out-of-market HQs of companies with a major Fort Worth presence. Chamber, CFW, area businesses
1.2.5.2. Partner with Fort Worth’s major employers to pursue supply-chain businesses. Start with industries that already have an existing cluster of suppliers and service providers (aerospace, transportation, oil & gas).
Chamber, CFW, area businesses
1.2.5.3. Focus on HQ relocations of major corporations within industries that already have a strong Fort Worth presence such as manufacturing and transportation.
Chamber, CFW, area businesses
1.2.6.1. Chamber marketing materials should promote and highlight Fort Worth’s urban core (downtown, Near Southside, Cultural District, the East Side, and surrounding urban districts).
Chamber, CFW, DFWI, Sundance, NSI, SEFWI
1.2.7.1. Extend incentives for business recruitment projects in Alliance, while encouraging economic benefits to the city as a whole. These benefits should take the form of high-wage jobs and additional business investments in other parts of the city. CFW, Hillwood
1.2.8.1. Work closely with the Fort Worth Convention & Visitor’s Bureau (CVB) to create strategies for targeted conferences and events that bring in business executives within the city’s target industries. Chamber, CVB, CFW
1.2.8.2. Put in place venue-specific strategies for leveraging Fort Worth’s major event spaces for target industry recruitment. Work with the CVB to identify and pursue events/conferences that bring business decision-makers into Fort Worth within the city’s target industries.
Chamber, CVB, CFW, major Fort Worth event venue operators (TCU, TCC, TWU, Alliance)
Timeframe
Initiative 1.1. Brand & Image. Elevate the profile of Fort Worth at the regional, national, and international levels.
Initiative 1.2. Marketing & Target Industry Recruitment. Attract new investments and businesses into the community, focusing on target industries that align with Fort Worth’s assets
1.2.3. Adopt creative and highly targeted marketing tactics.
1.2.4. Capitalize on one of the most fertile business recruitment environments in America: the Dallas-Fort Worth metro area.
1.2.5. Work through existing Fort Worth companies to recruit new expansion projects.
1.2.6. Business recruitment efforts should be location-specific.
1.2.7. Support Alliance’s business recruitment strategy. Elevate the role of City support when projects have strong spillover impacts for the city as a whole.
1.2.8. Establish stronger linkages between Fort Worth’s tourism and event promotion efforts and its business recruitment activities.
1.1.2. Launch a national strategy for generating attention and interest for Fort Worth among major real estate development and commercial brokerage firms.
1.1.3. Launch a real estate-focused foreign direct investment (FDI) strategy to build awareness of Fort Worth among global real estate investors.
1.1.4. Engage local chapters of real estate organizations, such as ULI or NAIOP, to host a design competition featuring a location in Fort Worth.
1.1.6. Identify and pursue Fort Worth expansion of regional trade associations, professional groups, and other special interest groups that are currently based in Dallas, but are meant to serve the entire metro area.
1.2.2. Enhance the Fort Worth economic development program’s online presence to communicate desired messages to target audiences.
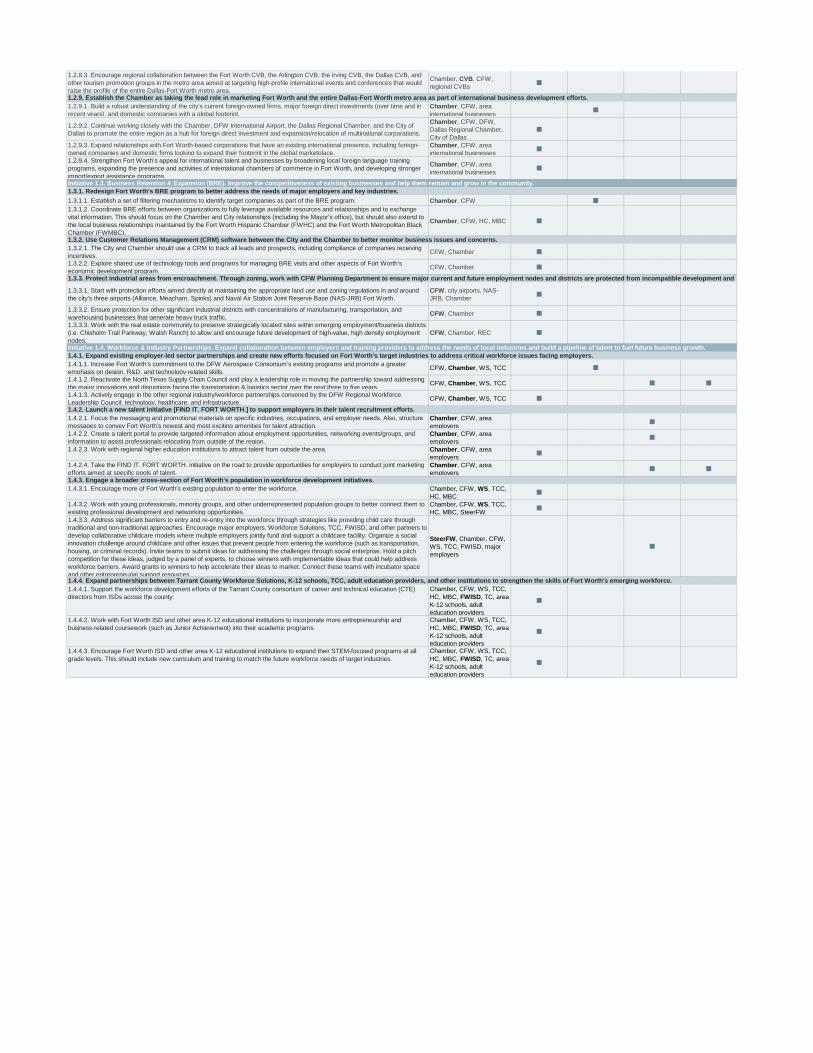
1.2.8.3. Encourage regional collaboration between the Fort Worth CVB, the Arlington CVB, the Irving CVB, the Dallas CVB, and other tourism promotion groups in the metro area aimed at targeting high-profile international events and conferences that would raise the profile of the entire Dallas-Fort Worth metro area.
Chamber, CVB, CFW, regional CVBs
1.2.9.1. Build a robust understanding of the city’s current foreign-owned firms, major foreign direct investments (over time and in recent years), and domestic companies with a global footprint.
Chamber, CFW, area international businesses
1.2.9.2. Continue working closely with the Chamber, DFW International Airport, the Dallas Regional Chamber, and the City of Dallas to promote the entire region as a hub for foreign direct investment and expansion/relocation of multinational corporations.
Chamber, CFW, DFW, Dallas Regional Chamber, City of Dallas
1.2.9.3. Expand relationships with Fort Worth-based corporations that have an existing international presence, including foreign-owned companies and domestic firms looking to expand their footprint in the global marketplace.
Chamber, CFW, area international businesses
1.2.9.4. Strengthen Fort Worth’s appeal for international talent and businesses by broadening local foreign language training programs, expanding the presence and activities of international chambers of commerce in Fort Worth, and developing stronger import/export assistance programs.
Chamber, CFW, area international businesses
1.3.1.1. Establish a set of filtering mechanisms to identify target companies as part of the BRE program. Chamber, CFW 1.3.1.2. Coordinate BRE efforts between organizations to fully leverage available resources and relationships and to exchange vital information. This should focus on the Chamber and City relationships (including the Mayor’s office), but should also extend to the local business relationships maintained by the Fort Worth Hispanic Chamber (FWHC) and the Fort Worth Metropolitan Black Chamber (FWMBC).
Chamber, CFW, HC, MBC
1.3.2.1. The City and Chamber should use a CRM to track all leads and prospects, including compliance of companies receiving incentives. CFW, Chamber 1.3.2.2. Explore shared use of technology tools and programs for managing BRE visits and other aspects of Fort Worth’s economic development program. CFW, Chamber
1.3.3.1. Start with protection efforts aimed directly at maintaining the appropriate land use and zoning regulations in and around the city’s three airports (Alliance, Meacham, Spinks) and Naval Air Station Joint Reserve Base (NAS-JRB) Fort Worth.
CFW, city airports, NAS-JRB, Chamber
1.3.3.2. Ensure protection for other significant industrial districts with concentrations of manufacturing, transportation, and warehousing businesses that generate heavy truck traffic. CFW, Chamber 1.3.3.3. Work with the real estate community to preserve strategically located sites within emerging employment/business districts (i.e. Chisholm Trail Parkway, Walsh Ranch) to allow and encourage future development of high-value, high density employment nodes.
CFW, Chamber, REC
1.4.1.1. Increase Fort Worth’s commitment to the DFW Aerospace Consortium’s existing programs and promote a greater emphasis on design, R&D, and technology-related skills. CFW, Chamber, WS, TCC 1.4.1.2. Reactivate the North Texas Supply Chain Council and play a leadership role in moving the partnership toward addressing the major innovations and disruptions facing the transportation & logistics sector over the next three to five years. CFW, Chamber, WS, TCC 1.4.1.3. Actively engage in the other regional industry/workforce partnerships convened by the DFW Regional Workforce Leadership Council: technology, healthcare, and infrastructure. CFW, Chamber, WS, TCC
1.4.2.1. Focus the messaging and promotional materials on specific industries, occupations, and employer needs. Also, structure messages to convey Fort Worth’s newest and most exciting amenities for talent attraction.
Chamber, CFW, area employers
1.4.2.2. Create a talent portal to provide targeted information about employment opportunities, networking events/groups, and information to assist professionals relocating from outside of the region.
Chamber, CFW, area employers
1.4.2.3. Work with regional higher education institutions to attract talent from outside the area. Chamber, CFW, area employers
1.4.2.4. Take the FIND IT. FORT WORTH. initiative on the road to provide opportunities for employers to conduct joint marketing efforts aimed at specific pools of talent.
Chamber, CFW, area employers
1.4.3.1. Encourage more of Fort Worth’s existing population to enter the workforce. Chamber, CFW, WS, TCC, HC, MBC
1.4.3.2. Work with young professionals, minority groups, and other underrepresented population groups to better connect them to existing professional development and networking opportunities.
Chamber, CFW, WS, TCC, HC, MBC, SteerFW
1.4.3.3. Address significant barriers to entry and re-entry into the workforce through strategies like providing child care through traditional and non-traditional approaches. Encourage major employers, Workforce Solutions, TCC, FWISD, and other partners to develop collaborative childcare models where multiple employers jointly fund and support a childcare facility. Organize a social innovation challenge around childcare and other issues that prevent people from entering the workforce (such as transportation, housing, or criminal records). Invite teams to submit ideas for addressing the challenges through social enterprise. Hold a pitch competition for these ideas, judged by a panel of experts, to choose winners with implementable ideas that could help address workforce barriers. Award grants to winners to help accelerate their ideas to market. Connect these teams with incubator space and other entrepreneurial support resources
SteerFW, Chamber, CFW, WS, TCC, FWISD, major employers
1.4.4.1. Support the workforce development efforts of the Tarrant County consortium of career and technical education (CTE) directors from ISDs across the county.
Chamber, CFW, WS, TCC, HC, MBC, FWISD, TC, area K-12 schools, adult education providers
1.4.4.2. Work with Fort Worth ISD and other area K-12 educational institutions to incorporate more entrepreneurship and business-related coursework (such as Junior Achievement) into their academic programs.
Chamber, CFW, WS, TCC, HC, MBC, FWISD, TC, area K-12 schools, adult education providers
1.4.4.3. Encourage Fort Worth ISD and other area K-12 educational institutions to expand their STEM-focused programs at all grade levels. This should include new curriculum and training to match the future workforce needs of target industries.
Chamber, CFW, WS, TCC, HC, MBC, FWISD, TC, area K-12 schools, adult education providers
1.4.4. Expand partnerships between Tarrant County Workforce Solutions, K-12 schools, TCC, adult education providers, and other institutions to strengthen the skills of Fort Worth’s emerging workforce.
1.2.9. Establish the Chamber as taking the lead role in marketing Fort Worth and the entire Dallas-Fort Worth metro area as part of international business development efforts.
1.4.2. Launch a new talent initiative [FIND IT. FORT WORTH.] to support employers in their talent recruitment efforts.
Initiative 1.4. Workforce & Industry Partnerships. Expand collaboration between employers and training providers to address the needs of local industries and build a pipeline of talent to fuel future business growth.1.4.1. Expand existing employer-led sector partnerships and create new efforts focused on Fort Worth’s target industries to address critical workforce issues facing employers.
Initiative 1.3. Business Retention & Expansion (BRE). Improve the competitiveness of existing businesses and help them remain and grow in the community.1.3.1. Redesign Fort Worth’s BRE program to better address the needs of major employers and key industries.
1.4.3. Engage a broader cross-section of Fort Worth’s population in workforce development initiatives.
1.3.2. Use Customer Relations Management (CRM) software between the City and the Chamber to better monitor business issues and concerns.
1.3.3. Protect industrial areas from encroachment. Through zoning, work with CFW Planning Department to ensure major current and future employment nodes and districts are protected from incompatible development and
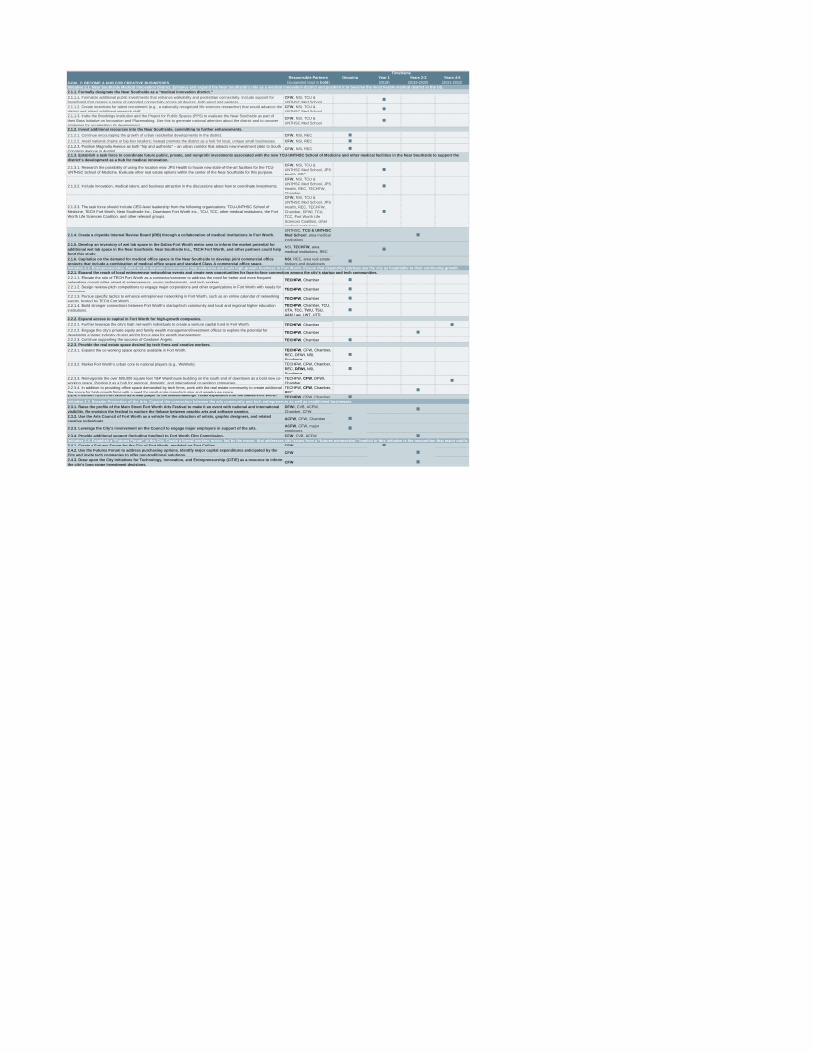
Responsible Partners Ongoing Year 1 Years 2-3 Years 4-5GOAL 2: BECOME A HUB FOR CREATIVE BUSINESSES. (suggested lead in bold) (2018) (2019-2020) (2021-2022)
2.1.1.1. Formalize additional public investments that enhance walkability and pedestrian connectivity. Include support for broadband that creates a sense of extended connectivity across all devices, both wired and wireless.
CFW, NSI, TCU & UNTHSC Med School
2.1.1.2. Create incentives for talent recruitment (e.g., a nationally recognized life sciences researcher) that would advance the district and attract additional research staff.
CFW, NSI, TCU & UNTHSC Med School
2.1.1.3. Invite the Brookings Institution and the Project for Public Spaces (PPS) to evaluate the Near Southside as part of their Bass Initiative on Innovation and Placemaking. Use this to generate national attention about the district and to uncover strategies for accelerating its development
CFW, NSI, TCU & UNTHSC Med School
2.1.2.1. Continue encouraging the growth of urban residential developments in the district. CFW, NSI, REC 2.1.2.2. Avoid national chains or big-box retailers; instead promote the district as a hub for local, unique small businesses. CFW, NSI, REC 2.1.2.3. Position Magnolia Avenue as both “hip and authentic” – an urban corridor that attracts new investment (akin to South Congress Avenue in Austin). CFW, NSI, REC
2.1.3.1. Research the possibility of using the location near JPS Health to house new state-of-the-art facilities for the TCU-UNTHSC School of Medicine. Evaluate other real estate options within the center of the Near Southside for this purpose.
CFW, NSI, TCU & UNTHSC Med School, JPS Health, REC
2.1.3.2. Include innovation, medical talent, and business attraction in the discussions about how to coordinate investments.
CFW, NSI, TCU & UNTHSC Med School, JPS Health, REC, TECHFW, Chamber
2.1.3.3. The task force should include CEO-level leadership from the following organizations: TCU-UNTHSC School of Medicine, TECH Fort Worth, Near Southside Inc., Downtown Fort Worth Inc., TCU, TCC, other medical institutions, the Fort Worth Life Sciences Coalition, and other relevant groups.
CFW, NSI, TCU & UNTHSC Med School, JPS Health, REC, TECHFW, Chamber, DFWI, TCU, TCC, Fort Worth Life Sciences Coalition, other medical institutions
2.1.4. Create a citywide Internal Review Board (IRB) through a collaboration of medical institutions in Fort Worth. UNTHSC, TCU & UNTHSC Med School, area medical institutions
2.1.5. Develop an inventory of wet lab space in the Dallas-Fort Worth metro area to inform the market potential for additional wet lab space in the Near Southside. Near Southside Inc., TECH Fort Worth, and other partners could help fund this study.
NSI, TECHFW, area medical institutions, REC
2.1.6. Capitalize on the demand for medical office space in the Near Southside to develop joint commercial office projects that include a combination of medical office space and standard Class A commercial office space.
NSI, REC, area real estate brokers and developers
2.2.1.1. Elevate the role of TECH Fort Worth as a connector/convener to address the need for better and more frequent networking opportunities aimed at entrepreneurs, young professionals, and tech workers. TECHFW, Chamber 2.2.1.2. Design reverse-pitch competitions to engage major corporations and other organizations in Fort Worth with needs for innovation TECHFW, Chamber 2.2.1.3. Pursue specific tactics to enhance entrepreneur networking in Fort Worth, such as an online calendar of networking events, hosted by TECH Fort Worth. TECHFW, Chamber 2.2.1.4. Build stronger connections between Fort Worth’s startup/tech community and local and regional higher education institutions.
TECHFW, Chamber, TCU, UTA, TCC, TWU, TSU, A&M Law, UNT, UTD
2.2.2.1. Further leverage the city’s high net-worth individuals to create a venture capital fund in Fort Worth. TECHFW, Chamber 2.2.2.2. Engage the city’s private equity and family wealth management/investment offices to explore the potential for developing a larger industry cluster and/or focus area for wealth management. TECHFW, Chamber 2.2.2.3. Continue supporting the success of Cowtown Angels. TECHFW, Chamber
2.2.3.1. Expand the co-working space options available in Fort Worth. TECHFW, CFW, Chamber, REC, DFWI, NSI, Sundance
2.2.3.2. Market Fort Worth’s urban core to national players (e.g., WeWork). TECHFW, CFW, Chamber, REC, DFWI, NSI, Sundance
2.2.3.3. Reinvigorate the over 600,000 square feet T&P Warehouse building on the south end of downtown as a bold new co-working space. Position it as a hub for regional, domestic, and international co-working companies.
TECHFW, CFW, DFWI, Chamber
2.2.3.4. In addition to providing office space demanded by tech firms, work with the real estate community to create additional flex space for high-growth firms with a need for small-scale manufacturing and warehouse space.
TECHFW, CFW, Chamber, REC
2.2.4. Position TECH Fort Worth as a lead player in the MassChallenge Texas expansion into the Dallas-Fort Worth t TECHFW, CFW, Chamber
Initiative 2.3. Broader Promotion of the Arts. Expand the connection between the arts community and tech entrepreneurs as well as established businesses.2.3.1. Raise the profile of the Main Street Fort Worth Arts Festival to make it an event with national and international visibility. Re-envision the festival to explore the linkage between graphic arts and software gaming.
DFWI, CVB, ACFW, Chamber, CFW
2.3.2. Use the Arts Council of Fort Worth as a vehicle for the attraction of artists, graphic designers, and related creative individuals. ACFW, CFW, Chamber
2.3.3. Leverage the City’s involvement on the Council to engage major employers in support of the arts. ACFW, CFW, major employers
2.3.4. Provide additional support (including funding) to Fort Worth Film Commission. CFW, CVB, ACFW Initiative 2.4. Establish a “Futures Forum” at the City. Create a formal working group, led by the mayor, that addresses city issues from a “futures perspective.” Implicit in this initiative is the recognition that major public investments, from transportation to water to energy, can be a significant stimulus for economic development.2.4.1. Create a Futures Forum for the City of Fort Worth, modeled on Fort Collins. CFW 2.4.2. Use the Futures Forum to address purchasing options. Identify major capital expenditures anticipated by the City and invite tech companies to offer non-traditional solutions. CFW 2.4.3. Draw upon the City Initiatives for Technology, Innovation, and Entrepreneurship (CITIE) as a resource to inform the city’s long-range investment decisions. CFW
Initiative 2.2. Entrepreneurship. Build on the dynamic environment that embraces and fuels high-growth business in Fort Worth. Ensure that expanding startups see the city as hospitable to their continuing growth.2.2.1. Expand the reach of local entrepreneur networking events and create new opportunities for face-to-face connection among the city’s startup and tech communities.
2.2.2. Expand access to capital in Fort Worth for high-growth companies.
2.2.3. Provide the real estate space desired by tech firms and creative workers.
Timeframe
Initiative 2.1. Near Southside Medical Innovation District. Enhance and expand the Near Southside’s role as a medical innovation district and position it to become the most livable medical district in the US.2.1.1. Formally designate the Near Southside as a “medical innovation district.”
2.1.2. Invest additional resources into the Near Southside, committing to further enhancements.
2.1.3. Establish a task force to coordinate future public, private, and nonprofit investments associated with the new TCU-UNTHSC School of Medicine and other medical facilities in the Near Southside to support the district’s development as a hub for medical innovation.
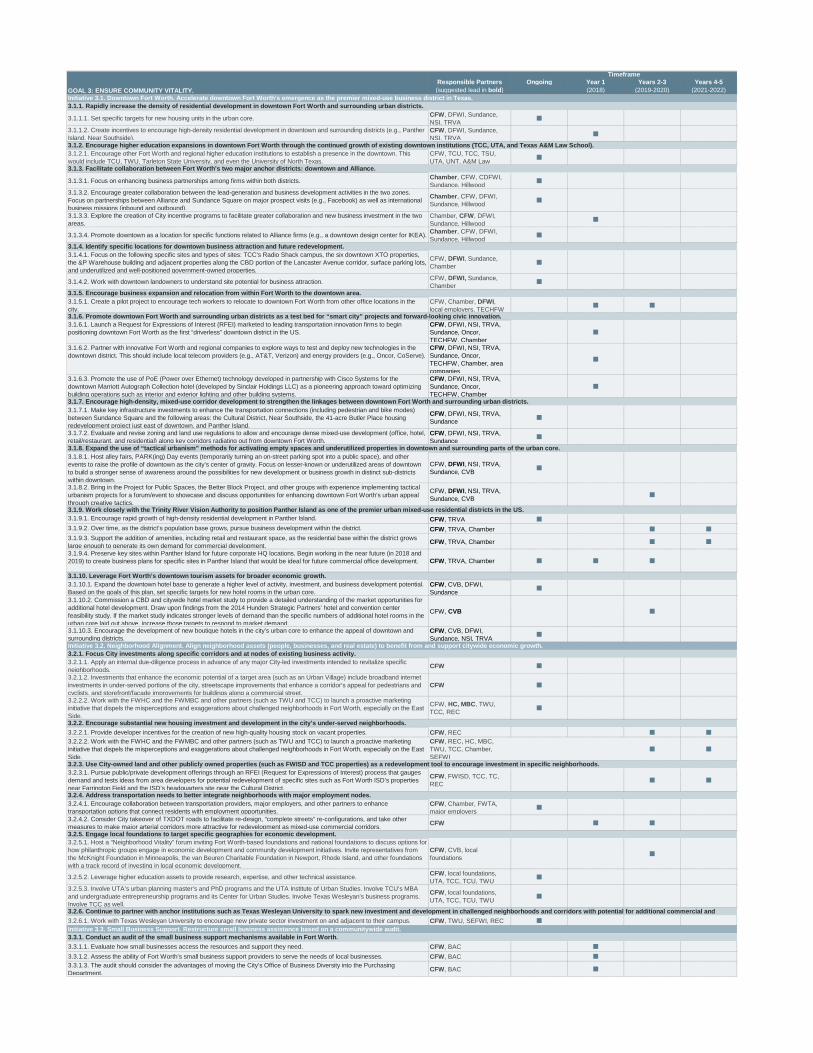
Responsible Partners Ongoing Year 1 Years 2-3 Years 4-5GOAL 3: ENSURE COMMUNITY VITALITY. (suggested lead in bold) (2018) (2019-2020) (2021-2022)
3.1.1.1. Set specific targets for new housing units in the urban core. CFW, DFWI, Sundance, NSI, TRVA
3.1.1.2. Create incentives to encourage high-density residential development in downtown and surrounding districts (e.g., Panther Island, Near Southside).
CFW, DFWI, Sundance, NSI, TRVA
3.1.2.1. Encourage other Fort Worth and regional higher education institutions to establish a presence in the downtown. This would include TCU, TWU, Tarleton State University, and even the University of North Texas.
CFW, TCU, TCC, TSU, UTA, UNT, A&M Law
3.1.3.1. Focus on enhancing business partnerships among firms within both districts. Chamber, CFW, CDFWI, Sundance, Hillwood
3.1.3.2. Encourage greater collaboration between the lead-generation and business development activities in the two zones. Focus on partnerships between Alliance and Sundance Square on major prospect visits (e.g., Facebook) as well as international business missions (inbound and outbound).
Chamber, CFW, DFWI, Sundance, Hillwood
3.1.3.3. Explore the creation of City incentive programs to facilitate greater collaboration and new business investment in the two areas.
Chamber, CFW, DFWI, Sundance, Hillwood
3.1.3.4. Promote downtown as a location for specific functions related to Alliance firms (e.g., a downtown design center for IKEA). Chamber, CFW, DFWI, Sundance, Hillwood
3.1.4.1. Focus on the following specific sites and types of sites: TCC's Radio Shack campus, the six downtown XTO properties, the &P Warehouse building and adjacent properties along the CBD portion of the Lancaster Avenue corridor, surface parking lots, and underutilized and well-positioned government-owned properties.
CFW, DFWI, Sundance, Chamber
3.1.4.2. Work with downtown landowners to understand site potential for business attraction. CFW, DFWI, Sundance, Chamber
3.1.5.1. Create a pilot project to encourage tech workers to relocate to downtown Fort Worth from other office locations in the city.
CFW, Chamber, DFWI, local employers, TECHFW
3.1.6.1. Launch a Request for Expressions of Interest (RFEI) marketed to leading transportation innovation firms to begin positioning downtown Fort Worth as the first “driverless” downtown district in the US.
CFW, DFWI, NSI, TRVA, Sundance, Oncor, TECHFW, Chamber
3.1.6.2. Partner with innovative Fort Worth and regional companies to explore ways to test and deploy new technologies in the downtown district. This should include local telecom providers (e.g., AT&T, Verizon) and energy providers (e.g., Oncor, CoServe).
CFW, DFWI, NSI, TRVA, Sundance, Oncor, TECHFW, Chamber, area companies
3.1.6.3. Promote the use of PoE (Power over Ethernet) technology developed in partnership with Cisco Systems for the downtown Marriott Autograph Collection hotel (developed by Sinclair Holdings LLC) as a pioneering approach toward optimizing building operations such as interior and exterior lighting and other building systems.
CFW, DFWI, NSI, TRVA, Sundance, Oncor, TECHFW, Chamber
3.1.7.1. Make key infrastructure investments to enhance the transportation connections (including pedestrian and bike modes) between Sundance Square and the following areas: the Cultural District, Near Southside, the 41-acre Butler Place housing redevelopment project just east of downtown, and Panther Island.
CFW, DFWI, NSI, TRVA, Sundance
3.1.7.2. Evaluate and revise zoning and land use regulations to allow and encourage dense mixed-use development (office, hotel, retail/restaurant, and residential) along key corridors radiating out from downtown Fort Worth.
CFW, DFWI, NSI, TRVA, Sundance
3.1.8.1. Host alley fairs, PARK(ing) Day events (temporarily turning an on-street parking spot into a public space), and other events to raise the profile of downtown as the city’s center of gravity. Focus on lesser-known or underutilized areas of downtown to build a stronger sense of awareness around the possibilities for new development or business growth in distinct sub-districts within downtown.
CFW, DFWI, NSI, TRVA, Sundance, CVB
3.1.8.2. Bring in the Project for Public Spaces, the Better Block Project, and other groups with experience implementing tactical urbanism projects for a forum/event to showcase and discuss opportunities for enhancing downtown Fort Worth’s urban appeal through creative tactics.
CFW, DFWI, NSI, TRVA, Sundance, CVB
3.1.9.1. Encourage rapid growth of high-density residential development in Panther Island. CFW, TRVA 3.1.9.2. Over time, as the district’s population base grows, pursue business development within the district. CFW, TRVA, Chamber 3.1.9.3. Support the addition of amenities, including retail and restaurant space, as the residential base within the district grows large enough to generate its own demand for commercial development. CFW, TRVA, Chamber 3.1.9.4. Preserve key sites within Panther Island for future corporate HQ locations. Begin working in the near future (in 2018 and 2019) to create business plans for specific sites in Panther Island that would be ideal for future commercial office development. CFW, TRVA, Chamber
3.1.10.1. Expand the downtown hotel base to generate a higher level of activity, investment, and business development potential. Based on the goals of this plan, set specific targets for new hotel rooms in the urban core.
CFW, CVB, DFWI, Sundance
3.1.10.2. Commission a CBD and citywide hotel market study to provide a detailed understanding of the market opportunities for additional hotel development. Draw upon findings from the 2014 Hunden Strategic Partners’ hotel and convention center feasibility study. If the market study indicates stronger levels of demand than the specific numbers of additional hotel rooms in the urban core laid out above, increase those targets to respond to market demand.
CFW, CVB
3.1.10.3. Encourage the development of new boutique hotels in the city’s urban core to enhance the appeal of downtown and surrounding districts.
CFW, CVB, DFWI, Sundance, NSI, TRVA
3.2.1.1. Apply an internal due-diligence process in advance of any major City-led investments intended to revitalize specific neighborhoods. CFW 3.2.1.2. Investments that enhance the economic potential of a target area (such as an Urban Village) include broadband internet investments in under-served portions of the city, streetscape improvements that enhance a corridor’s appeal for pedestrians and cyclists, and storefront/façade improvements for buildings along a commercial street.
CFW
3.2.2.2. Work with the FWHC and the FWMBC and other partners (such as TWU and TCC) to launch a proactive marketing initiative that dispels the misperceptions and exaggerations about challenged neighborhoods in Fort Worth, especially on the East Side.
CFW, HC, MBC, TWU, TCC, REC
3.2.2.1. Provide developer incentives for the creation of new high-quality housing stock on vacant properties. CFW, REC 3.2.2.2. Work with the FWHC and the FWMBC and other partners (such as TWU and TCC) to launch a proactive marketing initiative that dispels the misperceptions and exaggerations about challenged neighborhoods in Fort Worth, especially on the East Side.
CFW, REC, HC, MBC, TWU, TCC, Chamber, SEFWI
3.2.3.1. Pursue public/private development offerings through an RFEI (Request for Expressions of Interest) process that gauges demand and tests ideas from area developers for potential redevelopment of specific sites such as Fort Worth ISD’s properties near Farrington Field and the ISD’s headquarters site near the Cultural District.
CFW, FWISD, TCC, TC, REC
3.2.4.1. Encourage collaboration between transportation providers, major employers, and other partners to enhance transportation options that connect residents with employment opportunities.
CFW, Chamber, FWTA, major employers
3.2.4.2. Consider City takeover of TXDOT roads to facilitate re-design, “complete streets” re-configurations, and take other measures to make major arterial corridors more attractive for redevelopment as mixed-use commercial corridors. CFW
3.2.5.1. Host a “Neighborhood Vitality” forum inviting Fort Worth-based foundations and national foundations to discuss options for how philanthropic groups engage in economic development and community development initiatives. Invite representatives from the McKnight Foundation in Minneapolis, the van Beuren Charitable Foundation in Newport, Rhode Island, and other foundations with a track record of investing in local economic development.
CFW, CVB, local foundations
3.2.5.2. Leverage higher education assets to provide research, expertise, and other technical assistance. CFW, local foundations, UTA, TCC, TCU, TWU
3.2.5.3. Involve UTA’s urban planning master’s and PhD programs and the UTA Institute of Urban Studies. Involve TCU’s MBA and undergraduate entrepreneurship programs and its Center for Urban Studies. Involve Texas Wesleyan’s business programs. Involve TCC as well.
CFW, local foundations, UTA, TCC, TCU, TWU
3.2.6.1. Work with Texas Wesleyan University to encourage new private sector investment on and adjacent to their campus. CFW, TWU, SEFWI, REC
3.3.1.1. Evaluate how small businesses access the resources and support they need. CFW, BAC 3.3.1.2. Assess the ability of Fort Worth’s small business support providers to serve the needs of local businesses. CFW, BAC 3.3.1.3. The audit should consider the advantages of moving the City’s Office of Business Diversity into the Purchasing Department. CFW, BAC
3.2.5. Engage local foundations to target specific geographies for economic development.
3.2.1. Focus City investments along specific corridors and at nodes of existing business activity.
3.1.6. Promote downtown Fort Worth and surrounding urban districts as a test bed for “smart city” projects and forward-looking civic innovation.
3.1.7. Encourage high-density, mixed-use corridor development to strengthen the linkages between downtown Fort Worth and surrounding urban districts.
3.2.3. Use City-owned land and other publicly owned properties (such as FWISD and TCC properties) as a redevelopment tool to encourage investment in specific neighborhoods.
3.2.4. Address transportation needs to better integrate neighborhoods with major employment nodes.
3.3.1. Conduct an audit of the small business support mechanisms available in Fort Worth.
3.2.6. Continue to partner with anchor institutions such as Texas Wesleyan University to spark new investment and development in challenged neighborhoods and corridors with potential for additional commercial and
Timeframe
Initiative 3.1. Downtown Fort Worth. Accelerate downtown Fort Worth’s emergence as the premier mixed-use business district in Texas.3.1.1. Rapidly increase the density of residential development in downtown Fort Worth and surrounding urban districts.
3.1.2. Encourage higher education expansions in downtown Fort Worth through the continued growth of existing downtown institutions (TCC, UTA, and Texas A&M Law School).
3.1.3. Facilitate collaboration between Fort Worth’s two major anchor districts: downtown and Alliance.
3.1.4. Identify specific locations for downtown business attraction and future redevelopment.
Initiative 3.3. Small Business Support. Restructure small business assistance based on a communitywide audit.
3.1.9. Work closely with the Trinity River Vision Authority to position Panther Island as one of the premier urban mixed-use residential districts in the US.
3.1.10. Leverage Fort Worth’s downtown tourism assets for broader economic growth.
Initiative 3.2. Neighborhood Alignment. Align neighborhood assets (people, businesses, and real estate) to benefit from and support citywide economic growth.
3.1.5. Encourage business expansion and relocation from within Fort Worth to the downtown area.
3.1.8. Expand the use of “tactical urbanism” methods for activating empty spaces and underutilized properties in downtown and surrounding parts of the urban core.
3.2.2. Encourage substantial new housing investment and development in the city’s under-served neighborhoods.

3.3.1.4. The audit should also evaluate how the FWHC and the FWMBC can further support small business development throughout the city’s neighborhoods. CFW, BAC, HC, MBC 3.3.2. Re-focus the role of the BAC to serve as the primary connector/convener to address the need for support mechanisms aimed at small business startups, minority owned firms, and locally-serving businesses.
BAC, CFW, TECHFW, Chamber, HC, MBC
3.3.3. Leverage churches and other under-utilized buildings as shared space for co-working, small business development, workforce training, networking, and other purposes that support economic and workforce development within the city’s neighborhoods.
BAC, CFW, HC, MBC, WS, TCC
3.3.4. Showcase the success of La Gran Plaza, an under-appreciated minority-business success story and quality-of-life asset in Fort Worth.
BAC, CFW, HC, MBC, Chamber, REC
3.3.4.1. Use this as a model for other development projects in under-served neighborhoods in the city. Cultivate relationships with minority-focused real estate developers and investors with a track record of creating projects that provide retail and services to under-served populations in urban markets.
BAC, CFW, HC, MBC, Chamber, REC
3.3.5.1. To assist in capitalizing the fund, the City should pursue grants from the Economic Development Administration (EDA), the Department of Housing and Urban Development (HUD), and Community Development Block Grant (CDBG) program funds. BAC, CFW
3.3.5. Establish a citywide revolving loan fund to provide “gap” financing for small business expansions, startups, and relocations.
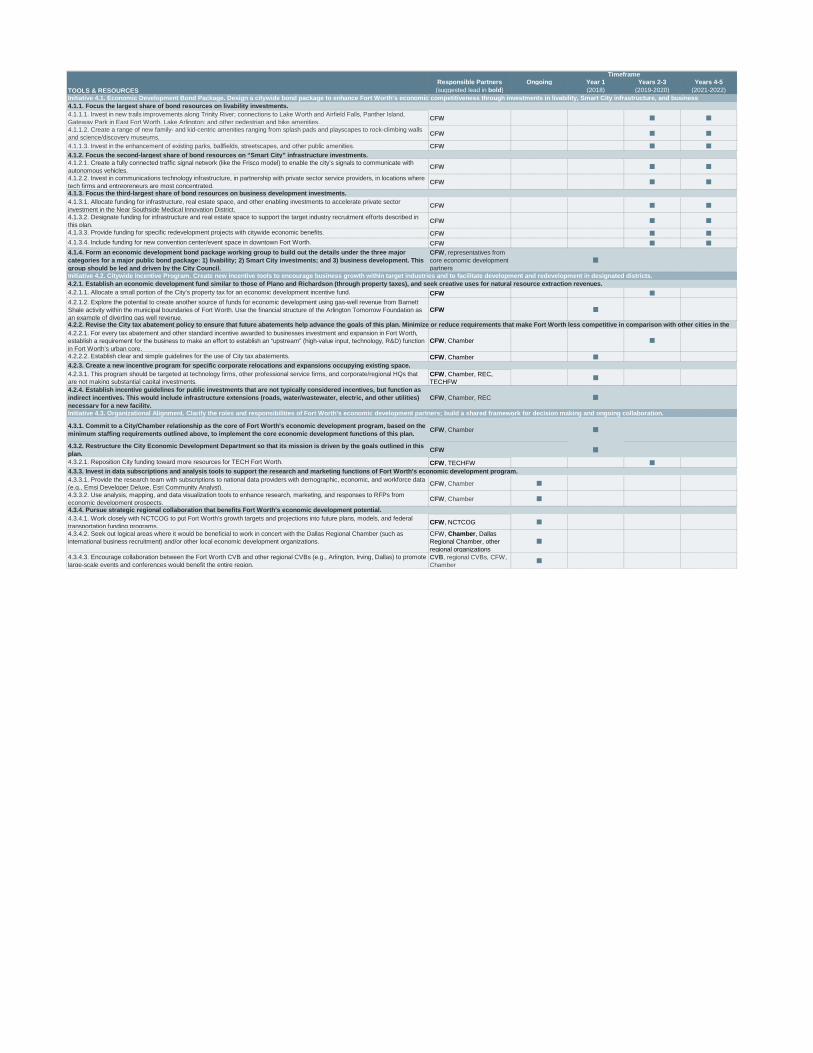
Responsible Partners Ongoing Year 1 Years 2-3 Years 4-5TOOLS & RESOURCES (suggested lead in bold) (2018) (2019-2020) (2021-2022)
4.1.1.1. Invest in new trails improvements along Trinity River; connections to Lake Worth and Airfield Falls, Panther Island, Gateway Park in East Fort Worth, Lake Arlington; and other pedestrian and bike amenities. CFW 4.1.1.2. Create a range of new family- and kid-centric amenities ranging from splash pads and playscapes to rock-climbing walls and science/discovery museums. CFW
4.1.1.3. Invest in the enhancement of existing parks, ballfields, streetscapes, and other public amenities. CFW 4.1.2. Focus the second-largest share of bond resources on “Smart City” infrastructure investments.4.1.2.1. Create a fully connected traffic signal network (like the Frisco model) to enable the city’s signals to communicate with autonomous vehicles. CFW 4.1.2.2. Invest in communications technology infrastructure, in partnership with private sector service providers, in locations where tech firms and entrepreneurs are most concentrated. CFW
4.1.3.1. Allocate funding for infrastructure, real estate space, and other enabling investments to accelerate private sector investment in the Near Southside Medical Innovation District. CFW 4.1.3.2. Designate funding for infrastructure and real estate space to support the target industry recruitment efforts described in this plan. CFW 4.1.3.3. Provide funding for specific redevelopment projects with citywide economic benefits. CFW 4.1.3.4. Include funding for new convention center/event space in downtown Fort Worth. CFW 4.1.4. Form an economic development bond package working group to build out the details under the three major categories for a major public bond package: 1) livability; 2) Smart City investments; and 3) business development. This group should be led and driven by the City Council.
CFW, representatives from core economic development partners
4.2.1.1. Allocate a small portion of the City’s property tax for an economic development incentive fund. CFW 4.2.1.2. Explore the potential to create another source of funds for economic development using gas-well revenue from Barnett Shale activity within the municipal boundaries of Fort Worth. Use the financial structure of the Arlington Tomorrow Foundation as an example of diverting gas well revenue.
CFW
4.2.2.1. For every tax abatement and other standard incentive awarded to businesses investment and expansion in Fort Worth, establish a requirement for the business to make an effort to establish an “upstream” (high-value input, technology, R&D) function in Fort Worth’s urban core.
CFW, Chamber
4.2.2.2. Establish clear and simple guidelines for the use of City tax abatements. CFW, Chamber
4.2.3.1. This program should be targeted at technology firms, other professional service firms, and corporate/regional HQs that are not making substantial capital investments.
CFW, Chamber, REC, TECHFW
4.2.4. Establish incentive guidelines for public investments that are not typically considered incentives, but function as indirect incentives. This would include infrastructure extensions (roads, water/wastewater, electric, and other utilities) necessary for a new facility.
CFW, Chamber, REC
4.3.1. Commit to a City/Chamber relationship as the core of Fort Worth’s economic development program, based on the minimum staffing requirements outlined above, to implement the core economic development functions of this plan. CFW, Chamber
4.3.2. Restructure the City Economic Development Department so that its mission is driven by the goals outlined in this plan. CFW 4.3.2.1. Reposition City funding toward more resources for TECH Fort Worth. CFW, TECHFW
4.3.3.1. Provide the research team with subscriptions to national data providers with demographic, economic, and workforce data (e.g., Emsi Developer Deluxe, Esri Community Analyst). CFW, Chamber 4.3.3.2. Use analysis, mapping, and data visualization tools to enhance research, marketing, and responses to RFPs from economic development prospects. CFW, Chamber
4.3.4.1. Work closely with NCTCOG to put Fort Worth’s growth targets and projections into future plans, models, and federal transportation funding programs. CFW, NCTCOG 4.3.4.2. Seek out logical areas where it would be beneficial to work in concert with the Dallas Regional Chamber (such as international business recruitment) and/or other local economic development organizations.
CFW, Chamber, Dallas Regional Chamber, other regional organizations
4.3.4.3. Encourage collaboration between the Fort Worth CVB and other regional CVBs (e.g., Arlington, Irving, Dallas) to promote large-scale events and conferences would benefit the entire region.
CVB, regional CVBs, CFW, Chamber
Timeframe
Initiative 4.1. Economic Development Bond Package. Design a citywide bond package to enhance Fort Worth’s economic competitiveness through investments in livability, Smart City infrastructure, and business 4.1.1. Focus the largest share of bond resources on livability investments.
Initiative 4.3. Organizational Alignment. Clarify the roles and responsibilities of Fort Worth’s economic development partners; build a shared framework for decision making and ongoing collaboration.
4.3.4. Pursue strategic regional collaboration that benefits Fort Worth’s economic development potential.
4.3.3. Invest in data subscriptions and analysis tools to support the research and marketing functions of Fort Worth’s economic development program.
4.1.3. Focus the third-largest share of bond resources on business development investments.
Initiative 4.2. Citywide Incentive Program. Create new incentive tools to encourage business growth within target industries and to facilitate development and redevelopment in designated districts.4.2.1. Establish an economic development fund similar to those of Plano and Richardson (through property taxes), and seek creative uses for natural resource extraction revenues.
4.2.2. Revise the City tax abatement policy to ensure that future abatements help advance the goals of this plan. Minimize or reduce requirements that make Fort Worth less competitive in comparison with other cities in the
4.2.3. Create a new incentive program for specific corporate relocations and expansions occupying existing space.
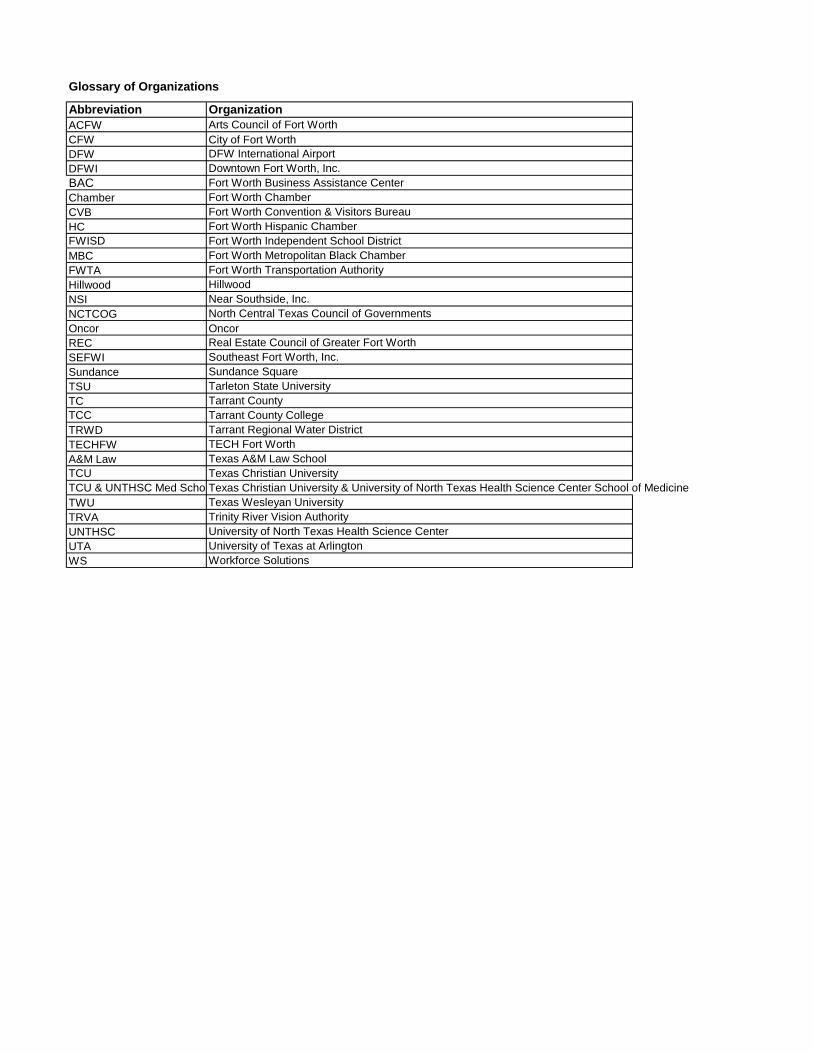
Glossary of Organizations
Abbreviation OrganizationACFW Arts Council of Fort WorthCFW City of Fort WorthDFW DFW International AirportDFWI Downtown Fort Worth, Inc.BAC Fort Worth Business Assistance CenterChamber Fort Worth ChamberCVB Fort Worth Convention & Visitors BureauHC Fort Worth Hispanic ChamberFWISD Fort Worth Independent School DistrictMBC Fort Worth Metropolitan Black ChamberFWTA Fort Worth Transportation AuthorityHillwood HillwoodNSI Near Southside, Inc.NCTCOG North Central Texas Council of GovernmentsOncor OncorREC Real Estate Council of Greater Fort WorthSEFWI Southeast Fort Worth, Inc.Sundance Sundance SquareTSU Tarleton State UniversityTC Tarrant CountyTCC Tarrant County CollegeTRWD Tarrant Regional Water DistrictTECHFW TECH Fort WorthA&M Law Texas A&M Law SchoolTCU Texas Christian UniversityTCU & UNTHSC Med SchooTexas Christian University & University of North Texas Health Science Center School of MedicineTWU Texas Wesleyan UniversityTRVA Trinity River Vision AuthorityUNTHSC University of North Texas Health Science CenterUTA University of Texas at ArlingtonWS Workforce Solutions