Examining the Role of Farm Activities in West Java
19
Munich Personal RePEc Archive An Analysis of Employment and Growth in Java after the Economic Crisis 1997/1998: Examining the Role of Farm Activities in West Java Fajar Bambang Hirawan SPES Development Studies, Faculty of Economics, University of Rome ”La Sapienza” 9. July 2008 Online at http://mpra.ub.uni-muenchen.de/10441/ MPRA Paper No. 10441, posted 13. September 2008 00:57 UTC
-
Upload
independent -
Category
Documents
-
view
1 -
download
0
Transcript of Examining the Role of Farm Activities in West Java
MPRAMunich Personal RePEc Archive
An Analysis of Employment and Growthin Java after the Economic Crisis1997/1998: Examining the Role of FarmActivities in West Java
Fajar Bambang Hirawan
SPES Development Studies, Faculty of Economics, University ofRome ”La Sapienza”
9. July 2008
Online at http://mpra.ub.uni-muenchen.de/10441/MPRA Paper No. 10441, posted 13. September 2008 00:57 UTC
i | P a g e
AN ANALYSIS OF EMPLOYMENT AND GROWTH IN JAVA
AFTER THE ECONOMIC CRISIS 1997/1998:
Examining the Role of Farm Activities in West Java
Fajar Bambang Hirawan*
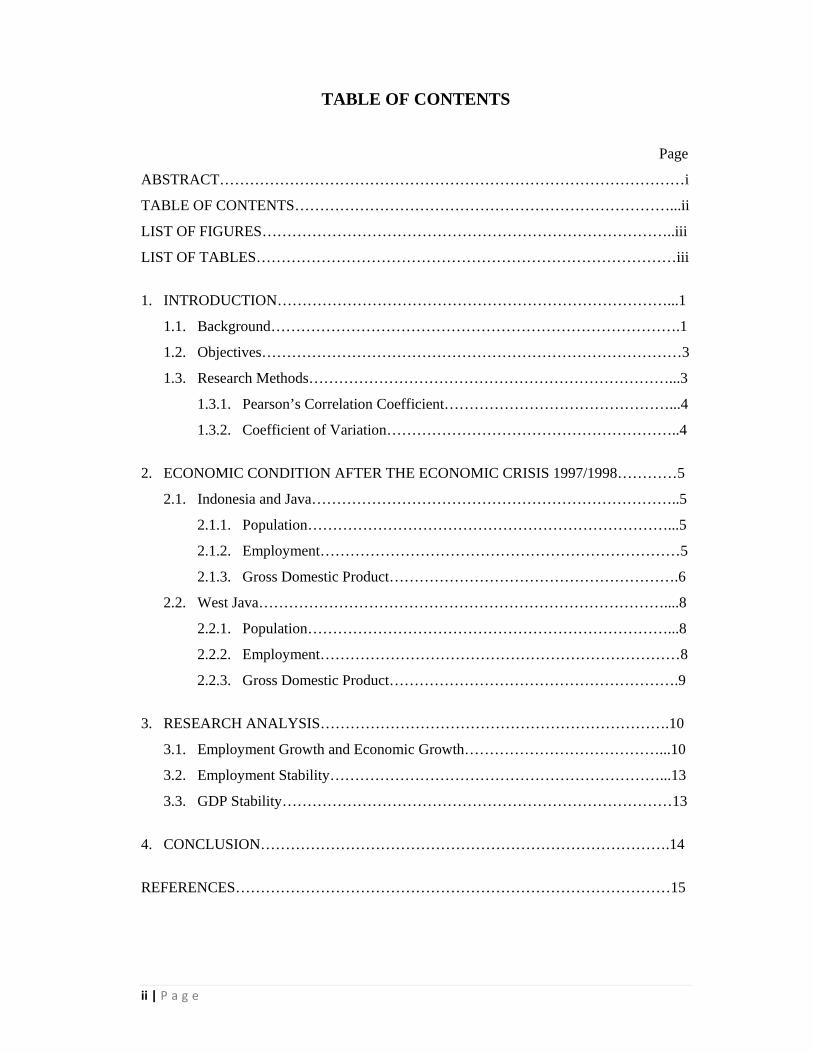
ABSTRACT
In this paper, we examine the relationship between employment and economic growth in
the most populated island in Indonesia, Java, specifically in West Java. When Indonesia
suffered a dreadful economic crisis during 1997/1998, none of the regions or sectors
survived its impact, especially farm and non-farm activities. The economy started to
improve in the year 2000, but non-economic fundamental factors significantly impacted the
economy at that time. The results of this paper indicate that employment has a relationship
to economic growth. In West Java farm activities, which are agriculture, livestock,
forestry, and fisheries (ALFF), have a negative correlation with economic growth. On the
other hand, non-farm activities have a positive correlation with economic growth. The
value of the coefficient of variation (CV) surprisingly signifies that employment and GDP
relating to farm activities in West Java are more stable than non-farm activities after the
economic crisis of 1997/1998.
JEL Classification: C22, C40, J21, O11, O47
Keywords: Employment, Economic Growth, West Java, Farm, Non-Farm
* I would like to say thank you to Prof. Alessandra De Rose, Faculty of Economics, University of Rome “La Sapienza,” for her valuable comments.
ii | P a g e
TABLE OF CONTENTS
Page
ABSTRACT…………………………………………………………………………………i
TABLE OF CONTENTS…………………………………………………………………...ii
LIST OF FIGURES………………………………………………………………………..iii
LIST OF TABLES…………………………………………………………………………iii
1. INTRODUCTION……………………………………………………………………...1
1.1. Background……………………………………………………………………….1
1.2. Objectives…………………………………………………………………………3
1.3. Research Methods………………………………………………………………...3
1.3.1. Pearson’s Correlation Coefficient………………………………………...4
1.3.2. Coefficient of Variation…………………………………………………..4
2. ECONOMIC CONDITION AFTER THE ECONOMIC CRISIS 1997/1998…………5
2.1. Indonesia and Java………………………………………………………………..5
2.1.1. Population………………………………………………………………...5
2.1.2. Employment………………………………………………………………5
2.1.3. Gross Domestic Product………………………………………………….6
2.2. West Java………………………………………………………………………....8
2.2.1. Population………………………………………………………………...8
2.2.2. Employment………………………………………………………………8
2.2.3. Gross Domestic Product………………………………………………….9
3. RESEARCH ANALYSIS…………………………………………………………….10
3.1. Employment Growth and Economic Growth…………………………………...10
3.2. Employment Stability…………………………………………………………...13
3.3. GDP Stability……………………………………………………………………13
4. CONCLUSION……………………………………………………………………….14
REFERENCES……………………………………………………………………………15
iii | P a g e
LIST OF FIGURES
Page
Figure 1. The Structural Transformation…………………………………………………...1
Figure 2. The Proportion of Population in Indonesia 2001-2006 (in percent)……………..5
Figure 3. The Proportion of Employment in Indonesia 2001-2006 (in percent)…………...6
Figure 4. The Proportion of Employment in Java 2002-2006 (in percent)………………...6
Figure 5. Indonesia’s GDP Contribution by Region 2001-2006 (in percent)……………...7
Figure 6. GDP Contribution in Java 2001-2006 (in percent)………………………………7
Figure 7. The Number of Population in Java, 2001-2006 (in thousands people)…………..8
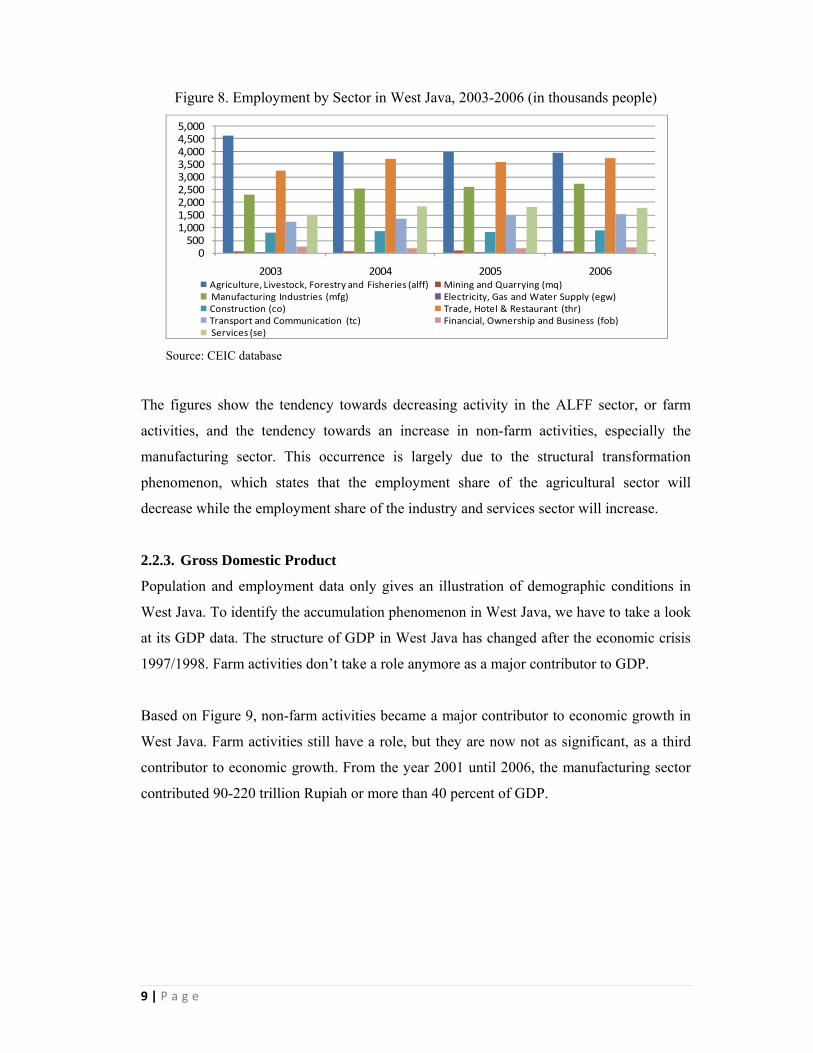
Figure 8. Employment by Sector in West Java, 2003-2006 (in thousands people)………...9
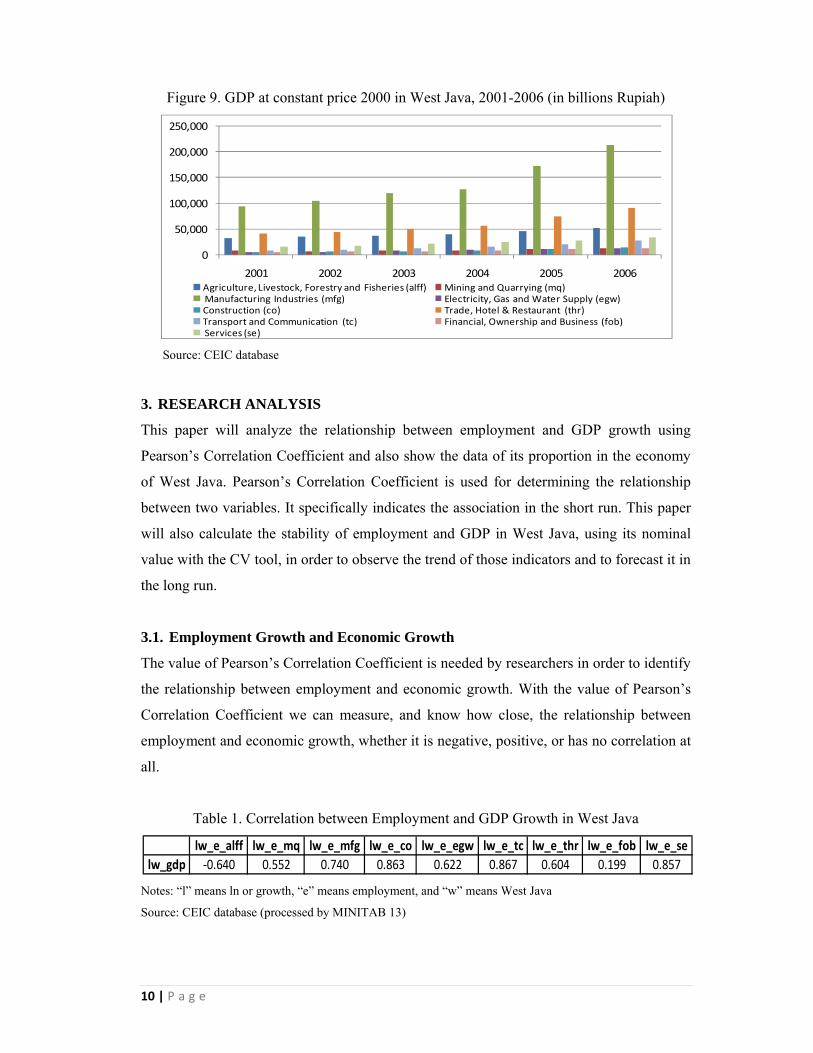
Figure 9. GDP at constant price 2000 in West Java, 2001-2006 (in billions Rupiah)…….10
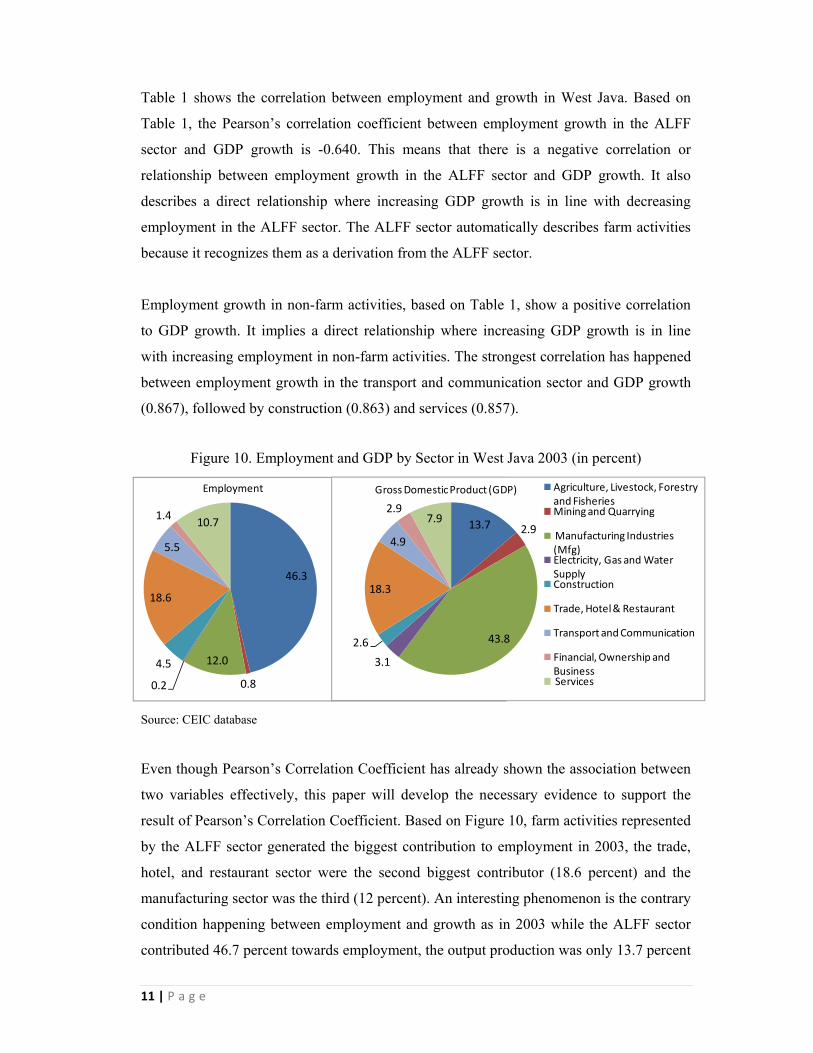
Figure 10. Employment and GDP by Sector in West Java 2003 (in percent)……………..11
Figure 11. Employment and GDP by Sector in West Java, 2006 (in percent)…………….12
LIST OF TABLES
Table 1. Correlation between Employment and GDP Growth in West Java……………...10
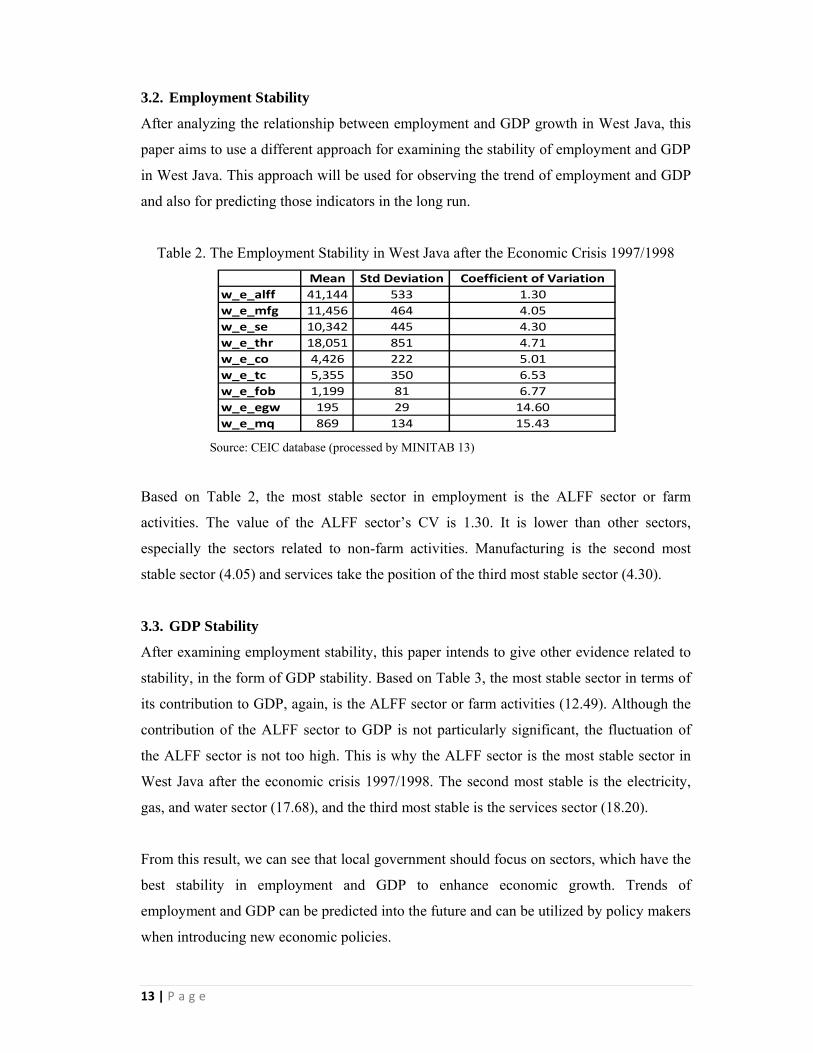
Table 2. The Employment Stability in West Java after the Economic Crisis 1997/1998…13
Table 3. The GDP Stability in West Java after the Economic Crisis 1997/1998………….14
1 | P a g e
VA/GDP or Employment
Share
Industry
Agriculture
Services
Post‐Industrialization
Pre‐Industrialization
Time
1. INTRODUCTION
1.1. Background
Several studies have investigated the relationship between employment and economic
growth. At the end of 1940s, Verdoorn published a paper about the relationship between
the growth of industrial output and labor productivity. It stated that there was a close
relationship between them in the long run (Verdoorn, 1949). In the mid 1960s, Kaldor
published a paper about the relationship between employment and economic growth. It
stated that an increase in output growth of 1 percent will lead to an increase in productivity
and employment growth of half a percentage point each (Kaldor, 1966).
Another famous economist who researched the relationship between employment and
economic growth was Arthur Melvin Okun. His famous theory was related to the
correlation between economic growth and the unemployment rate. In the 1960s and 1970s,
Okun’s law was clear, undisputed, and regarded as one of the most reliable
macroeconomic relations at that time (Walterskirchen, 1999). Okun’s law stated that an
increase of the economic growth rate by 3 percent was expected to reduce the
unemployment rate by 1 percentage point (Okun, 1962).
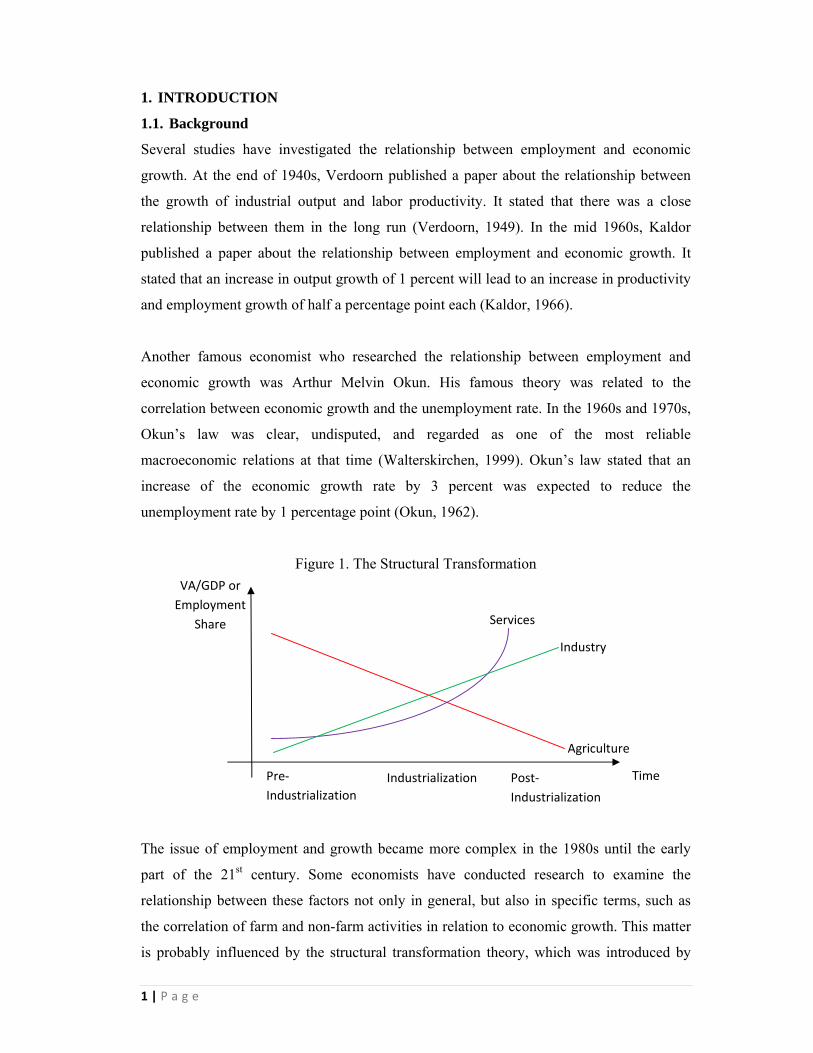
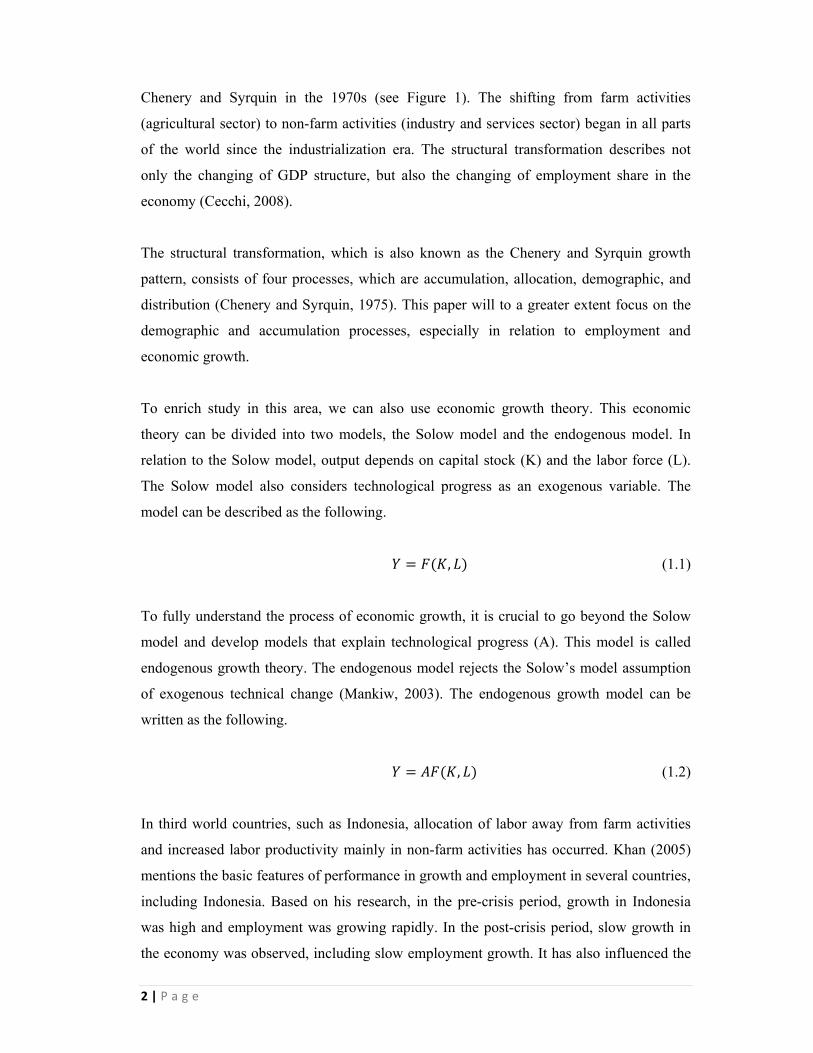
Figure 1. The Structural Transformation
The issue of employment and growth became more complex in the 1980s until the early
part of the 21st century. Some economists have conducted research to examine the
relationship between these factors not only in general, but also in specific terms, such as
the correlation of farm and non-farm activities in relation to economic growth. This matter
is probably influenced by the structural transformation theory, which was introduced by
Industrialization
2 | P a g e
Chenery and Syrquin in the 1970s (see Figure 1). The shifting from farm activities
(agricultural sector) to non-farm activities (industry and services sector) began in all parts
of the world since the industrialization era. The structural transformation describes not
only the changing of GDP structure, but also the changing of employment share in the
economy (Cecchi, 2008).
The structural transformation, which is also known as the Chenery and Syrquin growth
pattern, consists of four processes, which are accumulation, allocation, demographic, and
distribution (Chenery and Syrquin, 1975). This paper will to a greater extent focus on the
demographic and accumulation processes, especially in relation to employment and
economic growth.
To enrich study in this area, we can also use economic growth theory. This economic
theory can be divided into two models, the Solow model and the endogenous model. In
relation to the Solow model, output depends on capital stock (K) and the labor force (L).
The Solow model also considers technological progress as an exogenous variable. The
model can be described as the following.
, (1.1)
To fully understand the process of economic growth, it is crucial to go beyond the Solow
model and develop models that explain technological progress (A). This model is called
endogenous growth theory. The endogenous model rejects the Solow’s model assumption
of exogenous technical change (Mankiw, 2003). The endogenous growth model can be
written as the following.
, (1.2)
In third world countries, such as Indonesia, allocation of labor away from farm activities
and increased labor productivity mainly in non-farm activities has occurred. Khan (2005)
mentions the basic features of performance in growth and employment in several countries,
including Indonesia. Based on his research, in the pre-crisis period, growth in Indonesia
was high and employment was growing rapidly. In the post-crisis period, slow growth in
the economy was observed, including slow employment growth. It has also influenced the
3 | P a g e
state of employment in Indonesia, especially the falling growth in the formal sector and
shifting from farm to non-farm activities.
The previous knowledge leads into a good chance to do further study into the relationship
between employment and economic growth. This case study is also essential to analyze
detailed matters and to find an effective solution for creating a better economy. The island
of Java, specifically West Java, is a good example to analyze because it provides
researchers with sufficient data and also dynamic economic development compared to
other regions or provinces.
1.2. Objectives
Based on the previous background information, this paper attempts to answer the following
questions:
1. What are the trends of employment and GDP by sector in Java, especially West
Java, after the economic crisis 1997/1998?
2. What is the relationship between employment growth and GDP growth by sector
in West Java after the economic crisis 1997/1998?
3. Which employment sector has a significant role in enhancing West Java’s
economic growth?
4. How stable is employment and GDP by sector in West Java after the economic
crisis 1997/1998?
5. Which sector has good prospects for West Java’s economy related to its
employment and GDP stability?
1.3. Research Methods
In this paper, I will apply both qualitative and quantitative methods. Various studies have
been done on the subject of employment and economic growth. To deepen this study a
literature study survey will be undertaken. Secondary data will be used for the quantitative
method. This paper uses Indonesia’s employment and GDP figures at a constant price 2000
quarterly data, specifically West Java, from the year 2001 until 2006. The data is sourced
from the CEIC database. Since the study will be quantitative, basic statistics and
econometric analysis will be applied using the software MINITAB 13.
4 | P a g e
1.3.1. Pearson’s Correlation Coefficient
The correlation coefficient is used to measure the strength of a linear relationship between
two variables. Before using this simple statistics approach, researchers should consider the
assumptions that both variables are interval or ratio and normally distributed. Pearson's
Correlation Coefficient is usually implied by r (rho). It can take on the values from -1.0 to
1.0, where -1.0 is a perfect negative (inverse) correlation, 0.0 is no correlation, and 1.0 is a
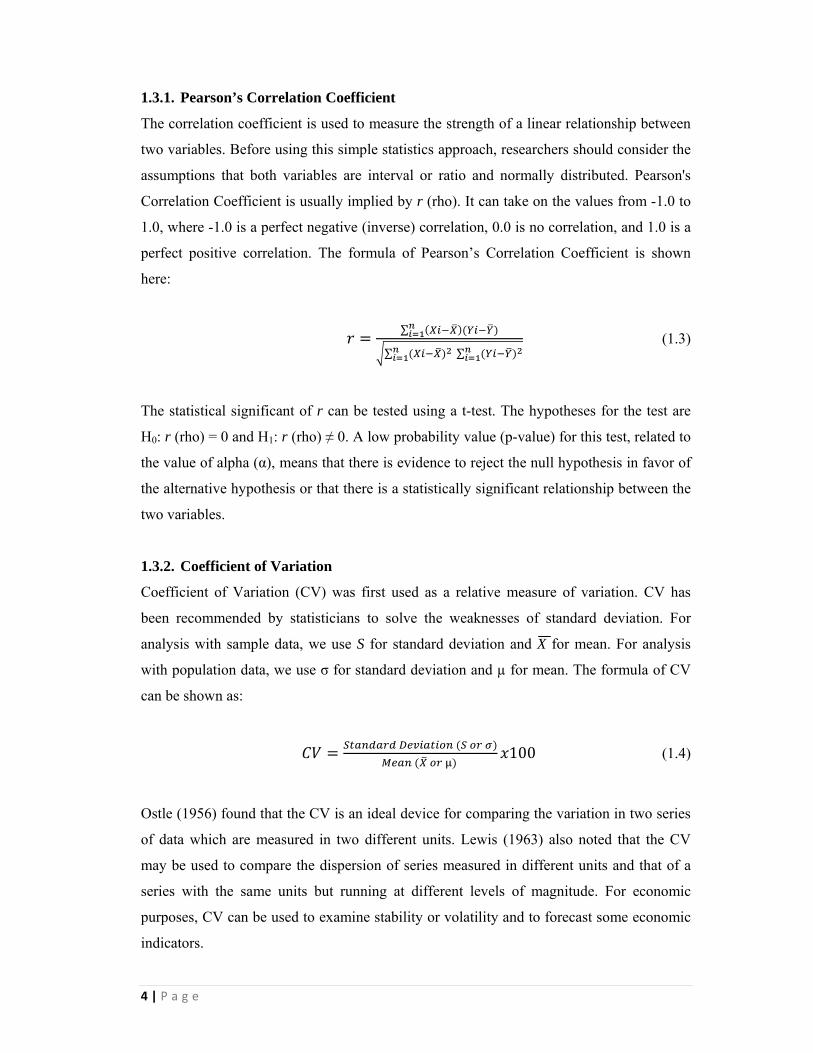
perfect positive correlation. The formula of Pearson’s Correlation Coefficient is shown
here:
∑
∑ ∑ (1.3)
The statistical significant of r can be tested using a t-test. The hypotheses for the test are
H0: r (rho) = 0 and H1: r (rho) ≠ 0. A low probability value (p-value) for this test, related to
the value of alpha (α), means that there is evidence to reject the null hypothesis in favor of
the alternative hypothesis or that there is a statistically significant relationship between the
two variables.
1.3.2. Coefficient of Variation
Coefficient of Variation (CV) was first used as a relative measure of variation. CV has
been recommended by statisticians to solve the weaknesses of standard deviation. For
analysis with sample data, we use S for standard deviation and X for mean. For analysis
with population data, we use σ for standard deviation and µ for mean. The formula of CV
can be shown as:
100 (1.4)
Ostle (1956) found that the CV is an ideal device for comparing the variation in two series
of data which are measured in two different units. Lewis (1963) also noted that the CV
may be used to compare the dispersion of series measured in different units and that of a
series with the same units but running at different levels of magnitude. For economic
purposes, CV can be used to examine stability or volatility and to forecast some economic
indicators.
5 | P a g e
2. THE ECONOMIC CONDITION AFTER THE ECONOMIC CRISIS 1997/1998
2.1. Indonesia and Java
2.1.1. Population
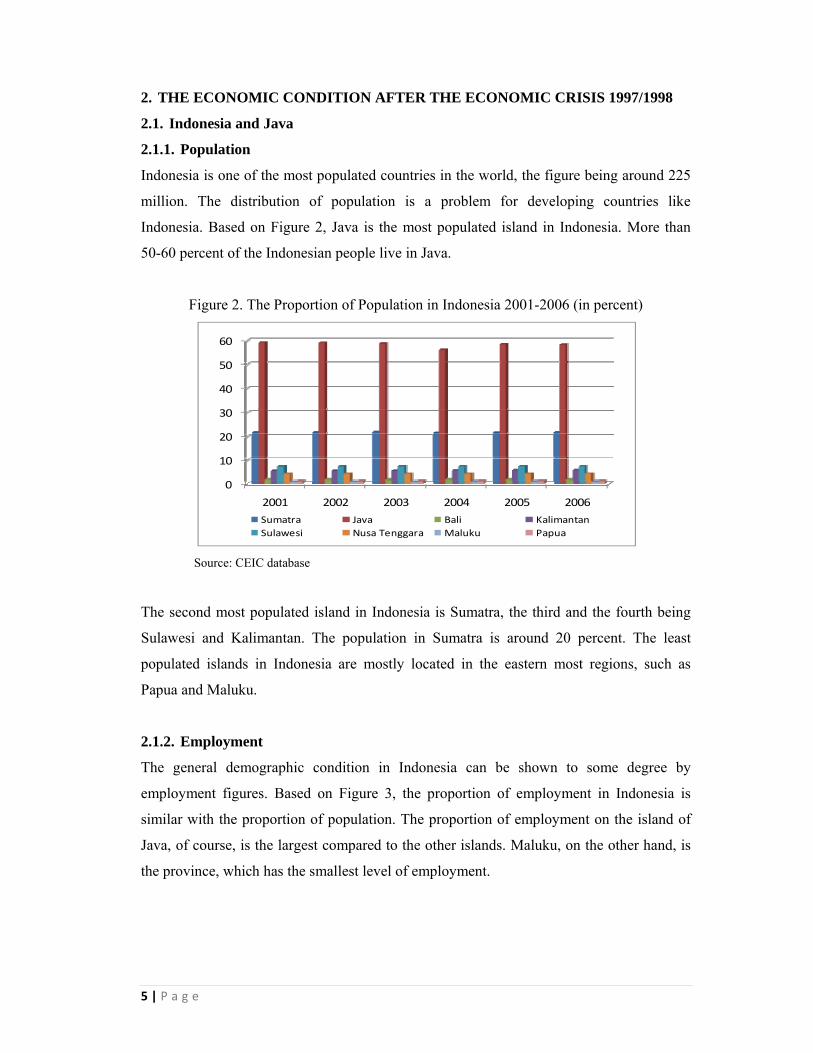
Indonesia is one of the most populated countries in the world, the figure being around 225
million. The distribution of population is a problem for developing countries like
Indonesia. Based on Figure 2, Java is the most populated island in Indonesia. More than
50-60 percent of the Indonesian people live in Java.
Figure 2. The Proportion of Population in Indonesia 2001-2006 (in percent)
Source: CEIC database
The second most populated island in Indonesia is Sumatra, the third and the fourth being
Sulawesi and Kalimantan. The population in Sumatra is around 20 percent. The least
populated islands in Indonesia are mostly located in the eastern most regions, such as
Papua and Maluku.
2.1.2. Employment
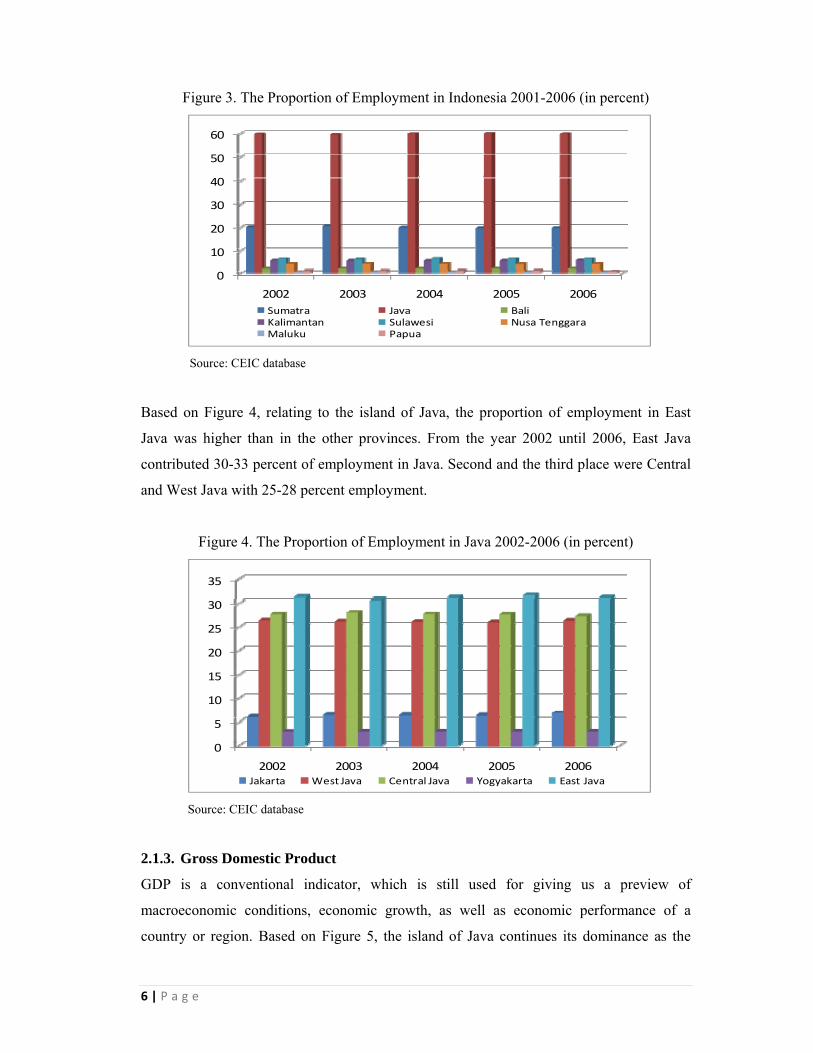
The general demographic condition in Indonesia can be shown to some degree by
employment figures. Based on Figure 3, the proportion of employment in Indonesia is
similar with the proportion of population. The proportion of employment on the island of
Java, of course, is the largest compared to the other islands. Maluku, on the other hand, is
the province, which has the smallest level of employment.
0
10
20
30
40
50
60
2001 2002 2003 2004 2005 2006
Sumatra Java Bali KalimantanSulawesi Nusa Tenggara Maluku Papua
6 | P a g e
Figure 3. The Proportion of Employment in Indonesia 2001-2006 (in percent)
Source: CEIC database
Based on Figure 4, relating to the island of Java, the proportion of employment in East
Java was higher than in the other provinces. From the year 2002 until 2006, East Java
contributed 30-33 percent of employment in Java. Second and the third place were Central
and West Java with 25-28 percent employment.
Figure 4. The Proportion of Employment in Java 2002-2006 (in percent)
Source: CEIC database
2.1.3. Gross Domestic Product
GDP is a conventional indicator, which is still used for giving us a preview of
macroeconomic conditions, economic growth, as well as economic performance of a
country or region. Based on Figure 5, the island of Java continues its dominance as the
0
10
20
30
40
50
60
2002 2003 2004 2005 2006Sumatra Java BaliKalimantan Sulawesi Nusa TenggaraMaluku Papua
0
5
10
15
20
25
30
35
2002 2003 2004 2005 2006Jakarta West Java Central Java Yogyakarta East Java
7 | P a g e
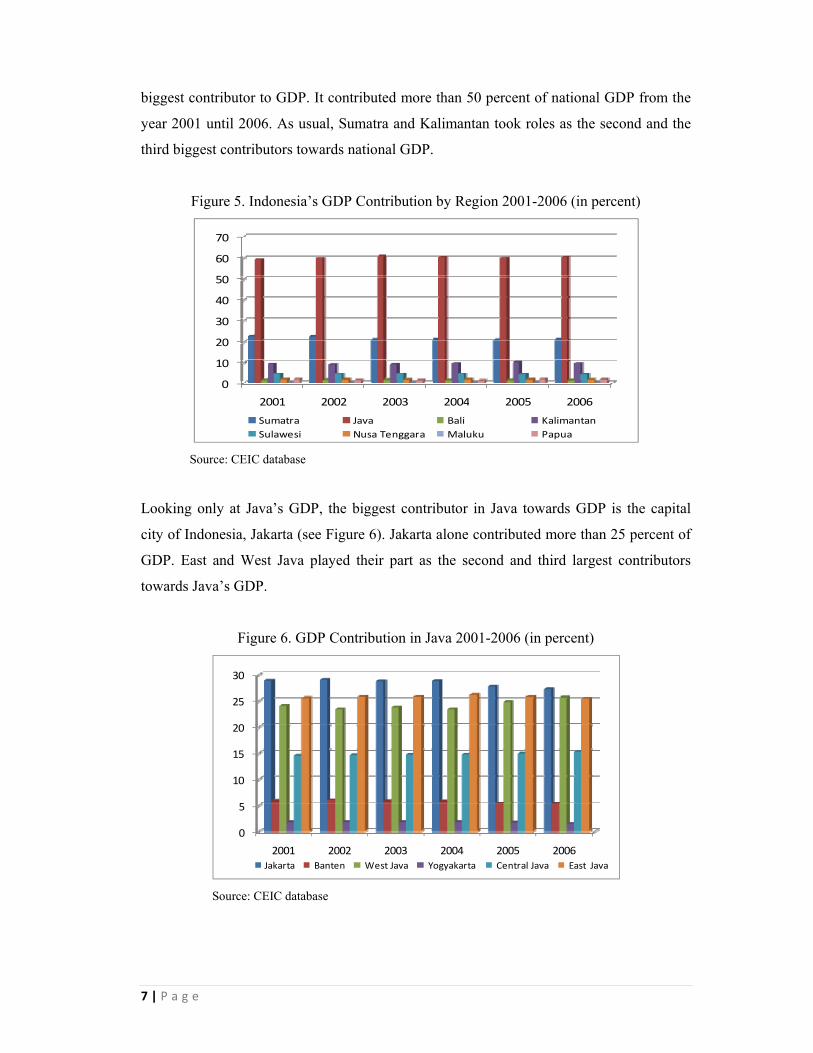
biggest contributor to GDP. It contributed more than 50 percent of national GDP from the
year 2001 until 2006. As usual, Sumatra and Kalimantan took roles as the second and the
third biggest contributors towards national GDP.
Figure 5. Indonesia’s GDP Contribution by Region 2001-2006 (in percent)
Source: CEIC database
Looking only at Java’s GDP, the biggest contributor in Java towards GDP is the capital
city of Indonesia, Jakarta (see Figure 6). Jakarta alone contributed more than 25 percent of
GDP. East and West Java played their part as the second and third largest contributors
towards Java’s GDP.
Figure 6. GDP Contribution in Java 2001-2006 (in percent)
Source: CEIC database
0
10
20
30
40
50
60
70
2001 2002 2003 2004 2005 2006
Sumatra Java Bali KalimantanSulawesi Nusa Tenggara Maluku Papua
0
5
10
15
20
25
30
2001 2002 2003 2004 2005 2006Jakarta Banten West Java Yogyakarta Central Java East Java
8 | P a g e
2.2. West Java
2.2.1. Population
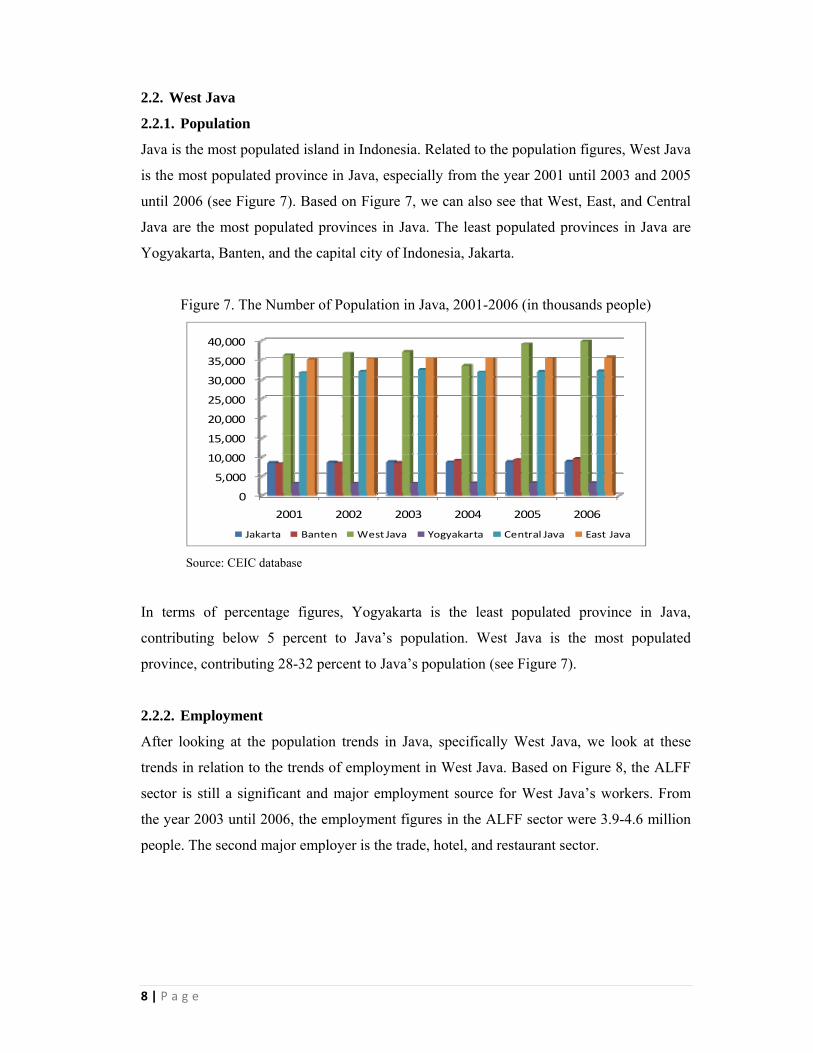
Java is the most populated island in Indonesia. Related to the population figures, West Java
is the most populated province in Java, especially from the year 2001 until 2003 and 2005
until 2006 (see Figure 7). Based on Figure 7, we can also see that West, East, and Central
Java are the most populated provinces in Java. The least populated provinces in Java are
Yogyakarta, Banten, and the capital city of Indonesia, Jakarta.
Figure 7. The Number of Population in Java, 2001-2006 (in thousands people)
Source: CEIC database
In terms of percentage figures, Yogyakarta is the least populated province in Java,
contributing below 5 percent to Java’s population. West Java is the most populated
province, contributing 28-32 percent to Java’s population (see Figure 7).
2.2.2. Employment
After looking at the population trends in Java, specifically West Java, we look at these
trends in relation to the trends of employment in West Java. Based on Figure 8, the ALFF
sector is still a significant and major employment source for West Java’s workers. From
the year 2003 until 2006, the employment figures in the ALFF sector were 3.9-4.6 million
people. The second major employer is the trade, hotel, and restaurant sector.
0
5,000
10,000
15,000
20,000
25,000
30,000
35,000
40,000
2001 2002 2003 2004 2005 2006
Jakarta Banten West Java Yogyakarta Central Java East Java
9 | P a g e
Figure 8. Employment by Sector in West Java, 2003-2006 (in thousands people)
Source: CEIC database
The figures show the tendency towards decreasing activity in the ALFF sector, or farm
activities, and the tendency towards an increase in non-farm activities, especially the
manufacturing sector. This occurrence is largely due to the structural transformation
phenomenon, which states that the employment share of the agricultural sector will
decrease while the employment share of the industry and services sector will increase.
2.2.3. Gross Domestic Product
Population and employment data only gives an illustration of demographic conditions in
West Java. To identify the accumulation phenomenon in West Java, we have to take a look
at its GDP data. The structure of GDP in West Java has changed after the economic crisis
1997/1998. Farm activities don’t take a role anymore as a major contributor to GDP.
Based on Figure 9, non-farm activities became a major contributor to economic growth in
West Java. Farm activities still have a role, but they are now not as significant, as a third
contributor to economic growth. From the year 2001 until 2006, the manufacturing sector
contributed 90-220 trillion Rupiah or more than 40 percent of GDP.
0500
1,0001,5002,0002,5003,0003,5004,0004,5005,000
2003 2004 2005 2006Agriculture, Livestock, Forestry and Fisheries (alff) Mining and Quarrying (mq)Manufacturing Industries (mfg) Electricity, Gas and Water Supply (egw)Construction (co) Trade, Hotel & Restaurant (thr)Transport and Communication (tc) Financial, Ownership and Business (fob)Services (se)
10 | P a g e
Figure 9. GDP at constant price 2000 in West Java, 2001-2006 (in billions Rupiah)
Source: CEIC database
3. RESEARCH ANALYSIS
This paper will analyze the relationship between employment and GDP growth using
Pearson’s Correlation Coefficient and also show the data of its proportion in the economy
of West Java. Pearson’s Correlation Coefficient is used for determining the relationship
between two variables. It specifically indicates the association in the short run. This paper
will also calculate the stability of employment and GDP in West Java, using its nominal
value with the CV tool, in order to observe the trend of those indicators and to forecast it in
the long run.
3.1. Employment Growth and Economic Growth
The value of Pearson’s Correlation Coefficient is needed by researchers in order to identify
the relationship between employment and economic growth. With the value of Pearson’s
Correlation Coefficient we can measure, and know how close, the relationship between
employment and economic growth, whether it is negative, positive, or has no correlation at
all.
Table 1. Correlation between Employment and GDP Growth in West Java
Notes: “l” means ln or growth, “e” means employment, and “w” means West Java
Source: CEIC database (processed by MINITAB 13)
0
50,000
100,000
150,000
200,000
250,000
2001 2002 2003 2004 2005 2006Agriculture, Livestock, Forestry and Fisheries (alff) Mining and Quarrying (mq)Manufacturing Industries (mfg) Electricity, Gas and Water Supply (egw)Construction (co) Trade, Hotel & Restaurant (thr)Transport and Communication (tc) Financial, Ownership and Business (fob)Services (se)
lw_e_alff lw_e_mq lw_e_mfg lw_e_co lw_e_egw lw_e_tc lw_e_thr lw_e_fob lw_e_selw_gdp ‐0.640 0.552 0.740 0.863 0.622 0.867 0.604 0.199 0.857
11 | P a g e
46.3
0.8
12.0
0.2
4.5
18.6
5.5
1.4 10.7
Employment
Table 1 shows the correlation between employment and growth in West Java. Based on
Table 1, the Pearson’s correlation coefficient between employment growth in the ALFF
sector and GDP growth is -0.640. This means that there is a negative correlation or
relationship between employment growth in the ALFF sector and GDP growth. It also
describes a direct relationship where increasing GDP growth is in line with decreasing
employment in the ALFF sector. The ALFF sector automatically describes farm activities
because it recognizes them as a derivation from the ALFF sector.
Employment growth in non-farm activities, based on Table 1, show a positive correlation
to GDP growth. It implies a direct relationship where increasing GDP growth is in line
with increasing employment in non-farm activities. The strongest correlation has happened
between employment growth in the transport and communication sector and GDP growth
(0.867), followed by construction (0.863) and services (0.857).
Figure 10. Employment and GDP by Sector in West Java 2003 (in percent)
Source: CEIC database
Even though Pearson’s Correlation Coefficient has already shown the association between
two variables effectively, this paper will develop the necessary evidence to support the
result of Pearson’s Correlation Coefficient. Based on Figure 10, farm activities represented
by the ALFF sector generated the biggest contribution to employment in 2003, the trade,
hotel, and restaurant sector were the second biggest contributor (18.6 percent) and the
manufacturing sector was the third (12 percent). An interesting phenomenon is the contrary
condition happening between employment and growth as in 2003 while the ALFF sector
contributed 46.7 percent towards employment, the output production was only 13.7 percent
13.7 2.9
43.8
3.1
2.6
18.3
4.9
2.97.9
Agriculture, Livestock, Forestry and FisheriesMining and Quarrying
Manufacturing Industries (Mfg)Electricity, Gas and Water SupplyConstruction
Trade, Hotel & Restaurant
Transport and Communication
Financial, Ownership and BusinessServices
GrossDomestic Product (GDP)
12 | P a g e
42.0
1.012.5
0.2
4.9
20.1
5.9
1.4 11.9
Employment
of GDP. The manufacturing sector only contributed 12 percent in employment terms but it
generated 43.8 percent of GDP and also took a role as the biggest contributor to economic
growth.
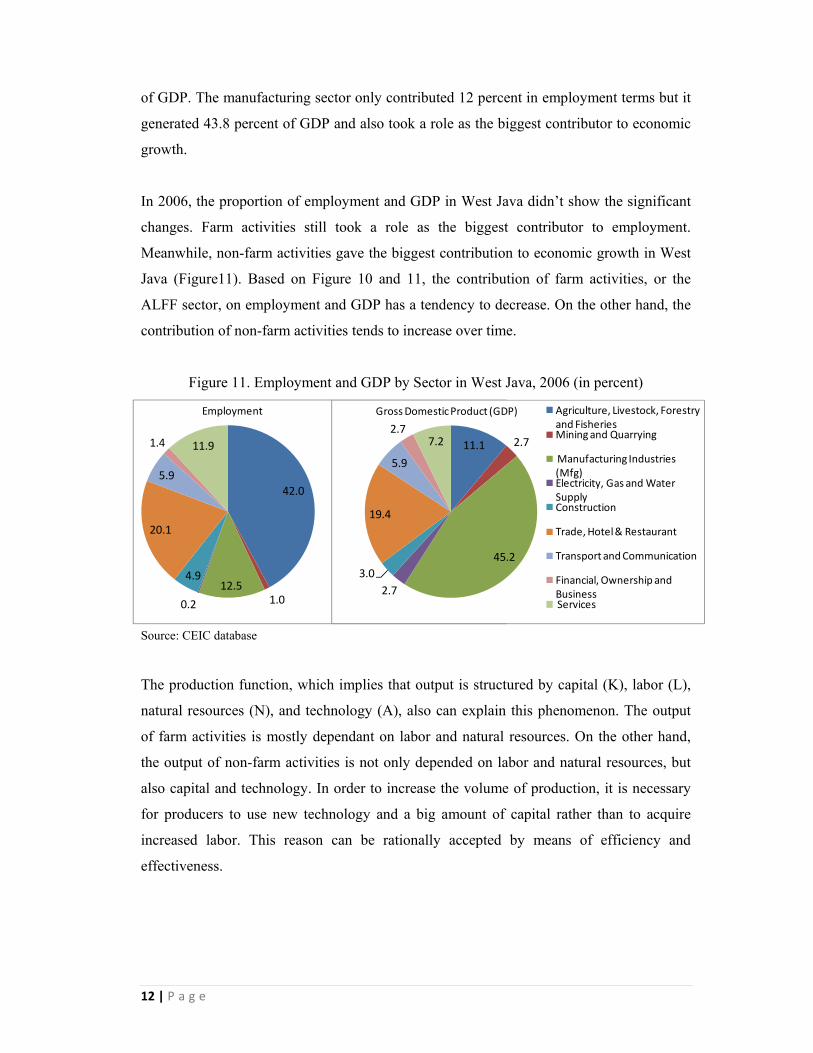
In 2006, the proportion of employment and GDP in West Java didn’t show the significant
changes. Farm activities still took a role as the biggest contributor to employment.
Meanwhile, non-farm activities gave the biggest contribution to economic growth in West
Java (Figure11). Based on Figure 10 and 11, the contribution of farm activities, or the
ALFF sector, on employment and GDP has a tendency to decrease. On the other hand, the
contribution of non-farm activities tends to increase over time.
Figure 11. Employment and GDP by Sector in West Java, 2006 (in percent)
Source: CEIC database
The production function, which implies that output is structured by capital (K), labor (L),
natural resources (N), and technology (A), also can explain this phenomenon. The output
of farm activities is mostly dependant on labor and natural resources. On the other hand,
the output of non-farm activities is not only depended on labor and natural resources, but
also capital and technology. In order to increase the volume of production, it is necessary
for producers to use new technology and a big amount of capital rather than to acquire
increased labor. This reason can be rationally accepted by means of efficiency and
effectiveness.
11.1 2.7
45.2
2.73.0
19.4
5.9
2.77.2
Agriculture, Livestock, Forestry and FisheriesMining and Quarrying
Manufacturing Industries (Mfg)Electricity, Gas and Water SupplyConstruction
Trade, Hotel & Restaurant
Transport and Communication
Financial, Ownership and BusinessServices
GrossDomestic Product (GDP)
13 | P a g e
3.2. Employment Stability
After analyzing the relationship between employment and GDP growth in West Java, this
paper aims to use a different approach for examining the stability of employment and GDP
in West Java. This approach will be used for observing the trend of employment and GDP
and also for predicting those indicators in the long run.
Table 2. The Employment Stability in West Java after the Economic Crisis 1997/1998
Source: CEIC database (processed by MINITAB 13)
Based on Table 2, the most stable sector in employment is the ALFF sector or farm
activities. The value of the ALFF sector’s CV is 1.30. It is lower than other sectors,
especially the sectors related to non-farm activities. Manufacturing is the second most
stable sector (4.05) and services take the position of the third most stable sector (4.30).
3.3. GDP Stability
After examining employment stability, this paper intends to give other evidence related to
stability, in the form of GDP stability. Based on Table 3, the most stable sector in terms of
its contribution to GDP, again, is the ALFF sector or farm activities (12.49). Although the
contribution of the ALFF sector to GDP is not particularly significant, the fluctuation of
the ALFF sector is not too high. This is why the ALFF sector is the most stable sector in
West Java after the economic crisis 1997/1998. The second most stable is the electricity,
gas, and water sector (17.68), and the third most stable is the services sector (18.20).
From this result, we can see that local government should focus on sectors, which have the
best stability in employment and GDP to enhance economic growth. Trends of
employment and GDP can be predicted into the future and can be utilized by policy makers
when introducing new economic policies.
Mean Std Deviation Coefficient of Variationw_e_alff 41,144 533 1.30w_e_mfg 11,456 464 4.05w_e_se 10,342 445 4.30w_e_thr 18,051 851 4.71w_e_co 4,426 222 5.01w_e_tc 5,355 350 6.53w_e_fob 1,199 81 6.77w_e_egw 195 29 14.60w_e_mq 869 134 15.43

14 | P a g e
Table 3. The GDP Stability in West Java after the Economic Crisis 1997/1998
Source: CEIC database (processed by MINITAB 13)
4. CONCLUSION
The aim of this paper was to examine the macroeconomic relationship between
employment and economic growth in the most populated province in Indonesia with both
literature and empirical studies. There are several conclusions from the findings of this
paper.
Firstly, based on the research analysis above, it can be found that employment growth in
the ALFF sector, or farm activities, in West Java have a negative relationship to economic
growth. Non-farm activities have a positive relationship to economic growth. This is not
surprising because this phenomenon has already been predicted before on the subject of
structural transformation. Hence, employment in non-farm activities, in the short run, has a
significant role in enhancing the economic growth in West Java.
Secondly, regarding the result of employment and GDP stability we can say that the role of
farm activities should always be recognized as a potential sector, which can support
economic growth especially in West Java. Employment and GDP stability in farm
activities are more stable than non-farm activities. Consequently, we can say that
employment and GDP in farm activities have good prospects for West Java’s economic
growth in the long run.
In summary, the role of farm activities is expected to become a key part of West Java’s
economic growth. For that reason, local government should be careful in managing its blue
print development program because the literature and empirical studies have proven that
farm activities have good prospects when it comes to boosting economic growth in the
long run.
Mean Std Deviation Coefficient of Variationw_gdp_alff 42,835 5,350 12.49w_gdp_egw 9,953 1,760 17.68w_gdp_se 25,821 4,700 18.20w_gdp_fob 9,880 2,014 20.38w_gdp_mq 10,010 2,043 20.41w_gdp_mfg 148,213 35,269 23.80w_gdp_thr 63,820 15,222 23.85w_gdp_co 9,578 2,627 27.43w_gdp_tc 17,872 5,029 28.14
15 | P a g e
REFERENCES
Cecchi, Claudio (2008). “Local Development System Approach,” Local Development
Lecture, Faculty of Economics, University of Rome “La Sapienza,” 17 June 2008.
Chenery, H. B., M. Syrquin (1975). Pattern of Development 1950-1970. London: Oxford
University Press.
Kaldor, N. (1966). Causes of the Slow Rate of Economic Growth in the United Kingdom.
Cambridge: Cambridge University Press.
Khan, A.R. (2005). “Growth, Employment, and Poverty: An Analysis of the Vital Nexus
based on some Recent UNDP and ILO/SIDA Studies,” Discussion Paper No. 19, New
York: United Nations Development Programme (UNDP).
Lewis, E.E. (1963). Methods of Statistical Analysis in Economics and Business, 2nd edition.
Boston, MA: Houghton Mifflin Co.
Mankiw, Gregory N. (2003). Macroeconomics, 5th Edition. New York: Worth Publishers.
Okun, A.M. (1962). Potential GDP: Its Measurement and Significance. Proceedings of the
Business and Economic Section. Washington DC: American Statistical Association, pp.
98-104.
Ostle, B. (1956). Statistics in Research, 2nd edition. Ames, Iowa: The Iowa State College
Press.
Verdoorn, P.J. (1949). “Fattori che regolano lo sviluppo della produttivita del lavoro,”
L’industria, pp. 45-53, translated in L.L. Pasinetti, Italian Economic Papers, Vol. 2,
Oxford, pp. 59-68.
Walterskirchen, Ewald (1999). “The Relationship between Growth, Employment, and
Unemployment in the EU,” European Economists for an Alternative Economic Policy
(TSER Network) Workshop Paper, Barcelona, 16-18 September 1999.