
evidence from a survey of loan officers in Nigerian banks.
317
Glasgow Theses Service http://theses.gla.ac.uk/ [email protected] Ekpu, Victor Uche (2015) The microstructure of bank lending to SMEs: evidence from a survey of loan officers in Nigerian banks. PhD thesis. http://theses.gla.ac.uk/6811/ Copyright and moral rights for this thesis are retained by the author A copy can be downloaded for personal non-commercial research or study This thesis cannot be reproduced or quoted extensively from without first obtaining permission in writing from the Author The content must not be changed in any way or sold commercially in any format or medium without the formal permission of the Author When referring to this work, full bibliographic details including the author, title, awarding institution and date of the thesis must be given
-
Upload
khangminh22 -
Category
Documents
-
view
1 -
download
0
Transcript of evidence from a survey of loan officers in Nigerian banks.

Glasgow Theses Service http://theses.gla.ac.uk/
Ekpu, Victor Uche (2015) The microstructure of bank lending to SMEs: evidence from a survey of loan officers in Nigerian banks. PhD thesis. http://theses.gla.ac.uk/6811/ Copyright and moral rights for this thesis are retained by the author A copy can be downloaded for personal non-commercial research or study This thesis cannot be reproduced or quoted extensively from without first obtaining permission in writing from the Author The content must not be changed in any way or sold commercially in any format or medium without the formal permission of the Author When referring to this work, full bibliographic details including the author, title, awarding institution and date of the thesis must be given

The Microstructure of Bank Lending to SMEs: Evidence
from a Survey of Loan Officers in Nigerian Banks
By
VICTOR UCHE EKPU
(Student No: 0802848)
Being a Thesis Submitted to the Adam Smith Business School, College of Social Sciences
University of Glasgow
In part-fulfilment of the Requirements for the Award of Doctor of Philosophy (PhD) in Economics
September 2015
V. Ekpu | The Microstructure of Bank Lending to SMEs | PhD Thesis | University of Glasgow | 2015
2
ABSTRACT
The opacity and riskiness of small and medium sized enterprises (SMEs) make them an interesting area for the study of banks’ lending practices and procedures. SMEs in Nigeria, like in many low and middle-income economies, face financing difficulties because they are relatively young, inexperienced and informationally opaque. Since the consolidation of the Nigerian banking industry in 2006, the share of commercial bank loans to SMEs has declined markedly despite the fact that Nigerian banks are well capitalized and are among the largest players in Sub-Saharan Africa. The researcher conducted a questionnaire survey to investigate the microstructure of SME lending decisions, policies and practices in Nigerian banks. Using a sample of 121 Nigerian bank lending officers, this study specifically investigates three research questions: (1) the demand and supply side constraints to bank involvement with SMEs (2) the determinants of loan contract terms (i.e. risk premium and collateralisation), and (3) the economic value to banks from investing in customer relationships.
Results from analysis of survey responses reveal that the high incidence of loan diversion, weak management capacity and the inability of SMEs to service debts are chief contributory factors to the riskiness of SME loans in Nigeria. On the supply side, the high transaction costs associated with processing and monitoring small loans impact negatively on lending profitability. There are also constraints posed by regulation and the business environment. Most notably, the recent rise in yield on competing assets, such as government treasury bills, has led to the crowding out of private sector lending as Nigerian banks hold a sizeable proportion of their assets in relatively safer government securities, which tends to lower their appetite for lending to SMEs. The risk profile of the SME sector is further enhanced by poor information economics, infrastructural deficiencies, the inefficient credit referencing on business loans as well as the inability to enforce loans contracts due to legal and judicial constraints.
The econometric results show that the determinants of risk premium on SME loans are largely connected with factors that underline the opacity and riskiness of SMEs in Nigeria. Customers with longer relationships with their bank tend to benefit from lower interest rates. What determines the likelihood of requesting collateral from SMEs varies significantly from bank to bank and is likely to be connected to the lenders’ specialization as well as differences in the business model and lending technologies used. Loan size, borrowing firm’s age and credit rating also determine the amount of collateral pledged.
There is also evidence to suggest that the predominantly centralised lending strategy in Nigerian banks impacts negatively on the accumulation of soft information by loan officers, implying that not all information collected by the loan officers is utilised in taking lending decisions. However, the proprietary information (or knowledge) loan officers gather through frequent communication and interaction with their customers is likely to yield some potential benefits for Nigerian banks. The most dominant is the high probability that customer satisfaction from bank relationships will generate repeat business for the banks.
V. Ekpu | The Microstructure of Bank Lending to SMEs | PhD Thesis | University of Glasgow | 2015
3
TABLE OF CONTENTS
Title Page ................................................................................................................................. 1 Abstract .................................................................................................................................... 2 List of Tables ........................................................................................................................... 6 List of Figures .......................................................................................................................... 7 Acknowledgement ................................................................................................................... 8 Author’s Declaration ............................................................................................................... 9 Key Abbreviations ................................................................................................................. 10
Chapter 1: Introduction ......................................................................................................... 12 1.1. Background to the Study ................................................................................................ 12 1.2. Objectives of the Study .................................................................................................. 15 1.3. Significance and Original Contributions of the Study ................................................... 16 1.4. Formulation of Research Propositions ........................................................................... 19 1.5. Research Methodology ................................................................................................... 21 1.6. Structure of the Thesis .................................................................................................... 23
Chapter 2: Bank Involvement with SMEs: Demand- and Supply-Side Constraints ........ 26 2.1. Introduction .................................................................................................................... 26 2.2. Theoretical Views on Money Creation and Credit Rationing ........................................ 29
2.2.1. Loanable Funds Theory Vs. Post-Keynesian Endogenous Money Theory ............. 29 2.2.2. Information Asymmetry and Credit Rationing ........................................................ 31
2.3. Financing Options for SMEs .......................................................................................... 34 2.4. Demand-Side Factors Affecting Bank Lending to SMEs .............................................. 37
2.4.1. Firm Characteristics ................................................................................................. 37 2.4.2. Owner Characteristics .............................................................................................. 41 2.4.3. Firm-Lender Relationship Characteristics ............................................................... 44 2.4.4. Demand-Side Market Failures ................................................................................. 47
2.5. Supply-Side Factors Affecting Bank Lending to SMEs ................................................. 50 2.5.1 Risk and Cost Factors ............................................................................................... 50 2.5.2 Financial Institution and Market Structure ............................................................... 53 2.5.3 Lending Technology ................................................................................................. 58 2.5.4 Lending Infrastructure .............................................................................................. 63
2.6. Chapter Conclusions ....................................................................................................... 66
Chapter 3: Trends in Lending to SMEs in Nigeria’s Post-Consolidated Banking Sector 69 3.1. Introduction .................................................................................................................... 69 3.2. Overview of the Nigerian Banking Industry .................................................................. 71
3.2.1. The Nigerian Banking Industry Before Consolidation ............................................ 72
V. Ekpu | The Microstructure of Bank Lending to SMEs | PhD Thesis | University of Glasgow | 2015
4
3.2.2. The Nigerian Banking Industry After Consolidation .............................................. 74 3.3. Trends in Bank Lending to SMEs in Nigeria ................................................................. 82
3.3.1 Financing Gap for SMEs in the Post-Consolidated Banking Sector ........................ 84 3.3.2 Government Initiatives to Boost Commercial Lending to SMEs ............................. 92 3.3.3 Microfinance for MSMEs ......................................................................................... 99
3.4. Features of SME Lending Facilities in Selected Nigerian Banks ................................ 101 3.5. Chapter Conclusions ..................................................................................................... 104
Chapter 4: Research Methodology ...................................................................................... 106 4.1. Data Collection ............................................................................................................. 106
4.1.1. Survey Instrument .................................................................................................. 107 4.1.2. Sampling Technique .............................................................................................. 110 4.1.3. Questioning Techniques, Variables and Coding Framework ................................ 114
4.2. Methods of Data Analysis ............................................................................................ 117 4.2.1 Sample Data Descriptives ....................................................................................... 117 4.2.2 Non-Parametric Methods for Ordinal Data Analysis ............................................. 123 4.2.3. Econometric Methods ............................................................................................ 130
4.3. Limitations of the Study ............................................................................................... 136
Chapter 5: What Constrains Bank Lending to SMEs in Nigeria: Demand-Side or Supply-Side Factors? ............................................................................................................ 138
5.1. Introduction .................................................................................................................. 138 5.2. Main Hypotheses and Related Literature ..................................................................... 140
5.2.1 Demand-Side Factors .............................................................................................. 140 5.2.2 Supply-Side Factors ................................................................................................ 143
5.3. Data and Analysis ......................................................................................................... 145 5.3.1 Demand-Side Factors Affecting Bank Lending to SMEs in Nigeria ...................... 146 5.3.2 Supply-Side Factors Affecting Bank Lending to SMEs in Nigeria ........................ 157
5.4. Chapter Conclusions ..................................................................................................... 170
Chapter 6: The Determinants of Risk Premium and Collateral on SME Loans in Nigerian Banks ...................................................................................................................... 172
6.1. Introduction .................................................................................................................. 172 6.2. Main Hypotheses and Related Literature ..................................................................... 174
6.2.1. The Determinants of Risk Premium on SME Loans ............................................. 174 6.2.2. The Determinants of Loan Collateral .................................................................... 183
6.3. Data and Methodology ................................................................................................. 188 6.3.1 Data Collection ....................................................................................................... 188 6.3.2 Descriptive Analysis ............................................................................................... 188 6.3.3 Econometric Model ................................................................................................. 198
V. Ekpu | The Microstructure of Bank Lending to SMEs | PhD Thesis | University of Glasgow | 2015
5
6.4. Empirical Results .......................................................................................................... 201 6.4.1 Empirical Determination of Risk Premium ............................................................ 201 6.4.2 Empirical Determination of Loan Collateral .......................................................... 204 6.4.3 Robustness Checks ................................................................................................. 207
6.5. Chapter Conclusions ..................................................................................................... 209
Chapter 7: Loan Officers, Information Acquisition and the Value of Relationship Lending to Nigerian Banks ................................................................................................... 210
7.1. Introduction .................................................................................................................. 210 7.2. Main Hypotheses and Related Literature ..................................................................... 213
7.2.1. The Role of Loan Officers in Soft Information Acquisition ................................. 213 7.2.2. Benefits and Costs of Relationship Lending .......................................................... 216
7.3. Data and Methodology ................................................................................................. 222 7.3.1 Data Collection ....................................................................................................... 222 7.3.2 Descriptive Analysis ............................................................................................... 222 7.3.3 Econometric Model ................................................................................................. 235
7.4. Empirical Results .......................................................................................................... 238 7.4.1 Information Acquisition and Loan Officer Activities ............................................. 238 7.4.2 Soft Information and Benefits from Relationship Lending .................................... 242 7.4.3 Robustness Checks ................................................................................................. 245
7.5. Chapter Conclusions ..................................................................................................... 246
Chapter 8: General Conclusions and Policy Implications ................................................. 248 8.1. General Conclusions ..................................................................................................... 248 8.2. Policy Implications of Findings for Nigerian Banks and Regulators ........................... 252
8.2.1 The Role of Nigerian Banks ................................................................................... 253 8.2.2 The Role of the Nigerian Government ................................................................... 255
8.3. Future Research Agenda ............................................................................................... 259
Appendices ............................................................................................................................. 261 5.1. Frequency Table on the Importance of Borrower Characteristics ................................ 261 5.2. Differences in Means of Borrower Factors by Branch Type ....................................... 262 5.3. T-test for Equality of Means of Borrower Factors Across Branch Type ..................... 263 5.4. Levene’s Test for Equality of Variances of Borrower Factors by Branch Type .......... 264 5.5. Frequency Table of Contributory Factors to the Riskiness of SME Loans .................. 265 5.6. Frequency Table for Supply Side Factors Affecting Bank Lending to SMEs ............. 265 5.7. Importance of Borrower and Lender Factors Affecting SME Loan Supply ................ 266 6.1. Results of Stepwise Procedure for Predictors of Risk Premium .................................. 267 6.2. Results of Stepwise Procedure for Predictors of Collateral Usage .............................. 269 6.3. Results of Stepwise Procedure for Predictors of Collateral Amount ........................... 271
V. Ekpu | The Microstructure of Bank Lending to SMEs | PhD Thesis | University of Glasgow | 2015
6
7.1. Results of Stepwise Procedure for Predictors of Information Acquisition .................. 272 7.2. Results of Stepwise Procedure for Predictors of Additional Business ......................... 274
Bibliography .......................................................................................................................... 276
Accompanying Materials ...................................................................................................... 298 Annex A: Survey Questionnaire .......................................................................................... 298 Annex B: Coding Framework for Survey Data ................................................................... 310
LIST OF TABLES
3.1. Indicators of Banking Sector Performance After Consolidation .................................... 76 3.2. Ranking of Top Nigerian Banks by Key Performance Indicators- 2013 F/Y ................ 81 3.3. Top Nigerian Banks by Key Performance Ratios- 2013 F/Y ......................................... 82 3.4. Ratio of Commercial Banks’ Loans to SMEs to Total Credits (1992-2012) ................. 85 3.5. Calculation of Mean Percentage of Loans Granted to SMEs (1992-1996) .................... 87 3.6. Calculation of Mean Percentage of Loans Granted to SMEs (1997-2005) .................... 88 3.7. Calculation of Mean Percentage of Loans Granted to SMEs (2006-2012) .................... 89 3.8. Aggregate Loans to Economy and SMEs by Period (1992-2012) ................................. 90 3.9. Financing Gap to SMEs (2006-2012) ............................................................................. 91 4.1. Questionnaire Distribution and Collection by Bank .................................................... 111 4.2. Demographic Characteristics of Loan Officers ............................................................ 113 4.3. Descriptives for Firm and Owner Characteristics ........................................................ 118 4.4. Descriptives for Lender Characteristics and External Factors ..................................... 120 4.5. Descriptives for Lending Practices and Preferences .................................................... 122 4.6. Parametric Tests and Analogous Nonparametric Procedures ...................................... 124 4.7. Tests of Normality for Firm and Owner Characteristics .............................................. 124 4.8. Tests for Normality for Lender Characteristics and External Factors .......................... 127 5.1. Demand Side Factors Affecting SME Loan Supply in Nigeria ................................... 147 5.2. K-Wallis Test for Differences in the Distribution of Borrower Factors by Banks ...... 150 5.3. Correlations Between Key SME Performance Indicators ............................................ 152 5.4. Correlations Between Key Indicators of Borrower Credit Quality .............................. 154 5.5. Ranking of Contributory Factors to Riskiness of SME Loans in Nigeria .................... 155 5.6. Institutional and Environmental Factors Affecting SME Loan Supply ....................... 157 5.7. K-Wallis Test for Differences in the Distribution of Lender Factors by Banks .......... 164 5.8. Correlation Between Idiosyncratic (Bank Level) Lender Factors ................................ 166 5.9. Correlation Between External (Environmental) Factors .............................................. 167 5.10. Changes in Lending Decisions, Preferences or Policies ............................................ 169 6.1. SME Loan Pricing Practices ......................................................................................... 189
V. Ekpu | The Microstructure of Bank Lending to SMEs | PhD Thesis | University of Glasgow | 2015
7
6.2. SME Loan Collateral Practices .................................................................................... 195 6.3. Types of Collateral Accepted ....................................................................................... 196 6.4. Model 1: Definition of Variables - Determinants of Risk Premium on SME Loans ... 199 6.5. Model 2: Definition of Variables – Determinants of Loan Collateral for SMEs ......... 200 6.6. Model 1: Regression Results – Determinants of Risk Premium on SME Loans ......... 202 6.7. Model 2: Regression Results – Determinants of Collateral ......................................... 205 7.1. Centralisation/Decentralisation of Lending Functions in Nigerian Banks ................... 223 7.2. Hierarchy of SME Loan Decision Making by Size of Loan ........................................ 225 7.3. Features of Relationship Lending in Nigerian Banks ................................................... 228 7.4. Frequency of Loan Officers’ Interactions with SME Customers ................................. 229 7.5. Economic Benefits of Relationship Lending ................................................................ 232 7.6. Economic Costs (Downsides) of Relationship Lending ............................................... 233 7.7. Model 1: Definition of Variables - Acquisition of Soft Information ........................... 236 7.8. Model 2: Definition of Variables - Soft Information & Benefits from Relationships . 237 7.9. Model 1: Regression Results - Information Acquisition and LO Activities ................ 239 7.10. Model 2: Regression Results – Benefits from Relationship Lending ........................ 243
LIST OF FIGURES
3.1. Structure of the Nigerian Credit Market ......................................................................... 83 3.2. Commercial Bank Loans to SMEs as % of Total Credit to Private Sector .................... 86 3.3. Commercial Banks’ Loans to the Economy and SMEs (1992-2012) ............................ 90 4.2. Box Plot for Firm and Owner Characteristics .............................................................. 118 4.3. Box Plot for Lender Characteristics and External Factors ........................................... 121 5.1. Nigerian Treasury Bill Rates (2009-2014) ................................................................... 159 5.2. Ratio of SME Loans to Total Loans by Top 12 Nigerian Banks (2013) ...................... 161 5.3. Loan to Deposit Ratios of Top 12 Nigerian Banks (2013) ........................................... 163 6.1. Spread Between Cost of Funds, PLR and SME Loan Rate (June 2014) ...................... 190 6.2. Reasons for High Risk Pricing of SME Loans ............................................................. 191 6.3. Interest Rate Smoothing in Nigerian Banks ................................................................. 192 6.4. Use of Collateral ........................................................................................................... 194 6.5. Amount of Collateral .................................................................................................... 194 6.6. Types of Collateral Accepted ....................................................................................... 197 7.1. Degree of Centralisation/Decentralisation of Lending Functions ................................ 224 7.2. Adoption or Use of Relationship Lending Techniques in Nigerian Banks .................. 227 7.3. Loan Officers’ Knowledge of Borrowers’ Business Model and Activities ................. 230 7.4. Net Benefits from Relationship Lending ...................................................................... 234

V. Ekpu | The Microstructure of Bank Lending to SMEs | PhD Thesis | University of Glasgow | 2015
8
ACKNOWLEDGEMENT
I am extremely grateful to my supervisors, Dr Alberto Paloni and Jeanette Findlay for their
great support, professional expertise and constructive comments as well as for their
conscientious efforts and patience in reading the draft severally during the period of this
doctoral thesis. It would not have been possible to complete this thesis except for their
guidance and painstaking commitment. I would also like to appreciate my external examiner,
Professor Jake Ansell, and my internal examiner, Dr Margaret Fletcher, for their insightful
comments and contributions.
I am indebted to the Scottish Institute for Research in Economics (SIRE) for funding my PhD
studies and the Adam Smith Business School for funding the survey project. Special thanks
also goes to the Relationship Managers/Loan Officers in Nigerian banks for agreeing to
respond to the questionnaire and for their time and commitment.
My immense gratitude goes to my beloved wife, Mrs Alaere Ekpu, for her love, patience and
understanding all through the duration of my study. I also thank my parents, Mr & Mrs S.D
Ekpu, my brother, Peter Ekpu, my other siblings, and my Mother in-law, Mrs Melland
Samuel, for their prayers, moral support and encouragement in seeing to the completion of my
studies. Special thanks also goes to my colleagues and friends, Chioma Nwafor and Timothy
Birabi, for their unwavering support and our fruitful collaborations in the course of my studies.
Above all, I am most grateful to Almighty God, for his grace, love, infinite wisdom,
knowledge and understanding granted me all through the studies.

V. Ekpu | The Microstructure of Bank Lending to SMEs | PhD Thesis | University of Glasgow | 2015
9
AUTHOR’S DECLARATION
I declare that, except where explicit reference is made to the contribution of others, that this
dissertation is the result of my own work and has not been submitted for any other degree at
the University of Glasgow or any other institution.
Signature:
Printed name: VICTOR UCHE EKPU

V. Ekpu | The Microstructure of Bank Lending to SMEs | PhD Thesis | University of Glasgow | 2015
10
KEY ABBREVIATIONS
ACGSF - Agricultural Credit Guarantee Scheme Fund
ACSS - Agricultural Credit Support Scheme
AMCON - Asset Management Corporation of Nigeria
ANOVA - Analysis of Variance
BBA - British Bankers Association
BERR - Department for Business Enterprise and Regulatory Reform
BIS - Department for Business Innovation and Skills
BOA - Bank of Agriculture
BOI - Bank of Industry
CACS - Commercial Agricultural Credit Scheme
CAR - Capital Adequacy Ratio
CBN - Central Bank of Nigeria
CGI - Corporate Guides International Limited
DMBs - Deposit Money Banks
EDCs - Entrepreneurship Development Centres
EFG - Enterprise Finance Guarantee Scheme
EFP - External Finance Premium
FCMB - First City Monument Bank
FCT - Federal Capital Territory
FOS - Federal Office of Statistics
FSS - Financial Sector Strategy
GAAP - Generally Accepted Accounting Principles
GDP - Gross Domestic Product
GTB - Guaranty Trust Bank
IFRS - International Financial Reporting Standards
IQR - Interquartile Range
LO - Loan Officer

V. Ekpu | The Microstructure of Bank Lending to SMEs | PhD Thesis | University of Glasgow | 2015
11
LTD - Loan-to-Deposit Ratio
LTV- Loan-to-Value Ratio
MFBs - Microfinance Banks
MFIs - Microfinance Institutions
MSMEs - Micro, Small and Medium Enterprises
MSMEDF - Micro, Small and Medium Enterprises Development Fund
MWW - Mann-Whitney-Wilcoxon Test
NDIC - Nigeria Deposit Insurance Corporation
NEXIM - Nigeria Export-Import Bank
NIPC - Nigeria Investment Promotion Council
NPL - Non-Performing Loans
NSSBF - National Survey of Small Business Finance
OLR - Ordinal Logistic Regression
PAT - Profit After Tax
PBT - Profit Before Tax
PLR - Prime Lending Rate
P2P- Peer-to-Peer Lending
ROAA - Return on Average Assets
ROAE - Return on Average Equity
RM - Relationship Manager
SAP - Structural Adjustment Programme
SMEs - Small and Medium Sized Enterprises
SMEDAN - Small and Medium Enterprises Development Agency
SMEEIS - Small and Medium Enterprises Equity Investment Scheme
SPSS - Statistical Package for Social Sciences
SSA- Sub-Saharan Africa
STATA - Statistical Analysis Package
UBA - United Bank for Africa

V. Ekpu | The Microstructure of Bank Lending to SMEs | PhD Thesis | University of Glasgow | 2015
12
CHAPTER 1
INTRODUCTION
1.1. Background to the Study
Over the past decade, the subject of bank finance for small and medium enterprises (SMEs)
has become a topic of importance both to national governments and internationally across
countries (as some World Bank research papers have revealed – Ayyagari et al., 2008, 2012;
Beck and Demirguc-Kunt, 2006; Beck et al., 2006, 2008a,b, 2011; Berg and Fuchs, 2013). On
the one hand, in the wake of the global financial crisis in 2008, there has been much comment
that banks are not lending enough to businesses, especially to SMEs; that lending is conducted
at rates that are too high, and that banks are turning down loan requests for viable businesses.
On the other hand, over this same period, many banks around the world have seen a steady
decline in demand for loans and a steep increase in the cost of wholesale funding, upon which
much of their lending depends.
In developing economies such as economies in Sub-Saharan Africa, SMEs are typically more
credit-constrained than large firms, severely affecting their possibilities to grow and expand
(Beck et al., 2005, 2006; Beck and Demirguc-Kunt, 2006; Beck et al., 2008a; Ayyagari et al.,
2008, 2012). With respect to external financing to SMEs, banks have an important role to play
as dominant players in the financial system in Sub-Saharan Africa, especially when it comes
to serving the higher end of the SME market segment. This is mostly due to the limitations of
informal finance in providing capital for business expansion (Ayyagari, et al., 2012). Other
external financing options such as corporate bonds and organised securities markets are
typically only accessed by larger firms requiring longer term funding (Beck et al., 2008a).
The extent to which commercial banks lend to SMEs depends on a range of country and bank-
specific factors. Among the main factors impacting bank financing for SMEs are inter alia the
macroeconomic environment, the legal and regulatory environment, the state of the financial
sector infrastructure, banks’ own internal limitations in terms of lending capacity and
technology, and SME-specific factors, particularly the SME landscape in terms of number,
size, and sector of business operation, as well as the inadequacy of proprietary information on
SMEs (Berger and Udell, 1998; Beck et al., 2008b; de la Torre et al., 2010; Beck et al., 2011).
V. Ekpu | The Microstructure of Bank Lending to SMEs | PhD Thesis | University of Glasgow | 2015
13
This study takes a specific look at the microstructure of bank lending to SMEs in the post-
consolidated banking sector in Nigeria, with specific focus on how lending decisions are taken
at the micro-level (bank-level). The reason for studying the Nigerian banking system is to
examine trends in the lending structures, practices and performance of banks in developing
credit markets like Nigeria, applying well known methods used in empirical studies on SME
lending across the developed credit markets. The Nigerian banking sector is one of the largest
in Sub-Saharan Africa, with more than 12 banks listed in the top 1,000 banks in the world, the
largest of any African country. This makes Nigerian banking sector a very important financial
centre in the developing world and worth investigating. Some World Bank policy research
papers and African Development Bank papers (e.g. Hesse, 2007; Beck et al., 2008a,b;
Ayyagari et al., 2008, 2012; Calice, Chando and Sekioua, 2012; Berg and Fuchs, 2013) have
revealed a number of interesting findings on the factors constraining lending to SMEs in sub-
Saharan African countries. Previous studies on bank lending in Nigeria have only taken a
macro view of the determinants of financial intermediation in Nigeria, but no study to the
researcher’s knowledge has taken a critical look at the microstructure of SME loan decision-
making and the inter-relationships that exists among key determinants of lending. This is thus
a major contribution of this thesis to the body of knowledge. For the purpose of this study,
SMEs were defined as enterprises with total asset size not exceeding N500 million (~ £2
million and with employees between 11 and 300 (CBN, 2010). SME loans are therefore loans
granted to firms of this nature, irrespective of loan size. The term ‘SME Loans’ refers to all
kinds of credit facilities to SMEs, including term loans, overdrafts, commercial mortgages,
lease financing and receivables financing (factoring).
The Rationale for Bank Finance for SME Borrowers
SME borrowers are faced with a plethora of financing sources ranging from debt finance,
equity capital and venture capital finance. However, there is considerable evidence to show
that bank finance is more patronised and hence a very important component of SME finance.
In a National survey of Small Business Finance (NSSBF) carried out by the US Federal
Reserve Bank in 2003, it was found that 86.5% of SMEs that required external finance
obtained credit from commercial banks, which by far surpasses the share of other types of
financial institutions (e.g. thrift institutions, credit unions, finance companies, etc) offering
small business loans and other financial services (Mach and Wolken, 2006). The survey

V. Ekpu | The Microstructure of Bank Lending to SMEs | PhD Thesis | University of Glasgow | 2015
14
classified small firms as those having net assets of $25 Million or less. Larger firms tend to
gain access to public capital markets by issuing commercial papers and bonds, whereas
smaller firms usually find it difficult to access these other sources of credit, and hence become
bank-dependent1. According to the Annual Survey of Small Businesses in Scotland (2005),
bank loans were the most often used source of finance (42%), followed by bank overdraft
(26%). 11% of small businesses obtained a grant, and a further 9% used leasing or hire
purchase arrangements, i.e. asset-based finance (pp.153). In more recent results from the
BERR’s Annual Small Business Survey 2007/08, it was found that of the number of UK
SMEs that sought external finance, 46% resorted to bank loans, confirming the importance of
Bank finance for small businesses (William and Cowling, 2009:09).
In Nigeria, however, a recent survey revealed that 80% of Nigerian SMEs are excluded from
the financial markets (Sanusi, 2013). Since 2003, commercial bank loans to SMEs have been
plummeting at an exponential rate. Analysis of the annual trend in the share of commercial
bank credit to SMEs indicates a decline of about 7.5% in 2003 to less than 1% in 2006 and a
further decline in 2012 to 0.14%. Notwithstanding the consolidation of the Nigerian banking
industry since 2006, which means that Nigerian banks are now more capitalised and
financially robust, the share of commercial bank loans to SMEs continues to decline
significantly. Despite the positive effects of bank consolidation, Nigerian banks have tended to
channel more of their loan portfolio to large corporates and multinational institutions, leaving
the lower end of the market (i.e. SMEs) due to the latter’s perceived riskiness and opacity.
A number of reasons have been identified for the poor funding of SMEs by commercial banks.
These include lack of managerial capacity, inadequate collateral, poor record keeping and poor
financial performance on the part of business borrowers, among others. On the supply side,
banks face high transaction costs mostly due to regulation and the business environment and
pass these costs on to borrowers. Lenders also lack understanding on the nature and operations
of SMEs. Since Nigerian banks tend to focus on lending to large corporations and
multinational companies, they devote less resources to building lending relationships with
SMEs and hence garner less information on their SME customers. Moreover, the information
environment on which the banks rely to make lending decisions is weak. For example,
1 In recent times, however, small firms have been able to access credit from the dotcoms.

V. Ekpu | The Microstructure of Bank Lending to SMEs | PhD Thesis | University of Glasgow | 2015
15
standard customer identification data and information on borrowers’ credit repayment rates is
inadequate and hardly accessed (FSS 2020).
1.2. Objectives of the Study
Given the above background, this research seeks to investigate the following questions:
(1) What are the demand and supply side constraints to bank involvement with SMEs in
Nigeria?
(a) What are the characteristics of SME borrowers which lenders consider important or
influential when appraising SME loan applications?
(b) What are the characteristics of lenders and their external environment, which in turn
influence their inclination to lend to SME borrowers?
(2) What are the determinants of loan contract terms in Nigerian banks?
(a) What are the determinants of risk premium on SME loans?
(b) What are the determinants of loan collateralisation?
(3) Of what economic value is relationship lending to banks in Nigeria?
(a) How do loan officers acquire and process soft information2?
(b) What are the benefits derivable from relationship lending based on soft information
accumulation and personal touch by relationship managers?
2 Soft information as used here and in this study largely refers to proprietary information (i.e. sensitive or marketable business information) privy to financial intermediaries having relationship and/or providing financial services to businesses. Soft information is obtained through social interaction of loan officers or relationship managers with their customers and from other local market sources. The financial and non-financial information that banks have of their customers are then synthesized to produce additional information on the credit worthiness or risk profile of business borrowers, which then helps in making lending decisions.

V. Ekpu | The Microstructure of Bank Lending to SMEs | PhD Thesis | University of Glasgow | 2015
16
1.3. Significance and Original Contributions of the Study
Significance of the Study to SME Lending Stakeholders
This study primarily uses survey methodology to investigate the microstructure of SME
lending decisions, practices and policies in Nigerian banks. It is hoped that the results of the
study will be of interest to the stakeholders in the SME lending market, that is, policy makers,
bankers and small business borrowers in Nigeria. First, SMEs are important to the Nigerian
economy. They account for more than 70% of industrial employment and more than 60% of
agricultural labour force (Lawal and Ijaiya, 2007). Thus, understanding the factors affecting
lenders’ decisions to lend to SMEs including the factors that affect the quantity and cost of
credit available to SMEs is thus crucial for improving SME lending policies. Secondly,
participating banks may especially benefit from this study as it might help respondent banks
understand the profitability and economics of their lending methods, policies, and business
models. In addition, they may understand the economic value/benefits of relationship lending
to their bank. While preserving anonymity of sensitive lender information, the results of this
survey may also assist respondent banks in benchmarking their lending performance with the
industry average, hence helping to improve their competitive business strategy. Thirdly, it is
intended that the results of this survey will also help improve the knowledge of bank-
dependent SME borrowers in Nigeria with respect to understanding banks’ requirements and
expectations for loan applicants and users of loanable funds in order to better satisfy their
banking and financial needs.
Original Contributions of the Study
Apart from the practical outcome of the research for banks, borrowers and policy makers, this
study also highlights some academic contributions to the understanding of the subject of SME
lending, which is an important area of bank lending that produces macroeconomic outcomes.
In specific terms, the original contributions of this study lie in the following areas:
1. Contributions to the literature on the supply side of SME financing:
This study contributes to the literature on the supply-side of bank financing to SMEs. While
many studies have already advanced our understanding of the demand-side of SME lending,
only a few studies exists on the supply side of bank financing. Further, only a few studies have

V. Ekpu | The Microstructure of Bank Lending to SMEs | PhD Thesis | University of Glasgow | 2015
17
taken a look at the relative influence between borrower characteristics versus lender
characteristics in determining SME loan supply in Nigeria. In addition, the study uses survey
data on Nigeria bank loan officers as against secondary data on bank lending, which do not
properly capture the idiosyncratic effects of each bank and the microstructure of the banks’
lending practices, business models and decision-making processes.
2. Contributions to the literature on the impact of bank size/lender size on SME lending:
This study is the only study to my knowledge that examines SME lending in Nigeria from the
perspective of a post-consolidated and post-crisis banking sector in Nigeria. The study shows
the impact of the 2006 consolidation in the Nigerian banking industry on lending volumes to
SMEs post-consolidation in comparison with pre-consolidation levels, which is a contribution
to the literature on bank size and the role of mergers and acquisitions on SME lending. Also,
as the study period examined is the period since the 2008 crisis, the study can potentially be
used for comparison purposes to show the impact of the crisis on SME lending.
3. Contributions to the micro-level aspects of SME lending:
Previous studies on bank lending in Nigeria have only focused on the macro view of the
determinants of financial intermediation in Nigeria, but no study to my knowledge has taken a
critical look at the micro-level aspects of loan decision-making and the inter-relationships that
exists among key determinants of lending. For example, this study shows that there are
significant differences in the lending behaviour of banks depending on a number of firm-
specific, bank-specific and external factors. Within the firm-specific factors, this study shows
that there are significant correlations between key SME performance indicators and between
key indicators of borrower credit quality. Furthermore, within the bank-specific factors, the
study also highlights significant relationships between idiosyncratic (bank-level) factors and
between external (environmental) factors. To the extent that this research examines the role of
these factors and how they interact together in determining the lending behaviour of banks,
this thesis fills a major gap in the literature on the microstructure of bank lending to SMEs in
Nigeria and hence represents a major contribution to the body of knowledge in credit research
in Nigeria.

V. Ekpu | The Microstructure of Bank Lending to SMEs | PhD Thesis | University of Glasgow | 2015
18
4. Contributions to the literature on the determinants of SME loan terms:
Not only does this study focus on the availability (i.e. quantity) of loans to SMEs in Nigeria, it
also examines the determinants of the terms on which such loans are made, (i.e. interest rates
and collateral requirements). Though previous studies in Nigeria have examined the
determinants of loan contract terms, these studies only consider the cost of overall lending and
do not focus on SME loans. The significance of this study is thus demonstrated by the fact that
it is the first major attempt (to my knowledge) aimed at exploring the micro-level determinants
of loan contract terms on SME loans in Nigeria. The study incorporates major theoretical
works on loan pricing, collateral determination and the value of relationships in loan
contracting.
5. Contributions to the literature on soft information acquisition and the role of loan officers
in relationship lending:
This study examines the economic benefits of relationship lending and how loan officers in
Nigeria acquire and process soft information. A number relationship lending studies (e.g.
Petersen and Rajan, 1994 and Berger and Udell, 1995, among others) have tended to focus on
the borrower benefits from relationship lending without due consideration to the role of loan
officers in generating those benefits. It is the loan officers themselves that have direct contact
with the bank’s borrowers and are responsible for carrying out due diligence during the
underwriting phase and monitoring the borrower after the loan has been disbursed. Thus,
while some studies talk about the bank-borrower relationship, this study takes a look at the
loan officer-borrower relationship (see Berger and Udell, 2002).
A significant contribution of this study is that by focusing on the activities of loan officers, we
can analyse the underlying mechanism that drives the accumulation of soft information. Thus,
in essence, this study addresses the fundamental issues of whether loan officers are central to
soft information acquisition, and what value relationship lenders derive from soft information
accumulation. In addition, this aspect of information acquisition in SME lending has never
been studied for Nigeria and hence this study represents a novel contribution to the body of
knowledge in this area in Nigeria and indeed Sub-Saharan Africa.
V. Ekpu | The Microstructure of Bank Lending to SMEs | PhD Thesis | University of Glasgow | 2015
19
1.4. Formulation of Research Propositions
In line with the objectives of the study, one can explain the rationale for formulating the
research questions and propositions of the study:
Proposition 1: Bank lending to SMEs in Nigeria in the post-consolidated banking sector and
in the post-crisis period is constrained by both demand- and supply-side factors.
Numerous papers have examined the drivers of bank involvement with SMEs and the
obstacles considered significant in constraining bank lending to SMEs (e.g. Fletcher, 1995;
Cole et al., 2004; Beck et al., 2008b; de la Torre, Martinez Peria and Schmukler, 2010; Bruns
and Fletcher, 2008). A World Bank survey on Nigerian firms’ access to finance showed that
most commercial banks are reluctant to provide long-term credit to SMEs (cited in Abosede
and Arogundade, 2011). This is because of perceived risks and uncertainties. Lenders cite a
number of demand-side factors plaguing the ability of SMEs to obtain bank finance. These
include poor record keeping, absence of the appropriate managerial skills, inadequate
collateral, and high risk of loan defaults, among other factors. However, there also exist
supply-side issues such as high transaction costs, regulatory/market requirements, and lack of
understanding by the banks of the nature and operations of SMEs. In addition, according to a
recent World Bank policy research paper (Berg and Fuchs, 2013), lending to SMEs in Africa
is largely driven by the structure and size of the economy, the degree of bank competition, the
extent of government borrowing and extent of innovation mainly introduced by foreign
entrants to financial sectors, and the state of the financial sector infrastructure and enabling
environment. Thus, a good understanding of the interplay of these factors will help us
comprehend the firm-specific (demand side), bank-specific (supply side) and external
constraints affecting SME lending and how to improve on the performance of the Nigerian
banking sector in the area of SME lending.
Proposition 2: The determinants of SME loan contract terms in Nigerian banks are largely
connected with the opacity and riskiness of SMEs, loan risk characteristics, bank-specific
factors and the nature of bank-borrower relationships.
SMEs in Nigeria, like in many low and middle-income economies, face financing difficulties
because they are relatively young, inexperienced and informationally opaque. Most of them
also lack good credit reputation and are exposed to huge operational risks especially from
V. Ekpu | The Microstructure of Bank Lending to SMEs | PhD Thesis | University of Glasgow | 2015
20
changes in the external business environment (Ayyagari, et al. 2008). Many of them do not
maintain proper accounting records let alone audited financial statements, thus accounting for
the acute shortage of information between borrowers (themselves) and the lenders. Given
these factors, when they eventually obtain credit from lenders, they do so at relatively high
costs. The case for Nigeria is particularly worrisome because of the high failure rate of SMEs
owing to operational and infrastructural deficiencies, which drives business costs higher, as
well as the high incidence of loan diversion to personal uses especially among small scale
agricultural producers and which poses great “moral hazard” risks to lenders. To mitigate
these risks and ultimately align the incentives of the borrower with those of the lender, banks
often decide not to lend, charge high interest rates to deserving borrowers and/or request for
fixed collateral, and in almost all cases do so at the full amount of the loan. This study thus
examines the micro-level determinants of the risk premium on SME loans and the incidence of
loan collateralisation in Nigeria.
Proposition 3: Relationship lending (based on information acquisition and personal touch by
relationship managers) is of high economic value or significance to Nigerian banks
A number of studies have highlighted the economic benefits and costs of relationship lending
both to banks and to business customers (e.g. Diamond, 1984; Haubrich, 1989; Petersen and
Rajan, 1994; Berger and Udell, 1995; Berlin, 1996; Levonian and Soller, 1996; Berlin and
Mester, 1998; Cole, 1998; Petersen, 1999; Boot 2000; Elyasiani and Goldberg, 2004;
Ergungor, 2005; Bharath et al., 2007; Peek, 2007; Benvenuti et al., 2010; Uchida et al., 2012).
This study, however, focuses on the benefits of relationship lending to banks (e.g. in Levonian
and Soller, 1996; Petersen, 1999; Boot, 2000; Bharath et al., 2007; Peek, 2007; Uchida et al.,
2012 etc). In the wake of the crisis, most national governments (including Nigeria) have called
for banks to return to the traditional banking model based on deposit taking and loan
origination and spin off investment banking-related entities. There is an on-going debate
between economic regulators and bankers as to the need to strike a balance between serving
business customers better (through relationship banking) and delivering higher return on
equity (ROE), the ultimate responsibility of the bank management to its shareholders and
investors. It has also been argued that, in a competitive environment, banks would improve
their competitiveness by establishing lending relationships with their SME customers (because
SMEs prefer to have a close relationship with their banks rather than an impersonal, arms-
V. Ekpu | The Microstructure of Bank Lending to SMEs | PhD Thesis | University of Glasgow | 2015
21
length relationship).
From the literature, the benefits of relationship lending to banks generally include: (i)
information efficiency in loan origination: here the value of relationship is measured in terms
of information adequacy and usefulness, screening ability or quality of lending decisions; (ii)
cost effectiveness of relationship lending: This is measured by the unit cost of making a loan;
(iii) customer satisfaction: Banks gain customer satisfaction from frequent and personalized
contact with SMEs (v) additional business: The repeat business that banks enjoy from their
business customers which is directly attributable to better customer satisfaction and the
relationship lender’s informational advantage over a non-relationship lender; (iv) loan
performance: This is measured by ratio of non-performing loans to total loan portfolio and
profit efficiency measures such as the rate of return on risk-adjusted SME loans.
1.5. Research Methodology
The methodology utilised by this study is quantitative analysis of survey data. According to
Saunders et al. (2007), quantitative analysis refers to techniques that can be used to process or
analyse numerical or quantitative data.
Data Collection
There are different possible data collection methods such as examining secondary sources,
observation, questionnaire survey and semi-structured or unstructured interviews (Saunders et
al., 2007). After evaluating all possible data collection methods, the researcher found that the
most appropriate method that will provide practical answers to the research questions and
stated objectives of the study was the use of a questionnaire survey. The use of a survey
questionnaire is most ideal for this type of project because it allows for responses to be
gathered in an articulate and standardised way and since the questions are interpreted the same
way by all respondents (Robson, 2011). Other methods such as observation and in-depth
interviews might be well suited for exploratory studies such as discovering customers’
attitudes or opinions. Data for this study was also collected from secondary sources such as
banks' annual reports, loan policy statements, relevant government/central bank publications
as well as previous survey research/published works on SME financing (e.g. World Bank

V. Ekpu | The Microstructure of Bank Lending to SMEs | PhD Thesis | University of Glasgow | 2015
22
research papers, and other development finance papers examining bank finance for SMEs in
Africa). The justification for using additional secondary sources is that where primary data is
unable to provide adequate and convincing evidence, secondary data sources will support and
validate the findings.
Sampling Technique
The sampling technique adopted for this study is purposeful sampling (also known as
judgmental sampling). Purposeful sampling is a non-probability sampling procedure in
which the judgment of the researcher is used to select cases that make up the sample to enable
him answer his research questions and meet his research objectives (Saunders et al., 2007).
Such samples cannot, however, be considered to be statistically representative of the entire
population. Patton (2002) emphasizes this point by contrasting the need to select information-
rich cases in purposeful sampling with the need to be statistically representative in probability
sampling. In connection with this need for sampling to be more representative, this study
selected twelve of the largest Nigerian banks for the survey. These include: (1) Zenith Bank
(2) First Bank (3) Guaranty Trust Bank (GTB) (4) Access Bank (5) United Bank for Africa
(UBA) (6) Ecobank Nigeria Plc (7) Fidelity Bank (8) First City Monument Bank (FCMB) (9)
Skye Bank (10) Diamond Bank (11) Stanbic IBTC, and (12) Union Bank of Nigeria. These 12
banks are headquartered in Lagos, the commercial capital of Nigeria. Together, these banks
account for more than 77% of the market share of assets and deposits and they were among
the only 13 Nigerian Banks listed in the Top 1,000 global banks in 2013 by the Banker
Magazine (Omoh, 2013). The reason for excluding 1 of the 13 largest banks is that it is a
foreign bank (Standard Chartered Bank), while the others are domestic banks, and including
just 1 foreign bank together with 12 domestic banks will misrepresent the overall findings
from the survey. Moreover domestic banks dominate the Nigerian banking system. By
estimation, these 12 banks also provide more than three-quarters of the total loans to SMEs in
Nigeria. The participants in the survey included loan officers, relationship/business managers
who are either directly or indirectly involved in appraising SME loan applications and/or
involved in disbursing, collecting or reviewing loans made by banks to SMEs resident in
Nigeria.
A total of 249 questionnaires were distributed to relationship managers and loan officers
spread geographically across 41 branches of the 12 banks in the Lagos Financial Centre, out of
V. Ekpu | The Microstructure of Bank Lending to SMEs | PhD Thesis | University of Glasgow | 2015
23
which 121 were returned, implying a moderately high response rate of 48.6% compared to
similar studies. For most academic studies involving top management or organisation’s
representatives, a response rate of approximately 35% is reasonable (Baruch, 1999). Saunders
et al. (2007: 358) also report that a response rate of 30-50% for questionnaires delivered and
collected is in fact normal. 56 respondents were loan officers serving low-end SME customers
in retail branches, while 65 loan officers were domiciled in corporate/commercial branches.
Using a 12-page questionnaire, a total of 30 broad questions were asked, which generated 166
variables in all. Questions asked related to how lending is organised at the bank level as well
as the characteristics of borrowers and lenders, which influence the bank's willingness to lend
to SMEs. It also includes questions on changes in lending policies/risk appetite since the
global financial crisis of 2008-09. The questions asked were also connected to the
determinants of SME credit terms, the role of loan officers in loan decision-making and the
economic value derivable from relationship lending.
Data Analysis
This study also utilizes quantitative methods of analysis, including frequency distributions,
descriptive statistics, ratio analysis, nonparametric statistics, and econometric testing of
relevant relationships using ordinal logistic regression (OLR) models. The reason for the
choice of ordinal logistic regression model over other conditional likelihood estimations such
as the binary logit and probit models or the multinomial logit and probit model is that all the
dependent variables are ordered outcomes. Where there are ordered outcomes exceeding two
categories, with meaningful sequence (e.g. opinion surveys- strongly agree to strongly
disagree; frequencies- never to always; ratings - poor to excellent, etc), OLR models become
inevitable (Norusis, 2012; Katchova, 2013; Torres-Reyna, 2014). The stepwise regression
procedure was also employed as part of robustness checks to test the quality of predictors used
in the OLR regression models in the empirical chapters.
1.6. Structure of the Thesis
This thesis is divided into seven chapters, including this introductory chapter, two literature
review chapters, three main empirical chapters, and a concluding chapter.
V. Ekpu | The Microstructure of Bank Lending to SMEs | PhD Thesis | University of Glasgow | 2015
24
Chapter 1 provides the background, motivation and justification for the research.
Chapter 2 contains a full literature survey on bank lending to SMEs, beginning with the
theoretical views on money creation and credit rationing by the new Keynesians and post
Keynesians. It then proceeds to examine in detail the financing options for SMEs as well as
the demand- and supply- side factors affecting banks’ involvement with SMEs.
Chapter 3 contains a literature review specific to the Nigerian banking industry, looking at
specific trends in bank lending to SMEs in the post-consolidated banking sector in Nigeria,
including the role of government institutions and financing programmes directed at boosting
commercial lending to SMEs.
Chapter 4 describes the research methods used in this study, including the data collection
method and procedures, sampling techniques and methods of data analysis. The limitations of
the study are also stated in this chapter.
Drawing from the content of chapter 2 and 3, the fifth, sixth and seventh chapters use survey
data to investigate the lending criteria, decisions and practices of Nigerian banks with respect
to SME loans as well as the effectiveness of the lending techniques used in making such loans.
Chapter 5 examines the relative influence between demand and supply-side factors affecting
bank lending to SMEs in Nigeria, including the factors banks consider influential in
determining whether or not to approve or reject an SME loan application, as well as the
correlations and inter-relationships between key SME performance and risk indicators,
indicators of credit quality, bank-level factors and external/environmental factors affecting
SME lending in Nigeria.
Chapter 6 applies the contemporary theory of loan pricing in investigating the determinants of
risk premium on SME loans and the incidence of loan collateralisation in Nigerian banks.
Chapter 7 explores the link between soft information acquisition and loan officer
attributes/lending activities, and examines the benefits or economic value of relationship
lending to Nigerian banks.

V. Ekpu | The Microstructure of Bank Lending to SMEs | PhD Thesis | University of Glasgow | 2015
25
Chapter 8, the final chapter concludes the research and offers some policy suggestions to both
Nigerian banks and the government. It also provides some future research agenda in the area
of SME lending.
V. Ekpu | The Microstructure of Bank Lending to SMEs | PhD Thesis | University of Glasgow | 2015
26
CHAPTER 2
BANK INVOLVEMENT WITH SMEs: DEMAND- AND SUPPLY-SIDE CONSTRAINTS
2.1: Introduction
The availability of bank finance to small and medium sized enterprises (SMEs) is an issue of
topical debate among policy makers and practitioners around the world especially at this time
of severe economic stress. SMEs play a significant role in the economies of most countries. In
the UK for instance, there are over 4.8 million SMEs, accounting for more than 50% of
employment and business turnover in UK3. In Nigeria, SMEs account for more than 70% of
industrial employment and more than 60% of agricultural labour force (Lawal and Ijaiya,
2007). Since small firms are innovative, flexible and adaptive, they have been described as
vital and crucial to the strength of the economy as a whole. Sadly, however, due to their small
scale of operations, most do not have adequate access to financial resources. In addition, the
quality of service they receive from their banks and the terms on which those services are
provided are key elements in determining the success of this sector. SMEs tend to face
financing difficulties because they are relatively young, inexperienced and informationally
opaque. Most of them also lack good credit reputation and are exposed to huge operational
risks. Given these factors, when they eventually obtain credit from lenders, they do so at
relatively high costs.
Since the onset of the global financial crisis in 2007, many banks around the world have
reduced lending to small businesses due to the so-called “liquidity squeeze” and the claim by
bank managers that they cannot find high quality applicants. While on the one hand, some
commentators (e.g. media, government) are of the opinion that banks (the supply side) are not
adequately supporting viable businesses, bankers on the other hand, see the biggest driver of
lending levels to be demand influenced by wider economic conditions and business
confidence. Conventional wisdom teaches that the demand for bank loans naturally declines
during a recession as businesses scale back on inventories and capital investment plans, while
tending to build up cash reserves. Similarly, banks tend to tighten credit supply during
3 See HM Treasury (2010); see also Competition Commission, 2002, volumes 1-4 for details of a report on banking services to SMEs in UK.
V. Ekpu | The Microstructure of Bank Lending to SMEs | PhD Thesis | University of Glasgow | 2015
27
financial crisis. Such a tightening in credit supply could be the result of a number of factors,
including an increase in banks’ cost of funds relative to the bank rate, or a reduction in risk
appetite (Bell and Young, 2010). However, in the light of the recent financial crisis,
quantitative easing (the process by which a central bank injects more money directly into the
economy) has helped to ameliorate the consequences of higher cost of funds, credit constraints
and the risk of very low inflation (Bank of England, 2009).
So the question remains, what is the relative influence between demand and supply in terms of
the availability and pricing of loans4? It is worth mentioning that for Post Keynesians, the
availability of credit is demand determined but this is subject to an assessment of the
borrower’s creditworthiness, while neoclassicals believe that credit is supply determined. The
post-Keynesian theory of endogenous money creation presupposes that money creation in a
modern economy is ultimately dependent on the demand for credit, and not the supply of
credit as most mainstream economists say (Pilkinton, 2014). The Bank of England, in a recent
paper (McLeay, Radia and Thomas, 2014), finally endorsed the post-Keynesian endogenous
money theory, though there are still a number of debates on the relative role of money demand
and supply in determining lending constraints. The paper explains that the majority of money
in the modern economy is created by commercial banks making loans, a phenomenon that is
contrary to the money multiplier theory found in most macroeconomics textbooks – which is
that banks simply act as intermediaries, lending out savings deposits that customers place with
them.
Generally, the decision to grant the loan requests of small firms is a function of several factors.
On the demand side, factors such as firm and owner characteristics, loan characteristics,
availability of collateral, as well as firm-lender relationship characteristics play crucial roles in
lending decisions. On the supply side, some of the major determinants of the willingness and
ability of banks to extend credit to SME borrowers are the effects of bank size as well as other
banking market characteristics. There are also possible interdependencies between these set of
variables. For example, the strength5 of the borrower-lender relationships has been found to
4 This study utilises a mix of primary and secondary data evidence to help to answer this question.
5 Berger and Udell (1995) used the length (duration) of borrower-lender relationship to measure the strength of relationship, while Petersen and Rajan (1994) utilised in addition to length other variables like the degree of a firm’s use of non-loan related financial services as well as a measure of the firm’s concentration of borrowing from a few lenders.
V. Ekpu | The Microstructure of Bank Lending to SMEs | PhD Thesis | University of Glasgow | 2015
28
have significant effects on loan contract characteristics. Specifically, longer relationships were
found to reduce loan rates and collateral requirements of banks (Petersen and Rajan, 1994;
Berger and Udell, 1995).
Bank characteristics have also been found to have effects on loan pricing and maturity (e.g
Hubbard, Kuttner and Palia, 2002; Coleman, Esho and Sharpe, 2002). Research also shows
that there are several factors that affect the use or non-use of the various lending technologies
and therefore the extent to which banks lend to credit worthy transparent and opaque SMEs.
Berger and Udell (2006) identify the financial institution structure and the lending
infrastructure6 as key elements in determining the availability and quantum of credit supplied
by banks to SMEs using different lending technologies. Financial institution structure implies
the market presence of different classes of financial intermediaries that provide credit, as well
as the competition among these institutions. Berger and Udell (2006) identify three major
categories, namely: large versus small banks; foreign owned7 versus domestically owned and
state-owned versus privately owned. A part of this review considers the dichotomy between
large and small banks and excludes the latter two categories in order to keep the research
focused on bank size features, which may exist in the country of study. There is also
considerable evidence that market concentration can affect the supply of credit to SMEs
(Petersen and Rajan, 1995). Other authors have raised concerns that the global consolidation
of financial services namely through mergers and acquisitions can arguably have adverse
effects - under certain market conditions - on the supply of credit to small businesses (e.g.
Peek and Rosengren, 1995a; Levonian and Soller, 1995; Berger and Udell, 1996). This stems
partly from the empirically negative association between bank size and allocation of assets to
SME lending. Overall, recent trends in deregulation and technological changes have also
fuelled significant changes made in SME credit availability. These factors have tended to
favour large banks, with many of them expanding their scale and scope of operations both
geographically and in product mix diversification with attendant effects on the future of SME
lending. 6 The lending infrastructure refers to the rules and conditions provided mostly by governments or their regulatory agencies that affect financial institutions and their abilities to lend to different potential borrowers. According to Berger and Udell (2006), the lending infrastructure consists of three environments: (a) the information environment (b) The legal judicial and bankruptcy environment (c) the tax and legal environments.
7 Foreign owned banks are typically part of a large banking group, and as such they have similar characteristics as large banks. They have a wholesale orientation and may therefore be disadvantaged in small business lending.
V. Ekpu | The Microstructure of Bank Lending to SMEs | PhD Thesis | University of Glasgow | 2015
29
The rest of this chapter investigates the literature on the various theoretical views on money
creation and credit rationing (section 2.2). Next, the chapter examines the financing options
available to SMEs (section 2.3), the demand-side or borrower factors affecting bank lending to
SMEs (section 2.4) as well as the lender-specific and environmental factors constraining bank
lending to SMEs (section 2.5). The chapter concludes in section 2.6
2.2. Theoretical Views on Money Creation and Credit Rationing
2.2.1. Loanable Funds Theory Vs. Post-Keynesian Endogenous Money Theory
In what appears to be an adequate explanation to how money is created in a modern fiat
money system, the Bank of England recently published an article in its quarterly review
published in March 2014 (i.e. McLeay, Radia and Thomas, 2014). This paper literally rejects
the conventional theories of bank lending and money creation (e.g. those found in
macroeconomics textbooks like Krugman and Wells, 2009; Mankiw, 2011) and seems to
endorse the endogenous money creation theory of Post-Keynesian heterodox economists. One
major misconception in most macroeconomics textbooks alluded to by the Bank of England is
that banks act simply as intermediaries, lending out the deposits that savers place with them.
According to this view, deposits are typically ‘created’ by the saving decisions of households,
and banks then ‘lend out’ those existing deposits to borrowers, for example to companies
looking to finance investment or individuals wanting to purchase houses. In fact, when
households choose to save more money in bank accounts, those deposits come simply at the
expense of money that would have otherwise gone to companies in payment for goods and
services. Saving does not by itself increase the deposits or ‘funds available’ for banks to lend
(McLeay et al., 2014). Thus in essence, viewing banks as simply intermediaries ignores the
fact that commercial banks are actually creators of deposit money. The Post-Keynesian
Endogenous Money theory presupposes that as financial intermediaries, commercial banks
have the capacity to create money. By lending money that they do not directly possess,
commercial banks are in effect issuing money. For example, whenever a bank makes a loan, it
simultaneously creates a matching deposit in the borrower’s bank account, thereby creating
new money. Though commercial banks create money through lending, their lending activities
V. Ekpu | The Microstructure of Bank Lending to SMEs | PhD Thesis | University of Glasgow | 2015
30
are however limited by prudential regulations, which imposes constraints as a way of
maintaining the resilience of the financial system.
Another area of misconception relates to the so-called “money multiplier approach” to the
creation of money, which suggests that the central bank determines the quantity of loans and
deposits in the economy by controlling the quantity of central bank money. According to this
view, central banks implement monetary policy by choosing a quantity of reserves. And
because, it is assumed that there is a constant ratio of broad money to base money, these
reserves are then “multiplied up” to a much greater change in bank loans and deposits
(McLeay et al., 2014). For this theory to hold, the amount of reserves must be a binding
constraint on lending, and the central bank must directly determine the amount of reserves.
According to the credit view of monetary policy, one channel through which changes in bank
reserves (induced by open market operations) can affect real activity is by affecting the
quantity of funds that banks have to lend (Bernanke and Lown, 1991). This is mostly achieved
by varying the reserve requirements of banks. Higher reserve ratios reduce the quantum of
funds available for onward lending, and vice versa. Though the money multiplier approach is
particularly useful in understanding how the amount of reserves is determined, it does not
describe how money is created in the real world.
In practice nowadays, rather than controlling the quantity of reserves, central banks typically
implement monetary policy by setting the price of reserves – that is, the interest rates.
According to Coppola (2014), the perception that the quantity of reserves created drives the
amount of loans granted by banks is wrong. This is because banks’ decisions to lend are based
on the availability of profitable lending opportunities at any given point in time. Lending is
driven by the banks’ risk appetite. Banks lend when the risk/return profile is in their favour.
When it is not, no amount of extra reserve creation will make them lend. Monetary policy
therefore focuses on the price of money, not its quantity, since changes in the price of money
will influence the returns available to banks for lending and therefore their willingness to lend.
The Bank of England’s recent paper (McLeay et al., 2014) argues that the most important
influence on money creation is the interest rate. It admits that monetary policy is the ultimate
constraint on lending.
“The interest rate that commercial banks can obtain on money placed at the central
bank influences the rate at which they are willing to lend on similar terms in sterling

V. Ekpu | The Microstructure of Bank Lending to SMEs | PhD Thesis | University of Glasgow | 2015
31
money markets — the markets in which the Bank and commercial banks lend to each
other and other financial institutions… Changes in interbank interest rates then feed
through to a wider range of interest rates in different markets and at different
maturities, including the interest rates that banks charge borrowers for loans and offer
savers for deposits. By influencing the price of credit in this way, monetary policy
affects the creation of broad money”. (McLeay et al., 2014:8)
The transmission mechanism of monetary policy described by the Bank of England does relate
perfectly with both the New-Keynesian literature and the Post-Keynesian endogenous money
theory. The Post-Keynesian literature, however, disagrees with the idea that the
characterization of the setting of interest rates is the ultimate constraint to lending as the Bank
of England posits (Pilkington, 2014). For post-Keynesians, the amount of money created in the
economy is ultimately dependent on the demand for credit. Though the supply price of credit
(that is, the interest rate) will influence the demand for credit, the experiences of the global
financial crises over the last few years do show that what truly drives credit creation and the
supply of credit is of secondary importance (Pilkington, 2014). Prior to the recent crises, most
central banks operated a loose monetary policy: policy discount rates (including interest rates
on large certificate of deposits CDs) were brought low, while other wholesale market funds
and managed liabilities were exempted from prudential reserve requirements. In essence,
banks were awash with liquidity so that evidence from the recent crises seems to refute the
hypothesis that supply was constrained by shortage of loanable funds. Moreover, the lending
boom that preceded the crisis was largely aided by the flow of cheap funds around the world,
especially from Asian markets to the developed markets. However, from 2008, with the
dramatic freezing of wholesale markets, this source of funding proved much less attractive.
This has increased demand for other, more traditional funding sources, such as retail deposits,
which in turn has increased the costs of banks raising funds to lend to something more like a
historical norm (BBA, 2011).
2.2.2. Information Asymmetry and Credit Rationing
This sub-section presents two opposing views on the theory of credit rationing: the New
Keynesian theory (or the mainstream view), pioneered by Stiglitz and Weiss (1981) and the
V. Ekpu | The Microstructure of Bank Lending to SMEs | PhD Thesis | University of Glasgow | 2015
32
post-Keynesian view. According to the current new-Keynesian mainstream economic theory,
asymmetric information is widespread in financial markets. It generates “adverse selection”
and “moral hazard” effects (as described in this section below), which explain why credit
rationing may persist even in liberalised financial markets. For the post-Keynesian view, both
adverse selection and moral hazard are unlikely to be serious problems in reality, so that the
Stiglitz and Weiss model is unrealistic (Paloni, 2014).
The New-Keynesian Theory - The Stiglitz and Weiss (S-W) Model
According to the New Keynesian theory of credit rationing, asymmetric information arises in
credit markets between the borrower and lender when one of the counterparties (usually the
lender) does not have sufficient information or knowledge of the other counterparty involved
in the loan transaction, which makes it difficult to make accurate lending decisions. For
example, a borrower who seeks a loan is believed to have better information about the
potential returns and risk associated with the investment project for which the loan is sought
than the lender does. In other words, the New Keynesian theory assumes that there is a precise
probabilistic distribution of returns from each project that a potential bank borrower wants to
undertake. This distribution is known by the borrower, but not by the lender. According to
Stiglitz and Weiss (1981: 395), though the lender may know the expected mean return of a
project, it cannot ascertain the riskiness of a project.
In market equilibrium, the presence of asymmetric information often leads to credit rationing
among potential borrowers (Stiglitz and Weiss, 1981; de Meza and Webb, 1987; Berger and
Udell, 1992; Petersen and Rajan, 1994). Banks making loans are concerned about the interest
rate they receive on the loan and the riskiness of the loan. However, the interest rate a bank
charges may itself affect the riskiness of the pool of loans in two ways, either by: (1) sorting
potential borrowers (“adverse selection” effect); or (2) affecting the actions of borrowers ex-
post (the incentive effect or “moral hazard”). Both effects derive directly from the residual
imperfect information, which is present in loan markets after banks have evaluated loan
applications (Stiglitz and Weiss, 1981).
The adverse selection aspect of interest rates is a consequence of different borrowers having
different probabilities of repaying their loan. The expected return to the bank depends on the
probability of repayment, so the bank would like to be able to identify borrowers who are
V. Ekpu | The Microstructure of Bank Lending to SMEs | PhD Thesis | University of Glasgow | 2015
33
more likely to repay. It is difficult for the bank to identify “good borrowers”, and to do so
requires the bank to use a variety of screening devices. One of such screening devices is the
interest rate that a borrower is willing to pay: those who are willing to pay high interest rates
may, on the average, be worse risks; they are willing to borrow at high interest rates because
they perceive their probability of repaying the loan to be low. As the interest rate rises, the
average “riskiness” of those who borrow increases, possibly lowering the bank’s profits.
Similarly, as the interest rate and other terms of the contract change, the behavior of the
borrower is likely to change (“moral hazard”). For instance, raising interest rates decreases the
return on projects that succeed. Higher interest rates induce firms to undertake projects with
lower probabilities of success but higher payoffs when successful.
The Post-Keynesian Theory of Credit Rationing
According to post-Keynesian theory, asymmetric information is in practice not very
significant, suggesting that neither the lenders nor the borrowers know the prospective yield of
an investment project. In their view, credit rationing exists because borrowers and lenders
have asymmetric expectations about the probability of repayment (Paloni 2014). Thus, why
the New Keynesians on the one hand believe that only one party (the lender) is uncertain about
the riskiness of the borrower, the Post-Keynesians on the other hand believe that both the
lender and borrower are oblivious of the probability of loan repayment. In other words, they
believe that the there is fundamental uncertainty about the risks and possible outcomes of an
investment project (Wolfson, 1996). This uncertainty is believed to affect the criteria that
banks use in forming judgments about the risk of repayment. Bankers, knowing that they do
not know the future, only rely on assumptions and certain conventions in their credit
assessment. They then form an opinion of the likelihood of repayment. For example,
borrowers who have a history of repaying loans on time and continue to maintain a strong
financial condition will be preferred. Bankers also take into cognisance the prevailing
macroeconomic conditions in making their assessment of the riskiness of a potential loan.
Post-Keynesians thus argue that with fundamental uncertainty, the past provides no
dependable guide to future events. They argue that investment is subject to uncertainty and not
risk (Paloni, 2014). For example, the outcome of an investment project depends upon future
economic circumstances, future inventions, as well as the actions of future competitors. The
V. Ekpu | The Microstructure of Bank Lending to SMEs | PhD Thesis | University of Glasgow | 2015
34
argument is that even if similar investments have been made in the past, the economic
environment of a new investment differs from those of past investments. This is the
probability theory upon which the post-Keynesians assume information asymmetry cannot be
used in these circumstances because uncertain outcomes are not constrained to any known
finite set of possibilities (Paloni, 2014).
Following from the concept of fundamental uncertainty, post-Keynesians also introduce the
concept of asymmetric expectations, which suggests that both the lender and borrower will
evaluate the future differently (i.e. they will reach different conclusions about the future) since
they are both uncertain about the future, thus showing that they have asymmetric expectations
about the future probability of any particular project (Wolfson, 1996). Since the borrower and
lender do not necessarily agree on the riskiness of a particular project, credit rationing tends to
occur based on this uncertainty. One implication of this is that the lender will be more risk-
averse than the borrower. In line with a Post Keynesian perspective of credit rationing,
Wolfson (1996) argues that bankers accommodate all credit-worthy demands for credit, and
ration all those demands not deemed creditworthy. According to him, a perceived change in
the financial condition of bank borrowers will be likely to change bankers’ conventional
valuations of the risk of lending, and thus the extent of credit rationing. As Minsky (1986)
argues, this change in valuation takes place endogenously. According to him, financial
fragility increases as borrowers take on more debt, as the maturity of that debt shortens, and as
liquidity declines. These borrower risk characteristics are examined in detail within the
context of SME lending in section 2.4.1. Next, this chapter considers the financing options
available to SMEs.
2.3. Financing Options For SMEs
SMEs generally follow a pecking order in their quest to raise external finance, i.e. they start
with cheaper sources of funds and then graduate to costlier financing sources. Apart from
internally generated cash flows such as retained earnings, capital from proprietors and
financial support from families and friends for start-ups, small businesses find debt finance
one of the relatively cheapest means of raising funds for their operations. Bank credit is an
extremely convenient form of finance for the firm that has a good relationship with his banker
V. Ekpu | The Microstructure of Bank Lending to SMEs | PhD Thesis | University of Glasgow | 2015
35
(Bates and Hally, 1982). Debt finance may be preferred to equity finance because it does not
dilute share ownership. Moreover, it is less likely to transmit control over the business, except
in instances where loan covenants and other contractual terms may cede a sizeable level of
control to external creditors (Berger and Udell, 2003). Debt finance may also reduce
verification costs because outside creditors will have to bear the cost and time of monitoring
the company’s cash flows or project returns in the event that debt repayment is not
forthcoming or is not paid in full. Optimal financial arrangements such as loan covenants and
other debt contracts will help to reduce monitoring costs and exert corporate control over
managers of the borrowing firm.
A borrower’s choice of financing sources is likely to be a function of its ‘credit history’ and its
‘investment opportunities’ (Bhattarcharya and Thakor, 1993:7). According to Diamond
(1991), new and inexperienced borrowers without a verifiable reputation prefer to borrow
from banks, while older firms with well-established reputation choose the capital market.
Rajan (1992), however, argues that when borrowers anticipate huge profitable project returns
in the future, they prefer arm’s length8 (direct) financing. In other words, while Diamond’s
view that the borrower’s reputation is a key factor in the choice of financing source is
‘retrospective’, Rajan’s prediction is rather ‘prospective’ (Bhattarcharya and Thakor,
1993:38), i.e. dependent on future investment returns. In essence, it can be noted that the
decision of a firm to choose to access funds from the capital market arises from the firm’s
financial growth life cycle. Many de novo firms use bank finance initially to gain credibility
or build public image before accessing capital markets as they become more profitable.
Another interesting argument in the literature focuses on the conflict between debt and equity
holders (see Campbell, 1979). Here, small high-quality, innovative firms tend to prefer
(bilateral9) bank finance to equity finance because they want to avoid the disclosure of private
information to product market competitors or to third parties10. Yet Campbell’s framework
8 Arm’s length debt here refers to financing sources which do not entail huge disclosure costs aside from publicly available information e.g. bondholders (See Rajan, 1992)
9 Bilateral financing is often characterised by a close relationship between a borrower and a lender and where because of this intimacy the lender does not require the borrower to disclose as much verifiable information to be able to access credit. Thus bilateral financing is less costly.
10 Interested third parties may be a regulator, the tax authority, or even the firm’s own labour union (See Rice, 1990)
V. Ekpu | The Microstructure of Bank Lending to SMEs | PhD Thesis | University of Glasgow | 2015
36
does not take into account the risk of conjecture on the part of interested third parties when
they discover that a bank loan has been granted (see Yosha, 1995). There can be scenarios
particularly under multilateral11 financing arrangements, where the private information of a
borrowing firm could be disclosed by a bank to a product market competitor who has
borrowed from the same bank. In fact, most models ignore the possibility of this kind of
tensions between the issuers of securities, on the one hand and third parties on the other hand.
This is especially the case with Diamond (1991) and Rajan (1992) where, since monitoring
and control rights are of meagre importance to low risk firms, they may prefer (less informed)
arm’s length debt to (informed) bank finance.
It is possible for a borrower’s financing choice to be adversely affected by information
leakages. Firms whose probability of success cannot be ascertained when they invest in private
knowledge-producing activities (i.e. R&D) might as well find multilateral financing more
beneficial to bilateral financing since it is baseless to try to shield their proprietary information
from the public. Conversely, if firms can significantly influence their chances of making
profits, they may find that because of free riding by competitors, multilateral financing may
not be a viable option (Bhattarcharya and Chiesa, 1995; Yosha, 1995)
Another potential source of finance for SMEs is venture capital (VC). It is hypothesised that
the most inexperienced borrowers who lack managerial skills resort to this type of capital (e.g
Chan et al., 1990), while those who can convince investors of their managerial skills but lack
credit reputation tend to approach banks (e.g. Bhattarcharya and Thakor, 1992). Larger firms
who are both skilled in management and have a reputation for creditworthiness opt for capital
market financing. It has been argued that small firms tend to be heavily reliant on bank finance
as opposed to venture capital for a number of reasons: First, there are huge fixed costs
associated with arranging venture capital finance and this may not be readily affordable by
small firms (e.g. Cowling, 1998). Most venture capital firms may not even be willing to admit
small risky businesses and incur huge operational costs (e.g. Harrison and Mason, 1986).
There is also considerable evidence of the increasing unwillingness of small firms to dilute
equity ownership to outsiders and thus risk losing their autonomy and control (e.g. Dow,
1992).
11 In contrast to bilateral financing, multilateral financing requires borrowers to disclose as much information as possible, and even to be audited to be able to convince lenders that they are credit worthy.
V. Ekpu | The Microstructure of Bank Lending to SMEs | PhD Thesis | University of Glasgow | 2015
37
2.4. Demand-Side Factors Affecting Bank Lending to SMEs
A number of demand-side factors affect the supply of bank loans, including: firm and owner
characteristics, borrower-lender relationship characteristics as well as demand-side market
failures. This section now reviews all of them in detail.
2.4.1. Firm Characteristics
Generally, lenders are willing to extend credit only when they have high expectations that the
borrower is able to repay. The less a banker knows about a firm, the more information the firm
must provide to be able to make a convincing case for receiving a loan (Barrett, 1990). Thus,
banks are likely to favour borrowers that exhibit characteristics that assure the bank of the
chance of being repaid. Sadly, however, most small businesses suffer disproportionately from
adverse selection because they are both more reliant on external finance and relatively more
opaque than older and larger firms.
Firm Size
A firm’s size is usually measured in different ways, most notably, asset size, annual sales or
turnover. It is expected that a larger firm will be more credit worthy because it is well
established and typically more diversified than a smaller firm so that it is more likely to be
approved for a loan (Cole, Goldberg and White, 2004; Cole, 2008). On the other hand, it is
generally believed that smaller firms are more prone to insolvency than large firms because
they are usually less diversified on the production and distributions side and are more likely to
face financing constraints (Behr and Guttler, 2007). This notion is taken into consideration by
banks that do not grant credit to high-risk borrowers.
Firm’s Age/Transparency
A borrowing firm’s age could affect the inclination of lenders to extend credit to it. Older
firms are thought to be more credit worthy because they have an established track record and
are relatively stable and less risky. They are also less opaque and relatively easy for a lender to
scrutinise and monitor. Empirical evidence shows that large banks tend to be attracted to older,
more established and financially stable firms (Haynes, Ou and Berney, 1999). Transparency
on the other hand, has to do with the availability of financial records and/or audited financial
statements. It is expected that a firm that has good financial records will be able to convince a
V. Ekpu | The Microstructure of Bank Lending to SMEs | PhD Thesis | University of Glasgow | 2015
38
bank of its ability to repay a loan. Incidentally, most young SMEs suffer financial constraints
because they are more informationally opaque than older and large firms. A business is said to
be opaque if outsiders (e.g. creditors, competitors, investors or rating agencies) cannot easily
determine its quality or ascertain its credit worthiness and hence its likelihood to repay a loan
given these information asymmetries (Hyytinen and Parajarinen, 2008).
Banks, especially large ones, rely hugely on audited financial statements as an important piece
of information in commercial lending decisions. Since large banks rely more on hard
information than do small (relationship) banks, they are more likely to approve loans for firms
with better financial records (mostly in the form of audited financial statements), and these
have often been proved to be relatively older and more transparent firms (Haynes, Ou and
Berney, 1999; Kim, 2008). In other words, large banking institutions tend to lend to relatively
transparent and safer borrowers that are likely to earn transactions credits. On their part, small
business borrowers may find it prohibitively expensive to engage the services of auditors and
hence are attracted to smaller (relationship) banks that rely mostly on non-financial
information in order to accommodate the opacity of the small business borrower.
Firm Profitability/Financial Performance
The past financial performance or profitability of a firm is an important indicator of its ability
and capacity to repay a loan (e.g. Berry et al., 1993). Profitability is usually measured by the
firm’s return on assets (ROA) or return on equity (ROE), among other measures. Lenders
generally expect that a firm with greater profitability will be able to demonstrate ability to
service its debts out of its earnings. According to Bruns and Fletcher (2008:13), “past
profitability shows the firm’s past operational success and thus provides tangible
representations of the competence of the SME”. A company is able to demonstrate its ability
to repay a loan through the strength of its financial statements. According to Berger and Udell
(2003, 2006), there are two important ingredients to the use of financial statement lending
technology. First, the borrower must have informative financial statements (e.g. audited
statements prepared by reputable accounting firms according to widely accepted accounting
standards such as GAAP or IFRS). Second, the borrower must have a strong financial
condition as reflected in the financial ratios calculated from these statements.
V. Ekpu | The Microstructure of Bank Lending to SMEs | PhD Thesis | University of Glasgow | 2015
39
The main purpose of accounting information is for lenders and other potential investors to
make rational financing decisions (Kam, 1990). Financial ratios calculated from financial
statements (e.g. cash flow, profit/loss and balance sheet statements) have been found to be
reliable predictors of corporate bankruptcy by some notable researchers (e.g. Beaver, 1967,
Altman, 1968, 1993; Ohlson, 1980), which indicate their importance in the prediction of credit
defaults. Therefore, information on past financial performance (obtained from financial ratios)
allows banks to assess the creditworthiness of a particular firm. Although a loan contract may
have different contracting elements, including collateral, personal guarantees and/or loan
covenants, the lender will view the expected future cash flow of the company as the primary
source of repayment. Any unanticipated defaults will then be compensated for by other
mitigants such as collateral and guarantees.
Financial Stability (Leverage and Liquidity)
A major concern in SME lending is the lack of an adequate equity stake or enough retention of
earnings to boost equity (Hutchinson and McKillop, 1992). Two main determinants of
financial stability for businesses are leverage or gearing and liquidity or cash flow. There are
two measures commonly used in the empirical literature for measuring leverage: the ratio of
debts to assets or the ratio of debt to equity (see Berry et al., 1993 and Cole et al., 2004).
Bankers often use the latter where the owners’ equity stake or retained earnings is considered
important. Berry et al. (1993) however, show that the calculation of the gearing level of
businesses is not straightforward as the basis of usage is not common among all banks or
bankers. In some cases, gearing is referred to the business as a whole, while in other cases a
banker might consider the gearing of the particular lending proposition. There have also been
cases that showed that what may have been an acceptable level of gearing to a banker when
the lending was within that banker’s mandate was less acceptable if the request had to be
referred to a more senior level (see, for example, Dewhurst and Burns, 1989:104). However,
according to Berry et al. (1993), four factors seem to influence the acceptable norms with
respect to leverage (1) the size of business and the stage of its development, (2) the purpose of
the borrowing (e.g. working capital or project finance), (3) the type of finance required
(whether short term or long term), and (4) the type of business. The bottom line here is that
highly leveraged firms are riskier and have greater chances of defaulting on a bank loan
because huge levels of indebtedness affects their ability to service their debts or even retain
V. Ekpu | The Microstructure of Bank Lending to SMEs | PhD Thesis | University of Glasgow | 2015
40
earnings. Cole et al. (2004) found that these firms are however more likely to apply to larger
banks who can hold riskier, yet more profitable asset portfolios.
The second measure of financial stability is the firm’s liquidity. This is usually measured by
the ratio of a firm’s cash assets to total assets. Firms with more liquid assets are generally
thought of as being credit worthy since they can convince lenders of their ability to meet their
current financial obligations (Cole, 2008). A banker can assess the borrower’s liquidity level
by monitoring the flow of funds in and out its bank accounts (Berry et al., 1993; Nakamura,
1994). This sort of monitoring tells a great deal how the business managers are managing its
working capital. It also “provides the early warning system for potential problems” and is also
used to form judgements on the ability of the SME owner to run the business profitably (Berry
et al., 1993:146). On the link between a firm’s liquidity and the type of lender, Cole et al.
(2004) finds that firms with more liquid assets tend to apply to larger banks. This is perhaps
due to the fact that they are able to obtain larger loan amounts from large banks.
Firm’s Organisational Form
A firm’s organisational form (i.e. whether it’s a sole proprietorship, partnership, limited
company or limited partnership) might matter in the lending decisions of banks. The degree of
informational asymmetry and the magnitude of agency conflicts between owners, managers
and creditors are likely to vary with organisational form (Cole, 1998). Moreover the nature of
a firm’s liabilities is also likely to be a function of its organisational form. Typically,
proprietorships or non-corporate institutions are assumed to be more credit worthy than
partnerships and corporations, ceteris paribus, because a lender can liquidate or sell both the
personal assets and business assets of the owner to fulfil a claim (Berkowitz and White, 2004).
In the same vein, a lender might prefer to lend to a partnership other than a corporation as it
can lay claims to the general partner’s personal assets in the event of a default (Cole, 2008). It
is expected that smaller banks would lend mostly to proprietors and partnerships while large
banks will lend mostly to larger firms and corporations. This therefore seems to indicate
precisely the existence of correlation with size.

V. Ekpu | The Microstructure of Bank Lending to SMEs | PhD Thesis | University of Glasgow | 2015
41
Nature of Business of firm’s Industrial Sector
Anecdotal evidence shows that a “firm’s sector of activity or industrial classification is often
used by bankers to evaluate a firm’s credit quality” (Cole, 1998:964). In other words, bankers
presume that there are certain sectors or industries where the borrowers are less likely to
default on a loan. If this is the case, banks may withdraw from funding certain other sectors
even when they are faced with financial difficulties. A firm’s industrial classification could
also give an indication of the type and maturity of the financing source12 it requires. Typically,
high-growth and non-high growth firms attract different funding preferences from lenders. For
example, small firms in the computer and software development and services sector or firms
that invest hugely on R&D are seen as high-growth firms. High growth firms usually do not
have adequate internal finance to fulfil their business needs and are therefore prone to raising
external finance. It is contended that though large banks are generally less attracted to small
businesses, they however prefer to lend to small hi-tech and super-growth13 firms.
Firm’s Credit Rating
A firm’s credit rating, as determined by previous loan repayments or number of delinquencies
is a crucial factor in influencing a lender’s decision. Number of delinquencies is the number of
business credit obligations on which the firm has been delinquent within the past three years.
Business delinquencies are a negative function of the likelihood that a lender will extend credit
to the firm (Cole, 1998, 2008; Cole et al., 2004).
2.4.2. Owner Characteristics
The literature shows that the decision of banks to grant credit to small businesses is also
largely dependent on the reputation of the owners as measured by their age, educational
attainment, business experience, physiological characteristics (e.g. race, ethnicity, gender),
personal wealth and delinquencies.
12 Research has shown positive relationships between the use of long-term debt and sectors such as retail, distribution, hotel, catering and ‘other manufacturing’ sectors (Bhaird, 2010:63).
13 Super-growth firms refer to firms that have consistently high growth rates and whose annual growth rates are in excess of 30% (See 2007 Survey of SME finance by Cosh, Hughes, Bullock and Milner, 2008)
V. Ekpu | The Microstructure of Bank Lending to SMEs | PhD Thesis | University of Glasgow | 2015
42
Owner/Entrepreneur’s Credit Rating
Business owners or entrepreneurs with bad credit history will find it more difficult to obtain
working capital loans. An entrepreneur’s credit rating can be measured by number of
delinquencies. This represents the number of personal credit obligations on which the
principal owner has been 60 or more days delinquent. Banks should be less inclined to lend to
firms whose owners have had a great deal of delinquencies (e.g. Cole, 1998, 2008; Cole et al.,
2004).
Owners’ Educational Attainment
This is measured by academic qualifications or other professional training and usually takes
the following order: high school, college degree, graduate degree or post-graduate degree.
Firms with more educated owners are thought of to be credit worthy as they will bring their
knowledge and skills to bear on the fortunes of the company. In an empirical study by MacRae
(1991), it was found that the major distinguishing feature between high growth and low
growth small firms was the education, training and experience of the senior managers and
owners. Small firm owners with strong managerial competences are also likely to attract,
develop and retain workforce with strong managerial talent (Martin and Staines, 1994) and
this would impact on the company’s financial performance.
Owners’ Business Experience
The quality of the human capital of the people working in the SME is a critical factor
influencing the likelihood that the business is able to grow successfully (Dess and Picken,
1999). Firms with more experienced owners are thus generally assumed to be more credit
worthy than younger entrepreneurs because of their expertise in the firm’s area of business. In
a survey of Scottish bank managers on their lending practices to small businesses, Fletcher
(1995) found that trading experience of the borrower is rated the most important factor for
lending to small businesses. In order for lending officers to be able to extend credit on a
particular project, they will need to ascertain that a borrower has the capability and a positive
track record of successfully managing a similar project in the past or a project that requires
comparable competence, know-how and technical skills to the new project under consideration
(Bruns and Fletcher, 2008). Borrowers that are able to demonstrate competence or a positive
V. Ekpu | The Microstructure of Bank Lending to SMEs | PhD Thesis | University of Glasgow | 2015
43
track record are likely to get a favourable decision from the lending officers (Sargent and
Young, 1991; Scherr et al., 1993).
Owner’s Equity Stake/Contribution
According to Bruns and Fletcher (2008), the probability that a lending officer will support
credit extension to a borrower will depend on the share of the investment the owner has in the
borrowing firm. Due to the combined role of management and ownership, the owner-manager
has both financial and human capital at risk in the firm. Lenders sometimes require small
business borrowers to make cash contribution of a certain percentage of the loan amount, so
the borrowers can demonstrate that they will act in the lender’s best interest. Mishkin
(2010:184) calls a debt contract of this nature “incentive compatible”, i.e. where the
borrower’s incentive is aligned with that of the lender. Equity stake is important from the point
of view of gearing and showing commitment by the owner (Fletcher, 1995). Equity stake
suggests that the track record of the owner (s) of the business is critical as an indication that
they have the ability to utilize the loan for the purpose for which it was initially contracted.
Owner’s Personal Wealth
The wealth of firm owners is likely to play a key role in determining the allocation of credit to
small firms where personal commitments are pre-requisites for obtaining credit, i.e. where
borrowers pledge their personal assets as collateral against the firm’s borrowings and/or make
personal guarantees in order to be able to reduce the risk of lending (Avery, Bostic and
Samolyk, 1998). Owners with greater personal assets and higher income should be able to
negotiate credit terms better as they can demonstrate good prospects to the bankers or
sufficient ability to repay a loan.
Owner’s Physical/Social Characteristics (e.g. Age, Gender, Race, and Nationality)
Firms with older owners are usually thought of to be wiser and to have more experience or
track record of credit-related transactions than young owners and are therefore more likely to
be given preference. Some bankers are also gender-bias in their lending practices. Firms
whose controlling owners are female usually face more stringent credit requirements than
males (e.g. Bellucci, Borisov and Zazzaro, 2009). Owners’ race/ethnicity is also a very
important factor in assessing banks that practice race-based discrimination. The victims are
V. Ekpu | The Microstructure of Bank Lending to SMEs | PhD Thesis | University of Glasgow | 2015
44
usually loan applicants from minority ethnic groups such as Black Africans, Hispanics and
Asians (e.g. Blanchard, Zhao and Yinger, 2008). In fact, using data from the 1993 and 1998
National Surveys of Small Business Finances to examine the existence of racial discrimination
in the small business credit market, Blanchflower, Levine and Zimmerman (2003) find that
black-owned small businesses are about twice as likely to be denied credit even after
controlling for differences in creditworthiness and other factors.
2.4.3 Firm-Lender Relationship Characteristics
The borrowers’ chances of accessing bank finance are partly dependent on the existence of
previous relationship with the lender. This sub-section examines how credit is constrained by
the existence or non-existence of prior relationships with the lender as well as the strength of
such relationships. Firms that have pre-existing relationships with their prospective lenders are
likely to be favoured to receive credit because it is expected that over the course of these
relationships, the lender would have garnered sufficient information about the credit
worthiness of the borrower. Cole et al. (2004) identify three types of pre-existing
relationships:
Deposit Relationship
It is expected that banks should favour firms that have a pre-existing deposit account
(checking or savings) at the bank. Nakamura (1994) and Boot (2000) note that through the
checking and savings account information of local customers, banks are able to ascertain the
credit worthiness of their loan applicants. Cole et al. (2004) also notes that banks would most
likely grant loan requests made by firms with pre-existing deposit relationships for fear of
losing them to their competitors because of the loan denial.
Loan Relationship
The lender is likely to favour applicants that have had a pre-existing loan relationship with the
bank. However, the effect of this relationship is rather ambiguous. This is because the lender
might be worried that a pre-existing loan clearly increases the firm’s leverage, ceteris paribus
(Cole, 1998). In addition, if a bank grants a second loan application to a borrower, it might
V. Ekpu | The Microstructure of Bank Lending to SMEs | PhD Thesis | University of Glasgow | 2015
45
signal concerns about the bank’s portfolio diversification and a possible violation of regulatory
restrictions on lending to a single borrower.
Financial Management Relationship
Like deposit relationship, it is expected that a firm with a pre-existing financial management
relationship with the bank will have greater chances of receiving a loan. Financial
management services used by SMEs include transaction services (the provision of paper
money and coins, credit card and debit card processing, night depository, and wire transfers);
cash management services (i.e the provision of liquid asset & interest-bearing accounts), and
credit-related services (including the provision of loans, trade credit and capital leases; letters
of credit, bankers’ acceptances and factoring). Other financial management services include
brokerage and trust services (pensions, business trusts and safe keeping of securities
(Elliehausen and Wolken, 1990; Cole, 1998; Mach and Wolken, 2006). These services are
typical of all types of banks. However, one would expect applicants to larger banks to have
had a pre-existing financial management relationship.
Even if a relationship exists between the borrower and the lender, the strength of that
relationship is also crucial in determining whether a borrower will get a loan or not. For the
purpose of this analysis, the strength of a borrower-lender relationship will be measured by the
following factors:
The Length and Exclusivity of Relationship
The length of a firm-bank relationship and the number of sources of financial services a
borrower deals with are important determinants of credit decisions. The longer the relationship
between a firm and a lender, the more time the potential lender has to acquire and develop
proprietary information about the applicant (Cole, 1998). Large banking institutions are found
to have temporarily shorter and less exclusive relationships with their business customers (e.g
Berger et al., 2005) owing mainly to competition from other financial service providers. Since
large banks tend to have weaker relationships with borrowers, they tend to employ more
transactions lending approaches. On the contrary, the relationship between banks and firms
tend to be long-lived and more exclusive when the firm in consideration borrows from a small
bank. This confirms the assertion made by Rajan (1992) that small firms tend to be tied to
banks that have accumulated soft information on them over time. The reason why small firms

V. Ekpu | The Microstructure of Bank Lending to SMEs | PhD Thesis | University of Glasgow | 2015
46
are unlikely to switch banks is that soft information is exclusive to the bank they are dealing
with and as such is not easily transferable across banks. On the other hand, a firm dealing with
a large bank is likely to find that the additional benefits of staying with the same bank or the
costs of switching to another lender is low (Berger et al., 2005: 245). However, it could be
argued that this might not be the case if the firm is considerably small.
Distance14 and Mode of Interaction15:
Large banks tend to develop more impersonal and longer distance relationships with their
SME loan customers. This is consistent with the view that large banks rely less on soft
information that is acquired mainly through personal contact with customers and by
observation. (Berger et al., 2005:240). By contrast, because small banks deal with
informationally opaque firms, they tend to more susceptible to the “shoe-leather” cost of
personal visits (ibid: 245). However, the fact that large banks deal with customers at an
impersonal level does not imply that they are incompetent in dealing more at a personal level,
but because the nature of the firms they deal with makes personal contact unsuitable.
Effects of Relationships on the Availability and Terms of Credit
So far, it has been argued that banks that are able to build stronger and lengthier relationships
with small firms are better able to acquire soft information, which then helps them to assess
the credit worthiness of borrowers. How do these stronger relationships translate into more
financing? The problem of measuring the availability of credit cannot be easily ascertained
from the books of small firms, as this might reveal a combination of both demand and supply
side effects. However, Petersen and Rajan (1994) suggest an alternative approach whereby the
degree to which a firm relies on trade credit can be used to ascertain the extent to which it has
been credit constrained and hence gives a signal on the firm’s source of bank finance. Under
this model, if a firm pays a greater proportion of its trade credit late (that is, after the due date),
it gives a reliable indication that the firm in question might have been rationed so that we
14 Distance refers to the physical (linear) space between the applicant firm’s address and the address of the bank branch with which the firm trades.
15 Mode of interaction can be classified into personal and impersonal. Personal Interaction is simply characterised by the banker’s face-to-face contact with the customer, while impersonal contact is characterised by a greater use of mails and phone calls in communications instead of face-to-face contact.
V. Ekpu | The Microstructure of Bank Lending to SMEs | PhD Thesis | University of Glasgow | 2015
47
conclude that the firm must have borrowed from a large bank. In other words, since credit
rationing among informationally opaque firms increases as bank size increases, it is expected
that a small firm that borrows from a large bank will be more prone to credit rationing. Older
and larger firms are arguably less constrained by banks and hence are likely to pay less of their
trade credit late. In the same vein, firms that have built long-term relationships with their
banks are also likely to pay less of their trade credit late (Berger et al., 2005:260).
The length of borrower-lender relationships can also influence the setting of loan contract
terms. Boot and Thakor (1994) show that when lenders and borrowers engage in repeated
interactions through time, they are able to build trust and credibility, which help to reduce
moral hazard problems. Banks that have gathered proprietary information over their clients
often use this information in refining contract terms offered to borrowers. Berger and Udell
(1995) in their study of the role of relationships in determining both price and non-price
contract terms of bank lines of credit extended to firms find that longer bank- borrower
relationships reduce the interest rates paid by borrowers and the chances that they will have to
pledge collateral16. To the extent that this occurs, longer duration of banking relationships
relaxes the terms of a loan, ameliorates credit constraints and hence raises firm value. More
analysis on the economic importance of relationship lending is provided in chapter 6.
2.4.4. Demand Side Market Failures
There are also market failures affecting the demand side for businesses seeking finance. These
come in the following forms:
Availability of Marketable Collateral
The use of collateral is a common feature of loan contracts between firms and lenders.
Collateral requirements either in the form of business or personal assets are used to reduce the
risk of lending which is caused by the presence of asymmetric information, adverse selection
and moral hazard. In collateralised lending, the borrower undertakes to relinquish ownership 16 According to Boot Thakor and Udell (1991), collateral is an alternative to trust and by developing relationships, it is expected that collateral requirements would be more relaxed. Jimenez, Salas and Saurina (2004) also found that the likelihood of collateral is lower in more concentrated credit markets and for loans made to borrowers with longer relationship with the lender that grants the loan.
V. Ekpu | The Microstructure of Bank Lending to SMEs | PhD Thesis | University of Glasgow | 2015
48
of a valuable asset to the lender if he or she fails to repay a loan. If the borrower defaults on
the loan, the lender reserves the right to seize, sell or liquidate the asset and use the proceeds
to offset the loan. Nakamura (1994:8) argues that, “because the lender has recourse to the
collateral, the borrower has a strong incentive to repay the loan in full17”. In this sense,
according to Voordeckers and Steijvers (2006), collateral may play a disciplinary role in the
behaviour of the borrower. Yet most small business borrowers, especially young and
inexperienced firms with low credit quality, do not have access to acceptable forms of
collateral, such as real estate, cash and other liquid assets. As part of efforts to solve this
problem in the UK, the UK government introduced the Enterprise Finance Guarantee Scheme
(EFG) in January 2009 to provide a 75% guarantee on individual loans made by participating
banks to small companies with turnover less than £25 million.
Strength of Borrowers’ Balance Sheet
During a recession, slow down in lending levels could be explained by the generally weak
state of borrowers' balance sheets (Bernanke and Lown, 1991). For example, many borrowers
significantly increased their leverage during the few years prior to the build up of the recent
crises, while falling prices for real estate and other assets have adversely affected potential
borrowers' net worth. Further, the recession has put additional pressures on cash flows. For a
given set of ultimate investment opportunities, borrowers who are less creditworthy (such as
those who have higher leverage or lower collateral) will have a lower effective demand for
external finance at given values of the safe real interest rate. Thus, it may be that in the recent
downturn the normal recessionary decline in credit demand has been exacerbated by a greater-
than-normal decline in the creditworthiness of potential borrowers.
Information Market Failures
There are information market failures affecting the demand side for businesses seeking
finance. SMEs may not fully understand the potential benefits to their business of raising
finance or their likely chance of success in gaining finance, which ultimately means they do
not apply for finance. This may restrict the growth of businesses. Survey evidence shows a
17 However, it should be noted that that there are huge transaction costs involved with administering the sale of a collateralised property. Moreover, in some cases the value of the collateral may have diminished beyond the amount borrowed. Thus the gains to the lender might be unobtrusive (Cole et al., 2004).
V. Ekpu | The Microstructure of Bank Lending to SMEs | PhD Thesis | University of Glasgow | 2015
49
small but significant proportion of SMEs are discouraged from applying for finance because
they think they will be rejected (BIS, 2012). The November 2011 SME Finance Monitor
survey in the UK estimates around 40% of would be seekers (12% of all SMEs) are
discouraged, and this is equivalent to around 5% of all SMEs that are discouraged from
applying for external finance (BDRC Continental, 2011).
Business Confidence
A lack of investment readiness also leads to SMEs lacking the ability to present themselves as
investable opportunities, for instance due to inadequate management skills or poor business
plans (BIS, 2012). For instance, according to the 2011 SME Finance Monitor, only 25% of
SMEs in the UK have a formally qualified financial manager, although this increases with the
size of business to 66% of medium sized businesses (BDRC Continental, 2011). This may
reflect why 41% of SME employers do not understand the way banks assess business credit
risk, and why they do not feel confident in raising finance. A greater number of SME
employers perceive they are poor (38%) at accessing finance compared to those reporting they
are strong (25%). However, most SMEs do not seek advice when applying for finance, with
only 9% of SMEs seeking advice when applying an overdraft and 20% of SMEs seeking
advice when applying for a loan (BDRC Continental, 2011).
Poor Quality of Projects
Another similar ‘demand side’ constraint has to do with the quality of projects submitted for
financing, which often falls short of the minimum standards. It is worth mentioning, however,
that the poor quality of projects is frequently invoked as an excuse by conservative bankers
not to extend lending to SMEs (Zavatta, 2008). Although it is not easy to come by potentially
viable projects, the issue of the quality of projects is a problem of perception.
Inability to Exploit Existing Opportunities
Notwithstanding the intrinsic quality of the projects being considered for financing, bankers
are also concerned that business promoters are often unable to make the best use of available
opportunities. This relates not only to their limited ability to convincingly articulate their
business ideas, but also to the unwillingness of many small-scale entrepreneurs to ‘waste time’
in dealing with financial institutions (Zavatta, 2008). Sometimes, business owners are

V. Ekpu | The Microstructure of Bank Lending to SMEs | PhD Thesis | University of Glasgow | 2015
50
unwilling to commit to building a strong relationship with bankers unless their business
proposals are first considered for financing. In fact, many small businesses often quickly
consider the option of switching to other financial service providers once they are unsatisfied
with the level of funding they get from their existing bankers. The costs of switching to other
financial service providers is, however, huge, when considering the extent of proprietary
information that has been acquired by the bankers over time as well as the costs of building
new relationships with new financial service providers.
2.5. Supply-Side Factors Affecting Bank Lending to SMEs
Supply side behaviour towards small business lending is mostly driven by (1) the risk and cost
factors associated with lending activity, (2) financial institution and market structure, (3)
lending technology and (4) the lending infrastructure.
2.5.1. Risk and Cost Factors
Cost of funds
Changes in the bank’s capital or balance sheet liquidity might affect cost of funds to
borrowers. In order to lend money to businesses, banks need to attract funds (e.g. bank capital,
deposit liabilities, or wholesale funds) by paying a return or interest on them. According to the
loanable funds theory, banks need to aim to hold deposits for similar lengths of time as the
term of loans financed. In order to survive, banks have to cover the interest rates they pay on
deposits from interest rates they charge on loans (interest margin). Higher loan prices in turn
affect the quantity of funds intermediated by banks.
Hubbard, Kuttner and Palia (2002) investigated the effects of banks’ financial condition on the
borrowers’ cost of funds after controlling for borrower risk and information costs. They find
that capital-constrained banks charge higher loan rates than well-capitalised banks and that
this cost difference is especially associated with borrowers for which ‘information costs’ and
‘incentive problems’ are most important (pp. 561). Their result is also consistent with models
that allow banks to charge a risk premium to borrowers facing switching costs in bank-

V. Ekpu | The Microstructure of Bank Lending to SMEs | PhD Thesis | University of Glasgow | 2015
51
borrower relationships, as well as models of the bank-lending channel of monetary
transmission.
Informational Asymmetries As noted earlier in section 2.2.2, informational asymmetries are always present in enterprise
financing transactions. Entrepreneurs typically possess privileged information on their
businesses that cannot be easily accessed—or cannot be accessed at all—by prospective
lenders. According to the New Keynesians, this leads to two problems. First, the
lender/investor may not be able to differentiate adequately between ‘high quality’ and ‘low
quality’ companies and projects. In that case, price variables (i.e. interest rates) may not work
well as a screening device, because high interests may lead to an excessively risky portfolio
(the ‘adverse selection’ problem). Second, once the lenders/investors have supplied the
funding, they may not be able to assess whether the enterprise is utilizing the funds in an
appropriate manner (the ‘moral hazard’ problem). To mitigate these problems, bankers may
adopt precautionary measures, such as requiring that financing be collateralised. Alternatively,
they may simply turn down the request for financing (‘credit rationing’). Informational
asymmetries tend to pose more severe problems for SMEs than for larger business. The
information that SME can realistically provide to external financiers (in the form of financial
accounts, business plans, feasibility studies, etc.) often lacks detail and rigor. This problem is
often aggravated by the low level of education of small entrepreneurs, who may not be in the
position to adequately articulate their case.
Lenders’ Risk Appetite
Following from Post Keynesian view of lenders behaviour, banks are only willing to lend to
borrowers when the risk/return profile of such borrowers are in their favour (Coppola, 2014).
Risk appetite is simply the extent to which a lender is willing or inclined to finance a
borrower. It is usually measured as positive, negative or neutral. Risk appetite is shaped by a
number of factors: history of previous loan performance, risk profile of business sectors being
financed, amount of loan security, financial regulations and general economic and financial
conditions. The amount and price of credit supplied to a borrower reflect, according to the
banks’ experience and its loan performance data, the probability of the borrower not being
able to repay the debt. The higher the level of risk, the higher the price must be to cover the

V. Ekpu | The Microstructure of Bank Lending to SMEs | PhD Thesis | University of Glasgow | 2015
52
likely loss. Banks are now more risk averse, both due to the credit crunch and because they are
required to be compliant with new financial services regulations (e.g. Basel III). These new
rules require banks to hold more capital against certain types of assets. For every loan a bank
makes, it must set capital aside to cover for unexpected losses. The idea is to ensure the bank
remains solvent and depositors are secure, even if that loan becomes impaired. In order to
protect depositors from losses and reinforce consumer confidence in the banking sector, all
banks around the world are currently holding higher levels of capital than in recent years.
There is a cost to holding this capital and, as banks have increased the amount set aside, this
cost has risen along with it.
The amount of risk a bank is faced with is also influenced by the level of security offered by
the borrower, so that when the value of security falls, such as commercial property values, the
risk increases, and vice versa. The Basel III regulatory framework sets the methodology and
calculations used to determine the cost associated with the risk of lending. Risk-adjusted loan
pricing enables higher-risk but still allows viable businesses to access finance whilst lower-
risk and well-managed firms get the benefit of lower-cost funding. Pricing of risk is in the
interest of businesses; even more marginal businesses can still get access to finance (BBA,
2011).
Transaction Costs
Besides risk profile considerations, the business of lending to SMEs is associated with several
transaction costs (e.g. Zavatta, 2008; Duan, Han and Yang, 2009; Venkatesh and Kumari,
2011). These include: (i) administrative costs (e.g. costs of meeting a business customer,
appraising a loan application and conducting due diligence, setting up a facility, monitoring,
controlling, and revising that facility, etc); (ii) legal fees (e.g. costs of providing the legal or
contract documentation, filing debt claims, etc); and (iii) costs related to the acquisition and
dissemination of information (e.g. costs of purchasing a credit profile from a specialized
agency and costs of disseminating regular information such as notification of interest rate
changes or changes to other lending fees).
While banks may use credit and performance-scoring tools, most lending decisions will also
require a judgement to be made by an experienced relationship manager. Due to their size,
smaller facilities tend to have a relatively higher transaction cost per pound lent than larger
V. Ekpu | The Microstructure of Bank Lending to SMEs | PhD Thesis | University of Glasgow | 2015
53
facilities, and not all of that cost can be recovered through fees. So small facilities tend to bear
higher margins, even if the risk is comparable with larger lending.
2.5.2. Financial Institution and Market Structure
Bank Size and Organisational Structure
Credit supply to SMEs is also constrained by the banks’ organisational structure in terms of
the decision making strategy vis-à-vis the administration of lending functions: appraising and
approving loan applications, monitoring of credit risks, reviewing loan performance, etc.
Differences in bank organisation structure account for the operational differences that exist in
the loan approval processes of banks. The operational differences between banks of different
sizes can be better understood within the framework of Williamson’s (1967) theory of
hierarchical control. As the size of an organisation increases, it loses control between
successive hierarchies because of its centralised decision making structure. Large banks
therefore tend to follow explicit rules and procedures in order to avoid distortions, which tend
to arise in a multiple layer structure. Small banks on the other hand may be able to give greater
discretion to their loan officers because of their fewer layers of management and decentralised
structure. Similarly, as large banks expand in size and geography (i.e. number of branches), it
becomes difficult to monitor the behaviour of employees and this could lead to agency
problems. In order to maintain control, large banks must establish formal lending procedures,
which all staff should follow (Cole, et al., 2004).
Although large banks tend to enjoy economies of scale in processing hard information, they
are relatively fraught with organisational diseconomies18 with respect to processing soft
information because it is difficult to quantify relationships and transmit them through the
channels of communication prevalent in large organisations (e.g. Stein, 2002; Berger and
Udell, 2006). For example, under relationship banking, large banks with a multi-branch
hierarchy face agency problems. This is because it may be difficult for a relationship manager
who is the custodian of soft information to communicate same to the management or owners
18 Organisational diseconomies in large firms can also be explained by the fact that large firms, especially those created by consolidation are efficient in financing transactions loans and offering wholesale services to large corporate customers making them reduce the provision of retail services to small firms (see for example, Williamson, 1967; 1988; Stein, 2002; Berger and Udell, 2006)

V. Ekpu | The Microstructure of Bank Lending to SMEs | PhD Thesis | University of Glasgow | 2015
54
of the bank. Thus this may give relative advantage in relationship banking to small institutions
because they typically have fewer intermediaries between ownership and management. This
means that because small institutions have lower agency costs in the sense that there is only a
thin line of separation between ownership and management, they are more likely to have
comparative advantage over their large multi-office counterparts in the financing of SMEs
using relationship-lending techniques.
Ownership Structure
Apart from size considerations, the lending practices of banks and their willingness to lend to
SMEs are also largely correlated with the type of ownership structure of the lender. For
example, conventional wisdom with regard to small business financing says that small
domestic private banks are more likely to finance SMEs because they are better suited to
utilising ‘relationship lending’ approaches based on the acquisition of soft information by the
loan officer through continuous, personalised, direct contacts with SMEs, their promoters and
the local business community in which they operate (e.g. Berger and Udell, 1995; Keeton,
1995, and Strahan and Weston, 1998). However, some recent studies (e.g. Berger and Udell,
2006, Berger, Rosen and Udell, 2007, and de la Torre, Martinez Peria and Schmukler, 2010)
have begun to dispute this conventional wisdom and propose a new paradigm for bank SME
finance, arguing that large and foreign banks can be as effective in SME lending through
transactions lending technologies (e.g. credit scoring, asset based lending, factoring, leasing,
etc) and centralised structures instead of relationship lending. In yet another recent study,
Beck et al. (2011) find that foreign, domestic, private and government owned banks use
different lending technologies and organisational structures for SME financing. However, they
find that the extent, type and pricing of SME loans are not strongly correlated with lending
technologies and organisational structures; suggesting that lending technologies are somewhat
irrelevant in issues of SME financing.
Effect of Bank Consolidation
The global consolidation in the banking industry has raised concerns about the survivability of
small banks, and as small banks are vital sources of credit for small firms, these concerns
become more important for the survival of the economy as a whole. The most compelling
evidence from numerous studies (especially for US) reveal that large banking institutions tend

V. Ekpu | The Microstructure of Bank Lending to SMEs | PhD Thesis | University of Glasgow | 2015
55
to reduce their small business lending after mergers and acquisitions. However, this reduction
appears to be offset at least in part by the decision of other banks in the same local market (de
novo banks) to substantially increase lending to small businesses by way of response. (e.g.
Peek and Rosengren, 1995a; Berger, Saunders, Scalise and Udell, 1998; Avery and Samolyk,
2004). Yet recent results shown in Schmieder, Marsch and Aerssen (2010) appear to be
intriguing as the authors found that consolidation does not have a sustainable negative impact
on the financing of SMEs in the German market. One reason alluded for this is the absence of
a “negative size effect” as well as the efficiency and competitiveness of the German banking
market, which reduces any potential threats to SME financing (pp.464). This perhaps also
suggests that the nature of the German financial system (being a bank-based system) has
positive effects on the financing of small businesses. Strahan and Weston (1998) investigated
the case of consolidation among small independent banks in USA and found a positive impact
on small business lending. However, for small banks that are members of a bank holding
company (BHC), results show that they tend to replicate the behaviour of their parent
companies, implying that they lend less to small businesses (Keeton, 1995; Jayaratne and
Wolken, 1999).
One crucial matter in considering the effect of consolidation on small business lending is the
issue of motives of the acquirer bank. Accordingly, if a large bank acquires a smaller bank
because it is mainly interested in acquiring low-cost deposits or in expanding its geographic
market reach, then there is likelihood that it might restrain its lending to small businesses
(Peek and Rosengren, 1995a). Furthermore, an acquirer bank might find that rather than
manage risks locally, it will be more profitable to manage its liquidity and loan diversification
more efficiently on a larger scale. On the other hand, a large bank might be attracted by a
small bank’s profitable small business loan portfolio. In that case, the large bank might be
strongly incentivised to maintain existing borrowing relationships. Hence it might want to
support an even greater level of small business lending (Levonian and Soller, 1996).
Mergers and acquisition also have an effect on loan pricing. Rauch and Hendrickson (2004)
found that, all else being equal, consolidation lowers the interest rates charged by large banks
for small business borrowers who qualify, while small banks raise the loan rates for borrowers
who do not. One of the factors that determine the post merger loan spreads in banks is the
operational efficiency of the enlarged group. Erel (2006) supports this argument and finds that
V. Ekpu | The Microstructure of Bank Lending to SMEs | PhD Thesis | University of Glasgow | 2015
56
mergers reduce loan spreads, especially when there are huge cost savings from the reduction
in post merger operating expenses and that this result is stronger when the acquirer bank and
the target bank have some market overlaps. However, there might be fears that significant in-
market overlaps could raise loan spreads and create more concerns for market power. As the
size and complexity of organisation increases, organisational diseconomies might set in as
costs of small business lending rises in the enlarged institution (Strahan and Weston, 1998;
Stein, 2002). There is also considerable evidence that even small banks’ acquisition of soft
information about borrowers reduces after a merger (e.g. Ogura and Uchida, 2007). This view
is consistent with Stein’s (2002) prediction that organisations with a relatively flatter structure
are likely to perform better in acquiring soft information. Cavallo and Rossi (2001) also
suggest that mergers should be oriented towards raising the scope for small banks to expand
their scale of production while enabling large banks to improve efficiency by focusing on
output mix diversification.
Effect of Bank Market Structure and Competition
Firms’ access to bank finance is also constrained by the bank market structure, i.e. the level of
competition and concentration in the bank market. Some studies find that higher concentration
is associated with higher credit availability, which is consistent with the information
hypothesis that less competitive banks have more incentive to invest in soft information. Other
empirical studies, however, find support for the market power hypothesis that credit rationing
is higher in less competitive bank markets (Carbo-Valverde et al., 2009). Market structure
effects on credit availability occur in at least two ways: product market competition and
regional or geographic market competition.
Product Market Competition: Product market competition can be explained in terms of the
size of loan as well as the range of financial services banks can offer their customers. Larger
banks are generally able to make larger loans than smaller relationship-driven banks. Since
there are fixed costs associated with processing and monitoring any size of loan, larger banks
benefit from scale economies when they make large loans. They are also able to benefit from
scale economies by using credit scoring to make large amounts of standardised loans and
credit cards to businesses. Large and foreign banks are also able to offer certain types of
financial services to their customers to generate additional fee income, such as foreign
V. Ekpu | The Microstructure of Bank Lending to SMEs | PhD Thesis | University of Glasgow | 2015
57
exchange transactions, interest rate swaps, asset financing, commercial papers, bankers’
acceptances, and so on.
Geographic or Regional Market Competition: Lending to small businesses can also be
influenced by the population density, competition and nature of economic activity in the local
area being served or where small business customers carry out their primary trading activities.
Large banks tend to situate their offices in areas of relatively high population density and
where there is a substantial amount of economic activity, while small banks generally have
higher market share in the rural areas due to the nature of their small business customers.
However, Gilbert (2000a&b) reports that the trends have since changed as he finds evidence
that large banks are gaining increasing interest and market share in small business lending in
many rural communities in US including relatively low population density areas.
Since the 1980s and early 1990s, increasing bank deregulation (namely the relaxation of
controls or constraints over the scale and scope of banking business19) has led to geographic
branch expansion by large banks across borders. Large banks especially are now able to make
distant loans to business customers, thanks to credit scoring and other transactions lending
approaches. However, such automated loans have certain limits20 beyond which the decision is
taken on the basis of other factors as decided by the relationship managers and credit risk
sanctioners. Critics of multi-office banks have argued that the lending behaviour of large
banks does not support small business lending (Keeton, 1995). First, because of their size,
large banks might have incentives to make more of large loans and less of small loans.
Second, large banks follow rigid lending rules due to their centralised organisational structure.
This might discourage relationship lending and hence result in fewer loans being granted to
small businesses. Lastly, large banks are assumed to use deposits acquired through their multi-
office branches to finance large institutional or cross border investments.
19 In US, the Riegel-Neal Interstate Banking and Branching Efficiency Act of 1994 removed restrictions on nationwide branching since June 1997 and permitted bank holding companies to buy existing banks and other holding companies located throughout the nation beginning from the fall of 1995 (Gilbert, 2000a,b).
20 In RBS for example, this limit is £25,000

V. Ekpu | The Microstructure of Bank Lending to SMEs | PhD Thesis | University of Glasgow | 2015
58
The Profitability Incentive
Banks’ supply of loans to SMEs is largely driven by their perception of the size and
profitability of the SME lending market. In fact, in a survey of lenders, 81% of banks in
developed countries and 72% of banks in developing countries indicate that profitability is the
most important determinant of their involvement with SMEs (Beck et al., 2008b). In a similar
survey of bankers’ view of lending relationships by Bharath et al. (2007), many bankers view
the generation of additional business in the future as the principal reason for engaging in
relationship lending. In fact, this search for yield contributed to the apparent replacement of
traditional business lending with securitization of bank loans during the build-up to the recent
financial crisis. Prior to the crisis, banks were regularly initiating loans with the intention of
selling off all or part of their holdings to other investors. Loans that are securitized in this
manner do not appear on banks' balance sheets and thus would not be counted in standard
measures of bank loans (Bernanke and Lown, 1991).
2.5.3 Lending Technology
Generally, SME lenders use a variety of lending technologies to resolve the problems of
informational opacity associated with small firms. Relationship lending and credit scoring
techniques are the two main lending technologies predominantly used in small business
lending. Nowadays, however, banks in developing credit markets are increasingly embracing
other cutting edge techniques in assessing borrowers, such as psychometric scoring and
judgmental score cards. In addition, as lending to SMEs shrinks in the wake of the recent
financial crisis, there is increasing use of online peer-to-peer lending techniques mostly in
advanced credit markets, which have now implications for the intermediation role of
traditional banks. This sub-section examines some of the features of these lending
technologies and how they determine banks’ involvement with SMEs.
Relationship Lending
Relationship lending largely refer to techniques involving the acquisition of soft information
on borrowers (through repeated interactions over time and across financial products) as a basis
for lending to informationally opaque SMEs. Banks are able to monitor the credit risks of
V. Ekpu | The Microstructure of Bank Lending to SMEs | PhD Thesis | University of Glasgow | 2015
59
firms when they build long-standing relationships with them. As noted earlier, banks that are
able to build stronger and lengthier relationships with small firms are better able to acquire
soft information, which then helps them to assess the credit worthiness of borrowers. Banks
can obtain information about borrowers by observing their credit history. For example, if a
prospective borrower has had a checking or savings account or other loans with a bank over a
long period of time, the loan officer can take a look at past activity on the accounts and learn
quickly about the borrower (Nakamura, 1994, Boot, 2000). Thus, long-term customer
relationships reduce the costs of information collection and make it easier to screen out bad
credit risks. A detailed analysis on the benefits and costs of relationship lending techniques is
examined in chapter 7.
Credit Scoring
With revolutions in technology, lending decisions are now made using the credit score of the
small business owner. Many banks, especially large ones now rely significantly on credit
scoring to assess the riskiness of less transparent SMEs. Credit scoring is an automated
lending technique, which involves the use of historical data and statistical measures to
ascertain or quantify the likelihood that a borrower will default on a loan (Berger and Udell,
2003). Credit scoring makes it easier for large banks to make large pool of loans faster,
cheaper and over great distances. Credit scoring has thus been viewed as an alternative
technology to relationship lending technology. It tends to replace traditional lending technique
based on subjective assessments of prospective borrowers – e.g. previous loan repayment
performance, current capacity and willingness to repay, the presence of collateral and other
forms of security and/or guarantees. The emergence of credit scoring has enhanced objectivity
in the loan approval process. This objectivity means that lenders are able to apply uniform
underwriting criteria to borrowers (see Mester, 1997:8-9). With credit scoring, it is relatively
easier for banks to build more reliable proprietary models from a large pool of loan database
(Berger and Udell, 2003:314). Large banks in particular are able to adapt new technology and
take advantage of scale economies to provide standardized services at relatively lower unit
costs (Carter and McNulty, 2005:1116).
The introduction of credit scoring may have significant effects on small business credit
markets, including the availability, riskiness and pricing of loans as well as the interactions
between the borrower and his lender. Numerous studies have found that the use of credit

V. Ekpu | The Microstructure of Bank Lending to SMEs | PhD Thesis | University of Glasgow | 2015
60
scoring is associated with an increase in small business lending, especially to relatively opaque
small firms, risky borrowers, borrowers in low and moderate income areas, etc (e.g. Frame,
Srinivasan and Woosley, 2001; Frame, Padhi and Woosley, 2004; Berger and Frame, 2005;
Berger, Frame and Miller, 2005; Berger, Cowan and Frame, 2009). On the efficiency of credit
scoring models, research has found that the use of credit scoring reduces the cost of
information between borrowers and lenders (Frame, et al., 2001:813) as well as the time and
human input involved in reviewing loan applications (Feldman, 1997). Since data has replaced
experience, the role of underwriters and human judgment in credit decisions is now less
important.
Changes in technology as exemplified by the use of credit scoring has also been found to
enhance large banks’ chances of making large amount of small business loans to small firms
even in distant markets. This is because credit scoring makes the credit evaluation of loans
faster and easier. Empirical evidence reveals that transactions-based loans tend to be carried
out over greater distances and for longer periods of time than relationship-based loans (Craig,
Jackson III and Thomson, 2005). As credit scoring does not require a physical market
presence, large banks can effectively penetrate new markets without having to bear the cost of
establishing branch networks. This assertion is corroborated by Anderson (2007) when he
stated “relationship lending is appropriate in communities where lender and borrower had
personal knowledge of each other, but is inefficient in an era of high customer mobility and
extended branch networks” (pp.7). For example, because of the use of scoring systems,
borrowers in distant markets are able to obtain ‘unsecure credit’ from banks through ‘direct
marketing channels’ (Akhavein, Frame and White, 2005:579). Thus, large banks because of
their centralized structure are able to specialize in distance lending to small opaque businesses
in order to beat their small bank competitors.
In spite of its advantages, credit scoring as a lending technology is not without limitations.
First, credit scoring has changed the relationship between borrowers and their lenders. Since
large banks are able to extend credit to small businesses from a distance, they now keep an
arm’s length from their customers and tend to invest less in building relationships. A second
disadvantage of credit scoring is that it lacks the forward-looking component, which is present
in relationship lending since it only considers mostly previous information on the borrower.
Thirdly, the accuracy of credit scoring models might be jeopardized if not based on balanced,
V. Ekpu | The Microstructure of Bank Lending to SMEs | PhD Thesis | University of Glasgow | 2015
61
reliable, and up-to-date information on both ‘well- performing’ and ‘poorly performing’ loans
(Mester, 1997:10). Fourth, large banks find it extremely difficult to monitor loans since a vast
majority of their clients are outside their traditional lending market. Small banks tend not to
have this constraint because they have a good knowledge of local market conditions in which
most of their borrowers operate. Thus, smaller banks may be able to maintain their advantage
over large banks in monitoring loans. For example, borrowers that fail to qualify for loans on
the basis of credit scores or other forms of hard information but are nonetheless credit worthy
on closer examination could possibly approach these relationship lenders as well.
Psychometric Scoring
Psychometric scoring is a cutting-edge tool used to offer cost-effective non-collateral loans to
SMEs. Psychometric tests are a computer-based questionnaire tool that assesses a borrower’s
personality traits and other traits known to differentiate between successful and unsuccessful
entrepreneurs. These traits include factors like business aptitude, intelligence, innovation,
locus of control, ethics, honesty, integrity, conscientiousness (dependability, industriousness,
efficiency) and optimism, and so on (Anderson, 2011). Certain other factors are often included
as control variables, such as age, past business experience, and firm size (Acharya, et al.,
2007). They are currently being introduced to developing credit markets like India, Peru,
Argentina, Mexico, South Africa, Kenya, Ghana, Nigeria, and Uganda who seem to have
growing interest in making significant investments in data infrastructure and risk assessment
models like advanced credit markets. They are used in micro-finance environments for
improving access to low-cost financial services and enhancing financial inclusion. In some
banks, SMEs are asked to provide a detailed business plan and repayment plan and then
appraisal is done on the merits of the outcome of the psychometric test.
Judgemental Score Cards
In appraising SME loans, loan officers consider a wide range of factors such as financial
capacity to repay loan, willingness to repay loan, collateral pledged, and the specific terms and
conditions of the loan contract. At the same time, banks do not want credit analysts to spend
hours spreading a small company’s financial statements to underwrite a £5,000 loan. The use
of simple scorecard that evaluates a mix of financial and non-financial factors has been found
to be the most appropriate way to appraise a large book of SME loans (Caire, 2004). Banks
V. Ekpu | The Microstructure of Bank Lending to SMEs | PhD Thesis | University of Glasgow | 2015
62
that adopt this approach are able to make SME loan underwriting more cost-effective and are
also be able to customize customer information to specific local economic and lender
conditions. In developing credit markets where third-party information infrastructure is not
fully developed, banks find it increasingly useful to mine their own institutional knowledge
and historical portfolio data to develop scorecards that suit their strategies for the SME market
segment. It is more sensible for banks in such markets to develop credit-scoring models that
utilize judgmental scorecards to predict loan defaults.
Judgmental scorecards structure credit policies and management risk preferences into a
mathematical model that ranks applicants according to risk. A judgmental model, unlike
statistical models, can be created without any historical data, so it can be applied to new
segments. The use of judgmental models can reduce the need to request collateral for loans
granted to young and informationally opaque SMEs. The technique combines both financial
and non-financial information about SMEs to make the default prediction models for SME
loans more comprehensive and to have a higher chance of being more accurate than if only
financial information was taken into consideration. Qualitative data relating to such variables
as legal action by creditors to recover unpaid debts, company filing histories, comprehensive
audit report/opinion data and firm-specific characteristics make a significant contribution to
increasing the default prediction power of risk models built specifically for SMEs (see
Altman, Sabato and Wilson, 2009).
Peer-to-Peer Lending
In the wake of the recent global financial crisis, there has been a rise of alternative finance
intermediaries, particularly in the developed credit markets, due to SMEs’ reduced access to
credit from traditional banks. The evolution of information technology in recent years has led
to the development of electronic marketplaces where commerce takes place remotely through
the economic interaction of market participants. Within the financial services industry, a new
and innovative method of loan origination has entered the credit market since 2005. This
method of lending, known as ‘peer-to-peer (P2P) lending’, ‘crowd funding’ or ‘social
lending’, is an online platform where borrowers place request for loans online and private
lenders bid to fund these loans in an auction-like process (Klafft, 2008). Online lending
platforms are now available in a wide range of advanced countries, such as the US (Prosper
Marketplace Inc., Lending Club Corporation), UK (Zopa Ltd, Funding Circle, Ratesetter,
V. Ekpu | The Microstructure of Bank Lending to SMEs | PhD Thesis | University of Glasgow | 2015
63
Wellesley, Assetz Capital), China (CreditEase, Lufax, Tuandai), Germany (Smava, Lendico,
Zencap), and Japan (Maneo, Exchange Corporation KK) just to mention a few. According to
Baeck and Collins (2013), more than US$2.7 billion was raised through crowd funding
globally in 2012, which helped to fund more than 1 million new projects.
There is an ongoing debate about disintermediation and the future relevance of traditional
financial intermediaries fuelled by the increasing role of online lending platforms, where an
electronic marketplace replaces a bank as the traditional intermediary and enables brokerage
of consumer and business loans directly between borrowers and lenders (see Berger and
Gleisner, 2009). Thus, the growth in online P2P lending sector has important implications for
competition for SME loans in traditional bank intermediaries. There is evidence to suggest that
there is a difference in the lending model and competitive strategy of P2P lenders and their
traditional bank counterparts. The main differentiation strategy between P2P lenders and
traditional banks is the speed and ease of processing loan transactions due to the help of
automated lending systems, which also help to reduce operating costs. In addition, investors in
P2P lending markets also earn rates of return on their investment, which tend to be higher than
those offered on traditional bank deposits (see Wang et al., 2009). The economic value created
by P2P lending intermediaries for borrowers has been summarized by Pierrakis and Collins
(2013) to include the following: (1) speed of securing finance, (2) competitive interest rates
vis-à-vis traditional banks, (3) improved cash flow, (4) increase in employment, (5) business
expansion and asset purchases, (6) increased overseas business growth, (7) increased sales,
and (8) increased R&D activities, including new product development. The main economic
benefits of P2P lending for lenders/investors are two fold: (1) higher average annualized
returns on investment than traditional bank savings, and (2) possibility of risk diversification,
evidenced by the ability to micromanage their investments.
2.5.4. Lending Infrastructure
The lending infrastructure is also a key element in determining the availability and quantum of
credit supplied by banks to small businesses. The lending infrastructure refers to the rules and
conditions provided mostly by governments or their regulatory agencies that affect financial
institutions and their abilities to lend to different potential borrowers. According to Berger and
V. Ekpu | The Microstructure of Bank Lending to SMEs | PhD Thesis | University of Glasgow | 2015
64
Udell (2006), the lending infrastructure consists of three environments: (a) the information
environment (b) The legal, judicial and bankruptcy environment (c) the tax and regulatory
environments. All of these elements may directly affect small business credit availability by
affecting the extent to which the different lending technologies can be legally and profitably
employed.
The Economics of Information
One important aspect of the information infrastructure is the accounting environment. As
findings from the literature have revealed, SMEs do not keep adequate accounting records and
as such are unable to satisfy the requirements of banks who rely very much on financial (hard)
information in making informed lending decisions. A robust accounting standards and the use
of credible independent accounting firms are necessary conditions for informative financial
statements. These are also necessary conditions for the feasibility of many components of loan
contracting. For example, financial covenants are not feasible if the financial ratios calculated
from bank financial statements are not reliable (Berger and Udell, 2006). Another important
aspect of the information infrastructure is the availability of information on payment
performance. Third party information exchanges or business credit bureaus provide a formal
organizational mechanism for the exchange of commercial information on payment
performance. The availability of commercial information like this has been shown to have
power in predicting firm failure beyond financial ratios and other descriptive information
about the firm (Kallberg and Udell, 2003). Survey data in the US also indicates that without
credit bureaus, the time to process loans, the cost of making loans, and the level of defaults
would all be higher (Miller, 2003).
The Legal, Judicial and Bankruptcy Environment
A country’s legal and judicial infrastructure significantly influences the context in which loan
contracting is conducted. The legal infrastructure that affects business lending consists of the
commercial laws that specify the property rights associated with a commercial transaction and
enforcement of these laws (Berger and Udell, 2006). The latter determines the confidence of
contracting parties in financial contracts. Collectively, these two features constitute the rule of
law as it relates to the extension of credit. Banks cannot effectively deploy specific contracting
elements (such as covenants, maturity, collateral and personal guarantees) without robust
V. Ekpu | The Microstructure of Bank Lending to SMEs | PhD Thesis | University of Glasgow | 2015
65
commercial and financial laws. According to Fleisig (1996), a number of legal reforms need to
be implemented in order to develop the use of contracting elements like collateral (including
movable assets) to secure loans, particularly in developing countries. These include: (1)
changing the law to permit a greater variety of security interests in a wider range of
transactions by a broader group of people; (2) making registry records public, reforming state-
operated registries, restructuring public registries to permit competition, and privatizing
registry services or allowing private registry services to compete with public ones; (3)
speeding up enforcement and making it cheaper, changing the law to permit private parties to
contract for non-judicial repossession and sale, and, when possible, allowing private parties to
contract for repossession and sale without government intervention. The efficiency of
bankruptcy system is also critical. How long a company stays in bankruptcy either in
liquidation or in reorganization is important. Also important is the degree to which bankruptcy
laws and their enforcement adhere to absolute priority. For example, the power of collateral
will ultimately depend on whether the priority rights of secured lenders are upheld in
bankruptcy.
The Tax and Regulatory Environment
The tax and regulatory environments may have direct effects on SME credit availability. A
country’s tax laws can either lure SMEs into the formal sector of the economy or keep them
out of it. The tax system can inadvertently place SMEs at a disadvantage. For example, the
taxation of manufacturers, traders and importers (e.g. import duty, sales tax, excise taxes, etc)
can affect the costs of doing business and profitability of businesses depending on the rate of
taxation and hence either encourage or discourage bank lending to SMEs. The second element,
the regulatory environment, may also restrict SMEs credit availability indirectly by
constraining the potential financial institution structure. In this connection therefore, the
enforcement of capital requirements and direct government intervention have the ability to
directly influence the quantity and cost of lending to SMEs. There is a direct link between
activities of bank regulators and bank lending behaviour, especially with respect to the
enforcement of capital requirements. Banks generally have a number of options when
improving its capital position. They can shrink assets by selling securities, selling other assets,
charging off loans or reducing new lending. In many cases, the enforcement of capital-to-asset
ratios leads to the shrinkage of new bank lending to bank-dependent customers (e.g. Peek and

V. Ekpu | The Microstructure of Bank Lending to SMEs | PhD Thesis | University of Glasgow | 2015
66
Rosengren, 1995b). Governments also often intervene in the lending market to influence loan
supply, e.g. through the use of interest rate subsidies, directed lending to specific sectors, loan
guarantee schemes, and a variety of other approaches to get SMEs financed. However, the gap
between SMEs and larger businesses remains. With the recent financial crisis, many
economies are looking to SMEs to provide much needed jobs and to help pull their economies
out of recession, putting SMEs back into the spotlight of development and political agendas.
2.6. Chapter Conclusions
This chapter has examined a great deal of theoretical and empirical literature on the demand
and supply side factors affecting bank involvement with SMEs. The theoretical models upon
which the foundation of bank lending is carried out are the money creation and credit rationing
concepts. The literature revealed a number of debates on the relative role of money demand
and supply in determining lending constraints. The post-Keynesians explain that banks do not
simply act as intermediaries, lending out savings deposits, but tend to create deposits by
extending loans, a phenomenon that is contrary to the so-called money multiplier theory.
Mainstream economic theory assumes that asymmetric information is widespread in financial
markets and that with the presence of “adverse selection” and “moral hazard” effects, credit
rationing may persist even in liberalised financial markets. For post-Keynesians, information
asymmetry is unrealistic because fundamental uncertainty exists in an investment project, so
that both the lender and borrower are oblivious of the riskiness of the project. For post-
Keynesians, the main constraints to bank lending are the changes in the financial condition of
borrowers (e.g. amount of indebtedness, cash flow, liquidity and financial fragility, etc), which
implies that banks also change their valuation of the riskiness of the borrowers.
It has been established that access to bank finance for SMEs is difficult and costly because
they are relatively young and informationally opaque. The literature also shows that SMEs
rely much on bank finance not just for their operational needs but also in order to build credit
reputation early in their life cycle. The factors affecting the supply of credit to SMEs can be
categorised into demand-side and supply-side factors. In particular, on the demand-side,
borrower characteristics such as firm and owner characteristics, and the nature of borrower-
lender relationships affect the underwriting practices of banks. Findings generally reveal that
V. Ekpu | The Microstructure of Bank Lending to SMEs | PhD Thesis | University of Glasgow | 2015
67
banks, especially large ones, tend to be attracted to larger, older, well-established and more
financially secure firms. Relationship-driven banks tend to pay more attention to applicants
that have pre-existing loan and deposit relationships with them. Banks are also more likely to
demand collateral from young and inexperienced SME borrowers. This is because SMEs are
known to be risky and have high failure rate. While smaller banks have longer and more
exclusive personal relationships with SME borrowers, large multi-office banks tend to have
more short-lived, less exclusive and distant relationships with their customers. Empirical
evidence reveals that longer firm-borrower relationships help to reduce loan prices and
collateral requirements of firms, thereby increasing firm value. The terms of a loan contract
(i.e. loan prices, maturity and collateral) are also dependent on a number of lender
characteristics such as liquidity, risk profile, monitoring ability, reputation and bargaining
power.
On the supply side, bank organisational structure, regulatory requirements, the type of lending
technology adopted, and the bank market structure are dominant factors. Banks that have a
relatively flatter organisational structure (such as smaller banks) tend to have advantages in
loan monitoring and increased loan officer discretion. However, large banks with multi-office
structures find it extremely costly to invest in relationships. Banks that are largely geared
towards SMEs are known to be heavily reliant on relationship lending techniques, while large
multi-office banks tend to have advantages in economies of scale and scope because they rely
on transactions-based lending and other financial management services. Regulatory factors
such as enforcement of capital requirements, sectoral credit limits and monetary policies also
affect the quantity and cost of loanable funds via lenders’ risk appetite, credit rationing and the
credit channel, respectively. Banking consolidation also tends to affect SME lending.
Empirical findings reveal that a large bank acquisition of a small bank often reduces SME
lending in the short run, but this effect is offset in the long run by the decision of other small
banks to increase lending to SMEs. Commercial lending is also affected by the structure of the
banking market. This manifests in two forms: product and geographic market competition.
Smaller banks tend to specialise in SME loans because they are unable to compete with larger
banks for larger loans in order to keep up with regulatory limits on loan concentration.
Moreover, they cannot offer a wide range of financial services, as do larger banks. Local and
regional banks tend to situate their offices mostly in (less competitive) rural areas, while large
banks operate in urban areas where most large businesses are found. However, with changes in
V. Ekpu | The Microstructure of Bank Lending to SMEs | PhD Thesis | University of Glasgow | 2015
68
regulation, large banks now penetrate rural banking markets, raising questions regarding the
survivability of small local banks and bank-dependent small business borrowers located in
those regions.
Another supply-side factor affecting SME lending is lending technology. In addition to the use
of relationship lending and credit scoring techniques, banks, particularly in developing credit
markets are increasingly embracing other cutting edge techniques in assessing borrowers, such
as psychometric scoring and judgmental score cards. Technological revolutions in advanced
credit markets have also made electronic marketplaces possible, such as in peer-to-peer
lending, where borrowers place request for loans online and private lenders bid to fund these
loans. The emergence of online intermediaries as alternative financing sources for businesses
has competitive implications for the intermediation functions of traditional banks. Lastly, the
lending infrastructure, which consists of three environments (the information environment, the
legal, judicial and bankruptcy environment and the tax and regulatory environments) directly
affect small business credit availability by affecting the extent to which the different lending
technologies can be legally and profitably employed.
Overall, this chapter has provided useful insights into the influence of demand side factors,
bank-level factors and other external factors on SME lending practices. Next, we examine the
trends in bank lending to SMEs in Nigeria.

V. Ekpu | The Microstructure of Bank Lending to SMEs | PhD Thesis | University of Glasgow | 2015
69
CHAPTER 3
TRENDS IN LENDING TO SMEs IN NIGERIA’s POST-CONSOLIDATED BANKING SECTOR
3.1. Introduction
Since 2004, the Nigerian banking sector has witnessed series of reforms aimed at making
Nigerian banks among the strongest banks in the world. These reforms included, amongst
others: (1) consolidation of the banking sector, and (2) introduction of the ‘Financial Sector
Strategy (FSS 2020)’. Consolidation is a reform designed to strengthen the banking sector
through recapitalization policy. The policy was to increase the minimum capital base of each
bank from N5 billion (~£20 million) to N25 billion (~£100 million). The additional capital
was raised through the capital market as well as through mergers and acquisitions. The
Financial Sector Strategy (FSS 2020) on the other hand, is a complementary reform blueprint
designed to transform the financial sector into a growth catalyst in order to make Nigeria a
“financial hub” in Africa and to achieve Nigeria’s goal to become one of the top 20 economies
in the world by the year 2020 (Adamu, 2009).
The vision’s strategy includes helping to build a vibrant SME sub-sector, known to be the
fulcrum of industrial development, worldwide. To achieve this, the banks needed to be re-
capitalized to enable them play their role effectively. According to the FSS 2020 MSME
Implementation Committee Report (2008), the SME development vision states that:
“By 2020, our credit to GDP ratio will be among the top three of emerging markets,
with the most productive MSME sub-sector and 70% of the Nigerian population having
access to credit”
The above stated vision for the SME hopes to make credit accessible, convenient and
affordable. It also hopes to foster a vibrant and competitive micro, small and medium
enterprises (MSME) sector that will enhance job creation, promote economic growth, reduce
poverty, and create wealth. Small and Medium Enterprises (SMEs) are defined as entities with
asset base not exceeding N500 million or ~ £2 million (excluding land and buildings) with
employees of between 11 and 200 (CBN, 2013). SMEs in Nigeria typically engage in the
following kinds of businesses: block making, soap and pomade making, leather

V. Ekpu | The Microstructure of Bank Lending to SMEs | PhD Thesis | University of Glasgow | 2015
70
manufacturing, livestock farming and other agri-business, food processing, bottle water
production, general trade and commerce, as well as services such as restaurant and bars,
educational services, transport services, haulage and logistics, etc
The catalyst for the growth of the Nigerian economy lies in the banking system through
efficient allocation of credit, especially to the real sector. Unfortunately, banks’ post
consolidation credit administration has continued to neglect SMEs and real sector
development. The huge capital acquired by the banks during the consolidation exercise has
been largely channeled to non-SME, non-real sector bad and doubtful loans, such as loans to
oil and gas as well as margin lending to the capital market, which lost over 66% of its value
during the financial crisis. In Nigeria, banks generally favour the financing of commerce for
quick returns to capital and tend to focus on their ability to generate high interest and fee-
based income within a short period. Consequently, all efforts made in the past to attract real
sector finance from the banking system have been largely unsuccessful. As examined in
chapter 2, the literature suggests that banks’ lending behavior reveal that the more banks are
capitalized or become larger by way of mergers and acquisitions, the fewer loans they grant to
SMEs (e.g. Peek and Rosengren, 1995a; Berger et al., 1998; Avery and Samolyk, 2004).
The aim of this chapter is to examine the trends in bank lending to SMEs in the post-
consolidated banking sector in Nigeria. The importance of SMEs in any economy cannot be
overemphasised. SMEs in Nigeria account for more than 70% of industrial labour force and
60% of agricultural employment (Lawal and Ijaiya, 2007). In 2012, Nigeria had about 17.6
million MSMEs employing about 32.4 million people, and contributing about 46.5% of
nominal GDP (Sanusi, 2013). However, one of the greatest obstacles facing SMEs in Nigeria
is poor access to funds. This is further compounded by the fact that even where credit facilities
are available, they may not be able to assemble the required collateral to access such funds.
Between 2003 and 2012, commercial bank loans to SMEs dropped at an exponential rate.
Analysis of the annual trend in the share of commercial bank credit to SMEs indicates a
decline from about 7.5% in 2003 to less than 1% in 2006 and a further decline in 2012 to
0.14%.
Given the constraints faced by SMEs in Nigeria, the government has over the years taken a
number of steps aimed at improving the prospects of SMEs, in terms of access to bank credit.
Some of these steps include the creation of the following agencies and schemes – Small and
V. Ekpu | The Microstructure of Bank Lending to SMEs | PhD Thesis | University of Glasgow | 2015
71
Medium Enterprises Development Agency (SMEDAN), Small and Medium Enterprises
Equity Investment Scheme (SMEEIS), Bank of Industry (BOI), Bank of Agriculture (BOA),
the CBN Intervention Fund for Refinancing/Restructuring loans to the Manufacturing Sector,
Agricultural Credit Schemes, and the Micro, Small, Medium Enterprise (MSME)
Development Fund, amongst other financing programs. These were aimed at addressing
difficulties SMEs face in obtaining loans, and helping commercial banks develop consistent
policies for dealing with SMEs, while ensuring that the provision of loans does not
compromise the long term sustainability of the banking industry (Ukoha, 2013a). Such policy
initiatives are necessary, given the importance of SMEs in driving innovation, growth and
employment generation. However, despite the efforts of the Federal Government of Nigeria
and other stakeholders to make it easier for SMEs to access bank loans, they still appeared to
find it difficult to meet the requirements for obtaining bank loans.
The rest of this chapter is structured as follows: Section 3.2 takes a look at the overview of the
Nigerian banking sector from pre-independence to post-consolidated era. Section 3.3 examines
the trends in commercial banks’ credit to SMEs in Nigeria, and highlights the differences
between bank lending to SMEs in the pre-consolidated and post-consolidated era. It also
discusses the efforts made by the Nigerian government to boost commercial lending to SMEs,
and the restructuring of the microfinance sub-sector as part of efforts to expand access to
financial services to MSMEs. In section 3.4, the types and features of commercial bank
lending facilities available to SMEs in Nigeria are highlighted to gain an understanding of the
lending practices and preferences of the banks. The chapter concludes in section 3.5.
3.2. Overview of the Nigerian Banking Industry
Before discussing the trends in SME lending in Nigerian banks, it is important to appreciate
the history of Nigerian banking system and how this sets the tone for understanding the nature
of commercial banks’ lending practices to SMEs in the country today. The evolution and
development of the Nigerian banking sector can be readily understood by categorizing the
history of banking in Nigeria under four broad phases: (1) the pre-independence era (1929-
1959), (2) the post-independence era (1960-1985), (3) the pre-consolidation era (1986-2004),
and (4) the post-consolidation era (2006-date).

V. Ekpu | The Microstructure of Bank Lending to SMEs | PhD Thesis | University of Glasgow | 2015
72
3.2.1. The Nigerian Banking Sector Before Consolidation
The Pre-Independence Era (1929-1959)
Under the British colonial rule, Nigeria effectively had no formal financial controls. The first
indigenous bank in Nigeria – the Industrial and Commercial Bank – was founded in 1929, “a
time when banking was effectively unregulated and entry was unrestricted” (Brownbridge,
2005). Between 1947 and 1952, more than 30 private local banks sprang up but went into
liquidation. Most of these banks at the time were short-lived due to a combination of
mismanagement, insider lending and inadequate capitalization. The first steps towards creating
a developed banking system came in 1948 with the creation of an inquiry to investigate
banking practices. The GD Paton report, which came from the inquiry, prompted the need for
regulatory intervention and for reforms to be instituted to address the anomalies in the industry
(Atuche, 2009; CGI, 2010). As a result, the Banking Ordinance Act of 1952, Nigeria’s first
banking law, came into existence. Banks now had to obtain a license to prove they had enough
funds to operate and were subject to governmental supervision. The introduction of the
ordinance for the first time imposed entry conditions for banks such as minimum capital
requirements, and the loss of public confidence induced by the failure of local banks, brought
the indigenous banking boom to an end by the mid-1950s (Nwankwo, 1980).
The next step forward came with the establishment of a central bank under the 1958 CBN Act,
which began operating in the mid-1959. The CBN was meant to oversee the distribution of
Nigeria’s currency, control and regulate the banking sector. As there were only 3 foreign
banks in the country at the time and 2 domestic banks, each with 20 branches, the central bank
was meant to lend to these banks and execute government monetary policy decisions.
The Post-Independence Era (1960-1985)
Only 4 indigenous banks survived until independence in 1960 and their survival was solely
due to substantial financial support from the regional governments then in existence
(Brownbridge, 2005). This marked the beginning of state government (then known as
‘regional government’) participation in banking. Despite the banking sector’s auspicious start,
much of the next 25 years saw huge corruption and stagnation in the sector. It was claimed
that nationalization in the 1970s and early 1980s would help protect and reform Nigeria’s
banks, but in fact nationalization made it even easier for the country’s leaders to engender

V. Ekpu | The Microstructure of Bank Lending to SMEs | PhD Thesis | University of Glasgow | 2015
73
corruption (CGI, 2010). Foreign banks dominated the Nigerian banking sector until 1970s and
1980s when a number of measures were taken by the government. Instead of foreign bank
domination, the new change resulted in a banking industry dominated by public sector
ownership, i.e. state banks (Aburime, 2007). This occurred as a result of government decision
to nationalize foreign banks, culminating in the federal government acquisition of 40% of the
shares in the 3 largest foreign banks at the time, which were Barclays (now Union Bank),
United Bank for Africa and Standard Bank (now First Bank). The rationale for government’s
participation in commercial banking was to break the monopoly power and discriminatory
practices of the expatriate banks and give financial assistance to indigenous banks (Nwankwo,
1980). The Economic Stabilization Act of 1982 and the National Economic Emergency
Decree of 1985 are inclusive of the other measures introduced to sanitize the banking system
from the financial distress that occurred in the early 1980s (Atuche, 2009).
The Pre-Consolidation Era (1986-2004)
General Ibrahim Babangida’s administration took the first step toward private enterprise as a
means of reinvigorating the sector with the 1986 Structural Adjustment Programme (SAP).
The deregulation of the sector saw a rush of new players to the sector – by 1992, the number
of banks had increased from just 40 banks in 1985 to 121 banks with over 2,000 branches. Not
only that, there were now more than 400 finance houses where there had been 10, and 250
mortgage lenders compared to just 1 that was in existence before SAP (CG1, 2010). The
average growth rate of banking assets sprang from less than 10% in 1985 to 30.4% in the same
period (Atuche, 2009). The sector had been somewhat secured by the 1988 creation of the
Nigeria Deposit Insurance Corporation (NDIC), which ran a deposit insurance scheme to
cover depositor’s money if their bank failed.
During this SAP era, the CBN adopted severe contractionary policies, which included the
withdrawal of billions of naira from the banking system. It further tightened the monetary
policy in August 1987 by raising the minimum discount rate by 400 basis points to 15%.
Interestingly, the SAP era is strikingly similar to today’s circumstances. In spite of this
contractionary stance, the boom in the sector continued unabatedly such that by 1994, there
were approximately 66 commercial banks, 54 merchant banks, 402 community banks, 228
people’s bank branches, 145 mortgage institutions, 132 bureau de change, 140 stock brokerage
firms, 666 insurance firms and 3 discount houses (Atuche, 2009). Although the SAP had led to
V. Ekpu | The Microstructure of Bank Lending to SMEs | PhD Thesis | University of Glasgow | 2015
74
an explosion in growth, structurally the banking sector was still on very shaky ground.
Deregulation had worked too well, attracting entrants to the sector who were using banks as
fronts for illegal practices like ‘round-tripping’, where banks could be used to buy hard
currency at a preferential rate, then resell it at higher market rate (CGI, 2010). The sector was
drastically under-capitalized, with many banks effectively insolvent, while others were totally
reliant on government deposits to stay in business. The CBN’s hands-off approach led to many
banks concealing bad debts with false accounting.
The government intervened in 1997 to ease the tension created by the unmitigated growth in
the boom period by raising capital requirements to N500 million (~£2 million) by December
1998 from mere N40 million (~£160,000) for commercial banks and N50 million (~£200,000)
for merchant banks. Overall, about 30 banks had to be liquidated by the end of 1998. As at
2001, the minimum capital base for banks stood at N1 billion (~£4 million) and was
subsequently raised to N2 billion (~£8 million) with December 2004 as the deadline set for
compliance. By 2003/2004, there were 89 banks in the now highly competitive sector, often
understaffed or run by people looking to make a quick profit at the expense of investors. Bank
credit as a ratio to GDP in Sub-Saharan Africa had an average of 57%. In the developed
world, such as Europe and US, it stood at 272%. In Nigeria, the ratio was just 24% (CGI,
2010). It became evident that something had to be done to stop the banking sector from
collapsing.
3.2.2. The Nigerian Banking Sector After Consolidation
Post-Consolidation Era (2006 till date)
The CBN’s assessment of the 89 banks, based on their returns, classified 62 as
sound/satisfactory, 14 as marginal and 11 as unsound as at end-March, 2004 (Adamu, 2009).
Further analysis of the marginal and unsound banks showed that they accounted for only
19.2% of the total assets of the banking system, 17.2% of the total deposit liabilities and
19.5% of the industry’s non-performing assets. Those banks were constrained by persistent
liquidity problems, poor asset quality and unprofitable operations. The major problems of
Nigerian banks at the time, according to Adamu (2009) and Nnaji (2011), included:

V. Ekpu | The Microstructure of Bank Lending to SMEs | PhD Thesis | University of Glasgow | 2015
75
§ High concentration of the banking sector – the ten largest banks accounted for about 50%
of the industry’s total assets and liabilities.
§ Weak corporate governance, evidenced by high turnover of board and management staff
§ Late or non-publication of annual accounts, inadequate reporting and non-compliance to
regulatory requirements
§ Gross insider abuse, resulting to huge non-performing credits
§ Negative capital adequacy ratios
§ Weak capital base – most banks had capitalization of less than US$10 million, with the
largest bank having a capital base of about US$240 million.
§ Huge operational costs – the small size of most of the banks resulted in heavy fixed costs
and operating expenses, and the concentration of most bank branches in a few commercial
centers, led to very high average cost for the industry. This in turn had implications for the
cost of financial intermediation, and the spread between deposit and lending rates.
§ Over-dependence on public sector deposits, leading to problems of volatility in liquidity.
§ Disintermediation – as evidenced by preference of most banks for businesses that give
quick-returns to capital (e.g. foreign exchange dealings, lending to oil and gas, imports,
etc), and
§ Neglect of small and medium class savers
Based on these factors, the Central Bank of Nigeria, led by the new Governor at the time,
Professor Charles Soludo, embarked on the consolidation of the banking system in 2004,
wherein the minimum capital base of the banks was raised from N5 billion (~£20 million) to
N25 billion (~£100 million), with December 31st, 2005 set as deadline for compliance. The
recapitalization process was introduced as part of a reform agenda aimed at saving the ailing
banking sector and give it the flexibility needed to support Nigeria’s ambitions of becoming a
major player on the world stage, ranking amongst the world’s top 20 economies by 2020. The
recapitalization exercise reduced the number of banks from 89 to 25. By 2008, there were 24
banks remaining – including 6 that had met the recapitalization requirements, and 18 created

V. Ekpu | The Microstructure of Bank Lending to SMEs | PhD Thesis | University of Glasgow | 2015
76
from mergers and acquisitions (CGI, 2010). A total of N 406.4 billion (~£1.62 billion) was
reported as funds raised by banks from the capital markets (Adamu, 2009). In addition, the
process attracted foreign capital inflow of over US$652 million (Anyanwu, 2010).
Prior to the recapitalization, majority of the banks were under private domestic ownership with
the exception of 3 foreign-owned banks operating in the country (Citibank, Standard
Chartered and Stanbic Bank). Following the consolidation, banks’ balance sheets expanded,
most of them venturing into universal banking and expanded cross-border transactions into
other African countries, United States and Europe. Credit to private sector equally increased
and all other developmental indicators of the banking sector increased as a result of the
consolidation exercise. Financial depth (measured by MS/GDP ratio) and intermediation into
the private sector (measured by credit to private sector/GDP) increased substantially (See table
3.1.).
Table 3.1. Indicators of Banking Sector Performance after Consolidation
Indicator Pre-consolidation (2004)
Post-consolidation (2008)
Number of banks 89 24 No of bank branches 3,382 4,500 Total Asset of Banks (US$ billion) 24 51.1 Loan to Deposit Ratio 85 98 Cash Reserve Ratio 59 61 Capital Requirements (N billion) 5 25 M2/GDP 19.8 37 Private Sector Credit/GDP 21 37 Total NPL/Total Loan Portfolio 21.9 6.3 MI/M2 32 16
Source: Nnaji (2011) – CBN Economic and Financial Review, Vol. 29, No.1
The liquidity generated by the inflow of funds into the banks induced interest rate to fall
significantly, while an unprecedented 30.8% increase was recorded in lending to the real
sector in 2005 (Anyanwu, 2010). With a higher single obligor limit, Nigerian banks now had a
greater capacity to finance big-ticket transactions. More banks now had access to credit from
foreign banks, while the capital market deepened. The stock market became active and total
market capitalization increased markedly from 24% to 41.8% as at December, 2006 (Adamu,
2009). Ownership structure was now diluted, helping to curb problems posed by insider abuse
V. Ekpu | The Microstructure of Bank Lending to SMEs | PhD Thesis | University of Glasgow | 2015
77
and weak corporate governance structures. The banks have begun to enjoy economies of scale,
and consequently, are passing on the benefit in the form of reduced cost of banking
transactions. The ratio of non-performing loans had declined from 21.9% pre-consolidation to
6.3% post-consolidation. In general, the reform efforts had engendered stable macroeconomic
environment evidenced by low inflation and relatively stable exchange rate (Anyanwu, 2010).
However, not long after the consolidation, the global financial and economic crises came in
2008, leading to the collapse of many financial institutions across the globe. It had been hoped
that Nigeria’s economy would be decoupled enough from the troubled economies of the
developed world to avoid the global financial crisis. Before the recession, Oceanic Bank had
jumped 565 places in the Banker’s Top 1,000 Banks, from 875 in 2007 to 310 in 2008, while
amassing US$ 1.75 billion in Tier 1 capital. Other banks such as Guaranty Trust Bank had
soared up 371 places to 369, while United Bank for Africa had leapt up 484 places to 392. The
sector as a whole made a healthy profit of US$ 3.1 billion (CG1, 2010). There were 12
Nigerian banks in the Banker’s list of top 20 African banks, with Zenith Bank and First Bank
of Nigeria leading the charge. The financial crisis reduced the gains made during the
consolidation of the Nigerian banking sector. In late 2008, the recession hit Nigeria’s stock
exchange hard, wiping out 60% of its value almost overnight. As a result, some banks faced
serious liquidity problems owing to their significant exposure to the capital market in the form
of margin trading loans, which stood at about N900 billion (~£3.6 billion) as at end-December
2008. The amount represented about 12% of the aggregate credit in the industry or 31.9% of
shareholders’ funds. Furthermore, rising oil prices also meant that a section of the banking
industry heavily exposed to the oil and gas sector was badly affected. As at end-December
2008, banks’ total exposure to the oil and gas industry stood at over N754 billion (~£3 billion),
representing over 10% of the industry total and over 27% of the shareholders’ funds
(Anyanwu, 2010).
By mid-2009, it was clear that many banks were struggling to survive in the face of the
economic storm. A new Governor for the CBN, Sanusi Lamido Sanusi, assumed office in June
2009, and in August 2009, an audit of the banking sector saw the heads of Afribank,
Intercontinental Bank, Union Bank, Oceanic Bank and Finbank removed. The Economic and
Financial Crimes Commission (EFCC) charged sixteen officials with a range of offences
including corporate fraud, lending to fake companies, giving loans to companies they had
V. Ekpu | The Microstructure of Bank Lending to SMEs | PhD Thesis | University of Glasgow | 2015
78
personal interest in and conspiring with stockbrokers to boost share prices for private gains. In
an effort to prevent a systemic crisis, the CBN injected the sum of N620 billion (~£2.48
billion) into the affected banks and changed the management of the banks. Arrangements were
also made to recover non-performing loans from banks’ debtors, while guaranteeing all
foreign credits and correspondent banking commitments of the affected banks. Furthermore,
the CBN proposed the establishment of the Asset Management Corporation of Nigeria
(AMCON). The AMCON as a resolution vehicle was designed to soak up the non-performing
loans of the troubled banks. The AMCON bought over toxic assets in excess of N1.2 trillion
(~£4.8 billion) in exchange for government bonds. This arrangement helped to free up the
affected banks’ balance sheet and made it easier for them to resume lending to the real sector.
By August 2011, the Central Bank invited new investors to take over the assets and some
liabilities of the affected banks and new ownership was named for the banks. Among the new
emerging banks are Main Street Bank Limited (acquired Afribank Plc), Keystone Bank
(acquired Bank PHB), and Enterprise Bank (acquired Spring Bank). Some existing banks also
took over the other failed banks, including Access Bank (acquired Intercontinental Bank),
FCMB (acquired Finbank), Ecobank (acquired Oceanic Bank), and Sterling Bank (acquired
Equatorial Trust Bank). The number of banks as at December 2013 stood at 24 banks, with a
few new players also joining the list of banks licensed as either national or regional banks.
Brief Profile and Overall Performance of Nigerian Banks21
Currently, the top 5 banks in Nigeria (known as Tier 1 banks) – Zenith Bank, First Bank,
GTB, UBA, and Access Bank dominate Africa’s highly competitive banking industry and
account for about 54% of Nigeria’s total banking sector assets, which stood at N22.5 trillion
(~£90 billion) as at June 2013 (Ecobank, 2013a; Chima, 2013) In 2011, these top five banks
had a combined balance sheet (including contingents) of N12.9 trillion (~£51.6 billion). In
addition, these five banks account for a sizeable portion of lending activities undertaken by the
industry. With this concentration level, these five banks provide a representative view of
Nigeria’s banking sector. Below is a brief profile of each of the five largest banks in Nigeria.
21 Adapted from Ventures Africa (2012)

V. Ekpu | The Microstructure of Bank Lending to SMEs | PhD Thesis | University of Glasgow | 2015
79
Zenith Bank Plc: Incorporated as Zenith Bank Limited in May 1990 and headquartered in
Lagos, the bank was licensed to carry on the business of banking the next month. The name
was changed to Zenith Bank Plc in 2004 to reflect its status as a public limited liability
company. The bank’s shares were listed on the Nigerian Stock Exchange (NSE) that year
following a highly successful Initial Public Offering (IPO). Nigerian institutions and
individuals numbering over 1 million currently own the shares of the bank. The bank has over
330 branches and 125 cash offices in Nigeria. The latest ranking of the Top 1,000 Global
Banks by the Influential Bankers placed Zenith as the largest bank in Nigeria and the seventh
biggest in Africa. It has US$2.4 billion of Tier-1 capital.
First Bank of Nigeria Plc: First Bank traces its history back to the first major financial
institution founded in Nigeria, hence its name. The bank is the largest retail lender in the
nation. While most banks gather funds from consumers and loan it out to large corporations
and multinationals, First Bank has created a small market for some of its retail clients. At the
end of December 2013, the bank had assets totaling approximately US$19.1 billion. The
bank’s profit after tax for the same period was approximately US$467.6 million. The bank
maintains a subsidiary in the United Kingdom, FBN Bank (UK), which has a branch in Paris,
and also has representative offices in South Africa and China. It is Nigeria’s second biggest
bank with US$2.36 billion of Tier-1 capital.
Guaranty Trust Bank Plc: Registered in 1990 by Central Bank of Nigeria, GTB Plc was
incorporated as a private limited liability company wholly owned by Nigerian individuals and
institutions. The approval as a commercial bank followed the same year and operations were
started in February 1991. It listed on the NSE in 1996, and became licensed as a universal
bank in 2002. In 2007 it became the first sub-Saharan African bank and first Nigerian joint
stock company, listed on the London Stock Exchange and Deutsche Börse. The IPO raised
US$750 million. In the same year, they successfully placed Nigeria’s first private Eurobond
issue on the international capital markets. GTB Plc is a partner of Morgan Stanley and BNP
Paribas and has Tier-1 capital of $1.48 billion.
Access Bank Plc: With the purchase of 75% equity stake in Intercontinental Bank Plc, Access
Bank Plc attained the fourth position in the Nigerian banking industry by total assets and

V. Ekpu | The Microstructure of Bank Lending to SMEs | PhD Thesis | University of Glasgow | 2015
80
contingents, with US$1.05 billion of Tier-1 capital. It has an asset base in excess of US$11.1
billion, as of December 2013. The shareholders’ equity in the bank is valued at approximately
US$2.33 billion. The purchase of Intercontinental goes alongside an international expansion
drive, which has seen the bank gain subsidiaries in Burundi, Côte d’Ivoire, the Democratic
Republic of the Congo, Ghana, Rwanda, Sierra Leone, The Gambia, Tanzania, United
Kingdom, and Zambia.
United Bank for Africa Plc: UBA is a Nigerian financial services provider with subsidiaries in
20 sub-Saharan countries and representative offices in France, the United Kingdom and the
United States. It offers universal banking services to more than 7 million customers across 750
branches. Formed by the merger of the commercially focused UBA and the retail focused
Standard Trust Bank in 2005, the Bank purports to have a clear ambition to be the dominant
and leading financial services provider in Africa. Listed on the Nigerian Stock Exchange in
1970, UBA claims to be rapidly evolving into a pan-African full service financial institution.
The Group adopted the holding company model in July 2011. As of December 2013, the
valuation of UBA Group’s total assets was approximately US$13.5 billion, with shareholders’
equity of about US$1.57 billion. It has over US$1 billion of Tier-1 capital.
Following the tier 1 banks category are the tier 2 banks, which include – Diamond Bank,
Stanbic IBTC, FCMB, Skye Bank, Fidelity Bank, Sterling Bank, and others. These tier 2
banks tend to have access to a wider pool of cheap retail deposits, though in general, they
incur higher cost of funds than tier 1 banks (tier 1 banks reported an average cost of funds of
3.6%, while tier 2 banks reported an average of about 5.3% for the first half of 2013 – Chima,
2013). Together, 13 Nigerian banks made it to the 2013 list of top 1,000 World Banks
Ranking of the Banker Magazine of the Financial Times Group, London, UK. The 13 banks
that made the ranking include: Zenith Bank (287), First Bank (367), GTB (417), Access Bank
(506), UBA (553), Ecobank, Fidelity Bank, FCMB, Skye Bank, Diamond Bank, Stanbic
IBTC, Union Bank and Standard Chartered Bank (Omoh, 2013). Table 3.2 and 3.3 rank the
top banks in Nigeria according to various performance measures as at 2013 year-end.

V. Ekpu | The Microstructure of Bank Lending to SMEs | PhD Thesis | University of Glasgow | 2015
81
Table 3.2. Ranking of Top Nigerian Banks by Key Performance Indicators – 2013 F/Y
Shareholders’ Fund Total Assets
Gross Earnings
Customer Deposits
(N billion) (N billion) (N billion) (N billion)
1 Zenith Bank 110.59 509.3 [1] 3,140 [2] 351.4 [1] 2,270 [2]2 GTB 107.09 332 [3] 2,100 [4] 242 [4] 1,440 [4]3 First Bank 76.85 350.71 [2] 3,250 [1] 284.44 [2] 2, 570 [1]4 UBA 51.84 259.54 [5] 2,220 [3] 214.27 [3] 1,797 [3]5 Access Bank 44.9 172.4 [7] 1,840 [5] 207 [5] 1,330 [5]
6 Diamond Bank 32.1 138 [10] 1,500 [6] 181 [6] 1,200 [6]7 Stanbic IBTC 24.61 97.6 [12] 763 [13] 111.2 [12] 416.3 [13]8 FCMB 18.2 144 [9] 1,008 [10] 131 [8] 715.2 [10]9 Skye Bank 17.13 120.4 [11] 1,110 [8] 127 [10] 996 [8]10 Ecobank 11.65 92.46 [13] 1,146 [7] 177 [7] 1,118 [7]11 Fidelity Bank 9.02 167 [8] 1,080 [9] 127 [9] 806.32 [9]12 Sterling Bank 9.31 321.75 [4] 909.4 [11] 92 [13] 570.51 [11]13 Union Bank 4.2 188 [6] 882 [12] 121 [11] 480 [12]14 Wema Bank 1.9 41 [14] 331 [14] 26 [14] 217 [14]
Rank by PBT Bank Profit Before Tax(N billion)
Tier I Banks
Tier II Banks
Source: Various Bank Annual Reports (2013) *Ranks are in parentheses []
In the area of profit before tax (PBT), the Tier-1 banks accounted for 76% of total profits of
the 14 banks under review, with Zenith Bank emerging as industry leader, declaring N110.59
billion (~£440 million) as PBT. In second position was GTB, which recorded a PBT of
N107.09 billion (~£428 million), while First Bank came third with a PBT of N76.85 billion
(~£307 million). Using shareholders’ funds as the barometer of banks’ performance showed
that the Tier-1 banks accounted for 65.4% of the 14 banks that were reviewed. Again, Zenith
Bank tops with N509.3 billion (~£2.03 billion), while Wema Bank occupied the bottom of the
table with shareholder funds of N41 billion (~£164 million). However, in terms of total assets,
First Bank emerged top place with N3.25 trillion (~£13 billion), while Zenith Bank, and UBA
occupied the 2nd and 3rd with N3.14 trillion and N2.22 trillion respectively.
In terms of key profitability ratios (see table 3.3), GTB is clearly the leader in the Nigerian
banking space as the lender tops the charts with respect to Return on Average Equity (ROAE),
and Return on Average Assets (ROAA) of 27.77% and 4.85% respectively. The bank’s
remarkable efficiency is revealed by its ability to churn out N107.09 billion in pretax profits
(PBT), almost double UBA’s N56.05 billion, even as its gross earnings of N242.2 billion were
less than UBA’s gross earnings of N264.6 billion. On the flip side, Union Bank is the worst
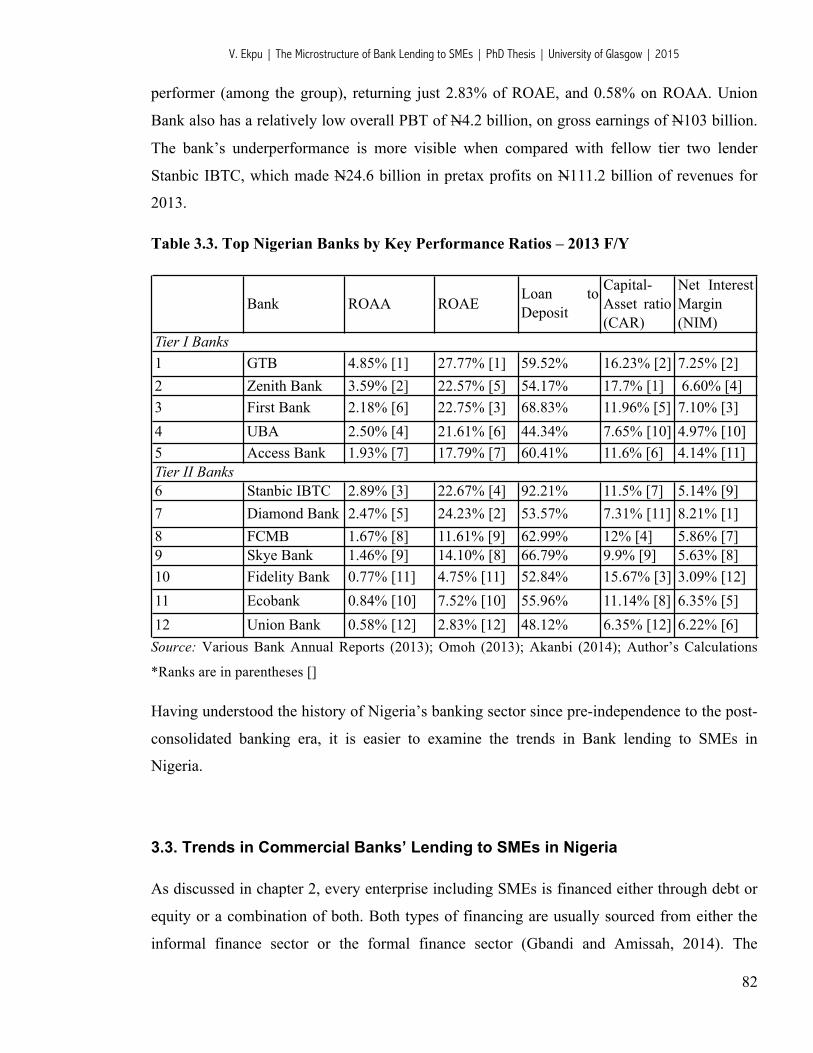
V. Ekpu | The Microstructure of Bank Lending to SMEs | PhD Thesis | University of Glasgow | 2015
82
performer (among the group), returning just 2.83% of ROAE, and 0.58% on ROAA. Union
Bank also has a relatively low overall PBT of N4.2 billion, on gross earnings of N103 billion.
The bank’s underperformance is more visible when compared with fellow tier two lender
Stanbic IBTC, which made N24.6 billion in pretax profits on N111.2 billion of revenues for
2013.
Table 3.3. Top Nigerian Banks by Key Performance Ratios – 2013 F/Y
Bank ROAA ROAELoan toDeposit
Capital-Asset ratio(CAR)
Net InterestMargin (NIM)
1 GTB 4.85% [1] 27.77% [1] 59.52% 16.23% [2] 7.25% [2]2 Zenith Bank 3.59% [2] 22.57% [5] 54.17% 17.7% [1] 6.60% [4]3 First Bank 2.18% [6] 22.75% [3] 68.83% 11.96% [5] 7.10% [3]4 UBA 2.50% [4] 21.61% [6] 44.34% 7.65% [10] 4.97% [10]5 Access Bank 1.93% [7] 17.79% [7] 60.41% 11.6% [6] 4.14% [11]
6 Stanbic IBTC 2.89% [3] 22.67% [4] 92.21% 11.5% [7] 5.14% [9]7 Diamond Bank 2.47% [5] 24.23% [2] 53.57% 7.31% [11] 8.21% [1]8 FCMB 1.67% [8] 11.61% [9] 62.99% 12% [4] 5.86% [7] 9 Skye Bank 1.46% [9] 14.10% [8] 66.79% 9.9% [9] 5.63% [8]10 Fidelity Bank 0.77% [11] 4.75% [11] 52.84% 15.67% [3] 3.09% [12]11 Ecobank 0.84% [10] 7.52% [10] 55.96% 11.14% [8] 6.35% [5]12 Union Bank 0.58% [12] 2.83% [12] 48.12% 6.35% [12] 6.22% [6]
Tier I Banks
Tier II Banks
Source: Various Bank Annual Reports (2013); Omoh (2013); Akanbi (2014); Author’s Calculations
*Ranks are in parentheses []
Having understood the history of Nigeria’s banking sector since pre-independence to the post-
consolidated banking era, it is easier to examine the trends in Bank lending to SMEs in
Nigeria.
3.3. Trends in Commercial Banks’ Lending to SMEs in Nigeria
As discussed in chapter 2, every enterprise including SMEs is financed either through debt or
equity or a combination of both. Both types of financing are usually sourced from either the
informal finance sector or the formal finance sector (Gbandi and Amissah, 2014). The
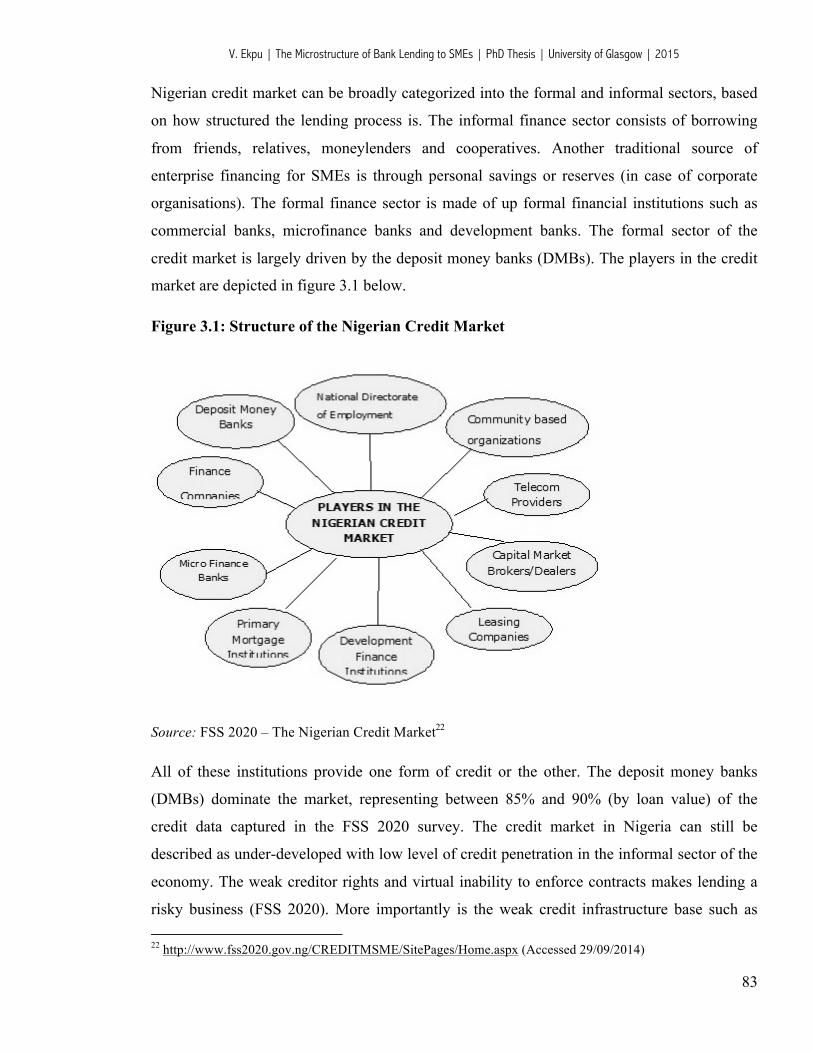
V. Ekpu | The Microstructure of Bank Lending to SMEs | PhD Thesis | University of Glasgow | 2015
83
Nigerian credit market can be broadly categorized into the formal and informal sectors, based
on how structured the lending process is. The informal finance sector consists of borrowing
from friends, relatives, moneylenders and cooperatives. Another traditional source of
enterprise financing for SMEs is through personal savings or reserves (in case of corporate
organisations). The formal finance sector is made of up formal financial institutions such as
commercial banks, microfinance banks and development banks. The formal sector of the
credit market is largely driven by the deposit money banks (DMBs). The players in the credit
market are depicted in figure 3.1 below.
Figure 3.1: Structure of the Nigerian Credit Market
Source: FSS 2020 – The Nigerian Credit Market22
All of these institutions provide one form of credit or the other. The deposit money banks
(DMBs) dominate the market, representing between 85% and 90% (by loan value) of the
credit data captured in the FSS 2020 survey. The credit market in Nigeria can still be
described as under-developed with low level of credit penetration in the informal sector of the
economy. The weak creditor rights and virtual inability to enforce contracts makes lending a
risky business (FSS 2020). More importantly is the weak credit infrastructure base such as 22 http://www.fss2020.gov.ng/CREDITMSME/SitePages/Home.aspx (Accessed 29/09/2014)

V. Ekpu | The Microstructure of Bank Lending to SMEs | PhD Thesis | University of Glasgow | 2015
84
street addresses, multiplicity of languages, no identification documentation23, constant power
outages and expensive telecommunication which made it difficult to check personal and
corporate records. As a result most lending relies on local market and community knowledge,
which restricts the ability of banks to scale up lending to support economic growth. It is
therefore widely believed that credit bureaus would improve credit repayment rates by
reducing moral-hazard problems, as well as support access to credit. The ability of credit
bureaus to significantly improve access to credit, however, critically depends on the inclusion
of information from the non-bank sector that requires both institutional and legal framework.
The key resource of the bureau is data, which presents major challenges.
3.3.1. Financing Gap for SMEs in the Post Consolidated Banking Sector
In Nigeria, the formal financial institutions, including the CBN and international development
agencies have played very prominent roles in the financing of SMEs over the years. In recent
times, however, commercial banks, despite being well capitalized and being the biggest source
of finance for the real sector, have continued to reduce their involvement with SMEs owing to
the challenges associated with the poor lending infrastructure among other factors. Given the
consolidation of the banking sector in Nigeria, which has led to the emergence of stronger and
more financially stalwart banks, one would have expected a progressive increase in credit
allocation to SMEs. However, as shown in Table 3.4 and figure 3.2, the proportion of total
commercial banks’ loans and advances to the economy accounted for by SMEs between 1992
and 2012 has been on a very sharp decline. Between 1992 and 1996, during the period of
mandatory banks’ credit allocation of 20% of total credits to SMEs, the mean percentage of
loans granted to SMEs was 26.6%. With the abolishment of the mandatory 20% allocation to
SMEs in 1996, the immediate pre-consolidation period of 1997 to 2005 saw the downward
trend of credit allocation to SMEs from 16.96% in 1997 to 2.7% in 2005. In spite of the
emergence of very large banks after the consolidation period, SME lending as a percentage of
total credit in the economy plummeted further from 2.7% in 2005 to a meager 0.14% in 2012.
23 In a bid to solve Nigeria’s customer identification problems, the Central Bank of Nigeria has recently (since February 2014) introduced the Bank Verification Number (BVN), which is a centralized biometric identification system aimed at giving customers a unique number that can be verified across the Nigerian banking industry.
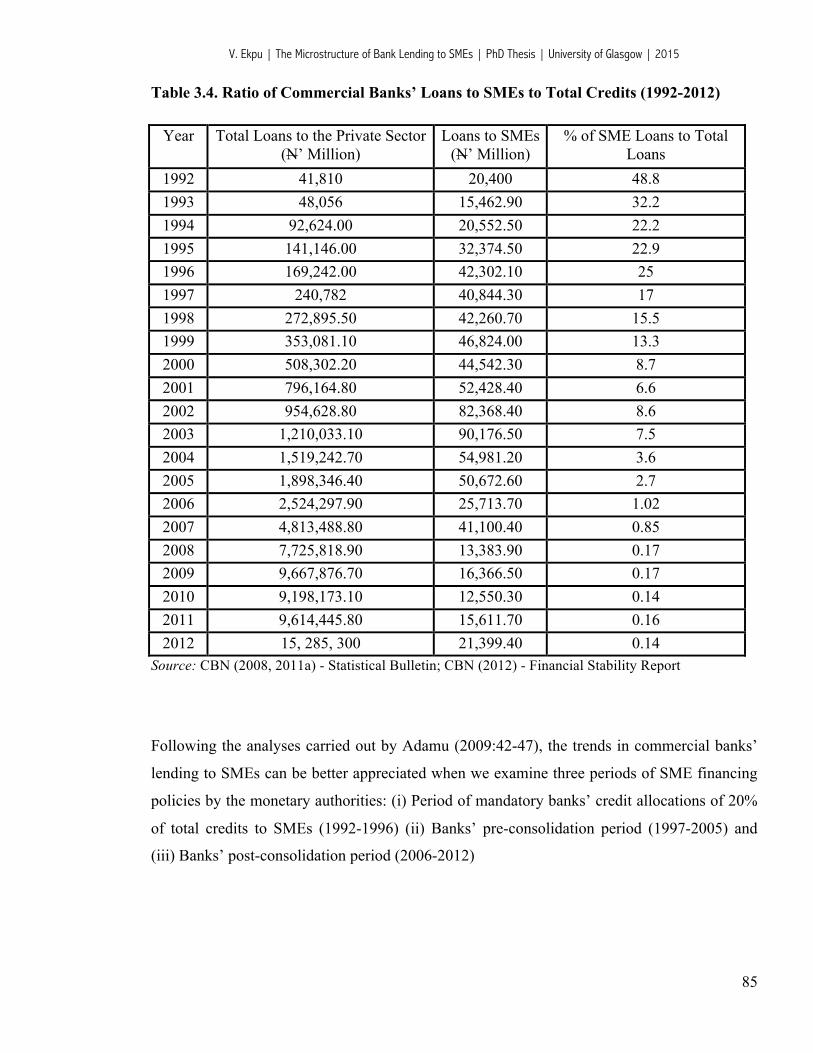
V. Ekpu | The Microstructure of Bank Lending to SMEs | PhD Thesis | University of Glasgow | 2015
85
Table 3.4. Ratio of Commercial Banks’ Loans to SMEs to Total Credits (1992-2012)
Year Total Loans to the Private Sector (N’ Million)
Loans to SMEs (N’ Million)
% of SME Loans to Total Loans
1992 41,810 20,400 48.8 1993 48,056 15,462.90 32.2 1994 92,624.00 20,552.50 22.2 1995 141,146.00 32,374.50 22.9 1996 169,242.00 42,302.10 25 1997 240,782 40,844.30 17 1998 272,895.50 42,260.70 15.5 1999 353,081.10 46,824.00 13.3 2000 508,302.20 44,542.30 8.7 2001 796,164.80 52,428.40 6.6 2002 954,628.80 82,368.40 8.6 2003 1,210,033.10 90,176.50 7.5 2004 1,519,242.70 54,981.20 3.6 2005 1,898,346.40 50,672.60 2.7 2006 2,524,297.90 25,713.70 1.02 2007 4,813,488.80 41,100.40 0.85 2008 7,725,818.90 13,383.90 0.17 2009 9,667,876.70 16,366.50 0.17 2010 9,198,173.10 12,550.30 0.14 2011 9,614,445.80 15,611.70 0.16 2012 15, 285, 300 21,399.40 0.14
Source: CBN (2008, 2011a) - Statistical Bulletin; CBN (2012) - Financial Stability Report
Following the analyses carried out by Adamu (2009:42-47), the trends in commercial banks’
lending to SMEs can be better appreciated when we examine three periods of SME financing
policies by the monetary authorities: (i) Period of mandatory banks’ credit allocations of 20%
of total credits to SMEs (1992-1996) (ii) Banks’ pre-consolidation period (1997-2005) and
(iii) Banks’ post-consolidation period (2006-2012)
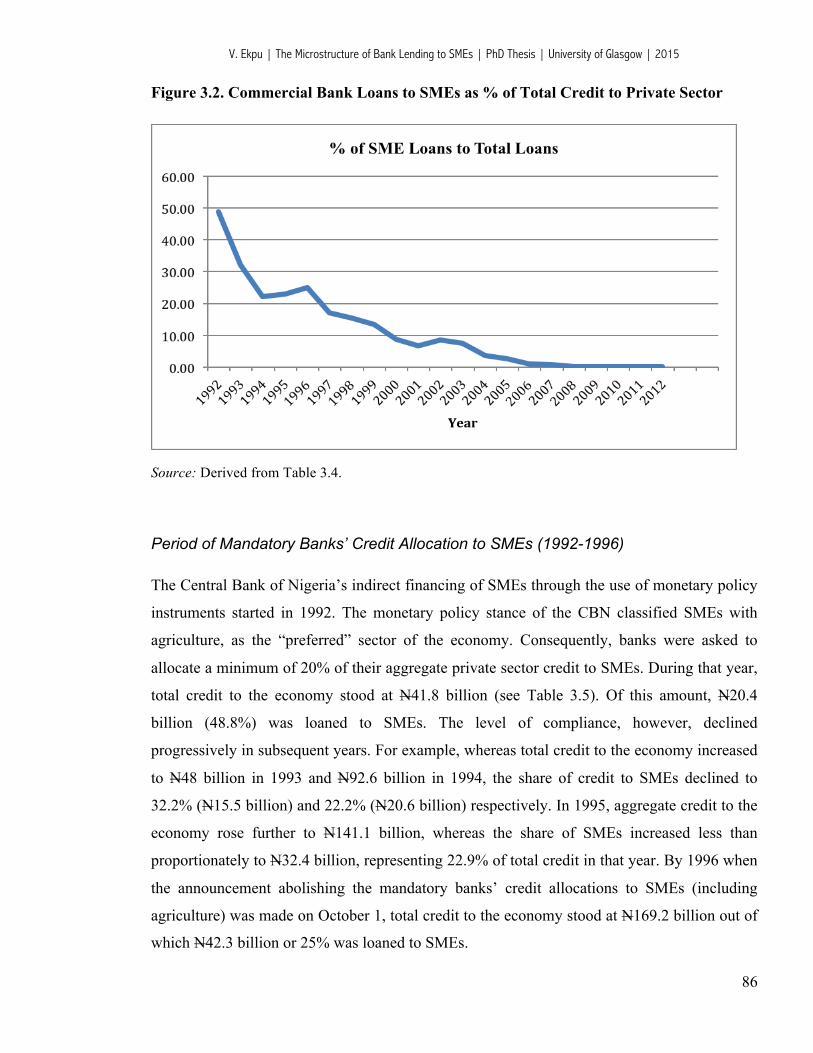
V. Ekpu | The Microstructure of Bank Lending to SMEs | PhD Thesis | University of Glasgow | 2015
86
Figure 3.2. Commercial Bank Loans to SMEs as % of Total Credit to Private Sector
Source: Derived from Table 3.4.
Period of Mandatory Banks’ Credit Allocation to SMEs (1992-1996)
The Central Bank of Nigeria’s indirect financing of SMEs through the use of monetary policy
instruments started in 1992. The monetary policy stance of the CBN classified SMEs with
agriculture, as the “preferred” sector of the economy. Consequently, banks were asked to
allocate a minimum of 20% of their aggregate private sector credit to SMEs. During that year,
total credit to the economy stood at N41.8 billion (see Table 3.5). Of this amount, N20.4
billion (48.8%) was loaned to SMEs. The level of compliance, however, declined
progressively in subsequent years. For example, whereas total credit to the economy increased
to N48 billion in 1993 and N92.6 billion in 1994, the share of credit to SMEs declined to
32.2% (N15.5 billion) and 22.2% (N20.6 billion) respectively. In 1995, aggregate credit to the
economy rose further to N141.1 billion, whereas the share of SMEs increased less than
proportionately to N32.4 billion, representing 22.9% of total credit in that year. By 1996 when
the announcement abolishing the mandatory banks’ credit allocations to SMEs (including
agriculture) was made on October 1, total credit to the economy stood at N169.2 billion out of
which N42.3 billion or 25% was loaned to SMEs.
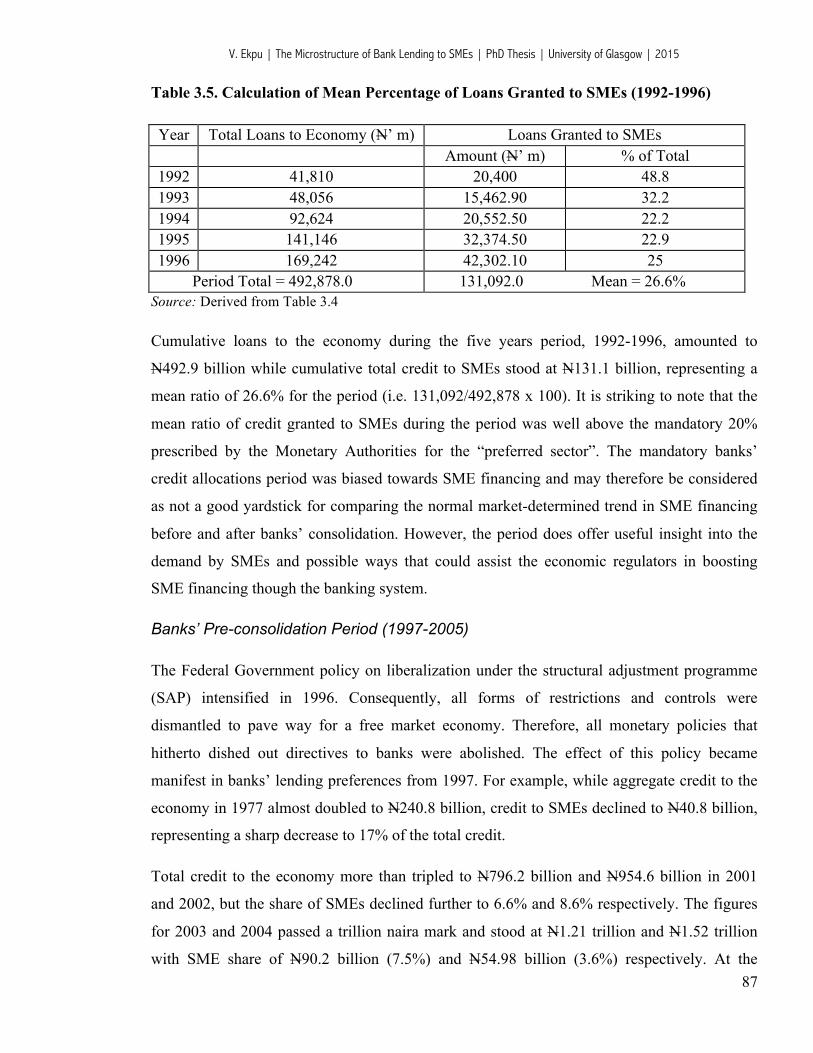
V. Ekpu | The Microstructure of Bank Lending to SMEs | PhD Thesis | University of Glasgow | 2015
87
Table 3.5. Calculation of Mean Percentage of Loans Granted to SMEs (1992-1996)
Year Total Loans to Economy (N’ m) Loans Granted to SMEs Amount (N’ m) % of Total
1992 41,810 20,400 48.8 1993 48,056 15,462.90 32.2 1994 92,624 20,552.50 22.2 1995 141,146 32,374.50 22.9 1996 169,242 42,302.10 25 Period Total = 492,878.0 131,092.0 Mean = 26.6%
Source: Derived from Table 3.4
Cumulative loans to the economy during the five years period, 1992-1996, amounted to
N492.9 billion while cumulative total credit to SMEs stood at N131.1 billion, representing a
mean ratio of 26.6% for the period (i.e. 131,092/492,878 x 100). It is striking to note that the
mean ratio of credit granted to SMEs during the period was well above the mandatory 20%
prescribed by the Monetary Authorities for the “preferred sector”. The mandatory banks’
credit allocations period was biased towards SME financing and may therefore be considered
as not a good yardstick for comparing the normal market-determined trend in SME financing
before and after banks’ consolidation. However, the period does offer useful insight into the
demand by SMEs and possible ways that could assist the economic regulators in boosting
SME financing though the banking system.
Banks’ Pre-consolidation Period (1997-2005)
The Federal Government policy on liberalization under the structural adjustment programme
(SAP) intensified in 1996. Consequently, all forms of restrictions and controls were
dismantled to pave way for a free market economy. Therefore, all monetary policies that
hitherto dished out directives to banks were abolished. The effect of this policy became
manifest in banks’ lending preferences from 1997. For example, while aggregate credit to the
economy in 1977 almost doubled to N240.8 billion, credit to SMEs declined to N40.8 billion,
representing a sharp decrease to 17% of the total credit.
Total credit to the economy more than tripled to N796.2 billion and N954.6 billion in 2001
and 2002, but the share of SMEs declined further to 6.6% and 8.6% respectively. The figures
for 2003 and 2004 passed a trillion naira mark and stood at N1.21 trillion and N1.52 trillion
with SME share of N90.2 billion (7.5%) and N54.98 billion (3.6%) respectively. At the

V. Ekpu | The Microstructure of Bank Lending to SMEs | PhD Thesis | University of Glasgow | 2015
88
threshold of consolidation in 2005, aggregate credit to the economy peaked for the period at
N1.899 trillion. Yet the share of SME declined further to 2.7% at an almost static figure of
N50.7 billion.
Table 3.6. Calculation of Mean Percentage of Loans Granted to SMEs (1997-2005)
Year Total Loans to Economy (N’ m) Loans Granted to SMEs Amount (N’ m) % of Total
1997 240,782 40,844.30 17 1998 272,895.50 42,260.70 15.5 1999 353,081.10 46,824.00 13.3 2000 508,302.20 44,542.30 8.7 2001 796,164.80 52,428.40 6.6 2002 954,628.80 82,368.40 8.6 2003 1,210,033.10 90,176.50 7.5 2004 1,519,242.70 54,981.20 3.6 2005 1,898,346.40 50,672.60 2.7 Period Total = 7,754, 476.0 505, 098.4 Mean = 6.5%
Source: Derived from Table 3.4
Cumulative credit to the economy during the nine-years period, 1997-2005 amounted to N7,
754.5 billion, with accumulated loans to SMEs totaling N505.1 billion, representing a mean
ratio of 6.5% for the period (i.e. 505,098.4/7,754,476.0 x 100).
Banks’ Post Consolidation Period (2006-2012)
According to recent figures from the CBN Financial Stability Report published December
2012, seven years after the banking consolidation, aggregate credit to the economy increased
geometrically to more than 7 times its pre-consolidation levels. On the contrary, however,
credit to SMEs declined by more than 70% in value. Total credit in the economy increased
from N2.5 trillion in 2006 to N7.7 trillion in 2008 and then rose further to over N9.6 trillion
between 2009 and 2011. In 2012, total credit to the economy increased by more than 60% to
N15.2 trillion (~£60.8 billion). Conversely, total credit granted to SMEs declined sharply from
N25.7 billion in 2006, N41.1 billion in 2007 to N16.3 billion in 2009 and dropped further to
N15.6 billion in 2011. In 2012, it however, increased to N21.3 billion but not in the same
proportion with the increase in total credit to the economy.
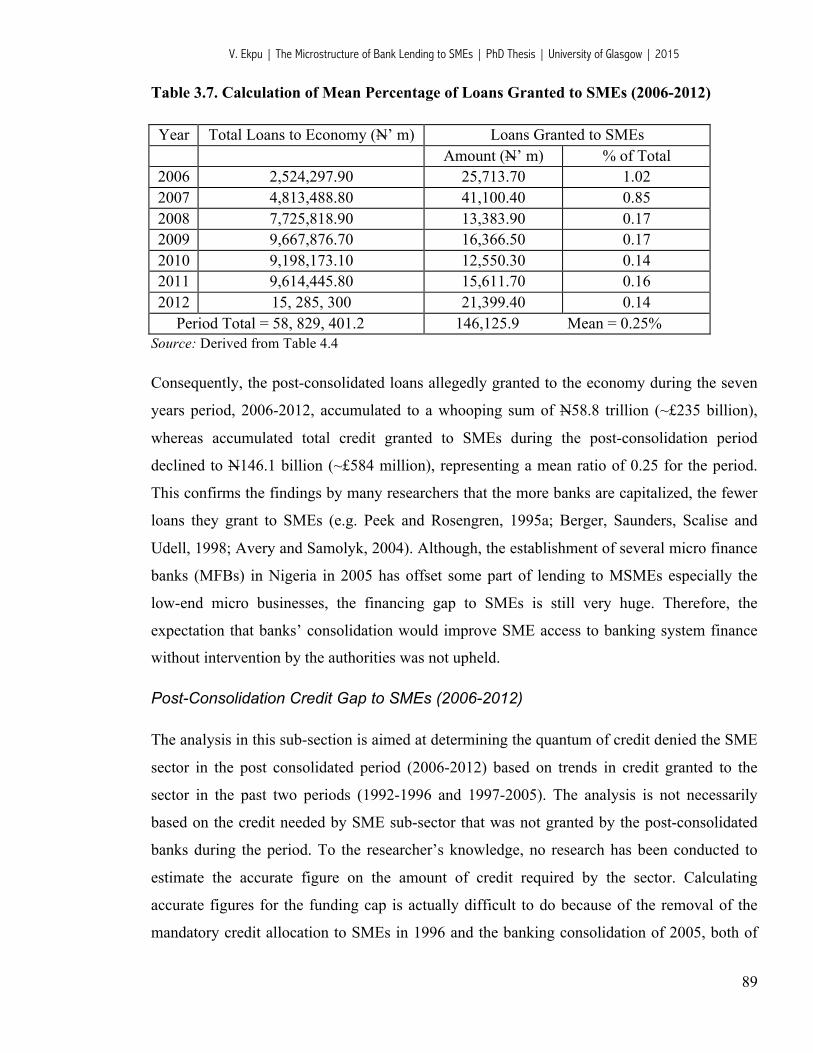
V. Ekpu | The Microstructure of Bank Lending to SMEs | PhD Thesis | University of Glasgow | 2015
89
Table 3.7. Calculation of Mean Percentage of Loans Granted to SMEs (2006-2012)
Year Total Loans to Economy (N’ m) Loans Granted to SMEs Amount (N’ m) % of Total
2006 2,524,297.90 25,713.70 1.02 2007 4,813,488.80 41,100.40 0.85 2008 7,725,818.90 13,383.90 0.17 2009 9,667,876.70 16,366.50 0.17 2010 9,198,173.10 12,550.30 0.14 2011 9,614,445.80 15,611.70 0.16 2012 15, 285, 300 21,399.40 0.14 Period Total = 58, 829, 401.2 146,125.9 Mean = 0.25%
Source: Derived from Table 4.4
Consequently, the post-consolidated loans allegedly granted to the economy during the seven
years period, 2006-2012, accumulated to a whooping sum of N58.8 trillion (~£235 billion),
whereas accumulated total credit granted to SMEs during the post-consolidation period
declined to N146.1 billion (~£584 million), representing a mean ratio of 0.25 for the period.
This confirms the findings by many researchers that the more banks are capitalized, the fewer
loans they grant to SMEs (e.g. Peek and Rosengren, 1995a; Berger, Saunders, Scalise and
Udell, 1998; Avery and Samolyk, 2004). Although, the establishment of several micro finance
banks (MFBs) in Nigeria in 2005 has offset some part of lending to MSMEs especially the
low-end micro businesses, the financing gap to SMEs is still very huge. Therefore, the
expectation that banks’ consolidation would improve SME access to banking system finance
without intervention by the authorities was not upheld.
Post-Consolidation Credit Gap to SMEs (2006-2012)
The analysis in this sub-section is aimed at determining the quantum of credit denied the SME
sector in the post consolidated period (2006-2012) based on trends in credit granted to the
sector in the past two periods (1992-1996 and 1997-2005). The analysis is not necessarily
based on the credit needed by SME sub-sector that was not granted by the post-consolidated
banks during the period. To the researcher’s knowledge, no research has been conducted to
estimate the accurate figure on the amount of credit required by the sector. Calculating
accurate figures for the funding cap is actually difficult to do because of the removal of the
mandatory credit allocation to SMEs in 1996 and the banking consolidation of 2005, both of

V. Ekpu | The Microstructure of Bank Lending to SMEs | PhD Thesis | University of Glasgow | 2015
90
which have changed the structure of banking and credit allocation in Nigeria over the past two
decades.
This study therefore used the past figures to calculate the mean percentages of the credits
granted in the preceding periods with a view to extrapolating the projected credit gap in the
post-consolidated period (2006-2012). The mean is very important in extrapolating the credit
gap to SMEs because it is the only rate that when multiplied to the total credit granted to the
economy in a specified period that can equate the cumulative loans granted or should have
been granted to the SME sub-sector in the given period.
Figure 3.3 below is a pictorial presentation of the annual disbursement of loans to the
economy and the portions that went to the SME sub-sector from 1992 to 2012.
Figure 3.3. Commercial Banks’ Loans to the Economy and SMEs (1992-2012)
A summary of the aggregate loans to the economy and the ratios to the SME sub-sector for the
various periods is presented below:
Table 3.8 Aggregate Loans to Economy and SMEs by Period (1992-2012)
Periods Aggregate Loans to Economy (N’ Million)
Aggregate Loans to SMEs (N’ Million)
Mean (%)
1992-1996 492, 878.0 131,092.00 26.6 1997-2005 7,754,476.60 505,098.40 6.5 2006-2012 58, 829, 401.2 146,125.90 0.25
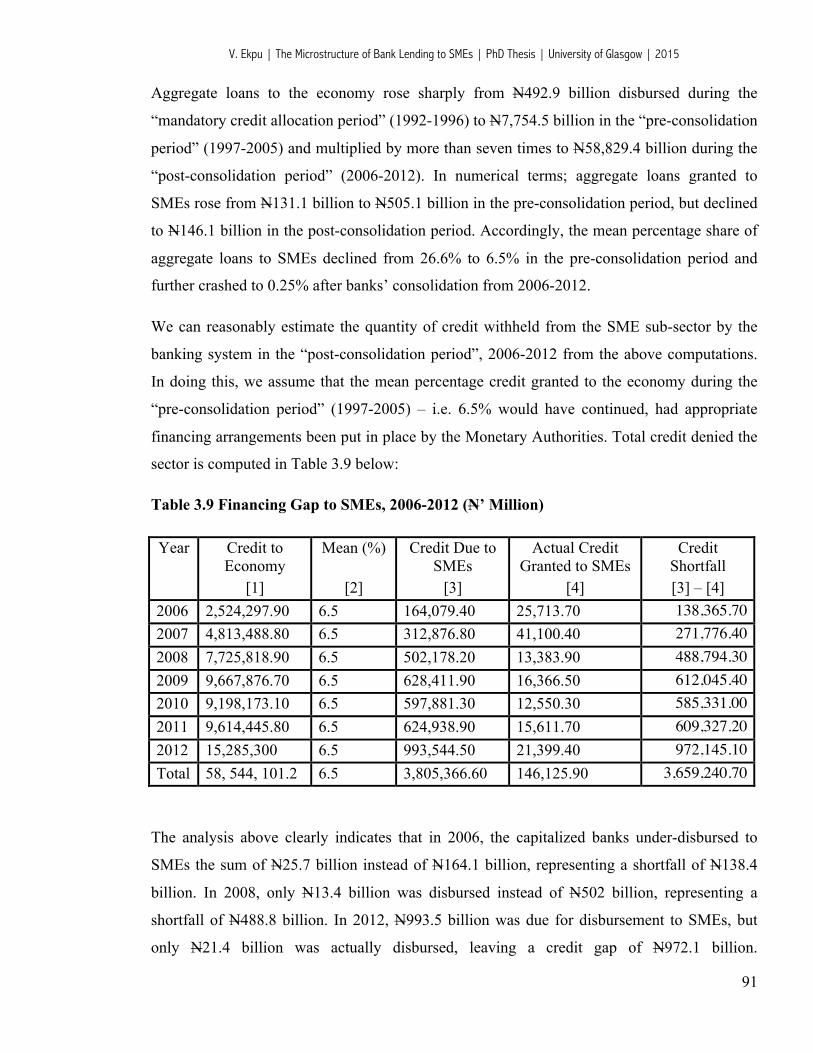
V. Ekpu | The Microstructure of Bank Lending to SMEs | PhD Thesis | University of Glasgow | 2015
91
Aggregate loans to the economy rose sharply from N492.9 billion disbursed during the
“mandatory credit allocation period” (1992-1996) to N7,754.5 billion in the “pre-consolidation
period” (1997-2005) and multiplied by more than seven times to N58,829.4 billion during the
“post-consolidation period” (2006-2012). In numerical terms; aggregate loans granted to
SMEs rose from N131.1 billion to N505.1 billion in the pre-consolidation period, but declined
to N146.1 billion in the post-consolidation period. Accordingly, the mean percentage share of
aggregate loans to SMEs declined from 26.6% to 6.5% in the pre-consolidation period and
further crashed to 0.25% after banks’ consolidation from 2006-2012.
We can reasonably estimate the quantity of credit withheld from the SME sub-sector by the
banking system in the “post-consolidation period”, 2006-2012 from the above computations.
In doing this, we assume that the mean percentage credit granted to the economy during the
“pre-consolidation period” (1997-2005) – i.e. 6.5% would have continued, had appropriate
financing arrangements been put in place by the Monetary Authorities. Total credit denied the
sector is computed in Table 3.9 below:
Table 3.9 Financing Gap to SMEs, 2006-2012 (N’ Million)
Year Credit to Economy
Mean (%) Credit Due to SMEs
Actual Credit Granted to SMEs
Credit Shortfall
[1] [2] [3] [4] [3] – [4] 2006 2,524,297.90 6.5 164,079.40 25,713.70 138,365.70 2007 4,813,488.80 6.5 312,876.80 41,100.40 271,776.40 2008 7,725,818.90 6.5 502,178.20 13,383.90 488,794.30 2009 9,667,876.70 6.5 628,411.90 16,366.50 612,045.40 2010 9,198,173.10 6.5 597,881.30 12,550.30 585,331.00 2011 9,614,445.80 6.5 624,938.90 15,611.70 609,327.20 2012 15,285,300 6.5 993,544.50 21,399.40 972,145.10 Total 58, 544, 101.2 6.5 3,805,366.60 146,125.90 3,659,240.70
The analysis above clearly indicates that in 2006, the capitalized banks under-disbursed to
SMEs the sum of N25.7 billion instead of N164.1 billion, representing a shortfall of N138.4
billion. In 2008, only N13.4 billion was disbursed instead of N502 billion, representing a
shortfall of N488.8 billion. In 2012, N993.5 billion was due for disbursement to SMEs, but
only N21.4 billion was actually disbursed, leaving a credit gap of N972.1 billion.
V. Ekpu | The Microstructure of Bank Lending to SMEs | PhD Thesis | University of Glasgow | 2015
92
Consequently, the aggregate credit denied the SME sub-sector during the post-consolidation
period (2006-2012) accumulated to N3.6 trillion (~£14.6 billion) as at end-December, 2012. It
should however be noted that the projection of the funding gap as analysed here is only a
guesstimate rather than actual substantive figures given that it is based on the assumption that
the 6.5% pre-consolidation average share of SME loans to total loans should have at least been
sustained through the post-consolidation era (2006 and beyond).
A number of reasons have been outlined in chapter 2 for why banks reduce lending to SMEs
after consolidation (i.e. mergers and acquisition). These include increased post-merger
operational costs leading to higher costs of SME loans (Strahan and Weston, 1998; Stein,
2002) and the need to manage liquidity risks and loan diversification more efficiently on a
larger scale rather than managing risks on a small scale through SME loans. In addition, where
a merger is motivated by the acquisition of low-cost deposits or expansion of geographic
market reach, this may discourage lending to SMEs (Peek and Rosengren, 1995a). Though the
main reasons for the consolidation in Nigeria is to raise the capital base of banks, the resultant
outcome of the exercise was more financially robust, geographically diverse large banks that
unequivocally reduced their appetite for SME loans. This is shown by the drastic reduction in
the proportion of total lending in the economy accounted for by SMEs from 6.5% in the period
before consolidation (1997-2005) to 0.25% in the period after consolidation (2006-2012).
3.3.2. Government Initiatives to Boost Commercial Lending to SMEs
Given the constraints faced by SMEs in Nigeria, the government has over the years taken a
number of steps aimed at improving the prospects of SMEs, in terms of access to bank credit.
These steps include the establishment of many agencies and schemes. According to Adamu
(2009), government intervention in SME finance comes in two main ways: (i) institutional
arrangements, and (ii) financing programs.
(I) Institutional Arrangements
All over the world, governments create enabling institutions that directly or indirectly provide
finance for SME operations. Some of the institutions established by the Nigerian government
to provide direct finance for SME operations over the years, include the following:
V. Ekpu | The Microstructure of Bank Lending to SMEs | PhD Thesis | University of Glasgow | 2015
93
Bank of Industry (BOI)
The Bank of Industry Limited (BOI) is Nigeria’s oldest, largest and most successful
development financing institution. It was reconstructed in 2001 out of the Nigerian Industrial
Development Bank (NIDB) Limited, which was incorporated in 1964. The core mandate of
BOI is to provide financial assistance for the establishment of large, medium and small
projects as well as expansion, diversification and modernization of existing enterprises and
rehabilitation of ailing industries. The bank is currently embarking on a N19.8 billion MSME
fund through the bank’s cooperative lending scheme. This is aimed at developing the MSME
sector in each of the participating states in Nigeria. The average interest rate is 5%. The bank
also has a bottom of the pyramid scheme, which is a new initiative aimed at deepening the
bank’s credit offerings to micro entrepreneurs through Microfinance banks in each state (see
BOI website)24.
Bank of Agriculture (BOA)
Bank of Agriculture (BOA) is the nation’s premier agricultural and rural development finance
institution. As a development finance institution, it is government owned (CBN 40% and
Federal Ministry of Finance 60%), and supervised by Federal Ministry of Agriculture. The
Bank was incorporated as Nigerian Agricultural Bank (NAB) in 1973 and was renamed three
times, first in 1978, as Nigerian Agricultural and Cooperative Bank (NACB), second in 2000
as Nigerian Agricultural Cooperative and Rural Development Bank Limited (NACRDB), and
subsequently in 2010 to Bank of Agriculture Limited (BOA).
The bank provides affordable credit facilities to segments of the Nigerian society who have
little access to the services of conventional banks. The bank accepts savings deposit from
customers and encourage banking habits at the grass roots. The BOA’s loan rate for
microcredit agricultural firms is 12%, while its rate for working capital and for SMEs involved
in agricultural production is 14%. As part of the bank’s loan conditions, SME borrowers must
have a minimum of 6 months deposit account relationship with the bank. The bank’s average
deposit rate is 2% (see BOA website)25.
24 http://boinigeria.com/state-msme-fund/ (accessed 16/08/2014)
25 http://www.bankofagricultureng.com/aboutus/Default.aspx (accessed 16/08/2014)

V. Ekpu | The Microstructure of Bank Lending to SMEs | PhD Thesis | University of Glasgow | 2015
94
Nigeria Export-Import Bank (NEXIM)
The Nigerian Export-Import Bank (NEXIM) was established in 1991 as an Export Credit
Agency (ECA) with a share capital of N50 billion, held equally by the Federal Ministry of
Finance and the Central Bank of Nigeria. The Bank which replaced the Nigerian Export Credit
Guarantee & Insurance Corporation earlier set up in 1988, has the following main statutory
functions: (1) provision of export credit guarantee and export credit insurance facilities to its
clients; (2) provision of credit in local currency to its clients in support of exports; (3)
establishment and management of funds connected with exports; (4) maintenance of a foreign
exchange revolving fund for lending to exporters who need to import foreign inputs to
facilitate export production; (5) provision of domestic credit insurance where such a facility is
likely to assist exports; and (6) maintenance of a trade information system in support of export
business.
The Bank presently provides short and medium term loans to Nigerian exporters. It also
provides short-term guarantees for loans granted by Nigerian Banks to exporters as well as
credit insurance against political and commercial risks in the event of non-payment by foreign
buyers (see NEXIM website)26.
Apart from credit granting institutions, the Nigerian government has also created institutions
to facilitate the flow of funds to SMEs through capacity building and provision of enabling
environment. Some of these agencies include the following:
Small and Medium Enterprises Development Agency of Nigeria (SMEDAN)
SMEDAN was established in 2003 to promote the development of micro, small and medium
enterprises (MSME) sector of the Nigerian economy. The agency has the following core
functions: (1) stimulating, monitoring and coordinating the development of the MSMEs
sector; (2) initiating and articulating policy ideas for the growth and development of MSMEs;
(3) promoting and facilitating development programmes, instruments and support services to
accelerate the development and modernization of MSME operation; (4) serving as vanguard
for rural industrialization, poverty reduction, job creation and enhance sustainable livelihoods;
(5) linking SMEs to internal and external sources of finance, appropriate technology, and
26 http://www.neximbank.com.ng/about-nexim/ (accessed 16/08/2014)

V. Ekpu | The Microstructure of Bank Lending to SMEs | PhD Thesis | University of Glasgow | 2015
95
technical skills as well as to large enterprises; (6) promoting information and providing access
to industrial infrastructure such as layouts, incubators, and industrial parks; (7) intermediating
between MSMEs and the Government; and (8) working in concert with other institutions in
both public and private sectors to create a good enabling environment for businesses in
general, and MSME activities in particular (see SMEDAN website)27.
Nigeria Investment Promotion Commission (NIPC)
NIPC is a Federal Government Agency in Nigeria established to encourage, promote, and
coordinate investments in Nigeria. The Agency provides services for the grant of business
entry permits, licenses, authorizations and incentives in a one-stop-shop environment. The
services are provided in a coordinated, streamlined, efficient and transparent manner to meet
the needs of investors.
Entrepreneurship Development Centers (EDCs)
As part of capacity building support for entrepreneurs in the SME and microfinance sub-
sectors, the CBN has established up to 6 EDCs. The aim is to build the entrepreneurial spirit of
the country’s youths to enable them contribute effectively to the sustainable development of
the economy. The first three centers were established in April 2008, and located in Onitsha,
Kano and Lagos. In the second half of 2012, the CBN approved the establishment of three
more centers, which were located in Makurdi, Maiduguri, and Calabar. In addition to existing
six satellite EDCs located in 6 states, three new satellite centers were approved. Since the
inception of the programme, a total of 41,441 individuals have been trained, 106,933
counseled, while 10,895 jobs had been created. In the same period, 1,034 trainees were able to
obtain loans valued at N220.04 million from banks (CBN, 2012).
(II) Government Financing Programmes
Government financing programmes are either direct or indirect. Direct financing programmes
involve direct dispensation of cash, equipment, and other forms of capital to various SME
promoters. Indirect financing programmes, on the other hand, involve offering some form of
27 http://www.smedan.org/functions.html (accessed 16/08/2014)

V. Ekpu | The Microstructure of Bank Lending to SMEs | PhD Thesis | University of Glasgow | 2015
96
guarantee to a third party to provide finance to SME promoters in a particular sector or sub-
sector of the economy. Examples of government financing programmes introduced by the
Nigerian Government include:
Small and Medium Enterprises Equity Investment Scheme (SMEEIS)
The Small and Medium Enterprises Equity Investment scheme (SMEEIS) is a voluntary
initiative of the Bankers’ Committee approved at its 246th Meeting held on 21st December
1999. The initiative was in response to the Federal Government’s concerns and policy
measures for the promotion of Small and Medium Enterprises (SMEs) as vehicles for rapid
industrialization, sustainable economic development, poverty alleviation and employment
generation. The Scheme requires all banks in Nigeria to set aside 10% of their Profit After Tax
(PAT) for equity investment and promotion of SMEs28. The scheme is essentially a pool for
venture capital. The funding provided under the scheme shall be in the form of loans or equity
investment or a combination of both in eligible enterprises. The interest on loans shall be a
single digit figure, subject to a maximum of 9%. Banks shall remain equity partners in the
business enterprises for a minimum of 3 years, after which they may exit. During this period,
banks are expected to provide financial, advisory, technical and managerial support from the
banking industry. Every legal business activity is covered under the Scheme with the
exception of trading/merchandising and financial services. Under the scheme, existing debts
owed to participating banks may be converted to equity (see CBN website29). As at end of
2009, the scheme had attracted a total amount of N42.3 billion, out of which N28.87 billion
had been invested as equity investment in 336 projects (Gbandi and Amissah, 2014).
Agricultural Credit Guarantee Scheme Fund (ACGSF)
The ACGSF was set up in 1977 by the CBN and commenced operations in 1978. The fund
guarantees credit facilities extended to farmers by commercial banks up to 75% of the amount
in default net of any security realized. The fund is managed by the CBN. Since inception in
28 Under the terms of the guidelines (amended by CBN circular to all banks dated 11/07/2006), the contributions will be 10% of profit after tax (PAT) and shall continue until the first five years, but banks’ contributions shall thereafter reduce to 5% of PAT. However, this is no longer mandatory. The SMEEIS reserves are non-distributable.
29 http://www.cenbank.org/devfin/smeeispage.asp (accessed 16/08/2014)
V. Ekpu | The Microstructure of Bank Lending to SMEs | PhD Thesis | University of Glasgow | 2015
97
1978, the CBN has guaranteed a total of 803,264 loans under the scheme, amounting to
N62.05 billion as at December 2012. The cumulative number and value of claims paid from its
inception to date stood at 14,582 claims, valued at N450.86 million. Under the interest
drawback programme (IDP) of the ACGSF, a cumulative total of 181,078 claims, valued at
N2.78 billion have been made under the scheme as at December 2012 (CBN, 2012:21).
Agricultural Credit Support Scheme (ACSS)
The ACSS was established to finance large ticket agricultural projects. The scheme, which is
an initiative of the Federal Government and the CBN with active participation of the bankers’
committee, has a prescribed fund of N50 billion (~£200 million). ACSS was introduced to
enable farmers exploit the untapped potentials of Nigeria’s agricultural sector, reduce
inflation, lower the cost of agricultural production, generate surplus for export, increase
Nigeria’s foreign earnings as well as diversify its revenue base. Under ACSS, funds are
disbursed to farmers and agro-allied entrepreneurs at a single-digit interest rate of 8.0%. At the
commencement of the project support, banks will grant loans to qualified applicants at 14.0%
interest rate. Applicants who pay back their facilities on schedule enjoy a rebate of 6.0%, thus
reducing the effective rate of interest to be paid by farmers to 8.0% (see CBN website30).
Since inception, the total rebate paid stood at N876.89 million to 46 projects (CBN, 2012).
Commercial Agricultural Credit Scheme (CACS)
The CACS was established in 2009 by the CBN in collaboration with the Federal Ministry of
Agriculture and Water Resources. The aim of the scheme is to provide finance for the
country’s agricultural value chain (production, processing, storage and marketing). The
scheme is financed through a N200 billion bond, raised by the Debt Management Office
(DMO). Loans under this scheme are disbursed at a maximum rate of 9%. According to
Sanusi (2013), as of June 2013, the full amount of the CACS Fund has been disbursed to 292
projects along the agriculture value chain. Out of the total number of projects financed, 48%
and 41% were for production and processing activities respectively. Average capacity
utilization of projects financed by CACS increases from 45% in 2009 to about 75% as at June
2013. Sanusi (2013) noted that the CBN’s agricultural lending interventions have yielded
30 http://www.cenbank.org/devfin/acgsf.asp (accessed 16/08/2014)

V. Ekpu | The Microstructure of Bank Lending to SMEs | PhD Thesis | University of Glasgow | 2015
98
positive results, as evidenced by the percentage of bank lending to agriculture, as a proportion
of total lending, which has increased from 1.4% in 2009 to 4% as at June 2013.
The SME Credit Guarantee Scheme (SMECGS)
The N200 billion SMECGS was established in April 2010 to fast-rack the development of the
manufacturing sector and SMEs by providing up to 80% guarantee for commercial bank loans
to SMEs (CBN, 2012; Gbandi and Amissah, 2014). As at December 2012, the total number of
applications guaranteed under the scheme since inception was forty-six (46), valued at N2.054
billion.
CBN Intervention Fund
The N235 billion (~£940 million) CBN intervention fund represents an intervention credit
granted to the commercial banks for the purpose of refinancing/restructuring loans to SMEs in
the manufacturing sector. The objectives of the fund are to improve the financial position of
the deposit money banks and facilitate more credits to manufacturers. The fund is managed
and administered by the bank of industry (BOI). The types of facilities granted under this
scheme include long-term loans for acquisition of plant and machinery, refinancing of existing
loans, resuscitation of ailing industries, refinancing of existing lease, and working capital
(CBN, 2010). The maximum loan amount obtainable by eligible manufacturers is N1billion (~
£4 million) for a single obligor in respect of refinancing/restructuring. The total facility is
secured by Nigerian Government Securities. The fund shall be administered at a maximum
(all-inclusive) interest rate of 7% payable on a quarterly basis. Specifically, the managing
agent (BOI) shall be entitled to a 1% management fee and the banks, a 6% spread. The
maximum tenor for term loans under the programme is 15 years, while the tenor for working
capital is 1 year, renewable annually subject to a maximum tenor of 5 years (Zenith Bank Plc,
2013).
Over 23 commercial banks and 1 development financial institution (DFI) have participated in
the scheme since inception. As at March 2013, over N229.18 billion have been disbursed to
more than 525 beneficiary companies of the scheme. A cumulative turnover of the obligors
increased from N2.97 billion per annum before intervention to N5.5 billion after intervention.
The scheme generated direct employment in beneficiary institutions, which increased from
86,513 before intervention to 130,143 after intervention, representing an increase of 50.4%.
V. Ekpu | The Microstructure of Bank Lending to SMEs | PhD Thesis | University of Glasgow | 2015
99
The scheme also generated indirect employment of 802,210. According to the BOI, the
scheme has enhanced the liquidity of the participating banks considerably (see BOI website)31.
3.3.3. Microfinance for MSMEs
Despite numerous financing programs designed by the Nigerian government over the years,
which were aimed at directing credit to the MSME sector, there exists a huge untapped market
for financial intermediation at the micro and rural levels of the Nigerian economy.
Microfinance services, particularly those sponsored by government, have adopted the
traditional supply-led, subsidized credit approach mainly directed to the agricultural sector and
non-farm activities such as trading, tailoring, weaving, blacksmithing, agro-processing and
transportation. Although the services have resulted in an increased level of credit disbursement
and gains in agricultural production and other activities, the effects were short-lived, due to the
unsustainable nature of the programs and poor capitalization.
In 2005, the Central Bank of Nigeria (CBN) moved to strengthen Nigeria’s microfinance
subsector by establishing microfinance banks (MFBs) to assist in expanding financial services
to meet the financial needs of Micro, Small and Medium Enterprises (MSMEs). Microfinance
is about providing financial services to micro-enterprises who are traditionally not served by
the conventional financial institutions. According to the CBN (2005), three features
distinguish microfinance from other formal financial products. These are: (1) the smallness of
loans advanced and/or savings collected, (ii) the absence of asset-based collateral, and (iii) the
simplicity of operations. The specific objectives of the CBN’s microfinance policy are the
following:
(i) Make financial services accessible to a large segment of the potentially productive
Nigerian population which otherwise would have little or no access to financial
services;
(ii) Promote synergy and mainstreaming of the informal sub-sector into the national
financial system;
31 http://boinigeria.com/cbn-intervention-fund/ (accessed 17/08/2014)

V. Ekpu | The Microstructure of Bank Lending to SMEs | PhD Thesis | University of Glasgow | 2015
100
(iii) Enhance service delivery and mobilize savings for intermediation by microfinance
institutions to MSME entrepreneurs;
(iv) Contribute to rural transformation; and
(v) Promote linkage programs between universal/development banks, specialized
institutions and microfinance banks to enable the latter source for wholesale funds and
refinancing facilities for onward lending to their clients.
This microfinance policy was revised in 2011 with the specification of licensing requirements
for three categories of MFBs (CBN, 2011b):
Category 1: Unit Microfinance Bank
A Unit Microfinance Bank is authorized to operate in one location. It shall be required to have
a minimum paid-up capital of N20 million (~£80,000) and is prohibited from having branches
and/or cash centers.
Category 2: State Microfinance Bank
A State Microfinance Bank is authorized to operate in one State or the Federal Capital
Territory (FCT). It shall be required to have a minimum paid-up capital of N100 million
(~£400,000) and is allowed to open branches within the same State or the FCT, subject to
prior written approval of the CBN for each new branch or cash center.
Category 3: National Microfinance Bank
A National Microfinance Bank is authorized to operate in more than one State including the
FCT. It shall be required to have a minimum paid-up capital of N2 billion (~£8 million), and is
allowed to open branches in all States of the Federation and the FCT, subject to prior written
approval of the CBN for each new branch or cash center.
The Central Bank of Nigeria regulates and supervises the activities of microfinance banks,
while the Nigeria Deposit Insurance Corporation (NDIC) insures the deposits of MFBs.
V. Ekpu | The Microstructure of Bank Lending to SMEs | PhD Thesis | University of Glasgow | 2015
101
MSME Development Fund (MSMEDF)
A N220 billion (~£880 million) MSME fund was recently launched by the CBN in 2013 and is
designed to further enhance access to finance by MSMEs with the following objectives: (i)
provide wholesale financing windows for participating financial institutions (PFIs); (ii)
improve the capacity of the PFIs to meet credit needs of MSMEs; (ii) provide funds at reduced
cost to PFIs; (iv) enhance access of women entrepreneurs to finance by allocating 60% of the
Fund to them and (v) improve access to NGOs/MFIs to finance (Sanusi, 2013; CBN, 2014).
The seed fund’s policy stipulates 80:20 prescription for on-lending to micro enterprises and
SMEs respectively (CBN, 2013).
3.4. Features of SME Lending Facilities in Selected Nigerian Banks
This section examines the features of SME lending facilities currently being offered to SMEs
in selected Nigerian banks. The idea is to appreciate the various types of financing that are
available to SMEs in Nigeria today and the cost and terms of such credit facilities. The content
was drawn from the respective banks’ websites.
Diamond Bank Plc32:
Diamond bank offers access to short and medium term financing for working capital and asset
purchase needs with reduced collateral requirements. These loan products are as follows:
§ Revolving Credit: is a line of credit or term loan for short-term financing (with a maximum
tenor of 1 year).
§ Instalment Loan: is a term loan for fixed assets financing available for up to 3 years.
§ Mediloan: is a Partnership between Diamond bank and USAID (United States Agency for
International Development) that has developed a credit Scheme focused on businesses
operating specifically in the health care sector.
§ Local Purchase Order (LPO) finance: is a short-term finance facility to MSME customers
to carry out supply requests. The supply order must come from only pre-approved
institutions by Diamond Bank Plc.
32 http://diamondbank.com/index.php/sme-banking (Accessed 19/08/2014)
V. Ekpu | The Microstructure of Bank Lending to SMEs | PhD Thesis | University of Glasgow | 2015
102
§ Contract Finance: is a short-term finance facility for the execution of contracts from
Diamond Bank’s approved list of companies. Finance is available for a variety of
legitimate contracts awarded by government agencies and reputable private organisations
in the country operating in the different sectors and contracts with varying levels of
complexity.
§ Import Finance: offers credit facilities to MSME customers who require finance for
importing either raw materials or finished goods for sale. It also offers short-term credit
facilities to these importers for the purpose of duty payment.
Access Bank Plc33:
Access Bank currently offers the following types of credit facilities for SMEs:
§ Trade Finance: Is targeted at importers and exporters and designed to assist the customer
in managing the trade cycle efficiently while making available the working capital to
finance the different stages.
§ Syndications: Syndicated credit facilities can also be arranged if the loan amount and risk
involved are large. Access bank will invite other banks on the customer’s behalf and draw
up agreeable terms34.
§ Distributor Credit Plans: This is a loan Access Bank offers to the distributors of
their own large corporate customers as well as other distributors to encourage the
development of SMEs in the country through the provision of competitively priced loans.
§ Term Loans: This is aimed specifically at transactions that involve capital projects or a
customer’s expansion programme.
§ Leases: Access Bank’s Lease Finance is fundamentally a business arrangement where the
owner of an asset (lessor) allows another person (lessee) to have possession and use the
asset for a consideration (rental). The rentals are fixed payments made on stipulated dates.
The lease facility enables businesses obtain specific type of assets (such as plant and
33 https://www.accessbankplc.com/business-loans (Accessed 19/08/2014)
34 It is however unusual to learn that banks could arrange syndicated credit facilities, which is known to be the kind of facilities offered to blue chip companies and multinationals.
V. Ekpu | The Microstructure of Bank Lending to SMEs | PhD Thesis | University of Glasgow | 2015
103
machinery, vehicles and computers, etc), while enjoying significant cash flow advantages
derivable from the structure of the lease transaction, which is usually customer-tailored.
§ Invoice Discounting: Access Bank’s Invoice Discounting gives the customer the benefit of
enjoying immediate cash flows from account receivables while still retaining sales
accounting and credit control functions. This involves a continuous arrangement between
the bank and the seller of goods or services on credit, whereby the bank purchases account
receivables for immediate cash. Invoice Discounting is undertaken either on a confidential
basis or on disclosed basis. Under the confidential basis, no notice of the bank’s interest in
the debt is given to the debtor. Under the disclosed basis, a notification is given to the
debtor of the assignment of the debts to the bank.
§ Revolving Credit Facilities: This is usually structured as short-term facility where the
customer repays each drawing by a fixed period of time, usually from 30 to 180 days. The
customer may re-borrow sums as needed up to the limit of the facility. This facility is
usually for companies in stable industries with strong financial planning systems and is
usually used for financing a company’s permanent working capital. The facility tenor
usually may not exceed 3 years.
Union Bank of Nigeria Plc35:
Union bank offers the following financing options to its SME customers:
§ Short and medium project loans with adequate moratorium: for the development of land &
factory buildings, acquisition of plant & machineries or any other fixed assets
§ Overdraft facility for working capital purpose: this type of facility is offered for purchase
of raw materials, for overhead cost, for stock acquisitions or for bridging debtors payment
period
§ Import Trade Finance Facility: establishment of letters of Credits (LCs) for importation of
raw material
§ Stocking term facility: for Bulk stocking of goods and raw material.
35 http://www.unionbankng.com/index.php/personal-banking/loans-and-overdrafts/sme-loans (Accessed 19/08/2014)
V. Ekpu | The Microstructure of Bank Lending to SMEs | PhD Thesis | University of Glasgow | 2015
104
§ Warehousing facility: for the purchase of goods stored in warehouses with joint control
with a gradual piece meal release upon payment.
§ Guarantee and Indemnity: bank guarantee and indemnity on behalf of the bank’s
customers and reputable institutions or organisations.
§ Equipment and Leasing Facility: for acquisition of fixed assets for production purpose
Introduction of Psychometric Tests by First Bank of Nigeria Plc:
First Bank offers its SME customers most of the facilities mentioned above, but has now
introduced a different approach to evaluating SME loan applications. As part of the bank’s
evaluation process, it uses psychometric tests. According to a statement by the bank’s Head of
SME banking, Mr Oluwafemi Akinfolarin:
“Getting loans without collateral is part of our contribution towards boosting the
growth of the SME segment. Most SMEs don’t have collateral to secure loans. With
this now, all a prospective borrower is asked to do is to go through a psychometric
test. Once the SME passes it, we advance the loan. That is a cutting edge innovation”
(Abioye, 2014).
As noted in chapter 2, psychometric tests are a computer-based questionnaire tool that assesses
a borrower’s personality traits and other traits known to differentiate between successful and
unsuccessful entrepreneurs. In the case of First Bank of Nigeria, SMEs are asked to provide a
detailed business plan and repayment plan and then appraisal is done on the merits of the
outcome of the psychometric test.
3.5. Chapter Conclusions
The Nigerian banking sector has faced a number of significant changes since 2004, namely the
consolidation of banks and the emergence of relatively large, well-capitalized banks that are
leading on the African continent and among the world’s top 1000 banks. The post-
consolidated banking sector is however marked by significant funding gaps for SMEs.
Notwithstanding all the efforts of the Federal Government of Nigeria and other stakeholders in

V. Ekpu | The Microstructure of Bank Lending to SMEs | PhD Thesis | University of Glasgow | 2015
105
the banking industry to make it easier for SMEs to access bank loans, majority of SMEs are
either excluded or still appeared to find it difficult to meet the requirements for obtaining bank
loans. An assessment of these various government-financing programs reveals that they have
only been able to provide marginal funds to a small segment of SME borrowers. For example,
the SMEEIS program has only attracted an investment of N42 billion (~£168 million) from
commercial banks since 1999, out of which less than N30 billion (~£120 million) has been
invested in only 336 projects. Similarly, the ACGSF has only been able to offer loans worth
N62 billion (~£248 million) since 1978. The N235 billion CBN intervention fund was
massively subscribed by the commercial banks, because it seemingly had minimal cost of
funds (only 1% management fee paid to the BOI, while the banks earned a spread of 6%).
Other schemes cumulatively have granted less than N10 billion (~£40 million) to MSMEs in
Nigeria.
Consequently, majority of the over 17.6 million MSMEs still lack access to finance, despite
the fact that there are at least 24 large commercial banks now sitting on more than N22.5
trillion naira (over £90 billion) in total assets as at June 2013. According to Sanusi (2013),
about 80% of MSMEs are excluded from the financial markets. As analyzed earlier, if we
assume only 6.5% of total commercial banks’ loans to the economy should be granted to
SMEs each year, a funding of gap of N3.6 trillion (or £14.4 billion) still exists in the post-
consolidated banking sector in Nigeria (i.e. 2006-2012). A small fraction of the MSME
financing gap left by conventional banks has been filled by microfinance banks (MFBs)
operating in Nigeria whose cumulative lending portfolio amounted to N53 billion as at
December 2010 (Ketley, 2012). The shortfall in credit allocation to SMEs may not be
unconnected to the poor information infrastructure available in the country, which makes
lending to informationally opaque SMEs a risky venture. An observation of the features of
commercial banks’ lending facilities reveals that Nigerian banks seem to be risk averse to new
business customers, only offering facilities to either customers who have deposit or loan
relationships with them or trading partners of their large corporate customers. SMEs are often
advised to open corporate accounts in banks that offer the kind of facilities that relate to their
kind of business. Nigerian banks also seem to have a preference for short-term lending,
offering facilities for an average tenor of 12 months, with term loans not exceeding 3 years in
most banks.
V. Ekpu | The Microstructure of Bank Lending to SMEs | PhD Thesis | University of Glasgow | 2015
106
CHAPTER 4
RESEARCH METHODOLOGY
The methodology utilised by this study in investigating the microstructure of bank financing
for SMEs in Nigeria is quantitative analysis of survey data. According to Saunders et al.
(2007), quantitative analysis refers to techniques that can be used to process or analyse
numerical or quantitative data. Quantitative data in its raw form (that is, before these data have
been processed and analyzed) convey very little meaning to most people. These data therefore
need to be processed to make them useful or informative. Quantitative analysis techniques
such as graphs, charts and statistics allow us to do this; helping us to explore, present, describe
and examine relationships and trends within our data. Quantitative data can range from simple
counts such as the frequency of occurrences to more complex data such as test scores, prices,
loan amounts or interest rates. To be useful these data need to be analyzed and interpreted.
Quantitative analysis techniques assist the researcher in this process. They range from creating
simple tables or diagrams that show the frequency of occurrence and using statistics such as
indices to enable comparisons, through establishing statistical relationships between variables
to complex econometric modeling. The main computing softwares used by this study for the
data analysis are IBM SPSS and STATA.
The rest of this chapter is structured as follows: Section 4.1 describes the data collection
method, sampling procedures and questioning techniques. Section 4.2 examines the methods
of data analysis, including the sample data descriptives, nonparametric statistics and
econometric method used. The limitations of the study are stated in section 4.3.
4.1. Data Collection
There are different possible data collection methods such as examining secondary sources,
observation, questionnaire survey and semi-structured or unstructured interviews (Saunders et
al., 2007). After evaluating all possible data collection methods, the researcher found that the
most appropriate method that will provide practical answers to the research questions and
stated objectives of the study was the use of a questionnaire survey.
V. Ekpu | The Microstructure of Bank Lending to SMEs | PhD Thesis | University of Glasgow | 2015
107
4.1.1. The Survey Instrument
Rationale for Using Survey Instrument
This study uses the questionnaire survey instrument as the primary data collection method.
The use of a survey instrument is most ideal for this type of project because it allows for
responses to be gathered in an articulate and standardised way and since the questions are
interpreted the same way by all respondents (Robson, 2011). Other methods such as
observation and in-depth interviews might be well suited for exploratory studies such as
discovering customers’ attitudes. Unlike other methods, questionnaires can be used for
descriptive or explanatory research, where for example, the aim is to describe the variability in
different phenomena or explain the relationship between variables, in particular, cause-effect
relationships (Saunders et al., 2007). The survey strategy allows the researcher to collect
quantitative data, which can be analysed quantitatively using descriptive and inferential
statistics. In addition, the data collected using a survey strategy can be used to determine
particular relationships between variables and to produce models of these relationships.
Questionnaires also tend to be more objective than other collection methods such as interviews
because of their standardised structure (Robson, 2011). Generally, it is relatively quick to
collect information using a questionnaire. If worded correctly, questionnaires normally require
less skill and sensitivity to administer than semi-structured or in-depth interviews (Jankowicz,
2005). Potentially, information can be collected from a large portion of a group. Using a
survey instrument should give the researcher more control over the research process and, when
sampling is used, it is possible to generate findings that are representative of the whole
population at a lower cost than collecting the data for the whole population.
Notwithstanding the disadvantages of using this method (for example, time taken to design it,
limit to number of questions that can be asked, low response rate, and time taken to analyse it),
questionnaire survey is still the most appropriate method for this type of research. The use of
questionnaire is supported by numerous other similar studies that use survey data, including
notable journal articles, World Bank research papers and working papers by African
Development Bank on SME financing in Sub-Saharan African countries (e.g. Owualah, 1988;
Fletcher, 1995; Lehmann and Neuberger, 2001; Cole et al., 2004; Bruns and Fletcher, 2008;
Ayyagari et al., 2008; Beck et al., 2008b; St-Pierre and Bahri, 2011; Calice, Chando and
Sekioua, 2012; Berg and Fuchs, 2013; Tronnberg and Hemlin, 2014 to mention a few). Apart
V. Ekpu | The Microstructure of Bank Lending to SMEs | PhD Thesis | University of Glasgow | 2015
108
from questionnaires, data was also collected from secondary sources such as banks' annual
reports, loan policy statements as well as previous survey research/published works on SME
financing. The use of secondary data helps to provide additional evidence to support and
validate the findings.
Designing the Survey Instrument
Saunders et al. (2007) explain the importance of having a research design, which will detail
the general plan of how the researcher intends to go about answering his research questions. A
research design will contain clear objectives, derived from the research questions and will
specify the sources of data collection and the constraints that will inevitably affect the data
collection process (e.g. access to data, time, location and money) as well as ethical issues.
In connection with these, the objectives of the survey instrument in the current study were
clearly specified at the beginning of the questionnaire. The survey stated that the survey will
be administered on relationship managers and senior loan officers of selected Nigerian banks
and will seek to investigate the characteristics of borrowers and lenders as well as business
environmental factors, which influence the availability of credit to SMEs; the determinants of
loan contract terms, lending preferences and approaches by Nigerian banks and lastly, the
economic value or benefits of lending relationships to Nigerian banks. The survey instrument
also stated the significance and benefits of the study for participating banks, policy makers and
bank dependent borrowers.
As part of the criteria for carrying out fieldwork, the survey instrument included a consent
form and some guidance notes to respondents of the survey in the form of a plain language
statement containing the purpose of the study, the reason why participants have been chosen,
the structure of questions asked and estimated time for completing the questionnaire. The
guidance notes also included the planned use and dissemination of the data collected and
assurance of confidentiality and anonymity for each participant and the bank. In terms of
ethical risks, there were no significant ethical risks involved in the research project, except for
the fact that the researcher undertook to guarantee the confidentiality of the participants to the
survey. Records held for each participant or bank was done in accordance with the University
of Glasgow research ethics code, which are reflective of generally accepted data protection
principles. Prior to the commencement of the research, the research supervisor wrote a letter of
V. Ekpu | The Microstructure of Bank Lending to SMEs | PhD Thesis | University of Glasgow | 2015
109
introduction for the researcher to the respective bank managers, which was accompanied by
the ethics approval letter from the College of Social Sciences Ethics Committee.
In preparing for fieldwork, Arthur and Nazroo (2003) emphasized the importance of a pilot
test as a critical part of the research. According to them, when assessing the scope of the study,
it is important to review whether it allows participants to give a full and coherent account of
the central issues of the study and incorporate issues they think are important. In other words,
a survey instrument should not constrain what participants want to say in relation to the
research questions. If a research instrument is not working, because it is not generating the
clarity, scope or depth of data sought, then it needs some revision. Yin (2009:92) also notes
that a pilot test helps the researcher to refine his data collection plans with respect to both the
content of the data and the procedures to be followed. In the current study, a pilot test was
carried out on 5 loan officers from three Nigerian banks (two tier I bank and 1 tier II bank)
prior to the final development of the survey questionnaire. However, the pilot test was only
conducted in the banks where the researcher had key contacts (research informants) as
opposed to using more standardised criteria for selecting the pilot cases. Moreover, the banks
were more geographically convenient and accessible.
It should be noted that after the pilot process, a number of relevant lines of questions were
further developed and/or modified which also helped to provide some conceptual clarification
of the research design. A few questions were removed while some other questions were added
after incorporating the comments of the informants. Due to the developing nature of the credit
system in Nigeria, questions that initially examined the use of credit scoring techniques in the
underwriting process were replaced with questions on relationship lending approaches, while
questions on borrower characteristics, lender characteristics and lending preferences were
modified to reflect the lending practices, bank organizational factors and business environment
factors peculiar to lending activity in Nigeria and sub-Saharan African countries in general. It
should also be noted that the data collected was done on the basis of the perceptions of the
respondents (i.e. the loan officers) and is mainly ordinal in nature.
V. Ekpu | The Microstructure of Bank Lending to SMEs | PhD Thesis | University of Glasgow | 2015
110
4.1.2. Sampling Technique
The sampling technique adopted for this study is purposeful sampling (also known as
judgmental sampling). Purposeful sampling is a non-probability sampling procedure in
which the judgment of the researcher is used to select cases that make up the sample to enable
him answer his research questions and meet his research objectives (Saunders et al., 2007).
According to Marshall (1996), the researcher actively selects the most productive sample to
answer the research question. This can involve developing a framework of the variables that
might influence an individual's contribution and will be based on the researcher's practical
knowledge of the research area, the available literature and evidence from the study itself.
Purposeful sampling is often used when working with very small samples such as in case
study research and when the researcher wishes to select cases that are particularly informative
(Neuman, 2000). Researchers adopting the grounded theory strategy may also use purposive
sampling. For such research, findings from data collected from the researcher’s initial sample
inform the way he extends his sample into subsequent cases. Such samples cannot, however,
be considered to be statistically representative of the entire population. Patton (2002)
emphasizes this point by contrasting the need to select information-rich cases in purposeful
sampling with the need to be statistically representative in probability sampling.
In connection with this need for sampling to be more representative, this study selected twelve
of the largest Nigerian banks for the survey. These include: (1) Zenith Bank (2) First Bank (3)
Guaranty Trust Bank (GTB) (4) Access Bank (5) United Bank for Africa (UBA) (6) Ecobank
Nigeria Plc (7) Fidelity Bank (8) First City Monument Bank (FCMB) (9) Skye Bank (10)
Diamond Bank (11) Stanbic IBTC, and (12) Union Bank of Nigeria. These 12 banks are
headquartered in Lagos, the commercial capital of Nigeria. Together, these banks account for
more than 77% of the market share of assets and deposits and they were among the only 13
Nigerian Banks listed in the Top 1,000 global banks in 2013 by the Banker Magazine. The
reason for excluding 1 of the 13 largest banks is that it is a foreign bank (Standard Chartered
Bank), while the others are domestic banks, and including just 1 foreign bank together with 12
domestic banks will misrepresent the overall findings from the survey. Moreover domestic
banks dominate the Nigerian banking system. By estimation, these 12 domestic banks provide
more than three-quarters of the total loans to SMEs in Nigeria.
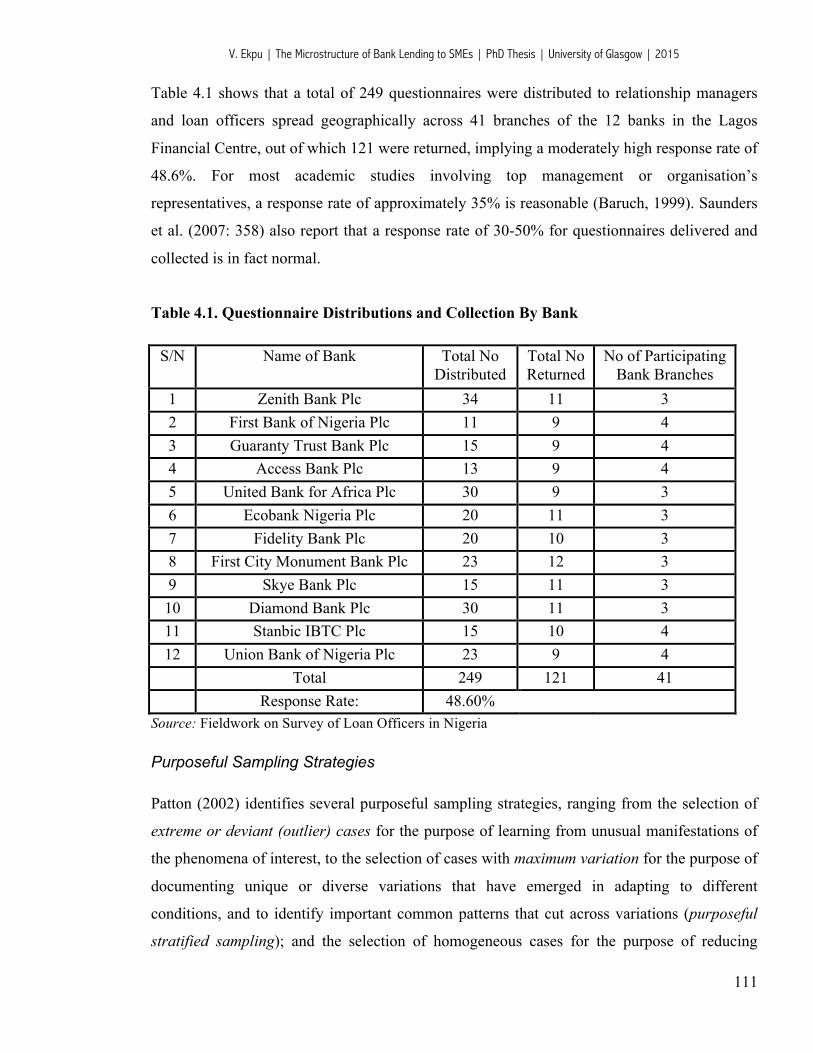
V. Ekpu | The Microstructure of Bank Lending to SMEs | PhD Thesis | University of Glasgow | 2015
111
Table 4.1 shows that a total of 249 questionnaires were distributed to relationship managers
and loan officers spread geographically across 41 branches of the 12 banks in the Lagos
Financial Centre, out of which 121 were returned, implying a moderately high response rate of
48.6%. For most academic studies involving top management or organisation’s
representatives, a response rate of approximately 35% is reasonable (Baruch, 1999). Saunders
et al. (2007: 358) also report that a response rate of 30-50% for questionnaires delivered and
collected is in fact normal.
Table 4.1. Questionnaire Distributions and Collection By Bank
S/N Name of Bank Total No Distributed
Total No Returned
No of Participating Bank Branches
1 Zenith Bank Plc 34 11 3 2 First Bank of Nigeria Plc 11 9 4 3 Guaranty Trust Bank Plc 15 9 4 4 Access Bank Plc 13 9 4 5 United Bank for Africa Plc 30 9 3 6 Ecobank Nigeria Plc 20 11 3 7 Fidelity Bank Plc 20 10 3 8 First City Monument Bank Plc 23 12 3 9 Skye Bank Plc 15 11 3 10 Diamond Bank Plc 30 11 3 11 Stanbic IBTC Plc 15 10 4 12 Union Bank of Nigeria Plc 23 9 4 Total 249 121 41 Response Rate: 48.60%
Source: Fieldwork on Survey of Loan Officers in Nigeria
Purposeful Sampling Strategies
Patton (2002) identifies several purposeful sampling strategies, ranging from the selection of
extreme or deviant (outlier) cases for the purpose of learning from unusual manifestations of
the phenomena of interest, to the selection of cases with maximum variation for the purpose of
documenting unique or diverse variations that have emerged in adapting to different
conditions, and to identify important common patterns that cut across variations (purposeful
stratified sampling); and the selection of homogeneous cases for the purpose of reducing
V. Ekpu | The Microstructure of Bank Lending to SMEs | PhD Thesis | University of Glasgow | 2015
112
variation, simplifying analysis, and facilitating group interviewing (homogeneity sampling).
Other types of sampling designs include criterion sampling, typical case sampling, snowball
sampling, intensity sampling, critical case sampling, theory-based sampling, confirming or
disconfirming case, purposeful random sampling, opportunistic or emergent sampling and
convenience sampling.
This study utilises two of these purposeful sampling strategies – criterion sampling and
purposeful stratified sampling. Criterion sampling involves reviewing and studying “all
cases that meet some predetermined criterion of importance” (Patton, 2002:238). This
approach is frequently employed by research synthesists to construct a comprehensive
understanding of all the studies that meet certain predetermined criteria. Most research
synthesists employ criterion sampling by stating explicit inclusion/exclusion criteria, which
includes specifications for methodological rigour (Suri, 2011). It is crucial to reflect critically
and realistically on the criteria being used, especially the criteria for methodological rigour. In
line with this idea and in order to achieve the specific objectives of this research, a number of
criteria were used to select the type of respondents that would participate in the survey. The
criteria used for this study were based on the functions of lending administration – loan
appraisal/underwriting, loan disbursement, loan monitoring/ongoing risk management, loan
collection and loan review. The participants selected for the survey thus included loan officers,
relationship managers and business managers who are either directly or indirectly involved in
appraising SME loan applications and/or involved in disbursing, monitoring, collecting or
reviewing loans made by banks to SMEs resident in Nigeria.
Another variant of purposeful sampling that was used in this study is stratified purposeful
sampling, which allows the researcher to select his case samples according to sub-groups to
be studied in greater detail. This type of sampling illustrates characteristics of particular sub-
groups of interest and facilitates comparisons between the different groups. The study thus
took samples across branch types serving SMEs (i.e. retail branches versus commercial
branches). Fifty-six respondents were loan officers serving low-end SME customers in retail

V. Ekpu | The Microstructure of Bank Lending to SMEs | PhD Thesis | University of Glasgow | 2015
113
branches, while sixty-five loan officers were domiciled in corporate/commercial branches36.
The study also took samples based on the level of relationship banking experience that
respondents had. Ninety-two of the loan officers (or 76%) had relationship banking experience
of over 5 years, while 29 (or 24%) had relationship banking experience of less than 5 years
(see table 4.2).
Table 4.2 Demographic Characteristics of Loan Officers
Frequency Percent Valid Percent
Cumulative Percent
Less than 5 years R /B experience 29 24 24 245 years or more R/B experience 92 76 76 100Total 121 100 100
Frequency Percent Valid Percent
Cumulative Percent
Retail Business Branches 56 46.3 46.3 46.3Commercial Business Branches 65 53.7 53.7 100Total 121 100 100
Respondents’ Relationship Banking Experience
Valid
Respondents’ Branch Type
Valid
Source: Fieldwork on Survey of Loan Officers in Nigeria
Challenges of Using Purposeful Sampling
Despite its wide use, there are numerous challenges in identifying and applying the
appropriate purposeful sampling strategy in any study. For instance, according to Palinkas et
al. (2013), the range of variation in a sample from which purposeful sample is to be taken is
often not really known at the outset of a study. To set as the goal the sampling of information-
rich informants that cover the range of variation assumes one knows that range of variation.
Consequently, an iterative approach of sampling and re-sampling to draw an appropriate
sample is usually recommended to make certain the theoretical saturation occurs (Miles and
Huberman, 1994). However, that saturation may be determined a priori on the basis of an
existing theory or conceptual framework, or it may emerge from the data themselves, as in a 36 In terms of geographic location, branches in Alimosho, Ojo and Amuwo Odofin Local government areas (LGAs) of the Lagos Financial Centre were designated as ‘Retail Business Branches’, while branches in Ikeja, Lagos Island and Airport Road, Oshodi/Isolo LGAs were designated as ‘Commercial Business Branches’.
V. Ekpu | The Microstructure of Bank Lending to SMEs | PhD Thesis | University of Glasgow | 2015
114
grounded theory approach (Glaser and Strauss, 1967). In addition, purposeful sampling
requires access to key informants37 in the field who can help in identifying information-rich
cases. Research retrieved through this channel is likely to be biased towards the beliefs
prevalent among these informants (Suri, 2011).
4.1.3. Questioning Techniques, Variables and Coding Framework
Using a 12-page questionnaire, a total of 30 broad questions were asked, which generated 166
variables in all (see annex A for the full questionnaire). The first batch of questions asked,
which cut across sections A and B, investigates the characteristics of borrowers and lenders
respectively that influence the bank's willingness to lend to SMEs. The inclusion of questions
on borrower and lender characteristics helped to explain the perception of bankers on the
demand-side and supply-side factors that drive or constrain their involvement with SMEs in
Nigeria’s post-consolidated and post-crisis period, thus providing suitable answers to
proposition 1 of the study. The sort of questions asked in these sections have been included by
previous survey studies (e.g. Owualah, 1988; Fletcher, 1995; Cole et al., 2004; Bruns and
Fletcher, 2008, etc) and seek to investigate the microstructure of small business lending by
banks in terms of the relative influence of financial and non-financial characteristics of
borrowers (e.g. loan purpose, loan security, firm size, financial performance, sector of
operation, credit rating, strength of previous and existing bank-borrower relationships,
owners’ business experience, professional training, personal guarantee, etc), as well as their
compatibility with the incentives and environments facing banks in the loan approval
processes. In addition, some recent studies (e.g. Ayyagari et al., 2008; Calice, et al., 2012;
Berg and Fuchs, 2013) have found that SME lending in sub-Saharan Africa is also largely
driven by macroeconomic factors, the degree of competition, the information environment, the
legal and contractual environment and government regulatory requirements, which were also
captured in the current study. Section B also included questions on changes in lending policies
and risk appetite since the global financial crisis of 2008-09. The idea of including questions
on the financial crisis is to see whether the risk preferences of banks have changed as a result
of the crisis and the implications these may have on SME lending.
37 Key informants have special expertise in the subject matter.
V. Ekpu | The Microstructure of Bank Lending to SMEs | PhD Thesis | University of Glasgow | 2015
115
The second batch of questions (section C) examines the determinants of SME credit terms,
which helped to provide answers to proposition 2 on the risk factors influencing loan contract
determination, particularly the determinants of risk premium between large (prime) customers
and small firms and the incidence of collateralization on SME loans. Some studies have shown
that the financing costs or risk premium for lines of credit on small business loans are
determined by a plethora of factors, such as borrowing firm’s size, loan size, firm’s age, firm’s
credit rating, availability of collateral or guarantees, nature of bank-borrower relationships, etc
(Cowling, 1999a; St-Pierre and Bahri, 2011). These factors have been included in the survey
to ascertain the loan pricing practices of Nigerian banks with respect to SME loans.
Furthermore, some other studies have also empirically examined the determinants of collateral
usage and the amount of collateral charged on SME loans using micro-level data. Jimenez et
al. (2006) use data from the Credit Register of Banco de Espana (CIR), while Cowling
(1999b) used data from a random sample of small businesses collected from an Association of
British Chambers of Commerce survey. The current study includes most of the variables tested
in these empirical studies in the survey such as loan size, firm size, type of customer (new or
existing), riskiness of project being financed, firm’s credit rating, owner’s credit rating,
competition and business cycle factors, etc. The idea is to ascertain the extent to which banks
take these factors into consideration in setting collateral requirements for SME loans, since
SMEs in Nigeria face perceived risks and uncertainties that make banks reluctant to provide
long-term credit to them. In addition, another question asks for the types of collateral that are
most frequently accepted by the banks from SME loan customers (e.g. real estate, vehicles and
business equipment, goods in stock, household goods, cash and other liquid assets, bank and
personal guarantees). This question has been previously asked by Beck et al. (2008b) in a
survey of 91 banks in 45 countries. Their results showed some notable differences in the
frequency of collateral practices between banks in developed and developing countries.
The third batch of questions was asked across two sections (sections D and E) with the aim of
providing answers to proposition 3 of the study on the significance of information acquisition
by loan officers and relationship lending techniques. Section D related to how lending is
organised at the bank level in terms of the centralization and decentralization of lending
administration functions and the role of loan officers in loan decision-making, while section E
probed into the information acquisition practices of Nigerian banks and the economic value
derivable from relationship lending. Specifically, the questions on the hierarchy of loan
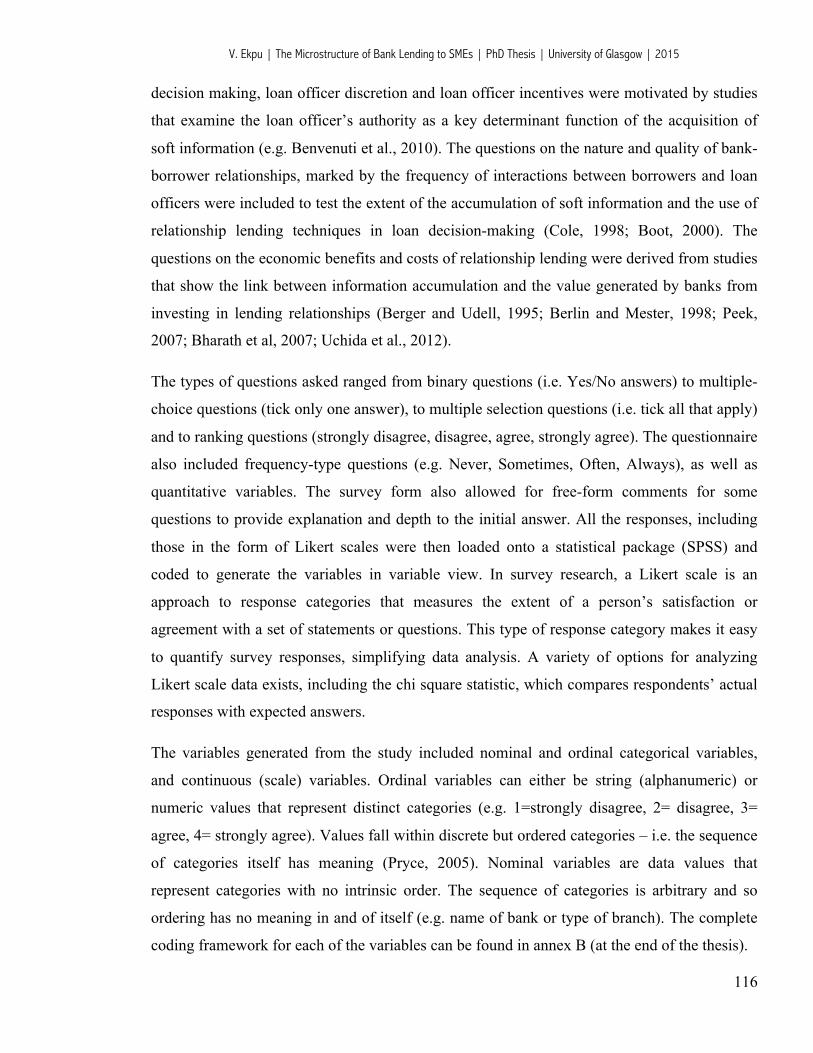
V. Ekpu | The Microstructure of Bank Lending to SMEs | PhD Thesis | University of Glasgow | 2015
116
decision making, loan officer discretion and loan officer incentives were motivated by studies
that examine the loan officer’s authority as a key determinant function of the acquisition of
soft information (e.g. Benvenuti et al., 2010). The questions on the nature and quality of bank-
borrower relationships, marked by the frequency of interactions between borrowers and loan
officers were included to test the extent of the accumulation of soft information and the use of
relationship lending techniques in loan decision-making (Cole, 1998; Boot, 2000). The
questions on the economic benefits and costs of relationship lending were derived from studies
that show the link between information accumulation and the value generated by banks from
investing in lending relationships (Berger and Udell, 1995; Berlin and Mester, 1998; Peek,
2007; Bharath et al, 2007; Uchida et al., 2012).
The types of questions asked ranged from binary questions (i.e. Yes/No answers) to multiple-
choice questions (tick only one answer), to multiple selection questions (i.e. tick all that apply)
and to ranking questions (strongly disagree, disagree, agree, strongly agree). The questionnaire
also included frequency-type questions (e.g. Never, Sometimes, Often, Always), as well as
quantitative variables. The survey form also allowed for free-form comments for some
questions to provide explanation and depth to the initial answer. All the responses, including
those in the form of Likert scales were then loaded onto a statistical package (SPSS) and
coded to generate the variables in variable view. In survey research, a Likert scale is an
approach to response categories that measures the extent of a person’s satisfaction or
agreement with a set of statements or questions. This type of response category makes it easy
to quantify survey responses, simplifying data analysis. A variety of options for analyzing
Likert scale data exists, including the chi square statistic, which compares respondents’ actual
responses with expected answers.
The variables generated from the study included nominal and ordinal categorical variables,
and continuous (scale) variables. Ordinal variables can either be string (alphanumeric) or
numeric values that represent distinct categories (e.g. 1=strongly disagree, 2= disagree, 3=
agree, 4= strongly agree). Values fall within discrete but ordered categories – i.e. the sequence
of categories itself has meaning (Pryce, 2005). Nominal variables are data values that
represent categories with no intrinsic order. The sequence of categories is arbitrary and so
ordering has no meaning in and of itself (e.g. name of bank or type of branch). The complete
coding framework for each of the variables can be found in annex B (at the end of the thesis).

V. Ekpu | The Microstructure of Bank Lending to SMEs | PhD Thesis | University of Glasgow | 2015
117
4.2. Methods of Data Analysis
This section explains the main statistics and tests conducted as well as the methods used in
estimating the relationships between key variables of interest. The quantitative methods used
in the study include descriptive statistics, nonparametric statistics and ordinal regression
analysis. The following three sub-sections will, respectively, address these methods.
4.2.1. Sample Data Descriptives
The use of simple descriptive statistics involves quantitatively describing the distribution of
variables or the main features of the data collected during the survey. Some measures that are
commonly used to describe a data set are measures of central tendency (the mean, median, and
mode), measures of variability or dispersion (minimum and maximum values of the variables,
range, standard deviation, variance, and interquartile range) and measures of the shape of the
distribution (i.e. kurtosis and skewness). Characteristics of a variable's distribution may also
be depicted in graphical or tabular format, including histograms, bar chart, pie chart, box plots
and stem-and-leaf display. Descriptive statistics could also come in the form of cross
tabulations and contingency tables, quantitative measures of dependence and descriptions of
conditional distribution.
Descriptives for Firm and Owner Characteristics
From table 4.3 it can be observed that five variables (purpose of loan, loan security,
profitability of business, firm’s credit rating and owners’ credit rating) have a median of 4,
while other firm and owner characteristics have a median of 3 or 2. This implies that at least
50% of the respondents rank these variables as very important in the deciding whether or not
to grant loans to SMEs, while 50% report other factors as either important or moderately
important. The mean ranking of importance of firm and owner characteristics range from 2.11
(distance to SME customer), which shows the least important variable, to 3.83 (purpose of
loan), which can be described as the most important borrower-specific variable in the lending
decision. The 5% trimmed mean, which calculates the mean after removing 5% of the largest
and smallest values still ranks the two variables as least important (2.06) and most important
(3.92) respectively. Chapter 5 provides a detailed analysis on the measures of central tendency
and the frequency of the distributions of firm and owner characteristics.
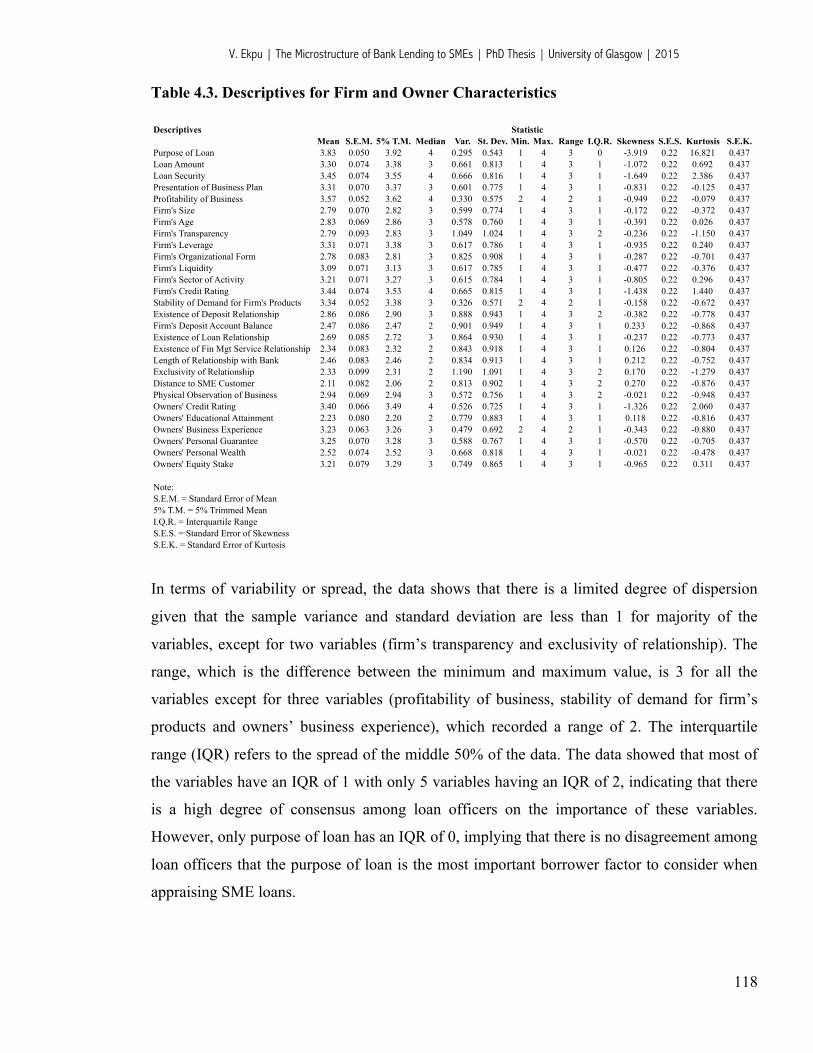
V. Ekpu | The Microstructure of Bank Lending to SMEs | PhD Thesis | University of Glasgow | 2015
118
Table 4.3. Descriptives for Firm and Owner Characteristics
Descriptives StatisticMean S.E.M. 5% T.M. Median Var. St. Dev. Min. Max. Range I.Q.R. Skewness S.E.S. Kurtosis S.E.K.
Purpose of Loan 3.83 0.050 3.92 4 0.295 0.543 1 4 3 0 -3.919 0.22 16.821 0.437Loan Amount 3.30 0.074 3.38 3 0.661 0.813 1 4 3 1 -1.072 0.22 0.692 0.437Loan Security 3.45 0.074 3.55 4 0.666 0.816 1 4 3 1 -1.649 0.22 2.386 0.437Presentation of Business Plan 3.31 0.070 3.37 3 0.601 0.775 1 4 3 1 -0.831 0.22 -0.125 0.437Profitability of Business 3.57 0.052 3.62 4 0.330 0.575 2 4 2 1 -0.949 0.22 -0.079 0.437Firm's Size 2.79 0.070 2.82 3 0.599 0.774 1 4 3 1 -0.172 0.22 -0.372 0.437Firm's Age 2.83 0.069 2.86 3 0.578 0.760 1 4 3 1 -0.391 0.22 0.026 0.437Firm's Transparency 2.79 0.093 2.83 3 1.049 1.024 1 4 3 2 -0.236 0.22 -1.150 0.437Firm's Leverage 3.31 0.071 3.38 3 0.617 0.786 1 4 3 1 -0.935 0.22 0.240 0.437Firm's Organizational Form 2.78 0.083 2.81 3 0.825 0.908 1 4 3 1 -0.287 0.22 -0.701 0.437Firm's Liquidity 3.09 0.071 3.13 3 0.617 0.785 1 4 3 1 -0.477 0.22 -0.376 0.437Firm's Sector of Activity 3.21 0.071 3.27 3 0.615 0.784 1 4 3 1 -0.805 0.22 0.296 0.437Firm's Credit Rating 3.44 0.074 3.53 4 0.665 0.815 1 4 3 1 -1.438 0.22 1.440 0.437Stability of Demand for Firm's Products 3.34 0.052 3.38 3 0.326 0.571 2 4 2 1 -0.158 0.22 -0.672 0.437Existence of Deposit Relationship 2.86 0.086 2.90 3 0.888 0.943 1 4 3 2 -0.382 0.22 -0.778 0.437Firm's Deposit Account Balance 2.47 0.086 2.47 2 0.901 0.949 1 4 3 1 0.233 0.22 -0.868 0.437Existence of Loan Relationship 2.69 0.085 2.72 3 0.864 0.930 1 4 3 1 -0.237 0.22 -0.773 0.437Existence of Fin Mgt Service Relationship 2.34 0.083 2.32 2 0.843 0.918 1 4 3 1 0.126 0.22 -0.804 0.437Length of Relationship with Bank 2.46 0.083 2.46 2 0.834 0.913 1 4 3 1 0.212 0.22 -0.752 0.437Exclusivity of Relationship 2.33 0.099 2.31 2 1.190 1.091 1 4 3 2 0.170 0.22 -1.279 0.437Distance to SME Customer 2.11 0.082 2.06 2 0.813 0.902 1 4 3 2 0.270 0.22 -0.876 0.437Physical Observation of Business 2.94 0.069 2.94 3 0.572 0.756 1 4 3 2 -0.021 0.22 -0.948 0.437Owners' Credit Rating 3.40 0.066 3.49 4 0.526 0.725 1 4 3 1 -1.326 0.22 2.060 0.437Owners' Educational Attainment 2.23 0.080 2.20 2 0.779 0.883 1 4 3 1 0.118 0.22 -0.816 0.437Owners' Business Experience 3.23 0.063 3.26 3 0.479 0.692 2 4 2 1 -0.343 0.22 -0.880 0.437Owners' Personal Guarantee 3.25 0.070 3.28 3 0.588 0.767 1 4 3 1 -0.570 0.22 -0.705 0.437Owners' Personal Wealth 2.52 0.074 2.52 3 0.668 0.818 1 4 3 1 -0.021 0.22 -0.478 0.437Owners' Equity Stake 3.21 0.079 3.29 3 0.749 0.865 1 4 3 1 -0.965 0.22 0.311 0.437
Note:S.E.M. = Standard Error of Mean5% T.M. = 5% Trimmed MeanI.Q.R. = Interquartile RangeS.E.S. = Standard Error of SkewnessS.E.K. = Standard Error of Kurtosis
In terms of variability or spread, the data shows that there is a limited degree of dispersion
given that the sample variance and standard deviation are less than 1 for majority of the
variables, except for two variables (firm’s transparency and exclusivity of relationship). The
range, which is the difference between the minimum and maximum value, is 3 for all the
variables except for three variables (profitability of business, stability of demand for firm’s
products and owners’ business experience), which recorded a range of 2. The interquartile
range (IQR) refers to the spread of the middle 50% of the data. The data showed that most of
the variables have an IQR of 1 with only 5 variables having an IQR of 2, indicating that there
is a high degree of consensus among loan officers on the importance of these variables.
However, only purpose of loan has an IQR of 0, implying that there is no disagreement among
loan officers that the purpose of loan is the most important borrower factor to consider when
appraising SME loans.
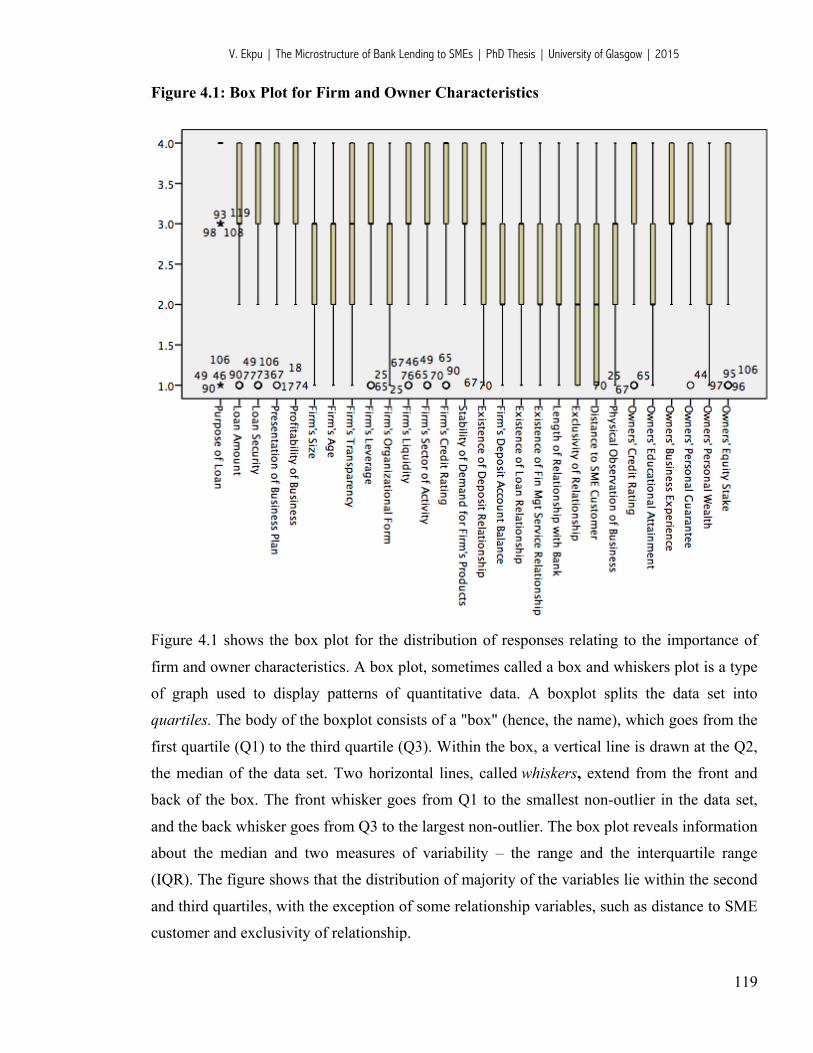
V. Ekpu | The Microstructure of Bank Lending to SMEs | PhD Thesis | University of Glasgow | 2015
119
Figure 4.1: Box Plot for Firm and Owner Characteristics
Figure 4.1 shows the box plot for the distribution of responses relating to the importance of
firm and owner characteristics. A box plot, sometimes called a box and whiskers plot is a type
of graph used to display patterns of quantitative data. A boxplot splits the data set into
quartiles. The body of the boxplot consists of a "box" (hence, the name), which goes from the
first quartile (Q1) to the third quartile (Q3). Within the box, a vertical line is drawn at the Q2,
the median of the data set. Two horizontal lines, called whiskers, extend from the front and
back of the box. The front whisker goes from Q1 to the smallest non-outlier in the data set,
and the back whisker goes from Q3 to the largest non-outlier. The box plot reveals information
about the median and two measures of variability – the range and the interquartile range
(IQR). The figure shows that the distribution of majority of the variables lie within the second
and third quartiles, with the exception of some relationship variables, such as distance to SME
customer and exclusivity of relationship.
V. Ekpu | The Microstructure of Bank Lending to SMEs | PhD Thesis | University of Glasgow | 2015
120
Descriptives for Lender Characteristics and External Factors
From table 4.4, only two variables - influence of regulatory requirements and bank lending
policies towards SMEs - have a median of 4, while other lender characteristics and external
factors have a median of 3. This suggests that at least 50% of the respondents rank these
variables as very important in deciding whether or not to grant loans to SMEs, while 50%
report other factors as important. The mean ranking of the importance of lender characteristics
also ranks these two factors, influence of regulatory requirements (3.64) and bank’s lending
policies towards SMEs (3.45) as the two most important variables respectively. These
statistics invariably suggests that the respondents perceive that the risk appetite of Nigerian
banks with respect to SME lending is principally driven by these two factors, while other
factors are of secondary importance.
Table 4.4. Descriptives for Lender Characteristics and External Factors
Descriptives StatisticMean S.E.M. 5% T.M. Median Var. St. Dev. Min. Max. Range I.Q.R. Skewness S.E.S. Kurtosis S.E.K.
Influence of Regulatory Requirements 3.64 0.062 3.73 4 0.46 0.681 1 4 3 1 -1.826 0.22 2.367 0.437Bank's Lending Policies Towards SMEs 3.45 0.067 3.52 4 0.55 0.742 1 4 3 1 -1.212 0.22 0.808 0.437Proportion of Bank's Asset Portfolio in SME Loans 2.98 0.075 3.03 3 0.68 0.826 1 4 3 2 -0.419 0.22 -0.447 0.437Sectoral Distribution of Outstanding Loans to SMEs 2.90 0.070 2.94 3 0.59 0.768 1 4 3 1 -0.389 0.22 -0.069 0.437History of Previous SME Loan Performance 3.36 0.065 3.42 3 0.51 0.717 1 4 3 1 -1.062 0.22 1.229 0.437Risk Profile of the SME Sector 3.41 0.061 3.48 3 0.44 0.667 1 4 3 1 -1.048 0.22 1.376 0.437Bank's Deposit Level and Financial Stability 3.32 0.069 3.39 3 0.57 0.755 1 4 3 1 -1.087 0.22 1.133 0.437Level of Bank Deposits 3.25 0.073 3.30 3 0.64 0.799 1 4 3 1 -0.778 0.22 -0.113 0.437Demand Facing Banks in the SME Loan Market 2.81 0.073 2.83 3 0.64 0.799 1 4 3 1 -0.141 0.22 -0.546 0.437Competition from other Banks for SME Loans 2.66 0.071 2.68 3 0.61 0.781 1 4 3 1 -0.392 0.22 -0.120 0.437Interest Rates or Returns from Competing Assets 2.93 0.078 2.97 3 0.74 0.858 1 4 3 2 -0.419 0.22 -0.477 0.437Maturity Structure of Bank's Security Holdings 2.68 0.078 2.70 3 0.74 0.858 1 4 3 1 -0.287 0.22 -0.480 0.437Specialization of Bank's Lending Officers 2.69 0.080 2.71 3 0.77 0.876 1 4 3 1 -0.322 0.22 -0.512 0.437High Transaction Costs Associated with SME Loans 2.88 0.074 2.92 3 0.66 0.812 1 4 3 1 -0.338 0.22 -0.355 0.437Adequacy of Information on Borrower Financial Condition 3.25 0.067 3.28 3 0.54 0.733 2 4 2 1 -0.427 0.22 -1.036 0.437Enforcement Actions from Regulators 3.07 0.070 3.11 3 0.59 0.766 1 4 3 1 -0.467 0.22 -0.219 0.437General Macroeconomic Conditions 2.98 0.069 2.99 3 0.57 0.758 1 4 3 2 -0.192 0.22 -0.640 0.437
Note:S.E.M. = Standard Error of Mean5% T.M. = 5% Trimmed MeanI.Q.R. = Interquartile RangeS.E.S. = Standard Error of SkewnessS.E.K. = Standard Error of Kurtosis
All of the variables, except three show an interquartile range (IQR) of 1, implying that there is
a high degree of consensus among the respondents on the importance of these variables. The
shape of the distribution is measured by the coefficient of skewness and kurtosis. From table
4.4, the coefficient of skewness shows that the data are negatively skewed (i.e. not a
symmetrical distribution). The tail of the distribution is to the left and mode is located to the
right of the mean. The interpretation is that majority of the respondents rank the lender
characteristics and external factors as more important than unimportant, hence the reason for
the high median and modal values (see chapter 5 for a detailed analysis on the frequency of
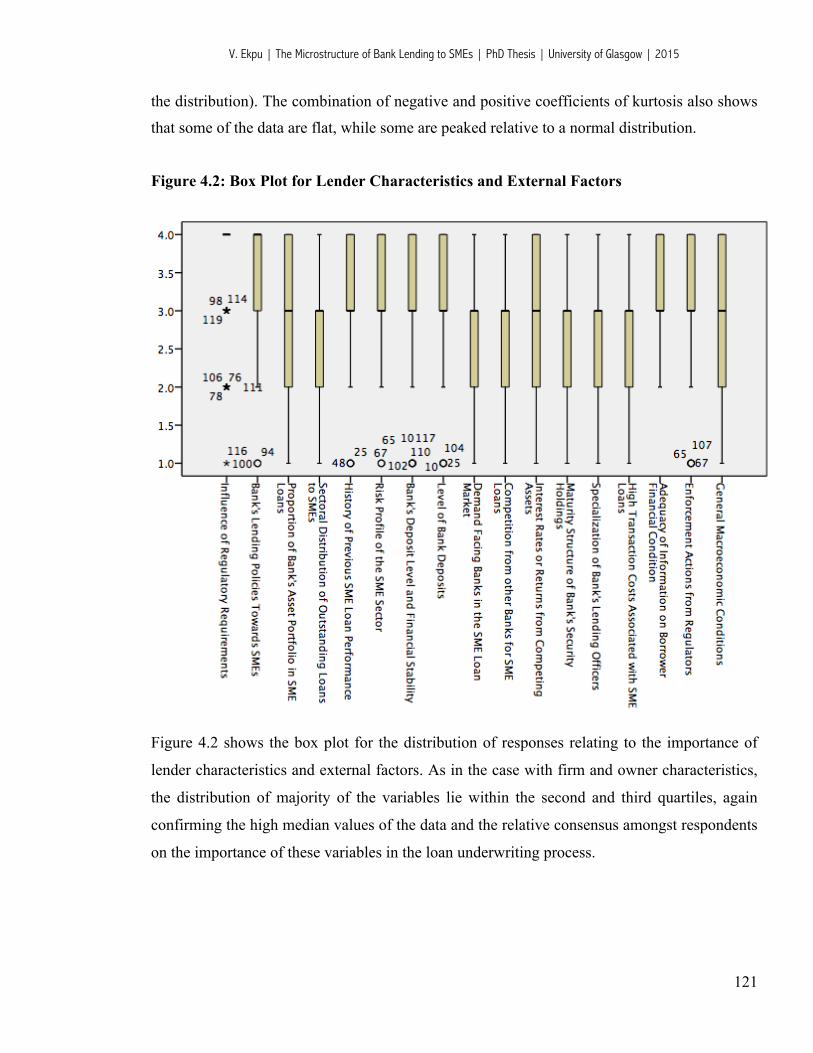
V. Ekpu | The Microstructure of Bank Lending to SMEs | PhD Thesis | University of Glasgow | 2015
121
the distribution). The combination of negative and positive coefficients of kurtosis also shows
that some of the data are flat, while some are peaked relative to a normal distribution.
Figure 4.2: Box Plot for Lender Characteristics and External Factors
Figure 4.2 shows the box plot for the distribution of responses relating to the importance of
lender characteristics and external factors. As in the case with firm and owner characteristics,
the distribution of majority of the variables lie within the second and third quartiles, again
confirming the high median values of the data and the relative consensus amongst respondents
on the importance of these variables in the loan underwriting process.
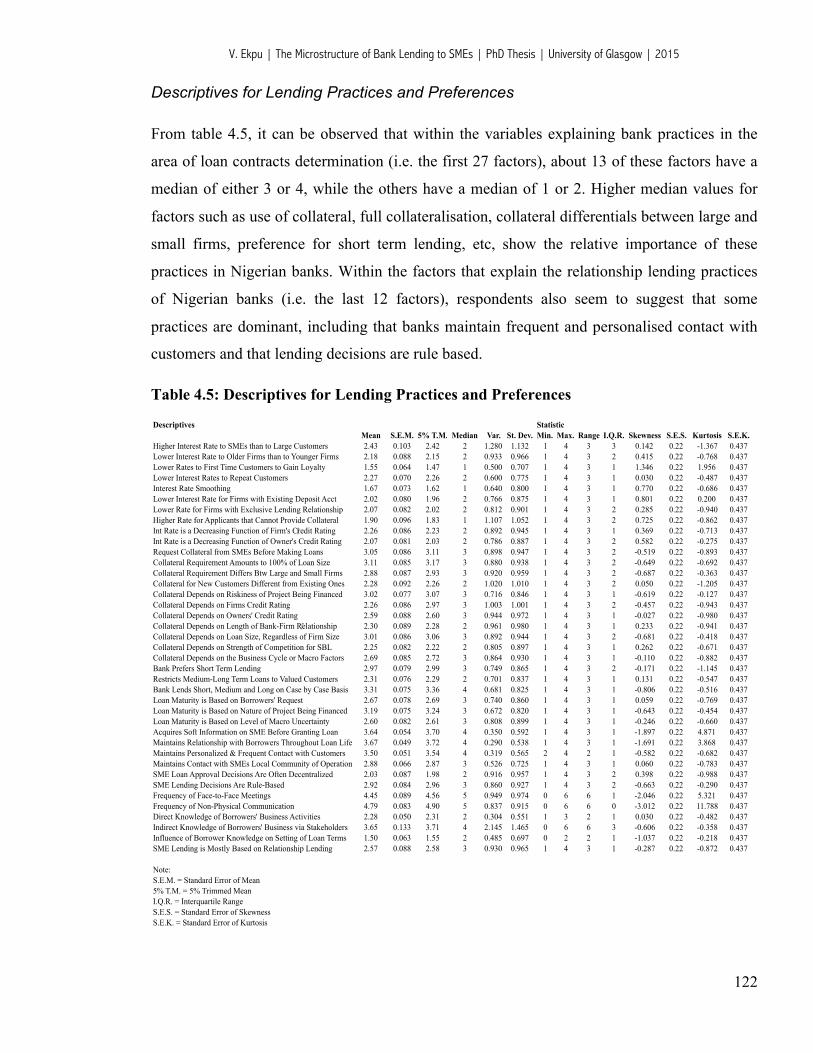
V. Ekpu | The Microstructure of Bank Lending to SMEs | PhD Thesis | University of Glasgow | 2015
122
Descriptives for Lending Practices and Preferences
From table 4.5, it can be observed that within the variables explaining bank practices in the
area of loan contracts determination (i.e. the first 27 factors), about 13 of these factors have a
median of either 3 or 4, while the others have a median of 1 or 2. Higher median values for
factors such as use of collateral, full collateralisation, collateral differentials between large and
small firms, preference for short term lending, etc, show the relative importance of these
practices in Nigerian banks. Within the factors that explain the relationship lending practices
of Nigerian banks (i.e. the last 12 factors), respondents also seem to suggest that some
practices are dominant, including that banks maintain frequent and personalised contact with
customers and that lending decisions are rule based.
Table 4.5: Descriptives for Lending Practices and Preferences
Descriptives StatisticMean S.E.M. 5% T.M. Median Var. St. Dev. Min. Max. Range I.Q.R. Skewness S.E.S. Kurtosis S.E.K.
Higher Interest Rate to SMEs than to Large Customers 2.43 0.103 2.42 2 1.280 1.132 1 4 3 3 0.142 0.22 -1.367 0.437Lower Interest Rate to Older Firms than to Younger Firms 2.18 0.088 2.15 2 0.933 0.966 1 4 3 2 0.415 0.22 -0.768 0.437Lower Rates to First Time Customers to Gain Loyalty 1.55 0.064 1.47 1 0.500 0.707 1 4 3 1 1.346 0.22 1.956 0.437Lower Interest Rates to Repeat Customers 2.27 0.070 2.26 2 0.600 0.775 1 4 3 1 0.030 0.22 -0.487 0.437Interest Rate Smoothing 1.67 0.073 1.62 1 0.640 0.800 1 4 3 1 0.770 0.22 -0.686 0.437Lower Interest Rate for Firms with Existing Deposit Acct 2.02 0.080 1.96 2 0.766 0.875 1 4 3 1 0.801 0.22 0.200 0.437Lower Rate for Firms with Exclusive Lending Relationship 2.07 0.082 2.02 2 0.812 0.901 1 4 3 2 0.285 0.22 -0.940 0.437Higher Rate for Applicants that Cannot Provide Collateral 1.90 0.096 1.83 1 1.107 1.052 1 4 3 2 0.725 0.22 -0.862 0.437Int Rate is a Decreasing Function of Firm's Credit Rating 2.26 0.086 2.23 2 0.892 0.945 1 4 3 1 0.369 0.22 -0.713 0.437Int Rate is a Decreasing Function of Owner's Credit Rating 2.07 0.081 2.03 2 0.786 0.887 1 4 3 2 0.582 0.22 -0.275 0.437Request Collateral from SMEs Before Making Loans 3.05 0.086 3.11 3 0.898 0.947 1 4 3 2 -0.519 0.22 -0.893 0.437Collateral Requirement Amounts to 100% of Loan Size 3.11 0.085 3.17 3 0.880 0.938 1 4 3 2 -0.649 0.22 -0.692 0.437Collateral Requirement Differs Btw Large and Small Firms 2.88 0.087 2.93 3 0.920 0.959 1 4 3 2 -0.687 0.22 -0.363 0.437Collateral for New Customers Different from Existing Ones 2.28 0.092 2.26 2 1.020 1.010 1 4 3 2 0.050 0.22 -1.205 0.437Collateral Depends on Riskiness of Project Being Financed 3.02 0.077 3.07 3 0.716 0.846 1 4 3 1 -0.619 0.22 -0.127 0.437Collateral Depends on Firms Credit Rating 2.26 0.086 2.97 3 1.003 1.001 1 4 3 2 -0.457 0.22 -0.943 0.437Collateral Depends on Owners' Credit Rating 2.59 0.088 2.60 3 0.944 0.972 1 4 3 1 -0.027 0.22 -0.980 0.437Collateral Depends on Length of Bank-Firm Relationship 2.30 0.089 2.28 2 0.961 0.980 1 4 3 1 0.233 0.22 -0.941 0.437Collateral Depends on Loan Size, Regardless of Firm Size 3.01 0.086 3.06 3 0.892 0.944 1 4 3 2 -0.681 0.22 -0.418 0.437Collateral Depends on Strength of Competition for SBL 2.25 0.082 2.22 2 0.805 0.897 1 4 3 1 0.262 0.22 -0.671 0.437Collateral Depends on the Business Cycle or Macro Factors 2.69 0.085 2.72 3 0.864 0.930 1 4 3 1 -0.110 0.22 -0.882 0.437Bank Prefers Short Term Lending 2.97 0.079 2.99 3 0.749 0.865 1 4 3 2 -0.171 0.22 -1.145 0.437Restricts Medium-Long Term Loans to Valued Customers 2.31 0.076 2.29 2 0.701 0.837 1 4 3 1 0.131 0.22 -0.547 0.437Bank Lends Short, Medium and Long on Case by Case Basis 3.31 0.075 3.36 4 0.681 0.825 1 4 3 1 -0.806 0.22 -0.516 0.437Loan Maturity is Based on Borrowers' Request 2.67 0.078 2.69 3 0.740 0.860 1 4 3 1 0.059 0.22 -0.769 0.437Loan Maturity is Based on Nature of Project Being Financed 3.19 0.075 3.24 3 0.672 0.820 1 4 3 1 -0.643 0.22 -0.454 0.437Loan Maturity is Based on Level of Macro Uncertainty 2.60 0.082 2.61 3 0.808 0.899 1 4 3 1 -0.246 0.22 -0.660 0.437Acquires Soft Information on SME Before Granting Loan 3.64 0.054 3.70 4 0.350 0.592 1 4 3 1 -1.897 0.22 4.871 0.437Maintains Relationship with Borrowers Throughout Loan Life 3.67 0.049 3.72 4 0.290 0.538 1 4 3 1 -1.691 0.22 3.868 0.437Maintains Personalized & Frequent Contact with Customers 3.50 0.051 3.54 4 0.319 0.565 2 4 2 1 -0.582 0.22 -0.682 0.437Maintains Contact with SMEs Local Community of Operation 2.88 0.066 2.87 3 0.526 0.725 1 4 3 1 0.060 0.22 -0.783 0.437SME Loan Approval Decisions Are Often Decentralized 2.03 0.087 1.98 2 0.916 0.957 1 4 3 2 0.398 0.22 -0.988 0.437SME Lending Decisions Are Rule-Based 2.92 0.084 2.96 3 0.860 0.927 1 4 3 2 -0.663 0.22 -0.290 0.437Frequency of Face-to-Face Meetings 4.45 0.089 4.56 5 0.949 0.974 0 6 6 1 -2.046 0.22 5.321 0.437Frequency of Non-Physical Communication 4.79 0.083 4.90 5 0.837 0.915 0 6 6 0 -3.012 0.22 11.788 0.437Direct Knowledge of Borrowers' Business Activities 2.28 0.050 2.31 2 0.304 0.551 1 3 2 1 0.030 0.22 -0.482 0.437Indirect Knowledge of Borrowers' Business via Stakeholders 3.65 0.133 3.71 4 2.145 1.465 0 6 6 3 -0.606 0.22 -0.358 0.437Influence of Borrower Knowledge on Setting of Loan Terms 1.50 0.063 1.55 2 0.485 0.697 0 2 2 1 -1.037 0.22 -0.218 0.437SME Lending is Mostly Based on Relationship Lending 2.57 0.088 2.58 3 0.930 0.965 1 4 3 1 -0.287 0.22 -0.872 0.437
Note:S.E.M. = Standard Error of Mean5% T.M. = 5% Trimmed MeanI.Q.R. = Interquartile RangeS.E.S. = Standard Error of SkewnessS.E.K. = Standard Error of Kurtosis
V. Ekpu | The Microstructure of Bank Lending to SMEs | PhD Thesis | University of Glasgow | 2015
123
Most of the variables (23) have an IQR of 1, while 13 of the variables have an IQR of 2. This
suggests the relative level consensus among the respondents in ranking these practices.
However, only one variable, frequency of non-physical communication, has an IQR of 0. This
seems to suggest that there is no disagreement among respondents about their perceptions of
the frequency of non-physical communication between loan officers and their business
customers. In terms of spread, the data shows that there is a limited degree of dispersion given
that the sample variance and standard deviation are less than 1 for majority of the variables.
There is however a considerable degree of divergent opinions with respect to certain practices
such as the extent to which interest rates on SME loans differ between large and small
customers, the extent to which banks charge higher rates for applicants that cannot provide
collateral, the extent to which collateral charged differ between new and existing customers
and the extent to which collateral depends on a firm’s credit rating. Respondents’ perceptions
are also different on the extent to which loan officers have indirect knowledge of their
borrowers’ business through information garnered from other stakeholders such as suppliers,
customers, competitors and neighbouring businesses of their customers.
4.2.2. Nonparametric Methods for Ordinal Data Analysis
Parametric Versus Non-Parametric Procedures
Theoretical distributions are described by quantities called parameters, notably the mean and
standard deviation. The term ‘parametric’ and ‘nonparametric’ are two broad classifications
of statistical properties (Conover, 1999). Methods that use the distributional assumptions are
called parametric methods, because we estimate the parameters of the distribution assumed for
the data. Frequently used parametric methods include t-tests and analysis of variance
(ANOVA) for comparing groups, and least squares regression and correlation for studying the
relationship between variables (Pryce, 2005; Altman and Bland, 2009). All of the common
parametric methods (“t methods”) assume that in some way the data follow a normal
distribution and also that the spread of the data (variance) is uniform either between groups or
across the range being studied. For example, the two samples t test assumes that the two
samples of observations come from populations that have normal distributions with the same
standard deviation. The importance of the assumptions for t methods diminishes as sample
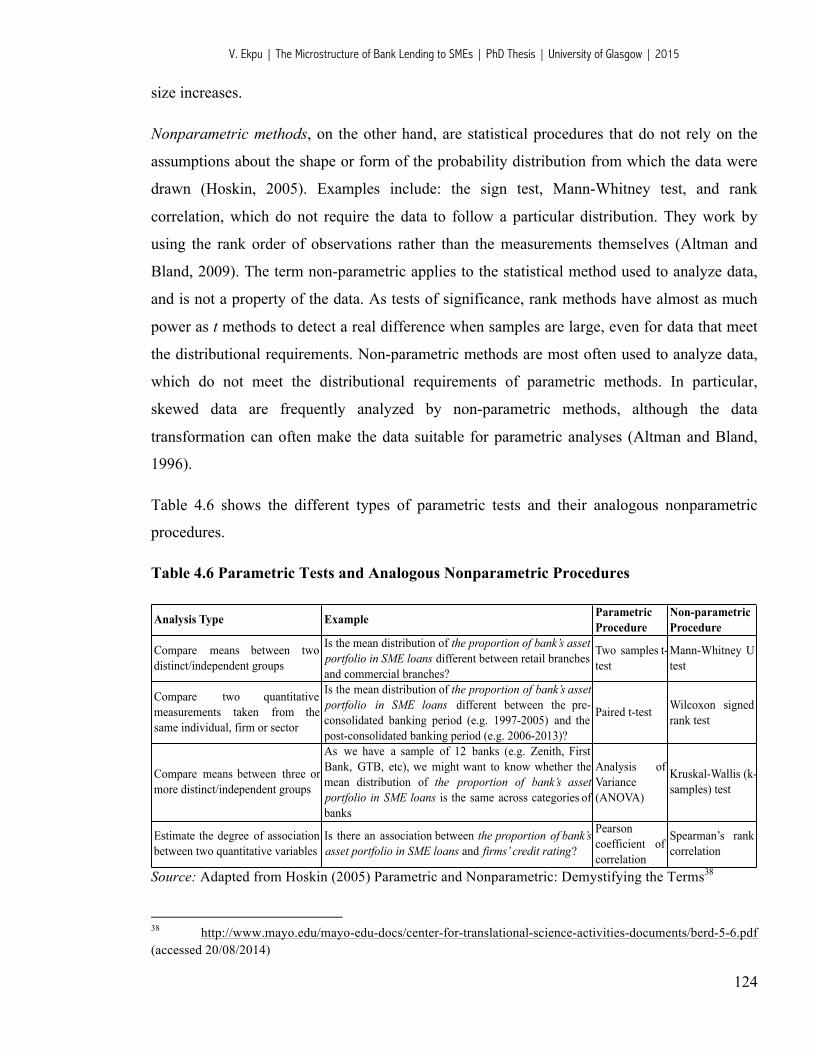
V. Ekpu | The Microstructure of Bank Lending to SMEs | PhD Thesis | University of Glasgow | 2015
124
size increases.
Nonparametric methods, on the other hand, are statistical procedures that do not rely on the
assumptions about the shape or form of the probability distribution from which the data were
drawn (Hoskin, 2005). Examples include: the sign test, Mann-Whitney test, and rank
correlation, which do not require the data to follow a particular distribution. They work by
using the rank order of observations rather than the measurements themselves (Altman and
Bland, 2009). The term non-parametric applies to the statistical method used to analyze data,
and is not a property of the data. As tests of significance, rank methods have almost as much
power as t methods to detect a real difference when samples are large, even for data that meet
the distributional requirements. Non-parametric methods are most often used to analyze data,
which do not meet the distributional requirements of parametric methods. In particular,
skewed data are frequently analyzed by non-parametric methods, although the data
transformation can often make the data suitable for parametric analyses (Altman and Bland,
1996).
Table 4.6 shows the different types of parametric tests and their analogous nonparametric
procedures.
Table 4.6 Parametric Tests and Analogous Nonparametric Procedures
Analysis Type Example Parametric Procedure
Non-parametric Procedure
Compare means between twodistinct/independent groups
Is the mean distribution of the proportion of bank’s asset portfolio in SME loans different between retail branches and commercial branches?
Two samples t-test
Mann-Whitney Utest
Compare two quantitativemeasurements taken from thesame individual, firm or sector
Is the mean distribution of the proportion of bank’s assetportfolio in SME loans different between the pre-consolidated banking period (e.g. 1997-2005) and thepost-consolidated banking period (e.g. 2006-2013)?
Paired t-test Wilcoxon signedrank test
Compare means between three ormore distinct/independent groups
As we have a sample of 12 banks (e.g. Zenith, FirstBank, GTB, etc), we might want to know whether themean distribution of the proportion of bank’s assetportfolio in SME loans is the same across categories ofbanks
Analysis ofVariance (ANOVA)
Kruskal-Wallis (k-samples) test
Estimate the degree of associationbetween two quantitative variables
Is there an association between the proportion of bank’sasset portfolio in SME loans and firms’ credit rating?
Pearson coefficient ofcorrelation
Spearman’s rankcorrelation
Source: Adapted from Hoskin (2005) Parametric and Nonparametric: Demystifying the Terms38
38 http://www.mayo.edu/mayo-edu-docs/center-for-translational-science-activities-documents/berd-5-6.pdf (accessed 20/08/2014)
V. Ekpu | The Microstructure of Bank Lending to SMEs | PhD Thesis | University of Glasgow | 2015
125
For survey results, both parametric and non-parametric statistical tests are often used to
analyze cross tabulations of the survey data (Conover, 1999; Hoskin, 2005). Since crosstabs
show the frequency and percentage of responses to questions by different segments or
categories of respondents (e.g. loan officers across different banks, loan officers from retail
branches versus commercial branches), the independent samples tests can tell us whether there
is a statistical difference between the segments/categories in how they answered the question.
Much of these analyses were carried out in chapter 5.
Critique of Nonparametric Statistics for Ordinal Data Analysis
It has generally been argued that parametric statistics should not be applied to data with non-
normal distributions. Empirical research has demonstrated that non-parametric procedures
such as Mann-Whitney U test have greater power than parametric statistics such as t-tests
unless data are sampled from the normal (Vickers, 2005). Where data are sampled from a
normal distribution, the t-test has very slightly higher power than Mann-Whitney, the non-
parametric alternative. However, when data are sampled from any one of a variety of non-
normal distributions, Mann- Whitney is superior, often by a large amount. Hoskin (2005) also
points out that if the data deviate strongly from the assumptions of a parametric procedure
(e.g. normal distribution), using a parametric procedure could lead to incorrect conclusions.
Given the ordinal nature of the data collected in the current study, nonparametric tests are
more appropriate than parametric tests for several reasons highlighted by Bruckers and
Molenberghs (2011). First, nonparametric tests are often used for data that are inherently in
ranks, and even for data measured in a nominal scale. In this sense, since most of the data
generated in this study are scores with limited possible values (such as order of importance,
order of agreement and frequency scales on SME lending practices) with only a few
measurement variables (such as margin of interest rate discretion, amount of autonomous
lending, etc), the use of rank methods is justified. Second, since nonparametric data uses
ranks, they are less sensitive to measurement errors. Third, nonparametric statistics are often
the only alternative in the case of small sample size, unless the nature of the population
distribution is known exactly. Given the relatively small sample size employed in this study
(121 loan officers), using parametric statistics is likely to yield misleading results, as the
number of observations is not large enough to assume a normal distribution. In fact, the
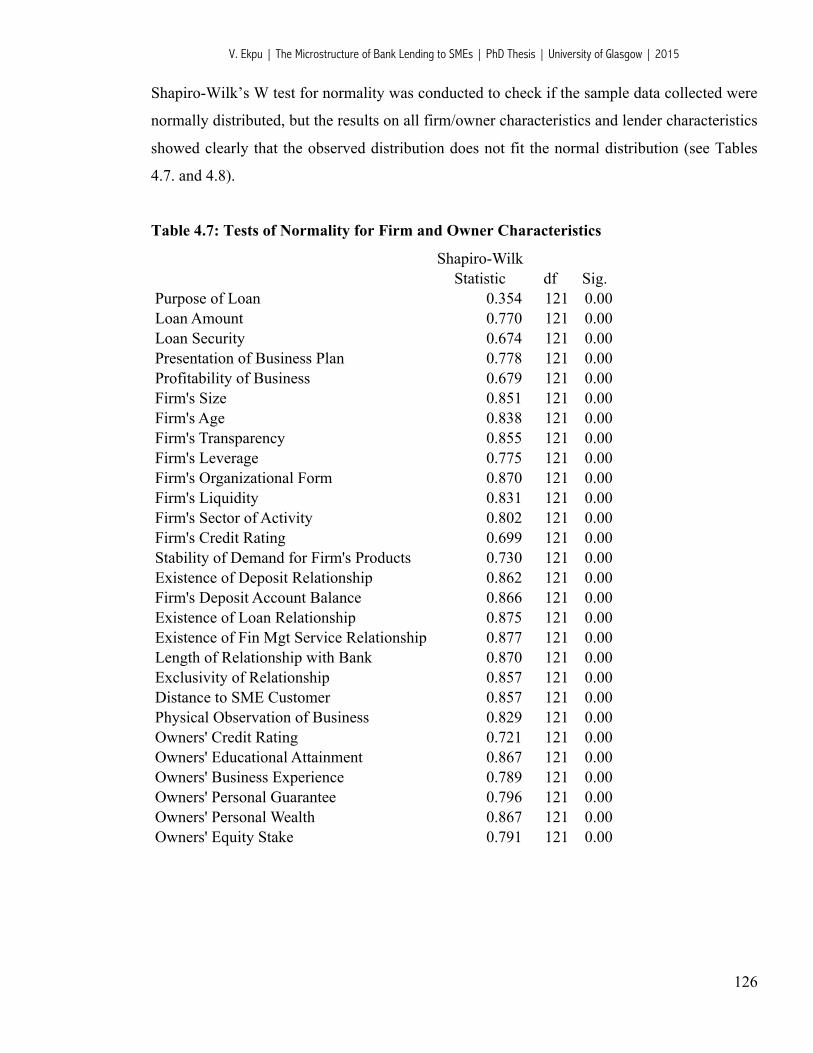
V. Ekpu | The Microstructure of Bank Lending to SMEs | PhD Thesis | University of Glasgow | 2015
126
Shapiro-Wilk’s W test for normality was conducted to check if the sample data collected were
normally distributed, but the results on all firm/owner characteristics and lender characteristics
showed clearly that the observed distribution does not fit the normal distribution (see Tables
4.7. and 4.8).
Table 4.7: Tests of Normality for Firm and Owner Characteristics
Shapiro-WilkStatistic df Sig.
Purpose of Loan 0.354 121 0.00Loan Amount 0.770 121 0.00Loan Security 0.674 121 0.00Presentation of Business Plan 0.778 121 0.00Profitability of Business 0.679 121 0.00Firm's Size 0.851 121 0.00Firm's Age 0.838 121 0.00Firm's Transparency 0.855 121 0.00Firm's Leverage 0.775 121 0.00Firm's Organizational Form 0.870 121 0.00Firm's Liquidity 0.831 121 0.00Firm's Sector of Activity 0.802 121 0.00Firm's Credit Rating 0.699 121 0.00Stability of Demand for Firm's Products 0.730 121 0.00Existence of Deposit Relationship 0.862 121 0.00Firm's Deposit Account Balance 0.866 121 0.00Existence of Loan Relationship 0.875 121 0.00Existence of Fin Mgt Service Relationship 0.877 121 0.00Length of Relationship with Bank 0.870 121 0.00Exclusivity of Relationship 0.857 121 0.00Distance to SME Customer 0.857 121 0.00Physical Observation of Business 0.829 121 0.00Owners' Credit Rating 0.721 121 0.00Owners' Educational Attainment 0.867 121 0.00Owners' Business Experience 0.789 121 0.00Owners' Personal Guarantee 0.796 121 0.00Owners' Personal Wealth 0.867 121 0.00Owners' Equity Stake 0.791 121 0.00

V. Ekpu | The Microstructure of Bank Lending to SMEs | PhD Thesis | University of Glasgow | 2015
127
Table 4.8: Tests for Normality for Lender Characteristics and External Factors
Shapiro-WilkStatistic df Sig.
Influence of Regulatory Requirements 0.573 121 0.00Bank's Lending Policies Towards SMEs 0.718 121 0.00Proportion of Bank's Asset Portfolio in SME Loans 0.847 121 0.00Sectoral Distribution of Outstanding Loans to SMEs 0.840 121 0.00History of Previous SME Loan Performance 0.753 121 0.00Risk Profile of the SME Sector 0.735 121 0.00Bank's Deposit Level and Financial Stability 0.761 121 0.00Level of Bank Deposits 0.797 121 0.00Demand Facing Banks in the SME Loan Market 0.856 121 0.00Competition from other Banks for SME Loans 0.840 121 0.00Interest Rates or Returns from Competing Assets 0.855 121 0.00Maturity Structure of Bank's Security Holdings 0.866 121 0.00Specialization of Bank's Lending Officers 0.865 121 0.00High Transaction Costs Associated with SME Loans 0.854 121 0.00Adequacy of Information on Borrower Financial Condition 0.786 121 0.00Enforcement Actions from Regulators 0.830 121 0.00General Macroeconomic Conditions 0.837 121 0.00
Hoskin (2005) and Altman and Bland (2009) point out that, although non-parametric (i.e.
rank) methods have the very desirable property of making fewer assumptions about the
distribution of the data, they have a few drawbacks. First, non-parametric tests generally are
less statistically powerful than the analogous parametric procedure when the data truly are
approximately normal. “Less powerful” implies that there is a smaller probability that the
procedure will tell us that two variables are associated with each other when they in fact truly
are associated. Second, rank methods also have the disadvantage that they are mainly suited to
hypothesis testing and no useful estimate is obtained, such as the average difference between
two groups. Estimates and confidence intervals are easy to find with t methods. Many non-
parametric tests use rankings of the values in the data rather than using the actual data. Third,
rank methods have the added disadvantage of not generalizing to more complex situations,
most obviously when we wish to use regression methods to adjust for several other factors.
Independent Samples Tests
These tests are applicable to situations where we are trying to compare the means of two
independent populations. The test is applicable to comparison of sub-groups, such as ‘loan
officers from retail branches’ and ‘loan officers from commercial branches’ based on the

V. Ekpu | The Microstructure of Bank Lending to SMEs | PhD Thesis | University of Glasgow | 2015
128
survey sample split. The two samples are assumed to be independent. This is distinct from
situations where the researcher observes the same person before and after a period (for such
tests, we use the paired samples t-test as illustrated in table 4.6). There are two formulae for
calculating the appropriate test statistic for comparing two population means: one assumes
equal (or homogenous) variances across the two populations, and the other assumes unequal
(or heterogeneous) variances across the two populations (see Pryce, 2005: 6-2 to 6-5). To
make computations easy, the relevant SPSS syntax is used to calculate the independent
samples significance test for equality of two means, in the first instance assuming pooled
variances and in the second instance, assuming different variances.
Levene’s Test for Equality of Variances
The test for the equality of variances means a test to see whether the sampling distributions of
the two populations have similar or different standard errors. Equality of variances is an
assumption for statistical methods such as Analysis of Variance (ANOVA)—a parametric
method—and the Kruskal-Wallis one-way analysis—a non-parametric method. The levene’s
test is a robust test that is performed to assess the assumption of equality of variances. It is
based on very complex formula that weights each case of the sample with a unique group
weight. It tests the null hypothesis that the population variances are equal (called homogeneity
of variance or homoscedasticity).
H0 :σ 1
2 =σ 22
H1 :σ 12 ≠ σ 2
2
If the resulting p-value of Levene's test is less than some significance level (typically 0.05),
the obtained differences in sample variances are unlikely to have occurred based on random
sampling from a population with equal variances. Thus, the null hypothesis of equal variances
is rejected and it is concluded that there is a difference between the variances in the
population. Levene's test is often used before a comparison of means. When Levene's test
shows significance, one should switch to more generalized tests, free from homoscedasticity
assumptions. We must be able to test for equality of variances in both normally distributed
data and non-normally distributed data. There are two separate tests for equality of variances:
(1) If we have normally distributed data, we should perform the parametric Levene's test; (2) If
we have non-normally distributed data, we should perform the non-parametric Levene's test.
V. Ekpu | The Microstructure of Bank Lending to SMEs | PhD Thesis | University of Glasgow | 2015
129
Mann Whitney U Test (2 samples)39:
Mann–Whitney U test (also called the Mann–Whitney–Wilcoxon (MWW), Wilcoxon rank-
sum test, or Wilcoxon–Mann–Whitney test) is a nonparametric test of the null hypothesis that
two populations are the same against an alternative hypothesis, especially that a particular
population tends to have larger values than the other. In SPSS, the MWW test can
automatically compare distributions across groups, such as bank categories or branch type as
this study shows. It has greater efficiency than the t-test on non-normal distributions, such as a
mixture of normal distributions, and it is almost as efficient as the t-test on normal
distributions.
The logic behind the Mann-Whitney test is to rank the data for each sample, and then see how
different the two rank totals are. If there is a systematic difference between the two samples,
then most of the high ranks will belong to one sample and most of the low ranks will belong to
the other one (Hole, 2011). As a result, the rank totals will be quite different. On the other
hand, if the two samples are similar, then high and low ranks will be distributed fairly evenly
between the two samples and the rank totals will be fairly similar. The Mann-Whitney test
statistic "U" reflects the difference between the two rank totals. A table of critical values of U
shows how likely it is to obtain a particular value of U purely by chance. The SMALLER it is
(taking into account how many participants we have in each group) then the more likely it is to
have occurred by chance. The BIGGER the test statistic, the less likely it is to have occurred
by chance).
Kruskal- Wallis 1-Way ANOVA (k-samples)
The Kruskal–Wallis one-way analysis of variance by ranks is a non-parametric method for
testing whether samples originate from the same distribution (Kruskal and Wallis, 1952). It is
used for comparing two or more samples that are independent, and that may have different
sample sizes, and extends the Mann-Whitney U test to more than two groups. The parametric
equivalent of the Kruskal-Wallis test is the one-way analysis of variance (ANOVA). Since it is
a non-parametric method, the Kruskal–Wallis test does not assume a normal distribution of the
39 The Wilcoxon rank-sum test is not the same as the Wilcoxon signed-rank test, although both are nonparametric and involve summation of ranks. The latter is used when comparing two related samples, matched samples, or repeated measurements on a single sample to assess whether their population mean ranks differ.
V. Ekpu | The Microstructure of Bank Lending to SMEs | PhD Thesis | University of Glasgow | 2015
130
residuals, unlike the analogous one-way analysis of variance. If the researcher can make the
more stringent assumptions of an identically shaped and scaled distribution for all groups,
except for any difference in medians, then the null hypothesis is that the medians of all groups
are equal, and the alternative hypothesis is that at least one population median of one group is
different than the population median of at least one other group.
Spearman’s Rank Correlation Coefficient
This study utilizes nonparametric correlation techniques in analyzing important associations
between variables. For example, the study analyses the relationship between measures of SME
riskiness, SME credit quality, lender characteristics and environmental factors as well as the
relationships between demand side factors and contributory factors to the riskiness of SME
loans. The correlation technique used in this study is the Spearman’s rank Correlation
Coefficient. It is a measure of the linear correlation (or dependence) between two
variables X and Y, giving a value between +1 and −1 (inclusive), where 1 is total positive
correlation, 0 is no correlation, and −1 is total negative correlation. It is widely used in the
social sciences as a measure of the degree of linear dependence between two variables. Like
any correlation calculation, spearman’s correlation coefficient is appropriate for both
continuous and discrete variables, including ordinal variables.
4.2.3. Econometric Methods
This sub-section describes the empirical models used in the econometric analysis (in particular
chapters 6 and 7). The research questions and the hypotheses of the study only make
conditional likelihood procedures relevant. Conditional likelihood procedures are statistical
techniques that estimate the probability of observing a given event conditional on a particular
set of parameters. There are several forms of conditional likelihood models, depending on the
number and order of the dependent variables. Binary logit/probit models40 are used when the
40 The main difference between a logit model and a probit model is that for the logit model, the cumulative distribution function (CDF) is the logistic distribution, while for the probit model, the CDF is the standard normal distribution. In both models, the predicted probabilities are limited between 0 and 1. Both models are estimated by maximum likelihood (ML). The choice between logit and probit models depends on the data generating process, which is unknown. Both models produce almost identical results (different coefficients but similar marginal effects).
V. Ekpu | The Microstructure of Bank Lending to SMEs | PhD Thesis | University of Glasgow | 2015
131
dependent variable is a binary response, i.e. it takes on two values: 0 and 1 (y = 0 if no, 1 if
yes). These binary outcome models estimate the probability that y=1 as a function of the
independent variables. Multinomial logistic regression is the linear regression analysis to
conduct when the dependent variable is nominal with more than two levels. Thus it is an
extension of the binary logistic regression, which analyses dichotomous dependents. The
ordinal logistic regression (OLR) model, also called the ordered logit model, is a statistical
technique with an ordered dependent variable. Examples include: rating systems (poor, fair,
good, excellent); opinion surveys (strongly agree, agree, neutral, disagree, strongly disagree);
ranking (unimportant, moderately important, important, very important), frequencies (never,
sometimes, often, always) etc. Among these conditional likelihood procedures, the only
method that suits the ordered structure of the variables obtainable from the questionnaire
conducted in this study is the ordinal logistic regression (OLR). The reason for the choice of
ordinal logistic regression model over other conditional likelihood estimations such as the
binary logit and probit models and the multinomial logit and probit model is that all the
variables of interest in this study are ordered outcomes. Where there are ordered outcomes
exceeding two categories, with meaningful sequence, OLR models become inevitable
(Norusis, 2012; Katchova, 2013; Torres-Reyna, 2014).
Fitting an OLR Model
An OLR model can be used when a dependent variable has more than two categories and the
values of each category have a meaningful sequential order where a value is indeed ‘higher’
than the previous one. The categories for the dependent variables are rankings so the numbers
do not make sense. For example, even if they are coded as 0, 1, 2, 3, 4 the difference between
the first and second outcome may not be the same as between the second and third (Katchova,
2013). Thus, in fitting an OLR model, the event of interest is observing a particular score or
less (Norusis, 2012). Assuming we are rating the frequency of loan pricing decisions by
Nigerian banks using the following scale: ‘never’ (1), ‘sometimes’ (2), ‘often’ (3) and
‘always’ (4), we can model the following odds41:
θ1 = prob (score 1)/prob (score greater than 1) ……………………………………………(4.1)
41 An odd is the likelihood or probability that an event occurs.

V. Ekpu | The Microstructure of Bank Lending to SMEs | PhD Thesis | University of Glasgow | 2015
132
θ2 = prob (score of 1 or 2)/ prob (score greater than 2)……………………………………(4.2)
θ3 = prob (score of 1, or 2, or 3)/ prob (score greater than 3)……………………..……….(4.3)
Notice that for the last category (always - 4), we do not include an equation since the
probability of scoring up to and including the last score is 1 (i.e. the only score greater than 3
is 4). This can be better understood by the concept of cumulative probability. An OLR model
simultaneously estimates multiple equations. The number of equations it estimates will depend
on the number of categories in the dependent variable minus one (Snedker et al., 2002). So
since we have four categories for the dependent variable, three equations will be estimated. All
of the odds are of the form:
θj = prob (score ≤ j) / prob (score > j)……………………………………………………….(4.4)
We can also write equation 4.4 as:
θJ = prob (score ≤ j)/ (1- prob (score ≤ j)),……………………………………………..…...(4.5)
since the probability of a score greater than j is 1- probability of a score less than or equal to j
The ordered logistic regression (OLR) model has the form:
LOGIT (p1) ≡ logp1
1− p1=α1 + β
' x
LOGIT (p1 + p2 ) ≡ logp1 + p2
1− p1 − p2=α 2 + β
' x
LOGIT (p1 + p2 + ...+ pk ) ≡ logp1 + p2 + ...+ pk
1− p1 − p2 − ...− pk=α k + β
' x
and : p1 + p2 + ...+ pk+1 = 1
……………………………(4.6)
This model is known as the proportional-odds model because the odds ratio of the event is
independent of the category j. The odds ratio is assumed to be constant for all categories
(Snedker et al., 2002). We can define an index model for a single latent variable y* (which is
unobservable, we only know when it crosses pre-defined thresholds):
yi* = xi
'β + µi ..........................................................................................................................(4.7)
yi = j if α j−1 < yi* ≤α j

V. Ekpu | The Microstructure of Bank Lending to SMEs | PhD Thesis | University of Glasgow | 2015
133
The probability that observation i will select the alternative j is:
pij = p(yi = j) = p(α j−1 < yi* ≤α j ) = F(α J − xi
'β )− F(α j−1 − xi'β )…………………………..(4.8)
For the ordered logit, F is the logistic cumulative distribution function (cdf)
F(z) = ez / (1+ ez ) . The ordered logit model with j alternatives will have one set of coefficients
with (j-1) intercepts. As noted earlier, the OLR model can be identified by multiple intercepts.
Interpretation of OLR Estimates
The sign of parameters shows whether the latent variable y* increases with the regressor. As
the dependent variable is a multiple factor, the way we interpret the OLR coefficients will also
be slightly different from how we would interpret logistic regression coefficients with only
one transition. A positive coefficient indicates an increased chance or likelihood that a subject
with a higher score on the independent variable will be observed in a higher category. A
negative coefficient indicates the chances or likelihood that a subject with a higher score on
the independent variable will be observed in a lower category (Snedker et al., 2002). So for
example, if we are interested in testing whether the risk premium on an SME loan depends on
whether a firm has collateral or not, a positive coefficient will imply that a firm with no
collateral to secure the loan is more likely to be charged a higher risk premium, while a
negative coefficient will mean that there is a lower likelihood of a higher risk premium with
available collateral.
It is worthy of note that logit coefficients are in log-odds units and cannot be read as regular
OLS coefficients so that we cannot interpret the magnitude of the coefficients. To interpret, we
will need to estimate the predicted probabilities that y*=1 for each score category. OLS
provides only one set of coefficients for each independent variable. Therefore, there is an
assumption of parallel regression (Torres-Reyna, 2014). That is, the coefficients for the
variables in the equations would not vary significantly if they were estimated separately. The
intercepts would be different, but the slopes would be essentially the same. This means that
the results are a set of parallel lines or planes – one for each category of the outcome variable
(Norusis, 2012). A significant test statistic provides evidence that the parallel regression
assumption has been violated.
V. Ekpu | The Microstructure of Bank Lending to SMEs | PhD Thesis | University of Glasgow | 2015
134
OLR Marginal Effects
In addition to the fixed effects OLR, we can also estimate the ordered logit marginal effects.
The ordered logit model with j alternatives will have j sets of marginal effects (Katchova,
2013). The marginal effect of an increase in a regressor xr on the probability of selecting
alternative j is:
∂pij / ∂xri = F ' (α j−1 − xi'β )− F ' (α J − xi
'β ){ }βr ……………………………………………..(4.9)
The marginal effects of each variable on the different alternatives sum up to zero. To interpret
the marginal effects, we say that each unit increase in the independent variable
increases/decreases the probability of selecting alternative j by the marginal effect expressed
as a percentage.
Alternative Multivariate Statistical Methods
Apart from conditional likelihood estimations, there are other alternative multivariate
statistical procedures, which can be used to analyze survey data (e.g. Principal Components
Analysis and Factor Analysis) but were not chosen for the study. Principal Components
Analysis (PCA) is a mathematical procedure that transforms a number of (possibly) correlated
variables into a (smaller) number of uncorrelated variables called principal components. The
main advantage of PCA is that it is a dimensionality reduction or data compression method.
The main disadvantage is that there is no guarantee that the reduced dimensions are
interpretable. Factor Analysis (FA) is a similar statistical procedure that identifies
interrelationships that exist among a large number of variables. However, it is mostly suited
for exploratory or confirmatory studies. As an exploratory procedure, factor analysis is used to
search for a possible underling structure in the variables. In confirmatory research, the
research evaluates how similar the actual structure of the data, as indicated by factor analysis,
is to the expected structure. The main reason for choosing conditional likelihood procedures
(in particular, the OLR) over other statistical methods is that they help in studying the
relationship between two or more variables or independent samples, without altering the
underlying structure of the dataset as does PCA or factor analysis. Moreover, as noted earlier,
given the nature of the research questions, only conditional likelihood procedures would help
provide statistically viable answers.
V. Ekpu | The Microstructure of Bank Lending to SMEs | PhD Thesis | University of Glasgow | 2015
135
Stepwise Regression Analysis
The stepwise regression procedure was employed as part of robustness checks to test the
quality of predictors used in the OLR regression models in chapters 6 and 7. The stepwise
regression is a multiple regression procedure that is used to determine the best combination of
independent (predictor) variables that would predict the dependent (predicted) variable.
Hauser (1974) describes stepwise regression as essentially a search procedure to identify
which independent variables, previously thought to be of some importance, actually appear to
have the strongest relationship with the dependable variable. In stepwise regression, predictor
variables are entered into the regression equation one at a time based upon statistical criteria.
At each step in the analysis, the predictor variable that contributes the most to the prediction
equation in terms of increasing the multiple correlation, R, is entered first. This process
continues only if additional variables improve the predictive power of the model or add
anything statistically to the regression equation. When no additional predictor variables add
anything statistically meaningful to the regression equation the analysis stops. Thus, not all
independent (predictor) variables may enter the equation in stepwise regression.
Stepwise analysis is an approach to selecting a subset of variables and to evaluate the order of
importance of variables in a regression model. It can be useful in the following situations (a)
There is little theory to guide the selection of terms for a model (b) the researcher wants to
explore which predictors seem to provide a good fit, or (c) the researcher wants to improve a
model’s prediction performance by reducing the variance caused by estimating unnecessary
terms. However, a number of problems have been identified with the application of stepwise
analysis. According to Thompson (1995) and Lewis (2007), there are three problems with
using stepwise procedures. First, computer packages use incorrect degrees of freedom in their
stepwise computations, resulting in artifactually greater likelihood of obtaining spurious
statistical significance. Second, stepwise methods do not correctly identify the best predictor
variable set of a given size. This problem is further compounded by the presence of
multicollinearity where predictors are correlated with each other. High intercorrelations result
in high standard errors for regression coefficients and the consequent exclusion of variables
from regression equations (Hauser, 1974). Thus, where independent variables are correlated,
relevant variables may be discarded purely on the grounds of collinearity, with resultant
V. Ekpu | The Microstructure of Bank Lending to SMEs | PhD Thesis | University of Glasgow | 2015
136
possibility of specification bias. Third, stepwise methods tend to capitalize on sampling error,
and thus tend to yield results that are not replicable.
4.3. Limitations of the Study
There is hardly any study within the social sciences that is not met with limitations. Some of
the limitations of this study include the following:
Limitations to Scope (One-sided View):
The study only takes a look at the supply-side perspective of bank lending to SMEs, especially
in regard to the obstacles to bank finance for SMEs. It does not take into consideration the
views of the borrowers or the demand-side. Thus, there may be reasonable grounds for some
bias on the part of the respondents. A more comprehensive approach to this study would have
been to also collect data from bank-dependent SMEs in Nigeria and compare findings across
both the demand and supply sides. In addition, some of the findings of the study, especially
those on the economic importance of relationship lending, are based on bankers’ opinions and
perceptions, which may not necessarily reflect reality.
Limited Data Sources:
There is also a lack of access to important data sources such as bank loan-level, which should
contain actual data on the structure and features of SME loans granted by the individual banks.
The survey data only provides limited, though valuable, information on the actual (self-
reported) practices of banks with respect to SME loans. Apart from qualitative interviews and
observation, a possible data collection source is the use of a central credit register containing
loan level data rather than bank-level data as well as information on the financial performance
and credit quality of businesses as is obtainable in some advanced credit markets like US,
Germany, Italy and Spain. This kind of data would have helped to model the actual risk
management practices of banks (particularly in SME default risk modelling) and unveil the
credit risk of firms more accurately. However, central credit registries are not available in
Nigeria. The only source of information in Nigeria is third party information exchanges such
as credit bureaus, but they are relatively new and don't have sufficient data on the payment
performance of all businesses or the level of loan defaults or delinquencies.
V. Ekpu | The Microstructure of Bank Lending to SMEs | PhD Thesis | University of Glasgow | 2015
137
Relatively Low Sample Size:
This study uses a sample of 121 Nigerian bank-lending officers. This is a relatively low
sample, given the number of variables that were generated from the survey instrument. Long
(1997) states that it is risky to use maximum likelihood estimates in samples less than 100,
while samples above 500 should be adequate. However this varies greatly with the data
structure under consideration. Studies with very common or extremely rare outcome generally
require larger samples. The number of exposure variables and their characteristics strongly
influences the required sample size. In connection with this, though a total of 166 variables
were generated from the questionnaire, the regression chapters (chapters 6 and 7) that used
maximum likelihood estimations (ordinal logistic regression - OLR) only utilized a maximum
of 25 variables in any single regression, including 14 dummy variables (12 bank dummies, 1
bank size dummy and 1 branch type dummy). Chapter 5 which utilized mainly descriptive
statistics made use of a total of 44 variables, however, not in regression estimations. Discrete
exposures also generally necessitate larger sample sizes than continuous exposures. Highly
correlated exposures need larger samples as well. Nemes et al. (2009) note that logistic
regression overestimates the odds ratios in studies with low to moderate sample size. The
small sample size induced bias is a systematic one, bias away from null. Regression
coefficient estimates shifts away from zero, odds ratios from one. However, as the sample size
increases, the distribution function of the odds ratio converges to a normal distribution
centered on the estimated effect. The log transformed odds ratio, the estimated regression
coefficients, converges more rapidly to normal distribution.
Hence, care should be taken to note that given the relatively small sample size employed in
this study, the distributions of the sample may be highly skewed and odds ratios may have
been overestimated. Consequently, the interpretation of the results presented in subsequent
analyses may not be totally free from error. Suffice to say that the reason for a relatively
insufficient sample size has to do with numerous constraints faced with in the course of the
study. These constraints include budget, time and other resource limitations. Nevertheless, it is
worth pointing out that, while the sample size of 121 loan officers used in this study may be
low relative to the population size and number of exposure variables, it does, however, surpass
those used by some authors who have published similar studies in notable journals [e.g. Bruns
and Fletcher (2008) - 114 loan officers; Tronnberg and Hemlin (2014) - 88 loan officers].
V. Ekpu | The Microstructure of Bank Lending to SMEs | PhD Thesis | University of Glasgow | 2015
138
CHAPTER 5
WHAT CONSTRAINS BANK LENDING TO SMEs IN NIGERIA: DEMAND-SIDE OR SUPPLY-SIDE FACTORS?
5.1. Introduction
Given the trends in SME lending in the post-consolidated banking sector and consequent
efforts by the Nigerian government to redress the situation without much success, the question
now goes: So what constrains bank lending to SMEs in Nigeria? This study takes a look at the
relative influence between borrower characteristics versus lender characteristics in
determining SME loan supply. As reviewed in chapter 2, numerous studies have examined the
drivers of bank involvement with SMEs and the obstacles considered significant in
constraining bank lending to SMEs (e.g. Fletcher, 1995; Cole et al., 2004; Beck et al., 2008b;
de la Torre, Martinez Peria and Schmukler, 2010; Bruns and Fletcher, 2008). This research
question is thus very important for lenders and policy makers to know where the problem of
SME lending lies mostly.
A World Bank survey on Nigerian firms’ access to finance showed that most commercial
banks are reluctant to provide long-term credit to SMEs (cited in Abosede and Arogundade,
2011). This is because of perceived risks and uncertainties. Lenders cite a number of demand-
side factors plaguing the ability of SMEs to obtain bank finance. These include poor record
keeping, absence of the appropriate managerial skills, inadequate collateral, and high risk of
loan defaults, among other factors. However, there also exist supply-side issues such as high
transaction costs, regulatory/market requirements and lack of understanding by the banks of
the nature and operations of MSMEs. Other external constraints plaguing the MSME sub-
sector in Nigeria include infrastructural deficiencies (especially power and transport), policy
inconsistencies, bureaucracy, multiple taxation and levies, weak intellectual property
protection and contract enforcement as well as insecurity (Zavatta, 2008; Adigwe, 2012;
Asuquo, 2012; Berg and Fuchs, 2013; Sanusi, 2013, Ukoha, 2013a; Gbandi and Amissah,
2014).
In addition to the above, according to a recent World Bank policy research paper (Berg and
Fuchs, 2013), lending to SMEs in Africa is largely driven by the structure and size of the
economy, the extent of government borrowing and degree of innovation mainly introduced by
V. Ekpu | The Microstructure of Bank Lending to SMEs | PhD Thesis | University of Glasgow | 2015
139
foreign entrants to financial sectors, and the state of the financial sector infrastructure and
enabling environment. Thus, a good understanding of the interplay of these factors will help us
understand the firm-specific, bank-specific and external constraints affecting SME lending and
how to improve on the performance of the Nigerian banking sector in this area.
Only a few studies have taken a look at the relative influence between borrower and lender
factors affecting bank lending to SMEs in the Nigeria, albeit not from the perspective of a
post-consolidated and post-crisis banking sector in Nigeria. For example, since the
consolidation of the Nigerian banking industry in 2006, the share of commercial bank loans to
SMEs has declined markedly. This study takes a look at the demand and supply side factors
that have constrained this reduction in SME lending notwithstanding the fact that Nigerian
banks are well capitalized and are among the largest players in Sub-Saharan Africa. In
addition, previous studies on bank lending in Nigeria have only focused on the macro view of
the determinants of financial intermediation in Nigeria, but no study to the researcher’s
knowledge has taken a critical look at the micro-level aspects of loan decision-making and the
inter-relationships that exists among key determinants of lending and the stakeholders or
participants in the SME lending market. This is thus a major contribution of this study to the
body of knowledge on bank lending to SMEs in Nigeria. Also, as the study period examined is
the period since the 2008 crisis, the study can potentially be used for comparison purposes to
show any impact of the crisis on SME lending.
Using survey data on bank loan decision making to SMEs in Nigeria, this chapter investigates
by means of descriptive statistics, the demand and supply side factors responsible for
constraining SME lending in Nigeria’s top 12 banks. The main finding from this study is that
loan purpose, the profitability of SME business operations and availability of collateral are
among the most important borrower factors considered by lenders in SME loan decision
making, while influence of regulatory requirements, bank-lending policies toward SMEs and
the risk profile of the SME sector are among the most important bank-level and external
factors affecting lenders’ inclination to extend credit to SMEs. In line with evidence of similar
surveys, this study also reveals that the high incidence of loan diversion amongst SME
borrowers, managerial incompetence, and the inability of firms to service debts contribute to
the riskiness of SME loans in Nigeria. The recent global financial crisis appeared not to have
reduced the nominal value of loans to SMEs in the recent years, but the proportion of total
V. Ekpu | The Microstructure of Bank Lending to SMEs | PhD Thesis | University of Glasgow | 2015
140
loan portfolio of banks accounted for by SMEs has been on the decline in both the post-
consolidated and post-crisis periods in Nigeria. The rest of the chapter is structured as follows:
Section 5.2 examines the hypotheses for the study, while Section 5.3 analyses the findings
from the descriptive statistics. Section 5.4 concludes the study.
5.2. Main Hypotheses and Related Literature
Following expectations from related studies on bank lending to SMEs – e.g. Berger and Udell
(1995), Berlin (1996), Lehmann and Neuberger (2001) and Cole Goldberg and White (2004),
Obamuyi (2007, 2010), Zavatta (2008), Adigwe (2012), Berg and Fuchs (2013), Ukoha
(2013a), etc - we can define a set of hypotheses that can be tested by means of statistical tests:
5.2.1. Demand Side Factors
Hypothesis 1: Lenders will extend credit only when they have high expectations of being
repaid and thus will favour borrowers with characteristics that reassure the bank as to the
likelihood of being repaid.
In granting loans to SMEs, commercial banks in Nigeria generally employ some standard
criteria, which they use to assess the creditworthiness of borrowers. The range of factors
include financial strength, profitability, borrower net worth, track record of loan repayments,
management quality, current and previous banking relationships evidenced by bank
statements, business prospects, cash flow projections, business risks and availability of
marketable collateral. According to Abosede and Arogundade (2011), banks are risk-averse
and consider the expected value of returns on an investment vis-à-vis the expected utility of
the investment outlay before channeling their funds. In many cases, banks request for personal
guarantee for SME loans and usually require collateral in excess of 100% of the loan amount.
For example, in making agricultural loans to high-end SME customers, First Bank of Nigeria
Plc accepts as collateral landed property with adequate title and marketable value of over
130% of the facility value, or stocks and shares worth 135% of the facility value, or cash
V. Ekpu | The Microstructure of Bank Lending to SMEs | PhD Thesis | University of Glasgow | 2015
141
deposit (100%)42. In addition, several respondents also reported similar figures in the survey
conducted on loan officers in Nigeria, which is considered later in this chapter. Some banks
may require prospective borrowers to sign an undertaking that they will lodge a certain
percentage of the proceeds or turnover from the business (e.g. 50%) with the lending bank as
part of loan covenants. As reviewed in Chapter 2, a debt contract that requires the borrower to
show financial commitment in this manner is “incentive compatible” and demonstrates that the
borrower will act in the lender’s best interest (Mishkin, 2010; Fletcher, 1995). All these
strongly suggest that Nigerian banks tend to shift all credit risk to borrowers, which is a strong
indication that banks are not in competition with each other on SME lending.
Hypothesis 1a: Lenders are constrained by the opacity and risk profile of the SME borrower
(firm performance indicators)
Generally, it is always difficult for the SMEs in Nigeria to meet the standardized requirements
of banks. However, when a bank is favorably disposed to lend to small firms, the operational
records of the firms with the banks were used to determine the suitability or otherwise of such
enterprises in obtaining loan (Obamuyi, 2007). In most cases, these small firms have relatively
low financial and operational transparencies as evidenced by shortage of information provided
and their poor accounting standards. Many of these firms are also unable to come up with
professional business plans or realistic forecasts of cash flow or profit projections. Following
from the literature, where a firm’s credit quality cannot be easily ascertained by lenders or
creditors, such a firm is said to be informationally opaque and will likely face credit
constraints (Hyytinen and Parajarinen, 2008).
Nigerian enterprises are also perceived to be risky due to high risk of diversion of funds,
inability to service debts or provide collateral, high costs of doing business, high costs of
monitoring loans, poor business experience and weak management capacity of the borrower
(Obamuyi, 2010; Sanusi, 2013; Ukoha, 2013a). There is also a general instability in the
demand for products made by SMEs. SMEs are unable to compete in domestic and
international markets because of the relatively low quality of their products and superior
technology used by their large competitors. Consumers sometimes prefer goods imported from 42 See First Bank’s conventional term loans and overdrafts, http://www.firstbanknigeria.com/products/individual/agricultural-finance/conventional-term-loans-and-overdrafts/ (Accessed 27/12/2014)

V. Ekpu | The Microstructure of Bank Lending to SMEs | PhD Thesis | University of Glasgow | 2015
142
developed countries. Thus the demand for SME products is limited in both domestic and
foreign markets (Adigwe, 2012). This could also be explained by the fact that SMEs have
inadequate access to new production techniques and generally have less capital to buy modern
equipment. In addition, there is also the risk that the death of the owner could lead to the death
of the business, further increasing the chances of loan default.
Hypothesis 1b: Lenders are constrained by the credit quality of the SME borrower (credit
quality indicators)
Due to the factors aforementioned, SMEs tend to have a very high risk of loan defaults.
Hence, commercial banks tend to guard against the loss of their investments by requesting
collateral security for loans they grant to SMEs. As noted earlier, most SMEs in Nigeria do not
possess fixed collateral (e.g. land and real estate), which in many cases, is most acceptable by
banks. Where collateral requirements are not satisfactory, lenders may require owners’
personal guarantee or other forms of guarantee, such as cash or near-cash assets or bank
guarantee. In this manner, collateral and guarantees play a disciplinary role in the behavior of
the borrower (Nakamura, 1994; Voordeckers and Steijvers, 2006). Another very important
factor lenders consider is the purpose of loan. Lenders are very much interested in knowing
what the loan will be used for in order to allay their fears of possible diversion or misuse of
funds (i.e. moral hazard). The most common uses of SME loans are working capital (to
finance purchase of raw materials, stock, payment of overheads, etc), asset finance (e.g.
vehicles, plant and machinery), project finance, equipment leasing, contract finance, import
trade finance or letters of credit and so on.
Sometimes, the existence of a deposit account or loan relationship with the bank may be
helpful to give insight into the credit quality of the borrower. As reviewed in chapter 2, banks
are likely to favour applicants with pre-existing deposit relationship, loan relationship and/or
financial management relationship with the bank, ceteris paribus (Nakamura, 1994; Cole,
1998; Boot, 2000). Furthermore, the length of time in which borrowers have been operating
their savings/checking accounts and the quality or strength of the customers’ relationship with
the bankers were sometimes considered by Nigerian banks in lending (Obamuyi, 2007). This
is because it is generally believed that the longer the relationship between a firm and a lender,
the more time the lender can acquire valuable information about the applicant’s credit
worthiness (Cole, 1998) which helps in making lending decisions.
V. Ekpu | The Microstructure of Bank Lending to SMEs | PhD Thesis | University of Glasgow | 2015
143
5.2.2. Supply-Side Factors
Apart from demand side factors, lenders could also be constrained by their own internal
limitations and by external or environmental factors.
Hypothesis 2: Lenders are likely to be constrained to extend credit to SMEs if their
idiosyncratic characteristics and other external/environmental factors are unfavourable
Hypothesis 2a: The supply of loans is constrained by lenders’ own internal limitations and
their SME lending policies (idiosyncratic factors)
According to the New Keynesian’s credit rationing theory led by Stiglitz and Weiss (1981),
one of the factors that constrain lenders in the loan market is the presence of asymmetric
information (i.e. information gaps) between the lender and the borrower. In this context, loan
officers might not have adequate information regarding certain SME proposals. This could be
a proposal for which there is limited available market intelligence, and as such reliable
information is scarce. The lack of adequate information about a proposed SME segment is
likely to result in the rejection of a loan application, given that there might not be enough
credit available for all sensible proposals that qualify for bank credit (Stiglitz and Weiss,
1981).
Another factor affecting the supply of loans in Nigeria is high interest rates. High interest rates
are not favorable to investors in the sense that the cost of funds could undermine profits, and
cause a loss of investment (Ogujiuba et al., 2004). Interest rates in Nigeria officially are as
high as between 21 to 26%, and this has a negative impact on the ability of SMEs to obtain
credit from the banks. The situation is all the more worrisome when we consider the trends in
the manufacturing sector. Commercial banks in Nigeria consider lending to the manufacturing
sector as high risk due to the huge operational costs of production in the face of existing
infrastructural bottlenecks. Therefore the banks lend to manufacturing companies on
differential rates. At times, the interest rate goes as high as 36% or even more. More generally,
lenders’ risk appetite could also favor policies that tend to restrict SME lending to certain
sectors, lend on a short-term basis or demand more stringent requirements. For example, the
decision by most Nigerian banks to significantly reduce credit to the capital markets after the
collapse of the market during the global financial crisis of 2008-2009.
V. Ekpu | The Microstructure of Bank Lending to SMEs | PhD Thesis | University of Glasgow | 2015
144
The quality of the lenders’ portfolio and previous history of SME loan performance are crucial
to the inclination of banks to further increase its risk assets in the SME sector (Akinleye et al.,
2012). As reviewed earlier in chapter 2, a bank’s inclination to lend to a borrower is
determined by its risk appetite, which is shaped, among other factors, by the history of
previous loan performance, the risk profile of the borrower or borrower’s sector and general
macroeconomic and financial conditions. In the Nigerian case, some of the determinant factors
include: the ratio of non-performing loans (NPL) to the total loan portfolio, the proportion of
the bank’s assets in SME loans as well as the percentage share of SME loans in the amount of
impaired assets. Although the ratio of NPL to total loans for most banks is now at an all-time
low compared to the 1980s and 1990s, with the present surge in bank credit, banks are even
more risk-averse than they were before the credit crisis. Another seemingly important factor
for lenders in lending to SMEs is the level of financial stability as evidenced by the level of
core deposits and cost of accessing funds. The higher the cost of funds to the lender, the more
credit is rationed and by implication, the higher the interest rates on loans advanced.
Hypothesis 2b: Credit supply to SMEs is constrained by external factors, including the legal
and regulatory environment, infrastructural deficiencies and the macroeconomic environment
(environmental factors)
One major external factor affecting banks’ willingness and capacity to lend to SMEs is the
influence of regulatory and market requirements, which affects the lending behavior of banks.
Regulatory requirements such as capital adequacy ratio, reserve requirements, and liquidity
ratio, tend to influence the SME lending decisions of banks. For example, Peek and Rosengren
(1995b) show that the enforcement of capital-to-asset ratios leads to the shrinkage of new bank
lending to bank-dependent customers. By extension, where banks face weaknesses such as
undercapitalization, illiquidity, weak/poor asset quality, poor earnings, among others, the
inadequate financial resources and distress may constrain credit to SMEs. As shown earlier in
chapter 3, the lending behavior of Nigerian banks has also been heavily influenced by the
consolidation of the Nigerian banking sector. As expected, larger firms that are created from
merger and acquisitions are predisposed to reducing the supply of loans to SMEs post-merger.
Asuquo (2012) found that the restructuring and direct effects of the banking sector
consolidation in Nigeria show that bank size is negatively related to SME lending.
V. Ekpu | The Microstructure of Bank Lending to SMEs | PhD Thesis | University of Glasgow | 2015
145
The difficulty in prosecuting SME owners, in cases of loan default, is another important
constraint to bank lending for SMEs. Banks in Nigeria operate in an underdeveloped legal and
judicial environment, and as such, they usually restrict lending to borrowers that can provide
either sufficient guarantees, or adequate information about their proposed projects. The
possibility of loan officers facing the consequences of making wrong loan decisions is
amplified by the difficulty in prosecuting loan defaulters. This difficulty in prosecuting loan
defaulters stems from the fact that the legal and contractual environment is largely
underdeveloped (Ukoha, 2013a). The quality of the legal environment thus influences the pace
of credit market growth and the kind of borrowers banks lend to, because the better the legal
system, the greater the chances of banks accepting different types of collateral, and hence
lending to informationally opaque borrowers (Haselmann and Wachtel, 2010).
Many banks also blame their inability to fund SMEs on the poor economic climate prevalent
in the country, citing for instance the low performance of public utilities (such as power
supply), poor road network and insecurity as some of the factors affecting the poor
performance of SMEs (Ogujiuba, et al., 2004). Infrastructural deficiencies contribute to high
costs of doing business, as entrepreneurs have to grapple with problems such as running
generators, inadequate marketability of products due to poor road network and security
challenges. Finally, the general macroeconomic conditions also shape the demand and supply
of credit in the economy. There is evidence to show that the growth of aggregate credit in
Nigeria has closely followed the growth of nominal GDP (Akinleye, et al., 2012). However,
the proportion of aggregate credit that is allocated to SME loans has declined over the years,
which is why SMEs have not been a veritable source of growth in Nigeria.
5.3. Data and Analysis
In order to test the above hypotheses, data was collected primarily by means of a questionnaire
survey of loan officers and relationship managers in selected Nigerian banks. The methods of
data collection, sampling technique and methods of data analysis have already been described
in chapter 4. This section takes a look at the characteristics of the research data collected and
some descriptive statistics and tests to see how the variables have behaved in comparison with
expected trends in literature. The questions asked in the section on demand and supply side
V. Ekpu | The Microstructure of Bank Lending to SMEs | PhD Thesis | University of Glasgow | 2015
146
factors related to how lending is organised at the bank level as well as the characteristics of
borrowers and lenders, which influence the bank's willingness to lend to SMEs. It also
includes questions on changes in lending policies/risk appetite since the global financial crisis
of 2008-09. A total of 44 demand and supply factors affecting bank lending decisions for SME
loan propositions were examined, while the respondents highlighted the importance of 11
contributory factors affecting the riskiness of SME loans in Nigeria. Independent samples tests
identified significant differences in the way respondents answered the questions depending on
the bank they work for or the type of branch they served. This section also examines the
changes in the SME lending policies, preferences and practices of Nigerian banks as a result of
the global financial crisis. Additional data was also collected from secondary sources such as
banks' annual reports, loan policy statements as well as previous survey research/published
works on SME financing, to provide adequate and convincing evidence, to support and
validate the findings.
5.3.1. Demand-Side Factors Affecting Bank Lending to SMEs in Nigeria
A cursory look at table 5.1 below reveals that the respondents ranked five factors - purpose of
loan, profitability of business, loan security, firm’s credit rating and owners credit rating - as
the most important borrower factors (each having a median value of 4). The frequency table
(appendix 5.1) shows that a vast majority (97.5%) of respondents ranked purpose of loan as
either important or very important. Purpose of loan is also the only borrower factor that has an
IQR of 0, implying that respondents had no disagreement in their perception of the importance
of loan purpose in loan decision-making. As earlier discussed, lenders in Nigeria have over the
years found that SME customers, especially sole business owners often divert loans granted as
working capital or to finance business projects into other private uses. This problem of
financial indiscipline obviously impacts on the survivability of the business and equally
compromises the ability of the firm to pay back loans (Ogujiuba, et al., 2004). The problem of
poor credit worthiness is further compounded by poor loan security on the part of the
borrowers (freq. = 90.9%, IQR =1). As stated earlier, SMEs in Nigeria do not have access to
fixed collateral and this affects their chances of obtaining bank loans, most of which have to
be collateralised.

V. Ekpu | The Microstructure of Bank Lending to SMEs | PhD Thesis | University of Glasgow | 2015
147
Table 5.1. Demand Side Factors Affecting SME Loan Supply in Nigeria
Lending Criteria Median Interquartile RangePurpose of Loan 4 0Profitability of Business 4 1Loan Security 4 1Firm's Credit Rating 4 1Owners' Credit Rating 4 1Stability of Demand for Firm's Products 3 1Firm's Leverage 3 1Presentation of Business Plan 3 1Loan Amount 3 1Owners' Personal Guarantee 3 1Owners' Business Experience 3 1Firm's Sector of Activity 3 1Owners' Equity Stake 3 1Firm's Liquidity 3 1Physical Observation of Business 3 2Existence of Deposit Relationship 3 2Firm's Age 3 1Firm's Transparency 3 2Firm's Size 3 1Firm's Organisational Form 3 1Existence of Loan Relationship 3 1Owners' Personal Wealth 3 1Firm's Deposit Account Balance 2 1Length of Relationship with Bank 2 1Existence of Fin Mgt. Service Relationship 2 1Exclusivity of Relationship 2 2Owners' Educational Attainment 2 1Distance to SME Customer 2 2Valid N - 121
The frequency table (appendix 5.1) also shows that almost 96% ranked profitability of
business as either important or very important. The profitability of business is key to the
chances of obtaining bank funds. Bankers are risk averse and will not invest in any business
that would not generate good enough returns for their shareholders. In fact, as reviewed in
chapter 2, Beck et al. (2008b) found that the perceived size and profitability of the SME
lending market were the most important determinants of bank’s involvement with SMEs. In
particular, they found that 81% of banks in developed countries and 72% of banks in
V. Ekpu | The Microstructure of Bank Lending to SMEs | PhD Thesis | University of Glasgow | 2015
148
developing countries indicate that profitability is the most important determinant of their
involvement with SMEs, which is corroborated by the result of this present study.
As noted in chapter 2, a firm’s credit rating or owners’ credit rating as determined by
previous loan repayments or the number of occurrence of loan delinquency usually influences
a lender’s decision (Cole, 1998; 2008; Cole et al., 2004). In an exploratory study of loan
delinquency among SMEs in Ondo State, South West Nigeria, Obamuyi (2007), however,
found that loan delinquency rate was as low as 6.9% of total loan obligations to SMEs. The
author attributes the results to the sound lending policies of Nigerian banks. Nigerian banks
would generally not approve loans to SMEs they think have high probability of default.
The profitability of business is generally believed to be influenced by other factors, which the
respondents also rank as important (with a median value of 3) such as stability of demand for
firm’s products, firm’s leverage or amount of debts outstanding, and firm’s liquidity or cash
flow level. According to the literature, highly leveraged firms are riskier and have greater
chances of defaulting on a bank loan because of huge levels of indebtedness (Berry et al.,
1993; Cole et al., 2004). With respect to cash flow, lenders generally expect that a firm with
greater profitability will be able to demonstrate ability to service its debts out of its earnings
(Bruns and Fletcher, 2008). This is because a company’s expected cash flow is a primary
source of repayment. The more liquid a firm is, the more the greater its chances of meeting its
financial obligations. A firm’s age as a measure of operational stability and firm’s size as
measured by total assets are also crucial factors. Larger, older and well established firms are
generally thought of to be more solvent, stable and more diversified than small and younger
firms and hence have a higher likelihood of loan repayment, whereas the latter category are
more likely to face financing constraints (Haynes et al., 1999; Cole et al., 2004; Behr and
Guttler, 2007; Cole, 2008).
Among the least important factors (with a median value of 2) are: distance to SME customers,
owners’ educational attainment, exclusivity of relationship, existence of financial management
service relationship and length of relationship with bank. These outcomes are indicative of the
fact that Nigerian banks rely less on the importance of bank-borrower relationships in making
lending decisions to SMEs. In a separate question on the nature of relationship lending in
Nigerian banks, 74.4% of loans officers agree that SME lending decisions are rule-based,
while only 33.9% of loan officers agree that SME loan decisions are often decentralised. As

V. Ekpu | The Microstructure of Bank Lending to SMEs | PhD Thesis | University of Glasgow | 2015
149
such, we can safely conclude that because Nigerian banks have more centralised lending
structures, they often discount the role of relationships in making loan approval decisions, a
feature that is consistent with many large multi-office banks (Keeton, 1995; Cole et al., 2004).
Borrower Factors: Independent Samples Test
In order to check for patterns on the importance of borrower characteristics, the full sample
was divided into sub-groups by bank categories and branch types and then a number of
parametric and nonparametric tests were carried out to check the differences in the distribution
of the responses by subsamples. The subsamples on bank categories separated the responses
by bank IDs, while the subsamples on branch type separated the banks into retail business
branches and commercial business branches. The latter indicates that the null hypothesis is to
assume that the importance of borrower factors to loan officers serving the lower end of the
SME lending market (i.e. retail branches) and to those serving the upper end of the market (i.e.
commercial branches) ranks the same way. In all, 56 respondents were from retail business
branches, while 65 respondents served SMEs in commercial branches. It should be noted that
the multiple tests conducted across these sub-samples revealed significant results by happen
chance.
The Kruskal-Wallis 1-Way ANOVA test (see table 5.2) reveals that the distribution of the
importance of borrower characteristics across various banks is not the same for eight factors:
Loan amount (sig 0.009), firm’s transparency (sig 0.034), existence of deposit relationship (sig
0.014), firm’s deposit account balance (sig 0.001), existence of loan relationship (sig 0.005),
length of bank-borrower relationship (sig 0.035), exclusivity of borrower relationship (sig
0.014) and owners’ personal guarantee (sig 0.007). This shows some differences in the lending
models of banks, particularly in the emphasis given to the role of relationships and
requirements for approving loans. For instance, some banks stipulate autonomous lending
limits for their selected categories of senior loan officers, branch heads and regional managers,
while some other banks do not. In fact, 100% of respondents from a particular bank indicated
that all lending functions were centrally executed, including loan appraisal, loan approval,
loan monitoring, loan review and loan recovery. This is untrue for many other banks that
practice a mix of centralised and decentralised lending strategies, in which case some lending
decisions are taken at the centre while others are taken at branch levels.
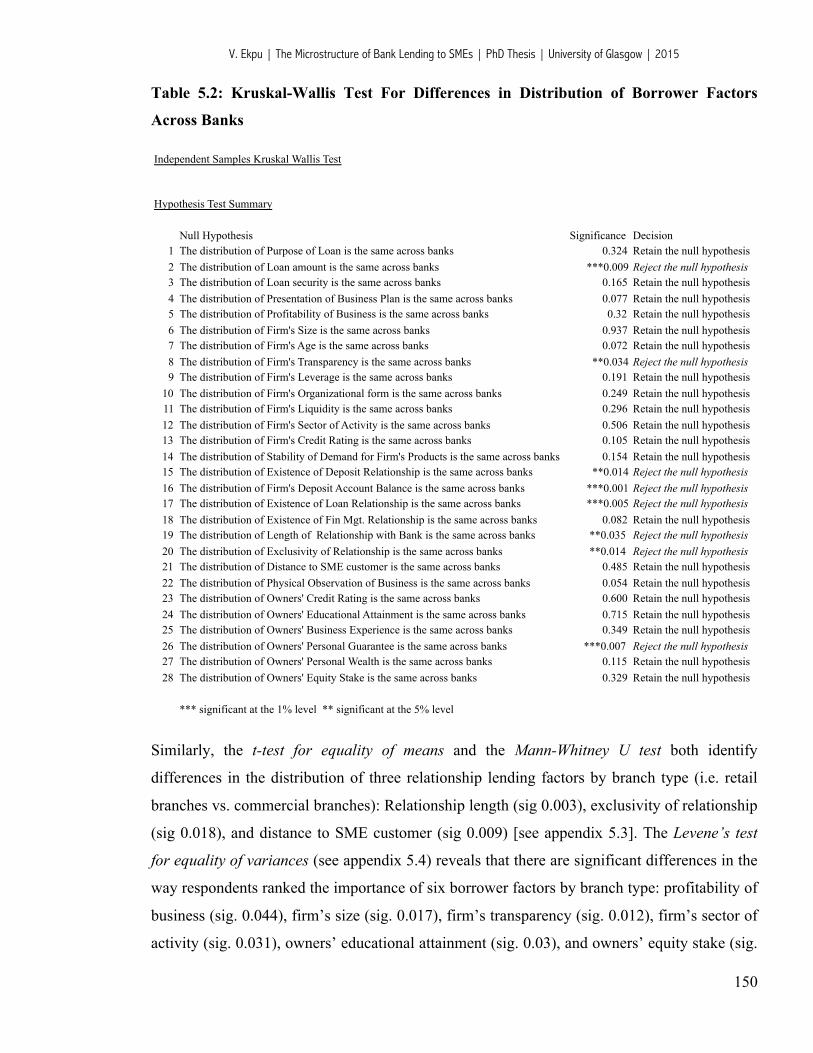
V. Ekpu | The Microstructure of Bank Lending to SMEs | PhD Thesis | University of Glasgow | 2015
150
Table 5.2: Kruskal-Wallis Test For Differences in Distribution of Borrower Factors
Across Banks
Independent Samples Kruskal Wallis Test
Hypothesis Test Summary
Null Hypothesis Significance Decision1 The distribution of Purpose of Loan is the same across banks 0.324 Retain the null hypothesis2 The distribution of Loan amount is the same across banks ***0.009 Reject the null hypothesis3 The distribution of Loan security is the same across banks 0.165 Retain the null hypothesis4 The distribution of Presentation of Business Plan is the same across banks 0.077 Retain the null hypothesis5 The distribution of Profitability of Business is the same across banks 0.32 Retain the null hypothesis6 The distribution of Firm's Size is the same across banks 0.937 Retain the null hypothesis7 The distribution of Firm's Age is the same across banks 0.072 Retain the null hypothesis8 The distribution of Firm's Transparency is the same across banks **0.034 Reject the null hypothesis9 The distribution of Firm's Leverage is the same across banks 0.191 Retain the null hypothesis
10 The distribution of Firm's Organizational form is the same across banks 0.249 Retain the null hypothesis11 The distribution of Firm's Liquidity is the same across banks 0.296 Retain the null hypothesis12 The distribution of Firm's Sector of Activity is the same across banks 0.506 Retain the null hypothesis13 The distribution of Firm's Credit Rating is the same across banks 0.105 Retain the null hypothesis14 The distribution of Stability of Demand for Firm's Products is the same across banks 0.154 Retain the null hypothesis15 The distribution of Existence of Deposit Relationship is the same across banks **0.014 Reject the null hypothesis16 The distribution of Firm's Deposit Account Balance is the same across banks ***0.001 Reject the null hypothesis17 The distribution of Existence of Loan Relationship is the same across banks ***0.005 Reject the null hypothesis18 The distribution of Existence of Fin Mgt. Relationship is the same across banks 0.082 Retain the null hypothesis19 The distribution of Length of Relationship with Bank is the same across banks **0.035 Reject the null hypothesis20 The distribution of Exclusivity of Relationship is the same across banks **0.014 Reject the null hypothesis21 The distribution of Distance to SME customer is the same across banks 0.485 Retain the null hypothesis22 The distribution of Physical Observation of Business is the same across banks 0.054 Retain the null hypothesis23 The distribution of Owners' Credit Rating is the same across banks 0.600 Retain the null hypothesis24 The distribution of Owners' Educational Attainment is the same across banks 0.715 Retain the null hypothesis25 The distribution of Owners' Business Experience is the same across banks 0.349 Retain the null hypothesis26 The distribution of Owners' Personal Guarantee is the same across banks ***0.007 Reject the null hypothesis27 The distribution of Owners' Personal Wealth is the same across banks 0.115 Retain the null hypothesis28 The distribution of Owners' Equity Stake is the same across banks 0.329 Retain the null hypothesis
*** significant at the 1% level ** significant at the 5% level
Similarly, the t-test for equality of means and the Mann-Whitney U test both identify
differences in the distribution of three relationship lending factors by branch type (i.e. retail
branches vs. commercial branches): Relationship length (sig 0.003), exclusivity of relationship
(sig 0.018), and distance to SME customer (sig 0.009) [see appendix 5.3]. The Levene’s test
for equality of variances (see appendix 5.4) reveals that there are significant differences in the
way respondents ranked the importance of six borrower factors by branch type: profitability of
business (sig. 0.044), firm’s size (sig. 0.017), firm’s transparency (sig. 0.012), firm’s sector of
activity (sig. 0.031), owners’ educational attainment (sig. 0.03), and owners’ equity stake (sig.
V. Ekpu | The Microstructure of Bank Lending to SMEs | PhD Thesis | University of Glasgow | 2015
151
0.028). This finding is important because it shows that the profitability of business in retail
branches, for example, is perceived to be different from that of commercial branches. Retail
branches in Nigeria are characterized by large numbers of financial services users who
perform low volume petty trade transactions as against quieter commercial branches with
significant volume of businesses. Similarly, the kind of business activities carried out by
SMEs in retail branches are mostly small and micro businesses, such as grocery stores, food
and drugs, clothes & fashion business, and other retail trades, while commercial branches are
known for serving merchants who deal in larger trades such as manufacturing, wholesale
product distribution, oil and gas servicing and other relatively large businesses. Hence, this
finding confirms that the nature of a firm’s industrial sector (contingent on whether the firm
operates in a retail or commercial sector) is likely to influence the way bankers evaluate the
firm’s credit quality (Cole, 1998) as well as the type and maturity of the loan they are ready to
finance (Bhaird, 2010). Bankers also show their lending preferences on the basis of whether
the firm operates in a low growth or high growth sector (Cosh et al., 2008)
In addition, while majority of business owners in retail branches have 100% equity stake in
their business (by virtue of being sole proprietors), many well-established companies in the
commercial areas will have more diluted ownership structure and as such, one would expect
loan transactions in commercial branches to take the borrower’s equity stake in the business
into consideration in loan approval decisions. It therefore follows that the personal
commitment or guarantee of the business owners is more likely to be able to reduce the risk of
lending in commercial branches than in retail branches, thus confirming the importance of
owners’ personal wealth in credit allocation decisions (Avery, Bostic and Samolyk, 1998).
Correlation Between Key Borrower Factors
The correlation between key borrower factors revealed very interesting findings. First, we look
at correlations between key SME performance indicators as measures of the profitability or
riskiness of SME business. These correlations show the link between the key performance
indicators and the inclination of banks to lend to SMEs. Second, we examine the correlation
between the measures of credit quality, which also show how lenders determine the
creditworthiness of SMEs from the interaction between key credit quality indicators.
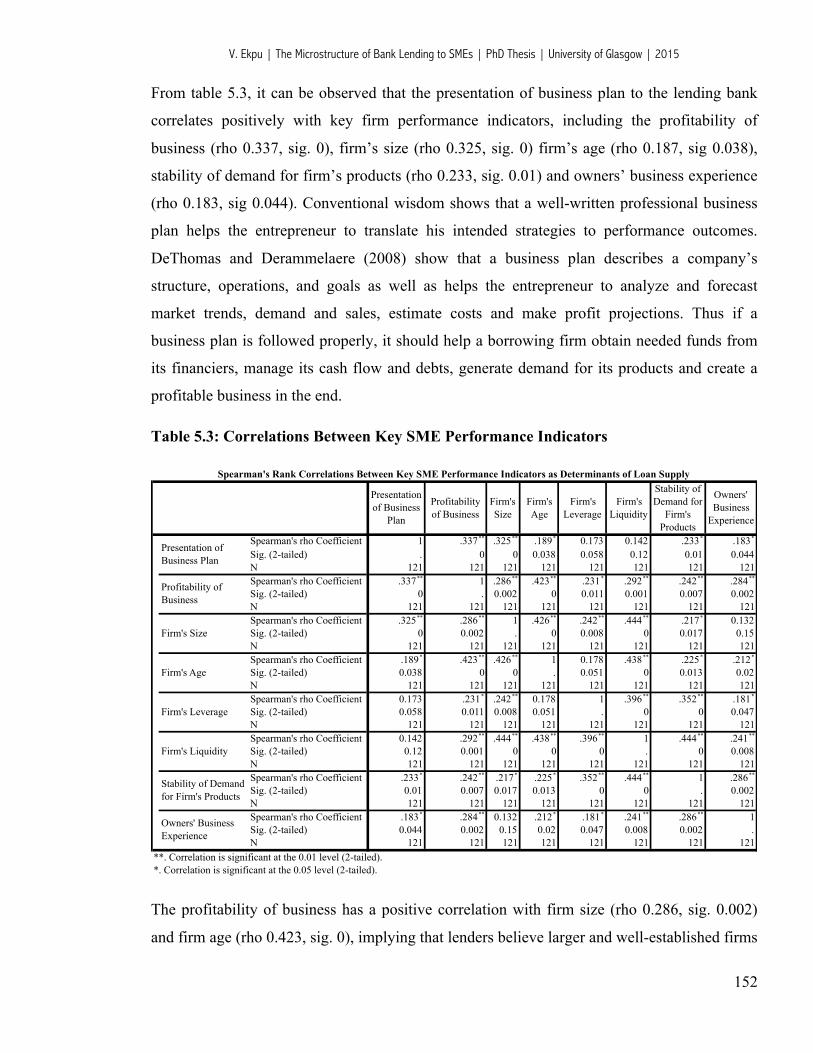
V. Ekpu | The Microstructure of Bank Lending to SMEs | PhD Thesis | University of Glasgow | 2015
152
From table 5.3, it can be observed that the presentation of business plan to the lending bank
correlates positively with key firm performance indicators, including the profitability of
business (rho 0.337, sig. 0), firm’s size (rho 0.325, sig. 0) firm’s age (rho 0.187, sig 0.038),
stability of demand for firm’s products (rho 0.233, sig. 0.01) and owners’ business experience
(rho 0.183, sig 0.044). Conventional wisdom shows that a well-written professional business
plan helps the entrepreneur to translate his intended strategies to performance outcomes.
DeThomas and Derammelaere (2008) show that a business plan describes a company’s
structure, operations, and goals as well as helps the entrepreneur to analyze and forecast
market trends, demand and sales, estimate costs and make profit projections. Thus if a
business plan is followed properly, it should help a borrowing firm obtain needed funds from
its financiers, manage its cash flow and debts, generate demand for its products and create a
profitable business in the end.
Table 5.3: Correlations Between Key SME Performance Indicators
Presentation of Business
Plan
Profitability of Business
Firm's Size
Firm's Age
Firm's Leverage
Firm's Liquidity
Stability of Demand for
Firm's Products
Owners' Business
Experience
Spearman's rho Coefficient 1 .337** .325** .189* 0.173 0.142 .233* .183*
Sig. (2-tailed) . 0 0 0.038 0.058 0.12 0.01 0.044N 121 121 121 121 121 121 121 121Spearman's rho Coefficient .337** 1 .286** .423** .231* .292** .242** .284**
Sig. (2-tailed) 0 . 0.002 0 0.011 0.001 0.007 0.002N 121 121 121 121 121 121 121 121Spearman's rho Coefficient .325** .286** 1 .426** .242** .444** .217* 0.132Sig. (2-tailed) 0 0.002 . 0 0.008 0 0.017 0.15N 121 121 121 121 121 121 121 121Spearman's rho Coefficient .189* .423** .426** 1 0.178 .438** .225* .212*
Sig. (2-tailed) 0.038 0 0 . 0.051 0 0.013 0.02N 121 121 121 121 121 121 121 121Spearman's rho Coefficient 0.173 .231* .242** 0.178 1 .396** .352** .181*
Sig. (2-tailed) 0.058 0.011 0.008 0.051 . 0 0 0.047N 121 121 121 121 121 121 121 121Spearman's rho Coefficient 0.142 .292** .444** .438** .396** 1 .444** .241**
Sig. (2-tailed) 0.12 0.001 0 0 0 . 0 0.008N 121 121 121 121 121 121 121 121Spearman's rho Coefficient .233* .242** .217* .225* .352** .444** 1 .286**
Sig. (2-tailed) 0.01 0.007 0.017 0.013 0 0 . 0.002N 121 121 121 121 121 121 121 121Spearman's rho Coefficient .183* .284** 0.132 .212* .181* .241** .286** 1Sig. (2-tailed) 0.044 0.002 0.15 0.02 0.047 0.008 0.002 .N 121 121 121 121 121 121 121 121
Spearman's Rank Correlations Between Key SME Performance Indicators as Determinants of Loan Supply
Presentation of Business Plan
Profitability of Business
Firm's Size
Firm's Age
Firm's Leverage
Firm's Liquidity
Stability of Demand for Firm's Products
Owners' Business Experience
**. Correlation is significant at the 0.01 level (2-tailed).*. Correlation is significant at the 0.05 level (2-tailed).
The profitability of business has a positive correlation with firm size (rho 0.286, sig. 0.002)
and firm age (rho 0.423, sig. 0), implying that lenders believe larger and well-established firms
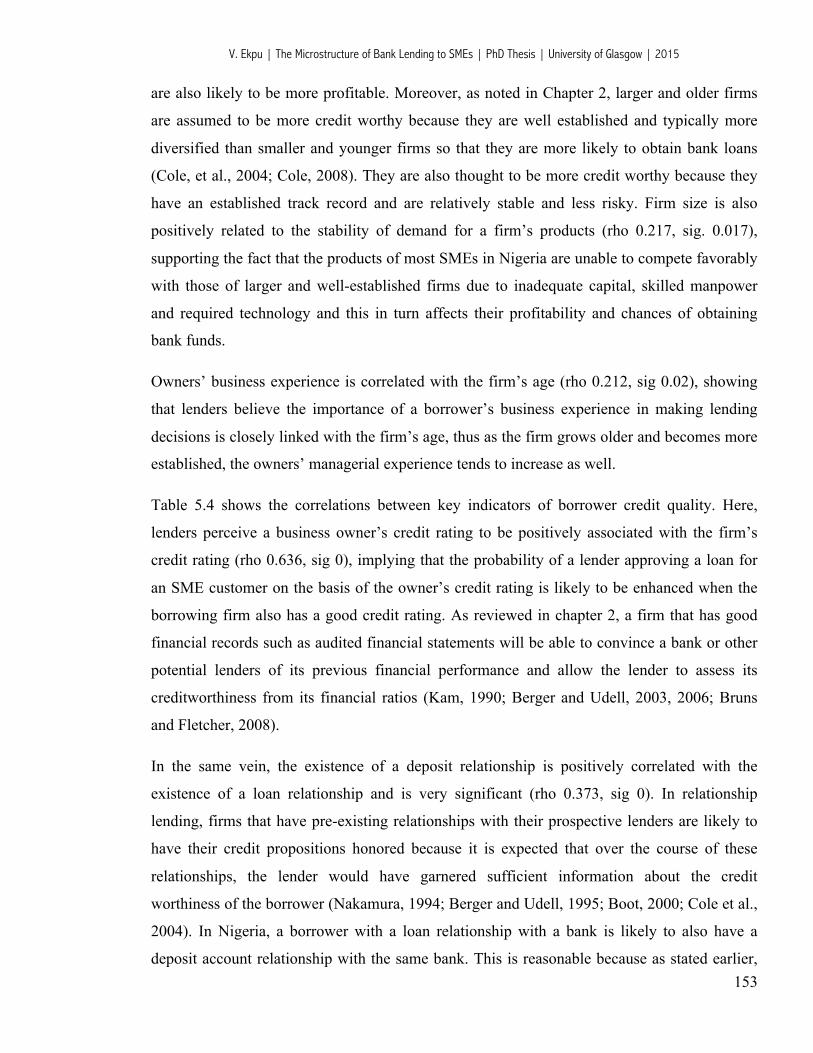
V. Ekpu | The Microstructure of Bank Lending to SMEs | PhD Thesis | University of Glasgow | 2015
153
are also likely to be more profitable. Moreover, as noted in Chapter 2, larger and older firms
are assumed to be more credit worthy because they are well established and typically more
diversified than smaller and younger firms so that they are more likely to obtain bank loans
(Cole, et al., 2004; Cole, 2008). They are also thought to be more credit worthy because they
have an established track record and are relatively stable and less risky. Firm size is also
positively related to the stability of demand for a firm’s products (rho 0.217, sig. 0.017),
supporting the fact that the products of most SMEs in Nigeria are unable to compete favorably
with those of larger and well-established firms due to inadequate capital, skilled manpower
and required technology and this in turn affects their profitability and chances of obtaining
bank funds.
Owners’ business experience is correlated with the firm’s age (rho 0.212, sig 0.02), showing
that lenders believe the importance of a borrower’s business experience in making lending
decisions is closely linked with the firm’s age, thus as the firm grows older and becomes more
established, the owners’ managerial experience tends to increase as well.
Table 5.4 shows the correlations between key indicators of borrower credit quality. Here,
lenders perceive a business owner’s credit rating to be positively associated with the firm’s
credit rating (rho 0.636, sig 0), implying that the probability of a lender approving a loan for
an SME customer on the basis of the owner’s credit rating is likely to be enhanced when the
borrowing firm also has a good credit rating. As reviewed in chapter 2, a firm that has good
financial records such as audited financial statements will be able to convince a bank or other
potential lenders of its previous financial performance and allow the lender to assess its
creditworthiness from its financial ratios (Kam, 1990; Berger and Udell, 2003, 2006; Bruns
and Fletcher, 2008).
In the same vein, the existence of a deposit relationship is positively correlated with the
existence of a loan relationship and is very significant (rho 0.373, sig 0). In relationship
lending, firms that have pre-existing relationships with their prospective lenders are likely to
have their credit propositions honored because it is expected that over the course of these
relationships, the lender would have garnered sufficient information about the credit
worthiness of the borrower (Nakamura, 1994; Berger and Udell, 1995; Boot, 2000; Cole et al.,
2004). In Nigeria, a borrower with a loan relationship with a bank is likely to also have a
deposit account relationship with the same bank. This is reasonable because as stated earlier,
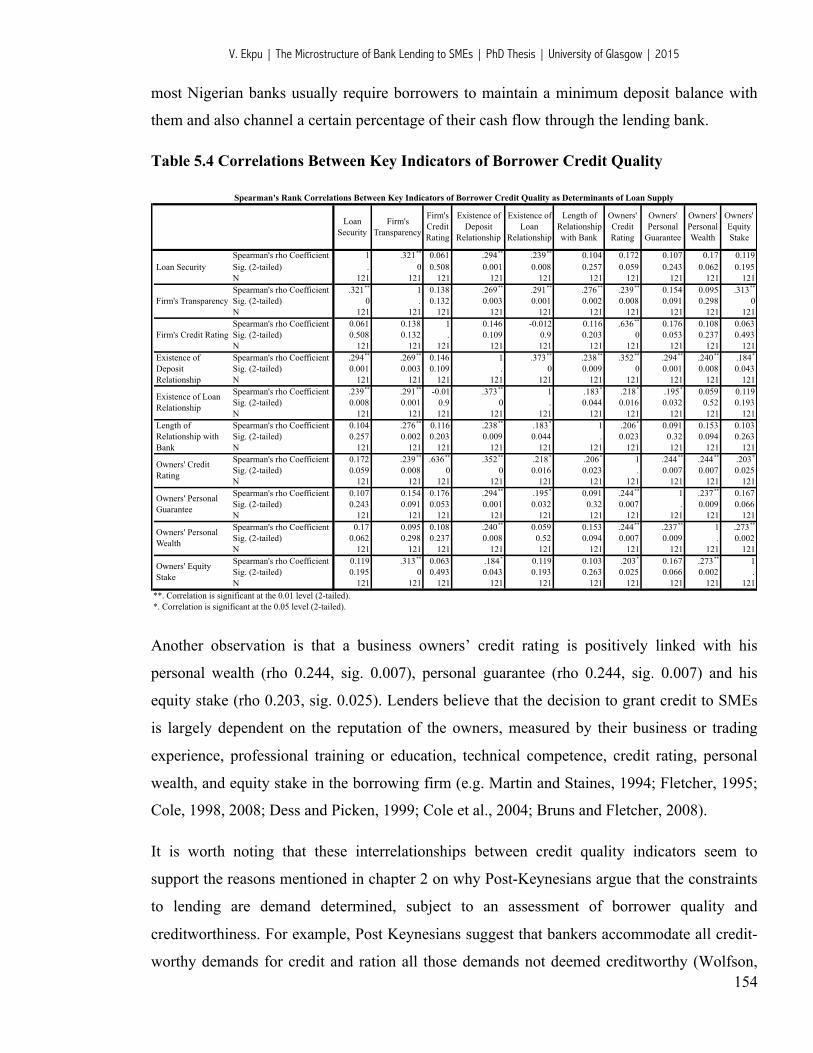
V. Ekpu | The Microstructure of Bank Lending to SMEs | PhD Thesis | University of Glasgow | 2015
154
most Nigerian banks usually require borrowers to maintain a minimum deposit balance with
them and also channel a certain percentage of their cash flow through the lending bank.
Table 5.4 Correlations Between Key Indicators of Borrower Credit Quality
Loan Security
Firm's Transparency
Firm's Credit Rating
Existence of Deposit
Relationship
Existence of Loan
Relationship
Length of Relationship with Bank
Owners' Credit Rating
Owners' Personal
Guarantee
Owners' Personal Wealth
Owners' Equity Stake
Spearman's rho Coefficient 1 .321** 0.061 .294** .239** 0.104 0.172 0.107 0.17 0.119Sig. (2-tailed) . 0 0.508 0.001 0.008 0.257 0.059 0.243 0.062 0.195N 121 121 121 121 121 121 121 121 121 121Spearman's rho Coefficient .321** 1 0.138 .269** .291** .276** .239** 0.154 0.095 .313**
Sig. (2-tailed) 0 . 0.132 0.003 0.001 0.002 0.008 0.091 0.298 0N 121 121 121 121 121 121 121 121 121 121Spearman's rho Coefficient 0.061 0.138 1 0.146 -0.012 0.116 .636** 0.176 0.108 0.063Sig. (2-tailed) 0.508 0.132 . 0.109 0.9 0.203 0 0.053 0.237 0.493N 121 121 121 121 121 121 121 121 121 121Spearman's rho Coefficient .294** .269** 0.146 1 .373** .238** .352** .294** .240** .184*
Sig. (2-tailed) 0.001 0.003 0.109 . 0 0.009 0 0.001 0.008 0.043N 121 121 121 121 121 121 121 121 121 121Spearman's rho Coefficient .239** .291** -0.01 .373** 1 .183* .218* .195* 0.059 0.119Sig. (2-tailed) 0.008 0.001 0.9 0 . 0.044 0.016 0.032 0.52 0.193N 121 121 121 121 121 121 121 121 121 121Spearman's rho Coefficient 0.104 .276** 0.116 .238** .183* 1 .206* 0.091 0.153 0.103Sig. (2-tailed) 0.257 0.002 0.203 0.009 0.044 . 0.023 0.32 0.094 0.263N 121 121 121 121 121 121 121 121 121 121Spearman's rho Coefficient 0.172 .239** .636** .352** .218* .206* 1 .244** .244** .203*
Sig. (2-tailed) 0.059 0.008 0 0 0.016 0.023 . 0.007 0.007 0.025N 121 121 121 121 121 121 121 121 121 121Spearman's rho Coefficient 0.107 0.154 0.176 .294** .195* 0.091 .244** 1 .237** 0.167Sig. (2-tailed) 0.243 0.091 0.053 0.001 0.032 0.32 0.007 . 0.009 0.066N 121 121 121 121 121 121 121 121 121 121Spearman's rho Coefficient 0.17 0.095 0.108 .240** 0.059 0.153 .244** .237** 1 .273**
Sig. (2-tailed) 0.062 0.298 0.237 0.008 0.52 0.094 0.007 0.009 . 0.002N 121 121 121 121 121 121 121 121 121 121Spearman's rho Coefficient 0.119 .313** 0.063 .184* 0.119 0.103 .203* 0.167 .273** 1Sig. (2-tailed) 0.195 0 0.493 0.043 0.193 0.263 0.025 0.066 0.002 .N 121 121 121 121 121 121 121 121 121 121
Spearman's Rank Correlations Between Key Indicators of Borrower Credit Quality as Determinants of Loan Supply
**. Correlation is significant at the 0.01 level (2-tailed).*. Correlation is significant at the 0.05 level (2-tailed).
Loan Security
Firm's Transparency
Firm's Credit Rating
Existence of Deposit Relationship
Existence of Loan Relationship
Length of Relationship with Bank
Owners' Credit Rating
Owners' Personal Guarantee
Owners' Personal Wealth
Owners' Equity Stake
Another observation is that a business owners’ credit rating is positively linked with his
personal wealth (rho 0.244, sig. 0.007), personal guarantee (rho 0.244, sig. 0.007) and his
equity stake (rho 0.203, sig. 0.025). Lenders believe that the decision to grant credit to SMEs
is largely dependent on the reputation of the owners, measured by their business or trading
experience, professional training or education, technical competence, credit rating, personal
wealth, and equity stake in the borrowing firm (e.g. Martin and Staines, 1994; Fletcher, 1995;
Cole, 1998, 2008; Dess and Picken, 1999; Cole et al., 2004; Bruns and Fletcher, 2008).
It is worth noting that these interrelationships between credit quality indicators seem to
support the reasons mentioned in chapter 2 on why Post-Keynesians argue that the constraints
to lending are demand determined, subject to an assessment of borrower quality and
creditworthiness. For example, Post Keynesians suggest that bankers accommodate all credit-
worthy demands for credit and ration all those demands not deemed creditworthy (Wolfson,
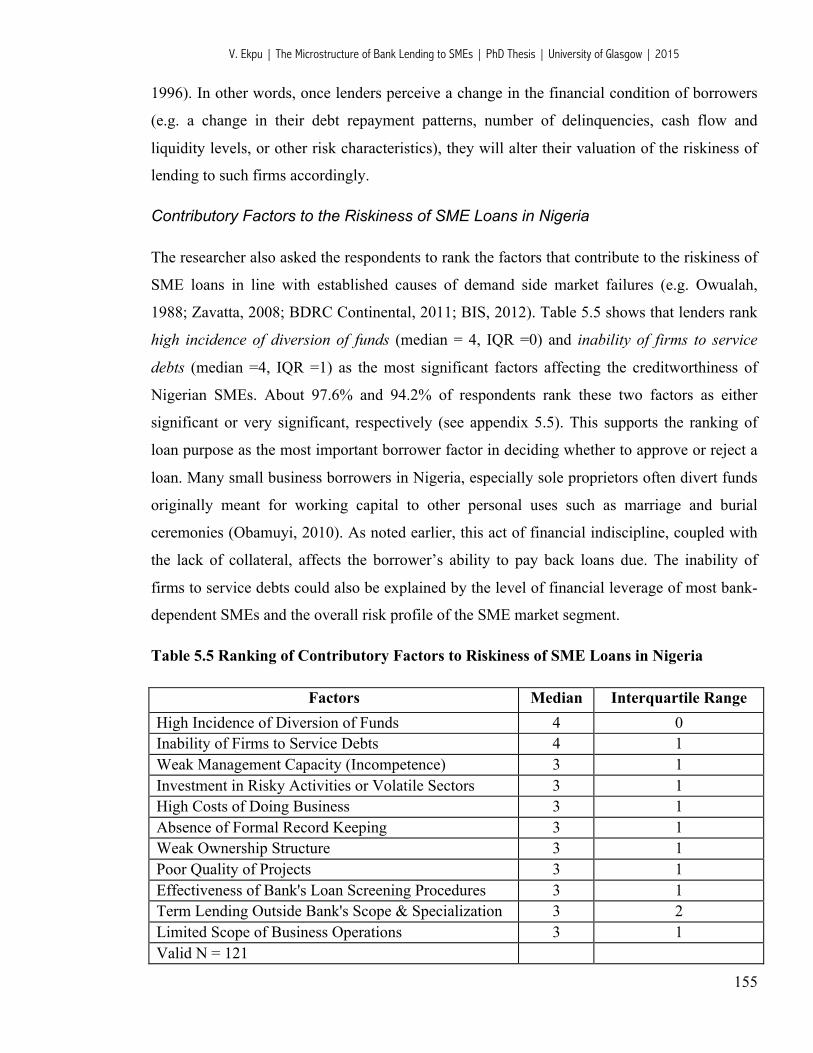
V. Ekpu | The Microstructure of Bank Lending to SMEs | PhD Thesis | University of Glasgow | 2015
155
1996). In other words, once lenders perceive a change in the financial condition of borrowers
(e.g. a change in their debt repayment patterns, number of delinquencies, cash flow and
liquidity levels, or other risk characteristics), they will alter their valuation of the riskiness of
lending to such firms accordingly.
Contributory Factors to the Riskiness of SME Loans in Nigeria
The researcher also asked the respondents to rank the factors that contribute to the riskiness of
SME loans in line with established causes of demand side market failures (e.g. Owualah,
1988; Zavatta, 2008; BDRC Continental, 2011; BIS, 2012). Table 5.5 shows that lenders rank
high incidence of diversion of funds (median = 4, IQR =0) and inability of firms to service
debts (median =4, IQR =1) as the most significant factors affecting the creditworthiness of
Nigerian SMEs. About 97.6% and 94.2% of respondents rank these two factors as either
significant or very significant, respectively (see appendix 5.5). This supports the ranking of
loan purpose as the most important borrower factor in deciding whether to approve or reject a
loan. Many small business borrowers in Nigeria, especially sole proprietors often divert funds
originally meant for working capital to other personal uses such as marriage and burial
ceremonies (Obamuyi, 2010). As noted earlier, this act of financial indiscipline, coupled with
the lack of collateral, affects the borrower’s ability to pay back loans due. The inability of
firms to service debts could also be explained by the level of financial leverage of most bank-
dependent SMEs and the overall risk profile of the SME market segment.
Table 5.5 Ranking of Contributory Factors to Riskiness of SME Loans in Nigeria
Factors Median Interquartile Range High Incidence of Diversion of Funds 4 0 Inability of Firms to Service Debts 4 1 Weak Management Capacity (Incompetence) 3 1 Investment in Risky Activities or Volatile Sectors 3 1 High Costs of Doing Business 3 1 Absence of Formal Record Keeping 3 1 Weak Ownership Structure 3 1 Poor Quality of Projects 3 1 Effectiveness of Bank's Loan Screening Procedures 3 1 Term Lending Outside Bank's Scope & Specialization 3 2 Limited Scope of Business Operations 3 1 Valid N = 121
V. Ekpu | The Microstructure of Bank Lending to SMEs | PhD Thesis | University of Glasgow | 2015
156
Lenders also rank other factors such as weak management capacity, investment in risky
activities and high costs of doing business (each with a median value of 3) as significant in
affecting the riskiness of SME loans in Nigeria. Most SMEs have weak managerial
competence because they lack the requisite professional training and business experience
unlike their peers in much larger and well-established firms who also have relatively higher
access to skilled manpower. The high costs of doing business in Nigeria also affect the
performance of SMEs. This is because structural problems such as inadequate power supply,
inadequate transportation network and absence of other social amenities tend to drive
operational costs high. Absence of formal record keeping, weak ownership structure and poor
quality of projects are also significant factors ranked with a median value of 3. The absence of
formal record keeping reduces the adequacy of information on the true financial condition of
most SMEs and this opacity further contributes to the riskiness of most SMEs. A few other
factors, which could be attributed to supply-side constraints, also affect lending to SMEs.
These include effectiveness of bank’s loan screening procedures and term lending outside
bank scope and specialization, which were also ranked as significant by the respondents. In a
similar survey of factors constraining lending to SMEs in Nigeria, Obamuyi (2010) reported
the following factors as most important: poor credit worthiness (41.7%), lack of collateral
(33.3%), poor project package (33.3%), lack of adequate record (25%), high risk (25%) and
diversion of funds (8.3%). In comparison with this study, three of these factors mentioned by
Obamuyi (2010) also rank among the significant factors affecting the riskiness of SME loans
in Nigeria (as shown in table 5.5), with new variables like inability of firms to service debt,
incompetence, high cost of doing business and weak ownership structure appearing as very
strong factors affecting the risk profile of SMEs in Nigeria.
The full implications of various constraints to lending have been that commercial banks
lending to the SME sector have been mainly doing so on short-term basis. This study further
reveals that an estimated 73.2% of commercial bank loans to SMEs in Nigeria have a term of
between 0 to 2 years, while the remaining 26.8% of total SME loans are granted for a term of
above 2 years. This finding validates the banks’ preference for short term lending and their
risk-averse lending behaviour towards SMEs.
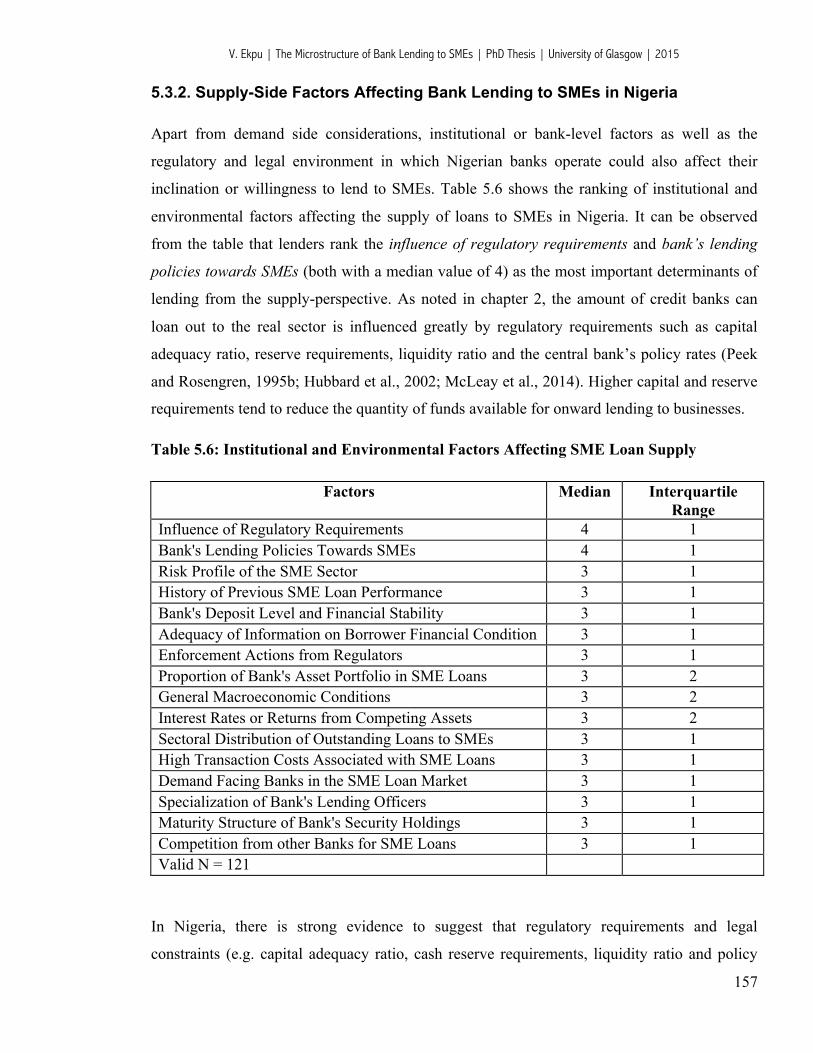
V. Ekpu | The Microstructure of Bank Lending to SMEs | PhD Thesis | University of Glasgow | 2015
157
5.3.2. Supply-Side Factors Affecting Bank Lending to SMEs in Nigeria
Apart from demand side considerations, institutional or bank-level factors as well as the
regulatory and legal environment in which Nigerian banks operate could also affect their
inclination or willingness to lend to SMEs. Table 5.6 shows the ranking of institutional and
environmental factors affecting the supply of loans to SMEs in Nigeria. It can be observed
from the table that lenders rank the influence of regulatory requirements and bank’s lending
policies towards SMEs (both with a median value of 4) as the most important determinants of
lending from the supply-perspective. As noted in chapter 2, the amount of credit banks can
loan out to the real sector is influenced greatly by regulatory requirements such as capital
adequacy ratio, reserve requirements, liquidity ratio and the central bank’s policy rates (Peek
and Rosengren, 1995b; Hubbard et al., 2002; McLeay et al., 2014). Higher capital and reserve
requirements tend to reduce the quantity of funds available for onward lending to businesses.
Table 5.6: Institutional and Environmental Factors Affecting SME Loan Supply
Factors Median Interquartile Range
Influence of Regulatory Requirements 4 1 Bank's Lending Policies Towards SMEs 4 1 Risk Profile of the SME Sector 3 1 History of Previous SME Loan Performance 3 1 Bank's Deposit Level and Financial Stability 3 1 Adequacy of Information on Borrower Financial Condition 3 1 Enforcement Actions from Regulators 3 1 Proportion of Bank's Asset Portfolio in SME Loans 3 2 General Macroeconomic Conditions 3 2 Interest Rates or Returns from Competing Assets 3 2 Sectoral Distribution of Outstanding Loans to SMEs 3 1 High Transaction Costs Associated with SME Loans 3 1 Demand Facing Banks in the SME Loan Market 3 1 Specialization of Bank's Lending Officers 3 1 Maturity Structure of Bank's Security Holdings 3 1 Competition from other Banks for SME Loans 3 1 Valid N = 121
In Nigeria, there is strong evidence to suggest that regulatory requirements and legal
constraints (e.g. capital adequacy ratio, cash reserve requirements, liquidity ratio and policy
V. Ekpu | The Microstructure of Bank Lending to SMEs | PhD Thesis | University of Glasgow | 2015
158
rates) have affected the bank’s lending policies. For example, the Central Bank of Nigeria
(CBN) increased the cash reserve ratio (CRR) on public sector deposits to 75% in 2013 from
50% in 2012 and also told lenders to lower fees and commissions to reduce costs to customers.
The regulator also raised requirements on private sector deposits to 15% from 12% to reduce
liquidity and support the value of the naira (Atuanya and Augie, 2014). A consequence of
tighter regulations like these is that it limits the inclination and capacity of banks to finance the
real sector. Similarly, enforcement actions from regulators (median =3; IQR =1) and sectoral
distribution of loans through government support schemes (median =3; IQR =1) also have the
capacity to influence the volume of bank lending to SMEs. Good examples are the CBN/BOI
Intervention Fund for SMEs in the manufacturing sector, the SMEEIS initiative, and the
Commercial Agricultural Credit Scheme (CACS), amongst others.
The interest rate on competing assets, that is, the yield on alternative investments (median=3;
IQR =2) also affects commercial banks’ lending behavior towards SMEs. This is influenced to
a large extent by government borrowing in Nigeria, which continues to lead to crowding out of
the private sector. In financial systems like Nigeria and other Sub-Saharan African countries
with relatively weak legal and regulatory structures and financial infrastructure, there appears
to be a strong correlation between banks’ willingness to lend to relatively risky private
enterprises (i.e. SMEs) and the availability of “safer” investment opportunities, such as
government securities (Berg and Fuchs, 2013). Banks in Nigeria hold a sizeable proportion of
their balance sheet in government securities. The rise in interest rates on government securities
such as treasury bill rates (see figure 5.1) lowers banks’ appetite for lending to SMEs beyond
the established value chains by placing an effective floor for yields (exclusive of the premium
above the prime lending rate) that needs to be attained to make lending attractive. With
interest rates on treasury bills ranging from 12 to 15%, banks have made government
securities their preferred investment option. As one commentator puts it “ the monetary policy
of the country is pro-government. So the banks are just willing to patronize the government;
they don’t want to take risks” (Ejembi, 2012 [sic]).

V. Ekpu | The Microstructure of Bank Lending to SMEs | PhD Thesis | University of Glasgow | 2015
159
Figure 5.1: Nigerian Treasury Bill Rates (2009-2014)
Source: Central Bank of Nigeria: Government Securities Summary43
In addition, the general macroeconomic conditions (median = 3; IQR =2) in Nigeria also pose
significant obstacles to SME financing. For example, commercial lenders in Nigeria bemoan
the high inflation and exchange rate volatility as affecting the ease of doing business with
SMEs. Earlier, we have identified the poor enabling environment and infrastructural
deficiencies as contributing to the riskiness and low performance of the SME sector.
Apart from the above environmental factors, several bank-level (or idiosyncratic factors) also
influence Nigerian banks’ involvement with SMEs. High transaction costs associated with
SME loans (median = 3; IQR=1) are often cited by lenders as affecting the profitability of
SME loans. Zavatta (2008) notes that the financing of SMEs is an expensive venture. As
reviewed in chapter 2, there are fixed costs associated with all commercial loans, including: (i)
administrative costs; (ii) legal fees; and (iii) costs related to the acquisition of information,
such as the purchase of credit profiles of businesses from credit bureaus (Zavatta, 2008; Duan,
Han and Yang, 2009; Venkatesh and Kumari, 2011). For SME loans, these costs could prove
more difficult to recover. Other costs include costs of field inspections and monitoring costs
after loan has been disbursed. The problem is more severe in developing countries like Nigeria
where the economic information industry is highly underdeveloped and the poor state of
certain public services such as registration of property titles and collaterals pose huge
43 http://www.cenbank.org/rates/govtsecurities.asp (Accessed 25/08/2014)
V. Ekpu | The Microstructure of Bank Lending to SMEs | PhD Thesis | University of Glasgow | 2015
160
constraints to small-scale loans. To some extent, raising the cost of financing through higher
interest rates can solve this problem. For example, commercial banks in Nigeria usually
charge SMEs rates far above the prime-lending rate, in order to cover these fixed costs and
make the loans profitable (Ogujiuba et al., 2004). To the extent that Nigerian banks charge
very high interest rates, they are exploiting SMEs. Nigerian banks are not really interested in
lending to SMEs, and therefore charge them high rates to make as much money as possible
knowing that there is no bank competition for SMEs. Chapter 5 takes a closer look at the
determinants of SME loan rates in Nigeria.
Another idiosyncratic factor affecting bank’s involvement with SMEs is the adequacy of
information on borrowers’ financial condition (median = 3; IQR=1). As noted earlier, the
information that SMEs can provide to external financiers (in the form of financial accounts,
business plans, feasibility studies, etc) often lacks detail and rigor. This problem is often
aggravated by the low level of education of Small business entrepreneurs, who may not be in
the position to adequate articulate their case (Zavatta, 2008). This problem is particularly acute
in developing countries like Nigeria, where the information supplied to bankers and outside
investors by family owned SMEs is often not fully accurate and realistic, and hence opaque
behavior may prevail. In other instances, entrepreneurs may decline from providing detailed
information on their proposal for fear that such disclosure may compromise their intellectual
property, or result in piracy (Shane and Cable, 2002). Under these conditions of information
asymmetry, banks adopt precautionary measures, such as requiring that financing be
collateralised, reduce the amount of financing sought or refuse it altogether (Stiglitz and
Weiss, 1981; Zavatta, 2008, Ukoha, 2013a).
Sometimes, banks’ inclination to lend to SMEs is determined by the proportion of total asset
portfolio in SME loans (median = 3; IQR =2) or the share of the loan book accounted for by
SMEs. Commercial banks in Nigeria tend to have set targets for the contribution of each
strategic business unit (SBU) to their total assets or loan book, and may decide to increase or
reduce this share from time to time depending on business and market conditions. These
business targets are usually set by the banks’ management (Akenbor and Imade, 2011) and are
often motivated by the need to satisfy customers (Ikpefan, 2013). Nigerian banks are aware of
the economic importance of satisfying customers (e.g. increased cash deposits, revenues and
business referrals) and may from time to time vary their loan sales targets in specific customer
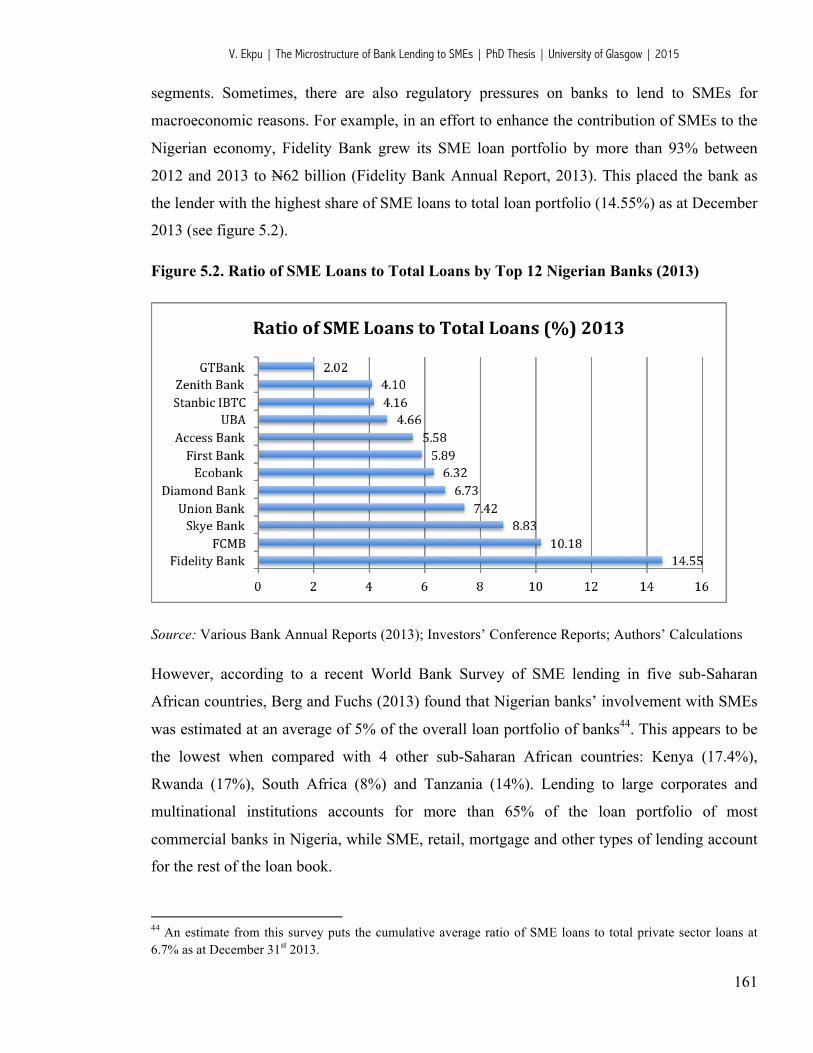
V. Ekpu | The Microstructure of Bank Lending to SMEs | PhD Thesis | University of Glasgow | 2015
161
segments. Sometimes, there are also regulatory pressures on banks to lend to SMEs for
macroeconomic reasons. For example, in an effort to enhance the contribution of SMEs to the
Nigerian economy, Fidelity Bank grew its SME loan portfolio by more than 93% between
2012 and 2013 to N62 billion (Fidelity Bank Annual Report, 2013). This placed the bank as
the lender with the highest share of SME loans to total loan portfolio (14.55%) as at December
2013 (see figure 5.2).
Figure 5.2. Ratio of SME Loans to Total Loans by Top 12 Nigerian Banks (2013)
Source: Various Bank Annual Reports (2013); Investors’ Conference Reports; Authors’ Calculations
However, according to a recent World Bank Survey of SME lending in five sub-Saharan
African countries, Berg and Fuchs (2013) found that Nigerian banks’ involvement with SMEs
was estimated at an average of 5% of the overall loan portfolio of banks44. This appears to be
the lowest when compared with 4 other sub-Saharan African countries: Kenya (17.4%),
Rwanda (17%), South Africa (8%) and Tanzania (14%). Lending to large corporates and
multinational institutions accounts for more than 65% of the loan portfolio of most
commercial banks in Nigeria, while SME, retail, mortgage and other types of lending account
for the rest of the loan book.
44 An estimate from this survey puts the cumulative average ratio of SME loans to total private sector loans at 6.7% as at December 31st 2013.
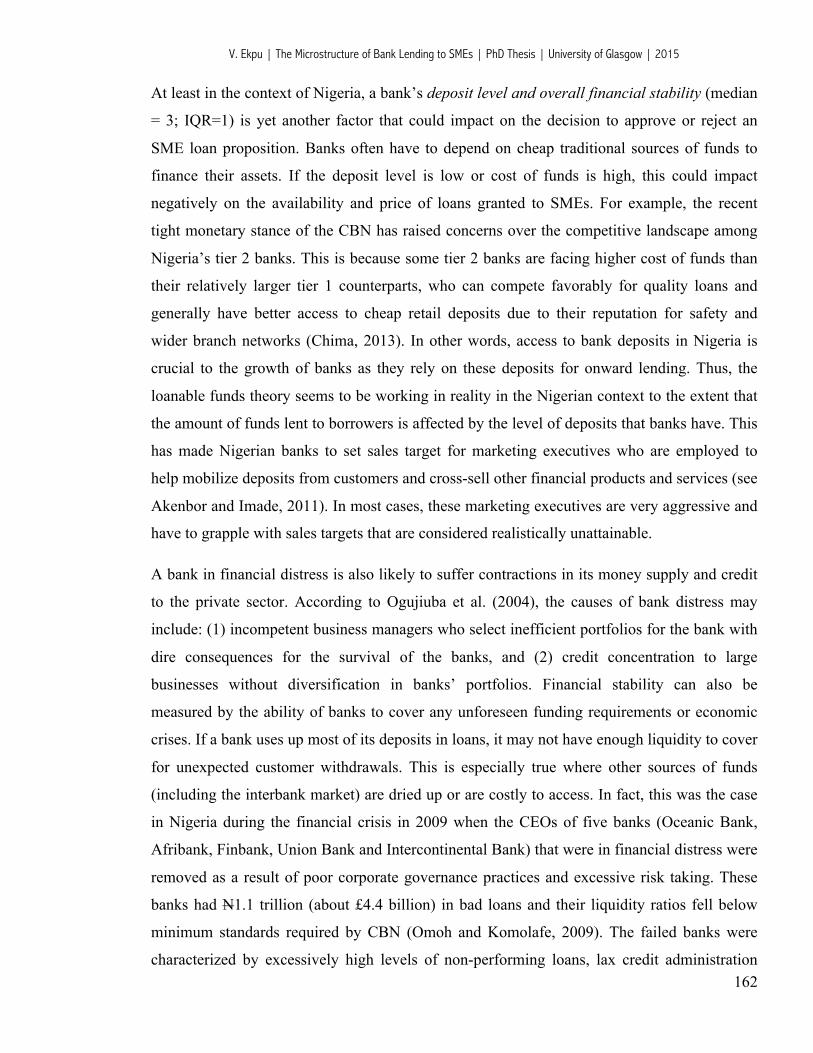
V. Ekpu | The Microstructure of Bank Lending to SMEs | PhD Thesis | University of Glasgow | 2015
162
At least in the context of Nigeria, a bank’s deposit level and overall financial stability (median
= 3; IQR=1) is yet another factor that could impact on the decision to approve or reject an
SME loan proposition. Banks often have to depend on cheap traditional sources of funds to
finance their assets. If the deposit level is low or cost of funds is high, this could impact
negatively on the availability and price of loans granted to SMEs. For example, the recent
tight monetary stance of the CBN has raised concerns over the competitive landscape among
Nigeria’s tier 2 banks. This is because some tier 2 banks are facing higher cost of funds than
their relatively larger tier 1 counterparts, who can compete favorably for quality loans and
generally have better access to cheap retail deposits due to their reputation for safety and
wider branch networks (Chima, 2013). In other words, access to bank deposits in Nigeria is
crucial to the growth of banks as they rely on these deposits for onward lending. Thus, the
loanable funds theory seems to be working in reality in the Nigerian context to the extent that
the amount of funds lent to borrowers is affected by the level of deposits that banks have. This
has made Nigerian banks to set sales target for marketing executives who are employed to
help mobilize deposits from customers and cross-sell other financial products and services (see
Akenbor and Imade, 2011). In most cases, these marketing executives are very aggressive and
have to grapple with sales targets that are considered realistically unattainable.
A bank in financial distress is also likely to suffer contractions in its money supply and credit
to the private sector. According to Ogujiuba et al. (2004), the causes of bank distress may
include: (1) incompetent business managers who select inefficient portfolios for the bank with
dire consequences for the survival of the banks, and (2) credit concentration to large
businesses without diversification in banks’ portfolios. Financial stability can also be
measured by the ability of banks to cover any unforeseen funding requirements or economic
crises. If a bank uses up most of its deposits in loans, it may not have enough liquidity to cover
for unexpected customer withdrawals. This is especially true where other sources of funds
(including the interbank market) are dried up or are costly to access. In fact, this was the case
in Nigeria during the financial crisis in 2009 when the CEOs of five banks (Oceanic Bank,
Afribank, Finbank, Union Bank and Intercontinental Bank) that were in financial distress were
removed as a result of poor corporate governance practices and excessive risk taking. These
banks had N1.1 trillion (about £4.4 billion) in bad loans and their liquidity ratios fell below
minimum standards required by CBN (Omoh and Komolafe, 2009). The failed banks were
characterized by excessively high levels of non-performing loans, lax credit administration
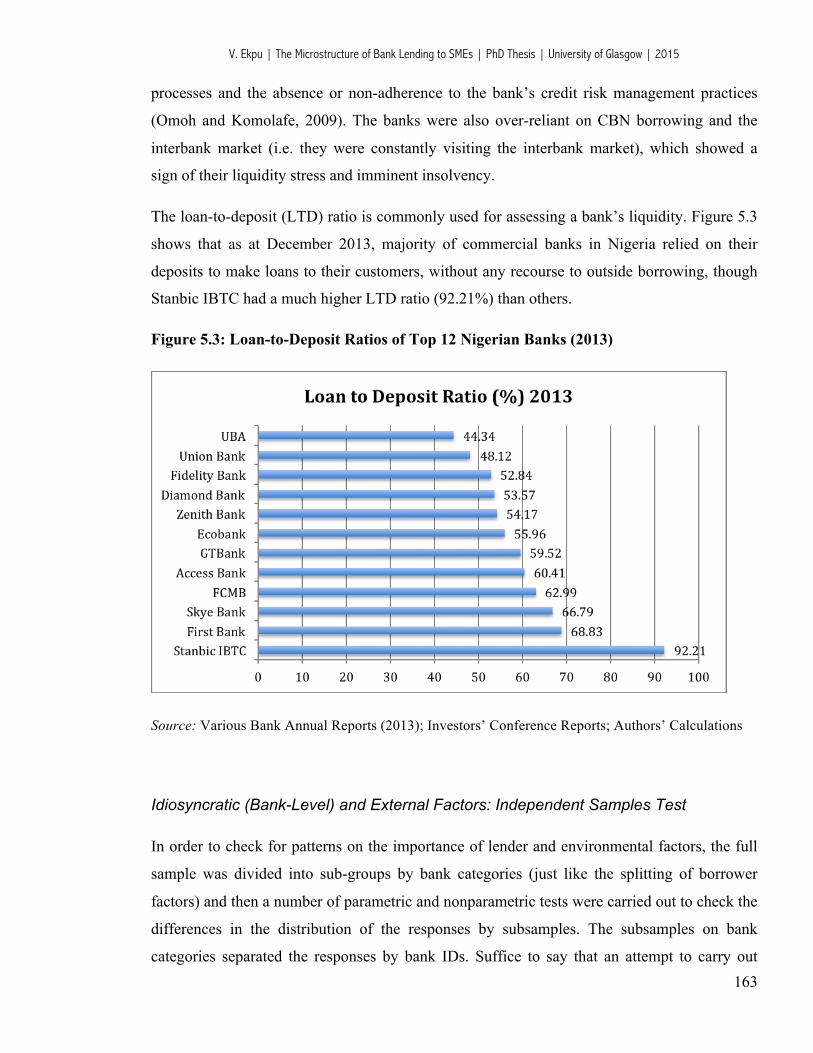
V. Ekpu | The Microstructure of Bank Lending to SMEs | PhD Thesis | University of Glasgow | 2015
163
processes and the absence or non-adherence to the bank’s credit risk management practices
(Omoh and Komolafe, 2009). The banks were also over-reliant on CBN borrowing and the
interbank market (i.e. they were constantly visiting the interbank market), which showed a
sign of their liquidity stress and imminent insolvency.
The loan-to-deposit (LTD) ratio is commonly used for assessing a bank’s liquidity. Figure 5.3
shows that as at December 2013, majority of commercial banks in Nigeria relied on their
deposits to make loans to their customers, without any recourse to outside borrowing, though
Stanbic IBTC had a much higher LTD ratio (92.21%) than others.
Figure 5.3: Loan-to-Deposit Ratios of Top 12 Nigerian Banks (2013)
Source: Various Bank Annual Reports (2013); Investors’ Conference Reports; Authors’ Calculations
Idiosyncratic (Bank-Level) and External Factors: Independent Samples Test
In order to check for patterns on the importance of lender and environmental factors, the full
sample was divided into sub-groups by bank categories (just like the splitting of borrower
factors) and then a number of parametric and nonparametric tests were carried out to check the
differences in the distribution of the responses by subsamples. The subsamples on bank
categories separated the responses by bank IDs. Suffice to say that an attempt to carry out
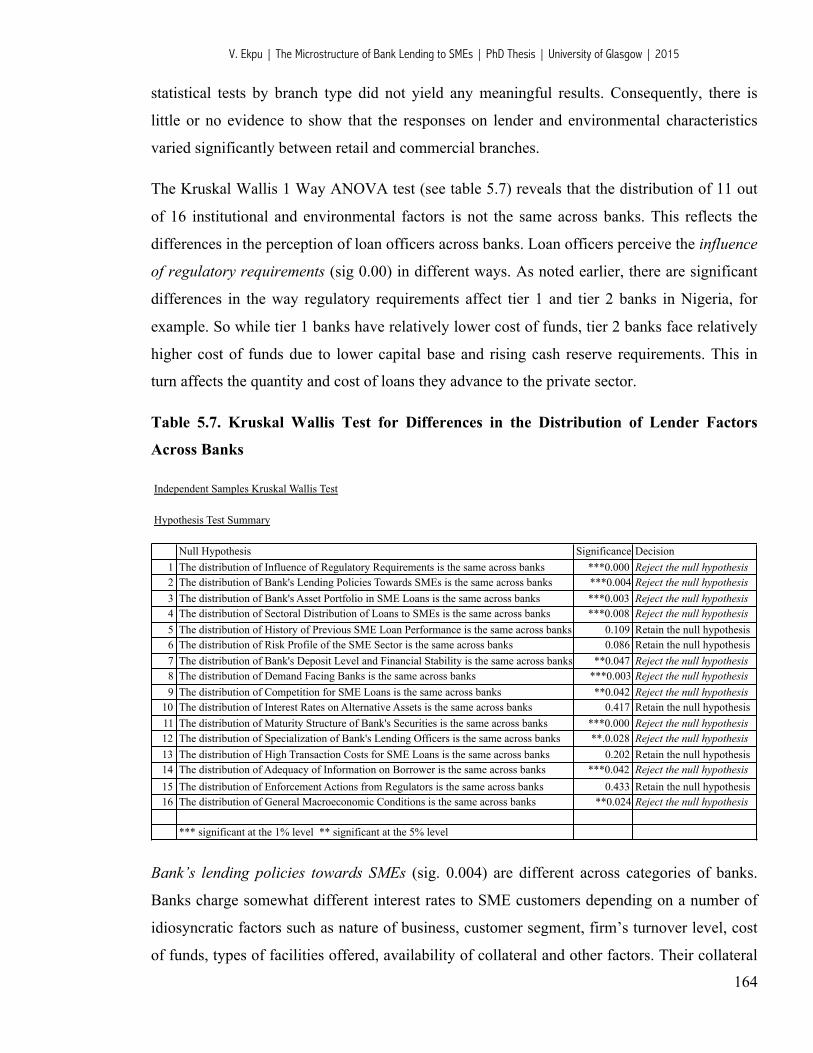
V. Ekpu | The Microstructure of Bank Lending to SMEs | PhD Thesis | University of Glasgow | 2015
164
statistical tests by branch type did not yield any meaningful results. Consequently, there is
little or no evidence to show that the responses on lender and environmental characteristics
varied significantly between retail and commercial branches.
The Kruskal Wallis 1 Way ANOVA test (see table 5.7) reveals that the distribution of 11 out
of 16 institutional and environmental factors is not the same across banks. This reflects the
differences in the perception of loan officers across banks. Loan officers perceive the influence
of regulatory requirements (sig 0.00) in different ways. As noted earlier, there are significant
differences in the way regulatory requirements affect tier 1 and tier 2 banks in Nigeria, for
example. So while tier 1 banks have relatively lower cost of funds, tier 2 banks face relatively
higher cost of funds due to lower capital base and rising cash reserve requirements. This in
turn affects the quantity and cost of loans they advance to the private sector.
Table 5.7. Kruskal Wallis Test for Differences in the Distribution of Lender Factors
Across Banks
Independent Samples Kruskal Wallis Test
Hypothesis Test Summary
Null Hypothesis Significance Decision1 The distribution of Influence of Regulatory Requirements is the same across banks ***0.000 Reject the null hypothesis2 The distribution of Bank's Lending Policies Towards SMEs is the same across banks ***0.004 Reject the null hypothesis3 The distribution of Bank's Asset Portfolio in SME Loans is the same across banks ***0.003 Reject the null hypothesis4 The distribution of Sectoral Distribution of Loans to SMEs is the same across banks ***0.008 Reject the null hypothesis5 The distribution of History of Previous SME Loan Performance is the same across banks 0.109 Retain the null hypothesis6 The distribution of Risk Profile of the SME Sector is the same across banks 0.086 Retain the null hypothesis7 The distribution of Bank's Deposit Level and Financial Stability is the same across banks **0.047 Reject the null hypothesis8 The distribution of Demand Facing Banks is the same across banks ***0.003 Reject the null hypothesis9 The distribution of Competition for SME Loans is the same across banks **0.042 Reject the null hypothesis
10 The distribution of Interest Rates on Alternative Assets is the same across banks 0.417 Retain the null hypothesis11 The distribution of Maturity Structure of Bank's Securities is the same across banks ***0.000 Reject the null hypothesis12 The distribution of Specialization of Bank's Lending Officers is the same across banks **.0.028 Reject the null hypothesis13 The distribution of High Transaction Costs for SME Loans is the same across banks 0.202 Retain the null hypothesis14 The distribution of Adequacy of Information on Borrower is the same across banks ***0.042 Reject the null hypothesis15 The distribution of Enforcement Actions from Regulators is the same across banks 0.433 Retain the null hypothesis16 The distribution of General Macroeconomic Conditions is the same across banks **0.024 Reject the null hypothesis
*** significant at the 1% level ** significant at the 5% level
Bank’s lending policies towards SMEs (sig. 0.004) are different across categories of banks.
Banks charge somewhat different interest rates to SME customers depending on a number of
idiosyncratic factors such as nature of business, customer segment, firm’s turnover level, cost
of funds, types of facilities offered, availability of collateral and other factors. Their collateral

V. Ekpu | The Microstructure of Bank Lending to SMEs | PhD Thesis | University of Glasgow | 2015
165
requirements in terms of the types of assets accepted might also be different. For example,
Diamond Bank tends to accept goods in stock (inventory), vehicles and business equipment as
collateral, while some other banks typically don't. First bank has now introduced a new
approach to SME lending based on psychometric tests, which is meant to replace the use of
collateral in some SME segments (Abioye, 2014). While some banks typically don't give loans
of more than 2 years maturity, others might prefer to finance SMEs over longer time periods.
Again, while some banks rely more on relationship lending techniques and some level of
decentralisation, others strictly adopt a wholly centralised lending strategy and follow hard
and fast rules. All these show the divergences in the lending practices of banks.
The respondents also believe that the influence of the demand facing banks (sig 0.003) as well
as the competition for SME loans (sig 0.042) as determining factors for lending to SMEs are
not the same across banks. Different banks are attracted to different kinds of SME customers.
Banks that tend to emphasise “hard” information or availability of financial records are often
attracted to well-established SMEs, while banks that offer some degree of relationship lending
techniques may be attracted to firms that by nature face greater credit constraints or are
informationally opaque (Berger, et al., 2001, 2005). In addition to matching firm
characteristics to banks, the demand facing banks for SME loans could also be determined by
geographic and branch network considerations (Cole et al., 2004) as well as regulatory
constraints. Notice that bankers perceive the importance of interest rates on alternative assets
(sig 0.417) to be the same across board, implying that the rates on alternative investments such
as treasury bills or other government securities are likely to influence lenders in the same
direction (i.e. will dissuade them from lending to risky SMEs) because of the flight to safety
and quality.
Correlation Between Key Lender Factors
Here the correlation analysis comes in two fold. First, we examine the correlation between
idiosyncratic (bank level factors) and the correlation between external (environmental) factors
as key supply side determinants of the availability of loans to SMEs. Table 5.8 shows that the
importance bankers attach to their bank’s lending policies towards SMEs positively correlates
with the proportion of bank’s assets portfolio in SME loans (rho 0.454, sig 0), history of
previous loan performance (rho 0.457, sig 0), maturity structure of bank’s security holdings
(rho 0.219, sig. 0.016) and specialization of bank’s lending officers (rho 0.282, sig 0.002).
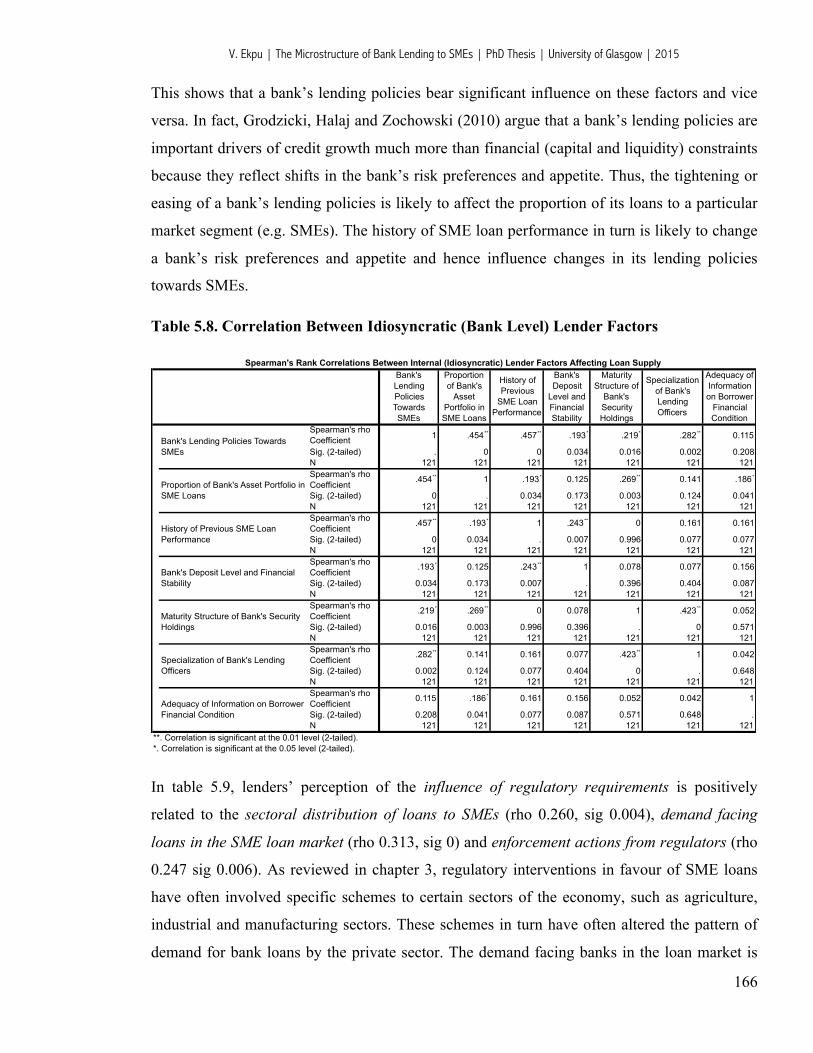
V. Ekpu | The Microstructure of Bank Lending to SMEs | PhD Thesis | University of Glasgow | 2015
166
This shows that a bank’s lending policies bear significant influence on these factors and vice
versa. In fact, Grodzicki, Halaj and Zochowski (2010) argue that a bank’s lending policies are
important drivers of credit growth much more than financial (capital and liquidity) constraints
because they reflect shifts in the bank’s risk preferences and appetite. Thus, the tightening or
easing of a bank’s lending policies is likely to affect the proportion of its loans to a particular
market segment (e.g. SMEs). The history of SME loan performance in turn is likely to change
a bank’s risk preferences and appetite and hence influence changes in its lending policies
towards SMEs.
Table 5.8. Correlation Between Idiosyncratic (Bank Level) Lender Factors
Bank's Lending Policies Towards SMEs
Proportion of Bank's
Asset Portfolio in SME Loans
History of Previous
SME Loan Performance
Bank's Deposit
Level and Financial Stability
Maturity Structure of
Bank's Security Holdings
Specialization of Bank's Lending Officers
Adequacy of Information on Borrower
Financial Condition
Spearman's rho Coefficient 1 .454** .457** .193* .219* .282** 0.115
Sig. (2-tailed) . 0 0 0.034 0.016 0.002 0.208N 121 121 121 121 121 121 121Spearman's rho Coefficient
.454** 1 .193* 0.125 .269** 0.141 .186*
Sig. (2-tailed) 0 . 0.034 0.173 0.003 0.124 0.041N 121 121 121 121 121 121 121Spearman's rho Coefficient
.457** .193* 1 .243** 0 0.161 0.161
Sig. (2-tailed) 0 0.034 . 0.007 0.996 0.077 0.077N 121 121 121 121 121 121 121Spearman's rho Coefficient
.193* 0.125 .243** 1 0.078 0.077 0.156
Sig. (2-tailed) 0.034 0.173 0.007 . 0.396 0.404 0.087N 121 121 121 121 121 121 121Spearman's rho Coefficient
.219* .269** 0 0.078 1 .423** 0.052
Sig. (2-tailed) 0.016 0.003 0.996 0.396 . 0 0.571N 121 121 121 121 121 121 121Spearman's rho Coefficient
.282** 0.141 0.161 0.077 .423** 1 0.042
Sig. (2-tailed) 0.002 0.124 0.077 0.404 0 . 0.648N 121 121 121 121 121 121 121Spearman's rho Coefficient
0.115 .186* 0.161 0.156 0.052 0.042 1
Sig. (2-tailed) 0.208 0.041 0.077 0.087 0.571 0.648 .N 121 121 121 121 121 121 121
Spearman's Rank Correlations Between Internal (Idiosyncratic) Lender Factors Affecting Loan Supply
Bank's Lending Policies Towards SMEs
Proportion of Bank's Asset Portfolio in SME Loans
History of Previous SME Loan Performance
Bank's Deposit Level and Financial Stability
Maturity Structure of Bank's Security Holdings
Specialization of Bank's Lending Officers
Adequacy of Information on Borrower Financial Condition
**. Correlation is significant at the 0.01 level (2-tailed).*. Correlation is significant at the 0.05 level (2-tailed).
In table 5.9, lenders’ perception of the influence of regulatory requirements is positively
related to the sectoral distribution of loans to SMEs (rho 0.260, sig 0.004), demand facing
loans in the SME loan market (rho 0.313, sig 0) and enforcement actions from regulators (rho
0.247 sig 0.006). As reviewed in chapter 3, regulatory interventions in favour of SME loans
have often involved specific schemes to certain sectors of the economy, such as agriculture,
industrial and manufacturing sectors. These schemes in turn have often altered the pattern of
demand for bank loans by the private sector. The demand facing banks in the loan market is

V. Ekpu | The Microstructure of Bank Lending to SMEs | PhD Thesis | University of Glasgow | 2015
167
also correlated with the competition from other banks for SME loans (rho 0.316, sig 0), while
the distribution of the importance of general macroeconomic conditions is positively
associated with a number of factors including the risk profile of SME loans (rho 0.315, sig
0.002), high transaction costs associated with SME loans (rho 0.255, sig 0.005) and
enforcement actions from regulators (rho 0.512, sig 0). Suffice to say that poor
macroeconomic conditions in Nigeria, namely high inflation, unemployment and exchange
rate volatility tend to impact on the risk profile of SMEs, while also triggering changes in
policy stance of the regulators and consequent enforcement actions. These in turn affect the
conditions on which banks lend to SMEs.
Table 5.9: Correlation Between External (Environmental) Factors
Influence of Regulatory
Requirements
Sectoral Distribution
of Outstanding
Loans to SMEs
Risk Profile of the SME
Sector
Demand Facing
Banks in the SME
Loan Market
Competition from other Banks for
SME Loans
Interest Rates or Returns
from Competing
Assets
High Transaction
Costs Associated with SME
Loans
Enforcement Actions from Regulators
General Macroeconomic
Conditions
Spearman's rho Coefficient 1 .260** 0.175 .313** 0.107 .196* 0.16 .247** 0.16
Sig. (2-tailed) . 0.004 0.054 0 0.242 0.031 0.079 0.006 0.08N 121 121 121 121 121 121 121 121 121Spearman's rho Coefficient
.260** 1 .201* .483** .331** .200* 0.148 .338** .355**
Sig. (2-tailed) 0.004 . 0.027 0 0 0.028 0.104 0 0N 121 121 121 121 121 121 121 121 121Spearman's rho Coefficient
0.175 .201* 1 0.151 0.108 0.1 .199* .441** .315**
Sig. (2-tailed) 0.054 0.027 . 0.097 0.236 0.275 0.029 0 0N 121 121 121 121 121 121 121 121 121Spearman's rho Coefficient
.313** .483** 0.151 1 .316** .191* 0.17 .230* .412**
Sig. (2-tailed) 0 0 0.097 . 0 0.036 0.062 0.011 0N 121 121 121 121 121 121 121 121 121Spearman's rho Coefficient
0.107 .331** 0.108 .316** 1 .338** 0.144 0.078 0.112
Sig. (2-tailed) 0.242 0 0.236 0 . 0 0.114 0.395 0.221N 121 121 121 121 121 121 121 121 121Spearman's rho Coefficient
.196* .200* 0.1 .191* .338** 1 0.168 .242** 0.099
Sig. (2-tailed) 0.031 0.028 0.275 0.036 0 . 0.065 0.008 0.28N 121 121 121 121 121 121 121 121 121Spearman's rho Coefficient
0.16 0.148 .199* 0.17 0.144 0.168 1 .344** .255**
Sig. (2-tailed) 0.079 0.104 0.029 0.062 0.114 0.065 . 0 0.005N 121 121 121 121 121 121 121 121 121Spearman's rho Coefficient
.247** .338** .441** .230* 0.078 .242** .344** 1 .512**
Sig. (2-tailed) 0.006 0 0 0.011 0.395 0.008 0 . 0N 121 121 121 121 121 121 121 121 121Spearman's rho Coefficient
0.16 .355** .315** .412** 0.112 0.099 .255** .512** 1
Sig. (2-tailed) 0.08 0 0 0 0.221 0.28 0.005 0 .N 121 121 121 121 121 121 121 121 121
**. Correlation is significant at the 0.01 level (2-tailed).*. Correlation is significant at the 0.05 level (2-tailed).
Spearman's Rank Correlations Between External (Environmental) Factors Affecting Loan Supply
Influence of Regulatory Requirements
Sectoral Distribution of Outstanding Loans to SMEs
Risk Profile of the SME Sector
Demand Facing Banks in the SME Loan Market
Competition from other Banks for SME Loans
Interest Rates or Returns from Competing Assets
High Transaction Costs Associated with SME Loans
Enforcement Actions from Regulators
General Macroeconomic Conditions
Importance of Borrower and Lender Factors
Appendix 5.7 combines the borrower and lender factors affecting SME loan supply in Nigeria,
and ranks them according to level of importance. It can be observed that the overriding factors
affecting SME loans in Nigeria are Loan purpose (ranked 1st), followed by the influence of
regulatory requirements (ranked 2nd), profitability of business (ranked 3rd), Loan Security and
V. Ekpu | The Microstructure of Bank Lending to SMEs | PhD Thesis | University of Glasgow | 2015
168
Bank’s lending policies towards SMEs, (ranked joint 4th) respectively. The least important
factors are Distance to customer (ranked 44th), owners’ educational attainment (ranked 43rd),
exclusivity of bank-borrower relationship (42nd), existence of financial management service
relationship (ranked 41st) and length of relationship (ranked 40th). The latter factors supports
the finding that the role of relationships in influencing lending decisions in Nigeria is
undermined.
Financial Crisis and Changes in SME Lending Policies
As reviewed in chapter 3, the global financial crisis of 2008-2009 hit Nigeria’s banking sector
hard, especially the nation’s stock market, which lost more than 66% of its market value
during the period. The crisis affected Nigerian banks to the extent that many banks, especially
the large players were exposed to huge loans in the capital market and oil and gas sectors,
which were at the time non-performing due to the margin calls and rising oil prices. Moreover,
the crisis also precipitated the reversal of capital inflows from Nigerian banks back to foreign
financial institutions during the dry up of liquidity in the world capital markets. The effect of
the crisis soon became evident as banks started to tighten their lending standards and
strengthen their risk management practices. Bernanke and Lown (1991) explain that during a
recession, reduction in lending levels could be explained by the generally weak state of
borrower’s balance sheets as result of increased leverage in the years prior to the crisis and
falling asset prices thus adversely affecting borrowers’ net worth. Banks also suffer from
shrinking balance sheet as a result of higher borrower default rates and higher cost of funds. A
good example for Nigeria is the case of the 2009 five failed banks explained earlier that were
characterised by huge non-performing loans and over-reliance on wholesale markets.
Nigerian banks have since the financial crisis made changes to their lending policies and risk
appetite. The survey revealed that 96.7% of relationship managers/loan officers admit that
there have been changes in their lending policies towards SMEs. Table 5.10 shows that 95.7%
of respondents say that their banks have adopted more stringent appraisal of SME loan
applications, while 75.9% agree that there have been no general reduction in lending to SMEs.
The latter finding is consistent with the finding by Ukoha (2013b) that the global financial
crisis did not cause a reduction in the volume of loans given to SMEs, since volume of loans
to the private sector in Nigeria increased steadily before, during and after the financial crisis.
However, when we look at the ratio of SME loans to total loans, the same cannot be
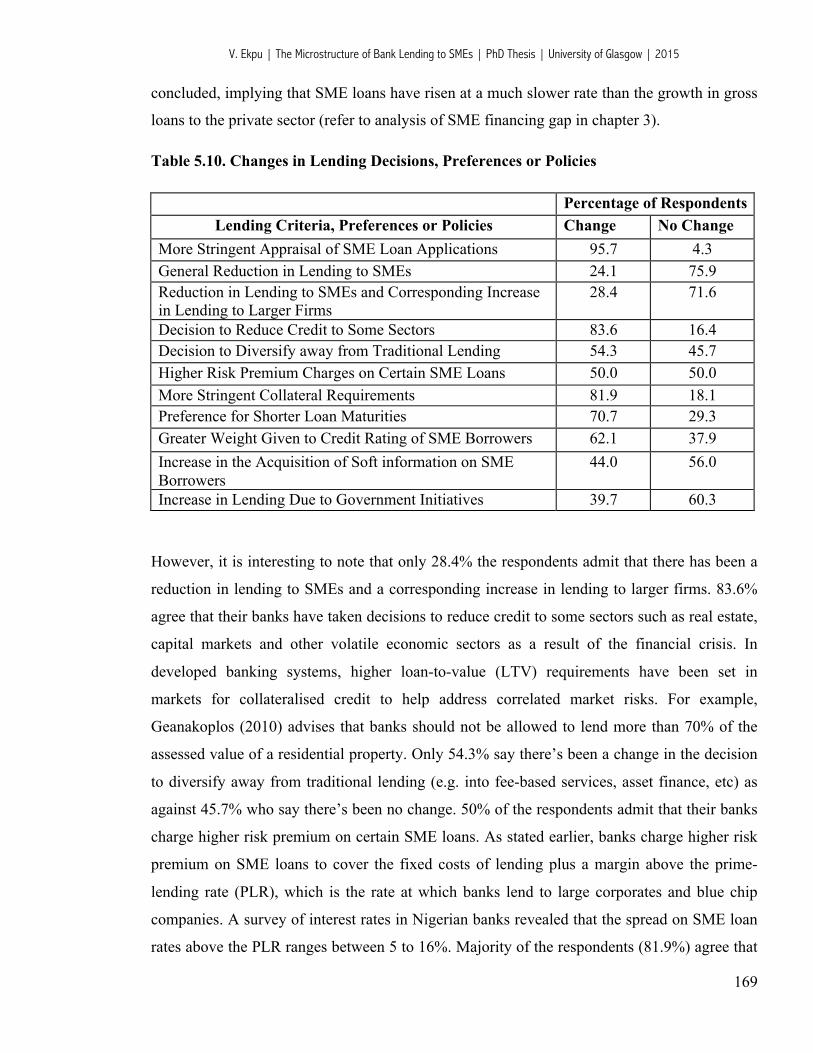
V. Ekpu | The Microstructure of Bank Lending to SMEs | PhD Thesis | University of Glasgow | 2015
169
concluded, implying that SME loans have risen at a much slower rate than the growth in gross
loans to the private sector (refer to analysis of SME financing gap in chapter 3).
Table 5.10. Changes in Lending Decisions, Preferences or Policies
Percentage of Respondents Lending Criteria, Preferences or Policies Change No Change
More Stringent Appraisal of SME Loan Applications 95.7 4.3 General Reduction in Lending to SMEs 24.1 75.9 Reduction in Lending to SMEs and Corresponding Increase in Lending to Larger Firms
28.4 71.6
Decision to Reduce Credit to Some Sectors 83.6 16.4 Decision to Diversify away from Traditional Lending 54.3 45.7 Higher Risk Premium Charges on Certain SME Loans 50.0 50.0 More Stringent Collateral Requirements 81.9 18.1 Preference for Shorter Loan Maturities 70.7 29.3 Greater Weight Given to Credit Rating of SME Borrowers 62.1 37.9 Increase in the Acquisition of Soft information on SME Borrowers
44.0 56.0
Increase in Lending Due to Government Initiatives 39.7 60.3
However, it is interesting to note that only 28.4% the respondents admit that there has been a
reduction in lending to SMEs and a corresponding increase in lending to larger firms. 83.6%
agree that their banks have taken decisions to reduce credit to some sectors such as real estate,
capital markets and other volatile economic sectors as a result of the financial crisis. In
developed banking systems, higher loan-to-value (LTV) requirements have been set in
markets for collateralised credit to help address correlated market risks. For example,
Geanakoplos (2010) advises that banks should not be allowed to lend more than 70% of the
assessed value of a residential property. Only 54.3% say there’s been a change in the decision
to diversify away from traditional lending (e.g. into fee-based services, asset finance, etc) as
against 45.7% who say there’s been no change. 50% of the respondents admit that their banks
charge higher risk premium on certain SME loans. As stated earlier, banks charge higher risk
premium on SME loans to cover the fixed costs of lending plus a margin above the prime-
lending rate (PLR), which is the rate at which banks lend to large corporates and blue chip
companies. A survey of interest rates in Nigerian banks revealed that the spread on SME loan
rates above the PLR ranges between 5 to 16%. Majority of the respondents (81.9%) agree that

V. Ekpu | The Microstructure of Bank Lending to SMEs | PhD Thesis | University of Glasgow | 2015
170
their banks have adopted more stringent collateral requirements, while 70.7% say that their
bank now prefers short term lending. There seems not be a general consensus that government
initiatives have been effective in increasing lending to SMEs, thus supporting the findings in
chapter 3.
5.4. Chapter Conclusions
This chapter has examined the factors responsible for the financing gap to SMEs, which
represent the demand and supply side constraints to loan supply to SMEs in Nigerian banks.
The study involved a survey of loan officers and relationship managers in the top 12
commercial banks. Findings from the descriptive statistics reveal that Nigerian banks seem to
be risk averse to SMEs and would only lend to borrowers that have characteristics that
reassure them of their ability to repay a loan. Banks in Nigeria generally lend between 5-7% of
their total loan portfolio to SMEs, on the average. In appraising a loan proposition, loan
officers admit that the purpose of a loan, the profitability of a business and the availability of
fixed collateral are the most important factors considered. Other important borrower factors
include the borrowers’ credit standing and the stability of the demand for their products.
Findings also show that the lending model of Nigerian banks does not emphasise the role of
bank-borrower relationships in determining the decision to approve or reject a loan as most
lending decisions are taken at the centre. Nigerian banks also ranked the high incidence of
diversion of funds, weak management capacity and the inability of SMEs to service debts as
chief contributory factors to the riskiness of SME loans. According to the lenders, low-end
borrowers often diverted funds meant to finance working capital or other projects into
personal uses, which when coupled with huge operational costs of doing business in Nigeria,
affects their inability to pay back loans due. There were also significant differences in some of
the responses of banks based on branch type and bank categories.
Apart from demand side factors, there are also supply-side considerations, which affect the
inclination or willingness of banks to lend to SMEs. Here, the main categories are bank-level
or institutional factors and external or environmental factors. The influence of regulatory
requirements and bank’s lending policies toward SMEs were regarded as the most important
supply side factors in approving or rejecting a loan. There is evidence to suggest that
V. Ekpu | The Microstructure of Bank Lending to SMEs | PhD Thesis | University of Glasgow | 2015
171
regulatory requirements and monetary policies in Nigeria have affected banks’ lending
policies towards SMEs. For example, the recent increase in cash reserve requirement from
50% to 75% and liquidity ratio on private sector deposits from 15% to 12% have affected the
availability of loanable funds to the private sector and by implication, to SMEs. Moreover,
recent rise in in yield on competing assets, such as government treasury bills, has led to the
crowding out of private sector lending as Nigerian banks hold a sizeable proportion of their
assets in relatively safer government securities, which tends to lower their appetite for lending
to SMEs. The risk profile of the SME sector is further enhanced by unfavourable
macroeconomic conditions (namely high inflation, unemployment and exchange rate
volatility) as well as infrastructural constraints such as inadequate power supply and poor
access to good roads, which further exacerbate operational costs of SMEs.
With respect to idiosyncratic (bank-level) factors, lenders believe that the high transaction
costs associated with processing, monitoring and reviewing SME loans also impact negatively
on the profitability of SME loans. This problem is further encouraged by the inadequacy of
information on borrowers’ financial condition due to poor credit record data and proprietary
issues on the part of borrowers. This information asymmetry contributes to the reason
Nigerians banks charge higher risk premiums for certain SME loans in comparison with larger
corporates who enjoy the prime-lending rate (PLR). The level of bank deposits and overall
financial stability of the lenders are other supply-side factors that impact on the decision to
approve or reject an SME loan proposition. There is evidence to suggest that Tier 1 banks in
Nigeria enjoy relatively lower cost of funds and relatively greater access to cheap deposits
than their Tier 2 counterparts due to their reputation for safety and wider branch networks.
Finally, the study also examined the changes in SME lending policies after the crisis. The
main finding here is that the financial crisis did not cause a reduction in the volume of loans
given to private sector, and by implication, SMEs. However, when the ratio of SME loans to
total loans is examined as in Chapter 3, it can be safely concluded that the SME loans have
risen at a much slower rate than the growth in aggregate loans to the economy.
V. Ekpu | The Microstructure of Bank Lending to SMEs | PhD Thesis | University of Glasgow | 2015
172
CHAPTER 6
THE DETERMINANTS OF RISK PREMIUM AND COLLATERAL ON SME LOANS IN NIGERIAN BANKS
6.1. Introduction
As noted in chapter 2, bank lending to SMEs is one of the most important services banks
undertake, though for Nigeria, the contribution of banks to SME lending remains largely
inadequate as bank lending to SMEs is a small percentage of bank activity in the post-
consolidated Nigerian banking sector as seen in Chapter 3. It is a known fact that lending
enables businesses to grow, take on more employees and ultimately generate greater wealth.
While the benefits of lending to SMEs and to the wider society are clear, it is important that
banks can earn a return on this activity in order to sustain that service throughout the business
cycle. Ultimately, banks tend to set the price of lending, even though market forces play a role
in the pricing behavior of banks. Lending is one of the key areas for competition as firms
choose where to place their business or switch banks: banks that overprice will lose business,
while those that underprice will not be able to sustain their operations (BBA, 2011). At the
same time, banks may compete for certain groups of borrowers but not for others (for
example, in Nigeria, banks tend to compete for large corporate borrowers, while exploiting
SMEs).
In performing their financing functions, profit maximising banks (who also seek to gain
market share) tend to charge borrowers interest rates as high as possible (depending on the
riskiness of and potential gross return from their investments) and pay depositors savings rates
as low as possible (depending on the source of funds). The wider the spreads between these
two returns the greater the increase in profits. In addition, the lower the losses and other non-
interest costs incurred on the loans advanced, the greater the profits that could be earned by
the banks and hence the greater the returns to their shareholders.
This chapter examines the hypotheses on SME loan pricing and then applies them in
investigating the determinants of risk premium and loan collateralisation in Nigerian banks. A
number of empirical studies have examined the costs of financial intermediation and the
determinants of interest spreads in Nigeria (e.g. Afolabi, Ogunleye, and Bwala, 2003; Enendu,
2003; Hesse, 2007; Abayomi and Adebayo, 2010; Haruna, 2011, 2012; Akinlo and Owoyemi,
V. Ekpu | The Microstructure of Bank Lending to SMEs | PhD Thesis | University of Glasgow | 2015
173
2012). These Nigerian studies find that interest spreads are affected by overhead costs, the
CBN’s cash reserve requirements, increased concentration in the banking sector and other
financial depth measures (Banking assets/GDP and average loans/average total deposits, etc).
Hesse (2007) also finds that increased holdings of liquidity and capital might have led to lower
spreads in the immediate pre-consolidated period of 2005, while a stable macroeconomic
environment is conducive to a more efficient channeling of savings to productive investments.
However, these studies only consider the cost of overall lending and do not focus on SME
loans. The significance of this chapter is thus demonstrated by the fact that it is the only study
(to the knowledge of the researcher) that examines the specific determinants of SME loan
pricing and collateral determination in Nigeria. In addition, the chapter uses survey data on
Nigeria bank loan officers as against secondary data on bank lending, which do not properly
capture the idiosyncratic effects of each bank and the microstructure of the banks’ lending
practices, business models and decision-making processes.
Generally, the micro-level factors determining loan contracts are connected largely to loan risk
characteristics, firm and lender-specific characteristics, relationship characteristics, and
external factors such as monetary policies, competition and the business cycle. This study
finds that for Nigeria, the determinants of risk premium on SME loans are largely connected
with factors that underline the opacity and riskiness of SMEs in Nigeria, and are less
connected with lender factors such as cost of funds and administrative expenses associated
with loan appraisal and disbursement. Relationships also play a role in determining risk
premiums. In most Nigerian banks, customers with longer relationships with the bank (i.e.
repeat customers) tend to benefit from lower interest rates. What determines the likelihood of
requesting collateral from SMEs in Nigerian banks is significantly related to the borrower’s
risk characteristics, especially the incidence of loan diversion among SMEs in Nigeria. A
higher perception of the incidence of loan diversion is likely to cause banks to request
collateral from the borrowing firm to secure the transaction. Loan size, firm size and
borrowers’ credit rating are significant factors that determine the probability that a bank will
request full or partial collateralisation.
The rest of this chapter is structured as follows: Section 6.2 examines the main hypotheses and
related literature on the determinants of risk premium and loan collateralisation on SME loans.
Section 6.3 presents the method of data collection and describes the characteristics and trends
V. Ekpu | The Microstructure of Bank Lending to SMEs | PhD Thesis | University of Glasgow | 2015
174
in the data collected. The econometric technique used in this chapter is the ordinal logistic
regression (OLR) method, and has been described extensively in chapter 4. However, a short
overview is included in sub-section 6.3.3. The definition of the variables used in the regression
analysis is also provided here. Section 6.4 discusses the empirical results. The chapter
conclusions are noted in section 6.5.
6.2. Main Hypotheses and Related Literature
6.2.1. The Determinants of Risk Premium on SME Loans
As reviewed in chapter 2, there are two competing theories that explain the riskiness of SME
lending. While the information asymmetry model championed by Stiglitz and Weiss (1981)
explains the riskiness of SMEs in Nigeria from the perspective of their relative opacity and
informational deficiencies, most of the hypotheses discussed under this section are consistent
with the Post-Keynesian asymmetry of expectations and credit rationing theories. One of the
high points of Post-Keynesian credit rationing theory (discussed in chapter 2) relates to the
idea of “fundamental uncertainty”, which characterizes the outcome of most investment
projects (Wolfson, 1996) and hence determines the risk premium of such projects. As a
follow-up therefore, this section examines the micro-level determinants of the risk premium
on SME loans. It also examines the external factors influencing loan profitability. A large
amount of studies have identified the relationship between loan pricing and a number of
borrower, loan and relationship characteristics (e.g. Petersen and Rajan, 1994; Berger and
Udell, 1995; Harhoff and Korting, 1998; Lehmann and Neuberger, 2001, etc). We now
examine in some detail the influence of these factors on risk pricing of SME loans.
Hypothesis 3: The determinants of SME loan pricing decisions are more connected with
borrowers’ risk characteristics and relationship factors than lender-specific characteristics.
Borrowing Firm’s Characteristics and Risk Premium
Hypothesis 3a: Banks are likely to charge higher differential interest rates to SMEs than to
large customers
V. Ekpu | The Microstructure of Bank Lending to SMEs | PhD Thesis | University of Glasgow | 2015
175
Firm Size: It is generally believed that smaller firms are more prone to insolvency than large
firms because they are usually less diversified on the production and distributions side and are
more likely to face financing constraints (Behr and Guttler, 2007). This notion is taken into
consideration by banks that do not grant credit to high-risk default risk borrowers. In an
empirical study of German SMEs, Harhoff and Korting (1998) observed a negative
relationship between firm size and interest rates, indicating that banks may use firm size as a
proxy for credit risk. Lehmann and Neuberger (2001) and D’Auria et al. (1999) obtained
similar results for Italy and Germany. The reputational effects and greater negotiating power
associated with larger firms could help in explaining why they obtain longer-term loans, pay
lower interest rates and provide less collateral than their smaller counterparts.
Firm’s Age/Opacity: Conventional wisdom in contemporary corporate finance literature
argues that younger SMEs are more likely to be less transparent or informationally opaque.
Hyytinen and Pajarinen (2008) find that a closely related proxy for informational opacity is a
firm’s age. Informationally opaque firms are likely to have poor financial records. As noted in
chapter 2, it is expected that a firm that has good financial records will be able to convince a
bank of its ability to repay a loan. The absence of formal financial records thus increases the
credit risk of a firm. In the context of Sub-Saharan Africa including Nigeria, there is acute
information asymmetry between young SMEs and their bankers. According to Lefilleur
(2009), a number of reasons account for this: First, most SMEs evolve in the informal sector
and are therefore not in a position to give banks the minimum information they generally
require (e.g. contact details, legal documents, financial statements, etc). In addition, for SMEs
evolving in the formal sector, the excessively high level of accounting information required by
international/regional financial reporting standards, coupled with the lack of independent,
competent and credible accounting firms, have an impact on the quality of information
transmitted to banks. Moreover, some entrepreneurs knowingly disseminate very limited or
even erroneous information in order to evade taxes. Finally, there are usually no tools that
would allow banks to learn about the payment behaviors of their new clients. Credit
referencing agencies either do not exist or are ineffective. In this context, banks use informal
communication to make up for the shortfall in financial information.
Hypothesis 3b: Banks are likely to charge higher interest rates to younger and
informationally opaque SMEs and lower rates to older and more established large firms.

V. Ekpu | The Microstructure of Bank Lending to SMEs | PhD Thesis | University of Glasgow | 2015
176
Stiglitz and Weiss’s (1981) model show that with a given creditworthiness, relatively young
firms seeking external finance are likely to be more credit constrained than a pool of more
established firms. Diamond (1989) also shows that the joint influence of adverse selection and
moral hazard reduces the ability of a recent entrant to raise external finance at a reasonable
cost. These problems are most severe when the firm is young (i.e. a start-up) and has only a
short track record, because then a severe enough adverse selection (leading to high interest
rates) undermines the firm’s incentives to behave diligently (e.g. to choose a low risk
investment project) as shown by Stiglitz and Weiss (1981). If the firm survives to the next
period despite its risky investment decision, adverse selection is less of a problem, for those
that survive are, on the average, of better quality. This decreases the interest rates that the
financiers demand and thus increases the firm’s incentive to choose less risky projects over
time.
Hypothesis 3c: Banks are likely to charge higher interest rates for SME loan applicants that
cannot meet the bank’s collateral requirements
Availability of Collateral/Guarantees: On a theoretical basis, the use and strength of
personal or business collateral supplied by the borrower should decrease the lender’s risk and
hence, improve financing conditions (Bruns and Fletcher, 2008; St-Pierre and Bahri, 2011).
The bank may insist on a personal commitment from the owner-manager in addition to
company guarantees, ensuring alignment of interests between bank and borrower and reducing
monitoring costs for the bank (Jimenez and Saurina, 2004). Under these circumstances, the
availability of collateral and/or guarantee should reduce interest rates. Secured loans tend to
carry lower loss given default and will lead to lower risk premiums. This is the “loss
mitigation” effect (Berger, Frame and Ioannidou, 2011). However, some studies have also
found that the use of collateral is a signal of high probability of default and is not associated
with reduced risk premium (see St. Pierre and Bahri, 2011). This reflects the argument that
banks use collateral to control presumed risk, because young, small, more indebted and less
solvent firms are more likely to be asked to guarantee loans. The finding suggests that the
dominant reason collateral banks require collateral is to help detect riskier borrowers (“lender
selection” effect).
Hypothesis 3d: Interest rate is likely to be a decreasing function of the applicant
firm’s/owner’s credit rating
V. Ekpu | The Microstructure of Bank Lending to SMEs | PhD Thesis | University of Glasgow | 2015
177
Firm/Owner’s Credit Rating: Credit risk is related to the firm’s financial standing and its
ability to meet its financial obligations. According to Bruns and Fletcher (2008), the lender’s
probability of advancing credit to the borrower could be dependent on both past performance
and current financial standing of the borrower. Past performance, measured by profit and
losses in the past increases or decreases the financial strength of the firm. In addition, the
number of business credit obligations on which the firm has been delinquent in the past is a
negative function of the quantity and cost of credit extended to the firm. Current financial
position is mainly an indicator of whether or not the borrower is solid enough to repay the loan
should the individual project that money is sought for fail. Therefore, the effect of financial
standing on the credit decision is similar to that of collateral – a strong financial position
indicates that the borrower is able to repay the loan irrespective of the outcome of the project.
Machauer and Weber (1998) confirm in their study a highly significant impact of credit rating
on loan prices, with a better rating lowering the cost of capital.
Lender Characteristics and Risk Premium
The pricing of loans to businesses can more closely be explained in terms of the cost, revenue
and risk elements associated with lending activity. As we know, the profitability of any
venture is directly determined by two major components: cost and revenue. The revenue
components of lending include interest income and other non-interest fees. Interest income is
interest earned on loans and other earning assets. The importance of interest income to
profitability is dependent on the relative proportion of earning assets (compared to non-
earning assets) in a bank’s total asset portfolio (Gup and Walter, 1989). Apart from interest
income, banks also earn revenue from fees charged on loans (Churchill and Lewis, 1986) and
similar financial services such as hire purchase, factoring and other asset-based lending.
Hypothesis 3e: Banks are likely to charge higher risk premiums on SME loans because of
higher cost of funds, cost of risk and costs of loan administration.
The BBA (2011) has identified three key drivers behind how banks price lending to SMEs: (1)
cost of funds, (2) cost of risk and capital, and (3) cost of administration.

V. Ekpu | The Microstructure of Bank Lending to SMEs | PhD Thesis | University of Glasgow | 2015
178
Cost of Funds: The risk premium on loans is usually affected by the cost of mobilizing
liquidity and accessing capital. According to the loanable funds theory, in order to lend money
to businesses, banks need to attract funds from depositors by paying them interest. They also
need to aim to hold deposits for similar lengths of time as the term of loans financed. As
mentioned in chapter 5, this seems to be the case in Nigeria where banks aggressively
mobilize deposits from customers and pay higher interest rates for longer-term deposits. They
also offer less stringent terms for cash backed loans (according to the survey of Nigerian loan
officers). Hubbard, Kuttner and Palia (2002) in a recent study investigated the effects of
banks’ financial condition on the borrowers’ risk premium after controlling for borrower risk
and information costs. They find that capital-constrained banks charge higher loan rates than
well-capitalised banks and that this cost difference is especially associated with borrowers for
which ‘information costs’ and ‘incentive problems’ are most important (pp. 561). Their result
is also consistent with models that allow banks to charge a risk premium to borrowers facing
switching costs in bank-borrower relationships as well as models of the bank-lending channel
of monetary transmission. The former concept refers to borrowers that switch from one bank
to the other in search of better credit relationships and have to bear the costs of building credit
reputation and transferring proprietary information to the new lender. The latter concept is
explained below under the credit channel of monetary policy.
Cost of Risk and Cost of Holding Capital: Costs can also be reckoned in terms of the risks
associated with bank lending such as funding liquidity, credit, and capital risks. All banks face
the risk of maturity transformation of assets and liabilities. They borrow short-term funds
(liquid liabilities) to finance long-term (illiquid) loans so that there is a disconnection between
their short term funding and their expected future cash flows. Banks are therefore exposed to
‘funding liquidity risk’ (Brunnermeier et al., 2009) and this affects their profitability and long-
run survival. For example, if banks face unexpected withdrawal of deposits on a large scale
and are unable to control the resulting cash shortage by borrowing from money markets, they
may be forced into early liquidation of their assets (i.e. fire sale) in order to realise cash, thus
lowering their book value. The situation becomes worse if contagion occurs: the entire
banking system will become vulnerable to destructive bank runs (Diamond and Dyvbig, 1983)
and confidence in the system will disappear quickly as the entire credit markets cease to
function.
V. Ekpu | The Microstructure of Bank Lending to SMEs | PhD Thesis | University of Glasgow | 2015
179
Banks also face credit risk or the risk that a borrower or counterparty will be unable to repay a
loan or interest due on the loan on the due date. Mainstream theory suggests that increased
exposure to credit risk is normally associated with lower bank profitability (e.g. Athanasoglou
et al., 2008). However, in Post-Keynesian economics, banks are equally prepared to face
higher credit risk with large firms because lending to them is more profitable, while small
borrowers are likely to have a higher possibility of deviation from their expected rate of return
than large firms due to uncertainty and other factors such as competition and macroeconomic
conditions (Basu, 2003). In any case, banks are able to improve credit risk through effective
screening and monitoring of borrowers. There is some evidence that large bank institutions are
less likely to lend to relatively young and informationally opaque entities because they lack
good credit reputation and hence could pose serious credit risks to lenders (Haynes, Ou and
Berney, 1999; Berger and Udell, 2006). On the liability side, banks could be significantly
dependent on a particular source of funding, e.g. borrowing heavily from the wholesale
interbank markets or through securitisations. In the Nigeria credit market, however, banks are
more reliant on customer deposits than wholesale funding, except in situations of financial
distress.
Now turning to capital risk, banks are highly levered financial institutions and the volume of
their businesses is in multiples of their regulatory capital. According to the Basel capital
accord, banks are required to keep about 8% of their assets in capital (CAR). Banks are
required to hold adequate capital to cushion the risks of loan losses and insulate depositors by
providing a first line of reserve to absorb such losses. However, increased nominal capital
requirements often results in banks taking on extra risks on their portfolios, and this could,
under some circumstances, actually increase the probability of bank failure, even if it
improves the bank’s franchise value45.
Administration Costs: Administration costs refer to the costs directly associated with the
loan administration and monitoring function, e.g. salaries of loan officers and other support
staff, benefits and other loan-related office expenses such as telephone bills, postage,
photocopying, transportation, etc (Churchill and Lewis, 1986:197). Smaller loan facilities tend
to have a relatively higher administrative cost per unit of currency lent than larger facilities,
45 Franchise value means the present value of the bank’s stream of future profits.
V. Ekpu | The Microstructure of Bank Lending to SMEs | PhD Thesis | University of Glasgow | 2015
180
and not all of that cost can be recovered through fees. So small loans tend to bear higher
margins, even if the risk is comparable with larger lending. Due to their size, large banks are
likely to incur higher operating and monitoring costs for smaller loans than for larger loans
due to diseconomies of scale. This suggests that most large banks are likely to lend
predominantly to larger corporates that seek out larger loans, and hence find relationship
lending to small local customers less cost effective and profitable.
The Role of Relationships in Loan Pricing
Hypothesis 3f: Banks are likely to offer lower interest rates to repeat customers (i.e.
customers with longer relationship with them)
Relationships also play a role in the determination of SME loan contracts. As examined in
chapter 7, relationship lending involves the acquisition of soft information by the lender about
the prospective borrower through one-to-one personal contact over time in which case the loan
officer uses the soft information obtained to make lending decisions. Several studies have also
found that relationship driven banks are able to benefit from the inter-temporal smoothing of
contract terms – e.g. by sacrificing short-term for long-term gains when they offer subsidized
credit to growing enterprises (Sharpe, 1990; Rajan, 1992; Petersen and Rajan, 1994, 1995;
Berger and Udell, 1995; Berlin and Mester, 1998; Boot, 2000). In addition, Berger and Udell
(1995) found that borrowers with longer relationships pay lower interest rates and are less
likely to pledge collateral. These results are consistent with theoretical arguments that
relationship lending generates valuable information about borrower quality.
Hypothesis 3g: Banks are likely to charge younger firms lower interest rates at the beginning
of their banking relationship with the hope of making higher returns in later years when their
business has become established (interest rate smoothing)
Since relationship lending involves a personal touch with local customers, relationship-driven
banks by virtue of their proximity to the local customers are arguably more efficient than their
non-relationship banks in delegated monitoring and enforcement of loan contracts (Diamond,
1984; Nakamura, 1994). This in turn improves loan quality, though this may not necessarily
improve lending profitability because small loans are also associated with higher costs of
V. Ekpu | The Microstructure of Bank Lending to SMEs | PhD Thesis | University of Glasgow | 2015
181
lending as literature suggests. In addition, through multiple interactions with the customer,
smaller banks are able to appraise their clients’ investments and provide support services (e.g.
business planning, accounting and tax planning solutions etc) in order to add real value to the
client and ensure better cash flow.
External Factors Affecting SME Loan Pricing
Apart from borrower and lender factors, a number of external factors impact on the pricing of
SME loans. These include the credit channel of monetary policy, the credit market structure
and business cycle fluctuations, among other external or macroeconomic factors
The Credit Channel of Monetary Policy: According to the credit channel theory presented
by Bernanke and Gertler (1995), the direct effects of monetary policy actions such as changes
in short term interest rates are amplified by endogenous changes in the external finance
premium (EFP), where EFP = cost of funds raised externally (by issuing equity and debt) and
cost of funds raised internally (by retaining earnings/profits). The size of the EFP reflects
imperfections in the credit markets that drive a wedge between the expected return received by
lenders and the costs faced by potential borrowers. Accordingly, a change in monetary policy
(i.e. an increase or reduction in interest rates) tends to change the EFP in the same direction.
Thus the impact of monetary policy on the cost of borrowing is magnified because of the
effect on the EFP.
Bernanke and Gertler (1995) describe two sub-channels of the credit channel: (1) the balance
sheet channel (explains the potential impact of monetary policy on borrower’s balance sheet
and (2) the bank lending channel (focuses on the possible effects of monetary policy on the
supply of loans by lenders). The latter is more important for the purpose of this study.
Monetary policy affects the EFP by shifting the supply of intermediate credit, particularly
loans by commercial banks. This is the bank-lending channel. Given the frictions in credit
markets (e.g. an increase in information asymmetry or asymmetry of expectations), a
reduction in the supply of bank loans for whatever reason may cause bank-dependent
borrowers (e.g. SMEs) to have reduced access to credit and hence increase the external finance
premium. They may not be totally constrained from obtaining credit, but they are virtually
certain to incur costs associated with finding a new lender and establishing a credit

V. Ekpu | The Microstructure of Bank Lending to SMEs | PhD Thesis | University of Glasgow | 2015
182
relationship. The analysis of both the balance sheet and bank lending channels of the credit
view also shows that the EFP increases for a longer time than the increase in short term
interest rates, magnifying the effect of a policy-induced credit constraint.
The Credit Market Structure: The structure of the lending market banks operates in
influences the profitability of commercial lending to SMEs. The bank market structure defines
the degree of market concentration or competition among banks of similar or different
characteristics, which in turn affects the level of profits they make. Recent evidence from
Berger, Rosen and Udell (2007) show that market size structure46 has been found to affect the
quantity and price of loans to businesses by banks of different sizes. They found that large
banks tend to charge lower premiums on loans than small banks and that this is so because
large banks tend to operate in local markets with high market shares for large banks. Higher
bank profits and interest margins would only be consistent with relatively weaker competition,
supporting the notion of a negative relationship between competition and loan profitability
(e.g. Short, 1979). However, because of this inverse relationship between competition and
loan profitability, banks now try to build comparative advantage, for example they offer
relationship lending in order to diversify their services from those of other banks and, in the
process, to earn more additional income. Chapter 7 expounds on this. In addition, for post-
Keynesians, competition is not determined solely by the number of players in the market but
also by the rate of return that lenders expect from different borrowing groups (Basu, 2003). So
for example, there is more competition for large customers than small ones because they offer
a higher expected rate of return. In Nigeria, the high-risk premium charged to SMEs can be
explained largely by the lack of bank competition for SMEs.
Business Cycle Fluctuations: During a downward slope of the business cycle, the risk of
business loans and the related capital requirements of banks tend to increase. There is
therefore a danger that banks become less forthcoming in extending loans, thus reinforcing the
cyclical slowdown in what is called a “credit crunch” (Bikker and Hu, 2002). There is a
possibility that loans will be extended less liberally during a cyclical downswing, the argument
being that risk premiums are, in fact, assumed to be insufficient cover for the increased risk or
46 Market size structure according to Berger et al. (2007) refers to the distribution of shares of different size classes of local market participants, where the sizes are inclusive of assets both within and outside the local market.
V. Ekpu | The Microstructure of Bank Lending to SMEs | PhD Thesis | University of Glasgow | 2015
183
inadequate due to adverse selection and moral hazard problems (Stiglitz and Weiss, 1981).
Moreover, during a downswing, loan demand tends to be more interest elastic than during
normal times.
6.2.2. The Determinants of Loan Collateral
As noted earlier, the theoretical literature on collateral demonstrates that collateral can be used
to reduce adverse selection problems (Stiglitz and Weiss, 1981, Chan and Kanatas, 1985;
Besanko and Thakor, 1987a,b; Mishkin, 2010). The following are the main drivers of the use
and amount of collateralisation.
Hypothesis 4: Nigerian banks request collateral from SMEs before making loans and
collateral requirement usually amounts to 100% (or more) of the loan size.
As noted in Chapter 5, Nigerian banks request for personal guarantee for SME loans and
usually require collateral in excess of 100% of the loan amount. For example, in making
agricultural loans to high-end SME customers, First Bank of Nigeria Plc accepts as collateral
landed property with adequate title and marketable value of over 130% of the facility value, or
stocks and shares worth 135% of the facility value, or cash deposit (100%)47. In addition,
several respondents also reported similar figures in the survey conducted on loan officers in
Nigeria. The reason for banks requiring a high collateral-to-loan value reflects the lenders’
consideration of the fact that small business borrowers will more likely default under poor
economic circumstances when the value of their collateral is lower (Epstein and Graham,
1991). Moreover, legal and practical problems of monitoring the collateral and gaining control
of it at the time of default can be quite significant and costly.
47 See First Bank’s conventional term loans and overdrafts, http://www.firstbanknigeria.com/products/individual/agricultural-finance/conventional-term-loans-and-overdrafts/ (Accessed 27/12/2014)

V. Ekpu | The Microstructure of Bank Lending to SMEs | PhD Thesis | University of Glasgow | 2015
184
Collateral and Loan Characteristics
Hypothesis 4a: Banks’ collateral requirement depends on the loan size, regardless of whether
the firm is large or small.
Loan Size: Jimenez et al. (2006) found a positive relationship between loan size and the
probability of requesting collateral from SMEs and opined that loan size indicates a lender’s
relative increase in credit risk. However, predictions from Boot et al. (1991) and Jimenez et
al. (2006) reveal that the amount of collateral pledged in a particular loan will increase if the
loan is granted in a period of higher real interest rates and will decrease with the size of the
loan.
Hypothesis 4b: Bank’s collateral requirement depends on the risk of loan default.
According to Cowling (1999b), the purpose for which a loan is being requested is important in
order to ascertain the riskiness of the loan contract. For example, the riskiness of a loan being
used to finance investment in fixed assets will be different from the riskiness of a loan used as
working capital or to finance cash expenses.
Incidence of Loan Diversion: Sometimes, especially among micro-enterprises, loans are
requested for one purpose and later diverted into other uses not approved by the bank. For
example, in Nigeria, loan diversion is a key moral hazard issue, particularly for the lower end
MSME customers. It was ranked as the most significant contributory factor to the riskiness of
SME loans in Nigeria. Moreover, a number of studies have found that loan diversion is one of
the principal factors affecting the repayment of loans in Nigeria, particularly among small-
scale farmers, traders and artisans (see Afolabi, 2010; Oboh and Ekpebu, 2011; Edet et al.,
2014). Many of them cite family commitments of the owners, untimely disbursement of loans
and high cost of agricultural production as the main reasons for default. To mitigate the risk of
default associated with loan diversion and tie the incentives of the borrower with that of the
lender, many banks request collateral.
Loan Duration: Long-term loans and short-term loans also explain the likelihood of collateral
covering 100% of the face value of the loan (full collateralisation) or the loan being only
partially covered by the collateral (Jimenez et al., 2006).
V. Ekpu | The Microstructure of Bank Lending to SMEs | PhD Thesis | University of Glasgow | 2015
185
Collateral and Borrower Risk Characteristics
Hypothesis 4c: Banks’ collateral requirements are likely to differ between large and small
firms
Firm Size: There is evidence to show that large prime borrowers are more likely to get
unsecured funding because they tend to have stronger capital base, more diversified ownership
structure, more stable cash flows and more certain investment opportunities. Berger and Udell
(1990) and Cowling (1999b), found a negative relationship between firm size and the
incidence of loan collateralisation, since the probability of failure declines with size.
Hypothesis 4d: Banks’ collateral requirement depends on the firm’s/owner’s credit rating or
number of delinquencies
Firm Risk Rating: If collateral is used as an incentive against borrower default, less credit
worthy borrowers will be required to offer more collateral for a given size of loan (Boot et al.,
1991; Chan and Kanatas, 1985, Jimenez et al., 2006). According to Berger and Udell (1990),
safer borrowers more often pledge collateral, which necessarily implies that secured loans are
less risky than unsecured loans. Collateral can also be used as a signal of high credit quality in
situations in which borrowers know their credit quality but lenders do not (Chan and Kanatas
(1985), Besanko and Thakor, 1987a). Besanko and Thakor (1987a) show that competition for
loans results in every borrower being offered a contract that maximizes its expected utility
subject to the constraint that the bank breaks even. They find that collateral plays a useful role.
By designing credit contracts with inversely related interest rates and collateral requirements,
banks can sort borrowers into risk classes. Low risk borrowers choose contracts with low
interest rates and high collateral requirements whereas high-risk borrowers choose contracts
with high interest rates and low collateral requirements. However, what happens in practice is
somewhat different: large firm borrowers (which are low-risk compared to SMEs) are offered
low interest rates (lower than SMEs) and collateral requirements are also lower.
Collateral and Lender Characteristics
Hypothesis 4e: Lender type, lender specialization and other differences in business model are
likely to affect banks’ decision on whether or not to request collateral from SMEs
V. Ekpu | The Microstructure of Bank Lending to SMEs | PhD Thesis | University of Glasgow | 2015
186
Collateralised Lending Versus Monitored Lending: The influence of lender characteristics
on loan contracts determination can be explained by the approach to lending adopted, i.e.
whether lending is secured or asset-backed (collateralised lending) or whether lending is
information and relationship-driven (monitored lending). In collateralised lending, the
borrower undertakes to relinquish ownership of a valuable asset to the lender if he or she fails
to repay a loan. If the borrower defaults on the loan, the lender reserves the right to seize, sell
or liquidate the asset and use the proceeds to offset the loan. Nakamura (1994) points out that
‘because the lender has recourse to the collateral, the borrower has a strong incentive to repay
the loan in full’ (pp. 8). However, it should be noted that that there are huge transaction costs
involved with administering the sale of a collateralised property. Moreover, in some cases the
value of the collateral may have diminished beyond the amount borrowed. Thus the gains to
the lender might be modest (Cole et al., 2004).
In monitored lending, the lender closely monitors the financial condition of the borrower and
intervenes quickly to protect its interest anytime it notices a sign that the borrower will default.
The lender can threaten to refuse future loan requests or force bankruptcy (Nakamura, 1994).
Effective monitoring and gathering of additional information regarding the financial condition
of the borrower will help the lender mitigate the risk of default (Diamond, 1984). A major
difference between collateralised lending and monitored lending is that in the former, the
lender monitors the value of the collateral but is less concerned about the financial status of
the borrower, whereas in monitored lending, the lender monitors the financial condition of the
borrower and takes necessary actions when the risk of default is higher. Monitored lending
therefore supports information disclosure and development of borrower-lender relationships.
Lender Type and Specialization: Jimenez et al. (2006) hypothesized that the use of
collateral in loan contracting is a function of the type of lender. They emphasised that young
and inexperienced banks with relatively lower expertise or specialization in loan contracting as
well as fewer financial resources to assess the riskiness of borrowers are more likely to
employ collateral as a substitute for such an evaluation. If this is the case, then it is expected
that small banks will fall into this category and are likely to have incentive to demand
collateral from applicants, especially those with low credit quality.
V. Ekpu | The Microstructure of Bank Lending to SMEs | PhD Thesis | University of Glasgow | 2015
187
Collateral and Loan Relationships
Hypothesis 4f: Banks’ collateral requirement depends on the strength/length of bank-
borrower relationships
As noted earlier, the length of borrower-lender relationships can influence the setting of loan
contract terms. Boot and Thakor (1994) show that when lenders and borrowers engage in
repeated interactions through time, they are able to build trust and credibility, which help to
reduce moral hazard problems. Banks that have gathered proprietary information over their
clients often use this information in refining contract terms offered to borrowers. Berger and
Udell (1995) in their study of the role of relationships in determining both price and non-price
contract terms of bank lines of credit extended to firms find that longer bank- borrower
relationships reduce the interest rates paid by borrowers and the chances that they will have to
pledge collateral. According to Boot, Thakor and Udell (1991), collateral is an alternative to
trust and by developing relationships, it is expected that collateral requirements would be more
relaxed. Jimenez et al. (2006) also found that the likelihood of collateral is lower for loans
made to borrowers with longer relationship with the lender that grants the loan. To the extent
that this occurs, longer duration of banking relationships relaxes the terms of a loan,
ameliorates credit constraints and hence raises firm value.
Collateral and External Factors
Hypothesis 4g: Bank’s collateral requirement also depends on external factors such as
competition and the business cycle
Competition: Besanko and Thakor (1987b) show that the competition facing firms lowers the
rents of lenders and suggests that the use of collateral is more likely with competition than
monopoly. Competition shortens the borrower-lender relationship and reduces the incentives
to invest in the acquisition of soft information (Chan et al., 1986, Diamond, 1991; Petersen
and Rajan, 1995). This could in turn increase asymmetric information and the riskiness of
business loans. Accordingly, the likelihood of requesting collateral is higher with increased
firm competition.
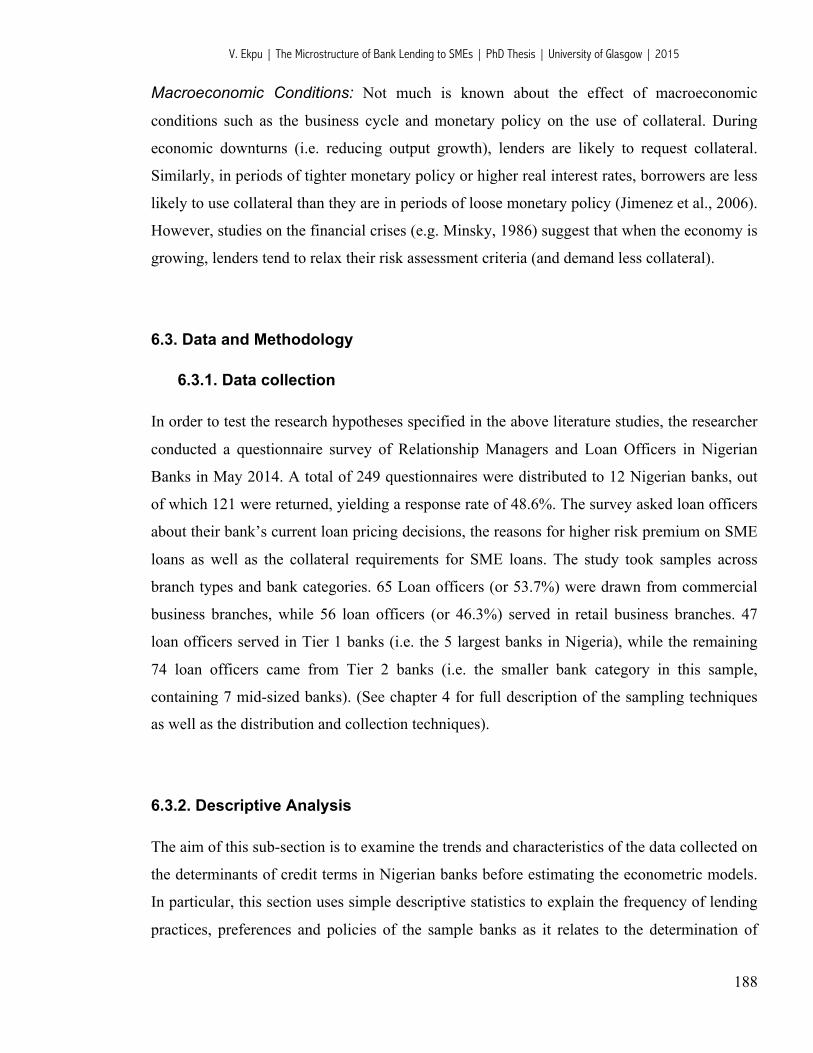
V. Ekpu | The Microstructure of Bank Lending to SMEs | PhD Thesis | University of Glasgow | 2015
188
Macroeconomic Conditions: Not much is known about the effect of macroeconomic
conditions such as the business cycle and monetary policy on the use of collateral. During
economic downturns (i.e. reducing output growth), lenders are likely to request collateral.
Similarly, in periods of tighter monetary policy or higher real interest rates, borrowers are less
likely to use collateral than they are in periods of loose monetary policy (Jimenez et al., 2006).
However, studies on the financial crises (e.g. Minsky, 1986) suggest that when the economy is
growing, lenders tend to relax their risk assessment criteria (and demand less collateral).
6.3. Data and Methodology
6.3.1. Data collection
In order to test the research hypotheses specified in the above literature studies, the researcher
conducted a questionnaire survey of Relationship Managers and Loan Officers in Nigerian
Banks in May 2014. A total of 249 questionnaires were distributed to 12 Nigerian banks, out
of which 121 were returned, yielding a response rate of 48.6%. The survey asked loan officers
about their bank’s current loan pricing decisions, the reasons for higher risk premium on SME
loans as well as the collateral requirements for SME loans. The study took samples across
branch types and bank categories. 65 Loan officers (or 53.7%) were drawn from commercial
business branches, while 56 loan officers (or 46.3%) served in retail business branches. 47
loan officers served in Tier 1 banks (i.e. the 5 largest banks in Nigeria), while the remaining
74 loan officers came from Tier 2 banks (i.e. the smaller bank category in this sample,
containing 7 mid-sized banks). (See chapter 4 for full description of the sampling techniques
as well as the distribution and collection techniques).
6.3.2. Descriptive Analysis
The aim of this sub-section is to examine the trends and characteristics of the data collected on
the determinants of credit terms in Nigerian banks before estimating the econometric models.
In particular, this section uses simple descriptive statistics to explain the frequency of lending
practices, preferences and policies of the sample banks as it relates to the determination of
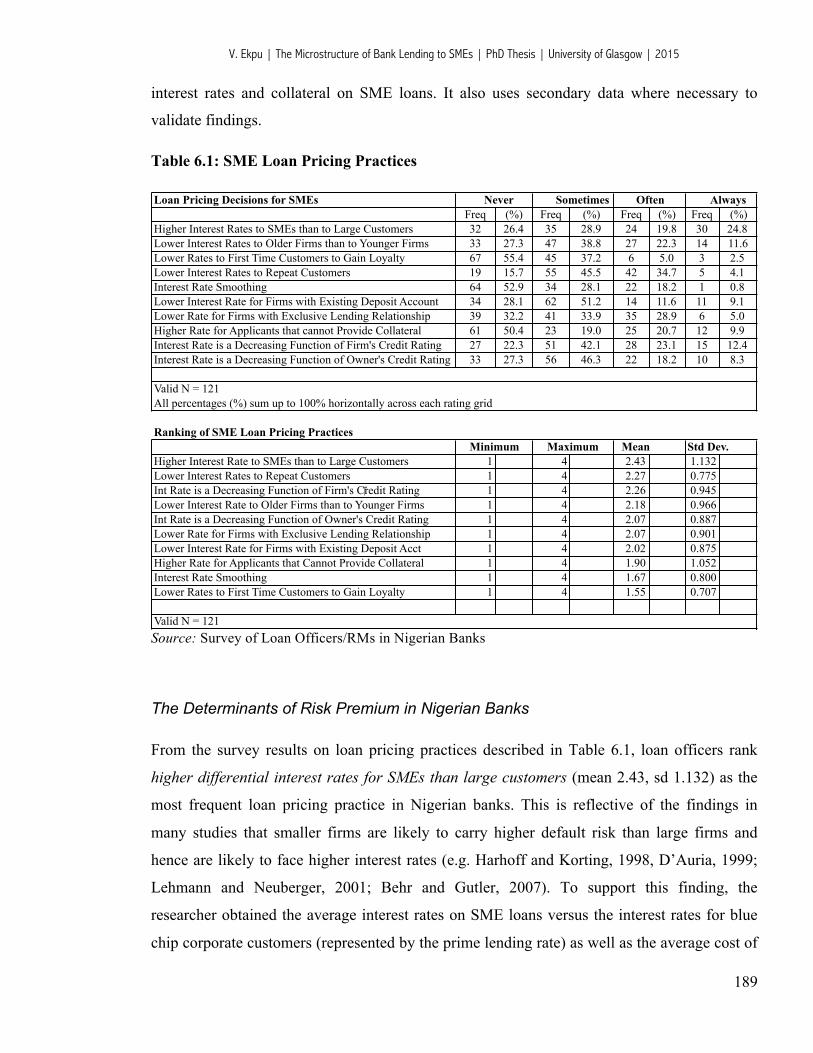
V. Ekpu | The Microstructure of Bank Lending to SMEs | PhD Thesis | University of Glasgow | 2015
189
interest rates and collateral on SME loans. It also uses secondary data where necessary to
validate findings.
Table 6.1: SME Loan Pricing Practices
Loan Pricing Decisions for SMEs Never Sometimes Often AlwaysFreq (%) Freq (%) Freq (%) Freq (%)
Higher Interest Rates to SMEs than to Large Customers 32 26.4 35 28.9 24 19.8 30 24.8Lower Interest Rates to Older Firms than to Younger Firms 33 27.3 47 38.8 27 22.3 14 11.6Lower Rates to First Time Customers to Gain Loyalty 67 55.4 45 37.2 6 5.0 3 2.5Lower Interest Rates to Repeat Customers 19 15.7 55 45.5 42 34.7 5 4.1Interest Rate Smoothing 64 52.9 34 28.1 22 18.2 1 0.8Lower Interest Rate for Firms with Existing Deposit Account 34 28.1 62 51.2 14 11.6 11 9.1Lower Rate for Firms with Exclusive Lending Relationship 39 32.2 41 33.9 35 28.9 6 5.0Higher Rate for Applicants that cannot Provide Collateral 61 50.4 23 19.0 25 20.7 12 9.9Interest Rate is a Decreasing Function of Firm's Credit Rating 27 22.3 51 42.1 28 23.1 15 12.4Interest Rate is a Decreasing Function of Owner's Credit Rating 33 27.3 56 46.3 22 18.2 10 8.3
Valid N = 121All percentages (%) sum up to 100% horizontally across each rating grid
Ranking of SME Loan Pricing Practices Minimum Maximum Mean Std Dev.
Higher Interest Rate to SMEs than to Large Customers 1 4 2.43 1.132Lower Interest Rates to Repeat Customers 1 4 2.27 0.775Int Rate is a Decreasing Function of Firm's Credit Rating 1 4 2.26 0.945Lower Interest Rate to Older Firms than to Younger Firms 1 4 2.18 0.966Int Rate is a Decreasing Function of Owner's Credit Rating 1 4 2.07 0.887Lower Rate for Firms with Exclusive Lending Relationship 1 4 2.07 0.901Lower Interest Rate for Firms with Existing Deposit Acct 1 4 2.02 0.875Higher Rate for Applicants that Cannot Provide Collateral 1 4 1.90 1.052Interest Rate Smoothing 1 4 1.67 0.800Lower Rates to First Time Customers to Gain Loyalty 1 4 1.55 0.707
Valid N = 121Source: Survey of Loan Officers/RMs in Nigerian Banks
The Determinants of Risk Premium in Nigerian Banks
From the survey results on loan pricing practices described in Table 6.1, loan officers rank
higher differential interest rates for SMEs than large customers (mean 2.43, sd 1.132) as the
most frequent loan pricing practice in Nigerian banks. This is reflective of the findings in
many studies that smaller firms are likely to carry higher default risk than large firms and
hence are likely to face higher interest rates (e.g. Harhoff and Korting, 1998, D’Auria, 1999;
Lehmann and Neuberger, 2001; Behr and Gutler, 2007). To support this finding, the
researcher obtained the average interest rates on SME loans versus the interest rates for blue
chip corporate customers (represented by the prime lending rate) as well as the average cost of
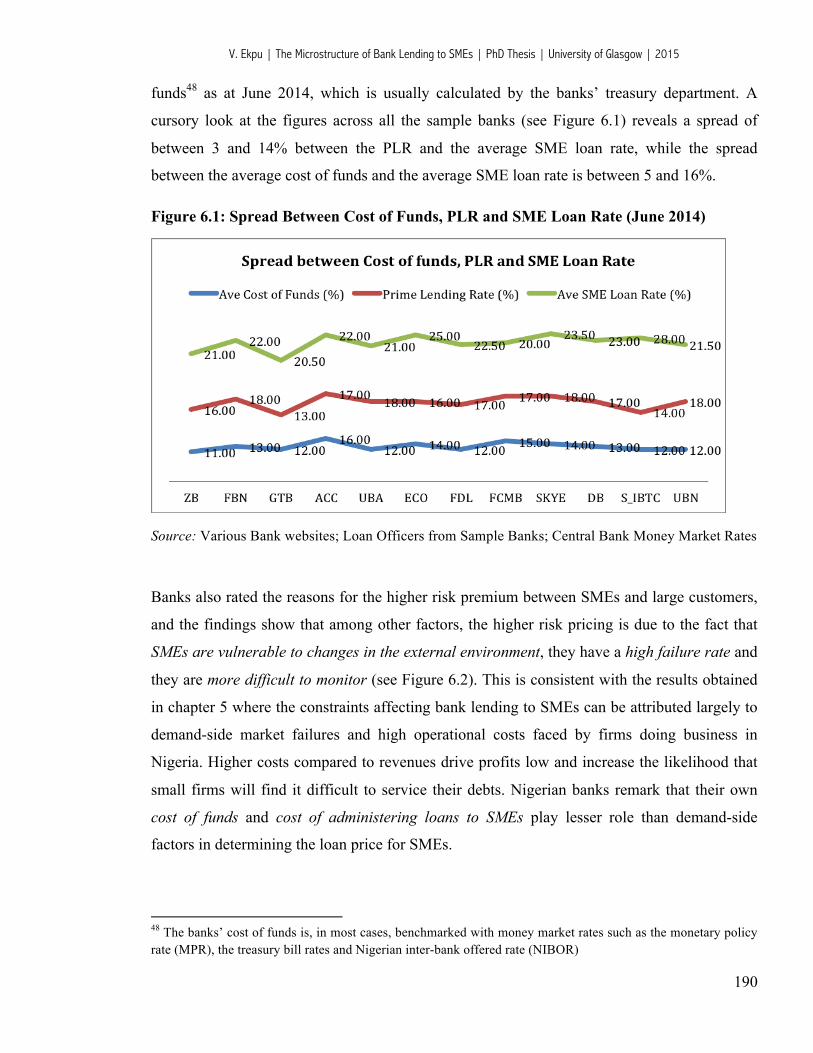
V. Ekpu | The Microstructure of Bank Lending to SMEs | PhD Thesis | University of Glasgow | 2015
190
funds48 as at June 2014, which is usually calculated by the banks’ treasury department. A
cursory look at the figures across all the sample banks (see Figure 6.1) reveals a spread of
between 3 and 14% between the PLR and the average SME loan rate, while the spread
between the average cost of funds and the average SME loan rate is between 5 and 16%.
Figure 6.1: Spread Between Cost of Funds, PLR and SME Loan Rate (June 2014)
Source: Various Bank websites; Loan Officers from Sample Banks; Central Bank Money Market Rates
Banks also rated the reasons for the higher risk premium between SMEs and large customers,
and the findings show that among other factors, the higher risk pricing is due to the fact that
SMEs are vulnerable to changes in the external environment, they have a high failure rate and
they are more difficult to monitor (see Figure 6.2). This is consistent with the results obtained
in chapter 5 where the constraints affecting bank lending to SMEs can be attributed largely to
demand-side market failures and high operational costs faced by firms doing business in
Nigeria. Higher costs compared to revenues drive profits low and increase the likelihood that
small firms will find it difficult to service their debts. Nigerian banks remark that their own
cost of funds and cost of administering loans to SMEs play lesser role than demand-side
factors in determining the loan price for SMEs.
48 The banks’ cost of funds is, in most cases, benchmarked with money market rates such as the monetary policy rate (MPR), the treasury bill rates and Nigerian inter-bank offered rate (NIBOR)
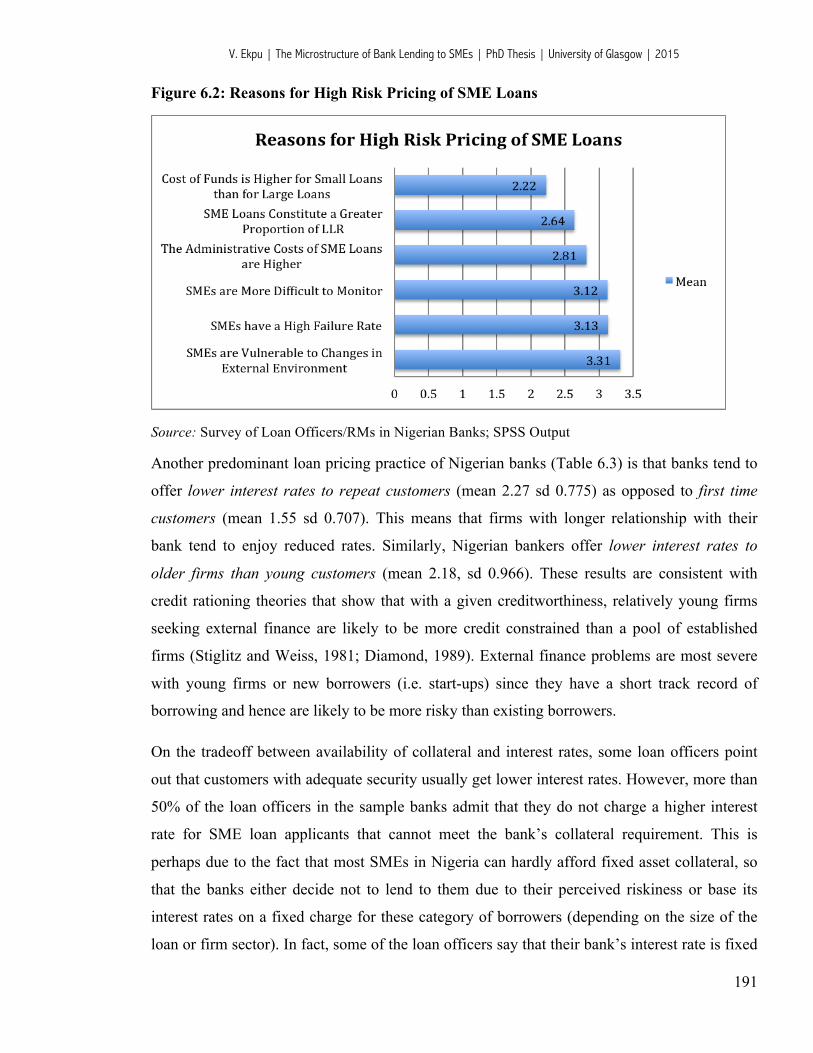
V. Ekpu | The Microstructure of Bank Lending to SMEs | PhD Thesis | University of Glasgow | 2015
191
Figure 6.2: Reasons for High Risk Pricing of SME Loans
Source: Survey of Loan Officers/RMs in Nigerian Banks; SPSS Output
Another predominant loan pricing practice of Nigerian banks (Table 6.3) is that banks tend to
offer lower interest rates to repeat customers (mean 2.27 sd 0.775) as opposed to first time
customers (mean 1.55 sd 0.707). This means that firms with longer relationship with their
bank tend to enjoy reduced rates. Similarly, Nigerian bankers offer lower interest rates to
older firms than young customers (mean 2.18, sd 0.966). These results are consistent with
credit rationing theories that show that with a given creditworthiness, relatively young firms
seeking external finance are likely to be more credit constrained than a pool of established
firms (Stiglitz and Weiss, 1981; Diamond, 1989). External finance problems are most severe
with young firms or new borrowers (i.e. start-ups) since they have a short track record of
borrowing and hence are likely to be more risky than existing borrowers.
On the tradeoff between availability of collateral and interest rates, some loan officers point
out that customers with adequate security usually get lower interest rates. However, more than
50% of the loan officers in the sample banks admit that they do not charge a higher interest
rate for SME loan applicants that cannot meet the bank’s collateral requirement. This is
perhaps due to the fact that most SMEs in Nigeria can hardly afford fixed asset collateral, so
that the banks either decide not to lend to them due to their perceived riskiness or base its
interest rates on a fixed charge for these category of borrowers (depending on the size of the
loan or firm sector). In fact, some of the loan officers say that their bank’s interest rate is fixed
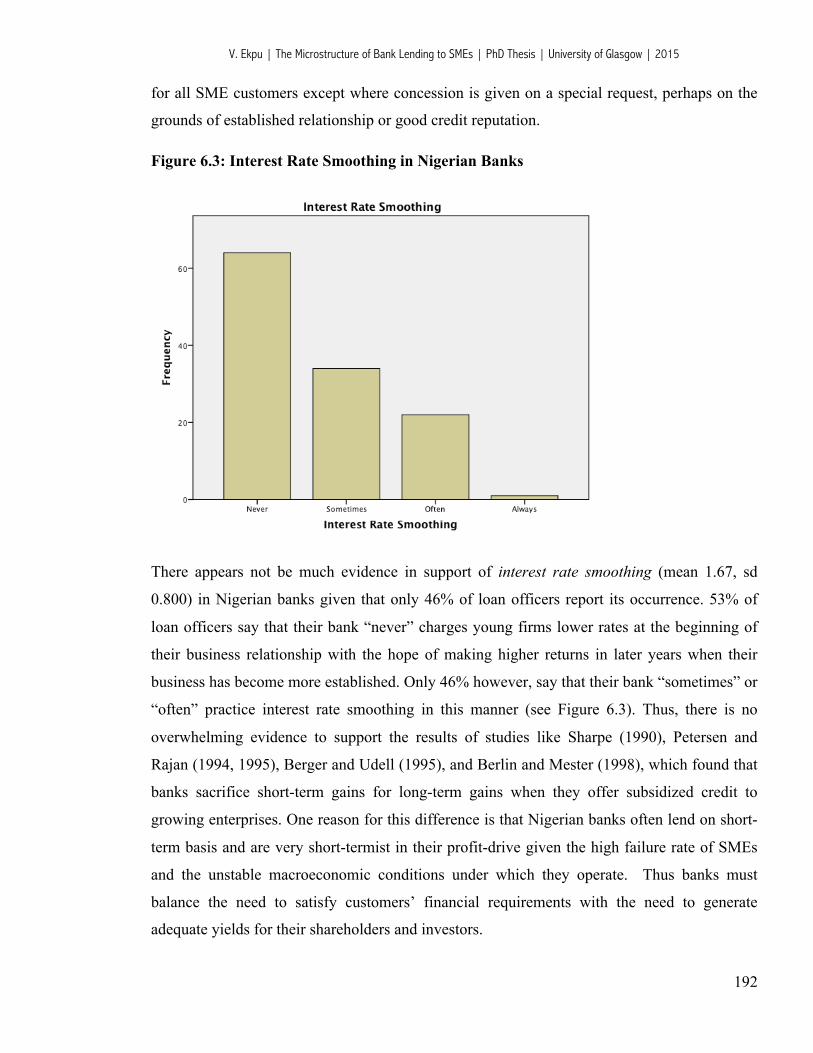
V. Ekpu | The Microstructure of Bank Lending to SMEs | PhD Thesis | University of Glasgow | 2015
192
for all SME customers except where concession is given on a special request, perhaps on the
grounds of established relationship or good credit reputation.
Figure 6.3: Interest Rate Smoothing in Nigerian Banks
There appears not be much evidence in support of interest rate smoothing (mean 1.67, sd
0.800) in Nigerian banks given that only 46% of loan officers report its occurrence. 53% of
loan officers say that their bank “never” charges young firms lower rates at the beginning of
their business relationship with the hope of making higher returns in later years when their
business has become more established. Only 46% however, say that their bank “sometimes” or
“often” practice interest rate smoothing in this manner (see Figure 6.3). Thus, there is no
overwhelming evidence to support the results of studies like Sharpe (1990), Petersen and
Rajan (1994, 1995), Berger and Udell (1995), and Berlin and Mester (1998), which found that
banks sacrifice short-term gains for long-term gains when they offer subsidized credit to
growing enterprises. One reason for this difference is that Nigerian banks often lend on short-
term basis and are very short-termist in their profit-drive given the high failure rate of SMEs
and the unstable macroeconomic conditions under which they operate. Thus banks must
balance the need to satisfy customers’ financial requirements with the need to generate
adequate yields for their shareholders and investors.
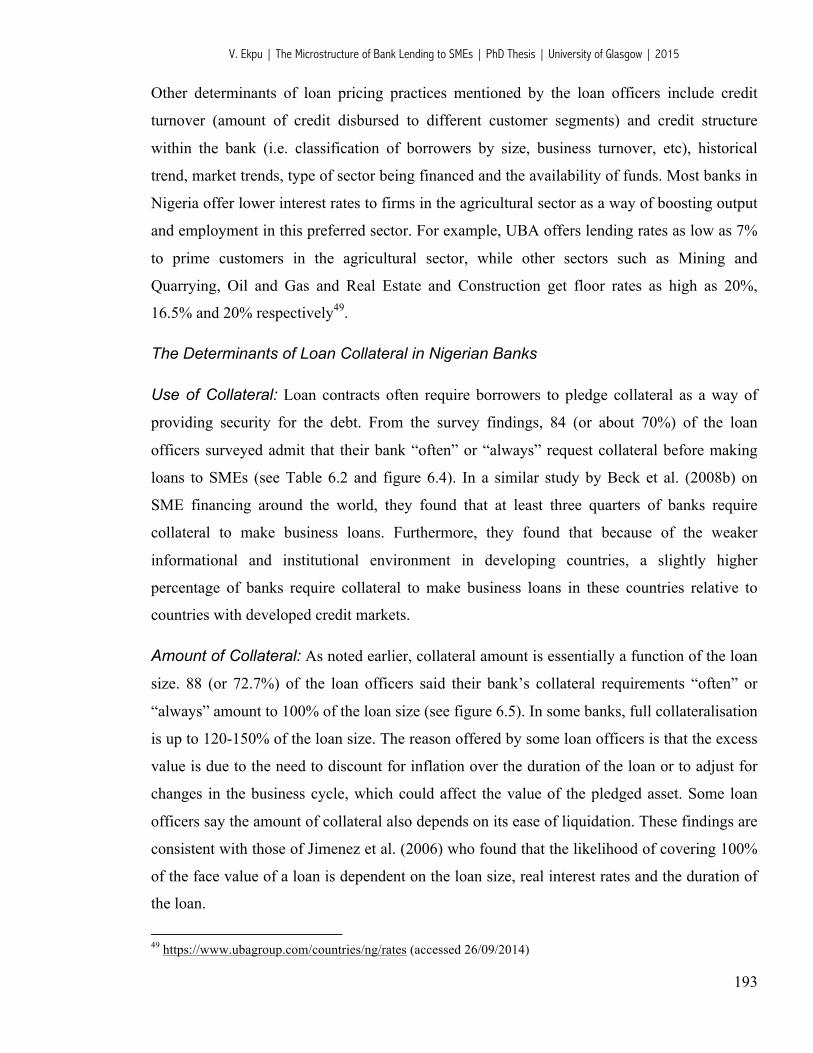
V. Ekpu | The Microstructure of Bank Lending to SMEs | PhD Thesis | University of Glasgow | 2015
193
Other determinants of loan pricing practices mentioned by the loan officers include credit
turnover (amount of credit disbursed to different customer segments) and credit structure
within the bank (i.e. classification of borrowers by size, business turnover, etc), historical
trend, market trends, type of sector being financed and the availability of funds. Most banks in
Nigeria offer lower interest rates to firms in the agricultural sector as a way of boosting output
and employment in this preferred sector. For example, UBA offers lending rates as low as 7%
to prime customers in the agricultural sector, while other sectors such as Mining and
Quarrying, Oil and Gas and Real Estate and Construction get floor rates as high as 20%,
16.5% and 20% respectively49.
The Determinants of Loan Collateral in Nigerian Banks
Use of Collateral: Loan contracts often require borrowers to pledge collateral as a way of
providing security for the debt. From the survey findings, 84 (or about 70%) of the loan
officers surveyed admit that their bank “often” or “always” request collateral before making
loans to SMEs (see Table 6.2 and figure 6.4). In a similar study by Beck et al. (2008b) on
SME financing around the world, they found that at least three quarters of banks require
collateral to make business loans. Furthermore, they found that because of the weaker
informational and institutional environment in developing countries, a slightly higher
percentage of banks require collateral to make business loans in these countries relative to
countries with developed credit markets.
Amount of Collateral: As noted earlier, collateral amount is essentially a function of the loan
size. 88 (or 72.7%) of the loan officers said their bank’s collateral requirements “often” or
“always” amount to 100% of the loan size (see figure 6.5). In some banks, full collateralisation
is up to 120-150% of the loan size. The reason offered by some loan officers is that the excess
value is due to the need to discount for inflation over the duration of the loan or to adjust for
changes in the business cycle, which could affect the value of the pledged asset. Some loan
officers say the amount of collateral also depends on its ease of liquidation. These findings are
consistent with those of Jimenez et al. (2006) who found that the likelihood of covering 100%
of the face value of a loan is dependent on the loan size, real interest rates and the duration of
the loan.
49 https://www.ubagroup.com/countries/ng/rates (accessed 26/09/2014)
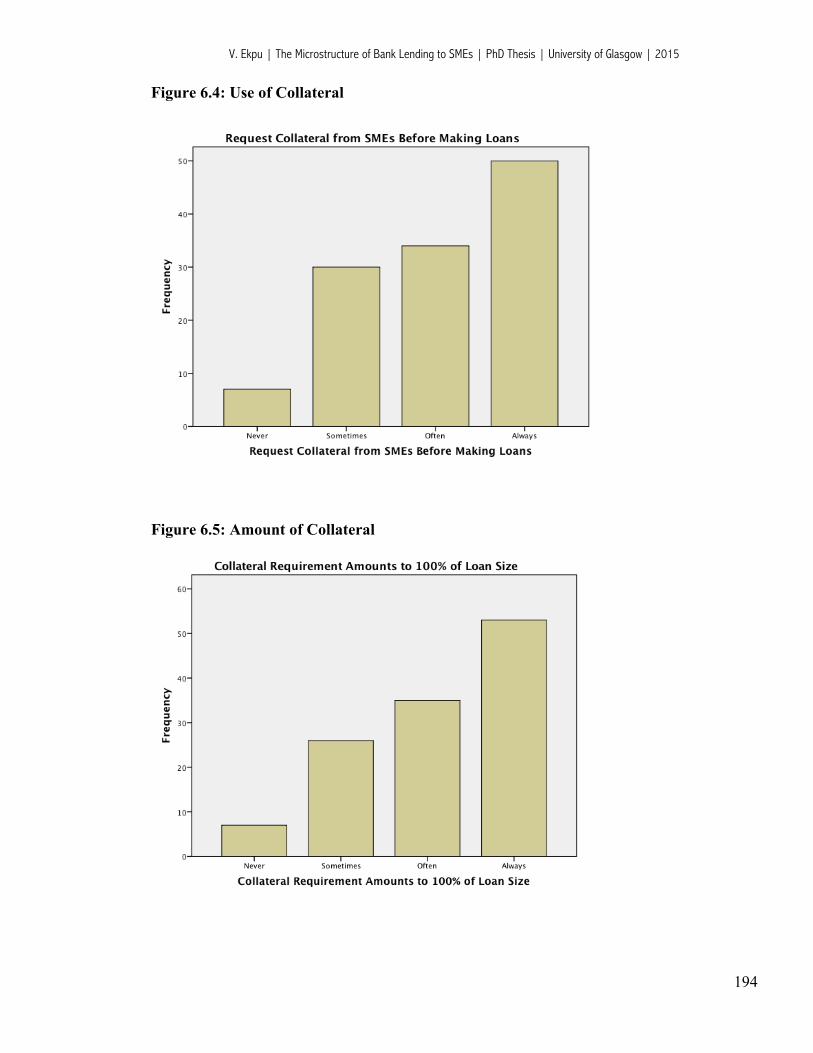
V. Ekpu | The Microstructure of Bank Lending to SMEs | PhD Thesis | University of Glasgow | 2015
194
Figure 6.4: Use of Collateral
Figure 6.5: Amount of Collateral
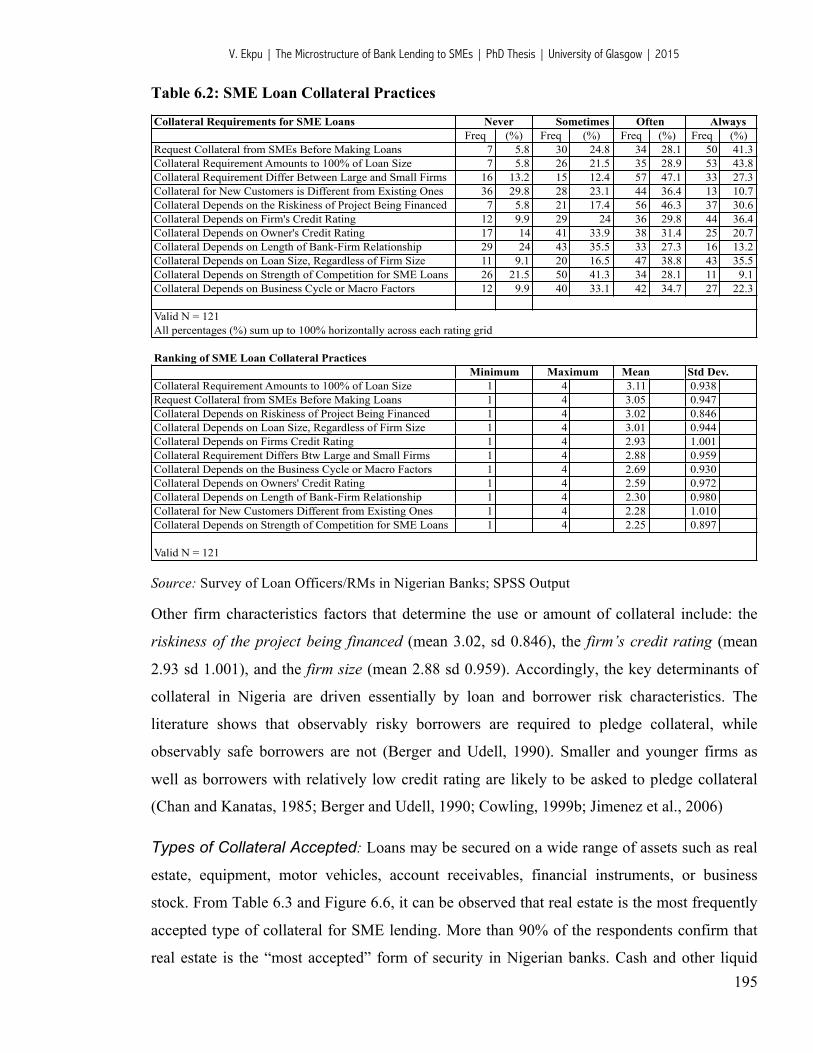
V. Ekpu | The Microstructure of Bank Lending to SMEs | PhD Thesis | University of Glasgow | 2015
195
Table 6.2: SME Loan Collateral Practices
Collateral Requirements for SME Loans Never Sometimes Often AlwaysFreq (%) Freq (%) Freq (%) Freq (%)
Request Collateral from SMEs Before Making Loans 7 5.8 30 24.8 34 28.1 50 41.3Collateral Requirement Amounts to 100% of Loan Size 7 5.8 26 21.5 35 28.9 53 43.8Collateral Requirement Differ Between Large and Small Firms 16 13.2 15 12.4 57 47.1 33 27.3Collateral for New Customers is Different from Existing Ones 36 29.8 28 23.1 44 36.4 13 10.7Collateral Depends on the Riskiness of Project Being Financed 7 5.8 21 17.4 56 46.3 37 30.6Collateral Depends on Firm's Credit Rating 12 9.9 29 24 36 29.8 44 36.4Collateral Depends on Owner's Credit Rating 17 14 41 33.9 38 31.4 25 20.7Collateral Depends on Length of Bank-Firm Relationship 29 24 43 35.5 33 27.3 16 13.2Collateral Depends on Loan Size, Regardless of Firm Size 11 9.1 20 16.5 47 38.8 43 35.5Collateral Depends on Strength of Competition for SME Loans 26 21.5 50 41.3 34 28.1 11 9.1Collateral Depends on Business Cycle or Macro Factors 12 9.9 40 33.1 42 34.7 27 22.3
Valid N = 121All percentages (%) sum up to 100% horizontally across each rating grid
Ranking of SME Loan Collateral Practices Minimum Maximum Mean Std Dev.
Collateral Requirement Amounts to 100% of Loan Size 1 4 3.11 0.938Request Collateral from SMEs Before Making Loans 1 4 3.05 0.947Collateral Depends on Riskiness of Project Being Financed 1 4 3.02 0.846Collateral Depends on Loan Size, Regardless of Firm Size 1 4 3.01 0.944Collateral Depends on Firms Credit Rating 1 4 2.93 1.001Collateral Requirement Differs Btw Large and Small Firms 1 4 2.88 0.959Collateral Depends on the Business Cycle or Macro Factors 1 4 2.69 0.930Collateral Depends on Owners' Credit Rating 1 4 2.59 0.972Collateral Depends on Length of Bank-Firm Relationship 1 4 2.30 0.980Collateral for New Customers Different from Existing Ones 1 4 2.28 1.010Collateral Depends on Strength of Competition for SME Loans 1 4 2.25 0.897
Valid N = 121
Source: Survey of Loan Officers/RMs in Nigerian Banks; SPSS Output
Other firm characteristics factors that determine the use or amount of collateral include: the
riskiness of the project being financed (mean 3.02, sd 0.846), the firm’s credit rating (mean
2.93 sd 1.001), and the firm size (mean 2.88 sd 0.959). Accordingly, the key determinants of
collateral in Nigeria are driven essentially by loan and borrower risk characteristics. The
literature shows that observably risky borrowers are required to pledge collateral, while
observably safe borrowers are not (Berger and Udell, 1990). Smaller and younger firms as
well as borrowers with relatively low credit rating are likely to be asked to pledge collateral
(Chan and Kanatas, 1985; Berger and Udell, 1990; Cowling, 1999b; Jimenez et al., 2006)
Types of Collateral Accepted: Loans may be secured on a wide range of assets such as real
estate, equipment, motor vehicles, account receivables, financial instruments, or business
stock. From Table 6.3 and Figure 6.6, it can be observed that real estate is the most frequently
accepted type of collateral for SME lending. More than 90% of the respondents confirm that
real estate is the “most accepted” form of security in Nigerian banks. Cash and other liquid
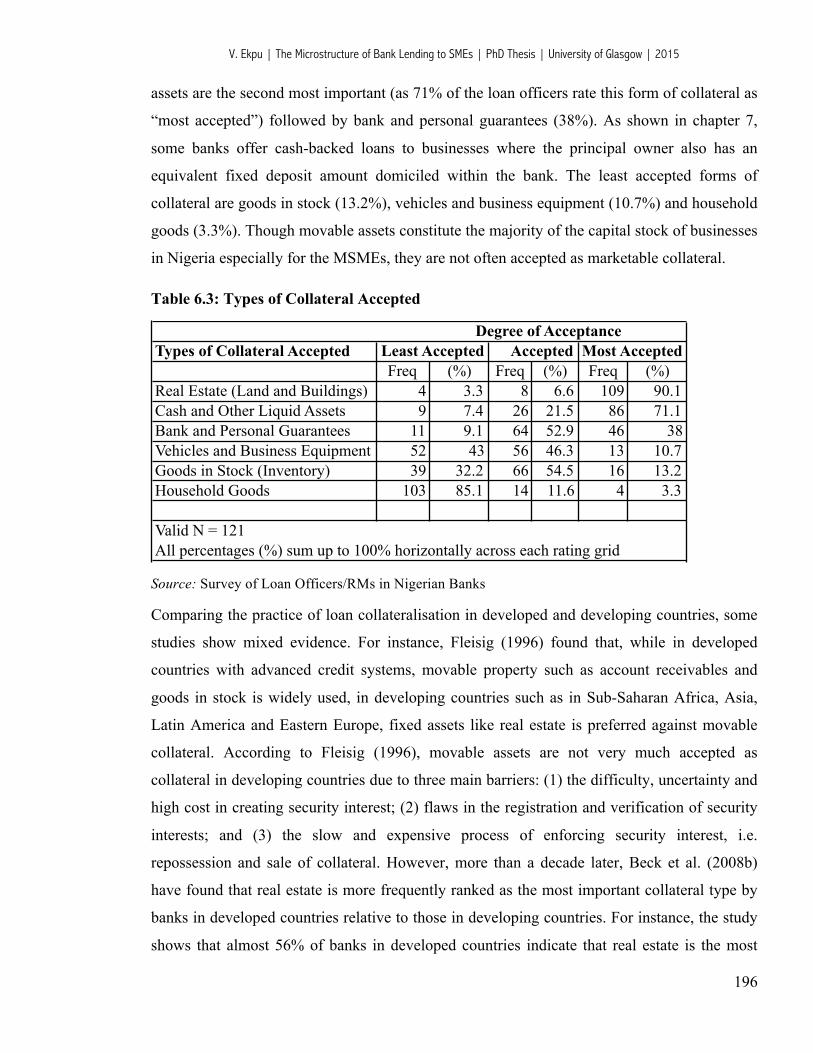
V. Ekpu | The Microstructure of Bank Lending to SMEs | PhD Thesis | University of Glasgow | 2015
196
assets are the second most important (as 71% of the loan officers rate this form of collateral as
“most accepted”) followed by bank and personal guarantees (38%). As shown in chapter 7,
some banks offer cash-backed loans to businesses where the principal owner also has an
equivalent fixed deposit amount domiciled within the bank. The least accepted forms of
collateral are goods in stock (13.2%), vehicles and business equipment (10.7%) and household
goods (3.3%). Though movable assets constitute the majority of the capital stock of businesses
in Nigeria especially for the MSMEs, they are not often accepted as marketable collateral.
Table 6.3: Types of Collateral Accepted
Degree of AcceptanceTypes of Collateral Accepted Least Accepted Accepted Most Accepted
Freq (%) Freq (%) Freq (%)Real Estate (Land and Buildings) 4 3.3 8 6.6 109 90.1Cash and Other Liquid Assets 9 7.4 26 21.5 86 71.1Bank and Personal Guarantees 11 9.1 64 52.9 46 38Vehicles and Business Equipment 52 43 56 46.3 13 10.7Goods in Stock (Inventory) 39 32.2 66 54.5 16 13.2Household Goods 103 85.1 14 11.6 4 3.3
Valid N = 121All percentages (%) sum up to 100% horizontally across each rating grid
Source: Survey of Loan Officers/RMs in Nigerian Banks
Comparing the practice of loan collateralisation in developed and developing countries, some
studies show mixed evidence. For instance, Fleisig (1996) found that, while in developed
countries with advanced credit systems, movable property such as account receivables and
goods in stock is widely used, in developing countries such as in Sub-Saharan Africa, Asia,
Latin America and Eastern Europe, fixed assets like real estate is preferred against movable
collateral. According to Fleisig (1996), movable assets are not very much accepted as
collateral in developing countries due to three main barriers: (1) the difficulty, uncertainty and
high cost in creating security interest; (2) flaws in the registration and verification of security
interests; and (3) the slow and expensive process of enforcing security interest, i.e.
repossession and sale of collateral. However, more than a decade later, Beck et al. (2008b)
have found that real estate is more frequently ranked as the most important collateral type by
banks in developed countries relative to those in developing countries. For instance, the study
shows that almost 56% of banks in developed countries indicate that real estate is the most
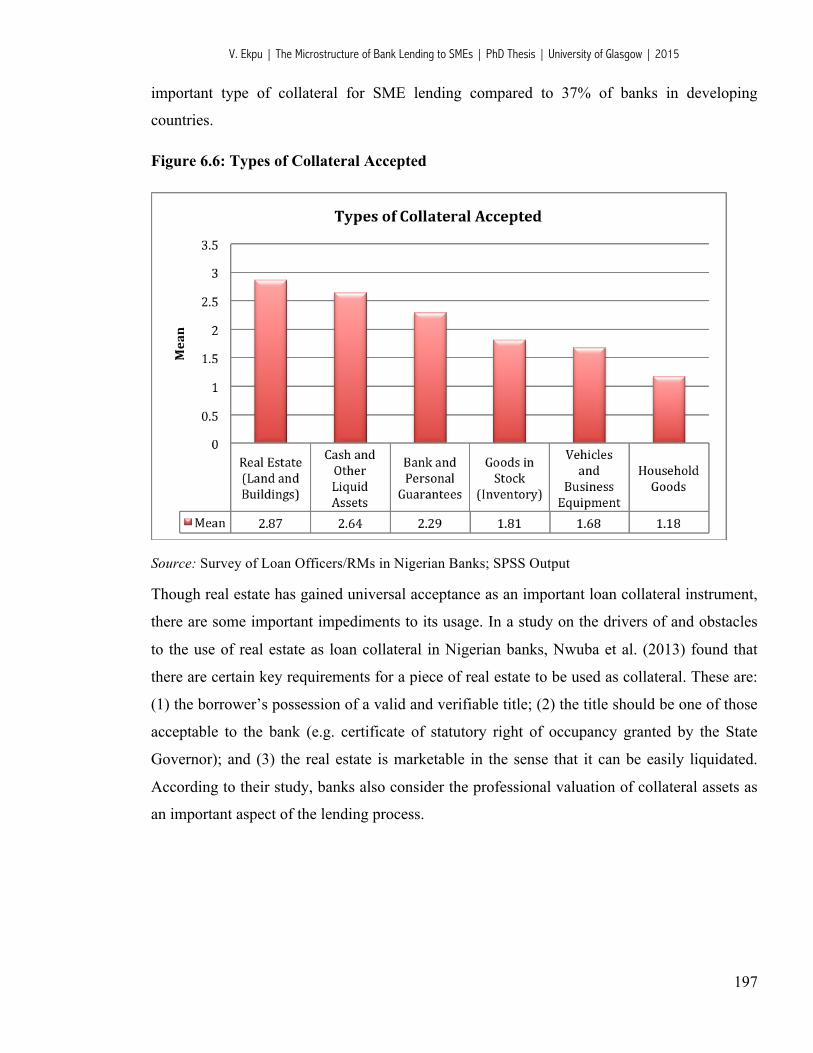
V. Ekpu | The Microstructure of Bank Lending to SMEs | PhD Thesis | University of Glasgow | 2015
197
important type of collateral for SME lending compared to 37% of banks in developing
countries.
Figure 6.6: Types of Collateral Accepted
Source: Survey of Loan Officers/RMs in Nigerian Banks; SPSS Output
Though real estate has gained universal acceptance as an important loan collateral instrument,
there are some important impediments to its usage. In a study on the drivers of and obstacles
to the use of real estate as loan collateral in Nigerian banks, Nwuba et al. (2013) found that
there are certain key requirements for a piece of real estate to be used as collateral. These are:
(1) the borrower’s possession of a valid and verifiable title; (2) the title should be one of those
acceptable to the bank (e.g. certificate of statutory right of occupancy granted by the State
Governor); and (3) the real estate is marketable in the sense that it can be easily liquidated.
According to their study, banks also consider the professional valuation of collateral assets as
an important aspect of the lending process.
V. Ekpu | The Microstructure of Bank Lending to SMEs | PhD Thesis | University of Glasgow | 2015
198
6.3.3. Econometric Model
To empirically examine the determinants of risk premium and collateral, the study uses the
ordinal logistic regression (OLR) method. As noted in chapter 4, OLR is a conditional
likelihood procedure that estimates the probability of observing a given event conditional on a
particular set of parameters. The OLR model is a statistical technique with an ordered
dependent variable. Full details on fitting an OLR model has earlier been provided in chapter 4
(the methodology chapter). In interpreting OLR estimates, the sign of parameters shows
whether the latent variable y* increases with the regressor. A positive coefficient indicates an
increased chance or likelihood that a subject with a higher score on the independent variable
will be observed in a higher category. A negative coefficient indicates the chances or
likelihood that a subject with a higher score on the independent variable will be observed in a
lower category (Snedker et al., 2002). So for example, if we are interested in testing whether
the risk premium on an SME loan depends on whether a firm has collateral or not, a positive
coefficient will imply that a firm with no collateral to secure the loan is more likely to be
charged a higher risk premium, while a negative coefficient will mean that there is a lower
likelihood of a higher risk premium with available collateral. In addition to the fixed effects
OLR, we can also estimate the ordered logit marginal effects as shown in chapter 4. To
interpret the marginal effects, we say that each unit increase in the independent variable
increases/decreases the probability of selecting alternative j by the marginal effect expressed
as a percentage (Katchova, 2013).
Definition of Variables
The various determinant factors explaining the risk premium and collateral requirements on
SME loans in Nigerian banks, which are used in the regression analysis, are explained in
Table 6.4 and 6.5. They derive from influential studies on the determinants of risk premium on
SME loans and the determinants of collateral (e.g. Petersen and Rajan, 1994; Berger and
Udell, 1995; Harhoff and Korting, 1998; Lehmann and Neuberger, 2001; Jimenez et al., 2006;
St-Pierre and Bahri, 2011) as examined in section 6.2. This chapter utilises 34 variables from
the questionnaire in the current study of loan contracts determination, including 20 core
variables, 12 bank dummies, 1 bank size dummy and 1 branch type dummy. However, no
more than 25 variables were used in any one single regression.
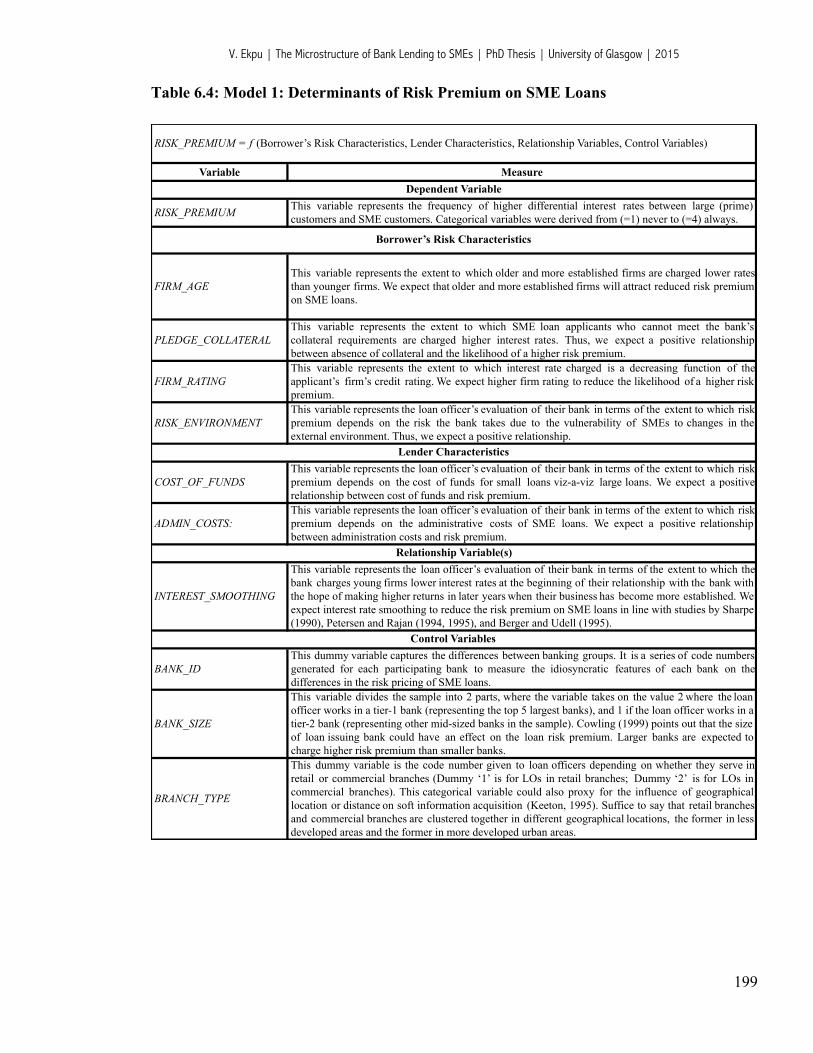
V. Ekpu | The Microstructure of Bank Lending to SMEs | PhD Thesis | University of Glasgow | 2015
199
Table 6.4: Model 1: Determinants of Risk Premium on SME Loans
Variable Measure
RISK_PREMIUM This variable represents the frequency of higher differential interest rates between large (prime)customers and SME customers. Categorical variables were derived from (=1) never to (=4) always.
PLEDGE_COLLATERALThis variable represents the extent to which SME loan applicants who cannot meet the bank’scollateral requirements are charged higher interest rates. Thus, we expect a positive relationshipbetween absence of collateral and the likelihood of a higher risk premium.
FIRM_RATINGThis variable represents the extent to which interest rate charged is a decreasing function of theapplicant’s firm’s credit rating. We expect higher firm rating to reduce the likelihood of a higher riskpremium.
RISK_ENVIRONMENTThis variable represents the loan officer’s evaluation of their bank in terms of the extent to which riskpremium depends on the risk the bank takes due to the vulnerability of SMEs to changes in theexternal environment. Thus, we expect a positive relationship.
COST_OF_FUNDSThis variable represents the loan officer’s evaluation of their bank in terms of the extent to which riskpremium depends on the cost of funds for small loans viz-a-viz large loans. We expect a positiverelationship between cost of funds and risk premium.
ADMIN_COSTS:This variable represents the loan officer’s evaluation of their bank in terms of the extent to which riskpremium depends on the administrative costs of SME loans. We expect a positive relationshipbetween administration costs and risk premium.
INTEREST_SMOOTHING
This variable represents the loan officer’s evaluation of their bank in terms of the extent to which thebank charges young firms lower interest rates at the beginning of their relationship with the bank withthe hope of making higher returns in later years when their business has become more established. Weexpect interest rate smoothing to reduce the risk premium on SME loans in line with studies by Sharpe (1990), Petersen and Rajan (1994, 1995), and Berger and Udell (1995).
BANK_IDThis dummy variable captures the differences between banking groups. It is a series of code numbersgenerated for each participating bank to measure the idiosyncratic features of each bank on thedifferences in the risk pricing of SME loans.
BANK_SIZE
This variable divides the sample into 2 parts, where the variable takes on the value 2 where the loanofficer works in a tier-1 bank (representing the top 5 largest banks), and 1 if the loan officer works in a tier-2 bank (representing other mid-sized banks in the sample). Cowling (1999) points out that the size of loan issuing bank could have an effect on the loan risk premium. Larger banks are expected tocharge higher risk premium than smaller banks.
BRANCH_TYPE
This dummy variable is the code number given to loan officers depending on whether they serve inretail or commercial branches (Dummy ‘1’ is for LOs in retail branches; Dummy ‘2’ is for LOs incommercial branches). This categorical variable could also proxy for the influence of geographicallocation or distance on soft information acquisition (Keeton, 1995). Suffice to say that retail branchesand commercial branches are clustered together in different geographical locations, the former in lessdeveloped areas and the former in more developed urban areas.
Relationship Variable(s)
Control Variables
RISK_PREMIUM = f (Borrower’s Risk Characteristics, Lender Characteristics, Relationship Variables, Control Variables)
Dependent Variable
Borrower’s Risk Characteristics
FIRM_AGE This variable represents the extent to which older and more established firms are charged lower ratesthan younger firms. We expect that older and more established firms will attract reduced risk premiumon SME loans.
Lender Characteristics
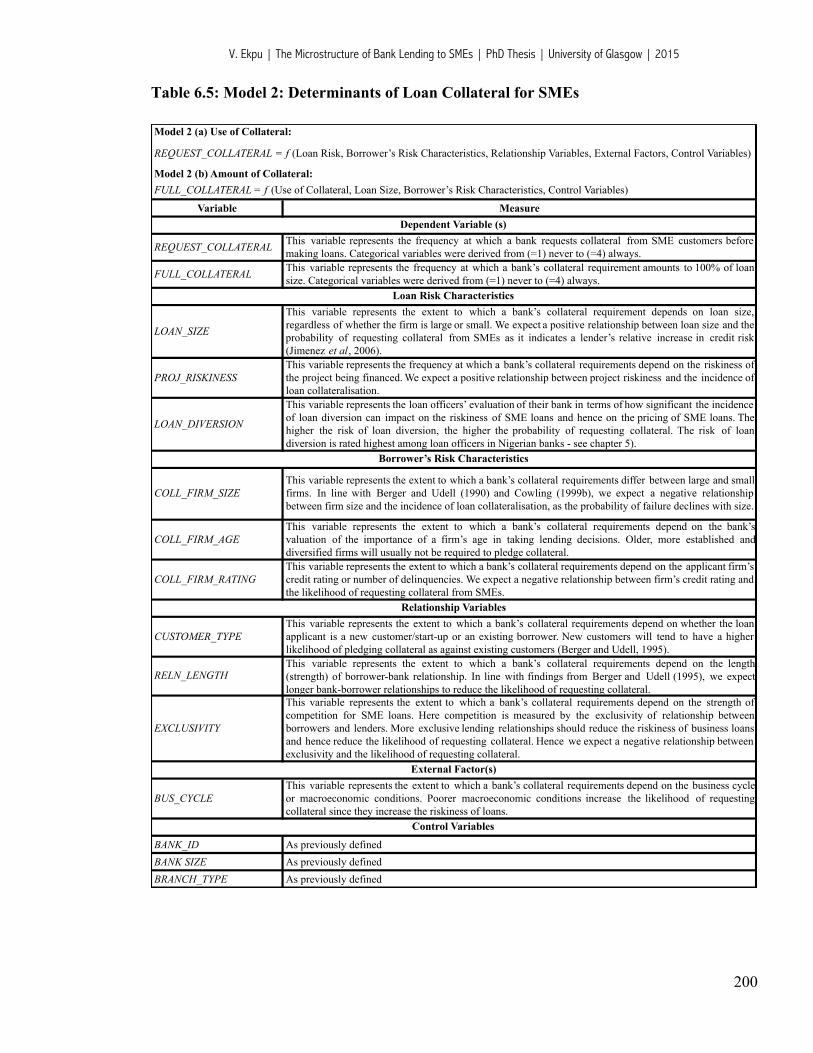
V. Ekpu | The Microstructure of Bank Lending to SMEs | PhD Thesis | University of Glasgow | 2015
200
Table 6.5: Model 2: Determinants of Loan Collateral for SMEs
Variable Measure
REQUEST_COLLATERAL This variable represents the frequency at which a bank requests collateral from SME customers beforemaking loans. Categorical variables were derived from (=1) never to (=4) always.
FULL_COLLATERAL This variable represents the frequency at which a bank’s collateral requirement amounts to 100% of loansize. Categorical variables were derived from (=1) never to (=4) always.
LOAN_SIZE
This variable represents the extent to which a bank’s collateral requirement depends on loan size,regardless of whether the firm is large or small. We expect a positive relationship between loan size and theprobability of requesting collateral from SMEs as it indicates a lender’s relative increase in credit risk(Jimenez et al, 2006).
PROJ_RISKINESSThis variable represents the frequency at which a bank’s collateral requirements depend on the riskiness ofthe project being financed. We expect a positive relationship between project riskiness and the incidence ofloan collateralisation.
LOAN_DIVERSION
This variable represents the loan officers’ evaluation of their bank in terms of how significant the incidenceof loan diversion can impact on the riskiness of SME loans and hence on the pricing of SME loans. Thehigher the risk of loan diversion, the higher the probability of requesting collateral. The risk of loandiversion is rated highest among loan officers in Nigerian banks - see chapter 5).
COLL_FIRM_AGEThis variable represents the extent to which a bank’s collateral requirements depend on the bank’svaluation of the importance of a firm’s age in taking lending decisions. Older, more established anddiversified firms will usually not be required to pledge collateral.
COLL_FIRM_RATINGThis variable represents the extent to which a bank’s collateral requirements depend on the applicant firm’scredit rating or number of delinquencies. We expect a negative relationship between firm’s credit rating and the likelihood of requesting collateral from SMEs.
CUSTOMER_TYPEThis variable represents the extent to which a bank’s collateral requirements depend on whether the loanapplicant is a new customer/start-up or an existing borrower. New customers will tend to have a higherlikelihood of pledging collateral as against existing customers (Berger and Udell, 1995).
EXCLUSIVITY
This variable represents the extent to which a bank’s collateral requirements depend on the strength ofcompetition for SME loans. Here competition is measured by the exclusivity of relationship betweenborrowers and lenders. More exclusive lending relationships should reduce the riskiness of business loansand hence reduce the likelihood of requesting collateral. Hence we expect a negative relationship betweenexclusivity and the likelihood of requesting collateral.
BUS_CYCLEThis variable represents the extent to which a bank’s collateral requirements depend on the business cycleor macroeconomic conditions. Poorer macroeconomic conditions increase the likelihood of requestingcollateral since they increase the riskiness of loans.
BANK_ID As previously definedBANK SIZE As previously definedBRANCH_TYPE As previously defined
RELN_LENGTH This variable represents the extent to which a bank’s collateral requirements depend on the length(strength) of borrower-bank relationship. In line with findings from Berger and Udell (1995), we expectlonger bank-borrower relationships to reduce the likelihood of requesting collateral.
External Factor(s)
Control Variables
Dependent Variable (s)
Loan Risk Characteristics
Borrower’s Risk Characteristics
COLL_FIRM_SIZE This variable represents the extent to which a bank’s collateral requirements differ between large and smallfirms. In line with Berger and Udell (1990) and Cowling (1999b), we expect a negative relationshipbetween firm size and the incidence of loan collateralisation, as the probability of failure declines with size.
Relationship Variables
Model 2 (a) Use of Collateral:
REQUEST_COLLATERAL = f (Loan Risk, Borrower’s Risk Characteristics, Relationship Variables, External Factors, Control Variables)
Model 2 (b) Amount of Collateral:FULL_COLLATERAL = f (Use of Collateral, Loan Size, Borrower’s Risk Characteristics, Control Variables)

V. Ekpu | The Microstructure of Bank Lending to SMEs | PhD Thesis | University of Glasgow | 2015
201
6.4. Empirical Results:
6.4.1 Empirical Determination of Risk Premium on SME Loans
Table 6.6 shows the ordinal logistic regression (OLR) estimation results for the determination
of risk premium on SME loans. The dependent variable is ‘RISK_PREMIUM’, which
measures the frequency at which Nigerian banks charge higher differential interest rates
between large (prime) customers and SME customers. The main independent variables of
interest are firm risk characteristics, lender characteristics and relationship variables already
described in Table 6.4. The results show that FIRM_AGE is significantly related to the
likelihood of higher differential interest rates between SME customers and large firms, thus
confirming hypothesis that banks are likely to charge higher interest rates to younger and
informationally opaque SMEs and lower rates to older and more established large firms. The
result also underscores the finding from the descriptive analysis that Nigerian banks offer
lower interest rates to older and more successful firms and tend to charge younger firms higher
rates due to their relative opacity. As noted in chapter 5, the information gap between SMEs
and Nigerian banks is huge. SMEs in Nigeria have poor accounting practices and do not
provide detailed financial information such as proper financial statements when seeking bank
loans (Ukoha, 2013a). Moreover, the acuteness of information asymmetry between banks and
SMEs leads to inaccurate risk assessments with risks often being overstated by banks. The
overestimation of risks, coupled with high operating costs on SME loans, prompts banks to
avoid lending to SMEs or offer rates that are excessively high (Lefilleur, 2009).
Notice that PLEDGE_COLLATERAL, which measures hypothesis that banks are likely to
charge higher interest rates for SME loan applicants that cannot meet the bank’s collateral
requirements, is insignificant, supporting the findings from the descriptive statistics that
Nigerian banks do not charge a higher interest rate for SME loan applicants that cannot meet
with the bank’s collateral requirement. Again, a reasonable explanation for this is that SMEs
in Nigeria can hardly afford fixed asset collateral and banks either decide not to lend to them
due to their perceived likelihood of default or charge the few credit worthy borrowers among
them fixed rates, irrespective of whether they possess collateral or not.

V. Ekpu | The Microstructure of Bank Lending to SMEs | PhD Thesis | University of Glasgow | 2015
202
Table 6.6: Model 1: Regression Results - Determinants of Risk Premium on SME Loans
Ordered Logistic Regression: RISK_PREMIUM Number of Observations =121 LR chi2 (19 degrees of freedom) = 59.67 Prob > chi2 = 0.0000 Pseudo R-Squared = 0.1790 Log likelihood = -136.8055
Type of Variable Variable Name Coefficient Std. Error Prob. INTERCEPT_1 1.937 2.362 = =
INTERCEPT_2 3.736 2.370 = = INTERCEPT_3 5.029 2.378 = =
Borrower’s Risk Characteristics
FIRM_AGE 0.532** 0.232 0.022 PLEDGE_COLLATERAL 0.200 0.213 0.346
FIRM_RATING 0.186 0.235 0.427 RISK_ENVIRONMENT 0.884*** 0.323 0.006
Lender Characteristics COST_OF_FUNDS 0.353 0.225 0.116 ADMIN_COSTS 0.316 0.284 0.265
Relationship Variable INTEREST_SMOOTHING -0.741*** 0.270 0.006 Control Variables/
Dummies BANK_SIZE -0.755 0.981 0.592
BRANCH_TYPE 0.041 0.475 0.931 BANK_DUMMY1 -0.909 0.938 0.333 BANK_DUMMY2 -0.239 1.012 0.814 BANK_DUMMY3 0.744 1.012 0.462 BANK_DUMMY4 -1.094 0.972 1.266 BANK_DUMMY5 (NA) (NA) (NA) BANK_DUMMY6 0.143 0.924 0.877 BANK_DUMMY7 0.562 0.939 0.550 BANK_DUMMY8 0.840 0.890 0.345 BANK_DUMMY9 -0.483 0.953 0.612 BANK_DUMMY10 -0.452 1.052 0.667 BANK_DUMMY11 -0.901 0.963 0.350 BANK_DUMMY12 (NA) (NA) (NA)
(Risk Premium) = f (Borrower’s Risk Characteristics, Lender Characteristics, Relationship Variables, Controls/Dummies). This table shows the OLR estimation results for the determination of risk premium on SME loans. The dependent variable is ‘risk_premium’, which measures the frequency of higher differential interest rates between large (prime) customers and SME customers - [categorical: from (=1) never to (=4) always]. The main independent variables are firm risk characteristics, lender characteristics and relationship variables already described in Table 6.4. The entry “(NA)” means the variable is omitted because of collinearity * means that the coefficient is statistically significant at a 10% level ** means that the coefficient is statistically significant at a 5% level *** means that the coefficient is statistically significant at a 1% level
!
However, the impact of RISK_ENVIRONMENT on the likelihood of higher risk premium on
SME loans is very significant (at the 1% level). This variable (i.e. the notion that lending to
SMEs is riskier because they are more vulnerable to changes in the external environment) was
rated the most important reason for higher risk premium on SME loans in Nigeria (see figure
6.2). Supporting this finding, Ayyagari et al. (2008) found evidence on the importance of the
business environment as a financing and growth constraint. In particular, they find that
inefficient functioning of financial markets, inadequate security, and enforcement of property
rights, poor provision of infrastructure, inefficient regulation and taxation, corruption, and
governance issues such as political and macroeconomic instability constrain the financing and
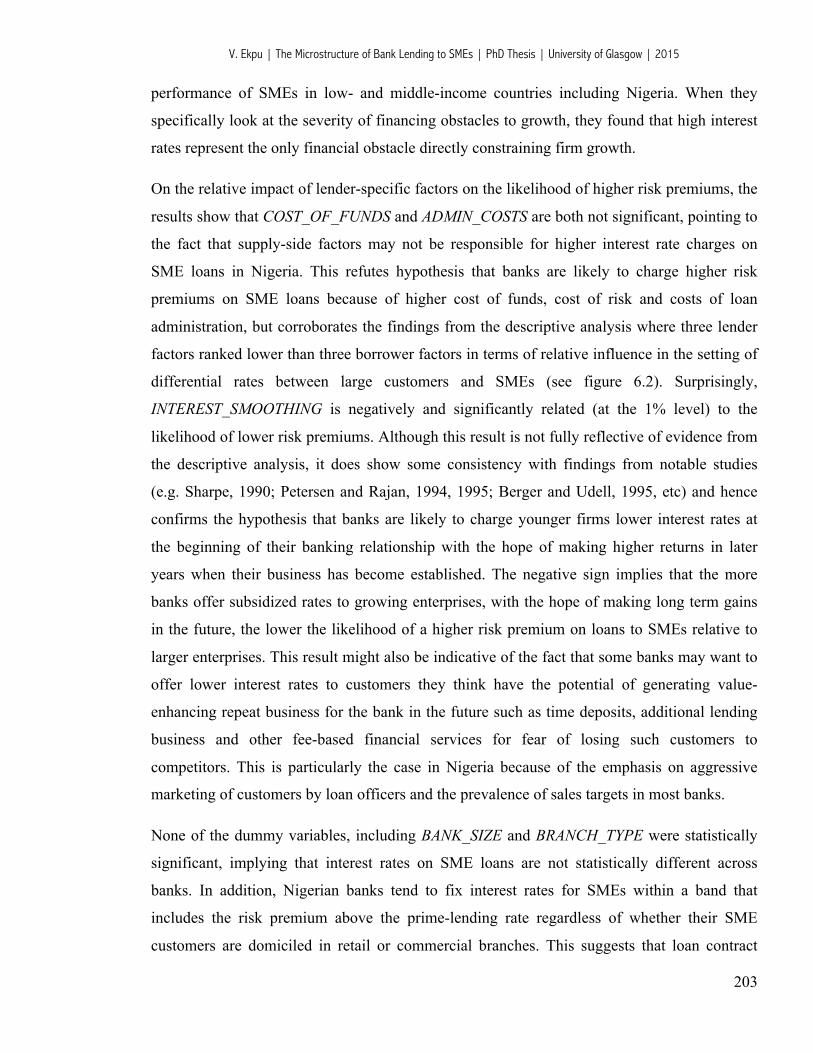
V. Ekpu | The Microstructure of Bank Lending to SMEs | PhD Thesis | University of Glasgow | 2015
203
performance of SMEs in low- and middle-income countries including Nigeria. When they
specifically look at the severity of financing obstacles to growth, they found that high interest
rates represent the only financial obstacle directly constraining firm growth.
On the relative impact of lender-specific factors on the likelihood of higher risk premiums, the
results show that COST_OF_FUNDS and ADMIN_COSTS are both not significant, pointing to
the fact that supply-side factors may not be responsible for higher interest rate charges on
SME loans in Nigeria. This refutes hypothesis that banks are likely to charge higher risk
premiums on SME loans because of higher cost of funds, cost of risk and costs of loan
administration, but corroborates the findings from the descriptive analysis where three lender
factors ranked lower than three borrower factors in terms of relative influence in the setting of
differential rates between large customers and SMEs (see figure 6.2). Surprisingly,
INTEREST_SMOOTHING is negatively and significantly related (at the 1% level) to the
likelihood of lower risk premiums. Although this result is not fully reflective of evidence from
the descriptive analysis, it does show some consistency with findings from notable studies
(e.g. Sharpe, 1990; Petersen and Rajan, 1994, 1995; Berger and Udell, 1995, etc) and hence
confirms the hypothesis that banks are likely to charge younger firms lower interest rates at
the beginning of their banking relationship with the hope of making higher returns in later
years when their business has become established. The negative sign implies that the more
banks offer subsidized rates to growing enterprises, with the hope of making long term gains
in the future, the lower the likelihood of a higher risk premium on loans to SMEs relative to
larger enterprises. This result might also be indicative of the fact that some banks may want to
offer lower interest rates to customers they think have the potential of generating value-
enhancing repeat business for the bank in the future such as time deposits, additional lending
business and other fee-based financial services for fear of losing such customers to
competitors. This is particularly the case in Nigeria because of the emphasis on aggressive
marketing of customers by loan officers and the prevalence of sales targets in most banks.
None of the dummy variables, including BANK_SIZE and BRANCH_TYPE were statistically
significant, implying that interest rates on SME loans are not statistically different across
banks. In addition, Nigerian banks tend to fix interest rates for SMEs within a band that
includes the risk premium above the prime-lending rate regardless of whether their SME
customers are domiciled in retail or commercial branches. This suggests that loan contract

V. Ekpu | The Microstructure of Bank Lending to SMEs | PhD Thesis | University of Glasgow | 2015
204
decisions are driven mainly by the credit quality of each borrower and the banks’ general
lending policies towards SMEs.
6.4.2 Empirical Determination of Loan Collateral
Column (A) of Table 6.7 shows the OLR estimation results for the determination of the use of
collateral. The dependent variable is ‘REQUEST_COLLATERAL’, which measures the
frequency with which a bank requests collateral from SME customers before making loans.
The main independent variables are loan risk, borrower’s risk characteristics, and relationship
variables, already described in Table 6.5. From column (A), the factors that affect the
likelihood of a bank requesting collateral from SMEs in Nigeria are significantly connected
with LOAN_DIVERSION, COLL_FIRM_SIZE, and COLL_FIRM_AGE, which measure the
risk of loan default, the risk of failure and the opacity of SME borrowers, respectively. The
new variable of interest introduced into the model to capture the risk of default on SME loans,
LOAN_DIVERSION, shows a significant and positive effect on the use of collateral (at the 5%
level). This supports the hypothesis that bank’s collateral requirement depends on the risk of
loan default, thus suggesting that the incidence of loan diversion increases the chances of
banks requesting collateral from SMEs because it reduces the likelihood of repayment of loans
granted by banks.
COLL_FIRM_SIZE has a positive and significant effect on the likelihood of pledging
collateral at the 10% level. This result is consistent with theories that advocate that banks
require collateral from borrowers that are perceived to be riskier, i.e. the “lender selection”
effect (Berger, et al. (2011), as the probability of default declines with firm size. Thus, the
results confirm the hypothesis that banks’ collateral requirements are likely to differ between
large and small firms. In line with Cowling (1999b), the age of firm, COLL_FIRM_AGE,
exerts a significant and negative effect upon the incidence of loan collateralisation, supporting
the theory that older and more established firms will usually not be required to pledge
collateral, while younger firms are likely to be required to pledge collateral because they have
a lower probability of survival and hence carry higher risk of default.
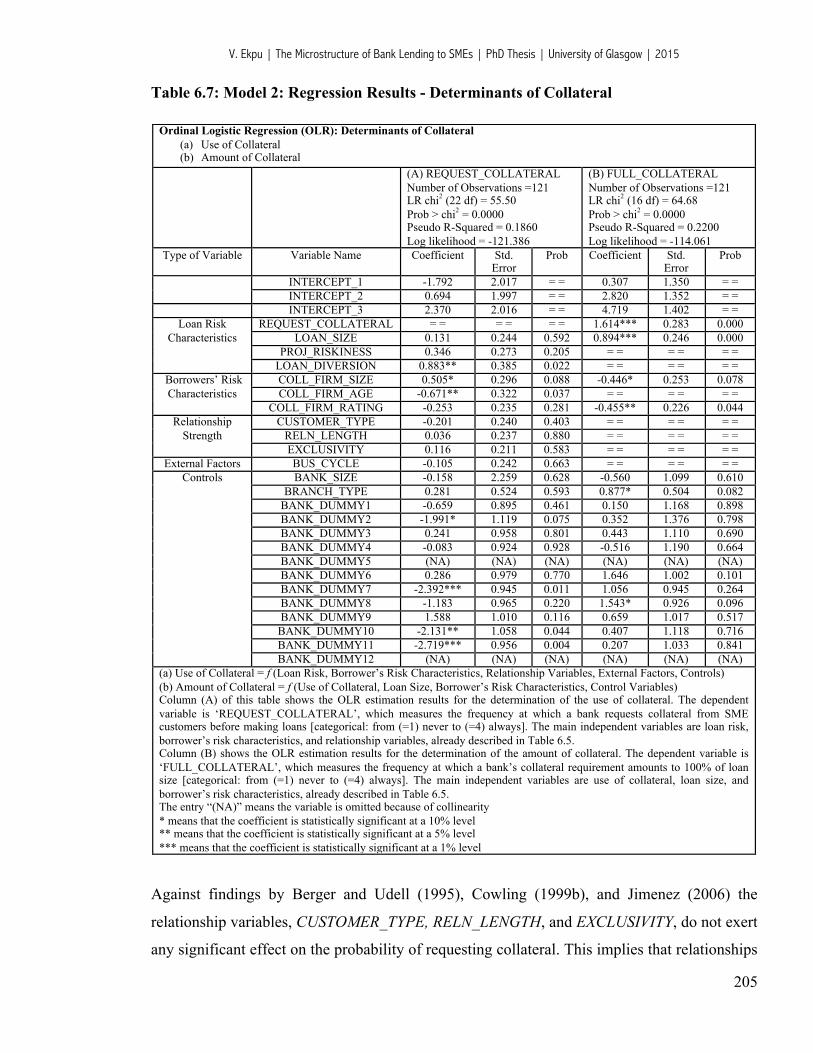
V. Ekpu | The Microstructure of Bank Lending to SMEs | PhD Thesis | University of Glasgow | 2015
205
Table 6.7: Model 2: Regression Results - Determinants of Collateral
Ordinal Logistic Regression (OLR): Determinants of Collateral (a) Use of Collateral (b) Amount of Collateral
(A) REQUEST_COLLATERAL Number of Observations =121 LR chi2 (22 df) = 55.50 Prob > chi2 = 0.0000 Pseudo R-Squared = 0.1860 Log likelihood = -121.386
(B) FULL_COLLATERAL Number of Observations =121 LR chi2 (16 df) = 64.68 Prob > chi2 = 0.0000 Pseudo R-Squared = 0.2200 Log likelihood = -114.061
Type of Variable Variable Name Coefficient Std. Error
Prob Coefficient Std. Error
Prob
INTERCEPT_1 -1.792 2.017 = = 0.307 1.350 = = INTERCEPT_2 0.694 1.997 = = 2.820 1.352 = =
INTERCEPT_3 2.370 2.016 = = 4.719 1.402 = = Loan Risk
Characteristics REQUEST_COLLATERAL = = = = = = 1.614*** 0.283 0.000
LOAN_SIZE 0.131 0.244 0.592 0.894*** 0.246 0.000 PROJ_RISKINESS 0.346 0.273 0.205 = = = = = =
LOAN_DIVERSION 0.883** 0.385 0.022 = = = = = = Borrowers’ Risk Characteristics
COLL_FIRM_SIZE 0.505* 0.296 0.088 -0.446* 0.253 0.078 COLL_FIRM_AGE -0.671** 0.322 0.037 = = = = = =
COLL_FIRM_RATING -0.253 0.235 0.281 -0.455** 0.226 0.044 Relationship
Strength CUSTOMER_TYPE -0.201 0.240 0.403 = = = = = =
RELN_LENGTH 0.036 0.237 0.880 = = = = = = EXCLUSIVITY 0.116 0.211 0.583 = = = = = =
External Factors BUS_CYCLE -0.105 0.242 0.663 = = = = = = Controls BANK_SIZE -0.158 2.259 0.628 -0.560 1.099 0.610
BRANCH_TYPE 0.281 0.524 0.593 0.877* 0.504 0.082 BANK_DUMMY1 -0.659 0.895 0.461 0.150 1.168 0.898 BANK_DUMMY2 -1.991* 1.119 0.075 0.352 1.376 0.798 BANK_DUMMY3 0.241 0.958 0.801 0.443 1.110 0.690 BANK_DUMMY4 -0.083 0.924 0.928 -0.516 1.190 0.664 BANK_DUMMY5 (NA) (NA) (NA) (NA) (NA) (NA) BANK_DUMMY6 0.286 0.979 0.770 1.646 1.002 0.101 BANK_DUMMY7 -2.392*** 0.945 0.011 1.056 0.945 0.264 BANK_DUMMY8 -1.183 0.965 0.220 1.543* 0.926 0.096 BANK_DUMMY9 1.588 1.010 0.116 0.659 1.017 0.517
BANK_DUMMY10 -2.131** 1.058 0.044 0.407 1.118 0.716 BANK_DUMMY11 -2.719*** 0.956 0.004 0.207 1.033 0.841 BANK_DUMMY12 (NA) (NA) (NA) (NA) (NA) (NA)
(a) Use of Collateral = f (Loan Risk, Borrower’s Risk Characteristics, Relationship Variables, External Factors, Controls) (b) Amount of Collateral = f (Use of Collateral, Loan Size, Borrower’s Risk Characteristics, Control Variables) Column (A) of this table shows the OLR estimation results for the determination of the use of collateral. The dependent variable is ‘REQUEST_COLLATERAL’, which measures the frequency at which a bank requests collateral from SME customers before making loans [categorical: from (=1) never to (=4) always]. The main independent variables are loan risk, borrower’s risk characteristics, and relationship variables, already described in Table 6.5. Column (B) shows the OLR estimation results for the determination of the amount of collateral. The dependent variable is ‘FULL_COLLATERAL’, which measures the frequency at which a bank’s collateral requirement amounts to 100% of loan size [categorical: from (=1) never to (=4) always]. The main independent variables are use of collateral, loan size, and borrower’s risk characteristics, already described in Table 6.5. The entry “(NA)” means the variable is omitted because of collinearity * means that the coefficient is statistically significant at a 10% level ** means that the coefficient is statistically significant at a 5% level *** means that the coefficient is statistically significant at a 1% level !
Against findings by Berger and Udell (1995), Cowling (1999b), and Jimenez (2006) the
relationship variables, CUSTOMER_TYPE, RELN_LENGTH, and EXCLUSIVITY, do not exert
any significant effect on the probability of requesting collateral. This implies that relationships

V. Ekpu | The Microstructure of Bank Lending to SMEs | PhD Thesis | University of Glasgow | 2015
206
play a lesser role in refining the collateral terms offered on bank lines of credit extended to
firms. Thus empirical evidence refutes the hypothesis that banks’ collateral requirement
depends on the strength/length of bank-borrower relationships.
However, the hypothesis that lender type, lender specialization and other differences in
business model are likely to affect banks’ decision on whether or not to request collateral from
SMEs is upheld as the negative signs and relative significance of BANK_DUMMY2,
BANK_DUMMY7, BANK_DUMMY10 and BANK_DUMMY11, are pointers to the fact that the
type of lender or differences in business model of banks makes it less likely that these banks
will request collateral from their SME customers. This may be a reflection of the fact that
some of these banks have introduced non-collateral loans for SMEs and thus have other ways
of assessing borrower’s riskiness (e.g. by using credit scoring, psychometric scoring, trade
credit or other lending technologies). Again, BANK_SIZE and BRANCH_TYPE don’t seem to
matter in determining the likelihood of requesting collateral.
Column (B) shows the OLR estimation results for the determination of the amount of
collateral for the same sample of loans used to estimate the models that explain the use of
collateral. The dependent variable is ‘FULL_COLLATERAL’, which measures the frequency
at which a bank’s collateral requirement amounts to 100% of loan size. The main independent
variables are use of collateral, loan size, and borrower’s risk characteristics, already described
in Table 6.2. From column B, it can be observed that REQUEST_COLLATERAL and
LOAN_SIZE are positive and very significant, both at 1% in explaining the likelihood of
collateral covering 100% of the face value of the loan. A positive value indicates that an
increase in the corresponding variable increases the likelihood that the bank will require the
use of full collateral as opposed to partial collateral. These results are consistent with the
predictions by Boot et al. (1991) and Jimenez et al. (2006) that the amount of collateral
pledged in a particular loan will increase with the size of the loan. Thus, the empirical
evidence confirms the hypothesis that banks’ collateral requirement depends on the loan size,
regardless of whether the firm is large or small.
FIRM_SIZE and FIRM_RATING are also negative and significantly related to the probability
of requesting full collateral on loans. A negative sign implies that larger firms and firms with
higher credit rating are less likely going to be asked to pledge full collateral. Interestingly, this
result corroborates theories that explain collateral as a “loss mitigation” device in response to

V. Ekpu | The Microstructure of Bank Lending to SMEs | PhD Thesis | University of Glasgow | 2015
207
adverse selection problems (Berger et al., 2011). Therefore, this empirical evidence is a case
of safer borrowers pledging less collateral, which necessarily implies that safer borrowers
have a lower probability of default and will attract lower risk premiums.
Finally, BRANCH_TYPE seems to have an effect on the amount of collateral requested,
implying that the amount of collateral requested (as a percentage of the loan size) could vary
significantly between retail branches and commercial branches.
It is worthy of mention that the reliability of parameter estimates provided in model 1 and 2
may have been compromised by the presence of multicollinearity, given that two of the bank
dummies, BANK_DUMMY5 and BANK_DUMMY12 were omitted as a result of collinearity.
This problem may have been caused by fitting models with a relatively small sample size
combined with a fairly large number of regressors. Long (1997) notes that highly correlated
exposures and discrete exposures need larger sample sizes. Nemes et al. (2009) also note that
logistic regression overestimates the odds ratios in studies with low to moderate sample size.
The small sample size induced bias is a systematic one, bias away from null. Regression
coefficient estimates shifts away from zero, odds ratios from one. However, as the sample size
increases, the distribution function of the odds ratio converges to a normal distribution
centered on the estimated effect. The log transformed odds ratio, the estimated regression
coefficients, converges more rapidly to normal distribution. Hence, care should be taken to
note that given the relatively small sample size employed in this study, the distributions of the
sample may be highly skewed and odds ratios may have been overestimated.
6.4.3 Robustness Checks
As part of robustness checks to test the quality of predictors in the models used, the stepwise
regression procedure was employed to determine the most important predictors of risk
premium and collateralization of SME loans in Nigerian banks. As noted in chapter 4, the
stepwise regression is a multiple regression procedure that is used to select useful subsets of
variables and to evaluate the order of importance of independent variables in predicting a
dependent variable (see chapter 4 for a detailed explanation of the procedure). Appendix 6.1
shows the results of the stepwise procedure for the predictors of risk premium earlier
examined. The dependent (or predicted) variable is RISK_PREMIUM, while the independent
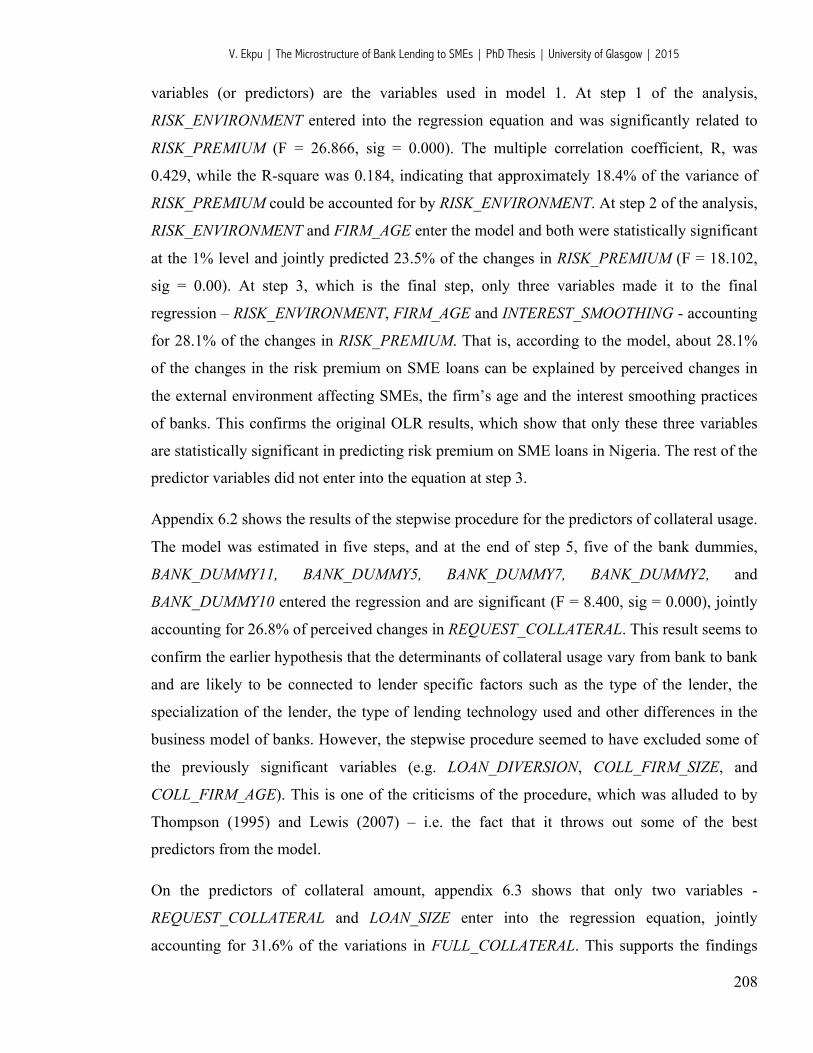
V. Ekpu | The Microstructure of Bank Lending to SMEs | PhD Thesis | University of Glasgow | 2015
208
variables (or predictors) are the variables used in model 1. At step 1 of the analysis,
RISK_ENVIRONMENT entered into the regression equation and was significantly related to
RISK_PREMIUM (F = 26.866, sig = 0.000). The multiple correlation coefficient, R, was
0.429, while the R-square was 0.184, indicating that approximately 18.4% of the variance of
RISK_PREMIUM could be accounted for by RISK_ENVIRONMENT. At step 2 of the analysis,
RISK_ENVIRONMENT and FIRM_AGE enter the model and both were statistically significant
at the 1% level and jointly predicted 23.5% of the changes in RISK_PREMIUM (F = 18.102,
sig = 0.00). At step 3, which is the final step, only three variables made it to the final
regression – RISK_ENVIRONMENT, FIRM_AGE and INTEREST_SMOOTHING - accounting
for 28.1% of the changes in RISK_PREMIUM. That is, according to the model, about 28.1%
of the changes in the risk premium on SME loans can be explained by perceived changes in
the external environment affecting SMEs, the firm’s age and the interest smoothing practices
of banks. This confirms the original OLR results, which show that only these three variables
are statistically significant in predicting risk premium on SME loans in Nigeria. The rest of the
predictor variables did not enter into the equation at step 3.
Appendix 6.2 shows the results of the stepwise procedure for the predictors of collateral usage.
The model was estimated in five steps, and at the end of step 5, five of the bank dummies,
BANK_DUMMY11, BANK_DUMMY5, BANK_DUMMY7, BANK_DUMMY2, and
BANK_DUMMY10 entered the regression and are significant (F = 8.400, sig = 0.000), jointly
accounting for 26.8% of perceived changes in REQUEST_COLLATERAL. This result seems to
confirm the earlier hypothesis that the determinants of collateral usage vary from bank to bank
and are likely to be connected to lender specific factors such as the type of the lender, the
specialization of the lender, the type of lending technology used and other differences in the
business model of banks. However, the stepwise procedure seemed to have excluded some of
the previously significant variables (e.g. LOAN_DIVERSION, COLL_FIRM_SIZE, and
COLL_FIRM_AGE). This is one of the criticisms of the procedure, which was alluded to by
Thompson (1995) and Lewis (2007) – i.e. the fact that it throws out some of the best
predictors from the model.
On the predictors of collateral amount, appendix 6.3 shows that only two variables -
REQUEST_COLLATERAL and LOAN_SIZE enter into the regression equation, jointly
accounting for 31.6% of the variations in FULL_COLLATERAL. This supports the findings
V. Ekpu | The Microstructure of Bank Lending to SMEs | PhD Thesis | University of Glasgow | 2015
209
from the OLR regression that the amount of collateral pledged will increase with the size of
the loan. Use of collateral and loan size are thus the most important amongst the pre-specified
predictors of full or partial collateralization in Nigerian banks. However, the procedure again
seemed to have excluded COLL_FIRM_SIZE and COLL_FIRM_RATING which were
previously significant in explaining the amount of collateral requested on SME loans.
6.5. Chapter Conclusions
This chapter has examined the determinants of risk premium and collateral on SME loans in
Nigerian banks. From the descriptive analysis and empirical results, the determinants of risk
premium on SME loans are largely connected with factors that underline the opacity and
riskiness of SMEs in Nigeria, and are less connected with lender factors such as cost of funds
and administrative expenses associated with loan appraisal and disbursement. The
predominant reasons why Nigerian banks charge higher risk premium on SME loans are
linked with SMEs’ susceptibility to failure and changes in the external environment.
Relationships also play a role in determining risk premiums. In most Nigerian banks,
customers with longer relationships with the bank (i.e. repeat customers) tend to benefit from
lower interest rates. Though not much evidence was available to support interest rate
smoothing among the sample of loan officers, the empirical results show that it is significantly
related to the likelihood of lower risk premium on SME loans in Nigeria.
The determinants of collateral usage vary from bank to bank and are likely to be connected to
the type of the lender, the specialization of the lender, the type of lending technology used and
other differences in the business model of banks. However, the likelihood that banks will
request collateral is also influenced by borrower characteristics such as the firm’ age, firm size
and the risk of loan diversion. Loan size, firm size and borrowers’ credit rating are also
significant factors that determine the probability that a bank will request full or partial
collateralisation. The descriptive analysis shows that real estate and cash-backed assets are the
most accepted forms of collateral used in Nigerian banks today, while movable assets are less
patronised because of the legal and financial constraints that come with their use.
V. Ekpu | The Microstructure of Bank Lending to SMEs | PhD Thesis | University of Glasgow | 2015
210
CHAPTER 7
LOAN OFFICERS, INFORMATION ACQUISITION AND THE VALUE OF RELATIONSHIP LENDING TO NIGERIAN BANKS
7.1. Introduction
Generally, SME lenders use a variety of lending technologies to resolve the problems of
informational opacity associated with small firms. The main categories are ‘relationship
driven’ technologies, and ‘transactions driven’ technologies (Berger and Udell, 1995, 2003,
2006; Stein, 2002). Relationship banking is a very popular term in the banking literature and it
refers to the provision of financial services by a financial intermediary that invests largely in
acquiring ‘customer-specific information’, especially of a ‘proprietary50 nature’ and adds to
this body of private information through ‘multiple interactions with the same customer over
time and/or across products’ (Boot, 2000:10) as well as through the local community in which
the customer operates. Banks obtain proprietary information often through screening and they
consolidate the information gathered over time as they appraise the profitability of their
clients’ investments through monitoring (i.e. multiple interactions). On the other hand,
transactions driven banking tend to provide arms-length finance and focuses on one
transaction rather than emphasising continuous information gathering across multiple
transactions and across time.
Some recent work on relationship lending has placed more emphasis on the role of bank loan
officers in acquiring soft information because it is the loan officers themselves that have direct
contact with the bank’s borrowers. More specifically, in the SME credit market, loan officers
are responsible for conducting due diligence during the underwriting phase and monitoring the
borrower after the loan is disbursed (e.g. Berger and Udell, 2006). However, institutional
frictions may make it difficult for loan officers to communicate soft information within large
banking organisations (e.g. Stein, 2002; Alessandrini et al., 2009; Liberti and Mian, 2009).
This means that because soft information is private (to the loan officer) and non-verifiable, it
is relatively more difficult to transmit across hierarchical layers within a large organisation
(Liberti and Mian 2009). For example, under full decentralisation of lending functions, a loan
50 Proprietary information refers to information that is privy to only the financial intermediary and the customer.
V. Ekpu | The Microstructure of Bank Lending to SMEs | PhD Thesis | University of Glasgow | 2015
211
officer has authority to allocate a bank’s funds. Given that he has capital to work with, he will
devote more time and effort to research and documentation since his incentives to do research
is relatively strong. This also makes the loan officer to develop his expertise. In contrast,
however, if a loan officer is functioning as part of a large multi-bank hierarchy where a
centralised lending strategy is in place, he is not motivated enough to give quality time to
research and documentation, because he knows that capital allocation will ultimately be
decided by someone higher up in the organisation. Since he doesn't get a chance to do a
thorough job for fear of his research efforts going into waste, he is unable to pass credible
information up the hierarchy and hence capital allocation is instead done using more of
objective criteria than subjective assessments. Since loan officers are the ones in contact with
local business customers, it then means that the relevant relationship in SME lending is the
loan officer-entrepreneur relationship, not the bank-entrepreneur relationship (see Berger and
Udell, 2002).
Notwithstanding the theoretical relevance of the role of loan officers to relationship lending,
there has been very little direct empirical research on the role of loan officers in providing this
lending technology. The theoretical foundations of relationship lending suggest some clear and
interesting empirical implications: If the loan officer plays such an important role in
relationship lending, then we would expect to see a link between loan officer attributes and
soft information acquisition as well as a link between loan officer underwriting/monitoring
activities and soft information acquisition. For example, we would expect to see an association
between the soft information acquisition and such things as the skill level of the loan officer
(an attribute) and the frequency of contact or meeting between the loan officer and the
borrower (an activity). This chapter explores the link between soft information acquisition and
loan officer attributes/lending activities as well as examines the benefits or economic value of
relationship lending to Nigerian banks. The latter hypothesis is a validation test to see the
impact of the accumulation of soft information on the benefits of relationship lending.
The significant contribution of this study is that by focusing on the activities of loan officers,
we can analyse the underlying mechanism that drives the accumulation of soft information.
Other relationship lending studies have tended to focus on the borrower benefits from
relationship lending without due consideration to the role of loan officers in generating those
benefits (e.g. Petersen and Rajan, 1994; Berger and Udell, 1995; Cole, 1998; Harhoff and

V. Ekpu | The Microstructure of Bank Lending to SMEs | PhD Thesis | University of Glasgow | 2015
212
Korting, 1998; Cerqueiro, et al., 2011; Agarwal and Hauswald, 2010). Thus in essence, this
study tends to address the fundamental issues of whether loan officers are central to soft
information acquisition, and what value relationship lenders derive from soft information
accumulation. This study derives its models mainly from the study by Uchida, Udell and
Yamori (2012). However, the essential difference is that while their study surveys firms, this
study examines the topic from a supply-side perspective. In addition, this study introduces
new parameters to the determinants of soft information accumulation (e.g. independent
approval of loans by loan officers, discretion in setting interest rates, frequency of
communication and relationship banking experience), as well as new measures of relationship
benefits (e.g. lending efficiency, cost effectiveness, customer satisfaction, additional business
and loan performance variables). Moreover, the country of study they used was Japan, a much
more developed banking system than Nigeria, which is used in this study. In addition, this
aspect of information acquisition in SME lending has never been studied for Nigeria, one of
the largest banking systems in Africa and hence this study represents a novel contribution to
the body of knowledge in Nigeria and indeed Sub-Saharan Africa.
The main findings from this chapter are two fold: (1) The predominantly centralised lending
strategy in Nigerian banks impacts negatively on the accumulation of soft information by loan
officers, implying that not all information collected by the loan officers is utilised in taking
lending decisions. (2) The proprietary information (or knowledge) loan officers gather through
social interaction with their customers, however, tends to yield some benefits for Nigerian
banks. The most dominant is the generation of repeat business through greater customer
satisfaction from bank relationships. Other benefits from relationship lending include better
lending decisions and greater loan quality.
The rest of this chapter is structured as follows: Section 7.2 highlights the main hypotheses
and examines in some detail the related literature on the role of loan officers in soft
information acquisition as well as the benefits and costs of relationship lending to banks. The
data and methodology are described briefly in section 7.3. This section also analyses the
findings from the descriptive statistics and presents an overview of the econometric method
used for the empirical analysis (full description of the econometric method, the OLR technique
is found in chapter 4). Section 7.4 presents and analyses the empirical results of the study,
while section 7.5 concludes the study.
V. Ekpu | The Microstructure of Bank Lending to SMEs | PhD Thesis | University of Glasgow | 2015
213
7.2. Main Hypotheses and Related Literature
Hypothesis 5: Relationship lending (based on information acquisition and personal touch by
relationship managers) is of high economic value or significance to Nigerian banks
7.2.1. The Role of Loan Officers in Soft Information Acquisition
The literature on bank lending to SMEs has emphasised the dichotomy between soft
information and hard information. Specifically, this literature has identified soft information
with “relationship lending”, and hard information with “transactions-based lending” (e.g.
Stein, 2002; Berger and Udell, 2003, 2006; Petersen, 2004; Berger, et al., 2005). Hard
information is quantitative, easy to store and transmit in impersonal ways, and its content is
independent of the collection process. On the contrary, soft information is not easily quantified
and consists of information gathered over time through contact with the firm, the firm’s
management/entrepreneur, the firm’s suppliers and customers, and other local sources (Uchida
et al., 2012).
Hypothesis 5a: Loan officers accumulate soft information by collecting, analysing and
synthesizing information gathered from SME borrowers over the life of their lending
relationship with the bank and through frequent and personalized contact with them and the
local community in which they operate.
The acquisition of soft information by relationship lenders is not an end in itself. Banks
(through the loan officers) acquire and process soft information and produce additional
information about firms and their investment projects in order to allocate capital efficiently
(Stein, 2002), i.e. make efficient lending decisions. First, banks acquire or gather information
supplied by firms about their business, sector of activity, products, services, markets,
suppliers, transaction history, and previous performance over time. Sometimes, relationship
lenders also garner pockets of classified business information from local market sources
collected from their borrower’s customers, suppliers, competitors or neighbouring businesses
(Petersen and Rajan, 1994; Berger and Udell, 1995; Mester et al., 1998; Degryse and
Cayseele, 2000). Secondly, banks process this information by analysing and profiling
customers’ according to their risk classes and profitability. They do this by observing their
character and fidelity to monetary obligations such as their ability to repay loans, frequency of
deposits or their level of commitment to any other financial services provided by the bank

V. Ekpu | The Microstructure of Bank Lending to SMEs | PhD Thesis | University of Glasgow | 2015
214
(Nakamura, 1994). They also analyse the demand for their products and the sales or revenue
trends of the customer’s business. Thirdly, on the basis of such knowledge and experiences,
banks then produce or generate additional information about the credit worthiness of their
customers (i.e. their ability to repay loans) and the viability of their investment projects for the
purpose of making informed lending decisions. In many banks, the information is usually
produced in the form of loan request documentation and credit risk reports sent to the head
office or the central credit committee, which ultimately culminates in either an acceptance or
rejection of the credit requests.
In advanced credit markets, the processing of information is mostly done electronically using
credit scoring models. In Nigeria and many Sub-Saharan African countries where the credit
system is still underdeveloped, banks rely hugely on traditional relationship lending and other
psychometric means of assessing borrowers, i.e. the use of qualitative assessment based on the
5Cs of lending – character, capacity, capital, collateral and conditions – in assessing the
chances of borrower default. Traditionally, relationship-driven banks rely on soft information
collected on borrowers (through repeated interactions over time) as a basis for lending to
informationally opaque SMEs as explained above.
Empirical evidence shows that relationship lending is beneficial to lenders because it improves
the efficiency of loan contracting and brings about an increase in borrower access to credit as
the relationship is deepened (Diamond, 1991, Boot and Thakor, 1994; Petersen and Rajan,
1994, 1995; Berger and Udell, 1995; Harhoff and Korting, 1998, Boot, 2000). Relationship
lenders tend to be more efficient in collating detailed local information about the credit risk
profile of their clientele before processing a loan. It has been widely argued that relationship
lenders are more informationally efficient than non-relationship lenders because they are
better able to acquire and synthesize soft information from their SME customers and then
produce additional information that aid in the capital allocation process or credit decision-
making. This is possible because the nature of SMEs business allows relationship banks to
develop longer and more personal relationships with their customers over time. Through the
checking and savings account history of their local customers, relationship banks are able to
monitor their cash flows and sales performance over time (Nakamura, 1994; Petersen and
Rajan, 1994; Carter, McNulty and Verbrugge, 2004) and then utilise this information in the
lending process (Akhigbe and McNulty, 2005; Berger et al., 2005). By contrast, non-

V. Ekpu | The Microstructure of Bank Lending to SMEs | PhD Thesis | University of Glasgow | 2015
215
relationship banks are unable to acquire detailed information like this since they mostly deal
with large firms who often have multiple business divisions and keep several banking
relationships (Nakamura, 1993a, 1993b; Carter, McNulty and Verbrugge, 2004). More so,
relationship banks have a long history of lending in the local community and this gives them
an edge over the local branches of their non-relationship banking counterparts51.
Hypothesis 5b: A decentralised lending structure, characterised by autonomous lending by
loan officers, reinforces the acquisition of soft information and hence allows relationship
banks to effectively act as delegated monitors.
Another aspect in which relationship banks are informationally efficient is in the type of
lending administration structure. In decentralised lending structures where the loan officer is
able to make some lending decisions autonomously, it is relatively easy to use proprietary
financial information about a customer’s loan portfolio and the surrounding business
circumstances to make lending decisions On the other hand, in a centralised lending structure
with many layers of managerial control and extensive branch network, it is difficult for top
managers to review all loan applications, particularly over a wide geographic area (Keeton,
1995). Thus, banks with this structure tend to centralise all lending decisions in order to avoid
agency problems. Loan officers at non-relationship banks are given less autonomy than their
counterparts in relationship banks and are often made to follow strict lending rules and
guidelines. As a result, non-relationship banks might have strong disincentives to build
business relationships in the local community and this means less acquisition of borrower
information. Since relationship lenders have cost advantage in information gathering by
proximity to customers, they are arguably more efficient than non-relationship banks in
delegated monitoring and enforcement of SME loan contracts (Diamond, 1984 and Nakamura,
1994).
51 Through frequent transactions with small businesses, relationship banks can also garner timely information about the local economic conditions prevalent in the community. On the other hand, the standardised criteria or policies of non-relationship banks may exclude any form of specialised information, which may be available to a loan officer (Nakamura, 1994)
V. Ekpu | The Microstructure of Bank Lending to SMEs | PhD Thesis | University of Glasgow | 2015
216
7.2.2. Benefits and Costs of Relationship Lending
The second objective of this chapter is to examine the economic value or benefits of
relationship lending by taking a look at the impact of soft information accumulation by loan
officers. While many studies have focused on the borrower benefits of relationship lending,
only a few studies have looked at the value of relationship lending to banks (e.g. Ergungor,
2005; Peek, 2007; Bharath et al., 2007). This subsection provides some background
information on the theoretical benefits of relationship lending, which also forms the basis of
the descriptive and empirical analyses sections.
Benefits of Relationship Lending
Under relationship lending, the acquisition of proprietary information over time about the
entrepreneur, his line of business and the local business community is more important than
formal financial ratios and other information readily available to the public. This is the essence
of relationship banking, i.e. building proprietary information by developing relationships with
customers over which will in turn be used to inform lending decisions.
Hypothesis 6a: Relationship lending allows banks to take better lending decisions (e.g. to
accommodate good borrowers and screen out bad borrowers)
Boot (2000) enumerates a number of benefits of relationship banking: First, it improves
information exchange between the lender and the borrower, thus overcoming the problems of
information asymmetry. In this regard therefore, relationships improve information quality and
reduce the probability of discouragement for good borrowers in a competitive market. Second,
it offers flexibility and discretion in financial services contracting. For example, under
relationship lending, renegotiation of loan contract terms is relatively easier, unlike in capital
markets where funding arrangements are rigid. Flexibility can also enhance investment
efficiency (Schmeits, 1999). In connection with flexibility, relationship lending can also
accommodate the intertemporal smoothing of contract terms. For example, banks are often
prepared to incur short-term bank losses for long-term gains when they offer subsidized credit
to de novo corporations. Longer bank-borrower relationships have been found to reduce loan
prices and the likelihood of the borrowing firm to pledge collateral (Petersen and Rajan, 1994;
Berger and Udell, 1995).
V. Ekpu | The Microstructure of Bank Lending to SMEs | PhD Thesis | University of Glasgow | 2015
217
Hypothesis 6b: Relationship lending (based on multiple interactions with SME customers
over time and/or across products) results in reduced screening and monitoring costs. Effective
monitoring also results in better loan quality.
A third benefit of relationship lending, according to Boot (2000), is that the use of loan
covenants and other financial arrangements or contracts under relationship banking allows for
better control of potential conflicts of interest and reduces agency costs. Fourth, the proximity
between the bank and the borrower can facilitate loan monitoring especially in asset-based
lending (e.g. in monitoring the value of collateral). This further enhances the acquisition of
more proprietary information, which could potentially generate more lending for the borrower,
and thus more rents for the bank.
In addition, because relationship lenders tend to have the advantage over non-relationship
lenders in information processing and in monitoring of small business loans, it is thus
expected that loan quality52 will be greater in relationship banks than in non-relationship
banks (Nakamura, 1994). However, loan quality may not always be guaranteed even with
information advantage and monitored lending, as there are other factors influencing loan
quality including local economic conditions, geographical location of business, competition
and other market factors (e.g. McNulty, Akhigbe and Verbrugge, 2001).
Hypothesis 6c: Relationship lending by banks results in greater customer satisfaction derived
from offering superior services to customers, which in turn produces repeat business for the
bank
Due to their personal touch with customers, relationship lenders are arguably better able to
offer a superior level of customer service than non-relationship lenders (Levonian and Soller,
1996). Better services to customers could translate into additional business for the bank, which
is often generated from customer satisfaction in previous or current lending relationships. In a
study by Bharath et al. (2007), relationship lending has been found to generate additional
business for the relationship lender. For example, a relationship lender may have a higher
probability of selling information-sensitive products to its borrowers, which could potentially
lead to the contracting of additional business, e.g. future lending business, debt/equity 52 Loan quality is measured in at least four ways: non-performing loans; loan loss provisions; net impairment charges (set off against loss reserves); and other real estate loans (all as a percentage of total loans).

V. Ekpu | The Microstructure of Bank Lending to SMEs | PhD Thesis | University of Glasgow | 2015
218
underwriting deals, and other fee based financial services. The results from Bharath et al.
(2007) also show that the probability of a relationship lender providing a future loan is 42%,
while for a non-relationship lender, this probability is 3% (Bharath et al. 2007).
Hypothesis 6d: Relationship lending improves the profitability of SME loan portfolio
Ultimately, for relationship lending to be considered an effective or valuable lending
technique, it must enhance profitability and shareholder value. The primary concern here is
whether relationship lenders are more profitable in SME lending than non-relationship lenders.
While relationship lenders tend to make use of ‘soft’ information based on relationships and
personal interactions in making non-standardised loans and offering customised financial
services (e.g DeYoung, Hunter and Udell, 2004; Carter and McNulty, 2005), the focus of non-
relationship lenders is on the use of ‘hard’ information to make standardised loans and
produce uniform types of financial services (e.g. credit card loans). Under these
circumstances, relationship lenders and non-relationship lenders will have different ways of
attaining high profits (Akhigbe and McNulty, 2005). In some studies on the profitability of
SME lending, Berney, Kolari and Ou (1998) found using a multivariate analysis that
relationship lenders (referring to small banks) earn higher profit rates on SME loans than
other assets on average. Even after controlling for various types of bank risk (credit, capital,
funding, and liquidity risks), asset size and market competition, they still find that SME loans
contribute positively and significantly to bank profits. In other words, the result displaces the
common belief that small business loans are too risky to indulge and should be done away
with. Also revealed from their study is the fact that relationship lenders have a higher
tolerance for risk than other banks. Relationship lenders tend to be more aggressive in
committing investible funds to small business loans than do non-relationship lenders.
From the above analysis, we can summarise the effectiveness and economic benefits of
relationship lending vis-à-vis a range of outcomes:
(i) Information Efficiency in Loan Origination: here the value of relationship is measured
in terms of information adequacy and usefulness, screening ability or quality of
lending decisions. In banks with decentralised lending structures, loan officers also
enjoy some amount of discretion in making lending decisions.
V. Ekpu | The Microstructure of Bank Lending to SMEs | PhD Thesis | University of Glasgow | 2015
219
(ii) Cost Effectiveness of Relationship Lending: Relationship lending reduces the unit cost
of making a loan, i.e. (screening costs) as well as the cost of monitoring customers ex-
post. Effective delegated monitoring can be expected to result in better loan quality, as
measured by the amount of non-performing loans as a percentage of total loan
portfolio
(iii) Additional Business: This has to do with the amount of repeat business the bank enjoys
from the small business customer which is directly attributable to better customer
satisfaction and the relationship lender’s informational advantage over a non-
relationship lender.
(iv) Profitability: Relationship lenders tend to be more profit efficient than non-relationship
lenders, at least from a long-term perspective. Profitability is measured in several
ways, one of which is the risk-adjusted returns on SME loans.
Costs of Relationship Lending
The benefits notwithstanding, relationship lending has been criticized on several grounds.
First, it is widely held that because it is difficult and costly for financial intermediaries to
obtain reliable information on SMEs, relationship lending is thus very costly. Since
asymmetric information is relatively more associated with SMEs than large businesses, banks
especially large ones have resorted to the use of impersonal approaches in lending to SMEs.
Impersonal lending approaches refer mostly to those lending practices that support lending at a
distance because of certain characteristics of the SME borrower or his firm. Such lending
practices might involve more of the use of mail or telephone conversations rather than
frequent personal visits to the bank as relationship banks do. (See Berger et al., 2005)
Apart from the diseconomies of scale, a second pitfall of relationship lending is the fact that it
takes a long time to make loans on the basis of relationship lending, since the bank must
acquire as much information as possible to be able to extend loans to credit-worthy businesses.
On the other hand, empirical evidence reveals that decisions on credit-scored loans (used
mostly in advanced credit markets) tend to be taken relatively easier and faster than
relationship-based loans and could be carried out over greater distances (e.g. Craig, Jackson III
and Thomson, 2005). Relationship banks are unable to effectively penetrate new markets
without having to bear the cost of establishing branch networks. This assertion is corroborated
V. Ekpu | The Microstructure of Bank Lending to SMEs | PhD Thesis | University of Glasgow | 2015
220
by Anderson (2007) when he stated that ‘...relationship lending is appropriate in communities
where lender and borrower had personal knowledge of each other, but is inefficient in an era
of high customer mobility and extended branch networks’ (pp.7).
Unlike relationship-based approaches, research has found that the use of credit scoring reduces
the cost of information between borrowers and lenders (Frame, et al., 2001:813) as well as the
time and human input involved in reviewing loan applications (e.g. Feldman, 1997). Since
data has replaced experience, the role of underwriters and human judgement in credit
decisions, as used in less developed credit markets, is now less important. To the extent that
distance lending is now feasible, most non-relationship banks tend to keep an arm’s length
from their customers and tend to invest less in building relationships.
Boot (2000:16-17) also explains the ‘dark sides’ of relationship banking using two key phases.
First is the ‘soft budget constraint’ problem and the second is the ‘hold-up’ problem. Soft
budget constraint refers to the problems that banks face when it appears that they are ‘tied in’
in a relationship as the borrower’s main source of external finance. There is therefore a
tendency for borrowers to have perverse incentives to compel their banks to grant additional
loans to forestall default on previously issued credit. The proximity that relationship banking
affords may make banks to soften (rather than being tough on) their approach to the
enforcement and/or renegotiation of loan contracts. One possible solution to this problem is to
enforce collateral and grant seniority of debt claims to banks. This will facilitate timely
intervention when a default is looming and insulate banks from undesirable consequences
(Boot, 2000). The hold-up problem occurs because the proprietary information that banks
obtain of firms gives them information monopoly and market power, which may result in
lending to firms at non-competitive rates in the future. This means that lenders may use long-
term implicit contracts where they charge higher loan rates in the long term to compensate for
subsidized rates granted to borrowers in the short term (Sharpe 1990; Rajan, 1992). A firm’s
reaction to the hold–up problem may be to withdraw from borrowing from the bank, but this
could lead to loss of potentially viable investment opportunities. Another solution could be to
resort to multiple bank relationships. Again, this may prove to be costly because it is difficult
for the firm’s new bankers to get the primary lender to transfer soft information it has gathered
on the firm over time. Moreover, it could even exacerbate the problem of credit availability
(Ongena and Smith, 2000). Another argument is that more competition could discourage
V. Ekpu | The Microstructure of Bank Lending to SMEs | PhD Thesis | University of Glasgow | 2015
221
relationships53 (Berlin, 1996; Boot, 2000) and undermine the value of information (Chan et al.,
1986). Fierce inter-bank competition may reduce the ability and willingness of banks to fund
de novo corporations. That is, competition may make credit subsidy to young firms
unsustainable, and hence frustrate the intertemporal pricing of loans.
The following points summarise the economic costs or downsides of relationship lending:
(i) Cost Ineffectiveness: Relationship lending consumes a lot of time and relies too much on
human input to assess the credit worthiness of a borrower. Moreover, relationship banks
are unable to issue standardized loans at relatively lower costs. Due to these setbacks,
investing in relationships is not cost-effective.
(ii) Inadequate Information: In many cases, relationship lending does not seem to incorporate
hard (quantitative) information on the borrower due to its relative absence for SMEs. It
relies mainly on soft information gathered over time through relationship development.
(iii) Adverse Selection: Soft information on borrowers is hardly adequate and hence lending
decisions taken based on inadequate or limited information could often be subjective and
wrong. This tends to discourage risk-based pricing of loans and may eventually lead to
inefficient credit rationing process.
(iv) Undue Relaxation of Credit Terms: Since relationship lending allows for flexibility in
loan contracting, it could sometimes lead to undue relaxation of loan terms, especially
when evaluating loans granted to longer-term bank customers. This is because of the
implicit principal agent problem which ‘relationships’ between loan officers and borrowers
sometimes entail, which could in effect limit the short- term profit maximisation objective
of the relationship bank.
(v) Shift away from Traditional Lending to fee Income: Since traditional SME lending is
costly and risky, relationship banks could prefer to finance SMEs through other means
(e.g. asset-based lending, leasing, etc) and provide other financial management services to
them.
53 The nature of the contract terms between a bank and a firm, and hence the amount of profit that the bank retains over the life of the lending relationship depends on the number and behaviour of the bank’s competitors, including both banks and non-bank lenders, e.g finance companies (See details in Berlin, 1996)
V. Ekpu | The Microstructure of Bank Lending to SMEs | PhD Thesis | University of Glasgow | 2015
222
7.3. Data and Methodology
7.3.1. Data Collection
This chapter utilizes the Questionnaire Survey of Relationship Managers and Loan Officers in
Nigerian Banks, which was conducted in 2014. A total of 249 questionnaires were distributed
to 12 Nigerian banks, out of which 121 were returned, yielding a moderately high response
rate of 48.6%. The survey asked loan officers about their role in SME loan decision making,
their bank’s lending administration structure, hierarchy of loan decision making, loan officer
lending discretion as well as the nature of bank-borrower relationships and the economic
benefits and costs of relationship lending to Nigerian banks. The study took samples across
branch types and bank categories. 65 Loan officers (or 53.7% of the respondents) were drawn
from commercial business branches, while 56 loan officers (or 46.3%) served in retail
business branches. 47 loan officers served in Tier 1 banks (i.e. the 5 largest banks in Nigeria),
while the remaining 74 loan officers came from Tier 2 banks (i.e. the smaller bank category in
this sample, containing 7 mid-sized banks). The study also considered the relationship banking
(RB) experience of the respondents. Out of the 121 respondents, 11 (or 9.1%) had RB
experience of less than 1 year, 31 (or 25.6%) had RB experience of between 1 to 5 years, 60 or
(49.6%) had RB experience of between 6 to 10 years, while 19 (or 15.7%) had more than 10
years RB experience. The mean number of RB experience was 6.59 years. (See chapter 4 for
full description of the sampling techniques as well as the distribution and collection
techniques).
7.3.2. Descriptive Analysis
This sub-section examines the data collected from the banks and describes the main features of
the lending administration structure in the sample Nigerian banks, including the degree of
centralisation and decentralisation of lending functions, hierarchy of lending decisions, and
loan officer authority, measured by the independent approval of loans and discretion in setting
interest rates. This sub-section also examines the nature of relationship lending in the sample
banks, the strength of bank-borrower relationships and information acquisition as well as the
banks’ perception (and rating) of the value derivable from investing in lending relationships.

V. Ekpu | The Microstructure of Bank Lending to SMEs | PhD Thesis | University of Glasgow | 2015
223
Decision Making by Loan Officers in Nigerian Banks
The study revealed that 3 out of the 12 sample banks practice a wholly centralised SME
lending strategy (in which case all SME lending decisions are taken at the head office), while
the remaining 9 banks practice a mix of centralised and decentralised strategy (in which case
some lending decisions are taken at the head office, while others are taken at the branch
levels). From table 7.1 and figure 7.1, about half (50.6%) of the loan officers say that loan
appraisal is carried out only at the branch level, while 27% say that appraisal is done at the
head office only. As reviewed in chapter 6, loan appraisal involves the evaluation of the merits
of a loan application in terms of the purpose of loan, genuineness of its need, the amount to be
borrowed, the borrower’s repayment capacity, availability of collateral and other parameters
upon which a loan decision is made. In some banks, the valuation of the borrower’s collateral
is done at the branch level, and reviewed by the head office.
Table 7.1. Centralisation/Decentralisation of Lending Functions in Nigerian Banks
Lending Functions Centralized Decentralized Mixed(%) (%) (%)
Loan Application Appraisal 27 50.6 22.5Loan Approval 62.9 12.4 24.7Ongoing Loan Monitoring/Risk Management 37.1 29.2 33.7Periodic Loan Review 47.2 22.5 30.3Recovery of Non-Performing Loans 36 28.1 36
Source: Survey of Loan Officers/RMs in Nigerian Banks
Majority of loan officers (62.9%) say that loan approval is solely decided at the head office,
while only 24.7% admit that loan approval decisions are taken at both the branch level and by
the central credit evaluation team. In some banks, approval is done in two stages: first
approval at the branch level, and then final approval by the credit sanctioning team at the head
office. Some of the loan officers reported that degree of centralisation or decentralisation of
loan approval depends on size of the loan, the type of facility sought (e.g. asset finance,
working capital, overdraft, retail credit etc) and the bank’s approval grid for the loan
specification.
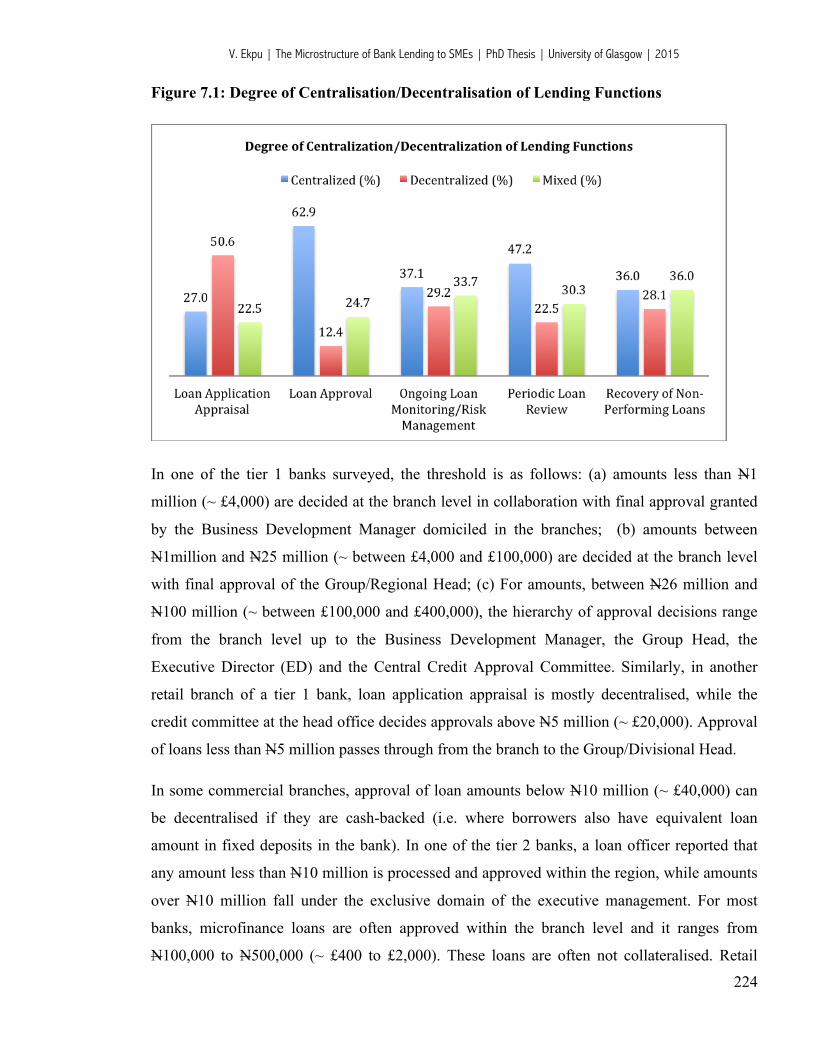
V. Ekpu | The Microstructure of Bank Lending to SMEs | PhD Thesis | University of Glasgow | 2015
224
Figure 7.1: Degree of Centralisation/Decentralisation of Lending Functions
In one of the tier 1 banks surveyed, the threshold is as follows: (a) amounts less than N1
million (~ £4,000) are decided at the branch level in collaboration with final approval granted
by the Business Development Manager domiciled in the branches; (b) amounts between
N1million and N25 million (~ between £4,000 and £100,000) are decided at the branch level
with final approval of the Group/Regional Head; (c) For amounts, between N26 million and
N100 million (~ between £100,000 and £400,000), the hierarchy of approval decisions range
from the branch level up to the Business Development Manager, the Group Head, the
Executive Director (ED) and the Central Credit Approval Committee. Similarly, in another
retail branch of a tier 1 bank, loan application appraisal is mostly decentralised, while the
credit committee at the head office decides approvals above N5 million (~ £20,000). Approval
of loans less than N5 million passes through from the branch to the Group/Divisional Head.
In some commercial branches, approval of loan amounts below N10 million (~ £40,000) can
be decentralised if they are cash-backed (i.e. where borrowers also have equivalent loan
amount in fixed deposits in the bank). In one of the tier 2 banks, a loan officer reported that
any amount less than N10 million is processed and approved within the region, while amounts
over N10 million fall under the exclusive domain of the executive management. For most
banks, microfinance loans are often approved within the branch level and it ranges from
N100,000 to N500,000 (~ £400 to £2,000). These loans are often not collateralised. Retail

V. Ekpu | The Microstructure of Bank Lending to SMEs | PhD Thesis | University of Glasgow | 2015
225
credits (usually not exceeding N5 million) also tend to be processed, approved and disbursed
at the branch and zonal levels for most banks. Table 6.2 shows the average number of
functional levels it takes to approve an SME loan in Nigerian banks beyond the initial level of
contact. It can be observed that as the size of loans increases, the number of hierarchical levels
required for approval also increases.
Table 7.2 Hierarchy of SME Loan Decision Making by Size of Loan
Loan Size 0 Functional Level 1 Functional Level 2 Functional Levels 3 Functional Levels > 3 Functional LevelsFreq (%) Freq (%) Freq (%) Freq (%) Freq (%)
Less than N100, 000 15 12.4 21 17.4 27 22.3 26 21.5 32 26.4N100, 000 to less than N500, 000 2 1.7 12 9.9 31 25.6 43 35.5 33 27.3N500, 000 to less than N2, 500,000 n.a n.a 4 3.3 30 24.8 49 40.5 38 31.4N2, 500,000 to less than N5, 000,000 n.a n.a 2 1.7 19 15.7 51 42.1 49 40.5N5, 000,000 to less than N10, 000,000 n.a n.a 1 0.8 15 12.4 51 42.1 54 44.6N10, 000,000 to less than N20, 000,000 n.a n.a 2 1.7 8 6.6 45 37.2 66 54.5N20, 000,000 to less than N50, 000,000 n.a n.a 2 1.7 6 5 38 31.4 75 62N50, 000,000 and Above n.a n.a n.a n.a 3 2.5 19 15.7 99 81.8
Valid N = 121n.a means "no score was obtained"All percentages (%) sum up to 100% horizontally across each rating grid
Source: Survey of Loan Officers/RMs in Nigerian banks
Loan monitoring, risk management, periodic loan review and recovery of non-performing
loans (NPLs) appear to be done extensively at both branch levels and at the head offices. Most
loan officers say that the reason for the sharing of these functions is so that monitoring and
risk management can be effective and comprehensive. Some also say that the combined effort
serves as a form of checks and balances. In most banks, loan monitoring is done daily at the
branch level, while extreme cases of past due obligations or default are escalated to designated
loan collection or remedial recovery teams. In some banks, the level of centralisation adopted
for the recovery of NPLs depends on the loan size. The head office handles larger amounts
(e.g. corporate loans), while smaller amounts (i.e. retail loans) are recovered at the branch
levels. In some instances, relationship managers are required to assist the recovery teams in
persuading customers to liquidate distress loans or arranging a possible work out. Also, in
quarterly loan portfolio review, relationship managers are required to present an update on
their personal efforts in loan recovery.
According to Uchida, et al. (2012), there is a link between these loan officer activities and the
accumulation of soft information. The degree of centralisation or decentralisation of these
functions determines the amount of soft information that loan officers can generate in the
course of underwriting and monitoring loans. It is possible to ascertain the level of acquisition
V. Ekpu | The Microstructure of Bank Lending to SMEs | PhD Thesis | University of Glasgow | 2015
226
of soft information by observing the degree of participation by local relationship
managers/loan officers in approving loans autonomously and taking interest rate decisions
(Williamson, 1967; Petersen, 1999; Stein, 2002; Petersen, 2004; Benvenuti, et al 2010). Only
9 (or 7.4%) of the 121 loan officers surveyed have authority to independently approve loans,
while only 18 (or 14.9%) have some degree of discretion in setting interest rates on SME
loans. This implies that the acquisition of soft information in Nigerian banks is unlikely to be
influenced by the decentralisation of the underwriting process.
It was also observed that those loan officers whose compensation is significantly tied to
deposit mobilisation also tend to have some degree of authority in approving SME loans
autonomously. However, most of those loans have to be cash-backed. Moreover, the size of
loans they can approve independently is relatively small (usually ranging from N50,000 to
N1,000,000). The typical margin of discretion in setting interest rates on SME loans for the
loan officers with some flexibility range from 25 to 400 basis points (or 0.25% to 4%) below
or above the prescribed rates.
To confirm the finding that Nigerian banks have a more centralised lending strategy, loan
officers were asked if they think that decisions about SME loan approval and risk management
are often decentralised. At least two-thirds (66.1%) of the respondents disagreed with the
proposition that lending decisions are often decentralised (see table 7.3). In addition, 74.4%
agree or strongly agree that lending decisions are rather rule-based, i.e. depend on hard and
fast rules (objective or pre-determined criteria) and the sole evaluation of loan applications.
Features of Relationship Lending in Nigerian Banks
This study evaluated the nature of bank-borrower relationships in Nigerian banks. For the
purpose of the study, the following definition of relationship lending was used, though the
understanding of relationship lending seemed slightly different across banks:
“Relationship lending is used here to denote a situation in which a bank is willing to
provide lending mostly on the basis of a previous relationship with the borrower such
as a previous loan, savings deposit, long-term deposits, etc. More precisely, with
relationship lending, financing is provided primarily on the basis of 'soft information',
e.g., borrower characteristics, credit history with the bank, loan size, purpose of the
loan, etc. Relationship lending involves frequent and personalised contact between the

V. Ekpu | The Microstructure of Bank Lending to SMEs | PhD Thesis | University of Glasgow | 2015
227
loan officer and the small firm, its owners/managers, or even the local community in
which it operates. Relationship lending is typically associated with decentralised loan
approval and risk management”. [Obtained from the Questionnaire – see Annex A]
Findings on the adoption or use of relationship lending techniques revealed that only 59.5% of
respondents agree or strongly agree that SME lending is mostly based on relationship lending
as defined above, while the remaining 40.5% either disagree or strongly disagree with this
proposition.
Figure 7.2. Adoption or Use of Relationship Lending Techniques in Nigerian Banks
Source: Survey of Loan Officers/RMs in Nigerian Banks
From table 7.3, it can be observed that majority of loan officers surveyed (98.3%) either agree
or strongly agree that their bank maintains a relationship with borrowers throughout the loan
life. As noted earlier, banks use long-term relationships to resolve information asymmetry
problems that may exist between the lender and the borrower (Berger and Udell, 1995). More
than 97% also admit that their bank acquires financial information on SMEs before granting
loans. Generally, in appraising commercial loans, bankers are interested in the following
aspects of financial information: (1) the credit history of the borrower; (2) the cash flow
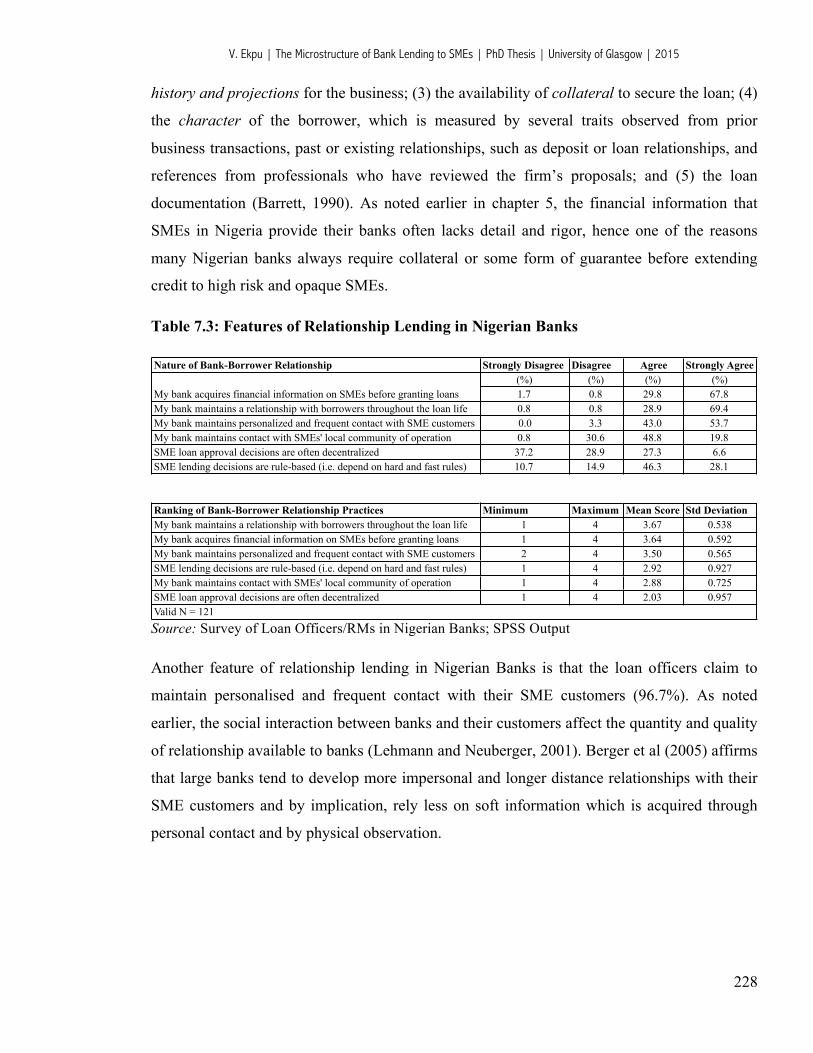
V. Ekpu | The Microstructure of Bank Lending to SMEs | PhD Thesis | University of Glasgow | 2015
228
history and projections for the business; (3) the availability of collateral to secure the loan; (4)
the character of the borrower, which is measured by several traits observed from prior
business transactions, past or existing relationships, such as deposit or loan relationships, and
references from professionals who have reviewed the firm’s proposals; and (5) the loan
documentation (Barrett, 1990). As noted earlier in chapter 5, the financial information that
SMEs in Nigeria provide their banks often lacks detail and rigor, hence one of the reasons
many Nigerian banks always require collateral or some form of guarantee before extending
credit to high risk and opaque SMEs.
Table 7.3: Features of Relationship Lending in Nigerian Banks
Nature of Bank-Borrower Relationship
My bank acquires financial information on SMEs before granting loans
My bank maintains personalized and frequent contact with SME customersMy bank maintains contact with SMEs' local community of operationSME loan approval decisions are often decentralizedSME lending decisions are rule-based (i.e. depend on hard and fast rules)
Ranking of Bank-Borrower Relationship Practices
My bank acquires financial information on SMEs before granting loansMy bank maintains personalized and frequent contact with SME customersSME lending decisions are rule-based (i.e. depend on hard and fast rules)My bank maintains contact with SMEs' local community of operationSME loan approval decisions are often decentralizedValid N = 121
My bank maintains a relationship with borrowers throughout the loan life
My bank maintains a relationship with borrowers throughout the loan life
Strongly Disagree Disagree Agree Strongly Agree(%) (%) (%) (%)1.7 0.8 29.8 67.80.8 0.8 28.9 69.40.0 3.3 43.0 53.70.8 30.6 48.8 19.8
37.2 28.9 27.3 6.610.7 14.9 46.3 28.1
Minimum Maximum Mean Score Std Deviation1 4 3.67 0.5381 4 3.64 0.5922 4 3.50 0.5651 4 2.92 0.9271 4 2.88 0.7251 4 2.03 0.957
Source: Survey of Loan Officers/RMs in Nigerian Banks; SPSS Output
Another feature of relationship lending in Nigerian Banks is that the loan officers claim to
maintain personalised and frequent contact with their SME customers (96.7%). As noted
earlier, the social interaction between banks and their customers affect the quantity and quality
of relationship available to banks (Lehmann and Neuberger, 2001). Berger et al (2005) affirms
that large banks tend to develop more impersonal and longer distance relationships with their
SME customers and by implication, rely less on soft information which is acquired through
personal contact and by physical observation.
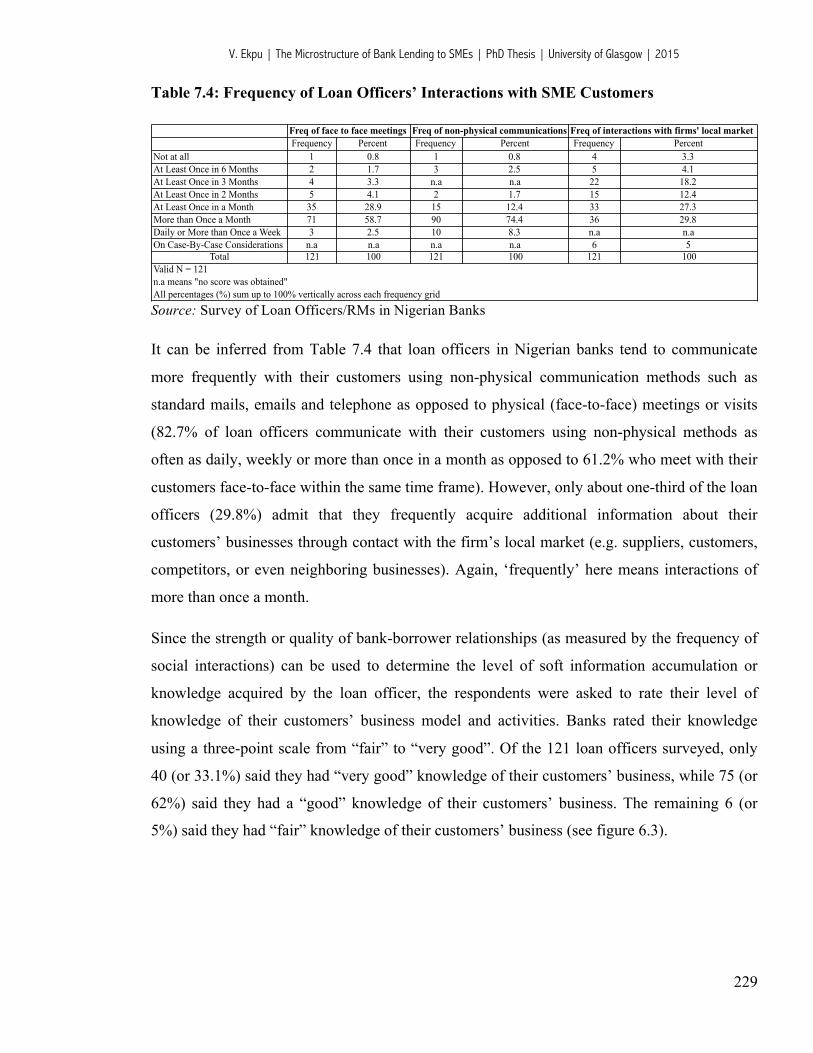
V. Ekpu | The Microstructure of Bank Lending to SMEs | PhD Thesis | University of Glasgow | 2015
229
Table 7.4: Frequency of Loan Officers’ Interactions with SME Customers
Freq of face to face meetings Freq of non-physical communications Freq of interactions with firms' local marketFrequency Percent Frequency Percent Frequency Percent
Not at all 1 0.8 1 0.8 4 3.3At Least Once in 6 Months 2 1.7 3 2.5 5 4.1At Least Once in 3 Months 4 3.3 n.a n.a 22 18.2At Least Once in 2 Months 5 4.1 2 1.7 15 12.4At Least Once in a Month 35 28.9 15 12.4 33 27.3More than Once a Month 71 58.7 90 74.4 36 29.8Daily or More than Once a Week 3 2.5 10 8.3 n.a n.aOn Case-By-Case Considerations n.a n.a n.a n.a 6 5
Total 121 100 121 100 121 100Valid N = 121n.a means "no score was obtained"All percentages (%) sum up to 100% vertically across each frequency grid
Source: Survey of Loan Officers/RMs in Nigerian Banks
It can be inferred from Table 7.4 that loan officers in Nigerian banks tend to communicate
more frequently with their customers using non-physical communication methods such as
standard mails, emails and telephone as opposed to physical (face-to-face) meetings or visits
(82.7% of loan officers communicate with their customers using non-physical methods as
often as daily, weekly or more than once in a month as opposed to 61.2% who meet with their
customers face-to-face within the same time frame). However, only about one-third of the loan
officers (29.8%) admit that they frequently acquire additional information about their
customers’ businesses through contact with the firm’s local market (e.g. suppliers, customers,
competitors, or even neighboring businesses). Again, ‘frequently’ here means interactions of
more than once a month.
Since the strength or quality of bank-borrower relationships (as measured by the frequency of
social interactions) can be used to determine the level of soft information accumulation or
knowledge acquired by the loan officer, the respondents were asked to rate their level of
knowledge of their customers’ business model and activities. Banks rated their knowledge
using a three-point scale from “fair” to “very good”. Of the 121 loan officers surveyed, only
40 (or 33.1%) said they had “very good” knowledge of their customers’ business, while 75 (or
62%) said they had a “good” knowledge of their customers’ business. The remaining 6 (or
5%) said they had “fair” knowledge of their customers’ business (see figure 6.3).
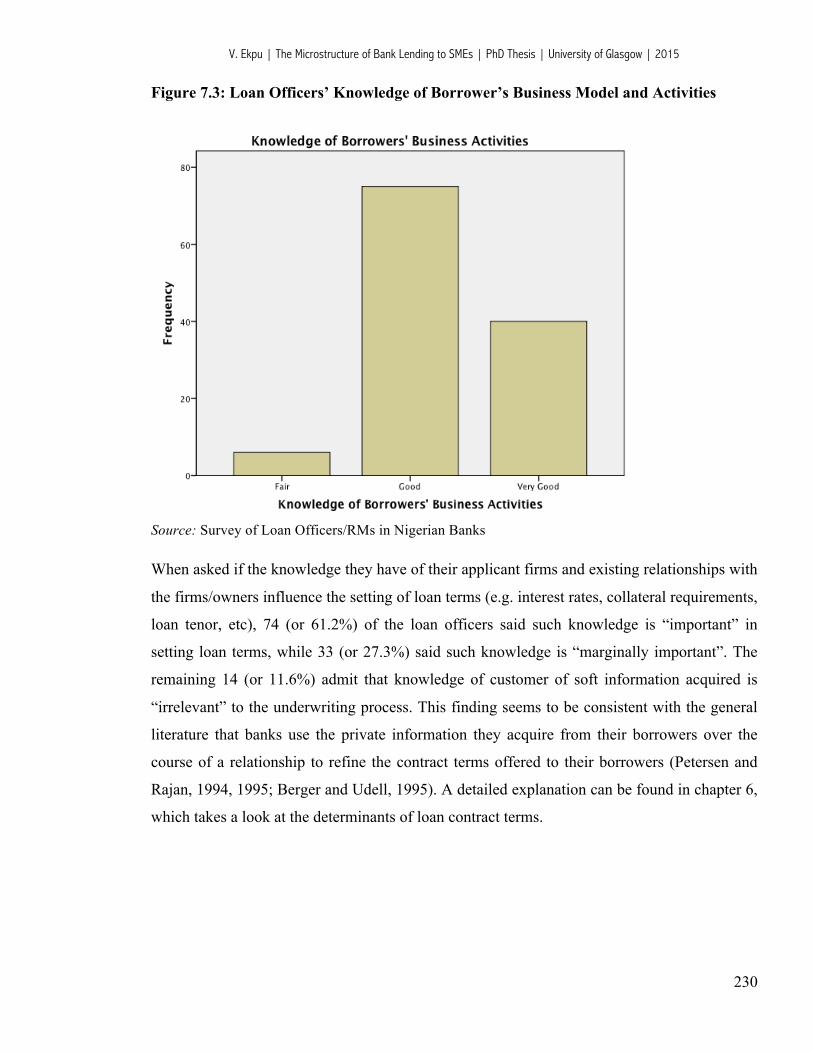
V. Ekpu | The Microstructure of Bank Lending to SMEs | PhD Thesis | University of Glasgow | 2015
230
Figure 7.3: Loan Officers’ Knowledge of Borrower’s Business Model and Activities
Source: Survey of Loan Officers/RMs in Nigerian Banks
When asked if the knowledge they have of their applicant firms and existing relationships with
the firms/owners influence the setting of loan terms (e.g. interest rates, collateral requirements,
loan tenor, etc), 74 (or 61.2%) of the loan officers said such knowledge is “important” in
setting loan terms, while 33 (or 27.3%) said such knowledge is “marginally important”. The
remaining 14 (or 11.6%) admit that knowledge of customer of soft information acquired is
“irrelevant” to the underwriting process. This finding seems to be consistent with the general
literature that banks use the private information they acquire from their borrowers over the
course of a relationship to refine the contract terms offered to their borrowers (Petersen and
Rajan, 1994, 1995; Berger and Udell, 1995). A detailed explanation can be found in chapter 6,
which takes a look at the determinants of loan contract terms.
V. Ekpu | The Microstructure of Bank Lending to SMEs | PhD Thesis | University of Glasgow | 2015
231
Economic Value of Relationship Lending to Nigerian Banks
Here, the bank’s view of the value of lending relationships is presented. The respondents were
asked to rate their perception of the benefits and costs associated with lending relationships.
The finding reveals that the principal benefit from relationship lending, according to the
bankers, is additional business (ranked 1st by mean 3.39, sd 0.631). About 94.5% of the
respondents agree or strongly agree with the proposition that relationship generates repeat
business for their bank (see table 6.5). This is consistent with the findings from Bharath et al
(2007) and Peek (2007), who found separate evidence that investing in lending relationships
attracts additional deposits, interest income and income from fee based activities, such as
future loan underwriting and investment banking deals. Relationship lenders are able to cross-
sell financial services products to relationship borrowers using the private information they
have of the borrowers.
At the moment, Nigerian banks earn fee income from a number of ancillary financial services
such as electronic banking, online bills pay, card based commission, cash management and
custody transaction fees, pay roll processing, loan documentation and admin fees, foreign
currency service fees, asset management fees, brokerage and financial advisory services,
insurance services, etc. This has resulted in Nigerian banks declaring huge non-interest income
as a key part of their annual operating income. For example, using 2013 year end figures,
Zenith Bank declared N52.5 billion as fee and commission income out of a total income base
of N311 billion (representing 16.88%). Similarly, Access Bank posted a fee income of N31.6
billion out of a total income of N213 billion (representing 14.83%). A tier 2 bank, Stanbic
IBTC, known for its core of investment banking and pensions business, posted a fee and
commission income of N33.3 billion out of a total income base of N85 billion (representing
39.41%).
The second benefit of relationship lending rated by the lenders is better lending decisions
(mean 3.39 sd 0.585). Over 93% of the respondents agree or strongly agree that relationship
lending allows their bank to take better lending decisions (i.e. to accommodate good
borrowers and screen out bad borrowers). As noted earlier in section 6.2, relationship banking
improves the exchange of value-enhancing information between borrowers and lenders, which
the latter then use in the loan origination process (Petersen, 1999; Boot, 2000). Nigerian

V. Ekpu | The Microstructure of Bank Lending to SMEs | PhD Thesis | University of Glasgow | 2015
232
banks, like other profit-seeking lenders will only extend credit to business ventures that have
the potential to pay back such loans, and will prefer to ration credit accordingly.
Table 7.5: Economic Benefits of Relationship Lending
Economic Benefits of Relationship Lending (Frequency) Strongly Disagree DisagreeFreq (%) Freq
Better Lending Decisions n.a n.a 6Reduced Screening & Monitoring Costs 1 1.1 21Greater Customer Satisfaction n.a n.a 8Generates Additional Business 1 1.1 4Improved Profitability of SME Loan Portfolio 2 2.2 8Reduced Amount of Loan Loss Provisions 1 1.1 18
Economic Benefits of Relationship Lending (Ranking) Min Max MeanGenerates Additional Business 1 4 3.39Better Lending Decisions 2 4 3.29Greater Customer Satisfaction 2 4 3.27Improved Profitability of SME Loan Portfolio 1 4 3.26Reduced Amount of Loan Loss Provisions 1 4 3.08Reduced Screening & Monitoring Costs 1 4 2.87
Valid N = 90n.a means "no score was obtained"All percentages (%) sum up to 100% horizontally across each rating grid
Disagree Agree Strongly Agree(%) Freq (%) Freq (%)6.7 52 57.8 32 35.623.3 57 63.3 11 12.28.9 50 55.6 32 35.64.4 44 48.9 41 45.68.9 45 50 35 38.920 44 48.9 27 30
Std Dev0.6310.5850.6140.7120.7380.622
Source: Survey of Loan Officers/RMs in Nigerian Banks
A third benefit from relationship lending is greater customer satisfaction (mean 3.27, sd
0.614). Since the nature of the bank-borrower relationship involves frequent and personalized
contact with the borrower, it is expected that relationship-driven banks are able to offer a
superior level of customer service to businesses than non-relationship lenders (Levonian and
Soller, 1996). The loan officers also alluded to the fact that relationship lending has improved
the profitability of their bank’s loan portfolio (mean 3.26, sd 0.712). This is because
relationship lending affords them the opportunity to monitor loans given to customers
effectively. Nakamura (1994) found that loan quality seemed to be greater in relationship-
driven banks as opposed to non-relationship banks. More than 75% of the Nigerian bankers
also seemed to suggest that relationship lending (based on multiple interactions with SME
customers over time and/or across products) has reduced the screening and monitoring costs
associated with SME loans, consistent with findings in the literature (e.g. Diamond, 1984;
Haubrick, 1989; Nakamura, 1994; Boot, 2000).
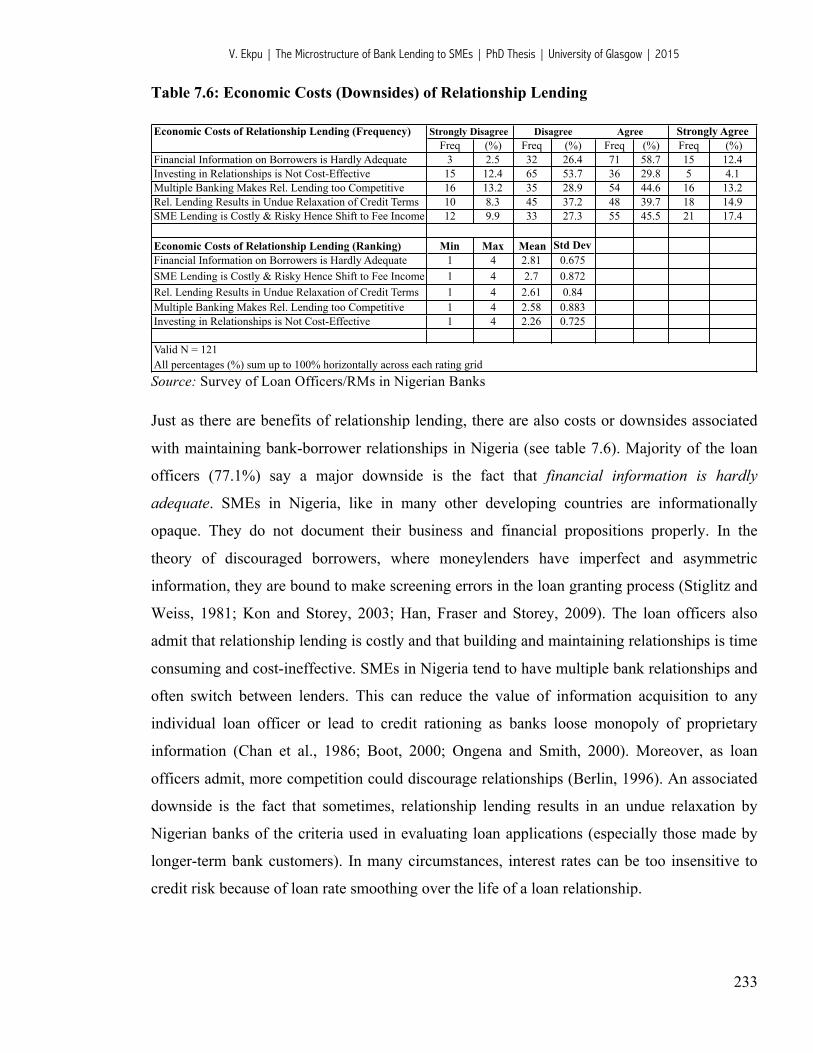
V. Ekpu | The Microstructure of Bank Lending to SMEs | PhD Thesis | University of Glasgow | 2015
233
Table 7.6: Economic Costs (Downsides) of Relationship Lending
Economic Costs of Relationship Lending (Frequency) Strongly Disagree DisagreeFreq (%) Freq
Financial Information on Borrowers is Hardly Adequate 3 2.5 32Investing in Relationships is Not Cost-Effective 15 12.4 65Multiple Banking Makes Rel. Lending too Competitive 16 13.2 35Rel. Lending Results in Undue Relaxation of Credit Terms 10 8.3 45SME Lending is Costly & Risky Hence Shift to Fee Income 12 9.9 33
Economic Costs of Relationship Lending (Ranking) Min Max MeanFinancial Information on Borrowers is Hardly Adequate 1 4 2.81SME Lending is Costly & Risky Hence Shift to Fee Income 1 4 2.7Rel. Lending Results in Undue Relaxation of Credit Terms 1 4 2.61Multiple Banking Makes Rel. Lending too Competitive 1 4 2.58Investing in Relationships is Not Cost-Effective 1 4 2.26
Valid N = 121All percentages (%) sum up to 100% horizontally across each rating grid
Disagree Agree Strongly Agree(%) Freq (%) Freq (%)26.4 71 58.7 15 12.453.7 36 29.8 5 4.128.9 54 44.6 16 13.237.2 48 39.7 18 14.927.3 55 45.5 21 17.4
Std Dev0.6750.8720.840.8830.725
Source: Survey of Loan Officers/RMs in Nigerian Banks
Just as there are benefits of relationship lending, there are also costs or downsides associated
with maintaining bank-borrower relationships in Nigeria (see table 7.6). Majority of the loan
officers (77.1%) say a major downside is the fact that financial information is hardly
adequate. SMEs in Nigeria, like in many other developing countries are informationally
opaque. They do not document their business and financial propositions properly. In the
theory of discouraged borrowers, where moneylenders have imperfect and asymmetric
information, they are bound to make screening errors in the loan granting process (Stiglitz and
Weiss, 1981; Kon and Storey, 2003; Han, Fraser and Storey, 2009). The loan officers also
admit that relationship lending is costly and that building and maintaining relationships is time
consuming and cost-ineffective. SMEs in Nigeria tend to have multiple bank relationships and
often switch between lenders. This can reduce the value of information acquisition to any
individual loan officer or lead to credit rationing as banks loose monopoly of proprietary
information (Chan et al., 1986; Boot, 2000; Ongena and Smith, 2000). Moreover, as loan
officers admit, more competition could discourage relationships (Berlin, 1996). An associated
downside is the fact that sometimes, relationship lending results in an undue relaxation by
Nigerian banks of the criteria used in evaluating loan applications (especially those made by
longer-term bank customers). In many circumstances, interest rates can be too insensitive to
credit risk because of loan rate smoothing over the life of a loan relationship.
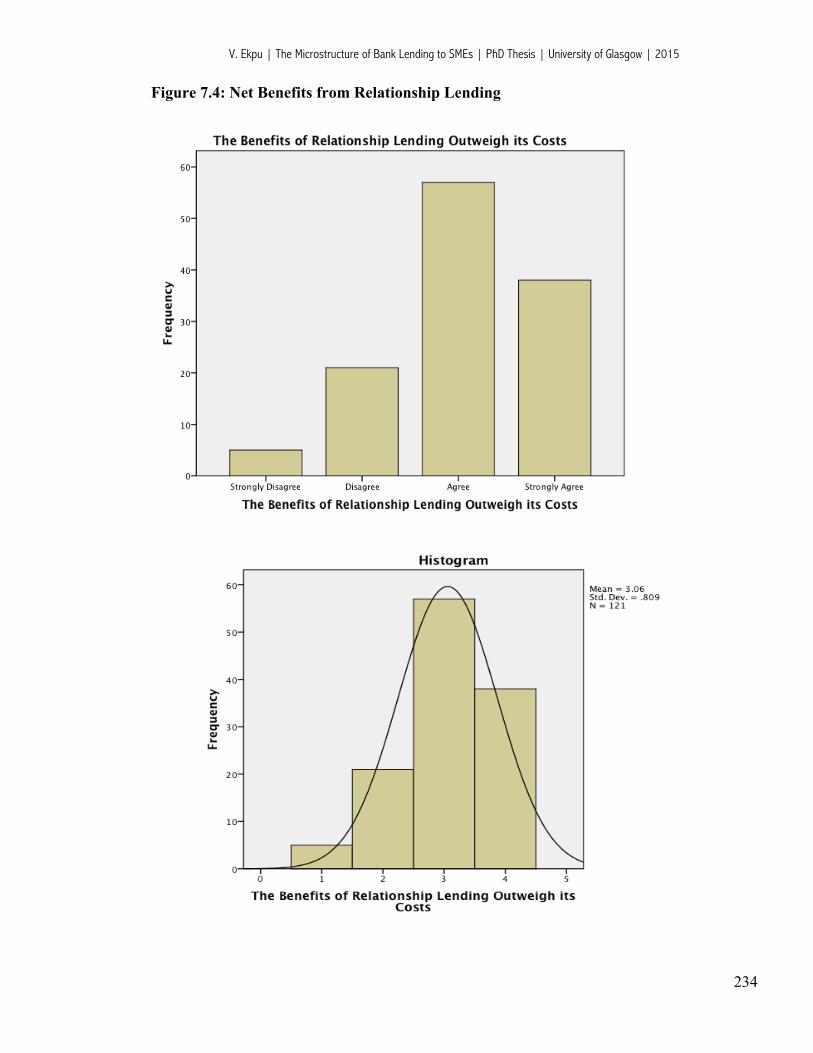
V. Ekpu | The Microstructure of Bank Lending to SMEs | PhD Thesis | University of Glasgow | 2015
234
Figure 7.4: Net Benefits from Relationship Lending

V. Ekpu | The Microstructure of Bank Lending to SMEs | PhD Thesis | University of Glasgow | 2015
235
As figure 7.4 shows, relationship lending in Nigeria tends to yield positive net benefits since
majority of respondents (78.5%) agree or strongly agree that its benefits outweigh its costs.
This is consistent with the views of some authors that the added revenue associated with
relationship lending exceeds the added information costs associated with evaluating and
monitoring small business commercial and industrial loans (e.g. Petersen, 1999; Peek 2007;
Bharath, et al., 2007). While it may be true that relationship lending yields positive net
benefits for many Nigerian banks, the result may reflect the bankers’ misperception of reality,
as this is a subjective assessment of the value derivable from relationship lending.
7.3.3. Econometric Model
The model used in the empirical analysis is the ordinal logistic regression (OLR) model.
(Please refer to Chapter 4 for a detailed description of the main procedures used in this
statistical technique). The essential difference between this chapter and the model described in
chapter 4 is the reduction in the number of odds from 4 to 3, since there are three scales used
to rate the amount of borrower information or knowledge acquired by loan officers in Nigerian
banks: ‘fair’ (1), ‘good’ (2), and ‘very good’ (3). The interpretation of the OLR estimates
follows the account described in chapter 4. The sign of parameters shows whether the latent
variable y* increases with the regressor. A positive coefficient indicates an increased chance
or likelihood that a subject with a higher score on the independent variable will be observed in
a higher category. A negative coefficient indicates the chances or likelihood that a subject with
a higher score on the independent variable will be observed in a lower category (Snedker et
al., 2002). So for example, if we are interested in testing whether the possibility of a loan
officer acquiring more soft information depends on whether or not he has authority to
independently approve loans, a positive coefficient will imply that a loan officer with authority
to approve loans autonomously is more likely to have higher level of knowledge of his
customers’ business activities, while a negative coefficient will mean that there are less
chances of acquiring soft information with independent approval authority.
Model 1: Acquisition of Soft Information
Adapting the model used by Uchida et al. (2012), we can examine the central role of loan
officers in relationship lending in Nigerian banks. Here, we test whether loan officer activities
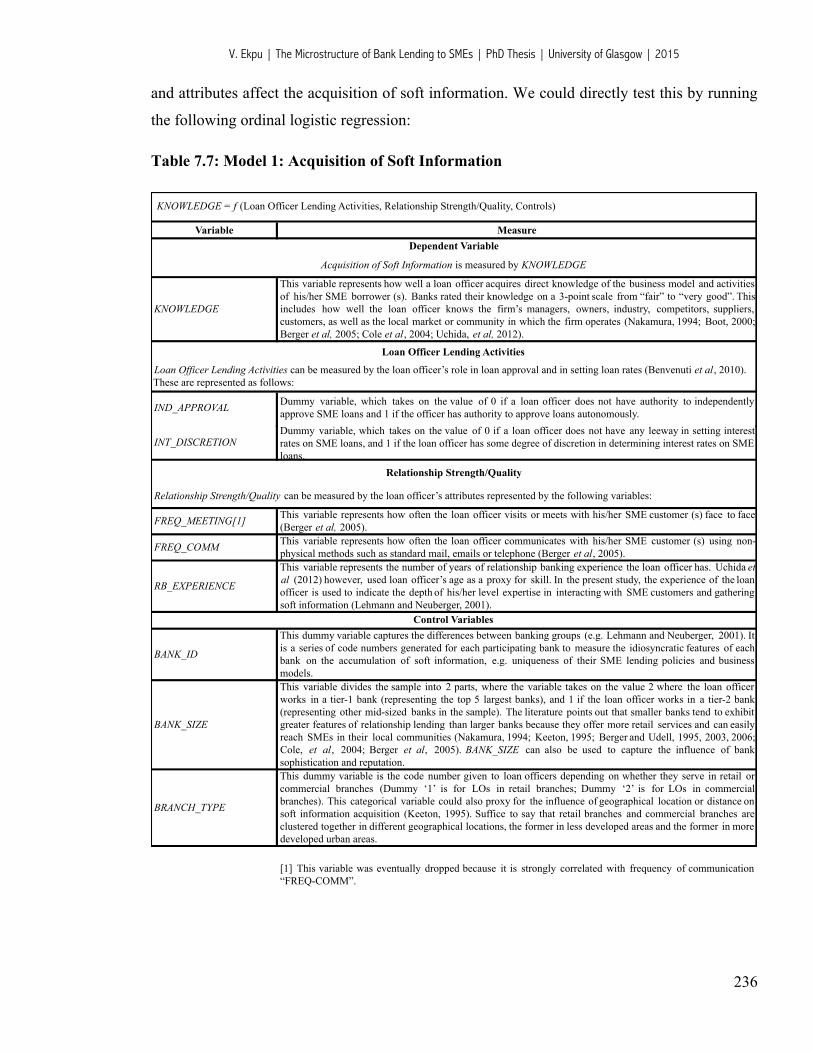
V. Ekpu | The Microstructure of Bank Lending to SMEs | PhD Thesis | University of Glasgow | 2015
236
and attributes affect the acquisition of soft information. We could directly test this by running
the following ordinal logistic regression:
Table 7.7: Model 1: Acquisition of Soft Information
Variable Measure
KNOWLEDGE
This variable represents how well a loan officer acquires direct knowledge of the business model and activitiesof his/her SME borrower (s). Banks rated their knowledge on a 3-point scale from “fair” to “very good”. Thisincludes how well the loan officer knows the firm’s managers, owners, industry, competitors, suppliers,customers, as well as the local market or community in which the firm operates (Nakamura, 1994; Boot, 2000;Berger et al, 2005; Cole et al, 2004; Uchida, et al, 2012).
KNOWLEDGE = f (Loan Officer Lending Activities, Relationship Strength/Quality, Controls)
Dependent Variable
Acquisition of Soft Information is measured by KNOWLEDGE
Loan Officer Lending Activities
Loan Officer Lending Activities can be measured by the loan officer’s role in loan approval and in setting loan rates (Benvenuti et al, 2010). These are represented as follows:
IND_APPROVAL Dummy variable, which takes on the value of 0 if a loan officer does not have authority to independentlyapprove SME loans and 1 if the officer has authority to approve loans autonomously.
INT_DISCRETIONDummy variable, which takes on the value of 0 if a loan officer does not have any leeway in setting interestrates on SME loans, and 1 if the loan officer has some degree of discretion in determining interest rates on SME loans.
FREQ_MEETING[1] This variable represents how often the loan officer visits or meets with his/her SME customer (s) face to face(Berger et al, 2005).
FREQ_COMM This variable represents how often the loan officer communicates with his/her SME customer (s) using non-physical methods such as standard mail, emails or telephone (Berger et al, 2005).
RB_EXPERIENCE
This variable represents the number of years of relationship banking experience the loan officer has. Uchida et al (2012) however, used loan officer’s age as a proxy for skill. In the present study, the experience of the loanofficer is used to indicate the depth of his/her level expertise in interacting with SME customers and gatheringsoft information (Lehmann and Neuberger, 2001).
BANK_ID
This dummy variable captures the differences between banking groups (e.g. Lehmann and Neuberger, 2001). Itis a series of code numbers generated for each participating bank to measure the idiosyncratic features of eachbank on the accumulation of soft information, e.g. uniqueness of their SME lending policies and businessmodels.
BANK_SIZE
This variable divides the sample into 2 parts, where the variable takes on the value 2 where the loan officerworks in a tier-1 bank (representing the top 5 largest banks), and 1 if the loan officer works in a tier-2 bank(representing other mid-sized banks in the sample). The literature points out that smaller banks tend to exhibitgreater features of relationship lending than larger banks because they offer more retail services and can easilyreach SMEs in their local communities (Nakamura, 1994; Keeton, 1995; Berger and Udell, 1995, 2003, 2006;Cole, et al, 2004; Berger et al, 2005). BANK_SIZE can also be used to capture the influence of banksophistication and reputation.
BRANCH_TYPE
This dummy variable is the code number given to loan officers depending on whether they serve in retail orcommercial branches (Dummy ‘1’ is for LOs in retail branches; Dummy ‘2’ is for LOs in commercialbranches). This categorical variable could also proxy for the influence of geographical location or distance onsoft information acquisition (Keeton, 1995). Suffice to say that retail branches and commercial branches areclustered together in different geographical locations, the former in less developed areas and the former in moredeveloped urban areas.
[1] This variable was eventually dropped because it is strongly correlated with frequency of communication“FREQ-COMM”.
Relationship Strength/Quality
Relationship Strength/Quality can be measured by the loan officer’s attributes represented by the following variables:
Control Variables
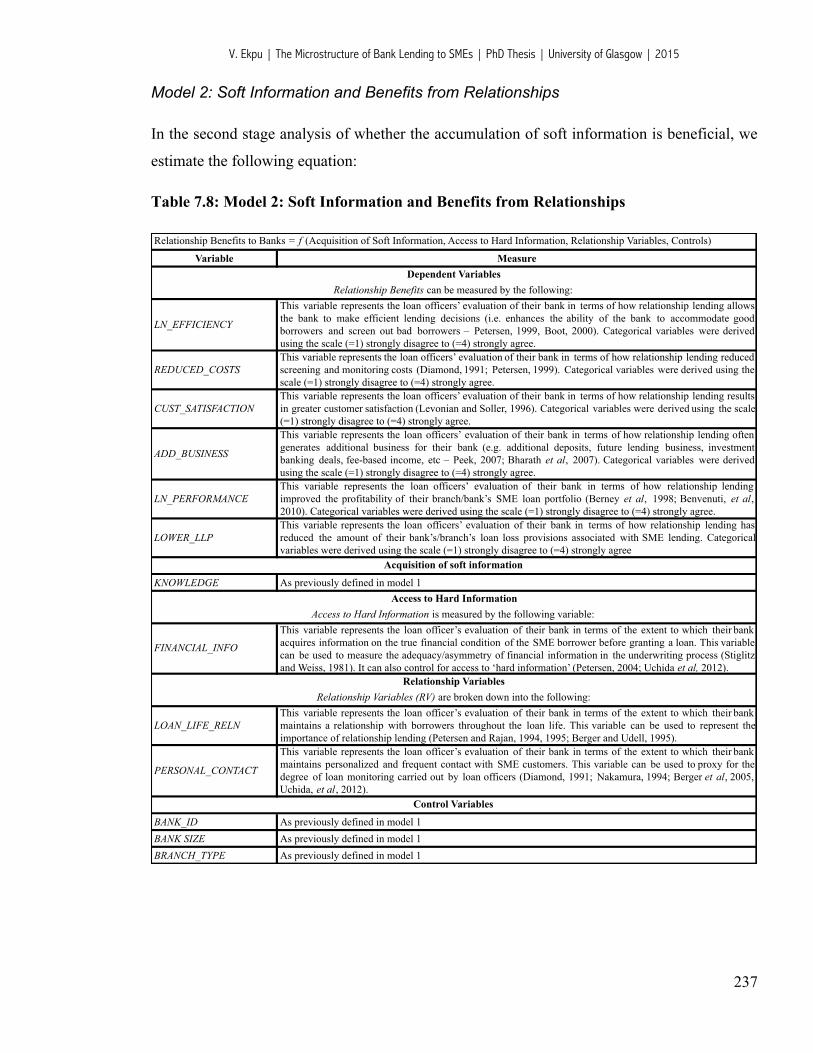
V. Ekpu | The Microstructure of Bank Lending to SMEs | PhD Thesis | University of Glasgow | 2015
237
Model 2: Soft Information and Benefits from Relationships
In the second stage analysis of whether the accumulation of soft information is beneficial, we
estimate the following equation:
Table 7.8: Model 2: Soft Information and Benefits from Relationships
Variable Measure
LN_EFFICIENCY
This variable represents the loan officers’ evaluation of their bank in terms of how relationship lending allowsthe bank to make efficient lending decisions (i.e. enhances the ability of the bank to accommodate goodborrowers and screen out bad borrowers – Petersen, 1999, Boot, 2000). Categorical variables were derivedusing the scale (=1) strongly disagree to (=4) strongly agree.
REDUCED_COSTSThis variable represents the loan officers’ evaluation of their bank in terms of how relationship lending reducedscreening and monitoring costs (Diamond, 1991; Petersen, 1999). Categorical variables were derived using thescale (=1) strongly disagree to (=4) strongly agree.
CUST_SATISFACTIONThis variable represents the loan officers’ evaluation of their bank in terms of how relationship lending resultsin greater customer satisfaction (Levonian and Soller, 1996). Categorical variables were derived using the scale(=1) strongly disagree to (=4) strongly agree.
ADD_BUSINESS
This variable represents the loan officers’ evaluation of their bank in terms of how relationship lending oftengenerates additional business for their bank (e.g. additional deposits, future lending business, investmentbanking deals, fee-based income, etc – Peek, 2007; Bharath et al, 2007). Categorical variables were derivedusing the scale (=1) strongly disagree to (=4) strongly agree.
LN_PERFORMANCEThis variable represents the loan officers’ evaluation of their bank in terms of how relationship lendingimproved the profitability of their branch/bank’s SME loan portfolio (Berney et al, 1998; Benvenuti, et al, 2010). Categorical variables were derived using the scale (=1) strongly disagree to (=4) strongly agree.
LOWER_LLPThis variable represents the loan officers’ evaluation of their bank in terms of how relationship lending hasreduced the amount of their bank’s/branch’s loan loss provisions associated with SME lending. Categoricalvariables were derived using the scale (=1) strongly disagree to (=4) strongly agree
KNOWLEDGE As previously defined in model 1
LOAN_LIFE_RELNThis variable represents the loan officer’s evaluation of their bank in terms of the extent to which their bankmaintains a relationship with borrowers throughout the loan life. This variable can be used to represent theimportance of relationship lending (Petersen and Rajan, 1994, 1995; Berger and Udell, 1995).
PERSONAL_CONTACT
This variable represents the loan officer’s evaluation of their bank in terms of the extent to which their bankmaintains personalized and frequent contact with SME customers. This variable can be used to proxy for thedegree of loan monitoring carried out by loan officers (Diamond, 1991; Nakamura, 1994; Berger et al, 2005, Uchida, et al, 2012).
BANK_ID As previously defined in model 1BANK SIZE As previously defined in model 1BRANCH_TYPE As previously defined in model 1
Relationship Variables (RV) are broken down into the following:
Control Variables
Acquisition of soft information
Access to Hard InformationAccess to Hard Information is measured by the following variable:
FINANCIAL_INFO
This variable represents the loan officer’s evaluation of their bank in terms of the extent to which their bankacquires information on the true financial condition of the SME borrower before granting a loan. This variablecan be used to measure the adequacy/asymmetry of financial information in the underwriting process (Stiglitzand Weiss, 1981). It can also control for access to ‘hard information’ (Petersen, 2004; Uchida et al, 2012).
Relationship Variables
Relationship Benefits to Banks = f (Acquisition of Soft Information, Access to Hard Information, Relationship Variables, Controls)
Dependent VariablesRelationship Benefits can be measured by the following:
V. Ekpu | The Microstructure of Bank Lending to SMEs | PhD Thesis | University of Glasgow | 2015
238
7.4. Empirical Results
7.4.1. Information Acquisition and Loan Officer Activities
The results for the estimation of model 1 are shown in columns (A) and (B) in Table 7.9.
Column (A) reports the OLR results for the acquisition of soft information using
KNOWLEDGE as the dependent variable, while column (B) estimates the marginal effects of
an increase in loan officer activities and relationship strength on the probability of selecting
alternative (3) – “very good” knowledge of borrower.
With respect to the key independent variables that measure loan officer activities, we find a
significant and negative coefficient on IND_APPROVAL and a significant and negative
coefficient on INT_DISCRETION. This implies that the level of authority loan officers have to
independently approve loans and the degree of discretion they have in setting interest rates on
SME loans are likely to reduce the knowledge they have of their customers’ business
activities. This may be explained by the fact that most of the critical lending decisions
(including loan approval decisions) in Nigerian banks are centralised, i.e. carried out at the
head office. Under such circumstances, local relationship managers have no incentives to
acquire soft information since they play fewer roles in lending decisions.
The marginal effects estimates (column B) predicts that a loan officer with no independent
approval authority reduces his/her likelihood of acquiring “very good” knowledge of the
customer by about 34.8%. Similarly, a loan officer with no margin of discretion in setting loan
rates for customers is 38% less likely to acquire “very good” knowledge of his/her customers’
business model and activities. This empirical evidence confirms the hypothesis that a
decentralised lending structure, characterised by autonomous lending by loan officers,
reinforces the acquisition of soft information and hence allows relationship banks to
effectively act as delegated monitors. The result is also consistent with findings from
Benvenuti et al. (2010) that only banks that delegate more decision-making power to branch
loan officers tend to increase their specialization in relationship lending to SMEs. Nigerian
banks do not fall into this category since they have a mostly centralised lending structure and
hence the reason for the negative signs.
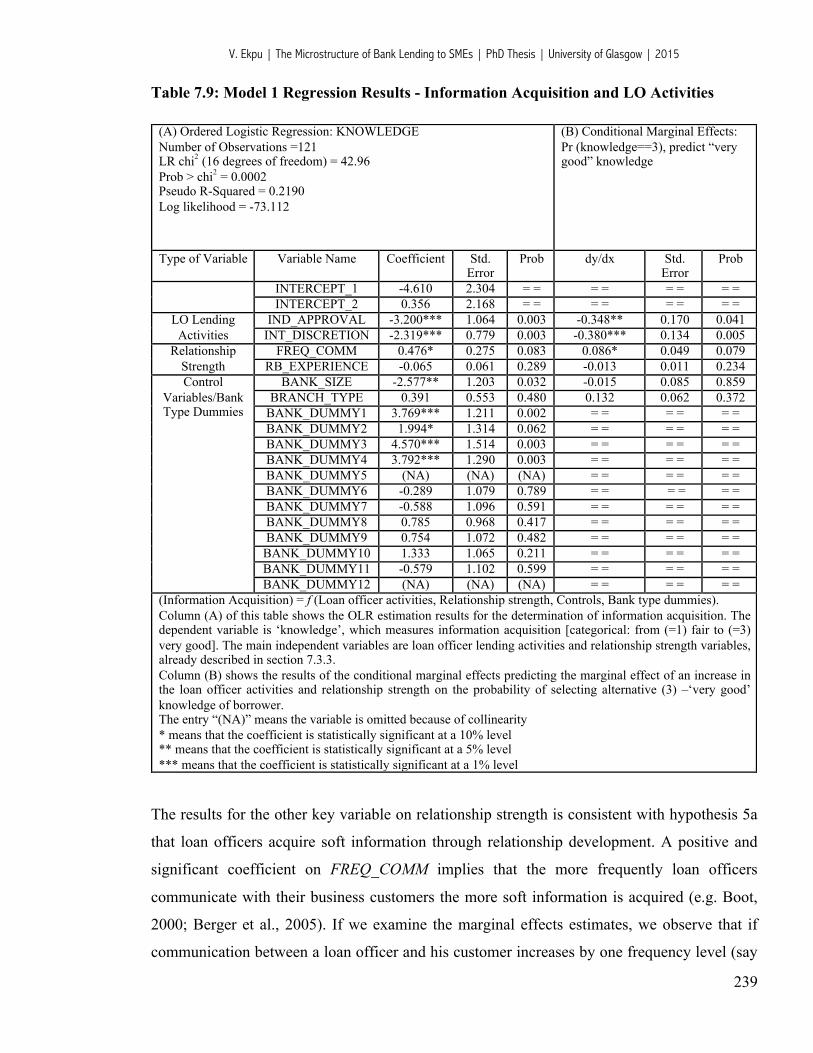
V. Ekpu | The Microstructure of Bank Lending to SMEs | PhD Thesis | University of Glasgow | 2015
239
Table 7.9: Model 1 Regression Results - Information Acquisition and LO Activities
(A) Ordered Logistic Regression: KNOWLEDGE Number of Observations =121 LR chi2 (16 degrees of freedom) = 42.96 Prob > chi2 = 0.0002 Pseudo R-Squared = 0.2190 Log likelihood = -73.112
(B) Conditional Marginal Effects: Pr (knowledge==3), predict “very good” knowledge
Type of Variable Variable Name Coefficient Std. Error
Prob dy/dx Std. Error
Prob
INTERCEPT_1 -4.610 2.304 = = = = = = = = INTERCEPT_2 0.356 2.168 = = = = = = = =
LO Lending Activities
IND_APPROVAL -3.200*** 1.064 0.003 -0.348** 0.170 0.041 INT_DISCRETION -2.319*** 0.779 0.003 -0.380*** 0.134 0.005
Relationship Strength
FREQ_COMM 0.476* 0.275 0.083 0.086* 0.049 0.079 RB_EXPERIENCE -0.065 0.061 0.289 -0.013 0.011 0.234
Control Variables/Bank Type Dummies
BANK_SIZE -2.577** 1.203 0.032 -0.015 0.085 0.859 BRANCH_TYPE 0.391 0.553 0.480 0.132 0.062 0.372
BANK_DUMMY1 3.769*** 1.211 0.002 = = = = = = BANK_DUMMY2 1.994* 1.314 0.062 = = = = = = BANK_DUMMY3 4.570*** 1.514 0.003 = = = = = = BANK_DUMMY4 3.792*** 1.290 0.003 = = = = = = BANK_DUMMY5 (NA) (NA) (NA) = = = = = = BANK_DUMMY6 -0.289 1.079 0.789 = = = = = = BANK_DUMMY7 -0.588 1.096 0.591 = = = = = = BANK_DUMMY8 0.785 0.968 0.417 = = = = = = BANK_DUMMY9 0.754 1.072 0.482 = = = = = =
BANK_DUMMY10 1.333 1.065 0.211 = = = = = = BANK_DUMMY11 -0.579 1.102 0.599 = = = = = = BANK_DUMMY12 (NA) (NA) (NA) = = = = = =
(Information Acquisition) = f (Loan officer activities, Relationship strength, Controls, Bank type dummies). Column (A) of this table shows the OLR estimation results for the determination of information acquisition. The dependent variable is ‘knowledge’, which measures information acquisition [categorical: from (=1) fair to (=3) very good]. The main independent variables are loan officer lending activities and relationship strength variables, already described in section 7.3.3. Column (B) shows the results of the conditional marginal effects predicting the marginal effect of an increase in the loan officer activities and relationship strength on the probability of selecting alternative (3) –‘very good’ knowledge of borrower. The entry “(NA)” means the variable is omitted because of collinearity * means that the coefficient is statistically significant at a 10% level ** means that the coefficient is statistically significant at a 5% level *** means that the coefficient is statistically significant at a 1% level !
The results for the other key variable on relationship strength is consistent with hypothesis 5a
that loan officers acquire soft information through relationship development. A positive and
significant coefficient on FREQ_COMM implies that the more frequently loan officers
communicate with their business customers the more soft information is acquired (e.g. Boot,
2000; Berger et al., 2005). If we examine the marginal effects estimates, we observe that if
communication between a loan officer and his customer increases by one frequency level (say
V. Ekpu | The Microstructure of Bank Lending to SMEs | PhD Thesis | University of Glasgow | 2015
240
for example, from once a month to more than once a month), then the loan officer is 8.5%
more likely to have “very good” knowledge of the borrower’s business. This result is
statistically significant at 10%.
It might be worthy to note that the marginal effect of FREQ_COMM might be indicative of the
fact that the accumulation of soft information is unlikely to be comprehensive where the loan
officer only uses non-physical methods of communication (i.e. standard mails, emails and
telephone). A more reliable way to garner information will be face-to-face meeting with the
customer or physical observation of the customer’s business activities (Uchida et al. 2012
found frequency of meeting to be significant in Japan).
RB_EXPERIENCE is never significant at a conventional level of significance, even after
controlling for its non-linearity. The result implies that if a loan officer’s relationship banking
experience reflects expertise, it does not seem to be important in acquiring soft information.
Uchida et al. (2012) reached a similar conclusion when they used loan officer’s age (which is
a proxy for skill). Usually, a less experienced (i.e. younger) loan officer should be associated
with less acquisition of soft information. However, it could also be the case that a more senior
officer could have a lower incentive to collect information, or possibly even lower ability (on
average), if the bank’s incentive structure is not based on merit (Uchida et al., 2012) or where
the bank operates a very centralised lending policy. Thus, according to the literature, there is
no clear relationship between a loan officer’s experience and expertise. In the case of Nigeria,
loan officers do not possess much incentive to collect information since they do not play a
major role in deciding how capital is allocated across projects.
The influence of BANK_SIZE on the accumulation of knowledge is significant at 5%. The
negative sign shows that as banks grow in size, they are less likely to generate soft information
due to their large multi-office structure and centralised lending strategy (Nakamura, 1994;
Keeton, 1995; Stein, 2002). Interestingly, however, the results show that four of the Tier 1
banks (BANK_DUMMY1, BANK_DUMMY2, BANK_DUMMY3, and BANK_DUMMY4) have
positive and significant coefficients, implying that their loan officers tend to have more
knowledge about their customers’ business activities than other banks. A very good
explanation for this is that from the survey responses, it was observed that these banks seemed
to give more discretion to their loan officers in approving small size loans autonomously as
well as having some leeway in determining interest rates granted to their business customers.

V. Ekpu | The Microstructure of Bank Lending to SMEs | PhD Thesis | University of Glasgow | 2015
241
However, as noted earlier, their independent approval limit (in terms of loan size) is relatively
small, and not all officers exercise this level of authority. Three banks (DUMMY6, DUMMY7
and DUMMY11) tend to have a negative, though insignificant coefficient, which may be
explained by the high level of centralisation of their lending functions.
The chi-square goodness of fit test (Prob > chi2 = 0.0002<0.05) for the overall suitability of
the model shows that the model fits well and that all the coefficients in the model are different
than zero. The pseudo R-squared measure of goodness of fit also shows that the predictors can
explain 21.9% of the changes in the value of the dependent variable. When compared with
those of other authors that used similar models (e.g. Uchida et al., 2012 who reported R-square
of between 17-19% for 1,027 observations), this model does very well. However, one
limitation of this model is that it was impractical to include some other key variables, which
could also explain the accumulation of soft information, such as type of loan officer
compensation schemes and the frequency of loan officer turnover (or mobility). The latter has
been found by several studies to have a negative relationship with soft information
accumulation and credit availability to SMEs (e.g. Scott, 2006; Benvenuti, et al., 2010;
Uchida, et al., 2012). The reason why it is impractical to include these variables is because this
information could only be obtained at the bank level (i.e. from the head office) and could not
be provided by the local relationship managers and so was not included in the questionnaire.
Another major drawback of the model is the fact that the reliability of the estimates may have
been compromised by the presence of collinearity, as two of the bank dummies,
BANK_DUMMY5 and BANK_DUMMY12 are excluded from the model. This situation is also
the case in model 2 (Table 7.10). As has already been alluded to in chapter 6, this outcome
might be unconnected to the relatively low sample size employed by the study, which means
that the distributions of the sample may be highly skewed and odds ratios may have been
overestimated. The robustness tests, which use stepwise regression analysis provides further
insights into the most important predictors in the model and their relative statistical power (see
section 7.4.3).
V. Ekpu | The Microstructure of Bank Lending to SMEs | PhD Thesis | University of Glasgow | 2015
242
7.4.2. Soft Information and Benefits from Relationship Lending
In the second stage analysis, Table 7.10 presents the OLR estimation results for the
presence/absence of benefits from strong bank-borrower relationships. The dependent variable
in each panel is a proxy for the benefits from bank-borrower relationship, which have been
described in section 7.3.3. The main explanatory variables of interest are KNOWLEDGE (a
measure for soft information acquisition) FINANCIAL_INFO (a measure for access to hard
information), LOAN_LIFE_RELN and PERSONAL_CONTACT (both measuring the
importance of relationships). All models control for bank size, branch type and bank
identification effects.
Beginning with Model 2(A), both FINANCIAL_INFO and LOAN_LIFE_RELN have positive
and significant effect on LN_EFFICIENCY, while KNOWLEDGE is insignificant. This result
implies that the influence of soft information on lending efficiency is marginal. The appraisal
and screening of borrowers is rather based on financial (hard) information, consistent with
studies that find that large banks rely more on hard (quantitative) information on the true
financial condition of the borrower (Bakker, Klapper and Udell, 2004; Berger and Udell,
2006; Kim, 2008). Nigerian banks, like most banks elsewhere, are interested in information
from the borrower’s financial statements and information from the valuation of collateral
before they extend credit to business customers. Banks want to know the financial strength of
a business using traditional financial ratios, e.g. liquidity ratios, debt and solvency ratios, asset
management ratios and profitability ratios. Another explanation for the insignificance of
KNOWLEDGE is that lending decisions in Nigerian banks are mostly done centrally so that
the accumulation of soft information is less important in determining lending decisions.
In Model 2(B), FINANCIAL_INFO and PERSONAL_CONTACT impact positively and
significantly on REDUCED_COSTS. This means that the adequacy of financial information
and frequent and personalized contact with borrowers reduces screening and monitoring costs
on business loans, consistent with the hypothesis that relationship lending (based on multiple
interactions with SME customers over time and/or across products) results in reduced
screening and monitoring costs. A number of studies have found that banks serve as delegated
monitors and that enduring relationships between banks and their customers produce
informational efficiencies which reduce monitoring costs and allows for repeated lending
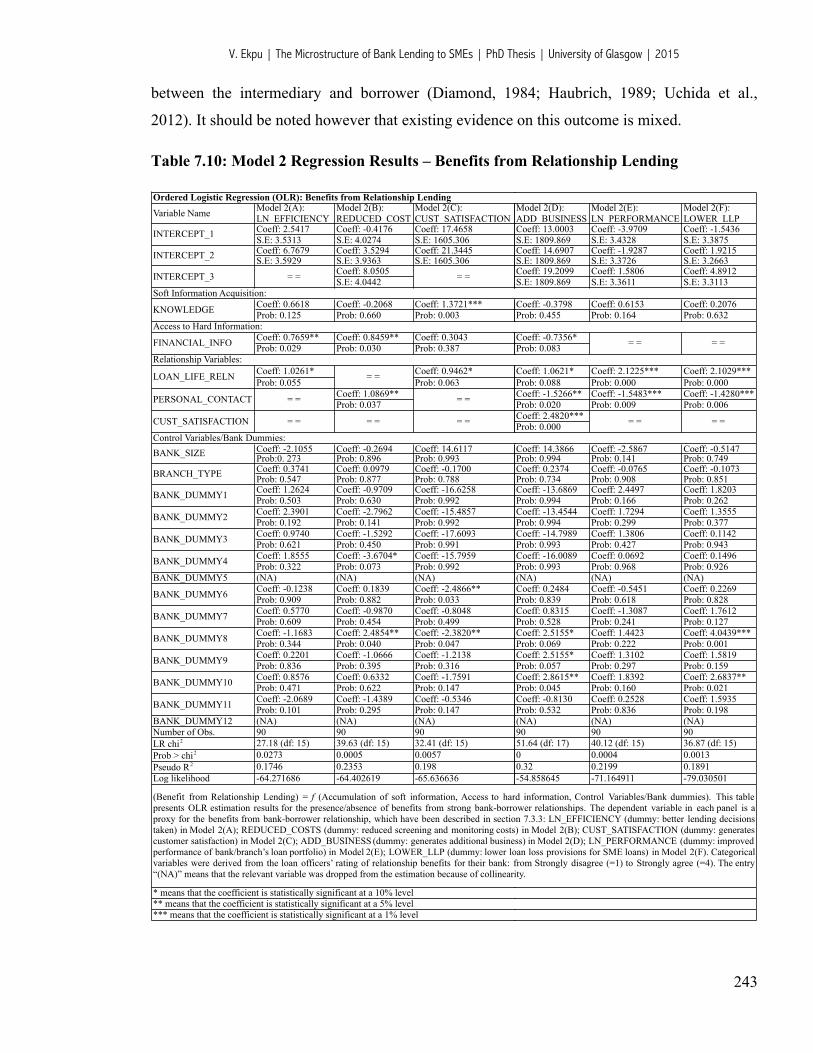
V. Ekpu | The Microstructure of Bank Lending to SMEs | PhD Thesis | University of Glasgow | 2015
243
between the intermediary and borrower (Diamond, 1984; Haubrich, 1989; Uchida et al.,
2012). It should be noted however that existing evidence on this outcome is mixed.
Table 7.10: Model 2 Regression Results – Benefits from Relationship Lending
Coeff: 2.5417 Coeff: -0.4176S.E: 3.5313 S.E: 4.0274Coeff: 6.7679 Coeff: 3.5294S.E: 3.5929 S.E: 3.9363
Coeff: 8.0505S.E: 4.0442
Coeff: 0.6618 Coeff: -0.2068 Coeff: 1.3721***Prob: 0.125 Prob: 0.660 Prob: 0.003
Coeff: 0.7659** Coeff: 0.8459** Coeff: 0.3043Prob: 0.029 Prob: 0.030 Prob: 0.387
Coeff: 1.0261* Coeff: 0.9462*Prob: 0.055 Prob: 0.063
Coeff: 1.0869**Prob: 0.037
Coeff: -2.1055 Coeff: -0.2694 Coeff: 14.6117Prob:0. 273 Prob: 0.896 Prob: 0.993Coeff: 0.3741 Coeff: 0.0979 Coeff: -0.1700Prob: 0.547 Prob: 0.877 Prob: 0.788Coeff: 1.2624 Coeff: -0.9709 Coeff: -16.6258Prob: 0.503 Prob: 0.630 Prob: 0.992Coeff: 2.3901 Coeff: -2.7962 Coeff: -15.4857Prob: 0.192 Prob: 0.141 Prob: 0.992Coeff: 0.9740 Coeff: -1.5292 Coeff: -17.6093Prob: 0.621 Prob: 0.450 Prob: 0.991Coeff: 1.8555 Coeff: -3.6704* Coeff: -15.7959Prob: 0.322 Prob: 0.073 Prob: 0.992
BANK_DUMMY5 (NA) (NA) (NA)Coeff: -0.1238 Coeff: 0.1839 Coeff: -2.4866**Prob: 0.909 Prob: 0.882 Prob: 0.033Coeff: 0.5770 Coeff: -0.9870 Coeff: -0.8048Prob: 0.609 Prob: 0.454 Prob: 0.499Coeff: -1.1683 Coeff: 2.4854** Coeff: -2.3820**Prob: 0.344 Prob: 0.040 Prob: 0.047Coeff: 0.2201 Coeff: -1.0666 Coeff: -1.2138Prob: 0.836 Prob: 0.395 Prob: 0.316Coeff: 0.8576 Coeff: 0.6332 Coeff: -1.7591Prob: 0.471 Prob: 0.622 Prob: 0.147Coeff: -2.0689 Coeff: -1.4389 Coeff: -0.5346Prob: 0.101 Prob: 0.295 Prob: 0.147
BANK_DUMMY12 (NA) (NA) (NA)Number of Obs. 90 90 90LR chi2 27.18 (df: 15) 39.63 (df: 15) 32.41 (df: 15)Prob > chi2 0.0273 0.0005 0.0057Pseudo R2 0.1746 0.2353 0.198Log likelihood -64.271686 -64.402619 -65.636636
** means that the coefficient is statistically significant at a 5% level*** means that the coefficient is statistically significant at a 1% level
51.64 (df: 17)00.32-54.858645
(Benefit from Relationship Lending) = f (Accumulation of soft information, Access to hard information, Control Variables/Bank dummies). This tablepresents OLR estimation results for the presence/absence of benefits from strong bank-borrower relationships. The dependent variable in each panel is aproxy for the benefits from bank-borrower relationship, which have been described in section 7.3.3: LN_EFFICIENCY (dummy: better lending decisionstaken) in Model 2(A); REDUCED_COSTS (dummy: reduced screening and monitoring costs) in Model 2(B); CUST_SATISFACTION (dummy: generatescustomer satisfaction) in Model 2(C); ADD_BUSINESS (dummy: generates additional business) in Model 2(D); LN_PERFORMANCE (dummy: improvedperformance of bank/branch’s loan portfolio) in Model 2(E); LOWER_LLP (dummy: lower loan loss provisions for SME loans) in Model 2(F). Categoricalvariables were derived from the loan officers’ rating of relationship benefits for their bank: from Strongly disagree (=1) to Strongly agree (=4). The entry“(NA)” means that the relevant variable was dropped from the estimation because of collinearity.
* means that the coefficient is statistically significant at a 10% level
BANK_DUMMY11 Coeff: -0.8130Prob: 0.532(NA)90
BANK_DUMMY9 Coeff: 2.5155*Prob: 0.057
BANK_DUMMY10 Coeff: 2.8615**Prob: 0.045
BANK_DUMMY7 Coeff: 0.8315Prob: 0.528
BANK_DUMMY8 Coeff: 2.5155*Prob: 0.069
BANK_DUMMY4 Coeff: -16.0089Prob: 0.993(NA)
BANK_DUMMY6 Coeff: 0.2484Prob: 0.839
BANK_DUMMY2 Coeff: -13.4544Prob: 0.994
BANK_DUMMY3 Coeff: -14.7989Prob: 0.993
BRANCH_TYPE Coeff: 0.2374Prob: 0.734
BANK_DUMMY1 Coeff: -13.6869Prob: 0.994
Control Variables/Bank Dummies:BANK_SIZE Coeff: 14.3866
Prob: 0.994
CUST_SATISFACTION = = = = = = Coeff: 2.4820***Prob: 0.000
PERSONAL_CONTACT = = = = Coeff: -1.5266**Prob: 0.020
Prob: 0.083Relationship Variables:
LOAN_LIFE_RELN = = Coeff: 1.0621*Prob: 0.088
FINANCIAL_INFO Coeff: -0.7356*
Ordered Logistic Regression (OLR): Benefits from Relationship Lending
Variable Name Model 2(A): LN_EFFICIENCY
Model 2(B): REDUCED_COST
Model 2(C): CUST_SATISFACTION
Access to Hard Information:
INTERCEPT_3 = = = =
Soft Information Acquisition:
KNOWLEDGE Coeff: -0.3798Prob: 0.455
INTERCEPT_1 Coeff: 17.4658S.E: 1605.306
INTERCEPT_2 Coeff: 21.3445S.E: 1605.306
Coeff: 13.0003 Coeff: -3.9709 Coeff: -1.5436S.E: 1809.869 S.E: 3.4328 S.E: 3.3875Coeff: 14.6907 Coeff: -1.9287 Coeff: 1.9215S.E: 1809.869 S.E: 3.3726 S.E: 3.2663Coeff: 19.2099 Coeff: 1.5806 Coeff: 4.8912S.E: 1809.869 S.E: 3.3611 S.E: 3.3113
Coeff: 0.6153 Coeff: 0.2076Prob: 0.164 Prob: 0.632
Coeff: 2.1225*** Coeff: 2.1029***Prob: 0.000 Prob: 0.000Coeff: -1.5483*** Coeff: -1.4280***Prob: 0.009 Prob: 0.006
Coeff: -2.5867 Coeff: -0.5147Prob: 0.141 Prob: 0.749Coeff: -0.0765 Coeff: -0.1073Prob: 0.908 Prob: 0.851Coeff: 2.4497 Coeff: 1.8203Prob: 0.166 Prob: 0.262Coeff: 1.7294 Coeff: 1.3555Prob: 0.299 Prob: 0.377Coeff: 1.3806 Coeff: 0.1142Prob: 0.427 Prob: 0.943Coeff: 0.0692 Coeff: 0.1496Prob: 0.968 Prob: 0.926(NA) (NA)Coeff: -0.5451 Coeff: 0.2269Prob: 0.618 Prob: 0.828Coeff: -1.3087 Coeff: 1.7612Prob: 0.241 Prob: 0.127Coeff: 1.4423 Coeff: 4.0439***Prob: 0.222 Prob: 0.001Coeff: 1.3102 Coeff: 1.5819Prob: 0.297 Prob: 0.159Coeff: 1.8392 Coeff: 2.6837**Prob: 0.160 Prob: 0.021Coeff: 0.2528 Coeff: 1.5935Prob: 0.836 Prob: 0.198(NA) (NA)90 9040.12 (df: 15) 36.87 (df: 15)0.0004 0.00130.2199 0.1891-71.164911 -79.030501
** means that the coefficient is statistically significant at a 5% level*** means that the coefficient is statistically significant at a 1% level
51.64 (df: 17)00.32-54.858645
(Benefit from Relationship Lending) = f (Accumulation of soft information, Access to hard information, Control Variables/Bank dummies). This tablepresents OLR estimation results for the presence/absence of benefits from strong bank-borrower relationships. The dependent variable in each panel is aproxy for the benefits from bank-borrower relationship, which have been described in section 7.3.3: LN_EFFICIENCY (dummy: better lending decisionstaken) in Model 2(A); REDUCED_COSTS (dummy: reduced screening and monitoring costs) in Model 2(B); CUST_SATISFACTION (dummy: generatescustomer satisfaction) in Model 2(C); ADD_BUSINESS (dummy: generates additional business) in Model 2(D); LN_PERFORMANCE (dummy: improvedperformance of bank/branch’s loan portfolio) in Model 2(E); LOWER_LLP (dummy: lower loan loss provisions for SME loans) in Model 2(F). Categoricalvariables were derived from the loan officers’ rating of relationship benefits for their bank: from Strongly disagree (=1) to Strongly agree (=4). The entry“(NA)” means that the relevant variable was dropped from the estimation because of collinearity.
* means that the coefficient is statistically significant at a 10% level
Coeff: -0.8130Prob: 0.532(NA)90
Coeff: 2.5155*Prob: 0.057Coeff: 2.8615**Prob: 0.045
Coeff: 0.8315Prob: 0.528Coeff: 2.5155*Prob: 0.069
Coeff: -16.0089Prob: 0.993(NA)Coeff: 0.2484Prob: 0.839
Coeff: -13.4544Prob: 0.994Coeff: -14.7989Prob: 0.993
Coeff: 0.2374Prob: 0.734Coeff: -13.6869Prob: 0.994
= = = =
Control Variables/Bank Dummies:Coeff: 14.3866Prob: 0.994
Coeff: 2.4820***Prob: 0.000
Coeff: -1.5266**Prob: 0.020
Prob: 0.083 = = = =
Relationship Variables:Coeff: 1.0621*Prob: 0.088
Coeff: -0.7356*
Ordered Logistic Regression (OLR): Benefits from Relationship LendingModel 2(D): ADD_BUSINESS
Model 2(E): LN_PERFORMANCE
Model 2(F): LOWER_LLP
Access to Hard Information:
Soft Information Acquisition:Coeff: -0.3798Prob: 0.455
V. Ekpu | The Microstructure of Bank Lending to SMEs | PhD Thesis | University of Glasgow | 2015
244
The importance of soft information in Nigerian banks is only underscored in Model 2(C),
where KNOWLEDGE is both positive and very significant on CUST_SATISFACTION. Due to
the personal touch with customers, relationship lenders are able to offer a superior level of
customer service than non-relationship lenders (Levonian and Soller, 1996).
LOAN_LIFE_RELN is also positive and significant at 10%, implying that banks that maintain
a relationship with borrowers throughout the loan life will be better positioned to serve
customers better and meet their needs and expectations. An interesting implication of
satisfying customers is that it is more likely to generate additional business opportunities for
banks (see Model 2(D) - CUST_SATISFACTION impacts positively and very significantly on
ADD__BUSINESS at the 1% level, confirming the hypothesis that relationship lending by
banks results in greater customer satisfaction derived from offering superior services to
customers, which in turn produces repeat business for the bank. As noted earlier in section
7.3.2, Nigerian banks net huge income from fee and commission-based transactions. This
performance seems to be significantly connected to the level of satisfaction customers derive
from relationships with their Nigerian banks, among other factors (FINANCIAL_INFO,
LOAN_LIFE_RELN, and PERSONAL_CONTACT). This result is consistent with recent
empirical studies by Bharath et al. (2007) and Peek (2007) which show that the benefits
accruing to banks from investing in lending relationships are not limited to the additional
interest income they are likely to earn from the private information they have of their
borrowers. Using valuable customer information, banks often cross sell financial products and
services to customers such as additional loans, equity underwriting deals, cash management
services, payroll processing, financial advisory services and other fee earning services.
Notice that FINANCIAL_INFO and PERSONAL_CONTACT both have a negative impact on
CUST_SATISFACTION. This may be connected to the finding that lenders believe that
financial information garnered on their business customers is hardly adequate and hence could
lead to the rejection of credit requests. In addition, customers often dislike being spied upon
(or constantly being monitored) by the bank for fear of losing sensitive proprietary
information to competitors. For example, Shane and Cable (2002) report that entrepreneurs
may decline from providing detailed information to bankers on their business prospects/plans
for fear that such disclosure may compromise their intellectual property, or result in piracy.
Under these circumstances, there is a higher likelihood that such customers would be
dissatisfied by the rejection of credit requests due to inadequate financial information and the
V. Ekpu | The Microstructure of Bank Lending to SMEs | PhD Thesis | University of Glasgow | 2015
245
risk of espionage arising from too frequent personal contacts. It is also worthy of mention that
the impact of customer satisfaction on the probability of additional business is huge as the
pseudo R-squared reduces from 32% to 19.48% with the removal of CUST_SATISFACTION
alone.
In Model 2(E) and 2(F), LOAN_LIFE_RELN has a positive and very significant impact on
LN_PERFORMANCE and LOWER_LLP respectively at the 1% level in both panels,
confirming the hypothesis that relationship lending improves loan profitability and results in
better loan quality. This is also consistent with findings from Carter, McNulty and Verbrugge
(2004) that relationship lenders earn higher risk-adjusted yields on SME loans than non-
relationship lenders. In Nigeria, most banks’ non-performing loan ratios as a proportion of
total loans seem to be very low (at between 3% - 4% on the average). As noted in chapter 5,
Nigerian banks are generally risk-averse and would only lend to businesses that reassure them
of a greater likelihood of paying back the loans extended to them.
7.4.3. Robustness Checks
To test the quality of predictors in the empirical models used in this chapter, the stepwise
regression procedure was employed to determine the most important predictors of information
acquisition and relationship benefits in Nigerian banks. As noted in chapter 4, the stepwise
regression is a multiple regression procedure that is used to determine the best combination of
independent (predictor) variables that would predict the dependent (predicted) variable (see
chapter 4 for a detailed explanation of the procedure).
Appendix 7.1 shows the results of the stepwise procedure for the predictors of information
acquisition. The dependent (or predicted) variable is KNOWLEDGE, while the independent
variables (or predictors) are the variables used in model 1. The model was estimated in four
steps. At the end of step 4, two bank dummies - BANK_DUMMY10 and BANK_DUMMY5,
entered into the regression equation along with INT_DISCRETION and IND_APPROVAL, the
two variables of interest introduced to account for loan officer activities. These four variables
are significantly related to KNOWLEDGE at least at 5% level of statistical significance. The
R-square for all four predictors (model 4) was 0.189, indicating that approximately 18.9% of
the variance of KNOWLEDGE could be accounted for by these four variables. The results of
V. Ekpu | The Microstructure of Bank Lending to SMEs | PhD Thesis | University of Glasgow | 2015
246
the stepwise analysis confirms the original OLR results, which show that the two variables of
interest, discretion in setting interest rates and autonomous approval of loans by loan officers
are statistically significant in predicting the acquisition of soft information, further validating
the hypothesis that a decentralized lending structure characterized autonomous lending by loan
officers reinforces the accumulation of soft information. In other words, in banks or bank
branches were loan officers have some degree of authority in taking lending decisions, the
acquisition of borrower information is more efficient than in banks or branches that operate a
fully centralized loan administration policy. However, the stepwise procedure excluded some
of the predictors of information acquisition that were previously significant, such as
FREQ_COMM and BANK_SIZE. This is one of the criticisms of the procedure, i.e. the fact
that it excludes some important predictors in a model.
Appendix 7.2 shows the results of the stepwise procedure for one of the dominant benefits of
relationship lending, which is additional business (ADD_BUSINESS). The model was
estimated in three steps, and at the end of step 3, three variables, BANK_DUMMY5,
BANK_DUMMY4 and CUST_SATISFACTION entered the regression in that order of
importance and are jointly significant (F = 9.681, sig = 0.000), accounting for 25.2% of
perceived changes in ADD_BUSINESS. This result seems to confirm the earlier finding that
customer satisfaction from relationship lending is likely to generate repeat business for the
bank over the life of a lending relationship. However, other previously significant predictors
of additional business, e.g. FINANCIAL_INFO, LOAN_LIFE_RELN and
PERSONAL_CONTACT have been excluded from the model.
7.5. Chapter Conclusions
This chapter takes a look at the administrative structure of lending decision-making in
Nigerian banks and the acquisition of soft information by loan officers/relationship managers.
It also examines the economic value of relationship lending to Nigerian banks in terms of the
benefits and costs of relationship lending. Findings from this chapter reveal that critical
lending functions in Nigerian banks such as loan approval and risk management are mostly
centralised, while loan appraisal decisions are mostly done in two stages: first at the branches,
and then at the head office, before loan approval decisions are taken. The empirical analysis
V. Ekpu | The Microstructure of Bank Lending to SMEs | PhD Thesis | University of Glasgow | 2015
247
shows that the benefits of relationship lending in Nigerian banks are driven largely by the
accumulation of financial (hard) information on customers, longer bank-borrower
relationships, frequent and personalized contact with SMEs and the customer satisfaction
derived over the life of loan relationships. The relative insignificance of soft information
accumulation by loan officers in loan underwriting is due to the high level of centralisation of
critical lending decisions, a result that is consistent with the empirical literature that large
banks are disadvantaged in the area of generating and processing soft information and tend to
rely more on the use of hard (quantitative) information. This study also reveals that a major
purpose for acquiring soft information is to help loan officers offer superior customer service
to their business customers. The satisfaction then derived from such services in turn increases
the likelihood of generating additional business for their bank over the life of such customer
relationships.
V. Ekpu | The Microstructure of Bank Lending to SMEs | PhD Thesis | University of Glasgow | 2015
248
CHAPTER 8
GENERAL CONCLUSIONS AND POLICY IMPLICATIONS
8.1. General Conclusions
This thesis has attempted to answer three major research questions on bank lending to SMEs
in Nigeria using contemporary SME banking theories. The study has examined: (1) the
demand and supply side constraints to bank involvement with SMEs in Nigeria (2) the
determinants of risk premium and collateralisation in Nigerian banks, and (3) the acquisition
of soft information by loan officers in Nigerian banks and the economic value derivable from
relationship lending. This section summarises the key findings and conclusions from the thesis
under the following five headings:
(1) The Effect of Bank Consolidation on SME lending and the Role of Government
The Nigerian banking sector has faced a number of significant changes since 2004, namely the
consolidation of banks and the emergence of relatively large, well-capitalized banks that are
leading on the African continent and among the world’s top 1000 banks. Though Nigerian
banks are now robust and well capitalized, with an aggregate balance sheet size in excess of
N22 trillion (~£90 billion), the post- consolidated banking sector is still marked by a
significant funding gap54 for SMEs, valued at N3.6 trillion (~£14.4 billion) using estimates
from 2006 to 2012. From the findings of this study, Nigerian SMEs like SMEs in other Sub-
Saharan African countries still have little access to bank finance, which thus hampers their
emergence and eventual growth.
Nigeria’s private sector consists of mostly informal micro-enterprises, operating alongside
large firms. About 98% of MSMEs in Nigeria are micro-enterprises (Ketley 2012). Most
companies are small because the private sector is new and because of legal and financial
obstacles to capital accumulation. Thus between these large and small firms, SMEs are very
scarce and constitute the “missing middle”. While microenterprises are catered for by the
informal financial sector and partly by the formal financial sector through microfinance banks
(MFBs), commercial banks have generally reduced lending to SMEs and have increased focus
54 In Sub-Saharan Africa, the funding gap within the SME segment is estimated at anything between US$100 billion to US$200 billion (see Oyebode, 2014)
V. Ekpu | The Microstructure of Bank Lending to SMEs | PhD Thesis | University of Glasgow | 2015
249
on lending to large corporates in order to optimise returns to their shareholders.
Notwithstanding all the efforts of the Federal Government of Nigeria and other stakeholders in
the banking industry to make it easier for SMEs to access bank loans, majority of 17.6 million
MSMEs in Nigeria are either excluded or still appeared to find it difficult to meet the
requirements for obtaining bank loans. The withdrawal of the compulsory 20% allocation of
total domestic credit to the SME sector by the government in 1996 precipitated a drastic
reduction in bank lending to SMEs, measured by the proportion of commercial banks’ total
loan portfolio that is accounted for by SMEs.
(2) Demand-Side Constraints and Market Failures
Banks in Nigeria generally lend only between 5-7% of their total loan portfolio to SMEs, on
the average. In appraising a loan proposition, loan officers admit that the purpose of a loan,
the profitability of a business and the availability of fixed collateral are the most important
factors considered. Other important borrower factors include the borrowers’ credit standing
and the stability of the demand for their products. Findings also show that the lending model
of Nigerian banks does not emphasise the role of bank-borrower relationships in determining
the decision to approve or reject a loan as most lending decisions are taken at the centre.
Nigerian banks also ranked the high incidence of diversion of funds, weak management
capacity and the inability of SMEs to service debts as chief contributory factors to the riskiness
of SME loans. According to the lenders, low-end borrowers often diverted funds meant to
finance working capital or other projects into personal uses, which when coupled with huge
operational costs of doing business in Nigeria, affects their inability to pay back loans due.
(3) Supply Side Constraints
Apart from demand side factors, there are also supply-side considerations, which affect the
inclination or willingness of banks to lend to SMEs. Here, the main categories are bank-level
or institutional factors and external or environmental factors.
(a) Bank-Level Factors
With respect to idiosyncratic (bank-level) factors, lenders believe that the high transaction
costs associated with processing, monitoring and reviewing SME loans impact negatively on
the profitability of SME loans. This problem is further encouraged by the inadequacy of
V. Ekpu | The Microstructure of Bank Lending to SMEs | PhD Thesis | University of Glasgow | 2015
250
information on borrowers’ financial condition due to poor credit record data and proprietary
issues on the part of borrowers. This information asymmetry contributes to the reason
Nigerians banks charge higher risk premiums for certain SME loans in comparison with larger
corporates who enjoy the prime-lending rate (PLR). The level of bank deposits and overall
financial stability of the lenders are other supply-side factors that impact on the decision to
approve or reject an SME loan proposition. There is evidence to suggest that Tier 1 banks in
Nigeria enjoy relatively lower cost of funds and relatively greater access to cheap deposits
than their Tier 2 counterparts due to their reputation for safety and wider branch networks.
(b) Constraints Posed by Regulation and the Business Environment
The influence of regulatory requirements, bank’s lending policies toward SMEs and the risk
profile of the SME sector were regarded as the most important supply side factors in approving
or rejecting a loan. There is evidence to suggest that regulatory requirements and monetary
policies in Nigeria have affected banks’ lending policies towards SMEs. For example, the
recent increase in cash reserve requirement from 50% to 75% and liquidity ratio on private
sector deposits from 15% to 12% have affected the availability of loanable funds to the private
sector and by implication, to SMEs. Moreover, recent rise in in yield on competing assets,
such as government treasury bills, has led to the crowding out of private sector lending as
Nigerian banks hold a sizeable proportion of their assets in relatively safer government
securities, which tends to lower their appetite for lending to SMEs. Findings from this study
show that SME loan approval decisions are mostly rule-based and often driven by the lenders’
risk appetite, which in turn is affected by a number of factors, including the quality of the
lenders’ portfolio, previous history of SME loan performance, the risk profile of the borrower
or borrower’s sector, government’s borrowing and directed lending policies and general
macroeconomic and financial conditions. This finding further supports the Post Keynesian
view that lending is driven by the bank’s risk appetite and not just the cost of funds.
The risk profile of the SME sector is further enhanced by a number of factors, including poor
information economics and inefficient credit referencing on business loans; inability to enforce
loans contracts due to legal and judicial constraints; unfavourable macroeconomic conditions
(namely high inflation, unemployment and exchange rate volatility) as well as infrastructural
constraints such as inadequate power supply and poor access to good roads, which further
exacerbate operational costs of SMEs. Surprisingly, the recent global financial crisis did not
V. Ekpu | The Microstructure of Bank Lending to SMEs | PhD Thesis | University of Glasgow | 2015
251
cause a reduction in the volume of loans given to private sector, and by implication, SMEs.
However, when the ratio of SME loans to total loans is examined, it can be safely concluded
that SME loans have risen at a much slower rate than the growth in aggregate loans to the
economy.
(4) Features of Bank Lending Facilities and Loan Contracts Determination
Findings from the survey reveal that Nigerian banks seem to be risk averse to SMEs and
would only lend to borrowers that have characteristics that reassure them of their ability to
repay a loan. An observation of the features of commercial banks’ lending facilities reveals
that Nigerian banks seem to be risk averse to new business customers, only offering facilities
to either customers who have deposit or loan relationships with them or trading partners of
their large corporate customers. SMEs are often advised to open corporate accounts in banks
that offer the kind of facilities that relate to their kind of business. Nigerian banks also seem to
have a preference for short-term lending, offering facilities for an average tenor of 12 months,
with term loans not exceeding 3 years in most banks and interest rates hovering between 18-
32% depending on the borrower’s credit quality, the lender’s cost of funds or loan
commitments between the bank and the borrower.
Findings from the descriptive and empirical analysis show that the determinants of risk
premium on SME loans are largely connected with factors that underline the opacity and
riskiness of SMEs in Nigeria, and are less connected with lender factors such as cost of funds
and administrative expenses associated with loan appraisal and disbursement. The
predominant reasons why Nigerian banks charge higher risk premium on SME loans are
linked with SMEs’ susceptibility to failure and changes in the external environment.
Relationships also play a role in determining risk premiums. In most Nigerian banks,
customers with longer relationships with the bank (i.e. repeat customers) tend to benefit from
lower interest rates. Though not much evidence was available to support interest rate
smoothing among the sample of loan officers, the empirical results show that it is significantly
related to the likelihood of lower risk premium on SME loans in Nigeria.
The determinants of collateral usage vary from bank to bank and are likely to be connected to
the type of the lender, the specialization of the lender, the type of lending technology used and
other differences in the business model of banks. However, the likelihood that banks will
V. Ekpu | The Microstructure of Bank Lending to SMEs | PhD Thesis | University of Glasgow | 2015
252
request collateral is also influenced by borrower characteristics such as the firm’ age, firm size
and the risk of loan diversion. Loan size, firm size and borrowers’ credit rating are also
significant factors that determine the probability that a bank will request full or partial
collateralisation. The descriptive analysis shows that real estate and cash-backed assets are the
most accepted forms of collateral used in Nigerian banks today, while movable assets are less
patronised because of the legal and financial constraints that come with their use.
(5) Features of Relationship Lending and Soft Information Acquisition
A review of the administrative structure of lending decision-making in Nigerian banks shows
that critical lending functions such as loan approval and risk management are mostly
centralised, while loan appraisal decisions are mostly done in two stages: first at the branches,
and then at the head office, before loan approval decisions are taken. The empirical results
show that the benefits of relationship lending in Nigerian banks are driven largely by the
accumulation of financial (hard) information on customers, longer bank-borrower
relationships, frequent and personalised contact with SMEs and the customer satisfaction
derived over the life of loan relationships. The findings also show that the accumulation of soft
information by loan officers is constrained by the high level of centralisation of critical
lending decisions, a result that is consistent with the empirical literature that large banks are
disadvantaged in the area of generating and processing soft information and tend to rely more
on the use of hard (quantitative) information. This study also reveals that a major purpose for
acquiring soft information in Nigerian banks is to help loan officers offer superior customer
service to their business customers. The satisfaction then derived from such services in turn
increases the likelihood of generating additional business for their bank over the life of such
customer relationships.
8.2. Policy Implications of Findings for Nigerian Banks and Regulators
The overall finding from this study reveals that, despite the huge potential benefits from
relationship lending in terms of possibility of additional business and other cross-selling
opportunities, Nigerian banks have continued to reduce their proportion of assets in SME
loans. This is perhaps due to the changing structure of global banking, which has been
particularly marked by the shift away from traditional banking to investment banking and fee
V. Ekpu | The Microstructure of Bank Lending to SMEs | PhD Thesis | University of Glasgow | 2015
253
based financial services. In addition, Nigerian banks tend to compete for large corporate
borrowers, while exploiting SMEs. They seem not to be really interested in lending to SMEs,
and therefore charge them high rates (rates that are far above the prime-lending rate - PLR) in
order to make as much money as possible knowing that there is no bank competition for
SMEs. Thus, if Nigeria is to experience sustainable growth of the SME segment, both
Nigerian banks and the government have a role to play in improving SMEs access to bank
finance at affordable rates as well as in ensuring the SME segment is well-served. This study
thus offers the following policy suggestions for Nigerian bankers and regulators to help tackle
the financing problems of SMEs in Nigeria.
8.2.1. The Role of Nigerian Banks
Given the informational opacity of Nigerian SMEs and the risk profile of the SME sector,
there is evidence to suggest that if Nigerian banks focus on the development of effective risk
management techniques and business models, it will help to improve access to bank finance
for deserving SMEs.
Strengthening the Relationship Banking Model
Findings from chapter 7 show that because Nigerian banks have more centralized lending
structures, they often discount the role of relationships in making loan approval decisions, a
feature that is consistent with many large multi-office banks. Bank-borrower relationships are
not as important in deciding whether to approve or reject an SME loan as they are important in
taking decisions on credit terms (e.g. interest rates). As a starting point, it will be beneficial for
Nigerian banks to strengthen their relationship-banking model. The effectiveness of
relationship banking can be seen in terms of a range of outcomes such as informed lending
decisions and customer satisfaction, which further leads to greater chances of securing
additional business opportunities. Better lending decisions also improves loan quality, loan
performance and ultimately greater return to shareholders’ equity. With 17.6 million MSMEs
in Nigeria, the MSME sector represents an important growth potential for the economy and a
huge opportunity for commercial banks. There is evidence to suggest that if banks can adopt a
more client-centred strategy and shift their focus from “product-push” to “customer-pull”, they
will remain competitive in the SME lending markets (see Accenture, 2011). Today’s SMEs
V. Ekpu | The Microstructure of Bank Lending to SMEs | PhD Thesis | University of Glasgow | 2015
254
want many things: more appropriate and innovative financial services; sound, commercially-
aware advice, not just on products and services, but also wider business issues; and more
tailored and responsive multi-channel banking. By driving a more customer-centred strategy,
through product, service and channel design, harnessing the power of new technology and
learning from other industries, banks can deliver all of these services and more.
Developing Judgmental Score Cards
One of the major supply-side factors affecting loan availability to Nigerian SMEs is the high
transaction costs incurred by lenders on small loans. As a way of reducing transaction costs on
small loans, Nigerian banks can develop judgmental scoring tools so that they are able to make
SME loan underwriting more cost-effective and so that they will also be able to customise
customer information to specific local economic and lender conditions. As reviewed in chapter
2, the use of simple judgmental scorecard that evaluates a mix of financial and non-financial
factors has been found to be the most appropriate way to appraise a large amount of SME
loans (Caire, 2004). Until third-party information infrastructure develops fully in Nigeria,
Nigerian banks may need to mine their own institutional knowledge and historical portfolio
data to develop scorecards that suit its strategies for the SME market segment. It will be more
sensible for Nigerian banks to begin to develop credit-scoring models that utilize judgmental
scorecards to predict loan defaults. If Nigerian banks can combine both financial and non-
financial information about SMEs, the default prediction models for SME loans will be more
comprehensive and will have a higher chance of being more accurate than if only financial
information was taken into consideration.
Use of Psychometric Tests
As reviewed in chapter 2 and 3, the introduction of non-collateral loans based on the use of
psychometric lending models in some Nigerian banks (such as Stanbic IBTC Bank and First
Bank) is a good development for Nigerian banking. As in the case of First Bank and Stanbic
IBTC, SMEs are asked to provide a detailed business plan and repayment plan and then
appraisal is done on the merits of the outcome of the psychometric test. Loans offered on the
basis of psychometric tests are quick (usually within 72 hours turnaround time) and with
minimal documentation and hassle (Oyebode, 2014).
V. Ekpu | The Microstructure of Bank Lending to SMEs | PhD Thesis | University of Glasgow | 2015
255
Use of Movable Collateral
One of the findings of this study is that Nigerian banks often emphasise a lot on the use of
fixed collateral such as real estate as the primary tool for mitigating moral hazard problems. It
will, however, be more beneficial to place more emphasis on the use of movable collateral as
supplemental sources of repayment as is the case in many developed credit markets. For
working capital financing, banks can use short-term assets such as accounts receivable and
inventory, while the use of business equipment can be restricted to long term financing. Asset
based lending will help solve the informational opacity problem of Nigerian SMEs by shifting
the underwriting criteria from a comprehensive evaluation of a firm’s risk profile to a specific
evaluation of a sub-set of the firm’s assets – specifically the tangible assets of accounts
receivable, inventory and equipment (see Berger and Udell, 2006). In order to make it easy to
secure loans with movable property, the Nigerian government will have to implement a
number of legal reforms to address the impediments to the use of movable collateral (see
improving the legal, judicial and bankruptcy environment under the role of government in
section 8.2.2 below).
8.2.2. The Role of the Nigerian Government
The Nigerian government has been playing an important role in supporting the SME sector
and should continue to do so, particularly where there is market failure or where incomplete
markets inhibit the provision of adequate financing on terms suitable for the SME’s stage of
development. Government measures to promote bank finance for SMEs should be carefully
focused, aimed at making markets work efficiently and at providing incentives for banks to
assume an active role in SME finance. If the CBN is able to measure the size of the SME
financing gap from time to time and evaluate the impact of government actions, it can more
readily assess the success of bank lending to SMEs and the impact of government financing
programmes. The findings from this study suggest that the number of beneficiaries from
government SME financing programmes is still inadequate. It will thus be appropriate for the
government to act to improve awareness among entrepreneurs of the range of financing
options available to them from government, international financial institutions, private

V. Ekpu | The Microstructure of Bank Lending to SMEs | PhD Thesis | University of Glasgow | 2015
256
investors and banks. Micro-credit and micro-finance schemes play an important role in
developing countries and efforts should be made to boost their effectiveness and diffusion.
Building Capacity and Addressing Infrastructural Bottlenecks
According to the Head of SME banking in Stanbic IBTC Bank, Mr Akintunde Oyebode, two
key factors constraining the contribution of the SME sector to the Nigerian economy are the
lack of capacity and infrastructural challenges (Oyebode, 2014). In other emerging markets
across Asia, Africa and the Middle East, SMEs grow at almost twice the growth rate of the
GDP but the reverse is the case with Nigeria because of these two challenges. According to
the findings from this study, banks rate “weak management capacity” or “incompetence” on
the part of SME owners/managers among the top three most important contributory factors to
the riskiness of SME loans in Nigeria alongside “high incidence of loan diversion” and
“inability to service debts”. Thus both government and banks will need to cooperate to build
capacity in the SME sector. According to the Stanbic-IBTC official, lenders should identify
that finance must be supported with the right level of technical assistance. The most successful
lending models are usually those backed by the right level of technical assistance to ensure the
borrowers maximize the funding provided. If government is able to provide more technical
assistance in addition to increasing access to finance via intervention funds and guarantee
schemes, this will aid the effective utilisation of loans and hence promote better loan
performance.
The current CBN initiative of establishing Entrepreneurship Development Centres (EDCs)
should be encouraged in order to educate and train young entrepreneurs on how to manage
their business profitably as well as how to access available SME development funds. The offer
of technical assistance to SMEs by SMEDAN is also necessary to improve business methods,
enhance corporate governance and monitoring and reduce SME failure rates. There is also an
urgent need for the Nigerian authorities to address the infrastructural bottlenecks that drive up
operational costs for businesses in Nigeria. Public Private Partnerships (PPP) offers a very
effective vehicle to develop infrastructure to boost SMEs. In line with the Federal Government
of Nigeria’s Vision 20:2020 document on SMEs, PPPs can be used as a model to develop
industrial parks, entrepreneurship centres and incubators to boost the development of SMEs.
By using this model, government can free its finances for social and capital intensive
infrastructure like education, health, power and transport.
V. Ekpu | The Microstructure of Bank Lending to SMEs | PhD Thesis | University of Glasgow | 2015
257
Improving the Lending Infrastructure
Following findings in chapter 3 and 5, there is evidence to suggest that the lending
infrastructure, particularly regulatory and legal constraints have affected Nigerian banks’
lending policies towards SMEs as it limits the inclination and capacity of banks to support the
real sector. On the one hand, regulatory requirements such as capital adequacy, liquidity ratio,
reserve requirements, and the central bank’s monetary policy rates influence the amount
(volume) and cost of funds that can be intermediated by banks. On the other hand, the
information environment and legal/judicial factors affecting debt contract enforcement also
aggravate the risk profile of the SME sector. Thus a major role of the Nigerian government is
to improve the lending infrastructure since it affects the availability of credit to SMEs. As
noted earlier in the literature chapter, the lending infrastructure may directly affect the
availability of credit to SMEs and the extent to which the different lending technologies may
be legally and profitably employed. The Nigerian government thus needs to improve the
information environment, the legal and judicial environment as well as the tax and regulatory
regime.
(a) Improving the Economics of Information: As the findings have revealed SMEs in
Nigeria do not keep adequate accounting records and as such are unable to satisfy the
requirements of Nigerian banks who rely very much on financial (hard) information in making
informed lending decisions. The key issues here are strengthening the accounting standards
and making sure that regulation promotes the use of credible independent accounting firms.
These are necessary conditions for informative financial statements. These are also necessary
conditions for the feasibility of many components of loan contracting. For example, financial
covenants are not feasible if the financial ratios calculated from bank financial statements are
not reliable. The CBN regulation, which stipulates that commercial banks should publish their
interest rates online, is also a welcome development. This will help bank-dependent borrowers
to make informed decisions about which banks offer the most competitive rates.
Another important aspect of the information infrastructure is the availability of information on
payment performance. More efforts should be made to strengthen the reliability and
transparency of the current credit information service providers in Nigeria, like CRC credit
bureau, CR service credit bureau and XDS credit bureau, among others. The recent
V. Ekpu | The Microstructure of Bank Lending to SMEs | PhD Thesis | University of Glasgow | 2015
258
introduction of the Bank Verification Number (BVN) where each bank customer is given a
unique identity that can be verified across the banking industry is also a step in the right
direction. This would ensure, among other things, that defaulters and blacklisted customers are
easily traced and hunted.
(b) Improving the Legal, Judicial and Bankruptcy Environment: The reform of Nigerian
commercial and financial laws is important in order to enable banks to deploy specific
contracting elements (such as covenants, maturity, collateral and personal guarantees) to
mitigate the problem of information opacity of SMEs. Since Nigerian banks currently use real
estate as the main tool for collateral, the possession of a valid and verifiable title is
fundamental to its use. Government should check land administration practices that make
land-titling process difficult, as ineffective processes are detrimental to bank lending and
business expansion (Nwuba, et al., 2013). Policy measures aimed at improving the efficiency
operations of land registries, especially the granting of statutory rights of occupancy will
generate growth and interest in secured credit transaction. A recent survey conducted by the
World Bank in 2013 on doing business in Nigeria55 reveals that the Nigerian law currently
permits the use of movable assets and that financial institutions accept such assets as
collateral. The law also allows businesses to grant a non-possessory security right in
substantially all of its assets (including movable assets), without requiring a specific
description of collateral. There are no public registries in Nigeria. The 2013 World Bank
Survey also shows that secured creditors are paid first (before tax claims and employee
claims) only when the debtor defaults outside an insolvency procedure, but not when a
business is liquidated.
(c) Improving the Tax and Regulatory Environment: Nigerian policy makers need to
ensure that the tax system does not inadvertently place SMEs at a disadvantage. The legal, tax
and regulatory framework should also be reviewed to ensure that it encourages the
development of SMEs. Where the government has assigned certain projects to contractors, it
should also ensure that it pays them promptly after the execution of such projects, since public
contracts are vital to the financial security of these firms. It will also be helpful to reduce the
cost of doing business in Nigeria. For example, taxation of small businesses can be kept at a
55 http://www.doingbusiness.org/data/exploreeconomies/nigeria/getting-credit (Accessed 28/09/2014)
V. Ekpu | The Microstructure of Bank Lending to SMEs | PhD Thesis | University of Glasgow | 2015
259
minimum and should not be duplicated; manufacturers and agriculture importers can also be
given import duty waivers or incentives.
There should also be a balance between regulation and competition. The CBN should check
that it does not stifle competition and profitability of banks with too much regulation, without
considering the impact it will have on credit extension to SMEs. For example, conventional
banking theory shows that increases in the cash reserve ratio and liquidity ratios of banks do
impact negatively on the creation of credit by respectively reducing the amount of deposits
available to the public as loanable funds and the proportion of a bank’s total assets that are
invested in government securities at the expense of illiquid loans. It will also be appropriate
for the CBN to make changes to monetary policy stance, where rates offered on government
securities such as treasury bills and other monetary instruments are priced appropriately in line
with market realities in order to discourage banks from adopting a “flight to safety”
investment model and thus encourage more commercial lending to SMEs.
8.3. Future Research Agenda
Though this study has been very insightful and significant in understanding the lending
policies, practices and business model of Nigerian banks in connection with SMEs, there is
still room for further research and analysis on SME lending in Nigeria, and perhaps in Sub-
Saharan Africa where government institutions and regulatory factors play a huge role in
determining the structure and cost of lending. In addition to surveying banks, it would also be
beneficial to survey small businesses and collect data on their business operations,
profitability, balance sheet and their use of credit. These would help to model the credit risk of
SMEs better and corroborate findings from the supply side. It would also be appropriate to
collect actual historical loan-level data on lines of credit granted by Nigerian banks to SMEs
where possible. This will not only assist to model banks’ risk management practices more
accurately but will also make it easier to disentangle the effects of (one-off) transactions
lending from relationship lending, which is measured over time. It would also be helpful to
investigate the lending infrastructure of banks more closely, with specific reference to the
information environment, the legal and judicial environment and the tax and regulatory

V. Ekpu | The Microstructure of Bank Lending to SMEs | PhD Thesis | University of Glasgow | 2015
260
environment as outlined in Berger and Udell (2006). This will help to x-ray the underlying
business environment problems constraining SME financing in Nigeria.
One area that is still under-researched is the role of microfinance banks in lending to MSMEs
in Nigeria. Since over 98% of MSMEs in Nigeria belong to the micro-lending subsector (i.e.
the lowest end of the MSME market segment), it will be interesting to investigate the
microstructure of MSME lending by microfinance banks (as well as other alternative providers
of funds to SMEs, such as development banks and finance companies) and perhaps compare
their lending practices and business model to those of large commercial banks (as seen in the
influential study by Cole et al., 2004). This will help to measure the impact of lender size on
banks’ SME lending business model even more effectively.
Another development in SME lending that is worth investigating particularly for advanced
credit markets (like USA and UK) is the rise of alternative finance intermediaries in the wake
of the financial crisis due to SMEs’ reduced access to credit from traditional banks. The
ongoing debate about disintermediation and the future relevance of traditional financial
intermediaries fuelled by the increasing role of online lending platforms will be worth
studying. It will thus be interesting to investigate what implications the growth of online P2P
platforms have for competition for SME loans against traditional bank intermediaries as well
as the differences in the lending model of P2P lenders vis-à-vis traditional banks as they seek
to create economic value for both borrowers and investors.
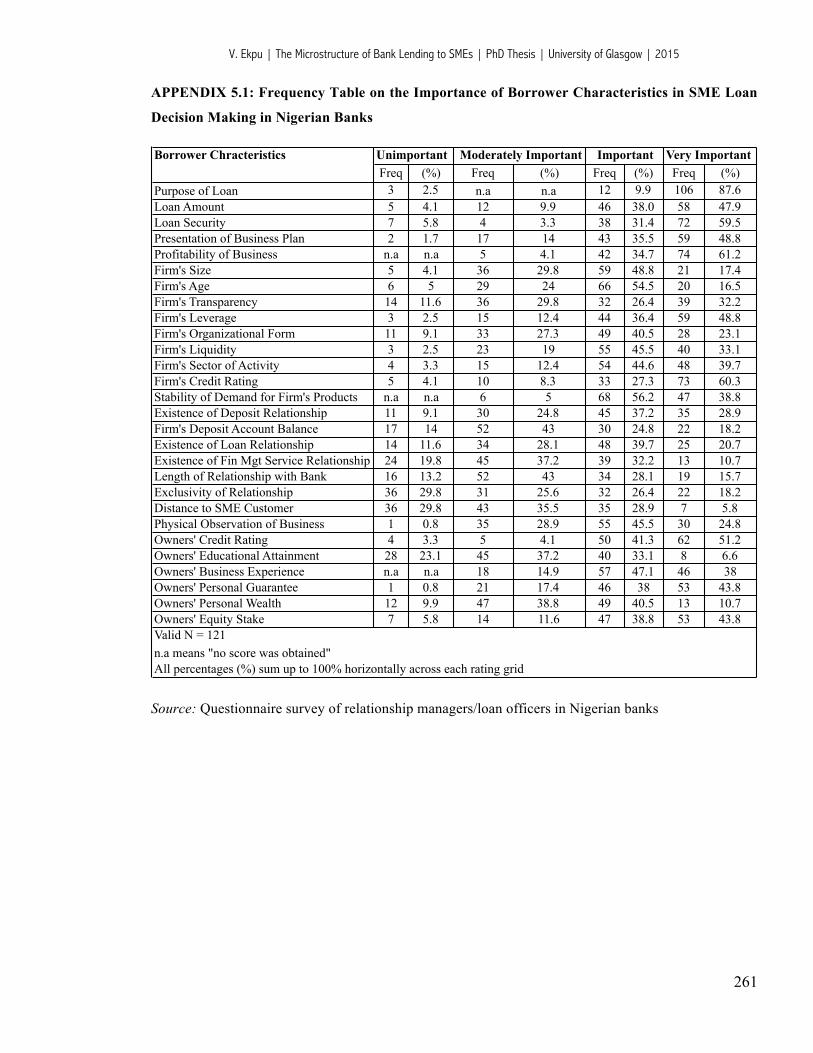
V. Ekpu | The Microstructure of Bank Lending to SMEs | PhD Thesis | University of Glasgow | 2015
261
APPENDIX 5.1: Frequency Table on the Importance of Borrower Characteristics in SME Loan
Decision Making in Nigerian Banks
Borrower Chracteristics Unimportant Moderately Important Important Very ImportantFreq (%) Freq (%) Freq (%) Freq (%)
Purpose of Loan 3 2.5 n.a n.a 12 9.9 106 87.6Loan Amount 5 4.1 12 9.9 46 38.0 58 47.9Loan Security 7 5.8 4 3.3 38 31.4 72 59.5Presentation of Business Plan 2 1.7 17 14 43 35.5 59 48.8Profitability of Business n.a n.a 5 4.1 42 34.7 74 61.2Firm's Size 5 4.1 36 29.8 59 48.8 21 17.4Firm's Age 6 5 29 24 66 54.5 20 16.5Firm's Transparency 14 11.6 36 29.8 32 26.4 39 32.2Firm's Leverage 3 2.5 15 12.4 44 36.4 59 48.8Firm's Organizational Form 11 9.1 33 27.3 49 40.5 28 23.1Firm's Liquidity 3 2.5 23 19 55 45.5 40 33.1Firm's Sector of Activity 4 3.3 15 12.4 54 44.6 48 39.7Firm's Credit Rating 5 4.1 10 8.3 33 27.3 73 60.3Stability of Demand for Firm's Products n.a n.a 6 5 68 56.2 47 38.8Existence of Deposit Relationship 11 9.1 30 24.8 45 37.2 35 28.9Firm's Deposit Account Balance 17 14 52 43 30 24.8 22 18.2Existence of Loan Relationship 14 11.6 34 28.1 48 39.7 25 20.7Existence of Fin Mgt Service Relationship 24 19.8 45 37.2 39 32.2 13 10.7Length of Relationship with Bank 16 13.2 52 43 34 28.1 19 15.7Exclusivity of Relationship 36 29.8 31 25.6 32 26.4 22 18.2Distance to SME Customer 36 29.8 43 35.5 35 28.9 7 5.8Physical Observation of Business 1 0.8 35 28.9 55 45.5 30 24.8Owners' Credit Rating 4 3.3 5 4.1 50 41.3 62 51.2Owners' Educational Attainment 28 23.1 45 37.2 40 33.1 8 6.6Owners' Business Experience n.a n.a 18 14.9 57 47.1 46 38Owners' Personal Guarantee 1 0.8 21 17.4 46 38 53 43.8Owners' Personal Wealth 12 9.9 47 38.8 49 40.5 13 10.7Owners' Equity Stake 7 5.8 14 11.6 47 38.8 53 43.8Valid N = 121n.a means "no score was obtained"All percentages (%) sum up to 100% horizontally across each rating grid
Source: Questionnaire survey of relationship managers/loan officers in Nigerian banks
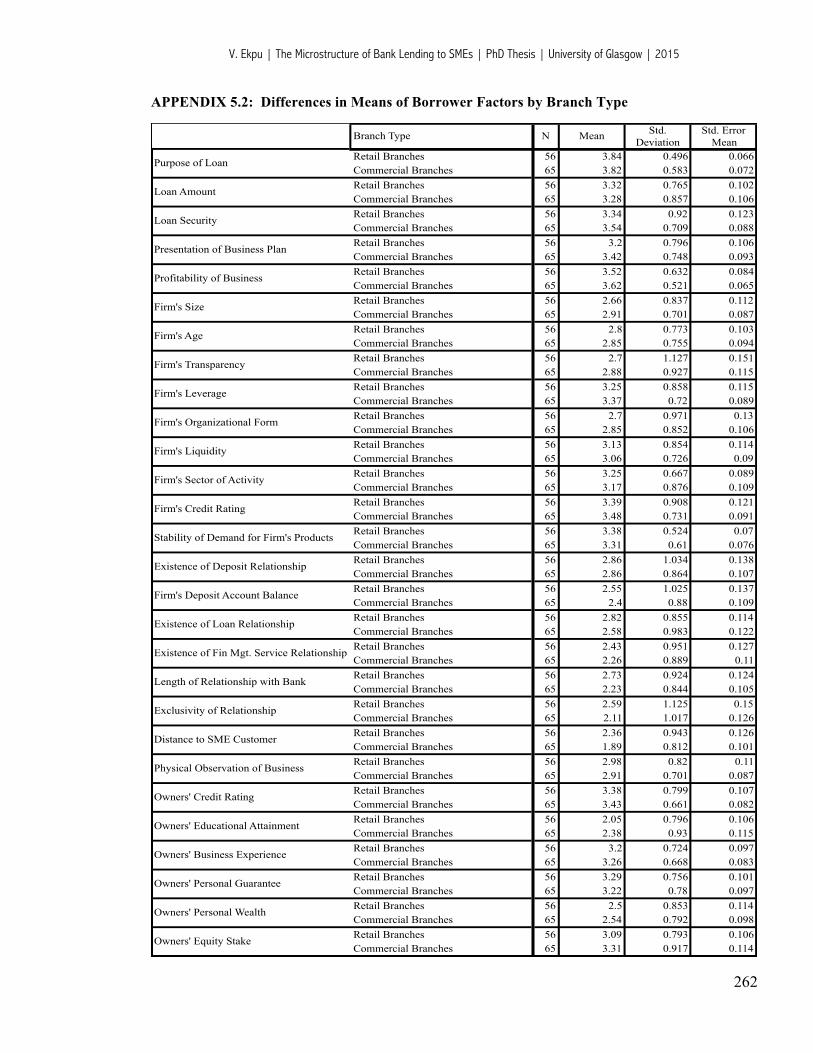
V. Ekpu | The Microstructure of Bank Lending to SMEs | PhD Thesis | University of Glasgow | 2015
262
APPENDIX 5.2: Differences in Means of Borrower Factors by Branch Type
Branch Type N Mean Std. Deviation
Std. Error Mean
Retail Branches 56 3.84 0.496 0.066Commercial Branches 65 3.82 0.583 0.072Retail Branches 56 3.32 0.765 0.102Commercial Branches 65 3.28 0.857 0.106Retail Branches 56 3.34 0.92 0.123Commercial Branches 65 3.54 0.709 0.088Retail Branches 56 3.2 0.796 0.106Commercial Branches 65 3.42 0.748 0.093Retail Branches 56 3.52 0.632 0.084Commercial Branches 65 3.62 0.521 0.065Retail Branches 56 2.66 0.837 0.112Commercial Branches 65 2.91 0.701 0.087Retail Branches 56 2.8 0.773 0.103Commercial Branches 65 2.85 0.755 0.094Retail Branches 56 2.7 1.127 0.151Commercial Branches 65 2.88 0.927 0.115Retail Branches 56 3.25 0.858 0.115Commercial Branches 65 3.37 0.72 0.089Retail Branches 56 2.7 0.971 0.13Commercial Branches 65 2.85 0.852 0.106Retail Branches 56 3.13 0.854 0.114Commercial Branches 65 3.06 0.726 0.09Retail Branches 56 3.25 0.667 0.089Commercial Branches 65 3.17 0.876 0.109Retail Branches 56 3.39 0.908 0.121Commercial Branches 65 3.48 0.731 0.091Retail Branches 56 3.38 0.524 0.07Commercial Branches 65 3.31 0.61 0.076Retail Branches 56 2.86 1.034 0.138Commercial Branches 65 2.86 0.864 0.107Retail Branches 56 2.55 1.025 0.137Commercial Branches 65 2.4 0.88 0.109Retail Branches 56 2.82 0.855 0.114Commercial Branches 65 2.58 0.983 0.122Retail Branches 56 2.43 0.951 0.127Commercial Branches 65 2.26 0.889 0.11Retail Branches 56 2.73 0.924 0.124Commercial Branches 65 2.23 0.844 0.105Retail Branches 56 2.59 1.125 0.15Commercial Branches 65 2.11 1.017 0.126Retail Branches 56 2.36 0.943 0.126Commercial Branches 65 1.89 0.812 0.101Retail Branches 56 2.98 0.82 0.11Commercial Branches 65 2.91 0.701 0.087Retail Branches 56 3.38 0.799 0.107Commercial Branches 65 3.43 0.661 0.082Retail Branches 56 2.05 0.796 0.106Commercial Branches 65 2.38 0.93 0.115Retail Branches 56 3.2 0.724 0.097Commercial Branches 65 3.26 0.668 0.083Retail Branches 56 3.29 0.756 0.101Commercial Branches 65 3.22 0.78 0.097Retail Branches 56 2.5 0.853 0.114Commercial Branches 65 2.54 0.792 0.098Retail Branches 56 3.09 0.793 0.106Commercial Branches 65 3.31 0.917 0.114
Owners' Equity Stake
Physical Observation of Business
Owners' Credit Rating
Owners' Educational Attainment
Owners' Business Experience
Owners' Personal Guarantee
Owners' Personal Wealth
Purpose of Loan
Loan Amount
Loan Security
Presentation of Business Plan
Profitability of Business
Firm's Size
Firm's Age
Firm's Transparency
Firm's Leverage
Firm's Organizational Form
Firm's Liquidity
Firm's Sector of Activity
Firm's Credit Rating
Stability of Demand for Firm's Products
Existence of Deposit Relationship
Firm's Deposit Account Balance
Existence of Loan Relationship
Existence of Fin Mgt. Service Relationship
Length of Relationship with Bank
Exclusivity of Relationship
Distance to SME Customer
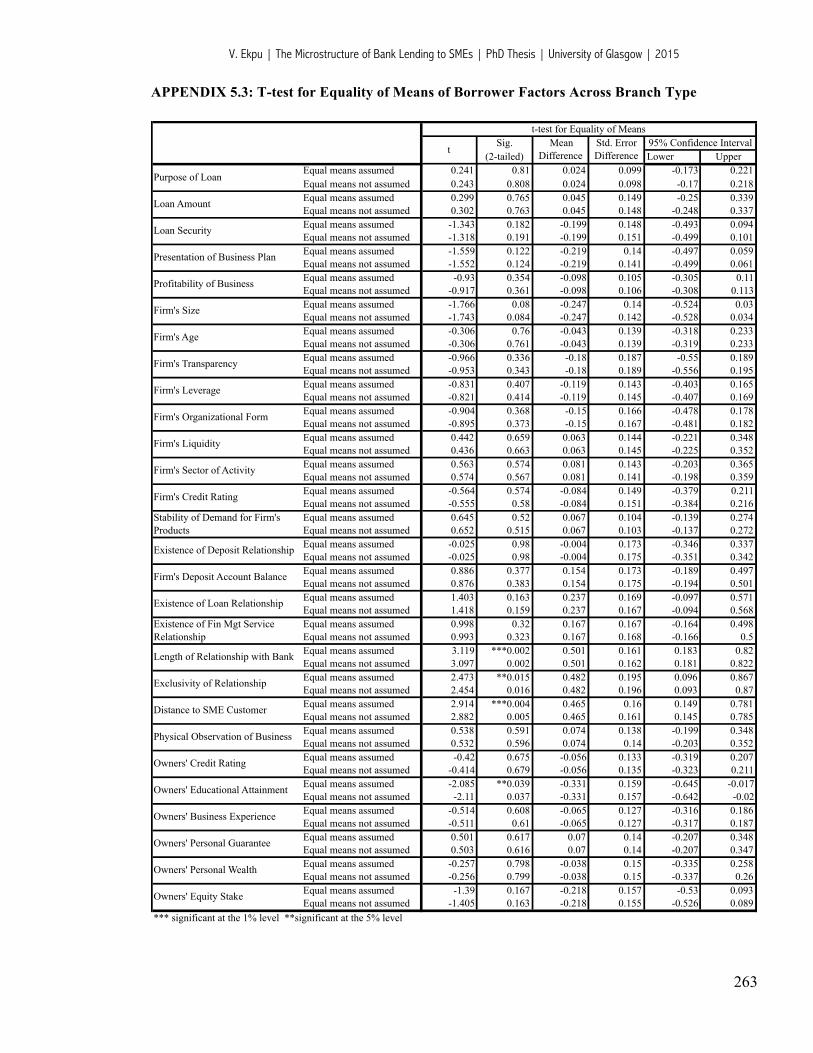
V. Ekpu | The Microstructure of Bank Lending to SMEs | PhD Thesis | University of Glasgow | 2015
263
APPENDIX 5.3: T-test for Equality of Means of Borrower Factors Across Branch Type
Sig. (2-tailed) Lower Upper
Equal means assumed 0.241 0.81 0.024 0.099 -0.173 0.221Equal means not assumed 0.243 0.808 0.024 0.098 -0.17 0.218Equal means assumed 0.299 0.765 0.045 0.149 -0.25 0.339Equal means not assumed 0.302 0.763 0.045 0.148 -0.248 0.337Equal means assumed -1.343 0.182 -0.199 0.148 -0.493 0.094Equal means not assumed -1.318 0.191 -0.199 0.151 -0.499 0.101Equal means assumed -1.559 0.122 -0.219 0.14 -0.497 0.059Equal means not assumed -1.552 0.124 -0.219 0.141 -0.499 0.061Equal means assumed -0.93 0.354 -0.098 0.105 -0.305 0.11Equal means not assumed -0.917 0.361 -0.098 0.106 -0.308 0.113Equal means assumed -1.766 0.08 -0.247 0.14 -0.524 0.03Equal means not assumed -1.743 0.084 -0.247 0.142 -0.528 0.034Equal means assumed -0.306 0.76 -0.043 0.139 -0.318 0.233Equal means not assumed -0.306 0.761 -0.043 0.139 -0.319 0.233Equal means assumed -0.966 0.336 -0.18 0.187 -0.55 0.189Equal means not assumed -0.953 0.343 -0.18 0.189 -0.556 0.195Equal means assumed -0.831 0.407 -0.119 0.143 -0.403 0.165Equal means not assumed -0.821 0.414 -0.119 0.145 -0.407 0.169Equal means assumed -0.904 0.368 -0.15 0.166 -0.478 0.178Equal means not assumed -0.895 0.373 -0.15 0.167 -0.481 0.182Equal means assumed 0.442 0.659 0.063 0.144 -0.221 0.348Equal means not assumed 0.436 0.663 0.063 0.145 -0.225 0.352Equal means assumed 0.563 0.574 0.081 0.143 -0.203 0.365Equal means not assumed 0.574 0.567 0.081 0.141 -0.198 0.359Equal means assumed -0.564 0.574 -0.084 0.149 -0.379 0.211Equal means not assumed -0.555 0.58 -0.084 0.151 -0.384 0.216Equal means assumed 0.645 0.52 0.067 0.104 -0.139 0.274Equal means not assumed 0.652 0.515 0.067 0.103 -0.137 0.272Equal means assumed -0.025 0.98 -0.004 0.173 -0.346 0.337Equal means not assumed -0.025 0.98 -0.004 0.175 -0.351 0.342Equal means assumed 0.886 0.377 0.154 0.173 -0.189 0.497Equal means not assumed 0.876 0.383 0.154 0.175 -0.194 0.501Equal means assumed 1.403 0.163 0.237 0.169 -0.097 0.571Equal means not assumed 1.418 0.159 0.237 0.167 -0.094 0.568Equal means assumed 0.998 0.32 0.167 0.167 -0.164 0.498Equal means not assumed 0.993 0.323 0.167 0.168 -0.166 0.5Equal means assumed 3.119 ***0.002 0.501 0.161 0.183 0.82Equal means not assumed 3.097 0.002 0.501 0.162 0.181 0.822Equal means assumed 2.473 **0.015 0.482 0.195 0.096 0.867Equal means not assumed 2.454 0.016 0.482 0.196 0.093 0.87Equal means assumed 2.914 ***0.004 0.465 0.16 0.149 0.781Equal means not assumed 2.882 0.005 0.465 0.161 0.145 0.785Equal means assumed 0.538 0.591 0.074 0.138 -0.199 0.348Equal means not assumed 0.532 0.596 0.074 0.14 -0.203 0.352Equal means assumed -0.42 0.675 -0.056 0.133 -0.319 0.207Equal means not assumed -0.414 0.679 -0.056 0.135 -0.323 0.211Equal means assumed -2.085 **0.039 -0.331 0.159 -0.645 -0.017Equal means not assumed -2.11 0.037 -0.331 0.157 -0.642 -0.02Equal means assumed -0.514 0.608 -0.065 0.127 -0.316 0.186Equal means not assumed -0.511 0.61 -0.065 0.127 -0.317 0.187Equal means assumed 0.501 0.617 0.07 0.14 -0.207 0.348Equal means not assumed 0.503 0.616 0.07 0.14 -0.207 0.347Equal means assumed -0.257 0.798 -0.038 0.15 -0.335 0.258Equal means not assumed -0.256 0.799 -0.038 0.15 -0.337 0.26Equal means assumed -1.39 0.167 -0.218 0.157 -0.53 0.093Equal means not assumed -1.405 0.163 -0.218 0.155 -0.526 0.089
*** significant at the 1% level **significant at the 5% level
Owners' Credit Rating
Owners' Educational Attainment
Owners' Business Experience
Owners' Personal Guarantee
Existence of Deposit Relationship
Firm's Deposit Account Balance
Existence of Loan Relationship
Existence of Fin Mgt Service Relationship
Length of Relationship with Bank
Exclusivity of Relationship
Distance to SME Customer
Physical Observation of Business
Firm's Leverage
Firm's Organizational Form
Firm's Liquidity
Firm's Sector of Activity
Firm's Credit Rating
Stability of Demand for Firm's Products
Loan Security
Presentation of Business Plan
Profitability of Business
Firm's Size
Firm's Age
Firm's Transparency
Owners' Personal Wealth
Owners' Equity Stake
t-test for Equality of Means
tMean
DifferenceStd. Error Difference
95% Confidence Interval
Purpose of Loan
Loan Amount

V. Ekpu | The Microstructure of Bank Lending to SMEs | PhD Thesis | University of Glasgow | 2015
264
APPENDIX 5.4: Levene’s Test for Equality of Variances of Borrower Factors by Branch Type
Equal variances assumed 0.269 0.605Equal variances not assumedEqual variances assumed 0.184 0.669Equal variances not assumedEqual variances assumed 2.986 0.087Equal variances not assumedEqual variances assumed 0.214 0.644Equal variances not assumedEqual variances assumed 4.126 **0.044Equal variances not assumedEqual variances assumed 5.885 **0.017Equal variances not assumedEqual variances assumed 0.731 0.394Equal variances not assumedEqual variances assumed 6.527 **0.012Equal variances not assumedEqual variances assumed 0.566 0.453Equal variances not assumedEqual variances assumed 1.594 0.209Equal variances not assumedEqual variances assumed 1.373 0.244Equal variances not assumedEqual variances assumed 4.781 **0.031Equal variances not assumedEqual variances assumed 1.826 0.179Equal variances not assumedEqual variances assumed 0.876 0.351Equal variances not assumedEqual variances assumed 1.837 0.178Equal variances not assumedEqual variances assumed 3.22 0.075Equal variances not assumedEqual variances assumed 2.719 0.102Equal variances not assumedEqual variances assumed 0.372 0.543Equal variances not assumedEqual variances assumed 1.944 0.166Equal variances not assumedEqual variances assumed 1.837 0.178Equal variances not assumedEqual variances assumed 1.916 0.169Equal variances not assumedEqual variances assumed 1.325 0.252Equal variances not assumedEqual variances assumed 0.962 0.329Equal variances not assumedEqual variances assumed 4.798 **0.03Equal variances not assumedEqual variances assumed 0.267 0.606Equal variances not assumedEqual variances assumed 0.026 0.873Equal variances not assumedEqual variances assumed 0.458 0.5Equal variances not assumedEqual variances assumed 4.957 **0.028Equal variances not assumed
**Significant at the 5% level
Levene's Test for Equality of Variances
F Sig.
Purpose of Loan
Loan Amount
Loan Security
Presentation of Business Plan
Profitability of Business
Firm's Size
Firm's Age
Firm's Transparency
Firm's Leverage
Firm's Organizational Form
Firm's Liquidity
Firm's Sector of Activity
Firm's Credit Rating
Stability of Demand for Firm's Products
Existence of Deposit Relationship
Firm's Deposit Account Balance
Existence of Loan Relationship
Existence of Fin Mgt Service Relationship
Length of Relationship with Bank
Exclusivity of Relationship
Distance to SME Customer
Physical Observation of Business
Owners' Credit Rating
Owners' Educational Attainment
Owners' Business Experience
Owners' Personal Guarantee
Owners' Personal Wealth
Owners' Equity Stake

V. Ekpu | The Microstructure of Bank Lending to SMEs | PhD Thesis | University of Glasgow | 2015
265
APPENDIX 5.5: Frequency Table of Contributory Factors to the Riskiness of SME Loans
Contributory Factors to the Riskiness of SME Loans Insignificant Moderately Significant Significant Very SignificantFreq (%) Freq (%) Freq (%) Freq (%)
High Incidence of Diversion of Funds 2 1.7 1 0.8 21 17.4 97 80.2Weak Management Capacity or Competence 1 0.8 5 4.1 57 47.1 58 47.9Absence of Formal Record Keeping n.a n.a 14 11.6 56 46.3 51 42.1Inability of Firms to Service Debts n.a n.a 7 5.8 50 41.3 64 52.9Investment in Risky Activities or Volatile Sectors n.a n.a 10 8.3 55 45.5 56 46.3Limited Scope of Business Operations 3 2.5 29 24 66 54.5 23 19Poor Quality of Projects 1 0.8 18 14.9 58 47.9 44 36.4Weak Ownership Structure n.a n.a 21 17.4 52 43 48 39.7High Costs of Doing Business 1 0.8 15 12.4 45 37.2 60 49.6(In)effectiveness of Bank's Screening Procedures 4 3.3 24 19.8 61 50.4 32 26.4Term Lending Outside of Bank's Scope & Specialization 2 1.7 37 30.6 48 39.7 34 28.1
Valid N = 121n.a means "no score was obtained"All percentages (%) sum up to 100% horizontally across each rating grid
Source: Questionnaire survey of relationship managers/loan officers in Nigerian banks
APPENDIX 5.6: Frequency Table for Supply Side Factors Affecting Bank Lending to SMEs
Lender Chracteristics & External Factors Unimportant Moderately Important Important Very ImportantFreq (%) Freq (%) Freq (%) Freq (%)
Influence of Regulatory Requirements 1 0.8 11 9.1 18 14.9 91 75.2Bank's Lending Policies Towards SMEs 2 1.7 12 9.9 36 29.8 71 58.7Proportion of Bank's Asset Portfolio in SME Loans 5 4.1 27 22.3 54 44.6 35 28.9Sectoral Distribution of Outstanding Loans to SMEs 5 4.1 27 22.3 64 52.9 25 20.7History of Previous SME Loan Performance 3 2.5 8 6.6 53 43.8 57 47.1Risk Profile of the SME Sector 2 1.7 6 5 53 43.8 60 49.6Bank's Deposit Level and Financial Stability 4 3.3 9 7.4 52 43 56 46.3Demand Facing Banks in the SME Loan Market 5 4.1 37 30.6 55 45.5 24 19.8Competition from other Banks for SME Loans 10 8.3 34 28.1 64 52.9 13 10.7Interest Rates or Returns from Competing Assets 7 5.8 28 23.1 53 43.8 33 27.3Maturity Structure of Bank's Security Holdings 12 9.9 34 28.1 56 46.3 19 15.7Specialization of Bank's Lending Officers 13 10.7 32 26.4 56 46.3 20 16.5High Transaction Costs Associated with SME Loans 6 5 30 24.8 58 47.9 27 22.3Adequacy of Information on Borrower Financial Condition n.a n.a 21 17.4 49 40.5 51 42.1Enforcement Actions from Regulators 3 2.5 22 18.2 59 48.8 37 30.6General Macroeconomic Conditions 2 1.7 30 24.8 58 47.9 31 25.6
Valid N = 121n.a means "no score was obtained"All percentages (%) sum up to 100% horizontally across each rating grid
Source: Questionnaire survey of relationship managers/loan officers in Nigerian banks
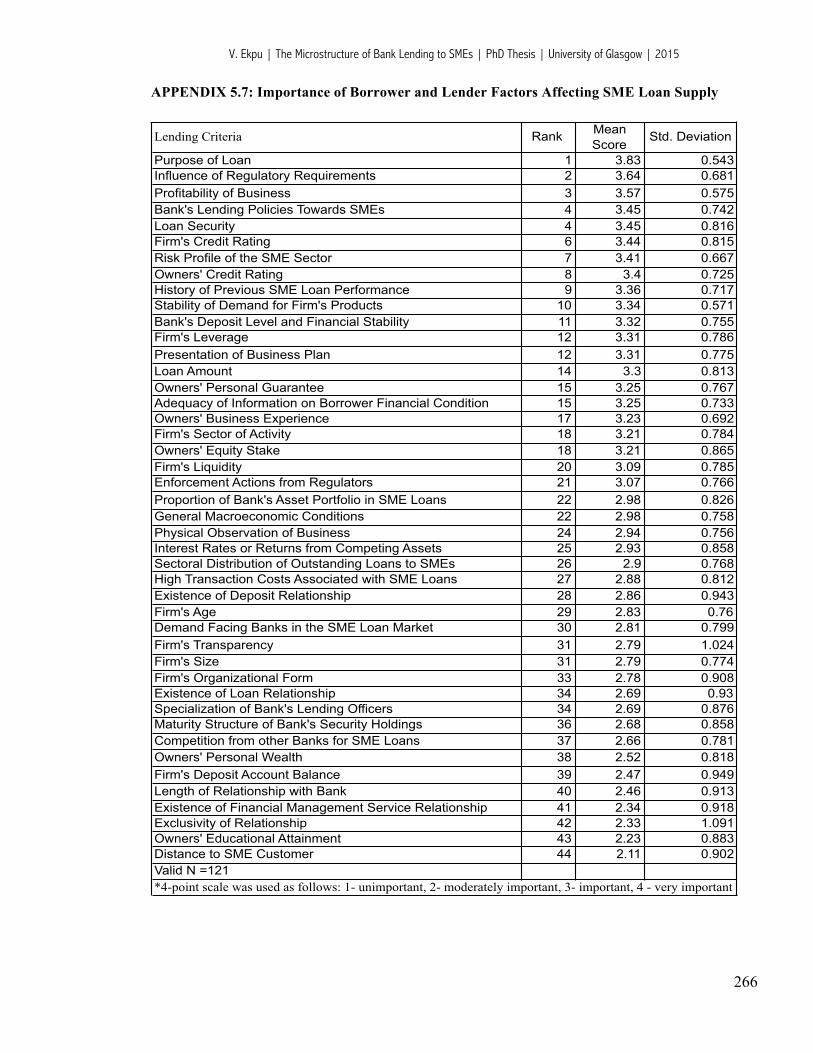
V. Ekpu | The Microstructure of Bank Lending to SMEs | PhD Thesis | University of Glasgow | 2015
266
APPENDIX 5.7: Importance of Borrower and Lender Factors Affecting SME Loan Supply
Lending Criteria Rank Mean Score
Std. Deviation
Purpose of Loan 1 3.83 0.543Influence of Regulatory Requirements 2 3.64 0.681Profitability of Business 3 3.57 0.575Bank's Lending Policies Towards SMEs 4 3.45 0.742Loan Security 4 3.45 0.816Firm's Credit Rating 6 3.44 0.815Risk Profile of the SME Sector 7 3.41 0.667Owners' Credit Rating 8 3.4 0.725History of Previous SME Loan Performance 9 3.36 0.717Stability of Demand for Firm's Products 10 3.34 0.571Bank's Deposit Level and Financial Stability 11 3.32 0.755Firm's Leverage 12 3.31 0.786Presentation of Business Plan 12 3.31 0.775Loan Amount 14 3.3 0.813Owners' Personal Guarantee 15 3.25 0.767Adequacy of Information on Borrower Financial Condition 15 3.25 0.733Owners' Business Experience 17 3.23 0.692Firm's Sector of Activity 18 3.21 0.784Owners' Equity Stake 18 3.21 0.865Firm's Liquidity 20 3.09 0.785Enforcement Actions from Regulators 21 3.07 0.766Proportion of Bank's Asset Portfolio in SME Loans 22 2.98 0.826General Macroeconomic Conditions 22 2.98 0.758Physical Observation of Business 24 2.94 0.756Interest Rates or Returns from Competing Assets 25 2.93 0.858Sectoral Distribution of Outstanding Loans to SMEs 26 2.9 0.768High Transaction Costs Associated with SME Loans 27 2.88 0.812Existence of Deposit Relationship 28 2.86 0.943Firm's Age 29 2.83 0.76Demand Facing Banks in the SME Loan Market 30 2.81 0.799Firm's Transparency 31 2.79 1.024Firm's Size 31 2.79 0.774Firm's Organizational Form 33 2.78 0.908Existence of Loan Relationship 34 2.69 0.93Specialization of Bank's Lending Officers 34 2.69 0.876Maturity Structure of Bank's Security Holdings 36 2.68 0.858Competition from other Banks for SME Loans 37 2.66 0.781Owners' Personal Wealth 38 2.52 0.818Firm's Deposit Account Balance 39 2.47 0.949Length of Relationship with Bank 40 2.46 0.913Existence of Financial Management Service Relationship 41 2.34 0.918Exclusivity of Relationship 42 2.33 1.091Owners' Educational Attainment 43 2.23 0.883Distance to SME Customer 44 2.11 0.902Valid N =121*4-point scale was used as follows: 1- unimportant, 2- moderately important, 3- important, 4 - very important
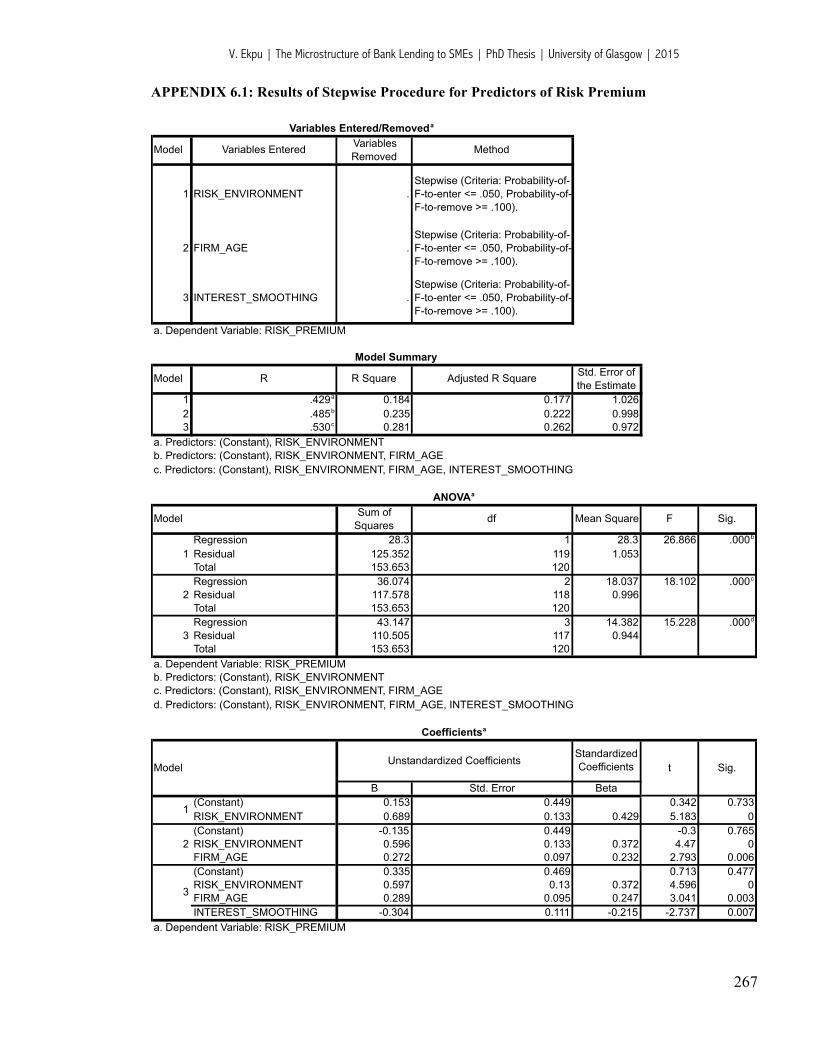
V. Ekpu | The Microstructure of Bank Lending to SMEs | PhD Thesis | University of Glasgow | 2015
267
APPENDIX 6.1: Results of Stepwise Procedure for Predictors of Risk Premium
Model Variables Entered Variables Removed
Method
1 RISK_ENVIRONMENT .Stepwise (Criteria: Probability-of-F-to-enter <= .050, Probability-of-F-to-remove >= .100).
2 FIRM_AGE .Stepwise (Criteria: Probability-of-F-to-enter <= .050, Probability-of-F-to-remove >= .100).
3 INTEREST_SMOOTHING .Stepwise (Criteria: Probability-of-F-to-enter <= .050, Probability-of-F-to-remove >= .100).
Model R R Square Adjusted R Square Std. Error of the Estimate
1 .429a 0.184 0.177 1.0262 .485b 0.235 0.222 0.9983 .530c 0.281 0.262 0.972
Sum of Squares
df Mean Square F Sig.
Regression 28.3 1 28.3 26.866 .000b
Residual 125.352 119 1.053Total 153.653 120Regression 36.074 2 18.037 18.102 .000c
Residual 117.578 118 0.996Total 153.653 120Regression 43.147 3 14.382 15.228 .000d
Residual 110.505 117 0.944Total 153.653 120
Standardized Coefficients
B Std. Error Beta(Constant) 0.153 0.449 0.342 0.733RISK_ENVIRONMENT 0.689 0.133 0.429 5.183 0(Constant) -0.135 0.449 -0.3 0.765RISK_ENVIRONMENT 0.596 0.133 0.372 4.47 0FIRM_AGE 0.272 0.097 0.232 2.793 0.006(Constant) 0.335 0.469 0.713 0.477RISK_ENVIRONMENT 0.597 0.13 0.372 4.596 0FIRM_AGE 0.289 0.095 0.247 3.041 0.003INTEREST_SMOOTHING -0.304 0.111 -0.215 -2.737 0.007
1
2
3
a. Dependent Variable: RISK_PREMIUM
b. Predictors: (Constant), RISK_ENVIRONMENTc. Predictors: (Constant), RISK_ENVIRONMENT, FIRM_AGEd. Predictors: (Constant), RISK_ENVIRONMENT, FIRM_AGE, INTEREST_SMOOTHING
Coefficientsa
ModelUnstandardized Coefficients
t Sig.
ANOVAa
Model
1
2
3
a. Dependent Variable: RISK_PREMIUM
Variables Entered/Removeda
a. Dependent Variable: RISK_PREMIUM
Model Summary
a. Predictors: (Constant), RISK_ENVIRONMENTb. Predictors: (Constant), RISK_ENVIRONMENT, FIRM_AGEc. Predictors: (Constant), RISK_ENVIRONMENT, FIRM_AGE, INTEREST_SMOOTHING
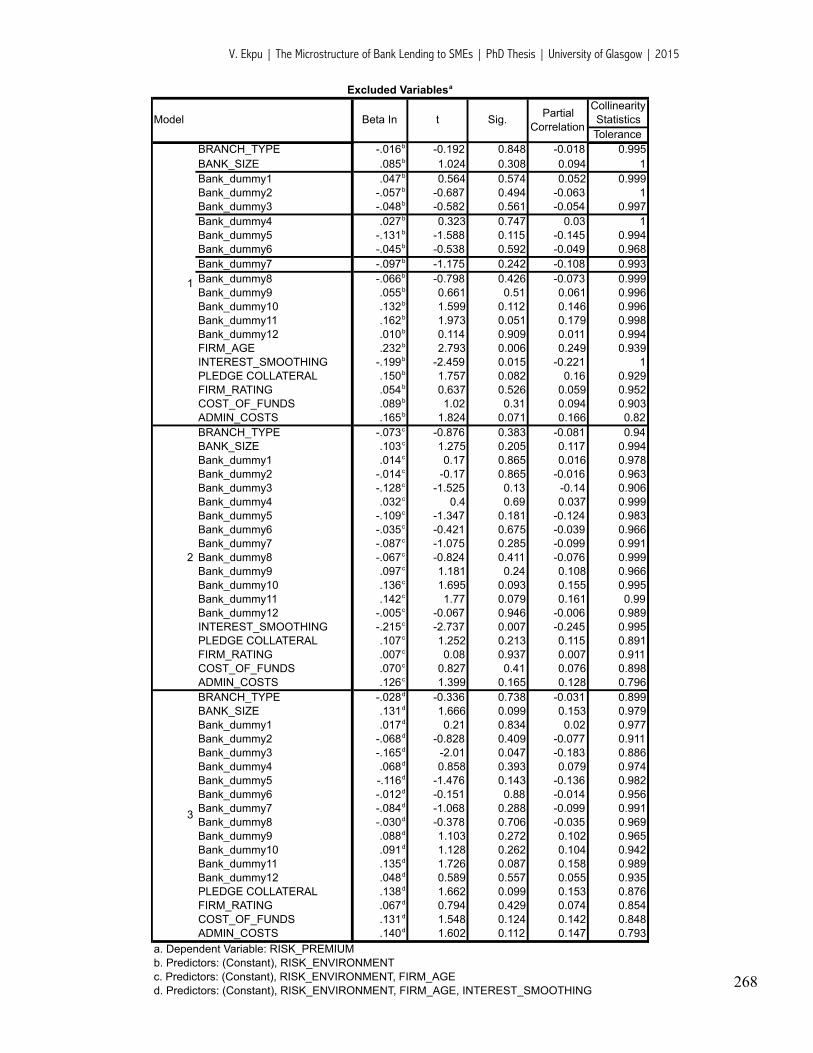
V. Ekpu | The Microstructure of Bank Lending to SMEs | PhD Thesis | University of Glasgow | 2015
268
Collinearity StatisticsTolerance
BRANCH_TYPE -.016b -0.192 0.848 -0.018 0.995BANK_SIZE .085b 1.024 0.308 0.094 1Bank_dummy1 .047b 0.564 0.574 0.052 0.999Bank_dummy2 -.057b -0.687 0.494 -0.063 1Bank_dummy3 -.048b -0.582 0.561 -0.054 0.997Bank_dummy4 .027b 0.323 0.747 0.03 1Bank_dummy5 -.131b -1.588 0.115 -0.145 0.994Bank_dummy6 -.045b -0.538 0.592 -0.049 0.968Bank_dummy7 -.097b -1.175 0.242 -0.108 0.993Bank_dummy8 -.066b -0.798 0.426 -0.073 0.999Bank_dummy9 .055b 0.661 0.51 0.061 0.996Bank_dummy10 .132b 1.599 0.112 0.146 0.996Bank_dummy11 .162b 1.973 0.051 0.179 0.998Bank_dummy12 .010b 0.114 0.909 0.011 0.994FIRM_AGE .232b 2.793 0.006 0.249 0.939INTEREST_SMOOTHING -.199b -2.459 0.015 -0.221 1PLEDGE COLLATERAL .150b 1.757 0.082 0.16 0.929FIRM_RATING .054b 0.637 0.526 0.059 0.952COST_OF_FUNDS .089b 1.02 0.31 0.094 0.903ADMIN_COSTS .165b 1.824 0.071 0.166 0.82BRANCH_TYPE -.073c -0.876 0.383 -0.081 0.94BANK_SIZE .103c 1.275 0.205 0.117 0.994Bank_dummy1 .014c 0.17 0.865 0.016 0.978Bank_dummy2 -.014c -0.17 0.865 -0.016 0.963Bank_dummy3 -.128c -1.525 0.13 -0.14 0.906Bank_dummy4 .032c 0.4 0.69 0.037 0.999Bank_dummy5 -.109c -1.347 0.181 -0.124 0.983Bank_dummy6 -.035c -0.421 0.675 -0.039 0.966Bank_dummy7 -.087c -1.075 0.285 -0.099 0.991Bank_dummy8 -.067c -0.824 0.411 -0.076 0.999Bank_dummy9 .097c 1.181 0.24 0.108 0.966Bank_dummy10 .136c 1.695 0.093 0.155 0.995Bank_dummy11 .142c 1.77 0.079 0.161 0.99Bank_dummy12 -.005c -0.067 0.946 -0.006 0.989INTEREST_SMOOTHING -.215c -2.737 0.007 -0.245 0.995PLEDGE COLLATERAL .107c 1.252 0.213 0.115 0.891FIRM_RATING .007c 0.08 0.937 0.007 0.911COST_OF_FUNDS .070c 0.827 0.41 0.076 0.898ADMIN_COSTS .126c 1.399 0.165 0.128 0.796BRANCH_TYPE -.028d -0.336 0.738 -0.031 0.899BANK_SIZE .131d 1.666 0.099 0.153 0.979Bank_dummy1 .017d 0.21 0.834 0.02 0.977Bank_dummy2 -.068d -0.828 0.409 -0.077 0.911Bank_dummy3 -.165d -2.01 0.047 -0.183 0.886Bank_dummy4 .068d 0.858 0.393 0.079 0.974Bank_dummy5 -.116d -1.476 0.143 -0.136 0.982Bank_dummy6 -.012d -0.151 0.88 -0.014 0.956Bank_dummy7 -.084d -1.068 0.288 -0.099 0.991Bank_dummy8 -.030d -0.378 0.706 -0.035 0.969Bank_dummy9 .088d 1.103 0.272 0.102 0.965Bank_dummy10 .091d 1.128 0.262 0.104 0.942Bank_dummy11 .135d 1.726 0.087 0.158 0.989Bank_dummy12 .048d 0.589 0.557 0.055 0.935PLEDGE COLLATERAL .138d 1.662 0.099 0.153 0.876FIRM_RATING .067d 0.794 0.429 0.074 0.854COST_OF_FUNDS .131d 1.548 0.124 0.142 0.848ADMIN_COSTS .140d 1.602 0.112 0.147 0.793
d. Predictors: (Constant), RISK_ENVIRONMENT, FIRM_AGE, INTEREST_SMOOTHING
1
2
3
a. Dependent Variable: RISK_PREMIUMb. Predictors: (Constant), RISK_ENVIRONMENTc. Predictors: (Constant), RISK_ENVIRONMENT, FIRM_AGE
Excluded Variablesa
Model Beta In t Sig. Partial Correlation
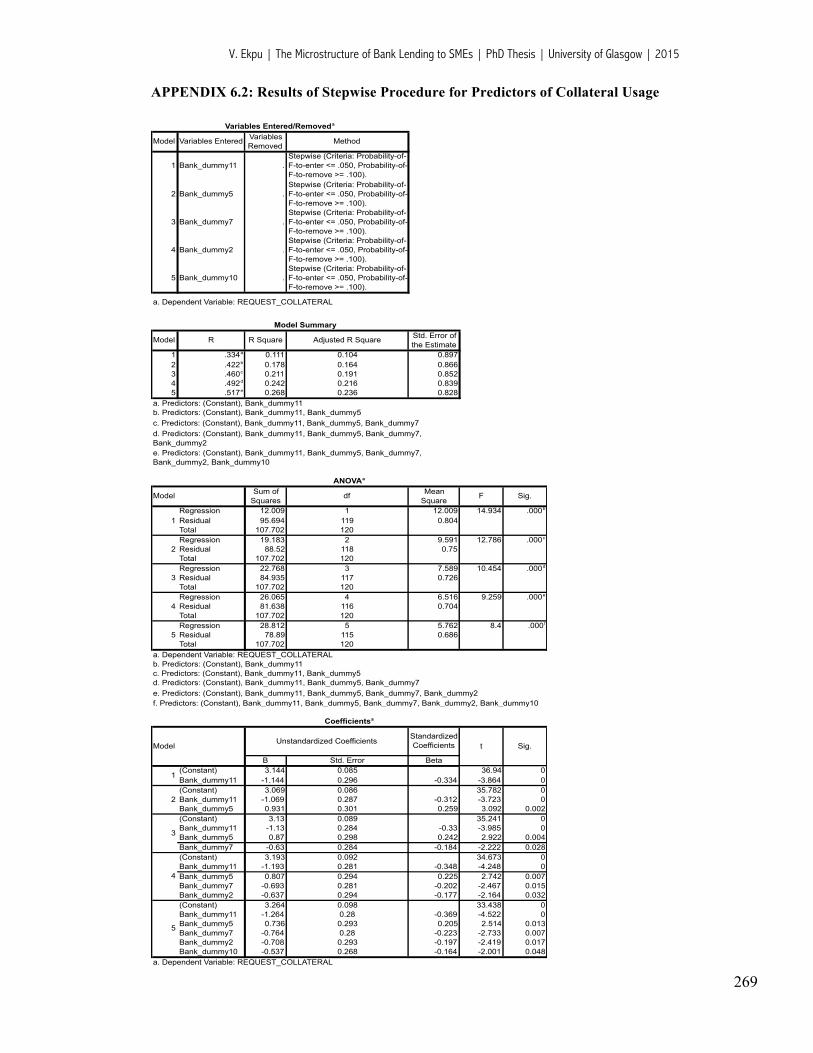
V. Ekpu | The Microstructure of Bank Lending to SMEs | PhD Thesis | University of Glasgow | 2015
269
APPENDIX 6.2: Results of Stepwise Procedure for Predictors of Collateral Usage
Model Variables Entered Variables Removed
Method
1 Bank_dummy11 .Stepwise (Criteria: Probability-of-F-to-enter <= .050, Probability-of-F-to-remove >= .100).
2 Bank_dummy5 .Stepwise (Criteria: Probability-of-F-to-enter <= .050, Probability-of-F-to-remove >= .100).
3 Bank_dummy7 .Stepwise (Criteria: Probability-of-F-to-enter <= .050, Probability-of-F-to-remove >= .100).
4 Bank_dummy2 .Stepwise (Criteria: Probability-of-F-to-enter <= .050, Probability-of-F-to-remove >= .100).
5 Bank_dummy10 .Stepwise (Criteria: Probability-of-F-to-enter <= .050, Probability-of-F-to-remove >= .100).
Model R R Square Adjusted R Square Std. Error of the Estimate
1 .334a 0.111 0.104 0.8972 .422b 0.178 0.164 0.8663 .460c 0.211 0.191 0.8524 .492d 0.242 0.216 0.8395 .517e 0.268 0.236 0.828
Sum of Squares
df Mean Square
F Sig.
Regression 12.009 1 12.009 14.934 .000b
Residual 95.694 119 0.804Total 107.702 120Regression 19.183 2 9.591 12.786 .000c
Residual 88.52 118 0.75Total 107.702 120Regression 22.768 3 7.589 10.454 .000d
Residual 84.935 117 0.726Total 107.702 120Regression 26.065 4 6.516 9.259 .000e
Residual 81.638 116 0.704Total 107.702 120Regression 28.812 5 5.762 8.4 .000f
Residual 78.89 115 0.686Total 107.702 120
Standardized Coefficients
B Std. Error Beta(Constant) 3.144 0.085 36.94 0Bank_dummy11 -1.144 0.296 -0.334 -3.864 0(Constant) 3.069 0.086 35.782 0Bank_dummy11 -1.069 0.287 -0.312 -3.723 0Bank_dummy5 0.931 0.301 0.259 3.092 0.002(Constant) 3.13 0.089 35.241 0Bank_dummy11 -1.13 0.284 -0.33 -3.985 0Bank_dummy5 0.87 0.298 0.242 2.922 0.004Bank_dummy7 -0.63 0.284 -0.184 -2.222 0.028(Constant) 3.193 0.092 34.673 0Bank_dummy11 -1.193 0.281 -0.348 -4.248 0Bank_dummy5 0.807 0.294 0.225 2.742 0.007Bank_dummy7 -0.693 0.281 -0.202 -2.467 0.015Bank_dummy2 -0.637 0.294 -0.177 -2.164 0.032(Constant) 3.264 0.098 33.438 0Bank_dummy11 -1.264 0.28 -0.369 -4.522 0Bank_dummy5 0.736 0.293 0.205 2.514 0.013Bank_dummy7 -0.764 0.28 -0.223 -2.733 0.007Bank_dummy2 -0.708 0.293 -0.197 -2.419 0.017Bank_dummy10 -0.537 0.268 -0.164 -2.001 0.048
1
2
3
4
5
a. Dependent Variable: REQUEST_COLLATERAL
d. Predictors: (Constant), Bank_dummy11, Bank_dummy5, Bank_dummy7e. Predictors: (Constant), Bank_dummy11, Bank_dummy5, Bank_dummy7, Bank_dummy2f. Predictors: (Constant), Bank_dummy11, Bank_dummy5, Bank_dummy7, Bank_dummy2, Bank_dummy10
Coefficientsa
ModelUnstandardized Coefficients
t Sig.
3
4
5
a. Dependent Variable: REQUEST_COLLATERALb. Predictors: (Constant), Bank_dummy11c. Predictors: (Constant), Bank_dummy11, Bank_dummy5
d. Predictors: (Constant), Bank_dummy11, Bank_dummy5, Bank_dummy7, Bank_dummy2e. Predictors: (Constant), Bank_dummy11, Bank_dummy5, Bank_dummy7, Bank_dummy2, Bank_dummy10
ANOVAa
Model
1
2
Variables Entered/Removeda
a. Dependent Variable: REQUEST_COLLATERAL
Model Summary
a. Predictors: (Constant), Bank_dummy11b. Predictors: (Constant), Bank_dummy11, Bank_dummy5c. Predictors: (Constant), Bank_dummy11, Bank_dummy5, Bank_dummy7
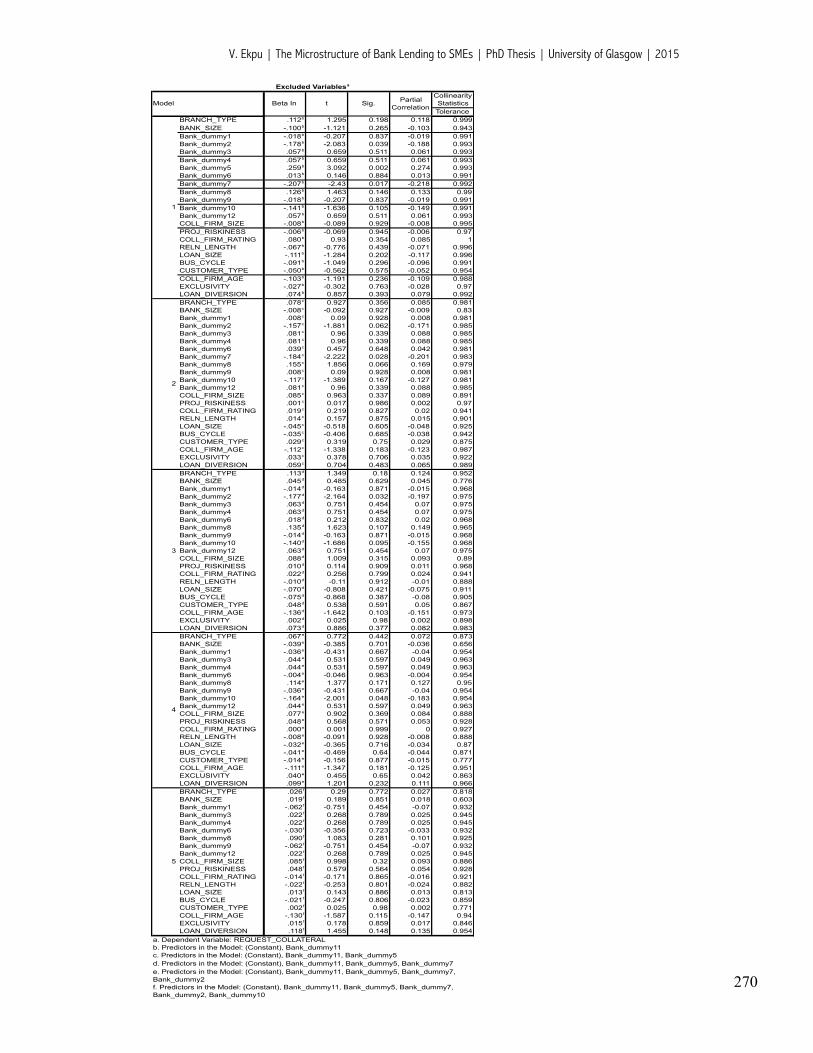
V. Ekpu | The Microstructure of Bank Lending to SMEs | PhD Thesis | University of Glasgow | 2015
270
Collinearity StatisticsTolerance
BRANCH_TYPE .112b 1.295 0.198 0.118 0.999BANK_SIZE -.100b -1.121 0.265 -0.103 0.943Bank_dummy1 -.018b -0.207 0.837 -0.019 0.991Bank_dummy2 -.178b -2.083 0.039 -0.188 0.993Bank_dummy3 .057b 0.659 0.511 0.061 0.993Bank_dummy4 .057b 0.659 0.511 0.061 0.993Bank_dummy5 .259b 3.092 0.002 0.274 0.993Bank_dummy6 .013b 0.146 0.884 0.013 0.991Bank_dummy7 -.207b -2.43 0.017 -0.218 0.992Bank_dummy8 .126b 1.463 0.146 0.133 0.99Bank_dummy9 -.018b -0.207 0.837 -0.019 0.991Bank_dummy10 -.141b -1.636 0.105 -0.149 0.991Bank_dummy12 .057b 0.659 0.511 0.061 0.993COLL_FIRM_SIZE -.008b -0.089 0.929 -0.008 0.995PROJ_RISKINESS -.006b -0.069 0.945 -0.006 0.97COLL_FIRM_RATING .080b 0.93 0.354 0.085 1RELN_LENGTH -.067b -0.776 0.439 -0.071 0.996LOAN_SIZE -.111b -1.284 0.202 -0.117 0.996BUS_CYCLE -.091b -1.049 0.296 -0.096 0.991CUSTOMER_TYPE -.050b -0.562 0.575 -0.052 0.954COLL_FIRM_AGE -.103b -1.191 0.236 -0.109 0.988EXCLUSIVITY -.027b -0.302 0.763 -0.028 0.97LOAN_DIVERSION .074b 0.857 0.393 0.079 0.992BRANCH_TYPE .078c 0.927 0.356 0.085 0.981BANK_SIZE -.008c -0.092 0.927 -0.009 0.83Bank_dummy1 .008c 0.09 0.928 0.008 0.981Bank_dummy2 -.157c -1.881 0.062 -0.171 0.985Bank_dummy3 .081c 0.96 0.339 0.088 0.985Bank_dummy4 .081c 0.96 0.339 0.088 0.985Bank_dummy6 .039c 0.457 0.648 0.042 0.981Bank_dummy7 -.184c -2.222 0.028 -0.201 0.983Bank_dummy8 .155c 1.856 0.066 0.169 0.979Bank_dummy9 .008c 0.09 0.928 0.008 0.981Bank_dummy10 -.117c -1.389 0.167 -0.127 0.981Bank_dummy12 .081c 0.96 0.339 0.088 0.985COLL_FIRM_SIZE .085c 0.963 0.337 0.089 0.891PROJ_RISKINESS .001c 0.017 0.986 0.002 0.97COLL_FIRM_RATING .019c 0.219 0.827 0.02 0.941RELN_LENGTH .014c 0.157 0.875 0.015 0.901LOAN_SIZE -.045c -0.518 0.605 -0.048 0.925BUS_CYCLE -.035c -0.406 0.685 -0.038 0.942CUSTOMER_TYPE .029c 0.319 0.75 0.029 0.875COLL_FIRM_AGE -.112c -1.338 0.183 -0.123 0.987EXCLUSIVITY .033c 0.378 0.706 0.035 0.922LOAN_DIVERSION .059c 0.704 0.483 0.065 0.989BRANCH_TYPE .113d 1.349 0.18 0.124 0.952BANK_SIZE .045d 0.485 0.629 0.045 0.776Bank_dummy1 -.014d -0.163 0.871 -0.015 0.968Bank_dummy2 -.177d -2.164 0.032 -0.197 0.975Bank_dummy3 .063d 0.751 0.454 0.07 0.975Bank_dummy4 .063d 0.751 0.454 0.07 0.975Bank_dummy6 .018d 0.212 0.832 0.02 0.968Bank_dummy8 .135d 1.623 0.107 0.149 0.965Bank_dummy9 -.014d -0.163 0.871 -0.015 0.968Bank_dummy10 -.140d -1.686 0.095 -0.155 0.968Bank_dummy12 .063d 0.751 0.454 0.07 0.975COLL_FIRM_SIZE .088d 1.009 0.315 0.093 0.89PROJ_RISKINESS .010d 0.114 0.909 0.011 0.968COLL_FIRM_RATING .022d 0.256 0.799 0.024 0.941RELN_LENGTH -.010d -0.11 0.912 -0.01 0.888LOAN_SIZE -.070d -0.808 0.421 -0.075 0.911BUS_CYCLE -.075d -0.868 0.387 -0.08 0.905CUSTOMER_TYPE .048d 0.538 0.591 0.05 0.867COLL_FIRM_AGE -.136d -1.642 0.103 -0.151 0.973EXCLUSIVITY .002d 0.025 0.98 0.002 0.898LOAN_DIVERSION .073d 0.886 0.377 0.082 0.983BRANCH_TYPE .067e 0.772 0.442 0.072 0.873BANK_SIZE -.039e -0.385 0.701 -0.036 0.656Bank_dummy1 -.036e -0.431 0.667 -0.04 0.954Bank_dummy3 .044e 0.531 0.597 0.049 0.963Bank_dummy4 .044e 0.531 0.597 0.049 0.963Bank_dummy6 -.004e -0.046 0.963 -0.004 0.954Bank_dummy8 .114e 1.377 0.171 0.127 0.95Bank_dummy9 -.036e -0.431 0.667 -0.04 0.954Bank_dummy10 -.164e -2.001 0.048 -0.183 0.954Bank_dummy12 .044e 0.531 0.597 0.049 0.963COLL_FIRM_SIZE .077e 0.902 0.369 0.084 0.888PROJ_RISKINESS .048e 0.568 0.571 0.053 0.928COLL_FIRM_RATING .000e 0.001 0.999 0 0.927RELN_LENGTH -.008e -0.091 0.928 -0.008 0.888LOAN_SIZE -.032e -0.365 0.716 -0.034 0.87BUS_CYCLE -.041e -0.469 0.64 -0.044 0.871CUSTOMER_TYPE -.014e -0.156 0.877 -0.015 0.777COLL_FIRM_AGE -.111e -1.347 0.181 -0.125 0.951EXCLUSIVITY .040e 0.455 0.65 0.042 0.863LOAN_DIVERSION .099e 1.201 0.232 0.111 0.966BRANCH_TYPE .026f 0.29 0.772 0.027 0.818BANK_SIZE .019f 0.189 0.851 0.018 0.603Bank_dummy1 -.062f -0.751 0.454 -0.07 0.932Bank_dummy3 .022f 0.268 0.789 0.025 0.945Bank_dummy4 .022f 0.268 0.789 0.025 0.945Bank_dummy6 -.030f -0.356 0.723 -0.033 0.932Bank_dummy8 .090f 1.083 0.281 0.101 0.925Bank_dummy9 -.062f -0.751 0.454 -0.07 0.932Bank_dummy12 .022f 0.268 0.789 0.025 0.945COLL_FIRM_SIZE .085f 0.998 0.32 0.093 0.886PROJ_RISKINESS .048f 0.579 0.564 0.054 0.928COLL_FIRM_RATING -.014f -0.171 0.865 -0.016 0.921RELN_LENGTH -.022f -0.253 0.801 -0.024 0.882LOAN_SIZE .013f 0.143 0.886 0.013 0.813BUS_CYCLE -.021f -0.247 0.806 -0.023 0.859CUSTOMER_TYPE .002f 0.025 0.98 0.002 0.771COLL_FIRM_AGE -.130f -1.587 0.115 -0.147 0.94EXCLUSIVITY .015f 0.178 0.859 0.017 0.846LOAN_DIVERSION .118f 1.455 0.148 0.135 0.954
b. Predictors in the Model: (Constant), Bank_dummy11c. Predictors in the Model: (Constant), Bank_dummy11, Bank_dummy5d. Predictors in the Model: (Constant), Bank_dummy11, Bank_dummy5, Bank_dummy7e. Predictors in the Model: (Constant), Bank_dummy11, Bank_dummy5, Bank_dummy7, Bank_dummy2f. Predictors in the Model: (Constant), Bank_dummy11, Bank_dummy5, Bank_dummy7, Bank_dummy2, Bank_dummy10
1
2
3
4
5
a. Dependent Variable: REQUEST_COLLATERAL
Excluded Variablesa
Model Beta In t Sig. Partial Correlation
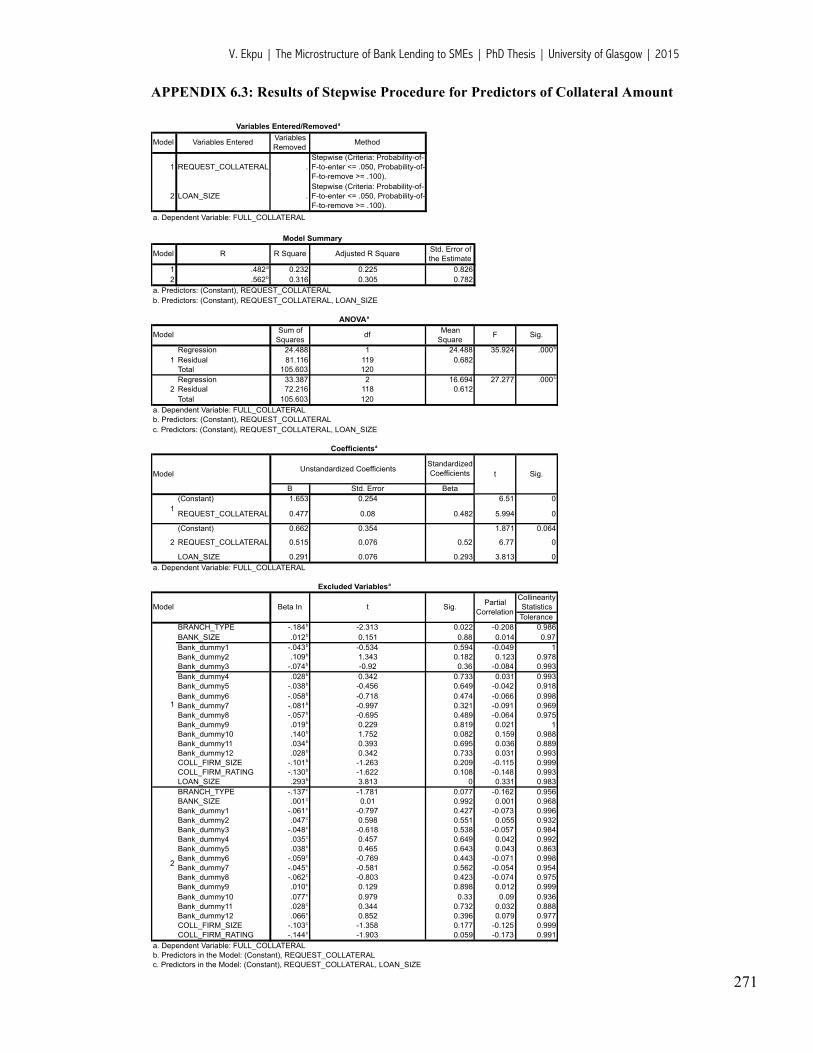
V. Ekpu | The Microstructure of Bank Lending to SMEs | PhD Thesis | University of Glasgow | 2015
271
APPENDIX 6.3: Results of Stepwise Procedure for Predictors of Collateral Amount
Model Variables Entered Variables Removed
Method
1 REQUEST_COLLATERAL .Stepwise (Criteria: Probability-of-F-to-enter <= .050, Probability-of-F-to-remove >= .100).
2 LOAN_SIZE .Stepwise (Criteria: Probability-of-F-to-enter <= .050, Probability-of-F-to-remove >= .100).
Model R R Square Adjusted R Square Std. Error of the Estimate
1 .482a 0.232 0.225 0.8262 .562b 0.316 0.305 0.782
Sum of Squares
df Mean Square
F Sig.
Regression 24.488 1 24.488 35.924 .000b
Residual 81.116 119 0.682Total 105.603 120Regression 33.387 2 16.694 27.277 .000c
Residual 72.216 118 0.612Total 105.603 120
Standardized Coefficients
B Std. Error Beta(Constant) 1.653 0.254 6.51 0
REQUEST_COLLATERAL 0.477 0.08 0.482 5.994 0
(Constant) 0.662 0.354 1.871 0.064
REQUEST_COLLATERAL 0.515 0.076 0.52 6.77 0
LOAN_SIZE 0.291 0.076 0.293 3.813 0
Collinearity StatisticsTolerance
BRANCH_TYPE -.184b -2.313 0.022 -0.208 0.986BANK_SIZE .012b 0.151 0.88 0.014 0.97Bank_dummy1 -.043b -0.534 0.594 -0.049 1Bank_dummy2 .109b 1.343 0.182 0.123 0.978Bank_dummy3 -.074b -0.92 0.36 -0.084 0.993Bank_dummy4 .028b 0.342 0.733 0.031 0.993Bank_dummy5 -.038b -0.456 0.649 -0.042 0.918Bank_dummy6 -.058b -0.718 0.474 -0.066 0.998Bank_dummy7 -.081b -0.997 0.321 -0.091 0.969Bank_dummy8 -.057b -0.695 0.489 -0.064 0.975Bank_dummy9 .019b 0.229 0.819 0.021 1Bank_dummy10 .140b 1.752 0.082 0.159 0.988Bank_dummy11 .034b 0.393 0.695 0.036 0.889Bank_dummy12 .028b 0.342 0.733 0.031 0.993COLL_FIRM_SIZE -.101b -1.263 0.209 -0.115 0.999COLL_FIRM_RATING -.130b -1.622 0.108 -0.148 0.993LOAN_SIZE .293b 3.813 0 0.331 0.983BRANCH_TYPE -.137c -1.781 0.077 -0.162 0.956BANK_SIZE .001c 0.01 0.992 0.001 0.968Bank_dummy1 -.061c -0.797 0.427 -0.073 0.996Bank_dummy2 .047c 0.598 0.551 0.055 0.932Bank_dummy3 -.048c -0.618 0.538 -0.057 0.984Bank_dummy4 .035c 0.457 0.649 0.042 0.992Bank_dummy5 .038c 0.465 0.643 0.043 0.863Bank_dummy6 -.059c -0.769 0.443 -0.071 0.998Bank_dummy7 -.045c -0.581 0.562 -0.054 0.954Bank_dummy8 -.062c -0.803 0.423 -0.074 0.975Bank_dummy9 .010c 0.129 0.898 0.012 0.999Bank_dummy10 .077c 0.979 0.33 0.09 0.936Bank_dummy11 .028c 0.344 0.732 0.032 0.888Bank_dummy12 .066c 0.852 0.396 0.079 0.977COLL_FIRM_SIZE -.103c -1.358 0.177 -0.125 0.999COLL_FIRM_RATING -.144c -1.903 0.059 -0.173 0.991
1
2
a. Dependent Variable: FULL_COLLATERALb. Predictors in the Model: (Constant), REQUEST_COLLATERALc. Predictors in the Model: (Constant), REQUEST_COLLATERAL, LOAN_SIZE
Excluded Variablesa
Model Beta In t Sig.
1
2
a. Dependent Variable: FULL_COLLATERAL
Partial Correlation
c. Predictors: (Constant), REQUEST_COLLATERAL, LOAN_SIZE
Coefficientsa
ModelUnstandardized Coefficients
t Sig.
ANOVAa
Model
1
2
a. Dependent Variable: FULL_COLLATERALb. Predictors: (Constant), REQUEST_COLLATERAL
Variables Entered/Removeda
a. Dependent Variable: FULL_COLLATERAL
Model Summary
a. Predictors: (Constant), REQUEST_COLLATERALb. Predictors: (Constant), REQUEST_COLLATERAL, LOAN_SIZE
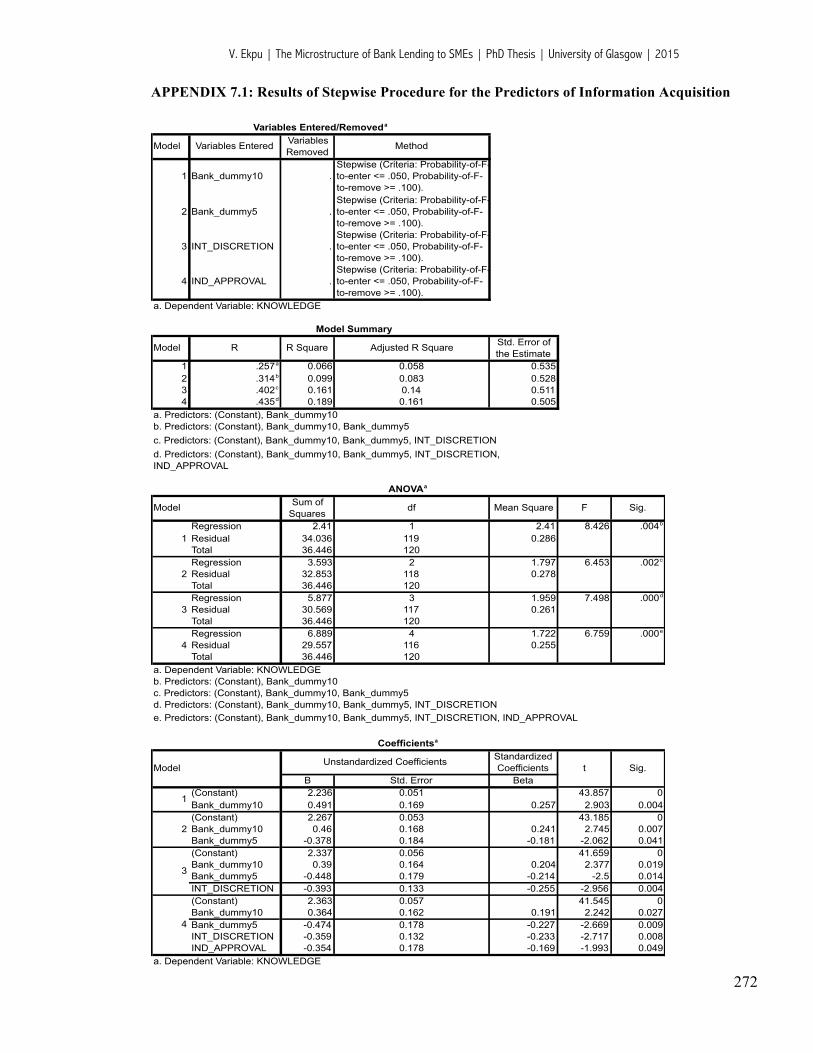
V. Ekpu | The Microstructure of Bank Lending to SMEs | PhD Thesis | University of Glasgow | 2015
272
APPENDIX 7.1: Results of Stepwise Procedure for the Predictors of Information Acquisition
Model Variables Entered Variables Removed
Method
1 Bank_dummy10 .Stepwise (Criteria: Probability-of-F-to-enter <= .050, Probability-of-F-to-remove >= .100).
2 Bank_dummy5 .Stepwise (Criteria: Probability-of-F-to-enter <= .050, Probability-of-F-to-remove >= .100).
3 INT_DISCRETION .Stepwise (Criteria: Probability-of-F-to-enter <= .050, Probability-of-F-to-remove >= .100).
4 IND_APPROVAL .Stepwise (Criteria: Probability-of-F-to-enter <= .050, Probability-of-F-to-remove >= .100).
Model R R Square Adjusted R Square Std. Error of the Estimate
1 .257a 0.066 0.058 0.5352 .314b 0.099 0.083 0.5283 .402c 0.161 0.14 0.5114 .435d 0.189 0.161 0.505
Sum of Squares
df Mean Square F Sig.
Regression 2.41 1 2.41 8.426 .004b
Residual 34.036 119 0.286Total 36.446 120Regression 3.593 2 1.797 6.453 .002c
Residual 32.853 118 0.278Total 36.446 120Regression 5.877 3 1.959 7.498 .000d
Residual 30.569 117 0.261Total 36.446 120Regression 6.889 4 1.722 6.759 .000e
Residual 29.557 116 0.255Total 36.446 120
Standardized Coefficients
B Std. Error Beta(Constant) 2.236 0.051 43.857 0Bank_dummy10 0.491 0.169 0.257 2.903 0.004(Constant) 2.267 0.053 43.185 0Bank_dummy10 0.46 0.168 0.241 2.745 0.007Bank_dummy5 -0.378 0.184 -0.181 -2.062 0.041(Constant) 2.337 0.056 41.659 0Bank_dummy10 0.39 0.164 0.204 2.377 0.019Bank_dummy5 -0.448 0.179 -0.214 -2.5 0.014INT_DISCRETION -0.393 0.133 -0.255 -2.956 0.004(Constant) 2.363 0.057 41.545 0Bank_dummy10 0.364 0.162 0.191 2.242 0.027Bank_dummy5 -0.474 0.178 -0.227 -2.669 0.009INT_DISCRETION -0.359 0.132 -0.233 -2.717 0.008IND_APPROVAL -0.354 0.178 -0.169 -1.993 0.049
2
3
4
a. Dependent Variable: KNOWLEDGE
Coefficientsa
ModelUnstandardized Coefficients
t Sig.
1
4
a. Dependent Variable: KNOWLEDGEb. Predictors: (Constant), Bank_dummy10c. Predictors: (Constant), Bank_dummy10, Bank_dummy5d. Predictors: (Constant), Bank_dummy10, Bank_dummy5, INT_DISCRETIONe. Predictors: (Constant), Bank_dummy10, Bank_dummy5, INT_DISCRETION, IND_APPROVAL
d. Predictors: (Constant), Bank_dummy10, Bank_dummy5, INT_DISCRETION, IND_APPROVAL
ANOVAa
Model
1
2
3
Variables Entered/Removeda
a. Dependent Variable: KNOWLEDGE
Model Summary
a. Predictors: (Constant), Bank_dummy10b. Predictors: (Constant), Bank_dummy10, Bank_dummy5c. Predictors: (Constant), Bank_dummy10, Bank_dummy5, INT_DISCRETION

V. Ekpu | The Microstructure of Bank Lending to SMEs | PhD Thesis | University of Glasgow | 2015
273
Collinearity StatisticsTolerance
BRANCH_TYPE -.106b -1.172 0.243 -0.107 0.949BANK_SIZE .004b 0.039 0.969 0.004 0.936Bank_dummy1 .074b 0.831 0.408 0.076 0.99Bank_dummy2 -.007b -0.082 0.934 -0.008 0.992Bank_dummy3 -.007b -0.082 0.934 -0.008 0.992Bank_dummy4 .108b 1.221 0.225 0.112 0.992Bank_dummy5 -.181b -2.062 0.041 -0.186 0.992Bank_dummy6 -.032b -0.355 0.723 -0.033 0.99Bank_dummy7 -.075b -0.845 0.4 -0.078 0.991Bank_dummy8 .110b 1.24 0.217 0.113 0.989Bank_dummy9 .074b 0.831 0.408 0.076 0.99Bank_dummy11 -.075b -0.845 0.4 -0.078 0.991Bank_dummy12 -.007b -0.082 0.934 -0.008 0.992IND_APPROVAL -.181b -2.062 0.041 -0.186 0.992INT_DISCRETION -.226b -2.592 0.011 -0.232 0.983FREQ_COMM .077b 0.865 0.389 0.079 0.998RB_EXPERIENCE -.020b -0.217 0.828 -0.02 0.956BRANCH_TYPE -.085c -0.945 0.346 -0.087 0.936BANK_SIZE -.069c -0.715 0.476 -0.066 0.825Bank_dummy1 .057c 0.64 0.524 0.059 0.98Bank_dummy2 -.024c -0.268 0.789 -0.025 0.984Bank_dummy3 -.024c -0.268 0.789 -0.025 0.984Bank_dummy4 .093c 1.056 0.293 0.097 0.984Bank_dummy6 -.050c -0.568 0.571 -0.052 0.98Bank_dummy7 -.093c -1.057 0.293 -0.097 0.982Bank_dummy8 .092c 1.045 0.298 0.096 0.978Bank_dummy9 .057c 0.64 0.524 0.059 0.98Bank_dummy11 -.093c -1.057 0.293 -0.097 0.982Bank_dummy12 -.024c -0.268 0.789 -0.025 0.984IND_APPROVAL -.199c -2.295 0.024 -0.208 0.984INT_DISCRETION -.255c -2.956 0.004 -0.264 0.965FREQ_COMM .090c 1.027 0.307 0.095 0.993RB_EXPERIENCE -.038c -0.418 0.676 -0.039 0.947BRANCH_TYPE -.060d -0.685 0.494 -0.064 0.926BANK_SIZE -.103d -1.101 0.273 -0.102 0.813Bank_dummy1 .057d 0.67 0.504 0.062 0.98Bank_dummy2 -.062d -0.714 0.477 -0.066 0.963Bank_dummy3 .033d 0.373 0.709 0.035 0.937Bank_dummy4 .127d 1.483 0.141 0.136 0.968Bank_dummy6 -.008d -0.088 0.93 -0.008 0.952Bank_dummy7 -.088d -1.035 0.303 -0.096 0.982Bank_dummy8 .050d 0.58 0.563 0.054 0.95Bank_dummy9 .037d 0.426 0.671 0.04 0.974Bank_dummy11 -.088d -1.035 0.303 -0.096 0.982Bank_dummy12 -.062d -0.714 0.477 -0.066 0.963IND_APPROVAL -.169d -1.993 0.049 -0.182 0.968FREQ_COMM .144d 1.678 0.096 0.154 0.956RB_EXPERIENCE -.053d -0.609 0.544 -0.056 0.944BRANCH_TYPE -.075e -0.854 0.395 -0.079 0.921BANK_SIZE -.140e -1.493 0.138 -0.138 0.788Bank_dummy1 .058e 0.682 0.496 0.063 0.98Bank_dummy2 -.076e -0.888 0.376 -0.083 0.957Bank_dummy3 .159e 1.601 0.112 0.148 0.703Bank_dummy4 .109e 1.276 0.205 0.118 0.955Bank_dummy6 -.031e -0.358 0.721 -0.033 0.935Bank_dummy7 -.108e -1.272 0.206 -0.118 0.971Bank_dummy8 .035e 0.399 0.691 0.037 0.941Bank_dummy9 .059e 0.687 0.494 0.064 0.959Bank_dummy11 -.108e -1.272 0.206 -0.118 0.971Bank_dummy12 -.054e -0.637 0.525 -0.059 0.961FREQ_COMM .161e 1.896 0.06 0.174 0.948RB_EXPERIENCE -.057e -0.666 0.507 -0.062 0.943
c. Predictors in the Model: (Constant), Bank_dummy10, Bank_dummy5d. Predictors in the Model: (Constant), Bank_dummy10, Bank_dummy5, INT_DISCRETIONe. Predictors in the Model: (Constant), Bank_dummy10, Bank_dummy5, INT_DISCRETION, IND_APPROVAL
1
2
3
4
a. Dependent Variable: KNOWLEDGEb. Predictors in the Model: (Constant), Bank_dummy10
Excluded Variablesa
Model Beta In t Sig. Partial Correlation
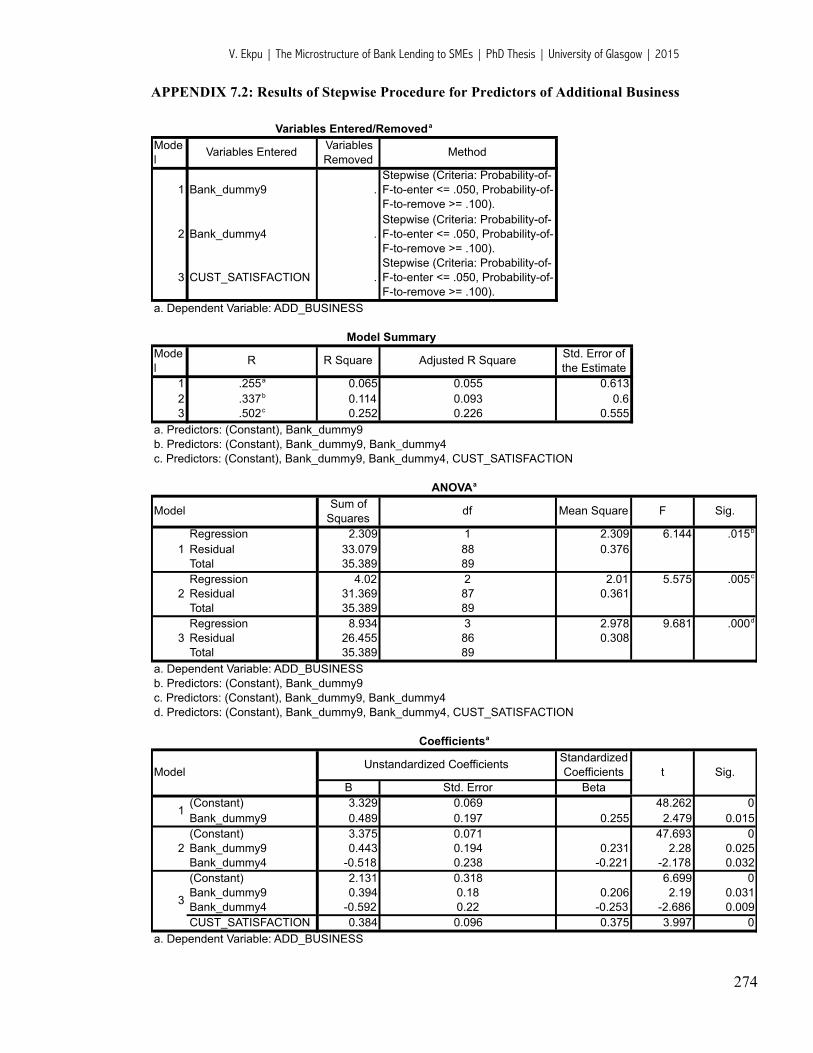
V. Ekpu | The Microstructure of Bank Lending to SMEs | PhD Thesis | University of Glasgow | 2015
274
APPENDIX 7.2: Results of Stepwise Procedure for Predictors of Additional Business
Model
Variables Entered Variables Removed
Method
1 Bank_dummy9 .Stepwise (Criteria: Probability-of-F-to-enter <= .050, Probability-of-F-to-remove >= .100).
2 Bank_dummy4 .Stepwise (Criteria: Probability-of-F-to-enter <= .050, Probability-of-F-to-remove >= .100).
3 CUST_SATISFACTION .Stepwise (Criteria: Probability-of-F-to-enter <= .050, Probability-of-F-to-remove >= .100).
Model
R R Square Adjusted R Square Std. Error of the Estimate
1 .255a 0.065 0.055 0.6132 .337b 0.114 0.093 0.63 .502c 0.252 0.226 0.555
Sum of Squares
df Mean Square F Sig.
Regression 2.309 1 2.309 6.144 .015b
Residual 33.079 88 0.376Total 35.389 89Regression 4.02 2 2.01 5.575 .005c
Residual 31.369 87 0.361Total 35.389 89Regression 8.934 3 2.978 9.681 .000d
Residual 26.455 86 0.308Total 35.389 89
Standardized Coefficients
B Std. Error Beta(Constant) 3.329 0.069 48.262 0Bank_dummy9 0.489 0.197 0.255 2.479 0.015(Constant) 3.375 0.071 47.693 0Bank_dummy9 0.443 0.194 0.231 2.28 0.025Bank_dummy4 -0.518 0.238 -0.221 -2.178 0.032(Constant) 2.131 0.318 6.699 0Bank_dummy9 0.394 0.18 0.206 2.19 0.031Bank_dummy4 -0.592 0.22 -0.253 -2.686 0.009CUST_SATISFACTION 0.384 0.096 0.375 3.997 0
1
2
3
a. Dependent Variable: ADD_BUSINESS
b. Predictors: (Constant), Bank_dummy9c. Predictors: (Constant), Bank_dummy9, Bank_dummy4d. Predictors: (Constant), Bank_dummy9, Bank_dummy4, CUST_SATISFACTION
Coefficientsa
ModelUnstandardized Coefficients
t Sig.
ANOVAa
Model
1
2
3
a. Dependent Variable: ADD_BUSINESS
Variables Entered/Removeda
a. Dependent Variable: ADD_BUSINESS
Model Summary
a. Predictors: (Constant), Bank_dummy9b. Predictors: (Constant), Bank_dummy9, Bank_dummy4c. Predictors: (Constant), Bank_dummy9, Bank_dummy4, CUST_SATISFACTION

V. Ekpu | The Microstructure of Bank Lending to SMEs | PhD Thesis | University of Glasgow | 2015
275
Collinearity StatisticsTolerance
BRANCH_TYPE .008b 0.075 0.941 0.008 0.944BANK_SIZE .182b 1.712 0.09 0.181 0.923Bank_dummy1 -.017b -0.16 0.873 -0.017 0.983Bank_dummy2 -.040b -0.383 0.703 -0.041 0.986Bank_dummy3 -.128b -1.244 0.217 -0.132 0.992Bank_dummy4 -.221b -2.178 0.032 -0.227 0.988Bank_dummy5 .162b 1.581 0.118 0.167 0.997Bank_dummy6 -.131b -1.269 0.208 -0.135 0.983Bank_dummy7 .074b 0.708 0.481 0.076 0.99Bank_dummy8 .062b 0.597 0.552 0.064 0.985Bank_dummy10 .213b 2.087 0.04 0.218 0.986Bank_dummy11 .002b 0.017 0.986 0.002 0.99Bank_dummy12 .086b 0.83 0.409 0.089 0.986KNOWLEDGE .037b 0.354 0.724 0.038 0.996CUST_SATISFACTION .353b 3.656 0 0.365 0.996FINANCIAL_INFO .052b 0.504 0.615 0.054 0.995LOAN_LIFE_RELN .087b 0.837 0.405 0.089 0.994PERSONAL_CONTACT -.117b -1.124 0.264 -0.12 0.983BRANCH_TYPE .031c 0.299 0.765 0.032 0.934BANK_SIZE .111c 0.979 0.33 0.105 0.791Bank_dummy1 -.044c -0.424 0.673 -0.046 0.969Bank_dummy2 -.064c -0.622 0.535 -0.067 0.976Bank_dummy3 -.147c -1.457 0.149 -0.155 0.985Bank_dummy5 .151c 1.504 0.136 0.16 0.994Bank_dummy6 -.160c -1.574 0.119 -0.167 0.969Bank_dummy7 .054c 0.53 0.597 0.057 0.982Bank_dummy8 .038c 0.369 0.713 0.04 0.972Bank_dummy10 .191c 1.902 0.061 0.201 0.976Bank_dummy11 -.018c -0.177 0.86 -0.019 0.982Bank_dummy12 .064c 0.622 0.535 0.067 0.976KNOWLEDGE .041c 0.399 0.691 0.043 0.995CUST_SATISFACTION .375c 3.997 0 0.396 0.989FINANCIAL_INFO .093c 0.904 0.369 0.097 0.965LOAN_LIFE_RELN .128c 1.25 0.215 0.134 0.965PERSONAL_CONTACT -.074c -0.709 0.48 -0.076 0.941BRANCH_TYPE .059d 0.604 0.548 0.065 0.929BANK_SIZE .113d 1.078 0.284 0.116 0.791Bank_dummy1 -.036d -0.374 0.71 -0.041 0.968Bank_dummy2 -.092d -0.967 0.336 -0.104 0.971Bank_dummy3 -.084d -0.879 0.382 -0.095 0.955Bank_dummy5 .083d 0.872 0.386 0.094 0.958Bank_dummy6 -.109d -1.145 0.255 -0.123 0.95Bank_dummy7 .038d 0.403 0.688 0.044 0.98Bank_dummy8 .115d 1.199 0.234 0.129 0.936Bank_dummy10 .165d 1.765 0.081 0.188 0.971Bank_dummy11 -.063d -0.663 0.509 -0.072 0.969Bank_dummy12 .012d 0.128 0.899 0.014 0.957KNOWLEDGE -.069d -0.708 0.481 -0.077 0.918FINANCIAL_INFO .019d 0.193 0.848 0.021 0.928LOAN_LIFE_RELN .030d 0.304 0.762 0.033 0.898PERSONAL_CONTACT -.189d -1.922 0.058 -0.204 0.875
d. Predictors in the Model: (Constant), Bank_dummy9, Bank_dummy4, CUST_SATISFACTION
1
2
3
a. Dependent Variable: ADD_BUSINESSb. Predictors in the Model: (Constant), Bank_dummy9c. Predictors in the Model: (Constant), Bank_dummy9, Bank_dummy4
Excluded Variablesa
Model Beta In t Sig. Partial Correlation

V. Ekpu | The Microstructure of Bank Lending to SMEs | PhD Thesis | University of Glasgow | 2015
276
BIBLIOGRAPHY
Books and Book Chapters
[1] Altman, E.I. (1993) Corporate Financial Distress and Bankruptcy: A Complete Guide to Predicting and Avoiding Distress and Profiting from Bankruptcy. Second Edition, John Wiley & Sons, New York
[2] Anderson, R. (2007) The Credit Scoring Toolkit: Theory and Practice for Retail Credit Risk Management and Decision Automation. Oxford University Press, 792pp
[3] Arthur, S. and J. Nazroo (2003) “Designing Fieldwork Strategies and Materials” in Ritchie, J. and J. Lewis (eds.) Qualitative Research Practice: A Guide for Social Science Students and Researchers, SAGE Publications; pp. 110-137.
[4] Bates, J. and D.S. Hally (1982) The Financing of Small Business. Third Edition Sweet and Maxwell, London; 243pp
[5] Berger, A.N. and G.F. Udell (1996) “Universal banking and the future of small business lending” book chapter in: Saunders, A., I. Walter (eds.), Financial System Design: The Case for Universal Banking. Irwin Burr, Ridge, IL, pp. 559-627
[6] Berger, A.N. and G.F. Udell (2003) “Small Business and Debt Finance”, book chapter in Acs, Z.J. and D.B. Audretsch (eds.), Handbook of Entrepreneurship Research 299-328, Kluver Academic Publishers, Great Britain.
[7] Bhaird, C. (2010) Resourcing Small and Medium Sized Enterprises: A Financial Growth Life Cycle Approach, Contributions to Management Science Series, Springer-Verlag; 210pp
[8] Brunnermeier, M., A. Crockett, C. Goodhart, A.D. Persaud, H.S. Shin (2009) The Fundamental Principles of Financial Regulation. Geneva Reports on the World Economy. International Centre for Monetary and Banking Studies, London.
[9] Conover, W.J. (1999) Practical Nonparametric Statistics, Third Edition, Wiley and Sons, New York; 592pp
[10] Creswell, J. (2012) Educational Research: Planning, Conducting, and Evaluating Quantitative and Qualitative Research. 4th Edition, Pearson; 672pp
[11] Dess, G.G. and H.C. Picken (1999) Beyond Productivity: How Leading Companies Achieve Superior Performance By Leveraging Their Human Capital. American Management Association, New York; 244pp
[12] DeThomas, A., Derammelaere, S. (2008) Writing a Convincing Business Plan. Third Edition, Barron’s Business Library; 263pp
[13] Dewhurst, J. and P. Burns (1989) Small Business: Planning, Finance and Control. Second Edition, Palgrave Macmillan, London; 392pp
[14] Elliot, A.C., W.A. Woodward (2007) Statistical Analysis Quick Reference Guidebook with SPSS Examples. Sage Publications; 280pp
V. Ekpu | The Microstructure of Bank Lending to SMEs | PhD Thesis | University of Glasgow | 2015
277
[15] Glaser, B.G. and Straus, A.L. (1967) The discovery of grounded theory: Strategies for qualitative research. New York: Aldine de Gruyter.
[16] Jankowicz, A.D. (2005) Business Research Projects (4th edition), Thomson Learning, London
[17] Kallberg, J.G. and G.F. Udell (2003) “Private Information Exchange in the United States, book chapter in Miller, M.J. (eds.) Credit Reporting Systems and the International Economy, MIT Press, Cambridge Massachusetts, pp. 203-227
[18] Kam, V. (1990) Accounting Theory. Second Edition, John Wiley & Sons, Singapore; 608pp
[19] Krugman, P. and R. Wells (2009) Macroeconomics, 2nd edition, Macmillan Higher Education, 524pp.
[20] Long, S.L. (1997) Regression Models for Categorical and Limited Dependent Variables. Advanced Quantitative Techniques in the Social Sciences 7. SAGE Publications, Thousand Oak.
[21] Mankiw, N.G. (2011) Principles of Macroeconomics, 6th edition, Cengage Learning, 576pp.
[22] Minsky, H. (1986) Stabilizing an Unstable Economy, Yale University Press, New Haven, CT
[23] Mishkin, F.S. (2010) The Economics of Money, Banking and Financial Markets. Ninth Edition, Pearson; 664pp
[24] Miller, M.J. (2003) Credit Reporting Systems and the International Economy, MIT Press, Cambridge Massachusetts, 465pp
[25] Nakamura, L.I. (1993a) “Commercial bank information: Implications for the structure of banking” book chapter in Klausner, M.D., L.J. White (eds.), Structural Change in Banking, Homewood, Illinois, pp. 131-160
[26] Neuman, W.L. (2000) Social Research Methods (2nd ed.), London, Allyn and Bacon
[27] Norusis, M.J. (2012) IBM SPSS Statistics 19 Advanced Statistical Procedures Companion. Pearson; 432pp
[28] Nwankwo, G.O. (1980) The Nigerian Financial System. Macmillan Publishers. London, 184pp
[29] Patton, M.Q. (2002) Qualitative research and evaluation methods (3rd ed.) Thousand Oaks, CA: Sage
[30] Pryce, G. (2005) Inference and Statistics in SPSS: A Course for Business and Social Science, GeeBeeJey Publishing, 177pp
[31] Robson, C. (2011) Real World Research (3rd edition), John Wiley & Sons, Chichester, 608pp
[32] Saunders, M., P. Lewis and A. Thornhill (2007) Research Methods for Business Students. Fourth Edition. Pearson, 624pp
V. Ekpu | The Microstructure of Bank Lending to SMEs | PhD Thesis | University of Glasgow | 2015
278
[33] Wang, H., Greiner, M. and Aronson, J.E. (2009) “People-to-People Lending: The Emerging E-Commerce Transformation of a Financial Market”, in M.L. Nelson et al (eds) Value Creation in e-Business Management, LNBIP 36:182-195
[34] Williamson, O. (1967) “The Economics of Defense Contracting: Incentives and Performance in Issues,” book chapter in R. McKean (ed.) Defense Economics. Columbia University Press, New York.
[35] Yin, R.K. (2009) Case Study Research: Design and Methods (4th edition), Applied Social Science Research Methods Series Vol. 5, SAGE Publications
Journal Articles and Working Papers
[1] Abayomi, T.O. and M.S. Adebayo (2010) “Determinants of Interest Rates in Nigeria: An Error Correction Model” Journal of Economics and International Finance 2 (12): 261-271
[2] Abosede, A.J., Arogundade, K.K. (2011) “Customers’ Perception of Determinants in Credit Granting by Nigerian Microfinance Institutions to Small and Medium Scale Enterprises: A Study of Ogun State, Nigeria”, International Journal of Business and Management Tomorrow, Vol. 1. No. 2, ISSN 2249-9962
[3] Aburime, U.T. (2007) “Impact of Ownership Structure on Bank Profitability in Nigeria”, Department of Banking and Finance, Faculty of Business Administration, University of Nigeria, Enugu
[4] Acharya, V., Rajan, A., Schoar, A. (2007) “What Determines Entrepreneurial Success? A psychometric study of rural entrepreneurs of India”
[5] Adamu, B.I. (2009) “Financing Gap for Small and Medium Enterprises (SMEs) in the Post Consolidated Banking Sector in Nigeria” Bullion, publication of the Central Bank of Nigeria, Vol. 33 (3): 38-53
[6] Adigwe, P.K. (2012) “Project Finance for Small and Medium Scale Enterprises (SMEs) in Nigeria” African Research Review: An International Multidisciplinary Journal, Ethiopia. Vol. 6 (1): 91-100
[7] Afolabi, J. (2010) “Analysis of Loan Repayment among Small Scale Farmers in Oyo State, Nigeria”, Journal of Social Sciences, 22 (2): 115-119
[8] Afolabi, J.A. R.W. Ogunleye and S.M. Bwala (2003) “Determinants of Interest Rate Spread in Nigeria: An Empirical Investigation” NDIC Quarterly 13 (1): 31-54
[9] Agarwal, S. and R. Hauswald (2010) “Distance and private information in lending” Review of Financial Studies 23: 2757-2788
[10] Akenbor, C.O. and S. Imade (2011) “Sales Target and Ethical Behaviour of Marketing Executives in the Nigerian Banking Industry” African Research Review, an international multi-disciplinary Journal, Ethiopia, Vol. 5 (3), Serial No. 20, pp. 212-225
V. Ekpu | The Microstructure of Bank Lending to SMEs | PhD Thesis | University of Glasgow | 2015
279
[11] Akhavein, J., W. S. Frame and L.J. White (2005), “The Diffusion of Financial Innovations: An Examination of the Adoption of Small Business Credit Scoring by Large Banking Organizations, The Journal of Business, Vol. 78, No.2, pp. 577-596
[12] Akhigbe, A, and J. McNulty (2005) “Profit Efficiency Sources and Differences among Small and Large U.S Commercial Banks,” Journal of Economics and Finance, Volume 29, Number 3, Fall 2005
[13] Akinleye, G.T., J.O. Ojenike, A.A. Afolabi (2012) “Demand for, and Supply of Credit in Nigerian Banking Sector” Research Journal of Finance and Accounting 3 (8): 38-43
[14] Akinlo, A.E. and B.O. Owoyemi (2012) “The Determinants of Interest Spreads in Nigeria: An Empirical Investigation” Modern Economy 3: 837-845
[15] Alessandrini, P., A. Presbitero, A. Zazzaro (2009) “Banks, distances and financing constraints for firms” Review of Financial Studies 13: 261-307
[16] Altman, E.I. (1968) “Financial Ratios, Discriminant Analysis and the Prediction of Corporate Bankruptcy” Journal of Finance 23 (4): 589–609
[17] Altman, D.G., Bland, J.M. (1996) “Transforming Data” British Medical Journal, 312:770
[18] Altman, D.G., Bland, J.M. (2009) “Parametric v non-parametric methods for data analysis” British Medical Journal 338:a3167
[19] Altman, E.I., G. Sabato, N. Wilson (2009), “The Value of Non-Financial Information in SME Risk Management” Paper presented at the Credit Scoring and Control XI conference, Edinburgh, Scotland, Aug 26-28
[20] Anderson, R. (2011) “Psychometrics: A new tool for Small Business Lending” Practitioner paper presented at the Credit Scoring and Control XII conference, Edinburgh, Scotland, Aug 24-26
[21] Anyanwu, C.M. (2010) “An Overview of Current Banking Sector Reforms and the Real Sector of the Nigerian Economy” Central Bank of Nigeria Economic and Financial Review Vol. 48 (4): 31-56
[22] Asuquo, A.I. (2012) “Empirical Analysis of Effects of Bank Mergers and Acquisitions on Small Business Lending in Nigeria” International Journal of Advancements in Research & Technology 1 (6):1-15
[23] Athanasoglou, P.P., S.N. Brissimis, and M.D. Delis (2008) “Bank-specific, industry-specific and macroeconomic determinants of bank profitability” International Financial Markets, Institutions and Money 18:121-136
[24] Atuche, F. (2009) “Nigerian Banking System and the Challenges of the Global Economic Crisis” Bullion, publication of the Central Bank of Nigeria 33 (3): 7-11
[25] Avery, R.B., R.W., Bostic and K.A. Samolyk (1998) “The role of personal wealth in small business finance” Journal of Banking and Finance, 22:1019-1061
[26] Avery, R.B. and Samolyk, K.A. (2004) “Bank Consolidation and the Provision of Banking Services: Small Commercial Loans” Journal of Financial Services Research 25: 291-325
V. Ekpu | The Microstructure of Bank Lending to SMEs | PhD Thesis | University of Glasgow | 2015
280
[27] Ayyagari, M., A. Demirguc-Kunt, and V. Maskimovic (2008) “How Important Are Financing Constraints? The Role of Finance in the Business Environment” World Bank Economic Review 2 (3): 483-516
[28] Ayyagari, M., A. Demirguc-Kunt and V. Maskimovic (2012) “Financing of Firms in Developing Countries: Lessons from Research”, World Bank Working Paper
[29] Baeck, P. and L. Collins (2013) “Working the Crowd: A Short Guide to Crowd Funding and How it Can Work for You”, Nesta 21.05.13
[30] Bakker, H.R., L. Klapper, and G.F. Udell (2004) Financing Small and Medium-size Enterprises with Factoring: Global Growth and Its Potential in Eastern Europe. World Bank Monograph, Washington, D.C
[31] Barrett, G.R. (1990) “What bankers want to know before granting a small business loan” Journal of Accountancy 169 (4): 47-54
[32] Baruch, Y. (1999) “Response rates in academic studies: a comparative analysis”, Human Relations 52 (4): 421-438
[33] Basu, S. (2003) “Why do Banks fail?” International Review of Applied Economics 17 (3): 231- 248
[34] Beaver, W. (1967) “Financial ratios as predictors of failure” Empirical Research in Accounting: Selected Studies 1966, Journal of Accounting Research, Supplement to Vol. 4:71-111
[35] Beck, T., A. Demirguc-Kunt, and V. Maskimovic (2005) “Financial and Legal Constraints to Growth: Does Firm Size Matter?” The Journal of Finance 14 (1): 137-177
[36] Beck, T., and A. Demirguc-Kunt (2006) “Small and Medium-Sized Enterprises: Access to Finance As a Growth Constraint” Journal of Banking and Finance 30: 2931-43
[37] Beck, T., A. Demirguc-Kunt, L. Laeven, and V. Maskimovic (2006) “The Determinants of Financing Obstacles” Journal of International Money and Finance 25:932-952
[38] Beck, T., A. Demirguc-Kunt, and V. Maskimovic (2008a) “Financing Patterns around the world: Are small firms different?” Journal of Financial Economics 89:467-487
[39] Beck, T., A. Demirguc-Kunt, and M. Martinez Peria (2008b) “Bank Financing for SMEs around the World: Drivers, Obstacles, Business Models, and Lending Practices”. World Bank Policy Research Working Paper 4785; Washington DC
[40] Beck, T., A. Demirguc-Kunt, and M. Martinez Peria (2011) “Bank Financing for SMEs: Evidence Across Countries and Bank Ownership Types” Journal of Financial Services Research 39:35-54
[41] Behr, P. and A. Guttler (2007) “Credit risk assessment and relationship lending: An empirical analysis of German small and medium-sized enterprises” Journal of Small Business Management 45 (2): 194-213
V. Ekpu | The Microstructure of Bank Lending to SMEs | PhD Thesis | University of Glasgow | 2015
281
[42] Bell, V. and G. Young (2010), “Understanding the weakness of bank lending” Bank of England’s Quarterly Bulletin Q4, 311-320.
[43] Belluci, A., A.V. Borisov and A. Zazzaro (2009), “Does Gender Matter in Bank-firm relationships? Evidence from Small Business Lending” Money and Finance Research Group (MoFiR) Working Paper No. 31, Oct.
[44] Benvenuti, M., L. Casolaro, S. Del Prete, P. Mistrulli (2010) “Loan Officer Authority and Small Business Lending: Evidence from a Survey” MPRA Paper No 26475
[45] Berg, G., Fuchs, M. (2013) “Bank Financing of SMEs in Five Sub-Saharan African Countries” Policy Research Working Paper 6563, Finance and Private Sector Development Unit, The World bank Africa Region
[46] Berger, A., A.M., Cowan, and W.S. Frame (2009) “The Surprising Use of Credit Scoring in Small Business Lending by Community Banks and the Attendant Effects on Credit Availability and Risk”, Federal Reserve Bank of Atlanta Working Paper Series 2009-9
[47] Berger, A. and W.S. Frame (2005), “Small Business Credit Scoring and Credit Availability”, Federal Reserve Bank of Atlanta
[48] Berger, A.N., W.S. Frame, and V. Ioannidou (2011) “Reexamining the Empirical Relation between Loan Risk and Collateral: The Roles of Collateral Characteristics and Types” Federal Reserve Bank of Atlanta Working Paper Series 2011-12, September
[49] Berger, A., W.S. Frame and N.H. Miller (2005), “Credit Scoring and the Availability, Price and Risk of Small Business Credit,” Journal of Money, Credit and Banking 37:191-222
[50] Berger, S.C and F. Gleisner (2009) “Emergence of Financial Intermediaries in Electronic Markets: The Case of Online P2P Lending” Business Research 2 (1): 39-65
[51] Berger, A.N., L.F. Klapper, and G.F. Udell (2001) “The Ability of Banks to Lend to Informationally Opaque Small Businesses” Journal of Banking and Finance 25: 2127-2167
[52] Berger, A.N., N.H. Miller, M.A. Petersen, R.G. Rajan, J.C. Stein (2005) Does function follow organisational form? Evidence from the lending practices of large and small banks, Journal of Financial Economics, 76: 237-269
[53] Berger, A.N., R.J. Rosen, and G. F. Udell, (2007) “Does Market Size Structure Affect Competition? The Case of Small Business Lending” Journal of Banking and Finance 31: 11-33, Elsevier
[54] Berger, A. N., A. Saunders, J. M. Scalise, and G. F. Udell (1998) “The Effects of Bank Mergers and Acquisitions on Small Business Lending” Journal of Financial Economics 50: 187-229.
[55] Berger, A.N. and G.F. Udell (1990) “Collateral, loan quality and bank risk” Journal of Monetary Economics 25:21-42
[56] Berger, A.N. and G.F. Udell (1992) “Some evidence on the empirical significance of credit rationing Journal of Political Economy 100 (5): 1047-1077

V. Ekpu | The Microstructure of Bank Lending to SMEs | PhD Thesis | University of Glasgow | 2015
282
[57] Berger, A.N. and G.F. Udell (1995) “Relationship lending and lines of credit in small firm finance” Journal of Business 68: 351-382
[58] Berger, A.N. and G.F. Udell (1998) “The economics of small business finance: The roles of private equity and debt markets in the financial growth cycle” Journal of Banking and Finance 2:613-673
[59] Berger, A.N. and G.F. Udell (2002) “Small Business Credit Availability and Relationship Lending: The Importance of Bank Organisational Structure” Economic Journal 112: F32-F53.
[60] Berger, A.N. and G.F. Udell (2006) “A More Complete Conceptual Framework for Financing of Small and Medium Enterprises” Journal of Finance and Banking 30 (11): 2945–2966
[61] Berkowitz, J. and M.J. White (2004) “Bankruptcy and small firms’ access to credit” RAND Journal of Economics 35 (1): 69-84
[62] Berlin, M. (1996) “For Better and For Worse: Three Lending Relationships”, Business Review, Federal Reserve Bank of Philadelphia (Nov/Dec): 3-12
[63] Berlin, M. and L. Mester (1998) “On the profitability and cost of relationship lending” Journal of Banking and Finance 22: 873-897
[64] Bernanke, B.S. and M. Gertler (1995) “Inside the Black Box: The Credit Channel of Monetary Policy Transmission” Journal of Economic Perspectives 9 (4):27-48
[65] Bernanke, B.S. and C.S. Lown (1991) “The Credit Crunch” Brookings Papers on Economic Activity 2: 205-247
[66] Berney, R., Kolari, J. and C. Ou (1998) “The Profitability of Small Business Lending by Small Banks”, SBA Office of Advocacy, Small Business Research Summary No. 184
[67] Berry, A.J., S. Faulkner, M. Hughes and R. Jarvis (1993) “Financial information, the banker and the small business” British Accounting Review 25:131-150
[68] Besanko, D. and A.V. Thakor (1987a) “Collateral and rationing: sorting equilibria in monopolistic and competitive markets” International Economic Review 28: 671-689
[69] Besanko, D. and A.V. Thakor (1987b) “Competitive equilibria in the credit market under asymmetric information” Journal of Economic Theory 42:167-182
[70] Bharath, S., S. Dahiya, A. Saunders and A. Srinivasan (2007) “So What do I get? The bank’s view of lending relationships” Journal of Financial Economics 85:368-419
[71] Bhattacharya, S. and G. Chiesa (1995) “Proprietary information, financial intermediation, and research incentives” Journal of Financial Intermediation 4: 328–357
[72] Bhattacharya, S. and A. Thakor (1993) “Contemporary Banking Theory” Journal of Financial Intermediation 3:2-50
[73] Bikker, J.A. and H. Hu (2002) “Cyclical Patterns in Profits, Provisioning and Lending of Banks”. DNB Staff Reports No. 86 De Nederlandsche Bank NV.
V. Ekpu | The Microstructure of Bank Lending to SMEs | PhD Thesis | University of Glasgow | 2015
283
[74] Blanchard, L., B. Zhao and J. Yinger (2008), “Do lenders discriminate against minority and woman entrepreneurs?” Journal of Urban Economics, 63:467-497
[75] Blanchflower, D.G. Levine, P.B. and Zimmerman, D.J. (2003) “Discrimination in the Small-Business Credit Market”. The Review of Economics and Statistics 85 (4): 930-943
[76] Boot, A.W.A. (2000) “Relationship banking: What do we know?” Journal of Financial Intermediation 9: 7–25
[77] Boot, A.W.A and A.V. Thakor (1994) “Moral hazard and secured lending in an infinitely repeated credit market game”. International Economic Review 35: 899–920
[78] Boot, A.W.A and A.V. Thakor (2000) “Can relationship banking survive competition?” Journal of Finance 55: 679 –713.
[79] Boot, A.W.A., A.V. Thakor, and G.F. Udell (1991) “Secured lending and default risk: equilibrium analysis, policy implications and empirical results” The Economic Journal 101: 458-472.
[80] Brannen, J. (2005) “Mixing Methods: The Entry of Qualitative and Quantitative Approaches into the Research Process” International Journal of Social Research Methodology 8:173-184
[81] Brownbridge (2005) “The Impact of Public Policy on the Banking System in Nigeria”, Institute of Development (IDS) Working Paper Series 31
[82] Bruns, V. and M. Fletcher (2008) “Banks’ risk assessment of Swedish SMEs” Venture Capital 10 (2): 171-194
[83] Caire, D. (2004) “Building Credit Scorecards for Small Business Lending in Developing Markets”, Bannock Consulting, November
[84] Calice, P., V.M. Chando, and S. Sekioua (2012) “Bank Financing to Small and Medium Enterprises in East Africa: Findings of a Survey in Kenya, Tanzania, Uganda and Zambia”, African Development Bank Group Working Paper Series 146, March
[85] Campbell, T. (1979) “Optimal investment financing decisions and the value of confidentiality”, Journal of Financial Quantitative Analysis 14: 913-924
[86] Carbo-Valverde, S., F. Rodriguez-Fernandez, and G.F. Udell (2009) “Bank Market Power and SME Financing Constraints” Review of Finance 13: 309-340
[87] Carter, D.A., and J.E McNulty (2005) “Deregulation, technological change, and the business-lending performance of large and small banks” Journal of Banking and Finance 29:1113-1130
[88] Carter, D.A., J.E. McNulty, and J.A. Verbrugge (2004) “Do Small Banks have an Advantage in Lending? An Examination of Risk-adjusted Yields on Business Loans at Large and Small Banks”, Journal of Financial Services Research 25: 233-252
[89] Cavallo, L., and P.S. Rossi (2001) “Scale and scope economies in the European banking systems,” Journal of Multinational Financial Management 11: 515-531
V. Ekpu | The Microstructure of Bank Lending to SMEs | PhD Thesis | University of Glasgow | 2015
284
[90] Cerqueiro, G., H. Degryse and S. Ongena (2011) “Rules versus Discretion in Loan Rate Setting” Journal of Financial Intermediation 20 (4): 503-529
[91] Chan, Y.S., S.I. Greenbaum, and A.V. Thakor (1986) “Information reusability, competition and bank asset quality” Journal of Banking and Finance 10: 255-276
[92] Chan, Y.S. and G. Kanatas (1985) “Asymmetric valuation and the role of collateral in loan agreements” Journal of Money, Credit and Banking 17(1): 85-95
[93] Chan, Y., D. Siegel and Thakor, A. (1990) “Learning, corporate control and performance requirements in venture capital contracts” International Economic Review 31:365-381
[94] Churchill, N.C. and V.L. Lewis (1986) “Bank Lending to New and Growing Enterprises” Journal of Business Venturing 1:193-206
[95] Cole, R. (1998) “The Importance of Relationships to the Availability of Credit” Journal of Banking and Finance 22: 959–997
[96] Cole, R. (2008) Who Needs Credit and Who Gets Credit? Evidence from the Surveys of Small Business Finances, MPRA Paper No 24691
[97] Cole, R.A., L.G. Goldberg, and L.J. White (2004) “Cookie-cutter versus character: The Micro Structure of Small Business Lending by Large and Small Banks” Journal of Financial and Quantitative Analysis 39 (2): 227-251.
[98] Coleman, D.F., N. Esho, and I. Sharpe (2002) “Do Bank Characteristics Influence Loan Contract Terms?” Australian Prudential Regulation Authority (APRA) Working Paper 2002-01
[99] Cosh, A., A. Hughes, A. Bullock, I. Milner (2008) “Financing UK Small and Medium Enterprises: The 2007 Survey,” A Report from the Centre for Business Research (CBR)
[100] Cowling, M. (1998), “Regional Determinants of Small Firm Loans under the U.K Loan Guarantee Scheme”, Small Business Economics, 11:155-167
[101] Cowling, M. (1999a) “The Determinants of Bank-Small Business Loan Premia in the UK” Applied Economics Letters 6 (4): 251-253
[102] Cowling, M. (1999b) “The incidence of loan collateralisation in small business lending contracts: evidence from the UK” Applied Economics Letters 6 (5): 291-293
[103] Craig, B.R., W.E, Jackson III, and J.B. Thomson (2005) “The Role of Relationships in Small-Business Lending,” Federal Reserve Bank of Cleveland Economic Commentary, October 15, ISSN 0428-1276
[104] D’Auria, C., A. Foglia and P.M. Reedtz (1999) “Bank interest rates and credit relationships in Italy” Journal of Banking and Finance 23:1067-1093
[105] Degryse, H. and P.V. Cayseele (2000) “Relationship lending within a bank-based system: evidence from European small business data”, Journal of Financial Intermediation 9: 90-109
V. Ekpu | The Microstructure of Bank Lending to SMEs | PhD Thesis | University of Glasgow | 2015
285
[106] De la Torre, A., M. Martinez Peria, and S.L. Schmukler (2010) “Bank Involvement with SMEs: Beyond relationship lending” Journal of Banking and Finance 34: 2280-2293
[107] De Meza, D. and D.C. Webb (1987) “Too Much Investment: A Problem of Asymmetric Information” Quarterly Journal of Economics 102: 281-292
[108] DeYoung, R., W. C. Hunter, and G. F. Udell. (2004) “The Past, Present, and Probable Future for Community Banks” Journal of Financial Services Research 25 (2/3): 85-133.
[109] Diamond, D.W (1984) “Financial intermediation and delegated monitoring” Review of Economic Studies 51: 393–414
[110] Diamond, D.W. (1989) “Reputation Acquisition in Debt Markets” Journal of Political Economy 97(4): 828-862
[111] Diamond, D.W. (1991) “Monitoring and Reputation: The choice between bank loans and directly placed debt” Journal of Political Economy 99:689-721
[112] Diamond, D.W. and P. Dybvig (1983) “Bank runs, deposit insurance and liquidity” Journal of Political Economy 91:401-419
[113] Dow, S. (1992), “The Regional Financial Sector: A Scottish Case Study” Regional Studies 26 (7)
[114] Duan, H., X. Han and H. Yang (2009) “An Analysis of Causes for SMEs Financing Difficulty” International Journal of Business and Management 4 (6): 73-75
[115] Edet, B.N., E.A. Atairet, K.K., Nkeme, and U.K. Sunday (2014) “Determinants of Loan Repayment: A Study of Rural Women Fish Traders in Akwa Ibom State, Nigeria”, British Journal of Economics, Management and Trade 4 (4): 541-550
[116] Elliehausen, G.E. and J.D. Wolken (1990) “Banking Markets and the Use of Financial Services by Small and Medium-Sized Businesses” Federal Reserve Bulletin, Staff Studies 160.
[117] Elyasiani, E. and L. G. Goldberg (2004) “Relationship Lending: a Survey of the Literature” Journal of Economics and Business 56(4): 315–330.
[118] Enendu, C.1. (2003) “Determinants of Commercial Bank Interest Rate Spread in a Liberalized Financial System: Empirical Evidence from Nigeria (1989-2000)” Central Bank of Nigeria Economic and Financial Review 41 (1), March 2003
[119] Epstein, J. and F. Graham (1991) “The Role of Collateral in Small Business Lending”, Research Paper prepared for the Office of Investment, Bureau for Private Enterprises, U.S. Agency for International Development (USAID), PN-ABN-271.
[120] Erel, I. (2006) “The Effect of Bank Mergers in Loan Prices: Evidence from the U.S” The Ohio State University.
[121] Ergungor, O. E. (2005) The Profitability of Bank-Borrower Relationships, Journal of Financial Intermediation 14 (4): 485-512.

V. Ekpu | The Microstructure of Bank Lending to SMEs | PhD Thesis | University of Glasgow | 2015
286
[122] Feldman, R. (1997) “Banks and a big change in technology called credit scoring,” The Region, The Federal Reserve Bank of Minneapolis, September, pp. 19-25
[123] Fleisig, H. (1996) “Secured Transactions: the Power of Collateral” Finance and Development, June: pp. 44-46
[124] Fletcher, M. (1995) “Decision Making by Scottish Bank Managers” International Journal of Entrepreneurial Behaviour and Research 1(2): 37-53.
[125] Frame, W. S., A. Srinivasan, and L. Woosley (2001) “The effect of credit scoring on small business lending” Journal of Money, Credit, and Banking 33: 813-825.
[126] Frame, W. S., M. Padhi, and L. Woolsey (2004) “Credit Scoring and the Availability of Small Business Credit in Low- and Moderate Income Areas.” Financial Review 39: 34-54
[127] Gbandi, E.C., Amissah, G. (2014) “Financing Options for Small and Medium Enterprises (SMEs) in Nigeria” European Scientific Journal 10 (1): 327-340.
[128] Geanakoplos, J. (2010) “Solving the present crisis and managing the leverage cycle”, Federal Reserve Bank of New York Economic Policy Review, August
[129] Gilbert, R.A. (2000a) “Nationwide Branch Banking and the Presence of Large Banks in Rural Areas” Federal Reserve Bank of St. Louis Review 82:13-28.
[130] Gilbert, R.A. (2000b) “Big Fish, Small Ponds: Large Banks in Rural Communities” The Regional Economist, July 2000
[131] Grodzicki, M., Halaj, G., Zockowski, D. (2010) “Commercial Bank Lending Policy and Loan Supply” Financial System Department, National Bank of Poland
[132] Gup, B.E. and J.R. Walter (1989) “Top Performing Small Banks: Making Money the Old-Fashioned Way” Federal Reserve Bank of Richmond Economic Review Nov/Dec: 23-35
[133] Han, L., S. Fraser and D.J. Storey (2009) “Are Good or Bad Borrowers Discouraged from Applying for Loans? Evidence from US Small Business Credit Markets” Journal of Banking and Finance 33(2): 415–424.
[134] Harhoff, D. and T. Korting (1998) “Lending relationships in Germany: Empirical results from survey data” Journal of Banking and Finance 22:1317-1354
[135] Harrison, R. and Mason, C. (1986) “The Regional Impact of the Small Firms Loan Guarantee Scheme in the United Kingdom” Regional Studies 20 (6): 535-550
[136] Haruna, M.A. (2011) “Empirical Analysis of Interest Rate Spread in Nigeria: Post Liberalization Period”, International Journal of Social Sciences and Humanities Review Vol. 2 No. 2
[137] Haruna, M.A. (2012) “Determinants of Cost of Financial Intermediation in Nigeria’s Pre-Consolidated Banking Sector” International Journal of Advanced Research in Management and Social Sciences 1(2): 180-194
V. Ekpu | The Microstructure of Bank Lending to SMEs | PhD Thesis | University of Glasgow | 2015
287
[138] Hasselmann, R., P. Wachtel (2010) “Institutions and Bank Behaviour: Legal Environment, Legal Perception, and the Composition of Bank Lending” Journal of Money, Credit and Banking 42 (5): 965-984
[139] Haubrich, J.G. (1989) “Financial Intermediation: Delegated Monitoring and Long-Term Relationships” Journal of Banking and Finance 13: 9-20
[140] Hauser, D.P. (1974) “Some Problems in the use of Stepwise Regression Techniques in Geographical Research”, Canadian Geographer XVIII, 2:148-158
[141] Haynes, G.W., C. Ou, and R. Berney (1999) “Small business borrowing from large and small banks” In Business Access to Capital and Credit, edited by Jackson L. Blanton, Alicia Williams, and Sherrie L.W. Rhine, A Federal Reserve System Research Conference, 287-327.
[142] Hesse, H. (2007) “Financial Intermediation in the Pre-Consolidated Banking Sector in Nigeria” World Bank Policy Research Working Paper 4267
[143] Hubbard, G., K. Kuttner, and D. Palia (2002) “Are there Bank Effects in Borrowers’ Costs of Funds? Evidence from a Matched Sample of Borrowers and Banks” The Journal of Business 75(4): 559-581.
[144] Hutchinson, R.W. and D.G. McKillop (1992) “Banks and small to medium size business financing in the United Kingdom: Some general issues” National Westminster Bank Quarterly Review, February, pp. 84-95
[145] Hyytinen, A. and M. Pajarinen (2008) “Opacity of young businesses: Evidence from rating disagreements” Journal of Banking and Finance 32: 1234-1241
[146] Ikpefan, O.A. (2013) “The impact of marketing of financial services in the Nigerian banking industry” Journal of Business Administration and Management Sciences Research 2(6): 148-162
[147] Jayaratne, J. and J.D. Wolken (1999) “How Important Are Small Banks to Small Business Lending? New Evidence from a Survey of Small Firms” Journal of Banking and Finance 23: 427–58
[148] Jimenez, G., V. Salas and J. Saurina (2006) “Determinants of Collateral” Journal of Financial Economics 81: 255-281
[149] Jimenez, G. and J. Saurina (2004) “Collateral, type of lender and relationship banking as determinants of credit risk” Journal of Banking and Finance 28: 2191-2212
[150] Kauffmann, C. (2005) “Financing SMEs in Africa” Policy Insights No.7, OECD Development Centre, derived from the African Economic Outlook 2004/2005, a joint publication of the African Development Bank and the OECD Development Centre
[151] Keeton, W.R. (1995) “Multi-office bank lending to small businesses: some new evidence,” Federal Reserve Bank of Kansas City Economic Review 81, 63-75
[152] Kim, N.J (2008) ‘Financial Statements and Loan Decision in Community Banks, International Review of Business Research Papers, Vol. 4, No 4, pp.199-207
V. Ekpu | The Microstructure of Bank Lending to SMEs | PhD Thesis | University of Glasgow | 2015
288
[153] Kon, Y. and D.J. Storey (2003) “A Theory of Discouraged Borrowers” Small Business Economics 21(1): 37–49.
[154] Kruskal, W.H., W.A. Wallis (1952) “Use of Ranks in One-Criterion Variance Analysis” Journal of the American Statistical Association 47 (260): 583-621
[155] Lawal, W.A. and M.A. Ijaiya (2007) “Small and Medium Scale Enterprises’ Access to Commercial Banks’ Credits and their Contribution to GDP in Nigeria” The Asian Economic Review, Journal of the Indian Institute of Economics Vol. 49 (3): 360-368
[156] Lefilleur, J. (2009) “Financing SMEs in a context of strong information asymmetry”, Private Sector & Development, Issue 1:13-15, May 2009
[157] Lehmann, E. and D. Neuberger (2001) “Do lending relationships matter? Evidence from bank survey data in Germany” Journal of Economic Behaviour and Organisation 45:339-359
[158] Levonian, M.E., Soller, J. (1996) “Small Banks, Small Loans, Small Business” Weekly Letter, Federal Reserve Bank of San Francisco
[159] Lewis, M. (2007) “Stepwise versus Hierarchical Regression: Pros and Cons”, paper presented at the annual meeting of the Southwest Educational Research Association, February 7, 2007, San Antonio.
[160] Liberti, J.M. and A.R. Mian (2009) “Estimating the Effect of Hierarchies on Information Use” The Review of Financial Studies 22 (10): 4057- 4090
[161] Mach, T.L. and J.D Wolken (2006) “Financial Services Used by Small Businesses: Evidence from the 2003 Survey of Small Business Finance” Federal Reserve Bulletin: A167–A195.
[162] Machauer, A., M. Weber (1998) “Bank behaviour based on internal credit ratings of borrowers” Journal of Banking and Finance 22:1355-1383
[163] MacRae, D. (1991) “Characteristics of High and Low Growth Small and Medium-sized Businesses”. Paper presented to 21st European Small Business Seminar, Barcelona, September
[164] Marshall, M.N. (1996) “Sampling for qualitative research”, Family Practice 13(6): 522-525
[165] Martin, G. and H. Staines (1994) “Managerial Competences in Small Firms”, Journal of Management Development 13 (7): 23-24
[166] McLeay, M., A. Radia, and R. Thomas (2014), “Money Creation in the Modern Economy”, Bank of England Quarterly Bulletin, Q1:1-14.
[167] McNulty, J.E., A.O. Akhigbe, J.A. Verbrugge (2001) “Small Bank loan quality in a deregulated environment: the information advantage hypothesis” Journal of Economics and Business 53:325-339
[168] Mester, L.J., (1997), “What’s the point of credit scoring?” Business Review, Federal Reserve Bank of Philadelphia, September/October, 3-16.
[169] Mester, L.J, L.I. Nakamura and M. Renault (1998) “Checking accounts and bank monitoring”, Working Paper, Federal Reserve Bank of Philadelphia

V. Ekpu | The Microstructure of Bank Lending to SMEs | PhD Thesis | University of Glasgow | 2015
289
[170] Miles, M.B. and Huberman, A.M. (1994) Qualitative data analysis: An expanded sourcebook (2nd ed.), Thousand Oaks, CA: Sage
[171] Mingers, J., Brocklesby, J. (1997) “Multimethodology: Towards a Framework for Mixing Methodologies”, Omega, International Journal of Management Science, Vol. 25, Number 25, pp. 489-509
[172] Nakamura, L. I. (1993b) “Recent research in commercial banking: Information and lending,” Financial Markets, Institutions and Instruments 2: 73-88
[173] Nakamura, L. I. (1994) “Small Borrowers and the Survival of the Small Bank: Is Mouse Bank Mighty or Mickey? Federal Reserve Bank of Philadelphia Business Review, (Nov/Dec): 3-15
[174] Nemes, S.; J.M. Jonasson; A. Genell, and G. Steineck (2009) “Bias in odds ratios by logistic regression modeling and sample size” BMC Medical Research Methodology 9:56
[175] Niglas, K. (2004) “The Combined Use of Qualitative and Quantitative Methods in Educational Research”. Being a Dissertation Submitted to the Faculty of Educational Sciences, Tallinn Pedagogical University Tallinn, Estonia.
[176] Nnaji, O. (2011) “Measuring Competition in the Nigerian Banking Sector” Central Bank of Nigeria Economic and Financial Review 49 (1): 45-66
[177] Nwuba, C.C., U.S. Egwuatu, B.M. Salawu (2013) “The Application of Real Estate as Loan Collateral in Nigeria’s Banking Sector” Research Journal of Finance and Accounting 4(11): 61-70
[178] Obamuyi, T.M. (2007) “An Exploratory Study of Loan Delinquency Among Small and Medium Enterprises (SMEs) in Ondo State of Nigeria” Labour and Management in Development Journal 8:1-10
[179] Obamuyi, T.M. (2010) “Firms’ Performance and Lending Constraints in Nigeria” Journal of Entrepreneurship 19 (2): 179-190
[180] Oboh, V.U., I.D. Ekpebu, (2011) “Determinants of formal agricultural credit allocation to the farm sector by arable crop farmers in Benue State, Nigeria” African Journal of Agricultural Research 6 (1): 181-185
[181] Ogujiuba, K.K., F.K. Ohuche, A.O. Adenuga (2004) “Credit Availability to Small and Medium Scale Enterprises in Nigeria: Importance of New Capital Base for Banks – Background and Issues”, Bullion, Publication of the Central Bank of Nigeria 28(4): 51-68
[182] Ogura, Y., and H. Uchida (2007) “Bank Consolidation and Soft Information Acquisition in Small Business Lending”, RIETI Discussion Paper Series 07-E-037
[183] Ohlson, J.A. (1980) “Financial Ratios and the Probabilistic Prediction of Bankruptcy” Journal of Accounting Research 18:109-131
[184] Ongena, S. and D.C. Smith (2000) “What determines the number of bank relationships? Cross-country evidence” Journal of Financial Intermediation 9: 26–56
V. Ekpu | The Microstructure of Bank Lending to SMEs | PhD Thesis | University of Glasgow | 2015
290
[185] Onwuegbuzie, A. and N. Leech (2005) “Taking the “Q” Out of Research: Teaching Research Methodology Courses Without the Divide Between Quantitative and Qualitative Paradigms” Quality and Quantity 39 (3): 267-296
[186] Owualah, S.I. (1988) “Small Business Loan Decisions: A Survey of Criteria in Japan and Nigeria” International Small Business Journal 7 (1): 29-42
[187] Palinkas, L.A., S.M. Horwitz, C.A. Green, J.P. Wisdom, N. Duan and K. Hoagwood (2013) “Purposeful Sampling for Qualitative Data Collection and Analysis in Mixed Method Implementation Research” Administration and Policy in Mental Health DOI 10.1007/s10488-013-0528-y
[188] Peek, J. (2007) “The Value to Banks of Small Business Lending” SBA Office of Advocacy Small Business Research Summary 301:1-33
[189] Peek, J. and S. Rosengren, (1995a) “Small business credit availability: how important is the size of lender?” Working Papers 95-5, Federal Reserve Bank of Boston.
[190] Peek, J. and E. Rosengren, (1995b) “Bank Regulation and the credit crunch” Journal of Banking and Finance 19: 679-692
[191] Petersen, M.A. (1999) “Banks and the Role of Lending Relationships: Evidence from the U.S Experience”, Being a paper presented at the “Credit Systems and Small and Medium Sized Firms” conference at the Kellogg School of Management, North Western University
[192] Petersen, M.A. (2004) “Information: Hard and Soft”, Kellogg School of Management, North Western University/NBER (Preliminary Draft)
[193] Petersen, M.A. and R.G. Rajan (1994) “The benefits of firm-creditor relationships: Evidence from small business data” Journal of Finance 49: 3-37.
[194] Petersen, M.A., and R.G. Rajan (1995) “The Effect of Credit Market Competition on Lending Relationship” Quarterly Journal of Economics 110: 407-443
[195] Pierrakis, Y. and L. Collins (2013) “Banking on Each Other: The rise of peer-to-peer lending to businesses”, Nesta, 25.04.13
[196] Rajan, R.G. (1992) Insiders and outsiders: The choice between informed and arm's-length debt. Journal of Finance 47: 1367–1400
[197] Rauch, J.H. and J.M. Hendrickson (2004) Does Consolidation Hurt the Small Business Borrower? Small Business Economics 23:219-226
[198] Rice, E. (1990) “Firms’ reluctance to go public: the deterrent effect of financial disclosure requirements” mimeo, Harvard University
[199] Sargent, M. and J.E. Young (1991) “The entrepreneurial search for capital: a behavioural science perspective” Entrepreneurship and Regional Development 3:237-252
[200] Scherr, F.C., T.F. Sugrue, and J.B. Ward (1993) “Financing the Small Firm Start-Up: Determinants of Debt Use” The Journal of Small Business Finance 3(1): 17-36
V. Ekpu | The Microstructure of Bank Lending to SMEs | PhD Thesis | University of Glasgow | 2015
291
[201] Schmeits, A. (1999) “Discretion in Bank Contracts and the Firm’s Funding Source Choice between Bank and Financial Market Financing,” Working Paper, Washington University
[202] Schmieder, C., K. Marsch, and K. Aerssen (2010) “Does banking consolidation worsen firms’ access to credit? Evidence from the German economy” Small Business Economics, 35:449-465
[203] Scott, J.A. (2006) “Loan Officer Turnover and Credit Availability for Small Firms”, Journal of Small Business Management 44: 544-562
[204] Shane, S. and D. Cable (2002) “Network Ties, Reputation, and the Financing of New Ventures” Management Science 48 (3): 364-381
[205] Sharpe, S. A. (1990) “Asymmetric information, bank lending, and implicit contracts: A stylized model of customer relationships” Journal of Finance 45: 1069-1087.
[206] Short, B.K. (1979) “The Relation between Commercial Bank Profit Rates and Banking Concentration in Canada, Western Europe, and Japan” Journal of Banking and Finance 3: 209-219.
[207] Stein, J. C. (2002) “Information Production and Capital Allocation: Decentralised vs. Hierarchical Firms” Journal of Finance 57: 1891-1921.
[208] Stiglitz, J. and A. Weiss (1981) “Credit rationing in markets with imperfect information” American Economic Review 71:393-410
[209] St-Pierre, J. and M. Bahri (2011) “The Determinants of Risk Premium: The Case of Bank Lines of Credit Granted to SMEs” Journal of Developmental Entrepreneurship 16 (4): 459-476
[210] Strahan, P.E. and J.P. Weston (1998) “Small Business lending and the changing structure of the banking industry” Journal of Banking and Finance 22:821-845
[211] Suri, H. (2011) “Purposeful sampling in qualitative research synthesis”, Qualitative research journal 11(2): 63-75
[212] Thompson, B. (1995) “Stepwise Regression and Stepwise Discriminant Analysis Need Not Apply”, paper presented at the annual meeting of the American Educational Research Association, San Francisco, CA, April 18-22, 1995
[213] Tronnberg, C. and S. Hemlin (2014) “Lending decision making in banks: A critical incident study of loan officers” European Management Journal 32:362-372
[214] Uchida, H., G. Udell, N. Yamori (2012) “Loan Officers and Relationship Lending to SMEs” Journal of Financial Intermediation 21:97-122
[215] Ukoha, C. (2013a) “Barriers to SMEs’ Access to Bank Loan in Nigeria” Scottish Journal of Arts, Social Sciences and Scientific Studies, ISSN 2047-1278: 70-80
[216] Ukoha, C. (2013b) “The Global Financial Crisis and Bank Lending to SMEs in Nigeria” Scottish Journal of Arts, Social Sciences and Scientific Studies ISSN 2047-1278: 65-77
[217] Venkatesh, J. and R.L. Kumari (2011) “Issues and Perspectives of Financing SME Sector” International Journal of Financial Management Research and Development (IJFMRD) 1 (1): 11-21
V. Ekpu | The Microstructure of Bank Lending to SMEs | PhD Thesis | University of Glasgow | 2015
292
[218] Vickers, A.J. (2005) “Parametric versus non-parametric statistics in the analysis of randomized trials with non-normally distributed data”, BMC Medical Research Methodology 5:35 doi10.1186/1471-2288-5-35
[219] Voordeckers, W. and T. Steijvers (2006) “Business Collateral and Personal Commitments in SME Lending’ Journal of Banking and Finance 30:3067-3086
[220] William, M. and Cowling, M. (2009) “Annual Small Business Survey 2007/08”, Department for Business Enterprise and Regulatory Reform, Institute of Employment Studies
[221] Williamson, O. (1988) “Corporate Finance and Corporate Governance” Journal of Finance 43: 567-91
[222] Wolfson, M.H. (1996) “A Post Keynesian Theory of Credit Rationing” Journal of Post Keynesian Economics 18 (3): 443-470
[223] Yosha, O. (1995) “Information disclosure costs and the choice of financing source” Journal of Financial Intermediation 4: 3–20
[224] Zavatta, R. (2008) Financing Technology Entrepreneurs and SMEs in Developing Countries. Wahington, DC: infoDev / World Bank
Corporate Reports, Bulletins and Press Releases
[1] Accenture (2011) Next Generation SME Banking: How banks can apply innovation to seize the SME revenue growth opportunity, http://www.accenture.com/SiteCollectionDocuments/gb-en/Accenture-Next-Generation-SME-Banking.pdf (Accessed 29/09/2014)
[2] Access Bank Plc (2013) Annual Report and Accounts 2013, https://www.accessbankplc.com/images/Financial%20Reports/Annual%20Reports/2013%20Annual%20Report.pdf (Accessed 18/08/2014)
[3] Bank of England (2009) Quantitative Easing Explained: Putting more money into our economy to boost spending, Bank of England, available at: http://www.bankofengland.co.uk/monetarypolicy/documents/pdf/qe-pamphlet.pdf (Accessed 23/12/2014
[4] BDRC Continental (2011) SME Finance Monitor Survey, November 2011, available at: http://bdrc-continental.com/wp-content/uploads/2014/11/Q3-2011-SME-Finance-Monitor.pdf (Last Accessed 11/02/2015)
[5] British Bankers Association (2011) “Small Business Lending Bank Facts”, published 10/08/2011 http://www.bba.org.uk/media/article/small-business-lending-bankfacts/press-pack/(Accessed 20/04/2013)
[6] Central Bank of Nigeria (2005) Microfinance Policy, Regulatory and Supervisory Framework for Nigeria,http://www.cenbank.org/Out/publications/guidelines/DFD/2006/MICROFINANCE%20POLICY.pdf (Accessed 29/09/2014)
V. Ekpu | The Microstructure of Bank Lending to SMEs | PhD Thesis | University of Glasgow | 2015
293
[7] Central Bank of Nigeria (2008) Statistical Bulletin, 50 Years Special Edition; December
[8] Central Bank of Nigeria (2010) N200 Billion Intervention Fund for Re-financing and Restructuring of Banks’ Loans to the Manufacturing Sector, available at: http://www.cenbank.org/Out/2010/publications/guidelines/dfd/GUIDELINES%20ON%20N200%20BILLION%20REFINANCING%20MANUFACTCTURING.pdf (Accessed 29/09/2014)
[9] Central Bank of Nigeria (2011a) Statistical Bulletin, Vol. 22
[10] Central Bank of Nigeria (2011b) Microfinance Policy Framework for Nigeria, Revised 29/04/2011, http://www.cenbank.org/out/2011/pressrelease/gvd/revised%20microfinance%20policy%20july%2012%202011.pdf (Accessed 29/09/2014)
[11] Central Bank of Nigeria (2012) Financial Stability Report, December, ISSN: 2141-9396
[12] Central Bank of Nigeria (2013) Guidelines for the Operation of Micro, Small and Medium Enterprises Development Fund for Nigeria, available at: http://www.lagoschamber.com/MSME%20DEV%20FUND.pdfhttp://www.lagoschamber.com/MSME%20DEV%20FUND.pdf (Accessed 16/08/2014)
[13] Central Bank of Nigeria (2014) Micro, Small and Medium Enterprises Development Fund (MSMEDF) Guidelines, Revised Aug 2014, Development Finance Department, available at: http://www.cenbank.org/Out/2014/DFD/MSMEDF%20GUIDELINES%20%20.pdf (Accessed 29/09/2014)
[14] Competition Commission (2002) Report on the Supply of Banking of Banking Services by Clearing Banks to Small and Medium-Sized Enterprises. London: HMSO (Volume 1-4).
[15] Corporate Guides International (2010) “Banking and Finance Overview: Directing liquidity into Nigeria’s real economy” in Corporate Nigeria: The Business, Trade and Investment Guide 2010/2011, pp. 102-105, available at:
http://www.infomercatiesteri.it/public/images/paesi/23/files/FDI%20CORPORATE%20NIGERIA%20%20012013.pdf (Accessed 29/09/2014)
[16] Department for Business Innovation and Skills (2012) “SME Access to External Finance”, BIS Economics Paper No. 16, January 2012, available at:
https://www.gov.uk/government/uploads/system/uploads/attachment_data/file/32263/12-539-sme-access-external-finance.pdf (Last Accessed 11/02/2015)
[17] Diamond Bank Plc (2013) Consolidated and Separate Financial Statements for the Period Ended 31st December 2013, http://diamondbank.com/images/downloads/2013_Financial_Statement_Final.pdf (Accessed 18/08/2014)
[18] Ecobank (2013a) “Nigerian Banking Sector FY2012 Review: GTBank Shines”, Middle Africa Insight Series – Banking. Ecobank Research
V. Ekpu | The Microstructure of Bank Lending to SMEs | PhD Thesis | University of Glasgow | 2015
294
[19] Ecobank (2013b) Annual Report 2013, available at: http://www.ecobank.com/upload/20140717070804117617CS9N8RVrc9.pdf (Accessed 18/08/2014)
[20] Fidelity Bank Plc (2013) Annual Report and Accounts 2013, available at: http://fidelitybankplc.com/forms/Fidelity%20Bank%20Plc%20Annual%20Report%202013.pdf (Accessed 18/08/2014)
[21] First Bank Holdings Plc (2013) Annual Report and Accounts 2013, available at: http://46.38.182.253/Portals/2/pdf/Reports/Annual%20reports%202013/FBN%20Holdings%202013%20Annual%20Report.pdf (Accessed 29/09/2013)
[22] First City Monument Bank Group Plc (2013) Annual Report and Accounts 2013, available at: http://phx.corporate-ir.net/phoenix.zhtml?c=217705&p=irol-reportsannual (Accessed 18/08/2014)
[23] FSS 2020 MSME Implementation Committee Report, 2008
[24] Guaranty Trust Bank Plc (2013) Annual Financial Report 2013, available at: http://gtbank.com/images/documents/investors/gtbank%20annual%20report%202013.pdf (Accessed 18/08/2014)
[25] HM Treasury (2010) Financing a Private Sector Recovery, Department for Business Innovation & Skills (BIS),https://www.gov.uk/government/uploads/system/uploads/attachment_data/file/253760/bis-10-1081-financing-private-sector-recovery.pdf (Accessed 08/06/2012)
[26] Ketley, R. (2012) Promoting Access to Credit for MSMEs through Effective Government Interventions, Enhancing Financial Innovation and Access (EFINA), available at: http://www.efina.org.ng/media-centre/events/breakfast-series/promoting-access-to-credit-for-micro-small-and-medium-enterprises-msmes-through-effective-government-initiatives/ (Accessed 29/09/14)
[27] Sanusi, L.S. (2013) Key Note Address at the Annual MSME Finance Conference & D-8 Workshop on Microfinance for SMEs – 15th August, available at: http://www.cenbank.org/OUT/2013/SPEECHES/MSMES.PDF (Accessed 29/09/2014)
[28] Skye Bank Plc (2013) Abridged Financial Report 2013, available at: https://www.skyebankng.com/docs/FY13%20Abridged%20Financials.pdf (Accessed 18/08/2014)
[29] Stanbic IBTC Holdings Plc (2013) Annual Report 2013, available at: http://www.stanbicibtcbank.com/standimg/Nigeria/newSite/HTML/IBT192%20Annual%20Report%202013%20FINAL%20LR.PDF (Accessed 18/08/2014)
[30] Union Bank of Nigeria Plc (2013) Full Year 2013 Results (Press Release), available at: http://www.unionbankng.com/images/downloads/UBNFY13FinancialsPressRelease.pdf (Accessed 19/08/2014)
[31] United Bank for Africa (2013) Annual Report and Accounts 2013, available at: https://www.ubagroup.com/upload/docs/2013-annual-report-and financi_UK4JS_20140509081439rnfungrxmk.PDF (Accessed 18/08/2014)

V. Ekpu | The Microstructure of Bank Lending to SMEs | PhD Thesis | University of Glasgow | 2015
295
[32] Zenith Bank Plc (2013) Consolidated and Separate Financial Statements for the Year Ended 31 December 2013,https://www.zenithbank.com/Annual%20report/FinancialStatementFull_12032014.pdf (Accessed 18/08/2014)
Newspaper Articles, Web Pages and Other Electronic Sources
[1] Abioye, O. (2014) “First Bank Introduces Non-Collateral Loans for SMEs”, PUNCH, March 27, 2014, available at: http://www.punchng.com/business/money/first-bank-introduces-non-collateral-loans-for-smes/ (Accessed 19/08/2014)
[2] Access Bank Plc: Business Loans, https://www.accessbankplc.com/business-loans (Accessed 19/08/2014)
[3] Akanbi, F. (2014) “2013 Financial Results/Part 2: Nigeria’s Top Banks: How they Rank”, ThisDay Live, May 5, 2014, available at: http://www.thisdaylive.com/articles/2013-financial-results-part-2-nigeria-s-top-banks-how-they-rank/177809/ (Accessed 13/08/2014)
[4] Atuanya, P. and B. Augie (2014) “Snapshot of Nigerian Banks Performance for 2013”, BusinessDay, April 28, 2014, available at: http://businessdayonline.com/2014/04/snapshot-of-nigerian-banks-performance-for-2013/#.U_4UeLxdUY4 (Accessed 26/08/2014)
[5] Bank of Agriculture: About Us, http://www.bankofagricultureng.com/aboutus/Default.aspx (Accessed 16/08/2014)
[6] Bank of Industry: State MSME Fund, http://boinigeria.com/state-msme-fund/ (Accessed 16/08/2014)
[7] Bank of Industry: CBN Intervention Fund, http://boinigeria.com/cbn-intervention-fund/ (Accessed 17/08/2014)
[8] Bruckers, L. and Molenberghs, G. (2011) “Parametric and non-parametric statistical methods for the life sciences - Session I”, Interuniversity Institute for Biostatistics and statistical Bioinformatics (I-Biostat) Universiteit Hasselt, June 7, 2011, available online at: https://www.uhasselt.be/Documents/Doctoral-School/statistical%20methods%20for%20the%20life%20sciences%20LB.pdf
[9] Central Bank of Nigeria: SMEEIS, http://www.cenbank.org/devfin/smeeispage.asp (Accessed 16/08/2014)
[10] Central Bank of Nigeria: Agricultural Credit Guarantee Scheme Fund, http://www.cenbank.org/devfin/acgsf.asp (Accessed 16/08/2014)
[11] Central Bank of Nigeria: Government Securities, http://www.cenbank.org/rates/govtsecurities.asp (Accessed 25/08/2014)
[12] Chima, O. (2013) “Tier 2 Banks May Face Capital Adequacy Challenges”, ThisDay Live, Oct 9, 2013, available at: http://www.thisdaylive.com/articles/tier-2-banks-may-face-capital-adequacy-challenges/161128/ (Accessed 13/08/2014)
V. Ekpu | The Microstructure of Bank Lending to SMEs | PhD Thesis | University of Glasgow | 2015
296
[13] Coppola, F. (2014) “The Money Multiplier is Dead”, Pieria, Mar 13, 2014, available at: http://www.pieria.co.uk/articles/the_money_multiplier_is_dead (Accessed 30/12/2014)
[14] Diamond Bank: MSME Banking, http://diamondbank.com/index.php/sme-banking (Accessed 19/08/2014)
[15] Ejembi, S. (2012) “Why banks shun lending to small businesses”, PUNCH, Dec 25, 2012, available at: http://www.punchng.com/business/business-economy/why-banks-shun-lending-to-small-businesses/ (Accessed 25/02/2013)
[16] First Bank: Conventional Term Loans and Overdrafts, available at: http://www.firstbanknigeria.com/products/individual/agricultural-finance/conventional-term-loans-and-overdrafts/ (Accessed 27/12/2014)
[17] FSS 2020: Nigeria’s Credit Market, available at:
http://www.fss2020.gov.ng/CREDITMSME/SitePages/Home.aspx (Accessed 29/09/2014)
[18] Hole, G. (2011) Research Skills: Mann Whitney Test Handout Version 1.0, Sussex University, available at: http://www.sussex.ac.uk/Users/grahamh/RM1web/MannWhitneyHandout%202011.pdf (Accessed 20/09/2014)
[19] Hoskin, T. (2005) Parametric and Non-Parametric: Demystifying the Terms, Centre for Translational Science, Mayo Clinic, available at: http://www.mayo.edu/mayo-edu-docs/center-for-translational-science-activities-documents/berd-5-6.pdf (Accessed 20/08/2014)
[20] Katchova, A. (2013) Ordered Probit and Logit Models, Econometrics Academy, available at: https://sites.google.com/site/econometricsacademy/econometrics-models/ordered-probit-and-logit-models (Accessed 29/09/2014)
[21] Nigerian Export Import Bank (NEXIM): About NEXIM, http://www.neximbank.com.ng/about-nexim/ (Accessed 16/08/2014)
[22] Omoh, G. (2013) “Zenith leads 12 other Nigerian banks in world top 1000”, Vanguard, July 6, 2013, available at: http://www.vanguardngr.com/2013/07/zenith-leads-12-other-nigerian-banks-in-world-top-1000/ (Accessed 21/03/2014
[23] Omoh, G. and Komolafe, B. (2009) “CBN Sacks 5 banks’ CEOs, appoints acting MD/CEOs”, Vanguard, Aug 14, 2009, available at: http://www.vanguardngr.com/2009/08/cbn-sacks-5-banks-directors/ (Accessed 29/12/2014)
[24] Oyebode, A. (2014) “Infrastructure Challenges are denying Nigeria of SME Gains”, ThisDay Live, June 22, 2014, available at: http://www.thisdaylive.com/articles/oyebode-infrastructure-challenges-are-denying-nigeria-of-sme-gains/181548/ (Accessed 26/09/2014)
[25] Paloni, A. (2014), “Banking Sector Development, Rationing and The Funding of Innovation”, Lecture notes on Financial Institutions and Markets in Developing Countries, Adam Smith Business School, University of Glasgow
V. Ekpu | The Microstructure of Bank Lending to SMEs | PhD Thesis | University of Glasgow | 2015
297
[26] Pilkington, P. (2014), “Bank of England Endorses Post-Keynesian Endogenous Money Theory”, available at: https://fixingtheeconomists.wordpress.com/2014/03/12/bank-of-england-endorses-post-keynesian-endogenous-money-theory/ (Accessed 24/12/2014)
[27] Small and Medium Enterprises Development Agency of Nigeria (SMEDAN): Functions, http://www.smedan.org/functions.html (Accessed 16/08/2014)
[28] Snedker, K., P. Glynn, C. Wang (2002) “Ordered/Ordinal Logistic Regression with SAS and STATA”. University of Washington, 10/25/02, available at: http://staff.washington.edu/glynn/olr.pdf (Accessed 29/09/2014)
[29] Torres-Reyna, O. (2014) “Getting Started in Logit and Ordered Logit Regression”, Data and Statistical Services, Princeton University, USA, available at: https://www.princeton.edu/~otorres/Logit.pdf (Accessed 29/09/2014)
[30] Union Bank of Nigeria Plc: SME Loans, http://www.unionbankng.com/index.php/personal-banking/loans-and-overdrafts/sme-loans (Accessed 19/08/2014)
[31] Ventures Africa (2012) “The 5 Biggest Banks in Nigeria”, Ventures Africa, Aug 16, 2012, available at: http://www.ventures-africa.com/2012/08/the-5-biggest-banks-in-nigeria/ (Accessed 21/03/2014)
[32] World Bank Group (2013) “Getting Credit in Nigeria” Doing Business, June 2013, available at: http://www.doingbusiness.org/data/exploreeconomies/nigeria/getting-credit (Accessed 26/09/2014)
V. Ekpu | The Microstructure of Bank Lending to SMEs | PhD Thesis | University of Glasgow | 2015
298
ANNEX A
BANK LENDING TO SMEs: SURVEY OF RELATIONSHIP MANAGERS/LOAN OFFICERS ON LENDING CRITERIA AND PRACTICES IN NIGERIAN BANKS
Purpose of the Study:
This survey project is part of a research study on The Microstructure of Bank Lending to SMEs in Nigeria. The questionnaire is being administered on selected Relationship Managers/Loan Officers in the top 12 Nigerian Banks. The survey seeks to investigate the following: (a) The characteristics of SME borrowers which lenders (banks) consider important or influential when
appraising SME loan applications (b) The characteristics of lenders and their environment which in turn influence their inclination to lend to SME
borrowers (c) The determinants of loan contract terms, lending preferences and lending approaches by Nigerian banks (d) The economic value or benefits of lending relationships to Nigerian banks Personal Information: Respondent’s Position in the Bank (Required).......................................................................................................... How long have you been in this role in the bank? (Required)…………………………………………………….. How long have you been in the bank overall? (Required)………………………………………………………… Guidance Notes:
(1) This survey is for loan officers who are involved in appraising SME loan applications and/or involved in disbursing, collecting or reviewing bank loans extended to SMEs resident in Nigeria.
(2) For the purpose of this survey, we define SMEs as enterprises with total asset size not exceeding N500 Million and with employees not exceeding 300. SME loans are therefore loans granted to firms of this nature, irrespective of loan size. The term ‘SME loans’ refers to all kinds of credit facilities to SMEs, including term loans, overdrafts, commercial mortgages, lease financing and receivables financing (factoring)
(3) The questionnaire is structured into five sections. Section A examines the relative importance of borrower characteristics as determinants of the decision to approve or reject a loan. Section B examines the relative importance of lender characteristics and their environment in SME lending decisions, while section C examines the determinants of SME credit terms. Section D takes a look at your bank’s lending administration structure and the role of loan officers in SME loan decision-making. Finally, section E examines the economic value derivable from relationship lending.
(4) Completing the entire questionnaire should take approximately 25 minutes. Please note that the return of the completed questionnaire will be taken to imply that you have given consent to participate in this research.
(5) All information collected about you during the course of the research will be kept strictly confidential. We do not require any form of personal identification. Your participation in this research is strictly anonymous. You will be assigned a unique identification (ID) number, but any information about you will be removed so that you cannot be recognised from it.
(6) The information obtained from this exercise will be used solely for academic purposes. The data collected will be analysed using appropriate techniques in survey data analysis. The results might then be published as a contribution to the body of knowledge and could be used for policy making. For this reason, please ensure

V. Ekpu | The Microstructure of Bank Lending to SMEs | PhD Thesis | University of Glasgow | 2015
299
your answers reflect as much as possible true, valid and reliable description of the state of affairs relating to your role as a loan officer and your bank’s practices.
(7) All matters concerning confidentiality and the use of confidential information have been reviewed and approved by the University of Glasgow’s College of Social Sciences Research Ethics Committee.
SECTION A: IMPORTANCE OF BORROWER CHARACTERISTICS
This section examines the relative importance of borrower characteristics in determining the decision to approve or reject a loan. It is also examines the contributory factors to the riskiness of SME loans in Nigeria.
Characteristics of SME Borrowers
1. How important are the following SME borrower characteristics for your bank/branch in deciding whether to approve or reject an SME loan application?
Ranking Codes: 1– Unimportant | 2– Moderately Important | 3- Important | 4- Very Important
Applicant Firm/Borrower Characteristics Please rank all 1 2 3 4 Purpose of Loan (e.g. working capital, project finance, investment etc) Loan amount Loan security (i.e. availability of marketable collateral) Presentation of business plan (showing projected income from business or project) Profitability of business Firm’s size (in terms of total assets) Firm’s age (i.e. measure of firm’s operational stability) Availability of audited financial statements (i.e. firm’s transparency) Firm’s leverage (i.e. value of outstanding debts, if any) Firm’s organisational form (i.e. whether firm is a sole proprietorship, partnership or corporation)
Firm’s liquidity (i.e. % of cash to total assets) Nature of Business (i.e. firm’s sector of activity) Firm’s credit rating (as determined by previous loan repayments or number of delinquencies)
Stability of demand for firm’s products and/or services Existence of deposit relationship with client (e.g. current or savings account) Firm’s deposit account balance Existence of loan relationship with client or lines of credit Existence of financial management service relationship with client (e.g. transaction services, cash management services, asset finance services or other credit-related services, trust services)
Length or duration of relationship with the bank Exclusivity of relationship (i.e. whether the loan applicant firm uses only your bank as provider of financial services or also other banks)
Distance to SME customer (i.e. physical proximity to applicant) Physical observation of business Owners’ credit rating (determined by previous loan repayments or number of delinquencies)
Owners’ educational attainment/professional training Owner’s business experience Owner’s personal guarantee Owners’ personal wealth Owners’ equity stake/contribution

V. Ekpu | The Microstructure of Bank Lending to SMEs | PhD Thesis | University of Glasgow | 2015
300
Contributory Factors to Riskiness of SME Loans
2. A number of factors contribute to the riskiness of SME loans in Nigeria. How would you rank the significance of these factors?
Ranking Codes: 1 – Insignificant | 2 – Moderately significant | 3 – Significant | 4- Very significant
Contributory Factors to the Riskiness of SME Loans Please rank all 1 2 3 4 High incidence of diversion and/or misuse of funds Weak management capacity or competence Shortage of information and absence of formal record-keeping Inability of firms to service debts Investment in risky activities or volatile economic sectors Inability to exploit existing opportunities due to limited scope of business operations Poor quality of projects Predominantly weak ownership structure, providing opportunities for skewed incentives High costs of doing business caused by lack of infrastructure and weak industrial policies Problem of developing internally effective screening, appraisal and supervisory procedures for small firm loans
Term lending outside of bank’s scope and specialization
SECTION B: IMPORTANCE OF LENDER CHARACTERISTICS AND ENVIRONMENTAL FACTORS
This section examines the relative importance of lender characteristics and environmental factors in influencing your bank’s willingness to lend to SMEs.
Lender Characteristics, Environmental Factors and Willingness to Lend
3. How important are the following factors in determining your bank’s willingness to lend to SME customers?
Ranking Codes: 1– Unimportant | 2– Moderately Important | 3- Important | 4- Very Important
Lender Characteristics & Environmental Factors Please rank 1 2 3 4 Influence of regulatory requirements and legal constraints (e.g. capital adequacy, reserve requirements, liquidity ratio, policy rates, etc)
Bank’s lending policies towards SMEs Proportion of bank’s asset portfolio in SME loans Sectoral distribution of outstanding loans to SMEs History of previous SME loan performance Risk profile of SME sector Bank’s deposit level and financial stability Level of bank deposits Demand facing banks in the SME loan market Competition from other banks for SME loans Interest rates or returns from competing assets/investments, e.g. treasury bills Maturity structure of bank’s security holdings Specialization of bank’s lending officers High transaction costs associated with SME loans (e.g. administrative costs, legal costs and information acquisition costs)
Adequacy of information on the true financial condition and performance of the SME borrower

V. Ekpu | The Microstructure of Bank Lending to SMEs | PhD Thesis | University of Glasgow | 2015
301
Enforcement actions from regulators such as maintenance of capital-asset ratio or reserve requirements
General macroeconomic conditions
Financial Crisis and SME Lending Policies
4. Have your bank’s SME lending policies and/or risk preference changed at any time during the past five years as a result of the recent financial crisis?
Yes No
5. (a) If your answer to question (4) is ‘no’, then please state your reasons below:
……………………………………………………………………………………………………………………..
……………………………………………………………………………………………………………………..
……………………………………………………………………………………………………………………..
5. (b) If your answer to question (4) is ‘yes’, which of the following changes have taken place? Please tick all that apply:
Changes in lending decisions, preferences or policies as a result of the recent financial crisis
Tick
A More stringent appraisal of SME loan applications
B General reduction in lending to SMEs
C General reduction in lending to SMEs and a corresponding increase in lending to larger firms
D Decision to reduce credit to some sectors (e.g. real estate, capital markets, etc)
E Decisions to diversify activities away from traditional lending (e.g., into fee-based services, asset finance, etc.)
F Higher risk premium charges on certain SME loans
G More stringent collateral requirements
H Preference for shorter loan maturities
I Greater weight given to credit rating of SME borrowers
J Increase in the acquisition of soft information on SME borrowers
K Increase in SME lending as a result of government initiatives
Others (Please specify)
L
M

V. Ekpu | The Microstructure of Bank Lending to SMEs | PhD Thesis | University of Glasgow | 2015
302
SECTION C: DETERMINANTS OF SME LOAN CONTRACT TERMS
This section covers your bank’s current loan pricing decisions, the riskiness of SME loans, collateral requirements and loan maturity.
SME Loan Pricing
6. What is the frequency of the following practices in the pricing of SME loans in your bank today?
Ranking Codes: 1 – Never | 2 - Sometimes | 3 – Often | 4 – Always (Please tick)
Loan Pricing Decisions for SMEs 1 2 3 4
My bank charges a higher interest rate to SME customers than to large customers My bank charges a lower interest rate to older and more established firms than to younger firms
My bank offers lower interest rates to first time customers in order to gain their loyalty My bank offers lower interest rates to repeat customers (i.e. customers with longer relationship with my bank)
My bank tends to charge young firms lower interest rates at the beginning of their relationship with us with the hope of making higher returns in later years when their business has become more established
My bank charges a lower interest rate for firms with existing deposit account with my bank
My bank charges a lower interest rate for firms with exclusive lending relationship with us
My bank charges a higher interest rate for SME loan applicants that cannot meet the bank's collateral requirements
My bank’s interest rate is a decreasing function of the applicant firm’s credit rating My bank’s interest rate is a decreasing function of the business owner’s credit rating If your bank follows practices not indicated above, please describe them below also indicating their frequency (1-4)
Riskiness of SME Loans 7. If your bank often or always charges a higher interest rate to SMEs than to large firms, what is/are the
reason(s)? (Please rank the reasons for your answer)
Ranking Codes: 1– Strongly disagree | 2- Disagree | 3–Agree | 4 – Strongly agree (Please tick)
Reasons for higher risk premium on SME loans 1 2 3 4 My bank’s cost of funds is higher for small loans than for large ones
Lending to SMEs is riskier because they are more difficult to monitor Lending to SMEs is riskier because they are more vulnerable to changes in the external environment
Lending to SMEs is riskier because they have a high failure rate
The administrative costs of SME loans are higher
SME loans constitute a greater proportion of my bank’s loan loss reserves

V. Ekpu | The Microstructure of Bank Lending to SMEs | PhD Thesis | University of Glasgow | 2015
303
SME Loan Collateral Requirements 8. What is the frequency of the following practices in setting collateral requirements for SME loans?
Ranking Codes: 1 – Never | 2 - Sometimes | 3 – Often | 4 – Always (Please tick)
Collateral Requirements for SME Loans 1 2 3 4 My bank requests collateral from SMEs before making loans My bank's collateral requirement amounts to 100% of loan size My bank’s collateral requirements differ between large and small firms My bank’s collateral requirements are different for loans to new customers/start-ups as against loans to existing customers
My bank’s collateral requirement depends on the riskiness of the project being financed My bank’s collateral requirement depends on the applicant firm’s credit rating or number of delinquencies
My bank’s collateral requirement depends on the entrepreneur/owner’s credit rating or number of delinquencies
My bank’s collateral requirement depends on the strength (length) of borrower-bank relationship
My bank’s collateral requirement depends on the loan size, regardless of whether the firm is large or small
My bank’s collateral requirement depends on the strength of competition for SME lending (i.e., other lenders’ collateral requirements)
My bank’s collateral requirement depends on the business cycle/macroeconomic conditions
If your bank follows practices not indicated above, please describe them below also indicating their frequency (1-4)
9. What types of collateral are most frequently accepted by your bank from SME loan customers? Please rank
the following collateral types in order of acceptance, from 1-3, 1 being the least accepted, 2 being accepted, and 3 being the most accepted
Types of Collateral Accepted 1 2 3 Real Estate (land and buildings) Vehicles and business equipment Goods in stock (inventory) Household goods Cash and other liquid assets Bank and personal guarantees
SME Loan Maturity 10. What is the frequency of the following practices in setting the maturity of SME loans?
Ranking Codes: 1 – Never | 2 - Sometimes | 3 – Often | 4 – Always
(Please tick) SME Loan Maturity Decisions 1 2 3 4
My bank prefers short term lending My bank restricts medium-long term loans to valued small firm customers My bank lends short, medium and long on case by case considerations Loan maturity is based on borrowers’ request

V. Ekpu | The Microstructure of Bank Lending to SMEs | PhD Thesis | University of Glasgow | 2015
304
Loan maturity is based on the nature of project being financed Loan maturity decisions are determined by the level of uncertainty in the macroeconomic environment
If your bank follows practices not indicated above, please describe them below also indicating their frequency (1-4)
11. In your assessment, how would you describe the number (in percentage terms) of SME loans granted by your
bank/branch within the following maturity bands?
SME Loan Maturity Period % of total SME Loans Less than 6 months maturity 6 – 24 months maturity 24 – 60 months maturity Above 60 months maturity Total 100%
SECTION D: THE ROLE OF LOAN OFFICERS IN LOAN DECISION MAKING This section seeks to examine your bank’s lending administration structure and the role of loan officers in loan decision-making within your bank’s lending administration process.
Lending Administration Structure
12. Does your bank have a separate specialized department responsible for managing SME lending relations? Yes/No
13. Which of the following best describes your bank’s SME lending administration policy?
(a) My bank practices a wholly centralised SME lending strategy (in which case all SME lending decisions are taken at the head office)
(b) My bank practices a wholly decentralised SME lending strategy (in which case all SME lending decisions are taken at the branch levels)
(c) My bank practices a mix of centralised and decentralised strategy with respect to all business lending (i.e. some lending decisions are taken at the head office, while others are taken at the branch levels)
14. If you selected (c) in question 13 above, please indicate which decisions or functions are centralised and which ones are decentralised. If some particular functions/decisions are both centralised and decentralised, please tick both boxes.
Functions/Decisions Centralised Decentralised
Loan application appraisal
Loan approval
Ongoing loan monitoring/risk management
Periodic loan review
Recovery of non-performing loans
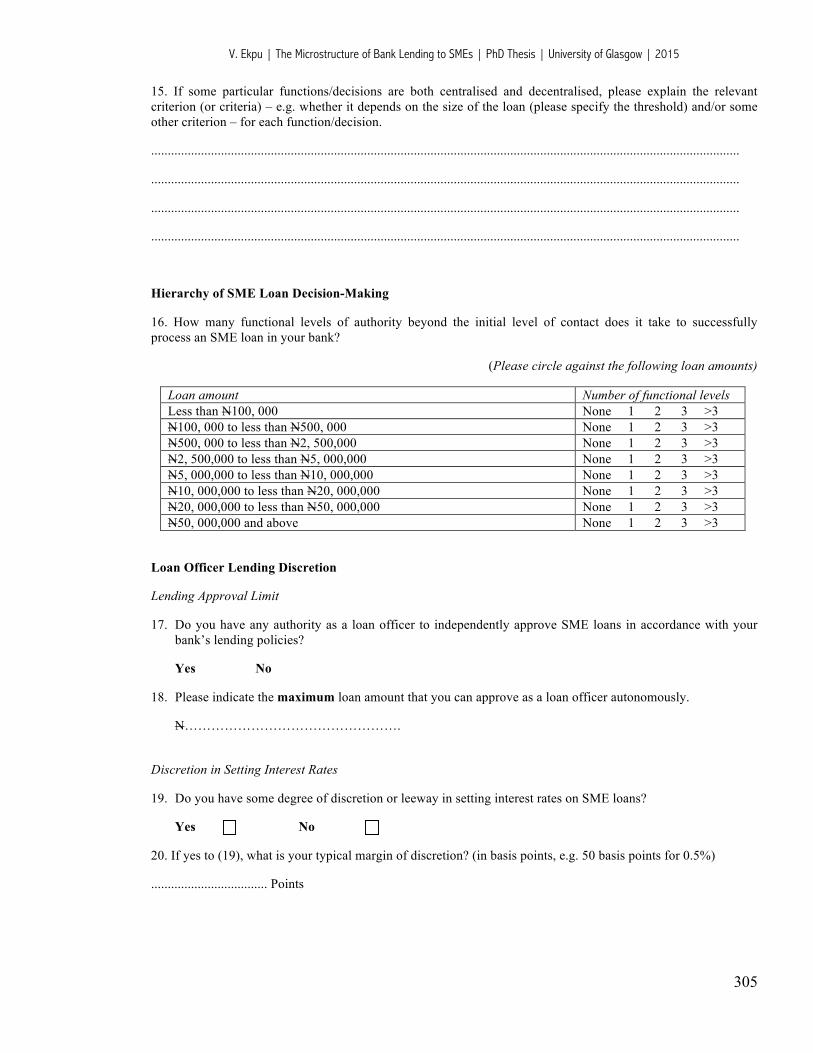
V. Ekpu | The Microstructure of Bank Lending to SMEs | PhD Thesis | University of Glasgow | 2015
305
15. If some particular functions/decisions are both centralised and decentralised, please explain the relevant criterion (or criteria) – e.g. whether it depends on the size of the loan (please specify the threshold) and/or some other criterion – for each function/decision.
.................................................................................................................................................................................
.................................................................................................................................................................................
.................................................................................................................................................................................
.................................................................................................................................................................................
Hierarchy of SME Loan Decision-Making
16. How many functional levels of authority beyond the initial level of contact does it take to successfully process an SME loan in your bank?
(Please circle against the following loan amounts)
Loan amount Number of functional levels Less than N100, 000 None 1 2 3 >3 N100, 000 to less than N500, 000 None 1 2 3 >3 N500, 000 to less than N2, 500,000 None 1 2 3 >3 N2, 500,000 to less than N5, 000,000 None 1 2 3 >3 N5, 000,000 to less than N10, 000,000 None 1 2 3 >3 N10, 000,000 to less than N20, 000,000 None 1 2 3 >3 N20, 000,000 to less than N50, 000,000 None 1 2 3 >3 N50, 000,000 and above None 1 2 3 >3
Loan Officer Lending Discretion
Lending Approval Limit
17. Do you have any authority as a loan officer to independently approve SME loans in accordance with your bank’s lending policies?
Yes No
18. Please indicate the maximum loan amount that you can approve as a loan officer autonomously.
N………………………………………….
Discretion in Setting Interest Rates
19. Do you have some degree of discretion or leeway in setting interest rates on SME loans?
Yes No
20. If yes to (19), what is your typical margin of discretion? (in basis points, e.g. 50 basis points for 0.5%)
................................... Points

V. Ekpu | The Microstructure of Bank Lending to SMEs | PhD Thesis | University of Glasgow | 2015
306
Loan Officer Incentives
21. Is the amount of compensation or bonus that you receive as a loan officer significantly related to the size of your loan portfolio? (Volume incentives)
Yes No
22. Is the amount of compensation or bonus that you receive as a loan officer significantly related to the profitability of your loan portfolio? (Profit incentives)
Yes No
23. Is the amount of compensation or bonus that you receive as a loan officer significantly related to the size of your deposit mobilization? (Deposit mobilization incentives)
Yes No
SECTION E: ECONOMIC BENEFITS OF RELATIONSHIP LENDING TO BANKS This section seeks to evaluate the nature of bank-borrower relationships in your bank as well as the economic value or benefits derivable from such lending relationships.
Definition of Relationship Lending:
Please note that the definition of relationship lending in this questionnaire may be different from that used by your bank. 'Relationship lending' is used here to denote a situation in which a bank is willing to provide lending mostly on the basis of a previous relationship with the borrower such as a previous loan, savings deposit, long-term deposits, etc. More precisely, with relationship lending, financing is provided primarily on the basis of 'soft information', e.g., borrower characteristics, credit history with the bank, loan size, purpose of the loan, etc. Relationship lending involves frequent and personalized contact between the loan officer and the small firm, its owners/managers, or even the local community in which it operates. Relationship lending is typically associated with decentralised loan approval and risk management.
Nature of Bank-Borrower Relationships
24. To what extent would you agree with the following statements about the nature of your bank’s relationship with its SME customers?
Ranking Codes: 1– Strongly disagree | 2- Disagree | 3–Agree | 4 – Strongly agree (Please tick)
Nature of bank-borrower relationships 1 2 3 4 My bank acquires knowledge of the firm’s business and obtains proprietary information before granting a loan
My bank maintains a relationship with borrowers throughout the loan life My bank maintains personalized and frequent contact with SME customers My bank maintains contact with the local community where our SME firms operate Decision about SME loan approval and risk management is often decentralised (i.e. made by local business managers)
In my bank, SME lending decisions are rather rule-based, i.e. depend mainly on hard and fast rules (objective or pre-determined criteria) and the sole evaluation of the loan application

V. Ekpu | The Microstructure of Bank Lending to SMEs | PhD Thesis | University of Glasgow | 2015
307
Quality of Relationship/Information Acquisition
Frequency of Meetings
25. How often do you meet with or visit your SME customers face to face?
(a) More than once a month
(b) At least once a month
(c) At least once in 2 months
(d) At least once in 3 months
(e) At least once in 6 months
(f) Not at all
(g) Other frequency levels (please specify)……………………………….
Frequency of Communication
26. How often do you communicate with your SME customers using non-physical methods such as standard mail, emails or telephone?
(a) More than once a month
(b) At least once a month
(c) At least once in 2 months
(d) At least once in 3 months
(e) At least once in 6 months
(f) Not at all
(g) Other frequency levels (please specify)……………………………….
Knowledge of Borrower’s Business Activities
27. How well do you know your customers’ business model and activities?
(a) I have no knowledge
(b) I have fair knowledge
(c) I have good knowledge
(d) I have very good knowledge

V. Ekpu | The Microstructure of Bank Lending to SMEs | PhD Thesis | University of Glasgow | 2015
308
Frequency of Interaction with the Local Market Community
28. How often do you acquire information about your customers’ businesses through contact with their suppliers, customers, competitors, or neighbouring businesses?
(a) More than once a month
(b) At least once a month
(c) At least once in 2 months
(d) At least once in 3 months
(e) At least once in 6 months
(f) Not at all
(g) Other frequency levels (please specify)……………………………….
29. Do factors such as the knowledge of an applicant firm and existing relationships with the firm/firm owner influence the setting of loan terms (e.g. interest rates, collateral requirements, loan maturity, etc)? Or are such factors of little practical relevance with respect to SME loan application? (Please tick one)
(a) Such factors are important
(b) Marginally important
(c) Irrelevant
Economic Benefits/Costs of Bank-Borrower Relationships
30. To what extent would you agree with the following statements concerning the economic benefits/costs of relationship lending (Please note that the statements below represent a mix of both positive and negative scenarios)
Ranking Codes: 1– Strongly disagree | 2- Disagree | 3– Agree | 4- Strongly agree
(Please tick) Economic Value of Relationship Lending 1 2 3 4
(a) In my bank, SME lending is mostly based on relationship lending as defined above
Economic Benefits of Relationship Lending (b) Relationship lending allows the bank to take better lending decisions (e.g., to accommodate good borrowers and screen out bad borrowers)
(c) Relationship lending (i.e. multiple interactions with SME customers over time and/or across products) results in reduced screening and monitoring costs
(d) Relationship lending (based on personalized and frequent contact of the bank with SME customers) results in greater customer satisfaction
(e) Relationship lending often generates additional business for my bank (e.g., additional deposits, future lending business, investment banking deals, fee-based services, etc

V. Ekpu | The Microstructure of Bank Lending to SMEs | PhD Thesis | University of Glasgow | 2015
309
(f) Relationship lending has improved the performance of my branch's SME loan portfolio
(g) Relationship lending has reduced the amount of my bank's/branch’s loan loss provisions associated with SME lending
Costs of Relationship Lending
(h) 'Soft information' is hardly adequate and, hence, lending decisions based on it are often wrong
(i) Investing in relationships is not cost-effective for my bank and as such the amount of SME lending that my bank is able to provide is reduced
(j) Most of our existing SME customers use multiple banks for their banking services so that it is too competitive investing in building relationships
(k) Sometimes, relationship lending results in an undue relaxation by the bank of criteria used in evaluating loan applications (especially those made by longer-term bank customers)
(l) Since traditional SME lending is costly and risky, my bank prefers to finance SMEs through other means (e.g., asset-based lending, leasing, etc) and to provide other services to them (e.g. financial management services, etc)
Net Benefits from Relationship Lending
(n) For overall bank profitability, the benefits of relationship lending outweigh its costs
*** END***
THANK YOU FOR YOUR PARTICIPATION!
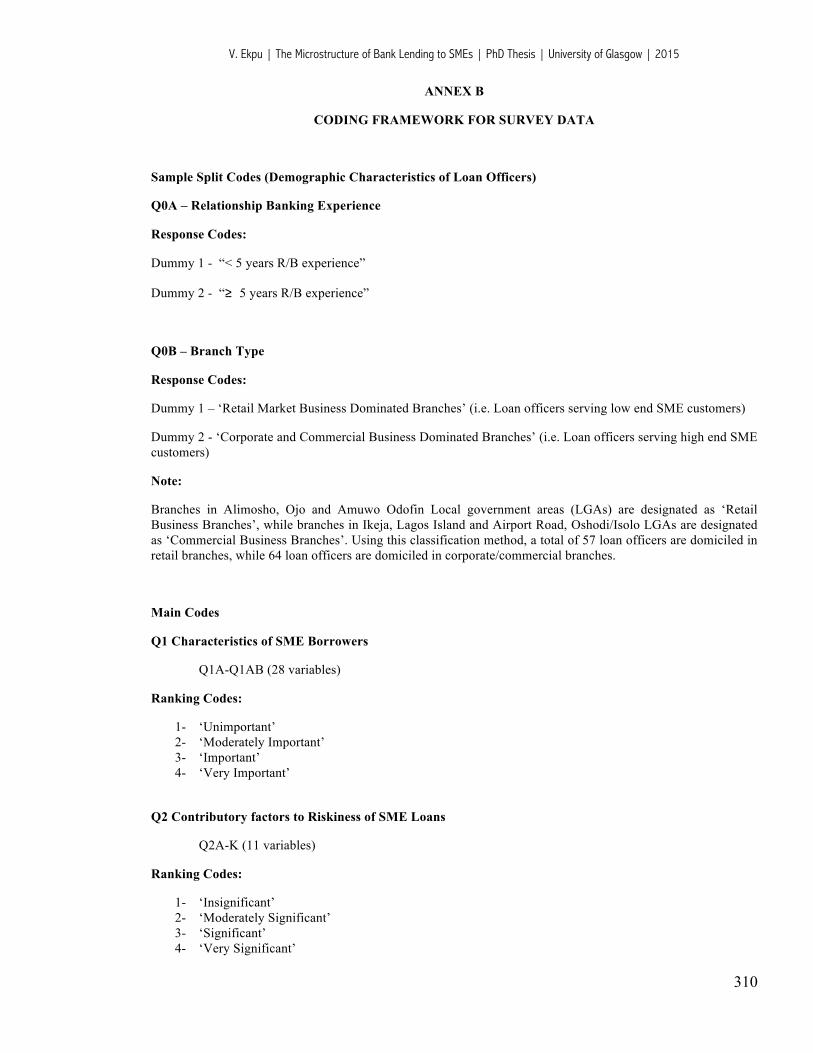
V. Ekpu | The Microstructure of Bank Lending to SMEs | PhD Thesis | University of Glasgow | 2015
310
ANNEX B
CODING FRAMEWORK FOR SURVEY DATA
Sample Split Codes (Demographic Characteristics of Loan Officers)
Q0A – Relationship Banking Experience
Response Codes:
Dummy 1 - “< 5 years R/B experience”
Dummy 2 - “≥ 5 years R/B experience”
Q0B – Branch Type
Response Codes:
Dummy 1 – ‘Retail Market Business Dominated Branches’ (i.e. Loan officers serving low end SME customers)
Dummy 2 - ‘Corporate and Commercial Business Dominated Branches’ (i.e. Loan officers serving high end SME customers)
Note:
Branches in Alimosho, Ojo and Amuwo Odofin Local government areas (LGAs) are designated as ‘Retail Business Branches’, while branches in Ikeja, Lagos Island and Airport Road, Oshodi/Isolo LGAs are designated as ‘Commercial Business Branches’. Using this classification method, a total of 57 loan officers are domiciled in retail branches, while 64 loan officers are domiciled in corporate/commercial branches.
Main Codes
Q1 Characteristics of SME Borrowers
Q1A-Q1AB (28 variables)
Ranking Codes:
1- ‘Unimportant’ 2- ‘Moderately Important’ 3- ‘Important’ 4- ‘Very Important’
Q2 Contributory factors to Riskiness of SME Loans
Q2A-K (11 variables)
Ranking Codes:
1- ‘Insignificant’ 2- ‘Moderately Significant’ 3- ‘Significant’ 4- ‘Very Significant’

V. Ekpu | The Microstructure of Bank Lending to SMEs | PhD Thesis | University of Glasgow | 2015
311
Q3 Lender Characteristics, Environmental Factors and Willingness to Lend
Q3A-P (17 variables)
Ranking Codes:
1- ‘Unimportant’ 2- ‘Moderately Important’ 3- ‘Important’ 4- ‘Very Important’
Q4: Financial Crisis and SME Lending
Response Codes:
Dummy 0 – ‘No’
Dummy 1 – ‘Yes’
Q5A: Reasons for ‘No’ Answer in Q4
Response Codes:
Dummy 0 – ‘Reasons Not Provided’
Dummy 1 – ‘Reasons Provided’
(11 entries were recorded)
Q5B: Changes in Lending Decisions, Preferences or Policies
Q5B_A-K (11 Variables)
Response Codes:
Dummy 0 – ‘No change’ (Represented by ý)
Dummy 1 – ‘Change’ (Represented by þ)
OTHER_CHANGES - Other changes due to the crisis specified (4 entries were recorded)
Q6: SME Loan Pricing
Q6A—J (10 variables)
Ranking Codes:
1- ‘Never’ 2- ‘Sometimes’ 3- ‘Often’ 4- ‘Always’
OTHER_PRICING – Other loan pricing practices specified (4 entries were recorded)

V. Ekpu | The Microstructure of Bank Lending to SMEs | PhD Thesis | University of Glasgow | 2015
312
Q7: Riskiness of SME Loans
Q7A-F (6 variables)
Ranking Codes:
1- ‘Strongly Disagree’ 2- ‘Disagree’ 3- ‘Agree’ 4- ‘Strongly Agree’
Q8: SME Loan Collateral Requirements
Q8A-K (11 variables)
Ranking Codes:
1- ‘Never’ 2- ‘Sometimes’ 3- ‘Often’ 4- ‘Always’
OTHER_COLLATERAL – Other determinants of collateral specified (2 entries were recorded)
Q9: Types of Collateral Accepted
Q9A-F (6 variables)
Ranking Codes:
1 – ‘Least Accepted’
2 - ‘Accepted’
3- ‘Most Accepted’
Q10: SME Loan Maturity
Q10A-F (6 variables)
Ranking Codes:
1- ‘Never’ 2- ‘Sometimes’ 3- ‘Often’ 4- ‘Always’
OTHER_MATURITY – Other determinants of loan maturity specified (1 entry was recorded)
Q11: SME Loan Maturity Period
Q11A-D (4 Variables)
Response Code:
Quantitative Amounts (expressed as % of total SME Loans)
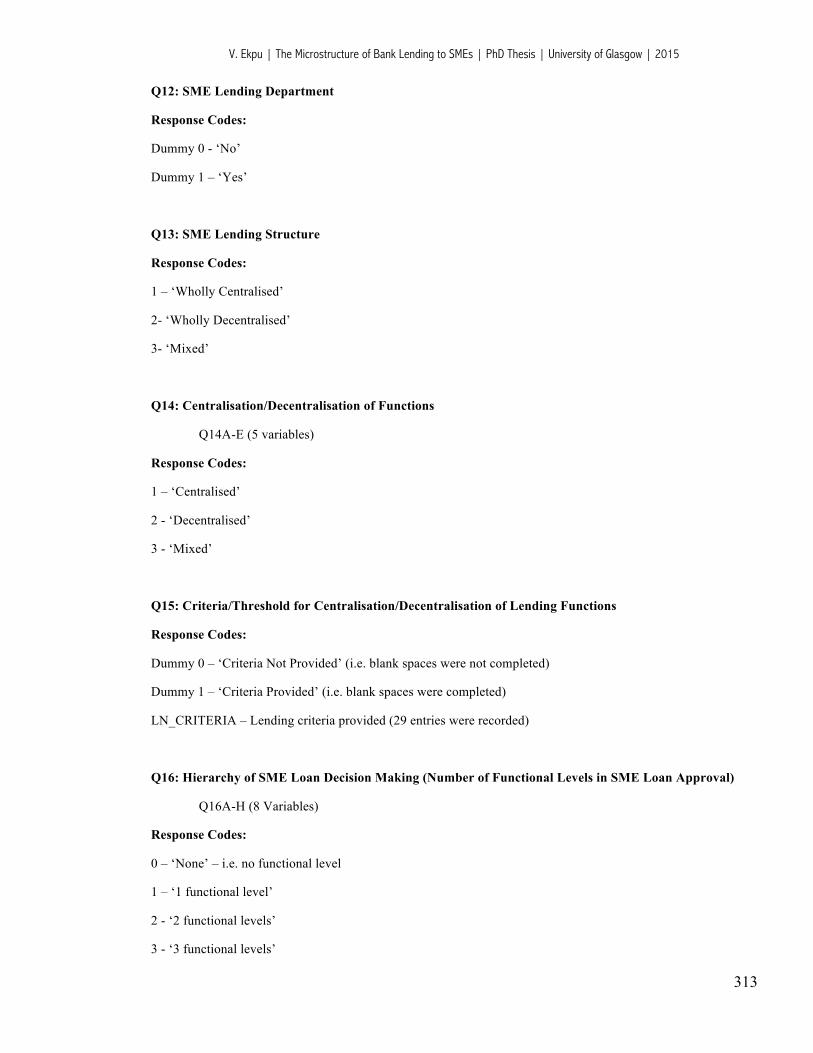
V. Ekpu | The Microstructure of Bank Lending to SMEs | PhD Thesis | University of Glasgow | 2015
313
Q12: SME Lending Department
Response Codes:
Dummy 0 - ‘No’
Dummy 1 – ‘Yes’
Q13: SME Lending Structure
Response Codes:
1 – ‘Wholly Centralised’
2- ‘Wholly Decentralised’
3- ‘Mixed’
Q14: Centralisation/Decentralisation of Functions
Q14A-E (5 variables)
Response Codes:
1 – ‘Centralised’
2 - ‘Decentralised’
3 - ‘Mixed’
Q15: Criteria/Threshold for Centralisation/Decentralisation of Lending Functions
Response Codes:
Dummy 0 – ‘Criteria Not Provided’ (i.e. blank spaces were not completed)
Dummy 1 – ‘Criteria Provided’ (i.e. blank spaces were completed)
LN_CRITERIA – Lending criteria provided (29 entries were recorded)
Q16: Hierarchy of SME Loan Decision Making (Number of Functional Levels in SME Loan Approval)
Q16A-H (8 Variables)
Response Codes:
0 – ‘None’ – i.e. no functional level
1 – ‘1 functional level’
2 - ‘2 functional levels’
3 - ‘3 functional levels’

V. Ekpu | The Microstructure of Bank Lending to SMEs | PhD Thesis | University of Glasgow | 2015
314
4 – ‘>3 functional levels’
Q17: Independent Lending Approval
Response Codes:
Dummy 0 - ‘No’
Dummy 1 – ‘Yes’ (9 entries were recorded)
Q18: Approval Limit (Maximum Amount for Autonomous Lending)
Response Code:
Quantitative Amount (expressed in Naira) – 9 entries were recorded
Q19: Discretion in Setting Interest Rates
Response Codes:
Dummy 0 - ‘No’
Dummy 1 – ‘Yes’ (18 entries were recorded)
Q20: Typical Margin of Discretion
Response Code:
Quantitative Amount (expressed in basis points) – 18 entries were recorded
Q21: Loan Volume Incentives
Response Codes:
Dummy 0 - ‘No’
Dummy 1 – ‘Yes’
Q22: Loan Profitability Incentives
Response Codes:
Dummy 0 - ‘No’
Dummy 1 – ‘Yes’

V. Ekpu | The Microstructure of Bank Lending to SMEs | PhD Thesis | University of Glasgow | 2015
315
Q23: Deposit Mobilization Incentives
Response Codes:
Dummy 0 - ‘No’
Dummy 1 – ‘Yes’
Q24: Nature of Bank Borrower Relationship
Q24A-F (6 variables)
Ranking Codes:
1- ‘Strongly Disagree’ 2- ‘Disagree’ 3- ‘Agree’ 4- ‘Strongly Agree’
Q25: Frequency of Meetings
Response Codes:
0- ‘Not at all’ 1- ‘At least once in 6 months’ 2- ‘At least once in 3 months’ 3- ‘At least once in 2 months’ 4- ‘At least once in a month’ 5- ‘More than once a month’ 6- ‘Other Frequency Levels – e.g. daily or more than once a week’
Q26: Frequency of Communications
Response Codes:
0- ‘Not at all’ 1- ‘At least once in 6 months’ 2- ‘At least once in 3 months’ 3- ‘At least once in 2 months’ 4- ‘At least once in a month’ 5- ‘More than once a month’ 6- ‘Other Frequency Levels – e.g. daily or more than once a week’
Q27: Knowledge of Borrower’s Business
Response Codes:
0- ‘No knowledge’ (no entry was recorded) 1- ‘Fair knowledge’ 2- ‘Good knowledge’ 3- ‘Very good knowledge’

V. Ekpu | The Microstructure of Bank Lending to SMEs | PhD Thesis | University of Glasgow | 2015
316
Q28: Frequency of Interaction with Local Market Community
Response Codes:
0- ‘Not at all’ 1- ‘At least once in 6 months’ 2- ‘At least once in 3 months’ 3- ‘At least once in 2 months’ 4- ‘At least once in a month’ 5- ‘More than once a month’ 6- ‘Other Frequency Levels’ – e.g. as the need arises or on case-by-case considerations depending on the
nature of customer’s business.
Q29: Influence of Borrower Knowledge on Setting of Loan Terms
Response Codes:
0- ‘Irrelevant’ 1- ‘Marginally Important’ 2- ‘Important’
Q30: Economic Benefits/Costs of Bank-Borrower Relationships
Q30A-M (13 variables)
Ranking Codes:
1- ‘Strongly Disagree’ 2- ‘Disagree’ 3- ‘Agree’ 4- ‘Strongly Agree’