Evidence for Mg-rich carbonates on Mars from a 3.9μm absorption feature
8
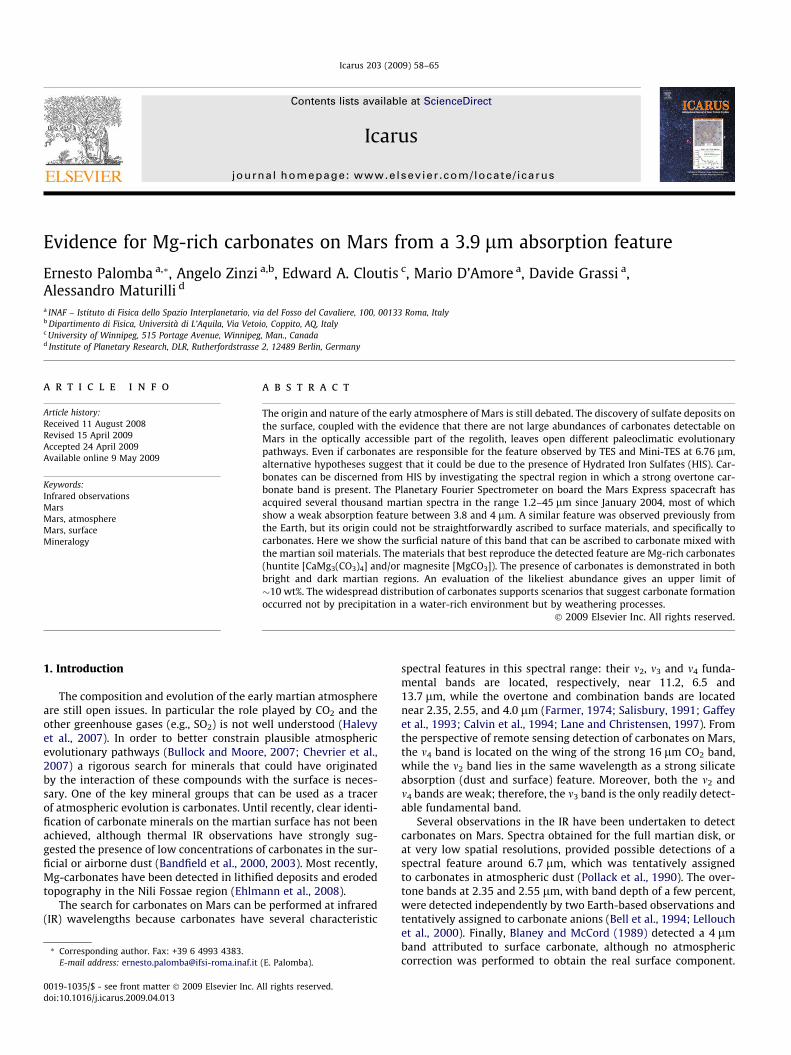
Evidence for Mg-rich carbonates on Mars from a 3.9 lm absorption feature Ernesto Palomba a, * , Angelo Zinzi a,b , Edward A. Cloutis c , Mario D’Amore a , Davide Grassi a , Alessandro Maturilli d a INAF – Istituto di Fisica dello Spazio Interplanetario, via del Fosso del Cavaliere, 100, 00133 Roma, Italy b Dipartimento di Fisica, Università di L’Aquila, Via Vetoio, Coppito, AQ, Italy c University of Winnipeg, 515 Portage Avenue, Winnipeg, Man., Canada d Institute of Planetary Research, DLR, Rutherfordstrasse 2, 12489 Berlin, Germany article info Article history: Received 11 August 2008 Revised 15 April 2009 Accepted 24 April 2009 Available online 9 May 2009 Keywords: Infrared observations Mars Mars, atmosphere Mars, surface Mineralogy abstract The origin and nature of the early atmosphere of Mars is still debated. The discovery of sulfate deposits on the surface, coupled with the evidence that there are not large abundances of carbonates detectable on Mars in the optically accessible part of the regolith, leaves open different paleoclimatic evolutionary pathways. Even if carbonates are responsible for the feature observed by TES and Mini-TES at 6.76 lm, alternative hypotheses suggest that it could be due to the presence of Hydrated Iron Sulfates (HIS). Car- bonates can be discerned from HIS by investigating the spectral region in which a strong overtone car- bonate band is present. The Planetary Fourier Spectrometer on board the Mars Express spacecraft has acquired several thousand martian spectra in the range 1.2–45 lm since January 2004, most of which show a weak absorption feature between 3.8 and 4 lm. A similar feature was observed previously from the Earth, but its origin could not be straightforwardly ascribed to surface materials, and specifically to carbonates. Here we show the surficial nature of this band that can be ascribed to carbonate mixed with the martian soil materials. The materials that best reproduce the detected feature are Mg-rich carbonates (huntite [CaMg 3 (CO 3 ) 4 ] and/or magnesite [MgCO 3 ]). The presence of carbonates is demonstrated in both bright and dark martian regions. An evaluation of the likeliest abundance gives an upper limit of 10 wt%. The widespread distribution of carbonates supports scenarios that suggest carbonate formation occurred not by precipitation in a water-rich environment but by weathering processes. Ó 2009 Elsevier Inc. All rights reserved. 1. Introduction The composition and evolution of the early martian atmosphere are still open issues. In particular the role played by CO 2 and the other greenhouse gases (e.g., SO 2 ) is not well understood (Halevy et al., 2007). In order to better constrain plausible atmospheric evolutionary pathways (Bullock and Moore, 2007; Chevrier et al., 2007) a rigorous search for minerals that could have originated by the interaction of these compounds with the surface is neces- sary. One of the key mineral groups that can be used as a tracer of atmospheric evolution is carbonates. Until recently, clear identi- fication of carbonate minerals on the martian surface has not been achieved, although thermal IR observations have strongly sug- gested the presence of low concentrations of carbonates in the sur- ficial or airborne dust (Bandfield et al., 2000, 2003). Most recently, Mg-carbonates have been detected in lithified deposits and eroded topography in the Nili Fossae region (Ehlmann et al., 2008). The search for carbonates on Mars can be performed at infrared (IR) wavelengths because carbonates have several characteristic spectral features in this spectral range: their m 2 , m 3 and m 4 funda- mental bands are located, respectively, near 11.2, 6.5 and 13.7 lm, while the overtone and combination bands are located near 2.35, 2.55, and 4.0 lm(Farmer, 1974; Salisbury, 1991; Gaffey et al., 1993; Calvin et al., 1994; Lane and Christensen, 1997). From the perspective of remote sensing detection of carbonates on Mars, the m 4 band is located on the wing of the strong 16 lm CO 2 band, while the m 2 band lies in the same wavelength as a strong silicate absorption (dust and surface) feature. Moreover, both the m 2 and m 4 bands are weak; therefore, the m 3 band is the only readily detect- able fundamental band. Several observations in the IR have been undertaken to detect carbonates on Mars. Spectra obtained for the full martian disk, or at very low spatial resolutions, provided possible detections of a spectral feature around 6.7 lm, which was tentatively assigned to carbonates in atmospheric dust (Pollack et al., 1990). The over- tone bands at 2.35 and 2.55 lm, with band depth of a few percent, were detected independently by two Earth-based observations and tentatively assigned to carbonate anions (Bell et al., 1994; Lellouch et al., 2000). Finally, Blaney and McCord (1989) detected a 4 lm band attributed to surface carbonate, although no atmospheric correction was performed to obtain the real surface component. 0019-1035/$ - see front matter Ó 2009 Elsevier Inc. All rights reserved. doi:10.1016/j.icarus.2009.04.013 * Corresponding author. Fax: +39 6 4993 4383. E-mail address: [email protected] (E. Palomba). Icarus 203 (2009) 58–65 Contents lists available at ScienceDirect Icarus journal homepage: www.elsevier.com/locate/icarus
-
Upload
independent -
Category
Documents
-
view
4 -
download
0
Transcript of Evidence for Mg-rich carbonates on Mars from a 3.9μm absorption feature
Icarus 203 (2009) 58–65
Contents lists available at ScienceDirect
Icarus
journal homepage: www.elsevier .com/ locate/ icarus
Evidence for Mg-rich carbonates on Mars from a 3.9 lm absorption feature
Ernesto Palomba a,*, Angelo Zinzi a,b, Edward A. Cloutis c, Mario D’Amore a, Davide Grassi a,Alessandro Maturilli d
a INAF – Istituto di Fisica dello Spazio Interplanetario, via del Fosso del Cavaliere, 100, 00133 Roma, Italyb Dipartimento di Fisica, Università di L’Aquila, Via Vetoio, Coppito, AQ, Italyc University of Winnipeg, 515 Portage Avenue, Winnipeg, Man., Canadad Institute of Planetary Research, DLR, Rutherfordstrasse 2, 12489 Berlin, Germany
a r t i c l e i n f o
Article history:Received 11 August 2008Revised 15 April 2009Accepted 24 April 2009Available online 9 May 2009
Keywords:Infrared observationsMarsMars, atmosphereMars, surfaceMineralogy
0019-1035/$ - see front matter � 2009 Elsevier Inc. Adoi:10.1016/j.icarus.2009.04.013
* Corresponding author. Fax: +39 6 4993 4383.E-mail address: [email protected]
a b s t r a c t
The origin and nature of the early atmosphere of Mars is still debated. The discovery of sulfate deposits onthe surface, coupled with the evidence that there are not large abundances of carbonates detectable onMars in the optically accessible part of the regolith, leaves open different paleoclimatic evolutionarypathways. Even if carbonates are responsible for the feature observed by TES and Mini-TES at 6.76 lm,alternative hypotheses suggest that it could be due to the presence of Hydrated Iron Sulfates (HIS). Car-bonates can be discerned from HIS by investigating the spectral region in which a strong overtone car-bonate band is present. The Planetary Fourier Spectrometer on board the Mars Express spacecraft hasacquired several thousand martian spectra in the range 1.2–45 lm since January 2004, most of whichshow a weak absorption feature between 3.8 and 4 lm. A similar feature was observed previously fromthe Earth, but its origin could not be straightforwardly ascribed to surface materials, and specifically tocarbonates. Here we show the surficial nature of this band that can be ascribed to carbonate mixed withthe martian soil materials. The materials that best reproduce the detected feature are Mg-rich carbonates(huntite [CaMg3(CO3)4] and/or magnesite [MgCO3]). The presence of carbonates is demonstrated in bothbright and dark martian regions. An evaluation of the likeliest abundance gives an upper limit of�10 wt%. The widespread distribution of carbonates supports scenarios that suggest carbonate formationoccurred not by precipitation in a water-rich environment but by weathering processes.
� 2009 Elsevier Inc. All rights reserved.
1. Introduction
The composition and evolution of the early martian atmosphereare still open issues. In particular the role played by CO2 and theother greenhouse gases (e.g., SO2) is not well understood (Halevyet al., 2007). In order to better constrain plausible atmosphericevolutionary pathways (Bullock and Moore, 2007; Chevrier et al.,2007) a rigorous search for minerals that could have originatedby the interaction of these compounds with the surface is neces-sary. One of the key mineral groups that can be used as a tracerof atmospheric evolution is carbonates. Until recently, clear identi-fication of carbonate minerals on the martian surface has not beenachieved, although thermal IR observations have strongly sug-gested the presence of low concentrations of carbonates in the sur-ficial or airborne dust (Bandfield et al., 2000, 2003). Most recently,Mg-carbonates have been detected in lithified deposits and erodedtopography in the Nili Fossae region (Ehlmann et al., 2008).
The search for carbonates on Mars can be performed at infrared(IR) wavelengths because carbonates have several characteristic
ll rights reserved.
(E. Palomba).
spectral features in this spectral range: their m2, m3 and m4 funda-mental bands are located, respectively, near 11.2, 6.5 and13.7 lm, while the overtone and combination bands are locatednear 2.35, 2.55, and 4.0 lm (Farmer, 1974; Salisbury, 1991; Gaffeyet al., 1993; Calvin et al., 1994; Lane and Christensen, 1997). Fromthe perspective of remote sensing detection of carbonates on Mars,the m4 band is located on the wing of the strong 16 lm CO2 band,while the m2 band lies in the same wavelength as a strong silicateabsorption (dust and surface) feature. Moreover, both the m2 andm4 bands are weak; therefore, the m3 band is the only readily detect-able fundamental band.
Several observations in the IR have been undertaken to detectcarbonates on Mars. Spectra obtained for the full martian disk, orat very low spatial resolutions, provided possible detections of aspectral feature around 6.7 lm, which was tentatively assignedto carbonates in atmospheric dust (Pollack et al., 1990). The over-tone bands at 2.35 and 2.55 lm, with band depth of a few percent,were detected independently by two Earth-based observations andtentatively assigned to carbonate anions (Bell et al., 1994; Lellouchet al., 2000). Finally, Blaney and McCord (1989) detected a 4 lmband attributed to surface carbonate, although no atmosphericcorrection was performed to obtain the real surface component.

E. Palomba et al. / Icarus 203 (2009) 58–65 59
Ehlmann et al. (2008), by using the orbiting CRISM instrument on-board MRO, identified lithified and eroded deposits of Mg-carbon-ate in the Nili Fossae region on the basis of diagnostic absorptionbands in the 2.3-, 2.5- and 4-lm regions.
TES observations of high-albedo regions and Mini-TES analysisof the Gusev Crater area showed a clear and complex spectralstructure with two emissivity minima at 6.33 and 7.19 lm (1580and 1390 cm�1) that were attributed to the strong spectral influ-ence that the m3 carbonate band has on the volume scattering com-ponent of the relatively non-absorbing basaltic matrix in theobserved spectra (Bandfield et al., 2003; Christensen et al., 2004).The study of this spectral behavior suggested an upper limit of5% by weight of carbonates in the high-albedo regions of the mar-tian surface. Since the low-albedo regions are formed by coarserparticles, in which the surface scattering component prevails overthe volume scattering component, the complex structure discussedabove is absent. However, the usual technique that is used to ex-tract compositional information in these regions (i.e., linear decon-volution) did not show evidence of carbonate, providing an upperlimit of 10–15 wt.% (Christensen et al., 2000).
More recent observations by the OMEGA spectrometer on boardthe Mars Express mission, while showing extensive deposits of sul-fates and hydrated minerals, have not yet provided evidence of car-bonates on the martian surface (Bibring et al., 2005), encouragingthe authors to hypothesize an ancient martian atmosphere notfavorable to carbonate formation (Chevrier et al., 2007).
The OMEGA ‘‘non-detection” could have been either due to theabsence of carbonate on the surface or the weakness of the carbon-ate overtone bands relative to the sulfate bands in the spectral re-gion investigated by OMEGA (k < 2.5 lm). The apparent absence ofcarbonates could be explained by the alternative presence of Hy-drous Iron Sulfates (HIS e.g., ferricopiapite and rozenite), whosespectral characteristics fit very well the observed TES and Mini-TES feature centered at 6.76 lm (1480 cm�1), similar to carbonates(Lane et al., 2004). It is worth noting that, in contrast to carbonates,HIS generally do not display strong overtone features at 4 lm(Bishop et al., 2006; Cloutis et al., 2006). Therefore, a clear detec-tion of carbonates on Mars can be fruitfully performed by analyz-ing this spectral range, and to this end we used Mars ExpressPlanetary Fourier Spectrometer (MEX-PFS) data, focusing our anal-ysis on data centered at 4 lm.
2. PFS data selection
The Planetary Fourier Spectrometer (PFS) on board the Euro-pean Space Agency/Mars Express mission (Formisano et al.,2005), operating since January 2004, is an infrared spectrometercovering the spectral range from 1.2 to 45 lm (with a single foot-print at periapsis about 10 km wide) by means of two spectralchannels: the short wavelength one (SW) operates between 1.2and 5.5 lm (8190–1820 cm�1) (Giuranna et al., 2005a) and thelong wavelength (LW) channel spans from 5.5 to 45 lm (1820–220 cm�1) (Giuranna et al., 2005b) (both with a spectral resolutionof 1.3 cm�1). Due to its configuration, the SW and LW channels ac-quire spectra of the same field of view at the same time.
We analyzed two sets of data, one from low-albedo regions (TESalbedo < 0.20) and one from high-albedo regions (TES albe-do > 0.25). The low-albedo regions included Syrtis Major, Margari-tifer Terra, Terra Cimmeria and Acidalia Planitia, and the high-albedo regions included Elysium Planitia and Lunae Planum. Spec-tra acquired over Syrtis Major were grouped spatially into threesubsets: East, Northwest and Southwest.
All the spectra analyzed in this work were acquired in nadirmode, i.e., in conditions where the air column between spacecraftand surface is minimum. A typical spectrum acquired over regions
with low surface temperature (e.g., 210 K) has a Signal-to-NoiseRatio (SNR) of 10 (Giuranna et al., 2005a). In order to improve thisvalue, we averaged up to 80 SW spectra for each orbit; similarspectral averaging was performed by Ehlmann et al. (2008) onCRISM data to also improve SNR. As a consequence, the corre-sponding footprint for a single averaged spectrum is elongatedand covers several thousand square kilometers (as shown inFig. 1) and a typical averaged spectrum has a SNR around 100,allowing us to discern band depths down to 1%.
3. Data analysis
By examining the PFS-SW averaged spectra we discerned anabsorption feature centered around 3.8–4 lm. This feature is pres-ent in nearly all the examined spectra, being absent only in smallareas inside Acidalia Planitia and Terra Cimmeria. We attribute thisfeature to carbonates present in the martian surface. Its intermit-tent nature is not unexpected if it is associated with the regolithand not the suspended dust. It is likely that the carbonate maybe associated with both surface components and dust, as carbon-ates appear to be present in both lithified deposits and eroded ter-rains (Ehlmann et al., 2008). It is not possible to specify to whatproportions the carbonates are associated with bedrock or wind-blown dust, but the fact that the carbonates are widespread andwhere absent, are absent only in dark regions (Acidalia Planitiaand Terra Cimmeria), favors a windblown origin.
The portion of the infrared spectrum that we studied (centeredaround 3.9 lm) lacks strong atmospheric features. However, sincethe observed band is weak, the degree of atmospheric contributionmust be evaluated; the main contribution being the CO2 isotopicbands, occurring at 4.00, 3.83, 3.63 lm (see Fig. 2, plot A). In addi-tion, solar lines (Fiorenza and Formisano, 2005) give a non-negligi-ble, constant contribution to the observed spectrum in thiswavelength interval (Smith and Gottlieb, 1974). Due to the two-channel instrumental configuration of PFS, we were able to per-form an ad hoc atmospheric correction for every SW spectrum bycomputing actual parameters (i.e., surface temperature and tem-perature profile) with the LW channel data and assuming that sur-face, atmospheric and solar contributions are multiplicative.
A typical sequence of atmospheric and solar removal methodol-ogy (Fig. 2) starts with the normalization of the PFS-SW observedband to a continuum (usually taken as a second order polynomialfit from the wings of the atmospheric band triplet, e.g., at 3.55,3.69, 4.06 lm). The solar contribution is removed first by ratioing,applying the solar spectrum (B) obtained by Fiorenza and Formisa-no (2005). The CO2 isotopic bands can vary in intensity, dependingon the local climate. We reproduced this behavior by using a radi-ative transfer model (Grassi et al., 2005), obtaining a syntheticspectrum (A) that is used to remove the isotopic bands from theobserved spectrum (D). In order to account for the real conditionsof observation, for each SW average spectrum we used the corre-sponding LW spectra to extract the actual vertical temperatureprofiles to be used in the model. Since the CO2 transmittance syn-thetic spectrum is obtained for fixed observational geometries (rel-ative to both incidence and emission angle equal to 0�), for eachspectrum we derived the proper transmittance of the air columnfor the actual observational parameters, applying a least squarefit algorithm. We finally remove the CO2 isotopic bands from theobserved band by ratioing the synthetic spectrum.
The best fit obtained by using only atmospheric and solar con-tributions leaves unaccounted for absorption features in the PFSband shape (Fig. 2 – plot E), indicative of the presence of an addi-tional spectral contribution. We attribute this additional spectralcomponent to surface materials. Before considering the surface asbeing responsible for the 4 lm spectral feature, several other pos-

Fig. 1. MOLA color shaded relief (128 ppd) maps of studied regions. (A) Syrtis Major divided into three sub-regions: Northwest (NW), Southwest (SW) and East (E). (B)Margaritifer Terra. (C) Lunae Planum. (D) Elysium. The PFS-SW footprints on the planetary surface are indicated by the white semitransparent strips. The spectra wereacquired during the first six months of PFS activity, corresponding to heliocentric longitude Ls 335 to 60 (northern fall to winter, which implies a decrease of the mean surfacetemperatures in most of the northern hemisphere).
Fig. 2. From top to bottom: (A) atmospheric CO2 transmittance (as computed byGrassi et al., 2005), (B) solar bands, (C) best fit accounting for the solar and theatmospheric bands, (D) PFS-SW band depth, (E) PFS-SW corrected (ratio) band and(F) bi-directional reflectance laboratory spectra of fine grained (<45 lm) huntite.The weight that the surficial band has on the observed PFS spectra is comparable toone of the atmospheric counterparts, even in different spectral intervals, as shownby the third, fourth and fifth spectra from the top.
60 E. Palomba et al. / Icarus 203 (2009) 58–65
sible processes (e.g., dust in the atmosphere, instrumental effectsand residual atmospheric bands) were considered. A more detaileddiscussion of atmospheric dust is needed, since it is a permanentand important component of the martian environment. Suspendeddust adds a transmittance contribution to the spectrum introduc-ing, possibly, only a spectral slope (Erard, 2001) The stretchingand bending vibration bands of common planetary materials occurbetween 8.5 and 40 lm (Hunt, 1982), while the 4 lm spectral re-gion is populated by overtone and combination bands. The absorp-tion coefficients of these bands are several times weaker than thecorresponding fundamentals. Therefore, the detection of overtonesin transmittance is possible only for minerals present in largequantities and during periods of high atmospheric dust opacity.As an example, for limestone the absorption coefficient of the4 lm overtone band is five times weaker than the m2 fundamentalat 11 lm (Orofino et al., 1998). A simulation of martian spectra fordust optical depth (s) = 0.2, with a dust composed of palagonite(85 wt.%) and limestone (15 wt.%) produces a 2% deep band at11 lm, and a smaller band depth for the overtone (Orofino et al.,1998). Definitive evidence that the atmospheric dust loading can-not be responsible for the observed feature is obtained by analyz-ing the behavior of the 3.9 lm band depth vs the dust optical depth(Fig. 3). Applying the retrieval algorithm described by Grassi et al.(2005), we computed the atmospheric dust loading (integrated s at1100 cm�1) from the PFS-LW data. If the 3.9 lm band was due tothe atmospheric dust, we should expect band depth to increasewith increasing s, a trend not evident in Fig. 3.
An alternative and more sophisticated approach to understandthe surficial origin of the observed spectral feature, ruling out both

Fig. 3. Variation of band depth at 3.9 lm with dust optical depth. No systematicbehavior is present. The bars represent the data standard deviations.
Fig. 4. Band depth vs surface temperature for Syrtis (circles) and Margaritifer(squares) regions. The vertical bars represent the band depth standard deviation.The temperature uncertainty is estimated to be near 5 K. The band depth behaviorwith respect to surface temperature is clearly evident, demonstrating the surfaceorigin of the band.
Table 1PFS surface band. Location of the two band minima and TES albedo relative to eachstudied region on Mars.
Region Band I position Band II position TES Albedo
Syrtis East 3.88 3.93 0.18Syrtis Northwest 3.89 3.93 0.14Syrtis Southwest 3.88 3.93 0.13Margaritifer 3.89 3.94 0.14Lunae Planum 3.89 3.93 0.24Elysium 3.89 – 0.26
E. Palomba et al. / Icarus 203 (2009) 58–65 61
instrumental and residual atmospheric effects, is based upon thethermal properties of the martian surface in the investigated spec-tral region. Since in the 3–5 lm interval the radiance from Marsconsists of thermal emitted and solar reflected radiation contribu-tions, their relative weights change dramatically with surface tem-perature and albedo; e.g., at 4 lm for dark regions (with a typicalreflectance factor at 4 lm of 0.18 – Erard and Calvin, 1997) thethermal contribution is less than 5% of the total radiation at225 K, while it reaches 41% at 270 K; conversely for a typical brightregion (reflectance factor at 4 lm equal to 0.3 – Erard and Calvin,1997) the thermal contribution is 2% of the total radiation forT = 225 K and 26% at 270 K. Taking this into account, and applyingKirchoff’s law to Mars (Salisbury and Wald, 1992) (i.e., emissivity isthe complement of reflectivity), troughs in reflection would appearas peaks in emission. The overall effect is an obliteration of theabsorption bands as the two contributions tend to be equivalent.This implies that, in this spectral region, the depth of an absorptionfeature for a fixed martian area (or for constant albedo) will de-crease with increasing surface temperature. This relationship isshown for the atmospherically removed PFS data in Fig. 4, wherethe 3.9 lm band depths are plotted against the surface tempera-tures (as obtained from the LW data).
4. Nature of the 3.9-lm region PFS absorption feature
The retrieved surface-related absorption feature displays a sim-ilar spectral shape in all the analyzed areas, with the two mainabsorption features centered near 3.88–3.89 and 3.93 lm (seeTable 1). The PFS band along with those of some minerals ofplanetary interest, are shown in Fig. 5. Of the various candidateminerals examined (see Table 2), only carbonates have similarband positions to the PFS bands, whereas minerals belonging toother classes almost always have bands located at least 50 nmfrom the PFS bands (Fig. 6). A few do have one or two bands within50 nm of the PFS bands, including sodium nitrite (3.78 and3.98 lm), sodium nitrate (4.03 and 4.09 lm), potassium nitrate(4.03 and 4.12 lm), coquimbite (a single shallow band at4.00 lm, about 4% deep), and the phosphate apatite (with a singleshallow band at 3.97 lm about 2% deep). However, these materials
either do not display two absorption bands close to the PFS valuesor exhibit additional absorption bands not seen in the PFS spectra(Fig. 5). We also examined bicarbonate minerals (nahcolite andtrona) and scapolites (generally metamorphic/metasomatic CO3-and SO4-bearing alumino-silicates (Deer et al., 1966). None of theseminerals exhibit absorption bands in the same positions as thoseseen in the PFS spectra. Thus, it appears that no plausible mineralclass other than carbonates can account for the PFS features in the3.9 lm region.
Of the carbonates, the best candidates are huntite, magnesite,hydromagnesite, northupite, and azurite. Of these, northupiteand azurite have a three-band feature with an additional and moreintense band at 3.95 and 4.0 lm, respectively, which are not seenin the PFS spectra. Of the remaining carbonates, hydromagnesiteis the least likely candidate: its absorption bands are weaker thanthe PFS surface bands, even for pure hydromagnesite and its spec-trum is generally blue-sloped (reflectance declining toward shorterwavelengths). Dehydration of hydromagnesite by heating the sam-ple does however result in its conversion to magnesite and a spec-trum that is nearly identical to that of naturally-occurringmagnesite. Both huntite and magnesite exhibit their major absorp-tion bands in the same region as the PFS surface spectra, with onlyminor differences (�10 nm) between them (Figs. 5 and 6). Conse-quently, huntite and/or magnesite are the best candidate(s), amongthe minerals that we included in our study, to explain the absorp-

Fig. 5. Spectra of some minerals of planetary interest compared with the PFSabsorption feature. From top to bottom: (A) PFS, (B) huntite, (C) magnesite, (D)northupite, (E) coquimbite, (F) azurite, (G) hydromagnesite, (H) anhydrite, (I)gypsum, (J) nitratine, and (K) apatite.
Table 2Minerals used for the determination of the best candidates responsible for the 3.9 lm banfrom Cloutis et al. (2006) that were also included in the analysis. Nahcolite and trona are
Carbonates and bicarbonates
1. Ammonium carbonate 2. Aragonite (with calcite)5. Brugnatellite 6. Calcite (synthethic)9. Dawsonite 10. Dolomite (1)13. Gaylussite 14. Huntite (1)17. Hydromagnesite (1) 18. Hydromagnesite (2)21. Magnesite (2) 22. Malachite (synthetic)25. Nahcolite 26. Northupite29. Siderite 30. Trona (1)
Nitrates1. Potassium nitrate 2. Sodium nitrate
Nitrites1. NaNO2 (synthetic) 2. Sodium nitrite
Scapolites1. Dipyre 2. Marialite5. Wernerite
Sulfates1. Coquimbite 2. Sideronatrite
Fig. 6. Wavelength positions of the bands seen in PFS surface spectra and in variousminerals (carbonates, bicarbonates, sulfates, nitrites, nitrates, scapolites). The smalland large squares give the bands observed by PFS and by Blaney and McCord (1989),respectively. Minerals with very weak bands, as discussed in the text are not shown.The number inside each data point is linked to material specified in Table 2. TheDipyre and Wernerite (scapolites) have the bands in the same position that isdisplayed in the plot by the scapolite dot number 1.
62 E. Palomba et al. / Icarus 203 (2009) 58–65
tion bands in the PFS spectra. The slight spectral variations that ex-ist among the PFS spectra for different regions could suggest thepresence of both huntite and magnesite, likely with variations inrelative abundances (see Fig. 7). The identification of Mg-rich car-bonates as the cause of this feature is consistent with the identifi-cation of Mg-rich carbonates as the cause of spectral features in the2.3-, 2.5-, and 4-lm region of spectra from Nili Fossae (Ehlmannet al., 2008).
If huntite and/or magnesite are indeed present on the martiansurface, we can explain the lack of detection of carbonates by theOMEGA spectrometer. The strongest shorter wavelength huntiteband is located near 2.49 lm. In pure huntite this band has a depthof 6% (for <45 lm sized particles). By contrast the 3.95 lm bandhas a depth of up to �60%, depending on where one constructsthe continuum to measure its depth. Therefore, at the abundancesof huntite that we have inferred from the PFS data, the 2.49 lmband would be exceedingly weak, and likely not detectable in
d. Not listed or shown (for the sake of clarity) is the extensive suite of sulfate spectrabicarbonates.
3. Aragonite 4. Azurite7. Cerussite (1) 8. Cerussite (2)11. Dolomite (2) 12. Gaspeite15. Huntite (2) 16. Hydrocerussite (synthethic)19. Hydromagnesite (3) 20. Magnesite (1)23. Malachite 24. Mn-Calcite27. Pirrsonite 28. Shortite31. Trona (2)
3. Meionite 4. Mizzonite

Fig. 7. Comparison between mixtures of basalt and magnesite/huntite and PFSsurface spectra of different martian regions. From top to bottom: basalt(90 wt.%) + magnesite (10 wt.%), basalt (90 wt.%) + huntite (10 wt.%), Lunae Planum(orbit 515), Margaritifer Terra (orbit 500), Syrtis Major E (orbit 41) (dotted), SyrtisMajor E (orbit 605), Syrtis Major NW and SW (orbit 510). The shown PFS spectra arefrom cold regions and are all resampled to 8 cm�1. The only warm region (dottedcurve) is displayed to show the decrease in band depth due to the thermal radiation(see Section 5). For clarity the spectra are vertically shifted.
Fig. 8. Band depths of different laboratory mineral mixtures compared with the PFbasalt + magnesite, (III) palagonite + huntite, (IV) palagonite + magnesite. In each plot, c
E. Palomba et al. / Icarus 203 (2009) 58–65 63
OMEGA spectra. Thus, use of the 4-lm region bands provides low-er detection limits than shorter wavelength bands.
Magnesite and huntite can form in a variety of geological envi-ronments. Of most relevance to Mars, these minerals occur in asso-ciation with serpentinite as alteration products (Cole and Lancucki,1975; Stanger and Neal, 1994; Chang et al., 1998; Wilson et al.,2006), as well as in supratidal evaporitic environments (Kinsman,1967).
5. Discussion
Our study indicates the presence of specific types of carbonateson the martian surface. The band shape and position constrain thecation content (high-Mg) of the carbonate(s). This result also sup-ports the hypothesis that TES and Mini-TES features for moderateto high-albedo regions and Gusev Crater are due to carbonates(Bandfield et al., 2003; Christensen et al., 2004) and not to hydrousiron sulfate (as suggested by Lane et al., 2004), and also supportsthe detection of similar Mg-rich carbonates in the Nili Fossae re-gion (Ehlmann et al., 2008).
Most notably, these results show that the presence of carbon-ates is not restricted to the brighter regions but extends to thelow-albedo regions of Mars, where the coarse particles formingthe regolith prevent the detection at 6.76 lm for abundances lowerthan 10–15 wt.% (Christensen et al., 2000). The detection of car-bonates in both bright and dark regions is consistent with erodedand redistributed carbonates, as seems to be occurring in the NiliFossae region (Ehlmann et al., 2008). It is worth noting that ourSyrtis Major East spectrum, which show the presence of Mg-car-bonates, is located just south of the Mg-carbonate exposures in
S band shape (Lunae Planum, orbit 515 – dashed line). (I) Basalt + huntite, (II)arbonate content increases from top to bottom (a) 5 wt.%, (b) 10 wt. %, (c) 20 wt.%.

Table 3Band widths (FWHM: full width at half maximum) and absolute depths for thevarious intimate minerals mixtures (all <45 lm grain size) used to model the PFSabsorption feature. For the PFS only spectra with surface temperature not larger than240 K were used.
Mixture (wt.% of end members) FWHM (lm) Band depth
Basalt 95–Huntite 5 0.12 0.04Palagonite 95–Huntite 5 0.19 0.04Basalt 95–Magnesite 5 0.11 0.03Palagonite 95–Magnesite 5 0.15 0.03Basalt 90–Huntite 10 0.12 0.08Palagonite 90–Huntite 10 0.18 0.06Basalt 90–Magnesite 10 0.10 0.06Palagonite 90–Magnesite 10 0.20 0.05Basalt 80–Muntite 20 0.14 0.16Palagonite 80–Huntite 20 0.21 0.13Basalt 80–Magnesite 20 0.13 0.12Palagonite 80–Magnesite 20 0.22 0.10PFS 3.9 lm band (cold regions) 0.19 ± 0.03 0.09 ± 0.01
64 E. Palomba et al. / Icarus 203 (2009) 58–65
the Nili Fossae region, which also exhibit an absorption feature inthe 4-lm region (Ehlmann et al., 2008).
Considering the coldest regions, the absorption feature will rep-resent the solar reflected radiation contribution nearly exclusivelyand can be used directly to estimate the carbonate abundance. Tothis aim we acquired reflectance spectra of intimate mixtures (5,10, and 20 wt.%) of huntite, and magnesite, with either basalt orpalagonite, for fine grain sizes (<45 lm). Absorption bands in the3.9 lm region of the PFS spectra are on the order of 6–10% deepand we found that carbonate abundances of 10 wt.% produce banddepths of this magnitude (see Fig. 8). These values are also consis-tent with expected band depths derived from mixing experimentsof carbonates and palagonite (Wagner and Schade, 1996; Fontiet al., 2001). It is worth noting that band depths (and detectionlimits) will be a function of many factors, including areal vs inti-mate mixtures, and relative grain sizes (Wagner and Schade,1996). Thus, our values represent one possible constraint on car-bonate abundances.
The PFS spectra have mean full width half maxima (FWHM) of190 nm, whereas the relative band width of carbonate mixturesvary between 100 and 220. Their FWHM seem to remain almostunchanged with carbonate abundance, while a larger width, closerto the PFS values, is shown by the mixtures containing palagonite(Fig. 8, Table 3). Thus, in both high and low-albedo regions thecomparison with laboratory data suggests abundances close to10% by weight, and more specific measurements are planned tomore accurately determine the abundance and distribution of car-bonates on the different martian surface units.
The widespread, rather than localized, distribution of carbon-ates suggests that at least some carbonate formation occurrednot by precipitation in a water-rich environment, but only whenthe hydrologic activity on Mars was ending, as suggested by Bull-ock and Moore (2007). According to this scenario the martianatmosphere during the late Noachian was made up principally ofCO2, with SO2 continuously added to the atmosphere by volcanism.A similar environment would have favored the formation of thicksulfate sediments, by maintaining surface temperature above thefreezing point of water in an acidic environment (Halevy et al.,2007). At the end of the active volcanism period (i.e., early Hespe-rian) the atmospheric SO2 rapidly waned, causing the temperaturesto drop below the freezing point of water. The subsequent collaps-ing of the atmospheric CO2, coupled with a more alkaline environ-ment, allowed the formation of carbonates in a poorly consolidatedform (Bullock and Moore, 2007) that no plausible destructivemechanisms, such as photodissociation, are able to remove (Quinnet al., 2006).
6. Summary
The detection of carbonates, specifically the Mg-rich specieshuntite and magnesite, across large parts of the martian surface,is consistent with earlier tentative detections of low abundancesof carbonates on Mars (e.g., Bandfield et al., 2003), and more recentdetections of Mg-rich carbonates (Ehlmann et al., 2008). Our studysuggests that the Nili Fossae region is a plausible source region forthe more widespread carbonates that we have detected and thatonce formed, these carbonates are resistant to decomposition(Cloutis et al., 2008).
Acknowledgments
We thank Dr. A. Graps for valuable comments on the manu-script, Dr. A. Terracina for the precious bibliographic work andstrong encouragements, Dr. P. Moretti for helpful discussions onthe topic, Dr. V. Formisano and the PFS team for their supportabout the PFS data and related facilities. EAC’s work has been sup-ported by grants from the Canadian Space Agency, NSERC, and theUniversity of Winnipeg.
References
Bandfield, J.L., Hamilton, V.E., Christensen, P.R., 2000. A global view of martiansurface compositions from MGS-TES. Science 287, 1626–1630.
Bandfield, J.L., Glotch, T.D., Christensen, P.H., 2003. Spectroscopic identification ofcarbonate minerals in the martian dust. Science 301, 1084–1087.
Bell, J.F., Pollack, J.B., Geballe, T.R., Cruikshank, D.P., Freedman, R., 1994.Spectroscopy of Mars from 2.04 to 2.44 micron during the 1993 opposition:Absolute calibration and atmospheric vs mineralogic origin of narrowabsorption features. Icarus 111, 106–123.
Bibring, J.P., and 10 colleagues, 2005. Mars surface diversity as revealed by theOMEGA/Mars Express observations. Science 307, 1576–1581.
Bishop, J.L., Brown, A.J., Parente, M., Lane, M.D., Dyar, M.D., Schiffman, P., Murad, E.,Cloutis, E., 2006, VNIR spectra of sulfates formed in solfataric and aqueous acidsulfate environments and applications to Mars. In: Workshop on martianSulfates as Recorders of Atmospheric-Fluid–Rock Interactions, October 22–24,2006 in Houston, Texas. LPI Contribution No. 1331, p. 14.
Blaney, D.L., McCord, T.B., 1989. An observational search for carbonates on Mars. J.Geophys. Res. 94, 10159–10166.
Bullock, M.A., Moore, J.M., 2007. Atmospheric conditions on early Mars and themissing layered carbonates. Geophys. Res. Lett. 34. CiteID L19201.
Calvin, W.M., King, T.V., Clark, R.N., 1994. Hydrous carbonates on Mars?: Evidencefrom Mariner 6/7 infrared spectrometer and ground-based telescopic spectra. J.Geophys. Res. 99 (E7), 14659–14675.
Chang, L.L.Y., Howie, R.A., Zussman, J., 1998. Non-silicates: sulphates, carbonates,phosphates, halides. In: Rock Forming Minerals, vol. 5B. second ed. TheGeological Society of London, London. 383 pp.
Chevrier, V., Poulet, F., Bibring, J.-P., 2007. Early geochemical environment of Marsas determined from thermodynamics of phyllosilicates. Nature 448, 60–63.
Christensen, P.R., Bandfield, J.L., Smith, M.D., Hamilton, V.E., Clark, R.N., 2000.Identification of a basaltic component on the martian surface from ThermalEmission Spectrometer data. J. Geophys. Res. 105 (E4), 9609–9621.
Christensen, P.R., and 36 colleagues, 2004. Initial results from the Mini-TESexperiment in Gusev Crater from the Spirit rover. Science 305, 837–842.
Cloutis, E.A., Hawthorne, F.C., Mertzman, S.A., Krenn, K., Craig, M.A., Marcino, D.,Methot, M., Strong, J., Mustard, J.F., Blaney, D.L., Bell III, J.F., Vilas, F., 2006.Detection and discrimination of sulfate minerals using reflectancespectroscopy. Icarus 184, 121–157.
Cloutis, E.A., Craig, M.A., Kruzelecky, R.V., Jamroz, W.R., Scott, A., Hawthorne, F.C.,Mertzman, S.A., 2008. Spectral reflectance properties of minerals exposed tosimulated Mars surface conditions. Icarus 195, 140–168.
Cole, W.F., Lancucki, C.J., 1975. Huntite from Deer Park, Victoria, Australia. Am.Mineral. 60, 1130–1131.
Deer, W.A., Howie, R.A., Zussman, J., 1966. An Introduction to the Rock-FormingMinerals. Longman, Harlow, England. 528 pp.
Ehlmann, B., Mustard, J.F., Murchie, S.L., Poulet, F., Bishop, J.L., Brown, A.J., Calvin,W.M., Clark, R.N., Des Marais, D.J., Milliken, R.E., Roach, L.H., Roush, T.L., Swayze,G.A., Wray, J.J., 2008. Orbital identification of carbonate-bearing rocks on Mars.Science 322, 1828–1832.
Erard, S., 2001. A spectro-photometric model of Mars in the near-infrared. Geophys.Res. Lett. 28, 1291–1294.
Erard, S., Calvin, W., 1997. New composite spectra of Mars, 0.4–5.7 lm. Icarus 130,449–460.
Farmer, V.C., 1974. The Infrared Spectra of Minerals. Mineralogical SocietyMonograph 4, London.
Fiorenza, C., Formisano, V., 2005. A solar spectrum for PFS data analysis. Planet.Space Sci. 53, 1009–1016.

E. Palomba et al. / Icarus 203 (2009) 58–65 65
Fonti, S., Jurewicz, A., Blanco, A., Blecka, M.I., Orofino, V., 2001. Presence anddetection of carbonates on the martian surface. J. Geophys. Res. 106 (E11),27815–27822.
Formisano, V., and 46 colleagues, 2005. The Planetary Fourier Spectrometer (PFS)onboard the European Mars Express mission. Planet. Space Sci. 53, 963–974.
Gaffey, S.J., McFadden, L.A., Nash, D., Pieters, C.M., 1993. Ultraviolet, visible, andnear-infrared reflectance spectroscopy: Laboratory spectra of geologicmaterials. In: Pieters, C.M., Englert, P. (Eds.), Remote Geochemical Analysis:Elemental and Mineralogical Composition. Cambridge Univ. Press, New York,pp. 43–77.
Giuranna, M., and 20 colleagues, 2005a. Calibration of the Planetary FourierSpectrometer short wavelength channel. Planet. Space Sci. 53, 975–991.
Giuranna, M., and 19 colleagues, 2005b. Calibration of the Planetary FourierSpectrometer long wavelength channel. Planet. Space Sci. 53, 993–1007.
Grassi, D., Ignatiev, N.I., Zasova, L.V., Maturilli, A., Formisano, V., Bianchini, G.A.,Giuranna, M., 2005. Methods for the analysis of data from the Planetary FourierSpectrometer on the Mars Express Mission. Planet. Space Sci. 53, 1017–1034.
Halevy, I., Zuber, M.T., Schrag, D.P., 2007. A sulfur dioxide climate feedback on earlyMars. Science 318, 1903–1907.
Hunt, G.R., 1982. Spectroscopic properties of rock and minerals. In: Carmichael, R.S.(Ed.), Handbook of Physical Properties of Rocks, vol. 1. CRC Press, Boca Raton, FL,pp. 295–385.
Kinsman, D.J.J., 1967. Huntite from a carbonate–evaporite environment. Am.Mineral. 52, 1332–1340.
Lane, M.D., Christensen, P.H., 1997. Thermal infrared emission spectroscopy ofanhydrous carbonates. J. Geophys. Res. 102 (E11), 25581–25592.
Lane, M.D., Dyar, M.D., Bishop, J.L., 2004. Spectroscopic evidence for hydrous ironsulfate in the martian soil. Geophys. Res. Lett. 31, 19. CiteID L19702.
Lellouch, E., Encrenaz, T., de Graauw, T., Erard, S., Morris, P., Crovisier, J.,Feuchtgruber, H., Girard, T., Burgdorf, M., 2000. The 2.4–45 lm spectrum ofMars observed with the infrared space observatory. Planet. Space Sci. 48, 1393–1405.
Orofino, V., Blanco, A., Fonti, S., Proce, R., Rotundi, A., 1998. The infrared opticalconstants of limestone particles and implications for the search of carbonateson Mars. Planet. Space Sci. 46, 1659–1669.
Pollack, J.B., Roush, T., Witteborn, F., Bregman, J., Wooden, D., Stoker, C., Toon, O.B.,Rank, D., Dalton, B., Freedman, R., 1990. Thermal emission spectra of Mars (5.4–10.5 lm): Evidence for sulfates, carbonates, and hydrates. J. Geophys. Res. 95(B9), 14595–14627.
Quinn, R., Zent, A.P., McKay, C.P., 2006. The photochemical stability of carbonates onMars. Astrobiology 6, 581–591. doi:10.1089/ast.2006.6.581.
Salisbury, J.W., 1991. Infrared (2.1–25 lm) Spectra of Minerals. John Hopkins Univ.Press, Baltimore, MD, USA.
Salisbury, J.W., Wald, A., 1992. The role of volume scattering in reducing spectralcontrast of reststrahlen bands in spectra of powdered minerals. Icarus 96, 121–128.
Smith, E., Gottlieb, D., 1974. Solar flux and its variations. Space Sci. Rev. 16, 771–802.
Stanger, G., Neal, C., 1994. The occurrence and chemistry of huntite from Oman.Chem. Geol. 112, 247–254.
Wagner, C., Schade, U., 1996. Measurements and calculations for estimating thespectrometric detection limit for carbonates in martian soil. Icarus 123, 256–268.
Wilson, S.A., Raudsepp, M., Dipple, G.M., 2006. Verifying and quantifying carbonfixation from serpentine-rich mine tailings using the Rietveld method with X-ray powder diffraction data. Am. Mineral. 91, 1331–1341.