Evaluation of a GIS-Based Integrated Vulnerability Risk Assessment for the Mancha Oriental System...
21
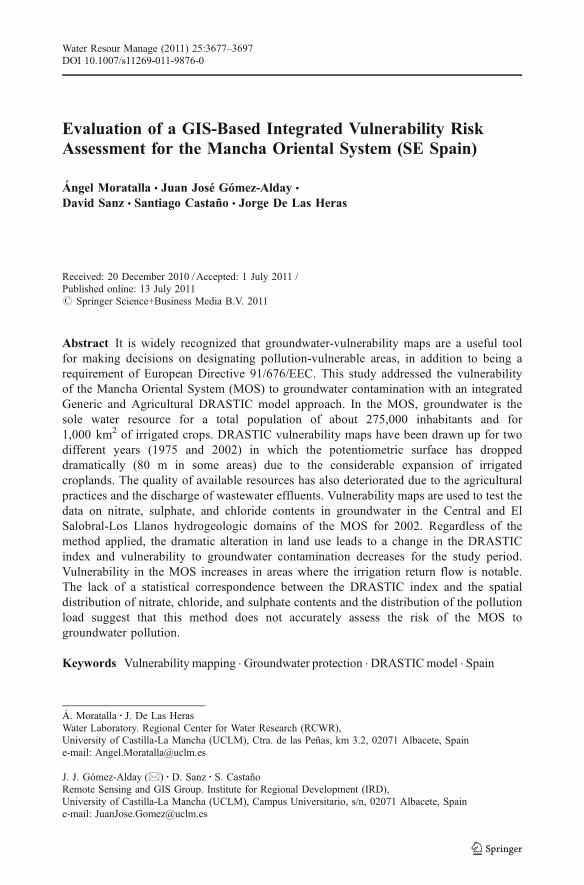
Evaluation of a GIS-Based Integrated Vulnerability Risk Assessment for the Mancha Oriental System (SE Spain) Ángel Moratalla & Juan José Gómez-Alday & David Sanz & Santiago Castaño & Jorge De Las Heras Received: 20 December 2010 / Accepted: 1 July 2011 / Published online: 13 July 2011 # Springer Science+Business Media B.V. 2011 Abstract It is widely recognized that groundwater-vulnerability maps are a useful tool for making decisions on designating pollution-vulnerable areas, in addition to being a requirement of European Directive 91/676/EEC. This study addressed the vulnerability of the Mancha Oriental System (MOS) to groundwater contamination with an integrated Generic and Agricultural DRASTIC model approach. In the MOS, groundwater is the sole water resource for a total population of about 275,000 inhabitants and for 1,000 km 2 of irrigated crops. DRASTIC vulnerability maps have been drawn up for two different years (1975 and 2002) in which the potentiometric surface has dropped dramatically (80 m in some areas) due to the considerable expansion of irrigated croplands. The quality of available resources has also deteriorated due to the agricultural practices and the discharge of wastewater effluents. Vulnerability maps are used to test the data on nitrate, sulphate, and chloride contents in groundwater in the Central and El Salobral-Los Llanos hydrogeologic domains of the MOS for 2002. Regardless of the method applied, the dramatic alteration in land use leads to a change in the DRASTIC index and vulnerability to groundwater contamination decreases for the study period. Vulnerability in the MOS increases in areas where the irrigation return flow is notable. The lack of a statistical correspondence between the DRASTIC index and the spatial distribution of nitrate, chloride, and sulphate contents and the distribution of the pollution load suggest that this method does not accurately assess the risk of the MOS to groundwater pollution. Keywords Vulnerability mapping . Groundwater protection . DRASTIC model . Spain Water Resour Manage (2011) 25:3677–3697 DOI 10.1007/s11269-011-9876-0 Á. Moratalla : J. De Las Heras Water Laboratory. Regional Center for Water Research (RCWR), University of Castilla-La Mancha (UCLM), Ctra. de las Peñas, km 3.2, 02071 Albacete, Spain e-mail: [email protected] J. J. Gómez-Alday (*) : D. Sanz : S. Castaño Remote Sensing and GIS Group. Institute for Regional Development (IRD), University of Castilla-La Mancha (UCLM), Campus Universitario, s/n, 02071 Albacete, Spain e-mail: [email protected]
-
Upload
independent -
Category
Documents
-
view
2 -
download
0
Transcript of Evaluation of a GIS-Based Integrated Vulnerability Risk Assessment for the Mancha Oriental System...
Evaluation of a GIS-Based Integrated Vulnerability RiskAssessment for the Mancha Oriental System (SE Spain)
Ángel Moratalla & Juan José Gómez-Alday &
David Sanz & Santiago Castaño & Jorge De Las Heras
Received: 20 December 2010 /Accepted: 1 July 2011 /Published online: 13 July 2011# Springer Science+Business Media B.V. 2011
Abstract It is widely recognized that groundwater-vulnerability maps are a useful toolfor making decisions on designating pollution-vulnerable areas, in addition to being arequirement of European Directive 91/676/EEC. This study addressed the vulnerabilityof the Mancha Oriental System (MOS) to groundwater contamination with an integratedGeneric and Agricultural DRASTIC model approach. In the MOS, groundwater is thesole water resource for a total population of about 275,000 inhabitants and for1,000 km2 of irrigated crops. DRASTIC vulnerability maps have been drawn up for twodifferent years (1975 and 2002) in which the potentiometric surface has droppeddramatically (80 m in some areas) due to the considerable expansion of irrigatedcroplands. The quality of available resources has also deteriorated due to the agriculturalpractices and the discharge of wastewater effluents. Vulnerability maps are used to test thedata on nitrate, sulphate, and chloride contents in groundwater in the Central and ElSalobral-Los Llanos hydrogeologic domains of the MOS for 2002. Regardless of themethod applied, the dramatic alteration in land use leads to a change in the DRASTICindex and vulnerability to groundwater contamination decreases for the study period.Vulnerability in the MOS increases in areas where the irrigation return flow is notable.The lack of a statistical correspondence between the DRASTIC index and the spatialdistribution of nitrate, chloride, and sulphate contents and the distribution of the pollutionload suggest that this method does not accurately assess the risk of the MOS togroundwater pollution.
Keywords Vulnerability mapping . Groundwater protection . DRASTICmodel . Spain
Water Resour Manage (2011) 25:3677–3697DOI 10.1007/s11269-011-9876-0
Á. Moratalla : J. De Las HerasWater Laboratory. Regional Center for Water Research (RCWR),University of Castilla-La Mancha (UCLM), Ctra. de las Peñas, km 3.2, 02071 Albacete, Spaine-mail: [email protected]
J. J. Gómez-Alday (*) : D. Sanz : S. CastañoRemote Sensing and GIS Group. Institute for Regional Development (IRD),University of Castilla-La Mancha (UCLM), Campus Universitario, s/n, 02071 Albacete, Spaine-mail: [email protected]

1 Introduction
Vulnerability maps can be used to delineate priority areas for monitoring networks in thesurveillance of potential pollution sites, to select areas for waste disposal and agriculturaland industrial development, to define critical areas for the maintenance of ecosystems, andfor the monitoring and assessment of transboundary groundwater systems. Groundwatervulnerability is considered an intrinsic property of groundwater that depends on itssensitivity to human and natural impacts defined by the combination of natural and humanfactors (Seeling and Nowatzki 2001; Babiker et al. 2005; Jamrah et al. 2008). In this sense,Vrba and Zaporozec (1994 and references therein) distinguish specific (or integrated)vulnerability when integrating the potential impacts of specific land uses and contaminants.Certain extensive agricultural practices and urban and industrial-related waste are the mostsignificant threats to groundwater. Prevention of this kind of pollution is critical foreffective groundwater management. In fact, European Directives have been established tominimize water body deterioration (OJEU 1991; OJEU 2000; OJEU 2006). The ManchaOriental System (MOS) was declared a vulnerable zone to nitrate pollution (OJCM 2003)by the Regional Government (Junta de Comunidades de Castilla-La Mancha). Groundwatervulnerability was addressed on the basis of the nitrogen load from agricultural activities(irrigation), groundwater consumption for urban supply, nitrate contents in groundwater,and the proximity of geologic materials to the ground surface. The boundaries of thevulnerability zone established were not delineated taking into account hydrogeologiccriteria, such as the hydrogeologic system boundaries.
The concept of groundwater vulnerability to contamination was introduced by Margat(1968), and since this work many techniques have been developed for analysing aquifervulnerability. Models can be grouped into overlay/index, process-based simulation, andstatistical inference approaches. A thorough overview of existing methods and theirlimitations can be found in Zhang et al. (1996), Tesoriero et al. (1998), Foster (2002),Babiker et al. (2005), Murray and McCray (2005), Almasri (2008), Chitsazan and Akhtari(2008), Sener et al. (2009), and Kaur and Rosi (2011), among others. For mappingvulnerability in the MOS, the DRASTIC method was selected because it is in agreementwith the hydrogeological knowledge available and it is the most popular and standardizedmethod. It was originally developed in the United States for achieving nationwideconsistency (Aller et al. 1987) and has since been put into practice for different aquifersystems globally (Al-zabet 2002; Vias et al. 2005; Ettazarini 2006; Almasri 2008; Al-Hanbali and Kondoh 2008; Sener et al. 2009). The target of the model is to categorizewhich zones are worthy of special attention, but it is not intended to predict the occurrenceof groundwater contamination. Basically, the model is constructed by designating mappableunits and superposing a relative numerical rating system. As agriculture is the main activityin the study area, the Agricultural DRASTIC index (ADi) maps were developed using theweights from the pesticide DRASTIC index proposed by Aller et al. (1987). This model is asuitable method for regions where modern irrigation methods and nitrogen-based fertilizersare mainly used (Ettazarini 2006; Remesan and Panda 2008). In these areas, it isappropriate to use a method that gives more weight to soil and topography impacts. Forcomparison purposes, the Generic DRASTIC index (GDi) has also been calculatedfollowing Aller et al. (1987).
The DRASTIC index is very sensitive to parameter ranges and weightings and thevalues assigned to those parameters are modified according to the particular characteristicsof the study area. This method has been successfully applied in many studies (Evans andMyers 1990; Secunda et al. 1998; Fritch et al. 2000; Baalousha 2006; Ettazarini 2006; Wen
3678 Á. Moratalla et al.
et al. 2008; Sener et al. 2009; Boughriba et al. 2010), although it does not always providereliable estimates of the contamination potential of groundwater bodies (Stark et al. 1999;Rupert 2001; Pérez and Pacheco 2004; Stigter et al. 2006; Baalousha 2006; Almasri 2008).Usually, method validation is addressed by comparing the DRASTIC vulnerability map togroundwater contamination derived by geostatistical interpolation of hydrochemicaldatasets (Secunda et al. 1998; Al-Adamat et al. 2003; Antonakos and Lambrakis 2007;Assaf and Saadeh 2008; Chitsazan and Akhtari 2008; Jamrah et al. 2008; Sener et al. 2009)and as a percentage of detection frequencies (as used by Murray and McCray 2005).
Vulnerability maps for the MOS on the basis of GDi and ADi models have been drawnup for 1975 and 2002. During this period, land use changed dramatically as a consequenceof an increase in irrigated cropland to about 1,000 km2, requiring about 398 Mm3 year−1 ofgroundwater supply. Certain groundwater pollutants have increased in tandem with theexpansion of the irrigated crop area and urban development. For instance, nitrate contentsin MOS groundwater jumped from a mean value of 8.1 mg l−1 in 1975 to 33.0 mg l−1 in2002. Nitrate contents in groundwater are higher than 25 mg l−1 in 53% of wells monitoredand exceed the EU maximum allowable contaminant level of 50 mg l−1 (OJEU 1991) in14% of wells sampled. Moratalla et al. (2009) point out that the nitrate source can beassociated with the use of inorganic fertilizers applied to crops, although highconcentrations of nitrates and chloride confined to localized areas may be related to urbanpollution sources (e.g., wastewater disposal from the city of Albacete and other smalltowns). Other pollutants such as anthropogenically derived sulphate may be contributing toMOS groundwater degradation as well. Anthropogenic sources of these solutes includefarming products (such as animal manure, fertilizer, and irrigation return flow), householdsewage, landfill leachates, and industrial effluents (Hem 1986; Hudak and Sanmanee 2003).In this study, the effect of the amount of cropland under intensive irrigation on theDRASTIC index spatial variability was analysed since this change has significantconsequences on groundwater flow and recharge patterns. The DRASTIC vulnerabilitymaps for groundwater contamination were checked against nitrate, sulphate, and chloridegroundwater concentrations derived by geostatistical interpolation, and the potentialpollution load. We also analysed the most effective parameter for explaining both thegroundwater vulnerability index and the calculated chemical species concentration maps.
2 The Study Area
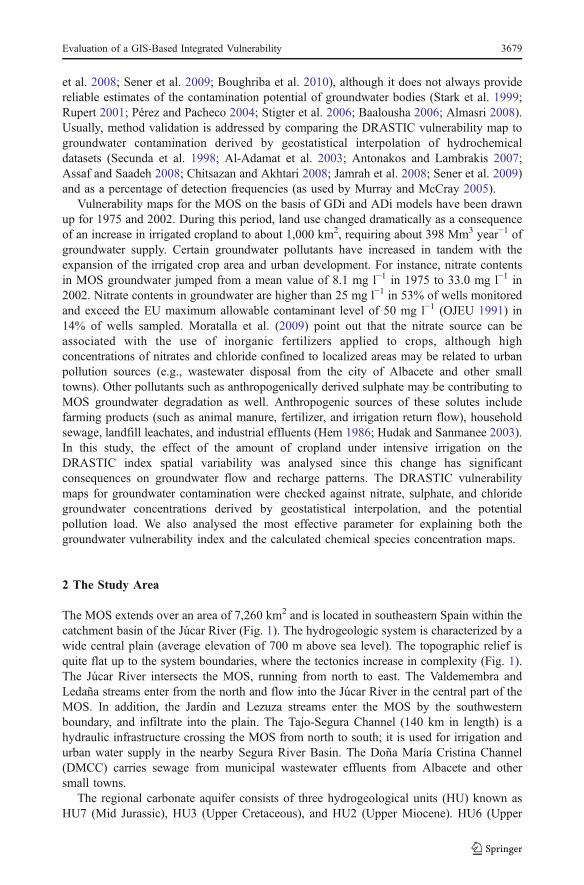
The MOS extends over an area of 7,260 km2 and is located in southeastern Spain within thecatchment basin of the Júcar River (Fig. 1). The hydrogeologic system is characterized by awide central plain (average elevation of 700 m above sea level). The topographic relief isquite flat up to the system boundaries, where the tectonics increase in complexity (Fig. 1).The Júcar River intersects the MOS, running from north to east. The Valdemembra andLedaña streams enter from the north and flow into the Júcar River in the central part of theMOS. In addition, the Jardín and Lezuza streams enter the MOS by the southwesternboundary, and infiltrate into the plain. The Tajo-Segura Channel (140 km in length) is ahydraulic infrastructure crossing the MOS from north to south; it is used for irrigation andurban water supply in the nearby Segura River Basin. The Doña María Cristina Channel(DMCC) carries sewage from municipal wastewater effluents from Albacete and othersmall towns.
The regional carbonate aquifer consists of three hydrogeological units (HU) known asHU7 (Mid Jurassic), HU3 (Upper Cretaceous), and HU2 (Upper Miocene). HU6 (Upper
Evaluation of a GIS-Based Integrated Vulnerability 3679
Jurassic) forms a locally important carbonate aquifer (Fig. 1). The HU8 (Lower Jurassic),HU5 (Upper Jurassic), HU4 (Lower Cretaceous), and HU1 (Lower to Upper Miocene) arecomposed of marly to fine- to coarse-grained detrital deposits and are considered to beregional aquitard or aquiclude units. The marl and clay deposits of HU8 are regarded as thebasal regional impermeable layer. HU9 (Upper Triassic) is made up of gypsum- and halite-bearing clays with heavily variegated colours. Based on the geological structure,groundwater level evolution, and hydrochemical zones, the MOS can be divided into sixhydrogeologic domains (Fig. 1): the Northern Domain (ND), Central Domain (CD), ElSalobral-Los Llanos Domain (SLD), Moro-Nevazos Domain (MND), Pozo Cañada Domain(PCD), and Montearagón-Carcelén Domain (MCD). The hydrochemical facies are inagreement with the carbonate and evaporite deposits from the MOS. The water type rangesfrom CaMgHCO3 in the north and centre to CaMgHCO3-CaMgSO4 in the south. TheMOS hydrogeology is described in detail in Sanz et al. (2009, 2010). The climate in thestudy area is continental and semi-arid, with extreme temperatures occuring in both summerand winter. During the summer, the average monthly temperature is about 22°C. In contrast,during the winter season it is about 6°C. The mean annual precipitation (1946–2002) isclose to 350 mm, ranging from 280 mm yr−1 in southern areas to 550 mm yr−1 in northernones. The precipitation pattern has high inter-annual variability, reaching as low as150 mm yr−1 in dry years and as high as 750 mm yr−1 in humid ones.
Irrigated crops covered an area of 170 km2 in 1975 (Arenas et al. 1982). A remarkableincrease in irrigated cropland occurred between 1985 and 2002, with approximately1,000 km2 of cropland currently under irrigation (Sanz et al. 2009). Groundwaterabstractions (398 Mm3 year−1 for irrigation; 8 Mm3 year−1 for urban supply) are notbalanced with available groundwater resources (323 Mm3 year−1, estimated by Estrela et al.2004), which has brought about a progressive drop in groundwater levels that amounts toabout 80 m in the SLD. The regional groundwater flow system has changed considerably intandem with the progressive rise in groundwater abstractions. In 1975, the effects ofgroundwater exploitation for irrigation purposes were not noticeable, and the MOS wasconsidered to be in steady state conditions, with regional groundwater flow convergingtowards the Júcar River. The expansion of irrigated cropland, though, has brought aboutnotable changes in groundwater flow, with shifts in flow directions observable in 2002 tosectors where cones of depression had developed as a result of irrigation withdrawals. TheJúcar River also changes in behaviour along the river course. The loss of saturatedthickness in the aquifer system due to groundwater abstractions is reduced due to rechargefrom the Júcar River.
The deterioration in MOS groundwater quality is evident when comparing thehydrochemical data bases for 1970–1975 and 1998–2004 in the CD and DSL (Moratalla2010). Mean concentrations of nitrate and sulphate in groundwater rose dramaticallybetween 1970–1975 and 1998–2004 (Table 1) in the CD and DSL. In the CD, nitratecontents vary from below detection limits to a mean value of 31.3 mg l−1; the meansulphate concentration has also increased, from 86.9 for 1970–1975 to 170.9 mg l−1 in1998–2004. In the SLD domain, mean nitrate concentrations range from below detectionlimits to a mean value of 23.9 mg l−1. An increase in sulphate contents is also evident,
Fig. 1 Location of study area in the Júcar River Basin (JRB) and simplified geological map of the MOSshowing sample supply wells. Segura River Basin (SRB). Hydraulic infrastructures are the Tajo-SeguraChannel (TSC) and Doña María Cristina Channel (DMCC). Hydrostructural domains, Northern Domain(ND), Central Domain (CD), El Salobral-Los Llanos Domain (SLD), Moro-Nevazos Domain (MND),Pozocañada Domain (PCD), and Montearagón-Carcelén Domain (MCD). Position of hydrostratigraphiccross-sections are indicated by Roman numerals I–I′ and II-II′
�
3680 Á. Moratalla et al.

Evaluation of a GIS-Based Integrated Vulnerability 3681
Tab
le1
DRASTIC
ratin
gsandweigh
tsadaptedforthisstud
y.D:d
epth
towater
table;R:n
etrecharge;A
:aquifer
media;S
:soilm
edia;T
:top
ograph
y;I:im
pactof
vado
sezone;
C:hydraulic
conductiv
ity.A
OS:Aridisol-Orthid-Salorthid;IO
R:Inceptisol-O
chrept-Rhodoxeralf;OXI:Oxisol;PA
:Poordevelopedor
absent
soil.
Generic(G
)andAgricultural
(A)weightsforDRASTIC
factorsareafterAlleret
al.(198
7)
Ratings
D(m
)R(m
m)
AS
T(%
)I
C(m
/day)
Range
Rating
Range
Rating
Range
Rating
Range
Rating
Range
Rating
Range
Rating
Range
Rating
<40
100–50
1HU2
6AOS
40–2
10UH7
10<4
2
40–80
950–100
3HU3
8IO
R5
2–6
9UH2
84–12
2
80–120
710
0–18
06
HU7
10OXI
96–12
5UH1
612–28
4
120–16
05
PA10
12–18
3UH3andUH4
428–40
6
160–20
02
>18
1UH4
140–80
8
>20
01
>80
10
Weights
G5
43
21
53
A5
43
53
42
3682 Á. Moratalla et al.

rising from 148.9 for 1970–1975 to 248.5 mg l−1 for 1998–2004. Mean chlorideconcentrations show subtle variations in these periods but can reach maximum values ofabout 324.4 mg l−1 in the CD, and 57.4 mg l−1 in the DSL during the same time span.Minimun chloride background values are around 3.0 mg l−1.
Corine Land Cover 2000 data (IGN 2000) indicates that the principal land use isagriculture, at 5,548 km2 (75.7%). Natural vegetation covers about 1,661 km2 (22.6%) andurban land use and surface water bodies only represent about 125 km2 (1.7%). Dry cropsoccupy 4,575 km2 and are mainly represented by cereals (barley and wheat), sunflower, andgrapevines. About 973 km2 is dedicated to irrigated crops, which are classified into summerirrigated crops (SUIC), spring irrigated crops (SIC), alfalfa, double harvest crops (DHC), andgrapevines. Major SUIC include corn, sunflower, beet, onion, tomato, and green beans;barley, SIC comprise wheat and garlic; and DHC are a combination of barley and corn.During the crop seasons, nitrogen fertilizers are extensively applied and constitute the largestN-input. Dry crops showed a N consumption of about 14,757 tyr−1 for 2000 (Moratalla2010). Irrigated crops occupy a smaller area but require about 12,894 tyr−1 of N fromfertilizers. Urban and industrial sources represent 4% of the total N-input (1,359 tyr−1).
3 Methodology
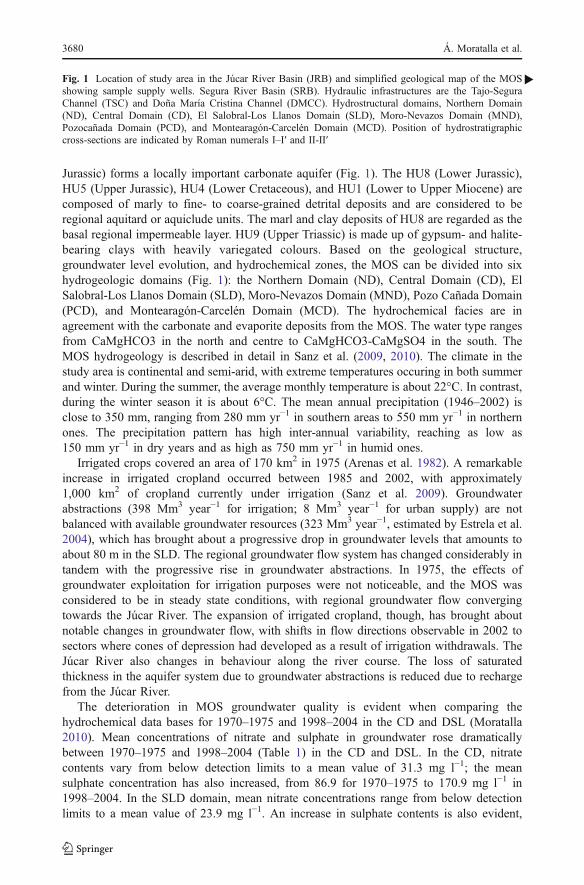
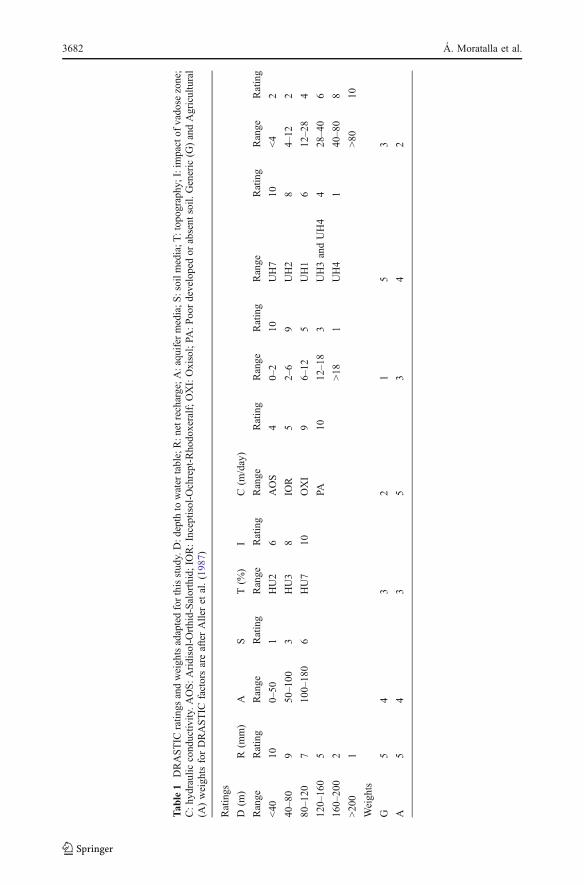
Seven parameters were used to calculate the DRASTIC vulnerability index: Depth to thewater table, net Recharge, Aquifer media, Soil media, Topography, Impact of vadose zone,and hydraulic Conductivity (see Aller et al. 1987, for further details). The significant mediaclassifications of each parameter represent the ranges, rated from 1 to 10 based on theirrelative effects on aquifer vulnerability. The seven parameters were then assigned weightsranging from 1 to 5 to reflect their relative importance in the study area (Table 1). TheDRASTIC index was computed by applying a linear combination of the factors consideredaccording to the following expression:
DRASTIC index ¼ DrDwþ RrRwþ ArAwþ SrSwþ TrTwþ IrIwþ CrCw ð1ÞWhere D, R, A, S, T, I, and C are the seven parameters mentioned above, and subscripts
r and w are the corresponding ratings and weights, respectively. Subscript r was selectedaccording to the Delphi technique (Aller et al. 1987). Generic (G) and Agricultural (A)weights for DRASTIC factors were taken from Aller et al. (1987) as they were consideredappropriate for the MOS. The large quantity of data gathered and the size of the study areamade it necessary to use a system for information organization and visualization.Alphanumeric data were georeferenced to the UTM coordinate system, European Datum30N, Hayford’s ellipsoid 1950 (ED50). The data was entered into a Microsoft OfficeAccess® geodatabase linked to GIS (Arc-Gis 9.2®) by means of Structural QueryLanguage. A finite difference grid with a uniform pixel size of 100×100 m2 was performedfor each of the seven parameters (thematic grid maps). The normalized work scale for theDRASTIC index obtained ranged from 1:250000 to 1:500000.
A total of 164 water samples were collected and analysed in 2002, and the Júcar RiverBasin Authority hydrochemical analyses were used to complete the hydrochemistrydatabase. Nitrate, chloride, and sulphate concentrations were obtained using ionicchromatography following standard methods (APHA-AWWA-WEF 1998). Ion concentra-tion maps were obtained using an ordinary kriging interpolation algorithm. A structuralanalysis of the variable to be interpolated was constructed by adjusting the experimental
Evaluation of a GIS-Based Integrated Vulnerability 3683
semivariograms on a theoretical basis to those with similar behaviour. This procedure servesto calculate a matrix of weights for each item and to estimate the statistical error affectingthe interpolation. For all cases, a stationary or spherical theoretical model was chosen.Correlation coefficient and regression analysis was performed to check to what extent theGDi or ADi maps, DRASTIC parameters, and potential pollution load agreed with thespatial distribution of, nitrate, chloride, and sulphate concentrations in groundwater.
4 DRASTIC Vulnerability Index Development
4.1 Depth to Water Table
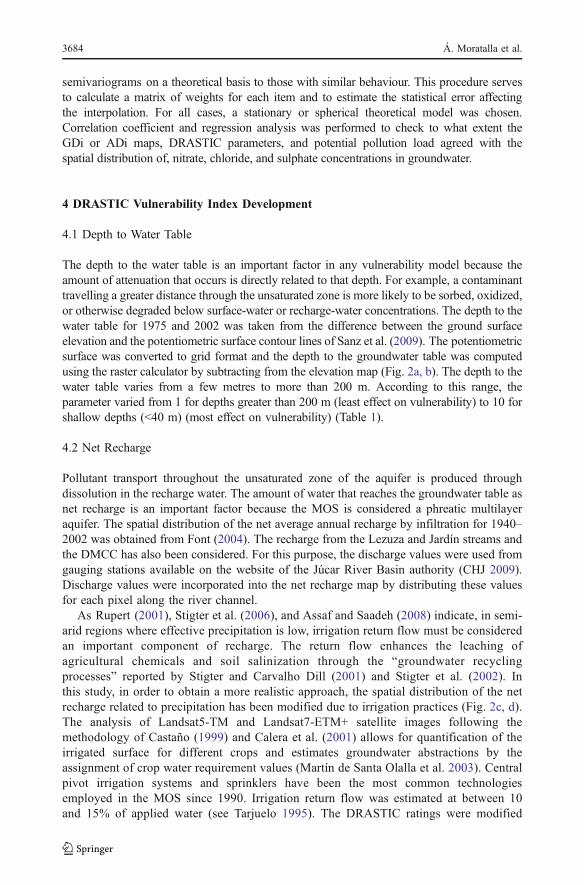
The depth to the water table is an important factor in any vulnerability model because theamount of attenuation that occurs is directly related to that depth. For example, a contaminanttravelling a greater distance through the unsaturated zone is more likely to be sorbed, oxidized,or otherwise degraded below surface-water or recharge-water concentrations. The depth to thewater table for 1975 and 2002 was taken from the difference between the ground surfaceelevation and the potentiometric surface contour lines of Sanz et al. (2009). The potentiometricsurface was converted to grid format and the depth to the groundwater table was computedusing the raster calculator by subtracting from the elevation map (Fig. 2a, b). The depth to thewater table varies from a few metres to more than 200 m. According to this range, theparameter varied from 1 for depths greater than 200 m (least effect on vulnerability) to 10 forshallow depths (<40 m) (most effect on vulnerability) (Table 1).
4.2 Net Recharge
Pollutant transport throughout the unsaturated zone of the aquifer is produced throughdissolution in the recharge water. The amount of water that reaches the groundwater table asnet recharge is an important factor because the MOS is considered a phreatic multilayeraquifer. The spatial distribution of the net average annual recharge by infiltration for 1940–2002 was obtained from Font (2004). The recharge from the Lezuza and Jardín streams andthe DMCC has also been considered. For this purpose, the discharge values were used fromgauging stations available on the website of the Júcar River Basin authority (CHJ 2009).Discharge values were incorporated into the net recharge map by distributing these valuesfor each pixel along the river channel.
As Rupert (2001), Stigter et al. (2006), and Assaf and Saadeh (2008) indicate, in semi-arid regions where effective precipitation is low, irrigation return flow must be consideredan important component of recharge. The return flow enhances the leaching ofagricultural chemicals and soil salinization through the “groundwater recyclingprocesses” reported by Stigter and Carvalho Dill (2001) and Stigter et al. (2002). Inthis study, in order to obtain a more realistic approach, the spatial distribution of the netrecharge related to precipitation has been modified due to irrigation practices (Fig. 2c, d).The analysis of Landsat5-TM and Landsat7-ETM+ satellite images following themethodology of Castaño (1999) and Calera et al. (2001) allows for quantification of theirrigated surface for different crops and estimates groundwater abstractions by theassignment of crop water requirement values (Martín de Santa Olalla et al. 2003). Centralpivot irrigation systems and sprinklers have been the most common technologiesemployed in the MOS since 1990. Irrigation return flow was estimated at between 10and 15% of applied water (see Tarjuelo 1995). The DRASTIC ratings were modified
3684 Á. Moratalla et al.

accordingly and a rating of 1 was set for low net recharge and a rating of 6 for high netrecharge (Table 1).
4.3 Aquifer Media
The aquifer media factor is related to the capacity of the aquifer material to store andtransport groundwater pollutants along a flow path. The three-dimensional hydrostrati-graphic framework visualization of the MOS constructed by Sanz et al. (2009) was used torepresent the spatial extent of the various aquifer types in the MOS vulnerability model.The elevations of the top and bottom of the HU2, HU3, and HU7 (with a total of 516points) with detailed stratigraphic data have been interpolated through the use ofgeostatistical methods such as ordinary kriging interpolation. Additional information wasobtained by digitizing and georeferencing the synthetic geological map (1:200000), and the
Fig. 2 Depth to groundwater level from ground surface (m.b.s) for: 1975 (a), 2002 (b) and estimatedirrigation return flow for: 1975 (c), 2002 (d)
Evaluation of a GIS-Based Integrated Vulnerability 3685
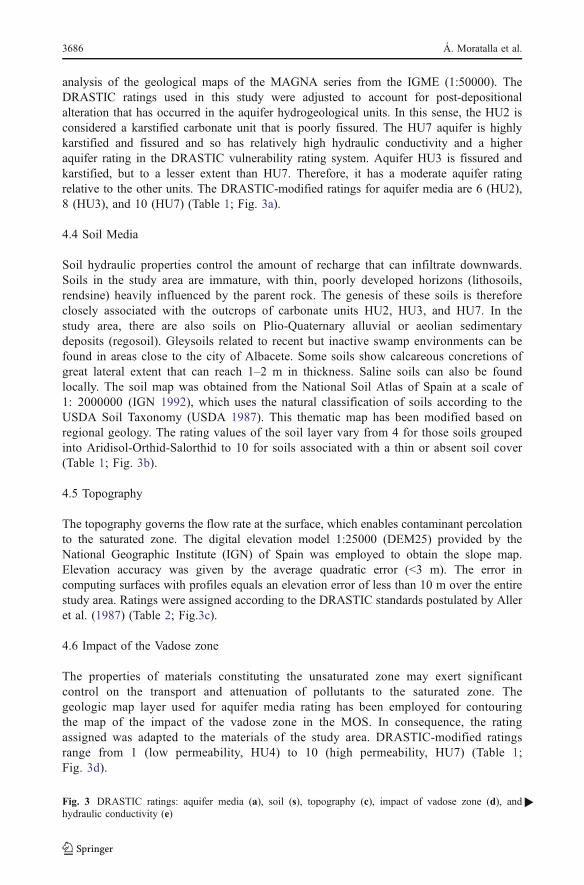
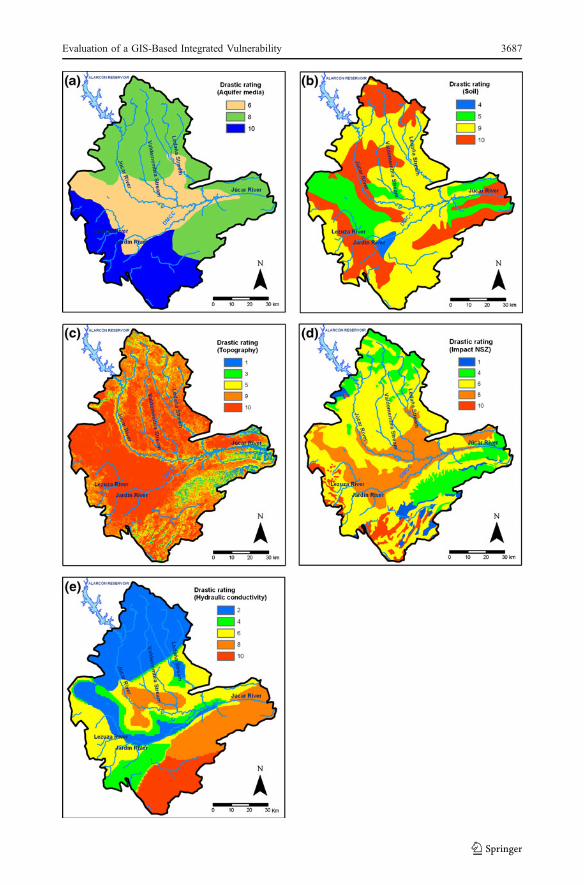
analysis of the geological maps of the MAGNA series from the IGME (1:50000). TheDRASTIC ratings used in this study were adjusted to account for post-depositionalalteration that has occurred in the aquifer hydrogeological units. In this sense, the HU2 isconsidered a karstified carbonate unit that is poorly fissured. The HU7 aquifer is highlykarstified and fissured and so has relatively high hydraulic conductivity and a higheraquifer rating in the DRASTIC vulnerability rating system. Aquifer HU3 is fissured andkarstified, but to a lesser extent than HU7. Therefore, it has a moderate aquifer ratingrelative to the other units. The DRASTIC-modified ratings for aquifer media are 6 (HU2),8 (HU3), and 10 (HU7) (Table 1; Fig. 3a).
4.4 Soil Media
Soil hydraulic properties control the amount of recharge that can infiltrate downwards.Soils in the study area are immature, with thin, poorly developed horizons (lithosoils,rendsine) heavily influenced by the parent rock. The genesis of these soils is thereforeclosely associated with the outcrops of carbonate units HU2, HU3, and HU7. In thestudy area, there are also soils on Plio-Quaternary alluvial or aeolian sedimentarydeposits (regosoil). Gleysoils related to recent but inactive swamp environments can befound in areas close to the city of Albacete. Some soils show calcareous concretions ofgreat lateral extent that can reach 1–2 m in thickness. Saline soils can also be foundlocally. The soil map was obtained from the National Soil Atlas of Spain at a scale of1: 2000000 (IGN 1992), which uses the natural classification of soils according to theUSDA Soil Taxonomy (USDA 1987). This thematic map has been modified based onregional geology. The rating values of the soil layer vary from 4 for those soils groupedinto Aridisol-Orthid-Salorthid to 10 for soils associated with a thin or absent soil cover(Table 1; Fig. 3b).
4.5 Topography
The topography governs the flow rate at the surface, which enables contaminant percolationto the saturated zone. The digital elevation model 1:25000 (DEM25) provided by theNational Geographic Institute (IGN) of Spain was employed to obtain the slope map.Elevation accuracy was given by the average quadratic error (<3 m). The error incomputing surfaces with profiles equals an elevation error of less than 10 m over the entirestudy area. Ratings were assigned according to the DRASTIC standards postulated by Alleret al. (1987) (Table 2; Fig.3c).
4.6 Impact of the Vadose zone
The properties of materials constituting the unsaturated zone may exert significantcontrol on the transport and attenuation of pollutants to the saturated zone. Thegeologic map layer used for aquifer media rating has been employed for contouringthe map of the impact of the vadose zone in the MOS. In consequence, the ratingassigned was adapted to the materials of the study area. DRASTIC-modified ratingsrange from 1 (low permeability, HU4) to 10 (high permeability, HU7) (Table 1;Fig. 3d).
Fig. 3 DRASTIC ratings: aquifer media (a), soil (s), topography (c), impact of vadose zone (d), andhydraulic conductivity (e)
�
3686 Á. Moratalla et al.
Evaluation of a GIS-Based Integrated Vulnerability 3687

4.7 Hydraulic Conductivity
The transport and fate of pollutants within the groundwater system depend greatly on thesystem capability for mass transfer. The magnitude and spatial distribution of hydraulicconductivity (C) is a key parameter to estimate pollutant transport time. C is directly related tothe transmissivity (T) through the saturated aquifer thickness (b). Transmissivity (T) andspecific yield (q) data were gathered in 587 boreholes employed to obtain T-q data pairs (seeSanz et al. 2009 for further details). Saturated aquifer thickness data (b) were acquired bysubtracting the elevations of the top and the bottom of HU2, HU3, and HU7. Statisticalanalysis of the T values estimated from the empirical relationship between log-T and log-q,and estimated b values, allow for the derivation of hydraulic conductivities. DRASTIC-modified ratings range from 2 (low hydraulic conductivity, HU4) to 10 (high hydraulicconductivity, HU7) (Table 1; Fig. 3e).
5 Results and Discussion
5.1 Consequences of Irrigated Cropland Expansion on DRASTIC Vulnerability Index
According to the GDi, the vulnerability map for 1975 showed that the high, very high, andextremely high DRASTIC index values covered an area of about 3,056 km2 (42.1%) (Table 2;Fig. 4a). The lowest values (low to very low DRASTIC index) corresponded to a total area ofabout 1,811 km2 (24.9%) (Table 2; Fig. 4a). Moderate vulnerability extended over 2,395 km2
(33.0%). The ADi results in 1975 revealed a very large increase in vulnerability (Table 2;Fig. 4c): high, very high, and extremely high values increased to 6,142 km2 (84.6%).181 km2 (2.5%) of the total area was occupied by low to very low vulnerability zones. Thearea of moderate risk occupied about 939 km2 (12.9%). The vulnerability maps obtained for2002 show the result of land use changes on the ADi (Fig. 4b, d). Vulnerable areas from high,very high, and extremely high DRASTIC index values comprise 2,407 km2 (33.2%) for theGDi and 5,977 km2 (82.3%) for the ADi (Table 2; Fig. 4b, d). Areas classified as low to verylow vulnerability represent 2,186 km2 (30.2%) and 198 km2 (2.7%) for the GDi and ADi,respectively (Table 2; Fig. 4b, d). For the GDi, the moderately vulnerable areas covered over2,668 km2 (36.7%). For ADi, areas of moderate potential risk covered 1,088 km2 (15%).
Table 2 Classification of DRASTIC index map in terms of vulnerability for 1975 and 2002
1975 (GDi) 2002 (GDi) 1975 (ADi) 2002 (ADi)
Class Range Area(km2)
Coverage(%)
Area(km2)
Coverage(%)
Area(km2)
Coverage(%)
Area(km2)
Coverage(%)
Extrematelyhigh
>180 20 0.3 21 0.3 2018 27.8 1429 19.7
Very high 160–180 434 6.0 449 6.2 2478 34.1 2534 34.9
High 140–160 2602 35.8 1937 26.7 1646 22.7 2014 27.7
Moderate 120–140 2395 33.0 2668 36.7 939 12.9 1088 15.0
Low 100–120 1089 15.0 1376 19.0 166 2.3 181 2.5
Very Low <100 722 9.9 810 11.2 15 0.2 17 0.2
Total 7262 100.0 7262 100.0 7262 100.0 7262 100.0
3688 Á. Moratalla et al.

Although the extent of the calculated vulnerability areas is different for the ADi and GDimodels, it is noticeable that the location of the vulnerable areas does not change significantlybetween the two. As can be seen, in both models the most vulnerable zones correspond to thecentral and southern domains (CD, SLD, and MND) (Fig. 4). The comparison between theDRASTIC models considered reveals the high sensitivity to changes in weighting scores, butnot in the distribution of the relative potential areas to groundwater degradation.
The correlation coefficient analyses between the GDi and ADi and the DRASTICparameters allowed the vulnerability maps to be interpreted more objectively in terms ofwhich of the hydrogeological features controlling groundwater pollution better explain theDRASTIC index distribution in the MOS (Table 3). The DRASTIC index (GDi and ADimodels) is closely related to the depth of the potentiometric level, regardless of the yearconsidered. The coefficient of this media varies from 0.77 in 1975 to 0.73 in 2002 for the
Fig. 4 MOS vulnerability maps for: General Drastic index in 1975 (a), General Drastic index in 2002 (b),Agricultural Drastic index in 1975 (c), and Agricultural Drastic index in 2002 (d)
Evaluation of a GIS-Based Integrated Vulnerability 3689

GDi and 0.74 in 1975 to 0.69 in 2002 for the ADi. The lithology of the vadose zone is thesecond factor in importance and the coefficients range from 0.64 in 1975 to 0.63 in 2002 forthe GDi. Topography and hydraulic conductivity can be ranked in third place whenconsidering their influence on the GDi. In the ADi, the soil media occupies third position.The negative coefficient found between the net recharge and the DRASTIC index issignificant in 1975: -0.32 for the GDi and −0.13 for the ADi. These results underscore thehigh vulnerability of the natural system in the central and southern domains, coincidingwith the proximity to the ground surface of both the potentiometric surface and the HU2and HU7. In these domains, there are no significant topographic differences, and thehydraulic soil properties are more favourable for contaminant percolation (Fig. 4). Thesystem is less vulnerable to groundwater pollution in the northern sector of the ND andMCD, where the potentiometric surface is below 160 m, the HU7 is located at the greatestdepths, and there is considerable topographic relief. The DRASTIC index shows moderatevulnerability coinciding with the existence of extensive HU1 deposits.
The differences in the quantified surfaces between the years considered indicate that theGeneric DRASTIC model shows a regional decrease in MOS vulnerability. Nonetheless,this difference is not as notable when applying the agricultural DRASTIC scores, wherehigh, very high, and extremely high DRASTIC index values represent a difference of165 km2 in the study period. Conceptually, the effect of the change in the “net recharge” onthe groundwater vulnerability of the system, considering the increase in the irrigation returnflow from the irrigation surface, is in opposition to the groundwater table drop. Thus, thedecrease of the MOS in vulnerability to groundwater pollution due to the lowering of thegroundwater level is partially compensated for by the increase in recharge, resulting insubtle changes in the ADi for the 1975 and 2000 vulnerability maps. In consequence, theMOS vulnerability increases locally in areas where the irrigated cropland has expanded dueto the effect of increased irrigation return flow (Fig. 4d). Obviously, the consideration ofirrigation returns as part of the net Recharge parameter in arid or semi-arid areas hasconsiderable consequences on the resulting vulnerability maps. Therefore, net recharge is ofgreat relevance to vulnerability modelling, as other authors have pointed out (see Murrayand McCray 2005), mostly when it is not homogenously distributed in the hydrogeologicalsystem.
5.2 Testing Integrated DRASTIC Vulnerability Maps for 2002
An evaluation of the agricultural and generic DRASTIC indices has been carried out in theCentral and El Salobral-Los Llanos domains for 2002, wherein the nitrate, chloride, andsulphate datasets are more complete and data points are spatially well distributed (Fig. 5). In2002, nitrate concentrations ranged from 0.3 to 264.0 mg l−1 (mean value of 33.0 mg l−1).Chloride contents in groundwater ranged from 5.0 to 166.4 mg l−1 (mean value of
Table 3 Correlation coefficients between the Generic DRASTIC index (GDi) and Agricultural DRASTICindex (ADi) and factors for 1975 and 2002
D R A S T I C
GDi 1975 0.77 −0.32 0.08 −0.04 0.35 0.64 0.25
GDi 2002 0.73 0.11 −0.07 −0.09 0.34 0.63 0.23
ADi 1975 0.74 −0.13 0.09 0.19 0.53 0.51 0.03
ADi 2002 0.69 0.20 0.00 0.17 0.52 0.53 0.03
3690 Á. Moratalla et al.

48.5 mg l−1). As for sulphate, concentrations varied from 7.3 to 1081.2 mg l−1 (mean valueof 210.4 mg l−1).
Although visual examination of the maps seems to validate the spatial distribution of theions and vulnerability zones considered, the statistical correlation among these variables ispoor even though the p-value is lower than 0.001 (Table 4). The multiple regressionanalyses considering the ADi or GDi and the potential pollution load (after Moratalla 2010)as independent variables, and nitrate contents in groundwater as the dependent variable,also shows p-values lower than 0.001. The R-square values indicate that the model onlyaccounts for about 5.67% of the total nitrate groundwater content variability for the ADiand 1.08% for the GDi (Table 5). Nonetheless, it is possible that the approach carried outmay not capture the probabilistic nature or the uncertainty of groundwater vulnerability,thus making the validation difficult.
Fig. 5 Groundwater contamination maps (mg l−1) for 2002 in the CD and SLD for: nitrate (a) chloride (b),sulphate (c), and pollutant load map (d)
Evaluation of a GIS-Based Integrated Vulnerability 3691

In order to identify the most effective parameter for explaining groundwatervulnerability and the calculated nitrate, chloride, and sulphate spatial distribution layer, acorrelation coefficient analysis was performed (Table 6). Statistical results suggest that thebest positive correlation is between the GDi and the sulphate spatial distribution (correlationcoefficient=0.31). With regard to nitrate and chloride distribution, the ADi shows a highercorrelation than the GDi (Table 6). The impact of the water table depth is the mostinfluential parameter on groundwater sulphate (correlation coefficient=0.46) and chloride(correlation coefficient=0.31) spatial distribution in the MOS. This positive correlation canbe explained by the effect of the intensive groundwater abstractions, which lead to a shift tosulphate and chloride hydrofacies. Nitrates and chloride show a positive correlation
Table 5 Results of multiple regression analysis between nitrate concentration, Agricultural DRASTIC index(ADi) or Generic DRASTIC index (GDi) and pollution load (pl) in the Central Domain and El Salobral-LosLlanos Domain for 2002. Std. Error: Standard error
Predictor Coefficient Std error p-value
Constant 2.20 1.69 0.081
ADi 0.22 0.01 <0.001
pl −0.01 0.07 <0.001
Square-R (%) 5.67
Nitrate=2.20+0.22 ADi-0.01 Land use
Constant 24.45 1.69 <0.001
GDi −0.14 0.01 <0.001
pl 0.17 0.07 <0.001
Square-R (%) 1.08
Nitrate=30.50+2.29 GDi+0.17 Land use
Table 4 Results of the simple regression analysis between the Agricultural DRASTIC index (ADi) andGeneric DRASTIC index (GDi) and nitrate, sulphate and chloride contents in the Central Domain and ElSalobral-Los Llanos Domain for 2002. Std. Error: Standard error
Predictor Coefficient Std error p-value Coefficient Std error p-value
ADi versus Nitrate contents GDi versus Nitrate contents
Constant 3.17 1.23 0.0103 22.50 1.36 <0.001
DRASTIC index 0.21 0.007 <0.001 0.12 0.001 <0.001
Square-R (%) 5.57 1.05
Nitrate=3.17+0.21 ADi Nitrate=22.50+0.12 GDi
ADi versus Sulphate contents GDi versus Sulphate contents
Constant 60.68 5.19 <0.001 −34.69 5.19 <0.001
DRASTIC index 0.74 0.04 <0.001 1.56 0.04 <0.001
Square-R (%) 4.22 11.11
Sulphate=60.68+0.74 ADi Sulphate=−34.70+1.56 GDi
ADi versus Chloride contents GDi versus Chloride contents
Constant 16.49 1.25 <0.001 25.53 1.37 <0.001
DRASTIC index 0.22 0.01 <0.001 0.20 0.01 <0.001
Square-R (%) 5.79 2.90
Chloride=16.49+0.22 ADi Chloride=25.53+0.20 GDi
3692 Á. Moratalla et al.

(correlation coefficient=0.57), suggesting common processes governing their transport andfate in the hydrogeological system, probably correlated with recharge patterns. Nitratespatial distribution also shows a poor but positive relationship with topography (correlationcoefficient=0.19). MOS irrigated crops occupy areas of flat relief. These areas concentratethe irrigation return flow, which leads to nitrate leaching in the unsaturated zone.
The DRASTIC index measures the potential of the MOS to facilitate downward seepageof pollutants to underlying groundwater, but does not take into account the transport andattenuation of system pollutants. MOS dilution, diffusion, and dispersion mechanisms maydrive changes in hydrochemistry, evolving in the direction of groundwater flow. As Glynnand Plummer (2005, pp. 265) point out, “flow patterns in regional aquifers inferred frommapping hydrochemical facies and zones can indicate flow directions that occurred overtime scales considerably greater than the time scale over which present-day, or evenpredevelopment water levels were established”. In consequence, the volume of aquifersystem affected by pollution does not necessarily correspond to the location of the diffuse-or point-pollution sources on the land surface.
The attenuation of contaminants by natural processes may also disturb thepredictable distribution of pollutants in the aquifer system. For example, denitrificationprocesses convert harmful nitrates into innocuous nitrogen through the consumption ofavailable electron donors such as organic matter, pyrite, or ferrous iron (Böttcher et al.1990; Korom 1992). The aquifer-river relationships play an important role whenconsidering the input-output mass of pollutants to the system. When the Júcar is a losingriver, some pollutants can be introduced into the system. Contaminated surface watersinfiltrating the aquifer may also lead to pollutant dilution. In contrast, when the Júcar is againing river, some pollutants can be incorporated to the discharge flow and nitrogen isexported to neighbouring hydrogeologic systems. In the MOS, a rough calculation of thenitrogen mass added to the discharge flow gives a figure of about 402 tyr−1. The Jardínand Lezuza streams import about 335 t nitrogen yr−1 to the MOS from the nearby JardínRiver Basin. On the other hand, the DRASTIC approach does not account for the effect ofurban or industrial point-pollution sources (landfill sites, septic tanks, wastewater effluentdischarge to channels).
Table 6 Correlation matrix between Agricultural DRASTIC index (ADi), Generic DRASTIC index (GDi)DRASTIC factors and ion contents in groundwater in the Central Domain and El Salobral-Los LlanosDomain for 2002. D: depth to water table; R: net recharge; A: aquifer media; S: soil media; T: topography; I:impact of vadose zone; C: hydraulic conductivity
GDi ADi D R A S T I C Nitrate Chloride
ADi 0.94
D 0.63 0.54
R 0.55 0.51 0.22
A 0.04 0.15 −0.47 −0.04S 0.32 0.57 −0.12 0.05 0.37
T 0.20 0.33 0.21 0.13 −0.01 −0.08I 0.30 0.15 0.09 0.01 −0.20 −0.10 −0.14C 0.26 0.18 −0.14 −0.04 0.15 0.20 −0.08 −0.15Nitrate 0.20 0.24 0.27 0.06 −0.07 0.08 0.19 0.00 −0.11Chloride 0.20 0.24 0.31 0.05 −0.27 0.17 0.05 0.11 −0.13 0.57
Sulphate 0.31 0.21 0.46 0.21 −0.35 −0.21 0.10 0.18 −0.06 0.10 0.20
Evaluation of a GIS-Based Integrated Vulnerability 3693
6 Conclusions
This study employed both Integrated Generic DRASTIC Index and Agricultural DRASTICmodels to determine the vulnerability of groundwater to contamination in the multilayerMancha Oriental System (MOS). Results indicate that the MOS, which is underdeteriorating quality conditions, is highly vulnerable to groundwater pollution. IntegratedGeneric DRASTIC Index and Agricultural DRASTIC Index maps show that changes inland uses can cause transient conditions that affect the spatial and temporal distribution ofthe DRASTIC vulnerability index in the MOS. At a regional scale, a comparison ofDRASTIC maps for 1975 and 2002 indicates that the increase in irrigated cropland surfacehas reduced the extent of the high to extremely high vulnerability areas. Nonetheless, inareas with irrigated cropland, the DRASTIC index increased locally in 2002. It isnoteworthy that the contribution of net recharge to vulnerability increased in 2002 when theirrigation return flow was significant. Statistical analyses by means of GIS tools indicate nocorrespondence between the spatial distribution of nitrate, chloride, and sulphate contents ingroundwater with the vulnerability maps.
Although DRASTIC-derived vulnerability maps are a useful tool as a general guidefor vulnerability assessment, it is evident that the method is not suitable to assess thedistribution of MOS contaminants resulting from interpolating concentrations bygeostatistical methods. The DRASTIC method has limitations because the robustnessof the DRASTIC index depends heavily on user capabilities in representing the realsystem, and the numerical probabilistic occurrence of the raster layers. In addition,when considering the depth to groundwater table and the net recharge as parameters inhighly modified systems, the approach is not conceptually valid since contaminantschange in distribution in accordance with the flow regime and biogeochemicalconditions. The poor statistical correspondence between the DRASTIC indices andthe spatial distribution of chemicals suggests that the map should be validated bygroundwater flow and hydrogeochemical models before interpretation and incorporationinto the decision-making process. Water authorities have to take into account thatvulnerability maps alter in consonance with changes in the hydrogeological system,above all concerning land-use changes, groundwater flow patterns, recharge regimes,and the natural attenuation of pollutants.
Acknowledgements This study is part of the Ph.D. Thesis of Angel Moratalla and David Sanz and wasfunded by the research projects PAC08-0187-6481 and PEIC11-0135-8842 of the Consejería de Educación yCiencia de la Junta de Comunidades de Castilla-La Mancha (JCCM), and research agreements among theJCCM, Albacete City Council, and the Univerity of Castilla-La Mancha (UCLM). Special thanks go to Dr.Alfonso Calera and Mr. Mario Belmonte from the Remote Sensing and GIS Group of the Institute forRegional Development (IDR) of the UCLM for providing the crop classification for the study area. We wouldlike to thank Christine Laurin for improving the English text. The authors would also like to thank theanonymous reviewers for their contributions in improving the manuscript.
References
Al-Adamat RAN, Foster IDL, Baban SMJ (2003) Groundwater vulnerability and risk mapping for theBasaltic aquifer of the Azraq basin of Jordan using GIS, remote sensing and DRASTIC. Appl Geogr23:303–324
Al-Hanbali A, Kondoh A (2008) Groundwater vulnerability assessment and evaluation of human activityimpact (HAI) within the Dead Sea groundwater basin, Jordan. Hydrogeol J 16:499–510
3694 Á. Moratalla et al.

Aller L, Bennet T, Leher JH, Petty RJ, Hackett G (1987) DRASTIC: a standardized system for evaluatingground water pollution potential using hydrogeological settings. EPA 600/2-87-035: 622
Almasri MN (2008) Assessment of intrinsic vulnerability to contamination for Gaza coastal aquifer,Palestine. J Environ Manage 88:577–593
Al-Zabet T (2002) Evaluation of aquifer vulnerability to contamination potential using the DRASTICmethod. Environ Geol 43:203–208
Antonakos AK, Lambrakis NJ (2007) Development and testing of three hybrid methods for the assessment ofaquifer vulnerability to nitrates, based on the drastic model, an example from NE Korinthia, Greece. JHydrol 333:288–304
APHA-AWWA-WEF (1998) Standard Methods for the Examination of Water and Wastewater, 20. AmericanPublic Health Association, Washington: 1085
Arenas M, Dichtl L, Fernández R, García U, Pérez A (1982) Study of the contamination of subterraneanwater by fertilizers and residual waters of the country of the plain of Albacete, Spain. Mém-Assoc IntHydrogéol 16:139–149
Assaf H, Saadeh M (2008) Geostatistical assesment of groundwater nitrate contamination with reflection onDRASTIC vulnerability assessment: the case of the Upper Litani Basin, Lebanon. Water Resour Manag23:775–779
Baalousha H (2006) Vulnerability assessment for the Gaza Strip, Palestine using DRASTIC. Environ Geol50:405–414
Babiker IS, Mohamed MAA, Hiyama T, Kato K (2005) A GIS-based DRASTIC model for assessing aquifervulnerability in Kakamigahara Heights, Gifu Prefecture, central Japan. Sci Total Environ 345:127–140
Böttcher J, Strebel O, Voerkelius S, Schmidt HL (1990) Using isotope fractionation of nitrate nitrogen andnitrate oxygen for evaluation of microbial denitrification in a sandy aquifer. J Hydrol 114:413–424
Boughriba M, Barkaoui A-E, Zarhloule Y, Lahmer Z, El Houadi B, Verdoya M (2010) Groundwatervulnerability and risk mapping of the Angad transboundary aquifer using DRASTIC index method inGIS environment. Arab J Geosci 3:207–220
Calera A, Martínez C, Meliá J (2001) A procedure for obtaining green plant cover. Its relation with NDVI ina case study for barley. Int J Remote Sens 22:3357–3362
Castaño S (1999) Aplicaciones de la Teledetección y SIG al control y cuantificación de las extracciones deagua subterránea. In: Ballester Rodríguez JA, Fernández Sánchez JA, Geta L (eds) Medida y Evaluaciónde las extracciones de agua subterránea. IGME, Madrid, pp 125–141
Chitsazan M, Akhtari Y (2008) A GIS-based DRASTIC model for assessing aquifer vulnerability in KherranPlain, Khuzestan, Iran. Water Resour Manag 23:1137–1155
Confederación Hidrográfica del Júcar (2009), Bases de Datos, 2009. CHJ. http://www.chj.es. Accessed 2March 2009
Estrela T, Fidalgo A, Fullana J, Maestu J, Pérez MA, Pujante AM (2004) Jucar Pilot River Basin. ProvisionalArticle 5 Report pursuant to the Water Framework Directive. Ministry for the Environment, Valencia,Spain. http://www.chj.es/CPJ3/imagenes/Art5/Articulo_5_completo.pdf. Accessed 21 March 2007
Ettazarini S (2006) Groundwater pollution risk mapping for the Eocene aquifer of the Oum Er-Rabia basin,Morocco. Environ Geol 51:341–347
Evans BM, Myers WL (1990) A GIS-based approach to evaluating regional groundwater pollution potentialwith DRASTIC. J Soil Water Conserv 45:242–245
Font E (2004) Colaboración en el desarrollo y aplicación de un modelo matemático distribuido de flujosubterráneo de la Unidad Hidrogeológica 08.29 Mancha Oriental, en las provincias de Albacete, Cuencay Valencia. Universidad Politécnica de Valencia, Escuela Técnica Superior de Ingenieros de CaminosCanales y Puertos, Valencia
Foster SSD (2002) Groundwater recharge and pollution vulnerability of British aquifers: a critical overview,in: Robins, N.S. (Ed.), Groundwater Pollution, Aquifer Recharge and Vulnerability Geological Society,London, Special Publications, 130: 7–22.
Fritch TG, McKnight CL, Yelderman JC, Arnold JG (2000) An aquifer vulnerability assessment of thePaluxy aquifer, central Texas, USA, using GIS and a modified DRASTIC approach. Environ Manag25:337–345
Glynn PD, Plummer LN (2005) Geochemistry and the understanding of ground-water systems. Hydrogeol J13:263–287
Hem JD (1986) Study and interpretation of the chemical characteristics of natural water. USGS Water-SupplyPaper 2254:1–263
Hudak PF, Sanmanee S (2003) Spatial patterns of nitrate, chloride, sulfate, and fluoride concentrations in thewoodbine aquifer of North-Central Texas. Environ Monit Assess 82:311–320
Instituto Geográfico Nacional (1992) Atlas Nacional de España, Sección II, Grupo 7, Edafología. IGN,Madrid
Evaluation of a GIS-Based Integrated Vulnerability 3695

Instituto Geográfico Nacional (2000) Corine Land Cover 2000 España data base. IGN, MadridJamrah A, Al-Futaisi A, Rajmohan N, Al-Yaroubi S (2008) Assessment of groundwater vulnerability in the
coastal region of Oman using DRASTIC index method in GIS environment. Environ Monit Assess147:125–138
Kaur R and Rosi KG (2011) Ground Water Vulnerability Assessment – Challenges and Opportunities. http://www.cgwb.gov.in/documents/papers/incidpapers/Paper%2012-%20R.%20Kaur.pdf. Accessed 12 May2011
Korom SF (1992) Natural denitrification in the saturated zone - a review. Water Resour Res 28:1657–1668
Margat J (1968) Vulnerabilite des nappes d’eau souterraine a la pollution [Groundwater vulnerability tocontamination]. Bases de al cartographie, (Doc.) 68 SGC 198 HYD, BRGM, Orleans, France
Martín De Santa Olalla F, Calera A, Domínguez A (2003) Monitoring irrigation water use by combiningIrrigation Advisory Service, and remotely sensed data with a geographic information system. Agr WaterManag 61:111–124
Moratalla A (2010) Evolución de los contenidos en nitrato en el Sistema Mancha Oriental (SE Español)como consecuencia de los cambios en el uso del suelo. Periodo 1998–2004. Dissertation, University ofCastilla-La Mancha
Moratalla A, Gómez-Alday JJ, De las Heras J, Sanz D, Castaño S (2009) Nitrate in the water-supply wells inthe Mancha Oriental hydrogeological system (SE Spain). Water Resour Manag 23:1621–1640
Murray KE, McCray JE (2005) Development and application of a regional-scale pesticide transport andgroundwater vulnerability model. Environ Eng Geosci 3:271–284
Official Journal of Castilla-La Mancha (OJCM) (2003) Resolución de 10 de febrero de 2003, de laConsejería de Agricultura y Medio Ambiente, por la que se designan, en el ámbito de la ComunidadAutónoma de Castilla-La Mancha, determinadas áreas como zonas vulnerables a la contaminaciónde las aguas producida por nitratos procedentes de fuentes agrarias. In: OJCM 26 de febrero de2003, nº 26, 2003. http://docm.jccm.es/portaldocm/verDiarioAntiguo.do?ruta=2003/02/26. Accessed2 March 2009
Official Journal of the European Union (2000) Directiva 2000/60/CE del Parlamento Europeo y del Consejo,de 23 de octubre de 2000, por la que se establece un marco comunitario de actuación en el ámbito de lapolítica de aguas. In: OJEU L 327/1, 2000. Retrieved from 2 March 2009 from http://eur-lex.europa.eu/LexUriServ/site/es/oj/2000/l_327/l_32720001222es00740083.pdf. Accessed 2 March 2009
Official Journal of the European Union (OJEU) (1991) Directiva 91/676/CEE del Consejo, de 12 dediciembre de 1991, relativa a la protección de las aguas contra la contaminación producida por nitratosutilizados en la agricultura. In: Diario Oficial de la Comunidad Europea L 375, 1991. http://www.miliarium.com/Legislacion/Aguas/ue/D91-676.asp. Accessed 2 March 2009
Official Journal of the European Union (OJEU) (2006) Directiva 2006/118/CE del parlamento europeo y delconsejo, de 12 de diciembre de 2006, relativa a la protección de las aguas subterráneas contra lacontaminación y el deterioro. In: OJEU L 372/19, 2006. http://eur-lex.europa.eu/LexUriServ/LexUriServ.do?uri=OJ:L:2006:372:0019:0031:ES:PDF. Accessed 2 March 2009
Pérez R, Pacheco J (2004) Vulnerabilidad del agua subterránea a la contaminación de nitratos en el estado deYucatán. Ingeniería 8:33–42
Remesan R, Panda RK (2008) Groundwater vulnerability assessment, risk mapping, and nitrate evaluation ina small Agricultural Watershed: Using the DRASTIC Model and GIS. Environ Quality Manage. DOI10.1002/tqem
Rupert MG (2001) Calibration of the DRASTIC ground water vulnerability mapping method. Ground Water39:625–630
Sanz D, Gómez-Alday JJ, Castaño S, Moratalla A, De las Heras J, Martínez-Alfaro PE (2009)Hydrostratigraphic framework and hydrogeological behaviour of the Mancha Oriental System (SESpain). Hydrogeol J
Sanz D, Castaño S, Cassiraga E, Sahuquillo A, Gómez-Alday JJ, Peña S, Calera A (2010) Modeling aquifer-river interactions under the influence of groundwater abstractions in the Mancha Oriental System.Hydrogeol J. doi:10.1007/s10040-010-0694-x
Secunda S, Collin ML, Melloul AJ (1998) Groundwater vulnerability assessment using a composite modelcombining DRASTIC with extensive agricultural land use in Israel’s Sharon region. J Environ Manage54:39–57
Seeling B, Nowatzki J (2001) How to assess for nitrogen problems in water resources. AE-1217. NorthDakota (USA), North Dakota State University. North Dakota State University. Nutrient ManagementPublications. http://www.ag.ndsu.edu/pubs/h2oqual/watnut/ae1217w.htm. Accessed 25 March 2009
Sener E, Sener S, Davraz A (2009) Assessment of aquifer vulnerability based on GIS and DRASTICmethods: a case study of the Senirkent-Uluborlu Basin (Isparta, Turkey). Hydrogeol J 17:2023–2035
3696 Á. Moratalla et al.
Stark SL, Nuckols JR, Rada J (1999) Using GIS to investigate septic system sites and nitrate pollutionpotential. J Environ Health 61:15–64
Stigter TY, Carvalho Dill AMM (2001) Limitations of the application of the DRASTIC vulnerability index toareas with irrigated agriculture, Algarve, Portugal. In: Ribeiro L (Ed) Proc. 3rd International Conferenceon Future Groundwater Resources at Risk, CVRM, Lisbon, Portugal, pp. 105–112
Stigter TY, Vieira J, Nunes LM (2002) Evaluation of the susceptibility to groundwater contamination as asupport to decision-making; case study: implantation of golf courses in Albufeira municipality(Algarve). In: Proc 6º Congresso da Água, APRH, Porto (CD-ROM)
Stigter TY, Ribeiro L, Carvalho Dill AMM (2006) Evaluation of an intrinsic and a specific vulnerabilityassessment method in comparison with groundwater salinisation and nitrate contamination levels in twoagricultural regions in the south of Portugal. Hydrogeol J 14:79–99
Tarjuelo JM (1995) El Riego por aspersión y su tecnología. Mundi-Prensa, MadridTesoriero AJ Inkpen EL Voss FD (1998). Assessing ground-water vulnerability using logistic regression.
Proceedings for the Source Water Assessment and Protection 98 Conference, Dallas, TX: 157–65United States Department of Agriculture (1987) Soil taxonomy: a basic system of soil classification for
making and interpreting soil surveys. USDA, Handbook, Washington, DCVias JM, Andreo B, Perles MJ, Carrasco F (2005) A comparative study of four schemes for groundwater
vulnerability mapping in a diffuse flow carbonate aquifer under Mediterranean climatic conditions.Environ Geol 47:586–595
Vrba J, Zaporozec A (1994) Guidebook on mapping groundwater vulnerability. Int Contrib Hydrogeol16:131
Wen X, Wu J, Si J (2008) A GIS-based DRASTIC model for assessing shallow groundwater vulnerability inthe Zhangye Basin, northwestern China. Environ Geol 57:1435–1442
Zhang R, Hamerlinck JD, Gloss SP, Munn L (1996) Determination of nonpoint-source pollution using GISand numerical models. J Environ Qual 25:411–418
Evaluation of a GIS-Based Integrated Vulnerability 3697