
Quantifying inter‐species differences in contractile function through biophysical modelling
JOURNAL OF GEOPHYSICAL RESEARCH, VOL. 104, NO. D14, PAGES 16,895-16,909, JULY 27, 1999
Evaluating the performance of a land Surface / ecosystem model with biophysical measurements from contrasting environments
Christine Delire and Jonathan A. Foley Climate, People, and Environment Program, Institute for Environmental Studies, University of Wisconsin, Madison
Abstract. Five sets of biophysical and hydrological measurements from across the globe are used to test the performance of the Integrated Biosphere Simulator (IBIS) [Foley et al., 1996] in reproducing short-term and long-term evolution of soil moisture and temperature, surface energy fluxes and CO2 fluxes. The sites include a soybean crop in southwestern France (HAPEX- MOBILHY, 1986), a meadow in the Netherlands (Cabauw, 1987), a grassland in Russia (Valday- Usadievskiy, 1966-1983), a prairie in Kansas (FIFE, site 16, 1987-1989), and a tropical forest in Brazil (ABRACOS, Reserva Jam, 1992-1993). IBIS adequately reproduces the evolution of the soil moisture together with the surface fluxes for those five different sites while only imposing a small number of site specific parameters describing vegetation characteristics and soil texture. The quality of the simulations is improved when detailed information regarding soil texture, rooting profiles, and leaf area index are available.
1. Introduction
The exchange of water, energy, and momentum between land surfaces and the atmosphere exerts considerable influence on the global climate system. Changes in land surface properties, often associated with changing vegetation and soil characteristics, have dramatic effects on the climate simulated by general circulation models (GCMs) [e.g., Lean and Warrilow, 1989; Bonan et al., 1992; Foley et al., 1994; Manzi and Planton, 1996; Costa and Foley, 1999]. Given the potential importance of land surface processes in the climate system, efforts have been made to develop process-based biophysical models of land-atmosphere exchange processes. The first models of this genre include BATS of Dickinson et al. [1986] and SiB of Sellers et al. [1986].
PILPS phase 2 activity are all from the middle latitudes (all in Europe) and consist of an agricultural field and two grasslands. P ILPS has not yet used data from tropical sites or from any forested sites.
Here we evaluate the performance of a single model, the Integrated Biosphere Simulator (IBIS) of Foley et al. [1996], against five sets of detailed biophysical measurements from across the globe. The five selected sites include all three of the PILPS study sites (Cabauw, HAPEX-Mobilhy/Caumont, and Valday/Usadievskiy), as well as data from the FIFE/site 16 (a prairie in the central United States), and ABRACOS/Reserva Jam (a tropical rainforest in the Brazilian Amazon) field campaigns. This suite of study sites cover a wide range of climatic and
Biophysically based land surface models are now an integral vegetation zones (from tropical forests, to midlatitude grasslands part of most GCMs. However, because of the complex nature of and agricultural fields, to northern grasslands). By evaluating the land surface processes, it is preferable to test land surface results of a single land surface model in a wide range of parameterizations separately from their host GCMs. Many authors have examined the stand-alone performance of land surface models at individual sites. However, only a few handful of studies have analyzed the simulations of stand-alone land surface models on regional to global scales [Levis et al., 1996; Douville, 1998].
During the last several years, there has also been an organized, international effort aimed at evaluating land surface parameterizations. The Project for Intercomparison of Land-
environmental conditions, we may better characterize the ability of the model to simulate land-atmosphere exchange processes across the globe.
2. IBIS 2: Model Description
In this study, we use an updated version of the integrated Surface Parameterization Schemes (PILPS) activity has evaluated biosphere simulator (IBIS) of Foley et al. [ 1996]. IBIS (version 2) the performance of numerous land surface models [Henderson- Sellers et al., 1996]. To date, the PILPS (phase 2) activity has compared the simulation of roughly 20 land surface models against detailed measurements made at three field sites: Cabauw (a grassland in the Netherlands), HAPEX-Mobilhy/Caumont (an agricultural field in France), and Valday/Usadievskiy (a grassland site in Russia). It is important to note that the sites included in the
Copyright 1999 by the American Geophysical Union.
Paper number 1999JD900212. 0148-0227/99/1997JD900212509.00
is a fairly comprehensive model of terrestrial biospheric processes and includes submodels of (1) land surface processes, (2) terrestrial carbon and nutrient cycling, and (3) vegetation dynamics.
The IBIS land surface module simulates the energy, water, carbon, and momentum balance of the soil-vegetation-atmosphere system on a relatively short time step (---20 to 60 min) to remain consistent with the time step used by GCMs. The land surface module borrows much of its basic structure from the LSX land
surface package [Thompson and Pollard, 1995 a, b]. The module includes two vegetation layers (i.e., "trees" and "grasses and shrubs") and six soil layers (to simulate soil temperature, soil
16,895

16,896 DELlRE AND FOLEY: PERFORMANCE OF A LAND SURFACE MODEL
water, and soil ice content over a total depth of---4 m). Physiologically based formulations of C3 and C4 photosynthesis [Farquhar e! al., 1980], stomatal conductance [Collatz e! al., 1991, 1992] and respiration [Arnthor, 1984] are used to simulate canopy gas exchange processes. This approach provides a mechanistic link between the exchange of energy, water, and CO2 between vegetation canopies and the atmosphere [Collatz et al., 1991; Arnthor, 1994; Bonan, 1995; Sellers e! al., 1996, 1997].
3. Site Descriptions
Here we describe the sites and data sets used to evaluate the
performance of the IBIS model. In all of the simulations presented here, the model physics was completely fixed. Only site-specific parameters (related to the vegetation cover, the soils, and the permeability of the bottom) were allowed to vary among the simulations.
3.1. HAPEX-MOBILHY Caumont Site (43ø41'N, 0ø6'W)
This site is a soybean crop field and was part of the larger HAPEX-MOBILHY experiment held in southwest France in 1986. A detailed description of the site and the measurement techniques can be found in the work of Goutorbe [1991]. This data set includes 1 year of half-hourly reference level weather observations, 1 year of weekly soil moisture measurements to 1.6 m (at 0.1 m intervals), and energy flux measurements every 15 min between May 28 and July 3, 1986. Net radiation, sensible heat, and soil conduction heat fluxes were directly measured, while the latent heat flux was calculated as the residual of the
energy balance. This data set was used by the PILPS group to compare the simulation of the soil moisture by the different land surface schemes [Shao and Henderson-Sellers, 1995].
Caumont is on a loam soil; no vertical profile of the soil texture is available. The seasonal evolution of the leaf area index, the
fractional vegetation cover, the root profile and the height of the canopy was not directly measured but estimated during the PILPS-RICE workshop [Shao and Henderson-Sellers, 1996].
3.2. FIFE Site 16 (39ø03'N, 96032 ' W)
The FIRST IS[SCP Field Experiment (FIFE) was held between 1987 and 1989 near Manhattan, Kansas, in a tallgrass prairie. Eddy correlation measurements of sensible and latent heat fluxes and CO2 fluxes were taken at site 16 during the growing season of 1987 and 1989 together with net radiation and soil heat conduction measurements [Verma et al., 1992]. Three years of atmospheric forcing are now available for this site. This extended and corrected data set was compiled by Colello et al. [1998] and is based on the existing FIFE area-wide average meteorology and on the' aeteorological observations taken at the adjacent Konza Prairie Long-Term Ecological Research (LTER) center [Sellers et al., 1992]. The neutron probe measurements of the soil water content were taken between 20 cm and 140 cm, and gravimetric measurement completed those data near the surface (2.5 cm and 7.5 cm). A survey of soil horizon is available for site 16 (FIFE- CDROM, or Table 3 of Colello et al. [ 1998]), giving the depth of the different horizons together with the texture, carbon, and nitrogen relative content. The Colello et al. [1998] data set also includes interpolated daily values of the leaf area index (LAD, the relative abundance of C3 versus C4 species, and the fraction of vegetation.
3.3. Cabauw (51ø58'N, 4ø56'E)
The Cabauw site is a meadow in the Netherlands. BeO'aars and Bosveld [ 1997] give a full description of the 1987 data, assessing the quality of the observations. The data set includes 1 year of atmospheric forcing and surface energy fluxes. There are no soil moisture observations reported, but it is known that the deep soil is saturated throughout the year [Chen et al., 1997]. This data set was used in the PILPS phase 2a experiment.
The soil at Cabauw is mainly silty clay (top 60 cm) above peat (below 75 cm). The vegetation is a sh9rtgrass that had been selected for high yield for that soil and climate [Beljaars and Bosveld, 1997]. Monthly values of the LAI and of the vegetation cover are estimated by PILPS [Chen et al., 1997].
3.4. Valday, Usadievskiy (57.6øN, 33.1øE)
Usadievskiy is a small catchment (0.36 km 2) inside the Valday water balance research site. The area is mainly covered by grassland (81%) [Vinnikov et al., 1996]. One remarkable feature of this data set is its length: there are 18 years of atmospheric forcing (at 3 hour intervals) between 1966 and 1983, which allows long-term evaluation of the model. The data set also contains most of the variables of the hydrologic balance of the catchment. Soil moisture, water table depth, runoff, snow depth, and precipitation were measured between 1960 and 1990. The total soil moisture
was measured monthly at 11 representative sites within the catchment. Because the seasonal variations of the total soil
moisture at the 11 sites are very similar, Schlosser et al. [1997] used the average value of the 11 sites for total soil moisture in the top 1 m to compare with model simulations. The runoff measurements are streamflow observations made at the outflow
point of the catchment. Estimates of monthly evaporation based on measurements for
summer time and on simple algorithm for the winter months are available until 1974. Downward longwave radiation was not measured at the Valday site, and the visible radiation data were released as 10-day average diurnal cycles. The 3-hourly visible and longwave radiation was estimated by Schlosser et al. [ 1997]. The data set completed by the radiation estimates using the Idso [ 1981] longwave algorithm is currently used in PILPS phase 2D. An additional longwave algorithm [Brutsaert, 1975] is also proposed by PILPS to test the sensitivity of the model to the parameterization of the longwave radiation. The catchment soil is loam over 56% of the area, sandy loam over 28%, and sandy for the remaining 16%. No vertical profile of the soil texture was available.
3.5. ABRACOS, Reserva Jaru (10ø05'S, 61ø55'W)
Reserva Jam is a forest site established in an ecological reserve in the Brazilian state of Rond6nia. It is one of the forest sites of
the Anglo-Brazilian Amazonian Climate Observation Study (ABRACOS) which was held from 1990 to 1994 [Gash et al., 1996]. Hourly atmospheric variables are available between November 1991 and December 1993. Neutron probe measurements of the soil moisture down to 3.6 m were taken
weekly during the same period. The surface energy fluxes were measured during two intensive field campaigns from August to October 1992 and from April to August 1993.
The soil at Reserva Jaru is mainly sandy near the surface (85% sand). The clay content increases gradually from 4% near the

DELIRE AND FOLEY: PERFORMANCE OF A LAND SURFACE MODEL 16,897
surface to 36% at 1 m (Wright et al. [1996, Table 2]). The site is an open tropical forest (RADAMBRASIL Projeto, 1978) with a mean canopy height of 30 m. Roots have been found as deep as 3.6 m, which was the lowest measurement taken. It seems that trees are able to extract water from below this level because no
significant decrease in forest transpiration was measured during the dry season when the moisture content within the 3.6 m of the soil surface was low [Wright et al., 1996].
4. Results
Here we present long-term simulations of surface fluxes, soil temperature, and soil moisture made by IBIS. While IBIS is also designed to simulate vegetation phenology and long-term vegetation dynamics, we only examine the ability of the model to simulate surface biophysical processes in this study. Therefore we impose the vegetation structure and composition, as well as the seasonal evolution of vegetation cover fraction and leaf area index (LAI). The soil texture is also imposed.
The number of soil layers and their depth are kept identical over the various sites except in the case of the Amazonian forest. The variation of texture with depth is used if known, otherwise a single bulk value is imposed for the whole profile. The vertical root profile proposed by Jackson et al. [1996] is used except in the Amazonian forest. In lB IS, the percolation rate at the bottom of the six layers can vary from zero (impermeable bedrock) to free gravitational drainage. The permeability of the bottom is imposed when known (Cabauw and FIFE, impermeable) or adjusted by comparing simulated to observed soil moisture content in winter when the evapotranspiration rate is low. When available, observed soil moisture and temperature are used as initial condition. If not, equilibrium values obtained by running the model for several years repeating the same atmospheric forcing are imposed. The sensitivity of the model to the choice of the initial conditions was tested to check for multiple equilibrium solutions, and drifting of the model.
4.1. HAPEX-Mobilhy, Caumont
For the HAPEX-Mobilhy site, we run the model for 1 year starting January 1, 1986. The soil moisture was initialized with the observed values, January 7, 1986, which are the first observation available. For this site, a constant soil texture is imposed (Table 1) and the vegetation of the site is described with parameters appropriate for a soybean crop.
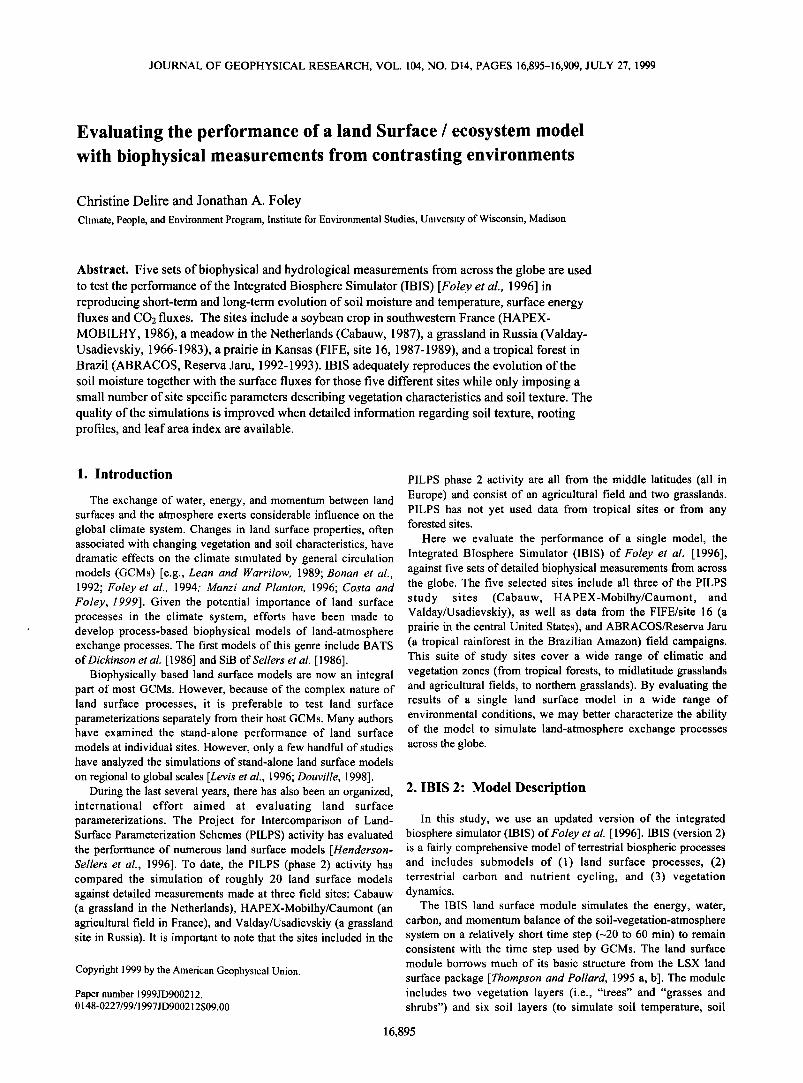
In IBIS, this type of vegetation cover is roughly described as a shortgrass with a C3 photosynthetic pathway. We use the monthly values of the LAI, the fractional vegetation cover, and the height of the lower canopy chosen by Shao et al. [1996]. The fractional vegetation cover and the LAI of the upper canopy are set to zero. The vertical root profile was not measured at Caumont, so the standard profile suggested by Jackson et al. [1996] is used. All the other parameters of IBIS characterizing the vegetation are kept to their standard "cool C3 grass" value except for the maximum capacity of Rubisco (Vmax, mol CO2 m -2 s 'l) and the leaf orientation factor that was set to zero (randomly oriented leaves). Typical values of Vmax at 15øC for soybean crops range from 35 to 75 gmol CO2 m -2 s -1 (adapted from Wullschleger [1993]). The highest value of Vmax gave the best simulated evapotranspiration for the May 28 to June 30 period when surface fluxes were measured.
Simulated versus observed net radiation (Rn), sensible heat flux (H), latent heat flux (LE), and soil heat conduction flux (G) are
16,898 DELIRE AND FOLEY: PERFORMANCE OF A LAND SURFACE MODEL
8OO
HAPEX - Caumont Net Radiation Sensible heat flux
300 ß ß
• 600 E
x 400
ß ,-' 200
E
6OO
I
E
•: 400 x
'o 200
._E 0
ß
ß
ß ß • eee,
ß ß
ß e e
ß e ß
200 400 600
Observed flux (W m -2) Latent heat flux
-.{
e• ß
eee
ß
I ß
eee e e e e ß ß
ß
8OO
'E 200
x
•- 100
E 0
-lOO -lOO
lOO
• 80
•x 40
'• 20
'5 0 E
r.o -20
I
ß
ee ß
eee
ß
ß ß ß
ß ß
eee ß
ß ß
.%' :': ß
0 100 200
Observed flux (W m -2) Soil heat conduction flux
.
ß •
e• ee ß ß ß ee ß •
e ß
e• I eee
ß
ß
ß
ß ß
300
ß
-200 -40 -200 0 200 400 600 0 50 100
Observed flux (W m -2) Observed flux (W m -2)
Figure 1. Calculated versus observed surface fluxes at Caumont between May 28 and June 30, 1986. The 15 min measured fluxes are averaged over 30 min to match the time step of the atmospheric forcing.
presented in Figure 1. The overestimation of the sensible heat flux under 100 W m '2 happens during cloudy days and is linked to high rates of dew formation in the model. Figure 2 presents I year simulated and observed volumetric moisture content of the first
four layers of IBIS and the volumetric moisture content over 1.6 m. With the standard root fraction and the standard hydrological parameters given by the texture, the total amount of soil moisture is reasonably well simulated (Figure 2, dotted curve). The simulated soil moisture in the fourth layer of soil can be improved by using a slightly different root distribution putting more roots under 50 cm (Figure 2, solid curve).
4.2. FIFE, Site 16
For the FIFE site, a 3 year simulation is performed with the Colello et al. data set (G.D. Colello et al., personal communication). The soil texture for the six layers (Table 1) is derived from Colello et al. [ 1998] by linear interpolation. As in the previous case, LAI and fractional vegetation cover of the upper canopy are set to zero. We used the daily evolution of the fraction of C3 versus C4 grass, the total LAI of the lower canopy, and the height of the canopy interpolated by G.D. Colello et al. (personal communication).
The eddy correlation measurements include measurements of the net ecosystem exchange (NEE) of CO2, which we use to test the simulation of the physiological processes linked to photosynthesis and respiration in the model. Because the photosynthetic process mainly controls the stomatal conductance, NEE provides an independent way of assessing the transpiration simulated by the model. Latent heat flux measurements do not allow testing of the simulation of the transpiration flux separately from the evaporation of the wet surfaces (soil and wet leaves).
The NEE of CO2 results from the CO2 assimilated by the canopy (net canopy photosynthesis) and from the effiux of CO2 from the soil due to autotrophic (root) and heterotrophic (microbial) respiration. Root respiration and microbial respiration due to organic matter decomposition are calculated by a submodel of IBIS [Kucharik, C.J., J.A. Foley, C. Delire, V.A. Fisher, M.T. Coe, S.T. Gower, J. Lenters, C. Molling, J.M. Norman, N. Ramankutty, The IBIS-2 dynamic global biosphere model: Model formulation and evaluation, submitted to Global Biogeochemical Cycles, 1999]. The two components of the soil respiration depend on the amount of carbon stored in the soil, the residue added to the soil through litterfall, the fine root turnover, the soil temperature and the soil moisture content. No value of the total soil carbon
content was available for FIFE site 16. As an initial guess, we use

DELIRE AND FOLEY: PERFORMANCE OF A LAND SURFACE MODEL 16,899
HAPEX Caumont 86, volumetric moisture content
0-51 o , .... , o , a
0.4 ,-0.3 0.2 ,
0.1
50 100 150 200 250 300 350
0.5
0.4 ß
•0.3
0.2
0.1
50 100 1 50 200 250 300 350
c ...... 0.4
0.2 '
50 100 150 200 250 300 350
0.41 , , , , , , ,
0.2 1 '- ...... .......
0.1 I ' I I ' 50 100 150 200 250 300 350
0'41 ' e
0.3 .'., .•_• 0.2 ' ' 01
50 100 150 200 250 300 350
Time (doy)
Figure 2. Evolution of the volumetric moisture content simulated by IBIS with the standard (dotted line) and modified (solid linc) root profile and wilting point in comparison to measurements (dots) for the Caumont site. (a) in the top 10 cm, (b) between 10 and 25 cm, (c) between 25 and 50 cm, (d) between 50 and 100 cm, (e) in the top 1600 cm.
the equilibrium value simulated by IBIS for this region after a 150 year simulation using a climatological forcing [Leeroans and Cramer, 1990]. A detailed description of this numerical experiment can be found in the work of Kucharik et al. [Kucharik, C.J., J.A. Foley, C. Delire, V.A. Fisher, M.T. Coe, S.T. Gower, J. Lenters, C. Molling, J.M. Norman, N. Ramankutty, The IBIS-2 dynamic global biosphere model: Model formulation and evaluation, submitted to Global Biogeochemical Cycles, 1999].
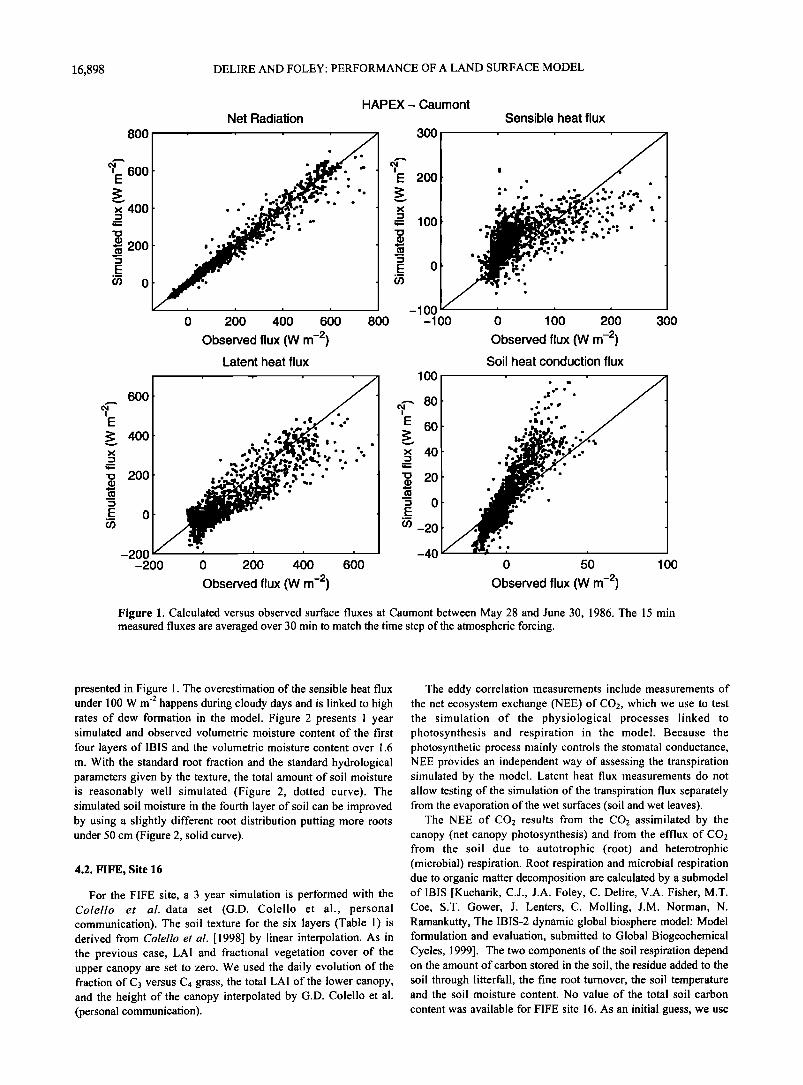
Figure 3 presents the time evolution of the surface energy fluxes and the NEE simulated and observed for the period starting July 1987. The NEE is generally well simulated especially during clear sky days (day of year (doy), 182 or 186). This agreement is also seen in the latent heat flux simulation. Nighttime values of NEE, which are linked to respiration processes, are less accurate. This might be due to the inaccurate specification of litter carbon pools. On the other hand, nighttime energy fluxes are well represented by the model during the same period. The evolution of the soil conduction heat flux is particularly well captured by the
model. Simulated versus observed fluxes are shown for 1987 and
1989 whenever eddy correlation measurements are available (Figure 4).
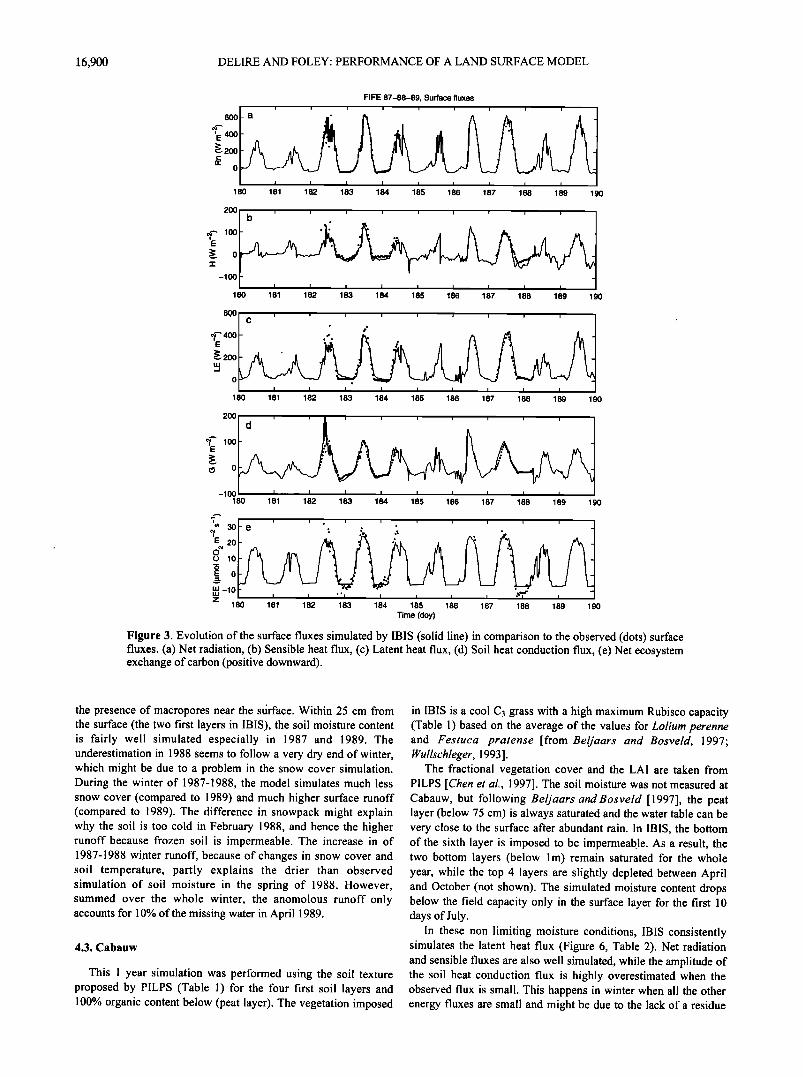
Measurements of soil temperature at 50 cm are compared with the weighted average of the simulated temperatures of the third (25-50 cm) and fourth (50-100 cm) layers in IBIS (Figure 5, a). The agreement is especially good in 1987 and 1989. During the winter of 1987-1988, the simulated temperature drops too much and the soil freezes for about 20 days in February, which was not observed. This discrepancy might be due to inaccuracy in the simulated snow cover or to the lack of a residue layer in IBIS that would insulate the surface soil. No snow records were available to
us to test the first hypothesis. The temperature of the 1988-1989 winter is accurately simulated.
The soil moisture content (Figure 5, b-d) was simulated using a higher than standard infiltration rate for the given texture (20xl 0 '6 kg m -2 s ']) as was used by Colello et al., [1998] in the calibrated version of the SiB model. This high infiltration rate is justified by
16,900 DELIRE AND FOLEY: PERFORMANCE OF A LAND SURFACE MODEL
FIFE 87-88-89, Sudace fluxes
600 a ' ' ß ' ' ' '
•"•' 400 ,•- 200 n- 0
180 181 182 183 184 185 186 187 188 189 190
180 181 182 183 184 185
i i i i
186 187 188 189 190
180 181 182 183 184 185 186 187 188 189 190
200 d ......... '7 loo ß
E
(5 0
-100 180 181 182 183 184 185 186 187 188 189 190
• 20 o 10 o
o uJ -10 z
180 181 182 183 184 185 186 187 188 189 190 Time (doy)
Figure 3. Evolution of the surface fluxes simulated by IBIS (solid linc) in comparison to the observed (dots) surface fluxes. (a) Net radiation, (b) Sensible heat flux, (c) Latent heat flux, (d) Soil heat conduction flux, (e) Net ecosystem exchange of carbon (positive downward).
the presence of macropores near the stirface. Within 25 cm from the surface (the two first layers in IBIS), the soil moisture content is fairly well simulated especially in 1987 and 1989. The underestimation in 1988 seems to follow a very dry end of winter, which might be due to a problem in the snow cover simulation. During the winter of 1987-1988, the model simulates much less snow cover (compared to 1989) and much higher surface runoff (compared to 1989). The difference in snowpack might explain why the soil is too cold in February 1988, and hence the higher runoff because frozen soil is impermeable. The increase in of 1987-1988 winter runoff, because of changes in snow cover and soil temperature, partly explains the drier than observed simulation of soil moisture in the spring of 1988. However, summed over the whole winter, the anomolous runoff only accounts for 10% of the missing water in April 1989.
4.3. Cabauw
This 1 year simulation was performed using the soil texture proposed by PILPS (Table 1) for the four first soil layers and 100% organic content below (peat layer). The vegetation imposed
in IBIS is a cool C3 grass with a high maximum Rubisco capacity (Table 1) based on the average of the values for Lolium perenne and Festuca praterise [from Beljaars and Bosveld, 1997; Wullschleger, 1993].
The fractional vegetation cover and the LAI are taken from PILPS [Chen et al., 1997]. The soil moisture was not measured at Cabauw, but following Beljaars and Bosveld [1997], the peat layer (below 75 cm) is always saturated and the water table can be very close to the surface after abundant rain. In IBIS, the bottom of the sixth layer is imposed to be impermeable. As a result, the two bottom layers (below l m) remain saturated for the whole year, while the top 4 layers are slightly depleted between April and October (not shown). The simulated moisture content drops below the field capacity only in the surface layer for the first 10 days of July.
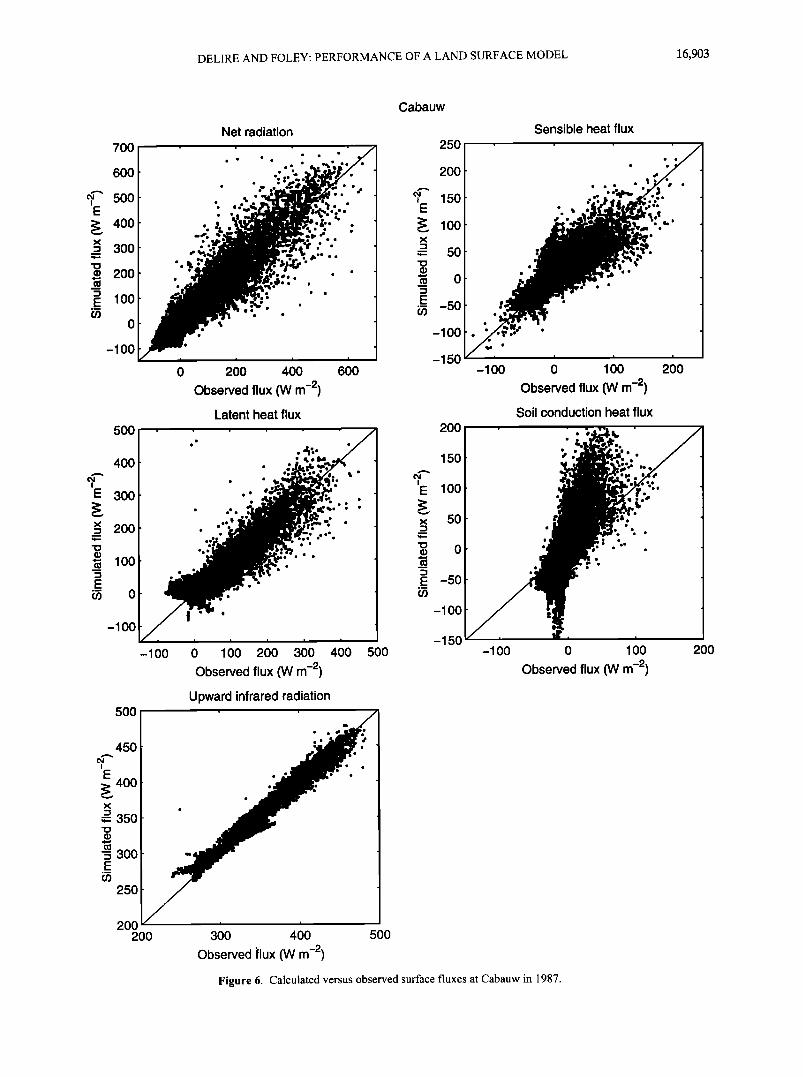
In these non limiting moisture conditions, IBIS consistently simulates the latent heat flux (Figure 6, Table 2). Net radiation and sensible fluxes are also well simulated, while the amplitude of the soil heat conduction flux is highly overestimated when the observed flux is small. This happens in winter when all the other energy fluxes are small and might be due to the lack of a residue

DELIRE AND FOLEY: PERFORMANCE OF A LAND SURFACE MODEL 16,901
FIFE - Site 16
800
o, 600 i
E
x 400
• 200 E
o_
6OO
• 400 E
x
= 200
.E_ 0
-2OO -200
Net radiation
ß
ß o ß
o•, ooo ø ß
ß
ß oo•Po ß
o' ß oo
! !
200 400 600
Observed flux (W m -2) Latent heat flux
*,I, *
8OO
0 200 400
Observed flux (W m -2) Net ecosystem exchange of (302
6OO
3OO
20O
100
o
-lOO
2OO
150
i
E
• 100 •.- 50
'5 0 E
-50
-lOO -lOO
Sensible heat flux
ß
ß
ß
ß
ß
-lOO
ß ß
do ß ß ß
ß
ß ß
ß
0 1 O0 200 300
Observed flux (W m -2) Soil heat conduction flux
. .
ß
ß
ß
ß ß oo oo
ß
ß d'
o ø ß
ß ß
ß
o lOO
Observed flux (W m -2) 2OO
ß i' 30 I
E • 20
o
o
E !0 x
'o 0
.E_ -10
ooo o • d,ß
ß ß
•u' ß t ß
ß ß
ß
*** ß
ß ß
ß
-10 0 10 20 2 S-•? Observed flux (gmol CO 2 m-
Figure 4. Calculated versus observed surface fluxes at FIFE site 16 when eddy correlation measurements are available.
16,902 DELIRE AND FOLEY: PERFORMANCE OF A LAND SURFACE MODEL
25
•15 -• lO
o
-5
FIFE, Soil temperature and volumetric moisture content .
i i i i i I i i i i
Apr87 Jul87 Oct87 Jan88 Apr88 Jul88 Oct88 Jan89 Apr89 Jul89 Oct89
0'51 ' ' ' ' ' ' ' ' ' ' ' I
0.4
0.2
0.1
t n
0.5
0.4
0.1
i i i i i i i i i i l
c
ß . ß
I I I I I I I I I I I
Apr87 Jul87 Oct87 Jan88 Apr88 Jul88 Oct88 Jan89 Apr89 Jul89 Oct89
0.5
0.4
E
%0.3
0.2
0.1
d i i i 1 i i i i i i i 1 ß
. ß .....
Apr87 Jul87 Oct87 Jan88 Apr88 Jul88 Oct88 Jan89 Apr89 Jul89 Oct89
Figure 5. Evolution of the soil temperature and the volumetric moisture content simulated by IBIS (solid line) and observed (dots) at site 16. (a) Soil temperature at 50 cm, volumetric moisture content (b) in the top 10 cm, (c) between 10 and 25 cm, (d) in the top first meter.
layer in the model that would insulate the soil from the atmosphere (as seen in the FIFE site). The simulated upward infrared fluxes (Figure 6) are very close to the observed, indicating that IBIS reproduces the surface temperature accurately.
4.4. Vaiday, Usadievskiy
The soil over the Usadievskiy catchment is mainly loam (Table 1), and no vertical profile is available. The vegetation type imposed is a "cool C3 grass" with a monthly evolution of the LAI given by PILPS. The simulation is conducted for the entire 18 year record of atmospheric forcing with Idso's [1981] longwave algorithm.
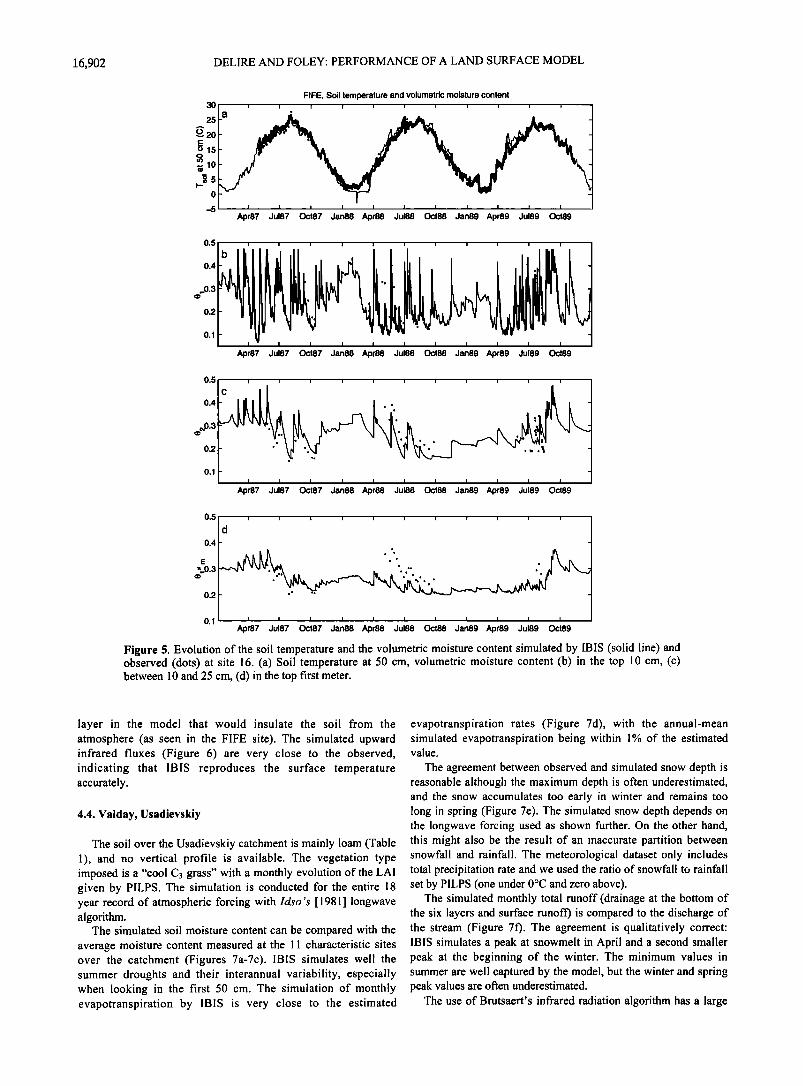
The simulated soil moisture content can be compared with the average moisture content measured at the 11 characteristic sites over the catchment (Figures 7a-7c). IBIS simulates well the summer droughts and their interannual variability, especially when looking in the first 50 cm. The simulation of monthly evapotranspiration by IBIS is very close to the estimated
evapotranspiration rates (Figure 7d), with the annual-mean simulated evapotranspiration being within 1% of the estimated value.
The agreement between observed and simulated snow depth is reasonable although the maximum depth is often underestimated, and the snow accumulates too early in winter and remains too long in spring (Figure 7e). The simulated snow depth depends on the longwave forcing used as shown further. On the other hand, this might also be the result of an inaccurate partition between snowfall and rainfall. The meteorological dataset only includes total precipitation rate and we used the ratio of snowfall to rainfall set by PILPS (one under 0øC and zero above).
The simulated monthly total runoff (drainage at the bottom of the six layers and surface runoff) is compared to the discharge of the stream (Figure 7f). The agreement is qualitatively correct: IBIS simulates a peak at snowmelt in April and a second smaller peak at the beginning of the winter. The minimum values in summer are well captured by the model, but the winter and spring peak values are often underestimated.
The use of Brutsaert's infrared radiation algorithm has a large
DELlRE AND FOLEY: PERFORMANCE OF A LAND SURFACE MODEL 16,903
7OO
6OO
500
400 300
200
100
0
-IO0
500
4OO
300
200
100
0
-IO0
-IO0
Net radiation
•jb oø oo ß
ß ß
ß ß
ß ß
200 400
Observed flux (W m -2) Latent heat flux
o ø ß
ß ß
o ø e e, ß ß ß
ß
6OO
•e e ß oo
o ß ß
0 100 200 300
Observed flux (W m -2)
Cabauw
250
200
t 150 E
• 100 x
= 50
• 0
.E_ -50
-100
-150
200
150
100
50
0
-50
-lOO
-150
-lOO
400 500 -lOO
Sensible heat flux
0 100
Observed flux (W m -2) Soil conduction heat flux
200
i
0 100
Observed flux (W m -2)
500
45O
i
E
• 400 x
= 350
'5 300 E
25O
200 200
Upward infrared radiation
300 400
Observed flux (Wm -2) 500
Figure 6. Calculated versus observed surface fluxes at Cabauw in 1987.
200

16,904 Table 2. Root-Mean-Square (rms) Errors and Mean Bias of Simulated Fluxes
Site Caumont FIFE 16 Cabauw
Number of points R. (W m '2)
rms error
mean bias
H (W m '2) rms error
mean bias
LE (W m -2) rms error
mean bias
G (W m -2) rms error
mean bias
NEE (gmol C m -2 s -]) rms error
mean bias
Upward IR (W m -2) rms error
mean bias
1584 1238 17520
21 43 45 -6 3 5
42 45 19 18 -9 1
72 62 34 -23 20 3
14 24 37 3 -1 3
3.8
0.5
Reserva Jam
Dry Wet
1361 2654
16 23
-5 -5
27 31
5 10
43 43
-9 -14
17 13
1 2
Usadievskiy ß Volumetric moisture content, snow depth, evaporation and total runoff
67 68 69 70 71 72 73 74 75 76 77 78 79 80 81 82 83
lb i i [ i [ i i i i i i i i i i i i • 0.41_ __ ß ß % • -.I
67 68 69 70 71 72 73 74 75 76 77 78 79 80 81 82 83
0'4 [(• ................. 4
o
67 68 69 70 71 72 73 74 75 76 77 78 79 80 81 82 83
.-.lSøjd , , , ß ' , , , , , ........ I
67 68 69 70 71 72 73 74 75 76 77 78 79 80 81 82 83
• e i i i i i i i i i
.
,_• 0If /J,.1 /,• /, . •, _ _ 67 68 69 70 71 72 73 74 75 76 77 78 79 80 81 82 83
• f ........ i
E 200 J I * ß
67 68 69 70 71 72 73 74 75 76 77 78 79 80 81 82 83 Time (years)
Figure ?a. Lon• tc• evolution of the hydrologic balance simulated by IBIS with [dso's (solid line) and BmtsacWs (dashed line) lonewave algorithm in comparison to observations (dots) at the Usadicvskiy catchmerit between 1966 and 1984. (a) Volumetric moisture content in the top 20 cm, (b) volumetric moisture content in the top 50 cm, (c) volumetric moisture content in the top meter, (d) monthly evaporation, (•) snow depth in water equivalent, (• total monthly ranoff.

DELIRE AND FOLEY: PERFORMANCE OF A LAND SURFACE MODEL 16,905
0.5
0.4
0.3
0.1
0.5
0.2
0.1
0
0.5
0.4
0.3
0.1
Usadievskiy ß Volumetric moisture content, evaporation, snow depth and total runoff 150
d
ß
E
•' 5o
o 69 70 71 70 71
69 70 71
69
250 e
.-. 200
,•150 E
"•1 O0 "' 50
0 - 69
'" I i
_
70 71
69
ß
70 71 6S 70 71
Time (years) Time (yearn)
Figure 7b. Same as Figure 7a. Zoom of years 1969 to 1972.
impact on the simulated snow depth (snow acts as a blackbody in the infrared waveband) and, as a consequence, on the wintertime values of total runoff and moisture content (Figure 7e). The infrared radiation is in this case 20% smaller in winter than with the Idso algorithm, allowing snow to accumulate more during the winter. The runoff peak at snowmelt is therefore increased and is also slightly delayed. The simulation of the secondary peak of runoff is also improved in both amplitude and phase. The 20 % drop in incoming radiative energy reduces the wintertime evaporation (Figure 7d), allows the soil moisture in the top 20 cm to increase more in winter, and hence affects the secondary peak at the beginning of the winter.
4.5. Reserva Jaru
At this ABRACOS site, we impose an upper canopy composed of tropical broadleaf trees and a lower canopy composed of shrubs and C3 and C4 grasses. The upper canopy LAI is equal to 4.6 [Wright et al., 1996] and has 99% fractional coverage (Table 1). The maximum Rubisco capacity used is similar to the one optimized by da Rocha et al. [1996] for the SiB model. The total soil depth was increased to 10 m in IBIS in order to take into account the fact that during the dry season, the forest does not
show any significant moisture stress when the water content within 3.6 m of the surface is far below field capacity. Consequently, there is strong evidence of water uptake from below a depth of 3.6 m, where no measurements are available.
The issue of deep roots in Amazon forests was first raised by Nepstad et al. [ 1994] and confirmed by Wright et al. [ 1996]. Several modeling exercises showed the necessity of incorporating deep roots [e.g., Delire et al., 1997, Kleidon and Heimann, 1998, Costa and Foley, 1999]. In the case of IBIS, increasing the soil depth is not sufficient to get unstressed transpiration rate during the dry season. In IBIS, photosynthesis and stomatal conductance are limited by a water stress function that depends on the available water content in each layer and the root fraction of each layer. The vertical profile of root water uptake is based on fine root biomass observations reported by clackson et al. [1996]. The fine root biomass of tropical forest ecosystems decreases strongly with depth. During the dry season, the upper soil layers are water depleted and water resides in the deeper layers where the fraction of root is small. Because IBIS calculates the total water stress as
the sum of the water stress in each individual layer, trees are water limited even if there is enough water in deeper layers. To overcome this problem, we calculate the water stress as a function of the total available water content in the 10-m soil column. In
16,906 DELIRE AND FOLEY: PERFORMANCE OF A LAND SURFACE MODEL
ABRACOS, volumetric moisture content
0.4 I I I I I I I I . .
01 I I J, I I I I I I I I I I I I I I I i ! I I I I J F M A M J J A S O N D J F M A M J J A S O N D
i i i I ! i i i i i i i i '1' i i i I ' I i i i i i 0.4 ,
J F M A M J J A S O N D J F M A M J J A S O N D
0.4 '" '" ß
I I I I I I I I ! I I I I I I I I I I /
J F M A M J J A S O N D J F M A M J J A S O N D
i i i i i
o 4 .,. , . .... ,
J F M A M J J A S O N D J F M A M J J A S O N D
i i i i i i ! 1 i i i i i i i i i i i i I i i i
ß
•o.2
0 I I I I I I I I I I I I I I I I I I I I I I I I J F M A M J J A S O N D J F M A M J J A S O N D
i i i I i i I i I i i i i i i i i 1 i i i i i 1 .,,.,y..]
• • ,' .•...'"': ........ • / /
0.2 I I I I I I I I I I I I I ! I I I I I / I I I I I
0 J F M A M J J A S O N D J F M A M J J A S O N D
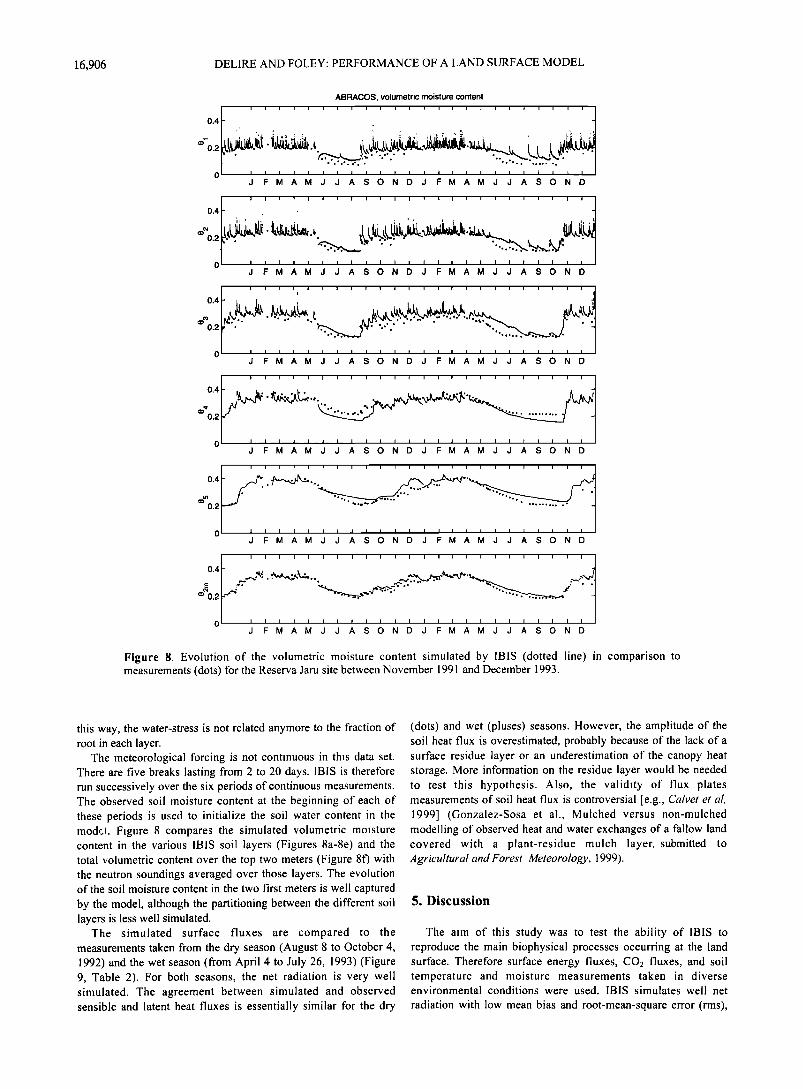
Figure 8. Evolution of the volumetric moisture content simulated by IBIS (dotted line) in comparison to measurements (dots) for the Reserva Jaru site between November 1991 and December 1993.
this way, the water-stress is not related anymore to the fraction of root in each layer.
The meteorological forcing is not continuous in this data set. There are five breaks lasting from 2 to 20 days. IBIS is therefore run successively over the six periods of continuous measurements. The observed soil moisture content at the beginning of each of these periods is used to initialize the soil water content in the mod½•. Figure 8 compares the simulated volumetric moisture content in the various IBIS soil layers (Figures 8a-8e) and the total volumetric content over the top two meters (Figure 8f) with the neutron soundings averaged over those layers. The evolution of the soil moisture content in the two first meters is well captured by the model, although the partitioning between the different soil layers is less well simulated.
The simalated surface fluxes are compared to the measurements taken from the dry season (August 8 to October 4, 1992) and the wet season (from April 4 to July 26, 1993) (Figure 9, Table 2). For both seasons, the net radiation is very well simulated. The agreement between simulated and observed sensible and latent heat fluxes is essentially similar for the dry
(dots) and wet (pluses) seasons. However, the amplitude of the soil heat flux is overestimated, probably because of the lack of a surface residue layer or an underestimation of the canopy heat storage. More information on the residue layer would be needed to test this hypothesis. Also, the validity of flux plates measurements of soil heat flux is controversial [e.g., Calvet et al, 1999] (Gonzalez-Sosa et al., Mulched versus non-mulched modelling of observed heat and water exchanges of a fallow land covered with a plant-residue mulch layer, submitted to Agricultural and Forest Meteorology, 1999).
5. Discussion
The aim of this study was to test the ability of IBIS to reproduce the main biophysical processes occurring at the land surface. Therefore surface energy fluxes, CO2 fluxes, and soil temperature and moisture measurements taken in diverse environmental conditions were used. IBIS simulates well net
radiation with low mean bias and root-mean-square error (rms),

DELlRE AND FOLEY' PERFORMANCE OF A LAND SURFACE MODEL 16,907
ABRACOS Reserva Jaru
800
600
400
200
0
Net radiation Sensible heat flux , , 250
•-- 200 I
E
• 150 x
•-- 100
• 50
E
(/) 0
-50 0 200 400 600 800 -50
Observed flux (W m -2)
o %
o
+
ß
+
ø4. + +
ß
o
*o4. O +
+o
ß o
ß +
50 100 150
Observed flux (W m -2) 200
6OO
• 500 I
E
•, 400 x • 300
• 200
.E_ 100
Latent heat flux
+ o
+ +
o o o
50
-50 0 200 400 600 -50
Observed flux (W m -2)
Soil heat conduction flux
0
Observed flux (W m -2)
Figure 9. Calculated versus observed surface fluxes at Reserva Jaru for the end of the dry season (pluses) from August 8 to October 4, 1992 and for the end of the wet season (dots) from April 4 to July 26, ! 993.
250
50
especially for the soybean crop in southwestern France and for the tropical forest in Rond6nia (Table 2). Radiative transfer through the canopy, surface albedo and surface temperature are therefore probably well simulated by IBIS. The low rms and mean bias of the simulated upward infrared radiation in Cabauw confirm this hypothesis. The scatter (described by the root-mean-square error) and bias on the sensible and latent heat fluxes are larger except for Cabauw. Except in the case of FIFE the amplitude of the soil heat conduction flux is overestimated by the model. The evolution of the total soil moisture is well captured by the model. To simulate correctly its vertical distribution, the model needs detailed information on the texture and on the root profile. There is not enough information on longwave radiation and snowfall versus rainfall rate at the Usadievskiy site to test the snow parameterization in IBIS.
Generally speaking, IBIS is able to accurately simulate the biophysical processes across a wide range of environmental conditions. Using data from contrasting climates (from tropical to continental high latitudes) and vegetation types (including forest,
grasslands, and crops), we have more confidence in the results than if we had only concentrated on a single site. However, it should be noted that a great deal of site-specific information (e.g., vegetation characteristics, soil texture) is required for accurate simulation.
The results of this data-model comparison exercise indicate several areas of improvement for the IBIS land surface model. In particular, several data sets suggest that the model overestimates the ground heat flux term, which suggests that the treatment of surface conductance or surface heat storage is in error. One possible explanation for this is that the model currently does not consider an organic residue (mulch) layer, which can strongly control the exchange of energy and water between the soil surface and the atmosphere. Results from the Amazonian site also suggest some improvement in the way the model calculates the limiting effect of soil water on stomatal conductance.
This exercise also points to several improvements for future data collection and reporting. In particular, future field campaigns should attempt to measure the vertical distribution of soil texture

16,908 DELlRE AND FOLEY: PERFORMANCE OF A LAND SURFACE MODEL
and fine root biomass. Also, information on the depth of the water table or better, on the depth of the impermeable layer would be necessary to improve the simulation of the deep soil water content. Furthermore, a greater emphasis on ecologically oriented variables (e.g., LA! phenology, Rubisco capacity, rooting depth) should be made in future studies. As land surface models become
more ecologically sophisticated, it is necessary for ecological measurements to be taken alongside the biophysical measurements.
The suite of numerical experiments conducted here increases our confidence that the model consistently represents a variety of environmental conditions in different climate regimes and therefore increases our confidence in larger-scale applications of the model. However, the ability to simulate land surface processes on the site-by-site level does not still guarantee that the model can accurately simulate land-atmosphere exchange processes on regional or global scales. To evaluate the simulations of land surface models at these spatial scales, we need fundamentally different data than what is provided by individual site-level flux measurements. For example, a large-scale network of eddy-flux measurements and soil moisture measurements would be
invaluable for validating land surface models on the regional and continental scale. Another promising technique for the large-scale evaluation of land surface models is to compare simulated runoff patterns to river discharge data [e.g., Coe, 1999].
Acknowledgments. We wish to thank Dave Pollard (Penn State University), John Norman, Chris Kucharik, Sam Levis, John Lenters, Navin Ramankutty, and Michael Coe for the input, advice, and comments throughout the work presented here. Fu•hermore, we wish to thank two anonymous reviewers whose comments substantially improved the manuscript. This work was supported by the National Science Foundation "Methods and Models for Integrated Assessment" program (grant ATM- 9711484) and by a NASA EOS Interdisciplinary Science Investigation (|DS, grant NAG5-3513).
References
Amthor, J. S., The role of maintenance respiration in plant growth, Plant Cell Environ., 7, 561-569, 1984.
Amthor, J. S., Scaling CO2-photosynthesis relationships from the leaf to the canopy, Photo.syn. Res., 39, 321-350, 1994
Beljaars, A.C., and F.C. Bosveld, Cabauw data for the validation of Land Surface Parameterization Schemes, J. Clim., 10, 1172-1193, 1997.
Bonan, G. B., Land-atmosphere CO2 exchange simulated by a land surface process model coupled to an atmospheric general circulation model., J. Geophys. Res., 100, 2817-2831, 1995.
Bonan, G.B., D. Pollard, and S.L. Thompson, Effects of boreal tbrest vegetation on global climate, Nature, 359, 716-718, 1992.
Brutsaert, W. H., On a derivable tbrmula for long-wave radiation from clear skies, Water Re¾our. Res., 11,742-744, 1975.
Calvet, J.-C., et al., MUREX: A land-surface field experiment to study the annual cycle of the energy and water budgets, Ann. Geophys., in press, 1999.
Chen, T., et al., Cabauw experimental results from the Project for Intercomparison of Land Surface Parameterization Schemes, J. Clim., 10, 1194-1215, 1997.
Collatz, G. J., J. T. Ball, C. Grivet, and J. A. Berry, Physiological and environmental regulation of stomatal conductance, photosynthesis and transpiration: a model that includes a laminar boundary layer, Agric. For. Meteorol., 54, 107-136, 1991.
Collatz, G. J., M. Ribas-Carbo, and J. A. Berry, Coupled photosynthesis- stomatal conductance model for leaves of C4 plants, A ust. J. Plant Physio!., 19, 519-538, 1992.
Coe, M. T., Modelling terrestrial hyd,'ological systems at the continental
scale: Testing the accuracy of an atmospheric GCM, J. C/im., in press, 1999.
Colello, G.D., C. Grivet, P.J. Sellers, and J. Berry, Modeling of energy, water, and CO2 flux in a temperate grassland ecosystem with SiB2: May-October 1987, J. Atmox. Sci., 55, 1141-1169, 1998.
Costa, M.H., and J.A. Foley, Combined effects of deforestation and doubled atmospheric COx concentrations on the climate of Amazonia, J. C/ira., in press, 1999.
da Rocha, H., P. Sellers, G. Collatz, I. Wright, and J. Grace, Calibration and use of the SiB2 model to estimate water vapour and carbon exchange at the ABRACOS forest sites, in Amazonian Deforestation and Climate, edited by J. Gash et al., pp. 474-504, John Wiley, New York, 1996.
Delire C., J.-C. Calvet, J. Noilhan, I. Wright, A. Manzi, and C. Nobre, Physical properties of Amazonian soils: A modeling study using the Anglo-Brazilian Amazonian Climate Observation Study data, J. Geophys. Res., 102, 30,119-30133, 1997.
Dickinson, R.E., A. Henderson-Sellers, P.J. Kennedy, and M.F. Wilson, Biosphere-Atmosphere Transfer Scheme (BATS) for the NCAR CCM, NCAR Tech. Note, NCAR/TN-275-STR, 69 pp., Natl. Cent. for Atmos. Res., Boulder, Co, 1986.
Douvil!e, H., Validation and sensitivity of the global hydrologic budget in stand-alone simulations with the ISBA land-surface scheme, Clim. Dyn., 14, 151-171, 1998.
Farquhar, G. D., S. von Caemmerer, and J. A. Berry, A biochemical model of photosynthetic CO2 assimilation in leaves of C3 species, Planta, 149, 78-90, 1980.
Foley, J. A., J. E. Kutzbach, M. T. Coe, and S. Levis, Feedbacks between climate and boreal forests during the Holocene epoch, Nature, 371, 52- 54, 1994.
Foley, J. A., C. I. Prentice, N. Ramankutty, S. Levis, D. Pollard, S. Sitch, and A. Haxeltine, An integrated biosphere model of land surface processes, terrestrial carbon balance, and vegetation dynamics, Global Biogeochem. Cycles', 10, 603-628, 1996.
Gash, J.C., C. Nobre, J. Roberts, and R. Victoria, An overview of ABRACOS, in Amazonian Deforestation and Climate, edited by J. Gash et al., pp. 1•14, John Wiley, New York, 1996.
Goutorbe, J.P., A critical assessment of the SAMER network accuracy, in Land Surface Evaporation, edited by T.J. Schmugge and J.-C. Andr6, pp. 171 - 182, Springer-Verlag, New York, 1991.
Henderson-Sellers, A., K. McGuffie, and A.J. Pitman, The Project for Intercomparison of Land-Surface Parameterization Schemes (PILPS): 1992 to 1995, Clim. Dyn., 12, 849-859, 1996.
|dso, S. B., A set of equations for full spectrum and 8-14 gm and 10.5- 12.5 gm thermal radiation from cloudless skies, Water Resour. Res., 17, 295-304. 1981.
Jackson, R.B., J. Canadell, J.R. Ehleringer, H.A. Mooney, O.E. Sala, and E.D. Schulze, A global analysis of root distributions for terrestrial biomes, Oecologia, 108, 389-411, 1996.
Kleidon, A., and M. Heimann, Optimized rooting depth and its impact on the simulated climate of an atmospheric general circulation model, Geophys. Res. Lett., 3, 345-348, 1998.
Lean, J., and D. Warrilow, A simulation of the impact of Amazon deforestation, Nature, 342, 411-413, 1989.
Leeroans, R., and W.P. Cramer, The IIASA database for mean monthly values of temperature, precipitation and cloudiness on a global terrestrial grid, IIASA WP-90-41, lnt. Inst. For Appl. Syst. Anal., Laxenburg, Austria, 1990.
Levis, S., M.T. Coe, and J.A. Foley, Hydrologic budget of a land surface model: A global application, J. Geophys. Res., 101, 16,921-16,930, 1996.
Manzi, A. O., and S. Planton, A simulation of Amazonian detbrestation using a GCM calibrated with ABRACOS and ARME data, in Amazoniaa Oejbrestation and Climate, edited by J. Gash et al., pp. 505-529, John Wiley, New York, 1996.
Nepstadt D.C., C. R. de Carvalho, E. A. Davidson, P.H. Jipp, P.A. Lefebvre, G.H. Negreiros, E.D. da Silva, T.A. Stone, S.E. Trumbore, and S. Vieira, The role of deep roots in the hydrological and carbon cycles of Amazonian tbrests and pastures, Nature, 372, 666-669, 1994.
Schlosser, C.A., A. Robock, K. Vinnikov, N.A. Speranskaya, and Y. Xue, 18-year land-surface hydrology model simulation for a midlatitude grassland catchment in Valday, Russia, Mon. Weather Rev., 125, 3279-3296, 1997.
Sellers P.J., Y. Mintz, Y.C. Sud, and A. Dalcher, A Simple Biosphere
DELIRE AND FOLEY: PERFORMANCE OF A LAND SURFACE MODEL 16,909
Model (SiB) tbr use within General Circulation Models, d. Atmos. Sci., 43,505-531, 1986.
Sellers, P.J., F.G. Hall, G. Asrar, D.E. Strebel, and R.E. Murphy, An overview of the First International Satellite Land Surface Climatology Project (ISLSCP) Field Experiment (FIFE), J. Geophys. Res., 97, 18,345-18,371, 1992.
Sellers, P.J., et al., Comparison of radiative and physiological effects of atmospheric CO2 on climate, Science, 271, 1402-1406, 1996.
Sellers, P.J. et al., Modeling the exchanges of energy, water, and carbon between continents and the atmosphere, Science, 275, 502-509, 1997.
Shao, Y., and A. Henderson-Sellers, Validation of soil moisture simulation in landsurface parameterisation schemes with HAPEX data, Global Planet. Changes, 13, 11-46, 1996.
Thompson, S. L., and D. Pollard, A global climate model (GENESIS) with a land-surface transfer scheme (LSX), Present climate simulation, J. C!im., 8, 732-76 !, 1995a.
Thompson, S. L., and D. Pollard, A global climate model (GENESIS) with a land-surface transfer scheme (LSX), CO2 sensitivity, J. C!im.., 8, 1104-1121, 1995b.
Verma, S.B., J. Kim, and R.J. Clement, Momentum, water vapor, and carbon dioxide exchange at a centrally located prairie site during FIFE, J. Geophys. Res., 97, 18,629-18,639, 1992.
Vinnikov, K.Y., A. Robock, N.A. Speranskaya, and C.A. Schlosser, Scales of temporal variability of midlatitude soil moisture, J. Geophys. Res., 101, D, 3, 7163-7174, 1996.
Wright, I.R., C. A. Nobre, J. Tomasella, H. R. da Rocha, J.M. Roberts, E. Vertamatti, A.D. Cull, R. C. S. Alvalh, M. G. Hodnett, and V. N. Ubarana, ,Towards a GCM surface parameterization of Amazonia, in Amazonian Dejbrestation and Climate, edited by J. Gash et al., pp. 474-504, John Wiley, New York, 1996.
Wullschleger, S. D., Biochemical limitations to carbon assimilation in C3 plants--A retrospective analysis of the A/C, curves from 109 species, d, Exp. Bot., 44(262), 907-920, 1993.
C. Delire and J. A. Foley, Climate, People, and Environment Program (CPEP), Institute for Environmental Studies, University of Wisconsin, 1225 W Dayton St., Madison, W1 53706. (cldelire•facstaff. wisc.edu)
(Received November 12, 1998; revised March 10, 1999; accepted March 22, 1999.)
Copyright © 2022 FDOKUMEN