
Evaluating patterns of fog water deposition and isotopic composition on the California Channel...
13
Evaluating patterns of fog water deposition and isotopic composition on the California Channel Islands Douglas T. Fischer 1 and Christopher J. Still 1 Received 23 April 2006; revised 20 December 2006; accepted 3 January 2007; published 14 April 2007. [1] Fog deposition is an important water source for endemic conifer species during the annual summer drought along the California coast (and in other coastal and montane areas). We present a new design for a passive fog collector that is useful both for characterizing fog regimes (timing and quantity of deposition) and for collecting fog water for subsequent isotopic analysis. The new collector both mimics vegetation collection efficiency and minimizes isotopic fractionation under a range of fog conditions. Low construction cost and collector durability allow widely distributed installation and greater insight into spatially heterogeneous fog patterns. We installed 21 fog collectors throughout a stand of Bishop pines (Pinus muricata D. Don) on Santa Cruz Island. In general, there was greater fog deposition with increasing elevation and decreasing frequency farther inland. Within these broad patterns, there was large spatial and temporal variability in fog deposition. Monthly samples of fog and rain waters reveal differences in stable isotope composition (d 18 O and dD) large enough to serve as tracers of different water sources moving through the ecosystem. Citation: Fischer, D. T., and C. J. Still (2007), Evaluating patterns of fog water deposition and isotopic composition on the California Channel Islands, Water Resour. Res., 43, W04420, doi:10.1029/2006WR005124. 1. Introduction 1.1. Ecosystem Importance of Fog and Motivation for New Collector Design [2] Fog has been recognized as an important hydrolog- ical input in many regions, including coastal areas, tropical montane cloud forests, and other areas worldwide [e.g., Marloth, 1905; Parsons, 1960; Kerfoot, 1968; Leyton and Armitage, 1968; Azevedo and Morgan, 1974; Schlesinger and Reiners, 1974; Goodman, 1985; Bruijnzeel, 1990; Bruijnzeel and Proctor, 1995; Walmsley et al., 1996; Dawson, 1998; Weathers, 1999; Corbin et al., 2005]. Rising interest in fog’s ecological and chemical impacts [Schemenauer and Cereceda, 1992; Weathers et al., 2000] has fueled the development of increasingly sophisticated methods for evaluating fog water inputs and distributions. Some of the most informative studies of fog’s ecosystem impacts use stable isotopes as tracers of water inputs from different sources [e.g., Ingraham and Matthews, 1995; Dawson, 1998; Scholl et al., 2002, 2007]. Provided that isotopic signatures of two water sources such as fog and rain are sufficiently distinct, their relative contributions to any water pool (e.g., soil water or plant xylem water) can be calculated with a simple mixing model [Dawson, 1993; Phillips and Gregg, 2001; Corbin et al., 2005]. All of these studies rely on fog and rain collectors that reliably sample fog water and rainwater without altering its ori- ginal isotopic composition. Collecting rainwater without alteration of its isotopic composition is frequently and easily accomplished, but much less work has been done to assess fog collector designs for reliable sampling of fog water isotopic signatures [Scholl et al., 2007]. 1.2. Fog Collector Design Considerations [3] The broader goal of our study is to assess the contribution of fog drip to water budgets of a fog-belt endemic pine species, Bishop pine ( Pinus muricata D. Don), on Santa Cruz Island in Channel Islands National Park. Anecdotal evidence suggests that this species relies in part on summer fog drip to survive the annual summer drought throughout its range along the coast of California. To accomplish this goal, we designed a new type of fog collector that could be used in remote locations and could quantify fog water inputs and stable isotope composition of the fog water for our plant ecological investigations. The quantity and isotopic composition of fog water can vary over relatively short distances [Scholl et al., 2007]. We were therefore interested in characterizing spatial and temporal variability in fog inputs and isotopic composition for a 25-km 2 study area, and planned to deploy a relatively dense network of 21 fog collectors dispersed across 12 sites. This large number of collectors raised the priority of reducing collector cost and complexity. Specifically, we desired a fog collector meeting, to the extent feasible, the following design criteria: (1) collect fog water in proportion to that collected by the vegetation under study (Bishop pines) under a variety of fog conditions (e.g., changing fog intensity, duration, and wind speed), including low-intensity, short-duration fog events; (2) collect fog water relatively consistently regardless of wind direction; and (3) collect fog water with minimal isotopic fractionation. [4] In this paper we compare the performance of a new fog collector design to that of previous collectors based on 1 Department of Geography, University of California, Santa Barbara, Santa Barbara, California, USA. Copyright 2007 by the American Geophysical Union. 0043-1397/07/2006WR005124$09.00 W04420 WATER RESOURCES RESEARCH, VOL. 43, W04420, doi:10.1029/2006WR005124, 2007 Click Here for Full Articl e 1 of 13
-
Upload
arcadis-us -
Category
Documents
-
view
1 -
download
0
Transcript of Evaluating patterns of fog water deposition and isotopic composition on the California Channel...

Evaluating patterns of fog water deposition and isotopic
composition on the California Channel Islands
Douglas T. Fischer1 and Christopher J. Still1
Received 23 April 2006; revised 20 December 2006; accepted 3 January 2007; published 14 April 2007.
[1] Fog deposition is an important water source for endemic conifer species during theannual summer drought along the California coast (and in other coastal and montaneareas). We present a new design for a passive fog collector that is useful both forcharacterizing fog regimes (timing and quantity of deposition) and for collecting fog waterfor subsequent isotopic analysis. The new collector both mimics vegetation collectionefficiency and minimizes isotopic fractionation under a range of fog conditions. Lowconstruction cost and collector durability allow widely distributed installation and greaterinsight into spatially heterogeneous fog patterns. We installed 21 fog collectors throughouta stand of Bishop pines (Pinus muricata D. Don) on Santa Cruz Island. In general, therewas greater fog deposition with increasing elevation and decreasing frequency fartherinland. Within these broad patterns, there was large spatial and temporal variability in fogdeposition. Monthly samples of fog and rain waters reveal differences in stable isotopecomposition (d18O and dD) large enough to serve as tracers of different water sourcesmoving through the ecosystem.
Citation: Fischer, D. T., and C. J. Still (2007), Evaluating patterns of fog water deposition and isotopic composition on the CaliforniaChannel Islands, Water Resour. Res., 43, W04420, doi:10.1029/2006WR005124.
1. Introduction
1.1. Ecosystem Importance of Fog and Motivation forNew Collector Design
[2] Fog has been recognized as an important hydrolog-ical input in many regions, including coastal areas, tropicalmontane cloud forests, and other areas worldwide [e.g.,Marloth, 1905; Parsons, 1960; Kerfoot, 1968; Leyton andArmitage, 1968; Azevedo and Morgan, 1974; Schlesingerand Reiners, 1974; Goodman, 1985; Bruijnzeel, 1990;Bruijnzeel and Proctor, 1995; Walmsley et al., 1996;Dawson, 1998; Weathers, 1999; Corbin et al., 2005].Rising interest in fog’s ecological and chemical impacts[Schemenauer and Cereceda, 1992; Weathers et al., 2000]has fueled the development of increasingly sophisticatedmethods for evaluating fog water inputs and distributions.Some of the most informative studies of fog’s ecosystemimpacts use stable isotopes as tracers of water inputs fromdifferent sources [e.g., Ingraham and Matthews, 1995;Dawson, 1998; Scholl et al., 2002, 2007]. Provided thatisotopic signatures of two water sources such as fog andrain are sufficiently distinct, their relative contributions toany water pool (e.g., soil water or plant xylem water) canbe calculated with a simple mixing model [Dawson, 1993;Phillips and Gregg, 2001; Corbin et al., 2005]. All ofthese studies rely on fog and rain collectors that reliablysample fog water and rainwater without altering its ori-ginal isotopic composition. Collecting rainwater withoutalteration of its isotopic composition is frequently and
easily accomplished, but much less work has been doneto assess fog collector designs for reliable sampling of fogwater isotopic signatures [Scholl et al., 2007].
1.2. Fog Collector Design Considerations
[3] The broader goal of our study is to assess thecontribution of fog drip to water budgets of a fog-beltendemic pine species, Bishop pine (Pinus muricataD. Don), on Santa Cruz Island in Channel Islands NationalPark. Anecdotal evidence suggests that this species relies inpart on summer fog drip to survive the annual summerdrought throughout its range along the coast of California.To accomplish this goal, we designed a new type of fogcollector that could be used in remote locations and couldquantify fog water inputs and stable isotope composition ofthe fog water for our plant ecological investigations. Thequantity and isotopic composition of fog water can varyover relatively short distances [Scholl et al., 2007]. We weretherefore interested in characterizing spatial and temporalvariability in fog inputs and isotopic composition for a 25-km2
study area, and planned to deploy a relatively dense networkof 21 fog collectors dispersed across 12 sites. This largenumber of collectors raised the priority of reducing collectorcost and complexity. Specifically, we desired a fog collectormeeting, to the extent feasible, the following design criteria:(1) collect fog water in proportion to that collected by thevegetation under study (Bishop pines) under a variety of fogconditions (e.g., changing fog intensity, duration, and windspeed), including low-intensity, short-duration fog events;(2) collect fog water relatively consistently regardless of winddirection; and (3) collect fog water with minimal isotopicfractionation.[4] In this paper we compare the performance of a new
fog collector design to that of previous collectors based on
1Department of Geography, University of California, Santa Barbara,Santa Barbara, California, USA.
Copyright 2007 by the American Geophysical Union.0043-1397/07/2006WR005124$09.00
W04420
WATER RESOURCES RESEARCH, VOL. 43, W04420, doi:10.1029/2006WR005124, 2007ClickHere
for
FullArticle
1 of 13

these three design criteria. Then, we report on how the dataobtained from these new collectors provided new insightsabout fog deposition on the southern California ChannelIslands and the implications for our ongoing plant-basedinvestigations.
1.3. Previous Fog Collector Designs
[5] Previously published fog collector designs fall intotwo main categories. ‘‘Active collectors’’ sample knownvolumes of air per unit time using a fan to pull air pastcollection surfaces [e.g., Daube et al., 1987a; Collett et al.,1989] (Figure 1a) and have been applied extensively in fogchemical analyses [e.g., Collett et al., 1989; Weathers andLikens, 1997; Collett et al., 2002; Burkard et al., 2003].‘‘Passive collectors’’ rely on wind to move air past collec-tion surfaces [e.g., Schemenauer and Cereceda, 1991], andalmost all studies of fog water isotopic composition havebeen conducted with such collectors. Active collectors canbe very complex (e.g., self-cleaning, computer-controlled,with closing doors and autosamplers to subsample indivi-dual fog events) and cost many thousands of dollars [e.g.,Collett et al., 1990; Demoz et al., 1996; Fuzzi et al., 1997;Burkard et al., 2003]. In contrast, the simplest passive
collectors can be built for only tens of dollars [e.g.,Schemenauer and Cereceda, 1994] (Figure 1b), can bedeployed in remote environments lacking electrical power,are easily replaced or repaired, and have a comparativelylow failure rate under harsh environmental conditions.[6] Both passive and active fog collectors can be further
subdivided based on the type of collection surfaces used. Themost common two types are ‘‘mesh collectors,’’ with horizon-tal and vertical strands, and ‘‘harp collectors,’’ with onlyvertical strands (Figures 1c and 1d). Mesh collectors aregenerally simpler to construct, utilizing a mass-manufacturedmesh that can be fastened to a simple frame [e.g., Schemenauerand Joe, 1989; Schemenauer and Cereceda, 1994; Juvikand Nullet, 1995]. Harp collectors are generally more time-consuming to build, requiringmanual stringing [e.g.,Falconerand Falconer, 1980]. For simplicity, the passive collectordesigns will be referred to in the remainder of the paper bythe first author’s name (i.e., Schemenauer, Falconer, and Juvikcollectors).
1.4. Mesh Versus Harp
[7] While mesh collectors are simpler than harps, onedrawback is that they tend to store more water on thecollector strands than a harp of similar collection area. Thisincreased ‘‘canopy storage’’ on the collector is caused bywater drops adhering in the corners of the mesh wherestrands cross. Thus mesh collectors generally take moretime to reach saturation and begin dripping at the beginningof a fog event. This effect was consistently observed in side-by-side comparison of harp, Juvik, and Schemenauer fogcollectors [Frumau et al., 2007; A. Frumau, personalcommunicaton, 2006]. The degree to which this delaymatches vegetation collection performance depends on thenature of the canopy under study. Needle-leaved trees, forinstance, tend to collect fog much more efficiently and shedfog drip more quickly than broader-leaved trees [Goodman,1985]. The increased ‘‘canopy storage’’ of water on thecollector means that mesh collectors generally do not reactas quickly to fog events, and may entirely miss low-intensity, short-duration fog events that often producemeasurable fog drip from pines at our sites. In initial testing,a prototype mesh style collector (a modified Juvik; after;T. E. Dawson, personal communication, 2003) failed torecord many fog events that were heavy enough to generatesubstantial fog drip from adjacent pine trees. This findingdictated the use of a harp collector for our study.[8] An additional consideration supported our choice of a
harp collector: For studies of the isotopic composition offog, increased canopy storage also allows more chance forisotopic enrichment by evaporation during intermittent fogevents. Water molecules containing lighter isotopes ofhydrogen and oxygen evaporate preferentially, so that anyliquid water remaining after evaporation is enriched inheavier isotopes [Craig, 1961; Gat, 1996; Mook and deVries, 2001]. Thus, at the end of a fog event, any water lefton the collector starts to evaporate and become isotopicallyenriched. Should fog deposition begin again before it hasevaporated completely, that enriched water would be col-lected and contaminate the previously stored sample. Theless water that is remaining on a collector at the end of a fogevent, the less time it will be around in a partially evapo-rated (isotopically enriched) state, available to contaminatethe collected sample if fog returns. We tested the amount of
Figure 1. Schematics of selected fog collector designs.Caltech Active Strand Cloudwater Collector (A) draws airacross a harp with a fan [Daube et al., 1987a, 1987b;Collett et al., 1989]. Schemenauer passive mesh collector(B) is nursery shade cloth stretched between posts andoriented orthogonal to prevailing wind flows [Schemenauerand Cereceda, 1994]. Falconer passive harp collector(C) is cylindrical with wires/strings as collection surfaces[Falconer and Falconer, 1980]. Juvik passive mesh collector(D) is metal mesh wrapped in a cylinder [Juvik and Nullet,1995].
2 of 13
W04420 FISCHER AND STILL: EVALUATING PATTERNS OF FOG WATER DEPOSITION W04420

water retained on our harp collector versus a mesh collectorsimilar to that described by Schemenauer and Cereceda[1994] by weighing both collectors before and after simu-lated fog events. After initial weighing, we simulated aheavy fog event by misting both collectors heavily with anatomizer until water ran freely off them at a steady rate. Westopped the mist, waited 5 min for the collectors to drain,and weighed them again. We then compared the amount ofwater retained as a function of collection area, whichdiffers by a factor of 6 (one-sided silhouette area ofcollecting strands is 0.093 m2 for our harp, 0.6 m2 forthe Schemenauer mesh collector). The new harp collectorretained 40% less water than the mesh collector per area(300 g/m2 versus 500 g/m2).
1.5. Sensitivity to Wind Direction
[9] The simplest passive fog collector, a flat meshSchemenauer collector, is sensitive to wind direction; itcollects more water when winds are perpendicular to thecollector than when winds are more nearly parallel [Juvikand Nullet, 1995; Schemenauer and Cereceda, 1995]. Thismeans that one needs to know the prevailing wind direc-tions during fog events (and not just the overall prevailingwind direction) prior to installation in order to collectrepresentative volumes. In many areas such knowledge isreadily available, but in other areas lack of a prioriknowledge and/or large variability in wind direction makesstrong directional sensitivity undesirable. Two solutions towind sensitivity have been proposed: mounting collectorsto pivot into the wind, or making ‘‘omnidirectional’’collectors that are the same from all sides. Pivots addsignificantly to complexity of construction, deployment,and maintenance; omnidirectional collectors are a moreelegant solution. Existing omnidirectional fog collectorsare cylindrical mesh (Juvik) or harp (Falconer) collectors.[10] We considered the cylindrical harp collector
designed by Falconer and Falconer [1980]. It is a cylin-
drical harp of Teflon strands strung between two horizontalpolypropylene disks (Figure 1c). Unlike the simplest planarfog collectors, it is not sensitive to wind direction. It is,however, time-consuming and expensive to build (as dis-cussed by Schemenauer and Cereceda [1994]). In theinterests of simplicity we opted to slightly relax the require-ment that the collector be strictly omnidirectional (i.e.,collecting fog consistently regardless of wind direction)and built one that is essentially two flat harps perpendicu-larly bisecting each other. This design reduces cost andcomplexity, allowing much greater spatial coverage of ourfield site, and the departure from strict omnidirectionality isminimal (see section 2.4 below).
2. New Design
2.1. System Description
[11] Our fog collector is a passive, harp-style collector. Itconsists of two perpendicular panels intersecting on avertical center post (Figure 2a). The panels consist of twolayers of monofilament fishing line stretched taut verticallybetween two stainless steel threaded rods. Water drippingoff the collecting strings collects in a small trough anddrains to a central funnel (Figure 2b), and from there thewater is routed either to a sampling bottle (designed tominimize isotopic enrichment from subsequent evaporation)or to a tipping bucket rain gauge (to log timing and quantityof collection). A plastic drum lid fits over the top of thecollector to somewhat reduce the amount of rain collected.[12] This collector was designed from readily available,
off-the-shelf components in U.S. industry-standard sizesand is relatively simple to construct. Several collectorscan easily be built in 2–3 days with materials cost ofaround $50 each. The central column is 3/400 PVC pipe(2.7 cm OD). Threaded rods inserted horizontally throughthe column are 3/800 (0.95 cm OD) stainless steel. Ourcollectors measure 61 cm (2 feet) between top and bottom
Figure 2. Schematic of new fog collector design. (a) Central column of PVC pipe supports cross armsof stainless steel threaded rod. Fog droplets collect on fishing line strung vertically between the crossarms. (b) Fog water drips off the lower cross arms into troughs that drain into a central funnel (which hasa screen to exclude debris). From there, fog water can be metered through a rain gauge or collected forisotopic analysis.
W04420 FISCHER AND STILL: EVALUATING PATTERNS OF FOG WATER DEPOSITION
3 of 13
W04420

threaded rods. The collector is strung with 122 m (400 feet)of monofilament fishing line with a diameter of 0.76 mmspaced 9 mm apart. While fishing line is inappropriate foratmospheric contaminant sampling (especially for nitrogencompounds), it is perfectly suitable for assessing fog waterquantity and isotopic composition. It is also less expensive,more readily available, and easier to work with than Teflonstrands.[13] Collection troughs are made of 1/200 PVC pipe
(2.1 cm OD) cut in half lengthwise. Once cut in half, thepipe is heated in the middle and shaped to a slight V, so thatwater drains to the center. A drain hole is drilled in thecenter, and attachment holes drilled at each end. The endsare heated and folded up to fit over the ends of the lowerthreaded rod. The narrower 1/200 pipe was used for troughsto reduce ‘‘by-catch’’ of rain. Even in relatively strongwinds, the drops of fog coming off the threaded rod arelarge enough to drip straight down into the troughs.[14] Installation is simple. We simply hose clamp a
collector to a T fence post (adding guy wires for thoseposts with tipping buckets). The collector is durable. Stain-less steel and gray PVC hold up in the harshest environ-ments. After 2 years of UV exposure, the fishing line hasremained strong and flexible. On monthly sampling trips,maintenance has consisted primarily of dusting off thecollector strands. More detailed construction informationcan be obtained from the authors.
2.2. Deployment on Santa Cruz Island
[15] Paired fog collectors were deployed at seven sites onSanta Cruz Island, the largest of the California ChannelIslands, located approximately 40 km south of SantaBarbara (Figure 3). At each site, one fog collector wasplumbed into a collection bottle to collect water samples forsubsequent isotopic analysis. We used amber plastic bottlesfor collection, with long vent tubes to minimize evaporation(see discussion by Scholl et al. [2007] of different methodsof protecting collected water from evaporation). This designwas tested for evaporation effects in northern California andfound to be satisfactory (T. Dawson, personal communica-tion, 2003). When subsamples were taken from these bottleseach month, fog water volumes were also recorded (up to amaximum volume of 4.4 L). The other fog collector wasplumbed to a tipping bucket rain gauge in order to record
timing and quantity of fog water inputs. Differences inmonthly collection volumes between the two collectors ateach site were noted (only possible when less than 4.4 L).These differences were sometimes large initially as a resultof clogged collection tubing. Clogs (primarily due toinvertebrates) were largely eliminated by the addition of afilter screen in the central funnel.[16] In the following sections, we address the perfor-
mance of the collector with respect to the design criteriafrom section 1 above based on field experience.
2.3. Collecting Volumes of Fog Water Representative ofVegetation Under Study
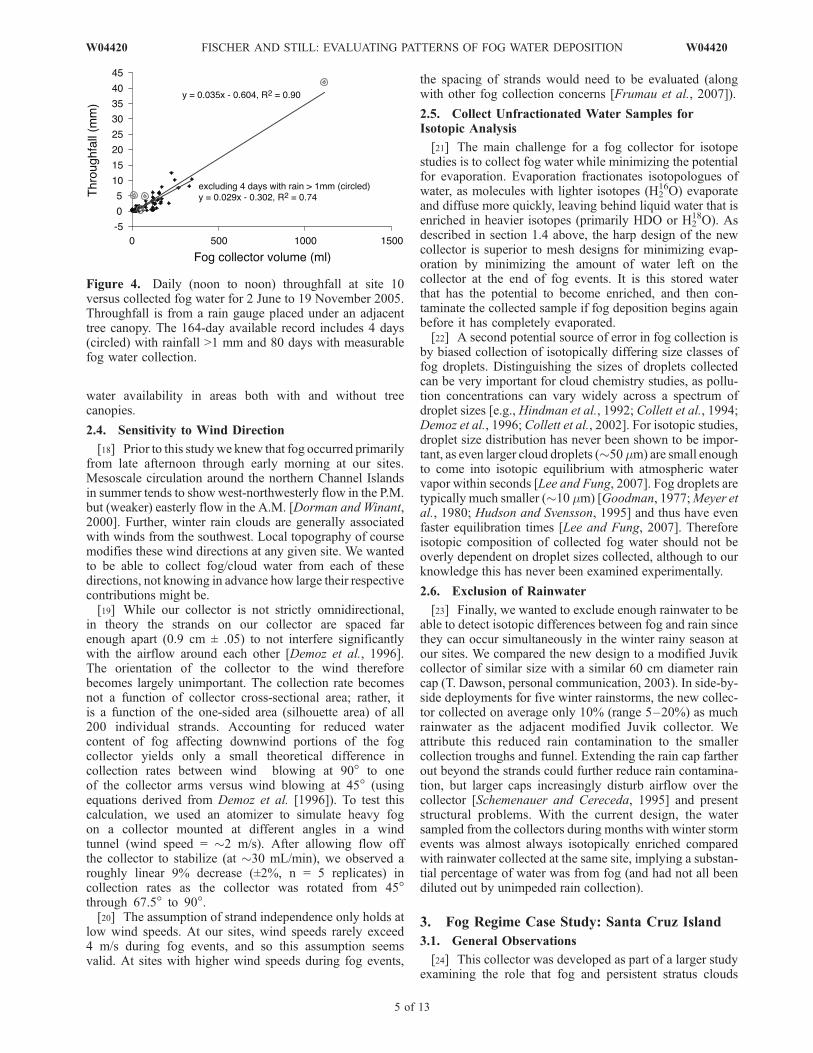
[17] For hydrologic studies, the volume of water from afog collector is a proxy for the amount of fog drippotentially generated by vegetation. The key measurementis whether, under a range of conditions, the fog collectorgenerates fog drip in some consistent proportion to fog dripgenerated by the vegetation under study. The Falconer harphas been shown to collect fog in linear proportion to conifercanopies, and so we expected our similar design also tocorrelate strongly with fog drip from pines [DeFelice andSaxena, 1990; Joslin et al., 1990]. That assumption wastested during the 2005 dry season by comparing daily fogcollection totals at site 10 to throughfall collected by arain gauge deployed under the canopy of adjacent pines(Figure 3). Daily fog drip throughfall totals (noon to noon)from that gauge are linearly correlated with fog watervolumes from the fog collector (Figure 4; R2 = 0.74 for80 foggy days out of 164 total days, excluding 4 dayswith rain >1 mm). The fog collector appears to have aslight bias toward recording small events that do notgenerate sufficient fog drip from the canopy to registeron the rain gauge. This oversensitivity bias can be filteredout of volumetric data (by setting a minimum dailythreshold) and is preferable to under-sensitivity. Further-more, it is possible that the pine canopy absorbs some ofthe fog it collects via foliar absorption [Leyton andArmitage, 1968; Boucher et al., 1995; Munne-Bosch etal., 1999; Burgess and Dawson, 2004], and such inputswould not be recorded by the throughfall collector butwould be recorded by our more sensitive collectors. Thelinear correlation supports our deployment of standardcollectors across the study area as a way to measure fog
Figure 3. Elevation map of Santa Cruz Island showing fog collector sites deployed on an E-W transectthroughout the island’s main stand of Bishop pines (Pinus muricata D. Don). Stations are numbered 1–12, west to east (numbers shown for sites where data loggers and paired fog collectors were installed).The island lies about 30 km off the coast of southern California, is 38 km long, and reaches 753 melevation. (Locator map redrawn with permission from Agenbroad et al. [2005].)
4 of 13
W04420 FISCHER AND STILL: EVALUATING PATTERNS OF FOG WATER DEPOSITION W04420
water availability in areas both with and without treecanopies.
2.4. Sensitivity to Wind Direction
[18] Prior to this studywe knew that fog occurred primarilyfrom late afternoon through early morning at our sites.Mesoscale circulation around the northern Channel Islandsin summer tends to show west-northwesterly flow in the P.M.but (weaker) easterly flow in the A.M. [Dorman and Winant,2000]. Further, winter rain clouds are generally associatedwith winds from the southwest. Local topography of coursemodifies these wind directions at any given site. We wantedto be able to collect fog/cloud water from each of thesedirections, not knowing in advance how large their respectivecontributions might be.[19] While our collector is not strictly omnidirectional,
in theory the strands on our collector are spaced farenough apart (0.9 cm ± .05) to not interfere significantlywith the airflow around each other [Demoz et al., 1996].The orientation of the collector to the wind thereforebecomes largely unimportant. The collection rate becomesnot a function of collector cross-sectional area; rather, itis a function of the one-sided area (silhouette area) of all200 individual strands. Accounting for reduced watercontent of fog affecting downwind portions of the fogcollector yields only a small theoretical difference incollection rates between wind blowing at 90! to oneof the collector arms versus wind blowing at 45! (usingequations derived from Demoz et al. [1996]). To test thiscalculation, we used an atomizer to simulate heavy fogon a collector mounted at different angles in a windtunnel (wind speed = !2 m/s). After allowing flow offthe collector to stabilize (at !30 mL/min), we observed aroughly linear 9% decrease (±2%, n = 5 replicates) incollection rates as the collector was rotated from 45!through 67.5! to 90!.[20] The assumption of strand independence only holds at
low wind speeds. At our sites, wind speeds rarely exceed4 m/s during fog events, and so this assumption seemsvalid. At sites with higher wind speeds during fog events,
the spacing of strands would need to be evaluated (alongwith other fog collection concerns [Frumau et al., 2007]).
2.5. Collect Unfractionated Water Samples forIsotopic Analysis
[21] The main challenge for a fog collector for isotopestudies is to collect fog water while minimizing the potentialfor evaporation. Evaporation fractionates isotopologues ofwater, as molecules with lighter isotopes (H2
16O) evaporateand diffuse more quickly, leaving behind liquid water that isenriched in heavier isotopes (primarily HDO or H2
18O). Asdescribed in section 1.4 above, the harp design of the newcollector is superior to mesh designs for minimizing evap-oration by minimizing the amount of water left on thecollector at the end of fog events. It is this stored waterthat has the potential to become enriched, and then con-taminate the collected sample if fog deposition begins againbefore it has completely evaporated.[22] A second potential source of error in fog collection is
by biased collection of isotopically differing size classes offog droplets. Distinguishing the sizes of droplets collectedcan be very important for cloud chemistry studies, as pollu-tion concentrations can vary widely across a spectrum ofdroplet sizes [e.g., Hindman et al., 1992; Collett et al., 1994;Demoz et al., 1996; Collett et al., 2002]. For isotopic studies,droplet size distribution has never been shown to be impor-tant, as even larger cloud droplets (!50mm) are small enoughto come into isotopic equilibrium with atmospheric watervapor within seconds [Lee and Fung, 2007]. Fog droplets aretypically much smaller (!10 mm) [Goodman, 1977;Meyer etal., 1980; Hudson and Svensson, 1995] and thus have evenfaster equilibration times [Lee and Fung, 2007]. Thereforeisotopic composition of collected fog water should not beoverly dependent on droplet sizes collected, although to ourknowledge this has never been examined experimentally.
2.6. Exclusion of Rainwater
[23] Finally, we wanted to exclude enough rainwater to beable to detect isotopic differences between fog and rain sincethey can occur simultaneously in the winter rainy season atour sites. We compared the new design to a modified Juvikcollector of similar size with a similar 60 cm diameter raincap (T. Dawson, personal communication, 2003). In side-by-side deployments for five winter rainstorms, the new collec-tor collected on average only 10% (range 5–20%) as muchrainwater as the adjacent modified Juvik collector. Weattribute this reduced rain contamination to the smallercollection troughs and funnel. Extending the rain cap fartherout beyond the strands could further reduce rain contamina-tion, but larger caps increasingly disturb airflow over thecollector [Schemenauer and Cereceda, 1995] and presentstructural problems. With the current design, the watersampled from the collectors during months with winter stormevents was almost always isotopically enriched comparedwith rainwater collected at the same site, implying a substan-tial percentage of water was from fog (and had not all beendiluted out by unimpeded rain collection).
3. Fog Regime Case Study: Santa Cruz Island
3.1. General Observations
[24] This collector was developed as part of a larger studyexamining the role that fog and persistent stratus clouds
Figure 4. Daily (noon to noon) throughfall at site 10versus collected fog water for 2 June to 19 November 2005.Throughfall is from a rain gauge placed under an adjacenttree canopy. The 164-day available record includes 4 days(circled) with rainfall >1 mm and 80 days with measurablefog water collection.
W04420 FISCHER AND STILL: EVALUATING PATTERNS OF FOG WATER DEPOSITION
5 of 13
W04420

play in ecological processes and plant distributions in theCalifornia Channel Islands and along the California coast.Previous studies along the California coast have used adiversity of fog collectors in different locales. Goodman[1985] used a planar harp (and a cylindrical harp) onMontara Mountain (450 km NNW) in the Bay Area. Estberg[2001] used a planar harp on the consistently cloudier/foggier San Miguel Island (50 km W), and at the sunnierTorrey Pines State Park (260 km ESE) near San Diego. Ruiz[2005] used a Schemenauer collector at two locations nearCalifornia State University Monterey Bay (345 km NNW).We present summer fog collection data from these studies(Table 1) normalized for collector silhouette area (as the
collectors differed by a factor of 6 in this regard). Thecollection rates from the current study on Santa Cruz Islandwere qualitatively similar, though lower than at the othersites, with the exception of Torrey Pines State Park. This fitsthe established positive correlation of summer fog/overcastintensity with latitude along the California coast [Filonczuket al., 1995].[25] Our primary study area is a stand of Bishop pines
(Pinus muricata D. Don) on Santa Cruz Island. The studyarea is subject to frequent short-duration, low-intensitynighttime fog events.[26] Dry season (May–September) fog water deposition
on western Santa Cruz Island comes mainly overnight in
Table 1. Volume of Fog Water Collected During Summer Dry Season for Several Coastal California Studiesa
Location Latitude, !N Longitude, !W Elevation, mCollection Surface
Area, m2
Fog Volume, L/m2
Year ReferenceJun Jul Aug Sep
Montara Mountain 37.5 122.5 550 0.4 293 235 166 . . . 1982 Goodman [1985]CSUMB 3 36.7 121.8 76 0.6 . . . 7 27 3 2005 Ruiz [2005]Glen Deven 1 36.4 121.9 292 0.6 . . . . . . 108 12 2005 Ruiz [2005]Glen Deven 2 36.4 121.9 271 0.6 . . . . . . 79 21 2005 Ruiz [2005]Site 1 (coastal) 34.0 119.9 61 0.093 2 2 0.04 0 2005 this studySite 2 34.0 119.8 147 0.093 8 16 3 0.4 2005 this studySite 7 34.0 119.8 296 0.093 38 66 33 8 2005 this studySite 8 34.0 119.8 200 0.093 18 14 2 1 2005 this studySite 10 34.0 119.8 437 0.093 17 24 6 5 2005 this studySite 11 34.0 119.8 402 0.093 43 11 17 4 2005 this studySite 12 (inland) 34.0 119.8 387 0.093 25 8 26 6 2005 this studySan Miguel Island 34.0 120.4 152 0.35–0.43 39–48 81–99 111–136 51–62 1995 Estberg [2001]Torrey Pines 32.9 117.3 101 0.35–0.43 0.1 0.4 0.3 0.1 1995 Estberg [2001]
aCollection volumes are normalized by one-sided collection surface area (silhouette area). Sites 1–12 are on a 7-km east-west transect on western SantaCruz Island (Figure 3). Collection surface area for the current collector is 200 strands, 610-mm " 0.76-mm diameter. The planar harp used by Goodmanhad 500 strands, 0.8-mm diameter, strung vertically in a 1-m " 1-m frame. The planar harp used by Estberg had 1066 strands, 0.41-mm diameter, strung ona rectangular frame with an area of 0.59 m2. The dimensions of the rectangle are not given, hence the uncertainty of the collection surface area. The fogcollector used by Ruiz has two layers of mesh with a combined estimated 40% void space on a 1-m " 1-m frame. While there is much interannualvariability in fogginess [Leipper, 1994], these data support generally increasing fogginess with increasing altitude, increasing latitude along California[Filonczuk et al., 1995], and increasing longitude west in the Channel Islands.
Figure 5. Total volumes of fog water collected (liters) as a function of wind direction at site 7. (a) Thegeneral summer pattern is of fog rolling in from the northwest in the evening, intensifying overnight, andthen burning off in the morning. A second pattern is for fog to come from the southeast in the earlymorning. When winds are less than 0.25 m/s, fog is plotted as coming from 000 degrees. (b) Total fogvolume as a function of wind speed. Almost all fog water is collected with northwest winds at 2–3 m/s.Fog deposited from the southeast is associated with lower wind speeds. The fog regime shown for thissite is typical of all but the easternmost two sites.
6 of 13
W04420 FISCHER AND STILL: EVALUATING PATTERNS OF FOG WATER DEPOSITION W04420

5–15 events per month, generally with relatively light NWwinds (typified at site 7, Figure 5). During these events,pines collect sufficient fog to produce drip that regularlywets the upper soil profile to 15 cm or deeper, raising soilwater potentials for significant periods of time (D. T.Fischer et al., Significance of summer overcast and fog tothe ecology of coastal California endemic species, submit-ted to Journal of Biogeography, 2007). Within this broadpattern, there is substantial local variation in timing andquantity of fog water inputs, which we sought to characterize.
3.2. Effects of Elevation
[27] Fog water collection was positively correlated withelevation at our sites. Figure 6 shows the cumulative fogwater volumes collected during the summer dry season atfive sites in 2004 (17 March to 16 October) and sevensites in 2005 (9 May to 16 October). The stations arelisted in order progressing from west to east, with higherelevation stations (300–440 m) shown with bold curvesand lower elevation stations (60–200 m) shown withthinner curves. Steep sections of the curves indicatesignificant fog events where large volumes of fog waterwere collected in a short period of time. Note that higher-elevation stations (bold curves) intercept consistentlygreater amounts of fog. This pattern is expected for threereasons. First, low stratus clouds over the Santa BarbaraChannel frequently form a solid layer overnight withcloud bases around 100–200 m and cloud tops around600–900 m elevation (based on pilot reports and ceilo-meter data from Santa Barbara Airport). After dawn, the
clouds begin to thin, evaporating from both top andbottom. The result is that our higher-elevation stations(300–440 m) spend many more hours inundated byclouds than lower-elevation stations. Other points on theisland at still higher elevations, however, are usually wellabove the stratus clouds, and so this positive correlationbetween fog collection and elevation is presumably limitedto elevations below the typical stratus tops. Second, theprevailing summertime NW winds encounter sharply risingterrain on the western part of the island, leading toorographic cloud formation on and above the ridges onthe western part of the island, including our sites. Sincehigher ridges provide more orographic lifting, they aremore likely to receive thicker orographic fogs for longerduration than lower-elevation stations. Third, wind speedsat higher-elevation stations tend to be slightly higher.Higher wind speeds will, all else being equal, push agreater volume of fog past a collection surface in the sametime period, resulting in higher rates of fog collection.
3.3. Spatial Variability
[28] At seven sites on Santa Cruz Island, we recordedwind speed and direction at 15-min intervals (hourly at sites 1and 10) to determine wind conditions during fog events. Atmost of our sites, wind direction during dry season fogevents is sufficiently consistent that it is less important thatfog collectors be omnidirectional (Figure 7). It worthnoting, however, that it is often difficult to know for certainwhat wind direction will prevail during fog events prior tomonitoring, especially in remote areas. We were surprised,
Figure 6. Cumulative fog water (liters per site) collected during annual summer dry season on SantaCruz Island. Five stations for 2004 (17 March to 16 October) and seven stations for 2005 (9 May to16 October). Stations are listed west to east (1–12). Higher-elevation stations (296–437 m) are plottedwith bolder curves and consistently record higher fog volumes than lower stations (61–200 m).Occasional clogs by invertebrates during 2004 mean these values are lower limits on actual fog deposition.
W04420 FISCHER AND STILL: EVALUATING PATTERNS OF FOG WATER DEPOSITION
7 of 13
W04420

for instance, at the variability of incoming fog direction atsite 11, and at the dominance of fogs from the east at site 12.It appears that even though prevailing winds at sites 11 and12 are from the NW, they are far enough inland (from thatdirection) that fog banks from the NW do not as reliablymake it across intervening topography.[29] For all but two sites, winds were consistently out of
the northwest during dry-season fog events (Figure 7).While there were periods with winds from the southeastquadrant, the total amount of fog collected during thoseperiods was minimal. At the eastern two sites, an increa-sing fraction of collected fog water came from the east.This change in prevailing wind direction for the easternstations suggests that fog deposition at those stationsresults from different mesoscale weather patterns thanthe prevailing patterns farther west. Further evidence ofdecoupling between eastern and western sites is that dailyfog totals at the easternmost site are not significantlycorrelated with daily totals at any of the five western sites(each R2 < 0.06, and p > 0.01 using pairwise t tests). Incontrast, daily fog totals at four of the five western sites(excluding the lowest one, which received almost no fog)are all significantly correlated (p < 0.0001) if weakly so(R2 = 0.18–0.48). An important implication of the ob-served decoupling between east and west is that fog waterinput is likely to be subject to different climatic controlsbetween east and west, and so respond differently toclimatic variability. Also, the eastern range boundary ofpines in this stand borders the two easternmost fog
stations, so it is possible that the differing fog regimeaffects the distribution of these pines.
3.4. Temporal Variability
[30] Note that some of the larger fog events are contem-poraneous at several stations, but absent at others (e.g.,15 July 2005, Figure 6). This small-scale spatial patternillustrates the importance of spatially distributed samplingof fog water inputs. Most of the ridge-top stations in the standreceive similar amounts of fog drip over the course of thesummer dry season (Figure 6). Despite this similarity, there isonly weak day-to-day correlation in the amount of fog waterdeposited at different ridge-top stations (with pairwise R2
values from 0 to 0.59, median 0.15). This low correlationreflects both temporal and spatial patchiness in fog deposi-tion and should not be overlooked by focusing solely on totalinputs. The temporal distribution of fog inputs at a given sitecan significantly affect the ecosystem availability of fogwater. Comparing two ridge-top stations in the 2005 dryseason, for instance, revealed that site 10 (near the middle ofthe study area) received 22% less fog water than site 12(farthest east). Despite receiving less total water, site 10 had22% more nights with measurable fog deposition (73 nightsversus 60, Table 2). Site 12 received fully 30% of its totalseasonal fog water in just three foggy nights, while site 10received only 17% in its three foggiest nights. Overall, fogdeposition is much less frequent and less evenly distributedin time in the eastern part of the study area, and this differencein the fog regime at this site is reflected in the difference indominant wind direction of fog events (Figure 7).
Figure 7. Fog deposition as a function of wind direction at seven weather stations on western SantaCruz Island. Plots are arranged to represent relative station locations from west to east. Sites arenumbered west to east along the main ridge. Sites 7 and 8 are south and north, respectively, of the mainridge. Lengths of arrows indicate the volume of fog water (liters) collected from each wind directionduring the 2005 dry season (10 May to 16 October 2005). Note that the scale differs between plots toclearly show relative proportions. The western five stations all receive almost all fog water from the NW(with slight variation due to local topography). The eastern two stations, however, show increasingimportance of fog from the east.
8 of 13
W04420 FISCHER AND STILL: EVALUATING PATTERNS OF FOG WATER DEPOSITION W04420
[31] Frequent light fog events (as at site 10) provide con-sistent small amounts of moisture that may be important forcertain ecosystem functions. Certainly there is a much higherdensity of lichen around site 10 (growing on all exposedsurfaces) than site 12. On the other hand, fog drip from lightevents is unlikely to penetrate deeply into the soil, and so agreater percentage may be lost to rapid reevaporation the nextmorning than would be the case with heavier fog events. Thisalso implies that understory grasses, herbs, and shrubs mightnot benefit as much from fog drip following such light events.Depending on the organisms of interest (e.g., lichens, grasses,pines) and processes under study (e.g., foliar absorption ofwater, litter decomposition, root uptake, etc.), temporal distri-bution of fog water inputs could be quite important.
4. Fog Water Isotopic Patterns
4.1. Observations
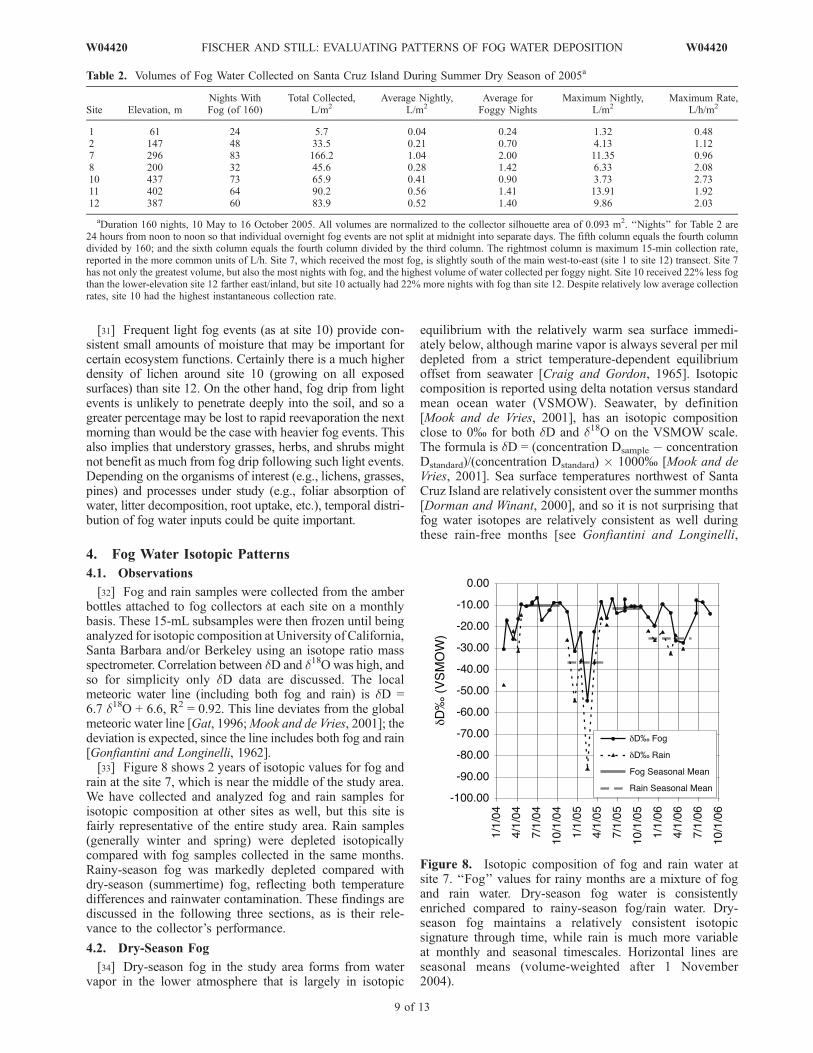
[32] Fog and rain samples were collected from the amberbottles attached to fog collectors at each site on a monthlybasis. These 15-mL subsamples were then frozen until beinganalyzed for isotopic composition at University of California,Santa Barbara and/or Berkeley using an isotope ratio massspectrometer. Correlation between dD and d18O was high, andso for simplicity only dD data are discussed. The localmeteoric water line (including both fog and rain) is dD =6.7 d18O + 6.6, R2 = 0.92. This line deviates from the globalmeteoric water line [Gat, 1996;Mook and de Vries, 2001]; thedeviation is expected, since the line includes both fog and rain[Gonfiantini and Longinelli, 1962].[33] Figure 8 shows 2 years of isotopic values for fog and
rain at the site 7, which is near the middle of the study area.We have collected and analyzed fog and rain samples forisotopic composition at other sites as well, but this site isfairly representative of the entire study area. Rain samples(generally winter and spring) were depleted isotopicallycompared with fog samples collected in the same months.Rainy-season fog was markedly depleted compared withdry-season (summertime) fog, reflecting both temperaturedifferences and rainwater contamination. These findings arediscussed in the following three sections, as is their rele-vance to the collector’s performance.
4.2. Dry-Season Fog
[34] Dry-season fog in the study area forms from watervapor in the lower atmosphere that is largely in isotopic
equilibrium with the relatively warm sea surface immedi-ately below, although marine vapor is always several per mildepleted from a strict temperature-dependent equilibriumoffset from seawater [Craig and Gordon, 1965]. Isotopiccomposition is reported using delta notation versus standardmean ocean water (VSMOW). Seawater, by definition[Mook and de Vries, 2001], has an isotopic compositionclose to 0% for both dD and d18O on the VSMOW scale.The formula is dD = (concentration Dsample # concentrationDstandard)/(concentration Dstandard) " 1000% [Mook and deVries, 2001]. Sea surface temperatures northwest of SantaCruz Island are relatively consistent over the summer months[Dorman and Winant, 2000], and so it is not surprising thatfog water isotopes are relatively consistent as well duringthese rain-free months [see Gonfiantini and Longinelli,
Table 2. Volumes of Fog Water Collected on Santa Cruz Island During Summer Dry Season of 2005a
Site Elevation, mNights WithFog (of 160)
Total Collected,L/m2
Average Nightly,L/m2
Average forFoggy Nights
Maximum Nightly,L/m2
Maximum Rate,L/h/m2
1 61 24 5.7 0.04 0.24 1.32 0.482 147 48 33.5 0.21 0.70 4.13 1.127 296 83 166.2 1.04 2.00 11.35 0.968 200 32 45.6 0.28 1.42 6.33 2.0810 437 73 65.9 0.41 0.90 3.73 2.7311 402 64 90.2 0.56 1.41 13.91 1.9212 387 60 83.9 0.52 1.40 9.86 2.03
aDuration 160 nights, 10 May to 16 October 2005. All volumes are normalized to the collector silhouette area of 0.093 m2. ‘‘Nights’’ for Table 2 are24 hours from noon to noon so that individual overnight fog events are not split at midnight into separate days. The fifth column equals the fourth columndivided by 160; and the sixth column equals the fourth column divided by the third column. The rightmost column is maximum 15-min collection rate,reported in the more common units of L/h. Site 7, which received the most fog, is slightly south of the main west-to-east (site 1 to site 12) transect. Site 7has not only the greatest volume, but also the most nights with fog, and the highest volume of water collected per foggy night. Site 10 received 22% less fogthan the lower-elevation site 12 farther east/inland, but site 10 actually had 22% more nights with fog than site 12. Despite relatively low average collectionrates, site 10 had the highest instantaneous collection rate.
Figure 8. Isotopic composition of fog and rain water atsite 7. ‘‘Fog’’ values for rainy months are a mixture of fogand rain water. Dry-season fog water is consistentlyenriched compared to rainy-season fog/rain water. Dry-season fog maintains a relatively consistent isotopicsignature through time, while rain is much more variableat monthly and seasonal timescales. Horizontal lines areseasonal means (volume-weighted after 1 November2004).
W04420 FISCHER AND STILL: EVALUATING PATTERNS OF FOG WATER DEPOSITION
9 of 13
W04420

1962; Ingraham and Matthews, 1995; Dawson, 1998; Schollet al., 2007].
4.3. Winter Rain
[35] The depleted signatures of winter rains are primarilydue to two processes. First, winter rains in the study area aregenerally from frontal storms coming down from highlatitudes, and so contain moisture evaporated off muchcolder ocean surfaces, which would lead to greater isotopicdepletion in rainwater derived from this vapor. Second, airmasses become progressively depleted in heavier isotopesover time by preferential condensation and rain-out of theheavier isotopes [Gat, 1996; Mook and de Vries, 2001].[36] The isotopic composition of rainfall did not vary
much spatially for a given month across the study area.Only once (of seven monthly samples from winter 2004–2005) did rainfall among the three stations analyzed (sites 2,7, 8) differ by more than 7% in dD. The one largedifference was in the mid-February 2005 samples. Thesesamples are a mixture of water from two storms in thepreceding month, 26–28 January and 12 February. Tippingbucket data show that the percentage of the total samplefrom the latter storm varied among stations (from 51 to63%), as did the sample’s isotopic composition (dD #77%to #111%). We used a linear mixing model between stationpairs to infer that the 26 January storm was around dD#32% (close to the volume-weighted seasonal rainfallmean dD of #36% for site 7), but the 12 February stormwas extremely depleted in heavy isotopes, with an inferreddD value lower than #120%. It appears that the spatialdifferences in isotopes for that month are related to differentamounts of rainwater contamination from the 12 Februarystorm that was strikingly depleted in heavier isotopes.[37] As noted above, differences in isotopic composition
between storms are largely due to air mass source regionsand history. While most winter storms in the area form asisotopically depleted low-pressure systems tracking downfrom Alaska, they also usually entrain a certain amount ofmoisture from the warmer, and therefore isotopicallyenriched, subtropical jet, east of Hawaii [e.g., NationalWeather Service, 2005]. Differences in dominance of thepolar jet versus the relatively enriched subtropical jets insupplying storm moisture can lead to large differences inrainwater isotopic composition.
4.4. Rainy-Season Fog
[38] Rainy-season fog is more isotopically depleted thandry-season fog for at least three reasons. First, sea surfacetemperatures are lower, so local water vapor in equilibriumwith the ocean is more depleted. In practice, however, theseasonal cycle in local sea surface temperatures generallyvaries between !10!C and !20!C [Dorman and Winant,2000]. The expected difference in liquid-vapor fractionationfor dD over this range is <5% [Majoube, 1971; Horita andWesolowski, 1994].[39] The second, and more important, cause of depletion
is rainwater contamination. This is always an issue withcollection of fog during rainy seasons (see discussion byScholl et al. [2007]). While the new collector collects lessrain than the modified Juvik collector, it certainly does notprevent all rainwater contamination. All of the isotopicvalues listed for ‘‘fog’’ during the rainy season are thereforeinevitably a combination of fog and rain. We calculated the
amount of fog water collected within an hour of recordedrainfall (i.e., potential rain contamination) as a percentage ofthe total monthly collection. For the seven months of the2004–2005 rainy season this was 50–98% of each monthlycumulative fog water sample (volume-weighted mean of71% at site 7). This might lead to the assumption that thecollector is merely collecting rainwater and that fog is notan important hydrologic input in the wet season. Isotopicanalysis, however, suggests otherwise. If we assume that the‘‘fog’’ water collected during rain events is all rainwater(and is therefore isotopically identical to collected rainwa-ter), then we can mathematically unmix the collected‘‘mixed fog’’ water into a rain component and a ‘‘true fog’’component.[40] For example, assume that in a given month that half
of the ‘‘mixed fog’’ water was collected during rain events,and half not during rain. Further assume that the collected‘‘mixed fog’’ water had a dD value of #30%. If thesampled rainwater had a dD value of #40%, we could thenassume that the ‘‘true fog’’ water must have had a dD valueof #20% (in order for a 50–50 mixture to end up with dD#30%). In practice, this unmixing approach does not work.The predicted, unmixed values for ‘‘true fog’’ (calculatedwith our actual measured values for ‘‘mixed fog’’ and rain)are all unreasonably enriched, with dD values well above0%, including some months in the hundreds. (Observedvalues for meteoric water are generally negative as they arereported versus standard mean ocean water, and water vaporis always depleted compared with the liquid it is evapora-ting from. Furthermore, the dD values of fog water in thecompendium of Scholl et al. [2007] rarely exceed #1%.)Our interpretation is that while rain does enter the collector,a significant proportion of the water collected during rainevents is actually fog water, both from low clouds and fromshallow ground fogs.[41] The third reason for isotopic depletion of winter fog
is that fog water associated with rain events is likely to bemodified by interaction with rain. The two types of rain-modified fog water are from low rain clouds and fromground fogs. When rain droplets are collected within thebase of a cloud, the isotopic composition of the rain andcloud droplets should be generally similar due to rapidisotopic equilibration with vapor [Lee and Fung, 2007].Where these low clouds intersect the ground, the fog waterthus collected will be similar to rain and thus quite depletedcompared with summer fog. The other rain-modified fogwater is from ground fogs that commonly form locallyduring and following rain events. They are typically just afew meters thick. The ground fogs have the potential to bequite enriched compared with rain. They are forming fromambient atmospheric vapor at low elevation. Ambient vaporshould contain a large component of (relatively enriched)water vapor that is in isotopic equilibrium with the seasurface. However, ambient vapor will also contain someportion of (relatively depleted) vapor from evaporated rainwater. These ground fogs will therefore be more depletedthan fog that is not associated with rain, but significantlyenriched in heavy isotopes compared with the rain itself.The observed difficulty in unmixing of ‘‘mixed fog’’ waterinto rain and believable ‘‘true fog’’ components is explainedby rejecting the assumption that all collected water during arain event is rainwater with the isotopic composition of
10 of 13
W04420 FISCHER AND STILL: EVALUATING PATTERNS OF FOG WATER DEPOSITION W04420

rainwater. Instead, much of that water is probably actual fogwater, enriched in heavy isotopes compared with rain.[42] Determining relative proportions of fog and rain
water when they occur simultaneously is recognized as adifficult problem [e.g., Frumau et al., 2007; Rhodes et al.,2007; Scholl et al., 2007]. To address this issue quantita-tively requires the use of more complex collectors [e.g.,Daube et al., 1987b]. Even with its limited ability toexclude rain, the new collector has allowed us to collectsamples suggesting that fog water may contribute signifi-cantly to local wet-season hydrology through deposition,even during rain events. This phenomenon merits furtherstudy, given the different implications of fog versus rainsources for aerosol deposition [e.g., Weathers et al., 2000]as well as hydrologic studies [e.g., Hutley et al., 1997;Holwerda et al., 2006] and isotopic studies [e.g., Dawson,1998; Corbin et al., 2005].
4.5. Isotopic Differentiation Between Dry-Season Fogand Winter Rain
[43] A primary goal of the larger study is to determine theecological importance of dry-season fog water inputs.Stable isotopes provide natural abundance tracers to addressthis question. The stable isotope approach relies on havingsubstantial differences between the isotopic signatures ofdifferent water inputs, in this case dry-season (fog) and wet-season (primarily rain) precipitation. The isotopic resultspresented here show that dry-season fog is sufficientlydistinct to allow the use of isotopes to partition plant wateruptake [e.g., Ingraham and Matthews, 1995; Dawson,1998] and adds to the small number of studies examiningthe isotopic composition of fog water (reviewed by Scholl etal. [2007]). Indeed, the isotopic offset between summer fogand winter rain is at least an order of magnitude greater thanthe measurement precision, providing further confidence ina water tracing study. As shown by Scholl et al. [2007], thenorthern California coast has the largest isotopic offsetbetween fog and rain of any systems studied to date,primarily because the fog and rain seasons are distinct(summer versus winter).
5. Conclusion
[44] Fog has long been recognized as an important watersource along many coasts and on mountains around theglobe. Quantifying the ecological importance of fog remainsa challenging problem, both in terms of estimating total fogwater inputs and tracing these inputs through ecosystemcomponents. Recent studies have focused on developingisotopic techniques to trace fog water through vegetationand soils, but this requires an unambiguous estimate of theoriginal fog water isotopic composition. The collection offog for isotopic analysis requires developing collectors withan appropriate set of design trade-offs. The fog collectordescribed here has proven useful in capturing fog watersamples for isotopic and fog regime analyses. Ease ofconstruction and maintenance allows mass deployments tocharacterize spatial as well as temporal dynamics of fogregimes. The new design has reduced rainwater contamina-tion compared with other designs examined. The reducedstorage of fog water on the collection surface (comparedwith mesh collectors) also minimizes the risk of isotopic
enrichment from evaporation of samples during prolonged,intermittent fog events.[45] The collector has been successfully deployed for
2.5 years along a 7-km east-west transect on Santa CruzIsland, revealing spatial and temporal patterns in fog depo-sition. Higher-elevation sites received much more fogdeposition than lower sites. Western sites (near the coast)received most summer fog from the northwest and werecorrelated in timing and quantity. Sites farther east (inland)collected similar overall amounts of fog but from the east,and in fewer, larger events. These results demonstrate thespatial and temporal patchiness of fog and support theimportance of spatially distributed sampling for ecologicalor hydrological fog studies.[46] The stable isotope composition of local fog water is
shown to differ significantly from local rain water, allow-ing the use of isotopes as natural abundance tracers of thetwo source waters through the ecosystem [Dawson, 1993;Dawson et al., 2002; Fischer, 2007].
[47] Acknowledgments. This work was supported by the Andrew W.Mellon Foundation and UCSB. The fieldwork was performed at theUniversity of California Natural Reserve System’s Santa Cruz IslandReserve, on property owned and managed by The Nature Conservancy.Throughfall data were generously provided by J. Baker at UC Davis. Weare grateful to J. B. Wall at CSU Northridge for long-term weather data, andto L. Laughrin and staff at the Reserve for weather records and fieldsupport. The manuscript was much improved with helpful comments fromT. E. Dawson, O. Chadwick, A. P. Williams, T. Eckmann, and twoanonymous reviewers. W. M. Fischer helped prepare the figures. We thankall the following for their assistance with fieldwork: C. Ebert, E. Thorsos,A. P. Williams, T. Eckmann, R. Richardson, M. Kelly, S. Battersby,J. Bernstein, A. Hartshorn, K. Cover, W. Anselem, E. Mason, R. Roff,N. Wilson, E. Edwards, J. Rumbly, J. Hecht, N. Nagle, P. Dennison,J. Baker, K. Hertel, T. Laverne, and all the Geography 194 students.
ReferencesAgenbroad, L. D., J. R. Johnson, D. Morris, and T. W. Stafford (2005),Mammoths and humans as late Pleistocene contemporaries on SantaRosa Island, in Proceedings of the Sixth California Islands Symposium,Ventura, California, December 1-3, 2003, Natl. Park Serv. Tech. Publ.,CHIS-05-01, p. 4, Inst. for Wildlife Stud., Arcata, Calif.
Azevedo, J., and D. L. Morgan (1974), Fog precipitation in coastal Cali-fornia forests, Ecology, 55, 1135–1141.
Boucher, J. F., A. D. Munson, and P. Y. Bernier (1995), Foliar absorption ofdew influences shoot water potential and root-growth in Pinus strobusseedlings, Tree Physiol., 15, 819–823.
Bruijnzeel, L. A. (1990), Hydrology of moist tropical forests and effects ofconversion: A state of knowledge review, UNESCO Int. Hydrol. Pro-gramme Humid Trop. Programme, Paris.
Bruijnzeel, L. A., and J. Proctor (1995), Hydrology and biogeochemistry oftropical montane cloud forests: What do we really know?, in TropicalMontane Cloud Forests, edited by L. S. Hamilton et al., pp. 38–78,Springer, New York.
Burgess, S. S. O., and T. E. Dawson (2004), The contribution of fog to thewater relations of Sequoia sempervirens (d. Don): Foliar uptake andprevention of dehydration, Plant Cell Environ., 27, 1023–1034.
Burkard, R., P. Butzberger, and W. Eugster (2003), Vertical fogwater fluxmeasurements above an elevated forest canopy at the Lageren researchsite, Switzerland, Atmos. Environ., 37, 2979–2990.
Collett, J., B. Daube, J. W. Munger, and M. R. Hoffmann (1989), Cloudwater chemistry in Sequoia National Park, Atmos. Environ., 23,903–1175.
Collett, J. L., B. C. Daube, J. W. Munger, and M. R. Hoffmann (1990),A comparison of two cloudwater fogwater collectors: The rotating armcollector and the Caltech active strand cloudwater collector, Atmos.Environ., Part A, 24, 1685–1692.
Collett, J. L., A. Bator, X. Rao, and B. B. Demoz (1994), Acidity variationsacross the cloud drop size spectrum and their influence on rates of atmo-spheric sulfate production, Geophys. Res. Lett., 21, 2393–2396.
Collett, J. L., A. Bator, D. E. Sherman, K. F. Moore, K. J. Hoag, B. B.Demoz, X. Rao, and J. E. Reilly (2002), The chemical composition
W04420 FISCHER AND STILL: EVALUATING PATTERNS OF FOG WATER DEPOSITION
11 of 13
W04420

of fogs and intercepted clouds in the United States, Atmos. Res., 64,29–40.
Corbin, J. D., M. A. Thomsen, T. E. Dawson, and C. M. D’Antonio (2005),Summer water use by California coastal prairie grasses: Fog, drought,and community composition, Oecologia, 145, 511–521.
Craig, H. (1987), Isotopic variations in meteoric waters, Science, 133,17021961.
Craig, H., and L. I. Gordon (1965), Deuterium and oxygen 18 variations inthe ocean and the marine atmosphere, in Proceedings of a Conference onStable Isotopes in Oceanographic Studies and Paleo-Temperatures, edi-ted by E. Tongiorgi, pp. 9–130, Cons. Naz. delle Richerche, Lab. deGeol. Nucl., Univ. of Pisa, Pisa, Italy.
Daube, B. C. Jr., R. C. Flagan, and M. R. Hoffmann (1987a), Active cloud-water collector, Patent 4,697,462, U. S. Patent and Trademark Off.,Washington, D. C.
Daube, B., K. D. Kimball, P. A. Lamar, and K. C. Weathers (1987b), Twonew ground-level cloud water sampler designs which reduce rain con-tamination, Atmos. Environ., 21, 893–900.
Dawson, T. E. (1993), Water sources of plants as determined from xylem-water isotopic composition: Perspectives on plant competition, distribu-tion, and water relations, in Stable Isotopes and Plant Carbon-WaterRelations, edited by J. R. Ehleringer et al., pp. 465–496, Elsevier,New York.
Dawson, T. (1998), Fog in the California redwood forest: Ecosystem inputsand use by plants, Oecologia, 117, 476–485.
Dawson, T. E., S. Mambelli, A. H. Plamboeck, P. H. Templer, and K. P. Tu(2002), Stable isotopes in plant ecology, Annu. Rev. Ecol. Syst., 33, 507–559.
DeFelice, T. P., and V. K. Saxena (1990), Mechanisms for the operation ofthree cloudwater collectors: Comparison of mountain top results, Atmos.Res., 25, 277–292.
Demoz, B. B., J. L. Collett, and B. C. Daube (1996), On the Caltech activestrand cloudwater collectors, Atmos. Res., 41, 47–62.
Dorman, C. E., and C. D. Winant (2000), The structure and variability ofthe marine atmosphere around the Santa Barbara Channel, Mon. WeatherRev., 128, 261–282.
Estberg, G. (2001), Intercomparison of fog water deposition between twosites in proximity to Pinus torreyana, in Proceedings of the SecondInternational Conference on Fog and Fog Collection, edited by R. S.Schemenauer and H. Puxbaum, pp. 189–191, FogQuest, Kamloops,B. C., Canada.
Falconer, R. E., and P. D. Falconer (1980), Determination of cloud wateracidity at a mountain observatory in the Adirondack Mountains of NewYork state, J. Geophys. Res., 85, 7465–7470.
Filonczuk, M. K., D. R. Cayan, and L. G. Riddle (1995), Variability ofMarine Fog Along the California Coast, Clim. Res. Div., Scripps Inst. ofOceanogr., La Jolla, Calif.
Fischer, D. T. (2007), Ecological and biogeographic impacts of fog andstratus clouds on coastal vegetation, Santa Cruz Island, CA, Ph.D. dis-sertation, Univ. of Calif., Santa Barbara.
Frumau, K. F. A., R. Burkard, S. Schmid, L. A. Bruijnzeel, C. Tobon-Marin, and J. Calvo (2007), Fog gauge performance under fog andwind-driven rain conditions, in Mountains in the Mist: Science for Con-serving and Managing Tropical Montane Cloud Forests, edited by L. A.Bruijnzeel et al., Univ. of Hawaii Press, Honolulu, in press.
Fuzzi, S., G. Orsi, G. Bonforte, B. Zardini, and P. L. Franchini (1997), Anautomated fog water collector suitable for deposition networks: Design,operation and field tests, Water Air Soil Pollut., 93, 383–394.
Gat, J. R. (1996), Oxygen and hydrogen isotopes in the hydrologic cycle,Annu. Rev. Earth Planet. Sci., 24, 225–262.
Gonfiantini, R., and A. Longinelli (1962), Oxygen isotopic composition offogs and rains from North Atlantic, Experientia, 18, 222–223.
Goodman, J. (1977), Microstructure of California coastal fog and stratus,J. Appl. Meteorol., 16, 1056–1067.
Goodman, J. (1985), The collection of fog-drip, Water Resour. Res., 21,392–394.
Hindman, E. E., E. J. Carter, R. D. Borys, and D. L. Mitchell (1992),Collecting supercooled cloud droplets as a function of droplet size,J. Atmos. Oceanic Technol., 9, 337–353.
Holwerda, F., R. Burkard, W. Eugster, F. N. Scatena, A. Meesters, and L. A.Bruijnzeel (2006), Estimating fog deposition at a Puerto Rican elfincloud forest site: Comparison of the water budget and eddy covariancemethods, Hydrol. Processes, 20, 2669–2692.
Horita, J., and D. J. Wesolowski (1994), Liquid-vapor fractionation ofoxygen and hydrogen isotopes of water from the freezing to thecritical-temperature, Geochim. Cosmochim. Acta, 58, 3425–3437.
Hudson, J. G., and G. Svensson (1995), Cloud microphysical relationshipsin California marine stratus, J. Appl. Meteorol., 34, 2655–2666.
Hutley, L. B., D. Doley, D. J. Yates, and A. Boonsaner (1997), Waterbalance of an Australian subtropical rainforest at altitude: The ecologicaland physiological significance of intercepted cloud and fog, Aust. J. Bot.,45, 311–329.
Ingraham, N. L., and R. A. Matthews (1995), The importance of fog-dripwater to vegetation: Point Reyes peninsula, California, J. Hydrol., 164,269–285.
Joslin, J. D., S. F. Mueller, and M. H. Wolfe (1990), Tests of models ofcloudwater deposition to forest canopies using artificial and living col-lectors, Atmos. Environ., Part A, 24, 3007–3019.
Juvik, J. O., and D. Nullet (1995), A proposed standard fog collector for usein high-elevation regions: Comment, J. Appl. Meteorol., 34, 2108–2110.
Kerfoot, O. (1968), Mist precipitation on vegetation, For. Abstr., 29, 8–20.Lee, J., and I. Fung (2007), Amount effect of water isotopes and quantita-tive analysis of post-condensation processes, Hydrol. Processes, in press.
Leipper, D. F. (1994), Fog on the United States west-coast: A review, Bull.Am. Meteorol. Soc., 75, 229–240.
Leyton, L., and I. P. Armitage (1968), Cuticle structure and water relationsof needles of Pinus radiata (D. Don), New Phytol., 67, 31–38.
Majoube, M. (1971), Oxygen-18 and deuterium fractionation betweenwater and steam, J. Chim. Phys. Phys. Chim. Biol., 68, 1423–1436.
Marloth, R. (1905), Results of further experiments on Table Mountain forascertaining the amount of moisture deposited from the southeast cloud,Trans. S. Afr. Philos. Soc., XVI, 97–105.
Meyer, M. B., J. E. Jiusto, and G. G. Lala (1980), Measurements ofvisual range and radiation-fog (haze) microphysics, J. Atmos. Sci., 37,622–629.
Mook,W. G., and J. J. de Vries (2001), Environmental Isotopes in the Hydro-logical Cycle—Principles and Applications, vol. I, Introduction: Theory,Methods, Review, UNESCO Int. Atom. Energy Agency, Vienna. (Avail-able at http://www.iaea.org/programmes/ripc/ih/volumes/volume1.htm)
Munne-Bosch, S., S. Nogues, and L. Alegre (1999), Diurnal variations ofphotosynthesis and dew absorption by leaves in two evergreen shrubsgrowing in Mediterranean field conditions, New Phytol., 144, 109–119.
National Weather Service (2005), Storm summaries, Calif. Nev. Riv. Fore-cast Cent., Sacramento, Calif. (Available at http://www.cnrfc.noaa.gov/jan2005storms.php, http://www.cnrfc.noaa.gov/feb2005storms.php,http://www.cnrfc.noaa.gov/may2005storms.php)
Parsons, J. J. (1960), ‘‘Fog drip’’ from coastal stratus, with special referenceto California, Weather, 15, 58–62.
Phillips, D. L., and J. W. Gregg (2001), Uncertainty in source partitioningusing stable isotopes, Oecologia, 127, 171–179.
Rhodes, A. L., A. J. Guswa, and S. E. Newell (2007), Using stable isotopesto identify orographic precipitation events in Montverde, Costa Rica, inMountains in the Mist: Science for Conserving and Managing TropicalMontane Cloud Forests, edited by L. A. Bruijnzeel et al., Univ. ofHawaii Press, Honolulu, in press.
Ruiz, G. (2005), Characterization of fog water collection potential andquality on California State University Monterey Bay and Glen DevenRanch near Big Sur, Eos Trans. AGU, 86(52), Fall Meet. Suppl., AbstractA33B-0891.
Schemenauer, R. S., and P. Cereceda (1991), Fog-water collection in aridcoastal locations, Ambio, 20, 303–308.
Schemenauer, R. S., and P. Cereceda (1992), The quality of fog watercollected for domestic and agricultural use in Chile, J. Appl. Meteorol.,31, 275–290.
Schemenauer, R. S., and P. Cereceda (1994), A proposed standard fogcollector for use in high-elevation regions, J. Appl. Meteorol., 33,1313–1322.
Schemenauer, R. S., and P. Cereceda (1995), A proposed standard fogcollector for use in high-elevation regions: Reply, J. Appl. Meteorol.,34, 2111–2112.
Schemenauer, R. S., and P. I. Joe (1989), The collection efficiency of amassive fog collector, Atmos. Res., 24, 53–69.
Schlesinger, W. H., and W. A. Reiners (1974), Deposition of water andcations on artificial foliar collectors in fir krummholz of New Englandmountains, Ecology, 55, 378–386.
Scholl, M. A., S. B. Gingerich, and G. W. Tribble (2002), The influence ofmicroclimates and fog on stable isotope signatures used in interpretationof regional hydrology: East Maui, Hawaii, J. Hydrol., 264, 170–184.
Scholl, M., W. Eugster, and R. Burkard (2007), Understanding the role offog in forest hydrology: Stable isotopes as tools for determining inputand partitioning of cloud water in montane forests, in Mountains in theMist: Science for Conserving and Managing Tropical Montane Cloud
12 of 13
W04420 FISCHER AND STILL: EVALUATING PATTERNS OF FOG WATER DEPOSITION W04420

Forests, edited by L. A. Bruijnzeel et al., Univ. of Hawaii Press, Hono-lulu, in press.
Walmsley, J. L., R. S. Schemenauer, and H. A. Bridgman (1996), A methodfor estimating the hydrologic input from fog in mountainous terrain,J. Appl. Meteorol., 35, 2237–2249.
Weathers, K. C. (1999), The importance of cloud and fog in the mainte-nance of ecosystems, Trends Ecol. Evol., 14, 214–215.
Weathers, K. C., and G. E. Likens (1997), Clouds in southern Chile: Animportant source of nitrogen to nitrogen-limited ecosystems?, Environ.Sci. Technol., 31, 210–213.
Weathers, K. C., G. M. Lovett, G. E. Likens, and N. F. M. Caraco (2000),Cloudwater inputs of nitrogen to forest ecosystems in southern Chile:Forms, fluxes, and sources, Ecosystems, 3, 590–595.
############################D. T. Fischer and C. J. Still, Department of Geography, University of
California, Santa Barbara, 3611 Ellison Hall, Santa Barbara, CA 93106,USA. ([email protected]; [email protected])
W04420 FISCHER AND STILL: EVALUATING PATTERNS OF FOG WATER DEPOSITION
13 of 13
W04420