EVALUATING INDIGENOUS SOCIOECONOMIC OUTCOMES IN THE RECONCILIATION DECADE, 1991-2001
15
Economic Papers Vol22 No. 4 December 2003 pp. 1 -I 5 EVALUATING INDIGENOUS SOCIOECONOMIC OUTCOMES IN THE RECONCILIATION DECADE, 1991-2001 JON ALTMAN AND BOYD HUNTER’ 1 Introduction The last decade of the 20th century is significant in Indigenous affairs policy for three reasons. First, the period loosely matched the decade of the government-created Council for Aboriginal Reconciliation that began work in 1991 and was disbanded on 3 1 December 2000 (Sanders 2002). Second, the Howard government came to office in 1996 with a socially conservative policy platform that was intended to indicate a marked break from the ‘progressive’ Labor party policies. Since 1996 there has been a key Indigenous public policy debate about whether the reconciliation process since 1991 has seen too much focus on symbolic reconciliation4n Indigenous rights, stolen generations, deaths in custody and the invalid alienation of land and resources-and too little focus on practical reconciliation. The new Howard government articulated a view, echoed in the popular media, that the Keating government had given too much emphasis to ‘symbolic reconciliation’ at the expense of ‘practical’ outcomes. The new government was going to redress this imbalance by giving greater emphasis to ‘practical reconciliation’, focusing on the key areas of health, housing, education and employment. At least rhetorically, this seems to be a defining difference between the pre- and post- 1996 national governments. Third, for the first time ever there has been a relatively close correlation between the five-yearly census and political cycles. In August of 1991, 1996 and 2001, the Australian Bureau of Statistics (ABS) conducted five-yearly censuses that are still the only comprehensive means to assess changes in Indigenous socioeconomic status over time and to compare the relative socioeconomic status of Indigenous and other Australians. The change in government shortly before the 1996 Census means that 1996 data reflect the Labor legacy rather than the effect of early policy initiatives of the new government. While arguably there are various types of policy lags (recognition lags, decision lags, implementation lags, and the ‘take-effect’ lags), the second inter-censal period (19962001) can be readily interpreted as the policy domain (and legacy) of the Howard government. * Centre for Aboriginal Economic Policy Research, The Australian National University. Helpful comments and suggestions from Will Sanders, John Taylor, Nic Peterson, Anne Daly and an anonymous referee and research assistance provided by Melissa Johns are all acknowledged. A version of this article was presented as a CAEPR seminar and at the Cranlana Programme seminar ‘Pathways for Reconciliation’ 4-5 September 2003. We would like to thank participants at both presentations for helpful feedback. 1
Transcript of EVALUATING INDIGENOUS SOCIOECONOMIC OUTCOMES IN THE RECONCILIATION DECADE, 1991-2001
Economic Papers Vol22 No. 4 December 2003 pp. 1 - I 5
EVALUATING INDIGENOUS SOCIOECONOMIC OUTCOMES IN THE RECONCILIATION DECADE,
1991-2001
JON ALTMAN AND BOYD HUNTER’
1 Introduction The last decade of the 20th century is significant in Indigenous affairs policy for three reasons. First, the period loosely matched the decade of the government-created Council for Aboriginal Reconciliation that began work in 1991 and was disbanded on 3 1 December 2000 (Sanders 2002).
Second, the Howard government came to office in 1996 with a socially conservative policy platform that was intended to indicate a marked break from the ‘progressive’ Labor party policies. Since 1996 there has been a key Indigenous public policy debate about whether the reconciliation process since 1991 has seen too much focus on symbolic reconciliation4n Indigenous rights, stolen generations, deaths in custody and the invalid alienation of land and resources-and too little focus on practical reconciliation. The new Howard government articulated a view, echoed in the popular media, that the Keating government had given too much emphasis to ‘symbolic reconciliation’ at the expense of ‘practical’ outcomes. The new government was going to redress this imbalance by giving greater emphasis to ‘practical reconciliation’, focusing on the key areas of health, housing, education and employment. At least rhetorically, this seems to be a defining difference between the pre- and post- 1996 national governments.
Third, for the first time ever there has been a relatively close correlation between the five-yearly census and political cycles. In August of 1991, 1996 and 2001, the Australian Bureau of Statistics (ABS) conducted five-yearly censuses that are still the only comprehensive means to assess changes in Indigenous socioeconomic status over time and to compare the relative socioeconomic status of Indigenous and other Australians. The change in government shortly before the 1996 Census means that 1996 data reflect the Labor legacy rather than the effect of early policy initiatives of the new government. While arguably there are various types of policy lags (recognition lags, decision lags, implementation lags, and the ‘take-effect’ lags), the second inter-censal period (19962001) can be readily interpreted as the policy domain (and legacy) of the Howard government.
* Centre for Aboriginal Economic Policy Research, The Australian National University. Helpful comments and suggestions from Will Sanders, John Taylor, Nic Peterson, Anne Daly and an anonymous referee and research assistance provided by Melissa Johns are all acknowledged. A version of this article was presented as a CAEPR seminar and at the Cranlana Programme seminar ‘Pathways for Reconciliation’ 4-5 September 2003. We would like to thank participants at both presentations for helpful feedback.
1
JON ALTMAN AND BOYD HUNTER However, it would be naive to assume that the year 1996 marks a complete
disjuncture between the ‘symbolic’ and the ‘practical’, or between the ‘progressives’ and the ‘conservatives’. This is clearly not the case, as many pre-1996 institutions in Indigenous affairs, such as the Community Development Employment Projects (CDEP) scheme and indeed the Aboriginal and Torres Strait Islander Commission (ATSIC) (until 1 July 2003), have in fact grown or remained relatively unchanged under the Howard governments. Further, the global economy has not been identical in both periods. But our analysis leads us to take the view that scrutinising change between 1991 and 1996, then between 1996 and 2001 and finally over the decade 1991 to 2001, is both instructive and informative.
In this article we aim to answer an apparently straightforward question that is rarely asked: how do the socioeconomic outcomes in the period 1991-96, represented by the Federal government and many conservative commentators as a period when symbolic reconciliation was dominant, compare with those in the period 199&2001 when a change in government saw a greater policy focus on practical reconciliation?
2 As a data source, the census has shortcomings-it is a blunt instrument that has not been designed to track changes in socioeconomic status over time. Indeed, the main reason that it generates social statistics about Indigenous people is as a by-product created by the introduction of an Indigenous identifier into the census in 1971.
There are three broad difficulties inherent in using census information to track changes in absolute and relative Indigenous socioeconomic status. These can be characterised as practical, compositional, and conceptual. They are briefly summarised as follows.
There are practical problems in defining the size of the Indigenous population and who is Indigenous. Even over the relatively short period being examined here, the census estimated that the Indigenous Australian resident population had increased from 265,000 in 1991, to 352,000 in 1996, to 460,000 in 2001. This growth was at a rate of 6.6 per annum in the first five-year period, and 6.1 per cent per annum in the second five years. It is now well recognised by demographers that such population growth does not just represent natural growth. It has two additional components, changed identification and inter-marriage, with offspring of ethnically-mixed couples likely to identify as Indigenous (Taylor 1997).
The nature of family and household composition is an important issue. There is growing evidence that a significant proportion of Indigenous people in couple relationships have a partner who is non-Indigenous. As noted above, this is a partial illuminator of fast Indigenous population growth because offspring of such mixed ethnicity couples are often identified by parents (and then self-identify) as Indigenous. In measuring changes in socioeconomic status, the high proportion of mixed couples creates difficulties that have previously been noted in the literature (see e.g. O’Reilly 1994).
Finally, there are conceptual difficulties in adopting normative criteria like social indicators from the census in cross-cultural situations. This is an issue that has been alluded to since census data were first used for comparing Indigenous and non-
Data sources, difficulties and caveats
L
EVALUATING INDIGENOUS SOCIOECONOMIC OUTCOMES Indigenous socioeconomic status (Altman & Nieuwenhuysen 1979). There is now growing recognition of the cultural heterogeneity of the Indigenous population Australia-wide. In some situations, standard social indicators have considerable relevance, in others they are close to meaningless (Morphy 2002)-social indicators reflect the values of the dominant society (Altman 200 1 ).
3 Monitoring practical reconciliation using census data is, however, very appropriate because in a number of speeches the current Prime Minister has highlighted health, housing, education and employment equality (or moves in that direction) between Indigenous and other Australians as the hallmark of his government’s approach (see http://www.pm.gov.au).
We focus on five sets of variables-employment, income, housing, education and health. We have included income even though it is rarely mentioned as a measure of practical reconciliation, because it is probably the most important summary statistic of economic wellbeing. In choosing these variables, we make no comment about their relationship, although obviously in many situations they are linked. And we do not attempt to combine them into any index of socioeconomic disadvantage, preferring to use the ‘raw’ census data.
Monitoring practical reconciliation: choice of variables
3. I Employment
We have chosen five variables to measure employment outcomes, including the unemployment rate, the employment to population ratio and the labour force participation rate; all these are standard measures of employment status. A key factor that impacts on employment is the CDEP scheme, an Indigenous work-for-the-dole scheme whose participants should be enumerated as employed in the census in specified areas (see Morphy & Sanders 2001). It is quite clear that all CDEP participants are not enumerated as employed in the census (especially in non-special enumeration regions), but it is also likely that they are not counted as unemployed (Altman & Gray 2000). It is noteworthy that at the 2001 Census there were 30,474 Indigenous CDEP participants- this is a very significant institution in the lives of working-age Indigenous Australians, representing about 2 1 per cent of Indigenous labour force participation.
While there is now a mainstream work-for-the-dole scheme, it is not directly analogous to the CDEP scheme because it is unlikely to be systematically coded as employment in the census. Two extra variables were included to control for the influence of the CDEP scheme: the proportion of adults who are in private sector jobs and those in full-time jobs. Both variables effectively exclude the influence of the scheme, and consequently it is relatively easy to compare the results for Indigenous and non-Indigenous Australians.
3.2 Income
To measure income status, we have selected two census-based variables, median adult income for Indigenous and non-Indigenous individuals (independent of families, households or dependents) and median income for Indigenous and non-Indigenous households bearing in mind that Indigenous households often have non-Indigenous
3
JON ALTMAN AND BOYD HUNTER members. Income has several shortcomings as a measure, especially as the usual focus is on cash income, and non-cash components that may include returns from customary (non-market) economic activity, employer superannuation contributions, and other non- pecuniary benefits available to wage and salary earners are not taken into account.
There is also evidence that in remote regions census collectors do not hlly enumerate income from non-standard sources like royalty payments or cash earned from sale of art (Morphy 2002). Income is sensitive to changes in the consumer price index so all dollars for the period 199 1-2001 are expressed in constant 200 1 terms.
3.3 Housing The two variables that are used to measure housing status involve establishing whether the home is owned or being purchased and the number of persons in the household. Home ownership is important in Australia because in the absence of any official statistical collections on wealth, home ownership is an important proxy of accumulated savings and command over resources (i.e. wealth). A problem with home ownership is that not only do many Indigenous people reside in public housing, but in some situations on Indigenous-owned land, individual home ownership (in a commercial sense) is either not possible or there is no real estate market. Similarly, the size of household is generally taken as a measure of over-crowding and poverty, but large household size can also reflect a cultural preference for co-residing within large extended families.
3.4 Education Educational status is measured by four variables, two that reflect negative measures that capture the historical legacy of disadvantage, ‘did not go to school’ and ‘left school aged less than 15 years’; and two that reflect positive measures, ‘currently attending a tertiary institution’ and ‘holding a post-school qualification’. Educational status is clearly influenced by location of residence, since in many rural and remote situations there are neither secondary schools nor tertiary education institutions. Education is a very important determinant of employment outcomes except possibly in remote contexts where labour markets may be small or non-existent.
3.5 Health Health status is broadly measured by three variables, life expectancy at birth differentiated by gender and the proportion of the population aged over 55 years. The focus in these measures of health status is on mortality, rather than morbidity which is equally important but for which historic comparative data, at a national level, are unavailable.
4 Analysis and findings Our analysis compares the two periods, 1991-96 and 199G2001, with a greater emphasis on the second five years because contemporary policy developments make such a focus more pertinent. The analysis uses 1991 as the base for measuring socioeconomic change. All the caveats on the quality of data and its applicability cross- culturally might suggest that the analysis has limited validity and this would be so if we
4
EVALUATING INDIGENOUS SOCIOECONOMIC OUTCOMES only relied on absolute figures. However, we adopt a twin approach that first assesses absolute change for the Indigenous population only, and then assesses change in Indigenoushon-Indigenous ratios over time. The analysis also mixes negative and positive social indicators-for example, the unemployment rate is a negative measure and the employment-population ratio is a positive measure. One would look for improvement to be reflected in a downward trend in the ‘negative measures’ and an upward trend in the ‘positive measures’. Socioeconomic improvement requires negative measure ratios to shift (from >1) towards one and positive measure ratios to shift (from < 1) towards one. While government policy is obviously not the only thing to change over the 199Os, it is reasonable to assume that it was an important influence given the prominence of the state in the everyday lives of Indigenous people.
4. I The Hawke-Keating years, 1991-1 996
Table 1 documents the change in social indicators during the Hawke and Keating years between 199 1 and 1996, and considers these as a measure of performance in terms of reducing the material disadvantage of Indigenous Australians in income, housing, education, health and labour force status.
On labour force status, the social indicators in both absolute and relative terms improved for Indigenous people for three of five indicators. The relative improvement for Indigenous employment correlated with the trend for the rest of the population. One area where the absolute move for Indigenous people was negative was in labour force participation, which declined, but this decline was consistent with broader patterns, and overall there was no relative change.
Turning to income, the median income of both Indigenous adults and families declined in absolute terms (adjusted for 2001 price levels) between 1991 and 1996, a surprising outcome that may reflect the rapid expansion of the CDEP scheme (Hunter 2002) with its links to Newstart allowance income levels. For example, as the CDEP scheme employs a larger proportion of the Indigenous population over time, the median worker is more likely to be a low income, presumably part-time worker. in relative terms though, this absolute change had mixed results-relative income for individuals got worse, but relative income for families improved.
The situation for housing was positive in both absolute and relative terms. The number of Indigenous home owners or purchasers increased, and household size, used here as a proxy for crowding (but also a possible measure of fertility decline) also declined.
The most important indicator of future prospects is education. The government’s performance here was statistically all positive: the proportion of adults (aged 15 and over) who have never gone to school and who left school aged less than 15 years declined both absolutely and relatively; and the numbers at tertiary institutions and with post-school qualifications increased.
Very mixed outcomes were evident in the area of health, although this area probably has the longest lag between policy implementation and eventual outcome-health is often affected crucially by early childhood and even in-utero experiences (Barker 1994). Census findings illustrate that life expectancy at birth is still much lower for Indigenous males and females, being about 20 years less than that of their non-
5
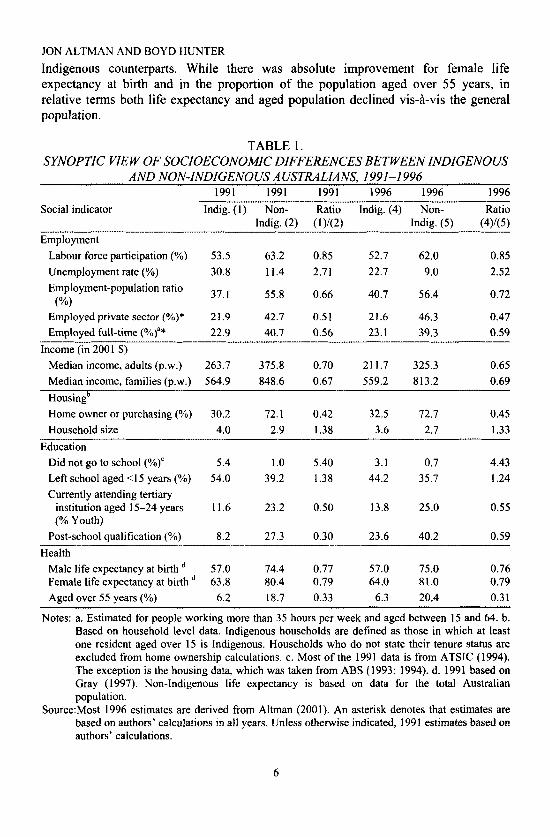
JON ALTMAN AND BOYD HUNTER Indigenous counterparts. While there was absolute improvement for female life expectancy at birth and in the proportion of the population aged over 55 years, in relative terms both life expectancy and aged population declined vis-a-vis the general population.
TABLE 1. SYNOPTIC VIEW OF SOCIOECONOMIC DIFFERENCES BETWEEN INDIGENOUS
1991 1991 1991 1996 1996 1996 Social indicator Indig. (1) Non- Ratio Indig. (4) Non- Ratio
Indig. (2) (1)/(2) Indig. ( 5 ) (4)/(5) Employment
Labour force participation (%) 53.5 63.2 0.85 52.7 62.0 0.85 Unemployment rate (%) 30.8 11.4 2.71 22.7 9.0 2.52
AND NON-INDIGENOUS AUSTRALIANS, 1991-1 996
37.1 55.8 0.66 40.7 56.4 Employment-population ratio (“4 0.72
Employed private sector (%)* 2 1.9 42.7 0.51 21.6 46.3 0.47 Employed full-time (%)’* 22.9 40.7 0.56 23.1 39.3 0.59
Median income, adults (P.w.) 263.7 375.8 0.70 21 1.7 325.3 0.65 Median income, families (P.w.) 564.9 848.6 0.67 559.2 813.2 0.69 Housingb Home owner or purchasing (YO) 30.2 72.1 0.42 32.5 72.1 0.45 Household size 4.0 2.9 1.38 3.6 2.7 1.33
Income (in 200 I $)
Education Did not go to school (%)‘ 5.4 1.0 5.40 3.1 0.7 4.43 Left school aged < I 5 years (%) 54.0 39.2 1.38 44.2 35.1 1.24 Currently attending tertiary
institution aged 15-24 years 1 1.6 23.2 0.50 13.8 25.0 0.55 (% Youth)
Post-school qualification (%) 8.2 27.3 0.30 23.6 40.2 0.59 Health
Male life expectancy at birth 57.0 74.4 0.77 57.0 75.0 0.76 Female life expectancy at birth 63.8 80.4 0.79 64.0 81.0 0.79 Aged over 55 years (%) 6.2 18.7 0.33 6.3 20.4 0.3 1
Notes: a. Estimated for people working more than 35 hours per week and aged between 15 and 64. b. Based on household level data. Indigenous households are defined as those in which at least one resident aged over 15 is Indigenous. Households who do not state their tenure status are excluded from home ownership calculations. c. Most of the 1991 data is from ATSIC (1994). The exception is the housing data, which was taken from ABS (1993; 1994). d. 1991 based on Gray (1997). Non-Indigenous life expectancy is based on data for the total Australian population.
Source:Most 1996 estimates are derived from Altman (2001). An asterisk denotes that estimates are based on authors’ calculations in all years. Unless otherwise indicated, 1991 estimates based on authors’ calculations.
6
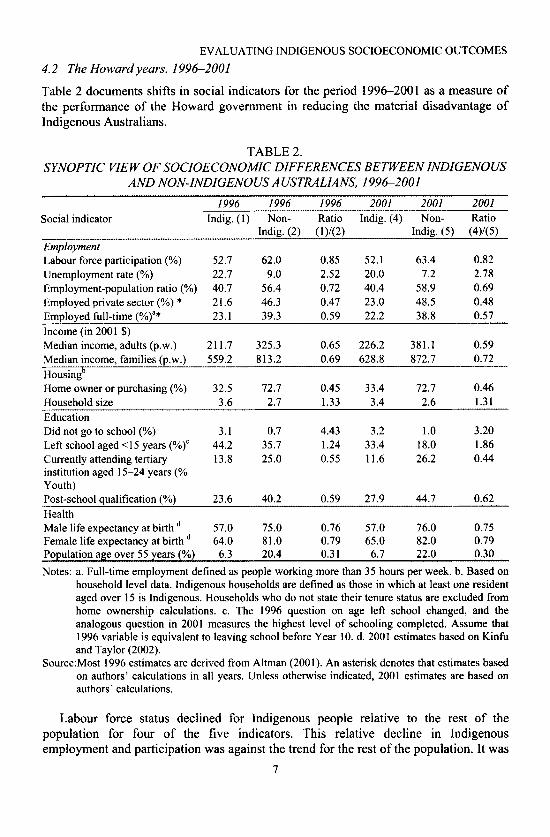
EVALUATING INDIGENOUS SOCIOECONOMIC OUTCOMES 4.2 The Howardyears, 1996-2001
Table 2 documents shifts in social indicators for the period 1996-200 1 as a measure of the performance of the Howard government in reducing the material disadvantage of Indigenous Australians.
TABLE 2. SYNOPTIC VIEW OF SOCIOECONOMIC DIFFERENCES BETWEEN INDIGENOUS
AND NON-INDIGENOUS AUSTRALIANS, 199&2001 1996 1996 1996 2001 2001 2001
Social indicator Indig. (1) Non- Ratio Indig. (4) Non- Ratio Indig. (2) (1)/(2) Indig. (5) (4)/(5)
Employment Labour force participation (YO) 52.7 62.0 0.85 52.1 63.4 0.82 Unemployment rate (%) 22.7 9.0 2.52 20.0 7.2 2.78 Employment-population ratio (“XI) 40.7 56.4 0.72 40.4 58.9 0.69 Employed private sector (YO) * 21.6 46.3 0.47 23.0 48.5 0.48 Emdoved full-time (%)a* 23.1 39.3 0.59 22.2 38.8 0.57 Income (in 2001 $) Median income, adults (P.w.) 21 1.7 325.3 0.65 226.2 381.1 0.59 Median income, families (P.w.) 559.2 813.2 0.69 628.8 872.7 0.72 Housingb Home owner or purchasing (%) 32.5 72.7 0.45 33.4 72.7 0.46 Household size 3.6 2.7 1.33 3.4 2.6 1.31 Education Did not go to school (%) 3.1 0.7 4.43 3.2 1 .O 3.20 Left school aged 4 5 years (%)‘ 44.2 35.7 1.24 33.4 18.0 1.86 Currently attending tertiary 13.8 25.0 0.55 11.6 26.2 0.44 institution aged 15-24 years (YO Youth) Post-school qualification (%) 23.6 40.2 0.59 27.9 44.7 0.62 Health Male life expectancy at birth 57.0 75.0 0.76 57.0 76.0 0.75 Female life expectancy at birth 64.0 81 .O 0.79 65.0 82.0 0.79 Population age over 55 years (%) 6.3 20.4 0.31 6.7 22.0 0.30 Notes: a. Full-time employment defined as people working more than 35 hours per week. b. Based on
household level data. Indigenous households are defined as those in which at least one resident aged over 15 is Indigenous. Households who do not state their tenure status are excluded from home ownership calculations. c. The 1996 question on age left school changed, and the analogous question in 2001 measures the highest level of schooling completed. Assume that 1996 variable is equivalent to leaving school before Year 10. d. 2001 estimates based on Kinfu and Taylor (2002).
Source:Most 1996 estimates are derived from Altman (2001). An asterisk denotes that estimates based on authors’ calculations in all years. Unless otherwise indicated, 2001 estimates are based on authors’ calculations.
Labour force status declined for Indigenous people relative to the rest of the population for four of the five indicators. This relative decline in Indigenous employment and participation was against the trend for the rest of the population. It was
I
JON ALTMAN AND BOYD HUNTER as much the product of improvements in non-Indigenous people’s labour market status as of any decline in the status of Indigenous people. For example, while the absolute overall Indigenous employment ratio fell only marginally, it fell more in relative terms because of a 2.5 percentage point increase in the non-Indigenous employment to population ratio. Similarly, at a time when non-Indigenous labour force participation increased by 1.4 percentage points, Indigenous participation actually fell slightly. Unemployment rates fell by less for the Indigenous population than for other Australians, despite rapid economic growth over the five-year period and growth in numbers participating in the CDEP scheme. There is little evidence of trickle down improving Indigenous economic participation and reducing the significance of non- employment (welfare) income. Given that low skilled workers are often the first to lose work in an economic downturn, the lack of improvement is worrying, especially if there is any significant deterioration in the Australian and international economies in the near future.
Private sector employment grew, possibly as a result of the success of the Indigenous Employment Policy (IEP) with its explicit goal of enhancing Indigenous private sector employment. The IEP generated 12,000 jobs for Indigenous people since its inception in 1998, with about 9,000 of these jobs being in the private sector.
The recent trend towards privatisation of public services may mean that many of the apparently new jobs are merely old public sector jobs that have been ‘re-badged’. In addition to limiting the effect of CDEP scheme on the analysis, the variable for full- time employment is included to control for any artificial changes in the composition of employment. On this score, the Howard government fares less favourably with fill-time employment declining in both absolute and relative terms,
In terms of income, the median income of Indigenous adults was relatively low in 1996, a situation that became worse by 200 1. Incomes for Indigenous individuals increased on average in the last inter-censal period, but by far less than for other Australians. The net result was that the relative income status of Indigenous individuals fell from 0.65 to 0.59.
The median income of Indigenous families fared better compared to other Australian families, principally as a result of larger Indigenous families, and a reformed set of family concessions (including beneficial tax arrangements) that tend to increase the relative income of large families with many young children. Whatever was driving changes in median family income, it increased substantially for both Indigenous and non-Indigenous families, with larger increases for the former resulting in a small improvement in relativities between Indigenous and non-Indigenous from 0.69 to 0.72.
In terms of housing, the proportion of Indigenous households who are home owners increased by almost one percentage point, and is now over one third for the first time. In contrast, home ownership among other Australians remained unchanged. Indigenous home ownership improved, therefore, in both absolute and relative terms, albeit marginally. Another positive sign is that, while the size of Indigenous households continues to be much larger than that of other Australians, there was some evidence of a minor convergence in household size.
In education, the proportion of adults (aged 15 and over) who have never gone to school actually increased for both the Indigenous and non-Indigenous populations. This result is surprising. However, the increases were small for both populations and the
8
EVALUATING INDIGENOUS SOCIOECONOMIC OUTCOMES extremely low numbers in this category for the non-Indigenous community meant that the situation appeared to improve in relative terms for Indigenous people.
A more robust indicator of education might be our proxy for early school leavers, that is, whether a person left before they were aged 15 years of age. Notwithstanding the difficulties in inter-temporal comparisons arising from the changes to the underlying census question, the incidence of leaving school early fell by much more for the non- Indigenous population, leading to substantial reduction in the relative educational attainment of Indigenous adults.
The proportion of Indigenous youth currently attending a tertiary education institution is around half that of other Australians. It is an indictment of cunrent education policy that there was a large decline in the Indigenous to non-Indigenous ratio between 1996 to 2001. When the Howard government first indicated it was considering changes to ABSTUDY, a number of researchers suggested the changes were likely to have a negative impact on Indigenous participation in education (Schwab & Campbell 1997; Stanley & Hansen 1998). However, given that the changes to the ABSTUDY scheme were implemented in January 2000, only 19 months before the 2001 Census, there are probably other reasons for the apparent withdrawal of Indigenous youth from tertiary education. Whatever the reason, future prospects for improved socioeconomic outcomes for the Indigenous population are not good when attendance of Indigenous youth at tertiary institutions fell by 2.2 percentage points. At the same time, the slight increase in attendance for other Australian youth (by 1.2 percentage points) means that the ratio of Indigenous to non-Indigenous outcomes fell markedly from 0.55 to 0.44 in the last inter-censal period.
We have focused here on the proportion of youth attending tertiary education because this is the leading indicator for what will happen to educational attainment in the near future. The use of age-specific rates for education is justified on the grounds that educational attendance is strongly correlated with the early stages of the lifecycle. The comparison of educational attendance over all age groups would probably be misleading as the Indigenous population is disproportionately young. Therefore, Indigenous trends may be more volatile than non-Indigenous trends. The latter would be dominated by mature people who may feel they were too ‘old’ to go ‘back to school’. While it is true that older Indigenous people are more likely to be studying relative to their non-Indigenous counterparts, the relative decline is still observed if those over the age of 25 years are included (Hunter & Schwab 2003).
On the positive side, there was a minor improvement in the proportion of Indigenous adults with post-school qualifications in both absolute and relative terms. A note of caution is raised by Hunter and Schwab (2003) who show that the majority of the improvement in incidence of Indigenous qualifications is due to the expansion of basic qualifications. Consequently, the type of qualifications being attained may only have limited impact on future employment outcomes. Even on its own terms the government is failing in the education arena.
It is not surprising that there has been no further clear improvement in Indigenous health given our previous comment about the lag between policy implementation and the eventual outcome. The upshot of census findings is that life expectancy at birth remains much lower for Indigenous males and females, being about 20 years less than that of their non-Indigenous counterparts. Furthermore, relative life expectancy
9
JON ALTMAN AND BOYD HUNTER worsened in the last inter-censal period as a result of improvements in non-Indigenous outcomes. It is noteworthy that life expectancy for Indigenous males remains stagnant at 57 years. The substantial inertia in Indigenous health is confirmed by the stability of the low proportion of the Indigenous population in the older age groups.
5
In Table 3 we provide a ‘score card’ comparing both absolute and relative changes in Indigenous socioeconomic status during the two periods under consideration. Our cautionary comments about data quality and their contestable meanings have made us equally cautious in interpreting change-we focus only on broad movements, positive, negative or unchanged, in the 10 selected variables and not on the extent of changes which readers are at liberty to calculate for themselves.
The use of a score card is problematic because the variables selected in Tables 1 and 2 are somewhat arbitrary, and should not necessarily be given equal weighting. For example, some variables measure similar things and to include all of them would give undue weight to certain aspects of practical reconciliation. In an attempt to avoid the lack of independence of some variables, a select group of variables are identified that do not duplicate information in other variables (e.g. female life expectancy is omitted because it attempts to measure a similar thing to male life expectancy). The following ‘score card’ only includes two variables from each of the main dimensions of practical reconciliation, in order to provide a balanced representation of recent trends.
It is important to note that the overall score in Table 3 is only broadly indicative of aggregation of improvement or decline in the variables. Ideally, scores that were all positive (and totalled +10 for the 10 variables) would reflect ideal public policy intervention outcomes.
Table 3 indicates that in the period 1991-1 996, absolute wellbeing improved for six variables, declined for three and remained the same for one. In the period 1996-2001, absolute well being also improved for six variables, declined for three and remained the same for one, an identical scorecard.
The issue of relative wellbeing is of greater significance. On one hand, the 1990s was a decade of general prosperity, and the period 19962001 was one of unparalleled national growth. On the other hand, practical reconciliation is as much about reducing relative disparities as about absolutes. Here there is some divergence of performance between the two periods under consideration.
Table 3 indicates that in the period 1991-1996, relative wellbeing improved for six variables, declined for three and remained static for one. In the period 1996-2001 relative well being improved for four variables and declined for six, a poor scorecard that suggests that Indigenous people have not shared in national economic growth to the same extent as other Australians.
Over the entire reconciliation decade 1991-2001, there was absolute improvement for five variables, a decline for three, and no change in two. However, in relative terms the story has been a little different. In the period 1991-2001, there was relative improvement in five variables, and a relative decline in five variables. Of particular concern was relative decline over the period in educational and health status. In terms of reconciliation, if this is interpreted in relative and practical socioeconomic terms,
10
Comparing symbolic and practical reconciliation
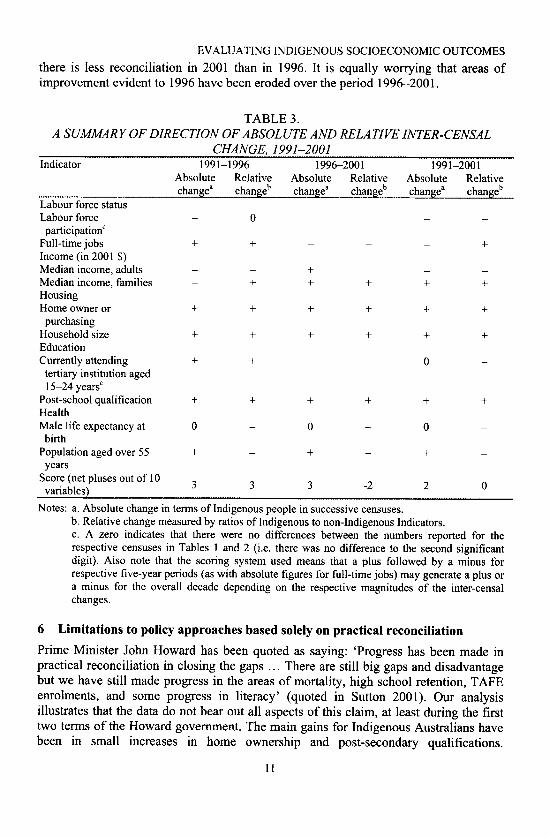
EVALUATING INDIGENOUS SOCIOECONOMIC OUTCOMES there is less reconciliation in 2001 than in 1996. It is equally worrying that areas of improvement evident to 1996 have been eroded over the period 1996-2001.
TABLE 3. A SUMMARY OF DIRECTION OF ABSOLUTE AND RELATIVE INTER-CENSAL
CHANGE, 1991-2001 Indicator 199 1-1996 1996-200 1 1991-2001
Absolute Relative Absolute Relative Absolute Relative changea changeb changea changeb changea changeb
Labour force status Labour force 0
Full-time jobs + + Income (in 2001 $) Median income, adults - -
+ + + + + Median income, families -
Housing Home owner or + + + + + + Household size + + + + + + Education
- - - - -
participation' - + - -
- - - +
purchasing
- 0 - - Currently attending + +
Post-school qualification + + + + + +
Male life expectancy at 0
Population aged over 55 + - + - + -
tertiary institution aged 15-24 years'
Health
birth
years
variables)
- 0 - 0 -
3 3 -2 2 0 Score (net pluses out of 10
Notes: a. Absolute change in terms of Indigenous people in successive censuses. b. Relative change measured by ratios of Indigenous to non-Indigenous Indicators. c. A zero indicates that there were no differences between the numbers reported for the respective censuses in Tables I and 2 (i.e. there was no difference to the second significant digit). Also note that the scoring system used means that a plus followed by a minus for respective five-year periods (as with absolute figures for full-time jobs) may generate a plus or a minus for the overall decade depending on the respective magnitudes of the inter-censal changes.
6 Prime Minister John Howard has been quoted as saying: 'Progress has been made in practical reconciliation in closing the gaps . . . There are still big gaps and disadvantage but we have still made progress in the areas of mortality, high school retention, TAFE enrolments, and some progress in literacy' (quoted in Sutton 2001). Our analysis illustrates that the data do not bear out all aspects of this claim, at least during the first two terms of the Howard government. The main gains for Indigenous Australians have been in small increases in home ownership and post-secondary qualifications.
11
Limitations to policy approaches based solely on practical reconciliation
JON ALTMAN AND BOYD HUNTER Unfortunately, none of the gains are unambiguous. For example, enthusiasm about improvements in educational qualifications must be tempered by the knowledge that retention rates and participation rates of Indigenous youth in tertiary education appear to have faltered.
The term practical reconciliation implies that it is relatively straightforward to address Indigenous disadvantage. However, the multifaceted and historically ingrained nature of this disadvantage means that deficits in particular social indicators might not be amenable to easy solutions. Pearson was prompted to point out the limitations of the approach: ‘The problems that we are talking about are not simply “practical” problems that can be solved with good intentions and sufficient funding’ (Pearson 2000).
Another important point, missed by advocates of practical reconciliation, is that physical and psycho-emotional needs must be satisfied simultaneously. One of the major problems with the practical reconciliation agenda is that it fails to recognise that many of the practical outcomes highlighted are driven, directly and indirectly, by social, cultural and spiritual needs. The current policy agenda ignores the interdependencies between many of the dimensions of Indigenous disadvantage, particularly how social and historical factors can influence contemporary Indigenous practical outcomes.
The emphasis on practical reconciliation stands in opposition to a rights-based approach, and in particular to recognition of rights that may arise from the unique position of Indigenous peoples as the original owners and occupiers of the land and users of its resources. Thus while in the government’s view special measures can be implemented to overcome disadvantage, they are not to be seen as providing any rights additional to, or different from, those available to other Australians (see Aboriginal and Torres Strait Islander Social Justice Commissioner 2001; Commonwealth of Australia 2002: 17). Social Justice Commissioner Jonas has pointed out that the emphasis on practical reconciliation has been used to remove the rights discourse from matters involved with Indigenous disadvantage: ‘In brief the problem with this approach is the simplistic, arbitrary and extremely artificial division it creates between measures which are described as practical as opposed to symbolic’ (Aboriginal and Torres Strait Islander Social Justice Commissioner 2001 : 23).
The importance of the inter-related dimensions of cultural, social and economic domains is the subject of much research (Borland & Hunter 2000; Hunter 1999; Hunter 2000). For example, social alienation feeds into substance abuse, which leads to crime, which affects education and hence employment. One weakness of the approach of practical reconciliation is that it tends to implicitly discount subtle interactions between the various dimensions of Indigenous disadvantage-sometimes termed the social exclusion of Indigenous people.
The discounting of the historical nature of Indigenous disadvantage is particularly problematic. Social problems often have their genesis long ago in, for example, a lack of appropriate parenting-something that was denied the stolen generation by government fiat. Note that this is not merely a symbolic issue. Being a member of the stolen generation has an impact on the rates of Indigenous arrest and consequently employment and education, especially lifelong learning (Borland & Hunter 2000; Hunter & Schwab 1998). Administrative policies that were implemented over 30 years ago can affect the lives of Indigenous people today. The main ‘impracticality’ of practical reconciliation is that it ignores the things that continue to divide Indigenous
12
EVALUATING INDIGENOUS SOCIOECONOMIC OUTCOMES Australians from the rest of the community. That is, even if we discount issues of social justice, so called ‘symbolism’ is important because it probably will have real effects on people’s psychological wellbeing and behaviour.
Similarly economic problems have their genesis long ago with the alienation of land and resource rights. While in recent years land rights and native title legislation have seen the return of much land to Indigenous Australians, there has been little restitution of commercially valuable property rights in resources (Altman 2002). While the restitution of such rights is based on a rights framework-so-called symbolic reconciliation-there is no doubt that it would have a significant impact on the socioeconomic status of Indigenous Australians. Conversely, to the extent that practical reconciliation is associated with socioeconomic equality, this will not be possible without an equality in the ownership of resource rights.
Another impediment to effective policy for Indigenous Australians is that current Indigenous employment programs and education policies still fail to take into account the recent large increases in the number of Indigenous youth entering the workforce (Taylor & Altman 1997; Taylor & Hunter 1998). It is also possible that educational participation is faltering because insufficient resources are allocated to deal with these increasing numbers of current and prospective students. There is a need for far greater investment in such areas if socioeconomic improvement is to occur.
While the growing numbers of Indigenous youth is a significant issue for employment and education policy, this demographic process will change. Current population projections indicate that the size of the Indigenous cohorts of youth entering the working-age population may decline after 20 1 1.
7 Conclusion The Howard government is highly critical of the performance of its predecessors in Indigenous affairs and it is now timely to evaluate its efforts. Practical reconciliation forms the basis for much of the Indigenous policy initiatives of the current government. Despite the policy rhetoric of the first two Howard governments 1996200 1, there is no statistical evidence from census information that their policies and programs are delivering better outcomes for Indigenous Australians, at the national level, than those of their political predecessors. This intractability is worrying in part because it is evident during a time when the Australian economy is growing rapidly. This suggests, in turn, that problems are deeply entrenched-it is not just a matter of governments choosing between practical and symbolic reconciliation. There are other pressing issues-the levels of investment to address historical legacies and contemporary shortfalls, the targeting of resources to the most needy, and the delivery of program support in whole-of-governments ways that will make a difference. A major problem for both Indigenous Australians and the nation is that other research ( Hunter, Kinfu & Taylor 2003) suggests that the situation described using the latest available 200 1 Census statistics is likely to get worse, rather than better, over the next decade. And yet there is no evidence of fundamental shifts in policy after 2001.
Reconciliation between Indigenous and non-Indigenous Australians is not conditional on the achievement of equality of living standards across the two populations, although movement towards equality is urgently needed. True
13
JON ALTMAN AND BOYD HUNTER reconciliation requires a dialogue between equals whereby each party comes to accept the diverse aspirations and beliefs of the other. Such connections though stray once again into the realm of the symbolic, an indispensable component in our view of policy approaches in Indigenous affairs that are likely to succeed.
REFERENCES Aboriginal and Torres Strait Islander Social Justice Commissioner 2001. Social Justice Report 2000,
ABS 1993. Australia’s Aboriginal and Torres Strait Islander Population, cat. no. 2740.0, ABS,
ABS 1994. Australia in Profile, cat. no. 2821.0, ABS, Canberra. Altman, J.C. 2001. ‘The economic status of Indigenous Australians’ in J. Jupp (eds) The Australian
People: An Encyclopedia of the Nation, Its People and Their Origins, Cambridge University Press, Cambridge.
Altman, J. C. 2002. ‘The Political Economy of a Treaty: Opportunities and Challenges for Enhancing Economic Development for Indigenous Australians’, The Drawing Board: An Australian Review of Public Affairs, 3 (2): 65-8 1.
Altman, J.C. and Gray, M.C. 2000. ‘The effects of the CDEP scheme on the economic status of Indigenous Australians: some analyses using the 1996 Census’, Discussion Paper No. 195, CAEPR, Canberra.
Altman, J.C. and Nieuwenhuysen, J. 1979. The Economic Status of Australian Aborigines, Cambridge University Press, Cambridge.
ATSIC 1994. Indigenous Australians Today: A statistical focus on ATSIC regions, ATSIC, Canberra. Barker, D.J.P. 1994. Mothers, Babies and Diseases in Later Life, BMJ Publishing Group, London. Borland, J. and Hunter, B.H. 2000. ‘Does crime affect employment status?-the case of Indigenous
Australians’, Economica, 67 (1): 1 2 3 4 . Commonwealth of Australia 2002. Commonwealth government response to the Council for Aboriginal
Reconciliation Final Report - Reconciliation: Australia ’s Challenge, Department of Immigration and Multicultural and Indigenous Affairs, Canberra.
Gray, A. 1997. ‘The explosion of aboriginality: components of lndigenous population growth 1991- 96’, CAEPR Discussion Paper No. 142, CAEPR, Canberra.
Hunter, B.H. 1999. ‘Three nations, not one: Indigenous and other Australian poverty’, CAEPR Working Paper No. I , CAEPR, Canberra, available online at httu://www.anu.edu.au/caeur/.
Hunter, B.H. 2000. ‘Social exclusion, social capital and Indigenous Australians: measuring the social costs of unemployment’, CAEPR Discussion Paper No. 204, CAEPR, Canberra.
Hunter, B.H. 2002. ‘The rise of the CDEP scheme and changing factors underlying Indigenous employment’, CAEPR Working Paper No. 13, CAEPR, ANU, Canberra, available online at
HREOC, Sydney.
Canberra.
httv://www.anu.edu.au/caem/. Hunter. B.H.. Kinfu. Y. and Taylor. J. 2003. ‘The future of Indigenous work forecasts of labour force
status to 201 l’, CAEPR Discussion Paper No. 251, CAEPR,>anberra. Hunter, B.H. and Schwab, R.G. 1998. ‘The determinants of Indigenous educational outcomes’,
CAEPR Discussion Paper No. 160, CAEPR, ANU, Canberra. Hunter, B.H. and Schwab, R.G. 2003. ‘Practical reconciliation and recent trends in Indigenous
education’, CAEPR Discussion Paper No. 249, CAEPR, ANU, Canberra. Kinh, Y. and Taylor, J. 2002. ‘Estimating the components of Indigenous population change: 1996-
2001’, CAEPR Discussion Paper No. 240, CAEPR, Canberra. Morphy, F. 2002. ‘When systems collide: the 2001 Census at a Northern Territory outstation’ in D.F.
Martin, F. Morphy, W.G. Sanders and J. Taylor (eds) Making Sense ofthe Census: Observations of the 2001 Enumeration in Remote Aboriginal Australia, Research Monograph No. 22, CAEPR, ANU, Canberra.
Morphy, F. and Sanders, W.G. (eds) 2001. The Indigenous Welfare Economy and the CDEP Scheme, CAEPR Research Monograph No. 20, CAEPR, Canberra.
14
EVALUATING INDIGENOUS SOCIOECONOMIC OUTCOMES O’Reilly, J. B. 1994. ‘Demographic implications of Aboriginal out-marriage’, Journal of the
Australian Population Association, 1 1 (2): 149-59. Pearson, N. 2000. Strong Families, then Strong Communities. Address to the Indigenous Families and
Communities Roundtable October 24, transcript available online at www.brisinst.org.au, Canberra. Sanders, W.G. 2002. ‘Journey without end: Reconciliation between Australia’s Indigenous and settler
peoples’, CAEPR Discussion Paper No. 237, CAEPR, ANU, Canberra. Schwab, R.G. and Campbell, S.F. 1997. ‘The future shape of ABSTUDY: practical and policy
implications of the recent proposed changes’, CAEPR Discussion Paper No. 140, CAEPR, Canberra.
Stanley, 0. and Hansen, G. 1998. ABSTUDY: An Investment for Tomorrow’s Employment, ATSIC, Canberra.
Sutton, P. 2001. ‘The politics of suffering: Indigenous policy in Australia since the Seventies’, Antrhopological Forum, 11 (2): 125-74.
Taylor, J. 1997. ‘The contemporary demography of indigenous Australians’, Journal ofthe Australian Population Association, 14 (1): 77-1 14.
Taylor, J. and Altman, J.C. 1997. The Job Ahead: Escalating Economic Costs of Indigenous Employment Disparity, Office of Public Affairs, ATSIC, Canberra.
Taylor, J. and Hunter, B.H. 1998. The Job Still Ahead: Economic Costs of Continuing Indigenous Employment Disparity, Office of Public Affairs, ATSIC, Canberra.
15