eth-8798-02.pdf - Research Collection
166
ETH Library Modeling memory system performance of NUMA multicore- multiprocessors Doctoral Thesis Author(s): Majó, Zoltán Publication date: 2014 Permanent link: https://doi.org/10.3929/ethz-a-010183063 Rights / license: In Copyright - Non-Commercial Use Permitted This page was generated automatically upon download from the ETH Zurich Research Collection . For more information, please consult the Terms of use .
-
Upload
khangminh22 -
Category
Documents
-
view
0 -
download
0
Transcript of eth-8798-02.pdf - Research Collection

ETH Library
Modeling memory systemperformance of NUMA multicore-multiprocessors
Doctoral Thesis
Author(s):Majó, Zoltán
Publication date:2014
Permanent link:https://doi.org/10.3929/ethz-a-010183063
Rights / license:In Copyright - Non-Commercial Use Permitted
This page was generated automatically upon download from the ETH Zurich Research Collection.For more information, please consult the Terms of use.

Modeling Memory System Performance of NUMA Multicore-Multiprocessors
Zoltan Majo

c© Zoltan Majo, 2014.

DISS. ETH No. 22006
Modeling Memory System Performance ofNUMA Multicore-Multiprocessors
A thesis submitted to attain the degree ofDOCTOR OF SCIENCES of ETH ZURICH
(Dr. sc. ETH Zurich)
presented byZOLTAN MAJO
Ing. dipl., Technical University of Cluj-Napocaborn on June 18, 1983
citizen of Hungary and Romania
accepted on the recommendation ofProf. Dr. Thomas R. Gross, examinerProf. Dr. Frank Muller, co-examiner
Prof. Dr. Michael Stumm, co-examiner
2014


Hathazi Anna-Marianak.


Abstract
The performance of many applications depends closely on the way they interact with the com-puter’s memory system: Many applications obtain good performance only if they utilize thememory system efficiently.
Unfortunately, obtaining good memory system performance is often difficult, as develop-ing memory system-aware (system) software requires a thorough and detailed understanding ofboth the characteristics of the memory system and of the interaction of applications with thememory system. Moreover, the design of memory systems evolves as newer processor genera-tions appear on the market, thus the problem of software–hardware interaction must be revisitedto understand the interaction of (already existing) software with newer memory system designsas well.
This thesis investigates the memory system performance of a recent class of machines,multicore-multiprocessors with a non-uniform memory architecture (NUMA). A NUMAmulticore-multiprocessor system consists of several processors where each processor integratesmultiple cores. Typically, cores of a multicore processor share resources (e.g., last-level caches)and contention for these shared resources can result in significant performance degradations.
NUMA multicore-multiprocessors are shared-memory computers, but the memory spaceof a NUMA multicore-multiprocessor system is partitioned between processors. Accessingthe memory of a local processor takes less time than accessing the memory of other (remote)processors, therefore data locality (a low number of remote memory accesses) is critical forgood performance on NUMA machines.
This thesis presents a performance-oriented model for NUMA multicore-multiprocessors.The model considers two application classes, multiprogrammed workloads (workloads that con-sist of multiple, independent processes) and multithreaded programs (programs that consist of anumber of threads that operate in a shared address space). The thesis presents an experimentalanalysis of memory system bottlenecks experienced by each application class. Moreover, thethesis presents techniques to reduce the performance-degrading effects of these bottlenecks.
We determine (based on experimental analysis) that the performance of multiprogrammedworkloads depends on both multicore-specific and NUMA-specific aspects of a NUMAmulticore-multiprocessor’s memory system. Therefore, a process scheduler must find a bal-ance between reducing cache contention and improving data locality; the N-MASS schedulerpresented by the thesis attempts to strike a balance between these, sometimes contradicting,goals. N-MASS improves performance up to 32% over the default setup in current Linux im-plementations on a recent 2-processor 8-core machine.
Based also on experimental analysis we find that data locality is of prime importance for theperformance of multithreaded programs. The thesis presents extensions to two popular parallelprogramming frameworks, OpenMP and Intel’s Threading Building Blocks. The extensions
v

vi
allow a programmer to express affinity of data and computations, which, if done appropriately,helps to improve data locality and thus performance on NUMA multicore-multiprocessors (byup to 220% on a recent 4-processor 32-core machine). The thesis also shows that adding NUMAsupport not only to the programmer interface, but also to the underlying runtime system, allowsprograms to be portable across different architectures as well as to be composable with otherprograms (that use the same runtime system).
Zusammenfassung
Die Rechenleistung vieler Software-Applikationen hangt von der Interaktion der Applikationmit dem Speichersystem des Computers ab: Viele Applikationen erreichen eine gute Rechen-leistung nur wenn sie das Speichersystem des Computers effizient nutzen.
Es ist aber leider oft schwierig Software zu entwickeln, die das Speichersystem effizientbenutzt, da Programmierer sowohl die Merkmale des Speichersystems wie auch das Zusam-menspiel der Software mit dem Speichersystem verstehen mussen, um effiziente Software ent-wickeln zu konnen. Daruber hinaus muss haufig das Zusammenspiel (schon existierender) Soft-ware erneut analysiert and verstanden werden, wenn neue Computerarchitekturen (eventuell miteinem neuen Typ von Speichersystem) auf den Markt gebracht werden.
Diese Dissertation analysiert das Speichersystem einer neuen Klasse von Rechnern,Multikern-Multiprozessoren mit einer nicht-uniformen Speicherarchitektur (engl.: non-uniformmemory architecture (NUMA)). Ein NUMA Multikern-Multiprozessor besteht aus mehrerenProzessoren; jeder Prozessor des Systems besteht aus mehreren Kernen. Die Kerne eines Multi-kernprozessors teilen in der Regel Ressourcen (z.B. den Cachespeicher des Prozessors) und dergleichzeitige Gebrauch von geteilten Ressourcen kann zu einer Erhohung der Laufzeit von Ap-plikationen fuhren (im Vergleich mit dem Fall wenn keine Ressourcen geteilt sind).
Jeder Prozessor eines NUMA Multikern-Multiprozessors hat Zugriff auf alle Spei-cherstellen des Systems, der Adressraum des Systems ist aber zwischen den Prozessoren par-tizioniert. Zugriffe auf Speicherstellen des lokalen Prozessors dauern weniger lang als Zugriffeauf Speicherstellen eines entfernten Prozessors, daher ist Datenlokalitat (eine niedrige Zahl vonZugriffen auf die Speicherstellen eines entfernten Prozessors) entscheidend fur die Rechenleis-tung vieler Applikationen.
Diese Dissertation beschreibt ein leistungsorientiertes Modell fur NUMA Multikern-Multiprozessoren. Das Modell betrachtet zwei Klassen von Software-Applikationen, multi-programmierte Applikationen, welche aus mehreren unabhangigen Prozessen bestehen, undmultithreaded Applikationen, welche aus mehreren Threads bestehen, die miteinander Datenteilen. Die Dissertation identifiziert Engpasse des Speichersystems, welche die Laufzeit vonApplikationen beider Klassen negativ beinflussen. Die Dissertation beschreibt auch Methodenum die negativen Auswirkungen der Engpasse zu reduzieren.
Wir stellen fest (mittels experimenteller Analyse), dass sowohl Datenlokalitat als auch diegleichzeitige Benutzung geteilter Ressourcen fur die Laufzeit multiprogrammierter Applikatio-nen entscheidend ist, und dass der Scheduler des Betriebsystem eine Balance zwischen den bei-den, oft miteinander im Konflikt stehenden Faktoren, finden muss. Die Dissertation beschreibteinen neuen Scheduler-Algorithmus, N-MASS. Die Verwendung von N-MASS ergibt eineVerbesserung der Laufzeit multiprogrammierter Applikationen von bis zu 32% (verglichen miteiner Standard Linux-Implementation auf einem modernen NUMA Multikern-Multiprozessor
vii
viii
mit zwei Prozessoren und 8 Kernen).Ausserdem stellen wir fest (auch mittels experimenteller Analyse), dass Datenlokalitat fur
eine effiziente Ausfuhrung von multithreaded Applikationen unerlasslich ist. Die Disserta-tion prasentiert Erweiterungen fur zwei bekannte Frameworks fur parallelle Progammierung,OpenMP und Intel Threading Building Blocks. Mit diesen Erweiterungen konnen Program-mierer die Affinitat von Daten und Berechnungen ausdrucken, was, wenn dies in geeigneterWeise getan wird, dazu fuhrt, dass Datenlokalitat und somit auch Rechenleistung sich deut-lich (bis zu 220% auf einem Rechner mit vier Prozessoren mit 32 Kernen) verbessert. DieDissertation zeigt auch, dass, wenn nicht nur die Programmierschnittstelle sondern auch dasLaufzeitsystem fur NUMA Multikern-Multiprozessoren angepasst wird, optimierte Programmeportabel sind und ihre Datenlokalitat auch dann bewahren, wenn sie mit anderen Programmenzusammengesetzt werden.
Acknowledgments
Many people helped me complete my doctoral studies.I am grateful to my advisor, Thomas R. Gross, for giving me the opportunity to study at
ETH. I thank Thomas for the advice and guidance he provided me during the years of mydoctoral studies and also for the excellent working environment that he has maintained in theresearch group.
I thank my co-examiners, Frank Muller and Michael Stumm, for being on the examinationcommittee and for their valuable feedback on the dissertation.
Many thanks to my colleagues in the Laboratory of Software Technology for the friendlyand collaborative environment. My thanks go to current colleagues, Luca Della Toffola, FaheemUllah, Martin Battig, Animesh Trivedi, Antonio Barresi, Remi Meier, Michael Fas, AristeidisMastoras, and Ivana Unkovic, as well as former members of the research group, Florian Schnei-der, Yang Su, Mihai Cuibus, Susanne Cech, Oliver Trachsel, Nicholas Matsakis, StephanieBalzer, Christoph Angerer, Mathias Payer, Stefan Freudenberger, Michael Pradel, and AlbertNoll.
I was fortunate enough to have many of my friends by my side during the PhD years. Thelist is, fortunately, so long that it would, unfortunately, not fit it onto one (and possibly not evenonto several) page(s). But I thank you all.
My biggest thanks go to my wife (Agota), to my parents (Julianna and Zoltan), to my sister(Zsuzsa), and to all my family for their unconditional love and support.
ix


Contents
Abstract v
Zusammenfassung vii
Acknowledgments ix
Contents xi
1 Introduction 11.1 Thesis statement . . . . . . . . . . . . . . . . . . . . . . . . . . . . . . . . . . 31.2 Organization of this dissertation . . . . . . . . . . . . . . . . . . . . . . . . . 4
2 Resource sharing and interconnect overhead 52.1 Sharing of local/remote memory bandwidth . . . . . . . . . . . . . . . . . . . 5
2.1.1 Experimental setup . . . . . . . . . . . . . . . . . . . . . . . . . . . . 62.1.2 Memory system performance . . . . . . . . . . . . . . . . . . . . . . 112.1.3 A simple model . . . . . . . . . . . . . . . . . . . . . . . . . . . . . . 122.1.4 Queuing fairness . . . . . . . . . . . . . . . . . . . . . . . . . . . . . 142.1.5 Aggregate throughput . . . . . . . . . . . . . . . . . . . . . . . . . . 152.1.6 Limitations . . . . . . . . . . . . . . . . . . . . . . . . . . . . . . . . 182.1.7 The next generation . . . . . . . . . . . . . . . . . . . . . . . . . . . . 182.1.8 Summary . . . . . . . . . . . . . . . . . . . . . . . . . . . . . . . . . 20
2.2 Cache contention and interconnect overhead . . . . . . . . . . . . . . . . . . . 212.2.1 Experimental setup . . . . . . . . . . . . . . . . . . . . . . . . . . . . 212.2.2 Memory system performance . . . . . . . . . . . . . . . . . . . . . . 222.2.3 Summary . . . . . . . . . . . . . . . . . . . . . . . . . . . . . . . . . 27
2.3 Conclusions . . . . . . . . . . . . . . . . . . . . . . . . . . . . . . . . . . . . 28
3 Cache-conscious scheduling with data locality constraints 293.1 Design . . . . . . . . . . . . . . . . . . . . . . . . . . . . . . . . . . . . . . . 29
3.1.1 Modeling memory system behavior . . . . . . . . . . . . . . . . . . . 293.1.2 Characterizing the memory behavior of processes . . . . . . . . . . . . 313.1.3 The N-MASS algorithm . . . . . . . . . . . . . . . . . . . . . . . . . 33
3.2 Implementation . . . . . . . . . . . . . . . . . . . . . . . . . . . . . . . . . . 363.3 Evaluation . . . . . . . . . . . . . . . . . . . . . . . . . . . . . . . . . . . . . 37
xi

xii CONTENTS
3.3.1 Experimental setup . . . . . . . . . . . . . . . . . . . . . . . . . . . . 373.3.2 Dimensions of the evaluation . . . . . . . . . . . . . . . . . . . . . . . 383.3.3 Influence of data locality and cache contention . . . . . . . . . . . . . 393.3.4 A detailed look . . . . . . . . . . . . . . . . . . . . . . . . . . . . . . 43
3.4 Process memory behavior characterization . . . . . . . . . . . . . . . . . . . . 443.4.1 Estimating the NUMA penalty . . . . . . . . . . . . . . . . . . . . . . 443.4.2 Monitoring cache pressure . . . . . . . . . . . . . . . . . . . . . . . . 443.4.3 Determining a process’s home node . . . . . . . . . . . . . . . . . . . 45
3.5 Discussion and limitations . . . . . . . . . . . . . . . . . . . . . . . . . . . . 483.6 Conclusions . . . . . . . . . . . . . . . . . . . . . . . . . . . . . . . . . . . . 48
4 Performance analysis of multithreaded programs 514.1 Performance scaling . . . . . . . . . . . . . . . . . . . . . . . . . . . . . . . . 524.2 Experimental setup . . . . . . . . . . . . . . . . . . . . . . . . . . . . . . . . 53
4.2.1 Hardware . . . . . . . . . . . . . . . . . . . . . . . . . . . . . . . . . 534.2.2 Benchmark programs . . . . . . . . . . . . . . . . . . . . . . . . . . . 544.2.3 Scheduling and memory allocation . . . . . . . . . . . . . . . . . . . . 564.2.4 Performance monitoring . . . . . . . . . . . . . . . . . . . . . . . . . 56
4.3 Understanding memory system behavior . . . . . . . . . . . . . . . . . . . . . 574.3.1 Data locality . . . . . . . . . . . . . . . . . . . . . . . . . . . . . . . 574.3.2 Prefetcher effectiveness . . . . . . . . . . . . . . . . . . . . . . . . . 59
4.4 Program transformations . . . . . . . . . . . . . . . . . . . . . . . . . . . . . 594.4.1 Distributing data . . . . . . . . . . . . . . . . . . . . . . . . . . . . . 604.4.2 Algorithmic changes . . . . . . . . . . . . . . . . . . . . . . . . . . . 60
4.5 Performance evaluation . . . . . . . . . . . . . . . . . . . . . . . . . . . . . . 654.5.1 Cumulative effect of program transformations . . . . . . . . . . . . . . 664.5.2 Prefetcher performance . . . . . . . . . . . . . . . . . . . . . . . . . . 70
4.6 Conclusions . . . . . . . . . . . . . . . . . . . . . . . . . . . . . . . . . . . . 724.6.1 Implications for performance evaluation . . . . . . . . . . . . . . . . . 724.6.2 Implications for performance optimizations . . . . . . . . . . . . . . . 72
5 Matching memory access patterns and data placement 755.1 Memory system behavior of loop-parallel programs . . . . . . . . . . . . . . . 75
5.1.1 Experimental setup . . . . . . . . . . . . . . . . . . . . . . . . . . . . 755.1.2 Data address profiling . . . . . . . . . . . . . . . . . . . . . . . . . . 775.1.3 Profile-based page placement . . . . . . . . . . . . . . . . . . . . . . 78
5.2 Memory access and distribution patterns: A detailed look . . . . . . . . . . . . 795.2.1 In-memory representation of matrices . . . . . . . . . . . . . . . . . . 795.2.2 Matrix memory access patterns . . . . . . . . . . . . . . . . . . . . . 805.2.3 Data sharing . . . . . . . . . . . . . . . . . . . . . . . . . . . . . . . 825.2.4 Two examples: bt and ft . . . . . . . . . . . . . . . . . . . . . . . . 82
5.3 Fine-grained data management and work distribution . . . . . . . . . . . . . . 865.3.1 Data distribution primitives . . . . . . . . . . . . . . . . . . . . . . . . 865.3.2 Iteration distribution primitives . . . . . . . . . . . . . . . . . . . . . . 89

CONTENTS xiii
5.4 Example program transformations . . . . . . . . . . . . . . . . . . . . . . . . 905.4.1 bt . . . . . . . . . . . . . . . . . . . . . . . . . . . . . . . . . . . . . 905.4.2 lu . . . . . . . . . . . . . . . . . . . . . . . . . . . . . . . . . . . . . 92
5.5 Evaluation . . . . . . . . . . . . . . . . . . . . . . . . . . . . . . . . . . . . . 925.5.1 Data locality . . . . . . . . . . . . . . . . . . . . . . . . . . . . . . . 935.5.2 Scalability . . . . . . . . . . . . . . . . . . . . . . . . . . . . . . . . 945.5.3 Comparison with other optimization techniques . . . . . . . . . . . . . 95
5.6 Conclusions . . . . . . . . . . . . . . . . . . . . . . . . . . . . . . . . . . . . 97
6 A parallel library for locality-aware programming 996.1 Practical aspects of implementing data locality optimizations . . . . . . . . . . 99
6.1.1 Introduction . . . . . . . . . . . . . . . . . . . . . . . . . . . . . . . . 996.1.2 Principles of data locality optimizations . . . . . . . . . . . . . . . . . 1006.1.3 Enforcing data locality in practice . . . . . . . . . . . . . . . . . . . . 1026.1.4 Goals of TBB-NUMA . . . . . . . . . . . . . . . . . . . . . . . . . . 104
6.2 Anatomy of TBB . . . . . . . . . . . . . . . . . . . . . . . . . . . . . . . . . 1046.2.1 User programs . . . . . . . . . . . . . . . . . . . . . . . . . . . . . . 1056.2.2 Parallel algorithm templates . . . . . . . . . . . . . . . . . . . . . . . 1056.2.3 Task scheduler . . . . . . . . . . . . . . . . . . . . . . . . . . . . . . 1056.2.4 Resource Management Layer . . . . . . . . . . . . . . . . . . . . . . 1066.2.5 Threads . . . . . . . . . . . . . . . . . . . . . . . . . . . . . . . . . . 107
6.3 Implementing NUMA support . . . . . . . . . . . . . . . . . . . . . . . . . . 1076.3.1 Threads . . . . . . . . . . . . . . . . . . . . . . . . . . . . . . . . . . 1076.3.2 Resource Management Layer . . . . . . . . . . . . . . . . . . . . . . 1076.3.3 Standard TBB task scheduler . . . . . . . . . . . . . . . . . . . . . . . 1086.3.4 TBB-NUMA task scheduler . . . . . . . . . . . . . . . . . . . . . . . 1106.3.5 Programming with TBB-NUMA . . . . . . . . . . . . . . . . . . . . . 115
6.4 Evaluation . . . . . . . . . . . . . . . . . . . . . . . . . . . . . . . . . . . . . 1156.4.1 Experimental setup . . . . . . . . . . . . . . . . . . . . . . . . . . . . 1156.4.2 Data locality optimizations . . . . . . . . . . . . . . . . . . . . . . . . 1166.4.3 Composability . . . . . . . . . . . . . . . . . . . . . . . . . . . . . . 1196.4.4 Portability . . . . . . . . . . . . . . . . . . . . . . . . . . . . . . . . . 121
6.5 Conclusions . . . . . . . . . . . . . . . . . . . . . . . . . . . . . . . . . . . . 121
7 Related work 1237.1 Memory system performance analysis . . . . . . . . . . . . . . . . . . . . . . 123
7.1.1 Memory controller performance . . . . . . . . . . . . . . . . . . . . . 1237.1.2 Shared resource contention . . . . . . . . . . . . . . . . . . . . . . . . 1247.1.3 Data sharing . . . . . . . . . . . . . . . . . . . . . . . . . . . . . . . 124
7.2 Performance optimizations . . . . . . . . . . . . . . . . . . . . . . . . . . . . 1257.2.1 Reducing shared resource contention . . . . . . . . . . . . . . . . . . 1257.2.2 Improving data locality . . . . . . . . . . . . . . . . . . . . . . . . . . 125
8 Conclusions 129

xiv CONTENTS
Bibliography 133
List of Figures 145

1Introduction
The performance of a large number of applications depends critically on the memory system;that is, numerous applications achieve good performance (low end-to-end execution time) onlyif they efficiently utilize the memory system of the machine.
Obtaining good memory system performance poses challenges for both hardware and soft-ware engineers. On the hardware side, it is challenging to design a memory system architecturethat provides high memory bandwidth and, at the same time, low memory access latency for allprocessor(s)/core(s) of a system. The problem of providing adequate memory access is furtherexacerbated by the recent trend of core counts increasing with every processor generation.
Producing (system) software that uses the capabilities of the memory system efficiently isdifficult as well. To achieve good performance, programmers must understand the interactionbetween hardware and software which requires detailed understanding of the properties of boththe memory system and the applications using it. More specifically, given a memory systemarchitecture, programmers need a performance-oriented model that comprehensively describesthe memory system performance of that architecture. Ideally, such a model
• identifies and describes the performance bottlenecks of the memory system architecture;
• defines and describes a set of application classes, where applications of the same classinteract with the memory system architecture in a well-defined and well-understood way(that is different from the way applications in other classes interact with the same memorysystem architecture);
• identifies and describes performance optimization techniques, that is, ways to improvethe memory system performance of a given application class.
Although a processor manufacturer’s manuals contain plentiful information about the prop-erties of a given processor [45], they usually specify only a few aspects related to the perfor-mance of the processor. Thus, manuals are usually augmented either by the processor manu-facturer itself (e.g., in the form of optimization guides [44, 57]) or by the research community(usually in the form of experimental studies [4, 18, 22, 39, 73, 108]).
Despite the efforts, however, there are still numerous open questions about memory systemperformance. Moreover, as processor memory system design evolves, existing performancemodels must be revisited and updated; moreover, if needed, new models must be developed.
For example, recent shared-memory multiprocessor systems (systems built with multipleprocessors operating within the same physical address space) are based on multicore processors
1

2 CHAPTER 1. INTRODUCTION
1
Processor 1
Core 4 Core 5
Core 6 Core 7
IC MC
DRAM
Processor 0
Core 0 Core 1
Core 2 Core 3
MC IC
DRAM
Last-‐level cache Last-‐level cache REMOTE_CACHE: 186 cycles
REMOTE_DRAM: 310 cycles
LOCAL_DRAM: 190 cycles
LOCAL_CACHE: 38 cycles
Figure 1.1: 2-processor 8-core NUMA multicore-multiprocessor.
(processors with multiple cores per processor). Moreover, these systems are typically equippedwith a non-uniform memory architecture (NUMA). These NUMA multicore-multiprocessorsare an attractive and popular platform that are used as both stand-alone systems (e.g., servercomputing) or as building blocks in supercomputers, thus it is important to understand thememory system performance of this class of machines.
The memory system of a typical NUMA multicore-multiprocessor is complex as it has char-acteristics specific to both its building blocks, that is, it has characteristics specific to both multi-core and NUMA systems. Although both types of memory system architectures are reasonablywell understood in isolation, the combination of the two memory system architectures requiresfurther investigation.
To better illustrate the features of the memory system of a NUMA multicore-multiprocessor,consider the example 2-processor 8-core system shown in Figure 1.1. In the example systemeach processor accesses a part of the main memory that is connected to the processor throughan on-chip memory controller (MC). Moreover, to allow each processor to access the memoryof the other processor as well, processors are connected to each other with a cross-chip inter-connect (each processor has an additional memory interface (IC) that allows the processor toconnect to the cross-chip interconnect).
Partitioning the memory space between processors has the benefit that the memory band-width available to applications scales with the number of processors. Nevertheless, a partitionedspace can have disadvantages as well, as applications can experience large performance penal-ties due to remote memory accesses. Remote memory accesses are transferred on the cross-chipinterconnect, thus they encounter an overhead relative to local memory accesses (accesses han-dled by the on-chip memory controller). Figure 1.1 shows the disparity between local- andremote memory access latencies, as measured on a NUMA multicore-multiprocessor that iscomposed of processors based on the recent Intel Nehalem microarchitecture [73] 1. NUMAmulticore-multiprocessor systems based on other microarchitectures, for example those devel-oped by AMD, show similar disparities between memory access latencies [39].
The effect of the remote memory access penalty on application performance is well-studied
1The latencies indicated in the Figure 1.1 are measured for read transfers (i.e., read accesses last-level cachesand to DRAM). For cache accesses we report latencies to cache lines in the E cache coherency state. See [73] forthe complete information, e.g., latencies for accessing cache lines in other cache coherency states as well.

1.1. THESIS STATEMENT 3
and well-understood and there exists a large body of work on data locality optimizations (op-timizations that attempt to reduce the number of remote memory accesses) [56, 60, 67, 68,72, 79]. However, the memory system of current multicore-based NUMA systems has aspectsspecific to multicore processors as well. In a multicore system, processor cores share (some)memory system resources; shared resources must be managed properly to obtain good mem-ory system performance. For example, recent multicore processors typically have a last-levelcache that is shared between a (subset) of the cores on a processor (e.g., in the example systemin Figure 1.1 four cores share a last-level cache). As shown recently, cache sharing can bothimprove [112] and deteriorate [33, 52] application performance in multicore systems.
In summary, due to the bivalence of NUMA multicore-multiprocessors several questionsarise:
• Do NUMA multicore-multiprocessors systems exhibit multicore-specific or NUMA-specific performance bottlenecks, or both?
• What kind of performance optimization techniques are worthwhile to be pursued to ad-dress these bottlenecks?
• Which are the application classes that benefit from these optimization techniques?
This thesis answers these questions by providing a performance-oriented model of applica-tion memory system performance on NUMA multicore-multiprocessor systems. The contribu-tions of this thesis are threefold. First, using experimental analysis, the thesis identifies and de-scribes a set of performance bottlenecks specific to NUMA multicore-multiprocessor memorysystems. Second, the thesis investigates the implications of the previously identified bottlenecksfor two different application classes. Third, the thesis describes performance optimization tech-niques applicable for each application class and presents a prototype implementation (and anexperimental evaluation) of each technique.
1.1 Thesis statement
The model presented by the thesis considers two application classes: (1) multiprogrammedworkloads, that is, workloads that consists of multiple, independent processes, and (2) multi-threaded programs, that is, programs that consist of a set of threads that operate on (possibly)shared data.
Thesis statements:
1. The memory system performance of multiprogrammed workloads on NUMA multicore-multiprocessors strongly depends on two factors: contention for shared resources and in-terconnect overhead. Information about a workload’s memory behavior enables processscheduling to improve the performance of multiprogrammed workloads by accounting forboth factors.
2. The memory system performance of multithreaded programs critically depends on the lo-cality of DRAM/cache accesses. If provided with task/data affinity information, a NUMA-aware runtime system can achieve good data locality without compromising load balance,furthermore, a NUMA-aware runtime system enables portable and composable data lo-cality optimizations and thus helps amortize the optimization effort.

4 CHAPTER 1. INTRODUCTION
1.2 Organization of this dissertation
This thesis is structured as follows.
The first part of the thesis (Chapters 2 and 3) focuses on multiprogrammed workloads.Chapter 2 presents an experimental analysis of the memory system performance of multipro-grammed workloads on NUMA multicore-multiprocessors. The analysis shows that a typicalNUMA multicore-multiprocessor memory system has several bottlenecks; good performancecan be achieved only if all these bottlenecks are taken into consideration. Then, in Chapter 3we describe the N-MASS process scheduling algorithm that attempts to find a balance betweentwo memory system bottlenecks, cache contention and interconnect overhead.
The second part of the thesis (Chapters 4, 5, and 6) focuses on multithreaded programs.Chapter 4 analyzes the performance impact of different schemes for mapping data and compu-tations. Then, Chapters 5 and 6 present language-level extensions to two parallel programmingframeworks, OpenMP and TBB, to support locality-aware programming.
Chapter 7 presents related work and Chapter 8 concludes the thesis.

2Resource sharing andinterconnect overhead
This chapter presents an experimental analysis of the memory system performance of NUMAmulticore-multiprocessors. We focus on a single application class, multiprogrammed workloads(workloads that consist of a set of independent processes that do not share data).
The main question addressed by this chapter is: How much does resource sharing impactapplication performance and what is (comparatively) the impact of interconnect overhead? Toprovide an answer, this chapter considers two aspects of NUMA-multicore memory systemperformance. First, in Section 2.1 we look into the relative cost of interconnect overhead andmemory controller contention by experimentally analyzing the sharing of local/remote memorybandwidth in a recent NUMA multicore-multiprocessor system. Then, in Section 2.2 we extendthe scope of the analysis and consider contention for a different shared resource, the last-levelcaches of a system, as well.
2.1 Sharing of local/remote memory bandwidth
In NUMA multicore-multiprocessors each processor accesses part of the physical memorydirectly (via an on-chip memory controller) and has access to the other parts of the physi-cal memory via the memory controller of other processors. Other processors are reached viathe cross-processor interconnect, and major processor manufacturers have developed their pro-prietary cross-chip interconnect technology that connects the processors (e.g., AMD’s Hyper-Transport [1] or Intel’s QuickPath Interconnect (QPI) [64]).
Remote memory accesses (accesses via the interconnect) are subject to various overheads.The bandwidth provided by the cross-chip interconnect is lower than the bandwidth providedby the local (on-chip) memory controller. Moreover, the latency of remote memory accesses ishigher than the latency of local (on-chip) memory accesses: Remote memory accesses are firstsent to the interconnect (arbitration may be needed if multiple cores access remote memory atthe same time), then a request is transmitted to another processor, and finally additional stepsmay be needed on this remote processor before the memory access can be done.
As a result, the performance penalty of remote memory accesses is significant (we callthis penalty the NUMA penalty): In current systems the NUMA penalty can be as high as2 (equivalent to a 2X slowdown) for some applications. The NUMA penalty in recent sys-tems is somewhat lower than in earlier implementations of NUMA (e.g., 3 to 5 in the StanfordFLASH [107]), but a slowdown of 2X is still high, thus avoiding the NUMA penalty must be
5

6 CHAPTER 2. RESOURCE SHARING AND INTERCONNECT OVERHEAD
considered in recent systems as well.
Traditionally, performance optimizations for NUMA systems aim for increasing data local-ity (i.e., reducing or even eliminating remote memory accesses in the system) by changing theallocation of memory and/or the mapping of computations in the system [13, 17, 27, 55, 58, 62,67, 68, 72, 77, 79, 102–104, 107, 109]. As the performance of many applications is ultimatelylimited by the performance of the memory system, it is important to understand the memorysystem of NUMA multicore-multiprocessors as simple and realistic models are crucial to findmappings (of data and computations) that result in good performance on these systems.
Previous research has focused on evaluating the bandwidth and latency of the on-chip mem-ory controller and of the cross-chip interconnect of modern NUMA machines in separation (i.e.,when there are either local or remote memory accesses in the system, but not both of them atthe same time) [39, 44, 66, 73]. However, it rarely happens in real systems that a computation’smemory traffic exclusively flows through either the local memory interface or the cross-chip in-terconnect that connects to the memory controller of a remote processor. So it is also importantto understand how these two types of memory accesses (local and remote) interact.
A recent study [6] evaluates the problems and opportunities posed by having multiple typesof memory controllers in a system. The authors show that a page placement algorithm thataccounts not only for data locality, but also for contention for memory controllers and for cross-chip interconnects can obtain good application performance in a system with multiple memorycontrollers. However, the study is more concerned about future architectures and less withexisting ones. In the following, we analyze the bandwidth sharing properties of a commercialmicroprocessor and discuss the implications of these properties for optimizing programs inmulticore systems. We show that in some cases–when the machine is highly loaded–the cross-chip interconnect outperforms the on-chip memory controller. Mapping computations so thatall memory traffic flows through the local memory interface is bound to be suboptimal in manysituations due to resource contention.
2.1.1 Experimental setup
In the following, we describe the memory system architecture of the evaluated system, thebenchmark programs, and the experimental methodology we use.
Hardware
We investigate the memory system of a multicore-multiprocessor machine based on the IntelNehalem microarchitecture. The machine is equipped with two Intel Xeon E5520 quad-coreCPUs running at 2.26 GHz and a total of 12 GB RAM. The memory system architecture of theNehalem-based system is sketched in Chapter 1 (see Figure 1.1). In this section we describe thememory system of the machine in more detail.
Figure 2.1 shows the Nehalem-based system we investigate. In this system each processorhas a direct connection to half of the memory space via a three-channel integrated memorycontroller. The on-chip integrated memory controller (IMC) provides a maximum theoreticalthroughput of 25.6 GB/s. Additionally, each processor has two QuickPath Interconnect (QPI)interfaces [64], one connecting to the remote processor and one to the I/O hub. The interconnecthas a maximum theoretical throughput of 11.72 GB/s in one direction and 23.44 GB/s in both

2.1. SHARING OF LOCAL/REMOTE MEMORY BANDWIDTH 7
IMC QPI QPI
L3 cache
QPI QPI IMCDDR3
I/O
Core 0 Core 2
Core 4 Core 6
Global Queue
Core 1 Core 3
Core 5 Core 7
L3 cache L3 cache
Global Queue
DDR3
Figure 2.1: Intel Nehalem in a 2-processor configuration.
directions.
Although the throughput of the QPI is almost as high as the throughput of the IMC, thereare two IMCs in the system, while there is only one QPI link connecting the two processors.Thus, if an application has good data locality (it predominantly accesses local memory), theapplication can exploit the throughput of the two IMCs (2X25.6 GB/s). Otherwise, the applica-tion’s performance can be limited by the throughput of the single QPI cross-chip interconnectin the system (23.44 GB/s). (In addition to bandwidth-related limitations, the application’s per-formance is negatively influenced by the increased latency of remote memory accesses relativeto local accesses [73].)
Furthermore, each core of a Nehalem processor has its own level 1 and level 2 exclusivecache, but the per-processor inclusive 8 MB last-level cache (LLC) is shared between all coresof the same processor. We refer to the subsystem incorporating the LLC, the arbitration mech-anisms, and the memory controllers as the uncore (the uncore is marked with dotted lines onFigure 2.1).
When a processor accesses a memory location, there are many different locations that canhold the data (e.g., local or remote caches, local or remote RAM). Similarly, there can be severalmemory requests outstanding, from multiple cores and processors, in flight at any point oftime, so a routing and arbitration mechanism for these requests is necessary. On the Nehalem,a part of the uncore called the Global Queue (GQ) arbitrates these requests [44]. The GQcontrols and buffers data requests coming from different subsystems of the processor. For eachsubsystem (processor cores, L3 cache, IMC, and QPI) there is a separate port at the GQ, asshown in Figure 2.2. Requests to local and remote memory are tracked separately. As manydifferent types of accesses go through the GQ, the fairness of the GQ is crucial to assure thateach subsystem experiences the same service quality in terms of the share of the total systembandwidth.
Intel Nehalem processors feature a dynamic overclocking mechanism called Turbo Boostthat allows raising the clock rate of processor cores over their nominal rate if the per-processorthermal and power limits still remain within the processor’s design specifications [22]. TurboBoost results in a performance improvement of up to 6.6% in both single- and multithreadedconfigurations of the benchmarks we use, but we disable it (together with dynamic frequencyscaling) to improve the stability of our measurements and to allow a focus on the memory sys-tem interface. The hardware and adjacent cache line prefetchers are enabled for all experiments.

8 CHAPTER 2. RESOURCE SHARING AND INTERCONNECT OVERHEAD
Global Queue
Cores 0, 2
Cores 4, 6
L3 cache
IMC
QPI
Figure 2.2: Global Queue.
Although our 8-core 2-processor evaluation system is small, it nevertheless allows interest-ing experiments, as it already offers the opportunity to study the interaction between local andremote memory accesses. It is possible to build larger systems (up to eight sockets) based onthe Intel Nehalem microarchitecture. These systems use a processor with a larger number ofQPIs to allow point-to-point connections between all processors. We used such a system with4 processors and 32 cores, but the uncore of these systems is more complicated [42]. Thus, apresentation of the possible interactions between the uncore components would make the exper-imental analysis much more complicated without giving significantly more (or different) insightinto the problem under investigation (i.e., the sharing of bandwidth between local/remote mem-ory accesses). Nevertheless, to assess the performance implications of having more than fourcores per processor, in Section 2.1.7 we briefly evaluate the memory system performance of the6-core die shrink of the Nehalem, the Westmere.
Benchmarks
We use the triad workload of the STREAM benchmark suite [71] to evaluate the sustainablememory bandwidth of individual cores, processors, and the complete system. The triadworkload is a program with a single execution phase with high memory demands. Figure 2.3shows the main loop of triad: triad operates on three arrays of double-precision floating-point numbers (a[], b[], and c[], as shown in the figure); the arrays must be sized so thatthey are larger than the last-level cache to cause memory controller traffic.
1 for ( i = 0 ; i < ARRAY SIZE ; i ++)2 {3 a [ i ] = b [ i ] + SCALAR ∗ c [ i ] ;4 }
Figure 2.3: triad main loop.
A single instance of the triad workload is not capable of saturating any of the memoryinterfaces of our evaluation machine, thus it does not allow us to explore the limits of themachine’s main memory subsystem. Besides, a single triad instance does not allow forevaluating the interaction between the different types of memory controllers, because we needat least one triad instance for each type of memory controller to have two types of memoryaccesses in the system at the same time. Hence, we construct multiprogrammed workloads thatconsist of co-executing instances of triad (also referred to as triad clones). We refer tothese workloads as xP, where x is the number of triad clones the workload is composed of(e.g., 3P represents a workload composed of three triad clones).

2.1. SHARING OF LOCAL/REMOTE MEMORY BANDWIDTH 9
IMC QPI QPI
L3 cache
QPI QPI IMCMemory
I/O
Core 0 Core 2
Core 4 Core 6
Global Queue
Core 1 Core 3
Core 5 Core 7
L3 cache L3 cache
Global Queue
L L R
DDR3
Figure 2.4: 3P workload in (2L, 1R) configuration.
To match the application class we study in this chapter (multiprogrammed workloads), theversion of the triad benchmark we use is multiprogrammed and uses processes. (The orig-inal implementation of the STREAM benchmark suite is implemented with OpenMP and usesthreads.) As a result of using processes, there is no data shared between co-executing triadclones. The Nehalem microarchitecture implements the MESIF cache coherency protocol, andaccesses to cache lines in each different state (i.e., Modified, Exclusive, Shared, Invalid, orForwarding) involve different access latencies [73]. By using a multiprogrammed benchmark,we restrict the types of cache lines accessed to M, E, and I. Therefore, we do not need to ac-count for the different latencies of accesses to cache lines in all possible states. As a result, ourmeasurement data are easier to interpret and to understand. Nevertheless, our analysis can beeasily extended to evaluate the bandwidth sharing properties of accesses to cache lines in othercoherency states as well, following the methodology described in [73].
There are two useful properties of triad that make it well suited for the main memorysystem evaluation. First, triad’s cache miss rate per instruction executed is the same (around53 misses per thousand instructions) for all configurations of the workload (for configurationswhen the workload is composed of several triad clones as well as the configuration when theworkload consists of a single triad instance); that is, co-executing triad clones that share aLLC do not cause additional inter-core misses [93] to each other. Therefore, triad is a cachegobbler type of program (according to the classification proposed by Sandberg et al. in [90]).The second useful property of triad is that 94–99% of its read memory accesses that requestdata from the LLC miss the LLC and are therefore served by main memory (for details aboutwrite accesses see Section 2.1.2).
As a result of these properties, triad slows down only because of bandwidth saturation,increased memory access latencies, and contention on the memory controllers of the system,but not due to an increase of its LLC miss rate. Hence, triad is well suited for evaluating thethroughput of the memory interfaces, and its performance is not influenced by caching effects(e.g., cache contention) at all (see Section 2.2 for an analysis that considers cache contention aswell).
We use standard Linux system calls [56] to control on which processor the memory is allo-cated and where the operating system processes executing the triad clones are scheduled. Weuse the terms triad process and triad clone interchangeably, as there is a one-to-one map-ping between a clone (an instance of the triad program) and the process executing it. To
10 CHAPTER 2. RESOURCE SHARING AND INTERCONNECT OVERHEAD
Bit type Bit nameRequest DMND DATA READ
DMND DATA RFODMND DATA IFETCHPF DATA READPF DATA RFOPF DATA IFETCH
Response LOCAL DRAMREMOTE DRAM
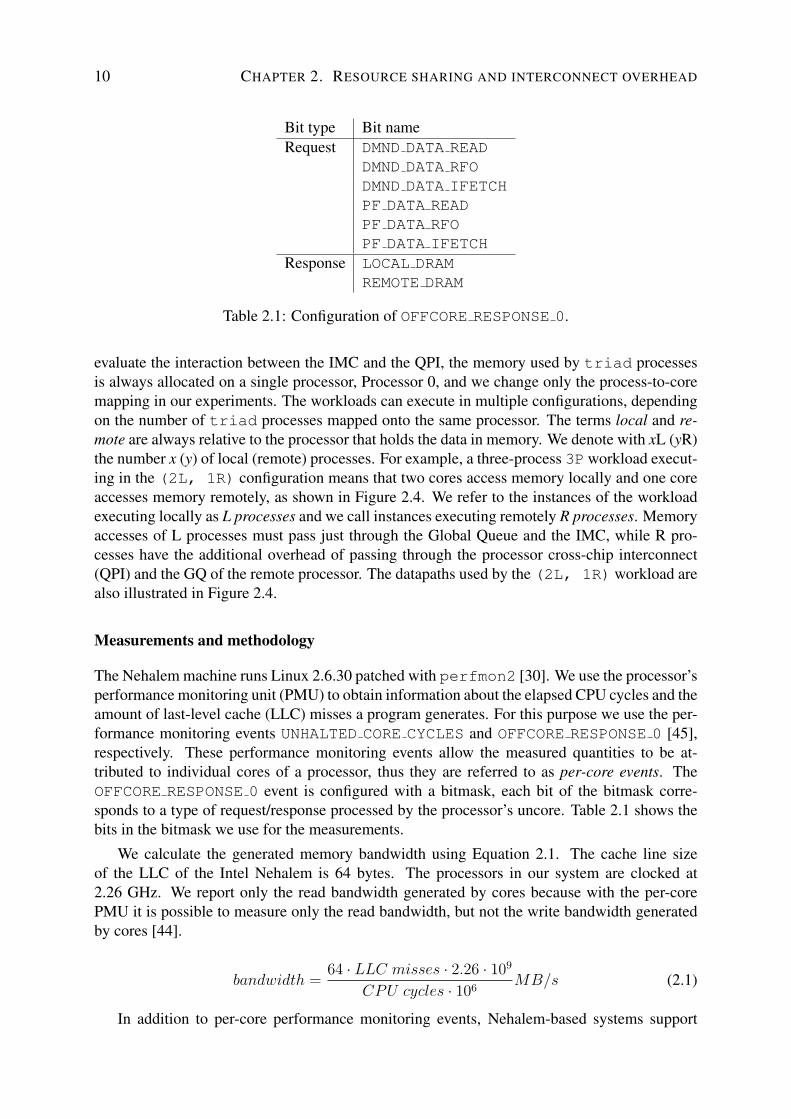
Table 2.1: Configuration of OFFCORE RESPONSE 0.
evaluate the interaction between the IMC and the QPI, the memory used by triad processesis always allocated on a single processor, Processor 0, and we change only the process-to-coremapping in our experiments. The workloads can execute in multiple configurations, dependingon the number of triad processes mapped onto the same processor. The terms local and re-mote are always relative to the processor that holds the data in memory. We denote with xL (yR)the number x (y) of local (remote) processes. For example, a three-process 3P workload execut-ing in the (2L, 1R) configuration means that two cores access memory locally and one coreaccesses memory remotely, as shown in Figure 2.4. We refer to the instances of the workloadexecuting locally as L processes and we call instances executing remotely R processes. Memoryaccesses of L processes must pass just through the Global Queue and the IMC, while R pro-cesses have the additional overhead of passing through the processor cross-chip interconnect(QPI) and the GQ of the remote processor. The datapaths used by the (2L, 1R) workload arealso illustrated in Figure 2.4.
Measurements and methodology
The Nehalem machine runs Linux 2.6.30 patched with perfmon2 [30]. We use the processor’sperformance monitoring unit (PMU) to obtain information about the elapsed CPU cycles and theamount of last-level cache (LLC) misses a program generates. For this purpose we use the per-formance monitoring events UNHALTED CORE CYCLES and OFFCORE RESPONSE 0 [45],respectively. These performance monitoring events allow the measured quantities to be at-tributed to individual cores of a processor, thus they are referred to as per-core events. TheOFFCORE RESPONSE 0 event is configured with a bitmask, each bit of the bitmask corre-sponds to a type of request/response processed by the processor’s uncore. Table 2.1 shows thebits in the bitmask we use for the measurements.
We calculate the generated memory bandwidth using Equation 2.1. The cache line sizeof the LLC of the Intel Nehalem is 64 bytes. The processors in our system are clocked at2.26 GHz. We report only the read bandwidth generated by cores because with the per-corePMU it is possible to measure only the read bandwidth, but not the write bandwidth generatedby cores [44].
bandwidth =64 · LLC misses · 2.26 · 109
CPU cycles · 106MB/s (2.1)
In addition to per-core performance monitoring events, Nehalem-based systems support

2.1. SHARING OF LOCAL/REMOTE MEMORY BANDWIDTH 11
uncore events. Accordingly, the processor’s uncore has a PMU as well, in addition to the PMUsof the individual processor cores. Uncore events can be used to measure quantities for thecomplete system, but, unlike per-core events, they do no allow quantities to be attributed toindividual cores. We use the uncore PMU to monitor the state of the GQ and to cross-checkthe bandwidth readings obtained with the per-core performance counters (in which case wecompare cumulative per-core event counts with the corresponding uncore counts).
We compile the triad workload with the gcc compiler version 4.3.3, optimization levelO2. To reduce the variation of the results, OS address space layout randomization is disabledand we also reduce the number of services running concurrently with our benchmarks as muchas possible. As the triad workload is bound on memory bandwidth and has a single programphase, its bandwidth and performance readings are very stable and do not depend on the factorsreported by Mytkowicz et al. [75] (e.g., the size of the UNIX environment and link-order). Allmeasurement data are the average of three measurement runs; the variation of the measurementsis negligible.
2.1.2 Memory system performance
To measure the bandwidth sharing properties of the Nehalem microarchitecture, we measure thebandwidth achieved by each instance of the triad benchmark. We configure the benchmarkwith a number of processes ranging from one to eight (the number of cores on our machine),and then measure all possible local-remote mapping configurations for any given number oftriad processes. Recall that only per-process read bandwidth can be reported due to lim-itations of the processor’s PMU. However, the total amount of read and write bandwidth onthe interfaces of the system can be measured using uncore performance counters (using theUNC QHL NORMAL READS and UNC QHL WRITES events). These measurements show thatthe triad benchmark is read-intensive, as in any configuration around 75% of the total mainmemory bandwidth is caused by reads, and around 25% is due to writes. Therefore, the mea-surements of the read bandwidth of the system are representative for the behavior of the memoryinterfaces of the Nehalem-based system.
Figure 2.5 shows results for the scenario where four local processes share the IMC band-width with different numbers of remote processes. If there are no remote processes, the com-plete bandwidth is allocated to local requests (4L, 0R). As a single remote process is added(resulting in configuration (4L, 1R)), the total bandwidth increases. Then, as the numberof remote processes further increases, the total bandwidth is reduced slightly (configurations(4L, 2R) to (4L, 4R)). Two remote processes consume the maximal bandwidth that canbe obtained through remote accesses; the share of the remote processes does not grow as weincrease the number of remote processes. As a consequence, each remote process realizes asmaller and smaller absolute memory bandwidth.
The data in Figure 2.5 might convince a system developer to favor mapping a process ontothe processor that holds the data locally. However, the situation is more complex: Figure 2.5shows the total bandwidth achieved by all processes. Figure 2.6 contrasts Figure 2.5 by show-ing the performance of individual R and L processes. If there is a single L and a single Rprocess, the L process captures almost 50% more of the memory bandwidth (L: 6776 MB/s,R: 4412 MB/s). As the number of L processes increases, these L processes compete for localaccess, and although the R process’s declines as well (to 3472 MB/s), the bandwidth obtainedby each L process declines a lot more (to 2622 MB/s).

12 CHAPTER 2. RESOURCE SHARING AND INTERCONNECT OVERHEAD
0
2
4
6
8
10
12
14
16
(4L, 0R) (4L, 1R) (4L, 2R) (4L, 3R) (4L, 4R)
Tota
l ban
dw
idth
[G
B/s
]
Configurations
L processes R processes
Figure 2.5: Bandwidth sharing: 4 L processes with variable number of R processes (Nehalem).
0%
10%
20%
30%
40%
50%
60%
70%
(1L,1R) (2L,1R) (3L,1R) (4L,1R)
Shar
e o
f to
tal b
and
wid
th
Configurations
L process
R process
Figure 2.6: Percentage of total memory bandwidth obtained by an L and an R process (Ne-halem).
Table 2.2 shows the complete measurement data. Each row reports the bandwidth obtainedby an L instance in the presence of varying number of R processes. Table 2.3 shows the band-width obtained by an R process in the same set of configurations as in Table 2.2. Figure 2.6contrasts column 2 of Tables 2.2 and 2.3. Tables 2.4 and 2.5 report the cumulative data (for allthe L respectively R processes in an experiment). Figure 2.5 is based on the last row of Tables2.4 and 2.5; the sum of these rows yields the total shown in the figure.
2.1.3 A simple model
Our experiments show that if there are only local processes running on the system, the totalbandwidth obtained by these processes can be described as:
bwLtotal= min(active cores ∗ bwL, bwLmax) (2.2)
In Equation 2.2, bwL is the bandwidth of a single, locally executing triad clone (L pro-cess) (see column “0 R” of Table 2.2). If the sum of the bandwidth of the individual coresbwLtotal
is greater than the threshold bwLmax (see column “0 R” of Table 2.4 for the exact val-ues), each core obtains an equal share of the threshold value (12925 MB/s).

2.1. SHARING OF LOCAL/REMOTE MEMORY BANDWIDTH 13
0 R 1 R 2 R 3 R 4 R0 L 0 0 0 0 01 L 7656 6776 6325 6185 62102 L 5512 4460 4189 4142 41213 L 4202 3389 3078 3047 30484 L 3231 2622 2348 2325 2326
Table 2.2: Per-core L bandwidth [MB/s].
0 R 1 R 2 R 3 R 4 R0 L 0 4844 3499 2313 17021 L 0 4412 3010 2007 14862 L 0 4056 2664 1778 13193 L 0 3675 2383 1581 11754 L 0 3472 2236 1486 1104
Table 2.3: Per-core R bandwidth [MB/s].
0 R 1 R 2 R 3 R 4 R0 L 0 0 0 0 01 L 7656 6776 6325 6185 62102 L 11024 8921 8379 8283 82423 L 12607 10167 9235 9141 91454 L 12925 10487 9393 9299 9302
Table 2.4: Total L bandwidth [MB/s].
0 R 1 R 2 R 3 R 4 R0 L 0 4844 6998 6938 68071 L 0 4412 6020 6020 59452 L 0 4056 5329 5335 52753 L 0 3675 4765 4742 46994 L 0 3472 4472 4459 4416
Table 2.5: Total R bandwidth [MB/s].
0 R 1 R 2 R 3 R 4 R0 L 0 4844 6998 6938 68071 L 7656 11188 12345 12205 121552 L 11024 12977 13708 13618 135173 L 12607 13842 14001 13882 138444 L 12925 13959 13865 13758 13719
Table 2.6: Total cumulative bandwidth [MB/s].
Similarly, the total bandwidth obtained by remote processes can be characterized as:
bwRtotal= min(active cores ∗ bwR, bwRmax) (2.3)
In Equation 2.3, bwR is the bandwidth achieved by a single triad instance executingremotely (R process) (see column “0 L” of Table 2.3). The maximum throughput of the R pro-cesses (bwRmax) is limited by the QPI interface and is 6998 MB/s (experimentally determined).The QPI is also fair in the sense that if the threshold is to be exceeded, each R processes obtainsan equal share of the total bandwidth.
The total bandwidth obtained by the system is composed of the bandwidth achieved by Land R processes and is shown in Table 2.6 for all configurations of the triad benchmark.The limit bwLmax of L processes can be observed in row “4 L” column “0 R” of Table 2.6.Similarly, the limit bwRmax of R processes can be observed in row “0 L” and column “2 R”of Table 2.6. Remote processes hit their limit bwRmax with two active cores, while four localprocesses are needed to hit the limit bwLmax . This is because the QPI is already saturated by twotriad clones, however all four cores need to be active to saturate the IMC. Next generationsof the Nehalem have a larger number of cores connected to the same local memory controller,therefore not all cores of a processor are required to achieve the saturation limit of the IMC. InSection 2.1.7 we briefly look at such a machine.
14 CHAPTER 2. RESOURCE SHARING AND INTERCONNECT OVERHEAD
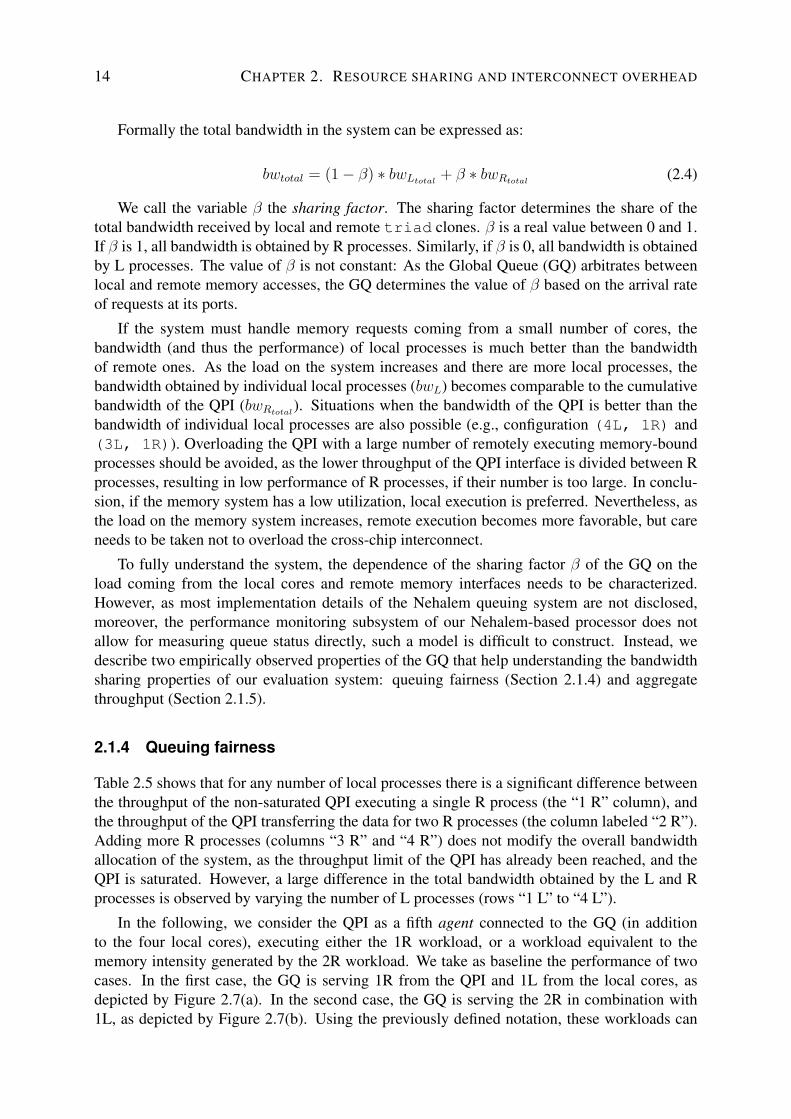
Formally the total bandwidth in the system can be expressed as:
bwtotal = (1− β) ∗ bwLtotal+ β ∗ bwRtotal
(2.4)
We call the variable β the sharing factor. The sharing factor determines the share of thetotal bandwidth received by local and remote triad clones. β is a real value between 0 and 1.If β is 1, all bandwidth is obtained by R processes. Similarly, if β is 0, all bandwidth is obtainedby L processes. The value of β is not constant: As the Global Queue (GQ) arbitrates betweenlocal and remote memory accesses, the GQ determines the value of β based on the arrival rateof requests at its ports.
If the system must handle memory requests coming from a small number of cores, thebandwidth (and thus the performance) of local processes is much better than the bandwidthof remote ones. As the load on the system increases and there are more local processes, thebandwidth obtained by individual local processes (bwL) becomes comparable to the cumulativebandwidth of the QPI (bwRtotal
). Situations when the bandwidth of the QPI is better than thebandwidth of individual local processes are also possible (e.g., configuration (4L, 1R) and(3L, 1R)). Overloading the QPI with a large number of remotely executing memory-boundprocesses should be avoided, as the lower throughput of the QPI interface is divided between Rprocesses, resulting in low performance of R processes, if their number is too large. In conclu-sion, if the memory system has a low utilization, local execution is preferred. Nevertheless, asthe load on the memory system increases, remote execution becomes more favorable, but careneeds to be taken not to overload the cross-chip interconnect.
To fully understand the system, the dependence of the sharing factor β of the GQ on theload coming from the local cores and remote memory interfaces needs to be characterized.However, as most implementation details of the Nehalem queuing system are not disclosed,moreover, the performance monitoring subsystem of our Nehalem-based processor does notallow for measuring queue status directly, such a model is difficult to construct. Instead, wedescribe two empirically observed properties of the GQ that help understanding the bandwidthsharing properties of our evaluation system: queuing fairness (Section 2.1.4) and aggregatethroughput (Section 2.1.5).
2.1.4 Queuing fairness
Table 2.5 shows that for any number of local processes there is a significant difference betweenthe throughput of the non-saturated QPI executing a single R process (the “1 R” column), andthe throughput of the QPI transferring the data for two R processes (the column labeled “2 R”).Adding more R processes (columns “3 R” and “4 R”) does not modify the overall bandwidthallocation of the system, as the throughput limit of the QPI has already been reached, and theQPI is saturated. However, a large difference in the total bandwidth obtained by the L and Rprocesses is observed by varying the number of L processes (rows “1 L” to “4 L”).
In the following, we consider the QPI as a fifth agent connected to the GQ (in additionto the four local cores), executing either the 1R workload, or a workload equivalent to thememory intensity generated by the 2R workload. We take as baseline the performance of twocases. In the first case, the GQ is serving 1R from the QPI and 1L from the local cores, asdepicted by Figure 2.7(a). In the second case, the GQ is serving the 2R in combination with1L, as depicted by Figure 2.7(b). Using the previously defined notation, these workloads can

2.1. SHARING OF LOCAL/REMOTE MEMORY BANDWIDTH 15
Processor 1Processor 0
L
RAM
QPI
L
L
L
contenders
R
(a) Baseline workload: (1L, 1R).
Processor 1
L
RAM
QPI
L
L
L
contenders
R
R
Processor 0
(b) Baseline workload: (1L, 2R).
Figure 2.7: Setup to evaluate GQ fairness.
be denoted with (1L, 1R) and (1L, 2R). To increase the contention on the GQ, one, two,or three additional L process(es) are executed on the system. These L processes (the base Lprocess plus the additional L processes) contend with the QPI for IMC bandwidth.
Figure 2.8 shows the variation of the sharing factor (parameter β of Equation 2.4) whencontention on the local port of the GQ increases. The sharing factor depends on the load on theGQ: the more traffic L processes generate, the larger a share of the bandwidth they obtain, andthe more the share of the R processes (given by β) decreases. Nonetheless, if we consider theperformance degradation of the two baseline workloads (1L, 1R) and (1L, 2R) (shown inFigure 2.9 and in Figure 2.10, respectively), the performance of individual L process in each ofthe two workloads degrades more than the performance of the QPI does. Therefore, the moreload there is on the GQ, the more attractive it is to execute some processes remotely.
In conclusion, if the GQ is contended, the Nehalem microarchitecture is unfair towards localcores (vs. the QPI), as local cores experience a performance degradation that is larger than theperformance degradation of the QPI. Still, this behavior is reasonable as the GQ does not allowremote cores to starve, and thus it avoids further aggravating the penalty of remote memoryaccesses. Nevertheless, this property of the Nehalem is undocumented and can be discoveredonly with experimental evaluation.
2.1.5 Aggregate throughput
To further motivate the benefit of having a good proportion of local and remote memory ac-cesses, we show in Figure 2.11 the total system throughput for the 4P workload in differentmapping configurations (ranging from the configuration when all processes execute locallyto the configuration with all processes executing remotely). In the configurations with someremote memory accesses the throughput of the memory system can be better (at a peak of13842 MB/s) relative to the configuration when all memory accesses are local (12925 MB/s).
To take a closer look at the total system throughput, we examine two cases. First, we mapthe processes of the triad workload onto local cores. This way, all memory operations use thelocal ports of the Global Queue. Then, we move one process to the remote processor, thus theQPI port of the GQ is also used to actively handle memory requests. For both cases, we compute

16 CHAPTER 2. RESOURCE SHARING AND INTERCONNECT OVERHEAD
0%
10%
20%
30%
40%
50%
60%
+0L +1L +2L +3L
Shar
ing
fact
or β
Additional contention
(1L,1R)
(1L,2R)
Figure 2.8: Dependence of β on aggregate load.
0%
20%
40%
60%
80%
100%
+1L +2L +3L
Per
form
ance
de
grad
atio
n
rela
tive
to
(1
L,1
R)
Additional contention
L process
QPI
Figure 2.9: Performance degradation of (1L, 1R).
0%
20%
40%
60%
80%
100%
+1L +2L +3L
Per
form
ance
de
grad
atio
n
rela
tive
to
(1
L, 2
R)
Additional contention
L process
QPI
Figure 2.10: Performance degradation of (1L, 2R).
overall system throughput as the sum of the instructions per cycle (IPC) values obtained by theprocesses:
IPCtotal =∑
p∈Processes
IPCp (2.5)
The number of instructions executed by the triad workload is measured using the perfor-mance monitoring event INSTRUCTIONS EXECUTED.

2.1. SHARING OF LOCAL/REMOTE MEMORY BANDWIDTH 17
0
2
4
6
8
10
12
14
16
(4L,0R) (3L,1R) (2L,2R) (1L,3R) (0L,4R)
Tota
l ban
dw
idth
[G
B/s
]
Configurations
Figure 2.11: Total bandwidth of the 4P workload in different configurations.
0%
1%
2%
3%
4%
5%
6%
7%
8%
2 3 4
Imp
rove
men
t
Number of processes
IPC
Bandwidth
Figure 2.12: Improvement of aggregate IPC and total memory bandwidth when an IMC and aQPI are used (relative to the case when a single IMC is used).
We are aware that in case of heterogeneous workloads (workloads that execute different in-struction streams) using the metric defined by Equation 2.5 may not be appropriate, as pointedout by Eyerman [31]. However, in our case all processes execute the same tight memory-intensive loop (shown in Figure 2.3) that processes identically sized data, therefore the instruc-tions executed by each workload are the same. The clock rate of all processor cores is also thesame, so the ratio of instructions executed and cycles consumed is a precise measure for systemthroughput. As most memory accesses of triad miss the last-level cache (and are thus servedby main memory), the aggregate memory bandwidth achieved on the system is also directlyproportional to the system throughput. This metric does not characterize the fairness of thesystem, but it accurately reflects the throughput of the main memory system.
Figure 2.12 shows the benefit of mapping one process remotely over the all-local case(where all memory requests come from local cores). The benefit is minor (1.7%) if thereare just two processes running on the system, but it gets significant (7.4 %) if there are fourprocesses. This increase of performance in the four-process case can be explained by the dis-tribution of contention on the GQ. When the GQ handles four locally executing triad clones,its local port is saturated (it is full 10% of the time). (GQ saturation is measured with theUNC GQ CYCLES FULL event [45]). Moving one process to the remote processor transferssome of load from the local port of the GQ to its remote port. In this new configuration neitherthe local nor the remote port of the GQ is saturated, therefore system throughput increases.
18 CHAPTER 2. RESOURCE SHARING AND INTERCONNECT OVERHEAD
However, if all processes execute remotely, the remote port of the GQ gets saturated (it is full31% of the time).
In conclusion, in a single-threaded context the bandwidth and latency of the on-chip mem-ory interface greatly outperform the same parameters of the QPI. However, in the case whenmultiple cores are competing, this advantage diminishes as contention on the queuing systemincreases. Distributing computations such that there are both local and remote accesses in thesystem helps to improve aggregate throughput.
2.1.6 Limitations
In our analysis we did not account for the overhead of the cache coherency protocol. On everycache miss, there is a snoop request towards the cache of the adjacent processor (as measuredon the read-, write-, and peer–probe-tracker of each processor’s uncore). Snoop requests aretransferred on the cross-chip interconnect of the system. However, while normal reads usuallyrequest data of the size equal to a cache line, we do not know the amount of data transferredwith a snoop request. Therefore, we cannot calculate the amount of traffic generated by snooprequests, and so we cannot calculate the bandwidth overhead of the cache coherency protocol.
We use a single, homogeneous workload (composed of multiple triad clones) to eval-uate the memory system performance of a NUMA-multicore machine. Because the triadbenchmark does not benefit from caching (at least not at the level of the LLC), triad’s per-formance describes the performance of the memory interfaces of our evaluation system well.In case of heterogeneous workloads (workloads composed of multiple programs with differentmemory intensity that have possibly more cache locality than triad), however, caching effectsalso come into play in addition to memory controller throughput. We discuss this scenario inSection 2.2.
2.1.7 The next generation
In 2010 Intel released a die shrink of the Nehalem codenamed Westmere. To see if the previ-ously described principles apply also to systems based on the Westmere microarchitecture, weperform all experiments with a Westmere-based machine as well. The Westmere-based systemwe evaluate has also two processors, however it shows some differences to the Nehalem-basedmachine we have looked at previously. The most important difference is that the processors inour Westmere-based system contain six cores per processor (two cores more than the processorsof the Nehalem-based system). A detailed comparison of the two systems is shown in Table 2.7.
We conduct the same set of experiments with the Westmere as with the Nehalem, but we donot present the complete data. Instead, we present two projections of the Westmere data, similarto the ones presented for the Nehalem in Figure 2.5 and Figure 2.6, respectively. In Figure 2.13four local processes share the bandwidth of the IMC of Processor 0. As one R process isadded, the total achieved bandwidth increases. Adding more R processes increases the shareof R processes until the saturation limit of the QPI is achieved (in the case of Westmere four Rprocesses are required to saturate the QPI versus two R processes in the case of the Nehalem).
Figure 2.13 shows a breakdown of the total bandwidth of the two types of processes, Land R. Figure 2.14 shows the memory bandwidth of a single L resp. R process with increasingnumber of L processes. On the Westmere a single R processes is able to achieve more bandwidth

2.1. SHARING OF LOCAL/REMOTE MEMORY BANDWIDTH 19
0
2
4
6
8
10
12
(4L, 0R)
(4L, 1R)
(4L, 2R)
(4L, 3R)
(4L, 4R)
(4L, 5R)
(4L, 6R)
Total ban
dwidth [G
B/s]
Configura8ons R processes L processes
Figure 2.13: Bandwidth sharing: 4 L processes with variable number of R processes (West-mere).
0%
10%
20%
30%
40%
50%
60%
70%
(1L, 1R) (2L, 1R) (3L, 1R) (4L, 1R) (5L, 1R) (6L, 1R)
Share of to
tal ban
dwidth
Configura4ons L process R process
Figure 2.14: Percentage of total memory bandwidth obtained by an L and an R process (West-mere).
Nehalem WestmereModel number Intel Xeon E5520 Intel Xeon X5680Number of processors 2 2Cores per processor 4 6Clock frequency 2.26 GHz 3.33 GHzL3 cache size 2x8 MB 2x12 MBIMC bandwidth 2x25.6 GB/s 2x19.2 GB/sQPI bandwidth 2x11.72 GB/s 2x12.8 GB/s
(2x5.86 GTransfers/s) (2x6.4 GTransfers/s)Main memory 2x6 GB DDR3 2x72 GB DDR3
Table 2.7: Parameters of the evaluation machines.
than an L process already in the configuration with two locally executing processes.
To compare the Nehalem to the Westmere, Figures 2.15 and 2.16 show the total read band-width measured on the Nehalem and the Westmere, respectively. As the Westmere includes two

20 CHAPTER 2. RESOURCE SHARING AND INTERCONNECT OVERHEAD
0 L1 L
2 L3 L
4 L
0
2
4
6
8
10
12
14
16
0 R1 R
2 R3 R
4 R
Tota
l ban
dw
idth
[G
B/s
]
Configurations
Figure 2.15: Total read bandwidth (Nehalem).
0 L1 L
2 L3 L
4 L5 L
6 L
0
2
4
6
8
10
12
0 R1 R
2 R3 R
4 R5 R
6 R
Tota
l ban
dw
idth
[G
B/s
]
Configurations
Figure 2.16: Total read bandwidth (Westmere).
cores more than the Nehalem, the thresholds bwLmax and bwRmax defined in Equations 2.2 and2.3 are more prominent than on the Nehalem: on the Westmere four triad clones are requiredto saturate the QPI (vs. two on the Nehalem), while the IMC saturates with four triad clones,just as on the Nehalem.
In conclusion, the principles we describe for the Nehalem also apply for the Westmeremicroarchitecture. Because the Westmere has more cores, a different LLC size, and memoryinterfaces with slightly different throughput as the Nehalem, the bandwidth sharing propertiesof this machine are quantitatively, but not qualitatively, different.
2.1.8 Summary
Today’s multicore processors integrate a memory controller with the cores and caches on asingle chip. Such a design leads to the new generation of NUMA multicore-multiprocessors

2.2. CACHE CONTENTION AND INTERCONNECT OVERHEAD 21
that present software developers with a new set of challenges and create a different class ofperformance optimization problems. The cores put pressure on the memory controller to servicethe local memory access requests while, at the same time, the memory controller must deal withrequests by other processors as well. So it is important that the software finds a balance betweenlocal and remote memory accesses if overall performance is to be optimized.
In this section (Section 2.1) we presented an experimental analysis of the bandwidth shar-ing properties of two commercially available multicore systems, the Intel Nehalem and its die-shrink, the Intel Westmere. The evaluation shows that if a large part or all of the cores of aprocessor are active and thus contention on memory controllers is high, favoring data localitymay not lead to optimal performance. In addition to data locality, the bandwidth limits of thememory controllers and the fairness of the arbitration between local and remote accesses areimportant. Moreover, the overhead of arbitration and queuing is likely to become more impor-tant in larger systems as the complexity of this mechanism increases with a growing numberof processors in the system. Therefore, it is important that software developers understand thememory system to be able to balance the memory system demands on such a system so that thebest tradeoff between local and remote accesses can be found.
2.2 Cache contention and interconnect overhead
In recent multicore architectures (including the Nehalem- and Westmere-based systems ana-lyzed in Section 2.1) there are usually multiple cores connected to a single last-level cache(LLC). Contention for shared LLCs (short: cache contention) appears when multiple, indepen-dent programs (e.g., programs of a multiprogrammed workload) are mapped onto a multicoremachine so that several programs use the same LLC simultaneously. Programs using the sameLLC at the same time can evict each other’s cache lines. Such activities result in less cachecapacity available to each program (relative to the case when a program uses the cache alone).Therefore, for memory intensive programs cache contention can result in severe performancedegradation, as shown by [8, 14, 20, 34, 40, 47, 52, 69, 70, 84, 97, 113].
Section 2.1 analyzes the relative cost of memory controller contention and interconnectoverhead by looking at the bandwidth sharing properties of Intel Nehalem- and Westmere-based machines. In this this section we extend the experimental analysis to take into accountthe relative cost of cache contention as well. Section 2.2.1 describes the experimental setup weuse, in Section 2.2.2 we discuss the effects of cache contention on application performance.
2.2.1 Experimental setup
The analysis in Section 2.1 uses the triad workload for experiments. The triad workloadhas a cache miss rate of almost 100% and thus its performance critically depends only on theavailable memory bandwidth, but not at all on the amount of cache capacity available to it. Asa result, triad is well suited to analyze the relative cost of memory controller contention andinterconnect overhead, but it cannot be used to compare the cost of cache contention and thecost of interconnect overhead.
In the current setup we consider programs of the SPEC CPU2006 benchmark suite, insteadof triad. Programs in the SPEC CPU2006 suite have various memory intensities, Sandberg etal. [90] provides a classification of programs based on their memory behavior. Some programs

22 CHAPTER 2. RESOURCE SHARING AND INTERCONNECT OVERHEAD
are not memory intensive at all, that is, their performance does not depend on the memory sys-tem at all (i.e., the “don’t care” category in the classification provided by the paper). Someprograms are similar to triad, that is, they are memory intensive but their performance doesnot dependent on the available LLC capacity (i.e., the “cache gobbler” category in the classifi-cation). Finally, numerous programs in the suite are memory intensive and their performanceclosely depends on the amount of LLC capacity available (e.g., “victim” and “gobblers andvictims” category in the classification in [90]).
We use programs from the “gobblers and victims” category to evaluate the relative cost ofcache contention and interconnect overhead. The programs are executed with the reference in-put size (the largest input size available in the suite). The hardware and software environmentused to run experiments is the same as the environment described in Section 2.1 (i.e., use thesame Nehalem- and Westmere-based machines), but we perform a different set of the experi-ments. First, we analyze the performance impact of cache contention and data locality usinga simple example: mapping two programs onto the 2-processor Nehalem-based system. Then,we extend the scope of the experiment and analyze the impact of cache contention and datalocality by investigating the mapping of a larger number of programs (on both the Nehalem-and Westmere-based system).
2.2.2 Memory system performance
Simple example: Mapping a 2-program workload
In this section we consider a simple example: mapping two programs, mcf and lbm, onto the2-processor Nehalem-based system. Both programs belong to the “cache gobbler and victim“category [90]. Moreover, both programs are single-threaded, so there is a one-to-one mappingbetween a program and the operating system process executing it. In the discussion that followswe use the term program and process interchangeably.
In a NUMA system a process’s data can be allocated in the memory of any processor in thesystem. We say that a process p is homed at Processor i of the system if the process’s data wasallocated only at Processor i. If a process runs on its home processor, it is executed locally.Similarly, if a process runs on a processor different from its home processor, it is executedremotely. For our experiments we assume that both processes (executing mcf resp. lbm) arehomed on Processor 0 of the machine. Because both programs are single-threaded, there arefour ways the processes executing the two programs can be mapped onto the system given thismemory allocation setup. Figure 2.17 shows all possible mappings:
(a) Both processes executed locally. As both processes execute on their respective home node(Processor 0), they both have fast access to main memory. As Processor 0 has only oneLLC, the processes contend for the LLC capacity of Processor 0.
(b) mcf executed locally, lbm executed remotely. As lbm is executed remotely (on Proces-sor 1), it accesses main memory through the cross-chip interconnect, therefore it experi-ences lower throughput and increased latency of memory accesses relative to local execu-tion. Additionally, as the two processes execute on two different processors, they do notshare an LLC, therefore there is no cache contention in the system.

2.2. CACHE CONTENTION AND INTERCONNECT OVERHEAD 23
Processor 0 Processor 1
mcf
Datamcf
lbm
Datalbm
(a) Both processes local.
Processor 0 Processor 1
mcf
Datamcf
lbm
Datalbm
(b) mcf local, lbm remote.
Processor 0 Processor 1
lbm mcf
Datamcf
Datalbm
(c) mcf remote, lbm local.
Processor 0 Processor 1
P1
Datamcf
P2mcf lbm
Datalbm
(d) Both processes remote.
Figure 2.17: Possible mappings of a 2-process workload (mcf and lbm).
(c) mcf executed remotely, lbm executed locally. This case is similar to case (b), but in thiscase mcf uses the cross-chip interconnect to access main memory instead of lbm.
(d) Both processes executed remotely. Both processes share the LLC, and both processes ex-ecute remotely. This setup is clearly the worst possible scenario for performance, thereforewe exclude this case from further investigation.
To measure how each mapping effects memory system performance, we execute the twoprograms simultaneously. More specifically, we start both programs at the same time. Then,if a program finishes execution earlier than the other program does, it is restarted (multipletimes, if needed) and is executed until the other program has completed execution as well.We report performance as the wall clock running time of the first execution of each program.The performance degradation of a program is calculated as the percent slowdown in wall clockrunning time relative to the running time in single-process mode (i.e., when the program isexecuted alone and locally on the system, also referred to as solo mode). We use the cachemiss rate per thousand instructions executed (MPKI) to characterize a program’s usage of theshared LLC. If a program contends with other programs for LLC capacity, the program’s MPKIincreases (relative to the MPKI measured on the program’s solo mode execution). A program’sMPKI can be measured using the hardware performance counter events listed in Section 2.1.1.(Due to the limitations mentioned in Section 2.1.1, we can measure only read cache misses.)
Figure 2.18 shows the increase of the MPKI of mcf and lbm relative to each program’sexecution in single-process mode. In case (a) (both processes locally executed), the MPKIincreases by 47% resp. 62% due to cache contention. In cases (b) and (c) (when the processesare mapped onto different processors, therefore different LLCs), the MPKI increases by at most4% relative to solo mode. It is unclear what the reason for this increase is, but as the amount ofincrease is small, we did not consider investigating this issue further.
Good data locality is crucial for obtaining good performance in NUMA systems. Fig-ure 2.19 shows the distribution of bandwidth over the interfaces of the system. In case (a),when both processes are executed locally, the system has good data locality: 100% of the mem-ory bandwidth in the system is provided by the local memory interface of Processor 0. In

24 CHAPTER 2. RESOURCE SHARING AND INTERCONNECT OVERHEAD
0%
10%
20%
30%
40%
50%
60%
70%
(a) (b) (c)
Cache miss rate (M
PKI)
increase re
la4v
e to so
lo
Mapping
mcf
lbm
Figure 2.18: Increase of cache miss rate in different mapping scenarios.
0 1 2 3 4 5 6 7
(a) (b) (c)
Total system ban
dwidth [G
B/s]
Mapping
Remote
Local
Figure 2.19: Bandwidth distribution in different mapping scenarios.
0%
5%
10%
15%
20%
25%
30%
(a) (b) (c)
Slow
down rela+v
e to so
lo
Mapping
mcf
lbm
average
Figure 2.20: Performance degradation in different mapping scenarios.
cases (b) and (c), when one of the two processes executes on Processor 1, data is transferredalso on the cross-chip interconnect of the system: 56% (resp. 33%) of the generated bandwidthis due to one of the two processes executing remotely. Figure 2.19 also shows the total band-width measured on the interfaces in the system. If the processes execute locally and thus sharethe cache (case (a)), the total bandwidth is approximately 50% higher than in cases (b) and (c)(when caches are not shared).
We investigate now: Which mapping leads to best performance: when cache contention

2.2. CACHE CONTENTION AND INTERCONNECT OVERHEAD 25
0%
10%
20%
30%
40%
0% 20% 40% 60% 80% 100%
Cache miss rate (M
PKI)
increase re
la4v
e to so
lo
Local references
maximum data locality
minimum cache conten4on
maximum data locality
minimum cache conten4on
Figure 2.21: Increase of cache miss rate vs. data locality of soplex (Nehalem).
0%
20%
40%
60%
80%
100%
120%
140%
0% 20% 40% 60% 80% 100%
Slow
down rela+v
e to so
lo
Local references
Local
Remote
Average minimum cache conten+on
maximum data locality
op+mum performance
Figure 2.22: Performance vs. data locality of soplex (Nehalem).
is minimized (cases (b) and (c)), or when data locality is maximized (case (a)). Figure 2.20shows the individual and average performance degradation of mcf and lbm in all three mappingscenarios. The average performance of the workload consisting of mcf and lbm is better incases (b) and (c) than in case (a). Case (b) shows only a minor improvement over case (a)because remote execution slows down lbm by almost 30%. However, in case (c) the degradationis reduced relative to case (a); mcf sees a small improvement, lbm’s slowdown is reduced from11% to 1%, so the average degradation is reduced from 17% to 11%.
Extended experiments
In general, the tradeoff between local cache contention and interconnect overhead can be ob-served with memory-bound programs. We focus in the presentation on the soplex benchmark.This program keeps large amounts of data in the caches, and its performance is hurt if the avail-able cache capacity is reduced because other memory-bound programs use the same cache atthe same time. There are several other memory-bound programs in the SPEC suite that showthis behavior (see [90] for details), and the principles we discuss here are valid for these pro-grams as well. We construct a multiprogrammed workload that consists of four identical copies(clones) of soplex. We allocate the memory of all clones on Processor 0 of the 2-processor

26 CHAPTER 2. RESOURCE SHARING AND INTERCONNECT OVERHEAD
8-core Nehalem-based NUMA-multicore system. We execute the multiprogrammed workloadin various mapping configurations with a different number of clones executed locally respec-tively remotely. The mapping configurations range from all four clones executed locally (onProcessor 0) to the configuration where all four clones execute remotely (on Processor 1). If aclone finishes earlier than the other clones in the workload, we restart it. We run the experimentuntil all clones execute at least once. We report data about the first execution of each clone.
Figure 2.21 shows the average of the number of misses per thousand instructions (MPKI)of all soplex clones relative to the solo mode MPKI of soplex (when the clone is executedalone in the system). Remember that the MPKI of a program increases if in its execution theprogram contends for LLC capacity with other programs using the same LLC. When the datalocality is maximal in the system (100% of the references are local because all clones executelocally on Processor 0), the average increase of MPKI peaks at 35% because all clones executeon the same processor and thus use the same LLC. When the data locality in the system is 57%(two clones execute on Processor 0 and two clones execute on Processor 1), cache contention isminimal as the MPKI increase is also minimal (19%).
In the mapping configuration with 57% data locality two locally executing clones obtaina higher fraction of the total memory bandwidth (57%) than two remotely executing clones(43%). Memory bandwidth is not equally partitioned between local and remote clones becauseremote clones encounter a higher memory access latency than local clones. As a result remoteclones can issue memory request at a lower rate than local clones.
Figure 2.22 shows the slowdown of the locally respectively remotely executing soplexclones. The slowdown is calculated relative to the solo mode execution of soplex. We alsoplot the average degradation of the clones. Clearly, neither the mapping with minimum cachecontention, nor the mapping with maximum data locality performs best. The average slowdown(and also the individual slowdown) of the clones is smallest if there is 80% data locality in thesystem (i.e., in the mapping configuration with three locally and one remotely executing clone).
We perform a similar experiment on a 2-processor 12-core machine (the Westmere-basedmachine described in Section 2.1.7). In this experiment we use a workload composed of 6soplex clones. Similar to the Nehalem-based experiments, we vary the number of clonesexecuted locally and remotely. The memory of all clones is allocated at Processor 0. As thereare 6 cores on each processor, the mapping configurations range from all 6 clones executedlocally to all clones executed remotely.
Figure 2.23 shows the average MPKI of all clones relative to the solo mode MPKI ofsoplex. Similar to the Nehalem case, cache contention is the lowest when there is 56%data locality in the system, moreover, when data locality is best (100% local accesses), cachecontention is highest.
Figure 2.24 shows the average slowdown of clones, as well as the individual slowdownof local and remote clones. The average slowdown is similar in the configuration with 56%data locality (and minimum cache contention) and in the configuration with 69% data locality.However, the slowdown of local and remote clones is around the same in the 69% case, whilein the 56% case remote clones experience more slowdown than local clones. Thus, the optimalmapping (with 69% data locality) is between the mapping with the lowest cache contention andthe mapping with the best data locality.

2.2. CACHE CONTENTION AND INTERCONNECT OVERHEAD 27
0% 10% 20% 30% 40% 50% 60% 70%
0% 20% 40% 60% 80% 100%
Cache miss rate (M
PKI)
increase re
la4v
e to so
lo
Local references
maximum data locality
minimum cache conten4on
maximum data locality
Figure 2.23: Increase of cache miss rate vs. data locality of soplex (Westmere).
0%
50%
100%
150%
200%
250%
300%
0% 20% 40% 60% 80% 100%
Slow
down rela+v
e to so
lo
Local references
Local
Remote
Average
minimum cache conten+on
maximum data locality
op+mum performance
Figure 2.24: Performance vs. data locality of soplex (Westmere).
2.2.3 Summary
In NUMA multicore-multiprocessor systems, good data locality is often beneficial for perfor-mance because local memory accesses have better memory access latency and bandwidth thanremote memory accesses [44, 73]. The experimental analysis in this section (Section 2.2) hasshown, however, that in scenarios when the load on LLCs is high, avoiding cache contention canimprove performance, even at the cost of compromising data locality. In other words, tradinglocal memory accesses for a combination of cache- and remote memory accesses can improveperformance; software must be aware of this tradeoff to be able to efficiently use the memorysystem.
The results presented in this section (Section 2.2) strongly depend on memory system pa-rameters (e.g., LLC size and memory access latencies) that are specific to our Nehalem- andWestmere-based machines. On other machines (with possibly different parameters) the resultsmay differ. For example, on a system with larger LLCs, cache contention might not causesignificant performance degradations; moreover, on systems with more processors and moreelaborate interconnects the penalty of remote memory accesses might be prohibitively highto allow favoring remote execution over local execution. Nevertheless, the analysis presentedin this section provides insight on (and also compares the cost of) two performance-degrading

28 CHAPTER 2. RESOURCE SHARING AND INTERCONNECT OVERHEAD
factors that effect programs on current NUMA multicore-multiprocessors, cache contention andinterconnect overhead. Moreover, the experiments can be easily repeated and be used to charac-terize any NUMA multicore-multiprocessor, including newer generations of NUMA-multicoresystems.
2.3 Conclusions
A typical NUMA multicore-multiprocessor memory system has several bottlenecks. This chap-ter analyzes two types of bottlenecks: (1) the sharing of memory system resources (e.g., mem-ory controllers and caches), and (2) interconnect overhead. Both types of bottlenecks havesignificant effect on application performance.
The performance of multiprogrammed workloads ultimately depends on the mapping of theworkload onto the hardware (i.e., the distribution of the workload’s data and the schedule of theworkload’s computations). It depends on the mapping which bottlenecks of the memory systeminfluence the performance of an application, if at all. More importantly, however, in somecases bottlenecks can impose limitations at the same time. Thus, a mapping must consider allbottlenecks of a memory system to obtain good performance.

3Cache-conscious schedulingwith data locality constraints
The memory system performance of a multiprogrammed workload critically depends on theway the workload is mapped onto the hardware. On NUMA multicore-multiprocessors a map-ping has two components: (1) the distribution of data (i.e., the way the application’s data isdistributed across the processors of the system), and (2) the schedule of computations (i.e., theway the computations of an application are scheduled onto the cores/processors of the system).
In this chapter we focus on the second component of a mapping, that is, on scheduling com-putations to cores/processors. (We assume that the distribution of data in the system is given,that is, data cannot be migrated.) As we consider multiprogrammed workloads, determiningthe schedule of computations is equivalent to deciding on how a set of independent operatingsystem processes are mapped onto the cores/processors of a system.
This chapter presents the design (Section 3.1), implementation (Section 3.2), and evaluation(Section 3.3) of N-MASS, a process scheduler tailored for NUMA-multicore systems. Ideally,a process scheduler balances between all bottlenecks of a NUMA-multicore memory system.N-MASS takes two bottlenecks into account, contention for shared last-level caches (LLCs)and interconnect overhead, and targets finding a balance these two bottlenecks.
To find a mapping that uses the memory system appropriately, a process scheduler requiresinformation about the interaction between the hardware and the scheduled processes (e.g., infor-mation about a process’s utilization of shared caches, about the performance penalty the processexperiences due to remote memory accesses, as well as about the locality of the process’s mainmemory accesses). As some of these information is not yet available in current systems, wesimulate their availability by using static traces of program memory behavior. In Section 3.4we elaborate on possibilities for future extension that could make our approach more practical.
3.1 Design
3.1.1 Modeling memory system behavior
As shown in Chapter 2, process scheduling on NUMA-multicores must target a tradeoff betweenimproving data locality and reducing cache contention (the optimum performance point onFigures 2.22 and 2.24). To simplify the discussion, we focus on a setup with two processors.We also assume that all the cores of a processor share an LLC. There are systems that do notsupport this assumption (see multi-socket implementations like the AMD Magny-Cours). In
29

30 CHAPTER 3. CACHE-CONSCIOUS SCHEDULING WITH DATA LOCALITY CONSTRAINTS
Load_0
Load_1
D
Load_1
Load_0
D/2
D/2
Cache 0
Pressure_0
Pressure_1
Cache 1
(a) Initial configuration.
Load_0 Load_1
D
Load_1Load_0
D/2
D/2
Cache 0
Pressure_0’
Cache 1
Pressure_1’
(b) SMP.
Load_0
Load_1
D
Load_1Load_0
D/2
D/2
Cache 0 Cache 1
NUMA penalty
Pressure_0’’Pressure_1’’
(c) NUMA.
Figure 3.1: Cache balancing in SMP and NUMA context.
this case you should consider all the cores that share a cache to form a “processor”.
To reduce cache contention in a system, a process scheduler must characterize the way pro-cesses utilize the shared caches of the system; that is, a process scheduler must characterizeboth the contentiousness and sensitivity of each scheduled process [99, 113]. A process’s con-tentiousness is a measure of how much performance degradation the process causes to otherprocesses with which it shares a cache. A process’s sensitivity is a measure of the performancedegradation a process suffers due to sharing the cache with other processes.
There are several approaches that enable a process scheduler to determine (or to esti-mate) the contentiousness and the sensitivity of a process [113]. In practice, however, manycontention-aware process scheduler implementations use a single measure, the cache pressure,to estimate both the contentiousness and sensitivity of a process [13, 83, 113]. A process’scache pressure is, by definition, the ratio of the number of cache misses encountered by the pro-cess and the number of instructions executed by the process. In current systems with a sharedLLC a process’s cache pressure is often defined as the number of LLC misses encountered bythe process divided by the number of instructions executed by the process. The pressure on ashared cache is, by definition, as the sum of the cache pressure of each process using that cache.
In recent systems, both a process’s LLC misses and the number of instructions executed by aprocess can often be measured using the processor’s performance monitoring unit (PMU) [52].The low cost of hardware performance counter measurements allow a process scheduler tocharacterize a process’s shared cache utilization at runtime with low overhead. Other syntheticmetrics like stack-distance profiles [20, 90] or miss-rate curves [97] can estimate shared cache
3.1. DESIGN 31
utilization with better precision, but generating these metrics might result in higher runtimeoverhead than PMU-based measurements. Therefore, we use the cache pressure metric in ourwork to characterize the way processes utilize shared caches.
Our approach builds upon the idea of scheduling algorithms for non-NUMA multicore-multiprocessors (i.e., symmetric multiprocessors (SMPs) built with multicore chips) with sharedcaches [52, 113]. The basic principle of these algorithms is illustrated in Figure 3.1 (for a systemwith two LLCs). If the difference D between the pressure on the two caches of the system islarge (Figure 3.1(a)), some processes (preferably processes with a cumulative cache pressureof D/2) are scheduled onto the cache with the smaller pressure. As a result, the differencebetween the pressure on the two caches is reduced (Figure 3.1(b)).
Our approach is similar to cache-balancing algorithms in SMPs and relies on two principles.First, we also distribute pressure across caches, however not evenly as in an SMP system: Theamount of cache pressure transferred to Cache 1 is less than D/2 (half of the difference) – asillustrated in Figure 3.1(c). If mapping processes onto a different LLC results in the remoteexecution of the re-mapped process, then we account also for the performance penalty of re-mote execution (i.e., the NUMA penalty previously defined in Section 2.1). The performancedegradation experienced by processes is equal if this penalty is also considered. The secondprinciple of our approach states that overloading the cross-chip interconnect with too many re-motely executing processes must be avoided. Therefore, if the pressure on the remote cache isabove a threshold, we do not re-map processes for remote execution.
Section 3.1.2 discusses a practical way to characterize a program’s memory behavior (i.e.,estimating the cache pressure and the NUMA penalty). Then, Section 3.1.3 presents the N-MASS algorithm that implements the previously discussed two principles.
3.1.2 Characterizing the memory behavior of processes
A scheduling algorithm targeting memory system optimizations must be able to quickly esti-mate the memory behavior of scheduled processes. Three parameters are necessary to character-ize the memory behavior of a process on a NUMA multicore-multiprocessor: (1) the cache pres-sure of the process, (2) the remote execution penalty the process experiences (i.e., the NUMApenalty), and (3) the distribution of the process’s data.
Cache pressure On many modern processors the cache pressure of process can be measuredusing the processor’s PMU. In the Intel Nehalem-based system that we use, however, it is pos-sible to measure only the LLC read misses of a process (see Section 2.1.1 for more details).Therefore, we estimate a program’s cache pressure by the read misses per thousand instructionsexecuted by the process (MPKI).
NUMA penalty As defined in Section 2.1, the NUMA penalty quantifies the slowdown of aremote execution of a process relative to the process’s local execution. Let CPIlocal denote theCPI (cycles per instruction) of a process executing locally, and let CPIremote denote the CPI ofthe same process executing remotely. Using this notation the NUMA penalty is:
NUMA penalty = CPIremote/CPIlocal (3.1)

32 CHAPTER 3. CACHE-CONSCIOUS SCHEDULING WITH DATA LOCALITY CONSTRAINTS
1
23
45
6
7
89101115
1617
18
192021
222324
25
262728
29
1.0
1.1
1.2
1.3
1.4
1.5
1.6
0 10 20 30 40
NU
MA
pe
nal
ty
MPKI
Figure 3.2: NUMA penalty vs. MPKI.
The NUMA penalty is a lower-is-better metric and its minimum value is 1 (if a process doesnot slow down in its remote execution). For example, if a process has a NUMA penalty equalto 1.3, the process slows down 30% on remote execution (i.e., the process’s remote executiontakes 30% more time than its local execution). We measure the NUMA penalty of a processby executing the process twice, once locally and once remotely. During the measurements allcores are inactive, except the core that executes the process. Figure 3.2 plots the NUMA penaltyof all programs of the SPEC CPU2006 benchmark suite against their MPKI (we use the SPECprograms for evaluating the N-MASS scheduler). All programs in the SPEC CPU2006 suite aresequential, therefore each program maps to a single OS process.
Table 3.1 shows the complete data. The numbers on Figure 3.2 correspond to the numbersin this table. For comparison, the table lists the MPKI and NUMA penalty of the sequentialversion of STREAM triad as well.
Figure 3.2 also plots a linear model fitted onto the data. (The triad benchmark is notshown in the figure, nor is it included in the linear model.) Although the two parameters arepositively correlated (the NUMA penalty increases with the MPKI), the coefficient of determi-nation (R2) is relatively low, 0.64. However, as today’s hardware does not provide informationon the NUMA penalty experienced by a process, this regression model can be a simple (andfast) way to estimate a process’s NUMA penalty based on its MPKI.
Data distribution To simplify the discussion, we assume that all the data of a process isallocated to one processor. This assumption includes scenarios when co-executing processeshave their memory allocated on specific, possibly different, processors; that is, we assume onlythat a single process’s memory is not scattered around in the system. We also assume thatthe home processor of a process (i.e, the target of the most of the process’s memory accesses)cannot be changed. That is, we assume a process’s data is not migrated, neither by the processscheduler, nor by the underlying OS. In case a process’s data is scattered around in the system,the home processor of the process must be determined at runtime. In most current systems thisinformation is not easy to obtain, we discuss this limitation in Section 3.5.

3.1. DESIGN 33
# Program MPKI NUMA Typepenalty (C: compute-bound,
M: memory-bound)1 mcf 39.67 1.20 M2 milc 26.82 1.46 M3 libquantum 23.49 1.45 M4 soplex 21.89 1.28 M5 lbm 16.34 1.30 M6 omnetpp 15.54 1.39 M7 gcc 7.01 1.21 M8 sphinx 1.04 1.04 C9 gobmk 0.74 1.02 C
10 perlbench 0.32 1.01 C11 namd 0.05 1.00 C12 h264 0.03 1.00 C13 gamess 0.00 1.00 C14 povray 0.00 1.00 C15 bzip2 0.07 1.00 C16 bwaves 9.72 1.08 M17 zeusmp 4.57 1.15 C18 gromacs 0.07 1.00 C19 cactusADM 2.90 1.10 C20 leslie3d 5.87 1.06 C21 dealII 2.72 1.06 C22 calculix 0.21 1.01 C23 hmmer 0.03 1.00 C24 sjeng 0.38 1.04 C25 gemsFDTD 11.14 1.22 M26 tonto 0.32 1.00 C27 astar 2.05 1.06 C28 wrf 3.93 1.03 C29 xalanbmk 3.22 1.17 C30 STREAM triad 53.48 1.58 M
Table 3.1: MPKI and NUMA penalty of SPEC benchmarks and STREAM triad.
3.1.3 The N-MASS algorithm
The NUMA–Multicore-Aware Scheduling Scheme (N-MASS) implements the two principlesof cache-aware scheduling in NUMA systems described in Section 3.1.1. Algorithm 1 presentsan outline of N-MASS. The algorithm is described for a 2-processor NUMA system, but it canbe extended to handle a higher number of processors as well. The algorithm is invoked aftera scheduler epoch has elapsed, and it calculates the mapping Mfinal : Processes 7→ Cores ofprocesses onto cores. The number of scheduled processes n equals at most the number of coresin the system (this limitation is discussed later in this section). The algorithm uses the followingperformance data about each scheduled process i: the process’s cache pressure (mpkii) and

34 CHAPTER 3. CACHE-CONSCIOUS SCHEDULING WITH DATA LOCALITY CONSTRAINTS
Algorithm 1 N-MASS: maps n processes onto a 2-processor NUMA-multicore system.Input: List of processes P0 and P1 homed on Processor 0 respectively Processor 1.Output: A mapping Mfinal of processes to processor cores.
1: // Step 1: Sort list of processes by NUMA penalty2: Psorted0 ← sort descending by np(P0)3: Psorted1 ← sort descending by np(P1)4: // Step 2: Calculate maximum-local mapping5: Mmaxlocal ← map maxlocal(Psorted0 , Psorted1)6: // Step 3: Refine maximum-local mapping7: Mfinal ← refine mapping(Mmaxlocal)
Algorithm 2 map maxlocal: maps n processes onto a 2-processor system NUMA system; pro-cesses are mapped onto the processor that holds their data in descending order of their NUMApenalty.Input: List of processes Psorted0 and Psorted1 homed on Processor 0 respectively Processor 1.
The lists are sorted in descending order of the processes’ NUMA penalty (np).Output: A mapping Mmaxlocal of processes to processor cores.
1: Mmaxlocal ← ∅2: p0 ← pop front(Psorted0); p1 ← pop front(Psorted1)3: while p0 6= NULL or p1 6= NULL do4: if p1 = NULL or npp0 > npp1 then5: core← get next available core(Processor 0)6: push back(Mmaxlocal, (p0, core))7: p0 ← pop front(Psorted0)8: else if p0 = NULL or npp0 ≤ npp1 then9: core← get next available core(Processor 1)
10: push back(Mmaxlocal, (p1, core))11: p1 ← pop front(Psorted1)12: end if13: end while
an estimate of the process’s NUMA penalty (npi). The N-MASS algorithm has three steps.First, for each processor, it sorts the list of processes homed on the processor in descendingorder of the processes’ NUMA penalty (lines 2-3). Second, it maps the processes onto thesystem using the maximum-local policy (line 5). If the pressure on the memory system of thetwo-processor system is unbalanced, then, in the third step, the algorithm refines the mappingdecision produced by the maximum-local mapping (line 7). In the following paragraphs wedescribe Step 2 and Step 3 of N-MASS.
Step 2: Maximum-local mapping The maximum-local scheme (described in detail by Al-gorithm 2) improves data locality in the system by mapping processes onto their home nodes indescending order of their NUMA penalty. The algorithm has as its input two lists of processes,P0 and P1. The processes in list P0 (P1) are homed on Processor 0 (Processor 1). The lists aresorted in descending order of the NUMA penalty of the processes they contain. The algorithmmerges the two lists. During the merge, the algorithm determines which core each process ismapped onto. The algorithm guarantees that processes with a high NUMA penalty are mapped

3.1. DESIGN 35
Algorithm 3 refine mapping: refines the maximum-local mapping of n processes to reducecache contention.Input: Maximum-local mapping of processesMmaxlocal. For each process i the NUMA penalty
respectively the MPKI of the last scheduler epoch is available in npi respectively mpkii.Output: A mapping Mfinal of processes to processor cores.
1: M0 = {(p, core) ∈Mmaxlocal | core ∈ Processor 0}2: M1 = {(p, core) ∈Mmaxlocal | core ∈ Processor 1}3: pressure0 =
∑{mpkip | (p, core) ∈M0}
4: pressure1 =∑{mpkip | (p, core) ∈M1}
5: repeat6: ∆← |pressure1 − pressure0|7: (p0, core0)← back(M0); (p1, core1)← back(M1)8: ∆MOVE0→1 ← mpkip0 · npp0
9: ∆MOVE1→0 ← mpkip1 · npp1
10: if ∆MOVE0→1 < ∆MOVE1→0 then11: pressure0 ← pressure0 −mpkip0
12: pressure1 ← pressure1 +mpkip0 · npp0
13: core← get next available core(Processor 1)14: // Could be on Processor 0 if 6 ∃ free core on Processor 115: if core 6∈ Processor 0
and pressure1 < THRESHOLD then16: pop back(M0, (p0, core0))17: push front(M1, (p0, core))18: decision← MOVE0→1
19: else20: decision← CURRENT21: end if22: end if23: if ∆MOVE0→1 ≥ ∆MOVE1→0
or decision = CURRENT then24: // Similar to the MOVE0→1 case25: end if26: until decision 6= CURRENT27: Mfinal ←M0 ∪M1
onto a core of their home node with higher priority than processes with a lower NUMA penaltythat are homed on the same processor. The lists P0 and P1, and the mapping Mmaxlocal ofprocesses, are double-ended queues. The function pop front(l) removes the element from thefront of the list l; the function push back(l, e) inserts element e at the back of the list l. Thefunction get next available core(p) returns the next free core, preferably from processor p. Ifthere are no free cores on processor p, the function returns a free core from a different processor.
Step 3: Cache-aware refinement If the maximum-local mapping results in increased con-tention on the caches of the system, Step 3 of the N-MASS algorithm refines the mappingproduced by the maximum-local scheme in Step 2. This step implements the two principlesof scheduling in NUMA-multicores previously discussed in Section 3.1.1, and is described in

36 CHAPTER 3. CACHE-CONSCIOUS SCHEDULING WITH DATA LOCALITY CONSTRAINTS
detail in Algorithm 3. First, the algorithm accounts for the performance penalty of remote ex-ecution by multiplying the MPKI of remotely mapped processes with their respective NUMApenalty (lines 8, 9, 12). Second, the algorithm avoids overloading the cross-chip interconnectby moving processes only if the pressure on the remote cache is less than a predefined threshold(line 14). We discuss in Section 3.2 how the threshold is determined. By construction (line 6and 10 of Algorithm 2) Mmaxlocal contains pairs (process, core) ordered in descending order ofthe processes’ NUMA penalty. The function back(l) returns the last element of list l withoutremoving it from the list; push front(l, e) inserts element e to the front of list l.
Limitations The N-MASS algorithm requires the number of processes n to be at most thetotal number of cores on the system, therefore it can only decide on the spatial multiplexing ofprocesses (and not on their temporal multiplexing). Nevertheless, if the OS scheduler decideson the temporal multiplexing (the set of processes that will be executed in the next schedulerepoch), N-MASS can refine this mapping so that the memory allocation setup in the system isaccounted for, and the memory system is efficiently used.
3.2 Implementation
To demonstrate that N-MASS is capable of finding the tradeoff between reducing cache con-tention and increasing data locality, we implemented a prototype version of N-MASS. N-MASStakes a set of programs and then executes these programs. The current implementation of N-MASS supports only sequential programs. As all programs are sequential, each program mapsto a single OS process. N-MASS periodically gathers information about the memory behav-ior of each process and then, based on the processes’ memory behavior, it decides on the wayprocesses are mapped onto the hardware.
As mentioned in Section 3.1.2, a process’s memory behavior is estimated based on threeparameters: the process’s MPKI, its NUMA penalty, and its home node. We simulate theavailability of “perfect” information about a program’s memory behavior: We obtain the MPKIand NUMA penalty of a process (more precisely: the MPKI and NUMA penalty of the programexecuted by the process) from a trace generated on a separate profiling run (with the programrun in solo mode). We use programs of the SPEC CPU2006 benchmark suite; a program tracecontain samples of the program’s memory behavior. Each sample contains information aboutthe MPKI and NUMA penalty of 2.26 million of instructions of the program’s lifetime. InSection 3.4 we also evaluate N-MASS with an on-line measurement of the MPKI and andon-line estimation of the NUMA penalty based on the MPKI. We assume, furthermore, that aprocess’s data is allocated at a single processor (each process’s home node is given as parameterto N-MASS that takes care of data placement).
N-MASS is designed to adapt to program phase changes. Each sample read by N-MASSincludes the MPKI of a process. The scheduler is invoked if a process’s MPKI changes bymore than 20% relative to the previous scheduler epoch. The costs of re-schedules (moving aprocess to a different core) can be high. We select an epoch length of 1 second. This epochlength almost completely eliminates the costs of re-schedules, while the scheduler is still ableto quickly react to program phase changes. We select 60 MPKI for the threshold used by therefinement step of the N-MASS algorithm (line 14 of Algorithm 3). We base our selectionon the experimental analysis of the Intel Nehalem memory system (Chapter 2). triad is the

3.3. EVALUATION 37
most memory-bound program we have encountered (it has the highest MPKI). The MPKI ofa triad instance is around 53 (see Table 3.1). We want to allow the remote execution of anumber of processes (processes that have a cumulative cache pressure that is approximatelythe same as that of a single triad instance), but we want to disallow the remote execution ofprocesses with a cumulative cache pressure larger than 60 MPKI in order not to saturate theQPI interconnect of our Nehalem-based system (as shown in Chapter 2, two triad instancessaturate the cross-chip interconnect).
The performance measurements of N-MASS include the overhead of performance moni-toring, as we sample the number of instructions executed by each process to keep track of theprocess’s execution in the trace file. We also record the number of elapsed processor cyclesto measure performance. N-MASS uses the perfmon2 [30] performance monitoring library togather hardware performance counter information.
3.3 Evaluation
3.3.1 Experimental setup
We use the 2-processor 8-core system based on the Intel Nehalem microarchitecture for evalu-ation. Detailed information about the machine’s hardware- and software configuration can befound in Section 2.1.1.
We are interested in multiprocessor performance, therefore we construct multiprogrammedworkloads with the programs of the SPEC CPU2006 benchmark suite. Our evaluation method-ology is very similar to the methodology used in [8, 14, 33, 34, 52, 113]. We use a subset of theSPEC CPU2006 benchmark suite (14 programs out of the total 29 in the suite). Our selectionincludes programs 1–14 in Table 3.1. The MPKI of a program (the second column in Table 3.1)estimates the cache pressure of the program. The selection we use includes both compute-boundprograms (programs with an MPKI less than 7.0) and memory-bound programs (programs withan MPKI greater or equal to 7.0). (Compute-bound programs are marked with ’C’ in the lastcolumn of the table, memory-bound programs are marked with ’M’ in the table.) The programsin the subset have a broad range of NUMA penalties (between 1.0 and 1.46).
The subset the SPEC CPU2006 suite we use allows us to construct a number of differentmultiprogrammed workloads (different in both terms of memory boundedness, i.e., total cachepressure, and in terms of the memory behavior of constituent programs). Therefore, the subsetis large enough for a meaningful performance evaluation, yet sufficiently small to allow for aconcise presentation of experimental data.
Similarly to [52], we run each multiprogrammed workload exactly one hour. If a programterminates before the other programs in a workload do, we restart the program that terminatedearly. We use the reference data set and follow the guidelines described in [75] to minimizemeasurement variance. This setup usually gives us three measurable runs for each workloadwithin the one hour limit. For each run we report the average slowdown of each constituentprogram relative to its solo mode performance. We also report the average slowdown of thewhole workload, as suggested by Eyerman et al. [31].

38 CHAPTER 3. CACHE-CONSCIOUS SCHEDULING WITH DATA LOCALITY CONSTRAINTS
0
20
40
60
80
100
120
50% 75% 100%
Tota
l MP
KI
Programs homed on Processor 0 [%]
Balanced memoryallocation
Unbalanced memoryallocation
Memory-boundworkloads
CPU-boundworkloads
Figure 3.3: Dimensions of the evaluation.
3.3.2 Dimensions of the evaluation
There are two dimensions that must be considered to evaluate the interaction between memoryallocation and process scheduling in a NUMA-multicore system. The two dimensions (shownin Figure 3.3) are (1) the memory boundedness of workloads (i.e., the total cache pressure ofworkloads shown on the y-axis) and (2) the balance of memory allocation in the system (shownon the x-axis).
Memory boundedness To show that N-MASS can handle workloads with different memory-boundedness, we use 11 different multiprogrammed workloads (WL1 to WL11). This setup cor-responds to evaluating N-MASS along the first dimension (the y-axis in Figure 3.3). The work-loads are composed of different number of compute-bound (C) respectively memory-bound (M)programs. The memory-boundedness of a workload is characterized by the sum of the MPKIsof its constituent programs (measured in solo mode for each program). The total MPKI of eachmultiprogrammed workload we use is shown in Figure 3.4. The composition of the multipro-grammed workloads is shown in Table 3.2. The workloads in the set of 4-process workloads(WL1 to WL9) contain one to four memory-bound programs. The 8-process workloads (WL10and WL11) contain three, respectively four, memory-bound programs. In the case of all 11workloads we add CPU-bound programs so that at the end there are four (respectively eight)programs in total in each workload.
Balance of memory allocation setup As the performance of process scheduling closely de-pends on the memory allocation setup in the system, for each workload we consider severalways memory is allocated in the 2-processor evaluation machine. The second dimension of ourevaluation (the x-axis in Figure 3.3) is the percentage of the processes of a multiprogrammedworkload homed on Processor 0 of the system. (Ideally, we would like to vary the percentageof memory references to local respectively remote memory, but as we can map only completeprocesses, we vary along this dimension by mapping processes.) The left extreme point ofthe x-axis represents the configuration with balanced memory allocation (50% of the processeshomed on Processor 0). On the other end of the x-axis we find the most unbalanced configura-

3.3. EVALUATION 39
0
20
40
60
80
100
120
WL6
WL1
WL7
WL5
WL4
WL2
WL3
WL8
WL10
WL9
WL11
Total M
PKI
Figure 3.4: Total MPKI of multiprogrammed workloads.
# Programs Type1 soplex sphinx gamess namd 1M, 3C2 soplex mcf gamess gobmk 2M, 2C3 mcf libquantum povray gamess 2M, 2C4 mcf omnetpp h264 namd 2M, 2C5 milc libquantum povray perlbench 2M, 2C6 sphinx gcc namd gamess 1M, 3C7 lbm milc sphinx gobmk 2M, 2C8 lbm milc mcf namd 3M, 1C9 mcf milc soplex lbm 4M
10 lbm milc mcf namd 3M, 5Cgobmk perlbench h264 povray
11 mcf milc soplex lbm 4M, 4Cgobmk perlbench namd povray
Table 3.2: Multiprogrammed workloads.
tion (100% of the processes homed on Processor 0). Because of the symmetries of the systemthere is no need to extend the range to the case with 0% of the processes’ memory allocatedon Processor 0. This corresponds to 100% of the processes homed on Processor 1, which isequivalent to all processes homed on Processor 0.
In Section 3.3.3 we evaluate N-MASS along both dimensions: the evaluation considersworkloads with different memory boundedness as well as different memory allocation setups.Then, in Section 3.3.4, we evaluate N-MASS with an unbalanced memory allocation setup.
3.3.3 Influence of data locality and cache contention
The second dimension of our evaluation is defined as the percentage of the processes homed onProcessor 0 of the system. This percentage, however, does not specify which constituent pro-cesses of a multiprogrammed workload are homed on each processor in the system. We definethe concept of allocation maps. An allocation map is a sequence M = (m0,m1, . . . , mn),
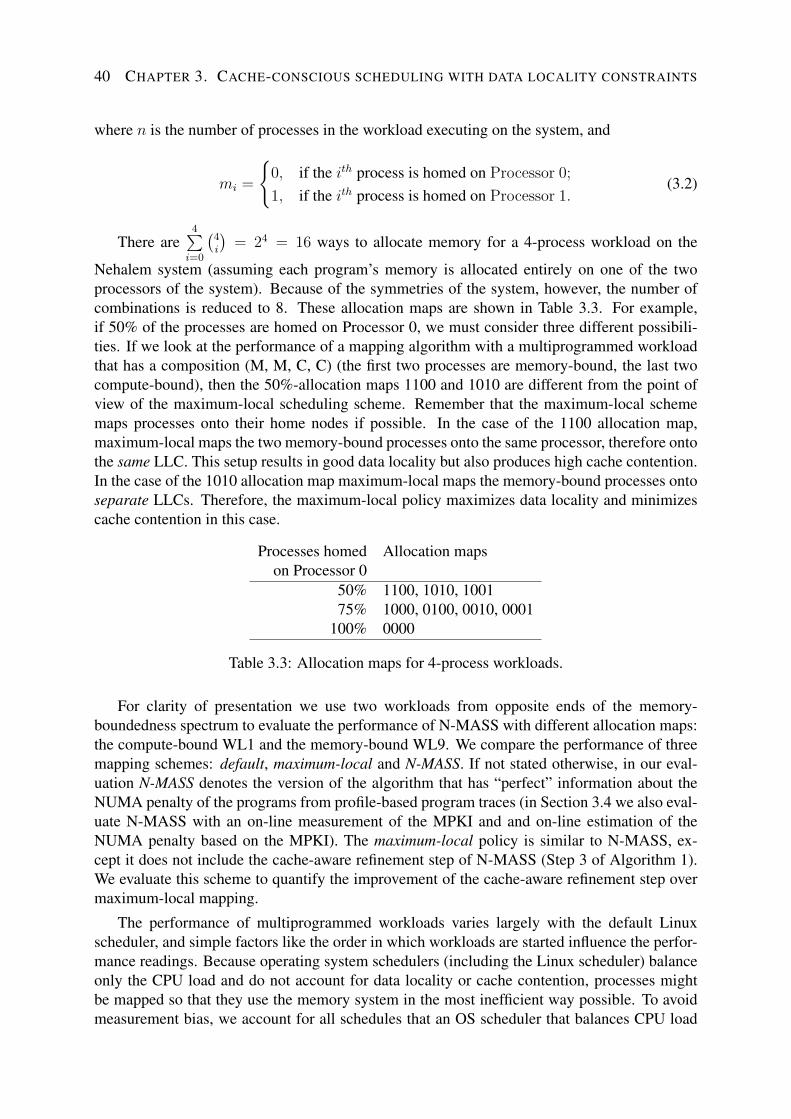
40 CHAPTER 3. CACHE-CONSCIOUS SCHEDULING WITH DATA LOCALITY CONSTRAINTS
where n is the number of processes in the workload executing on the system, and
mi =
{0, if the ith process is homed on Processor 0;
1, if the ith process is homed on Processor 1.(3.2)
There are4∑
i=0
(4i
)= 24 = 16 ways to allocate memory for a 4-process workload on the
Nehalem system (assuming each program’s memory is allocated entirely on one of the twoprocessors of the system). Because of the symmetries of the system, however, the number ofcombinations is reduced to 8. These allocation maps are shown in Table 3.3. For example,if 50% of the processes are homed on Processor 0, we must consider three different possibili-ties. If we look at the performance of a mapping algorithm with a multiprogrammed workloadthat has a composition (M, M, C, C) (the first two processes are memory-bound, the last twocompute-bound), then the 50%-allocation maps 1100 and 1010 are different from the point ofview of the maximum-local scheduling scheme. Remember that the maximum-local schememaps processes onto their home nodes if possible. In the case of the 1100 allocation map,maximum-local maps the two memory-bound processes onto the same processor, therefore ontothe same LLC. This setup results in good data locality but also produces high cache contention.In the case of the 1010 allocation map maximum-local maps the memory-bound processes ontoseparate LLCs. Therefore, the maximum-local policy maximizes data locality and minimizescache contention in this case.
Processes homed Allocation mapson Processor 0
50% 1100, 1010, 100175% 1000, 0100, 0010, 0001
100% 0000
Table 3.3: Allocation maps for 4-process workloads.
For clarity of presentation we use two workloads from opposite ends of the memory-boundedness spectrum to evaluate the performance of N-MASS with different allocation maps:the compute-bound WL1 and the memory-bound WL9. We compare the performance of threemapping schemes: default, maximum-local and N-MASS. If not stated otherwise, in our eval-uation N-MASS denotes the version of the algorithm that has “perfect” information about theNUMA penalty of the programs from profile-based program traces (in Section 3.4 we also eval-uate N-MASS with an on-line measurement of the MPKI and and on-line estimation of theNUMA penalty based on the MPKI). The maximum-local policy is similar to N-MASS, ex-cept it does not include the cache-aware refinement step of N-MASS (Step 3 of Algorithm 1).We evaluate this scheme to quantify the improvement of the cache-aware refinement step overmaximum-local mapping.
The performance of multiprogrammed workloads varies largely with the default Linuxscheduler, and simple factors like the order in which workloads are started influence the perfor-mance readings. Because operating system schedulers (including the Linux scheduler) balanceonly the CPU load and do not account for data locality or cache contention, processes mightbe mapped so that they use the memory system in the most inefficient way possible. To avoidmeasurement bias, we account for all schedules that an OS scheduler that balances CPU load

3.3. EVALUATION 41
0%
10%
20%
30%
40%
50%
Pe
rfo
rman
ce d
egr
adat
ion
Allocation map
mcf
milc
soplex
lbm
average
(a) Performance degradation with default scheduling.
-10%
0%
10%
20%
30%
40%
Imp
rove
me
nt
ove
r d
efa
ult
Allocation map
mcf
milc
soplex
lbm
average
(b) N-MASS improvement over default scheduling.
-10%
0%
10%
20%
30%
40%
Imp
rove
me
nt
ove
r d
efa
ult
Allocation map
maximum-local
N-MASS
(c) N-MASS compared to maximum-local. (Error bars: max/min performanceimprovement recorded for any constituent program of a workload.)
Figure 3.5: Performance evaluation of the maximum-local and N-MASS schemes with WL9.
would consider. For example, in the case of 4-process workloads the default Linux scheduleralways maps two processes onto each processor so that each processor is allocated half the totalCPU load. For each 4-process workload there are
(42
)= 6 equally probable different schedules
with the CPU load evenly distributed in the system. Running a single workload in all theseschedules takes 6 hours execution time with our evaluation methodology, which is tolerable.Therefore, for each multiprogrammed workload we run the workload in each schedule possi-ble for the default scheduler, and then we report the average performance degradation of the

42 CHAPTER 3. CACHE-CONSCIOUS SCHEDULING WITH DATA LOCALITY CONSTRAINTS
0%
10%
20%
30%
40%
50%
Pe
rfo
rman
ce d
egr
adat
ion
Allocation map
soplex
sphinx
gamess
namd
average
(a) Performance degradation with default scheduling.
-10%
0%
10%
20%
30%
40%
Imp
rove
me
nt
ove
r d
efa
ult
Allocation map
soplex
sphinx
gamess
namd
average
(b) N-MASS improvement over default scheduling.
-10%
0%
10%
20%
30%
40%
Imp
rove
me
nt
ove
r d
efa
ult
Allocation map
maximum-localN-MASS
(c) N-MASS compared to maximum-local. (Error bars: max/min performanceimprovement recorded for any constituent program of a workload.)
Figure 3.6: Performance evaluation of the maximum-local and N-MASS schemes with WL1.
multiprogrammed workload in all schedules as the performance of default scheduling.
Figure 3.5(a) (respectively Figure 3.6(a)) shows the performance degradation of the pro-grams of WL9 (WL1) with the default scheduler. (The degradations are calculated relative tothe solo mode performance of the programs.) WL9 is composed of more memory-bound pro-grams than WL1, therefore the degradations experienced by WL9 programs are higher (up to50% vs. 18%). 3.5(b) (respectively 3.6(b)) shows the performance improvement of N-MASSrelative to default scheduling. Performance improvements of individual programs up to 32%
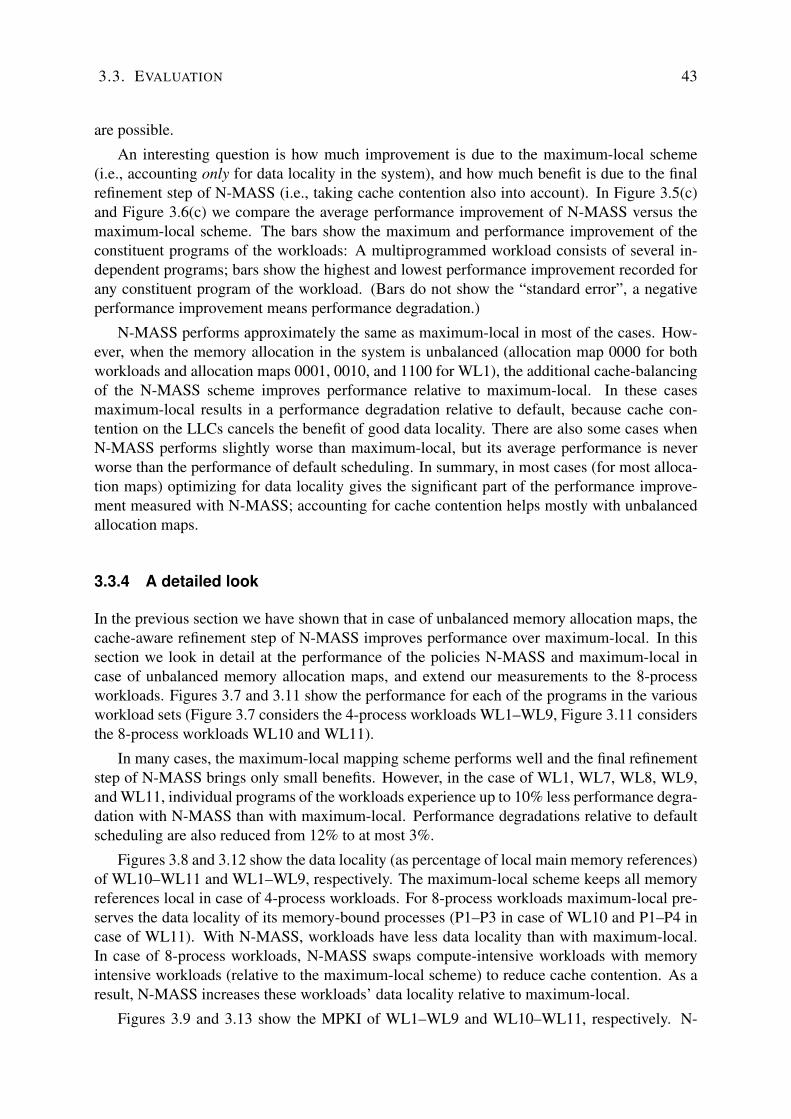
3.3. EVALUATION 43
are possible.
An interesting question is how much improvement is due to the maximum-local scheme(i.e., accounting only for data locality in the system), and how much benefit is due to the finalrefinement step of N-MASS (i.e., taking cache contention also into account). In Figure 3.5(c)and Figure 3.6(c) we compare the average performance improvement of N-MASS versus themaximum-local scheme. The bars show the maximum and performance improvement of theconstituent programs of the workloads: A multiprogrammed workload consists of several in-dependent programs; bars show the highest and lowest performance improvement recorded forany constituent program of the workload. (Bars do not show the “standard error”, a negativeperformance improvement means performance degradation.)
N-MASS performs approximately the same as maximum-local in most of the cases. How-ever, when the memory allocation in the system is unbalanced (allocation map 0000 for bothworkloads and allocation maps 0001, 0010, and 1100 for WL1), the additional cache-balancingof the N-MASS scheme improves performance relative to maximum-local. In these casesmaximum-local results in a performance degradation relative to default, because cache con-tention on the LLCs cancels the benefit of good data locality. There are also some cases whenN-MASS performs slightly worse than maximum-local, but its average performance is neverworse than the performance of default scheduling. In summary, in most cases (for most alloca-tion maps) optimizing for data locality gives the significant part of the performance improve-ment measured with N-MASS; accounting for cache contention helps mostly with unbalancedallocation maps.
3.3.4 A detailed look
In the previous section we have shown that in case of unbalanced memory allocation maps, thecache-aware refinement step of N-MASS improves performance over maximum-local. In thissection we look in detail at the performance of the policies N-MASS and maximum-local incase of unbalanced memory allocation maps, and extend our measurements to the 8-processworkloads. Figures 3.7 and 3.11 show the performance for each of the programs in the variousworkload sets (Figure 3.7 considers the 4-process workloads WL1–WL9, Figure 3.11 considersthe 8-process workloads WL10 and WL11).
In many cases, the maximum-local mapping scheme performs well and the final refinementstep of N-MASS brings only small benefits. However, in the case of WL1, WL7, WL8, WL9,and WL11, individual programs of the workloads experience up to 10% less performance degra-dation with N-MASS than with maximum-local. Performance degradations relative to defaultscheduling are also reduced from 12% to at most 3%.
Figures 3.8 and 3.12 show the data locality (as percentage of local main memory references)of WL10–WL11 and WL1–WL9, respectively. The maximum-local scheme keeps all memoryreferences local in case of 4-process workloads. For 8-process workloads maximum-local pre-serves the data locality of its memory-bound processes (P1–P3 in case of WL10 and P1–P4 incase of WL11). With N-MASS, workloads have less data locality than with maximum-local.In case of 8-process workloads, N-MASS swaps compute-intensive workloads with memoryintensive workloads (relative to the maximum-local scheme) to reduce cache contention. As aresult, N-MASS increases these workloads’ data locality relative to maximum-local.
Figures 3.9 and 3.13 show the MPKI of WL1–WL9 and WL10–WL11, respectively. N-
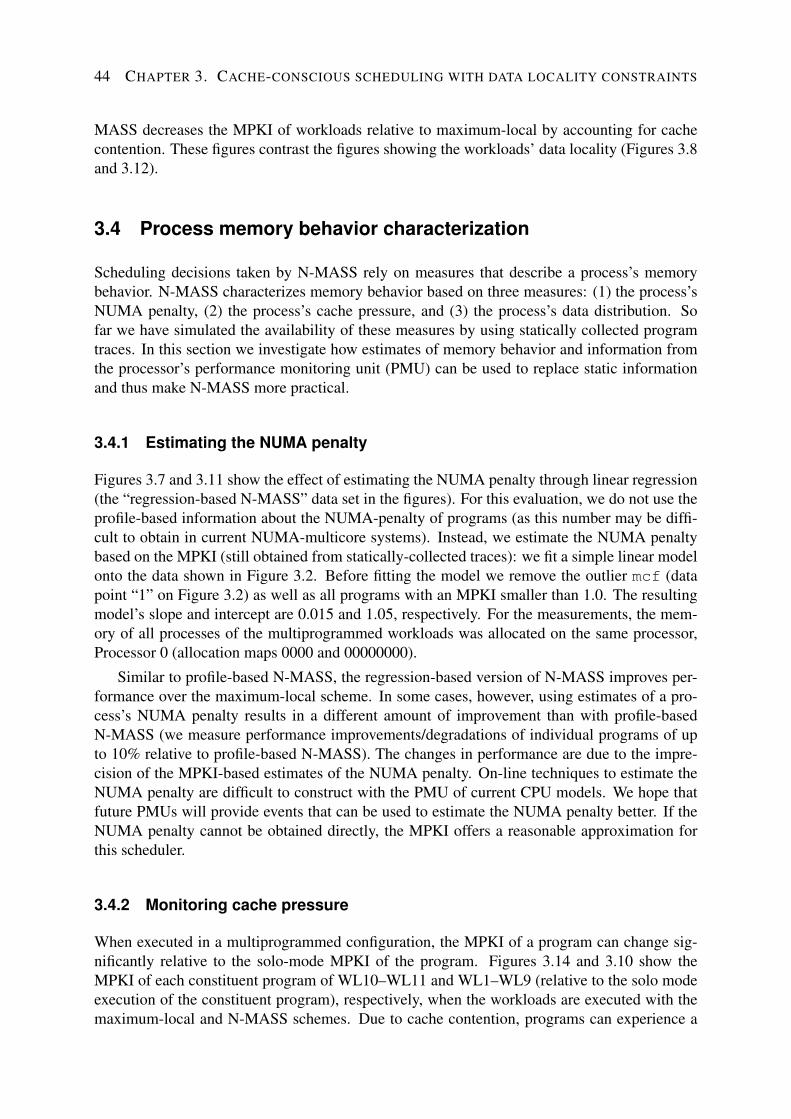
44 CHAPTER 3. CACHE-CONSCIOUS SCHEDULING WITH DATA LOCALITY CONSTRAINTS
MASS decreases the MPKI of workloads relative to maximum-local by accounting for cachecontention. These figures contrast the figures showing the workloads’ data locality (Figures 3.8and 3.12).
3.4 Process memory behavior characterization
Scheduling decisions taken by N-MASS rely on measures that describe a process’s memorybehavior. N-MASS characterizes memory behavior based on three measures: (1) the process’sNUMA penalty, (2) the process’s cache pressure, and (3) the process’s data distribution. Sofar we have simulated the availability of these measures by using statically collected programtraces. In this section we investigate how estimates of memory behavior and information fromthe processor’s performance monitoring unit (PMU) can be used to replace static informationand thus make N-MASS more practical.
3.4.1 Estimating the NUMA penalty
Figures 3.7 and 3.11 show the effect of estimating the NUMA penalty through linear regression(the “regression-based N-MASS” data set in the figures). For this evaluation, we do not use theprofile-based information about the NUMA-penalty of programs (as this number may be diffi-cult to obtain in current NUMA-multicore systems). Instead, we estimate the NUMA penaltybased on the MPKI (still obtained from statically-collected traces): we fit a simple linear modelonto the data shown in Figure 3.2. Before fitting the model we remove the outlier mcf (datapoint “1” on Figure 3.2) as well as all programs with an MPKI smaller than 1.0. The resultingmodel’s slope and intercept are 0.015 and 1.05, respectively. For the measurements, the mem-ory of all processes of the multiprogrammed workloads was allocated on the same processor,Processor 0 (allocation maps 0000 and 00000000).
Similar to profile-based N-MASS, the regression-based version of N-MASS improves per-formance over the maximum-local scheme. In some cases, however, using estimates of a pro-cess’s NUMA penalty results in a different amount of improvement than with profile-basedN-MASS (we measure performance improvements/degradations of individual programs of upto 10% relative to profile-based N-MASS). The changes in performance are due to the impre-cision of the MPKI-based estimates of the NUMA penalty. On-line techniques to estimate theNUMA penalty are difficult to construct with the PMU of current CPU models. We hope thatfuture PMUs will provide events that can be used to estimate the NUMA penalty better. If theNUMA penalty cannot be obtained directly, the MPKI offers a reasonable approximation forthis scheduler.
3.4.2 Monitoring cache pressure
When executed in a multiprogrammed configuration, the MPKI of a program can change sig-nificantly relative to the solo-mode MPKI of the program. Figures 3.14 and 3.10 show theMPKI of each constituent program of WL10–WL11 and WL1–WL9 (relative to the solo modeexecution of the constituent program), respectively, when the workloads are executed with themaximum-local and N-MASS schemes. Due to cache contention, programs can experience a
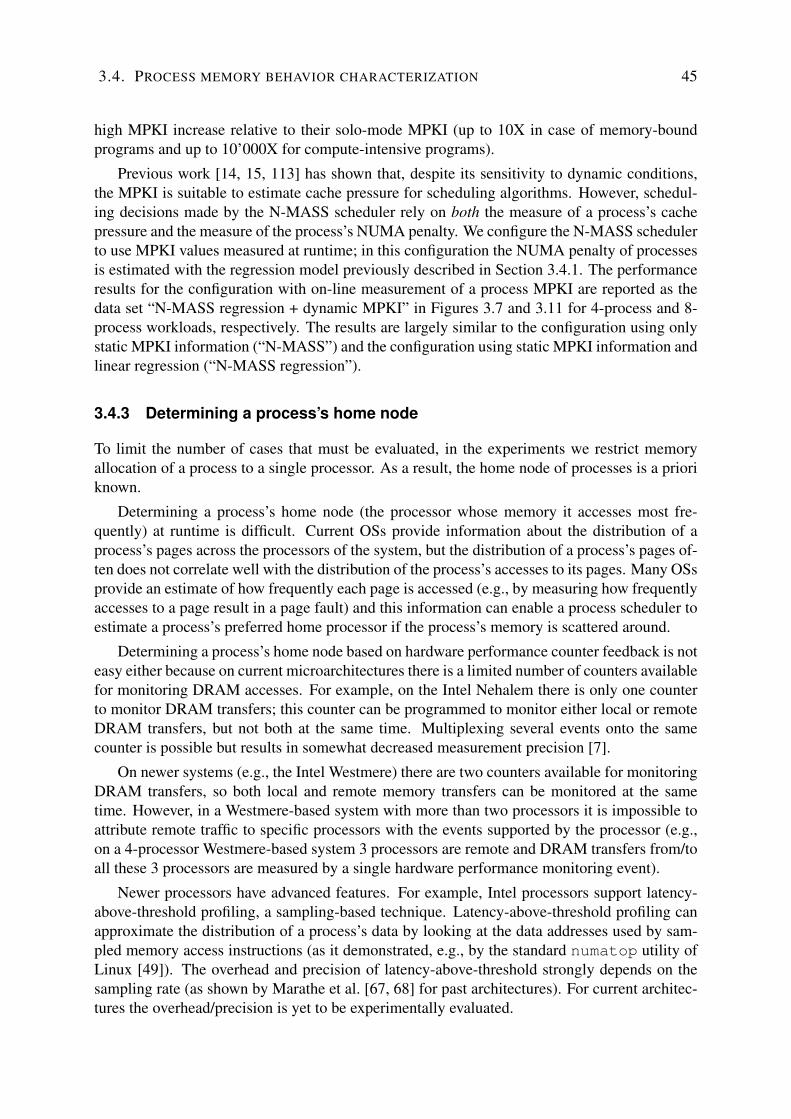
3.4. PROCESS MEMORY BEHAVIOR CHARACTERIZATION 45
high MPKI increase relative to their solo-mode MPKI (up to 10X in case of memory-boundprograms and up to 10’000X for compute-intensive programs).
Previous work [14, 15, 113] has shown that, despite its sensitivity to dynamic conditions,the MPKI is suitable to estimate cache pressure for scheduling algorithms. However, schedul-ing decisions made by the N-MASS scheduler rely on both the measure of a process’s cachepressure and the measure of the process’s NUMA penalty. We configure the N-MASS schedulerto use MPKI values measured at runtime; in this configuration the NUMA penalty of processesis estimated with the regression model previously described in Section 3.4.1. The performanceresults for the configuration with on-line measurement of a process MPKI are reported as thedata set “N-MASS regression + dynamic MPKI” in Figures 3.7 and 3.11 for 4-process and 8-process workloads, respectively. The results are largely similar to the configuration using onlystatic MPKI information (“N-MASS”) and the configuration using static MPKI information andlinear regression (“N-MASS regression”).
3.4.3 Determining a process’s home node
To limit the number of cases that must be evaluated, in the experiments we restrict memoryallocation of a process to a single processor. As a result, the home node of processes is a prioriknown.
Determining a process’s home node (the processor whose memory it accesses most fre-quently) at runtime is difficult. Current OSs provide information about the distribution of aprocess’s pages across the processors of the system, but the distribution of a process’s pages of-ten does not correlate well with the distribution of the process’s accesses to its pages. Many OSsprovide an estimate of how frequently each page is accessed (e.g., by measuring how frequentlyaccesses to a page result in a page fault) and this information can enable a process scheduler toestimate a process’s preferred home processor if the process’s memory is scattered around.
Determining a process’s home node based on hardware performance counter feedback is noteasy either because on current microarchitectures there is a limited number of counters availablefor monitoring DRAM accesses. For example, on the Intel Nehalem there is only one counterto monitor DRAM transfers; this counter can be programmed to monitor either local or remoteDRAM transfers, but not both at the same time. Multiplexing several events onto the samecounter is possible but results in somewhat decreased measurement precision [7].
On newer systems (e.g., the Intel Westmere) there are two counters available for monitoringDRAM transfers, so both local and remote memory transfers can be monitored at the sametime. However, in a Westmere-based system with more than two processors it is impossible toattribute remote traffic to specific processors with the events supported by the processor (e.g.,on a 4-processor Westmere-based system 3 processors are remote and DRAM transfers from/toall these 3 processors are measured by a single hardware performance monitoring event).
Newer processors have advanced features. For example, Intel processors support latency-above-threshold profiling, a sampling-based technique. Latency-above-threshold profiling canapproximate the distribution of a process’s data by looking at the data addresses used by sam-pled memory access instructions (as it demonstrated, e.g., by the standard numatop utility ofLinux [49]). The overhead and precision of latency-above-threshold strongly depends on thesampling rate (as shown by Marathe et al. [67, 68] for past architectures). For current architec-tures the overhead/precision is yet to be experimentally evaluated.
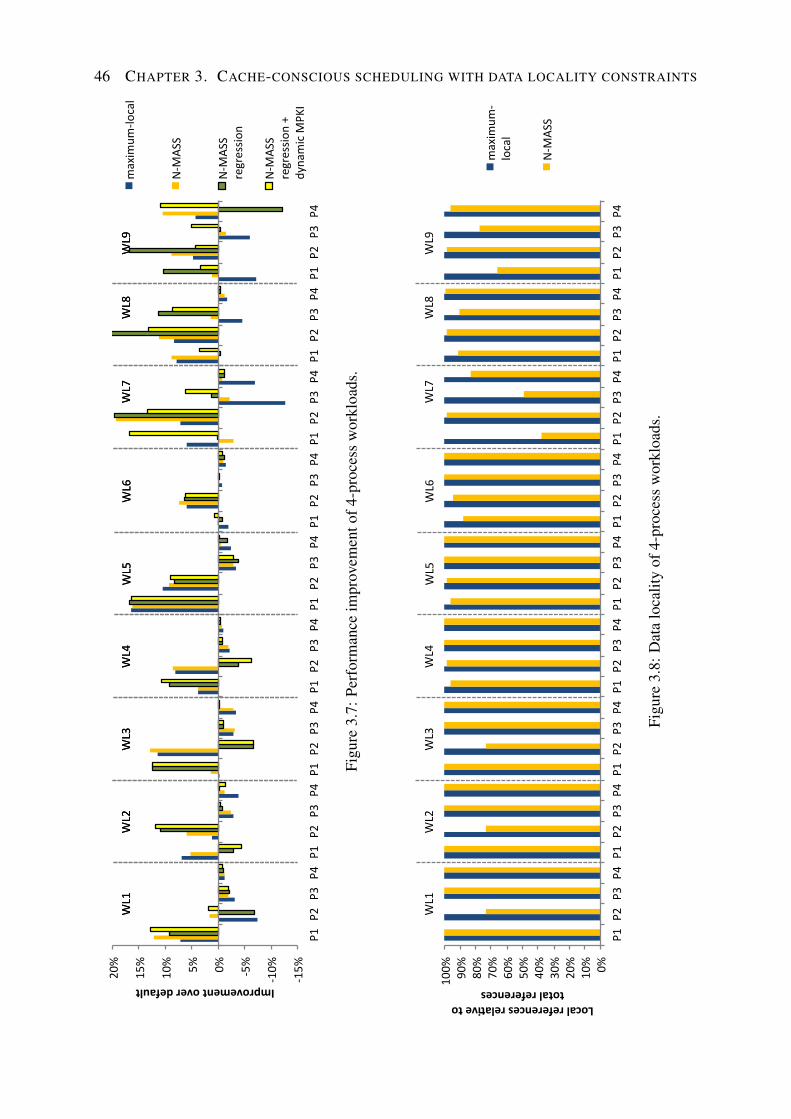
46 CHAPTER 3. CACHE-CONSCIOUS SCHEDULING WITH DATA LOCALITY CONSTRAINTS
-‐15%
-‐10%
-‐5%
0%
5%
10%
15%
20%
P1 P
2 P3
P4
P1 P
2 P3
P4
P1 P
2 P3
P4
P1 P
2 P3
P4
P1 P
2 P3
P4
P1 P
2 P3
P4
P1 P
2 P3
P4
P1 P
2 P3
P4
P1 P
2 P3
P4
Improvement over default maxim
um-‐lo
cal
N-‐M
ASS
N-‐M
ASS
regressio
n
N-‐M
ASS
regressio
n +
dynamic M
PKI
WL1
WL2
WL3
WL5
WL4
WL6
W
L7
WL8
WL9
WL1
WL2
WL3
WL5
WL4
WL6
W
L7
WL8
WL9
Figu
re3.
7:Pe
rfor
man
ceim
prov
emen
tof4
-pro
cess
wor
kloa
ds.
0%
10%
20%
30%
40%
50%
60%
70%
80%
90%
100%
P1 P
2 P3
P4
P1 P
2 P3
P4
P1 P
2 P3
P4
P1 P
2 P3
P4
P1 P
2 P3
P4
P1 P
2 P3
P4
P1 P
2 P3
P4
P1 P
2 P3
P4
P1 P
2 P3
P4
Local references rela,ve to total references
maxim
um-‐
local
N-‐M
ASS
WL1
WL2
WL3
WL5
WL4
WL6
W
L7
WL8
WL9
Figu
re3.
8:D
ata
loca
lity
of4-
proc
ess
wor
kloa
ds.

3.4. PROCESS MEMORY BEHAVIOR CHARACTERIZATION 47
0 10
20
30
40
50
60
70
80
P1 P
2 P3
P4
P1 P
2 P3
P4
P1 P
2 P3
P4
P1 P
2 P3
P4
P1 P
2 P3
P4
P1 P
2 P3
P4
P1 P
2 P3
P4
P1 P
2 P3
P4
P1 P
2 P3
P4
MPKI
maxim
um-‐
local
N-‐M
ASS
WL1
WL2
WL3
WL5
WL4
WL6
W
L7
WL8
WL9
Figu
re3.
9:A
bsol
ute
MPK
Iof4
-pro
cess
wor
kloa
ds.
1 10
100
1000
10000
100000
P1 P
2 P3
P4
P1 P
2 P3
P4
P1 P
2 P3
P4
P1 P
2 P3
P4
P1 P
2 P3
P4
P1 P
2 P3
P4
P1 P
2 P3
P4
P1 P
2 P3
P4
P1 P
2 P3
P4
MPKI rela*ve to solo MPKI
maxim
um-‐
local
N-‐M
ASS
WL1
WL2
WL3
WL5
WL4
WL6
W
L7
WL8
WL9
Figu
re3.
10:R
elat
ive
MPK
Iof4
-pro
cess
wor
kloa
ds.

48 CHAPTER 3. CACHE-CONSCIOUS SCHEDULING WITH DATA LOCALITY CONSTRAINTS
3.5 Discussion and limitations
In summary, if the memory allocation in the system is balanced (i.e., there is an approximatelyequal number of processes homed at every processor), then maximum-local scheduling pro-vides large performance benefits. If the memory allocation setup of the system is unbalanced,the mapping given by the maximum-local scheme often needs adjustment, as maximum-localmapping can result in contention for shared caches and thus a performance degradation (evenrelative to default scheduling). In cases with unbalanced memory allocation, the refinement stepof N-MASS can re-map processes onto a different LLC to reduce cache contention.
Memory migration is an alternative technique to improve data locality in NUMA systems.We limit the discussion to process scheduling because of two issues: (1) it is difficult to estimatethe cost of memory migration, and (2) memory migration is not always possible because thereis not always enough free memory available on the destination processor. In these cases theprocess scheduler is the only part of the system software that can optimize performance.
We do not consider multithreaded programs with a shared address space. For these programssharing caches can be beneficial, therefore finding a tradeoff between data locality and cachecontention is difficult. Recent work by Dey et al. [28] extends resource-conscious schedulingto multithreaded programs as well.
The N-MASS algorithm is designed for 2-processor systems. On systems with more proces-sors the algorithm must consider balancing between all caches/processors. That is, maximum-local mapping must distribute processes across all processors of the system (in descending orderof the processes’ NUMA penalties). Moreover, in cases when maximum-local mapping resultsin an unbalanced distribution of cache pressure between the LLCs of the system, it can be bene-ficial to distribute cache pressure across LLCs, but only judiciously, so that the remote executionpenalty experienced by processes remains within reasonable limits. We leave the extension ofthe N-MASS algorithm for larger systems for future work.
Porting the N-MASS scheduler to systems with enabled simultaneous multithreading(SMT) [106] would require extending the N-MASS algorithm to consider not only the per-formance degradation due to remote execution and cache contention, but also the performancedegradation due to sharing resources (e.g., execution units, memory ports) of a single core (e.g.,in cases when processes are mapped onto hardware threads of the same processor core). Exist-ing schedulers for SMT systems can evaluate [92] or approximate [32] on-line the performancedegradation programs experience due to sharing on-core resources. The N-MASS algorithmcould be extended to use any of the previously mentioned approaches to characterize the per-formance impact on on-core resource sharing as well. We leave the extension of N-MASS toSMT systems for future work.
3.6 Conclusions
We have shown that operating system scheduling fails to obtain good performance in NUMA-multicores if it does not consider the structure of the memory system and the allocation ofphysical memory in the system. If memory allocation in a NUMA-multicore system is bal-anced (the cumulative memory demand of processes homed on each processor in the systemis approximately the same), then it is beneficial to simply map processes onto the architec-ture so that data locality is favored, and avoiding cache contention does not bring any benefits.

3.6. CONCLUSIONS 49
-‐10%
0%
10%
20%
30%
40%
P1 P2 P3 P4 P5 P6 P7 P8 P1 P2 P3 P4 P5 P6 P7 P8
Improvem
ent o
ver d
efau
lt
maximum-‐local N-‐MASS N-‐MASS regression N-‐MASS regression + dynamic MPKI
WL10 WL11
Figure 3.11: Performance improvement of 8-process workloads.
0%
20%
40%
60%
80%
100%
P1 P2 P3 P4 P5 P6 P7 P8 P1 P2 P3 P4 P5 P6 P7 P8
Local referen
ces rela,
ve to
total referen
ces
maximum-‐local N-‐MASS
WL10 WL11
Figure 3.12: Data locality of 8-process workloads.
0 10 20 30 40 50 60 70 80
P1 P2 P3 P4 P5 P6 P7 P8 P1 P2 P3 P4 P5 P6 P7 P8
MPK
I
maximum-‐local N-‐MASS
WL10 WL11
Figure 3.13: Absolute MPKI of 8-process workloads.
1
10
100
1000
10000
100000
P1 P2 P3 P4 P5 P6 P7 P8 P1 P2 P3 P4 P5 P6 P7 P8
MPK
I rela*
ve to
solo M
PKI
maximum-‐local N-‐MASS
WL10 WL11
Figure 3.14: Relative MPKI of 8-process workloads.

50 CHAPTER 3. CACHE-CONSCIOUS SCHEDULING WITH DATA LOCALITY CONSTRAINTS
Nonetheless, when the memory allocation in the system is unbalanced (the sum of the memorydemands of processes homed on each processor in the system is different), then mapping pro-cesses so that data locality is favored can lead to severe cache contention. In these cases refiningthe maximum-local mapping so that cache contention is reduced improves performance, evenwith the cost of some processes executing remotely. The N-MASS scheme described in thischapter successfully combines memory management and process scheduling to better exploitthe potential of NUMA multicore-multiprocessors.

4Performance analysis ofmultithreaded programs
A multithreaded program consist of a set of threads that operate in a single shared memory re-gion. Multithreaded programs belong to a separate application class and are thus fundamentallydifferent from multiprogrammed workloads, the class of applications considered in the pre-vious chapters. Consequently, the memory system bottlenecks experienced by multithreadedprograms are possibly different from the bottlenecks experienced by multiprogrammed work-loads.
This chapter focuses on understanding the memory system performance of multithreadedprograms on NUMA multicore-multiprocessors. We start the discussion by investigating theperformance scaling of a set of programs from the well-known PARSEC benchmark suite [10](Section 4.1). Then, in Section 4.2 we present the setup we use for experimental evaluation.Section 4.3 presents a detailed analysis of the memory system performance of the PARSECbenchmark programs. Based on the analysis we identify and quantify two performance-limitingfactors, program-level data sharing and irregular memory access patterns. These factors resultin inefficient usage of the memory system: data sharing causes bad data locality, irregular mem-ory access patterns are difficult to predict by hardware prefetcher units and, as a result, programsexperience the full access latency of their memory accesses.
To understand the performance implications of program-level data sharing and irregularmemory access patterns, we restructure the benchmark programs to eliminate them so that thememory behavior of the programs matches with the requirements of the memory system. InSection 4.4 we describe three simple source-level techniques that we use: (1) controlling thedata distribution of the program to make sure that memory regions are allocated at well-definedand distinct processors, (2) controlling the computation distribution of the program to guaranteethat computations operate on distinct subsets of program data, and (3) regularizing memoryaccess patterns so that the access patterns are easier to predict for processor prefetcher units.All techniques rely either on using existing OS functionality or on simple algorithmic changes.
As the proposed techniques effect many layers of a modern NUMA-multicore memory sys-tem, Section 4.5 reports detailed measurements of orthogonal experiments to quantify howeach distinct layer is affected. Moreover, we compare the performance of the optimized pro-grams with other optimizations proposed for NUMA-multicores (e.g., page-level interleaving,data replication), hence the experiments help to understand the implications of data localityand resource contention for the performance of multithreaded programs on NUMA multicore-multiprocessors.
51
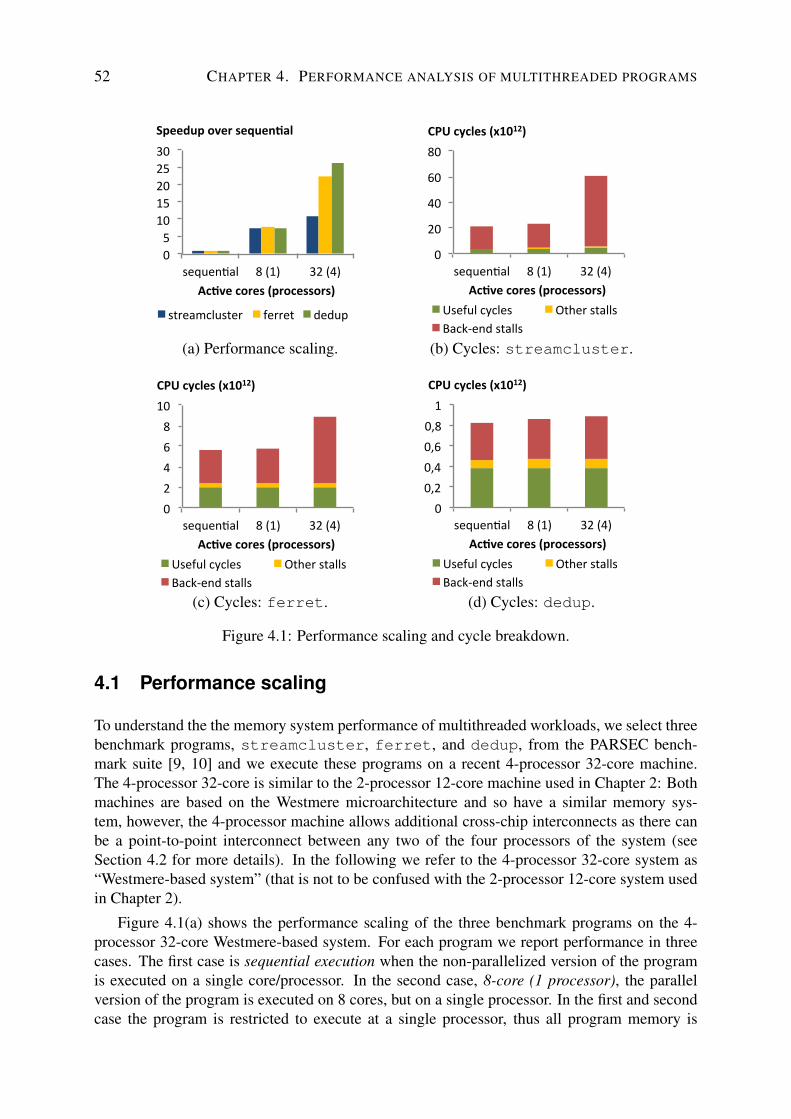
52 CHAPTER 4. PERFORMANCE ANALYSIS OF MULTITHREADED PROGRAMS
0 5 10 15 20 25 30
sequen,al 8 (1) 32 (4) Ac#ve cores (processors)
streamcluster ferret dedup
Speedup over sequen#al12
(a) Performance scaling.
0
20
40
60
80
sequen,al 8 (1) 32 (4) Ac#ve cores (processors)
Useful cycles Other stalls Back-‐end stalls
CPU cycles (x1012)
(b) Cycles: streamcluster.
0 2 4 6 8 10
sequen-al 8 (1) 32 (4) Ac#ve cores (processors)
Useful cycles Other stalls Back-‐end stalls
CPU cycles (x1012)
(c) Cycles: ferret.
0 0,2 0,4 0,6 0,8 1
sequen.al 8 (1) 32 (4) Ac#ve cores (processors)
Useful cycles Other stalls Back-‐end stalls
CPU cycles (x1012)
(d) Cycles: dedup.
Figure 4.1: Performance scaling and cycle breakdown.
4.1 Performance scaling
To understand the the memory system performance of multithreaded workloads, we select threebenchmark programs, streamcluster, ferret, and dedup, from the PARSEC bench-mark suite [9, 10] and we execute these programs on a recent 4-processor 32-core machine.The 4-processor 32-core is similar to the 2-processor 12-core machine used in Chapter 2: Bothmachines are based on the Westmere microarchitecture and so have a similar memory sys-tem, however, the 4-processor machine allows additional cross-chip interconnects as there canbe a point-to-point interconnect between any two of the four processors of the system (seeSection 4.2 for more details). In the following we refer to the 4-processor 32-core system as“Westmere-based system” (that is not to be confused with the 2-processor 12-core system usedin Chapter 2).
Figure 4.1(a) shows the performance scaling of the three benchmark programs on the 4-processor 32-core Westmere-based system. For each program we report performance in threecases. The first case is sequential execution when the non-parallelized version of the programis executed on a single core/processor. In the second case, 8-core (1 processor), the parallelversion of the program is executed on 8 cores, but on a single processor. In the first and secondcase the program is restricted to execute at a single processor, thus all program memory is

4.2. EXPERIMENTAL SETUP 53
allocated at that processor. As a result, there is no cross-chip traffic in the system. The third case,32-core (4 processors), considers the scenario when all cores (and thus all processors) of thesystem are used to execute program threads. As the program is running on all cores/processors,memory allocation is not restricted to a single processor.
Figure 4.1(a) shows that the performance of all three programs scales well to 8 cores (1 pro-cessor), but the picture is different in the 32-core (4 processors) case: streamcluster showsbad performance scaling (11X speedup over single-threaded execution), ferret scales better(20X speedup), and dedup scales well (26X speedup).
There are many possible reasons for the (non-)scalability of parallel programs (e.g., serial-ization due to extensive synchronization, load imbalance [87]), and there exist many techniquesthat target these problems. A crucial and interesting issue is, however, how inefficiencies relatedto the memory system effect performance scaling on NUMA-multicores. To get more insight,we break down the total number of CPU cycles of each program into three categories: (1) usefulcycles, when the CPU makes progress, (2) back-end stalls, when execution is stalled becausethe processor’s back-end cannot execute instructions due to the lack of hardware resources, and(3) other stalls, that is, stalls related to the processor’s front-end (e.g., instruction starvation).(See Section 4.2 for details about the performance monitoring setup used.)
In Intel Westmere processors the processor back-end can stall due to many reasons (includ-ing the memory system), however, due to limitations of the Westmere’s performance monitoringunit we cannot distinguish the number of back-end stalls related to the memory system fromback-end stalls due to other reasons. Nevertheless, as we change only the way a program ismapped onto the architecture (but not the instruction stream generated by the programs), wesuspect a change in the number of back-end stalls (when comparing two setups) is related tomemory system inefficiencies.
Figure 4.1(b) shows that the sequential version of streamcluster spends already a largefraction of its cycles on waiting for the back-end. We measure the same amount of back-endstalls for the case when the parallel version of the program is executed on a single processor(the 8-core (1-processor) case). However, when the program is executed on multiple processors,there is almost a 3X increase in the number of back-end stalls. ferret has similar, yet not aspronounced problems (2X more back-end stall cycles in the multiprocessor configuration thanin the single-processor configurations, as shown Figure 4.1(c)). The performance of dedupis not affected in the multiprocessor configuration, as its number of back-end stalls increasesonly slightly when executed on multiple processors (Figure 4.1(d)). In summary, as long as aprogram uses only one processor in a NUMA-multicore system, the performance of the paralleland sequential version of the program are similar, but if all processors are used, performance canunexpectedly degrade, most likely due to a program using the memory system inefficiently. Todetermine the exact cause, further investigation is needed. Sections 4.2 and 4.3 present detailsof this investigation.
4.2 Experimental setup
4.2.1 Hardware
Two machines are used for performance evaluation: a 2-processor 8-core (Intel Nehalem mi-croarchitecture) and a 4-processor 32-core (Intel Westmere microarchitecture) machine. Ta-

54 CHAPTER 4. PERFORMANCE ANALYSIS OF MULTITHREADED PROGRAMS
ble 4.1 lists the detailed configuration of both systems. The size of per-core level 1 and level 2caches is the same on both machines, however, the size of the level 3 cache differs between themachines. In both systems there is a point-to-point connection between every pair of proces-sors, thus every processor is a one-hop distance from any other processor of the system. Wedisable frequency scaling on both machines [22]. Processor prefetcher units are on if not statedotherwise.
In this chapter, we use the same 2-processor 8-core Nehalem-based machine, as in the pre-vious chapters, but in a configuration with different total main memory size (48 GB instead of12 GB). Although different in size, the clock rate, throughput, and the timings of the memorymodules are the same (DDR3-1066, 7-7-7), so the penalty of remote main memory accesses onthe Nehalem-based system is approximately the same in both configurations.
Nehalem WestmereModel number Intel Xeon E5520 Xeon E7-4830Number of processors 2 4Cores per processor 4 8Total number of cores 8 32Clock frequency 2.26 GHz 2.13 GHzL3 cache size 2x8 MB 4x24 MBMain memory 2x24 GB DDR3 4x16 GB DDR3Cross-chip interconnect 5.86 GTransfers/s 6.4 GTransfers/s
Table 4.1: Hardware configuration.
4.2.2 Benchmark programs
We consider three programs of the PARSEC benchmark suite [10].
• streamcluster is a data-parallel program that solves the on-line clustering problemfor a set of input points. The program consists of a series of processing loops. Eachloop is parallelized with the OpenMP parallel for directive with static scheduling;with static scheduling each worker thread is assigned a well-defined subset of the totaliterations processed by a loop [80]. If not specified otherwise, streamcluster isconfigured with a number of worker threads equal to the number of cores of the machineit executes on (so that it makes optimal use of the computational resources offered by thearchitecture).
• ferret is a pipeline-parallel program [37, 41, 76, 89, 95] that implements content-based similarity search of images: given a set of input images, ferret searches in animage database for images similar to the input image. The program is structured as aset of 6 stages, as shown in Figure 4.2(a). Stages are interconnected by queues, data“flows” from the input stage through intermediary stages towards the output stage of thepipeline. Each pipeline stage of ferret is executed by a number of threads equal tothe number of cores in the system; the input and the output stage is executed by a singlethread each. Figure 4.2(a) shows the runtime configuration of ferret on a 2-processor8-core machine.

4.2. EXPERIMENTAL SETUP 55
Stage 1: Segment
Stage 4: Rank
Input Output Stage 3: Index
Stage 2: Extract
Executed at Processor 0 T2 T3
T0 T1
T2 T3
T0 T1
T2 T3
T0 T1
T2 T3
T0 T1 T0
Executed at Processor 1 T6 T7
T4 T5
T6 T7
T4 T5
T6 T7
T4 T5
T6 T7
T4 T5
T0
(a) ferret.
Stage 1: FindItems
Stage 3: Compress
Stage 2: ItemProcess
Input Output
Executed at Processor 0 T2 T3
T0 T1
T2 T3
T0 T1
T2 T3
T0 T1 T0
Executed at Processor 1 T6 T7
T4 T5
T6 T7
T4 T5
T6 T7
T4 T5
T0
(b) dedup.
Figure 4.2: Structure and configuration of pipeline programs.
• dedup is also a pipeline-parallel programs that consists of 5 stages. dedup compressesand deduplicates files given to it as input. The structure and runtime configuration ofdedup (after cleanup) is shown in Figure 4.2(b) and it is similar to that of ferret.
Table 4.2 lists the benchmark programs together with the inputs considered for each pro-gram. We have grown the size of the inputs relative to native, the largest input size available inthe PARSEC suite. Most native-sized inputs fit into the last-level caches of the systems consid-ered (e.g., the 32-core machine has 96 MB of total last-level cache), thus growing the size ofthe inputs allows us to exercise the memory system of the machines.
Execution timeProgram Input Nehalem Westmere
(8 cores) (32 cores)streamcluster 10 M input points 1232 s 937 sferret image database with 700 M images 292 s 133 s
and 3500 input images to processdedup 4.4 GB disk image 46 s 14 s
Table 4.2: Benchmark inputs and run times with default setup.

56 CHAPTER 4. PERFORMANCE ANALYSIS OF MULTITHREADED PROGRAMS
4.2.3 Scheduling and memory allocation
In NUMA systems, the placement of memory pages has a large impact on performance. Bothmachines that we use for evaluation run Linux, which, similar to other OSs, relies on the first-touch page placement policy. According to this policy each page is placed at the processor thatfirst reads from/writes to the page after it has been allocated.
In NUMA systems not only the placement of memory pages at processors, but also the map-ping of program threads to cores impacts program performance. In their default configurationOSs tend to change the thread-to-core mapping during the execution of programs. Such changesresult in large performance variations. To reduce the negative effect of OS reschedules we useaffinity scheduling with identity mapping. Affinity scheduling restricts the execution of eachthread to a specific core. For streamcluster, worker threads that execute a parallel loopare always mapped to cores so that T0 is executed at Core 0, T1 is executed at Core 1, etc. Forferret and dedup identity mapping is used for each pipeline stage individually (i.e., for eachpipeline stage the worker threads executing that stage will be mapped to cores using identitymapping).
Identity mapping defines not only thread-to-core mappings, but implicitly also the thread-to-processor mapping (in NUMA systems, memory is distributed on a per-processor basis andnot on a per-core basis). By using identity affinity there is an equal number of threads executingeach parallel loop (in case of streamcluster) and each stage (in case of the pipeline pro-grams) at all processors of the system. For example, on the 2-processor 8-core system threadsT0–T3 of each parallel loop/stage execute on Processor 0, and threads T4–T7 of each paral-lel loop/stage execute on Processor 1. Figure 4.2(a) and Figure 4.2(b) show how threads aremapped to processors for the ferret and dedup benchmark, respectively. Using identitymapping for mapping threads to processors/cores reduces measurement variation; furthermore,it does not affect the cache performance of the programs, as noted by Zhang et al. in [112].Table 4.2 lists the execution time of the benchmark programs. The programs are compiled withthe GCC compiler version 4.6.1 using optimization level O3.
4.2.4 Performance monitoring
Table 4.3 lists the performance monitoring events used to break down execution cycles intothree categories (the breakdown shown in Figures 4.1(b)–4.1(d)): useful cycles, back-end stallcycles, and other stall cycles. As we disable simultaneous multithreading the cycles reported inthe “other stall cycles” category are due to instruction starvation [44] and are calculated as thedifference of the total number of measured stall cycles and the total number of back-end stallcycles.
Event name Reported asUNHALTED CORE CYCLES Total execution cyclesUOPS ISSUED:STALL CYCLES Total stall cyclesRESOURCE STALLS:ANY Total back-end stall cycles
Table 4.3: Performance monitoring events.
We measure the read memory traffic generated by programs on the uncore of the evaluationmachines. The uncore of a processor includes the processor’s last-level cache, its on-chip mem-

4.3. UNDERSTANDING MEMORY SYSTEM BEHAVIOR 57
ory controller, and its interfaces to the cross-chip interconnect. We break down uncore memorytraffic into four categories: local/remote last-level cache accesses (cache hits) and local/remotemain memory accesses (cache misses that are served either from local- or from remote mainmemory). The four categories are illustrated on Figure 1.1 for a 2-processor system. We usethe OFFCORE RESPONSE 0 performance monitoring event with the response types specifiedin Table 4.4. We use the same request types as previously shown in Table 2.1. Limitations ofthe performance monitoring unit restrict the kind of information that can be obtained: only readtransfers can be measured on Nehalem/Westmere processors.
Response type Reported asUNCORE HIT:OTHER CORE HIT SNP:OTHER CORE HITM Local L3 cache accessesREMOTE CACHE FWD Remote L3 cache accessesLOCAL DRAM Local DRAM accessesREMOTE DRAM Remote DRAM accesses
Table 4.4: Response types used with the OFFCORE RESPONSE 0 event.
4.3 Understanding memory system behavior
This section analyzes the memory system performance of the benchmarks. We focus on datalocality (Section 4.3.1) and prefetcher effectiveness (Section 4.3.2).
4.3.1 Data locality
Figure 4.3(a) (4.3(b)) shows the fraction of remote memory transfers relative to the total num-ber of memory transfers generated by the programs on the 8-core (32-core) machine. On bothmachines a large fraction (11–67%) of the program’s memory transfers are handled by remotemain memory. Moreover, in some configurations, the programs show a large fraction of remotecache accesses, up to 16% of the total number of uncore transfers of the program. The mea-surements indicate that the PARSEC programs use an ill-suited data distribution (i.e., programdata frequently resides in memory that is remote to the threads accessing it). Using affinityscheduling has the consequence that OS reschedules do not introduce remote memory transfers(as there are none). To understand the reasons for the ill-suited data distribution, we performdata address profiling on all three programs.
Data address profiling is a sampling-based approach that records the target data address (andthus the target memory page) of each sampled memory operation [2, 13, 27, 55, 62, 68]. Asdata address profiling is sampling-based, it only approximates program behavior. Nonetheless,profiling data addresses still provides a good indication of where to concentrate the optimizationeffort. Similarly to the MemProf profiler [55], we use the processor’s performance monitoringunit to gather address profiles. We use the load latency performance monitoring facility of In-tel processors [45, 68]. Other microarchitectures support data-address profiling as well (e.g.,AMD processors implement Instruction-Based Sampling [13, 27, 61] which offers functionali-ties similar to the Intel implementation of data address profiling).
Because of limitations of the Linux performance monitoring system, programs are profiledonly on the 2-processor 8-core Nehalem-based machine. On Nehalem-based systems the PMU

58 CHAPTER 4. PERFORMANCE ANALYSIS OF MULTITHREADED PROGRAMS
0%
20%
40%
60%
80%
streamc. ferret dedup
REMOTE_DRAM REMOTE_CACHE
Frac%on remote transfers
(a) 8-core machine.
0%
20%
40%
60%
80%
streamc. ferret dedup
REMOTE_DRAM REMOTE_CACHE
Frac%on total uncore transfers
(b) 32-core machine.
0.00.10.20.30.40.50.60.70.8
8-core 32-core
REMOTE_DRAM REMOTE_CACHE
Total uncore transfers (GTransfers)
Figure 4.3: Remote transfers as fraction of all uncore transfers.
gathers data address profiles for memory load operations (but not for stores) [45]. We use theMEM INST RETIRED event configured with the LATENCY ABOVE THRESHOLD mask; thesampling rate is set to 1. The PMU samples only memory load operations that have a latencygreater or equal than the latency threshold. On the Nehalem microarchitecture the L1 data cachecan be accessed in 4 cycles [57]. The latency threshold is therefore set to 4 cycles so that wesample accesses to all levels of the memory hierarchy.
Based on their target data address, we group memory accesses into two categories:
• accesses to non-shared heap pages (pages where only accesses by a single processor arerecorded)
• accesses to shared heap pages (pages accessed by both processors of the NUMA system).
Accesses to pages that hold the program’s image, dynamically-linked shared objects and theprogram’s stack are excluded from profiles.
Exclusively accessed heap pages are placed appropriately in processor memories by thefirst-touch page placement policy, as these pages are accessed only by a single core/processor.Moreover, data from private and exclusively accessed pages is present in only one cache of thesystem, so these pages are likely not to be accessed from remote caches. However, for sharedpages it is difficult to find an appropriate placement in a NUMA system: no matter at whichprocessor of the system a shared page is placed, there will be accesses to these pages from aremote processor, as all processors access the shared data during the lifetime of the program.Likewise, the contents of shared pages is likely to be present in multiple caches of the systemat the same time, thus reducing the capacity available to non-shared data and also leading toremote cache references.
Figure 4.4 shows the results of data address profiling for the PARSEC programs: a largefraction (10–70%) of the programs’ memory accesses are to problematic shared heap locations.Investigation of the address profiles and of the program source code reveals that data sharing iscaused by data structures being shared between all threads of the program: As program threadsexecute at different processors, some threads are forced to access the shared data structurethrough the cross-chip interconnect. In the case of streamcluster, data sharing is causedby accesses to the data structure holding the coordinates of processed data points. In the case offerret, data sharing is caused by lookups in the image database. In the case of dedup, most

4.4. PROGRAM TRANSFORMATIONS 59
0% 20% 40% 60% 80% 100%
streamc. ferret dedup
Non-‐shared heap pages
Shared heap pages
Percentage sampled address space
Figure 4.4: Data access characterization (8-core machine).
0% 1% 2% 3% 4% 5%
streamc. ferret dedup
8-‐core
32-‐core
Performance improvement (over prefetching disabled)
Figure 4.5: Performance gain w/ prefetching.
shared memory accesses are caused by accesses to a shared hash table that stores compressedchunks of the input file.
4.3.2 Prefetcher effectiveness
To assess the effectiveness of the hardware prefetchers, we measured the performance ofeach benchmark in two configurations: with disabled processor prefetcher units and withthe prefetcher units enabled. Figure 4.5 shows the performance improvement gained due toprefetching. In general, prefetchers improve performance, however the amount of performanceimprovement is small in most cases (5% at most), and in some cases prefetchers do not effectperformance at all. The ineffectiveness of hardware prefetching can be explained by the irreg-ular access patterns of the programs considered: streamcluster accesses the data pointsrandomly, and both ferret and dedup store/look up data in hash tables at locations that lookrandom to prefetchers that are good in recognizing strided data access patterns [110].
4.4 Program transformations
The previous section shows that two factors, program-level data sharing and irregular mem-ory access patterns, cause the poor performance scalability of the three PARSEC programs onNUMA systems. This section describes a set of simple source-level changes that allow thepreviously considered programs to better use the memory system of NUMA-multicores. Thechanges effect the mapping of programs, that is, changes effect both the data distribution andthe computation scheduling of the programs. We set up the mapping by using standard OS func-tionalities to distribute memory pages across processors (Section 4.4.1) and by making simplealgorithmic changes to the programs (Section 4.4.2).

60 CHAPTER 4. PERFORMANCE ANALYSIS OF MULTITHREADED PROGRAMS
1
T0
T1
A B C D E F G H
points coordinates
(a) Original state.
1
T0
T1
A B C D E F G H
points coordinates
(b) Pointer-based shuffle.
1
T0
T1
G C B H F E A D
points coordinates
(c) Copy-based shuffle.
Figure 4.6: streamcluster: Shuffles.
4.4.1 Distributing data
To avoid remote main memory accesses the programmer must control at which processor data isallocated. Current operating systems provide support for per-processor memory allocation. Forexample, Linux provides the numa alloc() function that allows the programmer to allocatememory at a specific processor. Because of its high overhead, however, it is recommended to usethis allocator only for the allocation of large memory regions. On Linux, once pages of a mem-ory region are allocated, they can be migrated to a specific processor using the move pages()system call. For the performance-critical memory regions of the programs considered we definea data distribution either by using numa alloc() or by using memory migration. Definingthe data distribution for these regions adds overhead. However, as we enforce the distributiononly once, at program startup, the overhead is compensated for by improved execution times.The overhead of distributing data is included in the performance measurements (reported inSection 4.5).
4.4.2 Algorithmic changes
streamcluster
The performance analysis described in Section 4.3 reveals that most memory accesses of theprogram are to coordinates of data points processed by the program. The coordinates are storedin an array, coordinates. The coordinates array is accessed through a set of pointersstored in the pointers array. Figure 4.6(a) shows the two data structures, assuming that theprogram is executed by two threads. Because of data parallelism each thread owns a distinctsubset of pointers (and thus accesses a distinct set of points and coordinates). The situation witha higher number of threads is analogous to the two-thread case.

4.4. PROGRAM TRANSFORMATIONS 61
Investigation of the program source reveals that the bad memory system performance ofstreamcluster is caused by a data shuffling operation: during program execution the setof data points processed by the program are randomly reshuffled so that clusters are discoveredwith higher probability. Figure 4.6(a) shows the state of the points and coordinatesarray when the program starts, Figure 4.6(b) shows the state of the program data after the firstshuffle. After shuffling, each thread accesses the same subset of the pointers array as beforethe shuffle, but the set of coordinates accessed is different. Shuffling is performed several timesduring the lifetime of the program.
The shuffling operation has negative effects on caching, prefetching and also on data locality.As the set of data accessed by threads changes during program execution, the program doesnot have much data reuse. The presence of random pointers makes the access patterns of theprogram unpredictable and thus prefetching is not useful for this program. Lastly, due to theshuffles, each piece of coordinate data is possibly accessed by all threads of the program, thuscoordinate data is shared between processors and it is impossible to distribute these data acrossthe processors of the system. As a result, most accesses to the coordinates array are remote.
To enable memory system optimizations we change the way shuffle operations are per-formed. Instead of shuffling pointers so that they point to different data, we keep the pointersconstant and move data instead. Figure 4.6(c) shows the data layout of streamcluster aftera copy-based shuffle is performed on the original data shown in Figure 4.6(a). After the copy-based shuffle, the location of the coordinate data in memory accessed by each thread is the sameas before the shuffling operations, however, the contents of the data locations has changed. Asa result, during the lifetime of the program each thread will access the same memory locations.Because data locations are not shared between threads, they can be distributed appropriatelybetween processors. Moreover, as each thread accesses its pointers sequentially, the access pat-terns of the program are regular, thus prefetchers have a better chance to predict what data willbe accessed next.
Figure 4.7(a) shows the code of the original, pointer-based shuffle, Figure 4.7(b) shows thecode of the copy-based shuffling operation. Copy-based shuffling involves memcpy operationsthat are more costly than switching pointers; however, shuffling is infrequent relative to dataaccesses, therefore this change pays off (see the performance evaluation in Section 4.5).
ferret
The performance analysis described in Section 4.3 indicates that ferret’s remote memoryaccesses are due to accesses to the shared image database. The image database is queriedin Stage 3 (the indexing stage) of the program. Figure 4.8(a) shows the original pipelinedimplementation of this stage. Stage 3 (and other stages as well) receives the processor numberp as parameter (line 1). As a result, each stage instance is aware of the processor as where it isexecuting (the processor p is specified by affinity scheduling with identity mapping). To keeplock contention low, two adjacent stages are usually interconnected by multiple queues, andonly a subset of all threads executing the stage uses the same queue. Thus, each stage instancereceives/puts data from/into queues local to that processor (lines 2 and 4). Database queries areimplemented by the index() function (line 3).
A way to reduce data sharing for the ferret benchmark is to partition the image databasebetween the processors of the system, so that each processor holds a non-overlapping subset

62 CHAPTER 4. PERFORMANCE ANALYSIS OF MULTITHREADED PROGRAMS
1 void s h u f f l e ( ) {2 for ( i = 0 ; i < NUM POINTS; i ++) {3 j = random ( ) % NUM POINTS;4 temp = po in t s [ i ] . coord ina tes ;5 po in t s [ i ] . coord ina tes = po in t s [ j ] . coord ina tes ;6 po in t s [ j ] . coord ina tes = temp ;7 }8 }
(a) Shuffle (pointer-based implementation).
1 void s h u f f l e ( ) {2 for ( i = 0 ; i < NUM POINTS; i ++) {3 j = random ( ) % NUM POINTS;4 memcpy( temp , po in t s [ i ] . coord inates , BLOCK SIZE ) ;5 memcpy( po in t s [ i ] . coord inates ,6 po in t s [ j ] . coord inates ,7 BLOCK SIZE ) ;8 memcpy( po in t s [ j ] . coord inates , temp , BLOCK SIZE ) ;9 }
10 }
(b) Shuffle (copy-based implementation).
Figure 4.7: streamcluster: Program transformations.
1 void i n d e x p i p e l i n e d ( Processor p ) {2 f ea tu res = indexQueue [ p ] . dequeue ( ) ;3 cand ida teL i s t = index ( fea tu res ) ;4 rankQueue [ p ] . enqueue ( cand ida teL i s t ) ;5 }
(a) Stage 3 (original implementation).
1 void i n d e x p i p e l i n e d ( Processor p ) {2 f ea tu res = indexQueue [ p ] . dequeue ( ) ;3 i f ( p == Processor . MIN) cand ida teL i s t = 0 ;4 cand ida teL i s t += index ( p , fea tu res ) ;5 i f ( p < Processor .MAX − 1) {6 dstProcessor = p + 1;7 indexQueue [ dstProcessor ] . enqueue ( cand ida teL i s t ) ;8 } else {9 rankQueue . enqueue ( cand ida teL i s t ) ;
10 }11 }
(b) Stage 3 (optimized implementation).
Figure 4.8: ferret: Program transformations.
of the image database. Partitioning is performed at program startup when the image databaseis populated. Data distribution (described in Section 4.4.1) is used to ensure that each sub-set is allocated at the appropriate processor. The image database uses a hash-based index forlookup [63] that is modified as well to include information about the processor at which eachimage is stored.
Database queries must also be changed to support data locality; Figure 4.8(b) shows

4.4. PROGRAM TRANSFORMATIONS 63
Stage 2: Extract
Stage 4: Rank
Stage 3-1: Index
Stage 3-0: Index
Executed at Processor 0 T2 T3
T0 T1
T2 T3
T0 T1
T2 T3
T0 T1
Executed at Processor 1 T6 T7
T4 T5
T6 T7
T4 T5
T6 T7
T4 T5
...
...
...
...
Figure 4.9: ferret: Stages 2, 3, and 4 (optimized implementation).
the locality-aware implementation of Stage 3. The index() function (line 4) is modifiedto operate only on a subset p of the image database (p ∈ [0,Processors.MAX) whereProcessors.MAX is the total number of processors in the system). As a result, a stageinstance executing at Processor p performs database queries only on partition p of the imagedatabase. Instances of Stage 3 are executed at every processor of the system (due to identityscheduling) thus all database partitions are eventually queried by the program. The final resultsof a query are composed from the results obtained by querying each partition of the completeimage database.
To make sure that each query is performed on all database partitions, the queuing sys-tem is modified to dispatch queries to the appropriate processor. The partial result (stored incandidateList) of a query on partition p of the image database is forwarded to an indexingstage executing at the next processor (i.e., the candidate list is forwarded from Processor p toProcessor p + 1) (lines 6–7 of Figure 4.8(b)). When all subsets of the image database have beenqueried, the candidate list contains the result of the query on the complete database and it issent to the ranking stage (line 9). All queries must start with the first partition of the imagedatabase. To ensure that each query starts with the first database partition, Stage 2 is modifiedto dispatch data to instances of Stage 3 executing at Processor 0. Similarly, to ensure load bal-ance, the instances of Stage 3 querying the last partition of the image database dispatch datato all instances of Stage 4 (executing on all processors). As these changes are small, they arenot shown in the code example. Figure 4.9 shows a graphical representation of Stages 2, 3, and4 of the optimized program as they are executed on a 2-processor system. This representationindicates the change of queuing in all stages.
The example shown in Figure 4.8(b) is for a 2-processor system. On this system the pro-posed optimization corresponds to creating two copies of Stage 3, where one copy of this stage,Stage 3-0, executes at Processor 0, and the other copy, Stage 3-1, executes at Processor 1. Thissolution scales with the number of processors (i.e., on n processors n copies of Stage 3 arecreated).
dedup
Figure 4.10(a) shows the pipelined implementation of Stage 1 and Stage 2 of dedup. Theperformance analysis described in Section 4.3 indicates that accesses to the shared hash table

64 CHAPTER 4. PERFORMANCE ANALYSIS OF MULTITHREADED PROGRAMS
1 / / Stage 1: Div ide data chunk i n t o i tems .2 void f i n d I t e m s p i p e l i n e d ( Processor p ) {3 f i l eChunk = inputQueue [ p ] . dequeue ( ) ;4 i tems = f i nd I t ems ( f i l eChunk ) ;5 for ( i tem : i tems )6 itemProcessQueue [ p ] . enqueue ( i tem ) ;7 }8 / / Stage 2: Process an i tem .9 void i t emProcess p ipe l ined ( Processor p ) {
10 i tem = itemProcessQueue [ p ] . dequeue ( ) ;11 i tem . key = getSHA1Signature ( i tem ) ;12 i f ( ( en t r y = hashTable . get ( key ) ) != n u l l ) {13 en t ry . count ++;14 outputQueue [ p ] . put ( i tem . key ) ;15 } else {16 compressQueue [ p ] . put ( i tem ) ;17 }18 }
(a) Stages 1 and 2 (original implementation).
1 / / Stage 1: Div ide data chunk i n t o i tems .2 void f i n d I t e m s p i p e l i n e d ( Processor p ) {3 f i l eChunk = inputQueue [ p ] . dequeue ( ) ;4 i tems = f i nd I t ems ( f i l eChunk ) ;5 for ( i tem : i tems ) {6 i tem . key = getSHA1Signature ( i tem ) ;7 dstProcessor = hashTable . processorForKey ( key ) ;8 itemProcessQueue [ dstProcessor ] . enqueue ( key ) ;9 }
10 }11 / / Stage 2: Process an i tem .12 void i t emProcess p ipe l ined ( Processor p ) {13 i tem = itemProcessQueue [ p ] . dequeue ( ) ;14 i tem . key = clone ( i tem . key ) ;15 i f ( ( en t r y = hashTable . get ( i tem . key ) ) != n u l l ) {16 en t ry . count ++;17 outputQueue [ p ] . put ( i tem . key ) ;18 } else {19 compressQueue [ p ] . put ( i tem ) ;20 }21 }
(b) ferret: Stages 1 and 2 (optimized implementation).
Figure 4.10: dedup: Program transformations.
(line 12–13) are the source of data sharing for dedup. Not just data items, but also the keyof every data item (initialized in line 11) is added to the hash table. As these keys are usedfrequently for hash table lookups, the processor that holds each key also plays an important rolefor data locality.
We change dedup to reduce sharing of hash table elements and also of the hash tablestructure itself; the changes are illustrated in Figure 4.10(b). The set of all hash keys is dividedinto p non-overlapping subsets, where p is the number of processors in the system. Each subsetis (conceptually) mapped to a different processor. As this mapping closely depends on the

4.5. PERFORMANCE EVALUATION 65
Stage 1: FindChunks
Stage 3: Compress
Stage 2: ChunkProcess
Executed at Processor 0 T2 T3
T0 T1
T2 T3
T0 T1
T2 T3
T0 T1
Executed at Processor 1 T6 T7
T4 T5
T6 T7
T4 T5
T6 T7
T4 T5
...
...
...
Dispatch data to Processor 1 Dispatch data to Processor 0
Figure 4.11: dedup: Stages 1, 2, and 3 (optimized implementation).
structure hash table, we add a new method to the hash table, processorForKey() thatdetermines for each key the processor associated with that key (line 7).
Enforcing the mapping of keys to processors requires data elements to be dispatched to theappropriate processor. We modify Stage 1 of dedup to achieve this. The original version ofStage 1 dispatches each data item to the same processor that the data was dequeued from (lines3 and 6 of Figure 4.10(a)). In the optimized version, however, each data item is dispatched tothe processor its key is associated with (lines 7–8 of Figure 4.10(b)). It is sufficient to changeStage 1 to enforce the mapping of keys to processors, because by default Stage 2 and Stage 3enqueue each data element at the same processor that the data was dequeued from, thus as soonas a data element is enqueued at the appropriate processor by Stage 1, it is processed at the sameprocessor by all subsequent stages.
Using locality-aware dispatching of data elements guarantees data locality for structuresrelated to the hash table but not for keys. As keys are computed before the dispatch to sub-sequent stages can happen (line 6 of Figure 4.10(b)), the keys are not necessarily allocated atthe processor that they are conceptually mapped onto. To enforce the mapping of keys to pro-cessors, a clone of each key is created after dispatch (in Stage 2, cloning shown in line 14 ofFigure 4.10(b)). As Stage 1 already enforces the previously described key-to-processor map-ping, the clones created in Stage 2 are guaranteed to reside on the appropriate processor dueto the first-touch page placement policy. Figure 4.11 shows a graphical representation of thelocality-aware implementation of stages 1, 2, and 3 of dedup, including queuing.
4.5 Performance evaluation
This section evaluates the performance of the program-level transformations proposed in Sec-tion 4.4. As transformations effect both data locality and prefetcher performance, we dividethe evaluation into two parts. First, in Section 4.5.1 we discuss the cumulative effect of theprogram transformations on data locality and prefetcher performance. Then, in Section 4.5.2we quantify the effect of the transformations on prefetcher performance individually.

66 CHAPTER 4. PERFORMANCE ANALYSIS OF MULTITHREADED PROGRAMS
4.5.1 Cumulative effect of program transformations
This section evaluates the effect of program transformations on both data locality and prefetcherperformance cumulatively, therefore the prefetcher units of the processors are turned on for themeasurements presented in this section.
The proposed program transformations influence both aspects of a program’s mapping, thatis, transformations change both the program’s schedule of computations and its data distribu-tion. The schedule of a program’s computations is defined by the way a program’s threads aremapped to the processors/cores of a system and by the way computations are mapped to threads.Threads are mapped using affinity scheduling with identity mapping in all experiments. Com-putations are mapped to threads by the rules defined by OpenMP static scheduling [80] (inthe case of streamcluster) or by the way pipeline stages are interconnected (in case offerret and dedup).
The schedule of computations effects caching and prefetcher performance, the distributionof data effects the locality of main memory accesses. To be able to delimit the effect of a trans-formation on each level of the memory system, we consider data distribution separately fromthe rest of changes involved by a transformation. More specifically, we evaluate performancewith a set of different execution scenarios. Each execution scenario defines
• the version of the program used (transformed or original), but without any considerationof the distribution of data, and
• the program’s data distribution, for example, the page placement policy used by the pro-gram independent of other source-level changes.
We consider four execution scenarios:
• original (first-touch) This execution scenario uses the original, out-of-the-box version ofthe programs. The memory allocation policy used is first-touch (the default on manymodern OSs). In the figures this scenario appears as original (FT).
• original (interleaved) This execution scenario also uses the original version of the pro-grams, but memory regions are allocated using the interleaved page placement policy. Theinterleaved page placement policy distributes pages of shared memory regions across theprocessors of the system in a round-robin fashion. Interleaved page allocation balancesthe load between the memory controllers of a NUMA system and thus mitigates the per-formance degradation caused by shared data regions being allocated at a single processorand was thus proposed by recent work [27, 55]. Using interleaved page placement isequivalent to disabling NUMA in our systems (in the BIOS). For this scenario we use theshorthand original (INTL) in the figures.
• transformed (interleaved) This scenario evaluates the proposed program transformationswith the interleaved page placement policy. As per-processor memory allocation is notused in this scenario, performance differences are only caused by the combined effectof improved caching and prefetcher performance. In the figures this scenario appears astransformed (INTL).

4.5. PERFORMANCE EVALUATION 67
• transformed (NUMA-alloc) This scenario evaluates the program transformations with per-processor memory allocation enabled. This scenario has the additional benefit of localmain memory accesses relative to the previous, transformed (interleaved), execution sce-nario. In the figures this scenario appears as transformed (NA).
We compare the performance of the three benchmarks, streamcluster, ferret anddedup in all execution scenarios on both machines described in Section 4.2 (2-processor 8-core and 4-processor 32-core NUMA). Any two adjacent execution scenarios differ in only oneparameter, thus comparing any two adjacent scenarios quantifies the exact cause of performanceimprovement. Besides reporting performance we quantify the effect of the transformationson the memory system by providing a breakdown of total uncore memory transfers for allconfigurations of the benchmark programs. (A processor’s uncore includes the processor’s last-level cache, its on-chip memory controller, and its interfaces to the cross-chip interconnect, thusat the uncore level we can distinguish between local/remote cache accesses and local/remotemain memory accesses.) In some cases the total number of uncore transfers differs when thesame program binary is executed on two different machines but in the same execution scenario.Although the two machines used for evaluation have the same microarchitecture, the sizes ofthe last-level caches differ between the two machines. The different size of the last-level cachesexplains the difference of the total number of total uncore transfers measured.
streamcluster
Figures 4.12(a) and 4.12(b) show the performance improvement of three scenarios, original(interleaved), transformed (interleaved), and transformed (NUMA-alloc), over the default setup(original (first-touch)). Figures 4.13(a) and 4.13(b) show the breakdown of all uncore transfersfor all the scenarios considered.
By default the complete coordinates of all data points accessed by streamcluster areallocated at a single processor. As all threads access these data, the memory controller andcross-chip interconnect of this processor are overloaded. Using the interleaved page placementpolicy instead of the first-touch page placement policy reduces neither the fraction of remotecache references nor the fraction of remote main memory accesses relative to the first-touchpage placement policy. However, as the interleaved policy distributes the pages of the imagedatabase across the processors of the system in a round-robin fashion, the load on the memorysystem is distributed between all memory controllers/cross-chip interconnects of the system.Using interleaved page placement for streamcluster has been previously suggested byLachaize et al. in [55] and it results in a performance improvement of 21% (106%) relative tothe default setup on the 8-core (32-core) machine.
The next scenario considered is program transformations with interleaved page placement(transformed (INTL)). The total number of transfers executed by the program decreases relativeto the previous scenario. This result indicates better cache usage. In addition, prefetchers arealso able to better predict the memory accesses of the program (see Section 4.5.2). The com-bined result of these two effects yields an additional performance improvement of 121% (50%)on the 8-core (32-core) machine. If the data distribution of the program is also set appropriately(i.e., by using per-processor memory allocation), we record an almost complete eliminationof remote main memory accesses. This setup is reported in the transformed (NA) executionscenario. For the transformed (NA) scenario we observe a performance improvement of 18%

68 CHAPTER 4. PERFORMANCE ANALYSIS OF MULTITHREADED PROGRAMS
0% 50% 100% 150% 200% 250%
original
(INTL)
transfom
ed (INT
L)
transfor
med (NA
)
Performance improvement (over original (FT))
(a) 8-core system.
0% 50% 100% 150% 200% 250%
original
(INTL)
transfom
ed (INT
L)
transfor
med (NA
)
Performance improvement (over original (FT))
(b) 32-core system.
Figure 4.12: streamcluster: Performance improvement (over original (FT)).
0 50 100 150 200 250
original
(FT)
original
(INTL)
transfom
ed (INT
L)
transfor
med (NA
)
Total uncore transfers (GTransfers)
(a) 8-core system.
0 50 100 150 200 250
original
(FT)
original
(INTL)
transfom
ed (INT
L)
transfor
med (NA
)
Total uncore transfers (GTransfers)
(b) 32-core system.
0.00.51.01.52.02.53.03.54.0
8-core 32-core
REMOTE_DRAM LOCAL_DRAM REMOTE_CACHE LOCAL_CACHE
Total uncore transfers (GTransfers)
Figure 4.13: streamcluster: Uncore memory transfers.
(38%) on the 8-core (32-core) machine, in addition to the program transformations (interleaved)scenario. In the end, the algorithmic changes coupled with per-processor memory allocation im-prove performance by 2.6X (2.94X) over the out-of-the-box version of the streamclusterbenchmark on the 8-core (32-core) machine.
ferret
Figures 4.14(a) and 4.14(b) compare the performance of ferret in the four execution scenar-ios considered, Figures 4.15(a) and 4.15(b) present the breakdown of uncore transfers corre-sponding to each scenario.
With the default setup a large fraction of ferret’s memory accesses hit in the remotecache or are served by remote main memory, thus ferret experiences large performancepenalties due to increased memory access latencies. By default, the complete image databaseis allocated at a single processor. As all threads use the database, the memory controller andcross-chip interconnect of this processor are overloaded. The interleaved policy balances theload between all memory controllers/cross-chip interconnects of the system, thus interleavedallocation results in a performance improvement of 35% relative to the default setup on the

4.5. PERFORMANCE EVALUATION 69
0% 10% 20% 30% 40% 50% 60%
original
(INTL)
transfom
ed (INT
L)
transfor
med (NA
)
replica
ted
Performance improvement (over original (FT))
(a) 8-core system.
0% 10% 20% 30% 40% 50% 60%
original
(INTL)
transfom
ed (INT
L)
transfor
med (NA
)
replica
ted
Performance improvement (over original (FT))
(b) 32-core system.
Figure 4.14: ferret: Performance improvement (over original (FT)).
0 5 10 15 20 25 30 35 40
original
(FT)
original
(INTL)
transfom
ed (INT
L)
transfor
med (NA
)
replica
ted
Total uncore transfers (GTransfers)
(a) 8-core system.
0 5 10 15 20 25 30 35 40
original
(FT)
original
(INTL)
transfom
ed (INT
L)
transfor
med (NA
)
replica
ted
Total uncore transfers (GTransfers)
(b) 32-core system.
0.00.51.01.52.02.53.03.54.0
8-core 32-core
REMOTE_DRAM LOCAL_DRAM REMOTE_CACHE LOCAL_CACHE
Total uncore transfers (GTransfers)
Figure 4.15: ferret: Uncore memory transfers.
32-core machine.
On the 8-core machine we do not observe any performance improvement with interleavedallocation. By default, the image database is allocated at a single processor and is thereforeaccessed through a single memory controller. In the 8-core machine less cores/processors (8cores/2 processors) access the image database than on the 32-core machine (32 cores/4 proces-sors); therefore the memory controller used to access the database must handle more load in the32-core machine than on the 8-core machine. As a result, distributing load across all memorycontrollers of the system this load gives more benefit on the 32-core machine than on the 8-coremachine.
The next execution scenario considered is the transformed version of the program used withinterleaved memory allocation. With this execution scenario each processor accesses only asubset of the complete image database, thus costly remote cache accesses are almost completelyeliminated. If the image database is shared between processors, each processor attempts tocache the complete image database, which can result in a cache line being loaded into multiplecaches at the same time. If data sharing is eliminated, each processor caches a distinct subset ofthe image database, therefore there is more cache capacity available to the program.
Measurements show that the cache hit rate of the program increases due to the program

70 CHAPTER 4. PERFORMANCE ANALYSIS OF MULTITHREADED PROGRAMS
transformations; this results in an additional 2% (6%) performance improvement relative tothe original (interleaved) execution scenario. Distributing pages appropriately at the processorsof the system (the transformed (NA) execution scenario) reduces the fraction of remote mainmemory references of the program and thus further improves performance by 9% (16%) on the8-core (32-core) machine. In summary, the performance of ferret improves 11% (57%) onthe 8-core (32-core) machine.
In the case of ferret, another optimization opportunity is to replicate the shared imagedatabase at each processor. Performance results for this optimization are reported as replicatedin Figures 4.14(a) and 4.14(b) (uncore transfers are reported in Figures 4.15(a) and 4.15(b)).Replication of the shared image database reduces the fraction of remote memory references,but it also reduces the effectiveness of caching because each processor’s last-level cache is usedfor caching a different replica. The results of replication are inferior to transformed (NA), whichgets the benefits of both caching and few remote memory accesses.
Replication is relatively simple to implement in case of ferret, because the performance-critical image database is read-only. In the general case (read-write accesses to replicated data),replication would require synchronizing the replicas, which can be complicated to implementand adds overhead (to limit the overhead, recent systems disable replication after a fixed numberof synchronization operations, e.g., after 5 synchronization operations in [27]). As the othertwo benchmark programs both read and write their critical data structures, we do not evaluatereplication for benchmarks other than ferret.
dedup
Figures 4.16(a) and 4.16(b) compare the performance of the four previously discussed execu-tion scenarios for the dedup benchmark. Figures 4.17(a) and 4.17(b) show the uncore trafficbreakdown for each configuration.
The shared hash table is constructed during program execution, and all threads add new filechunks to the hash table as deduplication progresses. As a result, with the first-touch alloca-tion policy the hash table is spread across the processors of the system. Therefore, all memorycontrollers/cross-chip interconnects of a system are used to access these data structures and noneof the interfaces to memory are overloaded. As a result, using the interleaved page placementpolicy does not significantly change performance over using the first-touch policy. However,the transformed version of the program uses locality-aware dispatching of data to processorsand so each processor accesses only a subset of the globally shared hash table. As a result,the fraction of remote cache accesses (and also the amount of total uncore transfers) decreaseson both machines. Due to better caching, performance increases by 6% (13%) on the 8-core(32-core) machine. In the last execution scenario considered (transformed with NUMA-awareallocation), dedup experiences fewer remote main memory transfers, which results in an addi-tional improvement of 5% (4%) on the 8-core (32-core) machine. In summary, the performanceof dedup improves 11% (17%) on the 8-core (32-core) machine over the default.
4.5.2 Prefetcher performance
The previous section evaluated in detail the performance benefits of the proposed program trans-formations, however, it did not clearly identify the benefits due to prefetching effects, because

4.5. PERFORMANCE EVALUATION 71
0%
5%
10%
15%
20%
original
(INTL)
transfom
ed (INT
L)
transfor
med (NA
)
Performance improvement (over original (FT))
(a) 8-core system.
0%
5%
10%
15%
20%
original
(INTL)
transfom
ed (INT
L)
transfor
med (NA
)
Performance improvement (over original (FT))
(b) 32-core system.
Figure 4.16: dedup: Performance improvement (over original (FT)).
0 1 2 3 4 5
original
(FT)
original
(INTL)
transfom
ed (INT
L)
transfor
med (NA
)
Total uncore transfers (GTransfers)
(a) 8-core system.
0 1 2 3 4 5
original
(FT)
original
(INTL)
transfom
ed (INT
L)
transfor
med (NA
)
Total uncore transfers (GTransfers)
(b) 32-core system.
0.00.51.01.52.02.53.03.54.0
8-core 32-core
REMOTE_DRAM LOCAL_DRAM REMOTE_CACHE LOCAL_CACHE
Total uncore transfers (GTransfers)
Figure 4.17: dedup: Uncore memory transfers.
the transition from the original (INTL) execution scenario to the transformed (INTL) showsimprovements due to both caching and prefetching effects.
To quantify how much performance benefit is due to the more regular access patterns causedby the source-level transformations, we perform a simple experiment: we execute each bench-mark with the processor prefetcher units disabled and then with prefetching enabled. In the endwe compare the performance of the two cases. The results are shown in Figure 4.18(a) (4.18(b))for the 8-core (32-core) machine.
For the original version of the program (executed in the original (INTL) scenario) there is amoderate performance improvement due to prefetching (at most 5%). The transformed versionof the program (executed in the transformed (INTL) scenario), however, shows performanceimprovements of 60% (11%) due to prefetching for the streamcluster benchmark on the 8-core (32-core) machine. For the other two benchmarks the benefit of prefetching is roughly thesame as with the original version of the program. As both programs use a hash table-based datastructure intensively, they both have irregular memory access patterns. The hash table is keyto the algorithms implemented by the programs, similarity search based on locality-sensitivehashing [63] in case of ferret, and data deduplication in case of dedup. Replacing hashtables with a different data structure would change the essence of these programs and requires

72 CHAPTER 4. PERFORMANCE ANALYSIS OF MULTITHREADED PROGRAMS
0%
20%
40%
60%
80%
streamc. ferret dedup
Performance improvement rela0ve to prefetching disabled
(a) 8-cores.
0%
5%
10%
15%
streamc. ferret dedup
Performance improvement rela0ve to prefetching disabled
(b) 32-cores.
0%
5%
10%
15%
streamc
luster
ferret
dedup
original (INTL) transformed (INTL)
Performance improvement rela0ve to prefetching disabled
Figure 4.18: Prefetcher performance.
more significant changes than those described in this chapter.
4.6 Conclusions
4.6.1 Implications for performance evaluation
Program-level data sharing and irregular memory access patterns are two factors with a largeinfluence on application performance on NUMA-multicore systems. The PARSEC benchmarkprograms, originally developed for earlier generations of symmetric multiprocessors, showsharing and access patterns that inhibit performance on modern platforms with advanced archi-tecture features such as prefetch units. These factors must be taken into account when evaluatingperformance.
By using the PARSEC programs out-of-the-box on recent NUMA-multicore systems, re-searchers might be misled to conclude that the microprocessor design, the compiler, or the run-time system are faulty when actually the application software contains performance-limitingfactors to be blamed for unsatisfactory performance. The measurement methodology pre-sented in this chapter allows for pinpointing software-related problems detrimental to NUMA-multicore memory system performance. Furthermore, we show that in many cases minorprogram-level adjustments suffice to fix these problems.
There are scenarios when it is important to use an out-of-the-box version of an applicationfor performance evaluation. But when, for example, in a research setting, new features are tobe evaluated, it is essential to identify limitations of an application’s implementation that standin the way of meaningful performance measurements. Publishing not only the results of theevaluation but also the software-level changes required to achieve them is necessary to fullyunderstand a workload’s or a system’s performance characteristics.
4.6.2 Implications for performance optimizations
Our experience with multithreaded programs from the PARSEC suite shows that programs canbe adjusted with minimal effort to fit modern memory system architectures. The transforma-tions result in better data locality (fewer accesses to remote data), better use of the caches, and

4.6. CONCLUSIONS 73
increased effectiveness of the prefetch unit. Simple source-level changes result in high perfor-mance improvements (up to 2.9X) for three benchmark programs on recent NUMA-multicores.The chapter reports detailed measurements of orthogonal experiments to quantify how thesechanges individually effect each distinct layer of a modern NUMA-multicore memory system.
Most program transformations described in this chapter improve the locality of cache- andmain memory accesses. We compare data locality optimizations with other optimization tech-niques proposed in the literature (e.g., interleaved memory allocation and data replication [27]).We find that in most cases optimizing multithreaded programs for data locality can result in bet-ter performance than any of alternative techniques we looked at. As we expect the performancegap between local and remote accesses to widen (with an increased number of processors andlarger caches), it is important that software developers have the tools and insight necessary toanalyze and understand problems related to data locality. Moreover, as the proposed source-level changes are specific to the PARSEC programs, more general approaches to implementdata locality optimizations are worthwhile to be considered for investigation.


5Matching memory access
patterns and data placement
The locality of a multithreaded program’s memory accesses can critically influence a program’sperformance. The previous chapter shows that in some cases minor source-level changes sufficeto achieve good data locality and thus improve performance. Moreover, by applying differentmanual optimization techniques to a single program we are able to better understand the wayeach technique effects the memory system. Nevertheless, the optimization techniques proposedin the previous chapter are ad-hoc, that is, they are specific to the programs considered.
This chapter investigates more systematic approaches to achieve good data locality for loop-parallel programs. In the first part of the chapter we analyze the memory system behavior ofmultithreaded scientific computations of the NAS Parallel Benchmark (NPB) suite [48]. Exper-iments show that in many of these computations the threads access a large number of memorylocations, and we characterize the applications with regard to their access patterns. A conse-quence of these access patterns is that it is difficult to obtain good data locality (and thus goodperformance) on NUMA systems. The experiments show furthermore that data migration (bothprofile- and program-based migration) and locality-aware iteration scheduling can in some casessoften the problems caused by global accesses, however, in many cases the overhead and/or thecomplexity of using these mechanisms cancels the benefits of good data locality (or worse).
The mismatch between the distribution of data across processors and the accesses to thesedata as performed by the processors’ cores is immediately felt by users of popular parallelizationdirectives like OpenMP. These directives allow partitioning of computations but do not allow aprogrammer to control either the mapping of computations to cores, or the placement of datain memory. In the second part of this chapter we present a small set of user-level directivesthat, combined with simple program transformations, can almost completely eliminate remotememory accesses for programs of the NPB suite and thus result in a performance improvementof up to 3.2X over the default setup in a 4-processor 32-core machine.
5.1 Memory system behavior of loop-parallel programs
5.1.1 Experimental setup
This section presents an analysis of the memory behavior of data-parallel programs of the NPBsuite version 2.3 [48]. Table 5.1 shows a short characterization of the NPB programs. The pro-grams are executed on the 2-processor 8-core Nehalem-based machine configured with 12 GB
75
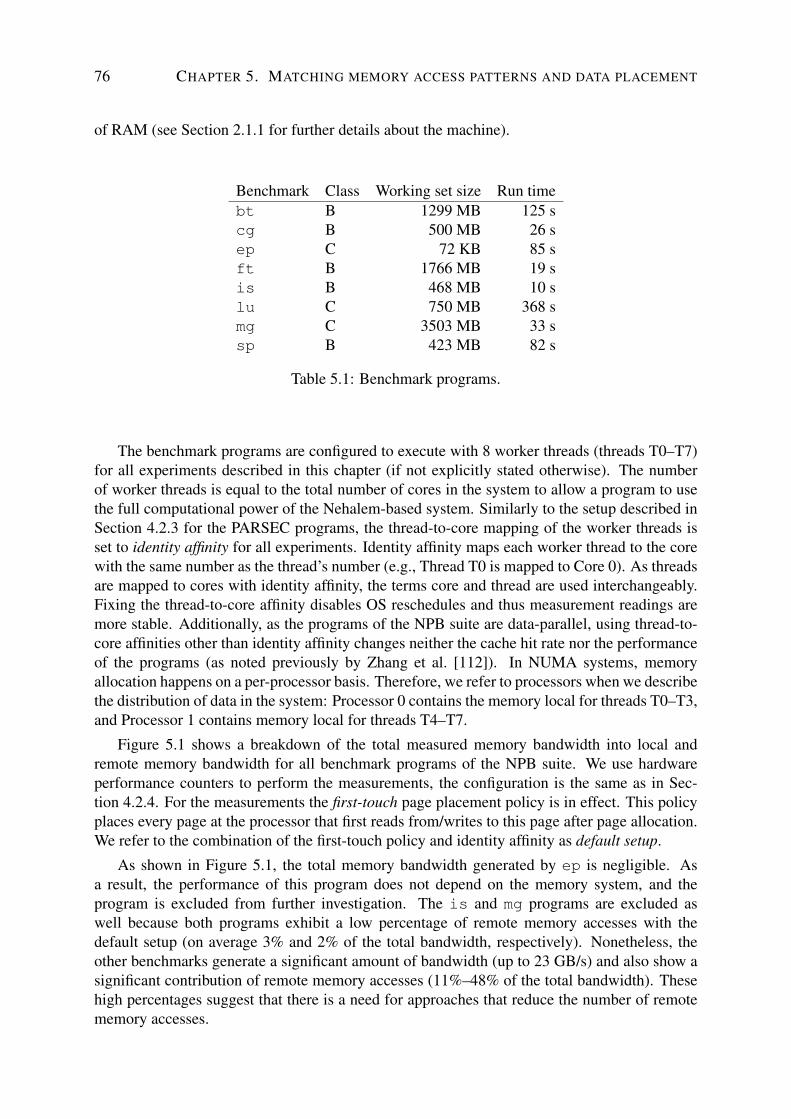
76 CHAPTER 5. MATCHING MEMORY ACCESS PATTERNS AND DATA PLACEMENT
of RAM (see Section 2.1.1 for further details about the machine).
Benchmark Class Working set size Run timebt B 1299 MB 125 scg B 500 MB 26 sep C 72 KB 85 sft B 1766 MB 19 sis B 468 MB 10 slu C 750 MB 368 smg C 3503 MB 33 ssp B 423 MB 82 s
Table 5.1: Benchmark programs.
The benchmark programs are configured to execute with 8 worker threads (threads T0–T7)for all experiments described in this chapter (if not explicitly stated otherwise). The numberof worker threads is equal to the total number of cores in the system to allow a program to usethe full computational power of the Nehalem-based system. Similarly to the setup described inSection 4.2.3 for the PARSEC programs, the thread-to-core mapping of the worker threads isset to identity affinity for all experiments. Identity affinity maps each worker thread to the corewith the same number as the thread’s number (e.g., Thread T0 is mapped to Core 0). As threadsare mapped to cores with identity affinity, the terms core and thread are used interchangeably.Fixing the thread-to-core affinity disables OS reschedules and thus measurement readings aremore stable. Additionally, as the programs of the NPB suite are data-parallel, using thread-to-core affinities other than identity affinity changes neither the cache hit rate nor the performanceof the programs (as noted previously by Zhang et al. [112]). In NUMA systems, memoryallocation happens on a per-processor basis. Therefore, we refer to processors when we describethe distribution of data in the system: Processor 0 contains the memory local for threads T0–T3,and Processor 1 contains memory local for threads T4–T7.
Figure 5.1 shows a breakdown of the total measured memory bandwidth into local andremote memory bandwidth for all benchmark programs of the NPB suite. We use hardwareperformance counters to perform the measurements, the configuration is the same as in Sec-tion 4.2.4. For the measurements the first-touch page placement policy is in effect. This policyplaces every page at the processor that first reads from/writes to this page after page allocation.We refer to the combination of the first-touch policy and identity affinity as default setup.
As shown in Figure 5.1, the total memory bandwidth generated by ep is negligible. Asa result, the performance of this program does not depend on the memory system, and theprogram is excluded from further investigation. The is and mg programs are excluded aswell because both programs exhibit a low percentage of remote memory accesses with thedefault setup (on average 3% and 2% of the total bandwidth, respectively). Nonetheless, theother benchmarks generate a significant amount of bandwidth (up to 23 GB/s) and also show asignificant contribution of remote memory accesses (11%–48% of the total bandwidth). Thesehigh percentages suggest that there is a need for approaches that reduce the number of remotememory accesses.

5.1. MEMORY SYSTEM BEHAVIOR OF LOOP-PARALLEL PROGRAMS 77
0
5
10
15
20
25
bt cg ep ft is lu mg sp
Local bandwidth Remote bandwidth
Memory bandwidth [GB/s]
Figure 5.1: Memory bandwidth generated by the programs of the NPB suite.
5.1.2 Data address profiling
To explore the memory performance issues in a limit study, we profile the execution of the NPBprograms using the latency-above-threshold profiling mechanism of the Intel Nehalem microar-chitecture. As already described in Section 4.3.1, this performance-counter-based mechanismsamples memory instructions with access latencies higher than a predefined threshold and pro-vides detailed information about the data address used by each sampled instruction. Based onthe sampled data addresses it is straightforward to estimate the number of times each page ofthe program’s address space is accessed by each core of the system. To account for accesses toall levels of the memory hierarchy, we set the latency threshold to 4 cycles (accesses to the firstlevel cache on the Nehalem-based system have a minimum latency of 4 cycles). We use a sam-pling rate of 1. The profiling technique is portable to many different microarchitectures, becausemost recent Intel microarchitectures support latency-above-threshold profiling and AMD pro-cessors support Instruction-Based Sampling [13], a profiling mechanism very similar to that ofIntel’s. Moreover, on architectures without hardware support for data address profiling, addressprofiles can be collected using software-only techniques as well [62].
As memory access profiling on the Intel Nehalem is sampling-based, not all pages of theprogram’s address space appear in the profiles. Figure 5.2(a) shows for each program the per-centage of the virtual address space covered by samples. A page of the address space is coveredif there is at least one sample in the profiles to an address that belongs to the page in question.Samples cover a large portion of the address space (up to 90%). The coverage is low in the caseof cg because around 50% of the program’s address space is occupied by data structures thatstore temporary data. As these structures are used only during the initialization phase of theprogram, very few samples are gathered for pages that store these structures.
A program’s address space can be divided into three categories. The first category containsprivate pages that belong to each thread’s stack. As the stack is private for each thread, the first-touch policy (remember that we profile program execution with the default setup) can allocatethe pages for thread-private stacks on each thread’s processor. The first category also containspages that are reserved for dynamically linked shared objects and the program’s image in mem-ory. These latter regions are small and are shared by all threads. As not much can be done forthe first category of pages as far as data placement is concerned, these pages are excluded fromfurther analysis and optimizations.

78 CHAPTER 5. MATCHING MEMORY ACCESS PATTERNS AND DATA PLACEMENT
0%
20%
40%
60%
80%
100%
bt cg ft lu sp
Shared pages Non-shared pages Private pages
Percentage total virtual address space covered by samples
(a) Sampled and covered address space.
0%
20%
40%
60%
80%
100%
0%
10%
20%
30%
bt cg ft lu sp
Improvement with profile-based allocation (over default setup)
Remaining remote memory acceses after profile-based allocation
Performance improvement Remaining remote accesses
(b) Performance improvement; remaining remote accesses.
Figure 5.2: Data address profiling.
Most data accessed by the computations is allocated on the heap, which holds the secondand third category of pages. Some heap pages are exclusively accessed by a single thread, thusthese pages are non-shared. Other heap regions, however, are accessed by multiple threads, andare thus shared. Figure 5.2(a) shows the percentages of the address space that belong to thethree categories previously described. The NPB programs we consider exhibit various degreesof sharing, ranging from almost no sharing (e.g., cg) to intense sharing when up to 51% of theprogram address space is accessed by multiple threads (e.g., lu).
5.1.3 Profile-based page placement
Profiles provide a great deal of information about the access patterns of a program, but the use-fulness of profiles for optimizing data locality remains to be determined. To optimize data lo-cality we adapt the profile-based page placement approach described by Marathe et al. [67, 68],and we use a simple heuristic to determine for each page the processor where the page shouldbe allocated at: On a profile-based run of a benchmark we allocate each page on the proces-sor whose cores accessed the page the most frequently. Figure 5.2(b) shows the performance

5.2. MEMORY ACCESS AND DISTRIBUTION PATTERNS: A DETAILED LOOK 79
improvement over the default setup when profile-based memory allocation is used. The perfor-mance measurements include the overhead of reading the profiles and placing data into memory.Profile-based allocation performs well for only the cg benchmark, which improves 20%; theremaining benchmarks show minor or no performance improvement over the default setup.
The same figure (Figure 5.2(b)) shows also the percentage of the programs’ default remotememory accesses remaining after profile-based allocation. The performance improvement cor-relates well with the reduction of the remote memory traffic measured with the default setup.For cg (the program with the largest performance improvement) a small percentage of the de-fault remote memory accesses remains after profile-based allocation. For programs with littleor no performance improvement (e.g., lu) remote memory traffic is the same as with the de-fault setup, because profile-based memory allocation was not able to determine a distribution ofpages in memory that reduces or removes remote memory traffic (that was originally observedwith the default setup).
The information about the number of shared pages (Figure 5.2(a)) provides additional in-sights into the performance improvement due to profile-based allocation (Figure 5.2(b)): thecg benchmark, which has a small fraction of shared pages, improves with profile-based mem-ory allocation 1, but the other benchmarks, which have a high fraction of shared pages, donot. Benchmarks with high degree of sharing have the same number of remote memory ac-cesses both with profile-based memory allocation and the default setup (Figure 5.2(b)). Thesemeasurements show that profile-based allocation cannot correctly allocate exactly those pagesthat are shared between multiple processors. In this chapter we describe various techniques toimprove the performance of programs with a high degree of data sharing.
5.2 Memory access and distribution patterns: A detailed look
NUMA systems introduce another aspect into the problem of managing a program’s data space.The program’s computation determines the memory locations that are accessed; directives (e.g.,OpenMP) or compilers and the runtime system determine how computations are partitionedrespectively mapped onto cores. A simple characterization of memory access patterns providesa handle to understand the memory behavior of programs. We start with the memory allocationand data access patterns that frequently appear in scientific computations (and thus in the NPBprograms). Then we analyze the ability of different mechanisms (in-program data migrationand loop iteration distribution) to improve data locality.
5.2.1 In-memory representation of matrices
Many scientific computations process multidimensional matrices. Figure 5.3 shows a three-dimensional matrix stored in memory (in row-major order, addresses increase from left to rightand from top to bottom, respectively). The matrix contains NX = 5 rows (the size of the matrixalong the x-dimension, shown vertically in the figure). Each row contains NY = 4 columns
1The cg benchmark touches most of its data for the first time during the initialization phase of the benchmark.The initialization phase of the benchmark is sequential; as a result, most of the benchmark’s data is allocated ata single processor (i.e., the processor where the initialization phase is executed). In the computational phase ofthe program, however, each thread predominantly accesses a disjoint subset of the benchmark’s data. As a result,profile-based can place most pages of the benchmark at the appropriate processor.

80 CHAPTER 5. MATCHING MEMORY ACCESS PATTERNS AND DATA PLACEMENT
NX
NY
NZ
NZ
NZ
NZ
NZ
NZ
NZ
NZ
NZ
NZ
NZ
NZ
NZ
NZ
NZ
NZ
0
1
2
3
4
NZ NZ NZ NZ
0 1 2 3
Figure 5.3: Memory layout of 3D matrix (row-major order).
(the size of the matrix along the y-dimension, shown horizontally). As the matrix has a third,z-dimension, the matrix contains a block of NZ items for each (x,y) element. The memorylayout of matrices with dimensionality higher than three is analogous to the three-dimensionalcase, therefore we do not discuss such matrices in detail. Moreover, to keep the followingdiscussion simple, we focus on two-dimensional matrices.
5.2.2 Matrix memory access patterns
When we study processor memories that are accessed by threads of scientific computations, weencounter two frequent data access and data distribution patterns for two-dimensional matrices.We call these the x-wise and y-wise pattern, respectively.
x-wise pattern Figure 5.4(a) shows a simple loop that accesses all elements of a two-dimensional matrix. In this example the outermost loop (the loop that iterates along the xdimension of the matrix) is parallelized with a standard OpenMP parallel for construct.The loop iterations are distributed across all worker threads (here: eight threads). Each threadgets a chunk of size D = NX / 8 of the total iteration space (assuming that NX is an integermultiple of 8). Figure 5.4(c) shows the assignment of iterations to worker threads for the codeshown in Figure 5.4(a). Each thread T0 to T7 accesses D non-overlapping rows of the matrix.Figure 5.4(c) shows the distribution of the matrix’s memory in the system for an x-wise dataaccess pattern. As we map threads to cores with identity affinity, the first-touch policy allocatesthe first 4 × D rows at Processor 0 and the second 4 × D rows at Processor 1. We call thisdistribution of the matrix in memory an x-wise data distribution.
y-wise pattern If the second for loop (the one that sweeps the y-dimension) is parallelized(as shown in Figure 5.4(b)), the result is a different, y-wise, data access and distribution pattern.Figure 5.4(d) shows both the allocation of the iteration space to worker threads and the distri-bution of the matrix memory to processors (based on a first-touch allocation). With the y-wiseaccess pattern, the first 4 × D columns are allocated at Processor 0, and the second 4 × Dcolumns are allocated at Processor 1.
Some programs that operate on data with a dimensionality higher than two can have higherorder access patterns. For example, in the case of a z-wise access pattern the iteration and datadistribution is analogous to the x-wise and y-wise patterns, respectively. The only difference isthat the blocks of data are distributed among the threads and processors of the system along thez-dimension.

5.2. MEMORY ACCESS AND DISTRIBUTION PATTERNS: A DETAILED LOOK 81
#pragma omp parallel for
for (i = 0; i < NX; i++)
for (j = 0; j < NY; j++)
// access m[i][j]
(a) x-wise data access pattern.
for (i = 0; i < NX; i++)
#pragma omp parallel for
for (j = 0; j < NY; j++)
// access m[i][j]
(b) y-wise data access pattern.
T1
T2
T3
T4
T5
T6
T7
T0
D
D
D
D
D
DD
D
NY
NX
Memory allocated at Processor 0
Memory allocated at Processor 1
(c) x-wise iteration distribution.
NX
D
T1 T2 T3 T4 T5 T6 T7T0
D D D D D D D
NY
Memory allocated at Processor 0
Memory allocated at Processor 1
(d) y-wise iteration distribution.
T1
T2
T3
T4
T5
T6
T7
T0
D
D
D
D
D
DD
D
NY
NX
D
T1 T2 T3 T4 T5 T6 T7T0
D D D D D D D
Non-shared memory
Shared memory
Stage 1: x-wise access
Stage 2: y-wise access
(e) Data sharing.
Figure 5.4: Access and distribution patterns; data sharing.

82 CHAPTER 5. MATCHING MEMORY ACCESS PATTERNS AND DATA PLACEMENT
5.2.3 Data sharing
The problem of many data-parallel programs is that in many cases programs access a singlememory region with multiple data access patterns. Let us assume that a two-dimensional matrixis accessed in two stages by eight worker threads (T0–T7). In the first stage (Figure 5.4(c)) theworker threads access the matrix with an x-wise access pattern, followed by a y-wise accesspattern in the second stage (Figure 5.4(d)). Figure 5.4(e) shows the iteration distribution (i.e.,mapping of rows respectively columns to threads for processing) for both stages: the iterationspace distribution of the two stages overlaps.
If we divide the matrix into four equal-sized memory sub-regions (quadrants), then in bothstages the upper left and lower right quadrants of the matrix are accessed exclusively by threadsT0–T3 and threads T4–T7, respectively. Therefore, these quadrants are non-shared and allo-cating these quadrants at Processor 0 (Processor 1) guarantees good data locality for threadsT0–T3 (T4–T7).
The upper right and lower left quadrants, however, are accessed (and thus shared) by allthreads. For our example, shared quadrants constitute 50% of the memory region presentedin this example. In this case the shared quadrants of the matrix are accessed equally often bythe threads of all processors of the NUMA system. Therefore, the profile-based optimizationtechnique described in Section 5.1 cannot determine the processor memory that should storethese quadrants. If the processor of threads T0–T3 is preferred in allocation, then threads T4–T7must access these regions remotely (or threads T0–T3 access their regions remotely if threadsT4–T7 are preferred). For many programs that perform scientific computations data sharingis a major performance limiting factor, as we have previously seen in Section 5.1. In the nextsection we describe in more depth two real-world examples of data-sharing, the bt and ftbenchmarks from NPB.
5.2.4 Two examples: bt and ft
The bt benchmark is a 3D computational fluid dynamics application [48] that iteratively solvesthe Navier-Stokes partial differential equations using the alternating direction implicit method(implemented by the adi() function in Figure 5.5). The adi() function calls several otherfunctions (also listed in the figure). These functions operate mostly on the same data, but theyhave different access patterns: The functions compute rhs(), y solve(), z solve(),and add() have an x-wise access pattern, but the function x solve() accesses memory y-wise. Moreover, as the adi() function is also used for data initialization in the first stageof bt, some of the regions (the ones that are first touched in compute rhs()) are laid outx-wise in memory, and some of the regions (first used in x solve()) are laid out y-wise. Asa result of this mismatch in data access and memory allocation patterns a high percentage ofthis program’s virtual address space is shared (35%), and the program has a high percentage ofremote memory accesses (19%).
The ft benchmark implements a spectral method that is based on a 3D Fast Fourier Trans-form (FFT). The memory access patterns of ft are similar to that of bt: the ft benchmarkalso alternates between accessing memory with x-wise and y-wise access patterns. ft showsless sharing than bt (9% of the program’s virtual address space is shared vs. 19% sharing), butft has a larger fraction of remote main memory references than bt (41% vs. 35%).

5.2. MEMORY ACCESS AND DISTRIBUTION PATTERNS: A DETAILED LOOK 83
1: adi() {
2: compute_rhs(); // x-wise pattern
3: x_solve(); // y-wise pattern
4: y_solve(); // x-wise pattern
5: z_solve(); // x-wise pattern
6: add(); // x-wise pattern
7: }
Figure 5.5: bt data access patterns.
1: adi() {
2: compute_rhs();
3:
4: distribute_to(y_wise);
5: x_solve();
6:
7: distribute_to(x_wise);
8: y_solve();
9:
10:
11: z_solve();
12:
13:
14: add();
15: }
Memory allocated at Processor 1
Memory allocated at Processor 0
Figure 5.6: bt with in-program data migration.
In-program data distribution changes
A simple approach to reduce the fraction of remote memory accesses of programs with datasharing is to change the distribution of the program’s data on-the-fly so that it matches eachdifferent access pattern that appears during program execution. A similar approach has beendescribed by Bikshandi et al. for a program that calculates the FFT of 3D data in a cluster con-text [11]. To evaluate the effectiveness of this approach in shared-memory systems we insertinto the code of the bt program calls to functions that change the data distribution in the sys-tem (lines 4 and 7 in Figure 5.6). These functions are based on the migration primitives offeredby the OS (see Section 5.3 for more details about the implementation). The data distributionof the regions accessed by x solve() is changed to y-wise data distribution before the callto x solve() and then changed back to x-wise after the x solve() function completes.The adi() function is executed in a tight loop; therefore, starting with the second iterationof the loop, the compute rhs() function will encounter the correct, x-wise, data distribu-tion it requires (due to the previous iteration of adi()). Similar in-program data distribution

84 CHAPTER 5. MATCHING MEMORY ACCESS PATTERNS AND DATA PLACEMENT
0%
20%
40%
60%
bt ft default setup in-program data migration
Remote bandwidth relative to total bandwidth
(a) Remote bandwidth.
0
1
2
3
bt ft computation data migration
Execution time relative to default setup
(b) Performance.
Figure 5.7: Evaluation of in-program data migration.
changes can used in case of the ft benchmark, as the memory access pattern of the ft programalternates between x-wise and y-wise as well.
Figure 5.7(a) compares the bandwidth distribution of the default setup (first-touch memoryallocation) with dynamic in-program data distribution changes for ft and bt. The figure re-ports the percentage of remote accesses relative to the total number of accesses, as measured inuser-mode. As data migration is performed by the kernel, the bandwidth generated by data mi-grations is not included in the figure. The measurements show that in-program data distributionsignificantly improves data locality for these two programs (bt: reduction of the percentageremote accesses from 19% to 1%, ft: reduction from 43% to 8%). This reduction of the frac-tion of remote accesses results in a reduction of execution time of the computations, as shownin Figure 5.7(b) (this figure shows execution time relative to the default setup, therefore lowernumbers are better). For the computation part, bt experiences a performance improvement ofaround 10%, and ft speeds up 16%. However, if we account for the overhead of data mi-gration, the total performance is worse than without data migration (bt slows down 2.5X, ftslows down 1.4X).
In conclusion, in-program data migration can eliminate remote memory accesses by guaran-teeing the data distribution required by each access pattern of the program. However, if accesspatterns change frequently (as it is in the case of bt and ft), the overhead of data migrationcancels the benefits of data locality. Moreover, data migrations serialize the execution of mul-tithreaded code, because access to the page tables shared by the threads requires acquiring ashared lock (parallel migrations do not result in any improvement relative to serial migrations).As a result, in-program data distribution changes should be avoided for programs with frequentaccess pattern changes (but data migration could be still a viable option for coarser-grainedparallel programs).
Iteration redistribution
Changing the data distribution at runtime causes too much overhead to be a viable option forprograms with alternating memory access patterns. As changing the distribution of compu-tations has far less overhead than redistributing data, in this section we explore the idea ofchanging the schedule of loop iterations so that the access patterns of the program match the

5.2. MEMORY ACCESS AND DISTRIBUTION PATTERNS: A DETAILED LOOK 85
NY
NX
(a) y-wise parallelization.NY
NX
(b) x-wise parallelization.
Figure 5.8: Access patterns of code with y-wise dependences.
distribution of data in memory.
We start with a simple approach: As the majority of the functions executed by bt has anx-wise access pattern, we change the distribution of all program data to x-wise (at programstartup). As a result, most functions experience good data locality and their performance im-proves. However, as the function x solve() has a y-wise access pattern, the number ofremote memory accesses it must perform increases due to the change of the data distribution tox-wise. At the end, the performance of the whole program (bt) does not improve. The sameapproach eliminates some of the remote memory accesses of ft (a reduction of the fraction ofremote memory references from 43% to 18%), but results only in a small improvement (2%).
As the data distribution of all data structures is now set to x-wise, we attempt to improveperformance by changing the memory access pattern of all y-wise loops to x-wise. In caseof bt, we change the distribution of loop iterations in x solve() to x-wise. Our approachis similar to those described in [51, 58]. This transformation, although it requires significantsource-level changes, reduces the percentage of remote memory accesses from 19% to 2%, andimproves the performance of bt significantly (by 14% relative to the default setup).
Transforming ft in the same way as bt would, however, require, inserting additional syn-chronization operations into the program code. Y-wise loops in ft have loop-carried depen-dences along the y-dimension of the processed data. Usually, iterations of loop-parallel codeare distributed among worker threads so that loop-carried dependences are within the iterationspace assigned to each thread for processing. The reason for that is to keep the number ofinter-thread synchronization operations low: if data dependences are within the iteration spaceassigned to each thread, threads do not need to synchronize. For example, Figure 5.8 shows thedistribution of the iteration space for two different parallelizations of a computation that has y-wise data dependences. In the first, y-wise, parallelization (Figure 5.8(a)) the loop dependencesdo not cross per-thread iteration space boundaries. In the second, x-wise parallelization of thecode (Figure 5.8(b)) the data dependences cross iteration space boundaries, thus inter-threadsynchronization is required. The overhead of inter-thread synchronization is potentially highand it can potentially cancel the benefit of data locality achieved with redistributing iterations,thus we do not explore this option for ft.

86 CHAPTER 5. MATCHING MEMORY ACCESS PATTERNS AND DATA PLACEMENT
data_distr_t *create_block_cyclic_distr(
void *m, size_t size, size_t block_size);
(a) Block-cyclic data layout.
data_distr_t *create_block_exclusive_distr(
void *m, size_t size, size_t block_size);
(b) Block-exclusive data layout.
void distribute_to(data_distr_t *distr);
(c) Apply data layout.
Figure 5.9: Data distribution primitives.
5.3 Fine-grained data management and work distribution
In-program data migration can be used to match the data distribution in the system to the accesspatterns of programs with data sharing; however, the high cost of the data migration cancelsthe benefit of improved data locality. Similarly, it is also possible to redistribute computationsso that the data access patterns of the program match a given data distribution, however thismethod can introduce potentially large synchronization overhead. To address the dual problemof distributing computations and data, we describe a simple system API that can be used tochange both the distribution of computations and the distribution of data in the system. Usingthe described API together with simple program-level transformations can almost completelyeliminate remote memory accesses in programs with data sharing and thus helps to better exploitthe performance potential of NUMA systems. The API presented here is implemented as alibrary and a set of C preprocessor macros. The API offers two kinds of language primitives:primitives to manipulate the distribution of a program’s data and additional schedule clauses fordistribution of loop iterations.
5.3.1 Data distribution primitives
Block-cyclic data distribution
The function create block cyclic distr() (shown in Figure 5.9(a)) is used to definea block-cyclic data distribution [12]. The block size given as a parameter to this function influ-ences the data distribution. Consider the case of a memory region that stores a two-dimensionalmatrix of size NX × NY (as shown in Figure 5.4(c)). If the block size is NX × NY / 2,the data region will be x-wise distributed as shown in Figure 5.4(c). If, however, the size ofthe block is NY / 2, the region will be y-wise distributed (Figure 5.4(d)). By further varyingthe block size the function can be used to set up a block-cyclic distribution for matrices withdimensionality higher than two as well.
Applying data distributions
The primitives of the API decouple the description of the data distribution from the oper-ations to implement a chosen data distribution. The function create block cyclic -

5.3. FINE-GRAINED DATA MANAGEMENT AND WORK DISTRIBUTION 87
distr() defines only a description of the distribution in memory of a given memory re-gion m (the memory region is passed to the function as a parameter; the memory region canbe, e.g., a two-dimensional matrix similar to the one described in Section 5.2). The functiondistribute to() shown in Figure 5.9(c) takes this description and then applies it (i.e., thefunction migrates data to enforce the distribution). For example, the in-program data distribu-tion described earlier for the bt and ft benchmarks uses this call to change the distributionof data in the system at runtime (see lines 4 and 7 of Figure 5.6). The implementation of thedistribute to() call relies on the Linux-standard move pages() system call. OtherOSs have similar mechanisms for user-level data migration that can be alternatively used. Inthe current implementation data distribution can be enforced at page-level granularity.
Block-exclusive data distribution
Access patterns cannot be easily changed, as changing the access pattern of code with loop-carried dependences can require frequent inter-thread synchronization. Inter-thread synchro-nization causes overhead and as a result the data locality gained from changing access patternsmight not increase performance. Alternatively, the distribution of a data region can be changedto block-exclusive (see Figure 5.10(a)). The key idea behind using a block-exclusive distribu-tion is that a region with a block-exclusive distribution can be swept by two different data accesspatterns (e.g, with an x-wise and a y-wise access pattern) with no parts of the memory regionshared between the processors of the system2. As a result, a block-exclusive data region can beplaced at processors so that all accesses to the region are local.
To illustrate the advantages of the block-exclusive data distribution let us consider thesimple example when eight worker threads access the block-exclusive memory region in Fig-ure 5.10(a). To simplify further discussion, we divide the memory region into four equal-sizedquadrants (Q1–Q4). The eight worker threads considered in this example traverse the mem-ory region with two different access patterns, first with an x-wise access pattern followed by ay-wise access pattern.
The x-wise traversal of the memory region must be processed in two phases due to the block-exclusive data distribution of the region. These two phases are illustrated in Figure 5.10(b) resp.Figure 5.10(c). In the first phase (Figure 5.10(b)) the worker threads process in parallel the lefthalf of the data region (quadrants Q1 and Q3). The iteration distribution is standard OpenMPstatic scheduling: threads are assigned iterations in the ascending order of their respective threadnumber (threads T0–T3 process Q1, threads T4–T7 process Q3)3. As a result, all threads accessmemory locally. In the second phase (Figure 5.10(c)) the threads process quadrants Q2 and Q4,which are allocated to processors in a different order than quadrants Q1 and Q3. To guaranteedata locality in the second phase as well, the distribution of iterations between the threads isdifferent from the first processing phase: threads T0–T3 process quadrant Q4, and threads T4–T7 process quadrant Q2 (as shown in Figure 5.10(c)). Between the two phases of the x-wisetraversal, thread synchronization is required; however, as there is only one place in the traversal
2Intuitively, a block-exclusive data distribution allows threads to sweep the data region with both and x-wiseand y-wise pattern so that threads running at each processor access a part of the data region mostly exclusively (inmany cases sharing between processors cannot be often completely eliminated as in practice data distributions canbe enforced only at page-level granularity).
3The OpenMP standard [16] does not require an assignment of loop iterations to threads in ascending order;however, many OpenMP implementations (e.g., the OpenMP implementation of GCC) assign loop iterations tothreads that way.
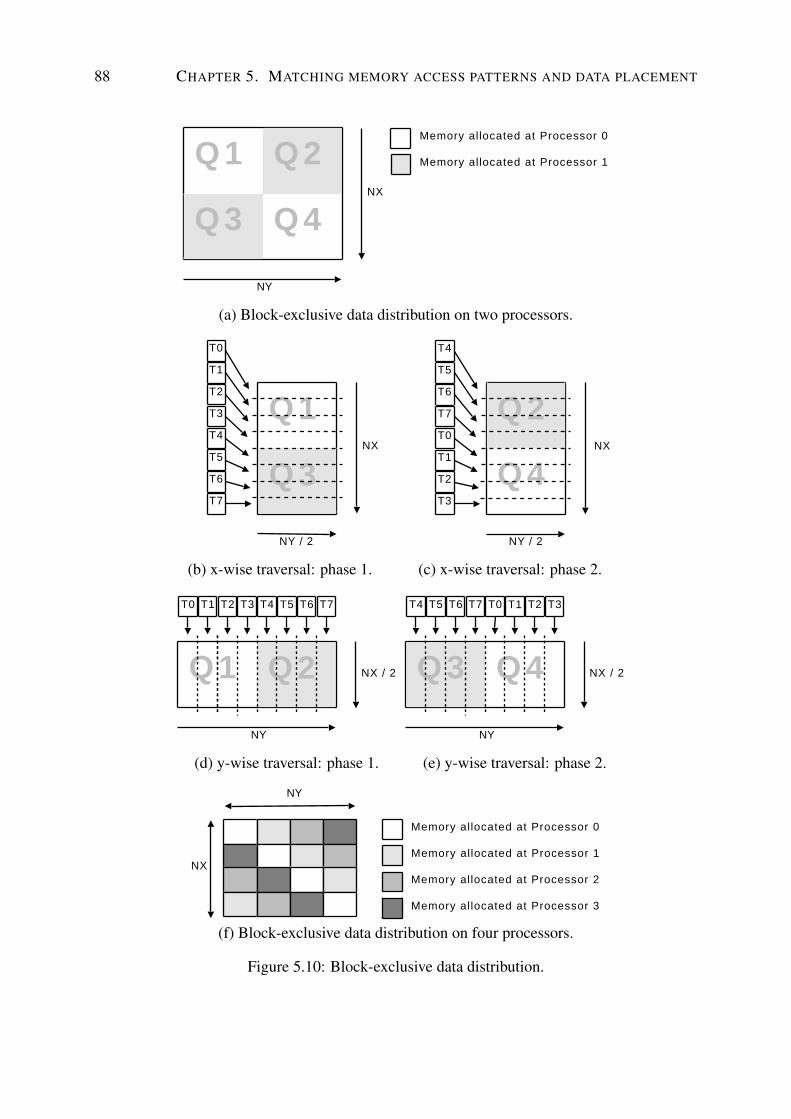
88 CHAPTER 5. MATCHING MEMORY ACCESS PATTERNS AND DATA PLACEMENT
NX
NY
Memory allocated at Processor 0
Memory allocated at Processor 1Q1 Q2
Q3 Q4
(a) Block-exclusive data distribution on two processors.
T1
T2
T3
T4
T5
T6
T7
T0
NY / 2
NX
Q1
Q3
(b) x-wise traversal: phase 1.
T5
T6
T7
T0
T1
T2
T3
T4
NY / 2
NX
Q2
Q4
(c) x-wise traversal: phase 2.
NX / 2
T1 T2 T3 T4 T5 T6 T7T0
NY
Q1 Q2
(d) y-wise traversal: phase 1.
NX / 2
T5 T6 T7 T0 T1 T2 T3T4
NY
Q3 Q4
(e) y-wise traversal: phase 2.
01
NX
NY
Memory allocated at Processor 0
Memory allocated at Processor 1
Memory allocated at Processor 2
Memory allocated at Processor 3
(f) Block-exclusive data distribution on four processors.
Figure 5.10: Block-exclusive data distribution.

5.3. FINE-GRAINED DATA MANAGEMENT AND WORK DISTRIBUTION 89
where cross-thread data is accessed (when execution transitions from processing the first twoquadrants to processing the second two), the cost of this synchronization is negligible.
Data sharing is in many cases caused by a memory region being traversed with an x-wisepattern followed by a y-wise pattern. So far we have seen an x-wise traversal of a block-exclusive memory region. A y-wise traversal of the same memory region is also possible, and itproceeds in two phases. In the first phase (Figure 5.10(d)) the worker threads process quadrantsQ1 and Q2, followed by quadrants Q3 and Q4 in the second phase (Figure 5.10(e)). As thedistribution of loop iterations in the phases of the y-wise traversal is similar to the case of thex-wise traversal, we do not discuss it any further. Please note, however, that the y-wise traversalof the memory region guarantees data locality as well.
Figure 5.9(b) shows the programming language primitive to create a block-exclusive datadistribution. So far we have discussed the block-exclusive layout only for two processors. Us-ing the create block exclusive distr() on a system with a number of processorshigher than two results in a latin-square [26, 98] distribution of memory. The latin-squaredistribution of a two-dimensional matrix on a 4-processor system is shown in Figure 5.10(f).The data distribution primitives described in this section can be used in a system with anynumber of cores/processors. The primitives only require that information about the number ofcores/processors is available at runtime (which is the case in many recent OSs, e.g., on Linuxthe libnuma library makes hardware-related information available at runtime).
5.3.2 Iteration distribution primitives
Well-known methods for iteration distribution, like static scheduling, are inflexible and cannotalways follow the distribution of data in the system. For example, the assignment of loopiterations to data shown in Figure 5.10(c) or Figure 5.10(e) is impossible in an OpenMP-likesystem. To alleviate this problem we provide a directive (shown in Figure 5.11(a)) to scheduleloop iterations with inverse static scheduling.
Similar to OpenMP static scheduling, inverse static scheduling partitions the iteration spaceof a loop into non-overlapping chunks and then assigns each chunk to a worker thread forprocessing. Figures 5.10(b) shows the assignment of loop iterations to worker threads withstandard OpenMP static scheduling: Threads are assigned loop iterations in the ascending orderof their respective thread number. Figure 5.10(c) shows the assignment of loop iterations toworker threads with inverse static scheduling (assuming a 2-processor system): The first halfof the loop iteration space is assigned to the second half of worker threads (threads T4–T7),the second half of the iteration space is assigned to the first half of the worker threads (threadsT0–T3). With static inverse scheduling, data locality can be achieved also for code accessingregions with distribution as in Figure 5.10(c) or Figure 5.10(e). To simplify the discussion andto improve the readability of code examples, Figure 5.11(a) shows a possible way to includeinverse scheduling into the OpenMP standard (and not the current implementation of inversescheduling using macros).
We have seen in the previous section that the block-exclusive data distribution can be gen-eralized to any number of processors (see Figure 5.10(f) for the 4-processor case). As thedistribution of loop iterations must match the distribution of data in the system for data local-ity, inverse scheduling must be generalized to any number of processors as well. We call thegeneralized scheduling primitive block-exclusive scheduling (syntax shown in Figure 5.11(b)).

90 CHAPTER 5. MATCHING MEMORY ACCESS PATTERNS AND DATA PLACEMENT
(a) Inverse static scheduling.
(b) Block-exclusive static scheduling.
Figure 5.11: Loop iteration scheduling primitives.
In the general case the block exclusive data distribution partitions a data region into blocks.In a system with p processors the data distribution can be seen either as p columns of blocks, oras p rows of blocks (see Figure 5.10(f) for a block-exclusive data distribution on a system withp = 4 processors). For example, on an x-wise traversal the data distribution can be viewed asp columns of blocks and on a y-wise distribution the data distribution can be viewed as p rowsof blocks. For both views of a block-exclusive data distribution there are p different iteration-to-core distributions, one iteration distribution for each different configuration of columns ofblocks respectively rows of blocks (so that the iterations are allocated to the processors thathold the block of data processed). As a result, a block-exclusive scheduling clause is defined asa function of two parameters. The first parameter specifies the view taken (columns of blocksrespectively row of blocks), and the second parameter specifies the identifier id (0 ≤ id < p)of the schedule used. Section 5.4 presents a detailed example of using the block-exclusive loopiteration distribution primitive.
5.4 Example program transformations
This section shows how two NPB programs can be transformed with the previously describedAPI to execute with better data locality.
5.4.1 bt
Figure 5.12(a) shows code that is executed in the main computational loop of bt (for brevitywe show only an excerpt of the complete bt program). The code has a y-wise access patternand accesses two matrices, lhs and rhs, in the matvec sub() function. There are loop-carried dependences in the code: The computations performed on the current row i depend onthe result of the computation on the previous row i - 1.
In a 2-processor system the code is transformed in two steps. At the start of the program thedistribution of both matrices, lhs and rhs, is changed to block-exclusive using the memorydistribution primitives described in Section 5.3. In the second step the outermost loop of thecomputation (the loop that iterates through the rows of the arrays using variable i) is split intotwo halves. The transformed code is shown in Figure 5.12(b). Both of the resulting half-loopsiterate using variable i, but the first loop processes the first (NX - 2) / 2 rows of the matri-ces, and the second loop processes the remaining (NX - 2) / 2 rows. The work distributionin the first loop is standard static block scheduling, but in the second loop inverse schedulingis required so that the affinity of the worker threads matches the data distribution. Splittingthe outermost loop results in the two-phase traversal previously shown in Figure 5.10(d) andFigure 5.10(e). Note that the transformation does not break any of the data dependences of the

5.4. EXAMPLE PROGRAM TRANSFORMATIONS 91
for (i = 1; i < NX - 1; i++)
#pragma omp parallel for schedule(static)
for (j = 1; j < NY - 1; j++)
for (k = 1; k < NZ - 1; k++)
matvec_sub(lhs[i][j][k][0],
rhs[i - 1][j][k],
rhs[i][j][k]);
(a) Original bt code.
for (i = 1; i < (NX - 2) / 2; i++) {
#pragma omp parallel for schedule(static)
for (j = 1; j < NY - 1; j++) {
for (k = 1; k < NZ - 1; k++) {
matvec_sub(lhs[i][j][k][0],
rhs[i - 1][j][k],
rhs[i][j][k]);
for (i = (NX - 2) / 2; i < NX - 1; i++) {
#pragma omp parallel for schedule(static-inverse)
for (j = 1; j < NY - 1; j++) {
for (k = 1; k < NZ - 1; k++) {
matvec_sub(lhs[i][j][k][0],
rhs[i - 1][j][k],
rhs[i][j][k]);
(b) 2-processor version of bt code.
for (p = 0; p < processors; p++) {
for (i = p * (NX - 2) / processors;
i < (p + 1) * (NX - 2) / processors;
i++) {
#pragma omp parallel for
schedule(block-exclusive, X_WISE, p)
for (j = 1; j < NY - 1; j++)
for (k = 1; k < NZ - 1; k++) {
matvec_sub(lhs[i][j][k][0],
rhs[i - 1][j][k],
rhs[i][j][k]);
}
(c) Generalized version of bt code.
Figure 5.12: Program transformations in bt.
program. Therefore, only one synchronization operation is required for correctness (at the pointwhere the first half of the iteration space has been processed). This program transformation canbe generalized to systems with an arbitrary number of processors as shown in Figure 5.12(c).
The main computational loop of bt executes other loops as well (not just the loop shown inFigure 5.12(a)). Many of these other loops have a different, x-wise, access pattern. To match theaccess patterns of these loops to the block-exclusive data distribution of the program’s data, the

92 CHAPTER 5. MATCHING MEMORY ACCESS PATTERNS AND DATA PLACEMENT
#pragma omp parallel for schedule(static)
for (i = 0; i < NX; i++)
for (j = 0; j < NY; j++)
// ...
(a) lu lower triangular part.
#pragma omp parallel for schedule(static)
for (i = NX - 1; i >= 0; i--)
for (j = NY - 1; j >= 0; j--)
// ...
(b) lu upper triangular part.
#pragma omp parallel for schedule(static-inverse)
for (i = NX - 1; i >= 0; i--)
for (j = NY - 1; j >= 0; j--)
// ...
(c) lu upper triangular part with inverse scheduling.
Figure 5.13: Program transformations in lu.
code must be transformed in a manner similar to the transformations shown in Figure 5.12(b)and 5.12(c). These transformations require programmer effort, but in the end the access patternsof all loops of the program match the blocked-exclusive distribution of shared data, and datadistribution is required only once (at the start of the program).
5.4.2 lu
The lu program solves the Navier-Stokes equations in two parts: a lower (Figure 5.13(a)),and an upper part (Figure 5.13(b)). Both parts have an x-wise access pattern, therefore thememory regions used by the program are initialized x-wise. However, as the upper triangularpart (Figure 5.13(b)) traverses rows in descending order of row numbers, the static schedulingclause of OpenMP distributes loop iterations between worker threads so that each worker threadoperates on remote data. To increase data locality we match the access pattern of lu to its datadistribution by using the static-inverse scheduling clause for the upper triangular part,as shown in Figure 5.13(c).
5.5 Evaluation
This section presents an evaluation of the previously described program transformations. In Sec-tion 5.5.1 we evaluate the effectiveness of the proposed techniques in improving data localityon the 2-processor 8-core Nehalem-based machine. In Section 5.5.2 we look at the scalabilityof program transformations using a larger, 4-processor 32-core machine based on the Westmeremicroarchitecture. In Section 5.5.3 we compare the performance of program transformationswith other optimization techniques described in related work. The software and hardware con-figuration we use is described in Section 4.2. The variation of the measurement readings isnegligible.

5.5. EVALUATION 93
0%
10%
20%
30%
40%
50%
bt cg ft lu sp
default setup
profile-based allocation
program transformations
Remote bandwidth / total bandwidth
(a) Bandwidth distribution.
0%
20%
40%
60%
80%
bt cg ft lu sp
default setup
profile-based allocation
program transformations
Percentage total address space shared
(b) Percentage shared pages.
0%
5%
10%
15%
20%
25%
bt cg ft lu sp
profile-based allocation
program transformations
Improvement over default setup
(c) Performance improvement over default setup (first-touch page placement and identity affinity).
Figure 5.14: Performance with program transformations (2-processor 8-core machine).
5.5.1 Data locality
The original version of sp is synchronization-limited due to a single triple-nested loop that isparallelized on the innermost level. We eliminate the synchronization boundedness of this loopby moving the parallelization primitive to the outermost loop. We also store data accessed by

94 CHAPTER 5. MATCHING MEMORY ACCESS PATTERNS AND DATA PLACEMENT
the loop in multi-dimensional arrays (instead of single-dimensional ones), so that loop-carrieddata dependences are eliminated; using multi-dimensional arrays results in a negligible increaseof the program’s memory footprint. This simple change gives a 10X speedup over the out-of-the-box version of the benchmark on our 2-processor 8-core machine; as a result, sp is memorybound and can profit further from data locality optimizations (we only use the improved versionof the benchmark in this chapter).
Figure 5.14(a) shows the percentage of remote memory bandwidth relative to the total band-width for each program we consider in three scenarios: (1) the default setup uses the combi-nation of first-touch page placement and thread mapping with identity affinity, as described inSection 5.1.1, (2) profile-based allocation (as described in Section 5.1.3), and (3) the programtransformations we propose. Programs are executed with 8 threads in all scenarios.
For bt, lu and sp, program transformations reduce the percentage of remote accesses sig-nificantly (to around 4% on average). For the cg benchmark, profile-based memory allocationalmost completely eliminates remote memory accesses (see Figure 5.2(b)). However, we areable to achieve the same effect without profiling by inserting data distribution primitives intothe program. In ft most remote memory accesses are caused by a single loop. Transformingthis loop is possible by inserting fine-grained inter-thread synchronization, which could resultin high overhead that can cancel the benefits of the improved data locality. Nonetheless, weobtain a reduction of the fraction of remote memory accesses relative to profile-based mem-ory allocation (from 23% to 18%) by distributing memory so that the distribution matches theaccess patterns of the most frequently executing loop of the program.
Figure 5.14(b) shows for each program we consider the percentage of program address spaceshared with the default setup, with profile-based memory allocation, and with program trans-formations (the figures consider only the sharing of heap pages). For three programs (bt, lu,and sp) program transformations reduce the fraction of shared pages, it is thus possible to placemore pages appropriately than with the original version of the program (either by using the pro-posed data distribution primitives, or by profiling the program). Finally, Figure 5.14(c) showsthe performance improvement with profile-based memory allocation and program transforma-tions relative to the default setup. By eliminating sharing we obtain performance improvementsalso when profile-based allocation does not. Moreover, for cg (the program that improves withprofile-based allocation) we are able to match the performance of profile-based allocation bydistributing memory so that the distribution of memory matches the program’s access patterns.
5.5.2 Scalability
Adding more processors to a NUMA system increases the complexity of the system. StandardOSs and runtime systems handle the increase of the number of processors gracefully, however, ifgood program performance is also desired, action must be taken (e.g., by the programmer). Thissection evaluates the scalability of the proposed program transformations on the 4-processor32-core Westmere-based machine described in Section 4.2 that is larger than the 2-processormachine previously examined. For all benchmark programs size C (the largest size) is used.
To look at the scalability of the benchmark programs each program is executed in fourdifferent configurations (i.e., with 4, 8, 16, and 32 threads, respectively). As cache contentioncan cause significant performance degradations in NUMA systems [13, 65], we fix the thread-to-core affinities so that the same number of threads is executed on each processor of the system

5.5. EVALUATION 95
0 5 10 15 20 25 30 35
4 8 16 32 4 8 16 32 4 8 16 32 4 8 16 32 4 8 16 32 Number of threads
default setup program transforma8ons
Speedup over sequen4al version
bt.C cg.C ;.C lu.C sp.C
Figure 5.15: Performance with program transformations (4-processor 32-core machine).
and thus the cache capacity available to each thread is maximized (remember that each processorhas a single last-level cache shared between all processor cores). For example, in the 4-threadconfiguration one thread is executed on each processor of the 4-processor system; in the 32-thread configuration each processor runs eight threads.
Figure 5.15 shows the speedup of the benchmark programs over their respective sequentialversion. The figure compares two versions of the benchmark for each runtime configuration.The default setup relies on the first-touch memory allocation policy and uses the previouslydiscussed thread-to-core assignment (which corresponds to identity affinity in the configurationwith 32-threads). With program transformations the memory distribution and the schedulingof loop iterations is changed so that data locality is maximized. Performance improves withprogram transformations, with results that are similar to those obtained on a 2-processor 8-core system. In the 32-thread configuration we measure a performance improvement of up to3.2X (and 1.7X on average) over the default setup. Program performance also scales betterwith program transformations than with the default setup. (For the programs of the NAS suitestudied here, the programs obtain a speedup of up to 33.6X over single-core execution, with amean speedup of 18.8X.)
5.5.3 Comparison with other optimization techniques
The approach presented in this chapter allows the programmer to control the distribution ofdata across the processor of a NUMA-multicore system. There exist, however, alternative tech-niques for managing a program’s data distribution. Two frequently used techniques are memoryreplication and interleaved page placement.
State-of-the-art software systems allow replication of memory regions. However, to limitthe overhead of synchronizing replicas, memory replication is enabled only for memory regionsthat are read-only or are written infrequently (e.g., in [27] only pages written less than 5 timesduring the lifetime of the program are replicated). The programs of the NAS PB suite we studyin this chapter frequently read/write shared memory regions. We believe, thus, that replicationwould cause high overhead for these programs (or it would result in replication to be disabled),therefore we do not compare our approach to data replication.
In some cases interleaved page placement (i.e., distributing memory pages round-robinacross processors) reduces contention on memory controllers relative to first-touch page place-

96 CHAPTER 5. MATCHING MEMORY ACCESS PATTERNS AND DATA PLACEMENT
-‐10% -‐5% 0% 5%
10% 15% 20% 25%
bt.B cg.B ..B lu.C sp.B
Number of threads
interleaved program transforma>ons + first-‐touch program transforma>ons + interleaved
Performance improvement over default setup
(a) Comparison with interleaved page placement (8-core machine).
0%
50%
100%
150%
200%
250%
bt.C cg.C -.C lu.C sp.C
Number of threads
interleaved program transforma<ons + first-‐touch program transforma<ons + interleaved
Performance improvement over default setup
(b) Comparison with interleaved page placement (32-core machine).
ment (the default policy of many OSs, including Linux). Figures 5.16(a) and 5.16(b) report theperformance of the NAS programs with interleaved page placement relative to the default setupfor the 2-processor 8-core and the 4-processor 32-core system, respectively. In some casesinterleaved page placement results in a performance improvement of up to 170% relative tofirst-touch page placement (the default setup). In some cases, however, interleaved placementcan decrease performance by at most 5%.
To allow a comparison with interleaved page placement, Figures 5.16(a) and 5.16(b) alsoreport the performance of the program transformations described earlier in this chapter. Trans-formations target only a subset of a program’s total data, that is, the migration primitives areapplied only to data structures identified as performance-critical by the programmer. The datadistribution of other program data (i.e., data structures not considered by the programmer) caneffect performance as well, thus we report the performance of program transformations in twocases:
program transformations + first-touch In this case memory regions not targeted byprogrammer-controlled data migration are managed using the default first-touch policy.This case is the same as the “program transformations” earlier in this chapter.
program transformations + interleaved In this case memory regions not targeted byprogrammer-controlled data migration are managed using interleaved page placement. In

5.6. CONCLUSIONS 97
this case a program is started up with the page placement policy set to interleaved. Thenthe program applies the data distribution specified by the programmer to performance-critical memory regions, but leaves the data distribution of other regions at interleaved toreduce memory controller contention caused by accesses to memory regions not consid-ered for data migration.
In most cases program transformations (both in combination with first-touch and with in-terleaved page placement) result in better performance than using interleaved page placementonly (up to 50% more performance improvement). The reason is that interleaved page place-ment reduces contention whereas transformations achieve good data locality. In one case (thebt benchmark on the 4-processor 32-core machine), program transformations improve per-formance over interleaving only when program transformations are used in combination withinterleaved page allocation. In this case the memory controller contention caused by accessesto data structures not targeted by programmer-controlled data migration is a significant factorfor the program’s performance; using interleaved page placement for these pages reduces con-tention and enables program transformations to improve over using interleaved page placementfor all program data.
For the ft benchmark interleaving results in better performance than program transforma-tions, mostly due to the overhead of data migration (encountered by program transformationsbut not in the case with interleaved page placement).
5.6 Conclusions
In NUMA systems the performance of many multithreaded scientific computations is limitedby data sharing. In-program memory migration, a conventional method in large cluster environ-ments, does not help because of its high overhead. In some cases it is possible to redistributeloop iterations so that the access patterns of a loop match the data distribution. However, inthe presence of loop-carried dependences redistribution of loop iterations is a complex task,moreover, redistribution can require extensive inter-thread synchronization that may reduce (orcompletely eliminate) the benefits of data locality.
This chapter presents a simple system API that is powerful enough to allow for programmingscientific applications in a more architecture-aware manner, yet simple enough to be used byprogrammers with a reasonable amount of knowledge about the underlying architecture. Usingthis API together with program transformations reduces the number of shared pages and remotememory accesses for many programs of the NPB suite. This API allows a programmer tocontrol the mapping of data and computation and realizes a performance improvement of upto 3.2X (1.7X on average) compared to the first-touch policy for NAS benchmark programs.Future multiprocessors are likely to see a widening performance gap between local and remotememory accesses. For these NUMA systems, compilers and programmer must collaborateto exploit the performance potential of such parallel systems. The techniques described hereprovide an approach that attempts to strike a balance between complexity and performance.

6A parallel library for
locality-aware programming
The previous chapter presented a simple API that allows adjusting the data distribution andcomputation scheduling of multithreaded programs. Source-level optimization can increasethe data locality (and thus the performance) of multithreaded programs. Moreover, in case ofprograms with complex memory access patterns and/or data sharing, source-level data localityoptimizations are an attractive alternative to automatic performance optimization techniques(e.g., profile-based data placement).
The API presented in the previous chapter is simple, but it has a number of limitations. First,the API supports only loop-parallel computations. Furthermore, implementing data localityoptimizations in practice requires additional aspects to be considered. For example, with currentparallel programming frameworks it is difficult to guarantee that data locality optimizations areportable. Moreover, optimizations implemented with current parallel programming frameworksare often not composable (e.g., they can lose their favorable properties in runtime systems thatsupport composable parallel software).
This chapter presents TBB-NUMA, a parallel programming library based on Intel Thread-ing Building Blocks (TBB) that supports portable and composable NUMA-aware programming.TBB-NUMA is based on task parallelism, but it supports loop-, pipeline-, and also other formsof parallelism through high-level algorithm templates. TBB-NUMA provides a model of taskaffinity that captures a programmer’s insights on mapping tasks to resources. NUMA-awarenessaffects all layers of the library (i.e., resource management, task scheduling, and high-level par-allel algorithm templates) and requires close coupling between all these layers. Data localityoptimizations implemented with TBB-NUMA (for a set of standard benchmark programs) re-sult in up to 57% performance improvement over standard TBB, but, more importantly, opti-mized programs are portable across different NUMA architectures and preserve data localityalso when composed with other parallel computations.
6.1 Practical aspects of implementing data locality optimizations
6.1.1 Introduction
Due to the large performance penalty of cross-chip memory accesses, performance optimiza-tions for NUMA systems typically target improving data locality, that is, the reduction (or evenelimination) of remote memory accesses [13, 17, 27, 58, 68, 79, 104, 107, 107]. Optimizations
99

100 CHAPTER 6. A PARALLEL LIBRARY FOR LOCALITY-AWARE PROGRAMMING
are often automatic, that is, the runtime system (e.g., the OS or the VM) profiles the memoryaccesses of programs and then, based on the profiles, it automatically adjusts the distribution ofdata and/or the scheduling of computations to more efficiently use the memory system.
Automatic optimizations for NUMA systems can be highly effective; however, for someprograms (e.g., programs with complex memory access patterns) profiles do not convey enoughinformation to enable the runtime system to carry out optimizations successfully. In these cases,high-level information about programs (e.g., program data dependences) is needed. As this typeof information is likely to be available to the programmer, several projects consider making thedevelopment toolchain NUMA-aware. E.g., recent profilers like MemProf [55], Memphis [72],and DProf [82] present information about a program’s memory behavior to the developer, whocan then change the code to improve performance.
Profilers pinpoint code locations with inefficient usage of the memory system. In practice,however, programs are rarely optimized for NUMA systems as commonly used parallel lan-guages and libraries like OpenMP or Intel Threading Building Blocks (TBB) are geared towardsexploiting the lower levels of the memory system (e.g., L1 and L2 caches), if at all, and haveno support for NUMA systems. More specifically, existing parallel programming frameworkshave three main limitations.
First, existing frameworks usually require memory-system-aware code to consider the lay-out of the memory system in full detail, thus optimized programs are not portable. Second,NUMA-aware code is not composable. Mapping data and computations depends on the hard-ware resources (i.e., cores/processors) available to the program. However, in frameworks withsupport for composable parallel software (i.e., parallel software composed of multiple, concur-rently executing parallel computations [81]) the amount of resources available to a computationcan change over time, which requires memory-system-aware programs to adapt the mapping atruntime. Existing frameworks provide the programmer little information about the program’sruntime configuration, thus optimizations often simply assume that all hardware resources (i.e.,all cores/processors) are continuously available. As a result, the advantages of memory sys-tem optimizations are annulled as soon as the optimized computation is composed with otherparallel computations. Finally, existing parallel programming frameworks have no support forexplicit mapping of data and computations, i.e., the programmer is required to be aware ofruntime/compiler/library internals to be able to set up a mapping. Thus, even if a program-mer conceptually knows how to optimize a program, implementing optimizations is difficult (oreven impossible) with existing frameworks.
Due to the previously mentioned limitations, source-level optimizations for NUMA systemsare rare in practice and the performance potential of NUMA systems is often unexploited. To fillthe gap in the development toolchain for NUMA systems, this chapter presents TBB-NUMA,a parallel programming library for programming NUMA systems. We first discuss theoreticaland practical considerations for implementing data locality optimizations (Sections 6.1.2 and6.1.3) and then we articulate the goals of TBB-NUMA library (Section 6.1.4).
6.1.2 Principles of data locality optimizations
Data locality optimizations for NUMA systems have traditionally targeted the co-location ofdata and computations. To understand the principles of these optimizations, let us consider anexample multithreaded program that is parallelized for a 2-processor 8-core NUMA system (the

6.1. PRACTICAL ASPECTS OF IMPLEMENTING DATA LOCALITY OPTIMIZATIONS 101
Processor 0
C0 C1
C2 C3
MC IC
DRAM
Last-‐level cache
Processor 1
C4 C5
C6 C7
IC MC
DRAM
Last-‐level cache
D0 D1 D2 D3 D4 D5 D6 D7
Figure 6.1: Computation optimized for data locality.
Processor 0
CA0 CA1
CA2 CA3
MC IC
DRAM
Last-‐level cache
Processor 1
CB0 CB1
CB2 CB3
IC MC
DRAM
Last-‐level cache
DA0 DA1 DB0 DB1 DA2 DA3 DB2 DB3
Figure 6.2: Shared threads: Unfortunate mapping.
Processor 0
CA0 CB0
CA1 CB1
MC IC
DRAM
Last-‐level cache
Processor 1
CA2 CB2
CA3 CB3
IC MC
DRAM
Last-‐level cache
DA0 DA1 DB0 DB1 DA2 DA3 DB2 DB3
Figure 6.3: Shared threads: Appropriate mapping.

102 CHAPTER 6. A PARALLEL LIBRARY FOR LOCALITY-AWARE PROGRAMMING
system in Figure 6.1). The program consists of a set of concurrently executing computationsC0, C1, . . . , C7; each computation accesses a subset D0, D1, . . . , D7 of the total data used bythe program.
To achieve good data locality, the programmer must go through a series of steps. First, theprogrammer must parallelize the algorithm (i.e., define the computations Ci) so that the datasubsets Di overlap as little as possible. Second, the programmer must distribute data subsetsamong processors. The final step is to schedule computations so that each computation Ci
executes at the same processor as where its data Di is placed at.
Figure 6.1 shows the mapping of the example program onto the 2-processor 8-core NUMAsystem. In the figure each computation executes at the processor where its data is allocated. Ifdata subsets do not overlap (small adjustments often suffice to adjust overlap in multi-threadedcomputations, as shown by previous work [112]), this mapping is beneficial for both cachingand DRAM performance: (1) The cache capacity available to the computation is maximized(data subsets are disjoint; as a result, each piece of data can be present in only one cache),(2) as data is placed at all DRAM modules, all paths to memory are utilized, which increasesthe bandwidth available to the program and reduces contention on memory interfaces, and (3)as each computation accesses locally placed data, the program does not encounter any remote(cache or DRAM) memory accesses.
6.1.3 Enforcing data locality in practice
Data locality optimizations are simple in theory but difficult to implement in practice. Althoughdata distribution is well supported in recent OSs (e.g., Linux supports per-processor memoryallocation through the libnuma library and memory migration through the move pages()system call), scheduling computations at appropriate processors is problematic in today’s paral-lel languages and libraries. In commonly used parallel frameworks scheduling computations atprocessors depends on two components. Most parallel frameworks operate with thread pools,thus computations must be first mapped to threads in the pool; this chapter concerns task-basedparallelism, we thus use the terminology of setting task-to-thread affinities for mapping compu-tations to threads. Second, threads from the pool must be pinned to processors of the system toensure that computations execute where intended. If both mappings are set up right, the systemguarantees data locality. In the following we discuss problems related to both components.
Component 1: Setting task-to-thread affinities
In commonly used parallel frameworks task-to-thread affinities are implicit, that is, the pro-grammer has no direct control on how to map computations to threads. OpenMP static looppartitioning is an example of implicit computation scheduling. For statically partitioned paral-lel loops the OpenMP runtime assigns a well-defined chunk of the iteration space to each thread.If the programmer is aware of the internals of static partitioning and knows which pieces of dataare touched by each loop iteration, she can distribute data among processors so that each threadaccesses its data locally. With other OpenMP work-division schemes (e.g., dynamic partition-ing), however, the distribution of loop iterations between threads is not deterministic [80], thusthe programmer cannot assume much about the data accesses of the program and data localityis, as a result, not controllable.

6.1. PRACTICAL ASPECTS OF IMPLEMENTING DATA LOCALITY OPTIMIZATIONS 103
Setting up task-to-thread affinities is not easy in case of systems based on task parallelismeither. For example, in Intel TBB each task can be assigned a special value; the value defines theaffinity of that task to a thread in the pool. The TBB Reference Manual [43] states the followingabout the values of a task’s affinity:
“A value of 0 indicates no affinity. Other values represent affinity to a particularthread. Do not assume anything about non-zero values. The mapping of non-zerovalues to threads is internal to the Intel TBB implementation.”
This would require the programmer to reverse-engineer the TBB implementation to be able toset up a mapping between tasks and threads. Due to this limitation, it is difficult to implementNUMA data locality optimizations in TBB.
Finally, defining task-to-thread affinities depends on the number of threads available to theprogram (a value that can change at runtime) but the distribution of data is expressed dependingon the number of processors in the system. To ensure data locality on any system and in anyruntime configuration the programmer must consider both parameters, which makes writingNUMA-aware programs with current systems even more cumbersome.
Component 2: Pinning threads to processors
The second component of mapping computations to processors is pinning threads to processors.Unless threads are pinned, the OS scheduler is allowed to freely move threads around in thesystem. OS re-schedules can result in remote memory accesses (or costly data migrations ifdata follows the computations using it, e.g., in systems with automatic data migration [13];therefore, this chapter assumes a standard OS without automatic data migration).
Some OpenMP implementations allow (although not required by the OpenMP stan-dard [80]) pinning thread pool threads to processors. Pinning threads requires understandingthe memory system for every new machine the program is to be run on. If threads are pinned toprocessors, moreover, the programmer has distributed data and she has also set up task-to-threadaffinities (e.g., by relying on the properties of static loop scheduling, as discussed before), eachpiece of data will be accessed at a well-defined processor and the program has thereby gooddata locality.
Pinning threads to processors works well as long as only one parallel computation uses athread pool at a time. Modern runtime systems, however, support composable parallel soft-ware, that is, programs that contain nested parallelism, programs that reuse functionality fromparallelized libraries, or programs that are parallelized using different parallel languages/li-braries [81]. For these programs the thread pool of the runtime is shared by multiple parallelcomputations and the runtime distributes threads between all computations registered with it.
To illustrate the problems composability causes for programs optimized for NUMA systems,Figure 6.2 shows an example where two parallel computations, CA and CB, execute in parallelon the example 2-processor 8-core system. Computation CA is composed of subcomputationsCA0 . . . CA3; each subcomputation CAi
accesses a different data subset DAi. Similarly, each
subcomputationCBiofCB accesses a distinct data subsetDBi
. The programmer optimized bothcomputations for NUMA, thus data used by the computations is distributed across processors(according to the principles discussed in Section 6.1.2). The programmer has set up task-to-thread affinities as well, but as the runtime is not aware of the programmer’s intentions, it can

104 CHAPTER 6. A PARALLEL LIBRARY FOR LOCALITY-AWARE PROGRAMMING
allocate threads to computations in several ways. Figure 6.2 shows an unfortunate allocationthat cancels the optimization intended by the programmer: CA is mapped to threads executingat Processor 0 and CB is mapped to threads executing at Processor 1. Thus, both computationsaccess some of their data remotely (DA2 , DA3 , DB0 , DB1). Figure 6.3 shows an appropriateassignment of threads to computations: In this case each computation is assigned threads fromboth processors so that each computation can access data locally and exploits all caches of thesystem.
6.1.4 Goals of TBB-NUMA
TBB-NUMA aims to support programming NUMAs by:
Explicit mapping The programmer can define the distribution of data among processors and,in addition, can also express the preferred schedule of computations in the form of hints tothe library’s work-stealing scheduler without being required to understand runtime systeminternals. The scheduler honors these hints unless there are idle resources; in this case atask may be moved by the scheduler to a different processor in an attempt to balance theload (as in current systems, incurring the overhead of remote execution is preferable toidling processing resources). To hide the complexity of the work-stealing scheduler andtherefore make writing NUMA-aware code easier, TBB-NUMA defines a set of parallelalgorithm templates that programmers can adapt and reuse.
Portability Programmers are not required to have information about the exact hardware layout:TBB-NUMA programs are written for a generic NUMA system with P processors, thelibrary automatically determines the remaining details of pinning threads to appropriateprocessors. As a result, optimized programs are portable.
Composability The runtime manages its thread pool so that the advantages of data localityoptimizations are preserved even if only a fraction of all system resources are availablefor an optimized computation. This setup allows optimized programs to be included aspart of libraries (or reuse functionalities from libraries already parallelized) and to utilizethe memory system appropriately at the same time.
TBB-NUMA extends Intel TBB, so the chapter first focuses on the architecture of stan-dard TBB (Section 6.2). Then, Section 6.3 highlights the differences between standard TBBand TBB-NUMA in terms of locality-aware programming. Finally, Section 6.4 presents anevaluation of the performance, composability, and portability of data locality optimizations im-plemented with TBB and TBB-NUMA for a set of well-known benchmark programs.
6.2 Anatomy of TBB
Standard TBB has a layered architecture (shown in Figure 6.4(a)1). This section describes thelayers top-down, that is, the discussion starts with the layer closest to the programmer and endswith the farthest layer (the layer closest to the hardware).
1TBB has an additional layer, the task arena, below the task scheduler layer. Threads are registered with thetask arena, the task scheduler implements only scheduling. To simplify the discussion we refer to the task schedulerand task arena layers as one layer (task scheduler), see [43] for exact details of TBB’s implementation.

6.2. ANATOMY OF TBB 105
Threads
T1 T2 … TN
Parallel algorithm templates
Task scheduler
User program
RML
(a) TBB layers.
Threads
T1 T2 … TN
.
.
.
TS
User program
RML
TS OMP
.
.
.
.
.
.
(b) Composed program.
Figure 6.4: TBB architecture.
6.2.1 User programs
There are two ways to implement parallelism with standard TBB: programmers can either usethe library’s Cilk-style work-stealing scheduler [35] directly or they can reuse parallel algorithmtemplates from a set of templates defined by the library. Templates hide the complexity of thework-stealing scheduler from the programmer, but they still use the work-stealing schedulerinternally.
6.2.2 Parallel algorithm templates
TBB supports loop parallelism through the parallel for algorithm template (and variationsof it, e.g., parallel reduce, parallel do). TBB supports pipeline-parallelism as well(through the pipeline template). In this chapter we concentrate on two algorithm templates,parallel for and pipeline, because they are widely used and they represent two signifi-cantly different ways of approaching parallelism. In standard TBB both templates are optimizedfor better utilizing L1 and L2 caches. The parallel for template preserves cache localityif it is given an affinity partitioner object as a parameter. We briefly discuss this op-timization in Section 6.3.3 (see [3] and [86] for details about the principles and implementationof this optimization, respectively). Parallel pipelines are optimized for better L1 and L2 cachelocality through the way they generate the task tree corresponding to a pipeline computation(see Section 6.3.4 for details).
6.2.3 Task scheduler
Similar to Cilk [35], the TBB task scheduler interface exposes library functions to spawn andjoin tasks (implemented in TBB by the spawn() and wait for all() methods and vari-ations of them). TBB allows but does not guarantee parallelism, thus the task scheduler canhave multiple threads (but must have at least one thread) at any given point of time. Each threadhas a local deque where spawned tasks are inserted. A thread removes tasks for execution fromits local deque in LIFO order and, if the local deque is empty, steals tasks from other threads’deques in FIFO order.
The task scheduler has a set of mailboxes. Each thread in the task scheduler is connected

106 CHAPTER 6. A PARALLEL LIBRARY FOR LOCALITY-AWARE PROGRAMMING
1. The task returned by the current task t.
2. The successor of t (if all predecessors of t have completed).
3. The task removed from the thread’s own deque (LIFO).
4. The task removed from the mailbox this thread is currently connected to.
5. The task removed from the task scheduler’s shared queue.
6. The task removed from an other randomly chosen thread’s deque (FIFO) (steals).
Figure 6.5: Standard TBB: Rules to fetch next task.
to a (different) mailbox. A task can be assigned a special value that specifies the affinity of thattask to a mailbox.
The definition of task affinities provided by the TBB Reference Manual (see Section 6.1.3and [43]) is misleading. According to the manual, a task affinity implies that a task is associatedwith a particular thread, yet an affinity value associates a task only with a mailbox. During thelifetime of a program possibly different threads (but only one thread at a time) can be connectedto a mailbox. Therefore, affinity values provided by the standard TBB implementation guaran-tee only that a task is associated with a mailbox, but not with any particular thread. We furtherdiscuss the implications of task-to-mailbox affinities in Section 6.3.3.
An affinitized task (a task with a non-zero affinity value) is sent to the thread currentlyconnected to the mailbox. Sending is realized by inserting the task into the mailbox. The threadconnected to the mailbox receives the task by removing it from the mailbox. Furthermore, anaffinitized task is inserted not only into the mailbox it is sent to, but into the local deque of thethread that created it as well. Lastly, task affinities are internal to the TBB implementation bydefinition and only the affinity partitioner uses them internally.
TBB supports asynchronous operations through the enqueue() call. Tasks to be executedasynchronously are inserted into a FIFO queue shared between all threads (but are not insertedinto any thread’s local deque). Due to the multiple types of queues in the task scheduler, TBBdefines a set of rules (Figure 6.5) that specify from where thread is supposed to fetch the nexttask to be executed. The rules are listed in order of decreasing priority. If a high priority rule isunsuccessful, the scheduler tries the next rule.
6.2.4 Resource Management Layer
The number of threads in a task scheduler is determined by the Resource Management Layer(RML). (To avoid excessive OS scheduler overhead, the RML limits the number of threadsavailable.) TBB is interoperable with other parallel frameworks (e.g., Intel OpenMP): If aprogram is composed of multiple computations (parallelized with possibly different parallelframeworks), all computations register with the same RML instance that assigns a subset ofthe available threads to each computation. Moreover, if the number of computations registeredwith a RML changes, threads are redistributed between computations. As a result, the numberof threads assigned to a computation can vary over time.

6.3. IMPLEMENTING NUMA SUPPORT 107
Figure 6.4(b) shows a program composed of two TBB task scheduler-based computations(TS) and one OpenMP-based (OMP) computation (computations are registered with the sameRML that has N threads). (The example omits higher-level details about the program, e.g., theparallel algorithm templates it uses.) Upcoming examples consider only TBB task schedulersbut not OpenMP runtimes to be registered with an RML. This simplifies the discussion but isnot a real restriction of either standard TBB nor TBB-NUMA.
6.2.5 Threads
In addition to task schedulers, threads are registered and managed by the RML as well. TheRML manages two types of threads: (1) The RML automatically creates N − 1 worker threads(N is the number of cores of the system); (2) master threads are created by the user programwith a suitable system library (e.g., pthreads) and are registered the first time they use aparallel construct.
6.3 Implementing NUMA support
Implementing support for NUMA-aware programming involves all layers of TBB-NUMA’sarchitecture, and, in some cases, it requires tight coupling between the layers. The discussionin this section follows the layers bottom to top. This section focuses on aspects specific toTBB-NUMA, contrasting it to standard TBB where interesting.
6.3.1 Threads
Previous parallel frameworks (e.g., Intel OpenMP) allow the user to pin thread to cores, i.e.,each thread is allowed to execute only at one specific core. TBB-NUMA automatically pinseach thread to a specific processor. If a thread is pinned to a processor, the thread is allowed toexecute at any core of that specific processor, but not at cores of any other processor. Threads arepinned to processors when they are created by the RML (worker threads) or when they registerwith the RML (master threads). Threads are distributed round-robin across the processors of asystem (the first thread registered/created is pinned to Processor 1, the second to Processor 2,and so on); we assume all processors are identical with regard to number and capabilities ofcores, thus the RML guarantees that there is an approximately equal number of threads pinnedto each processor at any given point of time. TBB-NUMA is aware of the memory system’slayout and threads are pinned to processors without user intervention.
The OS scheduler has fewer constraints with per-processor pinning than with per-core pin-ning, thus it can possibly balance load better if there are external (non-TBB) threads running onthe system. If threads are not pinned, the TBB-NUMA runtime cannot give any guarantees tothe layers above the threading layer, hence per-processor pinning is the minimal constraint thatmust be imposed on the OS scheduler to support NUMA-awareness.
6.3.2 Resource Management Layer
Similar to the RML in standard TBB, the TBB-NUMA RML distributes threads between allregistered task schedulers. In addition to the standard TBB, the TBB-NUMA RML is aware

108 CHAPTER 6. A PARALLEL LIBRARY FOR LOCALITY-AWARE PROGRAMMING
Level 3
Level 2
Level 1
1 [1-‐250]
4 [751-‐1000]
3 [501-‐751]
2 [251-‐500]
1 [1-‐500]
3 [501-‐1000]
1 [1-‐1000]
(a) Task tree with task-to-thread affinities (top) and partitioning (bottom).
Task scheduler
T1 T2
M1
T4 T3
M4 M2 M3
(b) TS fully populated.
Task scheduler
T1 ?
M1
? T3
M4 M2 M3
(c) TS partially populated.
Figure 6.6: Mailboxing (standard TBB).
of which processor each registered thread is pinned to and it distributes threads so that in eachregistered task scheduler there is an approximately equal number of threads from each proces-sor. Let us assume an example program with two task schedulers running on a 2-processor8-core system; there are 8 threads registered with the RML. In this case the RML assigns fourthreads to each task scheduler, with two threads pinned to Processor 1 and with two threadspinned to Processor 2. Distributing threads this way guarantees that each task scheduler has ac-cess to all memory system resources (i.e., last-level caches, memory controllers, and cross-chipinterconnects) and unfortunate assignments like that in Figure 6.2 are avoided.
6.3.3 Standard TBB task scheduler
In standard TBB each task scheduler has a set of mailboxes, the number of mailboxes is usuallyset to the number of cores of the machine. When the RML assigns a thread to a task scheduler,the thread connects to a randomly chosen mailbox.
Figure 6.6(b) shows a task scheduler with four mailboxes (M1 . . .M4); the task scheduleris allocated four threads by the RML (T1 . . . T4). During its lifetime, a task scheduler can beallocated different numbers of threads. Moreover, even if the same set of threads are allocated toa task scheduler, each thread can be connected to a different mailbox during the lifetime of thetask scheduler (e.g., if a thread leaves and then re-joins a scheduler, the thread can be assignedto a randomly chosen mailbox, and thus possibly not to the same mailbox as it was connectedto before it left the task scheduler). We refer to the combination of the number of threads ina task scheduler and the mailboxes used by these threads as a task scheduler configuration.Figure 6.6(b) shows the task scheduler in a fully populated configuration in which there is athread connected to each mailbox; in this configuration each thread Ti is connected to mailboxMi. In contrast, Figure 6.6(c) shows the task scheduler in a partially populated configuration inwhich only mailboxes M1 and M3 are used (by threads T1 and T3, respectively).
If a thread creates a task tree and then submits it to the task scheduler for execution, more-

6.3. IMPLEMENTING NUMA SUPPORT 109
over, tasks in the tree have affinities to mailboxes, these tasks are inserted into the creatorthread’s local deque as well as into the mailbox corresponding to the task’s affinity value.Threads in the task scheduler attempt to obtain tasks to execute. First, a thread tries to re-ceive a task from the mailbox the thread is connected to (Rule 4 in Figure 6.5). If the mailboxis empty, the thread falls back trying to remove a task from the shared queue (Rule 5) or torandomly stealing a task (Rule 6).
Figure 6.6(a) shows a task tree with three levels; tasks in the tree have affinities specified forthe task scheduler configuration shown in Figure 6.6(b). The example corresponds to a possiblepartitioning of an iteration space of 1000 iterations (as done, e.g., by the parallel forpattern). If the task tree is repeatedly executed with the same set of affinities and with the sametask scheduler configuration, the same subset of the iteration space is sent to the same mailbox.Thus, each thread processes the same subset of the iteration space. As a result, the computationhas good cache locality. In standard TBB the parallel for algorithm template is basedon this principle: If used with an affinity partitioner object, the parallel fortemplate stores task affinities into the partitioner object and reuses them on future executions.
In standard TBB affinities are only a hint on the preferred place of a task’s execution, thatis, the task scheduler is allowed to ignore task affinities to better balance the load. More specif-ically, tasks are not executed by the thread specified by affinities for three main reasons: (1)steals, (2) revokes, and (3) changes in the task scheduler configuration. First, affinitized tasksare also inserted into the local deque of the thread that creates them, thus they can be stolenbefore they are received at the mailbox they have affinity to. Second, if the thread that createdtasks executes Rule 3, it can revoke tasks from mailboxes and execute them locally itself. Third,the task scheduler configuration changes at runtime; Figure 6.6(c) shows the task schedulerpartially populated with only two threads. For this task scheduler configuration the affinitiesof the task tree do not make sense (because there is no thread connected to mailboxes M2 andM4), therefore all tasks of the tree (including those with affinity to threads T2 and T4) will beexecuted either by thread T1 or by thread T3.
Programmers cannot foresee dynamically changing runtime conditions, thus TBB does notencourage programmers to specify affinities for tasks. Instead, TBB keeps task affinities internalto the library’s implementation. The only case where TBB uses affinities, even internally, is theparallel for template used in combination with an affinity partitioner object.The parallel for algorithm template automatically and internally adapts the affinities oftask trees to match the effective place of execution. E.g., let us assume a task tree generatedby a parallel for partitioned with an affinity partitioner. Let us furthermoreassume that, when unfolding the task tree, the partitioner sets the affinity value of a task A in thetree to value 1 (indicating that A is preferably executed by the thread connected to mailbox M1).If task A is executed by a thread connected to a different mailbox Mi (because of any of thepreviously mentioned three reasons), the runtime overwrites the partitioner’s record about thetask’s affinity; after the update the task has its affinity value set to i and this value is used whenthe task is re-executed. This strategy is beneficial assuming that the affinities specified by thepartitioner match the configuration of the task scheduler for some time in the future. However,updating task affinities is not acceptable in NUMA systems: In NUMA systems task affinitiesmust stay constant because each task must execute at the processor where its data is located.

110 CHAPTER 6. A PARALLEL LIBRARY FOR LOCALITY-AWARE PROGRAMMING
Level 3
Level 2
Level 1
1 [1-‐250]
2 [751-‐1000]
2 [501-‐751]
1 [251-‐500]
1 [1-‐500]
2 [501-‐1000]
1 [1-‐1000]
(a) Task tree with task-to-processor affinities (top) and partitioning (bottom).
Task scheduler
T1 T2
M1
T4 T3
M2
Processor 1 Processor 2
(b) TS fully populated.
Task scheduler
T1 ?
M1
? T3
M2
Processor 1 Processor 2
(c) TS partially populated.
Figure 6.7: Mailboxing (TBB-NUMA).
4′ The task removed from mailbox Mi, where the current thread is pinned to Processor i.
5′ The task removed from the task scheduler’s shared queue i, where the current thread ispinned to Processor i.
5′′ The task removed from the task scheduler’s shared queue 0 (queue w/o affinity for anyprocessor).
5′′′ The task removed from the task scheduler’s shared queue k, where the current thread ispinned to Processor i and i 6= k.
Figure 6.8: Rules substituted by TBB-NUMA to fetch next task (relative to standard TBB).
6.3.4 TBB-NUMA task scheduler
Unlike in standard TBB, in TBB-NUMA the programmer can specify task affinities explicitly.Task affinities are hints in TBB-NUMA as well, but, unlike in standard TBB, affinities aresticky in TBB-NUMA. That is, the TBB-NUMA runtime is not allowed to modify a task’saffinity when the task is not executed on a different processor (i.e., a processor not originallyintended by the programmer). To help the TBB-NUMA task scheduler still honor affinities (andbalance load at the same time), the TBB-NUMA runtime implements a set of optimizations inaddition to standard TBB. We first define the semantics of task affinities in TBB-NUMA, thenwe describe the optimization to handle scheduler configuration changes, steals, and revokes.
Task-to-processor affinities
In TBB-NUMA tasks have affinity to a processor (instead of a mailbox as in standard TBB).That is, a task with an affinity value equal to i is not meant to be executed by the single thread

6.3. IMPLEMENTING NUMA SUPPORT 111
connected to mailbox Mi as in TBB, but by any thread running at Processor i. Thus, TBB-NUMA replaces Rule 4 of standard TBB (Figure 6.5) by Rule 4’ (Figure 6.8). Because affinityvalues have a clear meaning backed by the TBB-NUMA runtime system, the programmer isallowed to use them (either directly by using the task scheduler interface or indirectly by reusingparallel algorithm templates). To support per-processor task affinities, the number of mailboxesof a TBB-NUMA task scheduler is equal to the number of processors of the machine (i.e., ona P -processor system there are P mailboxes). A task with an affinity value of i is inserted intomailbox Mi and, as the RML allows only threads pinned to Processor i to use this mailbox, thetask is slated to be executed at the appropriate processor. Figure 6.7(b) shows the layout of atask scheduler populated with 4 threads (on a 2-processor system); two threads are pinned toeach processor.
Figure 6.7(a) shows a NUMA-aware affinitization of a task tree (also for a 2-processorsystem). In the example the first half of the iteration space (iterations [1-500]) is mappedto Processor 1, the second half (iterations [501-1000]) is mapped to Processor 2. If dataaccessed by iterations [1-500] ([501-1000]) is allocated at Processor 1 (Processor 2), thecomputation has good data locality and thus good performance with TBB-NUMA.
Handling configuration changes (Cause 1)
TBB-NUMA handles the problem of changing task scheduler configurations by hardware-awareresource management. The TBB-NUMA RML allocates threads to task schedulers so thateach scheduler has an approximately equal number of threads pinned to each processor. Asa result, in every task scheduler the number of threads using each per-processor mailbox isapproximately the same. Thus, every task scheduler has approximately the same share of eachprocessor’s computational and memory system resources. Figure 6.7(c) shows a task schedulerpopulated with two threads (two threads less than in Figure 6.7(b)). Each mailbox is served byone thread pinned to each processor and the affinitized task tree will execute with good datalocality, just as when the task scheduler is fully populated (Figure 6.7(b)).
In some scenarios (when the number of thread schedulers registered with the RML is closeto or is larger than the total number of threads registered with the RML) threads cannot beallocated to schedulers so that each mailbox is served by an equal number of threads. But aslong as the number of registered schedulers is low (which is frequently the case in practice), itis possible to evenly distribute threads between task schedulers.
Handling steals (Cause 2)
An affinitized task is present at two places: in the local deque of the thread that created it andin the mailbox it is sent to. Affinitization is successful if the task is removed from the mailboxby the thread connected to the mailbox. Affinitization is unsuccessful if the task is stolen by athread that has no work to do and it has fallen back to random stealing (Rule 6) (the stealingthread that has fallen through Rules 1–5 and is obtaining work according to Rule 6).
Standard TBB prevents a stealing thread from obtaining an affinitized task if there is a goodchance that the task is going to be removed from the destination mailbox soon. Before stealingan affinitized task, each thread checks if the destination mailbox of the task is idle (by callingthe is idle() function shown in Figure 6.9(a)). If the mailbox is marked as idle, the stealing

112 CHAPTER 6. A PARALLEL LIBRARY FOR LOCALITY-AWARE PROGRAMMING
1 void s e t i d l e ( a f f i n i t y id , bool f l a g ) {2 mailbox [ i d ] . f l a g = f l a g ;3 }4 bool i s i d l e ( a f f i n i t y i d ) {5 return mailbox [ i d ] . f l a g ;6 }
(a) Standard TBB.
1 void s e t i d l e ( a f f i n i t y id , bool f l a g ) {2 mailbox [ i d ] . counter += f l a g ? 1 : −1;3 }4 bool i s i d l e ( a f f i n i t y i d ) {5 bool threads expected = num threads act ive [ i d ]6 < num th reads a l l o t t ed [ i d ] ;7 return mailbox [ i d ] . counter > 0 | | threads expected ;8 }
(b) TBB-NUMA.
Figure 6.9: Indicating idleness.
thread bypasses the mailbox and tries to obtain a task from some other thread.
A mailbox is marked as idle (by the set idle() function in Figure 6.9(a)) in two cases:(1) when a thread falls through dequeuing from its local deque (Rule 3), but has not yet peeked atits mailbox yet (Rule 4), and (2) the thread connected to the mailbox has left the task scheduler.In the first case bypassing is well-justified because the task will be shortly received by the threadconnected to the mailbox. The second case needs more explanation. A thread leaves the taskscheduler when there is no work available for it. Alternatively, the RML can revoke the threadfrom the current task scheduler and then assign it to some other task scheduler. If the thread isassociated with the current task scheduler again, it will empty its mailbox and the task will beexecuted at the intended location. But if the thread is permanently assigned to some other taskscheduler, the task will be revoked (executed locally) by the thread spawning it and the task’saffinity will be updated (which is in conformity with the TBB principle of non-constant taskaffinities).
In TBB-NUMA task affinities are constant (by design), thus the idling mechanism of stan-dard TBB must be revised. If a task is executed repeatedly, due to the constant affinities, a taskwith affinity value i will be submitted to the same mailbox Mi over and over again. If thereare no threads connected to mailbox Mi, other threads in the scheduler will bypass mailbox Mi
(assuming the idling mechanism of standard TBB). Bypasses reject work thus they can resultin a high performance penalty. The idling mechanism of standard TBB must be updated alsobecause TBB-NUMA allows multiple threads attached to a single mailbox.
TBB-NUMA uses an idling mechanism that is tightly coupled with resource management.The idling mechanism of TBB-NUMA is based on incrementing/decrementing a counter, asimplemented by the set idle() function shown in Figure 6.9(b). A thread increments thecounter before receiving from its mailbox and decrements it after it has received a task. Unlikewith standard TBB, with TBB-NUMA a thread does not indicate idleness when it leaves thetask scheduler. To allow stealing those tasks that are not likely to be picked up at their destina-tion mailbox and thus provide good load balance, the is idle() function inspects both thecounter and the number of threads allocated/active in the destination’s mailbox, which avoids

6.3. IMPLEMENTING NUMA SUPPORT 113
Stage 3: 2
Stage 3: 2
Stage 1: 0
Stage 1: 0
Root
Stage 3: 2
Stage 3: 2
Stage 1: 0
Stage 1: 0
Task spawned
Task enqueued (at Processor 2)
Processor 2
Stage 2: 1
Stage 2: 1
Stage 2: 1
Stage 2: 1
Processor 1
Figure 6.10: Shallow task tree: 2-stage pipeline with affinities.
unnecessary bypasses.
Handling revokes (Cause 3)
Affinitized tasks are inserted into the local deque of the thread that creates them. An affinitizedtask is revoked if the creator thread retrieves it (Rule 3) before it can be received at the des-tination processor. Unlike Rule 6, Rule 3 does not bypass affinitized tasks (to guarantee thateach task is eventually executed before the program terminates). TBB-NUMA attempts to avoidrevokes in two ways: by controlling task submission order via reflection (in case of wide tasktrees) and by detaching subtrees (in case of shallow task trees).
Controlling task submission order In wide task trees each task (except leafs) has at leasttwo children tasks. When unfolding wide task trees, it is beneficial to submit tasks affinitizedfor the current processor last (the processor where the thread unfolding the tree executes). AsRule 3 retrieves tasks in LIFO order, tasks enqueued earlier have a chance to be picked up forexecution at their destination thread before the creator thread revokes them.
For example, when unfolding level 2 of the task tree shown in Figure 6.7(a), theparallel for template spawns the right subtree and continues executing the left subtree,if the current processor is Processor 1; otherwise it spawns the left subtree and continues exe-cuting the right subtree (assuming a 2-processor system). To control task submission order thecreator thread must determine its current processor. The library supports this kind of reflectionthrough the task scheduler init::get current cpu() call. This call is used inter-nally by the parallel for template. Code using the task scheduler directly can also rely onthis reflection-based capability to control submission order.
Detaching subtrees Figure 6.10 shows a shallow task tree. E.g., the pipeline algorithm tem-plate of TBB generates shallow subtrees: The pipeline template generates a distinct subtree foreach input element processed by the pipeline; each task in a subtree corresponds to a differentpipeline stage. The task tree shown in Figure 6.10 corresponds to a 3-stage pipeline computa-tion.

114 CHAPTER 6. A PARALLEL LIBRARY FOR LOCALITY-AWARE PROGRAMMING
In a shallow task tree each task (except the root task) has only one child task that is executednext by the task scheduler (according to Rule 3). If the memory accesses of a pipeline com-putation are dominated by accesses to input elements, shallow task trees can be beneficial forL1/L2 cache locality, because tree shallowness guarantees that each input element is processedby the same thread (thus the input element is in the cache used by this thread). In some cases,however, a child task predominantly accesses data other than the input element it processes.Moreover, in some cases the child task’s accesses do not hit in the L1/L2 cache and are servedby last-level caches (or even by DRAM). In these cases it can be beneficial to schedule the childtasks at threads executing at well-defined processors to achieve good last-level cache/DRAMdata locality.
E.g., in the pipeline computation in Figure 6.10, Stage 1 of the pipeline is not associatedwith any processor (its task-to-processor affinity is 0), but Stage 2 accesses data associated withProcessor 1 and Stage 3 accesses data associated with Processor 2 (Stage 2 and Stage 3 have atask-to-processor affinity value of 1 and 2, respectively). Spawning affinitized tasks and sendingthem to the mailbox of the appropriate thread does not help in this case because the affinitizedtask will be revoked (Rule 3 has priority over Rule 4). To allow a child task to execute at theprocessor it is associated with, the child task must be detached from its parent task, that is, itmust be sent to the destination processor without inserting it into the local queue.
Standard TBB facilitates detaching tasks through the enqueue() call. Enqueued tasksare inserted into a queue shared by all threads in a task scheduler, threads receive enqueuedtasks according to Rule 5. In standard TBB enqueued tasks are not allowed to have affinitiesto threads. TBB-NUMA extends standard TBB by allowing enqueued tasks to have affinitiesas well: the TBB-NUMA task scheduler has P + 1 shared queues (assuming a P -processorsystem), tasks with affinity for Processor i are enqueued at Qi, 1 ≤ i ≤ P , tasks with no task-to-processor affinity defined are enqueued at Q0, thus Rule 5 of TBB is replaced by a set ofrules in TBB-NUMA (Rule 5′-Rule 5′′′ in Figure 6.8).
To illustrate how enqueuing handles revokes, let us consider the 3-stage pipeline exampleagain (Figure 6.10). Let us assume that the root task runs at Processor 1 (as shown in thefigure). Stage 1 has no task-to-processor affinity, thus the root task unfolds Stage 1 tasks usingspawns. Let us assume that Stage 1 tasks are then also executed at Processor 1. The next stage(Stage 2) has affinity for Processor 1, but as all Stage 1 tasks are already running at Processor 1,Stage 2 tasks do not have to be detached (thus they are spawned). When, however, the task treeis unfolded further (i.e., Stage 3 tasks are created), these tasks have affinity for Processor 2 (aprocessor different from the current processor), thus Stage 3 tasks are not spawned but enqueued(with affinity for Processor 2). Threads at Processor 2 will then dequeue these tasks (Rule 5′)and each stage is executed where the programmer originally intended. Threads at Processor 1(the threads that originally unfolded the upper levels of the task tree) in the meantime unfoldnew subtrees to process any remaining input elements.
The decision whether to spawn or to enqueue tasks when unfolding a task tree dependson the processor the current thread is pinned to. The TBB-NUMA pipeline template uses re-flection to determine the current thread’s processor. E.g., if the root task of the example inFigure 6.10 executes at Processor 2 instead of Processor 1, enqueuing is used already whenunfolding Stage 2. Finally, similar to the affinity of mailboxed tasks, the affinity of enqueuedtasks is a hint on the preferred place of execution, that is, if a thread cannot get a task fromthe shared queue associated with its processor (i.e., Rule 5′ fails), the thread will try all otherqueues in the task scheduler (i.e., it will fall back to Rules 5′′ and 5′′′).

6.4. EVALUATION 115
6.3.5 Programming with TBB-NUMA
TBB-NUMA extends TBB, that is, the programmer can define at runtime which rules the taskscheduler uses, the rules of standard TBB or rules specific to TBB-NUMA. If TBB-NUMA isenabled, the parallel for algorithm template can be used with an additional parameter, adata distribution object that specifies the distribution of data for the iteration space processedby the loop. TBB-NUMA includes a set of predefined data distributions (e.g., the block-cyclicdistribution [12] shown in Figure 6.7(a) for a 2-processor system). If needed, the programmercan define custom data distributions: The parallel for template interfaces with data dis-tributions through a single method; this method is used to determine the affinity of a subrangeof the iteration space when the task tree corresponding to the iteration space is unfolded. Thepipeline template allows specifying the per-processor affinity of pipeline stages. Finally,with TBB-NUMA the semantics of task affinities is clearly defined (task-to-processor affinity),thus the programmer can use task affinities directly with the task scheduler interface.
In addition to specifying hints on the schedule of computations, TBB-NUMA defines helperfunctions to enforce data distributions on memory regions as well. Data distributions are en-forced through memory migrations (e.g., through the move pages() system call in Linux).Both data distributions and computation schedules depend on the actual hardware configuration.TBB-NUMA determines the number of processors at runtime and passes on this information touser programs. As a result, programs can be parametrized for a generic NUMA system and arethus portable.
6.4 Evaluation
The evaluation presented in this section attempts to answer three questions: (1) do optimiza-tions improve data locality and performance (Section 6.4.2), (2) are optimizations composable(Section 6.4.3), and (3) are optimizations portable (Section 6.4.4).
6.4.1 Experimental setup
Three machines are used to run experiments (see Table 6.1).
Intel E7-4830 Intel E5520 AMD 6212Microarchitecture Westmere Nehalem Bulldozer# of processors/cores 4/32 2/8 4/16Main memory 4x16 GB 2x24 GB 4x32 GBCross-chip interconnect QPI QPI HTLast-level cache 4x24 MB 2x8 MB 4x8 MB
Table 6.1: Hardware configuration (as reported by Linux).
We use five programs for performance evaluation, three programs use parallel algorithmtemplates and two programs use the task scheduler interface directly (see Table 6.2).

116 CHAPTER 6. A PARALLEL LIBRARY FOR LOCALITY-AWARE PROGRAMMING
Benchmark Parallel algorithmProgram Input suite template usedcg input size C NAS PB parallel formg input size C NAS PB parallel forstreamc. 10M input points PARSEC nonefluida. 500K particles/500 frames PARSEC noneferret database (700M images)/ PARSEC pipeline
3500 input images
Table 6.2: Benchmark programs.
6.4.2 Data locality optimizations
Performance in NUMA systems depends on two aspects: the data distribution policy used andthe policy used to schedule computations. We evaluate performance for a series of differentexecution scenarios; an execution scenario is defined by the pair (data distribution policy, com-putation schedule policy) used. Two execution scenarios consecutively listed in the evaluationdiffer in only one aspect, that is, they differ either in the data distribution policy used or thecomputation schedule policy used, but not both. Performance optimizations for loop-parallelprograms are evaluated in five execution scenarios:
(noap, FT) Default version of the program that does not use task affinitization and uses thefirst-touch page placement policy (default policy in many OSs, e.g., Linux).
(noap, INTL) Default version of the program used with the interleaved page placement pol-icy. The interleaved page placement policy distributes pages across processors in a round-robin fashion. Interleaved page placement is recommended for source-level optimizationsby [55] and is used in automatic systems as well [27]. Interleaved page placement im-proves performance by reducing contention on memory interfaces, but it does not reducethe number of remote memory accesses. In many systems (including the systems in Ta-ble 6.1) interleaved placement is equivalent to disabling NUMA (in the BIOS).
(ap, INTL) The parallel loops of the program are affinitized with the TBB-standardaffinity partitioner [86]; pages are placed interleaved, as in the previous con-figuration. The affinity partitioner is designed to improve cache performance.This configuration shows the benefits of using this partitioner.
(NACS, INTL) While the previous configurations can be achieved with standard TBB, thisconfiguration is achievable only with TBB-NUMA. This configuration uses NUMA-Aware Configuration Scheduling (NACS), that is, the task scheduler is given hints aboutthe distribution of data in memory. Normally, NACS effects both caching and DRAMdata locality. However, to assess how NACS effects caching only, data distribution is notenforced in this configuration. Instead, the interleaved page placement policy is used,thus this configuration differs only in one parameter (the schedule of computations) fromthe previous configuration.
(NACS, NADD) NUMA-Aware Data Distribution is enforced (in addition to NACS in the pre-vious configuration). The performance results in this configuration show the benefits dueto both cache and DRAM data locality.

6.4. EVALUATION 117
0.00 0.20 0.40 0.60 0.80 1.00 1.20
noap, F
T ap,
FT
ap, INT
L
NACS, IN
TL
NACS, N
ADD
Execu&on &me rela&ve to noap, FT
(a) cg performance.
0.00 0.20 0.40 0.60 0.80 1.00 1.20
noap, F
T ap,
FT
ap, INT
L
NACS, IN
TL
NACS, N
ADD
Execu&on &me rela&ve to noap, FT
(b) mg performance.
0,00
0,20
0,40
0,60
0,80
1,00
noap, FT
ap, FT ap, INTL NACS, INTL
NACS, NADD
Computa9on Migra9on
Execu&on &me rela&ve to default, FT
0
20
40
60
80
noap, F
T ap,
FT
ap, INT
L
NACS, IN
TL
NACS, N
ADD
Uncore transfers (GTransfers)
(c) cg uncore traffic.
0 2 4 6 8
10
noap, F
T ap,
FT
ap, INT
L
NACS, IN
TL
NACS, N
ADD
Uncore transfers (GTransfers)
(d) mg uncore traffic.
0.00.51.01.52.02.53.03.54.0
8-core 32-core
REMOTE_DRAM LOCAL_DRAM REMOTE_CACHE LOCAL_CACHE
Total uncore transfers (GTransfers)
Figure 6.11: Performance and uncore traffic of loop-parallel programs w/o contention (West-mere).
The evaluation described in this section uses the 4-processor 32-core Westmere system (seeSection 6.4.4 for evaluation on the other systems). Figure 6.11(a) and 6.11(b) show the relativeexecution time of cg and mg in all five configurations. The execution times are relative to the(noap, FT) configuration, which has a relative execution time of 1.0. The lower the relativeexecution time measured in a configuration, the better the performance of the program in thatconfiguration.
Relative to the best-performing configuration achievable with standard TBB,(ap, INTL), cg improves 18% (relative execution time of 0.34 with (NACS,NADD)vs. relative execution time of 0.4 with (ap, INTL), the best configuration that can berealized with standard TBB). The computation time of mg improves around 12%, but its overallperformance becomes slightly worse than the best configuration achievable with standard TBBbecause the cost of data migration (distributing data) cancels the improvement in computationtime.
To show that performance optimizations improve both cache- and DRAM locality, we mea-sure the number of uncore transfers a program generates in each of the five examined con-figurations. There are four types of uncore transfers: local cache/DRAM accesses and remotecache/DRAM accesses; the latencies of the different types of transfers are listed in Figure 1.1 fora 2-processor system. Figures 6.11(c) and 6.11(d) show the uncore traffic breakdown of cg and

118 CHAPTER 6. A PARALLEL LIBRARY FOR LOCALITY-AWARE PROGRAMMING
0.00 0.20 0.40 0.60 0.80 1.00 1.20
noap, F
T
noap, I
NTL
NACS, IN
TL
NACS, N
ADD
Execu&on &me rela&ve to noap, FT
(a) streamc. performance.
0.00 0.20 0.40 0.60 0.80 1.00 1.20
noap, F
T
noap, I
NTL
NACS, IN
TL
NACS, N
ADD
Execu&on &me rela&ve to noap, FT
(b) fluida. performance.
0.00 0.20 0.40 0.60 0.80 1.00 1.20
noap, F
T
noap, I
NTL
NACS, IN
TL
NACS, N
ADD
Execu&on &me rela&ve to noap, FT
(c) ferret performance.
0,00
0,20
0,40
0,60
0,80
1,00
noap, FT
ap, FT ap, INTL NACS, INTL
NACS, NADD
Computa9on Migra9on
Execu&on &me rela&ve to default, FT
0
50
100
150
200
noap, F
T
noap, I
NTL
NACS, IN
TL
NACS, N
ADD
Uncore transfers (GTransfers)
(d) streamc. uncore traffic.
0 1 2 3 4 5 6 7
noap, F
T
noap, I
NTL
NACS, IN
TL
NACS, N
ADD
Uncore transfers (GTransfers)
(e) fluida. uncore traffic.
0 5 10 15 20 25 30 35 40
noap, F
T
noap, I
NTL
NACS, IN
TL
NACS, N
ADD
Uncore transfers (GTransfers)
(f) ferret uncore traffic.
0.00.51.01.52.02.53.03.54.0
8-core 32-core
REMOTE_DRAM LOCAL_DRAM REMOTE_CACHE LOCAL_CACHE
Total uncore transfers (GTransfers)
Figure 6.12: Performance and uncore traffic of non–loop-based programs w/o contention (West-mere).
mg, respectively. In the (NACS, NADD) configuration almost all remote memory accesses areeliminated (relative to both the baseline (noap, FT) and the (ap, INTL) configuration).
Figures 6.12(a), 6.12(b), and 6.12(c) show the performance of the remaining three, non–loop-based programs. The affinity partitioner can be used only with loop-based pro-grams, thus the (ap, FT) and (ap, INTL) configurations are invalid for non–loop-based pro-grams. As a result, non-loop-based programs are evaluated in four instead of five configurations:the invalid configurations are replaced by the (noap, INTL) configuration (version of theprogram with no affinities specified, interleaved page placement policy). The principle that twosubsequently listed configurations change only in a single parameter still holds after this change.Similar to loop-based programs, the two last configuration scenarios shown in the figures canbe realized only with TBB-NUMA. For the non–loop-based programs NUMA-aware memorysystem optimizations result in performance improvements between 16–44% over the best pos-sible configuration achievable with standard TBB (e.g., in case of streamcluster relativeexecution time of 0.38 with (NACS, NADD) vs. relative execution time of 0.55 with (noap,INTL), the best configuration that can be realized with standard TBB). Figures 6.12(d), 6.12(e),and 6.12(f) show the breakdown of uncore traffic for all three programs in all configurations.Memory system optimizations reduce the number of remote accesses for these programs, too.

6.4. EVALUATION 119
0.00 0.20 0.40 0.60 0.80 1.00 1.20
noap, F
T ap,
FT
ap, INT
L
NACS, IN
TL
NACS, N
ADD
Execu&on &me rela&ve to noap, FT
(a) cg performance.
0.00 0.20 0.40 0.60 0.80 1.00 1.20
noap, F
T ap,
FT
ap, INT
L
NACS, IN
TL
NACS, N
ADD
Execu&on &me rela&ve to noap, FT
(b) mg performance.
0,00
0,20
0,40
0,60
0,80
1,00
noap, FT
ap, FT ap, INTL NACS, INTL
NACS, NADD
Computa9on Migra9on
Execu&on &me rela&ve to default, FT
0
20
40
60
80
noap, F
T ap,
FT
ap, INT
L
NACS, IN
TL
NACS, N
ADD
Uncore transfers (GTransfers)
(c) cg uncore traffic.
0 2 4 6 8
10
noap, F
T ap,
FT
ap, INT
L
NACS, IN
TL
NACS, N
ADD
Uncore transfers (GTransfers)
(d) mg uncore traffic.
0.00.51.01.52.02.53.03.54.0
8-core 32-core
REMOTE_DRAM LOCAL_DRAM REMOTE_CACHE LOCAL_CACHE
Total uncore transfers (GTransfers)
Figure 6.13: Performance and uncore traffic of loop-parallel programs w/ contention (West-mere).
6.4.3 Composability
This section evaluates how the properties of memory system optimizations are preserved whenonly a part of the hardware is available for executing optimized computations. Each benchmarkprogram is executed concurrently with a contender computation. The contender computationis parallelized and demands all hardware resources (just as the benchmark program it is co-runwith). The RML divides threads between the benchmark program and the contender program.This setup is similar to the scenario shown in Figure 6.4(b) with the difference that only twotask schedulers (TS) but no OpenMP runtime (OMP) use the RML. The contender computationis floating-point intensive and its working set fits into the private L1/L2 caches of the cores. Asa result, uncore transfers measured are predominantly caused by the benchmark program (andnot by the contender computation).
Figures 6.13(a), 6.13(b), 6.14(a), 6.14(b), and 6.14(c), show the performance of all bench-mark programs in all relevant configurations, Figures 6.13(c), 6.13(d), 6.14(d), 6.14(e), and6.14(f) show the breakdown of uncore traffic corresponding to each program/configuration.Performance is reported as execution time relative to the (noap, FT) configuration with en-abled contender. For each program/configuration performance results and the breakdown ofuncore traffic is similar to the corresponding case with no contention. We record minor dif-

120 CHAPTER 6. A PARALLEL LIBRARY FOR LOCALITY-AWARE PROGRAMMING
0.00 0.20 0.40 0.60 0.80 1.00 1.20
noap, F
T
noap, I
NTL
NACS, IN
TL
NACS, N
ADD
Execu&on &me rela&ve to noap, FT
(a) streamc. performance.
0.00 0.20 0.40 0.60 0.80 1.00 1.20
noap, F
T
noap, I
NTL
NACS, IN
TL
NACS, N
ADD
Execu&on &me rela&ve to noap, FT
(b) fluida. performance.
0.00 0.20 0.40 0.60 0.80 1.00 1.20
noap, F
T
noap, I
NTL
NACS, IN
TL
NACS, N
ADD
Execu&on &me rela&ve to noap, FT
(c) ferret performance.
0,00
0,20
0,40
0,60
0,80
1,00
noap, FT
ap, FT ap, INTL NACS, INTL
NACS, NADD
Computa9on Migra9on
Execu&on &me rela&ve to default, FT
0
50
100
150
200
noap, F
T
noap, I
NTL
NACS, IN
TL
NACS, N
ADD
Uncore transfers (GTransfers)
(d) streamc. uncore traffic.
0 1 2 3 4 5 6 7
noap, F
T
noap, I
NTL
NACS, IN
TL
NACS, N
ADD
Uncore transfers (GTransfers)
(e) fluida. uncore traffic.
0 5 10 15 20 25 30 35 40
noap, F
T
noap, I
NTL
NACS, IN
TL
NACS, N
ADD
Uncore transfers (GTransfers)
(f) ferret uncore traffic.
0.00.51.01.52.02.53.03.54.0
8-core 32-core
REMOTE_DRAM LOCAL_DRAM REMOTE_CACHE LOCAL_CACHE
Total uncore transfers (GTransfers)
Figure 6.14: Performance and uncore traffic of non–loop-based programs w/ contention (West-mere).
ferences in relative performance numbers and uncore traffic because with contention there is adifferent amount of per thread cache capacity available to programs than without contention. Inconclusion, the TBB-NUMA runtime preserves the properties of memory system optimizationseven if only a part of the hardware is available.
An interesting aspect is that using the affinity partitioner with cg causes a slow-down under contention. The RML is shared with the contender computation and threads fre-quently “migrate” between the two computations (i.e., thread previously assigned to the taskscheduler running cg are frequently reassigned to the task scheduler running the contendercomputation and vice versa). When a thread leaves a task scheduler (because the RML reas-signed the thread to an other task scheduler), the mailbox of the thread (i.e., the mailbox inthe task scheduler the thread was previously connected to) is marked as idle. Affinitized taskspresent in a mailbox that is marked idle are not removed by stealing threads (i.e., treads lookingfor work; see Section 6.3.4 for further details). Instead, the tasks are kept in the mailbox untilthe thread that created them becomes available and can process them.
In summary, if threads frequently migrate between task schedulers, stealing threads oftenreject work (i.e., reject to execute tasks) by bypassing mailboxes in which work (i.e., affinitizedtasks) is present. As a result, processor cores are often idle, which results in a slowdown in the

6.5. CONCLUSIONS 121
0.00 0.20 0.40 0.60 0.80 1.00 1.20
noap, F
T ap,
FT
ap, INT
L
NACS, IN
TL
NACS, N
ADD
Execu&on &me rela&ve to noap, FT
(a) cg performance.
0.00 0.20 0.40 0.60 0.80 1.00 1.20
noap, F
T ap,
FT
ap, INT
L
NACS, IN
TL
NACS, N
ADD
Execu&on &me rela&ve to noap, FT
(b) mg performance.
0.00 0.20 0.40 0.60 0.80 1.00 1.20
noap, F
T
noap, I
NTL
NACS, IN
TL
NACS, N
ADD
Execu&on &me rela&ve to noap, FT
(c) streamc. performance.
0.00 0.20 0.40 0.60 0.80 1.00 1.20
noap, F
T
noap, I
NTL
NACS, IN
TL
NACS, N
ADD
Execu&on &me rela&ve to noap, FT
(d) fluida. performance.
0.00 0.20 0.40 0.60 0.80 1.00 1.20
noap, F
T
noap, I
NTL
NACS, IN
TL
NACS, N
ADD
Execu&on &me rela&ve to noap, FT
(e) ferret performance.
0.00
0.20
0.40
0.60
0.80
1.00
noap, FT ap, FT ap, INTL NACS, INTL
NACS, NADD
Nehalem Bulldozer
Execu&on &me rela&ve to default, FT
Figure 6.15: Performance w/o contention (Nehalem and Bulldozer).
case of the cg benchmark. The TBB-NUMA task scheduler is coupled with resource allocationthat helps avoid unnecessary bypasses.
6.4.4 Portability
To show that memory system optimizations are portable, we run the same set of programson two additional systems. As memory system optimizations are implemented for a genericNUMA system, the programs are executed on these systems without modification. Perfor-mance results are shown in Figures 6.15(a)–6.15(e); the variation of the measurement readingsis negligible. On the Nehalem, optimizations result in 3–18% performance improvement overthe the best configuration that can be realized with standard TBB. On the Bulldozer we measure6–18% improvement (and no improvement (fluidanimate) resp. a 3% slowdown (mg)).
6.5 Conclusions
The work presented in this chapter contributes to the set of NUMA-aware development toolsthat aid programmers in finding and fixing NUMA-related performance problems. TBB-NUMAis an extension to standard TBB and the programmer can decide when to use NUMA-specificfunctionalities. TBB-NUMA supports portable and composable software for NUMA systems

122 CHAPTER 6. A PARALLEL LIBRARY FOR LOCALITY-AWARE PROGRAMMING
by providing a unified interface to the runtime system as well as by implementing memory-system-aware resource management.
There are several tools to provide information about NUMA performance bottlenecks, butprogrammers so far lack a unified way to control the execution of parallel programs on NUMAsystems. TBB-NUMA allows the programmer to pass directives (based on insights and/or per-formance monitoring information) about computation and data placement to the runtime sys-tem. With NUMA systems increasing in size we expect the gap between local and remotememory accesses to increase as well, thus we expect data locality optimizations to be evenmore important in the future.
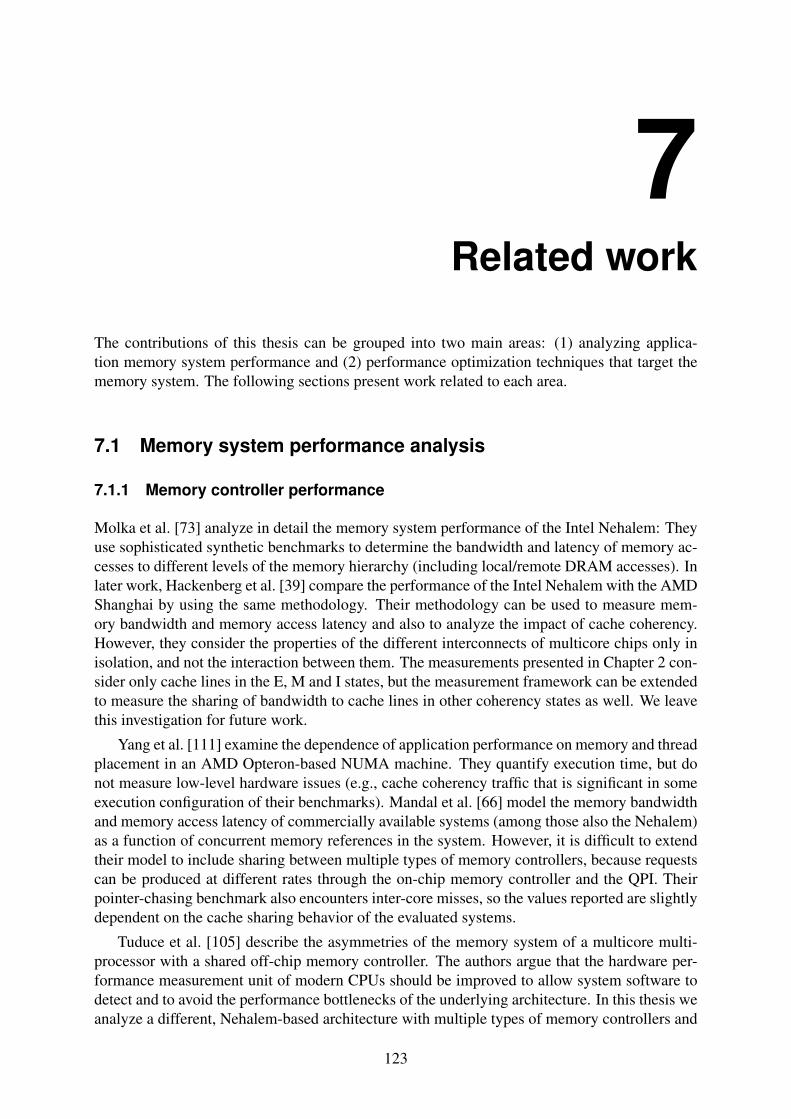
7Related work
The contributions of this thesis can be grouped into two main areas: (1) analyzing applica-tion memory system performance and (2) performance optimization techniques that target thememory system. The following sections present work related to each area.
7.1 Memory system performance analysis
7.1.1 Memory controller performance
Molka et al. [73] analyze in detail the memory system performance of the Intel Nehalem: Theyuse sophisticated synthetic benchmarks to determine the bandwidth and latency of memory ac-cesses to different levels of the memory hierarchy (including local/remote DRAM accesses). Inlater work, Hackenberg et al. [39] compare the performance of the Intel Nehalem with the AMDShanghai by using the same methodology. Their methodology can be used to measure mem-ory bandwidth and memory access latency and also to analyze the impact of cache coherency.However, they consider the properties of the different interconnects of multicore chips only inisolation, and not the interaction between them. The measurements presented in Chapter 2 con-sider only cache lines in the E, M and I states, but the measurement framework can be extendedto measure the sharing of bandwidth to cache lines in other coherency states as well. We leavethis investigation for future work.
Yang et al. [111] examine the dependence of application performance on memory and threadplacement in an AMD Opteron-based NUMA machine. They quantify execution time, but donot measure low-level hardware issues (e.g., cache coherency traffic that is significant in someexecution configuration of their benchmarks). Mandal et al. [66] model the memory bandwidthand memory access latency of commercially available systems (among those also the Nehalem)as a function of concurrent memory references in the system. However, it is difficult to extendtheir model to include sharing between multiple types of memory controllers, because requestscan be produced at different rates through the on-chip memory controller and the QPI. Theirpointer-chasing benchmark also encounters inter-core misses, so the values reported are slightlydependent on the cache sharing behavior of the evaluated systems.
Tuduce et al. [105] describe the asymmetries of the memory system of a multicore multi-processor with a shared off-chip memory controller. The authors argue that the hardware per-formance measurement unit of modern CPUs should be improved to allow system software todetect and to avoid the performance bottlenecks of the underlying architecture. In this thesis weanalyze a different, Nehalem-based architecture with multiple types of memory controllers and
123

124 CHAPTER 7. RELATED WORK
find that asymmetries are present in this system as well, however, they are of a different nature.In the Nehalem-based system analyzed in this thesis the fairness of the arbitration mechanism(the Global Queue) is crucial for performance, therefore better monitoring of this subsystemshould be made possible in successors of the Nehalem microarchitecture.
Awasthi et al. [6] investigate the problem of data placement in a system with multiple mem-ory controllers. They identify the performance degradation caused by overloading a singlememory controller in the system, and attribute the costs to increased queuing delays and de-creased DRAM row-buffer hit rates. However, their evaluation focuses more on future architec-tures and less on present and near-future systems. Blagodurov et al. [14] describe the sources ofperformance degradation that cause slowdowns to programs co-executing on NUMA systems(the remote latency and interconnect degradation). The NUMA penalty proposed in this thesisquantifies the slowdown that a single program experiences due to both factors. Moreover, thisthesis also considers issues related to the fairness of the memory controller’s queuing system.
7.1.2 Shared resource contention
Chandra et al. [20] use analytical models to predict the inter-thread cache contention of co-executing programs. Jiang et al. [47] prove that the complexity of optimal co-scheduling onchip multiprocessor systems is NP-complete. Mars et al. [69, 70] describe several systems thatcharacterize resource contention at runtime.
Zhuravlev et al. [113] quantify the performance impact of contention for different types ofshared resources in recent multicore-multiprocessor architectures. Furthermore, they comparethe accuracy of different metrics used to characterize the interference of co-executing programs.They find that the MPKI is reasonably accurate, thus we also use this metric in our work. Thework of Blagodurov et al. [13, 14] extends Zhuravlev’s work and considers contention for sharedresources on NUMA systems as well. Tang et al. [100] analyze the impact of contention forshared resources in NUMA-multicore systems on the performance of Google workloads.
7.1.3 Data sharing
Several authors have noticed the problem of data sharing in NUMA systems. Thekkath etal. [101] show that clustering threads based on the level of data sharing introduces load imbal-ances and cancels the benefits of data locality. Tam et al. [96] schedule threads with a highdegree of data sharing onto the same last-level cache. Verghese et al. [107] describe OS-leveldynamic page migration that migrates thread-private pages but does not consider shared pages.Therefore, their results show a significant amount of remaining remote memory accesses.
An approach similar to the work of Verghese et al. is described by Nikolopoulos et al. [77].Remote memory accesses are not eliminated by this approach either. Marathe et al. [67] describethe profile-based memory placement methodology we use, but they do not discuss how datasharing influences the effectiveness of their method. Tikir et al. [103] present a profile-basedpage placement scheme. Although successful in reducing the percentage of remote memoryaccesses for many benchmark programs, their method is not able to eliminate a significantportion of remote memory accesses for some programs, possibly due to data sharing.

7.2. PERFORMANCE OPTIMIZATIONS 125
7.2 Performance optimizations
7.2.1 Reducing shared resource contention
There are several methods to mitigate shared resource contention. Qureshi et al. [84] partitioncaches between concurrently executing processes. Tam et al. [97] identify the size of cachepartitions on runtime. Mars et al. [70] halt low priority processes when contention is detected.Herdrich et al. [40] analyze the effectiveness of frequency scaling and clock modulation toreduce shared resource contention. Awasthi et al. [6] show that data migration and adaptivememory allocation can be used to reduce memory controller overhead in systems with multiplememory controllers (such as NUMAs). OS process scheduling is also well suited for reducingcontention on shared caches, as described by Fedorova et al. [33].
Fedorova et al. [34] present an OS scheduling algorithm that reduces the performance degra-dation of programs co-executed on multicore systems. Banikazemi et al. [8] describe a cachemodel for a process scheduler that estimates the performance impact of program-to-core map-ping in multicore systems. The process scheduler mechanism described by Knauerhase etal. [52] and Zhuravlev et al. [113] is most closely related to the N-MASS scheme presentedin this dissertation. The schemes presented by both groups schedule processes so that eachLLC must handle approximately equal cache pressure. These approaches were evaluated onSMPs with uniform memory access times. We show that cache balancing algorithms do notwork well in NUMA systems if the memory allocation setup of the system is not considered.Many approaches on resource-aware scheduling target mostly the application class of multipro-grammed workloads, but the recent work of Dey et al. describes a resource-aware schedulerthat can handle multithreaded programs as well [28].
Recent research proposed performance-asymmetric multicore processors (AMPs). In con-trast to AMPs, the cores of a NUMA system have the same performance, but the memory systemis asymmetric and programs have different performance on remote execution. Li et al. presentan OS scheduler for AMPs [59]. They evaluate their system also on NUMA systems, but theydo not account for cache contention. Saez et al. [88] and Koufaty et al. [54] independently de-scribe a scheduler for AMPS based on the efficiency specialization principle. Their schedulersimplement a strategy similar to the maximum-local policy presented in this thesis, but theirsystem targets performance asymmetry instead of memory system asymmetry (compute-boundprocesses are scheduled onto high performance cores with larger priority than memory-boundprocesses).
7.2.2 Improving data locality
Many projects (including the auto partitioner approach of standard TBB) target im-proving the cache hit rate of programs [24, 50, 51, 86, 101, 112]. There are, however, someprograms whose cache hit rate cannot be easily improved (e.g., programs that process data setslarger than the size of the caches available on the machine used to execute the program) and inNUMA systems the locality of a program’s cache misses is often critical to performance. Datalocality optimizations are beneficial for programs that have a bad cache behavior and can thusbe considered orthogonal to cache locality optimizations.
In the following we present related work in the area of data locality optimizations.

126 CHAPTER 7. RELATED WORK
Automatic approaches
There exist many automatic approaches to improve the data locality of multithreaded programs.OSs are in a good position to increase data locality by migrating data close to the threads usingthem [13] and by replicating data across processors [27, 107]. These approaches have largeperformance benefits, but they face limitations in case of programs with data sharing, becauseno matter how threads/data are placed in the system, there will be some remote memory accessesto shared data. Tang et al. [100] show that scheduling threads close to the data they access canbe beneficial for data locality, but in some cases cache contention counteracts the benefits ofdata locality.
Data placement based on data access profiles gathered on separate profiling runs can im-prove the performance of multithreaded programs, as shown by Marathe et al. [68]. Page place-ment can also be performed at runtime based on dynamic data access profiles [77, 79, 104].Although these approaches are beneficial for performance, they work well only for programsthat have little data shared between threads.
Su et al. [94] show that dynamic data access profiles can guide not only data placement,but also thread placement to improve data locality. Tam et al. [96] cluster the threads of amultithreaded program based on the amount of data they share. Threads of the same cluster arethen scheduled onto cores connected to the same last-level cache to reduce the number of remotecache accesses. The programs considered by Tam et al. exhibit non-uniform data sharing (i.e.,each thread shares data with only a subset of the threads of the program), but data sharing canhinder thread clustering, as noted by Thekkath et al. [101]. We expect information additional todata access profiles (e.g., information about a program’s control flow [46]) can enable a profilerto better handle data and/or thread placement of programs with data sharing.
Tandir et al. [98] present an automatic compiler-based technique to improve data placement.It is not clear how their tool distributes loop iterations that access shared memory regions andhave loop-carried dependences at the same time. Kandemir et al. [51] describe an automaticloop iteration distribution method based on a polyhedral model. Their method can optimize fordata locality, however, in the presence of loop-carried dependences it inserts synchronizationoperations. We show that the number of additional synchronization operations can be kept lowif the memory distribution of the program is carefully adjusted. Reddy et al. [85] describe anapproach based on the polyhedral model that can handle both data placement and computationmapping for programs with affine loop nest sequences.
Language-based approaches
All previously mentioned approaches are fully automatic, that is, the runtime system, the OS,or the compiler is able to perform the optimizations without programmer intervention. Unfor-tunately, however, data locality optimizations cannot be automated in many cases because theyrequire high-level semantic information about the program.
Previous work has shown that the memory system performance (and thus the execution time)of many multithreaded programs can be improved on the source-code level by using compilerdirectives available in today’s commercially available state-of-the-art compilers [91], by makingsimple algorithmic changes to the program [112], or by using a combination of the two [55].Although all previously mentioned papers use recent multicore machines for evaluation, noneof them considers all aspects related to cross-processor accesses on NUMAs: [91] and [112] do

7.2. PERFORMANCE OPTIMIZATIONS 127
not consider NUMA at all; [55] does not take cache performance into account and in many casesit recommends disabling NUMA (i.e., using page-level interleaving) for problematic memoryregions.
In [78] Nikolopoulos et al. claim that data distribution primitives are not necessary forlanguages like OpenMP, because dynamic profiling can place pages correctly. We find thateven with perfect information available, runtime data migrations have too much overhead to bebeneficial for programs with data sharing. Bikshandi et al. [11] describe in-program data migra-tions in a cluster environment, but their language primitives are too heavyweight in small-scaleNUMA machines. Darte et al. [26] present generalized multipartitioning of multi-dimensionalarrays, a data distribution similar to the block-exclusive data distribution. Multipartitioning,however, relies on message-passing, while we consider direct accesses to shared memory.Zhang et al. [112] take an approach similar to the one described in the thesis: They showthat simple program transformations that introduce non-uniformities into inter-thread data shar-ing improve performance on multicore architectures with shared caches. Chandra et al. [21]describe language primitives similar to ours, but they do not show how programs must be trans-formed to eliminate data sharing. McCurdy et al. [72] show that adjusting the initializationphase of programs (so that data access patterns of the initialization phase are similar to that ofthe computations) gives good performance with the first-touch policy. We find that in programswith multiple phases that have conflicting access patterns, first-touch cannot place pages so thateach program phase experiences good data locality.
Several runtime systems (e.g., Microsoft’s ConcRT, Lithe [81], and Poli-C [5]), supportcomposable parallel software, but none of these systems is designed to preserve the data local-ity of NUMA-optimized code. There are several approaches to improve the cache locality ofwork stealing [24, 38]. However, [24] focuses only on improving cache utilization but not onreducing the number of remote memory accesses and [38] supports data locality optimizations,but balances load individually within the scope of each processor (and not between all proces-sors of a system, as the TBB-NUMA system presented in this thesis does). TBB-NUMA issimilar to existing PGAS languages [19, 23, 25] in that it gives the programmer explicit con-trol of the mapping of data and computations. However, while PGAS languages are gearedtowards large cluster-based systems and consequently require the programmer to design appli-cations with a mindset towards large machines, TBB-NUMA targets smaller machines with asingle shared memory domain and it allows (but does not require) the developer to custom-tailorexisting shared memory-based programs to NUMA architectures.
TBB-NUMA uses the concurrent queue of standard TBB to implement per-processormailboxes in the task scheduler. Recent work proposed NUMA-aware queuing and lockingtechniques [29, 36, 74], and wait-free queues have also been developed [53]. Although theTBB concurrent queue is highly optimized, it is neither NUMA-aware, nor wait-free,thus TBB-NUMA could profit from the previously mentioned techniques by using them toenqueue/dequeue tasks more efficiently. The goal of TBB-NUMA is, however, to optimizethe memory system performance of the tasks executed by the work-stealing system and notthe queuing itself; therefore, we leave the investigation of using NUMA-aware queues withTBB-NUMA to future work.


8Conclusions
This thesis presents a performance-oriented model for the memory system of NUMA multicore-multiprocessors, a type of shared-memory computers that appeared recently on the market. Thethesis investigates two application classes, multiprogrammed workloads and multithreaded pro-grams, and describes memory system bottlenecks experienced by each application class onNUMA multicore-multiprocessors. Furthermore, the thesis presents techniques to reduce neg-ative impact of these bottlenecks on application performance.
Using experimental analysis we show that the performance of multiprogrammed work-loads strongly depends on contention for processor-local resources, a factor that is specificto multicore processors (the building blocks of a NUMA multicore-multiprocessor). The non-uniformity of memory access times (a factor specific to NUMA systems) can have a large ef-fect on application performance as well. Thus, system software must consider both factors toachieve good application performance. The N-MASS process scheduler presented in this thesisaccounts for two performance-degrading factors, contention for shared caches and locality ofmain memory accesses, and improves performance by up to 32% and 7% on average over thedefault setup in current Linux implementations.
We show (also based on experimental analysis) that the locality of cache and DRAM mem-ory accesses is crucial for the performance of many multithreaded programs, the second ap-plication class we consider. Unfortunately, however, for some programs data locality can behard to achieve with today’s standard parallel programming frameworks. The thesis proposesextensions to two well-known parallel programming frameworks, OpenMP and TBB; the ex-tensions allow programmers to convey task and data affinity information to the runtime system.We show that, based on affinity information provided by the programmer, a NUMA-aware run-time can realize good data locality that results in up to 220% performance improvement over aNUMA-unaware runtime running on top of a standard implementation of Linux. Moreover, aNUMA-aware runtime can also preserve data locality when a program is ported to a differentmachine or is composed with other parallel computations.
In summary, this thesis shows the importance of taking the layout of the memory systeminto account when developing (system) software. We focus on a particular class of machines,NUMA multicore-multiprocessors, and we describe strategies to enhance the memory system-awareness of both OS process scheduling and parallel programming frameworks. We think thatin general there is a need to integrate better memory system support into compilers, runtimesystems, and operating systems if the performance potential of systems is to be exploited.
Currently, it seems likely that the number of cores per processor chip will continue to in-crease in the (near) future; a good example of this trend are manycore systems, e.g., the recentgeneration of Intel Xeon Phi processors with up to 61 cores per processor. More cores can place
129

130 CHAPTER 8. CONCLUSIONS
more demand on the memory system, thus we expect the memory system of future (manycore)systems to be even more elaborate than that of today’s multicore-based systems. Furthermore,we expect that future systems will exhibit non-uniform memory access times as well. It is,therefore, likely that on future architectures the performance penalty of inappropriately usingthe memory system will be as high (or possibly even higher) than on current systems; as a result,memory system-awareness will be even more important for future (system) software.
Producing memory system-aware software (and architecture-aware software in general) re-quires a thorough and detailed understanding of the interaction between applications and theunderlying hardware. Understanding hardware-software interaction is, however, difficult fortwo main reasons.
First, in practical systems there are usually many layers (e.g., the runtime system, the mem-ory allocator, the linker, or the OS) between the application and the hardware; the performanceof an application can closely depend on actions taken by intermediary layers of a system’ssoftware stack. In NUMA multicore-multiprocessors, for example, the OS’s decisions on pageplacement and on process/thread scheduling can influence application performance. A pro-grammer seeking to understand and to improve the application’s performance must control bothaspects to achieve meaningful measurement readings; furthermore, an OS must provide theprogrammer ways to control both aspects.
The state of the layers of the system’s software stack can also have a significant effect on anapplication’s performance. For example, in recent Linux distributions a seemingly innocuousaspect of the system’s state, the size and data distribution of the OS’s I/O buffer cache, has alarge influence on the data distribution of a program: If the OS’s buffer cache occupies a highfraction of a processor’s local memory, the OS may satisfy requests for new memory at thatprocessor from the memory of other (remote) processors. The OS’s decision to allocate pages ata remote processor can cause remote memory accesses, but, more importantly, it can contradictthe page distribution policy (e.g., first-touch page placement) that is assumed to be valid in thesystem. OS support for monitoring and controlling the distribution of the buffer cache acrossprocessors and/or OS-based notifications of violations of the system’s page placement policycould help a software developer to better and easier understand an application’s interaction witha NUMA-multicore system.
In summary, in current systems it is often difficult (or even impossible) to control and tomonitor many performance-relevant aspects of the system’s software stack. We hope that futuresystems will provide better means to diagnose and control the layers of the software stackto allow software developers better understand the software stack’s influence onto applicationperformance.
A second aspect of understanding hardware-software interaction is to understand how an ap-plication interacts with a given processor’s microarchitecture. Understanding the performancecharacteristics of a machine is, however, not always easy. Processor manufacturer’s manualsoften do no include all details about the characteristics of a given system; in these cases careful(and sometimes tedious) experimental analysis is needed to explore the characteristics of thesystem.
Feedback from the performance monitoring units of the processor gives insight into the in-ternals of a processor’s architecture and can thus also help to understand hardware performance.Moreover, as information from processor performance monitoring units is typically available atruntime, hardware performance monitoring can be used to understand and optimize application

131
performance on the fly. Unfortunately, however, the performance monitoring units of today’sprocessors have a number of limitations.
First, on today’s hardware only a low number of performance monitoring events can becounted simultaneously (recent systems have typically around 10 programmable hardware per-formance monitoring registers) and often not all types of events can be counted at the same time.As understanding an application’s performance often requires looking at several hardware-related aspects at the same time, it is important that a large number of events can be measuredsimultaneously. On current architectures, multiplexing performance monitoring events allowsseveral (even mutually exclusive) performance monitoring events to be measured together (withthe cost of somewhat reduced precision). It would be, however, beneficial, if future systems al-lowed simultaneous monitoring of a large number of events without imposing restrictions onthe events that can be measured together.
Second, both the design and the implementation of the hardware performance monitoringunits of today’s systems lack stability: Monitoring functionality can vary among different mi-croarchitectures, moreover, performance monitoring unit functionality is often complemented,reduced, or disabled as new processor models (even based on the same microarchitecture) arereleased. With unstable performance monitoring units software developers must first spendtime on understanding the monitoring unit of a system before being able to focus on actualperformance-related aspects of a system. Thus, stable performance monitoring units could po-tentially speed up the development of architecture-aware software.
Finally, the level of abstraction of most hardware events in current systems is close tothe microarchitecture. As hardware manufacturer’s do not usually describe all details of mi-croarchitectures they release, some performance monitoring events are difficult to understand.Moreover, as software often requires (at least in our experience) a level of abstraction abovethe abstraction level of the microarchitecture, supporting high-level events in the performancemonitoring unit (in addition to low-level ones) might be beneficial in the future.
We hope that this thesis provides supporting evidence to include appropriate performancemonitoring, debugging, and profiling support into future architectures to allow (easier) devel-opment of architecture-aware software.


Bibliography
[1] AMD HyperTransport technology-based system architecture. 2002.
[2] Using Intel Vtune performance analyzer to optimize software on Intel Core i7 Processors,2010.
[3] Umut A. Acar, Guy E. Blelloch, and Robert D. Blumofe. The data locality of workstealing. In Proceedings of the twelfth annual ACM symposium on Parallel algorithmsand architectures, SPAA ’00, pages 1–12, New York, NY, USA, 2000. ACM.
[4] Milena Milenkovic Aleksandar, Ar Milenkovic, and Jeffrey Kulick. Demystifying Intelbranch predictors. In Proceedings of the annual workshop on duplicating, deconstruct-ing, and debunking, WDDD ’02, pages 52–61. John Wiley & Sons, 2002.
[5] Zachary Anderson. Efficiently combining parallel software using fine-grained, language-level, hierarchical resource management policies. In Proceedings of the ACM interna-tional conference on Object oriented programming systems languages and applications,OOPSLA ’12, pages 717–736, New York, NY, USA, 2012. ACM.
[6] Manu Awasthi, David W. Nellans, Kshitij Sudan, Rajeev Balasubramonian, and Al Davis.Handling the problems and opportunities posed by multiple on-chip memory controllers.In Proceedings of the 19th international conference on Parallel architectures and com-pilation techniques, PACT ’10, pages 319–330, New York, NY, USA, 2010. ACM.
[7] Reza Azimi, Michael Stumm, and Robert W. Wisniewski. Online performance analysisby statistical sampling of microprocessor performance counters. In Proceedings of the19th annual international conference on Supercomputing, ICS ’05, pages 101–110, NewYork, NY, USA, 2005. ACM.
[8] Mohammad Banikazemi, Dan Poff, and Bulent Abali. PAM: A novel performance/poweraware meta-scheduler for multi-core systems. In Proceedings of the 2008 ACM/IEEEconference on Supercomputing, SC ’08, pages 39:1–39:12, Piscataway, NJ, USA, 2008.IEEE Press.
[9] Christian Bienia. Benchmarking Modern Multiprocessors. PhD thesis, Princeton Uni-versity, January 2011.
[10] Christian Bienia, Sanjeev Kumar, Jaswinder Pal Singh, and Kai Li. The PARSEC bench-mark suite: characterization and architectural implications. In Proceedings of the 17thinternational conference on Parallel architectures and compilation techniques, PACT’08, pages 72–81, New York, NY, USA, 2008. ACM.
133

134 BIBLIOGRAPHY
[11] Ganesh Bikshandi, Jia Guo, Daniel Hoeflinger, Gheorghe Almasi, Basilio B. Fraguela,Marıa J. Garzaran, David Padua, and Christoph von Praun. Programming for parallelismand locality with hierarchically tiled arrays. In Proceedings of the eleventh ACM SIG-PLAN symposium on Principles and practice of parallel programming, PPoPP ’06, pages48–57, New York, NY, USA, 2006. ACM.
[12] John Bircsak, Peter Craig, RaeLyn Crowell, Zarka Cvetanovic, Jonathan Harris,C. Alexander Nelson, and Carl D. Offner. Extending OpenMP for NUMA machines.In Proceedings of the 2000 ACM/IEEE conference on Supercomputing, SC ’00, Wash-ington, DC, USA, 2000. IEEE Computer Society.
[13] Sergey Blagodurov, Sergey Zhuravlev, Mohammad Dashti, and Alexandra Fedorova. Acase for NUMA-aware contention management on multicore processors. In Proceedingsof the USENIX Annual Technical Conference, USENIX ATC ’11, Berkeley, CA, USA,2011. USENIX Association.
[14] Sergey Blagodurov, Sergey Zhuravlev, and Alexandra Fedorova. Contention-awarescheduling on multicore systems. ACM Trans. Comput. Syst., 28:8:1–8:45, December2010.
[15] Sergey Blagodurov, Sergey Zhuravlev, Alexandra Fedorova, and Ali Kamali. A case forNUMA-aware contention management on multicore systems. In Proceedings of the 19thinternational conference on Parallel architectures and compilation techniques, PACT’10, pages 557–558, New York, NY, USA, 2010. ACM.
[16] OpenMP Architecture Review Board. OpenMP Application Program Interface. 2008.
[17] W. Bolosky, R. Fitzgerald, and M. Scott. Simple but effective techniques for NUMAmemory management. In Proceedings of the twelfth ACM symposium on Operating sys-tems principles, SOSP ’89, pages 19–31, New York, NY, USA, 1989. ACM.
[18] James R. Bulpin and Ian A. Pratt. Multiprogramming performance of the Pentium 4 withhyper-threading. In Proceedings of the annual workshop on Duplicating, deconstructingand debunking, WDDD ’04, pages 53–62, June 2004.
[19] Bradford L. Chamberlain. A brief overview of Chapel (revision 1.0). 2013.
[20] Dhruba Chandra, Fei Guo, Seongbeom Kim, and Yan Solihin. Predicting inter-threadcache contention on a chip multi-processor architecture. In Proceedings of the 11thinternational symposium on High-performance computer architecture, HPCA ’05, pages340–351, Washington, DC, USA, 2005. IEEE Computer Society.
[21] Rohit Chandra, Ding-Kai Chen, Robert Cox, Dror E. Maydan, Nenad Nedeljkovic, andJennifer M. Anderson. Data distribution support on distributed shared memory multi-processors. In Proceedings of the ACM SIGPLAN 1997 conference on Programminglanguage design and implementation, PLDI ’97, pages 334–345, New York, NY, USA,1997. ACM.
[22] James Charles, Preet Jassi, Narayan S. Ananth, Abbas Sadat, and Alexandra Fedorova.Evaluation of the Intel Core i7 Turbo Boost feature. In Proceedings of the 2009 IEEE

BIBLIOGRAPHY 135
international symposium on Workload characterization, IISWC ’09, pages 188–197,Washington, DC, USA, 2009. IEEE Computer Society.
[23] Philippe Charles, Christian Grothoff, Vijay Saraswat, Christopher Donawa, Allan Kiel-stra, Kemal Ebcioglu, Christoph von Praun, and Vivek Sarkar. X10: an object-orientedapproach to non-uniform cluster computing. In Proceedings of the 20th annual ACMSIGPLAN conference on Object-oriented programming, systems, languages, and appli-cations, OOPSLA ’05, pages 519–538, New York, NY, USA, 2005. ACM.
[24] Quan Chen, Minyi Guo, and Zhiyi Huang. CATS: cache aware task-stealing based ononline profiling in multi-socket multi-core architectures. In Proceedings of the 26th ACMinternational conference on Supercomputing, ICS ’12, pages 163–172, New York, NY,USA, 2012. ACM.
[25] Cristian Coarfa, Yuri Dotsenko, John Mellor-Crummey, Francois Cantonnet, Tarek El-Ghazawi, Ashrujit Mohanti, Yiyi Yao, and Daniel Chavarrıa-Miranda. An evaluationof global address space languages: Co-Array Fortran and Unified Parallel C. In Pro-ceedings of the tenth ACM SIGPLAN symposium on Principles and practice of parallelprogramming, PPoPP ’05, pages 36–47, New York, NY, USA, 2005. ACM.
[26] Alain Darte, John Mellor-Crummey, Robert Fowler, and Daniel Chavarrıa-Miranda. Gen-eralized multipartitioning of multi-dimensional arrays for parallelizing line-sweep com-putations. J. Parallel Distrib. Comput., 63(9):887–911, September 2003.
[27] Mohammad Dashti, Alexandra Fedorova, Justin Funston, Fabien Gaud, RenaudLachaize, Baptiste Lepers, Vivien Quema, and Mark Roth. Traffic management: A holis-tic approach to memory placement on NUMA systems. In Proceedings of the eighteenthinternational conference on Architectural support for programming languages and oper-ating systems, ASPLOS ’13, pages 381–394, New York, NY, USA, 2013. ACM.
[28] Tanima Dey, Wei Wang, Jack W. Davidson, and Mary Lou Soffa. Resense: Mappingdynamic workloads of colocated multithreaded applications using resource sensitivity.ACM Trans. Archit. Code Optim., 10(4):41:1–41:25, December 2013.
[29] Dave Dice, Virendra J. Marathe, and Nir Shavit. Flat-combining NUMA locks. In Pro-ceedings of the 23rd ACM symposium on Parallelism in algorithms and architectures,SPAA ’11, pages 65–74, New York, NY, USA, 2011. ACM.
[30] Stephane Eranian. What can performance counters do for memory subsystem analysis?In Proceedings of the 2008 ACM SIGPLAN workshop on Memory systems performanceand correctness, MSPC ’08, pages 26–30, New York, NY, USA, 2008. ACM.
[31] Stijn Eyerman and Lieven Eeckhout. System-level performance metrics for multipro-gram workloads. IEEE Micro, 28(3):42–53, 2008.
[32] Stijn Eyerman and Lieven Eeckhout. Probabilistic job symbiosis modeling for SMTprocessor scheduling. In Proceedings of the fifteenth international conference on Archi-tectural support for programming languages and operating systems, ASPLOS XV, pages91–102, New York, NY, USA, 2010. ACM.

136 BIBLIOGRAPHY
[33] Alexandra Fedorova, Margo Seltzer, Christoper Small, and Daniel Nussbaum. Perfor-mance of multithreaded chip multiprocessors and implications for operating system de-sign. In Proceedings of the USENIX Annual Technical Conference, ATEC ’05, pages26–26, Berkeley, CA, USA, 2005. USENIX Association.
[34] Alexandra Fedorova, Margo Seltzer, and Michael D. Smith. Improving performanceisolation on chip multiprocessors via an operating system scheduler. In PACT ’07: Pro-ceedings of the 16th International Conference on Parallel Architecture and CompilationTechniques, pages 25–38, Washington, DC, USA, 2007. IEEE Computer Society.
[35] Matteo Frigo, Charles E. Leiserson, and Keith H. Randall. The implementation of thecilk-5 multithreaded language. In Proceedings of the ACM SIGPLAN 1998 conferenceon Programming language design and implementation, PLDI ’98, pages 212–223, NewYork, NY, USA, 1998. ACM.
[36] Elad Gidron, Idit Keidar, Dmitri Perelman, and Yonathan Perez. SALSA: scalable andlow synchronization NUMA-aware algorithm for producer-consumer pools. In Proceed-inbgs of the 24th ACM symposium on Parallelism in algorithms and architectures, SPAA’12, pages 151–160, New York, NY, USA, 2012. ACM.
[37] Michael I. Gordon, William Thies, and Saman Amarasinghe. Exploiting coarse-grainedtask, data, and pipeline parallelism in stream programs. In Proceedings of the 12th inter-national conference on Architectural support for programming languages and operatingsystems, ASPLOS-XII, pages 151–162, New York, NY, USA, 2006. ACM.
[38] Yi Guo, Jisheng Zhao, Vincent Cav, and Vivek Sarkar. SLAW: A scalable locality-aware adaptive work-stealing scheduler. In Proceedings of the 24th IEEE internationalsymposium on Parallel and distributed processing, IPDPS ’10, pages 1–12. IEEE, 2010.
[39] Daniel Hackenberg, Daniel Molka, and Wolfgang E. Nagel. Comparing cache archi-tectures and coherency protocols on x86-64 multicore smp systems. In Proceedings ofthe 42nd Annual IEEE/ACM international symposium on Microarchitecture, MICRO 42,pages 413–422, New York, NY, USA, 2009. ACM.
[40] Andrew Herdrich, Ramesh Illikkal, Ravi Iyer, Don Newell, Vineet Chadha, and JaideepMoses. Rate-based QoS techniques for cache/memory in CMP platforms. In Proceedingsof the 23rd international conference on Supercomputing, ICS ’09, pages 479–488, NewYork, NY, USA, 2009. ACM.
[41] Amir H. Hormati, Yoonseo Choi, Manjunath Kudlur, Rodric Rabbah, Trevor Mudge, andScott Mahlke. Flextream: Adaptive compilation of streaming applications for heteroge-neous architectures. In Proceedings of the 2009 18th international conference on Parallelarchitectures and compilation techniques, PACT ’09, pages 214–223, Washington, DC,USA, 2009. IEEE Computer Society.
[42] Intel Corporation. Intel Xeon Processor 7500 Series Uncore Programming Guide, March2010.
[43] Intel Corporation. Intel(R) Threading Building Blocks Reference Manual, 2012.

BIBLIOGRAPHY 137
[44] Intel Corporation. Intel 64 and IA-32 Architectures Optimization Reference Manual,April 2012.
[45] Intel Corporation. Intel 64 and IA-32 Architectures Software Developer’s Manual (Com-bined Volumes: 1, 2A, 2B, 2C, 3A, 3B, and 3C, September 2013.
[46] Marty Itzkowitz, Oleg Mazurov, Nawal Copty nad, and Yuan Lin. An OpenMP runtimeAPI for profiling. Technical report, Sun Microsystems, Inc., 2007.
[47] Yunlian Jiang, Xipeng Shen, Jie Chen, and Rahul Tripathi. Analysis and approximationof optimal co-scheduling on chip multiprocessors. In Proceedings of the 17th interna-tional conference on Parallel architectures and compilation techniques, PACT ’08, pages220–229, New York, NY, USA, 2008. ACM.
[48] H. Jin, H. Jin, M. Frumkin, M. Frumkin, J. Yan, and J. Yan. The OpenMP implemen-tation of NAS parallel benchmarks and its performance. Technical report, NASA AmesResearch Center, Moffett Field, CA, 1999.
[49] Yao Jin. numatop: A tool for memory access locality characterization and analysis. IntelOpen Source Technology Center, 2013.
[50] Md Kamruzzaman, Steven Swanson, and Dean M. Tullsen. Inter-core prefetching formulticore processors using migrating helper threads. In Proceedings of the sixteenthinternational conference on Architectural support for programming languages and oper-ating systems, ASPLOS XVI, pages 393–404, New York, NY, USA, 2011. ACM.
[51] Mahmut Kandemir, Taylan Yemliha, SaiPrashanth Muralidhara, Shekhar Srikantaiah,Mary Jane Irwin, and Yuanrui Zhang. Cache topology aware computation mapping formulticores. In Proceedings of the 2010 ACM SIGPLAN conference on Programminglanguage design and implementation, PLDI ’10, pages 74–85, New York, NY, USA,2010. ACM.
[52] Rob Knauerhase, Paul Brett, Barbara Hohlt, Tong Li, and Scott Hahn. Using OS obser-vations to improve performance in multicore systems. IEEE Micro, 28(3):54–66, May2008.
[53] Alex Kogan and Erez Petrank. Wait-free queues with multiple enqueuers and dequeuers.In Proceedings of the 16th ACM symposium on Principles and practice of parallel pro-gramming, PPoPP ’11, pages 223–234, New York, NY, USA, 2011. ACM.
[54] David Koufaty, Dheeraj Reddy, and Scott Hahn. Bias scheduling in heterogeneous multi-core architectures. In Proceedings of the 5th European conference on Computer systems,EuroSys ’10, pages 125–138, New York, NY, USA, 2010. ACM.
[55] Renaud Lachaize, Baptiste Lepers, and Vivien Quema. Memprof: A memory profiler fornuma multicore systems. In Proceedings of the USENIX Annual Technical Conference,USENIX ATC’12, pages 5–5, Berkeley, CA, USA, 2012. USENIX Association.
[56] Christoph Lameter. Local and remote remory: Memory in a Linux/NUMA system. SGI,2006.

138 BIBLIOGRAPHY
[57] David Levinthal. Performance analysis guide for the Intel Core i7 Processor and theIntel Xeon 5500 processors. Intel Corporation, 2009.
[58] Hui Li, Hui Li Sudarsan, Michael Stumm, and Kenneth C. Sevcik. Locality and loopscheduling on NUMA multiprocessors. In Proceedings of the 1993 international confer-ence on Parallel processing, pages 140–147. CRC Press, Inc, 1993.
[59] Tong Li, Dan Baumberger, David A. Koufaty, and Scott Hahn. Efficient operating systemscheduling for performance-asymmetric multi-core architectures. In Proceedings of the2007 ACM/IEEE conference on Supercomputing, SC ’07, pages 1–11, New York, NY,USA, 2007. ACM.
[60] Wei Li and Keshav Pingali. Access normalization: Loop restructuring for NUMA com-pilers. In Proceedings of the Fifth International Conference on Architectural Supportfor Programming Languages and Operating Systems, ASPLOS V, pages 285–295, NewYork, NY, USA, 1992. ACM.
[61] Xu Liu and John Mellor-Crummey. Pinpointing data locality problems using data-centricanalysis. In Proceedings of the 9th annual IEEE/ACM international symposium on Codegeneration and optimization, CGO ’11, pages 171–180, Washington, DC, USA, 2011.IEEE Computer Society.
[62] Xu Liu and John Mellor-Crummey. A tool to analyze the performance of multithreadedprograms on NUMA architectures. In Proceedings of the 19th ACM SIGPLAN sympo-sium on Principles and practice of parallel programming, PPoPP ’14, pages 259–272,New York, NY, USA, 2014. ACM.
[63] Qin Lv, William Josephson, Zhe Wang, Moses Charikar, and Kai Li. Multi-probe LSH:efficient indexing for high-dimensional similarity search. In Proceedings of the 33rdinternational conference on Very large data bases, VLDB ’07, pages 950–961. VLDBEndowment, 2007.
[64] Robert A. Maddox, Gurbir Singh, and Robert J. Safranek. A first look at the Intel Quick-Path Interconnect. 2009.
[65] Zoltan Majo and Thomas R. Gross. Memory management in NUMA multicore systems:Trapped between cache contention and interconnect overhead. In Proceedings of theinternational symposium on Memory management, ISMM ’11, pages 11–20, New York,NY, USA, 2011. ACM.
[66] Anirban Mandal, Rob Fowler, and Allan Porterfield. Modeling memory concurrencyfor multi-socket multi-core systems. In Proceedings of the 2010 IEEE internationalsymposium on Performance analysis of systems and software, ISPASS ’10, pages 66–75,March 2010.
[67] Jaydeep Marathe and Frank Mueller. Hardware profile-guided automatic page placementfor ccNUMA systems. In Proceedings of the eleventh ACM SIGPLAN symposium onPrinciples and practice of parallel programming, PPoPP ’06, pages 90–99, New York,NY, USA, 2006. ACM.

BIBLIOGRAPHY 139
[68] Jaydeep Marathe, Vivek Thakkar, and Frank Mueller. Feedback-directed page place-ment for ccNUMA via hardware-generated memory traces. J. Parallel Distrib. Comput.,70:1204–1219, December 2010.
[69] Jason Mars, Lingjia Tang, and Mary Lou Soffa. Directly characterizing cross core inter-ference through contention synthesis. In Proceedings of the 6th international conferenceon High performance and embedded architectures and compilers, HiPEAC ’11, pages167–176, New York, NY, USA, 2011. ACM.
[70] Jason Mars, Neil Vachharajani, Mary Lou Soffa, and Robert Hundt. Contention awareexecution: Online contention detection and response. In Proceedings of the 2010 inter-national symposium on Code generation and optimization, CGO ’10, pages 257–265,New York, NY, USA, 2010. ACM.
[71] John D. McCalpin. Memory bandwidth and machine balance in current high perfor-mance computers. IEEE Computer Society Technical Committee on Computer Architec-ture (TCCA) Newsletter, pages 19–25, December 1995.
[72] Collin McCurdy and Jeffrey S. Vetter. Memphis: Finding and fixing NUMA-relatedperformance problems on multi-core platforms. In Proceedings of the IEEE internationalsymposium on Performance analysis of systems and software, ISPASS ’10, pages 87–96,2010.
[73] Daniel Molka, Daniel Hackenberg, Robert Schne, and Matthias S. Muller. Memoryperformance and cache coherency effects on an Intel Nehalem multiprocessor system.In Proceedings of the 2009 18th international conference on Parallel architectures andcompilation techniques, PACT ’09, pages 261–270, Washington, DC, USA, 2009. IEEEComputer Society.
[74] Adam Morrison and Yehuda Afek. Fast concurrent queues for x86 processors. In Pro-ceedings of the 18th ACM SIGPLAN symposium on Principles and practice of parallelprogramming, PPoPP ’13, pages 103–112, New York, NY, USA, 2013. ACM.
[75] Todd Mytkowicz, Amer Diwan, Matthias Hauswirth, and Peter F. Sweeney. Producingwrong data without doing anything obviously wrong! In Proceedings of the 14th inter-national conference on Architectural support for programming languages and operatingsystems, ASPLOS ’09, pages 265–276, New York, NY, USA, 2009. ACM.
[76] Angeles Navarro, Rafael Asenjo, Siham Tabik, and Calin Cascaval. Analytical modelingof pipeline parallelism. In Proceedings of the 2009 18th international conference on Par-allel architectures and compilation techniques, PACT ’09, pages 281–290, Washington,DC, USA, 2009. IEEE Computer Society.
[77] Dimitrios S. Nikolopoulos, Theodore S. Papatheodorou, Constantine D. Polychronopou-los, Jesus Labarta, and Eduard Ayguade. A case for user-level dynamic page migration.In Proceedings of the 2000 International Conference on Parallel Processing, ICPP ’00,pages 95–, Washington, DC, USA, 2000. IEEE Computer Society.
[78] Dimitrios S. Nikolopoulos, Theodore S. Papatheodorou, Constantine D. Polychronopou-los, Jesus Labarta, and Eduard Ayguade. Is data distribution necessary in OpenMP? In

140 BIBLIOGRAPHY
Proceedings of the 2000 ACM/IEEE conference on Supercomputing, Supercomputing’00, Washington, DC, USA, 2000. IEEE Computer Society.
[79] Takeshi Ogasawara. NUMA-aware memory manager with dominant-thread-based copy-ing GC. In Proceeding of the 24th ACM SIGPLAN conference on Object orientedprogramming systems languages and applications, OOPSLA ’09, pages 377–390, NewYork, NY, USA, 2009. ACM.
[80] OpenMP Architecture Review Board. OpenMP Application Programming Interface, Ver-sion 3.1, July 2011.
[81] Heidi Pan, Benjamin Hindman, and Krste Asanovic. Composing parallel software effi-ciently with lithe. In Proceedings of the 2010 ACM SIGPLAN conference on Program-ming language design and implementation, PLDI ’10, pages 376–387, New York, NY,USA, 2010. ACM.
[82] Aleksey Pesterev, Nickolai Zeldovich, and Robert T. Morris. Locating cache perfor-mance bottlenecks using data profiling. In Proceedings of the 5th European Conferenceon Computer Systems, EuroSys ’10, pages 335–348, New York, NY, USA, 2010. ACM.
[83] Kishore Kumar Pusukuri, David Vengerov, Alexandra Fedorova, and Vana Kalogeraki.FACT: A framework for adaptive contention-aware thread migrations. In Proceedingsof the 8th ACM international conference on Computing frontiers, CF ’11, pages 35:1–35:10, New York, NY, USA, 2011. ACM.
[84] Moinuddin K. Qureshi and Yale N. Patt. Utility-based cache partitioning: A low-overhead, high-performance, runtime mechanism to partition shared caches. In Pro-ceedings of the 39th Annual IEEE/ACM international symposium on Microarchitecture,MICRO 39, pages 423–432, Washington, DC, USA, 2006. IEEE Computer Society.
[85] Chandan Reddy and Uday Bondhugula. Effective automatic computation placement anddataallocation for parallelization of regular programs. In Proceedings of the 28th ACMinternational conference on Supercomputing, ICS ’14, pages 13–22, New York, NY,USA, 2014. ACM.
[86] A. Robison, M. Voss, and A. Kukanov. Optimization via reflection on work stealing inTBB. In Proceedings of the IEEE international symposium on Parallel and distributedprocessing, IPDPS’08, pages 1 –8, April 2008.
[87] M. Roth, M.J. Best, C. Mustard, and A. Fedorova. Deconstructing the overhead in par-allel applications. In Proceedings of the IEEE international symposium on Workloadcharacterization, IISWC’12, pages 59 –68, nov. 2012.
[88] Juan Carlos Saez, Manuel Prieto, Alexandra Fedorova, and Sergey Blagodurov. A com-prehensive scheduler for asymmetric multicore systems. In Proceedings of the 5th Eu-ropean conference on Computer systems, EuroSys ’10, pages 139–152, New York, NY,USA, 2010. ACM.
[89] Daniel Sanchez, David Lo, Richard M. Yoo, Jeremy Sugerman, and Christos Kozyrakis.Dynamic fine-grain scheduling of pipeline parallelism. In Proceedings of the 2011 In-ternational conference on Parallel architectures and compilation techniques, PACT ’11,pages 22–32, Washington, DC, USA, 2011. IEEE Computer Society.

BIBLIOGRAPHY 141
[90] Andreas Sandberg, David Eklov, and Erik Hagersten. Reducing cache pollution throughdetection and elimination of non-temporal memory accesses. In Proceedings of the 2010ACM/IEEE international conference for High performance computing, networking, stor-age and analysis, SC ’10, pages 1–11, Washington, DC, USA, 2010. IEEE ComputerSociety.
[91] N. Satish, C. Kim, J. Chhugani, H. Saito, R. Krishnaiyer, M. Smelyanskiy, M. Girkar,and P. Dubey. Can traditional programming bridge the Ninja performance gap for parallelcomputing applications? In Proceedings of the 39th annual international symposium onComputer architecture, ISCA’12, pages 440 –451, June 2012.
[92] Allan Snavely and Dean M. Tullsen. Symbiotic jobscheduling for a simultaneous mul-tithreaded processor. In Proceedings of the ninth international conference on Architec-tural support for programming languages and operating systems, ASPLOS IX, pages234–244, New York, NY, USA, 2000. ACM.
[93] Shekhar Srikantaiah, Mahmut Kandemir, and Mary Jane Irwin. Adaptive set pinning:managing shared caches in chip multiprocessors. In Proceedings of the 13th internationalconference on Architectural support for programming languages and operating systems,ASPLOS XIII, pages 135–144, New York, NY, USA, 2008. ACM.
[94] ChunYi Su, Dong Li, Dimitrios S. Nikolopoulos, Matthew Grove, Kirk Cameron, andBronis R. de Supinski. Critical path-based thread placement for NUMA systems. SIG-METRICS Perform. Eval. Rev., 40(2):106–112, October 2012.
[95] M. Aater Suleman, Moinuddin K. Qureshi, Khubaib, and Yale N. Patt. Feedback-directedpipeline parallelism. In Proceedings of the 19th international conference on Parallelarchitectures and compilation techniques, PACT ’10, pages 147–156, New York, NY,USA, 2010. ACM.
[96] David Tam, Reza Azimi, and Michael Stumm. Thread clustering: Sharing-awarescheduling on SMP-CMP-SMT multiprocessors. In Proceedings of the 2nd ACM SIGOP-S/EuroSys European conference on Computer systems, EuroSys ’07, pages 47–58, NewYork, NY, USA, 2007. ACM.
[97] David K. Tam, Reza Azimi, Livio B. Soares, and Michael Stumm. RapidMRC: ap-proximating L2 miss rate curves on commodity systems for online optimizations. InProceeding of the 14th international conference on Architectural support for program-ming languages and operating systems, ASPLOS ’09, pages 121–132, New York, NY,USA, 2009. ACM.
[98] S. Tandri and T.S. Abdelrahman. Automatic partitioning of data and computations onscalable shared memory multiprocessors. In Proceedings of the international conferenceon Parallel processing, pages 64 –73, August 1997.
[99] Lingjia Tang, Jason Mars, and Mary Lou Soffa. Contentiousness vs. sensitivity: Im-proving contention aware runtime systems on multicore architectures. In Proceedings ofthe 1st international workshop on Adaptive self-tuning computing systems for the exaflopera, EXADAPT ’11, pages 12–21, New York, NY, USA, 2011. ACM.

142 BIBLIOGRAPHY
[100] Lingjia Tang, Jason Mars, Xiao Zhang, Robert Hagmann, Robert Hundt, and Eric Tune.Optimizing Google’s warehouse scale computers: The NUMA experience. In Proceed-ings of the 2013 IEEE 19th international symposium on High performance computerarchitecture, HPCA ’13, pages 188–197, Washington, DC, USA, 2013. IEEE ComputerSociety.
[101] R. Thekkath and S. J. Eggers. Impact of sharing-based thread placement on multithreadedarchitectures. In Proceedings of the 21st annual international symposium on Computerarchitecture, ISCA ’94, pages 176–186, Los Alamitos, CA, USA, 1994. IEEE ComputerSociety Press.
[102] Mustafa M. Tikir and Jeffery K. Hollingsworth. NUMA-aware Java heaps for serverapplications. In Proceedings of the 19th IEEE international symposium on Parallel anddistributed processing, IPDPS ’05, Washington, DC, USA, 2005. IEEE Computer Soci-ety.
[103] Mustafa M. Tikir and Jeffrey K. Hollingsworth. Using hardware counters to automati-cally improve memory performance. In Proceedings of the 2004 ACM/IEEE conferenceon Supercomputing, SC ’04, page 46, Washington, DC, USA, 2004. IEEE ComputerSociety.
[104] Mustafa M. Tikir and Jeffrey K. Hollingsworth. Hardware monitors for dynamic pagemigration. J. Parallel Distrib. Comput., 68(9):1186–1200, 2008.
[105] Irina Tuduce, Zoltan Majo, Adrian Gauch, Brad Chen, and Thomas R. Gross. Asymme-tries in multi-core systems – or why we need better performance measurement units. TheExascale Evaluation and Research Techniques Workshop (EXERT) at ASPLOS 2010,2010.
[106] Dean M. Tullsen, Susan J. Eggers, and Henry M. Levy. Simultaneous multithreading:Maximizing on-chip parallelism. In 25 Years of the International Symposia on ComputerArchitecture (Selected Papers), ISCA ’98, pages 533–544, New York, NY, USA, 1998.ACM.
[107] Ben Verghese, Scott Devine, Anoop Gupta, and Mendel Rosenblum. Operating systemsupport for improving data locality on CC-NUMA compute servers. In Proceedingsof the seventh international conference on Architectural support for programming lan-guages and operating systems, ASPLOS ’96, pages 279–289, New York, NY, USA, 1996.ACM.
[108] Samuel Williams, Andrew Waterman, and David Patterson. Roofline: an insightful visualperformance model for multicore architectures. Commun. ACM, 52(4):65–76, 2009.
[109] Kenneth M. Wilson and Bob B. Aglietti. Dynamic page placement to improve localityin CC-NUMA multiprocessors for TPC-C. In Proceedings of the 2001 ACM/IEEE con-ference on Supercomputing, Supercomputing ’01, pages 33–33, New York, NY, USA,2001. ACM.
[110] Carole-Jean Wu and Margaret Martonosi. Characterization and dynamic mitigation ofintra-application cache interference. In Proceedings of the IEEE international symposium

BIBLIOGRAPHY 143
on Performance analysis of systems and software, ISPASS ’11, pages 2–11, Washington,DC, USA, 2011. IEEE Computer Society.
[111] R. Yang, J. Antony, P. P. Janes, and A. P. Rendell. Memory and thread placement effectsas a function of cache usage: A study of the gaussian chemistry code on the SunFireX4600 M2. In Proceedings of the the international symposium on Parallel architectures,algorithms, and networks, ISPAN ’08, pages 31–36, Washington, DC, USA, 2008. IEEEComputer Society.
[112] Eddy Z. Zhang, Yunlian Jiang, and Xipeng Shen. Does cache sharing on modern CMPmatter to the performance of contemporary multithreaded programs? In Proceedings ofthe 15th ACM SIGPLAN Symposium on Principles and Practice of Parallel Program-ming, PPoPP ’10, pages 203–212, New York, NY, USA, 2010. ACM.
[113] Sergey Zhuravlev, Sergey Blagodurov, and Alexandra Fedorova. Addressing shared re-source contention in multicore processors via scheduling. In Proceedings of the fifteenthinternational conference on Architectural support for programming languages and oper-ating systems, ASPLOS XV, pages 129–142, New York, NY, USA, 2010. ACM.


List of Figures
1.1 2-processor 8-core NUMA multicore-multiprocessor. . . . . . . . . . . . . . . 2
2.1 Intel Nehalem in a 2-processor configuration. . . . . . . . . . . . . . . . . . . 7
2.2 Global Queue. . . . . . . . . . . . . . . . . . . . . . . . . . . . . . . . . . . . 8
2.3 triad main loop. . . . . . . . . . . . . . . . . . . . . . . . . . . . . . . . . 8
2.4 3P workload in (2L, 1R) configuration. . . . . . . . . . . . . . . . . . . . . 9
2.5 Bandwidth sharing: 4 L processes with variable number of R processes (Ne-halem). . . . . . . . . . . . . . . . . . . . . . . . . . . . . . . . . . . . . . . 12
2.6 Percentage of total memory bandwidth obtained by an L and an R process (Ne-halem). . . . . . . . . . . . . . . . . . . . . . . . . . . . . . . . . . . . . . . 12
2.7 Setup to evaluate GQ fairness. . . . . . . . . . . . . . . . . . . . . . . . . . . 15
2.8 Dependence of β on aggregate load. . . . . . . . . . . . . . . . . . . . . . . . 16
2.9 Performance degradation of (1L, 1R). . . . . . . . . . . . . . . . . . . . . . 16
2.10 Performance degradation of (1L, 2R). . . . . . . . . . . . . . . . . . . . . . 16
2.11 Total bandwidth of the 4P workload in different configurations. . . . . . . . . . 17
2.12 Improvement of aggregate IPC and total memory bandwidth when an IMC anda QPI are used (relative to the case when a single IMC is used). . . . . . . . . . 17
2.13 Bandwidth sharing: 4 L processes with variable number of R processes (West-mere). . . . . . . . . . . . . . . . . . . . . . . . . . . . . . . . . . . . . . . . 19
2.14 Percentage of total memory bandwidth obtained by an L and an R process(Westmere). . . . . . . . . . . . . . . . . . . . . . . . . . . . . . . . . . . . . 19
2.15 Total read bandwidth (Nehalem). . . . . . . . . . . . . . . . . . . . . . . . . . 20
2.16 Total read bandwidth (Westmere). . . . . . . . . . . . . . . . . . . . . . . . . 20
2.17 Possible mappings of a 2-process workload (mcf and lbm). . . . . . . . . . . 23
2.18 Increase of cache miss rate in different mapping scenarios. . . . . . . . . . . . 24
2.19 Bandwidth distribution in different mapping scenarios. . . . . . . . . . . . . . 24
2.20 Performance degradation in different mapping scenarios. . . . . . . . . . . . . 24
2.21 Increase of cache miss rate vs. data locality of soplex (Nehalem). . . . . . . 25
2.22 Performance vs. data locality of soplex (Nehalem). . . . . . . . . . . . . . . 25
2.23 Increase of cache miss rate vs. data locality of soplex (Westmere). . . . . . . 27
145

146 LIST OF FIGURES
2.24 Performance vs. data locality of soplex (Westmere). . . . . . . . . . . . . . 27
3.1 Cache balancing in SMP and NUMA context. . . . . . . . . . . . . . . . . . . 30
3.2 NUMA penalty vs. MPKI. . . . . . . . . . . . . . . . . . . . . . . . . . . . . 32
3.3 Dimensions of the evaluation. . . . . . . . . . . . . . . . . . . . . . . . . . . . 38
3.4 Total MPKI of multiprogrammed workloads. . . . . . . . . . . . . . . . . . . 39
3.5 Performance evaluation of the maximum-local and N-MASS schemes with WL9. 41
3.6 Performance evaluation of the maximum-local and N-MASS schemes with WL1. 42
3.7 Performance improvement of 4-process workloads. . . . . . . . . . . . . . . . 46
3.8 Data locality of 4-process workloads. . . . . . . . . . . . . . . . . . . . . . . 46
3.9 Absolute MPKI of 4-process workloads. . . . . . . . . . . . . . . . . . . . . . 47
3.10 Relative MPKI of 4-process workloads. . . . . . . . . . . . . . . . . . . . . . 47
3.11 Performance improvement of 8-process workloads. . . . . . . . . . . . . . . . 49
3.12 Data locality of 8-process workloads. . . . . . . . . . . . . . . . . . . . . . . 49
3.13 Absolute MPKI of 8-process workloads. . . . . . . . . . . . . . . . . . . . . . 49
3.14 Relative MPKI of 8-process workloads. . . . . . . . . . . . . . . . . . . . . . 49
4.1 Performance scaling and cycle breakdown. . . . . . . . . . . . . . . . . . . . . 52
4.2 Structure and configuration of pipeline programs. . . . . . . . . . . . . . . . . 55
4.3 Remote transfers as fraction of all uncore transfers. . . . . . . . . . . . . . . . 58
4.4 Data access characterization (8-core machine). . . . . . . . . . . . . . . . . . . 59
4.5 Performance gain w/ prefetching. . . . . . . . . . . . . . . . . . . . . . . . . . 59
4.6 streamcluster: Shuffles. . . . . . . . . . . . . . . . . . . . . . . . . . . . 60
4.7 streamcluster: Program transformations. . . . . . . . . . . . . . . . . . . 62
4.8 ferret: Program transformations. . . . . . . . . . . . . . . . . . . . . . . . 62
4.9 ferret: Stages 2, 3, and 4 (optimized implementation). . . . . . . . . . . . . 63
4.10 dedup: Program transformations. . . . . . . . . . . . . . . . . . . . . . . . . 64
4.11 dedup: Stages 1, 2, and 3 (optimized implementation). . . . . . . . . . . . . . 65
4.12 streamcluster: Performance improvement (over original (FT)). . . . . . . 68
4.13 streamcluster: Uncore memory transfers. . . . . . . . . . . . . . . . . . 68
4.14 ferret: Performance improvement (over original (FT)). . . . . . . . . . . . 69
4.15 ferret: Uncore memory transfers. . . . . . . . . . . . . . . . . . . . . . . . 69
4.16 dedup: Performance improvement (over original (FT)). . . . . . . . . . . . . 71
4.17 dedup: Uncore memory transfers. . . . . . . . . . . . . . . . . . . . . . . . . 71
4.18 Prefetcher performance. . . . . . . . . . . . . . . . . . . . . . . . . . . . . . . 72
5.1 Memory bandwidth generated by the programs of the NPB suite. . . . . . . . . 77
5.2 Data address profiling. . . . . . . . . . . . . . . . . . . . . . . . . . . . . . . 78

LIST OF FIGURES 147
5.3 Memory layout of 3D matrix (row-major order). . . . . . . . . . . . . . . . . . 80
5.4 Access and distribution patterns; data sharing. . . . . . . . . . . . . . . . . . . 81
5.5 bt data access patterns. . . . . . . . . . . . . . . . . . . . . . . . . . . . . . . 83
5.6 bt with in-program data migration. . . . . . . . . . . . . . . . . . . . . . . . 83
5.7 Evaluation of in-program data migration. . . . . . . . . . . . . . . . . . . . . . 84
5.8 Access patterns of code with y-wise dependences. . . . . . . . . . . . . . . . . 85
5.9 Data distribution primitives. . . . . . . . . . . . . . . . . . . . . . . . . . . . 86
5.10 Block-exclusive data distribution. . . . . . . . . . . . . . . . . . . . . . . . . 88
5.11 Loop iteration scheduling primitives. . . . . . . . . . . . . . . . . . . . . . . . 90
5.12 Program transformations in bt. . . . . . . . . . . . . . . . . . . . . . . . . . . 91
5.13 Program transformations in lu. . . . . . . . . . . . . . . . . . . . . . . . . . . 92
5.14 Performance with program transformations (2-processor 8-core machine). . . . 93
5.15 Performance with program transformations (4-processor 32-core machine). . . 95
6.1 Computation optimized for data locality. . . . . . . . . . . . . . . . . . . . . . 101
6.2 Shared threads: Unfortunate mapping. . . . . . . . . . . . . . . . . . . . . . . 101
6.3 Shared threads: Appropriate mapping. . . . . . . . . . . . . . . . . . . . . . . 101
6.4 TBB architecture. . . . . . . . . . . . . . . . . . . . . . . . . . . . . . . . . . 105
6.5 Standard TBB: Rules to fetch next task. . . . . . . . . . . . . . . . . . . . . . 106
6.6 Mailboxing (standard TBB). . . . . . . . . . . . . . . . . . . . . . . . . . . . 108
6.7 Mailboxing (TBB-NUMA). . . . . . . . . . . . . . . . . . . . . . . . . . . . . 110
6.8 Rules substituted by TBB-NUMA to fetch next task (relative to standard TBB). 110
6.9 Indicating idleness. . . . . . . . . . . . . . . . . . . . . . . . . . . . . . . . . 112
6.10 Shallow task tree: 2-stage pipeline with affinities. . . . . . . . . . . . . . . . . 113
6.11 Performance and uncore traffic of loop-parallel programs w/o contention (West-mere). . . . . . . . . . . . . . . . . . . . . . . . . . . . . . . . . . . . . . . . 117
6.12 Performance and uncore traffic of non–loop-based programs w/o contention(Westmere). . . . . . . . . . . . . . . . . . . . . . . . . . . . . . . . . . . . . 118
6.13 Performance and uncore traffic of loop-parallel programs w/ contention (West-mere). . . . . . . . . . . . . . . . . . . . . . . . . . . . . . . . . . . . . . . . 119
6.14 Performance and uncore traffic of non–loop-based programs w/ contention(Westmere). . . . . . . . . . . . . . . . . . . . . . . . . . . . . . . . . . . . . 120
6.15 Performance w/o contention (Nehalem and Bulldozer). . . . . . . . . . . . . . 121


Curriculum Vitae
Zoltan Majo
June 18, 1983 Born in Cluj-Napoca/Klausenburg/Kolozsvar/Kloiznburg, Romania
1998–2002 “Apaczai Csere Janos” High School, Cluj-Napoca, Romania
2002 High school exit exam (maturity exam)
2002–2007 Studies in Computer Science,Technical University of Cluj-Napoca, Romania
2007 Diploma of Engineer (“Inginer diplomat”) in Computer Science,Technical University of Cluj-Napoca, Romania
2007–2008 Teaching Assistant and System Engineer,Technical University of Cluj-Napoca, Romania
since 2008 Research and Teaching AssistantLaboratory for Software Technology, ETH Zurich, Switzerland
149