FUENTE: INCLUD-ED Colección Estudios CREADE 2. EFECTOS SOBRE LAS EXPECTATIVAS
Upload
khangminh22Category
view
0download
0
ESTUDIOS SOBRE EL CONTROL
TRADUCCIONAL EN MODELOS NEURONALES
Y SU MODULACIÓN POR PDCD4
Tesis Doctoral
Programa de Desarrollo de las Ciencias Básicas
Área Biología
Mag. Guillermo Eastman
Departamento de Genómica
Instituto de Investigaciones Biológicas Clemente Estable
Julio 2021
______________________________________________________________________


Programa de Desarrollo de las Ciencias Básicas
Área Biología
Tesis de Doctorado
"Estudios sobre el control traduccional en modelos neuronales y su modulación por PDCD4"
Mag. Guillermo Eastman
Departamento de Genómica
Instituto de Investigaciones Biológicas Clemente Estable (IIBCE)
Julio 2021
Orientador: Dr. José Sotelo-Silveira
Co-Orientador: Dr. George Bloom (EE.UU.)
Tribunal
Dr. Rodney Colina (PRESIDENTE)
Dr. Alexander de Luna (VOCAL)
Dra. Patricia Lagos (VOCAL)
______________________________________________________________
Apoyo Financiero
ÍNDICE
I. Resumen 6
II. Introducción 8
Ribo-Seq: Una estrategia ómica para el estudio de la
traducción 8
Trabajo publicado I: Following Ribosome Footprints to
Understand Translation at a Genome Wide Level 9
PDCD4, un regulador de la traducción con posibles
funciones neuronales 20
Regulación de la traducción en enfermedades
neurodegenerativas 22
III. Hipótesis de trabajo y Objetivos 24
IV. Capítulo 1 – Búsqueda de ARNm blancos traduccionales de
PDCD4 mediante Ribo-Seq en neuronas obtenidas por
diferenciación de células PC12 25
Trabajo publicado II: PDCD4 regulates axonal growth by
translational repression of neurite growth-related genes
and is modulated during nerve injury responses 26
Regulación traduccional de PDCD4 sobre el ARNm de
Nfkb2 61
Materiales y Métodos 61
Cuantificación de la abundancia de ARNm en
distintas fracciones polisomales 61
Resultados 62
El ARNm de Nfkb2 aumenta su abundancia en las
fracciones polisomales tras silenciar PDCD4 62
Discusión 62
V. Capítulo 2 - Optimización y aplicación de la técnica de
Ribo-Seq en modelos neuronales in vitro e in vivo 65
Materiales y Métodos 68
Cultivo in vitro de neuronas corticales embrionarias 68
Disecado y obtención de homogenado a partir de
corteza cerebral de ratones adultos 68

Cultivo de células HEK293 69
Ribo-Seq 69
Análisis de datos 70
Resultados 71
Optimización del número de células y la cantidad
de enzima a utilizar en ensayos de digestión
sobre el sobrenadante postmitocondrial 71
Ensayo de Ribo-Seq sobre cultivos in vitro de
neuronas corticales primarias 75
Puesta a punto del protocolo de obtención de huellas
ribosomales a partir de corteza cerebral de ratón 77
Comparativa entre huellas ribosomales producidas
con Benzonasa y RNAsa I 79
Discusión 99
VI. Capítulo 3 - Traductómica de modelos murinos transgénicos
del mal de Alzheimer 107
Manuscrito I: Tandem transcriptional and translational
analysis of gene expression in mouse models of
Alzheimer's disease 108
VII. Conclusiones 168
VIII. Perspectivas 171
IX. Agradecimientos 175
X. Referencias 176
XI. Anexos 182
Notas 182
Apoyo Financiero 182
Figuras Suplementarias 183
Tablas Suplementarias 185
6
I. RESUMEN
El control de la expresión génica a nivel traduccional es un aspecto clave para el correcto
funcionamiento celular y es en particular importante en modelos neuronales debido al alto
grado de compartimentalización y sus grandes dimensiones. Por esta razón, en la presente
tesis nos hemos propuesto investigar distintos eventos de regulación traduccional en modelos
neuronales utilizando aproximaciones genómicas como Ribo-Seq y RNA-Seq.
En primer lugar, estudiamos el rol de PDCD4 en la regulación traduccional y sus posibles
ARNm blancos en un modelo neuronal. Resultados previos obtenidos en nuestro laboratorio
mostraron que PDCD4 se expresa en altos niveles en distintos tipos neuronales y ejerce una
regulación negativa sobre el crecimiento axonal. Utilizando células PC12 diferenciadas a
neuronas como modelo celular in vitro tipo neuronal, pudimos verificar el efecto inhibitorio de
PDCD4 en el crecimiento neurítico. También, mediante RNA-Seq y Ribo-Seq observamos el
control que PDCD4 ejerce a nivel traduccional y exploramos sus blancos traduccionales. Así,
reportamos una lista de 267 ARNm blancos de PDCD4 cuyos niveles traduccionales se ven
significativamente aumentados en ausencia de este factor. El análisis de dichos blancos nos
permitió reconocer una firma génica asociada al crecimiento neurítico y axonal que podría
justificar la regulación observada. La regulación ejercida sobre alguno de dichos blancos fue
confirmada por western blot y por cuantificación en fracciones polisomales.
En segundo lugar, optimizamos y aplicamos la técnica de Ribo-Seq en distintos modelos
neuronales como cultivos in vitro de neuronas corticales primarias y corteza cerebral de ratón.
En el primer caso evitamos la recuperación de la fracción polisomal lo cual nos permitió
trabajar con una menor cantidad de material biológico de partida, una de las principales
limitantes de la técnica. También, comparamos nuestro protocolo de producción de huellas
ribosomales con el protocolo original, ya que éstos difieren en la enzima utilizada en el ensayo
de digestión: Benzonasa y RNAsa I, respectivamente. Pudimos observar diferencias
principalmente a nivel del tamaño de las huellas, su presencia en la región 3’-UTR y en la
periodicidad de mapeo. También, en base a tres criterios complementarios, definimos un set
de genes cuya detección se ve favorecida con una enzima y no con la otra. El análisis
funcional de estos genes no reveló grandes diferencias a considerar aunque se destaca la
presencia de genes no codificantes y entre ellos especies de ARN pequeños.
En último lugar nos propusimos estudiar los eventos de regulación traduccional presentes en
modelos murinos transgénicos de la enfermedad de Alzheimer, donde los mecanismos
neuronales que determinan los eventos de neurodegeneración no se conocen en detalle. Para

7
esto utilizamos dos modelos murinos transgénicos de la enfermedad, en edades tempranas,
preferentemente asintomáticas (ratones CVN: App KM670/671NL, ED693/694QN; Nos2-/- y
ratones Tg2576: App KM670/671NL). Utilizando RNA-Seq y Ribo-Seq cuantificamos los
niveles de expresión transcripcional y traduccional de más de 14.000 genes en la corteza
cerebral y detectamos genes expresados diferencialmente en ambos niveles, en particular en
el modelo CVN, completamente asintomático a la edad utilizada. El análisis funcional reveló
principalmente una inhibición de procesos neurodegenerativos y la activación de procesos
tipo neuroprotectores como transmisión sináptica, cantidad de neuronas y neuroglias,
procesos de mielinización, entre otros. Además se detectó una firma génica asociada a la
activación de una subpoblación microglial asociada a la enfermedad y que responde a la
acumulación de Aβ, así como la activación de genes asociados al metabolismo de Aβ y APP.
En conclusión, en la presente tesis pudimos determinar por primera vez un set completo de
blancos traduccionales de PDCD4, entre los cuales reconocimos una firma génica asociada
al crecimiento neurítico y axonal que explica el rol que este factor tiene sobre dichos procesos.
También, aplicamos el protocolo de Ribo-Seq sobre diversos modelos neuronales in vitro e in
vivo, así como comparamos las huellas ribosomales producidas con distintas ARNasas. En
último lugar, exploramos eventos de regulación traduccional en modelos transgénicos de la
enfermedad de Alzheimer y observamos, por primera vez, la regulación traduccional que
controla la expresión de muchos genes previamente asociados a la enfermedad. Pensamos
que los aportes realizados por la presente tesis permitirán en un futuro explorar de manera
precisa la regulación traduccional en diversos modelos neuronales mediante técnicas ómicas
de última generación.

8
II. INTRODUCCIÓN
El estricto control de la expresión génica involucra variados mecanismos y etapas sucesivas
de regulación. Entre ellas, la regulación de los niveles de traducción de ARN mensajeros
(ARNm) es uno de los aspectos más relevantes (ejemplos en [1,2]). En particular si
consideramos los modelos neuronales, donde se observa tanto un alto nivel de polarización
como grandes dimensiones celulares, los mecanismos que controlan la expresión génica en
tiempo y espacio adquieren una relevancia aún mayor. Estos dos factores agregan un nivel
extra de complejidad en la regulación de la expresión génica, donde se destaca la regulación
traduccional local [3–9]. Por ejemplo, los mecanismos de regulación traduccional pueden ser
ejercidos de manera central, afectando los niveles traduccionales en el soma neuronal, o de
una manera completamente distinta afectando niveles traduccionales locales, regulando la
síntesis proteica en distintos dominios neuronales: axón, dendritas, terminal presináptica y
postsináptica. Respecto a la síntesis proteica local, nuestro grupo [9–17] junto con otros
[4,6,18–28], han realizado significativos aportes al área, aunque todavía resta por conocer en
detalle cómo se regulan estos procesos. Estudiar en profundidad los mecanismos de
regulación traduccional generales y locales es un objetivo clave para comprender una gran
variedad de procesos que ocurren en el intrincado panorama tridimensional de las células
neuronales.
A continuación procederemos a describir tres aspectos relevantes para el marco teórico de la
presente tesis. En primer lugar, se describe la estrategia de Ribo-Seq como una aproximación
novedosa para el estudio del compartimiento traduccional a nivel ómico ya que la misma
representa un insumo transversal a los distintos objetivos planteados. Luego nos centramos
en la regulación del proceso traduccional que ocurre tanto mediado por factores proteicos,
como PDCD4, y en el contexto de patologías neurodegenerativas. Así, describimos PDCD4
como un modulador traduccional cuyo rol neuronal exploraremos en la presente tesis.
Finalmente introducimos aspectos relevantes para entender posibles eventos de regulación
traduccional que puedan ocurrir en enfermedades neurodegenerativas, como nos planteamos
estudiar en el caso del mal de Alzheimer.
Ribo-Seq: Una estrategia ómica para el estudio de la traducción
Hace poco más de 10 años se publicaba el primer trabajo que describe el uso de una
novedosa aproximación metodológica basada en la tecnología de secuenciación masiva y que
9
permite el estudio global de los niveles traduccionales de los ARNm con una resolución a nivel
de sub codones [29]. En los años siguientes, los continuos avances tecnológicos aplicados a
técnicas de biología molecular y el desarrollo de nuevas y mejores capacidades para
secuenciar fragmentos de ácidos nucleicos, han permitido un uso masivo y extensivo de la
técnica conocida como ribosome profiling o Ribo-Seq.
Como parte de uno de los primeros pasos en el desarrollo de esta tesis nos propusimos
realizar una revisión actualizada de la metodología y sus aplicaciones. Se adjunta a
continuación la publicación de dicha revisión en formato de mini-review donde describimos la
metodología, discutimos los aspectos protocolares más relevantes y listamos diversos
programas y paquetes computacionales diseñados para la visualización, análisis e
interpretación de los datos producidos por Ribo-Seq. También discutimos algunos de los
principales hallazgos que se han descrito mediante el uso de esta metodología en distintos
sistemas y modelos biológicos.
Trabajo publicado I: Following Ribosome Footprints to Understand Translation at a
Genome Wide Level
Se adjunta a continuación.

Mini Review
Following Ribosome Footprints to Understand Translation at a GenomeWide Level
Guillermo Eastman a, Pablo Smircich a,b, José R. Sotelo-Silveira a,c,⁎a Department of Genomics, Instituto de Investigaciones Biológicas Clemente Estable, MEC, Av. Italia 3318, Montevideo, CP 11600, Uruguayb Laboratory of Molecular Interactions, Facultad de Ciencias, Universidad de la República, Iguá 4225, Montevideo, CP 11400, Uruguayc Department of Cell and Molecular Biology, Facultad de Ciencias, Universidad de la República, Iguá 4225, Montevideo, CP 11400, Uruguay
a b s t r a c ta r t i c l e i n f o
Article history:Received 16 January 2018Received in revised form 6 April 2018Accepted 10 April 2018Available online 01 May 2018
Protein translation is a key step in gene expression. The development of Ribosome Profiling has allowed theglobal analysis of this process at sub-codon resolution. In the last years the method has been applied to severalmodels ranging from bacteria to mammalian cells yielding a surprising amount of insight on the mechanismand the regulation of translation. In this review we describe the key aspects of the experimental protocol andcomment on the main conclusions raised in different models.©2018 Eastman et al.. PublishedbyElsevier B.V. on behalf of theResearchNetwork of Computational and StructuralBiotechnology. This is an open access article under the CC BY license (http://creativecommons.org/licenses/by/4.0/).
Keywords:Ribo-seqTranslationTranslatomeTranscriptomeRibosome profiling
Contents
1. Introduction . . . . . . . . . . . . . . . . . . . . . . . . . . . . . . . . . . . . . . . . . . . . . . . . . . . . . . . . . . . . . . 1672. Ribosome Profiling Protocol . . . . . . . . . . . . . . . . . . . . . . . . . . . . . . . . . . . . . . . . . . . . . . . . . . . . . . . 168
2.1. Protocol Description . . . . . . . . . . . . . . . . . . . . . . . . . . . . . . . . . . . . . . . . . . . . . . . . . . . . . . . 1682.2. Protocol Variants, User Decisions . . . . . . . . . . . . . . . . . . . . . . . . . . . . . . . . . . . . . . . . . . . . . . . . . 168
3. Biological Models and Contributions . . . . . . . . . . . . . . . . . . . . . . . . . . . . . . . . . . . . . . . . . . . . . . . . . . . 1703.1. Bacteria: Translational Pausing, Codon Use and Antibiotics . . . . . . . . . . . . . . . . . . . . . . . . . . . . . . . . . . . . . . 1713.2. Yeast: Start Codons, uORFs and Translational Pauses . . . . . . . . . . . . . . . . . . . . . . . . . . . . . . . . . . . . . . . . . 1713.3. Mammalian Cells: uORFs, Pauses, Initiation Sites and lncRNAs . . . . . . . . . . . . . . . . . . . . . . . . . . . . . . . . . . . . 171
3.3.1. uORFs . . . . . . . . . . . . . . . . . . . . . . . . . . . . . . . . . . . . . . . . . . . . . . . . . . . . . . . . . 1723.3.2. Translational Pauses and Elongation Speed . . . . . . . . . . . . . . . . . . . . . . . . . . . . . . . . . . . . . . . . . 1723.3.3. Translation Initiation Sites (TIS) . . . . . . . . . . . . . . . . . . . . . . . . . . . . . . . . . . . . . . . . . . . . . . 1723.3.4. Long Non Coding RNAs . . . . . . . . . . . . . . . . . . . . . . . . . . . . . . . . . . . . . . . . . . . . . . . . . . 172
3.4. Others Biological Models: Zebrafish, Drosophila, C. elegans, Trypanosomatids and Virus . . . . . . . . . . . . . . . . . . . . . . . . . 1734. Applications, Challenges and Perspectives . . . . . . . . . . . . . . . . . . . . . . . . . . . . . . . . . . . . . . . . . . . . . . . . . 173Acknowledgements . . . . . . . . . . . . . . . . . . . . . . . . . . . . . . . . . . . . . . . . . . . . . . . . . . . . . . . . . . . . . 174References . . . . . . . . . . . . . . . . . . . . . . . . . . . . . . . . . . . . . . . . . . . . . . . . . . . . . . . . . . . . . . . . . 174
1. Introduction
The decreasing cost of obtaining Next Generation Sequencing (NGS)data [1–3] together with the huge information sets arising from thesetechnologies is revolutionizing several research fields of life sciences(see an example in [4] or in disease biology [5,6]). Ingenuity is continu-ously leading to the development of new methods, a very interesting
Computational and Structural Biotechnology Journal 16 (2018) 167–176
⁎ Corresponding author at: Department of Genomics, Instituto de InvestigacionesBiológicas Clemente Estable, Av. Italia 3318, Montevideo, CP 11600, Uruguay.
E-mail addresses: [email protected] (G. Eastman), [email protected](P. Smircich), [email protected]
URL: http://www.iibce.edu.uy (J.R. Sotelo Silveira).
https://doi.org/10.1016/j.csbj.2018.04.0012001-0370/© 2018 Eastman et al.. Published by Elsevier B.V. on behalf of the Research Network of Computational and Structural Biotechnology. This is an open access article under the CCBY license (http://creativecommons.org/licenses/by/4.0/).
Contents lists available at ScienceDirect
journa l homepage: www.e lsev ie r .com/ locate /csb j

case is an application named Ribosome Profiling (RP), or Ribo-Seq, de-veloped by Ingolia &Weissman in 2009 [7] where the deep sequencingof mRNA fragments covered by ribosomes during translation yielded anoriginal view of translation at a genome wide scale. The footprints ofactive ribosomes are obtained using an RNAse protection assay, wherecontrolled digestion generates small mRNA fragments/footprints of ap-proximately 30nucleotides [8]. Therefore, after data processing, transla-tion can be observed at an unprecedented resolution in a variety ofbiological settings. Before performing the digestion, ribosomes arehalted over the mRNAs using translation inhibitory drugs or by quickdeep freezing the sample to avoid ribosome run-off. The resultingfragments, i.e. the ribosome footprints, are purified and used to con-struct sequencing libraries to feed short read sequencers. In this sce-nario, a transcriptome wide picture of the translating ribosomeslocation over mRNAs is obtained, together with an estimation of themRNAs translation rates. These expression levels estimated by RP definewhat is called translatome, in analogy to the term transcriptome.Translatome estimations of gene expression levels correlate betterwith proteomic data than transcriptome-derived estimations (seebelow). This increased correlation evidences the existence of mecha-nisms operating in the control of translation that fine tune the synthesisof cellular proteins.
In the context of the rich data obtained in a RP experiment, an inter-esting outcome was the definition of two concepts: translational effi-ciency and periodicity. The first concept refers to how much an mRNAis translated considering the level of its codingmRNA, so it is an impor-tant parameter yielding information on translation regulation.Translational efficiency is calculated as the ratio between translation(derived from counts of footprints per mRNA) over transcription(derived from RNA-seq mRNA levels) of particular mRNA. The second,refers to the three bases mapping periodicity observed for the reads de-rived from footprints as a consequence of ribosome movement alongmRNA. Since the ribosomemoves codon by codon, the 5′-end of the ri-bosome footprints tend to map at the same position of each codonthroughout the whole coding sequence.
Several aspects concerning protocol have been discussed, revisedand modified since the original protocol was established. Some aim toadapt the protocol to different biological models, like eukaryotic or pro-karyotic cells, specific tissues, etc. Other aspects have been intenselydiscussed, for example what the appropriatemethod to stop translationis or how to define the correct translation frame from ribosome foot-prints. Nevertheless, RP protocol is currently a widely used approachto study gene expression in different biological models from virus andbacteria to complex mammalian tissues (examples in [9–11]). In thismini-review we will discuss themain and critical steps in the RP proto-col, its uses and main findings obtained in different biological modelsand the contributions to our knowledge of cellular and molecularbiology.
2. Ribosome Profiling Protocol
2.1. Protocol Description
Ribosome Profiling comprise mainly five steps: sample preparation,RNAse protection assay, isolation of ribosome footprints, high-throughput sequencing and bioinformatic analysis (Fig. 1A) [12].Sample preparation refers to steps necessary to process the biologicalsample and obtain a post mitochondrial supernatant where lysis condi-tions ensure to preserve in vivo ribosome positioning and RNA integrity.Among others, alternative inputs could be tissue homogenates, isolatedtagged ribosomes or a bacterial cell lysate. Critical aspects concerningthis step are: ensuring enough biological material to produce quantifi-able ribosome footprints and avoiding ribosome run-off. For the last,either drugs inhibitors of translation or physical methods like flash-freezing using liquid nitrogen and dry ice can be used. Indeed, fast
freezing becomes crucial in cases where using translation inhibitorsare to be avoided.
The RNAse protection assay, also called nuclease footprinting, is an-other critical step in RP protocol. Several RNAses had been used, mainlyRNAse I and micrococcal nuclease (MNAse) in eukaryotic cell modelsand bacterial cells, respectively. At this step, controlling factors like reac-tion time and enzyme concentration are critical to ensure an appropri-ate mRNA digestion, for example it has been stablished that the ratiobetween RNA and RNAse controls footprints size [13].
The third step is one of the most laborious in terms of protocol. Dif-ferent strategies had been used to isolate ribosome protected fragmentsor ribosome footprints, but all of them imply a ribosome/poly-ribosomepurification step. Even though commercial columns are available to pu-rify monosomes, the most used approach is the differential sedimenta-tion of ribosomes through a sucrose cushion during ultracentrifugation.The use of this technique of subcellular fractionation ensures the purifi-cation of monosomes with bound ribosome footprints. Once mono-somes are purified, a polyacrylamide gel electrophoresis in denaturingconditions is run to separate the complex sample by length. Using ap-propriate size markers, the gel is cut at the corresponding length of28-30 nt using a dark field transilluminator, even if footprints are notvisible as it is usually the case. After disrupting the gel slices, precipita-tion and re-purification of ribosome footprints, samples are ready toproceed to library preparation.
Library preparation implies a set of protocol steps common in manyhigh-throughput sequencing experiments like end repair, 3′ adaptorligation, reverse transcription and PAGE cDNA purification, circulariza-tion of cDNA and PCR amplification. After checking length and concen-tration of the ribosome footprints library, they can be submitted tosequencing according to user-preferred sequencing technologies. Dueto footprints small size, neither long reads nor paired-end reads areneeded. Nevertheless, due to ribosomal rRNA presence in the footprintsfraction purified, depletion of rRNA, coupled with extra sequencingdepth are usually needed.
Finally, the bioinformatic analysis of data is the most user-dependent step. A typical analysis would include quality control ofraw reads,mapping, count normalization and gene expression levels es-timation. It could also include, for example, differential gene expressionanalysis if two biological conditions are contrasted. Table 1 showa list ofsome of the software available to perform classical analysis over RP data.Nevertheless, how deeply the data is interrogated is on user's hands,here we will discuss some of these downstream analyses later.
2.2. Protocol Variants, User Decisions
Up to this pointwehave reviewed themain steps in RP protocol con-sidering the classical approachesmost used in literature. Henceforthwewill mention some protocol variants and why they could be used if isnecessary (Fig. 1B). Considering the chronological order of the protocol,wewill start with one of the steps wheremore variants are described inthe literature: how to stop translation at the moment the experimentaldesign requires to do so. Efficient stop of translation avoids ribosomerun off, sharpening the picture taken of the translatome at a giventime point. In the original protocol, a classical translation inhibitor likecycloheximide was used to specifically target translation elongation.However, as it does not interfere with pre-initiation complex scanningand translation initiation, treatmentwith cycloheximide causes a signif-icant accumulation of ribosomes at initiation sites of mRNAs activelytranslated. This could represent a source of bias since a lot of ribosomefootprints will be generated by initiating ribosomes while elongationis stopped. This issuewas highly covered in the literature, with some au-thors proposing that this accumulation is actually due to an enrichmentof slow codons after the initiation and others are in line with the biashypothesis that generates a skewed distribution. Alternatively, it ispossible to stop translation using liquid nitrogen and dry ice [12]. Inthis scenario, ribosomes are flash-frozen and stopped just by reducing
168 G. Eastman et al. / Computational and Structural Biotechnology Journal 16 (2018) 167–176

kinetic energy to a minimum. This alternative seems to not affectribosome density and expression measurements but it's not the mostextended approach, maybe because of availability of liquid nitrogen inthe laboratories. When working with prokaryotes, besides flash-freezing, drugs like chloramphenicol and 5′-Guanylyl imidodiphosphatehad been used [9]. Finally, it is worth mentioning that other drugs thattarget translation had been used to reveal specific aspects of translation.One of themost extended example is the use of harringtonine or the com-bined use of cycloheximide and harringtonine. Since harringtonine it is aninhibitor of translation initiation, the use of this drug alone could revealtranslation initiation sites exclusively. Also, if harringtonine is firstapplied, and cycloheximide is applied after at different time points, it ispossible to measure very specific translation properties like translationelongation speed [14,15].
The second step we mentioned it is the RNAse protection assay. Inthis step enzyme selection is critical [16]. In first place the biologicalmodel (eukaryotic or prokaryotic) already limits the options. In theliterature, enzymes used for eukaryotic systems are mainly RNAse I, A,S7, T1 and MNAse, also used in prokaryotes. Since the method hasbeen mainly applied to eukaryotic cells, RNAse I is the more common
enzyme selected. In this case, the amount of RNA that is digested andother reaction conditions are well established, but when a new RNAseis being used, parameters like enzyme units and time of the digestionneeds to be specifically determined to ensure a correct ribosome foot-print production. It has been useful the use of enzymes, like Benzonase,or the above mentioned MNAse, that produce digestion products thatallow amore straight forward ligation of the linkers required to prepareNGS molecular libraries [17–20] simplifying the library preparationprotocol.
Once cells are harvested, lysed and the RNAse protection assay iscarried out, the next step is to collect ribosomes and specifically purifyribosome footprints. As we mentioned above, ribosome purificationcould be one of the most laborious step. Despite commercial columnsare available to purify ribosomes, more classical strategies tend to beused, like monosome separation by ultracentrifugation in sucrosecushions or gradients.While sucrose gradients fractionation is challeng-ing, sucrose cushions give similar results with less technical challenges.Other approaches to collect ribosomes are available, like genetic manip-ulation to add epitope tags to ribosomes, allowing affinity purification[21–23]. In any case, after ribosome isolation, footprints purification is
Fig. 1. Ribosome Profiling protocol description. A general description of RP protocol is shown in A, representing the main steps described in the text. The protocol variants discussed aresummarized in B, linked to the corresponding step where would be applied. Variants that correspond to prokaryotes are marked in italic.
169G. Eastman et al. / Computational and Structural Biotechnology Journal 16 (2018) 167–176

the immediate follow step. Since the RNAses used are endonucleases,they digest “unprotected” mRNA while also cutting fragments of rRNAexposed in ribosome's surface. This digestion produces a very complexmix of RNA fragments of diverse length that is separated by a denatur-ing PAGE. Using appropriate size markers (26 and 34 nt), the band cor-responding to ribosome footprints is excised from the gel and theRNA isisolated. Interestingly, a new population of small footprints of 20 nt inlength was recently described [24]. This small population would notbe recovered if we use the size markers mentioned above. In thiscontext, depending on the experiment being performed and on the re-search goals, size selection can be modified accordingly.
Since the original sample contains a lot of ribosomes, a very impor-tant fraction of the generated fragments comes from rRNA. This contam-ination, still present in ribosome footprints expected band, is animportant issue. One possible strategy is to continue with the protocolignoring this contamination and go deep in sequencing to obtainenough mRNA derived sequences to achieve RNA-seq like coverage.However, this contamination can represent up to 90% of the sample,so a subtracting strategy is usually necessary. Ribosomal RNA removalcan be achieved through streptavidin affinity purification using specificbiotinylated rRNA probes available for mouse and human. If thebiological model it is not mouse or human, synthesis of specific rRNAcomplementary oligos can be considered, provided by previous knowl-edge of the region of the rRNA protected in the model used. The latercan be obtained by sequencing at low depth to determine the mostabundant protected fragments derived from rRNA. Because different en-zymes can produce different protected rRNA due to allosteric impedi-ments or cleavage site sequence specificity, determining the identityof contaminating rRNAs could be necessary.
When footprints are collected, library construction and high-throughput sequencing are the next in line. Depending on the RNAseused, end repair could be necessary prior to linker ligation. While con-ventional protocols require PCR amplification and purification of theamplified PCR product by PAGE, as mentioned above some enzymessimplify these steps. Finally, sequencing is performed. While severalplatforms are available to perform high-throughput sequencing, longreads are not necessary as footprints are naturally short. Usually thedepth of coverage to be achieved is dependent on how much rRNA is
contaminating your footprints and how many mRNAs you will need toquantify.
Finally, data interpretation implies a complete in silico analysis (seeTable 1), although this is the step more flexible and open to user aims,it represents several challenges due to the particular features of RP.For example, reads are short in length, may have relatively high errorrates and depending on library construction protocol could have highbias. Also, some fragments tend to be enriched, because accumulated ri-bosomes at translation initiation sites or pausing sites, leading to highread counts. Beyond this, most of the available tool to process and ana-lyze experiments of RNA-Seq are suitable to use analyzing data fromRP,specifically the ones used to short length reads and/or single-end reads.Nevertheless, some aspects need to be considered due to the peculiari-ties of the data set analyzed. For example, gene isoforms studies are dif-ficult since ribosome footprints are short reads andmapping over splicejunctions tend to be unreliable. Briefly, bioinformatic analysis implies ingeneral: quality and adaptor trimming, mapping against a specific database of rRNA or ncRNAs to remove contamination, unmapped reads arealigned to an mRNA data base, counting reads, normalize counts andproceed to check statistical differences between conditions. As saidabove, diverse analysis can be done with data, just to mention some:check footprints periodicity, upstream Open Reading Frame (uORF)search, detection of different translation initiation sites, codon usageand search for translation pauses, among others. Even though general-purpose RNA-seq tools may be suitable, some specific software hasbeen developed to apply to RP data set that explicitly consider the influ-ence of transcript levels on translatome determinations (see examplesin Table 1).
3. Biological Models and Contributions
Up to date, the RP protocol has been applied to a large variety of bi-ologicalmodels from viruses and bacteria to yeast, mammalian cells andtissues, and embryos. In this section we will present themain contribu-tions done in each model, and also what we have learned about thetranslation mechanism using this methodology. In addition, in Table 2several RP works were grouped by the main topic analyzed, indicatingin each case the different organisms used.
Table 1Software available to analyze, interpret and visualize RP-derived data.A list of some of the software used to analyze RP data is briefly described, indicating its main features and the adequate environment to use it.
Name Functions/description Enviroment Ref.
riboSeqR Parsing data, align reads, plotting functions, frameshift detection and inferring alternative ORFs. R [101]RiboProfiling Quality assessment, read start position recalibration, counting of reads on CDS, 3′UTR, and 5′UTR, plotting of count data: pairs, log
fold-change, codon frequency and coverage assessment, principal component analysis on codon coverage.R [102]
RiboGalaxy On-line tools for the analysis and visualization of ribo-seq data (some of them use riboSeqR) Galaxy webserver [103]Plastid A handful of scripts for common high-throughput sequencing and ribosome profiling analyses, like: determining P-sites offsets Python Library [104]Ribomap Generates isoform-level ribosome profiles from ribosome profiling data Unix [105]RiboTraper Identifies translated regions Unix [106]Rfoot Identifies RNA regions protected by non-ribosomal protein complex present in Ribo-Seq data Perl [107]anota Analysis of differential translation and results visualization R [108]RiboDiff An statistical tool to detect changes in protein translation efficiency Unix [109]Xtail An analysis pipeline that identifies differentially translated genes in pairwise comparisons R [110]RiboTools Detection of translational ambiguities, stop codon readthrough events and codon occupancy. Provides plots for the visualization
of these events.Galaxy webserver [111]
Proteoformer Genome-wide visualization of ribosome occupancy and a translation initiation site calling algorithm. A protein database can beincorporated to increase protein identification
Galaxy webserver [112]
ORFscore Small ORF identification In SPECTtre [106];python
[75]
ORF-RATER Coding sequence annotation Python [113]FLOSS A metric for distinguishing between 80S footprints and nonribosomal sources using footprint size distributions In SPECTtre [106];
python[61]
tRanslatome Analysis of transcriptome, translatome and proteome data: Differentially expressed genes detection, gene ontology enrichmentcomparison and analysis of regulatory elements
R [114]
TranslatomeDB Differential gene expression, translation ratio, elongation velocity index and translational efficiency. Also comparision with otherRP experiments can be done
Online [115]
systemPipeR Filter/trim sequences, quality control, alignments, counting, peak detection, differentially expressed genes detection, enrichment,classification, several reports and graphs
R [116]
170 G. Eastman et al. / Computational and Structural Biotechnology Journal 16 (2018) 167–176

3.1. Bacteria: Translational Pausing, Codon Use and Antibiotics
In bacteria, ribosome profiling was applied in first place toEscherichia coli and Bacillus subtilis [9] to study the causes of transla-tional pausing. The authors observed that the presence of Shine-Dalgarno-like features in coding sequences are the major determinantsof translation rates in these models. Instead of codon usage or the pres-ence of rare tRNAs, interactions between rRNA and these Shine-Dalgarno-like features in mRNA can impact on ribosomal movementalong mRNA, which in turn affect footprints location and abundance[25]. Later, Schrader et al. [26] also applied RP, in Caulobacter crescentusand arrived to the same conclusion: ribosomes tend to pause at internalShine-Dalgarno-like sequences in coding genes. Although the later hy-pothesis regarding underlingmechanisms of translation pausing in bac-teria is still controversial (see an example in [27]), with authorssupporting classical hypothesis of tRNA abundance as main modulatorof translation speed, this is still a newpossiblemechanism for regulatingtranslation uncovered by the RP strategy.
In another study Oh et al. [28], investigated a chaperone trigger factorand how this protein regulates outer membrane proteins, using a RP pro-tocolmodified later in [29]. Balakrishnan et al. [30] studied translation ini-tiation on E. coli using RP, while translation elongation was covered byElgamal et al. [31], where authors find translational pauses associated toelongation factor P and amino acids motifs upstream to ribosome P-site(also found in [32]). Other bacteriawhere RPwas applied areMycoplasmagallisepticum [33,34],Mycobacterium abscessu [35] and Staphylococcus au-reus [36]. RP as a powerful technique to measure translation rates atsubcodon resolution, has allowed scientist to focus on the relationship be-tween translation efficiency and codon usage deriving in the optimizationbacterial vectors for expression of heterologous recombinant proteins[37,38].
Also, RP has given new insights on the antibioticsmechanisms to in-hibit translation [39]. Other studies have been using RP to investigatemechanisms for biofilm formation in B. subtilis [40], ethanol effects ontranslation [41] and mRNA cleavage by the endonuclease RelE [42].
3.2. Yeast: Start Codons, uORFs and Translational Pauses
Since RP was firstly described in the budding yeast Saccharomycescerevisiae [7], a lot of research has been done using this model and by
re-analyzing that public data sets generated. In the original article,Ingolia et al. [7] explored translation response to starvation. In this sem-inal paper the terms translation efficiency and periodicity were definedfor first time in this context (see Introduction). While translation effi-ciency is usually calculated in every experiment using RP, periodicityis not assessed so often, because it depends on RNAse amount usedand digestion time.
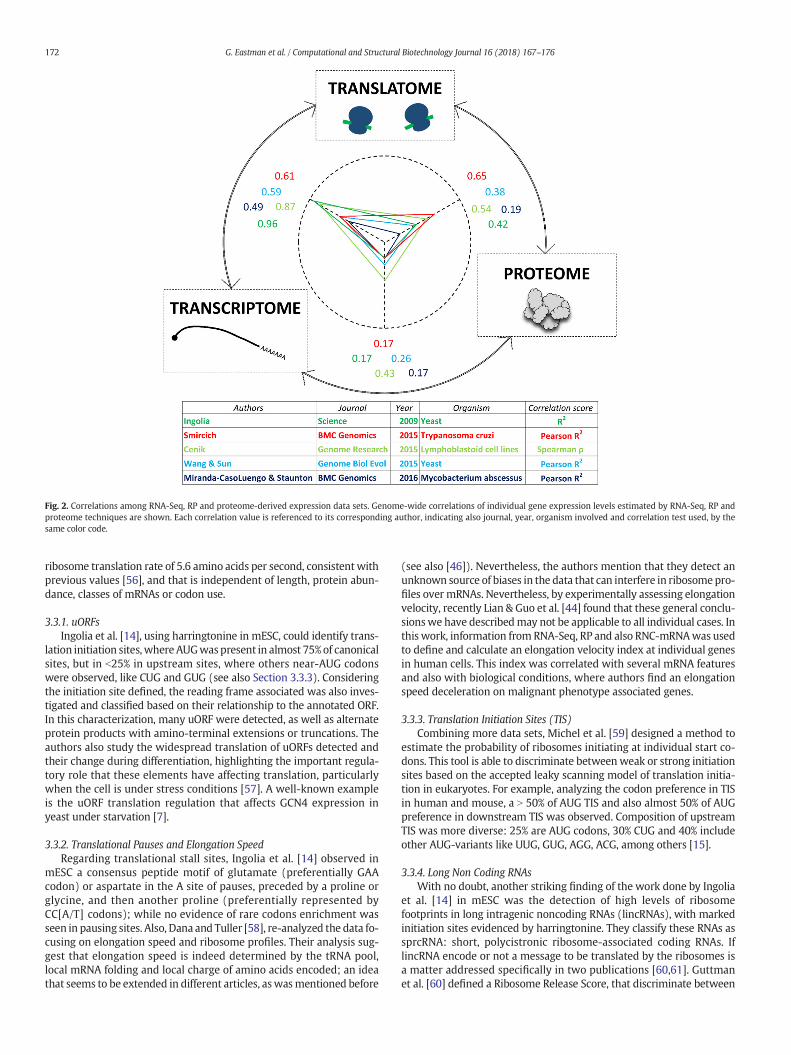
For first time, integrating all data obtained, correlations between ex-pression levels estimated by RNA-Seq (transcriptional levels), RP(translational levels) and proteomics (protein levels) could be obtained,reflecting the contribution of translational regulation in the fine tuningof final proteins levels (please see examples in Fig. 2). In this sense,other efforts have been made to correlate translation ratios and proteinabundance. For example, Wang et al. [43] by incorporating mRNAlength as a key factor, found a strong multivariate linear correlation be-tween protein levels and translation ratios estimated by ribosome-nascent chain complex sequencing (RNC-Seq). The correlation betweentranslational and protein levels estimated by RP andproteomics, respec-tively, may be improved if elongation velocity index are incorporated inthe analysis, according to the authors [44] (please see Section 3.3.2).
Also, start codons were also precisely determined in this work, andinitiation at non-AUG codons was observed as response to starvation.In the same way, detection of ribosome footprints at 5’-UTRs re-veals translational activity in these regionsmainly explained by the pres-ence of uORFs. In this way, a new approach to uORF study and itsrelationship with translation regulation was stablished, revealing acompletely new and complex field previously not covered in detail.
To highlight some of these contributions yeast models provided, wecan mention that distinct population of ribosome footprints were dis-covered and were assigned to distinct stages of translating ribosomes[24]. Furthermore, 80S ribosomes (monosomes) were detected astranslationally active, translating specific mRNAs encoding low abun-dance and regulatory proteins, among others [45]. In addition, codonusage, tRNA levels and how they influence translation was highly cov-ered [46–50]. The hypothesis that arise more strongly in yeast is thatbiochemical interactions between the nascent peptide and the ribo-somal exit tunnel (in particular the initial part of the tunnel) aremajor determinants on ribosome stalling [46]. A stalling signal of pro-line and arginine was detected, as others showed for bacteria [31,32].On the other hand, also the correlation between tRNA concentrationsand codon decoding time was evaluated, finding a significant negativecorrelation, supporting the idea that translation efficiency is influencedby tRNAs levels in the cells [48]. Also, RP was used to explore thegenome-wide translation of small ORFs (b100 amino acids) and longnon coding RNAs (lncRNAs) [51], ribosome rescue in 3′-UTR [52], theyeast meiotic program with important contributions to the area [53],and also how translation contributes to regulate gene-expression inyeast in an evolutionary view [54].
3.3. Mammalian Cells: uORFs, Pauses, Initiation Sites and lncRNAs
In mammalian cells, the first study carried out applied RP strategy toreveal aspects of microRNA's (miRNA) function in the cell [55]. The au-thors observed that miRNA predominantly affect mRNA levels, withonly a modest influence on translational efficiency. This study revealedfor first time that mRNA destabilization is the major consequence ofmiRNA regulation. So, from here to the end of this section we willpresent some interesting research and their results in mammaliancells mainly, but also in other eukaryotic models.
A significant study in terms of results, conclusions and repercus-sions, was done by the group who publish the RP protocol, but usingmouse embryonic stem cells (mESC) [14]. In this model, the authorsidentified thousands of pause sites and unannotated translation prod-ucts like amino-terminal extension and uORFswith potential regulatoryroles. In parallel, authors combine harringtonine and cycloheximide useto monitoring kinetic of translation as we describe below, evidencing a
Table 2Brief summary of RP works in several models, grouped by the main analyzed topic.
Topic Organism Ref.
Genomic/translation characterization Virus [11,86–88]Mycobacterium abscessus [35]Mammalian cells [14]
Translation initiation sites Caulobacter crescentus [26]Mammalian cells [59]
Translation elongation Saccharomyces cerevisiae [24]Caenorhabditis elegan [79]
Translational pausing Escherichia coli [9,27,32]Bacillus subtilis [9]Saccharomyces cerevisiae [46,67]
Codon usage Escherichia coli [37]Saccharomyces cerevisiae [47,49,50]
Small ORF Saccharomyces cerevisiae [51]Zebra fish [75]Drosophila melanogaster [77]Mammalian cells [65]
Translation dynamics on different stages Plasmodium falciparum [81,82]Trypanosoma cruzi [17]Trypanosoma brucei [83,84]
Stress response Escherichia coli [41]Mycoplasma gallisepticum [34]Arabidopsis thaliana [80]Saccharomyces cerevisiae [7]
lncRNAs translation Mammalian cells [60–64]
171G. Eastman et al. / Computational and Structural Biotechnology Journal 16 (2018) 167–176
ribosome translation rate of 5.6 amino acids per second, consistentwithprevious values [56], and that is independent of length, protein abun-dance, classes of mRNAs or codon use.
3.3.1. uORFsIngolia et al. [14], using harringtonine in mESC, could identify trans-
lation initiation sites,where AUGwaspresent in almost 75%of canonicalsites, but in b25% in upstream sites, where others near-AUG codonswere observed, like CUG and GUG (see also Section 3.3.3). Consideringthe initiation site defined, the reading frame associated was also inves-tigated and classified based on their relationship to the annotated ORF.In this characterization, many uORF were detected, as well as alternateprotein products with amino-terminal extensions or truncations. Theauthors also study the widespread translation of uORFs detected andtheir change during differentiation, highlighting the important regula-tory role that these elements have affecting translation, particularlywhen the cell is under stress conditions [57]. A well-known exampleis the uORF translation regulation that affects GCN4 expression inyeast under starvation [7].
3.3.2. Translational Pauses and Elongation SpeedRegarding translational stall sites, Ingolia et al. [14] observed in
mESC a consensus peptide motif of glutamate (preferentially GAAcodon) or aspartate in the A site of pauses, preceded by a proline orglycine, and then another proline (preferentially represented byCC[A/T] codons); while no evidence of rare codons enrichment wasseen in pausing sites. Also, Dana and Tuller [58], re-analyzed the data fo-cusing on elongation speed and ribosome profiles. Their analysis sug-gest that elongation speed is indeed determined by the tRNA pool,local mRNA folding and local charge of amino acids encoded; an ideathat seems to be extended in different articles, aswasmentioned before
(see also [46]). Nevertheless, the authors mention that they detect anunknown source of biases in the data that can interfere in ribosomepro-files over mRNAs. Nevertheless, by experimentally assessing elongationvelocity, recently Lian & Guo et al. [44] found that these general conclu-sionswe have describedmay not be applicable to all individual cases. Inthis work, information from RNA-Seq, RP and also RNC-mRNAwas usedto define and calculate an elongation velocity index at individual genesin human cells. This index was correlated with several mRNA featuresand also with biological conditions, where authors find an elongationspeed deceleration on malignant phenotype associated genes.
3.3.3. Translation Initiation Sites (TIS)Combining more data sets, Michel et al. [59] designed a method to
estimate the probability of ribosomes initiating at individual start co-dons. This tool is able to discriminate betweenweak or strong initiationsites based on the accepted leaky scanning model of translation initia-tion in eukaryotes. For example, analyzing the codon preference in TISin human and mouse, a N 50% of AUG TIS and also almost 50% of AUGpreference in downstream TIS was observed. Composition of upstreamTIS was more diverse: 25% are AUG codons, 30% CUG and 40% includeother AUG-variants like UUG, GUG, AGG, ACG, among others [15].
3.3.4. Long Non Coding RNAsWith no doubt, another striking finding of the work done by Ingolia
et al. [14] in mESC was the detection of high levels of ribosomefootprints in long intragenic noncoding RNAs (lincRNAs), with markedinitiation sites evidenced by harringtonine. They classify these RNAs assprcRNA: short, polycistronic ribosome-associated coding RNAs. IflincRNA encode or not a message to be translated by the ribosomes isa matter addressed specifically in two publications [60,61]. Guttmanet al. [60] defined a Ribosome Release Score, that discriminate between
Fig. 2. Correlations among RNA-Seq, RP and proteome-derived expression data sets. Genome-wide correlations of individual gene expression levels estimated by RNA-Seq, RP andproteome techniques are shown. Each correlation value is referenced to its corresponding author, indicating also journal, year, organism involved and correlation test used, by thesame color code.
172 G. Eastman et al. / Computational and Structural Biotechnology Journal 16 (2018) 167–176

coding and noncoding transcripts. Using this score, authors claim thatthe ribosome occupancy observed on lincRNAs per se is not an indicatorof active translation and describe possible reasonswhynoncoding RNAsshow ribosome footprints. One of these possibilities is that these foot-prints actually come from ribonucleo protein particles or others RNA-protein complexes. Alternatively, footprints could be generated by realengagement of ribosomes over ncRNAs that will not be functional atthe end. This interesting controversy was going to take an unexpectedturn when just over a year later, again Ingolia andWeissman describeda different metric to analyze footprints, that now classify lncRNAs ascoding [61]. This new metric called FLOSS (fragment length organiza-tion similarity score) measure the magnitude of disagreement betweenlength distribution of a set of transcripts of interest and annotatedprotein-coding transcripts. Based on FLOSS and other lines of evidence,the authors proposed that lncRNAs has ribosome footprints that showfeatures of translation. In addition alternative hypothesis werediscussed: i) translating ribosome could act as a potent helicase to re-model RNA structures and remove RNA-binding proteins; ii) translatedsequences may also act as cis-acting elements over lncRNAs that origi-nate them and iii) the authors discuss about a possible contribution ofthe proteins synthetized by noncanonical translation to serve as possi-ble antigens presented to the cellular immune system, expanding theuniverse of epitopes either in a viral infection or in a tumoral context.In any case, the fact that some ncRNAs are associated with ribosomes,translationally active or not, generates both challenging and interestingquestions that wait to be answered (see examples in [62–64]).
Using the data produced by RP onmESC, a lot of downstream analy-sis has been conducted. For example, an approach to search and predictputatively functional small ORF was developed to identify new classesof bioactive peptides [65]. Another example is the work done byZupanic et al. [66], where the authors developed a method to studymRNA translation regulation analyzing individual ribosome profiles. In-corporating RNA-Seq data to correct bias and artifacts, they look forchanges in ribosomedensity alongmRNAs to detectmechanisms of reg-ulation, like premature termination or new transcript isoforms.
Regarding bias, several articles have studied this important issue onRP data. Some improvements have been done in terms of understandthe bias source, and be able to correct it accurately [58,67,68].
Themovement of the ribosome over themRNAhas been studied an-alyzing in deepmapping periodicity leading to undercovermechanismsunderlying translational frameshifts [59]. Also regions in the human ge-nome that are dually decoded were identified (~1% of human genomeapprox.), either from different mRNAs as from the same, expandingour vision about translation regulation and even about central dogma[4,59].
In HeLa cells, RP was applied to explore the translational landscapeof cell cycle, and a widespread translation regulation was seen overcell cycle progression [69,70]. Surprisingly, evidence of functionalbicistronic mRNAs with antiviral functions in the innate immune sys-tem was also revealed by RP in a human cell line [71]. Furthermore RPwas used in humans to investigate genetic variants in lymphoblastoidcells derived from a diverse group of 30 individuals and how some ge-netic differences may modulate ribosome occupancy [72].
The mTOR pathway is a very important target of different drugs andhas been implicated in several diseases, including cancer. Since thiscomplex regulates cell growth and proliferation by regulating mRNAtranslation, it is interesting to use RP protocol to elucidate translationcontrol executed by mTOR. This was done by Sabatini's [73] andRuggero's [74] labs, and what they found was a surprising simplemodel of themRNA features thatmediatesmTORC1-dependent transla-tion: an established 5′ terminal oligopyrimidine (TOP) motifs. 5′-UTRlength or complexity was not associated with mTORC1 translation reg-ulation. The later also identify another motif called PRTE (pyrimidine-rich translational element) in 5′-UTR of mTOR targets mRNAs, whichin conjunction with TOP motif were founded in almost 90% of mTOR-sensitive genes. A common result of both works, which undoubtedly
draws attention, is the low regulatory spectrum found in terms ofnumber of messengers: mTOR-regulated mRNAs were 253 and 144, re-spectively for each publication, a low number of targets considering thecentral role of mTOR pathway in cellular metabolism and previous re-sults of translation control resolution using RP. It is still an open ques-tion whether this number changes in different cell types or conditions,since there are still several factors downstream of mTOR that influenceswhat is being translated.
3.4. Others Biological Models: Zebrafish, Drosophila, C. elegans,Trypanosomatids and Virus
Besides bacteria, yeast andmammalian cell lines, the RPmethodwasused to study translation regulation in others biological models aszebrafish [63,75], the fruit fly Drosophila [76–78], C. elegans [79],Arabidopsis [80] and also parasites like Plasmodium falciparum [81,82],Trypanosoma brucei [83,84] and T. cruzi [17]. Trypanosomatids undergoa complex life cycle with several distinct developmental forms, eachhaving particular morphologic and metabolic profiles. However, theseorganisms accomplish the associated gene expression changes withouttranscriptional control [85]. Indeed, translation regulation proved to bea key mechanism controlling protein levels as revealed by drasticchanges in translational efficiency for many developmentally regulatedgenes. For instance, the transition from a dividing to a non-divingparasite form was accompanied by a decrease in the translational effi-ciency of ribosomal proteins which in turn may explain the observedglobal decrease in protein synthesis. However, proteins required inthe non-dividing stage scape this general trend and are actively trans-lated as shown for the trans-sialidase family of virulence factors in T.cruzi [17]. Besides, the data allowed the curation of the available ge-nomes in these non-model organisms [84].
Also, RP was applied to study translation in virus like humancytomegalovirus and Kaposi's sarcoma-associated herpesvirus, bothherpesvirus, and also in Cricket paralysis virus and Influenza A virus(see [11,86–88], respectively).
4. Applications, Challenges and Perspectives
Besides classical applications we have been discussing above, likedetermine translation gene expression levels, pause associated motifs,codon translational rates, uORF and frameshift events detection,among others, here wewill mention specific protocols that had evolvedfrom initial RP experiments, like how to determine TIS by Qian lab[15,89]. In first place, they describe an approach named global transla-tion initiation sequencing (or GTI-Seq) that combine the use oflactimidomycin and cycloheximide to detect both initiation and elonga-tion ribosomes along transcripts, in human and mouse. The other, butsimilar approach, named QTI-Seq (Quantitative Translation InitiationSequencing) evaluating not only TIS qualitatively, but also quantita-tively, so statistical comparisons can be made between two conditions.In bacteria also exist an approach to identify TIS genome-wide namedtetracycline-inhibited RP [90].
Research on mitochondrial and chloroplast translation is alsopossible using RP [91–93]. Recently, an specific application of RPnamed mitochondrial ribosome (mitoribosome) profiling was devel-oped [94]. In this case, the approach developed in yeast consist in theimmunoprecipitation of mitoribosomes from cell lysates to performRNAse digestion. A similar approach but targeting reticulum-boundribosomes was also used, in mammalian cells, to study translationrelated to intracellular traffic of membranes [19].
Throughout thisminireviewwe have shownhow theRPmethod hasprovided the scientific community with a powerful system to study thetranslation mechanisms and regulation, and more generally a morecomplete picture of regulation of gene expression in several models.
However even when the seminal paper will turn 10 years old nextyear many aspects of the technique are not completely resolved, as
173G. Eastman et al. / Computational and Structural Biotechnology Journal 16 (2018) 167–176

can be shown in the continuous development of new experimentalprotocols and analysis tools. Variations of the method are emerging toaddress particular cases, such as the development of protocols to assesslocalized translation. For instance, Williams et al. [95] reportedproximity-specific ribosome profiling to target translation of nuclearencoded mitochondrial genes by tagging ribosomes in close contactwith the outer mitochondrial membrane. In this context, localizedtranslation can be investigated in more difficult scenarios like proteinsynthesis in neuronal projections [96–98], specifically Holt lab per-formed ribosome tagging and analyzed mRNA associated to taggedpolysomes in the pre-synaptic area of a minute portion of the brain[99] but the low input in mRNA would impair ribosome profiling. So,it is still necessary to develop methods that will allow the study ofsystemswhere input material is a limiting factor. Somework is startingto appear in this field [100].
Some intriguing questions have not been yet pursued, particularlythere are just a few reports where RP has been applied to disturbedsystems, for example drug treated cells or pathological cells, asneurodegenerative diseases tissue or cancer cells where translationme be playing a key role in the etiology of the abnormal molecularprocesses.
Acknowledgements
Wewould like to acknowledge Dr. DavidMunroe for his inspiration,advices and support for the development of RP protocol and encourage-ment to study translation regulation.
This work received financial support from: Master and PhD fellow-ships from Agencia Nacional de Investigación e Innovación (ANII) andComisión Académica de Posgrado (CAP) to GE (POS_NAC_2012_1_8584and POS_NAC_2016_1_129959), Comisión Sectorial de InvestigaciónCientífica (CSIC) for JRSS (CSIC grupos ID=108725 #144) and for GE(CSIC Iniciación #370), ANII to JRSS (FCE_1_2017_1_136082) and to PS(FCE_3_2016_1_126317), and from Programa de Desarrollo de lasCiencias Básicas (PEDECIBA).
References
[1] Sboner A, Mu XJ, Greenbaum D, Auerbach RK, Gerstein MB. The real cost of se-quencing: higher than you think! Genome Biol 2011;12:125. https://doi.org/10.1186/gb-2011-12-8-125.
[2] Buermans HPJ, Dunnen den JT. Next generation sequencing technology: advancesand applications. Biochim Biophys Acta 2014;1842:1932–41. https://doi.org/10.1016/j.bbadis.2014.06.015.
[3] Muir P, Li S, Lou S, Wang D, Spakowicz DJ, Salichos L, et al. Erratum to: the real costof sequencing: scaling computation to keep pace with data generation. GenomeBiol 2016;17:78. https://doi.org/10.1186/s13059-016-0961-9.
[4] Mouilleron H, Delcourt V, Roucou X. Death of a dogma: eukaryotic mRNAs can codefor more than one protein. Nucleic Acids Res 2016;44:14–23. https://doi.org/10.1093/nar/gkv1218.
[5] Vogelstein B, Papadopoulos N, Velculescu VE, Zhou S, Diaz LA, Kinzler KW. Cancergenome landscapes. Science 2013;339:1546–58. https://doi.org/10.1126/science.1235122.
[6] Campbell BB, Light N, Fabrizio D, Zatzman M, Fuligni F, de Borja R, et al. Compre-hensive analysis of hypermutation in human cancer. Cell 2017;171:1042–1056.e10. https://doi.org/10.1016/j.cell.2017.09.048.
[7] Ingolia NT, Ghaemmaghami S, Newman JRS, Weissman JS. Genome-wide analysisin vivo of translation with nucleotide resolution using ribosome profiling. Science2009;324:218–23. https://doi.org/10.1126/science.1168978.
[8] Steitz JA. Polypeptide chain initiation: nucleotide sequences of the three ribosomalbinding sites in bacteriophage R17 RNA. Nature 1969;224:957–64.
[9] Li G-W, Oh E, Weissman JS. The anti-Shine-Dalgarno sequence drives translationalpausing and codon choice in bacteria. Nature 2012;484:538–41. https://doi.org/10.1038/nature10965.
[10] Castelo-Szekely V, Arpat AB, Janich P, Gatfield D. Translational contributions to tis-sue specificity in rhythmic and constitutive gene expression. Genome Biol 2017;18:116. https://doi.org/10.1186/s13059-017-1222-2.
[11] Stern-Ginossar N, Weisburd B, Michalski A, Le VTK, Hein MY, Huang S-X, et al.Decoding human cytomegalovirus. Science 2012;338:1088–93. https://doi.org/10.1126/science.1227919.
[12] Ingolia NT, Brar GA, Rouskin S, McGeachy AM,Weissman JS. The ribosome profilingstrategy for monitoring translation in vivo by deep sequencing of ribosome-protected mRNA fragments. Nat Protoc 2012;7:1534–50. https://doi.org/10.1038/nprot.2012.086.
[13] McGlincy NJ, Ingolia NT. Transcriptome-wide measurement of translation by ribo-some profiling. Methods 2017;126:112–29. https://doi.org/10.1016/j.ymeth.2017.05.028.
[14] Ingolia NT, Lareau LF, Weissman JS. Ribosome profiling of mouse embryonic stemcells reveals the complexity and dynamics of mammalian proteomes. Cell 2011;147:789–802. https://doi.org/10.1016/j.cell.2011.10.002.
[15] Lee S, Liu B, Lee S, Huang S-X, Shen B, Qian S-B. Global mapping of translation ini-tiation sites in mammalian cells at single-nucleotide resolution. Proc Natl Acad SciU S A 2012;109:E2424-2. https://doi.org/10.1073/pnas.1207846109.
[16] Gerashchenko MV, Gladyshev VN. Ribonuclease selection for ribosome profiling.Nucleic Acids Res 2017;45:e6. https://doi.org/10.1093/nar/gkw822.
[17] Smircich P, Eastman G, Bispo S, Duhagon MA, Guerra-Slompo EP, Garat B, et al.Ribosome profiling reveals translation control as a key mechanism generating dif-ferential gene expression in Trypanosoma cruzi. BMC Genomics 2015;16:197.https://doi.org/10.1186/s12864-015-1563-8.
[18] Marcon BH, Holetz FB, Eastman G, Origa-Alves AC, Amorós M, de Aguiar AM, et al.Downregulation of the protein synthesis machinery is a major regulatory eventduring early adipogenic differentiation of human adipose-derived stromal cells.Stem Cell Res 2017. https://doi.org/10.1016/j.scr.2017.10.027.
[19] Reid DW, Nicchitta CV. Primary role for endoplasmic reticulum-bound ribosomesin cellular translation identified by ribosome profiling. J Biol Chem 2012;287:5518–27. https://doi.org/10.1074/jbc.M111.312280.
[20] Reid DW, Shenolikar S, Nicchitta CV. Simple and inexpensive ribosome profilinganalysis of mRNA translation. Methods 2015;91:69–74. https://doi.org/10.1016/j.ymeth.2015.07.003.
[21] Sanz E, Yang L, Su T, Morris DR, McKnight GS, Amieux PS. Cell-type-specificisolation of ribosome-associated mRNA from complex tissues. Proc Natl Acad SciU S A 2009;106:13939–44. https://doi.org/10.1073/pnas.0907143106.
[22] HeimanM, Schaefer A, Gong S, Peterson JD, Day M, Ramsey KE, et al. A translationalprofiling approach for the molecular characterization of CNS cell types. Cell 2008;135:738–48. https://doi.org/10.1016/j.cell.2008.10.028.
[23] Shigeoka T, Jung J, Holt CE, Jung H. Axon-TRAP-RiboTag: affinity purification oftranslated mRNAs from neuronal axons in mouse in vivo. Methods Mol Biol1649;2018:85–94. https://doi.org/10.1007/978-1-4939-7213-5_5.
[24] Lareau LF, Hite DH, Hogan GJ, Brown PO. Distinct stages of the translation elonga-tion cycle revealed by sequencing ribosome-protected mRNA fragments. Elife2014;3:e01257. https://doi.org/10.7554/eLife.01257.
[25] O'Connor PBF, Li G-W, Weissman JS, Atkins JF, Baranov PV. rRNA:mRNA pairing al-ters the length and the symmetry of mRNA-protected fragments in ribosome pro-filing experiments. Bioinformatics 2013;29:1488–91. https://doi.org/10.1093/bioinformatics/btt184.
[26] Schrader JM, Zhou B, Li G-W, Lasker K, Childers WS, Williams B, et al. The codingand noncoding architecture of the Caulobacter crescentus genome. PLoS Genet2014;10:e1004463. https://doi.org/10.1371/journal.pgen.1004463.
[27] Mohammad F, Woolstenhulme CJ, Green R, Buskirk AR. Clarifying the translationalpausing landscape in bacteria by ribosome profiling. Cell Rep 2016;14:686–94.https://doi.org/10.1016/j.celrep.2015.12.073.
[28] Oh E, Becker AH, Sandikci A, Huber D, Chaba R, Gloge F, et al. Selective ribosomeprofiling reveals the cotranslational chaperone action of trigger factor in vivo.Cell 2011;147:1295–308. https://doi.org/10.1016/j.cell.2011.10.044.
[29] Latif H, Szubin R, Tan J, Brunk E, Lechner A, Zengler K, et al. A streamlined ribosomeprofiling protocol for the characterization of microorganisms. Biotechniques 2015;58:329–32. https://doi.org/10.2144/000114302.
[30] Balakrishnan R, Oman K, Shoji S, Bundschuh R, Fredrick K. The conserved GTPaseLepA contributes mainly to translation initiation in Escherichia coli. Nucleic AcidsRes 2014;42:13370–83. https://doi.org/10.1093/nar/gku1098.
[31] Elgamal S, Katz A, Hersch SJ, Newsom D, White P, Navarre WW, et al. EF-P depen-dent pauses integrate proximal and distal signals during translation. PLoS Genet2014;10:e1004553. https://doi.org/10.1371/journal.pgen.1004553.
[32] Woolstenhulme CJ, Guydosh NR, Green R, Buskirk AR. High-precision analysis oftranslational pausing by ribosome profiling in bacteria lacking EFP. Cell Rep2015;11:13–21. https://doi.org/10.1016/j.celrep.2015.03.014.
[33] Fisunov GY, Evsyutina DV, Arzamasov AA, Butenko IO, Govorun VM. Profiling ofmycoplasma gallisepticum ribosomes. Acta Nat 2015;7:107–12.
[34] Fisunov GY, Evsyutina DV, Garanina IA, Arzamasov AA, Butenko IO, Altukhov IA, et al.Ribosome profiling reveals an adaptation strategy of reduced bacterium to acutestress. Biochimie 2017;132:66–74. https://doi.org/10.1016/j.biochi.2016.10.015.
[35] Miranda-CasoLuengoAA, StauntonPM,DinanAM, LohanAJ, Loftus BJ. Functional char-acterization of the Mycobacterium abscessus genome coupled with condition specifictranscriptomics reveals conservedmolecular strategies for host adaptation and persis-tence. BMC Genomics 2016;17:553. https://doi.org/10.1186/s12864-016-2868-y.
[36] Basu A, M-NF Yap. Ribosome hibernation factor promotes staphylococcal survivaland differentially represses translation. Nucleic Acids Res 2016;44:4881–93.https://doi.org/10.1093/nar/gkw180.
[37] Nakahigashi K, Takai Y, Shiwa Y, Wada M, Honma M, Yoshikawa H, et al. Effect ofcodon adaptation on codon-level and gene-level translation efficiency in vivo.BMC Genomics 2014;15:1115. https://doi.org/10.1186/1471-2164-15-1115.
[38] Li G-W. How do bacteria tune translation efficiency? Curr OpinMicrobiol 2015;24:66–71. https://doi.org/10.1016/j.mib.2015.01.001.
[39] Marks J, Kannan K, Roncase EJ, Klepacki D, Kefi A, Orelle C, et al. Context-specificinhibition of translation by ribosomal antibiotics targeting the peptidyl transferasecenter. Proc Natl Acad Sci U S A 2016;113:12150–5. https://doi.org/10.1073/pnas.1613055113.
[40] Subramaniam AR, Deloughery A, Bradshaw N, Chen Y, O'Shea E, Losick R, et al. Aserine sensor for multicellularity in a bacterium. Elife 2013;2:e01501. https://doi.org/10.7554/eLife.01501.
174 G. Eastman et al. / Computational and Structural Biotechnology Journal 16 (2018) 167–176

[41] Haft RJF, Keating DH, Schwaegler T, Schwalbach MS, Vinokur J, Tremaine M, et al.Correcting direct effects of ethanol on translation and transcriptionmachinery con-fers ethanol tolerance in bacteria. Proc Natl Acad Sci U S A 2014;111:E2576-5.https://doi.org/10.1073/pnas.1401853111.
[42] Hwang J-Y, Buskirk AR. A ribosome profiling study of mRNA cleavage by the endonu-clease RelE. Nucleic Acids Res 2017;45:327–36. https://doi.org/10.1093/nar/gkw944.
[43] Wang T, Cui Y, Jin J, Guo J, Wang G, Yin X, et al. Translating mRNAs strongly corre-late to proteins in a multivariate manner and their translation ratios are phenotypespecific. Nucleic Acids Res 2013;41:4743–54. https://doi.org/10.1093/nar/gkt178.
[44] Lian X, Guo J, GuW, Cui Y, Zhong J, Jin J, et al. Genome-wide and experimental res-olution of relative translation elongation speed at individual gene level in humancells. PLoS Genet 2016;12:e1005901. https://doi.org/10.1371/journal.pgen.1005901.
[45] Heyer EE, Moore MJ. Redefining the translational status of 80S monosomes. Cell2016;164:757–69. https://doi.org/10.1016/j.cell.2016.01.003.
[46] Sabi R, Tuller T. A comparative genomics study on the effect of individual aminoacids on ribosome stalling. BMC Genomics 2015;16(Suppl. 10):S5. https://doi.org/10.1186/1471-2164-16-S10-S5.
[47] Pop C, Rouskin S, Ingolia NT, Han L, Phizicky EM, Weissman JS, et al. Causal signalsbetween codon bias, mRNA structure, and the efficiency of translation and elonga-tion. Mol Syst Biol 2014;10:770. https://doi.org/10.15252/msb.20145524.
[48] Dana A, Tuller T. The effect of tRNA levels on decoding times of mRNA codons.Nucleic Acids Res 2014;42:9171–81. https://doi.org/10.1093/nar/gku646.
[49] Gardin J, Yeasmin R, Yurovsky A, Cai Y, Skiena S, Futcher B. Measurement of aver-age decoding rates of the 61 sense codons in vivo. Elife 2014;3:198. https://doi.org/10.7554/eLife.03735.
[50] Gorochowski TE, Ignatova Z, Bovenberg RAL, Roubos JA. Trade-offs between tRNAabundance and mRNA secondary structure support smoothing of translation elon-gation rate. Nucleic Acids Res 2015;43:3022–32. https://doi.org/10.1093/nar/gkv199.
[51] Smith JE, Alvarez-Dominguez JR, Kline N, Huynh NJ, Geisler S, Hu W, et al. Transla-tion of small open reading frameswithin unannotated RNA transcripts in Saccharo-myces cerevisiae. Cell Rep 2014;7:1858–66. https://doi.org/10.1016/j.celrep.2014.05.023.
[52] Guydosh NR, Green R. Dom34 rescues ribosomes in 3′ untranslated regions. Cell2014;156:950–62. https://doi.org/10.1016/j.cell.2014.02.006.
[53] Brar GA, Yassour M, Friedman N, Regev A, Ingolia NT,Weissman JS. High-resolutionview of the yeast meiotic program revealed by ribosome profiling. Science 2012;335:552–7. https://doi.org/10.1126/science.1215110.
[54] McManus CJ, May GE, Spealman P, Shteyman A. Ribosome profiling reveals post-transcriptional buffering of divergent gene expression in yeast. Genome Res2014;24:422–30. https://doi.org/10.1101/gr.164996.113.
[55] Guo H, Ingolia NT, Weissman JS, Bartel DP. Mammalian microRNAs predominantlyact to decrease target mRNA levels. Nature 2010;466:835–40. https://doi.org/10.1038/nature09267.
[56] Boström K, Wettesten M, Borén J, Bondjers G, Wiklund O, Olofsson SO. Pulse-chasestudies of the synthesis and intracellular transport of apolipoprotein B-100 in HepG2 cells. J Biol Chem 1986;261:13800–6.
[57] Andreev DE, O'Connor PBF, Fahey C, Kenny EM, Terenin IM, Dmitriev SE, et al.Translation of 5′ leaders is pervasive in genes resistant to eIF2 repression. Elife2015;4:e03971. https://doi.org/10.7554/eLife.03971.
[58] Dana A, Tuller T. Determinants of translation elongation speed and ribosomal pro-filing biases in mouse embryonic stem cells. PLoS Comput Biol 2012;8:e1002755.https://doi.org/10.1371/journal.pcbi.1002755.
[59] Michel AM, Andreev DE, Baranov PV. Computational approach for calculating theprobability of eukaryotic translation initiation from ribo-seq data that takes into ac-count leaky scanning. BMC Bioinf 2014;15:380. https://doi.org/10.1186/s12859-014-0380-4.
[60] Guttman M, Russell P, Ingolia NT, Weissman JS, Lander ES. Ribosome profiling pro-vides evidence that large noncoding RNAs do not encode proteins. Cell 2013;154:240–51. https://doi.org/10.1016/j.cell.2013.06.009.
[61] Ingolia NT, Brar GA, Stern-Ginossar N, Harris MS, Talhouarne GJS, Jackson SE, et al.Ribosome profiling reveals pervasive translation outside of annotated protein-coding genes. Cell Rep 2014;8:1365–79. https://doi.org/10.1016/j.celrep.2014.07.045.
[62] Cohen SM. Everything old is new again: (linc)RNAs make proteins! EMBO J 2014;33:937–8. https://doi.org/10.1002/embj.201488303.
[63] Chew G-L, Pauli A, Rinn JL, Regev A, Schier AF, Valen E. Ribosome profiling revealsresemblance between long non-coding RNAs and 5′ leaders of coding RNAs. Devel-opment 2013;140:2828–34. https://doi.org/10.1242/dev.098343.
[64] Li L-J, Leng R-X, Fan Y-G, Pan H-F, Ye D-Q. Translation of noncoding RNAs: focus onlncRNAs, pri-miRNAs, and circRNAs. Exp Cell Res 2017;361:1–8. https://doi.org/10.1016/j.yexcr.2017.10.010.
[65] Crappé J, Van Criekinge W, Trooskens G, Hayakawa E, Luyten W, Baggerman G,et al. Combining in silico prediction and ribosome profiling in a genome-widesearch for novel putatively coding sORFs. BMC Genomics 2013;14:648. https://doi.org/10.1186/1471-2164-14-648.
[66] Zupanic A, Meplan C, Grellscheid SN, Mathers JC, Kirkwood TBL, Hesketh JE, et al.Detecting translational regulation by change point analysis of ribosome profilingdata sets. RNA 2014;20:1507–18. https://doi.org/10.1261/rna.045286.114.
[67] Artieri CG, Fraser HB. Accounting for biases in riboprofiling data indicates a majorrole for proline in stalling translation. Genome Res 2014;24:2011–21. https://doi.org/10.1101/gr.175893.114.
[68] Bartholomäus A, Del Campo C, Ignatova Z. Mapping the non-standardized biases ofribosome profiling. Biol Chem 2016;397:23–35. https://doi.org/10.1515/hsz-2015-0197.
[69] Stumpf CR, Moreno MV, Olshen AB, Taylor BS, Ruggero D. The translational land-scape of the mammalian cell cycle. Mol Cell 2013;52:574–82. https://doi.org/10.1016/j.molcel.2013.09.018.
[70] Aramayo R, Polymenis M. Ribosome profiling the cell cycle: lessons and challenges.Curr Genet 2017;63:959–64. https://doi.org/10.1007/s00294-017-0698-3.
[71] Brubaker SW, Gauthier AE, Mills EW, Ingolia NT, Kagan JC. A bicistronic MAVS tran-script highlights a class of truncated variants in antiviral immunity. Cell 2014;156:800–11. https://doi.org/10.1016/j.cell.2014.01.021.
[72] Cenik C, Cenik ES, Byeon GW, Grubert F, Candille SI, Spacek D, et al. Integrativeanalysis of RNA, translation, and protein levels reveals distinct regulatory variationacross humans. Genome Res 2015;25:1610–21. https://doi.org/10.1101/gr.193342.115.
[73] Thoreen CC, Chantranupong L, Keys HR, Wang T, Gray NS, Sabatini DM. A unifyingmodel for mTORC1-mediated regulation of mRNA translation. Nature 2012;485:109–13. https://doi.org/10.1038/nature11083.
[74] Hsieh AC, Liu Y, Edlind MP, Ingolia NT, Janes MR, Sher A, et al. The translationallandscape of mTOR signalling steers cancer initiation and metastasis. Nature2012;485:55–61. https://doi.org/10.1038/nature10912.
[75] Bazzini AA, Johnstone TG, Christiano R, Mackowiak SD, Obermayer B, Fleming ES,et al. Identification of small ORFs in vertebrates using ribosome footprinting andevolutionary conservation. EMBO J 2014;33:981–93. https://doi.org/10.1002/embj.201488411.
[76] Dunn JG, Foo CK, Belletier NG, Gavis ER, Weissman JS. Ribosome profiling revealspervasive and regulated stop codon readthrough in Drosophila melanogaster.Elife 2013;2:e01179. https://doi.org/10.7554/eLife.01179.
[77] Aspden JL, Eyre-Walker YC, Phillips RJ, Amin U, Mumtaz MAS, Brocard M, et al. Ex-tensive translation of small open reading frames revealed by poly-Ribo-Seq. Elife2014;3:e03528. https://doi.org/10.7554/eLife.03528.
[78] Miettinen TP, Björklund M. Modified ribosome profiling reveals high abundance ofribosome protectedmRNA fragments derived from 3′ untranslated regions. NucleicAcids Res 2015;43:1019–34. https://doi.org/10.1093/nar/gku1310.
[79] Stadler M, Fire A. Wobble base-pairing slows in vivo translation elongation inmetazoans. RNA 2011;17:2063–73. https://doi.org/10.1261/rna.02890211.
[80] Juntawong P, Girke T, Bazin J, Bailey-Serres J. Translational dynamics revealed bygenome-wide profiling of ribosome footprints in Arabidopsis. Proc Natl Acad SciU S A 2014;111:E203-2. https://doi.org/10.1073/pnas.1317811111.
[81] Caro F, Ahyong V, Betegon M, DeRisi JL. Genome-wide regulatory dynamics oftranslation in the plasmodium falciparum asexual blood stages. Elife 2014;3:568.https://doi.org/10.7554/eLife.04106.
[82] Bunnik EM, Chung D-WD, Hamilton M, Ponts N, Saraf A, Prudhomme J, et al. Poly-some profiling reveals translational control of gene expression in the human ma-laria parasite plasmodium falciparum. Genome Biol 2013;14:R128. https://doi.org/10.1186/gb-2013-14-11-r128.
[83] Jensen BC, Ramasamy G, Vasconcelos EJR, Ingolia NT, Myler PJ, Parsons M. Exten-sive stage-regulation of translation revealed by ribosome profiling of Trypanosomabrucei. BMC Genomics 2014;15:911. https://doi.org/10.1186/1471-2164-15-911.
[84] Vasquez J-J, Hon C-C, Vanselow JT, Schlosser A, Siegel TN. Comparative ribosomeprofiling reveals extensive translational complexity in different Trypanosomabrucei life cycle stages. Nucleic Acids Res 2014;42:3623–37. https://doi.org/10.1093/nar/gkt1386.
[85] Clayton CE. Life without transcriptional control? From fly to man and back again.EMBO J 2002;21:1881–8. https://doi.org/10.1093/emboj/21.8.1881.
[86] Stern-Ginossar N, Ingolia NT. Ribosome profiling as a tool to decipher viral com-plexity. Annu Rev Virol 2015;2:335–49. https://doi.org/10.1146/annurev-virol-ogy-100114-054854.
[87] Khong A, Bonderoff JM, Spriggs RV, Tammpere E, Kerr CH, Jackson TJ, et al. Tempo-ral regulation of distinct internal ribosome entry sites of the dicistroviridae cricketparalysis virus. Virus 2016;8:25. https://doi.org/10.3390/v8010025.
[88] Bercovich-Kinori A, Tai J, Gelbart IA, Shitrit A, Ben-Moshe S, Drori Y, et al. A system-atic view on influenza induced host shutoff. Elife 2016;5:600. https://doi.org/10.7554/eLife.18311.
[89] Gao X, Wan J, Liu B, Ma M, Shen B, Qian S-B. Quantitative profiling of initiating ri-bosomes in vivo. Nat Methods 2015;12:147–53. https://doi.org/10.1038/nmeth.3208.
[90] Nakahigashi K, Takai Y, Kimura M, Abe N, Nakayashiki T, Shiwa Y, et al. Compre-hensive identification of translation start sites by tetracycline-inhibited ribosomeprofiling. DNA Res 2016;23:193–201. https://doi.org/10.1093/dnares/dsw008.
[91] Rooijers K, Loayza-Puch F, Nijtmans LG, Agami R. Ribosome profiling reveals fea-tures of normal and disease-associated mitochondrial translation. Nat Commun2013;4:2886. https://doi.org/10.1038/ncomms3886.
[92] Zoschke R, Watkins KP, Barkan A. A rapid ribosome profiling method elucidateschloroplast ribosome behavior in vivo. Plant Cell 2013;25:2265–75. https://doi.org/10.1105/tpc.113.111567.
[93] Chotewutmontri P, Barkan A. Dynamics of chloroplast translation during chloro-plast differentiation in maize. PLoS Genet 2016;12:e1006106. https://doi.org/10.1371/journal.pgen.1006106.
[94] Couvillion MT, Churchman LS. Mitochondrial ribosome (Mitoribosome) profilingfor monitoring mitochondrial translation in vivo. Curr Protoc Mol Biol 2017;119:4.28.1–4.28.25. https://doi.org/10.1002/cpmb.41.
[95] Williams CC, Jan CH, Weissman JS. Targeting and plasticity of mitochondrial pro-teins revealed by proximity-specific ribosome profiling. Science 2014;346:748–51. https://doi.org/10.1126/science.1257522.
[96] Sotelo-Silveira JR, Holt CE. Introduction to the special issue on local protein synthe-sis in axons. Dev Neurobiol 2014;74:207–9. https://doi.org/10.1002/dneu.22163.
[97] Sotelo-Silveira JR, Calliari A, Kun A, Koenig E, Sotelo JR. RNA trafficking in axons.Traffic 2006;7:508–15. https://doi.org/10.1111/j.1600-0854.2006.00405.x.
175G. Eastman et al. / Computational and Structural Biotechnology Journal 16 (2018) 167–176

[98] Calliari A, Farías J, Puppo A, Canclini L, Mercer JA, Munroe D, et al. Myosin Va asso-ciates with mRNA in ribonucleoprotein particles present in myelinated peripheralaxons and in the central nervous system. Dev Neurobiol 2014;74:382–96.https://doi.org/10.1002/dneu.22155.
[99] Shigeoka T, Jung H, Jung J, Turner-Bridger B, Ohk J, Lin JQ, et al. Dynamic axonaltranslation in developing and mature visual circuits. Cell 2016;166:181–92.https://doi.org/10.1016/j.cell.2016.05.029.
[100] Hornstein N, Torres D, Sharma Das S, Tang G, Canoll P, Sims PA. Ligation-freeribosome profiling of cell type-specific translation in the brain. Genome Biol2016;17:149. https://doi.org/10.1186/s13059-016-1005-1.
[101] Chung BY, Hardcastle TJ, Jones JD, Irigoyen N, Firth AE, Baulcombe DC, et al. The useof duplex-specific nuclease in ribosome profiling and a user-friendly softwarepackage for Ribo-seq data analysis. RNA 2015;21:1731–45. https://doi.org/10.1261/rna.052548.115.
[102] Popa A, Lebrigand K, Paquet A, Nottet N, Robbe-Sermesant K, Waldmann R, et al.RiboProfiling: a bioconductor package for standard Ribo-seq pipeline processing.F1000Res 2016;5:1309. https://doi.org/10.12688/f1000research.8964.1.
[103] Michel AM, Mullan JPA, Velayudhan V, O'Connor PBF, Donohue CA, Baranov PV.RiboGalaxy: a browser based platform for the alignment, analysis and visualizationof ribosome profiling data. RNA Biol 2016;13:316–9. https://doi.org/10.1080/15476286.2016.1141862.
[104] Dunn JG, Weissman JS. Plastid: nucleotide-resolution analysis of next-generationsequencing and genomics data. BMC Genomics 2016;17:958. https://doi.org/10.1186/s12864-016-3278-x.
[105] Wang H, McManus J, Kingsford C. Isoform-level ribosome occupancy estimationguided by transcript abundance with Ribomap. Bioinformatics 2016;32:1880–2.https://doi.org/10.1093/bioinformatics/btw085.
[106] Calviello L, Mukherjee N, Wyler E, Zauber H, Hirsekorn A, Selbach M, et al. Detect-ing actively translated open reading frames in ribosome profiling data. NatMethods 2016;13:165–70. https://doi.org/10.1038/nmeth.3688.
[107] Ji Z, Song R, Huang H, Regev A, Struhl K. Transcriptome-scale RNase-footprinting ofRNA-protein complexes. Nat Biotechnol 2016;34:410–3. https://doi.org/10.1038/nbt.3441.
[108] Larsson O, Sonenberg N, Nadon R. anota: analysis of differential translation ingenome-wide studies. Bioinformatics 2011;27:1440–1. https://doi.org/10.1093/bioinformatics/btr146.
[109] Zhong Y, Karaletsos T, Drewe P, Sreedharan VT, Kuo D, Singh K, et al. RiboDiff:detecting changes of mRNA translation efficiency from ribosome footprints.Bioinformatics 2017;33:139–41. https://doi.org/10.1093/bioinformatics/btw585.
[110] Xiao Z, Zou Q, Liu Y, Yang X. Genome-wide assessment of differential translationswith ribosome profiling data. Nat Commun 2016;7:11194. https://doi.org/10.1038/ncomms11194.
[111] Legendre R, Baudin-Baillieu A, Hatin I, Namy O. RiboTools: a galaxy toolbox forqualitative ribosome profiling analysis. Bioinformatics 2015;31:2586–8. https://doi.org/10.1093/bioinformatics/btv174.
[112] Crappé J, Ndah E, Koch A, Steyaert S, Gawron D, De Keulenaer S, et al.PROTEOFORMER: deep proteome coverage through ribosome profiling and MS in-tegration. Nucleic Acids Res 2015;43:e29-. https://doi.org/10.1093/nar/gku1283.
[113] Fields AP, Rodriguez EH, Jovanovic M, Stern-Ginossar N, Haas BJ, Mertins P, et al. Aregression-based analysis of ribosome-profiling data reveals a conserved complex-ity to mammalian translation. Mol Cell 2015;60:816–27. https://doi.org/10.1016/j.molcel.2015.11.013.
[114] Tebaldi T, Dassi E, Kostoska G, Viero G, Quattrone A. tRanslatome: an R/Bioconductor package to portray translational control. Bioinformatics 2014;30:289–91. https://doi.org/10.1093/bioinformatics/btt634.
[115] Liu W, Xiang L, Zheng T, Jin J, Zhang G. TranslatomeDB: a comprehensive databaseand cloud-based analysis platform for translatome sequencing data. Nucleic AcidsRes 2018;46:D206–12. https://doi.org/10.1093/nar/gkx1034.
[116] H Backman TW, Girke T. systemPipeR: NGS workflow and report generationenvironment. BMC Bioinf 2016;17:388. https://doi.org/10.1186/s12859-016-1241-0.
176 G. Eastman et al. / Computational and Structural Biotechnology Journal 16 (2018) 167–176

20
PDCD4, un regulador de la traducción con posibles funciones neuronales
Pocos reguladores traduccionales proteicos nuevos han sido descritos en la literatura
recientemente, en particular en modelos neuronales. En este sentido, nuestro laboratorio ha
explorado la presencia y el rol de la proteína PDCD4, capaz de regular la traducción, en
modelos neuronales in vitro e in vivo. Estos antecedentes, junto con resultados previos
obtenidos por el grupo (ver más adelante), sugieren para PDCD4 un posible rol neuronal.
PDCD4 fue identificado inicialmente como un gen cuya expresión aumentaba durante la
apoptosis [30]. Estudios posteriores mostraron que se trata de un gen supresor de tumores
involucrado en la regulación de la transcripción y traducción de ARNm, en las vías de
transducción de señales celulares y en la apoptosis, entre otros [31]. El gen de PDCD4
codifica para una proteína de 470 aminoácidos [30], muy conservada en vertebrados [31] y
de expresión ubicua en los tejidos [32]. Dicha proteína consta de tres dominios, uno amino-
terminal de unión al ARN y dos dominios MA-3 de interacción proteína-proteína: uno central
(MA-3m) y otro carboxilo-terminal (MA-3c) [31]. A nivel de secuencia, la proteína cuenta con
varios sitios plausibles de fosforilación que regulan su actividad, localización subcelular y
degradación mediada por el proteasoma [31,33]. El ARNm que codifica para PDCD4 cuenta
también con sitios blanco de micro ARN, los cuales regulan su traducción en condiciones
fisiológicas alteradas. El caso más estudiado es el del miRNA-21, quien inhibe la traducción
de PDCD4 en diversos tipos tumorales [34–37].
Respecto de las funciones a cargo de PDCD4, se ha descrito que interviene en la
transformación neoplásica donde se manifiesta como gen supresor de tumores, regulando
negativamente la proliferación celular, invasión celular, el crecimiento tumoral y la sobrevida
celular luego de daño al ADN [31]. Estas funciones implican el control a nivel transcripcional
y traduccional de la expresión génica por parte de PDCD4. A nivel transcripcional se ha visto
que PDCD4 regula la actividad de varios factores de transcripción al unirlos de forma directa.
Algunos ejemplos son: c-Jun [38,39], sp1 [40], Twist1 [41] y p53 [42]. A nivel traduccional,
mediante interacciones ARN-proteína PDCD4 es capaz de reconocer estructuras secundarias
en los 5'-UTR de sus ARNm blancos y de esta manera ejercer un control de forma específica
[43]. También se ha observado que mediante interacciones proteína-proteína PDCD4 se une
tanto con los factores de iniciación eucariotas eIF4A y eIF4G, así como con proteínas que se
encuentran en el complejo de iniciación 40S y complejo de preiniciación 43S [44,45]. En
condiciones normales, eIF4G une eIF4A e interacciones adicionales activan este último factor
para que manifieste su actividad de ARN helicasa, la cual le permite resolver estructuras
secundarias presentes en los 5'-UTR y que inhiben la traducción de los ARNm. PDCD4
compite con eIF4G y con el ARNm por la unión a eIF4A [46]. Cuando PDCD4 logra unir a

21
eIF4A, lo hace de manera estable y bloquea el sitio de unión al ARN de eIF4A, estabilizando
una conformación abierta inactiva del complejo de iniciación [43]. De esta forma, la interacción
de PDCD4 con eIF4A inhibe su actividad helicasa, lo cual en consecuencia inhibe de forma
directa la traducción cap-dependiente de ciertos mensajeros que aún no se conocen con
detalle (ver Figura II.1). También ha sido descrito un posible mecanismo por el cual PDCD4
es capaz de inhibir la traducción de ARNm de manera independiente del factor eIF4A [47,48].
Los mensajeros cuya traducción es inhibida por PDCD4, son los que por tanto se denominan
blancos traduccionales.
---------------------------------------------------------------------------------------------------- Figura II.1. Modelo molecular planteado para ilustrar la interferencia de PDCD4 con el complejo de preiniciación. El esquema muestra en la parte superior el correcto acople del factor eIF4H al complejo de preiniciación asociado al consumo de ATP. En la parte inferior se muestra la interacción de PDCD4 con eIF4A que desplaza a eIF4G de su posición y determina por tanto la inhibición de la actividad helicasa del factor 4A. Figura adaptada de Waters et al J Biol Chem (2011). ----------------------------------------------------------------------------------------------------

22
Nuestro grupo ha trabajado en la caracterización del rol de PDCD4 en diversos modelos
neuronales. Hemos descrito la expresión de este factor tanto en sistema nervioso central
como periférico mediante técnicas como microscopía confocal y RT-PCR [49] así como hemos
explorado posibles blancos traduccionales en modelos neuronales in vitro utilizando Ribo-Seq
[50]. De esta manera, comprender en detalle el rol de PDCD4 en modelos neuronales, así
como evidenciar y describir sus posibles blancos traduccionales en dichos modelos son
aspectos de interés para nuestro laboratorio.
Regulación de la traducción en enfermedades neurodegenerativas
El control de la expresión génica mediante la regulación de los niveles traduccionales,
independientemente de su modulación por factores proteicos, puede representar un aspecto
relevante en el desarrollo de neuropatologías. A modo de ejemplo, algunos de los procesos
neuronales donde el control traduccional es de particular importancia son: los procesos de
generación de memoria y consolidación por LTP o LDP [51–56], desórdenes genéticos
hereditarios que determinan retardo mental como el síndrome de X frágil [57–61],
neuropatologías y desórdenes neurodegenerativos como el mal de Parkinson [62,63] y el mal
de Alzheimer, en el cual nos enfocaremos en adelante.
El mal de Alzheimer es una enfermedad neurodegenerativa que afecta al cerebro y representa
la mayor proporción de los casos de demencia a nivel mundial [64]. Aunque sus causas no
son completamente entendidas, salvo casos de inicio temprano con mutaciones específicas
[65], la enfermedad está muy bien descrita histopatológicamente. El análisis post mortem de
cerebros de pacientes enfermos revela claramente pérdida de masa cerebral y de contactos
sinápticos, así como la presencia de placas amiloides y acúmulos de la proteína TAU
hiperfosforilada [66,67]. Mientras los acúmulos de TAU hiperfosforilada se observan a nivel
intracelular, las placas amiloides se observan principalmente a nivel extracelular y son el
resultado de la acumulación del péptido beta amiloide (Aβ), producido por el inapropiado
clivaje de la proteína APP [68,69].
A pesar de la gran cantidad de estudios de asociación genética y de expresión génica que
han sido realizados en distintos modelos de la enfermedad de Alzheimer, pocos han centrado
su atención en la regulación a nivel traduccional. A su vez, recientemente tanto el péptido Aβ
como la proteína TAU, los dos factores fundamentales de la enfermedad, han sido vinculados
con el proceso de síntesis proteica. Por ejemplo, se ha descrito la regulación de eventos de
síntesis proteica local en sinaptosomas obtenidos a partir de cerebros de modelos murinos
transgénicos de la enfermedad que sobreexpresan APP [23]. También se ha visto que la
23
presencia de oligómeros de Aβ inducen la síntesis de novo de TAU [70], que TAU es capaz
de interaccionar con el ribosoma in vitro [71] y que la síntesis de proteínas ribosomales puede
verse inhibida en modelos transgénicos que sobreexpresan TAU [72]. Al mismo tiempo, se ha
descrito un mecanismo de señalización iniciado por el péptido Aβ que regula la actividad del
complejo mTOR [73,74], quien cumple un rol fundamental en el control de la traducción [75].
Considerando toda esta evidencia previa, nos resulta interesante explorar posibles eventos
de regulación traduccional en modelos de la enfermedad de Alzheimer extendiendo el uso de
metodologías ómicas para el estudio de la traducción a nuevos modelos neuronales con una
clara relevancia en salud.

24
III. HIPÓTESIS DE TRABAJO Y OBJETIVOS
La hipótesis de trabajo en la cual se basa la presente tesis es que los mecanismos de
regulación traduccional son importantes para modular procesos celulares en las neuronas.
Los mecanismos de regulación traduccional pueden estar asociados a factores proteicos
reguladores como PDCD4 y/o pueden estar involucrados en neuropatologías complejas como
el mal de Alzheimer.
De esta manera, el principal objetivo de la presente tesis es contribuir a comprender
mecanismos y eventos de regulación traduccional en células neuronales utilizando estrategias
experimentales y bioinformáticas que permitan observar la traducción a nivel global.
En este contexto, la presente tesis doctoral se encuentra dividida en tres grandes capítulos
donde los siguientes objetivos específicos serán abordados y discutidos:
1. Investigar el rol que ejerce PDCD4 en la regulación traduccional y determinar sus
ARNm blancos en neuronas obtenidas por diferenciación de células PC12.
2. Optimización de Ribo-Seq en modelos neuronales in vitro de células primarias y tejido
nervioso animal in vivo.
3. Explorar la regulación traduccional en modelos transgénicos de la enfermedad de
Alzheimer.
En cada caso, luego de una breve introducción en cada capítulo plantearemos una hipótesis
de trabajo específica, dentro del marco de la hipótesis de trabajo aquí planteada, a ser
contrastada y evaluada mediante los objetivos específicos arriba mencionados.
25
IV. CAPÍTULO 1
BÚSQUEDA DE ARNm BLANCOS TRADUCCIONALES DE PDCD4 MEDIANTE RIBO-SEQ
EN NEURONAS OBTENIDAS POR DIFERENCIACIÓN DE CÉLULAS PC12
Uno de los primeros desafíos que abordamos en la presente tesis fue culminar los
experimentos iniciados durante mi tesis de Maestría relacionados a entender el posible rol de
PDCD4 en modelos neuronales, así como la búsqueda de sus blancos traduccionales en
dichos modelos. En este sentido, la hipótesis de trabajo que nos planteamos fue que PDCD4
es capaz de regular la traducción de un conjunto de ARNm blancos en modelos celulares
neuronales. Para verificar o rechazar esta hipótesis utilizamos la línea celular PC12, capaz de
diferenciar a un tipo neuronal bajo exposición a NGF. Durante mi etapa previa de maestría y
mediante transfección de vectores lentivirales, generamos una variante capaz de silenciar de
manera específica e inducible la expresión de PDCD4. Utilizando este modelo, aplicamos las
técnicas de RNA-Seq y Ribo-Seq para estudiar eventos de regulación traduccional
influenciados por la presencia/ausencia de PDCD4. En la presente tesis realizamos nuevos
experimentos de transfección y secuenciación masiva para aumentar la cantidad de réplicas
biológicas y junto con los datos previamente producidos, realizamos el análisis
correspondiente para determinar los blancos traduccionales de PDCD4 en el modelo de
trabajo tipo neuronal.
De esta manera pudimos estudiar con validez estadística los eventos de regulación
traduccional, comparando los niveles de eficiencia traduccional entre ambas condiciones. Así,
definimos una lista de ARNm posibles blancos traduccionales de PDCD4 como aquellos
genes cuya eficiencia traduccional aumenta con un p-valor asociado <0.05, en ausencia de
PDCD4 respecto del control (presencia de PDCD4). Esta lista de 267 ARNm es el primer
reporte de blancos traduccionales de PDCD4 en modelos neuronales estudiado mediante
aproximaciones ómicas. Anteriormente ha sido publicado el reporte de 62 ARNm blancos de
PDCD4, también determinados por Ribo-Seq, en un modelo celular inmortal de células
epiteliales [76]. Probablemente por lo alejado que se encuentra este modelo del modelo
celular neuronal, no comparten casi ningún ARNm.
A partir de la lista de blancos traduccionales encontrada, realizamos distintos tipos de análisis
que revelaron la presencia de una firma génica asociada al crecimiento neurítico o crecimiento
axonal, firma que describimos en detalle y reportamos. Realizamos también confirmaciones
de algunos de los blancos traduccionales más relevantes encontrados, ya sea por
cuantificación relativa de ARNm en fracciones de un gradiente polisomal, o por cuantificación

26
proteica mediante Western blot. Previamente habíamos observado que el crecimiento
neurítico en células PC12 diferenciadas a neuronas se encuentra aumentado en ausencia de
PDCD4. Estos resultados y observaciones están en línea con otros resultados de nuestro
grupo que también mostraban el mismo control negativo sobre el crecimiento neurítico y
axonal en cultivos primarios de neuronas corticales y del ganglio de la raíz dorsal.
De esta manera, gran parte de los resultados obtenidos durante esta etapa, junto con los
resultados obtenidos por Andrés Di Paolo durante su tesis de posgrado mencionados
anteriormente, formaron parte de una publicación en conjunto en la cual compartimos primer
autoría (ver trabajo publicado II a continuación). Los resultados obtenidos correspondientes a
este capítulo y no incluidos en la publicación son presentados y discutidos más adelante.
Trabajo publicado II: PDCD4 regulates axonal growth by translational repression of
neurite growth-related genes and is modulated during nerve injury responses
Se adjunta a continuación el manuscrito publicado junto con su material suplementario.
Por razones de tamaño y espacio las tablas suplementarias no fueron incluidas. Las mismas
pueden encontrarse en el siguiente enlace:
https://rnajournal.cshlp.org/content/26/11/1637/suppl/DC1.

PDCD4 regulates axonal growth by translational repressionof neurite growth-related genes and is modulated duringnerve injury responses
ANDRÉS DI PAOLO,1,9 GUILLERMO EASTMAN,2,9 RAQUEL MESQUITA-RIBEIRO,3 JOAQUINA FARIAS,2
ANDREW MACKLIN,4 THOMAS KISLINGER,4,5 NANCY COLBURN,6,10 DAVID MUNROE,7,10
JOSÉ R. SOTELO SOSA,1 FEDERICO DAJAS-BAILADOR,3 and JOSÉ R. SOTELO-SILVEIRA2,8
1Departamento de Proteínas y Ácidos Nucleicos, Instituto de Investigaciones Biológicas Clemente Estable, Montevideo 11600, Uruguay2Departamento de Genómica, Instituto de Investigaciones Biológicas Clemente Estable, Montevideo 11600, Uruguay3School of Life Sciences, University of Nottingham, Nottingham NG7 2UH, United Kingdom4Princess Margaret Cancer Centre, University Health Network, Toronto M5G 1L7, Canada5University of Toronto, Department of Medical Biophysics, Toronto M5S 1A1, Canada6Former Chief of Laboratory of Cancer Prevention at the National Cancer Institute-NIH at Frederick, Maryland 21702, USA7Former Laboratory of Molecular Technologies, LEIDOS at Frederick National Laboratory for Cancer Research, Frederick, Maryland 21702, USA8Departamento de Biología Celular y Molecular, Facultad de Ciencias UdelaR, Montevideo 11400, Uruguay
ABSTRACT
Programmed cell death 4 (PDCD4) protein is a tumor suppressor that inhibits translation through the mTOR-dependentinitiation factor EIF4A, but its functional role and mRNA targets in neurons remain largely unknown. Our work identifiedthat PDCD4 is highly expressed in axons and dendrites of CNS and PNS neurons. Using loss- and gain-of-function exper-iments in cortical and dorsal root ganglia primary neurons, we demonstrated the capacity of PDCD4 to negatively controlaxonal growth. To explore PDCD4 transcriptome and translatome targets, we used Ribo-seq and uncovered a list of po-tential targets with known functions as axon/neurite outgrowth regulators. In addition, we observed that PDCD4 canbe locally synthesized in adult axons in vivo, and its levels decrease at the site of peripheral nerve injury and before nerveregeneration. Overall, our findings demonstrate that PDCD4 can act as a new regulator of axonal growth via the selectivecontrol of translation, providing a target mechanism for axon regeneration and neuronal plasticity processes in neurons.
Keywords: programmed cell death 4 (PDCD4); axonal growth; axonal regeneration; translation; ribosome profiling
INTRODUCTION
The tumor suppressor programmed cell death 4 (PDCD4)protein was first described in cancer studies and hasbeen shown to regulate protein synthesis by inhibition ofEIF4A helicase activity (Yang et al. 2003; Suzuki et al.2008; Matsuhashi et al. 2019) and via interaction with spe-cific RNA motives present in a particular subset of targetmRNAs (Loh et al. 2009; Wedeken et al. 2011; Biyaneeet al. 2015). In mitogen stimulated cells, the degradationof PDCD4 is necessary for efficient protein translation,which is a prerequisite for cell growth and proliferation(Dorrello et al. 2006; Schmid et al. 2008). At present, while
numerous molecules have been shown to regulatePDCD4, including p21 (Göke et al. 2004), Cdk4 (Jansenet al. 2005), and JNK/c-Jun/AP-1 (Yang et al. 2003,2006; Bitomsky et al. 2004), there is also a growing list ofPDCD4 translational targets, including C-MYB, P53,SIN1, and BDNF (Singh et al. 2011; Wedeken et al.2011; Wang et al. 2017; Li et al. 2020), together with inter-nal ribosome entry site-regulated apoptosis inhibitors(Liwak et al. 2012). Although misregulation of PDCD4 ina variety of tumors (Zhang et al. 2006; Gao et al. 2007;Mudduluru et al. 2007; Zhen et al. 2016) suggests an im-portant role in cancer development (Zhang et al. 2006;Gao et al. 2007; Mudduluru et al. 2007; Zhen et al.2016), the full scope of PDCD4 translational targets andits potential role in other growth-dependent cellular9These authors contributed equally to this work.
10Deceased.Corresponding authors: [email protected],
[email protected] or [email protected] is online at http://www.rnajournal.org/cgi/doi/10.1261/rna.
075424.120. Freely available online through the RNA Open Accessoption.
© 2020 Di Paolo et al. This article, published in RNA, is availableunder a Creative Commons License (Attribution 4.0 International), asdescribed at http://creativecommons.org/licenses/by/4.0/.
RNA (2020) 26:1637–1653; Published by Cold Spring Harbor Laboratory Press for the RNA Society 1637
Cold Spring Harbor Laboratory Press on October 19, 2020 - Published by rnajournal.cshlp.orgDownloaded from

systems has only recently started to be elucidated (Haaset al. 2020). In this regard, the molecular pathways in-volved in the development of tumor cells share a signifi-cant overlap with axonal growth and regenerationprocesses in the nervous system, particularly in the contextof protein synthesis regulation (Chédotal et al. 2005; Heineet al. 2015).
The highly polarized nature that defines themorphologyof a neuron makes local protein synthesis in the differentcellular compartments (soma, dendrites and axons) an es-sential need for their development and function, beingalso important for plasticity and regenerative processesin the adult (Verma et al. 2005; Jiménez-Díaz et al. 2008;Huebner and Strittmatter 2009; Gumy et al. 2010; Parket al. 2010; Jung et al. 2011; Deglincerti and Jaffrey2012; Kar et al. 2013; Obara and Hunt 2014; Sotelo-Silveira and Holt 2014; Ohtake et al. 2015; Terenzio et al.2018). The acceptance of local protein translation as akey molecular mechanism in neuronal function hasprompted the development of a variety of experimentalmodels and omics approaches to investigate the specificaxonal transcriptomes and proteomes (for review, seeFarias et al. 2020). In this context, the elucidation of theregulatory pathways that can control the selective transla-tion of axonal mRNAs has become an essential step in theunderstanding of neuronal development, growth and ac-tivity (Swanger and Bassell 2011; Jung et al. 2012).Among the various molecular mechanisms reported sofar (Lin and Holt 2008; Holt et al. 2019), themammalian tar-get of rapamycin (mTOR) complex is described as a masterregulator of local axonal translation and an important sig-naling process in axonal regeneration (Verma et al. 2005;Park et al. 2008; Terenzio et al. 2018), while also being af-fected in many different tumor types (Murray and Tee2018). Interestingly, although PDCD4 protein has beendescribed as an important downstream component ofthe mTOR pathway, it has not been directly associatedwith axonal processes. So far, the function of PDCD4 inthe CNS has been linked to fetal alcohol syndrome, whereit regulates general protein synthesis in cortical neurons(Narasimhan et al. 2013; Riar et al. 2014) and depression-like behaviors via BDNF regulation (Li et al. 2020). In spinalcord injury, PDCD4 has been shown to be down-regulatedby microRNA-21 (Jiang et al. 2017) reinforcing the view ofits potential role in neuronal mechanisms.
Considering the reported overlap in the molecular pro-cesses that promote both tumor and axon growth(Chédotal et al. 2005; Duman-Scheel 2009; Frank andTsai 2009; Heine et al. 2015), we decided to investigatethe potential role of PDCD4 in axonal function and regen-eration. We hypothesized that as a repressor of translation,PDCD4 could be regulating mRNAs involved in axonalgrowth, regeneration and/or local protein synthesis andthat its expression would be tightly regulated during theseprocesses. Our study demonstrates how the manipulation
of PDCD4 levels in central and peripheral nervous systemneurons can control axonal growth, suggesting a poten-tially key role in axon regeneration in vivo. As away to iden-tify putative mRNAs regulated by PDCD4, we usedribosome profiling (Ribo-seq) to explore the translationaleffects of PDCD4 at a genome-wide level. We detectedmore than 250 possible mRNA candidates whose transla-tional efficiency (TE) levels increase in the absence ofPDCD4. Among them, we have identified a specific groupof genes reported to be relevant in neurite/axonal devel-opment and regeneration. Overall, our findings demon-strate that PDCD4 can act as a new regulator of axonalgrowth via the selective control of translational targets,providing a specific mechanism for axon regenerationand neuronal plasticity processes in neurons.
RESULTS
Localization of PDCD4 in the nervous system
To address the role of PDCD4 in neuronal cells, we first in-vestigated its localization across different neuronal types.As shown in Figure 1A, we could detect PDCD4 proteinin the central nervous system (CNS) of adult rats, both incell bodies and neurites of CA1 hippocampal, Purkinjeand cortical neurons. PDCD4 is also present in adult axonsof the peripheral nervous system (PNS), as demonstratedfollowing the analysis of its distribution in rat sciatic nerves,where specific axon detection can be more easily as-sessed. Crucially, this experimental approach allowed usto precisely detect high levels of PDCD4 inside the axo-plasmic region of both longitudinal and transversal nervecryosections (Fig. 1B).
Previous work in cancer cells demonstrated that both thetranslation and activity of PDCD4 can be regulated via themTOR-p70S6K pathway (Dorrello et al. 2006), promptingus to investigate the potential link between PDCD4 andits upstream regulator p70S6K. As shown in Figure 1C,both PDCD4 and phosphorylated (active) p70S6K-Thr-389 are present in longitudinal sections of ventral root ax-ons, evidence that the activated mTOR pathway colocal-izes with PDCD4 in the axoplasm of peripheral neurons.
Regulation of PDCD4 levels in primary neuronscan control axonal growth
Following the demonstration of PDCD4 expression in CNSand PNS neurons, we decided to explore its functional roleusing neuronal in vitro models. First, we used primary cor-tical neurons isolated fromembryonicmice. These cells canfully differentiate in culture to develop a morphologicallyintricate and functionally connectedneuronal network after10–12 d in vitro (Cotterill et al. 2016; Banker 2018).Following this period, axonal growth is decreased to allowthe synapticmaturation that leads to the establishment of a
Di Paolo et al.
1638 RNA (2020) Vol. 26, No. 11
Cold Spring Harbor Laboratory Press on October 19, 2020 - Published by rnajournal.cshlp.orgDownloaded from

functional network of connected neurons, which is ob-served after ∼2 wk in culture (Chiappalone et al. 2006).PDCD4 protein was detected in primary cortical neurons
throughout their development in culture, with levels signifi-cantly increasing in cell body and axons between days 2 andday 5, and a major increase also detected after 12 d in vitro(Fig. 2A). The observation that PDCD4 levels increase in thelate stages of neuronal network development and synapticmaturation (day 5–12) supports the hypothesis that increas-ing levels of PDCD4 could repress axon and/or neuritegrowth. To test this, we investigated the effect of PDCD4overexpression on axonal growth following transfectionwith a PDCD4 plasmid at day 2 (24 h after seeding), withanalysis of axonal length carried out 72 h later (day 5 ofcell culture). Before the functional evaluation, we confirmedthat neurons transfectedwith PDCD4plasmid have a signifi-cant increase in PDCD4 levels detected by immunocyto-chemistry (Supplemental Fig. S1A). Increased PDCD4levels during this period of active axonal growth (days 2–5in vitro) produced a significant reduction in axonal length(Fig. 2B). To furtherconfirm thedynamic regulationof axonalgrowth based on PDCD4 levels, we showed that the siRNA-
dependent knockdownof PDCD4pro-duced the opposite effect, with a sig-nificant increase in axonal length (Fig.2C). To assess if this effect was also ob-served inperipheral neurons,weevalu-ated axonal growth in dorsal rootganglia (DRG) neurons cultured incompartmentalizedmicrofluidic cham-bers. Addition of a cell-permeablesiRNA probe targeting PDCD4 pro-duced a significant increase in axonalgrowth (Fig. 2D). Importantly, we con-firmed that in both cortical and DRGneurons the addition of PDCD4 siRNAled to a significant decrease in PDCD4levels detected by immunochemistry(Supplemental Fig. S1B,C), an effectfurther confirmed by immunoblot-ting using the neuroblastoma N2a cellline, which has high transfectionefficiency (Supplemental Fig. S1D).Overall, these functional studies dem-onstrate that PDCD4modulates axonalgrowth in central and peripheral ner-vous system neurons.
Ribosome profiling reveals thatPDCD4 regulates the translationof genes involved in axon/neuritegrowth
To explore the capacity of PDCD4 toregulate translation in neurons, we
decided to use the ribosome profiling strategy (Ribo-seq)in differentiated PC12 neuron-like cells as a suitable andrelevant model for the investigation of neuronal mecha-nisms (Shao et al. 2016; Zheng et al. 2016). To confirmthe experimental validity of this approach, we first demon-strated the expression of PDCD4 in PC12 cells at differenttime points followingNGF-induced neuron differentiation,with levels remaining relatively stable throughout the cul-ture period (Supplemental Fig. S2A). Using a doxycyclineinducible shRNA system, we obtained stable cell popula-tions with inducible silencing of PDCD4 expression. Inthis way, addition of NGF and doxycycline for 72 h allowedus to achieve neuron differentiation of PC12 and silencingof PDCD4 expression (Supplemental Fig. S2B–G).As a first experimental approach to the use of PC12 neu-
ron-like cells, we analyzed if neurite growth was regulatedby the presence or absence of PDCD4. Confirming ourprevious observations in primary neuron cultures, knock-down of PDCD4 in PC12 cells increased neurite lengthcompared to controls (Fig. 3A,B), allowing us to validatetheir use in the search for putative PDCD4 translational tar-gets. For this, we isolated polysomal and total RNA from
B
A
C
FIGURE 1. PDCD4 is expressed in dendrites and axons of the central and peripheral nervoussystem. (A) Immunohistochemistry assays show the distribution of PDCD4 protein at differenttypes of neurons includingCA1 hippocampal neurons, Purkinje of cerebellum and cortical neu-rons of prefrontal cortex of adult rats. Cell bodies are indicated by filled arrows and axons (ordendrite for Purkinje neurons) by unfilled arrows (scale bar, 20 µm). (B) PDCD4 protein is alsodetected in peripheral axons, like sciatic nerves, by immunohistochemistry. The images abovecorrespond to longitudinal sections and the images below to transversal sections. Examples ofaxonal regions are highlighted in white dotted ROIs (scale bar, 10 µm). (C ) Longitudinal sec-tions of ventral roots. Examples of axonal regions are highlighted with white dotted ROIs. Apartial colocalization between PDCD4 and p70-S6K signals is detected (scale bar, 5 µm).
PDCD4 can modulate axonal growth and regeneration
www.rnajournal.org 1639
Cold Spring Harbor Laboratory Press on October 19, 2020 - Published by rnajournal.cshlp.orgDownloaded from

differentiated PC12 cells in the presence and absence ofPDCD4. Samples were analyzed using parallel RNA-seqand Ribo-seq protocols (Supplemental Fig. S3A–C), which
allowed us to determine steady-state transcriptome andtranslatome levels for over 10,000 mRNAs (SupplementalTable S1). Fold changes (shPDCD4/shScrambled) at both
B
A
C
D
FIGURE 2. PDCD4 axonal levels change during neuron development and modulation of this protein can control axonal growth.(A) Immunocytochemistry assays show that PDCD4 levels increase during cortical primary neurons differentiation in vitro (scale bar, 20 µm).Cell bodies were indicated by filled arrows and axons by unfilled arrows. The signal quantification shows that cell bodies and axons have a sig-nificant increase in PDCD4 expression for day 5, and a trend to increase for day 12, always compared to day 2 ([∗∗∗] P≤ 0.001, ANOVA test withpost-Tukey, error bars: SEM, n=3 independent primary cortical neuron cultures for day 2 and day 5, with three technical replicates for each in-dependent experiment; n=2 for day 12, with two technical replicates for each independent experiment). (B) Cotransfected cortical primary neu-rons with a GFP plasmid and a PDCD4 plasmid, or a GFP plasmid and a pcDNA plasmid (scale bar, 20 µm). Overexpression of PDCD4 intransfected neurons at day 5 induce a decrease in axonal length (25%) compared to control condition ([∗∗] P≤ 0.01, paired test, n=5 independentprimary cortical neuron cultures, error bars: SEM). (C ) Same as above but for PDCD4 knockdown using an siRNA for PDCD4 or an siRNA control(scale bar, 20 µm). Down-regulation of PDCD4 induces an increase in axonal length (18%) compared to the control condition ([∗∗] P≤ 0.01, pairedt-test, n=6 independent primary cortical neuron cultures, error bars: SEM). (D) Immunocytochemistry assays with acetylated tubulin in peripheralDRG neurons cultured in compartmentalized chambers and transfected with a permeable siRNA for PDCD4, or with a siRNA control (scale bar,500 µm).Quantification of axonal growth shows similar effect as above: down-regulation of PDCD4determines an increase (24%) of axonal growthincrease (∗ P≤ 0.05, Student’s t-test, n=4, error bars: SEM). In all cases, the “n” corresponds to independent biological replicates.
Di Paolo et al.
1640 RNA (2020) Vol. 26, No. 11
Cold Spring Harbor Laboratory Press on October 19, 2020 - Published by rnajournal.cshlp.orgDownloaded from

E F
BA
C D
FIGURE 3. Translatome and steady-state transcriptome levels of expression for mRNAs was quantified genome-wide by Ribo-seq and RNA-seq,respectively, in absence (shPDCD4) and presence (shScrambled) of PDCD4 achieved by lentiviral transfection in neuron-like differentiated PC12cells. (A) To explore if PDCD4 modulates neurite outgrowth also in differentiated PC12 cells, we compared neurite length in differentiated PC12growing in presence and absence of PDCD4. Three independent cultures were contrasted and illustrative fields are shown (scale bar, 50 µm).(B) Quantification of neurite length of A is shown and an increase of almost 1.6× in absence of PDCD4 is detected, with a marginal trend towardsignificance (P=0.052, Student’s t-test, n=3 independent cell cultures with an average of 80 neurites considered by replicate, error bars: SD).(C ) Scatter plot showing PDCD4 regulation at the level of transcriptome evaluated by RNA-seq. Red and green dots indicate differentially ex-pressed genes, up- and down-regulated, respectively (|fold change| >2 and P<0.05 estimated by edgeR). (D) Same as C but for PDCD4 regu-lation at the level of translatome evaluated by Ribo-seq. (E) Fold changes (shPDCD4/shScrambled) at transcriptome and translatome levels arecontrasted for detected genes. Possible PDCD4 translational targets are those that present a significant increase in translational efficiency (P<0.05 estimated byXtail), and are indicated in blue (267mRNAs). Along the scatter plot, vertical and horizontal histograms show fold change valuesdistribution estimated by Ribo-seq and RNA-seq. (F ) RPKM gene expression levels for PDCD4 translational targets indicated in blue in E areshown for the two compartments (RNA-seq and Ribo-seq) in each condition.
PDCD4 can modulate axonal growth and regeneration
www.rnajournal.org 1641
Cold Spring Harbor Laboratory Press on October 19, 2020 - Published by rnajournal.cshlp.orgDownloaded from

transcriptome and translatome levels were contrasted fordetected genes, and according to its previously describedrole (Matsuhashi et al. 2019), PDCD4-knockdown has animpact on both transcriptome and translatome compart-ments (Table 1; Fig. 3C,D; Supplemental Fig. S3D–G).To specifically study PDCD4 regulation in protein synthe-sis, we compared translation efficiency (TE) levels betweenconditions. TE, which is calculated as the ratio betweentranslatome over transcriptome levels for a particularmRNA, is an informative parameter to discriminate transla-tional regulation events from those exclusively transcrip-tional, and indicates how efficiently an mRNA istranslated (Ingolia et al. 2009). Using the Xtail R package(Xiao et al. 2016) to explore TE differences, we detected267 mRNAs whose TE levels significantly increase follow-ing PDCD4 knockdown (P<0.05; Table 1; Fig. 3E,F;Supplemental Fig. S4; Supplemental Table S2), and 100mRNAs whose TE decreases. The first group, which repre-sents potential PDCD4 targets, displays unalteredsteady-state transcriptome levels (88% has |fold change|<1.5-fold), but they increase their levels of translation(86% has fold change >1.5-fold; Fig. 3F). In order to ex-plore if the regulation of translational efficiency was alsobeing observed at the protein level, total protein samplesobtained at the same time of the sequencing analysis werequantified by label-free proteomics. Although we ob-served some specific correlations with Ribo-seq data, wecould only detect a small fraction of proteins changing sig-nificantly, with the sensitivity of this approach not sufficientto detect global correlations (Supplemental Fig. S5).
To investigate the functional implications of PDCD4 reg-ulation over the 267 putative targets that increase theirtranslational efficiency, protein association analysis wasperformed using STRING (Jensen et al. 2009). This re-vealed three to four related and altered protein coresand a network with significantly more interactions than ex-pected (P-value =0.0163; Supplemental Fig. S6A). Theobserved related protein cores within PDCD4 putative tar-gets are grouped under regulation of mitosis (Moustafa-Kamal et al. 2019), centromere and kinetochore; regulationof transcription and splicing (Kim et al. 2014; see Fig. 3C;
Supplemental Fig. S3D,E); regulation of mitochondrial ac-tivity (Zhang et al. 2006); and protein translocation to theendoplasmic reticulum (Hudson 2008; Wang et al. 2013).Interestingly,when analyzing the list of targetswhose trans-lational efficiency decreases in the absence of PDCD4 (100genes), we found that neither core-relatedproteinsnorpro-tein interactions were significantly altered (P-value =0.954;Supplemental Fig. S6B). This difference provides a goodindication that those putative targets increasing their trans-lation after PDCD4 knockdown represent a defined set ofcellular functions, while those down-regulated in our se-quencingdata are likelyemergingas a secondary cell effectand/or experimental noise.
In order to uncover those potential PDCD4 targets withfunctional links to neurite, axon and/or dendritic growth,we curated the list using in-house software that allowedus to link published articleswith gene lists and user-definedterms (Radío S, Sotelo-Silviera JR, and Smircich P, in prep.;https://github.com/sradiouy/IdMiner). We also exploredthe list of differentially expressed genes separately at thetranscriptome or translatome level (fold change >2 and P-value <0.05 estimated by edgeR), and the down-regulatedgenes at TE (100 genes with P-value <0.05 estimated byXtail), searching for genes that might inhibit neurite out-growth. This comprehensive approach highlighted severalexperimentally validated axon and/or neurite outgrowth-related genes from the list of potential PDCD4 translationaltargets. This signatureof 36geneswasmainly composedofup-regulated genes at the level of TE in PDCD4 absence(26 genes), but also by genes up-regulated only at thetranslatome (four genes) or transcriptome levels (threegenes), or down-regulated at TE (three genes) whose as-cribed function is to inhibit neurite outgrowth. Transcrip-tome and translatome levels of the 36 genes show aglobal induction of translation after PDCD4 knockdown,from low-middle to high translational levels (Fig. 4A).
Among the signature of neurite and axon-growth-relat-ed genes, we found genes previously reported to directlycontrol neurite outgrowth: Elavl4, Styxl1, Bdnf, Dmd,Lancl2, Lif, and Nfkb2. In the case of ELAVL4 (also knownas HUD), DMD and LANCL1 proteins, their expression isrequired for neurite outgrowth in PC12 cells (Mobaraket al. 2000; Acosta et al. 2004; Fukao et al. 2009; Zhanget al. 2009), while the pseudophosphatase MK-STYX(STYXL1) increases both the number of cells with neuriteextensions and neurite outgrowth in PC12 (Flowers et al.2014). Brain-derived neurotrophic factor (BDNF) wasshown to increase neurite length in rodent primary neuron-al cultures (Iwasaki et al. 1998; Cohen-Cory et al. 2010;Dajas-Bailador et al. 2012), as well as in PC12 cells(Squinto et al. 1991; Iwasaki et al. 1997). On the otherhand, the TE of LIF is down-regulated in PDCD4’s ab-sence, and it was shown that activating LIF receptor signal-ing can have a negative impact on neurite extension inPC12 cells (Ng et al. 2003). Particularly interesting is the
TABLE 1. Number of analyzed and differentially expressedgenes (P<0.05) estimated by edgeR for transcriptome andtranslatome, and by Xtail for translational efficiency
Analyzedgenes
Up-regulated Down-regulated
FC>2 FC>1 FC<−2 FC<−1
Transcriptome 10,946 73 999 134 1039
Translatome 9967 124 269 168 348
Translationalefficiency
9931 164 267 95 100
Di Paolo et al.
1642 RNA (2020) Vol. 26, No. 11
Cold Spring Harbor Laboratory Press on October 19, 2020 - Published by rnajournal.cshlp.orgDownloaded from

relationship between the transcription factor complexnuclear factor-kappa-B (NFκB) and neuritogenesis, whereactivating the NFκB pathway and increasing Nfkb2 geneexpression promotes neuritogenesis in PC12 cells(Manecka et al. 2013). This strong link motivated us to con-firm PDCD4 regulation of NFKB2 protein abundance. Forthis we used a model of cortical neurons in culture, silenc-ing PDCD4 by a new set of lentiviral particles with shRNAagainst PDCD4, and quantifying protein abundance bywestern blot. By this, we confirmed by an orthogonalmethod that NFKB2 total protein levels increase signifi-cantly after knockdown of PDCD4 (Supplemental Fig. S7).In line with the notion that PDCD4 can regulate axon-re-
lated mRNA translation in neurons, we found that a signifi-cant proportion of the 267 putative translational targetsidentified in our Ribo-seq analysis are found in two differ-ent published axonal transcriptomes from in vitro neuronmodels (Fig. 4B). On the other hand, those genes for whichwe observe a decrease in the TE after PDCD4 knockdown
are not specifically enriched in axonal transcriptomes, pro-viding further support to our hypothesis that they reflectsecondary mechanisms (Supplemental Fig. S8). A signifi-cant fraction of PDCD4 mRNA translational targets werealso found in the recently described in vivo motor axontranscriptome (Farias et al. 2020) (23 out of 255, in a setof 1008 mRNAs; P-value =2.8 ×10−04). These findingssupport the idea that PDCD4 could also be a player inregulating local axonal responses and plastic processesin vivo.
Sciatic nerve injury in vivo reduces local axonal levelsof PDCD4
Our in vitro functional studies and ribosome profiling datasupport the hypothesis that PDCD4 is a novel regulator ofaxonal function. For this reason, we decided to test ourfindings in vivo, using a model of axon regeneration, a cel-lular process where the regulation of axonal protein
BA
FIGURE 4. PDCD4 regulates translation of several neurite growth-related genes evidenced by Ribo-seq and RNA-seq. The putative PDCD4 tar-gets are present in previously described axonal transcriptomes. (A) Expression of neurite and axon growth-related genes is represented by a heat-map, where an induced expression at translation level is detected in the absence of PDCD4. (B) Venn diagram showing the intersection betweenthe potential PDCD4 targets and axonal transcriptomes derived from mESc (Zappulo et al. 2017; Nijssen et al. 2018). Separate and overlappingexpressions between samples are shown. Only transcripts with a level of expression of TPM≥ 1 were considered. The table shows the type ofneuron used in each study, the total genes detected and the number of common genes between potential PDCD4 targets (or potentialPDCD4 targets related to axonal growth) and each axonal transcriptome. The EASE Score (a modified Fisher exact P-value) is also shown, whichindicates gene enrichment.
PDCD4 can modulate axonal growth and regeneration
www.rnajournal.org 1643
Cold Spring Harbor Laboratory Press on October 19, 2020 - Published by rnajournal.cshlp.orgDownloaded from
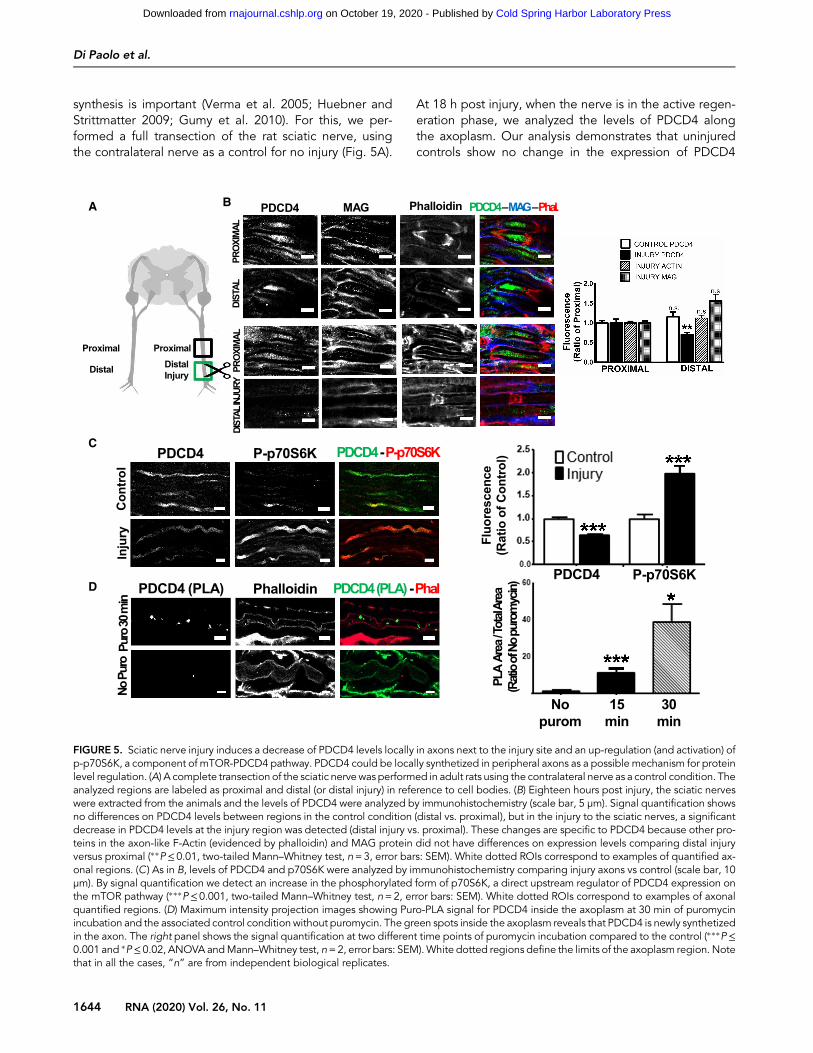
synthesis is important (Verma et al. 2005; Huebner andStrittmatter 2009; Gumy et al. 2010). For this, we per-formed a full transection of the rat sciatic nerve, usingthe contralateral nerve as a control for no injury (Fig. 5A).
At 18 h post injury, when the nerve is in the active regen-eration phase, we analyzed the levels of PDCD4 alongthe axoplasm. Our analysis demonstrates that uninjuredcontrols show no change in the expression of PDCD4
BA
C
D
FIGURE 5. Sciatic nerve injury induces a decrease of PDCD4 levels locally in axons next to the injury site and an up-regulation (and activation) ofp-p70S6K, a component of mTOR-PDCD4 pathway. PDCD4 could be locally synthetized in peripheral axons as a possible mechanism for proteinlevel regulation. (A) A complete transection of the sciatic nervewas performed in adult rats using the contralateral nerve as a control condition. Theanalyzed regions are labeled as proximal and distal (or distal injury) in reference to cell bodies. (B) Eighteen hours post injury, the sciatic nerveswere extracted from the animals and the levels of PDCD4 were analyzed by immunohistochemistry (scale bar, 5 µm). Signal quantification showsno differences on PDCD4 levels between regions in the control condition (distal vs. proximal), but in the injury to the sciatic nerves, a significantdecrease in PDCD4 levels at the injury region was detected (distal injury vs. proximal). These changes are specific to PDCD4 because other pro-teins in the axon-like F-Actin (evidenced by phalloidin) and MAG protein did not have differences on expression levels comparing distal injuryversus proximal (∗∗P≤0.01, two-tailed Mann–Whitney test, n=3, error bars: SEM). White dotted ROIs correspond to examples of quantified ax-onal regions. (C ) As in B, levels of PDCD4 and p70S6K were analyzed by immunohistochemistry comparing injury axons vs control (scale bar, 10µm). By signal quantification we detect an increase in the phosphorylated form of p70S6K, a direct upstream regulator of PDCD4 expression onthe mTOR pathway (∗∗∗P≤0.001, two-tailed Mann–Whitney test, n=2, error bars: SEM). White dotted ROIs correspond to examples of axonalquantified regions. (D) Maximum intensity projection images showing Puro-PLA signal for PDCD4 inside the axoplasm at 30 min of puromycinincubation and the associated control condition without puromycin. The green spots inside the axoplasm reveals that PDCD4 is newly synthetizedin the axon. The right panel shows the signal quantification at two different time points of puromycin incubation compared to the control (∗∗∗P≤0.001 and ∗P≤ 0.02, ANOVA andMann–Whitney test, n=2, error bars: SEM).White dotted regions define the limits of the axoplasm region. Notethat in all the cases, “n” are from independent biological replicates.
Di Paolo et al.
1644 RNA (2020) Vol. 26, No. 11
Cold Spring Harbor Laboratory Press on October 19, 2020 - Published by rnajournal.cshlp.orgDownloaded from

along the axoplasm of the sciatic nerves (Fig. 5B, confocalimages of “Proximal” and “Distal” axonal sections in rela-tion to the cell bodies). However, we observed a significantdecrease of ∼30% of PDCD4 axonal levels at the site of in-jury (“distal injury” in diagram) when compared to theproximal region of the same nerve segment (Fig. 5B).Importantly, these changes in PDCD4 levels are not dueto an overall loss of protein content at the site of injury,as the levels of actin and MAG do not change when com-paring all conditions (Fig. 5B). These findings allowed us toconclude that axonal levels of PDCD4 are dynamically de-creased at the site of axonal injury and during the regener-ation process.The potential role of PDCD4 as a translation regulator in
axonal growth would require the existence of precise mo-lecular pathways controlling its localized expression. In thisregard, degradation of PDCD4 would be able to rapidlypromote axon regeneration in the context of nerve injury.Indeed, concomitant to the decrease in PDCD4 levels ininjured axons, we found a significant increase in the acti-vated form of p70S6K (phospho-p706SK), which acts as adirect regulator of PDCD4 degradation via the mTORpathway (Fig. 5C; Dorrello et al. 2006). The tight controlof protein levels in the axoplasm is not only dependenton degradation, but also on localized protein translation(Vuppalanchi et al. 2009; Yoon et al. 2009; Sahoo et al.2018). Indeed, PDCD4 mRNA levels are detected in theaxon of peripheral neurons, both in vivo (Farias et al.2020) and in vitro in our DRG compartmentalized cultures,where qPCR analysis of RNA extracted from the axon com-partment showed an increase from day 3 to 12 (day 3 Ct
value=25.5 and day 12 Ct value=23.6) samples. To testif local translation could control PDCD4 levels in axons,we carried out the Puromycin-Proximity Ligation Assay orPuro-PLA in rat ventral roots in vivo (tom Dieck et al.2015) to explore local protein synthesis. Consistent withits dynamic role in the control of axon processes, our re-sults indicate that PDCD4 can be locally translated in ma-ture noninjured axons (Fig. 5D). Overall, these resultsrevealed two possible molecular mechanisms for the reg-ulation of PDCD4 levels in mature axons ex vivo, eithervia degradation and/or local protein synthesis.
DISCUSSION
Our studies demonstrate that PDCD4 is expressed in dif-ferent neuronal cell types of the CNS and PNS and is dis-tributed in axonal and dendritic compartments, possiblyinteracting with other components of the mTOR pathway,such as its upstream protein regulator p70S6K (Fig. 1).Since PDCD4 is known to regulate protein synthesis in tu-mor models and also act as a downstream component ofthe mTOR pathway, we postulated that it could have arole in molecular processes relevant to axonal function.The possibility that PDCD4 functions as a translation reg-
ulator factor in both cancer and neuronal cells agreeswith the observation that many of the key cellular hall-marks of cancer encompass molecular processes thatare crucial in nervous system development, such as inva-sive cell growth, cytoskeleton rearrangements, ECM dy-namic interactions and survival (Duman-Scheel 2009;Heine et al. 2015).In mouse primary cortical neurons, we observed that
PDCD4 is localized to the cell body and axons, with levelsincreasing during time in culture (Fig. 2A). This increase inPDCD4 levels correlates with neuronal network maturationand the establishment of synaptic contacts, a period thatrequires decreased axon growth. It is thus possible that el-evated levels of PDCD4 mark the end of active axonalgrowth and the establishment of a stable cortical network.Further confirmation came from the overexpression ofPDCD4, which caused a significant decrease in axonalgrowth. Importantly, the knockdown of PDCD4 levelscaused the opposite effect, with a significant increase inaxonal length (Fig. 2C,D). The analysis of axonal growthin primary cortical neurons constituted a useful approachfor the investigation of the cellular and molecular mecha-nisms that control neuronal network development in theCNS. However, the elucidation of those mechanismsthat can control axonal growth is also a fundamentalarea of research in the study of nerve regeneration inPNS (He and Jin 2016). It was thus important to investigateif PDCD4 could have a role in the regulation of axonalgrowth using an in vitro model of peripheral neurons,such as dissociated DRG primary neurons. Consistentwith the high levels of PDCD4 observed in peripheral ax-ons in vivo (Fig. 1B,C), and the functional data from corti-cal neurons (Fig. 2B,C), siRNA-dependent knockdown ofPDCD4 in DRG neurons grown in microfluidic chambers(Taylor and Jeon 2011; Dajas-Bailador et al. 2012) showeda significant increase in axon growth (Fig. 2D). Overall, thefunctional studies in primary neurons of central and pe-ripheral origin demonstrate a clear mechanistic link be-tween the control of PDCD4 levels and the regulation ofaxon growth and network development, confirming thatPDCD4 can modulate these processes, probably at thelevel of translation.In order to explore the molecular signature underlying
the link between PDCD4 and the control of neurite/axongrowth, we decided to use a genomic approach to eluci-date putative PDCD4 translational targets. To do this, wefirst generated a stable PC12 cell line able to inducePDCD4 knockdown by shRNA (Supplemental Fig. S2),and then confirmed that similar to primary neurons,PDCD4 knockdown caused an increase in the neuritelength of differentiated PC12 neuron-like cells (Fig. 3A,B). Despite its described role in selective mRNA transla-tional mechanisms, the investigation of PDCD4 targetshas been largely unexplored using genomics approaches,neither in cancer nor in neuronal models. However, very
PDCD4 can modulate axonal growth and regeneration
www.rnajournal.org 1645
Cold Spring Harbor Laboratory Press on October 19, 2020 - Published by rnajournal.cshlp.orgDownloaded from

recent work by Haas and collaborators described PDCD4targets using transcriptomics and Ribo-seq in a telome-rase-immortalized human epithelial cell line (Haas et al.2020). The implementation of Ribo-seq protocols, whichare based on deep sequencing of ribosome-protectedmRNA fragments, makes it possible to monitor translationdirectly, significantly improving the estimation of proteintranslation levels as compared to the classic RNA-seq ap-proaches (Ingolia et al. 2012; Eastman et al. 2018). OurRibo-seq data confirmed the key role of PDCD4 in the reg-ulation of translation and provided only the second ap-proximation to the full scope of its cellular targets andthe first in a neuronal cell model (Fig. 3C–F). It allowedus to compare the PDCD4-dependent transcriptome andtranslatome data sets (Fig. 3C,D), identifying 267 mRNAswith a potential role as PDCD4 translational targets (Fig.3E,F). This set of neuronal-related putative targets signifi-cantly increases their translational efficiency in the absenceof PDCD4 (P-value <0.05 estimated by Xtail; Supplemen-tal Table S2). We compared this list with that defined byHaas et al., where 62 mRNAs increase their translationupon PDCD4 silencing. Although 50 of those 62 targetscould be detected in our study and show considerable ex-pression levels, only Cldnd1, an apoptosis-related gene inepithelial cells (Achari et al. 2015), is common to both stud-ies. This is likely the reflection of differences in cell type,developmental stage and experimental model, and pro-vides a tantalizing perspective on the regulatory potentialthat can be attributed to PDCD4 and which is likely con-trolled by the additional recruitment of cell- and stage-specific mechanisms.
In order to further elucidate the regulatory mechanismsat play, samples from the same RNA-seq and Ribo-seq ex-perimental protocols were analyzed by label-free quantita-tive proteomics (LFQ). However, the number of observedand regulated proteins (∼3000 and 141 proteins, respec-tively) were lower than expected. From 141 differentiallyexpressed proteins (P-value <0.05; ANOVA), 87 of them(62%) show the same direction of change seen in theRibo-seq data (with similarly positive or negative foldchanges; Supplemental Fig. S5B). In addition to the lackof sensitivity, it is also likely that protein levels mightneed to be evaluated at later time points than the Ribo-seq data, but this was beyond the scope of this study.Ultimately, protein levels are also subject to dynamic reg-ulatory processes that control their half-life and degrada-tion, and which might prevent the direct correlation ofRibo-seq data with estimation of proteome levels, particu-larly for low expression genes, which could be relevant inPDCD4 function (Zubarev 2013; Kumar et al. 2016).
Based on our functional results with primary neurons, weinvestigated the list of potential PDCD4 targets identifiedfrom our Ribo-seq data to uncover a neurite/axon growthgene signature. A list of 36 PDCD4 targets emerged withaxon growth and/or neurite outgrowth links (Fig. 4A).
Besides the genes associated with neurite outgrowth inPC12 cells described previously, the remaining geneswere also described as associated with neurite or axonalgrowth previously in the literature (Bisogno et al. 2003;Nakanishi et al. 2006; Su et al. 2006; Ghiani et al. 2010;Fiesel et al. 2011; Bali et al. 2013; Kar et al. 2013; Olbrichet al. 2013; Mincheva-Tasheva et al. 2014; Munnamalai etal. 2014; Siddiq et al. 2015; Yu et al. 2016; Parviainenet al. 2017; Tang et al. 2017; Chen et al. 2019). Relevantand interesting examples include genes coding for pro-teins associated with the cytoskeleton, either actin withTmsb4x (van Kesteren et al. 2006; Yang et al. 2008) or mi-crotubules with Stmn3 (Riederer et al. 1997; Manna et al.2007); cell adhesion molecules like Cadm1 (Nagara et al.2012), Amigo2 (Kuja-Panula et al. 2003), Dscaml1 (Hattoriet al. 2008; Zhu et al. 2013; Hutchinson et al. 2014), andEmb (Lain et al. 2009), transmembrane proteins associatedto signal transduction including Tspan7 (Bassani andPassafaro 2012); calcium-binding proteins like Spock3(Schnepp et al. 2005; Yamamoto et al. 2014), Hpcal1(Braunewell et al. 2011; Wang et al. 2014), and Camk2b(Fink et al. 2003; Yan et al. 2016), anterograde and retro-grade transport and signaling with mRNAs like Dynll1 (Linet al. 2015) and Lancl2, different kinases like Tnik(Kawabe et al. 2010), Mob1b (Lin et al. 2011; Song et al.2018), Pnck (Wayman et al. 2004; Uboha et al. 2007), andalso synaptic-associated proteins like Rab3il1 (Villarroel-Campos et al. 2016). Importantly, a significant proportionof PDCD4 putative translational targets identified in ouranalysis were also found in axonal transcriptomes from invitro neuron models (Zappulo et al. 2017; Nijssen et al.2018) and in vivo motor axon transcriptome (Farias et al.2020) (Fig. 4B), supporting the validity of these processesbeyond our experimental models.
Indeed, our own work managed to extend the observa-tion of PDCD4’s capacity for regulation of axon growth inprimary neurons to an in vivo axon regeneration model,demonstrating that PDCD4 levels decrease following inju-ry and during the regenerative growth phase (Fig. 5A,B).Taking into consideration that PDCD4 levels are highalong adult peripheral axons in sciatic nerves (Fig. 1B),we believe a decrease in the levels of this translational re-pressor would allow the expression of growth-related pro-teins to aid local axon regeneration. Taken together, our invitro and in vivo experiments support the idea that the dy-namic control of PDCD4 levels in the neurons and axonscould act as a new regulatory mechanism of protein syn-thesis in a specific and growth-oriented manner.
The role proposed for PDCD4 in the regulation of localprotein synthesis in neurons would require a tight controlof its levels in the axon. In agreement with previous reports(Verma et al. 2005; Terenzio et al. 2018), we found that theactive form of p70S6K protein (phosphorylated at Thr 389)was increased twofold at the injury site, when compared touninjured axons (Fig. 5C). Given that the local activation of
Di Paolo et al.
1646 RNA (2020) Vol. 26, No. 11
Cold Spring Harbor Laboratory Press on October 19, 2020 - Published by rnajournal.cshlp.orgDownloaded from

the mTOR pathway in the injured axons increases axonalprotein synthesis (Verma et al. 2005; Terenzio et al.2018), our findings confirm that the increased phosphory-lation of p706SK in the axons correlates with a decrease inPDCD4 levels, likely mediated by activation of the protea-some system (Dorrello et al. 2006). In this scenario, thetranslation repression offered by PDCD4 would be re-moved, releasing the potential for growth mechanisms.Local depletion of PDCD4 would be useful to mediate a
rapid regeneration response; however, local neosynthesiscan be used as an important mechanism to modulate pro-tein synthesis of specific targets in other contexts of neurondevelopment, when axon growth is reduced and synapticconsolidation might be needed. Indeed, PDCD4 levelshavebeen shown tobe regulatedbymiR-21 in cancermod-els increasing transformation, invasion, and metastasis(Asangani et al. 2008; Matsuhashi et al. 2019). Consistentwith this, miR-21 is up-regulated during axonal growthand regeneration in DRG axons (Strickland et al. 2011)and miR-21 and PDCD4 have been analyzed in a modelof spinal cord injury, wherewhole tissue levels ofmiR-21 in-crease and PDCD4 decrease after injury (Jiang et al. 2017).To test thepotential existenceof local protein synthesis as aregulatory mechanism controlling PDCD4 protein levels inthe axoplasm, we used proximity ligation assays (PLA) (tomDieck et al. 2015).Our results suggest that PDCD4 is locallytranslated in the axoplasm of peripheral neurons (Fig. 5D),supporting previous neurite data of newly synthetized pro-teomics, where PDCD4 is also detected (Zappulo et al.2017).Overall, our study shows the expression of PDCD4 in dif-
ferent types of neurons ex vivo, in vitro and also at differentdevelopment stages in both mouse and rat experimentalmodels. These results demonstrate a role of PDCD4 in pro-cesses where the dynamic regulation of protein synthesis isof crucial importance, such as axonal growth, in both de-velopment and regeneration. We report the first Ribo-seq data set for PDCD4 in a neuronal model, defining267 mRNAs that could be regulated by PDCD4 at thetranslational level, with a significant number of these beingrelated to neuronal plasticity and axonal growth processes.The potential relevance of this regulatory capacity forPDCD4 is further suggested by its regulation by local pro-tein synthesis and/or degradation in peripheral axons.Taken together, our findings uncover a new role forPDCD4 in protein synthesis regulation at neuronal andspecifically axon levels. This represents new evidence ofthe interesting correlation between cancer and neuronalpathways, especially the ones related to axonal growthand regeneration during injury. Further studies should elu-cidate the functional implications of those specific mRNAsregulated by PDCD4 in neurons, and particularly those act-ing locally in axons, a process that could provide novelfunctional insights in both plasticity and regenerativeprocesses.
MATERIALS AND METHODS
Animals and injury procedures
Sprague-Dawley male adult rats (6–9 mo old) were used for exvivo experiments. The maintenance was made in accordancewith international agreements at IIBCE bioterium in Montevideo,Uruguay. Sciatic nerve transection was performed as in Cancliniand collaborators (Canclini et al. 2014). All the experimental pro-cedures were made according to the Uruguayan ethical nationalcommittee (CNEA) with approved project code “005/01/2014.”
Cell cultures
Rats (Sprague-Dawley) and mice (C57/BL6) used for primary neu-ron cultures were housed at the Animal Unit in the School of LifeSciences (University of Nottingham). They were bred and sacri-ficed according to the UK Animal (Scientific Procedures) Act1986. Primary cortical neuron cultures were obtained from C57/BL6 E16 mice brains as previously described (Lucci et al. 2020).Primary DRG cultures were obtained from E18 rat embryos.PC12 cell lines from ATCC (ATCC CRL-1721) were grown in colla-gen I (ThermoFisher, Cat# A1048301) coated plastic surfaces at 8µg/cm2. Complete medium was made of RPMI (ThermoFisher,Cat# 31800022), 10% of horse serum (ThermoFisher, Cat#26050088), 5% of fetal bovine serum (Capricorn Scientific, Cat#FBS-11A), and antibiotics (Sigma-Aldrich, Cat# A5955). The cellswere cultured following commercial instructions and neuronaldifferentiation was achieved by removing growth factors and an-tibiotics and exposing cells to 100 ng/mL of NGF 2.5S (Thermo-Fisher, Cat# 13257019) for at least 72 h. Neuroblastoma(Neuro2a) cell lines were a kind gift from the Robert Layfield lab-oratory, University of Nottingham, UK. For more details about cellcultures, please see Supplemental Materials and Methods.
siRNA and plasmid transfections
Primary cortical neurons and Neuro2a cells were both transfected24 h after neuron seeding (day 2 of culture). For siRNA experi-ments we used 25 nM of siGENOME Mouse Pdcd4 SMARTpool5 nmol (Cat# M-044032-01-0005) or siGENOME Non-TargetingsiRNA Control Pool No.1, 5 nmol (Cat# D-001206-13-05), bothfromGEHealthcareDharmacon—Horizon Solutions. Transfectionprotocols followed manufacturer’s instructions using Lipofect-amine 2000 (Invitrogen, ThermoFisher). Plasmid transfectionswere performed with 2 µg of PDCD4-pcDNA 3.1 (zeromycin),kindly gifted by YangHsin-Sheng, using an empty plasmid as con-trol. Cortical neurons were cotransfected with 1 µg pmax-GFPGreen-cat (ThermoFisher). In the specific case of primary DRGneuron cultures, the cell permeable Accell SMART POOL Pdcd4siRNA 5 nmol (Cat# E-097927-00-0005) or Accell Non-TargetingPool 5 nmol (Cat# D-001910-10-05), both from GE HealthcareDharmacon—Horizon Solutions, were incubated at 1 µM finalconcentration in the cell body side of compartmentalized cham-bers after DRGs develop neurites. The PC12 cell line was trans-fected using commercial lentiviral particles from DharmaconGE, with an inducible shRNA against PDCD4 (SMARTchoiceInducible Rat PDCD4 PGK–turboGFP shRNA, 100 μL, 107 TU/mL; Material# VSR6432-223515627), or shScrambled control
PDCD4 can modulate axonal growth and regeneration
www.rnajournal.org 1647
Cold Spring Harbor Laboratory Press on October 19, 2020 - Published by rnajournal.cshlp.orgDownloaded from

(SMARTchoice Inducible Non-targeting Control PGK/TurboGFP,50 μL, 107 TU/mL; Material# VSC6580). After transfection, cellswere grown in complete medium for 24 h and selected with 5µg/mL of puromycin (P7255, Sigma-Aldrich) for 3–5 d. Cellswere then cultured in complete medium to obtain stable cell linesable to induce silencing of PDCD4 or express a scrambled shRNAcontrol.
Immunohistochemistry and immunocytochemistry
For tissue sections, rats were intracardially perfused with 3%sodium citrate (S4641-500, Sigma-Aldrich) and 4% PFA(158127, Sigma-Aldrich) in Phosphate Buffer Saline (PBS) bufferpH 7.4 (137 mM NaCl, 2.7 mM KCl, 8 mM Na2HPO4, and 2 mMKH2PO4). Following standard cryoprotection and 0.5% tritonX-100 (13444259, ThermoFisher) permeabilization, 20 µm cryo-sections were made. Incubation with primary and secondary anti-bodies was performed in a blocking buffer with 5%NGS (MERCK,NS02L) overnight at 4°C. The PHEM buffer (60 mM PIPES, 25 mMHEPES, 10 mM EGTA, 2 mMMgCl2) was used for washes. For pri-mary neurons and cell lines, cells were rinsed with PBS buffer andfixed with 4% PFA, 5 mM CaCl2 and 4% sucrose in PBS buffer for30 min (RT), permeabilized in 0.2% Triton+ 10 mM glycine in PBSfor 20 min (RT) and incubated with antibodies overnight. Cellswere mounted using Vectashield with DAPI (H-1200-10,VectorLabs) or Pro-Long Gold Antifade (P36930, ThermoFisher)mountant reagents. For a list of antibodies and probes used,please see Supplemental Material.
Puro-PLA protocol
Ventral roots were extracted from adult rats and incubated in neu-robasal media with puromycin at 300 µM. Then a fixation with 4%PFA for 1 h was performed and cryosections were made as de-scribed above. The PLA protocol was carried out according tothe manufacturer’s instructions of DuoLink, Sigma using the fol-lowing reagents: Duolink In Situ PLA Probe Anti-Rabbit PLUS(Cat#DUO92002-30RXN), Duolink In Situ PLA Probe Anti-MouseMINUS (Cat#DUO92004-30RXN), Duolink In Situ Detection Re-agents FarRed (DUO92013-30RXN).
Image acquisition and quantification analysis
Neocortex, cerebellum, sciatic nerves, and PC12 cell images weretaken using an LSM confocal OLYMPUS FV300 with a 60× oil, NA1.42 objective. For primary cultures, we used an inverted fluores-cent microscope ZEISS axiovert 200 M coupled to a CCD camera(Photometrics CoolSnap MYO). For axonal length images, a 10×air NA 0.3 or 20× air NA 0.8 were used, while immuno-fluorescence quantification was done with a 63× oil NA 1.3. ForPLA experiments on ventral roots, an LSM confocal ZEISS 800was used with a 63× oil, NA 1.4. The stacks were always takenat an ideal μm number between each z plane.
For image quantification, the Fiji (Just Image J) tools(Schindelin et al. 2012) and the Neuron_Growth plugin softwaredeveloped by Fanti and collaborators at the UniversidadNacional Autónoma de México (http://www.ifc.unam.mx/ffm/
conditions.html) were used. For full details of quantificationmeth-ods, see Supplemental Methods.
Ribosome profiling
Cells were treated with 100 mg/µL of cycloheximide (01810,Sigma-Aldrich) for 1 h at 37°C in the hood to stop translation be-fore collection of RNA on ice. A transcriptome sample was sepa-rated to use as total RNA control and submitted to RNA extractionusing mirVana Isolation Kit (ThermoFisher, Cat# AM1560) andRNA-seq protocol. At the same time, a proteome samplewas sep-arated and submitted to label-free quantitative proteomics usingan LC-MS/MS Orbitrap Fusion. For translatome samples, cellswere lysed and a polysomal pellet was obtained by ultracentrifu-gation in sucrose cushion, resuspended and digested withBenzonase (Sigma-Aldrich, Cat# E1014). Ribosomal footprintswere isolated running a denaturalized 15% PAGE 7 M urea, cut-ting the proper band identified by length (∼30 nt) and extractingRNA from gel slice. Ribosomal footprints quality and quantity waschecked using 2100 Agilent Bioanalyzer Small RNA Kit and sub-mitted to small RNA-seq protocol. Two biological replicates percondition (shPDCD4 and shScrambled) and per compartment(transcriptome, translatome and proteome) were obtained.
Sequencing and bioinformatic analysis
All transcriptomeand translatomesampleswere sequenced inBGITech Solutions. Transcriptome samples were sequenced usingRNA-Seq Quantification Library (Normal Library: 2–10 µg) proto-col, with poly(A)+ selection and 20 million paired-end (2 ×100bp) reads obtained. Translatome samples were submitted toSmall RNA Library (Low-Input Library: 0.2–1 µg) protocol and40million single-end readswere obtained. Sequencedata is avail-able at the NCBI Sequence Read Archive (SRA; https:// trace.ncbi.nlm.nih.gov/Traces/sra/) under BioProject ID PRJNA6 11824.
Sequences were mapped using bowtie2 (Langmead andSalzberg 2012) versus curated mRNAs described in the mousegenome (available at NCBI ftp site). Read counts were estimatedby featureCounts (Liao et al. 2014) and differential gene expres-sion analysis between transcriptomes or translatomes was doneusing edgeR (Robinson et al. 2010). Normalized counts were ex-ported and translational efficiency was calculated and contrastedbetween conditions (shPDCD4 vs. shScrambled) using Xtail Rpackage (Xiao et al. 2016). Gene lists analysis was performed us-ing the online free tool STRING (Jensen et al. 2009) and in-housesoftware (Radío S, Sotelo-Silviera JR, and Smircich P, in prep.;https://github.com/sradiouy/IdMiner).
For comparison between potential PDCD4 translational targetsand axonal transcriptomes, we used published axonal RNA-seqdata sets (Zappulo et al. 2017; Nijssen et al. 2018). DownloadedFASTQ files were mapped to the Mus musculus genome(GRCm38) with HISAT2 (Kim et al. 2015). StringTie (Pertea et al.2015, 2016) was used to assemble and quantify the transcripts.For subsequent analysis, low expression genes were removed(TPM<1). For the comparison, mouse orthologs of the potentialPDCD4 translational targets were used, since all the axonal tran-scriptomes data sets come from murine models. The Venn dia-gram was performed with the VennDiagram package of R (Chenand Boutros 2011). The EASE Score (a modified Fisher exact
Di Paolo et al.
1648 RNA (2020) Vol. 26, No. 11
Cold Spring Harbor Laboratory Press on October 19, 2020 - Published by rnajournal.cshlp.orgDownloaded from

P-value) was used to test if axonal transcriptomeswere enriched inpotential PDCD4 translational targets, and specifically those relat-ed with axonal growth. Extended protocols and details are avail-able in SI Appendix.
SUPPLEMENTAL MATERIAL
Supplemental material is available for this article.
ACKNOWLEDGMENTS
We thank the School of Life Sciences Imaging (SLIM) facility in theUniversity of Nottingham and the IIBCEConfocal and SequencingFacility. We would like to acknowledge the following institutionsfor the financial support received: Agencia Nacional deInvestigación e Innovación (ANII) for funding projects codes:INI_X_2011_1_3852, POS_NAC_2012_1_8584, POS_NAC_2013_1_11165, POS_NAC_2016_1_129865, POS_NAC_2016_1_129959; Comisión Sectorial de Investigación Científica (CSIC)for funding projects codes: CSIC Inciación 2013 #197 and #370;Programa de Desarrollo de las Ciencias Básicas (PEDECIBA);Wellcome Trust (Seed Award UNS56079 to F.D.-B. and R.M.-R.);the International Union of Biochemistry and Molecular Biology(IUBMB) Wood-Whelan Fellowships grants of 2017, the 2018American Society for Biochemistry and Molecular Biology(ASBMB)-PROLAB fellowships, and the Science and InnovationFund from the Foreign and Commonwealth Office-ANII Grantcode UK_ID_2015_1_3.
Author contributions: J.R.S-S. conceived the project. J.R.S-S.and D.M. conceptualized the project. J.R.S-S. and F.D-B. de-signed and supervised the research. A.DP. performed the exper-iments for Figures 1, 2, 5 and Supplemental Figure S1. G.E.performed the experiments and data curation for Figures 3, 4and Supplemental Figures S2–S7. R.M-R. and J.F. performed ex-periments. A.M., T.K., and N.C. contributed new reagents and re-sources. A.DP. and G.E. analyzed data, and A.DP., G.E., F.D.-B.,and J.R.S.-S. wrote the paper.
Received March 22, 2020; accepted July 20, 2020.
REFERENCES
Achari C, Winslow S, Larsson C. 2015. Down regulation of CLDND1induces apoptosis in breast cancer cells. PLoS ONE 10:e0130300. doi:10.1371/journal.pone.0130300
Acosta R, Montañez C, Fuentes-Mera L, Gonzalez E, Gómez P,Quintero-Mora L, Mornet D, Alvarez-Salas LM, Cisneros B. 2004.Dystrophin Dp71 is required for neurite outgrowth in PC12 cells.Exp Cell Res 296: 265–275. doi:10.1016/j.yexcr.2004.01.015
Asangani IA, Rasheed SAK, Nikolova DA, Leupold JH, Colburn NH,Post S, Allgayer H. 2008. MicroRNA-21 (miR-21) post-transcrip-tionally downregulates tumor suppressor Pdcd4 and stimulatesinvasion, intravasation and metastasis in colorectal cancer.Oncogene 27: 2128–2136. doi:10.1038/sj.onc.1210856
Bali N, Arimoto JM, Morgan TE, Finch CE. 2013. Progesterone antag-onism of neurite outgrowth depends on microglial activation viaPgrmc1/S2R. Endocrinology 154: 2468–2480. doi:10.1210/en.2012-2109
Banker G. 2018. The development of neuronal polarity: a retrospec-tive view. J Neurosci 38: 1867–1873. doi:10.1523/JNEUROSCI.1372-16.2018
Bassani S, Passafaro M. 2012. TSPAN7: a new player in excitatory syn-apse maturation and function. Bioarchitecture 2: 95–97. doi:10.4161/bioa.20829
Bisogno T, Howell F, Williams G, Minassi A, Cascio MG, Ligresti A,Matias I, Schiano-Moriello A, Paul P, Williams E-J, et al. 2003.Cloning of the first sn1-DAG lipases points to the spatial and tem-poral regulation of endocannabinoid signaling in the brain. J CellBiol 163: 463–468. doi:10.1083/jcb.200305129
Bitomsky N, Böhm M, Klempnauer K-H. 2004. Transformation sup-pressor protein Pdcd4 interferes with JNK-mediated phosphoryla-tion of c-Jun and recruitment of the coactivator p300 by c-Jun.Oncogene 23: 7484–7493. doi:10.1038/sj.onc.1208064
Biyanee A, Ohnheiser J, Singh P, Klempnauer K-H. 2015. A novelmechanism for the control of translation of specific mRNAs by tu-mor suppressor protein Pdcd4: inhibition of translation elonga-tion. Oncogene 34: 1384–1392. doi:10.1038/onc.2014.83
Braunewell KH, Dwary AD, Richter F, Trappe K, Zhao C, Giegling I,Schönrath K, Rujescu D. 2011. Association of VSNL1 with schizo-phrenia, frontal cortical function, and biological significance forits gene product as a modulator of cAMP levels and neuronal mor-phology. Transl Psychiatry 1: e22. doi:10.1038/tp.2011.20
Canclini L, WallrabeH, Di Paolo A, Kun A, Calliari A, Sotelo-Silveira JR,Sotelo JR. 2014. Association of Myosin Va and Schwann cells-derived RNA in mammal myelinated axons, analyzed by immuno-cytochemistry and confocal FRET microscopy. Methods 66:153–161. doi:10.1016/j.ymeth.2013.06.007
Chédotal A, Kerjan G, Moreau-Fauvarque C. 2005. The brain withinthe tumor: new roles for axon guidance molecules in cancers.Cell Death Differ 12: 1044–1056. doi:10.1038/sj.cdd.4401707
Chen H, Boutros PC. 2011. VennDiagram: a package for the genera-tion of highly-customizable Venn and Euler diagrams in R. BMCBioinformatics 12: 35. doi:10.1186/1471-2105-12-35
Chen P, Xu L, Zhang J, Cai X, Yang Y, Yu J, Qiu J, Ge J, Yu K, Zhuang J.2019. Up-regulation of SorCS1, an important sorting receptor, inthe retina of a form-deprivation rat model. Cell Mol Neurobiol40: 395–405. doi:10.1007/s10571-019-00740-1
Chiappalone M, Bove M, Vato A, Tedesco M, Martinoia S. 2006.Dissociated cortical networks show spontaneously correlated ac-tivity patterns during in vitro development. Brain Res 1093: 41–53. doi:10.1016/j.brainres.2006.03.049
Cohen-Cory S, KidaneAH, ShirkeyNJ,Marshak S. 2010. Brain-derivedneurotrophic factor and the development of structural neuronalconnectivity. Dev Neurobiol 70: 271. doi:10.1002/dneu.20774
Cotterill E, Hall D, Wallace K, Mundy WR, Eglen SJ, Shafer TJ. 2016.Characterization of early cortical neural network development inmultiwell microelectrode array plates. J Biomol Screen 21: 510–519. doi:10.1177/1087057116640520
Dajas-Bailador F, Bonev B, Garcez P, Stanley P, Guillemot F,Papalopulu N. 2012. microRNA-9 regulates axon extension andbranching by targeting Map1b in mouse cortical neurons. NatNeurosci 15: 697–699. doi:10.1038/nn.3082
Deglincerti A, Jaffrey SR. 2012. Insights into the roles of local transla-tion from the axonal transcriptome. Open Biol 2: 120079. doi:10.1098/rsob.120079
Dorrello NV, Peschiaroli A, Guardavaccaro D, Colburn NH,Sherman NE, Pagano M. 2006. S6K1- and βTRCP-mediated deg-radation of PDCD4 promotes protein translation and cell growth.Science 314: 467–471. doi:10.1126/science.1130276
Duman-ScheelM. 2009. Netrin andDCC: axon guidance regulators atthe intersection of nervous system development and cancer. CurrDrug Targets 10: 602–610. doi:10.2174/138945009788680428
PDCD4 can modulate axonal growth and regeneration
www.rnajournal.org 1649
Cold Spring Harbor Laboratory Press on October 19, 2020 - Published by rnajournal.cshlp.orgDownloaded from

Eastman G, Smircich P, Sotelo-Silveira JR. 2018. Following ribosomefootprints to understand translation at a genome wide level.Comput Struct Biotechnol J 16: 167–176. doi:10.1016/j.csbj.2018.04.001
Farias J, Holt CE, Sotelo JR, Sotelo-Silveira JR. 2020. Axon micro-dis-section and transcriptome profiling reveals the in vivo RNA con-tent of fully differentiated myelinated motor axons. RNA 26:595–612. doi:10.1261/rna.073700.119
Fiesel FC, Schurr C, Weber SS, Kahle PJ. 2011. TDP-43 knockdownimpairs neurite outgrowth dependent on its target histone deace-tylase 6. Mol Neurodegener 6: 64. doi:10.1186/1750-1326-6-64
Fink CC, Bayer K-U, Myers JW, Ferrell JE Jr, Schulman H, Meyer T.2003. Selective regulation of neurite extension and synapse for-mation by the β but not the α isoform of CaMKII. Neuron 39:283–297. doi:10.1016/S0896-6273(03)00428-8
Flowers BM, Rusnak LE, Wong KE, Banks DA, Munyikwa MR,McFarland AG, Hinton SD. 2014. The pseudophosphatase MK-STYX induces neurite-like outgrowths in PC12 cells. PLoS ONE9: e114535. doi:10.1371/journal.pone.0114535
Frank CL, Tsai L-H. 2009. Alternative functions of core cell cycle reg-ulators in neuronal migration, neuronal maturation, and synapticplasticity. Neuron 62: 312–326. doi:10.1016/j.neuron.2009.03.029
Fukao A, Sasano Y, Imataka H, Inoue K, Sakamoto H, Sonenberg N,Thoma C, Fujiwara T. 2009. The ELAV protein HuD stimulatescap-dependent translation in a Poly(A)- and eIF4A-dependentmanner. Mol Cell 36: 1007–1017. doi:10.1016/j.molcel.2009.11.013
Gao F, Zhang P, Zhou C, Li J, Wang Q, Zhu F, Ma C, Sun W, Zhang L.2007. Frequent loss of PDCD4 expression in human glioma: pos-sible role in the tumorigenesis of glioma. Oncol Rep 17: 123–128. doi:10.3892/or.17.1.123
Ghiani CA, Starcevic M, Rodriguez-Fernandez IA, Nazarian R,Cheli VT, Chan LN, Malvar JS, de Vellis J, Sabatti C,Dell’Angelica EC. 2010. The dysbindin-containing complex(BLOC-1) in brain: developmental regulation, interaction withSNARE proteins and role in neurite outgrowth. Mol Psychiatry15: 115. 204–215. doi:10.1038/mp.2009.152
Göke R, Barth P, Schmidt A, Samans B, Lankat-Buttgereit B. 2004.Programmed cell death protein 4 suppresses CDK1/cdc2 via in-duction of p21Waf1/Cip1. Am J Physiol Cell Physiol 287: C1541–C1546. doi:10.1152/ajpcell.00025.2004
Gumy LF, Tan CL, Fawcett JW. 2010. The role of local protein synthe-sis and degradation in axon regeneration. Exp Neurol 223: 28–37.doi:10.1016/j.expneurol.2009.06.004
Haas A, Nilges BS, Leidel SA, Klempnauer K-H. 2020. PDCD4 controlsthe G1/S-phase transition in a telomerase-immortalized epithelialcell line and affects the expression level and translation of multiplemRNAs. Sci Rep 10: 2758. doi:10.1038/s41598-020-59678-w
Hattori D, Millard SS, Wojtowicz WM, Zipursky SL. 2008. Dscam-me-diated cell recognition regulates neural circuit formation. AnnuRev Cell Dev Biol 24: 597–620. doi:10.1146/annurev.cellbio.24.110707.175250
He Z, Jin Y. 2016. Intrinsic control of axon regeneration. Neuron 90:437–451. doi:10.1016/j.neuron.2016.04.022
Heine P, Ehrlicher A, Käs J. 2015. Neuronal and metastatic cancercells: unlike brothers. Biochim Biophys Acta 1853: 3126–3131.doi:10.1016/j.bbamcr.2015.06.011
Holt CE, Martin KC, Schuman EM. 2019. Local translation in neurons:visualization and function.Nat Struct Mol Biol 26: 557–566. doi:10.1038/s41594-019-0263-5
Hudson BJ. 2008. Loss of PDCD4 results in insulin resistance throughER stress. University of Pennsylvania. https://repository.upenn.edu/dissertations/AAI3347091
Huebner EA, Strittmatter SM. 2009. Axon regeneration in the periph-eral and central nervous systems. Results Probl Cell Differ 48: 339–351. doi:10.1007/400_2009_19
Hutchinson KM, Vonhoff F, Duch C. 2014. Dscam1 is required for nor-mal dendrite growth and branching but not for dendritic spacing inDrosophila motoneurons. J Neurosci 34: 1924–1931. doi:10.1523/JNEUROSCI.3448-13.2014
Ingolia NT, Ghaemmaghami S, Newman JRS, Weissman JS. 2009.Genome-wide analysis in vivo of translation with nucleotide reso-lution using ribosome profiling. Science 324: 218–223. doi:10.1126/science.1168978
Ingolia NT, Brar GA, Rouskin S, McGeachy AM, Weissman JS. 2012.The ribosome profiling strategy for monitoring translation in vivoby deep sequencing of ribosome-protected mRNA fragments.Nat Protoc 7: 1534–1550. doi:10.1038/nprot.2012.086
Iwasaki Y, Ishikawa M, Okada N, Koizumi S. 1997. Induction of a dis-tinct morphology and signal transduction in TrkB/PC12 cells bynerve growth factor and brain-derived neurotrophic factor. JNeurochem 68: 927–934. doi:10.1046/j.1471-4159.1997.68030927.x
Iwasaki K, Isaacs KR, Jacobowitz DM. 1998. Brain-derived neurotro-phic factor stimulates neurite outgrowth in a calretinin-enrichedneuronal culture system. Int J Dev Neurosci 16: 135–145. doi:10.1016/S0736-5748(98)00011-2
Jansen AP, Camalier CE, Colburn NH. 2005. Epidermal expression ofthe translation inhibitor programmed cell death 4 suppresses tu-morigenesis. Cancer Res 65: 6034–6041. doi:10.1158/0008-5472.CAN-04-2119
Jensen LJ, Kuhn M, Stark M, Chaffron S, Creevey C, Muller J,Doerks T, Julien P, Roth A, Simonovic M, et al. 2009. STRING 8—a global view on proteins and their functional interactions in630 organisms. Nucleic Acids Res 37: D412–D416. doi:10.1093/nar/gkn760
Jiang Y, Zhao S, Ding Y, Nong L, Li H, Gao G, Zhou D, Xu N. 2017.MicroRNA–21 promotes neurite outgrowth by regulating PDCD4in a rat model of spinal cord injury. Mol Med Rep 16: 2522–2528. doi:10.3892/mmr.2017.6862
Jiménez-Díaz L, Géranton SM, Passmore GM, Leith JL, Fisher AS,Berliocchi L, Sivasubramaniam AK, Sheasby A, Lumb BM,Hunt SP. 2008. Local translation in primary afferent fibers regulatesnociception. PLoS ONE 3: e1961. doi:10.1371/journal.pone.0001961
Jung H, O’Hare CM, Holt CE. 2011. Translational regulation in growthcones. Curr Opin Genet Dev 21: 458–464. doi:10.1016/j.gde.2011.04.004
Jung H, Yoon BC, Holt CE. 2012. Axonal mRNA localization and localprotein synthesis in nervous system assembly, maintenance andrepair. Nat Rev Neurosci 13: 308–324. doi:10.1038/nrn3210
Kar AN, MacGibeny MA, Gervasi NM, Gioio AE, Kaplan BB. 2013.Intra-axonal synthesis of eukaryotic translation initiation factorsregulates local protein synthesis and axon growth in rat sympathet-ic neurons. J Neurosci 33: 7165–7174. doi:10.1523/JNEUROSCI.2040-12.2013
Kawabe H, Neeb A, Dimova K, Young SM, Takeda M,Katsurabayashi S, Mitkovski M, Malakhova OA, Zhang D-E,Umikawa M, et al. 2010. Regulation of Rap2A by the ubiquitin li-gase Nedd4-1 controls neurite development. Neuron 65: 358–372. doi:10.1016/j.neuron.2010.01.007
Kim J, Park RY, Chen J-K, Kim J, Jeong S, Ohn T. 2014. Splicing factorSRSF3 represses the translation of programmed cell death 4mRNA by associating with the 5′-UTR region. Cell Death Differ21: 481–490. doi:10.1038/cdd.2013.171
Kim D, Langmead B, Salzberg SL. 2015. HISAT: a fast spliced alignerwith lowmemory requirements.Nat Methods 12: 357–360. doi:10.1038/nmeth.3317
Di Paolo et al.
1650 RNA (2020) Vol. 26, No. 11
Cold Spring Harbor Laboratory Press on October 19, 2020 - Published by rnajournal.cshlp.orgDownloaded from

Kuja-Panula J, Kiiltomäki M, Yamashiro T, Rouhiainen A, Rauvala H.2003. AMIGO, a transmembrane protein implicated in axon tractdevelopment, defines a novel protein family with leucine-rich re-peats. J Cell Biol 160: 963–973. doi:10.1083/jcb.200209074
Kumar D, Bansal G, Narang A, Basak T, Abbas T, Dash D. 2016.Integrating transcriptome and proteome profiling: strategies andapplications. Proteomics 16: 2533–2544. doi:10.1002/pmic.201600140
Lain E, Carnejac S, Escher P, Wilson MC, Lømo T, Gajendran N,Brenner HR. 2009. A novel role for embigin to promote sproutingof motor nerve terminals at the neuromuscular junction. J BiolChem 284: 8930–8939. doi:10.1074/jbc.M809491200
Langmead B, Salzberg SL. 2012. Fast gapped-read alignment withBowtie 2. Nat Methods 9: 357–359. doi:10.1038/nmeth.1923
Li Y, Jia Y, Wang D, Zhuang X, Li Y, Guo C, Chu H, Zhu F, Wang J,Wang X, et al. 2020. Programmed cell death 4 as an endogenoussuppressor of BDNF translation is involved in stress-induceddepression. Mol Psychiatry doi:10.1038/s41380-020-0692-x
Liao Y, Smyth GK, Shi W. 2014. featureCounts: an efficient generalpurpose program for assigning sequence reads to genomic fea-tures. Bioinformatics 30: 923–930. doi:10.1093/bioinformatics/btt656
Lin AC, Holt CE. 2008. Function and regulation of local axonal trans-lation. Curr Opin Neurobiol 18: 60–68. doi:10.1016/j.conb.2008.05.004
Lin C-H, Hsieh M, Fan S-S. 2011. The promotion of neurite formationin Neuro2A cells by mouse Mob2 protein. FEBS Lett 585: 523–530. doi:10.1016/j.febslet.2011.01.003
Lin T, Pan P-Y, Lai Y-T, Chiang K-W, Hsieh H-L,Wu Y-P, Ke J-M, LeeM-C, Liao S-S, Shih H-T, et al. 2015. Spindle-F is the central mediatorof Ik2 kinase-dependent dendrite pruning in Drosophila sensoryneurons. PLoS Genet 11: e1005642. doi:10.1371/journal.pgen.1005642
Liwak U, Thakor N, Jordan LE, Roy R, Lewis SM, Pardo OE, Seckl M,Holcik M. 2012. Tumor suppressor PDCD4 represses internal ribo-some entry site-mediated translation of antiapoptotic proteins andis regulated by S6 kinase 2. Mol Cell Biol 32: 1818–1829. doi:10.1128/MCB.06317-11
Loh PG, Yang H-S, Walsh MA, Wang Q, Wang X, Cheng Z, Liu D,Song H. 2009. Structural basis for translational inhibition by the tu-mour suppressor Pdcd4. EMBO J 28: 274–285. doi:10.1038/emboj.2008.278
Lucci C, Mesquita-Ribeiro R, Rathbone A, Dajas-Bailador F. 2020.Spatiotemporal regulation of GSK3β levels bymiRNA-26a controlsaxon development in cortical neurons. Development 147:dev180232. doi:10.1242/dev.180232
Manecka D-L, Mahmood SF, Grumolato L, Lihrmann I, Anouar Y.2013. Pituitary adenylate cyclase-activating polypeptide (PACAP)promotes both survival and neuritogenesis in PC12 cells throughactivation of nuclear factor κB (NF-κB) pathway: involvement of ex-tracellular signal-regulated kinase (ERK), calcium, and c-REL. J BiolChem 288: 14936–14948. doi:10.1074/jbc.M112.434597
Manna T, Grenningloh G, Miller HP, Wilson L. 2007. Stathmin familyprotein SCG10 differentially regulates the plus and minus end dy-namics of microtubules at steady state in vitro: implications for itsrole in neurite outgrowth. Biochemistry 46: 3543–3552. doi:10.1021/bi061819d
Matsuhashi S, Manirujjaman M, Hamajima H, Ozaki I. 2019. Controlmechanisms of the tumor suppressor PDCD4: expression andfunctions. Int J Mol Sci 20: 2304. doi:10.3390/ijms20092304
Mincheva-Tasheva S, Obis E, Tamarit J, Ros J. 2014. Apoptotic celldeath and altered calcium homeostasis caused by frataxin deple-tion in dorsal root ganglia neurons can be prevented by BH4domain of Bcl-xL protein. Hum Mol Genet 23: 1829–1841.doi:10.1093/hmg/ddt576
Mobarak CD, Anderson KD, Morin M, Beckel-Mitchener A,Rogers SL, Furneaux H, King P, Perrone-Bizzozero NI. 2000. TheRNA-binding protein HuD is required for GAP-43 mRNA stability,GAP-43 gene expression, and PKC-dependent neurite outgrowthin PC12 cells.Mol Biol Cell 11: 3191–3203. doi:10.1091/mbc.11.9.3191
Moustafa-Kamal M, Kucharski T, El Assad W, Gandin V, Abas Y,Nagar B, Pelletier J, Topisirovic I, Teodoro JG. 2019. ThemTORC1/S6K/PDCD4/eIF4A axis determines outcome of mitosis.bioRxiv 794545. doi:10.1101/794545v1.abstract
Mudduluru G, Medved F, Grobholz R, Jost C, Gruber A, Leupold JH,Post S, Jansen A, Colburn NH, Allgayer H. 2007. Loss of pro-grammed cell death 4 expressionmarks adenoma-carcinoma tran-sition, correlates inversely with phosphorylated protein kinase B,and is an independent prognostic factor in resected colorectalcancer. Cancer 110: 1697–1707. doi:10.1002/cncr.22983
Munnamalai V, Weaver CJ, Weisheit CE, Venkatraman P, Agim ZS,Quinn MT, Suter DM. 2014. Bidirectional interactions betweenNOX2-type NADPH oxidase and the F-actin cytoskeleton in neu-ronal growth cones. J Neurochem 130: 526–540. doi:10.1111/jnc.12734
Murray JT, Tee AR. 2018. Mechanistic target of rapamycin (mTOR) inthe cancer setting. Cancers (Basel) 10: 168. doi:10.3390/cancers10060168
Nagara Y, Hagiyama M, Hatano N, Futai E, Suo S, Takaoka Y,Murakami Y, Ito A, Ishiura S. 2012. Tumor suppressor cell adhesionmolecule 1 (CADM1) is cleaved by a disintegrin and metallopro-tease 10 (ADAM10) and subsequently cleaved by γ-secretasecomplex. Biochem Biophys Res Commun 417: 462–467. doi:10.1016/j.bbrc.2011.11.140
Nakanishi K, Aono S, Hirano K, Kuroda Y, Ida M, Tokita Y, Matsui F,Oohira A. 2006. Identification of neurite outgrowth-promoting do-mains of neuroglycan C, a brain-specific chondroitin sulfate pro-teoglycan, and involvement of phosphatidylinositol 3-kinase andprotein kinase C signaling pathways in neuritogenesis. J BiolChem 281: 24970–24978. doi:10.1074/jbc.M601498200
Narasimhan M, Rathinam M, Riar A, Patel D, Mummidi S, Yang H-S,Colburn NH, Henderson GI, Mahimainathan L. 2013.Programmed cell death 4 (PDCD4): a novel player in ethanol-me-diated suppression of protein translation in primary cortical neu-rons and developing cerebral cortex. Alcohol Clin Exp Res 37:96–109. doi:10.1111/j.1530-0277.2012.01850.x
Ng YP, HeW, Ip NY. 2003. Leukemia inhibitory factor receptor signal-ing negatively modulates nerve growth factor-induced neuriteoutgrowth in PC12 cells and sympathetic neurons. J Biol Chem278: 38731–38739. doi:10.1074/jbc.M304623200
Nijssen J, Aguila J, Hoogstraaten R, Kee N, Hedlund E. 2018. Axon-seq decodes the motor axon transcriptome and its modulationin response to ALS. Stem Cell Rep 11: 1565–1578. doi:10.1016/j.stemcr.2018.11.005
Obara I, Hunt SP. 2014. Axonal protein synthesis and the regulation ofprimary afferent function. Dev Neurobiol 74: 269–278. doi:10.1002/dneu.22133
Ohtake Y, Hayat U, Li S. 2015. PTEN inhibition and axon regenerationand neural repair.Neural Regeneration Res 10: 1363–1368. doi:10.4103/1673-5374.165496
Olbrich L, Wessel L, Balakrishnan-Renuka A, BöingM, Brand-Saberi B,Theiss C. 2013. Rapid impact of progesterone on the neuronalgrowth cone. Endocrinology 154: 3784–3795. doi:10.1210/en.2013-1175
Park KK, Liu K, Hu Y, Smith PD, Wang C, Cai B, Xu B, Connolly L,Kramvis I, Sahin M, et al. 2008. Promoting axon regeneration inthe adult CNS by modulation of the PTEN/mTOR pathway.Science 322: 963–966. doi:10.1126/science.1161566
PDCD4 can modulate axonal growth and regeneration
www.rnajournal.org 1651
Cold Spring Harbor Laboratory Press on October 19, 2020 - Published by rnajournal.cshlp.orgDownloaded from

Park KK, Liu K, Hu Y, Kanter JL, He Z. 2010. PTEN/mTOR and axon re-generation. Exp Neurol 223: 45–50. doi:10.1016/j.expneurol.2009.12.032
Parviainen L, Dihanich S, Anderson GW, Wong AM, Brooks HR,Abeti R, Rezaie P, Lalli G, Pope S, Heales SJ, et al. 2017. Glial cellsare functionally impaired in juvenile neuronal ceroid lipofuscinosisand detrimental to neurons. Acta Neuropathol Commun 5: 74.doi:10.1186/s40478-017-0476-y
Pertea M, Pertea GM, Antonescu CM, Chang T-C, Mendell JT,Salzberg SL. 2015. StringTie enables improved reconstruction ofa transcriptome from RNA-seq reads. Nat Biotechnol 33: 290–295. doi:10.1038/nbt.3122
Pertea M, Kim D, Pertea GM, Leek JT, Salzberg SL. 2016. Transcript-level expression analysis of RNA-seq experiments with HISAT,StringTie and Ballgown. Nat Protoc 11: 1650–1667. doi:10.1038/nprot.2016.095
Riar AK, Narasimhan M, Rathinam ML, Vedpathak D, Mummidi S,Henderson GI, Mahimainathan L. 2014. Ethanol-induced tran-scriptional activation of programmed cell death 4 (Pdcd4) is medi-ated by GSK-3β signaling in rat cortical neuroblasts. PLoS ONE 9:e98080. doi:10.1371/journal.pone.0098080
Riederer BM, Pellier V, Antonsson B, Di Paolo G, Stimpson SA,Lütjens R, Catsicas S, Grenningloh G. 1997. Regulation of microtu-bule dynamics by the neuronal growth-associated protein SCG10.Proc Natl Acad Sci 94: 741–745. doi:10.1073/pnas.94.2.741
RobinsonMD,McCarthy DJ, Smyth GK. 2010. edgeR: a Bioconductorpackage for differential expression analysis of digital gene expres-sion data. Bioinformatics 26: 139–140. doi:10.1093/bioinformatics/btp616
Sahoo PK, Smith DS, Perrone-Bizzozero N, Twiss JL. 2018. AxonalmRNA transport and translation at a glance. J Cell Sci 131:jcs196808. doi:10.1242/jcs.196808
Schindelin J, Arganda-Carreras I, Frise E, Kaynig V, Longair M,Pietzsch T, Preibisch S, Rueden C, Saalfeld S, Schmid B, et al.2012. Fiji: an open-source platform for biological-image analysis.Nat Methods 9: 676–682. doi:10.1038/nmeth.2019
Schmid T, Jansen AP, Baker AR, Hegamyer G, Hagan JP, Colburn NH.2008. Translation inhibitor Pdcd4 is targeted for degradation dur-ing tumor promotion. Cancer Res 68: 1254–1260. doi:10.1158/0008-5472.CAN-07-1719
Schnepp A, Komp Lindgren P, Hülsmann H, Kröger S, Paulsson M,Hartmann U. 2005. Mouse testican-2. Expression, glycosylation,and effects on neurite outgrowth. J Biol Chem 280: 11274–11280. doi:10.1074/jbc.M414276200
Shao J, Cao J, Wang J, Ren X, Su S, Li M, Li Z, Zhao Q, Zang W. 2016.MicroRNA-30b regulates expression of the sodium channelNav1.7 in nerve injury-induced neuropathic pain in the rat. MolPain 12: 1744806916671523. doi:10.1177/1744806916671523
Siddiq MM, Hannila SS, Carmel JB, Bryson JB, Hou J, Nikulina E,Willis MR, Mellado W, Richman EL, Hilaire M, et al. 2015.Metallothionein-I/II promotes axonal regeneration in the centralnervous system. J Biol Chem 290: 16343–16356. doi:10.1074/jbc.M114.630574
Singh P, Wedeken L, Waters LC, Carr MD, Klempnauer K-H. 2011.Pdcd4 directly binds the coding region of c-myb mRNA and sup-presses its translation. Oncogene 30: 4864–4873. doi:10.1038/onc.2011.202
Song Z, Han X, Zou H, Zhang B, Ding Y, Xu X, Zeng J, Liu J, Gong A.2018. PTEN-GSK3β-MOB1 axis controls neurite outgrowth in vitroand in vivo. Cell Mol Life Sci 75: 4445–4464. doi:10.1007/s00018-018-2890-0
Sotelo-Silveira JR, Holt CE. 2014. Introduction to the special issue onlocal protein synthesis in axons. Dev Neurobiol 74: 207–209.doi:10.1002/dneu.22163
Squinto SP, Stitt TN, Aldrich TH, Davis S, Bianco SM, Radziejewski C,Glass DJ, Masiakowski P, Furth ME, Valenzuela DM. 1991. trkB en-codes a functional receptor for brain-derived neurotrophic factorand neurotrophin-3 but not nerve growth factor. Cell 65: 885–893. doi:10.1016/0092-8674(91)90395-F
Strickland IT, Richards L, Holmes FE, Wynick D, Uney JB, Wong L-F.2011. Axotomy-induced miR-21 promotes axon growth in adultdorsal root ganglion neurons. PLoS ONE 6: e23423. doi:10.1371/journal.pone.0023423
Su C-W, Tharin S, Jin Y, Wightman B, Spector M, Meili D, Tsung N,Rhiner C, Bourikas D, Stoeckli E, et al. 2006. The short coiled-coil domain-containing protein UNC-69 cooperates with UNC-76to regulate axonal outgrowth and normal presynaptic organizationin Caenorhabditis elegans. J Biol 5: 9. doi:10.1186/jbiol39
Suzuki C, Garces RG, Edmonds KA, Hiller S, Hyberts SG,Marintchev A, Wagner G. 2008. PDCD4 inhibits translation initia-tion by binding to eIF4A using both its MA3 domains. Proc NatlAcad Sci 105: 3274–3279. doi:10.1073/pnas.0712235105
Swanger SA, Bassell GJ. 2011. Making and breaking synapsesthrough local mRNA regulation. Curr Opin Genet Dev 21: 414–421. doi:10.1016/j.gde.2011.04.002
Tang G-B, Zeng Y-Q, Liu P-P, Mi T-W, Zhang S-F, Dai S-K, Tang Q-Y,Yang L, Xu Y-J, Yan H-L, et al. 2017. The histone H3K27 demeth-ylase UTX regulates synaptic plasticity and cognitive behaviors inmice. Front Mol Neurosci 10: 267. doi:10.3389/fnmol.2017.00267
Taylor AM, Jeon NL. 2011. Microfluidic and compartmentalized plat-forms for neurobiological research. Crit Rev Biomed Eng 39: 185–200. doi:10.1615/CritRevBiomedEng.v39.i3.20
Terenzio M, Koley S, Samra N, Rishal I, Zhao Q, Sahoo PK, Urisman A,Marvaldi L, Oses-Prieto JA, Forester C, et al. 2018. Locally translat-ed mTOR controls axonal local translation in nerve injury. Science359: 1416–1421. doi:10.1126/science.aan1053
tom Dieck S, Kochen L, Hanus C, Heumüller M, Bartnik I, Nassim-Assir B, Merk K, Mosler T, Garg S, Bunse S, et al. 2015. Direct visu-alization of newly synthesized target proteins in situ. Nat Methods12: 411–414. doi:10.1038/nmeth.3319
Uboha NV, Flajolet M, Nairn AC, Picciotto MR. 2007. A calcium- andcalmodulin-dependent kinase Iα/microtubule affinity regulatingkinase 2 signaling cascade mediates calcium-dependent neuriteoutgrowth. J Neurosci 27: 4413–4423. doi:10.1523/JNEUROSCI.0725-07.2007
van Kesteren RE, Carter C, Dissel HMG, vanMinnen J, Gouwenberg Y,SyedNI, Spencer GE, Smit AB. 2006. Local synthesis of actin-bind-ing protein β-thymosin regulates neurite outgrowth. J Neurosci26: 152–157. doi:10.1523/JNEUROSCI.4164-05.2006
Verma P, Chierzi S, Codd AM, Campbell DS, Meyer RL, Holt CE,Fawcett JW. 2005. Axonal protein synthesis and degradation arenecessary for efficient growth cone regeneration. J Neurosci 25:331–342. doi:10.1523/JNEUROSCI.3073-04.2005
Villarroel-Campos D, Bronfman FC, Gonzalez-Billault C. 2016. RabGTPase signaling in neurite outgrowth and axon specification.Cytoskeleton 73: 498–507. doi:10.1002/cm.21303
Vuppalanchi D, Willis DE, Twiss JL. 2009. Regulation of mRNA trans-port and translation in axons.Results Probl Cell Differ 48: 193–224.doi:10.1007/400_2009_16
Wang Q, Dong Z, Liu X, Song X, Song Q, Shang Q, Jiang Y, Guo C,Zhang L. 2013. Programmed cell death-4 deficiency preventsdiet-induced obesity, adipose tissue inflammation, and insulin re-sistance. Diabetes 62: 4132–4143. doi:10.2337/db13-0097
Wang W, Zhong Q, Teng L, Bhatnagar N, Sharma B, Zhang X,Luther W, Haynes LP, Burgoyne RD, Vidal M, et al. 2014.Mutations that disrupt PHOXB interaction with the neuronal calci-um sensor HPCAL1 impede cellular differentiation in neuroblasto-ma. Oncogene 33: 3316–3324. doi:10.1038/onc.2013.290
Di Paolo et al.
1652 RNA (2020) Vol. 26, No. 11
Cold Spring Harbor Laboratory Press on October 19, 2020 - Published by rnajournal.cshlp.orgDownloaded from

Wang Q, Zhu J, Wang Y-W, Dai Y, Wang Y-L, Wang C, Liu J, Baker A,Colburn NH, Yang H-S. 2017. Tumor suppressor Pdcd4 attenuatesSin1 translation to inhibit invasion in colon carcinoma. Oncogene36: 6225–6234. doi:10.1038/onc.2017.228
Wayman GA, Kaech S, Grant WF, Davare M, Impey S, Tokumitsu H,Nozaki N, Banker G, Soderling TR. 2004. Regulation of axonal ex-tension and growth cone motility by calmodulin-dependent pro-tein kinase I. J Neurosci 24: 3786–3794. doi:10.1523/JNEUROSCI.3294-03.2004
Wedeken L, Singh P, Klempnauer K-H. 2011. Tumor suppressor pro-tein Pdcd4 inhibits translation of p53 mRNA. J Biol Chem 286:42855–42862. doi:10.1074/jbc.M111.269456
Xiao Z, Zou Q, Liu Y, Yang X. 2016. Genome-wide assessment of dif-ferential translations with ribosome profiling data.Nat Commun 7:11194. doi:10.1038/ncomms11194
Yamamoto A, Uchiyama K, Nara T, Nishimura N, Hayasaka M,Hanaoka K, Yamamoto T. 2014. Structural abnormalities of corpuscallosum and cortical axonal tracts accompanied by decreasedanxiety-like behavior and lowered sociability in spock3- mutantmice. Dev Neurosci 36: 381–395. doi:10.1159/000363101
Yan X, Liu J, Ye Z, Huang J, He F, Xiao W, Hu X, Luo Z. 2016. CaMKII-mediated CREB phosphorylation is involved in Ca2+-inducedBDNF mRNA transcription and neurite outgrowth promoted byelectrical stimulation. PLoS ONE 11: e0162784. doi:10.1371/journal.pone.0162784
Yang H-S, Jansen AP, Komar AA, Zheng X, Merrick WC, Costes S,Lockett SJ, Sonenberg N, Colburn NH. 2003. The transformationsuppressor Pdcd4 is a novel eukaryotic translation initiation factor4A binding protein that inhibits translation. Mol Cell Biol 23: 26–37. doi:10.1128/MCB.23.1.26-37.2003
Yang H-S, Matthews CP, Clair T, WangQ, Baker AR, Li C-CH, Tan T-H,Colburn NH. 2006. Tumorigenesis suppressor Pdcd4 down-regu-lates mitogen-activated protein kinase kinase kinase kinase 1 ex-pression to suppress colon carcinoma cell invasion. Mol Cell Biol26: 1297–1306. doi:10.1128/MCB.26.4.1297-1306.2006
Yang H, Cheng X, Yao Q, Li J, Ju G. 2008. The promotive effects ofthymosin β4 on neuronal survival and neurite outgrowth by upre-gulating L1 expression. Neurochem Res 33: 2269–2280. doi:10.1007/s11064-008-9712-y
Yoon BC, Zivraj KH, Holt CE. 2009. Local translation and mRNA traf-ficking in axon pathfinding. Results Probl Cell Differ 48: 269–288. doi:10.1007/400_2009_5
Yu J, Lin S,WangM, Liang L, Zou Z, Zhou X,WangM, Chen P,Wang Y.2016. Metastasis suppressor 1 regulates neurite outgrowth in pri-mary neuron cultures. Neuroscience 333: 123–131. doi:10.1016/j.neuroscience.2016.07.002
Zappulo A, van den Bruck D, Mattioli C C, Franke V, Imami K,McShane E, Moreno-Estelles M, Calviello L, Filipchyk A,Peguero-Sanchez E, et al. 2017. RNA localization is a key determi-nant of neurite-enriched proteome. Nat Commun 8: 583. doi:10.1038/s41467-017-00690-6
Zhang H, Ozaki I, Mizuta T, Hamajima H, Yasutake T, Eguchi Y,Ideguchi H, Yamamoto K,Matsuhashi S. 2006. Involvement of pro-grammed cell death 4 in transforming growth factor-β1-inducedapoptosis in human hepatocellular carcinoma. Oncogene 25:6101–6112. doi:10.1038/sj.onc.1209634
Zhang W, Wang L, Liu Y, Xu J, Zhu G, Cang H, Li X, Bartlam M,Hensley K, Li G, et al. 2009. Structure of human lanthionine synthe-tase C-like protein 1 and its interaction with Eps8 and glutathione.Genes Dev 23: 1387–1392. doi:10.1101/gad.1789209
Zhen Y, Li D, Li W, Yao W, Wu A, Huang J, Gu H, Huang Y,Wang Y, Wu J, et al. 2016. Reduced PDCD4 expression promotescell growth through PI3K/Akt signaling in non-small cell lung can-cer. Oncol Res 23: 61–68. doi:10.3727/096504015X14478843952861
Zheng W, Chong C-M, Wang H, Zhou X, Zhang L, Wang R, Meng Q,Lazarovici P, Fang J. 2016. Artemisinin conferred ERK mediatedneuroprotection to PC12 cells and cortical neurons exposed tosodium nitroprusside-induced oxidative insult. Free Radic BiolMed 97: 158–167. doi:10.1016/j.freeradbiomed.2016.05.023
Zhu K, Chen X, Liu J, Ye H, Zhu L, Wu JY. 2013. AMPK interacts withDSCAM and plays an important role in netrin-1 induced neuriteoutgrowth. Protein Cell 4: 155–161. doi:10.1007/s13238-012-2126-2
Zubarev RA. 2013. The challenge of the proteome dynamic range andits implications for in-depth proteomics. Proteomics 13: 723–726.doi:10.1002/pmic.201200451
PDCD4 can modulate axonal growth and regeneration
www.rnajournal.org 1653
Cold Spring Harbor Laboratory Press on October 19, 2020 - Published by rnajournal.cshlp.orgDownloaded from

10.1261/rna.075424.120Access the most recent version at doi: 2020 26: 1637-1653 originally published online August 3, 2020RNA
Andrés Di Paolo, Guillermo Eastman, Raquel Mesquita-Ribeiro, et al. growth-related genes and is modulated during nerve injury responsesPDCD4 regulates axonal growth by translational repression of neurite
Material
Supplemental
http://rnajournal.cshlp.org/content/suppl/2020/08/03/rna.075424.120.DC1
References
http://rnajournal.cshlp.org/content/26/11/1637.full.html#ref-list-1
This article cites 133 articles, 33 of which can be accessed free at:
Open Access
Open Access option.RNAFreely available online through the
License
Commons Creative
.http://creativecommons.org/licenses/by/4.0/(Attribution 4.0 International), as described at
, is available under a Creative Commons LicenseRNAThis article, published in
ServiceEmail Alerting
click here.top right corner of the article or
Receive free email alerts when new articles cite this article - sign up in the box at the
http://rnajournal.cshlp.org/subscriptions go to: RNATo subscribe to
© 2020 Di Paolo et al.; Published by Cold Spring Harbor Laboratory Press for the RNA Society
Cold Spring Harbor Laboratory Press on October 19, 2020 - Published by rnajournal.cshlp.orgDownloaded from
1
Supplementary Information PDCD4 regulates axonal growth by translational repression of neurite growth-related genes and is modulated during nerve injury responses Andrés Di Paolo, Guillermo Eastman, Raquel Mesquita-Ribeiro, Joaquina Farias, Andrew Macklin, Thomas Kislinger, Nancy Colburn, David Munroe, José Sotelo Sosa, Federico Dajas-Bailador, José Roberto Sotelo-Silveira. This file contains:
- Supplementary Materials and Methods - Supplementary Figures Legends - Supplementary Figures - Supplementary Tables Legends - SI References
Supplementary Materials and Methods Animals and injury procedures Sprague Dawley male adult rats (6-9 months old) were used for ex vivo experiments. The maintenance was made in accordance with international agreements at IIBCE bioterium in Montevideo, Uruguay. Animals were anesthetized with ketamine and xylazine mix (100 mg/kg, 10 mg/kg) by intraperitoneal injection. Afterwards the animals were intracardially perfused using paraformaldehyde.
● Sciatic nerve transection Adult Sprague-Dawley rats were anesthetized with 50 mg/kg pentobarbital. An incision was made at mid-thigh and the sciatic nerve was transected, which was then closed with cyanoacrylate glue. After 18 h recovery, rats were euthanized by decapitation and a 2-cm sciatic nerve segment proximal to the transection was removed. Equivalent contralateral uninjured segments were used as controls. Afterwards we labelled the proximal region using a strand and quickly fixed with PFA 4% for 1 hour at RT. Immunohistochemistry protocols were carried out as described for in vivo tissues. All the experimental procedures were made according to the Uruguayan ethical national committee (CNEA) with approved project code “005/01/2014”. Cell Cultures Rats (Sprague-Dawley) and mice (C57/BL6) used for primary neuron cultures were housed at the Animal Unit in the School of Life Sciences (University of Nottingham). They were bred and sacrificed according to the UK Animal (Scientific Procedures) Act 1986.
● Primary cortical neurons culture Primary cortical neuron cultures were obtained from C57/BL6 E16 mice brains as previously described (Lucci et al. 2020). Brain cortices were dissected, and the meninges separated under a dissection microscope. The tissue was further incubated in Hanks Balanced Salt Solution (HBSS, Ca2+ and Mg2+-free; Gibco) with 1 mg/ml trypsin and 5 mg/ml DNAse I (Sigma-Aldrich) at 37°C for 30’. Following the addition of 0.05% (v/v) soybean trypsin inhibitor (Sigma-Aldrich), the tissue was mechanically dissociated in Neurobasal media (Invitrogen) supplemented with 1X GlutaMax and 2% B-27 (Gibco). Dissociated neurons were resuspended in supplemented Neurobasal media (10x106 cells/mL).
● Primary DRG neurons culture Primary DRGs cultures were obtained from E18 rat embryos. Briefly, approximately 200 DRGs ganglions were extracted from 11-15 embryos per experiment in L15 cold media, trypsinized in Ca2+-Mg2+ PBS 0.025% trypsin for 10 minutes at 37°C, 5% CO2 and incubated with 0.1% collagenase type I (filtered 0.2 µm) for 20 min, 37°C, 5% CO2. Pellet is resuspended and dissociated in DMEM complete media (2% B27, 2 mM glutamate, 1% PE, 50 ng/mL NGF, 50 ng/µL GDNF, 4 µM APH). Cells were centrifuged at 1000 g for 5 minutes, and the pellet resuspended in complete media before seeding into compartmentalized microfluidic chambers (Xona Microfluidics, Xona SND 150) pre-coated with laminin 20 µg/mL for 1 hour, 37°C. Then 10 µL of dissociated DRGs were seeded into the designated channel (approximately 30 DRGs in each).
● PC12 cell line culture and lentiviral transfection

2
PC12 cells from ATCC were grown in RPMI 1640 medium (Gibco) supplemented with 10% horse serum, 5% of fetal bovine serum and antibiotics (penicillin and streptomycin), at 37°C with 5% CO2. Plastic surfaces were coated with 8 µg/cm2 collagen I from rat tail. Neuronal differentiation was achieved by removing growth factors and antibiotics and exposing cells to 100 ng/mL of NGF 2.5S for at least 72 h. To achieve PDCD4 silencing, commercial lentiviral viral particles from Dharmacon GE, with an inducible shRNA against PDCD4, were used. After transfection, cells were grown in complete medium for 24 hrs and selected with 5 µg/mL of puromycin for 3-5 days. Cells were then cultured in complete medium to obtain stable cell lines able to induce silencing of PDCD4 or express a scrambled shRNA control.
● Neuroblastoma (Neuro2a) Cell line culture Neuro2a cells were a kind gift from Robert Layfield lab, University of Nottingham, UK. Cells were maintained in DMEM, 10% FCS, 1% PS and seeded on 12-well plates at 1.5x10⁵ cells/well. siRNA and plasmid transfections In the primary cortical neuron and Neuro2a cell line, transfections were performed 24 hours after neuron seeding (day 2 of cell culture) using Lipofectamine 2000 (Invitrogen) as suggested by manufacturer’s instructions. 25 nM of siGENOME Mouse Pdcd4 SMARTpool 5 nmol (catalog number M-044032-01-0005) and siGENOME Non-Targeting siRNA Control Pool N°1 5 nmol (catalog number D-001206-13-05) both from GE Healthcare Dharmacon-Horyzon Solutions, using Lipofectamine 2000 (Invitrogen, Thermo Scientific), following the manufacturer's instructions. For plasmid transfections the PDCD4-pcDNA 3.1 (zero) was kindly gifted by Yang Hsin-Sheng, with empty plasmid used as a control. Both plasmids were applied at 2 µg final concentration and added 24 hours after neuron seeding (day 2 of cell culture). To identify transfected cortical neurons the siRNA and PDCD4 plasmids were co-transfected with pmax-GFP Green-cat (ThermoScientific) 1 µg of final concentration and cells were fixed 72 hours after transfection (day 5 of cell culture). In the specific case of primary DRG neuron cultures, the cell permeable Accell SMARTPOOL Pdcd4 siRNA 5 nmol (catalog number E-097927-00-0005) or Accell Non Targeting Pool 5 nmol (catalog number D-001910-10-05) both from Healthcare Dharmacon - Horyzon Solutions were incubated at 1 µM final concentration in the cell body side of compartmentalized chambers after DRGs develop neurites. 96 hours later neurons were fixed. Semi-quantitative Real Time PCR PDCD4 quantification in PC12 cells was performed by semi-quantitative real time PCR and ΔΔCt method (Livak and Schmittgen 2001). For this, RNA was isolated using Trizol (Invitrogen, Cat#15596026) or mirVana isolation kit (ThermoFisher, Cat# AM1560). Genomic DNA was removed by DNAse treatment (Invitrogen, Cat#AM2222) and RNA was re-isolated by the same method. cDNA was produced by retrotranscription by SuperScript II (Invitrogen, Cat#18064014) or III (Invitrogen, Cat#18080044) reverse transcriptase and quantified with SYBR Green Master Mix (Applied Biosystems, Cat#A25742) in Corbett Rotor-Gene 6000 instrument with the following PCR conditions: 10 minutes at 95°C, 40 cycles of: 15 seconds at 95°C, 15 seconds at 58°C and 45 seconds at 60°C; and 72°C to 90°C melting. In all cases, three independent biological replicates were used to evaluate significant differences by Student’s test using RPL29 gene as housekeeping (Zhou et al. 2010). For primary DRGs cultures, E18 rat embryos were cultured at two channel compartmentalized microfluidic chambers as described in the previous section. Axonal RNA was obtained as described previously (Garcez et al. 2016). To obtain cDNA, 50 ng of RNA were retrotranscribed by Superscript III reverse transcriptase (ThermoFisher, Cat#18080093) according to manufacturer instructions. The qPCR was performed using PowerUp SYBR Green (Applied Biosystems) in an Applied Biosystems Step One Plus thermocycler, using cycling parameters recommended by Applied Biosystems (mRNA). Data was acquired with Applied Biosystems SDS2.3 software. As above, RPL-29 gene was used as housekeeping gene (Zhou et al. 2010). Primers sequences were obtained from literature: PDCD4 forward: 5'-TGAGCACGGAGATACGAACGA-3' and PDCD4 reverse: 5'-GCTAAGGACACTGCCAACACG-3' from (Liu et al. 2010), RPL29 forward: 5'-CAAGTCCAAGAACCACACCAC-3' and RPL29 reverse: 5'-GCAAAGCGCATGTTCCTCAG-3' from (Parker et al. 2013). Immunohistochemistry and immunocytochemistry
● Tissue sections For brain, cerebellum and sciatic nerve tissue, rats were intracardially perfused with 3% sodium citrate and then 4% PFA in PBS buffer. Tissue extraction was done after two hours of perfusion, and a final fixation step was performed overnight (ON), 4°C for brain and cerebellum and 1 hour at RT for sciatic nerves. 3x10 minutes washes in PBS and cryo-protection steps with successive incubations in 15 and

3
30% sucrose ON, 4°C for one and two days respectively were performed. Cryosections of 20 µm were collected on glass slides pre-treated with Poly-L-Lysine 0.1% in mQ water. Permeabilization with 0.5% Triton in the PHEM buffer for 20 minutes at RT, 3x5 washes in PHEM buffer and blocking in 3% BSA, 1% glycine for 30 minutes at RT were developed. Incubation with the primary and secondary antibodies was performed in a blocking buffer with 5% NGS, ON at 4°C with 3x10 minutes washes in buffer PHEM between and after incubation.
● Primary neurons and cell lines For cortical, DRG neurons, PC12 and Neuro2a cell lines, the media was removed, and cells rinsed with PBS and fixed with 4% PFA with 5 mM CaCl2 and 4% sucrose in PBS buffer for 30 minutes (RT). Cells were permeabilized in 0.2% Triton + 10 mM glycine in PBS for 20 minutes at RT. Incubation with the primary antibody was made in 3% BSA ON at 4°C, while incubation with secondary antibodies was made in the same buffer for 2 hours at RT. Cells were mounted using Vectashield with DAPI or Pro-Long Antifade reagent. List of antibodies and probes Rabbit polyclonal PDCD4 antibody (dilution 1:200) Abcam (ab51495); Mouse monoclonal MAG antibody (dilution 1:1500) Millipore (Cat#MAB1567); Mouse monoclonal antibody Phospho-p70 S6 Kinase (Thr389) (1A5) (dilution 1:400) CellSignaling (#9206); Mouse Monoclonal Anti-Acetylated Tubulin antibody (dilution (1:1000) Sigma - Aldrich (Cat#T7451); Alexa Fluor 555 Phalloidin (dilution 1:150) Invitrogen-ThermoFisher (Cat#A34055); Alexa Fluor 647 Phalloidin (dilution 1:150) Invitrogen-ThermoFisher (Cat#A22287); Goat anti-Mouse IgG, (H+L) HRP conjugate antibody Millipore (Cat# AP308P); Swine anti-rabbit IgG HRP antibody Dako (Cat# P0217); Goat anti-Mouse IgG (H+L) Cross-Adsorbed Secondary Antibody Alexa Fluor 488 (dilution 1:1000) ThermoFisher (Cat# A-11001); Goat anti-Mouse IgG (H+L) Secondary Antibody, Alexa Fluor 555 conjugate (dilution 1:1000) ThermoFisher (Cat# A-21422); Goat Anti-Mouse IgG (H+L) Antibody Alexa Fluor 633 Conjugated (dilution: 1:1000) ThermoFisher (Cat# A-21052); DAPI (dilution 1:2000) ThermoFisher (Cat#D1306).
Puro-PLA protocol A total of 2 independent experiments were made. Ventral roots were extracted from adult rats and incubated in neurobasal media with puromycin at 300 µM final concentration for 15 and 30 minutes or without puromycin as a control condition. Then a fixation with 4% PFA for 1 hour was performed and cryosections were made as described above. The PLA protocol was carried-out according to the manufacturer's instructions of DuoLink, Sigma using the following reagents: Duolink® In Situ PLA® Probe Anti-Rabbit PLUS dilution 1/5 (Cat#DUO92002-30RXN), Duolink® In Situ PLA® Probe Anti-Mouse MINUS dilution 1/5 (Cat#DUO92004-30RXN), Duolink® In Situ Detection Reagents FarRed (DUO92013-30RXN). Protein extraction and western blot protocol for Neuro2a cell line A total of 3 independent experiments were performed. Cells were scraped 72 h after transfection, lysed with 150 µL of RIPA (50 mM Tris-HCl, pH 8.0, with 150 mM sodium chloride, 1.0% Igepal CA-630 (NP-40), 0.5% sodium deoxycholate and 0.1% sodium dodecyl sulphate), centrifuged for 20 min at 12,000g and supernatants collected and run on a 12% SDS-PAGE gel. Proteins were separated by standard electrophoresis protocol. For blocking step 5% milk in TBST (TBS buffer with Tween-20 0.1%) was used for 1 hour at RT. The primary antibodies were incubated ON, 4°C and a chemiluminescence protocol was performed using HRP secondary antibodies. The enzyme substrate was the Supersignal West femto-maximum sensitivity substrate revealed and was incubated for 1 minute and then washed with blocking buffer. Western blot bands were detected with a Las 3000 mini from FUJIFILM using the accumulated signal method. Image acquisition Neo-cortex, cerebellum, sciatic nerves and PC12 cells images were taken on the LSM confocal OLYMPUS FV300 using a 60X oil, NA 1.42 objective. The software for controlling the microscope and taking the images was the Fluoview version 5.0c. For primary cultures, an inverted fluorescent microscope ZEISS axiovert 200M coupled to a CCD camera (Photometrics CoolSnap MYO) was used. For axon length images, a 10X air NA 0.3 or 20X air NA 0.8 were used, while quantification of immunofluorescence used a 63X oil NA 1.3. The micromanager software version 1.4 was employed to acquire the images and control the microscope. For PLA experiments on ventral roots an LSM confocal ZEISS 800 was used. A 63x oil, NA 1.4 premium objective adapted for AiryScan was used for image acquisition. The stacks were always taken at ideal

4
μm number between each z plane. The software for controlling the microscope and taking the images was the ZEN Blue version 2.3. Image quantification and analysis In all image quantification analysis, we kept the same PMT (below 700 V) and/or time exposures of the camera in order to compare control and experimental conditions. We also kept the same PMT (below 700 V) and same laser intensities for each experiment between conditions, with all the images from each experimental group taken on the same day.
● Quantification of fluorescence Quantification of expression levels from immunofluorescence signals at different regions of interest (ROIs) was made with Fiji (Just ImageJ) software (Schindelin et al. 2012). Following the selection of ROIs, the Raw_Integrated_Density was calculated and divided by the size of the selected area. For each condition an average of these values was calculated and normalized against its control. The value for the controls was defined as 1. For the selection of ROIs in cortical and DRG neurons the acetylated tubulin was used to define subcellular compartments. For quantitative analysis in cortical neurons a total of 292 cell bodies and 129 axons were quantified from three independent experiments (unless as indicated for day 12) In experiments with sciatic nerve ventral roots axoplasms, MAG, phalloidin and light-chain neurofilament 68 KDa were used as counter-stains.
● Quantification of axonal length of cortical neurons Images were taken from at least four independent preparations. GFP-positive neurons were assessed with axons defined as a neurite that was longer than 80 μm and at least three times the length of other processes, measured from the cell body to the distal extent of the central region of the growth cone. Selected axon projections were measured using ImageJ, and the data expressed as percentage of the respective controls. For determination of axon versus branch, the axon was defined as the process that remained parallel to the axon segment proximal to the branch point. Branches were defined as processes extending at orthogonal angles to the axon. Total length of axon branches was not included in the measurement. The average length of axons in control groups was ± 341 μm (mean ± 14.92). The average for each experimental condition (siRNA PDCD4 or plasmid PDCD4) was normalized against its control. A total number of ~400 cortical axons were measured per condition for the PDCD4 overexpression analysis and ~600 axons per condition for the PDCD4 silencing analysis. The n number was defined as separate experiments from independent neuronal preparations for all conditions.
● Quantification of axonal length of DRG neurons A stitched image of the entire axonal channel of the microfluidic chambers stained for axons (acetylated tubulin) was obtained using micromanager software and the stitching plugin of Fiji software for each axonal microfluidic compartment. A total of 4 independent experiments with siRNA control chambers and 3 with siRNA of Pdcd4 were used (in total 9 siRNA Control and 7 siRNA PDCD4 chambers were used). Image analysis for neuron growth was processed using the Neuron_Growth plugin software developed by Fanti & collaborators at the Universidad Nacional Autónoma de México (http://www.ifc.unam.mx/ffm/conditions.html). The same software settings were used for all images and the percentage of the area covered by the axons was quantified. Average values were calculated for the siRNA control chambers and for the siRNA PDCD4 chambers and normalized to the internal control.
● Quantification of neurite length of differentiated PC12 cells Images were taken from five independent preparations. For quantifying neurite length of differentiated PC12 cells in the presence and absence of PDCD4, three independent cell cultures were growth for each condition. After 72 h of shRNA induction, cells were exposed to NGF for 72 h to achieve neuron-like differentiation. The free line tool of ImageJ was used to mark neurites in several optic fields for each culture and length was quantified. An average of 80 neurites were quantified per replicate. Neurite length was contrasted in the two conditions comparing 3 vs 3 averages per replicate
● Puro-PLA Pdcd4 spots quantifications Fiji (just ImageJ) software was used to quantify PLA signal. After selection of axoplasm regions (counterstained with phalloidin and/or light-chain-neurofilament) from Z-stack images a z project with maximum intensity projection algorithm was used to obtain a single image with all the PLA spots for each stack. Then a threshold was defined to detect each spot as black and the rest as white. Then the “analyze particles” algorithm was used with the size between 0.20-10 in all cases. The “masks display exclude clear” algorithm was used to count and see the mask on each spot and to control if the protocol was adequately working for each image. The experiment without puromycin was used as a control condition and the count of PLA/area were defined as “1”. Following this, the PLA counts for 15 minutes and 30 minutes exposure to puromycin were normalized to the control.
● Western Blot quantification

5
Images were obtained with the same exposure settings. Fiji (Just ImageJ) gel quantification software was used selecting ROIs equal to the biggest protein band for each image. Each band was quantified and then divided by the one corresponding to actin (control band) for each line. The values corresponding to siRNA PDCD4 were expressed as a percent of the siRNA control. Ribosome Profiling After 72 h of 100 ng/mL NGF 2.5S and 500 ng/mL doxycycline exposure, to achieve neuronal differentiation and shRNA expression, 80x106 cells per condition were used to isolate total RNA and polysomes, in two biological replicates per condition. For this, cells were treated with 100 mg/µL of cycloheximide (CHX) for 1 hour at 37°C in the hood to stop translation before collection of RNA on ice. A Transcriptome sample was separated to use as total RNA control and submitted to RNA extraction using mirVana isolation kit (ThermoFisher, Cat# AM1560) and RNA-Seq protocol. At the same time, a proteome sample was separated and submitted to label-free quantitative proteomics using an Orbitrap Fusion. For translatome samples, cells were lysed and post mitochondrial supernatant was loaded in a 12%-33.5% sucrose cushion and ultracentrifugated in SW40Ti rotor at 35,000 RPM for 2:45 hrs at 4°C. Polysomal pellet was resuspended and digested with 200 U of Benzonase for 10 minutes at RT. Digestion was stopped with mirVana Lysis Buffer to continue with RNA isolation. Ribosomal footprints were isolated running a denaturalized 15% PAGE 7M urea, cutting the proper band identified by length (~30nt) and extracting RNA from gel slice. Ribosomal footprints (Translatome sample) are then concentrated by precipitation and quality and quantity checked using 2100 Agilent Bioanalyzer Small RNA Kit. Sequencing and bioinformatic analysis All transcriptome and translatome samples were sequenced in BGI Tech Solutions. Transcriptome samples were submitted to RNA-Seq Quantification Library (Normal Library: 2-10 μg) protocol, using poly(A)+ selection and 20 millions of paired-end (2x100 bp) reads were obtained. Translatome samples were submitted to Small RNA Library (Low-Input Library: 0.2-1 μg) protocol and 40 millions of single-end reads were obtained. Fastq files obtained were analyzed using servers available in the Genomics Department at IIBCE. Sequences were mapped using bowtie2 (Langmead and Salzberg 2012) versus curated mRNAs described in the mouse genome (available at NCBI ftp site). For translatome samples, sequences were first mapped against Rattus norvegicus rRNA genes to remove contamination. Reads counts were estimated by featureCounts (Liao et al. 2014) and differential gene expression analysis between transcriptomes or translatomes was done using edgeR (Robinson et al. 2010). Normalized counts were exported and translational efficiency was calculated and contrasted between conditions (shPDCD4 vs shScrambled) using Xtail R package (Xiao et al. 2016). Gene lists analysis were performed using on-line free tools like STRING (Jensen et al. 2009) and an in-house software (manuscript in preparation; https://github.com/sradiouy/IdMiner). Protein samples were submitted to label-free quantitative proteomics using an LC-MS/MS Orbitrap Fusion instrument. Protein intensity values (LFQ/iBAQ) were averaged and statistical differences were reported using ANOVA. General statistical analysis All data groups shown are expressed as the mean ± SEM and the probability distribution of the data set was analyzed before further statistical analysis. Normality tests were made for all the data sets. With normal data, a two tailed t-student test was performed or paired t test for plasmid and siRNA axonal length quantifications. If the data sets don't pass the normality tests, a Mann Whitney test was used. In all cases p values less or equal to 0.05 were considered as significant. Each “n” was defined as an independent experiment from a separate culture preparation. The following general code was used: (*): p value <0.05; (**): p value <0.01; (***): p value <0.001.

6
Supplementary Figures Legends. Figure S1. (A) Fluorescent image of cortical neurons overexpressing PDCD4: GFP and PDCD4 expression is shown in cortical neurons transfected with a PDCD4 cDNA plasmid or with a pcDNA control plasmid. In both cases, a GFP co-transfected plasmid was used as a positive evidence of transfection. White arrows indicate the transfected neurons (scale bar 20 µm). The right panel shows quantification of PDCD4 levels, detecting an increase of 2.3 fold compared to the control condition (p value (***) ≤0.001, two tailed Mann Whitney test, n=3 with 3 technical replicates, error bars: SEM). (B) Same as (A) but for cortical neurons were PDCD4 was knockdown using a mix of 4 siRNA sequences against PDCD4 (Dharmacon siRNA SMARTPOOL) or a mix of 4 scrambled siRNA sequences as control. Again a GFP co-transfected plasmid was used, and the white arrows show the transfected neurons (scale bar 20 µm). The right panel shows quantification of PDCD4 levels, detecting a decrease of 0.66 fold compared to the control (p value (**) ≤0.01, two tailed Mann Whitney test, n=3 with 3 technical replicates, error bars: SEM). (C) Fluorescent image of DRG neurons were PDCD4 was knockdown using 4 cell permeable siRNA sequences against PDCD4 (Dharmacon Accell siRNA SMARTPOOL) or a mix of 4 Accell scrambled siRNA sequences as control. Tubulin and PDCD4 expression is shown (scale bar 20 µm). The right panel shows quantification of PDCD4 levels detecting a decrease of 0.65 fold compared to the control (p value (*) ≤0.02, two tailed Mann Whitney test, n=3 with 3 technical replicates, error bars: SEM). (D) To test if the siRNA probes or plasmids have an effect on total PDCD4 protein levels, we transfect N2A cell line, as a high transfection efficiency model. PDCD4 expression is shown by western blot as the upper bands, while lower bands correspond to actin as a loading control. The right panel shows relative quantification of PDCD4 Western Blots bands (p value (***) ≤0.001 and p value (*) ≤0.02, two tailed Mann Whitney test, n=3 with 2 technical replicates, error bars: SEM). Figure S2. PDCD4 expression silenced by inducible shRNA in the PC12 cell line. Inducible PDCD4 silencing in PC12 cells was achieved by lentiviral transfection and confirmed by semi-quantitative RealTime PCR and immunofluorescence. (A) PDCD4 expression was followed at different time points of NGF-induced neuron differentiation in wt PC12 cells using immunofluorescence. (B) Neuron-like phenotype achieved in PC12 cells after 72 h of NGF exposure, evidenced by phase contrast microscopy. (C) PDCD4 expression evaluated by immunofluorescence was analyzed in PC12-shScrambled and PC12-shPDCD4 cells after NGF exposure alone or with shRNA expression induction by doxycycline (DOX). Illustrative images are shown. (D) PDCD4 signal quantification shows a high decrease in PDCD4 only in PC12-shPDCD4 exposed to NGF+DOX (p value (**) <0.01, One-way ANOVA with post-hoc Tukey test; n=2 with almost 150 cells analyzed per replicate). (E) PDCD4 silencing was also confirmed by semi-quantitative RealTime PCR (p value (***) <0.001, Student’s t test, n=3, error bars: SD). (F) GFP expression was also monitored by immunofluorescence as an indication of shRNA expression induction by DOX. Illustrative images are shown. (G) Quantification of GFP signal shows insignificant levels in absence of DOX while considering levels when is present. Differences were statistically significant (p value (**) <0.01, one-way ANOVA with post-hoc Tukey test, n=2 with almost 150 cells analyzed per replicate). In A-C and F scale bars means 20 µm. Figure S3. RNA-Seq and Ribo-Seq data were analyzed individually by edgeR. (A) Ribosomal footprints periodicity was explored comparing 5’-end read mapping distribution among the three codon nucleotides. Each dot represents a fraction of reads in each position for each sample (transcriptome RNA-Seq derived and translatome Ribo-Seq derived). For translatome samples the first position in the codon tends to be enriched but for transcriptome samples distribution tends to be uniform. (B) Mapping distribution among mRNA features was studied comparing 5’UTR, CDS and 3’-UTR expression and comparing between transcriptomes and translatomes. In the first, the three regions are expressed while for translatome samples CDS is preferentially expressed over UTRs regions. (C) Inter-replicate Pearson correlation value is shown for transcriptome and translatome samples, in the two conditions (shScrambled and shPDCD4). (D) and (E) Volcano and MA plot, respectively, for transcriptome compartment (RNA-Seq). (F) and (G), same as (D) and (E) but for translatome compartment (Ribo-Seq). In D-G red and green dots indicate differentially expressed genes, up- and down-regulated, respectively (|fold change| >2 and p value <0.05).

7
Figure S4. Heatmap of potential PDCD4 targets. RNA-Seq and Ribo-Seq expression levels in PDCD4 presence and absence (shScrambled and shPDCD4, respectively) is shown for the 267 putative PDCD4 mRNA targets.
Figure S5. Quantification and comparison of protein abundance in PDCD4 presence and absence (shScrambled and shPDCD4, respectively) by label-free quantitative proteomics. (A) Scatter plot comparing protein abundance (LFQ/iBAQ values) in shScrambled and shPDCD4 conditions. Red and green dots indicate differentially expressed proteins, up- and down-regulated respectively (p value <0.05 estimated by ANOVA). PDCD4 is indicated in the scatter where the knock-down could be also evidenced. (B) Correlation between fold change values estimated by proteomics and Ribo-Seq for 87 differentially expressed proteins at the proteome that also show the same direction of change in the Ribo-Seq data.
Figure S6. Functional protein association network by STRING for PDCD4 putative translational targets defined by translational efficiency criteria (A) and for the opposite direction genes (B). In (A) the 4 functional-related clusters discussed in the text are indicated: Cluster 1 in blue, highlighting genes associated to mitosis and cell cycle; Cluster 2 in red, highlighting genes associated to the nucleus; Cluster 3 correspond to mitochondrial activity and Cluster 4 in yellow, highlighting genes associated to protein export. Disconnected nodes are hidden in (A) but shown in (B) for illustrative reasons.
Figure S7. Lentiviral shPDCD4 on cortical neurons cultured in vitro upregulates total levels of NFKB2 measured by Western Blot. (A) Cortical neurons were transfected with increasing amounts of lentiviral particles (+ and ++) containing shPDCD4 sequences, or with vehicle (no lentiviral particles). Western blot bands for PDCD4, NFKB2 and TUBB3 as non-target control are shown in each case. (B) Relative quantitation of PDCD4 and NFKB2 levels in each condition is shown. While levels of PDCD4 descend down to three-fold with increasing lentiviral particles, NFKB2 levels increase more than two fold.
Figure S8. Comparison of down-regulated mRNAs targets after PDCD4 knockdown with previously reported axonal transcriptomes. (A) Venn diagram showing the intersection between TE down-regulated mRNAs by PDCD4 and axonal transcriptomes described in Figure 4B. Separate and overlapping expressions between samples are shown. Only transcripts with a level of expression of TPM ≥ 1 were considered. (B) The table shows the type of neuron used in each study, the total genes detected and the number of common genes between potential PDCD4 targets (or potential PDCD4 targets related to axonal growth) and each axonal transcriptome. The EASE Score (a modified Fisher Exact p-value) is also shown, which indicates gene-enrichment.

8
Figure S1
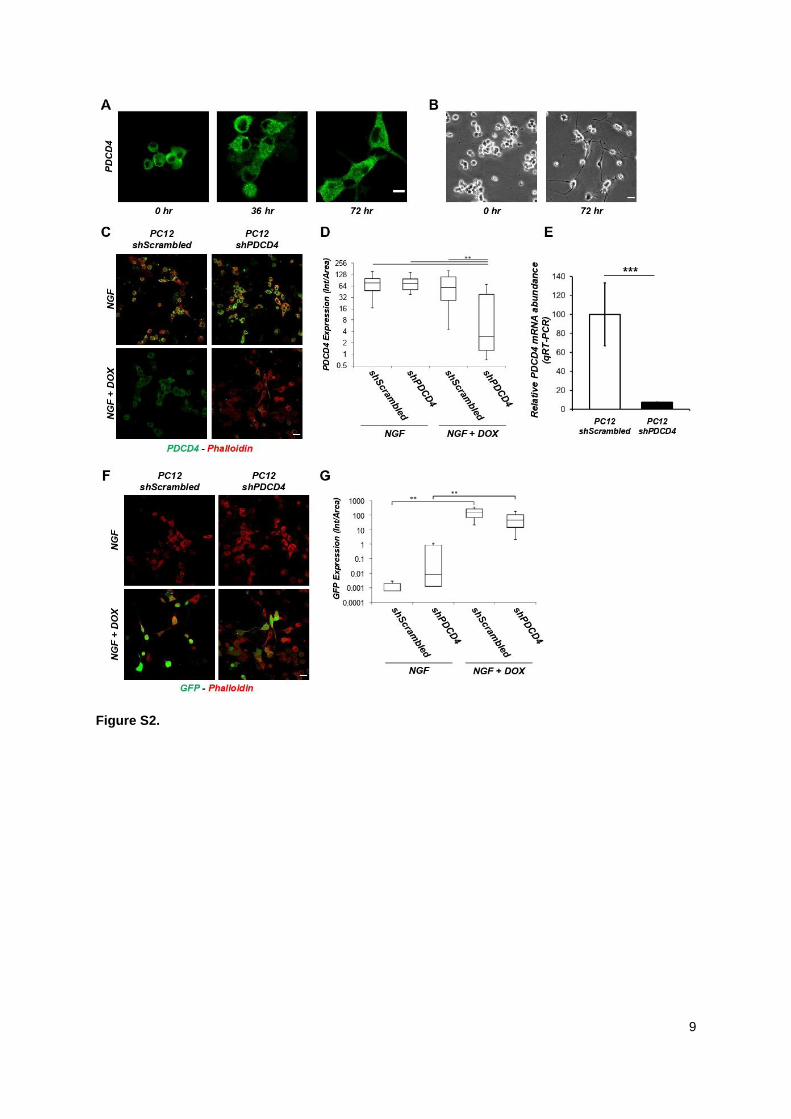
9
Figure S2.
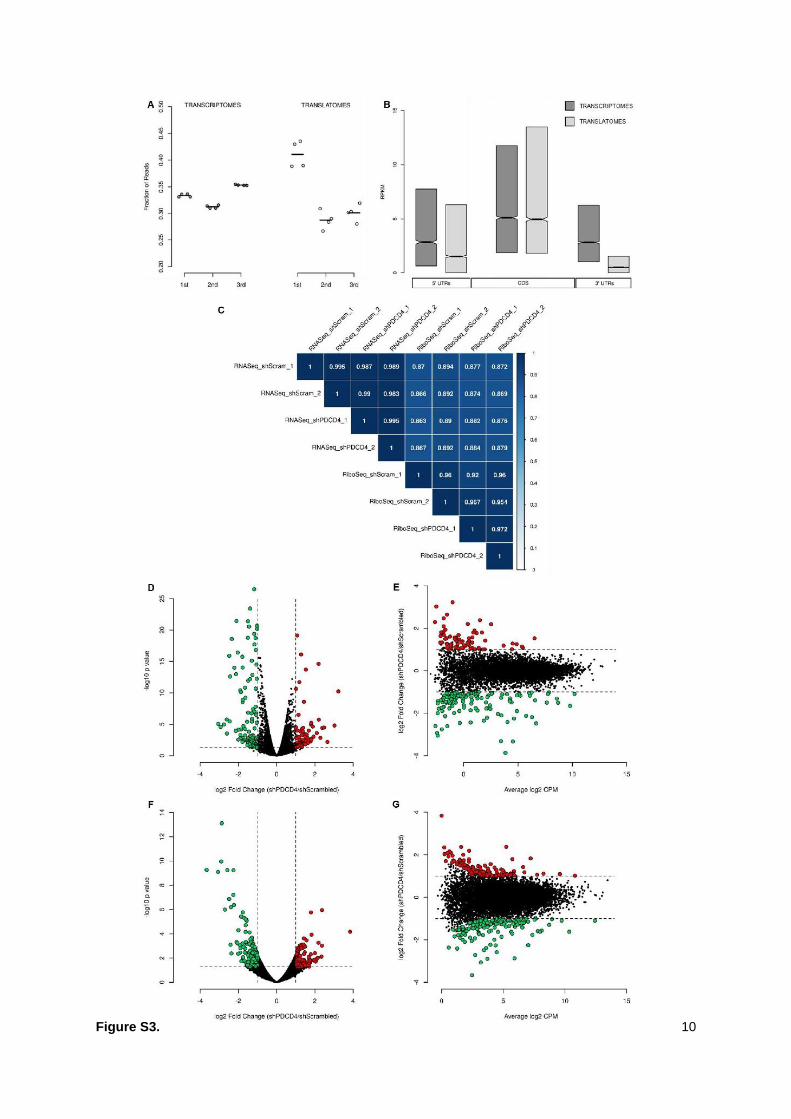
10
Figure S3.

11
Figure S4.

12
Figure S5.

13
Figure S6.

14
Figure S7.

15
Figure S8.

16
Supplementary Tables Legends. Table S1. Total number of reads sequenced and mapped in both transcriptome and translatome samples. Table S2. Average RPKM expression values, log2 fold change in translational efficiency and p values for putative PDCD4 targets.
17
SI References
Garcez PP, Guillemot F, Dajas-Bailador F. 2016. Study of miRNA Function in the Developing Axons of Mouse Cortical Neurons: Use of Compartmentalized Microfluidic Chambers and In Utero Electroporation. MicroRNA Technologies 59–71. http://dx.doi.org/10.1007/7657_2016_12.
Jensen LJ, Kuhn M, Stark M, Chaffron S, Creevey C, Muller J, Doerks T, Julien P, Roth A, Simonovic M, et al. 2009. STRING 8--a global view on proteins and their functional interactions in 630 organisms. Nucleic Acids Res 37: D412–6.
Langmead B, Salzberg SL. 2012. Fast gapped-read alignment with Bowtie 2. Nat Methods 9: 357–
359.
Liao Y, Smyth GK, Shi W. 2014. featureCounts: an efficient general purpose program for assigning sequence reads to genomic features. Bioinformatics 30: 923–930.
Liu X, Cheng Y, Yang J, Krall TJ, Huo Y, Zhang C. 2010. An essential role of PDCD4 in vascular smooth muscle cell apoptosis and proliferation: implications for vascular disease. Am J Physiol Cell Physiol 298: C1481–8.
Livak KJ, Schmittgen TD. 2001. Analysis of Relative Gene Expression Data Using Real-Time Quantitative PCR and the 2−ΔΔCT Method. Methods 25: 402–408.
http://dx.doi.org/10.1006/meth.2001.1262.
Lucci C, Mesquita-Ribeiro R, Rathbone A, Dajas-Bailador F. 2020. Spatiotemporal regulation of GSK3β levels by miRNA-26a controls axon development in cortical neurons. Development 147.
http://dx.doi.org/10.1242/dev.180232.
Parker SS, Mandell EK, Hapak SM, Maskaykina IY, Kusne Y, Kim J-Y, Moy JK, St John PA, Wilson JM, Gothard KM, et al. 2013. Competing molecular interactions of aPKC isoforms regulate neuronal polarity. Proc Natl Acad Sci U S A 110: 14450–14455.
Robinson MD, McCarthy DJ, Smyth GK. 2010. edgeR: a Bioconductor package for differential expression analysis of digital gene expression data. Bioinformatics 26: 139–140.
Schindelin J, Arganda-Carreras I, Frise E, Kaynig V, Longair M, Pietzsch T, Preibisch S, Rueden C, Saalfeld S, Schmid B, et al. 2012. Fiji: an open-source platform for biological-image analysis. Nat Methods 9: 676–682.
Xiao Z, Zou Q, Liu Y, Yang X. 2016. Genome-wide assessment of differential translations with ribosome profiling data. Nat Commun 7: 11194.
Zhou L, Lim Q-E, Wan G, Too H-P. 2010. Normalization with genes encoding ribosomal proteins but not GAPDH provides an accurate quantification of gene expressions in neuronal differentiation of PC12 cells. BMC Genomics 11: 75. http://dx.doi.org/10.1186/1471-2164-11-75.

62
Regulación traduccional de PDCD4 sobre el ARNm de Nfkb2
En la publicación anterior se presenta como ejemplo de regulación traduccional ejercida por
PDCD4 el caso de Nfkb2. Como se describe en la publicación, considerando el particular rol
que cumple dicho gen en el crecimiento neurítico se procedió a verificar el control negativo
que ejerce PDCD4 sobre la expresión traduccional del ARNm de Nfkb2. De esta manera, se
mostró mediante Western blot que silenciar la expresión de PDCD4 en cultivos de neuronas
corticales aumenta significativamente la abundancia proteica de NFKB2, respecto del control
(ver Figura Suplementaria 7 de Di Paolo & Eastman et. al RNA 2020). Con el objetivo de
complementar la evidencia a favor de dicha regulación, nos propusimos también cuantificar la
abundancia del ARNm de Nfkb2 en distintas fracciones de un gradiente polisomal en
presencia y ausencia de PDCD4. Efectivamente pudimos confirmar que en ausencia de
PDCD4, la cantidad de ARNm de Nfkb2 aumenta en las fracciones polisomales respecto del
control en presencia de PDCD4, como se describe a continuación.
Materiales y Métodos
● Cuantificación de la abundancia de ARNm en distintas fracciones polisomales
El mismo protocolo que el descrito para Ribo-Seq en el trabajo publicado II fue utilizado para
producir perfiles polisomales a partir de células PC12 diferenciadas a neuronas en presencia
y ausencia de PDCD4. En este caso, el sobrenadante postmitocondrial fue cargado en
gradientes lineales de sacarosa de 10% a 50% y ultracentrifugado en un rotor SW40Ti a
35.000 RPM por 2 horas a 4°C. Como control se utilizó 25 mM de EDTA para desensamblar
los polisomas. El perfil polisomal fue visualizado mediante un detector UV en línea (Cole-
Parmer) y se colectaron distintas fracciones. El ARN se purificó mediante Trizol (Invitrogen) y
se generó ADN copia mediante retrotranscripción (SuperScript II y III, Invitrogen). La
cuantificación relativa de los genes se realizó mediante el kit SYBR Green Master Mix
(Invitrogen) en el equipo BioRad CFX96 Touch™ Real-Time PCR Detection System. Las
secuencias de los cebadores utilizados fue diseñada con la herramienta Primer-BLAST del
NCBI y se muestran a continuación: NFKB2 forward: 5'-AGCATTGTACGGCTACGCTT-3',
NFKB2 reverse: 5'-GGAGACTTGCTGTCGTGGAT-3'.

63
Resultados
● El ARNm de Nfkb2 aumenta su abundancia en las fracciones polisomales tras silenciar
PDCD4.
Con el objetivo de visualizar mediante técnicas ortogonales el aumento en los niveles
traduccionales de blancos relevantes de PDCD4, nos propusimos colectar distintas fracciones
de un gradiente polisomal y evaluar la cantidad relativa de ARNm en cada fracción, en
presencia y ausencia de PDCD4. De esta manera, preparamos perfiles polisomales que
registramos en línea mediante cuantificación de absorbancia a λ=254 nm. Los picos
correspondientes tanto a las subunidades 40S y 60S del ribosoma, así como el ribosoma
completo, y la región polisomal fueron evidenciados mediante el tratamiento de la muestra
con 25 mM de EDTA, lo cual desensambla los ribosomas (ver Figura IV.1 A). Seleccionamos
entonces tres distintas regiones del gradiente que se corresponden a fracciones libres de
polisomas, con polisomas livianos o con polisomas pesados. La abundancia relativa de los
ARNm de Pdcd4 y Nfkb2, blanco traduccional de PDCD4 y regulador clave del crecimiento
neurítico en células PC12, fue evaluada mediante RT-PCR en tiempo real. Los resultados
muestran que para Pdcd4 se observa una disminución en la cantidad de ARNm que ingresa
en las fracciones polisomales, como es de esperarse, tras el silenciamiento. Por su parte, para
Nfkb2, observamos que en la condición sin PDCD4 la cantidad de ARNm aumenta en las
fracciones polisomales, en especial en la fracción de polisomas livianos (ver Figura IV.1 B).
Discusión
En este primer capítulo nos propusimos como objetivo determinar el rol de PDCD4 en modelos
neuronales y explorar su posibles ARNm blancos traduccionales. Para esto utilizamos la línea
celular PC12, capaz de diferenciar a un tipo neuronal tras exposición a NGF, y utilizando
vectores lentivirales producimos un modelo capaz de silenciar de manera inducible la
expresión de PDCD4, así como su respectivo control. Resultados obtenidos en simultáneo en
nuestro laboratorio, e incluidos en el trabajo publicado II presentado antes, mostraban que
PDCD4 podía regular el crecimiento axonal en neuronas corticales primarias y del ganglio de
la raíz dorsal. Por esta razón, primero exploramos si en nuestro modelo celular tipo neuronal
se observaba el mismo efecto sobre el crecimiento de neuritas. Efectivamente demostramos
que el silenciamiento de PDCD4 determina que las células PC12 diferenciadas presenten
neuritas más largas (en promedio 1,6 veces más largas; p valor = 0.052; ver trabajo publicado
II).

64
--------------------------------------------------------------------------------------------------------------------------- Figura IV.1. Cuantificación de Pdcd4 y Nfkb2 en distintas fracciones de un gradiente polisomal en presencia y ausencia de PDCD4. (A) Se muestra un perfil polisomal obtenido a partir de células PC12. La cantidad de ARN representada por el valor de absorbancia a 254 nm es graficado versus la posición en el gradiente de sacarosa de 10% a 50%. El gráfico en negro muestra la condición tratada con cicloheximida (CHX) que detiene la traducción, mientras que el gráfico punteado muestra la condición tratada con 25 mM de EDTA que desensambla los polisomas. Los picos correspondientes a las subunidades 40S, 60S, el ribosoma (80S) y la fracción polisomal son indicados. Además se muestra el rango en el cual se colectaron las 3 fracciones analizadas correspondientes a (1) fracción libre de polisomas, (2) fracción de polisomas livianos y (3) fracción de polisomas pesados. (B) Se muestra la cuantificación relativa de ARNm para Pdcd4 (arriba) y Nfkb2 (abajo) por RT-PCR para las tres fracciones colectadas. En azul se muestra la condición Control (o shScrambled) y en rojo la condición con PDCD4 silenciado (shPDCD4). ---------------------------------------------------------------------------------------------------------------------------
Con el objetivo de conocer las funciones posiblemente reguladas por PDCD4 y describir los
posibles blancos traduccionales de dicho factor en modelos neuronales, aplicamos la técnica
de Ribo-Seq en el modelo celular neuronal descrito anteriormente. De esta manera definimos
una lista de 267 ARNm posibles blancos traduccionales de PDCD4 cuya eficiencia de
expresión traduccional aumenta de manera significativa en ausencia de PDCD4.
Considerando que el efecto observado sobre el crecimiento neurítico o axonal era conservado
en distintos modelos neuronales in vitro, exploramos la lista de blancos traduccionales de
PDCD4 en búsqueda de una firma génica asociada al crecimiento neurítico o axonal. De esta

65
manera, describimos un grupo de 36 genes cuya eficiencia traduccional se ve aumentada en
ausencia de PDCD4 y cuyas funciones biológicas descritas están directamente asociadas al
crecimiento neurítico o axonal. Un ejemplo relevante es el gen de Nfkb2 que describimos
como blanco traduccional de PDCD4 y que se ha demostrado promueve la neuritogénesis en
PC12 diferenciadas [77]. Pudimos confirmar de manera ortogonal la regulación ejercida por
PDCD4 en dicho gen tras evaluar la abundancia proteica de NFKB2 en presencia y ausencia
de PDCD4 en un modelo de neuronas corticales in vitro (ver trabajo publicado II). Resultados
similares se obtuvieron al evaluar las cantidades relativas del ARNm de dicho gen en distintas
fracciones polisomales en presencia y ausencia de PDCD4 (ver Figura IV.1). En este caso
observamos que la cantidad relativa del ARNm de Nfkb2 aumenta en las fracciones
correspondientes a los polisomas luego de silenciar PDCD4, lo cual confirmaría también su
denominación como blanco traduccional de PDCD4.

66
V. CAPÍTULO 2
OPTIMIZACIÓN Y APLICACIÓN DE LA TÉCNICA DE RIBO-SEQ EN MODELOS
NEURONALES IN VITRO E IN VIVO
Durante mi tesis de Maestría trabajamos en la puesta a punto y realización de la técnica Ribo-
Seq utilizando líneas celulares [50]. De esa manera fue que logramos aplicarla con éxito
utilizando la línea celular PC12 que es capaz de diferenciar a un modelo tipo neuronal, como
se mencionó anteriormente. Sin embargo, nos planteamos como un primer objetivo de este
capítulo evaluar la aplicación de Ribo-Seq en distintos modelos neuronales, como cultivos de
neuronas embrionarias o tejidos nerviosos provenientes de animales. Conociendo las
ventajas y limitaciones que cada modelo neuronal posee, disponer de la técnica en un
conjunto variado de sustratos nos aportaría un valor adicional.
Como fuera mencionado en la Introducción (ver Trabajo publicado I), el protocolo de Ribo-
Seq puede ser dividido en tres pasos principales: i) obtención de una muestra representativa
del estado traduccional celular; ii) ensayo de digestión de dicha muestra con ARNasas y
recuperación de las huellas ribosomales y iii) secuenciación masiva de dichos fragmentos y
posteriores análisis in silico. Respecto del primer punto, el protocolo que nuestro grupo de
trabajo ha desarrollado y aplicado previamente [78–80] implica la recuperación de la fracción
polisomal activa mediante ultracentrifugación del sobrenadante postmitocondrial en colchones
de sacarosa [81]. Este representa ser un paso crítico debido al generalmente bajo rendimiento
en la recuperación de ARN tras la ultracentrifugación, lo cual implica disponer de una gran
cantidad de material de partida. Lamentablemente, esto no es posible es todos los modelos
biológicos, en particular en modelos neuronales donde el número de células con las que se
trabaja suele ser bajo en comparación a las que podemos obtener de cultivos de líneas
celulares. En la literatura algunas alternativas han sido descritas para sobrellevar este
problema. Por un lado, un trabajo liderado por Hornstein del grupo de Peter Sims [82] describe
un protocolo para producir librerías de huellas ribosomales para secuenciación masiva sin
pasos de ligación, lo cual reduce la complejidad del protocolo y permite obtener resultados a
partir de cantidades muy pequeñas de huellas ribosomales (>1 ng). Este protocolo se base
en producir las librerías de ADN en una sola reacción donde se utiliza una retrotranscriptasa
con actividad de cambio de hebra (del inglés, template switching) utilizada comúnmente en
protocolos de construcción de librerías de low-input ARN para secuenciación de célula única
(single cell RNA-Seq). Por otro lado, el grupo de Chekulaeva, utilizando modelos neuronales
y contrastando diferencias entre el soma y las neuritas [83], realizó el ensayo de digestión
67
directamente sobre el sobrenadante postmitocondrial, sin posterior recuperación de la fracción
monosomal, y comparó los resultados con el protocolo clásico donde sí se recupera dicha
fracción luego del paso de digestión. En este caso, los autores compararon diversos
parámetros entre ambos protocolos, como el largo de las huellas ribosomales obtenidas, su
distribución de mapeo sobre las distintas regiones del ARNm, su periodicidad, entre otros. Los
resultados no muestran diferencias significativas entre ambos protocolos por lo cual los
autores eliminaron el paso de recuperación de la fracción monosomal, también realizado
mediante ultracentrifugación y que por lo tanto requiere de una gran cantidad de material de
partida.
Contemplando estos antecedentes y con el objetivo de aplicar el protocolo de Ribo-Seq en
distintos modelos neuronales in vitro e in vivo, transformamos los desafíos de cada modelo
en particular en objetivos específicos a optimizar. Por ejemplo, en el caso de los cultivos de
neuronas in vitro, donde la cantidad de células obtenidas es bajo, nos propusimos trabajar en
la optimización del protocolo suprimiendo el paso de ultracentrifugación. En líneas generales,
el protocolo se reduce a obtener un sobrenadante postmitocondrial sobre el cual se realiza el
ensayo de digestión y se procede luego a la directa separación y recuperación de huellas
ribosomales mediante PAGE. Por otro lado, en el caso del uso de muestras de tejido nervioso,
como pueden ser distintas secciones de cerebro, la limitante de la cantidad de células puede
ser solucionada aumentando la cantidad de tejido. De esta manera, en este caso el principal
desafío fue poner a punto la rápida obtención del sobrenadante postmitocondrial asegurando
la total lisis de las células y la integridad de los polisomas. En suma, brevemente, en cada
caso se ajustaron la cantidad inicial de material a utilizar, los protocolos de lisis celular y
obtención de polisomas, así como el posterior ensayo de protección con ARNasa.
Por otro lado, en segundo lugar en este capítulo, nos planteamos realizar un ensayo
comparativo utilizando dos ARNasas distintas, por un lado la enzima Benzonasa con la cual
solemos trabajar en nuestro laboratorio, y por el otro lado la enzima RNAsa I, ampliamente
utilizada en los trabajos que siguen la descripción del protocolo original [84].
Benzonasa es el nombre comercial que recibe la enzima extracelular secretada por la bacteria
Serratia marcescens, por lo que también se la conoce como endonucleasa Serratia [85,86].
Esta enzima es un dímero de dos subunidades de 245 aminoácidos y 30 kDa, con dos puentes
de disulfuro esenciales [86]. Muestra un patrón de digestión no específico y es capaz de
degradar tanto ARN, como ADN, ya sean simple o doble cadena, lineares o circulares. Por el
otro lado, la enzima RNAsa I, que se obtiene de Escherichia coli [87,88], tiene un tamaño de
27 kDa y digiere de manera no específica solamente ARN, con una marcada preferencia por
ARN simple cadena respecto de ARN doble cadena. A pesar de no degradar ADN, se ha

68
observado que la enzima tiene capacidad de unirse al mismo. Más allá de estas diferencias,
en el contexto del protocolo de Ribo-Seq importa destacar que la enzima Benzonasa, la que
utilizamos en nuestros protocolos, produce fragmentos de ARN cuyos extremos 5’ se
encuentran fosforilados y 3’ desfosforilados, listos para la ligación de adaptadores y los
siguientes pasos del protocolo de producción de librerías de secuenciación. En cambio, los
fragmentos producidos por la RNAsa I tienen fosforilado el extremo 3’ por lo que es necesaria
la desfosforilación de los mismos antes de ligar adaptadores [84]. Esto introduce, al menos,
una ronda extra de precipitación, concentración y resuspensión del ARN que, además de
posiblemente introducir algún tipo de sesgo asociado a la reacción enzimática de
desfosforilación, disminuye la cantidad final recuperada por los rendimientos inherentes de
los protocolos de precipitación y concentración.
En este sentido, la hipótesis de trabajo planteada es que ambas enzimas producen huellas
ribosomales con características distintas, pero determinan niveles de expresión traduccional
comparables en un mismo modelo celular. Así, nos propusimos como objetivos producir y
secuenciar huellas ribosomales a partir de células HEK293 en condiciones basales, utilizando
las enzimas Benzonasa y RNAsa I por separado. Luego nos planteamos comparar las
características de las huellas ribosomales producidas en cada caso y también contrastar los
traductomas y los niveles de expresión traduccional definidos por cada enzima. Trabajos
similares en la literatura han estudiado el uso de distintas enzimas para la preparación de
huellas ribosomales, aunque sin incluir la enzima Benzonasa [89].
A modo de resumen, en el presente capítulo logramos poner a punto el uso de la técnica de
Ribo-Seq en desafiantes sustratos biológicos como cultivos primarios de neuronas (bajo
número de células) y tejido nervioso animal (complejos protocolos de lisis). En ambos casos,
las huellas ribosomales obtenidas y/o secuenciadas cumplieron todos los controles de calidad
esperados. En segundo lugar, también obtuvimos y comparamos huellas ribosomales
producidas a partir de dos ARNasas distintas, Benzonasa y RNAsa I. La cuantificación de los
niveles de expresión génica traduccional definidos por cada enzima resultaron comparables
a pesar de las diferencias observadas en las características de las huellas ribosomales, como
su tamaño, patrón de mapeo y periodicidad.
69
Materiales y Métodos
● Cultivo in vitro de neuronas corticales embrionarias
Los cultivos de neuronas corticales fueron obtenidos de embriones en gestación en el día 17-
18 siguiendo los protocolos utilizados en el laboratorio del Dr. George Bloom [68].
Brevemente, el cerebro de los embriones es removido y colocado en un ambiente estéril en
presencia de buffer HBSS donde se obtiene el tejido cortical. El tejido es digerido con tripsina
0,25% a 37°C por 40 minutos, luego la reacción es inactivada con suero fetal bovino y las
células son lavadas 3 veces con buffer HBSS. Se realiza un tratamiento con ADNasa y luego
se disocian las células mecánicamente con pipetas Pasteur. Las células son plaqueadas a
una tasa de 60.000 células por cm2 en medio neurobasal libre de suero y suplementado con
B27, L-glutamina, glucosa, antibióticos y 5% de suero fetal bovino. El medio de plaqueo es
removido luego de 3 horas y reemplazado por un medio idéntico sin suero fetal bovino. Se
realizan cambios de medio parciales (50%) cada 3-4 días hasta alcanzar los 10-12 días de
crecimiento in vitro. En todos los casos las neuronas crecen en superficies pretratadas con 10
µg/cm2 de poli-D-lisina overnight a 4°C (ver Nota 1 en Anexo).
● Procesamiento de corteza cerebral de ratones adultos para obtener el sobrenadante
postmitocondrial
Los ratones fueron crecidos, alimentados y reproducidos en el bioterio de la Universidad de
Virginia (EE.UU.) siguiendo los protocolos establecidos en su propia reglamentación. Para el
disecado de la corteza cerebral los ratones fueron sacrificados por dislocación cervical
previamente anestesiados en cámara de CO2. Rápidamente se procede a cortar la cabeza
del ratón, abrir el cráneo y obtener el cerebro entero que se coloca en una placa de plástico
fría con PBS y 100 µg/mL CHX (ver Nota 2 en Anexo). Utilizando bisturís y pinzas primero se
remueven el bulbo olfatorio y el cerebelo. Luego se divide el cerebro con un corte sagital en
sus dos hemisferios y se remueve el tejido blanco (hipocampo y otras estructuras
subcorticales) de manera de obtener solamente la corteza. Por último el tejido final es pesado,
triturado con bisturís y se termina de homogeneizar utilizando un homogenizador de vidrio y
buffer de lisis (5 mM Tris pH 7,5; 2,5 mM MgCl2; 1,5 mM KCl; 0,5% Tritón X-100; 0,5%
deoxicolato de sodio; 2 mM DTT y 100 µg/mL CHX) en relación 10% (m/v). El lisado es agitado
en vortex por 5 segundos y reposado 5 minutos en hielo. Los restos celulares, núcleos y
mitocondrias son eliminados mediante dos centrifugaciones consecutivas de 1 y 10 minutos,
a máxima velocidad y 4°C, recuperando el sobrenadante.

70
● Cultivo de células HEK293
Los cultivos de células HEK293 se realizaron sobre placas de plástico utilizando medio DMEM
suplementado con 10% de suero de ternero (Cosmic, GE Healthcare Life Sciences) y
antibióticos, en estufas a 37°C con atmósferas húmedas y 5% de CO2.
● Ribo-Seq
Tanto la fracción polisomal enriquecida como el sobrenadante postmitocondrial fueron
utilizados para los ensayos de Ribo-Seq. La obtención de los sobrenadantes
postmitocondriales a partir de los cultivos celulares in vitro, tanto para neuronas corticales
embrionarias como para células HEK293, se realizó de la siguiente manera: los cultivos
celulares son pretratados por 1 hora a 37°C con 100 µg/mL CHX e inmediatamente después
son colocados en hielo. Se remueve el medio y los cultivos son lavados de dos a tres veces
con PBS frío en presencia de 100 µg/mL CHX. Luego del último lavado se remueve el líquido
y las células son despegadas por acción mecánica mediante raspado. Mediante
centrifugación a 2000 RPM y 4°C por 10 minutos las células son concentradas y luego
resuspendidas en buffer de lisis (5 mM Tris pH 7,5; 2,5 mM MgCl2; 1,5 mM KCl; 0,5% Tritón
X-100; 0,5% deoxicolato de sodio; 2 mM DTT y 100 µg/mL CHX) intercalando agitaciones de
5 segundos en vortex. Por último se centrifuga a máxima velocidad y 4°C por 2 minutos para
obtener el sobrenadante postmitocondrial.
Las fracciones polisomales se obtuvieron mediante ultracentrifugación del sobrenadante
postmitocondrial en colchones de sacarosa de 12% y 33,5% en buffer polisomal (20 mM
HEPES pH 7,5; 5 mM MgCl2; 100 mM KCl y 100 µg/mL CHX) utilizando un rotor SW41Ti a
36,000 RPM y 4°C por 2 horas. El pellet polisomal obtenido es resuspendido en el mismo
buffer polisomal.
Los ensayos de protección con ARNasa se realizaron con distintas cantidades de la enzima
Benzonasa (Sigma) según correspondiere (los detalles en este paso de optimización se
discuten más adelante). En todos los casos, la digestión se realizó por 10 minutos a
temperatura ambiente y se interrumpió mediante el agregado de buffer de lisis del kit mirVana
(Invitrogen) para la posterior extracción de ARN con el mismo kit. El ARN obtenido fue
precipitado y concentrado con etanol 80% y acetato de sodio 3 M pH 5,2 para maximizar la
recuperación de fragmentos pequeños. En este caso y en todos los protocolos siguientes de
precipitación de ARN se utilizó una sustancia co-precipitante inerte, como el GlycoBlue
(Invitrogen), a los efectos de visualizar el pellet. Las digestiones fueron separadas utilizando
geles comerciales de poliacrilamida al 15% en presencia de Urea 7 M (Novex, Thermofischer)
en buffer TBE durante 65 minutos a 200 V. Un marcador de peso molecular de ADN de rango
71
ultra bajo (Invitrogen) y oligos de ARN de 26 y 34 nucleótidos (nt) de largo fueron utilizados
para reconocer las bandas correspondientes a las huellas ribosomales. Los geles fueron
revelados con GelRed (Biotium) y visualizados en cuarto oscuro bajo radiación UV donde se
cortan las bandas correspondientes a las huellas ribosomales. El ARN se extrajo del gel
overnight en agitación suave y en presencia de buffer de extracción (300 mM acetato de sodio
pH 5,2; 1 mM EDTA y 0,25% (m/v) de SDS). Luego el ARN es precipitado con isopropanol y
resuspendido en agua DEPC listo para control de calidad y envío a secuenciación.
En los experimentos donde se utilizó enzima RNAsa I (Invitrogen) para ensayos de digestión
se introdujeron las variantes que se describen a continuación. La digestión con RNAsa I se
realizó por 45 minutos a temperatura ambiente con agitación suave, utilizando 300 unidades
de enzima según el protocolo descrito [84]. Luego, se continuó con el mismo protocolo descrito
anteriormente para la extracción de ARN, separación por electroforesis y recuperación del
ARN correspondiente a las huellas ribosomales. Para la fosforilación de los extremos 5’ de
las huellas ribosomales producidas con la enzima RNAsa I se utilizaron 10 unidades de T4
quinasa (New England BioLabs) a 37°C por 30 minutos. La reacción se inactiva a 65°C por
20 minutos y luego el ARN se precipita y concentra con etanol 80% para sus posteriores usos
(control de calidad y/o secuenciación masiva).
El control de calidad de las muestras de huellas ribosomales fue realizado en la plataforma
2100 Agilent Bioanalyzer utilizando kits y chips para ARN pequeños (small RNA; Agilent). La
secuenciación masiva de las muestras se realizó utilizando servicios comerciales extranjeros
como BGI Tech Solutions - Hong-Kong. Para la secuenciación de huellas ribosomales se
utilizó el protocolo de small RNA library obteniendo al menos 80 millones de lecturas single-
end de 50 nt de largo.
● Análisis de datos
Los archivos de secuenciación fueron procesados en los servidores del Departamento de
Genómica. Para el análisis se utilizaron tanto software comerciales, como CLC Genomics
Workbench, como software libre. Brevemente la calidad de los archivos de secuenciación fue
evaluada mediante FastQC [90] y en caso de ser necesario las secuencias fueron trimeadas
por calidad utilizando sickle [91]. Para los mapeos se utilizó tanto bowtie1 [92] como bowtie2
[93] y las versiones disponibles más actualizadas de los genomas de referencia de ratón (Mus
musculus, versión mm10, 2011/12 - GRCm38) y humano (Homo sapiens, versión hg38,
GRCh38) descargadas del sitio web ftp del NCBI (ftp://ftp.ncbi.nlm.nih.gov/refseq/). Las tablas
de conteo fueron producidas con featureCounts [94] y los análisis de expresión génica
diferencial fueron realizados con el paquete de R edgeR [95,96]. Los análisis de ontología

72
génica fueron realizados con herramientas web libres como g:GOST de g:Profiler [97] y
STRING [98].
Se utilizaron scripts de elaboración propia en lenguaje python, así como samtools [99],
bedtools [100] y herramientas de bash para algunos análisis específicos, como el estudio de
la periodicidad de huellas ribosomales, la distribución de mapeos en regiones codificantes y
no codificantes, y la preferencia de sitio de corte de las enzimas. Diversos paquetes de R
fueron utilizados para la creación de gráficos y representación visual de datos.
Resultados
● Optimización del número de células y la cantidad de enzima a utilizar en ensayos de
digestión sobre el sobrenadante postmitocondrial
Considerando que una de las principales desventajas del protocolo de Ribo-Seq es la gran
cantidad de material de partida necesario, ya sean células creciendo in vitro o tejido, nos
propusimos en una primera instancia optimizar el protocolo para evitar el paso de purificación
de polisomas y realizar el ensayo de protección con ARNasa directamente sobre el
sobrenadante postmitocondrial, como ya ha sido descrito en trabajos previos [83]. Esta
variante, nos permitiría trabajar con muestras más delicadas de las cuales no sea factible
recoger las grandes cantidades de material de partida necesarias en la versión estándar del
protocolo, un ejemplo claro son los cultivos de neuronas embrionarias.
En una primera instancia utilizamos cultivos de células HEK293 de manera de evaluar el rango
óptimo de número de células necesaria para producir y recuperar huellas ribosomales en
cantidad y calidad adecuadas para su posterior secuenciación. También trabajamos en ajustar
la cantidad de enzima ARNasa a utilizar, considerando que en contraparte al ensayo clásico
donde la digestión se realiza sobre un pellet polisomal, en este caso tenemos una muestra
más compleja, que de hecho probablemente incluya restos de ADN que son también digeridos
por la enzima Benzonasa.
Como se muestra en la figura V.1 se utilizaron cantidades decrecientes de células para
obtener distintos sobrenadantes postmitocondriales. Estos sobrenadantes fueron digeridos
con cantidades adecuadas de Benzonasa según cálculos derivados de protocolos anteriores
(>250 U por cada 400 µg de ARN estimados por Nanodrop en el sobrenadante). El ARN de
cada digestión es purificado, obteniéndose cantidades decrecientes acordes, y luego dichas
digestiones fueron separadas mediante PAGE al 15% en condiciones desnaturalizantes. Las
bandas correspondientes a las huellas ribosomales fueron cortadas y el ARN recuperado fue

73
------------------------------------------------------------------------------------------------------------------------- Figura V.1. Optimización de la cantidad de células a utilizar para producir huellas ribosomales a partir del sobrenadante postmitocondrial. En el panel izquierdo de la figura se muestra un gel de poliacrilamida al 15% en condiciones desnaturalizantes por la presencia de urea 7 M. En el carril de más a la izquierda se muestra un marcador de peso molecular de ADN y se indica el tamaño de algunas bandas. Luego se muestra el perfil de las digestiones (A-F) realizadas a partir de cantidades decrecientes de células y por lo tanto cantidades decrecientes de ARN total sembrado (ver gráfico superior). En el rectángulo punteado blanco se muestra la región correspondiente a las huellas ribosomales que fue cortada y utilizada para recuperar el ARN. El ARN recuperado es evaluado en electroforesis capilar en el instrumento Bioanalyzer utilizando chips de small RNA. La reconstrucción virtual del gel se muestra en el panel derecho y abajo se puede observar la cuantificación de ARN recuperado en cada una de las fracciones correspondientes a las huellas ribosomales. -------------------------------------------------------------------------------------------------------------------------
observado por electroforesis capilar en un chip de Bioanalyzer que permitió evaluar el tamaño
y la cantidad del mismo. Los resultados indican que existe una saturación en la recuperación
de ARN correspondiente a las huellas ribosomales cuando partimos de grandes cantidades
de células. El rendimiento relativo máximo se obtiene para el caso donde separamos en el gel
de poliacrilamida una digestión que contiene 10 µg de ARN (muestra B), como esperábamos

74
según la literatura [84]. De todas maneras, a partir de todas las muestras se logró recuperar
ARN correspondiente a las huellas ribosomales en cantidades suficientes para lograr producir
librerías de secuenciación. La muestra con menor cantidad inicial (muestra F) representaba
aproximadamente menos de 3 millones de células, que implicaron 2,5 µg de ARN sembrados
en el gel de poliacrilamida. De la banda correspondiente a las huellas ribosomales se
obtuvieron apenas más de 50 ng de ARN, lo cual a pesar de ser una cantidad baja, es
suficiente para construir librerías de secuenciación con protocolos de low input.
Con el objetivo de evaluar la cantidad apropiada de enzima para realizar el ensayo de
digestión sobre el sobrenadante postmitocondrial, procedimos a realizar un ensayo de
digestión sobre muestras equivalentes con distintas cantidades de enzima. De esta manera,
se utilizaron nuevamente cultivos de células HEK293 en alto grado de confluencia para
obtener el sobrenadante postmitocondrial. Dicho sobrenadante fue digerido con cuatro
cantidades distintas de Benzonasa: 0; 2,5; 25 y 250 unidades. Los valores utilizados
responden a la experiencia previa y los cálculos realizados del experimento anterior, los
cuales indicaban que debíamos utilizar para este experimento puntual en el orden de 20
unidades. La figura V.2 muestra los resultados obtenidos. En primera instancia se pueden
observar claras diferencias entre las distintas muestras respecto del perfil de bandas que se
aprecian en el gel de poliacrilamida (ver Figura V.2 A). Mientras la muestra no digerida
prácticamente que no logra ingresar al gel y apenas se separan y observan unas bandas de
tamaños grandes (aproximadamente >100 nt), probablemente correspondientes a ARN
ribosomales pequeños y de transferencia, las distintas digestiones muestran patrones
similares a grandes rasgos. De todas maneras, se pueden observar diferencias entre los
perfiles de las distintas digestiones en cuanto a presencia y ausencia de bandas o intensidad
de las mismas, como era de esperar. Las muestras también fueron separadas por
electroforesis capilar utilizando chips de small RNA en el instrumento Bioanalyzer. En este
caso podemos observar con mayor detalle las diferencias entre las muestras observando los
electroferogramas generados (ver Figura V.2 B). En particular, si nos enfocamos en la región
entre 20 y 40 nucleótidos correspondiente a las huellas ribosomales podemos observar
diferencias mayores entre las distintas muestras. A pesar de que la digestión con 250
unidades de Benzonasa es la que muestra mayor cantidad de ARN en la región centrada en
los 30 nucleótidos, debido a que presenta el electroferograma con mayor intensidad, no se
observa un pico definido en dicha zona, solamente uno de menor tamaño (~25 nt). Algo similar
se observa para la digestión con 2,5 unidades de enzima, con la desventaja de que además
es la que presenta menos cantidad de ARN por mostrar valores más bajos de fluorescencia.
En cambio, la muestra digerida con 25 unidades de enzima presenta un claro pico del tamaño
esperado para las huellas ribosomales (30 nt) y con buenos valores de fluorescencia. Las
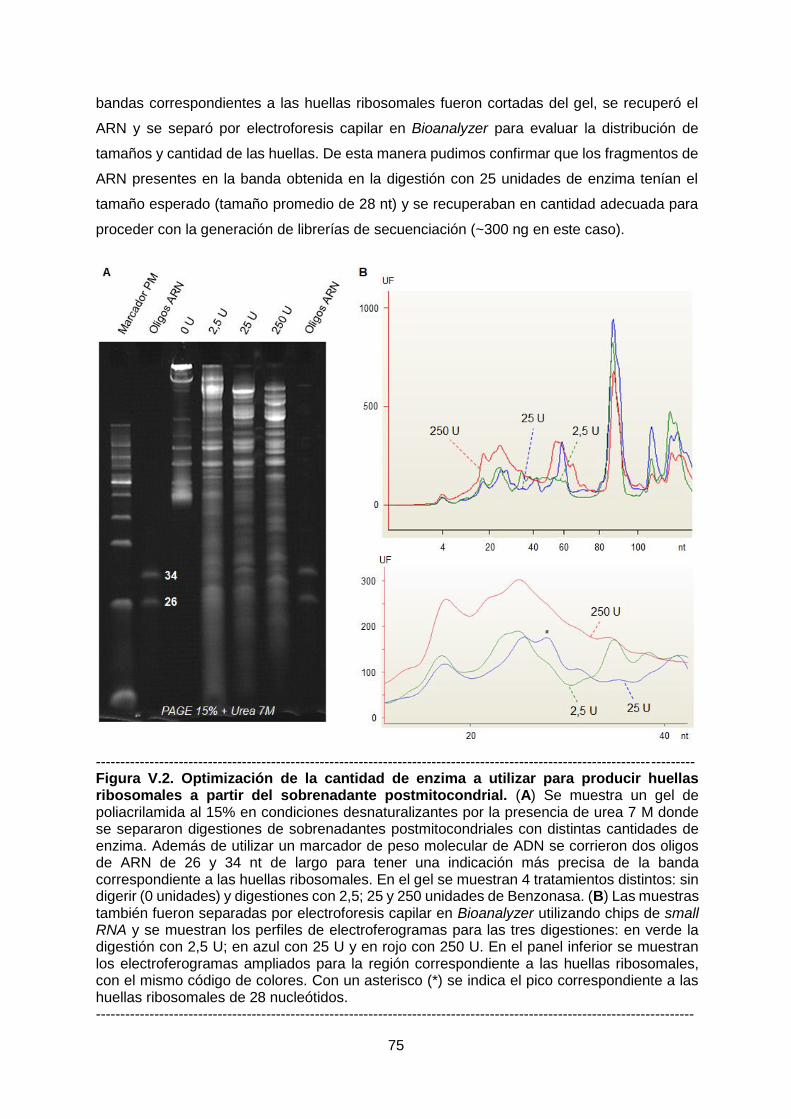
75
bandas correspondientes a las huellas ribosomales fueron cortadas del gel, se recuperó el
ARN y se separó por electroforesis capilar en Bioanalyzer para evaluar la distribución de
tamaños y cantidad de las huellas. De esta manera pudimos confirmar que los fragmentos de
ARN presentes en la banda obtenida en la digestión con 25 unidades de enzima tenían el
tamaño esperado (tamaño promedio de 28 nt) y se recuperaban en cantidad adecuada para
proceder con la generación de librerías de secuenciación (~300 ng en este caso).
--------------------------------------------------------------------------------------------------------------------------- Figura V.2. Optimización de la cantidad de enzima a utilizar para producir huellas ribosomales a partir del sobrenadante postmitocondrial. (A) Se muestra un gel de poliacrilamida al 15% en condiciones desnaturalizantes por la presencia de urea 7 M donde se separaron digestiones de sobrenadantes postmitocondriales con distintas cantidades de enzima. Además de utilizar un marcador de peso molecular de ADN se corrieron dos oligos de ARN de 26 y 34 nt de largo para tener una indicación más precisa de la banda correspondiente a las huellas ribosomales. En el gel se muestran 4 tratamientos distintos: sin digerir (0 unidades) y digestiones con 2,5; 25 y 250 unidades de Benzonasa. (B) Las muestras también fueron separadas por electroforesis capilar en Bioanalyzer utilizando chips de small RNA y se muestran los perfiles de electroferogramas para las tres digestiones: en verde la digestión con 2,5 U; en azul con 25 U y en rojo con 250 U. En el panel inferior se muestran los electroferogramas ampliados para la región correspondiente a las huellas ribosomales, con el mismo código de colores. Con un asterisco (*) se indica el pico correspondiente a las huellas ribosomales de 28 nucleótidos. ---------------------------------------------------------------------------------------------------------------------------

76
Vale mencionar que para este experimento trabajamos en el rango inferior del experimento
anterior, considerando que la cantidad de neuronas in vitro a disponer se encuentra en dicho
rango (entre 3 y 5 millones de células en una placa de petri de 10 cm). En este caso
nuevamente pudimos obtener fragmentos de ARN correspondientes a huellas ribosomales de
tamaño y cantidad esperados utilizando 25 unidades de Benzonasa.
● Ensayo de Ribo-Seq sobre cultivos in vitro de neuronas corticales primarias
Una vez ajustados los detalles del protocolo de Ribo-Seq para trabajar con un bajo número
de células, procedimos a aplicar esta estrategia en cultivos in vitro de neuronas corticales
embrionarias. Como primera aproximación, en este caso utilizamos dos genotipos distintos:
neuronas derivadas de embriones de ratones wild-type C57/BL6 (wt) o de ratones tau-
knockout (tauKO; [101]). Se obtuvieron aproximadamente 4 millones de células para cada
genotipo y se crecieron por entre 10-11 días in vitro (ver Figura V.3 A). Vale mencionar que
estos cultivos no se componen exclusivamente de células neuronales, sino que también están
presentes células no neuronales, como células gliales, aunque en menor medida. De todas
maneras, para simplificar la nomenclatura, los llamaremos cultivos de neuronas de aquí en
adelante. Una vez alcanzado el grado de diferenciación neuronal esperado, se obtuvieron los
sobrenadantes postmitocondriales y se realizaron los ensayos de digestión con la cantidad
adecuada de Benzonasa (ver más arriba). En este caso se logró recuperar cerca 230 ng de
ARN de las bandas correspondientes a las huellas ribosomales cuyo tamaño estimado por
Bioanalyzer fue de entre 25 y 34 nucleótidos (ver Figura V.3 B y C).
La secuenciación masiva de los fragmentos de ARN derivados de las huellas ribosomales
arrojó 92 y 141 millones de lecturas para las neuronas wt y tauKO, respectivamente. A pesar
de que, como era de esperar, gran parte de dichas lecturas derivan de fragmentos de ARN
ribosomal (ARNr) contaminante (84% y 78% respectivamente), se pudo obtener una gran
cantidad de lecturas mapeando sobre el transcriptoma de referencia (7,5 y 14,8 millones de
lecturas respectivamente). A su vez, una alta proporción de esas lecturas mapearon sobre
ARNm resultando en un total de 4 y 8,4 millones de lecturas mapeadas sobre transcriptos
codificantes.
En este caso realizamos una serie de análisis globales para evaluar la performance de la
técnica aplicada a este modelo biológico. En primer lugar evaluamos la cantidad de genes
detectados, o genes por encima de un mínimo de expresión, utilizando distintos umbrales
entre 1 y 100 CPM (conteos por millón; ver Figura V.4 A). Por ejemplo, utilizando un umbral
de 5 CPM que podríamos considerar adecuado, logramos detectar 11.274 y 11.589 en los
genotipos wt y tauKO, respectivamente. Dichos genes muestran valores de expresión que se

77
--------------------------------------------------------------------------------------------------------------------------
Figura V.3. Producción de huellas ribosomales a partir de cultivos in vitro de neuronas corticales primarias. (A) Imágenes ilustrativas de microscopía de contraste de fases tomadas a 10X mostrando los cultivos in vitro de neuronas corticales derivadas de embriones de ratones wild-type (wt; izquierda) y tau-knockout (tauKO, derecha). (B) Se muestra el gel de poliacrilamida al 15% con urea donde se separan las digestiones de los sobrenadantes postmitocondriales obtenidos. Se utilizaron oligos de ARN de 26 y 34 nt para reconocer las bandas correspondientes a las huellas ribosomales que fueron cortadas del gel. (C) Se muestra una reconstrucción digital del gel de electroforesis capilar obtenido en Bioanalyzer utilizando chips de small RNA. Además de las digestiones (Dig) puede observarse el perfil del ARN recuperado de las bandas del gel correspondientes a las huellas ribosomales (HR). --------------------------------------------------------------------------------------------------------------------------
distribuyen de la manera esperada y similar entre ambos genotipos (ver Figura V.4 B). Luego
evaluamos la distribución de la región de mapeo de las huellas ribosomales sobre los ARNm

78
comparando las regiones traducidas (CDS) versus las no traducidas (5’- y 3’-UTR). En este
caso observamos que, tanto para las huellas obtenidas del genotipo wt como tauKO, existe
una preferencia de mapeo sobre la región codificante (>60%). La región 5’-UTR casi no se ve
representada y la 3’-UTR si presenta mapeo de huellas ribosomales (ver Figura V.4 C). Estas
asimetrías no son resultado de diferencias en el tamaño de cada región estudiada, ya que es
de esperarse que regiones más largas presenten más lecturas. Esto no ocurre en este caso
ya que como se observa en la Figura V.4 D la distribución de tamaños de los CDS y 3’-UTR
estudiados es muy similar.
Por último, evaluamos otro parámetro característico de las huellas ribosomales como es la
periodicidad. Debido a que el ribosoma se mueve de codón en codón, suele observarse una
patrón de mapeo de las huellas ribosomales que refleja este movimiento. Si nos enfocamos
en genes de alta expresión y con cobertura homogénea, logramos ver como uno de los tres
nucleótidos del codón se ve favorecido en el mapeo de los extremos 5’ de las huellas
ribosomales [102]. En este caso, observamos dicha periodicidad en el subset de genes y
huellas ribosomales analizado (ver Figura V.4 E y F). De manera similar a lo que observamos
comúnmente cuando utilizamos Benzonasa, las huellas ribosomales muestran un claro patrón
de periodicidad cuando tienen un tamaño de 39 nt, ó cuando se alejan 3 nt (36 y 42 nt, por
ejemplo, ver más adelante).
En líneas generales podemos afirmar que el protocolo de producción y secuenciación masiva
de huellas ribosomales a partir de cultivos in vitro de neuronas corticales primarias funcionó
de manera óptima. Pudimos detectar niveles de expresión traduccional para una gran
cantidad de genes (>10.000), sobre los cuales las huellas ribosomales mapearon
preferentemente en las regiones codificantes y mostrando el patrón de periodicidad que las
caracteriza. En este caso utilizamos neuronas corticales derivadas de dos genotipos distintos
de ratones (wt y tauKO). De todas maneras todos los análisis globales realizados no arrojaron
diferencias sustanciales con base en el genotipo utilizado.
● Puesta a punto del protocolo de obtención de huellas ribosomales a partir de corteza
cerebral de ratón
Considerando otra alternativa posible de modelos neuronales a utilizar nos propusimos
trabajar con secciones de cerebro de ratón. Como primera aproximación nos centramos
específicamente en la corteza cerebral por tratarse de una de las regiones con mayor cantidad
de células y mayor proporción de células neuronales [103]. De esta manera, trabajamos
utilizando distintos protocolos de lisis evaluando la recuperación de la fracción polisomal
mediante ultracentrifugación en colchones de sacarosa, en presencia y ausencia de EDTA,

79
---------------------------------------------------------------------------------------------------------------------------
Figura V.4. Análisis globales de la secuenciación masiva de huellas ribosomales obtenidas a partir de cultivos in vitro de neuronas corticales primarias. (A) El gráfico muestra el número de genes detectado para cada uno de los genotipos utilizados (wt, wild-type y tauKO, tau-knockout) utilizando distintos valores de conteos por millón (CPM) como mínimo exigido. (B) Se muestra la distribución de los valores de expresión génica mediante boxplots, para ambos genotipos, utilizando aquellos genes con >5 CPM (11.274 y 11.589 genes en los genotipos wt y tauKO, respectivamente). (C) Se muestra la distribución de las regiones donde mapean las lecturas sobre el ARNm (5’-UTR, CDS y 3’-UTR) para ambos genotipos. (D) Como control de las distribuciones que se muestran en (C), se grafica la distribución de los tamaños de las regiones utilizadas. (E) Se muestra, mediante histogramas, la distribución de tamaño de las huellas ribosomales mapeadas en el genotipo wt y del subset utilizado para el cálculo de periodicidad (en negro). Los tamaños indicados con asteriscos (*) fueron utilizados para el cálculo de la periodicidad cuyo resultado se muestra a la derecha, donde se indica el porcentaje de lecturas que caen en cada uno de los tres nucleótidos del codón. (F) Idem (E) pero para el genotipo tauKO. ---------------------------------------------------------------------------------------------------------------------------
80
como agente que desensambla los polisomas. Por ejemplo, esperamos que la cantidad de
ARN presente en el pellet polisomal disminuya cuando corremos la muestra en presencia de
EDTA.
Una vez que logramos obtener pellet polisomales con suficiente cantidad de ARN,
procedemos a realizar los ensayos de digestión y separar las muestras en PAGE 15% con
urea 7 M. Luego cortamos las bandas correspondientes a las huellas ribosomales y
recuperamos el ARN de manera de evaluar el rendimiento final, la cantidad de ARN obtenido
y los tamaños de huellas recuperadas.
En la figura V.5 se muestra el resultado del protocolo final optimizado a partir del cual logramos
obtener huellas ribosomales a partir de corteza cerebral en cantidad, calidad y tamaño
adecuado para la posterior generación de librerías de secuenciación. Se muestra el gel
desnaturalizante de poliacrilamida al 15% donde puede verse el perfil de bandas generado,
así como el control sin digerir. Se muestra también la reconstrucción virtual del gel generada
por el Bioanalyzer resultado de la electroforesis capilar en chip de small RNA. En este caso
también se observa específicamente la muestra de ARN correspondiente a las huellas
ribosomales extraídas de la banda cortada del gel. Por último se muestran los perfiles de
electroferogramas de la digestión y las huellas ribosomales superpuestos. Puede observarse
como la muestra correspondiente a las huellas ribosomales está enriquecida en fragmentos
de 28 y 31 nt de largo como es de esperarse. En este caso se obtuvieron aproximadamente
300 ng de ARN lo cual es suficiente para proceder a los protocolos de secuenciación. Este
mismo protocolo, aquí optimizado y puesto a punto, será utilizado en el capítulo 3 (ver más
adelante).
● Comparativa entre huellas ribosomales producidas con Benzonasa y RNAsa I
Con el objetivo de buscar similitudes y diferencias en los resultados obtenidos a partir de
diferentes protocolos, donde se utilizan distintas enzimas para la producción de huellas
ribosomales, nos propusimos comparar los resultados obtenidos a partir de digestiones
realizadas con Benzonasa y RNAsa I. Nuestro grupo ha trabajado desde un principio con la
enzima Benzonasa debido a que es capaz de generar fragmentos de ARN con los extremos
5’ fosforilados y 3’ desfosforilados (ejemplos en [78–80]). Esto representa una clara ventaja
desde el punto de vista del protocolo pues permite la ligación directa de adaptadores de
secuenciación, sin necesidad de pasos intermedios de fosforilación, precipitación y
recuperación, que podrían introducir sesgos o disminuir los rendimientos [104,105]. Por el otro
lado, la enzima RNAsa I es la utilizada en el protocolo original y la más utilizada, en general,
en los trabajos donde se utiliza la técnica de Ribo-Seq [84]. Sin embargo, esta enzima si deja

81
-------------------------------------------------------------------------------------------------------------------------- Figura V.5. Purificación de huellas ribosomales a partir de corteza de ratón. (A) Se muestra el gel de poliacrilamida 15% con urea 7 M donde se sembró la digestión del pellet polisomal y el control correspondiente sin digerir. Los oligos de ARN de 26 y 34 nt fueron utilizados para reconocer las bandas de las huellas ribosomales. (B) Se muestra la reconstrucción virtual del gel corrido en Bioanalyzer utilizando chip de small RNA. Nuevamente se muestra el control sin digerir, la muestra digerida y la fracción de ARN correspondientes a las huellas ribosomales recuperada del gel. (C) Se muestran los electroferogramas obtenidos del Bioanalyzer superpuestos para la digestión del pellet polisomal de corteza en rojo y las huellas ribosomales recuperadas en azul. La zona correspondiente a las huellas ribosomales se muestra ampliada y se pueden apreciar los picos en 28 y 31 nt correspondientes a las huellas ribosomales. --------------------------------------------------------------------------------------------------------------------------

82
los extremos 3’ fosforilados por lo cual es necesario un paso de desfosforilación previo a la
construcción de librerías de secuenciación.
Para realizar dicha comparación obtuvimos distintos pellet polisomales a partir de células
HEK293 en cultivo y realizamos en paralelo y en duplicado digestiones con Benzonasa y
RNAsa I sobre muestras equivalentes. Purificamos el ARN de cada digestión y separamos las
mismas mediante corrida electroforética. Luego obtuvimos las huellas ribosomales a partir de
las bandas correspondientes y en el caso de las huellas ribosomales derivadas de la digestión
con la enzima RNAsa I, procedimos a fosforilar los extremos 5’ y desfosforilar los extremos 3’.
En último lugar el ARN es precipitado, recuperado y concentrado nuevamente (ver Figura
V.6).
Los perfiles de digestiones obtenidos con las dos enzimas muestran algunas diferencias que
son particularmente claras en las regiones de tamaños mayores a las huellas ribosomales
(ver Figura V.7 A y B). Específicamente en la región correspondiente a las huellas ribosomales
también se pueden apreciar diferencias. Por ejemplo, el electroferograma observado en la
región correspondiente a las huellas ribosomales muestra que las digestiones con Benzonasa
producen un pico cercano a 28 nt y dos hombros de menor absorbancia a 26 y 31 nt. Por su
parte, el perfil de digestión producido por la RNAsa I en estas condiciones muestra un pico
principal a 31 nt y un hombro a la altura de 28 nt (ver Figura V.7 B). Luego de purificadas y
concentradas, y para el caso de las huellas producidas con RNAsa I también desfosforiladas,
las huellas ribosomales muestran pequeñas diferencias de tamaños (ver Figura V.7 C). De
todas maneras, en ambos casos se obtuvieron cantidades suficientes para la construcción de
librerías de secuenciación: 768 y 636 ng de ARN para las huellas producidas con Benzonasa
y 370 y 350 ng de ARN para las producidas con RNAsa I. Se puede observar aquí que al
comparar la cantidad de huellas ribosomales producidas con RNAsa I recuperadas del gel y
la cantidad final obtenida luego de desfosforilar, precipitar y concentrar, observamos una
pérdida cercana al 50%, como mencionábamos anteriormente.
La secuenciación masiva de las huellas ribosomales, en duplicados biológicos, producidas
con Benzonasa y RNAsa I generó en promedio más de 120 millones de lecturas simples. De
éstas, cerca del 85% correspondían a fragmentos de ARNr mientras que cerca de 10 millones
mapearon sobre ARNm (ver Tabla V.1). El análisis de componentes principales (PCA)
muestra como las dos réplicas de cada condición, que a continuación llamaremos
directamente Benzonasa y RNAsa I, se separan claramente según la primera componente
que explica casi el 87% de la variación observada (ver Figura V.8 A). También se observa
cómo ambas réplicas de cada condición muestran altos niveles de correlación, con valores de
correlación de Pearson superiores a 0,98 (ver Figura V.8 B). Como una primera aproximación,

83
--------------------------------------------------------------------------------------------------------------------------- Figura V.6. Estrategia experimental para la producción y comparación de huellas ribosomales utilizando Benzonasa y RNAsa I. Se muestra un esquema del protocolo realizado para la obtención y secuenciación de huellas ribosomales generadas con Benzonasa y RNAsa I. Se cultivan células HEK293 en confluencia (i) y se lisan para obtener el sobrenadante postmitocondrial (PM; ii). Dicho sobrenadante es ultracentrifugado en colchones de sacarosa para obtener un pellet polisomal (iii). Cantidades equivalentes del pellet polisomal son digeridas en paralelo con ambas enzimas (iv) y las huellas ribosomales son recuperadas (v). Las huellas ribosomales producidas con la enzima Benzonasa presentan un extremo 5’ fosforilado y un extremo 3’ desfosforilado, por lo que son fragmentos ligables. Por su parte, las huellas producidas con RNAsa I son fragmentos no ligables por lo que requieren un paso adicional de fosforilación de extremos 5’ mediante acción de la T4 quinasa (T4 PNK; vi). Por último los fragmentos son evaluados en calidad y cantidad mediante chips de small RNA en Bioanalyzer (vii) y posteriormente secuenciados de manera masiva (viii). ---------------------------------------------------------------------------------------------------------------------------

84
---------------------------------------------------------------------------------------------------------------------------
Figura V.7. Purificación de huellas ribosomales utilizando Benzonasa y RNAsa I. (A) Se muestra la corrida en PAGE 15% con urea 7 M de las digestiones de pellet polisomales utilizando Benzonasa y RNAsa I, en duplicados. Los oligos de ARN se utilizaron para identificar y cortar las bandas correspondientes a las huellas ribosomales. (B) Las digestiones también fueron evaluadas por electroforesis capilar en chip de small RNA en Bioanalyzer. Se muestra el electroferograma observado para las dos enzimas: en rojo Benzonasa y en azul RNAsa I. Se muestra también ampliada la zona correspondiente a las huellas ribosomales. (C) Se observa la representación virtual del gel producida por el Bioanalyzer. Se pueden observar las distintas digestiones (Dig) obtenidas de las dos enzimas (Benz y RNAsa I), así como las bandas específicas de las huellas ribosomales (HR) obtenidas en último lugar. ---------------------------------------------------------------------------------------------------------------------------

85
-------------------------------------------------------------------------------------------------------------------------- Tabla V.1. Estadísticos de secuenciación y mapeo de huellas ribosomales obtenidas a partir de Benzonasa y RNAsa I. La tabla muestra el número total de lecturas obtenidas, el porcentaje de las mismas que corresponde a contaminación por ARNr, la cantidad de lecturas mapeadas sobre el transcriptoma de referencia y específicamente sobre los ARNm. --------------------------------------------------------------------------------------------------------------------------
Enzima # Total de
lecturas
% de
ARNr
Lecturas
mapeadas
Lecturas
mapeadas
sobre ARNm
% sobre
ARNm
Benzonasa
1 122.906.986 81,8% 16.673.224 14.720.802 88,3%
2 95.768.276 84,2% 9.438.694 8.106.113 85,9%
RNAsa I
1 123.579.208 87,7% 8.549.450 7.310.863 85,5%
2 153.015.842 88,7% 10.700.276 9.222.608 86,2%
comparamos la equivalencia de ambas enzimas para producir huellas ribosomales de los
mismos genes. Luego de filtrar según distintos valores de expresión, para evitar usar genes
con pocas lecturas cercanos al ruido, intersectamos las listas de genes detectados en cada
caso. De esta manera, por ejemplo, utilizando un filtro de genes con valores de expresión
mayores a 1 CPM, detectamos 15.631 genes con la enzima Benzonasa y 14.998 con la
RNAsa I, de los cuales 14.549 eran compartidos (el 93% y 97% respectivamente). De manera
similar, si filtramos según un valor de expresión mayor a 5 CPM se observan resultados
similares: 11.431 genes detectados con la Benzonasa y 11.084 con la RNAsa I habiendo
10.501 en común, el 92% y 95% respectivamente (ver Figura V.8 C). Además de compartir
un alto porcentaje de los genes detectados entre las dos condiciones, se puede observar una
buena correlación global entre los niveles de expresión cuantificados con cada enzima, como
se muestra en el scatter plot de la Figura V.8 D.
En primer lugar, nos planteamos estudiar si los niveles de expresión traduccional definidos
por cada enzima eran comparables o si existían grandes grupos de genes detectados con
una enzima pero ausentes con la otra. Así, nos propusimos evaluar posibles diferencias o
sesgos en los genes detectados por una enzima y no por la otra. De esta manera,
considerando que los valores de expresión génica calculados para cada enzima mostraban
distribuciones globales similares (ver Figura V.9 A), decidimos aplicar tres criterios para definir
los grupos de genes asociados a cada enzima. En cada grupo, se espera representar genes

86
-------------------------------------------------------------------------------------------------------------------------- Figura V.8. Comparación global de los niveles de expresión génica obtenidos a partir de las dos enzimas. (A) Se muestra un PCA de las 4 muestras donde se observa claramente la separación de las dos condiciones según la primera componente que explica el 86,9% de la variación. (B) Se muestra la correlación entre los valores de expresión génica calculados para cada réplica (n=2) según la enzima utilizada mediante sendos scatter plots (Benzonasa izquierda y RNAsa I derecha). Se indica también el valor de correlación de Pearson. (C) Los genes son filtrados según su nivel de expresión (>1 CPM, izquierda y >5 CPM, derecha) y las listas de genes son comparadas entre las dos enzimas. Se muestran los diagramas de Venn de dichas comparaciones. (D) Los valores promedio de expresión génica estimados según el uso de la Benzonasa y la RNAsa I son comparados en el scatter plot que se muestra. El valor de correlación de Pearson también es indicado. --------------------------------------------------------------------------------------------------------------------------
apenas detectados con una enzima pero muy bien expresados con la otra, o genes que varían
demasiado sus niveles de expresión entre las dos condiciones. Para esto, definimos tres
criterios de filtrado que denominamos, según su lógica, de la siguiente manera: filtro por
cuartiles, por expresión o por ranking. El filtro por cuartiles detecta aquellos genes que se
encuentran en el primer cuartil de la distribución para una condición, pero su valor está por
encima de la mediana en la segunda condición. El filtro por expresión devuelve aquellos genes
con las diferencias de expresión más altas entre las dos condiciones. En este caso nos
quedamos con el top50. En tercer lugar, el filtro por ranking selecciona aquellos genes que,
luego de ordenarlos por niveles de expresión, cambian su posición en el ranking entre las dos
condiciones más de 5000 puestos. Utilizando estos tres criterios filtramos 58, 50 y 136 genes
respectivamente, cuya expresión y/o presencia se ve favorecida con la enzima Benzonasa.
87
Por su parte, para la enzima RNAsa I, filtramos 39, 50 y 117 genes, respectivamente para los
tres criterios. Los valores de expresión de cada subgrupo así como la lógica de cada filtro
puede observarse en la Figura V.9 B. De todas maneras, los filtros no son excluyentes y existe
cierto solapamiento entre los distintos criterios. En el caso de la Benzonasa el número de
genes únicos total fue de 188 y para la RNAsa I de 170 (ver Figura V.9 C). En un primer lugar
nos interesaba conocer si este grupo de genes representaba alguna función biológica o
proceso en particular, por lo que realizamos análisis de ontología. Los resultados mostraron
por un lado que los 188 genes de detección sesgada con la Benzonasa no representaban
funciones ontológicas sobrerrepresentadas, solamente detectamos enriquecidas vías KEGG
asociadas al espliceosoma y al transporte de ARN (ver Figura V.9 D y Figura Suplementaria
XI.1). Por el otro lado, los 170 genes asociados a la RNAsa I si mostraron sobrerrepresentadas
categorías ontológicas principalmente relacionadas al ribosoma, unión al ARN, plegamiento
de proteínas y traducción (ver Tabla Suplementaria XI.1). En este caso las vías KEGG
enriquecidas fueron el ribosoma, el procesamiento de proteínas en el retículo endoplásmico
y el espliceosoma (ver Figura V.9 D y Figura Suplementaria XI.2). De todas maneras llamó
nuestra atención la baja proporción de genes codificantes en las listas analizadas. Por
ejemplo, el porcentaje de genes codificantes en ambas listas fue de 41,5% y 58,2% para
Benzonasa y RNAsa I respectivamente. Por esta razón exploramos la identidad de los genes
no codificantes en cada set de datos y encontramos una importante presencia de ARN
pequeños, en particular especies small nuclear y small nucleolar (ver Figura V.9 E).
En paralelo aplicamos paquetes de análisis de expresión génica diferencial para reconocer
genes cuyos valores de expresión estimados por las dos enzimas sean estadísticamente
diferentes y así complementar el análisis anterior en búsqueda de genes asociados a cada
enzima. Vale aclarar en este aspecto, que el concepto de expresión génica diferencial en este
caso no está asociado al clásico estudio de dos condiciones biológicas distintas, sino a la
comparación entre los niveles de expresión génica cuantificados mediante una y otra enzima
en la misma condición biológica. En este caso, la comparativa entre las dos réplicas de cada
condición pudo identificar una gran cantidad de genes expresados diferencialmente según el
criterio de tasa de cambio mayor a 2 y p-valor ajustado (FDR) menor a 0,05. De todas
maneras, observamos que una gran proporción de dichos genes indicados como diferenciales
corresponden a genes de baja expresión (<10 CPM en ambas condiciones): 1283 de los 2412
genes sobrerrepresentados con la enzima Benzonasa (47%) y 604 de los 1947
sobrerrepresentados con la enzima RNAsa I (31%; ver Figura V.10 A). Por dicha razón,
eliminamos estos genes de baja expresión de las listas de genes diferenciales. A nivel global,

88
--------------------------------------------------------------------------------------------------------------------------- Figura V.9. Identificación de genes asociados con cada enzima y análisis funcional de los mismos. (A) Se muestra la distribución global de los valores de expresión (CPM) determinados para cada enzima mediante boxplots. (B) Se muestran los niveles de expresión de los genes seleccionados por cada criterio de filtrado (Quartile, Expression y Ranking; se J (la leyenda continúa en la siguiente hoja)

89
indica el número de genes en cada caso). En rojo se representan los genes asociados a la Benzonasa y en azul a la RNAsa I. (C) Mediante diagramas de Venn se muestran las coincidencias entre cada una de las tres listas de genes producidas por cada criterio de filtrado. A la izquierda, en rojo, para los asociados a la Benzonasa y a la derecha, en azul, para la RNAsa I. (D) Se muestran los resultados del análisis de ontología génica realizados con la herramienta g:GOSt del g:Profiler. A la izquierda para los genes asociados a la Benzonasa y a la derecha para los asociados a la RNAsa I. En los dos casos se muestran las categorías de función molecular (GO:MF), procesos biológicos (GO:BP), compartimento celular (GO:CC) y vías KEGG (KEGG). Las vías KEGG señaladas numéricamente son indicadas a la derecha. (E) A la izquierda se muestra el número de genes codificantes y no codificantes asociados a cada enzima. A la derecha se muestran en detalle los genes no codificantes agrupados según distintas categorías, para las dos enzimas. En ambos casos, en rojo se muestran los genes asociados a la Benzonasa y en azul a la RNAsa I. ---------------------------------------------------------------------------------------------------------------------------
se observa el aumento de expresión de los genes diferenciales en cada condición (ver Figura
V.10 B y C). Si comparamos las listas de genes asociados a cada enzima discutidas
anteriormente observamos que una gran proporción de los genes se encuentran expresados
diferencialmente: 74% de los asociados a la Benzonasa y 83% de los asociados a la RNAsa
I (ver Figura V.10 D). El análisis de ontología de la lista de genes diferenciales arrojó varias
funciones enriquecidas de manera significativa, como era de esperar considerando la gran
cantidad de genes analizados (ver Figura V.10 E y F). Principalmente, en los genes
sobrerrepresentados con la enzima Benzonasa se reconocen procesos metabólicos
generales y funciones asociadas a la transcripción, mientras que en los genes
sobrerrepresentados con la enzima RNAsa I se destacan el ribosoma y la cadena de
transporte de electrones de la mitocondria.
De esta manera, con base en los resultados anteriores (ver Figuras V.8, V.9 y V.10) podemos
afirmar que a pesar de existir grupos de genes cuya detección parece verse asociada al uso
de una u otra enzima en particular, y encontrar eventos de expresión génica diferencial, los
compartimentos traduccionales definidos por ambas enzimas presentan estimaciones de
expresión génica comparables.
A continuación, y al igual que para el análisis de las huellas ribosomales producidas a partir
de los cultivos in vitro de neuronas corticales primarias, en este caso también analizamos
características globales de las huellas ribosomales producidas con cada enzima, por ejemplo
su distribución entre las regiones codificantes y no codificantes de los ARNm, su periodicidad
y preferencia de corte, así como también los perfiles de mapeo producidos en cada caso. En
primer lugar, la distribución de mapeo sobre las regiones del ARNm mostró los resultados
esperados (ver Figura V.11 A). Para ambas enzimas, las huellas mapean de manera
preferencial sobre las regiones correspondientes a los CDS respecto de las regiones no
traducidas. La distribución para las huellas generadas con Benzonasa muestra un perfil similar

90
--------------------------------------------------------------------------------------------------------------------------- Figura V.10. Análisis de expresión génica diferencial entre los traductomas producidos con Benzonasa y RNAsa I. (A) Scatter plot comparando los niveles de expresión determinados para cada enzima. En colores se indican los genes expresados diferencialmente: en rojo los sobrerrepresentados con la Benzonasa y en azul con la RNAsa I. Se muestra el corte en el valor de expresión de 10 CPM por debajo del cual se descartan esos genes por ser de baja expresión. (B) La distribución de los valores de expresión de todos los genes, los sobrerrepresentados con la Benzonasa y los sobrerrepresentados con la RNAsa I se muestran mediante boxplots. En rojo los valores de expresión para la condición J (la leyenda continúa en la siguiente hoja)
91
Benzonasa y en azul para la RNAsa I. (C) Se muestran los cambios en los niveles de expresión para los genes diferenciales asociados a cada enzima. En rojo para la Benzonasa y en azul para la RNAsa I. (D) Los genes comunes entre los asociadas a cada enzima definidos por los tres criterios definidos anteriormente y los genes expresados diferencialmente se muestran mediante diagramas de Venn para cada enzima. (E) Se muestran los resultados del análisis de ontología génica realizados con la herramienta g:GOSt del g:Profiler para los genes sobrerrepresentados con la Benzonasa. Se muestran las categorías de función molecular (GO:MF), procesos biológicos (GO:BP) y compartimento celular (GO:CC). En cada caso, las tres categorías más significativas son indicadas numéricamente e indicadas a la derecha. (F) Idem a (E) para los genes sobrerrepresentados con la enzima RNAsa I. ---------------------------------------------------------------------------------------------------------------------------
al obtenido para las neuronas in vitro (ver Figura V.4 C). De todas maneras se aprecian claras
diferencias al comparar las distribuciones entre las dos enzimas. Las huellas producidas con
RNAsa I muestran mapeos con un claro sesgo al CDS (93-94%) y casi no vemos
representadas a las regiones no traducidas, aunque el 5’-UTR se ve un poco más
representado que el 3’-UTR (3,2% y 0,6%, respectivamente; ver Figura V.11 A). Por su parte,
las huellas producidas con Benzonasa mapean con un patrón global distinto. Se distribuyen
de manera mayoritaria sobre la región codificante (70%), aunque la región correspondiente al
3’-UTR se ve más representada (20%) que en las huellas derivadas de la RNAsa I, mientras
que el 5’-UTR parece verse igual de representado (4%). Al igual que mencionamos
anteriormente, estas asimetrías en las distribuciones entre regiones codificantes y no
codificantes no se deben a diferencias en el tamaño de las regiones analizadas (ver Figura
V.11 B).
Inspirados en el trabajo de TP. Miettinen & M. Bjorklund (NAR, 2015) y en los resultados e
hipótesis que los autores elaboran, nos propusimos analizar un poco más en detalle posibles
razones que fundamenten la presencia de huellas ribosomales en el 3’-UTR, como se
describen en el caso de la Benzonasa. Pudimos observar que, tal como muestran los
anteriores autores, las huellas ribosomales presentes en el 3’-UTR tienen un tamaño distinto
al observado para las huellas que mapean en el 5’-UTR o CDS. La diferencia se observa tanto
en el caso de la Benzonasa, pero también para la RNAsa I aunque el porcentaje de lecturas
mapeadas en esta región sea muy bajo (ver Figura V.12). De hecho, a pesar de presentar
claras diferencias de tamaño en las huellas que mapean sobre el 5’-UTR y CDS (ver también
más adelante), las huellas que mapean sobre el 3’-UTR parecen tener una distribución de
tamaños similar con las dos enzimas, centradas en 35 nt de largo. En el trabajo anterior, una
de las posibles razones que los autores elaboran para fundamentar la observación de huellas
ribosomales en el 3’-UTR que encuentran con otra ARNasa (nucleasa micrococal), pero no

92
--------------------------------------------------------------------------------------------------------------------------- Figura V.11. Análisis de la distribución de las regiones de mapeo de las huellas ribosomales obtenidas con las dos enzimas. (A) Se muestra la distribución de las regiones donde mapean las lecturas en el ARNm (5’-UTR, CDS y 3’-UTR) para las dos réplicas de cada enzima (arriba y en rojo, Benzonasa; abajo y en azul, RNAsa I). (B) Como control de las distribuciones que se muestran en (A), se grafica la distribución de los tamaños de las regiones utilizadas. Puede observarse que el hecho de que se favorezcan los mapeos de las huellas ribosomales sobre la región traducida (CDS) no se debe a que éstas tengan un largo mayor y preponderante sobre las regiones no traducidas (5’ y 3’-UTRs). ---------------------------------------------------------------------------------------------------------------------------
con RNAsa I, es la diferencia en la agresividad de la digestión por cada enzima. Entre otros,
un argumento para fundamentar esto es que la RNAsa I produce fragmentos de ARNr
derivados del 18S y 28S, presentes en las subunidades menor y mayor del ribosoma,
respectivamente. En nuestro caso, efectivamente observamos fragmentos derivados de
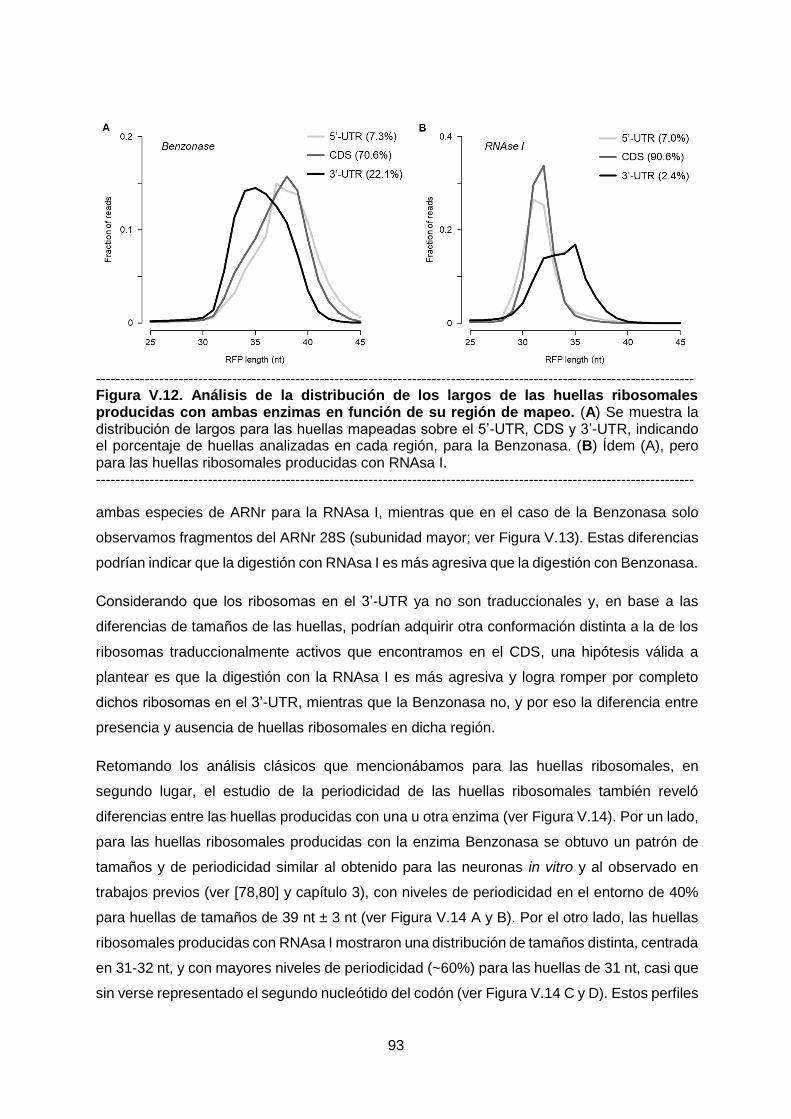
93
--------------------------------------------------------------------------------------------------------------------------- Figura V.12. Análisis de la distribución de los largos de las huellas ribosomales producidas con ambas enzimas en función de su región de mapeo. (A) Se muestra la distribución de largos para las huellas mapeadas sobre el 5’-UTR, CDS y 3’-UTR, indicando el porcentaje de huellas analizadas en cada región, para la Benzonasa. (B) Ídem (A), pero para las huellas ribosomales producidas con RNAsa I. ---------------------------------------------------------------------------------------------------------------------------
ambas especies de ARNr para la RNAsa I, mientras que en el caso de la Benzonasa solo
observamos fragmentos del ARNr 28S (subunidad mayor; ver Figura V.13). Estas diferencias
podrían indicar que la digestión con RNAsa I es más agresiva que la digestión con Benzonasa.
Considerando que los ribosomas en el 3’-UTR ya no son traduccionales y, en base a las
diferencias de tamaños de las huellas, podrían adquirir otra conformación distinta a la de los
ribosomas traduccionalmente activos que encontramos en el CDS, una hipótesis válida a
plantear es que la digestión con la RNAsa I es más agresiva y logra romper por completo
dichos ribosomas en el 3’-UTR, mientras que la Benzonasa no, y por eso la diferencia entre
presencia y ausencia de huellas ribosomales en dicha región.
Retomando los análisis clásicos que mencionábamos para las huellas ribosomales, en
segundo lugar, el estudio de la periodicidad de las huellas ribosomales también reveló
diferencias entre las huellas producidas con una u otra enzima (ver Figura V.14). Por un lado,
para las huellas ribosomales producidas con la enzima Benzonasa se obtuvo un patrón de
tamaños y de periodicidad similar al obtenido para las neuronas in vitro y al observado en
trabajos previos (ver [78,80] y capítulo 3), con niveles de periodicidad en el entorno de 40%
para huellas de tamaños de 39 nt ± 3 nt (ver Figura V.14 A y B). Por el otro lado, las huellas
ribosomales producidas con RNAsa I mostraron una distribución de tamaños distinta, centrada
en 31-32 nt, y con mayores niveles de periodicidad (~60%) para las huellas de 31 nt, casi que
sin verse representado el segundo nucleótido del codón (ver Figura V.14 C y D). Estos perfiles

94
de tamaños y periodicidad se asemejan a lo que se describe en la literatura en los trabajos
que utilizaron RNAsa I para producir huellas ribosomales (ejemplo en [29]).
--------------------------------------------------------------------------------------------------------------------------- Figura V.13. Distribución de fragmentos de ARNr producidos por ambas enzimas entre las distintas especies de ARNr. Se muestra la fracción de huellas ribosomales derivadas de ARNr entre las distintas especies de ARNr, principalmente ARNr 18S (presente en la subunidad menor del ribosoma) y 28S (presente en la subunidad mayor), para las dos réplicas de cada enzima. ---------------------------------------------------------------------------------------------------------------------------
En tercer lugar analizamos si se observaba una preferencia en el sitio de corte de las dos
enzimas evaluando la composición nucleotídica de los extremos de las lecturas. Pudimos
observar que, como se esperaba, tanto para la Benzonasa como para la RNAsa I no se
aprecian grandes sesgos o preferencias de corte (ver Figura V.15). Tanto en los primeros tres
nucleótidos de las huellas ribosomales, como en los últimos tres, la distribución de nucleótidos
es bastante uniforme.
En cuarto lugar, nos propusimos comparar perfiles de mapeos sobre algunos genes, en busca
de coincidencias o diferencias. Para esto, seleccionamos genes de alta expresión comunes
en todos los set de datos (ver Tabla Suplementaria XI.2), como ha sido realizado
anteriormente para este tipo de análisis [89]. Así, elegimos 5 genes, todos codificantes para
proteínas y con ARNm de un largo considerable (1285 a 3512 nt), y presentes en el top30 de
genes más expresados en cada set de datos (al menos >20.000 lecturas mapeadas en cada
muestra). A grandes rasgos, no se puede observar un patrón de mapeo conservado entre las
dos enzimas (ver Figura V.16). La Benzonasa parece favorecer picos sobre el codón de inicio,
que no se observan en los perfiles obtenidos con RNAsa I, y se observa mayor presencia de
lecturas en las regiones 3’-UTR en los mapeos producidos con Benzonasa (ver Figura V.16),
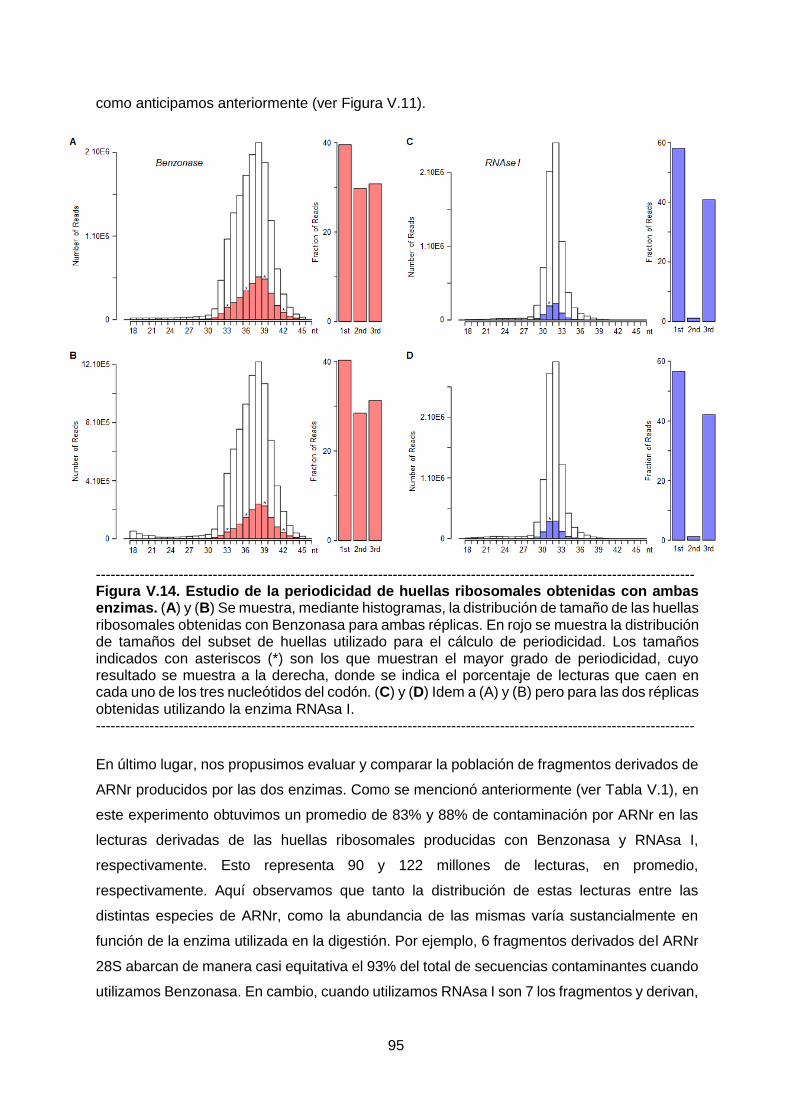
95
como anticipamos anteriormente (ver Figura V.11).
--------------------------------------------------------------------------------------------------------------------------- Figura V.14. Estudio de la periodicidad de huellas ribosomales obtenidas con ambas enzimas. (A) y (B) Se muestra, mediante histogramas, la distribución de tamaño de las huellas ribosomales obtenidas con Benzonasa para ambas réplicas. En rojo se muestra la distribución de tamaños del subset de huellas utilizado para el cálculo de periodicidad. Los tamaños indicados con asteriscos (*) son los que muestran el mayor grado de periodicidad, cuyo resultado se muestra a la derecha, donde se indica el porcentaje de lecturas que caen en cada uno de los tres nucleótidos del codón. (C) y (D) Idem a (A) y (B) pero para las dos réplicas obtenidas utilizando la enzima RNAsa I. ---------------------------------------------------------------------------------------------------------------------------
En último lugar, nos propusimos evaluar y comparar la población de fragmentos derivados de
ARNr producidos por las dos enzimas. Como se mencionó anteriormente (ver Tabla V.1), en
este experimento obtuvimos un promedio de 83% y 88% de contaminación por ARNr en las
lecturas derivadas de las huellas ribosomales producidas con Benzonasa y RNAsa I,
respectivamente. Esto representa 90 y 122 millones de lecturas, en promedio,
respectivamente. Aquí observamos que tanto la distribución de estas lecturas entre las
distintas especies de ARNr, como la abundancia de las mismas varía sustancialmente en
función de la enzima utilizada en la digestión. Por ejemplo, 6 fragmentos derivados del ARNr
28S abarcan de manera casi equitativa el 93% del total de secuencias contaminantes cuando
utilizamos Benzonasa. En cambio, cuando utilizamos RNAsa I son 7 los fragmentos y derivan,

96
5 del ARNr 28S y 2 del ARNr 18S (ver Figura V.17 y Tabla V.2), como anticipamos
anteriormente (ver Figura V.13).
-------------------------------------------------------------------------------------------------------------------------- Figura V.15. Análisis de la preferencia de corte de Benzonasa y RNAsa I. Se muestra la distribución de los nucleótidos en las tres primeras y las tres últimas posiciones de las huellas ribosomales producidas con Benzonasa (A) y RNAsa I (B). --------------------------------------------------------------------------------------------------------------------------

97
--------------------------------------------------------------------------------------------------------------------------- Figura V.16. Comparación de los patrones de mapeo sobre distintos ARNm de alta expresión entre ambas enzimas. Se muestran los perfiles de mapeo de huellas ribosomales producidas con Benzonasa (arriba, rojo) y RNAsa I (abajo, azul) para 5 distintos ARNm de alta expresión: ACTB, EEF1A1, ENO1, GAPDH y TUBA1B. En todos los casos se representa el ARNm maduro y se indica la región codificante (CDS). ---------------------------------------------------------------------------------------------------------------------------
En la Figura V.17 se puede observar el perfil de mapeo sobre los ARNr mencionados donde
solo se observan picos puntuales que corresponden a los fragmentos derivados de la digestión
del ribosoma y que concentran la gran mayoría de las secuencias. También podemos observar
que los perfiles de mapeos obtenidos sobre las mismas especies de ARNr con Benzonasa y
RNAsa I muestran distintos patrones de picos (ver Figura V.17 A). Tanto las secuencias como
el tamaño de estos picos pueden encontrarse en la Tabla V.2. Puede apreciarse aquí también
que no se comparte ninguno de los picos entre las dos enzimas. Del total de las 7 secuencias

98
contaminantes que aquí describimos en el ensayo con RNAsa I, encontramos 5 de ellas
descritas como parte de oligos biotinilados para la sustracción de contaminación de ARNr
según el protocolo original donde se utiliza esta misma enzima [84].
---------------------------------------------------------------------------------------------------------------------------
Figura V.17. Perfiles de mapeo sobre ARNr 28S y 18S con Benzonasa y RNAsa I. (A) Se muestran los perfiles de mapeo para un transcrito de ARNr 28S a modo de ejemplo (NR_145822), obtenidos a partir de la digestión con Benzonasa (arriba, rojo) y RNAsa I (abajo, azul). (B) Similar a (A) solo que se muestra el mapeo sobre un ARNr 18S (NR_145820) obtenido con RNAsa I. En cada caso se muestra, en la parte superior, una escala de tamaño del transcrito. ---------------------------------------------------------------------------------------------------------------------------

99
--------------------------------------------------------------------------------------------------------------------------- Tabla V.2. Secuencias y tamaños de los fragmentos de ARNr responsables de la contaminación producida con cada enzima. ---------------------------------------------------------------------------------------------------------------------------
RNAsa I
Picos en ARNr 28S Tamaño
5’-TCGTGGGGGGCCCAAGTCCTTCTGATCGAGGCC-3’ 33
5’-CAGTGCGCCCCGGGCGGGTCGCGCCGTCGGGCCCGGGGG-3’ 39
5’-AGCGCCGCGGAGCCTCGGTTGGCCTCGGATAGCCGGTCCCCCG-3’ 43
5’-CTGGGTCGGGGTTTCGTACGTAGCAGAGCAGCTCC-3’ 35
5’-TCGCTGCGATCTATTGAAAGTCAGCCCTCGACACAA-3’ 36
Picos en ARNr 18S
5’-CTTTGGTGACTCTAGATAACCTCGGGCCGATCGCAC-3’ 36
5’-GCCGCCTGGATACCGCAGCTAGGAATAATGGAATAG-3’ 36
Benzonasa
Picos en ARNr 28S
5’-CCGCGGCGGGGCGCGGGACATGTGGCGTACGGAAGACC-3’ 38
5’-GGATTCAACCCGGCGGCGGGTCCGGCCGTGTCGGCGGCCCGGCGGATCTTT
CCC-3’
54
5’-CGGCGTCTCCTCGTGGGGGGGCCGGGCCACCCCTCCCACGGCGCGAC-3’ 47
5’-CGCGCTCGCCGGCCGAGGTGGGATCCCGAGGCCTCTCCAG-3’ 40
5’-CGCGCGCCGGGACCGGGGTCCGGTGCGGAGTGCCCTTCGTCCTG-3’ 44
5’-CCCTCGCCCGTCACGCACCGCACGTTCGTGGGGAACCTGG-3’ 40

100
Discusión
En el presente capítulo nos propusimos como principales objetivos poner a punto el uso de la
técnica de Ribo-Seq en distintos modelos neuronales, así como comparar de manera global
los traductomas definidos por huellas ribosomales producidas con Benzonasa o con RNAsa
I.
En primer lugar, respondiendo al desafío de aplicar la técnica utilizando una baja cantidad de
células como es el caso de las cantidades que se obtienen de cultivos neuronales primarios,
trabajamos en la optimización de la obtención de huellas ribosomales realizando el ensayo de
digestión directamente sobre el sobrenadante postmitocondrial, suprimiendo la previa
purificación de pellet polisomal, como fuera realizado por Zappulo et. al [83]. De esta manera,
utilizando cantidades decrecientes de células hasta niveles comparables a los que obtenemos
en cultivos in vitro de neuronas corticales embrionarias, realizamos ensayos de digestión
sobre el sobrenadante postmitocondrial (ver Figura V.1). En todos los casos logramos obtener
huellas ribosomales en cantidades suficientes para producir librerías de secuenciación: al
menos >50 ng de ARN. También evaluamos distintas cantidades de enzima al momento de
realizar las digestiones debido a que se trata de una muestra distinta a la utilizada en el
protocolo habitual. Así, definimos el rango óptimo de uso de la enzima Benzonasa de manera
tal que produzca huellas ribosomales de los tamaños adecuados (28 a 31 nt; ver Figura V.2).
En este contexto, producimos y secuenciamos huellas ribosomales a partir de cultivos in vitro
de neuronas corticales primarias derivadas de embriones de ratones wt y tauKO, como una
primera aproximación (ver Figura V.3). Vale mencionar, como aclaramos anteriormente, que
en este caso los cultivos contienen otros tipos celulares accesorios, como células gliales, entre
otros, por lo que las huellas ribosomales no derivan exclusivamente de células neuronales.
Los análisis primarios y globales realizados sobre los traductomas secuenciados revelaron
resultados alentadores (ver Figura V.4). Se pudo obtener una gran cantidad de lecturas
mapeando sobre ARNm de manera tal que se pudieron estimar niveles de expresión génica
traduccional para más de 10.000 genes por encima del ruido (ver Figura V.4 A y B). Las
huellas ribosomales obtenidas mapean de manera preferencial sobre las regiones
codificantes de los ARNm y muestran además el patrón esperado de periodicidad (ver Figura
V.4 C-F). Un resultado que llamó nuestra atención fue el tamaño observado de las lecturas
correspondientes a las huellas ribosomales, que se ubicó entre 30 y 40 nt (ver Figura V.4 E y
F). A pesar de que el tamaño indicado por el Bioanalyzer era el adecuado (entre 25 y 34 nt;
ver Figura V.3 C) atribuimos esta diferencia a que posiblemente las bandas recortadas hayan
correspondido a tamaños levemente mayores y que la estimación por Bioanalyzer no haya
sido 100% precisa, como hemos observado en casos previos similares. De todas maneras,
vale destacar que las lecturas producidas muestran todas las características esperadas para

101
las huellas ribosomales, como mencionamos anteriormente, asimetría de mapeo en regiones
codificantes y no codificantes y periodicidad de mapeo (ver Figura V.4 C-F).
En segundo lugar y utilizando otro modelo neuronal, como es el tejido nervioso derivado de
animales, nos propusimos optimizar el protocolo de Ribo-Seq para su realización a partir de
la corteza cerebral de ratones. De esta manera trabajamos principalmente en los pasos de
obtención del tejido, lisado celular y obtención del sobrenadante postmitocondrial, y
purificación del pellet polisomal. Una vez ajustados estos pasos previos logramos obtener y
purificar huellas ribosomales del tamaño y calidad esperada y en cantidad suficiente para su
secuenciación masiva (28 a 31 nt y 300 ng de ARN, respectivamente; ver Figura V.5). En el
siguiente capítulo se describe cómo utilizamos este protocolo para su aplicación en modelos
murinos transgénicos de la enfermedad de Alzheimer.
Por último nos propusimos estudiar y comparar los protocolos de producción de huellas
ribosomales con Benzonasa, la enzima que utilizamos habitualmente en los protocolos del
laboratorio, y RNAsa I, la enzima utilizada en el protocolo descrito originalmente por Ingolia y
colaboradores [84]. Para esto utilizamos células HEK293 a partir de las cuales obtuvimos
pellet polisomales y ante muestras equivalentes realizamos, en duplicados, digestiones con
cada una de las enzimas. Las huellas producidas con la RNAsa I fueron fosforiladas en el
extremo 5’ y desfosforiladas en el 3’, como mencionábamos anteriormente, previo al envío a
los servicios de secuenciación masiva (ver Figura V.6). Los perfiles de bandas de las
digestiones obtenidas con cada enzima, así como las bandas específicas correspondientes a
las huellas ribosomales recuperadas ya mostraban algunas diferencias entre las dos enzimas
(ver Figura V.7). Los fragmentos de ARN correspondientes a las huellas ribosomales fueron
secuenciados de manera masiva y se obtuvieron en promedio más de 120 millones de lecturas
por muestra. Los porcentajes de contaminación por fragmentos derivados de ARNr fueron los
esperados, aunque levemente más altos en las muestras correspondientes a la RNAsa I (88%
vs 83%). Los niveles de mapeo sobre el transcriptoma de referencia fueron muy buenos, con
un alto porcentaje de las lecturas asignadas a ARNm (ver Tabla V.1).
El análisis de los datos producidos reveló que las muestras se separan de manera esperada
en un análisis de componentes principales y que las réplicas realizadas de cada enzima
correlacionan muy bien (ver Figura V.8 A y B). Utilizando distintos umbrales de filtrado de
genes de baja expresión observamos un gran porcentaje de genes compartidos entre ambas
enzimas (ver Figura V.8 C). También, a nivel global se observan buenos niveles de correlación
entre las estimaciones de expresión génica traduccional derivadas a partir de las dos enzimas
(ver Figura V.8 D), como ha sido documentado para otras enzimas [89].
102
En primer lugar nos interesamos en explorar diferencias y similitudes respecto del traductoma
definido por cada enzima, tanto en la identidad de los genes detectados como en sus niveles
de expresión. Para esto, buscamos genes particulares asociados a cada enzima, es decir,
genes cuya detección sea exclusiva mediante el uso de una enzima en particular, o cuyos
niveles de expresión sean claramente superiores en una condición respecto de la otra. De
esta manera diseñamos una estrategia en base a tres criterios de selección que
denominamos: filtrado por cuartiles, por expresión y por ranking. Cada criterio, como
mencionamos anteriormente, intenta seleccionar genes cuya detección esté asociada a una
enzima en particular o cuyos niveles de expresión varíen sustancialmente entre las dos
enzimas. Así, más allá de cierto grado de coincidencia entre los tres criterios, pudimos
seleccionar un total de 188 y 170 genes asociados a la Benzonasa y RNAsa I,
respectivamente (ver Figura V.9 A-C). El análisis funcional de estas listas de genes reveló
resultados interesantes. Por un lado, la lista asociada a la Benzonasa no muestra funciones
ontológicas sobrerrepresentadas, solamente vías KEGG asociadas al espliceosoma y al
transporte de ARN. Por el otro lado, la lista asociada a la RNAsa I muestra un claro
enriquecimiento de funciones ontológicas y vías KEGG asociadas al ribosoma, procesamiento
de proteínas en el retículo endoplásmico y espliceosoma (ver Figura V.9 D, Figuras
Suplementarias XI.1 y XI.2 y Tabla Suplementaria XI.1). A su vez, observamos una importante
componente de genes no codificantes presentes en las listas: 111 de 188 para la Benzonasa
y 70 de 170 para la RNAsa I son genes no codificantes. Por esto también analizamos las
distintas clases de genes no codificantes presentes en cada lista de genes (ver Figura V.9 E),
donde parecen predominar ARN del tipo small nuclear y small nucleolar.
Como una aproximación similar pero diferente también realizamos análisis de expresión
génica diferencial entre los traductomas obtenidos con las dos enzimas (ver Figura V.10). De
todas maneras, consideramos que la búsqueda de genes diferenciales representa una
estrategia diferente que no necesariamente se complementa o sustituye a la estrategia
discutida anteriormente. Entendemos que la comparación entre las huellas ribosomales
producidas por las dos enzimas no debe reducirse a cálculos de expresión génica diferencial,
sino que debe contemplar otro tipo de enfoque. Los análisis de expresión diferencial no
necesariamente solo abarcan los escenarios de cambios en la expresión génica que quisimos
representar mediante los criterios de filtrado anteriores, sino que también muchos otros casos
donde los genes son detectados en ambas condiciones pero a niveles de expresión distintos.
De hecho, las listas de genes expresados diferencialmente son mucho más extensas que la
cantidad de genes definidos como asociados a cada enzima y también abarcan a una gran
cantidad de éstos (ver Figura V.10 D). En este caso, el análisis ontológico de los genes
diferenciales mostró altos niveles de enriquecimiento en diversas funciones biológicas (ver

103
Figura V.10 E y F), donde se destacan proteínas de unión a ADN y ARN, así como el ribosoma
y la mitocondria.
A modo de resumen, más allá de poder definir un grupo de genes particularmente sesgados
al uso de una u otra enzima y observar eventos de expresión génica diferencial entre los
niveles estimados por las dos enzimas, los resultados funcionales muestran que no hay
grandes diferencias entre los traductomas definidos tanto por Benzonasa como por RNAsa I.
A continuación comparamos características propias de las huellas ribosomales definidas por
cada enzima, como ya realizamos anteriormente para otro set de datos, evaluando el mapeo
preferencial en las regiones codificantes de los ARNm, la periodicidad de las huellas y la
preferencia de corte. En primer lugar, más allá de que observamos claramente la preferencia
en el mapeo de las huellas ribosomales por las regiones codificantes para ambas enzimas
(ver Figura V.11), se pueden apreciar diferencias entre las distribuciones de mapeo de cada
enzima. Por un lado, las huellas ribosomales producidas con RNAsa I muestran una clara
preferencia por el CDS respecto de los 5’- y 3’-UTR (94% versus 3,2% y 0,6%;
respectivamente). Por el otro lado, las huellas derivadas de la digestión con Benzonasa se
distribuyen de la siguiente manera: 70% en el CDS, 20% en el 3’-UTR y 4% en el 5’-UTR. La
presencia de huellas ribosomales en el 3’-UTR ya ha sido descrita y evidenciada por otros
autores (ver ejemplos en: JG. Dunn et al. Elife 2013; MA. Skabkin et al. Molecular Cell 2013;
TP. Miettinen & M. Bjorklund NAR 2015; S. Archer et al. Nature 2016; DJ. Young et al.
Molecular Cell 2018), en particular al utilizar enzimas alternativas a la RNAsa I. En nuestro
caso, pudimos observar que las huellas ribosomales presentes en el 3’-UTR presentaban un
tamaño distinto al de las huellas derivadas del 5’-UTR o CDS (ver Figura V.12), lo cual sugiere
una conformación y/o composición del ribosoma distinta una vez finaliza la traducción.
Además, considerando que la digestión con RNAsa I es más agresiva, pues produce
fragmentos de ARNr derivados de las dos subunidades del ribosoma (ver Figura V.13), se
plantea la hipótesis de que la RNAsa I logra romper los ribosomas en el 3’-UTR y por eso no
se evidencian huellas ribosomales en esta región. Por su parte, la Benzonasa cuya digestión
es menos agresiva (solo produce fragmentos de ARNr derivados de la subunidad mayor),
conserva la integridad de los ribosomas en el 3’-UTR y por lo tanto se recuperan huellas
ribosomales en esta región, como se ha visto para otras enzimas como la nucleasa
micrococal.
En segundo lugar, al evaluar la periodicidad de las huellas ribosomales detectamos en primer
instancia claras diferencias en el tamaño de las huellas ribosomales mapeadas en cada caso
(ver Figura V.14). Las huellas producidas con Benzonasa resultaron en promedio más
grandes y de mayor rango que las producidas con RNAsa I (33 a 40 nt versus 31-32 nt,

104
respectivamente). Los porcentajes de periodicidad también mostraron diferencias. Mientras
que en el caso de la Benzonasa observamos porcentajes similares a los encontrados
previamente con esta enzima, cercanos al 40% [78,80] (ver también capítulo 3), para la
RNAsa I la distribución entre los tres nucleótidos del codón fue distinta, viéndose más
favorecido el primer nucleótido (<60%) y casi que sin verse representada la posición #2. Estos
patrones se parecen a los reportados previamente en estudios donde utilizaron la misma
enzima [29,106]. En tercer lugar, verificamos como se mencionaba anteriormente, que ambas
enzimas son inespecíficas y que ninguna presenta un sesgo en el sitio de corte, ya que ningún
nucleótido en particular se ve favorecido en los extremos de las huellas ribosomales
generadas con cada enzima (ver Figura V.15). De hecho, para la RNAsa I se observa una
mayor presencia de nucleótidos de guanina en la última posición de las huellas ribosomales,
como ha sido documentado previamente [89].
Con el objetivo de buscar diferencias entre las dos enzimas, también exploramos los perfiles
de mapeo generados con ambas enzimas en distintos genes de alta expresión (ver Figura
V.16 y Tabla Suplementaria XI.2). De la misma manera como ha sido descrito, aquí decidimos
utilizar genes con un tamaño adecuado y con un mínimo de cobertura y mapeos para
minimizar sesgos [89,107]. En primera instancia vale mencionar que los perfiles de cobertura
de las distintas réplicas biológicas son sumamente parecidos, casi idénticos. De todas
maneras, se observan grandes diferencias en los perfiles generados por las dos enzimas, con
apenas unos pocos picos de mapeos compartidos. Este resultado es similar a lo que ha sido
observado cuando se compararon otras ARNasas con la RNAsa I [89]. En nuestro caso, los
perfiles derivados de la Benzonasa presentan picos mayores en la zona del codón de inicio
así como se observan mapeos en la región 3’-UTR, como comentábamos antes. Diferencias
en los perfiles de mapeo sobre un mismo gen no solo han sido descritas para enzimas
distintas, sino que se ha observado diferencias utilizando la misma enzima, en el mismo
organismo, pero en distintos trabajos con protocolos ligeramente distintos [89].
Considerando este resultado, junto con los anteriores, es claro que existen diferencias entre
el uso de una enzima o lo otra. Además del tamaño de las lecturas, su patrón de periodicidad
y distribución de mapeos en las distintas regiones del ARNm, parecen existir pequeñas
diferencias en la identidad de los genes que cada enzima detecta. Éstas diferencias podrían
atribuirse a pequeños sesgos en los sitios de corte de cada enzimas, a diferencias en el
tamaño molecular, o a diferencias en la afinidad por el ARN simple cadena, que como se
mencionó al principio, son propiedades que difieren entre ambas enzimas. De todas maneras,
no parecen existir grandes grupos o funciones biológicas particularmente
sobrerrepresentadas o subrepresentadas en el uso de cada enzima. Aún así se observan
afectados muchos genes no codificantes, como ARN pequeños, que pueden estar presentes

105
en la fracción polisomal, y que por lo general no son el centro de los análisis del tipo
traductómicos. Un ejemplo que puede ilustrar que las diferencias encontradas no son
necesariamente importantes desde el punto de vista biológico es la presencia de distintas
variantes del gen de la actina en los genes asociados a cada enzima. La beta actina aparece
enriquecida en los genes asociados a la Benzonasa, seleccionada por el filtro de cambio en
el nivel de expresión. Por el otro lado, la alfa 1 y gamma 1 actinas aparecen en las listas de
genes asociados a la RNAsa I, seleccionadas por el filtro de cambio en el ranking de expresión
y cambio en el nivel de expresión, respectivamente. De todas maneras, si sumamos los
niveles de expresión de las 3 variantes obtenemos niveles comparables: 5.550 CPM con
Benzonasa y 5.880 CPM con RNAsa I. Esto podría indicar que pueden existir sesgos en la
producción de huellas ribosomales en este gen en particular, donde se favorece una variante
génica por encima de las otras con un enzima en particular. También, podría ocurrir que una
gran proporción de las huellas ribosomales producidas deriven de regiones conservadas de
este grupo de genes y al momento de mapear se distribuyan en las distintas variantes de
manera diferencial aunque efectivamente tengan el mismo origen.
Por último, uno de los aspectos claves a considerar en el diseño y puesta a punto de la
metodología de Ribo-Seq es la presencia no deseada de fragmentos derivados de ARNr.
Estos fragmentos, que se producen en la digestión de los polisomas con la enzima, suelen
representar un alto porcentaje de la población de ARN, alrededor del 80% y hasta el 95%, y
por lo tanto consumen un grado equivalente de los recursos de secuenciación masiva. Por
esto, como último punto nos propusimos evaluar los fragmentos correspondientes a ARNr
producidos en este experimento así como comparar los resultados obtenidos por las dos
enzimas. Como mencionamos antes, los porcentajes de contaminación por ARNr son
similares para los enzimas, aunque levemente superiores con la RNAsa I (88% vs 83%; ver
Tabla V.1). Para esta enzima se definieron 7 fragmentos contaminantes procedentes de ARNr
28S y 18S, mientras que para la Benzonasa se identificaron 6 fragmentos, todos derivados
de ARNr 28S (ver Tabla V.2 y Figura V.17). Los perfiles de mapeo sobre estos genes
ribosomales son distintos para cada enzima y en cada caso se reconocen picos particulares
donde se ven representadas las secuencias más abundantes generadas (ver Figura V.17).
Las secuencias representadas en cada pico, las cuales como decíamos no se comparten
entre las enzimas, representan información valiosa para la construcción de oligos biotinilados
u otra alternativa experimental, que nos permita sustraer estas especies claramente
abundantes (ver Tabla V.2). De hecho en la descripción del protocolo original que utiliza
RNAsa I están disponibles las secuencias de un total de 14 oligos biotinilados para la
sustracción de ARNr [84], de los cuales 5 están presentes entre las 7 secuencias que aquí
observamos. Sin dudas que conocer esta información es de gran utilidad ya que permite

106
diseñar estrategias de sustracción de ARNr específicas para el uso de la Benzonasa, que
como observamos en este caso, genera fragmentos completamente distintos a los producidos
y descritos para la RNAsa I.
En suma, se pueden identificar diferencias tanto a nivel de las huellas ribosomales producidas
por cada enzima como de los traductomas cuantificados a partir del mapeo de dichas huellas.
En cierto nivel, estas diferencias son esperadas respecto a lo que se ha visto en trabajos
previos, donde se compararon otras ARNasas con la RNAsa I [89]. De todas maneras, esta
es la primera vez que se realiza una comparación del estilo con la enzima Benzonasa. Es
interesante discutir acerca de las posibles razones biológicas que explican las diferencias
tanto en las características de las huellas ribosomales producidas como en los niveles de
expresión traduccional estimados a partir de ellas. Respecto a lo primero, parece ser claro
que las diferencias en tamaños se explican por diferencias en la actividad de las enzimas, sus
mecanismos de acción y tamaño. Mencionamos anteriormente que los sustratos de la
Benzonasa son más variados que los de la RNAsa I. Además, la Benzonasa es una enzima
de mayor tamaño lo cual seguramente dificulte su acceso a las regiones más cercanas al
ribosoma. En cambio, la RNAsa I de menor tamaño podría digerir más fácilmente las regiones
del mensajero cercanas al ribosoma, produciendo huellas ribosomales más pequeñas como
las que aquí, y en otros estudios, se observan [29,106]. Quizás diferencias en los mecanismos
de acción, procesividad y tamaños de las enzimas determinen que sean más o menos
agresivas con el ribosoma. Comprometer la integridad del ribosoma puede afectar no solo el
tamaño de la huella sino también su presencia o ausencia, justificando por ejemplo por que
se observan más huellas ribosomales producidas con Benzonasa mapeando en las regiones
3’-UTRs. Sin dudas que son hipótesis que resultan interesantes de explorar en un futuro.
Respecto a las diferencias en las estimaciones de expresión de los compartimentos
traduccionales, nuevamente las razones anteriores parecen estar involucradas. La capacidad
de cada enzima de digerir polisomas con gran o poca cantidad de ribosomas, con complejas
o simples estructuras secundarias de ARN, con varios o pocos factores proteicos unidos al
mismo, son sin duda factores que pueden explicar porque varían los niveles estimados de
expresión entre las dos enzimas. Nuevamente, estas diferencias, junto con las diferencias en
los patrones de mapeo sobre ARNm individuales han sido previamente documentadas en la
literatura comparando otras ARNasas como S7, T1 y A [89]. En nuestro caso, la comparativa
global de niveles de expresión fue lo suficientemente buena, con un valor de correlación de
Pearson de 0,91. De todas maneras, se pudieron identificar varios genes como expresados
diferencialmente. Además, un análisis detallado nos permitió, mediante tres criterios de
selección, identificar genes que estuvieran particularmente asociados a una enzima. Así,
identificamos menos de 200 genes que tienden a verse favorecidos con una enzima respecto

107
a la otra. Sin embargo, muchos de estos genes correspondían a genes no codificantes,
posiblemente presentes por arrastre en el pellet polisomal, asociados a ribonucleopartículas
o al propio ribosoma. Un ejemplo claro parecen ser los ARN del tipo small nucleolar, muy
abundantes dentro de los genes no codificantes asociados a cada enzima, en especial la
Benzonasa. Dado que las dos enzimas presentan actividades catalíticas distintas, se espera
que digieran el ribosoma de manera distinta. Este tipo en particular de ARN, se ha visto que
regulan modificaciones en el ARNr así como la propia biogénesis del ribosoma [108]. Para
finalizar, vale destacar que las diferencias que aquí observamos entre Benzonasa y RNAsa I
pueden darnos la seguridad de que el utilizar Benzonasa para la digestión polisomal no
introduce mayores sesgos de relevancia biológica, siempre y cuando utilicemos la misma
enzima para las distintas condiciones biológicas a estudiar.

108
VI. CAPÍTULO 3
TRADUCTÓMICA DE MODELOS MURINOS TRANSGÉNICOS DEL MAL DE ALZHEIMER
En la literatura los estudios de expresión génica mediante aproximaciones ómicas, o más
recientemente tecnologías de célula única (single cell RNA-Seq), son muy abundantes para
modelos animales o celulares del mal de Alzheimer e incluso para muestras humanas de
pacientes enfermos. De todas maneras, el centro de la atención ha sido principalmente el
control a nivel transcripcional, evaluando la expresión génica midiendo la abundancia de
ARNm mediante RNA-Seq. Sin embargo, algunas evidencias recientes indican la existencia
de eventos de regulación traduccional importantes en modelos de la enfermedad [23,72]. En
dichos eventos, la participación de las dos moléculas centrales en el desarrollo de la patología,
Aβ y TAU, ha sido documentada [70–74]. Por esta razón, en el presente capítulo nos
planteamos evaluar la siguiente hipótesis de trabajo: existen eventos de regulación
traduccional en modelos animales transgénicos de la enfermedad de Alzheimer que son
fundamentales para el desarrollo de esta patología neurodegenerativa. En este contexto,
definimos como principal objetivo estudiar los eventos de regulación traduccional, mediante
aproximaciones ómicas, en la corteza cerebral de modelos animales de la enfermedad, y
conocer los principales genes y funciones biológicas reguladas.
De esta manera, utilizando modelos murinos transgénicos que simulan el desarrollo de la
enfermedad, aplicamos la metodología de Ribo-Seq en la corteza cerebral de ratones machos
adultos de edad joven, preferentemente asintomáticos. Hasta donde conocemos, este es el
primer estudio de este tipo que se realiza en modelos animales o celulares de Alzheimer, ya
que aproximaciones similares (Ribo-Tag y polysome-seq) han sido aplicadas específicamente
a la microglia (ver SS. Kang et al. J Exp Med 2018 y Z. Haimon et al. Nat Immunol 2018).
Recientemente han sido publicados trabajos similares, dos en donde se aplicó Ribo-Seq en
distintas regiones del cerebro de ratones modelo del síndrome de X frágil [61,109], y el otro
en donde también se aplicó la técnica de Ribo-Seq en un modelo celular de Parkinson [62].
Los dos modelos animales utilizados, del tipo amiloides (CVN: App SwDI; Nos2-/- y Tg2576:
App Sw; ver Manuscrito I), mostraron eventos de regulación tanto a nivel transcriptómico,
como traductómico. En particular, los ratones CVN mostraron una mayor cantidad de genes
regulados a nivel de la traducción que el modelo Tg2576. Específicamente en ratones CVN,
los genes diferenciales en ambos niveles revelan la regulación positiva de una firma génica
microglial particular que responde a la acumulación de Aβ en las primeras etapas. El análisis
ontológico de las listas de genes regulados muestra una regulación negativa de varios

109
procesos de neurodegeneración, mientras que se favorecen procesos de tipo
neuroprotectores como el aumento de células neuronales y gliales y transmisiones sinápticas,
entre otros. En general, la identidad de los genes regulados en ambos niveles revelan una
compleja firma molecular que implica “los dos lados de la moneda”: por un lado encontramos
genes asociados a funciones neuroprotectoras o beneficiosas, como reducir los altos niveles
de Aβ, pero en el otro lado tenemos genes con funciones neurotóxicas relacionados a la
producción de Aβ o a la pérdida de funciones neuronales.
Este trabajo podría, probablemente, dilucidar nuevas vías comunes como posibles
marcadores tempranos de la enfermedad de Alzheimer y así permitirnos comprender mejor
los procesos moleculares aberrantes que podrían impulsar la neurodegeneración. A su vez,
el análisis de los datos revela eventos de regulación de la expresión génica que ocurren a
nivel traduccional, lo cual no ha sido considerado hasta el momento y permite entonces
explorar nuevos mecanismos de control y vías de señalización desreguladas.
Los resultados obtenidos, junto con una introducción al trabajo, materiales y métodos y la
discusión de los mismos, se presentan a continuación en formato de manuscrito.
Manuscrito I: Tandem transcriptional and translational analysis of gene expression in
mouse models of Alzheimer's disease
Se adjunta a continuación.

1
Tandem transcriptional and translational analysis of gene
expression in mouse models of Alzheimer's disease
Guillermo Eastmana, Elizabeth R. Sharlowb, John S. Lazob,c, George S. Bloomd,e,f * and José
R. Sotelo-Silveiraa,f *
aDepartamento de Genómica, Instituto de Investigaciones Biológicas Clemente Estable,
Ministerio de Educación y Cultura, Montevideo, Uruguay
bDepartment of Pharmacology, University of Virginia, Charlottesville, VA, USA
cDepartment of Chemistry, University of Virginia, Charlottesville, VA, USA
dDepartment of Biology, University of Virginia, Charlottesville, VA, USA
eDepartment of Cell Biology, University of Virginia, Charlottesville, VA, USA
fDepartment of Neuroscience, University of Virginia, Charlottesville, VA, USA
gSección Biología Celular, Facultad de Ciencias, Universidad de la República, Montevideo,
Uruguay
* Correspondence to:
José R. Sotelo-Silveira, Departamento de Genómica, Instituto de Investigaciones Biológicas
Clemente Estable, Av. Italia 3318, 11600, Montevideo, Uruguay. Tel.: +598 2487 1616
(173); E-mail: [email protected] or [email protected]
George S. Bloom, Department of Biology, University of Virginia, PO Box 400328,
Charlottesville, VA 22904-4328, USA. Tel.: +1 434 243 3543; E-mail: [email protected]
Running title: Comparative RNA-Seq and Ribo-Seq of AD Mouse Models

2
ABSTRACT (250 words)
Alzheimer's disease (AD) is the most common cause of dementia worldwide, but efforts to
prevent or delay symptom onset, or reduce the rate at which symptoms progress have so
far been unsuccessful. This devastating disorder has a well characterized neuropathology
that consists of extracellular plaques made predominantly from amyloid-beta (Aβ) peptides
and intraneuronal neurofibrillary tangles formed mainly by the neuron-specific microtubule-
associated protein, tau. Not surprisingly, most efforts to develop therapeutics for AD have
focused on reducing the burden of toxic forms of Aβ or tau in brain, but without much regard
for the normal cellular signaling networks they may compromise or the pathogenic signaling
they may provoke. With this background in mind, we compared gene expression profiles in
cerebral cortex of two AD model mouse strains and wild type (WT) mice of the same strain
background at 6 months of age by tandem transcriptome and translatome analysis. The
transgenic strains were CVN (APPSwDI;NOS2-/-) and Tg2576 (APPSw), and RNA-Seq and
Ribo-Seq were performed from identical starting pools of isolated bulk RNA for
transcriptomic and translatomic analysis, respectively. Compared to the WT strains, the AD
model mice had similar levels of transcription regulation, but differences at the level of
translation regulation. Besides cognitive performance are almost unaffected in the two
transgenic mice, both show decreased neurodegenerative-related processes and an
increased neuroprotective response, particularly the CVN model. A specific microglial
signature associated with early stages of Aβ accumulation is displayed up-regulated at both
transcriptome and translatome level in the CVN mice. Although the two mice do not share
large lists of regulated genes, they show common regulated pathways related to APP
metabolism associated with neurotoxicity and neuroprotective functions. This work
represents the first genome-wide study of translation regulation using the brain cortex of
transgenic mice models of AD and provides evidence of a tight and early translational
regulation of gene expression controlling the balance of neuroprotection and
neurodegeneration processes in the brain.
Keywords (4-10): Ribo-Seq; RNA-Seq; Tg2576 mice; CVN mice; Neurodegeneration; APP
metabolism.

3
INTRODUCTION
Alzheimer’s disease (AD) is a progressive brain neurodegenerative disorder
considered the main cause of dementia worldwide. For example, in the USA it’s considered
to be the most expensive disease, responding only marginally and briefly to currently
available drugs. At the histopathological level, AD has a well characterized hallmark that
consists of extracellular accumulation of amyloid-beta (Aβ) plaques, intracellular
accumulation of hyperphosphorylated tau protein and neuron loss [1].
The complete understanding of the molecular mechanisms underlying AD is
paramount for the development of novel therapies able to modify the biology of the disease
and efficiently fight the increase of AD with age in our ever-increasing life expectancy. In
particular, regulation of mRNA translation has been described and previously associated
with other neurological diseases, mainly in cellular models [2–5]. In the case of AD, revealing
results have been recently published linking Aβ and tau with translation [6–11]. For example,
it has been shown that local protein synthesis is deregulated in brain synaptosomes in a
transgenic mice model of AD APP-related [6]. Also, it has been demonstrated that Aβ
oligomers induce de novo protein synthesis of tau [8] and ATF4 [11], that tau is able to
interact with the ribosome in vitro [9] and decrease the synthesis of ribosomal proteins in
tau-related transgenic mice models [7]. At the same time, an interesting relation between Aβ
and mTOR complex has been described [12,13]. Considering the fully described role of
mTOR in controlling translation [14] and the previously described evidence, result of interest
to explore translation regulation events at a genome-wide level in AD models.
While powerful genomics tools to study transcriptional regulation are becoming more
frequently applied to AD research (see examples in [15–18]), focus on translation has been
almost unexplored. Here we use ribosome profiling (Ribo-Seq; [19–21]) as a genomic
screening technique to recognize mRNA translation regulation events in the brain cortex of
transgenic mice models of AD (CVN and Tg2576) at young ages, when learning and memory
in the mice is almost unaffected. In particular in the CVN model, neither cognitive nor
histopathological changes are noticed by the age used. Briefly, we produced and sequenced
ribosome footprints that reveal the exact position of an active ribosome at the mRNA.
Quantification analysis allows us to have an estimation of translational levels at a genome-
wide level and to compare translational efficiency [20] between transgenic mice and wild
type (WT) genotypes. Uncovered translational regulated genes at these asymptomatic

4
stages reveals a complex signature that implicates genes associated to protective/beneficial
functions for example involved in the reduction of high levels of Aβ, but on the other side we
have genes related to Aβ biosynthesis or neurotoxicity. In addition, the data obtained can
be of use to the community as a source for further data mining in the search for early AD
markers.
MATERIALS AND METHODS
Mice
Three 6 month old mice from each of the following genotypes were used: CVN
(APPSwDI/NOS2-/-) [22], Tg2576 (APPSw) [23]) and their respective WT controls (C57/BL6 and
B6;SJL, respectively; see Table 1). Animals were maintained, bred and euthanized in
compliance with all policies of the Animal Care and Use Committee of the University of
Virginia.
Transcriptomic and Ribosome Profiling of brain cortex
Cortices (~250 mg each) were dissected from freshly removed brains in cold PBS
containing of 100 µg/ml cycloheximide (CHX; Sigma-Aldrich, catalog # 01810). The tissue
was then cut into smaller pieces with a sterile scalpel and Dounce homogenized on ice in
lysis buffer (5 mM Tris pH 7.5, 2.5 mM MgCl2, 1.5 mM KCl, 0.5% Triton X-100, 0.5% sodium
deoxycholate, 2 mM DTT (1,4-dithiothreitol) and 100 µg/ml CHX), using 1 mL of lysis buffer
per 100 mg of tissue. At this point, a transcriptome sample was separated and total RNA
was isolated using a mirVana Total RNA Isolation Kit according to the product's
recommended protocol (Invitrogen, catalog # AM1560). Ribo-Seq was performed as
previously described [24,25]. Briefly, the sample was centrifuged twice at 4°C and full speed
(~17,000g), for 1 and 10 minutes consecutively, to remove large cellular debris, nuclei, and
mitochondria. The post-mitochondrial supernatant (~1.6 mL; OD260= 5-10 AU) was carefully
loaded onto a 12-33.5% (w/v) sucrose cushion prepared in polysome buffer (20 mM HEPES
pH 7.5, 5 mM MgCl2, 100 mM KCl, 100 µg/ml CHX) and centrifuged for 2 hours, at 36,000
rpm in a Beckman SW41Ti rotor at 4°C. The polysome-enriched pellet was resuspended in
polysome buffer and digested with 180-200 units of Benzonase nuclease (Millipore, catalog
# E1014) for 10 minutes at room temperature to produce the ribosome footprints and remove

5
the RNA that was not protected by ribosomes. Digestion was stopped by addition of 3
volumes of mirVana Lysis Buffer and the RNA was isolated and then concentrated by
overnight precipitation with 80% ethanol to maximize small RNA recovery. The
concentrated, ribosome-protected mRNA, ribosome footprints (10-15 µg per sample) was
then size fractionated by electrophoresis using 15% polyacrylamide-urea gels
(ThermoFisher Scientific, catalog # EC68852BOX), run at 200 volts in TBE (89 mM Tris-
borate, pH 8.3, 2 mM EDTA) for 65 minutes. Gels were stained using GelRed (Biotium,
catalog # 41003) and circular agitation for 10 minutes in the dark. The ribosome footprint
bands were identified using 26-mer and 34-mer RNA oligonucleotides [24] and excised in a
dark room under UV light exposure. RNA recovery from gel slices was done overnight at
room temperature by gentle mixing, e.g. on a Nutator [24]. Size, quality and quantity of both
transcriptome and translatome samples were evaluated in a Agilent 2100 Bioanalyzer using
Nano and Small RNA kits (Agilent Technologies, catalog #s 5067-1511 and 5067-1548,
respectively).
Sequencing
All transcriptome and translatome samples were sequenced at BGI Tech Solutions
(Hong Kong). Transcriptome samples were sequenced using an RNA-Seq quantification
library protocol with ribosomal RNA (rRNA) removal library preparation, yielding at least 20
million paired-end (2x100 bp) reads. Translatome samples (ribosome footprints) were
processed by small RNA library protocol, yielding at least 80 million single-end (50 bp) reads.
Raw sequence data are available at the NCBI Sequence Read Archive (SRA;
https://trace.ncbi.nlm.nih.gov/Traces/sra/) under BioProject ID PRJNA677972.
Data Analysis
Quality control of sequence files was performed using FastQC [26] and then mapped
against the Mus musculus genome (mm10/GRCm38 version) using bowtie2 [27]. Read
counts over mRNAs or genes were estimated by featureCounts [28], and differential gene
expression analysis of transcriptomes or translatomes was done separately using edgeR
[29] comparing each strain with their respective wild type. Normalized counts were exported,
and translational efficiency was calculated and contrasted between mice strain and WT
using the Xtail R package [30]. For both transcriptomes and translatomes, differentially
expressed genes (DEGs) were defined by a p-adjusted value (FDR) <0.05 and a fold change

6
of >1 or >1.5, as indicated accordingly in each case. Functional interpretation and ontology
enrichment analysis of DEGs lists were performed using IPA (QIAGEN Inc.) [31], online tools
as STRING [32] and g:Profiler [33], and in-house software (manuscript in preparation;
https://github.com/sradiouy/IdMiner). AmiGO2 database [34] was used to retrieve genes
related to APP, Aβ and tau metabolism. Plots were generated using R, by general or specific
packages as pheatmap (https://CRAN.R-project.org/package=pheatmap) and GOplot [35].
RESULTS
General features of the CVN and Tg2576 transcriptome and translatome data
Two transgenic mice models of AD at six months of age and their respective WT
controls (Table 1, Figure 1A) were used to explore transcriptional and translational gene
expression regulation in the brain cortex using RNA-Seq and Ribo-Seq, respectively (Figure
1B). More than 20 million of paired-end reads were obtained for transcriptomes and an
average of 120 million reads for translatomes (Table S1), derived from total RNA and
isolated ribosome footprints (Figure S1), respectively. For transcriptome samples 88% of
the reads aligned over the reference genome, of those, 90% mapped in gene regions and
77% in mRNA regions (Table S1A). On the other hand, for translatome samples we were
able to map more than 10 million reads over mRNAs regions (Table S1B). In this case,
ribosomal RNA depletion was avoided to minimize protocol biases.
Expression levels (CPM, counts per million) were estimated for more than 14
thousand different mRNAs in each sample above low/noise signal (Figure S2). Inter-
replicates correlation indicates high similarity between either transcriptome or translatome
samples, but lower correlations were obtained between RNA-Seq and Ribo-Seq data as
expected, hereafter named transcriptional and translational compartments (Figure S3). In
the same line, quality control comparisons between transcriptome and translatome samples
reveals the expected difference at the level of triplet periodicity and read distribution among
mRNA features (Figures S4 and S5). In addition, principal component analysis (PCA) shows
a clear separation between genotypes for both compartments (Figure S6).

7
Differential gene expression regulation
We used edgeR R package [29] to detect differential gene expression regulation
comparing each transgenic mice with their respective WT controls. For the CVN transgenic
model we found 469 differentially expressed genes (DEGs; p-adjusted value <0.05) at the
transcriptome level and 1165 at the translatome level. Of those, 240 and 377 were changing
at >1.5 fold in each level (Table 2 and Figure 2). For the Tg2576 model, we found 343 DEGs
at the transcriptome level and 135 at the translatome level. In this case, 140 and 94
respectively, change at >1.5 fold in each level (Table 2 and Figure 3).
In order to specifically identify translational regulation events and disentangle
transcriptome from translatome regulation we estimated and compared translational
efficiency as the ratio between translatome and transcriptome levels. For this we used the
Xtail R package [30] and found 797 genes regulated in the CVN model, of which 144 were
changing at >1.5 fold (Table 2 and Figure 2). On the other hand, 87 genes were statistically
regulated at translational efficiency levels and 50 of them were changing at >1.5 fold in the
Tg2576 model (Table 2 and Figure 3).
Global distribution of DEGs expression values, the relationship between fold change
and p-adjusted values and association between transcriptome and translatome fold changes
are shown for both models in Figures 2, 3, S7 and S8. As expected, DEGs are distributed
along all expression levels (Figure 2A and D, 3A and D) and the relationship between fold
change and p-adjusted values shows the classic Volcano plots for both transcriptome and
translational efficiency levels (Figure 2B and E, 3B and E). When fold change at the
translatome level is plotted against transcriptome fold change, a clear correlation is
evidenced (Figure 2C and 3C). For example, in the CVN model, 106 out of the 160 DEGs at
fold change >1.5 at the transcriptome level are also DEGs at the same cutoff at the
translatome level (Figure S9A). The same correlation is evidenced for the transcriptional
down-regulated genes: 32 out of 80 are also down-regulated at the translational level (Figure
S9B). This correlation, also observed in the Tg2576 model (Figure S9C and D), indicates
the expected association between transcriptome and translatome samples. Regulated
genes at the level of translational efficiency, although less in number than those regulated
at the transcriptome level, show a different pattern of regulation (Figure 2F and 3F). In
general, regulation at translational efficiency implies genes with minimal changes at
transcriptome levels (fold changes values close to one), while increasing or decreasing

8
translatome levels. This pattern is also observed in Figure 4 where an expression heatmap
of DEGs is shown (see below).
Expression levels of DEGs at the transcriptome level show classical patterns of
regulation (Figure 4A and C) but at the translational efficiency level, different scenarios could
explain the observed regulation. For example, similar expression levels at the transcriptome
but an increase/decrease at the translatome implies translational efficiency regulation. In the
same way, increasing transcriptome levels while reducing translatomes also leads to
changes in translational efficiency. All these scenarios can be observed in Figures 4B and
D. Heatmaps of regulated genes exclusively at the translational level are described in
Figures S7D and S8D for each transgenic model.
Functional analysis of regulated genes
In order to explore enriched biological functions up- or down-regulated we used IPA
(QIAGEN Inc.) [31]. As a group of genes we used DEGs changing at >1-fold to analyze a
larger gene list and obtain more robust biological signatures. As illustrated in Figure 5, the
CVN model shows a clear functional response at the transcriptome, translatome and
translational efficiency levels (Figure 5A, S10 and Table S2). For this model, down-regulated
biological functions are clearly related to neurodegeneration process (neurodegeneration,
degeneration of neurons, nerves and neuro system, release of L-glutamic acid, among
others). Regarding up-regulated functions, we observed a neuroprotective response of the
microglia cells probably to the early accumulation of Aβ and also other neuron-related
processes with protective functions, such as quantity of neurons, growth of neurites, synaptic
transmission, etc. However, we found evidence that activation of neurodegenerative-related
processes are occurring, especially at the transcriptome level, as the categories of axonal
growth were decreased and neuronal cell death processes were increased (Table S2). Also,
at the translational efficiency level, we found a marginal (low z-score) decreased category
corresponding to long-term potentiation (LTP) (Figure 5A). For the Tg2576 mice model, the
functional response was barely informative since only few categories were found as enriched
(Figure 5B and Table S2). At the transcriptome level only three categories were found as
increased, all of them related to neuroprotective functions. Also, at the translatome level only
one category was found decreased, but with a low z-score, and no results were found when
analyzing translational efficiency DEGs.

9
We then performed an upstream analysis to infer modulated genes by the observed
regulation of their targets. Here, we were able to reveal genes as inhibited or activated at
the three levels studied, that are not discovered among the DEGs. For the CVN model, most
of the upstream genes found are closely related to AD pathology and could be interpreted
as regulated in a protective direction, to avoid Aβ accumulation and response against
neurodegeneration (Figure 6). For example, inhibited upstream inferred genes include:
Psen1, Psen2, Apoe, B4galnt1, St8sia1 and Ctcf from the transcriptome level; Ssb from the
translatome level and Adora2a from the translational efficiency level (Figure 6A, C and E).
In all these genes, an inhibited activity could be interpreted as neuroprotective as is clear for
Psen1, Psen1 and Apoe, but also for B4galnt1 and St8sia1, two ganglioside synthase which
increase APP cleavage and affect memory [36,37]. CTCF, a transcription factor that could
act as activator or repressor, and is also an insulator protein that defines chromatin domains,
is able to up-regulate APP expression [38]. Also Ctcf knockout in mice hippocampus
increase cytokines expression and activates microglia [39]. In the case of ADORA2A, an
adenosine receptor, it has been observed that pharmacological inhibition or downregulation
of these receptors can restore LTP and revert memory deficits [40,41]. On the other hand,
upstream genes indicated as activated seems to represent both protective and degenerative
fashions (Figure 6B, D and F). Genes as Tcf7l2 and Csf1, inferred as activated from the
transcriptome level, have probably a protective function: TCF7L2 may be involved in
improving neurogenesis and compensate neuron loss [42] and CSF1 has been associated
to microglia activation, prevention of cognitive loss and reduction of Aβ accumulation [43,44].
Ptf1a and Ifng genes, defined as upstream activated gene from the translational level study,
may also act as protective. PTF1A can induce neuronal stem cell generation that can
improve cognitive dysfunction [45]. Interferon gamma can activate microglia to suppress Aβ
deposition and can induce neurogenesis improving cognition [46–48]. In addition, other
genes as Tnf may be activated in a degenerative fashion: TNF is a proinflammatory cytokine
that exacerbates both Aβ and tau pathologies in vivo and TNF inhibitors might slow down
cognitive decline [49]. However, the roles of cytokines as IFN-γ and TNF-α could be
controversial in AD [50]. The upstream activated genes identified from the translational
efficiency DEGs were Ptf1a (see above) and Prkcg, both probably protective. The protein
kinase C gamma, PRKCG, is able to stimulate the APP processing by α-secretase to
produce soluble fragments of APP and reduce Aβ accumulation [51]. On the other hand, as

10
anticipated by the uninformative functional enrichment analysis for the Tg2576 mice, we did
not observe any upstream regulated gene for this model.
Regulated genes in the CVN model reveals an specific microglia signature responding to Aβ
To complement the functional analysis we used an in-house developed tool named
IdMiner (manuscript in preparation; https://github.com/sradiouy/IdMiner) to fully interpret
represented functions in DEGs lists. This software is a text-mining tool that captures
previously reported associations between gene lists and user-defined terms using the
PubMed database. We found that among up-regulated genes in the CVN model at both
transcriptome and translatome levels there was a clear signature of disease-associated
microglia (DAM). This signature includes genes as Trem2, Tyrobp, Tlr2, Cd68, Gpr84,
Gpnmb, Itgax, Itgb2, Lpl, Clec7a, Cst7 and Ccl6 [17,18,52–55]. All these genes encode for
transmembrane proteins that were described to be highly expressed in a microglia
subpopulation that specifically respond against neurodegeneration. The overexpression of
these markers orchestrate DAM to localize Aβ deposition and favors its clearance [17,52].
This signature is part of the immune system process, a statistically overrepresented function
among up-regulated genes networks at the transcriptome and translatome level (Figures
S11 and S12).
Other up-regulated genes at both levels include genes expressed either in non-
neuronal or neuronal cells, as previously reported. For example Gfap and Serpin3 genes
were found to be overexpressed in astrocytes in AD conditions [56–59]. Solute carrier family
members and hippocalcin-like proteins are also up-regulated in accordance with their
possible neuroprotective described functions in AD context [60,61]. We also found up-
regulation of Mid1 gene expression, a member of the Mid1 complex which binds to and
accelerates App mRNA translation through mTOR pathway [62]. The tyrosine kinase Fgr
was also up-regulated at both levels. This kinase is able to bind tau but its interaction is not
well described [63]. However, the Fgr paralog Fyn is able to phosphorylate tau causing
neurotoxicity [64], so we hypothesize that Fgr could also be involved in post-translational
modifications of tau.
The analysis of the list of up-regulated genes specifically at the translatome level
reveals more interesting cases. For example, we found the histocompatibility 2 class II
antigen A gene, H2-Ab1, that is also described as a marker for DAM [52,53]. Also,
complement components 4a and 4b were up-regulated as previously described in response

11
to Aβ plaques increase [59]. The Csf3r gene was also up-regulated at the translatome level
as expected since it was found highly expressed in early stages of AD [65]. Deficiency in its
ligand, G-CSF, has a deep impact in hippocampal structure and function leading to
disruption in memory formation and impaired behavioral performance [66]. Concordantly, G-
CSF administration functions as a neurotrophic factor and induces astrocytes and microglia
activation [67,68], so probably, increasing G-CSF receptor CSF3R is a response mechanism
to mitigate neurodegeneration.
When studying the list of up-regulated genes particularly at translational efficiency
level, although having a small number of genes we found several interesting cases from
which we highlight Serpina3g, Frmd4a, Rras2, Nav2, Adam12, Pparg, Mid1, Ldlrad3 and
Cd44. Here we found some genes associated with protective/beneficial functions, for
example trying to reduce the high levels of Aβ production: Frmd4a, Pparg and Rras2 [69–
72], but also other genes (Adam12, Mid1 and Ldlrad3) related to Aβ production or
neurotoxicity [62,73,74].
Regarding down-regulated genes, we also found genes related to Aβ accumulation.
Complement defense 59a, Cd59a, was down-regulated at the transcriptome level as is
expected in response to Aβ and could explain neuronal vulnerability and loss [75,76].
Calbindin 2 or Calretinin (Calb2) positive interneurons are specifically decreased as early
targets of Aβ accumulation in the hippocampus [77] and here its expression was down-
regulated at the transcriptome and translatome levels. Pin4 was also down-regulated at both
levels in accordance with the decrease observed for Pin1, a paralog gene, which plays a
role in the accumulation of Aβ [78–80]. Other down-regulated genes, probably due to the
neuropathological context, were Rplp0 and Igf2 [7,81], while genes like Slc17a8 and
Tenascin-C were probably down-regulated in order to ameliorate pathology [82].
Tg2576 model shows differentially expressed genes associated to APP metabolism
The same analysis performed above was applied for the study of DEGs list in the
Tg2576 mice model. Although the number of DEGs in this model is almost half compared to
the CVN mice model, interesting genes arise from the analysis. For example, the Toll like
receptor 6 gene (Tlr6) was up-regulated at both the transcriptome and translatome levels.
This receptor is able to dimerize with TLR4 and interact with CD36 to bind Aβ and activate
microglia promoting neurodegeneration [83]. Calpain 11 was also up-regulated at the
transcriptome level, as expected since calpains are hyperactivated in AD [84,85]. Cdk5rap1,

12
an inhibitor of Cdk5, was also up-regulated and could have a protective effect since Cdk5
activation causes hyperphosphorylation of APP and tau leading to plaques and tangles [86–
88]. Also, CDK5 has been described as a mediator of Aβ-induced neuronal cell cycle reentry
that leads to neurodegeneration [89].
At the translatome level, other interesting up-regulated genes were found.
Apolipoprotein D, which has displayed a neuroprotective effect [90] and is induced in
hippocampal cells in response to Aβ [91], increases its translational levels. Another gene
with a neuroprotective function up-regulated at the translatome level was Metallothionein 3
which is expressed by the astrocytes to uptake Aβ [92]. However, its role is still controversial
with opposite findings in vitro and in vivo, and over the different models used. For example,
a study using the Tg2576 mice model shows that this gene could have opposite effects
depending on gender, brain region and age [93]. Genes up-regulated exclusively at the level
of translational efficiency were related to Aβ production and disease. For example Serf2, a
positive regulator of amyloid protein aggregation [94,95], and Hras2, described as an AD
biomarker, is stimulated by Aβ and produces a reduction in LTP [70].
Regarding down-regulated genes at transcriptome level, several cases confirm what
was expected from previous reports. For example, Klk6, a peptidase that cleaves APP was
found to be down-regulated in the cortex of human postmortem samples of AD patients
compared to controls [96,97]. The somatostatin receptor 5 was also down-regulated at both
transcriptome and translatome levels, consistently with the decreased levels found for these
receptors in the cortex of AD patients [98,99]. The Fabp5 gene was found to be down-
regulated at the translational efficiency level as expected since a FABP5 deficiency was
associated with increased vulnerability to cognitive deficits in mice with APP pathology
[100,101].
Common regulated genes in both transgenic mice models
In order to explore commonalities shared by both models, we compared DEGs
obtained in each comparison using a fold change cutoff of 1 to handle larger numbers (Table
2). Although common genes represent less than 10% in all pairs of lists compared some
interesting cases were observed. For example, when comparing up-regulated genes at the
transcriptome level between the CVN (282 genes) and the Tg2576 mice models (195 genes)
we found 25 shared genes. Of those, 19 are classified as predicted genes. Exhaustive
analysis reveals that those genes are mainly protein coding genes encoding for Zinc finger

13
proteins, Alpha-takusan like proteins, and also a long non-coding RNA (Gm26650). Alpha-
takusan proteins are a large family that regulates synaptic activity and have been reported
that can mitigate Aβ-induced synaptic loss [102,103]. Among common and annotated genes
we found Lrrc37a, a leucine-rich repeat containing gene that encodes a plasma membrane
protein involved in intracellular vesicle trafficking [104] and Osmr, the Oncostatin M
Receptor. Lrrc37a was previously associated with AD because it presents significant SNPs
genome-wide associations in APOE-affected individuals and it is located in a locus adjacent
to Mapt [105]. On the other hand, it has been reported that Oncostatin M has a
neuroprotective effect against Aβ toxicity [106].
When exploring the list of up-regulated genes at the translational level shared in both
transgenic models several interesting cases were noticed. In this particular case, due to the
small number of translational up-regulated genes in the Tg2576 model (66 genes, Table 2),
we only found 6 genes in common. However, among them we found the Lrrc37a gene and
a predicted gene (Gm3173) annotated as an alpha-takusan-like protein (see above). Other
interesting genes found were Gfap and hemoglobins alpha 1 and 2. Glial fibrillary acidic
protein (GFAP) is an intermediate filament protein and a glial marker highly expressed in the
reactive astrocytes who surround Aβ plaques [56,107]. Regarding hemoglobin alpha 1 and
2 (Hba-a1 and Hba-a2) it has been observed that neurons can express these proteins [108]
and that hemoglobin can bind Aβ and co-localize with plaques [109,110].
Among common down-regulated genes we found a total of 13 genes, 8 down-
regulated at the transcriptome level and 5 at the translational level. Here we highlight
Tmem59l (Transmembrane Protein 59 Like), an important paralog of Tmem59, down-
regulated at the transcriptome level. TMEM59 has been identified as a novel modulator of
APP shedding, controlling APP post-translational modification, APP cellular traffic and
cleavage [111]. More recently, it has been reported that TMEM59 interacts with TREM2 (see
above and discussion) and that TMEM59 homeostasis is regulated by TREM2 in order to
control microglia activity [112]. Common genes down-regulated at the translatome level
include ribosomal proteins and a ribosome biogenesis factor (Rpl5, Rpl32 and Wbscr22),
the fatty acid binding protein 5 (FABP5) discussed before and an adaptor related protein
complex 4 (AP4S1). It has been observed that the adaptor protein 4 interacts with APP and
that the disruption of this interaction stimulates APP cleavage and Aβ production [113].
Finally, we also observed biological functions shared between the two APP-related
mice models. For example, it is interesting to note that several genes affected in each model

14
are associated with APP and Aβ metabolism, either with neuroprotective or neurotoxic
functions (Figure 7).
DISCUSSION
We used RNA-Seq and Ribo-Seq to explore transcriptional and translational gene
expression regulation, respectively, in the brain of two transgenic mice models of AD. The
study of translation regulation using Ribo-Seq in animal’s brain tissue is not so extended
(see examples in [114–117]), and as far as we know, this work represents the first approach
in AD models. The selected transgenic mice models used are both amyloid models since
the two of them have a transgenic insertion of the APP gene with specific mutations that
increase levels of Aβ and amyloid plaques (Table 1). Mice were sacrificed at 6 months old,
as a relative adult age and preferentially asymptomatic: the CVN mice are completely
asymptomatic at this age, showing no phenotypic alteration reported. On the other hand, the
Tg2576 mice exhibit cognitive deficits before 6 months of age, but interestingly develop Aβ
plaques later, around 12 months of age (Figure 1A).
The isolated total RNA and ribosome footprints obtained from the brain cortex (Figure
S1) yield more than 20 and 120 millions of paired-end and single-end reads, respectively
(Table S1). We decided to specifically use the brain cortex in order to be focused on a region
highly degenerated and pathologically compromised over disease progression in humans,
but also in animal models. As anticipated, around 80% of the ribosome footprints samples
were rRNA fragments derived from the RNAse digestion. Having this in mind, we decided to
proceed with a deep sequencing in order to obtain a considerable amount of non-rRNA
reads. By doing so, we were able to get more than 10 million of ribosome footprints mapping
over mRNAs in each sample (Table S1), avoiding adding extra steps handling the footprints
in an effort to reduce variability and biases. In this scenario, we defined expression levels
for more than 14 thousands genes in each transgenic mice. As expected, almost all detected
genes at both transcriptome and translatome levels were in common (Figure S2). By
studying mapping features and read periodicity we could properly separate transcriptome-
derived from translatome-derived reads (Figures S4 and S5). Translatome-derived reads
are more prone to map over coding regions than transcriptome-derived reads that also are
found in untranslated regions as 5’- and 3’-UTRs. Also, translatome-derived reads show the

15
classical three nucleotide mapping pattern periodicity not detected in transcriptome-derived
reads, mounting evidence of a solid transcription and translation dataset.
Differential gene expression analysis was performed over transcriptome and
translatome samples separately, comparing transgenic mice versus WT, to explore
deregulated genes in each model. However, considering that differences at the translatome
level could be explained by regulation at the transcriptome level, we estimated translational
efficiency as the ratio between translatome and transcriptome levels to specifically identify
translational regulation events [19] (Figures 2 and 3). Despite the fact we have used different
animals as replicates, which compromise a considerable level of biological variation,
samples clustered as expected as evidenced by PCA (Figure S6). Also, we were able to
define lists of genes with a significant statistical difference between genotypes at the level
of p-adjusted value <0.05 (Table 2). Expression levels of DEGs also separates samples as
expected and shows the different levels of regulation observed, especially when analyzing
translational efficiency regulation (Figure 4). As a control comparison, we also explored
differential gene expression between WT animals. Although identifying DEGs, there is not a
considerable overlap with previously defined DEGs and enriched biological functions
observed were either not related to the results previously discussed or absent (Figures S13
and S14).
The functional analysis of regulated genes involves different approaches and
techniques. In the first place, we used standard gene ontology and functional enrichment
tools, as IPA and STRING. These approaches revealed interesting results indicating a clear
signature of decreased neurodegenerative-related process and increased neuroprotective-
related functions, particularly for the CVN strain (Figures 5 and 6). In second place, we
complement the analysis with an in-house developed tool
(https://github.com/sradiouy/IdMiner) to deeply explore DEGs lists in order to find relevant
associations between genes and biological functions related to pathology. By using this
approach we detected several genes associated either with the neurodegenerative and
neurotoxicity phenotype or with protective and beneficial functions (see below).
We identified a clear DAM gene signature in the CVN transgenic model mainly
composed of transmembrane proteins up-regulated at both transcriptome and translatome
levels, identified at a first place as members of an immune system process response (Figure
S11 and S12). The main functions of this DAM population, characterized by the presence of
these genes, is to localize Aβ plaques and proceed to its clearance and it has been

16
described before in other transgenic mice models of AD at the same age or at older ages
[17,18,52,53]. It is interesting to point out that this is the first time this signature is described
in the CVN transgenic model and that also is the first time it is seen activated at translatome
levels since previous studies were focused only on transcriptome quantifications. Also it is
noteworthy that this DAM population is present in a complete asymptomatic and early stage
of the mice phenotype, since this model is supposed to describe Aβ deposits and cognitive
impairment at 12 months old. Among the genes present in this signature we found several
interesting cases, for example Trem2 and Tyrobp genes both were up-regulated
(transcriptome level: fold change = 2.12 and 1.66, p-adjusted = 1.18E-15 and 6.22E-4,
respectively; translatome level: fold change = 1.90 and 1.72, p-adjusted = 4.25E-8 and
1.39E-4, respectively). The TREM2/TYROBP complex expressed in microglial is necessary
to prevent Aβ accumulation and diffusion [17,118–120]. TREM2/TYROBP-dependent cell
activation seems to be beneficial [121], while Trem2 deficiency impairs cellular metabolism
and promotes increased autophagy in microglia in an AD mouse model [122]. Concordantly,
we found several members of the TYROBP AD-related pathway [54,123] either regulated at
the transcriptome, translatome or both levels in the CVN mice (Figure S15). Regarding
TREM2, transgenic overexpression of the human version of this gene modified the
morphological and functional responses of microglia, which resulted in amelioration of the
pathology and memory deficits in an AD mouse model [124]. Interestingly, it has been
reported that TREM2 interacts with TREM59 and modulates microglia activation [112]. Here
we found Trem59l as a down-regulated gene at the transcriptional level present in both
transgenic mice models (CVN: fold change = -1.89 and p-adjusted = 3.56E-28; Tg2576: fold
change = -1.29 and p-adjusted = 0.01). Considering the upregulated genes at the
translational level, two different sets of genes are observed. One set associated with
protective functions like reducing Aβ production, and others related to the high levels of Aβ
and neurotoxicity. A similar interpretation is made from the lists of down-regulated genes.
Regarding the Tg2576 transgenic model, although it presents behavior alterations at
young ages, Aβ plaques are not described at 6 months old (Figure 1). However, we found a
group of genes regulated at transcriptome and/or translatome levels that have been reported
to be altered in response to the presence of Aβ. Also, as observed in the CVN model, we
found genes associated with neuroprotective functions and others with a neurodegenerative
phenotype related to APP metabolism.

17
We also explored common DEGs at transcriptome or translatome levels in both
transgenic mice models. In spite of each transgenic mice has a different genetic background
(Table 1), they show a complete different pattern of phenotypic alterations (Figure 1A) and
each model shows different regulation levels (Table 2), it is interesting that they share
regulated genes at the transcriptome and translatome levels. These genes, evidenced at
early stages of the disease, have described functions that could be associated with AD
pathology, for instance: alpha-takusan proteins, Lrrc37a, Osmr, Gfap, hemoglobins alpha 1
and 2, Tmem59l and Fabp5. Despite no Aβ plaques are described in the mice's brains at
this age, most of the genes are implicated in APP metabolism in a neuroprotective fashion
that responds to Aβ accumulation. This set of common regulated genes, and the set of genes
described before, represents interesting and challenging cases to further explore in order to
better understand the transcriptional and translational control of gene expression that is
occurring in AD pathology.
Recent advances in genomic views of translation have been essential to widen our
current concepts about the dynamic properties of protein translation as a process, and
increase the relevance that regulation of translation has on particular sets of mRNAs,
thereby later impacting the overall view of proteostasis. Besides pointing to novel
transcriptional regulation events in AD disease models, here we uncover that translation is
important in regulating key AD related genes at early asymptomatic stages of the disease
models that may impact in the slow and accumulative process that initiates AD. Several of
the dysregulated pathways observed here will need further study to elucidate regulation
mechanisms but certainly put translation regulation in the road map to understand AD
dysregulated processes.
ACKNOWLEDGMENTS
We thank members of Sotelo-Silveira lab for the results discussion and intellectual
input. We also thank members of Bloom lab Andrés Norambuena and Antonia Silva for their
support with wet lab experiments and especially to Dora Bigler-Wang and Nutan Shivange
for handling mice and brain dissections.

18
We would like to acknowledge the following institutions for the financial support
received: PhD fellowships from Agencia Nacional de Investigación e Innovación (ANII) to
GE (POS_NAC_2016_1_129959), Programa de Desarrollo de las Ciencias Básicas
(PEDECIBA) to GE and JRSS, PROLAB travel grant (PABMB/ASBMB/IUBMB) to GE and
Owen’s Family Foundation and Cure Alzheimer’s Fund to GSB.
CONFLICT OF INTEREST
The authors have no conflict of interest to report.
AUTHOR CONTRIBUTIONS
J.R.S-S. and G.S.B. conceived the project, designed and supervised the research.
J.S.L. and E.R.S. contributed to the project design and intellectual content. G.E. performed
the experiments. G.E. and E.R.S. analyzed data. G.E., J.R.S-S. and G.S.B. wrote the paper.
All authors approved the manuscript.
REFERENCES
(At the bottom)

19
TABLES
Table 1. Genotype description of the transgenic mice used.
Genotype Gene(s) Mutations Modification Genetic
Background
CVN APP,
NOS2
APP:
K670N/M671L,
E693Q, D694N
APP: Transgenic
NOS2: Knock-
Out
C57/BL6
Tg2576 APP APP: KM670/671NL APP: Transgenic B6;SJL

20
Table 2. The number of differentially expressed genes for CVN (upper panel) and Tg2576
(lower panel) transgenic mice contrasted to WT animals is shown. Differentially expressed
genes, defined by p-adjusted value <0.05, are separated by fold change intervals. For each
genotype, comparison at the transcriptome level (RNA-Seq) and translatome level (Ribo-
Seq) by edgeR; and at the translational efficiency (TE) level by Xtail, are shown.
CVN vs WT p-adjusted value < 0.05
FC > 1.5 FC > 1 FC < -1.5 FC < -1
edgeR RNA-Seq 160 282 80 187
Ribo-Seq 300 830 77 335
Xtail TE 88 491 56 306
Tg2576 vs WT p-adjusted value < 0.05
FC > 1.5 FC > 1 FC < -1.5 FC < -1
edgeR RNA-Seq 76 194 64 149
Ribo-Seq 46 66 48 69
Xtail TE 25 50 25 37

21
FIGURE LEGENDS
Figure 1. Phenotypical description of the transgenic mice used as AD amyloid-related
models and an illustrative representation of the protocol used. (A) Phenotype
characterization of each transgenic model, CVN and Tg2576, described by the Alzforum
organization website is shown. Three male, 6 months old mice were used per genotype. (B)
A brief illustrative description of the experimental approaches used here is presented. (i)
Brain cortex is dissected and (ii) homogenized using a glass Dounce homogenizer. At this
point, (iii. a) a transcriptome sample is separated to proceed with total RNA isolation and
RNA-Seq protocol. In parallel, (iii. b) post mitochondrial supernatant is obtained and (iv. b)
ultracentrifuged to isolate polysomes (v. b). An RNAse protection assay is performed over
polysomes (vi. b), where a controlled digestion generates small mRNA fragments. These
ribosome footprints are isolated (vii. b) and submitted to high-throughput sequencing (Ribo-
Seq protocol).
Figure 2. Differential expression analysis performed by edgeR for transcriptomes (A-C), and
by Xtail for translational efficiency values (D-F), comparing CVN transgenic mice against
wild type. Scatter plots comparing normalized CPM expression between genotypes for
transcriptome and translational efficiency values, respectively, are shown in (A) and (D).
Volcano plots where the relationship between fold change and p-adjusted values is
evidenced for transcriptome and translational efficiency comparison, respectively, are
shown in (B) and (E). Scatter plots comparing translational vs transcriptional fold change
are shown in (C) and (F). In both cases, regulated genes identified in each level are colored.
In all plots, colored dots indicates differentially expressed genes (p-adjusted value <0.05)
by the following criteria: red up-regulated genes by >1.5 fold, orange up-regulated by >1
fold, blue down-regulated genes by <-1.5 fold and sky-blue down-regulated genes by <-1
fold.
Figure 3. Differential expression analysis performed by edgeR for transcriptomes (A-C), and
by Xtail for translational efficiency values (D-F), comparing Tg2576 transgenic mice against
wild type. Scatter plots comparing normalized CPM expression between genotypes for

22
transcriptome and translational efficiency values, respectively, are shown in (A) and (D).
Volcano plots where the relationship between fold change and p-adjusted values is
evidenced for transcriptome and translational efficiency comparison, respectively, are
shown in (B) and (E). Scatter plots comparing translational vs transcriptional fold change
are shown in (C) and (F). In both cases, regulated genes identified in each level are colored.
In all plots, colored dots indicates differentially expressed genes (p-adjusted value <0.05)
by the following criteria: red up-regulated genes by >1.5 fold, orange up-regulated by >1
fold, blue down-regulated genes by <-1.5 fold and sky-blue down-regulated genes by <-1
fold.
Figure 4. Heatmap of DEGs (|fold change| >1.5 and p-adjusted value <0.05) at
transcriptome compartments (A and C) and at translational efficiency (B and D) for CVN (A-
B) and Tg2576 (C-D) transgenic mice models.
Figure 5. Functional enrichment analysis of DEGs. The top10 (z-score) most decreased and
increased functional categories are shown for each level (RNA-Seq or transcriptome, Ribo-
Seq or translatome, and translational efficiency) and for both transgenic mice, CVN (A) and
Tg2576 (B). Analysis was performed using IPA (QIAGEN Inc.) and graphical representation
was obtained from GOplot R package. See Table S2 to find the complete set of decreased
and increased pathway at each level and transgenic mice.
Figure 6. Upstream inferred regulation analysis performed by IPA. The inferred upstream
genes marked as inhibited (blue) or activated (red) based on their targets regulation
observed is shown for each level: RNA-Seq or transcriptome (A-B), Ribo-Seq or translatome
(C-D), and translational efficiency (E-F).
Figure 7. Expression regulation of genes related to Aβ, APP or tau metabolism in the CVN
(A) or Tg2576 transgenic mice (B). Several gene ontology categories of genes, obtained
from AmiGO2, were merged to consider all genes related to Aβ, APP or tau metabolism.

23
Genes were selected by p-adjusted value <0.05 and the expression level of those significant
genes is shown as a heatmap.

24
FIGURES
FIGURE 1

25
FIGURE 2

26
FIGURE 3

27
FIGURE 4

28
FIGURE 5

29
FIGURE 6

30
FIGURE 7

31
SUPPLEMENTARY MATERIAL
Table S1. The number of sequenced and mapped reads is shown for each model for both
transcriptome (RNA-Seq; A) and translatome (Ribo-Seq; B) samples.
A
Genotype # Total
Reads
PE reads
mapped
concordantly
PE reads
mapped
discordantly
Broken
PE reads
mapped
% of
map.
counting over
mRNAs (21 989) genes (46 095)
CVN
1 23,135,637 18,253,665 862,612 2,892,742 88.9% 31,934,134 77.7% 36,855,454 89.6%
2 22,997,533 18,104,983 843,327 2,861,377 88.6% 31,583,039 77.5% 36,571,542 89.7%
3 23,036,754 17,654,723 874,552 3,003,636 87.0% 30,657,313 76.5% 36,006,497 89.9%
Wt
1 23,263,962 18,347,017 855,608 2,928,713 88.8% 31,856,021 77.1% 37,089,239 89.7%
2 23,492,421 18,619,340 873,227 2,872,726 89.1% 32,376,097 77.3% 37,628,971 89.9%
3 23,609,748 18,518,928 834,489 2,968,238 88.3% 32,253,440 77.4% 37,445,618 89.9%
Tg2576
1 23,950,074 18,677,371 900,467 3,185,344 88.4% 32,346,342 76.4% 37,931,132 89.6%
2 23,656,574 18,517,226 854,470 3,006,279 88.2% 32,233,304 77.2% 37,456,950 89.7%
3 23,431,043 18,285,070 935,969 3,067,945 88.6% 31,390,282 75.6% 37,346,615 90.0%
Wt
Tg2576
1 21,085,032 15,995,496 797,005 2,833,921 86.4% 27,935,114 76.7% 32,647,797 89.6%
2 22,758,028 17,429,707 871,461 3,029,020 87.1% 31,077,379 78.4% 35,511,353 89.6%
3 23,032,760 18,036,162 829,500 2,945,435 88.3% 31,337,466 77.0% 36,505,692 89.7%
B
Genotype # Total Reads non rRNA
aligned
exactly 1
time
aligned >1
times
counting over
mRNAs (21 989) genes (46 095)
CVN
1 125,158,118 18,467,165 14.8% 11,294,565 4,039,692 11,817,046 77.1% 12,885,534 84.0%
2 124,834,868 19,343,288 15.5% 11,757,820 4,071,266 12,333,505 77.9% 13,623,963 86.1%
3 124,796,265 21,304,049 17.1% 11,469,519 4,897,991 12,138,772 74.2% 13,253,986 81.0%
Wt
1 125,600,184 16,312,016 13.0% 9,756,019 3,647,431 10,303,253 76.9% 11,447,979 85.4%
2 147,633,148 19,439,215 13.2% 11,483,105 4,298,470 12,055,087 76.4% 13,555,389 85.9%
3 98,153,015 12,829,605 13.1% 7,729,089 2,643,123 8,050,517 77.6% 8,896,089 85.8%
Tg2576 1 124,934,216 16,796,957 13.4% 10,220,204 3,399,665 10,695,295 78.5% 11,866,137 87.1%

32
2 125,030,269 18,376,892 14.7% 11,180,855 3,916,901 11,626,486 77.0% 12,872,033 85.3%
3 124,656,995 16,552,770 13.3% 9,729,332 3,516,747 10,093,511 76.2% 11,355,864 85.7%
Wt
Tg2576
1 125,767,260 14,955,168 11.9% 8,867,825 3,298,156 9,367,092 77.0% 10,254,327 84.3%
2 126,692,576 18,912,320 14.9% 11,609,538 4,463,051 11,938,808 74.3% 13,162,956 81.9%
3 125,199,385 15,079,762 12.0% 9,470,651 3,253,477 9,773,898 76.8% 10,773,420 84.7%

33
Table S2. Complete set of decreased and increased pathway for both transgenic mice at
the transcriptome, translatome and translational efficiency level determined by IPA.
(Excel file attached)

34
SUPPLEMENTARY FIGURE LEGENDS
Figure S1. Ribosome footprints purification. (A) Polysome fraction digested with Benzonase
were separated in a 15% PAGE with 7M Urea. Wells description: 1, 3 and 11 – RNA oligos
of 26 and 34 nucleotide in length; 2 an 12 – Ultra Low DNA Ladder (Invitrogen, catalog #
10597012); 4 to 6 – Polysome digestion of WT brain cortex; 8 to 10 – Polysome digestion
of CVN brain cortex. Using RNA oligos as markers (indicated in full line boxes), ribosome
footprints bands were identified and excised in a dark room under UV light exposure
(indicated in slashed line boxes). (B) Ribosome footprints quality was evaluated in a 2100
Agilent Bioanalyzer instrument using a Small RNA kit. Electropherograms of unpurified
polysome digestion sample (red line) and of purified ribosome footprints sample (blue line)
are shown. Ribosome footprints sample consists of RNA fragments around 30 nucleotides
in length.
Figure S2. Transcriptome and Translatome detected genes. Venn diagram indicates the
number of detected and shared genes for each compartment for CVN (A) and Tg2576
transgenic mice (B).
Figure S3. Inter-replicate correlation among transcriptomes and translatomes samples for
CVN (A) and Tg2576 mice (B). Pearson correlation value is shown for each pairwise
correlation and indicated in a color scheme.
Figure S4. Observed-to-expected ratio of the Ribo-Seq and RNA-Seq derived reads
mapping to each of the three nucleotides in codons. Ribo-Seq derived reads 5’ ends are
preferentially enriched at the first nucleotide of the codon (A), while RNA-Seq derived reads
5’ end are distributed more equally among the three nucleotides (B). The same periodicity
pattern is observed indistinctly in the CVN and Tg2576 transgenic mice models and their
wild type controls. The analysis was performed following the criteria described by Ingolia et
al. Science 2009 and Guo et al. Nature 2010.
35
Figure S5. Distribution of mapped reads among coding sequences (CDS), 5’ and 3’
untranslated regions (5’-UTR and 3’-UTR). (A) Fraction of mapped reads among mRNA’s
features is shown for CVN and Tg2576 transgenic mice models and their wild type controls,
for the Ribo-Seq and RNA-Seq data sets. Ribo-Seq derived reads map preferentially over
CDS and RNA-Seq derived reads are distributed in a more uniform pattern. This difference
is not due to a bias in feature length as is shown in (B).
Figure S6. Principal Component Analysis for transcriptomes (A and C) and translatomes
samples (B and D) of CVN (A-B) and Tg2576 (C-D) mice model. In each case, a 2D plot of
principal component 1 and 2 for transcriptomes or translatomes is shown with the scree plots
associated indicating the percentage of explained variation by each dimension of the PCA.
Figure S7. Differential expression analysis performed by edgeR for the translatome
compartment comparing CVN transgenic mice against wild type. (A) Shows a scatter plot
comparing normalized CPM expressions at the translatome between genotypes. (B) Shows
a volcano plot where the relationship between fold change and p-adjusted values is
evidenced for translatome comparison. (C) Shows a scatter plot comparing translational vs
transcriptional fold change, highlighting regulated genes at the translational level. (D)
Heatmap of differentially expressed genes (|fold change| >1.5 and p-adjusted value <0.05)
at the translatome compartment. In (A-C), colored dots indicates differentially expressed
genes (p-adjusted value <0.05) by the following criteria: red up-regulated genes by >1.5 fold,
orange up-regulated by >1 fold, blue down-regulated genes by <-1.5 fold and sky-blue down-
regulated genes by <-1 fold.
Figure S8. Differential expression analysis performed by edgeR for the translatome
compartment comparing Tg2576 transgenic mice against wild type. (A) Shows a scatter plot
comparing normalized CPM expressions at the translatome between genotypes. (B) Shows
a volcano plot where the relationship between fold change and p-adjusted values is
evidenced for translatome comparison. (C) Shows a scatter plot comparing translational vs
transcriptional fold change, highlighting regulated genes at the translational level. (D)
Heatmap of differentially expressed genes (|fold change| >1.5 and p-adjusted value <0.05)

36
at the translatome compartment. In (A-C), colored dots indicates differentially expressed
genes (p-adjusted value <0.05) by the following criteria: red up-regulated genes by >1.5 fold,
orange up-regulated by >1 fold, blue down-regulated genes by <-1.5 fold and sky-blue down-
regulated genes by <-1 fold.
Figure S9. Intersection between DEGs at transcriptome (RNA-Seq), translatome (Ribo-Seq)
and translational efficiency (TE) levels for CVN and Tg2576 transgenic models. The Venn
diagrams shows the intersection for DEGs up- and down-regulated genes for the CVN model
(A and B, respectively) and for the Tg2576 model (C and D, respectively).
Figure S10. Modulated pathways in the CVN transgenic model. Regulated pathways
showed in Figure 5 are reconstructed here showing affected genes and their relationship.
The three compartments are represented: transcriptome (A) and (B), translatome (C) and
(D), and translational efficiency (E) and (F), for decreased and increased pathways
respectively.
Figure S11. STRING network analysis for transcriptome up-regulated genes (160 genes at
fold change >1.5 and p-adjusted value <0.05) in CVN transgenic model. Network has
significantly more interactions than expected (296 vs 53; p-value <1.0E-16). Red nodes are
associated with the immune system process, an enriched biological process (FDR = 2.67E-
07). Disconnected nodes are hide and line thickness indicates the strength of data support.
Figure S12. STRING network analysis for translatome up-regulated genes (300 genes at
fold change >1.5 and p-adjusted value <0.05) in CVN transgenic model. Network has
significantly more interactions than expected (431 vs 164; p-value <1.0E-16). Red nodes
are associated with the immune system process, an enriched biological process (FDR =
3.44E-07). Disconnected nodes are hide and line thickness indicates the strength of data
support.

37
Figure S13. Differential expression analysis performed by edgeR for the transcriptome
compartment comparing WT strains (C57/BL6 vs B6;SJL). (A) PCA of samples. (B) Scatter
plot comparing normalized CPM expressions at the transcriptome between genotypes. (C)
Volcano plot where the relationship between fold change and p-adjusted values is evidenced
for transcriptome comparison. (D) Functional enrichment analysis of DEGs performed by
g:GOSt from g:Profiler. In (B) and (C), colored dots indicates differentially expressed genes
(p-adjusted value <0.05) by the following criteria: red up-regulated genes by >1.5 fold,
orange up-regulated by >1 fold, blue down-regulated genes by <-1.5 fold and sky-blue down-
regulated genes by <-1 fold.
Figure S14. Same as Figure S13, but for the translatome compartment comparison between
WT strains (C57/BL6 vs B6;SJL). (A) PCA of samples. (B) Scatter plot comparing
normalized CPM expressions at the transcriptome between genotypes. (C) Volcano plot
where the relationship between fold change and p-adjusted values is evidenced for
transcriptome comparison. (D) Functional enrichment analysis of DEGs performed by
g:GOSt from g:Profiler. In (B) and (C), colored dots indicates differentially expressed genes
(p-adjusted value <0.05) by the following criteria: red up-regulated genes by >1.5 fold,
orange up-regulated by >1 fold, blue down-regulated genes by <-1.5 fold and sky-blue down-
regulated genes by <-1 fold.
Figure S15. Gene expression regulation of TYROBP-related immune response in microglial
cells in the CVN transgenic mice. Pathway with direct and indirect causal inputs upstream
and downstream of TYROBP was obtained from WikiPathways, reconstructed from Zhang
B. et al. Cell (2013) and Ryu JK. et al. Nat Immunol (2018). Up-regulated genes at p-adjusted
value <0.1 for transcriptome or translatome data sets are indicated with red-colored boxes.
No significant down-regulated genes were found.

38
REFERENCES
[1] Bloom GS (2014) Amyloid-β and tau: the trigger and bullet in Alzheimer disease pathogenesis. JAMA Neurol 71, 505–508.
[2] Kapur M, Monaghan CE, Ackerman SL (2017) Regulation of mRNA Translation in Neurons-A Matter of Life and Death. Neuron 96, 616–637.
[3] Delaidelli A, Jan A, Herms J, Sorensen PH (2019) Translational control in brain pathologies: biological significance and therapeutic opportunities. Acta Neuropathol 137, 535–555.
[4] Taymans J-M, Nkiliza A, Chartier-Harlin M-C (2015) Deregulation of protein translation control, a potential game-changing hypothesis for Parkinson’s disease pathogenesis. Trends Mol Med 21, 466–472.
[5] Eshraghi M, Karunadharma PP, Blin J, Shahani N, Ricci EP, Michel A, Urban NT, Galli N, Sharma M, Ramírez-Jarquín UN, Florescu K, Hernandez J, Subramaniam S (2021) Mutant Huntingtin stalls ribosomes and represses protein synthesis in a cellular model of Huntington disease. Nat Commun 12, 1461.
[6] Cefaliello C, Penna E, Barbato C, Di Ruberto G, Mollica MP, Trinchese G, Cigliano L, Borsello T, Chun JT, Giuditta A, Perrone-Capano C, Miniaci MC, Crispino M (2020) Deregulated Local Protein Synthesis in the Brain Synaptosomes of a Mouse Model for Alzheimer’s Disease. Mol Neurobiol 57, 1529–1541.
[7] Evans HT, Benetatos J, van Roijen M, Bodea L-G, Götz J (2019) Decreased synthesis of ribosomal proteins in tauopathy revealed by non-canonical amino acid labelling. EMBO J 38, e101174.
[8] Li C, Götz J (2017) Somatodendritic accumulation of Tau in Alzheimer’s disease is promoted by Fyn-mediated local protein translation. EMBO J 36, 3120–3138.
[9] Banerjee S, Ferdosh S, Ghosh AN, Barat C (2020) Tau protein- induced sequestration of the eukaryotic ribosome: Implications in neurodegenerative disease. Sci Rep 10, 5225.
[10] Ghosh A, Mizuno K, Tiwari SS, Proitsi P, Gomez Perez-Nievas B, Glennon E, Martinez-Nunez RT, Giese KP (2020) Alzheimer’s disease-related dysregulation of mRNA translation causes key pathological features with ageing. Transl Psychiatry 10, 192.
[11] Baleriola J, Walker CA, Jean YY, Crary JF, Troy CM, Nagy PL, Hengst U (2014) Axonally synthesized ATF4 transmits a neurodegenerative signal across brain regions. Cell 158, 1159–1172.
[12] Norambuena A, Wallrabe H, McMahon L, Silva A, Swanson E, Khan SS, Baerthlein D, Kodis E, Oddo S, Mandell JW, Bloom GS (2017) mTOR and neuronal cell cycle reentry: How impaired brain insulin signaling promotes Alzheimer’s disease. Alzheimers Dement 13, 152–167.
[13] Norambuena A, Wallrabe H, Cao R, Wang DB, Silva A, Svindrych Z, Periasamy A, Hu S, Tanzi RE, Kim DY, Bloom GS (2018) A novel lysosome-to-mitochondria signaling pathway disrupted by amyloid-β oligomers. EMBO J 37,.
[14] Switon K, Kotulska K, Janusz-Kaminska A, Zmorzynska J, Jaworski J (2017) Molecular neurobiology of mTOR. Neuroscience 341, 112–153.
[15] Castanho I, Murray TK, Hannon E, Jeffries A, Walker E, Laing E, Baulf H, Harvey J, Bradshaw L, Randall A, Moore K, O’Neill P, Lunnon K, Collier DA, Ahmed Z, O’Neill MJ, Mill J (2020) Transcriptional Signatures of Tau and Amyloid Neuropathology. Cell Rep 30, 2040–2054.e5.

39
[16] Wan Y-W, Al-Ouran R, Mangleburg CG, Perumal TM, Lee TV, Allison K, Swarup V, Funk CC, Gaiteri C, Allen M, Wang M, Neuner SM, Kaczorowski CC, Philip VM, Howell GR, Martini-Stoica H, Zheng H, Mei H, Zhong X, Kim JW, Dawson VL, Dawson TM, Pao P-C, Tsai L-H, Haure-Mirande J-V, Ehrlich ME, Chakrabarty P, Levites Y, Wang X, Dammer EB, Srivastava G, Mukherjee S, Sieberts SK, Omberg L, Dang KD, Eddy JA, Snyder P, Chae Y, Amberkar S, Wei W, Hide W, Preuss C, Ergun A, Ebert PJ, Airey DC, Mostafavi S, Yu L, Klein H-U, Accelerating Medicines Partnership-Alzheimer’s Disease Consortium, Carter GW, Collier DA, Golde TE, Levey AI, Bennett DA, Estrada K, Townsend TM, Zhang B, Schadt E, De Jager PL, Price ND, Ertekin-Taner N, Liu Z, Shulman JM, Mangravite LM, Logsdon BA (2020) Meta-Analysis of the Alzheimer’s Disease Human Brain Transcriptome and Functional Dissection in Mouse Models. Cell Rep 32, 107908.
[17] Keren-Shaul H, Spinrad A, Weiner A, Matcovitch-Natan O, Dvir-Szternfeld R, Ulland TK, David E, Baruch K, Lara-Astaiso D, Toth B, Itzkovitz S, Colonna M, Schwartz M, Amit I (2017) A Unique Microglia Type Associated with Restricting Development of Alzheimer’s Disease. Cell 169, 1276–1290.e17.
[18] Pickett EK, Herrmann AG, McQueen J, Abt K, Dando O, Tulloch J, Jain P, Dunnett S, Sohrabi S, Fjeldstad MP, Calkin W, Murison L, Jackson RJ, Tzioras M, Stevenson A, d’Orange M, Hooley M, Davies C, Colom-Cadena M, Anton-Fernandez A, King D, Oren I, Rose J, McKenzie C-A, Allison E, Smith C, Hardt O, Henstridge CM, Hardingham GE, Spires-Jones TL (2019) Amyloid Beta and Tau Cooperate to Cause Reversible Behavioral and Transcriptional Deficits in a Model of Alzheimer’s Disease. Cell Rep 29, 3592–3604.e5.
[19] Ingolia NT (2014) Ribosome profiling: new views of translation, from single codons to genome scale. Nat Rev Genet 15, 205–213.
[20] Ingolia NT (2016) Ribosome Footprint Profiling of Translation throughout the Genome. Cell 165, 22–33.
[21] Eastman G, Smircich P, Sotelo-Silveira JR (2018) Following Ribosome Footprints to Understand Translation at a Genome Wide Level. Comput Struct Biotechnol J 16, 167–176.
[22] Wilcock DM, Lewis MR, Van Nostrand WE, Davis J, Previti ML, Gharkholonarehe N, Vitek MP, Colton CA (2008) Progression of amyloid pathology to Alzheimer’s disease pathology in an amyloid precursor protein transgenic mouse model by removal of nitric oxide synthase 2. J Neurosci 28, 1537–1545.
[23] Hsiao K, Chapman P, Nilsen S, Eckman C, Harigaya Y, Younkin S, Yang F, Cole G (1996) Correlative memory deficits, Abeta elevation, and amyloid plaques in transgenic mice. Science 274, 99–102.
[24] Ingolia NT, Brar GA, Rouskin S, McGeachy AM, Weissman JS (2012) The ribosome profiling strategy for monitoring translation in vivo by deep sequencing of ribosome-protected mRNA fragments. Nat Protoc 7, 1534–1550.
[25] Smircich P, Eastman G, Bispo S, Duhagon MA, Guerra-Slompo EP, Garat B, Goldenberg S, Munroe DJ, Dallagiovanna B, Holetz F, Sotelo-Silveira JR (2015) Ribosome profiling reveals translation control as a key mechanism generating differential gene expression in Trypanosoma cruzi. BMC Genomics 16, 443.
[26] Andrews S (2015) FastQC: A Quality Control Tool for High Throughput Sequence Data.
[27] Langmead B, Salzberg SL (2012) Fast gapped-read alignment with Bowtie 2. Nat Methods 9, 357–359.
[28] Liao Y, Smyth GK, Shi W (2014) featureCounts: an efficient general purpose program for assigning sequence reads to genomic features. Bioinformatics 30, 923–930.

40
[29] Robinson MD, McCarthy DJ, Smyth GK (2010) edgeR: a Bioconductor package for differential expression analysis of digital gene expression data. Bioinformatics 26, 139–140.
[30] Xiao Z, Zou Q, Liu Y, Yang X (2016) Genome-wide assessment of differential translations with ribosome profiling data. Nat Commun 7, 11194.
[31] Krämer A, Green J, Pollard J Jr, Tugendreich S (2014) Causal analysis approaches in Ingenuity Pathway Analysis. Bioinformatics 30, 523–530.
[32] Szklarczyk D, Franceschini A, Wyder S, Forslund K, Heller D, Huerta-Cepas J, Simonovic M, Roth A, Santos A, Tsafou KP, Kuhn M, Bork P, Jensen LJ, von Mering C (2015) STRING v10: protein-protein interaction networks, integrated over the tree of life. Nucleic Acids Res 43, D447–52.
[33] Raudvere U, Kolberg L, Kuzmin I, Arak T, Adler P, Peterson H, Vilo J (2019) g:Profiler: a web server for functional enrichment analysis and conversions of gene lists (2019 update). Nucleic Acids Res 47, W191–W198.
[34] Carbon S, Ireland A, Mungall CJ, Shu S, Marshall B, Lewis S, AmiGO Hub, Web Presence Working Group (2009) AmiGO: online access to ontology and annotation data. Bioinformatics 25, 288–289.
[35] Walter W, Sánchez-Cabo F, Ricote M (2015) GOplot: an R package for visually combining expression data with functional analysis. Bioinformatics 31, 2912–2914.
[36] Yamaguchi T, Yamauchi Y, Furukawa K, Ohmi Y, Ohkawa Y, Zhang Q, Okajima T, Furukawa K (2016) Expression of B4GALNT1, an essential glycosyltransferase for the synthesis of complex gangliosides, suppresses BACE1 degradation and modulates APP processing. Sci Rep 6, 34505.
[37] Bernardo A, Harrison FE, McCord M, Zhao J, Bruchey A, Davies SS, Jackson Roberts L 2nd, Mathews PM, Matsuoka Y, Ariga T, Yu RK, Thompson R, McDonald MP (2009) Elimination of GD3 synthase improves memory and reduces amyloid-beta plaque load in transgenic mice. Neurobiol Aging 30, 1777–1791.
[38] Yang Y, Quitschke WW, Vostrov AA, Brewer GJ (1999) CTCF is essential for up-regulating expression from the amyloid precursor protein promoter during differentiation of primary hippocampal neurons. J Neurochem 73, 2286–2298.
[39] McGill BE, Barve RA, Maloney SE, Strickland A, Rensing N, Wang PL, Wong M, Head R, Wozniak DF, Milbrandt J (2018) Abnormal Microglia and Enhanced Inflammation-Related Gene Transcription in Mice with Conditional Deletion of in -Expressing Neurons. J Neurosci 38, 200–219.
[40] Silva AC, Lemos C, Gonçalves FQ, Pliássova AV, Machado NJ, Silva HB, Canas PM, Cunha RA, Lopes JP, Agostinho P (2018) Blockade of adenosine A receptors recovers early deficits of memory and plasticity in the triple transgenic mouse model of Alzheimer’s disease. Neurobiol Dis 117, 72–81.
[41] Viana da Silva S, Haberl MG, Zhang P, Bethge P, Lemos C, Gonçalves N, Gorlewicz A, Malezieux M, Gonçalves FQ, Grosjean N, Blanchet C, Frick A, Nägerl UV, Cunha RA, Mulle C (2016) Early synaptic deficits in the APP/PS1 mouse model of Alzheimer’s disease involve neuronal adenosine A2A receptors. Nat Commun 7, 11915.
[42] Blom ES, Wang Y, Skoglund L, Hansson AC, Ubaldi M, Lourdusamy A, Sommer WH, Mielke M, Hyman BT, Heilig M, Lannfelt L, Nilsson LNG, Ingelsson M (2010) Increased mRNA Levels of TCF7L2 and MYC of the Wnt Pathway in Tg-ArcSwe Mice and Alzheimer’s Disease Brain. Int J Alzheimers Dis 2011, 936580.
[43] Kawanishi S, Takata K, Itezono S, Nagayama H, Konoya S, Chisaki Y, Toda Y, Nakata S, Yano Y, Kitamura Y, Ashihara E (2018) Bone-Marrow-Derived Microglia-Like Cells Ameliorate Brain Amyloid Pathology and Cognitive Impairment in a Mouse

41
Model of Alzheimer’s Disease. J Alzheimers Dis 64, 563–585. [44] Boissonneault V, Filali M, Lessard M, Relton J, Wong G, Rivest S (2009) Powerful
beneficial effects of macrophage colony-stimulating factor on beta-amyloid deposition and cognitive impairment in Alzheimer’s disease. Brain 132, 1078–1092.
[45] Xiao D, Liu X, Zhang M, Zou M, Deng Q, Sun D, Bian X, Cai Y, Guo Y, Liu S, Li S, Shiang E, Zhong H, Cheng L, Xu H, Jin K, Xiang M (2018) Direct reprogramming of fibroblasts into neural stem cells by single non-neural progenitor transcription factor Ptf1a. Nat Commun 9, 2865.
[46] He Z, Yang Y, Xing Z, Zuo Z, Wang R, Gu H, Qi F, Yao Z (2020) Intraperitoneal injection of IFN-γ restores microglial autophagy, promotes amyloid-β clearance and improves cognition in APP/PS1 mice. Cell Death Dis 11, 440.
[47] Chakrabarty P, Ceballos-Diaz C, Beccard A, Janus C, Dickson D, Golde TE, Das P (2010) IFN-gamma promotes complement expression and attenuates amyloid plaque deposition in amyloid beta precursor protein transgenic mice. J Immunol 184, 5333–5343.
[48] Baron R, Nemirovsky A, Harpaz I, Cohen H, Owens T, Monsonego A (2008) IFN-gamma enhances neurogenesis in wild-type mice and in a mouse model of Alzheimer’s disease. FASEB J 22, 2843–2852.
[49] Decourt B, Lahiri DK, Sabbagh MN (2017) Targeting Tumor Necrosis Factor Alpha for Alzheimer’s Disease. Curr Alzheimer Res 14, 412–425.
[50] Zheng C, Zhou X-W, Wang J-Z (2016) The dual roles of cytokines in Alzheimer’s disease: update on interleukins, TNF-α, TGF-β and IFN-γ. Transl Neurodegener 5, 7.
[51] Argellati F, Domenicotti C, Passalacqua M, Janda E, Melloni E, Marinari UM, Pronzato MA, Ricciarelli R (2009) Protein kinase C-dependent alpha-secretory processing of the amyloid precursor protein is mediated by phosphorylation of myosin II-B. FASEB J 23, 1246–1251.
[52] Sala Frigerio C, Wolfs L, Fattorelli N, Thrupp N, Voytyuk I, Schmidt I, Mancuso R, Chen W-T, Woodbury ME, Srivastava G, Möller T, Hudry E, Das S, Saido T, Karran E, Hyman B, Perry VH, Fiers M, De Strooper B (2019) The Major Risk Factors for Alzheimer’s Disease: Age, Sex, and Genes Modulate the Microglia Response to Aβ Plaques. Cell Rep 27, 1293–1306.e6.
[53] Mathys H, Adaikkan C, Gao F, Young JZ, Manet E, Hemberg M, De Jager PL, Ransohoff RM, Regev A, Tsai L-H (2017) Temporal Tracking of Microglia Activation in Neurodegeneration at Single-Cell Resolution. Cell Rep 21, 366–380.
[54] Zhang B, Gaiteri C, Bodea L-G, Wang Z, McElwee J, Podtelezhnikov AA, Zhang C, Xie T, Tran L, Dobrin R, Fluder E, Clurman B, Melquist S, Narayanan M, Suver C, Shah H, Mahajan M, Gillis T, Mysore J, MacDonald ME, Lamb JR, Bennett DA, Molony C, Stone DJ, Gudnason V, Myers AJ, Schadt EE, Neumann H, Zhu J, Emilsson V (2013) Integrated systems approach identifies genetic nodes and networks in late-onset Alzheimer’s disease. Cell 153, 707–720.
[55] Audoy-Rémus J, Bozoyan L, Dumas A, Filali M, Lecours C, Lacroix S, Rivest S, Tremblay M-E, Vallières L (2015) GPR84 deficiency reduces microgliosis, but accelerates dendritic degeneration and cognitive decline in a mouse model of Alzheimer’s disease. Brain Behav Immun 46, 112–120.
[56] Kamphuis W, Middeldorp J, Kooijman L, Sluijs JA, Kooi E-J, Moeton M, Freriks M, Mizee MR, Hol EM (2014) Glial fibrillary acidic protein isoform expression in plaque related astrogliosis in Alzheimer’s disease. Neurobiol Aging 35, 492–510.
[57] Tyagi E, Fiorelli T, Norden M, Padmanabhan J (2013) Alpha 1-Antichymotrypsin, an Inflammatory Protein Overexpressed in the Brains of Patients with Alzheimer’s Disease, Induces Tau Hyperphosphorylation through c-Jun N-Terminal Kinase

42
Activation. Int J Alzheimers Dis 2013, 606083. [58] Hol EM, Roelofs RF, Moraal E, Sonnemans MAF, Sluijs JA, Proper EA, de Graan
PNE, Fischer DF, van Leeuwen FW (2003) Neuronal expression of GFAP in patients with Alzheimer pathology and identification of novel GFAP splice forms. Mol Psychiatry 8, 786–796.
[59] Wirz KTS, Bossers K, Stargardt A, Kamphuis W, Swaab DF, Hol EM, Verhaagen J (2013) Cortical beta amyloid protein triggers an immune response, but no synaptic changes in the APPswe/PS1dE9 Alzheimer’s disease mouse model. Neurobiol Aging 34, 1328–1342.
[60] Lim Y-A, Giese M, Shepherd C, Halliday G, Kobayashi M, Takamatsu K, Staufenbiel M, Eckert A, Götz J (2012) Role of hippocalcin in mediating Aβ toxicity. Biochim Biophys Acta 1822, 1247–1257.
[61] Jamieson SE, White JK, Howson JMM, Pask R, Smith AN, Brayne C, Evans JG, Xuereb J, Cairns NJ, Rubinsztein DC, Blackwell JM (2005) Candidate gene association study of solute carrier family 11a members 1 (SLC11A1) and 2 (SLC11A2) genes in Alzheimer’s disease. Neurosci Lett 374, 124–128.
[62] Matthes F, Hettich MM, Schilling J, Flores-Dominguez D, Blank N, Wiglenda T, Buntru A, Wolf H, Weber S, Vorberg I, Dagane A, Dittmar G, Wanker E, Ehninger D, Krauss S (2018) Inhibition of the MID1 protein complex: a novel approach targeting APP protein synthesis. Cell Death Discov 4, 4.
[63] Reynolds CH, Garwood CJ, Wray S, Price C, Kellie S, Perera T, Zvelebil M, Yang A, Sheppard PW, Varndell IM, Hanger DP, Anderton BH (2008) Phosphorylation regulates tau interactions with Src homology 3 domains of phosphatidylinositol 3-kinase, phospholipase Cgamma1, Grb2, and Src family kinases. J Biol Chem 283, 18177–18186.
[64] Seward ME, Swanson E, Norambuena A, Reimann A, Cochran JN, Li R, Roberson ED, Bloom GS (2013) Amyloid-β signals through tau to drive ectopic neuronal cell cycle re-entry in Alzheimer’s disease. J Cell Sci 126, 1278–1286.
[65] López González I, Garcia-Esparcia P, Llorens F, Ferrer I (2016) Genetic and Transcriptomic Profiles of Inflammation in Neurodegenerative Diseases: Alzheimer, Parkinson, Creutzfeldt-Jakob and Tauopathies. Int J Mol Sci 17, 206.
[66] Diederich K, Sevimli S, Dörr H, Kösters E, Hoppen M, Lewejohann L, Klocke R, Minnerup J, Knecht S, Nikol S, Sachser N, Schneider A, Gorji A, Sommer C, Schäbitz W-R (2009) The role of granulocyte-colony stimulating factor (G-CSF) in the healthy brain: a characterization of G-CSF-deficient mice. J Neurosci 29, 11572–11581.
[67] Rah W-J, Lee Y-H, Moon J-H, Jun H-J, Kang H-R, Koh H, Eom HJ, Lee JY, Lee YJ, Kim JY, Choi Y-Y, Park K, Kim MJ, Kim S-H (2017) Neuroregenerative potential of intravenous G-CSF and autologous peripheral blood stem cells in children with cerebral palsy: a randomized, double-blind, cross-over study. J Transl Med 15, 1–9.
[68] Song S, Kong X, Acosta S, Sava V, Borlongan C, Sanchez-Ramos J (2016) Granulocyte-colony stimulating factor promotes brain repair following traumatic brain injury by recruitment of microglia and increasing neurotrophic factor expression. Restor Neurol Neurosci 34, 415–431.
[69] Martiskainen H, Viswanathan J, Nykänen N-P, Kurki M, Helisalmi S, Natunen T, Sarajärvi T, Kurkinen KMA, Pursiheimo J-P, Rauramaa T, Alafuzoff I, Jääskeläinen JE, Leinonen V, Soininen H, Haapasalo A, Huttunen HJ, Hiltunen M (2015) Transcriptomics and mechanistic elucidation of Alzheimer’s disease risk genes in the brain and in vitro models. Neurobiol Aging 36, 1221.e15–28.
[70] Darcy MJ, Jin S-X, Feig LA (2014) R-Ras contributes to LTP and contextual discrimination. Neuroscience 277, 334–342.
43
[71] Heneka MT, Reyes-Irisarri E, Hüll M, Kummer MP (2011) Impact and Therapeutic Potential of PPARs in Alzheimer’s Disease. Curr Neuropharmacol 9, 643–650.
[72] de la Monte SM, Wands JR (2006) Molecular indices of oxidative stress and mitochondrial dysfunction occur early and often progress with severity of Alzheimer’s disease. J Alzheimers Dis 9, 167–181.
[73] Malinin NL, Wright S, Seubert P, Schenk D, Griswold-Prenner I (2005) Amyloid-beta neurotoxicity is mediated by FISH adapter protein and ADAM12 metalloprotease activity. Proc Natl Acad Sci U S A 102, 3058–3063.
[74] Ranganathan S, Noyes NC, Migliorini M, Winkles JA, Battey FD, Hyman BT, Smith E, Yepes M, Mikhailenko I, Strickland DK (2011) LRAD3, a novel low-density lipoprotein receptor family member that modulates amyloid precursor protein trafficking. J Neurosci 31, 10836–10846.
[75] Kolev MV, Tediose T, Sivasankar B, Harris CL, Thome J, Morgan BP, Donev RM (2010) Upregulating CD59: a new strategy for protection of neurons from complement-mediated degeneration. Pharmacogenomics J 10, 12–19.
[76] Yang LB, Li R, Meri S, Rogers J, Shen Y (2000) Deficiency of complement defense protein CD59 may contribute to neurodegeneration in Alzheimer’s disease. J Neurosci 20, 7505–7509.
[77] Baglietto-Vargas D, Moreno-Gonzalez I, Sanchez-Varo R, Jimenez S, Trujillo-Estrada L, Sanchez-Mejias E, Torres M, Romero-Acebal M, Ruano D, Vizuete M, Vitorica J, Gutierrez A (2010) Calretinin interneurons are early targets of extracellular amyloid-beta pathology in PS1/AbetaPP Alzheimer mice hippocampus. J Alzheimers Dis 21, 119–132.
[78] Pastorino L, Ma SL, Balastik M, Huang P, Pandya D, Nicholson L, Lu KP (2012) Alzheimer’s disease-related loss of Pin1 function influences the intracellular localization and the processing of AβPP. J Alzheimers Dis 30, 277–297.
[79] Wang S, Simon BP, Bennett DA, Schneider JA, Malter JS, Wang D-S (2007) The significance of Pin1 in the development of Alzheimer’s disease. J Alzheimers Dis 11, 13–23.
[80] Pastorino L, Sun A, Lu P-J, Zhou XZ, Balastik M, Finn G, Wulf G, Lim J, Li S-H, Li X, Xia W, Nicholson LK, Lu KP (2006) The prolyl isomerase Pin1 regulates amyloid precursor protein processing and amyloid-beta production. Nature 440, 528–534.
[81] Pascual-Lucas M, Viana da Silva S, Di Scala M, Garcia-Barroso C, González-Aseguinolaza G, Mulle C, Alberini CM, Cuadrado-Tejedor M, Garcia-Osta A (2014) Insulin-like growth factor 2 reverses memory and synaptic deficits in APP transgenic mice. EMBO Mol Med 6, 1246–1262.
[82] Xie K, Liu Y, Hao W, Walter S, Penke B, Hartmann T, Schachner M, Fassbender K (2013) Tenascin-C deficiency ameliorates Alzheimer’s disease-related pathology in mice. Neurobiol Aging 34, 2389–2398.
[83] Stewart CR, Stuart LM, Wilkinson K, van Gils JM, Deng J, Halle A, Rayner KJ, Boyer L, Zhong R, Frazier WA, Lacy-Hulbert A, El Khoury J, Golenbock DT, Moore KJ (2010) CD36 ligands promote sterile inflammation through assembly of a Toll-like receptor 4 and 6 heterodimer. Nat Immunol 11, 155–161.
[84] Mahaman YAR, Huang F, Kessete Afewerky H, Maibouge TMS, Ghose B, Wang X (2019) Involvement of calpain in the neuropathogenesis of Alzheimer’s disease. Med Res Rev 39, 608–630.
[85] Ferreira A (2012) Calpain dysregulation in Alzheimer’s disease. ISRN Biochem 2012, 728571.
[86] Castro-Alvarez JF, Uribe-Arias SA, Kosik KS, Cardona-Gómez GP (2014) Long- and short-term CDK5 knockdown prevents spatial memory dysfunction and tau pathology
44
of triple transgenic Alzheimer’s mice. Front Aging Neurosci 6, 243. [87] Zheng Y-L, Kesavapany S, Gravell M, Hamilton RS, Schubert M, Amin N, Albers W,
Grant P, Pant HC (2005) A Cdk5 inhibitory peptide reduces tau hyperphosphorylation and apoptosis in neurons. EMBO J 24, 209–220.
[88] Liu F, Su Y, Li B, Zhou Y, Ryder J, Gonzalez-DeWhitt P, May PC, Ni B (2003) Regulation of amyloid precursor protein (APP) phosphorylation and processing by p35/Cdk5 and p25/Cdk5. FEBS Lett 547, 193–196.
[89] Lopes JP, Oliveira CR, Agostinho P (2009) Cdk5 acts as a mediator of neuronal cell cycle re-entry triggered by amyloid-beta and prion peptides. Cell Cycle 8, 97–104.
[90] Li H, Ruberu K, Muñoz SS, Jenner AM, Spiro A, Zhao H, Rassart E, Sanchez D, Ganfornina MD, Karl T, Garner B (2015) Apolipoprotein D modulates amyloid pathology in APP/PS1 Alzheimer’s disease mice. Neurobiol Aging 36, 1820–1833.
[91] Martínez E, Navarro A, Ordóñez C, Del Valle E, Tolivia J (2012) Amyloid-β25-35 induces apolipoprotein D Synthesis and growth arrest in HT22 hippocampal cells. J Alzheimers Dis 30, 233–244.
[92] Lee S-J, Seo B-R, Koh J-Y (2015) Metallothionein-3 modulates the amyloid β endocytosis of astrocytes through its effects on actin polymerization. Mol Brain 8, 84.
[93] Manso Y, Carrasco J, Comes G, Meloni G, Adlard PA, Bush AI, Vašák M, Hidalgo J (2012) Characterization of the role of metallothionein-3 in an animal model of Alzheimer’s disease. Cell Mol Life Sci 69, 3683–3700.
[94] Balasubramaniam M, Ayyadevara S, Shmookler Reis RJ (2018) Structural insights into pro-aggregation effects of C. elegans CRAM-1 and its human ortholog SERF2. Sci Rep 8, 14891.
[95] van Ham TJ, Holmberg MA, van der Goot AT, Teuling E, Garcia-Arencibia M, Kim H-E, Du D, Thijssen KL, Wiersma M, Burggraaff R, van Bergeijk P, van Rheenen J, Jerre van Veluw G, Hofstra RMW, Rubinsztein DC, Nollen EAA (2010) Identification of MOAG-4/SERF as a regulator of age-related proteotoxicity. Cell 142, 601–612.
[96] Ashby EL, Kehoe PG, Love S (2010) Kallikrein-related peptidase 6 in Alzheimer’s disease and vascular dementia. Brain Res 1363, 1–10.
[97] Diamandis EP, Yousef GM, Petraki C, Soosaipillai AR (2000) Human kallikrein 6 as a biomarker of alzheimer’s disease. Clin Biochem 33, 663–667.
[98] Kumar U (2005) Expression of somatostatin receptor subtypes (SSTR1-5) in Alzheimer’s disease brain: an immunohistochemical analysis. Neuroscience 134, 525–538.
[99] Davies P, Katzman R, Terry RD (1980) Reduced somatostatin-like immunoreactivity in cerebral cortex from cases of Alzheimer disease and Alzheimer senile dementa. Nature 288, 279–280.
[100] Pan Y, Choy KHC, Marriott PJ, Chai SY, Scanlon MJ, Porter CJH, Short JL, Nicolazzo JA (2018) Reduced blood-brain barrier expression of fatty acid-binding protein 5 is associated with increased vulnerability of APP/PS1 mice to cognitive deficits from low omega-3 fatty acid diets. J Neurochem 144, 81–92.
[101] Pan Y, Short JL, Choy KHC, Zeng AX, Marriott PJ, Owada Y, Scanlon MJ, Porter CJH, Nicolazzo JA (2016) Fatty Acid-Binding Protein 5 at the Blood-Brain Barrier Regulates Endogenous Brain Docosahexaenoic Acid Levels and Cognitive Function. J Neurosci 36, 11755–11767.
[102] Nakanishi N, Ryan SD, Zhang X, Khan A, Holland T, Cho E-G, Huang X, Liao F-F, Xu H, Lipton SA, Tu S (2013) Synaptic protein α1-takusan mitigates amyloid-β-induced synaptic loss via interaction with tau and postsynaptic density-95 at postsynaptic sites. J Neurosci 33, 14170–14183.
[103] Tu S, Shin Y, Zago WM, States BA, Eroshkin A, Lipton SA, Tong GG, Nakanishi N

45
(2007) Takusan: a large gene family that regulates synaptic activity. Neuron 55, 69–85.
[104] Giannuzzi G, Siswara P, Malig M, Marques-Bonet T, NISC Comparative Sequencing Program, Mullikin JC, Ventura M, Eichler EE (2013) Evolutionary dynamism of the primate LRRC37 gene family. Genome Res 23, 46–59.
[105] Jun G, Ibrahim-Verbaas CA, Vronskaya M, Lambert J-C, Chung J, Naj AC, Kunkle BW, Wang L-S, Bis JC, Bellenguez C, Harold D, Lunetta KL, Destefano AL, Grenier-Boley B, Sims R, Beecham GW, Smith AV, Chouraki V, Hamilton-Nelson KL, Ikram MA, Fievet N, Denning N, Martin ER, Schmidt H, Kamatani Y, Dunstan ML, Valladares O, Laza AR, Zelenika D, Ramirez A, Foroud TM, Choi S-H, Boland A, Becker T, Kukull WA, van der Lee SJ, Pasquier F, Cruchaga C, Beekly D, Fitzpatrick AL, Hanon O, Gill M, Barber R, Gudnason V, Campion D, Love S, Bennett DA, Amin N, Berr C, Tsolaki M, Buxbaum JD, Lopez OL, Deramecourt V, Fox NC, Cantwell LB, Tárraga L, Dufouil C, Hardy J, Crane PK, Eiriksdottir G, Hannequin D, Clarke R, Evans D, Mosley TH Jr, Letenneur L, Brayne C, Maier W, De Jager P, Emilsson V, Dartigues J-F, Hampel H, Kamboh MI, de Bruijn RFAG, Tzourio C, Pastor P, Larson EB, Rotter JI, O’Donovan MC, Montine TJ, Nalls MA, Mead S, Reiman EM, Jonsson PV, Holmes C, St George-Hyslop PH, Boada M, Passmore P, Wendland JR, Schmidt R, Morgan K, Winslow AR, Powell JF, Carasquillo M, Younkin SG, Jakobsdóttir J, Kauwe JSK, Wilhelmsen KC, Rujescu D, Nöthen MM, Hofman A, Jones L, IGAP Consortium, Haines JL, Psaty BM, Van Broeckhoven C, Holmans P, Launer LJ, Mayeux R, Lathrop M, Goate AM, Escott-Price V, Seshadri S, Pericak-Vance MA, Amouyel P, Williams J, van Duijn CM, Schellenberg GD, Farrer LA (2016) A novel Alzheimer disease locus located near the gene encoding tau protein. Mol Psychiatry 21, 108–117.
[106] Chang S-H, Hwang C-S, Yin J-H, Chen S-D, Yang D-I (2015) Oncostatin M-dependent Mcl-1 induction mediated by JAK1/2-STAT1/3 and CREB contributes to bioenergetic improvements and protective effects against mitochondrial dysfunction in cortical neurons. Biochim Biophys Acta 1853, 2306–2325.
[107] Kraft AW, Hu X, Yoon H, Yan P, Xiao Q, Wang Y, Gil SC, Brown J, Wilhelmsson U, Restivo JL, Cirrito JR, Holtzman DM, Kim J, Pekny M, Lee J-M (2013) Attenuating astrocyte activation accelerates plaque pathogenesis in APP/PS1 mice. FASEB J 27, 187–198.
[108] Richter F, Meurers BH, Zhu C, Medvedeva VP, Chesselet M-F (2009) Neurons express hemoglobin alpha- and beta-chains in rat and human brains. J Comp Neurol 515, 538–547.
[109] Wu C-W, Liao P-C, Yu L, Wang S-T, Chen S-T, Wu C-M, Kuo Y-M (2004) Hemoglobin promotes Abeta oligomer formation and localizes in neurons and amyloid deposits. Neurobiol Dis 17, 367–377.
[110] Oyama R, Yamamoto H, Titani K (2000) Glutamine synthetase, hemoglobin alpha-chain, and macrophage migration inhibitory factor binding to amyloid beta-protein: their identification in rat brain by a novel affinity chromatography and in Alzheimer’s disease brain by immunoprecipitation. Biochim Biophys Acta 1479, 91–102.
[111] Ullrich S, Münch A, Neumann S, Kremmer E, Tatzelt J, Lichtenthaler SF (2010) The novel membrane protein TMEM59 modulates complex glycosylation, cell surface expression, and secretion of the amyloid precursor protein. J Biol Chem 285, 20664–20674.
[112] Liu Z, Ning J, Zheng X, Meng J, Han L, Zheng H, Zhong L, Chen X-F, Zhang X, Luo H, Can D, Xu H, Zhang Y-W (2020) TMEM59 interacts with TREM2 and modulates TREM2-dependent microglial activities. Cell Death Dis 11, 678.

46
[113] Burgos PV, Mardones GA, Rojas AL, daSilva LLP, Prabhu Y, Hurley JH, Bonifacino JS (2010) Sorting of the Alzheimer’s disease amyloid precursor protein mediated by the AP-4 complex. Dev Cell 18, 425–436.
[114] Terrey M, Adamson SI, Gibson AL, Deng T, Ishimura R, Chuang JH, Ackerman SL (2020) GTPBP1 resolves paused ribosomes to maintain neuronal homeostasis. Elife 9,.
[115] Kapur M, Ganguly A, Nagy G, Adamson SI, Chuang JH, Frankel WN, Ackerman SL (2020) Expression of the Neuronal tRNA n-Tr20 Regulates Synaptic Transmission and Seizure Susceptibility. Neuron 108, 193–208.e9.
[116] Das Sharma S, Metz JB, Li H, Hobson BD, Hornstein N, Sulzer D, Tang G, Sims PA (2019) Widespread Alterations in Translation Elongation in the Brain of Juvenile Fmr1 Knockout Mice. Cell Rep 26, 3313–3322.e5.
[117] Hornstein N, Torres D, Das Sharma S, Tang G, Canoll P, Sims PA (2016) Ligation-free ribosome profiling of cell type-specific translation in the brain. Genome Biol 17, 149.
[118] Wang Y, Cella M, Mallinson K, Ulrich JD, Young KL, Robinette ML, Gilfillan S, Krishnan GM, Sudhakar S, Zinselmeyer BH, Holtzman DM, Cirrito JR, Colonna M (2015) TREM2 lipid sensing sustains the microglial response in an Alzheimer’s disease model. Cell 160, 1061–1071.
[119] Wang Y, Ulland TK, Ulrich JD, Song W, Tzaferis JA, Hole JT, Yuan P, Mahan TE, Shi Y, Gilfillan S, Cella M, Grutzendler J, DeMattos RB, Cirrito JR, Holtzman DM, Colonna M (2016) TREM2-mediated early microglial response limits diffusion and toxicity of amyloid plaques. J Exp Med 213, 667–675.
[120] Yuan P, Condello C, Keene CD, Wang Y, Bird TD, Paul SM, Luo W, Colonna M, Baddeley D, Grutzendler J (2016) TREM2 Haplodeficiency in Mice and Humans Impairs the Microglia Barrier Function Leading to Decreased Amyloid Compaction and Severe Axonal Dystrophy. Neuron 90, 724–739.
[121] Konishi H, Kiyama H (2018) Microglial TREM2/DAP12 Signaling: A Double-Edged Sword in Neural Diseases. Frontiers in Cellular Neuroscience 12,.
[122] Ulland TK, Song WM, Huang SC-C, Ulrich JD, Sergushichev A, Beatty WL, Loboda AA, Zhou Y, Cairns NJ, Kambal A, Loginicheva E, Gilfillan S, Cella M, Virgin HW, Unanue ER, Wang Y, Artyomov MN, Holtzman DM, Colonna M (2017) TREM2 Maintains Microglial Metabolic Fitness in Alzheimer’s Disease. Cell 170, 649–663.e13.
[123] Ryu JK, Rafalski VA, Meyer-Franke A, Adams RA, Poda SB, Rios Coronado PE, Pedersen LØ, Menon V, Baeten KM, Sikorski SL, Bedard C, Hanspers K, Bardehle S, Mendiola AS, Davalos D, Machado MR, Chan JP, Plastira I, Petersen MA, Pfaff SJ, Ang KK, Hallenbeck KK, Syme C, Hakozaki H, Ellisman MH, Swanson RA, Zamvil SS, Arkin MR, Zorn SH, Pico AR, Mucke L, Freedman SB, Stavenhagen JB, Nelson RB, Akassoglou K (2018) Fibrin-targeting immunotherapy protects against neuroinflammation and neurodegeneration. Nat Immunol 19, 1212–1223.
[124] Lee CYD, Daggett A, Gu X, Jiang L-L, Langfelder P, Li X, Wang N, Zhao Y, Park CS, Cooper Y, Ferando I, Mody I, Coppola G, Xu H, Yang XW (2018) Elevated TREM2 Gene Dosage Reprograms Microglia Responsivity and Ameliorates Pathological Phenotypes in Alzheimer’s Disease Models. Neuron 97, 1032–1048.e5.

Supplementary Figures
Figure S1

Figure S2

Figure S3

Figure S4

Figure S5

Figure S6

Figure S7

Figure S8

Figure S9

Figure S10

Figure S11

Figure S12

Figure S13

Figure S14

Figure S15

171
VII. CONCLUSIONES
En la presente tesis nos planteamos como objetivo general contribuir a comprender tanto los
mecanismos, como los distintos eventos de regulación de la expresión génica que ocurren a
nivel traduccional en modelos neuronales. Para esto, utilizamos principalmente enfoques
genómicos y técnicas de secuenciación masiva, como RNA-Seq y Ribo-Seq, sobre diversos
sustratos biológicos del tipo neuronal y en diversos contextos. Los resultados obtenidos en la
presente tesis nos permiten concluir lo siguiente:
1. La técnica de Ribo-Seq es una valiosa herramienta para el estudio del compartimento
traduccional y de los eventos de regulación que en este ocurren. Pudimos optimizar el
uso de la misma sobre diversos sustratos biológicos, del tipo neuronal, como: células
in vitro, cultivos in vitro de neuronas embrionarias primarias y tejido nervioso derivado
de animales.
2. En todos los casos fuimos capaces de detectar niveles confiables de expresión génica
a nivel traduccional para cerca de 10.000 genes. Las huellas ribosomales producidas
cumplieron con los controles de calidad esperados: mapeo preferencial sobre regiones
codificantes versus regiones no codificantes y periodicidad de mapeo.
3. El factor proteico PDCD4 es capaz de regular la traducción de un conjunto específico
de mensajeros (blancos traduccionales) en modelos neuronales. El reporte del
conjunto de 267 ARNm blancos traduccionales de PDCD4 es el segundo a la fecha
obtenido mediante aproximaciones genómicas y el primero en modelos neuronales.
4. Dentro de los blancos traduccionales reportados se reconoce una firma génica
asociada al crecimiento neurítico y/o axonal. Se destaca, por su función biológica
sobre el crecimiento neurítico, la regulación que ejerce PDCD4 sobre NFKB2. Dicha
regulación fue comprobada mediante técnicas ortogonales como Western blot y
cuantificación de ARNm en fracciones polisomales.
5. La elección de la enzima a utilizar en el ensayo de digestión del protocolo de Ribo-Seq
es un aspecto relevante. La comparativa entre las enzimas Benzonasa y RNAsa I
arrojó algunas diferencias, como esperábamos. De todas maneras, la identidad de los
genes observados en el compartimiento traduccional definido por cada enzima es muy
similar. En el análisis de expresión génica diferencial, pocos genes diferenciales

172
parecen estar exclusivamente asociados a una enzima en particular. Los grupos de
genes definidos como exclusivamente detectados por una enzima, no superan los 200
miembros y no revelan funciones biológicas particularmente comprometidas, de hecho
abundan los genes no codificantes y en particular especies pequeñas de ARN. Por lo
tanto, ambas enzimas son adecuadas para la producción de huellas ribosomales y
definen traductomas cuyos niveles de expresión son comparables.
6. Las huellas ribosomales producidas con las distintas enzimas difieren en su tamaño,
patrones de periodicidad y mapeo, y distribución sobre las distintas regiones
codificantes y no codificantes del ARNm. También se observaron diferencias en los
fragmentos de ARNr producidos como contaminación y se pudo conocer la secuencia
de dichos fragmentos a los efectos de diseñar oligos específicos para su sustracción
en futuros experimentos.
7. Existen importantes eventos de regulación de la expresión génica, tanto a nivel
transcripcional como traduccional, en la corteza cerebral de modelos murinos
transgénicos del mal de Alzheimer, en etapas preferentemente asintomáticas. En
particular, el modelo CVN es el que mayor nivel de regulación muestra a nivel
traduccional y es completamente asintomático a la edad utilizada.
8. El análisis de las funciones representadas por los genes regulados muestra que, en
particular para el modelo CVN, tanto a nivel transcripcional como traduccional, se
inhiben procesos asociados a la neurodegeneración mientras que se favorecen
procesos de tipo neuroprotector como la cantidad de células neuronales y
neurogliales, la transmisión sináptica y la neuritogénesis, entre otros. A su vez, el
modelo CVN muestra una firma génica regulada positivamente a nivel transcripcional
y traduccional asociada a una subpoblación microglial que responde a la acumulación
temprana de Aβ.
9. El análisis individual revela que ambos modelos regulan, tanto a nivel transcripcional
como traduccional, la expresión de genes asociados al metabolismo de APP y Aβ, ya
sea con funciones neurotóxicas o neuroprotectoras. La regulación temprana de estos
procesos ocurre en modelos murinos donde la presencia de placas amiloides no ha
sido descrita a la edad aquí utilizada. Además, se describe la regulación a nivel
traduccional de estos procesos por primera vez en este tipo de modelos.

173
10. A pesar de que los dos modelos transgénicos utilizados derivan de distintas cepas de
ratón, desarrollan la patología de maneras muy distintas y muestran distintos niveles
de regulación en la expresión génica, se observan genes regulados en común entre
ambos modelos. Aquí se destacan casos interesantes donde se observan genes
asociados a funciones neuroprotectoras que responden a la presencia y acumulación
de Aβ.

174
VIII. PERSPECTIVAS
Con respecto a las perspectivas derivadas de los experimentos realizados y los resultados
obtenidos en la presente tesis, surgen principalmente perspectivas tanto a corto, como a
mediano y largo plazo. Se presentan a continuación las perspectivas del presente trabajo
agrupadas según la organización en capítulos que se utilizó antes.
Respecto de la búsqueda de blancos traduccionales de PDCD4 en modelos neuronales nos
parece interesante continuar, a corto plazo, con la validación de los ARNm blancos
traduccionales encontrados. Estas confirmaciones se realizarían de la misma manera que se
realizó la confirmación particular de NFKB2, tanto mediante cuantificación de la abundancia
en fracciones polisomales, como mediante cuantificación de la abundancia proteica por
Western blot, en presencia y ausencia de PDCD4. Podríamos agregar también
confirmaciones por cuantificación de abundancia proteica mediante estimaciones de
intensidad en imágenes de microscopía confocal, una herramienta disponible en el Instituto
Clemente Estable con tecnología de punta. También nos resulta interesante estudiar en
particular el tipo de regulación que existe entre PDCD4 y sus ARNm blancos. Si dicha
regulación es mediada por estructuras secundarias en los 5’-UTRs o si la inhibición ocurre en
la etapa de elongación [48]. Podríamos manipular distintas secuencias derivadas de los
blancos traduccionales encontrados, estructuradas o no, en el 5’-UTR de un gen reportero
como la luciferasa y evaluar su actividad ante la presencia/ausencia de PDCD4. En el
escenario de regulación a nivel de la elongación, podríamos seleccionar candidatos a ser
regulados en esta etapa y modificar porciones de secuencias a lo largo del CDS hasta
evidenciar la regulación.
Nos resulta también interesante diseñar experimentos en los cuales podamos evidenciar la
regulación traduccional que ejerce PDCD4 de manera local. Una posibilidad es utilizar cultivos
de neuronas derivadas del ganglio de la raíz dorsal en cámaras compartimentalizadas. De
esta manera, luego de alcanzar los días de crecimiento in vitro necesarios para restablecer
altos niveles de expresión de PDCD4, podríamos silenciar dicho factor (como hemos ya
realizado en [78]), y así producir huellas ribosomales para determinar eventos de regulación
traduccional local específicos de axones.
Explorando posibilidades de más largo aliento, podría ser interesante evaluar el papel de
PDCD4 y sus ARNm blancos en modelos in vivo. Conocer los blancos traduccionales de
PDCD4 en, por ejemplo, fibras de nervio ciático y cómo éstos se modulan en respuesta a la
injuria se presenta como una hipótesis desafiante pero sumamente interesante. Hoy en día

175
se han desarrollado protocolos específicos para la producción de librerías de secuenciación
de small RNAs (las utilizadas en la secuenciación de huellas ribosomales) a partir de
cantidades muy pequeñas de material de partida, como podría ser el caso de la recuperación
de polisomas a partir de axoplasma de nervio ciático. Surgen, sin embargo, desafíos
adicionales asociados a este tipo de experimento que sin dudas representan aspectos a
resolver y optimizar, como la óptima purificación de axoplasma a partir de las fibras y el
silenciamiento de PDCD4.
Respecto al uso de Ribo-Seq en otros modelos neuronales descrito en el Capítulo 2, y en
conjunción con los objetivos estudiados en el Capítulo 3, surgen varias perspectivas a
explorar. En primer lugar, nos parece interesante estudiar el efecto de oligómeros tanto de
Aβ, como de TAU, sobre el compartimento traduccional de cultivos in vitro de neuronas
corticales primarias. Este tipo de cultivos y tratamientos son técnicas utilizadas
cotidianamente en el laboratorio de mi co-tutor George Bloom, con lo cual los protocolos para
la producción de ambos oligómeros, que suelen ser técnicas desafiantes, se encuentran
optimizados. De esta manera podríamos conocer si las dos piezas fundamentales en la
patología de Alzheimer tienen un rol sobre el compartimento traduccional en un modelo celular
neuronal. Vale recordar que, en particular la acumulación de Aβ, ocurre a nivel extracelular,
pero se ha demostrado que es reconocido por diversos receptores disparando vías de
señalización diversas, algunas de las cuales convergen en mTOR [73,74], y que además
podría tener un rol en la síntesis local en axones in vitro [110]. En este sentido, disponemos
de algunos resultados preliminares respecto de cómo se ve afectada la traducción in vitro de
GFP ante la exposición a distintas concentraciones de oligómeros de Aβ y TAU. Aunque los
resultados son preliminares, parece existir cierto impacto negativo en los niveles
traduccionales ante la exposición, en particular, de oligómeros de TAU.
Por otro lado, considerando el uso del protocolo de Ribo-Seq sobre la corteza cerebral de
modelos transgénicos del mal de Alzheimer se derivan también interesantes perspectivas a
estudiar. En primer lugar, consideramos que realizar una línea temporal y estudiar los
traductomas de las cortezas de los animales a distintas edades representa un trabajo atractivo
y desafiante. Lograr establecer dicha línea temporal nos permitiría realizar estudios de redes
de co-expresión génica en búsqueda de grupos de genes cuya expresión se vea modificada
con el avance en la edad de los ratones, esto es, con el desarrollo de la patología y de
alteraciones cognitivas. Es claro que, tanto en los modelos murinos transgénicos de la
enfermedad, como en la patología en sí observada en humanos, ocurren procesos dinámicos,
con diversos estadíos y particularmente en humanos con un desarrollo lento, progresivo y
largo. Este tipo de experimento representa un desafío de gran utilidad no solo para poder
comprender los cambios iniciales como intentamos responder en el capítulo 3, sino también

176
los eventos de regulación que ocurren en distintos estadíos más avanzados. Podemos
considerar también, como aspecto adicional, la posibilidad de discernir entre regiones más
acotadas del cerebro murino con importancia en la patología, como el hipocampo o la corteza
entorrinal [111].
También resulta interesante realizar experimentos similares a los realizados en el Capítulo 3
pero utilizando modelos transgénicos murinos cuya afectación esté asociada a la proteína
TAU, y extender el análisis a otros modelos no solo relacionados a APP o Aβ. Existen muchos
modelos transgénicos murinos donde el desarrollo de la patología está asociado a
manipulaciones genéticas de la proteína TAU. Dos ejemplos, disponibles en el laboratorio del
Dr. Bloom, son los ratones hTAU y tau-knockout. Los primeros tienen deletado el gen murino
Mapt, codificante para TAU, pero tienen un transgen para sobreexpresar las 6 isoformas de
TAU humano [112]. En cambio, los ratones tau-knockout, como su nombre lo indica solamente
tienen deletado el gen Mapt [101]. En este sentido, contamos con algunos experimentos y
resultados preliminares tanto en el uso del protocolo de Ribo-Seq en corteza de ratones hTau,
como en su uso en cultivo de neuronas corticales primarias derivadas de ratones tau-
knockout.
En último lugar, quisiéramos destacar dos posibles perspectivas más, una principalmente de
corto plazo y otra de más largo aliento. Respecto de la primera, en la presente tesis hemos
generado una gran cantidad de datos de secuenciación masiva, tanto producidos por RNA-
Seq como por Ribo-Seq. Estas secuencias representan un valioso insumo para utilizar en
distintos tipos de análisis complementarios a los aquí realizados. Por ejemplo, con los datos
derivados de RNA-Seq se podrían realizar ensamblados de los distintos transcriptomas en
búsqueda de nuevas o raras isoformas. En el caso de los datos derivados de Ribo-Seq las
distintas posibilidades de análisis son aún mayores, por ejemplo: búsqueda de sitios de pausa
definidos por grandes picos de mapeo [113,114], búsqueda de marcos de lectura abiertos en
los 5’-UTRs (uORFs por sus siglas en inglés; [115,116]), análisis de la preferencia de codón
iniciación utilizado [117], búsqueda de eventos de cambio en el marco de lectura [118], entre
otros. Con respecto a una segunda perspectiva asociada al trabajo aquí presentado, nos
resulta interesante destacar las tecnologías de secuenciación de célula única que se
encuentran en un momento de particular desarrollo y uso en la actualidad. Sin embargo, no
se conocen al momento protocolos específicos para la construcción de librerías del tipo Ribo-
Seq en célula única, aunque varios grupos de investigación se encuentran trabajando en el
desarrollo de dichos protocolos. Creemos que, superadas las limitaciones tecnológicas, podrá
ser posible conocer el perfil traduccional masivo de una única célula y esto despertará nuevas
interrogantes a ser respondidas. En particular, en el contexto de Alzheimer, donde las
tecnologías de RNA-Seq de célula única han realizado importantes aportes a la biología de la

177
enfermedad (ver ejemplos en [119–122]), creemos que la posibilidad de explorar los eventos
de regulación traduccional mediante esta técnica de última generación dará paso a nuevos
conocimientos que impulsarán el campo hacia nuevos horizontes.

178
IX. AGRADECIMIENTOS
Esta tesis es sin dudas el corolario de un proceso de formación en el quehacer científico que
empezó en el año 2011 cuando ingresé al Instituto a realizar la tesis de grado bajo la
orientación de Coya. Durante estos 10 años he compartido con, y aprendido de, mucha gente
a la cual debo agradecer. En primer lugar a Coya por recibirme y guiarme durante las distintas
etapas, en especial la que aquí culmina. El pensamiento crítico, la búsqueda de la siguiente
pregunta y la alegría del trabajo científico son aspectos que aprendí junto a Coya y en el
Departamento de Genómica que se formó durante este proceso. A todos los compañeros de
Genómica, actuales y anteriores, el agradecimiento por lo aprendido, lo compartido, el apoyo
y la compañía durante todos estos años. Quisiera agradecer también al IIBCE, y dentro de él
a los compañeros con los cuales compartimos la vocación científica, ya sea colaborando en
diversos proyectos o compartiendo IIBCE abiertos. El apoyo institucional recibido también fue
un soporte mayor para el pleno desarrollo de esta tesis. Un agradecimiento especial a George,
que además de co-orientar esta tesis me recibió en su laboratorio y me dio la total libertad de
trabajar a todo vapor en interrogantes biológicas sumamente desafiantes y novedosas.
Quisiera agradecer también a las distintas agencias financiadoras que han apoyado mis
estudios de doctorado mediante diversos instrumentos, tanto nacionales (PEDECIBA, ANII,
DICYT y D2C2), como internacionales (PROLAB-ASBMB). En especial destaco al
PEDECIBA, un programa de posgrado nacional formador de recursos humanos de altísima
calidad y cuya estructura da un soporte muy importante al crecimiento del sistema científico
nacional.
Agradecer también a los miembros del tribunal por su tiempo y ricos aportes a esta tesis y al
trabajo llevado a cabo. También destacar a los miembros de mi CAS por su seguimiento y los
aportes que han tenido con mi trabajo durante el desarrollo de esta tesis.
Por último destacar y agradecer el apoyo fundamental de Caro, familia y amigos durante estos
años. Cualquier descripción de su apoyo y energía será insuficiente.

179
X. REFERENCIAS
1. Larsson O, Tian B, Sonenberg N. Toward a genome-wide landscape of translational control. Cold Spring Harb Perspect Biol. 2013;5: a012302.
2. Larsson O, Nadon R. Gene expression - time to change point of view? Biotechnol Genet Eng Rev. 2008;25: 77–92.
3. Kim E, Jung H. Local protein synthesis in neuronal axons: why and how we study. BMB Rep. 2015;48: 139–146.
4. Holt CE, Schuman EM. The central dogma decentralized: new perspectives on RNA function and local translation in neurons. Neuron. 2013;80: 648–657.
5. Perry RB, Fainzilber M. Local translation in neuronal processes--in vivo tests of a “heretical hypothesis.” Dev Neurobiol. 2014;74: 210–217.
6. Wells DG. mRNA translation: regulating an out of soma experience. Curr Opin Cell Biol. 2012;24: 554–557.
7. Crispino M, Chun JT, Cefaliello C, Perrone Capano C, Giuditta A. Local gene expression in nerve endings. Dev Neurobiol. 2014;74: 279–291.
8. Jung H, Yoon BC, Holt CE. Axonal mRNA localization and local protein synthesis in nervous system assembly, maintenance and repair. Nat Rev Neurosci. 2012;13: 308–324.
9. Sotelo-Silveira JR, Calliari A, Kun A, Koenig E, Sotelo JR. RNA trafficking in axons. Traffic. 2006;7: 508–515.
10. Canclini L, Farias J, Di Paolo A, Sotelo-Silveira JR, Folle G, Kun A, et al. Association of microtubules and axonal RNA transferred from myelinating Schwann cells in rat sciatic nerve. PLoS One. 2020;15: e0233651.
11. Sotelo-Silveira JR, Calliari A, Kun A, Elizondo V, Canclini L, Sotelo JR. Localization of mRNA in vertebrate axonal compartments by in situ hybridization. Methods Mol Biol. 2011;714: 125–138.
12. Farias J, Holt CE, Sotelo JR, Sotelo-Silveira JR. Axon microdissection and transcriptome profiling reveals the in vivo RNA content of fully differentiated myelinated motor axons. RNA. 2020;26: 595–612.
13. Sotelo-Silveira J, Crispino M, Puppo A, Sotelo JR, Koenig E. Myelinated axons contain beta-actin mRNA and ZBP-1 in periaxoplasmic ribosomal plaques and depend on cyclic AMP and F-actin integrity for in vitro translation. J Neurochem. 2008;104: 545–557.
14. Kun A, Otero L, Sotelo-Silveira JR, Sotelo JR. Ribosomal distributions in axons of mammalian myelinated fibers. J Neurosci Res. 2007;85: 2087–2098.
15. Sotelo-Silveira JR, Calliari A, Cárdenas M, Koenig E, Sotelo JR. Myosin Va and kinesin II motor proteins are concentrated in ribosomal domains (periaxoplasmic ribosomal plaques) of myelinated axons. J Neurobiol. 2004;60: 187–196.
16. Sotelo-Silveira JR, Calliari A, Kun A, Benech JC, Sanguinetti C, Chalar C, et al. Neurofilament mRNAs are present and translated in the normal and severed sciatic nerve. J Neurosci Res. 2000;62: 65–74.
17. Sotelo JR, Kun A, Benech JC, Giuditta A, Morillas J, Benech CR. Ribosomes and polyribosomes are present in the squid giant axon: an immunocytochemical study. Neuroscience. 1999;90: 705–715.
18. Shahar OD, Schuman EM. Large-scale cell-type-specific imaging of protein synthesis in a vertebrate brain. Elife. 2020;9. doi:10.7554/eLife.50564
19. Biever A, Glock C, Tushev G, Ciirdaeva E, Dalmay T, Langer JD, et al. Monosomes actively translate synaptic mRNAs in neuronal processes. Science. 2020;367. doi:10.1126/science.aay4991
20. Shigeoka T, Koppers M, Wong HH-W, Lin JQ, Cagnetta R, Dwivedy A, et al. On-Site Ribosome Remodeling by Locally Synthesized Ribosomal Proteins in Axons. Cell Rep. 2019;29: 3605–3619.e10.
21. Holt CE, Martin KC, Schuman EM. Local translation in neurons: visualization and

180
function. Nat Struct Mol Biol. 2019;26: 557–566. 22. Shigeoka T, Jung H, Jung J, Turner-Bridger B, Ohk J, Lin JQ, et al. Dynamic Axonal
Translation in Developing and Mature Visual Circuits. Cell. 2016;166: 181–192. 23. Cefaliello C, Penna E, Barbato C, Di Ruberto G, Mollica MP, Trinchese G, et al.
Deregulated Local Protein Synthesis in the Brain Synaptosomes of a Mouse Model for Alzheimer’s Disease. Mol Neurobiol. 2020;57: 1529–1541.
24. Sahoo PK, Lee SJ, Jaiswal PB, Alber S, Kar AN, Miller-Randolph S, et al. Axonal G3BP1 stress granule protein limits axonal mRNA translation and nerve regeneration. Nat Commun. 2018;9: 3358.
25. Rozenbaum M, Rajman M, Rishal I, Koppel I, Koley S, Medzihradszky KF, et al. Translatome Regulation in Neuronal Injury and Axon Regrowth. eNeuro. 2018;5. doi:10.1523/ENEURO.0276-17.2018
26. Terenzio M, Koley S, Samra N, Rishal I, Zhao Q, Sahoo PK, et al. Locally translated mTOR controls axonal local translation in nerve injury. Science. 2018;359: 1416–1421.
27. Shigeoka T, Jung J, Holt CE, Jung H. Axon-TRAP-RiboTag: Affinity Purification of Translated mRNAs from Neuronal Axons in Mouse In Vivo. Methods Mol Biol. 2018;1649: 85–94.
28. Crispino M, Chun JT, Giuditta A. Squid Giant Axons Synthesize NF Proteins. Mol Neurobiol. 2018;55: 3079–3084.
29. Ingolia NT, Ghaemmaghami S, Newman JRS, Weissman JS. Genome-wide analysis in vivo of translation with nucleotide resolution using ribosome profiling. Science. 2009;324: 218–223.
30. Shibahara K, Asano M, Ishida Y, Aoki T, Koike T, Honjo T. Isolation of a novel mouse gene MA-3 that is induced upon programmed cell death. Gene. 1995;166: 297–301.
31. Lankat-Buttgereit B, Göke R. The tumour suppressor Pdcd4: recent advances in the elucidation of function and regulation. Biol Cell. 2009;101: 309–317.
32. Song X, Zhang X, Wang X, Zhu F, Guo C, Wang Q, et al. Tumor suppressor gene PDCD4 negatively regulates autophagy by inhibiting the expression of autophagy-related gene ATG5. Autophagy. 2013;9: 743–755.
33. Dorrello NV, Peschiaroli A, Guardavaccaro D, Colburn NH, Sherman NE, Pagano M. S6K1- and betaTRCP-mediated degradation of PDCD4 promotes protein translation and cell growth. Science. 2006;314: 467–471.
34. Frampton AE, Castellano L, Colombo T, Giovannetti E, Krell J, Jacob J, et al. MicroRNAs cooperatively inhibit a network of tumor suppressor genes to promote pancreatic tumor growth and progression. Gastroenterology. 2014;146: 268–77.e18.
35. Zhu Q, Wang Z, Hu Y, Li J, Li X, Zhou L, et al. miR-21 promotes migration and invasion by the miR-21-PDCD4-AP-1 feedback loop in human hepatocellular carcinoma. Oncol Rep. 2012;27: 1660–1668.
36. Frankel LB, Christoffersen NR, Jacobsen A, Lindow M, Krogh A, Lund AH. Programmed cell death 4 (PDCD4) is an important functional target of the microRNA miR-21 in breast cancer cells. J Biol Chem. 2008;283: 1026–1033.
37. Asangani IA, Rasheed SAK, Nikolova DA, Leupold JH, Colburn NH, Post S, et al. MicroRNA-21 (miR-21) post-transcriptionally downregulates tumor suppressor Pdcd4 and stimulates invasion, intravasation and metastasis in colorectal cancer. Oncogene. 2008;27: 2128–2136.
38. Bitomsky N, Böhm M, Klempnauer K-H. Transformation suppressor protein Pdcd4 interferes with JNK-mediated phosphorylation of c-Jun and recruitment of the coactivator p300 by c-Jun. Oncogene. 2004;23: 7484–7493.
39. Yang H-S, Knies JL, Stark C, Colburn NH. Pdcd4 suppresses tumor phenotype in JB6 cells by inhibiting AP-1 transactivation. Oncogene. 2003;22: 3712–3720.
40. Leupold JH, Yang H-S, Colburn NH, Asangani I, Post S, Allgayer H. Tumor suppressor Pdcd4 inhibits invasion/intravasation and regulates urokinase receptor (u-PAR) gene expression via Sp-transcription factors. Oncogene. 2007;26: 4550–4562.
41. Shiota M, Izumi H, Tanimoto A, Takahashi M, Miyamoto N, Kashiwagi E, et al. Programmed cell death protein 4 down-regulates Y-box binding protein-1 expression via

181
a direct interaction with Twist1 to suppress cancer cell growth. Cancer Res. 2009;69: 3148–3156.
42. Bitomsky N, Wethkamp N, Marikkannu R, Klempnauer K-H. siRNA-mediated knockdown of Pdcd4 expression causes upregulation of p21(Waf1/Cip1) expression. Oncogene. 2008;27: 4820–4829.
43. Suzuki C, Garces RG, Edmonds KA, Hiller S, Hyberts SG, Marintchev A, et al. PDCD4 inhibits translation initiation by binding to eIF4A using both its MA3 domains. Proc Natl Acad Sci U S A. 2008;105: 3274–3279.
44. Wedeken L, Ohnheiser J, Hirschi B, Wethkamp N, Klempnauer K-H. Association of Tumor Suppressor Protein Pdcd4 With Ribosomes Is Mediated by Protein-Protein and Protein-RNA Interactions. Genes Cancer. 2010;1: 293–301.
45. Loh PG, Yang H-S, Walsh MA, Wang Q, Wang X, Cheng Z, et al. Structural basis for translational inhibition by the tumour suppressor Pdcd4. EMBO J. 2009;28: 274–285.
46. Waters LC, Strong SL, Ferlemann E, Oka O, Muskett FW, Veverka V, et al. Structure of the tandem MA-3 region of Pdcd4 protein and characterization of its interactions with eIF4A and eIF4G: molecular mechanisms of a tumor suppressor. J Biol Chem. 2011;286: 17270–17280.
47. Fehler O, Singh P, Haas A, Ulrich D, Müller JP, Ohnheiser J, et al. An evolutionarily conserved interaction of tumor suppressor protein Pdcd4 with the poly(A)-binding protein contributes to translation suppression by Pdcd4. Nucleic Acids Res. 2014;42: 11107–11118.
48. Biyanee A, Ohnheiser J, Singh P, Klempnauer K-H. A novel mechanism for the control of translation of specific mRNAs by tumor suppressor protein Pdcd4: inhibition of translation elongation. Oncogene. 2015;34: 1384–1392.
49. Di Paolo A. Análisis de expresión de la proteína Pdcd4 en sistema nervioso. Silveira S JR, editor. Licenciado en Biología, Facultad de Ciencias, UdelaR. 2013.
50. Eastman G. Determinación de blancos traduccionales de PDCD4 (programmed cell death 4) mediante análisis de datos generados por secuenciación masiva de huellas polisomales. Munroe D, Silveira S JR, editors. Magister en Ciencias Biológicas, PEDECIBA, UdelaR. 2016.
51. Gal-Ben-Ari S, Kenney JW, Ounalla-Saad H, Taha E, David O, Levitan D, et al. Consolidation and translation regulation. Learn Mem. 2012;19: 410–422.
52. Sutton MA, Schuman EM. Dendritic protein synthesis, synaptic plasticity, and memory. Cell. 2006;127: 49–58.
53. Malenka RC, Bear MF. LTP and LTD: an embarrassment of riches. Neuron. 2004;44: 5–21.
54. Kandel ER. The molecular biology of memory storage: a dialog between genes and synapses. Biosci Rep. 2001;21: 565–611.
55. Matthies H. In search of cellular mechanisms of memory. Prog Neurobiol. 1989;32: 277–349.
56. Davis HP, Squire LR. Protein synthesis and memory: a review. Psychol Bull. 1984;96: 518–559.
57. Henderson C, Wijetunge L, Kinoshita MN, Shumway M, Hammond RS, Postma FR, et al. Reversal of disease-related pathologies in the fragile X mouse model by selective activation of GABAB receptors with arbaclofen. Sci Transl Med. 2012;4: 152ra128.
58. El Fatimy R, Tremblay S, Dury AY, Solomon S, De Koninck P, Schrader JW, et al. Fragile X mental retardation protein interacts with the RNA-binding protein Caprin1 in neuronal RiboNucleoProtein complexes [corrected]. PLoS One. 2012;7: e39338.
59. Niere F, Wilkerson JR, Huber KM. Evidence for a fragile X mental retardation protein-mediated translational switch in metabotropic glutamate receptor-triggered Arc translation and long-term depression. J Neurosci. 2012;32: 5924–5936.
60. Wang T, Bray SM, Warren ST. New perspectives on the biology of fragile X syndrome. Curr Opin Genet Dev. 2012;22: 256–263.
61. Das Sharma S, Metz JB, Li H, Hobson BD, Hornstein N, Sulzer D, et al. Widespread Alterations in Translation Elongation in the Brain of Juvenile Fmr1 Knockout Mice. Cell

182
Rep. 2019;26: 3313–3322.e5. 62. Kim JW, Yin X, Jhaldiyal A, Khan MR, Martin I, Xie Z, et al. Defects in mRNA
Translation in LRRK2-Mutant hiPSC-Derived Dopaminergic Neurons Lead to Dysregulated Calcium Homeostasis. Cell Stem Cell. 2020;27: 633–645.e7.
63. Taymans J-M, Nkiliza A, Chartier-Harlin M-C. Deregulation of protein translation control, a potential game-changing hypothesis for Parkinson’s disease pathogenesis. Trends Mol Med. 2015;21: 466–472.
64. Alzheimer’s association. [cited 16 Mar 2021]. Available: https://www.alz.org/alzheimers-dementia/difference-between-dementia-and-alzheimer-s
65. Rademakers R, Cruts M, Van Broeckhoven C. Genetics of early-onset Alzheimer dementia. ScientificWorldJournal. 2003;3: 497–519.
66. Hippius H, Neundörfer G. The discovery of Alzheimer’s disease. Dialogues Clin Neurosci. 2003;5: 101–108.
67. Elahi FM, Miller BL. A clinicopathological approach to the diagnosis of dementia. Nat Rev Neurol. 2017;13: 457–476.
68. Nussbaum JM, Schilling S, Cynis H, Silva A, Swanson E, Wangsanut T, et al. Prion-like behaviour and tau-dependent cytotoxicity of pyroglutamylated amyloid-β. Nature. 2012;485: 651–655.
69. Bloom GS. Amyloid-β and tau: the trigger and bullet in Alzheimer disease pathogenesis. JAMA Neurol. 2014;71: 505–508.
70. Li C, Götz J. Somatodendritic accumulation of Tau in Alzheimer’s disease is promoted by Fyn-mediated local protein translation. EMBO J. 2017;36: 3120–3138.
71. Banerjee S, Ferdosh S, Ghosh AN, Barat C. Tau protein- induced sequestration of the eukaryotic ribosome: Implications in neurodegenerative disease. Sci Rep. 2020;10: 5225.
72. Evans HT, Benetatos J, van Roijen M, Bodea L-G, Götz J. Decreased synthesis of ribosomal proteins in tauopathy revealed by non-canonical amino acid labelling. EMBO J. 2019;38: e101174.
73. Norambuena A, Wallrabe H, Cao R, Wang DB, Silva A, Svindrych Z, et al. A novel lysosome-to-mitochondria signaling pathway disrupted by amyloid-β oligomers. EMBO J. 2018;37. doi:10.15252/embj.2018100241
74. Norambuena A, Wallrabe H, McMahon L, Silva A, Swanson E, Khan SS, et al. mTOR and neuronal cell cycle reentry: How impaired brain insulin signaling promotes Alzheimer’s disease. Alzheimers Dement. 2017;13: 152–167.
75. Switon K, Kotulska K, Janusz-Kaminska A, Zmorzynska J, Jaworski J. Molecular neurobiology of mTOR. Neuroscience. 2017;341: 112–153.
76. Haas A, Nilges BS, Leidel SA, Klempnauer K-H. PDCD4 controls the G1/S-phase transition in a telomerase-immortalized epithelial cell line and affects the expression level and translation of multiple mRNAs. Sci Rep. 2020;10: 2758.
77. Manecka D-L, Mahmood SF, Grumolato L, Lihrmann I, Anouar Y. Pituitary adenylate cyclase-activating polypeptide (PACAP) promotes both survival and neuritogenesis in PC12 cells through activation of nuclear factor κB (NF-κB) pathway: involvement of extracellular signal-regulated kinase (ERK), calcium, and c-REL. J Biol Chem. 2013;288: 14936–14948.
78. Di Paolo A, Eastman G, Mesquita-Ribeiro R, Farias J, Macklin A, Kislinger T, et al. PDCD4 regulates axonal growth by translational repression of neurite growth-related genes and is modulated during nerve injury responses. RNA. 2020;26: 1637–1653.
79. Marcon BH, Holetz FB, Eastman G, Origa-Alves AC, Amorós MA, de Aguiar AM, et al. Downregulation of the protein synthesis machinery is a major regulatory event during early adipogenic differentiation of human adipose-derived stromal cells. Stem Cell Res. 2017;25: 191–201.
80. Smircich P, Eastman G, Bispo S, Duhagon MA, Guerra-Slompo EP, Garat B, et al. Ribosome profiling reveals translation control as a key mechanism generating differential gene expression in Trypanosoma cruzi. BMC Genomics. 2015;16: 443.
81. Angenstein F, Evans AM, Ling S-C, Settlage RE, Ficarro S, Carrero-Martinez FA, et al.

183
Proteomic characterization of messenger ribonucleoprotein complexes bound to nontranslated or translated poly(A) mRNAs in the rat cerebral cortex. J Biol Chem. 2005;280: 6496–6503.
82. Hornstein N, Torres D, Das Sharma S, Tang G, Canoll P, Sims PA. Ligation-free ribosome profiling of cell type-specific translation in the brain. Genome Biol. 2016;17: 149.
83. Zappulo A, van den Bruck D, Ciolli Mattioli C, Franke V, Imami K, McShane E, et al. RNA localization is a key determinant of neurite-enriched proteome. Nat Commun. 2017;8: 583.
84. Ingolia NT, Brar GA, Rouskin S, McGeachy AM, Weissman JS. The ribosome profiling strategy for monitoring translation in vivo by deep sequencing of ribosome-protected mRNA fragments. Nat Protoc. 2012;7: 1534–1550.
85. Miller MD, Tanner J, Alpaugh M, Benedik MJ, Krause KL. 2.1 A structure of Serratia endonuclease suggests a mechanism for binding to double-stranded DNA. Nat Struct Biol. 1994;1: 461–468.
86. Miller MD, Krause KL. Identification of the Serratia endonuclease dimer: structural basis and implications for catalysis. Protein Sci. 1996;5: 24–33.
87. Spahr PF, Hollingworth BR. Purification and Mechanism of Action of Ribonuclease from Escherichia coli Ribosomes. J Biol Chem. 1961;236: 823–831.
88. Meador J 3rd, Kennell D. Cloning and sequencing the gene encoding Escherichia coli ribonuclease I: exact physical mapping using the genome library. Gene. 1990;95: 1–7.
89. Gerashchenko MV, Gladyshev VN. Ribonuclease selection for ribosome profiling. Nucleic Acids Res. 2017;45: e6.
90. Andrews S. FastQC: A Quality Control Tool for High Throughput Sequence Data. 2010. Available: http://www.bioinformatics.babraham.ac.uk/projects/fastqc/
91. Joshi NA, Fass JN. Sickle: A sliding-window, adaptive, quality-based trimming tool for FastQ files. 2011. Available: https://github.com/najoshi/sickle
92. Langmead B, Trapnell C, Pop M, Salzberg SL. Ultrafast and memory-efficient alignment of short DNA sequences to the human genome. Genome Biol. 2009;10: R25.
93. Langmead B, Salzberg SL. Fast gapped-read alignment with Bowtie 2. Nat Methods. 2012;9: 357–359.
94. Liao Y, Smyth GK, Shi W. featureCounts: an efficient general purpose program for assigning sequence reads to genomic features. Bioinformatics. 2014;30: 923–930.
95. Robinson MD, McCarthy DJ, Smyth GK. edgeR: a Bioconductor package for differential expression analysis of digital gene expression data. Bioinformatics. 2010;26: 139–140.
96. McCarthy DJ, Chen Y, Smyth GK. Differential expression analysis of multifactor RNA-Seq experiments with respect to biological variation. Nucleic Acids Res. 2012;40: 4288–4297.
97. Raudvere U, Kolberg L, Kuzmin I, Arak T, Adler P, Peterson H, et al. g:Profiler: a web server for functional enrichment analysis and conversions of gene lists (2019 update). Nucleic Acids Res. 2019;47: W191–W198.
98. Jensen LJ, Kuhn M, Stark M, Chaffron S, Creevey C, Muller J, et al. STRING 8--a global view on proteins and their functional interactions in 630 organisms. Nucleic Acids Res. 2009;37: D412–6.
99. Li H, Handsaker B, Wysoker A, Fennell T, Ruan J, Homer N, et al. The Sequence Alignment/Map format and SAMtools. Bioinformatics. 2009;25: 2078–2079.
100. Quinlan AR, Hall IM. BEDTools: a flexible suite of utilities for comparing genomic features. Bioinformatics. 2010;26: 841–842.
101. Dawson HN, Ferreira A, Eyster MV, Ghoshal N, Binder LI, Vitek MP. Inhibition of neuronal maturation in primary hippocampal neurons from tau deficient mice. J Cell Sci. 2001;114: 1179–1187.
102. Ingolia NT. Genome-wide translational profiling by ribosome footprinting. Methods Enzymol. 2010;470: 119–142.
103. Keller D, Erö C, Markram H. Cell Densities in the Mouse Brain: A Systematic Review. Front Neuroanat. 2018;12: 83.

184
104. Lama L, Cobo J, Buenaventura D, Ryan K. Small RNA-seq: The RNA 5’-end adapter ligation problem and how to circumvent it. J Biol Methods. 2019;6. doi:10.14440/jbm.2019.269
105. Eastman G, Smircich P, Sotelo-Silveira JR. Following Ribosome Footprints to Understand Translation at a Genome Wide Level. Comput Struct Biotechnol J. 2018;16: 167–176.
106. Ingolia NT, Lareau LF, Weissman JS. Ribosome profiling of mouse embryonic stem cells reveals the complexity and dynamics of mammalian proteomes. Cell. 2011;147: 789–802.
107. Diament A, Tuller T. Estimation of ribosome profiling performance and reproducibility at various levels of resolution. Biol Direct. 2016;11: 24.
108. Terns MP, Terns RM. Small nucleolar RNAs: versatile trans-acting molecules of ancient evolutionary origin. Gene Expr. 2002;10: 17–39.
109. Liu B, Molinaro G, Shu H, Stackpole EE, Huber KM, Richter JD. Optimization of ribosome profiling using low-input brain tissue from fragile X syndrome model mice. Nucleic Acids Res. 2019;47: e25.
110. Baleriola J, Walker CA, Jean YY, Crary JF, Troy CM, Nagy PL, et al. Axonally synthesized ATF4 transmits a neurodegenerative signal across brain regions. Cell. 2014;158: 1159–1172.
111. Braak H, Braak E. Neuropathological stageing of Alzheimer-related changes. Acta Neuropathol. 1991;82: 239–259.
112. Andorfer C, Kress Y, Espinoza M, de Silva R, Tucker KL, Barde Y-A, et al. Hyperphosphorylation and aggregation of tau in mice expressing normal human tau isoforms. J Neurochem. 2003;86: 582–590.
113. Legendre R, Baudin-Baillieu A, Hatin I, Namy O. RiboTools: a Galaxy toolbox for qualitative ribosome profiling analysis. Bioinformatics. 2015;31: 2586–2588.
114. Kumari R, Michel AM, Baranov PV. PausePred and Rfeet: webtools for inferring ribosome pauses and visualizing footprint density from ribosome profiling data. RNA. 2018;24: 1297–1304.
115. Bazzini AA, Johnstone TG, Christiano R, Mackowiak SD, Obermayer B, Fleming ES, et al. Identification of small ORFs in vertebrates using ribosome footprinting and evolutionary conservation. EMBO J. 2014;33: 981–993.
116. Calviello L, Mukherjee N, Wyler E, Zauber H, Hirsekorn A, Selbach M, et al. Detecting actively translated open reading frames in ribosome profiling data. Nat Methods. 2016;13: 165–170.
117. Michel AM, Andreev DE, Baranov PV. Computational approach for calculating the probability of eukaryotic translation initiation from ribo-seq data that takes into account leaky scanning. BMC Bioinformatics. 2014;15: 380.
118. Michel AM, Choudhury KR, Firth AE, Ingolia NT, Atkins JF, Baranov PV. Observation of dually decoded regions of the human genome using ribosome profiling data. Genome Res. 2012;22: 2219–2229.
119. Castanho I, Murray TK, Hannon E, Jeffries A, Walker E, Laing E, et al. Transcriptional Signatures of Tau and Amyloid Neuropathology. Cell Rep. 2020;30: 2040–2054.e5.
120. Mathys H, Adaikkan C, Gao F, Young JZ, Manet E, Hemberg M, et al. Temporal Tracking of Microglia Activation in Neurodegeneration at Single-Cell Resolution. Cell Rep. 2017;21: 366–380.
121. Sala Frigerio C, Wolfs L, Fattorelli N, Thrupp N, Voytyuk I, Schmidt I, et al. The Major Risk Factors for Alzheimer’s Disease: Age, Sex, and Genes Modulate the Microglia Response to Aβ Plaques. Cell Rep. 2019;27: 1293–1306.e6.
122. Keren-Shaul H, Spinrad A, Weiner A, Matcovitch-Natan O, Dvir-Szternfeld R, Ulland TK, et al. A Unique Microglia Type Associated with Restricting Development of Alzheimer’s Disease. Cell. 2017;169: 1276–1290.e17.
185
XI. ANEXOS
Notas
Nota 1: En todos los casos, los cultivos in vitro de neuronas corticales primarias fueron
generados por la técnica del laboratorio de George Bloom, Nutan Shivange. En mi caso, solo
me encargué del mantenimiento y uso de los mismos para los experimentos mencionados.
Nota 2: En todos los casos, el manejo de animales de laboratorio así como su anestesia,
sacrificio y extracción de cerebro, fue siempre realizado por las técnicas del laboratorio de
George Bloom, Nutan Shivange y Dora Bigler Wang. En mi caso, me encargué de la disección
de la corteza y los pasos posteriores mencionados en la sección.
Apoyo Financiero
La presente tesis doctoral contó con el apoyo financiero de las siguientes agencias y
organizaciones:
- ANII, beca de posgrado (doctorado) llamado 2016: POS_NAC_2016_1_129959
- ANII, SNI llamado 2019: Ingreso categoría Iniciación, Ciencias Naturales y Exactas
- PEDECIBA, apoyo a estudiantes mediante alícuotas
- PEDECIBA, apoyo a pasantías en el exterior llamado 2017
- DICYT, programa de movilidad 2017
- D2C2, convocatorio Tocó Salir-I 2019
- ASBMB, becas PROLAB llamado 2017

186
Figuras Suplementarias
--------------------------------------------------------------------------------------------------------------------------- Figura Suplementaria XI.1. Red de asociación funcional de genes codificantes asociados a la Benzonasa. No se observan vías KEGG sobrerrepresentadas. Red obtenida con la herramienta STRING. ---------------------------------------------------------------------------------------------------------------------------

187
--------------------------------------------------------------------------------------------------------------------------- Figura Suplementaria XI.2. Red de asociación funcional de genes codificantes asociados a la RNAsa I. Las vías KEGG sobrerrepresentadas encontradas en el análisis se muestran en el siguiente esquema de colores: en rojo, ribosoma; en azul, procesamiento de proteínas del retículo endoplásmico y en verde, espliceosoma. Red obtenida con la herramienta STRING. ---------------------------------------------------------------------------------------------------------------------------
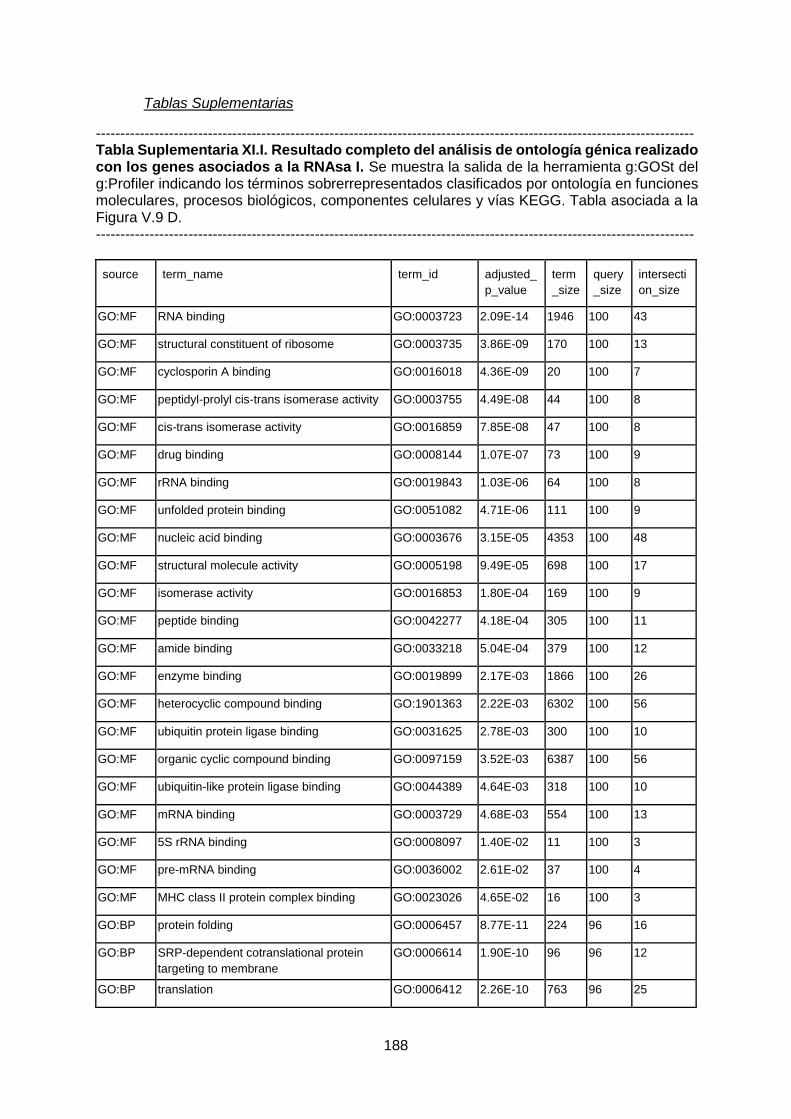
188
Tablas Suplementarias
--------------------------------------------------------------------------------------------------------------------------- Tabla Suplementaria XI.I. Resultado completo del análisis de ontología génica realizado con los genes asociados a la RNAsa I. Se muestra la salida de la herramienta g:GOSt del g:Profiler indicando los términos sobrerrepresentados clasificados por ontología en funciones moleculares, procesos biológicos, componentes celulares y vías KEGG. Tabla asociada a la Figura V.9 D. ---------------------------------------------------------------------------------------------------------------------------
source term_name term_id adjusted_
p_value
term
_size
query
_size
intersecti
on_size
GO:MF RNA binding GO:0003723 2.09E-14 1946 100 43
GO:MF structural constituent of ribosome GO:0003735 3.86E-09 170 100 13
GO:MF cyclosporin A binding GO:0016018 4.36E-09 20 100 7
GO:MF peptidyl-prolyl cis-trans isomerase activity GO:0003755 4.49E-08 44 100 8
GO:MF cis-trans isomerase activity GO:0016859 7.85E-08 47 100 8
GO:MF drug binding GO:0008144 1.07E-07 73 100 9
GO:MF rRNA binding GO:0019843 1.03E-06 64 100 8
GO:MF unfolded protein binding GO:0051082 4.71E-06 111 100 9
GO:MF nucleic acid binding GO:0003676 3.15E-05 4353 100 48
GO:MF structural molecule activity GO:0005198 9.49E-05 698 100 17
GO:MF isomerase activity GO:0016853 1.80E-04 169 100 9
GO:MF peptide binding GO:0042277 4.18E-04 305 100 11
GO:MF amide binding GO:0033218 5.04E-04 379 100 12
GO:MF enzyme binding GO:0019899 2.17E-03 1866 100 26
GO:MF heterocyclic compound binding GO:1901363 2.22E-03 6302 100 56
GO:MF ubiquitin protein ligase binding GO:0031625 2.78E-03 300 100 10
GO:MF organic cyclic compound binding GO:0097159 3.52E-03 6387 100 56
GO:MF ubiquitin-like protein ligase binding GO:0044389 4.64E-03 318 100 10
GO:MF mRNA binding GO:0003729 4.68E-03 554 100 13
GO:MF 5S rRNA binding GO:0008097 1.40E-02 11 100 3
GO:MF pre-mRNA binding GO:0036002 2.61E-02 37 100 4
GO:MF MHC class II protein complex binding GO:0023026 4.65E-02 16 100 3
GO:BP protein folding GO:0006457 8.77E-11 224 96 16
GO:BP SRP-dependent cotranslational protein
targeting to membrane
GO:0006614 1.90E-10 96 96 12
GO:BP translation GO:0006412 2.26E-10 763 96 25
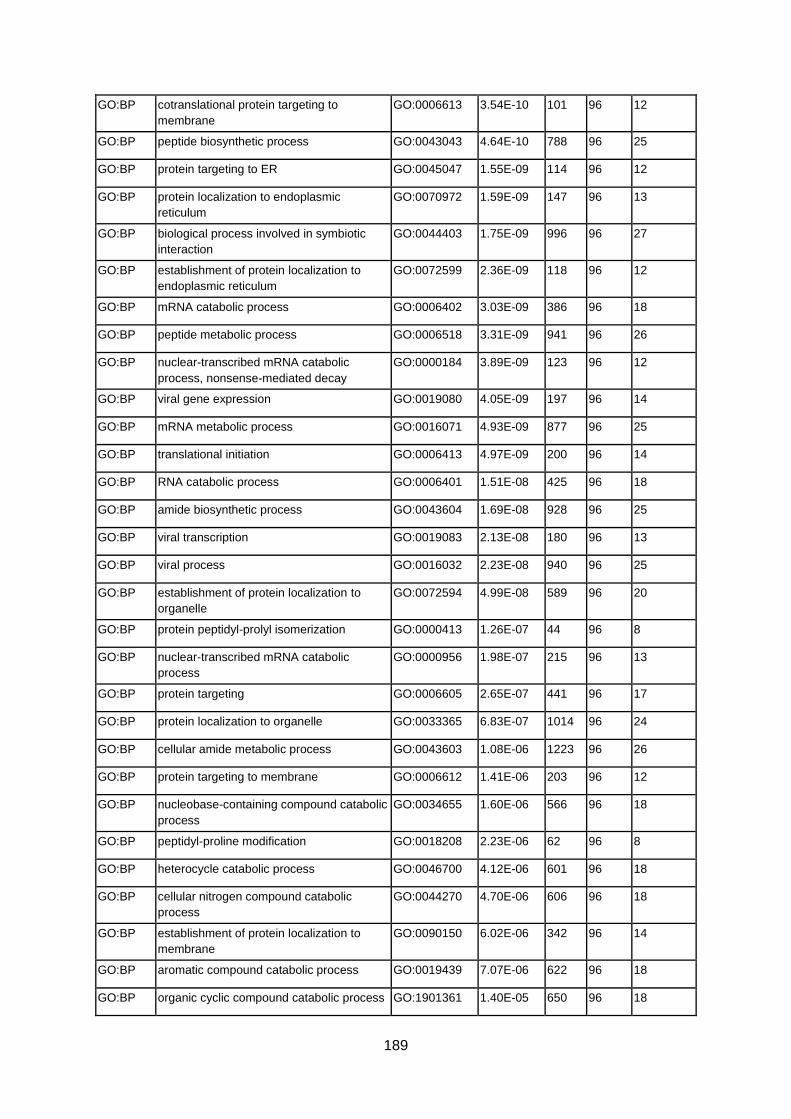
189
GO:BP cotranslational protein targeting to
membrane
GO:0006613 3.54E-10 101 96 12
GO:BP peptide biosynthetic process GO:0043043 4.64E-10 788 96 25
GO:BP protein targeting to ER GO:0045047 1.55E-09 114 96 12
GO:BP protein localization to endoplasmic
reticulum
GO:0070972 1.59E-09 147 96 13
GO:BP biological process involved in symbiotic
interaction
GO:0044403 1.75E-09 996 96 27
GO:BP establishment of protein localization to
endoplasmic reticulum
GO:0072599 2.36E-09 118 96 12
GO:BP mRNA catabolic process GO:0006402 3.03E-09 386 96 18
GO:BP peptide metabolic process GO:0006518 3.31E-09 941 96 26
GO:BP nuclear-transcribed mRNA catabolic
process, nonsense-mediated decay
GO:0000184 3.89E-09 123 96 12
GO:BP viral gene expression GO:0019080 4.05E-09 197 96 14
GO:BP mRNA metabolic process GO:0016071 4.93E-09 877 96 25
GO:BP translational initiation GO:0006413 4.97E-09 200 96 14
GO:BP RNA catabolic process GO:0006401 1.51E-08 425 96 18
GO:BP amide biosynthetic process GO:0043604 1.69E-08 928 96 25
GO:BP viral transcription GO:0019083 2.13E-08 180 96 13
GO:BP viral process GO:0016032 2.23E-08 940 96 25
GO:BP establishment of protein localization to
organelle
GO:0072594 4.99E-08 589 96 20
GO:BP protein peptidyl-prolyl isomerization GO:0000413 1.26E-07 44 96 8
GO:BP nuclear-transcribed mRNA catabolic
process
GO:0000956 1.98E-07 215 96 13
GO:BP protein targeting GO:0006605 2.65E-07 441 96 17
GO:BP protein localization to organelle GO:0033365 6.83E-07 1014 96 24
GO:BP cellular amide metabolic process GO:0043603 1.08E-06 1223 96 26
GO:BP protein targeting to membrane GO:0006612 1.41E-06 203 96 12
GO:BP nucleobase-containing compound catabolic
process
GO:0034655 1.60E-06 566 96 18
GO:BP peptidyl-proline modification GO:0018208 2.23E-06 62 96 8
GO:BP heterocycle catabolic process GO:0046700 4.12E-06 601 96 18
GO:BP cellular nitrogen compound catabolic
process
GO:0044270 4.70E-06 606 96 18
GO:BP establishment of protein localization to
membrane
GO:0090150 6.02E-06 342 96 14
GO:BP aromatic compound catabolic process GO:0019439 7.07E-06 622 96 18
GO:BP organic cyclic compound catabolic process GO:1901361 1.40E-05 650 96 18

190
GO:BP intracellular protein transport GO:0006886 1.77E-05 1195 96 24
GO:BP organonitrogen compound biosynthetic
process
GO:1901566 2.37E-05 1854 96 30
GO:BP biological process involved in interspecies
interaction between organisms
GO:0044419 1.81E-04 2272 96 32
GO:BP peptide transport GO:0015833 4.37E-04 1989 96 29
GO:BP amide transport GO:0042886 6.33E-04 2024 96 29
GO:BP cellular macromolecule catabolic process GO:0044265 6.93E-04 1237 96 22
GO:BP establishment of protein localization GO:0045184 7.80E-04 2044 96 29
GO:BP protein transport GO:0015031 9.96E-04 1946 96 28
GO:BP protein stabilization GO:0050821 1.42E-03 191 96 9
GO:BP posttranscriptional regulation of gene
expression
GO:0010608 1.74E-03 897 96 18
GO:BP protein localization GO:0008104 1.97E-03 2789 96 34
GO:BP intracellular transport GO:0046907 2.10E-03 1777 96 26
GO:BP cellular protein localization GO:0034613 2.21E-03 2024 96 28
GO:BP cellular macromolecule localization GO:0070727 2.46E-03 2035 96 28
GO:BP cellular protein metabolic process GO:0044267 2.57E-03 5225 96 50
GO:BP establishment of localization in cell GO:0051649 3.01E-03 2840 96 34
GO:BP protein localization to membrane GO:0072657 3.47E-03 660 96 15
GO:BP macromolecule catabolic process GO:0009057 3.61E-03 1477 96 23
GO:BP regulation of RNA splicing GO:0043484 4.03E-03 161 96 8
GO:BP protein metabolic process GO:0019538 4.16E-03 5806 96 53
GO:BP negative regulation of gene expression GO:0010629 5.85E-03 2516 96 31
GO:BP mRNA splicing, via spliceosome GO:0000398 6.09E-03 362 96 11
GO:BP RNA splicing, via transesterification
reactions with bulged adenosine as
nucleophile
GO:0000377 6.09E-03 362 96 11
GO:BP regulation of mRNA splicing, via
spliceosome
GO:0048024 6.19E-03 120 96 7
GO:BP RNA splicing, via transesterification
reactions
GO:0000375 6.60E-03 365 96 11
GO:BP ribonucleoprotein complex biogenesis GO:0022613 7.28E-03 445 96 12
GO:BP regulation of cellular amide metabolic
process
GO:0034248 8.06E-03 531 96 13
GO:BP regulation of protein stability GO:0031647 8.21E-03 302 96 10
GO:BP protein refolding GO:0042026 1.09E-02 23 96 4
GO:BP regulation of translation GO:0006417 1.09E-02 463 96 12
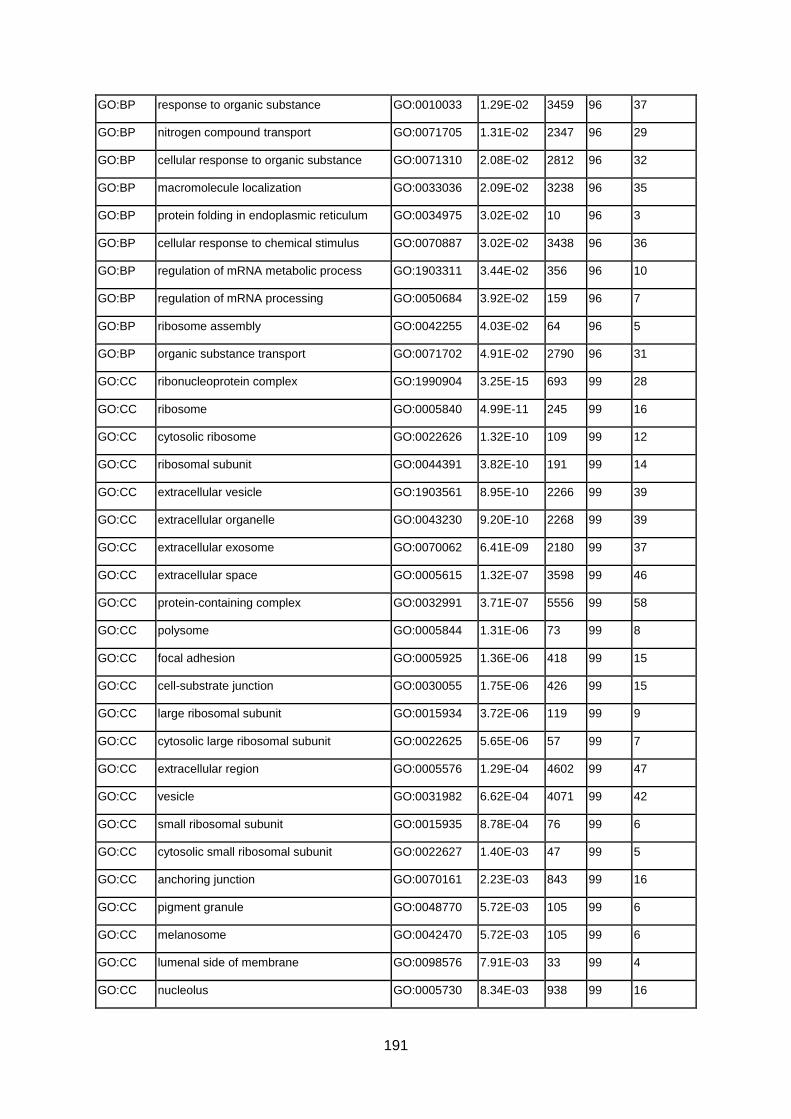
191
GO:BP response to organic substance GO:0010033 1.29E-02 3459 96 37
GO:BP nitrogen compound transport GO:0071705 1.31E-02 2347 96 29
GO:BP cellular response to organic substance GO:0071310 2.08E-02 2812 96 32
GO:BP macromolecule localization GO:0033036 2.09E-02 3238 96 35
GO:BP protein folding in endoplasmic reticulum GO:0034975 3.02E-02 10 96 3
GO:BP cellular response to chemical stimulus GO:0070887 3.02E-02 3438 96 36
GO:BP regulation of mRNA metabolic process GO:1903311 3.44E-02 356 96 10
GO:BP regulation of mRNA processing GO:0050684 3.92E-02 159 96 7
GO:BP ribosome assembly GO:0042255 4.03E-02 64 96 5
GO:BP organic substance transport GO:0071702 4.91E-02 2790 96 31
GO:CC ribonucleoprotein complex GO:1990904 3.25E-15 693 99 28
GO:CC ribosome GO:0005840 4.99E-11 245 99 16
GO:CC cytosolic ribosome GO:0022626 1.32E-10 109 99 12
GO:CC ribosomal subunit GO:0044391 3.82E-10 191 99 14
GO:CC extracellular vesicle GO:1903561 8.95E-10 2266 99 39
GO:CC extracellular organelle GO:0043230 9.20E-10 2268 99 39
GO:CC extracellular exosome GO:0070062 6.41E-09 2180 99 37
GO:CC extracellular space GO:0005615 1.32E-07 3598 99 46
GO:CC protein-containing complex GO:0032991 3.71E-07 5556 99 58
GO:CC polysome GO:0005844 1.31E-06 73 99 8
GO:CC focal adhesion GO:0005925 1.36E-06 418 99 15
GO:CC cell-substrate junction GO:0030055 1.75E-06 426 99 15
GO:CC large ribosomal subunit GO:0015934 3.72E-06 119 99 9
GO:CC cytosolic large ribosomal subunit GO:0022625 5.65E-06 57 99 7
GO:CC extracellular region GO:0005576 1.29E-04 4602 99 47
GO:CC vesicle GO:0031982 6.62E-04 4071 99 42
GO:CC small ribosomal subunit GO:0015935 8.78E-04 76 99 6
GO:CC cytosolic small ribosomal subunit GO:0022627 1.40E-03 47 99 5
GO:CC anchoring junction GO:0070161 2.23E-03 843 99 16
GO:CC pigment granule GO:0048770 5.72E-03 105 99 6
GO:CC melanosome GO:0042470 5.72E-03 105 99 6
GO:CC lumenal side of membrane GO:0098576 7.91E-03 33 99 4
GO:CC nucleolus GO:0005730 8.34E-03 938 99 16
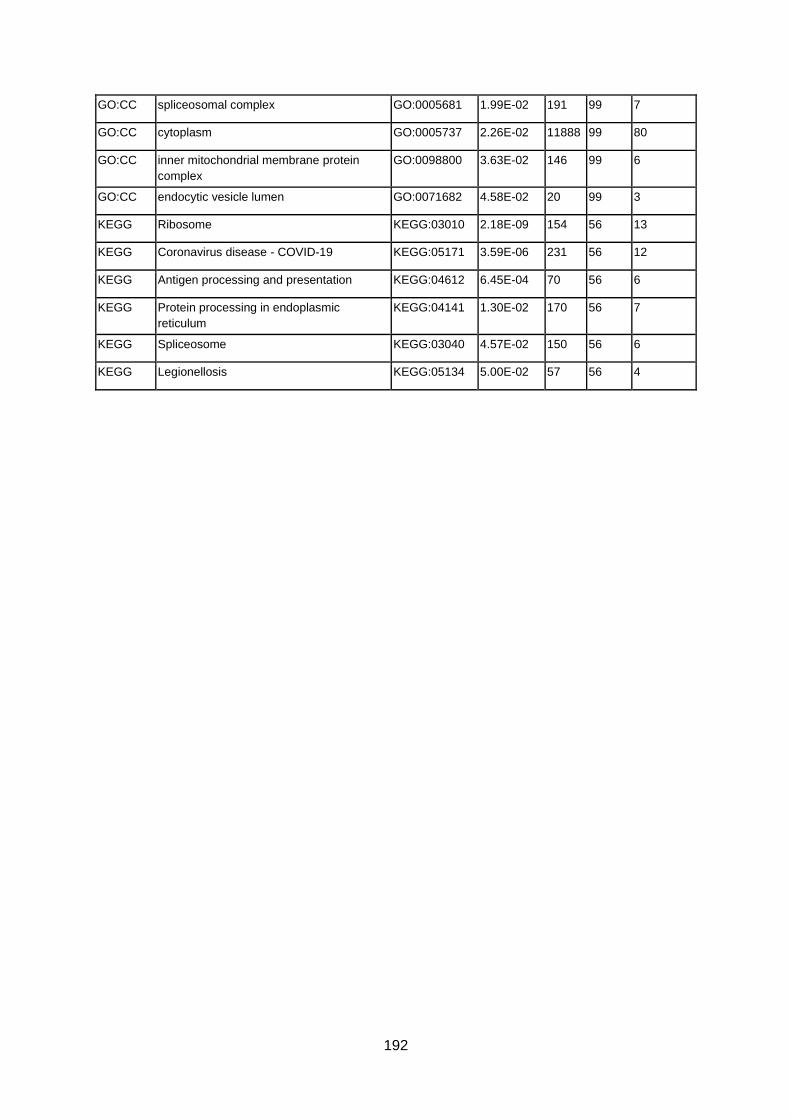
192
GO:CC spliceosomal complex GO:0005681 1.99E-02 191 99 7
GO:CC cytoplasm GO:0005737 2.26E-02 11888 99 80
GO:CC inner mitochondrial membrane protein
complex
GO:0098800 3.63E-02 146 99 6
GO:CC endocytic vesicle lumen GO:0071682 4.58E-02 20 99 3
KEGG Ribosome KEGG:03010 2.18E-09 154 56 13
KEGG Coronavirus disease - COVID-19 KEGG:05171 3.59E-06 231 56 12
KEGG Antigen processing and presentation KEGG:04612 6.45E-04 70 56 6
KEGG Protein processing in endoplasmic
reticulum
KEGG:04141 1.30E-02 170 56 7
KEGG Spliceosome KEGG:03040 4.57E-02 150 56 6
KEGG Legionellosis KEGG:05134 5.00E-02 57 56 4

193
--------------------------------------------------------------------------------------------------------------------------- Tabla Suplementaria XI.2. Genes de alta expresión seleccionados para comparar los perfiles de mapeos entre las enzimas. La tabla muestra el nombre del gen, su largo, su posición en el ranking de mayor expresión (#Rank) y la cantidad de lecturas mapeadas en cada caso para las dos enzimas utilizadas y sus dos réplicas. ---------------------------------------------------------------------------------------------------------------------------
Gen Largo
Benzonasa-1 Benzonasa-2 RNAsa I-1 RNAsa I-2
#Rank Lecturas #Rank Lecturas #Rank Lecturas #Rank Lecturas
EEF1A1 3.512 2 132.404 3 67.475 3 66.130 3 85.264
ACTB 1.812 5 55.393 7 33.817 25 20.351 29 24.730
GAPDH 1.285 6 55.083 5 35.568 11 34.756 11 42.149
ENO1 1.781 9 50.415 10 28.507 6 43.389 6 51.240
TUBA1B 1.627 10 48.969 11 28.139 16 27.293 19 32.242
Copyright © 2022 FDOKUMEN