Estimating the Flow of Methamphetamine and Other Synthetic ...
110
The author(s) shown below used Federal funds provided by the U.S. Department of Justice and prepared the following final report: Document Title: It Came from the North: Estimating the Flow of Methamphetamine and Other Synthetic Drugs From Quebec, Canada Author(s): David Farabee, Carlo Morselli, Sheldon Zhang Document No.: 248134 Date Received: September 2014 Award Number: 2010-IJ-CX-0020 This report has not been published by the U.S. Department of Justice. To provide better customer service, NCJRS has made this Federally- funded grant report available electronically. Opinions or points of view expressed are those of the author(s) and do not necessarily reflect the official position or policies of the U.S. Department of Justice.
-
Upload
khangminh22 -
Category
Documents
-
view
4 -
download
0
Transcript of Estimating the Flow of Methamphetamine and Other Synthetic ...

The author(s) shown below used Federal funds provided by the U.S. Department of Justice and prepared the following final report: Document Title: It Came from the North: Estimating the Flow of
Methamphetamine and Other Synthetic Drugs From Quebec, Canada
Author(s): David Farabee, Carlo Morselli, Sheldon Zhang Document No.: 248134 Date Received: September 2014 Award Number: 2010-IJ-CX-0020 This report has not been published by the U.S. Department of Justice. To provide better customer service, NCJRS has made this Federally-funded grant report available electronically.
Opinions or points of view expressed are those of the author(s) and do not necessarily reflect
the official position or policies of the U.S. Department of Justice.

It Came from the North:
Estimating the Flow of Methamphetamine and
Other Synthetic Drugs From Quebec, Canada
FINAL REPORT
NIJ Grant No. 2010 IJ CX 0020
March 31, 2014
David Farabee, University of California, Los Angeles
Carlo Morselli, University of Montreal
Sheldon Zhang, San Diego State University
This document is a research report submitted to the U.S. Department of Justice. This report has not been published by the Department. Opinions or points of view expressed are those of the author(s)
and do not necessarily reflect the official position or policies of the U.S. Department of Justice.

2
Table of Contents
I. ABSTRACT ............................................................................................................. 3
II. INTRODUCTION .................................................................................................... 4
II.1. THE RISING ROLE OF CANADA AS A GLOBAL SUPPLIER OF ILLICIT DRUGS .......................... 5 II.2. QUEBEC—A MAJOR METH PRODUCTION AND DISTRIBUTION REGION IN NORTH AMERICA 6
III. ANALYSIS AND FINDINGS ................................................................................ 7
III.A. ESTIMATING THE SIZE OF THE CANADIAN SYNTHETIC DRUGS MARKET ............................ 7 III.A.1. Patterns in ATS Use in Canada .................................................................................. 8 III.A.2. A New Method to Estimate Illicit Drug Use from Wastewater Analysis ................ 11 III.A.3. Patterns in ATS Production in Canada and the US .................................................. 12 III.A.4. Methods to Estimate the Size of Illegal Markets ..................................................... 15
III.A.5. Methods to Estimate Quantities of Drugs ................................................................ 20 III.A.6. Data Sources ............................................................................................................ 21 III.A.7. Results ...................................................................................................................... 23 III.A.8. Section Summary ..................................................................................................... 44
III.B. CHEMICAL COMPOSITION AND PRICE ASSESSMENTS OF THE ............................................ 46 III.B.1. Quebec Synthetic Drugs Market .............................................................................. 46 III.B.2. Assessments of the Synthetic Drug Market ............................................................. 47 III.B.3. Determinants of Illegal Drug Prices ......................................................................... 49 III.B.4. Analytical Approach ................................................................................................ 50 III.B.5. Sources of Synthetic Drug Tablets ........................................................................... 50
III.B.6. Profiling Quebec’s Synthetic Drug Market .............................................................. 51 III.B.7. Linking the Seized Drugs ......................................................................................... 51 III.B.8. The Structural Features of the Market ...................................................................... 53
III.B.9. Factors that Influence Synthetic Drug Prices ........................................................... 55 III.B.10. Section Summary ................................................................................................... 58
III. C. SPATIAL ANALYSES OF BORDER SEIZURE DATA ............................................................. 62 III.C.1. Georeferencing Method............................................................................................ 62 III.C.2. Analysis methods ..................................................................................................... 63 III.C.3. Results ...................................................................................................................... 64
III.C.4. Hot Spot Analysis..................................................................................................... 70 III.C.5. Seizures from the United States ............................................................................... 76 III.C.6. Seizures exported from Canada ................................................................................ 89
IV. CONCLUSIONS AND DISCUSSION .................................................................. 95
IV.1. Implications on Counter-Narcotic Strategies ............................................................... 96
V. REFERENCES ....................................................................................................... 98
VI. APPENDICES ................................................................................................... 102
VI.1. TABLES AND CLARIFYING DOCUMENTATION .................................................................. 102 VI.2. DATA FILES .................................................................................................................... 102
This document is a research report submitted to the U.S. Department of Justice. This report has not been published by the Department. Opinions or points of view expressed are those of the author(s)
and do not necessarily reflect the official position or policies of the U.S. Department of Justice.

3
I. Abstract
The focus of this study was to estimate the size of synthetic drug production
(methamphetamine in particular) in Quebec, Canada, assess its export potential, and explore
implications for counter-narcotics policies. Research on drug trafficking in the U.S. has mostly
centered on Latin America—particularly Mexico—in recent years due to widely publicized violence.
However, there have been well documented cases of drug trafficking organizations (DTOs) in
Canada, such as the Hells Angels and Asian gangs, that produce and transport large quantities of
cannabis and amphetamine-type stimulants (ATS) into the U.S. Official reports from both countries
and the United Nations suggest that Canada is becoming a major global supplier of synthetic drugs.
But little empirical research has been conducted to verify these claims or to estimate the size of the
drug trade. Estimating the production and trafficking of any illicit drugs is a daunting endeavor
because conventional sampling or statistical procedures are inadequate. However, without reliable
empirical knowledge, policy making becomes problematic. Innovative methods therefore must be
used to acquire the information in a systematic, albeit incremental, manner.
In this study, we used capture-recapture sampling and multiple data sources to gauge this
“hidden market” and its impact on the U.S. drug market. The scientific as well as policy implications
of this empirical effort cannot be overstated at a time when there is a resurgence of high-quality
synthetic drugs in the U.S. Policy makers and law enforcement agencies are searching for valid
empirical measures to marshal resources to mount counter measures. The specific objectives of this
study were as follows:
1. What is the scale of production and consumption of ATS in Quebec Canada, based on
capture-recapture sampling and analysis of official data?
2. What is the difference between production and consumption, assuming any surplus is
intended for export to other North American markets?
3. How are these drugs manufactured in Quebec (using lab records of chemical composition
assays of seized drugs to establish the origin of production)?
4. What are the organizational characteristics of those involved in the production and
distribution of methamphetamine and other synthetic drugs in Quebec?
5. What threats do these criminal organizations pose to both the U.S. and Canada, and what
policy implications can be drawn from our impact estimates?
This study capitalized on existing data sources and field research opportunities already
established by our Canadian colleagues. We had access to data sources of multiple years, which are
necessary for repeated sampling of the target population. The capture-recapture method specified in
this proposal has been around for many years but have rarely been applied to organized crime
research, particularly impact assessment. Based on our findings, it appears that the same method can
be applied to assess the impact of other illicit commodities or enterprising activities because
inference to larger populations is possible under theoretical and empirical assumptions. Findings
from this joint effort by U.S.- and Canada-based researchers provide much needed empirical
guidance to policy makers of federal and local governments of both countries.
This document is a research report submitted to the U.S. Department of Justice. This report has not been published by the Department. Opinions or points of view expressed are those of the author(s)
and do not necessarily reflect the official position or policies of the U.S. Department of Justice.

4
II. Introduction
Research on drug trafficking in the U.S. has historically focused on Latin America,
particularly Mexico, in the last few years because of widely publicized violence in that region
Glenny (2009). However, there have been many well documented stories of drug gangs in Canada,
such as the motorcycle gangs and Asian organized crime groups, that are actively involved in the
production and export of illicit drugs into the U.S. The most popular Canadian imports include
cannabis and synthetic drugs. Hardly any systematic research has been carried out to quantify the
scale of production and the volume of export to the U.S. market, rendering most of our policy
discussion and counter-strategy development speculative.
There are major methodological obstacles to any estimation of the production and
distribution of illicit drugs. We simply do not have simple ways to gauge the size of this illicit
business by conventional statistical methods. Although nuanced and intuitive, qualitative methods
(such as case studies and ethnography) cannot produce any parametric estimates that are imperative
for policy makers and government agencies to allocate or mobilize resources. Without the guidance
of sound, empirical data, policy making becomes problematic. Therefore the overarching goal of this
study is to assess the size of Canada’s drug trade and its impact on the U.S. drug market. The
objectives in this study are framed into five questions:
1. What is the scale of production and consumption of ATS in Quebec Canada, based on
capture-recapture sampling and analysis of existing official data?
2. What is the difference between production and consumption, assuming any surplus is
intended for export to other North American markets?
3. How are these drugs manufactured in Quebec (using lab records of chemical composition
assays of seized drugs to establish the origin of production)?
4. What are the organizational characteristics of those involved in the production and
distribution of methamphetamine and other synthetic drugs in Quebec?
5. What threats do these criminal organizations pose to both the U.S. and Canada, and what
policy implications can be drawn from our impact estimates?
This study takes advantage of existing data sources and field research opportunities already
established by our Canadian colleagues. We have access to data sources of multiple years, which are
necessary for repeated sampling of the target population. The capture-recapture method used in this
study has been around for many years but has rarely been applied to organized crime research,
particularly impact assessment.
With the globalization of commerce and advances in technology, criminal organizations have
been quick at adapting to expanding opportunities and “hitching a ride” with legitimate business
entities. Transnational organized crime has grown to threaten individual countries, as traditional
nation-state based legal systems can no longer adequately respond to borderless criminal
organizations. More than a decade ago, Shelley (1995) argued that in the 21st century transnational
organized crime would pose serious threats to the world order if the global community failed to
develop viable and coordinated international counter policies and measures.
Recognizing the threats posed by international organized crime (IOC) to the nation’s
economic and political security, the U.S. government has stepped up its counter efforts. In October
2007, the U.S. Department of Justice published the International Organized Crime Threat
Assessment to highlight priority areas where concerted efforts are needed (U.S. DOJ 2007). In the
following year, U.S. DOJ released the United States Law Enforcement Strategy to Combat
International Organized Crime and called for improved efforts to: (1) improve intelligence gathering;
(2) prioritize targets; (3) employ all available tools to dismantle IOC; and (4) dismantle entire
criminal organizations (U.S. DOJ 2008). More recently, in May of 2009, the International Organized
This document is a research report submitted to the U.S. Department of Justice. This report has not been published by the Department. Opinions or points of view expressed are those of the author(s)
and do not necessarily reflect the official position or policies of the U.S. Department of Justice.

5
Crime Intelligence and Operations Center (IOC-2) was established to coordinate intelligence
gathering and analysis, allocate resources and coordinate counter-IOC efforts among nine U.S. law
enforcement agencies and federal prosecutors (Ramonas 2009).
These efforts acknowledge the increasing threats posed by transnational criminal
organizations to government functions and legitimate market operations. Before resources can be
marshaled and deployed, careful assessment of the threats posed by IOCs must be made. This was an
impetus for the present study matters—to provide a systematic estimate of the size of
methamphetamine and other synthetic drug production and its impact in the United States.
Our quantitative component will be discussed in greater detail in the methods section. To
gain insight into the networks and business transactions of the drug trade requires conceptual
clarification and theoretical guidance. Aside from news stories and government reports, we know
little about the organizational attributes and operational characteristics of drug producers and
traffickers in Quebec, or anywhere else in Canada.
II.1. The Rising Role of Canada as a Global Supplier of Illicit Drugs
In popular culture, Mexico has attracted the most attention in recent years as a source and
transit country responsible for large volumes of illicit drugs flowing into the U.S. market. Few
suspect that Canada, our quiet northern neighbor, has emerged as a main export source for the U.S.
illicit drug market. However, the Canadian connection has long been reported. The U.S. Drug
Enforcement Agency (DEA) website lists many investigations that implicated the role of Canada as a
growing force in the global drug supply chain. For instance, after a two-year investigation dubbed
“Operation Candystore,” a federal task force charged 18 defendants (both Canadians and Americans)
of a bi-national drug-trafficking organization that imported ecstasy and marijuana from Canada and
sent cocaine to Canada from the U.S. (DEA 2008). DTOs exploit the region because of a Native
American reservation that straddles the remote land/water border between the Northern District of
New York and the Provinces of Quebec and Ontario. In November 2008, U.S. law enforcement
broke up a large marijuana trafficking organization headed by Mickey Woods of Ontario, Canada
(DEA 2008). It was reported that between 2005 and 2008, about 10 metric tons of Canadian
marijuana were smuggled by this organization through the St. Regis Mohawk Indian Reservation
(Akwesasne) into the U.S. market.
The DEA has for years claimed that illicit drugs are produced and trafficked from Canada by
Asian criminal organizations and motorcycle gangs into the U.S. market. Nearly a decade ago, in a
joint report by law enforcement agencies from both countries reported a rapid expansion of illicit
amphetamine-type stimulant production in Canada (DEA and RCMP 2001). Because of lax
regulatory control, Canada encountered serious so-called chemical diversion problems, which
reportedly contributed to the emergence of “super labs” in California and other locations in North
America. A surge in cash sales of unprecedented amounts of legitimate chemicals such as
Pseudoephedrine (PSE), sassafras oil, piperonal and gamma Butyrolactone (GBL) caught attention
from law enforcement agencies of both countries (DEA and RCMP 2001). For example, this joint
report listed a series of cash sales in Quebec in 2000, including 500 kilograms of piperonal (potential
yield of 205 kilograms of MDA), 3000 kilograms of sassafras oil (potential yield of 960 kilograms of
MDMA) and 2000 kilograms of cellulose (used to make tablets) (DEA and RCMP 2001).
Canada has long been known for its “B.C. Bud” and “Quebec Gold” (high quality
marijuana), but in recent years it has gained wide reputation as a global supplier of synthetic drugs
(Kirby and MacDonald 2009). Calling Canada the “new global drug lord,” Glenny (2009) explains
that, with the shift of the drug consumer market from the old “organic masters” (i.e., cocaine and
heroin) to synthetic drugs (i.e., methamphetamine and ecstasy), Canada is becoming a major supply
This document is a research report submitted to the U.S. Department of Justice. This report has not been published by the Department. Opinions or points of view expressed are those of the author(s)
and do not necessarily reflect the official position or policies of the U.S. Department of Justice.

6
source. According to Glenny (2009), U.S. customs agents are seizing increasingly large amounts of
methamphetamine and ecstasy in trucks and cars traveling from Canada to the United States. Asian
gangs and motorcycle gangs (such as the Hells Angels) are reportedly the main producers and
distributors of these drugs. According to the World Drug Report 2009 issued by the United Nations,
Canada has become “the most important producer of MDMA for North America,” and since 2006,
large-capacity meth and ecstasy laboratories are controlled by Asian organized crime groups and
outlaw motorcycle gangs (UNODC 2009). By applying “smurfing” techniques (converting legally
obtained precursors from pharmacies) into synthetic drugs, these criminal organizations have
significantly increased the export for the U.S. market, as well as to countries such as Japan, Korea
and parts of Southeast Asia. According to the same UNODC report, Canada accounts for 62 percent
of all seizures in Japan, and 83 percent in Australia. The U.S. Department of Justice estimates
Canadian drug traffickers now generate between US$337 billion and US$56.2 billion each year from
U.S. drug sales (Kirby and MacDonald 2009).
The National Drug Intelligence Center under the U.S. Department of Justice attributes the
recent resurgence of MDMA to Asian DTOs, particularly since 2005. These groups produce the drug
in Canada and smuggle it across the Northern Border into the United States, and the MDMA tablets
are increasingly being adulterated with other addictive drugs, particularly methamphetamine
(National Drug Intelligence Center 2009, 2010). This trend is evidenced by the seizures of increasing
quantities at the ports of entry along the U.S.–Canada border from 2004 (312,389 dosage units) to
2009 (2,167,238 dosage units; Watertown Daily Times, 2011). With so many speculations and news
stories, little systematic research has been carried out on the Canada-U.S. drug trade.
II.2. Quebec—A Major Meth Production and Distribution Region in North America
There are two main reasons for the selection of Quebec as our primary study site. First, the
province of Quebec has long attracted the attention from the international law enforcement
community as a hotbed of motorcycle gangs actively involved in manufacturing and distributing
synthetic drugs (Morselli et al. 2008; Tremblay et al. 1989). The unique geographic location makes
the Province of Quebec an ideal region for carrying out clandestine production and distribution of
illicit drugs. Quebec shares long borders with Maine, New Hampshire, Vermont, and New York
where cross-border commerce faces few obstacles. Its location makes it an ideal supply source for
some of the largest consumption markets in the United States (e.g. New York, Washington, D.C.).
Along the vast loosely patrolled border, there are Native American reservations that extend into both
countries, making it easy to cross with illicit cargoes. On the northern side of Quebec Province lies
vast swaths of farm lands and wooded areas, sparsely populated and poorly monitored (see Map of
Quebec in Appendix D.8).
Along with British Columbia and Ontario, Quebec’s geographical uniqueness makes it easy
to set up chemical labs and distribute drugs. According to the Criminal Intelligence Services Canada
(CISC 2009), criminal organizations maintain active presence in Quebec, involved in illicit
enterprises such as contraband tobacco, payment card fraud, and drug manufacturing and smuggling.
Manufacturing of illicit substances largely occurs on Aboriginal reserves in Quebec and Ontario as
well as some northern U.S. reservations. Along with BC and Ontario, Quebec forms the three main
production hubs for marijuana, large quantities of which are for export to meet the demands in
American markets (CISC 2009).
Second, there have been several large cases of drug seizures with confirmed links to
organized criminal groups based on Quebec. For instance, the Sûreté du Québec (Quebec Provincial
Police) led a three-year investigation which involved hundreds of police officers and intelligence
analysts from municipal, provincial and federal agencies, and disrupted the Hells Angels’ grip on the
This document is a research report submitted to the U.S. Department of Justice. This report has not been published by the Department. Opinions or points of view expressed are those of the author(s)
and do not necessarily reflect the official position or policies of the U.S. Department of Justice.

7
production and distribution of illicit drugs in the region. The operation resulted in the seizure of $5
million in cash, dozens of kilograms of cocaine, marijuana and hashish, and thousands of pills. It is
unclear whether in the absence of Hells Angels the Asian DTOs have moved in. In another case,
following a two-year investigation dubbed Operation Iron Curtain, U.S. law enforcement broke up a
large drug trafficking organization from Quebec in July 2009 (Meyers 2009). More than 45 arrests
including a key ring leader from Quebec. Drugs seized during the investigation included more than
5,000 pounds of marijuana, $6 million in U.S. currency and 25 kilograms of cocaine. Two main
routes were used by this DTO from Quebec: (1) the Akwesasne Mohawk Indian Territory on the St.
Lawrence River, and (2) a wooded area near Churubusco, New York (Customs and Border
Protection 2009).
III. Analysis and Findings
Because of the enormous amount of data included in this study and our separate analytical
approaches, we partitioned the analysis and findings into three distinct sections. Each of the segments
are comprised of a specific research background and methodological outline. The first part reports
our estimate of the size of the Canadian synthetic drug market. This is the key component of this
study, as the size of production, minus the domestic consumption, would tell us the maximum export
potential to the world market. The second part deals with our analysis of the chemical composition
and price assessments of the Quebec synthetic drugs. We hoped to understand, through the analysis
of the chemical compositions of synthetic drugs found in the Quebec market, where the precursors
were imported and the price fluctuations. By doing so, we can arrive at a more precise knowledge of
the dynamics in the manufacturing business. In the third part, we sought to gain additional
knowledge of the export potential of the Quebec drug market by analyzing border drug seizure data
from Canada to the U.S. While border seizures reflect law enforcement activities more than the
actual levels of drug export, the volumes can give some indication on the flow and direction of drug
trafficking business.
III.A. Estimating the Size of the Canadian Synthetic Drugs Market
The publication of the 2009 World Drug Report created a media frenzy of the wrong kind for
Canada as it was identified as one of the world’s leading producers of amphetamine-type stimulants
(ATS) such as crystal methamphetamines and ecstasy. Yet, the proposition that Canada is a primary
ATS producer and exporter may be premature. For one thing, the data requirements to assess with
any degree of certainty the quantity of illegal drugs produced in a single country are onerous –
imagine the problem of doing it for multiple countries. For another, little data has been provided to
support this claim, and the little available data provided is itself subject to a variety of interpretations
that are worth considering. While it is wise to make an effort to identify emerging patterns before
they become heavy trends, recent history has shown that caution should be exercised when trying to
understand patterns in global drug production (e.g. Bouchard, 2008; Kilmer and Pacula, 2009),
especially when relying (almost) solely on seizure data.
This study sought to address the lack of reliable estimates on the scope of amphetamine-type
stimulants (ATS: amphetamine, methamphetamine, ecstasy/MDMA) production in Canada. Such a
study allows for a thorough assessment of Canada’s role in global ATS production and exportation.
Using a multi-method approach, this research was designed to derive more accurate estimates of the:
total number of ATS users in Canada than currently exists, including an estimate of the
quantity of ATS consumed domestically;
total number of actors active on the supply side of ATS markets than currently exists;
This document is a research report submitted to the U.S. Department of Justice. This report has not been published by the Department. Opinions or points of view expressed are those of the author(s)
and do not necessarily reflect the official position or policies of the U.S. Department of Justice.

8
total production volume of ATS in Canada than currently exists, including an estimate of the
number of active ATS labs; and
total amount of ATS exported from Canada.
This part of the report begins with a literature review of patterns of ATS use and production
within and beyond Canada. Drawing from such past research, we layout a series of methods and data
sources that allowed us to estimate the size of these populations for the present study. The remainder
presents the results from the various estimation methods that were applied to assess the size of
various segments of the ATS market in Canada. The conclusion provides the main highlights and
recommendations from the overall study.
III.A.1. Patterns in ATS Use in Canada
The first step when thinking about illicit markets is to assess their size – in terms of the
number of producers, suppliers, and drug users. While estimates for the former two categories may
be harder to come by, there are some data available on the prevalence of ATS and MDMA use. Such
data are available through various surveys of specific populations. Surveys are a suitable starting
point to think about the size of the market to the extent that: a) such surveys are valid indicators of
the populations they aim to estimate; and b) there is a survey that can successfully capture all
segments of the user population. But there are validity issues to any type of survey, and even
combining all existing surveys may not capture all elements of the population – especially the elusive
population of heavy users.
A review of the most recent data available on ATS and MDMA use in Canada has been
conducted by Bouchard et al (2010). The results are briefly summarized here. Results were based
around three subpopulations: a) general; b) student; and c) “at-risk” populations (defined as those
shown to have higher rates of ATS use than other populations; e.g., street population, rave
participants, and Lesbian/Gay/Bisexual/ Transgender/Questioning). National population surveys
were relied upon to examine rates in the first subpopulation. For students, both general (e.g. Health
Behaviour in School-Ages Children Study (HBSC)) and province-specific surveys (e.g., Ontario
Drug Use and Health Survey (OSDUHS)) were examined. Finally, published reports of important
longitudinal studies in Canada were reviewed to provide results for at-risk populations. Results show
that levels of use remains low among students and especially in the general population, and are
generally on the decline. ATS use is higher in specific at-risk populations.
General population. Using a random sample of nearly 13,000 Canadians age 15 and older in
2009, the Canadian Alcohol and Drug Use Monitoring Survey found past- year prevalence rates of
0.1% for methamphetamine, 0.4% for “speed” and 0.9% for ecstasy (CADUMS, 2009). These
numbers are comparable to the 2004 Canadian Addiction Survey (CAS) (Adlaf, Begin, and Sawka,
2005) which found that 0.8% had used speed and 1.1% had used ecstasy at least once in the past
year. However, all the rates are down from the CADUMS survey conducted in 2008, which showed
that 0.1% of respondents had used meth, 1.1% had used speed, and 1.4% had used ecstasy
(CADUMS, 2008). Overall, however, the different surveys suggest a relatively stable trend in ATS
use in Canada in the general population.
Student population. Table 1 presents annual prevalence rates for student populations in most
Canadian provinces. The data were extracted from a few major surveys around the country, including
the OSDUHS which has been conducted for more than two decades. Rates of meth and crystal meth
use among adolescent students is generally low compared to cannabis use (under 2.5% used meth in
the past year, see Table 1), although it is higher than rates found for the general population. Over the
course of the past decade, rates of meth and crystal meth use have been decreasing. In all regions,
This document is a research report submitted to the U.S. Department of Justice. This report has not been published by the Department. Opinions or points of view expressed are those of the author(s)
and do not necessarily reflect the official position or policies of the U.S. Department of Justice.
9
ecstasy is the most heavily used ATS, ranging between 7.2% (past year) in Newfoundland and
Labrador and 3.2% in Ontario at the most recent measurements. Most regions have witnessed modest
increases in ecstasy use over the past decade. Estimates of amphetamine use range from 2% to 5.3%
(using both past year and lifetime measures). The most substantial changes over the past decade are
in amphetamine use. Interestingly, there are few substantial gender differences in ATS use.
At-risk populations. Despite a variety of recall periods, the findings of studies examining
ATS use among at-risk populations report much higher overall rates than student or general
population studies (Bouchard, Gallupe, and Descormiers, 2010). Non-Aboriginal street youth appear
to have the highest rates, though the ATS use of aboriginal street youth is not far off. Interestingly,
street-based drug injectors have substantially lower ATS use rates than other street populations,
though this could be a product of the sampling strategy that focussed on injectors who are more
likely to use substances other than ATS. The rates of use among the lesbian, gay, bisexual,
transsexual and questioning (LGBTQ) population appear to be higher than the general population but
lower than the street population. The Sex Now (SN) survey (Trussler, 2007) shows that crystal meth
consumption has been declining since the early 2000s among gay men. Rave attendees appear to
have the highest rates of ATS use. A recent survey of inpatient youth in northern BC showed that
methamphetamine was the primary drug of choice in 35% of treatment admissions for drug addiction
(Callaghan et al., 2005).
Although these surveys of at-risk populations are informative on the extent of consumption
for specific subgroups of at-risk individuals, it is much harder to make inferences about prevalence
from these numbers. Not only is it sometimes impossible to determine the boundaries from one
population to the next or the extent of overlap between them, but the problem of the denominator is
even greater – how many users over how many individuals susceptible to using? Such is the logic of
capture-recapture estimates: given the patterns found in the known population (numerator), how
many total users should be found (denominator)?
Note that an important missing sub-population is the criminal population. Surveys like the
Arrestee Drug Abuse Monitoring (ADAM) program were found to be extremely important in
estimating illicit drug use prevalence and incidence among heavy users in countries where it has been
implemented (Bennett and Holloway, 2007). In constant operation for over 10 years now, the Drug
Use Monitoring in Australia (DUMA) program is perhaps the best example of the group (Gaffney,
Jones, Sweeney, Payne, 2010). Because they are conducted quarterly (instead of annually), such
programs are key to detecting trends and changes in drug markets, including the emergence of new
drugs. A group of researchers led by Dr. Chris Wilkins at Massey University recently received a
grant to implement the program in New Zealand. Canada, unfortunately, does not currently have a
similar program. However, it is a recommendation of this study that the implementation of such a
program be seriously considered, given the demonstrated benefits of such programs in other
jurisdictions. An important complement to such surveys is to rely on capture-recapture estimates of
arrest data.
Estimating the quantity of ATS consumed from general population surveys: The Kilmer and
Pacula (2009) study. Kilmer and Pacula (2009) provide a method to estimate the quantity of ATS
consumed globally. This report is interesting on a number of levels, including the fact that a separate
estimate was produced for Canada (though only for ecstasy). A review of their methods illustrates
some of the data requirements for estimation exercises, and it also provides a useful ballpark figure to
compare with the estimates derived later for the purpose of this project. Table 3 reproduce Kilmer
and Pacula’s estimates for ecstasy in Canada in 2004.
This document is a research report submitted to the U.S. Department of Justice. This report has not been published by the Department. Opinions or points of view expressed are those of the author(s)
and do not necessarily reflect the official position or policies of the U.S. Department of Justice.

10
Table 3. Estimating the quantity of ecstasy consumed from general population surveys,
Canada, 2004 (from Kilmer and Pacula, 2009)
Ecstasy 2004
Past year ecstasy users from CAS 2004
244,526 users
Correction for under reporting (20%/50%)
Low (20%): 305,658
High (50%): 489,052
Mean tablets consumed/year
Low: 30 tablets/year
High: 139 tablets/year
Low tablets * low user estimate
9,169,738 tablets
High tablets * high user estimate
67,978,328 tablets
The estimated range is wide: from 9 million to 68 million ecstasy tablets consumed in
Canada in 2004. The mid-range estimate would be 38 million tablets, but the authors were not
comfortable in recommending settling for mid-range for any of their estimates. Note that the RCMP
typically seize over 1 million ecstasy units annually (1.5 million units in 2008, see UNODC, 2010)
and that an unknown quantity of domestic production is destined for market overseas. The estimated
range implies that whether the consumption estimate is closer to the low or high end estimate (which
are lower bounds of the total production which includes exports), the seizure rate achieved by law
enforcement agencies would at most be anywhere between 1% and 10%.
Two additional observations should be made on this estimate and its assumptions for the
purpose of this study:
First, the authors relied on a demand-side estimate based strictly on a general population
survey on drug use. Instead of generating separate estimates for different sub-population of ATS
users, the authors chose the past year’s general population estimate and then made corrections for
under-reporting. The size of under-reporting is unknown for ATS markets. However, studies
comparing self-reported drug use with hair- or urine-based drug test results have routinely shown that
half or more of those who have recently used cocaine or heroin deny having done so (Farabee &
Fredlund, 1996; ONDCP, 2013). The authors reasoned that the rate of use for a recreational drug like
ecstasy would fall somewhere in between those two rates. The alternative is, of course, to add
multiple, separate estimates for populations not covered in the general population survey (as do the
synthetic estimation methods proposed in this paper) and refrain from relying on such corrections.
The trade-off is the effort incurred in finding reliable, mutually exclusive estimates for different sub-
populations of ATS users. Should these be obtained, a comparison of both strategies would provide
more information on the suitability of this method and its assumptions.
Second, the authors derive one parameter of the mean number of tablets consumed per user
per year that is meant to capture the variety of ecstasy users and their intensity of use. The authors
assume that this parameter provides some middle ground to take into account those who use very
infrequently and may simply experiment with 1-2 tablets per year (the majority of users in the
general population) and the minority of heavy users who most likely use a lot more tablets than the
range of consumption proposed. The authors are prudent in proposing two estimates, one with the
lowest estimate found in the literature (30 tablets), and one with the highest (139 tablets). The truth
This document is a research report submitted to the U.S. Department of Justice. This report has not been published by the Department. Opinions or points of view expressed are those of the author(s)
and do not necessarily reflect the official position or policies of the U.S. Department of Justice.

11
may lie somewhere in between. UNODC (2009), for example used 5.45 grams/year/user, which
translates into a middle figure of 73 pills (at 75 mg of MDMA/pill).
This strategy of using one parameter over many proved sound in other contexts. Bouchard
(2008), for example, showed that his estimate of cannabis consumption in Quebec derived from a
careful breakdown of category of users and their individual consumption rates could have been
summarized by the use of a simple 100 gram/past year user parameter, a similar parameter to what
has been found for US consumption (Childress, 1994). The problem with measuring ATS
consumption is, of course, that much less is known about what that parameter might be, given that
much less is known about the size of the ATS market than others. A primary goal of this project is to
make progress towards that end.
III.A.2. A New Method to Estimate Illicit Drug Use from Wastewater Analysis
A recent article by Metcalfe et al. (2010) describes a novel method to estimate the size of
illegal drug markets in specific cities from wastewater analysis. Because illegal drugs are eliminated
through urine and excrement in the way any food or liquids are, it becomes possible to estimate how
many doses of various substances have been eliminated by the specific population served by a water
treatment plant. In the words of the authors:
Drug consumption can be estimated from data on the concentrations of the
target compounds in untreated wastewater, the flow rates into municipal
wastewater treatment plants (WWTPs), the population served by the WWTP,
human excretion rates for the target compounds in urine, and estimates of the
drug dose.
The authors do not identify by name the three cities where they conducted the analysis
outside of the “eastern Canada” locations, but they were careful in choosing three cities with very
different populations: 1.6 M (city 1), 500 000 (city 2), and 75 000 (city 3). Drug dosage estimates
were provided for three substances of interest for the purpose of this study (amphetamine,
methamphetamine, ecstasy), but also for cocaine which we will use as a benchmark for comparisons.
Table 4 presents the dosage estimates for those, with an estimation of the prevalence of users
for the communities served by the wastewater facilities. Three observations can be made from the
results. First, cocaine is much more prevalent than the other drugs, within similar proportions as it is
in general population surveys. Second, it is much easier to detect drug presence in the largest city
than others, which also reflects the higher prevalence of hard drug use in urban centers. The numbers
derived from this method may apply more to large cities than other regions, although a) the same can
be said of general population surveys, and b) meth use is common in many rural areas in the US
(Weisheit and White, 2009; Reding, 2009; Armstrong and Armstrong, 2009; Sexton, Carlson,
Leukefeld, & Booth, 2006). Third, drug concentrations expectedly vary per day of the week, making
it important for such analyses to be undertaken in both weekdays and weekends. Assuming that
Montreal is the city under analysis in this study (the population size suggests this is the case), the
ratio of cocaine to meth use found (2.5 – 5.5) can be tested against other demand-side estimates
provided in the current study.
Table 4. Summary of wastewater based estimates for four illegal drugs in three eastern
Canadian cities (source: Metcalfe et al., 2010).1
1 There are some indications in this study that suggest that the large city under analysis is Montreal, although the
authors never confirm this. We also suspect, based on the sizes reported, that the other cites are Hamilton and
This document is a research report submitted to the U.S. Department of Justice. This report has not been published by the Department. Opinions or points of view expressed are those of the author(s)
and do not necessarily reflect the official position or policies of the U.S. Department of Justice.

12
Large city
(1.6M)
Mid-Large city
(500K)
Small city (75K) Three cities
combined
Methamphetamine
Dose/day/1000 pop
(median)
4.2 – 10.1
≤ 1.0 ≤ 1.0 4.5
- - % prevalence 0.45%
Ecstasy
Dose/day/1000 pop
(median)
≤ 1.0 ≤ 1.0 ≤ 1.0 0.4
% prevalence 0.04%
Amphetamine
Dose/day/1000 pop
(median)
≤ 1.0 – 4.0 ≤ 2.0 ≤ 2.0 1.8
% prevalence 0.18%
Cocaine
Dose/day/1000 pop
(median)
10.5 (Tuesday) -
56.7 (Friday)
10.5 (weekday) -
44.0 (weekend)
8.1 (weekday) –
9.0 (weekend)
15.7
% prevalence 1.57%
Note. Combined estimates (last column) taken directly from the text. The majority of other estimates
are our approximations based on Figure 3 (p. 184) of the article.
III.A.3. Patterns in ATS Production in Canada and the US
Few studies focus primarily on ATS production, even less have a Canadian focus. This
section begins with a review of the small set of studies focusing on meth cooks and their methods in
North America. The second section examines in more detail what is known about patterns and trends
in ATS production in both Canada and the US.
Meth Cooks and Their Methods. One of the only studies interviewing meth cooks, the work
of Sexton et al. (2006) is informative, as they recruited through snowball sampling 10 meth cookers
active in Kentucky or Arkansas. All were white, and the mean age of the group was 38 years of age.
All of them would qualify as small-time producers running “addiction-based labs,” all producing
through the Birch method, which is the method that proved the most efficient at rapidly producing
quality meth (Man et al., 2009; Weisheit and White, 2009). The Birch method uses ephedrine or
pseudoephedrine and anhydrous ammonia as its main ingredients. It has also been reported as the
main production method elsewhere, including Canada. However, the RCMP (2009) notes that a
relative shortage in the availability of pseudoephedrine in 2009 may have caused a shift back to the
‘traditional’ P2P-based methods, which is based on a different precursor - phenyl-2-propanone (Man
et al., 2009). In fact, the meth industry in general appears to be very sensitive to changes in precursor
availability and control, something discussed further below.
Sexton et al.’s study of cooks also helps illustrate a few other interesting patterns about meth
production. First, meth is perceived as a very “white” drug to do, and to produce. These perceptions
were confirmed at the macro level by studies on the geography of meth production in the US
(Armstrong and Armstrong, 2009; Weisheit and Wells, 2010). Examining community characteristics
that are most likely to be associated with meth production, both find that communities with a
majority of white residents were most likely to have higher lab seizure rates. This is noteworthy
Peterborough. The Montreal estimates are important for our purposes because they inform us that the use of cocaine
compared to meth is 2.5 to 5.5 times higher in Montreal. Such a comparison may be confirmed with arrest data on
each of these drug markets.
This document is a research report submitted to the U.S. Department of Justice. This report has not been published by the Department. Opinions or points of view expressed are those of the author(s)
and do not necessarily reflect the official position or policies of the U.S. Department of Justice.

13
because racial heterogeneity is usually a positive predictor of the presence of illegal drug markets.
This illustrates the “rural feel” for meth production in the US, a phenomenon that has been captured
in non-fiction books as well (see Reding, 2009). Second, the study illustrates the simplicity of meth
production (“Dumb old country boy can do it” Sexton et al., 2006: p. 859), but also the dependence
of producers on the availability of the raw materials for production, including anhydrous ammonia,
the possession of which is restricted to authorized farmers. The cooks’ addiction, limited financial
means, but also availability of raw materials appeared to limit their production to little more than
what they need for their own consumption. This creates a situation where a) the ATS market may
fluctuate more than would otherwise be expected in markets for other illegal drugs, and b) criminal
organizations with good precursor-related connections overseas have a definite competitive
advantage over these small producers as they would be least affected by local changes in precursor
laws. Finally, this study illustrates that meth production is mainly learned from person to person, as
opposed to being learned from impersonal sources like books or the Internet. The reason is simple:
the hazards of meth cooking are quite high. The slightest mistake may prove fatal. As observed by
Weisheit and White (2009), the necessity of initial peer-to-peer mentorship may explain why there is
so much variation in meth seizure rates from one county to the next in the US - a community where
first-hand cooking knowledge has not been integrated may never see a meth lab at all.
Patterns and Trends in ATS Production. Drawing on a new method for estimating
production from the number of users, the 2009 UN World Drug Report estimated worldwide
meth/amphetamine production between 230 and 640 metric tons (mt). The range for ecstasy is 63-
128 mt. Using the same approach with minor variations in the assumptions in 2010, the estimate for
meth/amphetamine was 197-614 mt, and for ecstasy 53-132 mt. An important underlying assumption
behind the new method is that a valid estimate of the total number of users and of the mean quantity
consumed annually by an average user exists (12g and 5.5g, respectively in 2009 vs. 10.9g and 5.1g
in 2010). These estimates allow for the calculation of a seizure rate. For example, a total of 53 mt of
meth/amphetamine has been seized in 2007, producing a global seizure rate between 7 and 19% for
that year. The seizure rate for ecstasy is found to be between 6 and 12%. These figures loosely match
the detection rates (11%) found in a recent study drawing on capture-recapture methods to estimate
the size of cannabis production in Quebec, Canada (Bouchard, 2008).2
The 2009 World Drug Report is important for our purposes because Canada was alleged to
be a major exporter of methamphetamine and ecstasy to countries like the US, Japan, and Australia
(see also RCMP, 2007; for similar concerns over Southeast Asia, see McKetin et al., 2008). The
claims also included estimates of the proportion of meth and ecstasy produced domestically versus
the proportion exported overseas, as well as mentions of the participation of organized crime groups
(e.g., Asian-based, and biker gangs).
Given the clandestine nature of the ATS markets, no definite production figures exist. The
number of ATS trafficking cases in Canada declined from 9,000 in 2005 to 4,000 in 2007. The
number of meth labs detected in Canada annually remains relatively low compared to the US (17 vs.
5,700 in 2007; 7 vs. 7,225 in 2008), but it is their larger size that seems to pose the greatest problem.
While only 14 of the 5700 US labs qualified as “large” in 2007, a majority of the 17 Canadian based
labs that were detected could be classified as such (UNODC, 2009). But “large” is much larger in
some contexts than others. Cunningham et al. (2009), for example, report that large-scale labs in the
US produce 5-7 kg during a cook, compared to 70-90 kg for large Mexican labs. The Canadian
superlabs do not appear to be different than those found in the US. According to the numbers
provided in Diplock, Kirkland, Malm, and Plecas (2005) for BC, 17 of the 33 labs detected between
2 It should be noted, however, that the number of seizures reflect not only the number of labs but also the available
law enforcement in that jurisdiction.
This document is a research report submitted to the U.S. Department of Justice. This report has not been published by the Department. Opinions or points of view expressed are those of the author(s)
and do not necessarily reflect the official position or policies of the U.S. Department of Justice.

14
2003 and 2005 could qualify as superlabs (more than 5kg/cook). Seizure data for ecstasy, however,
show that just as many labs were detected in the US and in Canada in 2007 (12 labs), although the
US authorities seized 4 times the quantity of ecstasy seized in Canada (UNODC, 2010). MDMA
(ecstasy) is also the only drug seized in larger quantities along the Northern US border (Canada)
compared to the Southwest border (Mexico). In 2009, 303 kg of MDMA was seized entering the US
from Canada, compared to 10 kg for methamphetamine (US Department of Justice, 2010).
Figure 1 illustrates the distribution of ATS lab seizures in Canada in 2009 where a total of 45
labs were detected. The Figure suggests that 1) BC now shares with Ontario the distinction of being a
major ATS-producing province; 2) meth dominates the number of seizures, followed by MDMA; 3)
only a small number of labs were detected in Quebec, but as much as 5 process types/substances are
represented including the only “tablet extraction,” “PCP”, and “amphetamine” labs. Such diversity is
intriguing, as it may reflect a capacity of Quebec producers to adapt to local demand, and provide a
variety of locally synthesized products. But the numbers are too small to make much of those
interpretations, small enough to suggest a potentially large number of undetected labs3.
Source: RCMP (2009)
Another piece of the puzzle is the reverse trends between the US and Canada: while the
number of seized laboratories has been steadily declining in the US since 2003, the numbers have
risen in Canada, and also in Mexico (UNODC, 2009; Brouwer et al., 2006). According to a recent
evaluation by Cunningham et al. (2009), two trends emerge: a) the trends between all 3 countries are
interrelated; and b) the trends are affected by precursor regulations implemented in each country.
33 One reason is because Quebec arrest data indicates much larger MDMA and methamphetamine markets than the
lab seizure data suggests.
FIGURE 1.
This document is a research report submitted to the U.S. Department of Justice. This report has not been published by the Department. Opinions or points of view expressed are those of the author(s)
and do not necessarily reflect the official position or policies of the U.S. Department of Justice.

15
According to Cunningham et al. (2009), the 1995 ephedrine and 1997 pseudoephedrine US
regulations seemed to have created incentives for US producers to import their precursors from
Canada. When Canada followed through with regulations of their own in January and June 2003,
producers increasingly turned to Mexico for chemicals. Note that Mexico recently adopted similar
regulations in 2007 (Cunningham et al., 2009) – the effects of which on the US and Canada remain to
be seen.
Overall, seizure and detection data suggests that Canada is among the largest ATS producing
nations (UNODC, 2008, 2009, 2010; RCMP, 2007). For example, Canada ranked sixth in the world
in meth/amphetamine seizures with 1.54 mt seized (UNODC, 2009, p 136) and fourth in ecstasy
seizures (p 142) with 985 kg seized in total. Bouchard et al. (2010) suggested that these numbers
should be used and interpreted with extreme caution. For example, the 1.54 mt seized in 2007
represented a 2,500% increase from the preceding year where only 60kg were seized by the police.
The publication of the 2010 World Drug Report showed that such caution was warranted: 2008 meth
seizures fell to 371 kg in Canada, placing the country in 18th place that year. Ecstasy seizures
dropped to 491 kg in 2008, following a worldwide decreasing trend. This reminds us of the volatility
of seizure data from one year to the next, especially for smaller markets like ATS. One very large
seizure may greatly influence the absolute numbers. Seizure rates, like drug-related offense rates in
general, are also dependent on police priorities and funding. Trends should be monitored further
before they can be used to assess the size of the market or police detection rates.
III.A.4. Methods to Estimate the Size of Illegal Markets
Estimating the size of an illegal market is a complex task. As described in previous work
undertaken by the main researchers of the current proposal (e.g. Bouchard and Tremblay, 2005;
Bouchard, 2007; 2008; Kalacska and Bouchard, 2011; Tremblay, Bouchard, and Petit, 2009), it
requires the combination of numerous data sets, steps and assumptions. It also requires the use of
proper methodologies in a stepwise approach where any small error at any one step can completely
derail the whole procedure. These challenges point towards the use of: a) methods which have been
shown to be valid in illegal market settings in prior work; and b) a triangulation of methods wherever
possible in order to achieve the most valid estimates possible.
For this study, seven separate estimates were generated: four for different sub-populations of
individuals (users, dealers, producers, labs) and three for quantities of ATS (used, produced,
exported). For the majority of the estimates, a minimum of two different methods among the
following were used: multiplier methods, synthetic estimation methods, capture-recapture methods,
and economic modeling methods. It is impossible, given the short time frame to produce this study
and limited fieldwork data, to provide reliable estimates for all of these populations and quantities.
Our efforts should therefore be viewed as an exploration that lays the groundwork for a Canada-wide
study with a strong emphasis on collecting fieldwork data. Table 5 summarizes the work undertaken
for each estimate. More details on the data sources and each of the methods are presented below.
This document is a research report submitted to the U.S. Department of Justice. This report has not been published by the Department. Opinions or points of view expressed are those of the author(s)
and do not necessarily reflect the official position or policies of the U.S. Department of Justice.

16
Table 5. Summary of estimates to be provided, the methods required, and an example study
using these methods among the research team.
Type of estimate Method 1 Method 2 Reference
1. Number of ATS users Synthetic estimation
(multiple survey
results)
Multiplier methods
(overdose
data/wasterwater
analysis)
1. Bouchard and
Tremblay (2005)
2. Bouchard (2008)
2. Number of ATS
dealers
Capture-recapture
methods plus inference
(arrest data)
Multiplier methods
(dealer per user ratio)
1. Bouchard and
Tremblay (2005)
3. Number of ATS
producersa
Multiplier method I
(arrest ratio)
Multiplier method II
(producer per lab ratio)
1. Bouchard (2007)
4. Number of ATS labs Economic modeling
Multiplier methods
(detected to undetected
ratio - domestic)
1. Bouchard (2007;
2008)
2. Easton (2004)
5. Quantity of ATS
production
Using (4), method
proposed in Bouchard
et al. (2010):
TPVMeth/MDMA =
N
i
iii pkgc1
)**(
where TPV denotes
total production
volume, ∑ is the
summation operator, c
is the count of
clandestine production
facilities of size i (i = 1
through N) at risk of
detection, kg represents
the total weight in
kilograms of product
generated by
clandestine production
facilities of size i, and
p represents a purity
weight ranging from
0.0 to 1.0.
1. Bouchard and
Tremblay (2005)
2. Bouchard (2008)
3. Bouchard, Gallupe,
Descormiers (2010)
6. Quantity of ATS
consumed
Multiplier methods 1
(quantity per user ratio
– method 1 for
estimate 1 above)
Multiplier methods 2
(quantity per user ratio
– method 2 for
estimate 1 above)
Bouchard (2008)
7. Quantity of ATS
exported
(5) minus (6) above Bouchard (2008)
This document is a research report submitted to the U.S. Department of Justice. This report has not been published by the Department. Opinions or points of view expressed are those of the author(s)
and do not necessarily reflect the official position or policies of the U.S. Department of Justice.

17
a. Initially, we intended to estimate the size of the producer population through capture-recapture
methods. This proved not to be feasible because no producer was actually re-arrested for production
during the period under study.
Multiplier Methods. One form of multiplier method will be used for each of the estimates to
be provided in this study. Within this family are grouped all methods using a ratio from an observed
part of the population to make inferences on the unobserved part of the population. For example,
multiplier methods have been used to estimate the size of the heroin using populations from a ratio of
overdoses per user (Degenhardt, Rendle, Hall, Gilmour, & Law, 2004; Law, Degenhardt, &
McKetin, 2006). As in Brecht and Wickens (1993), it can be formulated as:
(1) N = d/p;
where N is the total population of users, d is the number of overdose deaths, and p is the
probability of dying from ATS use during a year.
Knowing, for example, that one out of 300 ATS users die of overdose during a given year,
we could estimate a prevalence of 10,000 ATS users knowing that 30 overdoses occurred over the
course of a year (30/0.003 = 10,000). Because it is dependent on many factors including the lethality
of a drug, variations in purity, location or methods of use, the rate of overdose per user varies per
type of drug, and even per region for a similar drug. Multipliers of 100 and 125 have been shown to
provide suitable estimates of heroin use in Australia a few years ago (Degenhardt et al., 2004). There
are currently no established multipliers for meth or ecstasy, but we know that they should be
substantially higher than the one used for a more lethal drug like heroin.
In the current study we propose to explore the possibility of establishing a suitable overdose
ratio for the ATS market by a) comparing the lethality of ATS to other drugs where overdose ratios
are more established (such as heroin), and b) comparing the overdose to ATS user ratios where
reliable estimates of ATS users have been provided through other methods (e.g. as in Chiang et al.,
2007; Hser, 1993).4 This work will lead to estimate 1 in Table 5 above.
These methods are also useful for supply side estimates, for example to estimate the size of
drug production from a quantity of drugs seized with some assumption about the risk of detection
(1%, 5%, 10% or 20%). The problem is of course that it is not adequately known what the detection
rates actually are (they have to be estimated through other methods) and these rates are likely to vary
from one year to the next (especially if the rates are driven by a particularly large seizure). Hence, the
amount of uncertainty is thus larger than for other methods. Triangulation with other methods, as
demonstrated in this study, is important. A detected-to-undetected ratio was used as a secondary
method for estimate 3 and 4 (Table 5).
Other studies have used variations in the multiplier methods that could be useful in
estimating the number of drug dealers (Bouchard and Tremblay, 2005; MacCoun and Reuter, 2001).
The ratio of interest here is the number of users per dealer. This ratio can be obtained from
surveillance investigations (Lacoste and Tremblay, 1999), but also from surveying drug dealers
directly in prison settings. After corrections to take into account variations in productivity per dealer,
4 A recent article by Gable (2004) reviewed a number of studies that examined the lethality of drugs. The study
found that the safety ratio (lethal dose/effective dose) for heroin was 6 – the smallest among all legal and illegal
drugs examined, meaning that the risks of overdoses were much higher for heroin than for other drugs. The safety
ratio for crystal meth was 10 (+150mg/15mg) – comparable to alcohol, higher than heroin, but lower than ecstasy
which was 16 (2g/125mg). From this, we can safely assume from the safety ratios that the proper multiplier for meth
and ecstasy will be higher than for heroin (125) but how much higher will be determined during the course of this
study.
This document is a research report submitted to the U.S. Department of Justice. This report has not been published by the Department. Opinions or points of view expressed are those of the author(s)
and do not necessarily reflect the official position or policies of the U.S. Department of Justice.

18
these ratios were found to be around 7 to 10 users per dealer for crack, heroin, and cocaine
(Bouchard and Tremblay, 2005). These ratios typically take into account the heterogeneity of the
dealing populations involved (e.g., a mix of part-time and full-time dealers), something that should
also be found in the ATS markets (e.g., rave party dealing). Assuming one has a valid estimate of the
number of ATS users and a users-per-dealer ratio, the number of ATS dealers can be estimated using
such a method (N dealers = users/users-per-dealer). These were used for estimates 2 and 3 above
(Table 5).
Capture-recapture Methods. Capture-recapture methods have been proven to provide
reliable estimates of hidden populations, including illegal populations (Bouchard, 2007; Bouchard et
al., 2010). Not unlike other estimation methods presented here, it relies on a pattern found in the
observed part of the population to make an inference on the unobserved part. The major difference is
that the inference follows a mathematical distribution, usually variations of the Poisson distribution.
Such distributions have been shown to reproduce quite well the distribution of rare events, such as
the distribution of arrests and re-arrests in an illegal population, or the distribution of entry and re-
entry into treatment for drug-using populations. These methods are relatively easy to implement, and
importantly, they do not require any new data collection. Capture-recapture estimates have a long
history of use in biological and ecological research. In criminology, such estimates are derived from
existing lists of individuals arrested for a specific offence (e.g., ATS dealing).
There are many variations in the capture-recapture family of models, all with slightly
different assumptions about the population of interest and how it behaves prior to, and after capture.
One particular model (Zelterman`s truncated Poisson estimator – Zelterman, 1988) proved to be
robust in a number of contexts, especially for the estimation of illegal populations where the
assumptions of the Poisson distribution5 may be violated (Bouchard, 2007; Bouchard and Tremblay,
2005; Choi and Comiskey, 2003; Smit, Toet, & van der Heijden, 1997; Bohning & Kuhnert, 2004).
One reason why Zelterman`s estimator proved to be robust with such populations is simple: its logic
is based on the idea that the projected rate of capture for those individuals not yet captured more
closely resembles the rate found for those individuals captured only once or twice. In others words,
offenders who have been arrested only once during a year are more likely to ‘resemble’ those who
have not been arrested than offenders arrested many times. Zelterman`s estimator is given by:
(2) Z = N / (1- e(-2*n2/n1));
where Z is the total population, N is the total number of individuals arrested, n1 is the number
of individuals arrested once, and n2 is the number of individuals arrested twice in a given time
period.
As shown elsewhere (Bouchard and Tremblay, 2005; Bouchard, 2007; Bouchard et al.,
2010), Zelterman`s model produces robust estimates in almost any context, with many different types
of capture distributions. The model is much simpler than most other models. It also requires only one
database (which can be crucial for difficult to track populations), while many other models require
the linkage of many databases to construct a capture distribution. Zelterman’s estimator is also robust
to many different types of data, and it is conservative by nature.
Zelterman Regression. A recent study by Bohning and van der Heijden (2009) provides an
interesting extension to Zelterman’s estimator for use in a standard regression. The authors noticed
Zelterman’s compatibility with standard logistic regression, notably its reliance on a binary outcome,
5 The assumptions are as follows: 1) the population under study must be closed (no entries and exits); 2) the
population has to be homogenous (same capture rate for everyone); 3) the probability for an individual to be
observed and re-observed must be held constant during the observation period.
This document is a research report submitted to the U.S. Department of Justice. This report has not been published by the Department. Opinions or points of view expressed are those of the author(s)
and do not necessarily reflect the official position or policies of the U.S. Department of Justice.

19
and proceeded to extend the estimator for use with covariates in a logistic regression, a procedure
that can be labelled as “Zelterman regression”. The authors published a STATA program in
supplementary materials provided with the article that has been adapted for use with the present data.
Note that running the procedure without covariates is equivalent to using equation 2 presented above.
An added benefit to using the program is the calculation of confidence intervals for every estimate
provided, including the no covariate estimate. The addition of covariates to the estimation procedures
is meant to account for the problem of unobserved heterogeneity in the no covariate estimates.
However, to the extent that the covariates are not significantly related to the probability of re-
recapture, the estimates won’t be affected. In other words, the more parsimonious model is either
assumed to perform well because of the absence of unobserved heterogeneity in the sample, or the
covariates added are simply not solving the problem of unobserved heterogeneity. The latter issue is
a real possibility with official arrest data which typically do not contain detailed information on
offenders arrested. Below the models without covariates are compared to models with age at first
arrest and gender as the main covariates.
In this project, arrest data and capture-recapture methods are drawn on to estimate the
number of ATS users (i.e., those users at risk of being arrested – mostly those found among the
criminally active population), and the number of ATS dealers in Quebec, from which the number of
dealers in Canada were inferred (estimate 2, Table 5).
Economic Modeling Methods. Easton (2004) drew from economic principles to estimate the
number of cannabis cultivation sites in British Columbia. The method proposed here for estimating
the number of ATS labs follows the same general outline as that used in the estimation of marijuana
grow operations in British Columbia (Easton, 2004). With the appropriate characterization of the
meth industry a similar technique can be applied to estimate the size of the activity. The basic outline
consists of the recognition that these are businesses and consequently are subject to many of the same
pressures as faced by legitimate enterprises. For example, among other constraints illegal producers
must make a rate of return that is at least as great as that which is received by other legitimate
activities; additional risk from both competitors and from law enforcement must be compensated by
a higher rate of return; and, producers have to pay people who work for the business a competitive
wage whether in goods in kind or in cash.
It is possible to identify the rate of return (ρ) of the operation as simply the value of sales (Q)
times the price (P) less costs (C) relative to total cost:
(3) ρ=(PxQ-C)/C
But ATS lab operations also face operating risks not faced by legitimate businesses: they run
the risk of losing their product from raids by the authorities or other criminals. This is not the same
kind of business risk faced by legitimate operators who may also lose their product due to fire and
flood and so forth. Illegal operators are not able to insure their equipment or product and that raises
the risk. To model this risk, assume that the producer faces a probability, π, of losing his production.
This means that the expected value of the production that is being brought to market is reduced by
that risk to (1- π)xPxQ.
At the same time we need to recognize that the rate of return faced by the producer must be
augmented by the risk he bears. This means that the rate of return, ρ, should be augmented by the risk
so that the correct measure of the return is ρ+ π. This leads to an equation that permits identification
of the size of the ATS production industry in Canada:
(4) ρ+ π = [(1- π)xPxQ-C]/C
This document is a research report submitted to the U.S. Department of Justice. This report has not been published by the Department. Opinions or points of view expressed are those of the author(s)
and do not necessarily reflect the official position or policies of the U.S. Department of Justice.

20
The reason that this equation permits identification of the size of the industry is that the
probability of being busted, π, can be calculated as B/T where B is the number of ATS lab “busts”,
and T is the total number of labs. “B” is known from police data. “T” is to be calculated. We know
the general rate of return to small businesses, ρ, as it has been the same for the past fifty years or so:
10%. For various reasons outlined below, it is possible that the rate of return for ATS labs is larger.
We use a figure of 50% in estimates below in illustrating different estimate scenarios. We know the
value of production for the average lab operation from police busts across the province. We can
calculate the cost of operating an ATS lab. In terms of equation 4 above, we know the values of all
the variables, ρ, P, Q, and C, and we know the number of “busts”, B. Eq. 4 can be solved for T, the
total number of ATS labs:
(5) T= Bx[1+(PxQ/C)]/[(PxQ/C)-(1+ρ)]
Because this method is applicable only to “businesses,” it was only used to estimate the
number of ATS labs in Canada (estimate 4, Table 5).
Composite Synthetic Estimation Methods. It is difficult or impossible to find an
appropriate data source that can cover the full range of possible ATS user populations. Illegal drug
users can be found among prisoner populations, but also among otherwise law-abiding citizens, as
well as adolescent, and homeless populations (Bouchard et al., 2010). Although we treat them as a
separate category for the purpose of this study, synthetic estimation techniques could be considered
as within the family of multiplier methods. Following Rhodes’ (1993) lead, the synthetic estimation
in this study consists of estimating the size of the ATS using populations in as many different sub-
populations as can be found: school students, general adult populations, individuals involved with the
criminal justice system, and the homeless. The idea is to derive estimates for each sub-population and
then combine them into one. Bouchard (2008) provided a version of this method for the cannabis
market in Quebec where he combined separate survey estimates for high school and adult
populations. The challenge, however, is much different for other drugs as standard survey methods
do not provide a valid estimate of the total number of users involved (Bouchard and Tremblay,
2005).
To derive synthetic estimates of the ATS user population, the following equation was used
(Wickens, 1993):
(6) 𝑁 = ƩiPc(i)Nt(i)
where,
𝑁 = predicted number of users
Ʃi = summation of the various i subpopulations
Pc(i) = proportion of users within population i
Nt(i) = number of individuals within target population i
III.A.5. Methods to Estimate Quantities of Drugs
The methods described above can be combined to estimate quantities of drugs (consumed,
produced, exported) as opposed to simply estimating individuals (whether users or sellers). For
example, once a valid estimate of the number of ATS users is provided, it becomes possible to
estimate the quantity of drugs they consume using the mean quantity consumed annually by an
average user. Based on past research on users, UNODC (2010) uses quantities of 10.9g for meth and
This document is a research report submitted to the U.S. Department of Justice. This report has not been published by the Department. Opinions or points of view expressed are those of the author(s)
and do not necessarily reflect the official position or policies of the U.S. Department of Justice.

21
5.1g for ecstasy to estimate the quantity of ATS consumed worldwide. A similar strategy was used in
this study to estimate the quantity of ATS consumed domestically (estimate 6, Table 5).
Importantly, a similar logic (although slightly more complex) can be applied to estimate
production. For example, Bouchard (2007, 2008) proposed the following equation to estimate the
number of cannabis cultivation sites:
(7) S = ∑ (Zi/ci)i,n
where S is the annual number of cultivation sites at risk of detection, Z is the prevalence of
growers of type i, c is the number of co-offenders working on a median size plot of type i, and
represents the proportion of seizures for type i and of sizes n.
Bouchard (2008) then started from this prevalence of sites estimate to derive an estimate for
the size of production, in metric tons of cannabis produced. Because fieldwork data showed that plant
yield decreases as a function of size (larger sites grow less productive plants, overall), the yield per
plant for a type of cultivation site has been calculated by regressing plant yield (in ounces) on the
number of plants grown in fieldwork data. The equation can be written as:
(8) TPVcannabis = S*(Adj. mean size*oz/plant*crops/year)
The adjusted mean size simply reflects the mean number of plants seized by the police minus
plant attrition (for any harvests, not all plants will produce). The equation produces an estimate in
ounces which can be transformed into metric tons. Using equation 7, Bouchard (2008) estimated
cannabis production at 300 metric tons for Quebec in 2002.
The same strategy was applied to estimate the total production of meth and MDMA. As first
presented in Bouchard et al. (2010), total production volume for ATS can be expressed as:
(9) TPVMeth/MDMA =
N
i
iii pkgc1
)**( ;
where, TPV denotes total production volume (which could be restated in metric tons), ∑ is
the summation operator, c is the count of clandestine production facilities of size i (i = 1 through N)
at risk of detection, kg represents the total weight in kilograms of product generated by clandestine
production facilities of size i, and p represents a purity weight ranging from 0.0 to 1.0. The indicator i
is needed to reflect varying production volumes and purity6 across the different facility sizes (which
would be coded using an ordinal scale). This work led to estimate 5 in Table 5.
Finally, once we had a valid estimate of domestic consumption and of domestic production, it
became possible to estimate the quantity of ATS potentially exported to other countries. For
example, Bouchard (2008) estimated that 56% of Quebec’s cannabis production was potentially
exported after having subtracted from his 300 metric ton production estimate the quantity of cannabis
consumed in Quebec (100 metric tons) and the quantity of cannabis seized by law enforcement
agencies (31 metric tons). The final estimate 7 (Table 5) was similar in nature, but for ATS markets
in Canada.
III.A.6. Data Sources
The main analyses were based on arrest data that were obtained for Quebec. In addition,
information obtained from a content analysis of existing literature on ATS cooks and their methods
(Chiu et al., 2011; Diplock et al., 2005; Sexton et al., 2006; Weisheit and White, 2009; see also
6 Purity data was unavailable and therefore, the purity parameter is held at 1.0 for the purpose of this study.
This document is a research report submitted to the U.S. Department of Justice. This report has not been published by the Department. Opinions or points of view expressed are those of the author(s)
and do not necessarily reflect the official position or policies of the U.S. Department of Justice.

22
Reding’s 2009 Methland) and a survey of the Internet and extant literature on the economics of ATS
production was also conducted in order to supplement the analyses that will be conducted throughout
the study.
Arrest Data. The main data requirement for capture-recapture estimates is a complete list of
arrested individuals for specific offenses for an extended period. In addition, each re-arrest for an
individual can be recognized and coded as such. We obtained access to official arrest data for all
crimes committed by adults in Quebec from 1999-2009.7 These data are recorded by law-
enforcement agencies across the province and compiled by crime event in the Module d’Information
Policières (MIP). Information on all arrestees is included for each event. While their identities have
been concealed for confidentiality reasons, each individual that has been arrested over this period is
tagged with a unique identification number that allows us to track his/her re-arrest in subsequent
periods. With such a lengthy period of arrest records, we were able to draw repeated samples and
arrive at more stable estimates.
Whereas estimating most crimes with such data is generally a straightforward procedure,
certain adjustments were necessary in the case of arrests linked with synthetic drugs markets. Table
6 presents the number of arrests from 1999 to 2009. Before 2006, all crimes that are of interest for
the present project were categorized under a generic ‘Other Drugs’ label. As of 2006, the possession,
traffic, import/export, and production of methamphetamine and ecstasy were included as specific
crimes. Table 6, however, illustrates that even though the crimes were explicitly registered as official
crimes, the coding of such events did not follow suit in any systematic way until a couple of years
after. In order to adjust for these coding limits, we included all arrests for ‘Other Drugs’ to the
ecstasy and methamphetamine related arrests. Without these additional arrests, this data set would be
significantly reduced and largely irrelevant for the market estimations designed for this research.
7 Access conditions with the Quebec Provincial Police required that youths (under 18 years of age) who were
arrested for such crimes be excluded from this data set.
This document is a research report submitted to the U.S. Department of Justice. This report has not been published by the Department. Opinions or points of view expressed are those of the author(s)
and do not necessarily reflect the official position or policies of the U.S. Department of Justice.

23
Table 6: Arrests for Main Crimes Related to Methamphetamine, Ecstasy, and ‘Other Drugs’
Markets, Quebec, 1999-2009.
1999 2000 2001 2002 2003 2004 2005 2006 2007 2008 2009 Total
Meth
.
Possession 0 0 0 0 0 0 0 0 3 176 302 481
Possession/Traffic 0 0 0 0 0 0 0 0 2 41 114 157
Traffic 0 0 0 0 0 0 0 1 0 28 100 129
Import/Export 0 0 0 0 0 0 0 0 0 1 2 3
Production 0 0 0 0 0 0 0 0 0 0 1 1
Ecst
asy
Possession 0 0 0 0 0 0 0 0 0 23 73 96
Possession/Traffic 0 0 0 0 0 0 0 0 0 3 32 35
Traffic 0 0 0 0 0 0 0 0 0 0 26 26
Import/Export 0 0 0 0 0 0 0 0 0 0 2 2
Production 0 0 0 0 0 0 0 0 0 0 1 1
Oth
er
Dru
gs
Possession 331 489 396 400 577 640 909 1,093 1,403 1,432 1,019 8,680
Possession/Traffic 132 180 138 167 181 239 399 488 573 585 452 3,534
Traffic 213 549 141 157 143 183 262 383 424 365 278 3,098
Import/Export 11 14 10 10 12 14 15 19 22 10 12 149
Production 0 0 0 0 0 0 0 0 0 15 34 49
Total 687 1,232 685 734 913 1,076 1,585 1,984 2,427 2,670 2,448 16,441
+ 3 Additional
Crimes 771 1,369 814 862 1,067 1,331 2,014 2,576 3,011 3,394 3,052 20,261
Because the goal of the project was estimate the size of the ecstasy and methamphetamine
markets as opposed to all ‘other drugs’ (which include LSD, various prescription pills), the most
detailed estimates have been developed for the years 2008 and 2009 where drug specific data were
available.
Overall, our data set is comprised initially of 16,441 events in which individuals were
arrested for methamphetamine, ecstasy, and ‘other drugs’ possession, traffic,
importation/exportation, and production as a main crime. If we expand beyond the main crime in any
event and include three additional crimes8, the number of arrests increases to 20,261 events (see last
row in Table 6). The addition of these three additional crimes that may be possibly linked to an event
is consistent across all years, with an increase of 7.5% to 8.9% of arrests per year for the entire
period. We used mostly the latter set of data for the estimates.
III.A.7. Results
III.A.7.a. Estimating the Number of ATS Users in Canada
Method 1 - Synthetic Estimation. First we drew from synthetic estimation methods (eq. 5
above) to estimate the number of ATS users in Canada. To do so, we combined estimates from 4
8 For example, an individual could be arrested for homicide as a main crime, conspiracy as a second crime, cocaine
trafficking as a third crime, and methamphetamine possession as a fourth crime.
This document is a research report submitted to the U.S. Department of Justice. This report has not been published by the Department. Opinions or points of view expressed are those of the author(s)
and do not necessarily reflect the official position or policies of the U.S. Department of Justice.

24
populations in 2009: general (15 years and older), adolescents (12-14 year olds), homeless, and
incarcerated populations.
An estimation of ATS prevalence in the general population of individuals age 15 and over in
2009 was found in the CADUMS survey (CADUMS, 2009). The ecstasy prevalence rate was
reported at 0.9% and the meth prevalence was reported at 0.1%. Census data from 2006 showed that
the population of individuals aged 15 and over was 26,033,060 (Statistics Canada, 2011a).
Multiplying the population by the proportion of users in the general population (ecstasy = 0.009;
meth = 0.001) resulted in estimated user populations of 234,298 for ecstasy and 26,033 for meth.
To derive estimates for the youth general population (students under age 15—ages 15+ were
covered by CADUMS), we used the ATS estimates reported in Atlantic Canada (Poulin & Elliott,
2007), Ontario (Paglia-Boak, Mann, Adlaf, & Rehm, 2009), and Alberta (AHSAMH, 2009) to be
representative of eastern, central, and western Canada, respectively. An overall ecstasy and meth
prevalence rate for 12 (grade 7s), 13 (grade 8s), and 14 year olds (grade 9s) was derived by pooling
the number of users and the sample size from each report. It is assumed that there is no ATS use
among youth under the age of 12. Multiplying the pooled prevalence rates by census age counts
(Statistics Canada, 2011b) resulted in an estimated 24,967 ecstasy users and 11,404 meth users in
Canada between the ages of 12 and 14. The estimated Canada-wide youth prevalence rates, census
counts, and estimated number of youth ATS users are reported in Table 7.
Finding estimates of the size of the homeless population was not straightforward. Radford,
King, and Warren (1989) estimated that there were approximately 150,000 street youths in Canada.
However, newer figures are desired. Many estimates are specific to certain regions (e.g., GVRSCH,
2010) that are not ideal for our purposes. We therefore chose to use the estimate of 150,000 homeless
individuals (adult and youth) in Canada as reported in Laird (2007) citing statistics from 2005 found
by the National Homelessness Initiative.9 We assume that the ATS prevalence is the same for all
homeless populations as it is for street-involved youth. Using prevalence rates for ecstasy of 5.1%
(2003 estimate, reported in PHAC, 2006) and 9.5% for meth (2005 estimate—reported in PHAC,
2009), we estimate that there are 7,650 homeless ecstasy users and 14,250 homeless meth users.
Table 7. Estimated Youth ATS Prevalence Rates, Canada, 2009
Ecstasy (%) Meth (%)
Census
count
Estimated
ecstasy #
Estimated
meth #
12 year olds 0.59 0.58 41,3660 2,453 2,387
13 year olds 0.65 0.02 42,3340 2,758 103
14 year olds 4.6 2.1 43,2600 19,756 8,914
Total 24,967 11,404
The final population to be estimated was the incarcerated population. According to Brochu et
al. (2001), “half of the offenders used illicit drugs at least once in the 6 months prior to their arrest”
(p. 21). Since they do not report ATS prevalence, we estimate this by assuming that the ratio of ATS
use to any drug use is the same in the prison population as it is in the general population (as reported
in CADUMS):
(9) Pa/Pd=Ga/Gd
9 www.homelessness.gc.ca - According to Laird, this federal initiative was closed in 2007 and the website no longer
exists.
This document is a research report submitted to the U.S. Department of Justice. This report has not been published by the Department. Opinions or points of view expressed are those of the author(s)
and do not necessarily reflect the official position or policies of the U.S. Department of Justice.

25
therefore,
(10) Pa=(Ga/Gd)Pd
where,
Pa=Prison ATS use (to be estimated)
Pd=Prison drug use (any drug) (50.0% - Brochu et al., 2001)
Ga=General population ATS use (ecstasy=0.9%; meth=0.1% - CADUMS, 2009)
Gd=General population drug use (any drug) (11.4% - CADUMS, 2009)
This resulted in prisoner ATS prevalence rates of 3.95% for ecstasy and 0.44% for meth.
The overall prisoner population was based on average daily counts. For adults, the average
number of incarcerated offenders was 37,234 in 2008 (Statistics Canada, 2011c) while for youths it
was 1,719 (Statistics Canada, 2011d) for a total daily average of 38,953. Using daily counts instead
of yearly admissions makes sense since many prisoners enter and leave (and occasionally re-enter)
prison in the course of a given year. Taking yearly prison admission numbers as the population not
eligible to be counted in the general population surveys would therefore overestimate the population
of incarcerated ATS users. The daily count is more likely to accurately represent the user population
not found in general population surveys since it would indicate the number of individuals not eligible
for general population surveys on any given day. Multiplying the prevalence rates by the daily
average count results in estimated prisoner ATS user populations of 1,537 for ecstasy and 171 for
meth.
Summing the estimated ATS user subpopulations results in an expected total Canadian
population of 268,452 ecstasy users and 51,858 meth users. There is not likely to be any overlap
among the populations. Street youth will not be found in general population surveys. The use of daily
average counts of prisoners eliminates any concern regarding overlap with either the street or general
populations since this is the population that is not eligible for inclusion in either street or general
population surveys on any given day. A population that is not explicitly included below because of
the risk of partial overlap with all of those categories is the ATS using population of non-incarcerated
offenders. Because of this omission, we believe those estimates to be conservative. In other words,
we would be surprised if the true populations were significantly below these, but not if they were
higher.
Table 8 provides a summary of the estimated subpopulation numbers of ATS users as well as
estimates assuming underreporting rates of 20% and 50%. It is difficult to determine which of the
three estimates provided is closest to the mark. In such cases, it might be preferable to not decide on
one, and instead work with a range of estimates which reflect the uncertain nature of such estimation
exercises.
Table 8. Prevalence of ecstasy and meth users in Canada, synthetic estimates at 0%, 20%, and
50% underreporting.
0%a 20%a 50%a
Ecstasy:
General population - age 15+ 234,298 281,157 351,446
General population - age 12-14 24,967 29,960 37,450
Street population 7,650 9,180 11,475
This document is a research report submitted to the U.S. Department of Justice. This report has not been published by the Department. Opinions or points of view expressed are those of the author(s)
and do not necessarily reflect the official position or policies of the U.S. Department of Justice.

26
Incarcerated 1,537 1,845 2,306
Total 268,452 322,142 402,677
Meth:
General population - age 15+ 26,033 31,240 39,050
General population - age 12-14 11,404 13,685 17,106
Street population 14,250 17,100 21,375
Incarcerated 171 205 257
Total 51,858 62,230 77,788
Ecstasy plus meth 320,310 384,372 480,465 aPercentage underreporting.
Method 2 - Multiplier Method. To estimate the ATS user population, we also used the
following equation (Brecht & Wickens, 1993):
N=d/p
where,
N=estimated number of ATS users
d=meth deaths (from coroner’s reports B.C.)
p=probability of death due to meth
No ecstasy-related deaths were found in coroner reports and, therefore, the equation above is
only applied to meth. Accessing published coroner reports from B.C. (BCCS, 2005), there were five
deaths caused by meth in 2003 and three deaths in 2004. The probability of death due to meth was
more complicated to derive. Darke, Kaye, McKetin, and Duflou (2008) state that: “In the case of
heroin, it is estimated that the proportion of overdoses that results in death is 2 – 4% (Darke, Mattick,
& Degenhardt, 2003). To date, there are no comparable data on methamphetamine toxicity, but one
Australian study has been conducted on non-fatal cocaine overdose (Kaye & Darke, 2004). This
found that 13% of regular cocaine users had overdosed on cocaine, and 7% had done so in the
preceding 12 months. Given the psychopharmacological similarities between these two
psychostimulants, similar rates might be expected for methamphetamine. Indeed, given the wider
availability of methamphetamine, rates may well be higher.” Based on the above quote, if we assume
that 7% of meth users overdose in any particular year and that 2% of overdoses are fatal, the
probability of death due to meth in a given year is 0.02(0.07)=0.0014. In other words, the meth
multiplier would be 714, that is, 1 overdose death per 714 meth users per year. In comparison, recall
that a multiplier of 125 was shown to provide valid estimates of heroin users in Australia
(Degenhardt et al. 2004). If the 714 multiplier is valid, this would mean that heroin is 5 to 6 times
more lethal than methamphetamine.
Using the 714 multiplier (or 0.0014 death rate), the following meth population in B.C. is
obtained:
Nmeth 2003 = 5/0.0014 = 3,571.43
Nmeth 2004 = 3/0.0014 = 2,142.86
This document is a research report submitted to the U.S. Department of Justice. This report has not been published by the Department. Opinions or points of view expressed are those of the author(s)
and do not necessarily reflect the official position or policies of the U.S. Department of Justice.

27
Based on the 51-77 000 range found in Table 4, these estimates would imply that BC had
between 4% and 7% of all meth users in 2003, which is an improbably low proportion. One
possibility is that the meth overdose measure (meth as cause) is too stringent. If we use the number of
deaths in which meth was present and not necessarily the main cause (n=15 in 2003; n=33 in 2004 –
BCCS, 2005), the following estimates are derived:
Nmeth 2003 = 15/0.0014 = 10,714.29
Nmeth 2004 = 33/0.0014 = 23,571.43
These new estimates would imply that BC had between 12% and 45% of Canadian meth
users, which may be closer to reality (which is partly a result of the large range provided). Overall,
we do not feel confident enough in the multiplier method to recommend using any of the estimates
provided above. Much more work is needed to determine whether any of the assumptions used in the
process are reasonable. An added disadvantage of this method is that no estimates could be derived
for ecstasy.
Method 3 – Alternative Method from Wastewater Analysis. Given the uncertainty with the
estimates provided by the multiplier method, we also tested whether the prevalence rates provided by
Metcalfe et al.’s (2010) testing of waste water could be used to derive valid estimations of the
Canadian ATS population. Multiplying the ATS user proportions reported by Metcalfe et al.
(meth=0.0045; ecstasy=0.0004) by the 12-59 Canadian metropolitan population (17,509,680
individuals from 12 to 59 years old in cities with population in excess of 10,000 – Statistics Canada,
2011e) results in an estimated 78,794 meth users and 7,004 ecstasy users in metropolitan areas in
Canada. Both estimates are beyond the range found with method 1. The estimated number of ecstasy
users is likely too low, which is consistent with Metcalfe et al.’s lack of confidence in the estimate.
The prevalence of meth users is outside of the 50-77,000 range estimated earlier at 78 794, but not
too much outside of it to be implausible. Because we cannot reach a wastewater estimate for ecstasy,
for consistency we will also refrain from using the wastewater meth estimate for that drug.
To summarize, we are most confident in the estimates provided from summing up mutually
exclusive prevalence estimates for the four populations presented in Table 8. The wastewater
estimate provides some validity to the range of estimates for methamphetamines, especially the high
estimate of 77,788. We used the ranges found in Table 8 where appropriate in analyses presented
below.
Capture-recapture Results. Before providing specific estimates for ATS participants active
on supplying the drug, it is worth describing the arrest data in greater detail. An analysis of arrest
data for Quebec shows that separate records for ecstasy and meth offences were only provided for
years 2008 and 2009. We will, therefore, focus on those two years for the majority of analyses
presented below. When appropriate for comparison purposes, we provide estimates for “any
synthetic drugs” for the 1999-2007 periods. We start by presenting the arrest distributions for all
synthetic drug offenders for 2008-2009 and then breaking it down by types of offences (possession,
selling – including possession with intent to sell, importation/exportation, and production). These
distributions are the basic ingredients needed for the capture-recapture analysis. Prior to discussing
the results, a discussion of certain features of the data are in order.
First, distributions overlap – many individuals arrested for selling are charged with
possession as well. They were included in both distributions for the purpose of capture-recapture
This document is a research report submitted to the U.S. Department of Justice. This report has not been published by the Department. Opinions or points of view expressed are those of the author(s)
and do not necessarily reflect the official position or policies of the U.S. Department of Justice.

28
estimation as they were effectively at risk of being arrested for both offences. Offence specific
distributions, however, strictly include arrests for the same type of crime (an offender arrested on a
possession charge at t1, and on a selling charge at t2 will only show up as a re-arrested offender in
the all offender distribution).
Second, to be included, re-arrests had to be separated from the previous arrest by at least 5
full days. This procedure deleted many consecutive day arrests that were inevitably related. While it
is certainly possible that many close range arrests of over 5 days are also related, we felt that such a
threshold also allowed for a bona fide recapture process to take place – e.g., an offender is arrested
on a Sunday, incarcerated 24 hours, released, goes back to selling the following Friday, and is
arrested again on a similar charge. Not being able to know for certain from the data, we established
the threshold at 5 days (Gallupe, Bouchard, and Caulkins, 2011 used a similar approach). A total of
1.4% arrest/lines were deleted in 2008 and 2009 in applying this criterion. Most were deleted because
multiple entries of the same capture were found on the same day. These procedures may have some
internal logic (separate deals, separate labs, etc), but they refer to the same “capture” for our
purposes, so they have to be counted as one.
Third, age and gender are included as variables in every analysis below, though they do not
always appear in regression models because they are rarely statistically significant. Age and gender
are nonetheless interesting covariates to examine with arrest data, especially as the goal is to estimate
the size of populations. For example, a significant effect of age in regression models would indicate
that older or younger offenders are at greater risks of re-arrest, something which would have practical
criminal justice implications.
Finally, arrest year is another important control variable because the timing of the first arrest
affects the likelihood of a second arrest: by default, an individual arrested for the first time in late
2009 has a much smaller likelihood of re-arrest than an individual first arrested in early 2008. This is
a peculiarity of this research design where the capture-recapture estimates are derived from a list that
accumulates over time, something that is not necessarily commonplace in biology where such
methods first originated. Controlling for arrest year partially offsets the effect of this bias by
explicitly introducing the information that an individual arrested in a certain year may have lower
probabilities of being arrested because of a smaller observation period, which is the case for 2009
arrestees in this sample.
Tables 9 to 13 present the arrest distribution for all synthetic drug offenders for 2008-2009.
Three key observations can be made in regard to these results. First, age and gender vary little
overall, with a mean of approximately 25 years of age and 86% male proportions, but it is worth
noting that: a) slightly more females are generally found in the meth market (16% vs. 14%), b)
ecstasy offenders are generally younger (24.7 sv 26.5), c) individuals charged with possession (Table
10) are generally younger than supply side offenders, especially those involved in import/export or
production (Tables 12-13). These results are not unexpected. Second, the proportion of offenders re-
arrested varies for the meth and ecstasy markets. Many more meth offenders are re-arrested than
what we found for ecstasy—this is perhaps linked to the younger age of ecstasy users and dealers,
and their (likely) lesser involvement in criminal activities. More extensive comparative profiles of
participants to those two markets would be needed to verify these hypotheses.
Tables 12 and 13 show that no offender was re-arrested for import/export or production in
2008-2009. We extended the period to include 11 years of data (1999-2009) and found that a single
offender had been re-arrested for the full time period. Such a situation makes capture-recapture
methods inoperative. Recall that production was not recorded as a separate offense until 2008. Those
offences were rare, and they were subsumed in the import/export category.
This document is a research report submitted to the U.S. Department of Justice. This report has not been published by the Department. Opinions or points of view expressed are those of the author(s)
and do not necessarily reflect the official position or policies of the U.S. Department of Justice.

29
Taken as a whole, synthetic drug production/importation/exportation rose steadily between
1999 and 2009, from 16 charges in 1999 to a high of 68 in 2009. A total of 48 of the 68 charges were
for production, a 2.4 production-to-importation/exportation ratio. This ratio was 0.95 (18/19) in 2008,
which is either an early sign of a turnaround in the industry (e.g. increased reliance on domestic
production - import substitution) or simply an early sign of a switch in law enforcement priorities (or
both, as we have seen in the cannabis cultivation industry—see Bouchard, 2007; Bouchard and Dion,
2009). The fact that arrest data do not distinguish between charges for importation and exportation
prevents us from being able to make any assumptions about market trends, at least using this data.
Table 9. Age at start of window period, gender, and arrest distribution for meth, ecstasy, and
other synthetic drug offenders, any charges, 2008-2009
Meth Ecstasy Other
synthetic10
All
synthetic
Mean age 2008
(std)
27.4 (10.5) 24.7 (8.8) 26.5 (10.4) 26.5 (10.4)
Male % 83.7 86.8 86.1 85.6
Arrests: n N N n
1 951 420 4,466 5,431
2 51 5 237 351
3 3 29 51
4 6 9
5 4 5
6 1
Total 1,005 425 4,472 5,848
Table 10. Age at start of window period, gender, and arrest distribution for meth, ecstasy, and
other synthetic drug offenders, at least one possession charges, 2008-2009
Meth Ecstasy Other
synthetic
All
synthetic
Mean age 2008
(std)
26.1 (9.3) 24.6 (9.1) 25.6 (10.0) 25.6 (9.9)
Male % 85.8 83.3 86.3 86.0
Arrests: N N N N
1 596 231 2,752 3,417
2 22 2 97 156
3 7 13
4 1
5 1
10 Other synthetic drugs include GHB, PCP, LSD, among others.We suspect that for many of the cases classified
under the “other synthetic” category are simply unknown at time of recording, and may include ecstasy and
methamphetamine.
This document is a research report submitted to the U.S. Department of Justice. This report has not been published by the Department. Opinions or points of view expressed are those of the author(s)
and do not necessarily reflect the official position or policies of the U.S. Department of Justice.

30
Total 618 233 2,856 3,588
Table 11. Age at start of window period, gender, and arrest distribution for meth, ecstasy, and
other synthetic drug offenders, at least one selling charge, 2008-2009
Meth Ecstasy Other
synthetic
All
synthetic
Mean age 2008 (std) 28.9 (11.9) 24.7 (8.5) 27.7 (10.9) 27.7 (11.0)
Male % 81.1 90.6 85.9 85.3
Arrests: n N N N
1 396 189 1,881 2,298
2 17 2 88 123
3 6 12
4 7 7
5 1 1
Total 413 191 1,983 2,443
Table 12. Age at start of window period, gender, and arrest distribution for meth, ecstasy, and
other synthetic drug offenders, at least one import/export charge, 2008-2009
Meth Ecstasy Other
synthetic
All
synthetic
Mean age 2008 (std) N = 6 N = 4 N = 29 29.0 (10.3)
Male % 84.6
Arrests: n N N N
1 39
Total 39
Note: we do not trust substance specific classification for import/export, thus we only provide
statistics for any synthetic drug import/export
Table 13. Age at start of window period, gender, and arrest distribution for meth, ecstasy, and
other synthetic drug offenders, at least one production charge, 2008-2009
Meth Ecstasy Other
synthetic
All
synthetic
Mean age 2008 (std) N = 4 N = 3 N = 63 29.6 (10.4)
Male % 87.9
Arrests: n N N N
1 66
This document is a research report submitted to the U.S. Department of Justice. This report has not been published by the Department. Opinions or points of view expressed are those of the author(s)
and do not necessarily reflect the official position or policies of the U.S. Department of Justice.

31
Total 66
Note: We do not trust substance specific classification for production, thus we only provide statistics
for any synthetic drug production.
An examination of the full time period (1999-2009) shows a steady increase in synthetic
drug-related arrests. The increase was most spectacular between 2005 and 2008 as the number of
offenders arrested more than doubled. This trend in Quebec is consistent with trends observed
elsewhere (McKetin et al., 2008; UNODC, 2009).
Table 14 presents the capture-recapture estimates for all synthetic drug offenders and then
breaks it down by type of offense (possession and selling, Tables 15-16). No estimates could be
provided for importation/exportation and production because not enough offenders were re-arrested
for those offences.
Table 14. Capture-recapture regression (Zelterman) estimates for meth, ecstasy, other
synthetic drugs, and any synthetic drugs - All offences, 2008-2009 (best model in bold).
AIC G2 P 𝑁 95% CI
Meth
Null 405.11 9,882 7,182-12,582
Year 396.67 10.43 .00 11,711 7,690-15,732
Ecstasy
Null 56.37 18,063 2,234-33,893
Other
synthetic
Null 1,880.11 47,092 41,123-53,061
Year + Age 1,857.89 26.23 .00 52,713 44,474-60,952
Any
synthetic
Null 2,649.05 48,230 43,17-53,243
Year 2,607.57 43.49 .00 54,666 47,528-61,804
Best annual
estimatesa
2008-
2009
2005-
2007
2002-
2004
1999-
2001
Meth 5,856 - - -
Ecstasy 9,032 - - -
Other synthetic 26,357 - - -
Any synthetic 27,333 19,370 11,235 6,619
Note. Regression models for 1999-2007 not shown, but available upon request
a. Moving average: the two year 2008-2009 estimates were divided by 2 to obtain annual estimates.
Unless otherwise noted, we always ran two separate models for each offense, and each
market (meth, ecstasy, other synthetic, and any synthetic (which combines them all). The first model
(Null) is the classic Zelterman (1988) estimator involving no covariates. The other model includes
one or more covariates among “Year of first arrest”, “Gender” or “Age”, depending on whether one
or more of them were significantly related to the probability of re-arrest for a specific offense/drug.
This document is a research report submitted to the U.S. Department of Justice. This report has not been published by the Department. Opinions or points of view expressed are those of the author(s)
and do not necessarily reflect the official position or policies of the U.S. Department of Justice.

32
We always started by running the full model with all covariates included, and then backward
estimated models until only significant covariates are included. This means that for some
offense/drug combinations, only the null model (no covariate, equivalent to Zelterman, 1988) proved
to be significant and is presented below.
For each set of estimates, Akaike's information criterion (AIC) indicates which model is a
better fit to the data (the smaller the AIC, the better the fit). The logic of AIC will make it biased
towards choosing the best fitting, most parsimonious model possible. In other words, it penalizes the
addition of non significant variables to models. For each model with covariates, we report whether
the model (G2) is significant (p), the population estimate (N), and the 95% confidence interval. The
smaller the interval, the more confidence one can have in the N estimate, although the intervals are
strictly based on statistical fit, it cannot be emphasized enough that there are no guarantees that they
are more or less on target.
A few additional notes are in order before the results are examined more closely:
Estimates will not vary much when covariates are not significant, as is most often the case
below. This is because the covariates used do not correct for any unobserved heterogeneity in
the data. In those situations, the simpler (Null) model is usually preferred.
When a covariate is shown to be significant, it will generally increase the estimated size of
the population. Although further tests are needed to better understand the model’s behavior in
different contexts, it appears to be a situation where the added information corrects an arrest
rate that was assumed to be too high for a significant portion of the population.
Estimates get extremely unstable in cases with smaller proportions of re-arrests. This is the
case for some of the estimates provided for the ecstasy market where some of the confidence
intervals cross zero (e.g. table 15), making the estimates invalid.
We provide estimates for two years of data. As such, the estimates should be interpreted as
representing a population that has been active at least for some time period during those two
years. If the interest is in annual populations of offenders, an argument can be made for
providing an annual ‘moving average’ estimate for a time period by dividing the size of the
population by two (or three for a three-year period), as others have done (Bouchard, 2007;
Bouchard and Tremblay, 2005). Although we only had two years of drug specific data, it
proved suitable to the application of capture-recapture methods.
Because arrest distributions overlap (see above), estimates for an offense category should not
be added to another in order to assess the size of those populations. We believe the ‘all
offenders’ estimates provide the best overall size estimate. The offense specific estimates are
nonetheless meaningful – many sellers are at risk of being arrested strictly for possession,
and it makes sense to have those sellers belong to both populations for the purpose of this
study.
Starting with all offences, Table 14 shows that the population of synthetic drug offenders at
risk of being arrested in Quebec is estimated to be around 55,000, with a relatively tight confidence
interval of 47,500-62,000. The 55,000 model is estimated from a model where our control for “year
of first arrest” was shown to be statistically significant (simply referred to as “year”), an expected
result that simply means that offenders who are first arrested in 2008 have a higher likelihood of
This document is a research report submitted to the U.S. Department of Justice. This report has not been published by the Department. Opinions or points of view expressed are those of the author(s)
and do not necessarily reflect the official position or policies of the U.S. Department of Justice.

33
being re-arrested before the end of the window period (December 31, 2009). The better fit of the
‘year’ model is a common result for all capture-recapture analyses presented in this study.
Table 14 also shows that offenders involved in synthetic drugs other than methamphetamine
and ecstasy are the most prevalent. The estimates suggest a prevalence of 12,000 for meth, 18,000 for
ecstasy, and over 52 000 for other synthetic drugs (a population which offenders with charges for
meth and ecstasy as well, something that is revealed by the only slightly higher 55,000 total
population estimate). It is uncertain whether the recording practices of law enforcement agencies are
consistent and that such a breakdown reflects true synthetic drug market patterns. We suspect that the
specific substance cannot always be accurately identified at the time of recording and that many
officers will file the arrest under the “other synthetic drug” category to err on the side of caution.
Without a clear answer to this question, we work with the assumption that the breakdown is
meaningful for the purpose of estimating the size of the meth and ecstasy markets in Quebec. This
assumption should be tested in future work.
Our results also include annual estimates for four time periods (1999-2001, 2002-2004, 2005-
2007, and 2008-2009) for “any synthetic drug offences”. 11 This exercise reveals what we already
knew from the arrest data, namely that the synthetic drug market exploded during those years, from
6,000 to 27,000 offenders in a 10 year span.
Table 15 and 16 show the estimates for possession and selling offences, respectively. As
expected, more offenders are at risk of being arrested for possession than for selling synthetic drugs,
which is to be expected as: a) there are more users than dealers, at least 10 times more for most
markets (Bouchard and Tremblay, 2005); and b) it is easier to charge someone for possession than
selling. A comparison shows that the population estimates for possession increased one period before
(2002-2004) it increased for selling (2005-2007) at a much faster pace than the one for selling. The
relatively linear increase for possession shows signs of stabilizing in 2008-2009, although more years
of data would be needed to confirm a trend.
The estimates for selling are especially important for our purposes as one of the objectives of
this study is to estimate the size of the dealer population. The results suggest an annual population of
3,500 meth dealers in Quebec. Unfortunately, the small proportion of ecstasy dealers re-arrested did
not produce a reliable estimate for that drug. The one actually produced suggests a larger number of
dealers for that drug (4,500), something that would be consistent with patterns found on the demand
side. An examination of the actual models shows that age was a significant factor for the “other” and
“any” synthetic drug markets. Where significant, the (positive) direction of the effect suggests that
risks of re-arrests increase with age. For the only instance where gender is significant (Table 16,
selling any synthetic drug), the direction of the effect suggests that risks of re-arrest are higher for
females. Consequently, it means that most of the time, neither males nor females are specific targets
of law enforcement agencies in the synthetic drug markets.
Table 15. Capture-recapture regression (Zelterman) estimates for meth, ecstasy, other
synthetic drugs, and any synthetic drugs – Posession offences, 2008-2009 (best model in bold).
AIC G2 P 𝑁 95% CI
Meth
Null 191.97 8,684 5,063-12,305
Year 183.86 10.11 .00 12,974 4,515-21,433
Ecstasy
11 Details of the estimates derived from 1999-2007 not presented in this final study are available upon request to the
first author.
This document is a research report submitted to the U.S. Department of Justice. This report has not been published by the Department. Opinions or points of view expressed are those of the author(s)
and do not necessarily reflect the official position or policies of the U.S. Department of Justice.

34
Null 25.01 13,573a -5,236-32,381
Other
synthetic
Null 848.38 41,959 33,625-50,292
Year 842.78 7.60 .01 45,664 34,909-56,419
Any
synthetic
Null 1,284.06 41,117 34,686-47,548
Year 1,275.93 10.12 .00 43,888 36,096-51,679
Best annual
estimatesb
2008-
2009
2005-
2007
2002-
2004
1999-
2001
Meth 6,487 - - -
Ecstasy 6,787 - - -
Other synthetic 22,832 - - -
Any synthetic 21,944 18,004 11,068 5,596
Note. Regression models for 1999-2007 not shown, but available upon request
a. Invalid estimate, confidence interval crosses zero
b. Moving average: the two year 2008-2009 estimates were divided by 2 to obtain annual estimates.
As noted above, it was impossible to derive population estimates for importation/ exportation or
production. We did have one offender arrested twice during period 1, which produced an estimate of
968 offenders at risk of being arrested for that time period (or 323 offenders annually, not shown).
However, we cannot put any trust in that estimate, especially considering the confidence interval
which crosses zero (lower bound equals -927, upper bound equals 2,864).
Table 16. Capture-recapture regression (Zelterman) estimates for meth, ecstasy, other
synthetic drugs, and any synthetic drugs – Selling offences, 2008-2009 (best model in bold).
AIC G2 P 𝑁 95% CI
Meth
Null 143.76 5020 2,640-7,399
Year 138.70 7.06 .01 6915 2,294-11,537
Ecstasy
Null 24.22 9121a -3,518-21,759
Other
synthetic
Null 721.01 22200 17,578-26,822
Year+Age 712.94 12.06 .00 24938 18,761-31,116
Any
synthetic
Null 974.66 24,045 19,815-28,275
Year+Age+Gender 958.19 22.47 .00 28,483 21,979-34,987
Best annualb
estimates
2008-
2009
2005-
2007
2002
-
2004
1999-
2001
Meth 3,458 - - -
Ecstasy 4,561 - - -
Other synthetic 12,469 - - -
This document is a research report submitted to the U.S. Department of Justice. This report has not been published by the Department. Opinions or points of view expressed are those of the author(s)
and do not necessarily reflect the official position or policies of the U.S. Department of Justice.

35
Any synthetic 14,242 11,944
4,84
8 4,281
Note. Regression models for 1999-2007 not shown, but available upon request
a. Invalid estimate, confidence interval crosses zero
b. Moving average: the two year 2008-2009 estimates were divided by 2 to obtain annual estimates.
III.A.7.b.Estimating the Number of ATS Dealers
Method 1. Capture-recapture Methods. No Canadian-wide data was available to estimate the
size of the ATS dealing population in Canada. Although not ideal, the results for Quebec presented
above are helpful in trying to provide a crude estimate of the number of sellers for Canada as a
whole. In the spirit of synthetic estimation methods, we first have to find meaningful ATS-related
data that is produced for both Quebec and Canada, an indicator that is likely to vary in similar ways.
One candidate is simply the number of users as estimated by the general population survey. One
reason why it is a suitable candidate is because the number of sellers is most likely to follow the
number of users. The same cannot be said, for example, for the number of producers which may or
may not follow trends in other market levels, depending on the intensity of the exportation activities.
Table 17 presents the estimates for the number of meth and ecstasy sellers, as estimated from
the prevalence of sellers found in Quebec (Table 16). The inference method make a number of
assumptions that may not always be tenable, including the assumption that patterns found in Quebec
are representative of patterns found in the rest of the country and the key assumption that we start
from reliable prevalence estimates.
Table 17. Inferring the prevalence of meth and ecstasy sellers in Canada from the number of
sellers in Quebec, 2009
Meth Ecstasy
Seller prevalence – Quebec 3,458 4,561
User prevalence - Quebec - CADUMS 6,294 62,936
User prevalence - Canada – CADUMS 26,033 234,298
Inference - Seller prevalence – Canada 14,303 16,980
Table 17 suggests that, based on the general population survey indicators, the estimated
population of meth and ecstasy dealers are 14 000, and 17 000, respectively. Are these estimates
plausible? One way to probe these dealer estimates is to see how they compare to the user prevalence
estimates of Table 8. For meth, we found a range of 52,000 to 78,000. A prevalence of 14,000
dealers implies a 3.7 to 5.6 user-to-dealer ratio, which is low, yet not implausible for non-cannabis
markets (see Bouchard and Tremblay, 2005). The user to dealer ratio derived for ecstasy is much
larger, between 15 and 24 which appears high, but again, not implausible. No hard statements can be
made about these estimates without finer research in the user-dealer dynamics for those markets in
Canada. In the meantime, the numbers derived appear reasonable enough (that is, within the limits of
a very large ball park) to proceed.
Method 2. Multiplier Method. The second method used to estimate the number of dealers
relies on the assumption of the reliability of two indicators: 1) the prevalence of ATS users, and 2)
the user-to-dealer ratio. We estimated the first indicator above. The second indicator requires
fieldwork data. Unfortunately, our attempts at interviews with insiders within the ATS markets in
Quebec were unsuccessful. Therefore, we need to rely on data derived from other drug markets, as
presented in Bouchard and Tremblay (2005). The good news is that those ratios vary relatively little
This document is a research report submitted to the U.S. Department of Justice. This report has not been published by the Department. Opinions or points of view expressed are those of the author(s)
and do not necessarily reflect the official position or policies of the U.S. Department of Justice.

36
by type of drug sold: 15 for cannabis, 11 for cocaine, 8 for crack, 7 for heroin. In the absence of ATS
data, we use the full range above (7-15) to produce the estimates.
Table 18. Estimates of the number of meth and ecstasy sellers in Canada, multiplier method
(user-to-dealer ratio), 2009
Meth Ecstasy
Prevalence of users - low
(0% underreporting)
51,858 268,452
Prevalence of users – high
(50% underreporting)
77,788 402,677
User to dealer ratio - low 7 7
User to dealer ratio - high 15 15
Low estimate:
Users low/high User-dealer ratio
3,457 17,897
High estimate:
Users high/low User-dealer ratio
11,113 57,525
Middle estimate 7,285 37,711
The range estimated for both substances is outside the one estimated with method 1 above.
For meth, the estimated range of 3,457-11,113 is completely below the 14,000 estimated above. For
ecstasy, the scenario is inversed: the 18,000-57,000 range is completely above the 17,000 estimated
with method 1. Which one is most plausible? It is hard to know for certain, as even the user-dealer
ratios were not derived from either market. Based on the above, the safest statement that can be made
at this point is that the population of meth dealers is found within the 3500-14000 range and that the
ecstasy dealer population is most likely to be found within the 17,000-57,000 range.
III.A.7.c. Number of ATS Labs
Despite our best efforts to locate ecstasy-specific production data, the simple fact is that more
data is available on meth labs than ecstasy labs. Given this situation, we settled on accumulating as
much data as possible on meth production for the purpose of estimating the number of ATS labs
more generally. Drug specific data on ATS seizures involves very small numbers, and some
uncertainty in regards to actual drugs being produced. In their survey of synthetic drug production in
BC, Diplock et al (2005) reported that 27 of the 33 files analyzed involved meth labs, five were
ectasy labs, and one was a GHB lab. They note that 7 of the 27 meth labs were set up to produce
ecstasy as well. The RCMP (2009) reported that, among the 45 synthetic drug lab seizures in 2008,
12 were ecstasy labs and 21 were meth labs. Given the results presented in Diplock et al. (2005),
however, and the small number of labs involved in seizures annually, we are not confident enough in
the distinction between the type of synthetic drug lab to produce drug specific estimates. With little
data on ecstasy production available at the current time, we make the assumption that the cost
structure of ecstasy production is comparable to what is derived for methamphetamine below.
Method 1. Economic Modeling Method . The chemicals frequently used to manufacture
methamphetamine include pseudoephedrine, anhydrous ammonia, and red phosphorus. However,
there are many methods that can be used to reach the same production goal. Many of the ingredients
have legal uses from cold remedies for pseudoephedrine to anhydrous ammonia for agricultural
fertilizer or red phosphorus for matches. This makes it particularly important to identify the cost of
the various methods to get a reliable fix on the number of labs. Thus far, we have not been able to
find anything other than what could be termed generic statements about cost. Some 32 different
This document is a research report submitted to the U.S. Department of Justice. This report has not been published by the Department. Opinions or points of view expressed are those of the author(s)
and do not necessarily reflect the official position or policies of the U.S. Department of Justice.

37
chemicals can be involved in the process although all start with ephedrine or pseudoephedrine (Chiu,
Leclerc, and Townsley, 2011). We have not been able to identify a price and quantity for each. This
would require supplemental information from participants in this market or law-enforcement experts.
We were, however, able to derive a partial estimate of the cost structure of meth production.
It takes about 10-20 milligrams of meth to have an effect in controlled conditions (Health Canada
2005). Often found in the literature is the assertion that there are roughly 110 doses per ounce or 3.88
doses per gram. If we take the smaller amount, we have about 10 doses to the gram. If meth retails
for $25 per quarter gram and $100 per gram, then one dose is $10. If you have 110 doses per ounce
and 28g/oz then each gram yields an average hit of 250 mg. Consequently, without access to street
level data, it is difficult to conclude what the “average” dose taken really looks like and indeed heavy
users need higher doses. A reasonable assumption would be that the total investment needed for a
one-ounce production of meth is approximately $200, plus the cost of anhydrous ammonia and the
labour cost of production, which should take the better part of a day (this is for a small lab since
larger amounts are produced by labs and “super labs”.) Assembling the materials is relatively time
consuming, although not too difficult for professionals. The cooked product is diluted to become two
to three ounces and sold for approximately $1500 an ounce, although of course this varies by region.
Labor costs and risks are not included in the assessment.
This study’s estimates are based solely on a survey of the internet rather than on police
statistics. Clearly there are areas in which some police data may be available, but more importantly
they illustrate the kind of information that would be usefully gathered by law enforcement to permit a
better estimate of the number of illicit labs.
In Canada there were close to 50 synthetic drug labs busted in 2009. This is a small number
and may well be too small to represent the population. However, to the extent that it reflects an
industry that is growing, it may also be associated with a higher rate of return than what we might
characterize as the "normal" rate of return which is about 10 percent for small business. In what
follows we will assume that in Canada a reasonable return requires the investor to obtain a fifty
percent return on his investment. This is likely to be a transitory assumption since a larger scale of
operation will surely reduce the return. The value of a gram of meth is assumed to be worth $100,
which is consistent with the UNODC (2009) retail estimate. The wholesale price reported by
UNODC is $22,086/kg. Following equation 5 with assumptions that the cost of producing an ounce
of meth is $200 worth of materials, plus another $200 in wages for the producer and another $100 for
rent and protection, yields an unrealistically small estimate of the number of labs in operation.
A more conservative approach to the economics of meth production leads to an estimate of
the number of producers that is signficantly greater. In particular, if we believe that the cost of
production is higher than the simple value of the ingredients since there is an apartment to be rented,
risk attached to the purchase of the materials, and the possibility of permanent injury during the
process of production, then combined with a higher rate of return required on the production process,
this leads to an estimate of the number of ATS labs of about 1,400. The assumptions are that the
value of production is $100 per gram, that a return of 50 percent is required, and that the cost of
production is about $1,800 an ounce. With 50 busts a year, this would imply a detection rate of 3.6%,
which would be 3 times lower than the rate for cannabis cultivation sites in Quebec (Bouchard, 2007;
2008). Decreasing the cost assumption to $1,700 yields an estimate of 560 labs, for a detection rate
of 9%, and another $100 decrease produces an estimate of 350 labs (14% detection rate). To refine
this estimate and get a stronger sense of the number of labs we need data from the larger labs so that
their economies of scale and cost of production can be more systematically developed. In the absence
of better data on ATS labs in Canada, a 560-1,400 range appears to be plausible, especially given the
amount of meth and ecstasy seized in 2007-2008 (UNODC 2009; 2010).
This document is a research report submitted to the U.S. Department of Justice. This report has not been published by the Department. Opinions or points of view expressed are those of the author(s)
and do not necessarily reflect the official position or policies of the U.S. Department of Justice.

38
Table 19 illustrates how estimates are sensitive to a change in the cost parameter, which we
make vary from $400 to $1800. This method also relies heavily on the number of labs detected – a
significant change in the number of labs detected would produce a significant change in the
prevalence estimate. Variations in costs across this range would lead to estimates of the number of
labs (N) from a low of 64 to a high of 1400. The probability of discovery (π) also decreases radically
(from 0.79 to 0.04) as the costs or estimated number of labs increases. Appendix B discusses some of
the ways in which this method can be improved should more detailed data be available in future
research endeavours.
Table 19. Variations in Lab Estimates in Accordance with Differential Cost Parameters
P Q C R B N π
2800 1 400 0.5 50 64 0.79
2800 1 500 0.5 50 68 0.73
2800 1 600 0.5 50 74 0.68
2800 1 700 0.5 50 80 0.63
2800 1 800 0.5 50 88 0.57
2800 1 900 0.5 50 97 0.52
2800 1 1,000 0.5 50 108 0.46
2800 1 1,100 0.5 50 122 0.41
2800 1 1,200 0.5 50 140 0.36
2800 1 1,300 0.5 50 165 0.30
2800 1 1,400 0.5 50 200 0.25
2800 1 1,500 0.5 50 255 0.20
2800 1 1,600 0.5 50 350 0.14
2800 1 1,700 0.5 50 560 0.09
2800 1 1,800 0.5 50 1,400 0.04
P= price per ounce;
Q = quantity in ounces;
C = assumed cost;
R = rate of return assumed (.5 is 50%);
B = number of discovered labs;
N = implied number of labs (raw);
π = probability of discovery
III.A.7.d. Estimating the Number of ATS Producers
No estimates can be derived through the capture-recapture method as no producer was re-
arrested in Quebec in 2008-2009 when this offense started to be recorded. Here we rely on multiplier
method estimates which are subject to even more uncertainty. Note that an estimate of the number of
producers is unnecessary for estimating the quantity of ATS production, which relies on the ATS lab
estimate.
Method 1. Multiplier Method – producer per lab ratio. A producer per lab ratio estimate
starts with the ATS lab estimate and derives the number of producers based on the division of labour
involved in a typical lab. For cannabis production, Bouchard (2008) suggested that, on average, four
individuals are involved from start to finish. Synthetic drug production is likely to involve either as
many people, or perhaps less (cannabis cultivation is generally perceived as more cumbersome and
This document is a research report submitted to the U.S. Department of Justice. This report has not been published by the Department. Opinions or points of view expressed are those of the author(s)
and do not necessarily reflect the official position or policies of the U.S. Department of Justice.

39
involves more steps requiring potential help from others, such as setting up the site, harvesting and
trimming the plants). Sexton et al.’s (2006) small-time producers suggested a process involving at
least two people, sometimes more if help is required to buy the ingredients. Chiu et al. (2011), who
examined court cases of large-scale meth labs in Australia, do not report any numbers but mention
four roles to be filled: operator/organizer, cook, worker (run errands, courier), and security. The more
productive the lab, the higher the likelihood of finding different people taking on such roles.
In the absence of ATS specific division of labour data, we believe that a ratio of three to four
producers per lab is reasonable. We use a ratio of 3.5 in the estimates presented below in table 20
below.
Table 20. A producer per lab estimate of the number of ATS producers in Canada
Low estimate High estimate
Number of labs 560 1,400
Number of producers per lab 3.5 3.5
Producer estimate 1,960 4,900
Table 20 suggests a population of 1960 to 4900 ATS producers in Canada. This estimate is,
needless to say, highly speculative. We do not have data on the number of producers arrested
annually in Canada. The data for Quebec (Table 13) shows that 66 individuals were arrested for
synthetic drug production in 2008-2009, a mean of 33 arrests per year. Assuming that 25% of
producers estimated in Table 20 are from Quebec (range: 490-1225), the risk of being arrested for
synthetic drug production would be 2.7-6.7%. This range would be consistent with the one found
through capture-recapture estimates of the number of cannabis growers in Quebec: 2-5% (Bouchard,
2007).
Method 2. Multiplier Method – arrest ratio. The second method considered simply estimates
the prevalence of producers through a hypothetical detected-to-undetected ratio, illustrated in Table
21 below. We know from Bouchard (2007) that the risks of being arrested for a cannabis producer
ranges between 2 % and 5% per annum. If we assume that the risks for ATS producers may not vary
too widely from those numbers, the estimates found in table 21 can be derived. These estimates are
almost purely based on hypotheticals, so even more caution than usual should be applied. Because
the substance specific arrest data has not been confirmed to be reliable, only one estimate for
synthetic drugs as a whole is produced.
Depending on whether one believes that 1% or 10% is the proper arrest rate, the population
of producers in Quebec varies between 330 and 3,300. Based on demand side proportions, the
Canadian estimate would likely be four times the Quebec estimates (1,320-13,200). It is an enormous
range, wide enough to not warrant further interpretation/consideration at this point. The true rate
could very well outside of that 1-10% range, there is simply no way to know for certain at this point.
For the moment, more faith should be put in the producer per lab ratio estimate for Canada found in
table 20: 1,960-4,900 producers, which may imply that arrest rates are at the lower end of the scale.
Table 21. Estimating the prevalence of ATS producers through hypothetical arrest rates,
Quebec, 2008-2009
Hypothetical yearly arrest risk
1% 2% 5% 10%
Mean annual number of synthetic drug producers 33 33 33 33
This document is a research report submitted to the U.S. Department of Justice. This report has not been published by the Department. Opinions or points of view expressed are those of the author(s)
and do not necessarily reflect the official position or policies of the U.S. Department of Justice.

40
arrested in 2008-2009
Estimated prevalence of synthetic drug producers 3,300 1,650 660 330
III.A.7.e. Quantity of ATS Production
Diplock et al. (Diplock et al. 2005, Table 3 and page 5) found that some 60 percent of the
labs discovered by the police in BC were capable of producing more than 5 pounds of meth or
ecstasy during a single cook. Of the 33 cases that were discovered, two were able to produce as
much as 250 grams (nine ounces), four between 250-500 grams; two between 500 g and one
kilogram; four between one and five kilograms; and twenty were able to produce five kilograms or
more. These values are decisively different from the previous exercise which was based on values of
one ounce or 28 grams of production.
Although we do not have a good read on the actual number of labs associated with what
would be a very different cost structure as well as product pricing, we can hazard a guess about
overall production if we assume that the crude distribution found in BC is similar to that in the rest of
the country. In Table 22, the percentages are those found in BC of ATS labs of different capacities.
This implies the number of labs of each size and the average number of grams of each "cook." This
estimate also keeps the purity parameter constant: without reliable data on purity, it is assumed that
ATS production refers to the weight of what will eventually be sold as ATS to drug users. The final
column in Table 22 gives the total production of the single cook by each type of lab, with an
estimated 2,297 kg from 560 labs, and 5,743 kg from 1,400 ATS labs.12
The vast bulk of production occurs in the large labs. Of course, this is based on an
assumption that the distribution of labs is the same as that discovered in BC, which is highly
unlikely. The police are more likely to find larger operations than a myriad of smaller ones so it is
likely that this is an overstatement of the total amount of production based on one cook. Yet, these
estimates should not be taken as final counts, as they are likely to be too low. The estimated
production is simply that of one "cook." Estimating the total quantity of ATS production in Canada
requires information on the mean number of annual cooks per lab. This is information is not available
at this time. Logistically, a small lab can potentially make four to six cooks a month. The limit, and it
could be an important one, is in consistently finding the required material for another cook. Note as
well that many of the 33 labs described by Diplock et al. (2005) in BC were inactive, suggesting that
many labs may not necessarily produce at their potential or even near their potential. Indoor cannabis
growers, for example, could produce up to eight crops a year, but rarely go beyond three or four
(Bouchard, 2008).
Table 22. Output Estimates of ATS labs based on one cook/lab
Implied output of 560 Labs
Number Average Total
Production %* of Labs cook (gr) Kilograms
50 - <250 g. 7 39.2 150 5.9
250 -<500 g. 13 72.8 375 27.3
500 g – 1 kg 7 39.2 750 29.4
1 - <5 kg 13 72.8 3,000 218.4
12 Arrest records for these seizures do not specify the extent to which each lab was producing drugs for personal use
or for sale or distribution.
This document is a research report submitted to the U.S. Department of Justice. This report has not been published by the Department. Opinions or points of view expressed are those of the author(s)
and do not necessarily reflect the official position or policies of the U.S. Department of Justice.

41
5 Kg+ 60 336.0 6,000 2016
TOTAL ONE COOK/LAB PRODUCTION 2,297.0
Implied output of 1400 Labs
Number Average Total
Production %* of Labs cook (gr) Kilograms
50 - <250 g. 7 98 150 14.7
250 -<500 g. 13 182 375 68.3
500 g – 1 kg 7 98 750 73.5
1 - <5 kg 13 182 3,000 546.0
5 Kg+ 60 840 6,000 5,040.0
TOTAL ONE COOK/LAB PRODUCTION 5,742.5
*Diplock et al., 2005. Calculations by the authors
Given the quantity of ATS consumed in Canada (a high estimate of close to 3 metric tons as
shall be seen below) the quantity of Canadian produced ATS seized annually (2.5 mt in 2007, 0.8 mt
in 2008), a ratio of two cooks per lab is minimally required for the low estimate to be realistic.
Whether such a ratio should be three or more cooks per lab is unknown. We believe that a ratio of
two cooks per lab is reasonably conservative given the current state of knowledge, leading to the
final estimates produced in Table 23, below.
Table 23. Total ATS production in Canada, 2009
Low estimate High estimate
Total production based on one cook 2,297 kg 5,742.5 kg
Number of cooks per lab/year 2 2
Total ATS production 4,594 kg 11,485 kg
Table 23 suggests a range of 4.5 to 11.5 mt of ATS produced annually in Canada. Given such
production, the seizure rate would have been 21.7-55.5% in 2007 with a record 2.5 mt of Canadian
produced ATS seized, and 7.4-18.9% in 2008 where a more modest 850kg of ATS was seized. The
seizure rate calculated by Bouchard (2008) for cannabis cultivation was 11%. Unless one believes
that law enforcement agencies are that much better at detecting ATS than cannabis (the low number
of seizures would indicate otherwise), the high estimate of 11.5 mt of ATS produced may be closer to
reality. Again, any strong conclusion is unwarranted at this stage. Based on UNODC’s (2010)
estimate of worldwide ATS production of 250-746 metric tons, the 4.5 mt scenario would imply that
Canada produces 0.6-1.8% of the total world amount. Based on the 11.5 mt scenario, we would
expect 1.5-4.6%, for a final range of 0.6 to 4.6%. Whether Canada deserves a ‘major player’
reputation based on those numbers is a matter of opinion, but under no plausible scenario can Canada
be considered as a major producer in the global ATS market under most standards.
III.A.7.f. Quantity of Domestic ATS Consumption
Method 1. Quantity per user ratio I. Using Kilmer and Pacula’s (2009) methods and
assumptions, we provide estimates of the amount of ecstasy (Table 24-25) and meth (Table 26)
consumed in Canada using the prevalence estimates derived above (Table 8). The estimated range for
both substances is wide. For ecstasy, it is from 8 million to 56 million ecstasy tablets consumed in
Canada in a given year. It is slightly lower than the one produced by Kilmer and Pacula (2009) for
2004, reflecting a slight decrease in ecstasy use noticeable in the general population survey. The mid-
This document is a research report submitted to the U.S. Department of Justice. This report has not been published by the Department. Opinions or points of view expressed are those of the author(s)
and do not necessarily reflect the official position or policies of the U.S. Department of Justice.

42
range estimate would be 32 million tablets. The RCMP typically seizes over 1 million ecstasy units
annually (1.5 million units in 2008, according to UNODC, 2010) and an unknown quantity of
domestic production is destined for markets overseas. The estimated range implies that whether the
consumption estimate is closer to the low or high end estimate (which are lower bounds of the total
production which includes exports), the seizure rate achieved by law enforcement agencies would at
most be anywhere between 1.8% and 19%.
Table 24. Estimating the quantity of ecstasy consumed in Canada in 2009 from the table per
user ratio found in Kilmer and Pacula (2009)
Ecstasy
Past year users (Table 8) above 268,452 users
Correction for under reporting (20%/50%) Low (20%): 322,142
High (50%): 402,678
Mean tablets consumed/year
(Kilmer and Pacula, 2009)
Low: 30 tablets/year
High: 139 tablets/year
Low tablets * low user estimate 8,053,560 tablets
High tablets * high user estimate 55,972,242 tablets
Table 25. Estimating the quantity of ecstasy consumed in Canada in 2009 from UNODC’s
(2010) gram per user ratio
Ecstasy
Past year users (Table 8) above 268,452 users
Correction for under reporting (20%/50%) Low (20%): 322,142
High (50%): 402,678
Mean amount of grams consumed/year
(UNODC, 2010) 5.1 grams
Low estimate – quantity 1,643 kg
High estimate – quantity 2,054 kg
When transformed back into kilograms at 75 mg/pill, the range found in Table 24 produces a
wide range of 604 to 4,198 kg of ecstasy used in Canada. Relying on UNODC’s 5.1 gram/user ratio,
the range is brought down to 1,643-2,054 kg (Table 25), which is considered as the best estimate for
the purpose of this study.
For meth, we had to modify Kilmer and Pacula’s method because the available Canadian
meth consumption data is not detailed enough. What we did for the lower bound is to use the mean
amount of meth used per year per user as provided in the UNODC’s World Drug Report 2010: 10.9
grams.
Table 26. Estimating the quantity of methamphetamine consumed in Canada in 2009 from
UNODC’s (2010) gram per user ratio
Meth
Past year users (Table 8) above 51,858 users
Correction for under reporting (20%/50%) Low (20%): 62,230
High (50%): 77,788
Mean amount of grams consumed/year
(UNODC, 2010) 10.9 grams
This document is a research report submitted to the U.S. Department of Justice. This report has not been published by the Department. Opinions or points of view expressed are those of the author(s)
and do not necessarily reflect the official position or policies of the U.S. Department of Justice.

43
Low estimate – quantity 678 kg
High estimate – quantity 848 kg
According to Table 26, Canadians consumed anywhere from 678 to 847 kg of
methamphetamines in 2009. Combined with ecstasy, this gives us a range of 2,321 to 2,902 kg of
ATS consumed by Canadians in 2009.
Method 2. Quantity per user ratio II. We also estimated the number of meth users in Canada
from the wastewater analysis method (Metcalfe et al., 2010). Because this estimate is so close to the
high end estimate presented in Table 26 (859 kg vs 848 kg), we simply rely on the range produced in
Table 26 for the purpose of estimating the quantity of ATS exported below.
III.A.7.g. Quantity of ATS Exported
The previous estimates allow us to assess the quantity of meth that is possibly exported from
Canada. As before, we offer two different scenarios (one low and one high estimate). Neither
scenario may be discarded at this point. Indeed, the true estimate could possibly even higher than
what is estimated here. It is not likely, however, that ATS production is lower than the low estimate
found in Table 27 (see below).
Drawing from mid-point estimates for consumption and seizure data, Table 27 suggests that
Canada would have had an excess of 1,733 kg to 8,624 kg of ATS available for exportation annually.
Table 27 also adds information about the quantity of Canadian produced ATS overseas to produce an
estimate of any ATS unaccounted for by Canadian users or law enforcement agencies around the
world. This serves as an indicator of whether the potential exportation estimates are potentially too
low (in the event that such an estimate produces a negative number). The exercise suggests that an
excess of 288 to 7179 kg of ATS was available for consumption overseas after domestic and
international seizures and consumption have been taken into account.
Table 27. Estimating potential ATS exports from Canada to any other country, 2009
Low estimate High estimate
Quantity of ATS produced 4,594 kg 11,485 kg
Minus:
- Total meth consumption
(mid-point estimate from Table 26) 763 kg 763 kg
- Total ecstasy consumption
(mid-point estimate from Table 25) 1,849 kg 1,849 kg
- Total meth seizures in Canada (mid-
point estimate for 2007-2008, from
RCMP, 2009)
141 kg 141 kg
- Total ecstasy seizures in Canada
(mid-point estimate for 2007-2008,
from RCMP, 2009)
108 kg 108 kg
=
Total ATS potentially exported to
other countries 1,733 kg 8,624 kg
Quantity of ATS seized overseas
(Mid-point estimate for 2007-2008 1,445 kg 1,445 kg
=
This document is a research report submitted to the U.S. Department of Justice. This report has not been published by the Department. Opinions or points of view expressed are those of the author(s)
and do not necessarily reflect the official position or policies of the U.S. Department of Justice.

44
Total ATS potentially exported +
not seized by law enforcement
agencies
288 kg 7,179 kg
Seizure rate 36.9% 14.8%
III.A.8. Section Summary
Is Canada really one of the world’s leading synthetic drug producers? Answering this
question requires that reliable estimates of the size of the ATS market in Canada be produced,
something that is simply not available. Although the estimates produced in this study are tentative, it
nonetheless offers a good starting point to consider Canada’s role in ATS production worldwide.
The current study addressed the lack of reliable estimates on the scope of the ATS market in
Canada. Drawing on a variety of methods, we estimated the size of four sub-populations of
individuals/units (ATS users, dealers, producers, labs), as well as three separate “quantity” estimates
(domestic consumption, domestic production, quantity exported). Such estimates allow us to assess
Canada’s role in the global ATS market. This will be particularly valuable in terms of establishing a
baseline for assessing the effectiveness of regulatory and enforcement efforts.
To derive these estimates, we used existing survey, arrest, and seizure data. Procedures used
included multiplier methods, synthetic estimation methods, capture-recapture methods, and economic
modeling methods. Table 28 presents a summary of estimates for segments of the meth and ecstasy
markets in Quebec, BC, or Canada.
In most analyses, the diverse methods that were applied yielded consistent results, but much
more research is required to provide further validation of this study’s results. This study should be
approached as a first step in developing standard methods that academics and policy makers can use
to make systematic assessments of the ATS and other illicit drug markets in Canada and beyond. Our
efforts should therefore be viewed as an exploration that lays the groundwork for a Canada-wide
study with a strong emphasis on collecting fieldwork data. The present experience suggests that some
methods (e.g., capture-recapture) are more accurate tools than others (e.g., multiplier estimates) for
estimating illegal markets.
Assessments of the demand-side of the ATS market, based on synthetic estimation
techniques, suggest that there are roughly 52,000 meth users and 270,000 ecstasy users in Canada.
This estimate is based on a low count of data which combines the general population that is twelve
years and older, the homeless population, and the inmate population. This total count of 320 000
likely underestimates the population of ATS consumers. Adjustments for 50% underreporting (high
count) suggest a much larger total population of about 480,000 users (77,788 meth users and 402,677
ecstasy users).
Table 28: Summary Estimates
Meth Estimates Ecstasy Estimates
Users
- Synthetic estimation
Low: 51,858 (Canada)
High: 77,788 (Canada)
Low: 268,452 (Canada)
High: 402,677 (Canada)
Dealers
- Capture-recapture
3,458 (Que.)
14,303 (Canada)
4,561 (Que.)
16,980 (Canada)
This document is a research report submitted to the U.S. Department of Justice. This report has not been published by the Department. Opinions or points of view expressed are those of the author(s)
and do not necessarily reflect the official position or policies of the U.S. Department of Justice.

45
- Multiplier (dealer : user) Low: 3,457 (Canada)
High: 11,113 (Canada)
Low: 17,897 (Canada)
High: 57,525 (Canada)
ATS Estimates
Labs
- Economic model
Low: 560 (Canada)
High: 1,400 (Canada)
Producers
- Multiplier (3.5 producers per lab)
- if 560 labs
- if 1400 labs
1,960 (Canada)
4,900 (Canada)
Total Consumption
Low: 2,321 kg (Canada)
High: 2,902 kg(Canada)
Total Production
Low: 4,594 kg(Canada)
High: 11,485 kg (Canada)
Total Potential Exportation
(after seizures taken into account)
Low: 1,733 kg (Canada)
- 38% is potentially exported
High: 8,624 kg (Canada)
- 75% is potentially exported
Our assessment of the supply-side of this market relied on arrest data. The market is
predominately male, but no more so than other illegal drug markets and crime settings in general.
The population estimates suggest that a steep increase occurred between 1999 and 2009 in Quebec,
echoing what has been found through other indicators in Canada. One limit in our analysis was that
we were unable to provide a valid estimate of importers, exporters, and producers. These populations
are small, captured offenders have a higher likelihood of being incarcerated for longer time periods
(and thus be unavailable for recapture), and simply not enough offenders get re-arrested for these
methods to be usable.
The populations of meth and ecstasy dealers were estimated using both capture-recapture and
multiplier estimates. Based on arrest data from Quebec, the capture-recapture estimate resulted in
3,458 meth dealers and 4,561 ecstasy dealers in Quebec. This allowed us to infer Canadian
populations of 14,303 meth dealers and 16,980 ecstasy dealers. Results from the multiplier procedure
for Canada that was based on a user:dealer ratio provided some validation at the higher end for meth
and lower end for ecstasy—the population of meth dealers was estimated from a low of 3,457 to a
high of 11,113 dealers, while the population of ecstasy dealers was estimated from a low of 17,897 to
a high of 57,525 dealers. Once again, the substantial range that emerges from the multiplier
procedure calls for considerable caution and additional verification with different data sources on a
variety of regions.
Estimates of the population of labs and producers were also derived using diverse methods.
While capture-recapture estimates proved to be amongst the more effective in this study, we were
unable to provide such an estimate for the number of producers since arrests were too few in our data
for this segment of the market. The number of ATS labs was estimated using an economic model.
This estimate ranged from a low of 560 labs to a high of 1,400 ATS labs in Canada. Such
This document is a research report submitted to the U.S. Department of Justice. This report has not been published by the Department. Opinions or points of view expressed are those of the author(s)
and do not necessarily reflect the official position or policies of the U.S. Department of Justice.

46
information was subsequently carried over to assess the number of producers in the country. A ratio
of 3.5 producers per lab was established, resulting in estimated low of 1,960 ATS producers if 560
labs were in operation to a high of 4,900 producers if 1400 labs were in operation in Canada.
Both ATS production and consumption were estimated in order to arrive at a final estimate of
how much meth could be reasonably exported from Canada. Such an analysis would lend some
substance to persistent claims and debate regarding Canada’s pivotal position in the international
ATS trade. Using the results from the economic model as a starting point, overall production was
estimated at 2,297 kg if the lower-end 560 labs scenario was accurate and 5,743 kg if the higher-end
1,400 labs scenario was accurate. Such results must be approached with caution since the estimates
are based on a single cook per lab in a given year—it may very well be the case that ATS labs
produce multiple batches and will likely yield much larger quantities than we estimate. Adjusting
these estimates to two ‘cooks’ per lab resulted in low-end estimate of 4,594 kg and high-end estimate
of 11,485 kg of meth in Canada.
Using a multiplier method to derive a quantity per user ratio, meth consumption for Canada
was estimated between 678 kg and 847 kg. Ecstasy production was estimated between 1643 and
2054 kg. Combining meth and ecstasy resulted in a total ATS consumption range of 2321 to 2902 kg
in Canada.
Based on mid-point estimates for consumption and seizure data, we estimated an excess of
1733 kg to 8624 kg of ATS available in Canada for annual exportation. This would suggest that 38%
(if 1733 kg of production) or 75% (if 8624 kg of production) of ATS produced in Canada is exported.
Information was also added regarding the quantity of Canadian produced ATS overseas to produce
an estimate of any ATS unaccounted for by Canadian users or law enforcement agencies around the
world. The exercise suggests that an excess of 288 to 7,179 kg of Canadian ATS was available for
consumption overseas after domestic and international seizures and consumption were subtracted
from overall production.
Does this make Canada a key player in the international ATS trade? The estimates produced
for the purpose of this study suggest that Canada produces as little as 0.6% of the world’s supply
according to the low estimate scenario or as much as 4.6% according to the high estimate scenario.
Whether Canada deserves a ‘major player’ reputation based on those numbers is a matter of opinion,
but Canada would not be considered to be a major producer in the global ATS market under most
standards. ATS, like cannabis, can be produced virtually anywhere in the world. Based on the
estimates produced in this study, Canada is no more and no less of a global player today than it was
five years ago.
III.B. Chemical Composition and Price Assessments of the
III.B.1. Quebec Synthetic Drugs Market
The production and export of synthetic drugs in Canada has garnered significant attention in
recent years. Large border seizures and reports published by narcotics bodies have triggered a surge
of interest, placing synthetic drugs at the forefront of national law enforcement agendas and in the
media spotlight. News sources, emphasizing a structured view of the market, have labeled Canada a
"global drug lord" (Glenny, 2009) and drawn parallels between the Canadian synthetic drug market
and highly organized Colombian drug enterprises (Godfrey, 2012). However, despite these
allegations and the heightened attention accompanying them, few analyses of basic elements of
Canada’s synthetic drug market have been conducted, particularly in regard to its organizational
characteristics and structural attributes. Further of the sparse set of studies, findings are often
fragmented and contingent on multiple assumptions, only providing glimpses into the market’s
structure or even echoing discredited allegations. This current lack of validated information may be
This document is a research report submitted to the U.S. Department of Justice. This report has not been published by the Department. Opinions or points of view expressed are those of the author(s)
and do not necessarily reflect the official position or policies of the U.S. Department of Justice.

47
attributed to the paucity of innovative methodological tools available to assess the clandestine
market, hindering the development of reliable analyses. Conventional analytical methods that rely on
peripheral and direct players for insight are limited in markets where access to participants is rare.
Attempting to narrow the gap between efforts to analyze the market and reliable methods to do so,
innovative approaches have emerged that use properties of the drug market to analyze its structure.
Adopting this model, we conducted a drug composition and economic analysis using two
fundamental elements of the market, seized drugs and prices, to provide an innovative and systematic
assessment of the structural characteristics and organizational features of Quebec’s synthetic drug
market.
Despite their prevalence, few researchers have turned to the central component of the drug
market, the drugs themselves as a unit of analysis. Drugs are frequently seized through law
enforcement procedures; however, given police and judicial mandates, their use often ends as a
justification for arrest and court room evidence. With the aid of chemical extraction and systematic
classification, these seized drugs can also serve another purpose: providing intelligence to gain
insight into the structural and organizational attributes of the drug market. Using seized drugs,
specifically drug composition data, as the basis of the current research, we analyzed the composition
and physical features of seized synthetic drugs in Quebec to assess the market’s structure. In
addition, drug prices, another component of the market, were incorporated into the analyses to
provide a comprehensive understanding of the market’s internal dynamics.
III.B.2. Assessments of the Synthetic Drug Market
The necessity of innovative and reliable approaches to assess the synthetic drug market
follows from the inconsistencies that have emerged from the sparse set of analyses. Recently, studies
have advanced the notion that a few illicit enterprises control significant shares of Canada’s synthetic
drug market (Canadian Security Intelligence Service (CSIS), 2010; Royal Canadian Mounted Police
(RCMP), 2010), contrasting with earlier research on crime groups that state they generally operate
within ephemeral and competitive structures (Block & Chambliss, 1981; Reuter, 1983; Haller, 1990;
Potter, 1994; Gruppo Abele, 2003). Many of the former allegations have been observed in reports
published by Canadian national intelligence bodies. CSIS in their 2010 Organized Crime Report
claim that clandestine ‘super labs’ have proliferated in Canada to meet the demands of consumer
countries, including Australia and New Zealand (CSIS, 2010). Also supporting these allegations is
the RCMP Criminal Intelligence Division in their 2009 report on the Illicit Drug Situation in Canada.
This report stated that not only are organized crime groups alleged to be in charge of “economic
based laboratories” (covert laboratories whose goals are to make profits by responding to both
national and international demand), but comparatively speaking, they are present in higher numbers
than “addiction-based labs” (smaller laboratories that are primarily for a consumer’s personal supply)
(RCMP, 2010). These statements suggest that large organizations play an integral role in the market,
responsible for supplying the bulk of consumer demand. Running these large laboratories to meet this
wholesale demand requires a high degree of organization, encouraging a rigid and structured
perspective of these criminal collectives.
However, these claims should be interpreted with caution, as much of the data and methods
are undisclosed, preventing independent researchers from reviewing and evaluating how the results
were obtained. Providing a glimpse into their methodology, the RCMP (2010) revealed that their
findings rely primarily on seizure data. However, in addition to a lack of detail that was provided for
this source (they only state that seizure data was used), seizure data has been criticized for not being
a valid indicator of drug markets due to its potential to fluctuate in response to factors that are not
related to or actual changes in the drug market, such as a single, significant seizure or shifts in law
This document is a research report submitted to the U.S. Department of Justice. This report has not been published by the Department. Opinions or points of view expressed are those of the author(s)
and do not necessarily reflect the official position or policies of the U.S. Department of Justice.

48
enforcement priorities (Bouchard et al, 2011). Variations in seizure data may indicate enhanced
police targeting and funding, rather than increases in production, informing us of police strategies
and thus the activities of these authorities, rather than actual market behaviour.
In contrast to these reports, a recent multi-site European study has emphasized that the
synthetic drug market is likely competitive and transient (Gruppo Abele, 2003). Over a three-year
period, research teams analyzed three European synthetic drug markets; Barcelona (Montañes,
Barruti, Pallarés & Domínguez, 2003), Amsterdam (Blickman, Korf, Siegel & Zaitch, 2003), and
Turin (Massari, Mareso, Monzini & Veglio, 2003). Applying a multifaceted approach that relied
primarily on qualitative research tools, including interviews with police officers and drug traffickers,
they established that many groups operated in a loosely structured, flexible, and decentralized
market, with few barriers to entry or exit. Their research was highly valuable as two of the drug
markets they observed were at different stages of development, allowing them to make distinctions
and study structural variations. A young market, Spain, consisted primarily of small amateur labs that
manufactured a relatively small amount of pills destined for local consumption (Montañes et al,
2003). In contrast, the Netherlands had developed into a more professionalized market that consisted
of small groups and a network structure that relied on the outsourcing of specialists, such as chemists
and individuals involved in the trade of precursors (Blickman et al, 2003). Regardless of degree of
professionalization their research allowed them to determine that all three markets were highly
adaptable and an “extremely fluid and multifaceted phenomena” (Gruppo Abele, 2003, p. 223).
Although this report provides an extensive analysis of the synthetic drug market, the primary
method to investigate the synthetic drug market by the Gruppo Abele was through the use of
interviews with active, former, and indirect participants involved in the illicit trade. While this
method provides a technique to learn more about the structure through insider accounts of the drug
markets, these sources may only provide partial or misinformed accounts and thus may misrepresent
the sphere and characteristics of the drug market as a whole. In addition, these methods primarily
relied on data obtained at the retail level, not allowing us to observe the higher level, and thus more
influential, actors in the market. To overcome these data limitations, quantitative data were also
obtained and integrated into the study to examine the market, although to a lesser extent. The report
concluded by emphasizing the necessity of conducting further studies on the market in this and other
regional and global contexts.
Using an innovative method, drug composition analysis, the current study aimed to resolve
these discrepancies, while providing a focused analysis of the synthetic drug market in Quebec. The
first method, drug composition analysis, was modeled off extensive research in Europe, particularly
studies conducted by Dujourdy et al (2003), Esseiva et al (2007), Marquis et al (2008), Weyermann
et al (2008), and Zingg (2005), which have examined the reliability of chemical extraction methods
for drug composition data and the utility of this information in a drug intelligence context. Drug
composition analysis is uniquely placed to derive information about the market, using the central
component of the market, the drugs themselves as the unit of analysis. Taking information obtained
from synthetic drug seizures, drug composition analysis examines the seized synthetic tablet’s
chemical makeup (the number of and concentration of different substances present in the tablet) and
physical properties (e.g. color and logo) to make inferences about the market’s features. At the core
of this method is the premise that each drug carries its manufacturer’s signature, based on the
“recipe” he or she used. Given the wide range of synthesis methods, an infinite number of cutting
agents, and the endless colors and logos the drug can be pressed into, it is assumed that drugs
produced by the same manufacturer carry the same profile and therefore can be identified through an
analysis of the drug’s chemical and physical characteristics. Thus, by linking and classifying drugs
according to their similar characteristics (tablets with the same concentration of active substances and
This document is a research report submitted to the U.S. Department of Justice. This report has not been published by the Department. Opinions or points of view expressed are those of the author(s)
and do not necessarily reflect the official position or policies of the U.S. Department of Justice.

49
organic impurities or physical features) we can gain insight into the number and size of drug
manufacturers in a given area, revealing the organizational characteristics and structural features of
this market.
To accurately conduct a drug composition analysis numerous characteristics of the synthetic
drug market need to be taken into account when interpreting results. In particular it is essential to
note the two distinct steps in the synthetic drug manufacturing process: the pre-tabletting stage,
which involves the chemical synthesis of the active substance, and the post-tabletting stage, the
compression of the powder into tablet form. The first step, the pre-tabletting component of
production, comprises the creation of the drug’s chemical composition, including the active
substance and organic impurities that are formed during synthesis as well as any cutting agents that
are added to the final product (Milliet, Weyermann & Esseiva, 2009). Following this step is the post-
tabletting stage, which creates the physical appearance of the tablet and involves the compression of
the powder into its final shape, determining the weight, diameter, logo, and other physical features of
the tablet (Milliet, Weyermann & Esseiva, 2009). After this step, the samples remain static with no
further changes to its structure until after purchase or seizure (Milliet, Weyermann & Esseiva, 2009).
While some researchers have noted systematic and strategic links between a drug’s composition and
its logo suggesting that both steps are conducted by the same individuals or groups (Karch, 2011), it
is essential to factor in these two stages when conducting a drug composition analysis, as they may
be conducted in different locations and reflect separate actors.
A further method to analyze the synthetic drug industry is through an economic analysis.
Drug prices are a valued research tool to analyze illegal drug industries, as they are a fundamental
component of drug markets and can reveal the economic forces and factors at work in illicit
enterprises (Caulkins & Reuter, 1996; Caulkins & Baker, 2010). Price data has been used extensively
to inform drug policies and provide insight into drug markets, including the effectiveness of law
enforcement interventions (Caulkins & Reuter, 2010) and to monitor changes in the structure of the
market (Rhodes, Hyatt & Scheiman, 1994). These studies rely primarily on price oscillations over
time to make inferences about changes in the drug market. However, to reliably use price data to
analyze illegal drug markets, it is essential that the determinants of illicit drug prices are
comprehensively understood; otherwise we risk making faulty conclusions and attributing price
fluctuations to unrelated factors. In addition knowledge of the determinants of these price variations
can provide information about the internal dynamics of the illicit market, revealing production costs,
behavioral trends, market structure, consumer trends, demand and supply and other factors that lead
to the final setting of prices. As we know little about the synthetic drug market we also know little
about price variations therein and the factors that account for such price variations.
III.B.3. Determinants of Illegal Drug Prices
Multiple factors influence the amount that illicit drugs are sold for. Drug markets are
influenced by both the same economic rules as legal markets as well as unique factors associated
with operating in an illegal market. Touching on the myriad of elements that can influence drug
prices, it is important to note that drug prices are governed by similar market forces as legal
commodities (Reuter & Haaga, 1989; Pietschmann, 1997; Ritter, 2006), complying with basic
economic supply and demand principles (Ritter, 2006). In its most basic form, changes in the market
are reflected in the supply or demand of a commodity, which subsequently impacts its price. Price
changes occur to restore market equilibrium, where supply equals demand, so as to regulate product
shortages or excesses (Moore et al, 2005).
Further, although drugs comply with some of the same principles as legal goods, current
prices of illicit drugs are significantly higher than if they were sold in the legal market (Reuter &
This document is a research report submitted to the U.S. Department of Justice. This report has not been published by the Department. Opinions or points of view expressed are those of the author(s)
and do not necessarily reflect the official position or policies of the U.S. Department of Justice.

50
Kleiman, 1986; Moore, 1990; Miron & Zwiebel, 1995). To account for these price disparities are
additional distinct factors, tied to their illegality, which also influence their retail price (Caulkins &
Reuter, 1998). While operating in an illegal market reduces some costs associated with running an
enterprise, additional risks are incurred by the product’s criminality and significantly increases risk
expenses including violence, risk of arrest, and judicial costs (Caulkins & Reuter, 1998). These
additional risks significantly hike transaction costs and subsequently the drugs final retail price.
Despite extensive studies on the determinants of drug prices, few have examined the factors that
influence the retail cost of synthetic drugs. Knowledge of these factors can reveal information about
the inner dynamics that characterize this clandestine market.
III.B.4. Analytical Approach
Aiming to provide a reliable picture of the structural attributes of Quebec’s synthetic drug
market while working within the confines of the data, this study proceeded in three stages. First a
descriptive analysis using the drug composition data will provide an initial overview of the market,
identifying links between drugs with shared characteristics and thus providing a detailed description
of the market’s structure. Second, building off these findings and using the same data, a cluster
analysis was conducted to statistically model these structural features by determining the optimal
number and nature of clusters for all the seized drugs and will provide for the creation of a structural
variable. Lastly, the price data were incorporated to examine how this structural variable and other
market indicators influence price variations across the province. In sum, this multi-faceted approach
allowed us to examine the industry at both the retail level, through an analysis of price determinants,
and the production level, through the composition of the drugs that manufacturers produce, providing
for a comprehensive analysis of the market’s features.
III.B.5. Sources of Synthetic Drug Tablets
This study relies on 365 synthetic drugs that were obtained through a project commissioned
by the Canadian government in response to concern over increased use of synthetic drugs. In
partnership with the provincial and municipal police forces in the province Quebec a sample of
seizures made by law enforcement agencies in Quebec between June 2007 and 2008 were analyzed
by Health Canada who extracted and systematically classified the synthetic drugs based on their
chemical composition (active substance and cutting agents) and physical features (score, color, and
logo). Among these tablets, there were four major active substances (MDMA, MDA,
methamphetamine, and amphetamine), and over forty adulterants, cutting agents, and/or by products
of the chemical reactions. The wide range of tablets with different chemical compositions was also
consistent with their physical characteristics, which contained both a high number of different logos
(n= 122) and colors (n=12). All the synthetic drugs in this sample were seized in nine different areas
across the Quebec province: Abitibi-Temiscamingue, Bas Saint-Laurent, Cote-Nord, Estrie,
Gaspesie, Mauricie, Montreal, Outaouais, and Quebec. This information provided us with valuable
information on potential regional differences and a more representative picture of the Quebec
province, reflecting both small remote regions and densely populated urban centres.
Additional information regarding the context and details of the seized drug in this sample was
also supplied from law enforcement investigative files, which included whether the drug trafficker
was selling his/her product as ecstasy or speed, irrespective of the actual composition and the retail
price of the drug (all in Canadian dollars). The majority of drugs were sold as speed (n=244; 66.8%)
and under one quarter as ecstasy (n=88; 24.1%). Prices of these drugs ranged from a minimum of two
dollars and fifty cents to a maximum of twenty dollars with the majority being sold for ten dollars
(n=133). As prices were obtained only for 261 of the drugs, this subsample comprises the economic
This document is a research report submitted to the U.S. Department of Justice. This report has not been published by the Department. Opinions or points of view expressed are those of the author(s)
and do not necessarily reflect the official position or policies of the U.S. Department of Justice.

51
analysis. The prices obtained in this seizure closely resemble prices of ecstasy in other Western
regions across Europe. The 2011 Annual Report by the European Monitoring Centre for Drugs and
Addiction (EMCDDA) stated that in the majority of countries ecstasy retail prices varied between
EUR $4-9 and Schifano et al (2006) observed that the average price of a tablet in 2003 cost
approximately £5.30 in the UK (Schifano et al, 2006). Still, it should be noted that drug prices are
affected by the level of availability in a certain region and the seller’s level within the distribution
hierarchy.
III.B.6. Profiling Quebec’s Synthetic Drug Market
Providing a model to utilize drug composition data is extensive research that has examined
statistical methods to determine cutting points for whether drugs originate from the same production
batch (Dujourdy et al, 2003; Esseiva et al, 2003; Zingg, 2005; Anderson et al, 2007; Esseiva et al,
2007; Weyermann et al, 2008; Marquis et al, 2008; Esseiva et al, 2011). According to these studies,
the pearson correlation has consistently been determined to be the most reliable method to determine
cutting points at which drugs with shared characteristics came from the same manufacturer. In these
studies researchers linked drugs based on detailed information including the quantity and
concentration of each substance present in each tablet (Esseiva et al, 2003; Zingg, 2005; Anderson et
al, 2007; Weyermann et al, 2008). However, contrary to this research, the data in the current study
does not provide the percentage of each ingredient, only yielding information on the substances
present in each tablet and not their respective concentration, precluding us from adopting the pearson
correlation. This level of chemical analysis was not integrated into the data that was shared with us,
and it was exceptional that we were able to receive any information in regard to the composition of
the tablets. Accounting for the differences in data, the analysis procedures were adapted accordingly,
substituting the pearson correlation with two distinct methods, a network and a cluster analysis.
Although these two methods perform the same assessments (they both organize the drugs into groups
according to shared properties), they were both incorporated in an effort to mitigate the limitations
inherent in each method and to provide a more detailed analysis of the drug market.
The first method, network analysis, permitted a detailed view of the drugs’ compositions and
physical attributes and how they were directly connected according to these features. It permitted us
to link each feature of a tablet, whether physical or chemical, with all of the 365 other tablets in the
sample. This contrasted with the cluster analysis, which could not capture this level of detail, as the
high variation in chemical and physical drug profiles and the low frequencies reported for much of
the drugs traits required that variables be regrouped into larger categories or eliminated entirely.
Despite providing less detail, the cluster analysis was incorporated to provide a statistical validation
of the relationships found in the network analysis. Further, it also created a dependent variable that
reflects the structural features of the market. Thus, within the framework of this study, the cluster
analysis served a statistical objective, aforementioned, while the descriptive network analysis served
to provide a detailed analysis into the number of distinct profiles, and thus insight into the structure
of the market.
III.B.7. Linking the Seized Drugs
Network analysis has been extensively applied in the field of criminology to examine the
relational ties between actors, including organized crime groups (McIllwain, 1999) and terrorist cells
(Krebs, 2002), to provide information about market structure. Although traditionally used with
individuals, this study used seized drug cases as the unit of analysis. This substitution is based on the
aforementioned premise that a seized drug serves as a manufacturer’s signature, and is therefore
reflective of the producer. Thus, the market structure will be assessed by examining the “ties”
This document is a research report submitted to the U.S. Department of Justice. This report has not been published by the Department. Opinions or points of view expressed are those of the author(s)
and do not necessarily reflect the official position or policies of the U.S. Department of Justice.

52
between each tablet based on the drugs shared chemical and physical characteristics. The network
analysis proceeded in a number of steps (UCINET was the main software used). First, all the data for
the physical (logo and colour) and chemical characteristics (active substance and cutting agents) for
the 365 drugs were input into a table, according to whether it shared one or more of these defining
features with another tablet in the sample. Thus, if two tablets shared three of the same characteristics
(e.g. both contained methamphetamine, diphenhydramine, and had a smiley logo) they were linked
across the table with the number three. This method not only allowed us to group the tablets
according to shared features, but also permitted us to examine the strength of the relationship
between tablets.
From the analysis, eighty different chemical compositions were identified among the 365
seized synthetic drugs, each tablet a different combination of the active substance(s) and/or cutting
agent(s). The most popular tablet in the sample contained methamphetamine and caffeine (n=100),
comprising 27.4% of all seized synthetic drugs. Other popular profiles included MDMA (n=18),
MDA (n=19), and methamphetamine (n=27). The wide range of tablets with different chemical
compositions was also consistent with their physical characteristics, which contained both a high
number of different logos and colors. Of the different logos in the sample, the most popular were a
symbol of a “star” and “on star”, which both, individually, accounted for 3.8% (n=14) of all drugs.
The drugs were one of twelve different colors, the most prevalent being white (n=224). A drug’s logo
and color rarely indicated the drug’s chemical composition; tablets with the same physical
characteristics frequently represented two different drugs. The largest group of tablets that shared
identical physical and chemical attributes consisted only of six tablets. Further deception was also
detected in the synthetic drug market through an examination of the contents of the drugs sold as
ecstasy or speed. Only 43% of the drugs sold as ecstasy and 66% of the drugs sold as speed
contained the active substance that they were being sold as. This deception in the synthetic drug
market is commonly observed, as toxicoepidemiologic monitoring of illegal street drugs has shown
that substances marketed as ecstasy or speed can contain a wide variety of compounds and frequently
do not contain the active ingredient (Spruit, 2001; Cole et al, 2002; Parrott, 2003).
To characterize the structure of the network and examine the overall connectivity, two
cohesion analysis tools, density and clustering coefficient, were conducted. Density provides an
overall analysis of the degree of connectivity of a network between subjects, while the clustering
coefficient identifies the degree of local clusters in the network, examining the degree of connectivity
between one tablet to all the tablets directly linked to it. Both methods are recommended to be
applied as group size may influence the clustering coefficient, with larger samples reducing the
coefficient (Hanneman & Riddle, 2005). This sample contained high connectivity with a density at
61% and a clustering coefficient at 83%. Accounting for these high densities were that most tablets
could be linked based on one or two shared characteristics. In this sample most drugs contained
either methamphetamine (n=208) or caffeine (n=222), with these two ingredients also representing
the drug category with the greatest frequency (methamphetamine and caffeine tablets consisted of
27.4% of all seized tablets). However, outside of this large group of tablets, most drugs that
contained methamphetamine or caffeine also contained additional adulterants (e.g. diphenhydramine
or dimethylsulfone), making it distinct from the others. Further distinguishing tablets from one
another, were the wide array of physical characteristics. Although the majority of tablets in this
sample were white, there were 122 different logos for the 365 tablets. Therefore even though many
drugs shared some similar chemical characteristics, few also shared the same physical appearance.
When the drug’s physical and chemical features were looked at collectively, there was high
variability between tablets, with only 48 drugs (13%) possessing identical characteristics with one or
This document is a research report submitted to the U.S. Department of Justice. This report has not been published by the Department. Opinions or points of view expressed are those of the author(s)
and do not necessarily reflect the official position or policies of the U.S. Department of Justice.

53
more tablet. This high variability in physical and chemical characteristics was also observed within
each region.
III.B.8. The Structural Features of the Market
To statistically model the relationships identified in the network analysis, a two-step cluster
analysis was conducted. To reliably use this method, the first step required us to narrow the long list
of variables to only those with higher frequencies and to create larger categories. It was determined
that the chemical variables’ values would be regrouped according to quality, allowing for the
preservation of some detail of the data, while variables that described the physical characteristics of
the synthetic drugs with low frequencies had to be eliminated, as they could not be assimilated into
larger categories. For the regrouping of the chemical variables, quality was determined based on the
drug’s level of purity; whether the synthetic tablet only contained active stimulant ingredient(s)
(either amphetamine, methamphetamine, MDMA or MDA), or whether its purity had been
contaminated with cutting agent(s). After consulting toxicology and pharmacology reference books,
these criteria permitted the identification of three groups, Grade A, Grade B, and Grade C drugs
(Ebadi, 2008; Barceloux, 2012); Grade A drugs were considered the highest quality drugs, consisting
only of the active ingredient (e.g. MDMA), Grade B drugs, were deemed medium quality drugs,
consisting of one active ingredient and one or more cutting agents (e.g. MDMA and caffeine), and
Grade C Drugs the lowest quality tablets, composed exclusively of one or more cutting agents (e.g.
caffeine). Ten drugs were excluded from the analysis, as they did not meet the criteria (e.g. one tablet
solely contained psilocybine, the active ingredient found in mushrooms). To ensure the correct
classification of the seized drugs into their appropriate categories they were also verified by a
professor of pharmacology at the Université de Montréal1. However, given that the data did not
provide information about the concentration of each substance caution should be exercised when
interpreting these groups, as it is possible that a tablet designated as a Grade A drug has a very low
purity consisting of 95% cutting agent and 5% active ingredient. Based on the above classification,
synthetic drugs in the Quebec market consisted primarily of Grade B drugs (n=227), followed by
Grade A drugs (n=71), and Grade C drugs (n=57).
Second, it was necessary to narrow the more than 107 values that characterize the physical
and visual characteristics of synthetic drugs (each a descriptor of the drug’s quality, color or logo)
down to variables that had a frequency of three or more. Only seven of the drugs’ possible twelve
colors and 20 of the 93 logos were included. The rational for choosing only a fraction of all the
colors and logos was empirical, as all variables had to have a sufficient number of cases (n=3) to
effect a reliable analysis. Given the above considerations, the clustering variables include the
following: the drug’s quality (Grade A, Grade B, and Grade C drugs), color (white, blue, yellow,
mauve, orange, pink, and green), and logo (bomb, capsule, heart, couche-tard, e, lightning bolt, star,
kärv, mercedes, MSN, on star, pepsi, pinup, 7up, playboy, puma, shell V power, transformers,
versace and no logo). It is important to note that descriptions of logos are subjective, as they can be
viewed and described in different ways.
All the variables, both physical and chemical were incorporated into a two-step cluster
analysis, allowing the software to select the optimal number of clusters. These clusters were then
verified through a direct comparison to the findings obtained from the descriptive analysis to ensure
consistency and validity between groups. In addition, a chi-square was conducted to determine the
goodness-of-fit of each variable incorporated in the cluster. Originally, the cluster analysis had been
designed to distinguish between the two stages of production, pre-tabletting, the synthesis of the
drug, and post-tabletting, the pressing of the drug into its final shape, allowing us to distinguish and
make comparisons between these two production stages. However, preliminary analysis
This document is a research report submitted to the U.S. Department of Justice. This report has not been published by the Department. Opinions or points of view expressed are those of the author(s)
and do not necessarily reflect the official position or policies of the U.S. Department of Justice.

54
demonstrated that the high number of logos and colors with low frequencies precluded us from
conducting a reliable cluster analysis for the drug’s physical features. Even when the variables with
insufficient cases were eliminated from the analysis, the high number of dichotomous variables did
not permit a reliable cluster analysis and any further removal of variables hindered the interpretation
and validity of the results. Given the inability to capture the differences between the two stages of
production through a cluster analysis, the two characteristics were combined for an overall analysis
of the tablets’ features.
Incorporating the grouped list of variables into the two-step cluster analysis, four distinct
clusters emerged. Findings were similar to the descriptive analysis, with a wide array of physical
characteristics being shared among a high range of drugs with different compositions. The most
distinctive feature that divided each cluster was its quality. One cluster grouped Grade A drugs, two
grouped Grade B drugs, and one grouped Grade C drugs, permitting us to assess which logos and
colors are most likely to be associated with drugs of different quality. This was further supported by
the chi-square statistic used as an estimate of the goodness-of-fit of the structural model. All results
for the quality and the tablets color were determined to be significant, while some of the logos
(bomb, heart, couche tard, lightning bolt, karv, on star, pin up, shell V power, and versace) did not
meet the statistical significance. Table 1 (below) demonstrates the division into four clusters and the
characteristics of each drug according to the categories. The findings from the cluster analysis can be
summarized as follows.
Table 1 Distinctions between Clusters
Variable Cluster 1
(%)
Cluster 2 (%)
Cluster 3
(%)
Cluster 4
(%)
Chi2 sig.
Grade A 100.0 0.0 0.0 0.0 .000
Grade B 0.0 99.0 100.0 0.0 .000
Grade C 0.0 1.0 0.0 99.0 .000
Bomb 0.0 3.0 2.9 0.0 .252
Capsule 1.4 1.0 0.0 7.0 .006
Heart 4.0 3.0 0.0 0.0 .060
Couche Tard 5.6 0.0 3.6 1.7 .151
E 8.5 0.0 0.0 0.0 .000
Lightning Bolt 1.4 1.0 2.9 0.0 .479
Star 1.4 11.0 2.9 0.0 .001
Kärv 0.0 1.0 2.9 0.0 .242
Mercedes 0.0 0.0 3.6 0.0 .043
MSN 0.0 5.0 0.0 0.0 .002
On Star 4.0 0.0 6.6 1.7 .058
Pepsi 5.6 0.0 1.4 0.0 .026
Pin up 4.0 2.0 5.0 0.0 .281
Playboy 0.0 0.0 8.8 0.0 .000
Puma 0.0 4.0 1.4 0.0 .105
7up 0.0 0.0 3.6 0.0 .043
Shell V Power 2.8 0.0 2.9 0.0 .224
Transformers 1.4 6.5 0.0 0.0 .003
Versace 4.0 1.0 0.7 0.0 .147
No logo 12.6 21.4 0.0 7.0 .001
White 59.1 4.3 100.0 64.2 .000
This document is a research report submitted to the U.S. Department of Justice. This report has not been published by the Department. Opinions or points of view expressed are those of the author(s)
and do not necessarily reflect the official position or policies of the U.S. Department of Justice.

55
Blue 5.6 14.1 0.0 5.3 .000
Yellow 1.4 10.8 0.0 8.9 .000
Mauve 1.4 11.9 0.0 0.0 .000
Orange 4.2 9.7 0.0 8.9 .003
Pink 18.3 32.6 0.0 3.5 .000
Green 2.8 9.7 0.0 1.7 .001
Cluster 1, or Grade A drugs (consist only of the active substance), possessed a high number
of different logos, the most popular being the letter “e” (8.5%), followed by couche tard (5.6%), and
pepsi (5.6%). Other drug logos included capsule, heart, lightning bolt, star, versace, pinup, on star
and shell v power. However, all logos that characterized Grade A drugs were also shared with drugs
of lower quality, with the exception of the logo “e”, which was observed exclusively within Grade A
drugs. Furthermore, all possible colors present in the sample were observed among Grade A drugs;
the most popular being white (59.1%), followed by pink (18.3%) and blue (5.6%). Thus, a drug’s
logo and color is rarely indicative of the drug’s quality. While some logos and colors have a higher
likelihood of being associated with Grade A drugs, they may also represent a different quality drug.
Turning to Cluster 2, Grade B drugs also contained a high number of different logos, with the
most popular being star (11%). Many of the same logos as Grade A drugs were shared with Grade B
drugs, including capsule, heart, lightning bolt, star, pinup, transformers, and versace. In addition,
Grade B drugs could be any of the seven possible colors (white, blue, yellow, mauve orange, pink
and green). However, in contrast to Grade A drugs, the most popular colors among Grade B drugs
were pink (32.6%), mauve (11.9%), and yellow (10.8%).
Both the second and third clusters were composed exclusively of Grade B drugs, having been
divided between the two clusters. However, the second group of Grade B drugs was distinct from the
first in that it was composed exclusively of white pills. Furthermore, an analysis of their chemical
compositions demonstrated that among the Grade B drugs in the third cluster, were composed
primarily of methamphetamine and caffeine, while the drugs in the second cluster had a high number
of different chemical profiles. Both clusters also shared many of the same logos, including bomb,
lightning bolt, star, karv, pin up, puma, and versace. However, the most popular logos in cluster
three were playboy (8.8%) and on star (6.6%).
The fourth cluster, Grade C drugs had a low number of logos; consisting only of four
different logos in total: capsule (7%), couche tard (1.7%), on star (1.7%) or no logo (7%). The few
logos present in this cluster may be explained by the fact that many logos were excluded from the
cluster analysis, as they had too low of a frequency. Similar to the first two clusters, Grade C drugs
contained all possible colors, with the exception of mauve. The most popular color was white
(64.2%), distantly followed by yellow (8.9%), and orange (8.9%). Across both the descriptive and
the cluster analysis consistency is found in the large overlap of shared characteristics between drugs.
For the remainder of the paper, these cluster groups will be referred to according to their quality, e.g.
either as Grade A drugs, Grade B colored drugs, Grade B white drugs, or Grade C drugs.
III.B.9. Factors that Influence Synthetic Drug Prices
Following the regrouping of variables into clusters, an ANOVA was conducted to examine
the influence of the structural variable and the marketing variable (whether the drug was being sold
as ecstasy or speed) on the drug’s price. First, an ANOVA was conducted on the entire province to
provide a comprehensive portrait of price determinants at the provincial level. Following this, a
second comparative analysis was conducted using two separate ANOVA tests to compare the
This document is a research report submitted to the U.S. Department of Justice. This report has not been published by the Department. Opinions or points of view expressed are those of the author(s)
and do not necessarily reflect the official position or policies of the U.S. Department of Justice.

56
determinants of drug prices in Montreal (n=108) to the rest of Quebec (n=153), allowing for insight
into geographical variations of price determinants. These two regions were selected based off the
number of seizures made in each area required to effect reliable comparisons.
III.B.9.a. Quebec
Based on the outcome of the ANOVA analysis for Quebec’s synthetic drug prices, one can
understand that there is a statistically significant difference between prices for both the cluster
variable (p<.05) and whether it was sold as ecstasy or speed (p<.01). Both these variables account for
10% of synthetic drug price variation for the Quebec province. A larger effect resulted in whether it
was being sold as ecstasy or speed (F=8.417) in comparison to the cluster variable (F=3.354). The
interaction effect between the cluster and marketing variable was not statistically significant (p>.05).
Table 2 below presents the results of the ANOVA analysis. A few unanticipated relationships
were borne out of the data for the cluster variable. Grade B colored drugs and Grade B white drugs
sold for the highest prices; Grade B colored drugs sold on average for $10.88 and Grade B white
drugs for $10.36. In contrast, Grade A drugs sold for approximately two dollars less ($8.81). In
addition, the differential in prices between Grade A and Grade C drugs were marginal with Grade C
drugs selling for a similar price as Grade A drugs, at $8.58.
Furthermore, it was also found that drugs sold as ecstasy cost approximately two dollars
more than if they had been sold as speed (respectively, $10.59 versus $8.73). This may support that
drug users are inclined to trust dealers and pay higher prices based on information derived from these
players. Supporting this, is the fact that ecstasy is deemed to be a more expensive to produce then
methamphetamine (Karch, 2011) and a better quality drug, involving more elaborate production
methods and higher skilled manufacturers.
Table 2 Price Determinants of Synthetic Drugs for the Quebec Province
III.B.9.b. Montreal
8.73
10.59
8.81
10.8810.36
8.58
0
2
4
6
8
10
12
Speed Ecstasy Grade A Grade BColoured
Grade BWhite
Grade C
p<.05
This document is a research report submitted to the U.S. Department of Justice. This report has not been published by the Department. Opinions or points of view expressed are those of the author(s)
and do not necessarily reflect the official position or policies of the U.S. Department of Justice.

57
ANOVA results for cases within the Montreal region indicated that there was a significant
difference between prices depending on whether it was being sold as ecstasy or speed (F=4.456,
p<.05). However, in contrast to ANOVA results for the entire Quebec province, the results sustained
that the cluster variable was not statistically significant at the .05 level (F=1.693, p>.05). Thus, the
drug’s quality did not play a role in influencing the drug’s price in Montreal. The marketing variable,
whether it was being sold as ecstasy or speed, explained 14.3% of synthetic drug price variation in
the Montreal region. Consistent with the ANOVA for the province, ecstasy was sold for a higher
price ($11.17) and speed for approximately two dollars less ($9.36). Consequently, we may also
conclude that in Montreal drug users may be more inclined to trust the dealer and pay higher prices
based on information derived from these players.
Table 3 Price Determinants of Synthetic Drugs in Montreal
III.B.9.c. The Province of Quebec outside Montreal
For comparative purposes, an ANOVA was also conducted to examine the determinants of
prices for the rest of Quebec outside Montreal. The results of the ANOVA sustained that there was a
significant difference, albeit weak, between prices for the cluster variable (F= 2.708, p<.05), but not
for the marketing variable (F= 2.367, p>.05). In this analysis, the cluster variable explained 10.1% of
synthetic drug price variation for the region. In contrast to all of Quebec, Grade A drugs were the
most expensive outside of Montreal ($10.65). Consistent with all of Quebec, Grade A and Grade C
drugs were similar in price, Grade C drugs being sold on average for thirty-six cents less (at $10.29).
In contrast, Grade B drugs were sold for the lowest prices; Grade B colored drugs for $8.49 and
Grade B white drugs for $7.47, as displayed in Table 4.
Table 4 Price Determinants of Synthetic Drugs for the Quebec Province Outside of Montreal
9.36
11.17
8.59
10.549.93
11.10
0
2
4
6
8
10
12
Speed Ecstasy Grade A Grade BColoured
Grade BWhite
Grade C
p<.05
p>.05
This document is a research report submitted to the U.S. Department of Justice. This report has not been published by the Department. Opinions or points of view expressed are those of the author(s)
and do not necessarily reflect the official position or policies of the U.S. Department of Justice.

58
III.B.10. Section Summary
The current study was designed to empirically assess structural features of the synthetic drug
market by examining links between seized synthetic drugs and their price determinants. The first
analysis demonstrated that a high number of different drugs are present in the market, potentially
indicating a high number of manufacturers. The second investigation confirmed that a drug’s
composition and whether the trafficker markets the drug as ecstasy or speed can marginally influence
its price, depending on the region. This study obtained divergent results for Montreal in comparison
to rest of Quebec; outside of Montreal prices were only influenced by quality, while prices in
Montreal were only influenced by whether it was marketed as ecstasy or speed.
III.B.10.a. Evidence of a Competitive Market
Given the high density reported in the UCInet findings, it may be argued that due to the
similarities between profiles and higher frequency of some profiles over others that a few
manufacturers have a significantly larger market share than others. Although this inference follows
from the logic expressed above, the ubiquity of these ingredients and the high number of different
combinations of these ingredients in this sample causes us to lean towards an alternative
interpretation. First, the most prevalent profile and substances in the sample consists of two very
common ingredients, methamphetamine and caffeine. Given the ease with which caffeine can be
obtained and that most synthesis procedures aim to produce methamphetamine, it is likely that
multiple manufacturers are producing a similar product that contains both these ingredients,
indicating multiple synthetic drug producers. These findings are further supported by the descriptive
analysis, which demonstrated the high number of different profiles, which was consistently reflected
across regions. However, due to the small sample sizes per region it is important to emphasize that
tablets seized in each region may reflect only a small subset of local production.
Further supporting a competitive market, of the drugs that share the same chemical makeup,
few of these also possess the same physical characteristics. Very few tablets shared both the same
physical and chemical features with another tablet. Assuming that the manufacturer consistently
8.40
10.2910.65
8.49
7.47
10.29
0.00
2.00
4.00
6.00
8.00
10.00
12.00
Speed Ecstasy Grade A Grade BColoured
Grade BWhite
Grade C
p<0.5
p>.05
This document is a research report submitted to the U.S. Department of Justice. This report has not been published by the Department. Opinions or points of view expressed are those of the author(s)
and do not necessarily reflect the official position or policies of the U.S. Department of Justice.

59
presses their tablets with the same logo, this supports the earlier conclusion that there are a high
number of drug manufacturers. Previous research suggests that manufacturers may be unlikely to use
multiple different logos, as logos may be strategically used to build brand loyalty among their
consumer base (Karch, 2011). As consumers begin to associate a logo with a high quality drug it is
suggested that they will attempt to obtain drugs with that same logo the following purchase (Karch,
2011). However, concern should be exercised, as logos may be duplicated by others to deceive
consumers into believing they have purchased a higher quality product or simply separate actors
producing the physical features of the tablet in the post-tabletting phase of production.
It is also important to note a further limitation with these interpretations. As the drug
composition data in this sample lacks detailed information only providing us with information on the
contents of each tablet and not the respective concentration of each substance, we risk inferring that
all tablets that contain both MDMA and caffeine came from the same production batch when in fact
each tablet has different quantities of each substance, which would indicate multiple manufacturers.
To minimize this possibility all physical and chemical features of the tablet were taken into account
when making links between drugs that came from the same origin. Thus, drugs that shared the
highest number of characteristics also had the highest likelihood of originating from the same
manufacturer. The data source used in this study is in contrast to research conducted by Esseiva et al
(2003), Esseiva et al (2007), and Zingg (2005) who performed highly sophisticated extraction
methods that recorded precisely the amount of each substance present in the seized drug, providing
more accurate links between drugs with shared characteristics.
In addition to the aforementioned limitation, this study hinges on a few principle
assumptions, the primary being the premise that manufacturers consistently use the same recipe and
methods. Very little research has explored the synthetic drug market and it has not been established
that manufacturers repeatedly produce the same tablets. Given this we risk concluding that there are
multiple producers operating in the synthetic drug market in cases where there are a large number of
distinct profiles present, when in fact it may be a single producer altering his manufacturing process.
III.B.10.b. Price Analysis Discussion
Moving to the price data, the drug’s quality, as determined by the cluster variable, was
deemed to have a statistically significant, albeit weak, effect on prices for the province as a whole
and for the region outside Montreal. However, this cluster variable exerted a different effect on prices
for these two geographical areas. When Montreal was excluded from the analysis drugs of higher
quality were sold for higher prices, with the exception of Grade C drugs (drugs with no active
ingredient were more expensive than Grade B drugs). Although initially counterintuitive that lower
quality drugs are more expensive, given research that has demonstrated that cocaine users perceive
low prices to be indicative of poor quality (Evrard, Legleye & Cadet-Taïrou, 2010), it is logical that
traffickers in efforts to deceive customers would sell these drugs at elevated prices. However, in
contrast, when examining Quebec as a whole, medium quality drugs (Grade B drugs) are sold for the
highest price, followed by high quality (Grade A drugs), and low quality (Grade C drugs). It is
notable that higher quality is associated with higher prices only in the province of Quebec when
Montreal is excluded, and that prices are not correlated with a drug’s quality within the Montreal
market.
III.B.10.c. Trafficker-Consumer Relations
This contrast between Montreal and the rest of Quebec may be attributed to two scenarios;
the market structure and differential production costs. In regard to the market structure outside of
Montreal, prices may be influenced by a drug’s quality due to trafficker-consumer relations.
This document is a research report submitted to the U.S. Department of Justice. This report has not been published by the Department. Opinions or points of view expressed are those of the author(s)
and do not necessarily reflect the official position or policies of the U.S. Department of Justice.

60
Traffickers in attempts to obtain return customers have provided reliable, valuable information about
their products to increase trust and future sales. Although it is unlikely that a trafficker will disclose
to a user that a drug contains no active ingredient, traffickers may accommodate users by presenting
drugs at different prices depending on what they can afford, leaving the decision with the user on
whether to purchase a higher or lower quality drug. In contrast, in Montreal, fewer incentives may be
in place for traffickers to develop a strong customer base through trusting relationships, as there may
be a higher demand for drugs and therefore traffickers may be less inclined to obtain a regular
clientele, with new customers always looking to buy the product. Indeed, the notion that ‘there’s a
sucker born every minute’ may be more in tune with a dense urban population that makes it more
difficult for consumers to keep suppliers in check.
III.B.10.d. Production Costs
The discrepancy on how the drug’s quality influences prices in different regions may also be
explained by looking at production costs. Research on illicit drug markets has stated that a drug’s
quality rarely influences its final price when production costs are insignificant, forming only a
fraction of the retail price (Reuter & Caulkins, 2012). For example, in the heroin market, the drug’s
retail value is marked up by 99% from its wholesale cost in the country of origin (Caulkins & Reuter,
1998). Applying this to the current study, quality may be more inclined to be associated with a drug’s
cost outside of Montreal because production costs are high (e.g precursors may be purchased in
smaller quantities and thus cost more) and play a larger role in influencing the drug’s final price.
Thus, synthetic drug manufacturers in the Montreal region may operate out of larger laboratories and
therefore acquire precursors in bulk, wholesale quantities, resulting in considerable cost reduction.
As supported by the above inferences in regard to trafficker-consumer relations, drug demand may be
higher in this large metropolitan area, which is reflected in the low accountability between dealers
and users. Thus producers, faced with larger demand may be inclined to obtain and produce drugs in
large quantities, reducing associated production costs. That large production facilities may be located
in a dense urban city contrasts with the cannabis market. Large expanses of land are generally
required to produce wholesale quantities of cannabis, and thus production facilities are more likely to
be located in vast, isolated expanses of land in rural areas. In contrast, synthetic drug production
requires relatively little space to produce significant output, allowing for a greater mobility and the
opportunity to set up near consumer markets.
III.B.10.e. Stage of Market Development
That the structure and distinctive features of Montreal’s synthetic drug market is different
from the rest of Quebec was also supported by the results of the marketing variable. Although
classification as ecstasy or speed influenced the price in Montreal, it did not exert a statistically
significant effect for the rest of Quebec. Thus, consumers in Montreal were more likely to rely on
what the drug trafficker stated about the drug, than the drug itself. This finding is consistent with
other studies on illegal drug markets (cannabis, cocaine) that demonstrate the perceived quality of the
drug is dependent on the information that is provided by the drug seller (Lakhdar, 2009; Evrard et al,
2010). This may be indicative of the presence of many first time transactions between dealers and
sellers or may reflect the demographics of the consumers, with many new users. Novice consumers
have little information (e.g., dealer’s reputation, familiarity with the drug) to rely on when making a
first purchase and may not be able to distinguish between different “highs,” therefore
indiscriminately purchasing drugs regardless of the price. As a buyer becomes a regular user and
their education about the drug increases they may develop the knowledge for what to look for, who
This document is a research report submitted to the U.S. Department of Justice. This report has not been published by the Department. Opinions or points of view expressed are those of the author(s)
and do not necessarily reflect the official position or policies of the U.S. Department of Justice.

61
to buy it from, and the expected subjective effects. Thus, these more experienced users may obtain
quality drugs through the contacts they make and the repeated use of the drug.
Further supporting this is the “Expected Purity Hypothesis” developed by Caulkins (1994),
which states that a key factor that influences drug prices are consumers’ perceptions of the drug’s
potency. Given that drugs are “experience goods” purchasers are often unable to assess their quality
until after consumption (Reuter & Caulkins, 2004; Caulkins, 2007). Thus, consumers, unable to
evaluate the drug’s quality may rely on other factors, such as the drug trafficker’s reputation and
statements to calculate the quality and hence the price they will pay.
However, these analyses are not entirely satisfactory, as the inferences about relationships
between suppliers and consumers are based on the assumption that the drug seller knows the true
quality of the drug, and is therefore aware that the consumer is being wrongfully manipulated. There
is evidence in other drug markets that suppliers deceive traffickers further down the chain about the
drug’s quality, to increase their respective profits (Reuter & Caulkins, 2004). In this sense, the retail
dealer is likely as misinformed as the consumer in regard to the commodity’s quality. A further
limitation in this study is that due to the shortcomings of the data it was not possible to examine all
price determinants of synthetic drugs. Thus, confounding factors may be at play in setting these
prices. Prices may be set according to the relations between a trafficker and consumer; closer
relationships justifying a lower price and unknown purchasers a higher price. In addition, a major
problem to using price data is that prices fluctuate in regard to quantity discounts, with higher prices
associated with smaller purchases and lower prices with bulk purchases (Caulkins & Padman, 1993).
The current data did not detail the amount of the drug that was purchased at each sale not allowing us
to account for this factor. Thus, more research is necessary to confirm the relationships between
prices and structural dynamics.
III.b.10.f. Location of Transactions
We may also make inferences about Quebec’s synthetic drug market based on an analysis of
the price variation. Generally, retail drug transactions are standardized and are made in rounded
dollar amounts. This finding has been documented in illegal drug markets across many countries
(Wendel & Curtis, 2000). Standardized drug prices generally result as drug sales are conducted
quickly in order to avoid police detection. Producing change prolongs this process and consequently
increases the risk of exposure to law enforcement (Reuter & Caulkins, 2012). However, we note that
in Quebec’s synthetic drug market, many drugs are sold for prices that may require the production of
change (e.g. $2.50, $7.50). This allows us to infer that some synthetic drug transactions may be
conducted in private locations, where law enforcement detection is diminished and the luxury of
making change can be permitted. This finding is also supported by the Gruppo Abele’s (2003)
research that found many synthetic drug purchases were made in private dwellings.
Overall, this segment of the research program aimed at bridging a knowledge gap about the
structural features of the synthetic drug market and factors that influence synthetic drugs prices. The
results of the analysis, albeit with limitations, provide support for a competitive perspective of the
drug market. These findings closely follow that of earlier research indicating that illegal crime groups
operate within ephemeral and competitive structures (Block & Chambliss, 1981; Reuter, 1983;
Haller, 1990; Potter, 1994; Gruppo Abele, 2003). What can be cautiously inferred from the data in
this study may assist authorities in designing more intelligence led and proactive programs to
effectively target drug manufacturers. This is particularly relevant given the lack of research to date
on the synthetic drug market and the priority that the Canadian government has accorded to combat
the synthetic drug industry. For resources to be effectively allocated programs should be designed
This document is a research report submitted to the U.S. Department of Justice. This report has not been published by the Department. Opinions or points of view expressed are those of the author(s)
and do not necessarily reflect the official position or policies of the U.S. Department of Justice.

62
that reflect the reality of the synthetic drug market in the Quebec province, and to take into account
variations in market characteristics according to region.
Although the limitations of the available data does not allow for validation of the market
structure, it does illustrate the distinct characteristics of this market and the value of applying
innovative methodological frameworks. This approach aligns with literature that has encouraged
innovative analyses for assessing illicit markets:
Although data presently available does not allow for model validation…nevertheless [it]
illustrates the richness of possible behaviours of markets for illicit drugs and the value of
being open to models built up from the special properties of those markets, rather than
merely importing standard analysis and conclusions (Caulkins & Reuter, 2006, p. 2).
In markets where research and data sources are scarce, the value of approaching an illicit
market from another method enriches our understanding and provides new models to validate
findings, rather than repeatedly using familiar methods that leave us with the same fragmented
conclusions. Triangulating the findings of studies with other sources augments the validity of results
and provides a comprehensive understanding of illicit markets. To enhance the reliability of the
findings, this study would benefit from a qualitative analysis that assessed production methods and
synthetic drug producers’ behaviours in addition to more detailed information regarding seizures,
including the concentration of substances in tablets, which can be used to validate links between
manufacturers at a more detailed level and provide greater understanding of this market traditionally
hidden from the purview of researchers. The benefits of using synthetic drug profiles, including more
effective police techniques and an enhanced understanding of market features, make this a method
that should be diligently pursued by researchers and enforcement organizations to effectively target
and understand the intricate processes that underlie the illegal synthetic drug market.
III. C. Spatial Analyses of Border Seizure Data
The data used for these analyses concerned synthetic drug seizures at Canadian borders from
2007 to 2012. The dataset was provided by the Canadian Border Services Agency (CBSA). For each
seizure, the specific border crossing where the seizure was made was provided, as well as the value
of the seizure (except for precursors), the country of origin and the type of drug seized. The types of
drugs were classified into five types: (1) Precursors, (2) MDMA, (3) Amphetamine, (4)
Methamphetamine and (5) Others. Most of the seizures (86.6%) were classified in this last category.
The country of origin of the seizure was also provided.
III.C.1. Georeferencing Method
The spatial reference in the dataset was the border crossing where the seizures were made.
Each border crossing was manually georeferenced in Google Earth, using the CBSA directory as a
guide. Since there were no clear indications on the location of the border crossing (except for the
name), the strategy behind the georeferencing was to locate first where the seizure was made. For
example, in the CBSA directory, the contact address of a land border might be in the nearby town,
but not at the border per se. When possible, we have put an emphasis on the border itself. When it
was impossible to locate precisely where the border crossing was13, we decided to georeference the
13 If the border is too vast to be referenced as a point, as is the case with the Montreal port, or if there are multiple places associated with the same border where the seizure was made, as is the case for Thunder Bay, for example, the CBSA office was georeferenced. In the last case, the data only indicated Thunder Bay as the place of seizure, without any precision about the exact location of the seizure and if it was a
This document is a research report submitted to the U.S. Department of Justice. This report has not been published by the Department. Opinions or points of view expressed are those of the author(s)
and do not necessarily reflect the official position or policies of the U.S. Department of Justice.

63
CBSA office associated with the seizures. Also, some borders were sometimes georeferenced twice,
discriminating for personal or commercial seizures (as indicated in the seizures dataset). In total, 130
border crossing sites were georeferenced. Finally, we categorised the borders into five categories.
They are as follow, with their proportions in parenthesis: (1) land (59.2%), (2) mail (2.3%), (3)
maritime (8.5%), (4) aerial (19.2%) and (5) other (10.8%). The last category contains multiple types,
longrooms and warehouses, where no mention is made of the channel in which the drug entered the
country.
Having a georeferenced dataset of border crossings, we were able to combine it with the
seizures dataset. To do so, we aggregated the seizures with every border crossing. The name of the
border crossing was the unique identifier. The 13,943 seizures were aggregated throughout the 130
border crossing sites. Therefore, the basic variables for each border crossing are the number of
seizures, the mean value of seizures and the type of border. We created multiple geographical
datasets with the data, in an exploratory manner. First, we created a dataset including the total of
seizures, one including the total of seizures without the “Others” category, another one containing
only the seizures for precursors and a last one composed by the MDMA, Methamphetamine and
Amphetamine seizures.
III.C.2. Analysis methods
Two types of analysis were performed. The first consisted of descriptive analysis. We
mapped the number of seizures by border crossing for the four categories mentioned earlier. Then,
we have mapped the mean value of seizures for all the seizures and for all the seizures without the
“Other” category. Since the “precursors” don’t have a value associated with the seizures, we
obviously couldn’t map them. Also, since we don’t have the value for “Precursors”, the MDMA,
amphetamine and methamphetamine are identical to the "Total without The Other Category," so
there is no need to map this category. This step in the analysis was necessary to understand where the
seizures are made, by numbers and value. These descriptive analyses are also useful to understand
the patterns identified by the spatial analysis. The symbols are constant in the descriptive analysis of
the number of seizures; the classes are the same to enable the comparison between maps. For the
mapping of mean value, we used Jenks' natural breaks to create five categories, because there is a lot
of variations in values within and between datasets.
The spatial analysis consisted of hot-spot identification using the Getis-Ord (Gi*) method.
We chose this method for a few reasons. First, we were not interested in the spatial distributions of
the borders crossings, but the attributes (type of border crossing, number of seizures and mean value)
of the border crossings, which are distributed spatially. As an example, we could not perform a point
density analysis, since this measure would only give us the density of border crossings, but not the
intensity of incidents happening at these border crossings. Therefore, in the context of this study, this
analysis would be rather pointless. Secondly, considering the elongated distribution of the border
crossings along the border, with the exception of a few other border crossings corresponding roughly
to larger urban areas, and considering the quite small sample (n=130), measuring patterns of
geographical distribution (mean center or ellipses) wouldn’t allow us to understand the deeper
implication of synthetic drug seizures going on at Canadian borders. Considering the limits imposed
by the nature of the dataset on spatial analysis and the objective of this report, we chose to use the
Gi* hot spot analysis.
The Gi* is a method that identifies the spatial concentration of a phenomenon. The
identification is made through the mapping of the Z-scores of each unit. The Z-score corresponds to
maritime or aerial border. Thus, we judged it safer to reference the CBSA office as the unique place of seizure for Thunder Bay.
This document is a research report submitted to the U.S. Department of Justice. This report has not been published by the Department. Opinions or points of view expressed are those of the author(s)
and do not necessarily reflect the official position or policies of the U.S. Department of Justice.

64
the significance of the distribution not being distributed randomly in space. The higher the Z-score
value, the more the phenomenon is concentrated and is not the result of a random spatial pattern. This
is a hot spot. Inversely, a highly negative Z-score indicates a poor concentration of the phenomena,
not being the result of a random spatial distribution, indicating a cold spot. The spatial relationship
between the geographic units was conceptualized as a fixed distance band using Euclidian distance.
The value of this distance was the average distance measured between each point in the dataset.
Thus, the weight of neighbouring geographical units within the distance is equal to “1”, while the
weight of units outside the radius is equal to “0”. Thus, if a unit has a strong value (a lot of seizures
or a high mean value) with neighbours within the threshold distance also having high values, it will
be considered a hot spot.
The methodological choices we made carry limitations that we should highlight before
presenting the results. The peculiar geographic distribution of border crossings (along the border and
concentrated in large urban areas) will amplify the identification of hot spots in urban areas
containing many border crossings, while inhibiting the identification of hot spots in more remote
locations. The fixed distance band spatial relationship is a binary conceptualization of spatial
relationship that adds up to the limit mentioned, because if a border crossing does not have any
neighbour within the distance threshold, it will never be identified as a hot spot. We chose to use the
average value because using the maximal distance between two border crossings would amplify in
even greater terms the identification of "urban hot spots" to a very large area. These limitations must
be acknowledged to ensure that no result is over interpreted.
III.C.3. Results
The results are presented in three sections. The first includes seizures from countries of all
origins. The second section only includes seizures from The United States, while the last section
draws a portrait of seizures of Canadian origin.
III.C.3.a. All Seizures
The goal of this section is to understand globally what is seized, where it is seized and if
there is a concentration of seizures among Canadian border crossings. We included all country of
origin in this section. For a detailed description of seizures by country, the reader should refer to the
Annex 1, where every source country is listed with the number of seizures and the mean value for
every country. The list is ordered from the highest number of seizures to the lowest. We then
separated the seizures whether they were made in Western Canada (Yukon, British Columbia,
Alberta, Saskatchewan or Manitoba) or Eastern Canada (Ontario, Québec, New-Brunswick or Nova
Scotia).
The descriptive analysis attempts to draw a simple portrait of the seizures made. With that
description made, we will be able to put the border crossings in relation with each other in the hot
spot analysis.
III.C.3.b. Descriptive Analysis
We first describe the number of seizures for the four categories explained earlier, followed by
a description of how the value of these seizures are distributed.
Number of Seizures. In Figure 1, we mapped the number of seizures for all types of drugs
and for all origins. We can see the type of borders differentiated by the shades. This map shows that
seizures happen near larger urban areas, but no clear patterns emerge as to the location and nature of
seizures. However, we do see that the three mail centers have had more than 500 seizures during the
period.
This document is a research report submitted to the U.S. Department of Justice. This report has not been published by the Department. Opinions or points of view expressed are those of the author(s)
and do not necessarily reflect the official position or policies of the U.S. Department of Justice.

65
Figure 1 - Total Number of Seizures for Every Border Crossings
In Figure 2, we removed the "Other" category which tends to be elusive and does not
necessarily inform us on the nature of the seizure. As we stated earlier, this category makes up for
the majority of seizures. This implies that we can't extrapolate the result of this figure to the total
number of seizures. That being said, we observe a change in the geographical distribution of seizures.
Whereas land border crossings were numerous in Figure 1, they are quite underrepresented. The mail
centres are still predominant places of seizures.
This document is a research report submitted to the U.S. Department of Justice. This report has not been published by the Department. Opinions or points of view expressed are those of the author(s)
and do not necessarily reflect the official position or policies of the U.S. Department of Justice.

66
Figure 2 - Total Number of Seizures without the “Other” category
In Figure 3, the precursors seizures are more scarcely distributed then in Figure 1 and 2. We
do observe a concentration in the three largest urban areas, although the Vancouver Mail Centre
stands out as a particular point of interest.
This document is a research report submitted to the U.S. Department of Justice. This report has not been published by the Department. Opinions or points of view expressed are those of the author(s)
and do not necessarily reflect the official position or policies of the U.S. Department of Justice.

67
Figure 3 - Number of Seizures for the “Precursors” category
The seizures illustrated in Figure 4 are evenly distributed among borders crossings, with no
region standing out from the others. However, we observe a concentration of seizures near urban
centers.
This document is a research report submitted to the U.S. Department of Justice. This report has not been published by the Department. Opinions or points of view expressed are those of the author(s)
and do not necessarily reflect the official position or policies of the U.S. Department of Justice.

68
Figure 4 - Number of Seizures for the MDMA, Methamphetamine and Amphetamine category
Finally, we understand from this section that, unsurprisingly, seizures are made near larger
urban areas, no matter what type of seizures were made
III.C.3.c. Value of Seizures
Figures 5 and 6 show a very interesting pattern concerning the mean value of the seizures
made. Indeed, when we look at Figure 5, the Montreal area stands out from other regions in Canada.
Figure 6 shows a shift in the distribution of mean values. When we remove the "Other" category,
Toronto and Vancouver seem to be the places where the most valuable seizures, in average, are
made.
This document is a research report submitted to the U.S. Department of Justice. This report has not been published by the Department. Opinions or points of view expressed are those of the author(s)
and do not necessarily reflect the official position or policies of the U.S. Department of Justice.

69
Figure 5 - Mean Value of Seizures for Every Type of Synthetic Drugs
This document is a research report submitted to the U.S. Department of Justice. This report has not been published by the Department. Opinions or points of view expressed are those of the author(s)
and do not necessarily reflect the official position or policies of the U.S. Department of Justice.

70
Figure 6 - Mean Value of Seizures for Every Type of Synthetic Drugs except the "Other" Category
III.C.4. Hot Spot Analysis
After describing where the synthetic drug seizures are made at Canadian border crossings, we
examined where the concentrations of seizures occurred. The hot spot analysis was conducted for the
number of seizures (for the four categories) and for the mean value (for the total seizures and total
seizures without the "Other" category). The average distance between border crossings in this dataset
was 37,243 meters. We attributed this value to the fixed distance band when conceptualizing the
spatial relationship between points.
III.C.4.a. Number of Seizures
The hot spots identified in Figure 7 are located in Toronto. This means that there are far more
seizures being made at the border crossings listed. As it was shown in Figure 1, urban areas attracted
more seizures. But the hot spot analysis shows us that for the total number of seizures, Toronto is a
hot spot, while Montreal and Vancouver are not identified as places where the number of seizures are
concentrated. The border crossings considered hot spots are mainly airports, with the mail centre and
the sufferance warehouse also included. This is interesting, considering nearby Niagara Falls or
Eastern Ontario land border crossings do not present a spatial concentration in the number of
seizures.
This document is a research report submitted to the U.S. Department of Justice. This report has not been published by the Department. Opinions or points of view expressed are those of the author(s)
and do not necessarily reflect the official position or policies of the U.S. Department of Justice.

71
Figure 7 - Hot Spots According to the Number of Seizures (Total Seizures)
Hot spots for the total number of seizures:
- Billy Bishop Toronto City Airport
- Interport Sufferance Warehouse
- Pearson Int'l Airport - Air Cargo
- Pearson Int'l Airport - Terminal 1
- Pearson Int'l Airport - Terminal 3
- Toronto CBSA Mail Centre
If we remove the "Other" category, we see that the hot spots have shifted from Toronto to
Vancouver, as it is illustrated in Figure 8. The hot spots identified are in border crossings of every
type except for the "Other" category. However, the spatial proximity of the different border crossings
amplify what we called earlier an amplification of urban border crossings. It is the case for the
Boundary Bay border crossing, which is included because of its proximity with other border
crossings of interest. Nonetheless, Figure 8 demonstrated that when we remove the "'Other" category
which doesn't inform us much on what is seized, we see that Vancouver is the hot spot for the
number of seizures.
This document is a research report submitted to the U.S. Department of Justice. This report has not been published by the Department. Opinions or points of view expressed are those of the author(s)
and do not necessarily reflect the official position or policies of the U.S. Department of Justice.

72
Figure 8 - Hot Spots According to the Number of Seizures (Total Seizures Without the “Other”
Category)
Hot spots for the total number of seizures (without the "Other" category):
- Vancouver Marine Vessel Operations
- Vancouver Container Examination Facility
- Vancouver International Mail Centre
- Vancouver Int'l Airport - Traffic
- Vancouver Int'l Airport - Cargo
- Vancouver Canadian National Train Terminal
- Boundary Bay
When we look at the seizures hot spots for the "Precursors" category, we see the same pattern
as in Figure 8. Vancouver is the hot spot, but considering there are fewer seizures in this category,
This document is a research report submitted to the U.S. Department of Justice. This report has not been published by the Department. Opinions or points of view expressed are those of the author(s)
and do not necessarily reflect the official position or policies of the U.S. Department of Justice.

73
there are fewer border crossings included. This map shows that precursor hot spots are not land-
border crossings, but air, maritime and mail border types.14
Figure 9 - Hot Spots According to the Number of Seizures (Precursors)
Hot spots for the total number of seizures (Precursors):
- Vancouver Int'l Airport - Traffic
- Vancouver Int'l Airport - Cargo
- Vancouver Container Examination Facility
- Vancouver International Mail Centre
The results depicted in Figure 10 also identify Vancouver as a hot spot, which is no surprise,
since the sum of this category and the precursors equals the total without the "Other" category. It
identifies a larger hot spot than what was identified in Figure 8.
14 It should be noted that many seizures in airports, cargo facilities, and mail centers are “in transit” and may have
been international shipments that are passing through Canada en route to other destinations.
This document is a research report submitted to the U.S. Department of Justice. This report has not been published by the Department. Opinions or points of view expressed are those of the author(s)
and do not necessarily reflect the official position or policies of the U.S. Department of Justice.

74
Figure 10 - Hot Spots According to the Number of Seizures (MDMA, Methamphetamine and
Amphetamine)
Hot spots for the total number of seizures (MDMA, Methamphetamine and Amphetamine):
- Vancouver Marine Vessel Operations
- Vancouver Container Examination Facility
- Vancouver International Mail Centre
- Vancouver Int'l Airport - Traffic
- Vancouver Int'l Airport - Cargo
- Vancouver Canadian National Train Terminal
- Boundary Bay
- Douglas
In the hot spot analysis of the number of seizures, Toronto was first identified as a hot spot.
When we remove the "Other" category, Vancouver emerges as a hot spot. Therefore, the numerous
seizures are concentrated in Vancouver and Toronto. Montréal, the second-largest metropolitan
region is not identified as a hot spot for the number of seizures.
III.C.4.b. Mean Value of Seizures
This document is a research report submitted to the U.S. Department of Justice. This report has not been published by the Department. Opinions or points of view expressed are those of the author(s)
and do not necessarily reflect the official position or policies of the U.S. Department of Justice.

75
Two hot-spot analyses wee made for the mean value of seizures. One was conducted for the
total number of seizures and another one for the total without the "Other" category. In Figure 11, the
hot spot for the mean value of seizures is located in Montréal. This contrasts with findings from the
previous section where Montréal did not emerge as a hot spot for the number of seizures, while
Toronto and Vancouver did. Land border south of Montréal didn't appear as hot spots, indicating that
the valuables seizures are made at the heart of the metropolis via air, maritime and mail border
crossings.
Figure 11 - Hot Spots According to the Mean Value of Seizures (Total)
Hot spots for the mean value of seizures (Total seizures):
- Cote de Liesse Warehouse
- Montreal CBSA Mail Centre (Leo-Blanchette)
- Montreal Longroom
- Montreal Marine and Rail Services
- Trudeau International Airport (unspecified)
- Trudeau International Airport - Cargo
- Trudeau International Airport - Traffic
This document is a research report submitted to the U.S. Department of Justice. This report has not been published by the Department. Opinions or points of view expressed are those of the author(s)
and do not necessarily reflect the official position or policies of the U.S. Department of Justice.

76
When we look at Figure 12, the hot spot concentration of valuable seizures has moved from
the East to the West. This indicates us that the seizures in Montréal are very valuable, but we don't
necessarily know their nature.
Figure 12 - Hot Spots According to the Mean Value of Seizures (Total without the "Other" Category)
Hot spots for the mean value of seizures (Total Seizures without the "Other" Category):
- Vancouver Marine Vessel Operations
- Vancouver Container Examination Facility
- Vancouver International Mail Centre
- Vancouver Int'l Airport - Traffic
- Vancouver Int'l Airport - Cargo
- Vancouver Canadian National Train Terminal
- Boundary Bay
III.C.5. Seizures from the United States
This document is a research report submitted to the U.S. Department of Justice. This report has not been published by the Department. Opinions or points of view expressed are those of the author(s)
and do not necessarily reflect the official position or policies of the U.S. Department of Justice.

77
In this section, we only considered seizures in provenance of the United States. We used the same
exploratory approach as the one used in the section for all seizures. Because there are fewer than 30
border crossings for the precursors, we were unable to perform a hot spot analysis for this type of
drug seizure.
III.C.5.a. Descriptive Analysis
Number of Seizures. When looking at Figure 13, we see a contrast with the patterns mapped
in Figure 1. Whereas larger metropolitan areas (Vancouver, Toronto and Montréal) stood out as
places with a lot of seizures, they are still important for US seizures, but the distribution seems more
evenly distributed among border crossings.
Figure 13 - Total Number of Seizures for Border Crossings (US Origin)
When we removed the "Other" category, the geographical pattern was a bit different. As
shown in Figure 14, the Windsor-Montréal axis and also Vancouver stand out as places where there
are numerous synthetic drug seizures.
This document is a research report submitted to the U.S. Department of Justice. This report has not been published by the Department. Opinions or points of view expressed are those of the author(s)
and do not necessarily reflect the official position or policies of the U.S. Department of Justice.

78
Figure 14 - Number of Seizures for Border Crossings (Total, Without the "Other" Category, US
Origin)
The results when mapping the precursors of US origin are quite clear. When we look at
Figure 15, we clearly see that the precursors seized tried to enter Canada through mail centres. We
must be careful not to draw hasty conclusions with this map, considering the small number of border
crossings present. That being said, in Figure 16, we see that MDMA, methamphetamine and
amphetamine seizures of US origins are located at land and air border crossings. These seizures are
located in Vancouver, Windsor and, to a lesser extent, in the greater Montréal region.
This document is a research report submitted to the U.S. Department of Justice. This report has not been published by the Department. Opinions or points of view expressed are those of the author(s)
and do not necessarily reflect the official position or policies of the U.S. Department of Justice.

79
Figure 15 - Number of Seizures for the “Precursors” category (US Origin)
This document is a research report submitted to the U.S. Department of Justice. This report has not been published by the Department. Opinions or points of view expressed are those of the author(s)
and do not necessarily reflect the official position or policies of the U.S. Department of Justice.

80
Figure 16 - Number of Seizures for the MDMA, Methamphetamine and Amphetamine category (US
Origin)
Value of Seizures. After the number of seizures, we looked at the mean value of seizures of US
origin. In Figure 17, the picture is clear. The highest mean values are located in Calgary and
Windsor. When removing the "Other" category (as shown in Figure 18), we see that the higher mean
values are located at the Eastern Ontario border crossings and in the greater Montréal border
crossings.
This document is a research report submitted to the U.S. Department of Justice. This report has not been published by the Department. Opinions or points of view expressed are those of the author(s)
and do not necessarily reflect the official position or policies of the U.S. Department of Justice.

81
Figure 17 - Mean Value of Seizures for Every Type of Synthetic Drugs (US Origin)
This document is a research report submitted to the U.S. Department of Justice. This report has not been published by the Department. Opinions or points of view expressed are those of the author(s)
and do not necessarily reflect the official position or policies of the U.S. Department of Justice.

82
Figure 18 - Mean Value of Seizures for Every Type of Synthetic Drugs except for the "Other"
Category (US Origin)
III.C.5.b. Hot-Spot Analysis
We performed a hot spot analysis in the same way as we did for the seizures of all origins.
However, the fixed distance band was adjusted to this specific dataset. We used the average distance
between the border crossings present in this dataset. Thus the fixed distance band was 43,456 meters.
Number of Seizures. We first identified hot spots for the number of seizures of all types of
drugs. The resulting map (Figure 19) presents results that show a concentration in the number of
seizures at Edmonton border crossings (Edmonton Airport). We should note that detection of these
drugs is affected by staffing resources and the priority given to interdiction rather than other threats,
such as terrorism.
This document is a research report submitted to the U.S. Department of Justice. This report has not been published by the Department. Opinions or points of view expressed are those of the author(s)
and do not necessarily reflect the official position or policies of the U.S. Department of Justice.

83
Figure 19 - Hot Spots According to the Number of Seizures (Total Seizures, US Origin)
Hot spots for the total number of seizures:
- Edmonton International Airport - Commercial Operations
- Edmonton International Airport - Traffic
When we consider the total seizures from US origin, without the "Other" category, we see a different
picture. In Figure 20, we see two hot spots, one in Vancouver and another one in Montréal. However,
the majority of border crossings in this analysis is a little less significant than 2.58. This means that
the concentration of seizure is not randomly distributed, but the level of confidence in which we can
say that there is a concentration is lower.
This document is a research report submitted to the U.S. Department of Justice. This report has not been published by the Department. Opinions or points of view expressed are those of the author(s)
and do not necessarily reflect the official position or policies of the U.S. Department of Justice.

84
Figure 20 - Hot Spots According to the Number of Seizures (Total Seizures Without the "Other"
category, US Origin)
Hot spots for the total number of seizures (without the "Other" category, US Origin):
All border crossings have a Z-score between 1.96 and 2.58, except when indicated in parenthesis.
British-Columbia
- Huntingdon - Traffic
- Aldergrove
- Douglas
- Pacific Highway - Commercial
- Pacific Highway - Traffic
- Vancouver Int'l Airport - Cargo (>2.58)
- Vancouver Int'l Airport - Traffic (>2.58)
- Vancouver International Mail Centre (>2.58)
- Vancouver Canadian National Train Terminal (>2.58)
Québec
This document is a research report submitted to the U.S. Department of Justice. This report has not been published by the Department. Opinions or points of view expressed are those of the author(s)
and do not necessarily reflect the official position or policies of the U.S. Department of Justice.

85
- Cote de Liesse Warehouse
- Mirabel Int'l Airport - Cargo
- Montreal CBSA Mail Centre (Leo-Blanchette)
- Trudeau International Airport - Traffic
In Figure 21, we identified the hot spots for the MDMA, methamphetamine and amphetamine
seizures originating from the US. In this case, we also identified two hot spots. One in Vancouver
and the other in Windsor. For the former, all border crossings have a Z-score above 2.58, while in the
latter, their Z-score are between 1.96 and 2.58.
Figure 21 - Hot Spots According to the Number of Seizures (MDMA, Methamphetamine and
Amphetamine, US Origin)
Hot spots for the number of seizures (MDMA, Methamphetamine and Amphetamine, US Origin):
Z-score above 2.58 :
- Huntingdon - Traffic
- Aldergrove
This document is a research report submitted to the U.S. Department of Justice. This report has not been published by the Department. Opinions or points of view expressed are those of the author(s)
and do not necessarily reflect the official position or policies of the U.S. Department of Justice.

86
- Douglas
- Pacific Highway - Commercial
- Pacific Highway - Traffic
- Vancouver Int'l Airport - Cargo
- Vancouver Int'l Airport - Traffic
- Vancouver International Mail Centre
- Vancouver Canadian National Train Terminal
Z-score between 1.96 and 2.58
- Windsor, Ambassador Bridge - Commercial
- Windsor, Ambassador Bridge - Traffic
- Windsor, D&C Tunnel - Traffic
Value of Seizures. Exploring hot spots by their mean values give some useful insights to
compare with the number of seizures. First, the mean value of all seizures of US origins are mapped
in Figure 22. The hot spots are consistent with what was observed in Figure 17. We see Calgary
airport as a hot spot with Z-score higher than 2.58, while Windsor emerge as a hot spot with Z-scores
between 1.65 and 1.96.
This document is a research report submitted to the U.S. Department of Justice. This report has not been published by the Department. Opinions or points of view expressed are those of the author(s)
and do not necessarily reflect the official position or policies of the U.S. Department of Justice.

87
Figure 22 - Hot Spots According to the Mean Value of Seizures (Total, US Origin)
Hot spots for the mean value of seizures (Total seizures, US Origin):
Hot spots with value above 2.58
- Calgary Int'l Airport - Commercial
- Calgary Int'l Airport - Traffic
Hot spots with value between 1.65 and 1.96
- Windsor, Ambassador Bridge - Commercial
- Windsor, Ambassador Bridge - Traffic Hot spots for the mean value of seizures (Total seizures, US
Origin):
- Windsor, D&C Tunnel - Traffic
When we remove the "Other" category, we see that the most valuable seizures for the
MDMA, methamphetamine and amphetamine types are located in the greater Montréal area, as
shown in Figure 23. This is interesting considering the fact that when we identified the hot spots for
the mean values of all seizures, Montréal was identified only when we included the "Other" category,
while in this case, it is when we remove the "Other" category that the spatial concentration of seizure
emerges.
This document is a research report submitted to the U.S. Department of Justice. This report has not been published by the Department. Opinions or points of view expressed are those of the author(s)
and do not necessarily reflect the official position or policies of the U.S. Department of Justice.

88
Figure 23 - Hot Spots According to the Mean Value of Seizures (Total without the "Other" Category,
US Origin)
Hot spots for the mean value of seizures (Total seizures Without the "Other" Category, US Origin):
- Herdman
- Cote de Liesse Warehouse
- Mirabel Int'l Airport - Cargo
- Montreal CBSA Mail Centre (Leo-Blanchette)
-Trudeau International Airport - Traffic
In the hot spot analysis we performed for seizures of US origin, a pattern emerged. When we
analyzed the seizures for all type of drugs, the Alberta airports emerged as hot spots, either for the
number of seizures or the mean value. To a lesser extent, we could include Windsor, but the spatial
concentration of activities were less important.
This document is a research report submitted to the U.S. Department of Justice. This report has not been published by the Department. Opinions or points of view expressed are those of the author(s)
and do not necessarily reflect the official position or policies of the U.S. Department of Justice.
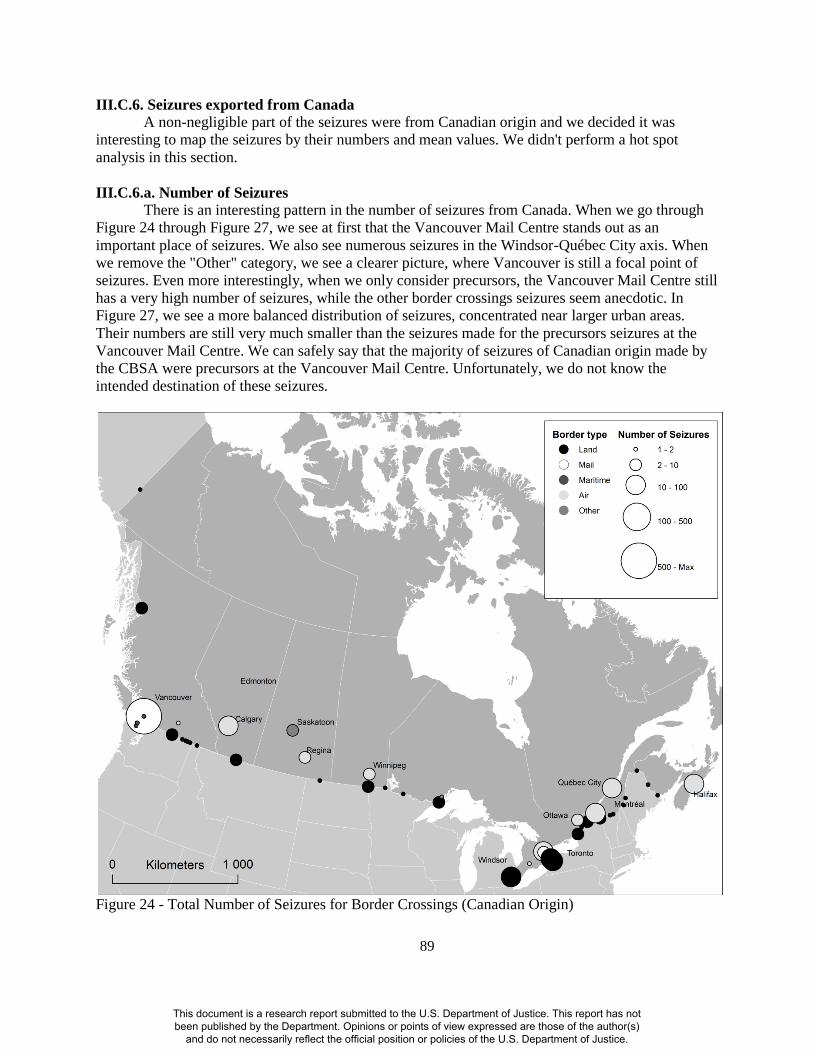
89
III.C.6. Seizures exported from Canada
A non-negligible part of the seizures were from Canadian origin and we decided it was
interesting to map the seizures by their numbers and mean values. We didn't perform a hot spot
analysis in this section.
III.C.6.a. Number of Seizures
There is an interesting pattern in the number of seizures from Canada. When we go through
Figure 24 through Figure 27, we see at first that the Vancouver Mail Centre stands out as an
important place of seizures. We also see numerous seizures in the Windsor-Québec City axis. When
we remove the "Other" category, we see a clearer picture, where Vancouver is still a focal point of
seizures. Even more interestingly, when we only consider precursors, the Vancouver Mail Centre still
has a very high number of seizures, while the other border crossings seizures seem anecdotic. In
Figure 27, we see a more balanced distribution of seizures, concentrated near larger urban areas.
Their numbers are still very much smaller than the seizures made for the precursors seizures at the
Vancouver Mail Centre. We can safely say that the majority of seizures of Canadian origin made by
the CBSA were precursors at the Vancouver Mail Centre. Unfortunately, we do not know the
intended destination of these seizures.
Figure 24 - Total Number of Seizures for Border Crossings (Canadian Origin)
This document is a research report submitted to the U.S. Department of Justice. This report has not been published by the Department. Opinions or points of view expressed are those of the author(s)
and do not necessarily reflect the official position or policies of the U.S. Department of Justice.

90
Figure 25 - Number of Seizures for Border Crossings (Total Without the "Other" Category, Canadian
Origin)
This document is a research report submitted to the U.S. Department of Justice. This report has not been published by the Department. Opinions or points of view expressed are those of the author(s)
and do not necessarily reflect the official position or policies of the U.S. Department of Justice.

91
Figure 26 - Number of Seizures for the “Precursors” category (Canadian Origin)
This document is a research report submitted to the U.S. Department of Justice. This report has not been published by the Department. Opinions or points of view expressed are those of the author(s)
and do not necessarily reflect the official position or policies of the U.S. Department of Justice.

92
Figure 27 - Number of Seizures for the MDMA, Methamphetamine and Amphetamine category
(Canadian Origin)
III.C.6.b. Mean Value of Seizures
The mean value of seizures are mapped in Figures 28 and 29. The patterns are not really
different in these two maps. The higher mean values are located first and foremost in Toronto (and
Niagara Falls). Vancouver still presents some higher values and, surprisingly, Eastern British
Columbia. While we observed higher mean values of seizures made in Montréal in prior analyses,
these seizures are not of Canadian origin.
This document is a research report submitted to the U.S. Department of Justice. This report has not been published by the Department. Opinions or points of view expressed are those of the author(s)
and do not necessarily reflect the official position or policies of the U.S. Department of Justice.

93
Figure 28 - Mean Value of Seizures for Every Type of Synthetic Drugs (Canadian Origin)
This document is a research report submitted to the U.S. Department of Justice. This report has not been published by the Department. Opinions or points of view expressed are those of the author(s)
and do not necessarily reflect the official position or policies of the U.S. Department of Justice.

94
Figure 29- Mean Value of Seizures for Every Type of Synthetic Drugs except for the "Other"
Category (Canadian Origin)
This document is a research report submitted to the U.S. Department of Justice. This report has not been published by the Department. Opinions or points of view expressed are those of the author(s)
and do not necessarily reflect the official position or policies of the U.S. Department of Justice.

95
IV. CONCLUSIONS AND DISCUSSION
The overarching goal of this study was to assess the impact of ATS production and
trafficking from Canada to the U.S. drug market, using multiple data sources anchored around the
methodology of capture-recapture sampling procedure. Results of this study revealed the following:
The population of methamphetamine dealers is found within the 3500-14000 range and that
the ecstasy dealer population is most likely to be found within the 17,000-57,000 range;
Between 288 to 7179 kg of ATS was available for consumption overseas after domestic and
international seizures and consumption have been taken into account; and
Canada contributes to 0.6 to 4.6% of the world’s supply of synthetic drugs.
Several other key findings emerged in this study. Our analysis of the composition of seized
synthetic drugs revealed that only 43% of the drugs sold as ecstasy and 66% of the drugs sold as
speed contained any amount of the purported psychoactive substances. In addition, our analyses of
pricing revealed an overall low correlation between drug quality and price—and no significant
correlation between these features when the analysis is limited to Montreal alone. In addition,
seizures are scattered across the Canadian-U.S. border, with no main focal point emerging (No clear
hot spot). This is consistent with the decentralized structure that represented the market in the
previous segments of analysis in this report. These findings—combined with our observation that the
synthetic drug manufacturers tend to be decentralized and fragmented—indicate that the Canadian
ATS market remains relatively unsophisticated.
This project required a large number of assumptions and techniques to achieve the stated
objectives. Although we tried to make the most defensible decisions at each step in this process, they
are not beyond controversy. For example, our multiplier methods relied on an estimated overdose
ration of one in 300 ATS users yearly, which was based on overdose rates for other drugs with a
more established literature base. In fact, overdose rates among this population may be substantially
higher or lower. Second, the capture-recapture methods assumed a “closed system,” which is
unlikely to be entirely accurate, given immigration patterns of offenders. In addition, the capture-
recapture method requires that the probability for an individual to be observed and re-observed is
constant over time, which is not the case for a short time frame (as in this study), since one is less
likely to be re-observed if they were first observed near the end of the time series. We acknowledge
that a longer period of observation would have been preferable. On the other hand, we endeavored to
couch our findings in this context by providing confidence ranges in our final estimates.
As Michel Schiray (2001) pointed out that despite the fact that drug trade has ranked high in
the priorities of many countries’ policy discussions, most of our knowledge has been provided by the
press and other media (film and television) that have long made much of the world of drug
trafficking. Although intelligence agencies inside law enforcement agencies of both countries gather
information on the drug trade, much of what they know is not open to the public. As McCoy (1992)
and Yawnghwe (1993) have suggested, not knowing exactly who the participants in the global drug
trade are, who benefit the most from the drug trade, and how the drug trade reacts to counter
measures may result in ineffective, or, and worse, counterproductive programs. We do not dismiss
the significance and credence of the press coverage of drug trafficking activities, but the fact remains
that few, if any, academic researchers have ever embarked on this journey to provide systematic,
non-sensation-driven, and independent examination of the drug trade between the two countries.
With regard to future directions under this line of research, we hope to capitalize on the
experiences gained through this process to apply similar methods to derive estimates of illicit
importation of pharmaceutical drugs into the US. The misuse of prescription medications has
escalated in recent years. In 2010, 2 million people reported past-year, non-medical use of
This document is a research report submitted to the U.S. Department of Justice. This report has not been published by the Department. Opinions or points of view expressed are those of the author(s)
and do not necessarily reflect the official position or policies of the U.S. Department of Justice.

96
prescription painkillers (SAMHSA, 2011). The rate of overdose deaths in the US is now higher than
that of cocaine and heroin combined (CDC, 2011). Many of these medications are obtained from US-
based physicians, then misused by patients’ social networks, or the patients themselves. As was the
case with methamphetamine over the past 10 years, the US crackdowns on doctor shopping and
sharing of prescription painkillers domestically will make it more profitable for Mexican criminal
groups to produce the drugs in Mexico and traffic them to the US and Canada. We hope to direct our
future efforts at documenting this shift (as well as increased importation from other countries) and
identifying promising targets for interdiction.
IV.1. Implications on Counter-Narcotic Strategies
Although some attention has been aroused by the media coverage of drug busts along the
U.S.-Canadian borders, our study findings suggest that the production of synthetic drugs in Canada
(at least in the Province of Quebec) is mostly limited to the local market. We believe the Canadian
production of synthetic drugs does not produce enough to supply Canadian and foreign (or U.S.)
consumers. Therefore it would be wise for policy makers to focus its attention to other sources of
production that seem to supply and sustain the U.S. domestic market. These sources may include
U.S. domestic production or trafficking from the U.S. southern borders. Our study does not support
the claims made by media stories about the threat of importation of synthetic drugs from Canada.
Law enforcement efforts and other counter-trafficking programs should therefore adjust their focus
accordingly.
Efforts should also be made to assess the chemical compositional nature of synthetic drug
consignments across the U.S., so as to determine its parallels (or distinctions) with the Quebec
market that was assessed in this study. If a young, growing market that is illogical in terms of price
structuring properties is also identified, this would indicate a more decentralized distribution market
that consists of many small dealing groups/firms that set their own prices across spatial regions. If,
instead, a more sophisticated market that follows consistent supply-demand dynamics is in place, this
would suggest that a more regulated economy (in an extra-legal sense) is in place, thus indicating a
more structured and likely centralized production and supply chain. Such price-structuring scenarios
are pivotal for orienting law-enforcement and wider policy strategies. In the decentralized context,
law enforcement interventions should follow a detection-disruption model, in which the main focus
of the counter measures is on disrupting the production and supply chain, thus increasing the cost of
doing business. Such tactics may also include random check of suppliers and a harm reduction
approach that sets itself into the market at an early stage. In the more centralized scenario, repression
methods should generally focus on the main supply groups that have emerged ahead of the
competition. Investments in long term investigations and breakup of large criminal entities will be
necessary. However, at this point, there is no serious empirical research to demonstrate that the U.S.
market, as a whole or across any of its specific geographical regions, should be more advanced than
what we find for the Canadian/Quebec context. More empirical evidence is needed.
The border seizure segment of the research also informs us on counter-narcotic policies. If
the Canadian context is any indication of the smuggling of synthetic drugs into the U.S., there is
indeed some level of concern to address the border between these two countries—the U.S. was one
of the main source countries for synthetic drugs into Canada. However, the problem is clearly not
restricted to this border. Several other countries emerged as key and often more prominent sources.
China, for example, was prominent for many years as the precursor supplier to the international
synthetic drug production. Perhaps more importantly, traditional transit countries, such as the
Netherlands and Belgium, were also prominent as source countries across Canadian border seizures.
Control methods should also vary in terms of the form of the product (e.g., precursors vs. pills), the
This document is a research report submitted to the U.S. Department of Justice. This report has not been published by the Department. Opinions or points of view expressed are those of the author(s)
and do not necessarily reflect the official position or policies of the U.S. Department of Justice.

97
physical point of entry (e.g., land port, maritime port, airport, mailroom), and the geographical region
under assessment.
The publication of the 2009 World Drug Report created a media frenzy of the wrong kind for
Canada in that the country was identified as one of the world’s leading producers of amphetamine-
type stimulants (ATS) such as crystal methamphetamines and ecstasy. The report led to Kirby and
MacDonald’s (2009) article in Maclean’s magazine which dubbed Canada as “Colombia North,” as
well as the “new global drug lord” (Glenny, 2009) for its role as a “leading producer and exporter of
illegal synthetic drugs.” Concerns regarding the role of Canada in the global synthetic drug trade
mainly emerged from two types of numbers. First, it was reported that the majority of amphetamine-
type stimulants (ATS) seized in two countries (Australia and Japan) were initially produced in
Canada. Second, a relatively large amount of amphetamine (1.54 metric tons) and ecstasy (985 kg)
was seized in 2007 within Canadian borders, numbers which put Canada among the leading nations
in the world.
In short, results of our analysis suggest that—although Canada does produce more ATS than
can be consumed domestically—the amount it exports accounts for less than 5% at most of the global
supply.
This document is a research report submitted to the U.S. Department of Justice. This report has not been published by the Department. Opinions or points of view expressed are those of the author(s)
and do not necessarily reflect the official position or policies of the U.S. Department of Justice.

98
V. References
Adlaf, E.M., Begin, P., & Sawka, E. (Eds.). (2005). Canadian Addiction Survey (CAS): A national
survey of Canadians' use of alcohol and other drugs: Prevalence of use and related harms:
Detailed report. Ottawa: Canadian Centre on Substance Abuse.
Anderson, K., Lock, E., Jalava, K., Huizer, H., Jonson, S., Kaa, E., Lopes, A., Poortman-van der
Meer, A., Sippola, E., Dujourdy, L., & Dahlén, J. (2007). Development of a harmonised
method for the profiling of amphetamines VI: Evaluation of methods for comparison of
amphetamine. Forensic Science International, 169(1), 86-99.
Block, Alan A., and Chambliss, William J. 1981. Organized Crime. New York: Elsevier.
Bohning, Dankmar, et al. (2004). Estimating the number of drug users in Bangkok 2001: A capture–
recapture approach using repeated entries in one list. European Journal of Epidemiology 19,12:
1075–1083.
Bouchard, Martin (2007). A Capture-Recapture Model to Estimate the Size of Criminal Populations
and the Risks of Detection in a Marijuana Cultivation Industry.” Journal of Quantitative
Criminology 23,3: 221-241.
Bouchard, Martin. (2008). Towards a Realistic Method to Estimate the Size of Cannabis Cultivation
Industry in Developed Countries. Contemporary Drug Problems 35,2/3:291-320.
Bouchard, Martin, and Pierre Tremblay (2005). Risks of Arrest Across Drug Markets: A Capture-
Recapture Analysis of Hidden Dealer and User Populations. Journal of Drug Issues 34,4 :733-
754.
Brenner, H. 1996. Effects of misdiagnoses on disease monitoring with capture-recapture methods.
Journal of Clinical Epidemiology, 11:1303-1307.
Cartier, J., Farabee, D., & Prendergast, M.L. (2006). Methamphetamine use, violence, and recidivism
among California parolees. Journal of Interpersonal Violence, 21, 435-445. (PMID:
16501213)
Caulkins, Jonathan (1997). Is Crack Cheaper than (Powder) Cocaine? Addiction 92: 1437-43.
Centers for Disease Control (2011). Vital Signs: Overdoses of Prescription Opioid Pain Relievers—
United States, 1999-2008. MMWR 2011; 60: 1-6.
Chao, Anne (2001). An Overview of Closed Capture-Recapture Models, Journal of Agricultural,
Biological, and Environmental Statistics 6 : 158-175.
Chiang, Shu-Chuan, et al. (2007). Prevalence of Heroin and Methamphetamine Male Users in the
Northern Taiwan, 1999–2002: Capture-Recapture Estimates. BMC Public Health 7, 292-299.
Chin, Ko-lin. 1999. Smuggled Chinese: Clandestine Immigration to the United States. Philadelphia:
Temple University Press.
Choi Y.H., and C.M.Comiskey. (2003). Methods for Providing the First Prevalence Estimates of
Opiate Use in Western Australia. International Journal of Drug Policy 14,4: 297–305.
Collins MF, Wilson RM (1990). Automobile theft: estimating the size of the criminal population.
Journal of Quantitative Criminology, 6:395–409.
Cressey, Donald. 1969. Theft of the Nation. New York: Harper & Row.
Criminal Intelligence Services Canada. 2009. Report on Organized Crime. Available at:
http://www.cisc.gc.ca/index_e.html.
Cunningham, James K., Lon-Mu Liu & Russell Callaghan. (2009). Impact of U.S. and Canadian
precursor regulation on methamphetamine purity in the United States. Addiction, 104(3),
441–453.
Customs and Border Protection (CBP). 2009. International Drug Ring Dismantled with Help from
CBP. Available at: http://www.cbp.gov/xp/cgov/newsroom/highlights/iron_curtain.xml.
This document is a research report submitted to the U.S. Department of Justice. This report has not been published by the Department. Opinions or points of view expressed are those of the author(s)
and do not necessarily reflect the official position or policies of the U.S. Department of Justice.

99
Dobinson, Ian. 1993. Pinning a tail on the dragon: The Chinese and the international heroin trade.
Crime & Delinquency 39 (3): 373-384.
Drug Enforcement Administration (DEA) and Royal Canadian Mounted Police (RCMP). 2001
(September). Chemical Diversion and Synthetic Drug Manufacture—a joint report prepared
by DEA and RCMP intelligence services. Available at:
http://www.erowid.org/archive/rhodium/pdf/chemical.diversion.pdf
Drug Enforcement Administration (DEA). 2008. Federal Authorities Dismantle Drug-Trafficking
Ring that Shipped Narcotics Between Canada and U.S. News Release, September 30.
Available at: http://www.justice.gov/dea/pubs/states/newsrel/2008/la093008.html.
DEA. 2008. "Mickey Woods" Marijuana Trafficking Organization Indicted. News Release,
November 18. Available at:
http://www.justice.gov/dea/pubs/states/newsrel/2008/nyc111808.html.
Dujourdy, Laurent et al. (2003). Evaluation of Links in Heroin Seizures, Forensic Science
International 131: 171-183.
Economist. 1998. Hells Angels, Crime and Canada. 346 (8061—March, 28th): 33-34.
Esseiva, Pierre et al. (2007). Forensic Drug Intelligence: An Important Tool in Law Enforcement,
Forensic Science International 167: 247-254.
Farabee, D., & Fredlund, E.V. (1996). Self-reported drug use among recently admitted jail inmates:
Estimating prevalence and treatment needs. Substance Use and Misuse, 31, 423-435.
Farabee, D., & Hawken, A. (2009). Methamphetamine and crime. In J. M. Roll, R. Rawson, W.
Ling, & S. Shoptaw (Eds). Methamphetamine addiction. pp. 157-151. New York:
Guilford
Farabee, D., Prendergast, M.L., & Cartier, J. (202). Methamphetamine use and HIV risk
among substance-abusing offenders in California. Journal of Psychoactive Drugs, 34(3),
295-300. (PMID: 12422940)
Farrell, G., K. Mansur, and M. Tullis (1996). Cocaine and Heroin in Europe 1983-1993: A Cross-
National Comparison of Trafficking and Prices, British Journal of Criminology 36: 255-
281.
Finckenauer, James O. 2007. Mafia and Organized Crime: A Beginner’s Guide. Oxford, UK:
Oneworld Publishers.
Fries, Arthur et al. (2008). The Purity and Price of Illicit Drugs, 1981-2007. Institute for Defense
Analysis, Alexandria.
Geffray, Christian. 2001. Introduction: Drug trafficking and the state. International Social Science
Journal 53, 3(169): 421-426.
Glenny, Misha. 2009. Canada: The new global drug lord. Maclean’s, 122(32): 16-18.
Gruppo Abele (2003). Synthetic Drugs Trafficking in Three European Cities: Major Trends and the
Involvement of Organised Crime, Final Report. Gruppo Abele, Torini.
Health Canada (2008). Drug Analysis Report on Designer Drugs Seized in Quebec, 2007-2008.
Minister of Health Canada, Ottawa.
Human, K. "Crimes of the Big Four motorcycle gangs." Journal of Criminal Justice 37.2 (2009): 174-
179.
Ioset, Serge et al. (2005). Establishment of an Operational System for Drug Profiling: A Swiss
Experience, Bulletin on Narcotics 57: 121-147.
Kinney, Michael (2006). From Pablo to Osama: Trafficking and Terrorist Networks, Government
Bureaucracies, and Competetive Adaptation. University Park: Penn State Press.
Kirby, Jason, and Nancy MacDonald. 2009. Canada is Colombia north. Maclean’s, 122(32): 18.
This document is a research report submitted to the U.S. Department of Justice. This report has not been published by the Department. Opinions or points of view expressed are those of the author(s)
and do not necessarily reflect the official position or policies of the U.S. Department of Justice.

100
Macoun, Robert J. and Peter Reuter (2001). Drug War Heresies: Learning from Other Vices, Times,
and Places. Cambridge: Cambridge University Press.
Meyers, Jeff. 2009. Officials: major Quebec drug-trafficking ring dismantled. Press Republican, July
7. Available at: http://pressrepublican.com/.
Morselli, Carlo 2009. Inside Criminal Networks. New York: Springer.
Morselli, Carlo 2009. Hells Angeles in spring time. Trends in Organized Crime, 12(2): 145-158.
Morselli, Carlo 2005. Contacts, Opportunities, and Criminal Enterprise. Toronto: University of
Toronto Press.
Morselli, Carlo, and Cynthia Giguere. 2006. Legitimate strengths in criminal networks. Crime, Law
& Social Change 45(3): 185–200.
Morselli, Carlo, and Julie Roy. 2008. Brokerage qualifications in ringing operations. Criminology.
46(1): 71-71-98.
Morselli, Carlo, Dave Tanguay and Anne-Marie Labalette (2008). “Criminal Conflicts and Collective
Violence: Biker-Related Account Settlements in Quebec, 1994-2001”, Chapter 11 (pp.145-164)
in D. Siegel and H. Nelen (eds.) Organized Crime: Culture, Markets, and Policies. New York:
Springer.
National Drug Intelligence Center. 2010. National Drug Threat Assessment 2010. U.S. Department
of Justice. Available at: http://www.justice.gov/ndic/pubs38/38661/38661p.pdf.
National Drug Intelligence Center. 2009. National Drug Threat Assessment 2010. U.S. Department
of Justice. Available at: http://www.justice.gov/ndic/pubs31/31379/31379p.pdf.
Office of National Drug Control Policy (2013). ADAM II 2012 Annual Report. Washington, DC:
Office of the President.
Passas, Nikos and Nelken, David. 1993. The Thin Line Between Legitimate and Criminal
Enterprises: Subsidy Frauds In The European Community. Crime, Law and Social Change
19(3): 223-243.
Ramonas, Andrew. 2009. DOJ launches center to fight international crime. Main Justice, May 29.
Available at: http://www.mainjustice.com/2009/05/29/doj-launches-center-to-fight-
international-crime/.
Ratle, Frédéric et al. (2008). Advanced clustering methods for mining chemical databases in forensic
science, Chemometrics and Intelligent Laboratory Systems
90: 123-131.
Reuter, Peter (1983). Disorganized Crime. Cambridge: MIT Press.
Reuter, Peter and Mark Kleiman (1986). Risks and Prices: An Economic Analysis of Drug
Enforcement. Pp. 289-340 in N. Morris and M. Tonry (eds.), Crime and Justice: An Annual
Review of Research 7. Chicago: University of Chicago Press.
Rossmo, D. Kim, Routledge, Rick (1990). Estimating the Size of Criminal Populations. Journal of
Quantitative Criminology 6: 293–314.
RCMP (2007). Prix des drogues illicites aux Canada, 2006-2007. Royal Canadian Mounted Police,
Ottawa.
Savona, Ernesto U. 1990. A Neglected Sector: The Economic Analysis of Criminality, Penal Law
and the Criminal Justice System. Sociologia-del-Diritto 17(1-2): 255-277.
Shelley, Louise. 1995. Transnational organized crime: An imminent threat to the nation state.
Journal of International Affairs, 48(2): 463-489.
Smit F, Toet J, van der Heijden P. (1997). Estimating the number of opiate users in Rotterdam using
statistical models for incomplete count data. In European Monitoring Centre for Drugs and
Drug Addiction (EMCDDA), 1997 Methodological Pilot Study of Local Prevalence
Estimates. EMCDDA, Lisbon.
This document is a research report submitted to the U.S. Department of Justice. This report has not been published by the Department. Opinions or points of view expressed are those of the author(s)
and do not necessarily reflect the official position or policies of the U.S. Department of Justice.

101
Substance Abuse and Mental Health Services Administration (2011). Results from the 2010 National
Survey on Drug Use and Health: volume 1: summary of national findings. Rockville, MD:
Substance Abuse and Mental Health Services Administration, Office of Applied Studies.
Thoumi, Francisco E. 2002. Illegal drugs in Colombia: From illegal economic boom to social crisis.
Annals of the American Academy of Political & Social Science 582: 102-116.
Tremblay, Pierre, Sylvie Laisne, Gilbert Cordeau, Brian MacLean, and Angela Shewshuck (1989).
“Carrières criminelles collectives: évolution d’une population délinquante (les groupes
motards)”, Criminologie 22: 65-94.
UNODC (2009). World Drug Report. United Nations Office on Drugs and Crime, New York.
U.S. Department of Justice. 2008. United States Law Enforcement Strategy to Combat International
Organized Crime. Available at: http://www.justice.gov/ag/speeches/2008/ioc-strategy-public-
overview.pdf.
Watertown Daily Times (2011). Law targets northern border drug trade. Jan 23, 2011.
Wilson, Richard M., and Mark F. Collins. (1992). Capture-Recapture Estimation with Samples of
Size One Using Frequency Data. Biometrika 79,3, 543-553.
Yawnghwe, Chao-Tzang. 1993. The political economy of the opium trade: Implications for Shan
State. Journal of Contemporary Asia 23 (3): 306-326.
Zaitch, Damian. 2002a. Bosses, brokers and helpers: Labour and business relations amongst
Colombian cocaine traffickers. Amsterdams Sociologisch Tijdschrift 29(4): 502-529.
________. 2002b. From Cali to Rotterdam: Perceptions of Colombian cocaine traffickers on the
Dutch port. Crime, Law & Social Change 38(3): 239-266.
Zhang, Sheldon X. 2008. Chinese Human Smuggling Organizations—Families, Social Networks, and
Cultural Imperatives. Palo Alto, CA: Stanford University Press.
Zhang, Sheldon X. 2007. Smuggling and Trafficking in Human Beings: All Roads Lead to America.
Westport, CT: Praeger/Greenwood.
Zingg, Christian (2005). The Analysis of Ecstasy Tables in a Forensic Drug Intelligence Perspective,
Doctoral thesis, l’Institut de Police Scientifique (IPS), l’Université de Lausanne.
This document is a research report submitted to the U.S. Department of Justice. This report has not been published by the Department. Opinions or points of view expressed are those of the author(s)
and do not necessarily reflect the official position or policies of the U.S. Department of Justice.

102
VI. Appendices
VI.1. Tables and Clarifying Documentation
VI.2. Data Files
Two data files generated from this proposed study are attached (in SPSS format). The first
data file contains arrest records, and the second file with lab results of the chemical compounds
gathered from official records. Codebooks are also included that explain the variable names and
values in both data files so researchers can examine the data elements. All data files and their
associated codebooks are enclosed with this final report.
This document is a research report submitted to the U.S. Department of Justice. This report has not been published by the Department. Opinions or points of view expressed are those of the author(s)
and do not necessarily reflect the official position or policies of the U.S. Department of Justice.

103
Seizure Data Tables
Region of Destination Canada (All) Western Canada Eastern Canada
Country of Origin
Number
of
Seizures
Mean
Value of
Seizures
Number
of
Seizures
Mean
Value of
Seizures
Number
of
Seizures
Mean
Value of
Seizures
Unknown 2997 884 2037 280 960 2458
India 2792 739 2566 475 226 3844
United States 1835 9864 901 1950 934 17322
Canada 1257 17178 226 8091 1031 22809
Pakistan 711 701 704 707 7 172
United Kingdom 580 1852 396 120 184 5582
China 422 15476 167 31526 255 5290
Argentina 302 93 301 93 1 n/a
Poland 253 504 250 509 3 25
South Africa 236 127 236 127 n/a n/a
Philippines 181 164 2 5010 179 110
Panama 173 55 170 55 3 49
Netherlands 149 87069 104 107376 45 59147
Romania 148 94 147 94 1 166
Iran 142 3165 101 4394 41 135
Mexico 124 19511 44 159 80 30289
Peru 113 692 100 672 13 844
Brazil 93 3646 90 3766 3 59
Germany 88 185 85 182 3 500
Thailand 86 105 8 21 78 114
El Salvador 76 80 74 80 2 78
United Arab Emirates 63 522 18 123 45 682
Hong Kong 55 1361 26 2536 29 307
Serbia 54 369 50 340 4 737
Portugal 50 277 47 293 3 38
Turkey 42 303 41 318 1 4
France 40 289 36 310 4 107
Vietnam 40 279 16 127 24 385
Costa Rica 40 65 36 67 4 42
Greece 38 118 37 115 1 240
Hungary 36 147 35 133 1 636
Dominican Republic 34 48 31 42 3 109
Taiwan 33 156 6 258 27 132
Spain 29 118 27 122 2 72
Czech Republic 27 162 23 166 4 143
This document is a research report submitted to the U.S. Department of Justice. This report has not been published by the Department. Opinions or points of view expressed are those of the author(s)
and do not necessarily reflect the official position or policies of the U.S. Department of Justice.

104
Cuba 27 102 21 116 6 53
Lebanon 25 129 20 132 5 117
Multiple 21 1387 12 1793 9 847
Bangladesh 20 1464 18 1620 2 60
Italy 19 409 17 336 2 1026
Egypt 19 57 16 48 3 104
Korea, Republic of 17 115 8 122 9 109
Colombia 17 103 14 71 3 250
Belgium 16 1066733 14 1219016 2 748
Nigeria 16 2749 13 3404 3 128
Bulgaria 16 182 15 191 1 50
Israel 15 109 14 110 1 100
Japan 13 342 4 770 9 128
Chile 13 111 9 108 4 119
Singapore 13 91 n/a n/a 13 91
Recovery Entry 12 753 7 38 5 1611
Saudi Arabia 12 237 8 79 4 473
Bolivia 11 250 10 275 1 0
Trinidad and Tobago 11 175 11 175 n/a n/a
Australia 11 87 n/a n/a 11 87
Switzerland 11 81 9 69 2 135
Haiti 10 173 10 173 n/a n/a
Russia 10 154 10 154 n/a n/a
Macedonia 9 174 9 174 n/a n/a
Guatemala 9 68 7 71 2 60
Croatia 8 168 8 168 n/a n/a
Ukraine 8 149 4 194 4 104
Ireland 8 123 6 141 2 67
Bosnia & Herzegovina 8 104 8 104 n/a n/a
Sri Lanka 7 418 7 418 n/a n/a
Syria 7 277 7 277 n/a n/a
New Zealand 6 398 1 2 5 477
Afghanistan 6 331 4 393 2 238
Jamaica 6 286 6 286 n/a n/a
Guyana 6 217 6 217 n/a n/a
Cambodia 6 101 2 40 4 132
Malaysia 6 63 n/a n/a 6 63
Indonesia 6 58 2 60 4 56
Slovakia 5 306 5 306 n/a n/a
Other 5 206 5 206 n/a n/a
Jordan 5 202 5 202 n/a n/a
Cameroon 5 189 4 209 1 109
This document is a research report submitted to the U.S. Department of Justice. This report has not been published by the Department. Opinions or points of view expressed are those of the author(s)
and do not necessarily reflect the official position or policies of the U.S. Department of Justice.

105
Ghana 4 1772 1 104 3 2328
Korea, Democratic People's Republic of 4 166 2 16 2 315
Morocco 4 97 4 97 n/a n/a
Honduras 4 89 3 109 1 30
Paraguay 4 79 3 102 1 8
Tunisia 4 64 4 64 n/a n/a
Faroe Islands 3 12000 3 12000 n/a n/a
Iceland 3 2343 3 2343 n/a n/a
Ecuador 3 354 3 354 n/a n/a
Fiji 3 257 n/a n/a 3 257
Sudan 3 226 n/a n/a 3 226
Venezuela 3 221 3 221 n/a n/a
Namibia 3 125 2 90 1 195
United States Minor Outlying Islands 3 82 1 160 2 4
Vanuatu 3 80 n/a n/a 3 80
Uganda 3 77 3 77 n/a n/a
Albania 3 76 3 76 n/a n/a
Moldova 3 69 1 86 2 61
Botswana 3 57 3 57 n/a n/a
Belize 3 38 3 38 n/a n/a
Kenya 2 6957 1 8371 1 5542
Tanzania 2 1530 1 3000 1 60
Iraq 2 575 2 575 n/a n/a
Burundi 2 488 2 488 n/a n/a
Togo 2 84 2 84 n/a n/a
Barbados 2 82 2 82 n/a n/a
Nepal 2 70 1 40 1 100
Netherlands Antilles 2 70 1 70 1
Union of Soviet Socialist Republics 2 63 1 5 1 120
Bahamas 2 45 2 45 n/a n/a
Nicaragua 2 45 2 45 n/a n/a
Senegal 2 38 2 38 n/a n/a
Algeria 2 37 2 37 n/a n/a
Cyrpus 2 23 2 23 n/a n/a
St Vincent and the Grenadines 1 3322 1 3322 n/a n/a
Eritrea 1 550 1 550 n/a n/a
Seychelles 1 300 1 300 n/a n/a
Neutral Zone 1 280 1 280 n/a n/a
Liberia 1 275 1 275 n/a n/a
Denmark 1 240 1 240 n/a n/a
Sweden 1 222 1 222 n/a n/a
Maldives 1 151 1 151 n/a n/a
This document is a research report submitted to the U.S. Department of Justice. This report has not been published by the Department. Opinions or points of view expressed are those of the author(s)
and do not necessarily reflect the official position or policies of the U.S. Department of Justice.

106
Azerbaijan 1 120 1 120 n/a n/a
Yugoslavia 1 120 1 120 n/a n/a
Malta 1 110 1 110 n/a n/a
Grenada 1 105 1 105 n/a n/a
Bermuda 1 98 1 98 n/a n/a
Madagascar 1 85 1 85 n/a n/a
Kazakhstan 1 58 1 58 n/a n/a
Austria 1 57 1 57 n/a n/a
Zimbabwe 1 50 n/a n/a 1 50
Guinea 1 48 1 48 n/a n/a
Guadeloupe 1 45 1 45 n/a n/a
Lithuania 1 44 1 44 n/a n/a
Benin 1 40 1 40 n/a n/a
Ethiopia 1 24 1 24 n/a n/a
Saint Lucia 1 20 1 20 n/a n/a
Congo 1 13 n/a n/a 1 13
Yemen 1 10 n/a n/a 1 10
Kuwait 1 7 n/a n/a 1 7
This document is a research report submitted to the U.S. Department of Justice. This report has not been published by the Department. Opinions or points of view expressed are those of the author(s)
and do not necessarily reflect the official position or policies of the U.S. Department of Justice.

107
Appendix A. Regression Tables with Significant Covariates.
Table A1 shows the output for regression models (all offences) in which significant
covariates were found. In the model with only gender as a covariate and in the model with both age
and gender, it is found that females are less likely to be rearrested. There is no relationship between
age and rearrest. Table A2 shows that females are less likely to be rearrested for a selling offence.
Table A1. All-offence models with significant covariates.
B 95% CI SE P
2005-2007
Gender model
Gender -0.408 -0.746 to -0.071 0.172 0.018
Constant -2.697 -2.801 to -2.592 0.053 0.000
AIC 3115.62
G2 6.216
�̂� (95% CI) 58,109 (52,282 to 63,935)
Age + gender model
Gender -0.403 -0.741 to -0.066 0.172 0.019
Age -0.003 -0.013 to 0.007 0.005 0.549
Constant -2.618 -2.895 to -2.340 0.142 0.000
AIC 3,117.26
G2 6.578
�̂� (95% CI) 58,161 (52,319 to 64,003)
Table A2. Selling model with significant covariate.
B 95% CI SE P
2005-2007
Gender model
Gender -0.792 -1.477 to -0.108 0.349 0.023
Constant -2.969 -3.146 to -2.791 0.091 0.000
AIC 1,112.39
G2 6.418
�̂� (95% CI) 35,832 (28,433 to 43,231)
This document is a research report submitted to the U.S. Department of Justice. This report has not been published by the Department. Opinions or points of view expressed are those of the author(s)
and do not necessarily reflect the official position or policies of the U.S. Department of Justice.

108
Appendix B. Refining the economic model in the context of added law enforcement
There are two additional pieces of information that can be usefully explored in this context.
The first is to relate the rate at which labs are discovered to the intensity of the police effort. The
second relates to a more careful characterization of the costs of the ingredients of the meth labs
themselves.
The difficulty with the evaluation of the prevalence of methamphetamine operations using
the current model and data is that we are dealing with very small numbers. The question about how
to apply the model going forward is one of integrating new data as they become available. In this
case there are two themes. The first is that of enforcement. How many resources are being devoted
to the exposure and busting of meth labs? The second is the underlying number of labs that are out
there. The questions are clearly related to each other. Consequently we need to take account of the
possibility of changes in the level of enforcement and apprehension.
To imagine that there is a functional relationship between the number of identified
methamphetamine operations, B, and the actual number of meth operations, T, the number of law
enforcement officers, L, actually engaged in targeting or otherwise identifying meth operations, the
security, S, mounted by the meth operations themselves, and other random events that bring meth
operations to light, X. The coefficients, bi, reflect the strength with which each variable impacts the
discovery of meth labs. More total labs, higher T, presumably lead to a greater number of
discoveries of labs. Consequently, b1 is positive. The same is true for increases in the amount of law
enforcement resources dedicated to the discovery of labs so that b2 is also assumed positive. A
higher level of security for meth labs reduces the number of labs discovered and so b3 is assumed to
be negative. The variables X are other random effects striking the discovery of meth labs not
specifically identified. This we can write as equation 6:
(6) B= b0+b1T+b2 L+b3 S+ X
We know from the discussion earlier that the total number of operations can be estimated
from the formula:
(5) T= Bx[1+(PxQ/C)]/[(PxQ/C)-(1+ρ)]
But in the case in which there is a relationship between the energy put toward finding meth
labs, then we need to account for the increase in resources devoted to the activity.
We have two choices. We can solve for the total number of meth labs as a function of the number of
busts directly, but if there are differences in the rate of enforcement, security and so forth, this will
not give a very useful picture since it implicitly assumes that the rate of enforcement is constant.
Although the information requirements are greater, we can account for increased enforcement
by estimating equations (5) and (6) simultaneously. This is something that should be considered in
the context of the small number of meth labs currently discovered. If they are in fact more prevalent
than the low rate of discovery would suggest, contrast that with some 2,000 or more marijuana
growing operations found each year in British Columbia alone, then correcting for the level of
enforcement is likely to be relevant if we want an accurate characterization of the number of
methamphetamine labs in the general population.
This document is a research report submitted to the U.S. Department of Justice. This report has not been published by the Department. Opinions or points of view expressed are those of the author(s)
and do not necessarily reflect the official position or policies of the U.S. Department of Justice.

109
What data are relevant for assessing the number of meth labs?
(1) Of those that are discovered, how large are they? Are they used once or twice or are they used
more frequently? Is output in ounces or pounds? What are the constraints on the process? Is it
because it cannot be produced or because it cannot be retailed?
(2) What chemical process is used to produce methamphetamine? There are many possible ways, but
if one route is more common, it suggests what raw materials are easiest to get.
(3) What is the price of the meth products over time and by region? In that absence of other data, this
is the most valuable kind of information. The price of the product will fluctuate and be associated
with various events such as large scale law enforcement pushes, border events, bad weather and so
forth. It will give a sense of how well the market is working and whether it is an integrated market or
a series of local markets.
(4) What are the costs of manufacture? We have discussed preliminary views of the costs, but there
is no substitute for on the ground data. Among the important issues are:
The cost of lab equipment;
The cost of the laboratory setting such as a house, back cottage, apartment and so forth.
Is the lab setting rented or owned?
How long is an average tenure after the lab is in operation?
Are there unsuccessful labs? What proportion fail?
How long does the process take from purchase of inputs to final sale of output?
(5) Group Dynamics
Who finances the operation?
How large is the group producing the product?
How do they split the take? For example, in BC with marijuana for some time organized
crime split the product 50/50 with the producer and would offer cash if in kind consumption
was not desired. Is the ratio of the product produced shared with the various producers or are they paid a wage?
(6) What are the dimensions that change with the scale of the operation? For example, in
marijuana growing operations, the key feature is the number of lights since that is the constraint on
the amount of energy getting to the plants. What distinguishes an industrial operation from a top of
the stove one ounce of production operation?
This document is a research report submitted to the U.S. Department of Justice. This report has not been published by the Department. Opinions or points of view expressed are those of the author(s)
and do not necessarily reflect the official position or policies of the U.S. Department of Justice.