Establish Davis Logistics Costs and Service 2013 As ...
40
Establish Davis Logistics Costs and Service 2013 As presented at CSCMPS Annual Global Conference Denver, October 20-23
-
Upload
khangminh22 -
Category
Documents
-
view
3 -
download
0
Transcript of Establish Davis Logistics Costs and Service 2013 As ...

Establish Davis Logistics Costs and Service 2013
As presented at
CSCMPS Annual Global Conference
Denver, October 20-23

© 2011 Establish 2
1. The Establish Davis Database Evolution
2. Logistics Cost and Service
3. What companies are doing to control/reduce costs

© 2011 Establish 3
1992
2001
Made Database form available on line
First private Database for FIEI
Restructured Database for globalization of logistics
1987
European Database expanded, 10 countries
1985
First European Database, France
Private benchmarking system for GE’s 72 divisions
1982
1974
Set up Database
Completed first Workbook
1983
GMA - Grocery Manufacturers of America Database
PMA - Pharmaceutical Manufacturers of America Database
DTPA - Drug and Toilet Preparations Association Database
Chemical Manufacturers of America
Database
1999
Davis Insights added
2003
New European Database
2005
Revised format
Extended options
Great recession
begins
2007
The Establish Davis Database Evolution Over Time
Great
recession ends
2009
© 2011 Establish 4
The Establish Davis Database Contains Many Industries/Groups
Consumer Electronics
High-Value Industrial Durable
Telecommunications
Industrial Replacement Parts
Chemicals
Industrial Supplies
Consumer Service Parts
Small Appliances
Large Appliances
Publishing
Tires
Consumer Packaged Goods
Building Supplies/Hardware Products
Low-Value Consumer Packaged Goods
High-Value Consumer Packaged Goods
Grocery
Produce and Fresh Foods
Meat and Fish Products
Frozen Food
Beverages
Consumer Household Products
Health and Beauty Aids
High-Value Pharmaceuticals
Low-Value Pharmaceuticals
Industrial and Consumer
Wholesalers/Distributors
Apparel Retailers
Drug Wholesalers
Mass Merchandisers
Low-Value Industrial Durable

© 2011 Establish 5
The Establish Davis Database
Participants confidential reports include:
Cost comparison by general industry group and product value.
Other cost comparisons participants receive:
By volume
By sales revenue

© 2011 Establish 6
Your company compared
to similar companies.

© 2011 Establish 7
Annually, we summarize the data, track it over time, and report the
results.
0
2
4
6
8
10
1974 1977 1980 1983 1986 1989 1992 1995 1998 2001 2004 2007 2010 2013Co
st A
s a
P
erc
en
t o
f S
ale
s
% of Sales
Logistics Cost as a Percent of Sales
The Establish Davis Database
8.41%

© 2011 Establish 8
Annual Functional Cost Change
(Percent of Sales)
Transportation
Inventory
Warehousing
The Establish Davis Database - Average Company
Logistics Costs Change
-75
-50
-25
0
25
50
75
Co
st
as
A P
erc
en
t o
f S
ale
s

© 2011 Establish 9
Establish Davis Database - Average Company
2013 - Key Findings
Logistics costs for the average company in the database are
8.41 percent of sales and $55.95 per hundredweight shipped.
Logistics costs increased moderately (2 to 3 percent) from 2012
to 2013. Transportation and warehousing costs drove the
increase.
Overall logistics costs are on an upward trend.
Companies with higher product values continue to have lower
logistics costs.
Smaller companies continue to have higher logistics costs.
Service performance levels have remained about the same for
several years.

© 2011 Establish 10
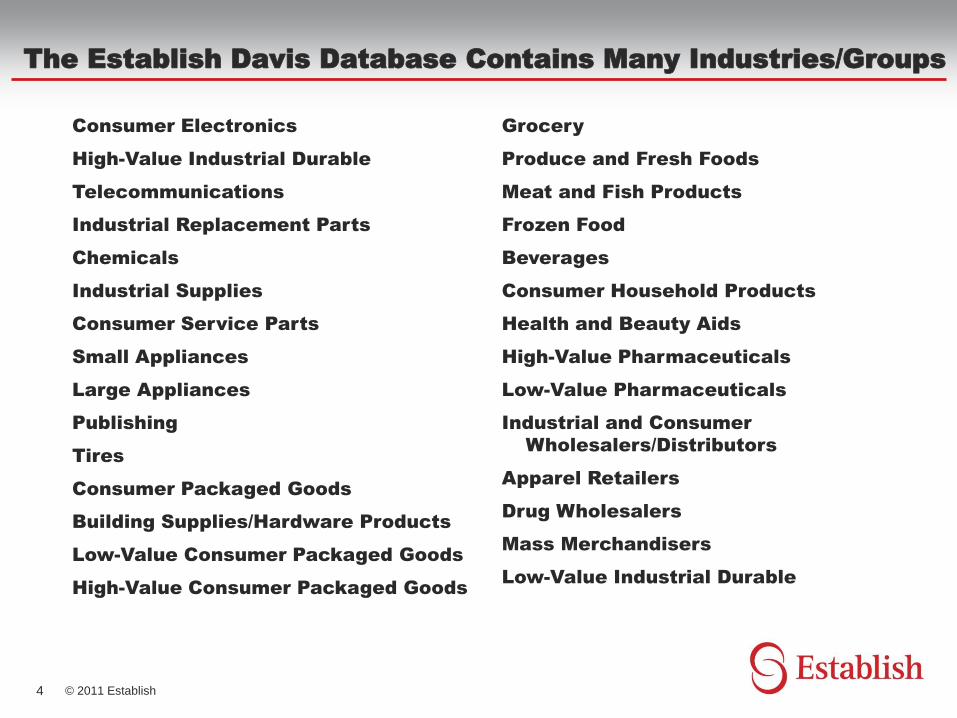
The Establish Davis Database - Average Company
2013 Logistics Costs
Cost
% of Sales $/CWT
Transportation 3.66% $25.99
Warehousing 2.04% $15.32
Customer Service 0.37% $1.94
Administration 0.22% $1.00
Inventory Carrying 2.11% $11.70
Total Logistics Costs 8.41% $55.95

© 2011 Establish 11
Cost as a Percent of Sales (8.41%)
Customer Service/
Order Entry
4%
Warehousing
24%
Administration
3% Inventory Carrying
25%
Transportation
44%

© 2011 Establish 12
Cost per Hundredweight (CWT – $55.95)
Warehousing
27% ($15.32)
Customer Service/
Order Entry
3% ($1.94)
Administration
2% ($1.00)
Inventory Carrying
21% ($11. 70)
Transportation
46% ($25.99)

© 2011 Establish 13
Cost as a Percent of Sales
Cost per Hundredweight
13
Warehousing
24%
Customer Service/
Order Entry
4%
Transportation
44%
Administration
3% Inventory Carrying
25%
Warehousing
27%
Customer Service/
Order Entry
3%
Transportation
46%
Administration
2% Inventory Carrying
21%

© 2011 Establish 14
The Establish Davis Database - Average Company
2013 vs. 2012 Logistics Costs
2013 Cost 2012 Cost
% of Sales $/CWT % of Sales $/CWT
Transportation 3.66% $25.99 3.44% $24.85
Warehousing 2.04% $15.32 1.89% $15.07
Customer Service 0.37% $1.94 0.30% $2.38
Administration 0.22% $1.00 0.19% $1.37
Inventory Carrying 2.11% $11.70 2.05% $13.02
Total Logistics Costs 8.41% $55.95 7.87% $56.69

© 2011 Establish 15
Transportation
Warehousing
Order Entry/Customer Service
Administration
Inventory
Total
% of Sales $/CWT
+7.9% +1.7%
-18.5%
-27.0%
-10.1%
-1.3%
The Establish Davis Database - Average Company
2013 vs. 2012 Logistics Costs Change
+2.9%
+6.9%
+6.4%
+23.3%
+15.8%
+4.6%

© 2011 Establish 16
The Establish Davis Database - Average Company
2013 Logistics Costs
Cost as
% of Sales
Transportation 3.66%
Warehousing 2.04%
Customer Service 0.37%
Administration 0.22%
Inventory Carrying 2.11%
Total Logistics Costs 8.41%

© 2011 Establish 17
0
1
2
3
4
5
2002 2003 2004 2005 2006 2007 2008 2009 2010 2011 2012 2013
Transportation Warehousing Customer Service Administration Inventory Carrying
Cost as a Percent of Sales Over Time
Co
st a
s a
P
erc
en
t o
f S
ale
s

© 2011 Establish 18
0
2
4
6
8
10
2002 2003 2004 2005 2006 2007 2008 2009 2010 2011 2012 2013
Co
st a
s a
P
erc
en
t o
f S
ale
s
Cost as a Percent of Sales Over Time
0
2
4
6
8
10
2001 2002 2003 2004 2005 2006 2007 2008 2009 2010 2011
Inventory Carrying Administration Customer Service Warehousing Transportation
0
2
4
6
8
10
2001 2002 2003 2004 2005 2006 2007 2008 2009 2010 2011
Inventory Carrying Administration Customer Service Warehousing Transportation
0
2
4
6
8
10
2001 2002 2003 2004 2005 2006 2007 2008 2009 2010 2011
Inventory Carrying Administration Customer Service Warehousing Transportation
0
2
4
6
8
10
2001 2002 2003 2004 2005 2006 2007 2008 2009 2010 2011
Inventory Carrying Administration Customer Service Warehousing Transportation
0
2
4
6
8
10
2001 2002 2003 2004 2005 2006 2007 2008 2009 2010 2011
Inventory Carrying Administration Customer Service Warehousing Transportation
© 2011 Establish 19
The Establish Davis Database - Average Company
2013 Logistics Costs
Cost
$/CWT
Transportation $25.99
Warehousing $15.32
Customer Service $1.94
Administration $1.00
Inventory Carrying $11.70
Total Logistics Costs $55.95
© 2011 Establish 20
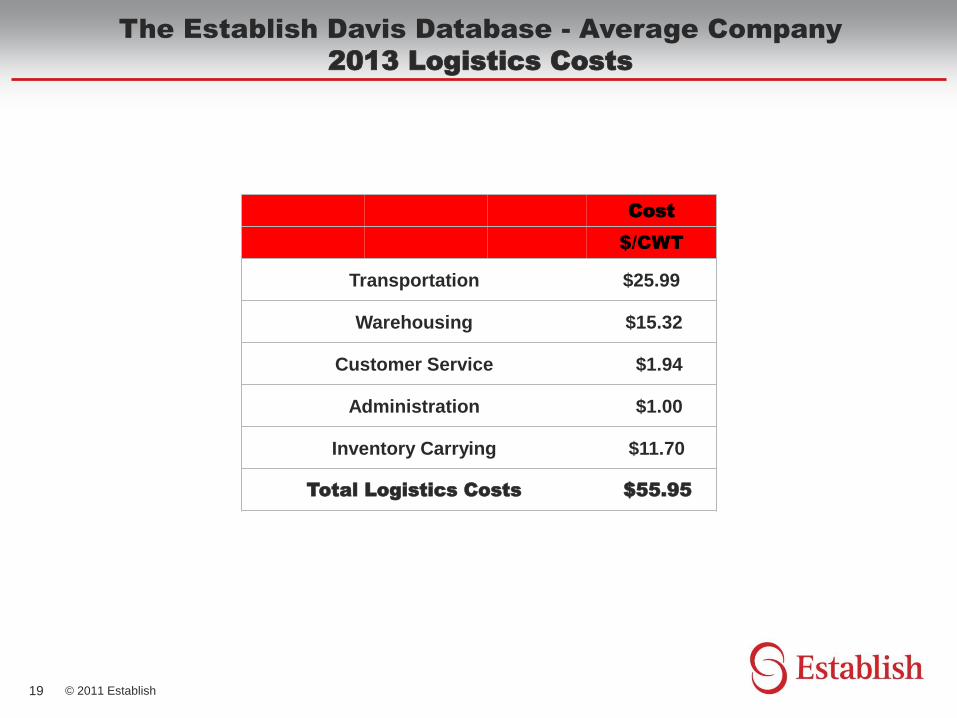
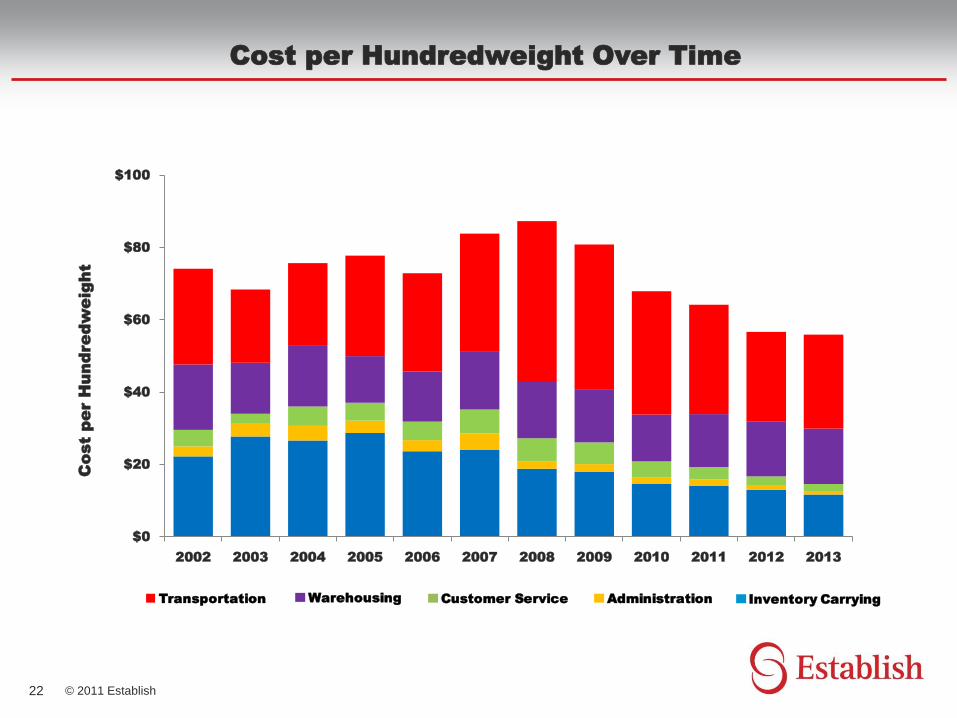
$0
$10
$20
$30
$40
$50
2002 2003 2004 2005 2006 2007 2008 2009 2010 2011 2012 2013
Transportation Warehousing Customer Service Administration Inventory Carrying
Cost per Hundredweight Over Time C
ost p
er H
un
dre
dw
eig
ht

© 2011 Establish 21
$0
$5
$10
$15
$20
$25
$30
$35
$40
$45
$50
$0,00
$0,50
$1,00
$1,50
$2,00
$2,50
$3,00
$3,50
$4,00
$4,50
2002 2003 2004 2005 2006 2007 2008 2009 2010 2011 2012 2013
On-Highway Diesel Fuel Cost Cost of Transportation
Source: U.S. Energy Information Administration
On-H
ig
hw
ay D
ie
se
l F
ue
l C
ost
Cost per H
undre
dw
eight
On-Highway Diesel Fuel Cost (Over Time)
© 2011 Establish 22
$0
$20
$40
$60
$80
$100
2002 2003 2004 2005 2006 2007 2008 2009 2010 2011 2012 2013
Co
st p
er H
un
dre
dw
eig
ht
Cost per Hundredweight Over Time
0
2
4
6
8
10
2001 2002 2003 2004 2005 2006 2007 2008 2009 2010 2011
Inventory Carrying Administration Customer Service Warehousing Transportation
0
2
4
6
8
10
2001 2002 2003 2004 2005 2006 2007 2008 2009 2010 2011
Inventory Carrying Administration Customer Service Warehousing Transportation
0
2
4
6
8
10
2001 2002 2003 2004 2005 2006 2007 2008 2009 2010 2011
Inventory Carrying Administration Customer Service Warehousing Transportation
0
2
4
6
8
10
2001 2002 2003 2004 2005 2006 2007 2008 2009 2010 2011
Inventory Carrying Administration Customer Service Warehousing Transportation
0
2
4
6
8
10
2001 2002 2003 2004 2005 2006 2007 2008 2009 2010 2011
Inventory Carrying Administration Customer Service Warehousing Transportation

© 2011 Establish 23
0
2
4
6
8
10
12
<$100 $100 - $500 $500 - $2,000 >$2,000
10.50
8.46
6.93
4.88
Company Size
Smaller companies continue to have higher logistics
costs.
Co
st a
s a
P
erc
en
t o
f S
ale
s
Annual Sales ($ MM)

© 2011 Establish 24
Co
st a
s a
P
erc
en
t o
f S
ale
s
Product Value in $/Pound
Product Value
Companies with higher product values continue to have
lower logistics costs.
0.00
2.00
4.00
6.00
8.00
10.00
12.00
<$5 $5 - $10 $10 - $20 >$20
9.14
10.91
5.89
4.24

© 2011 Establish 25
2013 Measurements
Total order cycle time - 11 days
Product Availability (Shipped Complete)
Orders 85%
Lines 95%
Units 92%
Customer Service Levels

© 2011 Establish 26
FULL DATABASE
Average Performance Reported
02 03 04 05 06 07 08 09 10 11 12 13
Total Cycle Time (Days) 8 7 8 8 8 9 9 8 7 7 10 11
Product Availability (% Orders) 88 85 91 88 84 83 90 91 92 93 85 84
(% Lines) 95 91 94 92 89 93 92 94 95 95 96 95
(% Units) 93 93 91 94 90 94 94 95 95 95 94 91

© 2011 Establish 27
What are companies doing to control/reduce costs
and add capacity in this economy?

© 2011 Establish 28
LOGISTICS NETWORKS

© 2011 Establish 29
LOGISTICS NETWORKS
Shifting to a global perspective.
Reconfiguring networks as a result of:
― Shifts in the manufacturing and customer base.
― Changes in carrier rate structures and service performance
levels.
Reconfiguring networks to consolidate the operations of:
– Internal organizations
– Acquired/merged organizations.
© 2011 Establish 30
TRANSPORTATION
(44% of the Logistics Spend)

© 2011 Establish 31
TRANSPORTATION
Centralizing the purchasing of transportation.
― Formalizing the carrier selection process.
― Leveraging volumes (plants/DCs - inbound from
sources/suppliers, transfers and customer shipments).
Re-evaluating ordering patterns to identify consolidation, pool
point, and cross dock opportunities.
Separating imbedded transportation costs from the landed cost
of materials/inventory from sources, to:
― Identify, evaluate and control costs.
― Leverage additional volumes.
Acquiring/upgrading transportation management systems (TMS)
to maximize control and cost reduction opportunities.

© 2011 Establish 32
WAREHOUSING
(24% of the Logistics Spend)

© 2011 Establish 33
WAREHOUSING
Leveraging volumes when:
― Purchasing supplies and equipment
― Engaging the services of third party providers (3PL)
Shifting to 3PLs and formalizing the engagement process.
Using more temporary personnel.
Increasing the capacity of existing warehouses by changing to
denser storage methods and by expanding the cube (adding on,
raising the roof, etc.).
Purchasing factory rebuilt equipment.
Adding/upgrading Warehouse Management Systems (WMSs).
Increasing ASN requirements to improve receiving and put away
productivity and efficiency.

© 2011 Establish 34
INVENTORY
(25% of the Logistics Spend)

© 2011 Establish 35
INVENTORY
Improving the forecasting/inventory planning processes.
Reducing the safety stock requirements by reducing the number
of warehouses.
Reducing inventory carrying costs and warehousing space
requirements by:
― Pushing inventory , all types, back to suppliers.
― Disposing of excess and obsolete inventory.

© 2011 Establish 36
CUSTOMER SERVICE
(4% of the Logistics Spend)

© 2011 Establish 37
CUSTOMER SERVICE
Migrating to automated attendants
Outsourcing the functional activities
Encouraging on-line order entry, tracking, etc.

© 2011 Establish 38
ADMINISTRATION
(3% of the Logistics Spend)

© 2011 Establish 39

© 2011 Establish 40
THANK YOU