Essentials of Radiologic Science - National Academic Digital ...
392
-
Upload
khangminh22 -
Category
Documents
-
view
1 -
download
0
Transcript of Essentials of Radiologic Science - National Academic Digital ...


Fosbinder_Text_FM.indd i 11/30/2010 4:53:18 PM

Essentials of
Radiologic Science
Fosbinder_Text_FM.indd i 11/30/2010 4:53:18 PM

Fosbinder_Text_FM.indd ii 11/30/2010 4:53:19 PM

Robert FosbinderDenise Orth
Essentials of
Radiologic Science
Fosbinder_Text_FM.indd iii 11/30/2010 4:53:19 PM

Acquisitions Editor: Pete SabatiniProduct Director: Eric BrangerProduct Manager: Amy MillholenMarketing Manager: Shauna KelleyArtist: Jonathan DimesCompositor: SPi GlobalPrinter: C&C Offset
Copyright © 2012 Wolters Kluwer Health|Lippincott Williams & Wilkins
351 West Camden Street Two Commerce SquareBaltimore, Maryland 21201 2001 Market Street Philadelphia, Pennsylvania 19103
Printed in China
All rights reserved. This book is protected by copyright. No part of this book may be reproduced in any form or by any means, including photocopying, or utilized by any information storage and retrieval system without written permission from the copyright owner.
The publisher is not responsible (as a matter of product liability, negligence or otherwise) for any injury resulting from any material contained herein. This publication contains information relat-ing to general principles of medical care which should not be construed as specifi c instructions for individual patients. Manufacturers’ product information and package inserts should be reviewed for current information, including contraindications, dosages and precautions.
Library of Congress Cataloging-in-Publication DataFosbinder, Robert. Essentials of radiologic science / Robert Fosbinder, Denise Orth. p. ; cm. Includes index. Summary: “LWW is proud to introduce Essentials of Radiologic Science, a core, comprehen-sive textbook for radiologic technology students. Focusing on covering the crucial components and minimizing extraneous content, this text will help prepare students for success on the The American Registry of Radiologic Technologists Examination in Radiography and beyond into practice. Topics covered include radiation protection, equipment operation and quality control, image production and evaluation, and patient care. This is a key and crucial resource for radiologic technology programs, focusing on providing relevancy and offering tools and resource to students of multiple learning types. These include a full suite of ancillary products, a variety of pedagogical features imbedded in the text, and a strong focus on the practical application of the concepts presented”—Provided by publisher. ISBN 978-0-7817-7554-0 1. Radiography, Medical—Textbooks. 2. Radiologic technologists—Textbooks. I. Orth, Denise. II. Title. [DNLM: 1. Technology, Radiologic. 2. Radiation Protection. WN 160] RC78.F575 2010 616.07'572—dc22
2010030972
The publishers have made every effort to trace the copyright holders for borrowed material. If they have inadvertently overlooked any, they will be pleased to make the necessary arrangements at the fi rst opportunity.
To purchase additional copies of this book, call our customer service department at (800) 638-3030 or fax orders to (301) 824-7390. International customers should call (301) 714-2324.
Visit Lippincott Williams & Wilkins on the Internet: http://www.LWW.com. Lippincott Williams & Wilkins customer service representatives are available from 8:30 am to 6:00 pm, EST.
12
1 2 3 4 5 6 7 8 9 10
Fosbinder_Text_FM.indd iv 11/30/2010 4:53:19 PM

v
Preface
the instructor’s current syllabus. We believe the area of Patient Positioning and Procedures is so extensive and complex that it requires a separate text.
It is our hope that this text will exceed the expectations of students and educators in their use of this book. We hope that instructors fi nd this book easy for their students to read and understand, and we know they will fi nd it a useful addition to their courses.
FeaturesThe text has many features that are benefi cial to students as they learn about the fascinating world of radiography. Key terms are highlighted with bold text and are located at the beginning of each chapter as well as inside the chapter material. A glossary provides defi nitions for each key term. Other features include objectives, full-color design, in-text case studies with critical thinking questions, critical think-ing boxes with clinical/practical application questions and examples, video and animation callouts, chapter summa-ries, and chapter review questions. One of the most excit-ing features of this text is the use of over 250 illustrations, radiographic images, photographs, and charts that provide graphic demonstration of the concepts of radiologic science while making the text visually appealing and interesting.
AncillariesThe text has ancillary resources available to the students to further assist their comprehension of the material. Student ancillaries include full text online, a registry
Essentials of Radiologic Science has been designed with students and educators in mind. The textbook is designed to distill the information in each of the content-specifi c areas down to the essentials and to present them to the student in an easy-to-understand format. We have always believed that the difference between professional radiographers and “button pushers” is that the former understand the science and technology of radiographic imaging. To produce qual-ity images, a student must develop an understanding of the theories and concepts related to the various aspects of using radiation. They should not rely on preprogrammed equipment and blindly set technical factors, as this is the practice of “button pushers.” We have made a special effort to design a text that will help the students achieve tech-nical competence and build their professional demeanor. We have placed the chapters in an order to help the stu-dent and educator progress from one topic to another. The chapters can be used in consecutive order to build compre-hension; however, each chapter can stand alone and can be used in the order that is appropriate for any program.
From the discovery of x-rays by Wilhelm Roentgen to modern day, there have been major changes in how radiography is performed and the responsibilities of the radiographer. The advancement of digital imaging and the elimination of fi lm in a majority of imaging depart-ments in the country have changed the required knowl-edge base for radiographers, which is different today than just a few years ago. This text addresses those changes and the way radiography students must be educated.
Our goal is to make this text a valuable resource for radiography students during their program of study and in the future. To this end, the text covers four of the fi ve content-specifi c areas contained in the registry examina-tion: Physics, Radiographic Image Production, Radiation Protection, and Patient Care. The sections are inde-pendent and designed to be combined in whatever fi ts
Fosbinder_Text_FM.indd v 11/30/2010 4:53:19 PM

vi Preface
WorkbookAn Essentials of Radiologic Science Workbook is available separately to supplement the text and to help the students apply knowledge they are learning. The Workbook provides additional practice and preparation for the ARRT exam and includes registry-style review questions, as well as other exercises (crossword puzzles, image labeling) and a laboratory experiments section. All the questions in the Workbook are correlated directly with the text. Use of the Workbook will enhance learning and the enjoyment of radiologic science concepts.
Robert FosbinderDenise Orth
exam–style question bank, a chapter review question bank, videos, and animations. These animations comple-ment the text with action-packed visual stimuli to explain complex physics concepts. For example, the topic of x-ray interactions contains an animation demonstrating the x-ray photon entering the patient and then undergoing photoelectric absorption, Compton scattering, or through transmission. Thus, the student can see how the exit radi-ation is made up of a combination of through transmitted and scattered photons. Videos provide the student with the “real world” example of different scenarios includ-ing venipuncture, taking vital signs, using correct body mechanics, hand hygiene, and patient rights.
We have also included valuable resources for educa-tors to use in the classroom. Instructor resources include PowerPoint slides, lesson plans, image bank, test genera-tor, answer key for text review questions, and Workbook answer key. Their purpose is to provide instructors with detailed lecture notes that tie together the textbook and all the other resources we are offering with it.
Fosbinder_Text_FM.indd vi 11/30/2010 4:53:19 PM

Fosbinder_Text_FM.indd vii 11/30/2010 4:53:20 PM

Fosbinder_Text_FM.indd viii 11/30/2010 4:53:23 PM

Fosbinder_Text_FM.indd ix 11/30/2010 4:53:27 PM

x User’s Guide
Additional Learning Resources
Valuable ancillary resources for both students and instructors are available on thePoint companion website at http://thepoint.lww.com/FosbinderText. See the inside front cover for details on how to access these resources.
Student Resources include a registry exam-style question bank, a chapter review question bank, videos, and animations.
Instructor Resources include PowerPoint slides, lesson plans, image bank, test generator, answer key for text Review Questions, and answer key for Workbook questions.
Fosbinder_Text_FM.indd x 11/30/2010 4:53:31 PM

xi
Reviewers
John H. Clouse, MSR, RTDeputy DirectorCenter for Disaster Medicine PreparednessDepartment of Emergency MedicineUniversity of Louisville School of MedicineLouisville, Kentucky
Anthony E. Gendill, BA, BS, DCMedical Instructor/Award Winning Faculty MemberAllied Health DepartmentInstitute of Business and Medical CareersFort Collins, Colorado
Kelli Haynes, MSRS, RT (R)Director of Undergraduate Studies/Associate Professor/Graduate FacultyRadiologic SciencesNorthwestern State UniversityShreveport, Louisiana
Judy Lewis, MEdProgram Director/InstructorRadiologic TechnologyMississippi Gulf Coast Community CollegeGautier, Mississippi
Catherine E. Nobles, RT (R), MEdDidactic/Clinical InstructorRadiography ProgramHouston Community College SystemHouston, Texas
George Pales, PhD, RT (R) (MR) (T)Radiography Program DirectorHealth Physics and Clinical SciencesUniversity of Nevada, Las VegasLas Vegas, Nevada
Lisa F. Schmidt, PhD, RT (R) (M)Program DirectorRadiographyPima Medical InstituteChula Vista, California
Deena Slockett, MBAProgram Coordinator/Associate ProfessorRadiologic SciencesFlorida Hospital College of Health SciencesOrlando, Florida
Fosbinder_Text_FM.indd xi 11/30/2010 4:53:31 PM

xii
I would like to thank all of my former students for their help in reading the book. I would also like to thank my family: my mother Kay; my sisters, Carol and Linda; my brother, Tom; and my wife, Tracy, for all of her help in typing.
Robert Fosbinder
I would like to acknowledge those individuals who have helped develop and publish this text. First, thank you, Peter Sabatini and Amy Millholen, for providing the assistance, encouragement, and support needed to complete this text. Thanks also to the production staff
whose dedicated work and professionalism are evident in the quality of their work. Special thanks to Jonathan Dimes for his wonderful illustrations and vision. I would also like to extend my appreciation to Starla Mason for developing the Workbook and ancillary resources. Many thanks to my colleagues for their encouragement and support.
Finally, to my husband Mark and our family, I wish to express my true appreciation for your unwavering sup-port, encouragement, and understanding during the pro-cess of writing this text.
Denise Orth
Acknowledgements
Fosbinder_Text_FM.indd xii 11/30/2010 4:53:31 PM

xiii
Preface v
User’s Guide vii
Reviewers xi
Acknowledgements xii
PART I: BASIC PHYSICS
Chapter 1 Radiation Units, Atoms, and Atomic Structure 2
Chapter 2 Electromagnetic Radiation, Magnetism, and Electrostatics 14
Chapter 3 Electric Currents and Electricity 30
PART II: CIRCUITS AND X-RAY PRODUCTION
Chapter 4 Transformers, Circuits, and Automatic Exposure Control (AEC) 45
Chapter 5 X-Ray Tubes 60
Chapter 6 X-Ray Production 72
Chapter 7 X-Ray Interactions 81
PART III: IMAGE FORMATION
Chapter 8 Intensifying Screens 92
Contents
Fosbinder_Text_FM.indd xiii 11/30/2010 4:53:31 PM

xiv Contents
Chapter 9 Film and Processing 102
Chapter 10 Density and Contrast 122
Chapter 11 Image Formation 139
Chapter 12 Grids and Scatter Reduction 164
PART IV: SPECIAL IMAGING TECHNIQUES
Chapter 13 Fluoroscopy, Conventional and Digital 184
Chapter 14 Digital Imaging 204
Chapter 15 Quality Control 221
Chapter 16 Mammography 240
Chapter 17 Computed Tomography 253
Chapter 18 Magnetic Resonance Imaging 271
PART V: RADIATION PROTECTION
Chapter 19 Radiation Biology 286
Chapter 20 Radiation Protection and Regulations 308
Chapter 21 Minimizing Patient Exposure and Personnel Exposure 320
PART VI: PATIENT CARE
Chapter 22 Medical and Professional Ethics 335
Chapter 23 Patient Care, Medications, Vital Signs, and Body Mechanics 346
Glossary 361
Index 367
Fosbinder_Text_FM.indd xiv 11/30/2010 4:53:31 PM

P A R T I
Basic Physics
Fosbinder_Text_Chap01.indd Sec1:1 11/20/2010 1:05:38 PM

2
Key TermsObjectivesUpon completion of this chapter, the student will be able to:
1. Identify the units of exposure, dose, and effective dose.
2. Defi ne atomic mass and atomic number.
3. Describe the Bohr model of the atom and its components.
4. Defi ne electron binding energy.
5. Describe the process of ionization.
6. Identify the types of ionizing radiation.
1
Radiation Units, Atoms, and Atomic Structure
● absorbed dose
● activity
● alpha particle
● atomic mass num-ber (A)
● atomic number (Z)
● beta particle
● effective dose
● electron binding energy
● electron volt
● exposure
● half-life
● ion
● ionization
● isotopes
● nucleons
● radioactive decay
● radioisotopes
Fosbinder_Text_Chap01.indd Sec1:2 11/20/2010 1:05:38 PM

Chapter 1: Radiation Units, Atoms, and Atomic Structure 3
IntroductionAn understanding of nuclear and atomic structure together with how nuclei and atoms interact is fundamental to an understanding of how medical imaging uses radiation to produce diagnostic images. In this chapter, we discuss the fundamental units of radiation and how atomic structure and the ionization of atoms affect the formation of the radiographic image.
smaller unit, the milliroentgen (mR), is more commonly used. One mR is 1,000 times smaller than a roentgen.
Absorbed DoseThe units of absorbed dose or absorbed energy are the gray (Gy) in the SI system and the rad (radiation absorbed dose) in the conventional system. Absorbed dose measures the amount of energy deposited in the patient by the x-rays. One gray is equivalent to 100 rads and 1 rad equals 10 mGy. Because the gray and rad are so large, the milligray (mGy) and the millirad (mrad) are more commonly used.
Effective DoseThe effective dose relates the risk from irradiating a part of the body to the risk of total body irradiation. In other words, the tissues of the body are not equally affected by ionizing radiation. Some tissues are more sensitive to the effects of ionizing radiation. We know that a dose of 6 sievert (Sv) to the entire body is fatal. However, a dose of 6 Sv to a patient’s hand or foot is not fatal. The harm from a radiation dose depends on both the amount of radiation or dose and the part of the body irradiated. The combination of the dose and the body parts irradiated is measured by the effective dose.
The effective dose is calculated by using weighting fac-tors (wet) for various organs or tissues. The weighting fac-tors are based on the organ sensitivities and importance of the organ to survival. The calculation multiplies the dose to the organ by its weighting factor. The effective dose has units of Sv in the SI system or rem (radiation equivalent man) in the conventional system. One sievert is equal to 100 rem. Because the units are so large, the millisievert (mSv) and the millirem (mrem) are often used.
The units in the conventional system are arranged so that 1 R is equal to 1 rad, which is equal to 1 rem.
ActivityRadioactive atoms spontaneously decay by transforming or disintegrating into different atoms. The amount of radioac-tive atoms present is measured by their activity or the num-ber of disintegrations per second, dps. The units of activity are the Becquerel (Bq) in the SI system and the Curie (Ci) in the conventional system. One becquerel is equal to one disintegration per second. The Curie is based on the num-ber of disintegrations per second from 1 g of radium. One Curie is equal to 3.7 × 10¹⁰ dps. Because the Curie is so large, the millicurie (mCi) is normally used (Table 1.1).
Units of RadiationHistorically, the quantities and units utilized to measure ionizing radiation included the roentgen (R), the rad, and the rem. In 1948, an international system of units based on the metric system was developed. These units are called SI units or Systems Internationale d’Unites. Although the SI units were formally adopted, the older traditional units are still in use today. This may cause confusion in understanding which units to use and how they are related to each other. The following discussion reviews both systems of measurement.
Radiography utilizes the units of radiation to deter-mine the amount of exposure that reached the patient, how much radiation was deposited in tissue, and how much damage occurred. The four fundamental units of radiation used in radiology are:
1. Exposure2. Absorbed Dose3. Effective dose4. Activity
ExposureExposure is defi ned as the amount of ionization produced by radiation in a unit mass of air. We could count the num-ber of x-rays, but it is easier to measure the amount of ion-ization produced by the x-rays. Ionization is discussed in more detail later in this chapter. Exposure is measured in the SI system by coulombs per kilogram (C/kg) or in the conventional system using roentgens (R). The relationship between the roentgen and coulombs per kilogram is 1 R = 2.58 × 10⁻⁴ C/kg. The roentgen is a fairly large unit so a
Fosbinder_Text_Chap01.indd Sec1:3 11/20/2010 1:05:38 PM

4 Part I: Basic Physics
Atomic Models
An animation for this topic can be viewed at http://thepoint.lww.com/FosbinderText
There have been many atomic models, beginning with those of the Greeks who believed there were four types of atoms: air, earth, fi re and water. In the early 1920s, scien-tists knew that atoms contained electrons and were elec-trically neutral. Two of the most popular models were the “plum pudding model” in which the electrons were distributed inside a positive cloud like chocolate chips in a muffi n and the Bohr model. The Bohr model describes the atom as a central dense positive nucleus surrounded by electrons moving around the nucleus. The Bohr model more accurately describes the experimental observations and so is widely accepted today.
The major problem with the Bohr model was that the negative electrons would be strongly attracted into the
TABLE 1.1 UNITS OF RADIATION
Quantity SI Unit Conventional Unit Ratio of SI to Conventional
Exposure Coulomb/kilogram (C/kg) Roentgen (R) 2.58 × 10⁻⁴ C/kg = 1 RDose Gray (Gy) rad 1 Gy = 100 radEffective Dose Sievert (Sv) rem 1 Sv = 100 remActivity Becquerel (Bq) Curie (Ci) 3.7 × 10¹⁰ Bq = 1 Ci
L shell
K shell
Dense positive nucleus
= Proton
= Electron
= Neutron
Figure 1.1. Bohr model.
positive nucleus resulting in the collapse of the atom. Bohr said that in an atom, electrons could only exist in shells or orbits around the nucleus and were forbidden to exist anywhere else. Although the Bohr model has been radically revised, his early model of the atom adequately describes the relationship of the nucleus of the atom to the orbital shells.
Most of the space in an atom is empty. If the nucleus were the size of a pin head, the atom diameter would be the length of a football fi eld. Figure 1.1 illustrates the essential features of the Bohr model of the atom. In the Bohr model, electrons move in orbits or shells around a dense central nucleus. The electrons are negative and the nucleus is positive.
Atomic StructureTo understand the effects of ionizing radiation on a tis-sue, one must fi rst grasp the concept of matter.
MatterIn nature, matter is commonly found as a mixture of two or more substances. A substance is defi ned as a material that has a defi nite, constant composition. Pure salt, sodium chloride, is an example of a substance. Substances may be either simple or complex. Simple substances, known as elements, cannot be broken down into a simpler sub-stance by chemical means.
The periodic table of elements lists 92 naturally occur-ring elements. When two or more elements are chemically combined a complex substance or compound is formed. A well-known example of a compound is salt. When an equal proportion of the element sodium (Na) is chemically combined with the element chlorine (Cl) salt is formed. The smallest particle of salt is called a molecule; therefore, each molecule of salt consists of an atom of sodium and
Fosbinder_Text_Chap01.indd Sec1:4 11/20/2010 1:05:39 PM

Chapter 1: Radiation Units, Atoms, and Atomic Structure 5
The shells are identifi ed by shell number or letters of the alphabet: the closest shell to the nucleus is No. 1 and is called the K shell, the No. 2 shell is called the L shell, and so on to shell No. 7 the Q shell in order of increas-ing distance from the nucleus. The order of the shell is important because the shell number designates the maxi-mum number of electrons the shell can hold.
The maximum number of electrons that can be con-tained in a shell is given by the equation:
Maximum number = 2n2.
where n is the shell number. For shell number 3, called the M shell, the maximum number of electrons that can occupy the shell is 18 (Table 1.2).
an atom of chlorine. Atoms are the fundamental building blocks of nature which can combine to form elements. Atoms are too small to see even with the most powerful microscopes. Instead of describing the atom by what we see, models are used to describe the atom.
Atomic NucleusAt the center of the atom, the nucleus contains nuclear particles called nucleons. Nucleons are either protons or neutrons. Protons have a single positive charge, neutrons have zero charge. The nucleons make up the majority of the mass of an atom. Revolving around the nucleus of the atom are the orbital electrons. The electrons carry a negative charge and add slightly to the mass of the atom.
Electron ShellsElectrons in an atom move around the nucleus in spe-cifi c orbits or shells. The number of shells occupied in a particular atom depends on how many protons are there in the nucleus. There is a limit to how many electrons can occupy each shell. The shell closest to the nucleus is called the K shell and can hold no more than two elec-trons. If an atom has more than two protons within the nucleus, the additional electrons are located in shells fur-ther from the nucleus. Atoms with more protons in the nucleus have more electrons in the surrounding shells. The number of electrons in the shells must equal the number of protons in the nucleus of a neutral atom.
TABLE 1.2 ATOMIC ELECTRON SHELLS
Shell Letter Shell NumberMaximum Electron Number
K 1 2L 2 8M 3 18N 4 32O 5 50P 6 72Q 7 98
L shell
K shell
= Proton
= Electron
= Neutron
K shell
H C
NA
K shell
L shellM shell
Figure 1.2. Electron shell structure of hydrogen, calcium, and sodium. (H) The electron shell structure of hydrogen (Z = 1). (C) Electron shell for carbon (Z = 6). (NA) Electron shell for sodium (Z = 11).
Fosbinder_Text_Chap01.indd Sec1:5 11/20/2010 1:05:39 PM

6 Part I: Basic Physics
Even though the maximum number of electrons that a shell can hold is 2n2, there is another rule that may override the maximum number. That overriding rule is the octet rule which states that the outer shell of a stable atom can never contain more than eight electrons.
Electron Binding EnergyElectron binding energy describes how tightly the elec-tron is held in its shell. The negative electron is attracted to the positive nucleus by electrostatic forces. Electrons in shells closer to the nucleus have a stronger attraction.
== ´=
2Maximum number 2[3]2 918 electrons.
Figure 1.2 illustrates the shell structure for hydrogen, carbon, and sodium. Hydrogen has a single electron in its shell. Carbon has six protons in the nucleus. It has two electrons in the K shell and four electrons in the L shell. Sodium has eleven electrons contained in three shells, two in the K shell, eight in the L shell, and one in the M shell.
K
Hydrogen
1e–
~0.02 KeV
1 P
K
L
M
N
0
Molybdenum
2e–1e– 8e–18e–13e–
~20.00 KeV
~2.87 KeV
~0.51 KeV
~0.6 KeV
42 P56 N
K
L
M
N
0
Iodine
2e–7e– 8e–18e–18e–
~33.17 KeV
~5.19 KeV
~1.07 KeV
~0.19 KeV
53 P74 N
K
L
M
N
0
P P
Tungsten
2e–8e–18e–32e–12e–2e–
~69.5 KeV
~12.10 KeV
~2.82 KeV
~0.59 KeV
~0.08 KeV
74 P110 N
K
L
M
N
0
Lead
2e–8e–18e–32e–18e–4e–
~88.01 KeV
~15.86 KeV
~3.86 KeV
~0.89 KeV
~0.15 KeV
82 P126 N
Figure 1.3. Binding shell energy. Electrons close to the nucleus will have the greatest binding energy.
Fosbinder_Text_Chap01.indd Sec1:6 11/20/2010 1:05:39 PM

Chapter 1: Radiation Units, Atoms, and Atomic Structure 7
The electron binding energy is the energy required to remove the electron from its shell and is measured in a unit called an electron volt (eV). An eV is a very small unit of energy. Electron binding energies can be as small as a few electron volts or as large as thousands of electron volts. A pencil falling from a desk has an energy of about 5 × 10¹¹ eV.
The binding energy of electrons decreases as the orbital shells get farther away from the nucleus. The K shell always has the highest binding energy because its electrons are closest to the nucleus, and the Q shell has the lowest binding energy because it is farthest from the nucleus. Therefore, it takes less energy to remove a Q-shell orbital electron than a K-shell orbital electron. Atoms with fewer protons in the nucleus have lower binding energies, while atoms with more protons in the nucleus have higher binding energies. The difference in binding energies is because atoms with more pro-tons have an increased positive charge. This means that electrons in atoms of high atomic number elements are bound more tightly than electrons in lower atomic num-ber elements (Fig. 1.3). The binding energy of K-shell electrons in lead is much higher than the binding energy of K-shell electrons of hydrogen.
IonizationIonization is the process of adding or removing an electron from its shell in the atom. When an electron
= Proton
= Electron
= Neutron
Negative ion(ejected negative electron)
13
14
13
14
X-ray photon
Neutral atom – 13 protons, 13 electrons Positive ion – 13 protons, 12 electrons
+
n
+
n
Figure 1.4. Ion pair.
is removed from an atom or when an electron is added to an atom, the atom becomes electrically charged and is called an ion. Therefore, if an electron is added, the atom is a negative ion because the atom has an extra negative charge, and if an electron is removed, the atom is a positive ion because it has an extra positive charge. Figure 1.4 shows the formation of a positive and a nega-tive ion, also termed an ion pair. The energy available to form the positive and negative ions must be suffi cient to overcome the binding energy of the orbital electron or ionization cannot occur. Ionization always results in the formation of a positive ion and a negative ion. Ions can expose fi lm, activate radiation detectors, and produce biological effects.
AtomsNow that you have an understanding of the compo-nents of an atom, we discuss the characteristics that determine the placement of an element on the periodic table.
Atomic MassBecause the proton and neutron masses are so small, the atomic mass unit (AMU) is used to describe the mass of
Fosbinder_Text_Chap01.indd Sec1:7 11/20/2010 1:05:40 PM

8 Part I: Basic Physics
for the element. The symbol for carbon with six protons and six neutrons is 6
12C. The atomic number, Z, is always smaller than the atomic mass number A except for hydro-gen where A and Z are equal. Table 1.4 gives the chemical symbol, atomic mass in AMU, atomic number, and K-shell binding energies of some elements of interest in radiology. Larger atoms with higher atomic numbers and larger atomic mass numbers have higher binding energies. The density and atomic numbers are important in radio-graphic imaging because elements with higher densities and higher atomic numbers are more effective in attenuat-ing x-rays. Differences in densities produce contrast differ-ences which are visible on the radiographic image.
Periodic TableThe periodic table of elements lists the elements in ascending order of atomic number.
In the periodic table the atomic number is located above the chemical symbol and the atomic weight is listed below the symbol. The atomic weight shown on the periodic table is an average of the different isotope masses and is usually not a whole number. The chemical symbol for calcium is "Ca". Its atomic number is 20 and its atomic weight is 40.08 AMU.
Figure 1.5 presents the periodic table. The periodic table is arranged so that elements with similar chemical characteristics lie underneath one another in a group or
an atom instead of the kilogram. The proton and neu-tron weigh almost exactly 1 AMU. The electron is about 2,000 times lighter. Table 1.3 gives the atomic mass in kilograms and in AMU and the charge of the electron, the proton, and the neutron.
The atomic mass number, A, is the mass of the atom in AMU. It is the sum of the protons and neutrons in the nucleus. The mass of the orbital electrons in an atom is so small that their contribution to the atomic mass is usu-ally ignored. The atomic mass number is symbolized by “A.” The atomic mass number is written above and to the left of the chemical symbol. An element Y with atomic mass A is written as AY.
Atomic NumberThe atomic number, Z, is equal to the number of protons in the nucleus. The atomic number is symbolized by “Z.” Element Y with an atomic number Z and atomic mass A would be written as Z
AY, where Y is the chemical symbol
TABLE 1.4 ELEMENTS OF INTEREST IN RADIOLOGY
Element Symbol Atomic Mass (A) Atomic Number (Z) K-shell binding energy (keV)
Hydrogen H 1 1 0.014
Carbon C 12 6 0.28
Nitrogen N 14 7 0.40
Oxygen O 16 8 0.54
Aluminum Al 27 13 1.56
Calcium Ca 40 20 4.04
Molybdenum Mo 98 42 20.0
Iodine I 127 53 33.2
Barium Ba 137 56 37.4
Tungsten W 184 74 69.6
Lead Pb 207 82 88.0
Uranium U 238 92 115.6
11
126
147
168
27
1340
2098
42
127
53
137
56184
74207
82
238
92
TABLE 1.3 ATOMIC MASS AND CHARGE
Particle Mass in kilograms Mass in AMU Charge
Proton 1.6726 × 10⁻²⁷ kg 1 +1 (positive)Neutron 1.6749 × 10⁻²⁷ kg 1 0 (neutral)Electron 9.109 × 10⁻³¹ kg 0 −1 (negative)
Fosbinder_Text_Chap01.indd Sec1:8 11/20/2010 1:05:40 PM

Chapter 1: Radiation Units, Atoms, and Atomic Structure 9
Group I II III IV
6C
12.01115
7N
14.0067
8O
15.9994
9F
18.9984
10Ne20.183
2He4.0026
5B
10.811
82Pb207.19
83Bi
208.980
84Po[210]*
85At[210]*
86Rn[222]*
81Ti
204.37
50Sn118.69
51Sb121.75
52Te
127.60
53I
126.9044
54Xe
131.30
49In
114.82
32Ge72.59
33As
74.9216
34Se78.96
35Br
79.909
36Kr83.80
31Ga69.72
76Os190.2
77Ir
192.2
78Pt
195.09
79Au
196.967
80Hg200.59
75Re186.2
44Ru101.07
45Rh
102.905
46Pd106.4
47Ag
107.870
48Cd112.40
43Tc[99]*
26Fe
55.847
27Co
58.9332
28Ni58.71
29Cu63.54
30Zn65.37
25Mn
54.9380
56Ba137.34 57-71
72Hf
178.49
73Ta
180.948
74W
183.85
55Cs
132.905
38Sr87.62
39Y
88.905
40Zr91.22
41Nb92.906
42Mo95.94
37Rb88.47
20Ca40.08
21Sc
44.956
22Ti
47.90
23V
50.942
24Cr
51.996
19K
39.102
12Mg24.312
11Na
22.9898
4Be9.0122
3Li
6.939
1H
1.00797
14Si
28.086
15P
30.9738
16S
32.064
17Cl
35.453
18A
39.948
13Al
26.9815
V VI VII
Hal
ogen
Nob
el g
ases
Alk
ali m
etal
s
Alk
alin
e - e
arth
met
als
VIII
88Ra[226]*
+89-103
87Fr
[223]*
K1
L2
M3
N4
O5
P6
Q7
Per
iod
Transitional elements
74W
183.85
= atomic number (Z)
= atomic mass
* A value given in brackets denotes the mass numer of the most stable isotopeRare earth metalsActinide metals+
Figure 1.5. Periodic table.
column. Fluorine, chlorine, bromine, and iodine all have similar chemical properties. That is, when combined with hydrogen, they form acids, and when they combine with sodium, they form salts.
The periodic table gets its name from the fact that the chemical properties of the elements are repeated periodi-cally. The simplest element is hydrogen and has an atomic number of 1. The next heavier element is helium, a light inert gas with an atomic number of 2 and an atomic mass of 4. The fi rst row of the periodic table is unusual because it contains only two elements. The fi rst element in the second row is lithium. Lithium has an atomic number of 3 and has one electron in the L shell. This lone electron in the outer shell makes lithium chemically reactive.
If the atomic number is increased by 1, the number of electrons in the outer shells also increases by 1 because atoms in nature are electrically neutral. Elements lying beneath one another in the periodic table have the same number of electrons in their outer shell. Their chemi-cal characteristics are similar because the chemical char-acteristics are determined by the number of electrons in the outer shell. The fi rst elements in the next three rows of the periodic table are sodium, potassium, and rubidium. Each of these elements has a single electron in the outer shell and has chemical characteristics similar to lithium. Each row in the periodic table ends with an
inert nonreactive gas. They are inert because their outer electron shell is fi lled with eight electrons and thus has no need to combine with other atoms.
IsotopesAtoms of the same element whose nuclei contain the same number of protons but a different number of neutrons are called isotopes. Such atoms have different mass numbers. Isotopes have the same chemical characteristics because they all have the same number of outer shell electrons. Table 1.5 shows some of the different isotopes of calcium.
TABLE 1.5 ISOTOPES OF CALCIUM
IsotopeAtomic Mass (A)
Number of protons
Number of Neutrons Abundance %
2039Ca 39 20 19 0.0
2040Ca 40 20 20 96.9
2041Ca 41 20 21 0.0
2042Ca 42 20 22 0.6
2043Ca 43 20 23 0.15
2044Ca 44 20 24 2.1
2045Ca 45 20 25 0.0
Fosbinder_Text_Chap01.indd Sec1:9 11/20/2010 1:05:40 PM

10 Part I: Basic Physics
electromagnetic radiation and differ only in their source or origin. Alpha particles and beta particles are forms of particulate radiation. X-rays and gamma rays are the most penetrating of the radiations from radioactive decay.
Most radioisotopes emit gamma rays. Gamma rays and x-rays are both electromagnetic radiations and are often called photons. Gamma rays are produced in the nucleus and are useful in nuclear medicine examinations. X-rays are produced through interactions in atomic shells. X-rays are important in radiography because their energy and quantity can be controlled. Due to their low ioniza-tion rate in tissue, x-rays are useful for medical imaging procedures.
Alpha ParticlesAn alpha particle is a form of particulate radiation which consists of two protons and two neutrons. It has an atomic mass of 4 and an atomic number of 2. It is identical to the nucleus of a helium atom. Alpha particles are emit-ted from the nuclei of very heavy elements when they undergo radioactive decay. The alpha particle is very large compared to other types of radiation but is not very penetrating. They cannot even penetrate the outer skin layer. Because of its size, the alpha particle only travels a short range in matter, only a few millimeters. Alpha par-ticles have no applications in diagnostic radiology.
Beta ParticlesA beta particle is identical to an electron except for its origin. Beta particles are emitted from the nuclei of radioactive material, while electrons exist in orbital shells around the nucleus. It has a single negative charge and a mass of 1/2,000 AMU. The beta particle is more pen-etrating than an alpha particle but less penetrating than a gamma ray or an x-ray. The beta particle can penetrate through several millimeters of tissue. Beta particles are encountered in nuclear medicine applications.
Some isotopes do not occur in nature and must be arti-fi cially produced. Their natural abundance is zero.
RadioisotopesMost isotopes are stable, but some are unstable and spon-taneously transform into a different element. Unstable isotopes are termed radioisotopes or radioactive isotopes. Their nuclei have either a defi ciency or an excess number of neutrons. Radioactivity is the spontaneous transformation of one element into another element and is accompanied by the release of electromagnetic or particulate radiation. The atomic number of radioactive nuclei changes during the nuclear transformation. The transformation of radio-active nuclei into a different element is also termed radio-active decay. The unit of activity is the Becquerel, which is one disintegration per second. The older, conventional unit is the curie. 1 Ci = 3.7 × 10¹⁰ dps.
Half-LifeThe half-life of a radioisotope is the time required to decay one half of the activity of the radioisotope. The half-life depends on the radioisotope. For example, 39Ca has a half-life of 0.8 seconds, the half-life of 41Ca is 8 × 10⁴ years, and the half-life of 45Ca is 2.7 minutes. A sample with an initial activity of 100 mCi of 39Ca will have an activity after time T as shown in Table 1.6.
Radiations from Radioactive DecayA radioisotope can release different forms of ionizing radiation which can be either electromagnetic or par-ticulate radiation. X-rays and gamma rays are forms of
TABLE 1.6 CA-39 RADIOACTIVITY REMAINING AFTER TIME T
Time (seconds)
Number of Half Lives
Remaining Radioactivity %
0 0 1000.8 1 501.6 2 252.4 3 12.53.2 4 6.254.0 5 3.13
Fosbinder_Text_Chap01.indd Sec1:10 11/20/2010 1:05:41 PM

Chapter 1: Radiation Units, Atoms, and Atomic Structure 11
Chapter SummaryThe Bohr model of the atom consists of a dense positive nucleus surrounded by electrons in shells. The nucleus contains nucleons which are either protons or neutrons. The proton has a positive charge and an atomic mass of 1 AMU. The neutron has zero charge and an atomic mass of 1 AMU. The atomic number (Z) is equal to the number of protons in the nucleus. The atomic mass (A) is equal to the sum of the neutrons and protons in the nucleus. The elec-tron has a negative charge and a mass of almost zero. Electrons in an atom only move in spe-cifi c orbits. Each orbit or shell has its own bind-ing energy. The binding energy is the energy required to remove an electron from its shell. The shells closer to the nucleus have higher binding energies. Ionization occurs when an electron is removed from an atom. This results in an ion pair made up of one positive and one negative ion. Ionizing radiation consists of electromagnetic and particulate radiations with enough energy to ionize atoms. X-rays and gamma rays are forms of electromagnetic radiation. Alpha and beta radiations are forms of particulate radiation.
There are two systems of radiation units, the SI and the conventional. The units of exposure are the roentgen (R) and the coulombs per kilogram (C/kg). The units of dose are the gray and the rad. The units of the effective dose are the sievert and the rem.
Elements with similar electron shell struc-tures have similar chemical properties. Isotopes are elements with the same atomic number but different atomic masses. Isotopes have the same chemical properties. The atomic weight of an element is the average of the atomic masses of naturally occurring isotopes. When elements are arranged in order of increasing atomic num-ber, they form the periodic table of elements.
Case StudyAn x-ray photon with energy of 3.86 keV inter-acts with an atom of lead.
Critical Thinking Questions
The energy is suffi cient to remove an electron from which shell?
How many keV are required to remove an O-shell electron?
What is the maximum number of electrons found in the L shell?
Electrons in the L shell have a binding energy of 3.86 keV. It will take an x-ray photon with this same energy to remove an electron from the M shell. Less energy is required to remove an O-shell electron because the O shell is farther away from the nucleus than the M shell; therefore, 0.15 keV is required to remove an O-shell electron. The L shell of a lead atom has 8 electrons.
The chemical characteristics of the elements are repeated periodically and elements which lie in the same column of the periodic table have similar chemical properties. Radioiso-topes undergo spontaneous transformation. The atomic number and the atomic weight can change during radioactive transformation or decay. The half-life of a radioisotope is the time required for half the material to transform. Radioisotopes can emit electromagnetic radia-tion, beta particles, or alpha particles. The unit of radioactive decay is the Becquerel or curie.
Fosbinder_Text_Chap01.indd Sec1:11 11/20/2010 1:05:41 PM

Review Questions
Multiple Choice
1. The Bohr model of the atom consists of a dense _______________.
A. positive nucleus surrounded by a diffuse cloud of negative charge
B. positive nucleus surrounded by electrons in defi -nite shells
C. negative nucleus surrounded by a diffuse cloud of positive charge
D. negative nucleus surrounded by protons in defi -nite shells
2. The electron binding energy is
A. the energy of attraction between electrons in the shells
B. the energy required to remove the nucleus from an atom
C. the energy required to remove an electron from the nucleus
D. the energy required to remove an electron from its orbital shell
3. The atomic number is the number of __________ in the nucleus.
A. protonsB. neutronsC. protons and electronsD. protons and neutrons
4. The nucleus of an atom contains which of the following?
1. Protons2. Neutrons3. Electrons4. Gamma rays
A. 1B. 1 and 2C. 2 and 3D. 1, 2, and 3
5. The periodic table of elements lists the elements in order of increasing
A. atomic numberB. atomic weightC. atomic neutronsD. atomic ionization
6. The atomic mass of an element is designated by which letter?
A. AB. MC. ZD. K
7. Which types of particulate radiation are given off when a radioisotope decays?
1. Beta2. Gamma3. Alpha
A. 1 onlyB. 2 onlyC. 1 and 2D. 1 and 3
Fosbinder_Text_Chap01.indd Sec1:12 11/20/2010 1:05:41 PM

Chapter 1: Radiation Units, Atoms, and Atomic Structure 13
4. Defi ne element.
5. Who developed the concept of the atom with the electrons orbiting the atom?
6. What is a compound? Write the chemical equa-tion for water.
7. Explain the half-life of an isotope.
8. Defi ne the octet rule.
9. What is electron binding energy?
10. Could atoms be ionized by changing the number of protons?
8. How many electrons does an element have when there are fi ve orbital shells?
A. 48B. 50C. 72D. 98
9. Which electron shell has the highest binding energy?
A. P shellB. L shellC. K shellD. Q shell
10. What is the conventional unit of absorbed dose?
A. CurieB. radC. remD. Roentgen
Short Answer
1. Explain the difference between alpha and beta particles.
2. What are the three units of radiation measurement and their associated conventional and SI units?
3. List the fundamental particles found in an atom.
Fosbinder_Text_Chap01.indd Sec1:13 11/20/2010 1:05:41 PM

14
2
Electromagnetic Radiation, Magnetism, and Electrostatics
ObjectivesUpon completion of this chapter, the student will be able to:
1. Name the different types of electromagnetic radiation and describe each.
2. Describe the characteristics of electromagnetic waves.
3. Describe the relationships between frequency, wavelength, velocity, and energy of electromagnetic radiation.
4. Defi ne radiation intensity and describe how it varies with distance from the radiation source.
5. State the laws and units of magnetism.
6. Identify the different types of magnetic materials.
7. Describe the methods of electrifi cation.
8. State the laws of electrostatics.
9. State Coulomb’s law.
● amplitude (of a wave)
● bipolar
● coulomb
● Coulomb’s law
● diamagnetic materials
● electric fi eld
● electrifi cation
● electromagnetic spectrum
● electrostatics
● ferromagnetic materials
● frequency (of a wave)
● gauss (G)
● intensity
● inverse square law
● magnetic dipole
● magnetic domain
● magnetic fi eld
● magnetic induction
● magnetism
● nonmagnetic materials
● paramagnetic materials
● period (of a wave)
● photon
● spin magnetic moment
● tesla (T)
● wavelength
Key Terms
Fosbinder_Text_Chap02.indd 14 10/30/2010 6:03:17 PM

Chapter 2: Electromagnetic Radiation, Magnetism, and Electrostatics 15
IntroductionAll radiologic equipment is based on the laws of electricity and magnetism. Thus, an understanding of the underlying principles of electricity and magnetism aids in understand-ing radiologic equipment and image produc-tion. In this chapter, we review the types and characteristics of electromagnetic radiation and discuss properties of magnetism, including types of magnetic materials, magnetic fi elds, and the laws and units of magnetism. Magnetic resonance imaging (MRI) has developed into a diagnostic imaging tool for imaging the body. In radiography, the properties of magnetism are used to make the anode rotate in the x-ray tube.
Finally, we consider the laws of electrostatics and the study of stationary electric charges. A thorough understanding of the principles of stationary charges will assist the student in under-standing how electricity is used in the x-ray tube.
Electromagnetic Radiation
An animation for this topic can be viewed at http://thepoint.lww.com/FosbinderText
Types of Electromagnetic RadiationAll electromagnetic radiation consists of simultaneous electric and magnetic waves. Typically, only one of these waves is used in illustrations. These waves are really fl uc-tuations caused by vibrating electrons within the fi elds. The amount of vibrations of the electrons will determine the frequency and wavelength for the various types of electromagnetic radiations. Electromagnetic radiation travels at the speed of light, and each type has its own unique frequency and wavelength (Fig. 2.1).
Electromagnetic radiation may appear in the form of visible light, x-rays, infrared, or radio waves, depending on
Electric field Magnetic field
Figure 2.1. Electromagnetic waveform illustrates the electric and magnetic waves which make up the electromagnetic wave-form. Typically, only the electric wave is shown in illustrations.
its energy. The entire band of electromagnetic energies is known as the electromagnetic spectrum.
The electromagnetic spectrum lists the different types of electromagnetic radiations varying in energy, frequency, and wavelengths. The energy of the radiation is measured in electron volts or eV. Figure 2.2 illustrates the different forms of the electromagnetic spectrum from long-wavelength, low-energy radio waves, to short-wavelength, high-energy gamma rays. Although Figure 2.2 appears to indicate sharp transitions between the types of radiations, there are no clear boundaries between the various regions in the electromagnetic spectrum.
Radio WavesRadio waves are long-wavelength (1–10,000 m), low-energy radiation waves. A radio wave that is 10,000 m in length is equivalent to placing approximately 92 football fi elds end-to-end. Radio frequency radiation is used in MRI. Cell phones utilize radio waves to transmit infor-mation from one cell tower to another and fi nally to a cell phone. Television antennae receive the electromag-netic wave from the broadcast station and the image is displayed on the television screen. Music can be heard because it reaches our ears in the form of a radio wave.
Radar and MicrowavesRadar and microwaves have shorter wavelengths (10−1–10−4m) and higher energy than radio waves. Microwaves are used in ovens, in transportation, and by law enforce-ment offi cers to monitor the speed of cars. In a microwave oven, the microwave energy forces the water molecules in food to rapidly vibrate, thus heating the food.
Infrared RadiationInfrared radiation, or heat, has shorter wavelengths and higher energy than radar and microwaves (10−1–10−4 m).
Fosbinder_Text_Chap02.indd 15 10/30/2010 6:03:18 PM

16 Part I: Basic Physics
Frequency (waves per second)
Sources
Low High
Radio Radar Infrared
Gamma Rays
X-raysUltr
avio
let
Vis
ible
Wavelength (in meters)
Size of a wavelength
Long Short
Energy of one photon (electron volts)
103 102 101 10-1 10-2 10-3 10-4 10-5 10-6 10-7 10-8 10-9 10-10 10-11 10-121
106 107 108 1010 1011 1012 1013 1014 1015 1016 1017 1018 1019 1020109
Low High
10-8 10-7 10-6 10-4 10-3 10-2 10-1 1 101 102 103 104 105 10610-510-9
Football field
House
Baseball
This dot
Cell
Bacteria
Virus
Protein
Watermolecule
Microwaveoven
AMRadio
FMRadio Radar Light bulb
X-raymachines
Radioactiveelements
Figure 2.2. Electromagnetic spectrum illustrates the range of electromagnetic radiation.
Infrared radiation can heat nearby objects. For example, you can feel the heat from your toaster, which uses infra-red radiation. The high-energy end of the infrared region is visible and can be seen in the red heating elements of your toaster.
Visible LightVisible light selectively activates cells in the eye. It occu-pies a narrow band in the electromagnetic spectrum, with wavelengths between 10−6 and 10−7 m. The color red has the longest wavelength and lowest energy. Blue and violet colors have the highest energy and the shortest wavelengths in the visible spectrum.
UltravioletUltraviolet is the part of the spectrum just beyond the higher energy end of the visible light region. Ultraviolet wavelengths range from 10−7 to 10−9 m. Ultraviolet lights are used in biological laboratories to destroy airborne
bacteria, and they are believed to be responsible for the majority of sunburn and skin cancer.
X-Rays and Gamma RaysX-rays and gamma rays have wavelengths between 10−9 and 10−16 m. They are very short wavelength, high-frequency, high-energy radiation. The energy is measured in thousands of electron volts (keV) and is capable of ionization. Ionizing radiation such as x-rays and gamma rays has enough energy to remove an electron from its orbital shell.
The only difference between x-rays and gamma rays is their origin. X-rays in radiology come from interactions with electron orbits. Gamma rays come from nuclear transformations (decay) and are released from the nucleus of a radioactive atom. Some x-rays in radiology have higher energy than some gamma rays and are used in radiation therapy to treat cancer. X-radiation is utilized in various industries including for screening baggage in
Fosbinder_Text_Chap02.indd 16 10/30/2010 6:03:18 PM

Chapter 2: Electromagnetic Radiation, Magnetism, and Electrostatics 17
per second has a period of one-half second; that is, one complete wave cycle occurs each half second. Figure 2.3 illustrates the relationship between frequency and period (time) in a sine wave.
WavelengthThe distance between adjacent peaks or adjacent val-leys of a wave is the wavelength and is represented by lambda (l). Wavelength is one of the important char-acteristics in determining the properties of x-rays. Elec-tromagnetic radiation with shorter wavelengths has higher energy and frequencies and greater penetration. Wavelength is measured in meters, centimeters, or millimeters. Figure 2.4 illustrates the relation between wavelength and frequency.
Electromagnetic wave velocity, frequency, and wave-length are related and a change in one factor causes a change in one or both of the other factors. The wave is demonstrated with this formula:
= lc f
where c (velocity) is the speed of light (3 × 10⁸ m/s, in air), f is the frequency, and lambda (l) is the wavelength. Note that the product of frequency and wavelength must always equal the velocity. Thus, frequency and wave-length are inversely proportional. Therefore, if the fre-quency increases, the wavelength must decrease, and if the frequency decreases, the wavelength must increase. For example, if frequency is doubled, the wavelength is halved, and if the frequency is tripled, the wavelength is reduced by one third.
airport security and large crates of merchandise at ports of entry as well as for imaging chest plates the military will use in combat.
Characteristics of Electromagnetic RadiationElectromagnetic radiation consists of vibrations in electric and magnetic fi elds. It has no charge and no mass and travels at the speed of light. The waves move in a sinusoidal (sine) waveform in electric and magnetic fi elds. Electromagnetic radiation is described in terms of the following characteristics:
● Velocity: how fast the radiation moves● Frequency: how many cycles per second are in the
wave● Period: the time for one complete cycle● Wavelength: the distance between corresponding
parts of the wave● Amplitude: the magnitude of the wave● Energy: the amount of energy in the wave● Intensity: the fl ux of energy
VelocityAll electromagnetic radiation travels in a vacuum or in air at 3 × 10⁸ m/s (186,000 miles/s), regardless of whether it is in a wave or particle form. Even though this is incred-ibly fast, light requires some time to travel huge distances. For example, it takes 8 minutes for light from the Sun to reach the Earth.
FrequencyThe frequency of a wave is the number of cycles per second. That is, the frequency is the number of peaks or valleys occurring each second. The unit of frequency is hertz (Hz), which is one cycle per second. In the United States, electricity has a frequency of 60 Hz, that is, 60 cycles per second. A typical radio wave has 700,000 Hz (700 kHz). A 1,000 Hz is equal to 1 kHz. One megahertz (MHz) is equal to one million (106) Hz or cycles per second.
PeriodThe period of a wave is the time required for one complete cycle. A wave with a frequency of two cycles
1 cycle
Time (s)
Frequency = 2 cycles/sPeriod = 0.5 s
Figure 2.3. The relationship between frequency and period of a waveform.
Fosbinder_Text_Chap02.indd 17 10/30/2010 6:03:20 PM

18 Part I: Basic Physics
CRITICAL THINKING
A radio station is broadcasting a signal with a frequency of 27,000 kHz. What is the wavelength of the signal in meters?
Answer
= ´=
´l =
´l =
´l =
8
8
8
4
3 10 m/ s27,000kHz3 10 m/ s27,000kHz3 10 m/ s2.7 10
11.1m
cf
CRITICAL THINKING
What is the frequency in MHz of a cell phone signal if the wavelength is 333 mm = 3 × 10⁸ m/s?
Answer
-
-
l =´
=
´= =
´´
=´
= ´
8
8
3
8
3
5
333mm3 10 m/ s
333mm3 10 m 1
333 10 m3 10 m
333 10 m0.009 10 Hz or 900MHz
f
fs
f
f
1 cycle
Long wavelengthLow frequency
Distance fromwave source
Short wavelengthHigh frequency
Distance fromwave source
1 wavelength
1 wavelength
1 cycle = 1 hertz
A
B
Figure 2.4. (A) Demonstrates the relationship between frequency and wavelength. When a short wavelength is seen, there is a greater number of vibrations. Note how the peaks are closer together. This waveform has high penetrability and represents an x-ray waveform. (B) In the bottom waveform, note the distance between the peaks. As the distance between the peaks increases, the wavelength becomes longer and there are fewer peaks. This waveform has low penetrability.
Fosbinder_Text_Chap02.indd 18 10/30/2010 6:03:20 PM

Chapter 2: Electromagnetic Radiation, Magnetism, and Electrostatics 19
1 cycle
1 cycle
Amplitude
Amplitude
Amplitude
Amplitude
Distance fromwave source
Distance fromwave source
A
B
Figure 2.5. (A) A bowling ball is dropped into a tank of smooth water. The weight of the object causes the water to have large ripples with lots of energy. (B) This wave represents the effect if a baseball were dropped into smooth water, and the ripples are smaller and therefore have less energy.
AmplitudeThe amplitude of a wave is the maximum height of the peaks or valleys (in either direction) from zero. As the energy of the wave increases, the height of the wave also increases. Figure 2.5 compares the amplitudes of two electromagnetic waves as a function of time.
Energy: Electromagnetic Radiation as a ParticleElectromagnetic radiation usually acts as a wave, but sometimes it acts as a particle. When electromagnetic radiation acts as a wave, it has a defi nite frequency, period, and wavelength. When electromagnetic radiation acts as a particle, it is called a photon or quanta. We use the photons or bundles of energy to produce x-radiation. The energy and frequency of the photons are directly proportional, but wavelength and energy are inversely proportional. Thus, the higher the energy, the shorter the wavelength and the higher the frequency. The formula that describes the relationship between photon energy and frequency is expressed as:
=E hf
where E is photon energy in electron volts, h is a conversion factor called Planck’s constant (4.15 × 10⁻¹⁵ eVs), and f is the photon frequency.
CRITICAL THINKING
What is the frequency of a 56-keV x-ray photon?
Answer
-
-
= ´
=
=´´
=´
= ´
15
4
15
19
56keV4.15 10 eVs
56 10 eV4.15 10 eVs1.34 10 Hz
E h fE
fh
f
f
f
CRITICAL THINKING
How much energy is found in one photon of radia-tion during a cell phone transmission of 900 kHz?
Answer
-
-
= ´= ´ ´= ´
15 5
9(4.15 10 e V s)(9 10 s)3.7 10 eV
E h fEE
Fosbinder_Text_Chap02.indd 19 10/30/2010 6:03:21 PM

20 Part I: Basic Physics
where I1, old intensity; I2, new intensity; d12, old distance
squared; d22, new distance squared. If the distance from
the x-ray source is doubled, the intensity decreases by a factor of 4. That is, the intensity at twice the distance is one-fourth the original value. If the distance from the x-ray source is halved, the intensity is four times greater. The exposure and exposure rate from an x-ray source also follow the inverse square law. To decrease radiation expo-sure during a fl uoroscopic exam, a technologist needs to increase his or her distance from the x-ray tube. Every step away from the tube decreases the amount of radiation the technologist will be exposed to.
Radiation Intensity and the Inverse Square LawAll electromagnetic radiation travels at the speed of light and diverges from the source at which it is emitted. Inten-sity is energy fl ow per second and is measured in watts/cm2. The intensity of the radiation decreases with an increase in the distance from the source. This is because the x-ray energy is spread over a larger area. This relation is known as the inverse square law. It is called the inverse square law because the intensity is inversely proportional to the square of the distance. Figure 2.6 illustrates how the intensity decreases as the distance from the source increases.
Mathematically, the inverse square law is expressed as follows:
æ ö ´= =ç ÷
è ø
2 21 1 1
2 1 22 2
dd
I dI I or I
d
Distance 2
Distance 1
Radiation source
Figure 2.6. The inverse square law relates the radiation inten-sity to the distance from the source. As distance is increased, the intensity of the radiation is decreased by one fourth.
CRITICAL THINKING
What is the exposure rate 4 m from a source that has an exposure rate of 32 mR/h at a distance of 1 m from the source?
Answer
If I1 is the exposure rate at 1 m and I2 is the exposure rate at 4 m, then
2 21
2 1 2 12
141
3216
2mR/ h
dI I I I
dæ ö æ ö= =ç ÷ ç ÷
è øè øæ ö= ç ÷è ø
=
CRITICAL THINKING
The x-ray intensity is measured at 40 mR/h at 36 in. What is the intensity at 72 in?
Answer
´=
==´
=
21 1
22
2
236 1,29672 5,184[40 1,296]
10mR/ h5,184
I dI
d
Fosbinder_Text_Chap02.indd 20 10/30/2010 6:03:21 PM

Chapter 2: Electromagnetic Radiation, Magnetism, and Electrostatics 21
domains are aligned in the same direction, which means they cannot be permanently magnetized and do not retain any magnetism after the magnetic fi eld is removed. Aluminum and platinum are examples of paramagnetic materials. MRI contrast agent, gadolinium, is also a para-magnetic material.
Diamagnetic MaterialsDiamagnetic materials are weakly repelled by a magnet. Copper, beryllium, bismuth, and lead are examples of diamagnetic materials.
Nonmagnetic MaterialsNonmagnetic materials do not react with magnetic fi elds. Wood, glass, rubber, and plastics are examples of nonmagnetic materials. In this type of material, there is an equal number of dipoles spinning in both directions; therefore, the material is not attracted to magnetic fi elds. Materials in the magnetic resonance room must be non-magnetic.
Magnetic FieldsA magnetic fi eld is the space surrounding a magnet or moving electric current in which magnetic forces are detectable. All magnets are surrounded by a magnetic fi eld. A magnetic material placed in a magnetic fi eld experiences a force. This magnetic force will align the domains along the magnetic fi eld. To understand the phenomenon of magnetism, it is important to study atomic structure and the effects of particle movement around a nucleus.
When a charged particle is in motion, a magnetic force fi eld is created. This force fi eld moves perpendicular to the charged particle and is represented as fi eld lines. In every magnet the lines of the magnetic fi eld are in closed
MagnetismEarly man discovered that some rocks seemed to have magical powers. They were called lodestones. Lodestones are natural magnets and attract pieces of iron. Magne-tism is the ability of a lodestone or magnetic material to attract iron, nickel, and cobalt. This magnetic property is used in medical imaging.
Types of Magnetic MaterialsDifferent types of materials respond differently to magnetic fi elds. There are four types of magnetic materials:
1. ferromagnetic materials, which react strongly with magnets or in a magnetic fi eld
2. paramagnetic materials, which are weakly attracted to magnets
3. diamagnetic materials, which are weakly repelled by all magnetic fi elds
4. nonmagnetic materials, which do not react in a magnetic fi eld
Each of these is discussed in detail below.
Ferromagnetic MaterialsFerromagnetic materials are attracted to a magnet. Fer-romagnetic materials—including iron, cobalt, and nick-el—are made up of small groups of atoms called magnetic domains. These domains act like tiny magnets inside the material. In the nonmagnetized state the domains are randomly oriented, so there is no net magnetization. When a ferromagnetic material is placed in a magnetic fi eld the domains are aligned. After the magnetic fi eld is removed, the domains remain aligned forming a per-manent magnet. Alnico is an alloy made of aluminum, nickel, and cobalt. It contains the magnetic properties of each metal to form a strong magnet. Figure 2.7 illustrates how ferromagnetic materials are magnetized by align-ing the domains inside the material. Heating a magnet can destroy its magnetism because heat rearranges the domains into a random orientation, resulting in a loss of permanent magnetism.
Paramagnetic MaterialsParamagnetic materials are weakly attracted to magnetic fi elds. When placed in a magnetic fi eld, some of the
Nonmagnetized
Magnetized - domains lined in one direction
Figure 2.7. Illustrates the magnetic domain alignment of magnetic and nonmagnetic materials.
Fosbinder_Text_Chap02.indd 21 10/30/2010 6:03:22 PM

22 Part I: Basic Physics
Laws of MagnetismThe laws of magnetism include the following:
Repulsion–Attraction: Like poles repel, unlike poles attract.
Magnetic poles: Every magnet has a north pole and a south pole.
Inverse square law: The magnetic force between two magnetic fi elds is directly proportional to the prod-uct of their magnitudes and inversely proportional to the square of the distance between them.
The fi rst law of magnetism, like poles repel and unlike poles attract, is true because when a magnet is placed in the force fi eld of another magnet it is acted upon by that force fi eld. An example of this law may be seen when the north pole of one bar magnet is placed near the south pole of another bar magnet their opposite fi eld lines will be attracted to each other. Likewise, when the north poles of two bar magnets are placed close together, the lines of force are in the same direction and will repel each other (Fig. 2.10). It is critical that this law is observed in an MRI department where the strength of the magnet will attract metallic objects and the metal objects will be attracted to or pulled into the magnet.
The second law of magnetism, every magnet has a north pole and a south pole. No matter how many times the magnet is divided, even into individual electrons, both poles will continue to exist. Perhaps the most dra-matic example of this law is the Earth itself, which is actually a giant magnet. Imagine that the Earth’s core is a very large bar magnet, as illustrated in Figure 2.11.
loops (Fig. 2.8). Every magnet is bipolar, having two poles: a north pole and a south pole.
All atoms have orbital electrons which spin on their axes around the nucleus of the atom. This effect cre-ated by the movement of these electrons is called spin magnetic moment. The disruption of this axial spinning and the energy released as it reorients itself are the basis behind MRI. Each atom acts as a very small magnet and is called a magnetic dipole. A group of such atoms with their dipoles aligned in the same direction creates a mag-netic domain. Atoms having an odd number of electrons which are all spinning in the same direction will exhibit a net magnetic fi eld.
Typically, magnetic domains are arranged randomly in an object. When the object is acted upon by an external force fi eld, the dipoles will become oriented to the fi eld. If enough of the dipoles become aligned in the same direction, the object will exhibit a strong magnetic fi eld and will then be called a magnet. These force fi elds are also called lines of force, lines of fl ux, or the magnetic fi eld. These magnetic fi eld lines fl ow from the north pole to the south pole on the outside of the magnet. Within the magnet the fi eld lines fl ow from the south pole to the north pole. The number and con-centration of fi eld lines will determine the strength of the magnet; the stronger the magnetic fi eld, the greater the number of fi eld lines and the more concentrated the fi eld lines are at the poles.
Breaking a magnet in half produces two smaller magnets, each with a north and a south pole. The pieces of the magnet can be divided multiple times and every time the pieces will be bipolar. Figure 2.9 illustrates how a magnet that is broken in half will produce two smaller magnets, each with its own north and south poles.
Atom Force field
Figure 2.8. Magnetic fi eld lines around an atom. Demon-strates the path of the magnetic fi eld lines surrounding a magnet.
Figure 2.9. Effect of dividing a magnet into increasing smaller pieces. Each piece, no matter how small, retains the original magnetic properties.
Fosbinder_Text_Chap02.indd 22 10/30/2010 6:03:22 PM

Chapter 2: Electromagnetic Radiation, Magnetism, and Electrostatics 23
inverse square law. An example of this law is demon-strated when opposite poles of two magnets are placed within 1 inch of each other. When the force fi elds of the two magnets infl uence each other, the magnets will be pulled together. Now take the two magnets and place them 2 inches apart, and if the force fi elds are strong enough, they may still interact with each other but fi rst they must overcome the distance between the magnets. As distance is doubled between two magnetic objects, the attraction will be one-fourth the original attraction.
Units of MagnetismThe SI units of magnetism are the gauss (G) and the tesla (T). One tesla is equal to 10,000 gauss. The Earth’s mag-netic fi eld is about 0.5 G or 5 × 10⁻⁵ T. A refrigerator magnet is about 10 G or 0.001 T. MRI units typically have magnetic fi elds of 0.1 to 3 T. MRI is discussed in Chapter 19.
Magnetic InductionWhen a nonmagnetized iron bar is brought within the fl ux lines of a strong magnet, the dipoles in the iron bar will tem-porarily align themselves with the fl ux lines passing through the iron bar. The iron bar will become temporarily magne-tized. When the strong magnetic fl ux lines are removed, the dipoles in the iron bar will return to their original ran-dom state. This process is called magnetic induction and it will work with any ferromagnetic material.
ElectrostaticsElectrostatics is the study of stationary or resting elec-tric charges. Another name for stationary charges is static electricity.
As we discussed in Chapter 1, the concept of electric charges can be seen at the atomic level, in positively charged protons and negatively charged electrons. The negatively charged electrons travel around atoms in orbital shells. Loosely bound electrons can be made to jump or move from one object to another object. The most familiar example of this is static electricity. In this chapter, we discuss how the movement of electrons, which are the basic charged particles, can cause electric charges on a larger level. A discussion of electrostatics
The Earth’s south magnetic pole lies under the ice in northern Canada while the north magnetic pole lies near Australia. The Earth’s magnetic poles should not be con-fused with the “geographic poles.” The north magnetic pole of a compass (marked “N”) will point toward the Earth’s south magnetic pole.
The third law of magnetism, the magnetic force between two magnets decreases as the square of the dis-tance between the magnets increases, is based on the
Like poles repel
Opposite poles attract
Figure 2.10. Repulsion-attraction of magnets. When the like poles of two magnets are close to each other, their force fi elds will repel each other. No matter how hard you try, you will not be able to make the two magnets touch. If you take one of the magnets and turn it so that the opposite pole is now facing the other magnet, their unlike poles will attract each other and the magnets will slam together. It will take a lot of force to separate these two magnets.
North Pole
South Pole
N
S
Compass pointingnorth
South magneticpole
Northmagneticpole
Figure 2.11. The Earth is a giant magnet and like all other magnets, it has two magnetic poles, one north and one south.
Fosbinder_Text_Chap02.indd 23 10/30/2010 6:03:22 PM

24 Part I: Basic Physics
wall, which has a primarily positive charge, the buildup of electrons will allow the balloon to stick to the wall.
ContactElectrifi cation by contact occurs when two objects touch, allowing electrons to move from one object to another. When an object charged by friction touches an uncharged object, the uncharged object will acquire a similar charge. If the fi rst object is positively charged, it will remove elec-trons from the uncharged object, causing it to be positively charged. Likewise, if a negatively charged object touches an uncharged object, it will give up some of its electrons, mak-ing the second object negatively charged. Therefore, we con-clude that a charged body confers the same kind of charge on any uncharged body with which it comes in contact.
Electrons move in an attempt to equalize the charged body. An example of this equalization can be seen when a per-son wearing socks walks across a wool rug and then touches a metal lamp. Electrons from the rug are transferred to the socks and eventually to the body, giving the person a nega-tive charge. Reaching out toward a metal lamp will cause a static discharge to jump between your hand and the metal lamp. The electrons move from a location of a high nega-tive charge to an area of low negative charge. This transfer of excess electrons will neutralize the person (Fig. 2.13).
InductionElectrifi cation by induction is the process of electrical fi elds acting on one another without making contact. A charged object has a force fi eld surrounding it, and if this force fi eld is strong enough, it can cause electrifi cation of a weakly charged object. The force fi eld is called an elec-tric fi eld. A neutral metallic object experiences a shift in electrons in the direction toward an opposite charge when
must begin with an understanding of electric fi elds and the various forms of electrifi cation.
Electric FieldsAn electric fi eld describes the electrical force exerted on a charge. An electric fi eld exists around all electric charges. The electric fi eld is directed away from positive charges and toward negative charges. When two charges are brought near each other, their fi elds interact. The resulting force of attraction or repulsion depends on the sign of the charges. There is no electric fi eld around neutral objects, however; neutral objects are affected by strongly charged objects.
Electrifi cationElectrifi cation occurs when electrons are added to or subtracted from an object; therefore an object can be negatively charged or positively charged. An object hav-ing more electrons than another object is considered to be negatively charged. The concept of a positively charged object does not mean the object has only positive charges or protons. We know this is true because atoms have orbital electrons; therefore, a positively charged object has a weaker negative charge. When discussing electric-ity, it is important to remember that the two objects are being compared, not their actual atomic charges. The three methods of electrifi cation include friction, contact, and induction (Fig. 2.12).
FrictionElectrifi cation by friction involves the removal of electrons from one object by rubbing it with another object. A famil-iar game that children play is to rub a balloon on their hair. Electrons from the hair will be transferred to the bal-loon causing the hair to be positively electrifi ed. When the negatively electrifi ed balloon is placed on a smooth
Charged objectUncharged object
Both objectscharged
Figure 2.13. Electrifi cation by contact.
+
Positively charged object
Negatively charged object
+ ++ +
+
Figure 2.12. Positively charged object. Negatively charged object.
Fosbinder_Text_Chap02.indd 24 10/30/2010 6:03:23 PM

Chapter 2: Electromagnetic Radiation, Magnetism, and Electrostatics 25
brought into the electric fi eld of a charged object. Keep in mind that a neutral object has an equal number of protons and electrons and when acted upon by a strongly charged metallic object, only the electrons will move.
As seen in Fig. 2.14, a negatively charged bar magnet is brought close to a neutral or uncharged metal ball but does not touch it. Excess electrons from the bar magnet will repel the electrons on the side of the ball which is closest to the bar magnet. This leaves the side of the ball closest to the bar magnet positively charged. The reverse occurs when a positively charged bar magnet is brought close to an uncharged metal ball. The electrons from the metal ball are attracted to the positive charge of the bar magnet, thus leaving the side of the ball closest to the bar magnet with a negative charge. In both examples, the electrifi cation by induction is a temporary opposite charge and the electrons will return to their original posi-tions when the charged object is withdrawn (Fig. 2.14).
Electrifi cation by induction can also be used to semipermanently change the charge of an object. This is accomplished by connecting the end of a metallic object to the ground. The Earth is a huge neutral object and an infi nite reservoir of electrons and can be used to neutralize any charged object. In Figure 2.15, a neutral metal ball is connected to ground. A negatively charged bar mag-net is brought close to the neutral metal ball. The forces of repulsion move the negative charges from the side of the metal ball closest to the bar magnet to the opposite side of the metal ball. Because the metal ball is attached to ground, the excess negative charges will fl ow to the ground. If the ground connection and bar magnet are removed, the metal ball will remain positively charged. It will retain this charge until the metal ball is attached to ground at which point the electrons will move up from the ground to neutralize the metal ball.
Unit of ChargeTo quantify these electric charges, a basic unit of measure is needed. Although the basic charged particle is the electron, the standard unit of charge is the cou-lomb. One coulomb is much larger than the charge on an electron. There are 6.3 × 10¹⁸ electron charges in one coulomb. Thus, the charge of one electron is 1.6 × 10⁻¹⁹ coulomb.
Electrostatic LawsCertain physical laws govern how these electrostatic charges interact. The major laws of electrostatics are as follows:
Repulsion–Attraction: Like charges repel and unlike charges attract.
Coulomb’s law: The electrostatic force between two charges is directly proportional to the product of their quantities and inversely proportional to the square of the distance between them.
Distribution: Electric charges reside on the external surface of a conductor.
Concentration: Electric charges concentrate on the surface of a conductor.
Movement: Only negative charges move along solid conductors.
The fi rst law, like charges repel and unlike charges attract, holds true because of the force fi eld surrounding electrical charges. As previously discussed, the force fi eld or lines of force act to repel like charged objects away from each other and to attract opposite charged objects together (Fig. 2.16).
The second law, the force between two charges is directly proportional to the product of their quantities
+++
+++ ++ +
++
Negatively charged Neutral
+++
+++ ++
++
Negatively charged
+
Figure 2.14. Electrifi cation by induction. The force of one magnetic fi eld on another magnetic fi eld can cause the objects to either repel or attract each other.
+++
+++ ++
++
Negatively charged
+
Figure 2.15. Grounding of electrical charges will allow excess electrons to fl ow into the Earth. This principle can be used to temporarily magnetize a metal object.
Fosbinder_Text_Chap02.indd 25 10/30/2010 6:03:23 PM

26 Part I: Basic Physics
and inversely proportional to the square of the distance between them.
Coulomb’s law describes the force between two charges. Coulomb’s law states that doubling the distance between two charges reduces the force by a factor of 4. Two charges of the same sign, either positive or negative, always have a repulsive force between them. Two charges of opposite signs always have an attractive force between them. The force between two charges increases as the strength of the charge increases. Likewise, the force between the charges increases as the distance between them decreases (Fig. 2.17)
This law is written as follows:
= 1 22
Q QF k
d
where F is the force, k is a proportionality constant, and d is the distance between charges Q1 and Q2.
The third law, electric charges reside on the external surface of a conductor, is true because when a metal wire is charged, all the negative charges (electrons) move to the outside of the wire leaving the inside of the wire uncharged (Fig. 2.18). This distribution occurs as the electrons attempt to get as far away from each other as possible. In a solid conductor, this occurs on the surface because the surface area is larger which allows the electrons to be repelled from one another.
Figure 2.18 illustrates the electrostatic law of distribution of charged particles.
The fourth law, electric charges concentrate on the surface of a conductor. Figure 2.19 illustrates how the electric charges will concentrate at the sharpest point on an object. This is also caused by the law of repulsion-attraction. Each negative charge is repelled by other negative charges, which causes the charges to
F F
+
F
F
+
F
F
+
Unlike charges attract
Like charges repel
Figure 2.16. The law of attraction and repulsion of electric charges.
Distance 2
Distance 1
Radiation source
Figure 2.17. Coulomb’s law.
–
–
–
–
––
– –
–
–
–
––
– ––
––
–
–
–
–
–
–– –
Current
Electrons
Conductor
Figure 2.18. Electrostatic law of distribution. Negative charges will reside on the surface of a solid conductor.
collect at the sharpest point. If enough negative charges collect, they can cause ionization in the air and discharge to the closest point of low concentration in an attempt to neutralize the excess negative charges.
The fi fth law, only negative charges move along solid conductors because the positive charges do not drift in solid conductors. The positive charges or protons are tightly bound inside the atom’s nucleus and are not easily moved. The electrons, which orbit the atom, can be easily removed with the appropriate amount of force.
Fosbinder_Text_Chap02.indd 26 10/30/2010 6:03:24 PM

Chapter 2: Electromagnetic Radiation, Magnetism, and Electrostatics 27
These laws are used in radiographic imaging equipment, including image intensifi er tubes, x-ray tubes, and image display systems. These systems can only operate through the use of electricity, and electricity cannot exist without utilizing the principles of electrostatics and moving nega-tive charges. Radiographic equipment uses electricity to power equipment and to create, drive, and focus elec-trons within the x-ray tube and image intensifi er tube. These concepts are built upon in subsequent chapters for a comprehensive understanding of the whole process of producing a radiographic image.
Case StudyJohn is being escorted into the MRI department for an exam. Prior to taking John into the exam room, Elizabeth, the MRI technologist, asked John to place his wrist watch, belt, keys, and any metal object he had into a locker in the dressing room. She explained that this was a policy of the hospital and was for the patient’s safety.
Critical Thinking Questions
Why did Elizabeth ask John to remove these objects and not take them into the MRI room?
Which law is Elizabeth thinking about when she makes this request?
MRI magnets are extremely powerful and have the ability to attract ferromagnetic objects that are brought into the MRI exam room. If a metallic object is brought into proximity of the MRI magnet, the powerful magnetic fi eld lines of the magnet will attract the object and it will become a fl ying projectile! This poses a lethal risk to any person standing between the magnet and the metal object. The law of repulsion/attraction teaches us this lesson, and because of the impact of this law, only nonferromagnetic materials are allowed in the exam room. Spe-cial wheelchairs, IV poles, and crash carts have been developed for safe usage in the MRI room.
Chapter SummaryThis chapter has continued to present foundational information that is essential for you to understand the science behind radiology and to prepare you for the later, more applied chap-ters. Electromagnetic radiation ranges from low-energy, low-frequency, long-wavelength radio waves to high-energy, high-frequency, short-wavelength gamma rays, all of which form an electromagnetic spectrum. Waves are character-ized by velocity, frequency, period, wavelength, and amplitude. The inverse square law describes how electromagnetic radiation intensity changes with distance. As the distance increases, the electromagnetic radiation intensity decreases.
Magnetism pertains to the attracting of iron by a magnet or moving electrical current. You have learned about four types of materials (ferromagnetic, paramagnetic, diamagnetic, and nonmagnetic) and their varying degree of
attraction to magnets, magnetic fi elds, the laws that govern magnets, and the units used to measure magnetic fl ux.
Electrostatics is the study of stationary electric charges and is governed primarily by fi ve laws, which describe how charges interact. You learned about the methods of electrifi ca-tion and how each infl uence electric charges. These concepts are further explored in Chapter 3: Electric Currents and Electricity.
–
–– –
–
–
––
– –
–
–
–
–
–
–
–
––
–
–
––
––
––
Figure 2.19. Electrostatic law of concentration. Due to repulsion, negative charges will concentrate to the sharpest point on a curved object.
Fosbinder_Text_Chap02.indd 27 10/30/2010 6:03:25 PM

Review Questions
Multiple Choice
1. What is the basic charged particle?
A. ElectronB. NeutronC. VoltD. Coulomb
2. The fi rst electrostatic law states that
A. a proton will repel a neutronB. an electron will repel a protonC. an electron will repel an electronD. a neutron will repel a neutron
3. Which statement is not one of the laws of magne-tism?
A. Like poles repelB. Unlike poles attractC. Stronger magnets have larger polesD. The force between magnets decreases with the
square of the distance between them
4. The frequency of an electromagnet wave is mea-sured in
A. the height of the waveB. the number of cycles per secondC. the distance between adjacent peaksD. the length of time it takes to complete one cycle
5. Which type of magnetic material is weakly repelled by other magnetic fi elds?
A. DiamagneticB. FerromagneticC. ParamagneticD. Nonmagnetic
6. The fi eld lines of a magnet fl ow _____________ to the magnet.
A. parallelB. perpendicularC. either parallel or perpendicularD. neither is correct
7. A spin magnetic moment is best described as
A. the domains in a magnetic material are all oriented in the same direction
B. the spinning of electrons on their axes as they orbit an atom
C. a group of atoms whose dipoles are aligned in the same direction
D. the domains in a magnetic material are randomly oriented
8. The Earth’s north magnetic pole is located
A. at the north geographic poleB. in northern CanadaC. near the south geographic poleD. near Australia
9. One gauss is equivalent to _____ tesla?
A. 10−6
B. 10−9
C. 10−4
D. 10−3
10. The electric charges on a curved surface will concentrate
A. at the sharpest curvatureB. at the area of least resistanceC. near the widest curvatureD. where the resistance is the greatest
Fosbinder_Text_Chap02.indd 28 10/30/2010 6:03:25 PM

Chapter 2: Electromagnetic Radiation, Magnetism, and Electrostatics 29
6. Give an example of electrifi cation by contact and explain the principles of this type of electrifi ca-tion.
7. What properties of x-rays are suitable for produc-ing an image?
8. If the frequency of a sine wave is decreased, what happens to the wavelength?
9. How is the amplitude of a sine wave related to the energy of the wave?
10. Which magnetic material is not affected by a magnetic fi eld?
Short Answer
1. Which type of electromagnetic radiation has the lowest energy and frequency but the longest wavelength?
2. Describe the change in intensity if the distance between two magnifi ed objects is doubled?
3. How do x-rays and gamma rays differ from each other?
4. Which electrostatic law deals with the force between two objects? Briefl y describe this law.
5. Describe the third law of magnetism.
Fosbinder_Text_Chap02.indd 29 10/30/2010 6:03:25 PM

30
3
Electric Currents and Electricity
ObjectivesUpon completion of this chapter, the student will be able to:
1. Identify the four types of electrical materials.
2. Describe the direction and movement of current fl ow.
3. Defi ne current, voltage, and electric power and identify their units.
4. Identify Ohm’s law and state the relationship between current, voltage, and resistance.
5. Distinguish between alternating and direct current.
6. Describe current induction.
7. Distinguish between electric generators and motors.
● alternating current (AC)
● ampere
● capacitor
● conductor
● current
● direct current (DC)
● electrodynamics
● electromagnet
● electromagnetic induction
● electromagnetism
● electromotive force (EMF)
● generator
● insulator
● motor
● mutual induction
● ohm
● potential difference
● power
● resistance
● rotor
● semiconductor
● stator
● superconductor
● voltage
● volts
Key Terms
Fosbinder_Text_Chap03.indd 30 10/30/2010 6:04:51 PM

Chapter 3: Electric Currents and Electricity 31
SemiconductorsSemiconductors can act as either conductors or insulators, depending on how they are made and their environment. Rectifi ers in an x-ray circuit are made of semiconduct-ing material. They conduct electrons in one direction but not in the other direction. Some semiconductors conduct or insulate, depending on surrounding conditions. A pho-todiode is a semiconductor that is an insulator in the dark but becomes a conductor when exposed to light.
SuperconductorsSuperconductors are materials that conduct electrons with zero resistance when they are cooled to very low tempera-tures. Superconductors are used to produce the magnetic fi elds in magnetic resonance imaging units. Table 3.1 summarizes the four types of electrical materials.
ElectrodynamicsThe study of moving electric charges is called electrody-namics. Moving electric charges or electric current can occur in a variety of conditions. Electrons can move in a vacuum, gas, isotonic solution, and metallic conductor. Of these, we will focus on the principles necessary for electrons to fl ow in a wire or metal conductor.
Movement of Electric ChargesElectric charges will move when an electrical poten-tial energy difference exists along a conductor. An electrical potential energy difference occurs when one end of a conductor has an excess of electrons while the other end has a defi ciency of electrons. When this occurs electrons will move from the area of excess to the area of defi ciency, which causes an electric current to fl ow.
IntroductionIn Chapter 2, you learned about electrostatic charges and the laws of electric charges at rest. In this chapter, we will build on these prin-ciples as we study the movement of electric charges or electricity. An understanding of the underlying principles of electricity and electric current aids in understanding radiologic equip-ment and image production. In this chapter, we identify different types of electrical materi-als and defi ne current, voltage, resistance, and electric power. We also discuss the difference between alternating current (AC) and direct current (DC), and induction.
Types of Electrical Materials
There are four types of electrical materials: conductors, insulators, semiconductors, and superconductors. Each is discussed in detail below.
ConductorsElectrons move freely through a conductor. Tap water containing impurities and most metals are good electrical conductors. Copper and silver are very good conductors. Electric current will fl ow easily through conductors.
InsulatorsThe electrons in an insulator are held tightly in place and are not free to move. Rubber, wood, glass, and many plastics are good insulators. Electric current will not fl ow in insulators.
TABLE 3.1 FOUR TYPES OF ELECTRICAL MATERIALS
Type of Material Characteristics Examples
Conductor Electrons move freely Copper, silverInsulator Electrons are fi xed; no current can fl ow Wood, plastic, glassSemiconductor Can be either a conductor or an insulator, depending on the conditions Silicon, germaniumSuperconductor Zero resistance to low temperatures; current will fl ow continuously once started Special metal alloys
Fosbinder_Text_Chap03.indd 31 10/30/2010 6:04:52 PM

32 Part I: Basic Physics
VoltageVoltage is the force or electrical pressure that produces electron movement and current fl ow. A voltage increase results in an increase in current fl ow, just as higher water pressure increases the amount of water fl ow. Electrons fl ow in response to the difference in pressure or potential difference (PD) in the circuit.
Unit of VoltageThe unit of voltage or electrical PD is measured in volts (V) and is sometimes called the electromotive force (EMF). EMF is the maximum PD between two points on a circuit. Therefore, the force with which electrons move can be described by the terms PD, EMF, or volt-age (V). Higher voltages give electrons higher energies. Voltages of 20,000 to 120,000 V are used in x-ray circuits to produce high-energy x-rays. One kilovolt (kV) is equal to 1,000 (103) volts.
There does not have to be current fl ow for a voltage to exist, just as there can be water pressure in a pipe but no water fl ow if the valve is closed. Figure 3.2 illustrates how voltage is similar to water pressure in a hose. Higher water pressure causes more water to fl ow, and higher volt-age produces more current fl ow.
ResistanceResistance is the opposition to current fl ow in a circuit. The unit of resistance is the ohm and the symbol is the omega (W). The composition of the circuit will determine the amount of resistance that is present. There are four factors which affect the amount of resistance in a circuit:
1. Conductive material2. Length of conductor3. Cross-sectional diameter4. Temperature
Conductive MaterialAs previously discussed, the conductive ability of the material will have a direct effect on the fl ow of electrons. The least amount of resistance is found in a wire which is made of a good conductive material like copper.
LengthThe length of the conductor is directly proportional to the amount of resistance in the wire. As the length of a
Unit of CurrentAn electric current is a fl ow of electrons over a set amount of time. The ampere (A) is the unit of current and is defi ned as one coulomb of electric charge fl owing per second (1 A = 1 C/1 s). The milliampere (mA) is a smaller unit of current; it is equal to 1/1,000 of an ampere (10−3 A). Diagnostic radiographic equipment uses a variety of mA units to regulate the number of electrons needed to pro-duce x-ray photons. Different current values are used in different parts of x-ray circuits (Table 3.2).
The fi lament of an x-ray tube is supplied with a high current, which heats the fi lament and causes electrons to be boiled off the fi lament. X-ray tubes are discussed more completely in Chapter 6.
Direction of Current FlowWhen Ben Franklin was working with electricity, he spec-ulated about whether positive or negative charges come out of the battery. Unfortunately, he guessed wrong. He thought that positive charges fl ow from the positive termi-nal (the anode) of a battery to the negative terminal (the cathode). What really happens is that negative charges (electrons) fl ow from the negative cathode to the posi-tive anode. In practice, all drawings of electric circuits are based on Ben Franklin’s theory. We assume that cur-rent is fl owing from positive to negative, even though we know that electrons are actually fl owing in the opposite direction. Figure 3.1 illustrates the direction of current and electron fl ow in a wire.
TABLE 3.2. TYPICAL CURRENTS ASSOCIATED WITH THE FILAMENT AND X-RAY TUBE
Location Current
X-ray fi lament 2–5 AX-ray tube 50–800 mA
––
––
––––––––
––––
––
––––
––
––
––
––
––––
––
––
Current direction
Electron direction
Electron
Figure 3.1. In an electric circuit, electrons fl ow in one direction and positive current fl ows in the opposite direction.
Fosbinder_Text_Chap03.indd 32 10/30/2010 6:04:52 PM

Chapter 3: Electric Currents and Electricity 33
Figure 3.2. Voltage is like water pressure in a hose.
––– –––
––––– ––
–––– –––
––––
––– –––––
–– ––––––– ––
–––
––
–––– ––
–––
––––––
––
––––
––
––––
–––
–––
––
–––––
––
–––
––
–– –––––– ––
–– –––– –– ––––––– –––– ––
––
–– –––––
–– –––––– ––
Electron direction
Electron flow more easily inshorter tube
Greater resistancedue to length of tube,electrons slow down
Figure 3.3. Long pipe = high resistance. Short pipe = low resistance.
conductor increases, so does the resistance. If the length of a water pipe doubles, the resistance to the fl ow of water will also double (Fig. 3.3).
Cross-sectional DiameterThe cross-sectional diameter of the wire is inversely pro-portional to the resistance. As the cross-sectional diameter
doubles, the resistance will be halved. A wire with a large diameter has more area for electron fl ow and therefore offers a small amount of resistance to the fl ow of elec-trons. This principle is utilized when it is desirable to decrease the overall resistance in a wire while maintain-ing the length of the wire (Fig. 3.4).
TemperatureWhen electrons fl ow along a conductor, heat is pro-duced. As the heat builds on the conductor the electrons
Electron direction
Greater resistancein the narrower tube
Figure 3.4. Illustrates the effect of cross-sectional area on resistance.
Fosbinder_Text_Chap03.indd 33 10/30/2010 6:04:53 PM

34 Part I: Basic Physics
CRITICAL THINKING
Calculate the current in a circuit with a voltage of 9 V and a resistance of 2 W. From Ohm’s law, if the resistance and voltage are known, the current can be calculated (Fig. 3.6).Answer
=
=
=
924.5A
VI
R
I
I
CRITICAL THINKING
What is the resistance of a circuit if the voltage is 100 V and the current is 5 A?
Answer
=
=
= W
1005
20
VR
I
R
R
have collisions with other electrons, which produce more resistance. Therefore, higher resistance leads to less cur-rent fl ow (Fig. 3.5).
Ohm’s lawGerman physicist Georg Ohm studied the relationships between voltage, current, and resistance. These relation-ships are expressed mathematically as:
V IRV
IRV
RI
=
=
=
where V, voltage; I, current; and R, resistance.Ohm’s law states that the voltage (V) is equal to the prod-
uct of the current (I) fl owing through a conductor and the resistance (R) of the conductor. Higher voltage and lower resistance result in higher current fl ow. As you can see, when one factor is changed it affects the remaining factors.
CRITICAL THINKING
What is the voltage in a circuit if current is 300 A and resistance is 4 W?
Answer
VVV V
´ = = 300 4 = 1200
IR
––––
––––––
––––
–––– ––
––
––
––
––––
––––
––––––––
––––
––
––––
––––
–––– –––
–––
––––
––––
––
––
––
–––
––
–– –––––––––
––––
––
––––
––
Heat
Cold
Electrons
Figure 3.5. High temperature = more resistance.
V
I R
Figure 3.6. Shows the circle of Ohm. This is an excellent way to remember the various combinations of Ohm’s law. The fi gure shows that V = IR or I = V/R or R = V/I. Remem-ber that V is always on top.
Fosbinder_Text_Chap03.indd 34 10/30/2010 6:04:56 PM

Chapter 3: Electric Currents and Electricity 35
positive half cycle is 1/120 seconds (s). The duration of the negative half cycle is also 1/120 seconds. One cycle per second is also known as one hertz (Hz).
Electric PowerElectric power is measured in watts (W). Power is the rate of energy used and describes the amount of work done or the amount of energy used per second. This is true for both AC and DC circuits. One watt is produced by one ampere of current fl owing with an electrical pressure of one volt. The relationship between power, current, and voltage is:
P = IV
where P, power in watts; I, current in amperes; and V, PD in volts.
CRITICAL THINKING
The power expended in a light bulb in a 100 V circuit with 0.6 A fl owing isAnswer
== ´=
0.6 10060W
P IVPP
CRITICAL THINKING
If a mobile x-ray machine operates from a 110 V wall outlet and is rated at a total resistance of 26 W, how much current does it draw during a 1-second expo-sure? How much power does it use per second?Answer
=
=
=== ´=
110264.2A
4.2 110462W
VI
R
I
IP IVPP
Direct and Alternating Currents
Current fl ow is demonstrated by using a sinusoidal or sine waveform. The vertical axis represents the amplitude of the current while the horizontal axis represents time. The sinusoidal wave is used to demonstrate current fl ow as either positive fl ow or negative fl ow. In DC circuits, electrons fl ow only in one direction. The waveform begins on the line or at zero amplitude when the electrons are at rest. As the elec-trons begin to move in the positive direction their potential increases until they reach the maximum potential which is represented by the peak of the waveform. Once the electrons have reached this peak, they begin to slow down until they again reach zero potential. For DC the electron fl ow will continue in this manner until the electricity is turned off.
AC fl ows half of the time in one direction, and the other half of the time in the other direction. The fi rst half of the AC sine waveform is identical to the DC waveform and consists of positive current fl ow. Once the positive direction fl ow has stopped and the electrons are at rest, the electron fl ow then reverses and fl ows in the negative direc-tion with increasing potential until maximum is reached. Once this occurs, the potential of the electron fl ow will decrease until zero potential is achieved. AC waveforms will continue this oscillation as long as a PD exists.
Figure 3.7 shows how AC changes direction with time and how DC has a constant direction.
In the United States, standard AC electric current has a frequency of 60 cycles per second. The duration of the
TimeCur
rent
(A
) 100
0
Cur
rent
(A
)
100
–100
0Time
Alternating current
Direct current
Figure 3.7. Alternating and direct currents.
Fosbinder_Text_Chap03.indd 35 10/30/2010 6:04:57 PM

36 Part I: Basic Physics
induction and is the basis of transformer operation. A changing magnetic fi eld produces an electric fi eld. This electric fi eld will cause electrons to fl ow in a con-ductor. Electromagnetic induction is the production of a current in a conductor by a changing magnetic fi eld near the conductor. The magnetic fi eld must be chang-ing. A steady magnetic fi eld does not induce an electric current.
The magnitude of the induced EMF depends on the number of magnetic fi eld lines crossed or cut per sec-ond. There are four factors that regulate the strength of induced current. Maximizing these variables will pro-duce the highest possible voltage for the materials used in the conductor. These four factors are:
ElectromagnetismElectromagnetism deals with the relationship between electricity and magnetism. A current fl owing in a conduc-tor creates a magnetic fi eld around the conductor. Figure 3.8 shows the magnetic fi eld around a current-carrying conductor. The accompanying magnetic fi eld is a funda-mental property of electric currents. The strength of the magnetic fi eld increases with an increase in the current.
When the conductor is coiled in a loop it forms a helix and when current is supplied to the helix it makes a sole-noid. The magnetic fi elds from different parts of the coil add together and increase the magnetic fi eld in the center of the coil. Increasing the current or the number of turns in the coil produces a stronger magnetic fi eld in the cen-ter of the coil. This occurs because the magnetic fi elds will interact with each other, which creates a stronger cur-rent fl ow. Adding a ferromagnetic material such as iron in the center of the coil also increases the magnetic fi eld strength by concentrating the fi eld through the center of the iron. The ferromagnetic iron becomes magnetized and its magnetic fi eld lines interact with the electric fi eld of the solenoid. This produces a powerful electromagnet, which is utilized in radiographic equipment. The electro-magnet will produce electric current as long as the helix is supplied with electricity; once the electricity is turned off, the electromagnet will no longer produce current. There-fore, an electromagnet is a temporary magnet. Figure 3.9 shows how the magnetic fi eld in the center of a coil is increased by adding turns to the coil and adding ferromag-netic material to the center of the coil.
Electromagnetic InductionThe relationship between current, a ferromagnetic core, and changing magnetic fi elds is called electromagnetic
––
––
–––––––
–––
––
––––
––
––
––
––
––––
––
––
Current
Electrons
Figure 3.8. A magnetic fi eld is always present around a wire that is carrying a current.
Single turn on coil
Many turns on coil
Ferromagneticcore added
Helix
A
B
C
Solenoid
Electromagnet
+ terminal
– terminal
+ terminal
– terminal
Figure 3.9. (A) Helix. (B) Helix + fl owing current = solenoid. (C) Solenoid + iron core = electromagnet.
Fosbinder_Text_Chap03.indd 36 10/30/2010 6:04:58 PM

Chapter 3: Electric Currents and Electricity 37
1. The strength of the magnetic fi eld. Increasing the magnetic fi eld strength will produce stronger fi eld lines, which will then produce a more powerful EMF in the conductor.
2. The speed of the motion between fi eld lines and the conductor. As the rate or speed at which the con-ductor crosses the magnetic fi eld lines increases, a higher EMF will be produced because more fi eld lines will be cut per second.
3. The angle between the magnetic fi eld lines and the conductor. Magnetic fi eld lines that are at a 90-degree angle to the conductor will produce the greatest amount of EMF because the conductor is crossing through the maximum number of fi eld lines possible per second.
4. The number of turns in the conducting coil. Con-ductors with more turns or coils will produce greater EMF because each turn or coil will pro-duce its own EMF, which will then interact with the other turns, thereby increasing the EMF even more. The induced EMF is directly proportional to the number of turns in the coil.
An electric current can be induced in a conductor in three ways.
One way is to move a magnet near a stationary con-ductor. As the magnet approaches the conductor, the magnetic fi eld around the conductor increases. As the magnet moves away from the conductor, the magnetic fi eld decreases. The change in the magnetic fi eld as the magnet approaches and recedes induces a current to fl ow in the conductor.
A second way to induce a current is by moving a con-ductor near a stationary magnet. In this case, the magnetic fi eld is stationary and the conductor moves. The relative motion between the magnet and the conductor is the same regardless of which moves and which is stationary. In either case, a current is induced to fl ow in the conductor.
A third way of inducing a current is to hold the con-ductor stationary and generate the magnetic fi eld with a stationary AC electromagnet. The magnetic fi eld from the electromagnet expands and contracts. This changing magnetic fi eld induces a current to fl ow in the conductor. AC fl owing in a conducting coil will produce a changing magnetic fi eld in the center of the coil.
In every case, the change in the magnetic fi eld induces the current. The amount of induced current depends
Current
Magnetic field
Conductor
Figure 3.10. Demonstrates the three ways in which current can be induced in a conductor.
on the strength of the magnetic fi eld and how fast it is changing (Fig. 3.10).
Mutual InductionMutual induction occurs when two coils are placed close to each other and a varying current supplied to the fi rst or primary coil induces a similar current fl ow in the sec-ond or secondary coil. AC in an electromagnet produces a changing magnetic fi eld. As the magnetic fi eld lines expand and contract in the primary coil, they are provid-ing the relative motion necessary to induce AC fl ow in the secondary wire. This is the principle of transformer operation (Fig. 3.11).
Electric Generators
An animation for this topic can be viewed at http://thepoint.lww.com/FosbinderText
An electric generator converts mechanical energy into electrical energy. A simple generator is made of a con-ductor and magnets arranged as shown in Figure 3.12. The conductor is a coil of wire called an armature, and the armature is set between the opposing magnetic poles.
Fosbinder_Text_Chap03.indd 37 10/30/2010 6:04:59 PM

38 Part I: Basic Physics
Magnetic field
Motion of wire
Current direction
+ –
–
Mechanical crank
Figure 3.12. AC generator. Mechanical energy rotates the shaft that is attached to the armature. As the armature rotates through the magnetic fi elds, it crosses through the magnetic lines of force and produces electric current.
As the armature is turned by a mechanical method, a current is induced in the armature that is moved through a magnetic fi eld across or perpendicular to the magnetic fi eld lines. If the conductor or armature moves parallel to the magnetic fi eld, there is no current induced in the conductor. The conductor must cut through the mag-netic fi eld lines in order to induce a current. It is crucial to note the method by which the induced current fl ows in a circuit. Each end of the armature is connected to brushes, which allow constant contact with a set of slip rings. The slip rings are stationary and allow the armature to rotate within the magnetic fi elds. The induced cur-rent fl ows from the armature through the slip rings to the brushes and fi nally through the circuit (Fig. 3.12). Thus, this type of generator produces AC.
As the coil rotates in a magnetic fi eld, the induced current rises to a maximum, drops to zero, and then increases to a maximum in the opposite direction. No current is induced when the wire is moving parallel to the magnetic fi eld. The induced current is an AC. Addi-tional loops in the coil increase the voltage induced in the coil. Figure 3.13 shows how a coil rotating in a mag-netic fi eld produces an AC. In a generator, the mechan-ical energy of rotation is converted into electric energy.
Prim
ary
circ
uit
Sec
onda
ry c
ircui
t
Supplied AC Induced AC
Alternately expanding and contractingmagnetic field
Figure 3.11. Mutual induction. When the primary coil is supplied with AC, lines of force are induced in the primary coil. These expanding and contracting lines of force then interact with the nearby secondary coil, thereby inducing AC fl ow in the secondary coil.
A DC generator utilizes the same design as an AC generator, except that the slip rings are replaced with a commutator ring. A commutator ring is a single ring that is divided in half with the halves separated by an insu-lator. Each half of the commutator ring is connected to one end of the armature. The armature is turned mechanically and moves through the magnetic fi eld lines inducing a current. Although the action of the DC generator is the same as an AC generator, the result-ing sine wave is routed differently. As the commutator ring rotates the armature through the magnetic fi eld, the polarity of each half of the ring will alternate. This allows the current to fl ow fi rst in one direction and then in the reverse direction resulting in current fl owing out of the commutator in one direction. This is illustrated in Figure 3.14.
Electric MotorsA motor converts electrical energy into mechanical energy. A current-carrying coil or armature is surrounded
Fosbinder_Text_Chap03.indd 38 10/30/2010 6:04:59 PM

Chapter 3: Electric Currents and Electricity 39
by a magnetic fi eld. If this armature is placed in an external magnetic fi eld, or between the north and south poles of a horseshoe magnet, the external magnetic fi eld and the magnetic fi eld of the coil interact. The laws of repulsion and attraction will determine the direction in which the armature will rotate. The armature will either
be repelled by the external magnetic fi eld if the external lines of force are in the same direction as the magnetic lines of force surrounding the armature or attracted to the external magnetic fi eld if the lines of force are in opposite directions to the armature’s magnetic fi eld. The result will be that the armature is pulled upward or downward. The
DBA C E
0° 90° 180° 270° 360°Time
Incr
easi
ng v
olta
ge
0
Angle between conductor and magnetic lines of flux
Figure 3.14. DC generator.
GCA
B D HF
E I
0° 45° 90° 135° 180° 215° 270° 315° 360°
Time
Incr
easi
ng v
olta
geth
is d
irect
ion
0
Incr
easi
ng v
olta
geth
is d
irect
ion
Figure 3.13. Rotating coil of wire produces an AC. Notice how the placement of the armature in relation to the magnetic fi eld is demonstrated on the sine wave.
Fosbinder_Text_Chap03.indd 39 10/30/2010 6:05:00 PM

40 Part I: Basic Physics
Magnetic field
Motion of wire
Current direction
To powersource
+
– –
Figure 3.15. The simple electric motor has the same basic construction as a DC generator, except there is an external power source supplying current to the commutator ring. The commutator ring directs the fl ow of current to the armature. As the magnetic fi eld of the armature is attracted to the external magnet, the armature will rotate through the exter-nal magnet’s magnetic fi eld. Just as the armature becomes aligned with the external magnet, the commutator switches the direction of current fl ow through the armature, thereby reversing the armature’s required alignment. At this point the magnetic fi elds of the external magnet and armature are the same, which will cause the armature to be repelled by the external magnet, moving the armature out of the external magnet’s fi eld. The armature will rotate 180 degrees toward the other pole of the external magnet, seeking alignment with that pole, which is the opposite polarity of the armature’s magnetic fi eld. As the armature moves into the magnetic fi eld, the commutator will again switch the current fl ow to force the armature to rotate again. This process will continue repeatedly keeping the armature rotating continuously.
interaction will continue as long as a current is supplied to the armature. Once the current is turned off, the mag-netic fi eld surrounding the armature will collapse and it will no longer move. Figure 3.15 illustrates the force on a current-carrying coil in a magnetic fi eld.
Induction MotorsInduction motors are AC motors which operate on the principle of mutual induction. In an x-ray tube, the rotat-ing anode is driven by a rotor attached to an induction
motor. The components of an induction motor include a rotor and a stator. The rotor is in the center of the induction motor and consists of copper bars arranged around a cylindrical iron core. The stator has an even number of stationary electromagnets placed around the rotor. Both the rotor and the anode are sealed inside an evacuated glass envelope. The stator, located outside the glass tube, is supplied with AC (multiphase current) which produces changing magnetic fi elds by switching the current in each set of electromagnets. The electro-magnets of the stator are energized in sequence, creat-ing magnetic fi elds that induce current in the copper bars. As the magnetic fi elds of the copper bars reach a point, they are equalized with the electromagnets mag-netic fi eld, the next set of electromagnets is activated by the multiphase current, thus forcing the rotor to follow the external magnetic fi elds of the stator, thereby pull-ing the rotor to the next position. This sequence contin-ues to occur as long as there is multiphase current being supplied to the stator.
CapacitorsCapacitors are used to temporarily store electric charge. A capacitor consists of two conducting plates separated by an insulator. The two conducting plates are connected to the two terminals of a DC source. Positive charges fl ow to one plate; negative charges fl ow to the other plate. The capacitor will accept a charge until it equals the DC volt-age. When the DC source is removed, the positive and negative charges on the plates remain attracted to each other, and the capacitor remains charged. If the capacitor is connected to a conductor such as a light bulb, a current will briefl y fl ow from the positive to the negative plate of the capacitor until the positive and negative charges are balanced. The current fl ow from a capacitor usually takes only a fraction of a second. Capacitors are used to store electric energy in some portable x-ray units.
Fosbinder_Text_Chap03.indd 40 10/30/2010 6:05:00 PM

Critical Thinking Questions
When designing the circuit, which factors must Liz utilize to decrease the total amount of resis-tance in the circuit?
Which type of material will provide the most conduction of the electrons?
How do these factors affect Liz’s design of the circuit?
What type of wire confi guration must be used to dissipate heat buildup from electron collisions?
When designing a circuit, the factors which must be considered are type of material, cross-sectional diameter, length, and temperature. When designing the circuit, Liz must remem-ber how each of these factors will affect the total amount of resistance in the circuit. Liz must fi rst use a conductive material that will allow the fl ow of electrons. Ferromagnetic materials, like copper, provide excellent con-duction of electrons because there is minimal resistance to the free fl ow of the electrons. The conductor Liz chooses must be of suffi cient length for the circuit without being overly long; long wires or conductors have more resistance so Liz will need to use the short-est length of wire possible. Liz also realizes that the conductor must have a large enough diameter so that the electrons will fl ow unim-peded along the conductor. Finally, Liz must remember that when electrons collide with each other the by-product is heat so Liz will need to use a wire with the following: shortest length, largest diameter, and conductive mate-rial, all of which will decrease the amount of electron collisions and thereby heat. By utiliz-ing all these factors, Liz will be able to make a circuit with the least amount of resistance while allowing signifi cant amount of voltage and current to fl ow.
Chapter 3: Electric Currents and Electricity 41
Case StudyLiz is designing a circuit for a new radiographic unit. There are many aspects that Liz must think about. Answering the following questions will help her design an appropriate circuit.
Chapter SummaryIn this chapter, you have learned the process of making current fl ow by using the principles of electromagnetism. Electrons moving through a conductor make up an electric current. Current is the amount of electrons moving in a conductor per second and is measured in amperes or mil-liamperes. Current fl ows from the positive to the negative terminal in an electric circuit. Electrons fl ow from the negative to the positive terminal. Voltage is the electrical pressure or EMF applied to the electrons in the conductor and is mea-sured in volts. Resistance, which is the opposition to current fl ow, is measured in ohms. Ohm’s law, written V = IR, states the relationship between voltage, current, and resistance. DC fl ows only in one direction. One cycle of AC consists of current fl ow in one direction for half of the time and in the other direction for the other half of the time. One cycle per second is one hertz.
Power is the rate at which energy is used. The equation for electric power is P = VI. Power is mea-sured in watts. Electromagnetic induction is the principle of electrons moving through a conductor and creating a magnetic fi eld around the conduc-tor. A changing magnetic fi eld induces a current in a conductor. This is known as mutual induction.
A generator converts mechanical energy into electric energy. Either AC or DC can be produced through the use of either slip rings or commutator ring. A motor converts electric energy into mechanical energy. The compo-nents are essentially the same as the generator and operate on the same principles only in reverse. An induction motor is used to rotate the anode inside an x-ray tube.
Fosbinder_Text_Chap03.indd 41 10/30/2010 6:05:01 PM

Review Questions
Multiple Choice
1. The unit of electric current is the
A. wattB. ampereC. voltD. ohm
2. The unit of electrical potential is the
A. wattB. ampereC. voltD. ohm
3. Electrons move from
A. positive to negativeB. negative to positiveC. neutral to positiveD. neutral to negative
4. An electronic device that is used to store an elec-tric charge is called a
A. motorB. rectifi erC. transformerD. capacitor
5. One kilovolt is equal to _____ V.
A. 1/1,000B. 1/100C. 1/10D. 1,000
6. Increasing the resistance in a circuit results in a(n)
A. increase in currentB. increase in voltageC. decrease in currentD. decrease in voltage
7. As the length of the wire increases, the resistance of the wire
A. increasesB. decreasesC. stays the same
8. Which of the following factors is inversely propor-tional to the resistance in a circuit?
A. Magnetic fi eld strengthB. Diameter of the conductorC. Length of the conductorD. Temperature
9. An electric motor has current supplied to the _____.
A. commutator ringB. armatureC. slip ringsD. brushes
10. In an induction motor, which component(s) is/are responsible for making the anode spin?
A. The EMF applied to the sets of electromagnets of the stator
B. An energized sequence of the electromagnetsC. The rotor moving in response to the electromag-
netsD. Each of the above is partially responsible for the
anode spinning
Fosbinder_Text_Chap03.indd 42 10/30/2010 6:05:01 PM

Chapter 3: Electric Currents and Electricity 43
Short Answer
1. Describe what a solenoid is.
2. List the four factors that relate to the magnitude of induced current.
3. What is an electromagnet?
4. Explain what mutual induction is.
5. Defi ne the four types of conducting materials.
6. Explain how an electric motor works.
7. What is the resistance in a circuit with 12,000 V and 65 A?
8. How much power was used in a mobile radio-graphic unit with 220 V and .8 A?
9. List the components of a generator.
10. Write the Ohm’s law formulas.
Fosbinder_Text_Chap03.indd 43 10/30/2010 6:05:01 PM

P A R T I I
Circuits and X-Ray Production
Fosbinder_Text_Chap04.indd 44 11/20/2010 2:15:18 PM

45
4
Key TermsObjectivesUpon completion of this chapter, the student will be able to:
1. Identify the difference between alternating and direct current.
2. Identify single-phase, three-phase, and high-frequency waveforms.
3. Describe the relationship between current and voltage in the primary and secondary sides of step-up and step-down transformers.
4. Identify the components of a typical x-ray circuit and their purpose.
5. Describe the purpose and operation of a rectifi er.
6. Describe the operation of a transformer.
7. Defi ne voltage ripple.
Transformers, Circuits, and Automatic Exposure Control (AEC)
● air core transformer
● autotransformer
● closed core trans-former
● half-wave rectifi cation
● open core transformer
● rectifi ers
● ripple
● shell type transformer
● single-phase circuits
● step-down transformer
● step-up transformer
● three-phase circuit
● tranformers
Fosbinder_Text_Chap04.indd 45 11/20/2010 2:15:18 PM

46 Part II: Circuits and X-Ray Production
IntroductionX-ray circuits convert electric energy into x-ray energy. Knowledge of the components of an x-ray circuit will assist the technologist in detecting and correcting problems with the technical settings used to produce the x-ray image. X-ray circuits generate x-rays using transformers that convert low voltage (100–400 volts [V]) into high voltage (thousands of volts). X-ray circuits utilize transformers to change the voltage, rectifi ers to convert alternating current (AC) into direct current (DC), and autotrans-formers to select the milliamperes and kilovolts peak applied to the x-ray tube. X-ray circuits were previously referred to as x-ray genera-tors. However, the term generator used in this context has nothing to do with the generators described in Chapter 3, which are used to gen-erate electric currents.
Direct and Alternating Currents
Electric current describes the amount of electric charge moving through a conductor and is measured in amperes or milliamperes. The two types of electric current are DC and AC. DC fl ows in only one direction. Batteries and recti-fi ers produce DC. DC is used in TV sets, microwave ovens, and x-ray tubes. Figure 4.1 is a graph of DC as a function of time. It also demonstrates the sine wave of DC.
The current fl ows in one direction at all times. In an AC circuit, shown in Figure 4.2, the current fl ows in the positive direction half of the time and in the negative direc-tion, the other half of the time. During the positive half of the AC sine wave the current fl ow begins at zero potential when the electrons are at rest; the electrons begin to rise to the maximum positive potential; the electrons begin to slow down and fl ow back to zero. At this point the electrons reverse the motion or change the direction and begin to fl ow in the negative direction; the electrons fl ow in the negative direction until they reach the maximum negative potential; the electrons then slow down and fl ow back to zero. The electrons will continue to oscillate from positive to negative in a sinusoidal manner, with each wave requir-ing 1/60 seconds. The voltage is measured at the peaks of the AC cycle. An AC voltage of 2,000 V is referred to as 2 kVp, where kVp means kilovolt peak.
AC is used in most electrical appliances. The x-ray machine utilizes AC in the high voltage circuits. In the United States, the current frequency for AC is 60 Hz.
High Voltage Components
Components of the high-voltage circuit include the primary and secondary windings of the step-up, high-voltage transformer, the primary and secondary windings of the step-down transformer, and the rectifi ers. Each of these types of transformers is necessary to produce the appropriate amount of voltage and amperage needed to produce x-rays.TimeV
olta
ge (
V) 100
0
Direct current
Figure 4.1. DC fl ows in one direction beginning at zero potential, upon reaching peak potential it then moves back to zero. This pattern is continued as long as the switch is open.
Alternating current
Time
Vol
tage
(V
) 100
–100
0
Figure 4.2. AC sinusoidal waveform.
An animation for this topic can be viewed at http://thepoint.lww.com/FosbinderText
Fosbinder_Text_Chap04.indd 46 11/20/2010 2:15:18 PM

Chapter 4: Transformers, Circuits, and Automatic Exposure Control (AEC) 47
The voltage in the secondary coil of a transformer is related to the voltage in the primary coil by the trans-former law for voltage:
Vs = Vp (Ns/Np)
where V is the potential difference in volts, N is the number of turns of wire in the coil, p is the primary coil, and s is the secondary coil. The turns ratio, Ns/Np, is the ratio of the number of turns in the secondary coil to the number of turns in the primary coil.
CRITICAL THINKING
If a transformer is supplied with 500 V to the primary coil, has 200 turns of wire in the primary coil and 40,000 turns of wire on the secondary coil, what will be the voltage in the secondary coil?
Answer
40,000500
200500(200)100,000 V or 100kV
ss p
p
s
s
s
NV V
N
V
VV
⎛ ⎞= ⎜ ⎟⎜ ⎟⎝ ⎠
⎛ ⎞= ⎜ ⎟⎝ ⎠==
CRITICAL THINKING
There are 140 turns on the primary side of a trans-former and 20,000 turns on the secondary side of a transformer. What is the turns ratio for this trans-former?
Answer
20,000142.8 or a turns ratio of 143
140
s
p
NN
⎛ ⎞⎜ ⎟⎜ ⎟⎝ ⎠
=
The output voltage in the secondary coil depends on the turns ratio and on the primary voltage. Increasing the number of turns in the secondary coil of a transformer increases the output voltage and decreases the output current. According to Ohm’s law, the induced voltage and current in the transformer coils are inversely related:
TransformersTransformers are used to change low voltages into higher voltages or vice versa in an AC circuit. A trans-former consists of a pair of wire coils joined together around an iron core. This iron core provides coupling of the magnetic fi elds between the coils. Transformers operate on the principle of mutual induction. Trans-formers can operate only with AC, not with DC. As the AC moves from positive to negative and back again, the fl ow of electrons causes a magnetic fi eld to continu-ously build and collapse around the wire carrying the AC. This action combined with the principles of mutual induction and Ohm’s law provides the basic functions of a transformer. Figure 4.3 illustrates the components of a transformer: primary coil, secondary coil, and fer-romagnetic core.
An AC supplied to the primary coil changes the magnetic fi eld around the coil. The changing magnetic fi eld from the primary coil, or input, induces a current in the secondary coil, or output. This is the principle of mutual induction. The magnetic fi elds surrounding the primary and secondary coils will continue to expand and collapse, thereby causing mutual induction in each coil. The input voltage and current on the primary coil differ from the out-put voltage and current on the secondary coil.
The secondary coil of a transformer is linked to the primary coil by an iron core to improve its effi ciency. The iron core acts as an electromagnet when current is sup-plied to the primary coil. When the magnetic fi elds of the primary coil interact with the iron core, the iron core will then produce a magnetic fi eld. This magnetic fi eld will then interact with the primary and secondary coils, therefore increasing the amount of mutual induction and ultimately increasing the amount of current fl owing in the secondary coil.
Primary coil Secondary coil
Ferromagnetic core
Figure 4.3. Components of a simple transformer.
Fosbinder_Text_Chap04.indd 47 11/20/2010 2:15:20 PM

48 Part II: Circuits and X-Ray Production
higher voltages in the secondary coil are accompanied by lower currents or amperage in the secondary coil. This occurs because the power output of the transformer can-not exceed the power input. When the secondary voltage is higher than the primary voltage, the secondary current must be less than the primary current. If the secondary voltage is lower than the primary voltage, the secondary current is higher than the primary current.
Transformers are used to change voltage; however, Ohm’s law is in effect and the effect of the transformer on voltage, amperage, and number of turns in the coil can be determined by combining the transformer law with Ohm’s law. The following formulas demonstrate the combination of the two laws:
Transformer law for current ps p
s
NI I
N⎛ ⎞
= ⎜ ⎟⎝ ⎠
Transformer law for voltage and current ⎛ ⎞
= ⎜ ⎟⎝ ⎠
ps p
s
VI I
V
where I is amperage, V is voltage, N the number of turns, p is the primary coil, and s is secondary coil.
CRITICAL THINKING
The turns ratio in a fi lament transformer is 0.175, and 0.6 A of current is fl owing through the primary coil. What will be the fi lament current?
Answer⎛ ⎞
= ⎜ ⎟⎝ ⎠⎛ ⎞= ⎜ ⎟⎝ ⎠
= ×=
ps p
s
10.6
0.1750.6 5.73.4 A of current flowing through the
s econdary coil of the filament transformer.
s
s
s
NI I
N
I
II
When working with transformers, it is helpful to remember that voltage and the number of turns are directly proportional, while voltage and amperage are inversely proportional. Therefore, the amperage and number of turns also have an inverse relationship. In a step-up transformer the voltage is increased but the amperage must decrease to keep the power constant. Conversely, a step-down transformer will decrease volt-age from the primary coil to the secondary coil, with a corresponding increase in amperage. The amount of
increase or decrease in voltage is directly related to the number of primary and secondary turns. Therefore, a step-up transformer will have more turns in the second-ary coil which means higher voltage and lower amper-age. A step-down transformer will have fewer turns in the secondary coil than the primary coil which provides a lower voltage and higher amperage in the secondary coil. As you can see, when voltage changes, amperage must have a corresponding change to keep power equal.
Transformer Effi ciencyAlthough transformer effi ciency is typically above 95%, several factors infl uence how much energy is lost. The high-voltage transformer used in x-ray equipment must step up voltage into the kilovolt range through the use of vast amount of wires that make up the secondary windings. The high voltage and vast amounts of wires cause some problems which affect the effi ciency or energy loss of the transformer.
The three principal causes of transformer energy loss are:
1. I2R loss: Electric current in copper wire experi-ences resistance that results in heat generation. This is also called copper loss.
2. Hysteresis loss: Results from energy expended as the continually changing AC current magnetizes, demagnetizes, and remagnetizes the core material.
3. Eddy currents loss: These currents oppose the mag-netic fi eld that induced them, thereby creating a loss of transformer effi ciency.
The current fl owing through the coils produces heat in the transformer, which must be dissipated. X-ray trans-formers are usually placed inside a metal box about the size of a kitchen table or a desk. The box is fi lled with oil to provide electrical and thermal insulation to prevent electric shock and to cool the transformer.
Types of Transformer CoresThere are many different ways to build a transformer to improve effi ciency and each has a different type of core confi guration. A simple transformer made with two coils of wire in close proximity to facilitate mutual induction is called an air core transformer. When the primary and secondary coils have an iron core placed within them, the strength of the magnetic fi eld is greatly increased, forming an open core transformer. The open ends of this type of transformer allow the magnetic fi eld lines to diverge at which point the fi eld lines are only interacting with air. The closed core transformer was designed to correct the diffi culties with an open core transformer by
Fosbinder_Text_Chap04.indd 48 11/20/2010 2:15:32 PM

Chapter 4: Transformers, Circuits, and Automatic Exposure Control (AEC) 49
of primary and secondary windings on their coils and a fi xed turns ratio. If the turns ratio is constant, the only way to change the output of a transformer is to change the input voltage. Figure 4.5 shows a schematic of the three types of transformers used in x-ray circuits.
AutotransformersThe function of an autotransformer is to provide different voltages for input to the step-up and step-down transformers. The output of the autotransformer is connected to the primary coil of the step-up or step-down transformer.
An autotransformer has an iron core with only one coil, which serves as both primary and secondary transformer windings. The primary side has output connections which are made at different points on the coil of an auto-transformer; these connections are called output taps. In an x-ray circuit, the output of an autotransformer is used to change the voltage in the primary coils of the step-up and step-down transformers. Different output voltages are obtained by selecting different autotransformer output taps; therefore changing the input voltage to the step-up or step-down transformer. Varying the voltage to the step-up
placing an iron bar on the top and bottom of the open core. This confi guration will direct the fi eld lines from primary to secondary cores toward each other, which results in a signifi cantly higher increase in fi eld strength. The shell type transformer uses a central iron core with both the primary and secondary wires wrapping around the iron core. The primary and secondary wires are heavily insulated to prevent the bare wires from touch-ing each other. Placing the wires around the iron core decreases the distance between the coils, which allows for maximum mutual induction to occur (Fig. 4.4).
Types of TransformersThere are three types of transformers used in x-ray circuits: autotransformers, step-up transformers, and step-down transformers. Autotransformers allow the selection of input voltage to step-up and step-down transformers. Step-up transformers are used to provide high voltage to the x-ray tube. Step-down transformers are used to provide high current to the x-ray tube fi lament. Both step-up and step-down transformers have a fi xed number
Air core
Open core
Closed core
Shell core
––––
–––––––––
– – – – – –
–
––––––––
–– –
– – – – –
–––––––––
– – – – – –
–
––––––––
–– –
– – – ––––––––––
– – –
– –
A C
DB
Figure 4.4. Types of transformer cores. (A) Air core; (B) open core; (C) closed core; and (D) shell type.
Fosbinder_Text_Chap04.indd 49 11/20/2010 2:15:38 PM

50 Part II: Circuits and X-Ray Production
Time
Vol
tage
Time
Vol
tage
Input
Cur
rent
Output
Cur
rent
Time Time
Figure 4.6. Voltage and current on the primary and secondary sides of a step-up transformer.
or step-down transformer allows for changes to the output voltage. As an example, if the input voltage of the auto-transformer is 220 V and the output tap is selected for half the voltage, the input voltage to the primary coil of the step-up or step-down transformer is 110 V.
Step-up TransformersA step-up transformer converts a lower AC voltage into a higher AC voltage and is also called the high-voltage
transformer. Step-up transformers have more turns in the secondary coil than in the primary coil. The output volt-age of a step-up transformer is higher than the input volt-age, and the output current is always less than the input current. Step-up transformers are used to supply high voltages to the x-ray tube. Figure 4.6 shows the input and output voltages and currents from a step-up transformer. Notice that an increase in voltage has a corresponding
Input Output
A
C
B
Step-up transformer
Prim
ary
coil
Sec
onda
ry c
oil
Input Output
Step-down transformer
Prim
ary
coil
Sec
onda
ry c
oil
Input
Output tap
Autotransformer
Prim
ary
coil
Sec
onda
ry c
oil
Figure 4.5. Three types of transformers. (A) Step-up transformer; (B) step-down transformer; and (C) autotransformer.
Fosbinder_Text_Chap04.indd 50 11/20/2010 2:15:38 PM

Chapter 4: Transformers, Circuits, and Automatic Exposure Control (AEC) 51
decrease in amperage. This occurs due to Ohm’s law, which states that as voltage is increased there must be a corresponding decrease in amperage.
Step-down TransformersA step-down transformer produces an output voltage that is lower than the input voltage. The number of turns on the secondary coil of a step-down transformer is less than the number of turns on the primary coil. The output current in the secondary coil of a step-down transformer
is greater than the input current. Step-down transformers are used to supply high currents to the tube fi lament. Figure 4.7 shows the input and output voltages and cur-rents from a step-down transformer.
As discussed, there are three important transformers in the x-ray circuit (Fig. 4.8). The autotransformer is used to vary the incoming line voltage for the high-voltage step-up transformer. The high-voltage step-up transformer is used to increase the incoming line voltage to the kilo-voltage range which is necessary for x-ray production.
mA selector
kVpmeter
Timecontrol
Control panel components X-ray tubeHigh-voltagecomponentsHigh-voltage
transformer
Rectifier– +
Anode
Cathode Filament
Filamenttransformer
X-ray tube
Roter
Stator
Autotransformer
Figure 4.8. Schematic representation of transformers in an x-ray circuit.
Time
Vol
tage Time
Vol
tage
InputC
urre
ntOutput
Cur
rent TimeTime
Figure 4.7. Voltage and current on the primary and secondary sides of a step-down transformer.
Fosbinder_Text_Chap04.indd 51 11/20/2010 2:15:39 PM

52 Part II: Circuits and X-Ray Production
The fi lament step-down transformer is used to decrease the incoming line voltage to 5 to 15 V and 3 to 5 A range to heat the x-ray tube fi lament. A rheostat is the component which varies current resistance and acts as a variable milliampere (mA) selector for the fi lament circuit. This allows the technologist to select mA for various radiographic examinations.
Rectifi ersRectifi ers are solid-state devices that allow current to fl ow in only one direction. They are used to convert high-voltage AC from the secondary side of the step-up transformer to high-voltage DC, which is applied to the x-ray tube. Current fl ows from the positive terminal of the x-ray tube, which is called the anode, to the nega-tive terminal of the x-ray tube, which is called the cath-ode.
Although current is said to fl ow from positive to neg-ative, in an x-ray tube electrons actually fl ow from the cathode to the anode or negative to positive. X-ray tubes operate best when receiving DC because if the tube were supplied with high-voltage AC, the electrons would fl ow in the wrong direction and cause signifi cant damage to the tube. The construction and operation of x-ray tubes are discussed more completely in Chapter 5. Rectifi ers are sometimes called diodes because they have two elec-
trodes; one electrode allows the easy fl ow of electrons, while the other electrode opposes the fl ow of electrons. Figure 4.9 illustrates the current fl ow through a typical rectifi er.
Half-wave Rectifi cationHalf-wave rectifi cation uses solid-state diodes to effectively suppress the negative portion of the AC sine wave. The positive portion of the sine wave is utilized to produce pulsating DC (Fig. 4.10).
Full-wave Rectifi cationThe output current shown in Figure 4.11 is known as full-wave-rectifi ed circuit because the negative part of the AC sine wave is converted to positive current. With full-wave rectifi cation, the positive fl ow remains the same but the negative portion is converted to positive current fl owing in only one direction, or DC. This produces a more uniform pulsating DC sine wave.
CircuitsX-ray equipment has utilized various types of circuits to provide DC to the x-ray tube. Historically, x-ray equip-ment has evolved from a simple unit, which used single-phase circuits, which were not very effi cient, to more advanced three-phase, which allows the x-ray circuits to operate in the most effi cient manner possible.
Single-Phase CircuitsSingle-phase circuits use single-phase power that results in a pulsating x-ray beam. This pulsation is caused by the alter-nating change in voltage from zero to maximum potential 120 times each second in a full-wave rectifi ed circuit. The x-rays produced when the voltage is near zero are of little
Electrode
ElectrodeCurrent
No current
Figure 4.9. This symbol for a diode represents the fl ow of current through a rectifi er. The current fl ows easily out of the point of the electrode. The other electrode blocks the fl ow of current.
Time (s)Cur
rent
Figure 4.10. Half-wave rectifi cation.
Fosbinder_Text_Chap04.indd 52 11/20/2010 2:15:40 PM

Chapter 4: Transformers, Circuits, and Automatic Exposure Control (AEC) 53
Time
Inpu
t cur
rent
Time
Out
put c
urre
nt
A
B
Figure 4.11. Output current for full-wave rectifi ed circuit.
Time
Inpu
t cur
rent
Figure 4.12. Single-phase current.
Time
Cur
rent
1
2
3
Figure 4.13. Current fl ow of a three-phase circuit.
diagnostic value as their energy is too low to adequately penetrate the tissue. The solution to this problem was to develop a method for using three simultaneous voltage waveforms out of step with one another.
The AC shown in Figure 4.12 is a single-phase cur-rent. By adding more circuit elements, it is possible to add two more phases to form a three-phase circuit. The major advantage of a three-phase circuit is that the cur-rent and voltage are more nearly constant, which results in more effi cient x-ray production (Fig. 4.13).
Three-Phase CircuitsBy the addition of two more circuits made up of transform-ers and rectifi ers, 120 degrees out of phase with each other and with the fi rst circuit, the output voltage and current can be made more constant. The result, known as a three-phase circuit, provides more effi cient x-ray production.
The three-phase six-pulse circuit requires six rectifi -ers to produce six usable pulses per cycle. The result is a waveform which never reaches zero, thereby providing an increased voltage. By adding additional components, it is possible to produce 3-phase, 12-pulse voltage. This provides a more constant voltage waveform. Increasing
the number of pulses in the waveform by using a 3-phase, 12-pulse circuit increases the average voltage but does not increase the maximum voltage. Figure 4.14 demonstrates the evolution from single-phase and three-phase waveforms with no rectifi cation and a rectifi ed three-phase waveform. Notice how the voltage becomes more consistent with the three-phase six-pulse waveform.
Table 4.1 presents the number of rectifi ers used in dif-ferent forms of x-ray circuits.
High-Frequency CircuitsTransformers operate more effi ciently at higher frequen-cies because the coupling between the primary and secondary windings is more effective. A high-frequency transformer operating at 3,000 Hz is much smaller and lighter than one designed to operate at 60 Hz.
Half wave
Full wave
Three phase,six pulse
Three pulsetwelve pulse
High frequency
=
=
=
Figure 4.14. Single phase and three-phase waveforms.
Fosbinder_Text_Chap04.indd 53 11/20/2010 2:15:40 PM

54 Part II: Circuits and X-Ray Production
TABLE 4.1 RECTIFIERS USED IN DIFFERENT FORMS OF X-RAY CIRCUITS
Type of Circuit Number of Rectifi ers
Single-phase, full-wave 2 or 4Three-phase, six-pulse 6Three-phase, twelve-pulse 12
High-frequency circuits fi rst change the input frequency from 60 Hz to a higher frequency (500–3,000 Hz) using a voltage inverter. The inverter converts the low-voltage AC to low-voltage DC using rectifi ers, then switching the low-voltage DC on and off rapidly. This switching con-verts the low-voltage DC to low-voltage high-frequency AC. A transformer then increases the voltage (to 20,000–150,000 V), and a rectifi er converts the AC into DC, which is applied to the x-ray tube. Figure 4.15 illustrates the basic operation of the high-frequency x-ray circuit.
Although there are many different design details, all high-frequency circuits switch the low-voltage (200 V) DC rapidly on and off to produce high-frequency but still low-voltage AC. This is applied to the primary of a step-up transformer to produce a high-frequency high-voltage output. The secondary voltage from the step-up transformer is then rectifi ed to produce high-voltage DC, which is applied to the x-ray tube.
The advantages gained from the high-frequency cir-cuit outweigh the cost and added complexity of the extra stages. The advantages of high-frequency circuits are smaller size, less weight, and improved x-ray production. Modern computed tomography (CT) scanners have high-frequency circuits mounted in the rotating gantry. High-frequency circuits with their lightweight transformers
make spiral CT practical. Most x-ray units installed today have high-frequency circuits.
RippleRipple measures the amount of variation between maximum and minimum voltage. Because most x-ray production occurs when the applied voltage is at maximum, the percent ripple provides a good indication of how much variation there is in the x-ray output. Lower-ripple circuits have more constant x-ray output and higher average voltage. As seen in Table 4.2, the percent of ripple has declined with each improvement of the circuit. This provides a nearly constant voltage to the circuit.
The amount of ripple actually present at the x-ray tube depends on the length and type of x-ray cables and the details of the high-voltage circuit.
Three-phase high-frequency circuits produce higher average voltage, but single-phase and three-phase circuits have the same maximum voltage. At higher voltages, the x-ray production process is more effi cient and the x-rays are more penetrating, so three-phase and high-frequency circuits require fewer milliamperes or less time to obtain the same image density.
High-Voltage CircuitsHigh-voltage x-ray circuits contain transformers, kVp and mA selectors, rectifi ers, and timing circuits. X-ray tubes operate only with DC. In diagnostic radiology, the voltage across the x-ray tube can be set at values from 20,000 to
Vol
tage
Low-frequency AC
Low-frequency DC Low-voltage,high-frequency AC
High-voltage DC
High-voltage,high-frequency AC
Rectifier High-frequencyInverter
Transformer Rectifier
A AB C
Figure 4.15. High-frequency x-ray circuit converts incoming AC to high voltage DC.
Fosbinder_Text_Chap04.indd 54 11/20/2010 2:15:41 PM

Chapter 4: Transformers, Circuits, and Automatic Exposure Control (AEC) 55
120,000 V or 20 to 120 kVp. This high voltage is required in order to produce diagnostic x-rays. A transformer is used to produce the high voltage. Transformers oper-ate by mutual induction; they can work only with AC. A transformer converts an input voltage of a few hundred volts to an output voltage of many thousands of volts; rec-tifi ers then convert the high-voltage AC to high-voltage DC. Finally, the high-voltage DC is applied to the x-ray tube and x-rays are produced.
Understanding the components of the x-ray circuit is important because changes in the circuit controls will alter the radiographic image. Figure 4.16 illustrates a typical x-ray circuit.
Control Panel Components
The control panel components of the x-ray circuit appear on the left side of Figure 4.16. The control panel com-ponents include the kVp, time and mA selectors, and the automatic exposure control (AEC) circuit.
kVp and mA SelectorsThe incoming electrical supply is connected to the auto-transformer. The kVp and mA selectors are also connected to the autotransformer. The only way to change the output voltage of a transformer is to change its input voltage. The autotransformer is used to select the input voltage to either the step-up or the step-down transformer. The step-up or high-voltage transformer generates the high voltage used to produce the x-rays. The step-down or fi lament transformer produces the mA tube current. Different autotransformers are used as the kVp and mA selectors.
Timing CircuitsTiming circuits shut off the high voltage to terminate the x-ray exposure after a selected exposure time. The timer opens a switch to cut off the high voltage from the x-ray tube and stop x-ray production. Exposure times are selected from the control panel to control the amount of x-rays produced. Short exposure times should be selected to minimize patient motion artifacts.
Automatic Exposure Control CircuitsAn AEC circuit measures the amount of radiation leav-ing the patient and turns off the x-ray beam when the cor-rect amount of radiation has reached the detector. The AEC circuit is calibrated to produce the proper image density regardless of patient size. Figure 4.17 illustrates the operation of an AEC circuit.
The purpose of the AEC unit is to provide the correct exposure regardless of patient size. At the control panel, the exposure mA and time can be selected independently, or the milliampere-time (mAs), which is the combination of milliamperes and time, can be selected, in which case the control circuits choose the highest mA and the short-est time allowed. The AEC detector is placed between the patient and the fi lm cassette or image receptor.
In operation, the AEC circuit acts as the timer for the x-ray circuit. Rather than turning off the x-ray beam when a fi xed time has been reached, the AEC unit turns off the x-ray beam when the proper amount of radiation has reached the image receptor. The AEC circuit still requires the technologist to set the mA and kVp correctly, although some units automatically select the highest mA allowable in order to reduce the exposure time and reduce the effects of patient motion.
Typical AEC systems have three rectangular-shaped detectors placed roughly at the corners of a triangle. In the past, AEC circuits were called phototimers because the detectors used were photomultiplying devices instead of ionization chambers. Figure 4.18 shows a picture of an image receptor holder with the position of the AEC detectors indicated.
The three detector cells can be selected to oper-ate singly, in pairs, or all together, depending on the examination and patient orientation. A vast majority of examinations utilize the center detector. The detectors can be ionization chambers, scintillators, or solid-state detectors. Regardless of the type of detector used, the AEC unit keeps the x-ray beam on until enough x-rays have
TABLE 4.2 THE AVERAGE VOLTAGE AND AMOUNT OF RIPPLE FROM DIFFERENT TYPES OF X-RAY CIRCUITS
Type of CircuitMax % Voltage Percent Ripple
Single-phase 0.71 Vmax 100Three-phase, six-pulse 0.95 Vmax 133-phase, 12-pulse 0.99 Vmax 3High-frequency generator 1.00 Vmax 1
Fosbinder_Text_Chap04.indd 55 11/20/2010 2:15:41 PM

56 Part II: Circuits and X-Ray Production
Figure 4.18. Photograph of an image receptor (vertical Bucky) with the outline of the AEC cell locations indicated.
AEG Circuit
X-ray timer
Film cassette
Detector
Figure 4.17. AEC circuit.
Timercircuit
Kilovolt-meter
Primary or low voltage circuit Secondary or high voltage circuitStep-up
transformer
Rectifier
Step-down filamenttransformer
X-ray tube
Autotransformer(kV selector)
Filamentammeter
Cable
Rheostat(mA selector)
Exposureswitch
MA
Figure 4.16. Schematic diagram of a typical x-ray circuit.
passed through the patient to provide proper exposure for the fi lm or detector. The AEC unit must initially be calibrated for the fi lm/screen combination used. If the fi lm/screen combination is changed, the AEC unit must
be recalibrated. Positioning is critical to allow the radiation to be detected through the part under examination.
AEC units have a provision for adjustments to give the technologist a way of modifying the overall density
Fosbinder_Text_Chap04.indd 56 11/20/2010 2:15:41 PM

Chapter 4: Transformers, Circuits, and Automatic Exposure Control (AEC) 57
or blackness of the fi lm. Each adjustment step produces about a 30% change in density.
Backup TimerThe backup timer terminates the exposure when the backup time is reached. It is necessary to set the backup timer in case something goes wrong. If the x-ray beam does not reach the AEC detectors, excess radiation could reach the patient and the tube could be damaged. This could happen if the x-ray beam and the detectors were not aligned. If the verti-cal Bucky AEC is selected and the x-ray beam is directed at the table, the x-ray beam will not turn off. The backup timer terminates the exposure before the tube limits are exceeded. Backup timers are usually set at 5 seconds.
Case StudyBill is assisting his imaging department in decid-ing which type of x-ray equipment would meet their needs. He has researched 3-phase 6-pulse, 3-phase 12-pulse, and high-frequency generator in his quest to fi nd the best equipment for the procedures the department performs.
Critical Thinking Questions
What is the percentage of ripple for each type of circuit?
What type of transformer will be used by the equipment?
What component changes the incoming line voltage into usable voltage in the x-ray tube?
How is the fi lament protected from damage?
Three-phase six-pulse has a 13% ripple, three-phase twelve-pulse has a 3% ripple, and high-frequency generator has a 1% ripple. To produce the voltage needed for these types of equipment, an autotransformer is necessary to increase incoming line voltage to the kilovolts necessary for radiographic examinations. Volt-age is increased by using a step-up transformer to produce the high voltages needed to operate the equipment. The x-ray tube must operate on DC and the autotransformer utilizes rectifi ers to change AC to DC. The autotransformer also uses a step-down transformer to reduce voltage to 10 to 15 V and increases amperage to 3 to 5 A. This change is necessary because the fi la-ment is a fi ne wire that cannot withstand high voltage. Decreasing the voltage protects the fi la-ment from breaking.
Chapter SummaryDC fl ows in only one direction. AC fl ows in two opposite directions, half one way and half the other way. X-ray circuits convert low-voltage AC input to high-voltage DC, which is applied to the x-ray tube. The kVp selector is an autotrans-former that changes the input to the step-up or high-voltage transformer. The mA selector is an autotransformer that changes the input to the step-down, or mA, transformer to control the fi l-ament current. The ratio of the number of turns on the secondary to the number of turns on the primary is called the turns ratio. A transformer with a turns ratio >1 is a step-up transformer; the output voltage is greater than the input volt-age. A transformer with a turns ratio less than 1 is a step-down transformer; the output voltage is less than the input voltage.
Ripple is a measure of the variation between the maximum and minimum voltage. Circuits with low ripple produce a more constant x-ray output. Three-phase and high-frequency x-ray circuits have less ripple and produce more con-stant output than single-phase x-ray circuits but do not change the maximum voltage.
Automatic exposure detectors are placed between the patient and the image receptor to terminate the x-ray exposure when the proper image density is reached. Selection of the proper combination of detector cells is based on the examination and patient orientation.
The backup timer prevents damage to the x-ray tube if the AEC circuit does not terminate the exposure before the tube limits are reached.
Fosbinder_Text_Chap04.indd 57 11/20/2010 2:15:48 PM

Review Questions
6. Which type of transformer has a primary and sec-ondary coil only?
A. closed coreB. shell typeC. air coreD. open core
7. Ripple measures
A. total tube voltageB. variation between maximum and minimum mAC. variation between maximum and minimum volt-
agesD. total mA
8. What is the output voltage of a transformer with a primary voltage of 150 V and with 500 turns on the primary and 400,000 turns on the secondary?
A. 20,000 VB. 120,000 VC. 250,000 VD. 400,000 V
9. The transformer that has a single winding that acts as both the primary and secondary windings is called a(n)
A. autotransformerB. step-down transformerC. step-up transformer
10. A transformer with more turns in its primary winding than in its secondary winding would be expected to
A. increase the voltage and decrease the amperageB. increase the voltage and increase the amperageC. decrease the voltage and decrease the amperageD. decrease the voltage and increase the amperage
Multiple Choice
1. The automatic exposure control circuit
A. turns off the x-ray beam when the proper expo-sure is reached
B. measures the amount of radiation striking the patient
C. measures the amount of radiation leaving the cathode
D. turns off the fi lament cooling circuit when the proper exposure is reached
2. A rectifi er in an x-ray circuit
A. prevents positive charge from reaching the anode
B. converts AC to DCC. prevents excess grid bias on the anode
3. A transformer can operate only on
A. ACB. DC
4. An x-ray tube can operate only on
A. ACB. DC
5. An autotransformer functions as a(n)
A. line-voltage compensatorB. kVp or mA selectorC. fi lament transformersD. automatic exposure controller
Fosbinder_Text_Chap04.indd 58 11/20/2010 2:15:49 PM

11. What is the turns ratio if the number of windings on the primary coil is 800 and the number of wind-ings on the secondary coil is 600,000?
A. 400B. 750C. 375D. 650
12. If a transformer is supplied with 700 V to the pri-mary coil and has 400 turns of wire on the primary coil and 60,000 turns of wire on the secondary coil, what will be the kilovoltage in the secondary coil?
A. 105,000B. 4.6C. 0.0046D. 105
Short Answer
1. List the four main components of the control panel.
2. What is the purpose of the fi lament step-down transformer?
3. Write the transformer law formula for current and voltage.
4. Describe the process of mutual induction.
5. Describe a rectifi er and how it changes AC to DC.
6. What is the relationship between the number of coils in a winding and the amount of voltage and amperage that is produced?
7. Explain the purpose of oil in a transformer.
8. Defi ne full-wave rectifi cation.
9. Compare a single-phase circuit to a three-phase six-pulse circuit.
10. Describe how an AEC operates.
Chapter 4: Transformers, Circuits, and Automatic Exposure Control (AEC) 59
Fosbinder_Text_Chap04.indd 59 11/20/2010 2:15:49 PM

60
5
X-Ray Tubes
ObjectivesUpon completion of this chapter, the student will be able to:
1. Defi ne thermionic emission.
2. Describe the line focus principle and the heel effect.
3. Defi ne anode heat units.
4. Recognize allowed and forbidden tube heat loads.
● actual focal spot
● anode
● anode angle
● cathode
● effective focal spot
● fi lament
● focal spot
● focal spot blooming
● focal track● focusing cup
● heel effect
● leakage radiation
● line focus principle
● off-focus radiation
● rotating anode
● rotor
● SID
● space charge effect
● thermionic emission
Key Terms
Fosbinder_Text_Chap05.indd 60 10/30/2010 6:09:27 PM

Chapter 5: X-Ray Tubes 61
are sealed inside an evacuated glass or metal envelope. The vacuum allows the electrons to travel freely from the negative cathode to the positive anode.
Tube HousingDuring the production of x-rays, they are emitted in all directions within the tube. The x-rays that are emitted through the thin window of the tube housing make up the primary beam. The thin window allows for the maxi-mum amount of x-rays to be transmitted with very little absorption in the beam direction. The remaining x-rays are absorbed by oil, which provides electrical insulation and cooling for the tube. The x-ray tube and oil are con-tained in a metal housing. The housing protects against electric shock and absorbs leakage radiation emitted out-side the x-ray beam. The leakage radiation is a source of unnecessary exposure for the radiographer and patient. Regulations require that the leakage radiation through the tube housing be less than 100 mR/h at one meter from the tube. A fan is often used to transfer the heat from the housing to the room air by convection (Fig. 5.1).
Glass EnvelopeThe x-ray tube is a vacuum tube with two electrodes: the cathode and the anode. These components are housed in an evacuated glass envelope made of Pyrex glass to withstand the tremendous heat generated by the produc-tion of x-rays. All air is removed from the glass envelope creating a vacuum which allows electrons to fl ow from the cathode to the anode. The vacuum allows an effi -cient production of x-rays and also extends the life of the tube.
IntroductionThis chapter covers the components, operation, and limitations of x-ray tubes.
The purpose of the x-ray tube is to produce an x-ray beam. The x-ray tube contains a negative electrode that when the current is applied to it, will produce a mass of electrons that will inter-act with a positive electrode in order to produce x-rays. The negative electrode is on one side of the x-ray tube. It is called the cathode. The cathode contains a fi lament. The positive electrode is on the opposite side of the x-ray tube. It is called the anode. The anode contains a focal spot where the electrons interact to produce the x-rays.
Focusing cup
Anode
Cathode
Filament
Glass envelope
Roter
Stator
Molybdenum shaft WindowFigure 5.1. Components of a typical x-ray tube.
X-Ray Tube
An animation for this topic can be viewed at http://thepoint.lww.com/FosbinderText
The cathode contains the fi lament, which is heated to boil off the projectile electrons. The cathode is shaped like a cup to focus the projectile electrons onto the posi-tive anode. The anode contains a focal spot, which has an area of only a few square millimeters. In order to spread the heat from the projectile electrons over a larger area of the anode, the anode rotates. The tube components
Fosbinder_Text_Chap05.indd 61 10/30/2010 6:09:27 PM

62 Part II: Circuits and X-Ray Production
0.4- to 1.2-mm focal spots, and small fi laments produce focal spots of 0.1 to 0.5 mm. Focal spot size is selected automatically by selecting larger or smaller mA stations or manually by the focal spot size selection.
Filament CurrentUpon turning on the x-ray machine, a low current fl ows through the fi lament to warm and prepare it for the high mA necessary to form a thermionic cloud. The x-ray tube has fi xed mA stations of 100, 200, 300, and so on to provide the necessary mA for a multitude of various exposures. When the fi lament current is high enough for thermionic emission, a small increase in fi lament current results in a large increase in tube current.
Focusing CupThe focusing cup is made of nickel and has two shal-low depressions which contain the fi laments. Electrons with their negative charge tend to diverge in a wide pat-tern because of electrostatic repulsion. The low negative charge on the focusing cup surface forces the projectile electrons together into a narrow beam as they are acceler-ated toward the anode. The anode region where the pro-jectile electrons strike is called the focal spot. Figure 5.3 shows the focusing action of a typical dual focus cup.
When suffi cient mA is applied, the electrons begin to build up into a cloud around the fi lament; this is called a space charge. The electrons reach a point where their negative charges begin to oppose the emission of addi-tional electrons in a phenomenon called space charge effect. The space charge effect limits x-ray tubes to maxi-mum mA ranges of 1,000 to 1,200.
Modern x-ray tubes are commonly designed with a metal envelope. They prolong the tube life and eliminate tung-sten vaporization which coats the inside of the envelope. This coating can result in electrons arcing which causes tube failure. The metal envelope avoids this from happen-ing because there is a constant electrical potential between the electrons in the tube current and the envelope.
CathodeThe cathode is the negative electrode of the x-ray tube. The function of the cathode is to produce a thermionic cloud, conduct the high voltage to the space between the cathode and anode, and focus the electron stream as it speeds toward the anode. It contains the fi lament or fi la-ments, focusing cup, and wiring for fi lament current
FilamentThe purpose of the fi lament is to provide projectile elec-trons for acceleration to the positive anode. The fi lament, a coil of tungsten alloy wire, is heated to boil off electrons. Tungsten is the material of choice because it has a high melting point and resists vaporization; rhenium and molyb-denum are also suitable materials. Vaporization produces particles that deposit on surfaces inside the tube, which reduces the vacuum in the tube. Changes in the fi lament current, termed milliamperes (mA), produce changes in the fi lament temperature. This causes a change in the number of projectile electrons boiled off the fi lament in a process called thermionic emission. Thermionic emis-sion causes electrons to be boiled off the fi lament wire and to form a thermionic cloud. Upon depression of the expo-sure switch, the electron cloud is driven toward the anode target where x-ray photons are produced. An increase or decrease in the number of projectile electrons striking the anode changes the number of x-rays produced.
The size of the focal spot is determined by the size of the fi lament coil. Modern diagnostic x-ray tubes have two fi laments, one large and one small, called a dual focus system (Fig. 5.2). The large fi lament is used when high x-ray production is needed. The larger fi lament produces a larger focal spot to distribute the heat over a larger area which allows higher tube currents without damaging the anode. The smaller fi lament produces a small focal spot when sharper images or better spatial res-olution is required. Lower tube currents should be used with small focal spots. Large fi laments typically produce
Front view
Oblique view, cut at level of red line
Figure 5.2. Dual focus system.
Fosbinder_Text_Chap05.indd 62 10/30/2010 6:09:28 PM

Chapter 5: X-Ray Tubes 63
operating temperatures. Tungsten also conducts heat very well, which helps the anode cool down. Heat from the focal spot is carried to the remainder of the anode by conduction. Anode heat is transferred from the anode to the walls of the tube housing by radiation. The housing walls are cooled by convection of room air, which may be increased by fans mounted on the housing (Fig. 5.4).
In addition to tungsten, molybdenum or graphite are layered under the tungsten target. Both molybdenum and graphite are less dense metals than tungsten, which makes it easier to rotate the anode. Molybdenum also has a high melting point while graphite-backed anodes can double the heat loading capacities without increasing wear to the bearings.
Rotating AnodeThe rotating anode consists of a target, shaft, and rotor. Rotating anodes spread the heat produced when the electrons bombard a circular track (Fig. 5.5) rather than concentrating the energy in a single spot on the anode surface. The x-ray source remains fi xed relative to the
AnodeThe positive anode contains the focal spot, which is the area where the projectile electrons stop. The anode is located on the positive side of the x-ray tube and it has three functions: it serves as a target surface for high-voltage electrons from the fi lament and is the source of x-ray photons; it conducts the high voltage from the cathode back into the x-ray circuitry; and it serves as the primary thermal conductor. When the projectile electrons hit the anode, more than 99% of the electron energy is deposited in the anode as heat. Only about 1% of the projectile electron energy is converted to x-ray photons.
Anode MaterialsThe focal spot on the anode can reach temperatures >3,000°C during an x-ray exposure. The anode must be made of a material with a high melting point because most metals melt at these temperatures. Tungsten-rhenium alloys, which melt at 3,400°C, are commonly used as the target focal track material in anode construc-tion. Tungsten is the metal of choice for three reasons:
1. high atomic number2. high melting point3. heat conduction ability
Tungsten’s atomic number of 74 results in production of diagnostic-range photons. There are tremendous temper-atures created with each x-ray exposure, and tungsten’s high melting point allows it to withstand normal use and
Focusing cup
Anode
Cathode
Negative charge
Electron beam
Focal spot
– –––– –– – –
– –––– –– –
–
––
Figure 5.3. Focusing action of a typical dual focus cup.
Molybdenum
Graphite
Tungsten-rhenium alloy
Figure 5.4. Typical anode construction.
Focal spot
Figure 5.5. Focal spot on anode.
Fosbinder_Text_Chap05.indd 63 10/30/2010 6:09:29 PM

64 Part II: Circuits and X-Ray Production
the tube never begins at zero because you must take into account the distance from the target to the image receptor.
In the rotating anode the circular path that will be bom-barded with the electron beam is called the focal track. The terms target, focal point, and focal spot all refer to the area on the focal track where the electron beam will strike. Two other terms we must discuss are actual focal spot and effective focal spot. Actual focal spot is used to describe the actual area on the focal track which is impacted. The effective focal spot describes the area of the focal spot that is projected out of the tube and toward the object being imaged (Fig. 5.6).
Line Focus PrincipleTilting the anode surface so there is an angle between the surface and the x-ray beam spreads the heat over a larger area while maintaining a smaller focal spot for sharper images. This is known as the line focus principle. The sharpness of the fi nal x-ray image is determined by the focal spot size. Smaller focal spots produce sharper images. The size of the focal spot, as seen by the patient or image receptor, is known as the effective focal spot size and is smaller than the actual focal spot size because of the line focus principle. The sur-face of the anode is angled to spread the heat from the pro-jectile electrons over a larger area. The angle between the anode surface and the x-ray beam shown in Figure 5.7 is called the anode angle. Figure 5.7 illustrates how reducing the anode angle reduces the effective focal spot size, while maintaining the same area on the anode surface (actual focal spot). Radiographic tubes have anode angles from 12 to 17 degrees. The smaller target angle results in a smaller effec-tive focal spot size, better detailed images, and decreased heat capacity in the anode. Spreading the heat over a larger area allows for increased mA values. The line focus princi-ple produces sharper images because the effective focal spot is always smaller than the actual focal spot. The anode angle is set during tube construction by the manufacturer. Unfor-tunately, reducing the target area on the anode by applying the line focus principle also increases the heel effect.
Heel EffectThe heel effect produces an intensity variation between the cathode and anode sides of the x-ray fi eld. This causes a variation in density across the image from the anode side
patient, but the heat is spread over a circular track as the anode rotates. Most anodes rotate at about 3,600 revo-lutions per minute (rpm); some high-speed tubes rotate at 10,000 rpm for greater heat dissipation. Changing the anode rotation speed changes the anode heat capacity but does not change the focal spot size.
The anode, shaft, and rotor are sealed inside an evacu-ated tube. Conventional motors using slip rings to provide electrical contact with the rotor are not used to drive the anode because the slip rings would destroy the vacuum inside the tube. Instead, an induction motor is used to rotate the anode. The rotor is made up of a shaft of cop-per bars with an iron core in the middle. Electromagnets called stators are fi xed on the outside of the glass envelope and are activated by an electric current in a synchronized arrangement. The magnetic fi eld of the electric current sets up around the stator and interacts with the ferromagnetic rotor, causing the rotor to turn in synch with the stator.
The shaft, connecting the rotating anode to the rotor, is made of molybdenum and is supported by bearings. Molybdenum is a strong metal with low heat conductiv-ity. Its low thermal conductivity prevents the anode heat from reaching and damaging the rotor bearings. Bearing damage is a major cause of tube failure.
Target AreaThe portion of the anode where the high-voltage electron stream will impact is called by the following names: the tar-get, the focal point, the focal spot, or the focal track. This is the area where the x-ray photons are created. Since the target is the point where x-ray photons are created, it is this exact point at which all tube-to-object and image-receptor distances are measured. The tape measure located on
15°
Large actualfocal point
Larger effective focal point
Central ray
Incident electronbeam
15° Small actualfocal point
Smaller effective focal point
Central ray
Incident electronbeam
Figure 5.6. Actual focal spot. Effective focal spot.
Fosbinder_Text_Chap05.indd 64 10/30/2010 6:09:30 PM

Chapter 5: X-Ray Tubes 65
30°
Actual focal point
Effective focal point
15°
Actual focal point
Effective focal point
Figure 5.7. Use of the line focus principle to obtain an effective focal spot which is smaller than the actual focal spot.
to cathode side, where the radiation intensity is greater on the cathode side. The heel effect is caused because most x-rays are produced below the anode surface. The x-ray intensity is decreased toward the anode side of the tube because the x-rays emitted in that direction must pass through more anode material than x-rays emitted toward the cathode side of the fi eld.
Anode
Central ray
Approximate intensity (%)
Cathode
100 105 110 12075 80 90
Figure 5.8. Approximate intensity of x-ray beam.
Figure 5.8 shows how x-rays emitted toward the cath-ode side of the x-ray tube pass through less anode material than x-rays emitted toward the anode side of the fi eld. The heel effect can produce intensity variations of more than 40% between the anode and cathode sides of the fi eld. The heel effect is more noticeable with smaller anode angles, larger fi eld sizes, and shorter source to image receptor distances (SIDs).
Smaller fi eld sizes and larger SID reduce the heel effect. The heel effect is applied in clinical situations to achieve a more uniform density when there is a large variation of body thickness across the x-ray fi eld. The anode is recognized as the “head” end of the table to more fully utilize the heel effect to the best advantage. The cathode side of the tube is placed over the thicker or more dense body part. An example of this would be imaging the thoracic spine in an AP projec-tion. The cathode side would be placed over the lower tho-racic spine with the anode toward the upper thoracic area to produce a more uniform density of the entire thoracic spine (Fig. 5.8).
Off-focus RadiationOff-focus radiation consists of x-rays produced at locations other than the focal spot. It occurs when projectile elec-trons strike other parts of the anode away from the focal spot. Off-focus radiation causes radiographic images to appear unsharp, decreases overall image quality by reduc-ing image contrast, and exposes the patient’s tissue outside the intended imaging area (Fig. 5.9). Most off-focus radia-tion is attenuated by the tube housing and the fi rst-stage collimator located near the window of the tube housing.
Fosbinder_Text_Chap05.indd 65 10/30/2010 6:09:30 PM

66 Part II: Circuits and X-Ray Production
Radiographic Tube Rating ChartsSometimes called tube rating charts, these charts are the most important charts because they guide the radiographer in determining the maximum technical factor combina-tion that can be used without overloading the tube. Each fi lament of each tube has a unique tube rating chart to assist in plotting milliamperes, kilovoltage, and time for an exposure. Each chart plots the kilovoltage on the y-axis and exposure time in seconds on the x-axis. The various mA stations are plotted within the chart and for any exposure with a combination of kVp and time which falls below or to the left of the mA station is considered safe. If an exposure is made with a combination of kVp and time which falls above or to the right of the mA station, the exposure is unsafe and may result in sudden tube failure (Fig. 5.10).
Focal Spot BloomingElectrostatic repulsion forces the negative electrons to repel each other while traveling from cathode to anode. Focal spot blooming refers to an increase in the focal spot size with an increase in mA caused by this electro-static repulsion. Focal spot blooming is important only with very high mA values and lower kilovoltage (kVp) settings.
Tube Rating Charts and Cooling Curves
Each radiographic unit has a set of charts which help the radiographer use the x-ray tube within a set of acceptable exposures to avoid damage to the x-ray tube. The three types of tube rating charts are:
1. radiographic tube rating charts2. anode cooling curves or charts3. housing cooling charts
Figure 5.9. Effect of off-focus radiation.
Maximum exposure time in seconds
60 Hertz Stator OperationEffective Focal Spot Size - 0.6 mm
.02 .04.06 0.1 0.2 0.4 0.6 1 2 4 6 10.01
Pea
k ki
lovo
lts
30
40
50
60
70
80
90
100
110
120
130
140
150
125 MA
150 MA
200 MA
250 MA
Figure 5.10. Tube rating charts.
CRITICAL THINKING
Referring to Figure 5.10, which of the following sets of exposure factors are safe and which are unsafe?
Answer
a. 0.6-mm focal spot: 100 kVp, 125 mA, 0.5 second (unsafe)
b. 0.6-mm focal spot: 85 kVp, 0.05 second, 200 mA (safe)
c. 0.6-mm focal spot: 115 kVp, 0.1 second, 200 mA (safe)
d. 0.6-mm focal spot: 100 kVp, 0.2 second, 250 mA (unsafe)
Fosbinder_Text_Chap05.indd 66 10/30/2010 6:09:31 PM

Chapter 5: X-Ray Tubes 67
Anode Cooling CurvesAnode cooling curves or charts allow the calculation of the time necessary for the anode to cool enough for additional exposures to be made. The heat deposited in the anode by the projectile electrons depends on the mA, kVp, and exposure time. Exposures with higher applied voltages, higher tube currents, and longer exposure times deposit more heat on the anode focal spot. The heat deposited in the anode is measured in heat units (HU). The number of HU is obtained by using the following formulas:
Single-phase: HU = kVp × mA × time
3-phase, six-pulse: HU = kVp × mA × time × 1.35
3-phase, 12-pulse or high-frequency: HU = kVp × mA × time × 1.41
1.35 and 1.41 are the factors that adjust for the difference in heat deposited in the anode because of the different electrical waveform utilized by x-ray circuitry.
CRITICAL THINKING
What is the heat load in HU from a single-phase exposure with technical factors of 100 kVp, 200 mA, and 0.1 second?
Answer
HU = kVp × mA × timeHU = 100 × 200 × 0.1HU = 2,000
CRITICAL THINKING
What are the HU if the exposure is made with a high-frequency circuit, 100 kVp, 200 mA, and 0.1 second?
Answer
HU = kVp × mA × time × 1.41HU = 100 × 200 × 0.1 × 1.41HU = 2,820
CRITICAL THINKING
Five abdominal fi lms are exposed with a three-phase, six-pulse circuit using 85 kVp and 135 mAs. What are the total HU generated?
Answer
HU = kVp × mA × time × 1.35HU = 85 × 135 × 1.35HU = 15,491Total HU = 5 × 15,491 HU
77,455 HU generated for fi ve sequential abdominal fi lms.
Modern x-ray circuits have safety circuits to prevent the selection of a single unallowed exposure, or multiple unallowed exposures with no cooling between exposures. It is essential to wait between multiple expo-sures to allow the anode to cool if each exposure is near the maximum heat capacity of the anode. Many x-ray cir-cuits will prevent additional exposures from being made until the anode has had suffi cient time to cool. Figure 5.11 represents an anode cooling curve with a maximum heat
Time in minutes
60 Hertz Stator OperationEffective Focal Spot Size - 0.6 mm
0 2 4 6 8 10 12 14 16
Hea
t uni
ts X
100
0
0
50
100
150
250
300
200
Figure 5.11. Anode cooling curve.
Fosbinder_Text_Chap05.indd 67 10/30/2010 6:09:34 PM

68 Part II: Circuits and X-Ray Production
Figure 5.12. Anode damage from not properly warming anode.
capacity of 350,000 HU. The chart is used to determine the amount of time it will take for the anode to completely cool after an exposure. The initial cooling is quite rapid but as the anode cools the rate of cooling slows down. For example, a cup of steaming hot chocolate is placed on the counter at room temperature of 70°F. There is a vast dif-ference between the hot chocolate temperature and room temperature, and the hot chocolate will begin to dissipate its heat rapidly. As the hot chocolate cools down, there is less heat to dissipate; therefore, the cooling process slows down. It occurs the same way with the cooling of the anode.
Another use for the anode cooling curve is to deter-mine if a set of exposures will overload the anode. Using Figure 5.11 again, how long would it take after an initial load of 300,000 HU before a series of exposures equal to 100,000 HU could be made? The maximum HU is 350,000, and the anode must cool to 250,000 HU in order to take the additional 100,000 HU. Solve the following:
CRITICAL THINKING
Using the anode cooling curve in Figure 5.11, cal-culate the length of time it will take for the anode to cool from 350,000 HU to accept a series of expo-sures totaling 100,000 HU on a single-phase unit?
Answer
350,000 HU − 100,000 HU = 250,000 HU (anode must cool to this level)350,000 HU = 0 minute250,000 HU = 1.3 minutes
It will take 1.3 minutes (1.3–0 minutes) before the next set of exposures can be made.
Housing Cooling ChartsThe housing cooling charts for the x-ray tube allow the cal-culations to determine how long it will take to cool the hous-ing so additional exposures can be made. The charts are very similar to anode cooling charts and are used exactly the same way. In all actuality, the anode will overheat long before the tube housing as the tube housing has a forced-air fan to dis-sipate the heat which has built up on the tube housing.
Anode Heat MonitorsModern x-ray circuits are equipped with an anode heat monitor. This monitor displays the percent of maxi-
mum allowed heat that has been deposited in the anode. The monitor uses the mA, time, and kVp settings to calculate the HU for each exposure. The anode cooling rate is included in the calculation.
Tube Life and Warm-up Procedures
An x-ray tube costs about the same as a full-size new car. It is important to extend the life of the tube by properly warm-ing up the tube before beginning clinical exposures. Tubes fail because of heat damage, either to the bearings or to the anode surface. Excessive heat can cause fi lament failure, bearing damage, and anode cracks. Proper tube warm-up will extend the tube life. Figure 5.12 shows an anode after a heat-induced crack split the anode into two pieces.
Proper warm-up exposures eliminate anode crack-ing by spreading the heat over the entire target surface. A proper warm-up procedure uses at least a 1-second exposure to include many rotations of the anode dur-ing the exposure. A very short exposure on a cold anode concentrates the heat on a fraction of the anode surface. This can cause uneven thermal expansion of the anode and may crack the anode. A typical warm-up procedure would consist of two 70 kVp with several low mA long exposures and 2-second exposures. Tube warm-up proce-dures should be performed whenever the x-ray tube has not been used for several hours.
While the x-ray unit is on, it remains in the standby mode with a fi lament current of a few amperes keeping the fi lament warm and ready to be heated to its operating temperature. Just before the exposure is made, the anode begins rotating and the fi lament is heated to operating
Fosbinder_Text_Chap05.indd 68 10/30/2010 6:09:35 PM

Chapter 5: X-Ray Tubes 69
temperature by the boost current. This is termed the prep stage of exposure. A safety circuit prevents exposure prior to the anode reaching full rotation speed. The boost current raises the fi lament temperature to begin thermionic emis-sion. The boost current is present while the exposure switch is activated. Maintaining the tube in the boost mode or prep stage after the x-ray exposure is completed can signifi cantly shorten tube life by burning out the fi lament. The exposure switch should be released as soon as the exposure is com-pleted. The standby mode does not shorten tube life.
Heat is the primary cause of tube failure. Heat increases rotor bearing wear and damages the anode surface. When tube bearings begin to fail, they emit a grinding noise noticeable after every exposure.
Chapter SummaryThe negative cathode of the x-ray tube contains the fi lament. Thermionic emission from the heated fi lament produces projectile electrons which are accelerated to the positive anode. The positive anode is a disk-shaped structure constructed of a high atomic number alloy with high thermal conductivity and has a high melting point. The anode and cathode are con-tained in an evacuated glass tube surrounded by oil inside a metal housing. The oil provides electrical insulation and cooling. The projectile electrons stop in the anode and produce x-rays photons. More than 99% of the electron energy is converted to heat in the anode; the remainder is converted to x-ray photons. X-ray tubes utilize rotating anodes to distribute the heat around a circular track on the anode surface.
The line focus principle uses an angled anode to spread the heat over a larger area (the actual focal spot) while still maintaining a smaller effective focal spot as seen by the patient.
The heel effect causes different x-rays intensi-ties at the cathode and anode ends of the tube that limit the useful fi eld size. The heel effect is caused because some of the x-rays are produced below the anode surface. These x-rays are attenuated as they leave the anode. The intensity at the anode end is less than at the cathode end of the fi eld.
HU are the product of the kVp, the mA, and the exposure time. HU depend on the focal spot size and the type of x-ray circuit used. It is important to extend the tube life by following
Case StudyMark is performing a barium study on a patient. During the exam the high-frequency x-ray machine stopped producing the x-ray beam because the maximum amount of heat units, 350,000, was used during fl uoroscopy. Mark needs to produce seven more images using 100 kVp and 250 mA.
Critical Thinking Questions
What is the formula to determine heat units?
How many heat units will this set of exposures produce?
Using the anode cooling curve in Figure 5.11, how long must the anode cool before the additional exposures can be made?
The formula is kVp × mAs × rectifi cation constant x number of exposures
HU = 100 kVp × 250 mAs × 1.41 × 7 = 199,500.
This set of exposures will produce approxi-mately 200,000 HU. Using the anode cooling chart, now determine how much time must elapse before Mark can make the additional exposures. The maximum amount of heat units was already used so you must subtract the addi-tional heat units from the maximum heat units. 350,000 HU − 200,000 HU = 150,000 HU. On the cooling curve 350,000 HU corresponds with 0 minute and 150,000 HU corresponds with 2.5 minutes. It will take 2.5 minutes for the anode to cool enough to make the additional exposures.
proper warm-up procedures. Heat limit curves demonstrate the allowed and unallowed expo-sure regions for tubes. There are separate curves for the large and small focal spots.
Fosbinder_Text_Chap05.indd 69 10/30/2010 6:09:36 PM

Review Questions
6. Which metal is used on the target of the anode?
A. MolybdenumB. RheniumC. GraphiteD. Tungsten alloy
7. The _____ is used to determine the maximum number of heat units an x-ray machine can handle.
A. anode cooling curveB. housing cooling chartC. tube rating chartD. all of the above
8. Which best describes thermionic emission?
A. The point where an electron’s negative charge begins to oppose the emission of additional elec-trons
B. The electrons boil off the fi lament and form a cloud, which is propelled toward the anode
C. Photons that were not produced at the focal spotD. The electrons boil off the anode prior to impact-
ing the cathode
9. Which of the following is not a reason to use tungsten in an x-ray tube?
A. Tungsten has a high melting pointB. It has a relatively high atomic numberC. It effi ciently dissipates heat which was produced
during the exposureD. Doubles the heat loading capacity of the anode
10. Which metal is combined with tungsten to form an alloy for the anode target?
A. RheniumB. GraphiteC. MolybdenumD. Copper
Multiple Choice
1. The Heel effect
A. causes greater radiation intensity on the cathode side
B. is caused because x-rays produced inside the cath-ode are attenuated
C. depends on mA and kVpD. is reduced by dual focal spots
2. The line focus principle
A. makes the focal spot appear larger than it really is
B. makes use of an angled cathode structureC. produces x-ray linesD. spreads the heat over a larger part of the anode
3. The purpose of the cathode focusing cup is to
A. alter the fi lament sizeB. group the electrons for their passage to the
anodeC. regulate the anode rotation speedD. increase the heat capacity of the tube
4. Most x-ray tubes have two fi laments
A. because the second fi lament can be used as a spare when the fi rst burns out.
B. to provide two focal spot sizesC. to allow for cooling of the fi lament by alternating
exposuresD. to improve tube cooling by sharing the heat
between the two fi laments
5. The Heel effect is more pronounced
A. further from the focal spotB. with a large focal spotC. with a small cassetteD. with a small target angle
Fosbinder_Text_Chap05.indd 70 10/30/2010 6:09:36 PM

Chapter 5: Film and Processing 71
5. Briefl y describe how to use a tube rating chart.
6. What is the purpose of the focusing cup?
7. Defi ne leakage radiation.
8. List the parts of the cathode.
9. Why is the fi lament embedded in a focusing cup?
10. Defi ne an x-ray photon?
Short Answer
1. Describe the type of radiation which does not contribute diagnostic information to the image but rather results in unnecessary exposure to the patient and radiographer.
2. Defi ne the heel effect and describe how it can be used to the radiographer’s advantage.
3. What is the purpose of having two fi laments?
4. Explain line focus principle.
Chapter 5: X-Ray Tubes 71
Fosbinder_Text_Chap05.indd 71 10/30/2010 6:09:37 PM

72
6
X-Ray Production
Key Terms● bremsstrahlung in-
teractions
● characteristic cascade
● characteristic inter-actions
● incident electron
● keV
● kVp
● x-ray beam quality
● x-ray beam quantity
ObjectivesUpon completion of this chapter, the student will be able to:
1. Describe the bremsstrahlung x-ray production process.
2. Describe the characteristic x-ray production process.
3. Identify the information contained in an x-ray spectrum.
4. Identify the changes in x-ray beam quality and quantity resulting from changes in kVp, mA, fi ltration, x-ray circuit waveform, and anode material.
Fosbinder_Text_Chap06.indd 72 10/30/2010 6:10:23 PM

Chapter 6: X-Ray Production 73
interacts with the force fi eld of the nucleus. The incident electron with its negative charge is attracted to the posi-tively charged nucleus. The incident electron must have enough energy to penetrate the orbital shells of the atom. When the incident electron gets close to the nucleus, the powerful nuclear force fi eld is much too great for the incident electron to penetrate. The force fi eld makes the electron slow down or brake and then causes the electron to change directions. As the electron slows down, it will lose energy that is emitted as an x-ray photon.
The bremsstrahlung process produces x-rays of much different energy because the incident electrons are slowed down at different rates. Figure 6.1 illustrates how incident electrons produce bremsstrahlung radiation of different energies.
Projectile or incident electrons that pass very close to the nucleus of the anode target atoms produce higher energy x-rays than those that pass further away. These x-ray photons are called bremsstrahlung photons and their energy is the difference between the kinetic energy of the incident photon and the kinetic energy of the brems photon. The amount of kinetic energy that is lost is dependent upon how close the incident elec-tron gets to the nucleus. When the incident electron is farther away from the nucleus, very little energy will be lost, resulting in a low-energy brems photon. When the incident electron is closer to the nucleus, more energy
IntroductionThis chapter covers the two x-ray production processes that take place in the anode, the bremsstrahlung and characteristic processes. The amount and energy distribution of the x-rays from these processes are different and infl uence the appearance of the fi nal image. This chapter describes the two x-ray production processes and the changes in the x-ray beam produced by changes in the kVp, mA, fi ltration, x-ray circuit waveform, and anode material.
X-Ray ProductionProjectile electrons produced by thermionic emission in the cathode are accelerated by the high voltage to the anode where either bremsstrahlung or characteristic radi-ation is produced. The bremsstrahlung process produces more than 90% of diagnostic x-rays. The remaining per-centage are characteristic x-rays.
The kinetic energy of the projectile electrons is con-verted into heat and x-ray energy. Most of the projectile electron energy is converted into heat energy, only about 1% is converted into electromagnetic energy or x-rays. The interaction that will occur depends on the electron kinetic energy and the electron binding energy of the electron shells.
Bremsstrahlung Interactions
Bremsstrahlung is the German word for “braking or slowing radiation”. Bremsstrahlung, also referred to as “brems,” is radiation that is produced when projectile electrons are slowed down in the anode. Bremsstrahlung interactions may only occur when the incident electron
= Proton
= Electron
= Neutron
K shell
L shell
M shell
N shell
90 keV
10 keV
80 keV
Figure 6.1. Demonstrates projectile electrons producing bremsstrahlung radiation of different energies.
An animation for this topic can be viewed at http://thepoint.lww.com/FosbinderText
Fosbinder_Text_Chap06.indd 73 10/30/2010 6:10:23 PM

74 Part II: Circuits and X-Ray Production
is lost, resulting in a higher energy brems photon. These incident electrons have the ability to interact with many target atoms and to cause many brems interactions. Each interaction will decrease the kinetic energy of the incident electron until the electron has no more kinetic energy and drifts away to join the current fl ow. The vast majority of diagnostic x-rays are produced by the bremsstrahlung process.
Bremsstrahlung X-Ray SpectrumA plot of the number of bremsstrahlung x-rays as a func-tion of their different x-ray energies is known as an x-ray spectrum. It plots how many x-ray energies there are from zero to the peak electron energy.
The maximum x-ray energy (Emax) produced by the bremsstrahlung process is equal to the energy of the pro-jectile electrons, and that is why it is called kVp or peak kilovoltage. The bremsstrahlung process produces a con-tinuous spectrum of x-ray energies; that is, there are no sharp peaks or valleys in the curve.
Low-energy x-rays are fi ltered out or stopped before they reach the patient. The dotted line shows an unfi ltered x-ray spectrum which would be observed at the anode surface. All x-ray tubes have added fi ltration to absorb low-energy x-rays. These lower energy x-rays cannot penetrate through the patient and would not contribute any information to the x-ray image but will contribute to patient dose. The average energy of the x-ray beam depends on many fac-tors. The majority of x-rays produced have an average of approximately one third of the maximumenergy (Emax).
keV and kVpThere are two energies associated with x-ray production. One is the energy of the individual x-rays; the other is the energy of the projectile electrons, which is determined by the voltage applied to the x-ray tube.
The energy of the individual x-rays is measured in kilo-electron volts (keV) and is distributed from zero to Emax, the maximum energy of the projectile electrons. The voltage applied to the x-ray tube is known as kilovoltage peak (kVp) and is equal to the energy of the projectile electrons. kVp is equal to the maximum energy of the x-rays, called Emax. Figure 6.2 shows that an applied volt-age of 70 kVp produces an x-ray spectrum with an Emax equal to 70 keV with an average x-ray energy of about 23 keV.
Characteristic Interactions
Characteristic interactions occur in a tungsten anode when an orbital electron fi lls a vacancy in a shell of a tungsten atom. When a projectile or incident elec-tron has suffi cient energy to ionize or remove an orbital electron from an inner electron shell, a vacancy is created and the atom becomes unstable. A higher energy outer-shell electron will immediately fi ll the lower energy vacancy that creates a characteristic x-ray photon. The difference in energy between the bind-ing energy of the vacant shell and the outer shell is the characteristic x-ray energy. The vacancy is usually fi lled by an electron in the next outer shell, but it is possible to have transitions to the vacancy from shells further from the nucleus. This transition of electrons between shells creates a process called a characteristic cascade, which can produce many x-ray photons for each electron that leaves the atom. The characteristic interactions created at the anode target are called pri-mary radiation.
In diagnostic x-ray tubes, with tungsten alloy anodes, the most common transition is from the L shell to the vacant K shell. Only K-shell vacancies from high–atomic num-ber elements produce characteristic x-ray photons with
X-ray energy (keV)
Ulfiltered beam
Average energy = 23 keV
Filtered beam
EmaxNum
ber
of x
-ray
s ha
ving
ener
gy E
20 50 7010
Figure 6.2. Shows the number of x-rays with different energies in the x-ray beam emitted from the anode.
An animation for this topic can be viewed at http://thepoint.lww.com/FosbinderText
Fosbinder_Text_Chap06.indd 74 10/30/2010 6:10:24 PM

Chapter 6: X-Ray Production 75
of the K-shell tungsten atom is 69.53 keV. Thus, the projectile electron must have an energy slightly >69.53 keV to remove a K-shell electron from a tungsten atom and pro-duce K characteristic radiation. K characteristic x-rays are only produced at 70 to 120 kVp. In diagnostic x-rays, in the range of 110 to 120 kVp, about 15% of the x-ray beam consists of K characteristic x-rays. The energy of the char-acteristic x-ray does not change with changes in the kVp.
X-Ray Beam Quality and Quantity
X-ray beam quality describes the penetrating ability of the x-ray beam. It depends on the average x-ray energy of the x-ray beam, which is controlled by the kVp setting. X-ray beam quantity or the amount of x-ray photons in the beam is related to x-ray intensity. Recall that intensity is a measure of the amount of x-ray energy fl owing through an area each second. Intensity depends on the number and energy of x-ray photons in the beam. X-ray beam quantity is controlled by the mA setting. Information about both beam quantity and beam quality is contained in the x-ray spectra curve. The intensity or quantity is represented by the area under the curve; the average energy is indicated by the peak of the curve. Figure 6.5 illustrates the intensity and average energy of two x-ray beams, one with a tungsten anode and the other with a molybdenum anode. The molybdenum anode tube is used in mammography.
high enough energy to be useful in diagnostic radiology. K characteristic x-ray photons produce a discrete spec-trum, meaning that only x-rays with the characteristic ener-gies are present (Fig. 6.3).
All characteristic x-rays resulting from L to K transitions in a tungsten anode have an energy of 57 keV. This is the predominant characteristic x-ray from tungsten. A less likely transition would be an M-shell electron fi lling the K-shell vacancy. M to K transitions produce 67 keV characteristic x-rays (Fig. 6.4).
To produce K characteristic x-rays, the K-shell orbital electron must be removed. The electron binding energy
K shell (69)
L shell (12)
M shell (2)
N shell (1)
70 keV
57 keV
Figure 6.3. Illustrates the fi lling of a tungsten K-shell vacancy with an L-shell or M-shell electron.
X-ray energy (keV)
Average energy
Num
ber
of x
-ray
s ha
ving
ener
gy E
58 67
L–K
M–K
Figure 6.4. Demonstrates the average energy of character-istic x-rays from a tungsten anode.
Photon energy (keV)
Characteristic x-rays
Num
ber
of x
-ray
s ha
ving
ener
gy E
20 100
Tungsten
MolybdenumEmax
40 60 80
Figure 6.5. Shows x-ray spectra produced from tungsten and molybdenum anodes.
Fosbinder_Text_Chap06.indd 75 10/30/2010 6:10:25 PM

76 Part II: Circuits and X-Ray Production
The characteristic x-ray energy does not change with a change in kVp.
This increase in energy refl ects a nearly doubled amount of energy. More x-rays are being emitted at all energies and this causes more density to appear on the image. Many radiographers use this process to decrease the amount of mAs used during an exposure. The rule of thumb which is used is called the 15% rule, which states that an increase in kVp of 15% is equivalent to doubling the mAs. This phenomenon occurs because the x-ray beam has more penetrability, which means that less of the radiation is absorbed by the patient and more radia-tion reaches the image receptor.
mAChanges in mA change the quantity but not the energy (quality) of the x-ray beam. Changing the mA does not change the average energy or the maximum x-ray beam energy. The number of characteristic x-rays increases with increasing mA, but the characteristic x-ray energy does not change. The quantity of the x-ray beam is directly proportional to the mA; doubling the mA doubles the intensity and quantity of the x-ray beam (Fig. 6.7).
TimeTime has the same effect on x-ray production as mA. Increasing the time increases the number of x-rays reach-ing the patient and the image receptor but does not change the quality or penetration characteristic of the x-ray beam.
X-Ray Spectra from Different Anode MaterialsDifferent anode materials produce different characteristic x-ray energies and different amounts of bremsstrahlung radiation. Tungsten alloy anodes are used in most diag-nostic x-ray tubes, although molybdenum anode tubes are used in mammography. Tungsten has 58 and 67 keV characteristic x-ray energies and molybdenum has 17 and 19 keV characteristic x-rays. Molybdenum anodes are used in mammography because their characteristic x-rays provide good contrast for breast imaging. The smooth curves represent the bremsstrahlung portions of the x-ray production curve, and the discrete or sharp peaks rep-resent the characteristic radiations from tungsten and molybdenum. The position of the sharp peaks indicates the energy of the characteristic x-rays.
In addition to the anode material, the four other fac-tors that can infl uence the x-ray spectra are shown in Table 6.1.
kVpChanges in the applied kVp change the average energy and the maximum energy of the x-ray beam. The quan-tity also changes with kVp because bremsstrahlung pro-duction increases with increasing projectile electron energy. Figure 6.6 shows the x-ray spectra resulting from exposures at 70 and 110 kVp. The x-ray intensity or area under the curve, the average energy, and the maximum energy (Emax) all increase when the kVp is increased.
TABLE 6.1 FOUR ADDITIONAL FACTORS THAT INFLUENCE THE X-RAY SPECTRA
kVp The applied voltage controls the projectile electron energy, the intensity, the Emax, and the average energy of the x-ray beam. Changing the kVp does not change the energy of the characteristic x-rays.
mA The mA controls the number of projectile electrons striking the anode and the intensity of the x-ray beam.
Beam fi ltration
Beam fi ltration infl uences the intensity and average energy of the x-ray beam.
Circuit waveform
The waveform infl uences the intensity and the average energy of the x-ray beam.
Photon energy (keV)
Average energy
Num
ber
of x
-ray
s
100
Low kVp
Emax
50 70
High kVp
Emax
Figure 6.6. Shows the x-ray spectra resulting from expo-sures at 70 and 110 kVp. Note how the curve shifts to the right or high-energy side when higher kVp is used.
Fosbinder_Text_Chap06.indd 76 10/30/2010 6:10:25 PM

Chapter 6: X-Ray Production 77
FiltrationWhen an x-ray beam is produced, there is a wide range of energies and wavelengths; the beam can be called poly-energetic or heterogeneous. The purpose of fi ltration is to remove low-energy x-rays before they strike the patient. The fi lter is made of thin sheets of aluminum or other metal attached to the output port of the tube housing. Adding fi ltration is also called hardening the x-ray beam. The fi ltration selectively removes more low-energy than high-energy x-ray photons (Fig. 6.8), thereby making the beam more homogeneous. Adding fi ltration increases the average x-ray energy and decreases the beam inten-sity. Filtration changes do not change the Emax of the x-ray beam or the energy of the characteristic x-rays.
Photon energy
Average energy
Inte
nsity
Emax
2 mm added filtration
4 mm Al
Figure 6.8. Illustrates the change in the x-ray spectrum resulting from added fi ltration.
Photon energy (keV)
Average energy
Inte
nsity
Emax
High frequency
Three phase
Single phase
110
Figure 6.9. Illustrates an x-ray spectrum from single-phase, three-phase, and high-frequency x-ray circuits.
X-Ray Circuit WaveformX-ray production depends on the type of x-ray circuit waveform. There are different types of circuits utilized for various x-ray equipment, such as single-phase, three-phase, and high-frequency circuits. As seen in Figure 6.9, circuits that allow for more constant voltage result in higher intensity and higher average energies for the same mA and kVp settings. The Emax does not change with changes in waveform. All modern x-ray equipment utilizes high-frequency circuits.
Photon energy (keV)
Average energy
Num
ber
of x
-ray
s
110
100 mA
Emax
200 mA
Figure 6.7. Illustrates the increase in x-ray quantity when the mA is increased from 100 to 200 mA. The increase in mA results in a proportionate increase in the amplitude of the x-ray spectrum at all energies.
Chapter SummaryX-rays are produced by either the bremsstrahl-ung process or the characteristic x-ray process. Bremsstrahlung x-rays are produced when the projectile or incident electrons are slowed down or stopped in the anode. Approximately 90% of diagnostic x-rays are produced by the bremsstrahlung process. Characteristic x-rays are produced by transitions of orbital electrons which fi ll vacancies in atomic shells. The char-acteristic x-ray energy depends only on the anode material. An x-ray spectrum is a plot of x-ray intensity as a function of x-ray energy. The energy of individual x-rays is measured in keV.
Fosbinder_Text_Chap06.indd 77 10/30/2010 6:10:26 PM

78 Part II: Circuits and X-Ray Production
Case StudyFigure 6.6 demonstrates the x-ray spectrum that resulted from two exposures, one at 70 kVp and the other at 110 kVp.
Critical Thinking Questions
What is the main factor that changed the Emax?
How does this factor affect the average and maximum energies?
How does it change the appearance of the curves in the graph?
What change in energy occurs when the factor is decreased?
kVp is the main factor that changes the appearance of the energy on the graph. When kVp is increased, the average and maximum energies will also increase. This increase in kVp is seen as a widening of the curve. When the kVp is decreased, the average and maximum energies will decrease and this will be seen on the graph as a narrowing of the curve.
The kVp is the voltage applied to the x-ray tube. The kVp is equal to the Emax. The average energy of the x-ray beam is one-third to one-half Emax.
The x-ray spectrum depends on the kVp, mA, time, fi ltration, and x-ray circuit waveform. Increasing the kVp increases the quantity, the average beam energy, and the Emax. Increasing the mA increases the quantity but does not change the average energy or Emax. Increasing the fi ltration decreases the quantity and increases the average beam energy but does not change the Emax. Changing from single- to multiphase x-ray circuits increases the quantity and the average energy of the x-ray beam but does not change the Emax.
Fosbinder_Text_Chap06.indd 78 10/30/2010 6:10:26 PM

Chapter 6: X-Ray Production 79
Multiple Choice 1. The bremsstrahlung process produces x-rays when
A. electrons are stopped in the cathodeB. a vacancy in an electron orbit is fi lledC. a vacancy in the nucleus is fi lledD. electrons are stopped or slowed down in the anode
2. Characteristic radiation is produced when
A. electrons are stopped in the cathodeB. a vacancy in an electron orbit is fi lledC. a vacancy in the nucleus is fi lledD. electrons are stopped in the anode
3. About _____% of the electron energy is converted to x-ray energy.
A. 1B. 10C. 25D. 99
4. The x-ray tube fi ltration fi lters out
A. low-energy electronsB. high-energy x-raysC. high-energy electronsD. low-energy x-rays
5. The energy of the photon is known as the
A. kVpB. keV
6. Interactions that produce x-rays in the anode include
1. coherent2. Compton3. bremsstrahlung4. pair production5. characteristic
A. 1, 3, and 5B. 2 and 4C. 3 and 5D. 1, 2, 3, 4, and 5
7. The quality of the beam is primarily determined by
A. mAB. kVpC. focal spot sizeD. target angle
8. An atom of tungsten has shell binding energies of K shell 69, L shell 11, M shell 2, and N shell 1. Incident electrons must have an energy of at least _____ keV to produce K characteristic x-rays from tungsten.
A. 50B. 70C. 67D. 58
9. A technologist can control the quantity of x-rays striking the patient by adjusting the
A. mAB. kVpC. mA and kVpD. mA, kVp, and anode materialE. mA, kVp, rectifi cation, and anode material
Review Questions
Fosbinder_Text_Chap06.indd 79 10/30/2010 6:10:26 PM

80 Part II: Circuits and X-Ray Production
5. Describe the characteristic interaction.
6. The majority of electron energy in the x-ray tube is converted to which form of energy?
7. Describe the bremsstrahlung interaction.
8. Explain what the characteristic cascade is.
9. What is an incident electron?
10. Explain how the x-ray circuit infl uences the production of x-rays.
10. The maximum kinetic energy of an incident electron accelerated across an x-ray tube depends on the
A. atomic number (Z) of the targetB. size of the focal spotC. kilovoltageD. type of rectifi cation
Short Answer
1. Defi ne and explain the 15% rule.
2. Using Figure 6.3, calculate energy of the charac-teristic x-ray if the K-shell electron is replaced by an L-shell electron.
3. Which type of interaction produces diagnostic x-rays?
4. What factors have an effect on the x-ray spectrum and describe how the spectrum is affected by each factor.
Fosbinder_Text_Chap06.indd 80 10/30/2010 6:10:27 PM

81
7
X-Ray Interactions
Key Terms● absorption
● attenuation
● beam quality
● beam quantity
● coherent scattering
● Compton scattering
● half-value layer
● pair production
● photodisintegration
● photoelectric effect
● photoelectron
● radiolucent
● radiopaque
● scattering
ObjectivesUpon completion of this chapter, the student will be able to:
1. Distinguish between absorption, scattering, and transmission of x-ray photons.
2. Identify the factors that affect the amount of attenuation.
3. Defi ne half-value layer.
4. State fi ve ways in which x-rays interact with matter.
5. Describe the two x-ray interactions important in image formation.
Fosbinder_Text_Chap07.indd 81 10/30/2010 6:11:22 PM

82 Part II: Circuits and X-Ray Production
complete or partial loss of the x-ray photon energy in the patient. Some x-ray photons will pass completely through the patient without interacting with the tissue (Fig. 7.1). Other x-ray photons will interact with an orbital electron, the whole atom, or just the nucleus. Upon interacting with tissue there will be either complete energy loss termed absorption and partial energy loss called scattering. When the photon energy is absorbed and completely transferred to the tissue, the photon will no longer exist. A photon that interacts and then scatters still has enough energy to go on to interact with another atom. This process will continue until the photon is completely out of energy and absorbed into the tissue (Fig. 7.2).
The amount of attenuation depends on the:
1. x-ray photon energy2. tissue thickness3. tissue density4. tissue material (atomic number)
These factors all infl uence the fi nal radiographic image.
X-Ray Photon EnergyHigher x-ray photon energies (shorter wavelengths) have greater penetration and lower attenuation values.
IntroductionX-ray photons entering a patient can be absorbed, scattered, or transmitted. When an x-ray photon is absorbed in a patient, all of the energy is transferred to the patient’s tissue. Scat-tering changes the x-ray photon direction and reduces its energy. Scatter contributes to radia-tion fog and reduces image contrast. Transmitted x-ray photons pass through the patient without interaction and form the radiographic image. Most diagnostic x-ray photons are absorbed or scattered. Only about 1% of the x-ray photons are transmitted through the patient. Radiation leaving the patient is termed exit radiation. Exit radiation consists of transmitted and scattered x-ray photons. Throughout the chapter the stu-dent will learn all these concepts and how they occur during an x-ray exposure (Fig. 7.1).
AttenuationAttenuation is the removal of x-ray photons from the beam by either absorption or scattering. Attenuation occurs when the x-ray beam passes through matter and there is a
Transmission Absorption Scattering
Lung
Lung
Heart
Spine
Image receptor
Figure 7.1. Shows absorption, scatter, and transmission.
Absorbed rays
Scattered rays
Figure 7.2. Shows how both absorption and scattering contribute to attenuation.
Fosbinder_Text_Chap07.indd 82 10/30/2010 6:11:22 PM

Chapter 7: X-Ray Interactions 83
Changing the x-ray photon energy, the keV, by changing the kVp will alter the penetration of the x-ray beam. Lower energy x-ray photons have higher attenuation and lower penetration values.
Beam Quality and QuantityBeam quality describes the penetration of the x-ray beam. Higher kVp x-ray beams have higher penetration meaning they can pass completely through the patient with little or no absorption. Beam quantity describes the amount of x-ray photons in the x-ray beam. Beams with higher beam quantity produce images with less noise. The amount of photons in the beam is controlled by the amount of mAs used to make the exposure.
Tissue ThicknessAs the tissue thickness increases, more x-ray photons are attenuated, either by absorption or scattering. More x-ray photons are attenuated by 22 cm of the tissue than by 16 cm of the tissue. Technical exposure factors (mAs and kVp) must be adjusted to compensate for different tis-sue thicknesses. Modern fi xed x-ray units have automatic exposure control circuits designed to adjust the mAs to compensate for different patient thicknesses. Exposure factors used with portable units must be selected by the radiographer.
Mass or Tissue DensityMass density or subject density refers to how closely packed the atoms are in a tissue. Density is measured in grams per cubic centimeter (g/cm3). X-ray photon attenu-ation is increased in dense tissue. Air or gas has the lowest density in the body. Muscle is more dense than fat. The attenuation of 1 cm of muscle is >1 cm of fat. Bone is denser than muscle. One centimeter of bone has more attenuation than 1 cm of muscle or fat. Table 7.1 lists the densities of some body tissues and materials important in radiology.
Tissue MaterialMaterials with higher atomic numbers (Z) have higher attenuation values. Table 7.1 presents the atomic num-ber of some tissues and materials common in diagnostic radiology. Air, iodine, and barium are contrast materials
often introduced into the body to improve image contrast. They are effective because their atomic numbers or their densities are signifi cantly higher from the surround-ing body tissues. Substances that are highly attenuating are termed radiopaque and easily absorb x-ray photons. Bone, barium, and iodine are examples of radiopaque substances. Substances having low attenuation values are termed radiolucent. Air, bowel gas, and lung tissue are relatively radiolucent and are easily penetrated by x-ray photons. Lung is a combination of air spaces and tissue and has a density between air and muscle.
Half-value LayerThe half-value layer (HVL) is defi ned as the amount of material required to reduce the x-ray beam intensity to one-half its original value. The HVL is affected by the amount of kVp and fi ltration in the beam. Twice the thick-ness of material does not produce twice the attenuation because the average energy of the x-ray beam changes as it passes through the body. The lower energy, less pen-etrating x-ray photons are removed from the beam so the exit beam is more penetrating and has a higher average energy than the entrance beam. This removal of “soft” x-ray photons results in a hardening of the beam, which increases the ability of the x-ray photons to penetrate tissue. At diagnostic x-ray energies the HVL of soft tis-sue is about four centimeters. Four centimeters of tissue reduces the x-ray intensity to one-half its original value. The HVL describes the x-ray beam quality or penetration of the beam. More penetrating x-ray beams have greater HVLs (Fig. 7.3).
TABLE 7.1 ATTENUATION CHARACTERISTICS OF SOME MATERIALS IMPORTANT IN RADIOLOGY
Material Density (g/cm3) Atomic Number
Air 0.0013 7.6Lung 0.32 7.4Fat 0.91 6.3Muscle 1.0 7.4Bone 1.9 13.8Iodine 4.9 53Barium 3.5 56Lead 11.4 82
Fosbinder_Text_Chap07.indd 83 10/30/2010 6:11:23 PM

84 Part II: Circuits and X-Ray Production
Types of X-Ray Interactions
The fi ve x-ray interactions possible in tissue are:
1. coherent scattering2. photoelectric effect3. Compton scattering4. pair production5. photodisintegration
These interactions take place between the x-ray photons and the target atoms in the tissue. Only the photoelectric and Compton interactions are important in diagnostic radiology.
Coherent Scattering
Coherent scattering, also called classical scattering, occurs when the incident photon interacts with electrons in an atom causing the electrons to become excited and vibrate. The excited atom immediately releases the excess energy as a scattered x-ray photon with the same wavelength as the incident photon. As seen in Figure 7.4, coherent scat-tering produces a change in x-ray photon direction with no change in energy. It occurs primarily at energies below 10 keV and is not important in diagnostic radiology. The
An animation for this topic can be viewed at http://thepoint.lww.com/FosbinderText
other interactions transfer some energy from the incident photons to tissue and do produce ionization.
The Photoelectric Effect
In a photoelectric effect or interaction, the incident photon is completely absorbed by the atom. The photon energy is totally transferred to an inner-shell electron. The atom is ionized when this electron is ejected from the atom. The ejected electron is called a photoelectron. The photoelectron has kinetic energy which is equal to the difference between the incident photon and the binding energy of the inner-shell electron. This is shown mathematically in the equation:
i b keE E E= +
where, Ei is the energy of the incident photon, Eb is the binding energy of the electron, and Eke is the kinetic energy of the photoelectron. For the interaction to occur, the incident photon needs an energy that is slightly greater than the binding energy of the electron. Most of the atoms in tissue are very low atomic number elements and have
An animation for this topic can be viewed at http://thepoint.lww.com/FosbinderText
L shell
K shell
Wavelength
Incident x-ray
Scattered x-ray
Figure 7.4. Illustrates coherent scattering, which does not produce ionization. Classical scattering occurs when an incident photon interacts with an orbital electron and excites the electron. The x-ray photon does not lose any energy but changes direction and leaves the atom.
4cm 4cm
50% x-rays100% x-rays 25% x-rays
Figure 7.3. Demonstrates how two HVLs reduce the intensity of the x-ray beam to one quarter of its original value.
Fosbinder_Text_Chap07.indd 84 10/30/2010 6:11:23 PM

Chapter 7: X-Ray Interactions 85
very low K-shell binding energies. The photoelectron is made up of matter and travels <1 mm in tissue. This type of localized absorption causes biological changes.
When the electron is removed from the atom it causes the atom to become unstable. The vacancy in the K shell will be fi lled with an electron from the L shell, M shell, or a free electron. Filling the inner-shell vacancy produces characteristic x-ray photons. Characteristic photons from tissue elements (carbon, nitrogen, and oxygen) have very low energies. They are called secondary radiation and act like scatter radiation. Most characteristic x-rays from the tissue do not exit the patient because of their extremely low energies (Fig. 7.5). The fi nal result of the photo-electric effect is the complete absorption of the incident photon. There is no exit radiation after a photoelectric interaction. The photoelectric effect produces the lighter densities on conventional x-ray images.
Variation of the Photoelectric Effect with Atomic NumberThe photoelectric effect increases with increasing atomic number (Z). Atoms with higher atomic numbers absorb more x-ray photons. Bone absorbs more photons than mus-cle because bone has a higher atomic number than muscle. The attenuation of bone is four times greater than the atten-uation of muscle at an x-ray energy of 40 keV (Fig. 7.6).
Barium and iodine are used as contrast agents because of their high atomic numbers. This results in an increased pho-toelectric effect. Structures containing these ra diopaque
L shell
K shell
Incident x-ray
Incoming x-ray
L shell
K shell
Photoelectron
L shell
K shell
L shell
K shell
Vacancy
L shell characteristic radiation
Figure 7.5. The photoelectric effect.
2
1
0.9
0.5
0.3
0.2
0.1
Energy (keV)
Atte
nuat
ion
BoneSofttissue
9
10
5
3
20 40 60 80 100
Figure 7.6. Shows that the photoelectric effect in bone is greater than in muscle.
Fosbinder_Text_Chap07.indd 85 10/30/2010 6:11:24 PM

86 Part II: Circuits and X-Ray Production
L shell
K shell
Wavelength
Incident x-ray
Scattered photon
Compton recoil electron
Figure 7.7. Illustrates Compton scattering of an incident x-ray by an outer-shell electron.
contrast agents appear lighter or brighter on conventional radiographic images.
Variation of Photoelectric Effect with X-Ray EnergyThe photoelectric effect decreases as the x-ray energy increases. Figure 7.7 shows the photoelectric effect in bone and muscle as a function of energy. At higher kVp settings there is less photoelectric effect in low atomic number structures such as soft tissues.
Compton Scattering
In Compton scattering, the incident x-ray photon interacts with a loosely bound outer-shell electron. The incident x-ray photon ionizes the atom by removing an outer-shell electron, and then the photon continues in a different direction. The energy of the incident photon is shared between the Compton or recoil scattered electron and the scattered x-ray photon. The Compton scattered x-ray photon has lower energy and longer wavelength than the incident photon (Fig. 7.7).
An animation for this topic can be viewed at http://thepoint.lww.com/FosbinderText
The Compton effect is represented by the following formula:
i s b keE E E E= + +
where, Ei is the energy of the incident photon, Es is the energy of the Compton scattered photon, Eb is the elec-tron binding energy, and Eke is the kinetic energy given to the Compton electron.
CRITICAL THINKING
A 35-keV x-ray photon ionizes an atom of iodine by ejecting an M-shell electron that has a binding energy of 1.07 with 16 keV of kinetic energy. What is the energy of the scattered x-ray photon?
Answer
s35 keV (1.07 16 keV)E= + +
s 35 keV (1.07 16 keV)E = - +
s 35 keV 17.07 keVE = -
s 17.93 keV Compton scattered photonE =
Compton scattering is almost independent of changes in material and atomic number. During radiographic examinations of larger areas of the body more tissues are irradiated due to the larger fi eld sizes, this produces more Compton scattering. The scatter radiation emitted from the patient is the primary cause of occupational exposure for the radiographer. Fluoroscopic examinations pose a serious radiation hazard due to the large amount of radia-tion that is scattered from the patient. This is why it is crucial for the radiographer to wear a lead apron, thyroid shield, and gloves during all fl uoroscopic examinations.
The amount of Compton scattering increases with increasing x-ray energy. Compton scattered photons can be scattered in any direction up to 180 degrees. The angle of defl ection is infl uenced by the energy of the initial photon. At a defl ection of 0 degrees no energy is transferred because the photon does not change its path from the original direction. As the defl ection increases to 180 degrees, more energy is given to the recoil electron and less energy stays with the scattered photon. When a
Fosbinder_Text_Chap07.indd 86 10/30/2010 6:11:25 PM

Chapter 7: X-Ray Interactions 87
scattered photon is scattered back in the direction of the incident photon, it is called backscatter radiation. Back-scatter radiation can cause artifacts on the radiographic image and decrease image quality. The backscatter radia-tion deposits unwanted exposure on the image and is called radiation fog. The increase in radiation fog causes a decrease in radiographic contrast.
Only photoelectric and Compton interactions are important in diagnostic radiology. At low energies, the Compton scattering and the photoelectric effect have nearly the same ratio of interactions, while at higher energies Compton scattering dominates (Fig. 7.8). As demonstrated in Figure 7.8, when the incident x-ray pho-ton energy is increased, the relative amount of the photo-electric interaction decreases and the relative amount of Compton scattering increases.
Pair Production
The incident x-ray photon must have energy of least 1.02 MeV for pair production to occur. In pair
An animation for this topic can be viewed at http://thepoint.lww.com/FosbinderText
X-ray energy (keV)
Compton
Rel
ativ
e im
port
ance
(%
)
Photoelectric
100
50
10 20 30 40 50
Figure 7.8. Demonstrates the relative importance of the photoelectric and Compton interactions as a function of x-ray energy.
production the incident x-ray photon is transformed into a positive and a negative electron pair when the high energy photon passes near the electrostatic force field of an atomic nucleus, causing the photon to disappear. In its place one positive and one negative electron share the incident photon energy (Fig. 7.9). Pair production does not occur at diagnostic radiology energies.
Photodisintegration
In photodisintegration, the incident x-ray photon has enough energy (>10 MeV) to break up the atomic nucleus. When the incident photon strikes the nucleus it gives up all its energy to the nucleus; this interaction excites the nucleus. The excited nucleus then emits a nuclear fragment (Fig. 7.10). Both pair production and photodisintegration require extremely high-energy x-rays and are not utilized in diagnostic radiology.
An animation for this topic can be viewed at http://thepoint.lww.com/FosbinderText
L shell
K shell
1.02 MeV
0.51 MeVpositron
0.51 MeV electron
Figure 7.9. Pair production occurs with x-ray photons having an energy of 1.02 MeV or greater. Upon interaction with the nuclear force fi eld, the photon disappears and two oppositely charged electrons take its place.
Fosbinder_Text_Chap07.indd 87 10/30/2010 6:11:26 PM

88 Part II: Circuits and X-Ray Production
Case StudyDuring the photoelectric effect the incident x-ray photon is completely absorbed by the atom. The energy from the photon is transferred to an inner-shell electron causing ionization of the atom and a resultant ejected electron.
Critical Thinking Questions
How far will the photoelectron travel in tissue?
What happens when the inner-shell vacancy is fi lled?
What will eventually happen to the photoelectron?
How does the photoelectric effect change the radiographic image?
When the photoelectron is ejected, it has very low energy and will only travel about 1 mm in tissue. The vacancy left by the ejected pho-toelectron will be fi lled by an electron from a higher level shell, resulting in the production of a characteristic x-ray photon. These charac-teristic photons have very low energy and act as scatter radiation; however, they do not leave the body. The photoelectron will continue to inter-act with inner-shell electrons until the photo-electron has lost all its energy and is completely absorbed. The photoelectric effect produces the lighter densities on the radiographic image.
L shell
K shell
10 MeV
Nuclear fragment
Figure 7.10. Illustrates the emergence of a nuclear frag-ment after the incident photon has gone through the process of photonuclear disintegration.
Chapter SummaryX-rays entering a patient can be transmit-ted, absorbed, or scattered. Attenuation is the combination of absorption and scattering. Attenuation depends on energy, tissue material (atomic number), tissue thickness, and tissue density. The HVL is the amount of material required to reduce the intensity to one-half its original value. The HVL of tissue is about four centimeters. Of the fi ve possible types of interactions in tissues only the photoelectric and Compton interactions are important in diagnostic radiology. The photoelectric effect results in complete absorption of the incident x-ray photon. Photoelectric effects decrease with increasing x-ray energy and increase with increasing atomic number (Z). Compton scat-tering changes the direction and energy of the x-ray photon. Compton scattering contributes to the loss of contrast on the image and to occupa-tional dose. Photoelectric interactions are most important at lower x-ray photon energies, and Compton scattering is more important at higher x-ray energies.
Fosbinder_Text_Chap07.indd 88 10/30/2010 6:11:27 PM

Review Questions
Multiple Choice 1. What is(are) the product(s) of Compton scattering?
A. ElectronB. Recoil electron and scattered x-ray photonC. Electron and positive electronD. Scattered x-ray photon
2. Compton scattering
A. produces scattering and degrades image contrastB. increases contrast in radiographsC. produces x-rays in the rotating anodeD. is more important at lower energies
3. Photoelectric interaction
A. involves changes in energy and directionB. involves complete absorption of the photoelec-
tronC. involves complete absorption of the incident
x-rayD. requires at least 1.02 MeV energy
4. Materials with small attenuation values are called
A. radiopaqueB. radiolucent
5. What percent of an incident x-ray beam is trans-mitted through a patient?
A. 1B. 10C. 50D. 90
6. The interaction that involves no loss of energy or ionization is
A. coherentB. photoelectricC. pair productionD. ComptonE. photodisintegration
7. Photodisintegration produces a _____ when the incident photon energy is
A. nuclear fragment, defl ectedB. scattered electron, partially absorbedC. scattered photon, completely absorbedD. nuclear fragment, completely absorbed
8. During pair production the resulting electrons have how much energy?
A. 44 keVB. 51 keVC. 36 keVD. 15 keV
9. Which x-ray interaction is the most hazardous to the patient and radiographer?
A. PhotoelectricB. Coherent scatteringC. PhotodisintegrationD. Compton scattering
10. When the ejected photoelectron leaves an inner-shell vacancy, which type of x-ray photons are pro-duced?
A. BremsstrahlungB. CharacteristicC. CoherentD. Compton
Fosbinder_Text_Chap07.indd 89 10/30/2010 6:11:27 PM

90 Part II: Circuits and X-Ray Production
6. What type of scattering is a change of direction of an x-ray photon without a change in the photons energy?
7. Write the formula for the photoelectric effect and explain why it is used.
8. Describe the coherent scatter interaction.
9. X-ray photon interaction with the force fi eld of the nucleus produces _____.
10. Is there an increase or decrease in Compton scat-tering if the incident photon energy is increased?
11. Which type of tissue will attenuate the greatest number of x-ray photons?
A. FatB. MuscleC. LungD. Bone
Short Answer
1. In which interaction is a secondary electron found?
2. Photodisintegration involves incident photon energies greater than _____.
3. Describe backscatter.
4. Defi ne attenuation.
5. How does the atomic number of tissue affect absorption?
Fosbinder_Text_Chap07.indd 90 10/30/2010 6:11:28 PM

Image Formation
P A R T I I I
Fosbinder_Text_Chap08.indd 91 11/20/2010 1:09:44 PM

Key Terms
92
8
Intensifying Screens
ObjectivesUpon completion of this chapter, the student will be able to:
1. Describe the purpose and construction of intensifying screens.
2. Describe the characteristics of intensifying earth screens.
3. Identify the factors that affect screen speed and spatial resolution.
4. Explain the construction of cassettes and how to care for cassettes.
5. Describe luminescence, fl uorescence, and phosphorescence.
● base
● conversion effi ciency
● fl uorescence
● intensifying screen
● luminescence
● orthochromatic
● panchromatic
● phosphor layer
● phosphorescence
● protective coat
● quantum mottle
● rare earth screens
● refl ective layer
● spatial resolution
Fosbinder_Text_Chap08.indd 92 11/20/2010 1:09:44 PM

Chapter 8: Intensifying Screens 93
IntroductionX-rays that penetrate through a thick patient will easily pass through the image receptor which is only a few millimeters thick. This means that there are few interactions in the image receptor. To increase the number of x-rays absorbed, and reduce the patient dose, intensifying screens convert x-rays into light, which then interact in the image receptor. Today essentially all radio-graphic images are formed using intensifying screens. This chapter covers the construction and characteristics of intensifying screens.
Intensifying ScreensThe purpose of an intensifying screen is to increase the effi ciency of x-ray absorption and decrease the dose to the patient. An intensifying screen converts a single x-ray photon into thousands of lower energy light photons that interact more effi ciently with the image receptor. The conversion of x-ray energy into light energy reduces the amount of radiation required to produce an acceptable image. Most x-ray photons that pass through a 30-cm-thick patient have no trouble passing through the image recep-tor a few millimeters thick. Only about 1% of the interac-tions in the image receptor are produced directly by x-ray photons, the other 99% result from intensifying screen light. This light is produced when an x-ray photon inter-acts with the phosphor crystals in the screen (Fig. 8.1).
The intensifying screens are typically used in pairs and are mounted inside the top and bottom of a light proof cassette. In a standard x-ray cassette, the fi lm is held in a light proof cassette, while in a direct imaging or
Exposure of film
Emission of many photons of visible light
Absorption by intensifying screen phosphors
X-ray photon
Figure 8.1. Illustrates the steps involved in converting a single x-ray photon into many visible light photons.
Intensifying screen
CR cassette
Figure 8.2. Shows a CR cassette with the detector located next to its intensifying screens.
CR system, a detector plate is in close contact with the intensifying screens (Fig. 8.2).
Intensifying Screen Construction
An animation for this topic can be viewed at http://thepoint.lww.com/FosbinderText
An intensifying screen consists of a plastic base support-ing a refl ective layer, a phosphor layer, and a protective coat (Fig. 8.3).
● Base● Refl ective Layer● Phosphor Layer● Protective Coat
Fosbinder_Text_Chap08.indd 93 11/20/2010 1:09:44 PM

94 Part III: Image Formation
BaseA 1-mm-thick polyester plastic screen base provides sup-port for the other components of the screen. It is fl exible yet tough, rigid, and chemically inert and is uniformly radiolu-cent. The base must be fl exible enough to fi t snuggly when sandwiched between the top and bottom of the cassette. It is necessary for the base to be chemically inert so that it will not react with the phosphor layer or interfere with the conversion of x-ray photons to light photons. The base material must also be uniformly radiolucent to allow the transmission of x-ray photons without causing artifacts to the image.
Refl ective LayerThe refl ective layer is made up a special refl ective mate-rial such as magnesium oxide or titanium dioxide that is approximately 25 mm thick. The screen phosphor crystals emit light with equal intensity in all directions upon interaction with an x-ray photon. Less than half the light produced by the screen phosphor crystals is directed toward the fi lm. The refl ective layer redirects the light from the phosphor toward the fi lm, thereby increasing the effi ciency of the intensifying screen (Fig. 8.4). Some intensifying screens use dyes to selectively absorb the
diverging light photons that have a longer wavelength, which reduces image sharpness.
Phosphor LayerThe active layer of the intensifying screen is the phosphor layer which is made up of crystals embedded in a clear plastic support layer. The phosphor crystals convert incident x-ray photons into visible light photons. The phosphor layer varies from 150 to 300 mm, depending on the speed and resolving power of the screen.
The material, size, and distribution of the phosphor crystals and the thickness of the phosphor layer deter-mine the speed and resolution of the intensifying screen. There is a trade-off between speed, patient dose, and res-olution. Thicker screens have higher speed and require lower patient dose but have poorer spatial resolution. Dif-ferent fi lm screen combinations are chosen for different clinical applications.
Protective CoatThe protective coat is a thin plastic layer about 25 mm thick that protects the phosphor layer from abrasion. The protective layer cannot withstand scratches from fi nger nails, rings, or hard objects. As seen in Figure 8.5, scratches that remove the protective layer also remove the phosphor layer producing white, negative density artifacts.
Phosphor MaterialsThe primary characteristics of phosphor materials that are important to radiography are:
● atomic number● conversion effi ciency● luminescence
Base
Phosphor
Protective coating
Reflectivelayer
1000um
25um
150-300um110-20um
Figure 8.3. Illustrates the construction of a typical intensi-fying screen.
Base
Visible light
Reflective layer
X-ray photonX-ray photon
ReflectivelayerPhosphor
Film
Visible light
No reflective layer
Figure 8.4. Shows how the refl ective layer redirects screen light back toward the fi lm.
Fosbinder_Text_Chap08.indd 94 11/20/2010 1:09:47 PM

Chapter 8: Intensifying Screens 95
Spectral MatchingSpectral matching refers to matching the wavelength or color of the light from the screen to the fi lm sensitiv-ity. Figure 8.6 compares the light output from calcium tungstate (CaWO4) and rare earth screens.
Different screen phosphors emit light of different colors or wavelengths. The response of the fi lm must be matched to the light wavelength of the intensifying screen. There are two classes of intensifying screens, those that emit blue light and those that emit green light. CaWO4 and some rare earth materials emit blue light. Other rare earth mate-rials emit green light. There are two general groups of fi lm whose sensitivities are designed to match the light from the different types of intensifying screens. Blue-sensitive, or panchromatic, fi lm is used with calcium tungstate and other blue-light-emitting screens. Green-sensitive, or orthochromatic, fi lm is used with green-light- emitting rare earth intensifying screens. A mismatch between intensifying screens and fi lm results in reduced effi ciency and increased patient dose. Table 8.1 presents representa-tive screen materials, their K-shell absorption edge energy, and the color of light emitted.
Rare Earth ScreensThe intensifying screens developed by Thomas Edison in the early 1900s used CaWO4 crystals as the phosphor. CaWO4 crystals give off blue light and are 3% to 5% effi -cient in converting x-ray energy into light (Fig. 8.6). They were in common use until the mid-1970s when rare earth screens were introduced. Rare earth screens use elements from the rare earth section (Z = 57−70) of the periodic table. Rare earth elements used in intensifying
Atomic NumberIntensifying screens are made of higher atomic number (higher Z) phosphors to increase x-ray interaction. About 5,000 light photons are produced by each x-ray photon absorbed by the phosphor crystal. To permit photoelec-tric and Compton interactions, the phosphor must have a high atomic number.
Conversion Effi ciencyThe number of light photons produced by one x-ray pho-ton is described by the conversion effi ciency. It is a mea-sure of the screen’s effi ciency in converting x-ray energy into light energy. As the conversion effi ciency increases, the radiation dose to the patient decreases.
LuminescenceLuminescence is the ability of a material to emit light in response to excitation. Luminescent materials will emit light with a wavelength that is specifi c to that particular luminescent material. The result is light emission of a specifi c characteristic color. There are two mechanisms that produce light, fl uorescence and phosphorescence. Fluorescence is the production of light during the stimu-lation of the phosphor by the x-ray photons. Fluorescence is an instantaneous emission of light. Phosphorescence is the continuation of light emission after the stimulation ceases. Most of the light output from intensifying screens is due to fl uorescence. Delayed phosphorescence cre-ates screen lag or afterglow and becomes increasingly more pronounced as the phosphor ages.
TABLE 8.1 SCREEN MATERIALS AND THEIR CHARACTERISTICS
Phosphor Material K-edge Energy Emitted Light Color
Calcium tungstate 70 BlueGadolinium 50 GreenLanthanum 39 BlueYttrium 17 Blue
Figure 8.5. Illustrates an artifact produced by a scratch on the intensifying screen.
Fosbinder_Text_Chap08.indd 95 11/20/2010 1:09:47 PM

96 Part III: Image Formation
three types of screens. The mAs must be changed to compensate for a change in screen speed. The amount of change is given by the ratio of the screen speed:
2 1
oldscreenspeedmAs mAs
new screenspeedæ ö
= ç ÷è ø
where mAs2 is the new mAs and the mAs1 is the old or original mAs used.
The automatic exposure circuit (AEC) must be cali-brated for a particular fi lm/screen combination. Using a cassette with a screen speed other than that for which the AEC is set, will produce an image with improper density. For example, if a detail screen is used with an AEC set for
screens include gadolinium, lanthanum, and yttrium. They are 15% to 20% effi cient in converting x-ray energy into light as compared to the calcium tungstate (CaWO4) because their K absorption edges are closer to the average energy of diagnostic x-ray beams.
Screen SpeedScreen speed or sensitivity is a term used to describe how much light is obtained from a given x-ray exposure. Stan-dard speed is set as a speed of 100 for historical reasons. The speed is controlled by phosphor size, layer thickness, kVp, and temperature. An increase in phosphor size and layer thickness will also increase the screen speed. When kVp is increased, the screen speed will also be increased. Intensifying screen phosphors have a high atomic num-ber so increasing kVp will increase the likelihood of light producing interactions within the phosphors. Increases in temperature can cause a signifi cant decrease in screen speed, especially in hot climates.
Types of ScreensFilm/screen systems range in speeds from 50 to 1,000. There are three types of screens: detail, medium or par speed, and high speed. Detailed screens, valued at 50, are used for higher-resolution imaging, such as extremity examinations. Medium- or par-speed screens, valued at 100, are used for routine imaging. High-speed screens, valued at 200 to 1,000, are used for examinations that require short exposure times. Table 8.2 illustrates the screen types and speeds associated with each of the
Calcium tungstate
X-r
ay a
bsor
ptio
n
Rare earth
1000 7050
K-shell binding energyfor calcium tungstate
K-shell binding energyfor rare earth
Energy (keV)
Figure 8.6. Absorption of x-ray photons by calcium tungstate and typical rare earth screen materials.
CRITICAL THINKING
Changing from high-speed to detail screens requires an increase in mAs to maintain the same optical den-sity. As an example, if a 400-speed screen is replaced by a 50-speed screen, if the original mAs was 5 mAs with the 400-speed screen, what is the new mAs for the 50-speed screen?
Answer
2 1
2 1
2
2
400mAs mAs
50
mAs = mAs (8)
mAs 5 8
mAs 40mAs
æ ö= ç ÷è ø
= ´
=
Fosbinder_Text_Chap08.indd 96 11/20/2010 1:09:48 PM

Chapter 8: Intensifying Screens 97
correlates to more light being emitted by the rare earth screens.
Radiographic Noise and Quantum Mottle
Radiographic noise or quantum mottle is the random speckled appearance of an image. It is similar to the “salt and pepper” or “snow” seen with poor TV reception. It is caused by the statistical fl uctuations in x-ray interac-tions. Quantum mottle is noticeable when the number of x-ray photons forming the image is too low. Screens with greater conversion effi ciency convert more x-ray photons into light so they require fewer photons and produce images with more noise. Radiographic noise or quantum mottle depends on the number of x-ray photons interact-ing with the phosphor crystals in the screen. Faster screen images have more image noise because they require fewer x-ray photons to produce the image. The technical factor that infl uences the amount of image noise or quantum mottle is mAs. The radiographer controls the quantity of the photons with the mAs setting. Increasing the mAs set-ting will effectively eliminate quantum mottle. Quantum mottle is commonly seen in fl uoroscopy due to the low mA settings. The image appears to be very grainy on the monitor. The radiographer can increase kVp, but this often results in lower subject contrast; however, increas-ing the mA setting and exposure rate will improve the fl uoroscopic image.
Spatial ResolutionSpatial resolution is the minimum distance between two objects at which they can be recognized as two separate objects. Spatial resolution is measured using a line pair test pattern and has units of line pairs per millimeter (lp/mm). Spatial resolution of the intensifying screen depends on the thickness of the layer, the phosphor size, and the concentration of the crystals. Intensifying screens with smaller crystals and a thinner layer increase resolu-tion but cause a decrease in screen speed. Thicker layers with larger crystals have poorer spatial resolution because
medium-speed screens, the image will appear too light because the detail screens would require a higher expo-sure than that produced by the AEC. Thicker screens have more phosphor crystals available for interaction with the x-rays and are faster because they absorb more x-rays. Fewer x-rays are needed to produce the same opti-cal density when the faster screens are used, resulting in lower patient dose (Table 8.2).
K-shell Absorption EdgeCaWO4 screens will absorb approximately 30% of the inci-dent beam, while rare earth screens will absorb approxi-mately 50% to 60%. The percentage varies depending on the keV of the incident beam. Practically all of the absorption takes place during photoelectric absorption. Photoelectric absorption in the screen depends on the x-ray photon energy and the K-shell binding energy of the specifi c phosphor material. The K-shell absorption energy refers to the x-ray photon energy just high enough to remove a K-shell electron from its orbit. In a CaWO4 screen, the tungsten has an atomic number of 74 and a K-shell binding energy of 70 keV; therefore, the inci-dent x-ray photon must have energy of at least 70 keV to remove the K-shell electron. When the incident x-ray photon matches the K-shell binding energy, there is a dramatic increase in characteristic photon production, which is called K-shell absorption edge.
The sharp rise in x-ray absorption occurs at the K-edge binding energy. X-ray energies above the K-shell binding energy have enough energy to interact with and remove a K-shell electron. X-ray energies below the K-shell bind-ing energy can only remove L-, M-, or N-shell electrons. If the x-ray energy is above the K-edge, energy absorp-tion is much higher. Rare earth phosphor materials are chosen because their K-edge energies occur in the diagnostic energy range of 35 to 70 keV. Additionally, rare earth screens absorb approximately fi ve times more x-ray photons than the calcium tungstate screens, which
TABLE 8.2 SCREEN TYPES AND SPEEDS
Screen Type Speed
Detail 50Medium speed 100High speed 200–1,000
Fosbinder_Text_Chap08.indd 97 11/20/2010 1:10:06 PM

98 Part III: Image Formation
side of the cassette is constructed of low atomic number material to reduce attenuation of the x-rays entering the cassette. The cassette also contains a thin layer of lead foil in the back to attenuate exit radiation. For this reason, the tube side is always indicated on the cassette. Film cas-settes come in a variety of sizes. Standard sizes are given in Table 8.3.
Film/Screen ContactPoor fi lm/screen contact destroys detail and spatial reso-lution because the light from the screen diffuses before it reaches the fi lm. Many cassettes have a slight curve on the door side of the cassette so that pressure is applied when the cassette is closed. This extra pressure ensures good fi lm/screen contact. Film/screen contact can be evaluated using the wire mesh test. A screen like wire mesh embedded in plastic is placed over the fi lm cassette to be tested. After exposure, the fi lm is developed. Any areas of poor fi lm/screen contact will appear as blurred or unsharp areas on the image. Figure 8.8 shows an image of a wire mesh test pattern showing good and poor fi lm/screen contact.
the light spreads sideways and blurs out the edges of an image but increase screen speed (Fig. 8.7). As described, the phosphor crystal size and layer thickness are both inversely related to resolution and directly related to screen speed. Thicker high-speed screens have poorer spatial resolution than slower speed screens. A screen with a larger concentration of crystals will have an increase in both spatial resolution and screen speed; therefore, phos-phor concentration is directly related to spatial resolution and screen speed.
Film/Screen CassettesDiagnostic fi lms are held inside of fi lm cassettes. A cas-sette has a pair of intensifying screens glued to the interior front and back. The purpose of the cassette is to provide a lightproof holder for the fi lm. Proper fi lm/screen con-tact is necessary to achieve good image detail. The front
Figure 8.7. Illustrates how thicker screens have poorer spatial resolution.
TABLE 8.3 STANDARD CASSETTE SIZES
Size in cm Size in inches
18 × 24 8 × 1024 × 30 10 × 1228 × 35 11 × 1435 × 43 14 × 17
A B
Figure 8.8. Examples of good (A) and poor (B) fi lm/screen contact.
X-ray photons X-ray photons
Phosphor
Film
Visible light photons
Fosbinder_Text_Chap08.indd 98 11/20/2010 1:10:06 PM

Chapter 8: Intensifying Screens 99
Cassette CareEvery screen cassette has an identifi cation number that appears on every exposed fi lm and can be used to trace arti-facts to a particular cassette. For example, a series of fogged fi lms caused by a light leak due to a dropped cassette, or a white area on the fi lm caused by removal of the intensifying phosphor by a scratch on the screen, can be readily traced to the damaged cassette. Screens should be cleaned regularly and whenever artifacts appear on the images. Dirt on the screens will result in white or negative density spots on the image. Areas of darker density are called positive densities.
Chapter SummaryIntensifying screens convert x-ray photon energy into light energy. Modern intensifying screens utilize rare earth phosphors whose K absorption edges are matched to diagnostic x-ray ener-gies. Upon stimulation by x-ray photons these phosphors emit green or blue light, which is matched to the spectral sensitivity of the fi lm.
There are three classes of screen speeds: high, medium, and detail. High-speed screens require fewer x-rays resulting in lower patient doses but have greater quantum noise. Detail screens produce superior spatial resolution but require increased patient dose.
Cassettes, which provide a light tight con-tainer for the fi lm, must be cleaned and checked regularly for good fi lm/screen contact. Cassettes utilize intensifying screens to improve the image quality through increasing the number of con-versions from x-ray photons to light photons.
Case StudyChase works in a facility that uses various fi lm/screen combinations and speeds with some being rare earth screens that emit blue light while others emit green light. Chase produced an image of the hand using a 100-speed rare earth fi lm/screen system sensitive to blue light. Upon reviewing the image there was a lack of
detail and spatial resolution with some areas of blurring. Before repeating the image, Chase needs to determine what happened to the image and how to correct the problems before a repeat image is obtained.
Critical Thinking Questions
Why are some areas of the image blurred and what may be the cause?
What could be causing the lack of detail and spatial resolution?
Was the cassette loaded with the proper fi lm to match the intensifying screens? What must Chase do before taking the repeat image to ensure that a diagnostic image is taken?
The areas of blurring are likely caused by poor fi lm/screen contact. A wire mesh test must be performed to determine if there is proper contact between the fi lm and screen. Until this test can be completed, Chase must take the cassette out of use so that no one else uses a potentially defective cassette. The lack of detail and spatial resolution could be caused from the wrong type of fi lm being loaded in the cassette. In a facility with various speeds and types of fi lm and screens, it is common for the wrong fi lm to be loaded in a cassette. It is essential to have correct spectral match-ing of the screen phosphors and the fi lm phosphors; incorrect spectral matching occurs when the phosphors are sensitive to differ-ent types of light. This can cause a decrease in effi ciency in converting x-ray photons to light when exposing the fi lm. Chase must get another cassette and double check the speed of the cassette and then load it with the proper fi lm. Only in this way can he be sure that he has the correct imaging system for the hand image.
Fosbinder_Text_Chap08.indd 99 11/20/2010 1:10:07 PM

Review Questions
Multiple Choice
1. In order to increase the spatial resolution of a fi lm/screen system, the most important factor would be to change
A. to a faster fi lmB. to a faster-speed fi lmC. to a slower-speed fi lmD. to extended processing
2. Film/screen contact is evaluated by a
A. line pair testB. densitometerC. wire mesh testD. sensitometer
3. Which of the following are rare earth phosphor materials?
1. Calcium tungstate2. Gadolinium3. Lanthanum4. Yttrium
A. 1, 2, and 3B. 2, 3, and 4C. 1, 3, and 4D. 1, 2, 3, and 4
4. When changing from a detail screen to a high-speed screen, the mAs should be
A. increasedB. decreasedC. not changedD. none of the above
5. Radiographic noise or quantum mottle can be reduced by using
A. high kVp and a small focal spotB. low kVp and high mAsC. high kVp and low mAsD. low mAs and large focal spot
6. What is the purpose of the phosphor layer in the intensifying screen?
A. To decrease the conversion from x-ray photons to light photons
B. To aid in increasing mAsC. To protect the screen base from harmD. To increase the number of conversions from x-ray
photons to light photons
7. Which part of the intensifying screen intercepts light photons going in various directions and redi-rects them to the fi lm?
A. Refl ective layerB. BaseC. Phosphor layerD. All of the above redirect light
8. A spotted, grainy image is best called
A. spatial resolutionB. radiographic noiseC. quantum mottleD. luminescence
Fosbinder_Text_Chap08.indd 100 11/20/2010 1:10:08 PM

Chapter 8: Intensifying screens 101
5. Name the properties of an intensifying screen base.
6. Describe the relationship between resolution and phosphor crystal size, layer thickness, and phos-phor concentration.
7. Describe the difference between panchromatic and orthochromatic.
8. Discuss the process of luminescence.
9. Why is it necessary to have the fi lm and intensify-ing screen spectrally matched? List the rare earth phosphors and their colors.
10. How do intensifying screens reduce patient dose?
9. The refl ective layer utilizes which of the following materials?
1. magnesium oxide2. calcium tungstate3. titanium dioxide
A. 1 and 2B. 2 and 3C. 1 and 3D. 1, 2, and 3
10. Dirt trapped inside a cassette will have a _____ or _____ appearance on the fi lm.
A. white, positiveB. black, negativeC. black, positiveD. white, negative
Short Answer
1. The intensifying screens serve what purpose in the radiographic cassette.
2. Describe the difference between fl uorescence and phosphorescence.
3. List the four layers that make up the intensifying screen.
4. Why is afterglow not desirable for a radiographic image?
Chapter 8: Intensifying screens 101
Fosbinder_Text_Chap08.indd 101 11/20/2010 1:10:08 PM

102
Film and Processing
Key Terms● activator
● base plus fog
● characteristic curve
● clearing agent
● crossover effect
● crossover network
● Dmax
● densitometer
● developing
● drive system
● emulsion layer
● fi lm contrast
● fi lm speed
● fi xing
● Gurney Mott theory
● hardener
● hydroquinone
● latent image
● latitude
● optical density
● penetrometer
● phenidone
● preservative
● restrainer
● sensitivity speck
● sensitometer
● sensitometry
● shoulder region
● solvent
● straight-line portion
● toe region
● transport racks
● transport system
ObjectivesUpon completion of this chapter, the student will be able to:
1. Discuss the components of a radiographic fi lm.
2. Identify the stages of image formation.
3. List and describe the important portions of the characteristic curve.
4. Identify the optical density, speed, contrast, and latitude of a radiographic fi lm.
5. Identify the stages in fi lm processing.
6. List the components and describe the operation of automatic fi lm processors.
9
Fosbinder_Text_Chap09.indd 102 10/30/2010 6:12:42 PM

Chapter 9: Film and Processing 103
IntroductionIn this chapter, we address the composition of an x-ray fi lm, the formation of the latent image, and the fi lm characteristic curve. The fi lm characteristic curve contains information on the speed, contrast, and latitude of a fi lm. It is important for the student to understand the characteristics of an x-ray fi lm and how changes in the fi lm characteristics can change the appearance of the x-ray image.
Radiographic fi lm is becoming obsolete in the radiology department. This is because of the advent of Computed Radiography (CR) and Digital Radiography (DR) as the new imag-ing devices that save and store the image on a computer and the image is sent to a Picture Archiving and Communication (PAC) system, which can then be transferred to a CD ROM or sent via dedicated telephone line to other physicians.
Film ConstructionRadiographic fi lm is produced in a variety of sizes (Table 9.1).
Radiographic fi lm is composed of a layer of emulsion applied to one or both sides of a transparent polyester plastic base. The emulsion is attached to the polyester base by a thin layer of transparent adhesive. The adhesive layer provides uniform adhesion of the emulsion to the base. The soft emulsion layer is covered by a supercoat of hard gelatin. The supercoat layer protects the emulsion from scratching, pressure, and contamination during storage, loading, and handling (Fig. 9.1).
TABLE 9.1 STANDARD CASSETTE SIZES
Sizes in cm Sizes in inches
18 ´ 24 8 ´ 1024 ´ 30 10 ´ 1228 ´ 35 11 ´ 1435 ´ 43 14 ´ 17
Emulsion
Emulsion
Plastic baseAdhesive
Protectivesupercoat
Protectivesupercoat
Figure 9.1. Shows a cross section of a typical double- emulsion fi lm.
Polyester BaseThe polyester base provides support for the emulsion. The primary purpose of the base is to provide a rigid yet fl exible structure for the emulsion to be adhered to. It is constructed from polyester plastic about 150 to 200 mm thick. The base layer is strong, fl exible, and trans-parent, so there is no underlying pattern on the base, which would cause artifact on the image. It is usually tinted blue to reduce viewer eyestrain and fatigue. The fi lm base is also coated with a substance to pre-vent light photons from one screen crossing over to the other screen. This refl ection of light photons is called the crossover effect, causing blurring of the image.
Emulsion LayerThe emulsion layer is made up of silver halide crystals uniformly distributed in a clear gelatin. The emulsion layer thickness ranges from 5 to 10 mm. The gelatin holds the silver halide crystals in place and acts as a neu-tral lucent suspension medium that separates the silver halide crystals. Gelatin distributes the silver halide crys-tals uniformly over the base, preventing the crystals from clumping in one area and causing excessive photosensi-tivity in one area. Other necessary properties of the gela-tin include it being clear to permit light to travel through it without interference and it must be fl exible enough to bend without causing distortion to the recorded image.
Each silver halide crystal is made up of silver, bro-mine, and iodide atoms in a crystal lattice. All the atoms are in an ionic form. The silver ion is positive because it has one electron missing from its outer shell. The bromine and iodine ions are negative because they have an extra electron in their outer shells. The pres-ence of bromine and iodine ions in the crystal results
Fosbinder_Text_Chap09.indd 103 10/30/2010 6:12:43 PM

104 Part III: Image Formation
in a negative charge on the crystal surface. Although each company has an exact formula, the typical emulsion consists of 95% to 98% silver bromide, with the remainder consisting of silver iodide.
Impurities are added to the silver halide crystals to form a sensitivity speck. The sensitivity speck provides fi lm sensitivity and during processing of the radio-graphic image, the silver atoms are attracted to and concentrate at the location of the sensitivity speck. Changing the size and mixture of the silver halide crys-tals changes the response characteristics of the fi lm. Films with larger crystals generally are faster—that is, they are more sensitive to radiation and light—than fi lms with smaller crystals. As seen in Table 9.2, the relationships between crystal size and emulsion layer thickness directly affect the resolution and speed of the imaging system.
The silver halide crystals are designed to be sensi-tive to different wavelengths or colors of light. Conven-tional blue-sensitive, or panchromatic, fi lm is sensitive to blue wavelengths or light. Green-sensitive, or ortho-chromatic, fi lm is sensitive to green wavelengths of
light. These fi lms are matched to the spectrum of light emitted from the intensifying screens. The construction and application of intensifying screens are covered in Chapter 8.
Latent Image FormationWhen the remnant radiation exits the patient, it hits the radiographic fi lm and deposits energy into the silver halide crystals. The energy is deposited in a pattern that represents the part of the anatomy being radiographed; at this point, the image is not visible and is called a latent image. The Gurney Mott theory indicates that x-rays and visible light cause ionization of the atoms in the crystal. Ionized crystals are said to be exposed. The free electrons from the ionization are attracted to the sensitivity speck. The collection of negative electrons at the sensitivity speck attracts positive silver ions (Ag+) to the sensitivity speck, where they are neutralized to form silver atoms. When silver atoms are collected at the sensitivity speck, the charge structure outside the crystal is altered and the exposed crystal becomes part of the latent image. The latent image is the distribu-tion of exposed and unexposed crystals in the unde-veloped fi lm, caused by differential absorption in the patient. The latent image must be developed to become visible. Developing converts the silver ions in the exposed crystals to black metallic silver, thereby mak-ing the radiographic image visible. Figure 9.2 illustrates the migration of silver ions to the sensitivity speck where they form silver atoms, altering the charge pattern of the silver halide crystal.
TABLE 9.2 RELATIONSHIP OF CRYSTAL SIZE AND EMULSION TO FILM FACTORS
Crystal Size Emulsion Layer
Small Large Thin Thick
Speed Slow Fast Slow FastResolution High Low High Low
Sensitivity speck – – – – – –
––
––
––
––
––
––
–
– – – – ––
–––
–––
––
––
––
Unexposed crystal Exposed crystal Ag+ + e– = Ag
– – – – – ––
–––
––
––
––
––
– – – – ––
–––
–––
––
–––
––
––
–––
–––
Negative charge orelectrons released fromouter surface of crystaldue to light exposure
Silver is attracted to electrons at sensitivity speck, this process isrepeated until there is a buildupof silver on the crystal
Light
e–
e–e– e–
e–
e–
Ag+
Ag+
Figure 9.2. The charge patterns surrounding silver halide crystals in the emulsion are changed after exposure.
Fosbinder_Text_Chap09.indd 104 10/30/2010 6:12:43 PM

Chapter 9: Film and Processing 105
DensitometerA densitometer measures the blackness or density of the step wedge increments in units of optical density. Darker fi lms have higher optical densities. Optical density is obtained by measuring the light transmission through a fi lm with the densitometer, which consists of a cali-brated light source and a light detector. The densitom-eter compares the intensity of the light passing through a point on the fi lm to 100% light transmission. Figure 9.4 shows a photograph of a sensitometer and densitometer, and Figure 9.5 shows an example of a gray scale pattern produced by a sensitometer.
Optical DensityOptical density is defi ned as the logarithm of the ratio of the incident light intensity on the fi lm to the light intensity transmitted through the fi lm (Fig. 9.6).
Sensitometry and Densitometry
The sensitometer and densitometer are utilized in radi-ology department quality assurance programs. Various equipment is necessary to perform sensitometry pro-cedures. A penetrometer or sensitometer is required to produce a uniform range of densities on a fi lm. A densi-tometer is required to provide an accurate reading of the densities or amount of light transmitted through the fi lm. The resulting densities are measured and evaluated to determine if the x-ray equipment is operating properly.
PenetrometerA penetrometer is a series of increasingly thick, uniform absorbers typically made of aluminum steps and is known as a step wedge. The penetrometer is used to produce a step wedge pattern on radiographic fi lm during an expo-sure of x-rays (Fig. 9.3). Due to the large number of vari-ables in generating an x-ray beam, the penetrometer is not recommended for use in a quality assurance program.
SensitometerSensitometry is the measurement of a fi lm’s response to processing and different amounts of light. A sensitometer is designed to expose the fi lm to a reproducible, uniform light through a series of progressively darker fi lters or opti-cal step wedges. The image formed by the sensitometer is a series of steps progressing from clear to black. The sen-sitometer is the preferred device because it reproduces the same amount of light each time it is used. Factors that might cause the intensity of the x-ray beam to fl uctu-ate are controlled by the circuitry that provides the exact quantity of power each time the sensitometer is used.
Figure 9.3. Penetrometer.
A
B
Figure 9.4. (A) Sensitometer. (B) Densitometer.
Fosbinder_Text_Chap09.indd 105 10/30/2010 6:12:44 PM

106 Part III: Image Formation
Table 9.3 shows the range of light transmission as it corresponds to various levels of optical density. The abil-ity of a fi lm to stop light transmission is called opacity. Darker fi lms have smaller transmission values and higher optical density or opacity values. Most diagnostic fi lms in radiology have optical densities in the range of 0.0 to 4.0. An optical density of 0.0 is clear, and an optical density of 4.0 is very black.
CRITICAL THINKING
A fi lm transmits 10% of the incident light. What is the optical density?
Answer
OD = log10 (Io/It)OD = log10 (100/10)OD = log10 (10)OD = 1
Using Table 9.3, it is easy to determine that with an OD of 1.0 only 10% of light is transmitted through the fi lm and there is a corresponding opacity of 10. If the OD number was increased to 1.3, the percentage of light
In mathematical terms, optical density is defi ned as:
OD = log10 (Io/It)
where Io is the incident light intensity and It is the trans-mitted light intensity.
Optical density is useful because the human eye has a log-arithmic response. If fi lm A has an optical density one-half that of fi lm B, then fi lm A will appear as bright as fi lm B.
Figure 9.5. Grayscale image produced by the sensitometer.
Light source
100%
1%
Figure 9.6. Shows the transmission of light through a fi lm that transmits 1% of the incident light and has an OD of 2.
TABLE 9.3 RANGE OF OPTICAL DENSITIES
Opacity OD Number Percentage of Light Transmitted
1 0.0 1002 0.3 504 0.6 258 0.9 12.510 1.0 1020 1.3 540 1.6 2.580 1.9 1.25100 2.0 1200 2.3 0.05400 2.6 0.025800 2.9 0.1251,000 3.0 0.12,000 3.3 0.054,000 3.6 0.0258,000 3.9 0.012510,000 4.0 0.01
Fosbinder_Text_Chap09.indd 106 10/30/2010 6:12:48 PM

Chapter 9: Film and Processing 107
before processing ranges from 0.05 to 0.10. Processing typically adds OD 0.05 to 0.10 in fog density. The total base plus fog should not exceed OD 0.20. In the toe region, only a few of the silver halide crystals have been exposed. The toe region represents the area of low expo-sure levels. The optical density in the toe region ranges from 0.2 to 0.5.
In the straight-line portion of the curve, there is a linear relationship between optical density and the logarithm of the relative exposure (log relative exposure). The straight-line portion of the characteristic curve is the range used in radiology. The optical density of the straight-line por-tion of the curve ranges from 0.5 to 2.5.
In the shoulder region of the curve, most of the silver halide crystals have been exposed and any additional exposure does not produce much additional blacken-ing. The shoulder region represents the area of high exposure levels. The optical density in the shoulder region is >2.5.
Dmax is the maximum density the fi lm is capable of recording. It is the highest point of the characteristic curve and represents the region where all the silver halide crystals are completely covered in silver atoms and can-not accept any more. Additional exposure will result in less density because the silver atoms will become ionized again, which will reverse their charge and cause them to be repelled from the sensitivity speck. This principle is utilized with duplication fi lm where the fi lm has been pre-exposed to Dmax and additional exposure will cause a reversed, duplicated image.
Film SpeedFilm speed describes the ability of an x-ray fi lm to respond to an x-ray exposure. Speed is determined by the fi lm’s sensitivity to exposure and is controlled by the activity of phenidone which affects the toe portion of the character-istic curve. The position of the toe will determine how soon the straight-line portion will begin, which is an indi-cation of the speed of the fi lm (Fig. 9.8). The sensitivity of the fi lm is determined by the size of the silver halide crystals, the number of sensitivity specks, and the thick-ness of the emulsion. Larger crystal size with increased numbers of sensitivity specks suspended in a thick emul-sion, all increase the speed of the fi lm.
The speed point of a fi lm describes the exposure required to produce an optical density of 1.0 above base
transmitted through the fi lm would be 5% or one-half. This change means that less light was transmitted through the fi lm so the opacity of the fi lm is doubled to 20. This demonstrates that changes of 0.3 increments in OD num-bers represent a doubling or halving in opacity.
Characteristic CurveThe three most important characteristics of a radio-graphic fi lm are speed, contrast, and latitude. A plot of the optical density as a function of the logarithm of the exposure is called the characteristic curve. The charac-teristic curve shows the speed, contrast, and latitude of a particular fi lm. Changing the emulsion thickness or the size or distribution of the silver halide crystals changes the fi lm characteristics. The characteristic curves are also known as the sensitometric, D log E, or H&D curves.
Figure 9.7 shows a typical characteristic curve. The four regions of the characteristic curve are the base plug fog, toe region, straight-line portion, shoulder region, and maximum density (Dmax).
The base plus fog region describes the initial fi lm density before exposure to x-ray photons. Base plus fog arises from the tint of the polyester support base plus any fog the fi lm has been exposed to. Fog may be caused from exposure to background radiation, heat, and chem-icals during storage. The optical density in the fi lm base
Base + fog
Opt
ical
den
sity
Log relative exposure (mR)1.0
1
3
2
Straight-lineportion
Shoulder
Toe
2.0 3.0 4.0
.02
Dmax
Figure 9.7. Characteristic curve.
Fosbinder_Text_Chap09.indd 107 10/30/2010 6:12:49 PM

108 Part III: Image Formation
increases latitude will decrease. Wide-latitude fi lms have low contrast; narrow-latitude fi lms have higher contrast.
Wide-latitude images are termed long grayscale con-trast and produce images with high kVp setting. They produce acceptable images over a greater range of tech-nical factors. There is more margin of error in the mAs settings with wide-latitude images. Conversely, an image
plus fog. The terms faster and slower survive from the early days of photography; when portrait photos required sitting still for long periods of time. Using a faster fi lm meant a shorter sitting time because the fi lm required less exposure. A faster fi lm requires less exposure and a lower mAs setting to produce the same optical density.
Film ContrastFilm contrast is the difference in optical density between two areas in the image. The contrast of a particular radio-graphic fi lm is fi xed by the manufacturer. Film contrast is measured on the slope of the straight-line portion of the characteristic curve at the speed point, which is also called the fi lm gamma. Films with exposures between OD 0.5 and 2.5 exhibit contrast in the diagnostic range. Films with optical density in the toe or shoulder portion of the characteristic curve demonstrate a loss of contrast (Fig. 9.9). Films with steeper straight-line portions have higher contrast (Fig. 9.10).
LatitudeLatitude describes the range of exposures that produce an acceptable radiograph with densities in the diagnostic range. Films can have wide or narrow latitude. Latitude and contrast are inversely related meaning that as contrast
Opt
ical
den
sity
Log relative exposure (mR)0.5
1
3
2
BA
1.0 2.0 3.0
Speedpoints
Figure 9.8. Shows the characteristic curves for two fi lms with different speeds. Film A is faster, and fi lm B is slower. Film A is faster than fi lm B because it requires less expo-sure to achieve an OD of 1 above the base plus fog level.
Opt
ical
den
sity
Log relative exposure (mR)0.3 0.6 0.9
1
0
3
4
2
1.2 1.5 1.8 2.1 2.4 2.7 3.0
Diagnosticallyusefuldensities
Figure 9.9. Contrast is reduced when an exposure results in densities that lie in the toe or shoulder regions. The radiographer must control exposure factors to produce optical densities in the diagnostic range.
Opt
ical
den
sity
Log relative exposure (mR)0.3 0.6 0.9
1
0
3
2
1.2 1.5 1.8 2.1 2.4 2.7 3.0 3.3 3.6
Film A
Film B
Figure 9.10. Comparison of fi lm contrast. Film A has higher contrast because it has a greater slope of the straight-line portion.
Fosbinder_Text_Chap09.indd 108 10/30/2010 6:12:50 PM

Chapter 9: Film and Processing 109
one side of the base, and so small objects and sharp edges are not blurred as much. In addition, there is a possibility that light from one intensifying screen will pass through the emulsion and fi lm base to expose the opposite emul-sion. Such “crossover” light is spread out and reduces the sharpness of the image.
It is possible to identify the emulsion side, even in the darkroom under safelights, because light refl ection makes the emulsion side look dull and the base side appear shiny. The manufacturers place notches on one edge of single-emulsion fi lm to aid in identifi cation of the emulsion side in the dark. When the fi lm is positioned with the notches at the upper right corner of the fi lm, the emulsion is fac-ing up. It is important to have the emulsion side of single-emulsion fi lm facing the intensifying screen, which is the light source. If the fi lm is facing backward, the image will be blurred because the light must pass through the base before reaching the emulsion.
Mammographic FilmMammographic fi lm is a single-emulsion fi lm with very fi ne crystals. Mammographic fi lms are a compromise between the need for high sensitivity with low patient dose and very high spatial resolution. Mammographic fi lms are designed to be used with a single high-resolution screen. The emulsion is always placed in contact with the intensifying screen (Fig. 9.12).
Duplication FilmDuplication fi lm is a specialty fi lm that is used to pro-duce copies of conventional radiographs. It is available in the same standard sizes as conventional fi lm. Dupli-cation fi lm is a single-emulsion fi lm that is designed to be sensitive to ultraviolet (UV) light from the duplicat-ing machine. The duplicating fi lm is placed in contact
with a narrow latitude requires the mAs and kVp to be set close to the optimal settings and are caused by using low kVp. Narrow-latitude images are termed short grayscale contrast or high contrast and there is less margin of error with the mAs and kVp settings. Figure 9.11 shows the characteristic curves of fi lms with different latitudes.
Film A has a narrower latitude and a higher contrast than fi lm B. Films with narrow latitudes produce high-contrast images. Film B has a wider latitude and pro-duces lower-contrast images. Generally, higher-speed fi lms have higher contrast and narrower latitude; slower-speed fi lms have lower contrast and wider latitude.
Specialty Types of Film
Specialty types of fi lm used in radiology include mam-mographic, hard copy, and duplication. All specialty fi lms are single-emulsion fi lms. A single-emulsion fi lm has emulsion on only one side of the polyester fi lm base. Single-emulsion fi lm is processed in the same manner as double-emulsion fi lm. It provides better resolution than double-emulsion fi lm because with double-emulsion fi lm, the images from the two sides are not exactly superimposed unless they are viewed directly head on, whereas with single-emulsion fi lm, the image is on only
Opt
ical
den
sity
Log relative exposure (mR)0.5
1
3
2
BA
1.0 2.0 3.0
Figure 9.11. Characteristic curves of fi lms having different latitude values.
Emulsion
Plastic base
Adhesive
Overcoat
Figure 9.12. Illustration of a single-emulsion mammographic fi lm.
Fosbinder_Text_Chap09.indd 109 10/30/2010 6:12:50 PM

110 Part III: Image Formation
Film Storage and Handling
Film is very sensitive to storage and handling conditions. Improper storage or handling can produce fog or artifacts. Fog is an increase in density over the entire fi lm. Artifacts are unwanted local densities on the fi nal image. Radiographic fi lm is sensitive to light, temperature, humidity, radiation, and improper handling. Exposed but undeveloped fi lm is much more sensitive to radiation than unexposed fi lm.
LightRadiographic fi lm is designed to be sensitive to light from the intensifying screens. It is also sensitive to vis-ible light and will fog if it is exposed to room lights. It must be handled and loaded in a darkroom. Darkrooms are equipped with safelights. Safelights are designed to fi lter out light that is energetic enough to exposure the fi lm. Blue-sensitive fi lm is not sensitive to amber light, so an amber safelight fi lter is used with blue-sensitive fi lm. Green-sensitive, or orthochromatic, fi lm is sensitive to an ordinary amber safelight and therefore requires a special deep red safelight fi lter such as a GBX fi lter (Fig. 9.14).
Temperature, Humidity, and StorageFilm should be stored in a cool, dry place with a temper-ature <68°F and with <60% relative humidity. Storage under heat conditions above 75°F will increase the fog and decrease the image contrast. Storage under condi-tions of low humidity, less than about 40%, will increase static artifacts.
Storage of fi lm should not be longer than the expira-tion date on the box of fi lm. Forty-fi ve days should be the average storage time. Film must be stored on end, not fl at. Film boxes must be carefully opened and the fi lm and cardboard insert should be removed carefully to avoid abrasion artifacts.
RadiationFilm must be shielded from radiation exposure. Even a few milliroentgens will produce a noticeable increase in
with the original fi lm and exposed in the duplicator for a few seconds. No x-rays are used. The duplication fi lm is then processed in the usual manner. Duplication fi lm is designed so that clear areas on the original fi lm produce clear areas on the duplicate fi lm. It is sometimes called reversal fi lm because its response to light is reversed from that of normal fi lm (Fig. 9.13). With normal fi lm, longer exposures result in darker images; with duplication fi lm, longer exposures produce lighter images. Duplicating fi lm uses UV light to expose the fi lm.
Hard Copy, Laser Printer, or Multiformat FilmHard copy fi lm is used to provide a permanent record of an electronically displayed image. Digital images from computed tomography, ultrasound, nuclear medicine, or magnetic resonance imaging units are initially presented on monitors or on electronic “soft” displays, and only certain images are selected for the permanent hard copy record. Hard copies can be produced by a laser printer or a multiformat camera. In a laser printer, the intensity of the laser beam depends upon the strength of the electronic image signal in a process called laser-beam modulation. While the beam is modulated the laser beam writes in a raster fashion over the entire fi lm. The spatial resolution of the laser printer is superior to that of the multiformat camera. The number of images on one fi lm, known as the image format, can be selected by the operator. Typical image formats are 4, 6, or 12 images on one fi lm.
Opt
ical
den
sity
Relative exposure
0
1
2
3
1.0 2.0 3.0 4.0
Figure 9.13. Shows H and D curves for duplicating fi lm.
Fosbinder_Text_Chap09.indd 110 10/30/2010 6:12:51 PM

Chapter 9: Film and Processing 111
fi lm processing can change the appearance of the fi nal image.
fog. Exposure to scattered radiation in fl uoroscopy rooms is a possible source of radiation fog. To decrease the chance of unwanted radiation exposure the fi lm bin is lined with lead and the darkroom must have lead shield-ing in the walls if the darkroom is located next to a radio-graphic room.
Improper Handling of FilmUnexposed fi lm is sensitive to shock, pressure, and improper handling. Dropping a box of unexposed fi lm can cause artifacts on the edge or corner that strikes the fl oor. The sensitivity of fi lm to pressure can be demon-strated by placing a piece of paper over an undeveloped fi lm and writing on the paper. The pressure of the pen through the paper will alter the emulsion so that the writ-ing will show after the fi lm is developed. Hands need to be clean and free from lotions or creams prior to handling fi lm. Creams and oils from the hands cause fi ngerprint artifacts on the fi lm emulsion. Film boxes should always be stored on end to avoid abrasion and pressure artifacts. Rough handling can cause crease densities to appear on the developed fi lm. Rapid removal of unexposed fi lm from the storage box can produce static artifacts.
After the invisible latent image is formed on the fi lm, it is necessary to develop the fi lm. This involves reducing the exposed silver halide crystals of the latent image to metallic silver and dissolving away the unexposed silver halide crystals. This development is a chemical process that is usually done in an automatic fi lm processor. It is important for the student to recognize how changes in
Ligh
t abs
orpt
ion
Orthochromatic film
700300 400Blue Green Yellow Red
600500
Green sensitive film
GBX or Red Safe Light
Filt
er a
bsor
ptio
n
Figure 9.14. Safelight curves for different types of fi lm
Automatic Film Processing
An animation for this topic can be viewed at http://thepoint.lww.com/FosbinderText
Processing a fi lm transforms the invisible latent image into a permanent visible image. The visible image is produced by reducing silver ions in the exposed crystals to black metallic silver. The metallic silver on the fi lm appears black instead of the familiar shiny silver color because the silver crystals are so small that they scatter light instead of refl ecting it. Film processing consists of four stages: developing, fi xing, washing, and drying. Each stage of processing is essential in the production of a diagnostic quality radiograph.
DevelopingDeveloping is the fi rst step in processing a fi lm. The devel-oper is a water-based solution containing chemicals that will reduce the exposed silver halide crystals to metallic
Fosbinder_Text_Chap09.indd 111 10/30/2010 6:12:52 PM

112 Part III: Image Formation
called fi xing. The fi xer stops the reducing action of the developer and removes the unexposed silver halide crystals. The fi xer solution is also called the clearing agent because it removes unexposed and undeveloped silver halide crystals from the emulsion. The clearing agent in the fi xer solution is ammonium thiosulfate. The action of the clearing agent prepares the fi lm for archiving. If the fi xer does not completely remove the unexposed silver halide crystals, the fi lm will have a milky appearance and will not stand up to the archival conditions. Although the clearing agent is the primary agent in the fi xer, other chemicals are also used to complete the fi xation process (Table 9.4).
● Activator: Acetic acid maintains the pH to enhance the clearing agent
● Preservative: Dissolves silver from the ammonium thiosulfate
● Hardener: Prevents scratches and abrasions during processing; insuffi cient hardener causes fi lms to have moist, soft surfaces
● Solvent: Dissolves other chemicals
WashingDeveloper or fi xer chemicals that are left in the emulsion will slowly be oxidized by the air and will turn the fi lm brown. The washing stage removes all chemicals remaining
silver without changing the unexposed silver halide crystals. The reducing agents used in automatic processors are phenidone and hydroquinone. Phenidone rapidly reduces silver and enhances fi ne detail and subtle shades of gray. It is not able to reduce heavily exposed areas of an image. Hydroquinone slowly reduces silver and produces areas of heavy density or the darkest shades. Combining these two chemicals creates a solution with exceptional reducing abilities that controls the optical density of the processed radiograph. Other chemicals are used during the develop-ing stage, which assist in producing a radiographic image.
● Activator: Enhances developer solution by maintain-ing an alkaline state
● Restrainer: Added to developer solution to restrict the reducing agent
● Preservative: Helps reduce oxidation when reduc-ing agents are combined with air
● Hardener: Controls swelling of gelatin, maintains uniform thickness, and hardens emulsion; insuffi cient hardener causes fi lms to have moist, soft surfaces
● Solvent: Filtered water that dissolves chemicals prior to use
FixingThe action of the developer must be stopped before the fi lm can be exposed to light; this is done by a process
TABLE 9.4 CHEMICALS CONTAINED IN THE DEVELOPER AND FIXER SOLUTION AND THEIR FUNCTIONS
Chemical Function
Developer
Hydroquinone Reducing Agent, slowly produces dark areasPhenidone Reducing Agent, rapidly produces fi ne detail shades of graySodium carbonate Activator, swells gelatin, maintain alkaline pHPotassium bromide Restrainer, decreases reducing agent activity, antifoggingSodium sulfi te Preservative, controls oxidationGlutaraldehyde Hardener, hardens emulsion, controls emulsion swellingWater Solvent, dissolves chemicals for use
Fixer
Ammonium thiosulfate Clearing Agent, removes undeveloped silver halide crystals from emulsion
Acetic acid Activator , provides acidic pHPotassium alum Hardener, hardens and shrinks emulsionSodium sulfi te Preservative, maintains acidic pHWater Solvent, dissolves chemicals
Fosbinder_Text_Chap09.indd 112 10/30/2010 6:12:52 PM

Chapter 9: Film and Processing 113
and turns on the transport system and the pumps to replenish the developer and fi xer solutions. The micro-switch remains on for the length of time that it takes the fi lm to travel through the microswitch.
The processing of each fi lm uses up small amounts of the developer and fi xer chemicals. The replenishment system automatically maintains the correct chemical con-centration. Each time a fi lm is processed, the microswitch activates the replenishment pumps to add developer and fi xer solutions. The replenishment solutions are contained in large replenishment tanks located near the processor.
Copy fi lms are different from conventional fi lms. Replenishment rates adjusted for conventional double-emulsion fi lms will not maintain the proper chemical con-centrations after a large number of copy fi lms have been processed because copy fi lm has only a single-emulsion layer. This is especially important if the processor is also used to develop mammography fi lms, which require crit-ical control of processor chemistry.
Automatic processors have a standby switch that turns the transport roller drive motor off after a few minutes of inactivity. This motor must be restarted before another fi lm can be processed.
Film Transport SystemThe fi lm transport system carries the fi lm through the developer, fi xer, and wash tanks and through the dryer chamber. The fi lm transport system regulates the amount of time the fi lm is immersed in each solution and agitates the chemicals to ensure maximum reaction. The feed tray at the entrance to the automatic processor guides the fi lm into the processor. Entrance rollers grip the fi lm as it begins the trip through the processor. At this point, there is also a microswitch that is activated by the fi lm. When feeding fi lms in the processor, it is necessary to place the fi lm on the tray so that the short axis enters the processor. This allows for the least amount of chemicals to be used to adequately process the fi lm. When feeding multiple fi lms into the processor, it is also necessary to alternate sides from fi lm to fi lm. This allows for even wear of the transport system components. The transport system con-sists of three distinct subsystems: transport racks, cross-over network, and drive system.
in the emulsion. The incoming wash water is fi ltered before it enters the wash tank. The water is constantly circulated and drained to ensure that it is clean. Unremoved fi xer can combine with metallic silver crystals to form silver sulfi de or dichroitic stains. Incomplete removal of the fi xer solu-tion is known as hyporetention. Degradation of the image quality of stored fi lms as a result of incomplete washing will appear only after several years.
DryingMost of the wash water is removed by the processor rollers as the fi lm is transported into the drying chamber. The fi nal drying of the fi lm is done by blowing hot air over both sides of the fi lm as it begins to exit the processor. Drying removes the remnants of the water on the fi lm. It also shrinks and hardens the emulsion and seals the supercoat to protect the fi lm during handling and storage. In order to suffi ciently dry the fi lm, the hot air must be between 120°F and 150°F (43°C–65°C).
ContaminationContamination of the basic developer by the acid fi xer lowers the pH, reducing the effectiveness of the devel-oper and producing lower-contrast, “washed-out” images. Contamination can occur when new chemicals are added or during the cleaning of fi lm transport compo-nents. Drops of warm fi xer can condense and contami-nate the developer solution when the processor is turned off. For this reason, the lid of the processor should always be lifted and propped partially open when the processor is turned off. This will allow vapors to escape and reduce cross-contamination and corrosion of processor parts.
Contamination of the fi xer by the developer is not a problem. Some developer is inevitably carried along when the fi lm is transferred into the fi xer tank. The processor system is designed to compensate for this contamination.
Recirculation and ReplenishmentThe developer and fi xer solutions must be constantly mixed to ensure that their chemical strength is uniform. Mixing also ensures that fresh chemicals come in contact with the emulsion. This mixing or agitation is produced by circulation pumps. A microswitch on the fi rst set of transport rollers senses each fi lm as it enters the processor
Fosbinder_Text_Chap09.indd 113 10/30/2010 6:12:52 PM

114 Part III: Image Formation
Crossover NetworksAs seen in Figure 9.17, at the top of each tank, the fi lm is carried across to the next tank by a crossover net-work. The crossover network also contains rollers and guide shoes. The rollers squeeze out the chemicals in the emulsion prior to the fi lm entering the next tank. The assembly is similar to that in the transport racks. If the guide shoes become misaligned, the fi lm emulsion will be scratched. The primary cause of guide-shoe mis-alignment is the improper seating of the transport racks and crossover networks.
Drive SystemThe drive system is a series of mechanical devices de signed to turn the rollers in the processor. The speed of the drive system is usually set to move the fi lm from the entrance rollers to the output bin. The transport system drive motor and gears are usually set for 90-second processing. The speed controls the length of time the fi lm spends in each solution. After washing, the fi lm passes through the dryer and is deposited in the output bin. The fi lm transport roll-ers, crossover racks, and guide shoes must be periodically cleaned to maintain good quality images.
Transport RacksThere are three types of rollers used in the transport racks: transport rollers, master rollers, and planetary roll-ers. Transport rollers, 1 inch in diameter, grip the fi lm at the feed tray and guide the fi lm into the processor.
As seen in Figure 9.15, the rollers are positioned oppo-site each other in pairs or are offset from one another; this provides constant tension to move the fi lm down into and up out of the processing tanks. When the fi lm reaches the end of a series of rollers, it must be bent and turned to travel in the reverse direction. At the bottom of each vertical rack there is a turnaround assembly containing a large master roller, smaller planetary rollers, and guide shoes that hold the fi lm against the master roller while the fi lm reverses direction. The guide shoes have ribs to reduce friction and keep the fi lm in alignment. Guide-shoe misalignment can remove some of the soft emul-sion, causing processor artifacts, which appear as white scratch lines in the direction of fi lm travel (Fig. 9.16).
After the fi lm has cleared the master roller, it will then be pointing upward and will be pulled along by the next set of offset rollers. When the fi lm reaches the top of the transport rack, it is guided into the next set of racks by a crossover network.
Guide shoe
FixerDeveloper Wash Dryer
Receiving bin
Feed tray
Transportrollers
Crossover racks
Figure 9.15. Illustrates the transport system that takes the fi lm from the feed tray through a series of rollers into the development tank, the fi xer tank, the wash tank, and fi nally the drying chamber.
Fosbinder_Text_Chap09.indd 114 10/30/2010 6:12:52 PM

Chapter 9: Film and Processing 115
A thermostat controls heating elements to maintain the developer and fi xer at the proper temperature. The thermostat is set to maintain the developer temperature in the range between 92°F and 95°F in 90-second auto-matic processors. Developer temperatures below this range result in slower chemical reactions and an under-developed fi lm with decreased density and low contrast. Temperatures above this range result in rapid chemical reactions, overdeveloped fi lm, increased image density, and a high-contrast, narrow-latitude image.
Rapid ProcessingBy increasing the temperature and chemical concen-trations, the total processing time can be reduced to 45 seconds. The sensitometric characteristics of rapid processing fi lms are designed to be identical to conven-tional 90-second processed fi lm.
Extended ProcessingExtended processing is used in mammography to increase the fi lm contrast and speed and reduce the patient dose.
Effect of Concentration, Time, and TemperatureAny change in developer concentration, developing time, or developing temperature will change the speed, contrast, and base fog of the image. An increase in time, temperature, or concentration will increase the fi lm speed and base plus fog. An increase in the time, tem-perature, or concentration will also increase the contrast of the fi lm.
The speed of the transport motor controls the amount of time the fi lm is immersed in the developer, fi xer, and wash tanks. Time and temperature are inversely propor-tional; as one is increased, the other must be decreased to maintain the same optical density for the same exposure.
Figure 9.16. Image shows artifacts produced by misaligned guide shoes.
Guide shoes
Turnaroundassembly
Transportrollers
Crossover racks Guide shoes
Figure 9.17. An expanded view of the transport system guide shoes and crossover rack.
Fosbinder_Text_Chap09.indd 115 10/30/2010 6:12:53 PM

116 Part III: Image Formation
Silver RecoveryThe fi nal processed fi lm contains only about half the silver contained in the original emulsion. Silver is classifi ed as a toxic heavy metal by the Environmental Protection Agency. Environmental laws restrict the amount of silver discharged in waste liquid to <5 parts per million. Therefore, the silver must be removed from the fi xer solution before that solu-tion is discarded as waste. The most common method of sil-ver removal is the electrolytic recovery system. This system is attached to the drain or waste line of the fi xer tank; the used fi xer solution circulates through the recovery system where an electric current removes the silver ions from the fi xer solution and converts them into metallic silver. The recovered silver can be sold to commercial companies.
Daylight Processing Systems
With daylight processing systems, a darkroom is not required in order to load and unload the fi lm cassettes. All fi lm handling is done automatically inside the day-light processor. An exposed cassette is placed in the entrance slot, and the cassette is drawn into the daylight
Standard chemicals and temperatures are used, but the processing time is extended to 3 minutes by slowing the fi lm transport speed.
Processor Quality AssuranceProcessing is the last in a long series of careful steps designed to produce a diagnostic quality image. Any error in process-ing will prevent the production of high-quality radiographs. Processor cleanliness, temperature, and chemical effec-tiveness must be maintained within strict limits. The roll-ers and gears must be periodically inspected for wear and replaced before their degradation affects image quality.
The DarkroomThe darkroom is an essential part of a radiology depart-ment. The darkroom entrance should be designed so that entry does not inadvertently expose fi lms. Lightproof mazes, rotating doors, interlocks, and double entry doors are used to eliminate the possibility of exposure of an undeveloped fi lm to light. The darkroom temperature and humidity must be controlled to avoid artifacts.
Darkroom SafelightsAn exposed fi lm is much more sensitive than an unex-posed fi lm because some silver halide crystals may have been partially exposed. Darkrooms do not have to be totally dark, but the light level must be very low. Safelights provide low-level illumination without exposing the fi lm. A safelight contains a low-wattage (7–15 W) light bulb with a special fi lter to maintain low light intensity. An amber fi lter is used with a blue-sensitive fi lm. The GBX fi lters produce a deep red light. Red light from the GBX fi lter has low energy and is safe for green-sensitive ortho-chromatic fi lms. The safelight must be 4 ft from the work area to prevent safelight fogging of the fi lm.
A test can be performed to determine the amount of safe-light fogging. Half of a uniformly exposed but undeveloped fi lm is covered with a piece of cardboard, and the fi lm is left on the darkroom table under the safelight for 2 minutes. The fi lm is then developed in the usual way. After processing, the difference in the optical density between the covered and uncovered sides should be <0.05 OD (Figure 9.18).
Figure 9.18. Result from a darkroom safelight test.
Fosbinder_Text_Chap09.indd 116 10/30/2010 6:12:55 PM

Chapter 9: Film and Processing 117
processor and opened. The fi lm is removed from the cassette and started through the processing cycle. The cassette is then reloaded with an unexposed fi lm, which is stored in a bulk magazine inside the daylight proces-sor, and returned ready for another exposure (Fig. 9.19). The daylight processor has a storage magazine for each size fi lm used by the department. Of course, a darkroom is still needed to load the daylight processor’s magazines. The development, fi xing, washing, and drying cycles are the same as in a conventional automatic processor.
Dry Processing FilmDry processing fi lm (Fig. 9.20) is used to permanently record digital images from computed tomography, mag-netic resonance imaging, ultrasound, and digital radio-graphic systems. The digital image data are transferred with a laser beam onto a special fi lm, which is then pro-cessed using heat to fi x the image on the fi lm. There are no chemicals used for dry processing and there is no need for silver reclamation.
Figure 9.19. Daylight processing system.
Figure 9.20. Dry fi lm processing system.
Fosbinder_Text_Chap09.indd 117 10/30/2010 6:12:56 PM

118 Part III: Image Formation
Case StudyJanet has just arrived at 6:00 am for her shift and turned on the processor. There is an emergency room patient who must have a single-view chest exam STAT. She performed the exam and has run the fi lm through the automatic processor. When the fi lm drops into the output bin, Janet notices that the fi lm has scratch lines in the direction the fi lm traveled through the processor. The fi lm also has a decreased amount of density and lower contrast than Janet expected. Using your knowledge of automatic processing determine answers to the following questions.
Critical Thinking Questions
How did scratch lines get on the fi lm?
Is this an adjustment Janet can make?
What has changed the appearance of the image?
Did Janet use enough kVp and mAs?
Or is it another problem?
The scratch lines occur when the guide shoes are not in alignment as the fi lm travels through
darkroom safelight and fi lter must match the characteristics of the fi lm used. The processing chemicals are classifi ed as hazardous materials and must be disposed of in an approved manner. Daylight processors permit the development of exposed fi lm without the need to open the exposed cassette in a darkroom. Dry fi lm systems do not require developing solutions; instead, they use heat to fi x the image on the fi lm.
Chapter SummaryRadiographic fi lms consist of an emulsion containing silver halide crystals coated on a polyester base. Exposure to x-rays and visible light produces changes in the silver halide crystals to form a latent image. The latent image is the distribution of exposed and unexposed silver halide crystals on the fi lm. Developing the fi lm changes the latent image into a perma-nent visible image. Film development converts exposed silver halide crystals to black metallic silver and removes the unexposed crystals. The transmission of light through a radiographic fi lm is described by the fi lm’s optical density. Optical density is a measure of the degree of darkness of the fi lm. Higher-speed fi lms require less expo-sure to produce a given density. High-contrast fi lms produce large density differences for small differences in exposure. Films with wide latitude produce acceptable image densities over a wide range of exposures. Orthochromatic fi lm is sensi-tive to green light and requires a special deep red safelight fi lter. Radiographic fi lm is sensitive to light, temperature, humidity, radiation, and pres-sure during storage and handling. Improper stor-age and handling can produce artifacts and fog that produces unwanted densities on the fi lm.
Film processing consists of developing, fi xing, washing, and drying. Film processing converts the latent image in the emulsion into a per-manent visible image by reducing the exposed silver halide grains to black metallic silver. Chemical agents in the basic developer solution include two reducing agents, hydroquinone and phenidone. The fi xer is an acidic solution that stops the developer action. It contains ammo-nium thiosulfate, which dissolves away the unexposed silver halide crystals. Changing the developer chemical concentrations, the time, or the temperature will change the speed, contrast, and base fog of the fi nal image.
Film must be processed in the dark, either in a darkroom or in a daylight fi lm processor. The
Fosbinder_Text_Chap09.indd 118 10/30/2010 6:12:59 PM

Chapter 9: Film and Processing 119
the automatic processor, the guide shoes help to move the fi lm around a roller. If the guide shoes are misaligned, they will leave scratch lines in the fi lm. When the transport racks were cleaned, the guide shoes must have become misaligned, and the processor repair man needs to be called to realign the guide shoes. In regard to the appearance of the images, Janet believes that it is not a problem with the tech-nique she used since she followed the tech-nique chart for body part and body habitus. She next turns her attention to the automatic pro-cessor. Since it is so early in the morning, the processor may not have been properly warmed up before she ran the processor. She will need to check the crossover racks and make sure they
are properly seated in the processor. This will fi x the problems of the scratches. Janet checks the temperature of the processor and it shows a temperature of 88°F. She knows the processor must be warmed to 92°F to 95°F to properly process the fi lms. The fi lm is underdeveloped because the developer has not reached the optimum temperature to ensure that proper chemical reactions take place between the developer chemicals and fi lm emulsion. This error has reminded Janet that she must check the temperature of the processor before run-ning fi lms, the decreased density on the fi lm meant that she would need to repeat the fi lm, which results in additional radiation dose for the patient.
Fosbinder_Text_Chap09.indd 119 10/30/2010 6:13:00 PM

120 Part III: Image Formation
Review Questions
6. The developer solution
A. softens the emulsionB. reduces the exposed silver halide crystals to black
metallic silverC. produces an alkaline pHD. does all of the above
7. Replenishment systems in an automatic processor replenish
A. unexposed fi lm emulsionB. developer and fi xer solutionsC. used wash waterD. drying racks
8. Which of the following is a reducing agent?
A. GlutaraldehydeB. HydroquinoneC. Acetic acidD. Alum
9. The hardening agent in the fi xer is
A. glutaraldehydeB. sodium sulfi teC. potassium alumD. ammonium thiosulfate
10. The purpose of the guide shoes in the transport racks is to
A. allow the fi lm to move up or downB. to force the edge of the fi lm around the master
rollerC. to bend the fi lm in the crossover networkD. pull the fi lm from the fi lm tray into the transport
rack
Multiple Choice 1. Which region of the characteristic curve represents
the inherent density in the fi lm?
A. Base plus fogB. Toe regionC. ShoulderD. Straight line portion
2. On the characteristic curve the toe region will display optical densities in which range?
A. 0.1 to 4.0B. 0.4 to 6.0C. 0.0 to 3.5D. 0.2 to 5.0
3. What is the relationship between optical density and the log relative exposure on the characteristic curve?
A. Non-linearB. LinearC. CurvilinearD. Non-curvilinear
4. Which area on the characteristic curve represents high exposure levels?
A. Toe regionB. Straight line portionC. ShoulderD. Dmax
5. A high-contrast fi lm has a _____ latitude.
A. wideB. narrow
Fosbinder_Text_Chap09.indd 120 10/30/2010 6:13:00 PM

Chapter 9: Film and Processing 121
11. The GBX fi lter is safe for use with which type of fi lm?
A. Films that are sensitive to blue lightB. Films that are sensitive to green light
12. What effect does increased developer solution temperature have on the fi lm?
A. The speed of the fi lm will decreaseB. The amount of fog on the fi lm will be decreasedC. The amount of contrast will be unchangedD. The amount of contrast will be increased
13. The emulsion layer must have a thickness of
A. 5 to 10 mmB. 10 to 20 mmC. 25 to 30 mmD. 150 to 300 mm
Short Answer
1. List the four primary steps in automatic processing.
2. What is the problem with the developer solution if the fi lm drops into the output bin damp or wet?
3. What is the purpose of the fi xer tank?
4. Explain the relationship between fi lm resolution and the size of the silver halide crystals.
5. Radiographic fi lm that has emulsion on both sides is _____.
6. Explain how photoelectric and Compton interac-tions relate to latent image formation.
7. Explain the difference between panchromatic and orthochromatic fi lms.
8. What is sensitometry? List the devices necessary for sensitometry.
9. Which type of image archival requires a laser beam and high heat?
10. When the characteristic curve shows a steep slope, there is _____ contrast on the fi lm. What type of contrast is on the fi lm when the slope is less steep?
Fosbinder_Text_Chap09.indd 121 10/30/2010 6:13:00 PM

122
10
Density and Contrast
Key Terms● contrast
● contrast agent
● differential absorp-tion
● fi lm contrast
● fi ltration
● optical densitometer
● optical density
● radiographic contrast
● SID
● subject contrast
ObjectivesUpon completion of this chapter, the student will be able to:
1. Identify the factors that affect image density.
2. Describe the operation of an automatic exposure control system.
3. Identify the factors that make up radiographic contrast.
4. Identify the factors that make up subject contrast.
5. Describe the difference between long-scale and short-scale contrast images.
Fosbinder_Text_Chap10.indd 122 11/20/2010 1:11:00 PM

Chapter 10: Density and Contrast 123
IntroductionThe appearance of an x-ray image used for a diagnosis depends on both the characteristics of the patient—that is, the x-ray interactions that occur in the different tissues of the patient—and the characteristics of the detector, usually fi lm. These two factors—the subject contrast due to the patient and the fi lm or detector contrast—combine to make up the overall or radiographic contrast. This chapter discusses the factors that infl uence radiographic contrast and image density and how the radiographer can alter the technical settings, such as kVp and mAs, to modify the image.
Optical DensityOptical density (OD), often called image density or simply density, describes the degree of darkness or blackening of the x-ray image. OD is the logarithm of the ratio of the inci-dent light intensity on the fi lm to the light intensity trans-mitted through the fi lm. Figure 10.1 illustrates the incident light intensity on and transmitted through the fi lm.
The formula for the OD is:
OD = log10 (I0/I1)
where I0, is the incident light intensity and I1, is the transmitted light intensity. In the example shown in Fig-ure 10.1, the incident light is 100% and only 1% of the light is transmitted through the fi lm. The OD of the fi lm is equal to 2 because log 100 = 2.
OD is measured using an optical densitometer. This instrument is shown in Figure 10.2.
OD is defi ned as a logarithm because the eye has a logarithmic response to changes in brightness, and so an image with twice the OD will appear twice as dark.
Images in diagnostic radiology have ODs that range from 0.2 to 3.0, with most of the useful information in the 0.5 to 1.5 range. It is just possible to read a newspaper through a fi lm with a density of 1.0.
100%Incident light
10% Transmitted light
OD = 1
100%Incident light
1% Transmitted light
OD = 2
Figure 10.1. OD is the logarithm of the ratio of incident light intensity to transmitted light intensity. Films that transmit 10% and 1% of the incident light have OD of 1 and 2, respectively.
Figure 10.2. Optical densitometer used to measure density on a fi lm.
Fosbinder_Text_Chap10.indd 123 11/20/2010 1:11:00 PM

124 Part III: Image Formation
the same. Different combinations of mA and exposure time can be used to produce the same density on an image. This is quite useful when imaging a patient who cannot hold still; the mA can be increased and time decreased to deliver the same amount of mAs with a shorter exposure time, which will result in less motion on the fi lm.
Density can be affected by other factors, but mAs is the factor of choice when it is necessary to control the amount of density on an image. To create a visible increase in density, the mAs must be increased by at least 30%; any change less than this will not produce a visible increase in density. Typically mAs is doubled or halved when an adjustment is needed. This is simple to do and produces an acceptable level of density on a repeat radiograph. If an image was produced with 5 mAs and is too light, the image should be repeated at 10 mAs. This will produce an image with acceptable density (Fig. 10.3).
Infl uencing factors● kVp● SID● Filtration● Beam restriction● Body part thickness● Grids
Technical Factors Affecting Density
There is a wide range of technical factors which affect density. These factors are classifi ed as either controlling (primary) or infl uencing. When a change is necessary to the overall density of an image, the controlling or primary factor, mAs, should be changed before any other change is made.
mAsThe mAs is the controlling or primary technical fac-tor used to control image density. mAs is defi ned as the product of mA and exposure time. The mA controls the number of x-ray photons in the beam or the quantity of x-rays. Larger mA values produce more x-ray photons. The exposure time controls the duration of the expo-sure. Longer exposure times result in the production of more x-rays. Larger mA values or longer exposure times produce darker, high-density images. Doubling the mAs produces an image with greater OD. Thicker body parts require higher mAs values to achieve proper OD.
Image density should remain the same as long as the total exposure to the image receptor and all other factors remain
A B C
Figure 10.3. Three-foot images demonstrating a doubling of mAs with each image. (A) 65 kVp at 3 mAs. (B) 65 kVp at 6 mAs. (C) 65 kVp at 12 mAs. (Courtesy Christa Weigel, FHSU.)
Fosbinder_Text_Chap10.indd 124 11/20/2010 1:11:02 PM

Chapter 10: Density and Contrast 125
in the form of scatter radiation. Scatter radiation will change the contrast on the image, which will increase the gray scale and may be detrimental to the image. A skilled radiographer will be able to distinguish the appropriate factor to use to make the desirable change in exposure on an image while maintaining density and gray scale. As seen in Figure 10.4, the change in gray scale on the image obscured the fi ne detail of the knee anatomy, thereby compromising the fi nal interpretation of the image.
SIDThe intensity of the x-ray photons striking the fi lm depends on the source-to-image receptor distance (SID). The SID is the distance between the image receptor and the focal spot or x-ray photon source. Increasing the SID decreases the number of x-ray photons striking the fi lm. This is a result of the inverse square law. Dou-bling the SID decreases the intensity to one-fourth of the original intensity. Reducing the SID to one-half the original value increases the intensity to four times the original intensity. This is mathematically represented by the formula:
21 2
22 1
=I DI D
kVpA factor that must be considered is kilovoltage and how it affects image density. Kilovoltage controls the energy of the x-ray photons, and when the kVp is increased, the quality of the beam is increased and the x-ray photons are able to penetrate the tissue of interest. Increasing kVp also increases the amount of scatter radiation reaching the image receptor, thereby adding density to the image. An experienced radiographer will be able to determine if the image requires a change in mAs or kVp to produce optimum density. The general rule that is used is the 15% rule. The 15% rule states that a 15% increase in kVp will equate to doubling the mAs on the image and a 15% decrease will halve the mAs on the image. This rule can be used for the following problem:
CRITICAL THINKING
An image of a hand is produced using 3 mAs and 50 kVp. What kVp would be required to halve the mAs to the image receptor while maintaining density?
Answer
50 kVp + (50 kVp × 15%)50 kVp + (50 kVp × 0.15)50 kVp + 7.5 kVp = 57.5 kVpNew factors: 58 kVp at 1.5 mAs
CRITICAL THINKING
The image of an abdomen was created using 10 mAs and 70 kVp. What change in kVp would be required to double the mAs while maintaining density?
Answer
70 kVp − (70 kVp × 15%)70 kVp − (70 kVp × 0.15)70 kVp − 10.5 kVp = 59.5 kVpNew factors: 60 kVp at 20 mAs
When using kVp to add density to the image, one must be careful because the additional kVp will add density
A B
Figure 10.4. (A) AP Knee using 70 kVp at 4 mAs. (B) AP Knee using 80 kVp at 2 mAs. Using the 15% rule to increase kVp and using half the mAs resulted in a long scale of gray which obscured the fi ne bony detail and a nondiagnostic image. (Courtesy Christa Weigel, FHSU.)
Fosbinder_Text_Chap10.indd 125 11/20/2010 1:11:04 PM
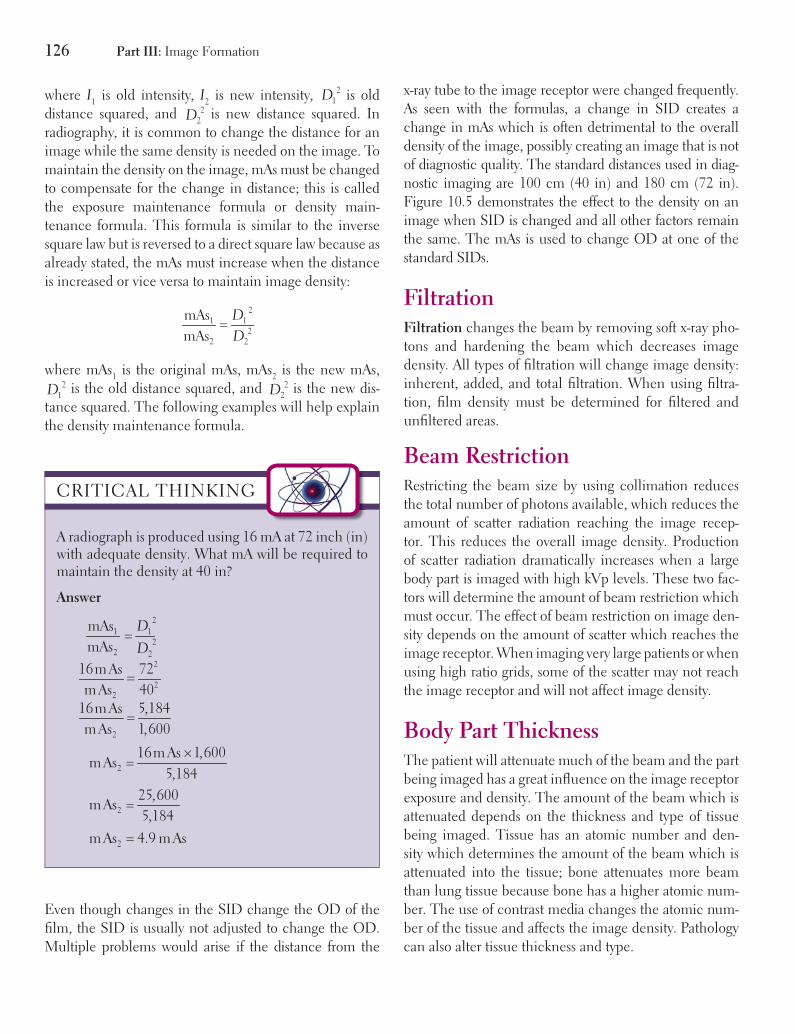
126 Part III: Image Formation
x-ray tube to the image receptor were changed frequently. As seen with the formulas, a change in SID creates a change in mAs which is often detrimental to the overall density of the image, possibly creating an image that is not of diagnostic quality. The standard distances used in diag-nostic imaging are 100 cm (40 in) and 180 cm (72 in). Figure 10.5 demonstrates the effect to the density on an image when SID is changed and all other factors remain the same. The mAs is used to change OD at one of the standard SIDs.
FiltrationFiltration changes the beam by removing soft x-ray pho-tons and hardening the beam which decreases image density. All types of fi ltration will change image density: inherent, added, and total fi ltration. When using fi ltra-tion, fi lm density must be determined for fi ltered and unfi ltered areas.
Beam RestrictionRestricting the beam size by using collimation reduces the total number of photons available, which reduces the amount of scatter radiation reaching the image recep-tor. This reduces the overall image density. Production of scatter radiation dramatically increases when a large body part is imaged with high kVp levels. These two fac-tors will determine the amount of beam restriction which must occur. The effect of beam restriction on image den-sity depends on the amount of scatter which reaches the image receptor. When imaging very large patients or when using high ratio grids, some of the scatter may not reach the image receptor and will not affect image density.
Body Part ThicknessThe patient will attenuate much of the beam and the part being imaged has a great infl uence on the image receptor exposure and density. The amount of the beam which is attenuated depends on the thickness and type of tissue being imaged. Tissue has an atomic number and den-sity which determines the amount of the beam which is attenuated into the tissue; bone attenuates more beam than lung tissue because bone has a higher atomic num-ber. The use of contrast media changes the atomic num-ber of the tissue and affects the image density. Pathology can also alter tissue thickness and type.
where I1 is old intensity, I2 is new intensity, 21D is old
distance squared, and 22D is new distance squared. In
radiography, it is common to change the distance for an image while the same density is needed on the image. To maintain the density on the image, mAs must be changed to compensate for the change in distance; this is called the exposure maintenance formula or density main-tenance formula. This formula is similar to the inverse square law but is reversed to a direct square law because as already stated, the mAs must increase when the distance is increased or vice versa to maintain image density:
21 1
22 2
mAs=
mAsDD
where mAs1 is the original mAs, mAs2 is the new mAs, 2
1D is the old distance squared, and 2
2D is the new dis-tance squared. The following examples will help explain the density maintenance formula.
CRITICAL THINKING
A radiograph is produced using 16 mA at 72 inch (in) with adequate density. What mA will be required to maintain the density at 40 in?
Answer2
1 12
2 22
22
2
2
2
2
mAs=
mAs16m As 72=m As 40
16m As 5,184=m As 1,600
16m As ×1,600m As =
5,18425,600
m As =5,184
m As = 4.9 m As
DD
Even though changes in the SID change the OD of the fi lm, the SID is usually not adjusted to change the OD. Multiple problems would arise if the distance from the
Fosbinder_Text_Chap10.indd 126 11/20/2010 1:11:13 PM

Chapter 10: Density and Contrast 127
A B
C
Figure 10.5. All three images were produced using the same kVp and mAs. (A) The SID was 30 in and resulted in an overexposed image. (B) A 40 in SID produced an image with optimum density. (C) The SID was at 60 in which produced an image that was underexposed.
The relationship between part thickness/type and image density is inversely related. As tissue thick-ness, atomic number, and tissue density increase, the image density decreases. This is due to the differential absorption of the beam by the different types of tissues. Adjustments to the amount of mAs and kVp necessary to properly image the patient is dependent upon the skill of the radiographer to identify when a change is needed.
GridsGrids absorb scatter before it can reach the fi lm and deposit unwanted density on the image. The more effi cient the grid, the lower the density on the image. There are vari-ous grid ratios available; compensating for a specifi c grid ratio typically requires an increase in mAs to maintain the density on the image. Grid ratios and their effect on scat-ter will be discussed in more detail in Chapter 12.
Fosbinder_Text_Chap10.indd 127 11/20/2010 1:12:05 PM

128 Part III: Image Formation
image receptor and terminates the exposure when the proper number of x-ray photons have reached the fi lm to provide optimal density.
It is critically important that the kVp and mA be prop-erly set because the AEC unit controls only the exposure time; the highest mA station compatible with tube limits should be chosen to ensure that the AEC utilizes the shortest exposure time to achieve the desired OD while reducing motion unsharpness.
AEC DetectorsIon chambers, scintillation detectors, or solid-state detec-tors are used as AEC detectors. Regardless of the type of detector used, there are usually three detectors located in a triangular confi guration. The two outer detectors are located on either side of the central detector.
The technologist is responsible for properly selecting the appropriate detectors and positioning the patient or the body part over the active detectors. Positioning the patient over the photocell must be accurate to ensure proper exposure. When the patient’s anatomy does not completely cover the photo cell, the primary beam will expose the phototime device and the exposure will
Image ReceptorThe type of image receptor, whether fi lm or intensifying screen, used to produce an image will alter the image den-sity. When the silver halide crystals form the latent image, they are forming the areas that will be converted to black metallic silver; this determines the amount of density in the image. The relative speed of the image receptor will also affect the amount of density in the image. As the rela-tive speed of the image receptor increases, the amount of mAs required to maintain the same fi lm density decreases. The following formula is used to maintain fi lm density:
1 12
2
RS ×mAsmAs =
RS
where mAs1 is old mAs, mAs2 is the new mAs, RS1 is old relative speed, and RS2 is the new relative speed.
CRITICAL THINKING
What is the new mAs when using a 100 RS system when technical factors of 75 kVp and 14 mAs pro-duce an acceptable image with a 400 RS system?
Answer
1 12
2
2
2
2
RS ×mAsmAs =
RS400 ×14
mAs =100
5,600mAs =
100mAs =56mAs
The new mAs is higher because a slower speed screen was used.
Automatic Exposure Control
The automatic exposure control (AEC) adjusts the expo-sure time to produce acceptable image densities. The AEC measures the amount of exit radiation striking the
Figure 10.6. Control panel with various combinations of detectors.
Fosbinder_Text_Chap10.indd 128 11/20/2010 1:12:07 PM

Chapter 10: Density and Contrast 129
not change the image density. The AEC circuit changes the exposure time to maintain the same density following changes in mA, kVp, or distance.
ContrastContrast is the difference in density between two areas on the image. Contrast is the radiographic quality that allows the radiographer to identify different areas of anat-omy. When there is no difference in contrast within an image, the human eye will not be able to visualize the image; likewise if there are minimal differences in con-trast, very little information will be available. Contrast is the result of differences in attenuation of the x-ray pho-tons with various tissues in the body; the density of the tissue will affect the amount of attenuation. Contrast is one of the most important factors in producing a quality diagnostic image.
Long-Scale and Short-Scale Contrast ImagesA diagnostic image is produced when the x-ray beam has suffi ciently penetrated the tissue. The penetrability of the primary x-ray beam is controlled by kilovoltage, therefore kVp is the controlling factor for contrast on an image. When considering the amount of contrast on an image, the radiographer must determine if a short or long scale of gray is most appropriate for the anatomy to be imaged. The number of densities from black to white on a radiographic image is an indication of the range of the scale of contrast. The terms long-scale and short-scale describe the number of different densities between black and white on the image. The choice of mAs or SID will not affect radiographic contrast. Figure 10.7 shows a step wedge of graduated thickness to illustrate how higher kVp examinations penetrate greater thicknesses and pro-duce long-scale contrast images. Low-kVp examinations penetrate fewer thicknesses and have only a few steps between black and white, and so produce short-scale contrast images.
When the primary beam penetrates through tissue with adjacent densities which have great differences in contrast, the image is described as high contrast. The image will have few shades of gray. A short-scale contrast
terminate prematurely. The result will be a lack of density in the image, likely resulting in a repeat exposure. The type of examination determines which detectors should be selected. For example, the posteroanterior chest exami-nation employs the two outer detectors to ensure proper density of the lung fi eld rather than the spine, whereas the lateral chest examination uses only the central detector. Most examinations utilize the central detector when the central ray is centered through the part.
Figure 10.6 illustrates a typical control panel showing how various combinations of detectors can be selected. Careful positioning and selection of the proper combina-tion of detectors are essential in producing a satisfactory radiograph with the AEC unit. With an AEC circuit in operation, changing the mA setting will not change the image density, because the AEC circuit will adjust the exposure time to obtain the same image density. Chang-ing the kVp will change the image contrast but not the image density when an AEC circuit is operating.
Backup TimerThe backup timer is designed to prevent catastrophic tube damage by terminating the exposure after a max-imum time if the AEC fails. A backup timer is always set in case something goes wrong with the AEC circuit. A typical backup timer setting is 5,000 milliseconds (ms). This means that the backup timer shuts off the x-ray beam after a 5-second(s) exposure. This might happen, for example, if a technologist neglected to empty a patient’s pockets and there was a radiopaque object in one pocket that shielded the detector. Another common situation in which the backup timer is essential is when the wall Bucky remains selected and the x-ray tube is directed toward the table Bucky. Without the backup timer, the exposure would continue until the tube failed.
Density ControlsThe AEC density controls of −2, −1, N, +1, and +2 per-mit adjustment of the image density to suit the prefer-ences of individual radiologists. N is the normal setting. Each incremental step changes the image density by about 30%. A properly calibrated AEC unit should not require adjustment of the density controls to produce an acceptable radiograph. Changing the mA or kVp selec-tors on an x-ray unit with a properly functioning AEC will
Fosbinder_Text_Chap10.indd 129 11/20/2010 1:12:26 PM

130 Part III: Image Formation
optimum contrast because the soft tissue of the abdomen is clearly visible, and it is easy to distinguish the borders of the kidneys, liver, and psoas muscles. C has the high-est contrast, which is excellent for spine imaging, but the outlines of the organs are not visible.
Table 10.1 provides a comparison of high contrast and low contrast and the terms used to describe both. It is critical for the radiographer to have an excellent under-standing of the scales of gray, how each is produced, and which scale is appropriate for specifi c anatomy.
Image or Radiographic Contrast
Radiographic contrast is made up of the total amount of contrast acquired from both the subject contrast and fi lm contrast. Film contrast is the difference in OD between different areas on the fi lm. Subject contrast describes the different amounts of exit radiation through different parts of the body. kVp is the primary controlling factor for radiographic contrast. Changing the mA, the exposure
image has fewer steps between black and white and is a high-contrast image. Low-kVp examinations produce short-scale contrast images. This is the preferred scale of contrast when imaging bone anatomy as this demon-strates the fi ne trabecular markings and fractures the best. A zebra is a great example of high contrast because it has black and white stripes.
Imaging the abdomen requires a long scale of gray because the anatomy of the abdomen is comprised of soft tissue and vital organs with minor density differ-ences. These images will have few differences in contrast because the differences between adjacent densities are small; this is referred to as a long-scale contrast image which has many steps between black and white and is a low-contrast image. Using higher kVp will produce more shades of gray which will allow for better visualization of abdomen anatomy. A herd of elephants is an excel-lent example of a long gray scale; each elephant will have a slightly different color than other elephants; however, they are all some shade of gray.
Figure 10.8 demonstrates three abdomen images. A has the lowest contrast which is obscuring the outlines of soft tissue organs like the kidneys and liver. B demonstrates
Low kVpLong wavelength
High kVpShort wavelength
Black Gray WhiteLightblack
Darkgray
Lightgray
Long-scale contrast
BlackGrayWhite White White Lightgray
Short-scale contrast
Figure 10.7. An increase in the thickness of the step wedge decreases the number of x-ray photons reaching the fi lm. Notice the wavelength of the photons for low kVp versus high kVp. Higher kVp photons have more energy and a short wavelength which allows more photons to pass through the step wedge.
Fosbinder_Text_Chap10.indd 130 11/20/2010 1:12:26 PM

Chapter 10: Density and Contrast 131
A B
C
Figure 10.8. (A) Low contrast hides soft tissue structures. (B) Optimum contrast allows visualiza-tion of abdomen structures. (C) High contrast is not effective for soft tissue structures.
time, or the SID does affect radiographic contrast, and this will be discussed in more detail later in the chap-ter. Figure 10.9 illustrates how bone, soft tissue, and lung have different amounts of exit radiation and different sub-ject contrast.
Film ContrastFilm contrast is the range of densities the fi lm is capa-ble of recording. Film contrast is represented as the slope of the characteristic curve. The four factors that
Fosbinder_Text_Chap10.indd 131 11/20/2010 1:12:27 PM

132 Part III: Image Formation
the contrast is increased. Various processing factors will affect the amount of contrast on the fi lm. Increasing the amount of time the fi lm is in the developer, the devel-oper temperature, or developer replenishment rate will increase the amount of chemical fog on the image. Each of these changes will increase the base fog and decrease contrast of the image.
Subject ContrastSubject contrast depends on differential absorption of the x-ray beam. Differential absorption occurs because different areas of the body have different transmission and attenuation effects on the x-ray beam. Structures in the body that highly attenuate x-ray photons, such as bone, are called radiopaque structures. The tissues that only partially attenuate x-ray photons and allow a majority of them to be transmitted, such as lung, are called radio-lucent. There are many factors that affect differential absorption and subject contrast: the thickness of the tis-sue, the atomic number and type of the tissue, the density of the tissue, the kVp setting, contrast media, and scatter radiation. Table 10.2 lists the factors that infl uence sub-ject contrast.
Tissue ThicknessThicker parts of the body attenuate more x-rays. An increase of 4 cm in soft tissue thickness decreases the exit radiation by about a factor of 2. Two parts of the body with different tissue thicknesses will produce a difference in subject contrast. This difference in absorption between the two thicknesses will infl uence the amount of subject contrast. The two tissues will appear as two different den-sities on the radiograph. As body part thickness increases, the amount of attenuation also increases, and when there is little difference in the thickness of adjacent body parts, the subject contrast will be decreased.
affect fi lm contrast are intensifying screens, fi lm density, characteristic curve, and processing. Intensifying screens create a higher contrast image due to the exposure of light to the fi lm. Film density is changed when there is a change in the fi lm contrast. There is an optimum range of densities for each fi lm which allows maximum visualization. Images which have too much or too little density demonstrate a decrease in contrast. When a fi lm is exposed to the correct exposure factors, the fi lm den-sities will fall within the diagnostic range of densities in the slope portion on the characteristic curve. Densities which fall in the toe or shoulder portion decrease the con-trast on the image. The slope of the characteristic curve also affects contrast. As the slope becomes steeper, the range of diagnostic densities becomes compressed and
TABLE 10.1 TERMS USED TO DESCRIBE CONTRAST
Low Contrast High Contrast
Many shades of gray Few shades of grayDecreased or low contrast Increased or high contrastHigh kVp Low kVpLong scale of contrast Short scale of contrast
TABLE 10.2 FACTORS THAT INFLUENCE SUBJECT CONTRAST
1. Tissue thickness2. Tissue type and atomic number3. Tissue density4. kVp or x-ray beam energy5. Contrast agents6. Scatter radiation
Lung
Soft tissue
Heart
Spine
Figure 10.9. Subject contrast depends on different amounts of exit radiation in adjacent areas, which is called differential absorption. Subject contrast describes how differ-ent areas of a patient attenuate x-ray photons differently.
Fosbinder_Text_Chap10.indd 132 11/20/2010 1:12:28 PM

Chapter 10: Density and Contrast 133
Tissue Type and Atomic NumberTissues with higher atomic numbers have greater attenu-ation values than tissues with lower atomic numbers. Bone, soft tissue, and fat all have different attenuation values. Bone has greater attenuation because bone has a higher atomic number than fat or soft tissue. Bone will appear as a higher density than soft tissue on the radio-graph, demonstrating a large difference in subject con-trast. Table 10.3 demonstrates the density and atomic number of tissues in the body and contrast mediums uti-lized to image the body.
Tissue DensityThe density of the body part in grams per cubic centi-meter (g/cm3) affects the amount of attenuation. Fat has lower density than soft tissue, so 1 cm of soft tissue attenu-ates more than an equal thickness of fat. Bone is more dense and has a higher atomic number than soft tissue, so 1 cm of bone has more attenuation than 1 cm of soft tissue. Tissue density or mass density should not be con-fused with OD. Mass density is the quantity of matter per unit of volume. When mass density is doubled, nearly twice as many x-ray photons will be absorbed and scat-tered in bone as in soft tissue.
When the difference in density between adjacent tis-sues is great, the subject contrast will be increased, and when the differences in density are small, the subject contrast is decreased. For example, bone tissue is denser than lung tissue, so it makes sense that there is great sub-ject contrast between bone and lung tissue. As you can see, the principles of tissue type and density are alike in how they affect contrast.
TABLE 10.3 DENSITIES AND ATOMIC NUMBERS OF TISSUES AND CONTRAST MEDIUMS ENCOUNTERED IN RADIOLOGY
Material Mass Density Atomic Number
Air 0.13 7.6Lung 0.32 7.4Fat 0.91 6.3Soft tissue 1.0 7.4Bone 1.9 13.8Iodine 4.9 53Barium 3.5 56
X-ray EnergyThe kVp controls the energy of the x-ray beam. Higher-energy x-ray photons have less differential absorp-tion because they are more penetrating. Higher-energy x-ray-photons also produce more Compton scattering than lower-energy x-rays because Compton scattering predomi-nates at higher x-ray energies. This combination of less differential absorption and more scattering results in less subject contrast at higher energies. Subject contrast depends on the average energy of the x-ray beam. Increasing the average energy of the x-ray beam by increasing the kVp or the beam fi ltration lowers the subject contrast. Lower kVp results in x-ray photons with less energy and more differen-tial absorption will occur, resulting in higher subject con-trast. Mammography utilizes a lower kVp to increase the subject contrast of the breast tissue. Figure 10.10 illustrates the change in subject contrast when the average energy of the beam is changed by changing the kVp.
Contrast AgentThe vessels and organs are soft tissue structures with simi-lar densities and are not easily visualized on a radiographic image. To make these structures visible, a substance with a higher density must be used. Adding a higher atomic number contrast agent to vessels or organs in the body increases the differential absorption and results in body structures becoming more visible. Iodine and barium are commonly used as contrast agents because they have high atomic numbers and high densities. Introducing barium into the intestines and introducing iodine into the kidneys are examples of the use of contrast agents in radiology. Barium and iodine are radiopaque substances which absorb the x-ray photons. The increased attenua-tion makes the structures containing the contrast agent appear lighter than the surrounding tissues and increases subject contrast. The differences in subject contrast between the soft tissue and the structure fi lled with the barium or iodine allow us to visualize the outline of the vessel or organ. Air is also used as a contrast agent. Air also increases differential absorption because its lower density increases transmission through the air-fi lled structures. Air is a radiolucent contrast agent which allows us to visu-alize lung tissue as well as the ribs and mediastinum out-line. Air increases subject contrast and provides a short scale of contrast to better visualize structures.
Fosbinder_Text_Chap10.indd 133 11/20/2010 1:12:29 PM

134 Part III: Image Formation
A B
Figure 10.10. Change in subject contrast produced by a change in average x-ray beam energy, demonstrated by radio-graphs of an anteroposterior knee phantom. (A) Demonstrates a shorter scale of contrast which is preferred for imaging bone. (B) Demonstrates a longer scale of gray which obscures the bony markings.
ScatterScatter is radiation that has undergone one or more Compton interactions in the body. As kVp is increased, the percentage of Compton interactions also increases, and the result is an increased amount of scatter reach-ing the image receptor. The presence of scatter reduces radiographic contrast because the scatter increases the
fi lm fog that results in a long scale of gray. Grids are devices used to absorb and reduce the scatter before it reaches the fi lm, thereby increasing contrast. Grids are used when imaging with a high kVp; low kVp imaging does not produce the high percentage of Compton inter-actions and does not require a grid to absorb the scatter before it reaches the fi lm.
Fosbinder_Text_Chap10.indd 134 11/20/2010 1:12:29 PM

Chapter 10: Density and Contrast 135
mAsmAs changes the exposure to the image receptor and density of the image, thereby affecting contrast. When the exposure is changed suffi ciently enough to move the fi lm density out of the diagnostic range, whether under-exposed or overexposed, the image contrast is decreased.
SIDAs the SID changes, the intensity of the beam also changes. The inverse square law governs the amount of change which will occur. Greater distances from the image receptor will cause less density on the image because the intensity of the beam is diminished, result-ing in decreased contrast. Using shorter SID will increase contrast. This occurs because the intensity of the beam is greater when the SID is closer to the image receptor.
FiltrationAll types of fi ltration will alter the image receptor expo-sure contrast. Filtration acts to absorb the weaker pho-tons that produce a more energetic beam. The increased beam energy will cause more Compton interactions and scatter radiation, both of which will decrease contrast.
Beam RestrictionCollimating, restricting the beam, or making the primary fi eld size smaller all contribute to reducing the total number of photons available for an exposure. The beam restriction acts to reduce the amount of scatter radiation which will reach the image receptor, thereby increasing contrast.
CRITICAL THINKING
A patient’s ankle was imaged using 64 kVp and 8 mAs. The resultant contrast scale was too short. What changes should be made in the repeat technique? Use the 15% rule to determine the answer.
Answer
Increasing kVp by 15%:64 kVp × 0.15 = 9.6 kVp (round up to 10)New kVp is 64 + 10 = 74 kVp
mAs must be reduced by one-half to keep the same density on the image
8 mAs × 0.5 = 4 mAsRepeat technique: 74 kVp at 4 mAs
CRITICAL THINKING
A clavicle was imaged using 80 kVp and 4 mA. The image was overly gray and did not adequately show the bony detail of the clavicle. What change should be made on the repeat radiograph?
Answer
Decrease kVp by 15% and double mAs to maintain density
80 kVp × 0.15 = 12 kVpNew kVp is 80 − 12 = 68 kVpNew mAs is 4 × 2 = 8 mAsRepeat technique: 68 kVp at 8 mAs
Technical Factors Affecting Contrast
When imaging the body, a suffi cient amount of contrast improves visibility of tissues within the body. As previ-ously discussed, kVp is the controlling factor for contrast. Other factors that infl uence contrast are mAs, SID, fi ltra-tion, and beam restriction.
Chapter SummaryImage density or OD describes the degree of blackness of the radiographic image. OD is the logarithm of the ratio of the incident light intensity to the light intensity transmitted through a fi lm. The most important technical factor infl uencing image density is mAs. The mAs is the primary controlling factor for OD.
Fosbinder_Text_Chap10.indd 135 11/20/2010 1:12:33 PM

136 Part III: Image Formation
Case StudyAaron performed a lumbar spine exam on a 19-year-old female patient. He used 80 kVp and 10 mAs for the AP image and did not collimate. The fi nal image demonstrated adequate pen-etration of the spine but was lacking suffi cient density to visualize all the bony anatomy of the lumbar spine. Additionally, the selected techni-cal factors produced an image with a long scale of contrast.
Critical Thinking Questions
When considering the overall density of the image, which factor or factors need to be
Increasing the mA or exposure time increases image density. Increasing the SID decreases image density. The purpose of an AEC circuit is to maintain the proper image density despite different patient thicknesses. The AEC detec-tors located between the patient and the image receptor terminate the exposure time when the proper density is achieved.
Contrast is the difference in optical densities between adjacent areas of the image. Radio-graphic contrast is a combination of subject and fi lm contrast. Subject contrast arises from differ-ences in exit radiation from different areas of the body. Film contrast is the difference in optical densities on the fi lm. Subject contrast is infl u-enced by tissue thickness differences, tissue type, atomic number, tissue density, x-ray beam energy and kVp, contrast media, and scatter. The num-ber of densities between black and white deter-mines the contrast scale. A long-scale contrast image is a low-contrast image with many density differences between black and white. High kVp examinations produce long-scale contrast images. A short-scale contrast image is a high-contrast image with fewer density differences between black and white. A low kVp examina-tion produces short-scale contrast images.
changed to produce an image with a short scale of contrast?
Should mAs or kVp be changed?
Which factors infl uence the density of the image?
Which is the controlling factor for image density?
What percentage of change in mAs is necessary to make a visible change in the image density?
What will be the new technical factors?
Upon critically evaluating the image, Aaron noted that the spine was adequately penetrated to demonstrate the lumbar spine; however, the appearance of the spine was grayer than he wanted and the spinous processes were not seen as well as they should be. He selected the technical factors because he wanted to reduce the amount of mAs for this patient, but in doing so, he sacrifi ced image quality. Aaron deduced that there were two problems with the image; the mAs was not high enough to adequately image the thick lumbar spine and the lack of collimation allowed excessive scatter to fog the fi lm. Because the anatomy was adequately penetrated, the kVp Aaron used was correct. Aaron also remembered that collimating the beam effectively reduced the low energy pho-tons and increased the average intensity of the beam. On the repeat image he collimated the beam to decrease the number of photons reach-ing the image receptor. mAs is the controlling factor for density on an image, so Aaron knew he must change the mAs. Aaron also knew that the mAs must be changed at least 30% to make the change in density visible. The repeat image was accomplished with 80 kVp and 13 mAs, the image demonstrated an acceptable short scale of gray for the lumbar spine, and the change in mAs provided the density necessary to visualize all the bony structures of the lumbar spine.
Fosbinder_Text_Chap10.indd 136 11/20/2010 1:12:34 PM

Review Questions
Multiple ChoiceMultiple Choice 1. Radiographic contrast depends on
A. tissue thicknessB. tissue densityC. kVpD. all of the above
2. Radiographic contrast is defi ned as
A. the difference in densities between adjacent areasB. the difference in attenuation between adjacent
areasC. the difference in scattering between adjacent areasD. the difference in bremsstrahlung between adja-
cent areas
3. What effect does the presence of scatter have on contrast?
A. Improves contrastB. Degrades contrastC. Has no effect on contrast
4. A short-scale contrast radiograph can be obtained by using
A. high kVp.B. lower kVp.
5. List in order of increasing x-ray attenuation
1. Bone2. Fat3. Soft tissue4. Lung
A. 1, 2, 3, 4B. 2, 4, 3, 1C. 4, 3, 2, 1D. 4, 2, 3, 1
6. Which rule is used to determine how much kVp should be changed to allow for mA to be halved?
A. 30% ruleB. 50% ruleC. 15% ruleD. 25% rule
7. An image is produced with 110 kVp and 4 mAs at 72 in. To maintain density, what will be the new mAs if the distance is reduced to 40 in?
A. 8 mAsB. 1.2 mAsC. 5 mAsD. 2.8 mAs
8. _____ is the degree of blackening on the fi lm.
A. ODB. Radiographic densityC. Subject contrastD. Tissue thickness
9. Which interaction will predominate when kVp is increased?
A. BremsstrahlungB. PhotoelectricC. CharteristicD. Compton
10. Increasing the amount of fi ltration will have what impact on contrast and density
A. increase contrast, increase densityB. decrease contrast, decrease densityC. increase contrast, decrease densityD. decrease contrast, increase density
Fosbinder_Text_Chap10.indd 137 11/20/2010 1:12:35 PM

138 Part III: Image Formation
4. An increase in SID will cause a _____ in OD.
5. What effect does a grid have on contrast?
6. Write the formula for fi lm density maintenance.
7. What is the controlling factor for density and how does it affect it?
8. High kVp produces _____ scale or _____ contrast while low kVp produces _____ scale or _____contrast.
9. Filtration changes the beam by removing _____ photons and _____ the beam which _____ image density.
10. How much of a change in kVp is needed to decrease mAs by one-half? To double mAs?
11. The most critical factor in obtaining diagnostic qual-ity images using an AEC circuit is the use of correct
A. positioningB. focal spot sizeC. SIDD. backup time
12. Tissues with a higher atomic number have greater
A. attenuationB. BremsstrahlungC. transmissionD. tissue thickness
13. If the OD of the fi lm is maintained the same, an image obtained with higher mA and an appropriate reduction in time is expected to have _____ contrast.
A. higherB. lowerC. the same
14. When utilizing the AEC, changing the mA from 100 to 300 will result in
A. more densityB. less contrastC. less distortionD. a shorter exposure time
Short Answer
1. Describe a long scale of contrast and the factor that affects the scale.
2. How do variations in the anatomical part affect density?
3. How are OD and mA related?
Fosbinder_Text_Chap10.indd 138 11/20/2010 1:12:35 PM

139
11
Image Formation
Key Terms● angulation
● bone mineral densitometry
● detail
● distortion
● elongation
● exposure angle
● focal plane
● foreshortening
● fulcrum
● involuntary motion
● magnifi cation
● object plane
● reciprocity law
● recorded detail
● section interval
● section level
● section thickness
● spatial resolution
● tomographic angle
● tomography
● voluntary motion
ObjectivesUpon completion of this chapter, the student will be able to:
1. Defi ne the factors that affect image detail.
2. Describe the various types of image distortion.
3. Explain the principles of magnifi cation radiography.
4. Describe the principles of linear tomography.
5. Describe the various geometric factors.
6. Discuss appropriate techniques to prevent motion.
Fosbinder_Text_Chap11.indd 139 11/20/2010 12:54:39 PM

140 Part III: Image Formation
IntroductionConventional radiography forms a two- dimensional image from projections through a three-dimensional patient. This chapter covers the factors that infl uence the appearance of the radiographic image. There are many ways in which the x-ray images can be distorted and it is important for the student to be able to recog-nize such distortions lest they result in missed or misleading diagnoses. The appearance of the fi nal radiographic image is affected by the technical factors of milliamperes, exposure time, kVp, distance, focal spot size, and the orientation of the x-ray beam with the patient. We will begin with a review of the proper selec-tion of these factors by the technologist as this is an essential step in the production of diagnostic quality radiographs. The student will also learn about magnifi cation radiography and tomogra-phy because these types of distortion are uti-lized to produce a diagnostic image.
Technical Factors
There are various technical factors which affect the appearance of the fi nal image. It is important for the student to have a thorough understanding of each of these factors. Many of these factors have been discussed throughout the textbook; however, it is appropriate to mention each here because a misstep with just one can compromise the image.
MilliamperesThe quantity or number of x-ray photons reaching the image receptor determines the noise, or a snowy
mA10 25 50 75 100 125 150 200 300 400 500 600
Figure 11.1. Shows the mA selector on a modern control panel.
appearance, in the image. The mA selector determines the number of x-ray photons produced and controls the noise in the image. Noise is simply background infor-mation that the image receptor receives. As long as the background noise is signifi cantly less than the amount of information coming into the image receptor, the noise can be fi ltered out. Changes in the mA control the number of electrons fl owing from the cathode to the anode in the x-ray tube. This results in changes in the quantity of x-ray photons produced. Doubling the mA doubles the number of x-ray photons. Milliampere selections on modern x-ray generators range from 25 to 1,000 mA (Fig. 11.1).
Exposure TimeExposure time also infl uences beam quantity. Exposure time can be expressed in milliseconds, or as a decimal, or a fraction of a second. Longer exposure times result in more x-ray photons striking the patient. Doubling the exposure time doubles the number of x-ray photons. Exposure times should be selected to allow for the shortest or fastest expo-sure time to minimize patient motion artifacts.
Milliampere Second (mAs)mAs is the product of mA and time which determines the number of x-ray photons reaching the image receptor. mAs is obtained by multiplying mA times the exposure time. An increase in mA or time results in an increase in x-ray photon quantity, which produces an increase in the number of x-rays photons and a decrease in image noise. To maintain the same noise level, the mA must be increased if the time is decreased.
Different combinations of mA and time can be selected to give the same mAs value and same image noise. This is known as the reciprocity law. To decrease patient motion on an image, larger mA values with a shorter time are used to produce a set density on the image. This same density can be accomplished by using smaller mA values with a longer time. Longer exposure times are benefi cial when
Fosbinder_Text_Chap11.indd 140 11/20/2010 12:54:39 PM

Chapter 11: Image Formation 141
imaging anatomy that requires a breathing technique; this effectively blurs anatomy which superimposes the anatomy of interest (Table 11.1).
KilovoltageChanges in the kVp alter the penetration or quality of the x-ray beam. Radiographic contrast depends on the quality of the x-ray beam. Increasing the kVp increases the amount of exit radiation through the patient and decreases differential absorption. Higher energy x-rays are more penetrating and produce more scatter radiation by way of increased Compton interactions.
The kVp setting is the primary controlling factor of radiographic contrast. Figure 11.2 demonstrates how
high kVp images have a long-scale contrast and smaller density differences between black and white. The mAs was adjusted to maintain the same central density for each image. The number of density differences visible in the 55 kVp image is less than the number of density differences visible in the 75 kVp image. The 75 kVp image is a long-scale contrast, low-contrast image. The 55 kVp image is a short-scale contrast, high-contrast image.
DistanceThe distance between the x-ray source or focal spot and the image receptor infl uences the image density. This distance is termed the source to image receptor distance
A B C
Figure 11.2. Demonstrates images of an aluminum step wedge and a knee phantom. (A) 55 kVp at 2 mAs. (B) 65 kVp at 2 mAs. (C) 75 kVp at 2 mAs. (Courtesy Christa Weigel, FHSU.)
TABLE 11.1 PRESENTS THE RELATIONSHIP BETWEEN THE DIFFERENT METHODS OF EXPRESSING mAs, WITH SOME TYPICAL mA VALUES AND EXPOSURE TIMES
Time mAs from
Milliseconds Decimals Fractions 25 mA 100 mA 300 mA 400 mA
10 0.01 1/100 0.25 1 3 425 0.025 1/40 0.625 2.5 7.5 1050 0.050 1/20 1.25 5.0 15 20100 0.1 1/10 2.5 10 30 40200 0.2 1/5 5.0 20 60 80250 0.25 1/4 6.25 25 75 100333 0.33 1/3 7.5 33 99 132500 0.50 1/2 12.5 50 150 2001,000 1.0 1 25 100 300 400
Fosbinder_Text_Chap11.indd 141 11/20/2010 12:54:41 PM

142 Part III: Image Formation
As demonstrated, the beam is one-fourth the intensity of the beam at the original distance.
Figure 11.3 illustrates how the beam is changed with an increase or decrease in SID. A decrease in the SID results in an increase in the number of x-ray photons striking the image receptor because the intensity is much greater and more easily penetrates the anatomy. As seen in the Critical Thinking exercise, when the distance is
(SID). Changes in SID infl uence the quality of the beam and the radiographic contrast; therefore, a change in distance requires a change in mAs to maintain beam intensity.
The x-ray intensity decreases with the square of the distance from the x-ray source. Doubling the distance decreases the x-ray intensity by a factor of 4. The x-rays are spread out over a larger area as the distance to the source increases. The variation of x-ray intensity as a function of distance is given by the inverse square law:
2
12 1
2
DI I
Dé ù
= ê úë û
or
21 2
22 1
=I DI D
where I2 is the new intensity, I1 is the old intensity, D2 is the new distance, and D1 is the old distance. This rela-tion is known as the inverse square law because the new intensity is inversely related to the ratio of the distances squared. An increase in distance results in a decrease in intensity.
SID = 40%
SID = 80%
Figure 11.3. Illustrates the decrease in x-ray intensity as the distance to the source increases.
CRITICAL THINKING
60 mR is used to make an exposure at 80 inches. Deter-mine the new intensity when the SID is decreased to 40 inches.
Answer2
22 1
12
2
22
2
8060mR
4060mR[2]240mR
DI I
D
I
II
é ù= ê ú
ë ûé ù= ê úë û
==
CRITICAL THINKING
An exposure was made with 60 mR at 40 inch SID. What is the intensity of the beam if the new distance is 80 inches?
Answer2
12 1
22
2
2
2
2
2
2
4060mR
801
60mR2
160
415mR
DI I
D
I
I
I
I
é ù= ê ú
ë ûé ù= ê úë ûé ù= ê úë û
é ù= ê úë û=
Fosbinder_Text_Chap11.indd 142 11/20/2010 12:54:41 PM
Chapter 11: Image Formation 143
The relation between mAs and distance is directly proportional and is opposite of the inverse relation between intensity and distance. In the mAs-distance relationship, the mAs must be increased to compensate for an increase in distance.
kVp and Image DensityA change in kVp will alter the image density because the penetration or quality of the x-ray photons changes. An increase in kVp results in an increase in exit radiation. When the x-ray quality is increased with higher kVp, less x-ray quantity is needed due to the higher penetration of the beam, so fewer x-ray photons are needed to produce the same optical density. A 15% change in kVp is equiva-lent to changing the mAs by a factor of 2. This is termed the 15 percent rule for kVp. If the kVp is decreased from 100 to 85 kVp, the mAs must be doubled to maintain the same image density. The same is true if the kVp is increased by 15%, the mAs should be decreased by a factor of 2.
decreased by one-half, the x-ray intensity will increase by four times.
Optical Density, mAs, and SIDChanges in SID will change the optical density unless the mAs is altered to compensate for changes in distance. To maintain the same optical density, the mAs must be increased if the distance is increased. If the distance is decreased, the mAs must be decreased. In diagnostic radi-ology, the SID is standardized at either 40 inches (100 cm) or 72 inches (180 cm). The SID is not utilized or changed to compensate for changes in optical density; the mAs is the primary controlling factor for density.
If the distance is doubled, the mAs must be increased by a factor of 4 to compensate for the decrease in inten-sity caused by the greater distance.
To calculate the amount of mAs change required to compensate for changes in SID, the mAs-distance formula is used:
2
2
1
mAsDDé ù
= ê úë û
2 1mAs
Here, the mAs2 is the new mAs, mAs1 is the old mAs, D2 is the new SID, and D1 is the old SID.
CRITICAL THINKING
A lateral c-spine projection examination in the emergency room was taken at 40 inches, 70 kVp, and 10 mAs and produced an image with satisfac-tory density. A follow-up lateral is to be taken in a general x-ray room where a 72 inch SID is uti-lized. What new mAs should be selected for this new distance?
Answer
The new mAs is given by2
2 1
22
2
2
72mAs mAs
40mAs 10 mAs [ ]1.80mAs 10 [ ]3.2mAs 32 mAs
é ù= ê úë û===
CRITICAL THINKING
An IV contrast study of the urinary system which is obtained at 80 kVp and 10 mAs has acceptable density but lacks suffi cient contrast. What mAs should be chosen if the new kVp is 15% less?
Answer
The calculation is set up as
80 kVp × 0.15 = 12 kVp80 kVp − 12 = 68 kVpNew mAs = old mAs × 2Old mAs × 2 = New mAs10 mAs × 2 = 20 mAsNew kVp = 68 kVp; new mAs = 20 mAs
The original image had a long scale of contrast, the kVp must be lowered to increase the contrast. A 15% decrease from 80 kVp resulted in the new kilovoltage of 68 kVp. To compensate for the 15% decrease in kVp, the mAs must be doubled to maintain image density. The new mAs would be 20 mAs.
Fosbinder_Text_Chap11.indd 143 11/20/2010 12:55:17 PM

144 Part III: Image Formation
exposure time and patient motion artifacts. It is often possible to obtain further reduction in exposure time by increasing the kVp by 15% and reducing the mAs by one-half. The skilled radiographer will be able to determine when this change will not affect the diagnostic quality of the image.
Recorded Detail
The appearance of the radiographic image is governed by two primary geometric factors, recorded detail and distortion. Recorded detail is the degree or amount of geometric sharpness of an object recorded as an image. The recorded detail in an image is easy to evaluate and adjust if you understand what comprises recorded detail. Recorded detail is also referred to as defi nition, sharpness, spatial resolution, or simply as detail. In this section, we will discuss the properties that affect recorded detail.
Image SharpnessDetail, Image Sharpness, and Spatial Resolution are terms used to describe the sharpness of the image and how well the system images small structures such as the edges or borders of structures which appear in hairline fractures. Detail is defi ned as the smallest separation of two lines or edges which can be recognized as separate structures on the image. An image with adequate detail will demonstrate even the smallest parts of the anatomy which will allow the radiologist to visualize all the struc-tures possible for a diagnosis.
The degree of sharpness or spatial resolution is deter-mined by line pairs per millimeter (lp/mm). A high contrast resolution phantom that has lead strips of dif-ferent widths and separations is used to produce the lp/mm image (Fig. 11.4). The radiographer evaluates the tool to determine which of the smallest lines are sepa-rated from one another while being easily discernable, this represents lp/mm. A system with lines 0.5 mm wide can image two objects 0.5 mm apart as distinct objects. Objects closer than 0.5 mm imaged with this system are blurred together and cannot be recognized as separate objects. Therefore, imaging systems with better resolu-tion can resolve more line pairs per millimeter.
Changes in kVp will change radiographic contrast when utilizing the 15% rule with the appropriate change in mAs. These changes will result in changes in the image contrast by creating a long scale of contrast (Table 11.2).
The technologist must select different combinations of kVp or mAs to optimize image density and contrast. Higher mA settings should be chosen to minimize the
TABLE 11.2 PRESENTS WAYS IN WHICH DENSITY AND CONTRAST ARE ALTERED BY A CHANGE IN TECHNICAL FACTORS
Factor Density Change Contrast Change
mA increase Increase Unchangeda
mA decrease Decrease Unchangeda
Time increase Increase Unchangeda
Time decrease Decrease Unchangeda
kVp increase Increase DecreasekVp decrease Decrease IncreaseSID increase Decrease Unchangeda
SID decrease Increase Unchangeda
Focal spot increase Unchanged UnchangedFocal spot decrease Unchanged Unchanged
aWhen mAs is changed and a corresponding change in SID is made to maintain density.
CRITICAL THINKING
A technologist reduces the mAs by half to reduce motion artifacts. What new kVp should be selected to maintain the same density as obtained from 60 kVp at 10 mAs?
Answer
old mAsNew mAs
210
New mAs 2
New mAs 5 mAs
=
=
=
The new kVp must be 15% higher than the old kVp
New kVp = 60 kVp × 0.15 = 9 kVp New kVp = 60 kVp + 9 kVp = 69 kVp.
New technical factors:
69 kVp at 5 mAs
Fosbinder_Text_Chap11.indd 144 11/20/2010 12:55:34 PM

Chapter 11: Image Formation 145
Factors That Affect DetailThe x-ray beam originates at the focal spot on the anode and travels toward the patient. The focal spot is a small point and produces a very narrow beam of photons. As the photons travel toward the patient, the beam becomes increasingly wider or more divergent. An example is to turn on a fl ash light and place it against a wall. Imagine the fl ash light is the focal spot and the wall is the image receptor. As the fl ashlight is pulled away from the wall, the circle of light becomes increasingly larger as the dis-tance increases. In Figure 11.5, notice the size of the beam as it leaves the tube and how the beam diverges to the level of the image receptor. Factors related to beam divergence are based on the inverse square law and a thorough knowledge of each is critical in producing a diagnostic image.
The visibility of detail in a radiographic image is con-trolled by different factors. Each must be considered when the image resolution is less than optimal. The geometric factors of the x-ray beam are the most important factors in producing an image with high resolution or recorded detail. The controlling factors that affect detail or sharp-ness are as follows:
1. Eliminate patient motion.2. Increase SID.3. Reduce focal spot size.4. Reduce object image distance (OID).5. Reduce intensifying screen phosphor size and
concentration.
Figure 11.4. Illustrates the concept of spa-tial resolution and line pairs per millimeter.
Heart
Spine
Kidney
Figure 11.5. Illustrates the divergence of the x-ray beam as it travels from the anode to the image receptor, getting progressively wider.
Distance (SID)The distances between the x-ray source or focal spot (SOD), object (OID), and image receptor (SID) are all critical pieces that affect the amount of recorded detail.
Fosbinder_Text_Chap11.indd 145 11/20/2010 12:55:43 PM

146 Part III: Image Formation
exams are performed with the part of interest directly placed on the image receptor. Although this works well for imaging anatomy <10 cm thick, it does not work well for parts larger than 10 cm thick, which require a grid. For such anatomy, the radiographer must consider the surface supporting the anatomy and the image receptor. The Bucky tray may be as much as 4 inches below the table top which would signifi cantly increase the OID and cause a loss in detail.
Resolution will improve when SID is increased and will be degraded when SID is decreased. Consider a lat-eral cervical spine image where there is signifi cant OID from the spine to the image receptor. The OID is signifi -cant because the width of the shoulder prevents the spine from being placed directly next to the Bucky. Because of this, a 72 inch SID is used to produce a lateral image where the size of the spine is comparable with the AP projection, which has a much smaller OID. If the lateral cervical spine were imaged with a 40 inch SID, the spine would appear magnifi ed compared with the AP projec-tion and it would have a loss of detail.
Focal Spot SizeThe line focus principle controls the focal spot size by reducing the effective focal spot. The angle of the anode has been designed to increase the actual focal spot to absorb the heat produced with each exposure while decreasing the size of the effective focal spot that is pro-jected toward the patient. The line focus principle makes use of an anode surface tilted or angled with respect to the x-ray beam. A small target angle produces an effective focal spot that is smaller than the actual focal spot. The effective focal spot is the size of the focal spot as seen by the patient. Because of the tilted anode angle, the effective focal spot is smaller on the anode side and larger on the cathode side. The result is less focal spot blur on the anode side and more blur on the cathode side of the image.
X-rays diverging from different parts of the focal spot will blur the edge of an image. This blur or unsharp shadow along the edge of the image is called penum-bra. Larger focal spots produce greater amounts of pen-umbra or blur. The size of the focal spot is a major controller of image resolution because it controls the amount of focal spot blur. When the focal spot size is decreased, the blur decreases, thereby increasing
As represented in Figure 11.6, SOD + OID = SID. When OID is reduced, the resolution is improved, and when OID increases, the resolution is degraded. For this reason, the affected side or part of interest is typi-cally placed as close as possible to the image receptor. Upon reviewing an image, if an improvement in detail is needed, the fi rst factor to consider is OID. The minimum OID is used to improve detail. Positioning protocols were established with this factor in mind. The PA chest projec-tion is preferred because it places the heart closest to the image receptor. The left lateral chest, AP kidney, and PA small bowel projections were all designed to place the part of interest as close as possible to the image receptor to decrease OID.
The OID can also be minimized by performing an exam on the table top instead of in the Bucky. Extremity
Source to imagereceptor distance(SID)
Source to objectdistance (SOD)
Object to imagereceptor distance (OID)
Figure 11.6. Distances in radiography.
Fosbinder_Text_Chap11.indd 146 11/20/2010 12:55:44 PM

Chapter 11: Image Formation 147
CRITICAL THINKING
Determine the amount of focal spot blur for an image taken with a 1.0-mm focal spot, at a 40 inch SID and an OID of 9 inches.
Answer
Focal spot size OIDSOD
P´
=
Determine the SOD fi rst: 40−9 inches = 31 inches
1.0 931
9310.29 mm
P
P
P
´=
=
=
CRITICAL THINKING
Calculate the size of focal spot blur for image taken with a 1.0-mm focal spot, at a 72 inch SID and an OID of 4 inches.
Answer
Focal spot size OIDSOD
P´
=
Find the SOD fi rst: 72−4 inches: = 68 inches
1.0 468
4680.05 mm
P
P
P
´=
=
=
resolution. The amount of blur is calculated by using the following formula:
Focal spot size OIDSOD
P´
=
where P is the width of penumbra, OID is object to image receptor distance, and SOD is source to object distance.
These examples demonstrate how the penumbra decreases when the SID increases. The penumbra will also decrease when the focal spot size decreases and when the OID decreases. Each of these changes will result in increased resolution of the anatomy.
In Figure 11.7A, the effect of the focal spot size on resolution is seen. When there is a large focal spot, the penumbra area is larger, whereas the small focal spot has a much smaller area of penumbra. The smaller focal spot size provides the best resolution possible because of
CRITICAL THINKING
Calculate the size of focal spot blur for an image taken with a 1.0-mm focal spot size, at 40 inch SID and an OID of 4 inches.
Answer
Focal spot size OIDSOD
P´
=
If the SID is 72 inches and the OID is 4 inches, the SOD = 40−4 inches = 36 inches.
1.0 4 inches36
4360.11 mm
P
P
P
´=
=
=
CRITICAL THINKING
Determine the size of focal spot blur for an image taken with a 2.0-mm focal spot, at a 40 inch SID and an OID of 4 inches.
Answer
Focal spot size OIDSOD
P´
=
First determine the SOD by subtracting SID and OID. 40−4 inches = 36 inch SOD.
2.0 4 inches36
8360.22 mm
P
P
P
´=
=
=
Fosbinder_Text_Chap11.indd 147 11/20/2010 12:55:44 PM

148 Part III: Image Formation
OID on penumbra. When there is increased OID, the area of penumbra will be larger, causing more geomet-ric unsharpness and less resolution in the image. If pos-sible, moving the OID closer to the image receptor will decrease the area of penumbra which improves resolu-tion. For all these reasons it is clear that the best resolu-tion can be achieved when the smallest OID and focal
less penumbra. Figure 11.7B demonstrates what occurs when the SID is changed. The small SID is so close to the image receptor that it does not allow the beam to fully diverge, producing a larger penumbra. The geom-etry of the beam allows the longer SID to produce a smaller area of penumbra, which increases resolution of the object. Finally, Figure 11.7C represents the effect of
SOD
OID
SOD
OID
Focal spot blur
Large OID Small OID
Focal spot blur
Large focal spot Small focal spotFocal spot blur
Large SIDSmall SIDA B
C Figure 11.7. Illustrations of focal spot blur.
Fosbinder_Text_Chap11.indd 148 11/20/2010 12:57:03 PM

Chapter 11: Image Formation 149
spot size are used with the longer SID possible for the anatomic area being imaged.
Image ReceptorFilm/screen combinations are classifi ed by speed. When imaging the extremities, it is preferred to use a slow speed fi lm/screen because these systems provide the best resolution possible to demonstrate the fi ne bony mark-ings. This speed of fi lm/screen would not be appropriate for abdomen imaging where fi ne detail or high resolu-tion is not needed. Higher speed fi lm/screens are uti-lized because they reduce patient dose for examinations which do not require the high resolution. Many facilities utilize the different speeds of fi lm/screen combinations to produce the most diagnostic images possible while being aware of decreasing patient exposure dose when-ever possible.
The resolution of an intensifying screen is depen-dent on phosphor size, phosphor layer thickness, and phosphor concentration. When phosphor size and layer thickness decrease, the resolution will increase, but this comes with a corresponding increase in patient dose. Increasing the phosphor concentrations will result in an intensifying screen that records more detail, this in turn allows the radiographer to use lower mAs which reduces the patient’s dose (Table 11.3). As previously stated, when the intensifying screen speed is decreased, there is an increase in resolution, but to offset the decrease in screen speed, the dose to the patient must be increased. A skilled radiographer will be able to determine which type of system to use to pro-vide maximum detail while not overly increasing the patient’s dose of radiation.
Another factor that must be considered is the produc-tion of quantum mottle when low mAs is used with high-speed intensifying screens. Many intensifying screens have been developed for use with low mAs settings; their phosphors are more effi cient in converting photons to
TABLE 11.3 SUMMARIZES THE EFFECTS ON IMAGE RESOLUTION WHEN INTENSIFYING SCREEN FACTORS ARE INCREASED
Phosphor Image Resolution Patient Dose Film Density
Size − − +Layer thickness − − +Concentration + − +
+ is an increase, − is a decrease.
emitted light which produces the radiographic image. When the image appears grainy or mottled, there were not enough incident x-ray photons reaching the intensify-ing screen; this causes an insuffi cient number of interac-tions with the phosphors and the phosphors are not able to emit enough light to completely cover the surface of the fi lm. Quantum mottle is only corrected by increasing mAs for the repeat image.
MotionMotion affects the recorded detail because it appears as a blurred series of densities where no fi ne detail can be visualized. There are various types of motion; most are controlled by the radiographer and include:
● Voluntary motion● Involuntary motion● Equipment motion● Communication● Reduced exposure time● Immobilization
Voluntary motion is motion that the patient directly controls. The radiographer must use effective commu-nication when working with all patients to ensure that the patient understands the necessity of holding still for the exposure. For the majority of exams the patient is able to comply with the positioning instructions as long as they understand what they are to do. The responsibil-ity of communicating in a professional and competent manner rests with the radiographer who must determine the method of communicating with the patient. Patients of all ages will respond to a gentle touch and comforting tone. Never assume that the patient is not able to under-stand the instructions. Even very young children can be cooperative when they wish to be, and adults with mental impairments will be able to follow instructions when pro-vided in a simple, clear manner.
Fosbinder_Text_Chap11.indd 149 11/20/2010 12:57:03 PM

150 Part III: Image Formation
boards, mummy wrapping techniques, Pig-O-Stats, and compression bands. Many experienced radiographers believe that tape is the best immobilization aid for a vast majority of exams. A strip of tape across the forehead with the sticky side out and not touching the skin has helped avoid repeated headwork exposures. A skilled radiographer will be able to determine if an immobiliza-tion aid is warranted or if communication will suffi ce. As a last resort, the patient’s family may be asked to hold the patient still. It is advised to have a male relative be the fi rst choice, female relatives are second, nonradiology personnel are third, and fi nally nonprofessional radiology personnel. Radiographers must always be the last choice for holding a patient, as their radiation levels are signifi -cantly higher than the above-listed people. It is crucial to remember that no one radiographer should routinely hold patients; the task should be shared by all radiogra-phers so that each radiographer can keep their radiation exposure as low as reasonably achievable.
Distortion
Distortion is the misrepresentation of the size or shape of an object. This misrepresentation is known as either size or shape distortion. Distortion reduces the visibility of detail and resolution in an image. The radiographer must be familiar with normal radiographic anatomy to assist in evaluating the diagnostic quality of the image. Careful evaluation of the image typically reveals that the distortion is directly related to positioning. The radiog-rapher must pay attention to using the proper SID, tube placement in relation to the anatomical part, proper cen-tral ray location, and accurate positioning of the part of interest to ensure the minimum OID. Size distortion is termed magnifi cation. Shape distortion is termed either elongation or foreshortening.
Size Distortion/Magnifi cationMagnifi cation results from the represented object appearing larger on the fi nal radiographic image. The majority of imaging procedures require the smallest amount of magnifi cation possible; however, there are limited situations when magnifi cation is necessary. An
Involuntary motion is not under the control of the patient. Examples include the heartbeat, peristalsis of the small and large intestines, and uncontrollable trem-bling caused by a disease process. The radiographer can reduce the motion artifact caused by involuntary motion by using the shortest exposure time possible.
Equipment motion can be caused by equipment which is not functioning properly or is not properly main-tained. Movement of a reciprocating grid which causes the grid to vibrate in the Bucky or an x-ray tube that drifts or vibrates are just a few examples of equipment motion. These types of motion artifact can be identifi ed by review-ing multiple images which were produced with the same radiographic equipment.
Communication is the most effective method of reduc-ing motion artifact. The radiographer must use effec-tive communication when using positioning aids such as radiolucent pads, sponges, and sandbags so that the patient understands the purpose of the positioning aids. Clear breathing instructions and allowing the patient enough time to comply with breathing instructions will eliminate motion artifact in images of the thorax and abdomen. With patients of all ages, the radiographer must use instructions that are clear, concise, and easily understood.
Exposure time must be reduced when the patient is not able to cooperate in holding still or in holding their breath for several seconds. Reducing exposure time and increasing mA will suffi ciently maintain density of the image while reducing motion artifact from involuntary motion. Other methods of decreasing exposure time while maintaining density include decreasing SID and using a higher speed fi lm/screen system.
Immobilization is used when communication and reduced exposure time are not suffi cient to reduce motion artifact. Immobilization devices such as angled sponges, sandbags, and foam pads are routinely used to hold the patient in the necessary position. These devices can assist an ill patient or a patient in pain with holding a position because it allows the patient to rest the part of interest on the pad, thereby reducing muscle fatigue and pain. The use of positioning aids is part of providing a professional service to the patient and should be utilized as frequently as possible.
Many examinations benefi t greatly from immobiliza-tion aids or devices that are specifi cally designed to hold the patient still. Some of these devices include pediatric
Fosbinder_Text_Chap11.indd 150 11/20/2010 12:57:03 PM

Chapter 11: Image Formation 151
Determining Size DistortionSize distortion is seen in each radiographic image as mag-nifi cation. The magnifi cation of an object is given by the magnifi cation factor which is the ratio between the SID and the SOD. The degree of magnifi cation is mathemati-cally represented by:
SIDmF =
SOD
where mF is the magnifi cation factor. Images that are formed with small SOD values and short SID values have larger magnifi cation factors (Fig. 11.9). Remem-ber the SOD is the OID minus the SID. An object midway between the image plane and the source has a
example would be performing a magnifi ed image of the scaphoid bone to identify hairline fractures. As routine practice, magnifi cation of a body part should be kept to a minimum to avoid masking other structures. Magni-fi cation is controlled by using the maximum SID pos-sible for the examination and positioning the body part to minimize OID.
Source-to-Image Receptor DistanceThe greater the SID the smaller the magnifi cation of the anatomical part. Routine radiographic protocols have been established to use a 40 inch SID for the majority of examinations. This SID represents the amount of dis-tance necessary to project the accurate size of the ana-tomical part onto the image receptor. For extremity and abdominal images, the 40 inch SID works exceptionally well; however when imaging with a horizontal beam, a 72 inch SID is routinely used. Chest imaging has been performed at 72 inch SID for many years to reduce the size of the heart shadow, and lateral cervical spine image also uses a 72 inch SID. The radiographer must deter-mine the appropriate SID for the examination when posi-tioning the patient.
The majority of body parts have a certain amount of OID over which the radiographer has limited control. The SID must be maximized to decrease the magnifi -cation created by the OID. Radiographic examinations of body parts with large OID, such as the sternum and lateral cervical spine, use a large SID when possible.
Object-to-Image Receptor DistanceOID also plays a critical role in magnifi cation and resolu-tion. Figure 11.8 demonstrates two relationships of OID: location in the body and size of the part. As seen in this cross-sectional image, each anatomical structure is at a dif-ferent level in the body, meaning that each has its own OID and will be projected onto the image as different sizes. The structures with the largest OID will be projected with a larger size than structures that have a small OID.
Another size relationship controlled by OID is seen in Figure 11.8. Structure B is a smaller object than structure C, but due to the inherent OID, structure B appears as the same size as structure C on the image. A thorough knowledge of normal radiographic anatomy is necessary when making judgments about size relationships and in determining the best position for achieving the minimum OID for the specifi c anatomy.
Large OID
Small OID
A
B
C
Figure 11.8. Demonstrates the effect of OID on image size magnifi cation. Structures A and C are the same size but due to their OID their projected images are of signifi -cantly different sizes. Structure B is signifi cantly smaller than C; however, their sizes appear identical because of B’s greater OID.
Fosbinder_Text_Chap11.indd 151 11/20/2010 12:57:04 PM

152 Part III: Image Formation
Magnifi cation occurs with an increase in OID. As OID increases SOD must decrease. SOD is inversely propor-tional to SID; therefore decreasing SOD increases the magnifi cation factor. An example of this is the thoracic spine. In an anteroposterior projection, the thoracic spine is placed very close to the image receptor. Now if the tho-racic spine is positioned in a lateral projection, the spine is further away from the image receptor yet closer to the x-ray tube or source. As seen in the next examples, objects that are closer to the source have a higher magnifi cation factor.
magnifi cation factor of 2. A magnifi cation of 1 means the image is the same size as the object. This occurs when the object is in contact with the image receptor.
CRITICAL THINKING
What is the magnifi cation of an image taken at 40 inch SID and 32 inch SOD?
Answer
SIDmF
SOD40
mF32
mF 1.25
=
=
=
The magnifi cation is 1.25, which means the image will appear 25% larger than the object.
Figure 11.9. Shows magnifi cation and its relationship between the true object size and the image size.
SOD
OID
True object size
Magnified image size
SID
CRITICAL THINKING
If the SID is 72 inches and the OID is 4 inches what is the magnifi cation factor? First you need to deter-mine SOD.
Answer
SOD SID OIDSOD 72 4 inchesSOD 68 inches
= -- -=
SIDmF
SOD72 inches
mF68 inches
mF 1.05
=
=
=
CRITICAL THINKING
An AP image of the thoracic spine was taken at 40 inch SID and a 3 inch OID. What is the magnifi cation factor?
Answer
SOD = 40−3 inchesSOD = 37 inches
SIDmF
SOD40 inches
mF37 inches
mF 1.08
=
=
=The magnifi cation will be 8% or the image will be 108% of the object size.
Fosbinder_Text_Chap11.indd 152 11/20/2010 12:57:25 PM

Chapter 11: Image Formation 153
Shape DistortionShape distortion depends on the alignment of the x-ray tube, the body part, and the image receptor. Shape distor-tion displaces the projected image of a structure from its actual position.
If the image is shorter in one direction than the object, the image is said to be foreshortened. If the image is longer in one direction than the object, it is said to be elongated. Foreshortening occurs only when the part is improperly aligned with the tube and image receptor. Elongation only occurs when the tube is angled. If the image is larger than the object in two directions, it is said to be magnifi ed (Fig. 11.10).
The central ray is the line connecting the focal spot to the center of the image receptor. The alignment of the central ray is critical in reducing or eliminating shape distortion. The central ray must be perpendicular to the image receptor and body part being examined to elimi-nate shape distortion. This means that the body part and image receptor must be parallel with each other. Another alignment issue that must be corrected is incorrect cen-tering which occurs when the tube is off-centered to the image receptor, when the image receptor is off-center to the tube, and when the anatomical part is incorrectly positioned in relation to the tube and image receptor. These relationships of misalignment are demonstrated in Figure 11.11.
Proper alignment of the tube, the patient, and the image receptor is particularly important in portable examinations. It is important to be certain that all fac-tors are in alignment with each other to produce an opti-mal radiograph. Portable examinations create a unique set of challenges to the radiographer as the patient may be lying on a mattress which causes the image receptor to be at an odd angle. Due diligence is necessary to be certain that all aspects are properly aligned. There is no shape distortion along the central ray. The central ray should be centered on the body part of interest. Objects distant from the central ray will be distorted due to the divergent beam away from the central portion of the beam.
Beam AngulationSome clinical situations use shape distortion to reduce the superimposition of overlying structures such as angling the central ray in axial images. The amount of angulation is used to create a controlled or expected amount of shape distortion. This will result in foreshortening or elongation
CRITICAL THINKING
A lateral image of the thoracic spine was taken at 40 inch SID with a 15 inch OID. What is the magnifi ca-tion factor?
Answer
SOD = 40−15 inchesSOD = 25 inches
SIDmF
SOD40 inches
mF25 inches
mF 1.6
=
=
=
The magnifi cation will be 60% or the image will be 160% of the object size.
The magnifi cation factor allows for the calculation of the actual size of the structure, which is projected as an image by using the following formula:
mFI
O =
where O is the object size, I is the image size, and mF is the magnifi cation factor.
CRITICAL THINKING
What is the size of an object radiographed at a 40 inch SID and a 10 inch OID if the image measures 2.4 inches?
Answer
Solution: image = 2.4 inchesSID = 40 inchesOID = 10 inchesSOD = 40−10SOD = 30
40mF 1.33
30
mF2.4 inches
1.8 inches1.33 inches
IO
O
= =
=
= =
The actual size of the object is 1.8 inches and the magnifi cation factor was 1.33.
Fosbinder_Text_Chap11.indd 153 11/20/2010 12:58:00 PM

154 Part III: Image Formation
Off-centeringof tube
Off-centering of imaging receptor
Incorrect positioningof part
Figure 11.11. Incorrect centering of tube, image receptor, and anatomy.
Elongated Foreshortened
Figure 11.10. Presents examples of foreshortening and elongation shape distortion due to changes in the alignment of the central ray.
of the structures overlying the body part of interest. Some examples include imaging the skull, clavicle, and calca-neus. The amount of angulation will cause a change in the SID, more angulation creates longer SIDs than less angu-lation. An angle of 5 degrees will not change the overhead
display of 40 inch SID, while an angle of 25 degrees requires the overhead display to read 36 inch SID. If the SID is not changed with greater tube angles, there will be a decrease in image receptor exposure because the tube is farther away from the image receptor.
Fosbinder_Text_Chap11.indd 154 11/20/2010 12:58:26 PM

Chapter 11: Image Formation 155
Tube Angle DirectionThe x-ray tube is commonly directed with the longitudinal axis of the table; this avoids issues with grid cutoff. The lon-gitudinal angles are either cephalic or caudal. A cephalic angle means the tube is angled toward the head of the patient, while a caudal angle is toward the patient’s feet. The amount and direction of tube angle is specifi ed by the examination and patient position. Common oblique cer-vical spine images are performed with the patient facing the tube and the tube is angled cephalic. If the patient’s position is reversed, the angle of the tube must be reversed to caudal. These principles are utilized to maintain the visualization of expected anatomy (Table 11.4).
Evaluating Image DistortionCritically evaluating the image for size and shape distor-tion requires the radiographer to apply their knowledge of normal anatomy and the images for each position. The evaluation for shape distortion is not as clear-cut as mag-nifi cation, and there is no formula that can be calculated to tell us there is shape distortion.
Size distortionSize distortion is the magnifi cation of the body part. All magnifi cation degrades the resolution of the image. As seen in Figure 11.12 of a PA hand at 40 inch SID, the scaphoid bone is rather small. Decreasing the SID to 32 inches produces a magnifi ed view of the schapoid bone, revealing hairline fractures which are diffi cult to visualize without the magnifi cation.
TABLE 11.4 IS A SUMMARY OF THE FACTORS THAT AFFECT RECORDED DETAIL AND DISTORTION. AS THE FACTORS ARE INCREASED, THEIR AFFECT CAN BE IDENTIFIED UNDER THE RESPECTIVE COLUMN
Factor Patient Dose Magnifi cation Focal Spot Blur Motion Blur Film Density
Film speed Decrease Unchanged Unchanged Decrease IncreaseScreen speed Decrease Unchanged Unchanged Decrease IncreaseGrid ratio Increase Unchanged Unchanged Unchanged DecreasePatient thickness Increase Increase Increase Unchanged DecreaseFocal spot size Unchanged Unchanged Increase Unchanged UnchangedSID Decrease Decrease Decrease Unchanged DecreaseOID Unchanged Increase Increase Unchanged UnchangedmAs Increase Unchanged Unchanged Unchanged IncreaseExposure time Increase Unchanged Unchanged Increase IncreasekVp Increase Unchanged Unchanged Unchanged Increase
Shape distortionShape distortion is much easier to evaluate and is seen as both elongation and foreshortening. Shape distortion can be used to our advantage but can be detrimental if used improperly or when not intended. Specifi c imaging protocols require the use of elongation to visualize the bony anatomy such as with imaging the sacrum where the proper angle elongates the sacrum to enhance visual-ization (Fig 11.13).
Tomography
An animation for this topic can be viewed at http://thepoint.lww.com/FosbinderText
Tomography is a special technique used to improve the visualization of selected objects by blurring out structures away from the objects of interest. In a conventional radio-graphic image, all the structures are seen with equal clar-ity even though the structures are superimposing each other. Tomography overcomes superimposition by utiliz-ing principles based on the synchronous movement of two of three elements: the x-ray tube, the object, and the image receptor.
The majority of units synchronize the movement of the x-ray tube and the image receptor. The x-ray tube and fi lm
Fosbinder_Text_Chap11.indd 155 11/20/2010 12:58:27 PM

156 Part III: Image Formation
image receptor are moved in opposite directions during the exposure. The exposure time must be long enough to provide continuous exposure during the tomographic motion. Tomographic exposures employ longer expo-sure times with lower mA values. In addition to selecting the appropriate technical factors, the radiographer must
select each of the following to produce a tomographic image:
● Fulcrum: pivot point of the tomographic image● Object plane or focal plane: area which appears in
focus● Tomographic angle or amplitude: total distance
the tube travels● Exposure angle or amplitude: distance the tube
travels during the exposure● Section thickness: width of the focal plane, con-
trolled by tomographic angle● Sectional interval: distance between fulcrum
levels
FulcrumThe x-ray tube and image receptor pivot at the fulcrum. The location of the fulcrum defi nes the object plane or focal plane and controls section level. The fulcrum may be fi xed so that the patient is moved up and down to change the section level. Modern equipment has an adjustable fulcrum that moves up and down while the patient remains stationary.
Object Plane or Focal PlaneStructures above and below the object plane appear blurred, while objects in the object plane are sharp and in focus in the tomographic images. The position of the object plane is defi ned by the location of the fulcrum. The position of the object plane is changed by changing the location of the fulcrum. This is usually done by rais-ing or lowering the table or the fulcrum. This is always in increments of millimeters or centimeters and is changed by the technologist to set the body part being examined to within the object plane (Fig. 11.14).
Tomographic Angle or AmplitudeThe tomographic angle, arc, or amplitude is the total distance the tube travels. The tomographic angle deter-mines the amount of tube and image receptor motion and is measured in degrees. Larger tomographic angles produce thinner tomographic cuts. Smaller tomographic angles produce thicker tomographic cuts. A tomographic angle of 50 degrees produces a 1–mm-thick object plane, a tomographic angle of 10 degrees produces a 6-mm
A
B
Figure 11.12. Magnifi cation size distortion of scaphoid bone. (A) Routine PA hand image at 40 inch SID. (B) Decreasing the SID will cause magnifi cation of the anatomy.
Fosbinder_Text_Chap11.indd 156 11/20/2010 12:58:28 PM

Chapter 11: Image Formation 157
A B
C
Figure 11.13. Shape distortion. (A) Perpendicular beam. (B) 30 degree cephalic angle. (C) 30 degree caudal angle.
object plane. As seen in Figure 11.15, the tomographic angle is longer than the exposure angle.
Exposure Angle or AmplitudeThe exposure angle is the total distance the tube travels during the exposure. When the exposure switch is engaged, the x-ray tube will turn on and will remain on during the entire exposure angle.
Section ThicknessSection thickness defines the width of the focal plane or the thickness of tissue that will not be blurred. The section thickness is controlled by the tomo-graphic angle. As stated under tomographic angle, large tomographic angles result in thinner cuts, while small tomographic angles result in thicker cuts (Fig. 11.16).
Fosbinder_Text_Chap11.indd 157 11/20/2010 12:58:29 PM

158 Part III: Image Formation
Section IntervalThe section interval is the distance between fulcrum levels. The section interval should never exceed the sec-tion thickness. For example, when using a section thick-ness of 0.8 mm, the section interval should be 0.7 mm; as the fulcrum level is changed for subsequent tomographic slices, the tissue will overlap by 0.1 mm. This will provide a complete imaging sequence of the affected area with-out missing any tissue.
Producing a Tomographic ImageNow that the fulcrum, tomographic angle, exposure angle, section thickness, and interval have been set, the radiographer is ready to produce an image. The tomographic examination begins with the x-ray tube and image receptor positioned on opposite sides of the
A BC
ABC
Tomographicangle
FulcrumObject plane
A
B
C
Figure 11.14. Tomographic relationship of fulcrum, object plane, and tomographic angle.
Tomographicangle
Exposureangle
FulcrumObject plane
Figure 11.15. Tomographic angle or amplitude in relation to exposure angle or amplitude.
fulcrum. The exposure switch is fully depressed and the exposure begins as the x-ray tube and image receptor move simultaneously in opposite directions. The image of the anatomic object lying in the object plane will have a fi xed position on the image throughout the tube movement. The images of structures which lie above and below the object plane will have varying positions on the image.
As seen in Figure 11.17, the images of points A and C are spread over the entire image receptor, while the posi-tion of B remains fi xed on the image receptor throughout the tomographic motion. Consequently, the margins of A and C will be overlapped and will appear blurred. The blurring of objects lying outside the object plane is an example of motion blur caused by the motion of the x-ray tube. Of all the objects, object A has the most OID and will experience increasing motion blur with increasing distance from the object plane. Object C will experience
Fosbinder_Text_Chap11.indd 158 11/20/2010 12:58:31 PM
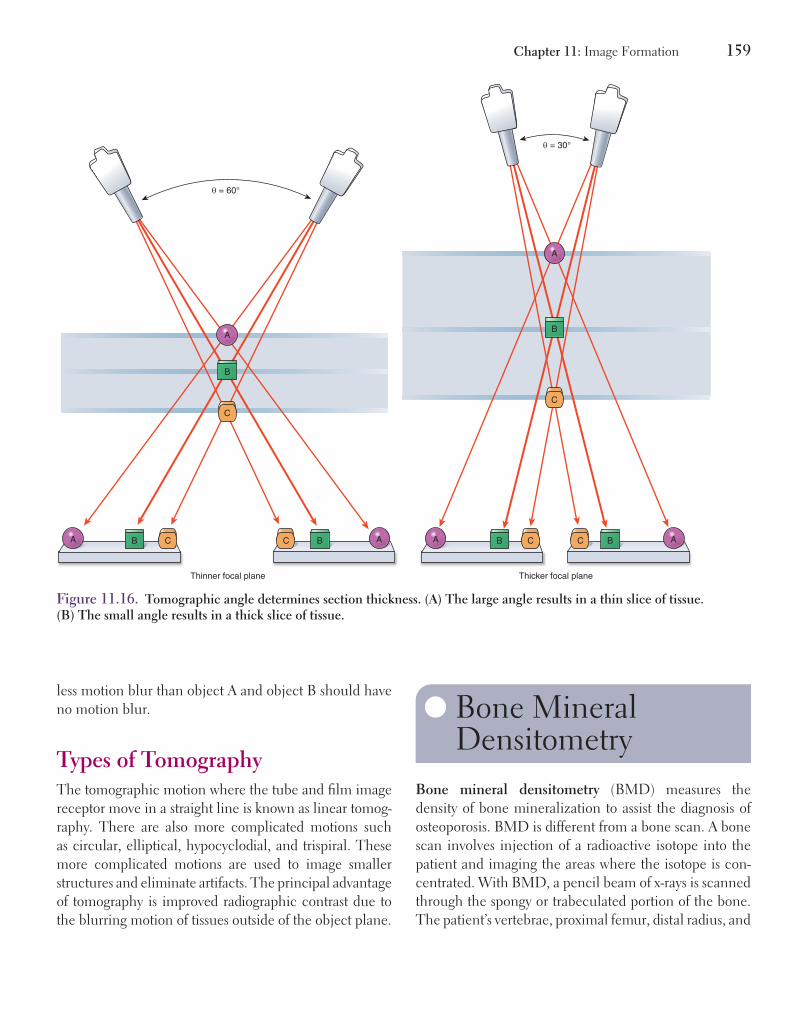
Chapter 11: Image Formation 159
less motion blur than object A and object B should have no motion blur.
Types of TomographyThe tomographic motion where the tube and fi lm image receptor move in a straight line is known as linear tomog-raphy. There are also more complicated motions such as circular, elliptical, hypocyclodial, and trispiral. These more complicated motions are used to image smaller structures and eliminate artifacts. The principal advantage of tomography is improved radiographic contrast due to the blurring motion of tissues outside of the object plane.
Bone Mineral Densitometry
Bone mineral densitometry (BMD) measures the density of bone mineralization to assist the diagnosis of osteoporosis. BMD is different from a bone scan. A bone scan involves injection of a radioactive isotope into the patient and imaging the areas where the isotope is con-centrated. With BMD, a pencil beam of x-rays is scanned through the spongy or trabeculated portion of the bone. The patient’s vertebrae, proximal femur, distal radius, and
Thicker focal plane
B
C
A B C ABC
A
θ = 60°
Thinner focal plane
B
C
A B C ABC
A
θ = 30°
Figure 11.16. Tomographic angle determines section thickness. (A) The large angle results in a thin slice of tissue. (B) The small angle results in a thick slice of tissue.
Fosbinder_Text_Chap11.indd 159 11/20/2010 12:58:33 PM

160 Part III: Image Formation
A BC
ABC
Tomographicangle
FulcrumObject plane
A
B
C
Figure 11.17. Illustrates the principles of tomography.
ulna are most commonly scanned and analyzed. BMD can detect bone mineral loss of a few percent, which may indicate the beginnings of osteoporosis. Some BMD units use two different x-ray energies to improve the analysis of the data.
Chapter SummaryX-ray quantity is determined by mAs which is the product of milliamperes and time. Image noise is primarily controlled by mAs. Image contrast is primarily controlled by kVp. High kVp techniques produce images with long-scale contrast and low contrast. Low kVp techniques produce images with short-scale contrast and high contrast. The inverse square law states that x-ray intensity varies inversely with the square of
the SID. As an example, the intensity decreases by a factor of 4 when the SID is doubled. Image noise increases as intensity decreases. To com-pensate for intensity changes produced by SID changes the mAs must be changed. A 15% change in kVp is equivalent to changing the mAs by a factor of 2.
Image sharpness or recorded detail describes how well small structures are recorded on the image. Detail depends on focal spot size, SID, OID, and motion. Sharp, high detail images are obtained using small focal spots, minimum OID, maximum SID, and short exposure times. Distortion is the misrepresentation of the size or shape of an object. Magnifi cation is size distor-tion and depends on SID and OID. Magnifi ca-tion increases geometric unsharpness. Shape distortion depends on the alignment of the central ray, the body part, and the image recep-tor. Shape distortion can appear as elongation or foreshortening.
Tomographic motions selectively blur out overlying structures to improve the contrast of structures lying in the object plane. The thick-ness of the object plane is determined by the tomographic angle. Thin tomographic cuts or object planes are produced using large tomo-graphic angles.
Case StudyAmanda performed an oblique hand image on a 78-year-old patient who had fallen and was complaining of severe pain. She used 55 kVp, 50 mA, 0.06 s, 40 inch SID, and did not use a radiolucent sponge. When Amanda viewed the image, the metacarpals and phalanges demon-strated a blurring effect that partially obscured areas of the anatomy. The overall density of the image is appropriate for this patient. Amanda decided to make some modifi cations and repeat the radiograph.
Fosbinder_Text_Chap11.indd 160 11/20/2010 12:58:34 PM

Chapter 11: Image Formation 161
Critical Thinking Questions
What modifi cations to the exam should Amanda make?
Should she use an immobilization aid?
Will she need to change kVp and mA or time?
How might communication help improve the next image?
Because the patient is 78 years old and complaining of severe pain, she will likely not be able to hold the oblique position for any length of time; this will cause fatigue in the mus-cles and possibly shaking. To prevent any type of motion artifact, Amanda should use a radio-lucent sponge for the patient to rest her hand
on. This simple maneuver will prevent muscle fatigue and shaking and will provide a base of support for the patient’s hand. The next change Amanda should make would be to change the mA station and length of time for the exposure. The density on the radiograph is acceptable and so no change in kVp or mAs is needed; however, decreasing the length of the exposure will help decrease motion blur on the image. Using a 100 mA station would allow the time to be decreased to 0.03 s, which will reduce any motion arti-fact. Finally, Amanda needs to be sure to use communication to let her patient know how important it is to hold still for the image. Communication is the best method of reduc-ing motion artifact, because when the patient understands the need to hold still, they are more likely to comply with the instructions.
Fosbinder_Text_Chap11.indd 161 11/20/2010 12:58:35 PM

Review Questions
Multiple Choice
1. In a radiographic image, focal spot blur is decreased by increasing
A. the size of the x-ray fi eldB. the size of the focal spot of the x-ray tubeC. the distance from the focal spot to the patientD. the patient motion
2. Radiographs are obtained utilizing 70 kVp and 10 mAs for proper density. The kVp is decreased by 15%. In order to obtain the same fi lm density, the mAs must be
A. 2.5B. 5C. 20D. 40
3. If the distance from the source is increased from 36 to 72 inch SID, the exposure at 36 inch SID used 70 kVp and 10 mAs, what new mAs should be chosen to maintain the same image density?
A. 2.5 mAsB. 5.0 mAsC. 20 mAsD. 40 mAs
4. The primary controlling factor for magnifi ca-tion is
A. kVpB. mAsC. focal spot sizeD. OID
5. Changing the kVp from 60 to 70 kVp and decreas-ing the mAs by one-half results in
A. a shorter scale of contrastB. increased optical densityC. a longer scale of contrastD. decreased optical density
6. If the distance from the source is decreased by a factor of 2, the mAs must be _____ to maintain the same image density.
A. increased by a factor of 2B. decreased by a factor of 4C. increased by a factor of 3D. decreased by a factor of 3
7. Which of the following would improve radio-graphic quality if patient motion is a problem?
A. 0.6 mm focal spot, 100 mA, 0.25 sB. 0.6 mm focal spot, 200 mA, 0.125 sC. 0.6 mm focal spot, 300 mA, 0.083 sD. 1.2 mm focal spot, 500 mA, 0.050 s
8. The _____ is the pivot point for the tube and image receptor during a tomographic exposure.
A. tomographic angleB. exposure angleC. section thicknessD. fulcrum
9. As the tomographic amplitude _____, a _____ slice of tissue will be imaged.
A. larger, thickerB. smaller, thinnerC. larger, thinnerD. amplitude has no relationship to slice thickness
Fosbinder_Text_Chap11.indd 162 11/20/2010 12:58:35 PM

Chapter 11: Image Formation 163
5. Name the factors that affect the resolving power of intensifying screens.
6. How are tomographic angle and section thickness related?
7. Explain how SID and OID affect size distortion.
8. What is the difference between elongation and foreshortening?
9. Describe the three ways to produce the sharpest recorded detail.
10. What formula is used to determine the intensity of the x-ray beam when the SID is changed?
10. The degree of spatial resolution is determined by
A. line focus principleB. line pairs per millimeterC. spinning top testD. wire mesh test
11. When a larger focal spot size is used, how will it affect the focal spot blur?
A. IncreasedB. DecreasedC. No change
12. What is the magnifi cation factor with a 40 inch SID and a 30 inch SOD?
A. 0.75B. 1.33C. 1.2D. 0.80
Short Answer
1. Why are tomographic images used as an alterna-tive to conventional radiographic images?
2. What is recorded detail?
3. What is the difference between voluntary and involuntary motion?
4. Defi ne fulcrum, focal plane, and tomographic amplitude.
Fosbinder_Text_Chap11.indd 163 11/20/2010 12:58:35 PM

164
12
Grids and Scatter Reduction
Key Terms● air gap technique● Bucky factor● Bucky grids● crossed grids● exit radiation● focused grids
● grid● grid cutoff● grid frequency● grid ratio● oscillating grid● parallel grids
ObjectivesUpon completion of this chapter, the student will be able to:
1. Describe the effect of scatter on radiographic contrast.
2. Identify the factors that affect the amount of scatter.
3. Identify methods of scatter reduction.
4. Describe the construction of an anti-scatter grid.
5. Identify the types of grids.
6. Explain the types of grid errors.
Fosbinder_Text_Chap12.indd 164 10/30/2010 6:19:24 PM

Chapter 12: Grids and Scatter Reduction 165
IntroductionMost of the x-ray photons entering a patient undergo Compton scattering before they exit the patient. Only those photons that do not have an interaction in the patient are useful in forming the diagnostic image. Scattered pho-tons contain no useful information and create fog on the image, which decreases the contrast of the image. Contrast is one of the most impor-tant characteristics of image production. Con-trast provides the many shades of gray which make a manifest image possible. Grids are the most widely used anti-scatter devices in radiol-ogy because they eliminate scatter before it can reach the fi lm.
Purpose of the GridA grid is a device used to absorb scatter radiation before it can reach the image receptor and fog the fi lm. Grids are used with radiographic exams which require a high kVp setting; this high kVp causes a high intensity beam and results in more Compton interactions. Controlling the amount of scatter radiation that reaches the image receptor controls the contrast in the image. Therefore, grids clean up scatter, which improves image contrast and makes the manifest image visible.
Exit RadiationExit radiation is a combination of transmitted and scat-tered radiation that passes through the patient. Transmit-ted radiation undergoes no interaction in the patient. The transmitted radiation passes through the patient with no change in direction or loss of energy (Fig. 12.1). Scat-tered radiation has undergone at least one Compton scat-tering interaction. The Compton interaction causes the scattered radiation to change directions and lose energy before leaving the patient. Scattered radiation has lower energy and is emitted in all directions from the patient. The scattered radiation is the source of exposure to per-sonnel in the room during fl uoroscopy and portable examinations.
Effect of Scatter on ContrastScattered radiation reduces radiographic contrast by adding a general background density over the entire image. Because the photons have changed direction they no longer relay anatomic information to the image recep-tor. For this reason, scattered radiation provides no diag-nostic information. The presence of scatter lowers image contrast which creates a long scale of gray that makes objects more diffi cult to see in the radiographic image.
Factors That Affect the Amount of ScatterScatter depends on patient thickness, x-ray photon energy, and fi eld size. Scatter does not depend on SID or focal spot size. The technologist can change the x-ray photon energy by changing the kVp and the fi eld size by adjusting the collimator to reduce scatter. Careful selec-tion of the fi eld size and kVp can signifi cantly reduce the amount of scatter and improve image quality.
Patient Thickness and Atomic NumberThe patient is the source of scatter which is degrad-ing the image. An increase in tissue thickness increases the amount of scatter because there are more atoms in the thicker tissue available for interactions. The greater number of these interactions produces more scatter. It is
Scattered exit radiation
Transmitted exit radiationImage receptor
Absorbedradiation
Figure 12.1. Illustrates how exit radiation is made up of transmitted and scattered radiation while some photons are absorbed in the tissue.
Fosbinder_Text_Chap12.indd 165 10/30/2010 6:19:24 PM

166 Part III: Image Formation
sometimes possible to reduce the patient or part thickness and reduce the amount of scatter with some examinations. Compression in mammography for example, reduces tis-sue thickness and scatter.
The grid is designed to absorb the unwanted scatter radiation that occurs with larger, thicker body parts and with procedures that use higher kVp techniques. Radiog-raphers must keep in mind the following to determine if a grid is needed for a given procedure:
1. Body part thickness >10 cm2. kVp above 60
When either of these factors applies to the patient, a grid must be used to clean up scatter radiation. Another source of scatter radiation is the type of tissue being irra-diated. Tissue with a higher atomic number will absorb more of the x-ray beam than tissue with a lower atomic number. Bone is an example of high atomic number tis-sue. Bone will absorb more of the beam and produce less scatter because bone absorbs more photons photoelec-trically. Soft tissue has a lower atomic number and less ability to absorb the photons, which then creates more Compton scatter radiation (Fig. 12.2).
X-ray Beam EnergykVp is the factor that controls x-ray energy or the pen-etrability of the beam. Increasing the kVp results in more forward scatter exiting the patient and striking the image receptor. Decreasing the kVp decreases the x-ray beam
energy and the amount of scatter. However, lower energy x-rays have decreased penetration and result in higher patient doses because more x-rays are absorbed in the patient. The kVp selected must be tailored to the body part under examination.
Field SizeImages of smaller fi elds have less scatter because there are fewer interactions taking place. Larger fi eld sizes produce more scatter because the larger area results in more tissue being irradiated. Decreasing the fi eld size decreases the area of tissue available for x-ray interactions. Smaller fi eld sizes result in less scattered radiation and higher image contrast.
CollimationThe purpose of collimation is to defi ne the size and shape of the primary x-ray beam striking the patient and to provide a visible light fi eld which outlines the x-ray fi eld (Fig. 12.3).
A light-localizing collimator consists of two pairs of lead shutters that are adjusted to intercept x-ray photons out-side the desired x-ray fi eld. The top pair of shutters absorbs off-focus radiation as it leaves the anode. The bottom set of shutters has two sets of shutters which allow the radiog-rapher to independently adjust the longitudinal and trans-verse edges of the fi eld. This allows for infi nite possibilities when matching the fi eld size to the patient’s anatomy.
Some collimators have an iris-like shutter that can approximate a circular fi eld. A light source is located off
Image receptor
Figure 12.2. Illustrates the increase in scatter as the patient thickness increases.
Fosbinder_Text_Chap12.indd 166 10/30/2010 6:19:25 PM

Chapter 12: Grids and Scatter Reduction 167
size can be reduced to limit the fi eld to the area of interest and decrease scatter. Limiting the fi eld size also improves image quality and minimizes patient dose.
Scatter Reduction TechniquesThe two most important methods of reducing scatter are beam collimation and grids. As previously stated, reduc-ing scatter radiation improves radiographic contrast. Reducing the fi eld size also reduces the amount of scatter radiation produced.
An animation for this topic can be viewed at http://thepoint.lww.com/FosbinderText
Grid ConstructionIn 1913, Dr. Gustave Bucky, an American radiologist, designed a grid in an attempt to remove scatter and improve contrast. The fi rst grid was a rather crude design with strips running in two directions which left a check-erboard pattern superimposed over the patient’s anatomy. Despite the checkerboard artifact, the grid removed scat-ter and improved the contrast of the image.
MaterialsA grid is a thin, fl at, rectangular device that consists of alternating strips of radiopaque and radiolucent materials. The radiopaque material is usually lead foil due to its high atomic number and increased mass density. Lead foil is easy to shape and is relatively inexpensive; these proper-ties along with the high atomic number make it the best material to clean up scatter. A grid absorbs scatter from the exit radiation before it reaches the image receptor. The grid is located between the patient and the image receptor. Scattered x-ray photons scatter in various angles as they leave the patient and are preferentially attenuated by the lead foil strips, because they are not parallel to the grid interspaces.
The interspace material, which is the radiolucent space between the lead strips, is made of plastic fi ber or
the x-ray beam axis and a mirror directs the light through the shutters. The x-ray beam passes through the mirror with very little attenuation. The distance from the mir-ror to the light source is equal to the distance from the mirror to the tube focal spot, so the light and radiation fi elds are the same distance from the patient surface. The collimator adjustment controls have indicators to show the fi eld size in centimeters or inches at different SIDs. The size of the light fi eld should never exceed the size of the image receptor since this would cause primary radia-tion to directly strike the table and create more scatter.
Positive beam limitation (PBL) collimators automatically adjust the x-ray beam to the size of the image receptor. Sen-sors in the cassette holder (sometimes called the Bucky tray) detect the size of the image receptor and adjust the collimator shutters to match the cassette size. A PBL collimator prevents selecting a fi eld larger than the image receptor. The fi eld
Lead shutters
Aluminum filtration
Lightsource
Mirror
Figure 12.3. Shows a schematic view of a light-localizing collimator.
Fosbinder_Text_Chap12.indd 167 10/30/2010 6:19:26 PM

168 Part III: Image Formation
The amount of scatter eliminated, often called the scatter cleanup, depends on the grid ratio. The grid ratio is the ratio of the height of the lead strips to the distance between the lead strips or the thickness of the interspace (Fig. 12.5). The formula to determine the grid ratio is:
GR = h/D
When the height of the grid is constant, the grid ratio can be increased by decreasing the space between the lead strips. To decrease the grid ratio of a grid with a constant height, the lead strips would be placed farther apart. High grid ratios are made by reducing the width of the interspace material, increasing the height of the lead strip, or using both methods. With high grid ratios higher exposure factors are required to permit a suffi cient number of x-ray photons to reach the image receptor. The higher ratio grids result in higher patient dose. Grid ratios typically range from 5:1 to 16:1. Grids with higher grid ratios remove more scattered radiation but are much more diffi cult to align properly. More attention must be paid to make sure that the grid and x-ray tube are prop-erly aligned to avoid errors in positioning. For this rea-son, portable examinations are usually taken using grid ratios of <12:1. General radiography examinations utilize an 8:1 or 10:1 grid ratio. Figure 12.6 demonstrates the
aluminum. Aluminum has a higher atomic number and produces less visible grid lines on the image. The use of alu-minum increases the absorption of primary x-ray photons in the interspace, especially at low kVp. Higher mAs factors are required to maintain image density but increase patient dose by approximately 20%. Plastic fi ber interspace mate-rials are preferred to aluminum interspace grids because there is no need to increase patient dose with these types of grids. There are positive and negative attributes to each type of interspace material, therefore both are manufactured.
The radiolucent interspace materials allow transmitted x-rays to reach the image receptor while intercepting or absorbing scattered x-ray photons. Only x-ray photons that are parallel or almost parallel with the interspaces pass through the grid. When to use a grid is a matter of profes-sional judgment. As a general rule, grids are employed when the body part is >10-cm thick (Fig. 12.4).
Grid RatioThe grid ratio has a major infl uence on the grid’s ability to clean up scatter and improve contrast. The amount of scattered radiation removed by the grid depends on the height of, and the distance between, the lead strips.
Film cassette
Grid
Interspace material Patient
Lead strips
Figure 12.4. Illustrates the construction of a typical grid and the absorption of scatter.
h
Interspace material
D
h
D
Lead strips
Figure 12.5. Illustrates the grid ratio from two different grids.
Less angle, photonmust be straighter
More angle is neededfor photon to go through
Figure 12.6. Grid ratio. Smaller angle = less scatter reaching image receptor.
Fosbinder_Text_Chap12.indd 168 10/30/2010 6:19:27 PM

Chapter 12: Grids and Scatter Reduction 169
strips that are parallel at the center of the grid, and as the strips move away from the center of the grid, they become progressively more angled. If imaginary lines were extended from the lead strips toward a fi xed focal distance, the lines would meet at a point, and this is called the convergence line. The distance from the front surface of the grid to the convergence line is called the grid radius. The focused grid is designed to match the divergence of the x-ray beam. This distance is known as the focal distance of the grid. The divergent rays transmitted from the x-ray source pass through the focused grid interspaces while the scattered x-rays are intercepted.
When using a focused grid, the x-ray tube must be located along the length of the strips. If the tube were placed so that the divergence of the beam ran perpen-dicular to the strips, grid cutoff would occur. Grid cutoff can affect a portion of the image or the whole image and results in reduced density or total absence of fi lm expo-sure. The term defi nes what occurs to the primary x-ray photons, they are cut off from the image receptor. Grid cutoff can also occur with parallel grids if the tube and grid are misaligned.
Parallel GridsParallel grid cutoff arises because parallel grids are con-structed with the lead strips parallel to the central axis of the x-ray beam, but x-ray photons diverge from the focal spot. Grid cutoff occurs because x-rays near the edge of the fi eld are not parallel to the lead strips and are attenu-ated. Parallel grid cutoff is greatest when the grid is used with short SID or with a large image receptor because the x-ray beam has a wide divergence at a shorter SID. The pronounced angle of divergence will cause more of the primary beam to be attenuated in the lead strips and grid cutoff will be seen along the outer edges of the image (Fig. 12.7).
Parallel grids should be used with smaller fi eld sizes and longer SIDs to reduce grid cutoff. The divergence of the beam is less with longer a SID, in other words, the beam will be straighter. This works well as the beam is more parallel to the grid strips and less attenuation will take place. Parallel grid cutoff produces a fi lm which has the correct intensity in the center but is lighter at both edges.
effect of grid ratio and the angle of scatter photons. The high-ratio grid absorbs scatter that is at a small angle to the lead strip, meaning that less scatter reaches the image receptor.
CRITICAL THINKING
A grid is made of lead with 40 mm thick placed between aluminum interspace material 350 mm thick. The height of the grid is 3.5 mm. Determine the grid ratio. (Hint: fi rst change the grid height to micrometers.)
Answer
GR = h/DGR = 3,500 mm/350GR = 10:1
Grid FrequencyThe grid frequency is the number of lead strips per centi-meter or inch. Grids with thinner strips have higher grid frequencies because the lead strips are closer together. The lead strips of a high frequency grid are less visible on the radiographic image. The higher the grid fre-quency the thinner the strips of interspace material must be and the higher the grid ratio. Typical grid frequen-cies range from 60 to 200 lines per inch. As the grid fre-quency increases, greater technical factors are required to produce an image with suffi cient density; this results in greater patient dose. This occurs because as the grid frequency and grid ratio increase, there are more lead strips absorbing the photons, which means fewer photons are reaching the image receptor.
Types of GridsThere are two types of grids, parallel and focused. Par-allel grids have parallel lead and interspace strips run-ning parallel to each other. Parallel grids are sometimes called linear grids because the lead and interspace strips run in one direction. Focused grids have the lead
Fosbinder_Text_Chap12.indd 169 10/30/2010 6:19:27 PM

170 Part III: Image Formation
Focused GridsFocused grids eliminate grid cutoff at the edges of the fi eld because the lead strips are angled toward the center and converge at the focal distance. When the x-ray source is in line with the center of the grid and located at the grid focal distance, there is no grid cutoff because the transmitted radiation passes through the radiolucent interspaces as seen in Figure 12.8. Focused grids are rec-ommended for examinations that must use large fi elds or short SIDs. An example would be abdominal imaging that requires both the large fi eld size and short SID to produce an acceptable image. Typical focused grid dis-tances are 100 and 180 cm (40 inch and 72 inch).
Each focused grid must be used with the appropriate focal range for which it was designed. The focal range includes short, medium, and long focal ranges where each is designed to be used with a specifi c SID. Mammography uses the short focal range grid, whereas chest radiography requires the long focal range grid. Focused grids can be used at distances within about 13 cm of the focal distance
Grid cutoff Exposed area Grid cutoff Grid cutoff Exposed area Grid cutoff
Grid
Image receptor
Short SID
Long SID
Figure 12.7. Illustrates parallel grid cutoff.
Figure 12.8. Illustrates the construction of a focused grid.
Fosbinder_Text_Chap12.indd 170 10/30/2010 6:19:28 PM

Chapter 12: Grids and Scatter Reduction 171
with no noticeable grid cutoff. Low grid ratio focused grids allow more latitude or leeway in the alignment of the tube to the grid before grid cutoff occurs. The higher the grid ratio, the less latitude the radiographer has with grid and tube alignment.
Focused grids that are used at other than the proper SIDs will show grid cutoff. Focused grids used outside the focal range show a decreased intensity toward both edges. Focused grids located off center or not perpendic-ular to the central ray show reduced intensity on only one side of the image.
The images in Figure 12.9 were taken with a 8:1 focused grid at 40 inch SID; image A is centered appropriately, while image B is off center 6 cm. Although the grid cutoff is subtle, there is a noticeable blurring of bony markings. The images demonstrate the increased degree of grid cut-off when the tube is off-centered from the grid.
Crossed GridsCrossed grids overcome the limitation of linear grids where the grids clean up scatter in only one direction. These grids are made by placing two linear grids on top of each other with the grid lines perpendicular to each other. Crossed grids are more effi cient than linear grids at cleaning up scatter. The crossed grids will clean up at least twice the amount of scatter when compared to a linear or parallel grid. An 8:1 crossed grid will clean up more scatter than a
A B
Figure 12.9. Grid cutoff. (A) 40 inch SID on center. (B) 40 inch SID, 6 cm off laterally.
Figure 12.10. Crossed grids constructed by placing two linear grids together with their grid strips perpendicular.
16:1 linear grid. The crossed grid is constructed by placing two 8:1 linear grids together (Fig. 12.10). Although these grids are capable of cleaning up more scatter, the technol-ogist must use precise positioning of the center of the grid
Fosbinder_Text_Chap12.indd 171 10/30/2010 6:19:28 PM

172 Part III: Image Formation
At the time of the exposure, an electromagnet pulls the grid to one side and then releases it. The grid will oscillate in a circular motion within the grid frame for approximately 20 to 30 seconds before ceasing motion.
Moving Grid Disadvantages and AdvantagesThe early use of grids demonstrated grid lines or the checkerboard pattern largely due to the large, thick strips and interspace material. Although cleaning up scatter and improving the contrast of the image, the grid lines were not acceptable as they distracted from the image. The moving grid was designed to remove the grid lines; however, there were some disadvantages with the design and placement of moving grids:
● Grid mechanism: mechanical mechanism that was subject to failure.
● Increased OID: the distance between the patient and fi lm was increased due to the size of the grid mechanism. The increased OID creates magnifi cation and blurring of the image.
● Motion: the nature of the moving grid incre-ased the motion of the fi lm holder, if not operat-ing perfectly the result would be additional image blur.
● Longer exposure time: the exposure time must be lengthened to allow the motion of the moving grid to have the intended effect of removing the grid lines. For some patients, this may be detrimental due to their inability to hold still or to hold their breath and the entire exposure.
The advantages of the moving grid have greatly improved overall image quality and far outweigh the disadvantages. Advantages of the moving grid include the following:
● Motion blur: grid mechanisms which are operating properly will completely blur out grid lines, mak-ing the overall image more diagnostic.
● Use in radiography: the moving grid is consistently used in radiography for body parts which measure >10 cm. This industry standard allows consistent imaging from one facility to the next.
to the center of the x-ray beam. Grid cutoff will occur if the crossed grid and x-ray beam are not perfectly lined up.
Stationary GridsStationary grids are used in radiography departments for mobile examinations, upright imaging, or horizontal beam views. Most radiography departments have a supply of stationary grids, some are directly mounted to the front of a cassette, while others are specially designed cassettes with the grid built-in called a grid cassette. When using stationary grids, the radiographer must be aware of the grid ratio and type of grid, whether linear or focused.
Grid MovementStationary grids with low grid frequencies produce notice-able grid lines on the fi nal image. One way to eliminate these grid lines is to move the grid during the exposure. This motion of the grid blurs out the grid lines, so they are not noticeable. Moving grids are termed Bucky grids, named after one of the inventors, Dr. Gustave Bucky. Bucky’s grid design was improved upon by Dr. Hollis Potter, a Chicago radiologist, in 1920 when he placed the strips in one direc-tion, made the strips thinner and designed a device that allowed the grid to move during the exposure. The device is called the Potter-Bucky diaphragm, Bucky diaphragm, and Bucky grid. The design is still in use today.
Reciprocating and OscillatingBucky grids are located directly under the table yet above the image receptor. Moving grids are typically focused grids which move when the exposure is being made. There are two types of moving grids used today:
● Reciprocating grid: the reciprocating grid is driven by a motor. During the exposure, it moves back and forth multiple times. The grid moves no more than 2 to 3 cm at a time. A selector at the control panel activates the grid motor. If the motor is not activated, the grid is stationary during exposure and grid lines will be apparent on the image.
● Oscillating grid: the oscillating grid is suspended in the center of a frame by four spring-like devices.
Fosbinder_Text_Chap12.indd 172 10/30/2010 6:19:30 PM

Chapter 12: Grids and Scatter Reduction 173
with higher grid ratios and higher kVp settings. The Bucky factor is mathematically represented as:
mAs with the gridGCF
mAs without the grid=
Grids are very useful in radiographic exams where the tissue thickness is above 10 cm, as the tissue thickness increases so does the amount of scatter. A skilled radiographer will be able to determine the proper grid for the examination that will be performed.
Grid SelectionSelecting the correct grid for a specifi c procedure requires consideration for the type of examination and the amount of kVp to be used. Examinations that require kVp settings over 95 kVp require a high-ratio grid for max-imum cleanup of scatter; higher kVp results in increased amounts of scatter. High-ratio grids are more effi cient at absorbing scatter, which results in less exposure to the image receptor. For some examinations, this could have a negative effect on the image, so with high-ratio grids, the exposure factors will need to be increased. mAs is typi-cally increased to maintain image density and gray scale, but the payoff is increased patient dose. In other words, the more effi cient the grid is at cleaning up scatter, the higher the dose to the patient.
Bucky FactorThe Bucky factor measures how much scatter is removed by the grid and how the technique factors must be adjusted to produce the same optical density. Scattered radiation accounts for a portion of the density on the fi nal radiograph. If a grid removes some scatter, the exposure factors must be increased to compensate for the decrease in x-ray photons reaching the image receptor. The Bucky factor or grid con-version factor (GCF) is the ratio of the mAs required with the grid to the mAs without the grid to produce the same optical density. The Bucky factor is always >1. The Bucky factor depends on the grid ratio and the grid frequency but is usually in the range 3 to 5. This means that adding a grid requires an increase in mAs by a factor of 3 to 5 to obtain the same optical density compared to a non-grid technique. The use of a grid increases the patient dose by the Bucky factor. The Bucky factor is used to calculate the necessary change in mAs when a grid is added or when changing to a grid with a different grid ratio. The GCF will increase
CRITICAL THINKING
A satisfactory AP knee radiograph was produced using 7 mAs at 75 kVp without a grid. A second image is requested using an 8:1 grid. Using Table 12.1, what mAs is needed for the second image?
Answer
mAs with the gridGCF
mAs without the gridmAs
47mAs4 7mAs28mAs
x
xx
=
=
= ´=
Required Change in mAs Following a Change of GridsIf a grid with a different grid ratio is used in a follow-up examination, the change in mAs is given by the ratios of the Bucky factors:
æ ö= ç ÷
è ø2
2 11
GCFmAs mAs
GCF
where mAs1 is the original mAs, mAs2 is the new mAs, GCF1 is the original GCF, and GCF2 is the new GCF.
TABLE 12.1 GRID RATIOS AND ASSOCIATED BUCKY FACTORS OR GCF
Grid Ratio Bucky Factor or GCF
None 15:1 26:1 38:1 410:1 or 12:1 516:1 6
Fosbinder_Text_Chap12.indd 173 10/30/2010 6:19:30 PM

174 Part III: Image Formation
1. High grid ratios increase patient dose.2. High kVp examinations typically use high-ratio
grids.3. Low kVp examinations result in increased patient
dose because more radiation is attenuated.4. High kVp examinations result in decreased patient
dose.
The utilization of grids for many examinations has required an increase in technical factors when compared to non-grid technical factor settings. The exposure time, mA, or kVp must be increased to provide adequate optical density on the image. Of these factors, kVp has been stan-dardized in many departments and the mAs is changed to compensate for the patient’s body habitus.
Grid ErrorsModern x-ray rooms use the moving grid in the table and upright Buckys. Improper usage of the moving Bucky will result in a poor radiographic image. Many errors occur because the design is a focus grid where the likeli-hood of an error is more common. Grid errors can be avoided if the technologist properly centers the x-ray tube with image receptor at the correct SID and if the moving mechanism is function normally.
The Potter-Bucky diaphragm or Bucky is mounted underneath the table top directly above the image recep-tor. The grid in the Bucky must move side to side or in a circular pattern perpendicular to the lead strips to effec-tively blur out the grid lines. If the Bucky were to move in the same direction as the lead strips, the grid lines would be visible on the image.
Improper positioning of the grid will always produce grid cutoff. The grid must be placed perpendicular to the central ray to eliminate grid cutoff. The central ray can be angled to the grid providing it is angled along the long axis of the grid strips but not across or perpendicular to the lead strips.
Grid cutoff rarely occurs in the radiology department where fi xed cassette holders or Bucky trays are routinely used. Grid alignment is more critical with high grid ratios and can be a serious problem with portable radiographs. Careful positioning of grids during portable examinations is especially important because even slight misalignments
CRITICAL THINKING
An examination taken in the department used 30 mAs with a 12:1 grid. What mAs should be used for the follow-up portable examination taken with an 8:1 grid?Answer
æ ö= ç ÷
è øæ ö= ç ÷è ø
=
22 1
1
2
GCFmAs mAs
GCF
4mAs 30
524mAs
The repeat image will require less mAs due to the lower GCF.
CRITICAL THINKING
A satisfactory abdominal radiograph was produced using an 8:1 grid, 25 mAs, and 90 kVp. Due to the long scale of contrast in the image, a second image was requested with a 12:1 grid. Using Table 12.1, what will be the new mAs for the second image?
Answer
æ ö= ç ÷
è øæ ö= ç ÷è ø
=
22 1
1
2
GCFmAs mAs
GCF
5mAs 25
431.3mAs
The second image will utilize a higher mAs setting and there will be more cleanup of scatter resulting in an image with more contrast and less gray scale.
As seen in the above examples, a change in mAs is required when the grid ratio changes. The major dis-advantage with using a high-ratio grid is the increased patient dose (Fig. 12.11). When using low-ratio grids with low kVp, there is still a concern for patient dose. The proper selection of the appropriate grid will increase image contrast and the diagnostic quality of the image. The radiographer must remember the following factors when selecting the correct grid for the exam:
Fosbinder_Text_Chap12.indd 174 10/30/2010 6:19:33 PM

Chapter 12: Grids and Scatter Reduction 175
from improper tube or grid positioning. Improper tube positioning occurs when the central ray is directed across the long axis of the table. Improper grid positioning most commonly occurs with stationary grids which are used for mobile procedures or decubitus imaging, for example, when a patient is lying on a grid for a mobile pelvis exam-ination and the patient’s weight is not evenly distributed on the grid causing the grid to angle underneath the patient. When the vertical x-ray beam is aligned to the angled grid, off-level grid error will occur. The image will demonstrate a decrease in density over the whole image. Figure 12.12 illustrates the angle of the grid compared to the vertical beam and the resultant radiographic image.
Off-center ErrorThe x-ray tube must be centered along with the center of a focused grid to prevent off-center error, also called
will produce noticeable grid cutoff. Grid cutoff during portable examinations is a major cause of retakes.
Grid errors occur most frequently because of improper positioning of the x-ray tube and grid. The grid will func-tion correctly when the x-ray tube and grid are precisely lined up with each other. When the radiographer is not careful and misaligns the tube and grid, the following errors will occur:
● Off-level error● Off-center error● Off-focus error● Upside down error
Off-level ErrorAn off-level error will occur when the x-ray tube is angled across or perpendicular to the grid strips. This can result
AB
C
Figure 12.11. Grid conversion. (A) The AP image of the abdomen shows low con-trast due to no grid being used. This is an acceptable image for the soft tissue but does not demonstrate the bone very well. (B) The same image, except an 8:1 grid, has been used. Notice the shorter scale of gray which demonstrates the bone. (C) A 12:1 grid has been used; the scale of contrast is too short to provide a diagnos-tic image of either the bone or soft tissue. (Courtesy Christa Weigel, FHSU.)
Fosbinder_Text_Chap12.indd 175 10/30/2010 6:19:35 PM

176 Part III: Image Formation
beam. When the x-ray tube is off-centered laterally, the perpendicular portion of the x-ray beam will intersect the angled grid strips causing a decrease in exposure across the image. As demonstrated in Figure 12.13, the diver-gence of the beam will not line up with the angle of the
off-axis and lateral decentering grid error. The center lead strips in a focused grid are perpendicular and the lead strips become more angled away from center as the strips get closer to the edges of the grid. The focused grid is designed to match the divergence of the x-ray
Lighter density grid cutoff
AB
Figure 12.12. Off-level error. (A) Diagram of off-level error. (B) A radiographic image demonstrating off-level grid error.
Lighter density grid cutoff
Image receptor
Focused grid
AB
Figure 12.13. Off-center error. (A) Diagram of off-center error. (B) A radiographic image demonstrating off-center grid error.
Fosbinder_Text_Chap12.indd 176 10/30/2010 6:19:36 PM

Chapter 12: Grids and Scatter Reduction 177
Image receptor
Focused grid
X-ray beam
A
Convergence point
BFigure 12.14. Off-focus error. (A) Diagram of off-focus error. (B) A radiographic image demonstrating off-focus grid error.
Fosbinder_Text_Chap12.indd 177 10/30/2010 6:19:38 PM

178 Part III: Image Formation
TABLE 12.2 GRID ARTIFACT APPEARANCES AND THEIR POSSIBLE CHANGES
Optical Density Possible Causes
Correct density in the center, lower density on both sides of image
Parallel grid at too short SID
Upside-down focused gridFocused grid outside focal
distance rangeCorrect density in the
center and on one side, low density on one side
Grid center not aligned with central axis
Grid not perpendicular to central axis
lead strips. This grid error can be avoided if the radiog-rapher correctly places the x-ray tube in the center of the grid; in some equipment, the tube will lock in place when correctly positioned to the detent in the middle of the table.
Off-focus ErrorThe off-focus error results when the focused grid is used with a SID that is out of the focal range and not specifi ed for the grid. Figure 12.14 illustrates what happens when a focused grid is not used in the proper focal range. Unlike the other grid errors, off-focus grid errors are not uniform across the entire image, rather there is severe grid cutoff at the periphery of the image. Positioning the grid at the proper focal distance is more crucial with high-ratio grids because these grids have less positioning latitude than low-ratio grids.
Upside-down ErrorThis type of error is readily seen and identifi ed imme-diately. When the grid is placed upside down, the lead strips are not angled toward the center of the grid. The
result will be severe grid cutoff on either side of the cen-ter of the image. The x-ray beam will pass through the central axis of the grid and will be attenuated by the lead strips that are angled in the opposite direction of the beam divergence (Fig. 12.15). Focused grids are clearly marked on the tube side of the grid. The radiographer has to merely look at the grid to know which surface needs to face the tube.
Table 12.2 presents the appearance of different forms of grid cutoff and the possible causes.
Image receptor
Focused grid
X-ray beam
A
Grid cutoff Exposed area Grid cutoff
B
Figure 12.15. Upside-down error. (A) Diagram of upside down error. (B) A radiographic image dem-onstrating upside-down grid error.
Fosbinder_Text_Chap12.indd 178 10/30/2010 6:19:39 PM

Chapter 12: Grids and Scatter Reduction 179
the OID is increased, there is an increase in magnifi cation and a reduction in detail. To compensate for this, a lon-ger SID is utilized with a small focal spot size. Because of the longer SID, the mAs must be increased to maintain radiographic density. The patient dose does not increase because the intensity of the x-ray beam will decrease with the longer SID.
Alternative Method to Reduce Scatter
Air Gap TechniqueThe air gap technique is an alternate scatter reduction method and can be used instead of a grid. The air gap technique uses an increased OID to reduce scatter reach-ing the image receptor. This technique is used in lateral C-Spine and chest radiographs. Remember that the patient is the source of scatter and the increased OID causes much of the scattered radiation to miss the image receptor. This eliminates the need for using a grid to reduce scatter and to improve the contrast of the image. A major disadvantage of the air gap technique is the loss of sharpness, which results from the increased OID. The air does NOT fi lter out the scattered x-rays.
An OID of at least 6 in is required for effective scatter reduction with the air gap technique (Fig. 12.16). When
Chapter SummaryRadiation leaving the patient is a combination of transmitted and scatter radiation. Scatter decreases contrast and depends on fi eld size, patient thickness, beam energy, or kVp. The primary methods of scatter reduction are reduc-tion in fi eld size and the use of a grid. In special applications, such as C-spine imaging, an air gap can be used to reduce scatter. Grids are constructed of alternating strips of a radiopaque material such as lead and a radiolucent material such as aluminum or plastic.
Using a grid with a higher grid ratio increases the patient dose, increases the Bucky factor, increases the fi lm contrast, and requires an increase in mAs. The Bucky factor is the ratio of mAs with the grid to mAs without the grid. High grid ratios are not used in portable imag-ing because the alignment is very critical. The types of grid errors include off-center, off-level, off-focus, and placing the grid upside down. These errors can be avoided when the radiogra-pher properly centers the tube with the Bucky and places the cassette properly with the tube side of the cassette toward the patient.
Figure 12.16. Illustrates how the air gap technique reduces scatter.
Patient
Scattered rays
Image receptor
6“ OIDAir gap
Case StudyTodd performed a portable abdominal radio-graph using a 40 inch SID, 5:1 grid, 85 kVp, and 20 mAs. Upon reviewing the image, Todd noticed that the overall appearance of the anatomy was not what he expected. The image lacked suffi cient contrast and had a long scale of
Fosbinder_Text_Chap12.indd 179 10/30/2010 6:19:40 PM

180 Part III: Image Formation
gray which obscured some anatomy. There also appeared to be less density over the whole image than what he expected and the spine was not in the middle of the image. Todd determined that the image would need to be repeated, but fi rst he had to decide the factors that would need to be changed to produce a diagnostic image.
Critical Thinking Questions
Did Todd use the correct grid ratio for the tech-nical factors he used?
With a higher kVp exam, should Todd have used a high-ratio grid?
If a change in grid ratio is determined, what will the new mAs be?
How will Todd address the placement of the spine in the image and how does this relate to the overall decrease in density on the image?
Todd determined that using 85 kVp required him to use a higher ratio grid, as a 5:1 grid will not effectively clean up scatter when the
kVp is above 80 kVp. He will need to use a 12:1 grid for the repeat. This will correct the lack of contrast by cleaning up more scatter and will produce a shorter scale of gray. When converting from a 5:1 grid to a 12:1 grid, Todd will need to make an increase in mAs. To determine exactly how much he will need to use the Bucky factor or grid conversion formula, mAs2 = mAs1 (GCF2)/(GCF1). 20 mAs (5/2) = 50 mAs will be the new mAs. The new factors of 85 kVp and 50 mAs will provide the neces-sary amount of photons to have a lower contrast image. The placement of the spine indicated that the grid was not placed completely under-neath the patient, and the lack of exposure density indicated that the tube was not centered with the grid, causing the grid to be off-centered toward one side. This error caused a decrease in density over the whole image. On the repeat, Todd will need to make certain that the grid is placed equally underneath the patient and that the tube is placed in the center of the patient. This will place the spine in the center of the image and will prevent the off-centering error which decreased the amount of exposure to the grid. Todd feels confi dent that with these changes the next abdomen radiograph will be a diagnostic image.
Fosbinder_Text_Chap12.indd 180 10/30/2010 6:19:40 PM

Review Questions
Multiple Choice
1. Exit radiation consists of
A. transmitted radiationB. scattered radiationC. transmitted plus scattered radiationD. transmitted minus scattered radiation
2. Increasing the fi eld size will _____ the amount of scatter.
A. increaseB. decrease
3. A grid is made of
A. alternating strips of muscle and fatB. alternating strips of lead and plasticC. alternating strips of gelatin and emulsionD. alternating strips of paper and plastic
4. The number of lead strips per centimeter is called the
A. Bucky factorB. grid ratioC. grid frequencyD. grid focal factor
5. An increase in patient thickness will increase the amount of scatter.
A. TrueB. False
6. What is the grid ratio for a grid made with 20 mm of lead between 437 mm of aluminum interspace material and a height of 3.5 mm?
A. 12:1B. 8:1C. 5:1D. 16:1
7. Which type of grid error occurs when the grid is not perpendicular to the x-ray tube?
A. Off-centerB. Off-focusC. Upside-downD. Off-level
8. Which type of tissue will attenuate more photons and create less scatter?
A. Soft tissueB. Adipose tissueC. BoneD. All tissue creates the same amount of scatter
9. A _____ grid has lead strips and interspace material which run parallel to each other.
A. focusedB. linear
10. High frequency grids _____ patient dose and typically have a_____ grid ratio.
A. increase, higherB. decrease, higherC. decrease, lowerD. increase, lower
Fosbinder_Text_Chap12.indd 181 10/30/2010 6:19:41 PM

182 Part III: Image Formation
6. Explain how the air gap technique improves contrast.
7. As the ability of a grid to clean up scatter improves, what is the effect on patient dose?
8. How does scatter radiation affect contrast?
9. What is the difference in the Bucky factor between a non-grid and a 16:1? Refer to Table 12.1.
10. Explain the differences between a reciprocating and oscillating grid.
11. Which material is preferred for the radiopaque grid strips?
A. Gold foilB. Platinum foilC. Lead foilD. Mangenese
Short Answer
1. How does a grid improve contrast?
2. A grid should be used when this general rule is applied.
3. Gustave Bucky’s original grid was a _____ grid.
4. Explain why lead is used as the grid strip material.
5. What is the advantage of a moving grid?
Fosbinder_Text_Chap12.indd 182 10/30/2010 6:19:41 PM

P A R T I V
Special ImagingTechniques
Fosbinder_Text_Chap13.indd 183 12/7/2010 2:52:20 PM

184
13
Fluoroscopy, Conventional and Digital
Key Terms● automatic bright-
ness control (ABC)● carriage● cathode ray tube● cine● ESE● fl uoroscopy
● fl ux gain● image intensifi er● magnifi cation● minifi cation gain● photocathode● SSD● vignetting
ObjectivesUpon completion of this chapter, the student will be able to:
1. Identify the components of a fl uoroscopic system.
2. Identify the components of an image intensifi er.
3. Describe the purpose of an automatic brightness control circuit.
4. Identify the factors that infl uence patient dose during fl uoroscopy.
5. Explain the effects of fl ux and minifi cation gain on total brightness gain.
6. Discuss the factors that affect fl uoroscopic image contrast, resolution, distortion and quantum mottle.
Fosbinder_Text_Chap13.indd 184 12/7/2010 2:52:20 PM

Chapter 13: Fluoroscopy, Conventional and Digital 185
Eye PhysiologyEarly fl uoroscopic systems employed a phosphor coating on a lead glass plate. The image brightness of these sys-tems was so low that they could be viewed only with a dark-adapted eye. The retina of the human eye has two types of light receptors, rods and cones. Cone vision requires bright light or daylight, which is called photo-pic vision. Rod vision is used in dim light or complete darkness, which is called scotopic vision. Cone vision has excellent spatial resolution with high visual acuity because the cones are concentrated near the center of the retina. Cones are also better able to distinguish the difference in brightness levels, are sensitive to a wide range of wavelengths of light, and can perceive color. Rod vision has poor spatial resolution and is color blind.
During a fl uoroscopic examination, maximum image detail is necessary and image brightness must be high. The image intensifi er was developed by Bell Laboratories to increase the brightness of the image so that the image could be viewed with cone vision.
FluoroscopyFluoroscopy is a dynamic imaging modality designed to observe moving structures in the body, in contrast to conventional radiography that produces static images of body structures. During fl uoroscopy, a radiologist views the fl uoroscopic image and obtains a diagnosis. Static digital images of the fl uoroscopic image can be obtained whenever a permanent record is needed. Fluoroscopy is currently used for examinations that require observation of physiologic functions such as the movement of barium through the gastrointestinal tract, injection of contrast medium into a joint or blood vessels.
Most fl uoroscopic rooms also have an overhead tube for conventional radiography and are called radiographic and fl uoroscopic rooms or “R and F” rooms. The fl uo-roscopic x-ray tube and image intensifi er are connected in a c-arm confi guration that allows synchronous move-ment (Fig. 13.1).
IntroductionFluoroscopy is a live, moving x-ray technique that is used to localize potential abnormali-ties without recording the images on fi lm. It gives a real-time or dynamic image as the x-rays pass through the patient. An image intensifi er converts x-ray energy into visible light energy. The image intensifi er is used during fl uoros-copy for increasing sensitivity and brightness, thus reducing the patient radiation dose. Inside the image intensifi er, the pattern of x-rays is converted into an electron pattern, and the electrons are accelerated onto an output phos-phor and converted into a brighter visible light image. In this chapter, we cover the construc-tion and application of an image intensifi er and the automatic brightness circuit of a fl uoro-scopic system.
Historical PerspectiveThomas A. Edison invented the fl uoroscope in 1896, the year after Roentgen’s discovery of x-rays. The origi-nal fl uoroscope was held by hand above the patient’s body in the path of the x-ray beam. The radiologist had to stand directly in front of the fl uoroscope to view the patient’s anatomy, which meant the radiologist’s head and eyes were in the direct path of the primary beam. The fl uoroscope emitted a very faint fl uorescent image, which required the radiologist to “dark adapt” his or her eyes. This meant the radiologist had to wear red goggles for up to 30 minutes prior to the examination to adjust his or her eyes and the examination had to be performed in a completely dark room. These conditions permit-ted the radiologist to see the faint fl uoroscopic image. Obviously, there were many hazards to the radiologist when viewing the fl uoroscopic image. Eventually, the fl uoroscopic screen was replaced with an image intensi-fi cation tube, video cameras, and monitors for viewing the image.
Fosbinder_Text_Chap13.indd 185 12/7/2010 2:52:20 PM

186 Part IV: Special Imaging Techniques
X-Ray TubeFluoroscopic x-ray tubes have the same design and con-struction as conventional x-ray tubes, but they are oper-ated for many minutes at a much lower milliampere (mA) value. Figure 13.2 shows a modern “R and F” room. Most of these rooms have digital capabilities; therefore, spot fi lm devices are not necessary. Typical fl uoroscopic tube currents are 0.5 to 5 mA, whereas radiographic tube currents are 50 to 500 mA. Fluroscopic kilovoltage or kVp is adjusted on the control panel. High kVp is usually selected with low fl uoroscopic mA. This kVp selector is separate from kVP used for conventional x-ray imaging. All fl uoroscopic and radiographic rooms have separate mA and kVp controls, depending upon the selection of fl uoroscopy or conventional x-ray imaging. The fl uoro-scopic tube is operated by a foot switch that allows the radiologist to use both hands to move the fl uoroscopic tower and to position the patient. When the equipment is set up for fl uoroscopy, care must be taken to avoid step-ping on the foot switch and inadvertently exposing the patient and personnel to unnecessary radiation.
The fl uoroscopic tube is usually located beneath the patient support table. Tube shielding and beam-limiting collimators are also located in the tube housing beneath
the table. The collimators adjust the size of the x-ray beam and restrict x-rays to the image receptor, which is the image intensifi er. The source to skin distance (SSD) of a fi xed fl uo-roscopic tube must be at least 38 centimeters (cm) (15 inches [in]) and a portable C-arm fl uoroscopic unit must have an SSD of at least 30 cm (12 inches). This is to limit the radia-tion dose to the skin during fl uoroscopic procedures.
TableThe table that supports the patient can be changed from a horizontal position into a vertical position for upright examinations. Some tables are constructed of carbon fi ber materials, which have great strength, and reduce attenuation of the x-ray beam by the tabletop, thus reduc-ing patient exposure. The table is equipped with a remov-able footboard for routine radiographic procedures. Care must be taken to properly secure the footboard on the table for fl uoroscopic examinations.
Image Intensifi er TowerThe image intensifi er tower contains the image intensifi er and a group of controls that allow the operator to adjust the fi eld size, move the x-ray tube and table, and make spot
Lead drape
Video camera
Under table tube
Image intensifier tube
Spot film holder
Table
Figure 13.1. Shows a typical older model fl uoroscopic room.
Fosbinder_Text_Chap13.indd 186 12/7/2010 2:52:21 PM

Chapter 13: Fluoroscopy, Conventional and Digital 187
Lead drape
Control panel
Under table tube
Image intensifier and CCD
Carriage
Footboard
Figure 13.2. Shows a modern “R and F” room.
fi lm exposures. A lead drape hangs from the image intensi-fi er tower to attenuate radiation scattered from the patient. This lead drape has 0.25 mm Pb (lead) equivalent. The TV camera is mounted at the top of the image intensifi er tower. The tower is connected to the x-ray tube mount, so that both move together as a unit. The x-ray tube can be pushed away from the table to allow access to the patient; however, it must be locked in place for the beam to be energized and directed toward the image intensifi er (Fig. 13.3).
Image Intensifi er Components
The image intensifi er is a sophisticated piece of electronic equipment which greatly increases the brightness of the image. Modern image intensifi ers can increase image
An animation for this topic can be viewed at http://thepoint.lww.com/FosbinderText
Electrostatic focusinglenses
Output phosphor
Input phosphor
Anode
Glass envelope
Photocathode
Figure 13.3. Illustrates a cross-sectional view of a typical image intensifi er tube.
Fosbinder_Text_Chap13.indd 187 12/7/2010 2:52:23 PM

188 Part IV: Special Imaging Techniques
phosphor is converted into a similar pattern of electrons leaving the photocathode. The pattern of photoelectrons carries the latent image of the patient’s anatomy.
LensesThe electrostatic lenses are located along the inside of the image intensifi er and are charged with a low voltage of 25 to 35 kVp to accelerate and focus the photoelec-trons. Electrostatic lenses inside the image intensifi er focus the negative photoelectrons from the photocath-ode onto the output phosphor. The concave surface of the photocathode reduces distortion by maintaining the distance between all points on the input screen and the output phosphor. As the photoelectrons travel to the out-put phosphor, they will cross at the focal point where the image is reversed, so the output phosphor image is reversed from the input phosphor. The focal point is the precise location where the photoelectrons cross; this location is changed when the image intensifi er is used in normal or magnifi cation mode (Fig. 13.4).
brightness up to 8,000 times. Figure 13.3 demonstrates the components of a typical image intensifi cation tube. The input screen absorbs the x-ray photons and emits light photons. The photocathode immediately absorbs the light photons and emits electrons. The electrons are accelerated from the photocathode toward the anode and the output screen. The electrons are accelerated and focused by electrostatic lenses. The output screen absorbs the electrons and emits light photons. These conversions and the properties which make them possible will be dis-cussed in this section.
Input PhosphorThe input phosphor of the image intensifi er tube is made of glass, titanium, steel, or aluminum and coated with cesium iodide (CsI) crystals because CsI has high x-ray photon absorption and light emission characteristics. The interactions in the input phosphor are similar to the inter-actions in an intensifying screen. The input phosphor is approximately 10 to 35 cm in diameter and absorbs about 60% of the exit radiation leaving the patient.
The input phosphor is concave to maintain the same distance between each point on the input phosphor and its matching location on the output phosphor. The con-cave surface enhances the sharpness of the image. The phosphor emits light in a vertical line, which improves image detail and spatial resolution. The light emitted is proportional to the absorption of the photons. Each x-ray photon produces between 1,000 and 5,000 light photons.
The input phosphor and photocathode are bonded together. The input phosphor is coated with a protective coating to prevent a chemical interaction with the photo-cathode materials. The photocathode is made of cesium and antimony which emit electrons when stimulated by light.
PhotocathodeThe photocathode is located on top of the input phos-phor and also has a concave surface. The photocathode is made of a special materials that emit photoelectrons when it is struck by light. This phenomenon is known as photoemission. Light from the input phosphor ejects photoelectrons from the photocathode. The number of photoelectrons is proportional to the amount of light striking the photocathode. Bright regions of the phosphor cause the photocathode to emit many photoelectrons. Dark regions of the phosphor result in the emission of few photoelectrons. The pattern of x-ray photons at the input
Output phosphor
Input phosphor
Anode
Magnification mode
Normal mode9”
6”
Figure 13.4. Illustrates the image intensifi er focusing for a normal and a magnifi ed image.
Fosbinder_Text_Chap13.indd 188 12/7/2010 2:52:27 PM

Chapter 13: Fluoroscopy, Conventional and Digital 189
Electrostatic lenses (–)
Output phosphor
Input phosphor
Anode (+)
Glass envelope
Photocathode (–)Light
Light
Conversions Parts (Charge)
Photo-electrons
Focal point
X-rayphotons
Figure 13.6. Summarizes the components of the image intensifi er and the process of converting remnant radiation with the latent image into light photons at the output phos-phor. A thorough knowledge of these concepts is critical in understanding how an image intensifi er works.
Brightness GainBrightness gain is a measurement of the increase in image brightness or intensifi cation achieved by the con-versions in the image intensifi cation tube. The increased illumination of the image is due to the multiplication of the light photons at the output phosphor compared to the incident x-ray photons which interact with the input phosphor. Two factors are used to determine the total brightness gain: fl ux gain and minifi cation gain. The total gain in brightness comes from a combination of acceleration of the photoelectrons, called fl ux gain, and compression of the image size, called minifi cation gain.
Anode and Output PhosphorPhotoelectrons from the photocathode are accelerated toward the positively charged anode by low voltage rang-ing from 25 to 35 kVp, this kVp accelerates the photo-electrons even more. This allows the photoelectrons to have high kinetic energy. The photoelectrons pass through the anode and strike the output phosphor. The output phosphor is approximately 2.5 to 5 cm in diam-eter. The output phosphor is made of zinc cadmium sulfi de (ZnCdS), which effi ciently converts photo-electron energy into visible light. Each photoelectron that reaches the output phosphor converts into 50 to 75 times more light photons (Fig. 13.5). The light pho-tons are emitted in all directions which risks some light photons being emitted toward the input phosphor, which would degrade the image. The output phosphor has a thin aluminum coating that prevents the light photons
Output phosphor
Input phosphor
Photocathode
3000 lightphotons
1000 photoelectrons
300 lightphotons
One incidentx-ray
Figure 13.5. In the image intensifi er tube, one incident x-ray photon that interacts with the input phosphor results in a large number of light photons at the output phosphor. This fi gure demonstrates the fl ux gain of 3,000 light photons.
from leaking back across the image intensifi er, thereby decreasing the image noise and improving the resolution of the image (Fig. 13.6).
Fosbinder_Text_Chap13.indd 189 12/7/2010 2:52:27 PM

190 Part IV: Special Imaging Techniques
CRITICAL THINKING
What is the minification gain when the input phosphor diameter is 9 inches and the output phosphor diameter is 2 inches?
Answer2
2
2
2
Input phosphor diameterMinification gain =
Output phosphor diameter
9Minification gain =
281
Minification gain =4
Minification gain = 20.25
Total Brightness GainTotal brightness gain is obtained by multiplying fl ux gain by minifi cation gain. Typical image intensifi ers have brightness gains of 5,000 to 30,000. The out-put image at the output phosphor is over 5,000 times brighter than the image at the input phosphor. The image intensifi er will have decreased brightness as it ages, resulting in increased patient dose to maintain brightness. The formula to determine the total bright-ness gain is:
Brightness gain = fl ux gain × minifi cation gain
CRITICAL THINKING
What is the total brightness gain if the fl ux gain is 70 and the minifi cation gains is 81?
Answer
Brightness gain = fl ux gain × minifi cation gainBrightness gain = 70 × 81Brightness gain = 5,670
In this example, the image at the output phosphor is over 5,000 times brighter than the incident x-ray photons.
Flux GainFlux gain is the ratio of the number of light photons at the output phosphor to the number of x-ray photons at the input phosphor, thus producing the conversion of the electron energy into light energy. If the output phosphor produces 100 light photons for each photoelectron that strikes it, the fl ux gain would be 100. Typical fl ux gains are 50 to 100.
Number of output light photonsFlux gain
Number of input x- ray photons=
CRITICAL THINKING
What is the fl ux gain if there are 50 x-ray photons at the input screen and 4,500 light photons at the out-put phosphor?
AnswerNumber of output light photons
Flux gain =Number of input x-ray photons
4,500Fluxgain =
50Fluxgain = 90
Minifi cation GainMinifi cation gain is the ratio of light from input phos-phor to light at the output phosphor, thus producing concentrated light from the larger input phosphor onto the smaller output phosphor. Minifi cation gains vary from 40 to 90. For example, an input phosphor diameter of 10 to 35 cm results in the light being concentrated to an output phosphor diameter of 2.5 to 5 cm. Mini-fi cation is an increase in brightness or intensity of the image; it is not an improvement in the quality or num-ber of photons making up the image, as this information is contained in the latent image as the x-ray photons exit the patient.
2
2
Input phosphor diameterMinification gain =
Output phosphor diameter
Fosbinder_Text_Chap13.indd 190 12/7/2010 2:52:28 PM

Chapter 13: Fluoroscopy, Conventional and Digital 191
which allows for better visualization of small structures. The operator can change the magnifi cation through the controls on the image intensifi er tower. Selection of a smaller portion of the input phosphor produces a magni-fi ed image but results in a higher patient dose because there is less minifi cation gain in the magnifi cation mode. When the magnifi cation mode is selected either on a dual-focused or tri-focused image intensifi er, the voltage supplied to the focusing electrodes inside the image inten-sifi er is increased, which causes the focal point to move closer to the input screen and the image to be magnifi ed. Figure 13.7 illustrates the area on the input phosphor that is used in the magnifi cation mode. Notice how the focal point has moved closer to the input phosphor; this movement causes the magnifi cation of the image.
Only the electrons from the diameter of the selected input phosphor and photocathode are used to accelerate to the output phosphor. In the magnifi cation mode, the minifi cation gain is reduced because there are fewer pho-toelectrons reaching the output phosphor, resulting in a dimmer image. This will cause the fl uoroscopic mA to be automatically increased to maintain the same brightness level, but it will also cause an increase in patient dose. In a dual-focused mode, selection of the magnifi cation can increase patient dose by two times. The increased patient dose will result in better image quality because more x-ray photons make up the latent image, which lowers
Automatic Brightness ControlThe automatic brightness gain or the automatic bright-ness control (ABC) circuit maintains the fl uoroscopic image density and contrast at a constant brightness by regulating the radiation output of the x-ray tube. This cir-cuit is also known as the automatic brightness stabilizer. A detector monitors the brightness level of the image inten-sifi er output phosphor. The ABC adjusts the fl uoroscopic mA to maintain a constant output brightness regardless of the thickness or density of the body part being examined. Fluoroscopic mA, 0.5 to 5 mA, is increased or decreased to compensate for various body thicknesses. The ABC has a relatively slow response time which temporarily affects the image on the monitor. During a fl uoroscopic exami-nation, rapid changes in body thickness can cause the ABC to lag behind for a moment or two before the kVp and mA is adjusted to provide the appropriate amount of brightness for the tissue thickness.
Magnifi cation TubesElectrostatic lenses can change the magnifi cation of the image by changing the focal point of the photoelectrons. Dual- or multiple-mode image intensifi ers provide dif-ferent magnifi cations for different applications. Mag-nifi cation is an increase in the image size of an object,
Low voltagesupplied toelectrostatic lenses
A B
High voltagesupplied toelectrostatic lenses
Focal point
Focal point
Figure 13.7. Voltage sup-plied to the electrostatic lenses controls the location of the focal point. (A) Low voltage supplied to lenses. (B) High voltage supplied to lenses. As the focal point gets closer to the input phosphor, the size of the area of the input phosphor decreases.
Fosbinder_Text_Chap13.indd 191 12/7/2010 2:52:32 PM
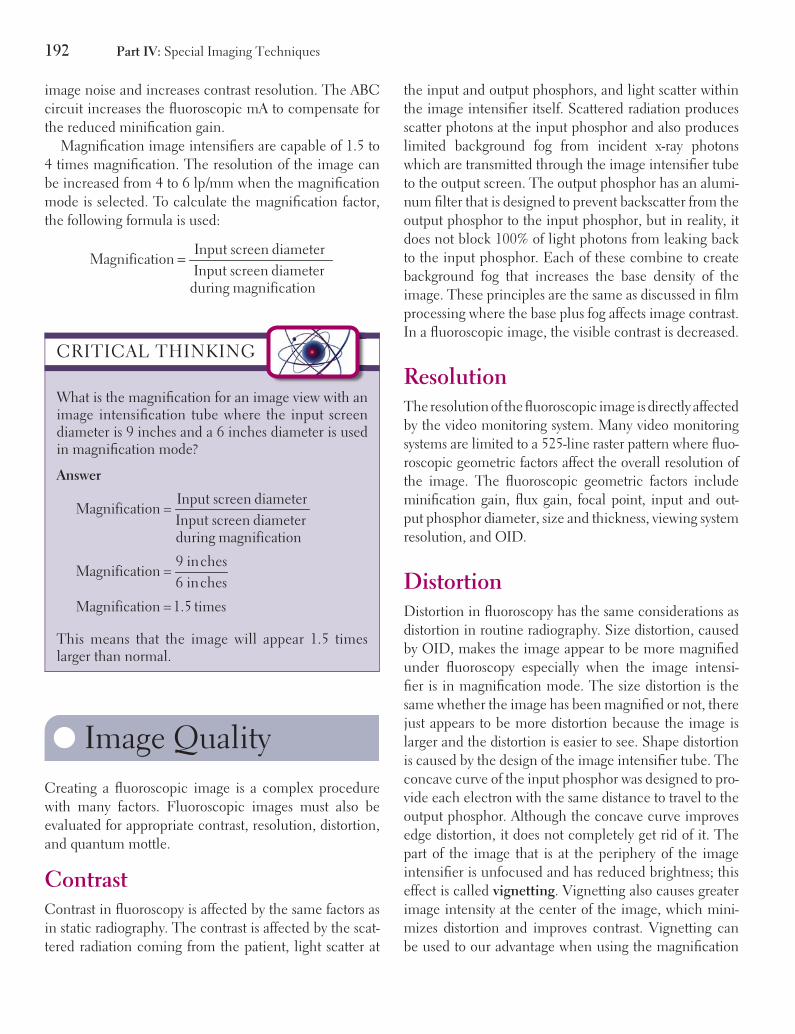
192 Part IV: Special Imaging Techniques
the input and output phosphors, and light scatter within the image intensifi er itself. Scattered radiation produces scatter photons at the input phosphor and also produces limited background fog from incident x-ray photons which are transmitted through the image intensifi er tube to the output screen. The output phosphor has an alumi-num fi lter that is designed to prevent backscatter from the output phosphor to the input phosphor, but in reality, it does not block 100% of light photons from leaking back to the input phosphor. Each of these combine to create background fog that increases the base density of the image. These principles are the same as discussed in fi lm processing where the base plus fog affects image contrast. In a fl uoroscopic image, the visible contrast is decreased.
ResolutionThe resolution of the fl uoroscopic image is directly affected by the video monitoring system. Many video monitoring systems are limited to a 525-line raster pattern where fl uo-roscopic geometric factors affect the overall resolution of the image. The fl uoroscopic geometric factors include minifi cation gain, fl ux gain, focal point, input and out-put phosphor diameter, size and thickness, viewing system resolution, and OID.
DistortionDistortion in fl uoroscopy has the same considerations as distortion in routine radiography. Size distortion, caused by OID, makes the image appear to be more magnifi ed under fl uoroscopy especially when the image intensi-fi er is in magnifi cation mode. The size distortion is the same whether the image has been magnifi ed or not, there just appears to be more distortion because the image is larger and the distortion is easier to see. Shape distortion is caused by the design of the image intensifi er tube. The concave curve of the input phosphor was designed to pro-vide each electron with the same distance to travel to the output phosphor. Although the concave curve improves edge distortion, it does not completely get rid of it. The part of the image that is at the periphery of the image intensifi er is unfocused and has reduced brightness; this effect is called vignetting. Vignetting also causes greater image intensity at the center of the image, which mini-mizes distortion and improves contrast. Vignetting can be used to our advantage when using the magnifi cation
image noise and increases contrast resolution. The ABC circuit increases the fl uoroscopic mA to compensate for the reduced minifi cation gain.
Magnifi cation image intensifi ers are capable of 1.5 to 4 times magnifi cation. The resolution of the image can be increased from 4 to 6 lp/mm when the magnifi cation mode is selected. To calculate the magnifi cation factor, the following formula is used:
Input screen diameterMagnification
Input screen diameterduring magnification
=
CRITICAL THINKING
What is the magnifi cation for an image view with an image intensifi cation tube where the input screen diameter is 9 inches and a 6 inches diameter is used in magnifi cation mode?
Answer
Input screen diameterMagnification =
Input screen diameterduring magnification
9 inchesMagnification =
6 inches
Magnification =1.5 times
This means that the image will appear 1.5 times larger than normal.
Image QualityCreating a fl uoroscopic image is a complex procedure with many factors. Fluoroscopic images must also be evaluated for appropriate contrast, resolution, distortion, and quantum mottle.
ContrastContrast in fl uoroscopy is affected by the same factors as in static radiography. The contrast is affected by the scat-tered radiation coming from the patient, light scatter at
Fosbinder_Text_Chap13.indd 192 12/7/2010 2:52:33 PM

Chapter 13: Fluoroscopy, Conventional and Digital 193
Fluoroscopic DisplaysThe most commonly used method of viewing the fl uoroscopic image is the television monitor. Before the image can be viewed, it must go through various types of equipment to make the electrical signal visible to the human eye. The image of the output phosphor of the image intensifi er can be coupled to a TV camera for TV monitor viewing or to a spot fi lm camera or cine camera. A close-circuit TV system is used for dynamic imaging; cine and spot fi lm images provide permanent records of the examination. Figure 13.8 illustrates how the out-put phosphor of the image intensifi er can be viewed or recorded in different ways. A beam-splitting mirror sends the output phosphor image to both the spot fi lm camera and the TV system.
Figure 13.9A and B show an illustration of the target assembly. The target assembly of a typical TV camera tube shows a large video signal produced by a large amount of
mode of the image intensifi er. Remember that when using the magnifi cation mode, the center of the input phosphor is used. The resulting image has less shape dis-tortion and improved spatial resolution.
Quantum MottleQuantum mottle is the grainy appearance which is caused by insuffi cient radiation to produce a uniform image. Quantum mottle is controlled by mA and time. In fl uoros-copy, a minimum number of photons are used to activate the fl uoroscopy screen; this can create noise on the video image and the grainy appearance. Various factors infl u-ence quantum mottle and increasing the effi ciency of any of the factors will assist in reducing quantum mottle. The factors are radiation output, beam attenuation by the patient, the conversion effi ciency of the input phosphor, minifi cation gain, fl ux gain, total brightness gain, and the viewing system. Although several of these factors are out of the control of the radiographer, the most useful solu-tion is to increase the mA setting to the fl uoroscopy tube.
Output phosphor
TV camera
Spot film camera
Mirror optics
Beam-splitting optics
TV Monitor
Closed-circuitvideo signal
Figure 13.8. Illustrates how the output phosphor of the image intensifi er can be viewed or recorded in different ways.
Fosbinder_Text_Chap13.indd 193 12/7/2010 2:52:35 PM

194 Part IV: Special Imaging Techniques
No light
WindowSignal plateTarget
No video signalA large video signaldue to a lot of light
A largeamount of lightElectron beam
A B
Figure 13.9. A, B shows an illustration of the target assembly when illuminated and the resulting video signal.
light striking the window compared to no video signal generated from no visible light striking the window of the target assembly.
The synchronized image intensifi er is viewed with a TV camera and displayed on a TV monitor. The TV camera is similar to a home video camera. The TV camera con-verts the light image from the output phosphor into elec-trical signals that are displayed on a standard TV monitor. The television camera is a glass tube usually about 1 inch in diameter and approximately 6 inches in length.
Video Camera TubesThe standard types are called the Vidicon and Plumbi-con or a charge-coupled device (CCD). The vidicon and plumbicon tubes are similar in operation; however, the
plumbicon tube has a faster response time. The tubes have a glass envelope which maintains a vacuum and provides support for the internal components (Fig 13.10). Inside the TV camera tube are a cathode and an electron gun, electrostatic or focusing coils, and the target assem-bly that is also the anode.
CathodeThe cathode has a heating assembly which forms an elec-tron gun through the process of thermionic emission. The electron gun forms an electron beam that is accelerated toward the target and strikes the signal plate of the target where the light from the output phosphor has removed electrons from the target and the electron beams fi lls the vacancy left by the removed electrons. This generates an electric signal that is amplifi ed and sent to the television
Signal plate
Target
Anode
Video signal
Glass face plate
Focusing coil
Electron beamControl grid
Deflecting coil
Cathode
Figure 13.10. A video camera tube and its components.
Fosbinder_Text_Chap13.indd 194 12/7/2010 2:52:35 PM

Chapter 13: Fluoroscopy, Conventional and Digital 195
AnodeThe anode in the vidicon or plumbicon tubes has a target assembly comprised of three layers: the glass face plate or window, signal plate, and target or photocathode. The glass face place acts as the window and is the thinnest part of the glass envelope. The signal plate is a thin coating of graphite on the inside of the glass window. The coating is thin enough to transmit light and yet thick enough to be an effi cient electrical conductor to conduct the electronic signal out of the tube into the external video circuit.
The inside of the signal plate is coated with a pho-toconductive layer which comprises the target. Vidi-con tubes use antimony trisulfi de and Plumicon tubes use lead oxide. The photoconductive layer is capable of absorbing light photons and releasing the amount of electrons which are equivalent to the intensity of the absorbed light, thereby making up the video signal (Fig. 13.12).
The vidicon tube is connected to the output phosphor of the image intensifi cation tube by either fi ber optics or an optical lens system. Of these methods, the fi ber optics is only a few millimeters thick and contains thousands of glass fi bers. The small size of the fi ber optics is an advantage when manipulating the image intensifi cation tower. The fi ber optics coupling allows the use of cas-settes to record spot fi lms but it doesn’t allow the use of cine or spot fi lm cameras. Cine and spot fi lming requires
monitor. As a result, the signal is generated from the conducted electrons that are the brightest area of the image and no signal from the dark areas of the image of the output phosphor.
At the target, the electron beam passes through a wire mesh and interacts with the target assembly where the beam is slowed down to a near standstill. The electrostatic coils focus the beam to a point so that resolution is main-tained. As the beam strikes the target, it is defl ected from one side to the other by pairs of defl ecting coils; this back and forth scan path is called a raster pattern (Fig. 13.11). The electron beam scans across the screen with extreme speed that will cause the image to fl icker. To avoid fl icker, the scan is divided in half, with the fi rst half scanning the odd-numbered lines and the second half scanning the even-numbered lines. This permits the scans to be pro-jected in more frames per second and eliminates fl icker.
Standard TV screens in the United States have 525 active trace lines at 1/30th of a second in a horizontal direction. The human eye cannot see any fl icker slower than a 30 time per second. This limits the resolution to about 2 line pairs per millimeter (lp/mm). The resolu-tion of the image intensifi er output phosphor is about 5 lp/mm, so the TV display is the weak link in the imag-ing chain. Some fl uoroscopic systems are equipped with 1,050-line display monitors to match the display to the resolution of the output phosphor.
2621/2 lines1/60 second
1st scan 2nd scan 3rd scan
2621/2 lines1/60 second
525 lines1/30 second
1
3
5
7
9
1
3
5
7
9
2
4
6
8
2
4
6
8
+ =
Figure 13.11. A video frame raster scan pattern. The electron beam scans the diagonal lines as active traces and the horizontal lines as inactive traces. The horizontal lines set up the position of the electron beam for the next scan. The electron beam scans 262½ alternate lines every 1/60 seconds until it reaches the bottom of the screen where a complete television fi eld is seen. To prepare for the next television fi eld, the screen is vertically retraced from bottom to top at which point the raster pattern scan takes place again and the next set of 262½ alternate lines are scanned every 1/60 seconds. The two scans are blended together to provide the 525 active trace line or raster pattern. This sequence occurs every 1/30 seconds so that there will be no fl icker in the image when it is viewed.
Fosbinder_Text_Chap13.indd 195 12/7/2010 2:52:36 PM

196 Part IV: Special Imaging Techniques
Camera lens
Spot film camera
Image intensifier
TV camera/CCD
Objectivelens
Fiberoptics
Beam splittingmirror
A B
Figure 13.12. Video camera tubes are coupled to the image intensifi er in two ways, (A) fi ber optics and (B) mirror lens system.
the optical lens system. Spot fi lming requires the use of beam-splitting mirrors which permits the image to be recorded while being viewed. As seen in Figure 13.12, optical lens systems are much larger than the fi ber optics coupling and are easily identifi ed by the large size of the housing on top of the image intensifi cation tube. Careful handling to avoid trauma is essential to keep the mirror and lens system precisely balanced.
Charge-Coupled DeviceSome fl uoroscopy systems use a CCD instead of a video tube. The CCD is a semiconducting device capable of stor-ing a charge from light photons striking a photosensitive surface. When light strikes the photoelectric cathode, elec-trons are released in response to the intensity of the inci-dent light. The CCD stores these electrons which make
Fosbinder_Text_Chap13.indd 196 12/7/2010 2:52:36 PM

Chapter 13: Fluoroscopy, Conventional and Digital 197
up the latent image. A video signal is then emitted in a raster scanning pattern by discharging the stored electrons as pulses. The main advantage of the CCD is the extremely fast discharge time which is useful in cardiac catheteriza-tion where high-speed imaging is critical to visualizing blood fl ow. The CCD operates at a lower voltage which prolongs its life, it is more sensitive than video tubes, and its resolution is adequate for imaging structures in the body.
Cathode Ray TubeThe cathode ray tube (CRT) is the type of monitor used to display the fl uoroscopic image. Like a video tube, it consists of a vacuum tube, an electron gun (cathode) with focusing and defl ecting electromagnets (Fig. 13.13) for steering the electron beam. It is much larger than the video tube and has an anode assembly with a fl uorescent phosphor coated on the inside of the front screen. The electron gun follows the same raster pattern used by the video camera tube or CCD and sprays the pulsed stream of electrons onto the anode or screen phosphor. The phosphor crystals emit light when struck by the electron beam and transmit the light as a visual image through the glass screen. At this point, the image is a manifest image, meaning it can be viewed.
Fluoroscopic ImageThe fl uoroscopic image is formed through a complex set of conversions beginning with the incident x-ray beam and fi nishing as the visible image on the monitor. A sim-plifi ed explanation will assist you in putting the pieces together. First, the incident x-ray beam is attenuated by the patient and the resulting x-ray photons then inter-act with the input phosphor of the image intensifi er.
The input phosphor converts the x-ray photons to light photons which are then converted to photoelectrons by the photocathode. The photoelectrons are accelerated and focused by electrostatic lenses toward the anode. As the photoelectrons pass through the anode, they come into contact with the output phosphor and are converted into light photons. At this point, the latent image has gone through the image intensifi er and is now ready to pass through the video camera tube.
The video camera tube transforms the visible light image of the output phosphor into an electrical video signal that is created by a constant electron beam in the video camera tube. The video signal then varies the electron beam of the CRT and transforms the electron beam into a visible image at the fl uorescent screen of the CRT. Both electron beams, the one in the video camera tube and the one in the CRT, are precisely focused pencil beams that are synchronized by external electromagnetic coils of each tube. Both beams are always at the same position at the same time and move in exactly the same fashion. This allows for an accurate image to be visualized by the technologist and radiologist.
Archiving the Fluoroscopic Image
Fluoroscopic images are recorded using static spot fi lm-ing, digital display, a standard videocassette recorder (VCR), or a digital image recorder. VCRs and cine cam-eras record dynamic images. VCR images are analog images recorded on magnetic tape. Cine cameras record
Phosphor
Electron beam
TV monitor
Light
Electrongun
Control grid
CathodeFocus coil Deflecting coil
Anode
Flourescentscreen
Figure 13.13. A CRT and its components.
Fosbinder_Text_Chap13.indd 197 12/7/2010 2:52:37 PM

198 Part IV: Special Imaging Techniques
Spot film holder
Figure 13.14. Demonstrates the image intensifi er with a slot fi lm device for a standard radiographic cassette.
the images on a 35-mm movie fi lm. Digital images provide a permanent static image of the anatomy viewed during fl uoroscopy. Fluoroscopic images can also be dig-itized and stored as digital data.
Spot FilmingSpot fi lming or imaging systems are necessary when a permanent image of the fl uoroscopic examination is needed to document the anatomy. Spot fi lming is used with almost every fl uoroscopic examination when the information is necessary to diagnose, either positively or negatively. During the fl uoroscopic examination, it is possible to use spot fi lming to rapidly record a series of static images so that when viewed, they provide a com-prehensive record of the patient’s anatomy and potential pathology. There are several methods for recording a spot fi lm, including standard cassettes and roll fi lm. With the advancement of more sophisticated equipment, roll fi lm has become obsolete and will not be discussed here.
Standard radiographic cassettes allow the radiologist to record one image on a fi lm or multiple images on a fi lm. Selections include 1-on-1, 2-on-1 vertical, 2-on-1 horizontal, or 4-on-1. Standard cassette sizes include 8 × 10 inch, 9 × 9 inch, or 10 × 12 inch. The image inten-sifi er has a lead-lined compartment where the cassette is stored (Fig. 13.14). At the time of a spot fi lm exposure, the cassette is moved into the primary beam by controls located in the fl uoro carriage. The carriage controls allow selection of the area of the cassette to be exposed, auto-matically collimate the tube and spot image mask shutters to the correct size, and position the cassette properly. The radiographer is responsible for replacing the cassettes that have been exposed with new cassettes for further imaging.
Spot fi lming is a slow process due to the time required to place the cassette for the exposure. This type of imaging causes the highest dose to the patient due to the increased mAs and kVp necessary to produce a diagnostic image.
Videocassette RecordingVideocassette recording makes a permanent record of the dynamic fl uoroscopic images on magnetic tape. VHS and high-resolution VHS-S videotape recorders are used to cre-ate the dynamic images. The VHS-S system requires high-resolution cameras, recorders, tape and monitors which offer a signifi cant increase in resolution that is desirable for viewing fl uoroscopic examinations. These images are the same as those displayed on the TV monitor and can be played back on a VCR unit similar to a home VCR player.
Cine RecordingFluoroscopic images can also be recorded on a 16- and 35-mm movie fi lm. Such recording is referred to as cine-fl uorography, or simply cine. The output phosphor image is directed to the cine camera by a beam-splitting mirror. Cine image recording uses a 16- or 35-mm fi lm to record static images at a high speed typically at 30 or 60 frames per second. Special x-ray tubes and generators that pulse the x-rays so that the x-ray beam is on only when the cine fi lm is in position and the camera shutter is open are required. Cine imaging is common in angiography and cardiac catheterization. The cine fi lm can be viewed as both a movie and stop-action fi lm. It must be shown at 16 frames per second for smooth motion to occur. The principal advantage of cine recording is the improved spa-tial resolution; however, radiation exposure rates are about ten times greater than in conventional fl uoroscopy.
Digital RecordingA majority of the new fl uoroscopic units have digital recording capabilities. The fl uoroscopic images are obtained in the conventional manner and then processed and stored as digital data in a manner similar to that used in computed tomography and magnetic resonance imag-ing. The digital images can be enhanced by changing the contrast or density prior to printing a hard copy. Ana-log images from the TV camera are converted to digital images and entered into computer fi les for later viewing.
Fosbinder_Text_Chap13.indd 198 12/7/2010 2:52:37 PM

Chapter 13: Fluoroscopy, Conventional and Digital 199
intensifi er, which looks like a “C.” The tube and image intensifi er can be moved to provide anteroposterior, pos-teroanterior, oblique, or lateral fl uoroscopic examina-tions as needed. C-arm fl uoroscopes are equipped with last image hold and digital recording capabilities.
Last Image HoldSome fl uoroscopic units can display the last image when x-ray production is stopped. This is also known as “freeze frame” capability. The output image is digitized and con-tinuously displayed on the output monitor. Most portable C-arm fl uoroscopic units have this capability. It allows the operator to study the image without continuously exposing the patient and staff to additional radiation.
Patient DoseThe patient dose during fl uoroscopy depends on the patient thickness, the exposure rate, and the duration of exposure. Higher exposure rates, thicker patients,
The digital images can be manipulated as desired and transferred multiple times to various locations without any loss of quality. When viewing the digital images on a monitor, the viewer is able to adjust the density and con-trast in the image, magnify the whole image or a portion of the image, and use fi lter or edge enhancements or other techniques to improve visualization of the image. The dig-ital image can be stored in multiple ways whether on the computer hard drive, compact disk, teleradiology systems, or printed as a hard copy on a laser dry image processor.
Mobile C-Arm Fluoroscopy
Mobile C-arm units are portable fl uoroscopy systems that are used in the operating room, the emergency room, and many other areas when it is not possible to bring the patient to the radiology department. Figure 13.15 shows a typical C-arm unit. The name comes from the physi-cal connection between the x-ray tube and the image
X-ray tube
Image intensifier
Figure 13.15. Shows a typical C-arm unit.
Fosbinder_Text_Chap13.indd 199 12/7/2010 2:52:38 PM

200 Part IV: Special Imaging Techniques
and longer fl uoroscopic examinations produce higher patient doses.
The exposure of the patient depends on the thick-ness and density of the body part being examined, the distance from the image intensifi er to the patient, and the image intensifi er magnifi cation. A change in any of these factors changes the exposure rate because the ABC circuit adjusts the mA to maintain constant output brightness. This mA adjustment changes the patient dose. Thicker, dense body parts are more diffi cult to penetrate and require higher exposure rates, resulting in higher patient doses.
The x-ray intensity at the image intensifi er depends on the source to image receptor distance (SID). Moving the image intensifi er closer to the patient decreases the SID and increases the beam intensity at the surface of the input phosphor. This results in the ABC decreasing the mA and producing a lower patient dose.
In addition to patient dose, other factors must be con-sidered when using a fl uoroscopic system. The entrance skin exposure (ESE) for the patient is that part of the patient which is closest to the x-ray source. For units with the x-ray tube under the table, the ESE is measured from the patient surface next to the tabletop. With the x-ray tube over the table, the ESE is measured from the patient surface closest to the fl uoro carriage. The table-top exposure rate should not exceed 10 R/min, with most units averaging from 1 to 3 R/min. The minimum source to skin distance for mobile fl uoroscopic equipment (c-arms) is 12 inches, while 15 inches is standard for sta-tionary fl uoroscopic equipment.
Fluoroscopic TimerAll fl uoroscopic systems are equipped with a 5-minute timer as required by law. The timer must audibly indicate when 5 minutes of fl uoroscopy has elapsed; this serves as a reminder to the radiologist of how much total exposure time has been used. This is a radiation safety device that will terminate the beam after 5 minutes, no matter how
Chapter SummaryFluoroscopy is a method of viewing dynamic moving structures. A fl uoroscopic system contains an x-ray tube, a patient support table, and an image intensifi er. The image intensifi er produces a brighter image by converting x-ray photons into visible light at the input phosphor, converting visible light into electrons at the photocathode, accelerating and focusing the electrons onto the output phosphor, and fi nally converting the electrons into visible light at the output phosphor. An ABC circuit maintains the brightness of the output phosphor at a constant level by adjusting the fl uoroscopic mA.
Brightness gain is a combination of fl ux gain and minifi cation gain. The output phosphor is brighter than the input phosphor because of brightness gain. Flux gain is produced by the acceleration of electrons in the image intensi-fi er tube. Minifi cation gain is produced because the output phosphor is smaller than the input phosphor. A TV camera views the output phosphor image and displays the image on a standard TV monitor. Fluoroscopic images can be recorded on spot fi lms, videotape, or cine fi lm. Patient dose is affected by patient size, the amount of magnifi cation, and the distance between the patient and the image intensifi er input surface. All fl uoroscopic systems must have a timer to audibly indicate when 5 minutes of fl uoroscopic beam on time has elapsed.
long the examination lasts. There is no limit to the number of times the timer may be reset. Some departments record the fl uoroscopy time in the patient’s record so that the fl uo-roscopic total dose can be calculated as necessary.
Fosbinder_Text_Chap13.indd 200 12/7/2010 2:52:39 PM

Chapter 13: Fluoroscopy, Conventional and Digital 201
Case StudyTami is the lead technologist in her radiology department. She is researching fl uoroscopy equipment so she can advise administration on an upcoming purchase. She discovered that there are many different types of machines but they were all very similar. The information Tami discovered included image intensifi ers with variable magnifi cation modes, different video camera tubes and CCDs, types of image display, and how to archive the image. In her report, Tami will answer the following questions.
Critical Thinking Questions
How does image intensifi er compare in size?
How is magnifi cation achieved? Which video camera tube or CCD will meet the depart-ment’s work fl ow?
What types of archiving are available?
There are various sizes of image intensifi ers that are commercially available. Various specifi ca-tions will need to be considered to determine if the R and F room is properly outfi tted for the new fl uoroscopy equipment, including the fact that electrical fi ttings in the room must be able to accommodate the unit. The input screen size will need to be considered as it directly relates to the variable magnifi cation modes available. Dual or multiple-mode image intensi-fi ers provide variable magnifi cation depending upon the examinations performed. Dual mode
image intensifi ers will increase patient dose by two times but will provide the radiologist with some magnifi cation options. The multiple mode will provide more magnifi cation options for a broader scope of examinations; however, it comes with increased patient dose as higher mA is needed to produce a quality image. Magnifi -cation image intensifi ers are capable of 1.5 to 4 times magnifi cation and this is accomplished by selecting a smaller portion of the input screen. These controls are on the carriage of the fl uoro tower and must be easily manipulated.
Tami learned that there are two basic types of video camera tubes, the vidicon and plum-bicon. Both provide the same basic functions; however, the plumbicon operates at a faster pace. A CCD is even faster than the video tubes and provides high-speed imaging for imaging small structures like coronary arteries. The type of video camera purchased will depend upon the typical use it will get with fl uoroscopic examinations, whether standard barium studies or more sophisticated interventional studies, where high-speed imaging is a necessity.
There are various ways to archive the images produced during the fl uoroscopic examinations. There are static imaging where cassettes are used and the equipment is capable of expos-ing the cassette multiple times, video cassette recording where a special playback unit, cine fi lming to provide a non-stop view of the anat-omy or can be played back frame by frame, and fi nally digital imaging where the images will be stored on a computer. The type of archiving depends on whether the department is still using fi lm/screen or has gone digital. As Tami learned, there are a multitude of choices avail-able when purchasing fl uoroscopic equipment.
Fosbinder_Text_Chap13.indd 201 12/7/2010 2:52:39 PM

Review Questions
5. The TV camera converts the light image from the output phosphor into a
A. brighter imageB. high-resolution imageC. magnifi ed light imageD. electrical signal
6. The input phosphor of an image intensifi er is coated with which material?
A. Zinc cadmium sulfi deB. Calcium tunstateC. Cesium iodideD. Iron oxide
7. Light photons are converted into electrons by which part of the image intensifi er?
A. Input phosphorB. AnodeC. Output phosphorD. Photocathode
8. The focusing electrostatic lenses in the image intensifi er
A. force photoelectrons to converge on the output phosphor
B. convert photoelectrons into light photonsC. convert light photons into photoelectronsD. force photoelectrons to converge on the input
phosphor
9. The lead drape on the image intensifi er tower must have a minimum of
A. 50 mm Pb equivalentB. 10 mm Pb equivalentC. 25 mm aluminum equivalentD. 25 mm Pb equivalent
Multiple Choice1. Changing from standard to magnifi cation mode
on an image intensifi er
1. increases the patient dose2. decreases the patient dose3. produces a magnifi ed image4. decreases the minifi cation gain
A. 2, 3, and 4B. 1 and 3C. 1, 3, and 4D. 2 and 4
2. Brightness gain is the product of the __________ gains.
A. magnifi cation and minifi cationB. minifi cation and fl uxC. fl ux and magnifi cationD. confi scation and fl ux
3. The _____ have good spatial resolution and are used for viewing in bright light.
A. rodsB. conesC. optic discD. olfactory bulb
4. Multiplying the fl ux gain by the minifi cation gain in the image intensifi er will equal the total
A. input phosphor sizeB. image sizeC. output phosphor sizeD. brightness gain
Fosbinder_Text_Chap13.indd 202 12/7/2010 2:52:39 PM

Chapter 13: Fluoroscopy, Conventional and Digital 203
4. During a fl uoroscopic examination, the radiologist sees something and would like to preserve that image on a 2-on-1 _____ _____.
5. What is the formula to determine brightness gain?
6. What are the basic components of the tube used in a video camera?
7. What is the difference between rod and cone vision? When is visual acuity greater? Defi ne pho-topic and scotopic vision.
8. The cassette spot fi lm is placed between the _____ and the _____.
9. What is the purpose of the ABC?
10. What are the types of dynamic and static fi lming systems used to record the fl uoroscopic image?
10. What is the fl ux gain if the input phosphor has 100 x-ray photons and the output phosphor has 6,000 light photons?
A. 6B. 60C. 0.16D. 16
11. What is the total brightness gain if the fl ux gain is 47 and the minifi cation gain is 80?
A. 2,500B. 1.7C. 3,760D. 1,880
12. The minimum distance between the source and the patient skin surface for a mobile fl uoroscopic unit is _____ inches.
A. 15B. 10C. 25D. 12
Short Answer
1. Draw a diagram of an image intensifi er tube and discuss the function of each part.
2. What is vignetting?
3. The electron gun in a vidicon is a heated fi lament that supplies a constant electron current by:
Fosbinder_Text_Chap13.indd 203 12/7/2010 2:52:40 PM

204
● analog-to-digital converter (ADC)
● digital imaging and communica-tionsin medicine (DICOM)
● digital-to-analog converter
● fl at panel detector● matrix● pixel● signal-to-noise ratio
(SNR)● thin-fi lm transistor
(TFT)
ObjectivesUpon completion of this chapter, the student will be able to:
1. Describe how a matrix of pixels is used to form a digital image.
2. Identify the relation between matrix size, pixel size, and fi eld of view.
3. Identify the components of a digital imaging system.
4. Describe the operation of a computed radiography system.
5. Explain elements used in the digital radiography system.
Digital Imaging
14
Key Terms
Fosbinder_Text_Chap14.indd 204 11/20/2010 1:23:21 PM

Chapter 14: Digital Imaging 205
48 2 4 48
14 0 4 14
14 0 4 14
48 2 4 48
Figure 14.2. Zero represents white or no intensity while higher numbers show darker shades of gray or more intensity.
IntroductionDigital images are used throughout radiology. They appear as computed tomographic (CT), magnetic resonance (MR), ultrasound, mammog-raphy, computed radiography (CR), direct radiog-raphy (DR), fl uoroscopy, nuclear medicine (NM), and diagnostic images. Unlike fi lm images, whose contrast, speed, and latitude are fi xed during processing, the appearance of digital images can be altered after they have been recorded and stored. Changes in the processing and display of the digital data can enhance information and sup-press noise in the fi nal image. An understanding of digital imaging systems will aid in producing diagnostic-quality digital images. The advantages of digital imaging include the ability to adjust the contrast after the image has been recorded, to pro-cess the image to emphasize important features, and to transfer the images to a remote site.
Digital Image Acquisition
A digital image is a matrix of picture elements or pixels. A matrix is a box of cells with numeric value arranged in rows and columns. Each cell corresponds to a specifi c location in the image. The numeric value represents the level of brightness or intensity at that location in the image. There are three numbers associated with each pixel, two to defi ne its location and the third to repre-sent the intensity of the image at that location. An image is formed by a matrix of pixels. The size of the matrix is described by the number of pixels in the rows and columns (Fig. 14.1). A small matrix has a small number of pixels, and a large matrix has a larger number of pixels. For example, a matrix with 256 pixels in each row and column is called a 256 by 256 matrix (written 256 × 256); one with 512 pixels in each row and column is called a 512 by 512 matrix. Some systems have a 1,024 by 1,024 matrix size which provides the smallest number of pixels in the matrix. Think of the matrix as a box in which you want to put in smaller boxes or pixels. In order to increase the number of small boxes in the matrix the size of each
small box must decrease to fi t more boxes in the matrix. The more small boxes or pixels there are in the matrix the better the resolution of the image. Digital images typically have between 25,000 and 1 million pixels. The more pixels there are the greater the image resolution.
Picture Elements or PixelsEach pixel in the matrix is capable of representing a wide range of shades of gray from white to black. The pixel contains bits of information and the number of bits per pixel that determines the shade of the pixel is called the bit depth. If a pixel has a bit depth of 10, then the number of gray shades the pixel can produce is 2 to the power of the bit depth, or 210 which is 1,024 shades of gray. Most digi-tal radiography systems use an 8, 10, or 12 bit depth. The human eye can only distinguish 32 shades of gray; how-ever, the computer with suffi cient capacity can distinguish up to 4,096 bit depth (Fig. 14.2). The level of gray will be a determining factor in the overall quality of the image.
1 2 3 4 5 6 7 8 9 10 11 12 13 14 15 16 17 18 19 20
20 X 20 Matrix of pixels
123
456789
101112
1314151617
18
1920
Figure 14.1. Shows how a matrix of numbers can be used to form a digital image.
Fosbinder_Text_Chap14.indd 205 11/20/2010 1:23:21 PM

206 Part IV: Special Imaging Techniques
CRITICAL THINKING
Change of matrix size from 256 × 256 to 512 × 512: What is the pixel size in millimeters of a 512 × 512 matrix for an image with a FOV of 20 cm?
Answer
20 cm = 200 mm200 mm/512 pixels = 0.4 mm/pixel
Spatial Resolution and Pixel SizeSpatial resolution describes the minimum separation between two objects at which they can be distinguished as two separate objects in the image. Specifi c to digital imag-ing, spatial resolution describes the ability of an imaging sys-tem to accurately display objects in two dimensions. Digital images with smaller pixel sizes have better spatial resolu-tion. In fi lm/screen imaging the crystal size and thickness of the phosphor layer determine resolution; in digital imag-ing pixel size will determine resolution. Spatial resolution is measured in line pairs per millimeter (lp/mm). Two pixels are required in order to image one line pair because a line pair consists of one bright and one dark line. Increasing the matrix size decreases the pixel size and improves spatial resolution, because there are more, but smaller, pixels in the matrix. Typical matrix sizes in diagnostic radiology are 256, 512, and 1,024, with some matrices as small as 64 × 64 or as large as 2,048 × 2,048 (Fig. 14.3).
Data CharacteristicsThe quality of the data acquired from the image recep-tor is measured in frequency, contrast, and noise. These characteristics must be considered to produce a diagnos-tic image.
FrequencyThe frequency data are the raw data to which an algo-rithmic formula is applied to create a digital image. The algorithmic formula is determined by the anatomy being image. For example, a hand image will have a different algorithmic formula than a chest image. The acquired fre-quency is a measurement of the total amount of contrast
Field of ViewThe fi eld of view (FOV) describes how much of the patient is imaged in the matrix. A 200-mm FOV means that a 200-mm-diameter portion of the patient is imaged. The matrix size and the FOV are independent. The matrix size can be changed without affecting the FOV, and the FOV can be changed without changing the matrix size. Changes in either the FOV or the matrix size will change the pixel size.
Relation Between Field of View, Matrix Size, and Pixel Size
CRITICAL THINKING
Original Image Size: What is the pixel size in milli-meters (mm) of a 256 × 256 matrix for an image with a 20 centimeter (cm) FOV?
Answer
20 cm = 200 mm200 mm/256 pixels = 0.8 mm/pixel
If the fi eld is changed and the matrix size stays the same, the pixel size changes.
If the FOV increases and the matrix size remains the same, the pixel size increases. If the FOV decreases and the matrix size remains the same, the pixel size decreases.
If the FOV remains the same and the matrix size changes, the pixel size changes. An increase in the matrix size results in a decreased pixel size (Table 14.1).
CRITICAL THINKING
Change of FOV from 20 to 30 cm: What is the pixel size in millimeters of a 256 × 256 matrix for an image with a FOV of 30 cm?
Answer
30 cm = 300 mm300 mm/256 pixels = 1.2 mm pixel
Fosbinder_Text_Chap14.indd 206 11/20/2010 1:23:22 PM

Chapter 14: Digital Imaging 207
as different densities. Contrast depends on the size of the pixels. Images with larger pixels have better contrast because the pixels cover a large area and have more infor-mation. In digital radiography, the contrast of an image is described by the number of data values between black and white. A high-contrast image has few data values between black and white; a low-contrast image has many
in an image. A high contrast image has a high frequency and a low contrast image has a low frequency.
ContrastContrast describes the minimum density difference between two tissues that can be detected in an image
A B
C D
32 x 32 64 x 64
256 x 256 1,024 x 1,024
Figure 14.3. Shows how the spatial resolution and appearance of a digital image change as the matrix size and pixel size change. (A) Large pixels are easy to distinguish. (B) The pixels are twice as small but it is still easy to determine individual pixels. (C) The pixels are even smaller and more diffi cult to see but the image has a blurred appearance. (D) Notice how the structures in the image are sharp and clear, the individual pixels cannot be distinguished.
Fosbinder_Text_Chap14.indd 207 11/20/2010 1:23:23 PM

208 Part IV: Special Imaging Techniques
is suffi cient contrast in the image for the computer to distinguish acquired data from noise.
Window Level and Window Width ControlsThe density and contrast of a digital image is controlled by the numerical value of each pixel. The human eye can distinguish 32 shades of gray; however, the x-ray photon beam that exits the patient contains over 1,000 shades. The majority of digital image receptors are sen-sitive to this large number of shades. This vast range of densities can be manipulated by radiographers, and it is their responsibility to choose the appropriate density and contrast ranges to be displayed. When processing the dig-ital image, the radiographers must use care in manipulat-ing the image so that they donot inadvertently obscure diagnostic information.
The contrast scale of a digital image can be electroni-cally altered by changing the window level and window width controls. The window level control sets the density value displayed as the center of the window or density range. As seen in Figure 14.5, the window level can be moved up and down the density scale from white to black while the window width can be widened or narrowed. There is a direct relationship between image density and window level; as the window level is increased the image density will increase. The window level must be set to the diagnostic range for the anatomy being visualized so that the proper level of diagnostically relevant informa-tion will be displayed. Any information not in the range will be obscured from view.
The window width control sets the number of density differences between black and white that are displayed. Window width controls image contrast therefore there is an inverse relationship between window width and image contrast. As the window width increases the image contrast will decrease. When imaging the abdomen
data values between black and white. An image with only two data values, black and white, has the highest con-trast; pixels in the image are either black or white. An image with four data values has pixels in the image that are black, dark gray, light gray, and white (Fig. 14.4).
High-contrast images are short-scale contrast images. They have superior contrast because it is easy to discrimi-nate between different densities. However, the image is useful only over a limited range of densities. In digital radiography, there is a direct relationship between sub-ject contrast and acquired data contrast. When subject contrast is high the acquired data contrast will also be high and vice versa for low subject contrast.
NoiseImage noise is made up of random background informa-tion, due to the constant fl ow of current in the circuit, that is detected but does not contribute to the image quality. Noise can be seen as the static “white noise” heard on certain frequencies between television stations. The overall noise in an image is measured as the signal-to-noise ratio (SNR). An image with high SNR has little noise to interfere with the appearance of the image. The noisiest component of most digital systems is the televi-sion camera. Some commercial systems have an SNR of 200 while the high resolution systems used in digital fl uo-roscopy have a SNR between 500 and 1,000, therefore a system with an SNR of 1,000 will have the least amount of noise.
On a digital image, noise looks like quantum mottle but it is really more like the effect of base plus fog on a standard radiographic image. Image noise has an inverse relationship to contrast. Increased noise decreases image contrast, however increased image contrast tends to decrease noise. In digital systems there will not be added density to the image because of noise, the computer will compensate for the lack of density as long as there
TABLE 14.1 SHOWS THE RELATIONSHIP BETWEEN FOV, MATRIX SIZE, PIXEL SIZE, AND SPATIAL RESOLUTION
FOV Matrix Size Pixel Size Spatial Resolution
Increases Remains constant Remains constant DecreasesDecreases Remains constant Remains constant IncreasesRemains constant Increases Decreases IncreasesRemains constant Decreases Increases Decreases
Fosbinder_Text_Chap14.indd 208 11/20/2010 1:23:26 PM

Chapter 14: Digital Imaging 209
the digital image a narrower window width is needed to adequately demonstrate the bony detail. Narrow win-dow settings produce short-scale contrast, high-contrast images because there are few density differences between black and white.
more shades of gray are required to provide diagnostically relevant information of the various soft tissues therefore a wider window width is needed (Fig. 14.6). This results in a decrease of image contrast. When imaging bony anatomy a shorter scale of contrast is necessary so with
(16 steps) (256 steps)
A B
C D
(2 steps) (4 steps)
Figure 14.4. Four images having different numbers of contrast densities. (A) This image represents a black and white scale of contrast. Much of the detail of the image is obscured because there is not enough information to form a complete image. (B) With four steps of gray scale, we can now begin to distinguish more areas of the picture. (C) The sky, rocks, and lighthouse are beginning to demonstrate more detail because there are more shades of gray. (D) An image with the maximum number of data values has pixels with densities covering a vast range; this provides the most comprehensive set of data for the image.
Fosbinder_Text_Chap14.indd 209 11/20/2010 1:23:26 PM

210 Part IV: Special Imaging Techniques
earliest detectors for digital systems, and one that is still widely used, is an image intensifi er tube connected to a fl uoroscopic imaging system. Most portable C-arm fl uo-roscopes and modern fi xed fl uoroscopic units convert image intensifi er images into digital data. It is also pos-sible to convert a conventional fi lm/screen image into a digital image using a fi lm digitizer.
Image AcquisitionImage acquisition begins with performing an x-ray expo-sure. The rules for positioning the part and correctly placing the central ray hold true for traditional and digital radiogra-phy. Digital systems cannot compensate for anatomy that is clipped or poorly positioned or for the lack of collima-tion. It is the responsibility of the radiographer to properly position the part of interest, to select the correct technical factors for the exposure, and to correctly collimate to the area of interest. Chronic overexposure should be avoided at all times (Fig. 14.8). This only increases the dose of radia-tion to the patient and does not result in a better image. A skilled radiographer will be aware of the range of exposures for the specifi c digital equipment in his or her department and will use the equipment with respect for patient safety.
Analog-To-Digital ConverterAll direct digital systems initially convert the analog sig-nal from the detector to a digital signal using an analog-to-digital converter (ADC). The digital data are then available for processing, display, and storage.
Imaging detectors produce continuously varying sig-nals called analog signals, these signals make up the latent image. Digital systems represent the signal by a series of discrete values which make up the intensity of the pixels. A digital signal can have either one value or the next value, but no value in between. Analog-to-digital converters convert analog signals to digital signals. Ana-log signals cannot be seen by the human eye and must be converted to digital signals for the manifest image to appear.
Digital-to-analog converters convert digital signals to analog signals. Digital signals with fi ner digitization (more discrete values) will more closely represent the analog signal. Conventional cable TV is an analog sig-nal because the voltage signal is continuously changing. Digital satellite TV is sent from the satellite to the home
Digital Imaging Systems
Digital imaging systems replace the traditional fi lm/screen systems with special detectors. There are two basic groups of digital imaging systems, either “cassette based” or “cassette-less.” Regardless of the system that is used, the process of obtaining an image is basically the same. After the primary x-ray beam passes through the patient, the exit radiation is detected, and the signal data are processed, displayed, and stored. Figure 14.7 illustrates the basic components of a digital imaging system.
Systems such as CR, MR, and CT collect image data directly as digital data (Table 14.2). These are known as direct digital systems. If the imaging system does not provide digital data directly, it is necessary to convert the analog data to digital data. One of the
An animation for this topic can be viewed at http://thepoint.lww.com/FosbinderText
White–1000
Black+1000
Windowlevel
Windowwidth
Figure 14.5. The window level can be moved up and down the density scale to change the density in the image. The window width can be widened or narrowed to change the amount of contrast in the image.
Fosbinder_Text_Chap14.indd 210 11/20/2010 1:23:29 PM

Chapter 14: Digital Imaging 211
Computed RadiographyCR is a “cassette-based” system that uses a special solid-state detector plate instead of a fi lm inside a cassette. The exte-rior dimensions and appearance of the CR cassette are the same as those of a conventional fi lm cassette. The CR cas-sette is placed in the Bucky tray or for portable examina-tions and exposed in the same manner as a conventional fi lm cassette. Most CR systems are set up to have the same response as a 200-speed fi lm per screen system, although this can be changed. The resolution of CR systems depends on the pixel size but is not as good as that of conventional
as a digital signal and then converted into an analog signal at the input to the home TV set (Fig. 14.9).
A
C D
B
D
Figure 14.6. Images represent how changing window width and window level controls affect image appearance. (A) High contrast abdominal image. (B) Low contrast abdominal image. (C) Low contrast thorax. (D) High contrast thorax.
TABLE 14.2 SHOWS THE FIVE MAJOR SOURCES OF DIGITAL IMAGES
1. Directly from MR, CT, or US2. Digitized fl uoroscopic images3. Computed radiographic plates4. DR5. Digitized conventional fi lm images
Fosbinder_Text_Chap14.indd 211 11/20/2010 1:23:30 PM
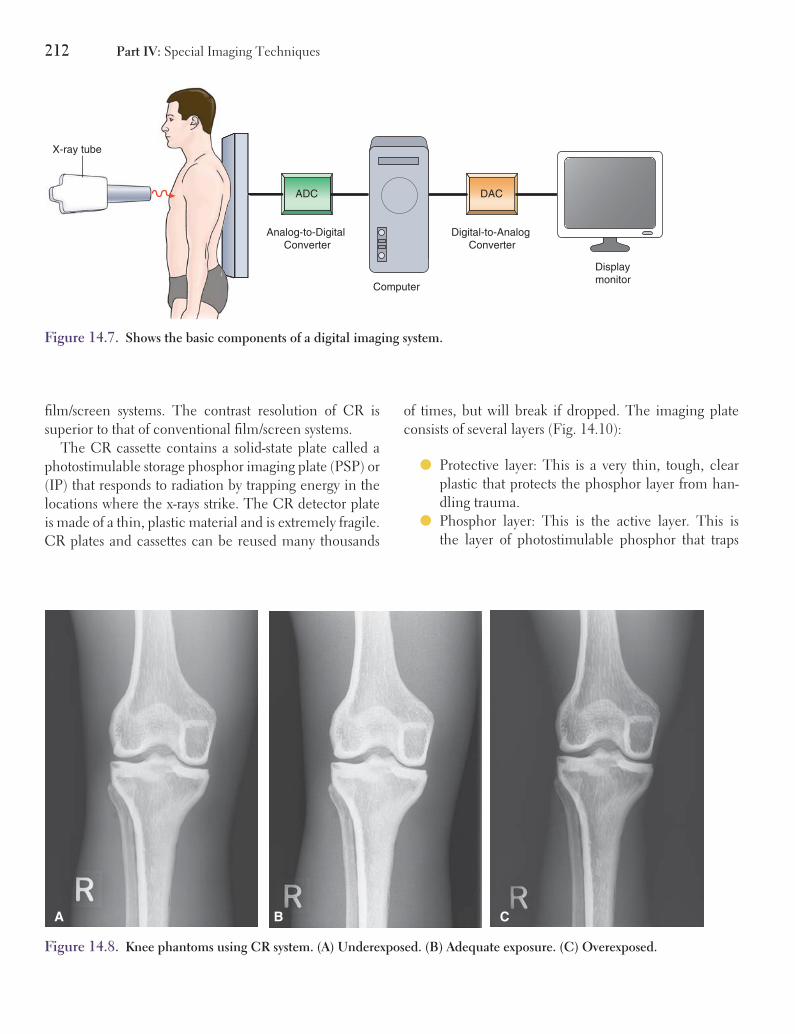
212 Part IV: Special Imaging Techniques
DACADC
X-ray tube
Computer
Displaymonitor
Analog-to-Digital Converter
Digital-to-Analog Converter
Figure 14.7. Shows the basic components of a digital imaging system.
fi lm/screen systems. The contrast resolution of CR is superior to that of conventional fi lm/screen systems.
The CR cassette contains a solid-state plate called a photostimulable storage phosphor imaging plate (PSP) or (IP) that responds to radiation by trapping energy in the locations where the x-rays strike. The CR detector plate is made of a thin, plastic material and is extremely fragile. CR plates and cassettes can be reused many thousands
of times, but will break if dropped. The imaging plate consists of several layers (Fig. 14.10):
● Protective layer: This is a very thin, tough, clear plastic that protects the phosphor layer from han-dling trauma.
● Phosphor layer: This is the active layer. This is the layer of photostimulable phosphor that traps
B CA
Figure 14.8. Knee phantoms using CR system. (A) Underexposed. (B) Adequate exposure. (C) Overexposed.
Fosbinder_Text_Chap14.indd 212 11/20/2010 1:23:35 PM

Chapter 14: Digital Imaging 213
Analog
Digital
Figure 14.9. Illustrates an analog signal and the corresponding digital signal.
electrons during exposure. It is typically made of barium fl uorohalide phosphors.
● Conductive layer: This layer grounds the plate to reduce static electricity problems and to absorb light to increase sharpness.
● Support layer: This is a semirigid material that pro-vides the imaging sheet with strength and is a base for coating the other layers.
● Light shield layer: This prevents light from erasing data on the imaging plate or striking through the backing layer.
● Backing layer: This is a soft polymer that protects the back of the cassette.
The radiation dose from a CR exposure is usually set to correspond to a comparable fi lm/screen exposure. The incident x-ray beam interacts with the photostimu-lable phosphors that are in the active layer of the imag-ing plate. The interaction stimulates the electrons in the phosphors allowing the electrons to enter the conduc-tive layer, where they are trapped in an area of the phos-phor known as the phosphor center. This is the latent image that will create the digital image for the computer to record and display. The trapped signal will remain
A
Imagingplate
CR casette
Phosphor
Light shield
Support
Conductor
Backing
Protectivesupercoat
B
Figure 14.10. (A) CR imaging plate. (B) Photostimulable phosphor imaging plate showing layers.
for hours or days; however, deterioration of the signal begins almost immediately, so it is vitally important to process the imaging plate immediately after exposure (Fig. 14.11).
An animation for this topic can be viewed at http://thepoint.lww.com/FosbinderText
Fosbinder_Text_Chap14.indd 213 11/20/2010 1:23:39 PM

214 Part IV: Special Imaging Techniques
ADC
AnalogLaser scanner
Exposure ofCR detector
1
2
3
CR detector inprocessing module
Laser dectector
Computer
Viewing monitor
Hardcopy printer
Network stations
Figure 14.11. A diagram of the steps in forming and developing a CR image.
Reading the Imaging PlateAfter the exposure, the CR cassette is placed in the processing reader to produce a visible image (Fig. 14.11). The processing reader opens the CR cassette and removes and scans the detector plate with a laser beam or solid-state laser diodes. As the plate is fed through the process-ing reader, a laser beam scans the plate with red light in a raster pattern and gives energy to the trapped electrons. The red laser light is emitted using 2 eV, which is needed to energize the trapped electrons. The trapped electrons are now able to leave the active layer where they emit blue light photons as they return to a lower energy state. As the laser beam scans, the imaging plate lines of light intensity information will be detected by a photomultiplier tube. The photomultiplier tube converts the visible light into an electronic signal which is in analog form. The analog signal must be converted to a digital signal for the com-puter to apply algorithmic formulas to the information.
The conversion is accomplished with an analog to digital converter.
When the laser beam scans the plate each line of the imaging plate correlates to one pixel dimension. The ana-log signal emitted for each pixel has an infi nite range of values which the ADC must convert into discrete values which can be stored as digital code. This digital code will determine the gray scale for each individual pixel. All the pixel densities will be combined to represent the many density values in the image which affects the density and contrast of the image. Once the conversion is complete, the light intensity and the position of the laser beam are stored as digital data for each pixel. At this point, the manifest image is now visible on the computer monitor. Another variable related to pixels is spatial resolution, the smaller the pixel the higher the spatial resolution. As pre-viously discussed, matrices with more and smaller pixels have higher spatial resolution.
Fosbinder_Text_Chap14.indd 214 11/20/2010 1:23:41 PM

Chapter 14: Digital Imaging 215
After the entire plate has been scanned, a high-intensity light source releases any remaining trapped energy to prepare the plate for reuse. The cassette is then closed and returned to the ready bin for reuse. The entire pro-cessing cycle requires about 60 seconds (s). It is never necessary to open the CR cassette or to handle the detec-tor plate.
The benefi t of using CR in radiography is utilizing your existing equipment. The other benefi t is storage. Films take up a lot of room to store. They also can be mis-placed or lost. With a CR system, the images are stored on computer with a back-up system in place. For CR radi-ography, you are able to transmit images to remote sites. The radiologist has quick access to previous CR images for comparison. This makes diagnosis of any abnormali-ties more accurate.
Direct RadiographyDR is yet another way to record the x-ray exposure after it has passed through the patient. DR is used to describe images which are recorded on an electronically read-able device that is hard-wired directly to the computer processing system. The detectors and sensors of a DR system are contained inside a rigid protective housing. DR uses an array of small solid state detectors to convert incident x-ray photons to directly form the digital image. The major advantage of the DR system is that no han-dling of a cassette is required as this is a “cassette-less” system.
The image data are transferred directly to the com-puter for processing. There are two forms of DR systems: one uses a linear array of detectors, which sweeps across the area to be imaged, the other has an array of detectors formed into a matrix. The linear array records the posi-tion of the array and the signal from each detector to form the image. In the matrix system, each detector provides data for one pixel. The linear array requires fewer detec-tors but a longer time to form each image. This increases the tube heat load and the possibility of patient motion artifacts.
A matrix array system requires many more detectors than a linear array system to achieve the same spatial resolution. For example, to image a 5 × 5-inch fi eld with a 5-lp/mm resolution requires 250,000 detectors, whereas a linear array requires only 500 detectors for the same
resolution. Film screen systems typically have resolutions of 8-lp/mm.
Direct radiography fl at panel detectors or imaging plates use a radiation conversion material or scintillator made of amorphous selenium (a-Se) which is a semi-conductor with excellent x-ray photon detection ability and spatial resolution. A high voltage charge is applied to the top surface of the selenium layer immediately prior to the x-ray exposure. The ionization created by the x-ray photons results in the selenium atoms releas-ing electrons which are absorbed by the electrodes at the bottom of the selenium layer. The electrons are transferred and stored in the TFT detectors. The thin-fi lm transistor (TFT) is a photosensitive array comprised of small pixels. Each pixel contains a pho-todiode that absorbs electrons and generates electrical charges. A silicon TFT separates each pixel element and sends the electrical charges to the image proces-sor (Fig. 14.12). The TFTs are positioned in a matrix which allows the charge pattern to be read pixel by pixel. This process is extremely fast where more than 1 million pixels can be read and converted into a digi-tal image in <1 second. All this information is read with dedicated electronics that facilitate fast image acquisition and processing.
Digital radiography is similar to CR because it is fi lm-less and the image is stored on the computer. It has the same benefi t as CR. The image is displayed for the tech-nologist to check prior to the next exposure. The images
+
Electrode (high voltage)
Charge collectionelectrodes
Thin film transistor (TFT)
Dielectric
Amorphous selenium
Glass backing
Carbon fiber case
Signal out
–
–
+–
– – – – – –– – – – –
Figure 14.12. Flat panel detector with direct conversion amorphous selenium.
Fosbinder_Text_Chap14.indd 215 11/20/2010 1:23:41 PM

216 Part IV: Special Imaging Techniques
are then sent to a storage system. This storage system allows for long term storage or the image can be printed out on a laser printer to fi lm. There are no cassettes with digital radiography. The image is transferred directly onto the computer.
When using CR or digital radiography imaging, both images are placed on computer. Once transferred, the images can be transferred electronically to “Picture Archiving and Communication System” (PACS). The images can then be sent to the radiologist and ordering physician. The images are then archived.
Film DigitizationAny image recorded using a conventional fi lm/screen cassette can be converted into a digital image by a fi lm digitizer. A fi lm digitizer measures the light transmitted at each location on the fi lm, converts the light intensity to a digital value, and records the location and intensity values as an image pixel. The fi lm is introduced into the feed tray and transported through the digitizer while the image is scanned for digitization. After digitization, the image can be processed, displayed, or transmitted just like any other digital image.
Picture Archiving and Communications System
No matter how the digital image is obtained, it can be sent over either a dedicated line or conventional telephone lines to other display sites in the hospital or elsewhere. There is no limit to the number of monitor stations that can display the same image simultaneously. Images of a trauma victim can be sent to the radiology, emergency, and surgery departments at the same time. Such distri-bution of images within a hospital is part of a PACS. It is also possible to send images across the street, state, or country. Once the image has been digitized there is no limit to the distance it can be sent. Sending images to remote sites is called teleradiology.
DICOMAt the advent of computerization in radiology it became necessary for medical facilities to have the ability to view images and reports from other facilities. The Digital Imaging and Communications in Medicine (DICOM) standard was implemented. DICOM is a set of computer software standards that permit a wide range of digital imaging programs to understand each other. Prior to DICOM-3 there were many medical imaging systems designed by various manufacturers which were not able to communicate with each other or share the same com-puter network. DICOM-3 allows the interfacing of many systems within an imaging department to share one net-work without confl ict. Digital images and reports can also be archived on a CD to be viewed at another facility.
Hard Copy ProductionDiagnostic interpretation can be made from the display monitor, called a soft copy display, or the image can be printed on fi lm, called a hard copy. Hard copies are pro-duced on multiformat cameras or laser printers.
A multiformat camera takes a picture of the display screen. It is called a multiformat camera because multiple images can be produced on a single sheet of fi lm. A laser printer scans a laser beam across a sheet of fi lm to expose the image. The intensity of the laser beam, and hence the density of the image, is controlled by the digital data. The laser printer can also produce multiple images on the same fi lm. Both the laser printer and the multiformat camera are connected to an automatic fi lm processor, so their images are ready for immediate interpretation after the fi lm is developed. The digital image data are stored in a computer and can be retrieved whenever required to produce additional hard copies or replace lost fi lms.
Dry Film ProcessorsImages from digital data can be formed using the dry fi lm processors that process and print the image in a single step. Dry fi lm processors require no chemical solutions to
Fosbinder_Text_Chap14.indd 216 11/20/2010 1:23:42 PM

Chapter 14: Digital Imaging 217
Case StudyJenny, a fi rst year radiologic technology student, is giving a presentation about digital radiography to her classmates. She has decided to explain the cassette-based system. During the presentation, she will answer the following questions.
Critical Thinking Questions
What are the components of the cassette-based system?
How does the imaging plate acquire an image?
How is the imaging plate read?
What must occur for the latent image to become visible on the computer screen?
Where is the fi nal image stored?
Chapter SummaryA digital image is formed by a matrix of num-bers called pixels. Each pixel specifi es a unique location and contains information about the image intensity at that location. The FOV describes how much of the patient is imaged. The spatial resolution of the digital image is lim-ited by the pixel size. Smaller pixels provide bet-ter spatial resolution. The contrast resolution of a digital image is established by the number of discrete values stored in the pixels. The window width control determines the number of den-sity differences between black and white in the display. The window level control sets the center density value in the display. A small number of densities produce a high-contrast image.
produce a ready-to-interpret image on fi lm. The special dry fi lms can be loaded into the holding magazine with the room lights on, because it is processed by a thermal printer head. When a hard copy of the digital data is formed in the dry processor, a sheet of the special fi lm is removed from the holding magazine and transported past the thermal head, which blackens the fi lm. Pixel locations with higher-intensities are displayed as darker areas on the fi lm. The special thermal fi lm cannot be processed in a conventional automatic processor and can be used only with digital data. Because the special dry fi lm is activated by heat and is insensitive to room lights, no darkroom is needed with a dry fi lm processor.
Data CompressionData compression reduces the number of pixels that are stored or processed in an image. Compression algorithms can reduce the size of the data in an image matrix by a factor of 30 or more, while maintaining the diagnostic content of the image. Compressed images require less storage space and can be transmitted more rapidly. This means that an original image requiring 30 minutes (min) to transmit can be sent in 1 min in a compressed form.
Digital imaging systems include CR, DR, MR, CT, NM, and fl uoroscopic units. Detectors used in digital imaging include fl uoroscopic image intensifi ers and scintillation crystals. Images on fi lm can be digitized and then processed and transmitted in PACS or teleradiology systems. An ADC changes analog signals into digital signals. CR employs a thin solid-state detector plate inside a special CR cassette that is the same size and shape as a conventional fi lm/screen cassette and can be used in the same Bucky holders. Data compression reduces the size of the image matrix and reduces the time required to transmit, process, and retrieve the images and the memory space required to store the images. Digital data can be displayed for interpretation on display monitors, called soft displays, or printed on fi lm, called hard copies. Hard copies of digital data can be produced by multiformat cameras, laser printers, or dry fi lm processors.
Fosbinder_Text_Chap14.indd 217 11/20/2010 1:23:42 PM

218 Part IV: Special Imaging Techniques
The cassette-based systems use a cassette which is loaded with a solid-state plated known as a photostimulable storage phosphor imaging plate; it is called an IP. The IP is made of a thin, plastic material with several layers of materials which work together to form the latent image. The layers include a protective layer, phosphor layer, conductive layer, support layer, light shield layer, and backing layer. The phosphor layer is made of barium fl uorohalide phosphors and is the active layer of the imaging plate. The image is acquired when the x-ray beam comes into contact with the phosphor layer and stimulates the electrons in the phosphors. This allows the electrons to move to the conductive layer. The conductive layer then traps the electrons in the phosphor center; these electrons make up the latent image. The imag-ing plate will contain the latent image until the cassette is placed in the reader and the image is removed from the imaging plate.
The imaging plate is read by a set of actions. First the cassette must be placed in the reader and then the reader must open the cassette and
remove the imaging plate. The imaging plate is then scanned with a laser beam that has a red light, this red light energizes the trapped electrons which allows them to emit blue light photons as they move to a lower energy level. The blue light photons are detected by a photomultiplier tube that converts the light photons into an electronic signal. This signal is an analog signal which must be con-verted into a digital signal by an ADC so that the computer can apply the correct imaging algorithms to the latent image. Once this is accomplished the image will be seen on the computer screen. The imaging plate is then exposed to a high energy light which erases the plate and prepares it for another exposure. The plate is placed back in the cassette; the cassette is closed and ejected from the reader. The fi nal image and all associated information will be stored on a PACS system. The PACS system allows several people to have access to the image at the same time and at various locations within the facility.
Fosbinder_Text_Chap14.indd 218 11/20/2010 1:23:42 PM

Review Questions
Multiple Choice1. If the FOV increases and the matrix size remains
unchanged, the contrast resolution will be
A. improvedB. degraded
2. Spatial resolution describes
A. the maximum separation of two objects that can be distinguished as separate objects on the image
B. the minimum density difference between two tissues that can be distinguished as separate tissues
C. the maximum density difference between two tissues that can be distinguished as separate tissues.
D. the minimum separation of two objects that can be distinguished as separate objects on the image
3. The window control sets the
A. number of density differences in the displayB. number of pixels in the matrixC. number of matrices in the pixelD. density value in the middle of the display
4. PACS stands for
A. primary access of compressed studiesB. picture archiving and computer systemC. picture archiving and communications systemD. picture access to communications system
5. Computed radiographic systems use
A. detector plates that are read by a scanning laser beam
B. detector plates of dry chemicalsC. detector plates that are read by a thermal headD. conventional screen cassettes
6. What is the pixel size in millimeters of a 512 matrix with a 15 cm FOV?
A. 0.03B. 0.3C. 3.0D. 30
7. How many pixels are necessary to image one line pair?
A. 1B. 2C. 3D. 4
8. PACS is the acronym for
A. primary access of compressed studiesB. picture archiving and computer systemC. picture archiving and communications systemD. picture access to communications system
9. The contrast in a digital image is best described as
A. the maximum separation of two objects that can be distinguished as separate objects on an image
B. the minimum separation of two objects that can be distinguished as separate objects on the image
C. the maximum density difference between two tissues that can be distinguished as separate tissues
D. the minimum density difference between two tissues that can be distinguished as separate tissues
10. A fi lm digitizer is capable of creating a digital image from an ordinary radiographic fi lm.
A. TrueB. False
Fosbinder_Text_Chap14.indd 219 11/20/2010 1:23:43 PM

220 Part IV: Special Imaging Techniques
6. Which material is used in a fl at panel detector to convert x-ray photons into electrons?
7. Explain how the imaging plate is read in a CR system.
8. What is the reason that all electronic devices are inherently noise?
9. The human eye is capable of seeing approximately _____ shades of gray.
10. A digital image with a 12-bit depth will contain how many gray values?
Short Answer
1. What are the principal advantages of digital radi-ography over conventional radiography?
2. For the same FOV, spatial resolution will be _____ with a _____ image matrix.
3. Explain how window level and window width can change a digital image.
4. What is image noise and how does it affect the digital image?
5. Explain the function of two of the layers of a pho-tostimulable phosphor imaging plate.
Fosbinder_Text_Chap14.indd 220 11/20/2010 1:23:43 PM

221
15
Quality Control
Key Terms● quality assurance ● quality control
ObjectivesUpon completion of this chapter, the student will be able to:
1. State the factors included in radiographic quality control (QC).
2. State the factors included in processor QC.
3. State the types and sources of fi lm artifacts.
4. State the factors included in mammographic QC.
5. State the factors included in fl uroscopic QC.
6. State the factors included in computed tomography QC.
Fosbinder_Text_Chap15.indd 221 11/23/2010 12:09:30 PM

222 Part IV: Special Imaging Techniques
Measurement of the Focal Spot or Spatial ResolutionAs the tube ages, the anode surface may become rough, resulting in a larger effective focal spot, because the rough surface leads to an increase in off-focus radiation. Degra-dation of the focal spot can produce blurred structures on the radiograph. This is known as focal spot blur. The focal spot size or spatial resolution should be measured annually or when the x-ray tube is replaced. For focal spots smaller than 0.8 mm, the size should be within ±50% of the nominal or stated focal spot size. Focal spots between 0.8 and 1.5 mm may be 40% larger than the stated size and focal spots larger than 1.5 mm can be 30% larger than the stated size. The pinhole camera and a star pattern phantom are used to measure the focal spot size. The most accurate method is the pinhole camera, which produces an image of the focal spot. However, the pin-hole camera is extremely diffi cult and time-consuming to set up and use. The star pattern uses an image of a star to determine the focal spot size by using a formula to relate the diameter of the star image to the size of the focal spot (Fig. 15.1).
The line pair resolution tool, an alternating series of metal strips with different separations, gives the spatial resolution of the system directly. The advantage of the line pair resolution tool is that it can readily detect deg-radation of image quality. The resolution of a fi lm screen system should be >8 line pairs per millimeter (lp/mm). Today almost all annual resolution monitoring tests are performed with a line pair resolution tool.
CollimationIt is important that the light fi eld and the radiation fi eld coincide so that the x-ray fi eld placement is correct. This is called light-radiation fi eld congruence. When the fi elds are misaligned, anatomy in the light fi eld will not be imaged, while anatomy outside the light fi eld will be irradiated.
The alignment of the collimator that defi nes the x-ray beam and the light fi eld must be checked annually and whenever the tube or fi eld light is replaced. To measure the light-radiation fi eld congruence, a fi lm cassette is placed on the tabletop. The edges of the light fi eld are marked on the cassette by placing metal markers such as coins or paper clips at the edge of the light fi eld.
IntroductionIn the health care industry, the terms quality assurance and quality control have different meanings. Quality assurance deals primar-ily with personnel and their interactions with the patient and other staff. It is the term used to describe the process or program used to maintain high-quality imaging. It is a many-step process that involves identifying goals, formulating plans to achieve these goals, implementing the plans, and evaluating the success of the program. Quality assurance also includes outcomes analysis, such as how often the radiologist’s report agrees with the patient’s condition.
Quality control (QC) refers to the mea-surement and evaluation of radiographic equipment, together with the identifi cation and correction of problems associated with the equipment. It includes periodic checks and monitoring of the operation of all equip-ment, initial acceptance testing of equipment, periodic testing of equipment performance, and the steps taken to correct deviations from expected performance. QC measurements often require specialized equipment. This chapter discusses the factors that should be monitored and the frequency of monitoring. Often regularly scheduled maintenance can detect and correct potential problems before they affect image quality. Documentation of all QC monitoring should include the date, the type of test, the outcome, and iden-tifi cation of the individual performing the monitoring test.
Radiographic Quality Control
Radiographic QC consists of periodic monitoring of the x-ray tube, the associated electric circuits, the accuracy of the exposure factors, and the fi lm processor (Table 15.1).
Fosbinder_Text_Chap15.indd 222 11/23/2010 12:09:31 PM

Chapter 15: Quality Control 223
TABLE 15.1 THE FACTORS THAT MUST BE MONITORED, THE TEST TOOLS USED, THE ACCEPTABLE LIM-ITS, AND THE FREQUENCY OF MONITORING
Factor Monitoring Frequency Limits Test Tool
1. Focal spot sizeSpatial resolution
Annual greater or less than 50% Slit or pinhole cameraBar phantom
2. Collimation Annual >8 lp/mm Film + metal markers3. kVp Annual greater or less than 4 kVp Penetrometer or step wedge4. Filtration Annual >2.5 mm Al Aluminum sheets5. Exposure time Annual <10 ms, greater or less than 20% Exposure meter or spinning top
Annual >10 ms, greater or less than 5%6. Exposure reproducibility Annual greater or less than 5% Exposure meter or ion chamber7. Exposure linearity Annual greater or less than 10% Exposure meter or ion chamber8. AEC Annual None Exposure meter
An exposure is made, and the edges of the light and radiation fi elds are measured. The sum of the differences between the light and radiation fi eld edges must be <2% of the source to image receptor distance (SID). The cen-tering indicator should be within 1% of the light fi eld central ray when the SID is at the correct distance. The positive beam-limiting mechanism should never allow the light fi eld size to be larger than the image receptor placed in the Bucky tray except when the override con-trol is active.
kVp AccuracyIf the kVp settings are incorrect, the patient dose may be increased and the image contrast compromised. The applied kVp can be measured directly using a voltage divider. This requires disconnecting the high-voltage cables from the x-ray tube and should only be done by a trained service person. Measurement of the kVp can also be made using a step wedge penetrometer. The opti-cal density (OD) under the steps of the penetrometer is related to the kVp of the beam because higher-kVp x-ray
photons have greater penetration. The same principle is used in modern electronic kVp meters (Fig. 15.2). Electronic detectors measure the penetration of the x-ray beam through two different attenuating fi lters. The ratio of the readings from the two detectors is used to calcu-late the kVp of the x-ray beam. Electronic kVp meters are more accurate than penetrometers and are the preferred method of measuring kVp. The kVp should be within plus or minus 4 kVp and should be tested annually. Electronic kVp meters are accurate to plus or minus 1 kVp and give the maximum, average, and effective kVp of the x-ray beam. kVp measurements are usually made by the service engineer or the medical physicist.
FiltrationThe fi ltration of an x-ray beam is reported in terms of its half-value layer (HVL), expressed in terms of aluminum thickness. The HVL of the x-ray beam is measured annu-ally to ensure that the penetrability of the beam has not been degraded. The HVL is measured using thin sheets of aluminum (Al). A series of output measurements is
Figure 15.1. Shows photo-graphs of the star and line pair resolution tool together with the star and line pair resolution tool images used to measure the size of the focal spot or determine the resolution of the imaging system.
Fosbinder_Text_Chap15.indd 223 11/23/2010 12:09:31 PM

224 Part IV: Special Imaging Techniques
Today all timer measurements are made electronically. A radiation detector measures the duration of the x-ray exposure. Timer accuracy should be checked annually and must be within ±5% for exposure times >10 ms and within ±20% for exposure times <10 ms.
Exposure ReproducibilityExposure reproducibility means that the radiation output (measured in milliroentgens [mR]) should be the same for a series of exposures in which all the technical fac-tors are held constant. Exposure reproducibility should be measured annually using a radiation dosimeter.
Exposure reciprocity means that each combination of mA and time that results in the same mAs should give the same radiation output (measured in milliroentgens) within ±5% of the average output (Table 15.2).
The differences in exposure as measured by the out-put in milliroentgens arise from slight differences in the calibration of the time and mA stations. Unit A meets the exposure reproducibility requirements because all mAs values are within ±5% of the average.
made, fi rst with no added aluminum in the beam, then with added thicknesses of Al. The HVL is calculated from the decrease in output as the Al thickness is increased. An HVL of at least 2.5 millimeters (mm) Al equivalent is required for a tube operating at 70 kVp or higher. The tube window and light fi eld mirror contribute about 1 mm Al to the total fi ltration.
Exposure TimeIf the timer settings are not accurate, the mAs values may be incorrect, resulting in poor-quality images and poten-tially more patient dose. In the past, a spinning top with a hole in a metal disk was used to check the timer stations. After an exposure of the spinning disk was made, the hole in the disk appeared as a series of dots on the fi lm because the x-rays are produced only at the peak of the voltage cycle. The exposure time can be determined by counting the number of dots. For example, a 0.1-second (s) expo-sure would be expected to show an image with 12 dots, representing 0.1 of the 120 pulses that occur each second with a single-phase full-wave-rectifi ed circuit (Fig. 15.3). A synchronous motor was used to check the timer accu-racy of three-phase and high frequency units (Fig. 15.4).
Figure 15.2. Shows an electronic kVp meter.
Figure 15.3. Spinning top test.
Figure 15.4. Synchronous motor.
TABLE 15.2 EXAMPLES FROM X-RAY UNIT A OF HOW DIFFERENT COMBINATIONS OF TIME AND mA CAN GIVE THE SAME mAs VALUE AND THE SAME RADIATION OUTPUT
Time Set mA mAs Radiation Output (mR)
0.02 500 10 400.033 300 10 420.05 200 10 410.1 100 10 400.2 50 10 400.4 25 10 39
Fosbinder_Text_Chap15.indd 224 11/23/2010 12:09:32 PM

Chapter 15: Quality Control 225
ViewboxViewbox illumination testing should be performed annu-ally. The test is performed with a photometer which mea-sures the light intensity at several areas of the viewbox. The intensity should not vary by more than ±10%. If it is deter-mined that the bulb is defective and needs to be replaced, then all the bulbs should be replaced in the viewbox. All viewboxes in a department should be consistent and should use the same bulbs from the same manufacturer.
SID and Centering AccuracyAs x-ray machines age, the SID and locking mechanisms tend to drift. These should be tested to determine if the distance, centering locks, stops and detents are accurate. SID indicators can be checked with a tape measure while centering indicators can be checked visually for the col-limator light beam. SID indicators should be ±10% and centering indicators should be ±2%. If either of these indi-cators is not within limits, they will need to be adjusted.
Angle AccuracyEquipment that angles must be checked periodically for accurate readings. The equipment includes the x-ray table, Bucky units, and x-ray tubes. This is critical because there are radiographic exams which require a specifi c tube angle to be used to image anatomy. The angle can be evaluated by using a protractor for angle measure-ments and a level to verify the locks, stops and detents are set to horizontal and perpendicular. The angles must be within ±1% for accuracy.
Cassette CleaningRadiographic cassettes and intensifying screens are exposed to dust and foreign objects during normal use. Periodic cleaning of the outside of the cassette will remove dirt and grime which can lead to artifacts. The intensifying screens on the inside of the cassettes must also undergo periodic cleaning with a specially formu-lated antistatic solution to remove artifacts. In addition to the special solution, the cassettes should be cleaned with a lint-free cloth. At the time the cassettes are being cleaned, they should also be inspected for wear at cor-ners, edges, and hinges. After the cassettes are cleaned, they must be placed vertically on a surface and allowed
Exposure LinearityExposure linearity is a measure of how the radiation output in milliroentgens increases with increasing mAs. Prior to testing for exposure linearity it is necessary to test the exposure timer to be certain it is accurate, if it is not it needs to be corrected before the linearity test can be performed. The radiation output per mAs (mR/mAs) should remain the same with ±10% as the mAs is changed (Table 15.3).
Unit B does not meet the linearity requirement because the 0.4 s, 25 mA entry differs from the average by more than 10%. We know that the 25 mA station rather than the 0.4 s time station is faulty because the 0.4 s, 50 mA selection gave an mR/mAs value with ±10% of the average value.
Intensifying ScreensIntensifying screens should be checked periodically for dust or other particles which enter cassettes when they are opened for loading and unloading fi lm. These particles will cause an artifact to appear on the image. Periodic cleaning of the screens with a soft, lint free cloth and cleaner from the manufacturer should be performed in accordance with the work load of the imaging department but should be performed at least every other month. When cleaning the cassette, it should be inspected for signs of wear at the corners and edges or for deformity of the screen, and if excessive wear or deformity is identifi ed, a wire mesh test must be performed to examine the extent of the damage. If there are areas of blurring on the wire mesh test image, the cassette should be taken out of service.
TABLE 15.3 EXAMPLES OF DIFFERENT COMBINATIONS OF TIME AND mA AND DIFFERENT mAs FROM X-RAY UNIT B
Time mA mAs mR mR/mAs
0.05 100 5 19 3.80.025 200 5 20 4.00.1 50 5 21 4.10.1 100 10 41 4.10.2 50 10 38 3.80.4 25 10 31 2.90.4 50 20 79 3.90.2 100 20 80 4.0
Fosbinder_Text_Chap15.indd 225 11/23/2010 12:09:33 PM

226 Part IV: Special Imaging Techniques
different in each unit. The equipment manuals must be referenced to know the exact range for the given unit.
Response CapabilityEach AEC has a minimum response time, and if it can-not respond by the minimum time, the radiographer can-not be sure the image will be produced with diagnostic quality. The response capability is measured by using a Lucite phantom with multiple layers. Multiple exposures are made with the phantom thickness being reduced for each exposure. The AEC should produce images with intensity within ±10% of one another until a time below the minimum exposure is used. If the minimum response time is longer than specifi ed the AEC should not be used until the error has been corrected.
Backup Timer Verifi cationThe AEC backup timer is used to terminate exposures when the x-ray beam has been activated for too long a time. To test the backup timer a lead plate is placed over the AEC ion chamber and an exposure is made. The backup timer should terminate the exposure and a warning alarm should be sounded. If the timer or alarm fails the AEC should not be used until the problem has been fi xed.
Tomography Quality Control
In addition to standard radiography, QC testing units with tomographic capabilities are required to have addi-tional tests.
Uniformity and Completeness of Tube MotionTomography relies on the motion of the tube to make a sectional image of the object during the exposure. QC tests must be completed to assure the smooth movement of the tube and to be sure the tube path is a complete path. To test tube movement a lead mask with a pinhole is placed several centimeters above the fulcrum and centered to the image receptor. A tomographic exposure will take place and the resultant image should have demonstrated a dot with a blurred line running through it. If the tube motion
to air dry. Once the screens are dry, the cassette can be reloaded with fi lm and placed in the fi lm bin for use.
Each cassette must be labeled with a number on the outside and inside. This will allow technologists to iden-tify the cassette which produced an artifact on an image. At this time the cassette is cleaned to remove the artifact and inspected for any structural problems.
Automatic Exposure Control
The automatic exposure control (AEC) is designed to compensate for differences in patient size by adjust-ing the time. The AEC measures the exit radiation and adjusts the exposure time to produce a proper density image. The AEC circuit is tested annually to verify that the mAs increases with increasing patient thickness.
Exposure ReproducibilityThe reproducibility standards for the AEC are the same as diagnostic radiography. Radiographs must be produced using a phantom and the densitometer readings of the images produced with the AEC should be within OD ±0.1%. If the readings are not within limits, the AEC gen-erator must be tested and recalibrated.
Ion Chamber SensitivityAEC’s have three ion chambers and permit activation of many combinations of the chambers during an exposure. Each ion chamber must be tested for its sensitivity and all three chambers must be equally sensitive. All three cham-bers are tested with a reproducibility test utilizing very low kVp. The next step is to block two chambers and produce an image with the unblocked chamber. This test must be done on each chamber. Each chamber must respond within ±10% from the other’s chambers to be in range.
Density Variation ControlAEC units have density variation controls to increase and decrease the density of the image by changing the sensitivity of the ion chamber. A mR/mAs measurement is taken to verify the intensity differences for each con-trol. Each unit is unique and the percentage of change is
Fosbinder_Text_Chap15.indd 226 11/23/2010 12:09:33 PM

Chapter 15: Quality Control 227
Section ThicknessThe section thickness of a tomogram is determined by the arc of the tomographic motion. The equipment man-ual will indicate the section thickness for each type of arc available on the unit. The arc and resulting section thick-ness are measured by using an angled wire mesh. When the angled wire mesh is imaged, the section thickness is determined by measuring the region of sharpness on the image. If the section thickness is not accurate, a qualifi ed service engineer must be notifi ed.
ResolutionTomographic resolution is tested by imaging a resolu-tion test pattern. The test pattern is placed at the fulcrum level, this is crucial because this is the only part of the image which is not blurred by the motion of the tube. The image is then inspected to determine the resolving capability of the unit. If the resolution is not adequate, diagnostic QC tests should be performed to determine what the problem is.
Processor Quality Control
Processor QC is necessary to ensure that the processed fi lms produce consistently high quality images. Processor QC consists of daily monitoring and periodic cleaning and main-tenance of the processor. All efforts expended in obtaining an excellent latent image are wasted if the latent image is not processed in a reproducible manner (Table 15.4).
were not complete there would not be a full length tracing. If the tube motion were erratic, there would be uneven densities along the pinhole exposure (Fig. 15.5).
Section Depth IndicatorThe area of interest that is placed at the fulcrum level should appear sharp and in focus on the tomographic image. All other structures above and below the fulcrum level should appear blurred. The section depth indicator test is performed to assess the accuracy of the fulcrum level. Using a commercial test tool with number levels, the ful-crum level is set and a tomographic image is made. The number at the level of the fulcrum should appear sharp; if it does not appear sharp, the fulcrum level must be adjusted. This way the radiographer can be sure that the anatomy of interest at specifi c fulcrum levels will be imaged.
A B
Figure 15.5. Tomographic uniformity and completeness of tube motion tested with a pinhole tracing image. Notice how the line in A is smooth and has uniform density. Line B has uneven densities along the pinhole exposure repre-senting a problem with the tube motion.
TABLE 15.4 LISTS THE PROCESSOR QUALITY ASSURANCE FACTORS TOGETHER WITH THEIR RECOMMENDED MONITORING FREQUENCY
Factor Monitoring Frequency Limits Test Tools
Sensitometry/densitometry Daily Department limits SensitometerDensitometer
Temperature Daily greater or less than 2°F Digital thermometerCrossover racks cleaning Daily Clean Visual inspectionReplenishment rates Weekly Manufacturer’s specifi cations Meter or gaugeTanks and transport roller
cleaningDepends on number of fi lms/week Clean Visual inspection
Fosbinder_Text_Chap15.indd 227 11/23/2010 12:09:33 PM

228 Part IV: Special Imaging Techniques
replenishment rates should be monitored weekly and maintained within the supplier’s tolerances.
Image ArtifactsAn artifact is an unwanted density or image on the radio-graph. Film artifacts can be divided into three categories based on their source. The major sources of artifacts are exposure artifacts, handling artifacts, and processor arti-facts.
Exposure ArtifactsAn exposure artifact occurs during the exposure of the patient rather than after the exposure has been made. They can be present with both fi lm and digital image receptors. Exposure artifacts are caused by improper positioning, technical factors, or patient motion. Grid cutoff due to improper alignment of the grid also can produce artifacts; these appear as lighter areas on one or both sides of the image. Exposure artifact can also be caused when the imaging receptor is not loaded with the correct fi lm for the intensifi cation screen, poor fi lm/screen contract, warped cassettes and improper position-ing of the grid.
Processor MonitoringThe overall operation of the processor is most easily mon-itored by preparing a sensitometric strip and processing it in the processor each morning as soon as the processor is warmed up.
The sensitometer is an instrument that exposes a test fi lm to light through a series of fi lters. Sensitometer elim-inates any variations due to x-ray output variations. The output of the sensitometer is a fi lm with a series of den-sities extending from base plus fog level to completely black in discrete steps. For this reason, this process is also called a step wedge exposure (Fig 15.6).
A densitometer is used to measure the OD of each step. The background density (which is the base plus fog den-sity), average speed, and contrast in the middensity range are calculated from the measured OD values. These val-ues are then recorded and compared with previous mea-sured values. The OD values from the daily sensitometric strip must be within acceptable limits, which are set by the department. The base plus fog value must be <0.05 OD. If the readings are outside the acceptable limits, the processor cannot be used clinically until the problem is corrected (Fig. 15.7).
The temperatures of the processor solutions, developer, fi xer, and wash water should be checked with a digital thermometer and recorded daily. Mercury thermometers should never be used to measure processor temperatures because mercury contamination of a processor is almost impossible to eliminate. Slight changes in the tempera-ture of the developer solution will produce signifi cant density changes in the fi nal radiograph. The developer temperature should be maintained within greater or less than 2°F of the set value. The developer and fi xer
Figure 15.6. Shows a sensitometer and a densitometer.
Figure 15.7. Shows a sensitometer strip image.
Fosbinder_Text_Chap15.indd 228 11/23/2010 12:09:34 PM

Chapter 15: Quality Control 229
on the image. Light leaks can also occur in the darkroom if the safelight has an improper fi lter, if the safelight is too bright or if the safelight is too close to the processing tray of the automatic processor. White light leaks can occur if the darkroom door allows light to leak through the perim-eter of the door or underneath the door. This white light will cause fog on the fi lm as it is loaded into the cassette or as the fi lm is placed on the processing tray.
Screens should be cleaned monthly with a special cleaning fl uid and lint-free wipes to remove any poten-tial dust and to prevent static buildup. Static artifacts are caused by electrical discharges and appear as positive dark lines on the image. They are most common in win-ter, when the air is dry and relative humidity is low. The three types of static artifacts are tree, which appear with branches; crown, which have many lines radiating from a common area; and smudge, which appear as slightly positive areas on the image. Film should be stored under
Lack of patient preparation can also be a signifi cant source of exposure artifacts. Failure to remove eyeglasses, jewelry, rings, watches, and hair clips will produce expo-sure artifacts. Hair, especially if braided or wet, can cause exposure artifacts. Exposure artifacts can be reduced or eliminated by careful attention to details before taking the exposure. Using excellent communication skills can prevent motion artifact caused by breathing or patient movement (Fig. 15.8).
Handling and Storage ArtifactsHandling artifacts occur because of improper handling and storage of the fi lm. Handling artifacts include light leaks, static, crease marks, and fi ngerprints. The source of handling artifacts is usually easy to identify because the cassettes must be light-tight; any physical damage or rough handling may destroy the light-tight integrity. Light leaks appear as positive-density areas, darker areas
Figure 15.8. Presents an example of an exposure artifact due to a necklace.
Fosbinder_Text_Chap15.indd 229 11/23/2010 12:09:36 PM

230 Part IV: Special Imaging Techniques
conditions where the relative humidity is between 40% and 60% and the temperature is below 72°F.
Rough handling of the undeveloped fi lm can pro-duce crease or kink marks, sometimes called fi ngernail marks because they resemble fi ngernail clippings. These positive-density marks result from bending or creasing of the fi lm during loading, unloading, or processing. Han-dling the fi lm with sweaty, greasy, or oily hands can result in negative-density areas, or lighter areas, in the form of fi ngerprint marks on the fi lm (Fig. 15.9).
Processor ArtifactsProcessor artifacts occur as a result of improper processor QC of the transport system. Processor artifacts include pi marks, guide-shoe marks, and chemical stains.
A deposit of dirt or chemicals on a portion of a roller will make a dark or positive mark on the fi lm on each revolution. These pi mark artifacts are perpendicular to the direction of fi lm travel through the processor and are spaced at pi, or 3.14-inch intervals. Typical transport rollers are 1 inch in diameter, so pi marks are usually 3.14 inches apart and represent one revolution of the roller. Regularly scheduled processor cleaning will elim-inate pi marks and many other processor artifacts. It is essential to clean the crossover racks daily.
Guide-shoe marks are caused by the guide shoes, which are used to reverse the direction of the fi lm at the crossover rack assembly. Guide-shoe marks indicate that the guide shoes are misaligned and are scratching the fi lm emulsion. These marks appear as light lines or
A
B
Tree
Smudge
Crown
Fingerprints
C Figure 15.9. (A–C) Presents examples of handling artifacts.
Fosbinder_Text_Chap15.indd 230 11/23/2010 12:09:38 PM

Chapter 15: Quality Control 231
sludge and other debris build up on rollers, they come into contact with fi lm as it is moved through the rollers. The sludge and debris can then fl ake off onto the fi lm causing artifacts. This can be prevented by daily cleaning of the crossover racks. The crossover racks are very easy to remove and clean. Proper cleaning prevents the sludge from building up and it also facilitates the movement of the fi lms through the rollers.
The processor must also have a weekly cleaning to remove the transport rollers and crossover racks. The processing tanks are cleaned and rinsed as well. This is a fairly simple task to perform and should only take a few minutes. A clean processor will produce high qual-ity radiographs which are free from artifacts and will also increase productivity because there will be no processor down time due to jammed fi lms.
Processor maintenance should be scheduled at regular intervals in addition to daily and weekly cleaning. Sched-uled maintenance is performed on a weekly or monthly basis where the mechanical parts are observed for wear and adjustment of belts, pulleys, and gears for proper operation. Automatic processors should have a planned maintenance program where parts are replaced at regu-lar intervals before the processor experiences failure and downtime. Unexpected failure can lead to processor downtime, which severely affects productivity of the radi-ography department. A proper program of scheduled and preventative maintenance will ensure the proper opera-tion of the processor and will keep unexpected failures to a minimum.
Computed Radiography Quality Control
As part of a computed radiography quality assurance program, it is important to monitor the sensitivity and dynamic range of the system annually to ensure that there has been no degradation of the detector plates’ effi ciency. The dynamic range is the difference between the lowest and highest signals the system can process.
Artifacts in computed radiography (CR) systems are usu-ally produced by sudden failure of internal components.
negative densities parallel to the fi lm direction. Realign-ment of the guide shoes will eliminate guide-shoe marks (Fig. 15.10).
Chemical fog can occur when there is improper chemistry in the processor. The chemical fog appears like light or radiation fog and has a dull gray appearance. The chemical fog is called a dichroic stain and typically is comprised of two colors. The stains can appear as yellow, green, blue, or purple on the fi lm. The chemical stains occur when a slow processor does not properly remove chemicals from the fi lm and the excess chemicals run down the leading or trailing edges of the fi lm.
Processor Cleaning and MaintenanceAutomatic processors operate at a high rate of fi lm pro-cessing and require weekly cleaning procedures to main-tain a properly operating processor. Processors operate at a high temperature with concentrated chemistry which causes wear and corrosion of the transport system and can contaminate the chemistry with processing sludge. When
Figure 15.10. Shows guideshoe marks.
Fosbinder_Text_Chap15.indd 231 11/23/2010 12:09:42 PM

232 Part IV: Special Imaging Techniques
Such artifacts are easy to detect because they occupy all or a signifi cant portion of the image and take the form of streaks or lines. Other artifacts may appear on the CR image and are classifi ed according to where they occur in the image processing sequence.
Phantom ImagesPhantom images may appear on an image and typically result from an incomplete image plate erasure. The image plate must be erased prior to the next exposure, and in cases where an extreme overexposure was made, the plate may need to be run through the erasure process more than once.
Permanent ArtifactsImaging plates are prone to scratches just like normal cassettes. When scratches appear on an imaging plate, the only solution is to replace the plate because the plate cannot be repaired.
Light SpotsCR cassettes are susceptible to exposure to dust and for-eign materials which collect on the imaging plate and are visualized on the image as light spots. The imag-ing plate can be cleaned according to manufacturer’s specifi cations to remove dust and to avoid permanent damage.
FoggingImaging plates are very sensitive and prone to fog-ging. Care must be taken to keep imaging plates away from radiation or light sources when not in use. Imag-ing plates which have not been used recently should be erased to remove any potential fogging prior to an exposure.
Quantum MottleQuantum mottle is considered an artifact. It is caused by an inadequate exposure where the mAs was not suffi cient for the part being imaged. Care must be taken to use the appropriate mAs for the anatomy being image to avoid quantum mottle.
Heat BlurHeat blur will occur when the image receptor is exposed to intense heat.
Fluoroscopy Quality Control
There are two types of fl uoroscopic units, stationary and mobile. Stationary fl uoroscopic units must be installed with a source to skin distance (SSD) of at least 38 cm (15 inches) at tabletop. Mobile C-arm fl uoroscopy units must have an SSD of at least 30 cm (12 inches). QC of fl uoroscopic sys-tems consists of monitoring the radiation output exposure rate, the spatial and contrast resolution, the operation of the automatic brightness control (ABC) of the system and other factors necessary to produce a quality fl uoroscopic image.
Radiation Output or Exposure RateThe exposure rate must be checked with an attenuation phantom placed in the beam to ensure that the mea-surements are made under conditions similar to those in clinical practice. Typical entrance skin exposure (ESE) rates are about 3 rad/min, (3 milligray [mGy/min]). Under normal conditions, the ESE should be <5 rad/min (50 mGy/min), and it must always be <10 rad/min (100 mGy/min). Because the ESE is higher with higher magnifi cation modes, it must be measured at all magni-fi cation modes. The ESE of a fl uoroscopic system must be measured annually. A general rule of thumb is that the ESE is about 2 rad/min/mA.
ResolutionThe spatial resolution of a fl uoroscopic system is checked by placing a resolution phantom in the beam and observ-ing the system resolution. The resolution phantom con-sists of a series of lead bars of differing separation labeled in line pairs per millimeter. The higher the number of line pairs per millimeter visible, the better the resolution of the system. Modern fl uoroscopic systems have resolu-tions between 1.2 and 2.5 lp/mm. The resolution must be checked annually at all magnifi cation modes (Fig. 15.11).
Fosbinder_Text_Chap15.indd 232 11/23/2010 12:09:43 PM

Chapter 15: Quality Control 233
images are affected not only by kVp, mAs, and the sensitivity of the fi lm/screen system but also by the charac-teristics of the image intensifi er. These images are recorded on the fi lm after the image has passed through the out-put phosphor of the image intensifi er tube. The ESE for photofl uorospot images is greatly reduced than cassette spot fi lms because of the properties of the image intensi-fi er which brightens the image thousands of times which means the kVp and mAs used to create the image can be much lower.
Exposure ReproducibilityFluoroscopic spot fi lm devices use AECs to record an image. The AECs should be evaluated according to established protocols.
Field Size and Beam AlignmentFluoroscopic units use fi eld size to image the patient, fi eld size is the equivalent to collimation in diagnostic radiography. Just as in diagnostic radiography, fl uoro-scopic tubes should not be capable of irradiating tissue outside the fi eld size area. The accuracy of the fi eld size in fl uoroscopy should be within 1 cm of the edges of the image intensifi er tube. The primary beam from the under-the-table x-ray tube must be aligned to the center of the image intensifi er.
Intensifi er Viewing System ResolutionResolution for proper visualization of anatomy and pathology is critical in fl uoroscopic imaging just as in radiographic or digital imaging. Fluoroscopic resolution is much poorer than radiographic resolution and must be checked periodically to ensure adequate resolution and to check for deterioration. A resolution pattern test tool
Automatic Brightness ControlABC circuits are designed to maintain constant image brightness regardless of the thickness of the patient. The operation of an ABC circuit is measured by placing attenuators of different thicknesses in the beam. The mAs should increase with increasing attenuator thickness. The operation of the backup timer in the radiographic mode can be verifi ed by placing a lead sheet in the beam. The beam should be terminated at the backup timer setting, usually about 500 mAs of 5 seconds. ABC circuits should be tested annually (Table 15.5).
Spot Film ExposuresSpot fi lm images can be produced in two ways: cassette spot fi lm and photofl uorospot. Proper exposure of the cassette spot fi lm depends on the kVp, mAs, and sensitiv-ity of the fi lm/screen systems being used. Entrance skin exposures vary widely; however, the ESE in mR is much higher for cassette spot fi lm than photofl uorospot images. This is due to the placement of the cassette between the patient and image intensifi er. The cassette is exposed with remnant radiation which has only passed through the patient. Subsequently, greater exposure factors are necessary to create a diagnostic image.
The photofl uorospot images use fi lm but require lower patient dose to create diagnostic images. Photofl uorospot
TABLE 15.5 SOME FLUOROSCOPIC QC TESTS AND THEIR LIMITS
Factor Frequency Limits Tools
Exposure rate Annual <10 rad/min Exposure meterResolution Annual None Resolution phantomABC Annual None Exposure meterProtective apparel Annual No cracks or gaps Fluoroscope or fi lm
Figure 15.11. Shows an example of an image obtained with a fl uoroscopic resolution phantom.
Fosbinder_Text_Chap15.indd 233 11/23/2010 12:09:44 PM

234 Part IV: Special Imaging Techniques
Computed Tomography Quality Control
Computed tomography has many moving parts which could experience instability, misalignment, miscalibra-tion, and malfunction. These parts include the gantry, detectors, console, computer, and patient couch. Com-puted tomographic QC includes annual tests of system noise and uniformity, linearity, spatial resolution, con-trast resolution, slice thickness, patient exposure, laser localizer, and support table increment accuracy. An effective QC program will encompass daily, weekly, monthly and annual measurements, and visual inspec-tion which coincides with a preventive maintenance program.
Noise and UniformityThe test for noise and uniformity is performed daily. A water phantom is scanned and the computer adjusts the system so that the value of water equals Hounsfi eld units (HU) of zero. The uniformity should be such that there is variation of <±10 HU across the image.
or fl uoroscopic mesh test tool can be imaged to visualize the resolution of the system.
Monitors and RecordersModern fl uoroscopic units use video systems to display the image. The monitors and recorders must be tested periodically to assess the resolution of the image on the monitors. The fl uoroscopic mesh test tool or wire mesh tool can be used to test for resolution. The test tool is imaged on the fl uoroscope to allow visual measurement of the system resolution on the monitor and to assess for distortion of the image.
Protective Apparel Quality Control
Protective aprons, gloves, gonadal shields and other radi-ation shields must be checked for tears, gaps, holes, and voids at least annually. All protective apparel should be visually inspected and also tested radiographically. This inspection may be performed fl uoroscopically or by tak-ing radiographs of the apparel. Any apparel which dem-onstrates defects must be replaced (Fig. 15.12).
A B
Figure 15.12. (A) Shows a photo-graph of a normal-appearing lead glove. (B) Shows a radiograph of the same glove that shows a gap in the protection because the internal lead shielding is torn and shifted.
Fosbinder_Text_Chap15.indd 234 11/23/2010 12:09:44 PM

Chapter 15: Quality Control 235
LinearityCT linearity is measured using a special phantom with plastic rods of different calibrated densities and HU. The coeffi cient correlation for the relationship between the densities and HU should equal or exceed 0.96%. The unit is initially calibrated so that water has a HU of 0 and air has a HU of −1000.
Spatial ResolutionMonitoring spatial resolution is the most critical compo-nent of the CT program. It is crucial to ensure the spatial resolution is at a maximum. This ensures that the detec-tor array and reconstruction electronics are performing properly and that the mechanical components of the CT unit are also performing as expected.
The QC tests for spatial resolution include imaging an edge to get edge-response function (ERF) and the modulation-transfer function. A line pair test pattern can also be used. The specifi c test used is the preference of the medical physicist. The spatial resolution should be assessed semiannually to be certain the unit stays within the manufacturer’s specifi cations.
Contrast ResolutionThe contrast resolution of the CT scanner is of superior quality. The specifi cations vary from one manufacturer to another and even between the different models. The current standard for all scanners is the ability to resolve 5 mm objects at 0.5% contrast. Contrast resolution test-ing should be performed semiannually and can be per-formed with low-contrast phantoms which have built-in analytical schemes.
Table Increment AccuracyThe patient table or couch moves with precision through the gantry while the patient is scanned. It is imperative that the patient table be evaluation monthly to make sure it is working correctly. The test can be performed when a patient is on the table. During the scan make note of the position of the table at the beginning and ending of the examination by using a tape measure on the table rails. Compare the measurement with the expected table movement; it should be within ±2 mm.
TABLE 15.6 LISTS THE QC TESTS FOR A CT SCANNER
Factor Frequency Limits
Noise Daily greater or less than 10 HU
Uniformity Daily greater or less than 0.04%
Spatial resolution Annual greater or less than 20%
Contrast resolution Annual greater or less than 0.5%
Slice thicknesses <5 mm
Annual 0.5 mm
Slice thicknesses >5 mm
Annual 1 mm
Support table indexing Annual greater or less than 1 mm
Slice ThicknessA specially designed phantom which has a ramp, spiral, or a step wedge is used to measure slice thickness. The slice thickness should be ±1 mm of an expected 5 mm or greater slice thickness. A slice thickness <5 mm has a tol-erance of 0.5 mm. The assessment should be performed on a semiannual basis.
Laser LocalizerMost CT scanners utilize internal and external laser lights for patient positioning. There are several specially designed phantoms for determining the accuracy of the laser localizers. The accuracy should be tested semiannu-ally and can be performed at the same time as the table movement evaluation.
Patient DoseDue to the broad range of examinations in CT, there are no maximum levels specifi ed for the permissible dose to the patient. The dose will vary according to the scan parameters with high resolution scanning requiring increased dose. There are some examinations that utilize a fi xed technique from one patient to the next; for these types of examinations, the patient dose should not vary by more than ±10%. The testing for patient dose should be performed on a semiannual basis and after the x-ray tube has been replaced (Table 15.6).
Fosbinder_Text_Chap15.indd 235 11/23/2010 12:09:46 PM

236 Part IV: Special Imaging Techniques
TABLE 15.7 SHOWS THE TESTS AND THE REQUIRED FREQUENCY OF EACH TEST FOR MAMMOGRAPHY QC
Test Frequency
Darkroom cleanliness DailyProcessor QC DailyScreen cleaning WeeklyView box cleaning WeeklyPhantom image quality WeeklyVisual inspection of equipment MonthlyRepeat analysis QuarterlyFixer retention QuarterlyFilm/screen contact SemiannuallyCompression device SemiannuallyDarkroom fog Semiannually
Mammographic Quality control
A facility must be accredited by a recognized agency to perform mammographic examinations. The federal Mam-mography Quality Standards Act sets out the standards that accredited facilities must meet. The mammography technologist is responsible for a series of daily, weekly, monthly, quarterly, semiannual, and annual monitoring tests. These tests must be documented and records must be available for the annual inspection (Table 15.7).
Chapter SummaryQuality assurance deals with personnel and the performance of the team required to produce high-quality radiographs. QC deals with equip-ment performance. Radiographic QC includes monitoring the components that affect radio-logic image quality. These include focal spot size, kVp, the timer, exposure linearity, and processor performance, including monitoring of processor temperature and replenishment rate. The focal spot size or system resolution should be measured at least annually to detect
gradual degradation of image resolution. Spatial resolution should be >±8 lp/mm.
Regular processor QC tests are necessary to ensure that the processed fi lms are of high quality. An exposure made with a sensitometer and measured with a densitometer gives a good measure of processor operation. Artifacts are unwanted densities or images on a radiograph. Pi marks are positive-density artifacts perpendic-ular to the direction of fi lm travel through the processor and separated by 3.14 inches. Guide-shoe marks are negative-density straight-line artifacts parallel to the direction of fi lm travel through the processor.
CT quality assurance tests include daily scanning of a water phantom to monitor HU and fi eld uniformity. Fluoroscopy QC involves monitoring the exposure rate and spatial resolu-tion. The tabletop dose rate must be <0.01 Gy/min (10 rad/min). Mammographic QC tests are specifi ed by the federal Mammographic Quality Standards Act.
Case StudyRecently several radiographs have come out of the processor with static artifacts and guide-shoe marks. Tess is the QC technologist and she is responsible for determining the causes of the artifacts and taking corrective action. After reviewing the various artifacts, Tess must answer the following questions.
Critical Thinking Questions
What QC tests should be performed?
What is the cause of static artifacts?
How can static artifacts be avoided?
What is the cause of the guide-shoe marks?
Fosbinder_Text_Chap15.indd 236 11/23/2010 12:09:46 PM

Chapter 15: Quality Control 237
How frequently should the processor be cleaned?
Tess must fi rst look at the QC manual to determine the last time QC was performed on the darkroom and processor. Tess needs to test the temperature and humidity in the darkroom. She knows that static artifacts are caused when the darkroom humidity is below 40% and when the temperature is above 72°F. This problem is common in the winter months when the air is dryer than normal. Static artifacts can be avoided by leaning the inten-sifying screens monthly since this decreases the static buildup on the screens. Guide-shoe marks are caused when the crossover rack assembly is not properly aligned. This can
happen if the crossover racks are not properly placed in the processor. The crossover rack assembly should be cleaned daily and prop-erly returned to its place. If guide-shoe marks are present on fi lms, then the crossover rack should be checked to see if it is properly seated in position. In addition to cleaning the crossover racks daily the transport rollers must be cleaned weekly, the crossover racks are cleaned at the same time. The processor should also have monthly preventive mainte-nance performed to check belts, pullies, and all mechanical parts for wear. Anytime the processor is dismantled and put back together, there is the risk of not properly placing the crossover racks. When guide-shoe marks are seen, the fi rst part of the processor to check is the crossover rack assembly.
Fosbinder_Text_Chap15.indd 237 11/23/2010 12:09:46 PM

Review Questions
Multiple Choice
1. An x-ray rube operating above 70 kVp must have an HVL of at least _____ mm Al.
A. 1.5B. 2.5C. 3.5D. 5
2. The developer temperature should be maintained within _____°F of the set value.
A. ±2B. ±4C. ±5D. ±8
3. The _____________ can be used to measure timer accuracy.
A. pinhole cameraB. optical densitometerC. spinning topD. line pair test pattern
4. A 4-min fl uoroscopic examination with a 1.5 mA tube current results in a patient dose of _____ rad.
A. 4B. 8C. 12D. 16
5. Which combination of temperature and humidity should be used for fi lm storage?
A. 60% relative humidity, 10°FB. 10% relative humidity, 10°FC. 98% relative humidity, 68°FD. 50% relative humidity, 68°F
6. Which QC test tool is used to determine blurring of an image?
A. Wire mesh testB. Star test patternC. Pinhole cameraD. ERF
7. The light intensity of a viewbox should not vary by more than _____ when comparing several areas.
A. 1%B. 20%C. 10%D. 15%
8. Exposure reproducibility for an AEC should not exceed
A. 8%B. 25%C. 0.5%D. 0.1%
9. Pi mark artifacts run ____________ to the direction of the fi lm travel and at intervals of __________.
A. parallel, 3.14 inchesB. perpendicular, 3.14 inchesC. perpendicular, 2.58 cmD. parallel, 2.58 cm
10. The ESE of a fl uoroscopic system is typically _____________.
A. 8 rad/minB. 3 mrad/minC. 3 mGy/minD. 6 mGy/min
Fosbinder_Text_Chap15.indd 238 11/23/2010 12:09:47 PM

Chapter 15: Quality Control 239
6. What is the importance of preventive maintenance for an automatic processor?
7. Name the three QC tools used to measure focal spot size.
8. List and briefl y describe the seven parts of com-puted tomography QC.
9. Defi ne linearity and provide the allowed varia-tion.
10. Refer to Table 15.1, list the parts of the radio-graphic equipment that is tested regularly and give the tolerance specifi cations for each.
Short Answer
1. Filtration is measured in radiography equipment using _____.
2. The indicated kVp should fall within _____ of the actual tested kVp.
3. The _____ test is performed on intensifying screens and cassettes to check for proper screen/fi lm contact.
4. The integrity of lead apparel should be checked how frequently?
5. The average skin dose during a fl uoroscopic exami-nation is __________.
Fosbinder_Text_Chap15.indd 239 11/23/2010 12:09:47 PM

240
16
Mammography
Key Terms● bias focusing● diagnostic
mammography● mammography
● molybdenum● rhodium● screening
mammography
ObjectivesUpon completion of this chapter, the student will be able to:
1. Describe the purpose of mammography.
2. Describe the x-ray spectra used in mammography.
3. Describe the fi lm/screen systems used in mammography.
4. State the reason for compression in mammography.
5. Specify the ancillary components of the mammography unit.
6. Explain the basic elements of digital mammography.
Fosbinder_Text_Chap16.indd 240 11/23/2010 3:46:24 PM

Chapter 16: Mammography 241
IntroductionMammography is the radiologic examina-tion of the breast and is utilized for the early detection of cancer. It is one of the most chal-lenging radiographic examinations because it requires imaging of both small, high-contrast calcifi cations and large, low-contrast masses. For this reason, special x-ray tubes and fi lms are used.
The differential absorption of fat, glandular tissue, fi brous tissue, and cancerous tissue is very similar. Small microcalcifi cations are often associated with cancer. All these tissues must be clearly imaged on a single fi lm. The techni-cal factors of the examination must be tightly controlled to produce diagnostic-quality mam-mograms. The federal Mammographic Quality Standards Act (MQSA) sets strict guidelines to ensure high-quality mammographic examina-tions. Only specially trained technologists are permitted to perform mammographic examina-tions. Mammography uses low-kVp values, in the range from 20 to 40 kVp. This voltage is lower than that for conventional radiography to increase differential absorption and improve subject contrast. The poor penetration of the low-energy x-rays is not a disadvantage because most breasts are <10 centimeters (cm) thick. Early detection of breast cancer can lead to cure rates as high as 90%.
Historical OverviewMammography is the visualization of breast tissue in a radiographic image. The soft tissue structures of the breast require a low kVp and high mAs approach which yields the highest resolution and contrast possible. Breast imaging was fi rst performed in the 1920s and continued on to the 1960s with unreliable images due to the lack of sophisticated equipment. Dr. Robert Egan is credited with the use of direct exposure imaging using low kVp
and high mAs. The main disadvantage to direct exposure imaging was the extremely high mAs that was required to produce a diagnostic image. In the late 1960s the fi rst dedicated mammography unit was introduced. The use of these units was widely accepted and the majority of large radiology departments were performing mammog-raphy. The equipment continued to change and improve the diagnostic capabilities while the radiation dose was decreased.
The American College of Radiology identifi ed the need for high standards in breast imaging and in 1987 developed an accreditation program which required mammography sites to voluntarily meet quality standards to ensure that optimally exposed breast images were pro-duced at low radiation exposures to the patient. The fed-eral government enacted the MQSA in 1994 to establish guidelines that required facilities to meet quality stan-dards. To date mammography is the only radiologic exam that is regulated by the federal government.
In early 2000, digital mammography was approved for sale in the United States. Digital mammography is rapidly replacing standard mammography units because of its extremely high quality images. In this chapter, we discuss current aspects of mammography. A com-plete discussion of this specialized modality is outside the realm of this textbook; however, at the completion of the chapter, the reader should be well versed in the various aspects of mammography.
Breast ImagingThere are two types of mammographic examinations performed. Screening mammography is performed on asymptomatic women using the craniocaudad and medio-lateral oblique views on each breast. These images are performed yearly on women 40 years of age with family history and for women age 50 who have no family history. Diagnostic mammography is performed on women who are symptomatic or for women whose screening mam-mogram demonstrated suspicious areas. This is used to further evaluate the tissue for microcalcifi cations and other pathologies. The diagnostic images can include magnifi cation, spot compression, and rolled images to name a few.
Fosbinder_Text_Chap16.indd 241 11/23/2010 3:46:24 PM

242 Part IV: Special Imaging Techniques
Greaterintensity
Image receptor
Lesser intensity
X-ray tube
Cathode
Anode
Figure 16.2. Shows the orientation of the cathode-anode axis in relation to the chest wall.
X-Ray TubeThe mammography x-ray tube is specially designed and dedicated for the imaging of breast tissue. Figure 16.1 illustrates a typical mammography unit. These units are lightweight (under 500 lb) and are fully self-contained. A mammography unit is designed for fl exibility in patient positioning and can be modifi ed to perform specialized views of the breast. The design of the x-ray tube and ancil-lary components are capable of producing high resolu-tion and high contrast images with moderate radiation exposure. The unit must be capable of providing the high contrast and resolution necessary to visualize microcalci-fi cations and subtle changes to breast tissue.
CathodeThe cathode has a standard helical-shaped tungsten fi la-ment in a focusing cup. This single fi lament is used for both large and small focal spot sizes therefore it is called
bias focusing. Other units use two separate fi laments for the large and small focal spots.
Due to the high resolution needed in mammography, a smaller effective focal spot size is needed. Additionally, mammography uses a much shorter source to image recep-tor distance (SID) of 24 to 30 inch which makes it necessary to have small focal spots to reduce the increased geometric unsharpness caused by the short SID. The typical large size focal spot of 0.3 mm is used for routine imaging, while a 0.1-mm small focal spot is used for magnifi cation images.
The mammographic x-ray tube is designed to place the cathode at the chest wall where the heel effect will have the greatest impact. The structures at the chest wall are diffi cult to visualize due to the thickness of the tissue so placing the stronger part of the beam at the chest wall will aid in visualization of the posterior breast tissue and chest wall (Fig. 16.2).
AnodeMammography tubes utilize a rotating anode to take advantage of tube loading. This is benefi cial in mammog-raphy because it allows the use of a higher mA to be used
Figure 16.1. Shows a typical mammographic unit.
Fosbinder_Text_Chap16.indd 242 11/23/2010 3:46:25 PM

Chapter 16: Mammography 243
which will improve visualization of breast anatomy. The disadvantage to using a low kVp range is the increased radiation exposure to the patient. The increased dose is a tradeoff with improved visualization of breast structures.
There are various advantages and disadvantages for using a molybdenum target in the anode for mammogra-phy tubes. The advantages are as follows:
● Increased number of low-energy photons are pro-duced.
● High radiographic contrast is achieved.● Production of specifi c x-ray energies necessary for
breast imaging.
Disadvantages of a molybdenum target are the following:
● Lower x-ray photon output.● Increased mAs needed to maintain image receptor
exposure.● Increased dose to the patient.
with exposure times of 1 second or less. The target angle of the anode is greater than a conventional x-ray anode target angle. Mammography units use a target angle from 22 to 24 degrees. The larger angle is necessary to cover the 24 × 30 cm image receptor at the 24 to 30 inch SID. Some manufacturers have developed a tilted x-ray tube which allows for the entire surface of the cassette to be covered while providing a narrower angle (Fig. 16.3)
Special mammographic x-ray units have molybdenum anodes to produce low-energy x-ray beams that are opti-mized for breast imaging. The molybdenum anode pro-duces K characteristic x-rays with energies of 17.4 to 19.9 kiloelectron volts (keV). This specifi c range of x-ray energies is necessary to maximize subject contrast and to visualize microcalcifi cations. Changing the applied kVp does not change the energy of the K characteristic x-rays; however, energies higher than this range will overpenetrate, scatter, and ultimately decrease contrast in the image. This range is also necessary for creating the photoelectric absorption interactions needed to produce the high contrast image
X-ray tube
Tumors
A B
Figure 16.3. (A) The heel effect is used in mammography to place the cathode toward the chest wall which pro-vides more uniform optical density on the image. (B) A tilted x-ray tube will allow a narrower effective focal spot to be used thereby improving spatial resolution.
Fosbinder_Text_Chap16.indd 243 11/23/2010 3:46:28 PM

244 Part IV: Special Imaging Techniques
x-rays decrease image contrast by overpenetrating the tissue and exposing the image receptor to excessive scat-ter radiation.
A 0.03-mm molybdenum fi lter allows the molybde-num characteristic x-ray photons to pass through while fi ltering out both higher and lower energy x-ray photons (Fig. 16.4). Some tubes with molybdenum anodes can be switched from molybdenum to rhodium fi lters when imaging thick or dense breasts. The half-value layer (HVL) of mammographic x-ray units is typically 0.3 to 0.4 mm aluminum (Al) equivalent at 30 kVp. Note that the HVL is expressed in millimeters of aluminum, even though the fi lter itself is made of molybdenum.
Exposure FactorsThe exposure factors used in mammography are the typical kVp, mA, and time that the radiographer is accus-tomed to radiography. The difference lies in the low kVp and high mAs necessary to produce high quality mam-mographic images.
kVpWhen compared to conventional x-ray equipment, mam-mography units use low kVp in the range of 25 to 28 kVp. The advantage of using low kVp is the production of low energy or soft x-ray photons which are necessary to produce a high contrast image. The breast tissue is
Some mammographic units have provision to select a rhodium anode and/or a rhodium fi lter. The binding energies of the K and L shells in rhodium are slightly higher than those of molybdenum. Rhodium produces K characteristic x-rays with energies of 20 and 23 keV. The beam from a tube with a rhodium fi lter and a molyb-denum anode has slightly higher penetration than a beam from a molybdenum anode with a molybdenum fi lter. Rhodium fi lters and anodes are used for patients with extremely dense or thick breasts. The patient dose and image contrast are decreased with the use of rhodium fi lters or anode. Tungsten anode tubes with aluminum fi lters are not used in mammography.
Focal Spot SizesMammographic tubes have two focal spot sizes, a large (0.3 mm) focal spot for routine mammography and a small (0.1 mm) focal spot for magnifi cation mammog-raphy. MQSA requirements state that a mammographic system must be able to image at least 13 line pairs per millimeter (lp/mm) in the direction parallel to the cath-ode-anode axis and 11 lp/mm in the direction perpen-dicular to the cathode-anode axis. The effective focal spot is smaller than the actual focal spot because of the line focus principle. The effective focal spot is smaller toward the anode or nipple side because the anode is tilted.
Heel EffectMammographic x-ray tubes are oriented with the cathode-anode axis perpendicular to the chest wall, with the cathode at the chest wall side. This orientation pro-duces an image with a more uniform density because the heel effect produces greater intensity at the thicker chest wall and less intensity toward the nipple.
FiltrationThe port of the mammography x-ray tube is typically made of beryllium because it has a low atomic number which permits the x-ray photons to exit the tube. The proper type and thickness of fi ltration must be installed as added fi ltration. The total beam fi ltration, added plus inherent, should not exceed 0.4 mm aluminum equiva-lent. The purpose of mammographic fi lter is to remove very low and high energy x-ray photons. Very low energy x-ray photons, below 17 keV, do not penetrate through the breast but increase the patient dose. Higher energy
Num
ber
of p
hoto
ns
Energy (keV)
1710 20 30
Figure 16.4. Illustrates the spectrum from a molybdenum anode tube with a 0.03-mm molybdenum fi lter.
Fosbinder_Text_Chap16.indd 244 11/23/2010 3:46:29 PM

Chapter 16: Mammography 245
that the average dose to the breast be <3 milligray (mGy) (300 millirad [mrad]) per view. The average glandular dose for each view imaged using a grid is usually about 1.4 mGy (140 mrad). Typical screening examinations consist of a craniocaudad and a mediolateral view, resulting in a dose to each breast of 2.8 mGy (280 mrad) per examination.
AncillariesThe quality of the mammographic image is dependent upon many factors including the amount of compression used, grids, AEC, fi lm/screen combinations, resolution, and fi lm processing (Fig. 16.6).
CompressionCompression of the breast with a radiolucent compres-sion device improves quality by reducing patient motion and providing more uniform tissue thickness. Appro-priately applied compression is one of the most critical components in the examination, and it is imperative the patient understands the need for adequate compression. Compression separates overlying tissue preventing
considered soft tissue and is made up of glands, fi bers, and fat or adipose tissue that has very low subject contrast (Fig. 16.5). To properly evaluate the image, the radiolo-gist must have a high contrast image to adequately visual-ize microcalcifi cations as small as 0.1 to 0.3 mm as well as other tissue structures. As previously stated, the major disadvantage of using low kVp is the high absorption of the low energy x-ray photons in the tissue which adds sig-nifi cantly to patient dose.
mA, Time, mAsThe generators used for mammography equipment have variable mA stations of 20 to 100 mA. The mA station selected is determined on the principle of keeping the exposure time as short as possible to decrease patient motion. The other part of the equation which must be considered is the length of the exposure. The time should not be too short as this could cause grid artifacts on the image, resulting in a repeat image to be taken. Expo-sure times in the clinical setting vary from 0.4 to over 1 second for standard projections. The length of time and ultimately the mAs delivered during the exposure is determined by the automatic exposure control (AEC) since it will terminate the exposure when the proper amount of radiation has reached the cells.
Radiation DoseThe radiation dose to the breast is reported as an average glandular dose. Glandular breast tissue is the tissue at risk for radiation-induced breast cancer. MQSA regulations require
Subcutaneous andmammary fat
Interlobular connectivetissue
Glands
Ampullae
Nipple
RibsLactiferous ducts
Muscle
Figure 16.5. Female breast architecture comprised of soft tissue structures which creates inherent low subject contrast.
Compression device
Image receptor
AEC detectors
Figure 16.6. Illustrates the relationship of the compres-sion device, image receptor, AEC detectors, and x-ray tube.
Fosbinder_Text_Chap16.indd 245 11/23/2010 3:46:29 PM

246 Part IV: Special Imaging Techniques
Compression DeviceThe compression device is made of a plastic that permits the transmission of low energy x-ray photons without attenuating the photons. The device has a straight chest wall edge to allow the device to properly grasp the breast tissue close to the chest wall. The amount of the com-pression is controlled by the radiographer. The average amount of compression which is applied to the breast tis-sue is between 25 to 45 lb of force. This is the amount of force required to effectively compress the breast tissue and immobilize the patient.
GridsThe purpose of grids is to remove scatter and improve image contrast. Larger or more dense breasts create signifi -cantly more scatter especially when higher kVp settings are used. Moving grids are used for routine mammographic examinations. Grids are capable of creating artifact if the exposure time is too short. The potential for grid artifact is negated by using the proper mA setting which will allow the AEC to use the appropriate length of time for the exposure. Grid ratios of about 4:1 to 5:1 and grid frequencies of 30 to 50 lines per centimeter (cm) are routinely employed in screening mammography. Using a grid in mammography signifi cantly improves contrast and increases the patient dose by about a factor of two times or doubling the mAs.
Automatic Exposure ControlThe correct selection of mAs exposure factors is critical in producing a high-quality mammographic image. The AEC circuit achieves proper image density by measuring the amount of exit radiation and terminating the exposure at the proper time. Breast tissue that has been compressed to a set thickness has a wide range of tissue densities when comparing women of similar age. Attaining proper den-sity is a challenge when attempting to manually set the exposure time because it is virtually impossible for the technologist to estimate the composition of breast tissue. The advent of the AEC on dedicated mammography units has provided more uniform imaging and signifi -cantly reduced the repeat rates for mammography.
The AEC detector is placed behind the fi lm cassette to prevent imaging of the detector. Mammographic units have provisions for changing the position of the AEC detector along the chest wall-nipple axis. Most detectors will have 10 stops between the chest wall and nipple which allows
superimposition of structures and it also places the tis-sue closer to the image receptor. As demonstrated in Figure 16.7, the compressed breast has uniform thickness and this decreased breast thickness reduces scatter and patient dose. Compression of the breast by 1 cm reduces the dose by a factor of 2 because the HVL in tissue is about 1 cm for mammographic energies.
The use of compression has defi nite advantages for the overall quality of the image. The advantages include the following:
● More uniform image receptor exposure.● Improved visualization of breast structures.● Reduced motion blur due to breast being immobi-
lized.● Reduced tissue thickness.● Reduced radiation exposure.● Reduced magnifi cation.
Compression device
Compressed
A
B
Uncompressed
Micro-calcifications
Lesion
Figure 16.7. Breast compression. (A) No compression means the tissue does not have uniform density and the OID of structures will cause magnifi cation. (B) Adequately compressed breast will have more uniform density, decreased tissue thickness, and decreased magnifi cation, all of which create greater resolution.
Fosbinder_Text_Chap16.indd 246 11/23/2010 3:46:30 PM

Chapter 16: Mammography 247
than conventional radiographic screens. A slow screen speed offers reduced noise and increased resolution. The use of the screen instead of direct exposure techniques signifi cantly lowers the radiation exposure to the patient while providing the maximum radiographic contrast available. The disadvantage of using a screen comes from the light emitted from the phosphors which can cause a reduction in resolution and increased image noise. Even with these disadvantages using screens in mammography has signifi cantly reduced radiation exposure for women and the sophisticated engineering of mammography units has given high resolution despite the use of a screen.
Film/Screen CombinationsIn mammography, single-emulsion fi lm with a single-screen cassette is generally used to maintain high detail imaging. A high-speed rare earth screen is used to reduce exposure time, patient motion, and radiation dose. The fi lm is positioned in front of the screen so that the exit radiation from the breast strikes the fi lm before reaching the intensifying screen. If the fi lm/screen order were reversed, the interactions in the screen would be further from the fi lm, and light diffusion through the greater distance would degrade image resolution because the spreading of light blurs the edges.
Special double-emulsion mammographic fi lms have been developed to further reduce exposure time and patient dose. These fi lms are used with half-thickness
for more accurate imaging. The AEC detector should be positioned under the portion of the breast with the greatest density, to avoid underexposed regions (Fig. 16.8).
Mammographic generators are equipped with a backup timer similar to conventional radiography generators. When using grid techniques the backup timer is set at 600 and 300 mAs for non-grid and magnifi cation techniques. If the backup time is reached during an exposure the tech-nologist must select a higher kVp setting for the repeat radiograph. Modern mammography generators have a microprocessor which controls circuits to provide accurate and reproducible fi lm densities over the complete kVp range. Some machines have the ability to change the kVp to a higher setting during the actual exposure. The circuit adjusts the kVp by sensing the radiation intensity during the fi rst 100 ms of the exposure which allows the fi lm to be properly exposed. It also prevents the backup time from being reached on a large or dense breast.
CassettesCassettes used in mammography have been specially designed for imaging the breast. The cassettes are made of plastic or low attenuation carbon fi ber. The cassette has a screen which is placed on top of a pressure pad. The fi lm is placed on top of the screen and when the cassette is closed the fi lm is at the top of the cassette and as close to the breast as possible (Fig. 16.9).
ScreensThe screens are typically green emitting gadolinium oxysulfi de. The mammography screens are much slower
Figure 16.8. Illustrates the possible positions of the AEC detector cells.
Base
Base
Foam pressure pad
X-ray
Emulsion
Phosphor
Film
Screen
Figure 16.9. Cross-section of mammography cassette. The single screen is placed under the fi lm. The single emulsion fi lm has direct contact with the single emulsion screen. This allows maximum absorption of the x-ray photons in the screen phosphors that are closest to the fi lm emulsion. This design reduces the spread of light emitted from the screen.
Fosbinder_Text_Chap16.indd 247 11/23/2010 3:46:30 PM

248 Part IV: Special Imaging Techniques
front screens and full-thickness back screens. The fi lms also have anti-crossover light properties which prevents blurring of the image. Double-emulsion fi lms have almost twice the speed of a single-emulsion fi lm with nearly the same detail resolution. Single-emulsion fi lm is used in mammography because it has superior spatial resolution compared with conventional double-emulsion fi lm. New digital mammography units are the CCD type charged couple device (Digital Image). Light from the screen is captured by fi ber optics then to the CCD which changes them into pixels.
ResolutionMammography systems must be capable of providing a minimum of 11 to 13 lp/mm of resolution. The dedicated design of the various components of the mammographic unit is crucial in achieving the high resolution necessary. The current standards for high resolution, high contrast images have been widely accepted by radiologists. Evalu-ation of small structures in images to diagnose cancer and other pathologies can be performed with routine images, magnifi cation images, specialty views, and through the use of a magnifying glass.
Film ProcessingMammographic fi lm can be developed using conven-tional or extended automatic processing. Extended processing uses the same chemicals and temperatures as regular processing, but the fi lm processing time is increased because the fi lm is in the developer for a longer time. Total processing time is increased from 90 seconds to 3 minutes by increasing the fi lm transport time. Extended processing increases fi lm speed and contrast and allows for a decrease in patient dose. However, extended pro-cessing results in reduced fi lm latitude, requiring careful selection of exposure factors to eliminate retakes.
Magnifi cation Mammography
Magnifi cation images are used to examine suspicious areas of the breast or when structures overlap each other and have to be separated. The SID is fi xed in mammographic units
to 50 to 80 cm or 20 to 30 inch, so magnifi ed images are obtained by decreasing the source to object distance (SOD) while increasing the object to image distance (OID). This technique requires a raised platform which is placed on the image receptor holder and the breast is placed on top of the platform and compressed for the exposure (Fig. 16.10).
When magnifi cation is used to image anatomy a loss of resolution is expected. A 0.1-mm focal spot is used to achieve good detail resolution. Magnifi cation factors of 1.5 to 2 are obtained using the 0.1-mm focal spot (60 cm or 24 inch). This follows the magnifi cation factor which is SID/SOD = MF. The air gap between the breast and the fi lm cassette reduces scatter and eliminates the need for a grid.
Image enhancements due to magnifi cation of the breast include the following:
● Increased resolution due to small focal spot size.● Reduction is scatter reaching the fi lm due to the air
gap technique.● Improved visibility of detail resulting from a larger
fi eld of view.
Figure 16.10. Shows an imaging plate and cassette from a CR unit.
Fosbinder_Text_Chap16.indd 248 11/23/2010 3:46:32 PM

Chapter 16: Mammography 249
Magnifi cation mammography has a limited fi eld of view and is not able to image the entire breast, however, this technique is only used on suspicious areas of the breast and it is not necessary to image the entire breast with magnifi cation. Due to the breast being so much closer to the x-ray tube, there is increased exposure to the breast for each exposure, as much as two to three times. The increased exposure is also due to the reduction in mA, which is required of the 0.10 focal spot size, and increase in exposure time. The increased exposure time could be as high as 4 seconds. Due to the technique of placing the breast on a platform and using longer exposure times, it is necessary for the mammographer to explain the additional images and the procedure of acquiring the images.
Digital Mammography
With digital mammography, there are four types of detec-tors to capture images of the breast compared to fi lm/screen mammography. They are computed radiography (CR), digital mammography (phosphor fl at panel sys-tem), phosphor CCD, and selenium fl at panel system. All of these detectors replace fi lm/screen imaging.
Computed RadiographyCR utilizes an imaging plate which replaces intensify-ing screens and fi lm. The imaging plate absorbs the exit radiation and captures the signal in the energy traps of the imaging plate (Fig. 16.10).
After the imaging plate is exposed, the plate is placed in a CR reader where a laser stimulates the stored image to give off light which is captured by the imaging plate and converted to a digital signal which is stored and displayed on a computer at a workstation or on laser printed fi lm. The imaging plate is then automatically erased and placed back into its cassette for reuse.
The benefi t of using CR for mammography is utiliz-ing your existing equipment. The other benefi t is storage. Films take up a lot of room to store. They also can be mis-placed or lost. With a CR system, the images are stored on computer with a back-up system in place.
For CR mammography, you are able to transmit images to remote sites. The radiologist has quick access to previous CR mammograms for comparison. This makes diagnosis of
any abnormalities in the breast more accurate. Transmitting the images electronically is termed telemammography.
Digital MammographyDigital mammography is similar to CR because it is fi lmless and the image is stored on computer. It has the same benefi t as CR. In digital mammography, the unit is dedicated digital equipment for mammography only. It can reduce the radia-tion dose to the breast by 50% and has a high digital resolu-tion around 20 lp/mm. A phosphor fl at panel system is used in digital mammography. The system consists of a large-area plate with photodiodes that are coated with thallium-activated cesium iodide phosphors. At the time of exposure, the photodiodes detect the light emitted by the phosphor and create an electrical signal that is transferred to the computer workstation. The image is displayed for the technologist to check prior to the next exposure. The images are then sent to a storage system. This storage system allows for long term storage or the image can be printed out on a laser printer to fi lm. There are no cassettes with digital mammography. The image is transferred directly onto the computer.
Phosphor CCDThe phosphor CCD detector also uses cesium iodide. Instead of using a large-area plate the detector is a nar-row 1 × 24 cm2 in size. The x-ray beam is collimated to the size of the detector the breast is scanned with both the detector and x-ray beam in unison. The light emitted from the phosphor is sent to a CCD which then converts the light into an electrical signal.
Selenium Flat PanelThis fi nal system uses an x-ray absorber made of amorphous selenium instead of a light emitting phos-phor. During the exposure the x-ray photons are absorbed by this material and converted into an electrical charge through a system of electrode pads.
When using any of the above systems, images have been placed on computer for initial viewing by the mammographer. Once the examination is complete, the images are transferred and placed electronically to Picture Archiving and Communications System (PACS) for archiving purposes. The images can then be sent to the radiologist for interpretation or sent electronically to other physicians, to other health care facilities for consul-tation and teaching, and to the ordering physician.
Fosbinder_Text_Chap16.indd 249 11/23/2010 3:46:32 PM

250 Part IV: Special Imaging Techniques
What is the anode angle in a horizontal x-ray tube?
Tilted x-ray tube?
Of the various types of metals used in anode tar-gets, why is the molybdenum target preferred?
What is the purpose and type of fi ltration used in the x-ray tube?
The cathode side of the x-ray tube has the most intense portion of the beam. The tissue at the chest wall is thicker than the rest of the breast tissue so the cathode should be placed toward the chest wall. This is commonly referred to as the “heel effect.” In a horizontal x-ray tube placement the anode is angled 22 to 24 degrees so that the entire image receptor can be bombarded with the x-ray photon beam. A narrower angle can be used if the x-ray tube is tilted thereby placing the cathode and anode at an angle to the image receptor. This type of tube placement is necessary for narrower anode angles which results in a smaller effec-tive focal spot size. The molybdenum target is preferred for several reasons. No. 1 it increases the number of low-energy photons, No. 2 increased image contrast is achieved, and No. 3 it produces the needed range of energies to produce low kVp for soft tissue imaging. The port of the x-ray tube is coated with beryllium because of its low atomic number it allows photons to exit the tube. The total fi ltration in the tube should not exceed 0.4-mm aluminum equivalent; this allows the adequate number of low energy photons to image the breast. The fi ltration also removes the very low energy photons because they do not have the energy to leave the tissue and only result in increased patient dose. Filtration also removes the high energy photons which have enough energy to penetrate the breast tissue but add excessive scatter to the image which decreases image contrast.
Case StudyMammographic x-ray tubes have a dedicated design for exclusively imaging breast tissue. Breast tissue is made up of soft tissue structures with little difference in the tissue densities; therefore, the cathode, anode, target material, and fi ltration were all designed with the char-acteristics of breast tissue in mind. The follow-ing questions will aid you in understanding the mammographic x-ray tube.
Critical Thinking Questions
Why is the cathode placed toward the chest wall?
Chapter SummaryMammography forms images of breast tissues with low differential absorption and small microcalci-fi cations using a low-kVp technique. Mammo-graphic tubes have special molybdenum anodes with 0.3- and 0.1-mm focal spots. The K character-istic of x-ray photons of molybdenum has energies of 17.4 and 19.9 keV. The 0.03-mm molybdenum fi lters pass the K characteristic x-ray photons and remove both higher and lower energy x-rays. Single-screen cassettes are used with single-emul-sion fi lms to obtain high detail images. Moving grids with 4:1 ratios remove scatter and improve image contrast. The AEC circuit, whose detectors are placed behind the fi lm cassette, terminates the exposure to produce the correct image density. Compression of the breast during mammogra-phy improves image quality by decreasing scat-ter and reducing patient motion. Magnifi cation mammography is used to study suspicious breast regions. Extended processing increases image contrast and speed while reducing fi lm latitude and patient dose. The typical glandular dose is about 2.8 mGy for a typical two-view examination. Various forms of digital mammography are widely accepted and provide the advantages of immedi-ate visualization of the image.
Fosbinder_Text_Chap16.indd 250 11/23/2010 3:46:33 PM

Review Questions
Multiple Choice
1. Mammographic tubes have _________ anodes and _________ fi lters.
A. tungsten, molybdenumB. molybdenum, molybdenumC. molybdenum, aluminumD. aluminum, molybdenum
2. Typical mammographic tube fi ltration placed in the beam is
A. 0.03 mm molybdenumB. 0.3 mm aluminumC. 0.3 mm molybdenumD. 0.3 mm aluminum
3. Compression of the breast during mammography
A. reduces patient motionB. reduces scatterC. reduces patient doseD. all of the above
4. Exit radiation passes through the _________ fi rst after exiting the breast.
A. intensifying screenB. fi lmC. AECD. cathode
5. The AEC detector is located
A. in front of the cassetteB. behind the cassetteC. above the patient’s breast
6. Magnifi cation mammography is best used for which of the following?
A. Routine breast imagingB. In the place of screening imagesC. To examine suspicious areasD. All of the above
7. Which type of digital mammography system uses electrode pads and _________ to absorb x-ray photons?
A. Computer radiographyB. Selenium fl at panelC. Phosphor CCDD. Phosphor fl at panel
8. Which of the following mA ranges is used in mam-mography?
A. 20 to 100 mAB. 40 to 200 mAC. 100 to 400 mAD. 400 to 800 mA
9. Digital mammography was fi rst approved for sale in the United States in
A. 1950B. 1970C. 1990D. 2000
10. The phosphor CCD in a digital mammography unit utilizes a detector which is
A. 24 × 35 cmB. 1 × 24 cmC. 8 × 10 inchD. 2 × 14 inch
Fosbinder_Text_Chap16.indd 251 11/23/2010 3:46:33 PM

252 Part IV: Special Imaging Techniques
6. What is the maximum pound of compression allowable on mammographic equipment?
7. The fi lm is placed _____ to the x-ray tube.
8. Name the focal spot sizes used in mammography and explain why they are needed.
9. The emulsion surface of the fi lm must always be toward the _____.
10. What does MQSA stand for?
Short Answer
1. What is the difference between a screening and diagnostic mammogram?
2. What are three types of breast tissue?
3. Why does mammography require a low kVp technique?
4. List the advantages to using compression.
5. Mammographic cassettes have a latching mecha-nism which is designed for close fi lm-screen con-tact to minimize _________.
Fosbinder_Text_Chap16.indd 252 11/23/2010 3:46:33 PM

253
17
Computed Tomography
Key Terms● convolution
● deconvolution
● gas-fi lled ionization detectors
● indexing
● photomultiplier (PM) tube
● pitch
● scintillation detectors
● solid-state detectors
● voxel
ObjectivesUpon completion of this chapter, the student will be able to:
1. Compare the different generations of computed tomography (CT) scanners.
2. Describe the operation of a CT scanner.
3. Identify the components of a CT scanner.
4. Defi ne CT numbers.
5. Identify the factors that infl uence spatial and contrast resolution.
6. Explain common CT artifacts.
Fosbinder_Text_Chap17.indd 253 10/30/2010 6:22:37 PM

254 Part IV: Special Imaging Techniques
IntroductionThe invention of the computed tomography (CT) scanner revolutionized radiographic examinations because of the difference in appearance and sensitivity of CT scans. CT scanners produce cross-sectional images of the body with the tissues and organs dis-played separately, instead of superimposed as in a conventional radiograph. CT scans are much more sensitive to small differences in tissue composition than are conventional radiographs. CT views are perpendicular to the body axis and are called transaxial images.
Historical PerspectiveGodfrey Hounsfield is credited with the invention of computed tomography; however, early work on the mathematics used to reconstruct CT images was done by Allan Cormack, a physicist at Tufts University. Hounsfield was an engineer with Electric and Musi-cal Industries (EMI) Ltd. in England. His work with computed tomography in the early 1970s produced a scanner that required 9 days to scan an object and produce a single-section image. Hounsfield and Allan Cormack were awarded the Nobel Prize in Physics in 1979.
Scanning ProjectionsIn CT, the scan produces a transverse or axial image. This image is perpendicular to the long axis of the body. Digital processing of the transverse data produces images in sagittal and coronal sections (Fig. 17.1). Using post-acquisition algorithms, various images can be produced without the need to rescan the patient and expose them to additional radiation.
A
B
CFigure 17.1. Scanning Projections. (A) Sagittal. (B) Transverse. (C) Coronal.
Fosbinder_Text_Chap17.indd 254 10/30/2010 6:22:37 PM

Chapter 17: Computed Tomography 255
CT Scanner Generations
Since the original EMI scanner, there have been rapid advancements in CT scanners. As technology has pro-gressed, the development of scanners has kept pace. Cur-rently, there are seven generations of scanners with each generation providing faster scan times and improved image manipulation.
First GenerationThe fi rst generation CT scanner was a single ray system designed to examine only the head. This scanner used two detectors and a single x-ray tube which were con-nected in a c-arm fashion (Fig. 17.2). The detectors were sodium iodide scintillation crystals with photomultiplier tubes. CT scanners measure the transmission of the x-ray beam through the body.
The x-ray beam was a pencil thin slit fi eld which scanned 180 degrees around the patient’s head. The fi rst genera-tion scanner used a translate-rotate system. The x-ray tube and detectors were connected and moved synchronously from one side to the other while scanning the patient; this is called translation. The x-ray tube then rotates 1 degree into the next position and scans again. The x-ray beam was turned on while scanning and off during rotation.
This process was performed 180 times for each scan. The major drawback to the fi rst generation units was that it took nearly 5 minutes to complete one slice.
Second GenerationThe second generation CT scanner used a single pro-jection fan-shaped beam and a linear array with up to 30 detectors (Fig. 17.3). The x-ray tube and detectors move in unison just like the fi rst-generation scanner. The translate-rotate mechanism was used, and with the increased number of detectors, there were fewer linear movements. A scanner with 30 detectors could complete a 180 degrees linear scan in six rotations compared with the fi rst generation which required 180 rotations. Scan time was reduced to approximately 10 to 90 seconds per slice; this allowed for the patient to hold his or her breath long enough for a complete scan. With these advance-ments, the rest of the body could be scanned.
Third GenerationA primary limitation with prior generations of scanners was the scanner’s inability to rotate in a 360 degrees arc around the patient. Third-generation scanners use a wider fan-shaped beam and a curved array of 250 to 750 detectors which rotate 360 degrees within the gantry (Fig. 17.4). For the fi rst time, the detectors and x-ray tube had the ability to continuously rotate. The translate-rotate mechanism was replaced with this rotate-rotate mechanism. The x-ray tube and detectors both rotate in a circle around the patient, and the x-ray beam slices through the body to produce the
Figure 17.2. Shows a schematic view of a fi rst-generation CT scanner.
Scan90
Scan135
Scan45
Scan90
Scan45
Scan135
Detectorarray
Narrowfanbeam
Detectorarray
Tube
Collimator
Beam
Figure 17.3. Second-generation CT scanner.
Fosbinder_Text_Chap17.indd 255 10/30/2010 6:22:38 PM

256 Part IV: Special Imaging Techniques
The tube fi rst scans in a clockwise direction and then counterclockwise; this motion continues until the exam is complete. These scanners are capable of 1 second scan times. A principle disadvantage of fourth-generation scan-ners is the increased dose of radiation to the patient.
Fifth GenerationThe fi fth-generation scanner is a dedicated cardiac unit designed around a rotating electron beam. This type of scanner is also called the Electron Beam CT scanner (EBCT). The design of the EBCT scanner produces high-resolution images of moving organs such as the heart without motion artifact. The x-ray tube has been replaced with an electron gun which uses defl ection coils to direct a 30 degrees beam of electrons in an arc around four adjacent tungsten target rings. These rings are sta-tionary and span a 20-degree arc. The arrangement of the detector array allows for either two slices to be acquired with one target ring or eight slices when all four target rings are used in sequence. This scanner is ten times faster than conventional CT scanners, which makes it fast enough to provide real-time dynamic sectional images of the beating heart.
Sixth GenerationGenerations one through four utilized cables to provide the electricity necessary to move the components of the scanner while also providing kilovoltage for the x-ray exposure. The cables limited the scanners because the cables could only rotate a certain amount before they had to be “unwound.” The sixth-generation scanner was designed to use slip-ring technology to replace the cables. The slip-ring technology allows continuous rotation of the x-ray tube and detectors around the patient.
As the x-ray tube circles around the patient, the patient table is continuously moved through the bore of the gan-try. This allows for a continuous set of attenuation data to be obtained in a helical or spiral manner; therefore, this generation of scanner is referred to as a helical/spiral scan-ner (Fig. 17.6). Spiral scanning differs from conventional CT scanning in that the support table is not stopped at the center of each slice location while the data are collected.
The primary advantage of the helical scanning is a dra-matically shorter scan time; spiral CT examinations can be completed in <1 minute. Other advantages include
image data. The support table and the patient advance, and the tube again rotates around the patient to generate data for the next image. With this generation of scanner, the entire patient can be viewed with each scan. The scan time was reduced to 1 second per slice.
Fourth GenerationFourth-generation scanners use a single projection fan-shaped beam with 600 to 2,000 detectors mounted to an array which forms a 360 degrees ring on the inside of the gantry. The ring of detectors remains stationary, while the x-ray tube rotates within the gantry (Fig. 17.5).
Rotating detector system
Figure 17.4. Third-generation CT scanner.
Stationary detector system
Figure 17.5. Fourth-generation CT scanner.
Fosbinder_Text_Chap17.indd 256 10/30/2010 6:22:39 PM

Chapter 17: Computed Tomography 257
vascular studies of the arteries where contrast is moving quickly through the vessels.
Seventh GenerationThe seventh-generation CT scanners are most com-monly called multisection or multislice computer tomog-raphy (MSCT). Multisection scanners are able to expose multiple detectors simultaneously due to detector tech-nology which permits an array of thousands of parallel bands of detectors to operate at the same time (Fig. 17.7). This coupled with helical scanning drastically reduces the total exam time for an entire chest or abdomen to
the ability to complete the entire exam with the patient holding his or her breath one time, lower amount of con-trast media to produce a diagnostic image, and a decrease in motion artifacts.
The acquisition time is the time required to collect the CT data. The acquisition time for conventional axial CT scans is typically several seconds per slice. The acquisi-tion time for spiral scans is about 30 seconds. The exami-nation time is the total time required to collect the CT data. For spiral scanning, the acquisition time and the examination time are the same. For conventional axial CT scanning, the examination time includes the time for both data acquisition and table indexing to the next slice position. A conventional axial CT examination requires several minutes to complete, which is much longer than a spiral CT examination.
PitchPitch is the distance that the patient travels through the CT scanner in the time the x-ray tube makes one full 360-degree rotation which is divided by the width of the slice. Pitch is a ratio of the tube movement to section thickness. In a ratio, the second number is always 1 as in 1:1 or 2:1. In a 1:1 ratio, the table movement is equal to the section thickness. Faster tube travel and thicker sections make for a faster scan, but the resolution is less. Most multislice spiral CT scans have rotation times of 1 second or less. This is utilized frequently when scanning
X-ray source
X-ray detector
Figure 17.6. Illustrates how the x-ray tube of a spiral CT scanner rotates around the patient, while the patient support table moves through the CT scan plane.
Isocenter
Collimatorbeam width
Detector width
Figure 17.7. Seventh-generation CT scanner.
Fosbinder_Text_Chap17.indd 257 10/30/2010 6:22:39 PM

258 Part IV: Special Imaging Techniques
The gantry frame maintains the proper alignment of the x-ray tube and detectors. The frame also contains the components necessary to perform scanning movements. The gantry has a 20- to 34-inch aperture for the patient to pass through during the scan. Inside the gantry cover is a large ring that holds the detectors and the track for the x-ray tube while it rotates around the patient.
Most CT gantries can be angled up to 30 degrees to permit positioning the patient for coronal images and to align the slice plane to certain anatomy such as the base of the skull or lumbar spine curvature. The gantry can be angled toward or away from the patient table and may permit coronal scanning of body areas, especially the head. There are also positioning lights mounted on the gantry. There are intense white lights and low-power red laser lights which assist the positioning of the body. The body area of interest must be properly aligned and cen-tered in the aperture. There can be three lights which are used to accurately line the patient up for sagittal, coronal, and transverse centering.
X-Ray CircuitThere are two kinds of x-ray circuits: one operates at low frequency (60 hertz [Hz]) and is about the size of a large offi ce desk; and the other is a high-frequency circuit (3,000 Hz) about the size of a suitcase. The 60 Hz circuit, because of its size, must be located outside the gantry in the CT room and is connected to the rotating x-ray tube by thick, fl exible high-voltage cables. The cables prevent the tube from rotating >360 degrees without rewinding so axial CT examination collects data one slice at a time.
15 to 20 seconds. The MSCT is designed to be more effi cient, reduce patient exposure to radiation, improve image resolution, and allow unprecedented postacquisi-tion reconstruction of acquired data.
Regardless of the generation of CT scanner the latent image is acquired and archived in a similar manner. The exit radiation is detected and converted into a digital sig-nal by the analog-to-digital converter or ADC. Data from many different entrance angles are processed in a com-puter to determine the transmission and attenuation char-acteristics of the tissues in the section under examination (Fig. 17.8). The data are stored in a matrix of pixels. The digital pixel data are processed in a digital-to-analog con-verter (DAC) before being displayed. The DAC converts the digital data into an analog signal for display.
Components of a CT Scanner
A CT scanner consists of a doughnut-shaped gantry, a patient support table, a computer system, and an opera-tor’s console with display. (Fig. 17.9)
The GantryThe gantry is a doughnut-shaped structure containing the x-ray circuit, the x-ray tube, the radiation detectors, the high-voltage generator, and mechanical supports.
Gantry
Patient support table
Rib
Pancreas
Aorta
Verterbra
Left Kidney
CT image of upper abdomen
Detectors
Figure 17.8. Shows a schematic view of a CT scanner and the resultant image.
Fosbinder_Text_Chap17.indd 258 10/30/2010 6:22:41 PM

Chapter 17: Computed Tomography 259
The high-frequency circuit is small enough to be mounted with the x-ray tube on the rotating frame inside the gantry. Both the tube and the circuit rotate together around the patient. The input voltage is connected to the circuit through slip rings that allow the circuit and the x-ray tube to continuously rotate. Continuous rotation is necessary for spiral CT scanning.
X-Ray TubeThe x-ray tube which produces a continuous beam is a high-heat capacity tube that is capable of operating up to 400 milliamperes (mA) and 120 to 150 peak kilovolts (kVp) for several seconds. Units with a pulsed beam tube operate at 120 kVp and up to 1,000 mA. Many CT tubes are designed with anode heat capacities >1 million heat units. In modern CT units, the x-ray beam is collimated into a fan-shaped beam. The thickness of the beam is set by adjustable collimators located at the exit of the x-ray tube housing. The x-ray beam is also collimated at the detector entrance. The thickness of the beam determines
the amount of tissue irradiated and the volume of each pixel element (Fig. 17.10). The volume element is called a voxel. This is determined by the slice thickness. The collimator and detector geometry prevents most scattered x-rays from reaching the detectors.
Radiation DetectorsThe radiation detectors in the gantry can be mounted either in a stationary ring around the gantry or on a sup-port frame called an array that rotates in a circle around the patient opposite the x-ray tube. The fourth-generation scanners utilized the stationary ring confi guration; how-ever, these are not commonly used and are no longer being manufactured with the advent of fi fth-generation scanners. In either system, the detectors measure the exit radiation transmitted through the patient at different angles around the patient. Systems with stationary detec-tors utilize >4,000 detectors. Rotating detector systems use enough detectors to intercept the entire fan beam.
Gantry
Patient support table
Figure 17.9. Shows the gantry and patient support table of a modern CT scanner.
Fosbinder_Text_Chap17.indd 259 10/30/2010 6:22:42 PM

260 Part IV: Special Imaging Techniques
but are not conducive to the modern scanners because of the phosphorescent afterglow properties of the scintil-lation crystals. The sodium iodide was replaced by bis-muth germanate and cesium iodide. The current crystal of choice is cadmium tungstate which has 90% effi ciency but minimal afterglow.
Gas-Filled Ionization DetectorsGas-fi lled ionization detectors use xenon gas to produce an electrical signal when x-ray photons pass through the chamber. Thin tungsten plates spaced 1.5 mm apart make up the electrodes in the ionization chamber (Fig. 17.12). The space between the electrodes acts as radiation detec-tors. Each electrode produces an electric fi eld across the gas-fi lled chamber. X-ray photons produce ionization in the gas. The electric fi eld pulls the negative ions to the positive electrode and the positive ions to the negative electrode. This fl ow of electrons is an electric current. The current produced is proportional to the ionization in the chamber and the energy of the radiation passing through the chamber. The detected energy makes up the
Pixel
Voxel
Figure 17.10. Shows a fan-shaped beam from a CT scanner and the relationship between an individual pixel and voxel.
The image quality, resolution, and effi ciency of the stationary and rotating detector systems are effectively the same.
CT scanners employ scintillation crystals, gas-fi lled ionization chambers, or solid-state detectors as radiation detectors. The image quality and detection effi ciency of the different types of detectors are approximately the same.
Scintillation DetectorsScintillation detectors are comprised by sodium iodide crystals that give off a fl ash of light when an x-ray pho-ton is absorbed by the crystal. The radiation produces light in proportion to the intensity of the photon and at the site where the photon struck the crystal. The light from the scintillation crystal is detected by a photomul-tiplier (PM) tube (Fig. 17.11). The light photon strikes the cathode of the PM tube where it is converted into electrons. The electrons are then amplifi ed by a chain of dynodes as they pass through the PM tube. The dyn-odes have progressively higher voltage which causes an increase in the number of electrons as they move toward the anode. Once the electrons bombard the anode, they are converted into an amplifi ed electrical signal which is then processed by the computer. The scintillation crystals and PM tubes were used in early generations of scanners
Circuit
Crystal
Photon
Light
Photomultiplying tube
Cathode
Anode
Focuselectrode
Electron
Dynode
Figure 17.11. Shows a typical scintillation detector.
Fosbinder_Text_Chap17.indd 260 10/30/2010 6:22:44 PM

Chapter 17: Computed Tomography 261
the divergence of the fan-shaped beam. This permits the entire array of detectors to operate simultaneously. The photodiode detects the light photons emitted by the scin-tillator and converts them into an electrical signal which is used by the computer to form the digital image.
The arrangement and type of detectors used in a par-ticular CT scanner are selected by the manufacturer for commercial reasons. The processing of the signal from any type of detector is essentially the same in all CT scan-ners. The image quality of all modern CT scanners is effectively the same.
CollimationCollimation is required in CT scanning for exactly the same reasons as in radiography. Proper collimation reduces patient dose by restricting the amount of tissue which is irradiated. Collimation also enhances image contrast by limiting scatter radiation. CT units often use two collimators. The prepatient collimator is mounted on the tube housing and limits the area of the patient that is exposed to the primary beam. This collimator determines the slice thickness and patient dose. The postpatient col-limator restricts the x-ray fi eld viewed by the detector array, thereby reducing scatter radiation on the detector. This collimator helps to determine the slice thickness as well. Since the postpatient collimator is placed between the patient and the detector array, it does not infl uence patient dose.
Patient Support TableThe CT table may be either curved or fl at. The patient support table is constructed of low atomic number carbon graphite fi ber to reduce attenuation of the x-ray beam. The tabletop must be able to support the entire weight of the patient when the table is moved into the gantry aperture. Tabletops are rated for maximum weight and are constructed to support patients weighing as much as 450 to 600+ lb. Attempting to move the tabletop with patients weighing more than the maximum weight can result in extensive damage to the table. The table should also be capable of moving up and down for ease in trans-ferring patients onto and off of the table and in positioning the patient correctly in the aperture.
The positioning of the table is called indexing. Table indexing must be accurate and reproducible within
digital signal that is sent to the computer. The detector effi ciency for an ionization chamber–type detector is approximately 50%.
Solid-State DetectorsSolid-state detectors are used in helical and MSCT scanners. Solid-state detectors combine a calcium tungstate, yttrium, or gadolinium ceramic scintillator with a photodetector. As seen in Figure 17.13, when the x-ray photon interacts with the solid-state scintilla-tor, light photons are emitted isotropically in proportion to the intensity of the light. The scintillator is able to accept incoming x-ray photons because it is sensitive to
Ceramic Tungsten plateelectrode
Charges
Xenon(in interspacematerial)
Figure 17.12. Shows a typical gas-fi lled ionization detector.
Photodiode
Electrical signal
X-ray beam
Isotropicallyemitted light
X-ray Large acceptanceangle
Figure 17.13. Solid-state detector. The photodiode is coated with a scintillator. When the remnant x-ray pho-tons activate the scintillator, light photons are emitted and detected by the photodiode. The photodiode then gives off an electrical signal.
Fosbinder_Text_Chap17.indd 261 10/30/2010 6:22:45 PM

262 Part IV: Special Imaging Techniques
Display ConsoleThe display console is often part of the main control and is a separate cathode ray tube or fl at panel display with controls. The console is a separate workstation that allows radiologists to display and manipulate images, and to electronically dictate the results. CT display consoles permit a wide range of features to enhance the digital image. These features include:
● Scanogram: A scout image of the area to be scanned. Dotted lines corresponding to the section intervals provide a convenient reference guide when view-ing the images.
● Multiplanar Reconstructions (MPRs): A computer process which stacks transverse images on top of each other to form a three-dimensional (3D) set of data.
● Reverse Display: Allows the image to be reverse from right to left and to reverse density displays so that black appears white and white appears black.
● Magnifi cation: Is available but will distort the image if used beyond three times magnifi cation.
● Suppression: Allows a problem area to be outlined and deleted from the reconstruction data.
● Region of Interest (ROI): An area of an anatomic structure which is measured to display the average HU/CT number.
● Annotation: Text that is added to images for ana-tomical labeling or descriptive purposes.
● Maximum Intensity Projections (MIP): A type of 3D procession by reconstructing an image by selecting the highest value pixels along a line through the data set and exhibiting only those pixels.
● Three-Dimensional Imaging: Specialized software and image processing units allow the manipulation of the image to visualize structures that are hidden. The image can be rotated, tumbled, or tilted, and densities can be made more translucent or divided.
CT NumbersThe CT number of each voxel is calculated from the transmission data collected as the beam passes through the patient at many different angles. Each pixel is dis-played on the video monitor as a level of brightness which corresponds to the level of optical density in the pixel. The relative attenuation characteristics of a voxel are reported as a CT number and sometimes referred to as
1 millimeter (mm). In conventional axial CT scanning, the tube rotates around the patient to collect data for one slice, the table indexes into the gantry at a preset distance, and the tube rotates again to collect data for the next slice. The x-ray beam is on only during tube rotation. A typical axial CT examination involves collecting data from ten or more sections and requires several minutes to com-plete. In spiral scanning, the support table moves steadily through the gantry while the tube continuously rotates around the table and the patient, and the entire spiral CT examination can be completed in <1 minute.
Computer SystemThe CT computer is a unique component of the CT system. The computer must have suffi cient speed and memory to solve as many as 30,000 calculations simulta-neously. The CT computer is designed to control data acquisition, processing, display, and storage. At the CT console, the technologist has access to software programs that allow processing and display of the images. The com-puter system calculates the attenuation of the individual voxels using the x-ray exit radiation data collected at many different tube positions around the patient. These trans-mission data are converted into attenuation data for each voxel. The computer programs used to perform these cal-culations are called algorithms. The calculations of the CT numbers must be very fast to produce images for immedi-ate viewing. The digital data are stored for later recall on a computer server, magnetic tape, or CD-ROM.
Operator’s ConsoleThe console permits control of all scan parameters including selecting proper technical factors, movement of the gantry and patient table, and computer commands that allow reconstruction and transfer of image data for storage in a data fi le. The CT console operates a menu of directory operations. The console is preprogrammed with the kVp and mA values for individual anatomic sites. The technologist uses a keyboard and mouse to indicate the desired operation for the anatomy to be scanned. Each scan must have patient information, such as identifi ca-tion and medical history entered prior to beginning the scan. Hard copy images are printed on fi lm using a multi-format camera or laser printer. These images are reviewed for diagnostic interpretation by the radiologist.
Fosbinder_Text_Chap17.indd 262 10/30/2010 6:22:46 PM

Chapter 17: Computed Tomography 263
Hounsfi eld units. The CT numbers range from −1,000 to +1,000 for each pixel. Table 17.1 shows the CT values of various tissues. Changing the size of either the matrix or the slice thickness may change the CT number because different tissues may be included in the voxel. The CT number of a tissue is always calculated relative to the atten-uation of water. The CT number of a tissue is given by:
CT number of tissue = [(ump − mw)/umw)] × 1,000
where mp is the linear attenuation coeffi cient of the pixel and mw is the linear attenuation coeffi cient of water. Because the CT number is based on the difference between the linear attenuation coeffi cient of each pixel and the attenuation coeffi cient of water, the CT number of water is always equal to zero. Tissues with densities greater than that of water have positive CT numbers; tis-sues with densities less than that of water have negative CT numbers. Tissues with negative CT numbers are dis-played as darker objects. Tissues with positive CT num-bers appear as lighter densities.
Image QualityImage quality is controlled by the resolution of the image and the amount of noise in the image. There are four basic characteristics which determine the overall quality of a CT image.
TABLE 17.1 HOUNSFIELD UNITS OF VARIOUS TISSUES
Tissue Hounsfi eld Unit or CT Number
Air −1,000Lung −150 to 400Fat −100Water 0Tumors +5 to 35Blood +13 to 18Cerebrospinal fl uid + 15Gray matter +20 to 40White matter +36 to 46Muscle +50Liver +40 to 70Blood, clotted +55 to 75Dense bone +1,000
Spatial ResolutionSpatial resolution is defi ned as the minimum separation of two objects that can be distinguished in the image as two separate objects. Spatial resolution is measured in line pairs per centimeter (lp/cm). Typical CT resolu-tion depends on the design of the unit but is generally between 0.6 and 1.0 lp/cm. Two pixels are required to image one line pair. Increasing the matrix size decreases the pixel size and improves spatial resolution but increases the time required for processing and storing the images. Spatial resolution in CT scanning depends on a combination of factors, including focal spot size, beam collimation, detector size, matrix size, pixel size, and sub-ject contrast. Larger matrices with small pixels and high subject contrast have better spatial resolution. Utilizing small focal spots and narrow collimation provides better spatial resolution.
Contrast ResolutionOne of the major advantages of CT scanning is its abil-ity to image tissues with similar attenuation characteris-tics. Contrast resolution is the ability to distinguish two objects with similar attenuation values. CT images have high contrast resolution, which is the biggest advantage of CT imaging. For example, Figure 17.14 demon-strates how blood and liver are very close in attenuation
Liver
Aorta
Figure 17.14. Demonstrates the difference in appearance between blood in the aorta and liver tissue in a CT exami-nation of the abdomen.
Fosbinder_Text_Chap17.indd 263 10/30/2010 6:22:46 PM

264 Part IV: Special Imaging Techniques
of the image. System noise should be evaluated daily by scanning a phantom and using an ROI to measure the Hounsfi eld units for control areas.
LinearityThe CT scanner must be calibrated so that water is consis-tently represented as zero HU, and other tissues are repre-sented by their appropriate CT value. A fi ve-pin phantom is scanned and the CT number for each pin is recorded. When plotted on a graph, the CT number versus the lin-ear attenuation coeffi cient should travel in a straight line going through zero. Any deviation from linearity is an indi-cation of a malfunction or misalignment in the scanner.
Scanning Parameters
Section Interval and ThicknessThe section interval is the distance between scan sec-tions, while the section thickness is the width of the volume of tissue being imaged (voxel). The section thickness is typically less than voxel width due to the divergence of the x-ray beam. The divergence of the x-ray beam causes a problem where either overlapping or excluding tissue between sections occurs. The tech-nologist must take this into consideration when setting up the section interval and thickness for a given scan. If a voxel width of 5 mm is selected, then the section inter-val should be 11 mm; this will prevent any tissue from being missed. CT units have preset programs which standardize scanning parameters for given procedures that take into account the correct amount of overlap needed; however, the parameters can be modifi ed to accommodate special circumstances.
Exposure FactorsMost CT scanners operate at a preset kVp. Because of spiral scanning, time is not a factor because it is con-trolled by the scanning program so that the suffi cient exposure can be made to the detectors. The technologist can change the mA setting to control the primary beam. It is critical that the correct amount of mA be used to keep the dose to the patient as low as possible while pro-viding optimum images.
characteristics but have different appearance on a CT scan of the abdomen.
Contrast resolution is determined by the number of density differences stored in each matrix. A low-contrast image has many density differences in the entire image, while a high-contrast image has few density differences. The level of contrast in each pixel is determined by the absorption of x-ray photons in tissue which is characterized by the linear attenuation coeffi cient. Tissue with a higher atomic number will attenuate more photons and will have a higher linear attenuation coeffi cient (Fig. 17.15).
CT examinations using iodinated contrast media are performed to image both arterial and venous phases of the circulatory system. Iodinated contrast media is injected either by hand or by a power injector. Power injectors, or automatic injectors, permit more accurate timing of contrast delivery. Power injectors are also used in cardiol-ogy and angiography to inject a known amount of con-trast at a fi xed rate. Typical CT contrast examinations are performed fi rst without contrast and then scanned again after contrast injection. This permits observation of the structures under examination.
NoiseAll digital images have problems with system noise. Noise in the CT image is directly related to the amount of data collected by the detector. The noise is seen as quantum mottle or graininess and makes up a small percentage
Fat –100
Liver +40-70 Dense bone +1000
Figure 17.15. The soft tissues in the abdomen are very similar in density. The CT scanner is excellent in distin-guishing between these small differences and allows a clear image of all the structures.
Fosbinder_Text_Chap17.indd 264 10/30/2010 6:22:47 PM

Chapter 17: Computed Tomography 265
Helical InterpolationHelical scanning creates a “corkscrew” image where the information is acquired at an angle. Typically if imaging, a perpendicular plane is desirable. In helical scanning, inter-polation is used to “straighten” the image. This process uses postacquisition algorithms to produce a new set of images. The process takes the raw data and projects or interpolates it forward and backward into a new section or image. By using interpolation, a new set of images can be produced without exposing the patient to additional radiation (Fig. 17.16).
ReformattingReformatting uses data from a series of sectional images to produce an image in a new scan plane without actu-ally scanning the patient. Reconstruction algorithms can take the scanned transverse sections and extract coro-nal or sagittal images to provide additional views of the patient’s anatomy (Fig. 17.17). Multidetector CT cou-pled with reconstruction software excels in producing two-dimensional multiplanar reformation (MPR). MPR allows improved visualization of the normal anatomy and anatomic variants as well as greater diagnostic accuracy in the evaluation of organs and blood vessels.
ArtifactsAs with conventional imaging, CT images can be pro-duced with various types of artifacts.
AlgorithmsWhen setting up a scan, the technologist must select the appropriate algorithm for the scan. The operator’s con-sole combines the correct algorithm with the scanning procedure. The use of the correct algorithm will make it possible for the CT unit to fi lter unwanted artifacts so they are not displayed in the fi nal image.
Field of ViewThe fi eld of view (FOV) or scan fi eld size is set to accom-modate the size of the body area being scanned. The matrix size is fi xed, and when the FOV is increased, the size of each pixel will be increased proportionally. When the FOV is increased from 512 × 512 to 1024 × 1024, the size of each pixel is smaller. As previously discussed, the smaller the pixel size, the better the image resolution.
Image ReconstructionAs the patient is being scanned, the detectors send infor-mation proportional to the attenuation coeffi cient of the voxel of tissue lying between the detector and the x-ray tube. The image is then reconstructed by the computer using complicated mathematical algorithms called Fou-rier reconstruction. The reconstruction of the image often takes up to 30 seconds; however, when an array processor is used, the reconstruction time is reduced to <1 second. The Fourier reconstruction is primarily used in MRI to reconstruct images, while a modern CT scan-ner uses fi lter back projection or convolution.
Convolution and DeconvolutionConvolution is the process of modifying pixel values by using a mathematical formula or fi lter. When viewing the image, it is sometimes useful to enhance or suppress the visual characteristics of an image. Convolution is sometimes called a mask because the fi lter overlies each pixel and changes the value of the pixel effectively producing an image free of blurring or motion artifact. This operation can be repeated multiple times to dis-play a fi nal modifi ed image. Deconvolution is the pro-cess of returning the pixel values back to their original value.
Helical scanacquisition
Raw data pointinterpolated toreconstruction plane
Selectionthickness
Reconstruction plane
Figure 17.16. Helical interpolation. The dotted line indicates the location where the raw data is projected. This section forms the image that is displayed.
Fosbinder_Text_Chap17.indd 265 10/30/2010 6:22:48 PM

266 Part IV: Special Imaging Techniques
MotionMotion artifact on a CT image appears as a streak through the image. This type of artifact occurs when an error in the algorithm does not detect the changes in attenua-tion that occur at the edges of the moving part. The CT image will have blank pixels which appear as a streak in the areas of algorithm error.
Figure 17.17. Sagittal image. Image produced from trans-verse plane with postacquisition algorithms.
Figure 17.18. Star artifact. (Courtesy of Teal Sander, Fort Hays State University.)
Metal or StarMetallic materials in the patient can cause streak artifacts but may also cause a star artifact (Fig. 17.18). The artifact is caused when the metal object attenuates 100% of the primary beam, thereby producing an incomplete projec-tion. If the algorithm is not able to create a full set of sur-rounding projections to smooth the edges of the object, the star artifact will be visible.
Figure 17.19 demonstrates a metallic artifact. In this image, the arrow is pointing to the area where there may be a metallic object such as a Port-a-Cath implanted at the chest wall. Because the metal is attenuating a large amount of radiation in this area, there is not suffi cient information for the computer algorithm to adequately produce an image.
Beam HardeningBeam hardening artifacts occur as the beam is attenuated when it passes through the patient. This type of artifact results from the beam being signifi cantly attenuated as it passes through the patient. These artifacts appear as broad dark bands or streaks in the image.
Partial Volume EffectPartial volume effect occurs when tissue that is smaller than the section thickness or voxel width is hidden from
Figure 17.19. Metal artifact. (Courtesy of Teal Sander, Fort Hays State University.)
Fosbinder_Text_Chap17.indd 266 10/30/2010 6:22:48 PM

Chapter 17: Computed Tomography 267
A B
Figure 17.20. (A) Ring artifact. (B) Ring artifact in volume rendered 3D reconstructed image. (Courtesy of Teal Sander, Fort Hays State University.)
the view on the image. This artifact is produced because the data from the whole section thickness is averaged together to form the image. This type of artifact can also occur if a tiny portion of a large structure is located in the section thickness; the tiny portion is simply averaged in with the rest of the information.
Ring ArtifactsRing artifacts occur when a single detector goes out of calibration and does not properly record attenuated data. The detector error has a unique annular or ring appear-ance in the image (Fig. 17.20).
CT FluoroscopySpiral CT allows the continuous imaging of a section of the body, or real-time CT fl uoroscopy. CT fl uoroscopy is used for lesion drainage and biopsies. The tube continu-ously rotates around the patient, and the physician can control the position of the support table to move anatomy in or out of the fi eld. Entrance exposure rates are two to three times higher than conventional fl uoroscopy.
Radiation Dose from CT Scanning
Exposure to radiation during a CT scan is measured by two means: (a) the computed tomography dose index (CTDI) and (b) the multiple scan average dose (MSAD). The CTDI measures the radiation dose in the primary beam that was delivered to the patient. The MSAD rep-resents the average dose the patient received during the entire examination. Unlike radiography entrance skin doses, these dose measurements refl ect actual tissue dose.
The radiation dose per slice is about 15 milligray (mGy) (1,500 millirads [mrad]). This is delivered to a point in the patient. The contribution because of scatter radiation from adjacent slices in a multislice examination doubles this dose. The dose to a point in the middle of a ten-slice examination is about 30 mGy (3,000 mrad). A ten-slice scan is equal to 3 rad. Typical dose per examina-tion is equal to 3 to 5 rad; however, the dose is dependent upon the type of unit used. The dose from conventional and spiral CT scans is approximately the same.
Fosbinder_Text_Chap17.indd 267 10/30/2010 6:22:50 PM

268 Part IV: Special Imaging Techniques
Chapter SummaryCT scanners provide cross-sectional images, also called transaxial images, of the body by measur-ing the x-ray transmission through the body. The x-ray tube is mounted on a circular frame inside the gantry together with the radiation detectors. The detectors are mounted either on a stationary ring or on a support frame that rotates opposite the x-ray tube. The x-ray tube has collimators to set the size of the x-ray beam and a high heat capacity rotating anode. The high-voltage circuit is connected to the tube through thick cables if it operates at 60 Hz or is mounted on the rotating ring with the tube if it is a high-frequency circuit. A thin x-ray beam is transmitted through the patient and detected by the radiation detectors. Scintillators, gas-fi lled detectors, or solid-state detectors intercept the radiation passing through the patient and transmit the data to the computer.
The patient support table moves the patient through the gantry at preset increments in con-ventional CT scanning. In spiral CT scanning, the tube and detectors rotate continuously while the support table and patient are moved into the gantry. Spiral CT scans produce a complete examination in a shorter time because the tube rotates continuously around the patient instead of starting and stopping for each slice. Typical radiation doses for a CT scan are from 30 to 50 mGy (3,000–5,000 mrad) per examination.
The spatial resolution of CT scans depends on the focal spot size, pixel size, and matrix size. Smaller pixel sizes give better spatial resolution. The CT number of a tissue describes the differ-ence in density between the tissue and water. The CT number of water is always 0. The CT numbers of fat and lung are <0; those of muscle and bone are >0. In most CT displays, air is dark and bone is white. Contrast resolution describes how close in density two tissues can be and still be recognized as separate tissues. High mA CT scans with large pixels have superior contrast resolution because they have more x-ray counts in each pixel.
Helical CT units have the computer software abilities to reconstruct or reformat data to display various images. This permits additional images for the radiologist while sparing the patient
additional radiation exposure. CT fl uoroscopy is the continuous imaging at a section of the body.
There are several artifacts which are unique to computed tomography. The more common artifacts include motion, star, beam hardening, partial volume effect, and ring artifacts.
Case StudyCT scanners utilize radiation detectors to gather remnant radiation which contains the latent image. Various generations of scanners have used scintillation detectors, gas-fi lled ionization detectors, or solid-state detectors.
Critical Thinking Questions
Of the three types of detectors, which type is used in a helical scanner?
What materials are used in the detector?
How is it different from the scintillation detectors?
How is the digital image formed?
Helical or MSCT scanners use solid-state detec-tors. Solid-state detectors use a photodiode which is combined with a scintillator that is made of calcium tungstate, yttrium, or gadolinium. Scintillation detectors use a PM tube to convert x-ray photons into an electrical signal which the computer uses to form the visible image. In a solid-state detector, the scintillator gives off light photons which are then detected by the pho-todiode and then converted into an electrical signal. The solid-state diode is preferred because its scintillator materials do not phosphoresce or cause afterglow like the scintillation detectors. The computer system uses the electrical signal and converts it to a digital signal. The computer applies algorithms to the digital signal to form individual voxels of information. The voxels are stored in a matrix and make up the digital image.
Fosbinder_Text_Chap17.indd 268 10/30/2010 6:22:53 PM

Review Questions
Multiple Choice
1. CT scanning provides a(n) _____ view of the body.
A. axialB. linearC. longitudinalD. transaxial
2. The gantry of a spiral CT scanner contains
A. the tubeB. the detectorsC. high-voltage circuitD. all of the above
3. The x-ray beam in a CT scanner is shaped into a _____ beam.
A. pencilB. circularC. fanD. hypocycloidal
4. In spiral CT scanning, pitch is the ratio of
A. the rotation speed to the patient motion per revolution
B. the amount of table advance per revolution to the section thickness
C. the section thickness to the revolutions per second
D. the section thickness to the revolutions per patient motion
5. The CT number of water is
A. −1,000B. −50C. 0D. 1,000
6. When the fi eld of view increases and the matrix size remains unchanged, the contrast resolution will be
A. improvedB. degradedC. unchanged
7. The number of pixels required to image one line pair is
A. 1B. 2C. 4D. 8
8. The detector which employs a photomultiplier tube in the detection circuit is
A. solid-stateB. gas-fi lledC. scintillationD. all of the above
9. The patient support table is capable of a maximum weight of
A. 450 lbB. 350 lbC. 500 lbD. 400 lb
Fosbinder_Text_Chap17.indd 269 10/30/2010 6:22:54 PM

270 Part IV: Special Imaging Techniques
10. The Hounsfi eld unit for blood is
A. +60B. −40C. −300D. +40
Short Answer
1. Who is the person credited with the invention of computed tomography?
2. The patient support table is made up of which material?
3. Using Table 17.1, the CT number of −100 relates to which type of tissue?
4. Explain why the CT computer must be high speed and have a large capacity?
5. Why is collimation important in CT scanning?
6. What are the components of the gantry?
7. Which device controls the slice thickness of a CT scan?
8. The numerical information contained in each pixel is a(n) _____ or _____.
9. Defi ne linearity and contrast resolution.
10. Defi ne the terms axial, translation, and reformatting.
Fosbinder_Text_Chap17.indd 270 10/30/2010 6:22:54 PM

271
18
Magnetic Resonance Imaging
Key Terms● bore● Faraday cage● fringe fi eld● gradient coils● Larmor frequency● main magnetic coil● permanent magnets● precession
● proton density● RF pulse● shim coils● superconducting
magnets● surface coils● T1 relaxation time● T2 relaxation time
ObjectivesUpon completion of this chapter, the student will be able to:
1. State the physical process involved in magnetic resonance imaging.
2. Identify the components and describe the operation of a magnetic resonance (MR) unit.
3. Identify the difference between T1 and T2 relaxation times.
4. Describe the use of paramagnetic contrast agents to improve image contrast.
5. Describe some safety hazards present near a MR unit.
Fosbinder_Text_Chap18.indd 271 10/30/2010 6:24:24 PM

272 Part IV: Special Imaging Techniques
IntroductionThe human body consists of more than 85% water, which consists of two hydrogen atoms and one oxygen atom (H2O). Magnetic reso-nance imaging (MRI) uses radio frequency (RF) signals from hydrogen protons in the body to form images of body structures. It does not use x-rays or any other form of ionizing radia-tion. The magnetic resonance (MR) magnet provides a magnetic fi eld to align the protons. This magnetic fi eld is called the external or main magnetic fi eld to distinguish it from the local magnetic fi elds in the immediate vicinity of the individual protons. The strength of the main magnetic fi eld is given the symbol B0. The protons in body tissues are aligned in the magnetic fi eld and then moved out of align-ment by RF pulses. Moving protons out of alignment is termed resonance, or the fl ipping of the protons out of alignment. The frequency of the RF pulses is selected to resonate with the protons in the body. Only protons with the correct resonant frequency are moved out of alignment with the external magnetic fi eld. As the out of alignment protons move back into alignment, they produce an RF signal, which is used to construct the MR image.
Proton AlignmentHydrogen is the most abundant element in the body. Hydrogen nuclei, or protons, are constantly spinning on an axis of rotation. This spinning causes the protons to act like tiny magnets, which are called a magnetic moment. In a magnetic fi eld, the protons line up in the direction of the magnetic fi eld, similar to the way a compass lines up in the earth’s magnetic fi eld. All the protons pointing in the direction of the magnetic fi eld act together to pro-duce a net magnetization, as if they were combined into one larger magnet. When a patient’s body is placed in a magnetic fi eld, the hydrogen protons line up in the direc-tion of that magnetic fi eld. The protons are not all per-fectly aligned along the external magnetic fi eld—some point in other directions—but there are more aligned
protons with the magnetic fi eld direction than in any other direction (Fig. 18.1).
PrecessionThe phenomenon of precession occurs whenever a spin-ning object is acted upon by a static external magnetic fi eld. When rapidly spinning hydrogen protons align themselves into the direction of the external magnetic fi eld, the nucleus will begin to wobble or rotate around the axis of rotation (Fig. 18.2). This rotation, or preces-sion, into alignment with the magnetic fi eld is similar to the spinning action of a child’s top or gyroscope. The precession of the spinning top is around the direction of gravity; the precession of the protons is around the direc-tion of the magnetic fi eld’s lines of fl ux. When these pro-tons precess into alignment with the external fi eld, they will rotate with the exact same frequency and will have a horizontal orientation. A RF is given off as the protons precess into alignment and induces MR (Fig. 18.3).
Larmor FrequencyAll protons in the body have a resonance frequency called the Larmor frequency. This means that all the protons of a specifi c element will rotate with the exact same frequency when placed in a static magnetic fi eld. The Larmor frequency is the speed of the proton as it
+
Magnetic field
+++
+
++
+
++
Figure 18.1. Demonstrates how the protons line up in a magnetic fi eld.
Axis of magnetic field
Precess
+
Figure 18.2. Example of precession.
Fosbinder_Text_Chap18.indd 272 10/30/2010 6:24:24 PM

Chapter 18: Magnetic Resonance Imaging 273
wobbles in the external magnetic fi eld. The Larmor frequency depends on the magnetic fi eld strength. Pro-tons in stronger magnetic fi elds have higher resonance frequencies. Magnetic fi eld strengths are measured in gauss (G) or tesla (T). The Larmor frequency of hydro-gen is 42.6 megahertz per tesla (MHz/T). This means that a proton in a magnetic fi eld with strength of 1 T will have a resonant frequency of 42.6 MHz. As seen in Table 18.1, each magnetic fi eld strength has a unique Larmor frequency. Radio waves are used in MR because the radio waves have the same Larmor frequency as the hydrogen protons. Other forms of electromagnetic waves like microwaves and visible light have wavelengths which will not be in resonance with the precessing nuclei and are not useful in creating the MR image.
Producing a Magnetic Resonance Signal
Magnetic ResonanceProtons have the ability to either align with the exter-nal magnetic fi eld or against it, which creates two proton orientations relative to the external magnetic
fi eld: parallel and antiparallel. The protons can be made to alternate from parallel to antiparallel when an RF fi eld, that is alternating or resonating at its Larmor frequency, is applied to a static magnetic fi eld. Magnetic resonance is the emission of excess energy by antiparallel protons at certain specifi c frequencies. Emission of the RF causes the protons to fl ip or resonate out of alignment with the external magnetic fi eld.
Radio and TV circuits are built to have selectable resonance frequencies. These circuits respond to a sig-nal only at the selected resonance frequency and amplify only that signal. Resonance is used in TV sets to distin-guish between, for example, signals from channels 4 and 5 because channels 4 and 5 have different frequencies.
A hydrogen proton in a 1 T fi eld will react strongly to energy from only 42.6 MHz RF pulses. Radio waves affect the precessing nuclei because the time-varying magnetic fi eld of the radio waves changes or alternates at the same rate as the nuclei precesses. In other words, an RF pulse is a short burst of RF energy at a specifi c frequency. As the nucleus rotates the magnetic fi eld, the RF pulse will appear at the proper time to have maximum effect in rotating the protons out of alignment with the external magnetic fi eld. When the protons move back into align-ment with the external magnetic fi eld, they give off RF signals, which are used to form MR images (Fig. 18.4). If the RF pulse is not matched to the Larmor resonance frequency of the protons, they will remain aligned with the external magnetic fi eld and will produce no signal.
A common example of resonance is pushing a child on a merry-go-round. When pushing a child on a merry-go-round we automatically push the child with the same force as the merry-go-round returns to us. In other words, we are matching the frequency of the merry-go-round with
Magnetic field
+
RF Energy
+
+
+
+
+
Figure 18.3. How protons precess into alignment with the external magnetic fi eld.
TABLE 18.1 LARMOR FREQUENCY AS A FUNCTION OF MAGNETIC FIELD STRENGTH
Magnetic Field Strength (T) Larmor Frequency
0.5 21.11.0 42.61.5 63.42.0 84.6
Magnetic field
+
+
+ +
+
++
RF pulse
Figure 18.4. How an external RF pulse (called the excita-tion pulse) can rotate the protons out of alignment with the external magnetic fi eld.
Fosbinder_Text_Chap18.indd 273 10/30/2010 6:24:25 PM

274 Part IV: Special Imaging Techniques
bonds are different. These differences in T1 relaxation times are used to form T1-weighted MR images.
T2 Relaxation TimeProtons in a magnetic fi eld also have a second relaxation time, called T2 or spin-spin relaxation time. T2 relax-ation time is the time required for precessing nuclei to lose 63% of their alignment with each other due to interactions with other spinning nuclei. The T2 relax-ation time depends on interactions between the protons in a small volume of tissue. When an RF excitation pulse rotates the protons out of alignment, all the pro-tons start to precess back into alignment at the Larmor frequency. When the protons begin precessing, they all point in the same direction at the same time. They are said to be in phase. Because the local magnetic fi elds near the different protons are not exactly the same, some protons precess faster and some slower than the average. Because of these small differences in the local magnetic fi elds, the protons gradually lose phase and no longer point in the same direction at the same time (Fig. 18.7). When the T2 relaxation occurs, the MRI signal will decrease in strength to 37% of its maximum value. The T2 relaxation time of a tissue is the time it takes for the protons to lose their phase (Table 18.2). The T2 relaxation time of a tissue is always shorter than its T1 relaxation time.
an equal frequency that will allow the merry-go-round to move away from us (Fig. 18.5). If we use a different frequency to push the merry-go-round, we will not have the same effect.
Proton DensityProton density is the quantity of hydrogen nuclei reso-nating in a given volume of tissue. It is the determining factor of the MR signal strength, which is sometimes called image brightness. Proton density is also referred to as spin density. The higher the number of protons emit-ting an RF signal, the greater the proton density will be. Proton density images have a relatively low contrast due to the slight differences in the amounts of hydrogen pres-ent within various tissues.
T1 Relaxation TimeThe time it takes for a proton to precess into alignment with the external magnetic fi eld is called the T1 relax-ation time. It is also referred to as spin-lattice relaxation time, longitudinal relaxation time, and thermal relaxation time. T1 relaxation occurs when the horizontal, spinning nuclei begin to precess at smaller and smaller angles until they have a more vertical orientation (Fig. 18.6). This process causes the MRI signal to decrease in strength. This defi nes the time required for the signal to decrease to 63% of its maximum value as T1. Differences in T1 relax-ation times depend on binding of the protons in different tissues. Protons in different types of tissues have different relaxation times because their elasticity and chemical
Resonance
Transferral of energy requires matching of frequency
Figure 18.5. Example of resonance.
100
63
0
TimeT1
Per
cent
MRIsignal
Figure 18.6. T1 or spin-lattice relaxation.
Fosbinder_Text_Chap18.indd 274 10/30/2010 6:24:25 PM

Chapter 18: Magnetic Resonance Imaging 275
Paramagnetic Contrast AgentsSoft-tissue contrast with MRI is superior to that with CT because of the T1 and T2 differences shown in
Image ContrastMR images can be modifi ed to emphasize either T1 or T2 relaxation times by adjusting the RF excitation pulse. These modifi cations result in either T1- or T2-weighted images. The same anatomy can have different appear-ances with T1- and T2-weighted images. Maximum image contrast is obtained when the RF signal strength is at its greatest difference between two tissues. All tissues have two relaxation times, T1 and T2, and these are used to distinguish different tissues in the MR images. T1- and T2-weighted images of the same tissues often have dif-ferent appearance (Fig. 18.8). The decision to obtain a T1- or T2-weighted image is based upon the structures to be imaged. Contrast resolution is more superior in MR than in computed tomography (CT).
100
37
0
Time
Per
cent
MRIsignal
T2
Figure 18.7. T2 or spin-spin relaxation.
TABLE 18.2 T1 AND T2 VALUES FOR VARIOUS ORGANS AT 1 T MAGNETIC FIELD STRENGTH
Organ T1 (ms) T2 (ms)
Fat 240–250 60–80Liver 490 40Spleen 460 80Muscle 580 40White matter 350 80Gray matter 500 100Cerebrospinal fl uid 2,200–2,400 500–1,400Blood 720 175Water 2,500 2,500
A
B
Figure 18.8. (A) T1-weighted image and (B) T2-weighted image. Notice how the images of the brain have different appearances.
Fosbinder_Text_Chap18.indd 275 10/30/2010 6:24:26 PM

276 Part IV: Special Imaging Techniques
These magnets are stationary and must have extremely strong fi eld strengths. Currently, fi eld strengths range from 0.10 to 7.0 T. The strength of a magnetic fi eld is measured in tesla or gauss. One tesla is equal to 10,000 G. The earth’s magnetic fi eld is about 0.5 G (5 × 10⁻⁵ T). A refrigerator magnet has a fi eld strength of about 10 G. The external magnetic fi eld used to align the protons can be produced by either a permanent magnet or a superconducting magnet. The external magnetic fi eld must be uniform to +50 microtesla (mT) so that a proton in a particular tissue has the same Larmor resonance frequency no matter where in the body it is located.
The magnetic fi eld extending outside the bore and sur-rounding the magnet is called the fringe fi eld. Its strength depends on the magnet type and the fi eld strength. The higher the fi eld strength, the larger the fringe fi eld. Sur-rounding the magnet is a line, which specifi es the area where the static magnetic fi elds are higher than 5 G. Fields stronger than 5 G have the ability to turn metallic objects into fl ying projectiles which will be pulled into the bore of the magnet. The magnetic fi eld that would extend out from the sides of the magnet is reduced almost to zero by special shielding coils.
Permanent MagnetsPermanent magnets are made of a ferromagnetic metal alloy that produces fi elds with strengths from 0.25 to 0.4 T. They are called ceramic magnets and are very large in size. They require no current-carrying coils, need little maintenance, and have a large bore. This is an advan-tage in scanning large patients or individuals who have claustrophobia because most superconducting MR units have a 60-centimeter (cm) diameter bore and looks like a long tube. Permanent magnet MR units produce smaller RF signals, which may result in longer scan times. These magnets have a minimal fringe fi eld because they have low fi eld strength. They are often installed in private clin-ics because they are less expensive to install and operate than superconducting MRI units.
Superconducting MagnetsSuperconducting magnets employ coils made of a super-conducting material to produce the magnetic fi eld. The superconducting coils surround the bore of the magnet. Typical superconducting bore diameters are 50 to 60 cm. The bore diameter limits the size of patients who can be scanned in a superconducting magnet (Fig. 18.9).
Table 18.3; however, it is often benefi cial to use the prop-erties of contrast agents to further enhance tissue. MRI utilizes specialized paramagnetic contrast agents that are designed to enhance the T1 and T2 relaxation times of hydrogen nuclei. Various methods of administering the contrast agents have been developed, but at the present time, the intravenous agents are predominantly used. Intravenous MR contrast agent gadolinium diethylenetri-aminepentaacetic acid (Gd-DTPA) is used to improve MR image contrast because it has T1 and T2 values that are very different from those of tissue.
EquipmentAn MR imaging system consists of a magnet coil surround-ing an opening called the bore, shim coils, gradient coils, surface coils, a patient support table, a computer, and a display system. The main magnet coil produces the exter-nal magnetic fi eld used to align the hydrogen protons in the body. The main magnetic fi eld strength is represented by B0. Shim coils are used to improve the uniformity of the magnetic fi eld near the edges of the bore. The patient is placed within the bore of the magnet during the scan. The table supports the patient within the magnetic fi eld during the MR scan. The gradient coils are used to select the imaging plane. Surface coils detect the weak RF sig-nals from the protons precessing back into alignment. The computer sets the times for the RF signals and processes the precession RF signal data to form the MR images. The display system allows viewing of the digital images on a TV monitor or recording them as hard copies.
MagnetsThe two common types of magnets used in MR units are superconducting magnets and permanent magnets.
TABLE 18.3 THE APPEARANCE OF SOME BODY TISSUES IN T1- AND T2-WEIGHTED MR IMAGES
Body TissueAppearance in T1-Weighted Image
Appearance in T2-Weighted Image
White matter Bright DarkGray matter Dark BrightSpinal fl uid Dark BrightHematoma Bright Dark
Fosbinder_Text_Chap18.indd 276 10/30/2010 6:24:27 PM

Chapter 18: Magnetic Resonance Imaging 277
Once the current is fl owing in the superconducting coils, no additional electric power is needed to maintain the current fl ow because the coils have zero resistance. The magnetic fi eld of a superconducting unit is never turned off. Superconducting magnets produce magnetic fi elds from 1 to 4 T or more.
The superconducting coils operate in the same way as a conventional electromagnet to generate the magnetic fi eld. The strong magnetic fi elds require enormous amounts of wire to accommodate the electricity needed for the magnet. A 1.5 T magnet may require 1,000 loops, and each loop may carry up to 1,000 A. This amount of amperage fl owing in a circuit with all these loops will produce an enormous amount of heat as well as consum-ing a great deal of power. Current fl owing in the super-conducting coils produces the magnetic fi eld.
The difference from conventional electromagnets is that superconducting coils allow the current to fl ow with-out any resistance at temperatures below 264°C (9.5 K). Cryogens must be used to achieve the extremely low temperatures necessary for superconductive magnets. Liquid helium is a cryogenic that has a boiling point of 4 K (−269°C) and is used to maintain this low tempera-ture. The liquid helium is contained in a vacuum ves-sel called a dewar which is an insulated chamber that provides thermal insulation for the electromagnetic coils. The dewar acts as a giant insulated Thermos bot-tle. As seen in Figure 18.10, the liquid helium is then surrounded by another dewar, which contains liquid nitrogen that has a boiling point of 77 K (−196°C). The nitrogen acts as an additional insulator to help maintain the temperature necessary for helium to remain a liquid.
Support table
SuperconductingmagnetHead coil
Figure 18.9. A superconducting MRI unit with a surface coil designed for MR scans of the head on the support table. The superconducting coils, which have zero electrical resistance, are surrounded by liquid helium in a dewar to maintain them at a temperature below 9.5 K.
Liquid helium
Liquid nitrogen
Shim coils
Dewar vacuum
Gradient coils
RF coil
Superconducting coil
Figure 18.10. Cross-sectional view of the superconduct-ing magnet demonstrating the cryogenic dewars, coils, and bore.
Fosbinder_Text_Chap18.indd 277 10/30/2010 6:24:27 PM

278 Part IV: Special Imaging Techniques
the type and locations of imaging planes (Fig. 18.11). Coronal, sagittal, transverse, or oblique sections can be selected. Pulsing of the gradient coils during image acquisition produces the familiar knocking or rapping noise heard during MR scanning.
Surface CoilsBoth permanent and superconducting MR units use sur-face coils to send the RF excitation pulses into the patient and to detect the RF signal from the precessing protons. It is essential to produce images with the best clarity of soft tissue as well as bony areas, and this is accomplished by using surface coils. These coils are so named because they are placed on the surface of the patient as close to the region of interest as possible. Head, neck, and extrem-ity surface coils are designed for imaging these specifi c regions of the body (Fig. 18.12). It is critical to select the correct surface coil for the area being imaged so that the RF signal can be focused on the area. Surface coils are also called signal coils or radiofrequency coils.
Patient Support TableThe patient table supports the patient and allows the patient to be moved into the bore for scanning. The table is curved for patient comfort so that it conforms to the shape of the bore. The table must be capable of support-ing at least 350 lb. The tables have a maximum weight limit which should not be exceeded as damage will occur
Shim CoilsSuperconducting magnets use shim coils to improve the uniformity of the external magnetic fi eld and improve the quality of the MR images. They concentrate the magnetic fi eld through the bore. The shim coils can be resistive or superconducting and are mounted around the bore. Each shim coil is custom fi tted for each MR unit by adjusting the current to each shim coil. Current in the shim coils improves the uniformity of the external magnetic fi eld within the bore to +50 mT.
Gradient CoilsGradient coils produce slight differences in the fi eld strength at different locations in the patient. They are the coils that determine the slice orientation—sagittal, coro-nal, transverse, or oblique. Slight differences in the fi eld produce different Larmor frequencies at different loca-tions in the body. By selecting the proper gradient fi eld, a specifi c slice location and orientation can be chosen. Only the protons at the selected location are rotated out of alignment and contribute to the MR signal. Each image slice requires a separate gradient setting. During an MRI scan, the current through the gradient coils is automati-cally changed to collect data from the individual slices. The electronic indexing of the slice locations means that the patient is not moved during the scan.
Both permanent and superconducting MR units use shim and gradient coils to allow the operator to select
Shim coilsGradient coils
Shim coilsGradient coils
Magnet
Figure 18.11. The location of the gradient coils in a typical MR unit.
Fosbinder_Text_Chap18.indd 278 10/30/2010 6:24:31 PM

Chapter 18: Magnetic Resonance Imaging 279
to the table. It is constructed of nonmagnetic material to avoid altering the magnetic fi eld. The table is not used to move the patient during the scanning process as in CT scanning because the scan slice location and orientation are selected electronically using the gradient coils. The table is driven with a hydraulic system which allows it to be raised and lowered to assist the patient in lying on the table and the hydraulic system also moves the patient into the bore of the magnet.
ComputerThe computer is a major component in the formation of MR images. It programs the gradient coils to select differ-ent imaging planes, and it processes the RF signals from surface coils into digital data to create the MR images. The digital MR images can be transmitted, stored, and displayed just like any other digital images on PACS. Display systems allow viewing of the images on a TV monitor. A laser printer can be coupled to the computer system to produce hard copies on fi lm.
Operating ConsoleThe MRI technologist controls the scanning parameters by selecting the RF, pulse sequence and pulsing time intervals, matrix size, number of acquisitions, fi eld of view, and section parameters. The technologist adjusts the RF to the proper Larmor frequency for the specifi c
tissue being imaged. Once the parameters are set, the MR computer will begin the RF and magnetic fi eld pulses to acquire the selected sequence.
The matrix size is selected for the specifi c scan to be performed. An increased matrix size produces images with higher resolution but increases the overall scan time. The technologist also selects the fi eld of view. The fi eld of view has a direct effect on resolution: the smaller fi eld of view increases image resolution. The section, interval between sections, and the section thickness are all controlled by the technologist.
Display ConsoleThe display console is used for image reconstruction. The MRI computer utilizes a set of sophisticated algorithms to process the large quantities of data produced during the scanning phase. The data can be manipulated into oblique sections along with the routine sagittal, coronal, and 3D reconstructions. The display console also permits the application of fi lters to smooth the image, decrease image noise, and for edge enhancement. The MRI display console permits density level windows and contrast widths to be set with the digital image processing. The data can be reformatted into transverse, sagittal, coronal, oblique, and 3D images without performing additional scans. Many of these functions are similar to CT imaging; however, MR collects a signifi cantly greater amount of data.
Figure 18.12. An extremity surface coil.
Fosbinder_Text_Chap18.indd 279 10/30/2010 6:24:31 PM

280 Part IV: Special Imaging Techniques
RF ShieldingThe MR room is surrounded by a copper screen called a Faraday cage. The Faraday cage prevents external RF sig-nals from entering the room because the RF energy can-not penetrate through the copper screen. RF shielding is necessary because the RF signals from the precessing pro-tons in the patient are very weak. In order to detect their weak signals, external RF energy must be minimized. Individuals in the scan room do not have to be shielded.
Image QualityAs with other digital imaging, the quality of the fi nal image can be affected by several factors. One of these factors is the brightness of the image which is actually the density of the MR image. The primary factor which determines brightness is the RF signal strength.
Magnetic Field StrengthHigher magnetic fi eld strength produces a stronger RF signal. MR units come in a variety of magnetic strengths, and some units are more effi cient than other units. The strength of the magnet will determine the scanning parameters and resultant image. When scanning the same type of tissue in magnets with different strengths, the images will have a very different appearance. The most effi cient fi eld has not been determined; however, magnets with fi eld strength between 1 and 3 T are con-sidered to produce better images.
Section ThicknessIn MRI, section thickness is determined by the size or depth of the tissue voxel. Section thickness is the primary factor for image quality because all the RF signals from a single voxel are combined into one image value for the voxel. In other words, the algorithms determine the smallest tissue differences that can be imaged in a voxel.
MRI Imaging ParametersPresently MRI examinations include at least one T1-weighted image and one T2-weighted image. This is because the
proton precession varies depending on adjacent tissues in the region of interest. This also determines the RF signal that is emitted. By using the two weighted images, tissues will have different appearances, which will help distinguish normal and abnormal variances in various types of tissues.
Motion ArtifactsMotion artifacts are a special problem in MRI because of the extremely long scan times. It can be very diffi cult for patients to hold still for lengthy exams. Good commu-nication with the patient is the best method of ensuring the patient holds still, thereby reducing motion artifacts. In addition to motion artifacts, some patients experience claustrophobia due to the small diameter and long length of the bore. The percentage of these patients who cannot be scanned is small. For these patients, an alternative to the closed bore MRI unit is the open MRI unit. These specially designed units do not have a long bore that the patient is placed in but rather a more open design where the patient is better able to manage their claustrophobia.
Spatial ResolutionAs mentioned in other chapters, resolution is the abil-ity to distinguish one structure from another. In MRI, the spatial resolution is determined by the homogeneity of the static external magnetic fi eld, the gradient fi elds, and the scan time. The signal-to-noise ratio has a defi nite effect on the resolution; when the ratio is low, the image quality begins to decrease.
Signal-to-Noise RatioThe signal-to-noise ratio is determined by the voxel size and detection volume, the quantity of precessing protons, the pulse sequence, and the fi eld strength. As with all digital images, signal-to-noise ratio degrades the image by reducing the visibility of low-contrast structures. It can be enhanced by averaging a series of RF signals and by using a stronger magnetic fi eld.
Scan TimeThe scan time depends on the quantity of data that must be processed by the computer. In MRI, it depends on the pulse sequences, number of phase encoding steps, and the number of excitations. 3D imaging requires a much longer scan time to acquire all the data necessary to pro-duce the 3D images. Scan time can be reduced by using multisection and multiecho pulse sequences.
Fosbinder_Text_Chap18.indd 280 10/30/2010 6:24:36 PM

Chapter 18: Magnetic Resonance Imaging 281
HazardsThere is no ionizing radiation associated with MR imaging, so none of the potential hazards of x-ray exposure are pres-ent during MR examinations. The strong magnetic fi elds and the energy from the RF signals are the major hazards in MR imaging. The effect of magnetic fi elds changes very quickly in relation to the distance an object is from the magnetic fi eld. Individuals without knowledge of the prop-erties of a magnetic fi eld do not often understand the prin-ciples of working safely in the MRI environment. In the MRI procedure room, ferromagnetic objects can become projectiles when they are attracted into the bore of the magnet by the fringe fi eld. Screwdrivers, IV poles, scissors, and oxygen bottles are some of the more common objects that can become projectiles. Magnetic objects should not be brought into the MR room because they pose a lethal threat to any person who is between the magnetic object and the bore of the magnet. MRI units must have spe-cialized medical equipment which can be brought into the MRI room in case of an emergency. Crash carts and stretchers must be made from nonferromagnetic materials so that they can be taken into the MRI room.
When in the MRI unit, the closer you get to the unit the greater the attraction to the magnetic fi eld will be. Magnetic fi eld strength is governed by the inverse cube law where the strength of the fi eld decreases exponentially with the cube of the distance resulting in a rapid decrease of the magnetic fi eld strength. A distance as small as 1 inch can make the difference between being able to hold onto an object and having it fl y swiftly into the bore of the mag-net. We would all benefi t from remembering how incred-ibly powerful an extremely strong magnetic fi eld can be. Superconductor magnets maintain their magnetic fi eld at all times and are therefore dangerous at all times. It is important to treat the magnetic fi eld as if it is on all the time and we should educate others about this fact so that we can all have a healthy respect for the powerful magnet.
Patients with metallic implants, even if they are not fer-romagnetic, such as metal prostheses, surgical clips, and cochlear implants, may be excluded from MR scanning because of possible interaction between the RF energy and the metal, just as may happen if a metal fork is left in a microwave oven. It is also possible that these implanted surgical objects may experience torque during the MRI exam with lethal consequences. It is entirely possible for a
torqued aneurysm clip to open an artery and cause a fatal hemorrhage. Patients with cardiac pacemakers should not be near the magnet because the fringe fi eld may interfere with the pacemaker operation. Prior to each MRI exam, a medical history must be obtained to determine if the patient has any risk factors for metallic objects. Patients with a his-tory of working with metal may have x-ray screening images performed for the purpose of identifying any potential metal objects that the patient may not be aware of.
Chapter SummaryThe protons used in MRI are the hydrogen nuclei in the human body. Protons in a magnetic fi eld align in the direction of the magnetic fi eld. Their Larmor resonance frequency depends on the magnetic fi eld strength. Protons in stronger magnetic fi elds have higher Larmor frequen-cies. An RF excitation pulse is used to rotate the protons out of alignment with the magnetic fi eld. As the protons precess back into alignment, they give off RF energy at their Larmor frequency. These RF signals are used to form MR images.
There are two relaxation times, T1 and T2, associated with the proton realignment. T1- and T2-weighted images of the same tissues can have different appearances. Both T1- and T2-weighted images provide excellent soft-tissue contrast. The decision to obtain a T1- or T2-weighted image is based upon the structures to be imaged. The external magnetic fi eld used to align the protons can be produced by either a permanent magnet or a superconducting magnet.
Magnetic fi elds are measured in units of tesla or gauss. Permanent magnet units have fi eld strengths of 0.25 to 0.5 T. MR units with super-conducting magnets have fi eld strengths of 1.0 to 1.5 T. The coils of superconducting magnets have zero electrical resistance. The coils are maintained at 4 K by liquid helium contained in a dewar vacuum container. Gradient coils are used to select the MRI planes. Surface coils emit the excitation RF pulses and receive the RF signals from the protons precessing back into alignment.
MRI image quality is affected by the strength of the magnetic fi eld. Section thickness, motion
Fosbinder_Text_Chap18.indd 281 10/30/2010 6:24:36 PM

282 Part IV: Special Imaging Techniques
1.5 T has up to 1,000 loops of wire supplying current or amperage to the magnet. Each loop carries approximately 1,000 A of electricity. This amount of amperage in all these loops will cre-ate a tremendous amount of heat in the mag-net. The heat causes the magnet to use a great deal of power. A superconducting magnet needs to be super cooled to help dissipate the extreme amounts of heat. The superconducting magnet requires the unit to be cooled to <9.5 K because at this low temperature, the electricity can fl ow without any resistance and no heat will be pro-duced. Liquid helium and liquid nitrogen are used to cool the magnet.
There are three types of coils: shim coils, gradient coils, and surface coils. The shim coils focus the magnetic fi eld lines through the bore of the magnet, which creates a more uniform fi eld and produces quality images. The gradi-ent coils create small differences in the fi eld strength at different locations in the patient’s tissue so that the specifi c area of interest has the hydrogen protons precessing to create the mag-netic signal. The gradient coils allow the tech-nologist to select the slice orientation for the examination being performed. The slice orien-tations include sagittal, coronal, transverse, and oblique. The gradient coils gather information from each slice to help form the image. The surface coils are the smaller coils, which are placed directly on the patient. These coils help to further focus the RF excitation pulses into the patient and to detect the RF signal from the precessing protons. The magnetic fi eld of the superconducting magnet is very powerful and can attract metal objects into the center of the bore. When metal objects are brought into the magnets room, the fringe fi eld will attract these metal objects and can make them fl y with great speed into the bore. This can be very dangerous for anyone who is standing between the mag-nets bore and the fl ying object. MRI technolo-gists must be very cautious when entering the magnets room, and they must also make sure that no one brings any metal into the room. It is part of their responsibilities to keep everyone safe when they are close to the magnet.
artifacts, spatial resolution, and signal-to-noise resolution all affect the overall quality of the MRI image. These parameters are controlled by the technologist at the operating console and when they select the correct RF for the procedure.
No ferromagnetic objects should be brought into the MR room because of the strength of the magnetic fi eld. Metallic implants may be heated by the RF signals, causing thermal burns. A Faraday cage surrounding the room shields the MR unit from external RF signals which will interfere with the weak hydrogen protons.
Case StudyAna is an MRI technologist who is giving a pre-sentation about superconducting magnets to a seventh grade science class. She collected ques-tions from the students in order to answer their questions about a superconducting magnet. Ana answered the following questions.
Critical Thinking Questions
How big is the bore?
Is there a weight limit?
Why does the magnet require extremely low temperatures?
How do the various coils work together to make the image?
Why can’t metal objects be brought close to the magnet?
The bore is 50 to 60 cm in diameter and is sur-rounded by the superconducting coils. There is a weight limit of 350 lb which must be followed because of potential damage to the table if too much weight were placed on the table. The superconducting magnet with the strength of
Fosbinder_Text_Chap18.indd 282 10/30/2010 6:24:36 PM

Review Questions
6. Currently, magnetic fi eld strengths range from
A. 0.1 to 7 TB. 0.3 to 4 TC. 0.1 to 3 TD. 1 to 7 T
7. The knocking or rapping noise during scanning is caused by pulsing of the
A. magnet coilB. gradient coilsC. signal coilsD. shim coils
8. The purpose of using liquid helium is
A. to heat the superconducting coilsB. used in permanent magnet MR unitsC. to increase the rate of precession of protonsD. used to cool superconducting coils
9. The Larmor frequency of hydrogen is
A. 13.8 MHz/TB. 23.7 MHz/TC. 50 MHz/TD. 42.6 MHz/T
10. The MR room is surrounded by a copper screen called a
A. Faraday cageB. Oersted cageC. Tesla cageD. Bohr cage
Multiple Choice 1. Precession is
A. the diameter of the boreB. proton rotation around the magnetic fi eld
directionC. spinning of the RF fi eldD. a unit of magnetic fi eld strength
2. The most abundant element in the human body is
A. oxygenB. hydrogenC. carbonD. nitrogen
3. Shim coils are used to
A. select the slice to be imagedB. produce and detect RF signalsC. prevent excess heating during scanningD. improve the homogeneity of the magnetic fi eld
4. Safety concerns in MRI include
A. effects on pacemakersB. ferromagnetic projectilesC. heating of metallic implantsD. all of the above
5. The MR room is shielded against
A. ionizing radiationB. RF energy leaving the roomC. RF energy entering the roomD. external magnetic fi elds
Fosbinder_Text_Chap18.indd 283 10/30/2010 6:24:37 PM

284 Part IV: Special Imaging Techniques
Short Answer
1. Explain why hydrogen atoms are used to create the MR image.
2. Describe what a magnetic moment is and how it affects the protons in a magnetic fi eld.
3. What is the Larmor frequency?
4. How does the proton density affect the magnetic signal strength?
5. What is the T1 value for white matter?
6. What is the contrast agent used the most frequently in MR imaging?
7. Why do superconducting magnets use liquid helium and liquid nitrogen?
8. How do shim coils improve the quality of MR images?
9. _____ coils are placed directly on the patient in the region of interest.
10. Which type of metal is used in a Faraday cage?
Fosbinder_Text_Chap18.indd 284 10/30/2010 6:24:37 PM

P A R T V
Radiation Protection
Fosbinder_Text_Chap19.indd 285 12/7/2010 2:44:10 PM

286
● carcinogen
● cataracts
● chromosomes
● deoxyribonucleic acid (DNA)
● doubling dose
● epilation
● erythema
● gastrointestinal (GI) syndrome
● genetic cells
● GSD
● germ cells
● hematologic syndrome
● latent period
● LD50/30
● linear energy transfer (LET)
● LNT
● manifest stage
● meiosis
● mitosis
● oxygen enhance-ment ratio (OER)
● prodromal stage
● relative biological effectiveness (RBE)
● ribonucleic acid (RNA)
● somatic cells
● stem cells
● threshold dose
Key TermsObjectivesUpon completion of this chapter, the student will be able to:
1. Describe the reproductive cycle of the human cell.
2. Identify the relative radiation sensitivity of human cells, tissues, and organs.
3. Describe the dose-response models.
4. Identify the stages of acute radiation effects.
5. Discuss target theory of radiobiology.
6. Relate the Law of Bergonie and Tribondeau.
7. List and discuss the biologic factors that affect the degree of tissue damage in relation to radiation exposure.
Radiation Biology
19
Fosbinder_Text_Chap19.indd 286 12/7/2010 2:44:10 PM

Chapter 19: Radiation Biology 287
IntroductionRadiation biology is the study of the effects of ionizing radiation on biological tissue. Radiobi-ology research is striving to accurately describe the effects of radiation on humans so that safe levels of exposure to radiation can be deter-mined. The advent of using radiation to image the human body has provided unparalleled information for radiologists to diagnose and image pathologies. Radiation must be used with respect for the potentially damaging effect it can have on tissue. It is the responsibility of the radiographer, radiologist, and medical physicist to produce high-quality images while using the least amount of radiation possible. With this approach, there will be a lower risk of radiation exposure to patients and radiation workers. This chapter examines the concepts of human biol-ogy and the body’s response to radiation.
Human BiologyAbout 80% of the human body is water. The remainder of the body consists of 15% proteins, 2% lipids, 1% car-bohydrates, 1% nucleic acid, and 1% of other materials. These constituents are combined into cells. The human body is made up of many different types of cells. The cells of a specifi c type combine to form tissues, and tis-sues combine to form organs. The functions of cells can differ greatly, but all cells in the body have many com-mon features. They absorb nutrients, produce energy, and synthesize molecular compounds. These activities are called metabolism. There are two types of cells in the body: genetic and somatic. Genetic cells are cells of the reproductive organs. Somatic cells are all the other cells in the human body (skin, nerve, muscle, etc.).
DNAThe central nucleus of a human cell contains the genetic code, which is held in large macromolecules of deoxyribo-nucleic acid (DNA). The DNA contains all the hereditary
information representing the cell. Germ cells contain all the hereditary information for the whole individual. The cell’s genetic information is transferred by chromosomes, which are clusters of DNA molecules. The cell nucleus is surrounded by the cytoplasm. The cytoplasm contains organelles that produce energy, synthesize proteins, and eliminate waste and toxins. The entire cell contents are contained within the cell membrane (Fig. 19.1).
The genetic information about a cell’s form and func-tion is contained in the DNA molecule. This molecule is shaped in the form of a double helix. The two helices of the DNA molecule are connected by base pairs attached to the side chains like the rungs of a ladder (Fig. 19.2).
Mitochondria
Nuclear membraneCentrioles
Endoplasmic reticulum
Cytoplasm
Cell membraneRibosomes
Nucleoli
Lysosome
Figure 19.1. The structure of a human cell.
C G
T A
G C
T A
C G
G C
T A
C G
G C
T A
SS
SSPP
PP
SS
SS
SS
S
SS
SS
SS
SS
S
SPP
PP
PPS
PP
P P
P PS
P
Figure 19.2. A schematic diagram of a DNA molecule.
Fosbinder_Text_Chap19.indd 287 12/7/2010 2:44:10 PM

288 Part V: Radiation Protection
prepares for DNA synthesis. During the S phase, each DNA molecule is duplicated to form two identical daughter DNA molecules. These DNA molecules will combine to form duplicate chromosomes during the S phase. After synthesis is completed, the cell enters into the post-DNA synthesis, or G2 phase, during which the cell continues to mature. At the end of the G2 phase, the cell enters interphase. Interphase is the period of growth of the cell between divisions. At the end of interphase, the cell begins the cycle over and starts with the M phase, where mitosis or meiosis occurs. Different cell types have different cell cycle times. For example, some blood cells progress through their cell cycle in a few days, which other cells require many months to progress through their cell cycle.
MitosisMitosis describes the division of somatic cells. The cell division, or M, phase of the cell cycle is divided into four subphases:
● First: Prophase● Second: Metaphase● Third: Anaphase● Fourth: Telophase
Before cell division begins, the cell has 46 chromosomes arranged in 23 pairs. During prophase, the nucleus begins to swell and the chromosomes become visible under a microscope. At metaphase, the chromosomes align them-selves on fi bers along the center of the nucleus. In ana-phase, the chromosomes begin to divide at the centromere so that two chromotids and a centromere are connected by a fi ber to the poles of the nucleus. The poles are called spindles and the fi bers are spindle fi bers. This division
The rungs are made up of four different base pairs: adenine, guanine, thymine, and cytosine. Adenine and guanine are purines. Thymine and cytosine are pyrimi-dines. The sequence of these bases and how they are con-nected to the side chains encode the information in the DNA molecule. The adenine is bonded to thymine, and the cytosine is bonded to the guanine. In this sequence of bases, no other bonding combination is possible.
RNARibonucleic acid (RNA) molecules, which are contained in both the cell nucleus and the cytoplasm, are similar to DNA molecules, but they have only a single strand of nucleic acid, whereas the DNA molecules have two strands. The RNA molecules serve as templates for the replication of DNA molecules. There are two types of RNA cells: messenger RNA and transfer RNA. These molecules are distinguished according to their biochemi-cal functions. They are involved in the growth and devel-opment of the cell by way of protein synthesis and other biochemical pathways.
Cell ProliferationCell proliferation is the act of a single cell or group of cells reproducing and multiplying in number. Cells go through a sequence or cycle during proliferation or divi-sion. The end result of the cycle is the division of a single cell into two cells. Two types of cells exist in the human body: somatic cells and genetic cells. The genetic cells are the oogonium of the female and the spermatogonium of the male, the rest of the cells are somatic cells. The proliferation or division of somatic cells is called mitosis, and the proliferation or division of genetic cells is called meiosis. Both mitosis and meiosis occur during one phase of a well-defi ned cell cycle. Table 19.1 lists the phases a cell must cycle through for successful proliferation to occur.
Cell division occurs during the M phase of the cell cycle. At the beginning of the M phase, the DNA mol-ecules clump together to form visible chromosomes. Cell division results in two cells. After cell division, each new cell passes through a growth phase, G1, in which it
TABLE 19.1 LISTS THE PHASES OF THE CELL CYCLE
Phase of Cell Cycle Description
M Mitosis or meiosisG1 Pre-DNA synthesis, cell growthS DNA synthesisG2 Cell growth following DNA synthesis
Fosbinder_Text_Chap19.indd 288 12/7/2010 2:44:11 PM

Chapter 19: Radiation Biology 289
the two daughter cells. Each daughter cell nucleus contains 46 chromosomes and contains exactly the same genetic material as the parent cell (Fig. 19.3). The newly formed daughter cells are immature or young somatic cells and are called stem cells. They remain stem cells until they grow, develop, and mature.
MeiosisMeiosis is the reduction and division process of genetic cells. Immature genetic cells, called germ cells, begin with the same number of chromosomes as somatic cells have. However, genetic cell division during meiosis dif-fers from somatic cell division during mitosis. During meiosis, the number of chromosomes is reduced to half of the normal 46 so that each germ cell contains only 23 chromosomes. Following conception, each of the two germ cells contributes half of the chromosomes when they combine to form a daughter cell containing the stan-dard number of 46 chromosomes. As seen in Figure 19.4, genetic cells progress through the same phases in meiosis as somatic cells do in mitosis.
Tissues and OrgansCells in the body with similar structure and function combine to form specifi c tissues. These tissues com-bine in a precise manner to form organs. Organ systems
leaves each new cell with 23 pairs of chromosomes, which migrate toward the nuclear spindle. Two sets of chromo-somes have been formed. During telophase, the two sets of chromosomes blend into two separate nuclei to form a mass of DNA and the nuclear membrane completes its division. Each new cell has one half the cytoplasm of the original cell and the new mass of DNA, thereby forming
Chromosome Centriole
Double-structuredchromosome
Propose
Telophase Daughter cellsAnaphase
Prometaphase MetaphaseA C
D
B
E F
Figure 19.3. Mitosis is the phase of the cell cycle where the chromosomes become visible, divide, and migrate to daugh-ter cells. (A) Prophase. (B) Prometaphase. (C) Metaphase. (D) Anaphase. (E) Telophase. (F) Daughter cells. (Reprinted with permission from Sadler T, Ph.D. Langman’s Medical Embryology. 9th Ed. Baltimore, MD: Lippincott Williams & Wilkins, 2003.)
Gametes
Anaphase IIMetaphase II
Prophase II
Late anaphaseInterphase
Metaphase
Early anaphase
Meiosis II
Meiosis I
Figure 19.4. Cell Meiosis. Meio-sis is the process of reduction and division of germ cells. (Image from LifeART Super Anatomy Collection 2, CD-ROM. Baltimore, MD: Lip-pincott Williams & Wilkins.)
Fosbinder_Text_Chap19.indd 289 12/7/2010 2:44:12 PM

290 Part V: Radiation Protection
3. Mature cells are less radiosensitive.4. As the growth rate of cells increases, so does their
radiosensitivity.
These points are more important in diagnostic radiol-ogy because the fetus, which contains younger or imma-ture cells, and cells that are rapidly dividing, are more sensitive to radiation than adult cells. Cells are most sensitive to radiation exposure during the M phase of the cell cycle when the proliferation and division are occurring. They are most resistant to radiation exposure in the S phase. Germ and stem cells are more radiosen-sitive than mature cells of the same type. Stem cells of a particular type are identifi ed with the suffi x-blast. For example, immature red blood cells are known as eryth-roblasts, and bone stem cells are known as osteoblasts. Blastic cells are more radiosensitive than mature cells of the same type. Cells that are less sensitive to radia-tion are called radioresistant. Radioresistant cells show fewer biologic effects of radiation than do radiosensitive cells. In keeping with the law of Bergonie and Tribon-deau, nerve cells of the brain and spinal cord are most radioresistant because once they are developed, these nerve cells do not undergo further cell division. Lym-phocytes and gonadal cells are the most radiosensitive because they undergo rapid cell division and are con-stantly developing.
Factors Affecting RadiosensitivityWhen irradiating tissue, the response to the radiation is determined by the amount of energy deposited per unit mass: the dose in rad (gray [Gy]). During experiments to test the response of tissue to equal doses of radiation to equal tissue specimens, the results will vary depending upon physical factors that affect the degree of response to the radiation dose.
Linear Energy Transfer
An animation for this topic can be viewed at http://thepoint.lww.com/FosbinderText
The characteristics of particulate and electromagnetic radiation can affect the amount of biologic damage.
perform specifi c functions. Different types of tissues and organs have cells with different structures and functions. Examples of major organ systems include the nervous, respiratory, digestive, endocrine, circulatory, and repro-ductive systems. The effects of radiation exposure that appear at the whole body level begin with damage at the cellular level and progress to the organ systems.
The cells of a tissue system are characterized by their rate of proliferation and their stage of development. Immature cells are called undifferentiated cells, precur-sor cells, or stem cells. When the cell grows and matures, it goes through various stages of differentiation into a complete functional cell. The state of maturity and its functional role in the organ system infl uence the cells’ sensitivity to radiation. Typically, immature cells are more sensitive to radiation than mature cells. Table 19.2 lists various types of cells according to their degree of sen-sitivity to radiation.
The Law of Bergonie and TribondeauTwo French scientists, Bergonie and Tribondeau, studied the effect of radiation on cells, tissues, and organs. Their obser-vations relate to the sensitivity of cells, tissues, and organs, which were being exposed to ionizing radiation. Important points of the Bergonie and Tribondeau law are as follows:
1. Younger or immature cells are more radiosensitive.2. Rapidly dividing cells are more radiosensitive.
TABLE 19.2 RADIATION SENSITIVITY OF SOME CELLS, TISSUES, AND ORGANS
Most sensitive LymphocytesGonadsSpermatogoniaOogoniaHemopoietic tissues/erythroblasts
Intermediate Intestine/intestinal crypt cellsBone/osteoblastsSkin/epithelial cellsLens of eye/corneaThyroid
Least sensitive Muscle cellsNerve cellsSpinal cellsBrain cells
Fosbinder_Text_Chap19.indd 290 12/7/2010 2:44:13 PM

Chapter 19: Radiation Biology 291
Relative Biological EffectivenessThe biological effects of radiations with different LET val-ues are compared by comparing their relative biological effectiveness (RBE) values. RBE is the ratio of doses of a standard radiation to a test radiation required to produce the same biologic effect. Diagnostic x- and gamma-rays have a RBE value close to 1. High-LET radiations have higher RBE values because they produce the same effect at lower doses.
When radiation is absorbed in biological material, the energy is deposited along the tracks of charged particles in a pattern that is characteristic of the type of radiation involved. After exposure to x- or gamma-rays, the ioniza-tion density would be quite low. After exposure to neu-trons, protons, or alpha particles, the ionization along the tracks would occur much more frequently, thereby producing a much denser pattern of ionizations. These differences in density of ionizations are a major reason that neutrons, protons, and alpha particles produce more biological effects per unit of absorbed radiation dose than do more sparsely ionizing radiations such as x-rays, gamma-rays, or electrons (Table 19.3).
Types of Cell DamageSeveral things can happen when ionization occurs within a cell. The cell can die and form scar tissue. The cell can repair itself from the damage. Repaired cells can continue to function normally after repair. Alterna-tively, the cell can be transformed into an abnormal cell. Transformed cells may begin the process of becoming cancer cells.
If a large number of ionizations occur in a cell over a short period of time, the cell’s repair mechanisms may be overwhelmed and it may not be able to repair the damage. Biologic effects of low dose rate exposures are less than those from high dose rate exposures. Long-term exposures
The radiation characteristic that is most important in determining cell damage is the rate at which the radia-tion deposits its energy.
The term linear energy transfer (LET) describes how the ionizing radiation energy is deposited along a tract or path in tissue. LET has units of kiloelectron volts per micrometer (keV/mm). As the radiation passes through tissue, it deposits energy and produces ioniza-tion of the cells in the tissue. Different types of ionizing radiation have different LET values. As high-LET radi-ation passes through tissue, it deposits large amounts of energy in a short distance. Accordingly, high-LET radiation has a greater biologic effect but very little penetrating ability because it loses all its energy in a short distance.
Low-LET radiation is very penetrating because it spreads its energy over large distances. There is little chance that a low-LET radiation will deposit more than one ionization in any one cell. Current theories sug-gest that two or three ionizations in a cell nucleus are required to produce biologic effects (Fig. 19.5). Because the ionizations from low-LET radiation are spread over many cells, this radiation does not usually cause signifi -cant damage in any one cell.
Alpha and beta particles and protons are types of high-LET radiation, with alpha particles having the highest LET. High-LET radiation has values from 10 to 200 keV/mm with ranges of a few millimeters in tissue. X- and gamma-rays are types of low-LET radiation, with values from 0.2 to 3 keV/mm and ranges of many centi-meters in tissue.
High-LETradiation
Ionization
Cells
Low-LETradiation
Figure 19.5. The ionization along the tracks of a high and a low LET radiation.
TABLE 19.3 RADIATION WEIGHTING FACTORS
Type and Energy Range Radiation Weighting Factor
X- and gamma-rays 1Electrons 1Neutrons 5–20Protons 5Alpha particles 20
Fosbinder_Text_Chap19.indd 291 12/7/2010 2:44:14 PM

292 Part V: Radiation Protection
Tissue that is anoxic or hypoxic is less sensitive to the effects of radiation. This characteristic of biologic tissue is called the oxygen effect.
Direct and Indirect Effects
The amount of cell damage depends on both the qual-ity of radiation and how the radiation is deposited in the cell. If the radiation directly damages the cell nucleus, the damage is called a direct effect. If the radiation depos-its its energy outside the nucleus, the damage is called an indirect effect.
Direct effects result from ionizing radiation deposit-ing its energy within the cell nucleus and breaking the DNA molecular bonds. The target for direct effects is the DNA molecule. High LET radiation primarily produces direct effects. High LET ionizations are deposited inside the cell nucleus and damage so many DNA molecules that the cell is unable to repair all the damage. High LET radiation usually results in cell death.
Indirect effects result from ionizing radiation deposit-ing its energy within the cytoplasm outside of the cell nucleus. Low LET radiation primarily produces indirect effects. Free radicals have excess energy and when they migrate to a target molecule, they transfer their energy, which results in damage to the target molecule.
Radiolysis of WaterLow LET radiation can damage the cell by producing an intermediate, toxic product in the cytoplasm that then interacts with the DNA in the nucleus. The human body comprises 80% water molecules, and when irradiated, the water molecules will dissociate into a toxic product. The most common toxic product is produced by the radi-olysis of water. In radiolysis of water, the water molecule is broken into two ionized particles: HOH+ and an elec-tron. At this point, various reactions can occur (Fig. 19.7). First, the ion pair may rejoin into a stable water molecule in which case no damage occurs. Second, the ions do not rejoin and the negative ion (the electron) attaches to another water molecule and produces yet another ion
An animation for this topic can be viewed at http://thepoint.lww.com/FosbinderText
over months or years show about half the effect as those caused by short-term exposures involving the same dose.
Radiosensitivity FactorsIn addition to the physical factors, which affect radiosen-sitivity, there are a number of biologic conditions, which alter the tissues response to radiation. These factors have to do with the state of the host such as age, gender, and metabolic rate. The age of the individual directly affects his or her sensitivity to radiation. As seen in Figure 19.6, humans are most radiosensitive in utero and as they approach childhood, their radiosensitivity lowers. The sensitivity is the lowest in adulthood when humans are the most radioresistant to radiation-induced effects. Dur-ing the elder years, humans become somewhat more radiosensitive but not to the same level as the fetus. These factors explain the necessity to use proper radiation pro-tection for patients during imaging procedures where they will be exposed to ionizing radiation.
The issue of gender and radiosensitivity has not gar-nered conclusive evidence to predict with absolute cer-tainty which gender is more resistant to the effects of radiation. Although the results are not all in agreement, the indication is that the female is less sensitive to radia-tion than the male.
Another factor to consider is the amount of oxygen present in tissue. Tissue is more sensitive to radiation when it is irradiated under aerobic or oxygenated conditions.
Sen
sitiv
ity to
rad
iatio
n
In utero Childhood Adult Aged
Radiation dose (rad)
Birth
High
Low
Figure 19.6. Radiosensitivity varies with the age of the person. Research shows that the very young and the elderly are the most sensitive to the effects of radiation.
Fosbinder_Text_Chap19.indd 292 12/7/2010 2:44:14 PM

Chapter 19: Radiation Biology 293
radioresistant because they are avascular, that is, they lack an adequate blood supply.
Target TheoryEach cell in the body has an overabundance of cellular components. When the cell is irradiated, one or more of these components may be damaged. If the damaged com-ponent cannot continue to support the function of the cell, other similar molecules would be available to take its place. Other molecules are vital to the function of the cell, and in many cells, there may only be one such molecule. Radiation damage to such a molecule could have a severe effect on the cell, and there would be no similar molecules to take its place. The concept of a key sensitive molecule is the foundation for target theory. Target theory suggests that for a cell to die after radiation exposure its target molecule must be inactivated or damaged beyond repair.
In target theory, the target is considered to be an area of a cell occupied by the target molecule, usually the DNA. The act of irradiating the target molecule is completely random, and its sensitivity to radiation is simply because of its vital function in the cell. The interaction between the radiation and target molecule can either be direct or indirect as it is impossible to know for sure. Regardless of the type of interaction, the target molecule is hit by the radiation, which inactivates the target molecule and ultimately leads to cell death.
Cell Survival Curve
The number of cells that survive after being exposed to radiation depends on the radiation dose. A cell survival curve is a plot of the fraction of cells surviving as a func-tion of radiation dose. It is obtained through a series of experiments in which groups of cells are exposed to dif-ferent doses of radiation.
HOH−. The HOH+ and HOH− ions are unstable and can dissociate into still smaller molecules as follows:
+ +HOH H + OH∗→∗→- -HOH OH + H
Finally, radiolysis of water results in the formation of an ion pair, H+ and OH−, and two free radicals, H∗ and OH∗. The ions can recombine, and there would be no biologic damage. Although free radicals are uncharged, they have an unpaired electron in the valence or outer shell and are very chemically reactive. Free radicals, which are pro-duced primarily in the cytoplasm, have a short life, but they exist long enough to reach the nucleus and damage the DNA molecules by easily breaking the DNA bonds. Free radicals produced from the radiolysis of water can also combine to form hydrogen peroxide, H2O2, which is toxic to cells. Most damage from low LET radiation is caused by indirect effects because the low LET ioniza-tions are separated by distances much larger than a cell.
Free radicals are produced more readily when there is an abundance of oxygen present. The cytoplasm, which consists primarily of H2O, is an abundant reservoir of oxygen. The effect of oxygen is measured by the oxygen enhancement ratio (OER), which is the ratio of the radi-ation doses necessary to produce the same effect with-out and with oxygen present. OER values for high LET radiations are close to 1 because the high LET radiations are so effective in producing damage that the presence or absence of oxygen does not matter. Low LET radiations typically have OER values of 2 to 3, meaning that oxygen enhances the effects of radiation.
More indirect effects occur if there is more oxygen present because free radicals are readily produced by ion-izations in the presence of oxygen. Oxygen is a radiosen-sitizer because cells in the presence of oxygen are more sensitive to radiation. Cells in tissues with a poor blood supply are more resistant to radiation damage because they have a diminished oxygen supply. Many tumors are
HH
O
H2O Unstable ions
HOH+
HOH–
Ionpair
H+
H–
Freeradicals
OH*H*
OH* + OH* = H2O2
Hydrogenperoxide
Figure 19.7. The formation of a free radical pair by radiolysis of water.
Fosbinder_Text_Chap19.indd 293 12/7/2010 2:44:14 PM

294 Part V: Radiation Protection
Different cell and tissue types have different DO and DQ values. Radioresistant cells have large DO values because they require a large radiation dose to reduce the number of surviving cells to 37% of the original popula-tion. Radiosensitive cells have small DO values because they require a smaller radiation dose to reduce the num-ber of surviving cells to this degree.
Stochastic EffectsStochastic effects are the frequency of a biological response to radiation dose. Stochastic effects also occur randomly in irradiated tissue. Stochastic effects are those effects that occur by chance; they occur among unexposed as well as exposed individuals. In the context of radiation exposure, stochastic effects mean cancer and genetic effects. The result of exposure to radiation increases the probability of occurrence of the effect, with the increase in response being proportional to the size of the dose. A larger exposure to radiation equates into a larger potential for cell damage or biological response. The incidence of the biological response in relation to the dis-ease process will increase proportionally with the radia-tion dose but there is no dose threshold. This means that no amount of radiation exposure is safe and that there is always a chance for tissue damage to occur.
Nonstochastic EffectsNonstochastic effects or deterministic effects are the biological response that will cause an effect because of a threshold. In other words, a minimum dose of radia-tion will not cause any biological damage or any amount of radiation below the threshold is considered safe. The increase in biological damage will increase with an increase in radiation dose after the threshold. Nonsto-chastic effects are characterized by three qualities:
1. A certain minimum dose must be exceeded before the particular effect is observed.
2. The magnitude of the effect increases with the size of the dose.
3. There is a causal relationship between exposure to radiation and an observed effect.
The stochastic and nonstochastic effects are plotted on the linear and nonlinear dose-response models.
The cell survival curve can be divided into two parts: the S or shoulder region and the L or linear region. The shoulder of the curve in the S region indicates the amount of cell repair or recovery (Fig. 19.8). At very low doses, almost 100% of the cells survive. As the dose is increased, some of the cells are killed, but most recover from the radiation damage and survive. The dose at which an extrapolation of the straight-line portion of the survival curve intersects the 100% survival line is known as DQ the threshold dose. DQ is a measure of the width of the shoulder portion and is related to the amount of cellular repair or sublethal damage. Cells with greater repair or recovery capability have a larger shoulder region and a larger DQ value. High LET radia-tions produce cell survival curves with almost no shoul-der region and very small DQ values. This is due to the high LET radiations’ ability to overwhelm the cell’s repair mechanism.
The linear region occurs at higher doses where the survival curve becomes a straight line when cell survival is plotted on a logarithmic scale. In the L region, cell sur-vival is inversely proportional to dose. An increase in dose produces a decrease in cell survival. The dose required to reduce the population of surviving cells to 37% of the original value is DO, the mean lethal dose.
Fra
ctio
n of
cel
l sur
vivi
ng
200
0.01
1.0
0.1
400 600 8000.001
1000
Radiation dose (rad)
Shoulder
Straight-line portion
D0
DQ
DQ
Figure 19.8. The fraction of surviving cells plotted against the radiation dose.
Fosbinder_Text_Chap19.indd 294 12/7/2010 2:44:16 PM

Chapter 19: Radiation Biology 295
threshold dose, which is defi ned as the minimum dose at which biologic effects become evident.
Linear Dose-Response ModelThe linear dose-response model demonstrates that any dose of radiation will produce an effect. This model also demonstrates that there is a natural incidence in the population of cancer, genetic diseases, and leukemia, which must be accounted for. A linear model predicts a doubling of the biologic effect if the radiation dose is doubled. A linear model can have either a threshold or a nonthreshold response with a stochastic effect. A linear response that begins at zero demonstrates a nonthreshold response. The nonthreshold response demonstrates that any dose, regardless of its size, is expected to produce a response. A linear response that rises at some dose greater than zero is a threshold response, meaning that for any dose below the threshold, no response will be demon-strated. The type of response that the patient experiences is stochastic. Figure 19.9 demonstrates a simple linear dose-response relationship.
The linear model extrapolates by using a straight line to connect the data for high doses to the 0 point of radia-tion dose from the graph. The linear model predicts that biologic effects are directly proportional to the radiation dose. The magnitude of the effects gradually increases with increasing radiation dose until the two models pre-dict the same biologic effects at high doses, where human data are available. The linear nonthreshold (LNT) dose-response model is used to estimate radiation effects in the
Dose-Response ModelsRadiation dose-response relationships have important applications in radiology. First, these relationships are used to design radiation therapy protocols for cancer patients. Second, studies have been designed to deter-mine the effects of low-dose radiation. The data gathered from these studies are the foundation for radiation con-trol programs whose main goal is the reduction of radia-tion exposure in diagnostic imaging.
A dose-response curve shows the relationship between the radiation dose and the resulting biologic effects. Bio-logic data on humans are available only at doses greater than about 1 Gy (100 rad). No biologic effects have been observed at doses of a few milligray. These are the dose levels usually encountered in diagnostic radiology.
The dose-response models demonstrate the natural incidence of cancer in humans as well as the body’s response to overexposure. There is a certain point on the dose-response models where there is no distinguishable difference between people who have not been irradiated and those who have received an overexposure. It should be emphasized that although overexposure to radiation increases the likelihood of cancer, it is impossible to defi nitely identify any particular cancer with any given exposure.
Data obtained at higher doses can be extrapolated to lower doses to estimate biologic effects at the lower dose levels. These extrapolations are done using dose-response models. There are two types of dose-response models: the linear and nonlinear models. Either model can exhibit a
Radiation dose Radiation dose
Obs
erve
d re
spon
se
Obs
erve
d re
spon
se
A. Linear threshold B. Linear nonthreshold
N N
Figure 19.9. The linear dose-response model with and without a threshold, (A) and (B) respectively. Notice the natural incidence of radiation effects on the bottom of the chart and how the linear response begins on this line.
Fosbinder_Text_Chap19.indd 295 12/7/2010 2:44:16 PM

296 Part V: Radiation Protection
This report dealt with the somatic effects and genetic effects of exposure to low doses of low-LET radiation. The fi ndings of the study are directly applicable to diagnostic imaging. At this time, the committee concluded that effects followed a linear, quadratic dose-response relationship (Fig. 19.11). The linear quadratic model predicted small effects at low doses. Subsequent data that determined this type of dose-response relationship overestimated the risk associated with diagnostic radiation. In 1990, the BEIR committee revised its radiation risk estimates, leading to the use of the linear, nonthreshold model as the most appropriate model to use for establishing radiation pro-tection guidelines that refl ect a safe approach.
diagnostic energy range. Diagnostic x-rays are assumed to follow a LNT dose response.
Nonlinear Dose-Response ModelA nonlinear model predicts a different type of relation between the dose and its effect; however, the effect will be stochastic or random in manifestation. A nonlinear model can have either a threshold or a nonthreshold response. The nonlinear, nonthreshold response curve represents that in a low-dose range, there will be very lit-tle biological response. At high doses, the same amount of dose will produce a much larger response. When the nonlinear model has a threshold, the curve is moved to the right on the graph to represent that a safe dose of radi-ation can occur at the low range (Fig. 19.10).
Linear, Quadratic Dose-Response ModelIn 1980, the Committee on Biological Effects of Ionizing Radiations (BEIR) of the National Academy of Sciences completed a thorough review of scientifi c information from several different studies including:
● The continuing studies of Japanese survivors of nuclear bombings during World War II
● Radiation accidents● Patients who were exposed to radiation during
medical treatment
Radiation dose Radiation dose
Obs
erve
d re
spon
se
Obs
erve
d re
spon
se
A. Nonlinear threshold B. Nonlinear nonthreshold
N N
Figure 19.10. The curves obtained from the nonlinear model with and without a threshold, (A) and (B) respectively. In practice, almost all nonlinear curves have a threshold below which there are no observable biologic effects.
Res
pose
Radiation dose
Linear
Linear-quadratic
Figure 19.11. Linear, quadratic dose-response relation-ship. Applies to low dose low-LET radiation effects.
Fosbinder_Text_Chap19.indd 296 12/7/2010 2:44:16 PM

Chapter 19: Radiation Biology 297
Male GonadsData collected from patients who have undergone radiation therapy treatments for testicular cancer and volunteer convicts determined that after high doses of radiation, the testes will begin to atrophy. After irradia-tion of the testes, the maturing cells (spermatocytes) and spermatids are relatively radioresistant and will continue to mature. The spermatogonial stem cells are the most sensitive phase in development. There is no signifi cant reduction in the number of spermatozoa until several weeks after exposure. Radiation doses as low as 100 mGy (10 rad) can result in the reduction in the number of spermatozoa. The reduction will continue to take place over a long period of time. Doses of up to 2 Gy (200 rad) will produce temporary infertility, which will begin a full 2 months after irradiation and will last approximately 12 months. If the dose is 5 Gy (500 rad), permanent ste-rility will occur. When radiation exposure to the testes is approximately 100 mGy (10 rad), the male should refrain from procreation for up to 4 months due to the increased risk of fetal abnormalities.
Female GonadsWhen the ovaries are exposed to radiation early in life, the ovaries will be reduced in size or will atrophy. After puberty, irradiation can suppress and delay the menstrual cycle. The oocyte in the mature follicle is the most radi-osensitive cell in female reproduction. The effect that radiation has on the ovaries is somewhat dependent on the age of the female when the irradiation occurred. Dur-ing the fetal stage and early childhood, the ovaries are the most radiosensitive. The radiosensitivity will decline to the lowest level when the woman is between 20 and 30 years of age. After this, the radiosensitivity will begin to increase with continued age. Doses as low as 100 mGy (10 rad) may cause suppression or delay in menstruation in the mature female. Temporary sterility will occur with a dose of approximately 2 Gy (200 rad) with permanent sterility occurring at approximately 5 Gy (500 rad). In addition to the destruction of fertility, irradiation of the ovaries with moderate doses has shown to cause increase in genetic mutations. Women are encouraged to abstain from procreation for several months after ovarian doses in excess of 100 mGy (10 rad) to minimize the possibility of genetic mutations in the offspring.
LD50/30The LD50/30 is used to express the lethal dose of radiation to humans. LD50/30 is a threshold response and nonlinear, meaning any amount of radiation will elicit a biological response. At lower dose of approximately 1 Gy (100 rad), no exposed individual is expected to die. When the dose is above approximately 6 Gy (600 rad), all individuals irradiated would be expected to die unless immediate, vigorous medical support is available. Irradiation doses above 10 Gy (1,000 rad) will result in death regardless of medical treatment. If death does occur, it will likely hap-pen within 30 days of the exposure (Table 19.4).
Acute radiation lethality is the radiation dose to the whole body that will produce death in 50% of the exposed population within 30 days. The LD50/30 for humans is about 3 Gy (300 rad) for individuals without medical treatment and somewhat higher for individuals with proper medical care.
Gonadal EffectsThe gonads have particular importance as target organs. They are particularly sensitive to radiation with responses at doses of 10 rad or less being reported. Data have been gathered from radiation therapy patients, radiation accident victims, and volunteer convicts to complete a description of the response of gonads to radiation.
TABLE 19.4 LD50/30 FOR WHOLE BODY RADIATION EXPOSURE
Species LD50/30 (rad)
Pig 250Dog 275Human 300Guinea pig 425Monkey 475Opossum 510Mouse 620Hamster 700Rat 710Rabbit 725Gerbil 1,050Turtle 1,500Armadillo 2,000
Fosbinder_Text_Chap19.indd 297 12/7/2010 2:44:17 PM

298 Part V: Radiation Protection
who are exposed to radiation levels >1 Gy (100 rad) usually show prodromal symptoms, which include vary-ing degrees of nausea, vomiting, and diarrhea. The pro-dromal stage can begin within a few minutes to hours following exposure and last for a few hours to a few days. The time between the exposure and the onset of prodromal symptoms is an indication of the magnitude of the exposure. Higher exposure levels result in shorter times to the onset of the prodromal symptoms. The severity of the symptoms is dose related, and at doses exceeding 10 Gy (1,000 rad), the symptoms can be quite violent. The onset of prodromal symptoms shortly after exposure indicates a major radiation exposure to the whole body.
Latent PeriodThe second stage of high-dose effects is the latent period. During the latent period, the exposed individual has no clinical symptoms or illness from the radiation exposure and appears to have recovered with no ill effects. How-ever, even though there are no visible symptoms, there may be ongoing cell damage. The latent period can extend from a few hours to several days, depending on the dose. Higher doses result in shorter latent periods.
Manifest StageDuring the manifest stage of radiation response, the full clinical effects are evident. As seen in Figure 19.12,
High-Dose Radiation Effects
The early effects of high doses of radiation have been studied in animals in the laboratory, and there is limited information about human exposure. To date, no human has died from exposure to radiation following a diagnos-tic imaging procedure. The early pioneers in radiology were exposed to extremely high total radiation dose, which led to early deaths for some individuals. In mod-ern diagnostic radiology departments, the exposures that are made are not suffi ciently intense enough to cause death.
Historically, there have been accidental exposures of persons to extremely high doses of radiation. In April 1986, an accident with a nuclear reactor at Chernobyl caused 134 people to be diagnosed with acute radiation syndrome; of these, 30 people died within 3 months of the accident. Individuals exposed to the radioac-tive fallout from Chernobyl will be followed for years to come to gather data on the effects of the radiation exposure.
Acute radiation effects result from high radiation doses delivered to the whole body in a few hours or less. This is called acute radiation syndrome and leads to death within days or weeks. The clinical signs and symptoms of radiation exposure present themselves in four stages:
1. The prodromal stage2. The latent period3. The manifest stage4. The fi nal stage, resulting in recovery or death
The duration of each stage and the severity of each stage depend on the radiation dose or whole body dose.
Prodromal StageThe fi rst stage of radiation response following an expo-sure is the prodromal stage. The prodromal stage shows the clinical signs and symptoms resulting from radia-tion exposure to the whole body within hours of the exposure and can last up to a day or two. Individuals
Figure 19.12. Chernobyl victim suffering from acute radiation syndrome a few weeks after the accident. Note the hair loss, indicating a radiation dose of several hundred rem. Also, note injury to the skin of the lower extremi-ties as a result of high (a few thousand rem) doses of beta ( nonpenetrating) radiation.
Fosbinder_Text_Chap19.indd 298 12/7/2010 2:44:17 PM

Chapter 19: Radiation Biology 299
will appear. At very high doses, the CNS syndrome becomes evident. Thus, an individual exposed to 10 Gy (1,000 rad) will display the symptoms of all three syndromes (Table 19.5).
The dose necessary to produce a given syndrome and related effects is often seen in a given range for each syndrome. It is expected that patients will experience each phase of the syndrome; however, the sequence of events in each syndrome is not always seen (Fig. 19.13). Exposure to very high radiation doses will often result in the latent period disappearing while very low doses may have no prodromal stage and consequently no associated latent period.
Hematologic SyndromeIn this syndrome, the effects are mainly on the blood-forming tissues. The hematologic or hemopoietic syn-drome is characterized by depression or ablation of the bone marrow and the physiological consequences of this damage. The major hematologic effect of radia-tion exposure is a decrease in leukocytes, erythrocytes, thrombocytes, and lymphocytes. This means that the body’s defenses against infection are reduced or elimi-nated. Individuals exposed to whole body dose levels above about 1 Gy (100 rad) experience sudden nausea and vomiting during the prodromal stage, which occurs within several hours after the overexposure. The person may experience loss of hair during the second or third week after exposure. Hematologic effects follow a latent period of a few weeks. During the latent period, there are no apparent symptoms characterized by a general feel-ing of well-being, but blood cell damage is still being expressed. The body’s defense mechanisms begin to recover about 30 days after exposure, and a full recov-ery may take as long as 6 months. When these defense
this victim of the Chernobyl nuclear power plant accident has experienced hair loss and radiation burns from the exposure to a few thousand rem. The three syndromes that become manifest during this stage are the hematologic syndrome, the gastrointestinal (GI) syndrome, and the central nervous system (CNS) syn-drome. Certain effects are seen in all categories and include:
● Nausea and vomiting● Malaise and fatigue● Increased temperature● Blood changes
Final StageThe survival of an individual depends on many com-plex factors, including the amount and distribution of the radiation, the individual’s general health, individ-ual’s sensitivity to radiation, and the medical treatment obtained. No individual has survived whole body expo-sures of 10 Gy (1,000 rad) or greater. Human data on exposures at these levels are sparse, but it appears that survival from doses of 6 to 7 Gy (600–700 rad) is pos-sible with vigorous medical treatment that includes large doses of antibiotics and maintenance of body fl u-ids and electrolyte balance. The mean survival time is the average time of survival and is dose related; higher doses have shorter mean survival times. Although there are no absolute values, the mean survival time for the hematologic syndrome is 45 days, for GI syndrome is 8 days, and that for the CNS syndrome is 2 days.
Whole Body Radiation Exposures
The whole body dose determines the effects that an individual will display during each stage. At higher dose levels, the effects observed may include more than one syndrome. The three syndromes resulting from high-dose whole body exposures are dose related. The first syndrome to appear is the hematologic syndrome; then, if the whole body dose is high, the GI syndrome
TABLE 19.5 DOSE LEVELS AT WHICH BIOLOGIC EFFECTS APPEAR
Dose Level (Gy) Biologic Effect Latent Period
<1 No observable effect1 Hematologic 2–4 wk3 GI 10–14 d>50 CNS A few hours
Fosbinder_Text_Chap19.indd 299 12/7/2010 2:44:18 PM

300 Part V: Radiation Protection
and bloody stools. Massive infection occurs as the intestines break down, allowing a loss of body fl uids and an invasion of bacteria. This occurs just as the body’s defenses are beginning to fail because of the hemato-logic effects. Death usually occurs about 2 weeks after exposure.
Death occurs primarily because of the severe dam-age to the cells lining the intestines. These cells are normally in a rapid state of proliferation and are con-tinually being replaced by new cells. The normal process of cell proliferation is approximately 3 to 5 days. These cells are very sensitive to the effects of radiation and the high dose of radiation will kill the most sensitive cells, the stem cells, and this determines the length of time until death. When the intestinal lining is completely denuded of cells, the result is uncontrollable passage of fl uids across the intestinal membrane, severe electrolyte imbalance, and dehydration. Bacteria are absorbed into the blood stream via the small bowel wall. The patient will experience a severe septic infection and intensifi ed dehydration. Even with aggressive, immediate medical care, death is likely in 2 weeks due to the failure of the hematologic system.
Central Nervous System SyndromeAt doses >10 Gy (1,000 rad), the radiation damages the nerve cells, and the body’s regulatory mecha-nisms begin to fail within minutes of the exposure and complete failure occurs within a few days. The onset of severe nausea and vomiting will occur in minutes
mechanisms against infection are fully active, complete recovery can be expected. Individuals exposed to doses as high as 6 Gy (600 rad) can recover if they are given medical care to prevent infection.
The main effects occur in the bone marrow and blood. Marrow depression is seen at 2 Gy (200 rad); at about 4 to 6 Gy (400–600 rad), almost complete ablation of the marrow occurs. Bone marrow can spontaneously regrow if the victim survives the physiological effects of the denuding of the marrow. An exposure of 7 Gy (700 rad) or higher leads to irreversible ablation of the mar-row. When the radiation injury is severe, the reduction in blood cells will continue until the body can no lon-ger defend against infection. Death at these exposure levels is due to infection, electrolyte imbalance, and dehydration.
Gastrointestinal SyndromeGI symptoms appear at whole body doses of 6 to 10 Gy (600–1,000 rad). Whole body doses kill most of the stem cells in the GI tract. The patient will experience all the hematologic effects, but severe nausea, vomiting, and diarrhea will begin very soon after exposure. The pro-dromal stage occurs within hours of the exposure and may last as long as a day. Following the prodromal stage, there is a latent period of about 3 to 5 days during which the patient experiences no symptoms. After the latent period, the individual experiences another bout of nau-sea, vomiting, and diarrhea with the patient becoming lethargic and possibly prostrating. The diarrhea persists and increases in severity, leading to loose then watery
Figure 19.13. Whole body radiation syndromes. At a dose of approximately 300 rad of whole body radiation, a syndrome characterized by hematologic failure develops within 2 weeks. In the vicinity of 1,000 rad, a GI syndrome with a latency of only 3 days is seen. With doses of 2,000 rad or greater, disease of the CNS appears within 1 hour, and death ensues rapidly. (Image from Rubin E, M.D., Farber JL, M.D. Pathology. 3rd Ed. Philadelphia, PA: Lippincott Williams & Wilkins, 1999.)
Fosbinder_Text_Chap19.indd 300 12/7/2010 2:44:18 PM

Chapter 19: Radiation Biology 301
Late Somatic Effects
Somatic cells, which are exposed to radiation often dem-onstrate an effect many months or years after the irradia-tion occurred. Late somatic effects can occur to the cells’ response to either whole body or partial body exposure to high radiation doses, to individual low doses, or to chronic low doses sustained over several years. The cells respond to the radiation by mutating into cancerous cells, which leads to various types of cancer. Carcinogenesis has an increased frequency in the exposed population with long latent periods of 20 to 30 years for solid tumors to appear.
with the patient experiencing dehydration, drowsiness, and brain edema. The patient will become lethargic due to the edema in the brain and cell damage to the cerebellum. Convulsions will likely ensue within hours of the exposure. The latent period may be as short as a few hours with very high doses. Higher doses result in shorter latent periods. After the latent period, the exposed individual loses consciousness and stops breathing. Exposures at these dose levels always result in death because the hematologic and GI systems have also been destroyed.
Effects of Partial Body Irradiations
Exposure of localized portions of the body to radiation produces different effects from exposure of the whole body. Localized exposures show striking, but nonlethal effects, including erythema, epilation, and cataracts. Radiation exposures to limited portions of the body can also induce cancer and leukemia.
Localized exposure to the skin will produce erythema, or skin reddening, at dose levels near 6 Gy (600 rad). The skin erythema dose for 50% of the population (SED50) is 6 Gy (600 rad). The radiation causes local damage to the skin stem cells, producing reddening of the skin within a few days. The latent period for skin erythema is a few days. Signifi cant exposure to the skin can lead to damage at the cellular level where the cells have begun to necrose. As seen in Figure 19.14, this localized skin lesion appeared to heal; however, over the course of many months, the skin has broken down and required a skin graft to treat the lesion.
Epilation, or temporary hair loss, occurs at doses above a threshold of 3 Gy (300 rad) with a latent period of a few weeks. Regrowth of the hair begins in about 2 months and is complete in about 6 months.
Cataracts, or cloudiness or opacity, of the eye are pro-duced by a single acute dose of 2 Gy (200 rad) to the lens of the eye. Exposures occurring over a period of months or years demonstrate a threshold dose of 10 Gy (1,000 rad). The latent period for cataract development is sev-eral years.
A B
C D
Figure 19.14. Time line of a major radiation injury. Early erythema and blistering at approximately 8 weeks are seen in (A). This has resolved by approximately 20 weeks (B); however, the tissue is necrotic. The tissue has broken down by 20 months (C). A skin graft was required (D). (Reprinted with permission from Donald S. Baim. Grossman’s Cardiac Catheterization, Angiography, and Intervention. 7th Ed. Philadelphia, PA: Lippincott Williams & Wilkins, 2006.)
Fosbinder_Text_Chap19.indd 301 12/7/2010 2:44:20 PM

302 Part V: Radiation Protection
25 years. In an unexposed population of 1 million, there will be over 200,000 cancer deaths. The current best esti-mate of the risk of dying from a radiation-induced cancer is 5%/Gy (0.05% per rad). In other words, if 1 million individuals were exposed to 10 mGy (1 rad), an extra 500 deaths due to radiation-induced cancers would be pre-dicted. Deaths due to cancer would rise from 200,000 to 200,500 in the exposed population. These estimates are based on the LNT dose-response model.
Radiation and Pregnancy
From early medical applications of radiation, there has been concern and apprehension in regard to the effect radiation will have on the embryo and developing fetus. The effects of radiation in utero are dose related and time related. The effects include preimplantation death, neonatal death, congenital abnormalities, malignancy induction, general impairment of growth, genetic effects, and mental retardation. The embryo is very sensitive to radiation because it is made up of rapidly dividing cells. The fetus is most sensitive to radiation during the fi rst trimester of pregnancy. The effects on the fetus depend on the stage of fetal development at which the radiation exposure occurs and the fetus will experience an all or nothing effect, either the fetus will develop an abnormal defect or will be born without any sign of defect.
High-dose radiation exposure during the preimplan-tation stage of the fi rst 2 weeks will result in spontane-ous death or the fetus will be viable with no apparent effects. It is during this time that the stem cells for major organs are formed. Damage due to radiation will cause irreversible congenital abnormalities. During the phase of organogenesis from weeks 2 to 8, skeletal and organ abnormalities can be induced. The fetus may exhibit congenital or long-term effects. Abnormalities to the CNS cannot be detected until after birth. Radiation exposure throughout the pregnancy can result in malig-nancy, mental retardation, neonatal death, genital defor-mities, and sense organ damage.
There appears to be a threshold of about 0.1 Gy (10 rad) for fetal damage. Routine diagnostic procedures never reach this level. There is no reason to recommend
As with other population exposed to radiation, there is a stochastic or random effect, so it is diffi cult to predict with absolute certainty which person will develop can-cer. Various forms of cancer, which have been identifi ed include the following:
● Breast cancer: Several studies followed women who had multiple exposures to their chests during TB testing and/or fl uoroscopy to identify their rates of breast cancer compared to women who did not receive the same amount or type of radiation.
● Skin cancer: Early radiation workers were exposed to large amounts of radiation to their hands. Chronic, severe doses of radiation resulted in skin lesions.
● Bone cancer: Identifi ed in radium watch dial painters. The paint was laced with radium, which is a bone-seeking element. Patients developed osteogenic sarcoma as a direct result of ingesting the paint when they moistened the brush with their lips.
● Liver cancer: Thoratrast was used in medical imag-ing to image the liver. Patients ingested thorium for radiographic images of the liver. These patients demonstrated an increase in liver cancer due to the thorium releasing alpha particles as the thorium decayed.
● Lung cancer: Uranium miners inhaled radioactive dust, which lead to their increased rates of lung and bronchial epithelium cancer. There was also an increased incidence of lung cancer in atomic bomb survivors.
● Cataractogenesis: Can occur with advanced age, but there is an increased risk for individuals exposed to radiation. Latent period can be as long as 35 years.
Cancer and Leukemia InductionCancer is the second leading cause of death in the United States, exceeded only by cardiovascular disease. More than one in fi ve individuals will die from cancer. Ionizing radiation can cause cancer and leukemia; it is a carcinogen. Leukemia is a cancer of the blood. There are many other carcinogens, including smoking, diet, and environmental factors. It is diffi cult to determine the exact cause of any particular cancer because cancers induced by radiation have latent periods of from 10 to
Fosbinder_Text_Chap19.indd 302 12/7/2010 2:44:21 PM

Chapter 19: Radiation Biology 303
Chapter SummaryCell division consists of four phases: M, G1, S, and G2. The M phase consists of mitosis or mei-osis. Somatic cell division is called mitosis, and the division of genetic cells is called meiosis. Cells are most sensitive to radiation exposure during the M phase and most radioresistant in the late S phase. Immature somatic cells are called stem cells, and immature genetic cells are called germ cells. Germ and stem cells are more radiosensitive than mature cells. The law of Bergonie and Tribondeau states that younger, immature, and rapidly dividing cells are more radiosensitive. Direct effects result from ioniza-tion and breaking of DNA molecule bonds in the cell nucleus. Indirect effects are produced when radiation interacts with the cytoplasm to produce free radicals that damage the cell. The effect of oxygen on tissue radiosensitivity is measured by the oxygen enhancement ratio. Well-vascularized tissues are more radiosensi-tive than tissues with smaller blood supplies and less oxygen.
LET describes how energy is deposited along the radiation path in tissue. High LET radiation produces direct biologic effects; low LET radia-tion produces biologic effects through indirect effects. The effects of radiations with different
an elective abortion if the dose to the fetus is <0.1 Gy (10 rad). At fetal doses above 0.25 Gy (25 rad), serious discussion with the parents is advisable. The overlying tissue and amniotic fl uid provide signifi cant shielding to the fetus. The dose to the fetus is usually about 25% of the entrance skin dose. All institutions should have a pol-icy regarding x-ray examinations of potentially pregnant patients to ensure that all patients are treated the same way. Medically necessary examinations should never be delayed because of pregnancy as an examination that can be postponed until the birth of the baby is not a necessary examination.
The technologist should give special attention to proper positioning and should seek to minimize the num-ber of exposures. Shielding the abdomen of a pregnant patient is not advisable. If the pelvis is being examined, shielding will compromise the examination. If the pelvis is not in the collimated direct beam, only internal scat-tered radiation will reach the fetus. External shielding will not attenuate the internal scattered radiation. However, providing a pregnant patient with an abdominal shield demonstrates commendable concerns for the safety of her baby.
Genetic Effects
There are 110,000 abnormalities per million live births in a nonirradiated population. Many experiments have been conducted to evaluate the effect of radiation dam-age on future generations. Germ cells are radiosensitive because they are immature genetic cells. The extrapo-lated estimate of genetic damage is that an additional 100 abnormalities per million live births would be expected if the reproductive organs of the parents were irradiated to 10 mGy (1 rad). That is, if the parents of 1 million babies were exposed to 10 mGy, the number of abnor-malities would rise from 110,000 to 110,100. This is <1% increase.
Genetically Signifi cant DoseThe genetically signifi cant dose (GSD) measures the effect on the genetic pool of radiation exposure to the gonads. The GSD is defi ned as that dose which, if
delivered to every member of the population, would produce the same genetic effect as is produced by the actual dose to the individual members of the population. Medical exposures contribute about 200 mGy (20 mrad) to the GSD in the United States.
Doubling DoseThe doubling dose is defi ned as that radiation dose that produces twice the genetic mutation rate in a population as is seen in the population without the radiation dose. The doubling dose is estimated to be between 0.5 and 1 Gy (50 and 100 rad).
Fosbinder_Text_Chap19.indd 303 12/7/2010 2:44:21 PM

304 Part V: Radiation Protection
Case StudyLaura is a second year radiologic technology student. During her course in radiation biology, she was assigned to perform research on people who have received a whole body exposure to 600 rad or 6 Gy of radiation. In her assignment, she is to answer the following questions.
Critical Thinking Questions
What does LD50/30 represent?
How does the level of radiation exposure correlate to patient survival? Which symptoms will the patient likely experience?
Which late effect syndromes will be identifi ed with this level of exposure?
LD50/30 is a measured used to express the lethal dose of radiation to humans. If a given population is exposed to high doses of radiation, we would expect to see 50% of the population die within the fi rst 30 days; this determines the LD50/30 for this specifi c radiation exposure. Patients who receive a dose of approximately 100 to 300 rad can be expected to survive if aggressive medical care is immediately avail-able. Patients who receive the very low doses of approximately 100 rad are expected to recover. Patients whose exposure is approximately 600 rad are not expected to survive past 30 days even if vigorous medical treatment is available. An exposure of 600 rad will produce the rather swift development of a multitude of symptoms. With this level of exposure, the patient will begin to experience symptoms in a matter
LET values can be evaluated by comparing their RBE values. X-rays and gamma radiations are forms of low LET radiations. Alpha and beta particles are high LET radiations.
A cell survival curve plots the percentage of surviving cells against the radiation dose. A radiation dose-response curve plots the relation-ship between the radiation dose and the bio-logic effects produced. Different dose-response models use linear and nonlinear, threshold and nonthreshold curves. The effects of diagnostic radiation are assumed to follow the LNT dose-response model. Acute effects from high-dose whole body radiation include the hematologic effect, which appears at doses of about 1 Gy (100 rad); the GI effect, which appears at about 3 Gy (300 rad); and the CNS effect, which appears at doses of about 50 Gy (5,000 rad). Dose levels in diagnostic radiology are not high enough to produce acute effects.
Local effects and their threshold dose levels include epilation (3 Gy [300 rad]), erythema (6 Gy [600 rad]), and cataract formation (10 Gy [1,000 rad]). The increase in cancer due to radiation is estimated to be 5%/Gy. Radiation doses to the male and female can affect the person’s fertility. The oocyte in the female is the most radiosensitive cell during the reproductive cycle. After irradiation, the ovary will atrophy, which will have an impact on the number of viable ovum remaining. The testes will have a reduction of spermatozoa after irradiation has occurred. Doses of 200 rad can produce tempo-rary sterility while a dose of 500 rad to the testes will produce permanent sterility.
During the gestational period, the fetus is sensitive to the effects of radiation. No ill effects on the fetus have been observed at doses <100 mGy (10 rad). Genetic effects are described by the GSD. The doubling dose is about 0.5 Gy.
Fosbinder_Text_Chap19.indd 304 12/7/2010 2:44:22 PM

Chapter 19: Radiation Biology 305
of minutes, and during this prodromal stage, the patient will experience nausea, vomiting, and diarrhea. After several minutes to hours, the patient may experience the next stage where the symptoms seem to go away and the patient feels better, this is the latent stage. This stage will not last as there is signifi cant damage at the cel-lular level, which will manifest itself in a new round of symptoms during the manifest stage. The nausea, vomiting, and diarrhea will begin again in addition to malaise, fatigue, increased temperature, and blood changes. These symp-toms may subside with vigorous medical treat-ment; however, the overall health of the patient prior to the exposure will also determine if the patient will survive this level of exposure. The late effect syndromes, which will be seen are the hematologic and GI. The hematologic syn-drome is identifi ed because the blood-forming
tissues have been damaged. The bone marrow has been ablated or severely depressed resulting in a decrease in leukocytes, erythrocytes, throm-bocytes, and lymphocytes. At this point, the body’s defenses against infection are reduced or eliminated, which means these patients must have antibiotic medications to help prevent infection. The other syndrome that will be seen is the GI syndrome. In this syndrome, the symptoms will progress especially manifesting in very loose, watery, and bloody diarrhea. This occurs because the lining of the small intestine has been denuded and can no longer absorb liquid produced in the body. The intestinal wall breaks down allowing bacteria to enter the blood stream, which produces massive infection. The patient will likely not survive more than 2 weeks with this level of radiation exposure.
Fosbinder_Text_Chap19.indd 305 12/7/2010 2:44:22 PM

Review Questions
Multiple Choice
1. The most radiosensitive tissues and organs are
1. muscle2. nerve3. gonads4. intestine
A. 1 and 3B. 1 and 2C. 1 and 4D. 3 and 4
2. A direct effect of radiation exposure to the cell involves the
A. DNA bondB. cell membraneC. cytoplasmD. organelles
3. The fetus is most sensitive to radiation during the _____ trimester of pregnancy.
A. fi rstB. secondC. thirdD. fourth
4. The LD50/30 represents a radiation dose that will kill
A. 30 people in 50 daysB. 30% of the cells in 50 daysC. 50% of the people in 30 daysD. 50% of the cells in 30 days
5. The fi rst stage of radiation response following an exposure is the _____ stage.
A. prodromalB. latentC. acuteD. fi nal
6. Alpha particles have which of the following prop-erties?
1. Emitted from uranium and radium2. Large particles3. Deep penetrating power
A. 1 onlyB. 1 and 2C. 2 and 3D. 1, 2, and 3
7. Which of the following will have the highest LET?
A. Alpha particlesB. X-raysC. Beta particlesD. Fast neutrons
8. If the quality factor of ionizing radiation is higher, the RBE
A. is also higherB. is lowerC. remains the sameD. changes with LET
9. Biologic material is MOST sensitive to irradiation under which of the following conditions?
A. AnoxicB. HypoxicC. OxygenatedD. Deoxygenated
Fosbinder_Text_Chap19.indd 306 12/7/2010 2:44:22 PM

Chapter 19: Radiation Biology 307
4. Defi ne acute radiation syndrome. What was the outcome of the 30 people who were diagnosed with acute radiation syndrome after the Chernobyl nuclear power plant accident?
5. The clinical signs and symptoms of the manifest illness stage of acute radiation lethality can be clas-sifi ed into what groups?
6. Which stage of acute radiation syndrome simulates recovery?
7. Defi ne early and late effects of radiation exposure.
8. What are the stages of cell division in a somatic cell?
9. Give a defi nition of RBE.
10. If the initial ionizing event occurs on a molecule, the effect is said to be _____.
10. What unit of measure expresses the amount of energy to which tissue has been subjected?
A. roentgen (C/kg)B. rad (Gy)C. rem (Sv)D. RBE
11. During radiolysis of water, which type of toxic chemical can be produced when free radicals com-bine?
A. WaterB. SulfahydrylsC. OxygenD. Hydrogen Peroxide
12. _____ refers to damage in a DNA nucleotide sequence as a result of radiation exposure.
A. Target theoryB. RadiolysisC. Compton interactionD. Mitosis
Short Answer
1. Who were the French scientists who theorized about the radiosensitivity of human tissue? Explain the law that bears their names.
2. How does age of the host affect the radiosensitivity of the tissue?
3. What is target theory in radiology?
Fosbinder_Text_Chap19.indd 307 12/7/2010 2:44:23 PM

308
20
Radiation Protection and Regulations
Key Terms● fi lm badge
dosimeters
● Geiger-Muller counters
● HVL
● ion chambers
● OSL
● primary radiation
● scintillation detectors
● secondary radiation
● TLD
● TVL
ObjectivesUpon completion of this chapter, the student will be able to:
1. State the requirements for personnel monitoring.
2. Describe the construction of protective barriers and identify factors that determine the thickness of lead in the barriers.
3. Identify devices used to detect and measure radiation.
4. State the requirements for construction of radiographic equipment.
5. Describe safety requirements of mobile and fl uoroscopic equipment.
Fosbinder_Text_Chap20.indd 308 11/23/2010 12:11:56 PM

Chapter 20: Radiation Protection and Regulations 309
CollimatorRadiographic equipment must have a variable aperture rectangular collimator with a light beam to specify the size of the x-ray beam. The x-ray beam and light beam must be within 2% of the SID. The collimator shutters must attenuate the same amount of useful beam as the protective housing (Fig. 20.1).
Positive Beam LimitationModern x-ray equipment contains positive beam limita-tion (PBL) devices which open the collimator shutters to the exact size of the image receptor. The PBL devices must be adjusted so that for all standard SIDs the shutters will open to match the image receptor size (Fig. 20.2). The PBL must be accurate to 2% of the SID.
Beam AlignmentImproper alignment of the x-ray tube and image receptor will produce an unacceptable image and lead to a repeat image. Each x-ray tube must have a beam indicator alignment to assist the radiographer in lining up the x-ray tube with the image receptor. Lining up the x-ray tube with the image receptor will prevent a repeat image for this type of error.
IntroductionDesigning a radiographic room is the basis for protecting the patient and radiologic technologist from unnecessary exposure to radiation. Room design includes protective barriers for the walls and control booth, x-ray tube design, and fl uoro-scopic equipment design. Many of the principles also apply to mobile radiographic procedures. During radiographic procedures, personnel monitoring devices are required to monitor the amount and type of radiation a technologist is exposed to on a daily basis. At the conclusion of this chapter, the student will have a thorough knowledge of radiographic room design.
Equipment Regulations
There are federal and state regulations on radiation-pro-ducing equipment. Modern x-ray equipment has vari-ous radiation protection devices that must comply with standard regulations for safety. Following is a description for the devices which are required for all radiographic equipment.
Protective X-ray Tube HousingThe x-ray tube is contained within a protective housing. The leakage radiation from the housing of the x-ray tube must be <1 mSv/h (100 mR/h) at a distance of 1 m.
Source-to-Image Receptor Distance IndicatorThe source-to-image receptor distance (SID) indicator must be provided on each piece of radiographic equip-ment. Typically, it is a simple tape measure which is attached to the tube housing. Modern equipment may have laser light or digital displays to indicate the SID. Regardless of the method for measuring the SID, it must be accurate to within 2% of the indicated SID.
Figure 20.1. Current acceptable limits.
SID2%
PBL2%
Leakageradiation
100 mR/hr
Collimator2%
Fosbinder_Text_Chap20.indd 309 11/23/2010 12:11:56 PM

310 Part V: Radiation Protection
Total FiltrationAll general purpose x-ray tubes must have a total fi ltration (inherent plus added) of at least 2.5 mm aluminum when operated above 70 kVp. Tubes operated between 50 and 70 kVp must have at least 1.5 mm aluminum, and tubes operating below 50 kVp must have a minimum of 0.5 mm aluminum total fi ltration.
Exposure ReproducibilityExposure reproducibility is crucial in consistently pro-ducing high-quality images. A radiographic technique is selected and an exposure is made, the intensity of the out-put radiation will be measured. Several more exposures will be made with the same exposure techniques and the technologist will measure the average variation of these exposures. The average variation of radiation intensity must not exceed 5%.
mA Station LinearityWhen using adjacent mA stations with adjusted expo-sure times to produce constant mAs, the output radiation
intensity must remain constant. The radiation intensity is expressed in units of mR/mAs with a maximum accept-able variation of 10%.
Exposure SwitchThe exposure switch must be located in the protected con-trol area. The switch must either be fi xed to the control panel or on a short cord. Under no circumstances should the radiographer be able to stand in the exam room and make an exposure. If the need arises for the technologist to be in the room with the patient, they must wear pro-tective apparel and another technologist must make the exposure.
Mobile Radiography UnitDuring all mobile radiographic exams, the radiographer must wear protective apparel. The exposure switch must be attached to a long cord to allow the technologist to stand at least 180 cm from the x-ray tube during the exposure. Additionally, the radiographer must use care to make certain the x-ray tube is not directed toward the radiographer or other personnel.
Collimator
A B
X-ray tube
Figure 20.2. (A) Properly collimated fi eld size. (B) Improperly collimated fi eld size. A PBL which is working properly will minimize the amount of scatter radiation produced because the entire use-ful beam is intersecting with the patient and image receptor.
Fosbinder_Text_Chap20.indd 310 11/23/2010 12:11:58 PM

Chapter 20: Radiation Protection and Regulations 311
design that prevents the x-ray tube from operating when the carriage is in the parked position.
Total FiltrationThe total fi ltration of the fl uoroscope must be at least 2.5 mm aluminum equivalent. The total fi ltration includes the tabletop and any material located between the x-ray tube and table top.
CollimationThe fl uoroscopic x-ray beam collimators must be adjusted to show a border around the image when it is viewed on the monitor. When the radiologist uses the primary beam length and width collimators to confi ne the fi eld size, the patient’s dose decreases signifi cantly. Some fl uoroscopic units have automatic collimating devices so that the border is automati-cally adjusted with varying heights of the image intensifi er.
Exposure SwitchThe fl uoroscopic exposure switch (foot pedal) must be a dead-man type switch. The purpose of this type of switch is that when a person steps on the switch it activates the x-ray beam. If the person were to suddenly drop dead, the exposure would be terminated.
Bucky Slot CoverThe table Bucky must be moved to the foot of the table for the fl uoroscopic exam. A Bucky slot shielding device of at least 0.25 mm lead equivalent should automatically cover the Bucky slot. This shielding provides the radiologist and radiographer with protection at the gonadal level.
Fluoroscopic EquipmentX-ray Beam IntensityFixed fl uoroscopy units must have dose rates of <100 mSv/min (10 R/min) at the tabletop, unless there is an audible alarm that sounds during the high dose rate mode. The high dose rate fl uoroscopy unit has a maximum tabletop intensity of 10 R/min.
Source-to-Skin DistanceTo avoid excessive entrance exposure to the patient and to reduce the total exposure to both the patient and radiographer, the source to tabletop distance recommen-dations must be followed. Fixed fl uoroscopic units must have a 38 cm (15 inch) distance between the focal spot and the tabletop. A 30 cm (12 inch) minimum distance is required, but a 38 cm (15 inch) minimum distance is pre-ferred for all image intensifi cation systems (Fig. 20.3).
Remember that the x-ray tube is located in the bottom of the x-ray table and if the fl uoroscopic tube was <38 cm below the table the patient would experience a higher skin entrance dose. Increasing the distance between the fl uoroscopic tube and the patient will result in a lower patient dose. C-arm and portable fl uoroscopic units must have 30 cm (12 inch) distance between the focal spot and the patient entrance surface.
Primary Protective BarrierThe image intensifi er carriage acts as a primary protective barrier and must have 2 mm lead equivalent. The carriage must be attached to the x-ray tube and include a safety
Exit dose
Entrance dose
Figure 20.3. When the x-ray tube is placed close to the tabletop, the patient will have a higher skin entrance dose.
Fosbinder_Text_Chap20.indd 311 11/23/2010 12:11:58 PM

312 Part V: Radiation Protection
the protective barrier depends on the distance from the radiation source, the workload, the use of the space on the other side of the wall, and the amount of time the beam is pointed at the wall. Room shielding must protect against both primary and secondary radiation.
Primary BarriersIn each radiographic imaging room, there are three types of radiation which must be considered when determining the protective barriers (Fig. 20.5): primary, scatter, and leakage. Primary radiation is the direct, collimated, use-ful x-ray beam. Typical primary barrier in diagnostic room walls is 1/16th inch of lead. The wall on which the vertical Bucky is mounted is always a primary barrier. This barrier needs to extend 7 ft upward from the fl oor when the x-ray tube is 5 to 7 ft from the wall. The fl oors and ceilings of diagnostic x-ray rooms do not require additional shielding if they are made of concrete because the thickness of con-crete required supporting the fl oor also provides adequate shielding against scattered radiation. The primary beam is never directed at a secondary barrier.
Secondary BarriersSecondary radiation is made up of scattered and leakage radiation. Secondary barriers protect against secondary radiation. Secondary radiation has lower energy than the
Protective CurtainThe image intensifi er carriage has a protective curtain or panel of at least 0.25 mm lead equivalent that is posi-tioned between the fl uoroscopist and the patient. With-out the use of the protective curtain and the Bucky slot cover, the exposure of radiology personnel exceeds 100 mR/h at 2 ft (Fig. 20.4). Using these devices decreases the exposure to 5 mR/h.
Fluoroscopic TimerThere must be a cumulative timer that sounds an audi-ble alarm or temporarily interrupts the x-ray beam after 5 minutes of fl uoroscopy beam on time. It makes the radi-ologist aware of the amount of time for which the patient has received radiation exposure. When the fl uoroscope is activated for shorter amounts of time, the patient, radi-ologist, and radiographer all receive less exposure.
Room Shielding
Room shielding is designed to prevent the transmission of radiation through the room walls. Almost all diagnostic and fl uoroscopic rooms have shielding in at least some of the walls. The radiation shielding required is specifi ed in terms of thickness of lead or concrete. The thickness of
50 mR/hr
100 mR/hr
500 mR/hr
3’ 2’ 1’A
3’ 2’ 1’B
5 mR/hr
Figure 20.4. (A) When no protective curtain or Bucky slot cover is used, the fl uoroscopist will receive a signifi cant dose of radiation. (B) With the protective curtain and Bucky slot cover properly used, the radia-tion dose is signifi cantly decreased.
Fosbinder_Text_Chap20.indd 312 11/23/2010 12:11:59 PM

Chapter 20: Radiation Protection and Regulations 313
between the source and barrier the less the exposure rate to the barrier, thus the barrier can be made of less thickness of lead. If the design of the room allows the x-ray tube to be positioned by a wall, then this wall will likely require more shielding because of the hazard of leakage radiation.
Occupancy FactorThe rooms in a hospital are considered to be either an uncontrolled area or controlled area. Uncontrolled areas are those areas where the general public can be found. This includes waiting rooms, stairways, hallways, the out-side of the hospital, and restrooms with general hospital access. Uncontrolled areas also include individuals who work in a hospital yet outside of the imaging department. The term controlled area includes areas occupied by per-sonnel who have been trained in radiation safety proce-dures and who wear radiation-monitoring devices. The controlled area required the barrier reduce the exposure rate in the area to <100 mR/wk. The uncontrolled area has a maximum allowed rate of 2 mR/wk.
WorkloadThe amount of shielding required for an x-ray room depends on the amount of procedures performed in the room. The higher the number of procedures performed each week the thicker the shielding must be. The work-load is a combination of the number of patients and the technical exposure factors used. The workload is mea-sured in milliampere-minutes per week. If the number of procedures performed in a room is increased, the workload values per week will also be higher. Such a room requires thicker shielding to maintain within levels of cumulative absorbed dose equivalent to those occupy-ing areas adjacent to the room for any long period of time. Workloads are typically meant to be an overestimation of the amount of procedures performed in a given room so that shielding will be more than adequate to ensure the protection of personnel and the public.
Use FactorThe use factor indicates the amount of time during which the x-ray beam will be energized and directed toward a particular barrier. The NCRP recommends that primary wall barriers be assigned a use factor of ¼ and the fl oor a use factor of 1. Secondary and leakage radiation are pres-ent 100% of the time the x-ray tube is energized; thus, secondary barriers are given a use factor of 1. The ceiling
primary beam, and so less shielding thickness is required. The required thickness of lead is 1/32nd inch. The control booth also has a window for viewing the patient during the exposure. This window can either be made of glass or clear plastic that is impregnated with 30% lead by weight. To ensure maximum protection during exposures, it is crucial for personnel to remain completely behind the barrier. The wall of the control booth and its window are always a secondary barrier because the beam is never directed at the control booth. Secondary radiation includes scatter from the patient and leakage radiation escaping through the tube housing in all directions. Regulations require that leakage radiation be <100 mR/h at 1 m. Leakage radiation is not a problem with modern x-ray tubes because they are manufactured with adequate shielding in their housing.
Protective Barrier Thickness ConsiderationsSeveral factors must be considered when determining the thickness requirements for protective barriers. These factors include distance, occupancy, workload, and use factor.
DistanceThe thickness of the barrier depends on the distance from the x-ray source to the barrier. The greater the distance
Scatter
Leakage
Useful beam
Primary Useful beamSecondary Leakage Scatter
Figure 20.5. The three types of radiation which are considered when designing protective barriers for imaging rooms.
Fosbinder_Text_Chap20.indd 313 11/23/2010 12:12:00 PM

314 Part V: Radiation Protection
Scintillation DetectorsScintillation detectors use crystals that give off light when struck by radiation. The amount of light depends on the radiation energy deposited in the crystal. Higher radiation energy deposited results in greater light emis-sion. The light emitted by the crystal is detected by a pho-tomultiplier tube, which converts the light output into an electrical output signal, which is then measured. Scintil-lators are used as detectors in CT scanners and nuclear medicine gamma cameras.
Personnel MonitorsPeople who work in imaging departments and who are routinely exposed to ionizing radiation should be sup-plied with personnel monitoring devices which will estimate the amount of exposure they received. The personnel monitoring device measures the quantity of exposure it has received during the technologists’ occu-pational duties (Fig. 20.7). The radiographer is typically given one personnel monitoring device to wear and it should be worn on the anterior surface of the body between the chest and waist level. Some of these devices are meant to be worn at the level of the throat. Regardless of the location, the personnel monitoring devices must be worn each day while the radiographer is producing x-radiation and the device should be worn at the same location every day.
is most often considered to be a secondary barrier for radiographic procedures.
Half-Value LayerThe half-value layer (HVL) is that amount of shielding required to reduce the radiation intensity to half the origi-nal value. The tenth-value layer (TVL) is the amount of shielding required to reduce the radiation to one tenth its original value. The TVL is used in determining the amount of shielding required for primary and secondary barriers.
Radiation Detectors
There are various dose-measuring devices which are used to measure or detect radiation exposure from x-rays. Dose-measuring devices are also known as dosimeters. These devices are classifi ed as fi eld survey instruments or personnel monitoring devices.
Gas-Filled DetectorsIon chambers and Geiger-Muller counters are gas-fi lled detectors that collect the ions produced by ionizing radia-tion. The ions are collected, measured, and amplifi ed to produce the output signal. Geiger-Muller counters are most effi cient in detecting charged particles like beta particles but are ineffi cient in detecting x- and gamma-radiation. Geiger-Muller counters are sensitive to low levels of radiation. They are used in survey instruments to detect radioactive contamination in a nuclear medi-cine department, as detectors in CT scanners, and as calibration instruments for the calibration of x-ray tubes and nuclear medicine dose calibrators.
The ion chambers are primarily used to measure the primary and secondary radiation beam for the purposes of evaluating equipment performance, assessment of scatter and leakage radiation, and to measure patient dose. The ionization chamber has a certain volume of air and an electrode. This chamber works on the principle that when radiation interacts with the electrons in the air, positive ions are produced. These positive ions then produce an electrical charge that can then be measured (Fig. 20.6).
Figure 20.6. Portable Geiger-Muller counters and ion chambers used for radiation surveys.
Fosbinder_Text_Chap20.indd 314 11/23/2010 12:12:00 PM

Chapter 20: Radiation Protection and Regulations 315
Thermoluminescent DosimetersA TLD uses a lithium fl uoride crystal as the radiation detector. When it is exposed to x-rays, the lithium fl uoride crystal traps the radiation energy. This trapped energy can be released as light by heating the crystals to over 100°C. The light is detected by a photomultiplier tube and con-verted into an electrical output signal. These dosimeters are called TLDs because they give off light after heat-ing. The amount of light is proportional to the radiation dose absorbed in the crystal (Fig. 20.8). Lithium fl uoride has almost exactly the same energy response to radia-tion as human tissue. TLDs are very small and typically used in ring badges to monitor radiation exposure to the extremities.
There are several types of personnel monitors: fi lm badge dosimeters, thermoluminescent dosimeter (TLD), pocket dosimeter, and optically stimulated luminescent (OSL) dosimeters.
Film Badge DosimetersFilm badge dosimeters contain a small piece of fi lm that will have a specifi c optical density after exposure to radiation and development. The silver halide in the fi lm emulsion makes the fi lm response very sensitive to x-ray energy. Radiation energies near the K-edge of silver are preferentially absorbed and produce correspondingly higher optical densities. The higher the exposure, the greater the optical density. Personnel monitors using fi lm as a detector have copper, cadmium, and aluminum fi l-ters to estimate the energy of the incident radiation.
An energy correction, obtained from the optical densities under the fi lters, is applied to calculate the radia-tion dose from the unfi ltered optical density. Film badges measure exposures ranging from approximately 0.1 mSv (10 mrem) to 20 Sv (2,000 rem) and are used to measure total body exposure. Readings lower than 0.1 mSv are generally not detectable and may be reported as minimal on a fi lm badge dosimetry report.
Film is sensitive to heat, light, and moisture as well as radiation. Personnel monitor dosimeters that use fi lm must be kept dry and cool. Storing them in a hot car during the summer or passing them through a washing machine will render them useless.
Figure 20.7. A variety of personnel monitors.
X-ray photons Light
Phosphor
Metal planchet
HeatA B C
PMtube
Figure 20.8. The process of reporting the exposure absorbed by a TLD. (A) Crystal is exposed to ionizing radia-tion. (B) Crystal is heated and emits visible light.(C) Photomultiplier tube measures intensity of light.
Fosbinder_Text_Chap20.indd 315 11/23/2010 12:12:02 PM

316 Part V: Radiation Protection
is over, the fi lm badge dosimeter or TLD monitor is returned to the supplier for reading. The fi lm is devel-oped, and the optical density is converted to a radiation dose in tissue. The lithium fl uoride crystal from the TLD monitor is heated to over 100°C, and the amount of light released is converted to a radiation dose in tissue. Both types of personnel monitors can detect radiation levels below about 20 mrad. The personnel monitor must be worn on the collar outside the protective apparel. The clip on the monitor should be closest to the body, with the face of the monitor directed outward away from the body. Pregnant technologists must be issued a second badge to be worn at the abdominal level under the apron to estimate the dose to the fetus. Radiation received as a patient is not included in the occupational exposure. An individual’s personnel monitoring badge must not be worn during an x-ray examination as a patient.
The supplier generates a report which is sent to the facility. The report includes participant identifi cation information, the type of dosimeter used, and the radia-tion exposures that were received. The radiation expo-sure is given as the dose equivalent in millirem for the wear period, a quarterly accumulated dose equivalent, a year to date dose equivalent, and a lifetime dose equiv-alent for each participant. The report also provides exposure rates for deep dose, lens of the eye, and shal-low dose equivalents. The report should be reviewed by each participant for each wear date period.
Pocket DosimetersPocket dosimeters are the most sensitive personnel monitoring devices. The pocket dosimeter looks like an ordinary writing pen but contains a thimble ionization chamber. There are two types of pocket dosimeters: the self-reading device which contains a built-in electro-meter and the non–self-reading type which requires a special accessory electrometer to read the device. Both types detect the presence and sign of an electric charge. There are multiple ranges available but the one usually used in radiography has a range of 0 to 200 mR.
The use of the pocket dosimeter can be time con-suming because before it is used, it must be charged to a preset voltage which sets the scale reading to 0. When exposed to radiation, the charge in the chamber becomes neutralized. The chamber is analyzed at the end of each workday to determine the remaining charge in the chamber, and this indicates the amount of radia-tion exposure.
Pocket ionization chambers are not routinely used in diagnostic imaging because each day the pocket dosi-meters must by charged, read, and the facility must keep records of the exposure. This can all be quite time con-suming. In addition, they do not have the type of range necessary for measuring exposure to radiation. If an expo-sure was above the range of the pocket dosimeter, the precise level of exposure would not be known.
Optically stimulated luminescenceWhen using OSL, the detector material is aluminum oxide in a crystal form. Some of the electrons are stimulated by the amount of radiation exposure. The OSL is processed using green light either by laser or light-emitting diode which causes the electrons to return to their normal state. This will result in a blue light emit-ted from the Al2O3 electrons. The intensity of the visible light emission is proportional to the amount of radiation exposure. The OSL reports doses as low as 1 mrad which makes them more sensitive than TLDs. The OSL can also have further analysis for confi rmation of dose.
Monitoring PeriodThe monitoring period for personnel dosimeters is usu-ally 1 month; however, the wear date periods can range from weekly to quarterly. After the monitoring period
Chapter SummaryRadiographic rooms and equipment must comply with federal and state requirements for safety in radiation departments. Stationary radiographic equipment has a separate set of regulations than mobile radiographic equip-ment. Primary radiation is the direct x-ray beam. Primary barriers protect against primary radiation; secondary barriers protect against secondary radiation, which includes scatter and leakage radiation. Leakage radiation must be <100 mR/h at a distance of 1 m from the tube housing. Scatter radiation is lower in intensity and energy than the primary beam. The HVL is
Fosbinder_Text_Chap20.indd 316 11/23/2010 12:12:03 PM

Chapter 20: Radiation Protection and Regulations 317
How will John test exposure reproducibility?
What is mA station linearity?
For these questions include the established guidelines.
John must check multiple aspects of each x-ray tube. The tubes need to be checked for leakage radiation. The amount of leakage radiation must be <100 mR/h at 1 m from the tube. Next, he needs to check the SID to make sure the distance from the source to the tabletop is accurate. It must be accurate within 2% from indicated distance. The collimator must be checked to make sure the size of the light fi eld matches the size of the x-ray beam, this measurement must be within 2%. Next he will need to check the PBL and make any required adjustments. The PBL devices must be adjusted so that for all standard SIDs, the shutters will open to match the image recep-tor size. The PBL must be accurate to 2% of the SID.
The alignment of the x-ray tube to the table Bucky and upright Bucky must be checked and adjustments made if the alignment is not per-fect. When the tube and Bucky are not aligned properly, the image receptor will not receive or be exposed to the whole x-ray beam but only a portion; this causes repeat imaging because of the missed anatomy. To test for reproducibil-ity, John will need to make multiple exposures using the same mA, time, and kVp factors. The output radiation intensity for each exposure will be measured with the read outs not varying by more than 5% of each other. John will also need to check the mA station linearity. To do this, he must select multiple mA stations in sequence and use a set exposure time for each station so that the same mAs is produced each time. The output radiation will be measured for each exposure and must not vary more than 10%.
the amount of shielding required to reduce the intensity to one-half its original value. The TVL is the amount of shielding required to reduce the intensity to one tenth its original value. The primary barriers are those walls which have an upright Bucky or where the x-ray tube is stored. The primary barrier will protect people on the opposite side of the wall from leakage radiation and radiation due to exposures.
Personnel who work in radiation depart-ments are required to wear radiation-monitoring devices. The personnel monitor should be worn on the outside of the protective apparel near the collar. Gas-fi lled detectors are used to calibrate x-ray units. TLDs are used in personnel moni-tors and must be heated to obtain a reading. Film badge dosimeters use a piece of fi lm and specialized fi lters to absorb incident radiation. The OSL uses an aluminum oxide crystal to absorb radiation, and when exposed to a green laser, the crystal will emit light with an intensity proportional to the radiation exposure.
Case StudyJohn is a biomedical technician who is respon-sible for performing annual maintenance on the x-ray equipment in his facility. He is responsible for checking the x-ray tube and making sure it is operating within federal guidelines. John must also test the mA stations and radiation output of the equipment.
Critical Thinking Questions
Which aspects related to the x-ray tube must he check?
Will he need to check alignment of the tube, table Bucky, and upright Bucky?
If so, what is the purpose of testing alignment?
Fosbinder_Text_Chap20.indd 317 11/23/2010 12:12:03 PM

Review Questions
b. reduces the exposed silver halide crystals to black metallic silver
c. is basicproduces an alkaline pHd. is/does all of the above
7. Replenishment systems in automatic processor replenish
a. unexposed fi lm emulsionb. developer and fi xer solutionsc. used wash waterd. drying racks
8. Which of the following is a reducing agent?
a. Glutaraldehydeb. Hydroquinonec. Acetic acidd. Alum
9. The hardening agent in the fi xer is
a. Glutaraldehydeb. Sodium sulfi tec. Potassium alumd. Ammonium thiosulfate
10. The purpose of the guide shoes in the transport racks is to
a. allow the fi lm to move up or downb. to force the edge of the fi lm around the master
rollerc. to bend the fi lm in the crossover networkd. pull the fi lm from the fi lm tray into the transport
rack
Multiple ChoiceIn the characteristic curve shown below, identify the regions (used for questions 1-4)
1. The base plus fog region of the curve is
a. 1b. 2c. 3d. 4
2. The shoulder region of the curve is
a. 1b. 2c. 3d. 4
3. The toe region of the curve is
a. 1b. 2c. 3d. 4
4. The straight-line region of the curve is
a. 1b. 2c. 3d. 4
5. A high-contrast fi lm has a _____ latitude
a. wideb. narrow
6. The developer solution
a. softens the emulsion
Review Questions
Multiple Choice
1. Federal government specifi cations recommend a minimum total aluminum equivalent fi ltration of _____ for fl uoroscopic units.
A. 1.0 mmB. 1.5 mmC. 2.0 mmD. 2.5 mm
2. The personnel monitor should be worn
A. under the protective apparel near the waistB. outside the protective apparel near the collarC. under the protective apparel near the collarD. outside the protective apparel near the waist
3. Primary barriers protect against _____ radiation.
A. directB. leakage and scatter
4. Secondary radiation is made up of _____ radia-tion.
A. leakage and scatteredB. primary, leakage, and scatteredC. scattered and secondaryD. leakage and primary
5. Which of the following is a primary barrier?
1. Wall with vertical Bucky cassette holder2. Wall of the control booth3. Floor
A. 1B. 1 and 3C. 2 and 3D. 1, 2, 3, and 4
6. Fixed fl uoroscopic systems require a source-to- tabletop distance of at least _____ but prefer a distance of not less than _____.
A. 15 cm, 30 cmB. 30 cm, 38 cmC. 38 cm, 45 cmD. 23 cm, 30 cm
7. When the radiologist limits fl uoroscopic fi eld size to include only the area of clinical interest
A. exposure factors must be increased signifi cantly to provide adequate compensation
B. patient dose increases somewhatC. patient dose decreases signifi cantlyD. patient dose remains the same
8. Both alignment and length and width dimensions of the radiographic and light beams must corre-spond to within
A. 1% of SIDB. 10% of SIDC. 5% of SIDD. 2% of SID
Fosbinder_Text_Chap20.indd 318 11/23/2010 12:12:03 PM

Chapter 20: Radiation Protection and Regulations 319
4. Describe how reproducibility and linearity are different when measuring the intensity of the x-ray beam.
5. How long must the exposure cord be for a mobile radiographic unit?
6. How are fi lm badge dosimeters to be worn and where are they placed on the body?
7. What exposure data are included in the personnel monitoring report?
8. Why is the use factor for secondary barriers always 1?
9. What are the three types of radiation exposure that are of concern when determining protective barriers?
10. During both fl uoroscopy and radiography, the _____ is the single most important scattering object.
9. HVL may be defi ned as the thickness of a designated absorber required to
A. decrease the intensity of the primary beam by 50% of its initial value
B. decrease the intensity of the primary beam by 25% of its initial value
C. increase the intensity of the primary beam by 50% of its initial value
D. increase the intensity of the primary beam by 25% of its initial value
10. A cumulative timing device times the x-ray expo-sure and sounds an audible alarm after the fl uoro-scope has been activated for
A. 1 minuteB. 3 minutesC. 5 minutesD. 7 minutes
Short Answer
1. What are the four factors that are taken into con-sideration when determining a barrier for a radio-graphic room?
2. Defi ne controlled and uncontrolled areas in a hospital.
3. _____ is the limit of leakage radiation from the x-ray tube during an exposure.
Fosbinder_Text_Chap20.indd 319 11/23/2010 12:12:03 PM

320
21
Minimizing Patient Exposure and Personnel Exposure
Key Terms● ALARA
● effective dose
● occupationally exposed workers
● protective apparel
● skin entrance exposure
● 10-day rule
ObjectivesUpon completion of this chapter, the student will be able to:
1. Describe the methods of reducing radiation exposure.
2. Describe ALARA.
3. State the three methods of radiation reduction to staff.
4. Name the dose limits for occupational and nonoccupational workers.
5. Discuss the radiosensitivity of pregnancy.
Fosbinder_Text_Chap21.indd 320 11/23/2010 12:12:42 PM

Chapter 21: Minimizing Patient Exposure and Personnel Exposure 321
IntroductionReducing patient and personnel exposure should follow the ALARA principle to keep the exposure to the patient and personnel to As Low As Reasonably Achievable. There are many ways this exposure level can be reduced. In this chapter the exposure to radiographers and patients will be discussed. Protective apparel is an integral aspect of keeping radiation dose as low as possible as well as using appropriate technical factors. At the conclusion the stu-dent will have learned about dose limits for the occupationally and nonoccupationally exposed individual.
Reducing Exposure to Ionizing Radiation
As discussed in previous chapter material, exposure to ionizing radiation carries a risk of biological effects. Due to these effects, it is necessary to reduce or limit the amount of radiation exposure to radiation workers and the public. For radiation protection purposes indi-viduals will be divided into two main groups. The fi rst group comprises the individuals who work with radiation and because of their duties they are routinely exposed to radiation. These individuals are called radiation work-ers or occupationally exposed workers. Radiation work-ers receive special instruction and training regarding the hazards to radiation exposure and proper radiation pro-tection practices. The second group includes members of the general public.
The technologist has several means of reducing radia-tion exposure to himself or herself, the patient, and radi-ologist. This reduction is accomplished by using basic principles in radiation safety while being in the radio-graphic room during an exposure.
Effective DoseThe effective dose of an examination is that dose to the whole body that would cause the same harm as a partial
or localized dose for a particular x-ray examination. Effective dose is introduced to account for the irradiation of different parts of the body. The hazardous effects of whole-body radiation have been extensively studied. Irra-diating a portion of the body does not produce the same ill effects as a whole-body exposure to the same dose. A whole-body exposure of 7 Gy (700 rad) is a lethal dose, but if the radiation dose is delivered to a localized portion of the body, the effects are less severe. Radiation therapy patients routinely receive 70 Gy (7,000 rad) to portions of their body during cancer treatment and survive for many years.
Effective dose is expressed in units of millisieverts (mSv) and is the basis for our dose limits. As seen in Table 21.1, the radiation weighting factor is dependent upon the type of LET associated with the different types of radiation. Radiation which deposits more radiation in the tissue (high LET) has a higher weighting factor than radiation which deposits a low amount of radiation. Also of importance is the sensitivity of different tissues in the body. Table 21.2 has the tissue weighting factor which accounts for the relative radiosensitivity of vari-ous tissues and organs. The effective dose is obtained by multiplying the dose to a particular organ by a weighing factor.
The effective dose from a posteroanterior (PA) chest examination is about 0.1 mSv (10 millirem [mrem]) although the entrance dose is about 0.70 mSv (70 mrem). The difference between the entrance dose and the effec-tive dose occurs because many of the organs used to cal-culate the effective dose are not exposed to the primary beam during the examination.
TABLE 21.1 RADIATION WEIGHTING FACTOR FOR TYPES OF RADIATION
Type and Energy RangeRadiation Weighting
Factor (Wr)
X- and gamma-rays, electrons 1Neutrons, energy<10 keV 110–100 keV 10>100 keV–2 MeV 20>29 MeV 10Protons 2Alpha particles 20
Fosbinder_Text_Chap21.indd 321 11/23/2010 12:12:42 PM

322 Part V: Radiation Protection
Dose Limit RegulationsFederal and state regulations have been established to limit occupational exposures. An occupational exposure is radiation exposure received during normal work duties. There are limits on the whole body dose, the dose to the lens of the eye, and the dose to any other organ of the body. The employer must ensure that no worker’s annual dose exceeds these limits.
The limit on the whole body dose for a radiation worker is 50 mSv (5 rem or 5,000 mrem) per year. The dose limit per quarter is 12.5 mSv (1.25 rem or 1,250 mrem). There is also a limit on the total dose that can be accumulated in a life-time, which is called the cumulative limit. The cumulative effective dose limit (E) is the age in years (N) times 10 mSv.
require issuing a personnel dose monitor to any staff member who might be exposed to more than 10% of the limits listed in Table 21.3. Most radiology departments change the personnel monitors monthly, but the moni-toring interval can be as long as 3 months. The personnel monitoring reports should be available for review by all monitored individuals.
For members of the general public the recommended dose limits are established as one tenth of the effective dose limit for the occupationally exposed worker. Indi-viduals who have infrequent exposure to radiation have a dose limit of 5 mSv (0.5 rem) and for frequent exposure the limit is 1 mSv (0.1 rem). These limits do not include any exposure received from medical procedures. Individ-uals who work in education and training have the same dose limits as the general public who receive frequent exposure, 1 mSv (0.1 rem).
ALARAAll radiation protection programs must operate under the principle of keeping the radiation exposure to staff, patients, and public As Low As Reasonably Achievable (ALARA). This means that it is the responsibility of the radiographer that steps must be taken to reduce radiation exposure well below maximum regulatory limits. Techni-cal factors such as kVp, mA, length of exposure, distance, shielding, fi ltration, collimation, SID, beam area, and type of image receptor all infl uence the radiation levels to the staff and public.
Reduction of Radiation Exposure to Staff
Basic PrinciplesWhen performing radiographic procedures the radiogra-pher must apply the three methods or cardinal rules for radiation protection. The three methods of reducing the radiation exposure of the staff are to:
1. Reduce time spent in the vicinity of radiation2. Increase distance from the radiation source3. Wear appropriate shielding to attenuate radiation
TABLE 21.2 WEIGHTING FACTORS USED IN CALCULATING EFFECTIVE DOSE
Tissue/Organ Tissue Weighting Factor (Wt)
Gonads 0.20Active bone marrow 0.12Colon 0.12Lungs 0.12Stomach 0.12Bladder 0.05Esophagus 0.05Liver 0.05Thyroid 0.05Bone surfaces 0.01Skin 0.01Remainder 0.05
Although most x-ray technologists never receive even a small fraction of the annual dose limit, they are still issued personnel radiation monitors. The regulations
CRITICAL THINKING
What is the cumulative limit for a 32-year-old technologist?
Answer
E = N × 10 mSvE = 32 × 10 mSvE = 320 mSv (32 rem)
Fosbinder_Text_Chap21.indd 322 11/23/2010 12:12:43 PM

Chapter 21: Minimizing Patient Exposure and Personnel Exposure 323
to as long as an hour or more. The dose to an individual is directly related to the length of time the beam is on. If the length of the exposure to radiation is doubled then the exposure to the person will also be doubled.
Patient exposure during fl uoroscopy is determined by the length of time the patient is in the x-ray beam. Shorter fl uoroscopic exposure times result in lower doses to patients and staff. Regulations require that fl uoroscopic units be equipped with a timer to indicate the total fl uoro-scopic beam on time. This timer must provide an audible reminder to indicate when 5 minutes of beam on time has elapsed. Most fl uoroscopic procedures require <5 min-utes, although the timer can be reset when necessary.
During fl uoroscopy the patient’s dose and therefore the dose to the radiographer can be reduced if pulsed fl uoroscopy is used. This prevents the beam from being on continuously while still providing the physician with the image necessary for the exam. If the fl uoroscopy unit does not have pulsing capability, the radiologist should alternate between beam on and beam off during the course of the procedure. This will decrease the dose to the patient and all persons in the room.
The radiation exposure of the technologist and radiologist can be decreased by reducing the time the individual is exposed to radiation, increasing the individual’s distance from the radiation source, and increasing the amount of shielding between the radiation source and the individual. The major source of radiation to the radiologist and tech-nologist is scatter from the patient. The diagnostic x-ray beam should always be collimated to the smallest fi eld size applicable for each examination. Smaller fi eld sizes pro-duce less scatter because less tissue is irradiated. The tech-nologist should never be in the direct beam or in the room during a diagnostic radiographic exposure. The technolo-gist should never hold a patient during the exposure.
TimeRoutine radiographic procedures utilize extremely short exposure time to minimize motion artifact and during these procedures the technologist should not be in the room with the patient. During fl uoroscopy procedures, whether in the x-ray room or surgery, the radiographer is often required to be operating equipment while the beam is turned on. The length of time can be several minutes
TABLE 21.3 EFFECTIVE DOSE LIMIT RECOMMENDATIONS
Dose Limit Values
Occupational ExposuresEffective dose limits a. Annual 50 mSv (5 rem) b. Cumulative 10 mSv × age (1 rem × age)Equivalent annual dose limits for tissues and organs a. Lens of eye 150 mSv (15 rem) b. Skin, hands, and feet 500 mSv (50 rem)
Public Exposure (Annual)Effective dose limit a. continuous or frequent exposure 1 mSv (0.1 rem) b. infrequent exposure 5 mSv (0.5 rem)Equivalent dose limits for tissues and organs a. Lens of eye 15 mSv (1.5 rem) b. Skin, hands, and feet 50 mSv (5 rem)
Embryo/Fetus Exposures a. Total equivalent dose limit 5 mSv (0.5 rem) b. Monthly equivalent dose limit 0.05 mSv (0.05 rem)
Education and Training Exposures (Annual)Effective dose limit 1 mSv (0.1 rem)Equivalent dose limits for tissues and organs a. Lens of eye 15 mSv (1.5 rem) b. Skin, hands, and feet 50 mSv (5 rem)
Fosbinder_Text_Chap21.indd 323 11/23/2010 12:12:43 PM

324 Part V: Radiation Protection
in a manner which would prevent the x-ray tube from emitting primary radiation toward the portable unit or technologist.
ShieldingShielding is used when the technologist must be in the room when the x-ray beam is turned on. Placing pro-tective shielding between the radiation source and the technologist will greatly reduce the level of exposure. Shielding in the radiography department typically con-sists of lead apparel, mobile shields, and building mate-rials which are all designed to provide the maximum protection possible to shield the technologist from radia-tion. The lead apparel and mobile shields must be used any time it is not possible to take advantage of the fi xed structural barriers.
Protective ApparelRadiographers are trained to wear protective apparel for examinations where they will be exposed to ionizing radi-ation. Protective aprons have equivalent lead thicknesses of 0.25, 0.5, or 1 millimeter (mm) lead. The protection is equivalent to that of pure lead of the thickness indicated. Drapes hanging from the image intensifi er, protective aprons, gloves, Bucky slot covers, and fold-up shields are designed to intercept the scattered radiation and reduce the radiation exposure of the staff. The Bucky tray should be moved to the foot of the table when possible to ensure that the Bucky slot cover is in place. Lead glasses and thyroid shields can also be used to protect specifi c areas of the body.
DistanceDuring fl uoroscopy, when the technologist must be in the room while the beam is on, the patient is the source of scattered radiation. The intensity of scattered radiation is less than that of the primary beam by a factor of 1,000. That is, the intensity of the scattered radiation 1 meter (m) from the patient is 1/1,000 of the primary beam intensity. During the procedure the tech-nologist should stand as far away from the patient and fl uoroscope as possible while still being able to render assistance to the patient when needed. Increasing the distance from the patient decreases the scattered radia-tion reaching the staff. According to the inverse square law, doubling the distance from the source reduces the radiation intensity to one fourth its original value (Fig. 21.1). Moving one step away from the edge of the fl uoroscopic table reduces the radiation exposure sig-nifi cantly. If the patient does not require assistance dur-ing the procedure the technologist must stand in the control area and as far away from the scattered radiation as possible. The technologist should be wearing appro-priate protective apparel so that if he or she needs to assist the patient there will not be a delay in providing that assistance.
The patient is also the source of scatter during por-table examinations. Increasing the distance from the patient during portable examinations decreases scattered radiation to the technologist. Portable units are equipped with an exposure switch on the end of a 180-centimeter (cm) (6-foot [ft]) cord to allow the technologist to move away from the patient before making the exposure. The technologist must use caution to place the portable unit
Figure 21.1. Typical exposure levels at various distances from a fl uoroscopic table.
100 mR/h
10 mR/h
Fosbinder_Text_Chap21.indd 324 11/23/2010 12:12:43 PM

Chapter 21: Minimizing Patient Exposure and Personnel Exposure 325
vinyl surface to aid in cleaning. The interior vinyl-lead composition is fl exible but will crack if it is bent too far or bent repeatedly in the same location. Lead aprons must never be tossed in a heap or folded over for stor-age. They must be stored properly on reinforced hanging racks or laid fl at on a table (Fig. 21.2). Because they are so susceptible to cracking when stored improperly, lead aprons and other protective apparel should be inspected annually, both visually and under fl uoroscopy or by tak-ing radiographs. This inspection must be documented. If a defect in a protective apron, glove, or shield is detected, the item must be immediately removed from service.
Because there is no protective barrier present, lead aprons must always be worn by radiographers during mobile radiographic procedures. A protective apron should be assigned to every portable unit. If no lead apron is present on a portable unit the technologist must locate a lead apron to use for the procedure. Aprons vary in weight from a few pounds to approximately 25 lb depending on the design and lead content. Figure 21.3
Scatter radiation to the lens of the eyes can be substantially reduced by wearing protective eyeglasses with optically clear lenses that contain a minimum lead equivalent protection of 0.35 mm.
Table 21.4 presents the types of protective shielding, their equivalent lead thickness, and the approximate attenuation of scattered radiation.
Lead aprons are worn to protect vital organs. They are made of a vinyl-lead mixture covered with a smooth
TABLE 21.4 PROTECTIVE APPAREL THICKNESS IN MILLIMETERS LEAD EQUIVALENT AND ATTENUATION VALUES
Apparel Thickness (mm) Attenuation (%)
Apron 0.50 99.9Gloves 0.25 99Thyroid 0.50 99Glasses 0.35 99Fluoroscopic drape 0.25 99
Figure 21.2. (A) A photograph of a hanging rack with protective aprons. (B) Photograph of a glove.
A B
Fosbinder_Text_Chap21.indd 325 11/23/2010 12:12:44 PM

326 Part V: Radiation Protection
Figure 21.4, the weight of the apron is divided between the shoulders and pelvis while providing complete wrap-around protection.
Proximity to RadiationDuring any fl uoroscopic exam, radiographers should remain at least one or two steps back from the table if their assistance is not required. Additionally, if radiographers are wearing the apron shown in Figure 21.3, they must be aware of keeping their backs turned away from the source of radiation since their backs are not protected.
Holding the PatientRadiographers should never stand in the primary or useful beam to immobilize or hold a patient during an exposure. There may be instances when the radiographer
is an example of a lead apron that covers the front of the body, wraps around the sides, and extends from the shoul-ders to the knees. Lead aprons with 1 mm lead equivalent will possess a signifi cant weight and will cause fatigue for the radiographer if the apron is worn for extended periods of time. This type of apron is commonly used for fl uoro-scopic and mobile procedures but lacks protection for the persons back. The protective aprons must have a minimum of 0.5 mm lead equivalent when used for procedures where the x-ray beam peak energy will reach 100 kVp. Most departments will use aprons with 0.5 mm lead equivalent as a balance between weight and protection.
Protective aprons for interventional suites or cardiac catheterization labs should be of the wrap around type. The procedures which are performed in these settings require personnel to move around the room where their back may be exposed to scatter radiation from the patient. Technologists who work in these areas must wear their lead aprons for a signifi cant portion of each day which can lead to fatigue in the shoulders and back. To provide complete protection and to minimize fatigue a two-piece wraparound lead equivalent apron is preferred. As seen in
Figure 21.4. Two-piece lead apron and thyroid shield.
Figure 21.3. Lead apron and thyroid shield.
Fosbinder_Text_Chap21.indd 326 11/23/2010 12:12:48 PM

Chapter 21: Minimizing Patient Exposure and Personnel Exposure 327
a faster fi lm/screen combination when one is available, will reduce retakes due to patient motion. Increasing the kVp is always associated with decreased mAs to obtain an acceptable optical density which results in a reduced exposure to radiation. The relationship between mAs and patient dose is linear, as the mAs decreases so does the dose the patient receives. When selecting technical fac-tors the radiographer must use care to select the appropri-ate kVp because using kVp which is too high will produce a poor quality image that will likely not provide the radi-ologist with the necessary quality to make a diagnosis.
Using good collimation practices is essential to good radiographic technique. The radiographer has the ability to reduce the fi eld size for each radiographic image. By reducing fi eld size the patient receives a lower dose of radiation and the image quality will also be improved due to the reduction of scatter radiation.
Repeat RadiographsThe single most important factor in reducing the patient dose is limiting or eliminating retakes. A retake doubles the patient dose to obtain information that should have been obtained with the initial exposure. Retakes can be reduced by careful patient positioning, selection of cor-rect exposure techniques, and good communication so that the patient knows what is expected of her or him. Causes of repeat examinations are typically improper positioning and poor radiographic technique resulting in an image that is too light or too dark. Some repeat examinations are caused by processor artifacts, chemical fog, light leaks, grid errors, multiple exposures on one image, motion, and improper collimation. Careful atten-tion to detail will result in the production of a quality radiographic image.
Shielding DevicesThe nature of radiographic examinations results in a partial-body exposure to radiation. To ensure the other areas of the body are spared exposure to radiation the technologist can use collimation and area shielding. The use of area shielding is indicated when an organ or tissue which is radiosensitive will be near or in the useful beam. Gonadal shielding should be considered as a secondary measure against radiation exposure to the reproductive organs and not a substitute for a properly collimated
must hold a patient during an exposure. The radiographer should stand at right angles or 90 degrees to the scatter-ing object, when the protection factors of distance and shielding have been accounted for, this is where the least amount of scattered radiation will be received. Nonoccu-pational persons who are wearing appropriate protective apparel or mechanical immobilization devices should be used to perform this function when required.
Holding a patient may be necessary when an ill or injured person is not able to physically support himself or herself. For example, weak elderly patients may be unable to stand alone and raise their arms above their head for a lateral chest x-ray. In this situation, a relative or friend may need to hold the patient in position during the exposure. A mechanical immobilization device may be used to hold an infant in the proper upright position for chest radiographs. Supine imaging of the chest will not result in the maximum quality necessary for diagnosing pneumonia or fl uids in the lungs, only an upright posi-tion will demonstrate the air-fl uid levels appropriately. If the infant is too small for the immobilizer or the device is not available, appropriate nonoccupational individuals would be needed to hold the child upright during the exposure.
When nonoccupational individuals such as nurses, orderlies, relatives, or friends assist in holding the patient during an exposure, suitable protective apparel should be worn by each person participating in the examination. The radiographer must be sure the person does not stand in the useful beam. Pregnant females should never be permitted to assist in holding a patient during an exposure as this could result in exposure to the embryo or fetus.
Reduction of Radiation Dose to the Patient
The radiation dose to the patient can be reduced by care-ful selection of exposure techniques and adherence to good radiographic procedures. Selection of higher-kVp, lower-mAs techniques reduces the patient dose.
Radiographic TechniquesReducing the exposure time by using a higher mA sta-tion with a corresponding shorter time or by selecting
Fosbinder_Text_Chap21.indd 327 11/23/2010 12:12:53 PM

328 Part V: Radiation Protection
Radiographic procedures of the lumbar spine, pelvis, and hip have the highest ESE due to the higher kVp and mAs that is required for quality images of the dense bone in these areas. When performing these examinations, the radiographer must carefully consider the purpose for the examination, correct positioning protocols, patient instructions, optimal technical factors based on body habitus, and shielding. Each of these factors plays a vital role in producing a quality image the fi rst time the expo-sure is made. The ESE of a patient who measured 23 cm thick and who had an AP Lumbar spine is 342 mR, while a PA chest fi lm on a patient who measured 23 cm pro-duces an ESE of 9 mR. There is a signifi cantly higher ESE for one AP Lumbar spine image, and with this high of an ESE it is easy to determine why it is so critical that the radiographer practices good judgment in positioning and exposing the patient.
Pediatric ConsiderationsWhen considering the potential for biological damage from exposure to ionizing radiation, children are more vulnerable to late somatic effects and genetic effects than adults. Imaging children requires special consideration to make sure the principles of ALARA are followed as well as appropriate shielding.
To image a child smaller doses of radiation are used to obtain diagnostic quality images than the doses used for adults. The entrance exposure below 5 mR will result from an AP projection of an infant’s chest where the same projection of an adult’s chest will yield an entrance exposure ranging from 12 to 26 mR.
Patient motion is the most common problem encoun-tered in pediatric radiography. When working with chil-dren the radiographer needs to be aware of the child’s limited ability to understand the procedure, to cooper-ate, or to remain still for the exposure. To minimize this problem the radiographer must use communication to explain what the child is to do and to elicit cooperation from the child. If the child is not able to hold completely still the radiographer will need to utilize various immo-bilization devices. There are specially designed pediatric immobilization devices on the market to hold the patient securely and safely in the required position. The use of such devices along with the use of appropriate technical factors greatly reduces or eliminates the need for repeat images that increase patient dose. The techniques of
beam. Proper collimation of the useful beam must always be the fi rst step in gonadal protection.
The gonads (ovaries and testes) are frequently shielded from primary radiation to minimize the possibility of any genetic effect occurring with future children. Gonadal shielding is only necessary for use on pediatric patients and adults of childbearing age. Gonadal shields are made in two basic types: fl at contact shields and shadow shields.
Flat Contact ShieldsFlat contact shields are fl at, fl exible shields made of lead strips or lead-impregnated materials. These shields are placed directly over the patient’s reproductive organs. Flat contact shields are most effective when used for patients who are recumbent on the radiographic exam table whether in the anteroposterior (AP) or PA posi-tion. Flat contact shields are not suitable for use during upright imaging and fl uoroscopy examinations.
Shadow ShieldsShadow shields are made of a radiopaque material. These shields are suspended above the collimator and are placed within the light fi eld over the area of clinical interest to cast a shadow over the patient’s reproductive organs. To ensure proper placement of the shadow shield the light fi eld must be properly positioned. In this man-ner the shadow shield will not interfere with adjacent tis-sue. Improper positioning of the shadow shield can result in a repeat radiograph which causes an increase in dose to the patient.
Radiation DoseEach year more and more individuals are undergoing diagnostic radiologic procedures which equates into more irradiation of the general population. Because there is great concern about the risks associated with irradia-tion, it is imperative that risk to the patients be reduced whenever possible. In Chapter 19, the effects of whole body irradiation were discussed and were mainly con-cerned with genetic effects or somatic effects. In addition to these considerations we must consider the effect to the skin during a radiographic procedure where only a por-tion of the body is receiving radiation. It is obvious that the maximum exposure occurs at the skin entrance to the body and not at the area of interest. This is called the skin entrance exposure or ESE.
Fosbinder_Text_Chap21.indd 328 11/23/2010 12:12:53 PM

Chapter 21: Minimizing Patient Exposure and Personnel Exposure 329
on a separate record with the waist device being identifi ed as exposure to the fetus. Historically, review of these addi-tional monitors consistently refl ects that exposures to the fetus are insignifi cant.
Fetal DoseThe NRC regulations state that the dose equivalent to the embryo or fetus during the entire pregnancy cannot exceed 5 mSv. The NRCP recommends that the fetal exposure be restricted to an equivalent dose of 0.5 mSv (0.05 rem or 50 mrem) per month. These two limits com-plement each other since the normal gestation period is 10 months; therefore, 0.5 mSv/mo equates to 5 mSv for the entire pregnancy.
Pregnant PatientUnfortunately, most women are not aware that they are pregnant during the earliest stage of pregnancy so there is concern over the exposure of the abdominal area in potentially pregnant women. To minimize the possible exposure to an embryo in the earliest days of a pregnancy a guideline known as the 10-day rule has been recom-mended by various advisory agencies. This guideline states that elective abdominal x-ray examinations for women of childbearing age must be postponed until the 10-day period following the onset of menstruation. It is considered unlikely that a woman would be pregnant during these 10 days. Because on our current under-standing of radiobiology of radiation and pregnancy, the 10-day rule is obsolete. This is primarily because the egg for the next cycle reaches maximum sensitivity dur-ing this 10-day period. The risks of injury resulting from irradiation in utero are small. The physician ordering the radiologic examination will carefully weigh the risks of the irradiation to the fetus with the benefi ts of the exam.
It should be noted that only medically necessary exam-inations should be performed. The radiographer per-forming the examination must use precisely collimated fi eld sizes and should carefully position protective shields where appropriate. High kVp techniques are most appro-priate in these situations so that the dose, mAs, can be kept low.
gonadal shielding must also be applied to the pediatric patient.
Reducing Exposure During Pregnancy
In medical imaging there is heightened concern for the damaging effects of irradiation to the developing embryo or fetus. Special care is taken in medical radiography to prevent unnecessary exposure of the abdominal area of pregnant females. There is concern for the pregnant radiographer and for the pregnant patient.
Pregnant RadiographerThe pregnant radiographer has the right to choose whether or not to declare her pregnancy. When the preg-nant radiographer notifi es her supervisor in writing of her pregnancy, the pregnancy becomes declared and the dose limit for the pregnancy becomes 0.5 mSv/mo. The equivalent dose limit for the fetus is 5 mSv for the entire pregnancy which is a dose level the majority of radiogra-phers do not reach. Most radiographers receive <1 mSv/y as determined with a personnel monitoring device which is worn at the collar outside of protective lead aprons. The exposure at the waist under the protective apron will not normally exceed 10% of the dose registered at the collar.
Lead aprons with 0.5 mm lead equivalent provide approximately 90% attenuation of radiation at 75 kVp which will suffi ciently protect the pregnancy. Some aprons have a 1mm lead equivalent; however, such thick-ness creates a heavier apron which could cause back problems during pregnancy. A wrap-around lead apron will provide maximum protection while distributing the weight to the shoulders resulting in fewer back problems. A facility should make a special effort to provide an apron of proper size for the pregnant technologist to wear.
It is reasonable for a pregnant technologist to request a second personnel monitoring device to be worn under lead aprons and at the waist level. The report for both the collar and waist monitoring devices should be maintained
Fosbinder_Text_Chap21.indd 329 11/23/2010 12:12:53 PM

330 Part V: Radiation Protection
Chapter SummaryThis chapter has described the need for protecting the patient during radiographic procedures and the various tools and techniques used in radiography. To reduce the dose to patients, the radiographer should use increased kVp, lower mAs, and faster fi lm/screen combi-nations. Decreased exposure time will reduce patient motion artifacts. Careful positioning and good communication with the patient will reduce retakes. The effective dose relates the actual dose given to a portion of the body to the dose that would produce the same harm if delivered to the entire body.
The three methods for reducing radiation exposure to personnel are reduction of exposure time, increased distance, and increased shield-ing. All radiation exposure should follow the ALARA principle. The single most important factor for reducing the patient dose is to limit the amount of retakes for the image. Retakes double the patient dose. Careful positioning and good communication with the patient also helps reduce patient dose.
The radiographer must use safe practices when performing examinations. These prac-tices include wearing protective apparel when remaining in the room while the x-ray beam is turned on and standing as far away from the radiation source as possible during exposures. Nonoccupational individuals should hold patients when necessary for an exposure. The use of immobilization devices should be incor-porated into examinations where they will hold the patient still in order to prevent a potential repeat exposure. The radiographer must also use the correct technical factors for the age and body habitus of the patient as a measure of preventing a repeat radiograph due to inappro-priate technical factors.
The use of shielding devices is widely accepted in radiography departments. There are fl at contact shields and shadow shields which are used to protect the gonads from exposure to
primary radiation. These shielding devices are used on pediatric patients and those adults who are of child-bearing age.
Care must be taken to reduce radiation exposure to any pregnant woman, including pregnant or potentially pregnant patients and pregnant radiographers. The current recom-mendation for equivalent dose limit for the embryo or fetus is 0.05 mSv for any month after the pregnancy has been declared.
Case StudyJessica is preparing to perform a fl uoroscopic procedure on a 25-year-old patient. She has explained the examination to the patient and has answered the patient’s questions. Jessica is cer-tain the patient understands the expectations for the procedure. As Jessica is putting on her pro-tective apparel she is thinking of safe radiation practices she can take during the procedure.
Critical Thinking Questions
Name the primary practices Jessica is thinking of.
What is the purpose of putting on protective apparel?
Which apparel should she put on?
What is another method she can use to further decrease her exposure to scatter radiation?
If Jessica were to stand close to the patient, in which location would she receive the least exposure to scatter radiation?
Jessica is thinking of the ALARA concept of radiation protection and the three cardinal
Fosbinder_Text_Chap21.indd 330 11/23/2010 12:12:54 PM

Chapter 21: Minimizing Patient Exposure and Personnel Exposure 331
wrap-around lead apron to provide a barrier between her and the radiation. In addition to wearing a lead apron, Jessica also knows that when she stands farther away from the patient her exposure to radiation is signifi cantly reduced. She will only stand as close to the patient as needed for proper assistance. Jessica also knows that the majority of scatter radiation emitted by the patient is at varying angles from the patient and the area of least exposure is at a 90 degree angle. By following the ALARA con-cept and the three cardinal rules, Jessica will signifi cantly decrease her exposure to radiation.
rules. She must keep her exposure as low as reasonably achievable while following safe radiation practices. Additionally she must comply with the three cardinal rules of time, distance, and shielding. She knows she must only be in the area of exposure for the short-est time possible and the radiologist should use only the lowest necessary amount of radia-tion possible for the procedure. Jessica knows she must wear protective apparel because of the signifi cant amount of scatter radiation which is produced during fl uoroscopic stud-ies. She decides to put on a thyroid shield and
Fosbinder_Text_Chap21.indd 331 11/23/2010 12:12:54 PM

Review Questions
b. reduces the exposed silver halide crystals to black metallic silver
c. is basicproduces an alkaline pHd. is/does all of the above
7. Replenishment systems in automatic processor replenish
a. unexposed fi lm emulsionb. developer and fi xer solutionsc. used wash waterd. drying racks
8. Which of the following is a reducing agent?
a. Glutaraldehydeb. Hydroquinonec. Acetic acidd. Alum
9. The hardening agent in the fi xer is
a. Glutaraldehydeb. Sodium sulfi tec. Potassium alumd. Ammonium thiosulfate
10. The purpose of the guide shoes in the transport racks is to
a. allow the fi lm to move up or downb. to force the edge of the fi lm around the master
rollerc. to bend the fi lm in the crossover networkd. pull the fi lm from the fi lm tray into the transport
rack
Multiple ChoiceIn the characteristic curve shown below, identify the regions (used for questions 1-4)
1. The base plus fog region of the curve is
a. 1b. 2c. 3d. 4
2. The shoulder region of the curve is
a. 1b. 2c. 3d. 4
3. The toe region of the curve is
a. 1b. 2c. 3d. 4
4. The straight-line region of the curve is
a. 1b. 2c. 3d. 4
5. A high-contrast fi lm has a _____ latitude
a. wideb. narrow
6. The developer solution
a. softens the emulsion
Review Questions
Multiple Choice 1. Methods to reduce radiation exposure to the staff
include
1. Reduce time2. Increase distance3. Reduce shielding4. Reduce fi eld size
A. 1, 2, 3, and 4B. 1, 2, and 4C. 2, 3, and 4D. 1 and 2
2. ALARA means
A. as low as readily achievableB. as low as reasonably achievableC. always low and really achievableD. always low and readily accessible
3. Lead aprons and other protective apparel should be inspected for hidden cracks at least
A. dailyB. weeklyC. monthlyD. annually
4. The major source of radiation exposure to radiol-ogy personnel is the
A. primary beamB. BuckyC. image intensifi erD. patient
5. A protective apron should be assigned to _____ portable units.
A. allB. mostC. manyD. no
6. Whenever scattered radiation decreases, the radiog-rapher’s exposure
A. decreasesB. increases slightlyC. remains the sameD. increases 100 times
7. If the peak energy of the x-ray beam is 140 kVp, the primary protective barrier should consist of _____ and extend _____ upward from the fl oor of the x-ray room when the tube is 5 to 7 ft from the wall in question.
A. 1/32 in lead, 10 ftB. 1/32 in lead, 7 ftC. 1/16 in lead, 7 ftD. 1/16 in lead, 10 ft
8. The cord leading to the exposure switch of a mobile radiographic unit should be long enough to per-mit the radiographer to stand at least _____ from the patient, the x-ray tube, and the useful beam to reduce occupational exposure.
A. 1 m (3 ft)B. 2 m (6 ft)C. 3 m (9 ft)D. 5 m (15 ft)
Fosbinder_Text_Chap21.indd 332 11/23/2010 12:12:54 PM

Chapter 21: Minimizing Patient Exposure and Personnel Exposure 333
4. Which two examination procedures does the highest radiation dose occur for diagnostic imag-ing personnel?
5. Explain the importance of gonadal dose.
6. Name the standard thickness of protective apparel.
7. Explain the procedure for holding patients during x-ray examinations.
8. Defi ne tissue weighting factor (Wt).
9. What is the whole body occupational dose limit for radiography students under 18 years old?
10. List the four concepts of patient shielding during x-ray examinations.
9. When performing a mobile radiographic examination, if the protection factors of distance and shielding are equal, the radiographer should stand at _____ to the scattering object.
A. a 30 degree angleB. a 45 degree angleC. a right angleD. a 75 degree angle
10. If the intensity of the x-ray beam is inversely pro-portional to the square of the distance, when the distance from a point source of radiation is tripled, the intensity
A. increases by a factor of 3 at the new distanceB. increases by a factor of 9 at the new distanceC. decreases by a factor of 3 at the new distanceD. decreases by a factor of 9 at the new distance
Short Answer
1. Explain the purpose of the 5-minute reset timer on all fl uoroscopy units.
2. List the three cardinal rules of radiation protec-tion. How are they applied to diagnostic imaging?
3. Using Table 21.3 what is the annual dose limit recommendation for a 37-year-old radiographer.
Fosbinder_Text_Chap21.indd 333 11/23/2010 12:12:54 PM

P A R T V I
Patient Care
Fosbinder_Text_Chap22.indd 334 10/30/2010 6:28:35 PM

22
335
ObjectivesUpon completion of this chapter, the student will be able to:
1. Describe medical ethics.
2. Understand legal aspects for the Radiologic Technologist.
3. Identify Health Insurance Portability and Accountability Act and its components.
4. Understand patient records, charting, and medical histories.
5. Identify patient rights and responsibilities.
6. Describe intentional and unintentional misconduct that may occur in a radiology department.
Medical and Professional Ethics
Key Terms● assault
● autonomy
● battery
● benefi cence
● ethics
● false imprisonment
● fi delity
● justice
● libel
● malpractice
● morals
● negligence
● nonmalefi cence
● slander
● tort
● veracity
Fosbinder_Text_Chap22.indd 335 10/30/2010 6:28:35 PM

336 Part VI: Patient Care
their duties. Professionalism encompasses dedicated study to one’s profession throughout one’s career. Learn-ing does not stop when the students have completed their program of study, but rather they are required to continue their education in the fi eld of radiology so that they may provide the highest quality examination possible for their patients.
Professional OrganizationsOne hallmark of a profession is to have an established professional organization. The professional organiza-tion for the radiologic sciences is the American Soci-ety of Radiologic Technologists (ASRT). The ASRT was founded to advance the profession and to promote high standards of education and patient care. The ASRT and the International Society of Radiographers and Radiological Technologists (ISRRT) both hold high standards for their members and the profession on a global scale. The American Registry of Radiologic Technologists is the agency that oversees certifi cation and registration of technologists who practice the vari-ous imaging modalities. Other organizations which are affi liated with the ASRT but which serve special profes-sional interests include American Healthcare Radiol-ogy Administrators (AHRA), which provides a network and resources for administrators, and the Association of Collegiate Educators in Radiologic Technology and the Association of Educators in Imaging and Radiologi-cal Sciences (AEIRS), which provide guidance to tech-nologists who teach the radiological sciences. Other organizations exist for technologists who practice in specialized modalities such as the Society of Diagnostic Medical Sonography, the Society of Nuclear Medicine, and the Association of Vascular and Interventional Radiographers.
Practice StandardsThe ASRT is the only nationally recognized professional society representing all radiologic technologists in the Unites States today. The ASRT has worked for many years to advance the radiologic profession and to attain profes-sional status for radiologic technologists. To attain this goal the ASRT developed a set of practice standards and scopes of practice to outline duties and responsibilities of radiologic technologists. The document which defi nes
IntroductionPatient care is a vital part of Radiography and Radiologic Technology. Patient care is included on the National Registry Exam which makes up fi ve content specifi c areas for the A.R.R.T exam. This chapter covers medical ethics, profession-alism, professional ethics, Health Insurance Portability and Accountability Act (HIPAA) information, legal considerations, and recording patient information in the medical record.
Radiography as a Profession
Radiologic technology has been utilized in medical facilities since x-rays were discovered in 1895. Over the course of these many years, radiologic technology has evolved from a vocational program into a profession with a set curriculum. Students who are training in radiologic technology programs are required to have extended train-ing and specialized education in the theories and prac-tices of radiography. Students are taught to uphold the highest standards of the profession and to continue this practice as radiologic technologists. These individuals strive to improve the profession through a commitment to truth and to providing patients with excellent service. Radiologic technology has grown into a profession whose members have specialized skills and serve a specifi c need for society.
A profession is organized to govern itself. To effectively set standards of professional behavior, scopes of practice for technologists, education, qualifi cations to practice, and the ability to enforce those standards with its mem-bers. A profession will also advance the knowledge of the profession by having a peer reviewed journal or publica-tion because this allows the profession to advance and to continually review and challenge the base of knowledge on which it functions.
ProfessionalismIndividuals who work in a profession are expected to uphold the highest level of professionalism in performing
Fosbinder_Text_Chap22.indd 336 10/30/2010 6:28:35 PM

Chapter 22: Medical and Professional Ethics 337
Standards of Ethics for RadiographersThe Standards of Ethics is made up of two separate parts: the Code of Ethics and the Rules of Ethics. The ASRT and ARRT joined forces to develop, revise, and adopt the Code of Ethics in 1998. This document serves as a guide to maintain ethical conduct in all areas of the radiologi-cal sciences. The Rules of Ethics were added in 2001, all radiologic technologists must comply with these rules and the ARRT enforces the Rules of Ethics. The Rules of Eth-ics promote protection, safely, and comfort of the patient. Technologists who violate the Rules of Ethics are subject to sanctions by the ARRT and may have their certifi cations revoked.
ARRT Code of EthicsThe American Registry of Radiologic Technologist has listed ten separate principles for the technologist to follow. They are listed in the Code of Ethics for the Radiologic Technology profession. They are as follows:
Principle 1. The Radiologic Technologist functions effi ciently and effectively, demonstrating conduct and attitudes refl ecting the profession.
1.1. Responds to patient needs1.2. Performs tasks competently1.3. Supports colleagues and associates in providing
quality patient care.
Principle 2. The Radiologic Technologist acts to advance the principal objective of the profession to provide services to humanity with full respect for the dignity of humankind.
2.1. Participates in and actively supports the profes-sional organizations for radiologic technology
2.2. Acts as a representative for the profession and the tenants for which it stands
2.3. Serves as an advocate of professional policy and procedure to colleagues and associates in the health care delivery system
Principle 3. The Radiologic Technologist provides ser-vice to patients without discrimination.
3.1. Exhibits no prejudice for sex, race, creed, religion
clinical practice, performance standards, and quality standards is called The Practice Standards for Medical Imaging and Radiation Therapy. These standards are used by technologists, administrators, and lawyers to determine the accepted level of care and to determine if the professional standard has been met by radiologic technologists in the performance of their duties.
Medical and Professional Ethics
In society today, it has become common place for indi-viduals to seek litigation to recoup real or imagined dam-ages. The radiologic technologists must be ever aware of the implications of their actions when caring for patients. They must be familiar with the moral, ethical, and legal consequences of their actions.
Morals and EthicsFor some people morals and ethics mean basically the same things when in fact they are quite different. Our moral compass is based on lessons of right and wrong we learned at an early age. These lessons are based on a set of standards or morals which govern how we relate to other people and how we get along with society. There are also group morals which govern our relationships as profes-sionals and how we perform duties for our patients which include providing proper care, maintaining professional competence, and maintaining confi dential patient infor-mation.
Ethics are defi ned as a set of moral principles that gov-ern our course of action. Each person has his or her own personal code of ethics that are based on cultural and environmental background. Our upbringing is strongly based on rights and wrongs that are set forth by our cul-tural group or society. Our ethics also help us place value on behaviors and determine if a given action is either good or bad. Each of us makes decisions which are infl uenced by our morals and ethics; sometimes, our personal morals and ethics are in confl ict with our professional. It is up to each individual to balance his or her personal ethics with the professional ethics which govern all radiologic technologists.
Fosbinder_Text_Chap22.indd 337 10/30/2010 6:28:36 PM

338 Part VI: Patient Care
8.1. Protects the patient’s right to quality radiologic technology care
8.2. Provides the public with information related to the profession and its functions
8.3. Supports the profession by maintain and upgrad-ing professional standards
Principle 9. The Radiologic Technologist respects con-fi dences entrusted in the course of professional practice.
9.1. Protects the patient’s right to privacy 9.2. Keeps confi dential information relating to
patients, colleagues, and associates 9.3. Reveals confi dential information only as
required by law or to protect the welfare of the individual or the community
Principle 10. The Radiologic Technologist recognizes that continuing education is vital to maintaining and advancing the profession.
10.1. Participates as a student in learning activities appropriate to specifi c areas of responsibility as well as to the Scope of Practice
10.2. Shares knowledge with colleagues10.3. Investigates new and innovative aspects of pro-
fessional practice
Ethical Judgments and Confl ictsDuring the course of a radiologic technologists career, there will be situations that will require the technologist to analyze the ethics of the situation and whether correc-tive action is needed. Many situations which occur are obviously unethical and unacceptable to most everyone; however, there are circumstances that make each of us question our moral compass and ethics. Often our per-sonal ethics are in confl ict with another person’s ethics which poses a dilemma. You must be prepared to assess the confl ict objectively and to determine the best course of action for all interested parties. There are four steps you can take to help you solve an ethical dilemma:
● Identify the problem● Develop alternative solutions● Select the best solution● Defend your rationale and selection
3.2. Provides service without regard to social or economic status
3.3. Delivers care unrestricted by concerns for per-sonal attributes, nature of the disease or illness
Principle 4. The Radiologic Technologist practices technology founded on scientifi c basis.
4.1. Applies theoretical knowledge and concepts in the performance of tasks appropriate to the practice
4.2. Utilizes equipment and accessories consistent with the purpose for which it has been designed
4.3. Employs procedures and techniques appropri-ately, effi ciently, and effectively
Principle 5. The Radiologic Technologist exercises care, discretion, and judgment in the practice of the profession.
5.1. Assumes responsibility for professional decisions5.2. Assess situations and acts in the best interest of
the patient
Principle 6. The Radiologic Technologist provides the physician with pertinent information related to diagnosis and treatment management of the patient.
6.1. Complies with the fact that diagnosis and inter-pretation are outside the scope of practice for the profession
6.2. Acts as an agent to obtain medical informa-tion through observation and communication to aid the physician in diagnosis and treatment management
Principle 7. The Radiologic Technologist is respon-sible for protecting the patient, self, and others from unnecessary radiation.
7.1. Performs service with competence and expertise7.2. Utilizes equipment and accessories to limit radia-
tion to the affected area of the patient7.3. Employs techniques and procedures to minimize
radiation exposure to self and other members of the health care team
Principle 8. The Radiologic Technologist practices ethical conduct befi tting the profession.
Fosbinder_Text_Chap22.indd 338 10/30/2010 6:28:36 PM

Chapter 22: Medical and Professional Ethics 339
not let the patient’s morals detract from performing their duties with compassion, respect, and tolerance for the patient’s moral beliefs. The professional stan-dards assure us that ethical judgments can be made with confi dence that a person in a similar situation would make the same decision.
Patient Rights and Responsibilities
A video for this topic can be viewed at http://thepoint.lww.com/FosbinderText
As health care consumers, patients have rights with which all health care personnel must comply. Radiographers must be aware of these rights so that they do not infringe upon the patient’s rights lest they be held legally liable. Examples of some rights include the following:
● Providing patients with a diagnosis, impression, or the results of an examination
● Providing patient considerate and respectful care● Identifying the correct patient before performing
an examination● Maintaining the patient’s modesty and privacy
during examinations● Maintaining the highest quality images possible
while using the lowest possible amount of radiation
A radiographer must never assume the role of other medical personnel in the hospital. It is not within the scope of practice for a radiographer to read radiographic images and provide an explanation of the results to patients or their family. Finally, the radiographer is responsible for the physical care of the patient. If the patient has been injured while in the radiographers care, a physician must assess the patient before they are dismissed from the department.
Patients also have responsibilities for their care and interaction with health care personnel. The patient must also abide by the Patient Bill of Rights which includes the following:
● The patient has the obligation to provide an accurate and complete health history.
● The patient is responsible for her or his own actions when refusing treatment or not following his or her physician’s instructions.
Following these four steps with the Code of Ethics and Rules of Ethics as your ethical compass will assist you in making the best decision possible. In addition, the technologists have the Practice Standards and Scopes of Practice to aid them in making a decision.
Ethical PrinciplesEthics can be a double edged sword because there are times when our professional ethics are in confl ict with a patient’s claim to his or her rights. To assist the radiographer in solving the ethical dilemma, we have six ethical principles which are accepted as guides to the right action which should be respected by others unless they have a compelling ethical or moral reason to discount it. The six principles are as follows:
1. Autonomy: Defi ned as self-determination. All persons have the right to make rational decisions concerning their lives and you must respect those decisions.
2. Benefi cence: Goodness. All actions that bring about a good result or are benefi cial are considered right.
3. Nonmalefi cence: The duty to prevent harm or the obligation to not infl ict harm. Radiographers are obligated to practice in a safe manner at all times and to not infl ict harm on a patient.
4. Veracity: An obligation to tell the truth and be hon-est in all aspects of your professional life.
5. Fidelity: Faithfulness. The duty to fulfi ll your com-mitments and applies to both stated and implied promises. Radiographers must not promise patients results that you cannot achieve.
6. Justice: Treating all persons fairly and equally. You must treat all patients the same regardless of your personal feelings.
With these principles as a guide, the radiographer can develop a better understanding of the patient’s point of view while in our care. The patient may fi nd his or her morals and ethics are in confl ict with the individuals who are administering care to them. Ethi-cal confl icts can be troublesome when our ethics do not match the ethics of the patient or the ethics of the group we work with. Professionals must not let their personal morality to supersede the group’s moral duty to provide quality patient care. Professionals also must
Fosbinder_Text_Chap22.indd 339 10/30/2010 6:28:36 PM

340 Part VI: Patient Care
This will educate the patient and allow the radiographer to effi ciently complete the ordered exam.
Battery is the unlawful touching of a person with-out his or her consent. If the patient refuses to undergo the exam, his or her choice should be respected. If the radiographer did the exam despite the patient’s refusal, the radiographer could be charged with battery. Assault and battery are often linked together, meaning a threat of harm existed before the actual contact was made.
Libel and Slander: Libel and/or slander occurs when patient information is maliciously spread without a patient’s consent, and the end result defames that patient’s character or damages his or her reputation. Libel refers to written information. Slander refers to verbal information. Any violation of confi dentiality; in particular, the mali-cious spread of information is a direct violation of HIPAA.
False imprisonment is the unjustifi able detention of a person against his or her will. This becomes an issue when the patient wishes to leave and is not allowed to do so. Patients can claim false imprisonment if they are restrained against their will. Many hospitals have a no restraining policy without a physician’s direct order. Restraints are commonly applied if it is demonstrated that the patient will be harmed by their actions. Using the side rails on hospital beds and stretchers is a method of restraining a patient without physical restraints.
The radiographer is responsible to maintain patient confi dentiality at all times and not disclose confi dential patient information without the patient’s written consent. Invasion of privacy can be charged if the patient’s con-fi dentiality has not been maintained or if the patient’s body has been improperly and unnecessarily exposed or touched. Hospitals and their employees must be mindful of the health information they have access to and must make certain that the information remains protected. In 1996, the Health Insurance Portability and Accountabil-ity Act came into effect. This Federal legislation provides guarantees that a patient’s fi nancial and health informa-tion will be private and secure in any format that the information is stored. HIPAA protects a patient’s privacy when medical information is transmitted outside the aus-pices of the patient’s healthcare providers. Medical and fi nancial information cannot be released to employers, fi nancial institutions, or other medical facilities without the express written consent of the patient.
Additionally, the patient’s modesty must be protected while the patient is in the care of the hospital. Many
● The patient is responsible for following hospital policies and regulations regarding patient care and conduct.
● The patient is responsible for being considerate for the rights of others and to respect other people’s property.
The American Hospital Association developed the Patient’s Bill of Rights and is responsible for maintaining the document and recommending changes.
Legal Aspects for Radiologic Technologists
Radiographers must abide by the laws which govern the delivery of health care, the professional practice of radi-ography, and interpersonal interactions. Laws are divided into two major categories: criminal law and civil law. Criminal law is an offense against society, a person, or the government. Criminal law is further defi ned by the seriousness of the crime. A serious crime is a felony and potentially punishable with imprisonment. A less serious crime is a misdemeanor, which is punishable by a fi ne or by imprisonment for <1 year.
Civil law deals with the rights and duties of individuals with respect for others. The punishment for those individu-als found guilty of breaking civil law can be paying a sum of money to offset the damages of the crime. A civil law that is committed against a person or property is called a tort.
TortsTort law involves personal injury or damage to property, which results in civil litigation to obtain payment for the damages. A tort may be committed intentionally or unin-tentionally. An intentional tort or misconduct of the tech-nologist can include assault, libel, slander, battery, false imprisonment, and invasion of privacy.
Assault is the unlawful threat of touching a person in an injurious way; actual physical contact is not made. As a radiographer, you should explain what is going to occur to the patient prior to performing a procedure.
Fosbinder_Text_Chap22.indd 340 10/30/2010 6:28:36 PM
Chapter 22: Medical and Professional Ethics 341
can avoid a possible malpractice claim. Establishing a professional, trusting relationship with the patient has proven effective in avoiding a malpractice lawsuit. Radiog-raphers who clarify patient identifi cation, accurately administer medications, and comply with patient safety requirements have taken positive steps to provide optimal patient care and to avoid potential malpractice lawsuits. Radiographers who understand that their limitations and lack of experience are opportunities to learn from expe-rienced care givers minimize the risk of harming their patients and of having a malpractice claim against them.
Patient Records, Charting, and Medical History
Health care facilities utilize many forms of patient chart-ing. Patient charting is used for communication (i.e., physician’s orders), between all providers. Patient history, admitting and discharge diagnosis, physician progress notes, nurse’s notes, physical therapy notes, occupational therapy notes, laboratory examinations, and radiology reports are all examples of different types of charting that are contained within the patient’s main chart. The radiog-rapher’s charting may include medications administered during a procedure, identifi cation of contrast agents injected, type and amount of contrast agents used, timing of the procedure, and any sort of reaction that the patient may have had to the use of contrast media. The radiogra-pher is responsible for obtaining a complete and accurate history of the patient, the reason for the ordered exami-nation, identifi cation of the examination performed and completed, and the patient’s reaction or actions during the procedure itself.
As a radiographer, you are accountable for document-ing the number of images for the exam, exposure factors or CR/DR numbers, and the amount of fl uoroscopic time used for the procedure. You are also responsible for taking a pertinent medical history for the examination which has been ordered for the patient. Many procedures require a baseline set of vital signs as well as monitoring throughout the procedure, verifi cation of a female’s last menstrual cycle and possibility of pregnancy, history of
radiographic procedures require a certain amount of exposing the patient for the purposes of performing the examination. It is the radiographer’s duty to maintain the patient’s modesty as much as possible.
Unintentional torts include negligence and malprac-tice. Negligence is the neglect or omission of reason-able care or caution. The standard of care is based on principle of the reasonably prudent person and if they would have performed in a similar manner under simi-lar circumstances. A radiographer has the duty to provide reasonable care to a patient. In a court of law the radiog-rapher will be held to the standard of care and skill of a reasonable radiographer in a similar situation.
Negligence is further delineated by gross negligence, contributory negligence, and corporate negligence. Gross negligence is an act that demonstrates reckless disregard for life and limb. This is the highest degree of negligence and results in more serious penalties. Contributory negli-gence refers to an act of negligence in which the behavior of the injured person contributed in some manner to the injury. Corporate negligence applies when the hospital is negligent.
Four conditions must be found true to establish a claim of malpractice:
1. The person being sued had a duty to provide reasonable care to the patient.
2. The patient suffered injury or some loss.3. The person being sued is the party responsible for
the loss.4. The loss is directly attributed to negligence or
improper practice.
Negligence is proven when the court is convinced that the loss or injury is a result of negligent care or treat-ment. This must be proven before the patient is entitled to damages. To prove negligence, the court will have to determine if the radiographer performed his or her duty in accordance with current, acceptable practice. To avoid an accusation of negligence, the radiographer must be aware of professional ethics and practice within established guidelines.
Malpractice PreventionRadiographers who practice with the best interest of the patient in mind and who are cautious in their actions
Fosbinder_Text_Chap22.indd 341 10/30/2010 6:28:36 PM

342 Part VI: Patient Care
Chapter SummaryRadiography is a medical fi eld with a set of professional standards, ethics, and organizations that set the ethical standards for the profession. Radiographers are required to practice with the Code of Ethics and Rules of Ethics. It is essential for radiographers to be responsible for their actions and the safety and well being of their patients. All health care personnel must also comply with protecting the privacy of our patients. Privacy of patients’ condition and their records is protected by HIPAA, the Health Insurance Portability and Accountability Act. Ethics are moral standards that oversee the con-duct of the radiologic technologist.
Professional behavior involves moral, legal, and ethical implications for our actions. Radiog-raphers must use sound ethical judgment to resolve confl icts between their personal moral beliefs and ethics and the moral beliefs and ethics of other persons. Radiographers must not impose their ethical or moral beliefs on a patient as each patient has the right to his or her own beliefs. The Patients Bill of Rights assures patients the sanctity of their rights while in a healthcare facility. Patients also have certain responsibilities for their care which they must be aware of.
Criminal law deals with felonies and mis-demeanors, crimes against the state which are
allergies, trauma, types and amounts of contrast media given, and patient education that was provided before and after the examination. Each of these must be placed in the patient’s medical record to document the continu-ity of care the patient received and the demonstration of following established protocols and guidelines.
Requirements for Entries in the Medical RecordGreat care must be taken when charting. A radiographer’s subjective comments have no place in charting. For exam-ple, stating “patient is drunk for his examination” is not a valid history. “Patient staggered into exam room. Strong odor of alcohol noted on patient’s breath. Patient unco-operative during examination by refusing to hold breath” are acceptable forms of objective charting. Entries in a chart should be complete, objective, consistent, leg-ible, and accurate. When documenting information on paper forms the notations must be legible, written in ink, and must be dated and signed by the person making the notation, including your title or credentials.
Computerized medical records provide access to patient health history for the radiographer. Access to electronic medical records is protected and radiog-raphers will be required to log onto the system with their own password or by using a barcode identifi ca-tion which is scanned. The fi les and types of informa-tion that you are authorized to access may be limited. When fi nished entering information into the com-puter, be sure to log off so as to not permit another person from using your password to access confi dential medical records.
Correcting Entries in the Medical RecordWhen an entry needs to be corrected, there are sev-eral rules that should be followed. They include the following:
● To delete an entry, simply draw a line through it; do not erase or use corrective fl uid.
● Always initial and date corrections.● Never leave blanks on the form. Insert NA or draw
a line through the blank followed by your initials.● Never insert loose slips of paper.
● Always use the four digits for the year when dating written forms.
● Date and sign entries you make include your title or credentials.
Following these simple rules will ensure the entries you make are benefi cial to the medical record. Remember that all information in patient records is confi dential and must not be left where unauthorized individuals can read it. The chart is a legal document that can substantiate or refute charges of negligence or malpractice. The course of treatment and quality of care the patient received are refl ected in the chart.
Fosbinder_Text_Chap22.indd 342 10/30/2010 6:28:36 PM

Chapter 22: Medical and Professional Ethics 343
me! That is completely a lie. My husband is not drunk! He is a diabetic and the nurses were giving him glucose because he was having an insulin reaction. I am going to report you to Human Resources for spreading slanderous rumors about my husband.”
Critical Thinking Questions
Were Sara’s comments wrong?
If so, what did she do wrong?
Which medical ethics did Jenny and Sara violate?
Was she out of line and being rude or is there probable cause for litigation?
Should Jenny and Sara have been discussing the patient outside the radiology department?
Sara’s comments were unjustifi ed and inappropriate. She did not protect the patient’s private information because she was discussing a patient’s medical information where anyone could hear her. She used poor ethical judgment and didn’t comply with the following Code of Ethics: Principle 8.3, 9.1, 9.2, and 9.3 because she didn’t uphold current professional standards and she didn’t protect the patient’s right to pri-vacy. She acted unprofessionally when she inten-tionally spread malicious information about Mr. Johnson. Sara and/or Jenny could be accused of violating civil tort law which is punishable with a fi ne. Mrs. Johnson may have a legal case of slander as well as a violation of HIPAA policies. Sara and Jenny should not have been discussing a patient outside the radiology department. Shar-ing patient information must be done in an area where unauthorized personnel cannot overhear what is being said about the patient. In fact, if a radiographer is not directly involved in the exam they are guilty of unprofessional behavior when they discuss details about the patient and/or the exam with another radiographer.
punishable by imprisonment or fi nes. Felonies are serious crimes committed against a person or the state and are punishable by imprisonment. Misde-meanors are lesser crimes which are punishable by fi nes and rarely result in imprisonment.
Torts are violations of civil law, intentional misconduct, or negligence. Torts result in harm or injury to a patient or other person while in our care. Intentional misconduct includes assault, battery, false imprisonment, invasion of privacy, libel, and slander. Negligence is the neglect of reasonable care which is based on professional practice standards of care of a prudent person.
Radiographers should be aware of their responsibilities to accurately report information in the patient’s medical record. Medical records may be in paper form or on a computer, regard-less the radiographer must follow the accepted criteria for documenting aspects of the patients care during an examination. The medical record includes reports from the lab, radiol-ogy, nurse’s notes, doctor’s notes, and physical therapy. The radiographer has the responsibil-ity to protect the patient’s information from unauthorized individuals.
Case StudyWhile walking to the cafeteria, Jenny and Sara were discussing a patient they had performed an exam on this morning. Jenny and Sara work as radiographers in the radiology depart-ment. “What is the story with the drunk patient in the emergency room?” Jenny asked. Sara replied, “another technologist told me that Mr. Johnson owns a bank in town. He was so drunk this morning that he was slurring his speech and stumbled and hit his head on the marble fl oor at the bank! When we got to the emergency room there was blood everywhere and the nurses were giving him some type of medication to calm him down.” Suddenly from behind them they heard a rather loud “Excuse
Fosbinder_Text_Chap22.indd 343 10/30/2010 6:28:36 PM

Review Questions
Multiple Choice
1. The professional society for radiologic technolo-gist in the United States is
A. ASRTB. ISRRTC. AEIRSD. ARRT
2. HIPAA protects the patient’s
A. painB. asthmaC. privacyD. family
3. Assault is the unlawful
A. touching of the patient without his or her consentB. patient information spread without the patient’s
consentC. yelling at the patientD. none of the above
4. Principle 9 for the technologist refers to
A. performs service with competence and expertiseB. exhibits no prejudiceC. protects the patient’s right to privacyD. performs tasks competently
5. Which of the following protects the patient’s medical information?
A. MisconductB. HIPAAC. Medical historyD. Slander
6. The use of arm and leg restraints without the express order of the physician or the patient’s permission could result in charges of
A. batteryB. false imprisonmentC. invasion of privacyD. assault
7. _________ is the omission of reasonable care in the constructs of a professional relationship.
A. nonmalefi cenceB. misdemeanorC. malpracticeD. neglect
8. Which of the following is NOT a cause for malpractice?
A. The patient did not fully disclose his or her medical condition of COPD.
B. The patient suffered injury or some loss.C. The person being sued is the party responsible for
the loss.D. The loss is directly attributed to negligence or
improper practice.
9. When correcting entries in the medical record, which of the following must be completed?
A. Use four digits for the year in the date of the entry.
B. Always initial and date corrections.C. Never leave any blanks on the form.D. All of the above must be done.
Fosbinder_Text_Chap22.indd 344 10/30/2010 6:28:37 PM

Chapter 22: Medical and Professional Ethics 345
6. Which federal policies are guidelines for protecting patient’s health information?
7. When a radiographer administers the incorrect medication to a patient, the radiographer may be guilty of __________.
8. Defi ne benefi cence.
9. _________ and ________ are often committed at the same time.
10. The Radiologic Technologist practices ethical conduct befi tting the profession is which ethical principle?
10. __________ is defi ned as a person’s right to make rational decisions concerning his or her life.
A. VeracityB. FidelityC. AutonomyD. Benefi cence
Short Answer
1. The radiologic technology fi eld has two major pro-fessional organizations which are __________ and __________.
2. What are the criteria of a profession? How does radiologic technology meet these criteria?
3. Defi ne professional ethics.
4. Provide an example of an unintentional tort.
5. Explain the purpose for patient rights and responsibilities.
Fosbinder_Text_Chap22.indd 345 10/30/2010 6:28:37 PM

346
Key Terms● base of support
● bradycardia
● bradypnea
● BUN
● center of gravity
● creatinine
● dyspnea
● extravasation
● hemostasis
● infi ltration
● ionic
● line of gravity
● nonionic
● sphygmomanometer
● tachycardia
● tachypnea
● venipuncture
ObjectivesUpon completion of this chapter, the student will be able to:
1. Understand the proper administration of giving medications and contrast media.
2. Identify the different contrast media and the common patient reactions.
3. Understand and be able to perform proper vital signs.
4. Describe and apply proper body mechanics used in lifting and transferring patients.
Patient Care, Medications, Vital Signs, and Body Mechanics
23
Fosbinder_Text_Chap23.indd 346 10/30/2010 6:29:10 PM

Chapter 23: Patient Care, Medications, Vital Signs, and Body Mechanics 347
A video for this topic can be viewed at http://thepoint.lww.com/FosbinderText
The technologist is responsible for applying these fi ve rights to every patient who will be receiving medication. In addition, the radiographer must document the admin-istration of medication in the patient’s medical record. The documentation should include the fi ve rights of administration, any reaction the patient had to the medi-cation, course of treatment for the reaction, and outcome of the treatment.
The radiologic technologist would give very little con-trolled medication. The special procedure or interven-tional technologist might administer diazepam (Valium) intravenously to a patient sometimes, but a lot of radio-logic technologists will administer contrast agents IV for a lot of different exams.
CT, MRI, and urinary studies, such as IVPs, require the administration of contrast media to adequately visualize anatomy. Any time iodinated contrast media is given there is always a possibility of contrast reactions. The technolo-gist needs to have all supplies necessary to aid the patient for any reaction that could occur. Medications and con-trast administration routes consist of IV injections, oral, and intramuscular injections. The technologist should assemble all necessary supplies to perform venipuncture so the IV can be established.
Needle Sizes and TypesNeedle size is measured in gauge sizes. They come in gauge sizes of 18, 20, 21, 22, and 26 for most needles. The smaller the gauge size, is the larger circumference of the needle. For example, an 18 gauge is a larger needle than a 21 gauge. Most IV injections performed in radiol-ogy for contrast injection uses a 21 gauge needle and an 18 gauge for arterial injections. The 26-gauge needle is routinely used for placing a wheal of medication into the superfi cial layers of the skin as in a TB skin test. In the radiology department the radiologist often places a wheal of lidocaine in the area where a needle puncture will be made. This is done to numb the skin and decrease the amount of pain the patient experiences.
There are different types of needles to choose from and the type of injection will determine the type and size of needle which will be used. The straight steel needle has a hub which is attached to a Luer-Lock syringe
IntroductionPatient care is a vital part of Radiography and Radiologic Technology. Patient care is included on the National Registry Exam which makes up fi ve content-specifi c areas for the A.R.R.T exam. This chapter covers intravenous (IV) injection of various contrast agents, needles, syringes, injection sites, vital signs, body mechanics, and patient transfer.
Administration of Medications
In the radiology department, various types of medications are administered to patients for imaging examinations. Contrast media is considered a pharmaceutical agent because it causes effects in the body. The radiologic technologist must be competent in administering routine medications in a safe manner for patients. The radiogra-pher’s role is to work with existing IV lines or to start an IV for the procedure. In the acute care or short stay sur-gery environment, many patients will have an established IV line for administration of fl uids and medications. The radiographer will need to know how to use existing IV lines connected to infusion pumps to safely inject con-trast media for radiographic examinations.
When preparing to administer medication to a patient the technologist must verify the patient identifi cation and check the order to determine the dosage of medication to be given. Second, the medication and expiration date must be verifi ed. Third, check the patient’s chart for a his-tory of allergies or obtain the information from the patient. Finally, the technologist must perform hand hygiene prior to handling the medication. There is a proper practice we follow when we must administer any medications. This is called the fi ve rights of medication administration:
1. The right dose2. The right patient3. The right medication4. The right time5. The right route
Fosbinder_Text_Chap23.indd 347 10/30/2010 6:29:10 PM

348 Part VI: Patient Care
(Fig. 23.1). This type of lock provides a secure connection of the needle to a syringe.
Winged needles come with one or two wings com-monly referred to as the butterfl y needle. This needle also has a short tubing with a hub at the opposite end from the needle. The hub can either be a Luer-Lock or tapered end; each is designed to fi t a corresponding syringe. The Luer-Lock hub is attached to a Luer-Lock syringe (Fig. 23.2). The wings of the butterfl y needle provide a secure method of holding onto the needle as it is inserted
into a vein. Once the needle is properly placed in the vein, the wings can be taped to the skin to secure the needle in place. The tubing comes in various lengths to connect to a handheld syringe or an automatic injector syringe.
Angiocath (peripheral) is a needle with a fl exible cath-eter surrounding it (Fig. 23.3). Once inserted, the needle is removed and the catheter remains in the vein. This also has a hub with a Luer-Lock device. The purpose of a fl exible angiocath is to allow movement of the arm at the insertion site. This is commonly used in CT, MRI, and interventional radiology where movement of the arm is necessary.
Insertion of a NeedleThe method of inserting a needle is dependent upon the parenteral route which is most appropriate for the medi-cation. In radiography we typically use a superfi cial vein in the arm which requires the needle to be inserted at approximately a 15- to 30-degree angle. Needles have a beveled side where the bore of the needle is. As seen in Figure 23.4, during insertion the bevel side must be
18 Gauge
21 Gauge
26 Gauge
Figure 23.1. Photo of straight needles and different gauges.
18 Gauge 21 Gauge 26 Gauge
Figure 23.2. Photo of wing type needles.
Figure 23.3. Photo of angiocath needle.
Fosbinder_Text_Chap23.indd 348 10/30/2010 6:29:11 PM

Chapter 23: Patient Care, Medications, Vital Signs, and Body Mechanics 349
syringe; the contrast comes in a 50-mL amount. This allows room for the 60-mL syringe plunger to be pulled back to 50 mL.
facing up to make the insertion into the vein easier. This bevel should puncture the skin fi rst and then the vein.
SyringesMost injections in radiology utilize plastic syringes because they are disposed off after they are used for injec-tions. They basically have three parts to each syringe (Fig. 23.5). The tip where the needle is attached, the barrel where the milliliters marking are placed, and the plunger located on the inside of the syringe.
Syringes come in different sizes or milliliter volume. The milliliter markings are placed on the syringes. General syringe sizes in radiology are 5, 10, 20, 60, and 100 mL. Most syringes are the Luer-Lock kind. They have a lock-ing device at the tip which holds the hub of the needle. Most IV contrast is injected intravenously with a 60-mL
Vein
15-30˚
Needle Skin
Figure 23.4. Diagram of a beveled needle piercing the vein at a 15 to 30 degree angle.
Luer-LockConnection Barrel
ml markings
Plunger
Figure 23.5. Photo of a typical syringe with its parts marked.
Venipuncture
A video for this topic can be viewed at http://thepoint.lww.com/FosbinderText
The IV route is used most frequently to deliver an injec-tion of contrast media for a radiographic examination. Venipuncture is used to establish an IV site for this injec-tion. Venipuncture can be accomplished with a butterfl y set, angiocath, or angioset. There are several steps involved in performing venipuncture and are explained below.
Venipuncture SitesThe medication or contrast agents are injected into a vein. The most common site for venipuncture injection in radiology is the basilica vein on the medial side of the anterior surface of the forearm and elbow. Superior from the basilica vein on the medial side of the forearm is the median cubital or antecubital vein. The lateral side of the forearm even with the antecubital vein is the cephalic vein (Fig. 23.6). Selecting a vein can be a challenge especially on children or elderly adults; however if these simple steps are followed, it will make the selection easier.
● Apply tourniquet 3 to 4 inches proximal to antecu-bital area.
● Vein must be readily seen and palpated.● Vein must be at least two times the diameter of the
needle.● Vein does not appear to curve for a distance equal
to the length of the needle.● If the vein is not apparent, let the arm hang down
for a few seconds to engorge veins.● If a vein is still not seen remove the tourniquet and
repeat this process with the other arm.
A video for this topic can be viewed at http://thepoint.lww.com/FosbinderText
Fosbinder_Text_Chap23.indd 349 10/30/2010 6:29:17 PM

350 Part VI: Patient Care
site. An alcohol wipe may be used on the site instead of antiseptic solution. The skin is to be cleansed in a circu-lar motion from the inside to the outside; this prevents oils and pathogens from being placed over the cleansed area. The puncture site is now ready and should not be touched with the technologist’s gloved fi nger (Fig. 23.7).
InjectionWhen injecting a drug or contrast media by IV injection, the site should be observed for any signs of extravasation or infi ltration. Extravasation occurs when the contrast media has leaked out of the vessel and has been injected into surrounding tissue out of the vein. When this occurs the injection should be stopped immediately, the needle should be removed and apply pressure to the site until bleeding has stopped. If the patient is experiencing pain at the injection site a cold compress is applied to relieve any discomfort. The extravasation should be attended to before the technologist proceeds with an injection at another site. After the injection is complete, the IV site must be maintained until the end of the procedure. If the patient has a reaction to the contrast media or medica-tion that was injected, the physician has an established IV that can be used to inject medication to counteract the reaction. When the examination is completed the needle is removed and hemostasis is achieved before the patient is dismissed. The needle must remain attached to the syringe and uncapped when placed in the sharps container, this will prevent an accidental needle stick.
Contrast Media
Aqueous or water soluble iodinated contrast media is used for injection into arteries and veins. This contrast media has an iodine content which is bound chemically, uses water as the principal solvent, and uses meglumine salts to improve solubility. These contrast agents readily mix with blood and body fl uids. The iodine absorbs radia-tion to a greater degree than soft tissue or vessels causing the structure to appear white on the radiographic image. This white appearance allows the visualization of the soft tissue structures and vessels for the purpose of providing a diagnosis.
Cephalic v.
Basilic v.
Median cubital v.
Accesorycephalic v.
Cephalic v.Median antebrachialvein
Brachial a.
Basilic v.
Figure 23.6. Veins used for venipuncture.
Once the vein is selected the skin needs to be cleansed in preparation for the puncture. All supplies should be close by so that there is no delay in puncturing the vein. Supplies needed include:
● Needle● Antiseptic solutions● Cotton ball● Tape● Band-aid● Syringe fi lled with contrast media● Gloves
Skin PreparationThe injection site must be prepared by using a ster-ile method and the use of antiseptic solution which is a disinfectant that kills pathogenic bacteria on the skin
Fosbinder_Text_Chap23.indd 350 10/30/2010 6:29:19 PM

Chapter 23: Patient Care, Medications, Vital Signs, and Body Mechanics 351
resist disassociation when mixed with blood. This results in fewer, less severe contrast reactions. Nonionic contrast media is primarily used because they are safer for the patient without having to compromise on the quality of the image.
PrecautionsCompromised renal function impairs the kidneys abil-ity to eliminate contrast media and may result in a toxic response. The patient’s kidneys can still be affected by either type of contrast that is used; this is why the
Ionic Versus Nonionic Contrast MediaThere are two types of iodinated contrast media: ionic and nonionic. Ionic contrast media contains three par-ticles of iodine and three side chains on the benzoic acid ring. Upon injection into the vessel this benzoic ring disassociates or breaks apart. This results in a higher num-ber of contrast media reactions. Nonionic contrast media also contains the three particles of iodine and three side chains on the benzoic ring; the primary difference is in the chemical compounds of the three side chains which
A B
C D
E
Figure 23.7. (A) Place tourniquet and select vein. (B) Cleanse area. (C) Anchor skin for puncture. (D) Tape needle in position. (E) Remove needle and hold pressure over site.
Fosbinder_Text_Chap23.indd 351 10/30/2010 6:29:19 PM

352 Part VI: Patient Care
reassurance; ongoing patient observation and monitoring is essential during any IV contrast injection. The tech-nologist should take a complete history on the patient prior to any contrast injection and notify the radiologist of any potential contraindications.
Vital Signs A video for this topic can be viewed at http://thepoint.lww.com/FosbinderText
Vital signs include the patient’s blood pressure, pulse rate, respiratory rate, and body temperature. Vital signs measure the proper homeostasis, or internal environ-ment, of the body. It is very important that the radiog-rapher understands vital signs and is able to obtain accurate vital sign readings. During any type of contrast media reaction, the technologist will be asked to obtain the patient’s vital signs. Even with minor patient anxi-ety, the patient’s blood pressure can change and his or her respirations can increase. The patient should receive reassurance from the technologist. Listed are the normal values for the vital signs.
Blood PressureBlood pressure readings are obtained with a sphygmoma-nometer and a stethoscope (Fig. 23.8). The sphygmoma-nometer is also known as a blood pressure cuff. The cuff is placed on the upper arm or humerus above the antecu-bital space. To infl ate the cuff, a bulb is used which is part of the sphygmomanometer. When the bulb is pumped up to approximately 180 mm Hg, the cuff fi lls with air and cuts off the systolic pressure by collapsing the brachial artery. When the cuff is defl ated slowly, the needle on the gauge will move slowly and arterial sound can be heard through the stethoscope. The fi rst sound heard is the sys-tolic pressure. When this sound fades and goes away, this pressure is the diastolic. Blood pressures are measured by systolic over diastolic. The new normal blood pressure for an adult is 119 over 79 mm Hg. When the systolic pressure is between 120 and 139 mm Hg and the dia-stolic pressure is between 80 and 89 mm Hg the patient is considered to have prehypertension. Prehypertension
patient has to have prior laboratory test to determine the creatinine levels and the BUN (Blood, Urea, and Nitrogen) levels. If these levels are high prior to the contrast exam, the exam could be cancelled until these levels become normal. The normal values for the BUN is 8.0 to 24.0 and the normal values for creatnine is 0.8 to 1.3. Any iodine containing contrast media can cause a reaction at any time, even if the patient has been given contrast media before without any reaction. A contrast media reaction is known as anaphylaxis and must be treated immediately.
Contrast Media ReactionsIodinated contrast media reactions can be mild, moder-ate, or severe. The radiographer must observe the patient after the injection for at least 20 minutes for any sign of a reaction. If a reaction is seen the radiologist must be notifi ed immediately in order for a course of treatment to counteract the reaction to be determined. The type of symptoms the patient experiences will indicate the level of severity for the reactions. Symptoms of these reactions are listed on Table 23.1.
Any of these contrast reactions need appropriate patient care such as medication to counteract the symp-toms. These include giving oxygen, nitroglycerine, atro-pine, epinephrine, rapid IV fl uids, and taking vitals signs. The radiographer should provide positive support and
TABLE 23.1 CONTRAST MEDIA REACTIONS
Mild SevereUrticaria Laryngeal edemaFlushing UnresponsivenessChills ConvulsionEdema of eyes and face ArrhythmiasSneezing CyanosisCoughing DyspneaHead ache Profound shockNausea, vomiting Respiratory arrestItching Sudden drop in blood pressureDiaphoresis Apnea
Cardiac arrestModerateWheezingExcessive urticariaHypotension, hypertensionBronchospasmsBradycardia, tachycardia
Fosbinder_Text_Chap23.indd 352 10/30/2010 6:29:28 PM

Chapter 23: Patient Care, Medications, Vital Signs, and Body Mechanics 353
femoral artery, apical or apex of the heart, and pedal pulses in the feet. Normal pulse rates are 60 to 100 beats/min in the resting adult. Children have rates of 70 to 120 beats/min. When the adult pulse rates are over 100 beats/min, this is known as tachycardia. When the pulse rate is below normal or very decreased it is known as bradycardia.
Respiration RatesRespiration rate is the number of breaths a patient takes per minute. When a patient shows evidence of respiratory distress, a respiratory rate will aid in making an assessment. The normal cycles of respiration for an adult at rest are 12 to 20 breaths/min. Children are 14 to 30 breaths/min. Slow breathing with fewer than 12 breaths/min is called bradypnea and rapid breathing in excess of 20 breaths/min is called tachypnea. When a patient com-plains of having a diffi cult time breathing (dyspnea) or exhibits an abnormal respiratory rate, the radiologist must
is likely to increase the risk of a heart attack or stroke if left untreated. When the systolic and diastolic values are higher than 140 systolic and 90 diastolic, this is known as hypertension or high blood pressure. When the values are low, systolic pressure below 90 mm Hg and diastolic below 50 mm Hg, it is known as hypotension. This is an indication of shock and must be treated immediately as shock is a life threatening occurrence.
Pulse RatePulse rate is the patient’s heart rate. The pulse rate is measured by placing the forefi nger and middle fi nger over a superfi cial artery. There are three common sites for measuring a patient’s pulse rate: the radial artery on the thumb side of the anterior wrist, brachial artery on the anterior side of the antecubital part of the elbow, and the carotid artery in the neck region (Fig. 23.9). The radial artery is the most commonly used artery for alert patients while the carotid artery is used for unconscious patients. Other pulse points include the
Blood Pressure Cuff
Stethoscope
Bulb pump
Blood pressure gauge
Figure 23.8. Illustration of the placement of a blood pres-sure cuff and stethoscope.
Temporal
Carotid
Apical
Radial
Femoral
Popliteal
Pedal
Figure 23.9. Pulse points on the body.
Fosbinder_Text_Chap23.indd 353 10/30/2010 6:29:28 PM

354 Part VI: Patient Care
Principles of Body MechanicsStandard ways of proper body mechanics include the base of support, center of gravity, and line of gravity.
1. Base of support: The portion of the body that is in contact with the fl oor. It is important to have a secure base of support and this is when the technologist stands with his or her feet spread. A broad base of support provides stability for body position and movement.
2. Center of gravity: This is the point at which your body weight is balanced, typically at the pelvis or lower abdomen. The body is most stable when the center of gravity is nearest the center of the base of support.
3. Line of gravity: This is a vertical line passing through the center of gravity. The body is most stable when the line of gravity intersects with the base of support.
Using these concepts, the technologist will minimize the risks of injury when moving patients. There are fi ve simple rules that should be followed to safely move patients (Table 23.2). Also avoid bending and twisting at the waist when lifting objects because this will cause back strain (Fig. 23.10). A broad and stable base of support is accomplished by standing with the feet approximately shoulder width apart with one foot slightly advanced. The knees should also be slightly bent to engage the strong thigh muscles. Planning ahead and using the resources available to you will help decrease injury for all members of the team when transferring patients.
Transferring Patients
Patients are often transported to radiology by wheelchair or cart. Some patients are capable of ambulating with-out any diffi culty and do not need a wheelchair or cart.
be notifi ed immediately. The radiographer must prepare supplemental oxygen equipment for immediate use if the radiologist orders it.
Body TemperatureAn accurate temperature reading provides important information about the body’s metabolic state. In the medical imaging department the technologist is rarely required to take a patient’s temperature, however they must be able to do so competently. The normal body temperature varies from 98.6°F to 99.8°F when taken orally. The technologist can take the patient tempera-ture by various methods: oral, axillary, rectal, tympanic, or temporal artery. Temperatures can be measured in Fahrenheit (F) or in Celsius (C). The axillary tempera-ture is usually 1 degree lower than oral and the rectal temperature is 1 degree higher. Radiographers are rarely required to obtain a rectal temperature. In the past, the rectal route was routinely used for pediatric patients but this has been mostly replaced by using tympanic or tem-poral artery thermometers.
The glass thermometers are no longer used in clinical settings because of regulations which strictly limit the use of any device that contains mercury. These thermometers have been replaced with electronic digital thermometers which are safer for patients and which provide a reading in a few seconds.
Body Mechanics A video for this topic can be viewed at http://thepoint.lww.com/FosbinderText
The principles of proper body alignment, movement, and balance are called body mechanics. Using proper body mechanics minimizes the amount of effort required to perform tasks that require stooping, lifting, pushing, pulling, and carrying objects or patients. It is important to know the proper way to lift and transfer patients to avoid injury to the patient or to yourself. The most com-mon injury occurs in the back; in particular, the lumbar spine.
TABLE 23.2 RULES OF BODY MECHANICS
Provide a broad base of support.Work at a comfortable height with the table or bed.Bend your knees and keep your back straight when lifting.Keep the load close to your body and well balanced.Roll or pull a heavy object. Avoid pushing or lifting.
Fosbinder_Text_Chap23.indd 354 10/30/2010 6:29:31 PM

Chapter 23: Patient Care, Medications, Vital Signs, and Body Mechanics 355
When lifting or transferring a patient, the technologist establishes a proper stable base of support. The limb muscles should be used to lift the patient. Always let the patient do as much of the transferring as possible. This would occur with the independent patients. The wheel-chair and cart are routinely used for transferring patients to the radiology department. Using this equipment may seem elementary, but care must be taken to prevent falls and accidents.
Wheelchair Transfers
A video for this topic can be viewed at http://thepoint.lww.com/FosbinderText
When preparing to transfer a patient from his or her wheel-chair to the x-ray table, always place the wheelchair parallel to the table with the wheels locked and move the foot-rests out of the way prior to assisting the movement of the patient. If you are fortunate enough to have an x-ray table that is adjustable in height, then it will need to be lowered to match the height of the wheelchair. Have the patient
move forward in the wheelchair, and have the patient stand up and pivot with the patient’s back toward the table and hands holding the table. Then assist the patient on the table in a seated position prior to lying down.
If the table height is fi xed, position a step stool with a tall handle nearby. After the patient has stood up, have the patient place one hand on the stool handle and hold-ing your hand with his or her other hand. Your free hand should be placed around the patient’s waist for support. The patient should step up onto the stool, pivoting with his or her back to the table. Assist the patient to sit and then lie down on the table.
To return the patient to his or her wheelchair, the pro-cess will be reversed. Special care must be taken if the patient has one leg that is weaker than the other leg. For this type of patient, remember this saying, “The good leg goes up and the bad leg goes down.” In other words, when assisting the patient up onto the table, the “good leg” goes up onto the step stool fi rst because it is the strongest. When assisting the patient off the table, the “bad leg” goes down fi rst, and you will be standing on the patient’s “bad” side to support him or her much like using a crutch.
Cart TransfersA cart or stretcher is used to transport any patient who is not able to stand safely. For the cart or stretcher trans-fer, place the cart along side the table and lock the wheels. If the patient is capable of self-transfer, allow the patient to move on his or her own and provide sup-port. When you are alone, it is advisable to place one arm underneath the patient’s shoulders and the other arm under the patient’s pelvis. On your command, have the patient push with his or her feet and elbows as you lift and pull the patient toward the stretcher. If this can-not be done safely, seek assistance from another health care professional.
If the patient cannot move with assistance, there are various techniques that can be used depending on the patient’s weight and ability to assist. When planning a transfer, it is best to have adequate staff available to help move the patient. Two methods of transfer involve the use of draw sheets and slide boards to safely move the patient. With either method, the patient should be instructed to place his or her arms across the chest to protect the arms and hands during the transfer.
Figure 23.10. Proper body mechanics while lifting.
Fosbinder_Text_Chap23.indd 355 10/30/2010 6:29:31 PM

356 Part VI: Patient Care
Case StudyJanice has been sent to bring Juanita Watson to the radiography department for an exam. Juanita has been in the hospital for a few days
Chapter SummaryAdministration of medication follows the fi ve rights: (1) right dose, (2) right patient, (3) right medication, (4) right time, and (5) right route. The technologist must be skilled in selecting the appropriate needle size and type for each patient. Needles come in different gauge sizes from 26 to 18 gauge. Most departments use 21 gauge or 22 gauge needles for contrast injections. The skin at the injection site is properly prepared for a sterile technique. Syringes come in different sizes from 5 to 100 mL. When injecting contrast into the vein, the technologist must observe for any con-trast reaction that can occur. Allergic reactions to contrast media can be minor, moderate, or severe.
Vital signs included body temperature, pulse rate, respiratory rate, and blood pressure. The radiographer must understand vital signs and their normal values. The radiographer also must be able to perform them on a patient.
Body mechanics are the proper way to lift and transfer the patient. Proper body mechanics help to avoid injury to the technologist such as a back injury. Patients are transferred by either wheelchair or cart. When assisting the patient onto the x-ray table, care must be taken to assist the patient to stand on a step stool and sit on the table. The proper use of a draw sheet, slide board, or mechanical lift will ensure the patient is moved safely from the cart to the x-ray table.
Draw Sheet TransfersA single sheet is folded in half and placed under the patient between the shoulders and hips. When moving the patient the edges of the draw sheet are rolled up close to the patient’s body. The rolled edges provide a handhold for lifting and pulling the patient. While using proper body mechanics the patient is transferred to the cart or x-ray table. Care must be taken to ensure that the patient’s head and feet move safely with the trunk of the body. These transfers require at least two people to move the patient and possibly more depending upon the patient’s weight.
Slide Board Transfers
A video for this topic can be viewed at http://thepoint.lww.com/FosbinderText
Slide board transfer is a variation of a draw sheet trans-fer. The slide board is a strong, rigid sheet of plastic that is large enough to support the patient’s body. The slide board has handholds along each side to assist the technologists in moving the slide board. To place the slide board the patient is rolled onto one side, the slide board is placed under the draw sheet and approximately halfway under the patient. The remaining width of the board spans the space between the cart and x-ray table or bed. Have the patient cross his or her arms safely across the chest; two technologists will grip the rolled edge of the draw sheet and slide the patient smoothly across the board. Slide boards reduce the amount of effort required to move a patient while protecting the technologists from back injury.
Due to the morbid obesity of many patients, it is not safe to use a draw sheet or slide board to transfer the patient out of the patient’s hospital bed onto a cart. Many facilities have employed the use of mechanical lifts to safely transfer patients. The mechanical lifts have a har-ness which is secured around the patient and with the aid of hydraulics the patient is lifted out of bed. The tech-nologist will assist in guiding the patient from the bed to the cart where the patient will be gently lowered. This maneuver can cause anxiety for the patient; however the technologist can ease the anxiety by providing the patient with an explanation of the maneuver and by reassuring the patient throughout the process.
When transporting patients on a cart the side rails must remain in the elevated and locked position. This ensures
the patient will not fall or attempt to climb off without assistance. Application of side rails during transport is an extremely important safety practice that must be followed without exception. Side rails must also be raised when the patient is left unattended on a stretcher.
Fosbinder_Text_Chap23.indd 356 10/30/2010 6:29:32 PM

Chapter 23: Patient Care, Medications, Vital Signs, and Body Mechanics 357
the transfer on her own. If Juanita is not able to move at all then Janice will need to have at least one other person help her transfer Juanita. Due to Juanita’s weight Janice determines the slide board is the most appropriate moving aid to use. To move Juanita safely, Janice will need to perform the following steps:
1. Position the cart next to Juanita’s bed, lower the side rails, and lock the wheels.
2. If Juanita is self transferring, Janice will need to assist her in moving to the cart.
3. If Juanita is not able to move on her own then Janice will use the slide board method.
4. An assistant will roll Juanita onto one side using a draw sheet.
5. The slide board will be placed half-way under Juanita with the other half on the cart.
6. Juanita will be rolled back onto the slide board and will fold her arms across her chest.
7. Janice and her assistant will then use the draw sheet to move Juanita across the slide board and onto the stretcher.
8. The side rails will be elevated during the transport.
and is on complete bed rest orders. Juanita weighs 185 lb and is able to sit up in bed. Janice will need to bring Juanita down on a cart.
Critical Thinking Questions
How can Janice determine the type of transfer that is appropriate?
How many people will Janice need to assist in moving Juanita?
Which moving aid is most appropriate; draw sheet, slide board, or mechanical lift?
What steps must Janice take to safely transfer Juanita from her bed to the cart?
Janice must fi rst talk with Juanita to determine if she is able to move on her own. If Juanita can move from one side to the other she will likely be able to perform a self transfer, in which case Janice may be able to perform
Fosbinder_Text_Chap23.indd 357 10/30/2010 6:29:32 PM

Review Questions
Multiple ChoiceMultiple Choice
1. Skin preparation for the injection site should include
A. alcoholB. antiseptic solutionC. warm salineD. no preparation is neededE. A and BF. B and C
2. The term anaphylaxis is used to describe
A. an infl ammatory reactionB. chest painC. allergic shockD. asthma
3. A blood pressure of 120/80 mm Hg or 120 over 80. What is the 120 called?
A. DiastolicB. SystolicC. DyspneaD. Top blood pressure
4. When lifting or transferring a patient from a stretcher to the x-ray table, you should
A. push the patientB. bend at your waist and shove the patientC. pull the patientD. do not transfer the patient
5. The normal breaths per minute for an average adult is
A. 5 to 10B. 12 to 20C. 35 to 65D. 65 to 85
6. Medications can be administered by which of the following routes?
1. Orally2. Intravenously3. Rectally
A. 1 and 2B. 2 and 3C. 1 and 3D. 1, 2, and 3
7. Patients may be moved by which methods?
1. Ambulation2. Wheelchair3. Cart
A. 1 and 2B. 1 and 3C. 2 onlyD. 1, 2, and 3
8. Which of the following is the opacifying agent in nonionic contrast media?
A. Meglumine saltsB. IodineC. Carbon ionsD. Hydrogen ions
Fosbinder_Text_Chap23.indd 358 10/30/2010 6:29:32 PM

Chapter 23: Patient Care, Medications, Vital Signs, and Body Mechanics 359
9. Which of the following are necessary to assess vital signs?
1. Shygmomanometer2. Stethoscope3. Thermometer
A. 1 and 2B. 1 and 3C. 2 onlyD. 1, 2, and 3
10. A person with a heart rate over 100 beats/min is experiencing
A. tachycardiaB. bradypneaC. tachypneaD. bradycardia
Short Answer
1. Which vessels can be used for venipuncture?
2 List the supplies needed to perform venipuncture.
3. Syringes are marked in _____.
4. The needle with the smallest gauge number has the _____ diameter.
5. What is the solubility agent in ionic contrast media?
6. List the rights of drug administration.
7. List the moderate reactions a patient can expe rience after contrast media injection.
8. What is the purpose of a slide board for cart transfers?
9. When assisting a patient with diffi culty standing off a x-ray table which leg moves down to the step stool fi rst?
10. Which type of connection is used on needles and syringes?
Fosbinder_Text_Chap23.indd 359 10/30/2010 6:29:32 PM

Fosbinder_Text_Chap23.indd 360 10/30/2010 6:29:33 PM

361
Glossary
absorbed dose quantity of radiation in rad or gray (Gy).absorption complete transfer of the x-ray photons’ energy to an atom.activator the chemical used in fi lm developing to main-tain the pH balance.activity describes the quantity of radioactive mate-rial; expressed as the number of radioactive atoms that undergo decay per unit time.actual focal spot the physical area on the focal track that is impacted.air core transformer a simple transformer made with two coils of wire placed close to each other to facilitate induction.air gap technique a technique that uses increased OID to reduce scatter radiation reaching the image receptor.alpha particle ionizing radiation having two protons and two neutrons emitted from the nucleus of a radioisotope.alternating current (AC) current that fl ows in a posi-tive direction for half of the cycle and then in a negative direction for the other half of the cycle.ampere the unit of electric current; it is the number of electrons fl owing in a conductor.amplitude the maximum height of the peaks or valleys of a wave.analog-to-digital converter (ADC) converts an analog signal to a digital signal for a computer to analyze.angulation angle of the beam that creates a controlled or expected amount of shape distortion.anode angle the angle between the anode surface and the central ray of the x-ray beam.anode the positive electrode of an x-ray tube that con-tains the target that is struck by the projectile electrons.atomic mass number (A) the number of nucleons (neutrons plus protons) in the nucleus.atomic number (Z) the number of protons in the nucleus.attenuation the removal of incident x-ray photons from the beam by either absorption or scattering.
automatic brightness control (ABC) a circuit that maintains the fl uoroscopic image at a constant brightness.autotransformer a transformer with a single winding used to change the input voltage to a step-up or step-down transformer.base plus fog the density on the fi lm at no exposure.base the base material that the fi lm or intensifying screen is made from; it is usually polyester, tough, rigid, stable, and uniformly radiolucent.beam quality the penetrating characteristics of the x-ray beam.beam quantity the amount or intensity of the photons in the x-ray beam.beta particle ionizing radiation with characteristics of an electron; emitted from the nucleus of radioactive materials; it is very light and negatively charged.bipolar every magnet has two poles; a north pole and a south pole.bone mineral densitometry measures the density of bone mineralization to assist the diagnosis of osteoporosis.bremsstrahlung interactions x-rays produced when projectile electrons are stopped or slowed in the anode.Bucky factor the ratio of the mAs required with a grid to the mAs required without a grid to produce the same optical density. The amount of mAs increase required when a grid is added.Bucky grids moving grids designed to blur out the grid lines and absorb scatter radiation.capacitors an electrical device used to temporarily store electrical charge.carriage the arm that supports the fl uoroscopic equip-ment suspended over the table.cathode ray tube television monitor used to display the fl uoroscopic image.cathode the negative electrode of an x-ray tube, which contains the fi lament that emits electrons for x-ray production.
Fosbinder_Text_Glossary.indd 361 11/23/2010 12:13:30 PM

362 Glossary
characteristic cascade the process of electrons moving into the holes created during a characteristic interaction until there is only a hole in the outer shell.characteristic curve a graph of optical density and relative exposure that is characteristic of a particular type of x-ray fi lm.characteristic interactions x-ray production that occurs when an orbital electron fi lls a vacancy in the shell of the atom.cine cinefl uorography is associated with rapid (30 frames per second or more) sequence fi lming.clearing agent the primary agent, ammonium thiosul-fate, in fi xer that removes undeveloped silver bromine from the emulsion.closed core transformer a transformer with two coils of wire each with an iron placed close to each other to facilitate induction.coherent scattering low-energy scattering involving no loss of photon energy, only a change in photon direction.Compton scattering scattering of x-ray photons that results in ionization of an atom and loss of energy in the scattered photon.conductor a material in which electrons can move freely.contrast agent material added to the body to increase the subject contrast. Contrast media has densities and atomic numbers very different from body tissues.contrast the difference between adjacent densities that makes detail visible.conversion effi ciency a measure of a screen’s effi ciency in converting x-ray photon energy into light energy.coulomb the standard unit of charge.Coulomb’s law the electrostatic force between two charges is directly proportional to the product of their quantities and inversely proportional to the square of the distance between them.crossed grids two linear grids placed on top of one another so that the lead strips form a crisscross pattern.crossover effect blurring of the image caused by light from one screen crossing into the light from another screen.crossover network part of the automatic fi lm proces-sor system designed to bend and turn the fi lm when it reaches the top of the transport rack and must be directed down into the next tank.current the quantity or number of electrons fl owing.densitometer a device used to measure the amount of light transmitted through the fi lm, giving the numerical value of its optical density.detail the degree of geometric sharpness or resolution of an object recorded as an image.
developing the step in fi lm processing where exposed silver halide crystals turn into metallic silver making the latent image visible.diamagnetic materials magnetic materials that are weakly repelled by a magnet.differential absorption varying degrees of absorption in different tissues that results in radiographic contrast and visualization of anatomy.digital imaging and communications in medicine (DICOM) computer software standards that permit a wide range of digital imaging programs to understand each other.digital-to-analog converter (DAC) converts a digital signal to an analog signal.direct current (DC) current that fl ows in only one direction.distortion a misrepresentation of the size and shape of the anatomic structures being imaged.Dmax the maximum density the fi lm is able to record.drive system the mechanical system responsible for turning the rollers in the processor.effective dose the dose to the whole body that would cause the same harm as the actual dose received from the examination; used to measure the radiation and organ system damage in man.effective focal spot the area of the focal spot that is projected toward the object being imaged.electric fi eld the force fi eld surrounding an object, resulting from the charges of the object.electrifi cation occurs when electrons are added to or subtracted from an object.electrodynamics the study of moving electric charges.electromagnet temporary magnet produced by moving electric current.electromagnetic induction production of a current in a conductor by a changing magnetic fi eld near the conductor.electromagnetic spectrum describes the different forms of electromagnetic radiation.electromagnetism deals with the relationship between electricity and magnetism.electromotive force (EMF) electrical potential that is measured in volts (V) or kilovolts (kV).electron binding energy the amount of energy needed to remove the electron from the atom.electron volt measurement of the binding energy of an electron; the energy one electron will have when it is accelerated by an electrical potential of 1 V.electrostatics the study of stationary or resting electric charges.
Fosbinder_Text_Glossary.indd 362 11/23/2010 12:13:30 PM

Glossary 363
elongation projection of a structure making it appear longer than it actually is.emulsion layer a layer of gelatin containing the silver halide crystals; thin coating that acts as a neutral lucent suspension for the silver halide crystals.ESE entrance skin exposure.exit radiation the combination of transmitted and scat-tered radiation that passes through the patient.exposure angle the total distance the tube travels while the exposure is being made.exposure quantity of radiation intensity (R or C/kg).ferromagnetic materials materials that are easily magnetized.fi lament the source of electrons in the cathode.fi lm contrast the difference in optical density between a region of interest and its surroundings.fi lm speed a measure of fi lm sensitivity; faster fi lms require less exposure.fi ltration the removal of low energy x-ray photons from the primary beam with aluminum or other metal.fi xing the process where the reducing action of the developer is stopped and the undeveloped silver halide crystals are removed; makes the image permanent.fl at panel detector plates used in direct digital imaging.fl uorescence the production of light in the intensifying screen phosphor by x-ray photons.fl uoroscopy dynamic x-ray technique for viewing mov-ing structures.fl ux gain a measurement of the increase in light photons due to the conversion effi ciency of the output screen.focal plane region of anatomy of interest in tomogra-phy; also object plane.focal spot blooming an increase in focal spot size with an increase in mA caused by this electrostatic repulsion.focal spot the area on the anode where the projectile electrons strike, the source of x-ray photons.focal track the area of the anode where the high-voltage electrons will strike.focused grids grids whose radiopaque lead strips are tilted to align, at a predetermined SID, with the diver-gent x-ray beam.focusing cup the shallow depression in the cathode that houses the fi lament or fi laments.foreshortening projection of a structure making it appear shorter than it actually is.frequency the number of cycles per second that are in a wave.fulcrum pivot point between the tube and image receptor.gauss (G) the SI unit for magnetism.
generator a device that converts mechanical energy into electrical energy.grid cutoff the interception of transmitted x-ray photons by the radiopaque strips of a grid, resulting in lighter density at one or both edges of the fi eld.grid frequency the number of lead strips per cm or per inch.grid ratio the ratio of the height of the lead strips to the distance between the lead strips in a grid.grid scatter reduction device consisting of alternating strips of radiopaque and radiolucent material.Gurney Mott theory a theory of how the silver halide crystals are exposed to form a latent image and devel-oped to form a visible radiographic image.half-life the time it takes for a radioisotope to decay to one half its activity.half-value layer (HVL) the thickness of an absorbing material that will reduce the intensity of the primary beam by one half the original value.half-wave rectifi cation rectifi cation resulting from one half of the incoming alternating current being con-verted to pulsating direct current.hardener a chemical used to stiffen and shrink emul-sion; prevents scratching and abrasions during processing.heel effect decreased intensity from the cathode side of the x-ray beam to the anode side. The lightest part of an image is at the anode side of the image.hydroquinone a reducing agent in the developing solu-tion that slowly changes the silver halide crystals into metallic silver.image intensifi er converts x-ray photons into a brighter visible image.incident electron the electrons from the thermionic cloud that bombard the anode target.insulator a material in which electrons are fi xed and cannot move freely.intensifying screen increases the effi ciency of x-ray absorption and decreases the dose to the patient by converting x-ray photon energy into visible light energy.inverse square law the Electrostatic Law that states the force between two charges is directly proportional to the product of their quantities and inversely proportional to the square of the distance between them.involuntary motion movement that is not in the con-trol of the patient.ion an atom that has gained or lost an electron.ionization the process of adding or removing an electron from an atom.
Fosbinder_Text_Glossary.indd 363 11/23/2010 12:13:30 PM

364 Glossary
open core transformer two coils of wire each having an iron core placed close to each other to facilitate induction.optical densitometer a device to measure the blackness or optical density of a fi lm.optical density a measure of the degree of blackness of the fi lm expressed on a logarithmic scale. The primary controlling factor is mAs.orthochromatic fi lm sensitive to light from green-light emitting screens.oscillating grid mechanism that moves the grid in a circular pattern above the image receptor.pair production an interaction between x-ray photons and the force fi eld of the nucleus of an atom resulting in the x-ray photon energy being completely converted into a positive and negative electron.panchromatic fi lm sensitive to all wavelengths of visible light.parallel grids grids that have parallel lead strips.paramagnetic materials materials that are weakly attracted to magnetic fi elds.penetrometer aluminum step wedge with increasingly thick absorbers; uses x-ray beam to produce step wedge image for quality assurance.period (of a wave) the time required for one complete cycle of a waveform.phenidone a reducing agent in the developing solution that rapidly changes the silver halide crystals into metallic silver.phosphor layer a layer of material used in intensifying screens that is capable of absorbing the energy from incident x-ray photon and emitting light photons.phosphorescence the continuation of light emission from intensifying screens after the stimulation from the x-ray photons ceases (afterglow).photocathode converts light photons into photoelec-trons in the image intensifi er.photodisintegration an interaction between an x-ray pho-ton and the nucleus of an atom where the nucleus absorbs all the photons’ energy and emits a nuclear fragment.photoelectric effect complete absorption of the inci-dent photon by the atom.photoelectron an electron ejected from an atom fol-lowing a photoelectric interaction.photon small bundles of energy used to produce x- radiation; also called quantum.pixel a picture element of a matrix that contains infor-mation on its location and intensity.positive beam limitation an automatic collimator that adjusts to the size of the cassette.
isotopes atoms of the same element whose nuclei contain the same number of protons but a different number of neutrons.keV kiloelectron volt. A measure of the energy of an x-ray photon or an electron.kVp kilovoltage potential. A measure of the voltage applied to the x-ray tube.latent image the unseen image stored in the exposed silver halide emulsion; the image is made manifest dur-ing processing.latitude range of exposures or densities over which a radiographic image is acceptable.leakage radiation radiation outside the primary x-ray beam emitted through the tube housing.line focus principle used to reduce the effective area of the focal spot.luminescence the ability of a material to emit light in response to stimulation.magnetic dipole a group of atoms with their dipoles aligned in the same direction.magnetic domain a group of atoms with their dipoles aligned in the same direction.magnetic fi eld the force fi elds that are created when dipoles align in the same direction; also called lines of force or lines of fl ux.magnetic induction temporary alignment of dipoles when acted upon by a strong magnetic fi eld.magnetism the ability of a magnetic material to attract iron, nickel, and cobalt.magnifi cation an increase in the image size of an object.matrix a group of numbers arranged in rows and columns.minifi cation gain resulting from the electrons that were produced at the input phosphor being compressed into the area of the smaller output phosphor.motor an electrical device used to convert electrical energy into mechanical energy.mutual induction the result of two coils being placed in close proximity with a varying current supplied to the fi rst coil, which then induces a similar fl ow in the sec-ond coil.nonmagnetic materials materials that do not react to magnetic fi elds. Examples: wood, glass, plastic.nucleons nuclear particles; either neutrons or protons.object plane region of anatomy of interest in tomogra-phy; also focal plane.off-focus radiation photons that were not produced at the focal spot.ohm the unit of electrical resistance (W).
Fosbinder_Text_Glossary.indd 364 11/23/2010 12:13:31 PM

Glossary 365
rotor the central rotating component of an electric motor, used to rotate the anode.scattering the photon interaction with an atom result-ing in a change of direction and loss of energy.section interval the distance between the fulcrum levels.section level the variable location of structures of inter-est, controlled by the fulcrum.section thickness the width of the focal or object plane, controlled by tomographic angle.semiconductors a material that can act as a conductor or insulator, depending on how it is made and its environment.sensitivity speck an impurity added to the silver halide crystals that attracts free silver ions during latent image formation.sensitometer a device that uses light to produce a step wedge image for processor quality assurance.sensitometry the measure of the characteristic responses of fi lm to exposure and processing.shell type transformer a central iron core with both the primary and secondary wires wrapping around the iron core to facilitate induction.shoulder region area of high exposure levels on a characteristic curve.SID source to image receptor distance. The distance from the radiation source to the image receptor.signal-to-noise ratio (SNR) white noise that interferes with the digital image.single-phase circuits a circuit that allows the potential difference to build then drop to zero with each change in direction of current fl ow.solvent chemicals suspended in water that are used in developing fi lm.space charge effect with the buildup of electrons by the fi lament, the electrons’ negative charges begin to oppose the emission of additional electrons.spatial resolution the minimum separation at which two objects can be recognized as two separate objects.spin magnetic moment the magnetic effect created by orbital electrons spinning on their axes around the nucleus of the atom.SSD source to skin distance.stator the fi xed winding of an electric motor.step-down transformer a transformer that has more turns in the primary winding than in the secondary winding, which decreases the voltage.step-up transformer a transformer that has more turns in the secondary winding than in the primary winding, which increases the voltage.
potential difference the force or strength of electron fl ow; also known as electromotive force (EMF).power the amount of energy used per second. Electric power is the current multiplied by the voltage and is measured in watts.preservative a chemical additive that maintains chemi-cal balance in the developer and fi xer.protective coat a material used in an intensifying screen that is applied to the top of the phosphor layer to protect it from abrasions and trauma.quality assurance the activities that are performed to provide adequate confi dence that high-quality images will be consistently produced.quality control the measurement and evaluation of equipment to maintain superior standards.quantum mottle the random speckled appearance of an image, similar to the “snow” seen with poor TV reception. Quantum mottle is greater when high-speed screens and low mAs techniques are used, because there are fewer interactions.radioactive decay the transformation of radioactive nuclei into a different element followed by the emission of particulate or electromagnetic radiation.radiographic contrast a combination of fi lm and sub-ject contrast.radioisotopes an unstable isotope that spontaneously transforms into a more stable isotope with the emission of radiation.radiolucent low attenuating material or tissue that appears dark on a radiographic image.radiopaque highly attenuating material or tissue that appears bright on a radiographic image.rare earth screens rare earth phosphors employed in intensifying screens such as gadolinium, lanthanum, and yttrium.reciprocity law the same mAs, regardless of the values of mA and seconds, should give the same image density.recorded detail one of the geometric properties identi-fi ed as the degree of sharpness in an image; also detail, sharpness, or spatial resolution.rectifi ers an electrical device that allows current to fl ow only in one direction to convert AC into DC.refl ective layer a layer of material used in an intensify-ing screen to refl ect light back toward the fi lm.resistance the opposition to current fl ow.restrainer a chemical added to the developer to restrict the reducing agent activity, acts as an antifogging agent.ripple measures the amount of variation between maxi-mum and minimum voltage.rotating anode an anode that turns during an exposure.
Fosbinder_Text_Glossary.indd 365 11/23/2010 12:13:31 PM

366 Glossary
of tissue while structures above and below this plane appear blurred.transformers electrical devices to change voltage from low to high or vice versa.transport racks part of the automatic processing trans-port system consisting of three rollers located at the bot-tom of the processing tank that move the fi lm through the tank.transport system part of the automatic processor designed to move the fi lm through developer, fi xer, wash, and dryer sections.vignetting the reduction of brightness at the periphery of an image.voltage a measure of electrical force or pressure.volts the unit of potential difference.voluntary motion motion that can be controlled by the patient.wavelength the distance between adjacent peaks or adjacent valleys of a wave.x-ray beam quality a measurement of the penetrating ability of the x-ray beam.x-ray beam quantity a measurement of the number of x-ray photons in the useful beam.
straight-line portion the useful range of densities on the characteristic curve.subject contrast the difference in x-ray photon transmission between different areas of the body. The primary controlling factor is kVp.superconductors a material in which electrons can fl ow freely with no resistance when the material is cooled to an extremely low temperature.tesla (T) the SI unit for magnetism.thermionic emission the emission of electrons by heating of the fi lament in the cathode.thin-fi lm transistor (TFT) a photosensitive array, made up of small pixels, converts the light into electrical charges.three-phase circuit a full rectifi cation circuit that produces a higher average voltage with less ripple.toe region area of low exposure levels on a characteristic curve.tomographic angle the total distance the tube moves during a tomographic exposure; also tomographic amplitude.tomography a radiographic imaging technique that uses motion to demonstrate structures lying in a plane
Fosbinder_Text_Glossary.indd 366 11/23/2010 12:13:31 PM

Index
AAbsorbed dose, 3, 361AEC. See Automatic exposure controlAir gap technique, 179, 179f, 361Alternating current, 35, 35f, 46, 46f, 361American Registry of Radiologic
Technologist (ARRT) Code of Ethics, 337–338
Analog-to-digital converter (ADC), 210–211, 213f, 361
Anodecooling curves/charts, 67–68, 67fheat monitors, 68materials, 63, 63frotating anode, 63–64, 63ftarget area, 64, 64f
As low as reasonably achievable (ALARA), 322
Assault, 340Atomic mass unit (AMU), 7–8Atomic models, 4, 4fAtomic number, 8Atomic structure
atomic nucleus, 5electron binding energy, 6–7, 6felectron shells, 5–6, 5f, 5tionization, 7, 7fmatter, 4–5
Atomsalpha particle, 10atomic mass, 7–8, 8tatomic number, 8, 8t, 361beta particle, 10half-life, 10, 10tisotopes, 9–10periodic table, 8–9, 9fradiations, radioactive decay, 10radioisotopes, 10
Automatic brightness control (ABC), 191, 233, 233t, 361
Automatic exposure control (AEC)backup timer verifi cation, 226circuit, 55–57, 56fdensity
backup timer, 129density controls, 129detectors, 128–129, 128f
density variation control, 226exposure reproducibility, 226ion chamber sensitivity, 226mammography, 246–247, 247fresponse capability, 226
Automatic fi lm processingcontamination, developer and fi xer,
113developing, 111–112drying, 113fi xing, 112, 112trecirculation and replenishment,
113washing, 112–113
Autonomy, 339Autotransformer, 49–50, 50f, 361
BBackup timer, 57Base of support, 354Battery, 340Beam alignment, 309Beam angulation, 153–154Beam hardening, 266Beam quality and quantity
defi nition, 361x-ray interactions, 83x-ray production, 75
Benefi cence, 339Bergonie and Tribondeau law, 290Bias focusing, 242Blood, urea, and nitrogen (BUN)
levels, 352
Body mechanics, 354, 354t, 355fBohr model, 4fBone mineral densitometry (BMD),
159–160, 361Bradycardia, 353Bradypnea, 353Breast imaging, 241Bremsstrahlung interactions, 73–74,
73f–74fBrightness gain
automatic brightness control, 191fl ux gain, 190magnifi cation tubes, 191–192,
191fminifi cation gain, 190total brightness gain, 190
Bucky factor, 173, 173t, 361Bucky grids, 361. See also Moving
grids
CCancer, 302Capacitors, 40, 361Carcinogen, 302Cart/stretcher patient transfers
draw sheet transfers, 355–356slide board transfer, 356
Cataracts, 301Cathode, 361
fi lament, 62, 62ffi lament current, 62focusing cup, 62, 63f
Cell damage, 291–292Center of gravity, 354Central nervous system syndrome,
300–301Characteristic curve, 107, 107f, 362
fi lm contrast, 108, 108ffi lm speed, 107–108, 108flatitude, 108–109, 109f
Note: Page numbers followed by f indicate fi gure. Page numbers followed by “t” indicate table.
367
Fosbinder_Text_Index.indd 367 12/7/2010 2:48:21 PM

368 Index
Circuitshigh-frequency circuits, 53–54, 54fripple, 54, 55tsingle-phase circuits, 52–53, 53fthree-phase circuits, 53, 53f, 54t
Cloudiness. See CataractsCoherent scattering, 84, 84fCollimation, 261Compton scattering, 86–87, 86f–87f,
362Computed radiography (CR)
benefi t, 215dimensions and appearance, 211image formation and development,
214–215, 214fimaging plate, 212–213, 213fquality control, 231–232radiation dose, 213resolution, 211
Computed tomography (CT)artifacts
beam hardening, 266metal/star, 266, 266fmotion, 266partial volume effect, 266–267ring, 267, 267f
componentscollimation, 261computer system, 262CT number, 262–263, 263tdisplay console, 262gantry, 258–259, 259f–260foperator’s console, 262patient support table, 261–262radiation detectors, 259–261,
260f–261fCT scanner generation
fi fth generation, 256fi rst generation, 255, 255ffourth generation, 256, 256fsecond generation, 255, 255fseventh generation, 257–258, 258fsixth generation, 256–257, 257fthird generation, 255–256, 256f
historical perspective, 254image quality
contrast resolution, 263–264, 263f–264f
linearity, 264noise, 264spatial resolution, 263
image reconstruction, 265, 265f–266fquality control, 234–235, 235tscanning parameters
algorithm, 265exposure factors, 264fi eld of view, 265section interval and thickness, 264
scanning projections, 254, 254fConductors, 31Cone vision, 185Contrast. See also Image contrast;
Optical densityimage quality, 129image/radiographic contrast
fi lm contrast, 131–132subject contrast, 132–134
long- and short-scale contrast images, 129–130, 130f–131f, 131t
resolution, 235technical factors affecting, 135
Contrast media, 362diagnosis, 350ionic vs. nonionic, 351precautions, 351–352reactions, 352, 352t
Control panel componentsautomatic exposure control circuits,
55–57, 56fbackup timer, 57kVp and mA selectors, 55timing circuits, 55X-ray circuit, 55, 56f
Conventional fl uoroscopy. See Fluoroscopy
Conversion effi ciency, 95, 362Convolution, 265Coulomb’s law, 25–26, 26fCrossed grids, 171–172, 171fCrossover effect, 103, 362
DDarkroom, 116, 116fData compression, 217Daylight processing systems, 116–117,
117fDeconvolution, 265Densitometry, 105, 105f–106fDensity. See Optical densityDeoxyribonucleic acid (DNA), 287–288,
287fDiagnostic mammography, 241Digital fl uoroscopy. See FluoroscopyDigital imaging
data characteristicscontrast, 207–208frequency, 206–207noise, 208
window level and width controls, 208–209, 210f–211f
data compression, 217dry fi lm processors, 216–217fi lm digitization, 216hard copy, 216image acquisition
fi eld of view (FOV), 206matrix and pixel size relationship,
206, 208tpicture elements/pixels, 205, 205fspatial resolution and pixel size,
206, 207fimaging system
ADC and DAC, 210–211, 213fcomponents, 210, 212fcomputed radiography, 215–216,
215fdirect radiography, 211–215,
213f–214fimage acquisition, 210, 212fimage sources, 211t
picture archiving and communica-tions system, 216
Digital imaging and communications in medicine (DICOM), 216, 362
Digital mammography, 248f, 249Digital-to-analog converter (DAC),
210–211, 213fDirect current (DC), 35, 35f, 46,
46f, 362Direct radiography, 215–216, 215fDistortion, 192–193, 362
evaluationshape distortion, 155, 157fsize distortion, 155, 156f
size distortion/magnifi cation (see Magnifi cation)
Doubling dose, 303Dry fi lm processors, 216–217Dry processing fi lm, 117, 117fDuplication fi lm, 109–110, 110fDyspnea, 353
EEffective dose, 3, 321, 321t–322tElectric currents and electricity
capacitors, 40direct and alternating currents,
35, 35felectric generators, 37–38, 38felectric motors, 38–40, 39f–40felectric power, 35
Fosbinder_Text_Index.indd 368 12/7/2010 2:48:21 PM

Index 369
electrical materials, 31, 31telectrodynamics (see Electrodynamics)electromagnetism
(see Electromagnetism)induction motors, 40Ohm’s law, 34, 34f
Electrifi cationcontact, 24, 24ffriction, 24induction, 24–25, 25fnegatively and positively charged
object, 24, 24fElectrodynamics, 362
current, 32, 32f, 32telectric charge movement, 31resistance
conductive material, 32conductor length, 32–33, 33fcross-sectional diameter, wire,
33, 33ftemperature, 33–34, 34f
voltage, 32, 33fElectromagnetic radiation
characteristicsamplitude, 19, 19fenergy, 19frequency and period, 17, 17fradiation intensity and the inverse
square law, 20, 20fvelocity, 17wavelength, 17, 18f
typeselectromagnetic spectrum, 15, 16infrared radiation, 15–16microwaves and radar, 15radio waves, 15visible and ultraviolet light, 16x-rays and gamma rays, 16–17
Electromagnetism, 362electromagnetic induction, 36–37,
37fmagnetic fi eld, 36, 36fmutual induction, 37, 38fproduction, electromagnet, 36
Electron beam CT scanner (EBCT), 256
Electrostatic lenses, 188, 188f, 191Electrostatics, 362
electric fi elds, 24electrifi cation, 24–25electrostatic laws
Coulomb’s law, 25–26, 26flaw of concentration, 26, 27flaw of distribution, 26, 26f
law of movements, 26repulsion–attraction, 25, 26f
unit, 25Elongation, 153, 363Entrance skin exposure (ESE), 200Epilation, 301Errors
grid artifact, 178tgrid cutoff, 174–175grid positioning, 174off-center grid error, 175–176,
176f, 178off-focus grid error, 177f, 178off-level grid error, 175, 176fupside-down grid error, 178, 178f
ESE. See Entrance skin exposureExposure, radiation, 3, 363Extravasation, 350
FFalse imprisonment, 340Fidelity, 339Film and processing
automatic fi lm processingcontamination, developer and
fi xer, 113developing, 111–112drying, 113fi xing, 112, 112trecirculation and replenishment,
113washing, 112–113
characteristic curve, 107, 107ffi lm contrast, 108, 108ffi lm speed, 107–108, 108flatitude, 108–109, 109f
darkroom, 116, 116fdaylight processing systems, 116–117,
117fdensitometry, 105, 105f–106fdry processing fi lm, 117, 117ffi lm construction
double-emulsion fi lm, 103, 103femulsion layer, 103–104, 104tlatent image formation, 104, 104fpolyester base, 103standard cassette sizes, 103t
fi lm storage and handling, 110–111, 111f
fi lm transport systemconcentration, time, and tempera-
ture effect, 115crossover networks, 114, 115fdescription, 113
drive system, 114extended processing, 115–116processor quality assurance, 116rapid processing, 115transport racks, 114, 114f–115f
optical density, 105–107, 106f, 106tpenetrometer, 105, 105fsensitometry, 105, 105fsilver recovery, 116types
duplication fi lm, 109–110, 110fhard copy fi lm and laser printer,
110mammographic fi lm, 109, 109fmultiformat fi lm, 110
Film badge dosimeters, 315Film digitization, 216Flat contact shields, 328Flat panel detectors, 215, 215f, 363Fluorescence, 95Fluoroscopy, 363
brightness gainautomatic brightness control, 191fl ux gain, 190magnifi cation tubes, 191–192,
191fminifi cation gain, 190total brightness gain, 190
cone and rod vision, 185fl uoroscopic displays
cathode ray tube, 197, 197fcharge-coupled device, 196–197output phosphor, 193, 193ftarget assembly, 193–194, 194fTV camera and monitor, 194video camera tubes, 194–196,
194f–196ffl uoroscopic rooms, 185, 186fhistorical perspective, 185image archiving, 197
cine recording, 198digital recording, 198–199spot fi lming, 198, 198fvideocassette recording, 198
image intensifi eranode, 189, 189felectrostatic lenses, 188, 188finput phosphor, 188output phosphor, 189, 189fphotocathode, 188tower, 186, 187f
image qualitycontrast, 192distortion, 192–193
Fosbinder_Text_Index.indd 369 12/7/2010 2:48:21 PM

370 Index
Fluoroscopy (Continued )quantum mottle, 193resolution, 192
mobile C-arm fl uoroscopy, 199, 199fpatient dose, 199–200quality control
automatic brightness control, 233, 233t
exposure reproducibility, 233fi eld size and beam alignment,
233intensifi er viewing system resolu-
tion, 233–234monitors and recorders, 234radiation output/exposure rate, 232spatial resolution, 232, 233fspot fi lm images, 233
radiation regulation, 311–312, 311f–312f
table, 186technique, 185x-ray tubes, 186, 187f
Flux gain, 190Focal spot blooming, 66, 363Focal spot sizes, 244Focused grids, 170–171, 170f–171fFogging, 232Foreshortening, 153Fringe fi eld, 276Full-wave rectifi cation, 52, 53f
GGantry
frame, 258radiation detectors (see Radiation
detectors)x-ray circuit, 258–259x-ray tube, 259, 259f
Gas-fi lled detectors, 260–261, 261f, 314, 314f
Gastrointestinal syndrome, 300Geiger-Muller counters, 314, 314fGenerators, electric, 37–38, 38fGenetically signifi cant dose (GSD),
303Gradient coils, 278, 278fGrid artifact, 178t. See also Grid cutoffGrid conversion factor (GCF). See
Bucky factorGrid cutoff, 363
crossed grid, 172focused grid, 170–171forms and causes, 178tgrid positioning, 174
occurrence, 169parallel grid, 169portable examination, 175
Grid ratio, 168–169, 363Grids
collimation, 166–167, 167fconstruction
grid frequency, 169grid ratio, 168–169, 168fmaterials, 167–168, 168f
errorsgrid artifact, 178tgrid cutoff, 174–175grid positioning, 174off-center error, 175–176, 176f,
178off-focus error, 177f, 178off-level error, 175, 176fupside-down error, 178, 178f
exit radiation, 165, 165fmoving grids
advantages, 172–173disadvantages, 172reciprocating and oscillating grids,
172purpose, 165scatter reduction techniques
air gap technique, 179, 179fradiographic contrast improve-
ment, 167scattered radiation, 165–166, 166fselection
Bucky factor, 173, 173tmAs, 173–174, 175f
typescrossed grids, 171–172, 171ffocused grids, 170–171, 170f–171fparallel grids, 169, 170fstationary grids, 172
Grounding, 25, 25fGurney Mott theory, 104, 363
HHalf-value layer (HVL), 83, 84f, 314,
363Half-wave rectifi cation, 52, 52fHard copy fi lm, 110, 216Heat blur, 232Heat monitors, anode, 68Heel effect, 64–65, 65f, 244, 363Hematologic syndrome, 299–300Hemostasis, 350High voltage components
rectifi ers, 52, 52f
transformers (see Transformers)High-voltage circuits, 54–55Human biology
DNA, 287–288, 287fRNA, 288
IImage acquisition
fi eld of view (FOV), 206matrix and pixel size relationship,
206, 208tpicture elements/pixels, 205, 205fspatial resolution and pixel size, 206,
207fImage archiving, 197
cine recording, 198digital recording, 198–199spot fi lming, 198, 198fvideocassette recording, 198
Image contrast, 275, 275f. See also Contrast
fi lm contrast, 131–132subject contrast
contrast agent, 134differential absorption, 132infl uencing factors, 132tscatter, 135tissue density, 133tissue thickness, 132tissue type and atomic number,
133, 133tx-ray energy, 134, 135f
Image density. See Optical densityImage formation
bone mineral densitometry, 159–160density and contrast (see Contrast;
Optical density)distortion
evaluation, 155, 156f–157fsize distortion/magnifi cation,
150–155fi lm and processing (see Film and
processing)grids and scatter reduction (see
Grids)intensifying screens (see Intensifying
screens)recorded detail
beam size, 145, 145fdistance, 145–146, 146ffocal spot size, 146–149, 148fimage receptor, 149, 149timage sharpness, 144, 145fmotion, 149–150
Fosbinder_Text_Index.indd 370 12/7/2010 2:48:22 PM

Index 371
technical factorsdistance, 141–143, 142fexposure time, 140kilovoltage, 141, 141fmilliampere second, 140–141,
141tmilliamperes, 140, 140foptical density, 143–144, 144t
tomographydescription, 155–156exposure angle/amplitude, 157fulcrum, 156object/focal plane, 156, 158fprinciples, 158, 160fsection interval, 158section thickness, 157, 159ftomographic angle/amplitude,
156–157, 158ftypes, 159
Image intensifi er, 363anode, 189, 189felectrostatic lenses, 188, 188finput phosphor, 188output phosphor, 189, 189fphotocathode, 188tower, 186, 187f
Image qualitycontrast, 192distortion, 192–193magnetic resonance imaging, 280quantum mottle, 193resolution, 192
Image reconstruction, 265, 265f–266fImage resolution, 192Imaging techniques
computed tomography (see Com-puted tomography)
digital imaging (see Digital imaging)fl uoroscopy (see Fluoroscopy)magnetic resonance imaging (see
Magnetic resonance imaging)mammography (see Mammography)quality control (see Quality control)
Indexing, 261Induction motors, 40Infi ltration, 350Insulators, 31Intensifying screens
construction, 93–94, 94f–95fCR cassette, 93, 93ffi lm/screen cassettes
cassette care, 99fi lm/screen contact, 98, 98fstandard sizes, 98, 98t
phosphor crystal x-ray photon inter-action, 93, 93f
phosphor materials, 94–95purpose, 93quantum mottle, 97radiographic noise, 97rare earth screens, 95–96, 96fscreen speed
K-shell absorption edge, 97types, 96–97, 97t
spatial resolution, 97–98, 98fspectral matching, 95, 95t, 96f
Inverse square law, 20, 23, 363Involuntary motion, 150Ion chambers, 314
JJustice, 339
LLarmor frequency, 272–273, 273tLaser localizer, 235Laser printer, 110Latent image, 104, 104f, 364Lethal dose (LD50/30), 297Leukemia, 302Libel, 340Light spots, 232Line focus principle, 64, 65f, 364Line of gravity, 354Linear energy transfer (LET), 290–291,
291fLinearity, 235Lodestones, 21Luminescence, 95, 364
MMagnetic fi eld strength, 280Magnetic resonance imaging
equipmentcomputer, 279display console, 279gradient coils, 278, 278fmagnets, 276–277, 277foperating console, 279patient support table, 278–279shim coils, 278surface coils, 278, 279f
hazards, 281image quality, 280proton alignment, 272–273,
272f–273fRF shielding, 280signal production
image contrast, 275, 275fmagnetic resonance, 273–274,
273f–274fparamagnetic contrast agents,
275–276, 276tproton density, 274T1 relaxation time, 274, 274fT2 relaxation time, 274, 275f,
275tMagnetism, 364
diamagnetic materials, 21ferromagnetic materials, 21, 21flaws of magnetism, 22–23, 23fmagnetic fi elds, 21–22, 22fmagnetic induction, 23nonmagnetic materials, 21paramagnetic materials, 21units, 23
Magnifi cation, 191–192, 191f, 364beam angulation, 153–154mammography, 248–249, 248fobject-to-image receptor distance,
151, 151fshape distortion, 153, 154fsize distortion, 151–152, 152fsource-to-image receptor distance,
151tube angle direction, 155, 155t
Malpractice, 341Mammography
ancillaries, 245fautomatic exposure control,
246–247, 247fbreast compression, 245–246, 246fcassettes, 247, 247ffi lm processing, 248fi lm/screen combinations,
247–248grids, 246resolution, 248screens, 247
breast imaging, 241digital, 248f, 249exposure factors, 244–245, 245ffi lm, 109, 109fhistorical perspective, 241magnifi cation, 248–249, 248fquality control, 236, 236tx-ray tube, 242, 242f
anode, 242–244, 243fcathode, 242, 242ffi ltration, 244, 244ffocal spot sizes, 244heel effect, 244
Fosbinder_Text_Index.indd 371 12/7/2010 2:48:22 PM

372 Index
Medical and professional ethicsethical judgments and confl icts,
338–339ethical principles, 339legal aspects
malpractice prevention, 341Tort law, 340–341
morals and ethics, 337patient records, charting, and
medical history, 341–342patient rights and responsibilities,
339–340radiography
practice standards, 336–337professional organizations, 336professionalism, 336training and education, 336
standards, 337–338Medical record, 342Medication administration
contrast mediadiagnosis, 350ionic vs. nonionic contrast media,
351precautions, 351–352reactions, 352, 352t
needleangiocath needle, 348, 348finsertion, 348–349, 349fstraight steel needle, 347–348, 348fwinged needles, 348, 348f
rights, 347syringes, 349, 349fvenipuncture (see Venipuncture)
Meiosis, 289, 289fMetal artifacts, 266, 266fMinifi cation gain, 190, 364Mitosis, 288–289, 289fMobile C-arm fl uoroscopy, 199, 199fMotion artifacts, 266, 280Motors, electric, 38–40, 39f–40fMoving grids
advantages, 172–173disadvantages, 172reciprocating and oscillating grids, 172
Multiformat fi lm, 110Multisection/multislice computed
tomography (MSCT), 257–258, 257f–258f
Mutual induction, 37, 38f
NNegligence, 341Noise
CT, 234, 364digital imaging, 208radiographic, 97
Nonmalefi cence, 339
OOccupancy factor, 313Occupationally exposed workers, 321Off-focus radiation, 65, 66f, 364Ohm’s law, 34, 34fOpacity. See CataractsOptical density (OD), 105–107, 106f,
106t, 364. See also ContrastAEC (see Automatic exposure
control)formula, 123image formation, 143–144, 144tinfl uencing factors
beam restriction, 126body part thickness, 126–127fi ltration, 126grids, 127image receptor, 128kVp, 125, 125fSID, 125–126, 127f
optical densitometer, 123ftechnical factors affecting, 124, 124f
Optically stimulated luminescence (OSL), 316
Oxygen effect, 292Oxygen enhancement ratio (OER), 293
PPair production, 87, 87f, 364Parallel grids, 169, 170f, 364Paramagnetic contrast agents, 275–276,
276tPartial body irradiation effects, 301,
301fPartial volume effect, 266–267Patient and personnel exposure
reductionionizing radiation exposure
ALARA, 322dose limit regulations, 322, 323teffective dose, 321, 321t–322toccupationally exposed workers,
321patient radiation dose
pediatric considerations, 328–329radiation dose during diagnosis, 328radiographic techniques, 327repeat radiographs, 327shielding devices, 327–328
pregnancy, 329radiation exposure to staff
basic principles, 322–324, 324fpatient immobilization, 326–327protective apparel, 324–326,
325f–326f, 325tproximity to radiation, 326
Patient carebody mechanics, 354, 354t, 355fmedical and professional ethics (see
Medical and professional ethics)medication (see Medication admin-
istration)patient transfer
cart/stretcher transfers, 355–356wheelchair transfers, 355
vital signs (see Vital signs)Patient radiation dose
CT quality control, 235, 235tpediatric considerations, 328–329radiation dose during diagnosis, 328radiographic techniques, 327repeat radiographs, 327shielding devices, 327–328
Penetrometer, 105, 105fPermanent magnets, 276Personnel monitors
fi lm badge dosimeters, 315optically stimulated luminescence,
316pocket dosimeters, 316thermoluminescent dosimeters, 315,
315fvariety, 314, 315f
Phantom images, 232Phosphor
CCD detector, 249layer, 94materials, 94–95
Phosphorescence, 95, 364Photodisintegration, 87, 88fPhotoelectric effect, 84–85, 85f, 364
atomic number, 85–86, 85fx-ray energy, 86, 86f
Photomultiplier (PM) tube, 260Photon, 19Photopic vision, 185Photostimulable storage phosphor
(PSP) imaging plate, 212Picture archiving and communications
system (PACS), 216Pitch, 257Pocket dosimeters, 316Power, electric, 35
Fosbinder_Text_Index.indd 372 12/7/2010 2:48:22 PM

Index 373
Precession, 272, 272f–273fPregnancy and radiation, 302–303
10-day rule, 329fetal dose, 329pregnant radiographer, 329
Primary radiation, 312, 313fProcessor quality control
image artifactsexposure artifact, 228–229, 229fhandling artifacts, 229–230, 230fprocessor artifacts, 230–231, 231f
processor cleaning and maintenance, 231
processor monitoring, 228, 228fquality assurance factors, 227t
Protective appareldrapes and Bucky tray, 324lead aprons, 325–326, 325f–326ftypes, 325twrap around, 326
Protective coat, 94, 95fProton alignment, 272–273,
272f–273fProton density, 274
QQuality assurance, 365Quality control, 365
computed radiography, 231–232computed tomography (see
Computed tomography)fl uoroscopy (see Fluoroscopy)mammographic, 236, 236tprocessor (see Processor quality
control)protective apparel, 234radiographic (see Radiographic
quality control)tomography (see Tomography)
Quanta. See PhotonQuantum mottle, 97, 193, 232, 365
RRadiation biology
cell proliferationcell cycle phases, 288tmeiosis, 289, 289fmitosis, 288–289, 289f
cell survival curvedose-response models, 295gonadal effects, 297LD50/30, 297, 297tlinear dose-response model,
295–296, 295f
linear, quadratic dose-response model, 296, 296f
nonlinear dose-response model, 296, 296f
nonstochastic effects, 294parts, 293–294, 294fstochastic effects, 294
genetic effects, 303high-dose radiation effects
fi nal stage, 299latent period, 298manifest stage, 298–299, 298fprodromal stage, 298
human biologyDNA, 287–288, 287fRNA, 288
late somatic effects, 301–302partial body irradiation effects, 301,
301fpregnancy, 302–303tissues and organs
Bergonie and Tribondeau law, 290cell damage, 291–292direct and indirect effects, 292linear energy transfer, 290–291,
291fradiation sensitivity, 290tradiation weighting factors, 291tradiolysis of water, 292–293, 293fradiosensitivity factors, 292, 292frelative biological effectiveness,
291, 291ttarget theory, 293
whole body radiation exposurescentral nervous system syndrome,
300–301dose levels, biologic effects, 299t,
300fgastrointestinal syndrome, 300hematologic syndrome, 299–300
Radiation detectorsarray, 259gas-fi lled ionization detectors,
260–261, 261frotating detector system, 259scintillation detectors, 260, 260fsolid-state detectors, 261, 261f
Radiation dose, 245. See also Patient radiation dose; Staff radiation dose
Radiation protection and regulations. See also Patient and personnel exposure reduction; Radiation biology
equipment regulationsbeam alignment, 309collimator, 309, 309fexposure reproducibility, 310exposure switch, 310fl uoroscopic equipment, 311–312,
311f–312fmA station linearity, 310mobile radiography units, 310positive beam limitation, 309,
310fprotective x-ray tube housing,
309source-to-image receptor distance
(SID) indicator, 309total fi ltration, 310
radiation detectorsgas-fi lled detectors, 314, 314fmonitoring period, 316personnel monitors, 314–316, 315fscintillation detectors, 314
room shieldinghalf-value layer, 314primary barriers, 312, 313fprotective barrier thickness consid-
erations, 313–314secondary barriers, 312–313
Radiation units, 3, 4tRadioactivity, 3Radiofrequency (RF) pulse, 273, 273fRadiofrequency (RF) shielding, 280Radiographic contrast. See Image
contrastRadiographic noise, 97Radiographic quality control
angle accuracy, 225automatic exposure control, 226cassette cleaning, 225–226collimation, 222–223exposure linearity, 225, 225texposure reproducibility, 224, 224texposure time, 224, 224ffi ltration, 223–224focal spot/spatial resolution
measurement, 222, 223fintensifying screens, 225kVp accuracy, 223, 224fperiodic monitoring, 222, 223tSID and centering accuracy, 225viewbox illumination testing, 225
Radioisotopes, 10, 365Radiolucent, 83Radiolysis of water, 292–293, 293fRadiopaque, 83
Fosbinder_Text_Index.indd 373 12/7/2010 2:48:22 PM

374 Index
Radiosensitivityage, gender, and metabolic rate, 292,
292fcells, tissues, and organs, 290tlinear energy transfer, 290–291, 291frelative biological effectiveness, 291,
291tRare earth screens, 95–96, 96fReciprocity law, 140, 365Rectifi ers, 52, 52fRefl ective screen, 94, 94fRelative biological effectiveness (RBE),
291, 291tRepulsion–attraction
electric charges, 25, 26fmagnets, 22, 23f
Ribonucleic acid (RNA), 288Ring artifacts, 267, 267fRipple, 54, 55tRod vision, 185
SScatter reduction techniques. See also
Gridsair gap technique, 179, 179fradiographic contrast improvement,
167Scintillation detectors, 260, 260f, 314Scotopic vision, 185Screening mammography, 241Secondary radiation, 312–313Selenium fl at panel, 249Semiconductors, 31Sensitivity speck, 104Sensitometry, 105, 105f, 365Shadow shields, 328Shielding devices, 327–328Shim coils, 278Signal-to-noise ratio (SNR), 208.
See also NoiseSkin entrance exposure, 328Slander, 340Slice thickness, 235Solid-state detectors, 261, 261fSpatial resolution, 97–98, 98f, 144, 235Spectral matching, 95, 95t, 96fSphygmomanometer, 352, 353fSpot fi lming, 198, 198fStaff radiation dose
basic principles, 322–324, 324fpatient immobilization, 326–327protective apparel (see Protective
apparel)proximity to radiation, 326
Star artifacts. See Metal artifactsStatic electricity, 23Stationary grids, 172Step-down transformers, 51–52, 51f, 365Step-up transformers, 50–51, 50f, 365Superconducting magnets, 276–277, 277fSuperconductors, 31, 366Surface coils, 278, 279f
TT1 relaxation time, 274, 274fT2 relaxation time, 274, 275f, 275tTable increment accuracy, 235Tachycardia, 353Tachypnea, 353Target theory, 293Temporary hair loss. See Epilation10-day rule, 329Tenth-value layer (TVL), 314Thermoluminescent dosimeters (TLD),
315, 315fThin-fi lm transistor (TFT), 215, 366Threshold dose, 297Timing circuits, 55Tissue interactions, 82, 82f, 83Tomography, 366
description, 155–156exposure angle/amplitude, 157fulcrum, 156object/focal plane, 156, 158fprinciples, 158, 160fquality control
resolution, 227section depth indicator, 227section thickness, 227uniformity and completeness, tube
motion, 226–227, 227fsection interval, 158section thickness, 157, 159ftomographic angle/amplitude,
156–157, 158ftypes, 159
Tort law, 340–341Transformers
components, 47, 47fformulas, 48transformer cores, 48–49, 49ftransformer effi ciency, 48transformer law, 47–48types
autotransformer, 49–50, 50fstep-down transformer, 51–52, 51fstep-up transformers, 50–51, 50f
Tube rating charts, 66, 66f
UUse factor, 313–314
VVenipuncture
injection, 350sites, 349–350, 350fskin preparation, 350, 351f
Veracity, 339Videocassette recording (VCR), 198Vital signs
blood pressure, 352–353, 353fbody temperature, 354pulse rate, 353, 353frespiration rate, 353–354
Voluntary motion, 149Voxel, 259, 260f
WWheelchair transfers, 355Whole body radiation exposures,
299–301Workload, 313
XX-ray beam hardening, 77X-ray interactions
attenuation, 83–84, 83f, 84thalf-value layer, 83, 84ftypes
coherent scattering, 84, 84fCompton scattering, 86–87,
86f–87fpair production, 87, 87fphotodisintegration, 87, 88fphotoelectric effect, 84–86,
85f–86fX-ray photon energy, 82–83X-ray production
beam quality and quantityfi ltration, 77, 77fintensity and average energy, 75, 75fkVp, 76, 76fmA, 76, 77ftime, 76x-ray circuit waveform, 77, 77fx-ray spectra, 76, 76t
bremsstrahlung interactions, 73–74, 73f–74f
characteristic interactions, 74–75, 75fx-ray interactions (see X-ray
interactions)x-ray tubes (see X-ray tubes)
Fosbinder_Text_Index.indd 374 12/7/2010 2:48:22 PM

Index 375
X-ray spectra, 76, 76fbremsstrahlung, 74factors infl uencing, 76t
X-ray tubes, 186, 187fanode
heat monitors, 68materials, 63, 63frotating anode, 63–64, 63ftarget area, 64, 64f
cathodefi lament, 62, 62ffi lament current, 62focusing cup, 62, 63f
focal spot blooming, 66glass envelope, 61–62heel effect, 64–65, 65fline focus principle, 64, 65foff-focus radiation, 65, 66f
tube housing, 61, 61ftube life and warm-up procedures,
68–69, 68ftube rating charts and cooling curves
anode cooling curves/charts, 67–68, 67f
housing cooling charts, 68radiographic tube rating charts,
66, 66f
Fosbinder_Text_Index.indd 375 12/7/2010 2:48:22 PM

Fosbinder_Text_Index.indd 375 12/7/2010 2:48:22 PM