Escaping poverty and becoming poor in 36 villages of Central and Western Uganda PLEASE SCROLL DOWN...
27
This article was downloaded by: [Cornell University Library] On: 08 February 2015, At: 22:12 Publisher: Routledge Informa Ltd Registered in England and Wales Registered Number: 1072954 Registered office: Mortimer House, 37-41 Mortimer Street, London W1T 3JH, UK The Journal of Development Studies Publication details, including instructions for authors and subscription information: http://www.tandfonline.com/loi/fjds20 Escaping poverty and becoming poor in 36 villages of Central and Western Uganda Anirudh Krishna a , Daniel Lumonya b , Milissa Markiewicz c , Firminus Mugumya d , Agatha Kafuko e & Jonah Wegoye a Duke University , Durham, NC, USA b Makerere University c Duke University , Durham, NC, USA d Makerere University e Makerere University Published online: 19 Aug 2006. To cite this article: Anirudh Krishna , Daniel Lumonya , Milissa Markiewicz , Firminus Mugumya , Agatha Kafuko & Jonah Wegoye (2006) Escaping poverty and becoming poor in 36 villages of Central and Western Uganda, The Journal of Development Studies, 42:2, 346-370, DOI: 10.1080/00220380500405634 To link to this article: http://dx.doi.org/10.1080/00220380500405634 PLEASE SCROLL DOWN FOR ARTICLE Taylor & Francis makes every effort to ensure the accuracy of all the information (the “Content”) contained in the publications on our platform. However, Taylor & Francis, our agents, and our licensors make no representations or warranties whatsoever as to the accuracy, completeness, or suitability for any purpose of the Content. Any opinions and views expressed in this publication are the opinions and views of the authors, and are not the views of or endorsed by Taylor & Francis. The accuracy of the Content should not be relied upon and should be independently verified with primary sources
Transcript of Escaping poverty and becoming poor in 36 villages of Central and Western Uganda PLEASE SCROLL DOWN...
This article was downloaded by: [Cornell University Library]On: 08 February 2015, At: 22:12Publisher: RoutledgeInforma Ltd Registered in England and Wales Registered Number: 1072954Registered office: Mortimer House, 37-41 Mortimer Street, London W1T 3JH,UK
The Journal of DevelopmentStudiesPublication details, including instructions for authorsand subscription information:http://www.tandfonline.com/loi/fjds20
Escaping poverty and becomingpoor in 36 villages of Centraland Western UgandaAnirudh Krishna a , Daniel Lumonya b , MilissaMarkiewicz c , Firminus Mugumya d , Agatha Kafuko e &Jonah Wegoyea Duke University , Durham, NC, USAb Makerere Universityc Duke University , Durham, NC, USAd Makerere Universitye Makerere UniversityPublished online: 19 Aug 2006.
To cite this article: Anirudh Krishna , Daniel Lumonya , Milissa Markiewicz , FirminusMugumya , Agatha Kafuko & Jonah Wegoye (2006) Escaping poverty and becoming poorin 36 villages of Central and Western Uganda, The Journal of Development Studies,42:2, 346-370, DOI: 10.1080/00220380500405634
To link to this article: http://dx.doi.org/10.1080/00220380500405634
PLEASE SCROLL DOWN FOR ARTICLE
Taylor & Francis makes every effort to ensure the accuracy of all theinformation (the “Content”) contained in the publications on our platform.However, Taylor & Francis, our agents, and our licensors make norepresentations or warranties whatsoever as to the accuracy, completeness, orsuitability for any purpose of the Content. Any opinions and views expressedin this publication are the opinions and views of the authors, and are not theviews of or endorsed by Taylor & Francis. The accuracy of the Content shouldnot be relied upon and should be independently verified with primary sources
of information. Taylor and Francis shall not be liable for any losses, actions,claims, proceedings, demands, costs, expenses, damages, and other liabilitieswhatsoever or howsoever caused arising directly or indirectly in connectionwith, in relation to or arising out of the use of the Content.
This article may be used for research, teaching, and private study purposes.Any substantial or systematic reproduction, redistribution, reselling, loan, sub-licensing, systematic supply, or distribution in any form to anyone is expresslyforbidden. Terms & Conditions of access and use can be found at http://www.tandfonline.com/page/terms-and-conditions
Dow
nloa
ded
by [
Cor
nell
Uni
vers
ity L
ibra
ry]
at 2
2:12
08
Febr
uary
201
5
Escaping Poverty and Becoming Poorin 36 Villages of Central and WesternUganda
ANIRUDH KRISHNA*, DANIEL LUMONYA**,MILISSA MARKIEWICZ{, FIRMINUS MUGUMYA***,AGATHA KAFUKO{{, & JONAH WEGOYE*Duke University, Durham, NC, USA, **Makerere University, {Duke University, Durham, NC, USA,
***Makerere University, {{Makerere University
ABSTRACT Twenty-four per cent of households in 36 village communities of Central andWestern Uganda have escaped from poverty over the past 25 years, but another 15 per cent havesimultaneously fallen into poverty. A roughly equal number of households escaped from povertyin the first period (ten to 25 years ago) as in the second period (the last ten years) examinedhere. However, almost twice as many households fell into poverty during the second period as inthe first period. Progress in poverty reduction has slowed down as a result. Multiple causes areassociated with descent into poverty and these causes vary significantly between villages in thetwo different regions. For nearly two-thirds of all households in both regions, however, ill healthand health-related costs were a principal reason for descent into poverty. Escaping poverty is alsoassociated with diverse causes, which vary across the two regions. Compared to increases in urbanemployment, however, land-related reasons have been more important for escaping poverty inboth regions.
I. Introduction
According to the most commonly cited estimates, poverty in Uganda declined from56 per cent in 1992 to 35 per cent in 2000, and a combination of economic growthand recovery from civil war damage are widely regarded to be responsible for thisaccomplishment (Appleton, 2001a; Collier and Reinikka, 2001; GoU, 2001).However, reduced poverty in the 1990s may have gone hand-in hand with increasedinequality (Appleton, 2001b; Deininger and Okidi, 2003; Hickey, 2005) and thedegree to which different segments of the population can take advantage of andbenefit from further growth-induced opportunities is in doubt (Okidi and Mugambe,2002; Mijumbi and Okidi, 2001; Ssewanyana et al., 2004). Poverty reduction mayhave slowed down after 2000 (Kappel, Lay and Steiner, 2005) and the extent to
Correspondence Address: Anirudh Krishna, Assistant Professor of Public Policy and Political Science,
Duke University, Box 90245, Durham, NC 27708-0245, USA. Email: [email protected]
Journal of Development Studies,Vol. 42, No. 2, 346–370, February 2006
ISSN 0022-0388 Print/1743-9140 Online/06/020346-25 ª 2006 Taylor & Francis
DOI: 10.1080/00220380500405634
Dow
nloa
ded
by [
Cor
nell
Uni
vers
ity L
ibra
ry]
at 2
2:12
08
Febr
uary
201
5

which ‘sustained growth can facilitate an escape from poverty – even in the longerterm – for those left behind is debatable’ (CPRC, 2004: 67).
What needs to be done now for the one-third of the population left behind inpoverty? A different set of strategies will most likely be required (Brock et al., 2002;Lwanga-Ntale and McClean, 2003), but it is not entirely clear what these strategiesshould be. Some insights have been provided by household surveys and participatorypoverty assessments carried out in the past (GoU, 2002a; Lawson et al., 2003).Additional knowledge of a disaggregated nature is required, however, for identifyingpoverty-reducing and poverty-creating processes at work within different regions ofthe country (Jayne et al., 2003; Johnson, 2002; Woodhouse, 2003).
The present study was designed in order to identify these processes and fill some ofthe remaining gaps in poverty knowledge in Uganda. It utilises the Stages-of-Progress methodology that was developed and applied earlier in two parts of Indiaand one region of Kenya (Krishna, 2004; Krishna et al., 2004; Krishna, 2005).Everything worth knowing about poverty cannot be learned using only oneparticular methodology. Different methodologies complement rather than competewith one another (McGee, 2004). The Stages-of-Progress methodology complementsand enriches findings from household surveys and participatory assessments, and itadds significant new knowledge about processes and reasons.
Before applying this methodology extensively in two regions of Uganda, afeasibility study and pilot test was first carried out in February 2004 in Rakaidistrict. Following refinements and adaptations, the Stages-of-Progress methodology(described in Section II) was implemented in 36 village communities of Western andCentral regions.
Data presented in Section III show that poverty in these 36 villages has fallenoverall from 47 per cent 25 years ago, to 37 per cent ten years ago, to 35 per cent atthe present time. A significant gender gap persists, however: while 31 per cent ofmale-headed households are poor at the present time, 46 per cent of female-headedhouseholds are poor.
Escaping poverty and falling into poverty have gone hand in hand in thesevillages. A total of 24 per cent of village households have escaped from poverty overthe past 25 years. Simultaneously, however, another 15 per cent of households havefallen into poverty in these villages.
While escaping poverty in these communities is associated with one set of factors,falling into poverty is associated with another and different set of factors. Twodifferent sets of policy responses are required, therefore: one set to help promotehouseholds’ escape from poverty, and another set to prevent descent into poverty.Factors associated with escaping poverty and falling into poverty are not similarbetween the two regions. Therefore, regionally differentiated policies are required formore effective poverty reduction.
Section IV discusses reasons associated with escaping poverty and falling intopoverty, respectively. While ill health and high healthcare expenses are commonly andincreasingly associated with descents in both the Western and Central regions, someother poverty-causing factors – including crop disease, land exhaustion, large familysize, marriage expenses, and land division – vary significantly between the two regions.
Growth in industry and the urban sectors have not been the major removers ofpoverty in these villages. Commonly in both regions, land-related factors have been
Escaping Poverty and Becoming Poor in Western Uganda 347
Dow
nloa
ded
by [
Cor
nell
Uni
vers
ity L
ibra
ry]
at 2
2:12
08
Febr
uary
201
5

associated with a much larger number of escapes from poverty, and finding regularemployment has been associated with many fewer escapes. Because jobs have notbeen more significant, education also does not have a strong association withescaping poverty. The direct impact on poverty of these factors relative to others hasalso declined over time.
Section V concludes by discussing the policy implications of these results.Notably, descents into poverty have become more frequent in recent times, andeven as growth has accelerated, poverty reduction has slowed down. Regularmonitoring of factors associated with descent and with escape in each region willbe required in order to keep policy interventions more current and relevant infuture. A methodology for performing such exercises on a continuous basis ispresented in the next section.
II. Methodology: Stages of Progress
A total of 36 villages were studied: six villages in each of three districts in theWestern and Central regions of Uganda. A total of 2,631 households are resident inthese villages, and following the participatory, community-based methodologydescribed below, the poverty status of each household was ascertained for thepresent time, for 25 years ago, and for an interim period, ten years ago. Thetrajectory of each household was compiled in this manner, and reasons associatedwith these trajectories were examined for a random sample of 40 per cent of allhouseholds. Members of 1,068 households were individually interviewed to verifyand elaborate upon information collected at a community meeting.
We selected three districts within each region, Central and Western, with the intentof covering a range of diversity. In the Central region, we selected Mukono, Luwero,and Ssembabule, while in the Western region, we selected Bushenyi, Kabale, andNtungamo.1 We conducted initial visits to the six district headquarters. We met andsolicited support from the administrative and political leaders, and we selected 25experienced Research Assistants (RAs) from among staffs of the communitydevelopment departments of these districts.
Villages for study were also selected at this time in consultation with districtofficials. In each district, six villages were selected, two located near the district towncentre, two located near a main road but not near the district town centre, and twolocated relatively far away from either a main road or the district town centre andare therefore relatively remote and hard to access. The selected villages representquite well the considerable diversity that exists within the two selected regions; theyare not, however, ‘representative’ in the statistical sense of this term.
The 25 selected RAs took part in a ten-day training exercise during which themethodology was explained and practised in detail. Training included two completerehearsals of all steps of the methodology. Villages located close to the trainingcentre were selected for these rehearsals. The RAs were then divided into four teams,with two teams assigned to each of the two regions. Members of each team werefluent in the local language of the region (Luganda for Central and Ruyankole andRukiga for Western) and also in English. With the four teams workingsimultaneously and supervised closely by the authors, data was collected over atotal period of 28 days.
348 A. Krishna et al.
Dow
nloa
ded
by [
Cor
nell
Uni
vers
ity L
ibra
ry]
at 2
2:12
08
Febr
uary
201
5
The study in each village commenced with a community meeting. Dates for thesemeetingswere determined in advance throughprior consultationswith theLocalCouncil(LC1) chairperson of each village. Members of each village community attended in largenumbers. Males and females were equally represented in most cases, and older villagerswere also present in significant numbers. As the issues to be discussed were sometimessensitive, deliberate efforts were made to encourage free, frank and open discussions.
A key aspect of introducing the study to community members was making clearthat project staff did not represent any government or NGO programme, andemphasising that no ‘beneficiaries’ were to be selected; that is, no immediate materialbenefits (or losses) would be brought into the community as a result of the study.Members therefore were less likely to deliberately misrepresent any household’spoverty status with the hope of attaining material gains.
The community meetings began with the research teams asking community groupsto define the local terms that people apply to those whose conditions construed aclear and commonly understood state of poverty. In this study, the term Omworocame up most often in the west, while in the Central region the terms OmwavuLunkupe or Omwavu Lukyolo were most often used.
Once community members’ attention was focused on discussing poverty and its localcharacteristics, they were asked to delineate the locally applicable Stages of Progressthat poor households typically followed while making their ways out of poverty. Whatdoes a household in your village usually do, we asked the assembled villagers, when itclimbs out gradually from a state of acute poverty? Which expenditures are the veryfirst ones to be made? ‘Food,’ was invariably the answer. Which expenditures followimmediately after? ‘Some clothes,’ we were invariably told. As more money flows in,what does this household do in the third stage, in the fourth stage, and so on? Thisprocess was continued until the community meeting had defined a progression of stagesup to a point where a household was clearly very well off in the community’sestimation. No more than 12 stages were defined in any village.
Lively discussions were held as villagers identified these stages, but the answers theyprovided, particularly about the first four Stages of Progress, were invariant across allvillages in both regions. Table 1 presents the typical Stages of Progress reported inthese 36 villages. The first four stages are exactly the same in all 36 villages.
It is hardly surprising that communities sharing common economic and culturalspaces should, in fact, report a common set of aspirations, represented in the locallyapplicable Stages of Progress that poor households typically follow on theirpathways out of poverty. Poverty, like any other relational concept, is sociallyconstructed and collectively defined, and the Stages of Progress provide a convenientand well-tested device to get closer to these communal definitions.2
Community groups were asked to identify two cut-off points on the progression ofstages. The first cut-off denotes the stage after achieving which a household is nolonger regarded as poor. It is equivalent to the concept of the poverty line commonlyused in poverty studies in the sense that it enabled villagers to classify who was poorand who was not. Instead of being defined by outsiders, however, the poverty cut-offin this case was determined by villagers themselves. As Table 1 shows, the first cut-off was made in all villages after stage four. Basic needs had been met, includingfood, clothing, shelter and basic education, and the household could now begin tomake small investments in housing, in small animals, or in a tiny plot of land.3
Escaping Poverty and Becoming Poor in Western Uganda 349
Dow
nloa
ded
by [
Cor
nell
Uni
vers
ity L
ibra
ry]
at 2
2:12
08
Febr
uary
201
5

The second cut-off point, which was drawn after stage eight, denotes theprosperity line. Once a household has crossed beyond this cut-off, it is regarded ashaving left poverty quite far behind. In villages of the Central region it was quitecommon for the community to say that at this stage the household could becharacterised as oyo avudeyo, meaning that it was now quite a distance away frompoverty and could make significant investments.
The next step of the Stages-of-Progress methodology was to develop a completelist of all households in the village. This list was generated during the communitymeeting in some villages, while in other villages it was obtained beforehand throughconsultations with the LCI chairperson.
Next, researchers worked with the community assembly to identify a clearlyunderstood and commonly remembered milestone to denote the time period of 25years ago, and another such milestone to denote ten years ago. Establishing thesemilestones provided community members with a specific reference point, which theyremember clearly, rather than referring to some particular year, which may havelittle meaning for many. During the pilot test and training exercises, communitieshad identified the coming to power of Obote II (in 1980) as the milestone for 25 yearsago, while they regarded the Constituent Assembly elections (held in 1994) as theappropriate milestone for ten years ago.
Community groups were asked to identify each household’s specific location alongthe Stages of Progress for each of the two milestones and also for the present time.Referring constantly to the Stages of Progress and to the household lists, communitymembers were asked, for example, ‘At what stage on the Stages of Progress wasNsubuga’s household at the time the Obote II regime came into power (that is, 25years ago)? What stage did these household members occupy at the time of theConstituent Assembly elections (that is, ten years ago)? At what stage are they now?’Community members participated enthusiastically in the discussions, and there wasoften considerable debate about the status of some particular household. Thediscussion continued until this information had been obtained for every householdpresently resident in the village.4
Table 1. Stages of progress
1. Food for the family2. Some clothes for the family3. Send children to school4. Repair the existing shelter (Roof with iron sheets) Poverty cut-off
5. Buy small animals like goat, chicken, sheep, rabbits6. Buy a small piece of land7. Buy a bicycle for transportation8. Buy more land Prosperity cut-off
9. Build permanent house10. Start operating a business of few farm products11. Buy a car/ build commercial property
350 A. Krishna et al.
Dow
nloa
ded
by [
Cor
nell
Uni
vers
ity L
ibra
ry]
at 2
2:12
08
Febr
uary
201
5

Based on this information, the research team categorised each household in thefollowing manner:
Category A: Poor 25 years ago and poor today (Remained poor)Category B: Poor 25 years ago but not poor today (Escaped poverty)Category C: Not poor 25 years ago but poor today (Became poor)Category D: Not poor 25 years ago and not poor today (Remained not poor)
Present-day households constituted the unit of analysis for this exercise. When askingabout conditions at the present time we inquired about present-day households’members, and when asking about conditions in the previous time period we asked aboutconditions faced by these samemembers 25 years ago. In case of younger households, weasked about conditions in their parents’ household 25 years ago.5
Once the categorisation was complete, a random sample of 40 per cent ofhouseholds in each category was selected, and in-depth discussions were held withthe community group regarding the reasons associated with each household in thesample – for moving into or out of poverty, as the case may be, or for staying pooror not poor. A comparative framework was adopted for these inquiries. Aftercompleting this step, the community meeting was concluded.
Interviews with individual members of the selected households followed the next day.These interviews were conducted to verify, validate and complement the informationprovided by the community group. Household members were interviewed in the privacyof their homes. The stages and reasons provided by the community group were verifiedseparately with each household in the sample. Additional household-level informationwas also obtained at this time, including information on demographic features and assetsowned.Rarelywas a single reason responsible for descent or escape, andmultiple reasonswere usually associated with each household’s trajectory. Up to five reasons wererecorded for each selected household.
III. Trends in Escape and Descent
Onaverage in these 36 villages, 45 per cent of all households lived in poverty 25 years ago,37 per cent were poor ten years ago, and 35 per cent are poor at the present time. Overall,poverty has fallen consistently over this period, and the average figure at present for these36 villages – 35 per cent in poverty – is the same as the average figure for the entire country(Deininger and Okidi, 2003; Lawson et al., 2003), suggesting that these villages are notdissimilar in terms of poverty from other areas in the country.
Table 2 shows that of the total of 2,631 households resident in these 36 villages,20.4 per cent were poor 25 years ago and they are also poor today, and 40.6 per centwere not poor 25 years ago and they are not poor today. Twenty-four per cent ofhouseholds escaped poverty during this time, and another 15 per cent simultaneouslyfell into poverty, making for a net poverty reduction of 9 per cent over the 25-yearperiod. While the large numbers escaping poverty, 24 per cent, are heartening toobserve, the substantial numbers who fell into poverty during the same period givecause for concern.
It is useful to examine the relationship that the four categories utilised in thismethodology have with some other indicators of poverty, more often utilised within
Escaping Poverty and Becoming Poor in Western Uganda 351
Dow
nloa
ded
by [
Cor
nell
Uni
vers
ity L
ibra
ry]
at 2
2:12
08
Febr
uary
201
5
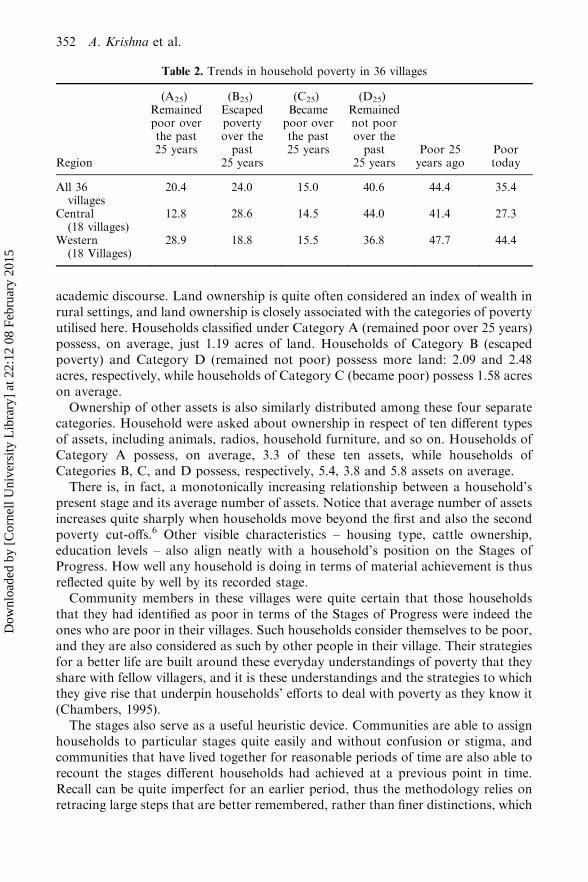
academic discourse. Land ownership is quite often considered an index of wealth inrural settings, and land ownership is closely associated with the categories of povertyutilised here. Households classified under Category A (remained poor over 25 years)possess, on average, just 1.19 acres of land. Households of Category B (escapedpoverty) and Category D (remained not poor) possess more land: 2.09 and 2.48acres, respectively, while households of Category C (became poor) possess 1.58 acreson average.
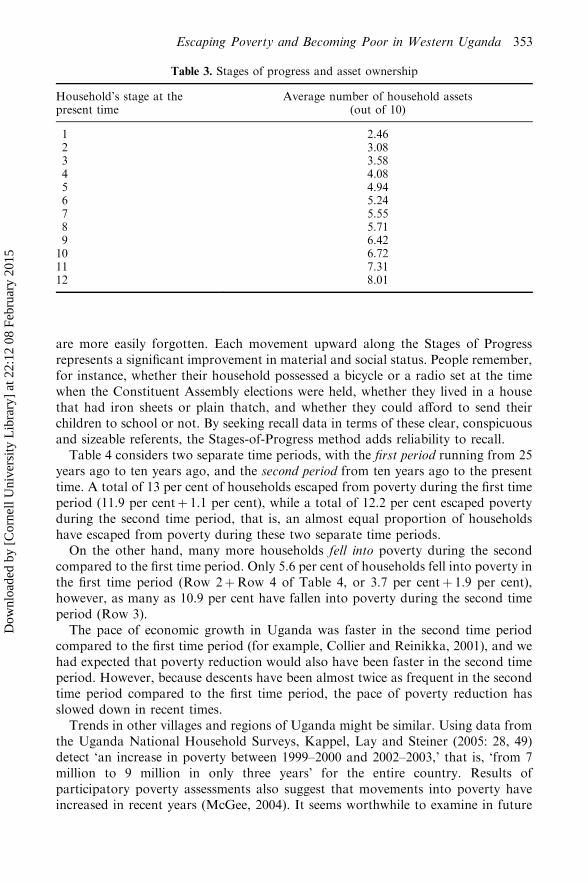
Ownership of other assets is also similarly distributed among these four separatecategories. Household were asked about ownership in respect of ten different typesof assets, including animals, radios, household furniture, and so on. Households ofCategory A possess, on average, 3.3 of these ten assets, while households ofCategories B, C, and D possess, respectively, 5.4, 3.8 and 5.8 assets on average.
There is, in fact, a monotonically increasing relationship between a household’spresent stage and its average number of assets. Notice that average number of assetsincreases quite sharply when households move beyond the first and also the secondpoverty cut-offs.6 Other visible characteristics – housing type, cattle ownership,education levels – also align neatly with a household’s position on the Stages ofProgress. How well any household is doing in terms of material achievement is thusreflected quite by well by its recorded stage.
Community members in these villages were quite certain that those householdsthat they had identified as poor in terms of the Stages of Progress were indeed theones who are poor in their villages. Such households consider themselves to be poor,and they are also considered as such by other people in their village. Their strategiesfor a better life are built around these everyday understandings of poverty that theyshare with fellow villagers, and it is these understandings and the strategies to whichthey give rise that underpin households’ efforts to deal with poverty as they know it(Chambers, 1995).
The stages also serve as a useful heuristic device. Communities are able to assignhouseholds to particular stages quite easily and without confusion or stigma, andcommunities that have lived together for reasonable periods of time are also able torecount the stages different households had achieved at a previous point in time.Recall can be quite imperfect for an earlier period, thus the methodology relies onretracing large steps that are better remembered, rather than finer distinctions, which
Table 2. Trends in household poverty in 36 villages
Region
(A25)Remainedpoor overthe past25 years
(B25)Escapedpovertyover thepast
25 years
(C25)Becamepoor overthe past25 years
(D25)Remainednot poorover thepast
25 yearsPoor 25years ago
Poortoday
All 36villages
20.4 24.0 15.0 40.6 44.4 35.4
Central(18 villages)
12.8 28.6 14.5 44.0 41.4 27.3
Western(18 Villages)
28.9 18.8 15.5 36.8 47.7 44.4
352 A. Krishna et al.
Dow
nloa
ded
by [
Cor
nell
Uni
vers
ity L
ibra
ry]
at 2
2:12
08
Febr
uary
201
5
are more easily forgotten. Each movement upward along the Stages of Progressrepresents a significant improvement in material and social status. People remember,for instance, whether their household possessed a bicycle or a radio set at the timewhen the Constituent Assembly elections were held, whether they lived in a housethat had iron sheets or plain thatch, and whether they could afford to send theirchildren to school or not. By seeking recall data in terms of these clear, conspicuousand sizeable referents, the Stages-of-Progress method adds reliability to recall.
Table 4 considers two separate time periods, with the first period running from 25years ago to ten years ago, and the second period from ten years ago to the presenttime. A total of 13 per cent of households escaped from poverty during the first timeperiod (11.9 per centþ 1.1 per cent), while a total of 12.2 per cent escaped povertyduring the second time period, that is, an almost equal proportion of householdshave escaped from poverty during these two separate time periods.
On the other hand, many more households fell into poverty during the secondcompared to the first time period. Only 5.6 per cent of households fell into poverty inthe first time period (Row 2þRow 4 of Table 4, or 3.7 per centþ 1.9 per cent),however, as many as 10.9 per cent have fallen into poverty during the second timeperiod (Row 3).
The pace of economic growth in Uganda was faster in the second time periodcompared to the first time period (for example, Collier and Reinikka, 2001), and wehad expected that poverty reduction would also have been faster in the second timeperiod. However, because descents have been almost twice as frequent in the secondtime period compared to the first time period, the pace of poverty reduction hasslowed down in recent times.
Trends in other villages and regions of Uganda might be similar. Using data fromthe Uganda National Household Surveys, Kappel, Lay and Steiner (2005: 28, 49)detect ‘an increase in poverty between 1999–2000 and 2002–2003,’ that is, ‘from 7million to 9 million in only three years’ for the entire country. Results ofparticipatory poverty assessments also suggest that movements into poverty haveincreased in recent years (McGee, 2004). It seems worthwhile to examine in future
Table 3. Stages of progress and asset ownership
Household’s stage at thepresent time
Average number of household assets(out of 10)
1 2.462 3.083 3.584 4.085 4.946 5.247 5.558 5.719 6.4210 6.7211 7.3112 8.01
Escaping Poverty and Becoming Poor in Western Uganda 353
Dow
nloa
ded
by [
Cor
nell
Uni
vers
ity L
ibra
ry]
at 2
2:12
08
Febr
uary
201
5
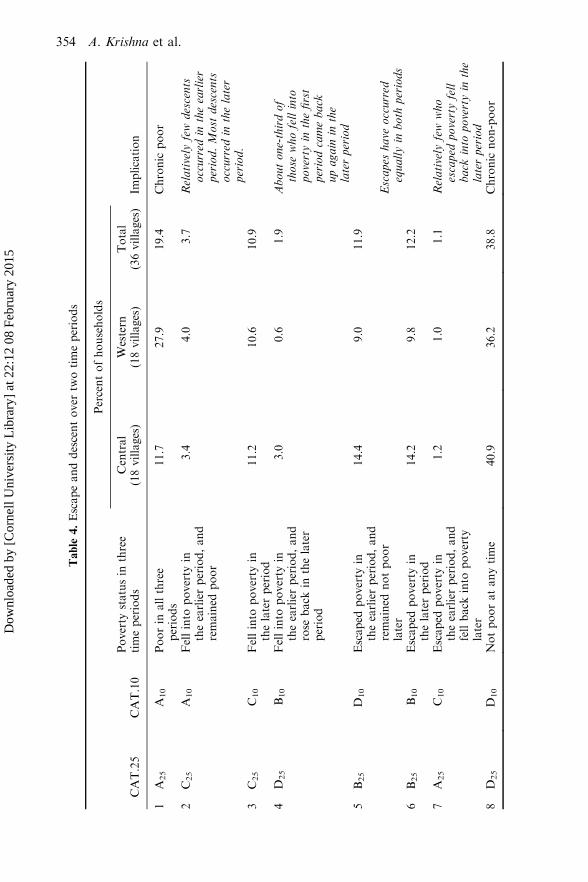
Table
4.Escapeanddescentover
twotimeperiods
Percentofhouseholds
CAT.25
CAT.10
Poverty
statusin
three
timeperiods
Central
(18villages)
Western
(18villages)
Total
(36villages)
Implication
1A
25
A10
Poorin
allthree
periods
11.7
27.9
19.4
Chronic
poor
2C25
A10
Fellinto
poverty
intheearlierperiod,and
remained
poor
3.4
4.0
3.7
Relatively
few
descents
occurred
intheearlier
period.Most
descents
occurred
inthelater
period.
3C25
C10
Fellinto
poverty
inthelaterperiod
11.2
10.6
10.9
4D
25
B10
Fellinto
poverty
intheearlierperiod,and
rose
back
inthelater
period
3.0
0.6
1.9
Aboutone-thirdof
those
whofellinto
povertyin
thefirst
periodcameback
upagain
inthe
laterperiod
5B25
D10
Escaped
poverty
intheearlierperiod,and
remained
notpoor
later
14.4
9.0
11.9
Escapes
have
occurred
equallyin
both
periods
6B25
B10
Escaped
poverty
inthelaterperiod
14.2
9.8
12.2
7A
25
C10
Escaped
poverty
intheearlierperiod,and
fellback
into
poverty
later
1.2
1.0
1.1
Relatively
few
who
escaped
povertyfell
back
into
povertyin
the
laterperiod
8D
25
D10
Notpooratanytime
40.9
36.2
38.8
Chronic
non-poor
354 A. Krishna et al.
Dow
nloa
ded
by [
Cor
nell
Uni
vers
ity L
ibra
ry]
at 2
2:12
08
Febr
uary
201
5
studies why higher volatility has gone together with greater liberalisation andcommercialisation, especially since the late 1990s.
Gender disparity has also worsened during the second period. While 10.4 per centof male-headed households fell into poverty during this period, 17.6 per cent offemale-headed households joined the ranks of the poor.
Some comfort can be taken from observing that of all households that fell intopoverty during the first period (5.6 per cent) about one-third (1.9 per cent) were ableto overcome poverty during the second time period. The majority of thesehouseholds, two-thirds, remained poor at the end of the second time period,however, indicating that falling into poverty is not merely a temporary inconvenience.
Some households that escaped from poverty during the first period have alsofallen back into poverty in the second time period. Fortunately, relatively fewhouseholds experienced such reversals. Of 13.3 per cent of households that escapedfrom poverty in the first time period, less than one-tenth (1.1 per cent) fell back intopoverty during the second time period.
These averages for all 36 villages conceal the very substantial differences,however, that exist from village to village. In as many as 16 of the 36 villages thatwe studied, net poverty has increased over the 25-year period.7 Villages such asKitinda (Ntumgamo district) where household poverty increased by 53 per cent,Yandwe (Luwero district) where it increased by 38 per cent, and Katooma Central(Bushenyi district) where it increased by 29 per cent, are particularly worrying in thisrespect.8
Providing more effective assistance for those who have been left behind inpoverty – and for those who have actually become poor over the past ten or25 years – will require addressing separately the reasons for escape and for descent.These reasons are discussed in the next section.
IV. Factors Associated with Escape and with Descent
Previous studies of poverty dynamics provide important clues about some factorsassociated with decline and ascent in Uganda. Participatory poverty assessmentsconducted in 36 sites in 1998 and in 60 additional sites in 2002 suggest thatalcoholism, large family size, ill health, and expenses on dowries and funerals can beimportant reasons for descending into poverty. Separately, Deininger and Okidi(2003) and Lawson (2004) also found ill health to be significantly associated withdescent into poverty. Bird and Shinyekwa (2003) found multiple correlated reasonsassociated with descent, including ill health and drunkenness. Respondents tosurveys have also indicated several other factors that are associated in their view withascent out of poverty, including multiple income sources, access to employment,land and start-up capital, and higher education and skills (GoU, 2002a; Lawson,et al. 2003; Lwanga-Ntale and McClean, 2003).
Reasons for escape and descent identified by these studies served as a startingpoint for our investigations. Many among these reasons were confirmed by therandom sample of 1,068 households whom we interviewed. However, some amongthese reasons were not validated by the experiences and trajectories that weexamined. On the other hand, some other reasons were also identified that have notbeen recognised by previous studies.
Escaping Poverty and Becoming Poor in Western Uganda 355
Dow
nloa
ded
by [
Cor
nell
Uni
vers
ity L
ibra
ry]
at 2
2:12
08
Febr
uary
201
5

While previous studies have relied upon the collective opinion of villagersregarding factors associated with escape and descent, this study matches factors andcauses to the actual experiences of specific households. Reasons for escape anddescent were identified through community meetings in each village and they wereverified and cross-checked with members of each selected household. Themethodology used here provides an opportunity to examine the relative frequency,magnitude, and statistical significance of these factors, while at the same timeidentifying additional factors and processes of change, thereby complementingknowledge obtained through other methods.
Eight factors are associated with decline in a household’s material circum-stances. These eight factors form three separate clusters. Ill health, healthcareexpenses, and death of income earners form the first and numerically mostimportant cluster. The second cluster is related to social and behavioural factors,including family size, funeral and marriage expenses, alcoholism and laziness. Thethird cluster includes all land-related factors, especially land division, cropdisease, and land exhaustion.
Health and health-related expenses are the single most important reasonassociated with descending into poverty. More than 70 per cent of households thatfell into poverty (Category C) cited ill health and healthcare expenses as the mostimportant part of the process leading to their descent. Deaths of income earners,which have occurred mostly on account of disease, are important in the case ofanother 35 per cent of such households. As examined later, the impact of thesehealth-related factors on descent has become even more deleterious during thesecond period (the last ten years) compared to the first period (ten to 25years ago).9
Twenty-five years ago my welfare was good. My husband was still alive andwe had enough land and animals. My husband was sick for ten years beforehe died and all the money we had was spent on medical charges. We even soldsome animals and land to raise money for treatment. Our welfare becameworse because we were left with small land and few animals. My children haddropped out of school because we could not pay school fees. Then myhusband died and the small land we had left was shared among my sons. Mywelfare became even worse because I was left with a very small piece of landand I can’t even get enough food to eat. Now I work as a casual labourer onother people’s farms. (Female respondent, Kikoni village, Ntungamo district,Western Region) I lost my husband who had a government job as apharmacist to sickness. I used to grow some crops for cash but now I am eversick and the little I get from my garden I use for buying drugs. Some of mygrandchildren are sickly and I may tell you some of my children died ofAIDS. (Female respondent, Katega village, Mukono district, Central Region)
Social and behavioural factors, including family size, age of household head,funeral and marriage expenses, alcoholism and laziness, constitute the secondcluster. These factors were examined because they are frequently brought upin poverty analyses. Large family size was quite important for descent in these36 villages. In all, 39 per cent of households that have fallen into poverty over the
356 A. Krishna et al.
Dow
nloa
ded
by [
Cor
nell
Uni
vers
ity L
ibra
ry]
at 2
2:12
08
Febr
uary
201
5
25-year period mentioned large family size as a critical factor associated with thisdecline. This factor was also significant in regression analysis, presented below.
None of the other factors in the second cluster are significantly associated withdescent. Funeral and marriage expenses are not significant for this analysis.Drunkenness is also not significant, as seen below in regression analysis. Alcoholismis, no doubt, a serious social ill, and we came across evidence of considerabledrunkenness in many villages that we visited. It does not appear to be associatedpreponderantly with households that have suffered a decline in their circumstances,and households that have improved their status provide evidence of drunkenness asmuch as households that have declined. Drunkenness does not emerge consequentlyas a factor particularly associated with descent. Laziness is similarly not importantfor this analysis, and it is unfortunate that people should ever consider it to be so.10
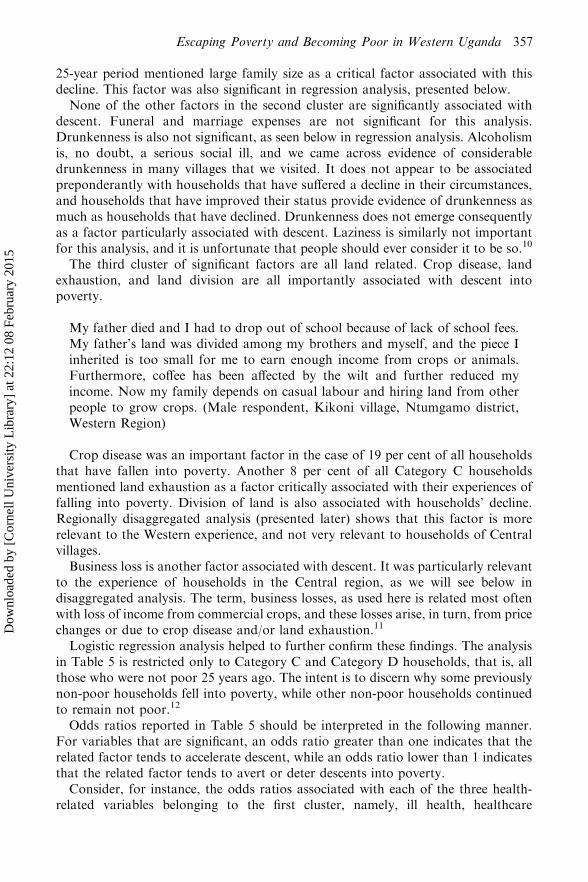
The third cluster of significant factors are all land related. Crop disease, landexhaustion, and land division are all importantly associated with descent intopoverty.
My father died and I had to drop out of school because of lack of school fees.My father’s land was divided among my brothers and myself, and the piece Iinherited is too small for me to earn enough income from crops or animals.Furthermore, coffee has been affected by the wilt and further reduced myincome. Now my family depends on casual labour and hiring land from otherpeople to grow crops. (Male respondent, Kikoni village, Ntumgamo district,Western Region)
Crop disease was an important factor in the case of 19 per cent of all householdsthat have fallen into poverty. Another 8 per cent of all Category C householdsmentioned land exhaustion as a factor critically associated with their experiences offalling into poverty. Division of land is also associated with households’ decline.Regionally disaggregated analysis (presented later) shows that this factor is morerelevant to the Western experience, and not very relevant to households of Centralvillages.
Business loss is another factor associated with descent. It was particularly relevantto the experience of households in the Central region, as we will see below indisaggregated analysis. The term, business losses, as used here is related most oftenwith loss of income from commercial crops, and these losses arise, in turn, from pricechanges or due to crop disease and/or land exhaustion.11
Logistic regression analysis helped to further confirm these findings. The analysisin Table 5 is restricted only to Category C and Category D households, that is, allthose who were not poor 25 years ago. The intent is to discern why some previouslynon-poor households fell into poverty, while other non-poor households continuedto remain not poor.12
Odds ratios reported in Table 5 should be interpreted in the following manner.For variables that are significant, an odds ratio greater than one indicates that therelated factor tends to accelerate descent, while an odds ratio lower than 1 indicatesthat the related factor tends to avert or deter descents into poverty.
Consider, for instance, the odds ratios associated with each of the three health-related variables belonging to the first cluster, namely, ill health, healthcare
Escaping Poverty and Becoming Poor in Western Uganda 357
Dow
nloa
ded
by [
Cor
nell
Uni
vers
ity L
ibra
ry]
at 2
2:12
08
Febr
uary
201
5
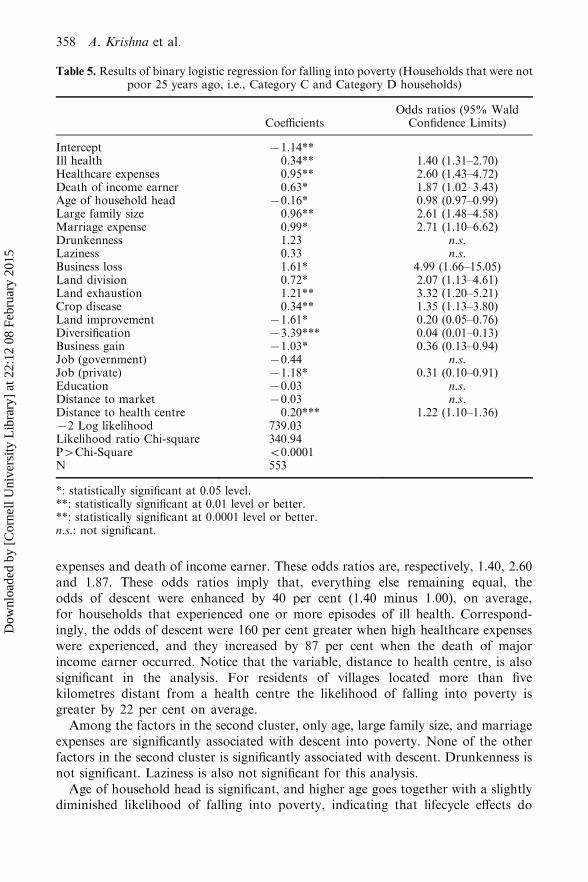
expenses and death of income earner. These odds ratios are, respectively, 1.40, 2.60and 1.87. These odds ratios imply that, everything else remaining equal, theodds of descent were enhanced by 40 per cent (1.40 minus 1.00), on average,for households that experienced one or more episodes of ill health. Correspond-ingly, the odds of descent were 160 per cent greater when high healthcare expenseswere experienced, and they increased by 87 per cent when the death of majorincome earner occurred. Notice that the variable, distance to health centre, is alsosignificant in the analysis. For residents of villages located more than fivekilometres distant from a health centre the likelihood of falling into poverty isgreater by 22 per cent on average.
Among the factors in the second cluster, only age, large family size, and marriageexpenses are significantly associated with descent into poverty. None of the otherfactors in the second cluster is significantly associated with descent. Drunkenness isnot significant. Laziness is also not significant for this analysis.
Age of household head is significant, and higher age goes together with a slightlydiminished likelihood of falling into poverty, indicating that lifecycle effects do
Table 5. Results of binary logistic regression for falling into poverty (Households that were notpoor 25 years ago, i.e., Category C and Category D households)
CoefficientsOdds ratios (95% Wald
Confidence Limits)
Intercept 71.14**Ill health 0.34** 1.40 (1.31–2.70)Healthcare expenses 0.95** 2.60 (1.43–4.72)Death of income earner 0.63* 1.87 (1.02–3.43)Age of household head 70.16* 0.98 (0.97–0.99)Large family size 0.96** 2.61 (1.48–4.58)Marriage expense 0.99* 2.71 (1.10–6.62)Drunkenness 1.23 n.s.Laziness 0.33 n.s.Business loss 1.61* 4.99 (1.66–15.05)Land division 0.72* 2.07 (1.13–4.61)Land exhaustion 1.21** 3.32 (1.20–5.21)Crop disease 0.34** 1.35 (1.13–3.80)Land improvement 71.61* 0.20 (0.05–0.76)Diversification 73.39*** 0.04 (0.01–0.13)Business gain 71.03* 0.36 (0.13–0.94)Job (government) 70.44 n.s.Job (private) 71.18* 0.31 (0.10–0.91)Education 70.03 n.s.Distance to market 70.03 n.s.Distance to health centre 0.20*** 1.22 (1.10–1.36)72 Log likelihood 739.03Likelihood ratio Chi-square 340.94P4Chi-Square 50.0001N 553
*: statistically significant at 0.05 level.**: statistically significant at 0.01 level or better.**: statistically significant at 0.0001 level or better.n.s.: not significant.
358 A. Krishna et al.
Dow
nloa
ded
by [
Cor
nell
Uni
vers
ity L
ibra
ry]
at 2
2:12
08
Febr
uary
201
5

matter somewhat. The impact of age is quite slight, however; other variablescontinue to matter when life cycle effects are considered, and many among themmatter considerably more.
Four factors included within our third cluster are all significantly associated withdescent. The likelihood of a household falling into poverty is enhanced by, onaverage, 399 per cent, 232 per cent, 107 per cent, and 35 per cent, respectively, whenthe household concerned experienced business loss, land exhaustion, land division,or crop disease.
Table 5 also shows that some factors have worked in the opposite direction. Fivesignificant factors – including age, diversification, business gain, land improvement,and private sector job attainment – have odds ratios lower than one, which indicatesthat the presence of these factors reduces the likelihood of falling into poverty.For instance, the likelihood of falling into poverty was lower by 96 per cent (0.04minus 1.00), on average, for a household that undertook diversification of incomesources. Similarly, the likelihood of falling into poverty was reduced, on average, by80 per cent, 64 per cent, and 69 per cent, respectively, when land improvement,business gain, and private sector job attainment formed part of a household’sreported trajectory. By preventing or offsetting the effects of factors that exert adownward pull, these positive factors enabled Category D households to retain theirnon-poor status.
Factors responsible for households’ falling into poverty have to be consideredalongside other factors that help households escape from or stave off poverty.While these two sets of factors are quite different from each other, individualhouseholds are simultaneously susceptible to factors belonging to both sets. Whereany households land up eventually is the net result, therefore, of both sets offactors.
Examining the experiences of households that escaped from poverty shows thatthe same set of four positive factors – including land improvement, diversification ofincome sources, gain from business (mainly commercial crops), and obtaining aprivate sector job – is significantly associated with movements upward, out ofpoverty.
Among all households of Category B, that is, those who escaped from povertyover the 25-year period, 27 per cent cited diversification of income sources as aprincipally important factor. Households that were able to vary their sources ofincome were more likely to escape poverty than those who could not.
My husband died in the war in Luwero. I started brewing waragi and got areasonable amount of money from it and was able to start up a small piggeryproject. The project is still paying me very much. I also generate some moneyfrom making and selling mats and baskets. (Female respondent, Katega village,Mukono district, Central Region)
Land-related factors, especially improving productivity and diversifying intocommercial crops, were comparatively much more important in both these regionsof Uganda. Business gains were often associated with such land-related activities (asalso found by Kappel, Lay and Steiner, 2005). These two factors were significantlyassociated with escape for 38 per cent of Category B households.
Escaping Poverty and Becoming Poor in Western Uganda 359
Dow
nloa
ded
by [
Cor
nell
Uni
vers
ity L
ibra
ry]
at 2
2:12
08
Febr
uary
201
5
After the war I worked so hard in agriculture. I grew a lot of coffee, which had amarket then and sold it. Now the most selling item is bananas, which make localbrew and I am seriously doing that. The difference between other bananagrowers and me is that I make the beer myself instead of selling the bananas.Therefore, I earn more. (Male respondent, Lwanda village, Luwero district,Central Region)
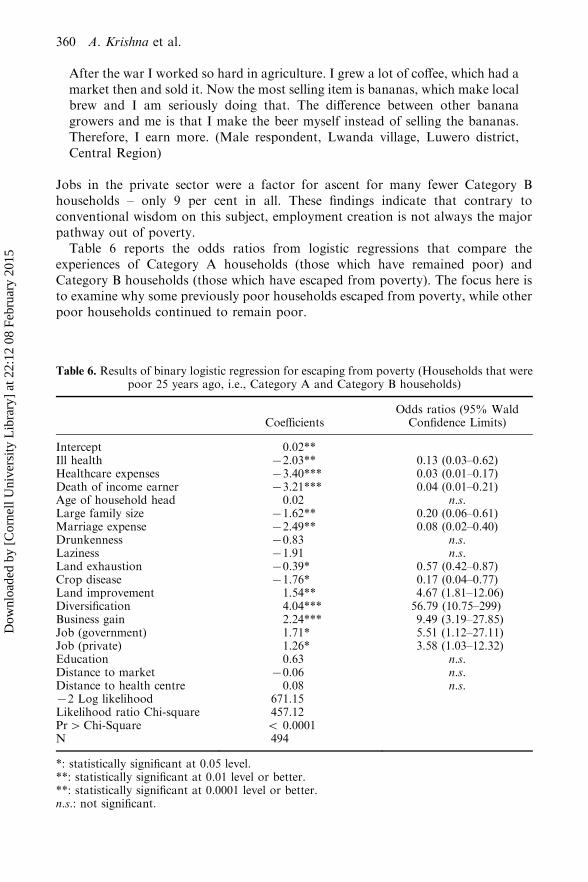
Jobs in the private sector were a factor for ascent for many fewer Category Bhouseholds – only 9 per cent in all. These findings indicate that contrary toconventional wisdom on this subject, employment creation is not always the majorpathway out of poverty.
Table 6 reports the odds ratios from logistic regressions that compare theexperiences of Category A households (those which have remained poor) andCategory B households (those which have escaped from poverty). The focus here isto examine why some previously poor households escaped from poverty, while otherpoor households continued to remain poor.
Table 6. Results of binary logistic regression for escaping from poverty (Households that werepoor 25 years ago, i.e., Category A and Category B households)
CoefficientsOdds ratios (95% Wald
Confidence Limits)
Intercept 0.02**Ill health 72.03** 0.13 (0.03–0.62)Healthcare expenses 73.40*** 0.03 (0.01–0.17)Death of income earner 73.21*** 0.04 (0.01–0.21)Age of household head 0.02 n.s.Large family size 71.62** 0.20 (0.06–0.61)Marriage expense 72.49** 0.08 (0.02–0.40)Drunkenness 70.83 n.s.Laziness 71.91 n.s.Land exhaustion 70.39* 0.57 (0.42–0.87)Crop disease 71.76* 0.17 (0.04–0.77)Land improvement 1.54** 4.67 (1.81–12.06)Diversification 4.04*** 56.79 (10.75–299)Business gain 2.24*** 9.49 (3.19–27.85)Job (government) 1.71* 5.51 (1.12–27.11)Job (private) 1.26* 3.58 (1.03–12.32)Education 0.63 n.s.Distance to market 70.06 n.s.Distance to health centre 0.08 n.s.72 Log likelihood 671.15Likelihood ratio Chi-square 457.12Pr4Chi-Square 5 0.0001N 494
*: statistically significant at 0.05 level.**: statistically significant at 0.01 level or better.**: statistically significant at 0.0001 level or better.n.s.: not significant.
360 A. Krishna et al.
Dow
nloa
ded
by [
Cor
nell
Uni
vers
ity L
ibra
ry]
at 2
2:12
08
Febr
uary
201
5
Notice that the likelihood of escaping from poverty is substantially higher, onaverage, for households that have experienced land improvement, diversification,business gains, or obtained jobs in the government or private sector. These oddsratios imply, for instance, that for a household which was poor in the previousperiod the likelihood of escaping poverty increased by 5.5 times in cases where ahousehold member obtained a job in the government. However, members of only 33households in all were lucky enough to obtain a government job. Even though thelikelihood of escaping poverty increased a great deal when this factor was present,this factor was present overall for only a small number of households. Private sectorjobs similarly represent a substantially increased likelihood of escaping frompoverty. However, relatively few poor households (only 9 per cent in all) have beenable to find this pathway to escape.
Notice also that the factors previously found to be significantly associated withdescent – including ill health, healthcare expenses, death of income earners, largefamily size, marriage expenses, land exhaustion and crop disease – are alsosignificant in this analysis of escaping poverty.13 The presence of these factorshas acted as a dampening effect upon the prospects for escape. Households ofCategory A (remained poor) have experienced these negative factors more oftenthan have households of Category B (escaped poverty), and their non-escape isaccounted for as much by the absence of positive factors as by the presence ofnegative ones.
More disaggregated analysis shows that factors of escape and descent aresignificantly different across the two separate regions. They have also changedsomewhat from the first time period (ten to 25 years go) to the second time period(present time to ten years ago).
More reasons for descent have begun to operate during the second time period,and the overall pace of poverty reduction has slowed down. Household poverty fellby 9 per cent during entire 25-year period. Reduction over the past ten years hasbeen just 1.6 per cent in all.
Table 7 presents the disaggregated picture for the two regions and the twoseparate time periods. Separate regression analyses were carried out for eachseparate region and time period. To facilitate brevity and enable comparison, onlyodds ratios for statistically significant variables are reported.
Factors that were significant for descent in the first time period have continued toremain significant during the second time period. However, several additionalfactors have also become significant for descent in the second time period. It shouldcome as no surprise, therefore, that almost twice as many households fell intopoverty during the second period as compared to the first.
None of the three factors in the first cluster – ill health, healthcare expenses, anddeath of income earner – was significant for descent in Western villages during thefirst period, and only one of these three factors, healthcare expenses, was significantduring the earlier period in Central villages. During the past decade, all three of thesefactors have become significant for descent in both regions.
The second cluster of descent-related factors included large family size andmarriage expenses. The figures in Table 7 show that none of these factors wassignificantly associated with descent in the first time period in either the Central orthe Western region. During the second time period, however, large family size
Escaping Poverty and Becoming Poor in Western Uganda 361
Dow
nloa
ded
by [
Cor
nell
Uni
vers
ity L
ibra
ry]
at 2
2:12
08
Febr
uary
201
5
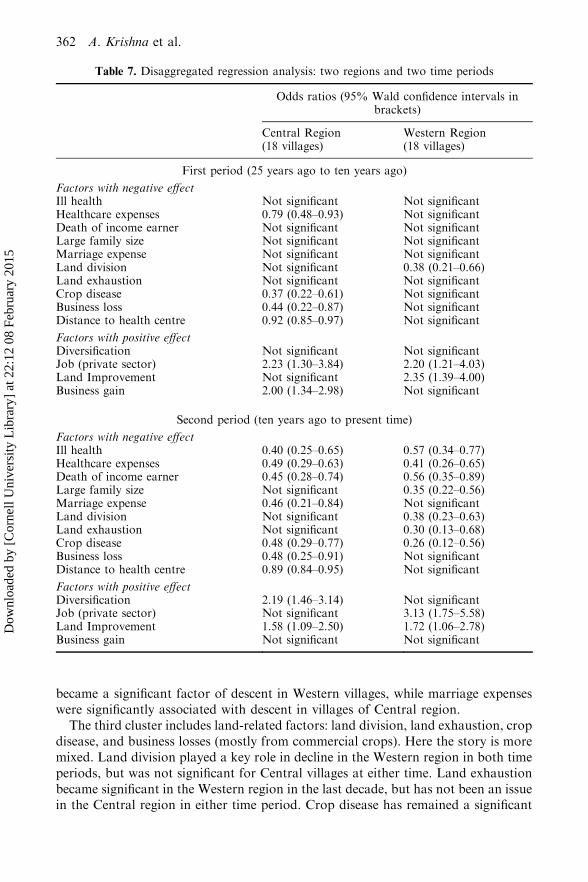
became a significant factor of descent in Western villages, while marriage expenseswere significantly associated with descent in villages of Central region.
The third cluster includes land-related factors: land division, land exhaustion, cropdisease, and business losses (mostly from commercial crops). Here the story is moremixed. Land division played a key role in decline in the Western region in both timeperiods, but was not significant for Central villages at either time. Land exhaustionbecame significant in the Western region in the last decade, but has not been an issuein the Central region in either time period. Crop disease has remained a significant
Table 7. Disaggregated regression analysis: two regions and two time periods
Odds ratios (95% Wald confidence intervals inbrackets)
Central Region(18 villages)
Western Region(18 villages)
First period (25 years ago to ten years ago)
Factors with negative effectIll health Not significant Not significantHealthcare expenses 0.79 (0.48–0.93) Not significantDeath of income earner Not significant Not significantLarge family size Not significant Not significantMarriage expense Not significant Not significantLand division Not significant 0.38 (0.21–0.66)Land exhaustion Not significant Not significantCrop disease 0.37 (0.22–0.61) Not significantBusiness loss 0.44 (0.22–0.87) Not significantDistance to health centre 0.92 (0.85–0.97) Not significant
Factors with positive effectDiversification Not significant Not significantJob (private sector) 2.23 (1.30–3.84) 2.20 (1.21–4.03)Land Improvement Not significant 2.35 (1.39–4.00)Business gain 2.00 (1.34–2.98) Not significant
Second period (ten years ago to present time)
Factors with negative effectIll health 0.40 (0.25–0.65) 0.57 (0.34–0.77)Healthcare expenses 0.49 (0.29–0.63) 0.41 (0.26–0.65)Death of income earner 0.45 (0.28–0.74) 0.56 (0.35–0.89)Large family size Not significant 0.35 (0.22–0.56)Marriage expense 0.46 (0.21–0.84) Not significantLand division Not significant 0.38 (0.23–0.63)Land exhaustion Not significant 0.30 (0.13–0.68)Crop disease 0.48 (0.29–0.77) 0.26 (0.12–0.56)Business loss 0.48 (0.25–0.91) Not significantDistance to health centre 0.89 (0.84–0.95) Not significant
Factors with positive effectDiversification 2.19 (1.46–3.14) Not significantJob (private sector) Not significant 3.13 (1.75–5.58)Land Improvement 1.58 (1.09–2.50) 1.72 (1.06–2.78)Business gain Not significant Not significant
362 A. Krishna et al.
Dow
nloa
ded
by [
Cor
nell
Uni
vers
ity L
ibra
ry]
at 2
2:12
08
Febr
uary
201
5
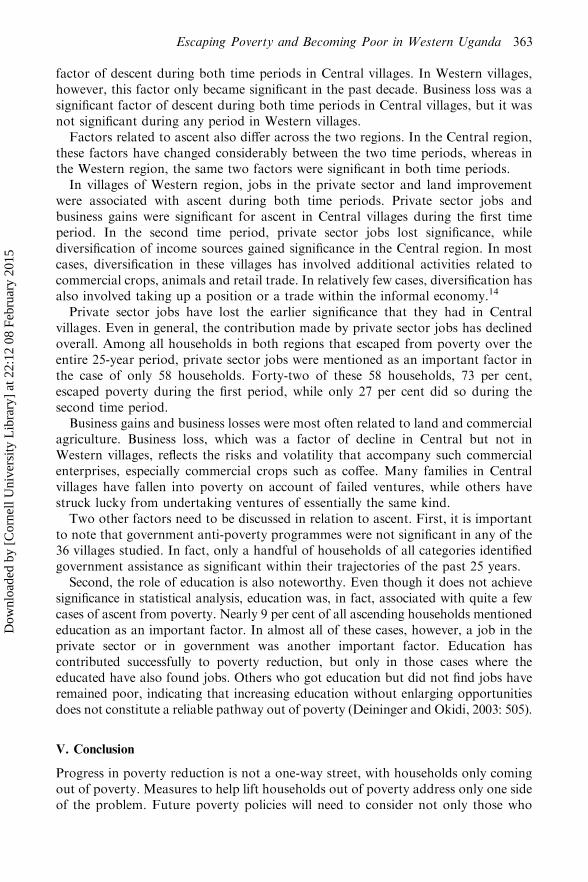
factor of descent during both time periods in Central villages. In Western villages,however, this factor only became significant in the past decade. Business loss was asignificant factor of descent during both time periods in Central villages, but it wasnot significant during any period in Western villages.
Factors related to ascent also differ across the two regions. In the Central region,these factors have changed considerably between the two time periods, whereas inthe Western region, the same two factors were significant in both time periods.
In villages of Western region, jobs in the private sector and land improvementwere associated with ascent during both time periods. Private sector jobs andbusiness gains were significant for ascent in Central villages during the first timeperiod. In the second time period, private sector jobs lost significance, whilediversification of income sources gained significance in the Central region. In mostcases, diversification in these villages has involved additional activities related tocommercial crops, animals and retail trade. In relatively few cases, diversification hasalso involved taking up a position or a trade within the informal economy.14
Private sector jobs have lost the earlier significance that they had in Centralvillages. Even in general, the contribution made by private sector jobs has declinedoverall. Among all households in both regions that escaped from poverty over theentire 25-year period, private sector jobs were mentioned as an important factor inthe case of only 58 households. Forty-two of these 58 households, 73 per cent,escaped poverty during the first period, while only 27 per cent did so during thesecond time period.
Business gains and business losses were most often related to land and commercialagriculture. Business loss, which was a factor of decline in Central but not inWestern villages, reflects the risks and volatility that accompany such commercialenterprises, especially commercial crops such as coffee. Many families in Centralvillages have fallen into poverty on account of failed ventures, while others havestruck lucky from undertaking ventures of essentially the same kind.
Two other factors need to be discussed in relation to ascent. First, it is importantto note that government anti-poverty programmes were not significant in any of the36 villages studied. In fact, only a handful of households of all categories identifiedgovernment assistance as significant within their trajectories of the past 25 years.
Second, the role of education is also noteworthy. Even though it does not achievesignificance in statistical analysis, education was, in fact, associated with quite a fewcases of ascent from poverty. Nearly 9 per cent of all ascending households mentionededucation as an important factor. In almost all of these cases, however, a job in theprivate sector or in government was another important factor. Education hascontributed successfully to poverty reduction, but only in those cases where theeducated have also found jobs. Others who got education but did not find jobs haveremained poor, indicating that increasing education without enlarging opportunitiesdoes not constitute a reliable pathway out of poverty (Deininger and Okidi, 2003: 505).
V. Conclusion
Progress in poverty reduction is not a one-way street, with households only comingout of poverty. Measures to help lift households out of poverty address only one sideof the problem. Future poverty policies will need to consider not only those who
Escaping Poverty and Becoming Poor in Western Uganda 363
Dow
nloa
ded
by [
Cor
nell
Uni
vers
ity L
ibra
ry]
at 2
2:12
08
Febr
uary
201
5
have been ‘left behind’ by growth, but must also pay deliberate attention to thesignificant numbers of households that continue to fall into poverty.
Escapes from poverty occurred at roughly the same rate in the two time periods.However, nearly twice as many households fell into poverty in the last decade ascompared to the earlier period. While 5.6 per cent of households fell into povertyin the first period, 10.9 per cent fell into poverty during the second period. As aresult of this increased pace of descents, poverty reduction in these two regions ofUganda has slowed over the past ten years, even as national economic growth hasaccelerated.
Different sets of factors are associated, respectively, with movements upward, outof poverty, and movements downward, into poverty. Therefore, different policymeasures will be required for dealing with these two separate sets of factors. Inaddition to cargo nets, which help carry households out of poverty, stronger safetynets will also be required that can prevent or slow down descents into poverty(Barrett, 2005; Devereux, 2002; Lipton, 1997).
Policies aimed at controlling descent will – and should – have some commonaspects across both regions. However, more region-specific policies are also neededthat address specific factors associated with the distinct geographic, cultural andsocio-economic conditions of each separate region.
Slowing descent that has accelerated in recent years will require dealing urgentlywith three sets of negative factors. Ill health, high healthcare expenses, and theassociated deaths of major income earners constitute the first of these three sets.These factors have contributed principally to households’ descent into poverty inboth regions – and they have become more significant for descent within the last tenyears. Providing better and more affordable healthcare will therefore constitute amajor part of the response to poverty-causing factors in both regions.
Other studies point similarly to the role played by health-related factors. Lawson(2004) and Deininger and Okidi (2003) similarly found ill health to be significantlyassociated with descent, with the latter study also indicating how sickness hasincreased in all regions of the country between 1992 and 1999. Infant mortalityremains high and has not improved over the past five years (GoU, 2002b). Sicknessis a very important reason for children dropping out of school and frequent schoolabsences (Mijumbi and Okidi, 2001), and a close relationship exists between povertyand disability (Lwanga-Ntale, 2003).15 Distance to health centres plays an importantrole in a household’s ability to fend off sickness and poverty. While the location ofthe facility is not the only means of reducing vulnerability to poverty on account ofill health, it does have a significant impact (Okwi, 1999).
It is quite likely that AIDS has an important part to play in the increasedsignificance of ill health between the first period and the second. We do not have anydirect evidence about AIDS and its effects in these villages. Our method does notpermit an examination of which particular illness is associated with each particularcase of descent into poverty. It would be important, however, to examine better infuture the associations that particular diseases have in different regions withpathways leading into poverty.
We examined the likely impact of HIV/AIDS indirectly, however, byconstructing an interactive variable multiplying together the variables for largefamily size and death of income earner. This interactive variable was significantly
364 A. Krishna et al.
Dow
nloa
ded
by [
Cor
nell
Uni
vers
ity L
ibra
ry]
at 2
2:12
08
Febr
uary
201
5
associated with descent in both regions during the second time period (though notin the first time period). Okidi and Mugambe (2002) find evidence of a similarinteraction between AIDS incidence and large family size. As many as 1.4 millionchildren have been orphaned by AIDS in Uganda, and the households thathave taken in these children have grown in size and become more vulnerable topoverty.
AIDS is not, however, the only cause of death or debility. Malaria continues toaccount for more deaths than AIDS (Hutchinson, 2001), so dealing with ill health asa reason for deepening poverty will require doing more than controlling AIDS andalleviating its effects in terms of increased dependence ratios.
Land and socially related factors must also be considered when formulatingpolicies to control descent into poverty. Dealing with these two other clusters ofnegative factors will require more regionally differentiated responses. For example,while land exhaustion was salient for descent in Western villages, it was notsignificant in Central villages. Reducing future descents will require focusing onmitigating this factor in the Western region, while working to prevent itsoccurrence in Central villages. Analysis by Pender et al. (2004) suggests that soilfertility appears to have degraded throughout most of Uganda, while Olson andBerry (2003) indicate that large percentages of land in each region faceacute degradation, with this percentage going as high as 90 per cent in Kabaledistrict.
Cultural practices also vary between the two regions, giving rise to differentfactors associated with decline. Division of land and large family size are moresalient for decline in Western compared to Central villages. Marriage expenses havethe opposite effect, however, being significantly associated with material decline inCentral but not in Western villages. Region- and even district-specific policies will berequired to address these factors better.
A different set of policies will be needed to assist households in their efforts toescape from poverty. More focus on land-based policies for supporting escape willalso be of considerable utility. Nearly 70 per cent of all households escaping povertyover the past 25 years were assisted in this transition by increased incomes derivedfrom commercial cropping and diversification on agricultural land. However,concerns related to crop disease and land exhaustion must be addressed if thisavenue out of poverty is to remain viable.
Less than 10 per cent of households escaping poverty over the past 25 years wereassisted in this achievement by obtaining a job in the private sector. Indeed, theimportance of private sector employment has diminished from the earlier period (tento 25 years ago) to the more recent period (the past ten years).
Policies must stay current with these changes in order to remain relevant and to bemore effective. Policies must also be differentiated significantly for different regionsand districts, suggesting that causes associated with escape and descent will need tobe studied more regularly on a decentralised and localised basis.
The Stages-of-Progress methodology is helpful for these purposes. In addition toexamining the status and various characteristics of different households, it alsoenables an examination of the processes that accompany households’ escapeor descent. Positive reasons – those which help pull households upward – canbe identified along with negative reasons, which push households downward, and
Escaping Poverty and Becoming Poor in Western Uganda 365
Dow
nloa
ded
by [
Cor
nell
Uni
vers
ity L
ibra
ry]
at 2
2:12
08
Febr
uary
201
5
policies can be formulated to address both sets of reasons as they operate within anyspecific region.
The application of this method within these 36 villages in Uganda shows thatpoverty policies will have to concentrate better upon expanded and more easilyaccessed rural health services, improved agricultural research and extension, andbetter incentives for private sector development. Preventing descents more effectivelyby focusing on the negative factors will be as important as promoting escapesthrough attending to the positive factors.
Why people fall into poverty needs to be known much better, and why only somepeople (and not others) are able to benefit from opportunities generated by growthalso needs to be investigated more closely. Suitable methodologies need to bedeveloped for figuring out better the processes that are associated with escape anddescent at the micro level. The Stages-of-Progress methodology was developed withthis purpose in mind, and it is currently being adapted and implemented in differentparts of the developing world. Not only analysts, but also communities, can utilisethese methods on their own to track poverty in their midst, to isolate reasons forescape and for descent, and to develop strategies to deal with these reasons.
Some limitations will need to be addressed, however, as this methodology isextended further. First, it will need to deal better with intra-household differences,particularly those based on gender. In its present form, the methodology does notdisaggregate further below the household level.16
Second, the methodology will need to be adapted for dealing better with newlyformed communities, particularly those in large cities. Because it relies uponcommonly shared community memories, this methodology works better amongmore longstanding and close-knit communities. Such communities are easier to findin rural areas, and they are less prevalent in metropolitan areas, which limits thereach of the methodology in its present form.
Third, in order to understand poverty comprehensively in any region it isimportant to use multiple methods, including household surveys, panel studies, andparticipatory appraisals. Each method enables us to learn better about differentaspects of poverty, and none can entirely replace the learning that accrues fromanother method.
Combining multiple methods in a single study will also help to validate resultsderived from each of them. Thus, single-period poverty statistics from the Stages-of-Progress method can and should be checked against results from conventionalhousehold surveys. At the same time, changes in poverty over time as indicated byrepeat household surveys should be verified in terms of processes and reasonsidentified by a Stages-of-Progress study.
Because studies using different methods are undertaken in dissimilar spaces, it isnot possible at the present time to compare results and obtain more comprehensiveinformation on poverty and its causes.17 We end, therefore, with a plea for a new setof more eclectic studies, concerned simultaneously with issues of ‘how much’(poverty there is at some point in time) and issues of ‘why’ (households fall into orcome out of poverty in some region). Studies combining different methods willcontain in-built cross-checks on data and methods, they will be richer in terms ofinformation provided, and more relevant for policy formation than any single-method study can ever be.
366 A. Krishna et al.
Dow
nloa
ded
by [
Cor
nell
Uni
vers
ity L
ibra
ry]
at 2
2:12
08
Febr
uary
201
5
Acknowledgement
Krishna is Assistant Professor of Public Policy and Political Science at DukeUniversity; Lumonya is Lecturer, Department of Social Work and SocialAdministration, Makerere University; Markiewicz is Program Director, CrossSectoral Public Policy, Duke University; Kafuko and Magumya are AssistantLecturers in the Department of Social Work and Social Administration at MakerereUniversity; Wegoye provided data management expertise. Research support fromthe Cross Sectoral Public Policy programme at Duke University and I@mak atMakerere University is acknowledged with gratitude. Chris Barrett, Sam Hickey,John Hoddinott, David Hulme, Patti Kristjanson, Francis Lethem, Ole Therkildsen,Norman Uphoff, Steven Younger, participants at a workshop held in Kampala on 6December 2004, and anonymous reviewers provided helpful comments. Specialthanks to lead trainer, Dr. Mahesh Kapila and to the 25 research assistants andvillage community members who shared their knowledge with us. All of the usualdisclaimers apply. Corresponding author: [email protected]
Notes
1. Initial interviews with key informants suggested the inclusion of these particular districts for the following
reasons: In Central region, Mukono is often regarded as a model district in terms of growth and poverty
reduction, and it is also located close to the capital city, Kampala. Ssembabule is most remotely located in
this region. Luwero has a history of insurgency; it was the epicentre of the prolonged bushwar. InWestern
region, Bushenyi has a concentration of plantation agriculture, particularly coffee and bananas. Kabale
has relatively high population density, mountainous terrain, and diverse agriculture, while cattle farming
dominates the economy of Ntungamo district. Districts in these regions are considerably diverse, and
selecting districts for diversity seemed appropriate in this context.
2. Later Stages of Progress beyond the first four were also very similar in these 36 villages. Some
discrepancies arose, but they relate to the ordering of these later stages and not so much to their
identification. Commonly shared Stages of Progress were also similarly reported when similar
investigations were carried out in village communities of India and Kenya (Krishna, 2004, 2005;
Krishna et al., 2004).
3. In five villages of Central region, community groups added ‘household utilities,’ that is, a basic few
pots and pans, as an additional stage after Send Children to School and before Repair the Existing
Shelter. The poverty cut-off in these five villages was drawn after stage five consequently. This
additional stage did hardly anything to change the identity of households identified as poor: adjusting
for it affected the classification of only three out of 494 households in these villages.
4. Villagers were usually not reticent about either their own or other households’ situations along the
Stages of Progress. Poverty is not stigmatised in these villages, as it is, for instance, in the West, and it
is regarded as resulting from misfortune more than personal failure. The researchers did not label or
otherwise segregate those who were found to occupy a stage below the poverty cut-off, and making
clear that no material benefits would follow from this exercise removed the incentive for deliberate
misrepresentation. The researchers also stressed that the respondents’ names and material status
would be held in confidence.
5. Some studies consider households of the previous time period as their unit of analysis, the Stages-of-
Progress method does the reverse, considering households of the present time as its unit of analysis.
This method fails to capture households of 25 years ago from which no single member survives in the
community, and some bias is likely to arise on this account. Local inquiries revealed that this
‘survivorship bias’ affected both ends of the household distribution. A few households that no longer
remained in these villages had done extremely well by migrating to cities. Some others that had done
extremely poorly had also entirely vanished leaving no trace behind. Permanent migration out of these
villages has been relatively small, however, affecting less than 3 per cent of all households.
Escaping Poverty and Becoming Poor in Western Uganda 367
Dow
nloa
ded
by [
Cor
nell
Uni
vers
ity L
ibra
ry]
at 2
2:12
08
Febr
uary
201
5
6. There is an interesting correspondence, thus, between the Stages-of-Progress methodology and the
asset-based framework of Barrett and Carter (2004).
7. We met with Uganda Bureau of Statistics (UBoS) officials to find whether other researchers had also
come across similarly large downward trends in these or other villages. While we could not obtain any
comparable village-level data from them, recent research by Kappel, Lay and Steiner (2005) and
McGee (2004) provides similar evidence of a downward trend.
8. We examined a host of village-level features, including distance to market, population size, type of
school facility, and so forth, but apart from distance to health centre none of the others was
significantly associated with higher or lower poverty reduction.
9. An analysis of household panel data for 1992–99 similarly found ill health and death of income
earners on account of illness to be particularly associated with descent into poverty (Lawson, 2004).
10. For an interesting examination of ‘laziness’ as a factor that is uncritically associated by some analysts
with abiding poverty in rural Africa, see Whitehead (2000).
11. Coffee is particularly important in this respect. Place, Ssenteza and Otsuka (2001: 229) notes that
‘while the average profit is higher for coffee, its variance is also higher’. Many respondents associated
coffee cultivation with greater risk of loss and enhanced volatility.
12. Table 6 presents the complementary analysis of escaping from poverty. Category A and Category B
households are considered here, to examine why some (but not other) previously poor households
were able to escape from poverty. Independent variables were selected for both sets of analyses based
on the previous analysis of interview and frequency data. Some variables (for example, ill health) can
be alternately both causes and effects of poverty, thus these results should be interpreted with caution,
especially to the extent they are not otherwise validated by household interviews and other data.
13. Age, or lifecycle effect, which was marginally significant (at the 5 per cent level though not at the 1 per
cent level) while examining falling into poverty in Table 5, is not significant for the analysis of escaping
poverty presented in Table 6.
14. Okidi and McKay (2003) also identify diversification as an important factor of ascent. Investigations
conducted in other parts of the developing world similarly reveal the role that diversifying income
sources has played for assisting households’ escapes from poverty. See, for example, Ellis (2000) and
Krishna (2004, 2005).
15. Uganda is hardly unique in this respect. In eight other African countries, studied by Christiaensen
et al. (2002), ill health is also significantly associated with descent. Fabricant et al. (1999: 181–4)
present evidence from a range of countries, which demonstrates how poorer households spend a much
greater proportion of their incomes on healthcare. Sinha and Lipton (1999: 39) indicate how, in
general, poorer households are exposed to different and more serious illness, injury and consequent
costs. Macinko, Shi and Starfield (2004) demonstrate how the same is true within wealthy
industrialised countries.
16. Intra-household differences based on gender can be investigated perhaps through incorporating an
adapted version of the method used by Ravnborg, Boesen and Sorensen (2004).
17. For instance, only a very small number of households are studied in any village that is selected in
national sample frames used for conventional household surveys. On the other hand, the Stages-of-
Progress method considers all households in each studied village, and it ranks their poverty status in
comparison with one another. This mismatch between study sites and study design makes it difficult at
present to compare, combine and validate results from different studies.
References
Appleton, S. (2001a) Changes in poverty and inequality, in Ritva Reinikka and Paul Collier (Eds)
Uganda’s Recovery: The Role of Farms, Firms, and Government (Washington, DC: World Bank),
pp. 83–102.
Appleton, Simon (2001b) Poverty in Uganda, 1999/2000: Preliminary Estimates from the UNHS
(Nottingham: University of Nottingham).
Barrett, C., Reardon T. and Webb P. (2001) Nonfarm diversification and household livelihood strategies
in rural Africa: concepts, dynamics, and policy implications. Food Policy, 26, pp. 315–31.
Barrett, C. (2005) Rural poverty dynamics: development policy implications. Agricultural Economics,
forthcoming.
368 A. Krishna et al.
Dow
nloa
ded
by [
Cor
nell
Uni
vers
ity L
ibra
ry]
at 2
2:12
08
Febr
uary
201
5
Bird, K. and Shinkeya, I. (2003) Multiple shocks and downward mobility: learning from the life histories
of rural Ugandans. CPRC working paper 36, Chronic Poverty Research Centre, Manchester, UK.
Brock, K., McGee, R. and Ssewakiryanga, R. (2002) Poverty knowledge and policy processes: a case study
of Ugandan national poverty reduction policy. Research report 53, Institute of Development Studies,
Brighton, UK.
Carter, M. and Barrett, C. (2004) The economics of poverty traps and persistent poverty: an asset-based
approach. Presented at the BASIS-CRSP Policy Conference, Washington DC, 15–16 November 2004,
available at www.basis.wisc.edu/persistentpoverty.html.
Chambers, R. (1995) Poverty and livelihoods: whose reality counts. Discussion paper 347. Institute of
Development Studies, Brighton, UK.
Christiaensen, L., Demery, L. and Paternostro, S. (2002) Growth, Distribution and Poverty in Africa:
Messages from the 1990s (Washington, DC: World Bank).
Collier, P. and Reinikka, R. (2001) Introduction, in R. Reinikka and C. Collier (Eds) Uganda’s Recovery:
The Role of Farms, Firms, and Government (Washington, DC: World Bank), pp. 1–12.
CPRC (2004) The Chronic Poverty Report 2004 – 05 (Manchester, UK: Chronic Poverty Research Centre).
Deininger, K. and Okidi, J. (2003) Growth and poverty reduction in Uganda, 1992 – 2000: panel data
evidence. Development Policy Review, 21(4), pp. 481–509.
Devereux, S. (2002) Can social safety nets reduce chronic poverty? Development Policy Review, 20(5), pp.
657–75.
Ellis, F. (2000) Rural Livelihoods and Diversity in Developing Countries (New York: Oxford University
Press).
Fabricant, S., Kamara, C, and Mills A. (1999) Why the poor pay more: household curative expenditures in
rural Sierra Leone. International Journal of Health Planning and Management, 14, pp. 179–99.
GoU (2001) Poverty Status Report (Kampala: Ministry of Finance, Planning and Economic Development,
Government of Uganda).
GoU (2002a) Second Participatory Poverty Assessment Report: Deepening the Understanding of Poverty
(Kampala: Ministry of Finance, Planning and Economic Development, Government of Uganda).
GoU (2002b) Infant Mortality in Uganda, 1995–2000: Why the Non-Improvement? (Kampala: Ministry of
Finance, Planning and Economic Development, Government of Uganda).
Hickey, S. (2005) The politics of staying poor in Uganda: exploring the political space for poverty
reduction in Uganda. World Development, forthcoming.
Hutchinson, P. (2001) Combating illness, in Ritva Reinikka and Paul Collier (Eds) Uganda’s Recovery:
The Role of Farms, Firms, and Government (Washington, DC: World Bank), pp. 407–9.
Jayne, T.S., Yamano, T., Weber, M., Tschirley, D., Benfica, R., Chapoto, A. and Zulu, B. (2003)
Smallholder income and land distribution in Africa: implications for poverty reduction strategies.
Food Policy, 28, pp. 253–73.
Kappel, R., Lay, J. and Steiner, S. (2005) Uganda: no more pro-poor growth? Development Policy Review,
23(1), pp. 27–53.
Krishna, A. (2004) Escaping poverty and becoming poor: who gains, who loses, and why? World
Development, 32(1), pp. 121–36.
Krishna, A. (2005) Why growth is not enough: household poverty dynamics in northeast Gujarat, India.
Journal of Development Studies, forthcoming.
Krishna, A., Kristjanson, P., Radeny, M. and Nindo, W. (2004) Escaping poverty and becoming poor in
20 Kenyan villages. Journal of Human Development, 5(2), pp. 211–26.
Lawson, D. (2004) Uganda: the influence of health on chronic and transitory poverty. CPRC working
paper 41, Chronic Poverty Research Centre, Manchester, UK, available at www.chronicpoverty.org.
Lawson, D., McKay, A. and Okidi, J. (2003) Poverty persistence and transitions in Uganda: a combined
qualitative and quantitative analysis. CPRC working paper 38, Chronic Poverty Research Centre,
Manchester, UK.
Lipton, M. (1997) Editorial: poverty – are there holes in the consensus?World Development, 25(7), 1003–7.
Lwanga-Ntale, C. (2003) Chronic poverty and disability in Uganda. CPRC working paper, Chronic
Poverty Research Centre, Manchester, UK.
Lwanga-Ntale, C. and McClean, K. (2003) The face of chronic poverty in Uganda as seen by the poor
themselves. CPRC working paper, Chronic Poverty Research Centre, Manchester, UK.
Macinko, J., Shi, L. and Starfield, B. (2004) Wage inequality, the health system, and infant mortality in
wealthy industrialised countries, 1970–1996. Social Science and Medicine, (58), 279–92.
Escaping Poverty and Becoming Poor in Western Uganda 369
Dow
nloa
ded
by [
Cor
nell
Uni
vers
ity L
ibra
ry]
at 2
2:12
08
Febr
uary
201
5
McGee, R. (2004) Constructing poverty trends in Uganda: a multidisciplinary perspective. Development
and Change, 35(3), pp. 499–523.
Mijumbi, P. and Okidi, J. (2001) Analysis of poor and vulnerable groups in Uganda. Occasional paper
No.16, Economic Policy Research Centre, Kampala.
Okidi, J. and McKay, A. (2003) Poverty dynamics in Uganda: 1992 to 2000. CPRC working paper 27,
Chronic Poverty Research Centre, Manchester, UK.
Okidi, J. and Mugambe, G. (2003) An overview of chronic poverty and development policy in Uganda.
CPRC working paper 11, Chronic Poverty Research Centre, Manchester, UK.
Okwi, P. (1999) Poverty in Uganda: a multivariate analysis. EPRC research series No.22, Economic Policy
Research Centre, Kampala.
Olson, J. and Berry, L. (2003) Land degradation in Uganda: its extent and impact, available at
lada.virtualcentre.org/eims/download.asp?pub_id=92082.
Pender, J., Jagger, P., Nkonya, E. and Sserunkuuma, D. (2004) Development pathways and land
management in Uganda. World Development, 32(5), pp. 767–92.
Place, F., Ssenteza, J. and Otsuka, K. (2001) Customary and private land management in Uganda, in
Otsuka and Place (Eds) Land Tenure and Natural Resource Management (Baltimore: Johns Hopkins
University Press), pp. 195–233.
Ravnborg, H. M., Boesen, J. and Sorensen, A. (2004) Gendered district poverty profiles and poverty
monitoring: Kabarole, Masaka, Pallisa, Rakai and Tororo Districts, Uganda. DIIS working paper
2004: 1, Danish Institute for International Studies, Copenhagen.
Sinha, S. and Lipton, M. (1999) Damaging fluctuations, risk and poverty: an overview. Background paper
for the World Development Report 2000/2001. Poverty Research Unit, University of Sussex.
Ssewanyana, S., Okidi, J., Angemi, D. and Barungi, V. (2004) Understanding the Determinants of Income
Inequality in Uganda (Kampala: Economic Policy Research Institute).
Whitehead, A. (2000) Continuities and discontinuities in political constructions of the working man in
sub-saharan Africa: the ‘lazy man’ in African agriculture. European Journal of Development Research,
12 (2), pp. 23–52.
Woodhouse, P. (2003) Local identities of poverty: poverty narratives in decentralised government and the
role of poverty research in Uganda. Working paper, IDPM, University of Manchester.
370 A. Krishna et al.
Dow
nloa
ded
by [
Cor
nell
Uni
vers
ity L
ibra
ry]
at 2
2:12
08
Febr
uary
201
5