Epidemiological Health Study of a Town Exposed to Chemicals* 1
16
Epidemiological Health Study of a Town Exposed to Chemicals ROSEMARIE M. BOWLER,* LONG NGO,² CHRIS HARTNEY,‡ KEVIN LLOYD,§ IRA TAGER, \ JOHN MIDTLING,¶ AND GUY HUEL** *San Francisco State University, 8371 Kent Drive, El Cerrito, California 94530; ²University of California at Berkeley School of Public Health, 63 Emery Bay Drive, Emeryville, California 94608; ‡San Francisco State University, 1039 Creston Road, Berkeley, California 94708; §San Francisco State University, 812 Grove Street, San Francisco, California 94117; \ Division of Public Health Biology and Epidemiology, University of California at Berkeley School of Public Health, 140 Warren Hall 7360, Berkeley, California 94720; ¶Medical College of Wisconsin, 8701 Watertown Plank Road, Milwaukee, Wisconsin 53226; and **U169–INSERM, 16 avenue Paul Vaillant Couturier, 94807 Villejuif Cedex, France Received February 13, 1996 The purpose of this survey was to assess the health status of community residents exposed to a 16-day release of Catacarb from a nearby refinery and to document the prevalence rates of symptoms and illnesses of this town. The health status of the exposed residents was compared to that of unex- posed residents of a demographically similar con- trol town. An epidemiologic study design was used and questionnaires were mailed to all households in both towns. Response rate was 43%. Household clus- ter effects, gender, education, and race were con- trolled in the analysis. Questionnaire health data reveal increased reporting of symptoms in the ex- posed, specifically headaches, respiratory, visual, gastrointestinal, and dermatologic with odds ratios ranging between 1.3 and 3. Exposure relationships with increased symptoms and worsening of ill- nesses was found. © 1997 Academic Press INTRODUCTION Large-scale exposures to humans from environ- mental chemical releases which cause adverse health symptoms and illnesses are occurring at a rapidly increasing rate in the United States (Caldi- cott, 1992). A recent accidental chemical release over a period of 16 days from a petroleum refinery in Northern California resulted in the spillage of over 200 tons of the toxic chemical Catacarb. Residents in the town adjacent to the refinery reported early acute symptoms consistent with exposure to toxic chemicals: headache, diarrhea, fatigue and vomit- ing, disorientation, flu-like symptoms, and general weakness. Residents who had previous respiratory, dermatological, or visual problems reported a wors- ening of their symptoms. Previous studies of com- munities and cohorts exposed to toxic chemicals have shown a significant increase in symptoms (Bowler et al., 1996). Case control studies of toxic waste sites also show an increase in symptom re- porting in both urban and rural communities in the United States (Baum, 1987; Spurgeon et al., 1996) and Australia (Deloraine et al., 1995). A case-control study assessing the health effects of an industrial toxic waste landfill in France found an association between exposure and psychiatric disorder and non- specific irritative respiratory symptoms. Some of these studies have shown an increase in illness (De- loraine et al., 1995) and an increase in use of medi- cation (Dayal et al., 1994). A number of industrial environmental disasters involving neurotoxins or radioactive agents have oc- curred in past decades (Valciukas, 1991; Realmuto et al., 1991), but have been relatively unstudied. The Three Mile Island (TMI) accident was found to be associated with an increase in physiological stress (Gatchell et al., 1985; Baum et al., 1986), psychologi- cal stress (Baum et al., 1983; Davidson et al., 1982; Fleming et al., 1982; Gatchell et al., 1985; Davidson and Baum, 1986; Schaeffer and Baum, 1984; Baum et al., 1982), and an increased rate of cancer one decade later (Hatch et al., 1991). Industrial disasters have also been shown to in- crease the prevalence of posttraumatic stress disor- der (PTSD) (Bowler et al., 1994; Green, 1991). Both physical and psychological symptoms are an inte- gral part of PTSD, which has been postulated to be due to sympathetic hyperactivity (McFarlane et al., 1994). The chemical solution released in this investiga- tion, Catacarb, contains a mixture of various chemi- cals and has been commonly used by refineries since ENVIRONMENTAL RESEARCH 72, 93–108 (1997) ARTICLE NO. ER963721 93 0013-9351/97 $25.00 Copyright © 1997 by Academic Press All rights of reproduction in any form reserved.
-
Upload
independent -
Category
Documents
-
view
0 -
download
0
Transcript of Epidemiological Health Study of a Town Exposed to Chemicals* 1
Epidemiological Health Study of a Town Exposed to Chemicals
ROSEMARIE M. BOWLER,* LONG NGO,† CHRIS HARTNEY,‡ KEVIN LLOYD,§ IRA TAGER,\ JOHN MIDTLING,¶ ANDGUY HUEL**
*San Francisco State University, 8371 Kent Drive, El Cerrito, California 94530; †University of California at Berkeley School of PublicHealth, 63 Emery Bay Drive, Emeryville, California 94608; ‡San Francisco State University, 1039 Creston Road, Berkeley, California
94708; §San Francisco State University, 812 Grove Street, San Francisco, California 94117; \Division of Public Health Biology andEpidemiology, University of California at Berkeley School of Public Health, 140 Warren Hall 7360, Berkeley, California 94720;
¶Medical College of Wisconsin, 8701 Watertown Plank Road, Milwaukee, Wisconsin 53226; and **U169–INSERM,16 avenue Paul Vaillant Couturier, 94807 Villejuif Cedex, France
Received February 13, 1996
The purpose of this survey was to assess thehealth status of community residents exposed to a16-day release of Catacarb from a nearby refineryand to document the prevalence rates of symptomsand illnesses of this town. The health status of theexposed residents was compared to that of unex-posed residents of a demographically similar con-trol town. An epidemiologic study design was usedand questionnaires were mailed to all households inboth towns. Response rate was 43%. Household clus-ter effects, gender, education, and race were con-trolled in the analysis. Questionnaire health datareveal increased reporting of symptoms in the ex-posed, specifically headaches, respiratory, visual,gastrointestinal, and dermatologic with odds ratiosranging between 1.3 and 3. Exposure relationshipswith increased symptoms and worsening of ill-nesses was found. © 1997 Academic Press
INTRODUCTION
Large-scale exposures to humans from environ-mental chemical releases which cause adversehealth symptoms and illnesses are occurring at arapidly increasing rate in the United States (Caldi-cott, 1992). A recent accidental chemical releaseover a period of 16 days from a petroleum refinery inNorthern California resulted in the spillage of over200 tons of the toxic chemical Catacarb. Residents inthe town adjacent to the refinery reported earlyacute symptoms consistent with exposure to toxicchemicals: headache, diarrhea, fatigue and vomit-ing, disorientation, flu-like symptoms, and generalweakness. Residents who had previous respiratory,dermatological, or visual problems reported a wors-ening of their symptoms. Previous studies of com-
munities and cohorts exposed to toxic chemicalshave shown a significant increase in symptoms(Bowler et al., 1996). Case control studies of toxicwaste sites also show an increase in symptom re-porting in both urban and rural communities in theUnited States (Baum, 1987; Spurgeon et al., 1996)and Australia (Deloraine et al., 1995). A case-controlstudy assessing the health effects of an industrialtoxic waste landfill in France found an associationbetween exposure and psychiatric disorder and non-specific irritative respiratory symptoms. Some ofthese studies have shown an increase in illness (De-loraine et al., 1995) and an increase in use of medi-cation (Dayal et al., 1994).
A number of industrial environmental disastersinvolving neurotoxins or radioactive agents have oc-curred in past decades (Valciukas, 1991; Realmutoet al., 1991), but have been relatively unstudied. TheThree Mile Island (TMI) accident was found to beassociated with an increase in physiological stress(Gatchell et al., 1985; Baum et al., 1986), psychologi-cal stress (Baum et al., 1983; Davidson et al., 1982;Fleming et al., 1982; Gatchell et al., 1985; Davidsonand Baum, 1986; Schaeffer and Baum, 1984; Baumet al., 1982), and an increased rate of cancer onedecade later (Hatch et al., 1991).
Industrial disasters have also been shown to in-crease the prevalence of posttraumatic stress disor-der (PTSD) (Bowler et al., 1994; Green, 1991). Bothphysical and psychological symptoms are an inte-gral part of PTSD, which has been postulated to bedue to sympathetic hyperactivity (McFarlane et al.,1994).
The chemical solution released in this investiga-tion, Catacarb, contains a mixture of various chemi-cals and has been commonly used by refineries since
ENVIRONMENTAL RESEARCH 72, 93–108 (1997)ARTICLE NO. ER963721
93
0013-9351/97 $25.00Copyright © 1997 by Academic Press
All rights of reproduction in any form reserved.
the early 1970s. It is used generally in hydrogenproduction facilities to separate carbon monoxideand carbon dioxide from hydrogen. After thesechemicals are separated, the Catacarb solution isrecovered in a regenerator tower by steam stripping.The regeneration tower used for this process by therefinery in this investigation developed a hole in itswall and began to leak Catacarb into the atmo-sphere beginning August 22, 1994. The tower wasnot shut down for repair until 16 days after the be-ginning of the leak. Meterologic data taken from aweather station at the refinery was available for thelast week of the spill and showed a consistent windwas present to carry the Catacarb from the refineryto the northeast and east of the exposed town (Con-tra Costa County Health Services Department Pub-lic Health Division, 1994, October).
Refinery records indicate the chemical compoundscontained in the Catacarb solution were about 50%water, 20 to 25% potassium carbonate, 5 to 7% po-tassium borate, 0.25 to 0.33% potassium metavana-date, and 2 to 15% diethanolamine (DEA). Releaseestimates were included in citations given the refin-ery by both the United States Environmental Pro-tection Agency (EPA) and the Bay Area Air QualityManagement District (BAAQMD) for the release(and for notification violations related to the release)of Catacarb between August 22 and September 6,1994: the EPA reported about 200,000 lbs ofCatacarb were released containing 10,000 lbs ofDEA (U.S. EPA, 1995, December), while theBAAQMD reported 232,000 lbs of Catacarb were re-leased consisting of 32,500 lbs DEA, 255 lbs vana-dium, and 1856 lbs boron. The BAAQMD estimates278 lbs/hr or particulate emissions of liquidCatacarb, and 2030 lbs/day organic compounds witha concentration of 34,000 ppm (DEA is an organiccompound) for the 16-day period August 22 to Sep-tember 6.
No human blood or urine samples were takenfrom the residents of the exposed town, no airsamples were taken during the release, andCatacarb deposition measurements were limited towindow scrapings taken in two locations by theBAAQMD and grass and soil samples taken else-where as part of a risk assessment performed by arisk assessment company on behalf of the refinery(Karas and Wocasek, 1995; Montgomery Watson,1996, January). Estimates of the deposition in theexposed town rage from 0.1 to 12 g/m2 depending onthe sampling method, the location in the exposedtown, and the estimation method (i.e., whether va-nadium or DEA was used as the indicator of totalCatacarb). Scrape samples taken in two locations in
Crockett indicated up to 1.0 g/m2 on September 6,one of the heaviest release days. Grass samplestaken at a third location in Crockett indicated arange of 2 to 120 ppm for DEA and a range of 2.2 to20 ppm for vanadium, indicating an estimate of de-position for total Catacarb of 0.1 to 12 g/m2.
The wide range of deposition rates in the differentareas of the exposed town indicate ‘‘the high degreeof variability and localized nature of the depositionthat occurred during the release’’ (Montgomery Wat-son, 1996, January). These varied figures have alsolead to varied estimates of total Catacarb released,with the company-sponsored risk assessment re-porting an estimate of deposition for total Catacarbof 0.1 to 12 g/m2 and the community risk assessmentreporting 1 to 15 g/m2. Estimates of actual exposurewere further complicated by the variable preemis-sion composition of Catacarb, variable volume andrates of emission during the 16-day release, the me-terologic and geographic conditions in the exposedtown, and uncertainties concerning the decomposi-tion of Catacarb after entering the atmosphere. Ac-cording to the company risk assessment, the maxi-mum one hour average concentrations of Catacarbin the exposed town ranged from 8.299 to 12.472mg/m3, with potassium carbonate ranging from2.075 to 3.118 mg/m3, boron from .060 to .091 mg/m3,DEA from .415 to .624 mg/m3, and vanadium from.046 to .069 mg/m3. Despite the lack of agreement inexposure estimation, the company risk assessmentreport, which supported the lowest rates of deposi-tion and exposure, states there is ‘‘a likelihood ofhealth effects resulting from short-term atmo-spheric exposures to the catacarb solution release,’’with the most likely symptoms including eye irrita-tion and respiratory problems.
The constituent components of Catacarb havebeen shown to be irritants to the respiratory system,stomach and digestive tract, skin, and eyes, and inacute reactions are known to cause coughing,breathing difficulties, nausea, vomiting, diarrhea,headache, and skin problems (Melnick et al., 1994).
Of the chemicals released, potassium carbonateand potassium dicarbonate are thought to be rela-tively harmless and no delayed health effects in hu-mans have been reported.
Although the number of boron compounds in thischemical release was purportedly small, boron, con-tained in potassium borate and in common house-hold laundry detergent, is known to cause acute ef-fects of diarrhea, vomiting, and respiratory prob-lems, as well as adverse effects on the liver andkidney (U.S. Department of Health & Human Ser-vices, 1995, Toxicological Profile for Boron, TP-91/
BOWLER ET AL.94
05). In high doses, central nervous system effectshave been reported as well as birth defects and re-productive problems in animals.
Vanadium (potassium metavanadate) overexpo-sure in humans can affect the nervous system andmay be a possible carcinogen (Bofetta, 1993). Vana-dium has been shown to cause respiratory irritationand, in animal studies, adverse effects on the repro-ductive system, the spleen, blood, and lungs. A re-lationship of high vanadium content in the soil; highvanadium levels in the urine, kidneys, and lungs;and metabolic problems was reported in a study of avillage in Thailand (Sitprija et al., 1993).
DEA, a common ingredient in cosmetics andshampoo, can also transform into the more highlytoxic N-nitrosodiethanolamine (N-DEAL). DEA andN-DEAL animal studies have shown adverse effectson the skin, the liver, kidney, heart, blood, CNS, andreproductive system in addition to being a knownanimal carcinogen (Cosmetic Ingredient Review,1983). The 1995 Unocal Material Safety Data Sheet(MSDS; Unocal Corporation, 1995, February) re-ports exposure limits for DEA ranging from 0.46 to 3ppm. No exposure guidelines have been establishedfor potassium carbonate, potassium borate, or potas-sium metavanadate. Potential health effects notedin the MSDS were severe eye irritation, includingstinging, watering, redness, swelling, and eye dam-age; severe skin irritation, including redness, burn-ing, swelling, and eye damage; severe skin irrita-tion, including redness, burning, and severe skindamage; severe irritation and burns of the nose,throat, and respiratory tract if inhaled; and severeirritation and burns of the mouth, throat, and diges-tive tract if swallowed. The target organs are thekidney, liver, blood elements, central nervous sys-tem, male reproductive system, and heart, and signsand symptoms include, in addition to the symptomsdescribed above, headaches, coughing, nausea, vom-iting, diarrhea, metallic taste, green tongue, ab-dominal cramping and pain, breathing difficulties,and pulmonary edema.
Summaries of the animal literature on DEA re-viewed by Melnick (1994) indicate kidney, liver, andheart problems; anemia; decreased sperm motility;necropathy of brain and spinal cord; demyelinationchanges; skin alteration; and death at high doses.No human studies are available on the specific mix-ture, and overall few reports of the effect of the par-ticular constituents in Catacarb are available.
The purpose of this survey was to assess thehealth status of the community and to document theprevalence rates of symptoms and illnesses of theexposed town’s residents. Additional goals were to
investigate the relationship between Catacarb expo-sure and symptoms and illnesses and to compare theincidence and prevalence rates of illnesses andsymptoms of the exposed with those of a demograph-ically similar control town.
METHOD
At the request of community leaders, a commu-nity-based health assessment was undertaken to tryto define the extent and type of increased morbiditythat might have been associated with the release.An epidemiologic study design that sampled the ex-posed community and a similar control communitywas followed.
Data were collected via a questionnaire mailed toresidents of both the exposed town and the controltown, which is similar in size and socioeconomic sta-tus to the exposed town.
Providing information about the study to the com-munity was required by the community leaders andurged by the California State County Health De-partment. Therefore, all households in the exposedtown and the unexposed control town were sent anindividual invitation to attend a community meetingdescribing the study and announcing the mailing ofthe questionnaires. At the community meeting thestudy methodology was discussed and resident coop-eration elicited; the study was described as a generalinvestigation of the health status of the town. Nospecific references to, nor confirmation of, expectedsymptoms were made and all participants were en-couraged to complete the questionnaires, whether ornot they experienced symptoms after the release. Infact, the importance of having information from non-symptomatic residents as well as from those withsymptoms was stressed, in order to gain accurateinformation about the health status of the town.Community attendance at these meetings was rela-tively small (about 100–150 persons) in relation tothe size of the town (3228).
Following these meetings, personalized letters,enclosed in the packet of questionnaires, weremailed to each residence, informing them of the pur-pose of the study and describing the procedures forcompleting the questionnaires. Up to two adults inthe household were asked to sign a letter of informedconsent explaining the study and the health surveybefore completing the questionnaires. An attemptwas made to maximize response rate through an ex-tensive system of telephone follow-up calls, re-minder mailings, and in-person contacts. Othermethods used in survey research shown to enhanceresponses (Fox et al., 1988) were used, such as ques-tionnaires printed on color paper.
EPIDEMIOLOGICAL STUDY OF A TOWN EXPOSED TO CHEMICALS 95
Description of the Study Area
Both towns are attractive residential communitiesin hilly terrain, located on the Northern edge of theSan Francisco Bay. Estimates of pollution (with theexception of releases from the nearby refinery in theexposed town) are low overall in both towns.
Exposed Community
Demographic data from the 1990 U.S. Census forthe areas of the exposed and the control towns wereobtained. The exposed town is located in ContraCosta County, in very hilly terrain on the San Fran-cisco Bay, within approximately 5 miles of the refin-ery which caused the release. According to the 1990U.S. Census, the exposed town has population of3228 with 1422 households. Males make up 49% ofthe town and females 51%. The median age for theexposed town residents is 37.2 years, they are pre-dominantly white with 355 (11%) Hispanic. The percapita income is $19,067 a year. Eighteen percent ofthe exposed town residents had less than a highschool diploma and 23% had a bachelors degree orhigher.
Baseline prevalence rates for illnesses are similarin the exposed and control towns, with the controltown reporting a slightly higher percentage of mostillnesses prior to the spill in the exposed town (seeTable 5).
Control Community
The control town is located in Marin County, alsoin hilly terrain on the San Francisco Bay, approxi-mately 25 miles from the refinery causing the re-lease under study. The control town differs primar-ily in that it is not located adjacent to refineries.
According to the 1990 U.S. Census data, the con-trol town has 3362 residents with 1322 householdsand a very similar socioeconomic status. Malesmake up 49% of the town and females 51%. Themedian age for the control town residents is 38.3years. It is predominantly white with 336 (10%) His-panic. The per capita income is $19,907 a year. Sev-enteen percent of the control town residents had lessthan a high school diploma and 26% had a bachelorsdegree or higher.
Procedure
Identical procedures for both towns were followed,including community meetings, announcements ofthe upcoming study, and mailing of personalized let-ters.
Recruitment of Participants
Community Health Study Forums, news releases,flyers, posters, and advertisements in local papersannounced the mailing of the questionnaires within6 months of the release and urged residents’ partici-pation in the study. The residential telephone direc-tory for the exposed town and the control town wereused to compare residential street addresses withthose on governmental maps showing each lotwithin each town. Households not having a listedtelephone number thereby were identified, permit-ting mailing to each household. In addition, residen-tial mailing labels purchased from a commercial ad-dress label company were used in cross checking thenames of householders and addresses. Thus, everyhousehold in the exposed and the control town wasidentified, and questionnaires were mailed.
Residents were asked to return the completedquestionnaires and consent forms in self-addressed,stamped envelopes as quickly as possible. If no re-sponse was received within 7 calendars days aftersending the questionnaires, the residents werecalled on the telephone and trained study staff ex-plained the importance of participation in the studyand requested completion of the questionnaires. Ifthey had not received the questionnaires, a secondset were delivered to their address. Those personswho did not have a listed telephone were contactedwith a follow-up letter requesting participation andgiven the telephone number of the study staff. Eachnonrespondent resident with a listed telephonenumber was called a minimum of three times (after-noons, evenings, and weekends) before they weredropped from the study. In total over 1000 follow-uptelephone calls and personalized letters requestingparticipation were made.
Recruitment of the controls followed an identicalpattern as in the exposed town. While it was ex-pected that the exposed residents would be moti-vated to participate in the study for self-evident rea-sons, the control participants were offered an hono-rarium of $10.00 for each completed questionnaire.
Procedure for Eliciting Participation and InformedCommunity Consent
Informed community consent was obtained in thecommunity meeting. In addition to numerous meet-ings with health committee members and other com-munity leaders of both towns, specific presentationof the health study plan and methods were given toCommunity Boards, County Health Departments,and at the special community meeting. At eachmeeting, the speakers took care not to bias the po-
BOWLER ET AL.96
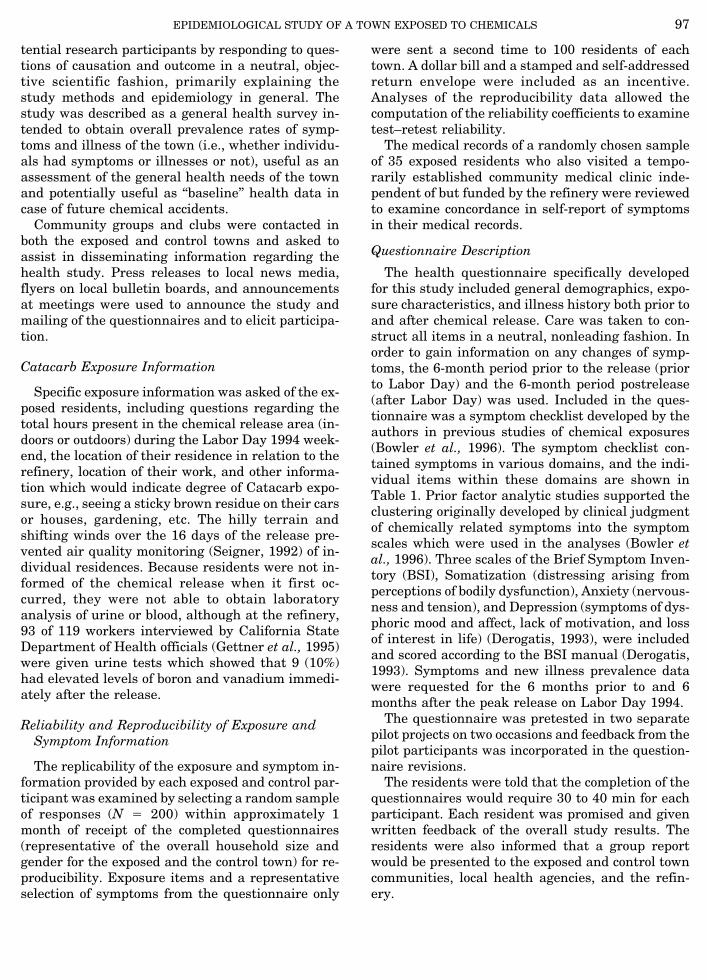
tential research participants by responding to ques-tions of causation and outcome in a neutral, objec-tive scientific fashion, primarily explaining thestudy methods and epidemiology in general. Thestudy was described as a general health survey in-tended to obtain overall prevalence rates of symp-toms and illness of the town (i.e., whether individu-als had symptoms or illnesses or not), useful as anassessment of the general health needs of the townand potentially useful as ‘‘baseline’’ health data incase of future chemical accidents.
Community groups and clubs were contacted inboth the exposed and control towns and asked toassist in disseminating information regarding thehealth study. Press releases to local news media,flyers on local bulletin boards, and announcementsat meetings were used to announce the study andmailing of the questionnaires and to elicit participa-tion.
Catacarb Exposure Information
Specific exposure information was asked of the ex-posed residents, including questions regarding thetotal hours present in the chemical release area (in-doors or outdoors) during the Labor Day 1994 week-end, the location of their residence in relation to therefinery, location of their work, and other informa-tion which would indicate degree of Catacarb expo-sure, e.g., seeing a sticky brown residue on their carsor houses, gardening, etc. The hilly terrain andshifting winds over the 16 days of the release pre-vented air quality monitoring (Seigner, 1992) of in-dividual residences. Because residents were not in-formed of the chemical release when it first oc-curred, they were not able to obtain laboratoryanalysis of urine or blood, although at the refinery,93 of 119 workers interviewed by California StateDepartment of Health officials (Gettner et al., 1995)were given urine tests which showed that 9 (10%)had elevated levels of boron and vanadium immedi-ately after the release.
Reliability and Reproducibility of Exposure andSymptom Information
The replicability of the exposure and symptom in-formation provided by each exposed and control par-ticipant was examined by selecting a random sampleof responses (N 4 200) within approximately 1month of receipt of the completed questionnaires(representative of the overall household size andgender for the exposed and the control town) for re-producibility. Exposure items and a representativeselection of symptoms from the questionnaire only
were sent a second time to 100 residents of eachtown. A dollar bill and a stamped and self-addressedreturn envelope were included as an incentive.Analyses of the reproducibility data allowed thecomputation of the reliability coefficients to examinetest–retest reliability.
The medical records of a randomly chosen sampleof 35 exposed residents who also visited a tempo-rarily established community medical clinic inde-pendent of but funded by the refinery were reviewedto examine concordance in self-report of symptomsin their medical records.
Questionnaire Description
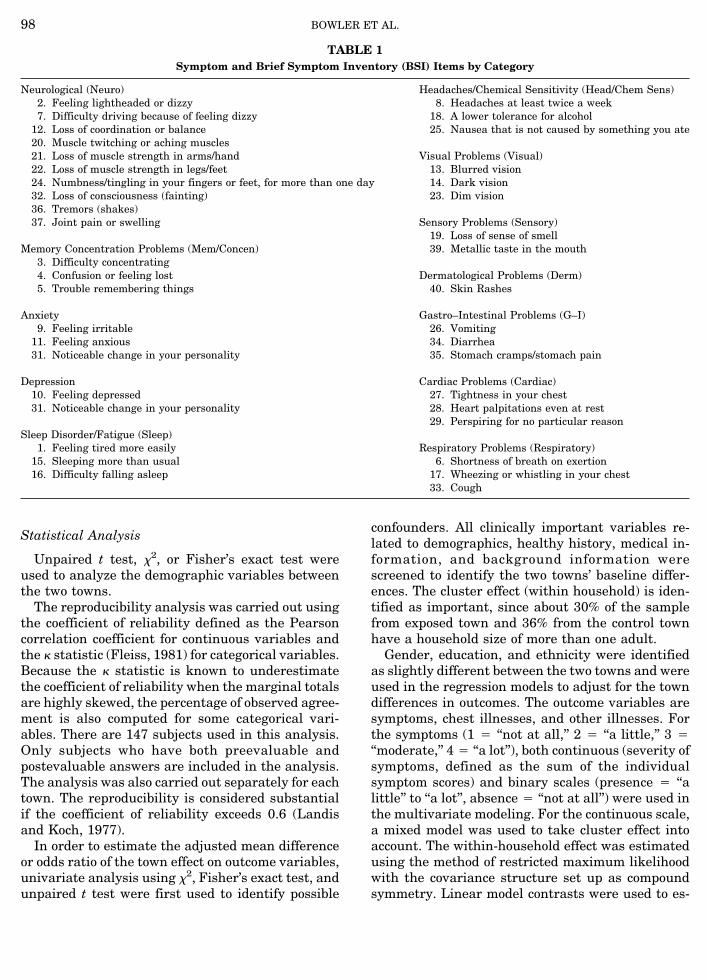
The health questionnaire specifically developedfor this study included general demographics, expo-sure characteristics, and illness history both prior toand after chemical release. Care was taken to con-struct all items in a neutral, nonleading fashion. Inorder to gain information on any changes of symp-toms, the 6-month period prior to the release (priorto Labor Day) and the 6-month period postrelease(after Labor Day) was used. Included in the ques-tionnaire was a symptom checklist developed by theauthors in previous studies of chemical exposures(Bowler et al., 1996). The symptom checklist con-tained symptoms in various domains, and the indi-vidual items within these domains are shown inTable 1. Prior factor analytic studies supported theclustering originally developed by clinical judgmentof chemically related symptoms into the symptomscales which were used in the analyses (Bowler etal., 1996). Three scales of the Brief Symptom Inven-tory (BSI), Somatization (distressing arising fromperceptions of bodily dysfunction), Anxiety (nervous-ness and tension), and Depression (symptoms of dys-phoric mood and affect, lack of motivation, and lossof interest in life) (Derogatis, 1993), were includedand scored according to the BSI manual (Derogatis,1993). Symptoms and new illness prevalence datawere requested for the 6 months prior to and 6months after the peak release on Labor Day 1994.
The questionnaire was pretested in two separatepilot projects on two occasions and feedback from thepilot participants was incorporated in the question-naire revisions.
The residents were told that the completion of thequestionnaires would require 30 to 40 min for eachparticipant. Each resident was promised and givenwritten feedback of the overall study results. Theresidents were also informed that a group reportwould be presented to the exposed and control towncommunities, local health agencies, and the refin-ery.
EPIDEMIOLOGICAL STUDY OF A TOWN EXPOSED TO CHEMICALS 97
Statistical Analysis
Unpaired t test, x2, or Fisher’s exact test wereused to analyze the demographic variables betweenthe two towns.
The reproducibility analysis was carried out usingthe coefficient of reliability defined as the Pearsoncorrelation coefficient for continuous variables andthe k statistic (Fleiss, 1981) for categorical variables.Because the k statistic is known to underestimatethe coefficient of reliability when the marginal totalsare highly skewed, the percentage of observed agree-ment is also computed for some categorical vari-ables. There are 147 subjects used in this analysis.Only subjects who have both preevaluable andpostevaluable answers are included in the analysis.The analysis was also carried out separately for eachtown. The reproducibility is considered substantialif the coefficient of reliability exceeds 0.6 (Landisand Koch, 1977).
In order to estimate the adjusted mean differenceor odds ratio of the town effect on outcome variables,univariate analysis using x2, Fisher’s exact test, andunpaired t test were first used to identify possible
confounders. All clinically important variables re-lated to demographics, healthy history, medical in-formation, and background information werescreened to identify the two towns’ baseline differ-ences. The cluster effect (within household) is iden-tified as important, since about 30% of the samplefrom exposed town and 36% from the control townhave a household size of more than one adult.
Gender, education, and ethnicity were identifiedas slightly different between the two towns and wereused in the regression models to adjust for the towndifferences in outcomes. The outcome variables aresymptoms, chest illnesses, and other illnesses. Forthe symptoms (1 4 ‘‘not at all,’’ 2 4 ‘‘a little,’’ 3 4‘‘moderate,’’ 4 4 ‘‘a lot’’), both continuous (severity ofsymptoms, defined as the sum of the individualsymptom scores) and binary scales (presence 4 ‘‘alittle’’ to ‘‘a lot’’, absence 4 ‘‘not at all’’) were used inthe multivariate modeling. For the continuous scale,a mixed model was used to take cluster effect intoaccount. The within-household effect was estimatedusing the method of restricted maximum likelihoodwith the covariance structure set up as compoundsymmetry. Linear model contrasts were used to es-
TABLE 1Symptom and Brief Symptom Inventory (BSI) Items by Category
Neurological (Neuro) Headaches/Chemical Sensitivity (Head/Chem Sens)2. Feeling lightheaded or dizzy 8. Headaches at least twice a week7. Difficulty driving because of feeling dizzy 18. A lower tolerance for alcohol
12. Loss of coordination or balance 25. Nausea that is not caused by something you ate20. Muscle twitching or aching muscles21. Loss of muscle strength in arms/hand Visual Problems (Visual)22. Loss of muscle strength in legs/feet 13. Blurred vision24. Numbness/tingling in your fingers or feet, for more than one day 14. Dark vision32. Loss of consciousness (fainting) 23. Dim vision36. Tremors (shakes)37. Joint pain or swelling Sensory Problems (Sensory)
19. Loss of sense of smellMemory Concentration Problems (Mem/Concen) 39. Metallic taste in the mouth
3. Difficulty concentrating4. Confusion or feeling lost Dermatological Problems (Derm)5. Trouble remembering things 40. Skin Rashes
Anxiety Gastro–Intestinal Problems (G–I)9. Feeling irritable 26. Vomiting
11. Feeling anxious 34. Diarrhea31. Noticeable change in your personality 35. Stomach cramps/stomach pain
Depression Cardiac Problems (Cardiac)10. Feeling depressed 27. Tightness in your chest31. Noticeable change in your personality 28. Heart palpitations even at rest
29. Perspiring for no particular reasonSleep Disorder/Fatigue (Sleep)
1. Feeling tired more easily Respiratory Problems (Respiratory)15. Sleeping more than usual 6. Shortness of breath on exertion16. Difficulty falling asleep 17. Wheezing or whistling in your chest
33. Cough
BOWLER ET AL.98
timate the estimated mean differences and confi-dence intervals between the two towns for each ofthe outcome variables. The interaction effect be-tween town and each of the covariates (sex, educa-tion, and race) was examined, and no evidence ofinteraction was found. Proc Mixed (SAS Institute)was used to analyze the mixed models (SAS Techni-cal Report, 1P-229, 1992). For the binary-scaled out-comes, the generalized estimating equation (GEE)(Groemping, 1993; Zeger and Liang, 1986) was usedto estimate the odds ratio for the variable town. Thesame three covariates above were entered into themodel and compound symmetry structure was usedin the covariance matrix. Robust odds ratio, confi-dence interval, and P value were obtained for each ofthe outcome variables.
For the exposure assessment analysis in the ex-posed town sample, only the number of hours spentoutside was continuous. The other nine exposurevariables were binary (‘‘Yes’’ or ‘‘No’’). A linear
mixed-effects model and a GEE model were set up toestimate the effect of exposure variables on symp-tom outcome data. The total number of binary expo-sure variables was also examined as a continuousexposure variable. In order to combine all exposurevariables (1 continuous, 9 binary) into a compositeexposure score, principal component analysis wasused to identify the first 6 components (among 10),which extracted about 80% of the total variability.The score was then shifted to range from 0 to 15.This adjusted exposure composite index was thenalso used in the mixed model to obtain the odds ratiofor each of the symptom outcome variables.
RESULTS
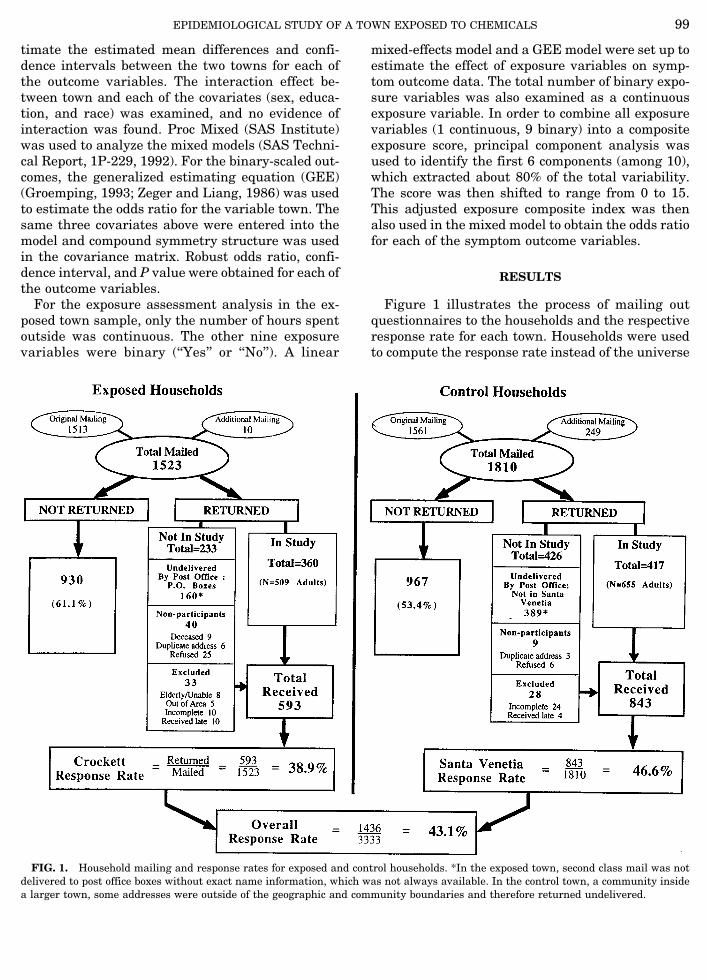
Figure 1 illustrates the process of mailing outquestionnaires to the households and the respectiveresponse rate for each town. Households were usedto compute the response rate instead of the universe
FIG. 1. Household mailing and response rates for exposed and control households. *In the exposed town, second class mail was notdelivered to post office boxes without exact name information, which was not always available. In the control town, a community insidea larger town, some addresses were outside of the geographic and community boundaries and therefore returned undelivered.
EPIDEMIOLOGICAL STUDY OF A TOWN EXPOSED TO CHEMICALS 99

of persons from each household, as the exact numberof adults for each household was unknown. In total3333 questionnaires were mailed to the two towns.The total response rate was 43.1%, for the exposedtown 38.9% and for the control town 46.6%.
Table 2 indicates the demographic characteristicsfor each town. No differences between the two townswere found on household size and age. Compared tothe control town, the exposed town participants hadfewer children (1.5 vs 1.7, P 4 0.028), fewer whites(91% vs 95%, P 4 0.014), lower levels of income (P 40.033), and were less likely to have additional col-lege years (41% vs 49%, P 4 0.006). No clinical norstatistical differences were found on other demo-graphic variables, such as employment status, jobtype, health insurance coverage, and financial assis-tance received.
Table 3 shows the reproducibility coefficients forthose questionnaires which were evaluated for thefirst and second responding for each town and theobserved agreement. All coefficients of reliabilitywere substantial (0.60 or higher) for the continuousvariables and the exposed town’s binary symptomvariables. Due to low symptom reporting in the con-
trol town, the contingency table has very skewedmarginal totals, a situation to which the k statistic issensitive. Therefore, the percentage of observedagreement is also reported in order to show re-sponses are highly reliable.
In addition to these reproducibility results, themedical review of independent physician case histo-ries and notes are also indicated a high concordancerate between symptoms reported in the question-naires and those reported to physicians duringmedical visits: headaches, 86%; visual symptoms,83%; fatigue, 80%; gastrointestinal symptoms, 77%;and pulmonary and dermatological symptoms, 71%.
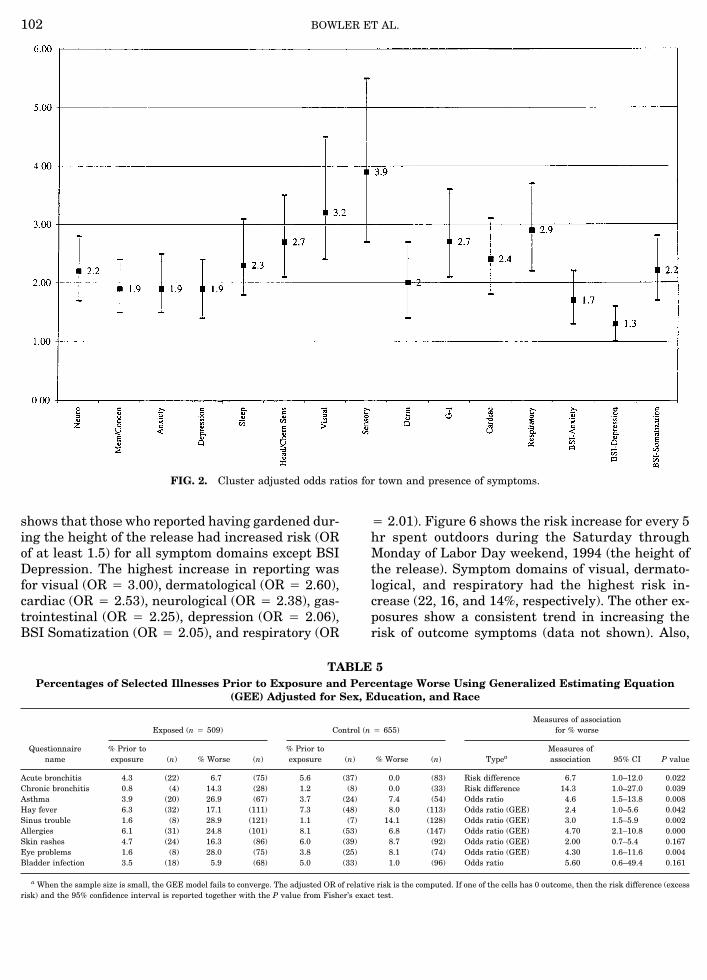
Table 4 illustrates the presence of symptoms foreach symptom domain and BSI scale scores andtheir relative risk of occurrence for the exposedtown. All but the BSI Depression scale had adjustedodds ratios greater than 1.5 (range: 1.3–3.9). Figure2 shows the odds ratios for the presence of eachsymptom scale and the three BSI scales by town.The highest adjusted odds ratios were obtained forsensory (3.9, CI: 2.7 to 5.5), visual (3.2, CI: 2.4 to4.5), and respiratory symptoms (2.9, CI: 2.2 to 3.7).Table 5 shows reported illnesses prior to the LaborDay chemical release for each group and for thoseillnesses which were reported to have worsened 6months after the chemical release. Prior to the ex-posure, the two towns reported similar prevalence ofillnesses, with the control town reporting more ofmost symptoms, including acute bronchitis (4.3% vs5.6%), hay fever (6.3% vs 7.3%), allergies (6.1% vs8.1%), skin rashes (4.7% vs 6.0%), eye problems(1.6% vs 3.8%), and bladder infection (3.5% vs 5.0%).The report of worsening of these conditions after theCatacarb exposure was significantly greater in theexposed town except for skin rashes and bladder in-fection. Acute and chronic bronchitis, bladder infec-tions, allergies, and asthma worsened. Sinus troublewas reported as worse for both towns (exposed,28.9%; control, 14.1%), some of which can be ex-plained by the winter season in which the partici-pants were asked to rate their health.1
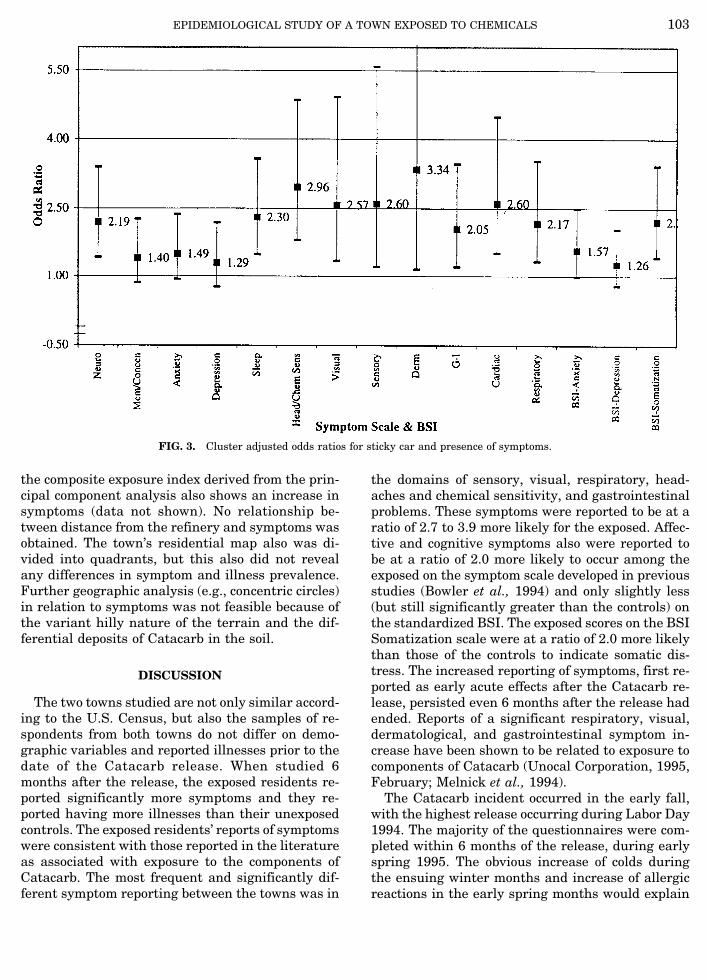
For the exposed town, adjusted odds ratios com-pared symptom prevalence of those participants whoendorsed various exposure items with those who didnot. Figure 3 shows that those who reported seeingsticky brown deposits on their car had increased re-porting (odds ratio of at least 1.5) for all but foursymptom domains (memory/concentration, anxiety,depression, and BSI Depression). The highest in-
1 The severity of illnesses (measured on a continuous scale) wasalso investigated, and the results showed that the exposed townconsistently reported greater symptomatology (data not shown).
TABLE 2Demographics and Comparisons for Control and
Exposed Towns
Exposed Control
Range (n) Mean ± SD Range (n) Mean ± SD
Age 18–91 (509) 51.5 ± 15.4 19–90 (655) 53.0 ± 15.1Number in
household 0–7 (496) 2.2 ± 1.1 0–7 (640) 2.3 ± 1.1Number of
children 0–6 (495) 1.5 ± 1.3 0–9 (643) 1.7 ± 1.5
Exposed% (n)
Control% (n) P value
GenderMale 46.4 (236) 41.5 (272)
0.099
Female 53.6 (273) 58.5 (383)
Age categories18–39 24.6 (125) 20.9 (137)
0.144
40–49 25.5 (130) 24.9 (163)50–62 25.1 (128) 23.7 (155)63+ 24.8 (126) 30.5 (200)
Ethnicity 0.014White 91.2 (464) 95.0 (621)Nonwhite 8.8 (45) 5.0 (34)
Education 0.006High school or less 28.3 (144) 21.1 (138)Some college 30.8 (157) 30.1 (197)AA or higher 40.9 (208) 48.9 (320)
Salary 0.033$0–19999 27.0 (127) 31.2 (199)$20000–29999 20.6 (97) 17.9 (114)$30000–49999 34.4 (162) 28.3 (180)$50000+ 18.0 (85) 22.6 (144)
BOWLER ET AL.100
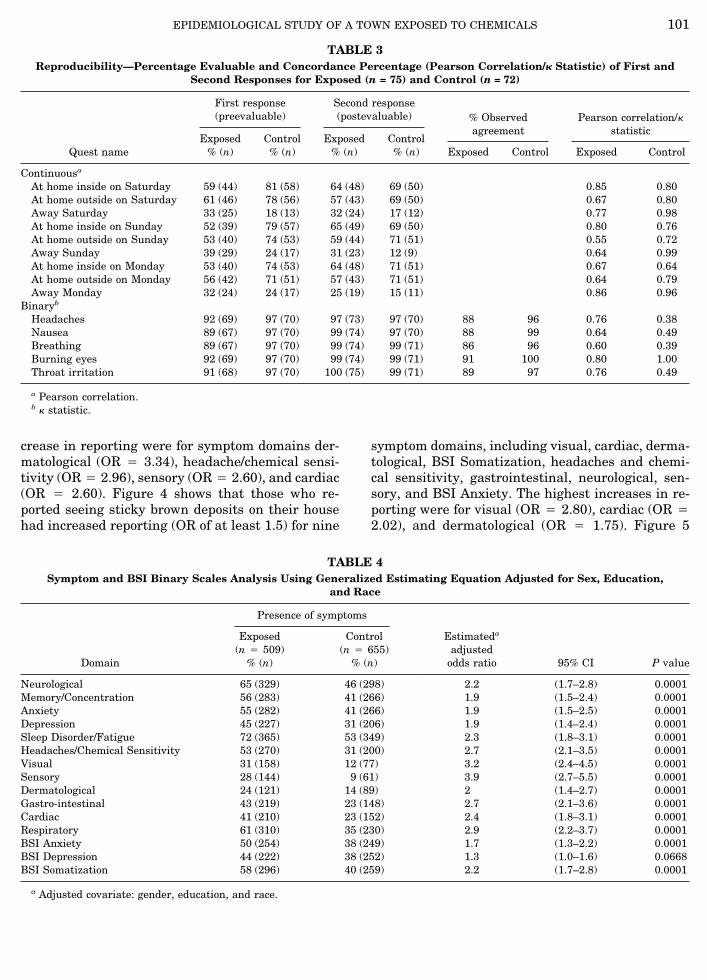
crease in reporting were for symptom domains der-matological (OR 4 3.34), headache/chemical sensi-tivity (OR 4 2.96), sensory (OR 4 2.60), and cardiac(OR 4 2.60). Figure 4 shows that those who re-ported seeing sticky brown deposits on their househad increased reporting (OR of at least 1.5) for nine
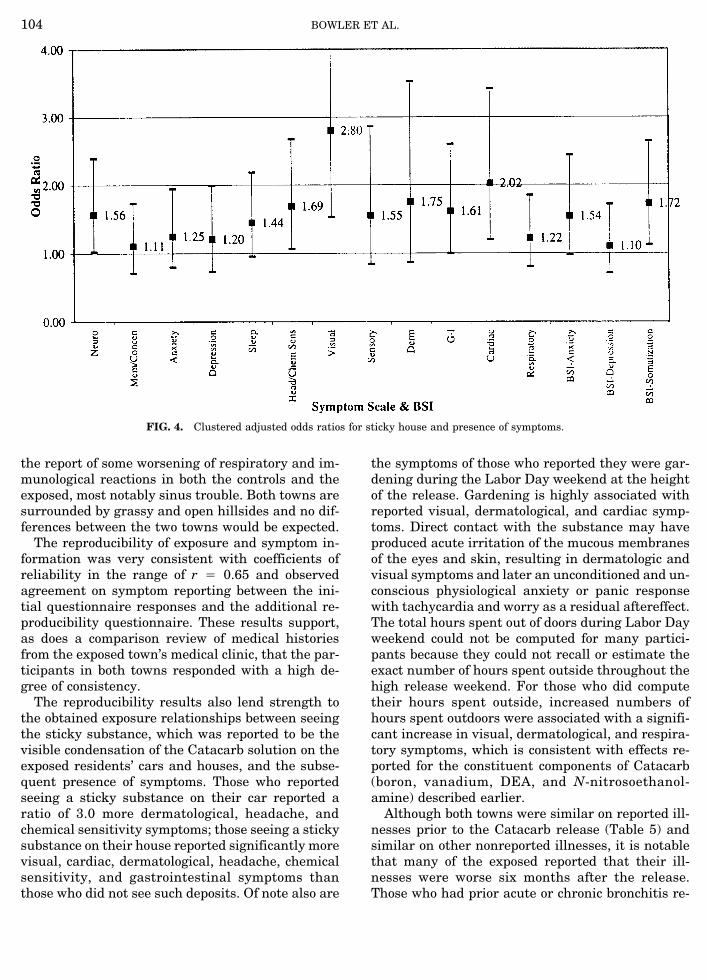
symptom domains, including visual, cardiac, derma-tological, BSI Somatization, headaches and chemi-cal sensitivity, gastrointestinal, neurological, sen-sory, and BSI Anxiety. The highest increases in re-porting were for visual (OR 4 2.80), cardiac (OR 42.02), and dermatological (OR 4 1.75). Figure 5
TABLE 4Symptom and BSI Binary Scales Analysis Using Generalized Estimating Equation Adjusted for Sex, Education,
and Race
Domain
Presence of symptoms
Estimateda
adjustedodds ratio 95% CI P value
Exposed(n 4 509)
% (n)
Control(n 4 655)
% (n)
Neurological 65 (329) 46 (298) 2.2 (1.7–2.8) 0.0001Memory/Concentration 56 (283) 41 (266) 1.9 (1.5–2.4) 0.0001Anxiety 55 (282) 41 (266) 1.9 (1.5–2.5) 0.0001Depression 45 (227) 31 (206) 1.9 (1.4–2.4) 0.0001Sleep Disorder/Fatigue 72 (365) 53 (349) 2.3 (1.8–3.1) 0.0001Headaches/Chemical Sensitivity 53 (270) 31 (200) 2.7 (2.1–3.5) 0.0001Visual 31 (158) 12 (77) 3.2 (2.4–4.5) 0.0001Sensory 28 (144) 9 (61) 3.9 (2.7–5.5) 0.0001Dermatological 24 (121) 14 (89) 2 (1.4–2.7) 0.0001Gastro-intestinal 43 (219) 23 (148) 2.7 (2.1–3.6) 0.0001Cardiac 41 (210) 23 (152) 2.4 (1.8–3.1) 0.0001Respiratory 61 (310) 35 (230) 2.9 (2.2–3.7) 0.0001BSI Anxiety 50 (254) 38 (249) 1.7 (1.3–2.2) 0.0001BSI Depression 44 (222) 38 (252) 1.3 (1.0–1.6) 0.0668BSI Somatization 58 (296) 40 (259) 2.2 (1.7–2.8) 0.0001
a Adjusted covariate: gender, education, and race.
TABLE 3Reproducibility—Percentage Evaluable and Concordance Percentage (Pearson Correlation/k Statistic) of First and
Second Responses for Exposed (n = 75) and Control (n = 72)
Quest name
First response(preevaluable)
Second response(postevaluable) % Observed
agreementPearson correlation/k
statisticExposed
% (n)Control% (n)
Exposed% (n)
Control% (n) Exposed Control Exposed Control
Continuousa
At home inside on Saturday 59 (44) 81 (58) 64 (48) 69 (50) 0.85 0.80At home outside on Saturday 61 (46) 78 (56) 57 (43) 69 (50) 0.67 0.80Away Saturday 33 (25) 18 (13) 32 (24) 17 (12) 0.77 0.98At home inside on Sunday 52 (39) 79 (57) 65 (49) 69 (50) 0.80 0.76At home outside on Sunday 53 (40) 74 (53) 59 (44) 71 (51) 0.55 0.72Away Sunday 39 (29) 24 (17) 31 (23) 12 (9) 0.64 0.99At home inside on Monday 53 (40) 74 (53) 64 (48) 71 (51) 0.67 0.64At home outside on Monday 56 (42) 71 (51) 57 (43) 71 (51) 0.64 0.79Away Monday 32 (24) 24 (17) 25 (19) 15 (11) 0.86 0.96
Binaryb
Headaches 92 (69) 97 (70) 97 (73) 97 (70) 88 96 0.76 0.38Nausea 89 (67) 97 (70) 99 (74) 97 (70) 88 99 0.64 0.49Breathing 89 (67) 97 (70) 99 (74) 99 (71) 86 96 0.60 0.39Burning eyes 92 (69) 97 (70) 99 (74) 99 (71) 91 100 0.80 1.00Throat irritation 91 (68) 97 (70) 100 (75) 99 (71) 89 97 0.76 0.49
a Pearson correlation.b k statistic.
EPIDEMIOLOGICAL STUDY OF A TOWN EXPOSED TO CHEMICALS 101
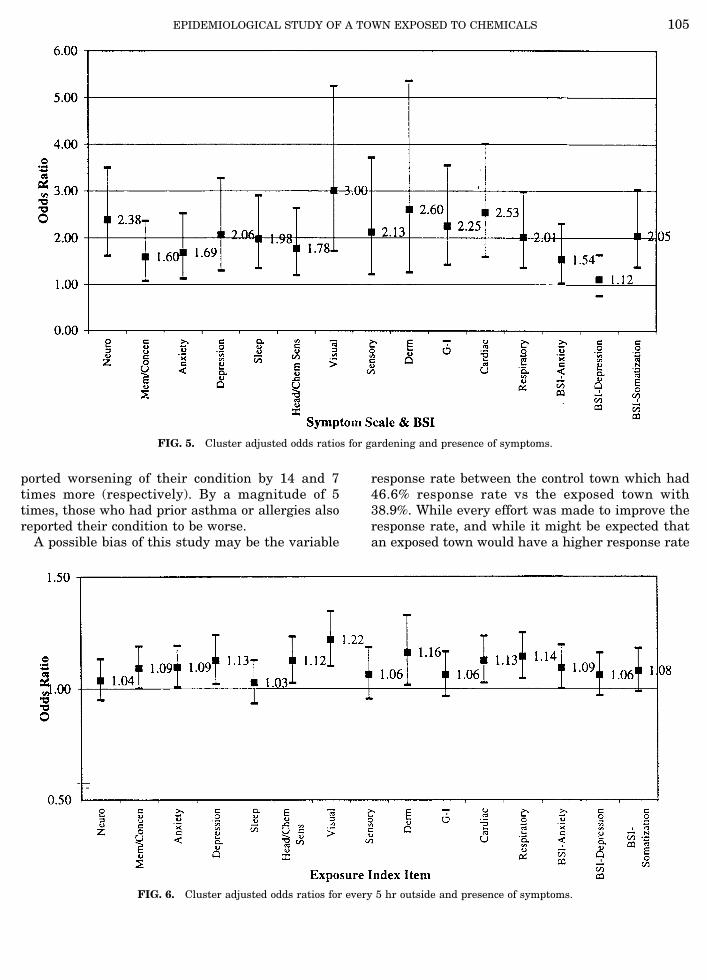
shows that those who reported having gardened dur-ing the height of the release had increased risk (ORof at least 1.5) for all symptom domains except BSIDepression. The highest increase in reporting wasfor visual (OR 4 3.00), dermatological (OR 4 2.60),cardiac (OR 4 2.53), neurological (OR 4 2.38), gas-trointestinal (OR 4 2.25), depression (OR 4 2.06),BSI Somatization (OR 4 2.05), and respiratory (OR
4 2.01). Figure 6 shows the risk increase for every 5hr spent outdoors during the Saturday throughMonday of Labor Day weekend, 1994 (the height ofthe release). Symptom domains of visual, dermato-logical, and respiratory had the highest risk in-crease (22, 16, and 14%, respectively). The other ex-posures show a consistent trend in increasing therisk of outcome symptoms (data not shown). Also,
TABLE 5Percentages of Selected Illnesses Prior to Exposure and Percentage Worse Using Generalized Estimating Equation
(GEE) Adjusted for Sex, Education, and Race
Questionnairename
Exposed (n 4 509) Control (n 4 655)Measures of association
for % worse
% Prior toexposure (n) % Worse (n)
% Prior toexposure (n) % Worse (n) Typea
Measures ofassociation 95% CI P value
Acute bronchitis 4.3 (22) 6.7 (75) 5.6 (37) 0.0 (83) Risk difference 6.7 1.0–12.0 0.022Chronic bronchitis 0.8 (4) 14.3 (28) 1.2 (8) 0.0 (33) Risk difference 14.3 1.0–27.0 0.039Asthma 3.9 (20) 26.9 (67) 3.7 (24) 7.4 (54) Odds ratio 4.6 1.5–13.8 0.008Hay fever 6.3 (32) 17.1 (111) 7.3 (48) 8.0 (113) Odds ratio (GEE) 2.4 1.0–5.6 0.042Sinus trouble 1.6 (8) 28.9 (121) 1.1 (7) 14.1 (128) Odds ratio (GEE) 3.0 1.5–5.9 0.002Allergies 6.1 (31) 24.8 (101) 8.1 (53) 6.8 (147) Odds ratio (GEE) 4.70 2.1–10.8 0.000Skin rashes 4.7 (24) 16.3 (86) 6.0 (39) 8.7 (92) Odds ratio (GEE) 2.00 0.7–5.4 0.167Eye problems 1.6 (8) 28.0 (75) 3.8 (25) 8.1 (74) Odds ratio (GEE) 4.30 1.6–11.6 0.004Bladder infection 3.5 (18) 5.9 (68) 5.0 (33) 1.0 (96) Odds ratio 5.60 0.6–49.4 0.161
a When the sample size is small, the GEE model fails to converge. The adjusted OR of relative risk is the computed. If one of the cells has 0 outcome, then the risk difference (excessrisk) and the 95% confidence interval is reported together with the P value from Fisher’s exact test.
FIG. 2. Cluster adjusted odds ratios for town and presence of symptoms.
BOWLER ET AL.102
the composite exposure index derived from the prin-cipal component analysis also shows an increase insymptoms (data not shown). No relationship be-tween distance from the refinery and symptoms wasobtained. The town’s residential map also was di-vided into quadrants, but this also did not revealany differences in symptom and illness prevalence.Further geographic analysis (e.g., concentric circles)in relation to symptoms was not feasible because ofthe variant hilly nature of the terrain and the dif-ferential deposits of Catacarb in the soil.
DISCUSSION
The two towns studied are not only similar accord-ing to the U.S. Census, but also the samples of re-spondents from both towns do not differ on demo-graphic variables and reported illnesses prior to thedate of the Catacarb release. When studied 6months after the release, the exposed residents re-ported significantly more symptoms and they re-ported having more illnesses than their unexposedcontrols. The exposed residents’ reports of symptomswere consistent with those reported in the literatureas associated with exposure to the components ofCatacarb. The most frequent and significantly dif-ferent symptom reporting between the towns was in
the domains of sensory, visual, respiratory, head-aches and chemical sensitivity, and gastrointestinalproblems. These symptoms were reported to be at aratio of 2.7 to 3.9 more likely for the exposed. Affec-tive and cognitive symptoms also were reported tobe at a ratio of 2.0 more likely to occur among theexposed on the symptom scale developed in previousstudies (Bowler et al., 1994) and only slightly less(but still significantly greater than the controls) onthe standardized BSI. The exposed scores on the BSISomatization scale were at a ratio of 2.0 more likelythan those of the controls to indicate somatic dis-tress. The increased reporting of symptoms, first re-ported as early acute effects after the Catacarb re-lease, persisted even 6 months after the release hadended. Reports of a significant respiratory, visual,dermatological, and gastrointestinal symptom in-crease have been shown to be related to exposure tocomponents of Catacarb (Unocal Corporation, 1995,February; Melnick et al., 1994).
The Catacarb incident occurred in the early fall,with the highest release occurring during Labor Day1994. The majority of the questionnaires were com-pleted within 6 months of the release, during earlyspring 1995. The obvious increase of colds duringthe ensuing winter months and increase of allergicreactions in the early spring months would explain
FIG. 3. Cluster adjusted odds ratios for sticky car and presence of symptoms.
EPIDEMIOLOGICAL STUDY OF A TOWN EXPOSED TO CHEMICALS 103
the report of some worsening of respiratory and im-munological reactions in both the controls and theexposed, most notably sinus trouble. Both towns aresurrounded by grassy and open hillsides and no dif-ferences between the two towns would be expected.
The reproducibility of exposure and symptom in-formation was very consistent with coefficients ofreliability in the range of r 4 0.65 and observedagreement on symptom reporting between the ini-tial questionnaire responses and the additional re-producibility questionnaire. These results support,as does a comparison review of medical historiesfrom the exposed town’s medical clinic, that the par-ticipants in both towns responded with a high de-gree of consistency.
The reproducibility results also lend strength tothe obtained exposure relationships between seeingthe sticky substance, which was reported to be thevisible condensation of the Catacarb solution on theexposed residents’ cars and houses, and the subse-quent presence of symptoms. Those who reportedseeing a sticky substance on their car reported aratio of 3.0 more dermatological, headache, andchemical sensitivity symptoms; those seeing a stickysubstance on their house reported significantly morevisual, cardiac, dermatological, headache, chemicalsensitivity, and gastrointestinal symptoms thanthose who did not see such deposits. Of note also are
the symptoms of those who reported they were gar-dening during the Labor Day weekend at the heightof the release. Gardening is highly associated withreported visual, dermatological, and cardiac symp-toms. Direct contact with the substance may haveproduced acute irritation of the mucous membranesof the eyes and skin, resulting in dermatologic andvisual symptoms and later an unconditioned and un-conscious physiological anxiety or panic responsewith tachycardia and worry as a residual aftereffect.The total hours spent out of doors during Labor Dayweekend could not be computed for many partici-pants because they could not recall or estimate theexact number of hours spent outside throughout thehigh release weekend. For those who did computetheir hours spent outside, increased numbers ofhours spent outdoors were associated with a signifi-cant increase in visual, dermatological, and respira-tory symptoms, which is consistent with effects re-ported for the constituent components of Catacarb(boron, vanadium, DEA, and N-nitrosoethanol-amine) described earlier.
Although both towns were similar on reported ill-nesses prior to the Catacarb release (Table 5) andsimilar on other nonreported illnesses, it is notablethat many of the exposed reported that their ill-nesses were worse six months after the release.Those who had prior acute or chronic bronchitis re-
FIG. 4. Clustered adjusted odds ratios for sticky house and presence of symptoms.
BOWLER ET AL.104
ported worsening of their condition by 14 and 7times more (respectively). By a magnitude of 5times, those who had prior asthma or allergies alsoreported their condition to be worse.
A possible bias of this study may be the variable
response rate between the control town which had46.6% response rate vs the exposed town with38.9%. While every effort was made to improve theresponse rate, and while it might be expected thatan exposed town would have a higher response rate
FIG. 6. Cluster adjusted odds ratios for every 5 hr outside and presence of symptoms.
FIG. 5. Cluster adjusted odds ratios for gardening and presence of symptoms.
EPIDEMIOLOGICAL STUDY OF A TOWN EXPOSED TO CHEMICALS 105
than a control town, several causative factors aregiven. First, the exposed residents were frightened,confused, and angry after learning of the refineryleak and that they had been exposed without theirknowledge. Second, it was learned that the exposedtown has slightly more elderly residents than thecontrol town who (presumably) had greater adversehealth effects from this exposure and subsequentlywere not energetic and well enough to complete therather lengthy questionnaires used in this study.This was in fact reiterated by informed communityleaders. Third, as appears to be the case in anychemical or technological accidents, a distrust of anyinstitution emerges which further diminishes will-ingness to trust even a university-sponsored healthstudy. Fourth, it was learned during telephone callsfrom some of the residents in the exposed town, thatattorneys informed exposed town residents not tocooperate in completing questionnaires by any out-side group.
It is not possible with this study to attribute long-term health effects in the exposed town’s residents.However, the results of this study suggest that theexposed residents experienced acute health effectsand adverse symptoms after the release, that theseeffects persisted at least six months, that they wereassociated with both the seeing of and having physi-cal contact with residues of the Catacarb substance,and that the symptoms were consistent with thosereported following exposure to components ofCatacarb. Reports are currently in preparation bythe California State Health Department of a studyof the workers at the refinery who were evaluatedfor onset of symptoms in relation to the chemicalrelease. These refinery worker health study findings(still in preparation and not yet released) and theresults of the risk assessment and biological moni-toring of some of the workers are consistent with thechemically induced symptoms experienced by theresidents of the adjacent town. Anxiety may havecontributed to elevated symptom development,which has been shown in toxic waste disposal sitestudies (Roht et al., 1985), but it seems unlikely thatanxiety alone was the precipitating factor.
Although measurements of chemicals in soil or airand especially in the body of exposed persons incases of chemical releases are highly desirable, thisis rarely possible at the time of the release as fre-quently unsuspecting communities are unaware ofsuch biological assessment methods within the re-quired time frame needed to permit computation ofindividual dose–response relationships. Retrospec-tive estimates of risk of exposure seem only to com-plicate the issue further as they appear highly in-
fluenced by who performs the estimates (i.e., com-pany or community sponsored) as was the case inthis release.2 The refinery has agreed to fencelineair monitoring of chemical emissions. This monitor-ing is presently being implemented and would per-mit a better estimate of exposure relationships infuture releases and/or studies. In this community,future studies would be valuable in using this fence-line monitoring equipment in gaining more accuratedata on the relationship of onset of symptoms withexposure.
Major chemical releases appear to have devastat-ing effects on communities which experience them(Brown, 1995; Bowler et al., 1994; Dayal et al., 1992;Gill and Picou, 1991; Green, 1991; Green et al., 1990;Baum, 1987; Fleming et al., 1982). Not only shouldmore effort be expended and policies established toassist communities effected by such chemical acci-dents, but prevention methods targeting stress-related illnesses might actually serve to diminishthe overall negative health effects. The relationshipof stress and illness has been well established sinceHans Selye’s early work (1976) on the Stress Re-sponse Syndrome and is further shown in the asso-ciation of such reactive and serious disorders asPTSD. McFarlane and co-workers (1994) showedphysical symptoms as an ‘‘accompaniment’’ of PTSDin a sample of firefighters who had higher rates ofcardiovascular, respiratory, musculoskeletal, andneurological symptoms. To minimize such negativesymptoms and the development of illnesses, theseauthors also suggest, as did Kinston and Rosser asearly as 1974, that much psychological work isneeded to minimize the psychological impact ofchemical releases and disasters on subsequentphysical and psychological illness.
This study is one of the first epidemiological stud-ies of health status of residents from two towns (ex-posed and control) within 6 months after a chemicalrelease. The strength and consistency of the findingsreported here, the large sample size, and the cor-roborating findings of both the reproducibility studyand the review of medical records makes it difficultto dismiss the town’s adverse health experience. Fur-ther clinical studies are presently underway and it isintended that a follow-up study of the participants inthis epidemiological study will be carried out. Suchstudies may answer some of the remaining questionsand concerns about long-term effects that both citi-zens and health care professionals continue to have.
2 An additional community risk assessment is presently beingprepared by an university toxicologist which has higher estimatesof levels of Catacarb exposure.
BOWLER ET AL.106

ACKNOWLEDGMENTS
Ms. Patti Young and Ms. Virginia Bray, members of the Shore-line Environmental Health Alliance, and other community lead-ers and activists are thanked for initially requesting the healthstudy and for their tireless support and input into the study. Dr.Jonathan Frisch and Dr. Mary McDaniel are thanked for assis-tance in gaining funding from Unocal for this investigation underGood Neighbor Agreement No. 5. The residents of both towns arethanked for their participation. The health study staff, primarilySan Francisco State University psychology students, too numer-ous to name, are thanked for their dedication in mailing, phonecalling, data entry, and many other necessary tasks. Particularappreciation is expressed to Michael Biel for data project man-agement and to Hilary Foster for the mailing of the question-naires and managing follow-up phone calls. Dr. Margot Smith isthanked for her supportive assistance in questionnaire construc-tion and in searching the U.S. Census data for a suitable controltown. Dr. Stephen Rauch is thanked for his editing, assistance inquestionnaire construction, supervision, and untiring support ofthe project during the active study phase. The San FranciscoState University administrators, staff, faculty, and committeemembers involved in the project are thanked for their supportiveand competent management of the many difficulties projects suchas this encounter.
REFERENCES
Baum, A., Fleming, I., Israel, A., and O’Keeffe, M. K. (1992).Symptoms of chronic stress following a natural disaster anddiscovery of a human-made hazard. Environ. Behav. 24(3),347–365.
Baum, A. (1987). Toxins, technology and natural disaster. In‘‘Cataclysms, Crises and Catastrophes: Psychology in Action’’(G. R. Van Der Bos and B. K. Bryant, Eds.). American Psycho-logical Association, Washington, DC.
Baum, A., Gatchell, R. J., and Schaeffer, M. A. (1983). Emotional,behavioral, and physiological effects of chronic stress at ThreeMile Island. J. Consult. Clin. Psych. 51, 565–572.
Baum, A., Fleming, R., and Singer, R. (1982). Stress at Three MileIsland: Applying psychological impact analysis. In Applied Soc.Psych. Annual (L. Bickman, Ed.), pp. 217–248. Sage, BeverlyHills, CA.
Boffetta P. (1993). Carcinogenicity of trace elements with refer-ence to evaluations made by the International Agency for Re-search on Cancer. Scand. J. Work Environ. Health, 19 (Suppl.1), 67–70.
Bowler, R. M., Mergler, D., Harrison, R., Rauch, S., and Cone, J.(1991). Affective and personality disturbances among femaleformer microelectronics workers. J. Clin. Psych. 47, 41–52.
Bowler, R., and Schwarzer, R. (1991). Environmental anxiety:Assessing emotional distress and concerns after toxin exposure.Anxiety Res. 4, 167–180.
Bowler, R., Mergler, D., Huel, G., and Cone, J. (1994). Psycho-logical, psychosocial, and psychophysiological sequelae in acommunity affected by a railroad chemical disaster. J. Traum.Stress 7, 1–23.
Bowler, R., Huel, G., Mergler, D., Cone, J., Rauch, S., and Hart-ney, C. (1996). Symptom base rates after chemical exposure forWhite, Hispanic, and African-Americans. NeuroToxicology17(3). In press.
Bowler, R., Mergler, D., Bowler, R., and Rauch, S. (1992). Affec-
tive disorders in solvent exposed workers. Wom. Health 18(3),27–47.
Brown, P. (1995). Race, class, and environmental health: A re-view and systematization of the literature. Environ. Res. 69,15–30.
Caldicott, H. (1992). If You Love This Planet: A Plan to Heal theEarth. Norton, New York.
Contra Costa County Health Services Department Public HealthDivision. (1994, October). ‘‘Unocal Rodeo Refinery ChemicalLeak.’’ Martinez, CA.
Cosmetic Ingredient Review (1993). Final report on the safetyassessment of triethanolamine, diethanolamine and monoetha-nolamine. J. Am. Coll. Toxicol. 2(7), 183–227.
Davidson, L. M., and Baum, A. (1986). Chronic stress and post-traumatic stress disorders. J. Cons. Clin. Psych. 54, 303–308.
Davidson, L., Baum, A., and Collins, D. L. (1982). Stress and con-trol-related problems at Three Mile Island. J. Appl. Soc. Psych.12, 349–359.
Dayal, H. H., Brodwick, M., Morris, R., Baranowski, T., Trieff, N.,Harrison, J., Lisse, J., and Ansari, G. A. S. (1992). A commu-nity-based epidemiological study of health sequelae of exposureto hydroflouric acid. Ann. Epidemiol. 2, 213–230.
Dayal, H. H., Hwei Li, H., Dayal, V., Mittal, C. K., andSnodgrass, W. (1994). Use of medication data to validate anassociation in community-based symptom prevalence studies.Arch. Environ. Health 49(2), 93–97.
Deloraine, A., Zmirou, D., Tillier, C., Boucharlat, A., and Bouti,H. (1995). Case-control assessment of the short-term healtheffects of an industrial toxic waste landfill. Environ. Res. 68,124–132.
Derogatis, L. R. (1993). ‘‘BSI Brief Symptom Inventory Adminis-tration, Scoring and Procedures Manual.’’ National ComputerSystems, Inc., Minneapolis, MN.
Fleiss, J. L. (1981). ‘‘Statistical Methods for Rates and Propor-tions,’’ 2nd ed. Wiley, New York.
Fleming, R., Baum, A., Gisriel, M., and Gatchel, R. (1982). Medi-ating influences of social support on stress at Three Mile Is-land. J. Hum. Stress 14–22.
Fox, R., Crask, M., and Kim, J. (1988). Mail survey response ratea meta-analysis of selected techniques for inducing response.Pub. Opin. Quart. 52, 467–491.
Gatchell, R. J., Schaeffer, M. A., and Baum, A. (1985). A psycho-physiological field study of stress at Three Mile Island. Psycho-physiology 22, 175–181.
Gettner, S., Cone, J. E., and Osorio, A. M. (1995). ‘‘Monitoring forHealth Effects of Catacarb Following a Refinery Leak.’’ Paperpresented at the Advances in Medical Surveillance for Environ-mental and Occupational Health: From Exposure Onsetthrough Health Outcome SOEH Conference, Bethesda, MD.
Gill, D., and Picou, J. S. (1991). The social psychological impactsof a technological accident: Collective stress and perceivedhealth risks. J. Haz. Mater. 27, 77–89.
Green, B. L. (1991). Evaluating the effects of disasters. Psych.Assess. 3, 538–546.
Groemping U. (1993). ‘‘GEE: A SAS Macro for Longitudinal DataAnalysis.’’ Fachbereich Statistik, Universitaet Dortmund, Ger-many.
Hatch, M., Wallenstein, S., Beyea, J., Nieves, J., and Susser, M.(1991). Cancer rates after the Three Mile Island nuclear acci-
EPIDEMIOLOGICAL STUDY OF A TOWN EXPOSED TO CHEMICALS 107
dent and proximity of residence to the plant. Am. J. Pub.Health 81, 6.
Karas, J., and Wocasek, D. (1995). ‘‘Investigation of CatacarbRelease during August–September 1994: Unocal Refinery Ro-deo, California’’ Bay Area Air Quality Management District,San Francisco. [Report].
Kinston, W., and Rosser, R. (1974). Disaster: Effects on mentaland physical state. J. Psychosom. Res. 18, 437–456.
Landis, J. R., and Koch, G. G. (1977). The measurement of ob-server agreement for categorical data. Biometrics 33, 159–174.
McFarlane, A. C., Atchison, M., Rafalowicz, E., and Papay, P.(1994). Physical symptoms in post-traumatic stress disorder. J.Psychosom. Res. 38(7), 715–726.
Melnick, R. L., Mahler, J., Bucher, J. R., Thompson, M., Hejt-mancik, M., Ryan, M. J., and Mezza, L. E. (1994). Toxicity ofdiethanolamine. 1. Drinking water and topical application ex-posures in F344 rats. J. Appl. Toxicol. 14(1), 6–8.
Melnick, R. L., Mahler, J., Bucher, M., Hejtmancik, M., Singer,A., and Persing, R. L. (1994). Toxicity of diethanolamine. 2.Drinking water and topical application exposures in B6CX3Fmice. J. Appl. Toxicol. 14(1), 11–19.
Montgomery Watson (1996, January). ‘‘Unocal Refinery at RodeoCatacarb Solution Release August 22–September 6, 1994: FinalHealth Risk Assessment.’’ Unocal Corporation, San Francisco.
Realmuto, G. M., Wagner, N., and Bartholow, J. (1991). TheWilliams Pipeline Disaster: A controlled study of a technologi-cal accident. J. Traum. Stress 4, 469–479.
Roht, L. H., Vernon, S. W., Weir, F. W., Pier, S. M., Sullivan, P.,
and Reed, L. J. (1985). Community exposure to hazardouswaste disposal sites: Assessing reporting bias. Am. J. Epide-miol. 122, 418–424.
SAS Technical Report P-229 (1992). ‘‘SAS/STAT Software:Changes and Enhancements: Release 6.07,’’ pp. 287–368. SASInstitute Inc. Cary, NC.
Schaeffer, M., and Baum, A. (1984). Adrenal cortical response tostress at Three Mile Island. Psychosom. Med. 46, 227–237.
Seigner, C., (1992). Understanding the basics of air-quality mod-eling. Chem. Eng. Prog. March, 68–74.
Selye, H. (1976). ‘‘The Stress of Life.’’ McGraw–Hill, New York.
Spurgeon, A., Gompertz, D., and Harrington, J. M. (1996). Modi-fiers of nonspecific symptoms in occupational and environmen-tal syndromes. Occup. Environ. Med. 53, 361–366.
Unocal Corporation (1995, February). ‘‘Unocal Material SafetyData Sheet.’’ Los Angeles.
U.S. Department of Health & Human Services Public Health Ser-vice Agency for Toxic Substances and Disease Registry (1995).‘‘Toxicological Profile for Boron, TP-91/05.’’
U.S. Environmental Protection Agency (1995, December). ‘‘Envi-ronmental News: U.S. EPA Cites Unocal for Spill Violations.’’San Francisco.
Valciukas, J. (Ed.). (1991). ‘‘Foundations of Environmental andOccupational Neurotoxicology.’’ Van Nostrand Reinhold, NewYork.
Zeger, S. L., and Liang, K. Y. (1986). Longitudinal data analysisfor discrete and continuous outcomes. Biometrics 42, 121–130.
BOWLER ET AL.108