Environmental effects of Deccan volcanism across the Cretaceous–Tertiary transition in Meghalaya,...
15
(This is a sample cover image for this issue. The actual cover is not yet available at this time.) This article appeared in a journal published by Elsevier. The attached copy is furnished to the author for internal non-commercial research and education use, including for instruction at the authors institution and sharing with colleagues. Other uses, including reproduction and distribution, or selling or licensing copies, or posting to personal, institutional or third party websites are prohibited. In most cases authors are permitted to post their version of the article (e.g. in Word or Tex form) to their personal website or institutional repository. Authors requiring further information regarding Elsevier’s archiving and manuscript policies are encouraged to visit: http://www.elsevier.com/copyright
Transcript of Environmental effects of Deccan volcanism across the Cretaceous–Tertiary transition in Meghalaya,...
(This is a sample cover image for this issue. The actual cover is not yet available at this time.)
This article appeared in a journal published by Elsevier. The attached
copy is furnished to the author for internal non-commercial research
and education use, including for instruction at the authors institution
and sharing with colleagues.
Other uses, including reproduction and distribution, or selling or
licensing copies, or posting to personal, institutional or third party
websites are prohibited.
In most cases authors are permitted to post their version of the
article (e.g. in Word or Tex form) to their personal website or
institutional repository. Authors requiring further information
regarding Elsevier’s archiving and manuscript policies are
encouraged to visit:
http://www.elsevier.com/copyright
Author's personal copy
Environmental effects of Deccan volcanism across the Cretaceous–Tertiary transitionin Meghalaya, India
B. Gertsch a,⁎, G. Keller b, T. Adatte c, R. Garg d, V. Prasad d, Z. Berner e, D. Fleitmann f
a Earth, Atmospheric and Planetary Science Department, Massachussetts Institute of Technology, Cambridge MA 02139, USAb Department of Geosciences, Princeton University, Princeton NJ 08544, USAc Institut de Géologie et Paléontology, Université de Lausanne, Anthropole, CH-1015 Lausanne, Switzerlandd Marine Micropalaeontology Group, Birbal Sahni Institute of Palaeobotany, Lucknow 226007, Indiae Institute for Mineralogy & Geochemistry, Karlsruhe Institute of Technology, 76128 Karlsruhe, Germanyf Institute of Geological Sciences, University of Bern, CH-3012 Bern, Switzerland
a b s t r a c ta r t i c l e i n f o
Article history:
Received 22 February 2011
Received in revised form 24 July 2011
Accepted 10 August 2011
Available online xxxx
Editor: G. Henderson
Keywords:
Deccan volcanism
Iridium
Meghalaya
KT boundary
mass extinction
The Um Sohryngkew section ofMeghalaya, NE India, located 800–1000 km from the Deccan volcanic province,
is one of the most complete Cretaceous–Tertiary boundary (KTB) transitions worldwide with all defining and
supporting criteria present: mass extinction of planktic foraminifera, first appearance of Danian species, δ13C
shift, Ir anomaly (12 ppb) and KTB red layer. The geochemical signature of the KTB layer indicates not only an
extraterrestrial signal (Ni and all Platinum Group Elements (PGEs)) of a second impact that postdates
Chicxulub, but also a significant component resulting from condensed sedimentation (P), redox fluctuations
(As, Co, Fe, Pb, Zn, and to a lesser extent Ni and Cu) and volcanism. From the late Maastrichtian C29r into the
early Danian, a humid climate prevailed (kaolinite: 40–60%, detrital minerals: 50–80%). During the latest
Maastrichtian, periodic acid rains (carbonate dissolution; CIA index: 70–80) associated with pulsed Deccan
eruptions and strong continental weathering resulted in mesotrophic waters. The resulting super-stressed
environmental conditions led to the demise of nearly all planktic foraminiferal species and blooms (N95%) of
the disaster opportunist Guembelitria cretacea. These data reveal that detrimental marine conditions prevailed
surrounding the Deccan volcanic province during the main phase of eruptions in C29r below the KTB.
Ultimately these environmental conditions led to regionally early extinctions followed by global extinctions at
the KTB.
© 2011 Elsevier B.V. All rights reserved.
1. Introduction
For the past 30 years, the Cretaceous–Tertiary boundary (KTB)
mass extinction has been attributed to an extraterrestrial impact
based mainly on the presence of a global Ir enrichment in a thin KTB
red clay layer (Alvarez et al., 1980), which was subsequently
attributed to the Chicxulub impact crater on Yucatan that distributed
impact glass spherule ejecta near the KTB in Central and North
America (e.g., Pope et al., 1991; Schulte et al., 2010; Smit et al., 1996).
This theory and its corollary interpretations have remained contro-
versial because of contradictory evidence (Keller, 2010), including the
discovery of the oldest impact spherule layer in late Maastrichtian
sediments in NE Mexico and Texas that indicates a pre-KT age for the
Chicxulub impact (e.g., Keller et al., 2003, 2007, 2009a).
Also for the past 30 years, Deccan volcanism has been advocated as
potential cause for the KTB catastrophe (e.g., Courtillot et al., 1986,
1988; Duncan and Pyle, 1988; MacLean, 1985). But this hypothesis
was considered unlikely because volcanism was generally believed to
have occurred over about one million years prior to the mass
extinction leaving sufficient time for recovery between eruptions.
More recently, major studies of the Deccan Volcanic Province (DVP)
have greatly improved understanding of the age and tempo of
eruptions, revealing three major phases: initial phase-1 in C30n at
~67.4 Ma, the main phase-2 in C29r just before the KTB, and the last
phase-3 in the early Danian (base C29n). Phase-2 is the most critical
period of Deccan volcanism as it accounts for ~80% of the entire
3500 m thick Deccan lava pile, and erupted in rapid pulses over a
short interval in C29r just prior to the KTB mass extinction (Chenet
et al., 2007, 2008, 2009; Keller et al., 2008, 2009b,c). In another
interpretation, Hooper et al. (2010) suggest that although the bulk of
the major eruptions started in C29r, it continued into C29n. New data
from ten deep wells in the Krishna-Godavari Basin support Chenet et
al.'s model of two separate volcanic phases with the major phase-2 in
C29R below the KTB and Phase-3 in C29N (Keller et al., 2011). It
cannot be ruled out that minor volcanic eruptions continued in C29R
above the KTB, although these would have been locally more
restricted. Phase-2 created the world's longest lava flows, spanning
N1500 km across India and into the Gulf of Bengal (Keller et al., 2011;
Earth and Planetary Science Letters 310 (2011) 272–285
⁎ Corresponding author.
E-mail address: [email protected] (B. Gertsch).
0012-821X/$ – see front matter © 2011 Elsevier B.V. All rights reserved.
doi:10.1016/j.epsl.2011.08.015
Contents lists available at SciVerse ScienceDirect
Earth and Planetary Science Letters
j ourna l homepage: www.e lsev ie r.com/ locate /eps l

Author's personal copy
Self et al., 2008). These lava flows ended at or near the KTB mass
extinction (Keller et al., 2008), as revealed in intertrappean sediments
overlying phase-2 basalt flows in Rajahmundry quarries (Andra
Pradesh) and Jhilmili (Madhya Pradesh, Keller et al., 2009a,b). These
studies strongly suggest that the biotic and environmental effects of
Deccan volcanism at KTB time may have been vastly underrated.
This report investigates the climatic and environmental conse-
quences of Deccan phase-2 volcanism in themost complete KTBmarine
sequence known from India and comparable to the most complete
sequences worldwide (e.g., Tunisia, Texas, Spain). The section is
exposed along the Um Sohryngkew River in Meghalaya, NE India, and
is about 800–1000 km from themain Deccan volcanic province (Fig. 1).
A thin red clay layer enriched in Ir and other Platinum Group Elements
(PGEs) marks the KTB (Bhandari et al., 1993, 1994; Garg et al., 2006;
Pandey, 1990). Our investigations are based on the same sequence
studied by these workers and employ a multi-proxy approach that
includes: 1) biostratigraphy to provide high-resolution age control and
evaluation of the biotic effects of Deccan volcanism; 2) carbon isotope
stratigraphy as independent marker of the KTB; 3) sedimentology,
microfacies analysis andbulk rockmineralogy to identify environmental
changes; 4) clay mineralogy to infer paleoclimatic conditions, and
comparisonwith data fromother sites in India; 5) platinumgroup, trace
andmajor elements geochemistry to evaluate evidence for an impact at
the KTB; and 6) major and trace element geochemistry to identify a
causal-relationship between Deccan volcanic activity and periods of
high-stress conditions in marine environments.
2. Methods
The Um Sohryngkew section was examined in the field for
lithological changes, burrows and shell layers, which were described,
measured and photographed (by RG and VP). A total of 143 samples
were collected at an average of 50 cm, except for the KT transition
where samples were taken at 10 cm intervals. In the laboratory,
samples were processed for foraminiferal extraction using standard
methods (Keller et al., 1995).
Carbon and oxygen isotope measurements were carried out on
powdered bulk rock samples at the stable isotope laboratories at the
University of Bern, Switzerland, using an Optima (Micromass, UK)
ratio mass spectrometer equipped with an online carbonate prepa-
ration line (Multi Carb) with separate vials for each sample and a VG
Prism II ratio mass spectrometer, respectively. The results were
calibrated to the PDB scale with standard errors of 0.05‰ for δ13C.
Major and trace elements were analyzed at the Geological Institute
of the University of Lausanne, Switzerland, by XRF spectroscopy with
a PANalytical PW2400with a RX tube (Rh anode). PGEswere analyzed
at the Institute for Mineralogy and Geochemistry, University of
Karlsruhe, by isotope dilution HR-ICP-MS (Axiom, VG Elemental) after
pre-concentration and matrix reduction by Ni-fire assay (Gertsch
et al., 2011).
Bulk rock and clay mineral assemblages were analyzed by X-ray
diffraction (Xtra ARL Diffractometer) at the Geological Institute of the
University of Lausanne, Switzerland, based on procedures described
by Adatte et al. (1996). The semi-quantification of bulk-rock
mineralogy is based on XRD patterns of random powder samples by
using external standards with an error margin between 5 and 10% for
the phyllosilicates and 5% for grain minerals. Clay mineral analysis
follows the methods described by Adatte et al. (1996). The intensities
of the identified minerals are measured for a semi-quantitative
estimate of the proportion of clayminerals, which is therefore given in
relative percent without correction factors, because of the small error
margin (b5%).
3. Geological context and lithology
The Meghalaya area is located in northeastern India, north of
Bangladesh, and characterized by the Shillong Plateau, which includes
Garo, Khasi, Jaintia and Mikir hills (Fig. 1). The Shillong Plateau is
tectonically related to the formation of Himalaya and corresponds to
an uplifted Precambrian massif of the peninsular India shield
formation with up to 6 km of Cretaceous through Miocene marine
to continental sedimentary rocks that unconformably overlie the
basement along the eastern, western and southern limbs (Alam et al.,
2003; Clark and Bilham, 2008; Das Gupta and Biswas, 2000; Ghosh
et al., 2005; Rao et al., 2008; Reimann, 1993; Rowley, 1996).
The Um Sohryngkew section lies on the southern side of the
Shillong Plateau near the village of Therria along the Um Sohryngkew
river. The sedimentary record shows uninterrupted marine shelf
sedimentation from the Campanian to the Eocene during the
formation of a gulf on the northeastern edge of greater India due to
rifting along the Indo-Burmese orogen (Acharyya and Lahiri, 1991;
Banerji, 1981; Krishnan, 1968; Nagappa, 1959; Reimann, 1993).
Sediments consist mainly of thick sandstone layers, marls, shale and
carbonates characteristic of coastal, estuarine and nearshore environ-
ments (Banerji, 1981; Krishnan, 1968; Nagappa, 1959).
For this study, investigations focused only on the Maastichtian–
Danian interval of the Um Sohryngkew section. Sediments in the lower
part of the section (0–14.26 m) consist of bioturbated clayey marls
(0–8 m), silty sandy shales (8–10 m), clayey marls (10–14.26 m), and
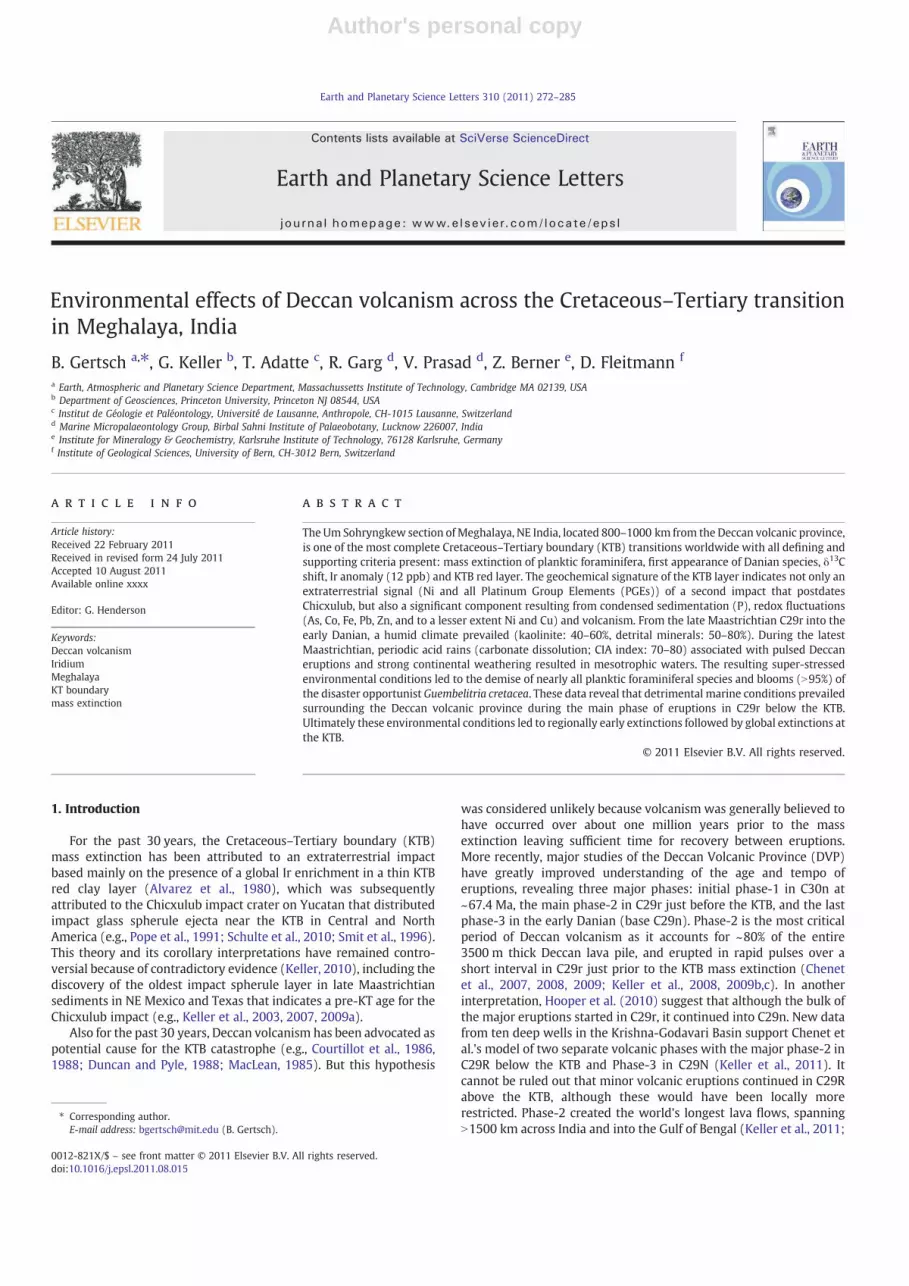
three 10–40 cm thick sandstone beds (2.4 m, 4.5 m, 13.3 m; Fig. 2). The
KTB (14.26–14.28 m) ismarked by a 2 cm thick rust-red-colored sandy-
silty layer with abundant subangular quartz in a red-brown matrix
enriched in Ir and other PGEs, but devoid of calcite and microfossils
(Figs. 2, 3A, B). In the lower Danian, silty, sandy shalewith a 10 cm thick
bioturbated sandstone layer (15.3–15.4 m) is followed by shales, clayey
marls, marls, and marly limestones (15.5–30 m).
Fig. 1. A) Geographic map of India with position of Meghalaya and the Deccan Volcanic
Province. B) Map of the Meghalaya area with the location of the Um Sohryngkew
section near the village of Therria.
273B. Gertsch et al. / Earth and Planetary Science Letters 310 (2011) 272–285
Author's personal copy
4. Biostratigraphy
Previous micropaleontological studies of the Maastrichtian to
Paleocene Um Sohryngkew section of Meghalaya based on planktic
foraminifera failed to identify the KTB red layer and PGE anomalies,
possibly because different intervals or sections were collected, or
sampling intervals were too large (e.g., Mukhopadhyay, 2007). In
contrast, nannofossil and dinoflagellate studies (Garg et al., 2006;
Nandi, 1990) were based on sample collections of the same intervals
where PGE anomalies were identified (Bhandari et al., 1993, 1994;
Pandey, 1990). This report is based on planktic foraminifera from the
same section and samples previously reported by Garg et al. (2006),
and represents the first documentation of the mass extinction across
the KTB transition of the Um Sohryngkew section. Age and biozones
are based on the combined planktic foraminiferal zonal scheme of
Keller et al. (1995, 2002), and Li and Keller (1998).
4.1. Late Maastrichtian
The latest Maastrichtian nannofossils zone Micula prinsii marks the
4 m below the KTB (Garg et al., 2006), which correspond to planktic
foraminiferal zones CF2 and CF1 (Keller et al., 2009d). Planktic
foraminiferal assemblages in this interval are dominated byGuembelitria
blooms (N95%) that characterize zone CF1 and CF2 in shallow-water
environments globally (see reviews in Keller and Abramovich, 2009;
Pardo and Keller, 2008). The remaining assemblage consists of rare and
sporadic occurrences of heterohelicids, planoglobulinids, pseudoguem-
belinids, racemiguembelinids, globotruncanids and rugoglobigerinids
(Fig. 3). However, in the 0.6 m below the KTB only rare, dwarfed and
stress-resistant species are present (e.g., heterohelicids and guembeli-
trids). The exclusionof all subsurfacedwellers suggests a shallower inner
neritic environment. Enhanced carbonate dissolution in this interval
may be linked to Deccan volcanism. In the Micula murus zone only rare
planktic foraminifera are preserved in the predominantly sandy-silty
shales, clayey marls and sandstones.
4.2. KT Boundary and early Danian
The Um Sohryngkew section contains the most complete KTB
transition in India, which can be correlated to the El Kef stratotype
section and point (GSSP) in Tunisia (Cowie et al., 1989; Keller et al.,
1995; Remane et al., 1999). As at El Kef, the KTB is identified by the
mass extinction of planktic foraminifera followed by the first
appearances of Danian species in zones P0 and P1a (e.g., Parvular-
ugoglobigerina extensa, P. eugubina, Woodringina hornerstownensis,
Globoconusa daubjergensis; Keller et al., 1995, 2002; Molina et al.,
2006). Also present are the same three KTB-supporting criteria, the
negative δ13C shift, the Ir anomaly and other PGEs in a thin red layer.
The δ13C excursion at the Um Sohryngkew section shows the same
trend as in the complete and expanded KTB sequences in Tunisia and
Texas (Keller et al., 2002, 2009a).
Fig. 2. Litholog of the UmSohryngkew section and illustrations: A)Outcrop of the KT transitionwithMaastrichtian graymarls topped by the KT red layer andDanian shales; B) close-up of
the KT boundary. Thin section micrographs of the KT red layer show abundant sub-angular quartz crystals (gray) in a brownmatrix. (For interpretation of the references to color in this
figure legend, the reader is referred to the web version of this article.)
274 B. Gertsch et al. / Earth and Planetary Science Letters 310 (2011) 272–285
Author's personal copy
The mass extinction pattern differs from the deep-sea record by its
lower diversity (24 species as compared with over 30 in comparable
shallow environments, Keller andAbramovich, 2009), the rare, sporadic
pre-KTB species occurrences in the 4 m below the KTB, and blooms
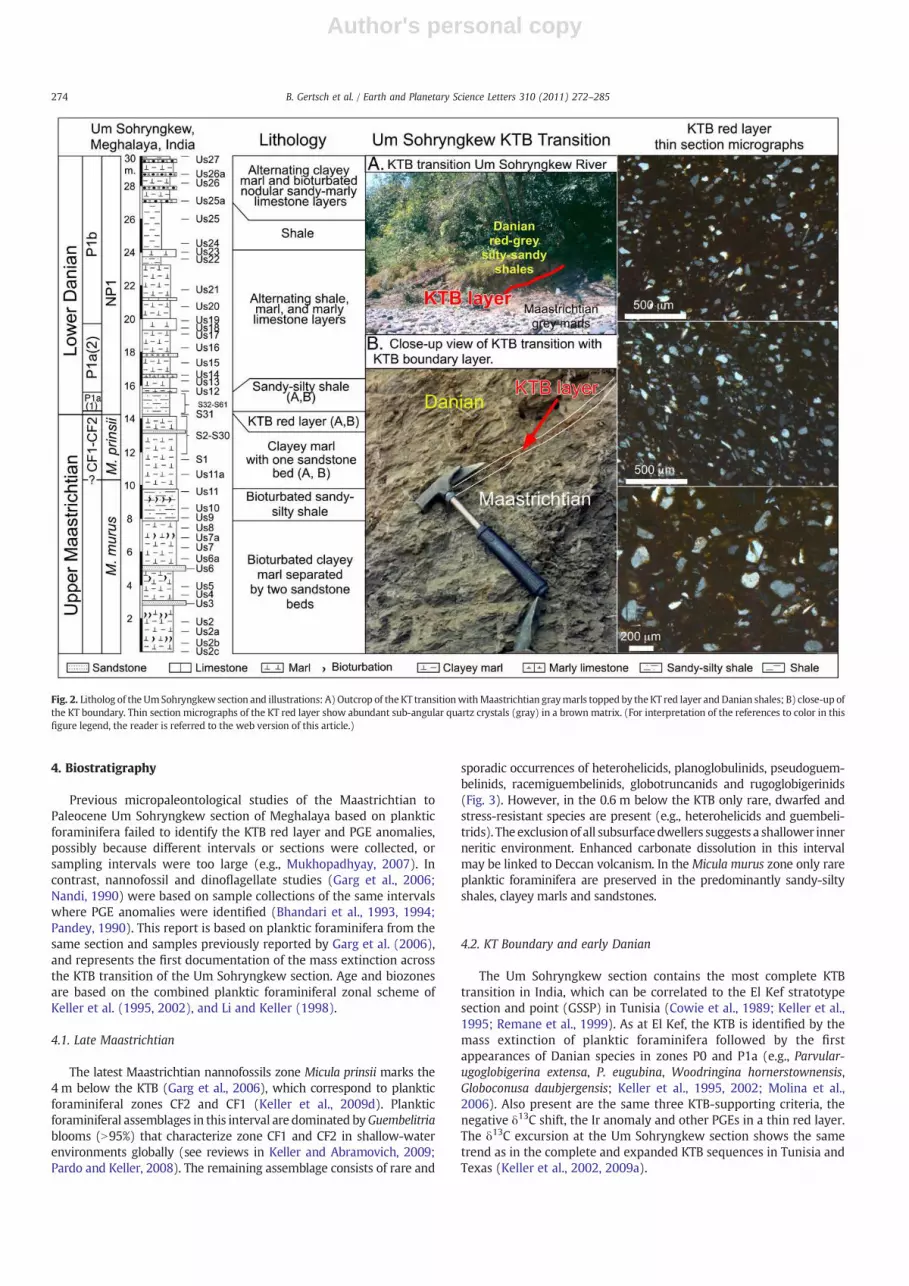
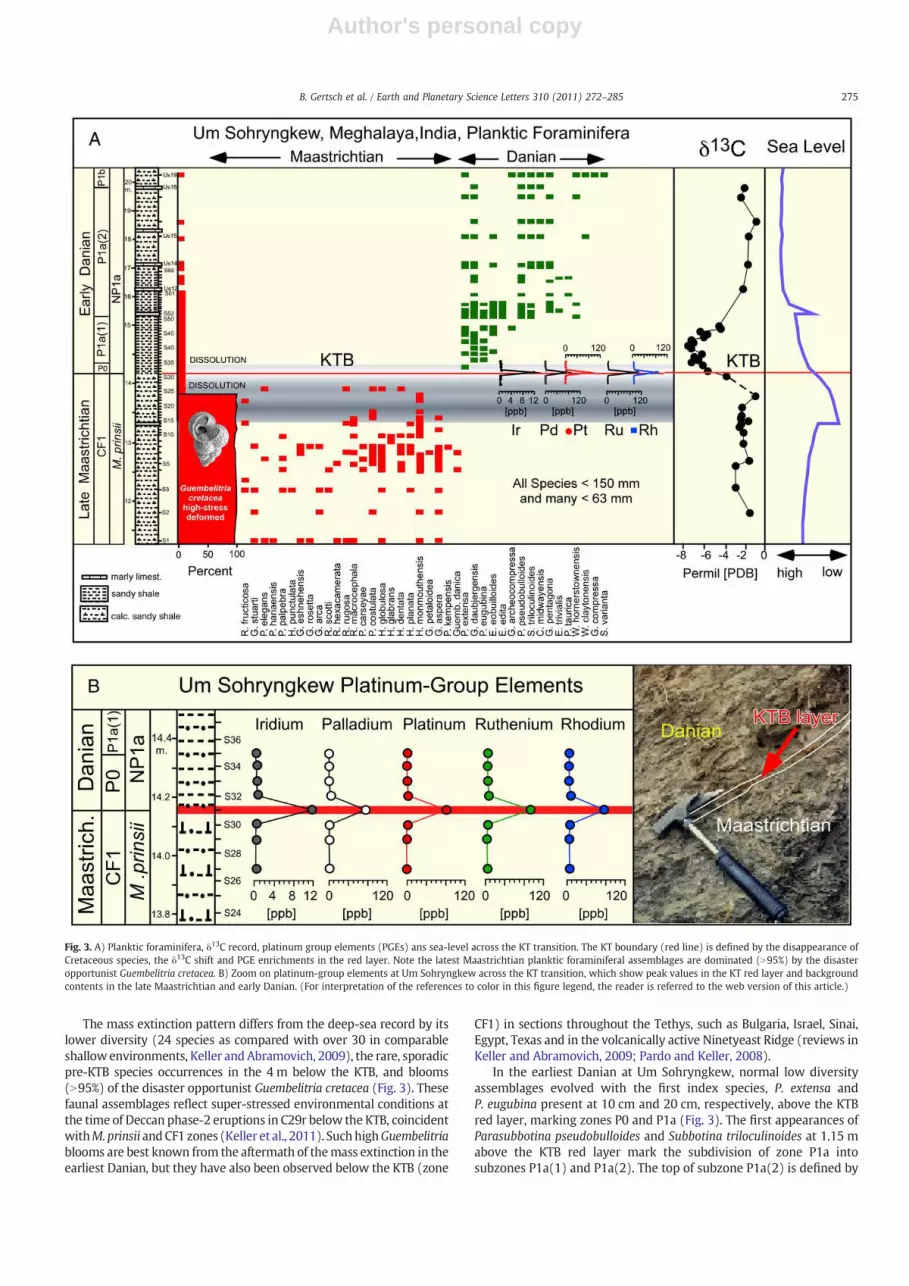
(N95%) of the disaster opportunist Guembelitria cretacea (Fig. 3). These
faunal assemblages reflect super-stressed environmental conditions at
the time of Deccan phase-2 eruptions in C29r below the KTB, coincident
withM.prinsii andCF1 zones (Keller et al., 2011). SuchhighGuembelitria
blooms are best known from the aftermath of themass extinction in the
earliest Danian, but they have also been observed below the KTB (zone
CF1) in sections throughout the Tethys, such as Bulgaria, Israel, Sinai,
Egypt, Texas and in the volcanically active Ninetyeast Ridge (reviews in
Keller and Abramovich, 2009; Pardo and Keller, 2008).
In the earliest Danian at Um Sohryngkew, normal low diversity
assemblages evolved with the first index species, P. extensa and
P. eugubina present at 10 cm and 20 cm, respectively, above the KTB
red layer, marking zones P0 and P1a (Fig. 3). The first appearances of
Parasubbotina pseudobulloides and Subbotina triloculinoides at 1.15 m
above the KTB red layer mark the subdivision of zone P1a into
subzones P1a(1) and P1a(2). The top of subzone P1a(2) is defined by
Fig. 3. A) Planktic foraminifera, δ13C record, platinum group elements (PGEs) ans sea-level across the KT transition. The KT boundary (red line) is defined by the disappearance of
Cretaceous species, the δ13C shift and PGE enrichments in the red layer. Note the latest Maastrichtian planktic foraminiferal assemblages are dominated (N95%) by the disaster
opportunist Guembelitria cretacea. B) Zoom on platinum-group elements at Um Sohryngkew across the KT transition, which show peak values in the KT red layer and background
contents in the late Maastrichtian and early Danian. (For interpretation of the references to color in this figure legend, the reader is referred to the web version of this article.)
275B. Gertsch et al. / Earth and Planetary Science Letters 310 (2011) 272–285

Author's personal copy
the last appearance (LA) of P. eugubina at 19.8 m (Fig. 3). The presence
of these early Danian biozones indicates a relatively continuous and
high rate of sediment accumulation.
5. Carbon isotopes
In the Um Sohryngkew section, δ13C was measured on selected
bulk-rock samples that contain N10% carbonate. The δ13C values are
generally very negative (−1 to −7.5‰) but their global trends are
comparable to former studies (Barrera and Keller, 1990; Keller and
Lindinger, 1989; Stueben et al., 2002; Zachos et al., 1989). Diagenetic
influence on the δ13C values in Um Sohryngkew is evaluated by oxygen
isotope values (−8.39 to−5.64‰) and the coefficients of correlations
between δ13C values and calcite percentages (R2=0.19), and δ13C and
δ18O (R2=0.62) respectively. Very low negative δ18O values suggest
strongdiagenesis (dissolution–precipitationprocesses), but their effects
on the δ13C trends across the KTB are limited in Um Sohryngkew as
indicated by low coefficients of correlation between δ13C values and
calcite percentages, and δ13C and δ18O respectively.
In the late Maastrichtian, negative values vary between −2 and
−3‰ (11.75–13.75 m, Fig. 3). No data is recoverable in the 50 cm
below the KTB due to strong carbonate dissolution. However, just
below the KTB red layer δ13C values show a drop to−4‰ followed by
rapid decrease to −7.25‰, forming a trough (14.35–14.70 m) in
zones P0 and P1a(1). The return to pre-KTB δ13C values of −2‰ is
observed in zone P1a(2) (16.25–19.75 m; Fig. 3). In the Um
Sohrynkew section, carbonate is very low (b20%) and the dissolution
and re-precipitation processes in tropical environments, such as
precipitation from waters enriched in dissolved inorganic carbon
(DIC) with low δ13C due to oxidation of organic matter, may explain
the very negative δ13C values (Tucker and Wright, 1990).
6. Mineralogy: results
6.1. Bulk-rock
Quartz and phyllosilicates are the dominant minerals in the Um
Sohryngkew section, whereas calcite, K-feldspars and plagioclases are
intermittently abundant (Fig. 4). Unquantified minerals record impor-
tant values in the lower part of section below the KTB and consist of
poorly crystallized phyllosilicates, organic matter, phosphate minerals
and Fe-hydroxide/-oxide minerals. In upper Maastrichtian sediments,
mineralogical assemblages are dominated by detrital minerals, such as
quartz, phyllosilicates, K-feldspars and plagioclases,whereas calcite and
ankerite are rare or absent (0–25%; Fig. 4). The silty red KTB layer
consistsmainly of detrital components, suchasquartz (21%), plagioclase
(18%), K-feldspars (8.5%) and phyllosilicates (14%), together with high
goethite (19.8%) and low calcite (10%). In lower Danian (P1a zone)
sediments, calcite rapidly increases and dominates (25–40%), whereas
phyllosilicates and unquantified minerals decrease. At the P1a/P1b
boundary, calcite content drops to 10–20% and remains low, whereas
quartz, K-feldspars, phyllosilicates, and plagioclases contents increase
slightly (Fig. 4).
6.2. Clay minerals
Clay assemblages (fraction b2 μm) in the Um Sohryngkew section
are composed of smectite, kaolinite, chlorite, illite–smectite (I–S)
mixed layer and illite (Fig. 4). The basal part (0–13.4 m) is dominated
by illite (20–60%) and kaolinite (20–45%). Smectite, chlorite and I–S
mixed layer show low values (0–20%) with scattered peaks. The KT
transition (13.4–14.4 m) is marked by a gradual increase in kaolinite
(50%) and decrease in illite (10%). Smectite gradually increases (15%),
whereas chlorite (0–10%) and I–S mixed layer (2–20%) remain low
Fig. 4. Bulk-rock and clay mineralogy data of the Um Sohryngkew section. A three-points moving average is plotted for all minerals, except goethite, ankerite, chlorite, I/S mixed
layers and kaolinite/illite ratios. Unquantified minerals refer to organic matter and poorly crystallized minerals. Bulk-rock assemblages dominated by detrital minerals (quartz,
phyllosilicates, plagioclases and K-feldspars) and clay assemblages dominated by kaolinite suggest high continental runoff caused by humid and warm climates in Meghalaya. (For
interpretation of the references to color in this figure legend, the reader is referred to the web version of this article.)
276 B. Gertsch et al. / Earth and Planetary Science Letters 310 (2011) 272–285
Author's personal copy
and constant. The KTB red layer (14.26–14.28 m) is composed of illite
(51%), kaolinite (40%) and chlorite (9%). In the upper part of the Um
Sohryngkew section (14.4–30 m) kaolinite (40–50%) and illite (40%)
dominate. Smectite and I–S mixed layers gradually decrease (b5%),
whereas chlorite remains low with scattered peaks and no significant
trend (0–25%). The kaolinite/illite index reflects steady values
throughout the sequence, except for a gradual increase across the
KTB followed by a maximum in the lower part of subzone P1a(1)
followed by an abrupt return to background ratios.
7. Major, trace and platinum group element geochemistry
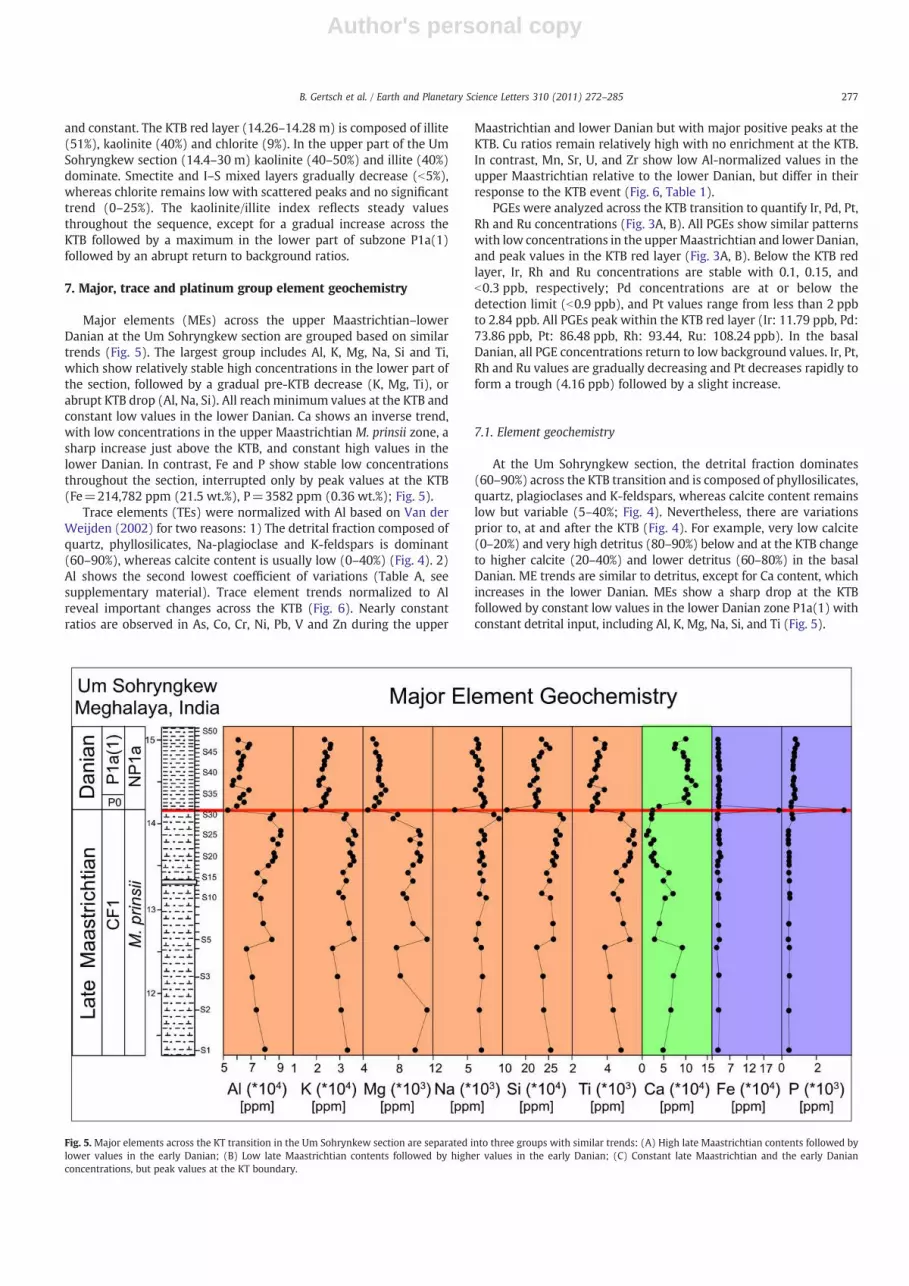
Major elements (MEs) across the upper Maastrichtian–lower
Danian at the Um Sohryngkew section are grouped based on similar
trends (Fig. 5). The largest group includes Al, K, Mg, Na, Si and Ti,
which show relatively stable high concentrations in the lower part of
the section, followed by a gradual pre-KTB decrease (K, Mg, Ti), or
abrupt KTB drop (Al, Na, Si). All reach minimum values at the KTB and
constant low values in the lower Danian. Ca shows an inverse trend,
with low concentrations in the upper Maastrichtian M. prinsii zone, a
sharp increase just above the KTB, and constant high values in the
lower Danian. In contrast, Fe and P show stable low concentrations
throughout the section, interrupted only by peak values at the KTB
(Fe=214,782 ppm (21.5 wt.%), P=3582 ppm (0.36 wt.%); Fig. 5).
Trace elements (TEs) were normalized with Al based on Van der
Weijden (2002) for two reasons: 1) The detrital fraction composed of
quartz, phyllosilicates, Na-plagioclase and K-feldspars is dominant
(60–90%), whereas calcite content is usually low (0–40%) (Fig. 4). 2)
Al shows the second lowest coefficient of variations (Table A, see
supplementary material). Trace element trends normalized to Al
reveal important changes across the KTB (Fig. 6). Nearly constant
ratios are observed in As, Co, Cr, Ni, Pb, V and Zn during the upper
Maastrichtian and lower Danian but with major positive peaks at the
KTB. Cu ratios remain relatively high with no enrichment at the KTB.
In contrast, Mn, Sr, U, and Zr show low Al-normalized values in the
upper Maastrichtian relative to the lower Danian, but differ in their
response to the KTB event (Fig. 6, Table 1).
PGEs were analyzed across the KTB transition to quantify Ir, Pd, Pt,
Rh and Ru concentrations (Fig. 3A, B). All PGEs show similar patterns
with low concentrations in the upperMaastrichtian and lower Danian,
and peak values in the KTB red layer (Fig. 3A, B). Below the KTB red
layer, Ir, Rh and Ru concentrations are stable with 0.1, 0.15, and
b0.3 ppb, respectively; Pd concentrations are at or below the
detection limit (b0.9 ppb), and Pt values range from less than 2 ppb
to 2.84 ppb. All PGEs peak within the KTB red layer (Ir: 11.79 ppb, Pd:
73.86 ppb, Pt: 86.48 ppb, Rh: 93.44, Ru: 108.24 ppb). In the basal
Danian, all PGE concentrations return to low background values. Ir, Pt,
Rh and Ru values are gradually decreasing and Pt decreases rapidly to
form a trough (4.16 ppb) followed by a slight increase.
7.1. Element geochemistry
At the Um Sohryngkew section, the detrital fraction dominates
(60–90%) across the KTB transition and is composed of phyllosilicates,
quartz, plagioclases and K-feldspars, whereas calcite content remains
low but variable (5–40%; Fig. 4). Nevertheless, there are variations
prior to, at and after the KTB (Fig. 4). For example, very low calcite
(0–20%) and very high detritus (80–90%) below and at the KTB change
to higher calcite (20–40%) and lower detritus (60–80%) in the basal
Danian. ME trends are similar to detritus, except for Ca content, which
increases in the lower Danian. MEs show a sharp drop at the KTB
followed by constant low values in the lower Danian zone P1a(1) with
constant detrital input, including Al, K, Mg, Na, Si, and Ti (Fig. 5).
Fig. 5. Major elements across the KT transition in the Um Sohrynkew section are separated into three groups with similar trends: (A) High late Maastrichtian contents followed by
lower values in the early Danian; (B) Low late Maastrichtian contents followed by higher values in the early Danian; (C) Constant late Maastrichtian and the early Danian
concentrations, but peak values at the KT boundary.
277B. Gertsch et al. / Earth and Planetary Science Letters 310 (2011) 272–285

Author's personal copy
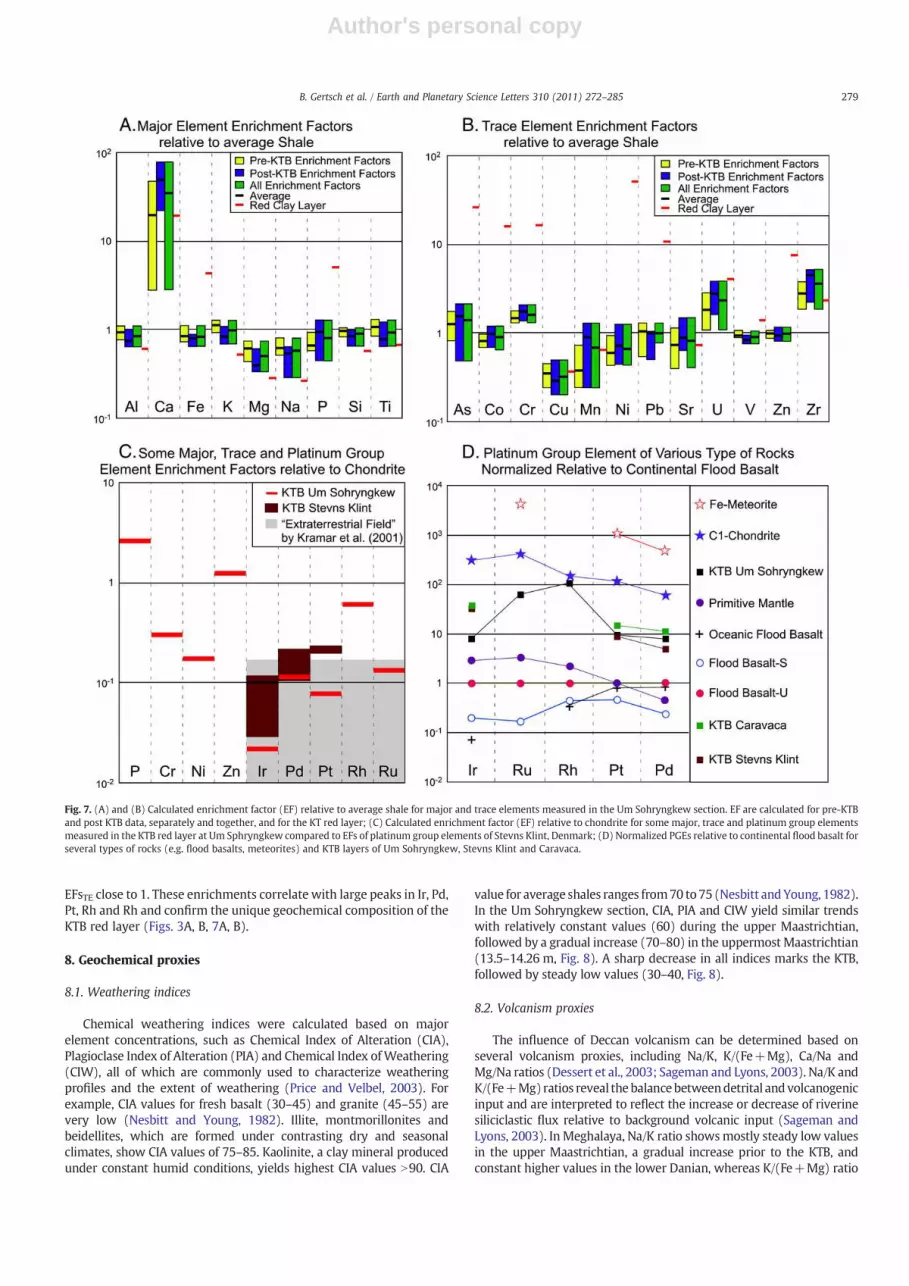
ME and TE trends can be assessed by calculating enrichment
factors (EFME=Y/Yaverage shale, where Y is a specific major element;
EFTE=(X/Al)/(X/Al)average shale, where X is a specific trace element)
using average shale values of Wedepohl (1971). Fig. 8A and B shows
this calculation for the upper Maastrichtian (pre-KTB), lower Danian
(post-KTB), the Maastrichtian–Danian combined, and separately for
the KTB red layer. Average EFME and EFTE calculated for the entire
interval are generally close to 1, which indicates a major and trace
element composition nearly similar to average shale (Fig. 7A, B).
Exceptions are Mg, Na, Cu, and Mn, which are slightly depleted
relative to average shale, whereas Ca, U, and Zr, are enriched relative
to average shale (Fig. 7A, B). For pre-KTB and post-KTB intervals, most
average EFsME and EFsTE remain relatively close to the averages
calculated for the entire interval (Fig. 7A, B), except for small
differences in the average EFTE between pre-KTB and post-KTB
sediments (Fig. 7A, B).
The KTB red layer composition in MEs and TEs differs significantly
from upper Maastrichtian and lower Danianmarls and shales (Fig. 7A,
B). MEs record enrichments in Ca, Fe and P, whereas all other major
elements are slightly depleted (Fig. 7A). TE enrichment factors display
a distinct composition relative to average shale with important
enrichments in As, Co, Cr, Ni, Pb, and Zn, whereas all other TEs show
Fig. 6. Trace elements at Um Sohrynkew are grouped into two categories based on trends: (A) Constant late Maastrichtian and the early Danian concentrations with peak values at
the KT boundary, except for Cu; (B) Low late Maastrichtian contents followed by a gradual increase to higher values in the early Danian. Dashed line represents the Al-normalized
ratio for each element in the average shale.
Table 1
Major and trace element abundances measured in red clay (Chester, 2000), chondrite (Anders and Grevesse, 1989), crust (Wedepohl, 1995), deccan basalts (Crocket and Paul, 2004,
2008) and shale (Wedepohl, 1971).
As [ppm] Ba [ppm] Ce [ppm] Co [ppm] Cr [ppm] Cu [ppm] Ga [ppm] Hf [ppm] La [ppm] Mn [ppm] Nb [ppm] Nd [ppm]
Red clay 162 371 0 184 897 10 18 0 30 331 17 0
Chondrite 2 2 1 502 2660 126 10 0 0 1990 0 0
Crust – 584 60 24 126 25 15 5 30 774 19 –
Deccan basalts – 122 32 – 135 214 – 4 – 1549 10 –
Ni [ppm] Pb [ppm] Rb [ppm] S [ppm] Sc [ppm] Sr [ppm] Th [ppm] U [ppm] V [ppm] Y [ppm] Zn [ppm] Zr [ppm]
Red clay 2135 131 46 13,407 48 131 25 9 110 35 435 225
Chondrite 11,000 2 2 62,500 6 8 0 0 57 2 312 4
Crust 56 15 78 – 16 333 9 2 98 24 65 203
Deccan basalts 90 – 8 46 36 218 2 0 – 31 109 106
Al [ppm] Ca [ppm] Fe [ppm] K [ppm] Mg [ppm] Na [ppm] P [ppm] Si [ppm] Ti [ppm]
Red clay 53,263 39,234 214,782 15,475 4539 3108 3583 158,196 3126
Chondrite 8680 9280 190,400 558 98,900 5000 1220 106,400 436
Crust 79,913 39,308 43,923 19,924 22,319 23,739 786 287,539 4076
Deccan basalts 71,499 72,899 100,017 3902 37,581 17,508 1047 227,553 13,485
Shale 88,381 15,723 48,348 29,885 15,684 11,870 698 275,383 4675
278 B. Gertsch et al. / Earth and Planetary Science Letters 310 (2011) 272–285
Author's personal copy
EFsTE close to 1. These enrichments correlate with large peaks in Ir, Pd,
Pt, Rh and Rh and confirm the unique geochemical composition of the
KTB red layer (Figs. 3A, B, 7A, B).
8. Geochemical proxies
8.1. Weathering indices
Chemical weathering indices were calculated based on major
element concentrations, such as Chemical Index of Alteration (CIA),
Plagioclase Index of Alteration (PIA) and Chemical Index ofWeathering
(CIW), all of which are commonly used to characterize weathering
profiles and the extent of weathering (Price and Velbel, 2003). For
example, CIA values for fresh basalt (30–45) and granite (45–55) are
very low (Nesbitt and Young, 1982). Illite, montmorillonites and
beidellites, which are formed under contrasting dry and seasonal
climates, show CIA values of 75–85. Kaolinite, a clay mineral produced
under constant humid conditions, yields highest CIA values N90. CIA
value for average shales ranges from70 to75 (Nesbitt andYoung, 1982).
In the Um Sohryngkew section, CIA, PIA and CIW yield similar trends
with relatively constant values (60) during the upper Maastrichtian,
followed by a gradual increase (70–80) in the uppermost Maastrichtian
(13.5–14.26 m, Fig. 8). A sharp decrease in all indices marks the KTB,
followed by steady low values (30–40, Fig. 8).
8.2. Volcanism proxies
The influence of Deccan volcanism can be determined based on
several volcanism proxies, including Na/K, K/(Fe+Mg), Ca/Na and
Mg/Na ratios (Dessert et al., 2003; Sageman and Lyons, 2003). Na/K and
K/(Fe+Mg) ratios reveal the balancebetweendetrital andvolcanogenic
input and are interpreted to reflect the increase or decrease of riverine
siliciclastic flux relative to background volcanic input (Sageman and
Lyons, 2003). In Meghalaya, Na/K ratio showsmostly steady low values
in the upper Maastrichtian, a gradual increase prior to the KTB, and
constant higher values in the lower Danian, whereas K/(Fe+Mg) ratio
Fig. 7. (A) and (B) Calculated enrichment factor (EF) relative to average shale for major and trace elements measured in the Um Sohryngkew section. EF are calculated for pre-KTB
and post KTB data, separately and together, and for the KT red layer; (C) Calculated enrichment factor (EF) relative to chondrite for some major, trace and platinum group elements
measured in the KTB red layer at Um Sphryngkew compared to EFs of platinum group elements of Stevns Klint, Denmark; (D) Normalized PGEs relative to continental flood basalt for
several types of rocks (e.g. flood basalts, meteorites) and KTB layers of Um Sohryngkew, Stevns Klint and Caravaca.
279B. Gertsch et al. / Earth and Planetary Science Letters 310 (2011) 272–285

Author's personal copy
shows the opposite trend (Fig. 8). Compared to Sageman and Lyons
(2003), bothproxies recordvalues indicativeof a predominantly detrital
influence across the KTB transition in the Um Sohryngkew area
(0.1bNa/Kb0.3; 0.2bK/(Fe+Mg)b0.8; Fig. 8).
Ca/Na and Mg/Na ratios recorded in basaltic river waters show
remarkably high values (Dessert et al., 2003), which may have
significantly affected the geochemical signal of near-shore environ-
ments during the erosion of Deccan basalt traps. However, in the Um
Sohryngkew section, these ratios show opposite trends that render
the use of these ratios invalid as geochemical proxies for subaerial
Deccan volcanism in marine sediments (Fig. 8). This indicates that
Meghalaya was not part of the drainage domain of the Deccan
volcanic province (Dessert et al., 2003).
8.3. Hydrothermal activity proxies
Hydrothermal proxies consist mainly of Al/(Al+Fe+Mn), to-
gether with single elements, such as Pb, Zn, Cu and Co, (Chester, 2000;
Pujol et al., 2006). In the Um Sohryngkew section, hydrothermal
proxies record steady high values (0.6–0.7) in the upper Maastrich-
tian and lower Danian marls and shale, which indicates that
hydrothermal influence was absent (Fig. 8). The Al/(Al+Fe+Mn)
ratios show a negative peak that is linked to the presence of goethite
at the KTB, and not related to a potential hydrothermal influence.
These trends are corroborated by single elements, which record
constant values in the Maastrichtian and Danian, but peak only in Pb
and Zn at the KTB (Fig. 6).
8.4. Extraterrestrial proxies
Extraterrestrial impact(s) and dust input(s) were evaluated based
on the Ni/Cu ratio and PGEs. The Ni/Cu ratio has been used as
extraterrestrial proxy due to the similar Cu contents in chondrite and
continental crust, and also because of the large concentrations of Ni
(10,624 ppm) present in C1-chondrite in comparison to continental
crust (47 ppm) (Munsel et al., 2011). In the Um Sohryngkew section,
Ni/Cu ratios peak at the KTB (213.5) and suggest an extraterrestrial
source, but are constant during the upper Maastrichtian (2) and lower
Danian (4). A slight difference between Maastrichtian and Danian
Ni/Cu ratios likely results from lower oxygen conditions in the early
Danian, rather than from increased input of extraterrestrial dust
because neither element is enriched relative to average shale (Fig. 7B).
PGEs, including Ir, Pd, Pt, Ru and Rh, are common proxies used to
detect extraterrestrial impact(s) due to their rare occurrence on Earth
(Wedepohl, 1991, 1995). In the Um Sohryngkew section, a marked
peak in all PGEs occurs at the KTB, but no significant enrichment in
PGEs is recorded during the late Maastrichtian and early Danian
(Fig. 3).
9. Discussion
9.1. Depositional environment: planktic foraminifera
In the Um Sohryngkew section, planktic foraminiferal biostratig-
raphy reveals high and relatively continuous sedimentation during
the upper Maastrichtian and lower Danian (Fig. 3). However, in the
Fig. 8. Summary of all proxies used in this study (weathering, hydrothermal activity, volcanism vs detritism, basalt weathering, cosmic input) based on major and trace element
geochemistry.
280 B. Gertsch et al. / Earth and Planetary Science Letters 310 (2011) 272–285

Author's personal copy
uppermost 2 m of the Maastrichtian species assemblages reflect
super-stress condition, intermittent strong carbonate dissolution
(e.g., poor preservation, broken or fragmented shells), sporadic
species occurrences, variable abundances, dwarfing of species and
Guembelitria blooms. Guembelitria blooms are best known from the
aftermath of the KTBmass extinction when they thrivedworldwide to
the exclusion of other species and are therefore known as disaster
opportunists. But similar blooms are also known from the latest
Fig. 9. A) Summary of major results in the Um Sohryngkew section. Note the paleoclimatic conditions show decreasing intensities in “mock aridity” from central to eastern India,
related to Deccan volcanism. Note also the good correlation between the main Phase-2 of Deccan volcanism, high chemical weathering indices and disaster/opportunist Guembelitria
blooms during the terminal Maastrichtian, which suggest a close link between Deccan volcanism and high-stress environmental conditions. B) Model of the possible feedbacks and
environmental consequences resulting from the Deccan main phase-2 during the terminal Maastrichtian.
281B. Gertsch et al. / Earth and Planetary Science Letters 310 (2011) 272–285
Author's personal copy
Maastrichtian zone CF1, where they correlate with periods of intense
continental runoff and submarine volcanic activity (reviews in Keller
and Abramovich, 2009; Pardo and Keller, 2008).
The Guembelitria blooms in Meghalaya correlate well with low
amounts of productivity sensitive elements, such as P, Cu, and Ni, and
high weathering indices during the latest Maastrichtian when Deccan
volcanic activity reached itsmaximum in phase-2 (Figs. 5, 6, 8). Strong
weathering indices indicate intense chemical weathering in nearby
continental areas of the Um Sohryngkew section and are likely due to
acid rains resulting from SO2 emissions from Deccan volcanism (Self
et al., 2006). The acidic waters lead to super-stress conditions in the
Meghalaya area inhibiting CaCO3, production, which favored blooms
of the small thin-shelled surface dwellers Guembelitria blooms and
explains the intermittent strong dissolution of planktic foraminiferal
assemblages (Fig. 9A, B). Similar Guembelitria blooms indicating high-
stress conditions are observed in the latest Maastrichtian and early
Danian throughout the Tethys and into the South Atlantic (e.g., Egypt,
Israel, Tunisia, Bulgaria, Texas, Argentina) (Abramovich and Keller,
2002; Adatte et al., 2002; Keller, 2002; Keller et al., 2007).
9.2. Sea-level: lithology and mineralogy
Combined with lithologies and foraminiferal assemblages, bulk-
rock mineralogy is an excellent environmental proxy to infer
fluctuations in sea-level and associated erosion and continental runoff
based on the distribution of calcite and detrital minerals (quartz,
phyllosilicates, plagioclases and K-feldspars; Adatte et al., 2002). High
calcite content generally indicates deeper environments, diminished
erosion and low continental runoff, whereas high detritus input
suggests shallower environments and high continental runoff.
In Meghalaya, detrital minerals in bulk-rock assemblages are
dominant and calcite is low but fluctuating in the upper Maastrichtian
marls and shale, which suggests deposition in a shallow water
environment (b100 m depth) with high terrigenous influx. For
example, the thin sand layer at 13.3 m (0.66 m below the KT
boundary) coincides with a marked decrease in species richness of
planktic foraminifera and the absence of deeper dwelling species,
which indicates a drop in sea level to inner neritic depth (Fig. 3A).
Enhanced carbonate dissolution between this sandstone layer and the
KTB may be due to the sandy, shallow water environment and/or acid
rain linked to the main phase of Deccan volcanism in C29r (Chenet
et al., 2007). Above the sandstone layer, sea level gradually increased
and reached a maximum at the KTB clay layer. Similar sea-level
changes have been observed in KTB sections from Israel, Egypt,
Tunisia, Texas, and Mexico (Adatte et al., 2002; Keller et al., 2003,
2007).
Across the KT transition and in the lower Danian high detrital
input continues into a relatively shallow though deepening marine
environment. The sandstone layer marks a small sea level drop and
possibly short hiatus, as indicated by the abrupt increase in Danian
species coincidentwith the P1a(1)/P1a(2) subzone boundary (Fig. 3). A
hiatus at this interval has been documented from many lower Danian
sequences (Keller et al., 2003). A deepening and more open marine
environments dominated by carbonate sedimentation prevailed during
the lower Danian (Figs. 3 and 4).
9.3. Climate proxies: clay and bulk-rock mineralogy
Clayminerals are byproducts resulting from the interplay between
climate, continental morphology, tectonic activity and sea-level
variations, and therefore can be used as climatic and environmental
proxies (Chamley, 1989). In the Um Sohryngkew section, clay
assemblages are dominated by kaolinite, which is formed in tropical
soils under constant warm and humid conditions, and illite, which is a
byproduct of tectonic uplift and physical weathering (Chamley, 1989;
Robert and Chamley, 1990). Illite is poorly crystallized, which
indicates significant chemical weathering caused by hydrolysis.
Illite/Smectite (I/S) mixed layers are poorly ordered (R=0) and
contain 25–50% of expandable layers. Smectite is a “smectoid”, an I/S
mixed layers with around 80–90% of expandable layers. High I/S
mixed layers and low smectite contents suggest a diagenetic overprint
linked to high burial depths (N3 km, Reimann, 1993) that resulted in
the transformation of smectite into I/S mixed layers (Chamley, 1989).
Smectites and I/S mixed layer are therefore not reliable paleoclimatic
proxies.
The paleoclimate of Meghalaya is characterized by predominantly
humid conditions and strong chemical weathering, as indicated by high
kaolinite, poorly crystallized illite and high kaolinite/illite ratios (Fig. 4).
The dominant detrital minerals (Fig. 6), high weathering indices and
palynological data (Nandi, 1990) support this general pattern (Fig. 8).
All of these indices suggest that predominant chemical weathering in
combination with physical weathering under humid conditions
prevailed across the KTB in near-shore environments of Meghalaya.
High kaolinite and poorly crystallized illite contents linked to
increasingly humid conditions across the KTB transition are not
restricted to Meghalaya but are encountered worldwide from low to
middle latitudes, except in areas close to India (Abramovich et al.,
2002; Adatte et al., 2002, 2005; Keller et al., 1998; Madhavaraju et al.,
2002; Pardo et al., 1999; Robert and Chamley, 1990). Terrestrial and
marine sections from central and eastern India close to the DVP show
dramatically different compositions of clay mineral assemblages with
high smectite and absent kaolinite, which reveals predominantly arid
to semi-arid conditions with seasonal wet and dry cycles (Keller et al.,
2008, 2009c).
Most studies relate the global increase in kaolinite and poorly
crystallized illite input into the oceans to the short warm event of the
latest Maastrichtian (zone CF1), which generated wetter conditions,
more rainfall and intensified continental runoff probably linked to
Deccan volcanism and its gas emissions (see reference above). Local
aridity close to the DVP is interpreted as a result of “mock aridity” (e.g.
volcanically induced xeric conditions and extreme geochemical
alkalinity in the context of a regionally more humid climate) induced
by Deccan volcanism (Harris and Van Couvering, 1995; Khadkikar
et al., 1999). In this context, paleoclimatic information gathered from
the Um Sohryngkew section reveals that the “mock aridity” zone
caused by Deccan volcanism across the KTB transition is restricted to
the Deccan volcanic province with gradually decreasing intensities
from central India to the rim of the DVP (Fig. 9A, B).
9.4. KTB red layer geochemistry and potential origins
On a global basis, the KTB red clay layer shows peak concentrations
in PGEs (Ir, Rh, Ru, Pd, Pt) accompanied by enrichments in several
major (Fe, P) and trace (As, Ba, Co, Cr, Cu, Ni, Sb, Sc, Th, U, V, Zn)
elements, which are all postulated to originate from a single
extraterrestrial impact based mainly on the Ir and siderophile
elements (e.g. Co, Ni) (Alvarez et al., 1980; Bhandari et al., 1993,
1994; Joyce Evans et al., 1993; Martinez-Ruiz et al., 2006). In the Um
Sohryngkew section, the KTB red layer has high silt content (Fig. 4)
with peak concentrations in major, trace and platinum group
elements, except for Cu (Figs. 3, 5, 6). Maximum values in PGEs,
specific TEs (e.g. Cr) and the Ni/Cu ratio suggest an extraterrestrial
origin (Figs. 5, 6, 8; Table 1), as previously observed by Bhandari et al.
(1993, 1994). Normalized PGEs relative to chondrite, which are
commonly used to identify extraterrestrial signals at the KTB, show a
fairly flat line but all values fall in the “extraterrestrial origin” field
defined by Kramar et al. (2001) and are similar to values of the KTB
red clay layer at Stevns Klint, Denmark (Fig. 7C). Based on the
observations that the Chicxulub impact predates the KTB (Keller et al.,
2003, 2007, 2009a), the Ir and PGE anomalies at the KTB in Meghalaya
and worldwide is likely from another large impact for which no
impact crater is known to date.
282 B. Gertsch et al. / Earth and Planetary Science Letters 310 (2011) 272–285

Author's personal copy
Nevertheless, the impact hypothesis can only partly account for
the PGE and TE enrichments at the KTB. Based on major and trace
element concentrations of chondrite, an extraterrestrial impact
cannot explain the peaks in As, Pb, U, and V, or the low Mn
concentrations observed in the KTB red layer at Um Sohryngkew
(Table 1). Enrichment factors based on average chondrite composition
(EFchondrite=(X/Fe)/(X/Fe)chondrite, where X is a specific major, trace
or platinum group element), are very low for most trace elements
(Cr, Ni) and high for P (Fig. 8C), which does not support an
extraterrestrial origin. Thus, elemental enrichments in the KTB red
clay layer clearly show that an extraterrestrial impact alone cannot
be the sole source of this geochemical signature.
Several studies have proposed intense phase-2 Deccan Trap
volcanism as alternative cause for the KTB mass extinction and as
alternative source for the trace and platinum group element
enrichments in the KTB red layer (Courtillot et al., 1986; MacLean,
1985; Toutain and Meyer, 1989; Zoller et al., 1983). In Meghalaya, the
volcanic proxies used in this study to investigate the volcanic
influence in the KTB show no causal link (Fig. 8, Table 1), though
single element concentrations cannot rule out volcanism as direct
(e.g. triggered by a sudden eruption) or indirect (e.g. intense basalt
weathering) source, as hypothesized by Bhandari et al. (1993, 1994).
At Um Sohryngkew, normalized PGEs relative to continental flood
basalts show high and fluctuating values for the KTB red clay layer, but
these results do not correlate with normalized PGEs for the KTB at
Stevns Klint and Caravaca (Fig. 7D). These contrasting results suggest
that further investigations are needed to evaluate the influence of
Deccan volcanism on the KTB geochemistry.
Hydrothermal activity is a frequently overlooked or underesti-
mated factor in KTB enrichments, and its proxy (Al/[Al+Mn+Fe])
indicates a significant influence in the KTB red layer (Fig. 8). However,
several problems remain: 1) Neither hydrothermal activity nor sub-
marine volcanism is known to be prevalent at the KTB and Deccan
volcanism was predominantly continental with limited interaction
with marine environments (Keller et al., 2008; Self et al., 2008). 2)
Environmental perturbations, such as lower seawater pH and acids
rains, due to lava–seawater interaction could be locally restricted
(Edmonds and Gerlach, 2006). And 3) sediments affected by
hydrothermal activity are generally enriched in both Fe and Mn
(Chester, 2000), not only Fe as in the Um Sohryngkew section (Fig. 5).
In the Um Sohryngkew section, goethite (FeO(OH)) is the main
mineral in the KTB layer and results from late diagenetic alteration of
pyrite after deposition, as observed globally (e.g. Elles, Tunisia),
except for rare localities, where a hematite-rich layer occurs at the
KTB (Adatte et al., 2005; Pardo et al., 1999). Very high enrichments in
some TEs (As, Cr, Co, Cu, Ni), high Fe contents, and highly significant
correlation rate (R2=0.8–1) of As, Cr, Co, Cu, Ni, U, V and Zn with Fe
(Table B, see supplementary material) support the primary precipi-
tation of pyrite under sulfidic redox conditions in the KTB red layer
during deposition and compaction of sediments (Gavrilov, 2010; Pujol
et al., 2006; Schmitz, 1985, 1992). However, enrichment factors of the
redox-sensitive proxies U and V are not high enough to confirm
sulfidic conditions (Fig. 7; Algeo andMaynard, 2004; Brumsack, 2006;
Tribovillard et al., 2006). Although present-day weathering may have
partly leached redox-sensitive trace elements, environmental condi-
tions are not drastically reducing, but only dysoxic, by the time of the
deposition of the red clay layer to trap abundant Fe, S andmost pyrite-
linked TEs at or below the sediment–water interface.
Reduced sedimentation rates across the KTB, which are known to
concentrate MEs, TEs and PGEs (Bruns et al., 1997; Donovan et al.,
1988), are likely significant factors in the KTB geochemistry, as
observed by extremely large PGE and P concentrations in Meghalaya.
These results suggest a strongly condensed sedimentation in the KTB
red layer linked to a rapid sea-level rise culminating in the maximum
flooding surface globally observed at or near the KTB (Fig. 3; Adatte
et al., 2002, 2005; Donovan et al., 1988).
9.5. Depositional scenario across the KT boundary
During the late Maastichtian C29r (zone CF1) Deccan volcanism
reached its maximum (phase-2) accumulating 80% of the entire
3500 m thick Deccan lava pile with some mega-flows spanning over
1500 km across India and out into the Bay of Bengal (Chenet et al.,
2007, 2008; Keller et al., 2008; Self et al., 2008). Volcanic phase-2
ended at or near the KT mass extinction as evident from planktic
foraminifera in intertrappean sediments in deep wells of the Krishna-
Godavari Basin (Keller et al., 2011), as well as shallow sequences from
Rajahmundry, Andhra Pradesh and Central India (Jhilmili, Madhya
Pradesh, Keller et al., 2008, 2009b,c).
In Meghalaya to the northeast, the late Maastrichtian at the Um
Sohryngkew section was deposited in a shallow near-shore sea
(b100 m) about 800–1000 km from the Deccan volcanic province. In
this coastal area of India, climate change due to Deccan volcanism
resulted in humid conditions that contrasted with the semi-arid
conditions and “mock aridity” that dominated the center of the Indian
continent (Fig. 9A, B). Abundant precipitation, high continental runoff
and high weathering resulted in a major influx of detritus (quartz,
K-Feldspars, plagioclases), which led to increasingly turbid and
mesotrophic waters. These high-stress environmental conditions were
amplified by periodic acid rains associated with Deccan pulses, which
increased chemical weathering (Fig. 9A, B) and led to the exclusion of
most planktic foraminifera and blooms of the disaster opportunist
Guembelitria. Similar Guembelitria blooms correlate with the main
phase-2 of Deccan volcanism in C29r below the KTB in shallow water
sequences worldwide (Keller and Abramovich, 2009; Pardo and Keller,
2008).
Prior to the KTB mass extinction increasing volcanic intensity and
SO2 release led to acid rains that raised the pH of seawater and
inhibited or reduced carbonate precipitation and production leading
to the early disappearance of many planktic foraminiferal species.
Well prior to the KTB mass extinction these conditions favored the
survival of small species leading to dwarfism, and particularly small
thin-walled species that resulted in the observed Guembelitria blooms.
In the Um Sohryngkew section, the mass extinction coincides with a
silty red layer, a major Ir anomaly and the negative δ13C shift that
marks the productivity crash due to the mass extinction. Danian
species evolved shortly thereafter as also observed globally (Figs. 3,
9A, B).
At the KTB red layer, the origin of PGEs and trace element
enrichments (e.g., As, Co, Cr, Ni, Pb, U and Zn, Figs. 3, 5 and 6) indicate
an extraterrestrial source from a second major impact postdating
Chicxulub (Keller et al., 2003, 2007, 2009a), but not as sole origin.
Other enrichment processes, including fluctuating redox conditions
and condensed sedimentation likely contributed to the KTB geo-
chemical signature. During the early Danian marine productivity
gradually recovered (upper part of zone P1a) and diversity slightly
increased, but species remained very small, indicating continued
high-stress conditions (Fig. 3). In NE India humid conditions and
abundant precipitation lead to steady detrital input into the ocean,
whereas on the Indian continent semi-arid to arid (“mock aridity”)
conditions prevailed (Fig. 9A).
10. Conclusions
• The Um Sohryngkew section of Meghalaya, India, represents one of
the most continuous Cretaceous–Tertiary boundary (KTB) sequences
in India that correlates globallywith theGSSP section at El Kef, Tunisia,
and yields critical information related to the main phase-2 of Deccan
volcanism during the latest Maastrichtian C29r.
• Sediment deposition occurred in a shallow-water environment
(b100 m) dominated by high continental runoff due to subtropical
humid conditions with abundant precipitation, which contrasts
283B. Gertsch et al. / Earth and Planetary Science Letters 310 (2011) 272–285
Author's personal copy
with the local semi-aridity induced by Deccan volcanism in central
India.
• Super-stress conditions prevailed during the latest Maastrichtian
(M. prinsii, CF1 zones) as indicated by G. cretacea blooms (N95%),
which are likely due to the combination of mesotrophic conditions
and acid rains linked to Deccan volcanism.
• The KTB silty red layer is enriched in major elements (Fe, P), trace
elements (As, Co, Cr, Ni, Pb, Zn) and platinum group elements
(Ir, Ru, Rh, Pt, Pd), which are comparable to othermajor KTB localities.
An extraterrestial origin is supported in part, but condensed
sedimentation, fluctuating redox conditions at the time of deposition,
and secondary redox fluctuations likely account for the relatively high
enrichments observed at Um Sohryngkew.
Supplementarymaterials related to this article can be found online
at doi:10.1016/j.epsl.2011.08.015.
Acknowledgements
We thank Mike Widdowson and three anonymous reviewers for
insightful comments. The material of this study is based upon work
supported by the US National Science Foundation through the
Continental Dynamics Program and Sedimentary Geology Program
under NSF Grants EAR-0207407, EAR-0447171, EAR-0750664 and
EAR 1026271 (GK). We thank Tiffany Monnier for sample preparation
for XRF analysis and Jean-Claude Lavanchy (University of Lausanne)
for XRF measurements. A special thank you to André Villard
(University of Neuchâtel) for thin section preparation.
References
Abramovich, S., Keller, G., 2002. High stress late Maastrichtian paleoenvironment:inference from planktonic foraminifera in Tunisia. Palaeogeography, Palaeoclima-tology, Palaeoecology 178, 145–164.
Acharyya, S.K., Lahiri, T.C., 1991. Cretaceous palaegeography of the Indian subcontinent:a review. Cretac. Res. 12, 3–26.
Adatte, T., Stinnesbeck, W., Keller, G., 1996. Lithostratigraphic and mineralogiccorrelations of near K/T boundary sediments northeastern Mexico: implicationsfor origin and nature of deposition. The Cretaceous–Tertiary Event and OtherCatastrophes in Earth History, Boulder, Colorado. Geol. Soc. Am. Spec. Pap. 307,211–226.
Adatte, T., Keller, G., Stinnesbeck, W., 2002. Late Cretaceous to early Paleocene climateand sea-level fluctuations: the Tunisian record. Palaeogeogr. Palaeoclimatol.Palaeoecol. 178, 165–196.
Adatte, T., Keller, G., Stueben, D., Harting, M., Kramar, U., Stinnesbeck, W., Abramovich,S., Benjamini, C., 2005. Late Maastrichtian and K/T paleoenvironment of the easternTethys (Israel): mineralogy, trace and platinum group elements, biostratigraphyand faunal turnovers. Bull. Soc. Geol. Fr. 176, 37–55.
Alam, M., Alam, M.M., Curray, J.R., Luftar Rahman Chowdhury, M., Royhan Gani, M.,2003. An overview of the sedimentary geology of the Bengal Basin in relation to theregional tectonic framework and basin-fill history. Sediment. Geol. 15, 179–208.
Algeo, T.J., Maynard, J.B., 2004. Trace-element behavior and redox facies in core shalesof Upper Pennsylvanian Kansas-type cyclothems. Chem. Geol. 206, 289–318.
Alvarez, L.W., Alvarez, W., Asaro, F., Michel, H.V., 1980. Extraterrestrial Cause for theCretaceous–Tertiary boundary. Science 208, 1095–1108.
Anders, E., Grevesse, N., 1989. Abundances of the elements: meteoritic and solar.Geochimica et Cosmochimica Acta 53, 197–214.
Banerji, R.K., 1981. Cretaceous–Eocene sedimentation, tectonism and biofacies in theBengal basin, India. Palaeogeogr. Palaeoclimatol. Palaeoecol. 34, 57–85.
Barrera, E., Keller, G., 1990. Foraminiferal stable isotope evidence for gradual decreaseof marine productivity and Cretaceous species survivorship in the earliest Danian.Paleoceanography 5, 867–890.
Bhandari, N., Shukla, P.N., Cini Castognoli, G., 1993. Geochemistry of some K/T sectionsin India. Palaeogeogr. Palaeoclimatol. Palaeoecol. 104, 199–211.
Bhandari, N., Gupta, M., Panday, J., Shukla, P.N., 1994. Chemical profiles in K/T boundarysection of Meghalaya, India: cometary, asteroidal or volcanic. Chem. Geol. 113,45–60.
Brumsack, H.-J., 2006. The trace metal content of recent organic carbon-rich sediments:implications for Cretaceous black shale formation. Palaeogeogr. Palaeoclimatol.Palaeoecol. 232, 344–361.
Bruns, P., Rakoczy, H., Pernicka, E., Dullo, W.-C., 1997. Slow sedimentation and Iranomaly at the Cretaceous/Tertiary boundary. Geol. Rundsch. 86, 168–177.
Chamley, H., 1989. Clay Sedimentology. Springer Verlag, Berlin.Chenet, A.-L., Quidelleur, X., Fluteau, F., Courtillot, V., 2007. 40 K/40Ar dating of the main
Deccan large igneous province: further evidence of KTB age and short duration.Earth Planet. Sci. Lett. 263, 1–15.
Chenet, A.-L., Fluteau, F., Courtillot, V., Gerard, M., Subbarao, K.V., 2008. Determinationof rapid Deccan eruptions across the Cretaceous–Tertiary boundary usingpaleomagnetic secular variation: results from a 1200-m-thick section in theMahabaleshwar. J. Geophys. Res. 113. doi:10.1029/2006JB004635.
Chenet, A.L., Courtillot, V., Fluteau, F., Gérard, M., Quidelleur, X., Khadri, S.F.R., Subbarao,K.V., Thordarson, T., 2009. Determination of rapid Deccan eruptions across theCretceous–Tertiary boundary using paleomagnetic secular variation: 2. Constraintsfrom analysis of eight new sections and synthesis for a 3500-m-thick compositesection. J. Geophys. Res. 114 (B06103). doi:10.1029/2008JB005644.
Chester, R., 2000. Marine Geochemistry. Blackwell, London.Clark, M.K., Bilham, R., 2008. Miocene rise of the Shillong Plateau and the beginning of
the end for the Eastern Himalaya. Earth Planet. Sci. Lett. 269, 337–351.Courtillot, V., Besse, J., Vandamme, D., Montigny, R., Jaeger, J.-J., Cappetta, H., 1986.
Deccan flood basalts at the Cretaceous/Tertiary boundary? Earth Planet. Sci. Lett.80, 361–374.
Courtillot, V., Feraud, G., Maluski, H., Vandamme, D., Moreau, M.G., Besse, J., 1988.Deccan flood basalts and the Cretaceous/Tertiary boundary. Nature 333, 843–846.
Cowie, J.W., Ziegler, W., Remane, J., 1989. Stratigraphic Commission acceleratesProgress, 1984 to 1989. Episodes 12, 79–83.
Crocket, J.H., Paul, D.K., 2004. Platinum-group elements in Deccan mafic rocks: acomparison of suites differentiated by Ir contents. Chemical Geology 208, 273–291.
Crocket, J.H., Paul, D.K., 2008. Platinum-group elements in igneous rocks of the Kutchrift basin, NW India: implications for relationships with the Deccan volcanicprovince. Chemical Geology 248, 239–255.
Das Gupta, A.B., Biswas, A.K., 2000. Geology of Assam. Geological Society of India,Bangalore, India, p. 169.
Dessert, C., Dupre, B., Gaillardet, J., Francois, L.M., Allegre, C.J., 2003. Basalt weatheringlaws and the impact of basalt weathering on the global carbon cycle. Chem. Geol.202, 257–273.
Donovan, A.D., Baum, G.R., Blechschmidt, G.L., Loutit, T.S., Pflum, C.E., Vail, P.R., 1988.Sequence stratigraphic setting of the Cretaceous–Tertiary Boundary in CentralAlabama. In: Wilgus, C.K., Hastings, B.K., Posamentier, H., Van Wagoner, J., Ross,C.A., Kendall, C.G.St.C. (Eds.), Sea-Level Changes—An integrated Approach: SEPMSpecial Publication, 42, pp. 299–307.
Duncan, R.A., Pyle, D.G., 1988. Rapid eruption of the Deccan flood basalts at theCretaceous/Tertiary boundary. Nature 333, 841–843.
Edmonds, M., Gerlach, T.M., 2006. The airborne lava–seawater interaction plume atKilauea Volcano, Hawaii. Earth Planet. Sci. Lett. 244, 83–96.
Garg, R., Khowaja-Ateequzzaman, Prasad, V., 2006. Significant dinoflagellate cystBiohorizons in the Upper Cretaceous–Palaeocene succession of the Khasi Hills,Meghalaya. J. Geol. Soc. India 67, 737–747.
Gavrilov, Y.O., 2010. Diagenetic migration of sulfides in sediments accumulated indifferent sedimentation settings. Lithol. Miner. Resour. 45, 120–135.
Gertsch, B., Keller, G., Adatte, T., Berner, Z., 2011. Platinum Group Element (PGE)Geochemistry of Brazos Sections, Texas, U.S.A. In: Keller, G., Adatte, T. (Eds.), TheEnd-Cretaceous Mass Extinction and the Chicxulub impact in Texas: SEPM SpecialPublication, No. 100.
Ghosh, S., Fallick, A.E., Paul, D.K., Potts, P.J., 2005. Geochemistry and origin ofNeoproterozoic granitoids of Meghalaya, northeast India: implications for linkagewith amalgamation of Gondwana supercontinent. Gondwana Res. 8, 421–432.
Harris, J., Van Couvering, J., 1995. Mock aridity and the paleoecology of volcanicallyinfluenced ecosystems. Geology 23, 593–596.
Hooper, P., Widdowson, M., Kelley, S., 2010. Tectonic settling and timing of the finalDeccan flood basalt eruptions. Geology 38, 839–842.
Joyce Evans, N., Gregoire, D.C., Grieve, R.A.F., Goodfellow, W.D., Veizer, J., 1993. Useof platinum-group elements for impact or identification: terrestrial impactcraters and Cretaceous–Tertiary boundary. Geochim. Cosmochim. Acta 57,3737–3748.
Keller, G., 2002. Guembelitria dominated late Maastrichtian planktic foraminiferalassemblages mimic early Danian in the Eastern Desert of Egypt. Mar. Micro-paleontol. 47 (l–2), 71–99.
Keller, 2010. KT Mass Extinction: Theories and Controversies. Geoscientist online, May2010. https://www.geolsoc.org.uk/gsl/geoscientist/features/keller/page7669.html.
Keller, G., Abramovich, S., 2009. Lilliput effect in late Maastrichtian plankticforaminifera: response to environmental stress. Palaeogeogr. Palaeoclimatol.Palaeoecol. 284, 47–62.
Keller, G., Lindinger, M., 1989. Stable isotope, TOC and CaCO3 record across theCretaceous/Tertiary Boundary at El Kef, Tunisia. Palaeogeogr. Palaeoclimatol.Palaeoecol. 73, 243–265.
Keller, G., Li, L., MacLeod, N., 1995. The Cretaceous/Tertiary boundary stratotype sectionat El Kef, Tunisia: how catastrophic was the mass extinction? Palaeogeogr.Palaeoclimatol. Palaeoecol. 119, 221–254.
Keller, G., Adatte, T., Stinnesbeck, W., Stueben, D., Kramar, U., Berner, Z., Li, L., von SalisPerch-Nielsen, K., 1998. The Cretaceous–Tertiary transition on the shallow Saharanplatform of southern Tunisia. Geobios 30, 951–975.
Keller, G., Adatte, T., Burns, S.J., Tantawy, A.A., 2002. High-stress paleoenvironmentduring the late Maastrichtian to early Paleocene in Central Egypt. Palaeogeogr.Palaeoclimatol. Palaeoecol. 187, 35–60.
Keller, G., Stinnesbeck, W., Adatte, T., Stueben, D., 2003. Multiple impacts across theCretaceous–Tertiary boundary. Earth Sci. Rev. 62, 327–363.
Keller, G., Adatte, T., Berner, Z., Harting, M., Baum, G., Prauss, M., Tantawy, A., Stueben,D., 2007. Chicxulub impact predates K–T boundary: new evidence from Brazos,Texas. Earth Planet. Sci. Lett. 255, 339–356.
Keller, G., Adatte, T., Gardin, S., Bartolini, A., Bajpai, S., 2008. Main Deccan volcanismphase ends near the K–T boundary: evidence from the Krishna–Godavari Basin, SEIndia. Earth Planet. Sci. Lett. 268, 293–311.
284 B. Gertsch et al. / Earth and Planetary Science Letters 310 (2011) 272–285
Author's personal copy
Keller, G., Adatte, T., Pardo Juez, A., Lopez–Oliva, J., 2009a. New evidence concerning theage and biotic effects of the Chicxulub impact in NE Mexico. J. Geol. Soc. 166,393–411.
Keller, G., Khosla, S.C., Sharma, R., Khosla, A., Bajpai, S., Adatte, T., 2009b. Early Danianplanktic foraminifera from Cretaceous–Tertiary intertrappean beds at Jhilmili,Chhindwara District, Madhya Pradesh, India. J. Foraminifer. Res. 39, 40–55.
Keller, G., Adatte, T., Bajpai, S., Mohabey, D.M., Widdowson, M., Khosla, A., Sharma, R.,Khosla, S.C., Gertsch, B., Fleitmann, D., Sahni, A., 2009c. K–T transition in Deccantraps and intertrappean beds in central India mark major marine seaway acrossIndia. Earth Planet. Sci. Lett. 282, 10–23.
Keller, G., Abramovich, S., Berner, Z., Adatte, T., 2009d. Biotic effects of the Chicxulubimpact, K–T catastrophe and sea-level change in Texas. Palaeogeogr. Palaeoclimatol.Palaeoecol. 271, 52–68.
Keller, G., Bhowmick, P.K., Upaidhyay, H., Dave, A., Reddy, A.N., Jaiprakash, B.C., Adatte,T., 2011. Deccan volcanism linked to the Cretaceous–Tertiary Boundary (KTB) massextinction: new evidence from ONGC wells in the Krishna-Godavari Basin, India.J. Geol. Soc. India, Sept.–Oct. issue.
Khadkikar, A.S., Sant, D.A., Gogte, V., Karanth, R.V., 1999. The infliuence of Deccanvolcanism in climate: insights from lacustrine intertrappean deposits, Anjar,western India. Palaeogeogr. Palaeoclimatol. Palaeoecol. 147, 141–149.
Kramar, U., Stüben, D., Berner, Z., Stinnesbeck, W., Philipp, H., Keller, G., 2001. Are Iranomalies sufficient and unique indicators cosmic events? Planet. Space Sci. 49,831–837.
Krishnan, M.S., 1968. Geology of India and Burma. In: Krishnan, M.S. (Ed.), . Madras,536 pp.
Li, L., Keller, G., 1998. Diversification and extinction in Campanian–Maastrichtianplanktic foraminifera of northwestern Tunisia. Eclogae Geol. Helv. 91, 75–102.
MacLean, D., 1985. Deccan traps mantle degassing in the terminal Cretaceous marineextinctions. Cretac. Res. 6, 235–259.
Madhavaraju, J., Ramasamy, S., Ruffell, A., Mohan, S.P., 2002. Clay mineralogy of the LateCretaceous successions of the Cauvery Basin (southeastern India): implications forsediment source and palaeoclimates at the K/T boundary. Cretac. Res. 23, 153–163.
Martinez-Ruiz, F., Ortega-Huertas, M., Rivas, P., 2006. Rare earth element compositionas evidence of the precursor material of Cretaceous–Tertiary boundary sedimentsat distal sections. Chem. Geol. 232, 1–11.
Molina, E., Alegret, L., Arenillas, I., et al., 2006. The global boundary stratotype sectionand point for the base of the Danian Stage (Paleocene, Paleogene, ‘Tertiary’,Cenozoic) at El Kef, Tunisia—original definition and revision. Episodes 29, 263–273.
Mukhopadhyay, S.K., 2007. Planktonic foraminiferal succession in late Cretaceous toearly Paleocene strata in Meghalaya, India. Lethaia 41, 71–84.
Munsel, D., Berner, Z., Stueben, D., 2011. The sandstone complex in the Brazos Riverbedsection: geochemical constraints on genesis and depositional conditions. In: Keller,G., Adatte, T. (Eds.), End-Cretaceous mass extinction and the Chicxulub impact inTexas: SEPM Special Publication, No. 100.
Nagappa, Y., 1959. Foraminiferal Biostratigraphy of the Cretaceous:Eocene Successionin the India–Pakistan–Burma Region. Micropaleontology 5, 145–192.
Nandi, B., 1990. Palynostratigraphy of Upper Cretaceous sediments, Meghalaya,northeastern India. Rev. Palaeobot. Palynol. 65, 119–129.
Nesbitt, H.W., Young, G.M., 1982. Early Proterozoic climates and plate motions inferredfrom major element chemistry and lutites. Nature 299, 715–717.
Pandey, J., 1990. Cretaceous/Tertiary boundary, iridium anomaly, and foraminiferbreaks in the Um Sohryngkew river section, Meghalaya. Curr. Sci. 59, 570–575.
Pardo, A., Keller, G., 2008. Biotic effects of environmental catastrophes at the end of theCretaceous and early Tertiary: Guembelitria and Heterohelix blooms. Cretac. Res. 29,1058–1073.
Pardo,A., Adatte, T., Keller, G., Oberhansli, H., 1999. Paleoenvironmental changes across theCretaceous–Tertiary boundary at Koshak, Kazakhstan, based on planktic foraminiferaand clay mineralogy. Palaeogeogr. Palaeoclimatol. Palaeoecol. 154, 247–273.
Pope, K.O., Ocampo, A.C., Duller, C.E., 1991. Mexican site for K/T impact crater. Nature351, 105.
Price, J.R., Velbel, 2003. Chemical weathering indices applied to weathering profilesdeveloped on heterogeneous felsic metamorphic parent rocks. Chem. Geol. 202,397–416.
Pujol, F., Berner, Z., Stueben, D., 2006. Palaeoenvironmental changes at the Frasnian/Famennian boundary in key European sections: chemostratigraphic constraints.Palaeogeogr. Palaeoclimatol. Palaeoecol. 240, 120–145.
Rao, J.M., Rao, G.V.S.P., Sarma, K.P., 2008. Precambrian mafic magmatism of the ShillongPlateau, Meghalaya and their evolutionary history. J. Geol. Soc. India 73, 143–152.
Reimann, K.-U., 1993. Geology of Bangladesh. In: Reimann, K.-U. (Ed.), GebruderBorntraeger. Berlin, Stuttgart, 160 pp.
Remane, J., Keller, G., Hardenbol, J., Ben Haj Ali, M., 1999. Report on the InternationalWorkshop on Cretaceous–Paleogene Transitions. Episodes 22, 47–48.
Robert, C., Chamley, H., 1990. Paleoenvironmental significance of clay mineralassociation at the Cretaceous–Tertiary boundary. Palaeogeogr. Palaeoclimatol.Palaeoecol. 79, 205–219.
Rowley, D.R., 1996. Age of initiation of collision between India and Asia: a review ofstratigraphic data. Earth Planet. Sci. Lett. 145, 1–13.
Sageman, B.B., Lyons, T.W., 2003. Geochemistry of fine-grained sediments andsedimentary rocks. In: Holland, H.D., Turekian, K.K. (Eds.), Treatise on Geochem-istry. chapter 7.06.
Schmitz, B., 1985. Metal precipitation in the Cretaceous–Tertiary boundary clay atStevns Klint. Geochim. Cosmochim. Acta 49, 2361–2370.
Schmitz, B., 1992. Chalcophile elements and Ir in continental Cretaceous–Tertiary boundaryclay: from western interior of the USA. Geochim. Cosmochim. Acta 56, 1695–1703.
Schulte, P., Alegret, L., Arenillas, I., Arz, J.A., Barton, P.J., Bown, P.R., Bralower, T.J.,Christeson, G.L., Claeys, P., Cockell, C.S., Collins, G.S., Deutsch, A., Goldin, T.J., Goto,K., Grajales-Nishimura, J.M., Grieve, R.A.F., Gulick, S.P.S., Johnson, K.R., Kiessling, W.,Koeberl, C., Kring, D.A., MacLeod, K.G., Matsui, T., Melosh, J., Montanari, A., Morgan,J.V., Neal, C.R., Nichols, D.J., Norris, R.D., Pierazzo, E., Ravizza, G., Rebolledo-Vieyra,M., Reimold, W.U., Robin, E., Salge, T., Speijer, R.P., Sweet, A.R., Urrutia-Fucugauchi,J., Vajda, V., Whalen, M.T., Willumsen, P.S., 2010. The Chicxulub asteroid impact andmass extinction at the Cretaceous–Paleogene boundary. Science 327, 1214–1218.
Self, S., Widdowson, M., Thordarson, T., Jay, A.E., 2006. Volatile fluxes during floodbasalt eruptions and potential effects on the global environment: a Deccanperspective. Earth Planet. Sci. Lett. 248, 518–532.
Self, S., Jay, A.E., Widdowson, M., Keszthelyi, L.P., 2008. Correlation of the Deccan andRajahmundry trap lavas: are these the longest and largest lava flows on Earth?J. Volcanol. Geotherm. Res. 172, 3–19.
Smit, J., Roep, T.B., Alvarez, W., Montanari, A., Claeys, P., Grajales-Nishimura, J.M., 1996.Coarse-grained, clastic sandstone complex at the K/T boundary around the Gulf ofMexico: Deposition by tsunamiwaves induced by the Chicxulub impact? In: Ryder, G.,Fatovsky, D., Gartner, S. (Eds.), The Cretaceous–Tertiary event and other catastrophesin Earth history: Geological Society of America Special Paper, 307, pp. 151–182.
Stueben, D., Kramar, U., Berner, Z., Stinnesbeck, W., Keller, T., Adatte, T., 2002. Traceelements, stable isotopes, and clay mineralogy of the Elles II K–T boundary sectionin Tunisia: indications for sea level fluctuations and primary productivity.Palaeogeogr. Palaeoclimatol. Palaeoecol. 178, 321–345.
Toutain, J.-P., Meyer, G., 1989. Iridium-bearing sublimates at a hot-spot volcano (Pitonde la Fournaise, Indian Ocean). Geophys. Res. Lett. 16, 1391–1394.
Tribovillard, N., Algeo, T.J., Lyons, T., Riboulleau, A., 2006. Trace elements as paleoredoxand paleoproductivity proxies: an update. Chem. Geol. 232, 12–32.
Tucker, M.E., Wright, V.P., 1990. Carbonate Sedimentology. Blackwell, Oxford. 482 pp.Van der Weijden, C.H., 2002. Pitfalls of normalization of marine geochemical data using
a common divisor. Mar. Geol. 184, 167–187.Wedepohl, K.H., 1971. Environmental influences on the chemical composition of shales
and clays. In: Ahrens, L.H., Press, F., Runcorn, S.K., Urey, H.C. (Eds.), Physics andChemistry of the Earth. Pergamon, Oxford, pp. 305–333.
Wedepohl, K.H., 1991. Chemical composition and fractionation of the continental crust.Geol. Rundsch. 80, 207–223.
Wedepohl, K.H., 1995. The composition of the continental crust. Geochim. Cosmochim.Acta 59, 1217–1232.
Zachos, J.C., Arthur, M.A., Dean, W.E., 1989. Geochemical evidence for suppression ofpelagic marine productivity at the Cretaceous/Tertiary boundary. Nature 337,61–64.
Zoller, W.H., Parrington, J.R., Phelan Kotra, J.M., 1983. Iridium Enrichment in Airborneparticles from Kilauea Volcano: January 1983. Science 222, 1118–1121.
285B. Gertsch et al. / Earth and Planetary Science Letters 310 (2011) 272–285