Environment-aware Evasion of Android Sandboxes - Nick ...
16
The Droid is in the Details: Environment-aware Evasion of Android Sandboxes Brian Kondracki Stony Brook University [email protected] Babak Amin Azad Stony Brook University [email protected] Najmeh Miramirkhani Stony Brook University [email protected] Nick Nikiforakis Stony Brook University [email protected] Abstract—Malware sandboxes have long been a valuable tool for detecting and analyzing malicious software. The proliferation of mobile devices and, subsequently, mobile applications, has led to a surge in the development and use of mobile device sandboxes to ensure the integrity of application marketplaces. In turn, to evade these sandboxes, malware has evolved to suspend its malicious activity when it is executed in a sandbox environment. Sophisticated malware sandboxes attempt to prevent sandbox detection by patching runtime properties indicative of malware- analysis systems. In this paper, we propose a set of novel mobile-sandbox- evasion techniques that we collectively refer to as “environment- aware” sandbox detection. We explore the distribution of artifacts extracted from readily available APIs in order to distinguish real user devices from sandboxes. To that end, we identify Android APIs that can be used to extract environment-related features, such as artifacts of user configurations (e.g. screen brightness), population of files on the device (e.g. number of photos and songs), and hardware sensors (e.g. presence of a step counter). By collecting ground truth data from real users and Android sandboxes, we show that attackers can straightforwardly build a classifier capable of differentiating between real Android devices and well-known mobile sandboxes with 98.54% accuracy. More- over, to demonstrate the inefficacy of patching APIs in sandbox environments individually, we focus on feature inconsistencies between the claimed manufacturer of a sandbox (Samsung, LG, etc.) and real devices from these manufacturers. Our findings emphasize the difficulty of creating robust sandbox environments regardless of their underlying platform being an emulated en- vironment, or an actual mobile device. Most importantly, our work signifies the lack of protection against “environment-aware” sandbox detection in state-of-the-art mobile sandboxes which can be readily abused by mobile malware to evade detection and increase their lifespan. I. I NTRODUCTION Mobile devices have become an integral part of our lives. With Android having over 70% of mobile market share [14], these handheld devices now hold our most sensitive personal and financial information. This data, as well as the powerful devices that house it, have increasingly become a target for attackers. In 2009, the security community started observing malware samples, such as, Spitmo and Zeus [33], which were equipped with a mobile counterpart used to steal two-factor authentica- tion tokens. Mobile malware samples found at the time were most often accompanied with a desktop counterpart that would be responsible for stealing banking information. Soon after however, as mobile devices started to get more traction, mobile malware evolved. Namely, new malware surfaced that per- formed on-device phishing, subscribed to premium numbers, and stole sensitive information [56]. This shift to mobile-first malware, emphasized the growing need for mobile malware detection. Unlike desktop applications, which are independently downloaded and installed from the software manufactur- ers’ websites, mobile applications are commonly distributed through centralized application stores; such as, the Google PlayStore [9] and the iOS App Store [10] hosting 2.9 million and 1.96 million apps respectively at the time of writing [21]. This makes the parties responsible for hosting and delivering these applications the first line of defense to stop mobile malware before reaching the user’s device. To that end, de- fenders have proposed static and dynamic analysis methods for malware detection that app stores have, to a certain extent, adopted [22], [23], [25], [30], [54], [57], [61]. Over time, however, mobile malware increased in complexity, introducing evasion techniques such as code obfuscation to hinder static analysis, and sandbox detection to bypass dynamic analy- sis [47], [55]. A requirement for sandbox environments is scalability and the capability to revert to a clean state to evaluate new samples. This makes Android emulators the primary option for building mobile sandboxes. Thus, there exists a large body of work (from both academic research as well as malware samples) describing techniques to fingerprint emulated environments, mostly revolving around artifacts of emulation [27], [34], [49], [51]–[53], [58]. These approaches focus on features of the emulator, such as, the CPU architecture and instruction-level behavior, performance of emulators, and the discrepancy of OS-level APIs in real vs. emulated environments. An important distinction between desktop and mobile sand- box fingerprinting comes from the limited variation of mobile devices. These devices ship with specific hardware features (e.g., sensors, camera, and storage) as well as distinct soft- ware properties (e.g., system applications and bloatware). This makes building believable mobile-sandbox environments more challenging, as sandboxes must hide signs of emulation, mimic real-device configurations, and display signs of real-device Network and Distributed Systems Security (NDSS) Symposium 2022 27 February - 3 March 2022, San Diego, CA, USA ISBN 1-891562-74-6 https://dx.doi.org/10.14722/ndss.2022.23056 www.ndss-symposium.org
-
Upload
khangminh22 -
Category
Documents
-
view
1 -
download
0
Transcript of Environment-aware Evasion of Android Sandboxes - Nick ...

The Droid is in the Details: Environment-awareEvasion of Android Sandboxes
Brian KondrackiStony Brook University
Babak Amin AzadStony Brook University
Najmeh MiramirkhaniStony Brook University
Nick NikiforakisStony Brook [email protected]
Abstract—Malware sandboxes have long been a valuable toolfor detecting and analyzing malicious software. The proliferationof mobile devices and, subsequently, mobile applications, has ledto a surge in the development and use of mobile device sandboxesto ensure the integrity of application marketplaces. In turn,to evade these sandboxes, malware has evolved to suspend itsmalicious activity when it is executed in a sandbox environment.Sophisticated malware sandboxes attempt to prevent sandboxdetection by patching runtime properties indicative of malware-analysis systems.
In this paper, we propose a set of novel mobile-sandbox-evasion techniques that we collectively refer to as “environment-aware” sandbox detection. We explore the distribution of artifactsextracted from readily available APIs in order to distinguish realuser devices from sandboxes. To that end, we identify AndroidAPIs that can be used to extract environment-related features,such as artifacts of user configurations (e.g. screen brightness),population of files on the device (e.g. number of photos and songs),and hardware sensors (e.g. presence of a step counter).
By collecting ground truth data from real users and Androidsandboxes, we show that attackers can straightforwardly build aclassifier capable of differentiating between real Android devicesand well-known mobile sandboxes with 98.54% accuracy. More-over, to demonstrate the inefficacy of patching APIs in sandboxenvironments individually, we focus on feature inconsistenciesbetween the claimed manufacturer of a sandbox (Samsung, LG,etc.) and real devices from these manufacturers. Our findingsemphasize the difficulty of creating robust sandbox environmentsregardless of their underlying platform being an emulated en-vironment, or an actual mobile device. Most importantly, ourwork signifies the lack of protection against “environment-aware”sandbox detection in state-of-the-art mobile sandboxes which canbe readily abused by mobile malware to evade detection andincrease their lifespan.
I. INTRODUCTION
Mobile devices have become an integral part of our lives.With Android having over 70% of mobile market share [14],these handheld devices now hold our most sensitive personaland financial information. This data, as well as the powerfuldevices that house it, have increasingly become a target forattackers.
In 2009, the security community started observing malwaresamples, such as, Spitmo and Zeus [33], which were equippedwith a mobile counterpart used to steal two-factor authentica-tion tokens. Mobile malware samples found at the time weremost often accompanied with a desktop counterpart that wouldbe responsible for stealing banking information. Soon afterhowever, as mobile devices started to get more traction, mobilemalware evolved. Namely, new malware surfaced that per-formed on-device phishing, subscribed to premium numbers,and stole sensitive information [56]. This shift to mobile-firstmalware, emphasized the growing need for mobile malwaredetection.
Unlike desktop applications, which are independentlydownloaded and installed from the software manufactur-ers’ websites, mobile applications are commonly distributedthrough centralized application stores; such as, the GooglePlayStore [9] and the iOS App Store [10] hosting 2.9 millionand 1.96 million apps respectively at the time of writing [21].This makes the parties responsible for hosting and deliveringthese applications the first line of defense to stop mobilemalware before reaching the user’s device. To that end, de-fenders have proposed static and dynamic analysis methodsfor malware detection that app stores have, to a certain extent,adopted [22], [23], [25], [30], [54], [57], [61]. Over time,however, mobile malware increased in complexity, introducingevasion techniques such as code obfuscation to hinder staticanalysis, and sandbox detection to bypass dynamic analy-sis [47], [55].
A requirement for sandbox environments is scalability andthe capability to revert to a clean state to evaluate new samples.This makes Android emulators the primary option for buildingmobile sandboxes. Thus, there exists a large body of work(from both academic research as well as malware samples)describing techniques to fingerprint emulated environments,mostly revolving around artifacts of emulation [27], [34], [49],[51]–[53], [58]. These approaches focus on features of theemulator, such as, the CPU architecture and instruction-levelbehavior, performance of emulators, and the discrepancy ofOS-level APIs in real vs. emulated environments.
An important distinction between desktop and mobile sand-box fingerprinting comes from the limited variation of mobiledevices. These devices ship with specific hardware features(e.g., sensors, camera, and storage) as well as distinct soft-ware properties (e.g., system applications and bloatware). Thismakes building believable mobile-sandbox environments morechallenging, as sandboxes must hide signs of emulation, mimicreal-device configurations, and display signs of real-device
Network and Distributed Systems Security (NDSS) Symposium 202227 February - 3 March 2022, San Diego, CA, USAISBN 1-891562-74-6https://dx.doi.org/10.14722/ndss.2022.23056www.ndss-symposium.org

usage. With these details in mind, we propose “environment-aware” sandbox evasion which uses artifacts from the mobileenvironment to identify sandboxes, rather than the specificbehavior of emulators.
To evaluate an attacker’s ability to evade sandboxes basedon environment artifacts, we implement an Android applicationthat extracts statistics from an extensive list of mobile APIs(e.g. the number of contacts, the number of calls, the numberof photos, etc.). We select these APIs by reviewing AndroidAPI reference documentation, focusing on those that exposeenvironment-related information. We submit this application to12 popular Android sandboxes (including VirusTotal) as wellas multiple app stores (e.g. Google PlayStore and SamsungGalaxy Market), with the expectation that apps uploaded inapp stores are also executed in mobile-specific sandboxes formalware-detection purposes. In parallel, we conduct an IRB-approved study inviting users from a crowdsourcing platformas well as our institution to participate in our experimentsby downloading and installing the same app. Through thisprocess, we were able to obtain data from 1,245 user Androiddevices and collect environment statistics that we later useas ground truth in our machine-learning-powered classificationmodels.
Based on the collected information, we build a classifierthat detects mobile sandbox environments with 98.54% accu-racy, demonstrating the power of artifact-based classificationand thereby sandbox evasion, without the need of emulationartifacts that may change every time the emulating softwareupdates. We show that the trained models are robust to incre-mental sandbox patches, finding that defenders can “remove”more than 60 out of 81 features, without radically affectingthe performance of the classifier.
Finally, we build manufacturer-specific models based onthe settings, system applications, and factory bloat on devicesof popular manufacturers. We discover that for only threesandboxes, the claimed device model matches the environ-ment features based on the manufacturer-specific classifiers.Contrastingly, for 75% of sandboxes, we observe that ourmanufacturer-specific classifiers trained on data from real userdevices, identify that the sandboxes are effectively lying abouttheir make. Through our experiments, we demonstrate that asandbox can be discovered, not just because it looks like othersandboxes (in terms of its artifacts) but also because it doesnot look like a device from the manufacturer (Samsung, LG,etc.) that it claims to be.
In summary, we make the following contributions:
• We collect data on environment artifacts from physicalAndroid devices and mobile sandbox services whichwe use to identify trends and large differences in theirdistributions.
• We train a machine-learning classifier utilizing a widerange of Android device artifacts that is capable of effec-tively differentiating real Android devices from sandboxenvironments of top anti-malware services.
• We utilize device-hardware configuration artifacts to trainan ensemble of manufacturer-specific machine learningclassifiers, and use them to discover discrepancies inthe Android device manufacturers reported by sandboxservices, enabling manufacturer-based sandbox evasions.
II. BACKGROUND
Detection and analysis of computer malware is an impor-tant, yet challenging task. One of the most vital tools for thistask are malware sandboxes. In this section, we provide a briefbackground on sandboxes and how malware has evolved tobypass them.
A. Malware Sandboxes
Sandboxes are isolated environments where software canexecute under observation. They allow defenders to examineunknown software for malicious behavior, as well as knownmalware in order to create behavioral signatures for use inanti-malware systems. These systems can be physical ma-chines (known as bare-metal sandboxes) with limited networkcapabilities in order to contain the unwanted side effects ofpotentially malicious code. However, due to the vast numberof software executables analyzed, virtual machines and othersystem emulators provide a scalable platform to create malwaresandboxes.
The explosion of mobile-device adoption has led to a surgein new software in the form of mobile applications. The GooglePlayStore, the largest application marketplace on the Androidplatform, currently has nearly 3 million applications availablefor download, with that number increasing every day [21]. Thismassive influx of new applications makes manual analysis ofevery single app impossible. Rather, application marketplacesand security firms turn to malware sandboxes to automate theprocess of finding and removing malicious applications fromthe ecosystem.
B. Sandbox Evasion
Evading detection from defenders is a crucial aspect ofmodern malware. Once malware is discovered by a sandbox,signatures are created describing the malware sample and itsbehaviors. These signatures are then distributed throughoutthe anti-malware ecosystem, severely hampering (from theattacker’s point of view) the number of affected victims.Thus, attackers are always improving upon their methodsto detect sandbox environments so that malware does notdemonstrate its malicious behavior while under the observationof defenders.
a) Device-based Evasion: One of the most trivial meth-ods used to detect a sandbox environment is to look for so-called “Red Pills” i.e., static values that betray the presenceof sandboxes. As many sandboxes utilize virtual machines,a common check conducted by malware is to look for VM-specific system properties. These come in the form of staticidentifiers such as MAC addresses or serial numbers, devicedrivers, and system modules. Malware can easily evade sand-boxes by simply checking the value of these tell-tale systemproperties.
Additionally, sandboxes running in an emulated environ-ment must ensure they report realistic values for all hardwareand software on the system. Inclusion or exclusion of unusualhardware or software can lead to successful malware evasion.For example, a mobile sandbox neglecting to emulate a cameramodule when its existence is expected, can raise a red flag forattackers.
2

Feature Extraction Agent
Online Sandboxand AV Engines
App Stores
Real user devices
Collected Artifacts
Sandbox vs real human device model
Device specific models
Feature Extractor APK
Design an APK that collectsvarious features from the deviceand sends them to our server.
Data Collection
Submit this APK to onlineapplication stores along with auser study to collect sandboxvs real device features.
Analysis of Artifacts
At this step, artifacts from variouscategories (contacts, calendar,reminders, photos, network andsongs) are collected.
ML Model Training
Train an ML model to detect Sandbox vsReal human device as well as devicespecific models that can detect real devicesbased on the artifacts inherent to specificdevice models.
Fig. 1: Flow of data from sources to our machine learning model.
Sophisticated sandboxes tackle these issues by presentingrealistic values for these variables (e.g. reporting a realisticMAC address or serial-number value rather than the defaultVM-specific values). While this raises the bar for attackers,these sandboxes can still be evaded through analysis of runtimebehaviors. For instance, previous work has shown how certaincode sequences have implicitly different behavior when exe-cuting on a bare-metal machine compared to an emulator [60].
b) Environment-based Evasion: Some sandboxeschoose to utilize bare-metal devices rather than virtualmachines and emulators. This eliminates the chance ofevasion due to the detection of emulation as all hardware andsoftware is authentic. However, many sandboxes neglect toprepare their environments to appear genuine (e.g. a Windowssandbox claiming to be a three-year old installation butshowing little user activity in terms of installed programs anduser files). Researchers have shown that these differences canbe capitalized by malware to evade sandboxes and to evenestimate the true age of a machine based on the presentedwear and tear [48].
III. DATA COLLECTION
In this section, we begin with an overview of the artifactswe collect to differentiate real Android devices from sandboxenvironments. We then describe the Android application wedesigned and implemented for data collection, the sources wecollect data from, and the details of our user study. Lastly, weanalyze the collected data to discover trends in real Androiddevices compared to sandboxes, and identify differences intheir distributions which would allow for the creation of amachine-learning classifier capable of differentiating betweenthem. Details of our entire data collection and analysis pipelineis listed in Figure 1.
A. Artifact categories
To effectively evade mobile sandboxes, attackers must uti-lize as many sources of information as possible. This allows forthe creation of a detailed model of real Android devices, whichis robust against incremental improvements to sandboxes. Tothis end, we followed the methodology of Kurtz et al. [44]by systematically searching the Android SDK documentationfor any API endpoint returning environment information. We
identified a total of 81 features, split into three major artifactgroups unique to mobile devices. Below, we describe thesegroups as well as the features belonging to each one, with afull listing of all artifacts located in Table VIII of the Appendix.
1) Wear-and-Tear Artifacts: Wear-and-tear artifacts are thenatural side effect of mobile device usage. They describe thebehavior of the user and can be used to estimate the age ofthe device. The different categories of these artifacts that weused for our study are as follows:
Photos For this feature category, we collect the number ofpictures on the device, their average orientation (ratio ofvertical to horizontal images), and the last time a picturewas taken. Note that for photos (as well as other potentiallyPII-revealing artifacts listed later in this section), we collectstatistics about them (such as the quantity of photos) but notthe actual photos themselves.
Songs and albums For songs, we look at their total number,the number of artists, and the oldest and newest release dates.
Contacts We collect information such as the total numberof contacts, as well as the number of those with a phonenumber or a picture associated with them. We also collectthe number of “starred” contacts, custom ringtones, the totalnumber of calls, and time of the last call. As with photos andsongs, we calculate the statistics on the device (e.g. the numberof contacts) and collect these statistics. We never extract theunderlying sensitive information for obvious privacy reasons.
Calendars, events, and reminders We collect the total num-ber of calendars, event types and their status (i.e. accepted,tentative, and canceled), and whether there is a reminderassociated with these events. For reminders, we look at thereminder medium (i.e., Alarm, SMS, Email, and Default). Wecollect these features in bulk and not for individual calendarentries.
Packages, file system and running processes We extract thetotal number of packages installed on user devices. Whilemalicious actors can go one step further and also extractindividual package names and their installation dates, we chosenot to do so in our study for privacy reasons. Similarly, wecollect the number of documents, downloaded files, and files
3

listed under the /proc directory to obtain the number ofrunning processes. Access to /proc has been discontinuedsince Android 6.0 and therefore our collection of that specificfeature works on a best-effort basis.
Network and location For this set of features, the most notablefeature that we take into consideration is the number of WiFiconfigurations saved on the device which, in principle, shouldcorrelate with the usage of the device (the longer users owna device, the larger the number of stored configurations ontheir phones). Moreover, we extract the number of ARP cacheentries, which represents the number of devices on the localnetwork that the Android device has recently communicatedwith.
2) Device Configuration Artifacts: Similarly to wear-and-tear artifacts, user-provided configuration options can showa degree of customization of a mobile device. When onebegins to use their device, they change specific values in thedevice settings to meet their specific needs. By consideringthe values of specific configuration options, we can estimatethe degree of customization of the device. However, whilethese configuration options indicate device usage, they are notquantifiable over long periods of time. Therefore, we discussthem separately from wear-and-tear artifacts.
We collect certain values under the device settings such asautomatic update of time and time zone, data roaming, “stayon while plugged in”, screen brightness level, as well as sound-related settings. One important feature in this category is thedevice uptime with the expectation that most users rarely turn-off/reboot their smartphones.
3) Device Hardware Artifacts: Unlike their desktop coun-terparts which can be assembled by users from individual com-ponents, mobile devices are inherently limited in the hardwareconfigurations provided to users. These unique configurationsof device components and settings can be used to supplementthe aforementioned usage artifacts. Additionally, discrepanciesin the configuration of a device compared to the reporteddevice model can serve as a tell-tale sign of a sandbox’spresence.
Our agent collects information about the device modelitself such as phone manufacturer, model, and Android ver-sion. Additionally, it records the presence of certain hardwaresensors, such as a heart rate monitor or a step counter.
B. Feature Collector Agent
To conduct data collection on mobile environments, we im-plemented an Android application which utilizes the AndroidSDK to gather the previously described artifacts, and transmitthem to our servers. Our compiled application consists of asingle APK file, allowing us to easily upload it to sandboxservices for scanning or distribution to users through appli-cation marketplaces. Android applications are required to askfor permission from users to query specific APIs (e.g. contacts)and read certain configurations (e.g. saved WiFi access points).In older versions of Android, prior to 6.0 (API 23), all ofthe permissions would be acquired at installation time. Inmore recent versions, users are prompted at runtime to grantthese permissions to the application. In total, our applicationrequests five permissions: three runtime permissions, and two
install-time permissions. The three runtime permissions requestaccess to read the user’s calendar, contacts, and documentson storage devices; whereas the two install-time permissionsrequest access to read the WiFi state, and user dictionaries.
Data is transmitted from our application to our servers overa single POST request sent over an HTTPS connection. There,we store the information in our database to be used in trainingand validating our machine learning model. Each APK thatwe distribute on a marketplace or submit to a sandbox has aunique ID which is transmitted with all data in each request toour servers, and is used to distinguish data between differentsources (e.g. Google Play Store vs. VirusTotal AV).
C. Collection of Features
To systematically search for all active sandbox providers,we conducted a literature review in the field of mobile sandboxdevelopment. Additionally, we utilized search engine queriesfor terms such as “Android Sandbox”, “mobile sandbox”, and“malware sandbox”. This search resulted in a large collectionof mobile sandboxes, ranging from open-source academictools to commercial services. For each sandbox discovered,we upload or scan our client application. Additionally, wedistribute our application on popular Android marketplacesin order to capture data on sandboxes and malware scannersused by these entities. We note that there are a numberof other sandbox services we discovered in this search thatwere either broken, discontinued, or operated in such a waythat prevented us from evaluating them. For instance, weidentified 29 mobile antimalware software out of which, 17either only performed static analysis or did not allow outboundHTTP/DNS connections to our servers. Ultimately, we testedour application on 12 working antimalware sandboxes.
To capture the state of new Android devices and build abaseline model (i.e. the distributions of the aforementionedartifacts in newly-purchased devices), we utilized AmazonDevice Farm [2] and Google Firebase Test Lab [7]. Theseservices allow developers to test their applications on a largeslate of real, physical devices and pay for the time theyuse each device. We uploaded to each of these services anaugmented version of our Android client which automaticallyinitiates data collection without any user interaction.
a) IRB Approval and User Study: Collecting data fromreal Android devices required the assistance of real users.Thus, we obtained an Institutional Review Board (IRB) ap-proval for our study. Upon providing thorough details on whatdata we would collect from participants as well as how wewould protect participant privacy, we obtained an IRB approvalon October 7, 2020.
The data we collect from users does not contain any person-ally identifiable information (PII). All artifacts we describedpreviously are statistical in nature. For instance, we collect thetotal number of contacts on a user’s device, rather than thecontact information itself.
To recruit participants, we sent out emails to students ofour institution asking for them to participate in our study fora chance to win a gift card. Recruitment emails were sentfrom our institutional email accounts, to ensure participantswere confident they were not spear-phishing attempts. All
4

0.0 0.2 0.4 0.6 0.8 1.00.0
0.2
0.4
0.6
0.8
1.0Fr
eque
ncy
2012 2013 2014 2015 2016 2017 2018 2019 2020 2021Release Year
0
50
100
150
200
250
300
200 400 600 800 1000Release Price
0
50
100
150
Fig. 2: Distribution of device release dates and prices in our dataset.
instructions were provided to participants within the recruit-ment email. Users were asked to download and install ourapplication onto their Android mobile device from the GooglePlay Store. After providing the required permissions, we askedthem to navigate to the “User Study” tab in the application andclick on the “Get Token” button. At this point, our applicationtransmits the collected artifacts to our servers, and participantsreceive a token which proves their participation. The total timerequired by participants was between 3-5 minutes.
To bolster our dataset of real user devices, we conductedthe same user study with hired workers on the Microwork-ers [13] platform. Instructions for participants were listed onthe Microworkers job listing, and participation tokens whereshared using the job listing as well. Workers on this platformwere paid an average of $0.75 for their participation, ratherthan an entry into the gift-card raffle. In total, we spentapproximately $850 to complete our user study.
D. Dataset Statistics
Using our Android agent, we collected data from 1,245real user devices, 398 baseline devices, and 210 sandboxdevices. Baseline devices are real Android phones accessiblethrough Google Firebase Test Lab [7] and Amazon DeviceFarm [2] services, which provide cloud-based applicationtesting. Of real user devices, 92 originated from students ofour institution, and 1,153 from the users of the Microworkersplatform. Figure 2 presents the distributions of device releasedates and release-time prices of devices (in US dollars) inour dataset. Here, we see a diverse range of device ages andprices. However, most devices in our dataset are on the cheaperend, which can be explained by the demographic distributionof workers on the Microworkers platform, favoring budgetdevices [37]. Additionally, Table I shows the total numberof data points we collected from each sandbox service, aswell as the number of unique devices encountered. We observe
TABLE I: Number of samples collected from each sandbox in ourdataset, as well as the number of unique devices collected from eachsource.
Sandbox # Samples # DevicesVirusTotal AV 73 17Comodo Sandbox 27 12GData AV 18 9Google PlayStore Market 15 3eScan (mwti.net) AV 12 1Samsung Galaxy Store Market 10 1GetJar Market 10 4Tgsoft AV 9 8Amazon AppStore Market 9 2Kaspersky AV 8 5DrWeb AV 5 2SandDroid Sandbox 5 2AMAass Sandbox 3 1JoeSandbox 3 2BitDefender AV 2 2Nviso Sandbox 1 1
TABLE II: Distribution of Android device manufacturers in our realdevices compared to sandboxes.
Manufacturer Real Devices SandboxesXiaomi 25.50% 1.16%Samsung 23.89% 7.56%Huawei 8.31% 5.23%Oppo 5.97% 0.00%Realme 5.17% 0.00%Vivo 3.95% 2.33%LG 3.79% 27.33%Motorola 2.58% 0.00%Oneplus 1.94% 0.00%Hmd global 1.86% 0.00%Asus 1.86% 8.14%
that the majority of sandbox services launch our applicationmultiple times after submission. However, we find most ofthese repeated launches occur from one or a small groupof device models, using a varied group of reported Androidversions. We can infer that this differentiation is an attempt tocoerce malicious behavior out of malware that may be targetingspecific devices and Android versions.
We notice a large number of execution data points origi-nating from our Android client submitted to VirusTotal as wellas popular application marketplaces. VirusTotal’s APK fileevaluation currently uses 28 underlying antimalware checks.As a result, a single file will be analyzed and dynamicallyexecuted multiple times. Not all of the antimalware engines inVirusTotal perform dynamic analysis and one cannot chooseto analyze the submitted file on a subset of engines separately.Unlike sandbox services, data points from marketplaces maybe varied with some coming from the vetting procedure of themarketplace as well as real users downloading our application.To differentiate between these two scenarios, we used the ASNof the source IP address of each connection. If it belongs to theorganization of the marketplace or of an organization providingcomputing resources (such as a public cloud), we consider thata sandbox, otherwise we consider it a real device.
5

4.0 5.0 6.0 7.0 8.0 9.0 10.0 11.0Android Release
0.00
0.05
0.10
0.15
0.20
0.25
0.30
0.35
Freq
uenc
yRealSandbox
Fig. 3: Distribution of Android versions among real user devices andsandboxes that report an Android release version.
Table II shows the distribution of device manufacturersamong our datasets of real user devices and mobile sandboxesas reported by the Android build API. Here, we observe thatthe majority of real users own devices from popular smart-phone manufacturers such as Samsung and Xiaomi. However,there is a lack of representation of these popular devicesin mobile sandboxes. We find that 34.8% of sandboxes donot report any device manufacturer when requested by ourapplication.
We also observe that this same group of sandboxes (34.8%of our dataset), do not report an Android version whenrequested. Figure 3 shows the distributions of reported Androidsoftware versions in both real user devices and mobile sand-boxes. Most sandboxes that report an Android version claimto be running a very early release. This may be an attemptto coerce malware into revealing malicious behavior whenencountering an outdated and vulnerable device. However, wesee that real user devices in our dataset are more likely to runa recent release of Android.
These discrepancies are alarming as it is important formobile-sandbox providers to follow the usage trends of realAndroid mobile devices in order to prevent trivial sandboxdetection. “Red Pill” information such as this is powerfuland non-invasive, meaning attackers can easily and stealthilyacquire this information to evade sandboxes. At the sametime, this type of manufacturer-based and Android-version-based evasions can be straightforwardly patched by sandboxesmerely reporting the appropriate values. As such, we focus ourattention on more inconspicuous information that can betraythe nature of the sandbox while also requiring a greater amountof effort for sandbox providers to properly counter.
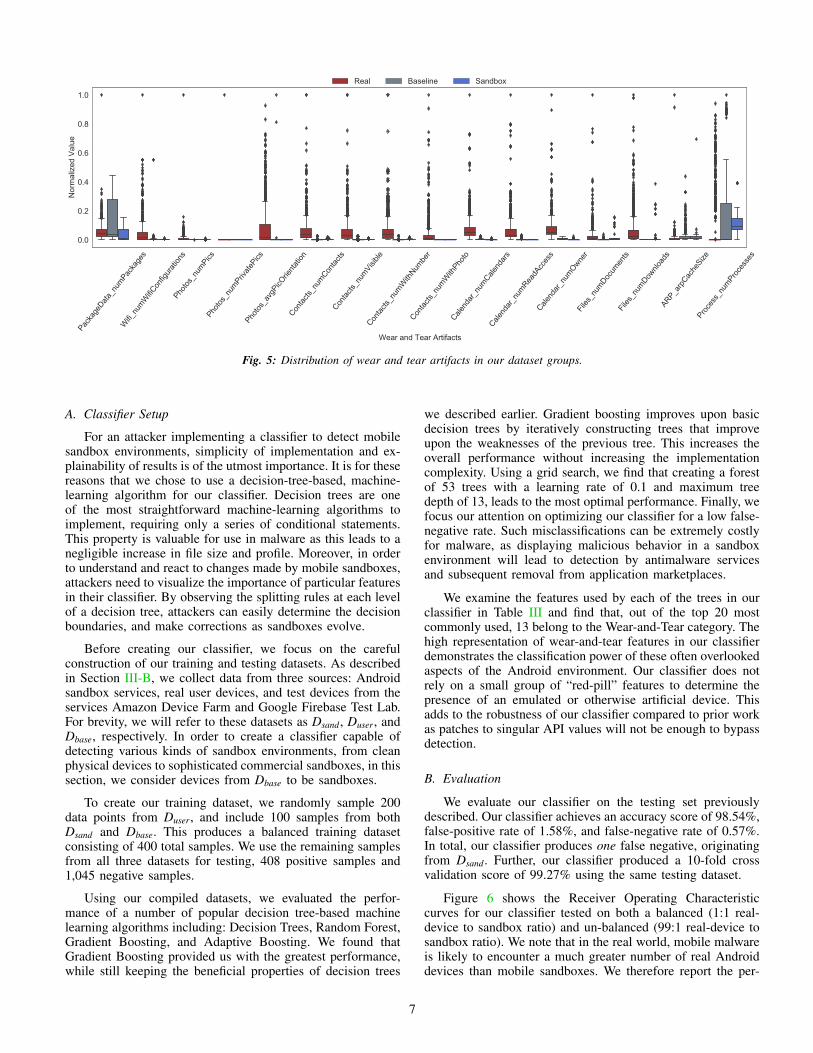
Figure 5 shows the distributions of wear-and-tear artifactsin our dataset. For increased clarity, we show 16 out of atotal of 41 wear-and-tear artifacts. We find that, in most cases,real user devices produce wear-and-tear artifacts of a largermagnitude (e.g. a large number of WiFi configurations) and alarger variance than those in our sandbox and baseline datasets.This observation shows how the usage of a mobile devicecan be quantified from wear-and-tear artifacts, and that theseartifacts can be used to reliably differentiate a mobile sandbox
Sens
or_n
umSe
nsor
s
Sens
or_a
ccel
erom
eter
Sens
or_g
ravi
ty
Sens
or_g
yros
cope
Sens
or_h
eartB
eat
Sens
or_h
eartR
ate
Sens
or_l
ight
Sens
or_m
agne
tic
Sens
or_m
otio
n
Sens
or_p
ress
ure
Sens
or_p
roxi
mity
Sens
or_s
tepC
ount
er
Number of Sensors
0.0
0.2
0.4
0.6
0.8
1.0
Nor
mal
ized
Val
ue
Real Baseline Sandbox
Fig. 4: Distribution of sensor hardware in our dataset groups. Boxand whiskers encompass 90% of data group values.
environment from a real user’s device. We do, however, en-counter some features which unexpectedly provide less classi-fication power than we originally expected. One such exampleis the number of processes running on a device. Intuitively, onewould expect a real device to have more running processes dueto users launching many applications during typical use. Sincewe do not collect the actual packages installed on a device,we cannot conclusively explain this discrepancy. One possibleexplanation is that sandbox services have extra logging andanalysis processes running in parallel with suspected malware,thus leading to inflated process counts.
Next to wear-and-tear artifacts, the relative stability ofmobile device hardware compared to desktop computers allowsfor the use of hardware configuration artifacts in sandboxevasion. Figure 4 shows the distribution of sensors in de-vices of each category in our dataset. We find that mobilesandboxes are less likely to include emulated hardware suchas environment sensors, creating an additional differentiatingfactor between artificial and genuine Android environments.We further expand upon these artifacts in Section V, wherewe create machine learning models for popular Android devicemanufacturers.
IV. MOBILE SANDBOX DETECTION
In the previous section, we described the artifacts that canbe used to differentiate real Android devices from mobilesandboxes operated by appstores and anti-malware companies.Our initial analysis of data collected from real-user devices,baseline devices, and sandboxes, demonstrated that real An-droid devices and sandbox environments produce unique distri-butions for many of these artifacts, pointing to an opportunityfor their differentiation. In this section, we use these artifactsas features in a machine-learning classifier that can be used bymobile malware to evade analysis by defenders.
6
Packa
geData
_num
Packa
ges
Wifi_
numW
ifiCon
figura
tions
Photos
_num
PicsPho
tos_n
umPriv
atePics
Photos
_avg
PicOrie
ntatio
nCon
tacts_
numCon
tacts
Contac
ts_nu
mVisible
Contac
ts_nu
mWith
Numbe
r
Contac
ts_nu
mWith
Photo
Calend
ar_nu
mCalend
ars
Calend
ar_nu
mReadA
cces
sCale
ndar_
numOwne
rFil
es_n
umDoc
umen
tsFil
es_n
umDow
nload
sARP_a
rpCac
heSize
Proces
s_nu
mProces
ses
Wear and Tear Artifacts
0.0
0.2
0.4
0.6
0.8
1.0
Nor
mal
ized
Val
ueReal Baseline Sandbox
Fig. 5: Distribution of wear and tear artifacts in our dataset groups.
A. Classifier Setup
For an attacker implementing a classifier to detect mobilesandbox environments, simplicity of implementation and ex-plainability of results is of the utmost importance. It is for thesereasons that we chose to use a decision-tree-based, machine-learning algorithm for our classifier. Decision trees are oneof the most straightforward machine-learning algorithms toimplement, requiring only a series of conditional statements.This property is valuable for use in malware as this leads to anegligible increase in file size and profile. Moreover, in orderto understand and react to changes made by mobile sandboxes,attackers need to visualize the importance of particular featuresin their classifier. By observing the splitting rules at each levelof a decision tree, attackers can easily determine the decisionboundaries, and make corrections as sandboxes evolve.
Before creating our classifier, we focus on the carefulconstruction of our training and testing datasets. As describedin Section III-B, we collect data from three sources: Androidsandbox services, real user devices, and test devices from theservices Amazon Device Farm and Google Firebase Test Lab.For brevity, we will refer to these datasets as Dsand, Duser, andDbase, respectively. In order to create a classifier capable ofdetecting various kinds of sandbox environments, from cleanphysical devices to sophisticated commercial sandboxes, in thissection, we consider devices from Dbase to be sandboxes.
To create our training dataset, we randomly sample 200data points from Duser, and include 100 samples from bothDsand and Dbase. This produces a balanced training datasetconsisting of 400 total samples. We use the remaining samplesfrom all three datasets for testing, 408 positive samples and1,045 negative samples.
Using our compiled datasets, we evaluated the perfor-mance of a number of popular decision tree-based machinelearning algorithms including: Decision Trees, Random Forest,Gradient Boosting, and Adaptive Boosting. We found thatGradient Boosting provided us with the greatest performance,while still keeping the beneficial properties of decision trees
we described earlier. Gradient boosting improves upon basicdecision trees by iteratively constructing trees that improveupon the weaknesses of the previous tree. This increases theoverall performance without increasing the implementationcomplexity. Using a grid search, we find that creating a forestof 53 trees with a learning rate of 0.1 and maximum treedepth of 13, leads to the most optimal performance. Finally, wefocus our attention on optimizing our classifier for a low false-negative rate. Such misclassifications can be extremely costlyfor malware, as displaying malicious behavior in a sandboxenvironment will lead to detection by antimalware servicesand subsequent removal from application marketplaces.
We examine the features used by each of the trees in ourclassifier in Table III and find that, out of the top 20 mostcommonly used, 13 belong to the Wear-and-Tear category. Thehigh representation of wear-and-tear features in our classifierdemonstrates the classification power of these often overlookedaspects of the Android environment. Our classifier does notrely on a small group of “red-pill” features to determine thepresence of an emulated or otherwise artificial device. Thisadds to the robustness of our classifier compared to prior workas patches to singular API values will not be enough to bypassdetection.
B. Evaluation
We evaluate our classifier on the testing set previouslydescribed. Our classifier achieves an accuracy score of 98.54%,false-positive rate of 1.58%, and false-negative rate of 0.57%.In total, our classifier produces one false negative, originatingfrom Dsand. Further, our classifier produced a 10-fold crossvalidation score of 99.27% using the same testing dataset.
Figure 6 shows the Receiver Operating Characteristiccurves for our classifier tested on both a balanced (1:1 real-device to sandbox ratio) and un-balanced (99:1 real-device tosandbox ratio). We note that in the real world, mobile malwareis likely to encounter a much greater number of real Androiddevices than mobile sandboxes. We therefore report the per-
7

TABLE III: The 20 most important features to our classifier based onthe percentage of trees that rely on each. W&T, DH, and DC representWear-and-Tear, Device Hardware, and Device Configuration artifacts,respectively.
Category Feature % of TreesW&T Process numProcesses 88.7%W&T Photos numPics 83.0%W&T Calendar numOwner 75.5%W&T Calendar numCalendars 73.6%W&T Contacts numContacts 71.7%DH GyroscopeSensorReadings 64.2%DC Device UpTime 64.2%W&T Contacts numVisible 62.3%DC StayOnWhilePluggedIn 52.8%W&T numWifiConfigurations 45.3%DH DeviceTemperatureSensorReadings 45.3%W&T ArpCacheSize 45.3%W&T Events avgEventLen 41.5%W&T Contacts numWithNumber 41.5%DH Sensor proximity 39.6%W&T Events numTentative 37.7%DH LightSensorReadings 35.9%DC DeviceRooted 35.9%W&T Photos avgPicOrientation 18.9%W&T Contacts numWithPhoto 18.9%
0.000 0.005 0.010 0.015 0.020 0.025 0.030False Positive Rate
0.85
0.90
0.95
1.00
True
Pos
itive
Rat
e
1:1 Ratio99:1 Ratio
Fig. 6: Receiver-Operator Characteristic Curves of our mobilesandbox classifier tested on datasets with a 1:1 and 99:1 real-deviceto sandbox ratios
formance of our classifier on an un-balanced dataset to reducespatial bias in our experimental outcomes [50]. We find that inboth cases, our classifier is able to effectively differentiate realAndroid environments from artificial environments created bysandbox services, as it can achieve a true positive rate of over99% with a false positive rate of below 3%.
An important property of mobile sandboxes is that theycan constantly evolve to prevent evasion. Thus, quirks whichcurrently betray the nature of the sandbox are not guaranteedto exist in the future. To ensure our classifier does not overfiton a small subset of powerful features, we study the decayof model performance as we iteratively remove the mostimportant features. We determine the importance of eachfeature to the performance of our classifier by iterativelyremoving each feature, retraining, and evaluating the resultingperformance. We then rank the importance of each feature bythe performance dropoff of the classifier when that feature wasomitted. Figure 7 shows the decrease in accuracy as well asincrease in false positive and negative rates as features are
Features Dropped
0.9
1.0
0 20 40 60 80Features Removed
0.0
0.1
0.2
Accuracy False Positive Rate False Negative Rate
Fig. 7: Drop-off in classifier performance when removing the mostimportant feature and re-training.
removed. We observe that even after removing the top 60features, the accuracy of our classifier remains above 95%,only severely dropping once over 70 features are removed.This shows how our classifier does not rely on a small groupof powerful features, but rather the entire ensemble of featuresas a whole.
We also record the performance of our classifier whenisolating each of the three identified feature groups. This allowsus to determine which specific areas sandbox services failin their emulation of real Android devices. Table IV showsthe performance of the feature groups: wear-and-tear, device-hardware properties, and device-configuration properties, asdescribed in Section III-A.
We find that for the task of sandbox detection, deviceconfiguration and wear-and-tear artifacts perform the greatest,while a model using only device-hardware properties, thoughstill powerful, exhibits a 2×-6× more false positives, com-pared to the other models. When isolating only wear-and-tear artifacts, our classifier achieves an accuracy of 97.9%.Similarly, when using only device configuration artifacts suchas the state of device settings like WiFi and Bluetooth, ourclassifier achieves an accuracy score of 98.7%. As these twogroups account for 62 features, the lack of attention to detailby sandbox services here means attackers can create powerfuland robust classifiers to effectively evade detection by theseservices.
Finally, we measure the performance of our classifierwhen tested on devices of different ages and price ranges. Todetermine performance by device age, we divide our testingdataset into three groups: devices released before 2015, devicesreleased between 2015 and 2018, and devices released after2018. Additionally, to determine performance by device price,we divide our testing dataset into three additional groups:devices costing less than $250, devices costing between $250and $750, and devices costing over $750. Note: we labeleach device by the release MSRP in US Dollars. We observein Table V that the performance of our classifier does notdrastically change when encountering devices of these groups.This demonstrates that while Android device hardware andsoftware changes over time and among different price ranges,the magnitude of these changes is not large enough to affectthe environment differences between real devices and mobilesandboxes.
8

TABLE IV: Classifier performance when trained on artifact groupsin isolation (FPR = False Positive Rate, FNR = False Negative Rate).
Artifact Type #Artifacts Accuracy FPR FNRDevice Hardware 19 91.8% 5.1% 3.06%Device Config. 21 98.7% 0.58% 0.73%Wear-and-Tear 41 97.9% 0.87% 1.17%
TABLE V: Classifier performance when tested on devices of differentages and price ranges. We consider a device to be old if it wasreleased prior to 2015, intermediate if it was released between 2015and 2018, and new if it was released any time after 2018.
Device Age Accuracy FPR FNROld 100.00% 0% 0%Intermediate 94.8% 6.3% 0%New 99.3% 0.8% 2.6%Device Price Accuracy FPR FNR$0-$249 99.58% 0.44% 0%$250-$749 95.54% 4.25% 5.45%$750-$1,000 100% 0% 0%
Minimizing the number of requested permissions
Android malware is limited in its stealthiness compared toits desktop counterparts due to the fact that security-sensitiveoperations such as accessing certain APIs is blocked by theAndroid permission system. Any application that requiresaccess to such functionality needs to declare the necessarypermissions in the manifest file. This can lead to suspicionby malware scanners if too many sensitive permissions arerequested. Moreover, Android permissions are divided into twomain categories: install-time and runtime permissions. Androidinstall-time permissions are listed in the manifest file, and aregranted at install-time. Runtime permissions are also listed inthe manifest, but prompt the user for further confirmation whenthe sensitive action is invoked. Depending on the declarednature of the app, these prompts could lead to the maliciousbehavior of the application being discovered (e.g. a weatherapplication suddenly requesting access to the user’s contactlist). Therefore, it is in the best interest of the attacker to onlyrequest the permissions required for the malicious activities.
Figure 8 lists the permissions that our Android agentrequests along with the number of features which rely on eachpermission. The features we use in our classifier extend acrosssix different permission groups. We determine the dropoff inclassifier performance when removing requested permissionsby dropping features associated with each permission, retrain-ing our classifier, and evaluating its new performance. We findthat when using only features that either do not need explicitlystated permissions, or only require an install-time permission,our classifier still achieves an accuracy score of 99.08%, a falsepositive rate of 0.44%, and a false negative rate of 0.73%.Restricting a classifier to these features would, at the timeof this writing, allow an attacker to reliably evade Androidmalware analysis systems without the need to include anyadditional permissions other than what is required for the de-sired malicious actions. By not requiring runtime permissions,malware can stealthily determine the current environment.Moreover, as the false negative rate remains low, attackers canbe confident that a negative classification is correct and won’tinadvertently give away the application’s malicious behavior.
0 5 10 15 20 25 30 35Number of Features
None
READ_CALENDAR
ACCESS_WIFI_STATE
READ_CONTACTS
READ_EXT_STORAGE
READ_USER_DICTIONARY
Perm
issi
on
InstallRuntime
Fig. 8: Number of artifacts collected by our Android client brokendown by the permissions required to access each.
V. DEVICE MANUFACTURER CLASSIFICATION
In the previous section, we showed how various aspects ofAndroid mobile devices can be used to differentiate betweenreal and sandbox environments. We discovered that sandboxproviders do not effectively emulate all aspects of real Androidmobile devices and, therefore, attackers can create powerfuland robust classifiers to evade detection. In this section, weexplore discrepancies involving the reported manufacturer ofmobile devices to determine if characteristics of the environ-ment do not align with what is reported by the device.
We focus on a subset of artifacts of those listed in Sec-tion III-A that represent Android devices independent of theactions of users, and can provide insight into the device’smanufacturer. We then show how we can use these artifactsto create machine-learning classifiers specific to each devicemanufacturer. Lastly, we demonstrate how attackers can usethese classifiers as an additional side-channel in determiningthe presence of a sandbox by examining discrepancies intheir output compared to the manufacturer reported by thedevice. Effectively, we investigate whether a sandbox can bediscovered, not because it looks like other sandboxes (in termsof its artifacts) but because it does not look like a device fromthe manufacturer (e.g. Samsung, LG, etc.) that it claims to be.
A. Device Hardware Properties
Due to their form-factor and locked-down nature, mobiledevices are typically limited to the hardware chosen by themanufacturer, with few options for user customizability. Thus,a particular Android device model will always have thesame hardware configuration, regardless of the user. More-over, hardware configurations amongst device models of thesame manufacturer will likely remain consistent. Therefore, ifsandbox services do not pay attention to details such as these,attackers who are aware of typical hardware configurations ofa particular manufacturer can use these discrepancies to evadethe sandbox.
As we described in Section III-A, we define device hard-ware configuration as the set of artifacts which correspondto specialized hardware components. This hardware includesenvironment sensors (e.g. light and gravity sensors), healthtrackers (e.g. heart rate and step counters), and communicationmodules (e.g. WiFi radios). In Section III-D, we exploredthe unique hardware configuration distributions between Duser,
9

LGE Samsung Sony Asus Google Xiaomi Huawei Lenovo HTCDevice Manufacturer
50
100
150
200
250
300
350
# Sy
stem
Pac
kage
sBaseline Sandbox
Fig. 9: Distribution of system image packages in real Android devicescompared to mobile sandboxes.
Dbase, and Dsand and showed the divide between these groupsin Figure 4. Among others, we discovered that device statistics,such as, the number of each kind of environment sensors andconfiguration options of communication modules, can varydrastically from manufacturer to manufacturer. Additionally,this information from the hardware specifications can beacquired by attackers stealthily as they require no runtimepermissions.
B. Quantifying Device Bloat
Operating system bloat is a trend common to many popularAndroid mobile devices. Manufacturers pre-load their deviceswith a tailored Android distribution containing extra, oftenundesired, software packages. This software, referred to asbloatware, is commonly bound to the device and cannot beeasily removed. Different manufacturers will include variousamounts of bloatware onto the system images of devices theysell. By studying the bloatware included by each manufacturer,we can determine the expected size, in number of includedpackages, of each manufacturer’s system image.
We collect the number of packages on the image of eachAndroid device by counting the number of entries in their/system/app and /system/priv-app directories. Asdescribed in [35], packages in these directories are pre-installedon the system image, whereas applications installed by usersare located in /data/app. It should be noted that not allpackages in these directories are stand-alone applications.Rather, many execute as background processes related to theoperating system. We count all entries regardless of whetherthey are stand-alone applications as even packages providingbackground services can be linked to manufacturer bloatware.
Figure 9 shows the distributions of pre-installed packagesfor each device manufacturer observed in both Dbase and Dsand.We can see that in the case of all manufacturers, real devicesin our dataset have significantly more pre-installed packagesthan sandbox devices supposedly of the same manufacturer. Inone specific scenario, a Google Pixel 3 XL running Android 9in Dbase contained 141 pre-installed packages, while the samepurported device running the same version of Android in Dsandonly had 82 pre-installed packages. This can be explained bysandbox providers stripping out unnecessary bloatware in anattempt to increase the performance of their sandbox. However,it is unlikely that a normal user will attempt to do the sameon their personal device. Therefore, attackers can use thisdiscrepancy to determine the presence of a sandbox.
0.0 0.2 0.4 0.6 0.8 1.00.0
0.2
0.4
0.6
0.8
1.0
True
Pos
itive
Rat
e
0.0 0.2 0.4 0.6 0.8 1.00.0
0.2
0.4
0.6
0.8
1.0
0.0 0.2 0.4 0.6 0.8 1.0False Positive Rate
0.0
0.2
0.4
0.6
0.8
1.0
LG Samsung Google Sony
Fig. 10: Receiver Operating curves for manufacturer-specific machinelearning classifiers performing on data collected from real Androiddevices (top), and mobile sandbox services (bottom).
C. Device Manufacturer Classifiers
So far, we demonstrated the differences in configurationsof device hardware and pre-installed software between realAndroid devices and mobile sandboxes. We now describe howattackers can use these artifacts to train manufacturer-specificmachine learning classifiers for the devices of top Androidmanufacturers, and show how their outputs can be used to pickup on discrepancies in sandbox environments for the purposeof evasion.
When deciding upon how to classify device manufac-turers, we chose to create an ensemble of classifiers, eachspecialized in detecting a particular manufacturer, rather thanone multiclass classifier. As the number of potential devicemanufacturers can be large, this can have a negative effecton the performance of such a classifier. Further, multipleindividual classifiers can allow attackers to specifically targetone or a small set of devices with greater precision.
To create manufacturer-specific classifiers utilizing the fea-tures previously described, we re-upload an augmented versionof our Android application to each of the identified sandboxservices, as well as Google Firebase and Amazon Test Lab.We configure our application to collect the total number ofsystem packages as opposed to the number of user installedpackages, as we did for the datasets discussed in Section IV.This allows us to observe the device bloat of Android devicemanufacturers rather than wear-and-tear artifacts produced byusers.
We assemble training and testing datasets by assigningdata points from Dbase corresponding to each manufacturer asthe positive data points, and all other samples from Dbase asnegative. Training datasets are created by randomly sampling75% of all given positive data points, and an equal number
10

TABLE VI: Percentage of samples from Android sandboxes inwhich the reported device manufacturer matches the output of ourmanufacturer classifier ensemble.
Sandbox Samples % Manufacturer MatchSandbox 1 16 100.0%Sandbox 2 4 100.0%Sandbox 3 4 100.0%Sandbox 4 36 25.0%Sandbox 5 36 20.0%Sandbox 6 64 14.3%Sandbox 7 60 11.1%Sandbox 8 8 0.0%
of negative data points. All remaining samples are consideredthe testing set for that manufacturer. Note that we do not trainclassifiers for device manufacturers for which we are lacking asufficient number of data points (at least ten total samples perdevice manufacturer in the training dataset). In total, we createfour datasets for popular device manufacturers and use the datafrom Dsand to determine how effective mobile sandboxes arein emulating real Android devices.
Using our compiled datasets, we train four Gradient Boostdecision tree classifiers, each optimized independently usingGrid Search. Figure 10 shows the performance of our clas-sifiers when testing on real Android device data and mobilesandbox data. We find that our classifier achieves consistentlygreater performance on data from real Android devices, whilesuffering on sandbox data. This, along with the device-specificfeature distributions in Figure 4 and Figure 9, demonstrates thatthe data originating from mobile sandbox services does notmatch the distributions of real Android devices from the man-ufacturers they claim to be. Intuitively, a lower performance byour device-specific classifiers on mobile sandbox data indicatesthat, due to the values of the features previously described inrelation to the expected distributions, the classifier determinedthe device was not of the reported manufacturer (leading toa “misclassification”). It is this discrepancy that attackers canleverage to determine the presence of a sandbox.
Furthermore, Table VI shows the performance of ourmanufacturer-specific classifiers on data from each of the sand-boxes that report using a device from the same manufactureras one of the classifiers in our ensemble. We anonymizethe sandbox names to prevent direct comparisons betweencommercial products. Here, a sandbox performs well if theclassifier for the manufacturer reported by the device outputsa positive label. In these cases, malware utilizing such aclassifier would conclude that they are executing on a realdevice and manifest their malicious behavior, allowing thesandbox to create a signature. Conversely, sandboxes with alow manufacturer-match percentage do not sufficiently emulatethe environments they claim to be. As such, using classifiersfrom our ensemble, attackers can observe the reported devicemanufacturer differing from that of the classifier output, andevade the sandbox. In our dataset, only three sandboxes achievea 100% manufacturer match rate, while one sandbox producesdiscrepancies in all samples.
To demonstrate how attackers can use both of our pro-posed classification methods (Sandbox classifier and Devicemanufacturer discrepancy) in tandem to evade mobile sandbox
TABLE VII: Verification of samples labeled as real devices (negativelabel) by classifier in Section IV.
Sandbox Classifier Manufacturer Discrepancy?Output Samples Yes NoTrue Negative 378 0 378False Negative 1 1 0
environments, we verify all samples classified as real mobiledevices in Section IV. The idea is that the attacker will usethe device discrepancy model after the first classifier on non-sandbox classifications to further reduce the false negatives andensure that malware does not execute inside of a sandbox. Tosimulate this two-step evasion strategy, we pass the subset ofthe samples which report a device manufacturer matching oneof our classifiers in our ensemble and determine the updatedoutput. We focus on the samples labeled as real devices byour classifier in Section IV as these could be false negatives.Additionally, we remove the system package count featurefrom our manufacturer classifiers as the data from Section IVcontains the number of user-installed packages. Instead wefocus only on the device hardware properties as these featuresare consistent between both datasets.
In total, we verify 379 negative samples from Section IVwhose reported manufacturer is one of the four popular manu-facturers we created classifiers for, out of 1,019 total negatives.Of these samples, 378 were true negatives and 1 was a falsenegative from the first classifier. Table VII lists the resultsof this verification. We find that none of the true negativeshad a discrepancy between the output of our manufacturerclassifiers and the manufacturer reported by the device, whilethe single false negative was corrected. From the perspectiveof an attacker, preventing false negatives is more importantthan reducing false positives as mislabeling a sandbox as areal device can lead to detection and prompt removal fromapplication marketplaces.
In summary, we conclude that it is not sufficient to patchindividual Android APIs to return believable values in isolationwhen constructing a malware sandbox and the relationship be-tween API values and device model is an important factor. Thisdetail has been overlooked by the majority of sandboxes in ourdataset. Our ensemble of manufacturer-specific classifiers isable to effectively identify Android devices of particular man-ufacturers using only their unique sensor configurations. Thedecrease in performance observed when testing on data frommobile sandboxes demonstrates that while sandboxes mayidentify themselves as a device of a particular manufacturer,their reported hardware configurations do not support thoseclaims. This discrepancy, along with any other environmentdiscrepancies, is enough for attackers to detect the sandboxand evade analysis.
VI. DISCUSSION
In this section, we discuss our main findings, theenvironment-related weaknesses of current Android sandboxes,and suggest improvements to build sandbox environments thatare more resilient to evasion. Additionally, we discuss thedisclosure of our findings to sandbox services.
11

A. Weakness of Android Sandbox Services
Our work has shed light onto the shortcomings of mobilesandboxes in emulating the full Android environment. Westress that when creating a mobile sandbox, attention to smalldetails is of critical importance. More specifically, contrary todesktop sandboxes, we demonstrate that it is not sufficient topatch individual APIs and the whole environment should matchthe details of the claimed device manufacturer and model.While we find some sandboxes are successful in emulatingthe hardware of real Android devices, usage-based artifactsstill allow for the effective differentiation between artificialand real Android devices.
Due to this, we were able to train a machine learn-ing classifier capable of differentiating real Android devicesfrom sandboxes with 98.54% accuracy. More importantly, ourclassifier achieved a false negative rate of 0.57%, meaningmalware utilizing similar techniques could evade the existingcommercial and state-of-the-art sandboxes (including Virus-Total and Google PlayStore) with a very low probability ofdetection. Furthermore, we trained an additional ensemble ofmachine learning classifiers, each specialized to detect Androiddevices of a particular manufacturer. We demonstrated how wecould use these classifiers to verify the results of our mainclassifier, effectively eliminating false negatives. Our findingsreinforce the fact that if mobile sandboxes do not pay therequired attention to every small detail of real Android devices,attackers can bypass their analysis.
B. Mitigations
Effective emulation of any computer system is not a trivialtask. Attempting to do so for the purposes of malware analysiswill undoubtedly lead to mistakes which attackers can use toevade detection. We therefore suggest mobile sandbox servicesutilize real Android devices rather than emulators. This, alongwith populating devices with usage-based artifacts to simulatereal use will significantly raise the bar for attackers. Servicessuch Google Firebase Test Lab and Amazon Device Farm haveshown that large-scale application testing on physical devicescan be achieved. However, cost may still be a limiting factorfor smaller sandbox services.
An alternative method for improving mobile sandboxeswhile maintaining use of emulators, would be to constantlymonitor the artifacts that malware collect and dynamicallyreturn realistic values to these queries. While this well-knownpractice is already employed by antimalware engines, ourresults show a gap between malware capabilities and existingdefensive mechanisms when it comes to sandbox evasion.Nevertheless, the inherent limitations of this arms race ulti-mately leads to evasion techniques as sandbox services wouldconstantly remain a step behind malware in determining whichartifacts are of the most interest to attackers.
Our results demonstrate the power of usage-based artifactsin sandbox detection. Table III shows that 13 of the top20 most important features to our classifier correspond toartifacts of real device usage. Sandbox providers must ensurethey accurately model this aspect of the Android mobileenvironment to match the distributions of real user devices.In Section III-B, we show that crowd-sourcing can be used
to collect usage statistics on a wide variety of real Androiddevices. Sandbox providers and application marketplaces canuse such techniques to constantly generate up-to-date usagestatistics to construct more realistic sandbox environments.
Prior work in the area of adversarial machine learning hasshown that small-magnitude perturbations added to the trainingdatasets of deep neural networks can result in significantclassification errors [32]. These malicious data points aretypically generated by attackers with Generative AdversarialNeural Networks (GANNs) that learn based off of the behaviorof the targeted neural network. In the case of sandbox evasionthat we demonstrate in this paper, attackers create machinelearning classifiers using data generated from trusted sourcessuch as physical Android devices and online sandboxes. Thus,sandbox providers who may utilize adversarial machine learn-ing techniques to bypass sandbox evasion classifiers wouldsimply be generating data that matches the distribution of realAndroid devices. We leave investigation into the use of suchtechniques to generate realistic Android device usage data tofuture work.
C. Limitations
Even though our work has uncovered valuable insightsinto the current state of mobile sandboxes and the weaknessesthereof, it is not without limitations. One limitation is dueto the size of our real device dataset, Duser. In total, wecollected data on 1,245 real Android devices from users fromour institution as well as crowd sourcing on the Microworkersplatform. While this dataset was sufficient in discoveringartifacts of use in mobile devices, an even larger dataset wouldallow us to discover differences in artifact distributions acrossvarious populations (e.g. explore country-specific trends).
However, crowd-sourcing large, representative datasets isnot a trivial process. We encountered issues performing ourstudy on certain large crowd-sourcing platforms, due to theservices’ policy restricting the installation of software onworkers’ devices.
In order to preserve the privacy of participants in our study,we limit the artifacts we collect to only those that are statisticalin nature. Since attackers are not limited in such ways, weexpect malware utilizing evasion techniques such as those wepresented to be even more effective. For instance, the analysisof package names and installation dates, or contact names andphone numbers is likely to result in even stronger classifiers.Although we did not include these types of features in ourstudy, they serve as examples of minute details that attackerscan and will use to evade analysis.
Lastly, this paper focuses on mobile-sandbox evasion onthe Android platform. Previous work has demonstrated thatenvironment-based artifacts can be used to track iOS users,similar to how device fingerprinting can be used to track webusers [44]. Though we anticipate that the general concept ofdifferentiating between users and sandboxes via environmentartifacts will apply equally well to the iOS ecosystem, we leavethe actual evaluation to future work.
12

D. Ethical Considerations
When developing and testing our Android sandbox de-tection techniques, we opted to create a machine learningclassifier completely external to the Android application usedto collect data. This approach, modeled after Miramirkhani etal. [48], allows us to collect data once from sandbox providers,and test various classifier hyperparameters without resubmit-ting our application, reducing strain on sandbox resources.Additionally, embedding the classifier into the applicationwould require us to also package real malware to gauge realevasion success. As our application was submitted to popularAndroid marketplaces, we opted to remove the possibility ofharm to real users who may download our application.
E. Responsible Disclosure
Our research has presented the weaknesses of mobilesandboxes, allowing for malware to effectively bypass analysis.We are in the process of reaching out to all sandbox servicesthat we collected artifacts from and disclosing our findings. Wehope that by doing so, sandbox services will begin to patchthe artifacts which we currently use in our machine learningclassifiers.
VII. RELATED WORK
Sandboxes are a common means of dynamic malwareanalysis for both mobile and desktop. The described relatedwork includes the study of malware samples that detect andevade sandboxes, as well as the design of resilient sandboxenvironments.
Mobile malware detection and sandboxes Dynamic analysistechniques and sandboxes are commonly used to study mobilemalware [23], [26], [36], [64]. The sandbox environments thatwe studied in this paper include those from the academia [17],[61], commercial antimalware software [3]–[6], [8], [11], [12],[15], VirusTotal and popular Android application stores [1],[9], [16]. Unfortunately, many of the academic sandboxes areno longer maintained or available [30], [45], [57]. Neverthe-less, there is no reason why our approach would not apply tothose environments, given their described setup.
Mobile sandbox detection The main body of the work inthis area has mostly focused on identifying “red pills” totell real devices from sandboxes apart, that is, discoveringspecific API values and behaviors that can give away thepresence of an emulated environment [27], [34], [49], [51]–[53], [58]. Spreitzenbarth et al. propose a mobile sandboxarchitecture and evaluate it against a dataset of Androidmalware samples [53]. Similarly, Gajrani et al. study the stateof the art in emulator detection, and provide a pragmaticdesign of a sandbox environment based on emulators thatis resilient against identification based on common APIs andemulator detection methods [34]. Because of their focus onmasking specific API values, sensor readings and emulationdetection, their system would not be resilient against ourdetection scheme that focuses on artifacts of device usage.
Vidas et al. worked on the detection of mobile sand-boxes [58]. They propose detection mechanisms through adifference in the returned values of various Android APIs, sen-sors, and the detection of the underlying emulator hypervisor
itself through performance measurements. Along the same line,Petsas et al. incorporate the static properties, dynamic sensorinformation and VM-related intricacies (QEMU specific) todetect Android emulators [51]. The authors go as far asrepackaging a malware sample with their developed heuristicsand demonstrate their ability to bypass the 12 existing sandboxenvironments.
The goal of Spreitzenbarth and Vidas et al. is similar toours, but they focus on features that are specific to emulatedenvironments such as the hardware performance metrics andartificial or hardcoded values returned by Android APIs (e.g.,battery level, build information, etc.). Conversely, we do notfocus on making a distinction between real and emulatedenvironments. Rather, our focus is on the artifacts of realdevice usage compared to sandbox devices, regardless ofthem being based on a real or emulated setup. Moreover, wesystematically analyze a large number of APIs against sandboxand real user devices and build a model capable of detectingthe real usage of Android devices.
Costamagna et al. look at the returned value of certainAndroid APIs and check for the presence of static vs random-ized values [27]. Compared to our work, while a portion of theAPIs that we looked at is similar, we employ machine learningto model the distribution of values from these APIs on user(collected from real devices) versus sandbox devices.
Finally, Jing et al. proposed a framework to automaticallyextract heuristics to detect emulator-based Android environ-ments [39]. In their study, the authors compare emulator-basedAndroid sandboxes with real devices from online mobile testfarms, similar to our Dbase dataset. As a result, the focus oftheir work is to identify emulators in contrast to baseline realdevices and produce heuristics in the form of “Red Pills”.While their approach suffers from the use of real devices inonline sandboxes, in our study, we consider such devices assandboxes. Given the absence of wear-and-tear artifacts onDbase devices, our proposed classifiers mark them as sandboxeswith high accuracy.
Our approach focuses on the mobile environment as awhole, including information about the device itself as wellas user-specific attributes. We demonstrated that our classifierdoes not simply detect emulated devices, but is able to furtherdistinguish the minute differences between a device thoroughlyused by a real person, as opposed to an artificial sandboxenvironment. This significantly raises the bar for sandboxproviders who must account for a much larger set of featurescompared to the heuristics introduced in prior work.
Desktop sandboxes The area of desktop sandbox detectionand the study of evasive malware predates that of mobilesandbox detection and therefore has received more attention.Dynamic code analysis and use of sandbox environments [29],[31], [38], [42], [59], [60], [62] as well as evasive malware hasbeen studied in [24], [41], [46]. Similarly, system configurationof the target system and its usage in sandbox detection has beenthe topic of significant study [19], [20], [28], [48], [63].
Most notably, Miramirkhani et al. have looked at deviceusage artifacts on desktop environments and showed thatthey can be used to identify desktop sandboxes with highaccuracy [48]. They incorporate information from different
13
parts of the system, network, disk, browser, and registry (whichthey call wear-and-tear artifacts) to build a statistical model ofexisting sandboxes. Our work is similar to theirs in that weboth incorporate usage-related artifacts to train ML models ofnormal vs. sandboxed environments. The main distinction ofour work apart from our focus on a different platforms (i.e.mobile instead of desktop), is our effort to train manufacturer-specific ML models. Namely, we showed that attackers cancapitalize on the fact that mobile devices from the samemanufacturer share similar hardware and bloat, by trainingmanufacturer-specific models to increase the accuracy of theirclassification and therefore their ability to evade sandboxes.
VIII. CONCLUSION
In this work, we explored the concept of “environment-aware” sandbox evasion where attackers can leverage artifactspresent in mobile devices, to differentiate between executionsin real-user devices and those in sandboxes. By analyzing tensof artifacts and their distributions, we were able to identifyexactly where and how sandboxes fail in their emulation ofreal Android environments. We showed how attackers canstraightforwardly use these artifacts to train a classifier capableof differentiating between artificial and real Android environ-ments with 98.54% accuracy and a 0.57% false-negative rate.These results demonstrate that such a model can be used bymalware to hide their activity in the presence of a sandbox,leading to a longer lifetime and greater inflicted damage uponusers and systems.
To reinforce our mobile-sandbox classifier, we used devicehardware configuration artifacts to create an ensemble ofmanufacturer-specific classifiers, each trained to detect devicesof a particular manufacturer (such as, Samsung and LG).We showed that these classifiers can uncover discrepanciesbetween the stated environment vs. the actual environmentin sandboxes and can be combined with the mobile-sandboxclassifier to dramatically reduce false negatives.
Our results demonstrate that mobile sandboxes are not ef-fectively emulating real mobile-device environments, allowingmobile malware to bypass analysis. While some sandboxeshave glaring weaknesses leading to trivial evasions, the major-ity simply overlook small details. However, these details are allthat is necessary for malware to detect artificial environments.We hope that our work can provide valuable insights intothe weaknesses of mobile sandboxes and can help strengthenthese services against future generations of environment-aware,mobile malware.
Availability In an effort to strengthen the security of theAndroid ecosystem, we will release our dataset of real An-droid device artifacts to sandbox services and security re-searchers, along with our trained models. We expect that ourdataset will enable sandbox services to create more realisticexecution environments with manufacturer-specific, artifactdistributions. All supplementary materials can be found athttps://droid-in-the-details.github.io.
Acknowledgments: We thank the anonymous reviewers fortheir helpful feedback. This work was supported by the Officeof Naval Research (ONR) under grants N00014-20-1-2720and N00014-21-1-2159, as well as by the National ScienceFoundation (NSF) under grants CMMI-1842020 and CNS-2126654.
REFERENCES
[1] Amazon app store. https://developer.amazon.com/apps-and-games.
[2] Aws device farm. https://aws.amazon.com/device-farm.
[3] Bitdefender antivirus. https://www.bitdefender.com/consumer/support/answer/40673/.
[4] Comodo antivirus. https://www.comodo.com/home/internet-security/submit.php.
[5] Drweb antivirus. https://vms.drweb.com/sendvirus/.
[6] escan antivirus. http://support.mwti.net/support/index.php?/Tickets/Submit.
[7] Firebase. https://firebase.google.com.
[8] Gdata - mobile security for android. https://su.gdatasoftware.com/us/sample-submission/.
[9] Google play store. https://play.google.com/store.
[10] ios appstore. https://www.apple.com/app-store/.
[11] Joesandbox cloud. https://www.joesandbox.com/.
[12] Kaspersky - threat intelligence portal. https://opentip.kaspersky.com/.
[13] Microworkers. https://microworkers.com.
[14] Mobile operating systems’ market share worldwide from jan-uary 2012 to june 2021. https://www.statista.com/statistics/272698/global-market-share-held-by-mobile-operating-systems-since-2009/.
[15] nviso antivirus. https://apkscan.nviso.be.
[16] Samsung galaxy app store. https://www.samsung.com/us/apps/galaxy-store/.
[17] Sanddroid - an automatic android application analysis system. http://sanddroid.xjtu.edu.cn/.
[18] scikit-learn. https://scikit-learn.org/stable/.
[19] A. singh, defeating darkhotel just-in-time decryption. https://labs.lastline.com/defeating-darkhotel-just-in-time-decryption, 2015.
[20] Proofpoint, ursnif banking trojan campaign ups the ante with new sand-box evasion techniques. https://www.proofpoint.com/us/threatinsight/post/ursnif-banking-trojan-campaign-sandbox-evasiontechniques, 2016.
[21] Number of apps available in the google playstore andios app store. https://www.statista.com/statistics/276623/number-of-apps-available-in-leading-app-stores, 2020.
[22] Yousra Aafer, Wenliang Du, and Heng Yin. Droidapiminer: Mining api-level features for robust malware detection in android. In Internationalconference on security and privacy in communication systems. Springer,2013.
[23] Vitor Afonso, Anatoli Kalysch, Tilo Muller, Daniela Oliveira, AndreGregio, and Paulo De Geus. Lumus: Dynamically Uncovering EvasiveAndroid Applications: 21st International Conference, ISC. 2018.
[24] Mohsen Ahmadi, Kevin Leach, Ryan Dougherty, Stephanie Forrest, andWestley Weimer. Mimosa: Reducing malware analysis overhead withcoverings, 2021.
[25] Daniel Arp, Michael Spreitzenbarth, Malte Hubner, Hugo Gascon,Konrad Rieck, and CERT Siemens. Drebin: Effective and explainabledetection of android malware in your pocket. In NDSS, 2014.
[26] Alexei Bulazel and Bulent Yener. A survey on automated dynamicmalware analysis evasion and counter-evasion: Pc, mobile, and web.In Proceedings of the 1st Reversing and Offensive-Oriented TrendsSymposium, ROOTS, 2017.
[27] Valerio Costamagna, Cong Zheng, and Heqing Huang. Identifying andevading android sandbox through usage-profile based fingerprints. InProceedings of the First Workshop on Radical and Experiential Security,RESEC, 2018.
[28] D Desai. Malicious documents leveraging new anti-vm & anti-sandboxtechniques, 2016.
[29] Artem Dinaburg, Paul Royal, Monirul Sharif, and Wenke Lee. Ether:malware analysis via hardware virtualization extensions. In Proceedingsof the 15th ACM conference on Computer and communications security,2008.
14

[30] Thomas Eder, Michael Rodler, Dieter Vymazal, and Markus Zeilinger.Ananas - a framework for analyzing android applications. InternationalConference on Availability, Reliability and Security, 2013.
[31] Manuel Egele, Theodoor Scholte, Engin Kirda, and ChristopherKruegel. A survey on automated dynamic malware-analysis techniquesand tools. ACM computing surveys (CSUR), 2008.
[32] Kevin Eykholt, Ivan Evtimov, Earlence Fernandes, Bo Li, Amir Rah-mati, Chaowei Xiao, Atul Prakash, Tadayoshi Kohno, and Dawn Song.Robust physical-world attacks on deep learning visual classification. InProceedings of the IEEE conference on computer vision and patternrecognition, pages 1625–1634, 2018.
[33] Adrienne Porter Felt, Matthew Finifter, Erika Chin, Steve Hanna, andDavid Wagner. A survey of mobile malware in the wild. In Proceedingsof the 1st ACM Workshop on Security and Privacy in Smartphones andMobile Devices, SPSM, 2011.
[34] Jyoti Gajrani, Jitendra Sarswat, Meenakshi Tripathi, Vijay Laxmi, M. S.Gaur, and Mauro Conti. A robust dynamic analysis system preventingsandbox detection by android malware. In Proceedings of the 8thInternational Conference on Security of Information and Networks, SIN,2015.
[35] Julien Gamba, Mohammed Rashed, Abbas Razaghpanah, Juan Tapiador,and Narseo Vallina-Rodriguez. An analysis of pre-installed androidsoftware. arXiv preprint arXiv:1905.02713, 2019.
[36] Le Guan, Shijie Jia, Bo Chen, Fengwei Zhang, Bo Luo, Jingqiang Lin,Peng Liu, Xinyu Xing, and Luning Xia. Supporting transparent snapshotfor bare-metal malware analysis on mobile devices. ACSAC, 2017.
[37] Matthias Hirth, Tobias Hossfeld, and Phuoc Tran-Gia. Anatomy ofa crowdsourcing platform - using the example of microworkers.com.pages 322 – 329, 08 2011.
[38] Xuxian Jiang and Xinyuan Wang. “out-of-the-box” monitoring of vm-based high-interaction honeypots. In International Workshop on RecentAdvances in Intrusion Detection. Springer, 2007.
[39] Yiming Jing, Ziming Zhao, Gail-Joon Ahn, and Hongxin Hu. Mor-pheus: automatically generating heuristics to detect android emulators.In Proceedings of the 30th Annual Computer Security ApplicationsConference, pages 216–225, 2014.
[40] Dhilung Kirat, Giovanni Vigna, and Christopher Kruegel. Barebox:efficient malware analysis on bare-metal. In Proceedings of the 27thAnnual Computer Security Applications Conference, 2011.
[41] Dhilung Kirat, Giovanni Vigna, and Christopher Kruegel. Barecloud:bare-metal analysis-based evasive malware detection. In 23rd USENIXSecurity Symposium, 2014.
[42] Alexander Kuchler, Alessandro Mantovani, Yufei Han, Leyla Bilge, andDavide Balzarotti. Does every second count? time-based evolution ofmalware behavior in sandboxes. In NDSS, 2021.
[43] Alexander Kuchler, Alessandro Mantovani, Yufei Han, Leyla Bilge, andDavide Balzarotti. Does every second count? time-based evolution ofmalware behavior in sandboxes. 2021.
[44] Andreas Kurtz, Hugo Gascon, Tobias Becker, Konrad Rieck, and FelixFreiling. Fingerprinting mobile devices using personalized configura-tions. Proceedings on Privacy Enhancing Technologies, 2016.
[45] M. Lindorfer, M. Neugschwandtner, L. Weichselbaum, Y. Fratantonio,V. v. d. Veen, and C. Platzer. Andrubis – 1,000,000 apps later: A viewon current android malware behaviors. In Third International Workshopon Building Analysis Datasets and Gathering Experience Returns forSecurity (BADGERS), 2014.
[46] Martina Lindorfer, Clemens Kolbitsch, and Paolo Milani Comparetti.Detecting environment-sensitive malware. In International Workshopon Recent Advances in Intrusion Detection. Springer, 2011.
[47] L. Liu, Y. Gu, Q. Li, and P. Su. Realdroid: Large-scale evasivemalware detection on ”real devices”. In 26th International Conferenceon Computer Communication and Networks (ICCCN), 2017.
[48] N. Miramirkhani, M. P. Appini, N. Nikiforakis, and M. Polychronakis.Spotless sandboxes: Evading malware analysis systems using wear-and-tear artifacts. In IEEE Symposium on Security and Privacy (SP), 2017.
[49] Sebastian Neuner, Victor van der Veen, Martina Lindorfer, MarkusHuber, Georg Merzdovnik, Martin Mulazzani, and Edgar Weippl.Enter sandbox: Android sandbox comparison. arXiv preprintarXiv:1410.7749, 2014.
[50] Feargus Pendlebury, Fabio Pierazzi, Roberto Jordaney, Johannes Kinder,and Lorenzo Cavallaro. {TESSERACT}: Eliminating experimental biasin malware classification across space and time. In 28th {USENIX}Security Symposium ({USENIX} Security 19), pages 729–746, 2019.
[51] Thanasis Petsas, Giannis Voyatzis, Elias Athanasopoulos, MichalisPolychronakis, and Sotiris Ioannidis. Rage against the virtual machine:Hindering dynamic analysis of android malware. In Proceedings of theSeventh European Workshop on System Security, EuroSec, 2014.
[52] Onur Sahin, Ayse K Coskun, and Manuel Egele. Proteus: Detectingandroid emulators from instruction-level profiles. In InternationalSymposium on Research in Attacks, Intrusions, and Defenses. Springer,2018.
[53] Michael Spreitzenbarth, Felix Freiling, Florian Echtler, ThomasSchreck, and Johannes Hoffmann. Mobile-sandbox: Having a deeperlook into android applications. In Proceedings of the 28th Annual ACMSymposium on Applied Computing, SAC, 2013.
[54] Guillermo Suarez-Tangil, Santanu Kumar Dash, Mansour Ahmadi,Johannes Kinder, Giorgio Giacinto, and Lorenzo Cavallaro. Droid-sieve: Fast and accurate classification of obfuscated android malware.CODASPY, 2017.
[55] Guillermo Suarez-Tangil and Gianluca Stringhini. Eight years of ridermeasurement in the android malware ecosystem. IEEE Transactions onDependable and Secure Computing, 2020.
[56] Kimberly Tam, Ali Feizollah, Nor Badrul Anuar, Rosli Salleh, andLorenzo Cavallaro. The evolution of android malware and androidanalysis techniques. ACM Computing Surveys (CSUR), 2017.
[57] Kimberly Tam, Salahuddin Khan, Aristide Fattori, and Lorenzo Cav-allaro. Copperdroid: Automatic reconstruction of android malwarebehaviors. In NDSS, 2015.
[58] Timothy Vidas and Nicolas Christin. Evading android runtime analysisvia sandbox detection. In Proceedings of the 9th ACM Symposiumon Information, Computer and Communications Security, ASIA CCS,2014.
[59] Carsten Willems, Thorsten Holz, and Felix Freiling. Toward automateddynamic malware analysis using cwsandbox. IEEE Security & Privacy,2007.
[60] Carsten Willems, Ralf Hund, Andreas Fobian, Dennis Felsch, ThorstenHolz, and Amit Vasudevan. Down to the bare metal: Using processorfeatures for binary analysis. In Proceedings of the 28th AnnualComputer Security Applications Conference, 2012.
[61] Lok Kwong Yan and Heng Yin. Droidscope: Seamlessly reconstructingthe OS and dalvik semantic views for dynamic android malwareanalysis. In 21st USENIX Security Symposium, 2012.
[62] Heng Yin, Dawn Song, Manuel Egele, Christopher Kruegel, and EnginKirda. Panorama: capturing system-wide information flow for malwaredetection and analysis. In Proceedings of the 14th ACM conference onComputer and communications security, 2007.
[63] Akira Yokoyama, Kou Ishii, Rui Tanabe, Yinmin Papa, Katsunari Yosh-ioka, Tsutomu Matsumoto, Takahiro Kasama, Daisuke Inoue, MichaelBrengel, Michael Backes, et al. Sandprint: Fingerprinting malwaresandboxes to provide intelligence for sandbox evasion. In InternationalSymposium on Research in Attacks, Intrusions, and Defenses. Springer,2016.
[64] Lun-Pin Yuan, Wenjun Hu, Ting Yu, Peng Liu, and Sencun Zhu.Towards large-scale hunting for android negative-day malware. In22nd International Symposium on Research in Attacks, Intrusions andDefenses (RAID), 2019.
15

IX. APPENDIX
Table VIII lists all the artifacts that we extract from mobileenvironments for the purpose of differentiating between userdevices and mobile sandboxes.
TABLE VIII: Full list of artifacts used in our mobile sandbox machine learning classifier.
Artifact Name Artifact Type Artifact Name Artifact TypeARP Root
arpCacheSize Numeric deviceRooted BinaryAccessibility Sensor
hasAccessibility Binary gyroscopeSensorReadings NumericCalendar lightSensorReadings Numeric
numCalendars Numeric deviceTemperatureSensorReadings NumericnumOwner Numeric numSensors NumericnumReadAccess Numeric gravity Numeric
Contacts gyroscope NumericlastCallTime Numeric heartBeat NumericnumContacts Numeric heartRate NumericnumCustomRingtone Numeric light NumericnumSentToVoicemail Numeric magnetic NumericnumStarred Numeric motion NumericnumTotalCalls Numeric accelerometer NumericnumVisible Numeric pressure NumericnumWithNumber Numeric proximity NumericnumWithPhoto Numeric stepCounter Numeric
Dictionary SettingsdictionarySize Numeric autoTime BinarydictionaryNumLocales Numeric autoTimeZone BinarydictionaryAvgFrequency Numeric bluetoothEnabled Binary
Device brightness NumericupTime Numeric brightnessMode NumericsdkVersion Numeric dataRoamingEnabled Binary
Events deviceProvisioned BinaryavgEventLen Numeric soundEffectsEnabled BinarynumAllDay Numeric stayOnWhilePluggedIn BinarynumCancelled Numeric usbMassStorageEnabled BinarynumConfirmed Numeric vibrateWhenRinging BinarynumEvents Numeric wifiOn BinarynumRecurring Numeric SongsnumTentative Numeric avgNumberSongs NumericnumWithAlarm Numeric avgYearLength NumericnumWithData Numeric numAlbums Numeric
Files numUniqueArtists NumericnumDocuments Numeric WifinumDownloads Numeric 5ghtzBandSupported Binary
PackageData deviceToApRTTSupported BinarynumPackages Numeric enhancedPowerRoutingSupported Binary
Photos networkOffloadSupported BinaryavgPicOrientation Numeric numWifiConfigurations NumericnumPics Numeric p2pSupported BinarynumPrivatePics Numeric scanAvailable Binary
Processes tdlsSupported BinarynumProcesses Numeric wifiEnabled Binary
RemindersavgMin NumericnumAlert NumericnumDefault NumericnumEmail NumericnumReminders Numeric
16